February 4, 2014 2014 Q1 Earnings Conference Call February 4, 2014
February 4, 2014 2 This presentation contains certain forward-looking statements that management believes to be reasonable as of today’s date only. Actual results may differ significantly because of risks and uncertainties that are difficult to predict and many of which are beyond management’s control. You should read UGI’s Annual Report on Form 10-K for a more extensive list of factors that could affect results. Among them are adverse weather conditions, cost volatility and availability of all energy products, including propane, natural gas, electricity and fuel oil, increased customer conservation measures, the impact of pending and future legal proceedings, domestic and international political, regulatory and economic conditions including currency exchange rate fluctuations (particularly the euro), the timing of development of Marcellus Shale gas production, the timing and success of our commercial initiatives and investments to grow our business, and our ability to successfully integrate acquired businesses and achieve anticipated synergies. UGI undertakes no obligation to release revisions to its forward-looking statements to reflect events or circumstances occurring after today. About This Presentation
February 4, 2014 John Walsh President & CEO, UGI Kirk Oliver Chief Financial Officer, UGI Jerry Sheridan President & CEO, AmeriGas
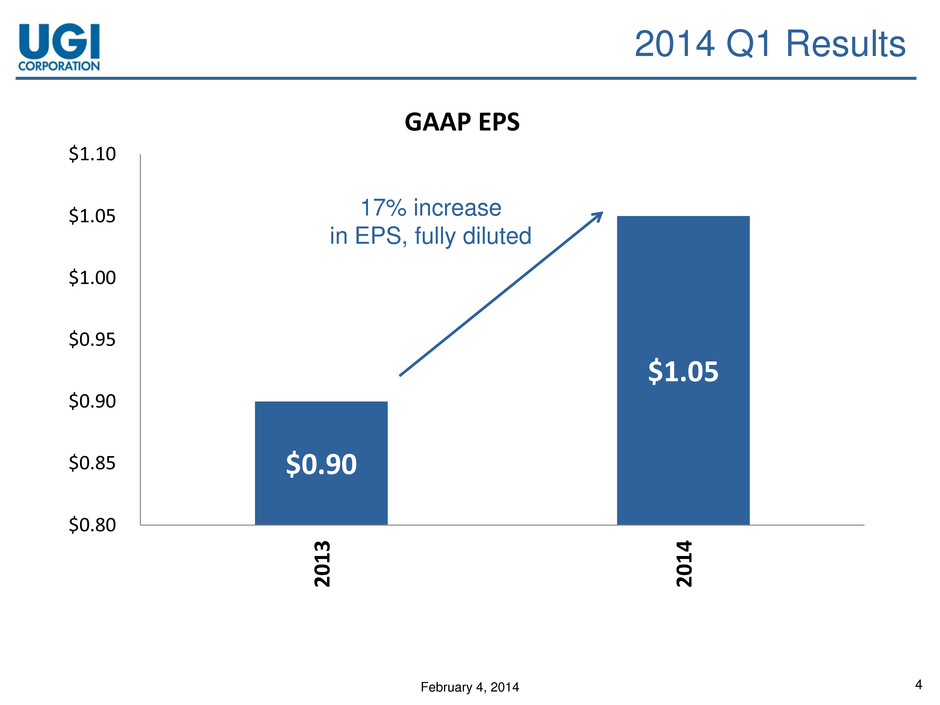
February 4, 2014 4 2014 Q1 Results $0.90 $1.05 $0.80 $0.85 $0.90 $0.95 $1.00 $1.05 $1.10 2 0 1 3 2 0 1 4 GAAP EPS 17% increase in EPS, fully diluted
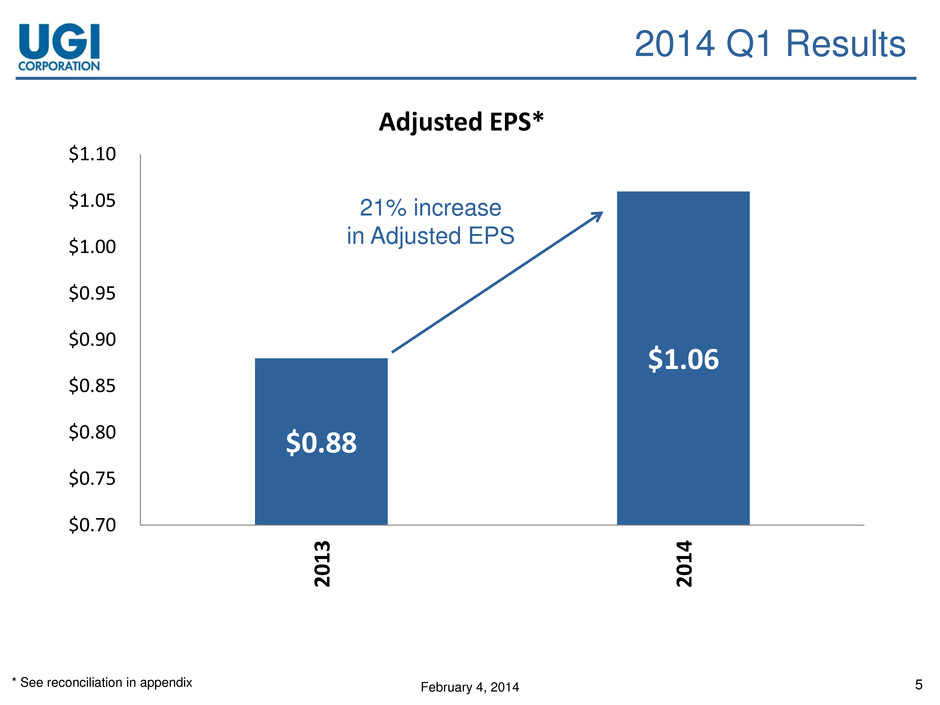
February 4, 2014 5 2014 Q1 Results $0.88 $1.06 $0.70 $0.75 $0.80 $0.85 $0.90 $0.95 $1.00 $1.05 $1.10 2 0 1 3 2 0 1 4 Adjusted EPS* * See reconciliation in appendix 21% increase in Adjusted EPS
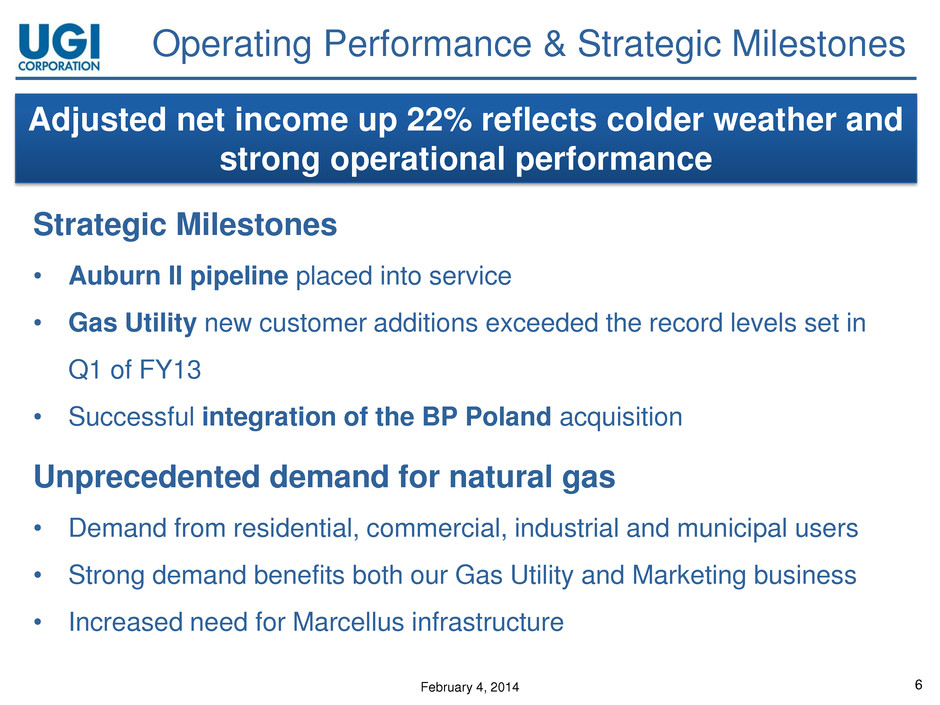
February 4, 2014 6 Operating Performance & Strategic Milestones Strategic Milestones • Auburn II pipeline placed into service • Gas Utility new customer additions exceeded the record levels set in Q1 of FY13 • Successful integration of the BP Poland acquisition Unprecedented demand for natural gas • Demand from residential, commercial, industrial and municipal users • Strong demand benefits both our Gas Utility and Marketing business • Increased need for Marcellus infrastructure Adjusted net income up 22% reflects colder weather and strong operational performance
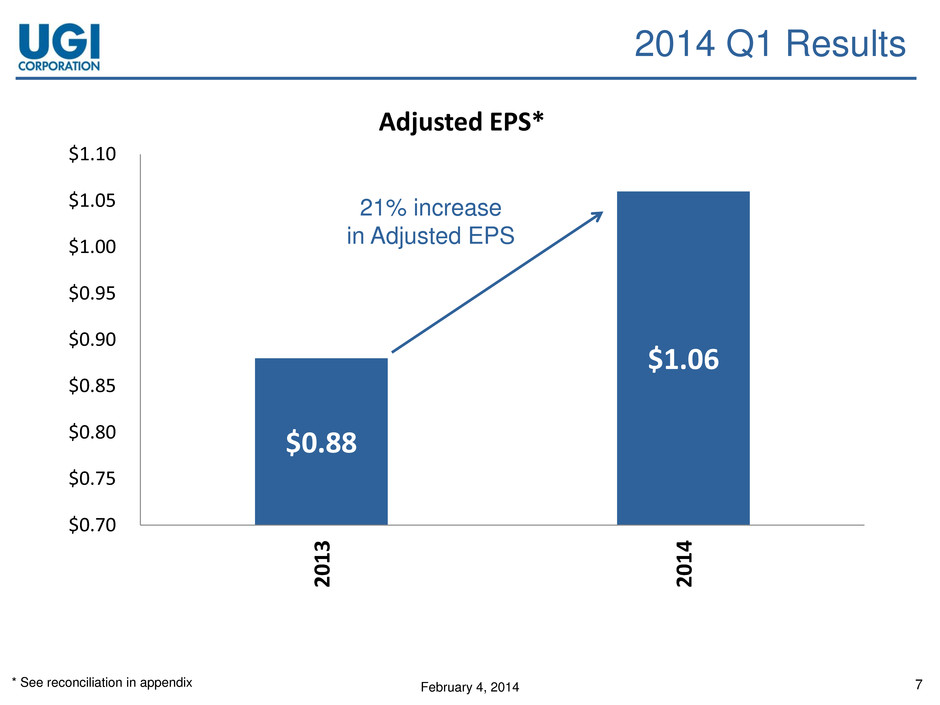
February 4, 2014 7 2014 Q1 Results $0.88 $1.06 $0.70 $0.75 $0.80 $0.85 $0.90 $0.95 $1.00 $1.05 $1.10 2 0 1 3 2 0 1 4 Adjusted EPS* * See reconciliation in appendix 21% increase in Adjusted EPS
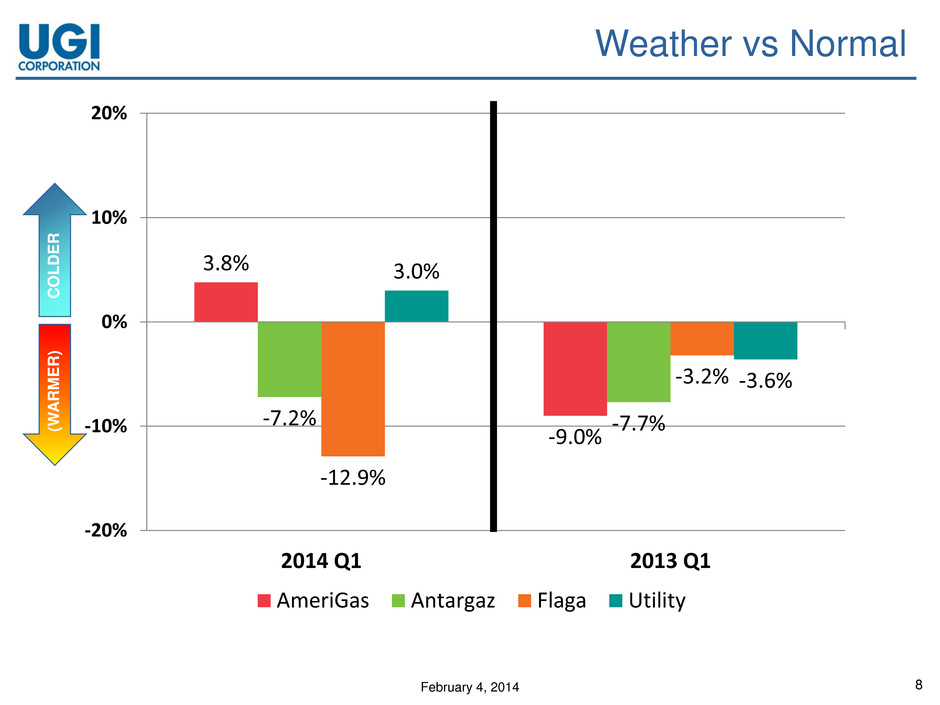
February 4, 2014 8 Weather vs Normal 3.8% -9.0% -7.2% -7.7% -12.9% -3.2% 3.0% -3.6% -20% -10% 0% 10% 20% 2014 Q1 2013 Q1 AmeriGas Antargaz Flaga Utility (W A R M E R ) COL D E R (W A R M E R )
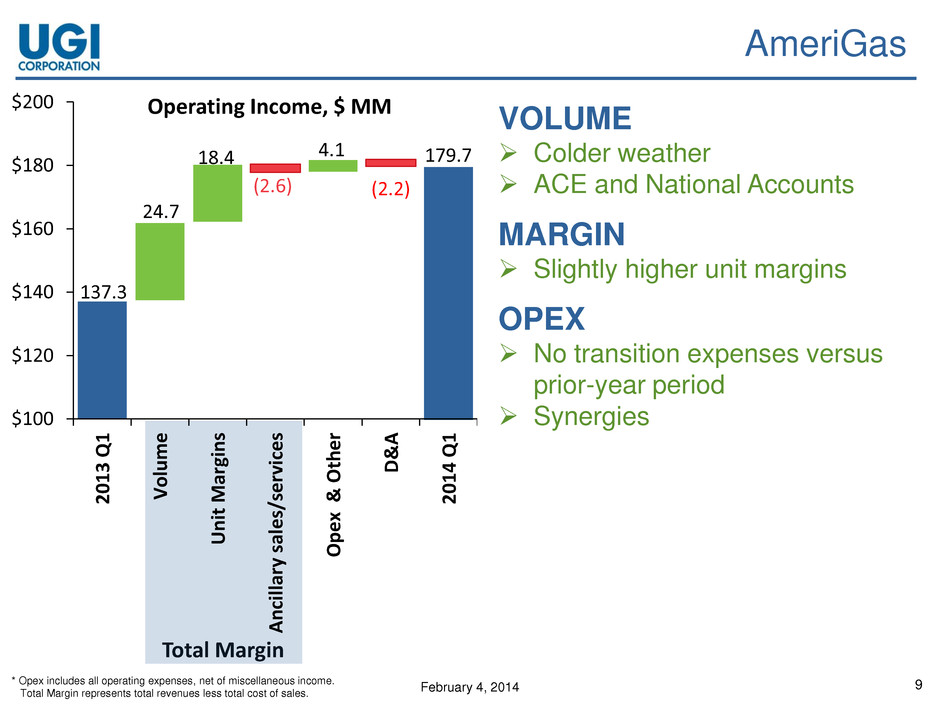
February 4, 2014 9 AmeriGas VOLUME Colder weather ACE and National Accounts MARGIN Slightly higher unit margins OPEX No transition expenses versus prior-year period Synergies Total Margin 179.7 24.7 18.4 (2.6) 4.1 (2.2) $100 $120 $140 $160 $180 $200 2 0 1 3 Q 1 V o lu m e U n it Mar gi n s A nc ill ar y sa les/ serv ic e s O p ex & O th e r D & A 2 0 1 4 Q 1 Operating Income, $ MM 137.3 * Opex includes all operating expenses, net of miscellaneous income. Total Margin represents total revenues less total cost of sales.
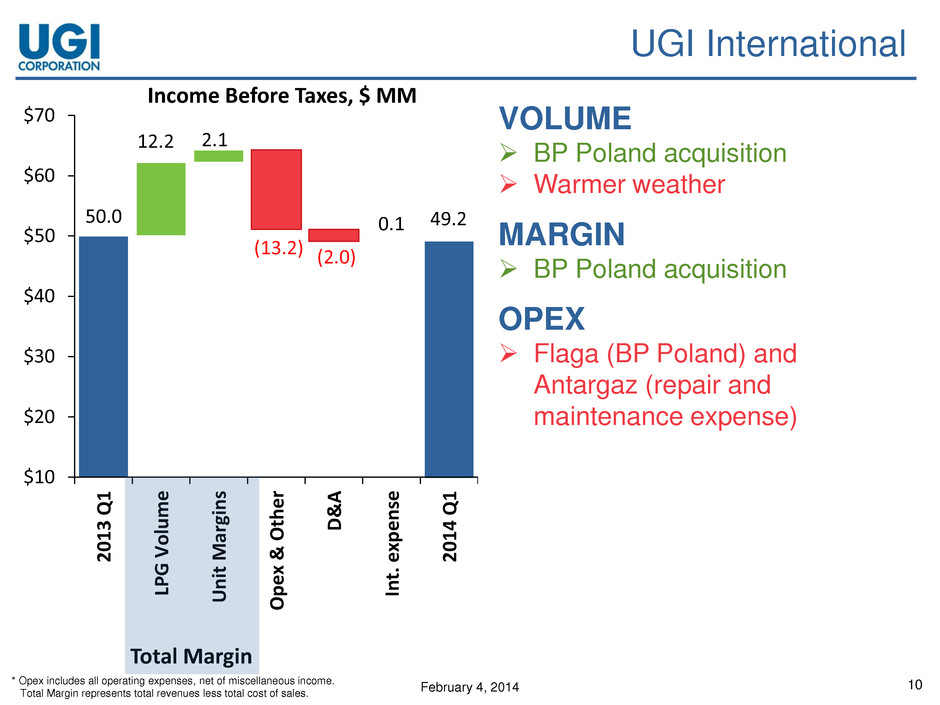
February 4, 2014 10 UGI International VOLUME BP Poland acquisition Warmer weather MARGIN BP Poland acquisition OPEX Flaga (BP Poland) and Antargaz (repair and maintenance expense) 12.2 2.1 (13.2) (2.0) 0.1 $10 $20 $30 $40 $50 $60 $70 2 0 1 3 Q 1 LPG V o lu m e U n it Mar gi n s O p ex & O th e r D & A In t. ex p e n se 2 0 1 4 Q 1 Income Before Taxes, $ MM Total Margin * Opex includes all operating expenses, net of miscellaneous income. Total Margin represents total revenues less total cost of sales. 49.2 50.0
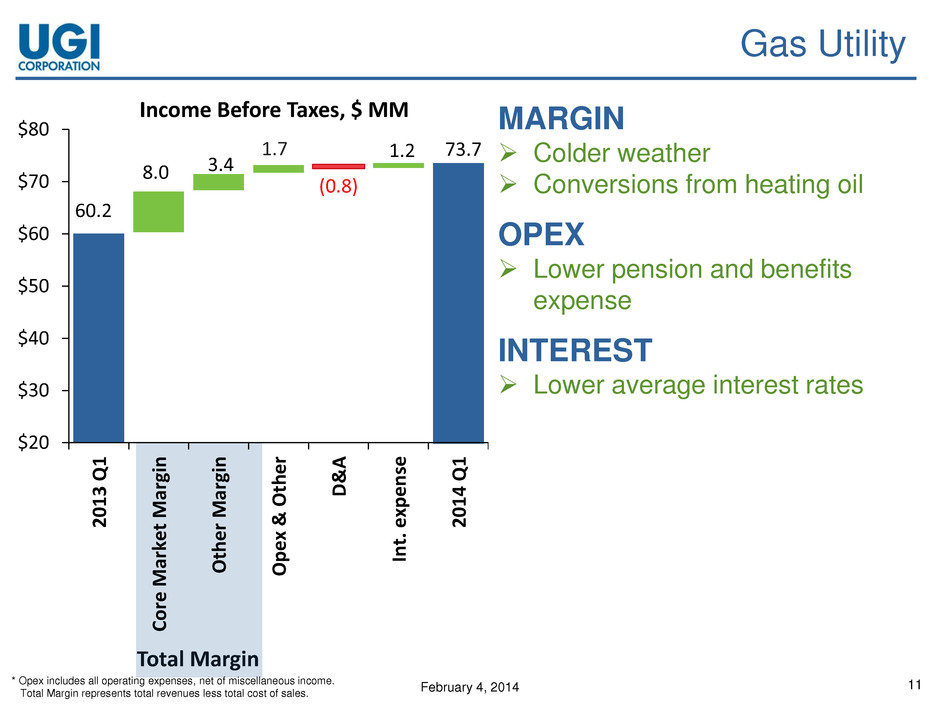
February 4, 2014 11 Gas Utility MARGIN Colder weather Conversions from heating oil OPEX Lower pension and benefits expense INTEREST Lower average interest rates Total Margin 60.2 73.7 8.0 3.4 1.7 (0.8) 1.2 $20 $30 $40 $50 $60 $70 $80 2 0 1 3 Q 1 C o re M ar ket M ar gi n Ot h er Mar gi n O p ex & O th e r D & A Int. ex p e n se 2 0 1 4 Q 1 Income Before Taxes, $ MM * Opex includes all operating expenses, net of miscellaneous income. Total Margin represents total revenues less total cost of sales.
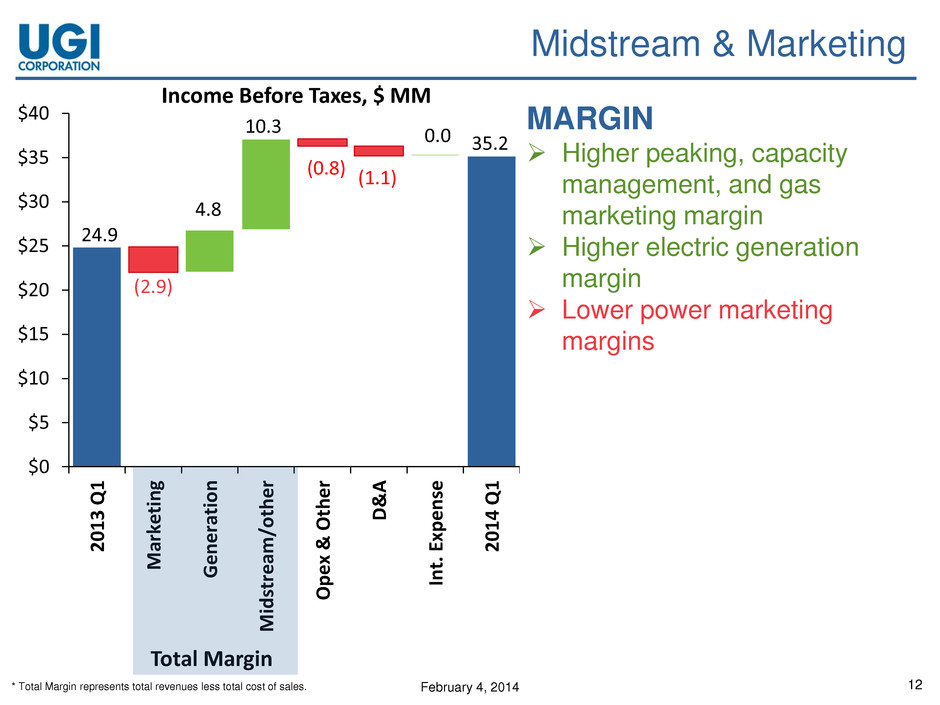
February 4, 2014 12 Midstream & Marketing MARGIN Higher peaking, capacity management, and gas marketing margin Higher electric generation margin Lower power marketing margins 24.9 (2.9) 4.8 10.3 (0.8) (1.1) 0.0 $0 $5 $10 $15 $20 $25 $30 $35 $40 2 0 1 3 Q 1 M ar ketin g Ge n erati o n M id st re am/ot h e r O p ex & O th e r D & A In t. Ex p e n se 2 0 1 4 Q 1 Income Before Taxes, $ MM 35.2 Total Margin * Total Margin represents total revenues less total cost of sales.
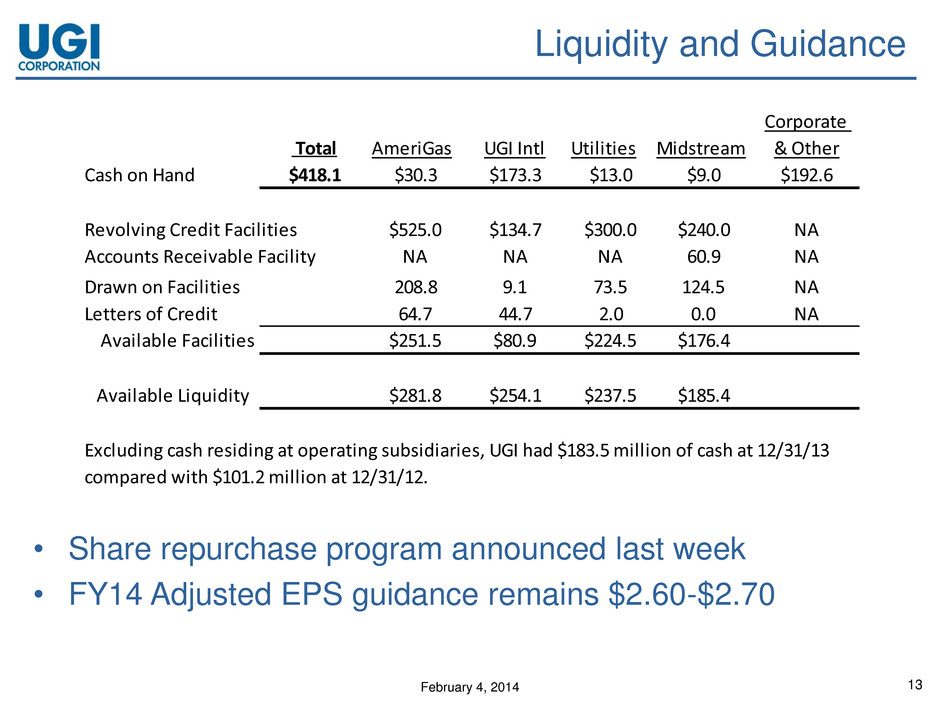
February 4, 2014 13 Liquidity and Guidance • Share repurchase program announced last week • FY14 Adjusted EPS guidance remains $2.60-$2.70 Total AmeriGas UGI Intl Utilities Midstream Corporate & Other Cash on Hand $418.1 $30.3 $173.3 $13.0 $9.0 $192.6 Revolving Credit Facilities $525.0 $134.7 $300.0 $240.0 NA Accounts Receivable Facility NA NA NA 60.9 NA Drawn on Facilities 208.8 9.1 73.5 124.5 NA Letters of Credit 64.7 44.7 2.0 0.0 NA Available Facilities $251.5 $80.9 $224.5 $176.4 Available Liquidity $281.8 $254.1 $237.5 $185.4 Excluding cash residing at operating subsidiaries, UGI had $183.5 million of cash at 12/31/13 compared with $101.2 million at 12/31/12.
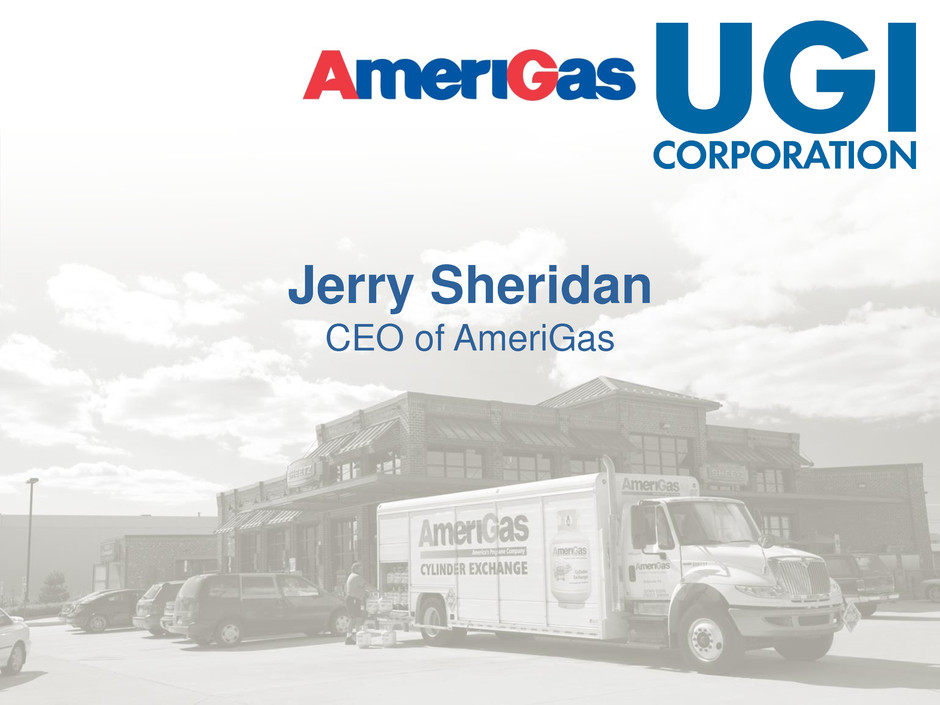
February 4, 2014 Jerry Sheridan CEO of AmeriGas
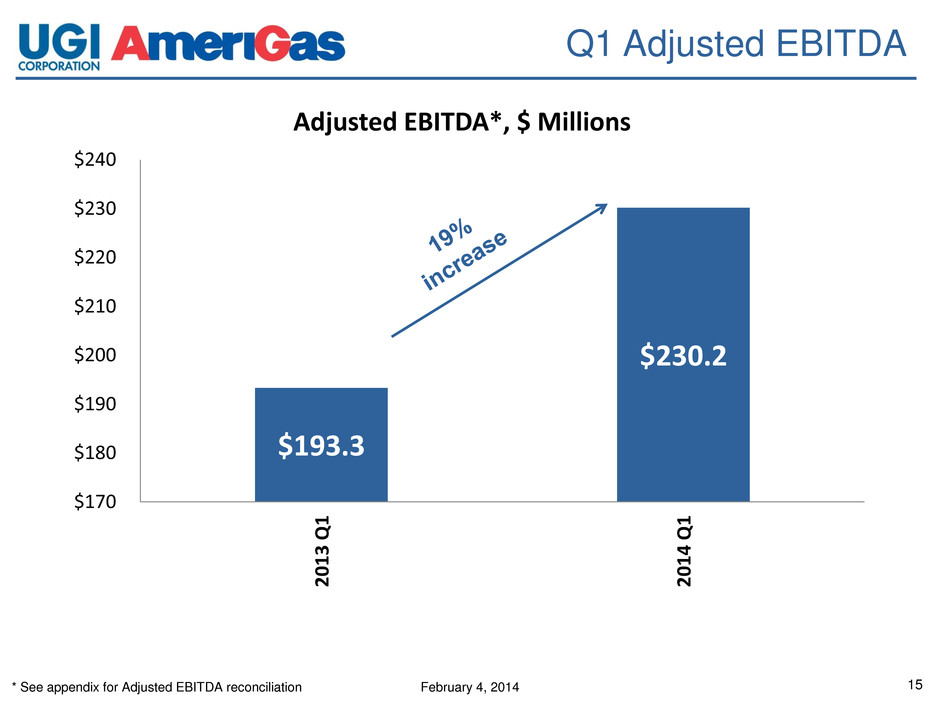
February 4, 2014 15 Q1 Adjusted EBITDA $193.3 $230.2 $170 $180 $190 $200 $210 $220 $230 $240 2 0 1 3 Q 1 2 0 1 4 Q 1 Adjusted EBITDA*, $ Millions * See appendix for Adjusted EBITDA reconciliation
February 4, 2014 16 Operational Update Operations • Volume increased 7% versus last year’s first quarter on weather that was 14% colder than last year • Volume in December was up 19% from last year on 22% colder weather • Operating expenses were $5.9 million below last year; Excluding transition expenses, operating expenses declined $0.5 million • Wholesale prices at Mt Belvieu are approximately 35% higher than the average cost this time last year • Our supply/logistics groups have taken extraordinary measures to secure and deliver propane to all residential and commercial customers • Although costs rose quickly during the quarter, margins were modestly higher than in the prior-year period and we continue to actively manage costs in a challenging environment
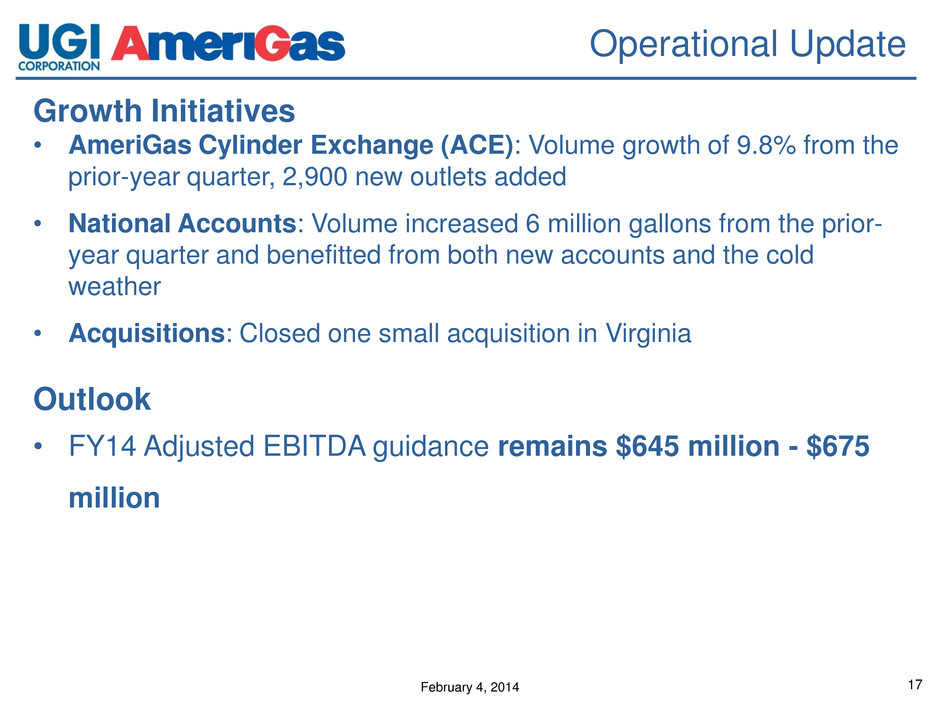
February 4, 2014 17 Operational Update Growth Initiatives • AmeriGas Cylinder Exchange (ACE): Volume growth of 9.8% from the prior-year quarter, 2,900 new outlets added • National Accounts: Volume increased 6 million gallons from the prior- year quarter and benefitted from both new accounts and the cold weather • Acquisitions: Closed one small acquisition in Virginia Outlook • FY14 Adjusted EBITDA guidance remains $645 million - $675 million
February 4, 2014 John Walsh President & CEO
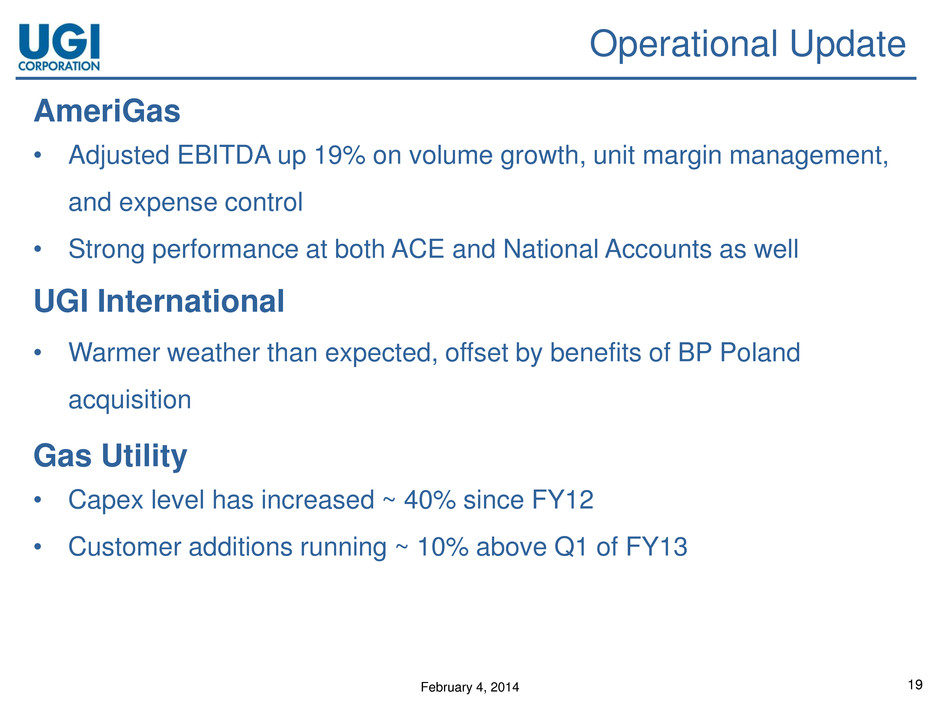
February 4, 2014 19 Operational Update AmeriGas • Adjusted EBITDA up 19% on volume growth, unit margin management, and expense control • Strong performance at both ACE and National Accounts as well UGI International • Warmer weather than expected, offset by benefits of BP Poland acquisition Gas Utility • Capex level has increased ~ 40% since FY12 • Customer additions running ~ 10% above Q1 of FY13
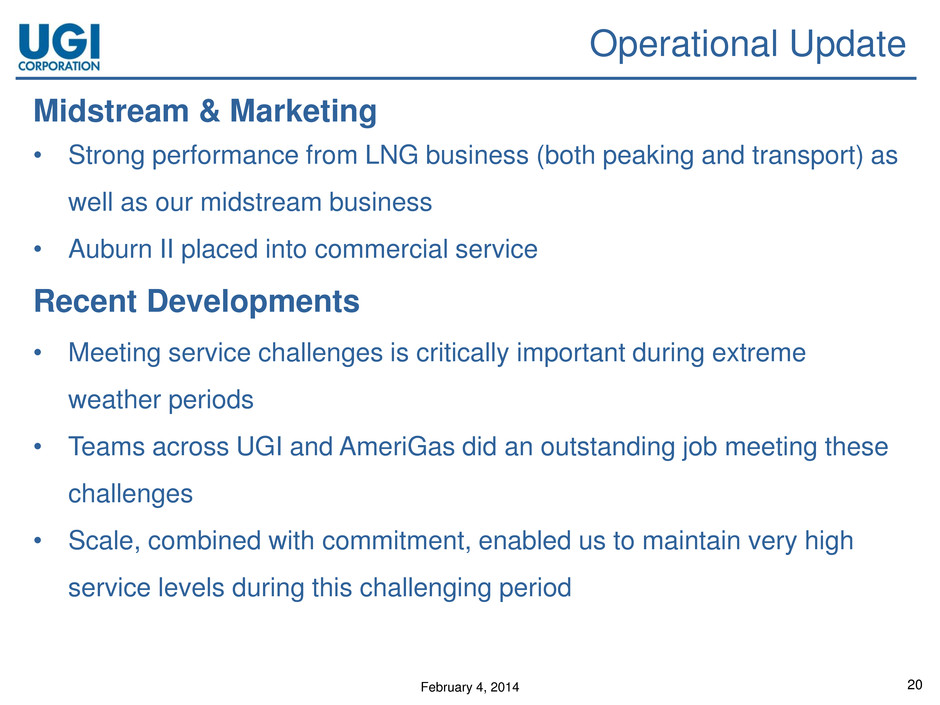
February 4, 2014 20 Operational Update Midstream & Marketing • Strong performance from LNG business (both peaking and transport) as well as our midstream business • Auburn II placed into commercial service Recent Developments • Meeting service challenges is critically important during extreme weather periods • Teams across UGI and AmeriGas did an outstanding job meeting these challenges • Scale, combined with commitment, enabled us to maintain very high service levels during this challenging period
February 4, 2014 Q&A
February 4, 2014 Appendix
February 4, 2014 23 UGI Supplemental Information: Footnotes Management uses "adjusted net income attributable to UGI" and "adjusted diluted earnings per share," both of which are non-GAAP financial measures, when evaluating UGI's overall performance. Adjusted net income attributable to UGI is net income attributable to UGI excluding (i) changes in the fair values of Midstream & Marketing's unsettled commodity derivative instruments as well as gains and losses on settled commodity derivative instruments not associated with current period transactions and (ii) those items that management regards as highly unusual in nature and not expected to recur. Midstream & Marketing accounts for commodity derivative instruments at fair value with changes in fair value included in earnings as a component of cost of sales or revenues. Volatility in net income at UGI can occur as a result of changes in the fair values of Midstream & Marketing's unsettled commodity derivative instruments as well as timing differences between the settlement of commodity derivative instruments and the income statement impact of the purchase or sale of the associated commodity. Non-GAAP financial measures are not in accordance with, or an alternative to, GAAP and should be considered in addition to, and not as a substitute for, the comparable GAAP measures. Management believes that these non- GAAP measures provide meaningful information to investors about UGI's performance because they eliminate the impact of (i) changes in the fair values of Midstream & Marketing's unsettled commodity derivative instruments as well as gains and losses on settled commodity derivative instruments not associated with current period transactions that are required, under GAAP, to be recorded in current period earnings but are economic hedges of the related commodity transactions and (ii) those items that management regards as highly unusual in nature and not expected to recur. The following table reconciles consolidated net income attributable to UGI Corporation, the most directly comparable GAAP measure, to adjusted net income attributable to UGI, and reconciles diluted earnings per share, the most comparable GAAP measure, to adjusted diluted earnings per share, to reflect the adjustments referred to above:
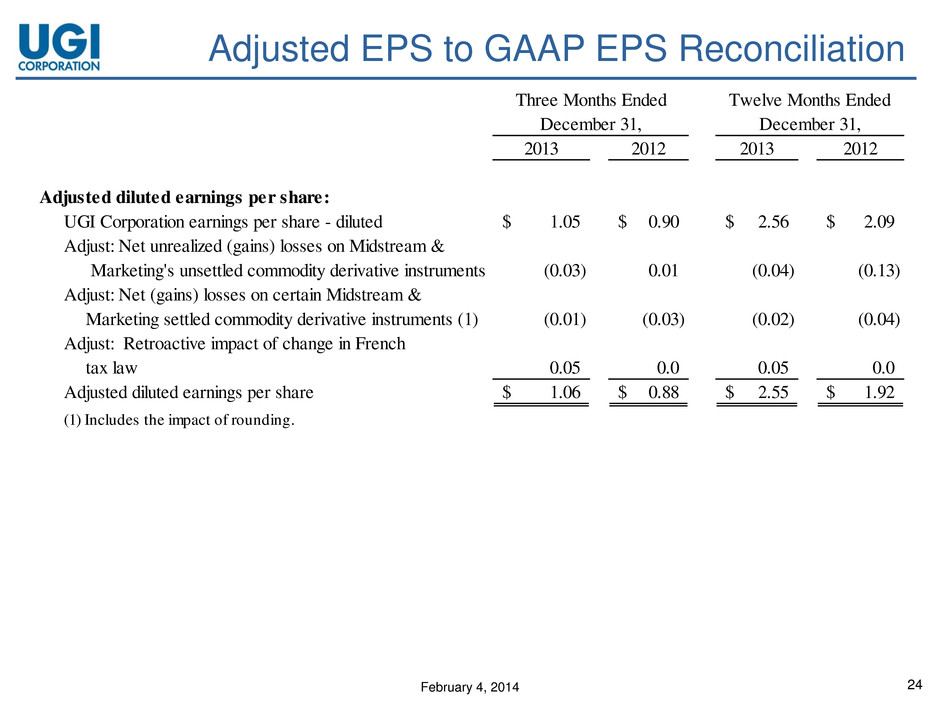
February 4, 2014 24 Adjusted EPS to GAAP EPS Reconciliation Three Months Ended Twelve Months Ended December 31, December 31, 2013 2012 2013 2012 Adjusted diluted earnings per share: UGI Corporation earnings per share - diluted 1.05$ 0.90$ 2.56$ 2.09$ Adjust: Net unrealized (gains) losses on Midstream & Marketing's unsettled commodity derivative instruments (0.03) 0.01 (0.04) (0.13) A just: Net (gains) losses on certain Midstream & Marketing settled commodity derivative instruments (1) (0.01) (0.03) (0.02) (0.04) Adjust: Retroactive impact of change in French tax law 0.05 0.0 0.05 0.0 Adjusted diluted earnings per share 1.06$ 0.88$ 2.55$ 1.92$ (1) Includes the impact of rounding.
February 4, 2014 25 AmeriGas Supplemental Information: Footnotes The enclosed supplemental information contains a reconciliation of earnings before interest expense, income taxes, depreciation and amortization ("EBITDA") and Adjusted EBITDA to Net Income. EBITDA and Adjusted EBITDA are not measures of performance or financial condition under accounting principles generally accepted in the United States ("GAAP"). Management believes EBITDA and Adjusted EBITDA are meaningful non-GAAP financial measures used by investors to compare the Partnership's operating performance with that of other companies within the propane industry. The Partnership's definitions of EBITDA and Adjusted EBITDA may be different from those used by other companies. EBITDA and Adjusted EBITDA should not be considered as alternatives to net income (loss) attributable to AmeriGas Partners, L.P. Management uses EBITDA to compare year-over-year profitability of the business without regard to capital structure as well as to compare the relative performance of the Partnership to that of other master limited partnerships without regard to their financing methods, capital structure, income taxes or historical cost basis. Management uses Adjusted EBITDA to exclude from AmeriGas Partners’ EBITDA gains and losses that competitors do not necessarily have to provide additional insight into the comparison of year-over-year profitability to that of other master limited partnerships. In view of the omission of interest, income taxes, depreciation and amortization from EBITDA and Adjusted EBITDA, management also assesses the profitability of the business by comparing net income attributable to AmeriGas Partners, L.P. for the relevant years. Management also uses EBITDA to assess the Partnership's profitability because its parent, UGI Corporation, uses the Partnership's EBITDA to assess the profitability of the Partnership, which is one of UGI Corporation’s industry segments. UGI Corporation discloses the Partnership's EBITDA in its disclosures about its industry segments as the profitability measure for its domestic propane segment.
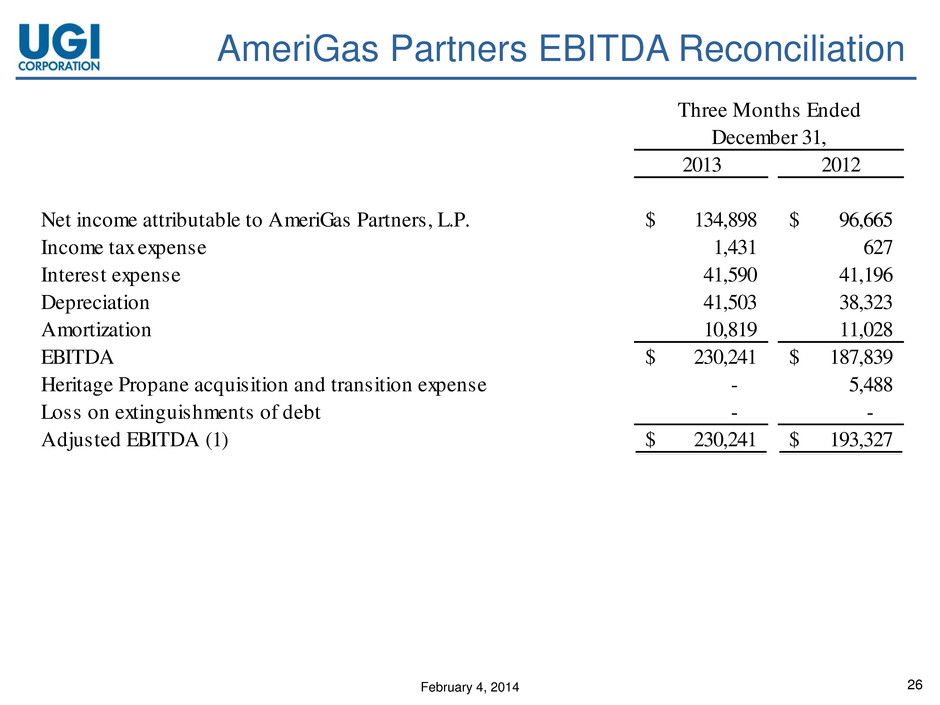
February 4, 2014 26 AmeriGas Partners EBITDA Reconciliation 2013 2012 Net income attributable to AmeriGas Partners, L.P. 134,898$ 96,665$ Income tax expense 1,431 627 Interest xpense 41,590 41,196 Depreciation 41,503 38,323 Amortization 10,819 11,028 EBITDA 230,241$ 187,839$ Heritage Propane acquisition and transition expense - 5,488 Loss on extinguishments of debt - - Adjusted EBITDA (1) 230,241$ 193,327$ December 31, Three Months Ended

February 4, 2014 Investor Relations: 610-337-1000 Simon Bowman (x3645) bowmans@ugicorp.com


