Fiscal 2019 Results and Fiscal 2020 Outlook John L. Walsh President & CEO, UGI Corporation Ted J. Jastrzebski Chief Financial Officer, UGI Corporation Roger Perreault Executive Vice President, Global LPG, UGI Corporation
About This Presentation This presentation contains statements, estimates and projections which are forward-looking statements (as defined in Section 21E of the Securities and Exchange Act of 1934, as amended). Management believes that these are reasonable as of today’s date only. Actual results may differ significantly because of risks and uncertainties that are difficult to predict and many of which are beyond management’s control. You should read UGI’s Annual Report on Form 10-K and Quarterly Reports on Form 10-Q for a more extensive list of factors that could affect results. Among them are adverse weather conditions, cost volatility and availability of all energy products, including propane, natural gas, electricity and fuel oil, increased customer conservation measures, the impact of pending and future legal proceedings, continued analysis of recent tax legislation, liability for uninsured claims and for claims in excess of insurance coverage, domestic and 2 international political, regulatory and economic conditions in the United States and in foreign countries, including the current conflicts in the Middle East, and foreign currency exchange rate fluctuations (particularly the euro), the timing of development of Marcellus Shale gas production, the availability, timing and success of our acquisitions, commercial initiatives and investments to grow our business, our ability to successfully integrate acquired businesses and achieve anticipated synergies, including certain integration risks relating to the acquisition of CMG, and the interruption, disruption, failure, malfunction, or breach of our information technology systems, including due to cyber-attack the inability to complete pending or future pipeline projects, and our ability to achieve the operational and cost efficiencies expected from the completion of pending and future internal business transformation initiatives. UGI undertakes no obligation to release revisions to its forward-looking statements to reflect events or circumstances occurring after today. In addition, this presentation uses certain non-GAAP financial measures. Please see the appendix for reconciliations of these measures to the most comparable GAAP financial measure. UGI Corporation | Fiscal 2019 Results 2
Fiscal Year Recap 3 John L. Walsh President & CEO, UGI Corporation
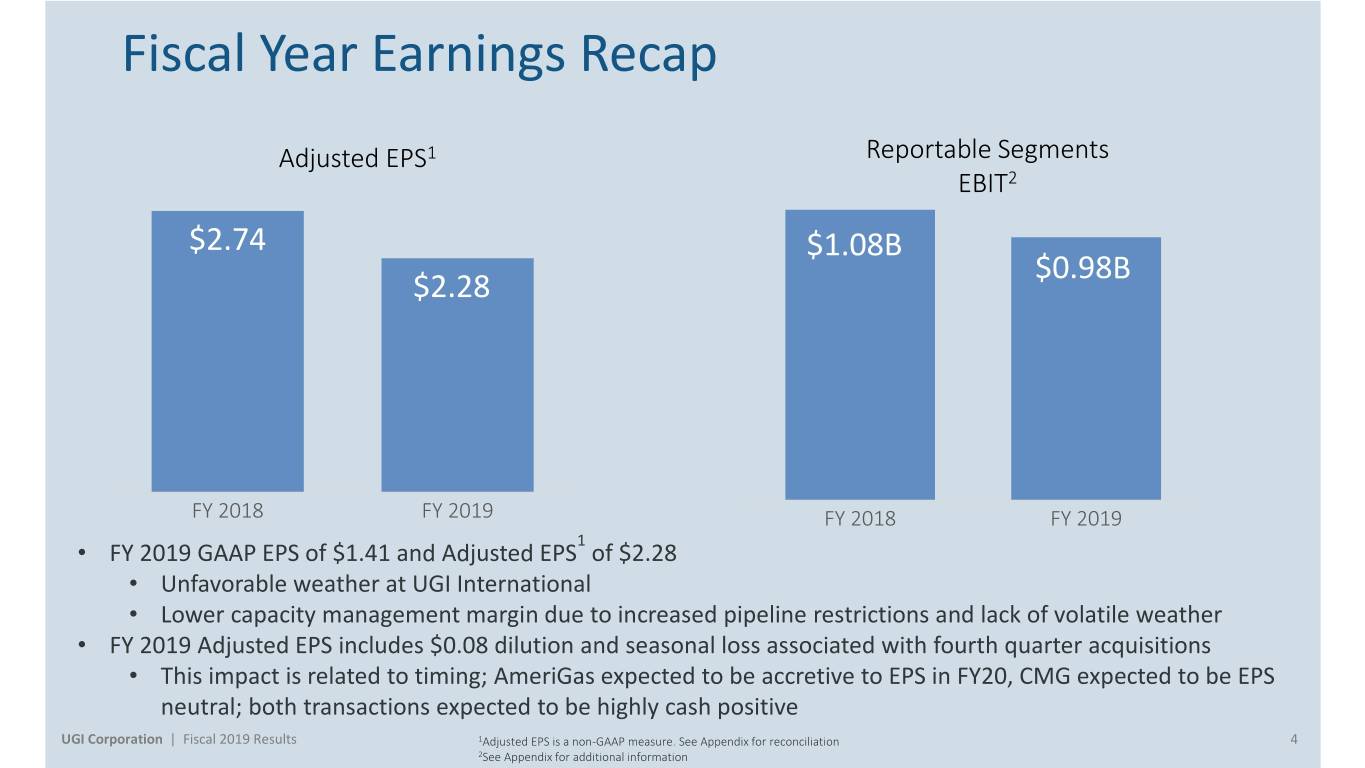
Fiscal Year Earnings Recap Adjusted EPS1 Reportable Segments EBIT2 $2.74 $1.08B $0.98B $2.28 FY 2018 FY 2019 FY 2018 FY 2019 1 • FY 2019 GAAP EPS of $1.41 and Adjusted EPS of $2.28 • Unfavorable weather at UGI International • Lower capacity management margin due to increased pipeline restrictions and lack of volatile weather • FY 2019 Adjusted EPS includes $0.08 dilution and seasonal loss associated with fourth quarter acquisitions • This impact is related to timing; AmeriGas expected to be accretive to EPS in FY20, CMG expected to be EPS neutral; both transactions expected to be highly cash positive UGI Corporation | Fiscal 2019 Results 1Adjusted EPS is a non-GAAP measure. See Appendix for reconciliation 4 2See Appendix for additional information
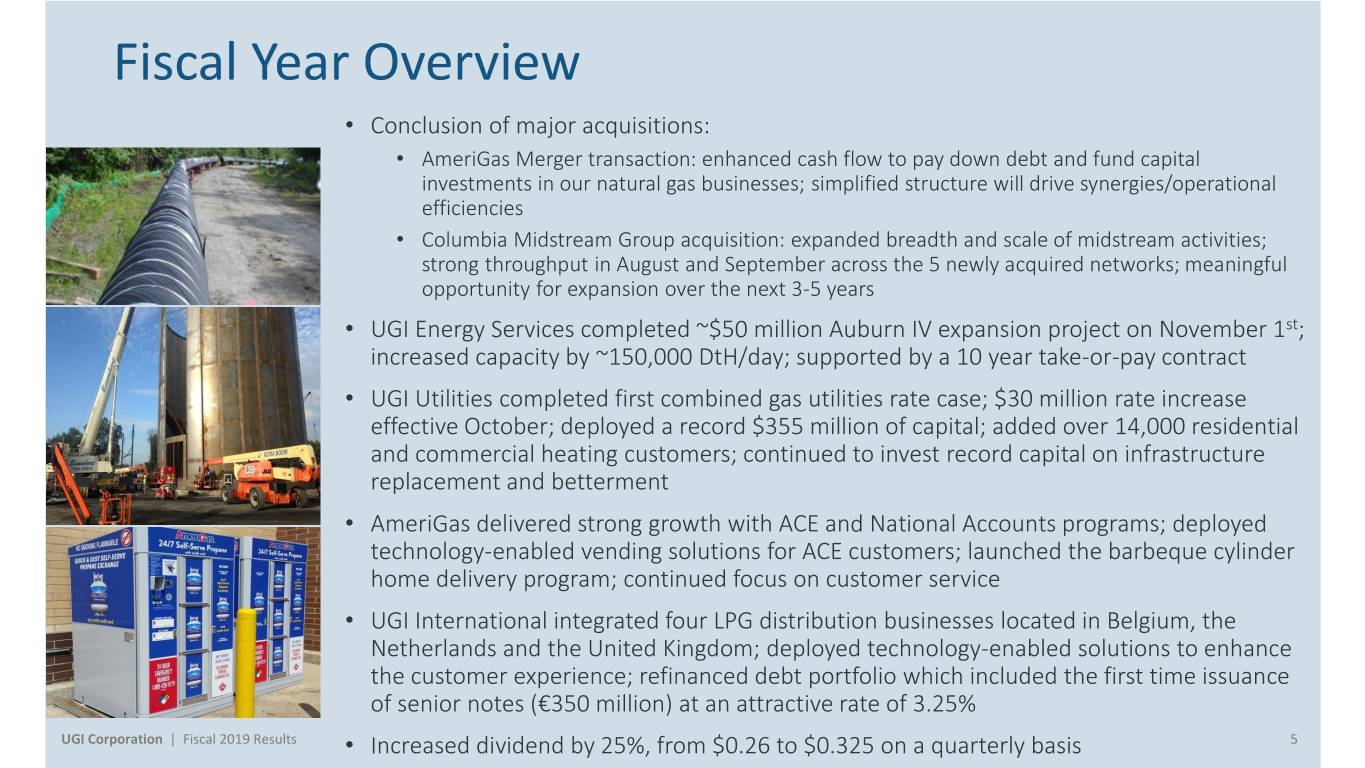
Fiscal Year Overview • Conclusion of major acquisitions: • AmeriGas Merger transaction: enhanced cash flow to pay down debt and fund capital investments in our natural gas businesses; simplified structure will drive synergies/operational efficiencies • Columbia Midstream Group acquisition: expanded breadth and scale of midstream activities; strong throughput in August and September across the 5 newly acquired networks; meaningful opportunity for expansion over the next 3-5 years • UGI Energy Services completed ~$50 million Auburn IV expansion project on November 1st; increased capacity by ~150,000 DtH/day; supported by a 10 year take-or-pay contract • UGI Utilities completed first combined gas utilities rate case; $30 million rate increase effective October; deployed a record $355 million of capital; added over 14,000 residential and commercial heating customers; continued to invest record capital on infrastructure replacement and betterment • AmeriGas delivered strong growth with ACE and National Accounts programs; deployed technology-enabled vending solutions for ACE customers; launched the barbeque cylinder home delivery program; continued focus on customer service • UGI International integrated four LPG distribution businesses located in Belgium, the Netherlands and the United Kingdom; deployed technology-enabled solutions to enhance the customer experience; refinanced debt portfolio which included the first time issuance of senior notes (€350 million) at an attractive rate of 3.25% UGI Corporation | Fiscal 2019 Results • Increased dividend by 25%, from $0.26 to $0.325 on a quarterly basis 5
Fiscal Year Financial Review Ted J. Jastrzebski Chief Financial Officer, UGI Corporation
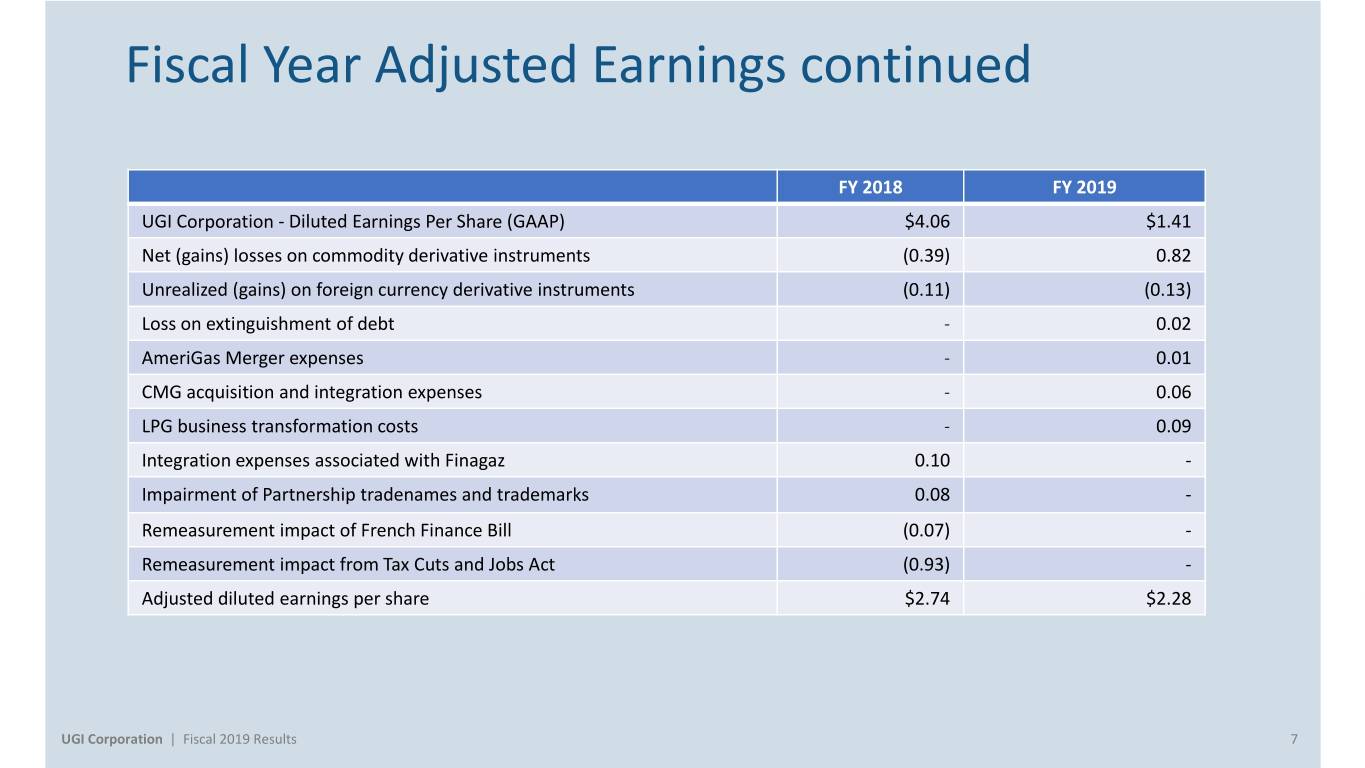
Fiscal Year Adjusted Earnings continued FY 2018 FY 2019 UGI Corporation - Diluted Earnings Per Share (GAAP) $4.06 $1.41 Net (gains) losses on commodity derivative instruments (0.39) 0.82 Unrealized (gains) on foreign currency derivative instruments (0.11) (0.13) Loss on extinguishment of debt - 0.02 AmeriGas Merger expenses - 0.01 CMG acquisition and integration expenses - 0.06 LPG business transformation costs - 0.09 Integration expenses associated with Finagaz 0.10 - Impairment of Partnership tradenames and trademarks 0.08 - Remeasurement impact of French Finance Bill (0.07) - Remeasurement impact from Tax Cuts and Jobs Act (0.93) - Adjusted diluted earnings per share $2.74 $2.28 UGI Corporation | Fiscal 2019 Results 7
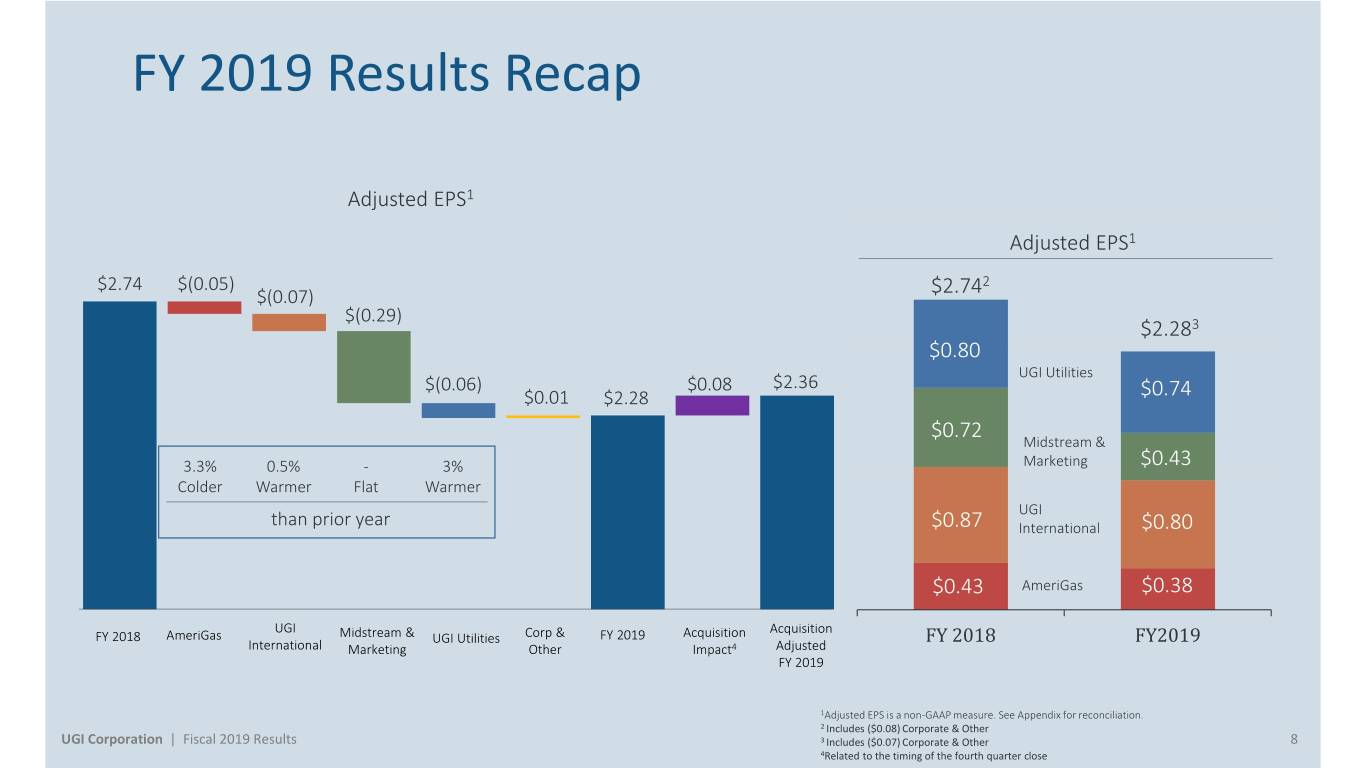
FY 2019 Results Recap Adjusted EPS1 Adjusted EPS1 $2.74 $(0.05) 2 $(0.07) $2.74 $(0.29) $2.283 $0.80 UGI Utilities $(0.06) $0.08 $2.36 $0.01 $2.28 $0.74 $0.72 Midstream & 3.3% 0.5% - 3% Marketing $0.43 Colder Warmer Flat Warmer UGI than prior year $0.87 International $0.80 $0.43 AmeriGas $0.38 UGI Acquisition FY 2018 AmeriGas Midstream & UGI Utilities Corp & FY 2019 Acquisition FY 2018 FY2019 International Marketing Other Impact4 Adjusted FY 2019 1Adjusted EPS is a non-GAAP measure. See Appendix for reconciliation. 2 Includes ($0.08) Corporate & Other UGI Corporation | Fiscal 2019 Results 3 Includes ($0.07) Corporate & Other 8 4Related to the timing of the fourth quarter close
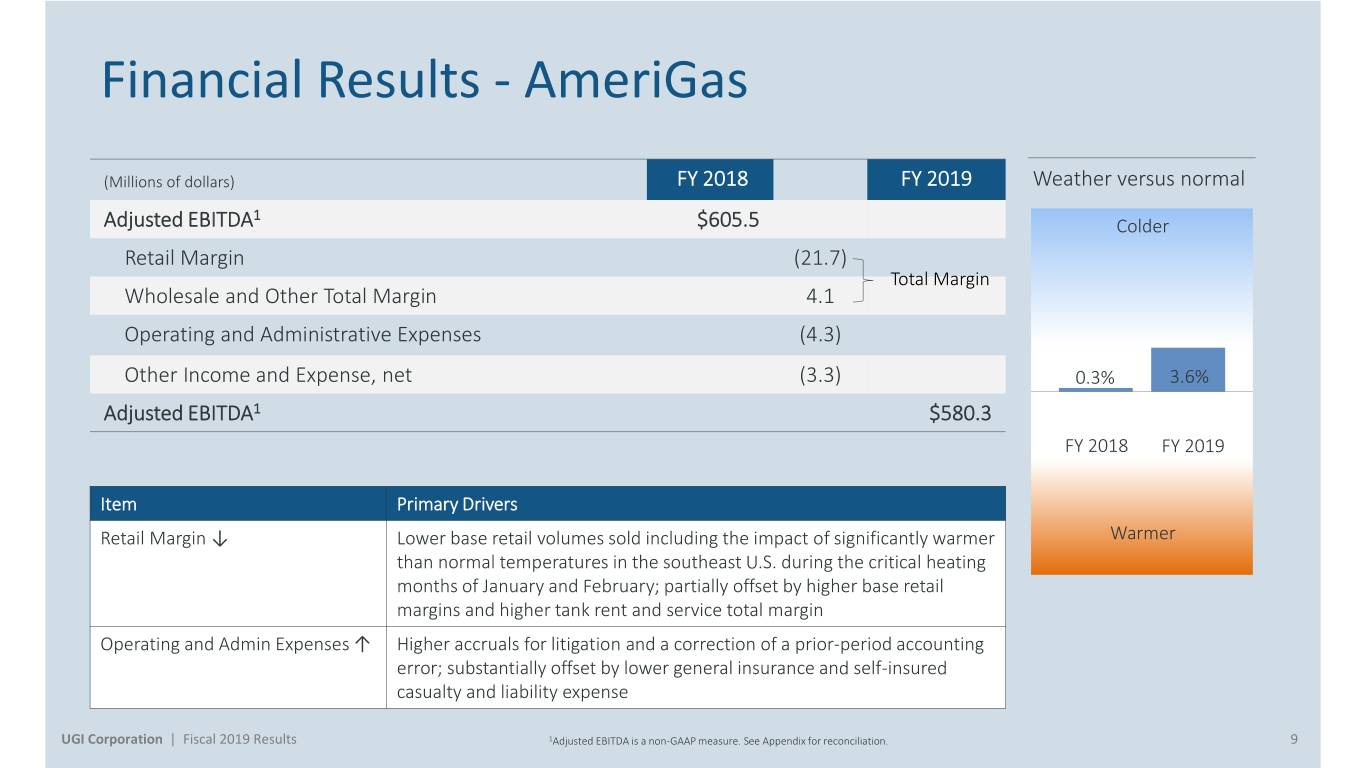
Financial Results - AmeriGas (Millions of dollars) FY 2018 FY 2019 Weather versus normal 1 Adjusted EBITDA $605.5 Colder Retail Margin (21.7) Total Margin Wholesale and Other Total Margin 4.1 Operating and Administrative Expenses (4.3) Other Income and Expense, net (3.3) 0.3% 3.6% Adjusted EBITDA1 $580.3 FY 2018 FY 2019 Item Primary Drivers Retail Margin ↓ Lower base retail volumes sold including the impact of significantly warmer Warmer than normal temperatures in the southeast U.S. during the critical heating months of January and February; partially offset by higher base retail margins and higher tank rent and service total margin Operating and Admin Expenses ↑ Higher accruals for litigation and a correction of a prior-period accounting error; substantially offset by lower general insurance and self-insured casualty and liability expense UGI Corporation | Fiscal 2019 Results 1Adjusted EBITDA is a non-GAAP measure. See Appendix for reconciliation. 9
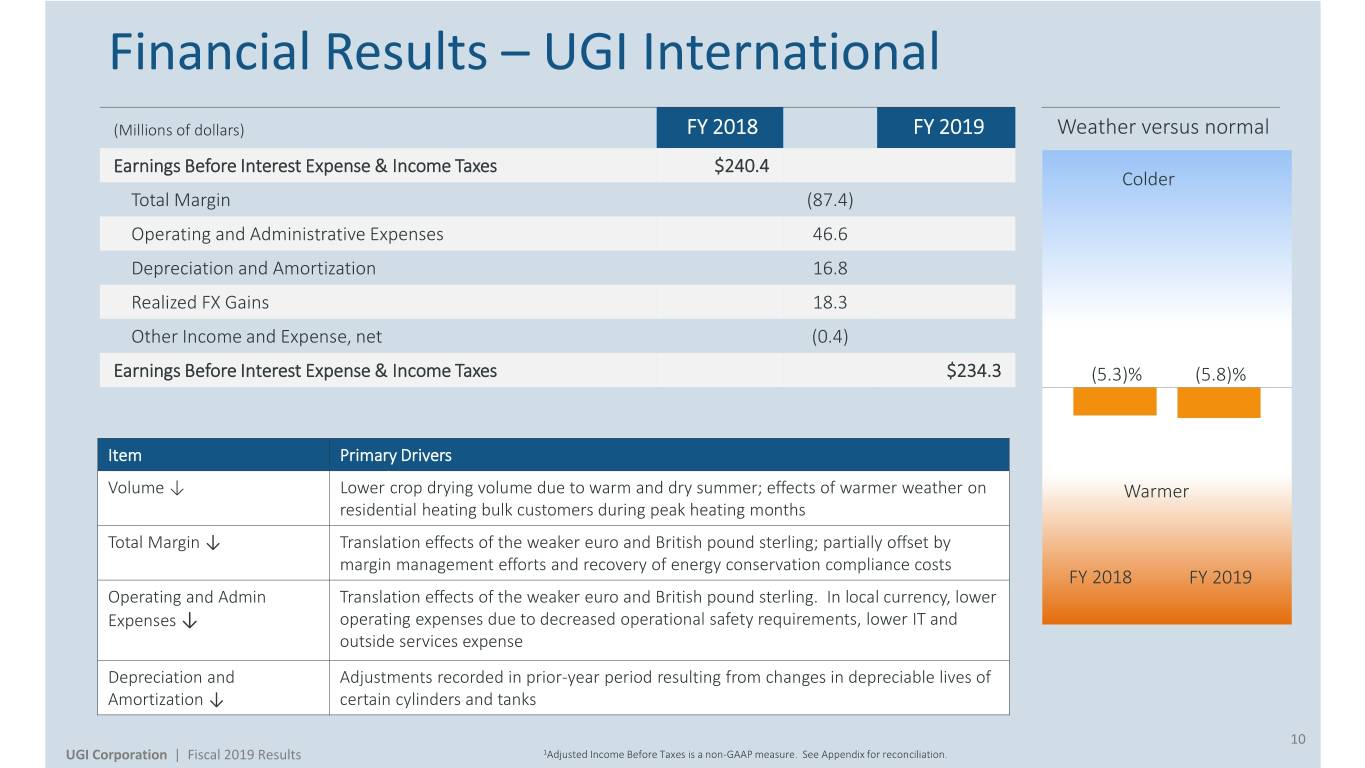
Financial Results – UGI International (Millions of dollars) FY 2018 FY 2019 Weather versus normal Earnings Before Interest Expense & Income Taxes $240.4 Colder Total Margin (87.4) Operating and Administrative Expenses 46.6 Depreciation and Amortization 16.8 Realized FX Gains 18.3 Other Income and Expense, net (0.4) Earnings Before Interest Expense & Income Taxes $234.3 (5.3)% (5.8)% Item Primary Drivers Volume ↓ Lower crop drying volume due to warm and dry summer; effects of warmer weather on Warmer residential heating bulk customers during peak heating months Total Margin ↓ Translation effects of the weaker euro and British pound sterling; partially offset by margin management efforts and recovery of energy conservation compliance costs FY 2018 FY 2019 Operating and Admin Translation effects of the weaker euro and British pound sterling. In local currency, lower Expenses ↓ operating expenses due to decreased operational safety requirements, lower IT and outside services expense Depreciation and Adjustments recorded in prior-year period resulting from changes in depreciable lives of Amortization ↓ certain cylinders and tanks 10 UGI Corporation | Fiscal 2019 Results 1Adjusted Income Before Taxes is a non-GAAP measure. See Appendix for reconciliation.
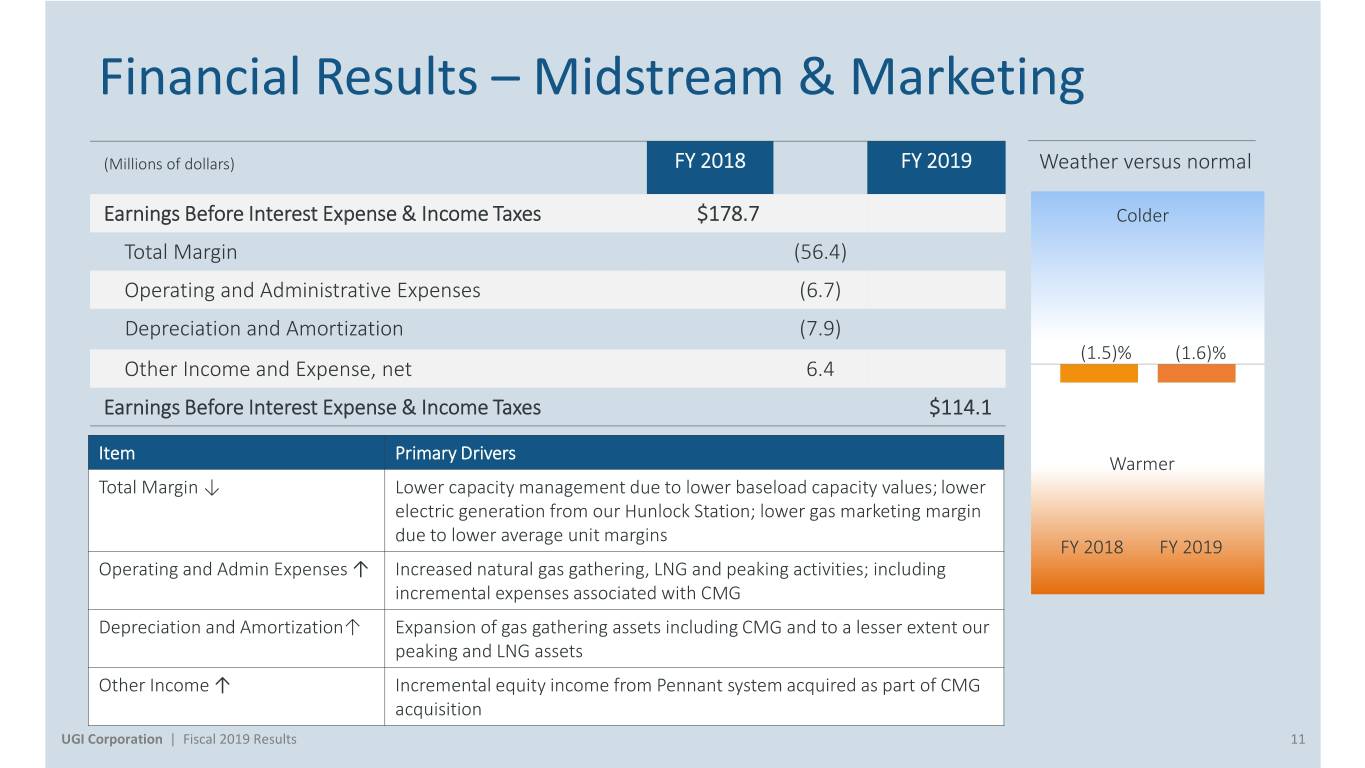
Financial Results – Midstream & Marketing (Millions of dollars) FY 2018 FY 2019 Weather versus normal Earnings Before Interest Expense & Income Taxes $178.7 Colder Total Margin (56.4) Operating and Administrative Expenses (6.7) Depreciation and Amortization (7.9) (1.5)% (1.6)% Other Income and Expense, net 6.4 Earnings Before Interest Expense & Income Taxes $114.1 Item Primary Drivers Warmer Total Margin ↓ Lower capacity management due to lower baseload capacity values; lower electric generation from our Hunlock Station; lower gas marketing margin due to lower average unit margins FY 2018 FY 2019 Operating and Admin Expenses ↑ Increased natural gas gathering, LNG and peaking activities; including incremental expenses associated with CMG Depreciation and Amortization↑ Expansion of gas gathering assets including CMG and to a lesser extent our peaking and LNG assets Other Income ↑ Incremental equity income from Pennant system acquired as part of CMG acquisition UGI Corporation | Fiscal 2019 Results 11
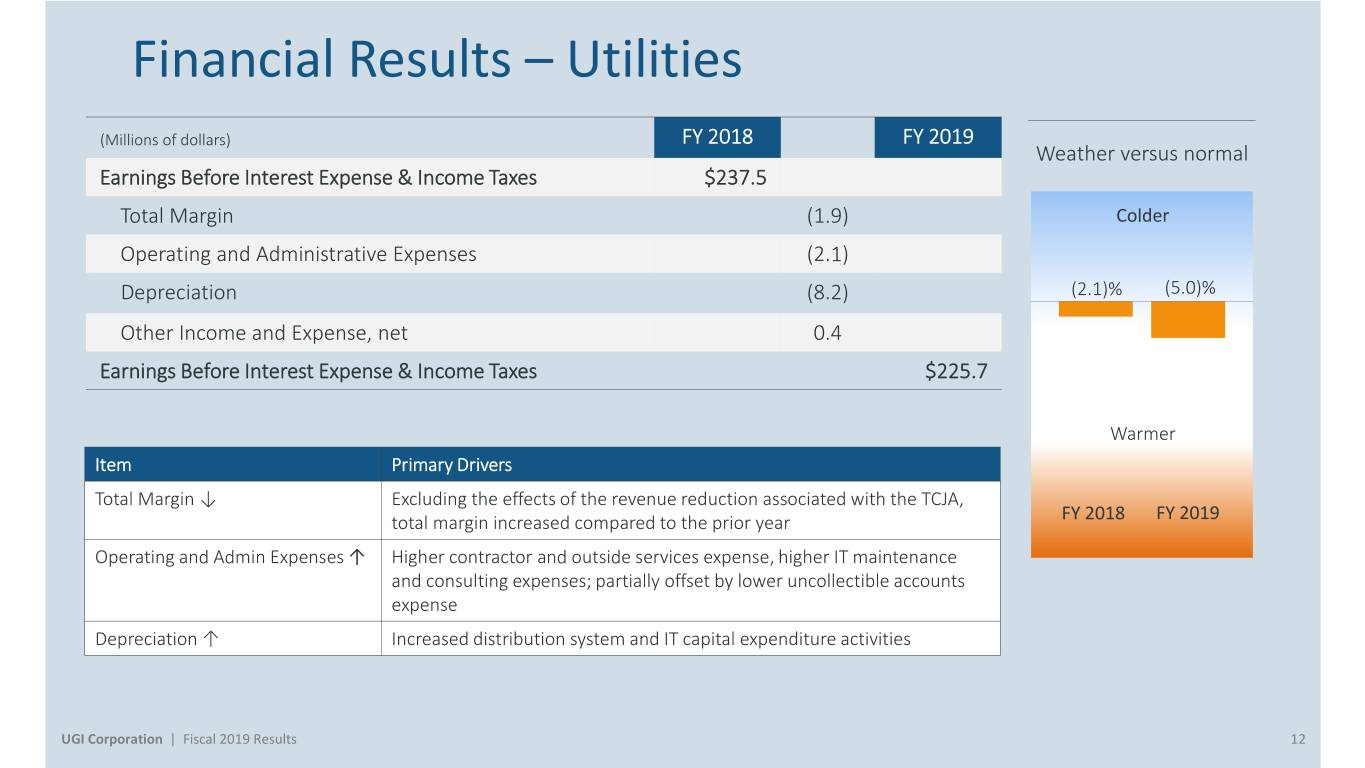
Financial Results – Utilities (Millions of dollars) FY 2018 FY 2019 Weather versus normal Earnings Before Interest Expense & Income Taxes $237.5 Total Margin (1.9) Colder Operating and Administrative Expenses (2.1) Depreciation (8.2) (2.1)% (5.0)% Other Income and Expense, net 0.4 Earnings Before Interest Expense & Income Taxes $225.7 Warmer Item Primary Drivers Total Margin ↓ Excluding the effects of the revenue reduction associated with the TCJA, total margin increased compared to the prior year FY 2018 FY 2019 Operating and Admin Expenses ↑ Higher contractor and outside services expense, higher IT maintenance and consulting expenses; partially offset by lower uncollectible accounts expense Depreciation ↑ Increased distribution system and IT capital expenditure activities UGI Corporation | Fiscal 2019 Results 12
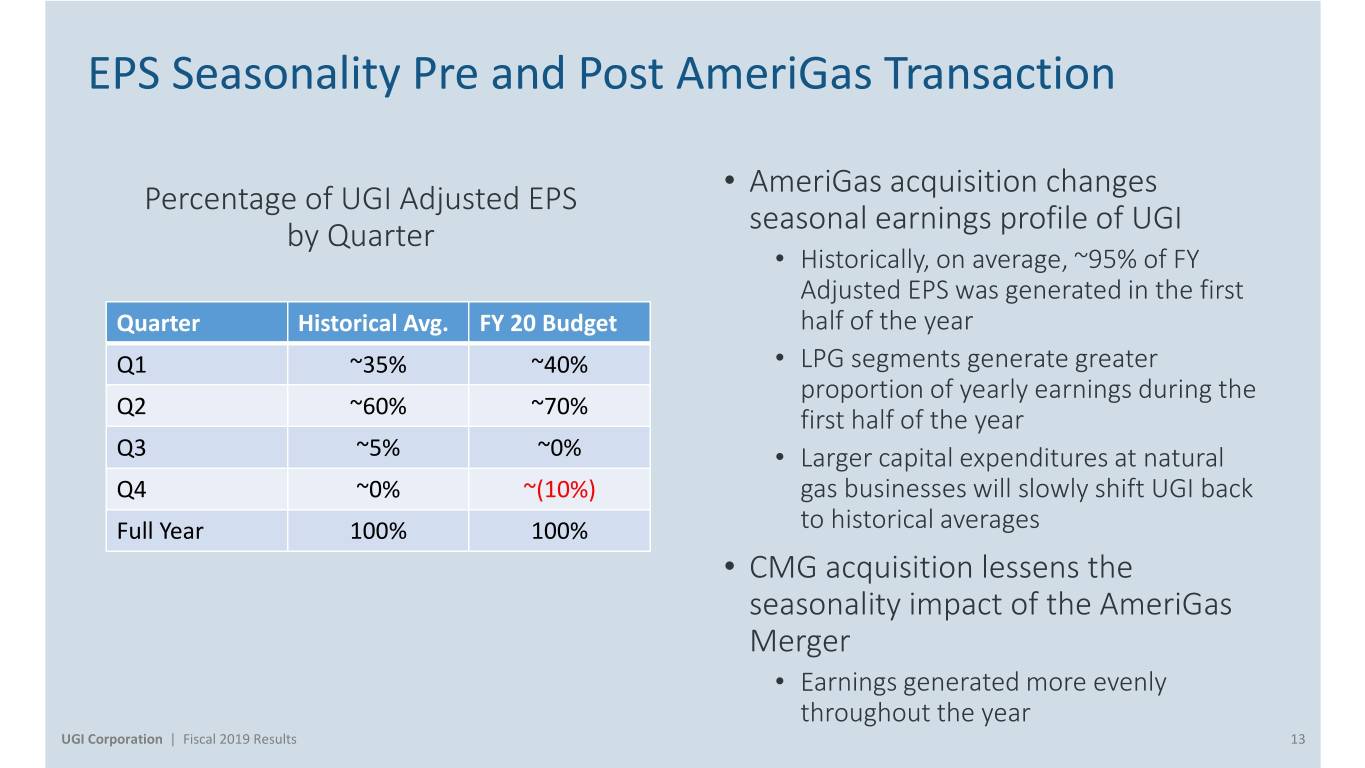
EPS Seasonality Pre and Post AmeriGas Transaction • AmeriGas acquisition changes Percentage of UGI Adjusted EPS seasonal earnings profile of UGI by Quarter • Historically, on average, ~95% of FY Adjusted EPS was generated in the first Quarter Historical Avg. FY 20 Budget half of the year Q1 ~35% ~40% • LPG segments generate greater proportion of yearly earnings during the Q2 ~60% ~70% first half of the year Q3 ~5% ~0% • Larger capital expenditures at natural Q4 ~0% ~(10%) gas businesses will slowly shift UGI back Full Year 100% 100% to historical averages • CMG acquisition lessens the seasonality impact of the AmeriGas Merger • Earnings generated more evenly throughout the year UGI Corporation | Fiscal 2019 Results 13
Global LPG Update Roger Perreault Executive Vice President, Global LPG, UGI Corporation
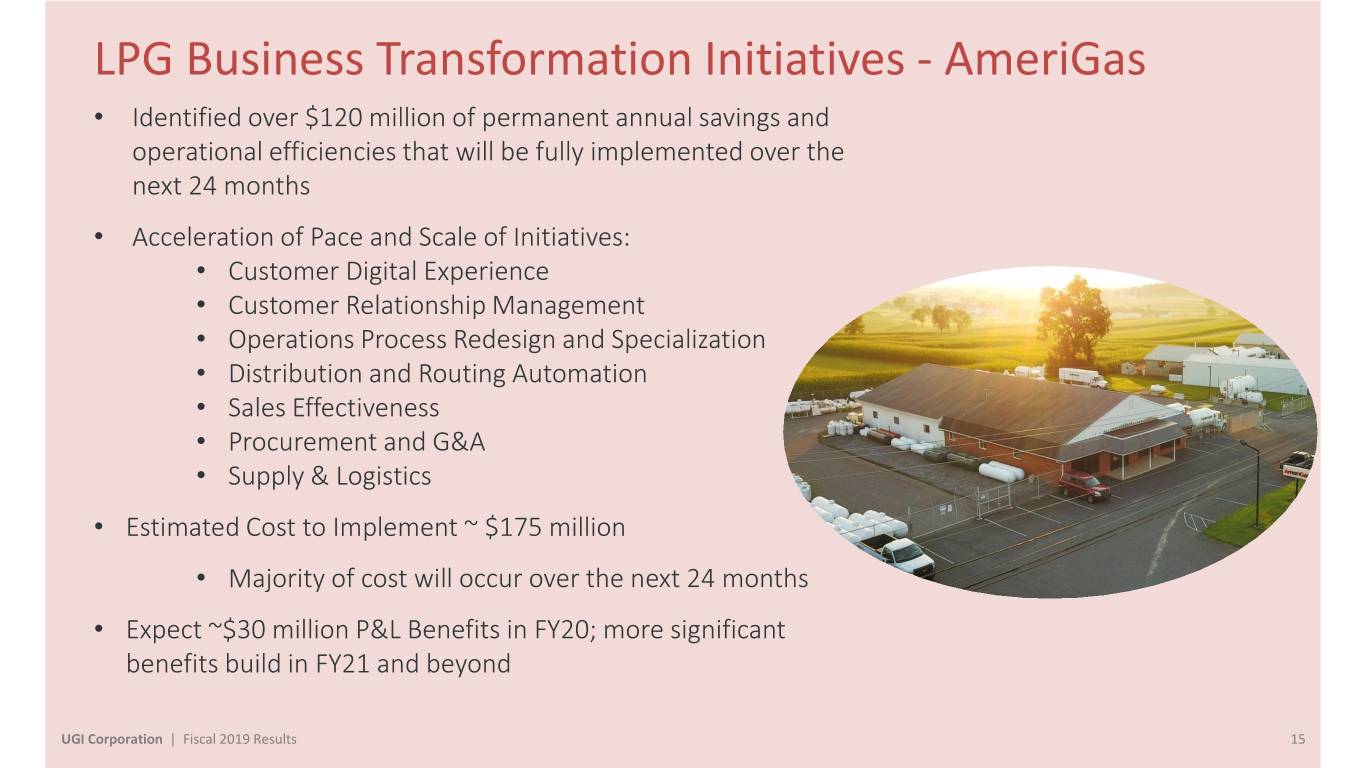
LPG Business Transformation Initiatives - AmeriGas • Identified over $120 million of permanent annual savings and operational efficiencies that will be fully implemented over the next 24 months • Acceleration of Pace and Scale of Initiatives: • Customer Digital Experience • Customer Relationship Management • Operations Process Redesign and Specialization • Distribution and Routing Automation • Sales Effectiveness • Procurement and G&A • Supply & Logistics • Estimated Cost to Implement ~ $175 million • Majority of cost will occur over the next 24 months • Expect ~$30 million P&L Benefits in FY20; more significant benefits build in FY21 and beyond UGI Corporation | Fiscal 2019 Results 15
LPG Business Transformation Initiatives – UGI International • Identified over €30 million of permanent annual savings and operational efficiencies that will be fully realized by the end of FY22 • Centralization of back office functions • Identification of synergies and best practices across Europe • Continued emphasis on customer service and safe operations • Establishment of 2 Centers of Excellence • Commercial Excellence – continuous improvement to customer experience • Operational Excellence – focus on distribution network and filling plants • Estimated Cost to Implement ~ €55 million • Majority of cost will occur over the next 24 months • Expect ~€5 million P&L benefit in FY20; more significant benefits build in FY21 and beyond UGI Corporation | Fiscal 2019 Results 16
Conclusion and Q&A John L. Walsh President & CEO, UGI Corporation
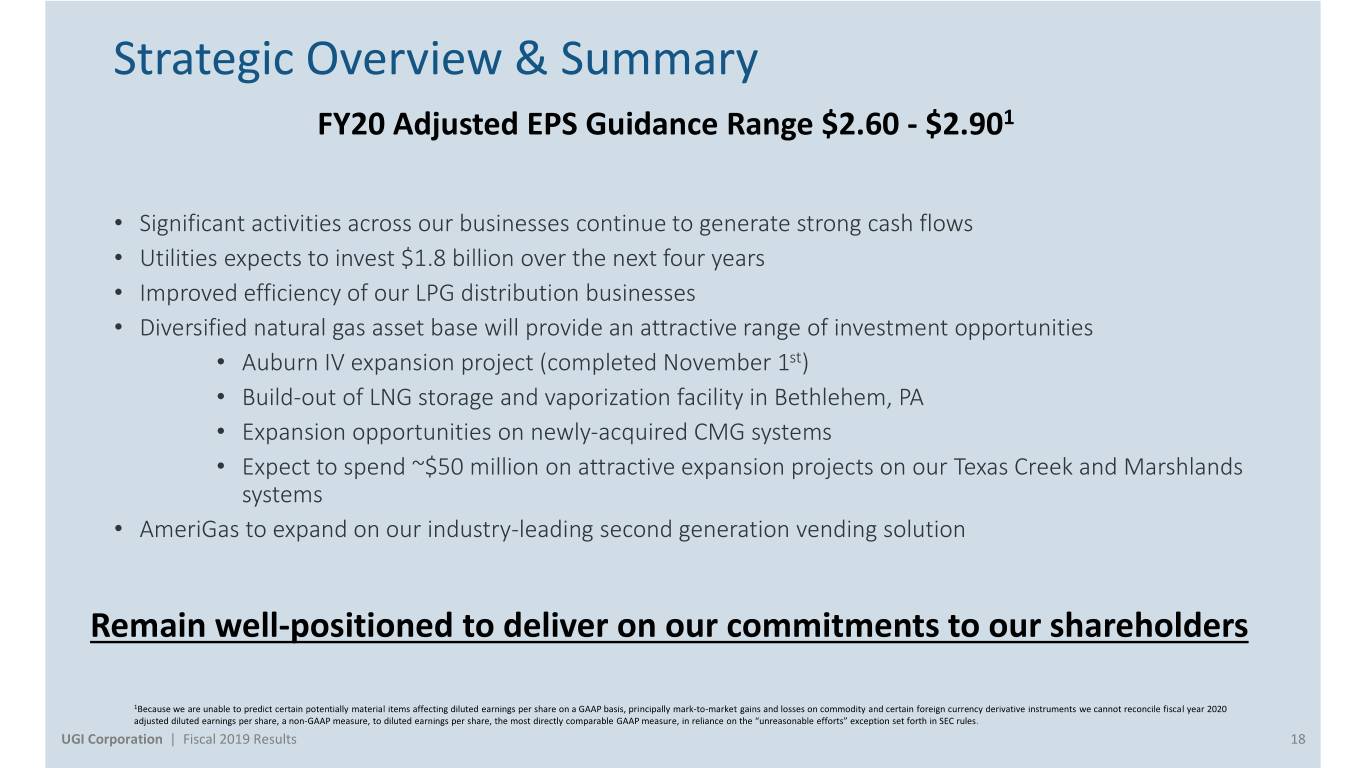
Strategic Overview & Summary FY20 Adjusted EPS Guidance Range $2.60 - $2.901 • Significant activities across our businesses continue to generate strong cash flows • Utilities expects to invest $1.8 billion over the next four years • Improved efficiency of our LPG distribution businesses • Diversified natural gas asset base will provide an attractive range of investment opportunities • Auburn IV expansion project (completed November 1st) • Build-out of LNG storage and vaporization facility in Bethlehem, PA • Expansion opportunities on newly-acquired CMG systems • Expect to spend ~$50 million on attractive expansion projects on our Texas Creek and Marshlands systems • AmeriGas to expand on our industry-leading second generation vending solution Remain well-positioned to deliver on our commitments to our shareholders 1Because we are unable to predict certain potentially material items affecting diluted earnings per share on a GAAP basis, principally mark-to-market gains and losses on commodity and certain foreign currency derivative instruments we cannot reconcile fiscal year 2020 adjusted diluted earnings per share, a non-GAAP measure, to diluted earnings per share, the most directly comparable GAAP measure, in reliance on the “unreasonable efforts” exception set forth in SEC rules. UGI Corporation | Fiscal 2019 Results 18
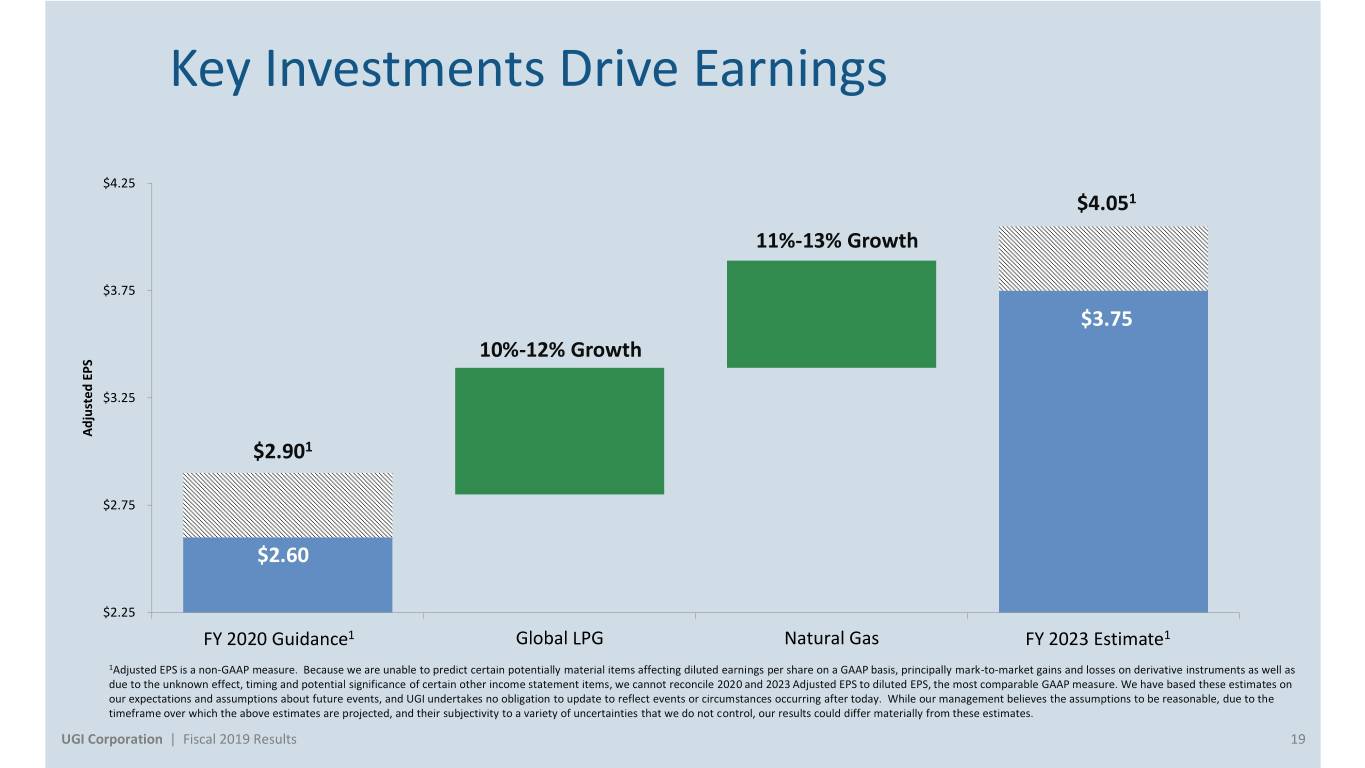
Key Investments Drive Earnings $4.25 $4.051 11%-13% Growth $3.75 $3.75 10%-12% Growth $3.25 AdjustedEPS $2.901 $2.75 $2.60 $2.25 FY 2020 Guidance1 Global LPG Natural Gas FY 2023 Estimate1 1Adjusted EPS is a non-GAAP measure. Because we are unable to predict certain potentially material items affecting diluted earnings per share on a GAAP basis, principally mark-to-market gains and losses on derivative instruments as well as due to the unknown effect, timing and potential significance of certain other income statement items, we cannot reconcile 2020 and 2023 Adjusted EPS to diluted EPS, the most comparable GAAP measure. We have based these estimates on our expectations and assumptions about future events, and UGI undertakes no obligation to update to reflect events or circumstances occurring after today. While our management believes the assumptions to be reasonable, due to the timeframe over which the above estimates are projected, and their subjectivity to a variety of uncertainties that we do not control, our results could differ materially from these estimates. UGI Corporation | Fiscal 2019 Results 19

Q&A
Appendix
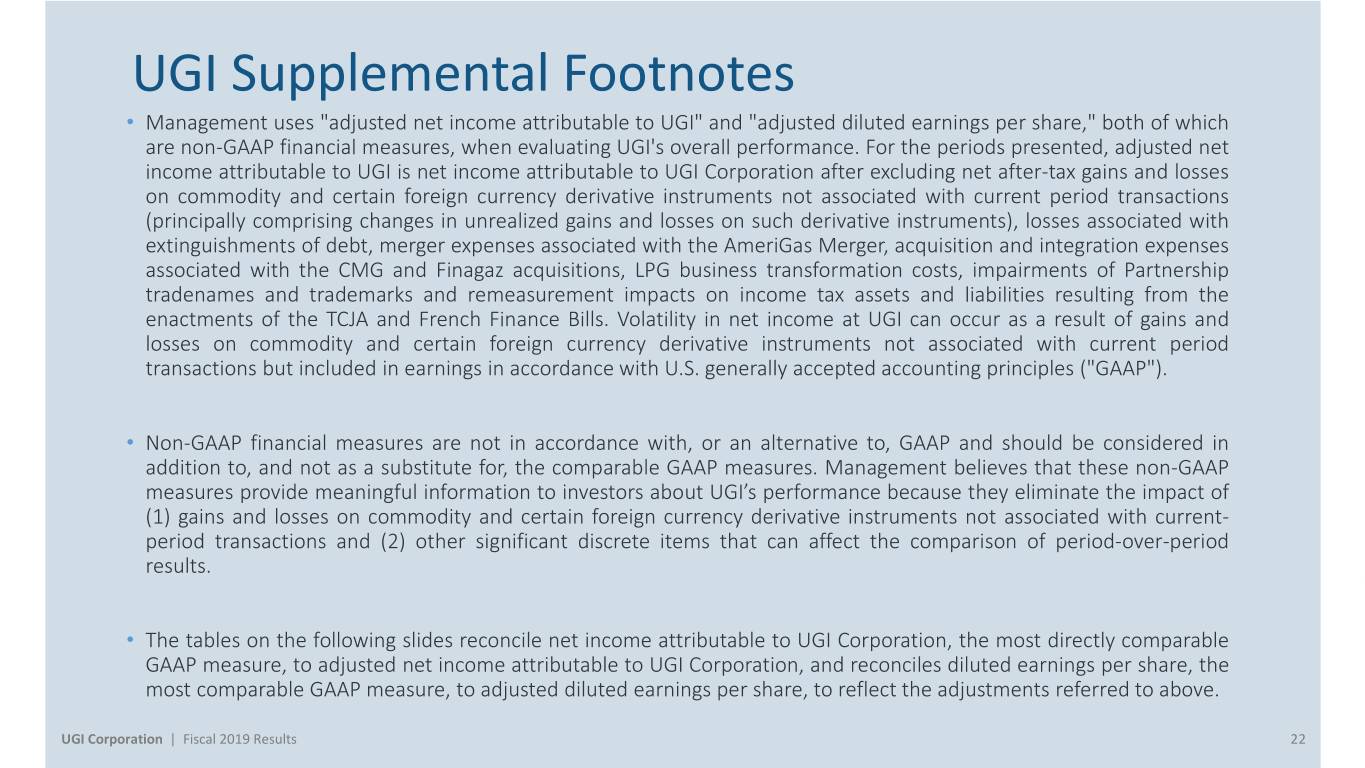
UGI Supplemental Footnotes • Management uses "adjusted net income attributable to UGI" and "adjusted diluted earnings per share," both of which are non-GAAP financial measures, when evaluating UGI's overall performance. For the periods presented, adjusted net income attributable to UGI is net income attributable to UGI Corporation after excluding net after-tax gains and losses on commodity and certain foreign currency derivative instruments not associated with current period transactions (principally comprising changes in unrealized gains and losses on such derivative instruments), losses associated with extinguishments of debt, merger expenses associated with the AmeriGas Merger, acquisition and integration expenses associated with the CMG and Finagaz acquisitions, LPG business transformation costs, impairments of Partnership tradenames and trademarks and remeasurement impacts on income tax assets and liabilities resulting from the enactments of the TCJA and French Finance Bills. Volatility in net income at UGI can occur as a result of gains and losses on commodity and certain foreign currency derivative instruments not associated with current period transactions but included in earnings in accordance with U.S. generally accepted accounting principles ("GAAP"). • Non-GAAP financial measures are not in accordance with, or an alternative to, GAAP and should be considered in addition to, and not as a substitute for, the comparable GAAP measures. Management believes that these non-GAAP measures provide meaningful information to investors about UGI’s performance because they eliminate the impact of (1) gains and losses on commodity and certain foreign currency derivative instruments not associated with current- period transactions and (2) other significant discrete items that can affect the comparison of period-over-period results. • The tables on the following slides reconcile net income attributable to UGI Corporation, the most directly comparable GAAP measure, to adjusted net income attributable to UGI Corporation, and reconciles diluted earnings per share, the most comparable GAAP measure, to adjusted diluted earnings per share, to reflect the adjustments referred to above. UGI Corporation | Fiscal 2019 Results 22
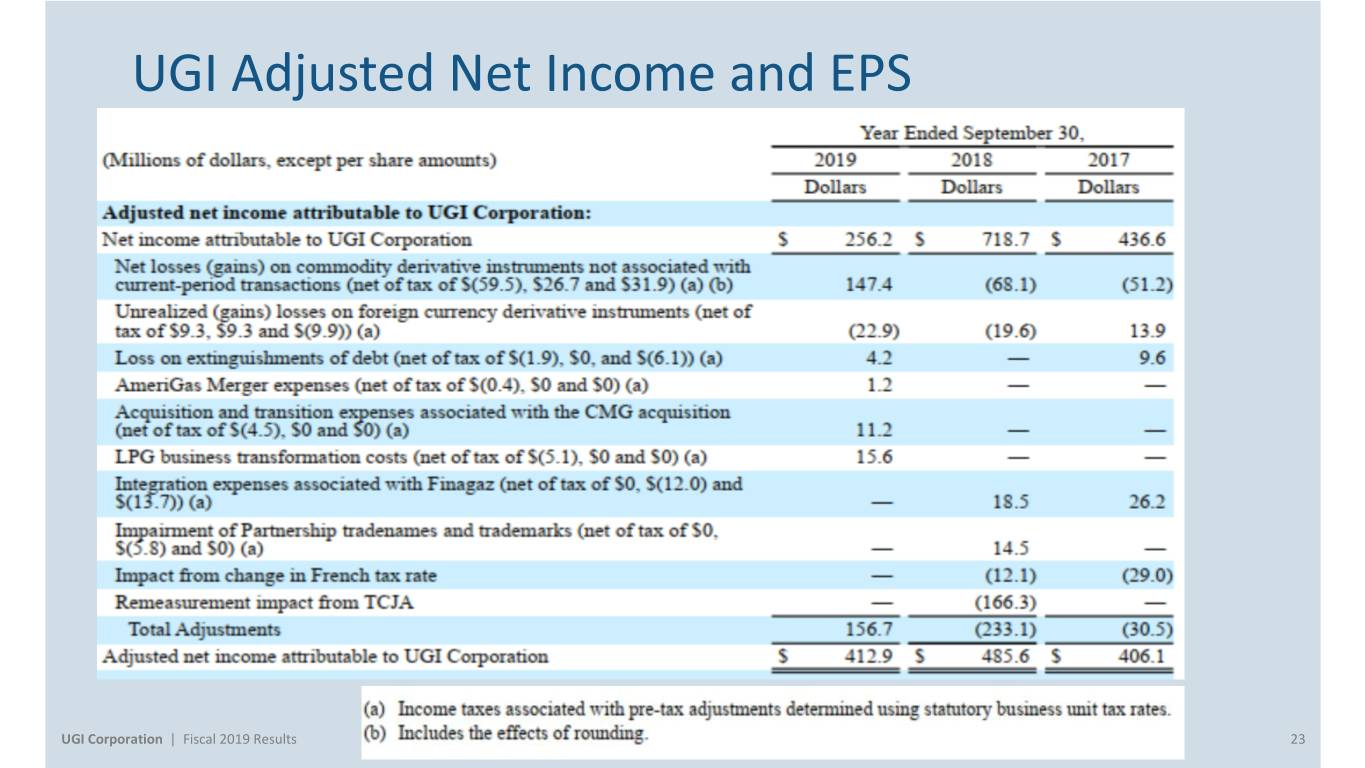
UGI Adjusted Net Income and EPS UGI Corporation | Fiscal 2019 Results 23
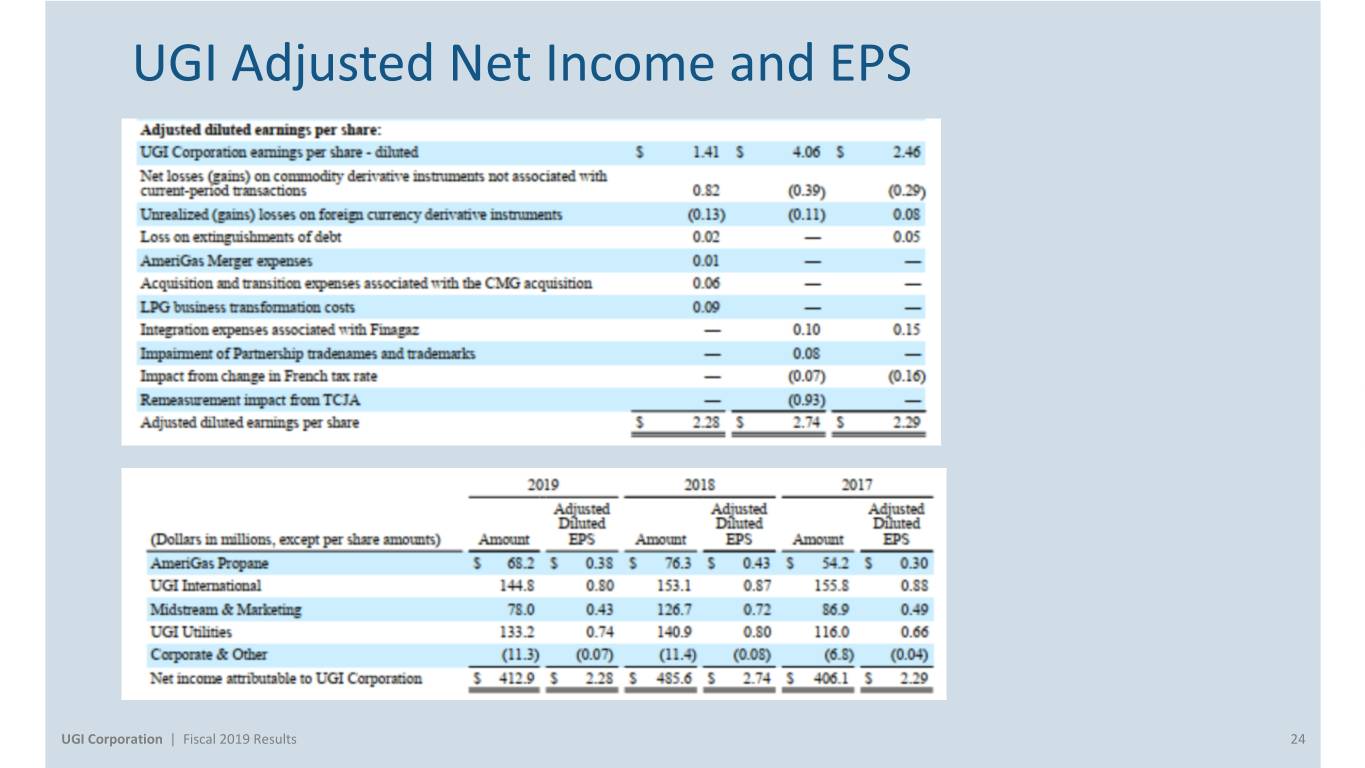
UGI Adjusted Net Income and EPS UGI Corporation | Fiscal 2019 Results 24
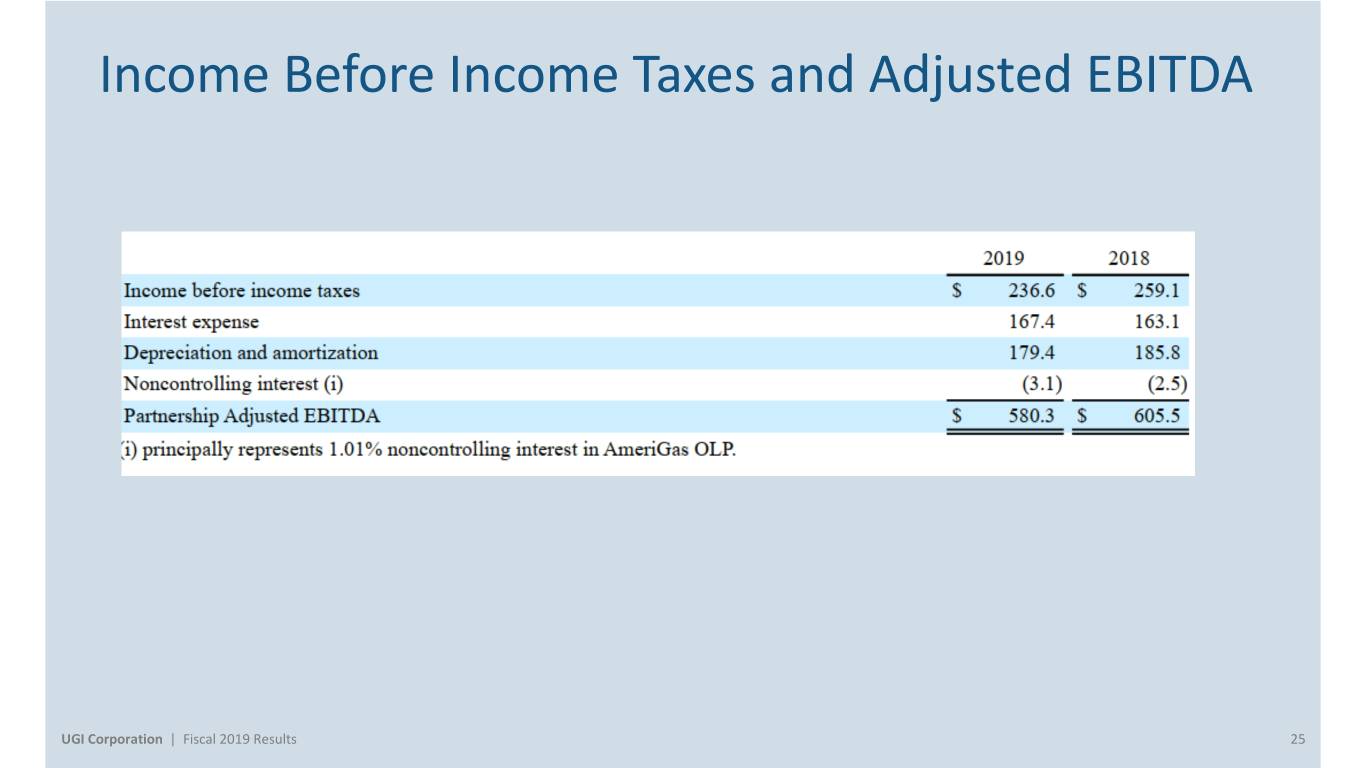
Income Before Income Taxes and Adjusted EBITDA UGI Corporation | Fiscal 2019 Results 25
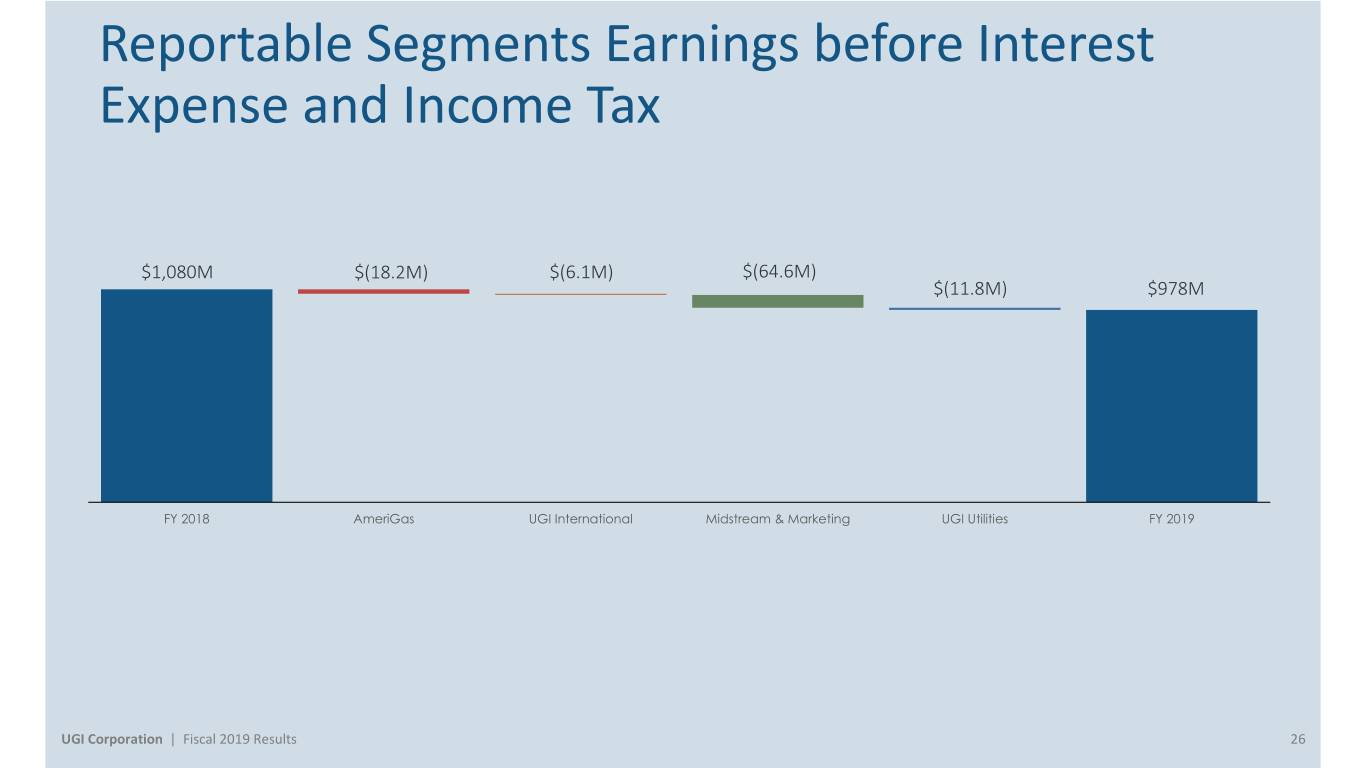
Reportable Segments Earnings before Interest Expense and Income Tax $1,080M $(18.2M) $(6.1M) $(64.6M) $(11.8M) $978M FY 2018 AmeriGas UGI International Midstream & Marketing UGI Utilities FY 2019 UGI Corporation | Fiscal 2019 Results 26

Investor Relations: Brendan Heck Alanna Zahora 610-456-6608 610-337-1004 heckb@ugicorp.com zahoraa@ugicorp.com


