Fiscal 2020 March
About This Presentation This presentation contains statements, estimates and projections which are forward-looking statements (as defined in Section 21E of the Securities and Exchange Act of 1934, as amended). Management believes that these are reasonable as of today’s date only. Actual results may differ significantly because of risks and uncertainties that are difficult to predict and many of which are beyond management’s control. You should read UGI’s Annual Report on Form 10-K for a more extensive list of factors that could affect results. Among them are adverse weather conditions and the seasonal nature of our business, cost volatility and availability of all energy products, including propane, natural gas, electricity and fuel oil, increased customer conservation measures, the impact of pending and future legal proceedings, liability for UGI CORPORATION uninsured claims and for claims in excess of insurance coverage, domestic and international political, 2 regulatory and economic conditions in the United States and in foreign countries, including the current conflicts in the Middle East and the potential withdrawal of the United Kingdom from the European Union, and foreign currency exchange rate fluctuations (particularly the euro), the timing of development of Marcellus Shale gas production, the availability, timing and success of our acquisitions, commercial initiatives and investments to grow our business, our ability to successfully integrate acquired businesses and achieve anticipated synergies, including certain integration risks relating to the acquisition of CMG, and the interruption, disruption, failure, malfunction, or breach of our information technology systems, including due to cyber-attack, the inability to complete pending or future energy infrastructure projects, and our ability to achieve the operational benefits and cost efficiencies expected from the completion of pending and future transformation initiatives at our business units. This presentation also includes forward- looking statements addressing the anticipated impact of COVID-19 on our business, operations and financial condition. UGI undertakes no obligation to release revisions to its forward-looking statements to reflect events or circumstances occurring after today.
Use of Non-GAAP Measures In this presentation, Management uses UGI Corporation Free Cash Flow, a non-GAAP financial measure. This financial measure is not in accordance with, or an alternative to, GAAP and should be considered in addition to, and not as a substitute for, the comparable GAAP measures. Management believes the presentation of these non-GAAP financial measures provides useful information to investors to more effectively evaluate cash flow generation of the Company’s businesses. A reconciliation of this non-GAAP financial measure to the most directly comparable financial measure calculated and presented in accordance with GAAP is presented in the UGI CORPORATION Appendix of this presentation. 3
Impact of COVID-19 • Implemented a COVID-19 Response Plan that assures the following: • Businesses are staffed for continuous supply of energy to our customers and for emergency calls • Employees take all necessary measures to keep themselves and our customers safe • Customer service centers are available to respond to customer calls • UGI’s business is considered an essential service • Minimal disruptions to operations domestically and in Europe, including France and Italy UGI CORPORATION 4 • No anticipated supply chain issues • Expect some volume challenges, particularly from “non-essential” Commercial and Industrial customers • Continue to refine the impact of both warm weather and COVID-19 on Q2 and FY2020 earnings; intend to update guidance as more information becomes available
Strong Balance Sheet and Liquidity • Increased short-term liquidity by $210 million • March 19th – UGI Utilities completed a Note Purchase Agreement for a $150 million private placement priced at 3.12% with a maturity date of April 2050 • Proceeds will be used primarily to reduce short-term borrowings • March 6th – UGI Energy Services increased its Senior Secured Revolving Credit Facility by $60 million and extended the maturity of the facility to March 2025 • Total liquidity as of 2/29/20 $1.15 billion UGI CORPORATION 5 • Natural Gas and Global LPG businesses have access to capital as available financing capacity is evenly distributed • Low commodity prices experienced in fiscal Q1 and Q2 • Lower working capital requirements in fiscal Q3 and Q4 • No near-term senior note or term loan maturities
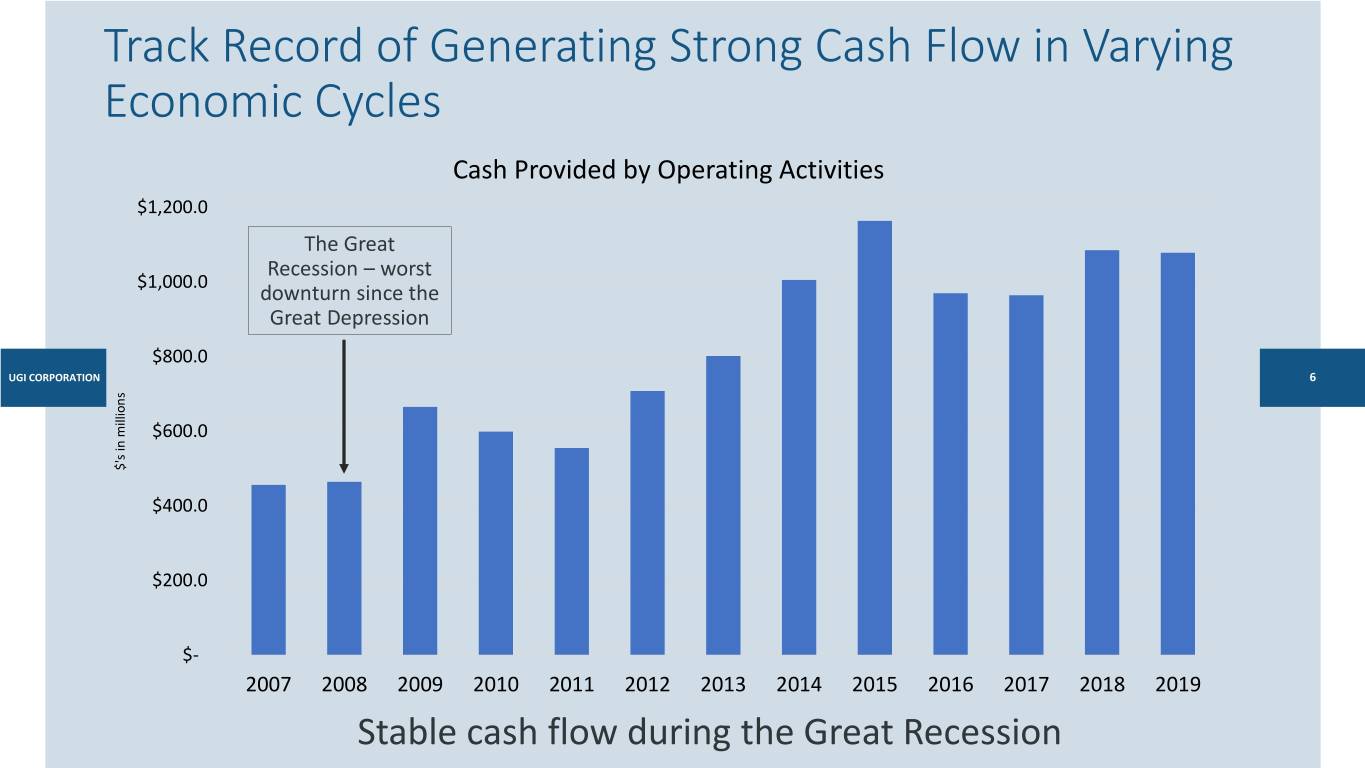
Track Record of Generating Strong Cash Flow in Varying Economic Cycles Cash Provided by Operating Activities $1,200.0 The Great Recession – worst $1,000.0 downturn since the Great Depression $800.0 UGI CORPORATION 6 $600.0 $'s $'s inmillions $400.0 $200.0 $- 2007 2008 2009 2010 2011 2012 2013 2014 2015 2016 2017 2018 2019 Stable cash flow during the Great Recession
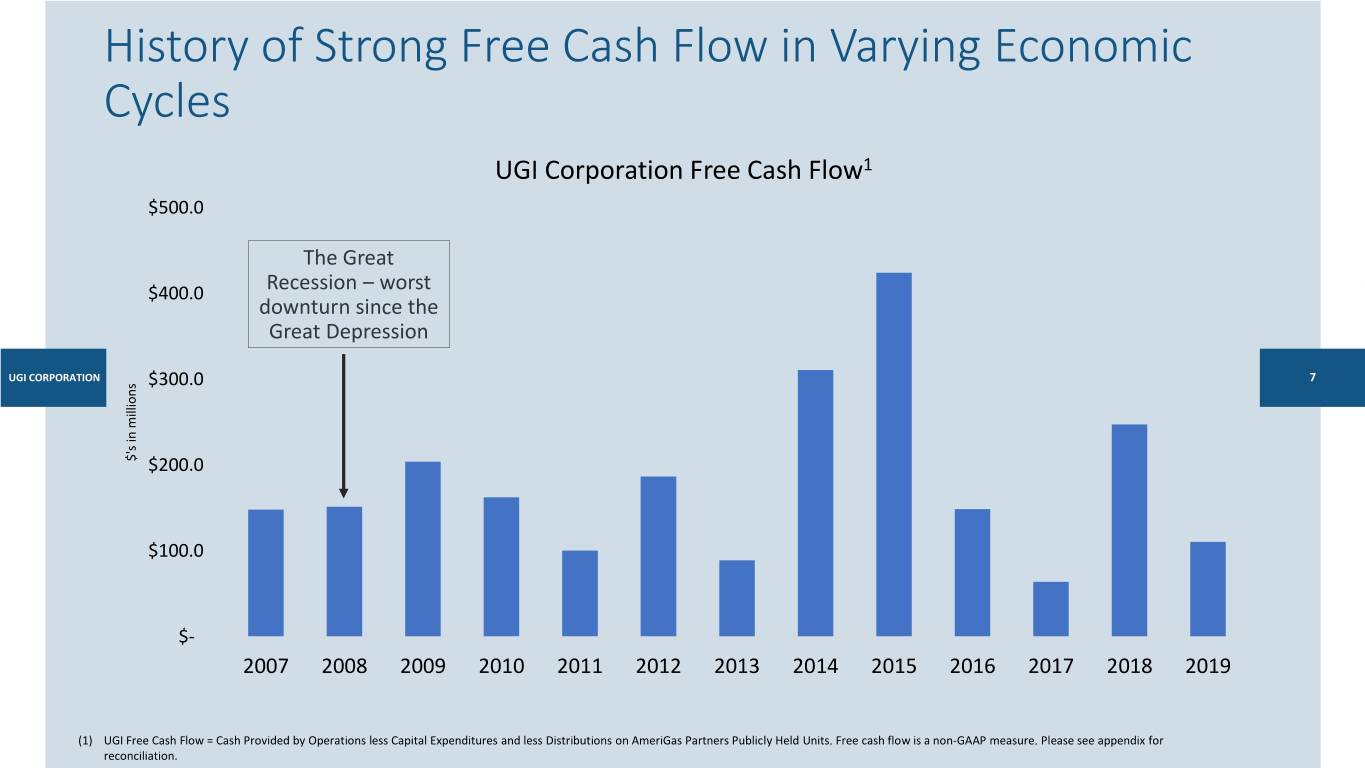
History of Strong Free Cash Flow in Varying Economic Cycles UGI Corporation Free Cash Flow1 $500.0 The Great $400.0 Recession – worst downturn since the Great Depression UGI CORPORATION $300.0 7 $'s $'s inmillions $200.0 $100.0 $- 2007 2008 2009 2010 2011 2012 2013 2014 2015 2016 2017 2018 2019 (1) UGI Free Cash Flow = Cash Provided by Operations less Capital Expenditures and less Distributions on AmeriGas Partners Publicly Held Units. Free cash flow is a non-GAAP measure. Please see appendix for reconciliation.
Capex Update • Evaluating capex impact of COVID-19 across our businesses • No longer expect to spend $850 million; plan to reduce capex by a minimum of $120 million • Will communicate updated capex guidance as more information emerges • UGI Utilities – active dialogue with PA PUC; limiting direct interaction with customers; reprioritization of work UGI CORPORATION 8 • UGI Energy Services – construction to slow down on build-out of LNG storage and vaporization facility in Bethlehem, PA and expect lower capex on expansion projects on Texas Creek and Marshlands systems • Global LPG – continue to make progress on LPG business transformation initiatives; evaluating impact of COVID-19

Summary • UGI’s business is considered an essential service • UGI is well-prepared financially to deal with COVID-19 downturn • Strong Balance Sheet • $1.15 billion in total available liquidity UGI CORPORATION • Expect some volume challenges particularly from “non-essential” Commercial and 9 Industrial customers • History of strong operating and free cash flow has allowed UGI to weather market disruptions well • COVID-19 will impact FY 2020 Capex guidance of $850 million by a minimum of $120 million • Evaluating impact and plan to communicate updates as more information emerges
Appendix
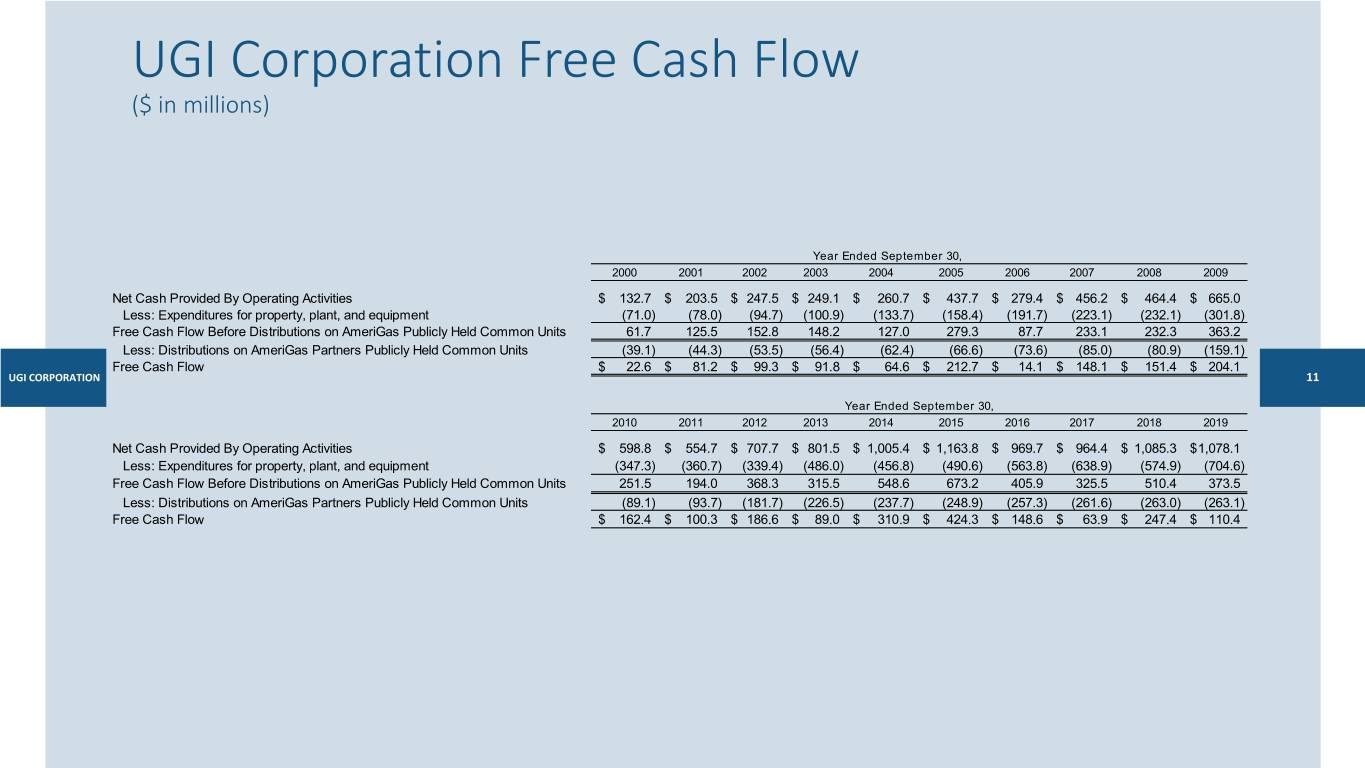
UGI Corporation Free Cash Flow ($ in millions) Year Ended September 30, 2000 2001 2002 2003 2004 2005 2006 2007 2008 2009 Net Cash Provided By Operating Activities $ 132.7 $ 203.5 $ 247.5 $ 249.1 $ 260.7 $ 437.7 $ 279.4 $ 456.2 $ 464.4 $ 665.0 Less: Expenditures for property, plant, and equipment (71.0) (78.0) (94.7) (100.9) (133.7) (158.4) (191.7) (223.1) (232.1) (301.8) Free Cash Flow Before Distributions on AmeriGas Publicly Held Common Units 61.7 125.5 152.8 148.2 127.0 279.3 87.7 233.1 232.3 363.2 Less: Distributions on AmeriGas Partners Publicly Held Common Units (39.1) (44.3) (53.5) (56.4) (62.4) (66.6) (73.6) (85.0) (80.9) (159.1) Free Cash Flow $ 22.6 $ 81.2 $ 99.3 $ 91.8 $ 64.6 $ 212.7 $ 14.1 $ 148.1 $ 151.4 $ 204.1 UGI CORPORATION 11 Year Ended September 30, 2010 2011 2012 2013 2014 2015 2016 2017 2018 2019 Net Cash Provided By Operating Activities $ 598.8 $ 554.7 $ 707.7 $ 801.5 $ 1,005.4 $ 1,163.8 $ 969.7 $ 964.4 $ 1,085.3 $ 1,078.1 Less: Expenditures for property, plant, and equipment (347.3) (360.7) (339.4) (486.0) (456.8) (490.6) (563.8) (638.9) (574.9) (704.6) Free Cash Flow Before Distributions on AmeriGas Publicly Held Common Units 251.5 194.0 368.3 315.5 548.6 673.2 405.9 325.5 510.4 373.5 Less: Distributions on AmeriGas Partners Publicly Held Common Units (89.1) (93.7) (181.7) (226.5) (237.7) (248.9) (257.3) (261.6) (263.0) (263.1) Free Cash Flow $ 162.4 $ 100.3 $ 186.6 $ 89.0 $ 310.9 $ 424.3 $ 148.6 $ 63.9 $ 247.4 $ 110.4


