
1 1 Fiscal 2021 Results Ro ge r Pe r re a u l t President and CEO, UGI Corporation Te d J . J a s t r ze bs k i Chief Financial Officer, UGI Corporation Ro b e r t F. B e a rd Executive Vice President, Natural Gas, Global Engineering & Construction and Procurement 1

2 2 About This Presentation This presentation contains statements, estimates and projections that are forward-looking statements (as defined in Section 21E of the Securities Exchange Act of 1934, as amended). Management believes that these are reasonable as of today’s date only. Actual results may differ significantly because of risks and uncertainties that are difficult to predict and many of which are beyond management’s control. You should read UGI’s Annual Report on Form 10-K for a more extensive list of factors that could affect results. Among them are adverse weather conditions (including increasingly uncertain weather patterns due to climate change) and the seasonal nature of our business; cost volatility and availability of all energy products, including propane, natural gas, electricity and fuel oil as well as the availability of LPG cylinders; increased customer conservation measures; the impact of pending and future legal or regulatory proceedings, inquiries or investigations, liability for uninsured claims and for claims in excess of insurance coverage; domestic and international political, regulatory and economic conditions in the United States and in foreign countries, including the current conflicts in the Middle East and the withdrawal of the United Kingdom from the European Union, and foreign currency exchange rate fluctuations (particularly the euro); the timing of development of Marcellus and Utica Shale gas production; the availability, timing and success of our acquisitions, commercial initiatives and investments to grow our business; our ability to successfully integrate acquired businesses and achieve anticipated synergies; the interruption, disruption, failure, malfunction, or breach of our information technology systems, including due to cyber- attack; the inability to complete pending or future energy infrastructure projects; our ability to achieve the operational benefits and cost efficiencies expected from the completion of pending and future transformation initiatives including the impact of customer disruptions resulting in potential customer loss due to the transformation activities; uncertainties related to the global pandemics, including the duration and/or impact of the COVID-19 pandemic; and the extent to which we are able to utilize certain tax benefits currently available under the CARES Act and similar tax legislation and whether such benefits will remain available in the future.

3 3 Fiscal Year 2021 Summary Roger Perreault President and CEO, UGI Corporation
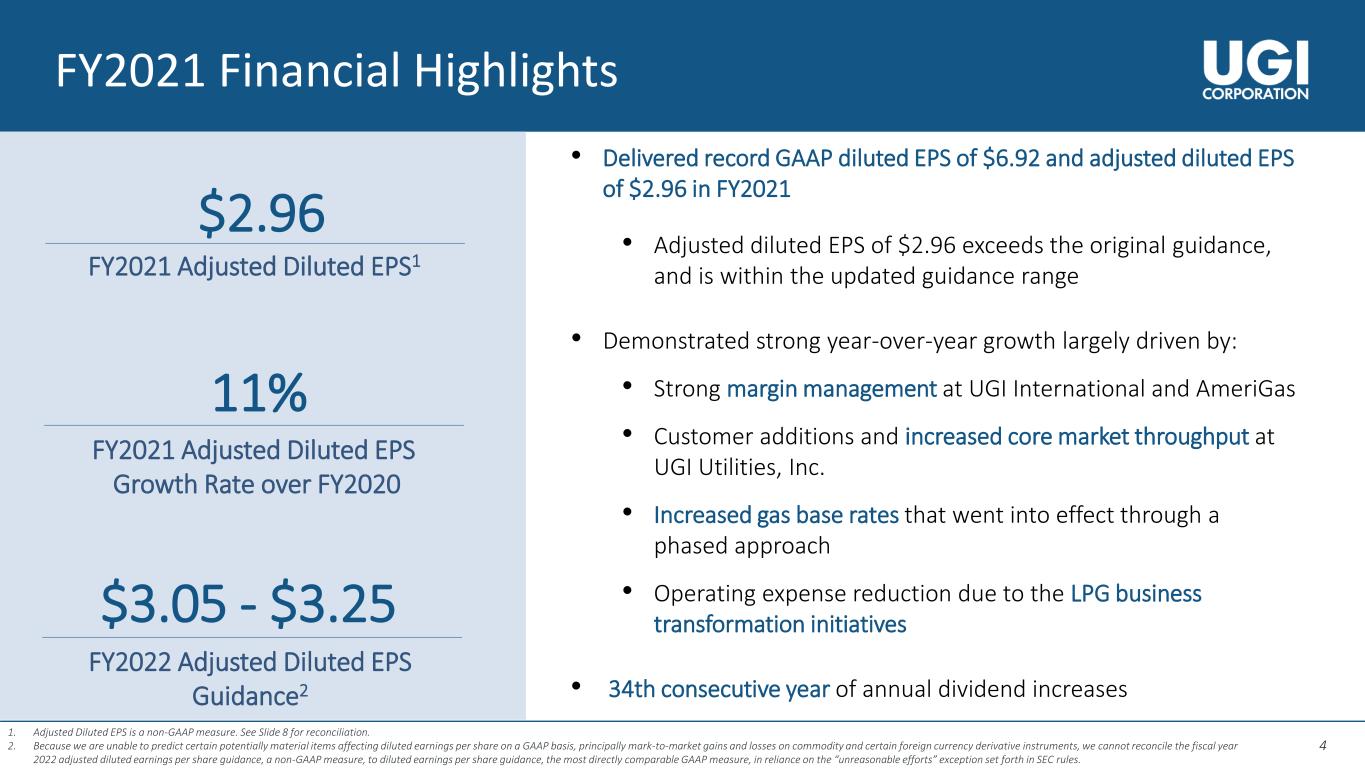
4 4 FY2021 Financial Highlights 4 • Delivered record GAAP diluted EPS of $6.92 and adjusted diluted EPS of $2.96 in FY2021 • Adjusted diluted EPS of $2.96 exceeds the original guidance, and is within the updated guidance range • Demonstrated strong year-over-year growth largely driven by: • Strong margin management at UGI International and AmeriGas • Customer additions and increased core market throughput at UGI Utilities, Inc. • Increased gas base rates that went into effect through a phased approach • Operating expense reduction due to the LPG business transformation initiatives • 34th consecutive year of annual dividend increases 1. Adjusted Diluted EPS is a non-GAAP measure. See Slide 8 for reconciliation. 2. Because we are unable to predict certain potentially material items affecting diluted earnings per share on a GAAP basis, principally mark-to-market gains and losses on commodity and certain foreign currency derivative instruments, we cannot reconcile the fiscal year 2022 adjusted diluted earnings per share guidance, a non-GAAP measure, to diluted earnings per share guidance, the most directly comparable GAAP measure, in reliance on the “unreasonable efforts” exception set forth in SEC rules. FY2021 Adjusted Diluted EPS1 FY2021 Adjusted Diluted EPS Growth Rate over FY2020 $2.96 11% FY2022 Adjusted Diluted EPS Guidance2 $3.05 - $3.25
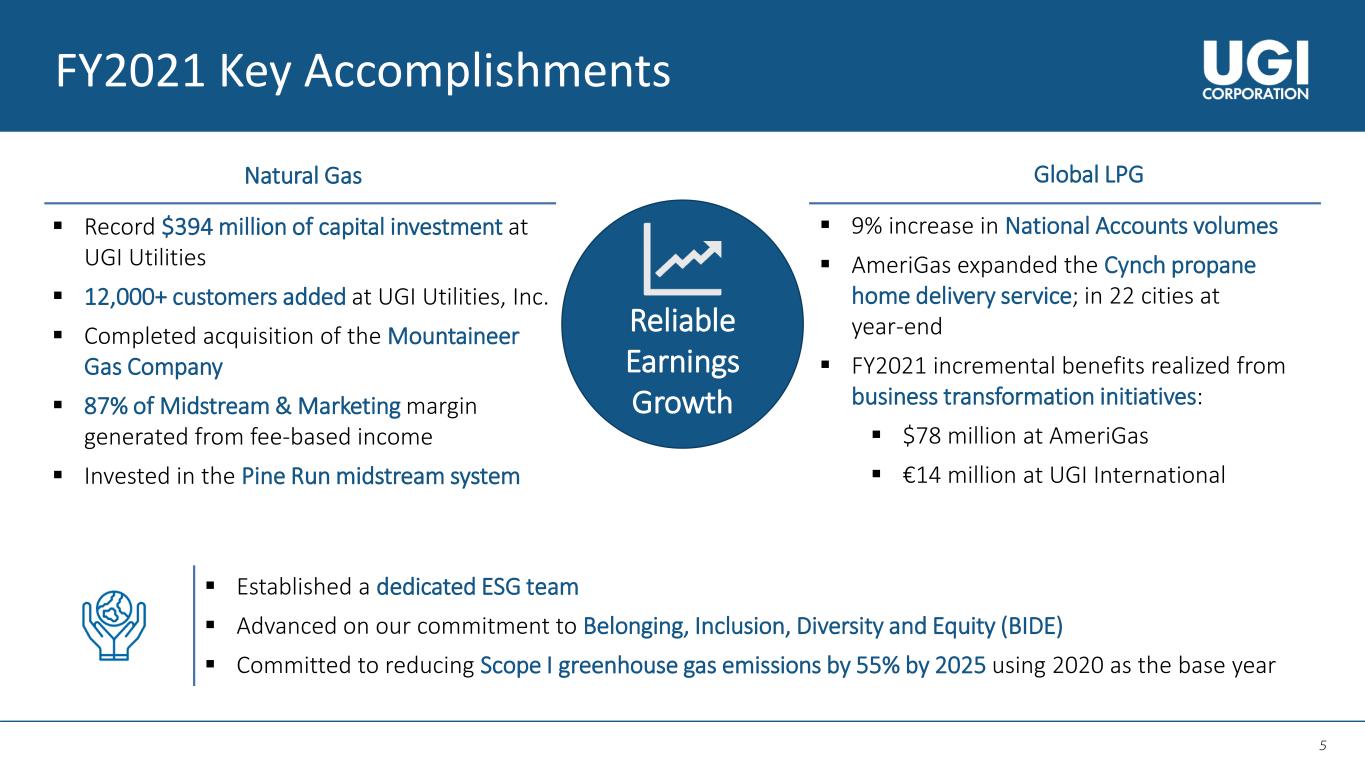
5 5 FY2021 Key Accomplishments Reliable Earnings Growth Record $394 million of capital investment at UGI Utilities 12,000+ customers added at UGI Utilities, Inc. Completed acquisition of the Mountaineer Gas Company 87% of Midstream & Marketing margin generated from fee-based income Invested in the Pine Run midstream system Natural Gas 9% increase in National Accounts volumes AmeriGas expanded the Cynch propane home delivery service; in 22 cities at year-end FY2021 incremental benefits realized from business transformation initiatives: $78 million at AmeriGas €14 million at UGI International Global LPG Established a dedicated ESG team Advanced on our commitment to Belonging, Inclusion, Diversity and Equity (BIDE) Committed to reducing Scope I greenhouse gas emissions by 55% by 2025 using 2020 as the base year

6 6 FY2021 Key Accomplishments Renewables We continued to rebalance the portfolio through: • The Mountaineer acquisition • Record capital spend at our PA regulated utilities business • Investment in Pine Run midstream system • Progressing on our commitment towards renewables investments Recent announcements demonstrate commitment towards renewables and provide momentum for the future RNG Bio-LPG and rDME • Committed $100M+ to RNG projects in Idaho, upstate New York, Ohio, Kentucky, and South Dakota • Entered a RNG interconnect agreement with a landfill gas developer in northeast Pennsylvania • Announced intended joint venture to advance the production and use of rDME in the LPG industry in the US and Europe • Entered strategic partnership that provides exclusive supply of bio-LPG, enabling UGI International to better meet customer needs Rebalancing

7 7 Fiscal Year 2021 Financial Review Ted J. Jastrzebski Chief Financial Officer, UGI Corporation
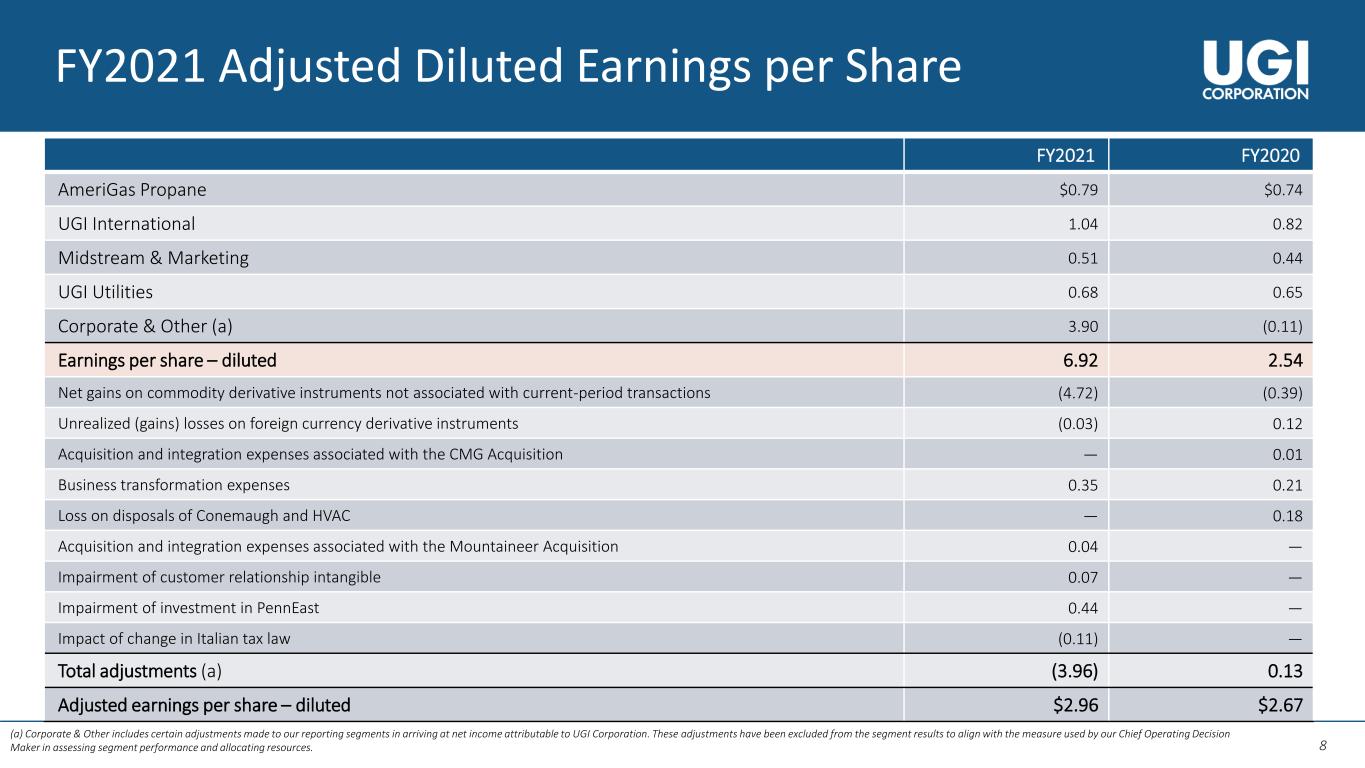
8 8 FY2021 Adjusted Diluted Earnings per Share FY2021 FY2020 AmeriGas Propane $0.79 $0.74 UGI International 1.04 0.82 Midstream & Marketing 0.51 0.44 UGI Utilities 0.68 0.65 Corporate & Other (a) 3.90 (0.11) Earnings per share – diluted 6.92 2.54 Net gains on commodity derivative instruments not associated with current-period transactions (4.72) (0.39) Unrealized (gains) losses on foreign currency derivative instruments (0.03) 0.12 Acquisition and integration expenses associated with the CMG Acquisition — 0.01 Business transformation expenses 0.35 0.21 Loss on disposals of Conemaugh and HVAC — 0.18 Acquisition and integration expenses associated with the Mountaineer Acquisition 0.04 — Impairment of customer relationship intangible 0.07 — Impairment of investment in PennEast 0.44 — Impact of change in Italian tax law (0.11) — Total adjustments (a) (3.96) 0.13 Adjusted earnings per share – diluted $2.96 $2.67 (a) Corporate & Other includes certain adjustments made to our reporting segments in arriving at net income attributable to UGI Corporation. These adjustments have been excluded from the segment results to align with the measure used by our Chief Operating Decision Maker in assessing segment performance and allocating resources.

9 9 0.74 0.79 0.82 1.04 0.44 0.51 0.65 0.68 FY2020 FY2021 FY2021 Results Recap UGI Utilities Midstream & Marketing UGI International AmeriGas FY2021 Adjusted Diluted EPS1 – Segment Split 1. Adjusted Diluted EPS is a non-GAAP measure. See Slide 8 for reconciliation. 2. Includes $0.02 Corporate & Other. 3. Includes $(0.06) Corporate & Other. In addition, $0.03 relates to the non-cash dilutive impact of the $220 million in equity units issued in May 2021 now reflecting the required if-converted method. Consistent with market practice, the underlying shares were previously accounted for using the treasury stock method and not included within our calculation of weighted average shares outstanding. 4. Includes Mountaineer Gas Company acquired on September 1, 2021. $2.672 $2.963 FY2021 GAAP diluted EPS of $6.92 compared to $2.54 in FY2020 FY2021 Adjusted Diluted EPS1 – Comparison with FY2020 $2.96 $2.67 $0.05 $0.22 $0.07 $0.03 ($0.08) FY2020 AmeriGas UGI International Midstream & Marketing UGI Utilities Corporate & Other FY2021 4
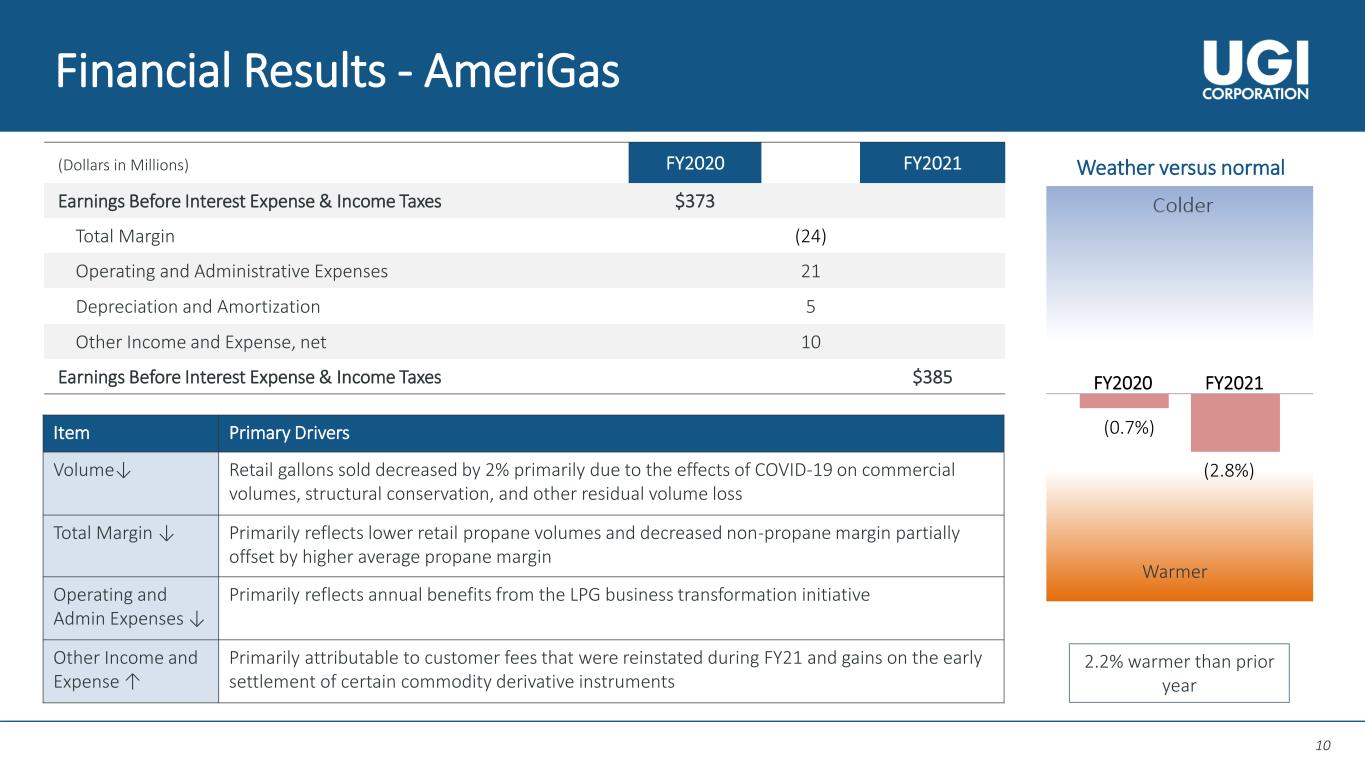
10 10 Financial Results - AmeriGas (Dollars in Millions) FY2020 FY2021 Earnings Before Interest Expense & Income Taxes $373 Total Margin (24) Operating and Administrative Expenses 21 Depreciation and Amortization 5 Other Income and Expense, net 10 Earnings Before Interest Expense & Income Taxes $385 Item Primary Drivers Volume↓ Retail gallons sold decreased by 2% primarily due to the effects of COVID-19 on commercial volumes, structural conservation, and other residual volume loss Total Margin ↓ Primarily reflects lower retail propane volumes and decreased non-propane margin partially offset by higher average propane margin Operating and Admin Expenses ↓ Primarily reflects annual benefits from the LPG business transformation initiative Other Income and Expense ↑ Primarily attributable to customer fees that were reinstated during FY21 and gains on the early settlement of certain commodity derivative instruments Weather versus normal 2.2% warmer than prior year Warmer (0.7%) (2.8%) FY2021FY2020
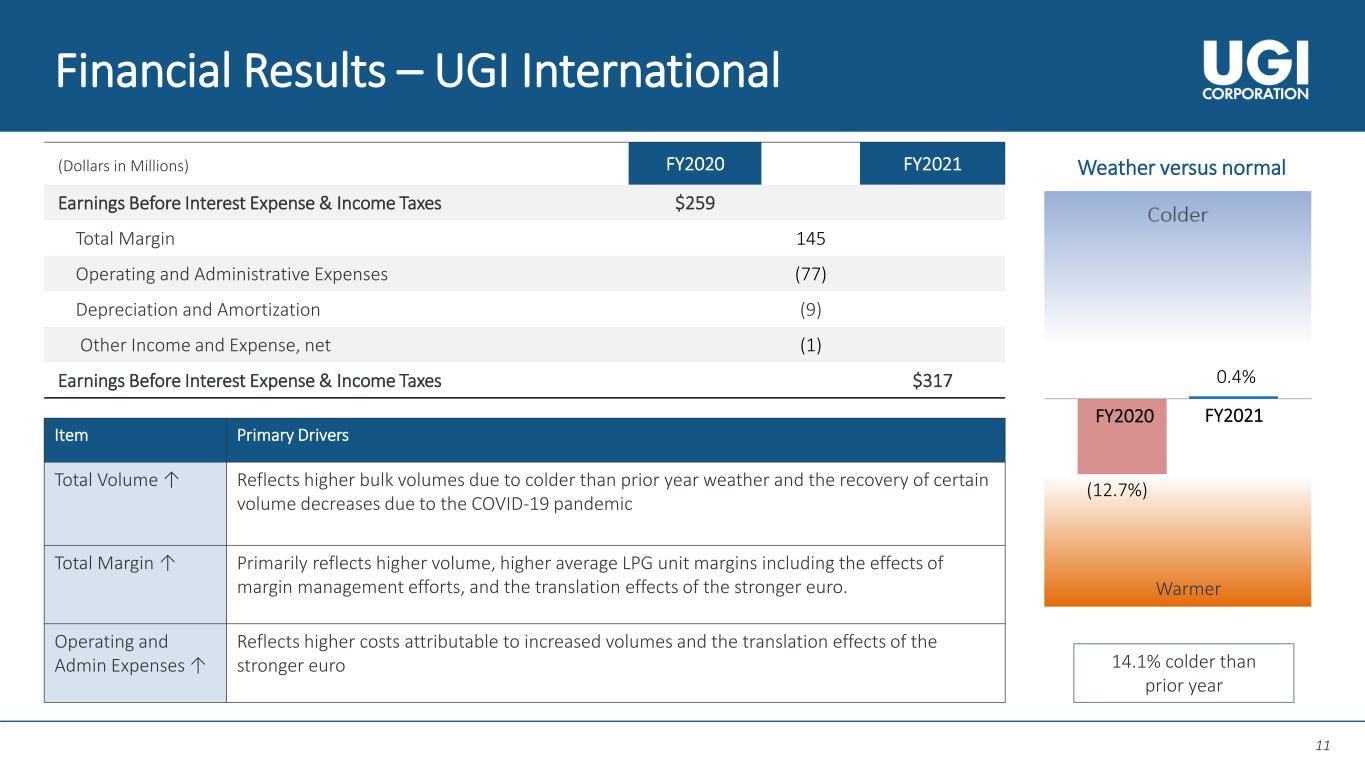
11 11 Item Primary Drivers Total Volume ↑ Reflects higher bulk volumes due to colder than prior year weather and the recovery of certain volume decreases due to the COVID-19 pandemic Total Margin ↑ Primarily reflects higher volume, higher average LPG unit margins including the effects of margin management efforts, and the translation effects of the stronger euro. Operating and Admin Expenses ↑ Reflects higher costs attributable to increased volumes and the translation effects of the stronger euro Financial Results – UGI International (Dollars in Millions) FY2020 FY2021 Earnings Before Interest Expense & Income Taxes $259 Total Margin 145 Operating and Administrative Expenses (77) Depreciation and Amortization (9) Other Income and Expense, net (1) Earnings Before Interest Expense & Income Taxes $317 Weather versus normal 14.1% colder than prior year (14.7%) Warmer 0.4% FY2020 FY2021 (12.7%)

12 12 Item Primary Drivers Total Margin ↑ Reflects increased margins from capacity management driven by timing of mark to market contract settlements, gas gathering and renewable energy marketing activities, partially offset by the absence of margins attributable to HVAC and Conemaugh that were divested in FY20 Operating and Admin Expenses ↓ Largely reflects absence of the previously mentioned divested assets partially offset by increase in employee and benefits-related costs and increases related to new assets placed in service Other Income and Expense, net ↓ Adjustment to the contingent consideration related to the GHI acquisition ($9 million), partially offset by higher equity income largely due to the Pine Run investment Financial Results – Midstream & Marketing Weather versus normal 2.6% warmer than prior year Warmer (6.9%) FY2020 FY2021 (4.5%) (Dollars in Millions) FY2020 FY2021 Earnings Before Interest Expense & Income Taxes $168 Total Margin 18 Operating and Administrative Expenses 11 Depreciation and Amortization (1) Other Income and Expense, net (6) Earnings Before Interest Expense & Income Taxes $190

13 13 Item Primary Drivers Volume ↑ Natural gas core market throughput increased 3% reflecting continued customer growth and the recovery of certain volume decreases attributable to COVID-19 Total Margin ↑ Reflects higher core market volume, increase in base rates that became effective in 2021 as part of a phased approach, and margin from the Mountaineer acquisition Operating and Admin Expenses ↑ Attributable to incremental activities related to Mountaineer ($7 million) and higher contracted labor expenses and employee costs Depreciation ↑ Continued distribution system and IT capital expenditure activity Financial Results – UGI Utilities (Dollars in Millions) FY2020 FY20211 Earnings Before Interest Expense & Income Taxes $229 Total Margin 39 Operating and Administrative Expenses (15) Depreciation (14) Other Income and Expense, net 3 Earnings Before Interest Expense & Income Taxes $242 Weather versus normal 1.0% warmer than prior year Warmer (7.9%) FY2020 FY2021 (6.9%) 1. Includes Mountaineer Gas Company acquired on September 1, 2021.
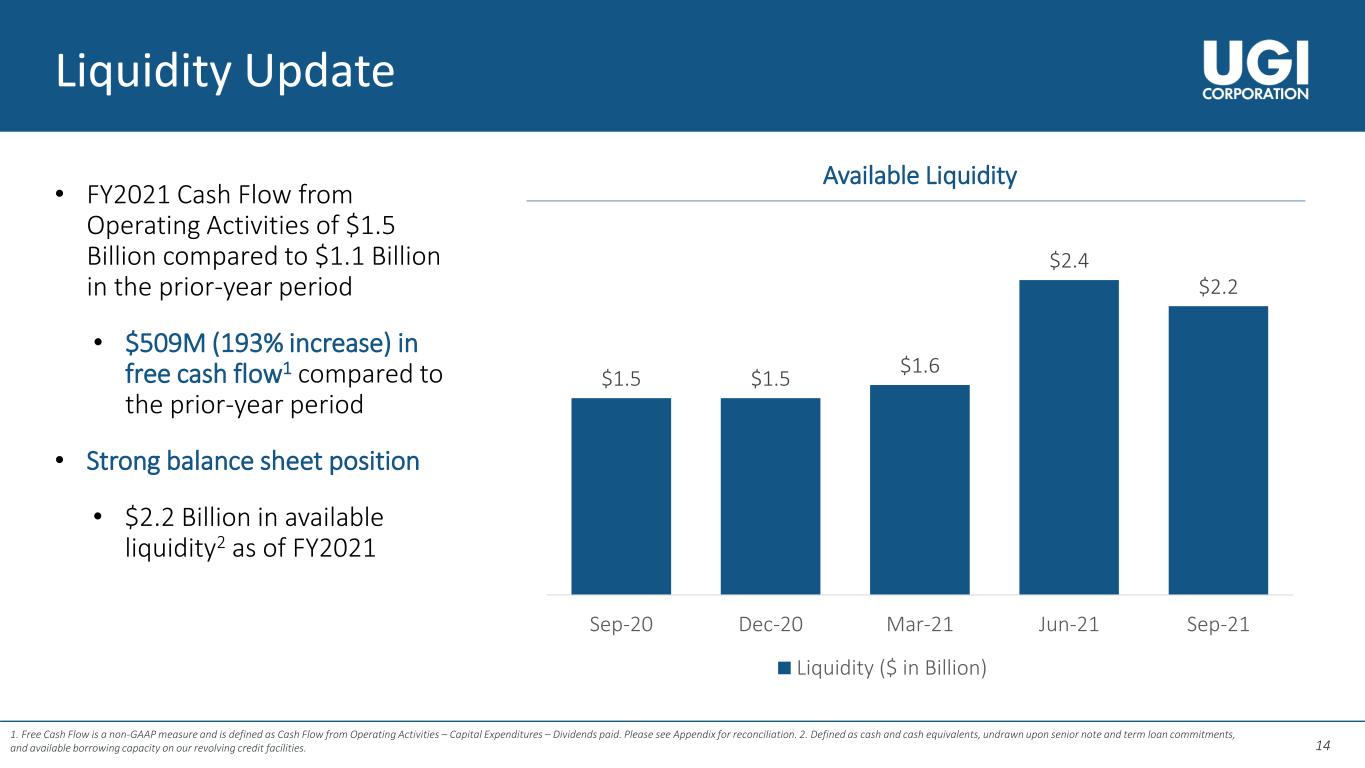
14 14 Liquidity Update • FY2021 Cash Flow from Operating Activities of $1.5 Billion compared to $1.1 Billion in the prior-year period • $509M (193% increase) in free cash flow1 compared to the prior-year period • Strong balance sheet position • $2.2 Billion in available liquidity2 as of FY2021 $1.5 $1.5 $1.6 $2.4 $2.2 Sep-20 Dec-20 Mar-21 Jun-21 Sep-21 Available Liquidity Liquidity ($ in Billion) 1. Free Cash Flow is a non-GAAP measure and is defined as Cash Flow from Operating Activities – Capital Expenditures – Dividends paid. Please see Appendix for reconciliation. 2. Defined as cash and cash equivalents, undrawn upon senior note and term loan commitments, and available borrowing capacity on our revolving credit facilities.

15 15 FY2022 Guidance FY2022 Adjusted Diluted EPS Guidance1 – Comparison with FY2021 $3.05 $2.96 $0.13 $(0.12) $(0.03) $0.06 $0.15 FY2021 Adjusted Diluted EPS COVID-19 Headwind FY21 Tax Benefits Equity Units Mountaineer Other Growth Drivers FY2022 Guidance $3.25 1. The forward looking information used on this slide is for illustrative purposes only. Actual numbers may differ substantially from the figures presented. Because we are unable to predict certain potentially material items affecting diluted earnings per share on a GAAP basis, principally mark-to-market gains and losses on commodity and certain foreign currency derivative instruments, we cannot reconcile the fiscal year 2022 adjusted diluted earnings per share guidance, a non-GAAP measure, to diluted earnings per share guidance, the most directly comparable GAAP measure, in reliance on the “unreasonable efforts” exception set forth in SEC rules. 2. Adjusted Diluted EPS is a non-GAAP measure. See Slide 8 for reconciliation. 3. Relates to the non-cash dilutive impact of the $220 million in equity units issued in May 2021 now reflecting the required if-converted method. Consistent with market practice, the underlying shares were previously accounted for using the treasury stock method and not included within our calculation of weighted average shares outstanding. 4. Includes Business Transformation and other efficiencies. Well positioned to deliver reliable earnings growth FY2022 Adjusted Diluted EPS Guidance Growth over FY2021 Actual (Using the mid-point of FY2022 guidance) 6.4% Long-term EPS Growth Commitment 6%-10% 4 3 2

16 16 Conclusion Roger Perreault President and CEO, UGI Corporation
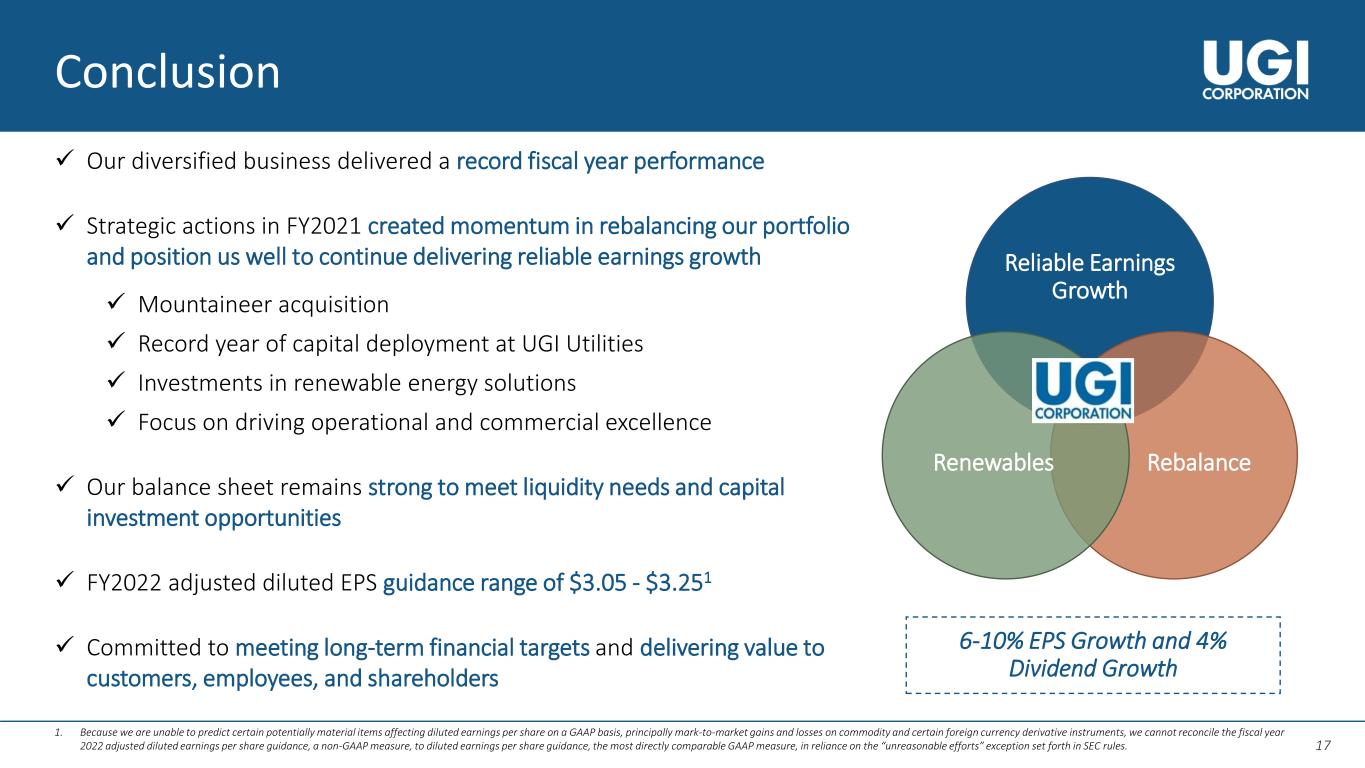
17 17 Conclusion Our diversified business delivered a record fiscal year performance Strategic actions in FY2021 created momentum in rebalancing our portfolio and position us well to continue delivering reliable earnings growth Mountaineer acquisition Record year of capital deployment at UGI Utilities Investments in renewable energy solutions Focus on driving operational and commercial excellence Our balance sheet remains strong to meet liquidity needs and capital investment opportunities FY2022 adjusted diluted EPS guidance range of $3.05 - $3.251 Committed to meeting long-term financial targets and delivering value to customers, employees, and shareholders Reliable Earnings Growth RebalanceRenewables 6-10% EPS Growth and 4% Dividend Growth 1. Because we are unable to predict certain potentially material items affecting diluted earnings per share on a GAAP basis, principally mark-to-market gains and losses on commodity and certain foreign currency derivative instruments, we cannot reconcile the fiscal year 2022 adjusted diluted earnings per share guidance, a non-GAAP measure, to diluted earnings per share guidance, the most directly comparable GAAP measure, in reliance on the “unreasonable efforts” exception set forth in SEC rules.

18 18 Q & A Q
19 19 Appendix
20 20 UGI Supplemental Footnotes • Management uses “adjusted net income attributable to UGI Corporation”, “free cash flow” and “adjusted diluted earnings per share,” all three of which are non-GAAP financial measures, when evaluating UGI’s overall performance. Management believes that these non-GAAP measures provide meaningful information to investors about UGI’s performance because they eliminate gains and losses on commodity and certain foreign currency derivative instruments not associated with current-period transactions and other significant discrete items that can affect the comparison of period-over-period results. • Management does not designate its commodity and certain foreign currency derivative instruments as hedges under GAAP. Volatility in net income attributable to UGI can occur as a result of such gains and losses on commodity and certain foreign currency derivative instruments not associated with current-period transactions. These gains and losses result principally from recording changes in unrealized gains and losses on unsettled commodity and certain foreign currency derivative instruments and, to a much lesser extent, certain realized gains and losses on settled commodity derivative instruments that are not associated with current-period transactions. However, because these derivative instruments economically hedge anticipated future purchases or sales of energy commodities, or in the case of certain foreign currency derivatives, reduce volatility in anticipated future earnings associated with our foreign operations, we expect that such gains or losses will be largely offset by gains or losses on anticipated future energy commodity transactions or mitigate volatility in anticipated future earnings. • Non-GAAP financial measures are not in accordance with, or an alternative to, GAAP and should be considered in addition to, and not as a substitute for, the comparable GAAP measures. • The table on slide 21 reconciles net income attributable to UGI Corporation, the most directly comparable GAAP measure, to adjusted net income attributable to UGI Corporation, and the table on slide 8 reconciles diluted earnings per share, the most comparable GAAP measure, to adjusted diluted earnings per share, to reflect the adjustments referred to above. Slide 22 reconciles the free cash flow to the Net cash provided by operating activities.
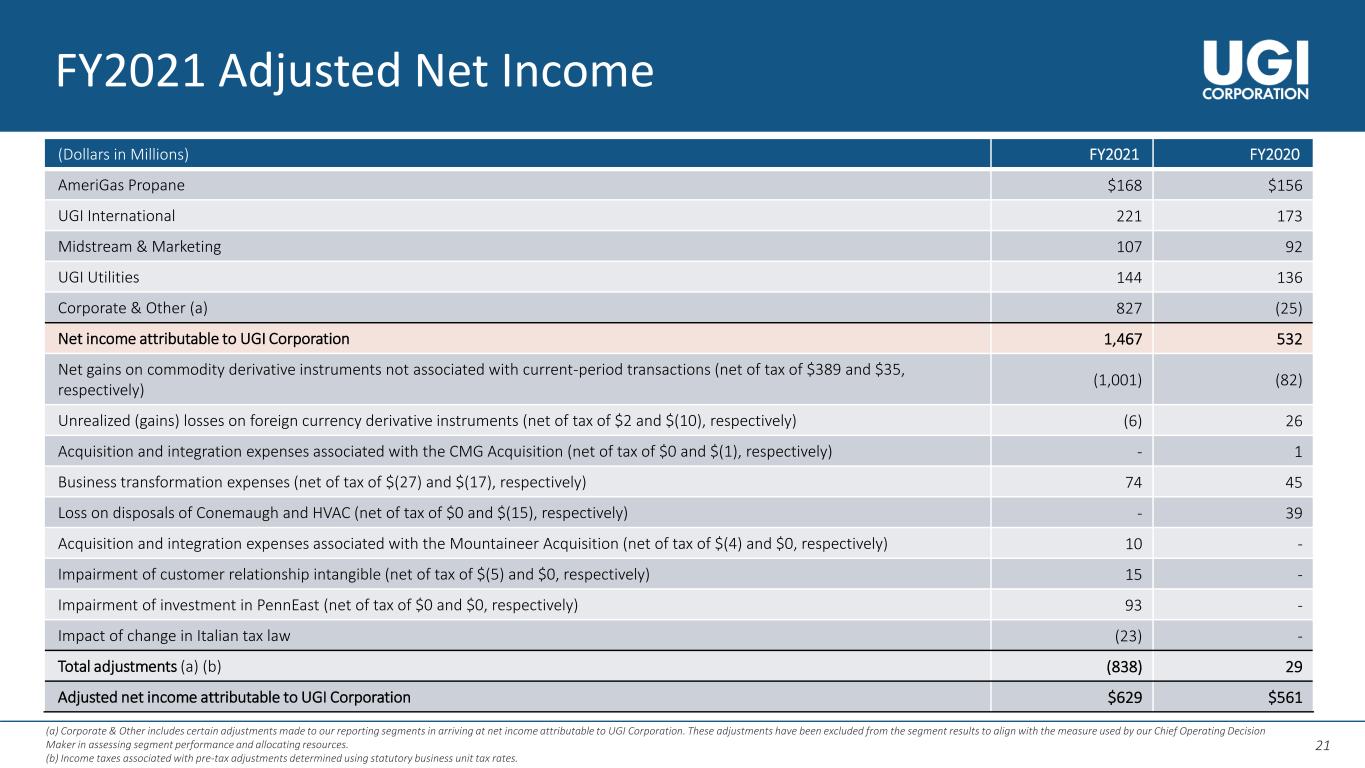
21 21 FY2021 Adjusted Net Income (Dollars in Millions) FY2021 FY2020 AmeriGas Propane $168 $156 UGI International 221 173 Midstream & Marketing 107 92 UGI Utilities 144 136 Corporate & Other (a) 827 (25) Net income attributable to UGI Corporation 1,467 532 Net gains on commodity derivative instruments not associated with current-period transactions (net of tax of $389 and $35, respectively) (1,001) (82) Unrealized (gains) losses on foreign currency derivative instruments (net of tax of $2 and $(10), respectively) (6) 26 Acquisition and integration expenses associated with the CMG Acquisition (net of tax of $0 and $(1), respectively) - 1 Business transformation expenses (net of tax of $(27) and $(17), respectively) 74 45 Loss on disposals of Conemaugh and HVAC (net of tax of $0 and $(15), respectively) - 39 Acquisition and integration expenses associated with the Mountaineer Acquisition (net of tax of $(4) and $0, respectively) 10 - Impairment of customer relationship intangible (net of tax of $(5) and $0, respectively) 15 - Impairment of investment in PennEast (net of tax of $0 and $0, respectively) 93 - Impact of change in Italian tax law (23) - Total adjustments (a) (b) (838) 29 Adjusted net income attributable to UGI Corporation $629 $561 (a) Corporate & Other includes certain adjustments made to our reporting segments in arriving at net income attributable to UGI Corporation. These adjustments have been excluded from the segment results to align with the measure used by our Chief Operating Decision Maker in assessing segment performance and allocating resources. (b) Income taxes associated with pre-tax adjustments determined using statutory business unit tax rates.

22 22 Free Cash Flow (Dollars in Millions) FY2021 FY2020 Net cash provided by operating activities $1,481 $1,102 (-) Expenditures for property, plant and equipment (690) (655) (-) Dividends on UGI Common Stock (282) (273) Free Cash Flow $509 $174

23 23 Investor Relations: Tameka Morris 610-456-6297 morrista@ugicorp.com Arnab Mukherjee 610-768-7498 mukherjeea@ugicorp.com


