
1 1 Fiscal 2022 Second Quarter Results Ro ge r Pe r re a u l t President and CEO, UGI Corporation Te d J . J a s t r ze bs k i Chief Financial Officer, UGI Corporation Ro b e r t F. B e a rd Executive Vice President, Natural Gas, Global Engineering & Construction and Procurement 1

2 2 About This Presentation This presentation contains forward-looking statements, including estimates and projections, within the meaning of Section 27A of the Securities Act of 1933, as amended, and Section 21E of the Securities Exchange Act of 1934, as amended. Forward-looking statements are based on management’s beliefs and assumptions and can often be identified by terms and phrases that include believe,” “plan,” “anticipate,” “continue,” “estimate,” “expect,” “may,” “intend,” “target,” “project,” “forecast,” or other similar words. Management believes that these are reasonable as of today’s date only. Actual results may differ significantly because of risks and uncertainties that are difficult to predict and many of which are beyond management’s control; accordingly, there is no assurance that results will be realized. You should read UGI’s Annual Report on Form 10-K and quarterly reports on Form 10-Q for a more extensive list of factors that could affect results. Among them are adverse weather conditions (including increasingly uncertain weather patterns due to climate change, resulting in reduced demand) and the seasonal nature of our business; cost volatility and availability of all energy products, including propane and other LPG, natural gas, electricity and fuel oil as well as the availability of LPG cylinders, and the capacity to transport product to our customers, increased customer conservation measures; the impact of pending and future legal or regulatory proceedings, inquiries or investigations, liability for uninsured claims and for claims in excess of insurance coverage; domestic and international political, regulatory and economic conditions in the United States, Europe and other foreign countries, including uncertainties related to the military conflict between Russia and Ukraine, and foreign currency exchange rate fluctuations (particularly the euro); the timing of development of Marcellus and Utica Shale gas production; the availability, timing and success of our acquisitions, commercial initiatives and investments to grow our business; our ability to successfully integrate acquired businesses and achieve anticipated synergies; the interruption, disruption, failure, malfunction, or breach of our information technology systems, including due to cyberattack; the inability to complete pending or future energy infrastructure projects; our ability to achieve the operational benefits and cost efficiencies expected from the completion of pending and future transformation initiatives including the impact of customer disruptions resulting in potential customer loss due to the transformation activities; uncertainties related to a global pandemic, including the duration and/or impact of the COVID-19 pandemic; the impact of proposed or future tax legislation, including the potential reversal of existing tax legislation that is beneficial to us; and our ability to overcome supply chain issues that may result in delays or shortages in, as well as increased costs of, equipment, materials or other resources that are critical to our business operations.

3 3 Second Quarter Summary Roger Perreault President and CEO, UGI Corporation

4 4 Q2 FY22 Financial Highlights GAAP diluted EPS of $4.32 vs. $2.33 in Q2 FY22 Adjusted diluted EPS1 of $1.91 in Q2 FY22 vs $1.99 in Q2 FY21 Results reflect: Incremental contribution from strategic investments in the natural gas businesses, including Mountaineer Impact of significant increases and volatility in commodity prices on energy marketing margins in Europe Lower retail volumes at AmeriGas Margin management and expense control efforts Revised guidance range of $2.90 to $3.003 1. Adjusted Diluted EPS is a non-GAAP measure. See Slide 7 and Appendix for reconciliation. 2. Excludes EBIT related to Corporate & Other. 3. The previous guidance for Adjusted EPS provided on November 19, 2022, was $3.05 – $3.25. Because we are unable to predict certain potentially material items affecting diluted earnings per share on a GAAP basis, principally mark-to-market gains and losses on commodity and certain foreign currency derivative instruments, we cannot reconcile fiscal year 2022 adjusted diluted earnings per share, a non-GAAP measure, to diluted earnings per share, the most directly comparable GAAP measure, in reliance on the “unreasonable efforts” exception set forth in SEC rules. Reportable Segments Earnings before interest expense and income taxes ($ in Million)2 $630 $631 Q2 FY21 Q2 FY22 $1.99 $1.91 Q2 FY21 Q2 FY22 Q2 FY22 Adjusted Diluted EPS1
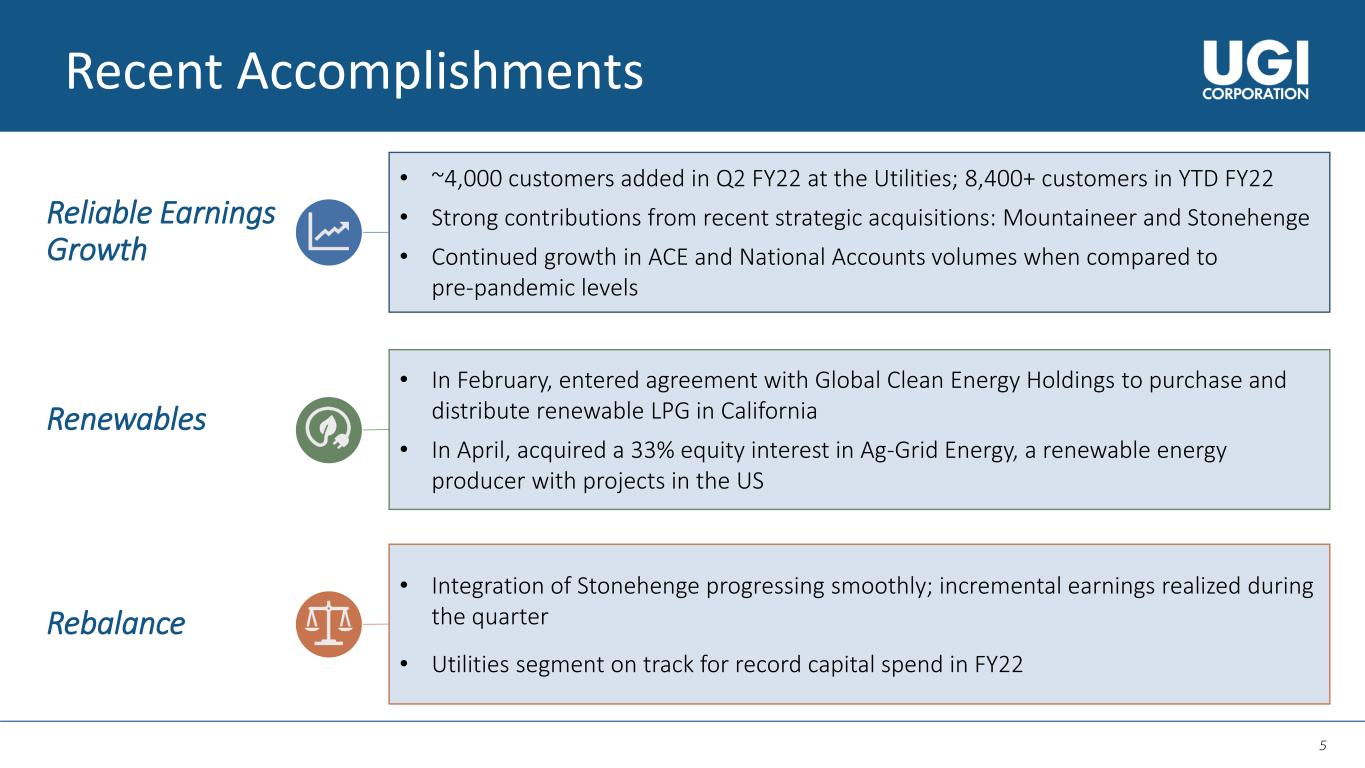
5 Recent Accomplishments1 Reliable Earnings Growth Renewables Rebalance • ~4,000 customers added in Q2 FY22 at the Utilities; 8,400+ customers in YTD FY22 • Strong contributions from recent strategic acquisitions: Mountaineer and Stonehenge • Continued growth in ACE and National Accounts volumes when compared to pre-pandemic levels • In February, entered agreement with Global Clean Energy Holdings to purchase and distribute renewable LPG in California • In April, acquired a 33% equity interest in Ag-Grid Energy, a renewable energy producer with projects in the US • Integration of Stonehenge progressing smoothly; incremental earnings realized during the quarter • Utilities segment on track for record capital spend in FY22

6 6 Second Quarter Financial Review Ted J. Jastrzebski Chief Financial Officer, UGI Corporation
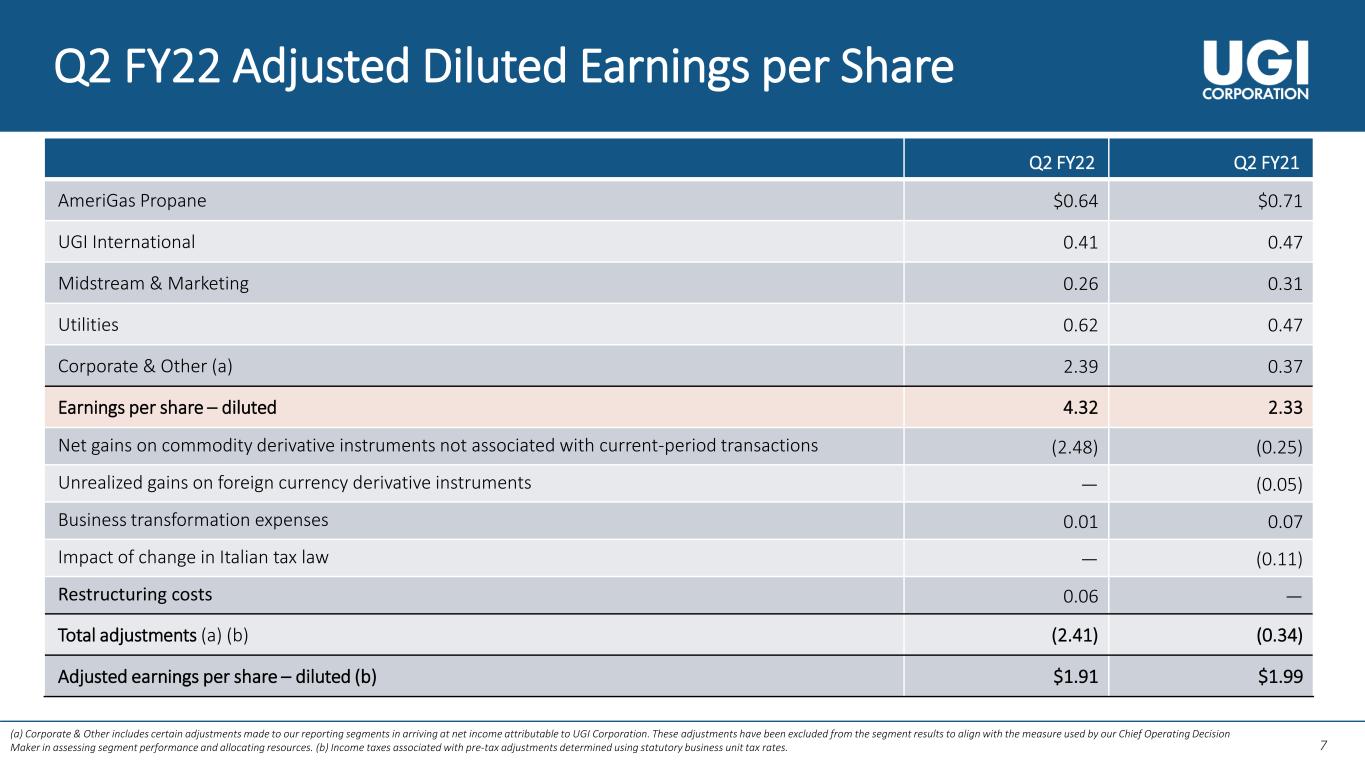
7 7 Q2 FY22 Adjusted Diluted Earnings per Share Q2 FY22 Q2 FY21 AmeriGas Propane $0.64 $0.71 UGI International 0.41 0.47 Midstream & Marketing 0.26 0.31 Utilities 0.62 0.47 Corporate & Other (a) 2.39 0.37 Earnings per share – diluted 4.32 2.33 Net gains on commodity derivative instruments not associated with current-period transactions (2.48) (0.25) Unrealized gains on foreign currency derivative instruments — (0.05) Business transformation expenses 0.01 0.07 Impact of change in Italian tax law — (0.11) Restructuring costs 0.06 — Total adjustments (a) (b) (2.41) (0.34) Adjusted earnings per share – diluted (b) $1.91 $1.99 (a) Corporate & Other includes certain adjustments made to our reporting segments in arriving at net income attributable to UGI Corporation. These adjustments have been excluded from the segment results to align with the measure used by our Chief Operating Decision Maker in assessing segment performance and allocating resources. (b) Income taxes associated with pre-tax adjustments determined using statutory business unit tax rates.

8 8 $1.91 $1.99 ($0.07) ($0.06) ($0.05) $0.15 ($0.05) Q2 FY21 AmeriGas UGI International Midstream & Marketing Utilities Corporate & Other Q2 FY22 1.07 0.80 0.91 0.68 0.47 0.50 0.71 0.91 YTD FY21 YTD FY22 Q2 FY22 Results Recap 1. Adjusted Diluted EPS is a non-GAAP measure. See Slide 7 and Appendix for reconciliation. 2. Includes Mountaineer Gas Company acquired on September 1, 2021. 3. Includes $0.01 Corporate & Other. 4. Includes ($0.05) Corporate & Other. Q2 FY22 GAAP diluted EPS of $4.32 compared to $2.33 in Q2 FY21 Q2 FY22 Adjusted Diluted EPS1 Compared to Q2 FY21 2 Utilities Midstream & Marketing UGI International AmeriGas YTD Adjusted Diluted EPS1 by Segment $3.173 $2.844 YTD FY22 GAAP diluted EPS of $3.87 compared to $3.77 in YTD FY21
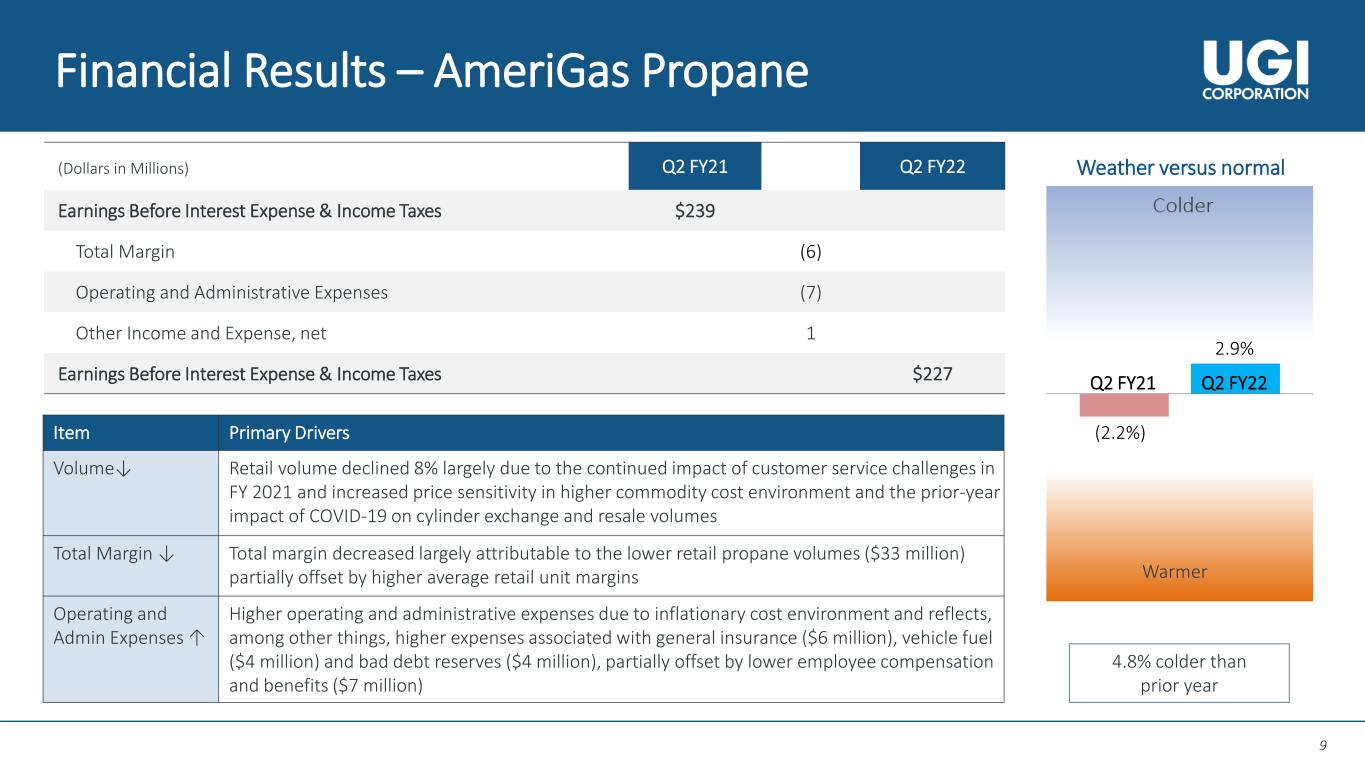
9 9 Financial Results – AmeriGas Propane (Dollars in Millions) Q2 FY21 Q2 FY22 Earnings Before Interest Expense & Income Taxes $239 Total Margin (6) Operating and Administrative Expenses (7) Other Income and Expense, net 1 Earnings Before Interest Expense & Income Taxes $227 Item Primary Drivers Volume↓ Retail volume declined 8% largely due to the continued impact of customer service challenges in FY 2021 and increased price sensitivity in higher commodity cost environment and the prior-year impact of COVID-19 on cylinder exchange and resale volumes Total Margin ↓ Total margin decreased largely attributable to the lower retail propane volumes ($33 million) partially offset by higher average retail unit margins Operating and Admin Expenses ↑ Higher operating and administrative expenses due to inflationary cost environment and reflects, among other things, higher expenses associated with general insurance ($6 million), vehicle fuel ($4 million) and bad debt reserves ($4 million), partially offset by lower employee compensation and benefits ($7 million) Weather versus normal 4.8% colder than prior year Warmer (2.2%) 2.9% Q2 FY22Q2 FY21

10 10 Warmer (5.7%) Q2 FY21 (3.4%)Item Primary Drivers Total Volume ↑ Total LPG retail gallons sold increased slightly and was attributable to the recovery of certain bulk and autogas volumes that were negatively impacted by COVID-19 offset by the effects of warmer weather Total Margin ↓ Decreased primarily reflecting lower total margin from energy marketing business and the translation effects of weaker foreign currencies (~$20 million), partially offset by higher total LPG margins Other Income and Expense, net ↑ Includes gains on the sale of assets Financial Results – UGI International (Dollars in Millions) Q2 FY21 Q2 FY22 Earnings Before Interest Expense & Income Taxes $149 Total Margin (49) Operating and Administrative Expenses 2 Depreciation and Amortization 5 Realized FX Gains 5 Other Income and Expense, net 8 Earnings Before Interest Expense & Income Taxes $120 Weather versus normal 4.9% warmer than prior year Q2 FY22
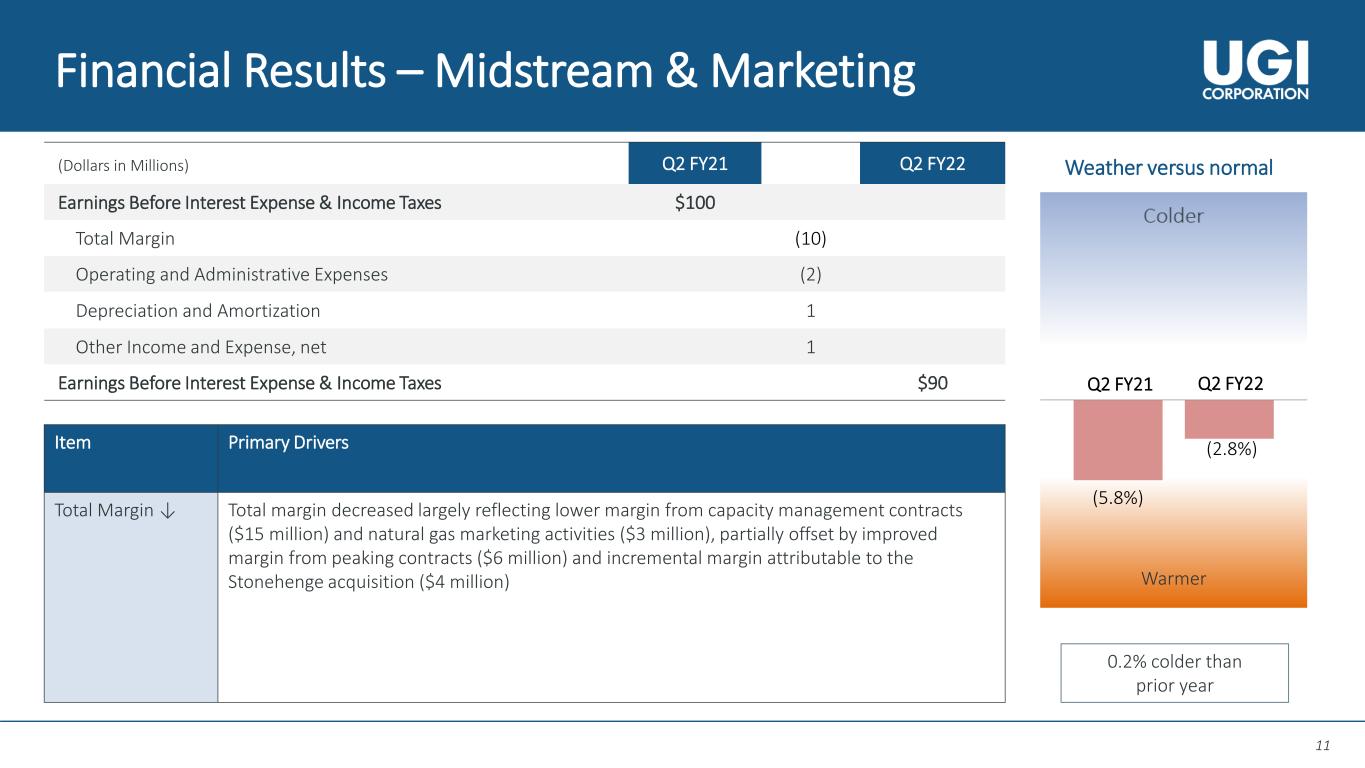
11 11 Item Primary Drivers Total Margin ↓ Total margin decreased largely reflecting lower margin from capacity management contracts ($15 million) and natural gas marketing activities ($3 million), partially offset by improved margin from peaking contracts ($6 million) and incremental margin attributable to the Stonehenge acquisition ($4 million) Financial Results – Midstream & Marketing Weather versus normal 0.2% colder than prior year Warmer (2.8%) Q2 FY21 Q2 FY22 (5.8%) (Dollars in Millions) Q2 FY21 Q2 FY22 Earnings Before Interest Expense & Income Taxes $100 Total Margin (10) Operating and Administrative Expenses (2) Depreciation and Amortization 1 Other Income and Expense, net 1 Earnings Before Interest Expense & Income Taxes $90

12 12 Item Primary Drivers Volume ↑ Core market and total volume were up over prior-year largely due to the incremental volume from Mountaineer and colder weather Total Margin ↑ Total margin increased largely reflecting incremental margin attributable to Mountaineer. Other factors include implementation of a DSIC, higher margin from large delivery service customers including the effects of customer growth compared to the prior-year period, and higher volumes Operating and Admin Expenses ↑ Principally related to incremental expenses attributable to Mountaineer Depreciation ↑ Principally related to incremental expenses attributable to Mountaineer Financial Results – Utilities (Dollars in Millions) Q2 FY21 Q2 FY221 Earnings Before Interest Expense & Income Taxes $142 Total Margin 79 Operating and Administrative Expenses (24) Depreciation (7) Other Income and Expense, net 4 Earnings Before Interest Expense & Income Taxes $194 Weather versus normal 3.7% colder than prior year Warmer (3.4%) Q2 FY21 Q2 FY22 (8.1%) 1. Includes Mountaineer Gas Company acquired on September 1, 2021.
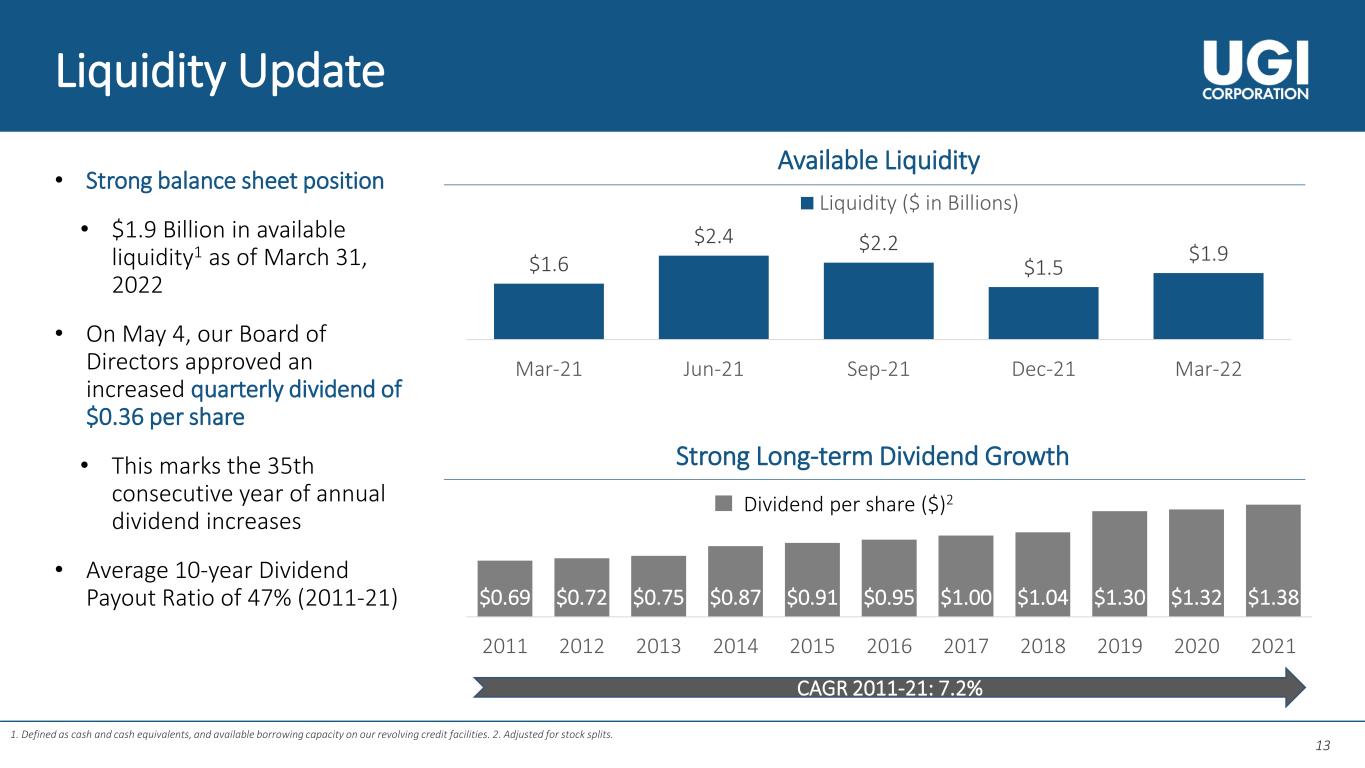
13 13 Liquidity Update • Strong balance sheet position • $1.9 Billion in available liquidity1 as of March 31, 2022 • On May 4, our Board of Directors approved an increased quarterly dividend of $0.36 per share • This marks the 35th consecutive year of annual dividend increases • Average 10-year Dividend Payout Ratio of 47% (2011-21) $1.6 $2.4 $2.2 $1.5 $1.9 Mar-21 Jun-21 Sep-21 Dec-21 Mar-22 Available Liquidity Liquidity ($ in Billions) 1. Defined as cash and cash equivalents, and available borrowing capacity on our revolving credit facilities. 2. Adjusted for stock splits. Strong Long-term Dividend Growth $0.69 $0.72 $0.75 $0.87 $0.91 $0.95 $1.00 $1.04 $1.30 $1.32 $1.38 2011 2012 2013 2014 2015 2016 2017 2018 2019 2020 2021 CAGR 2011-21: 7.2% Dividend per share ($)2
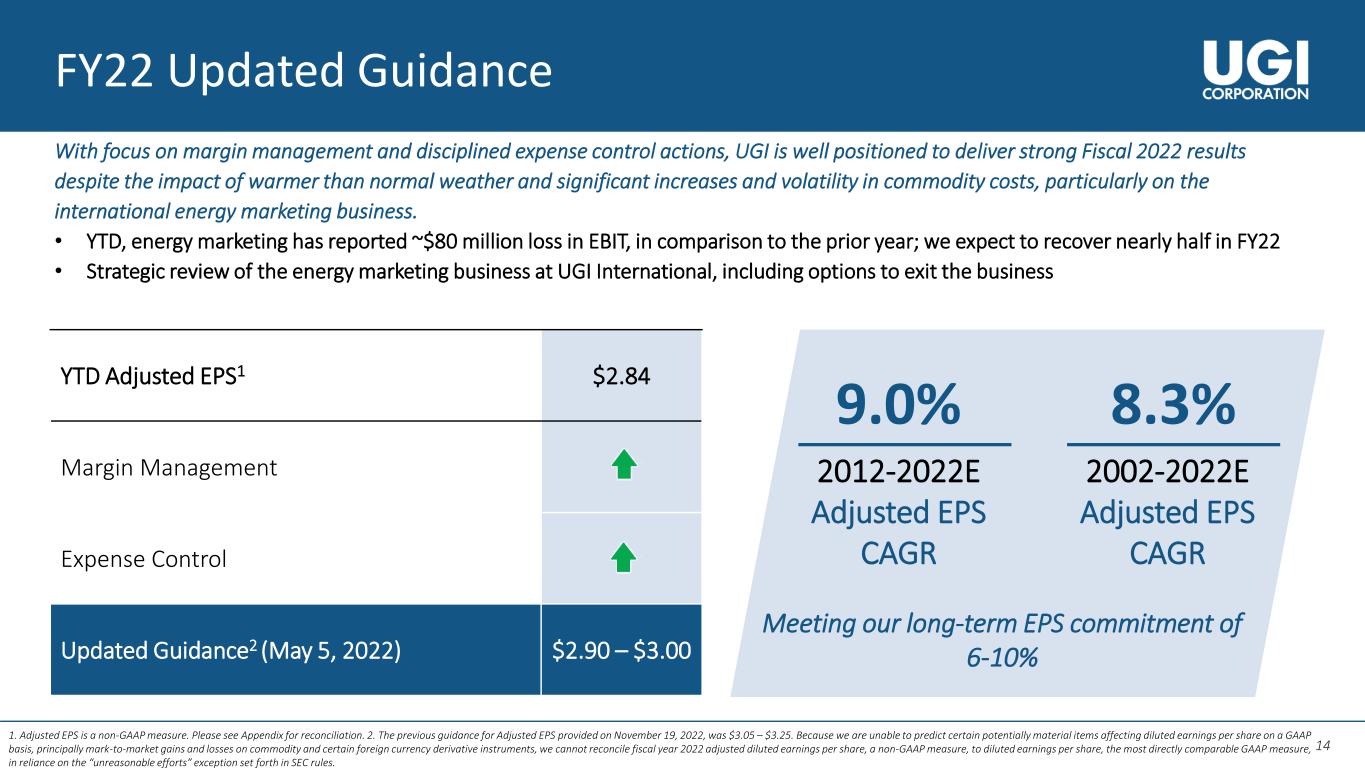
14 14 FY22 Updated Guidance With focus on margin management and disciplined expense control actions, UGI is well positioned to deliver strong Fiscal 2022 results despite the impact of warmer than normal weather and significant increases and volatility in commodity costs, particularly on the international energy marketing business. • YTD, energy marketing has reported ~$80 million loss in EBIT, in comparison to the prior year; we expect to recover nearly half in FY22 • Strategic review of the energy marketing business at UGI International, including options to exit the business 1. Adjusted EPS is a non-GAAP measure. Please see Appendix for reconciliation. 2. The previous guidance for Adjusted EPS provided on November 19, 2022, was $3.05 – $3.25. Because we are unable to predict certain potentially material items affecting diluted earnings per share on a GAAP basis, principally mark-to-market gains and losses on commodity and certain foreign currency derivative instruments, we cannot reconcile fiscal year 2022 adjusted diluted earnings per share, a non-GAAP measure, to diluted earnings per share, the most directly comparable GAAP measure, in reliance on the “unreasonable efforts” exception set forth in SEC rules. 2012-2022E Adjusted EPS CAGR 9.0% 2002-2022E Adjusted EPS CAGR 8.3% Meeting our long-term EPS commitment of 6-10% YTD Adjusted EPS1 $2.84 Margin Management Expense Control Updated Guidance2 (May 5, 2022) $2.90 – $3.00

15 15 Conclusion Roger Perreault President and CEO, UGI Corporation
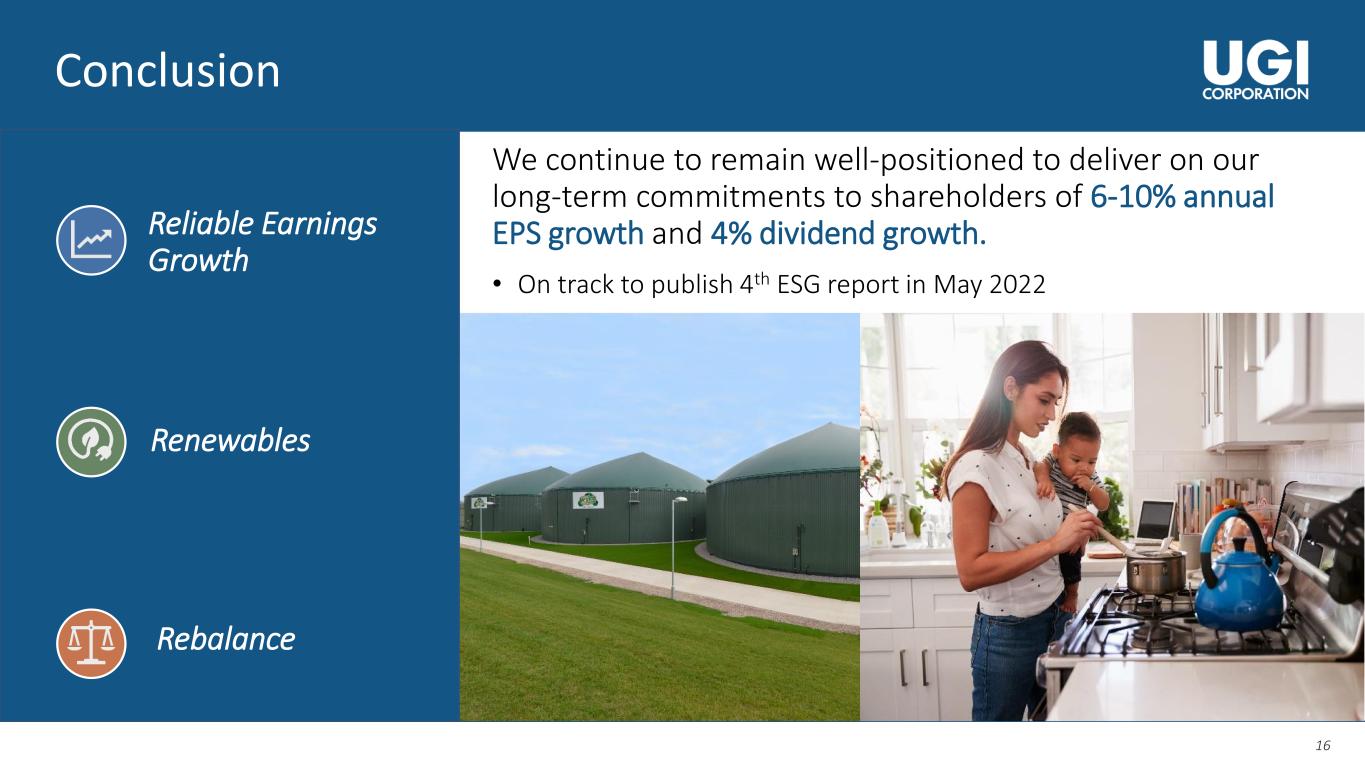
16 16 Conclusion We continue to remain well-positioned to deliver on our long-term commitments to shareholders of 6-10% annual EPS growth and 4% dividend growth. • On track to publish 4th ESG report in May 2022 Reliable Earnings Growth Renewables Rebalance

17 17 Q & A Q
18 18 Appendix
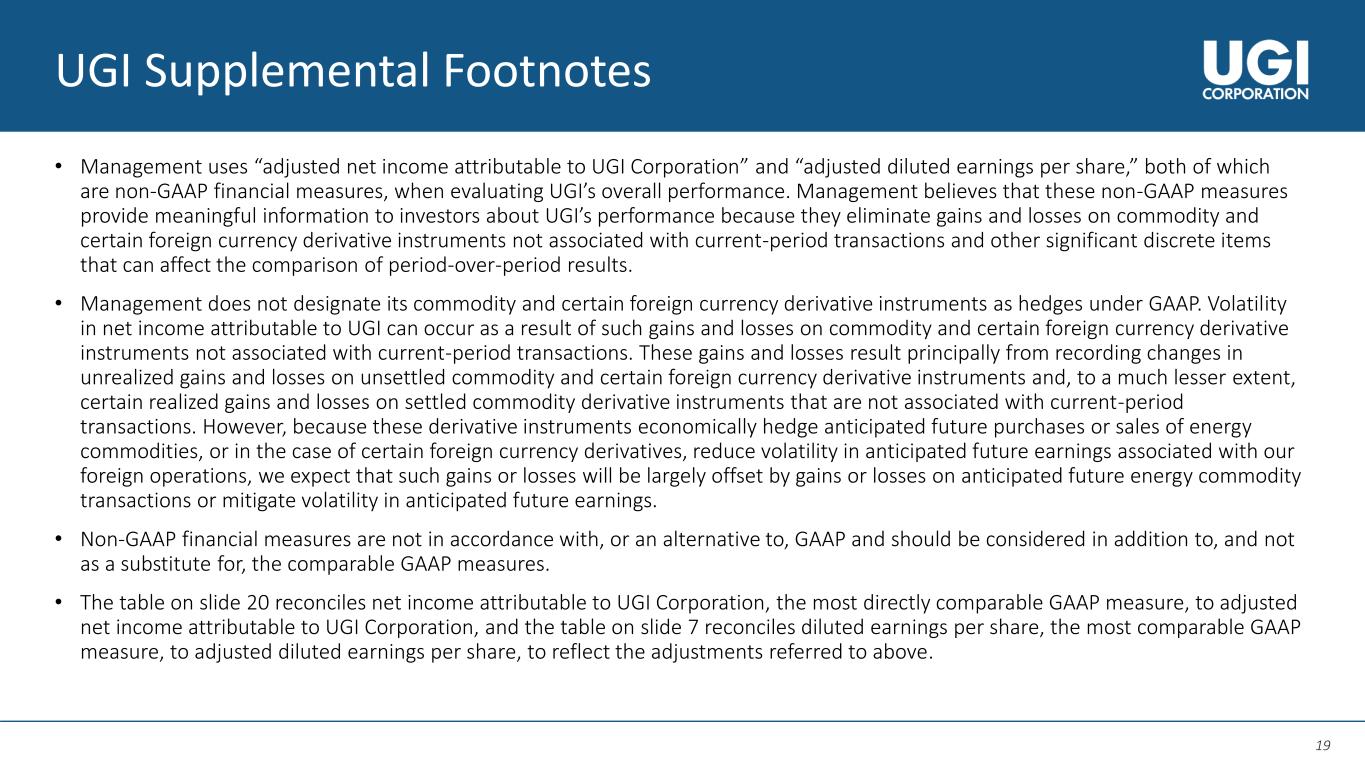
19 19 UGI Supplemental Footnotes • Management uses “adjusted net income attributable to UGI Corporation” and “adjusted diluted earnings per share,” both of which are non-GAAP financial measures, when evaluating UGI’s overall performance. Management believes that these non-GAAP measures provide meaningful information to investors about UGI’s performance because they eliminate gains and losses on commodity and certain foreign currency derivative instruments not associated with current-period transactions and other significant discrete items that can affect the comparison of period-over-period results. • Management does not designate its commodity and certain foreign currency derivative instruments as hedges under GAAP. Volatility in net income attributable to UGI can occur as a result of such gains and losses on commodity and certain foreign currency derivative instruments not associated with current-period transactions. These gains and losses result principally from recording changes in unrealized gains and losses on unsettled commodity and certain foreign currency derivative instruments and, to a much lesser extent, certain realized gains and losses on settled commodity derivative instruments that are not associated with current-period transactions. However, because these derivative instruments economically hedge anticipated future purchases or sales of energy commodities, or in the case of certain foreign currency derivatives, reduce volatility in anticipated future earnings associated with our foreign operations, we expect that such gains or losses will be largely offset by gains or losses on anticipated future energy commodity transactions or mitigate volatility in anticipated future earnings. • Non-GAAP financial measures are not in accordance with, or an alternative to, GAAP and should be considered in addition to, and not as a substitute for, the comparable GAAP measures. • The table on slide 20 reconciles net income attributable to UGI Corporation, the most directly comparable GAAP measure, to adjusted net income attributable to UGI Corporation, and the table on slide 7 reconciles diluted earnings per share, the most comparable GAAP measure, to adjusted diluted earnings per share, to reflect the adjustments referred to above.

20 20 Q2 FY22 Adjusted Net Income (Dollars in Millions) Q2 FY22 Q2 FY21 AmeriGas Propane $138 $150 UGI International 89 99 Midstream & Marketing 58 64 Utilities 134 99 Corporate & Other (a) 514 77 Net income attributable to UGI Corporation 933 489 Net gains on commodity derivative instruments not associated with current-period transactions (net of tax of $204 and $22, respectively) (535) (52) Unrealized gains on foreign currency derivative instruments (net of tax of $(1) and $4, respectively) — (11) Acquisition and integration expenses associated with the Mountaineer Acquisition (net of tax of $0 and $0, respectively) — 1 Business transformation expenses (net of tax of $0 and $(5), respectively) 2 14 Impact of change in Italian tax law — (23) Restructuring costs (net of tax of $(5) and $0, respectively) 13 — Total adjustments (a) (b) (520) (71) Adjusted net income attributable to UGI Corporation $413 $418 (a) Corporate & Other includes certain adjustments made to our reporting segments in arriving at net income attributable to UGI Corporation. These adjustments have been excluded from the segment results to align with the measure used by our Chief Operating Decision Maker in assessing segment performance and allocating resources. (b) Income taxes associated with pre-tax adjustments determined using statutory business unit tax rates.

21 21 YTD FY22 Adjusted Diluted Earnings per Share (Dollars in Millions) YTD FY22 YTD FY21 AmeriGas Propane $0.80 $1.07 UGI International 0.68 0.91 Midstream & Marketing 0.50 0.47 Utilities 0.91 0.71 Corporate & Other (a) 0.98 0.61 Earnings per share – diluted 3.87 3.77 Net gains on commodity derivative instruments not associated with current-period transactions (1.11) (0.65) Unrealized (gains) losses on foreign currency derivative instruments (0.02) 0.02 Loss on extinguishment of debt 0.03 — Acquisition and integration expenses associated with the Mountaineer Acquisition — 0.01 Business transformation expenses 0.01 0.13 Impact of change in Italian tax law — (0.11) Restructuring costs 0.06 — Total adjustments (a) (b) (1.03) (0.60) Adjusted earnings per share – diluted (b) $2.84 $3.17 (a) Corporate & Other includes certain adjustments made to our reporting segments in arriving at net income attributable to UGI Corporation. These adjustments have been excluded from the segment results to align with the measure used by our Chief Operating Decision Maker in assessing segment performance and allocating resources. (b) Income taxes associated with pre-tax adjustments determined using statutory business unit tax rates.
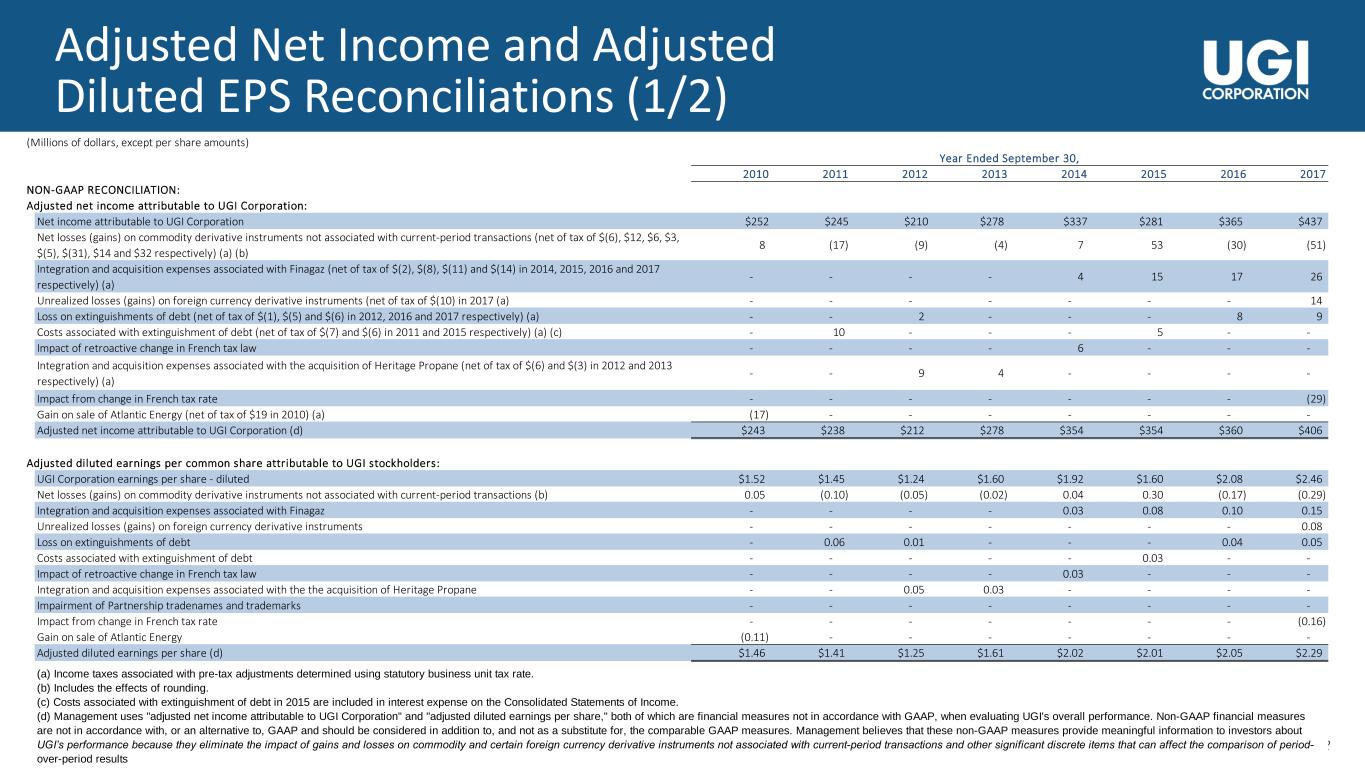
22 22 Adjusted Net Income and Adjusted Diluted EPS Reconciliations (1/2) (Millions of dollars, except per share amounts) Year Ended September 30, 2010 2011 2012 2013 2014 2015 2016 2017 NON-GAAP RECONCILIATION: Adjusted net income attributable to UGI Corporation: Net income attributable to UGI Corporation $252 $245 $210 $278 $337 $281 $365 $437 Net losses (gains) on commodity derivative instruments not associated with current-period transactions (net of tax of $(6), $12, $6, $3, $(5), $(31), $14 and $32 respectively) (a) (b) 8 (17) (9) (4) 7 53 (30) (51) Integration and acquisition expenses associated with Finagaz (net of tax of $(2), $(8), $(11) and $(14) in 2014, 2015, 2016 and 2017 respectively) (a) - - - - 4 15 17 26 Unrealized losses (gains) on foreign currency derivative instruments (net of tax of $(10) in 2017 (a) - - - - - - - 14 Loss on extinguishments of debt (net of tax of $(1), $(5) and $(6) in 2012, 2016 and 2017 respectively) (a) - - 2 - - - 8 9 Costs associated with extinguishment of debt (net of tax of $(7) and $(6) in 2011 and 2015 respectively) (a) (c) - 10 - - - 5 - - Impact of retroactive change in French tax law - - - - 6 - - - Integration and acquisition expenses associated with the acquisition of Heritage Propane (net of tax of $(6) and $(3) in 2012 and 2013 respectively) (a) - - 9 4 - - - - Impact from change in French tax rate - - - - - - - (29) Gain on sale of Atlantic Energy (net of tax of $19 in 2010) (a) (17) - - - - - - - Adjusted net income attributable to UGI Corporation (d) $243 $238 $212 $278 $354 $354 $360 $406 Adjusted diluted earnings per common share attributable to UGI stockholders: UGI Corporation earnings per share - diluted $1.52 $1.45 $1.24 $1.60 $1.92 $1.60 $2.08 $2.46 Net losses (gains) on commodity derivative instruments not associated with current-period transactions (b) 0.05 (0.10) (0.05) (0.02) 0.04 0.30 (0.17) (0.29) Integration and acquisition expenses associated with Finagaz - - - - 0.03 0.08 0.10 0.15 Unrealized losses (gains) on foreign currency derivative instruments - - - - - - - 0.08 Loss on extinguishments of debt - 0.06 0.01 - - - 0.04 0.05 Costs associated with extinguishment of debt - - - - - 0.03 - - Impact of retroactive change in French tax law - - - - 0.03 - - - Integration and acquisition expenses associated with the the acquisition of Heritage Propane - - 0.05 0.03 - - - - Impairment of Partnership tradenames and trademarks - - - - - - - - Impact from change in French tax rate - - - - - - - (0.16) Gain on sale of Atlantic Energy (0.11) - - - - - - - Adjusted diluted earnings per share (d) $1.46 $1.41 $1.25 $1.61 $2.02 $2.01 $2.05 $2.29 (a) Income taxes associated with pre-tax adjustments determined using statutory business unit tax rate. (b) Includes the effects of rounding. (c) Costs associated with extinguishment of debt in 2015 are included in interest expense on the Consolidated Statements of Income. (d) Management uses "adjusted net income attributable to UGI Corporation" and "adjusted diluted earnings per share," both of which are financial measures not in accordance with GAAP, when evaluating UGI's overall performance. Non-GAAP financial measures are not in accordance with, or an alternative to, GAAP and should be considered in addition to, and not as a substitute for, the comparable GAAP measures. Management believes that these non-GAAP measures provide meaningful information to investors about UGI’s performance because they eliminate the impact of gains and losses on commodity and certain foreign currency derivative instruments not associated with current-period transactions and other significant discrete items that can affect the comparison of period- over-period results

23 23 Adjusted Net Income and Adjusted Diluted EPS Reconciliations (2/2) (Millions of dollars, except per share amounts) Year Ended September 30, 2018 2019 2020 2021 NON-GAAP RECONCILIATION: Adjusted net income attributable to UGI Corporation: Net income attributable to UGI Corporation $719 $256 $532 $1,467 Net losses (gains) on commodity derivative instruments not associated with current-period transactions (net of tax of $27, $(60) and $35 respectively) (a) (b) (69) 148 (82) (1,001) Integration and acquisition expenses associated with Finagaz (net of tax of $(12) in 2018 respectively) (a) 19 - - - Unrealized losses (gains) on foreign currency derivative instruments (net of tax of $9, $9, $(10) in 2018, 2019 and 2020, respectively) (a) (20) (23) 26 (6) Loss on extinguishments of debt (net of tax of $(2) in 2019) (a) - 4 - - AmeriGas Merger expenses (net of tax $0 across all years) (a) - 1 - - Acquisition and integration expenses associated with the CMG Acquisition (net of tax of $(5) and $(1) in 2019 and 2020, respectively) (a) - 11 1 - LPG business transformation expenses (net of tax of $(5) and $(17) in 2019 and 2020, respectively) (a) - 16 45 74 Loss on disposals of Conemaugh and HVAC (net of tax of $(15) in 2020) (a) - - 39 - Impairment of Partnership tradenames and trademarks (net of tax of $(6) in 2018) (a) 15 - - - Impact from change in French tax rate (12) - - - Reameasurement impact from TCJA (166) - - - Acquisition and integration expenses associated with the Mountaineer Acquisition (net of tax of $(4) in 2021) - - - 10 Impairment of customer relationship intangible (net of tax of $(5) in 2021) - - - 15 Impairment of investment in PennEast (net of tax of $0 in 2021) - 93 Impact of change in Italian tax law - - - (23) Adjusted net income attributable to UGI Corporation (d) $485 $413 $561 $629 Adjusted diluted earnings per common share attributable to UGI stockholders: UGI Corporation earnings per share - diluted $4.06 $1.41 $2.54 $6.92 Net losses (gains) on commodity derivative instruments not associated with current-period transactions (b) (0.39) 0.82 (0.39) (4.72) Integration and acquisition expenses associated with Finagaz 0.10 - - - Unrealized losses (gains) on foreign currency derivative instruments (0.11) (0.13) 0.12 (0.03) Loss on extinguishments of debt - 0.02 - - AmeriGas Merger expenses - 0.01 - - Acquisition and integration expenses associated with the CMG Acquisition - 0.06 0.01 - LPG business transformation expenses - 0.09 0.21 0.35 Loss on disposals of Conemaugh and HVAC - - 0.18 - Impairment of Partnership tradenames and trademarks 0.08 - - - Impact from change in French tax rate (0.07) - - - Remeasurement impact from TCJA (0.93) - - - Acquisition and integration expenses associated with the Mountaineer Acquisition 0.04 Impairment of customer relationship intangible 0.07 Impairment of investment in PennEast 0.44 Impact of change in Italian tax law (0.11) Adjusted diluted earnings per share (d) $2.74 $2.28 $2.67 $2.96 (a) Income taxes associated with pre-tax adjustments determined using statutory business unit tax rate. (b) Includes the effects of rounding. (c) Costs associated with extinguishment of debt in 2015 are included in interest expense on the Consolidated Statements of Income. (d) Management uses "adjusted net income attributable to UGI Corporation" and "adjusted diluted earnings per share," both of which are financial measures not in accordance with GAAP, when evaluating UGI's overall performance. Non-GAAP financial measures are not in accordance with, or an alternative to, GAAP and should be considered in addition to, and not as a substitute for, the comparable GAAP measures. Management believes that these non-GAAP measures provide meaningful information to investors about UGI’s performance because they eliminate the impact of gains and losses on commodity and certain foreign currency derivative instruments not associated with current-period transactions and other significant discrete items that can affect the comparison of period-over-period results

24 24 Q2 FY22 Segment Reconciliation (GAAP) ($ in Million) 1. For US GAAP purposes, certain revenue-related taxes within our Utilities segment are included in “Operating and administrative expenses” above. Such costs reduce margin for Management’s Results of Operations reported in our periodic filings. 1 1 Total AmeriGas Propane UGI International Midstream & Marketing Utilities Corp & Other Revenues $3,466 $1,048 $1,224 $671 $707 $(184) Cost of sales (1,470) (545) (930) (540) (380) 925 Total margin 1,996 503 294 131 327 741 Operating and administrative expenses (553) (240) (162) (30) (101) (20) Depreciation and amortization (128) (44) (29) (18) (36) (1) Other operating income (expense), net 17 8 8 2 1 (2) Operating income 1,332 227 111 85 191 718 Income from equity investees 5 - - 5 - - Other non-operating income (expense), net 11 - 9 - 3 (1) Earnings before income taxes and interest expense 1,348 227 120 90 194 717 Interest expense (82) (38) (8) (10) (16) (10) Income before income taxes 1,266 189 112 80 178 707 Income tax expense (332) (51) (22) (22) (44) (193) Net income including noncontrolling interests 934 138 90 58 134 514 Deduct net income attributable to noncontrolling interests (1) - (1) - - - Net income attributable to UGI Corporation $933 $138 $89 $58 $134 $514

25 25 Investor Relations: Tameka Morris 610-456-6297 morrista@ugicorp.com Arnab Mukherjee 610-768-7498 mukherjeea@ugicorp.com


