
Fiscal 2025 First Quarter Earnings Presentation February 6, 2025

About This Presentation 2 This presentation contains statements, estimates and projections that are forward-looking statements (as defined in Section 21E of the Securities Exchange Act of 1934, as amended, and Section 27A of the Securities Act of 1933, as amended). Such statements use forward-looking words such as “believe,” “plan,” “anticipate,” “continue,” “estimate,” “expect,” “may,” or other similar words and terms of similar meaning, although not all forward-looking statements contain such words. These statements discuss plans, strategies, events or developments that we expect or anticipate will or may occur in the future. Management believes that these are reasonable as of today’s date only. Actual results may differ significantly because of risks and uncertainties that are difficult to predict and many of which are beyond management’s control; accordingly, there is no assurance that results will be realized. You should read UGI’s Annual Report on Form 10-K for a more extensive list of factors that could affect results. We undertake no obligation (and expressly disclaim any obligation) to update publicly any forward-looking statement, whether as a result of new information or future events, except as required by the federal securities laws. Management uses “adjusted net income attributable to UGI Corporation”, “adjusted diluted earnings per share (“EPS”)”, and “UGI Corporation Adjusted Earnings before interest, taxes, depreciation and amortization (EBITDA)”, all of which are non-GAAP financial measures, when evaluating UGI's overall performance. Management believes that these non- GAAP measures provide meaningful information to investors about UGI’s performance because they eliminate the impacts of (1) gains and losses on commodity and certain foreign currency derivative instruments not associated with current-period transactions and (2) other significant discrete items that can affect the comparison of period-over- period results. Volatility in net income attributable to UGI can occur as a result of gains and losses on commodity and certain foreign currency derivative instruments not associated with current-period transactions but included in earnings in accordance with U.S. generally accepted accounting principles (“GAAP”). Non-GAAP financial measures are not in accordance with, or an alternative to, GAAP and should be considered in addition to, and not as a substitute for, the comparable GAAP measures. The tables in the Appendix reconcile adjusted diluted earnings per share (EPS), adjusted net income attributable to UGI Corporation, and UGI Corporation adjusted EBITDA to their nearest GAAP measures.
Bob Flexon President & Chief Executive Officer Sean O’Brien Chief Financial Officer

Q1 FY25 Highlights Adjusted Diluted EPS1 Q1 FY25 GAAP diluted EPS of $1.74 vs. $0.44 in Q1 FY24 $1.20 $1.37 Q1 FY24 Q1 FY25 1. Adjusted diluted EPS is a non-GAAP measure. See Appendix for reconciliation. 2. Includes investments in equity method investees. ✓ 14% increase in Adjusted Diluted EPS driven by solid business performance and benefits from our tax optimization strategies ❑ Natural Gas - Strong gas demand and higher gas rates at Mountaineer, our West Virginia gas utility ❑ Global LPG - Solid LPG volumes and lower operating and administrative expenses ✓ Disciplined capital allocation fueling long-term growth ❑ $236 million2 of capital expenditure with 84% invested in the natural gas businesses ❑ Sustained customer additions and a focus on providing superior customer service o Added 4,000+ customers at the Utilities o UGI Utilities recognized as a Cogent 2024 Utility Customer Champion ❑ Through Pine Run Gathering (49% owned by UGI Energy Services), acquired Superior Appalachian, which owns and operates 3 gathering systems in Pennsylvania, for $120 million; the transaction was wholly financed by debt at Pine Run Gathering ❑ Achieved substantial completion on several RNG facilities, namely MBL Bioenergy - Brookings and Lakeside, and Cayuga - Bergen Farms. At full production, these facilities will have the capacity to produce 650+ Mmcf of RNG from dairy feedstock ✓ Filed gas base rate case for UGI Utilities with the PA Public Utility Commission, requesting an overall distribution rate increase of ~$110 million 4

n Improved financial profile Portfolio optimization Talent and culture Operating model and processes Performance at AmeriGas Propane FY25 Strategic Priorities 5 Onboarding our new business leader – President, AmeriGas Propane Organizational design Identification of core focus areas to drive better business performance Core Focus Areas ❑ Order to Cash ❑ Customer Value Proposition & Retention ❑ Call Center ❑ LPG Supply & Logistics ❑ Routing & Delivery
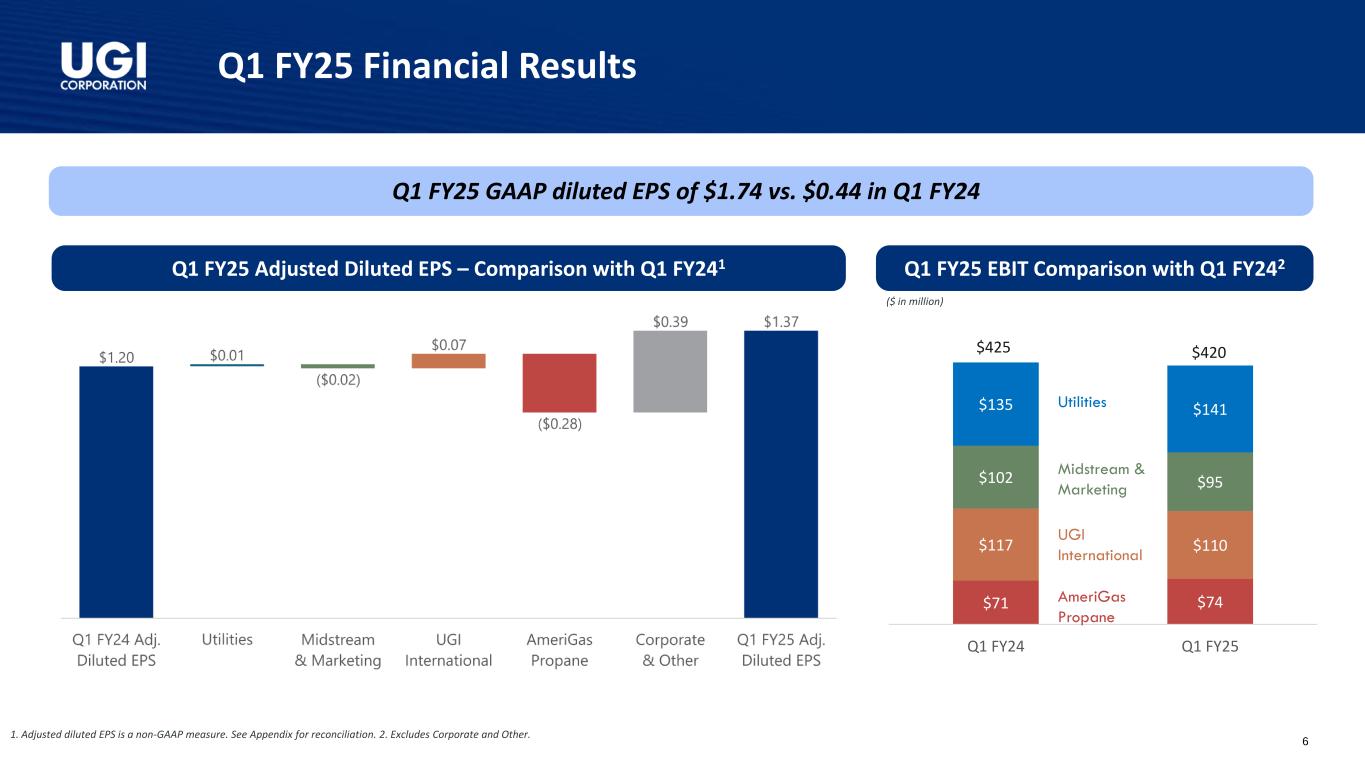
Q1 FY25 Financial Results Q1 FY25 GAAP diluted EPS of $1.74 vs. $0.44 in Q1 FY24 Q1 FY25 Adjusted Diluted EPS – Comparison with Q1 FY241 Q1 FY25 EBIT Comparison with Q1 FY242 $71 $74 $117 $110 $102 $95 $135 $141 Q1 FY24 Q1 FY25 $425 $420 1. Adjusted diluted EPS is a non-GAAP measure. See Appendix for reconciliation. 2. Excludes Corporate and Other. Utilities Midstream & Marketing UGI International AmeriGas Propane 6 ($ in million)
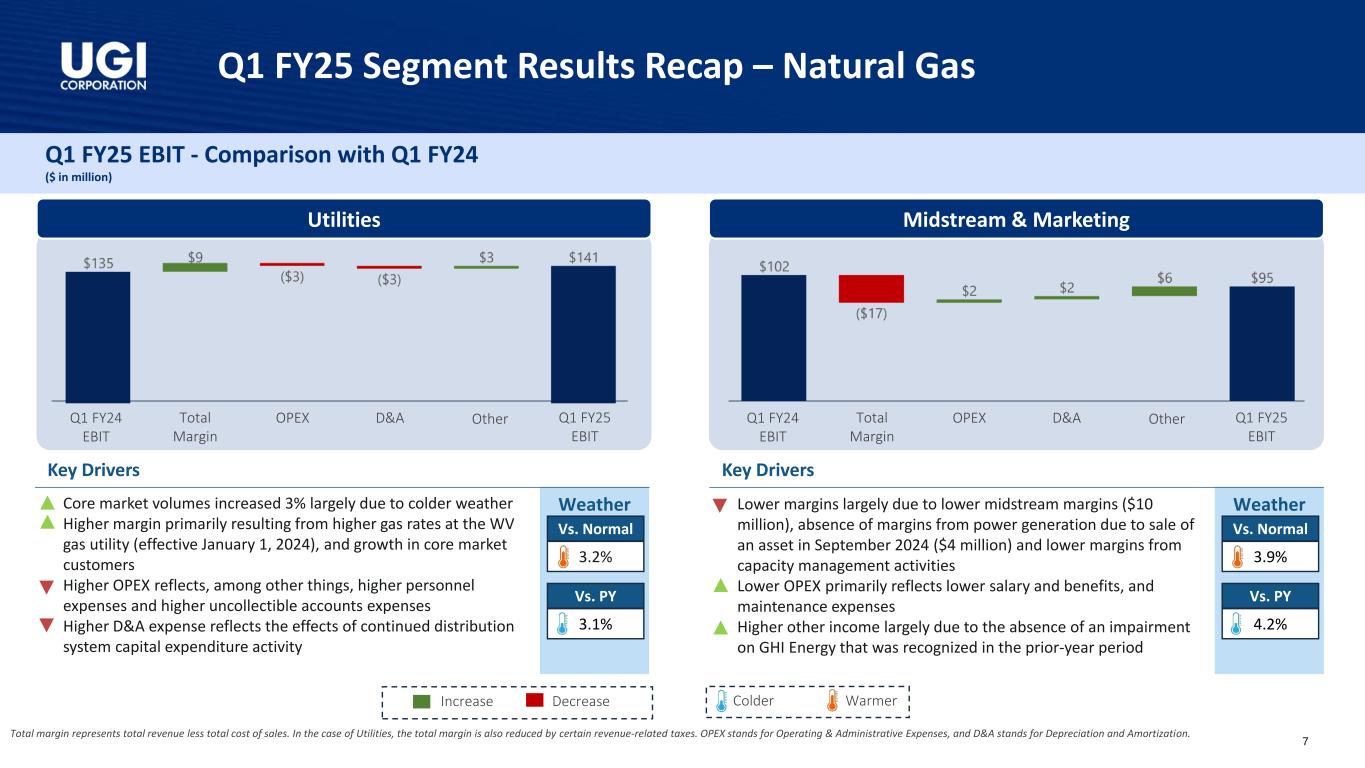
Q1 FY25 Segment Results Recap – Natural Gas Q1 FY25 EBIT - Comparison with Q1 FY24 ($ in million) Utilities Midstream & Marketing Weather Total margin represents total revenue less total cost of sales. In the case of Utilities, the total margin is also reduced by certain revenue-related taxes. OPEX stands for Operating & Administrative Expenses, and D&A stands for Depreciation and Amortization. Key Drivers • Core market volumes increased 3% largely due to colder weather • Higher margin primarily resulting from higher gas rates at the WV gas utility (effective January 1, 2024), and growth in core market customers • Higher OPEX reflects, among other things, higher personnel expenses and higher uncollectible accounts expenses • Higher D&A expense reflects the effects of continued distribution system capital expenditure activity 3.2% 3.1% Vs. Normal Vs. PY Increase Decrease WarmerColder Weather Key Drivers • Lower margins largely due to lower midstream margins ($10 million), absence of margins from power generation due to sale of an asset in September 2024 ($4 million) and lower margins from capacity management activities • Lower OPEX primarily reflects lower salary and benefits, and maintenance expenses • Higher other income largely due to the absence of an impairment on GHI Energy that was recognized in the prior-year period 3.9% 4.2% Vs. Normal Vs. PY Q1 FY24 EBIT Q1 FY25 EBIT Total Margin OPEX D&A Other Q1 FY24 EBIT Q1 FY25 EBIT Total Margin OPEX D&A Other 7

Q1 FY25 Segment Results Recap – Global LPG Q1 FY25 EBIT - Comparison with Q1 FY24 ($ in million) UGI International AmeriGas Propane Weather Key Drivers • Retail volumes were 2% higher largely due to increased volumes from crop drying campaigns and the effects of colder weather • Lower margin from the non-core energy marketing activities and, to a lesser extent, lower LPG unit margins partially offset by higher LPG volumes • Lower OPEX reflects lower personnel-related and maintenance expenses, and the effect of exiting substantially all of the non-core energy marketing business • Other includes the effect of exiting the energy marketing business in the prior year and lower foreign currency transaction gains Increase Decrease WarmerColder Weather Key Drivers • Retail gallons decreased 1% as the effect of net customer attrition was partially offset by weather that was significantly colder than the prior December period • Total margin was fairly consistent as higher LPG unit margins ($7 million) offset the impact of a modest decline in retail volume ($3 million) and lower fee income • Lower OPEX primarily reflects lower compensation expenses • Reduced other income largely due to lower gains on asset sales 3.5% 8.2% Vs. Normal Vs. PY 6.3% 0.1% Vs. Normal Vs. PY Q1 FY24 EBIT Q1 FY25 EBIT Total Margin OPEX D&A Other Q1 FY24 EBIT Q1 FY25 EBIT Total Margin OPEX D&A Other 8 Total margin represents total revenue less total cost of sales. OPEX stands for Operating & Administrative Expenses, and D&A stands for Depreciation and Amortization.
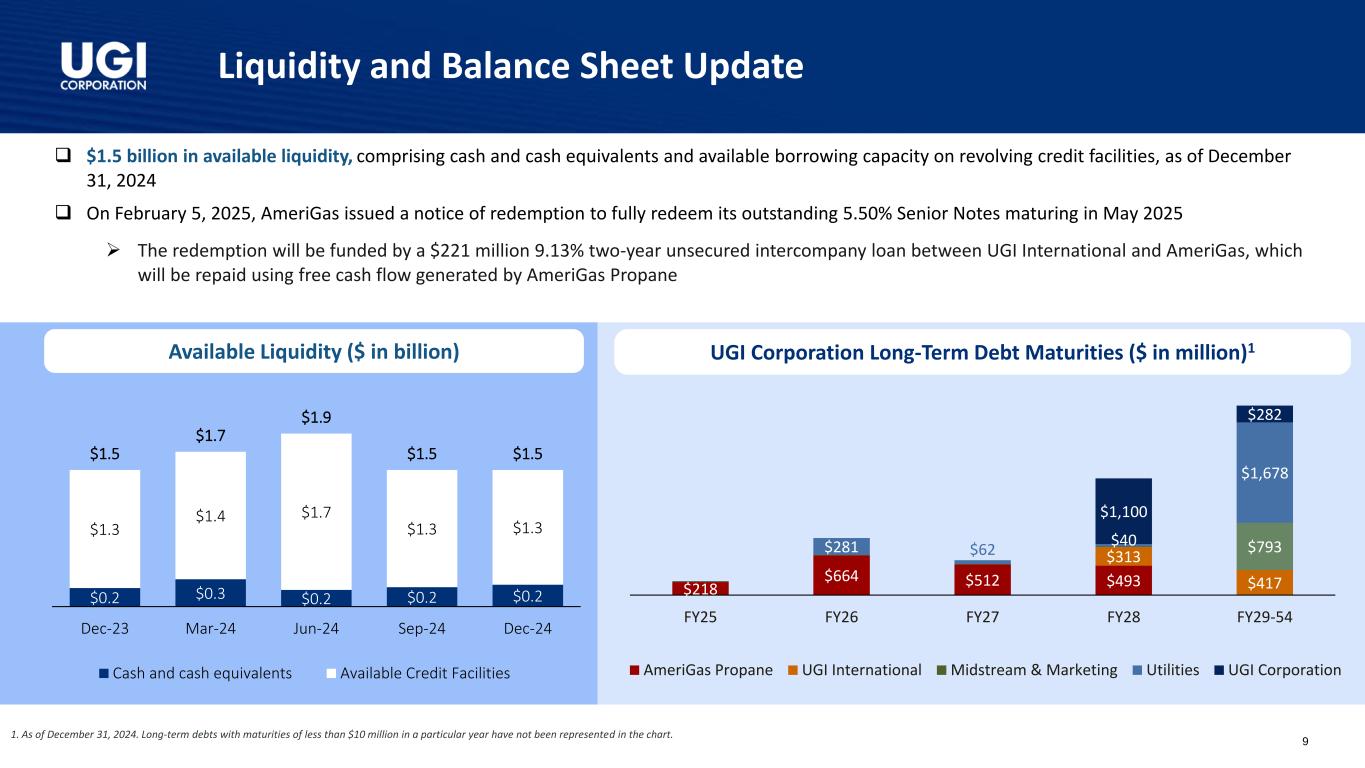
Liquidity and Balance Sheet Update 1. As of December 31, 2024. Long-term debts with maturities of less than $10 million in a particular year have not been represented in the chart. ❑ $1.5 billion in available liquidity, comprising cash and cash equivalents and available borrowing capacity on revolving credit facilities, as of December 31, 2024 ❑ On February 5, 2025, AmeriGas issued a notice of redemption to fully redeem its outstanding 5.50% Senior Notes maturing in May 2025 ➢ The redemption will be funded by a $221 million 9.13% two-year unsecured intercompany loan between UGI International and AmeriGas, which will be repaid using free cash flow generated by AmeriGas Propane UGI Corporation Long-Term Debt Maturities ($ in million)1Available Liquidity ($ in billion) $0.2 $0.3 $0.2 $0.2 $0.2 $1.3 $1.4 $1.7 $1.3 $1.3 $1.5 $1.7 $1.9 $1.5 $1.5 Dec-23 Mar-24 Jun-24 Sep-24 Dec-24 Cash and cash equivalents Available Credit Facilities 9 $218 $664 $512 $493 $313 $417 $793 $281 $62 $40 $1,678 $1,100 $282 FY25 FY26 FY27 FY28 FY29-54 AmeriGas Propane UGI International Midstream & Marketing Utilities UGI Corporation
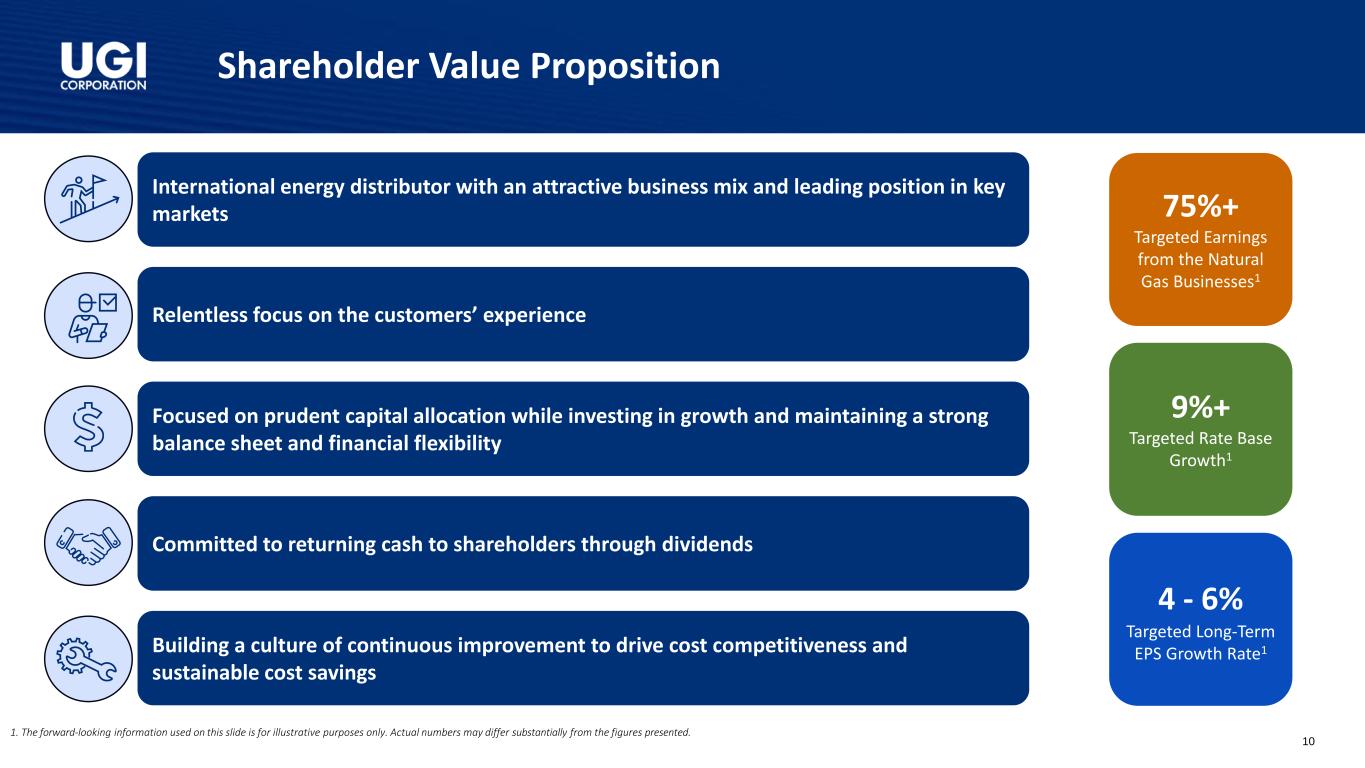
Shareholder Value Proposition 1. The forward-looking information used on this slide is for illustrative purposes only. Actual numbers may differ substantially from the figures presented. 75%+ Targeted Earnings from the Natural Gas Businesses1 4 - 6% Targeted Long-Term EPS Growth Rate1 9%+ Targeted Rate Base Growth1 International energy distributor with an attractive business mix and leading position in key markets Focused on prudent capital allocation while investing in growth and maintaining a strong balance sheet and financial flexibility Committed to returning cash to shareholders through dividends Building a culture of continuous improvement to drive cost competitiveness and sustainable cost savings 10 Relentless focus on the customers’ experience

Q & Q A

APPENDIX
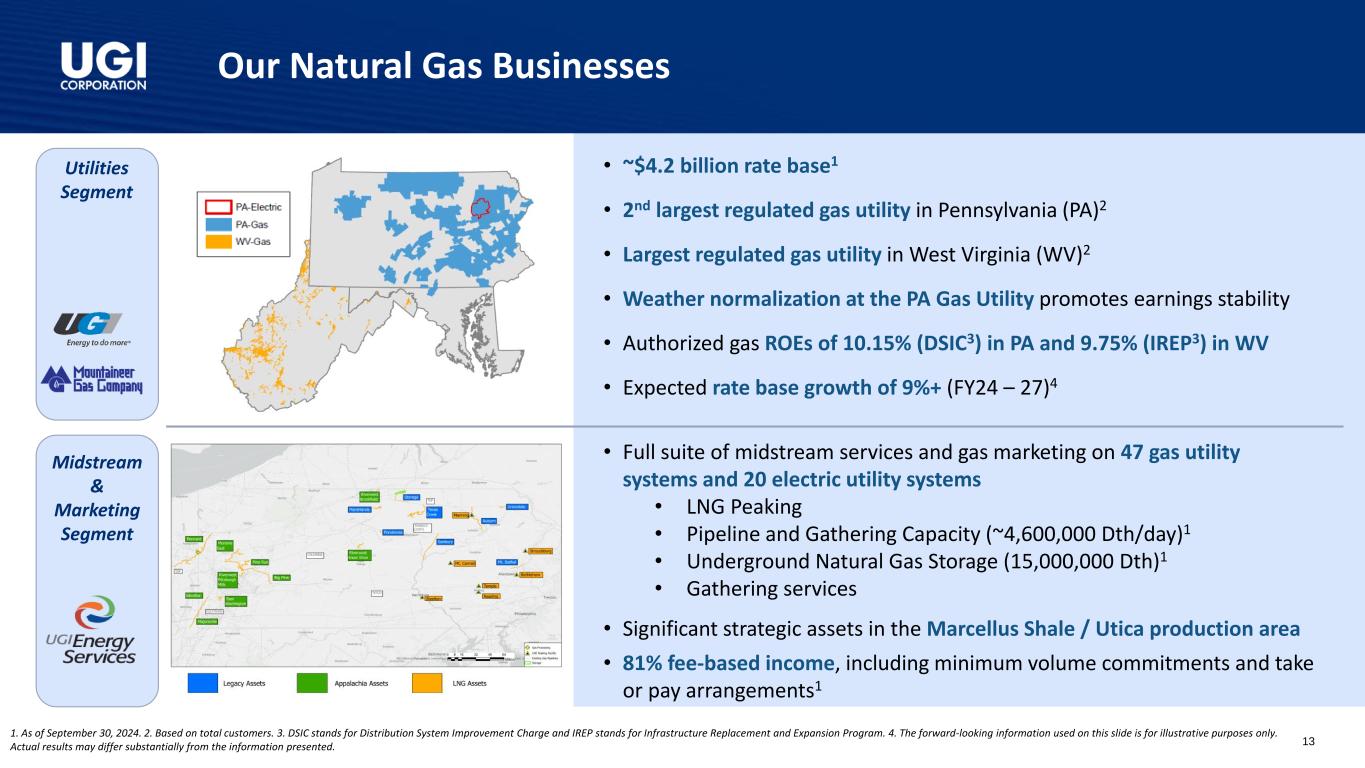
Our Natural Gas Businesses 13 Utilities Segment Midstream & Marketing Segment • ~$4.2 billion rate base1 • 2nd largest regulated gas utility in Pennsylvania (PA)2 • Largest regulated gas utility in West Virginia (WV)2 • Weather normalization at the PA Gas Utility promotes earnings stability • Authorized gas ROEs of 10.15% (DSIC3) in PA and 9.75% (IREP3) in WV • Expected rate base growth of 9%+ (FY24 – 27)4 • Full suite of midstream services and gas marketing on 47 gas utility systems and 20 electric utility systems • LNG Peaking • Pipeline and Gathering Capacity (~4,600,000 Dth/day)1 • Underground Natural Gas Storage (15,000,000 Dth)1 • Gathering services • Significant strategic assets in the Marcellus Shale / Utica production area • 81% fee-based income, including minimum volume commitments and take or pay arrangements1 1. As of September 30, 2024. 2. Based on total customers. 3. DSIC stands for Distribution System Improvement Charge and IREP stands for Infrastructure Replacement and Expansion Program. 4. The forward-looking information used on this slide is for illustrative purposes only. Actual results may differ substantially from the information presented.
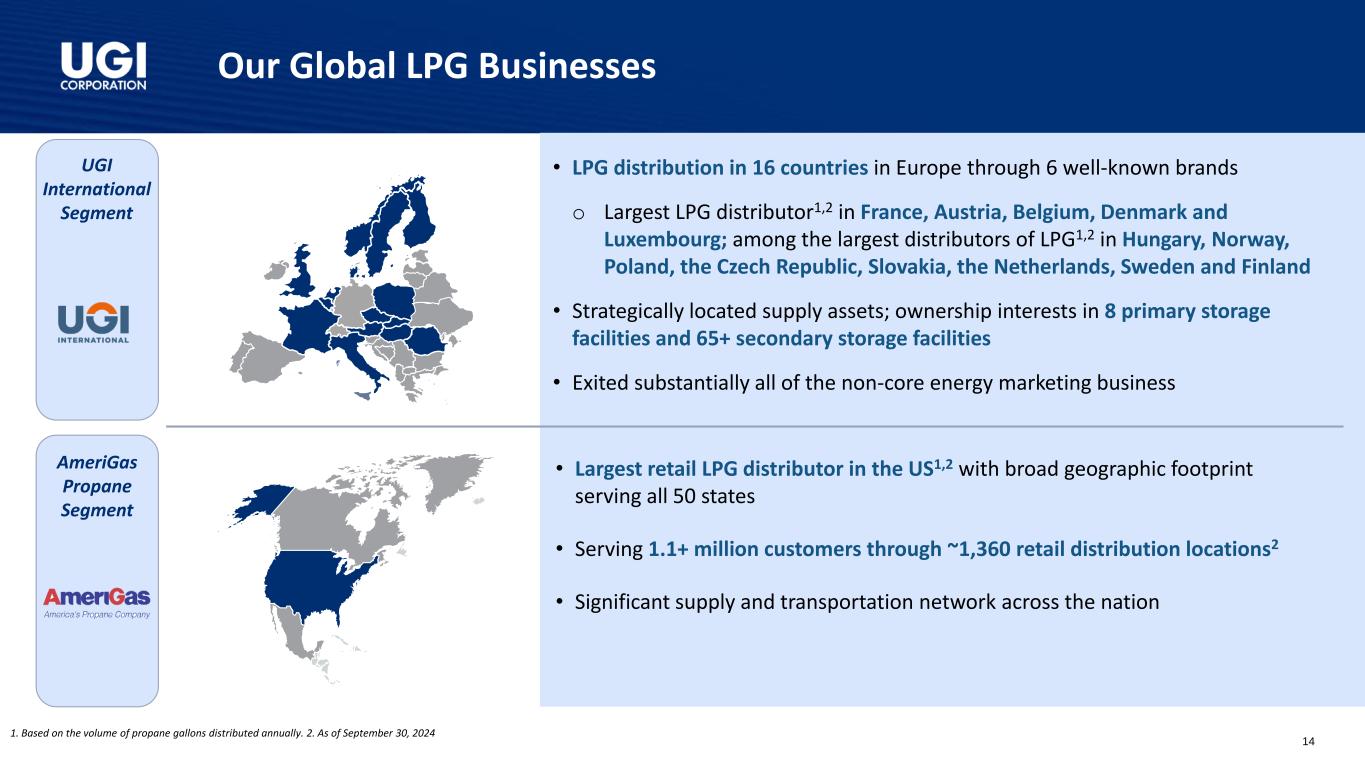
Our Global LPG Businesses UGI International Segment AmeriGas Propane Segment • LPG distribution in 16 countries in Europe through 6 well-known brands o Largest LPG distributor1,2 in France, Austria, Belgium, Denmark and Luxembourg; among the largest distributors of LPG1,2 in Hungary, Norway, Poland, the Czech Republic, Slovakia, the Netherlands, Sweden and Finland • Strategically located supply assets; ownership interests in 8 primary storage facilities and 65+ secondary storage facilities • Exited substantially all of the non-core energy marketing business • Largest retail LPG distributor in the US1,2 with broad geographic footprint serving all 50 states • Serving 1.1+ million customers through ~1,360 retail distribution locations2 • Significant supply and transportation network across the nation 1. Based on the volume of propane gallons distributed annually. 2. As of September 30, 2024 14

FY25 Guidance1 1. The forward-looking information used on this slide is for illustrative purposes only. Actual numbers may differ substantially from the figures presented. 2. Because we are unable to predict certain potentially material items affecting diluted earnings per share on a GAAP basis, principally mark-to-market gains and losses on commodity and certain foreign currency derivative instruments, we cannot reconcile FY25 adjusted diluted earnings per share, a non-GAAP measure, to diluted earnings per share, the most directly comparable GAAP measure, in reliance on the “unreasonable efforts” exception set forth in SEC rules. $2.75 - $3.05 Adjusted Diluted EPS Guidance2 Capital Expenditure $800 - $900 Million Rate Base Growth 9%+ 15
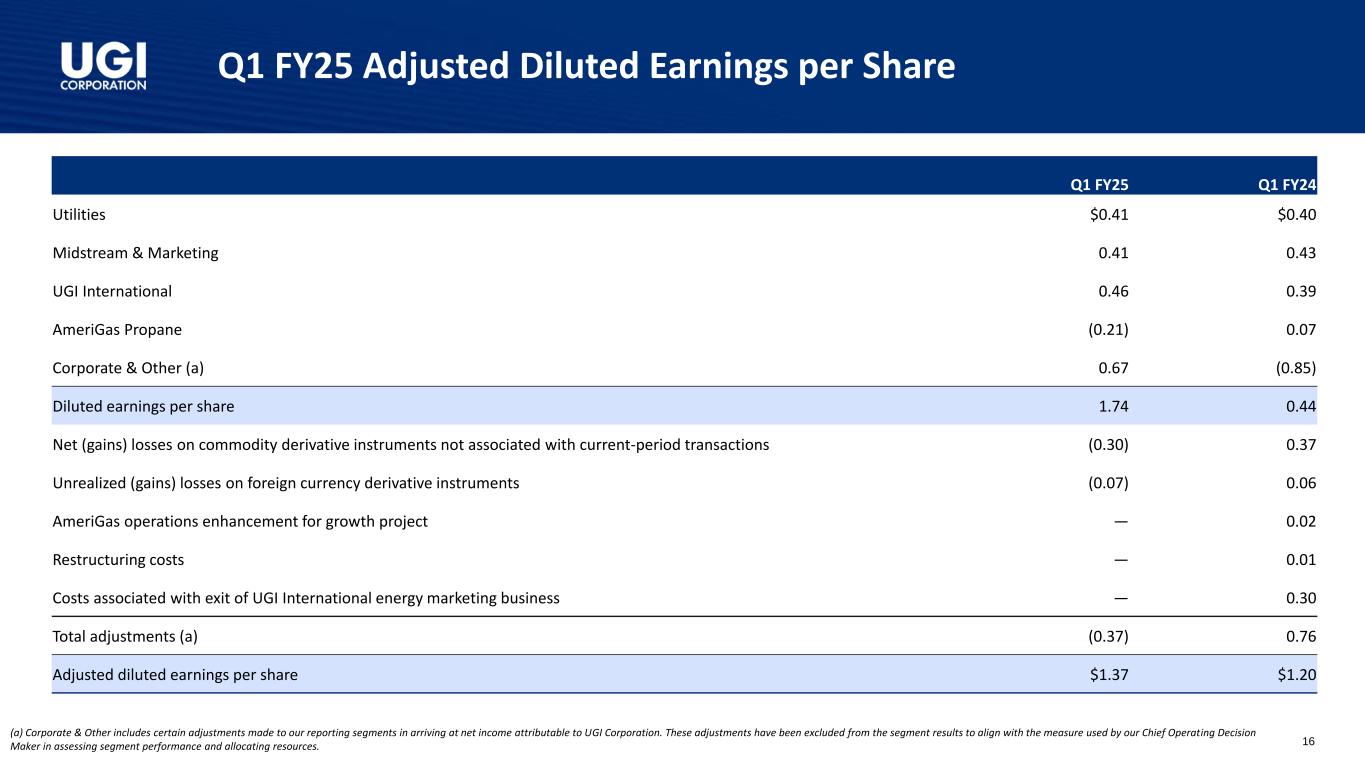
Q1 FY25 Adjusted Diluted Earnings per Share (a) Corporate & Other includes certain adjustments made to our reporting segments in arriving at net income attributable to UGI Corporation. These adjustments have been excluded from the segment results to align with the measure used by our Chief Operating Decision Maker in assessing segment performance and allocating resources. 16 Q1 FY25 Q1 FY24 Utilities $0.41 $0.40 Midstream & Marketing 0.41 0.43 UGI International 0.46 0.39 AmeriGas Propane (0.21) 0.07 Corporate & Other (a) 0.67 (0.85) Diluted earnings per share 1.74 0.44 Net (gains) losses on commodity derivative instruments not associated with current-period transactions (0.30) 0.37 Unrealized (gains) losses on foreign currency derivative instruments (0.07) 0.06 AmeriGas operations enhancement for growth project — 0.02 Restructuring costs — 0.01 Costs associated with exit of UGI International energy marketing business — 0.30 Total adjustments (a) (0.37) 0.76 Adjusted diluted earnings per share $1.37 $1.20

Q1 FY25 Adjusted Net Income (a) Corporate & Other includes certain adjustments made to our reporting segments in arriving at net income attributable to UGI Corporation. These adjustments have been excluded from the segment results to align with the measure used by our Chief Operating Decision Maker in assessing segment performance and allocating resources. (b) Income taxes associated with pre-tax adjustments determined using statutory business unit tax rates. 17 ($ in Million) Q1 FY25 Q1 FY24 Utilities $89 $86 Midstream & Marketing 89 92 UGI International 100 83 AmeriGas Propane (46) 16 Corporate & Other (a) 143 (183) Net income attributable to UGI Corporation 375 94 Net (gains) losses on commodity derivative instruments not associated with current-period transactions (net of tax of $14 and $(18), respectively) (64) 77 Unrealized (gains) losses on foreign currency derivative instruments (net of tax of $6 and $(6), respectively) (16) 14 AmeriGas operations enhancement for growth project (net of tax of $0 and $(2), respectively) — 5 Restructuring costs (net of tax of $0 and $(1), respectively) — 3 Costs associated with exit of UGI International energy marketing business (net of tax of $0 and $(13), respectively) — 65 Total adjustments (a) (b) (80) 164 Adjusted net income attributable to UGI Corporation $295 $258
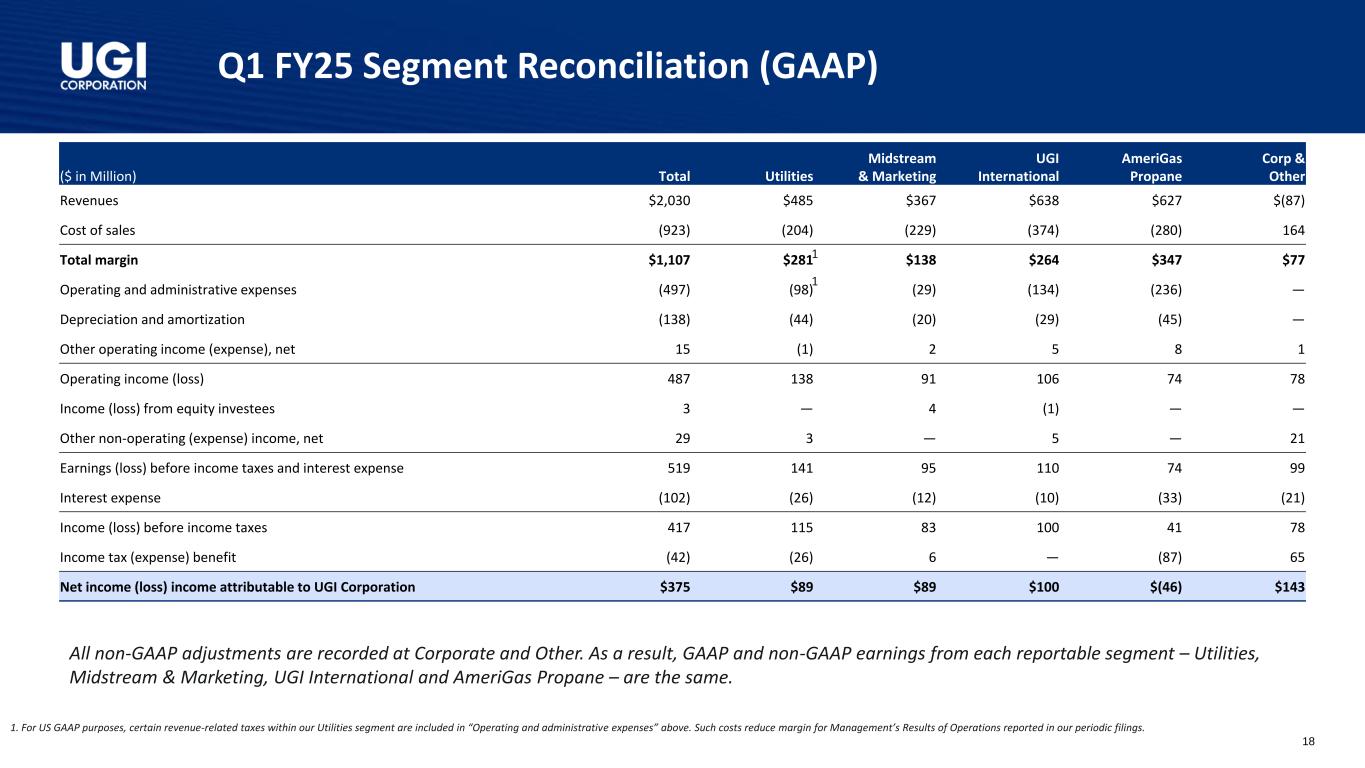
Q1 FY25 Segment Reconciliation (GAAP) 1. For US GAAP purposes, certain revenue-related taxes within our Utilities segment are included in “Operating and administrative expenses” above. Such costs reduce margin for Management’s Results of Operations reported in our periodic filings. 1 1 All non-GAAP adjustments are recorded at Corporate and Other. As a result, GAAP and non-GAAP earnings from each reportable segment – Utilities, Midstream & Marketing, UGI International and AmeriGas Propane – are the same. 18 ($ in Million) Total Utilities Midstream & Marketing UGI International AmeriGas Propane Corp & Other Revenues $2,030 $485 $367 $638 $627 $(87) Cost of sales (923) (204) (229) (374) (280) 164 Total margin $1,107 $281 $138 $264 $347 $77 Operating and administrative expenses (497) (98) (29) (134) (236) — Depreciation and amortization (138) (44) (20) (29) (45) — Other operating income (expense), net 15 (1) 2 5 8 1 Operating income (loss) 487 138 91 106 74 78 Income (loss) from equity investees 3 — 4 (1) — — Other non-operating (expense) income, net 29 3 — 5 — 21 Earnings (loss) before income taxes and interest expense 519 141 95 110 74 99 Interest expense (102) (26) (12) (10) (33) (21) Income (loss) before income taxes 417 115 83 100 41 78 Income tax (expense) benefit (42) (26) 6 — (87) 65 Net income (loss) income attributable to UGI Corporation $375 $89 $89 $100 $(46) $143
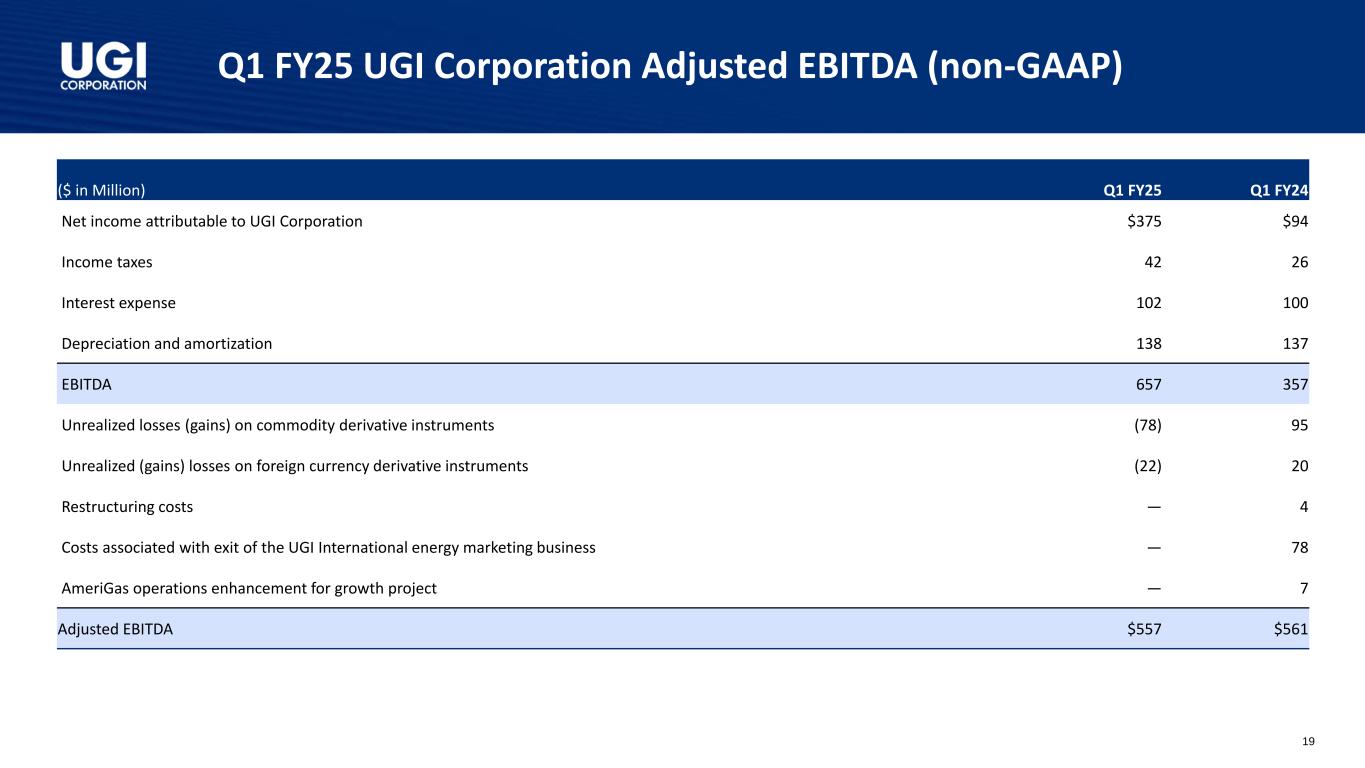
Q1 FY25 UGI Corporation Adjusted EBITDA (non-GAAP) 19 ($ in Million) Q1 FY25 Q1 FY24 Net income attributable to UGI Corporation $375 $94 Income taxes 42 26 Interest expense 102 100 Depreciation and amortization 138 137 EBITDA 657 357 Unrealized losses (gains) on commodity derivative instruments (78) 95 Unrealized (gains) losses on foreign currency derivative instruments (22) 20 Restructuring costs — 4 Costs associated with exit of the UGI International energy marketing business — 78 AmeriGas operations enhancement for growth project — 7 Adjusted EBITDA $557 $561
Investor Relations: Tameka Morris morrista@ugicorp.com Arnab Mukherjee mukherjeea@ugicorp.com


