Exhibit 99.1

UGI CORPORATION July 17, 2019
About This Presentation All statements in this presentation (and oral statements made regarding the subjects of this communication) other than historical facts are forward-looking statements. The safe harbor provisions under Section 27A of the Securities Act of 1933 and Section 21E of the Securities Exchange Act of 1934 do not apply to forward-looking statements made or referred to in this presentation. These forward-looking statements rely on a number of assumptions concerning future events and are subject to a number of uncertainties and factors, many of which are outside the control of UGI and AmeriGas, which could cause actual results to differ materially from such statements. Forward-looking information includes, but is not limited to: statements regarding the expected benefits of the proposed transaction to UGI and its shareholders and to AmeriGas and its unitholders; the anticipated completion of the proposed transaction and the timing thereof; the expected future growth, dividends and distributions of the combined company; and plans and objectives of management for future operations. While UGI believes that the assumptions concerning future events are reasonable, it cautions that there are inherent difficulties in predicting certain important factors that could impact the future performance or results of its business. Among the factors that could cause results to differ materially from those indicated by such forward-looking statements are: the failure to realize the anticipated costs savings, synergies and other benefits of the transaction; the possible diversion of management time on transaction-related issues; the risk that the requisite approvals to complete the transaction are not obtained; 2 local, regional and national economic conditions and the impact they may have on UGI, AmeriGas and their customers; changes in tax laws that impact MLPs and the continued analysis of recent tax legislation; conditions in the energy industry, including cost volatility and availability of all energy products, including propane, natural gas, electricity and fuel oil as well as increased customer conservation measures; adverse weather conditions; the financial condition of UGI’s and AmeriGas’ customers; any non-performance by customers of their contractual obligations; changes in customer, employee or supplier relationships; changes in safety, health, environmental and other regulations; liability for uninsured claims and for claims in excess of insurance coverage; domestic and international political, regulatory and economic conditions in the U.S. and in foreign countries, including the current conflicts in the Middle East; foreign currency exchange rate fluctuations (particularly the euro); the timing of development of Marcellus Shale gas production; the results of any reviews, investigations or other proceedings by government authorities; addressing any reviews, investigations or other proceedings by government authorities or shareholder actions; the performance of AmeriGas; and the interruption, disruption, failure, malfunction or breach of UGI’s or AmeriGas’ information technology systems, including due to cyber-attack. These forward-looking statements are also affected by the risk factors, forward-looking statements and challenges and uncertainties described in each of UGI’s and AmeriGas’ Annual Reports on Form 10-K for the fiscal year ended September 30, 2018, and those set forth from time to time in each entity’s filings with the SEC, which are available at www.ugicorp.com and www.amerigas.com, respectively. Except as required by law, UGI and AmeriGas expressly disclaim any intention or obligation to revise or update any forward-looking statements whether as a result of new information, future events or otherwise.
Use ofNon-GAAP Measures In this presentation, Management uses certain non-GAAP financial measures, including UGI Corporation adjusted earnings per share, UGI Corporation Free Cash Flow, Midstream & Marketing Total Margin, UGI International Total Margin, and UGI France and AmeriGas Unit Margins. These financial measures are not in accordance with, or an alternative to, GAAP and should be considered in addition to, and not as a substitute for, the comparable GAAP measures. Management believes the presentation of these non-GAAP financial measures provide useful information to investors to more effectively evaluate period-over-period earnings, profitability and cash flow generation of the Company’s businesses. Reconciliations of these non-GAAP 3 financial measures to the most directly comparable financial measure calculated and presented in accordance with GAAP are presented in the Appendix of this presentation.
Legal Disclaimer No Offer or Solicitation This presentation is for informational purposes only and shall not constitute an offer to sell or the solicitation of an offer to buy any securities pursuant to the proposed transaction or otherwise, nor shall there be any sale of securities in any jurisdiction in which the offer, solicitation or sale would be unlawful prior to the registration or qualification under the securities laws of any such jurisdiction. No offer of securities shall be made except by means of a prospectus meeting the requirements of Section 10 of the Securities Act of 1933, as amended. Additional Information and Where You Can Find It In connection with the AmeriGas Merger Transaction, UGI Corporation and AmeriGas Partners, L.P., as applicable, filed a registration statement on FormS-4, including a proxy statement/prospectus, and other related documents, including a Schedule13E-3, with the SEC on May 6, 2019. In addition, UGI Corporation and AmeriGas Partners, L.P. each filed with the SEC on April 2, 2019 a Current Report on Form8-K, which contained, among other things, a copy of the merger agreement and the support agreement. This presentation is not a substitute for the merger agreement, proxy statement/prospectus, the Schedule13E-3 or any other document that UGI Corporation or AmeriGas Partners, L.P. may file with the SEC in connection with the transaction. BEFORE MAKING ANY VOTING DECISION OR ELECTION, SECURITY HOLDERS OF AMERIGAS ARE ADVISED TO CAREFULLY READ THE MERGER AGREEMENT, THE PROXY STATEMENT/PROSPECTUS (INCLUDING ALL AMENDMENTS AND SUPPLEMENTS THERETO), THE SCHEDULE13E-3, AND ANY OTHER DOCUMENTS TO BE FILED WITH THE SEC IN CONNECTION WITH THE TRANSACTION, WHEN THEY BECOME AVAILABLE BECAUSE THEY WILL CONTAIN IMPORTANT INFORMATION ABOUT THE TRANSACTION, THE PARTIES TO THE TRANSACTION AND THE RISKS ASSOCIATED WITH THE TRANSACTION. A definitive proxy statement/prospectus will be sent to AmeriGas Partners, L.P. unitholders in connection with the special meeting. Investors and security holders may obtain a free copy of the proxy statement/prospectus (when available), the Schedule13E-3 (when available) and other relevant documents filed by UGI Corporation or AmeriGas Partners, L.P. with the SEC from the SEC’s website at www.sec.gov. Security holders and other interested parties will also be able to obtain, without charge, a copy of the proxy statement/prospectus, the Schedule13E-3 and other relevant documents (when available) from www.ugicorp.com under the tab “Investor Relations” and then under the heading “SEC Filings.” Participants in the Solicitation UGI Corporation, AmeriGas Partners, L.P., AmeriGas Propane, Inc. and each of their respective directors, executive officers and certain other members of management may be deemed to be participants in the solicitation of proxies from their respective security holders with respect to the transaction. Information about these persons is set forth in UGI Corporation’s proxy statement relating to its 2019 Annual Meeting of Shareholders, which was filed with the SEC on December 20, 2018, and AmeriGas Partners, L.P.’s Annual Report on Form10-K for the fiscal year ended September 30, 2018, which was filed with the SEC on November 20, 2018, and subsequent statements of changes in beneficial ownership on file with the SEC. Security holders and investors may obtain additional information regarding the interests of such persons, which may be different than those of the respective companies’ security holders generally, by reading the joint proxy statement/prospectus and other relevant documents regarding the transaction, which will be filed with the SEC.
Acquisition of Columbia Midstream Group, LLC
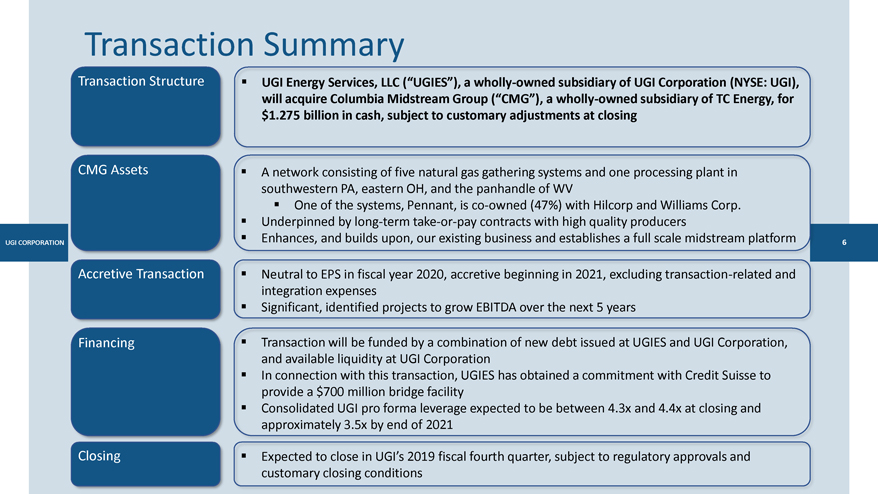
Transaction Summary Transaction Structure UGI Energy Services, LLC (“UGIES”), a wholly-owned subsidiary of UGI Corporation (NYSE: UGI), will acquire Columbia Midstream Group (“CMG”), a wholly-owned subsidiary of TC Energy, for $1.275 billion in cash, subject to customary adjustments at closing CMG Assets A network consisting of five natural gas gathering systems and one processing plant in southwestern PA, eastern OH, and the panhandle of WV One of the systems, Pennant, is co-owned (47%) with Hilcorp and Williams Corp. Underpinned by long-termtake-or-pay contracts with high quality producers Enhances, and builds upon, our existing business and establishes a full scale midstream platform Accretive Transaction Neutral to EPS in fiscal year 2020, accretive beginning in 2021, excluding transaction-related and integration expenses Significant, identified projects to grow EBITDA over the next 5 years Financing Transaction will be funded by a combination of new debt issued at UGIES and UGI Corporation, and available liquidity at UGI Corporation In connection with this transaction, UGIES has obtained a commitment with Credit Suisse to provide a $700 million bridge facility Consolidated UGI pro forma leverage expected to be between 4.3x and 4.4x at closing and approximately 3.5x by end of 2021 Closing Expected to close in UGI’s 2019 fiscal fourth quarter, subject to regulatory approvals and customary closing conditions
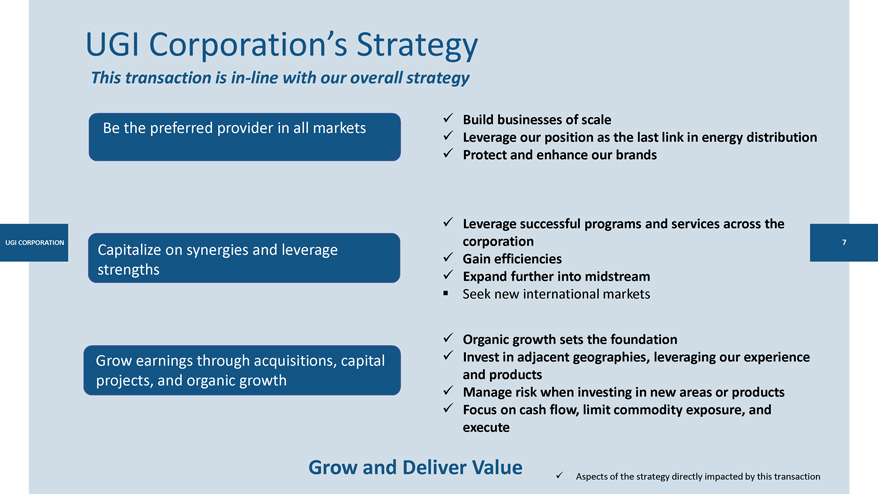
UGI Corporation’s Strategy This transaction is in-line with our overall strategy Build businesses of scale Be the preferred provider in all markets ✓ Leverage our position as the last link in energy distribution Protect and enhance our brands Leverage successful programs and services across the corporation Capitalize on synergies and leverage Gain efficiencies strengths Expand further into midstream Seek new international markets Organic growth sets the foundation Grow earnings through acquisitions, capital ✓ Invest in adjacent geographies, leveraging our experience projects, and organic growth and products ✓ Manage risk when investing in new areas or products ✓ Focus on cash flow, limit commodity exposure, and execute Grow and Deliver Value ✓ Aspects of the strategy directly impacted by this transaction
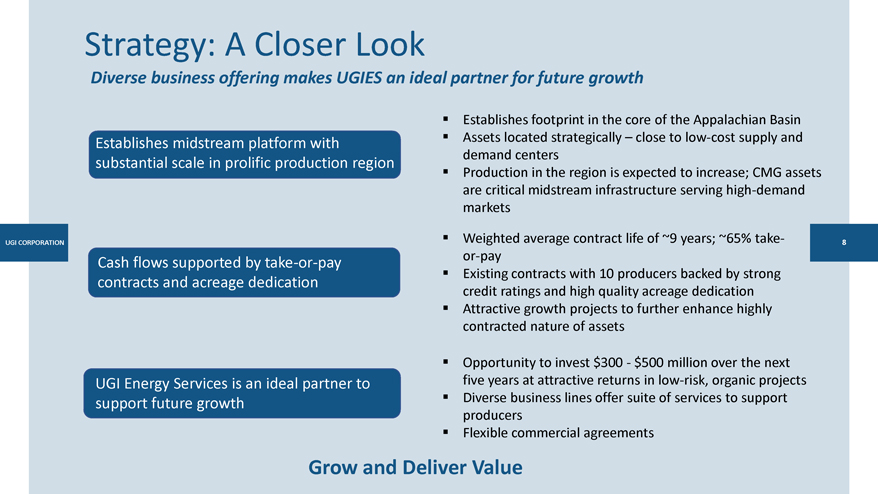
Strategy: A Closer Look Diverse business offering makes UGIES an ideal partner for future growth Establishes footprint in the core of the Appalachian Basin Assets located strategically – close tolow-cost supply and Establishes midstream platform with demand centers substantial scale in prolific production region Production in the region is expected to increase; CMG assets are critical midstream infrastructure serving high-demand markets Weighted average contract life of ~9 years; ~65%take-or-pay Cash flows supported bytake-or-pay producers backed by strong Existing contracts with 10 contracts and acreage dedication credit ratings and high quality acreage dedication Attractive growth projects to further enhance highly contracted nature of assets Opportunity to invest $300—$500 million over the next UGI Energy Services is an ideal partner to five years at attractive returns inlow-risk, organic projects support future growth Diverse business lines offer suite of services to support producers Flexible commercial agreements Grow and Deliver Value
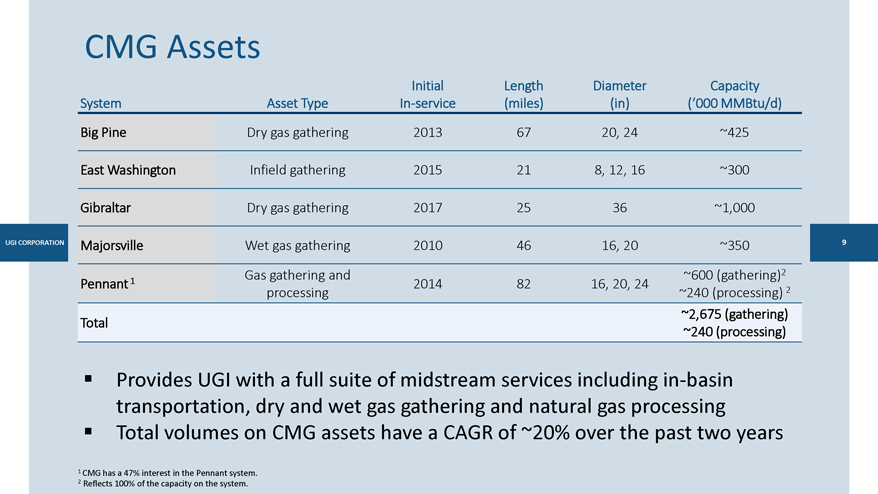
CMG Assets Initial Length Diameter Capacity System Asset TypeIn-service (miles) (in) (‘000 MMBtu/d) Big Pine Dry gas gathering 2013 67 20, 24 ~425 East Washington Infield gathering 2015 21 8, 12, 16 ~300 Gibraltar Dry gas gathering 2017 25 36 ~1,000 Majorsville Wet gas gathering 2010 46 16, 20 ~350 Gas gathering and ~600 (gathering)2 Pennant1 2014 82 16, 20, 24 processing ~240 (processing) 2 ~2,675 (gathering) Total ~240 (processing) Provides UGI with a full suite of midstream services includingin-basin transportation, dry and wet gas gathering and natural gas processing Total volumes on CMG assets have a CAGR of ~20% over the past two years 1 CMG has a 47% interest in the Pennant system. 2 Reflects 100% of the capacity on the system.
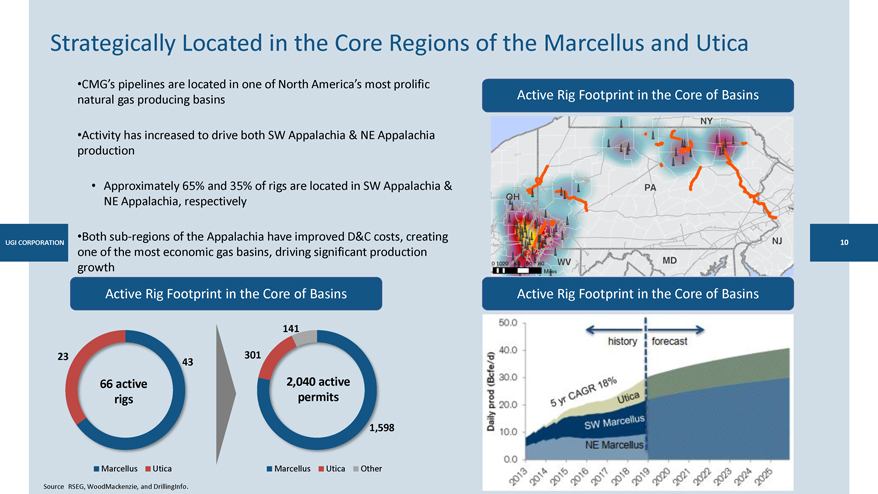
Strategically Located in the Core Regions of the Marcellus and Utica •CMG’s pipelines are located in one of North America’s most prolific Active Rig Footprint in the Core of Basins natural gas producing basins •Activity has increased to drive both SW Appalachia & NE Appalachia production • Approximately 65% and 35% of rigs are located in SW Appalachia & NE Appalachia, respectively •Bothsub-regions of the Appalachia have improved D&C costs, creating CORPORATION one of the most economic gas basins, driving significant production growth Active Rig Footprint in the Core of Basins Active Rig Footprint in the Core of Basins 141 23 301 43 66 active 2,040 active rigs permits 1,598 Marcellus Utica Marcellus Utica Other Source RSEG, WoodMackenzie, and DrillingInfo.
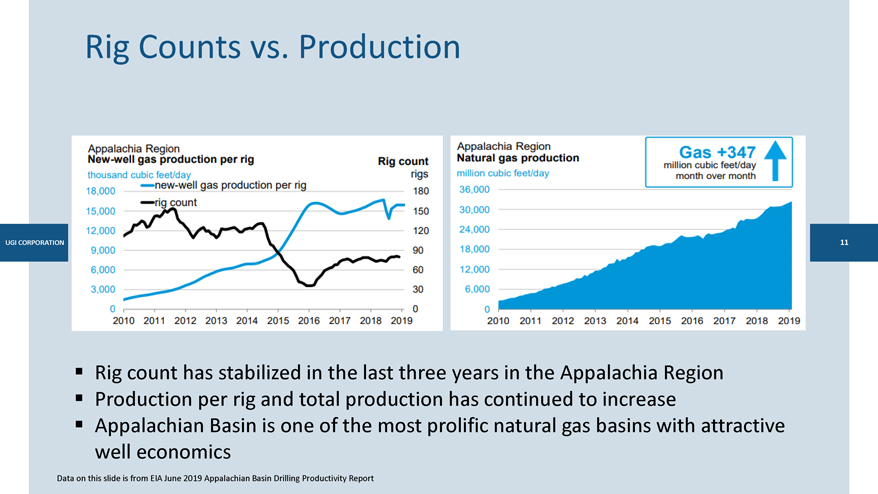
Rig Counts vs. Production Rig count has stabilized in the last three years in the Appalachia Region Production per rig and total production has continued to increase Appalachian Basin is one of the most prolific natural gas basins with attractive well economics Data on this slide is from EIA June 2019 Appalachian Basin Drilling Productivity Report
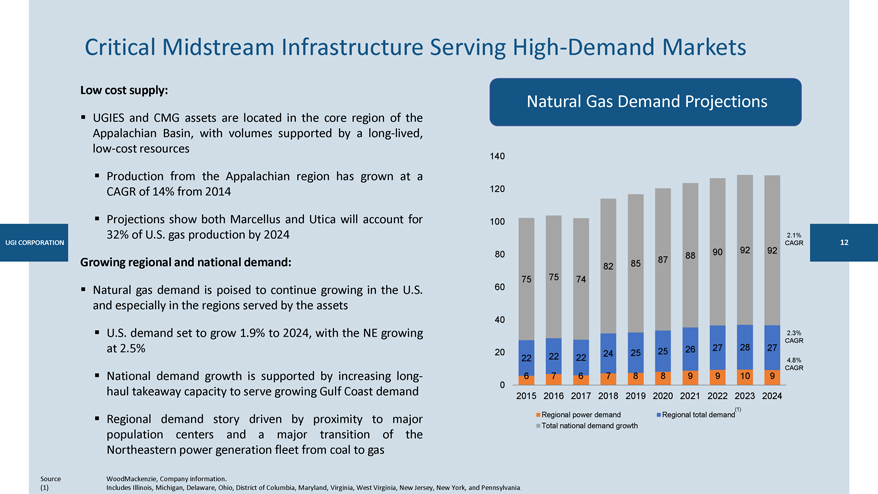
Critical Midstream Infrastructure Serving High-Demand Markets Low cost supply: Natural Gas Demand Projections UGIES and CMG assets are located in the core region of the Appalachian Basin, with volumes supported by a long-lived,low-cost resources 140 Production from the Appalachian region has grown at a CAGR of 14% from 2014 120 Projections show both Marcellus and Utica will account for 100 32% of U.S. gas production by 2024 2.1% CORPORATION 92 CAGR 80 90 92 88 Growing regional and national demand: 85 87 82 75 75 74 Natural gas demand is poised to continue growing in the U.S. 60 and especially in the regions served by the assets 40 U.S. demand set to grow 1.9% to 2024, with the NE growing 2.3% at 2.5% 27 28 27 CAGR 20 25 25 26 22 24 22 22 4.8% CAGR National demand growth is supported by increasing long- 6 7 6 7 8 8 9 9 10 9 0 haul takeaway capacity to serve growing Gulf Coast demand 2015 2016 2017 2018 2019 2020 2021 2022 2023 2024 Regional power demand Regional total demand(1) Regional demand story driven by proximity to major population centers and a major transition of the Total national demand growth Northeastern power generation fleet from coal to gas Source WoodMackenzie, Company information. (1) Includes Illinois, Michigan, Delaware, Ohio, District of Columbia, Maryland, Virginia, West Virginia, New Jersey, New York, and Pennsylvania.
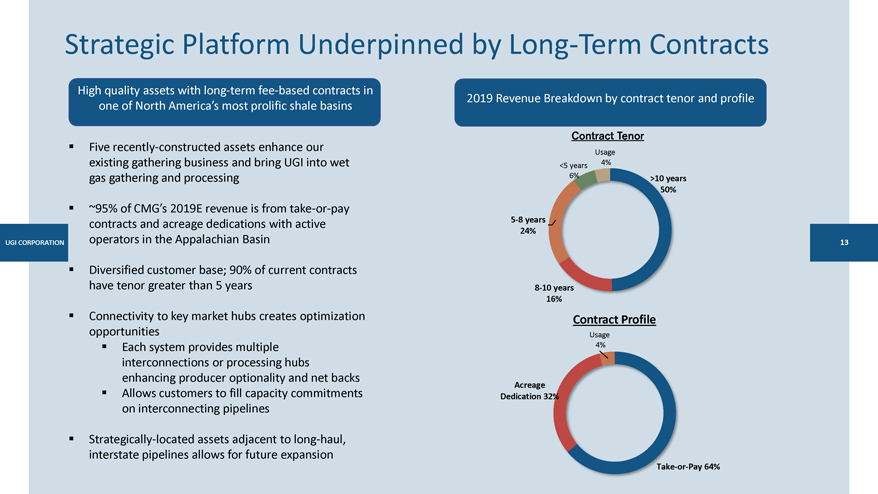
Strategic Platform Underpinned by Long-Term Contracts High quality assets with long-termfee-based contracts in 2019 Revenue Breakdown by contract tenor and profile one of North America’s most prolific shale basins Contract Tenor Five recently-constructed assets enhance our Usage existing gathering business and bring UGI into wet 4% <5 years gas gathering and processing 6% >10 years 50% ~95% of CMG’s 2019E revenue is fromtake-or-pay contracts and acreage dedications with active5-8 years operators in the Appalachian Basin 24% Diversified customer base; 90% of current contracts have tenor greater than 5 years8-10 years 16% Connectivity to key market hubs creates optimization Contract Profile opportunities Usage Each system provides multiple 4% interconnections or processing hubs enhancing producer optionality and net backs Acreage Allows customers to fill capacity commitments Dedication 32% on interconnecting pipelines Strategically-located assets adjacent to long-haul, interstate pipelines allows for future expansionTake-or-Pay 64%
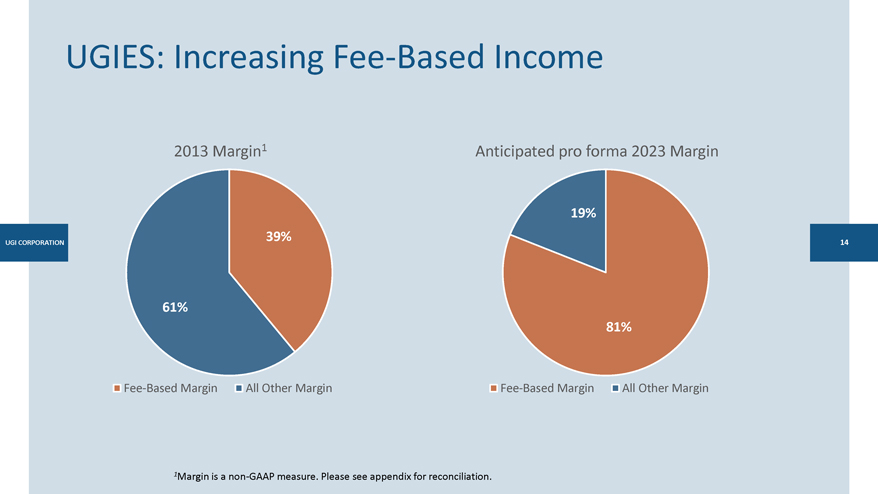
UGIES: IncreasingFee-Based Income 2013 Margin1 Anticipated pro forma 2023 Margin 19% 39% 61% 81%Fee-Based Margin All Other MarginFee-Based Margin All Other Margin 1Margin is anon-GAAP measure. Please see appendix for reconciliation.
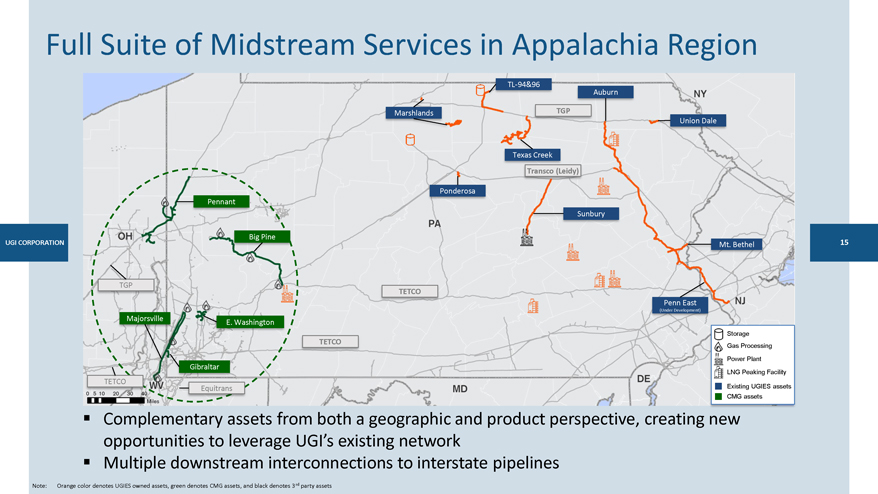
Full Suite of Midstream Services in Appalachia RegionTL-94&96 Auburn Marshlands TGP Union Dale Texas Creek Transco (Leidy) Ponderosa Pennant Sunbury CORPORATION Big Pine Mt. Bethel TGP TETCO Penn East (Under Development) Majorsville E. Washington Storage TETCO Gas Processing Power Plant Gibraltar LNG Peaking Facility TETCO Equitrans Existing UGIES assets CMG assets Complementary assets from both a geographic and product perspective, creating new opportunities to leverage UGI’s existing network Multiple downstream interconnections to interstate pipelines Note: Orange color denotes UGIES owned assets, green denotes CMG assets, and black denotes 3rd party assets
An Ideal Partner for Growth 1. UGIES Other Services Retail end demand complements producers who are naturally long Work with producers to split bid/ask spread and increase netbacks Utilize existing capacity portfolio to optimize supply Offer producers hedging services and supply and marketing services 2. Provide infield gathering services so producers can focus financial resources on drilling Negotiate with producers to monetize existing systems in exchange for minimum volume commitments and acreage dedications Partner with producers to construct greenfield systems and expand existing systems 3. Offer flexible commercial agreements Flexible terms enable partners to share in upside while minimizing risk for both UGIES and producer Lower corporate overhead translates to lower costs to producer
Summary Transaction adds stable, visible cash flows underpinned by long-termtake-or-pay contracts and acreage dedications with well-capitalized producers who hold some of the best acreage in the Appalachian Basin CMG complements UGI’s existing footprint in north-central and eastern PA and creates a full scale midstream platform with scale that can provide producers with a full suite of midstream services from Ohio to Susquehanna County, PA Identified opportunities to invest an additional $300—$500 million over the next 5 years Synergy opportunities for UGI’s downstream businesses created by CMG’s multiple downstream interconnections to interstate pipelines EPS neutral in fiscal year 2020, accretive beginning in fiscal year 2021, excluding transaction-related and integration expenses Transaction will be funded by a combination of new debt at UGIES and UGI Corporation, as well as available liquidity at UGI Corp Expected to close in the fourth quarter of fiscal year 2019, subject to customary regulatory and other closing conditions
Corporate Overview
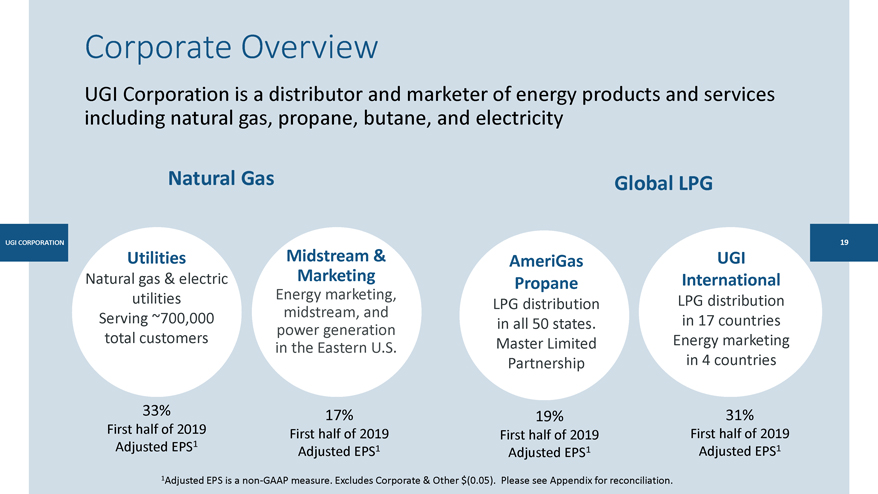
Corporate Overview UGI Corporation is a distributor and marketer of energy products and services including natural gas, propane, butane, and electricity Natural Gas Global LPG Utilities Midstream & AmeriGas UGI Natural gas & electric Marketing International Propane utilities Energy marketing, LPG distribution LPG distribution Serving ~700,000 midstream, and in all 50 states. in 17 countries power generation total customers Master Limited Energy marketing in the Eastern U.S. in 4 countries Partnership 33% 17% 19% 31% First half of 2019 First half of 2019 First half of 2019 1 First half of 2019 Adjusted EPS Adjusted EPS1 1 Adjusted EPS1 Adjusted EPS 1Adjusted EPS is anon-GAAP measure. Excludes Corporate & Other $(0.05). Please see Appendix for reconciliation.

A Compelling Value Proposition Highest 10-year free cash flow as a % of EBITDA among Outstanding cash generation Multi-Utilities in the S&P Utilities index Commitment FY13-18 Strong track record of disciplined Actual capital deployment and meeting our Adjusted EPS16-10% 11.2% commitments Dividend 4% 6.8% ✓ Strong and growing natural gas demand ✓ Utility rate base and customer growth ✓ Marcellus-based infrastructure Clear path to growth ✓ National Accounts and Cylinder Exchange ✓ Targeted M&A ✓ LNG and energy marketing expansion ✓ Broadening of activities in Europe (1) Adjusted EPS is anon-GAAP measure. See Appendix for reconciliation.
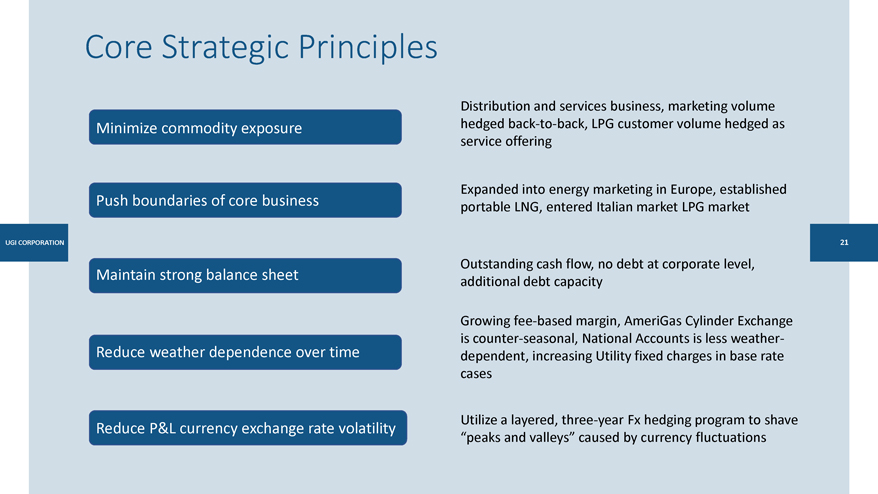
Core Strategic Principles Distribution and services business, marketing volume Minimize commodity exposure hedgedback-to-back, LPG customer volume hedged as service offering Expanded into energy marketing in Europe, established Push boundaries of core business portable LNG, entered Italian market LPG market Outstanding cash flow, no debt at corporate level, Maintain strong balance sheet additional debt capacity Growingfee-based margin, AmeriGas Cylinder Exchange is counter-seasonal, National Accounts is less weather-Reduce weather dependence over time dependent, increasing Utility fixed charges in base rate cases Utilize a layered, three-year Fx hedging program to shave Reduce P&L currency exchange rate volatility “peaks and valleys” caused by currency fluctuations
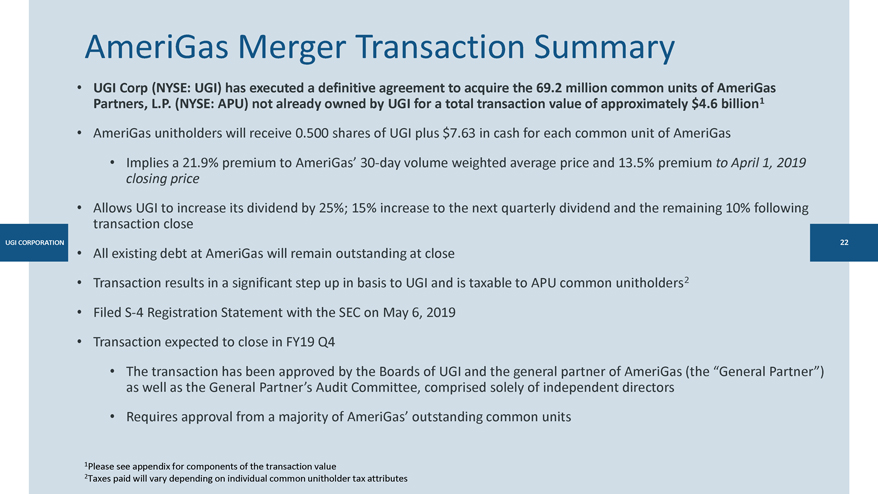
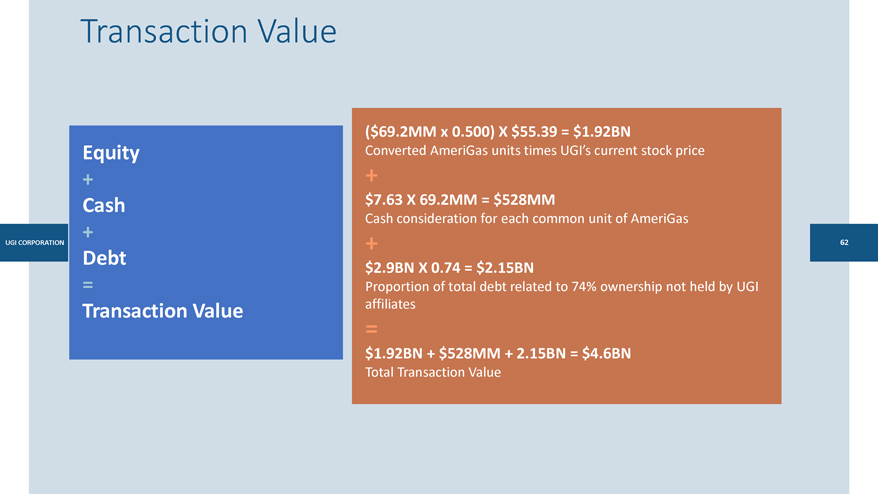
AmeriGas Merger Transaction Summary • UGI Corp (NYSE: UGI) has executed a definitive agreement to acquire the 69.2 million common units of AmeriGas Partners, L.P. (NYSE: APU) not already owned by UGI for a total transaction value of approximately $4.6 billion1 • AmeriGas unitholders will receive 0.500 shares of UGI plus $7.63 in cash for each common unit of AmeriGas • Implies a 21.9% premium to AmeriGas’30-day volume weighted average price and 13.5% premium to April 1, 2019 closing price • Allows UGI to increase its dividend by 25%; 15% increase to the next quarterly dividend and the remaining 10% following transaction close • All existing debt at AmeriGas will remain outstanding at close • Transaction results in a significant step up in basis to UGI and is taxable to APU common unitholders2 • FiledS-4 Registration Statement with the SEC on May 6, 2019 • Transaction expected to close in FY19 Q4 • The transaction has been approved by the Boards of UGI and the general partner of AmeriGas (the “General Partner”) as well as the General Partner’s Audit Committee, comprised solely of independent directors • Requires approval from a majority of AmeriGas’ outstanding common units 1Please see appendix for components of the transaction value 2Taxes paid will vary depending on individual common unitholder tax attributes
Benefits of AmeriGas Merger Transaction • Strong business with exceptional cash flow • Expected to increase cash available for growth investments and dividends • Over $200 million in additional annual free cash flow to UGI • Funds growth opportunities across the business • Reduces MLP administrative and structural complexities • Resolves AmeriGas’ distribution coverage challenges • Expected to be accretive to UGI beginning in FY20
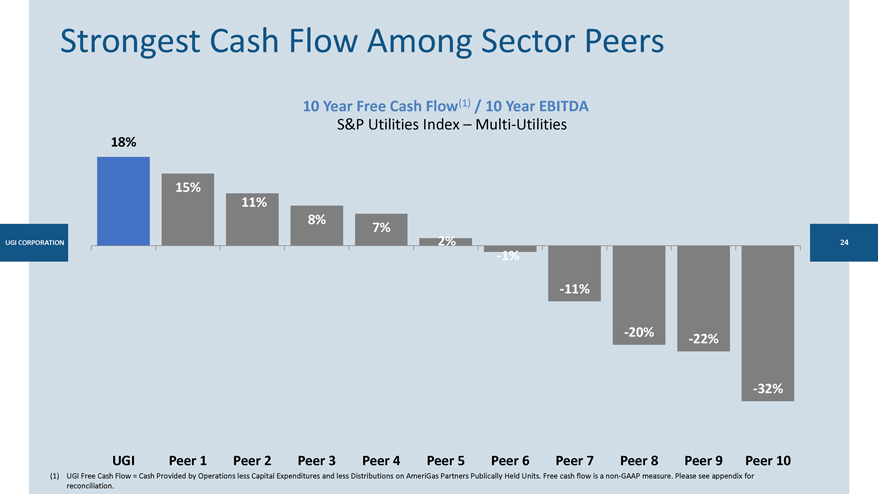
Strongest Cash Flow Among Sector Peers 10 Year Free Cash Flow(1) / 10 Year EBITDA S&P Utilities Index – Multi-Utilities 18% 15% 11% 8% 7% CORPORATION 2% -1% -11% -20% -22% -32% UGI Peer 1 Peer 2 Peer 3 Peer 4 Peer 5 Peer 6 Peer 7 Peer 8 Peer 9 Peer 10 (1) UGI Free Cash Flow = Cash Provided by Operations less Capital Expenditures and less Distributions on AmeriGas Partners Publically Held Units. Free cash flow is anon-GAAP measure. Please see appendix for reconciliation.
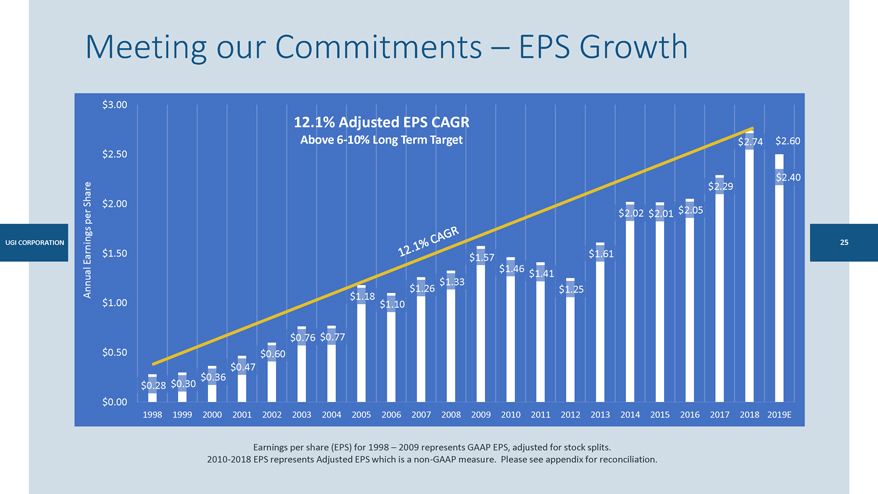
Meeting our Commitments – EPS Growth $3.00 12.1% Adjusted EPS CAGR Above6-10% Long Term Target $2.74 $2.60 $2.50 $2.40 Share $2.29 $2.00 per $2.02 $2.01 $2.05 25 $1.50 $1.61 Earnings $1.57 $1.46 $1.33 $1.41 Annual $1.18 $1.26 $1.25 $1.00 $1.10 $0.76 $0.77 $0.50 $0.60 $0.47 $0.36 $0.28 $0.30 $0.00 1998 1999 2000 2001 2002 2003 2004 2005 2006 2007 2008 2009 2010 2011 2012 2013 2014 2015 2016 2017 2018 2019E Earnings per share (EPS) for 1998 – 2009 represents GAAP EPS, adjusted for stock splits. 2010-2018 EPS represents Adjusted EPS which is anon-GAAP measure. Please see appendix for reconciliation.
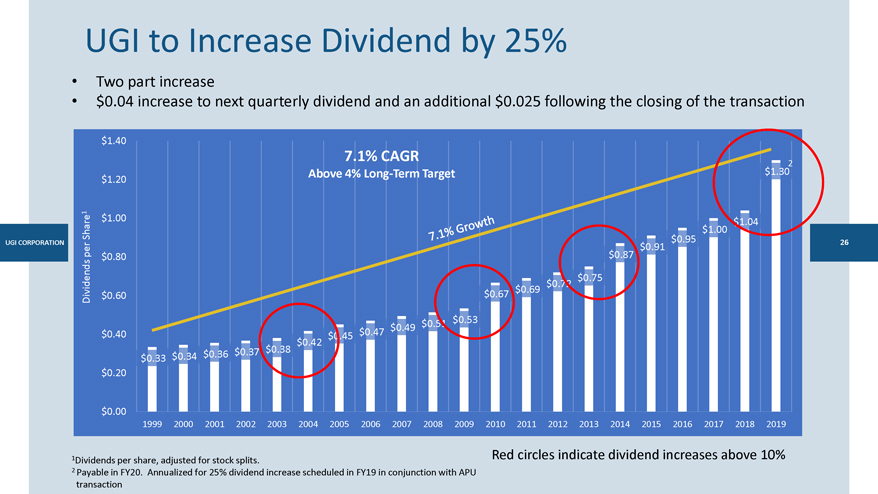
UGI to Increase Dividend by 25% • Two part increase • $0.04 increase to next quarterly dividend and an additional $0.025 following the closing of the transaction $1.40 7.1% CAGR $1.302 Above 4% Long-Term Target $1.20 1 are $1.00 $1.04 $1.00 Sh $0.95 per $0.91 $0.87 $0.80 $0.75 $0.72 $0.69 Dividends $0.60 $0.67 $0.51 $0.53 $0.49 $0.40 $0.45 $0.47 $0.42 $0.37 $0.38 $0.34 $0.36 $0.33 $0.20 $0.00 1999 2000 2001 2002 2003 2004 2005 2006 2007 2008 2009 2010 2011 2012 2013 2014 2015 2016 2017 2018 2019 1 Red circles indicate dividend increases above 10% Dividends per share, adjusted for stock splits. 2 Payable in FY20. Annualized for 25% dividend increase scheduled in FY19 in conjunction with APU transaction
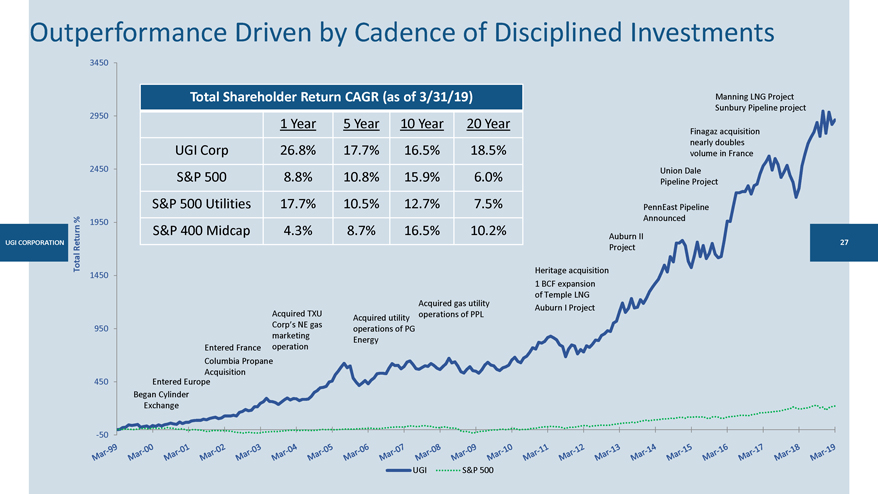
Outperformance Driven by Cadence of Disciplined Investments 3450 Total Shareholder Return CAGR (as of 3/31/19) Manning LNG Project Sunbury Pipeline project 2950 1 Year 5 Year 10 Year 20 Year Finagaz acquisition nearly doubles UGI Corp 26.8% 17.7% 16.5% 18.5% volume in France 2450 Union Dale S&P 500 8.8% 10.8% 15.9% 6.0% Pipeline Project S&P 500 Utilities 17.7% 10.5% 12.7% 7.5% PennEast Pipeline % Announced 1950 S&P 400 Midcap 4.3% 8.7% 16.5% 10.2% Auburn II CORPORATION eturn 27 R Project Total Heritage acquisition 1450 1 BCF expansion of Temple LNG Acquired gas utility Auburn I Project Acquired TXU operations of PPL Corp’s NE gas Acquired utility 950 marketing operations of PG operation Energy Entered France Columbia Propane Acquisition 450 Entered Europe Began Cylinder Exchange -50 UGI S&P 500
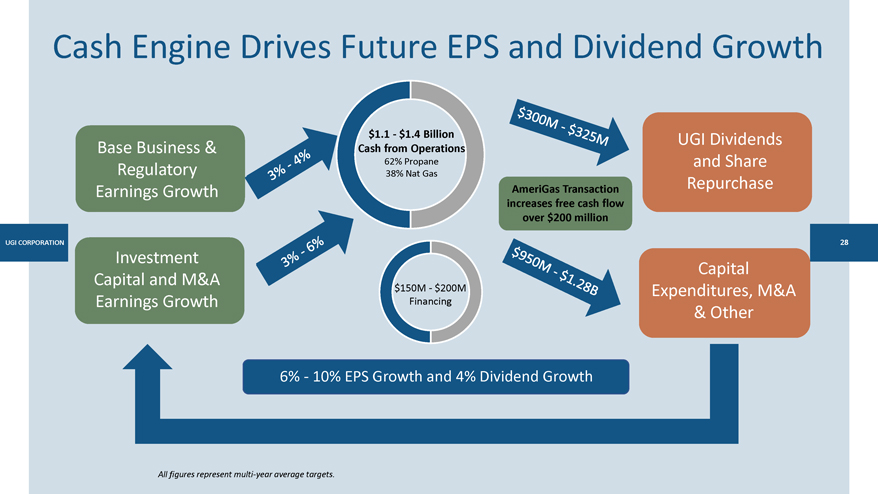
Cash Engine Drives Future EPS and Dividend Growth $1.1—$1.4 Billion UGI Dividends Base Business & Cash from Operations 62% Propane and Share Regulatory 38% Nat Gas Repurchase Earnings Growth AmeriGas Transaction increases free cash flow over $200 million CORPORATION Investment Capital Capital and M&A $150M—$200M Expenditures, M&A Earnings Growth Financing & Other 6%—10% EPS Growth and 4% Dividend Growth All figures represent multi-year average targets.
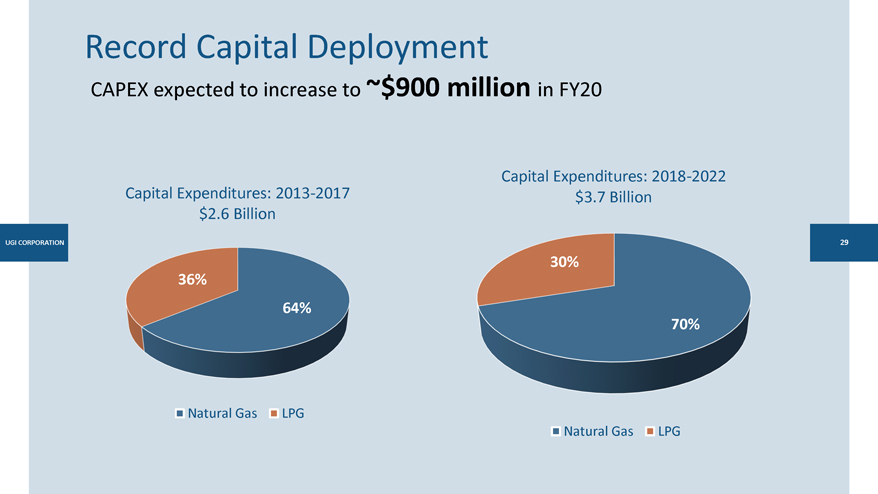
Record Capital Deployment CAPEX expected to increase to ~$900 million in FY20 Capital Expenditures: 2018-2022 Capital Expenditures: 2013-2017 $3.7 Billion $2.6 Billion 30% 36% 64% 70% Natural Gas LPG Natural Gas LPG

UG Energy to do more
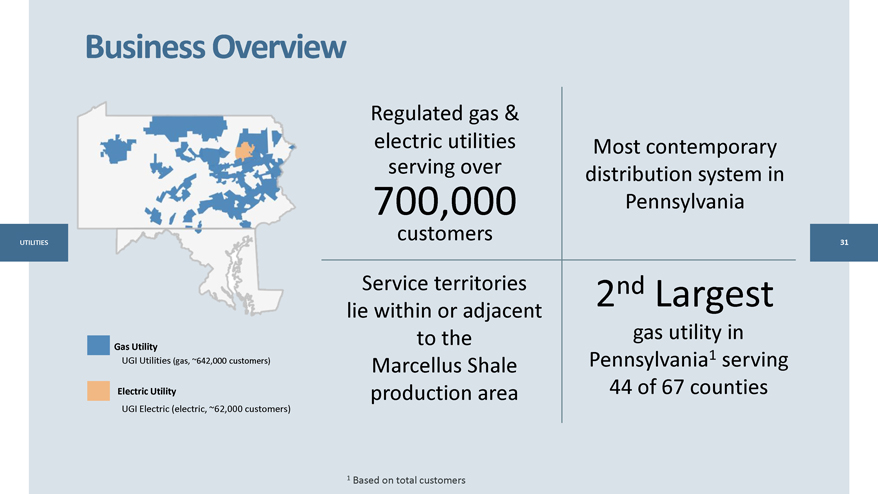
Business Overview Regulated gas & electric utilities Most contemporary serving over distribution system in 700,000 Pennsylvania customers Service territories 2nd Largest lie within or adjacent to the gas utility in Gas Utility 1 UGI Utilities (gas, ~642,000 customers) Marcellus Shale Pennsylvania serving Electric Utility production area 44 of 67 counties UGI Electric (electric, ~62,000 customers) 1 Based on total customers
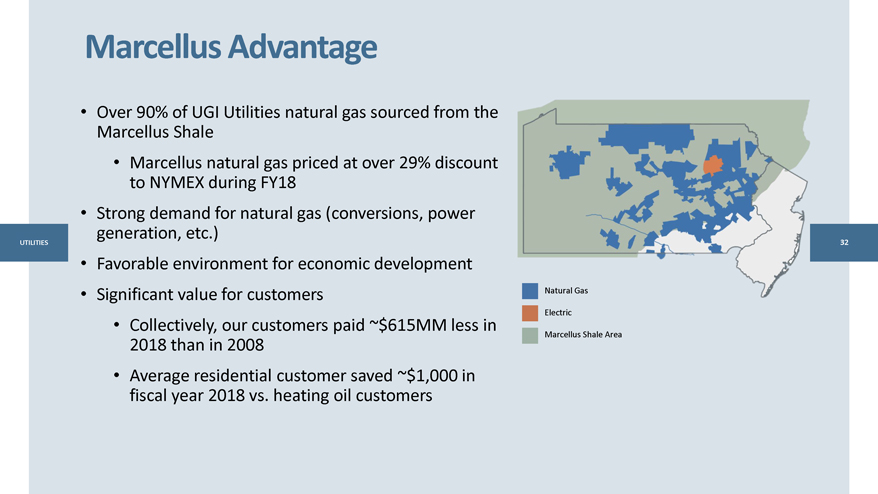
Marcellus Advantage • Over 90% of UGI Utilities natural gas sourced from the Marcellus Shale • Marcellus natural gas priced at over 29% discount to NYMEX during FY18 • Strong demand for natural gas (conversions, power generation, etc.) • Favorable environment for economic development • Significant value for customers Natural Gas Electric • Collectively, our customers paid ~$615MM less in Marcellus Shale Area 2018 than in 2008 • Average residential customer saved ~$1,000 in fiscal year 2018 vs. heating oil customers
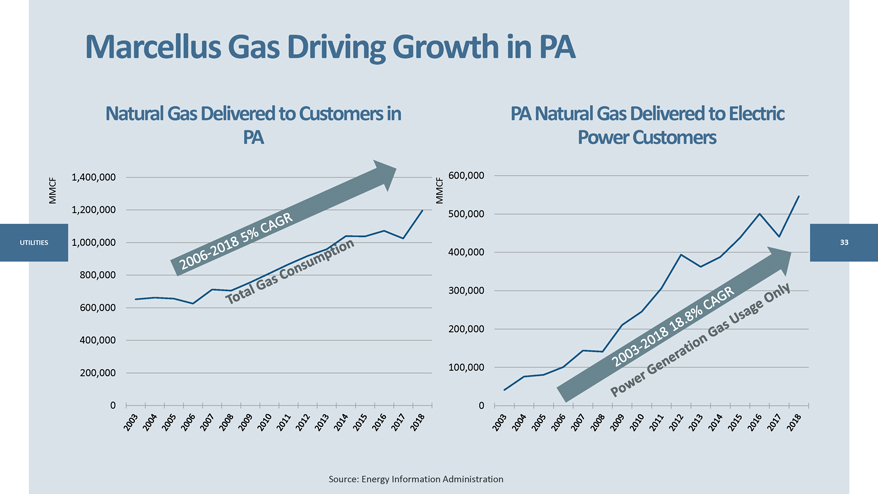
Marcellus Gas Driving Growth in PA Natural Gas Delivered to Customers in PA Natural Gas Delivered to Electric PA Power Customers 1,400,000 600,000 MMCF MMCF 1,200,000 500,000 1,000,000 400,000 800,000 300,000 600,000 200,000 400,000 100,000 200,000 0 0 Source: Energy Information Administration
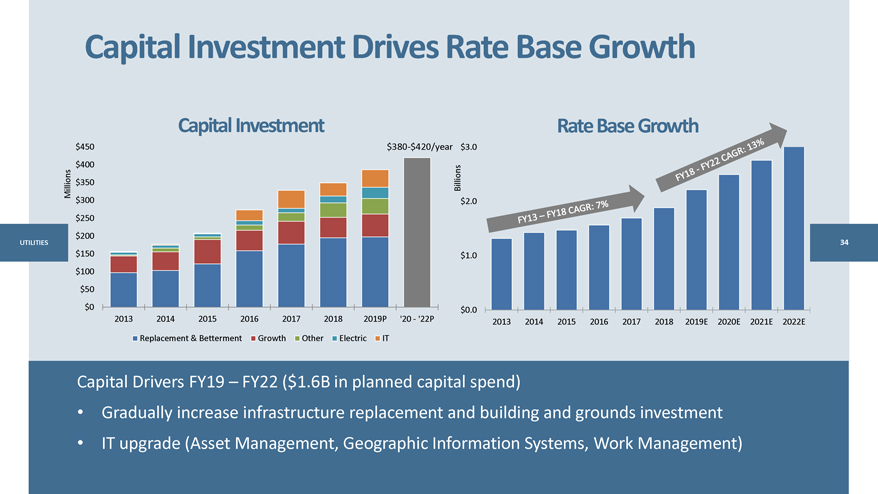
Capital Investment Drives Rate Base Growth Capital Investment Rate Base Growth $450$380-$420/year $3.0 $400 Millions $350 Billions $300 $2.0 $250 $200 34 $150 $1.0 $100 $50 $0 $0.0 2013 2014 2015 2016 2017 2018 2019P ‘20—‘22P 2013 2014 2015 2016 2017 2018 2019E 2020E 2021E 2022E Replacement & Betterment Growth Other Electric IT Capital Drivers FY19 – FY22 ($1.6B in planned capital spend) • Gradually increase infrastructure replacement and building and grounds investment • IT upgrade (Asset Management, Geographic Information Systems, Work Management)
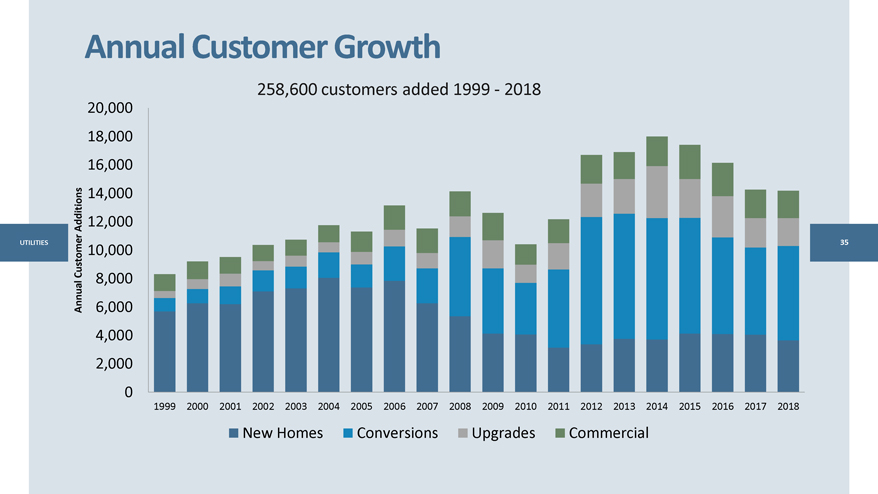
Annual Customer Growth 258,600 customers added 1999—2018 20,000 18,000 16,000 14,000 Additions 12,000 35 Customer 10,000 8,000 Annual 6,000 4,000 2,000 0 1999 2000 2001 2002 2003 2004 2005 2006 2007 2008 2009 2010 2011 2012 2013 2014 2015 2016 2017 2018 New Homes Conversions Upgrades Commercial
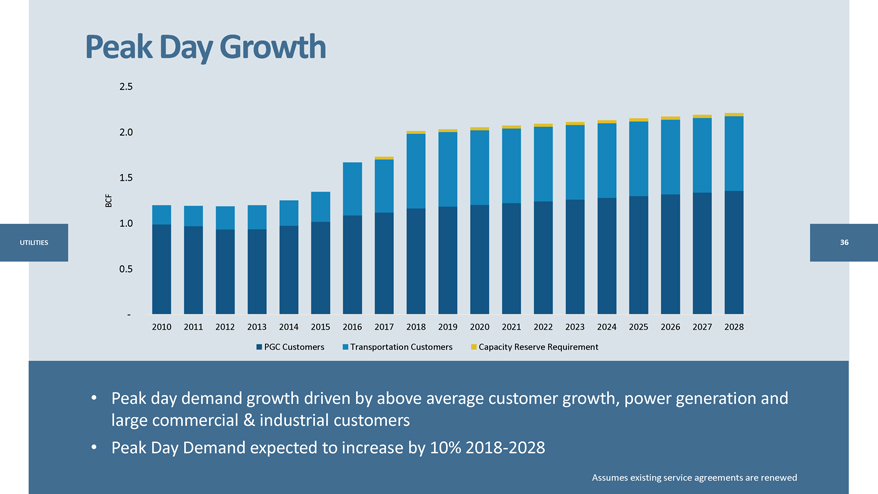
Peak Day Growth 2.5 2.0 1.5 BCF 1.0 0.5 - 2010 2011 2012 2013 2014 2015 2016 2017 2018 2019 2020 2021 2022 2023 2024 2025 2026 2027 2028 PGC Customers Transportation Customers Capacity Reserve Requirement • Peak day demand growth driven by above average customer growth, power generation and large commercial & industrial customers • Peak Day Demand expected to increase by 10% 2018-2028 Assumes existing service agreements are renewed

UGI Energy Services
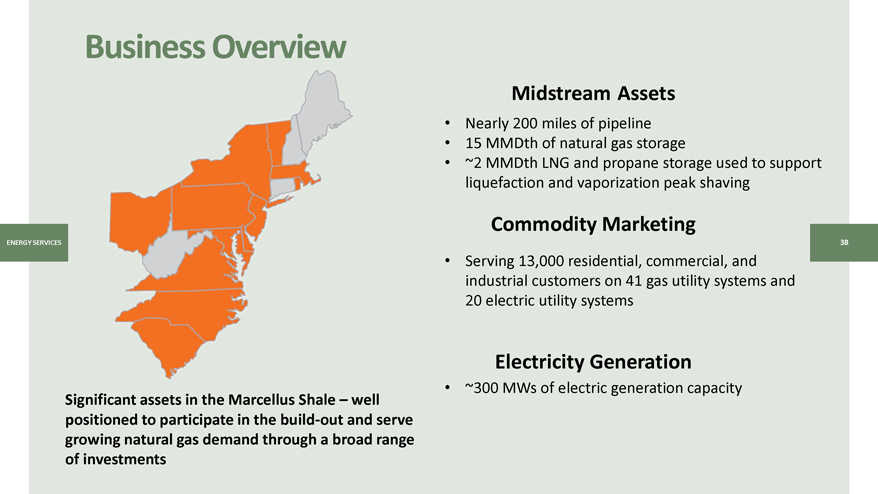
Business Overview Midstream Assets • Nearly 200 miles of pipeline • 15 MMDth of natural gas storage • ~2 MMDth LNG and propane storage used to support liquefaction and vaporization peak shaving Commodity Marketing SERV • Serving 13,000 residential, commercial, and industrial customers on 41 gas utility systems and 20 electric utility systems Electricity Generation Significant assets in the Marcellus Shale – well • ~300 MWs of electric generation capacity positioned to participate in thebuild-out and serve growing natural gas demand through a broad range of investments
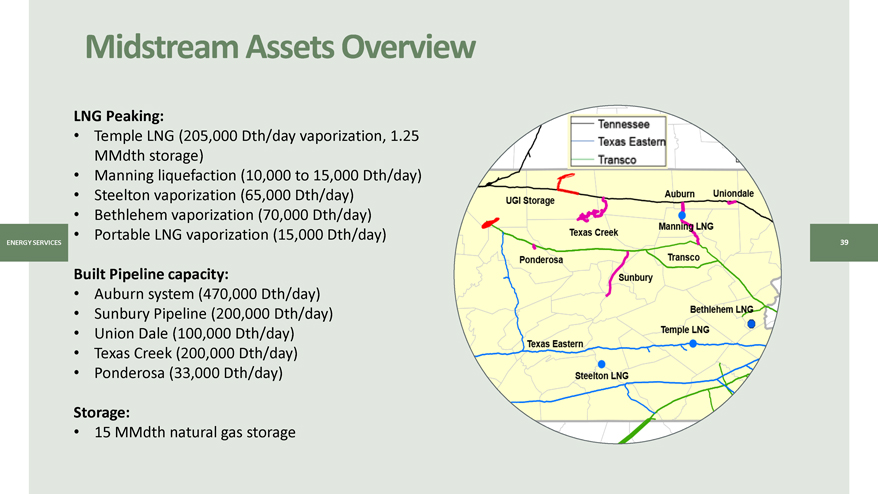
Midstream Assets Overview LNG Peaking: • Temple LNG (205,000 Dth/day vaporization, 1.25 MMdth storage) • Manning liquefaction (10,000 to 15,000 Dth/day) • Steelton vaporization (65,000 Dth/day) • Bethlehem vaporization (70,000 Dth/day) • Portable LNG vaporization (15,000 Dth/day) Built Pipeline capacity: • Auburn system (470,000 Dth/day) • Sunbury Pipeline (200,000 Dth/day) • Union Dale (100,000 Dth/day) • Texas Creek (200,000 Dth/day) • Ponderosa (33,000 Dth/day) Storage: • 15 MMdth natural gas storage
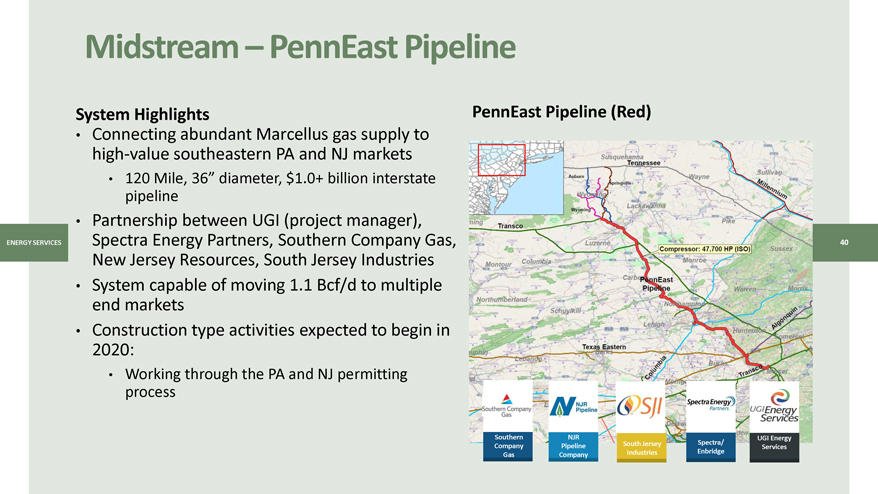
Midstream – PennEast Pipeline System Highlights PennEast Pipeline (Red) • Connecting abundant Marcellus gas supply to high-value southeastern PA and NJ markets • 120 Mile, 36” diameter, $1.0+ billion interstate pipeline • Partnership between UGI (project manager), Spectra Energy Partners, Southern Company Gas, New Jersey Resources, South Jersey Industries • System capable of moving 1.1 Bcf/d to multiple end markets • Construction type activities expected to begin in 2020: • Working through the PA and NJ permitting process Southern NJR Company Pipeline South Jersey Gas Company Industries
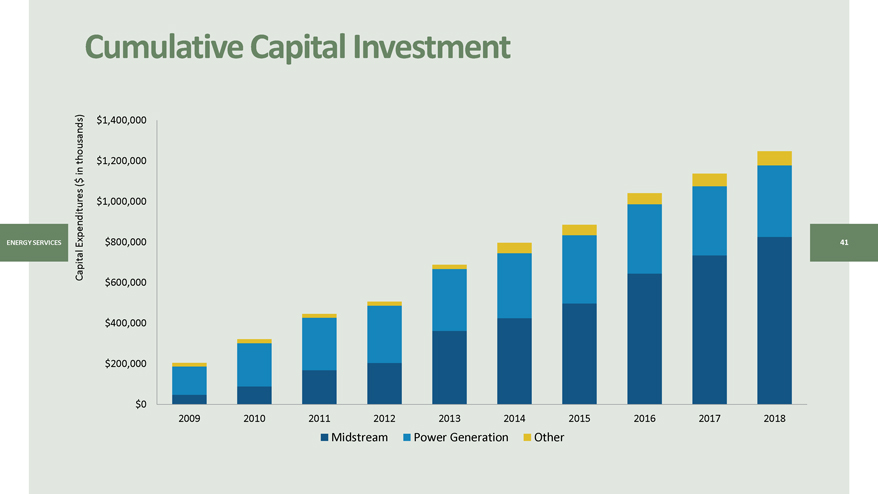
Cumulative Capital Investment $1,400,000 thousands) $1,200,000 in ( $ $1,000,000 Expenditures $800,000 Capital $600,000 $400,000 $200,000 $0 2009 2010 2011 2012 2013 2014 2015 2016 2017 2018 Midstream Power Generation Other
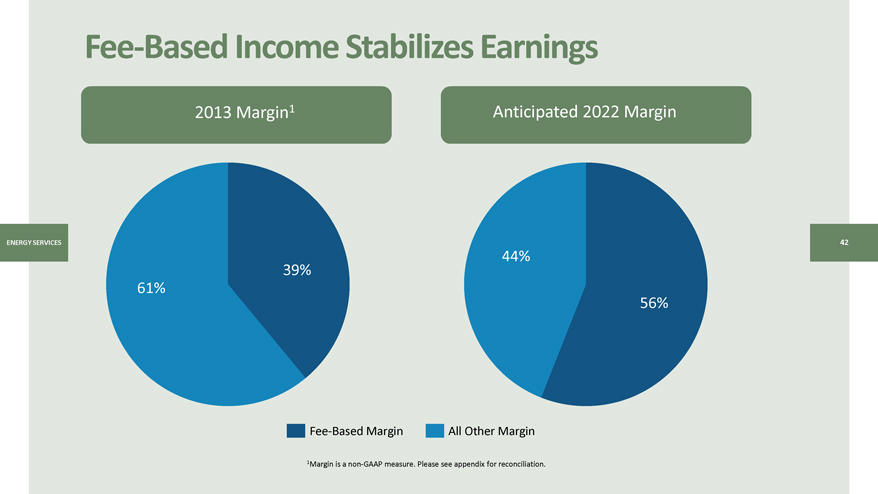
Fee-Based Income Stabilizes Earnings 2013 Margin1 Anticipated 2022 Margin 44% 39% 61% 56%Fee-Based Margin All Other Margin 1Margin is anon-GAAP measure. Please see appendix for reconciliation.
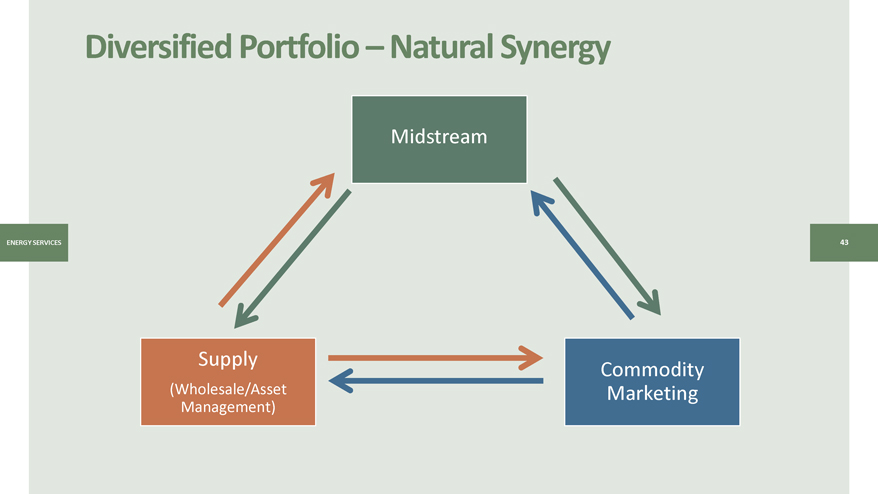
Diversified Portfolio – Natural Synergy Midstream Supply Commodity (Wholesale/Asset Marketing Management)
UGI INTERNATIONAL
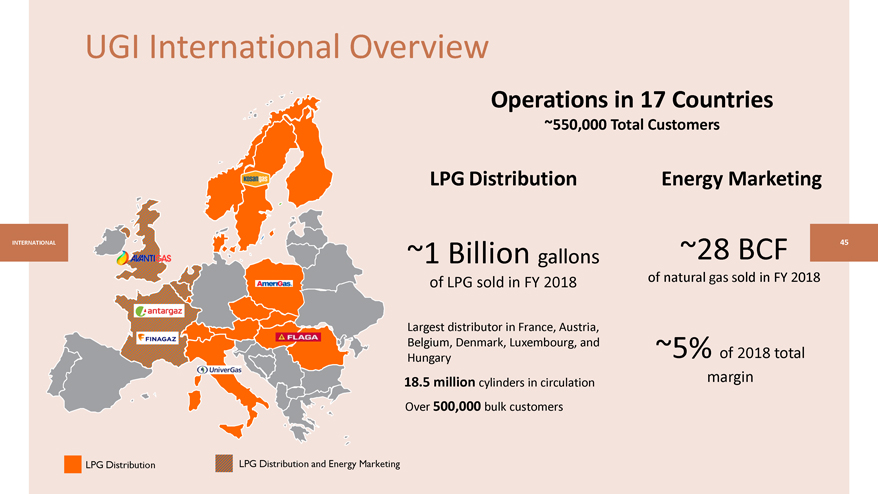
UGI International Overview Operations in 17 Countries ~550,000 Total Customers LPG Distribution Energy Marketing ~1 Billion gallons ~28 BCF of LPG sold in FY 2018 of natural gas sold in FY 2018 Largest distributor in France, Austria, Belgium, Denmark, Luxembourg, and ~5% Hungary of 2018 total 18.5 million cylinders in circulation margin Over 500,000 bulk customers LPG Distribution LPG Distribution and Energy Marketing
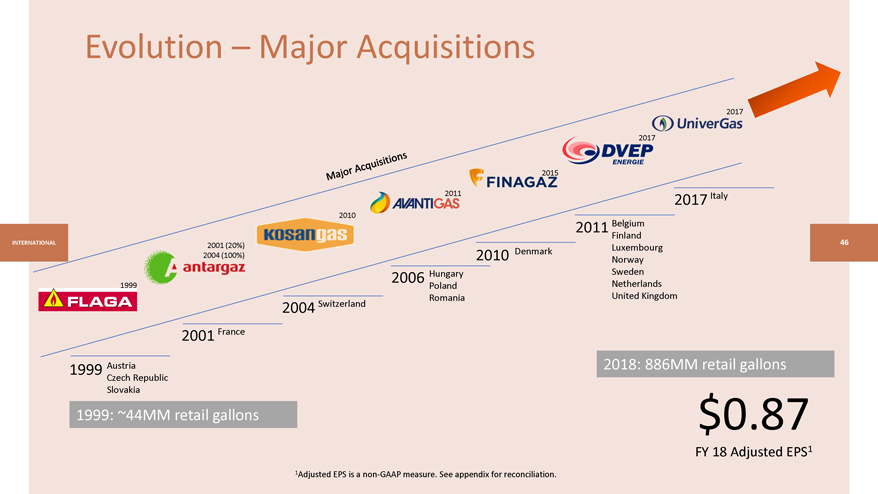
Evolution – Major Acquisitions 2017 2017 2015 2011 2017 Italy 2010 2011 Belgium Finland INTERNATIONAL 2001 (20%) Denmark Luxembourg 2004 (100%) 2010 Norway 2006 Hungary Sweden 1999 Poland Netherlands Switzerland Romania United Kingdom 2004 2001 France 1999 Austria 2018: 886MM retail gallons Czech Republic Slovakia 1999: ~44MM retail gallons $0.87 FY 18 Adjusted EPS1 1Adjusted EPS is anon-GAAP measure. See appendix for reconciliation.
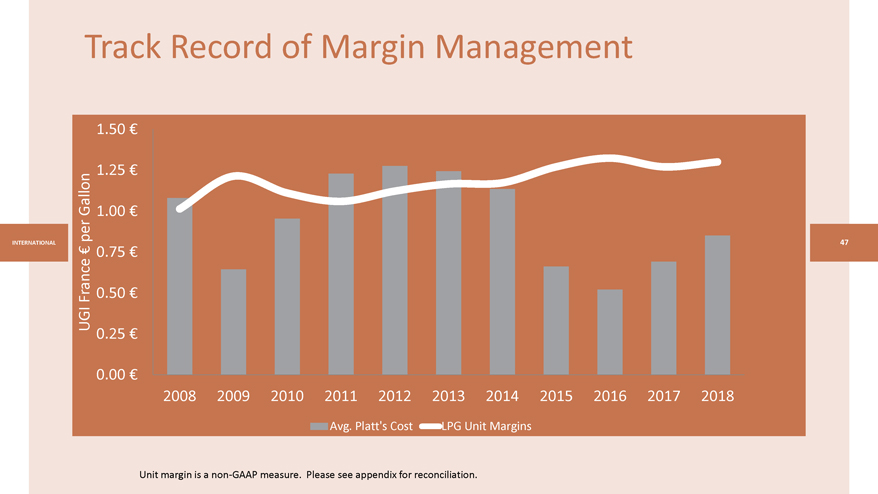
Track Record of Margin Management 1.50 € 1.25 € Gallon 1.00 € per INTERNATIONAL € 0.75 € France 0.50 € UGI 0.25 € 0.00 € 2008 2009 2010 2011 2012 2013 2014 2015 2016 2017 2018 Avg. Platt’s Cost LPG Unit Margins Unit margin is anon-GAAP measure. Please see appendix for reconciliation.

Strategically located LPG Supply Assets Provide Flexibility • UGI stores LPG at various Import terminal—SEA storage facilities and terminals Import terminal—PIPELINE Import terminal—RAILCARS across UGI Terminal—REFINERY • Ownership interests in 10 Intra-Europe trade Depots / Railheads / Storage flows are increasing Hamina primary storage facilities and over 70 secondary INTERNATIONAL Mossmorran storage facilities 48 Esbjerg Stanlow • Manages extensive logistics Malaszewicze Norgal and transportation network Slawkow Imports from outside Donges FR: 40+ depots Halmeu Europe growing (43% of Ambes consumption in 2017), particularly from US Lavera
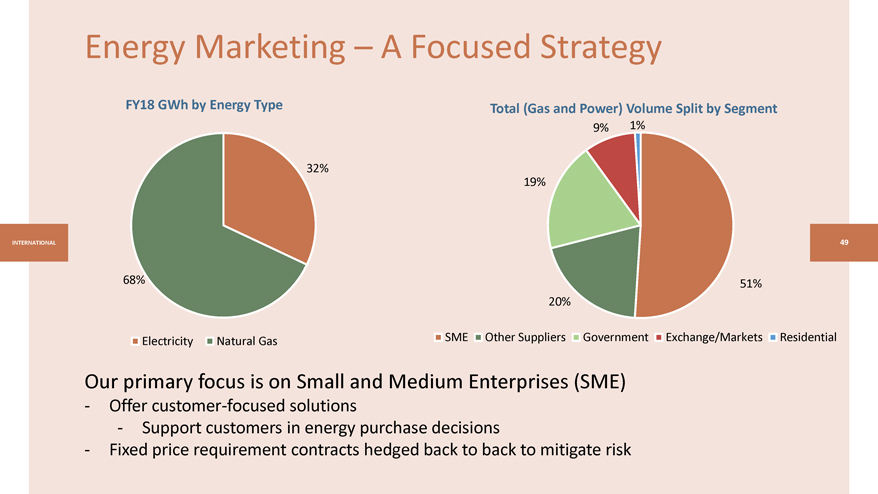
Energy Marketing – A Focused Strategy FY18 GWh by Energy Type Total (Gas and Power) Volume Split by Segment 9% 1% 32% 19% INTERNATIONAL 49 68% 51% 20% Electricity Natural Gas SME Other Suppliers Government Exchange/Markets Residential Our primary focus is on Small and Medium Enterprises (SME) - Offer customer-focused solutions - Support customers in energy purchase decisions - Fixed price requirement contracts hedged back to back to mitigate risk
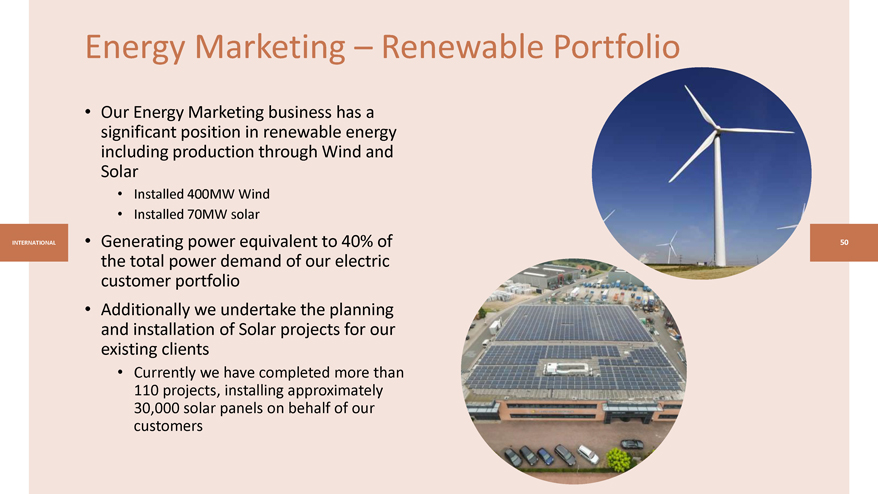
Energy Marketing – Renewable Portfolio • Our Energy Marketing business has a significant position in renewable energy including production through Wind and Solar • Installed 400MW Wind • Installed 70MW solar INTERNATIONAL • Generating power equivalent to 40% of the total power demand of our electric customer portfolio • Additionally we undertake the planning and installation of Solar projects for our existing clients • Currently we have completed more than 110 projects, installing approximately 30,000 solar panels on behalf of our customers
AmeriGas
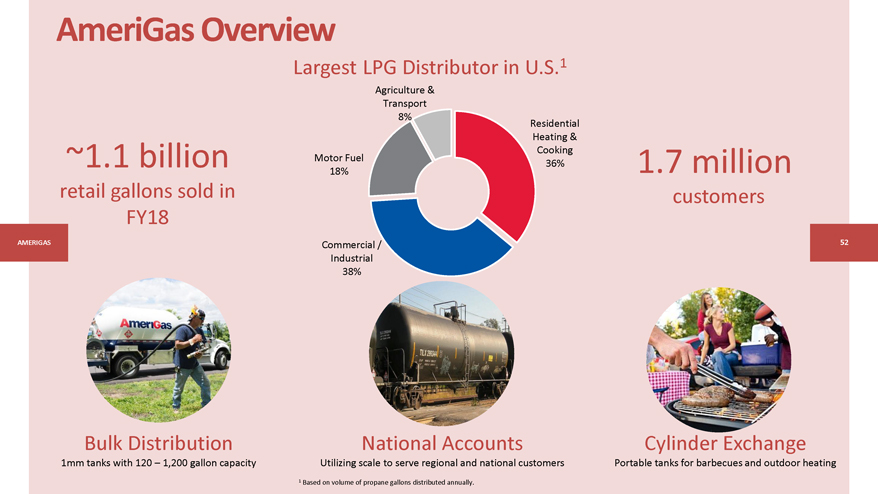
AmeriGas Overview Largest LPG Distributor in U.S.1 Agriculture & Transport 8% Residential Heating & Motor Fuel Cooking ~1.1 billion 18% 36% 1.7 million retail gallons sold in customers FY18 AMERIGAS Commercial / 52 Industrial 38% Bulk Distribution National Accounts Cylinder Exchange 1mm tanks with 120 – 1,200 gallon capacity Utilizing scale to serve regional and national customers Portable tanks for barbecues and outdoor heating 1 Based on volume of propane gallons distributed annually.
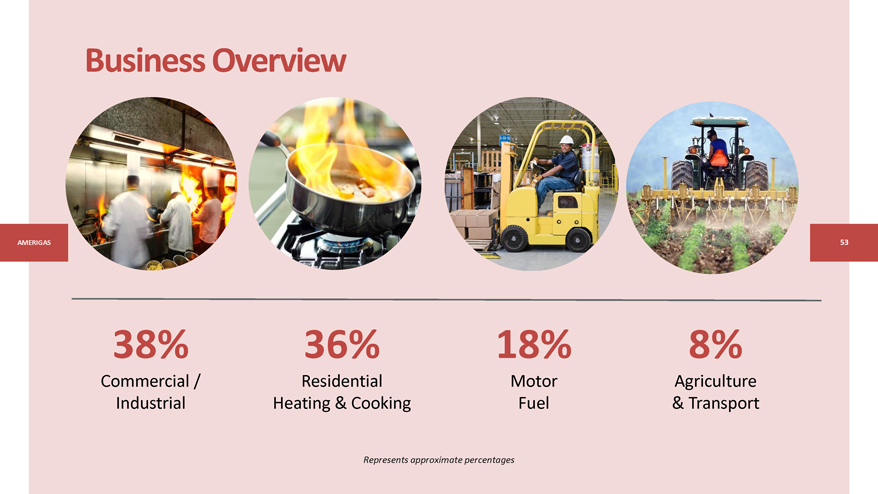
Business Overview AMERIGAS 38% 36% 18% 8% Commercial / Residential Motor Agriculture Industrial Heating & Cooking Fuel & Transport Represents approximate percentages
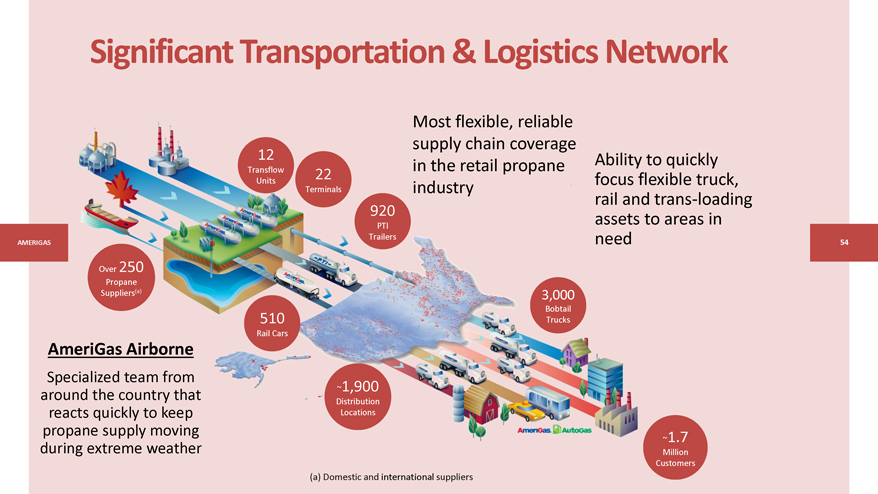
Significant Transportation & Logistics Network Most flexible, reliable supply chain coverage 12 quickly Transflow in the retail propane 22 Units xible truck, Terminals industry trans-loading 920 areas in PTI AMERIGAS Trailers Over 250 Propane Suppliers(a) 3,000 Bobtail 510 Trucks Rail Cars AmeriGas Airborne Specialized team from around the country that ~1,900 Distribution reacts quickly to keep Locations propane supply moving ~1. 7 during extreme weather Million Customers (a) Domestic and international suppliers
Technology to Drive Efficiency • Efficiency benefits are implemented across a broad platform • Improved distribution efficiency • Miles per stop improved 3% from FY17 and 7% from FY16 • Low fuel deliveries improved 7% from FY17 and 16% from FY16 • Route planning and visualization AMERIGAS • Enhanced performance monitoring • Technology-enabled marketing efforts • Ability to identify coaching and training opportunities Real-time performance AmeriMobile Routing indicators facilitate deeper Cost Savings 2016-2018 insight intoday-to-day $20MM management
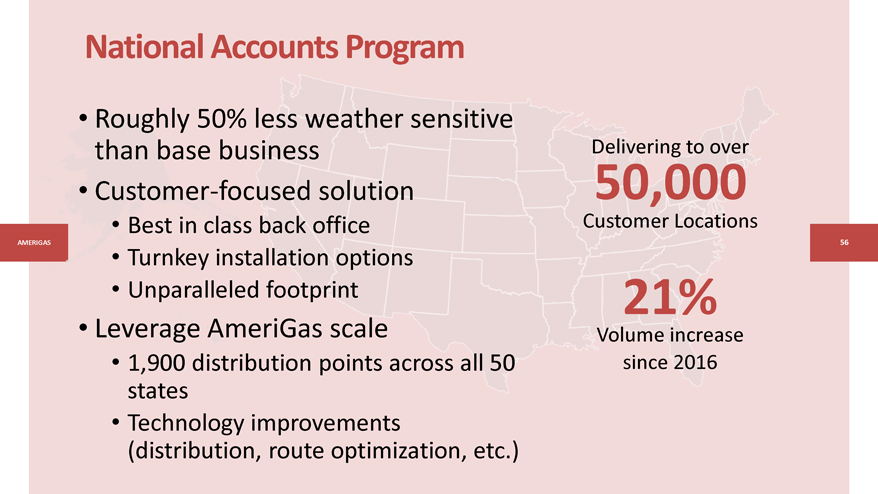
National Accounts Program • Roughly 50% less weather sensitive than base business Delivering to over • Customer-focused solution 50,000 • Best in class back office Customer Locations AME 56 • Turnkey installation options • Unparalleled footprint 21% • Leverage AmeriGas scale Volume increase • 1,900 distribution points across all 50 since 2016 states • Technology improvements (distribution, route optimization, etc.)
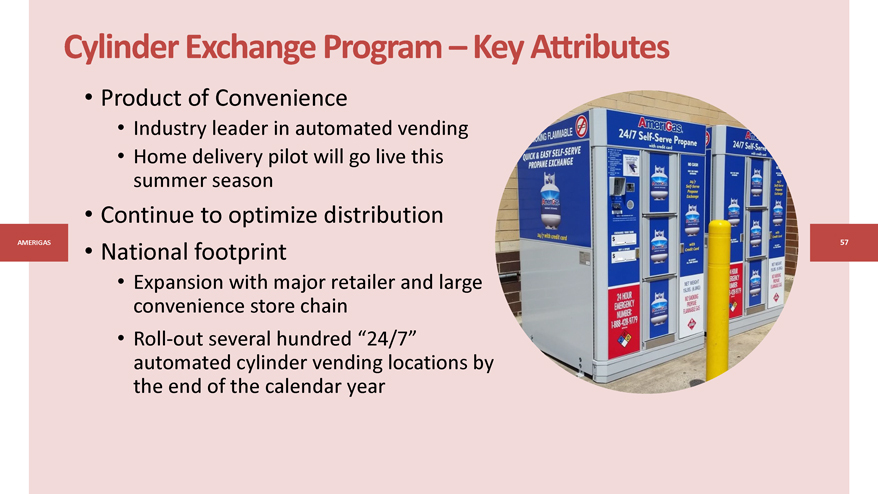
Cylinder Exchange Program – Key Attributes • Product of Convenience • Industry leader in automated vending • Home delivery pilot will go live this summer season • Continue to optimize distribution AMERIGAS • National footprint 57 • Expansion with major retailer and large convenience store chain •Roll-out several hundred “24/7” automated cylinder vending locations by the end of the calendar year
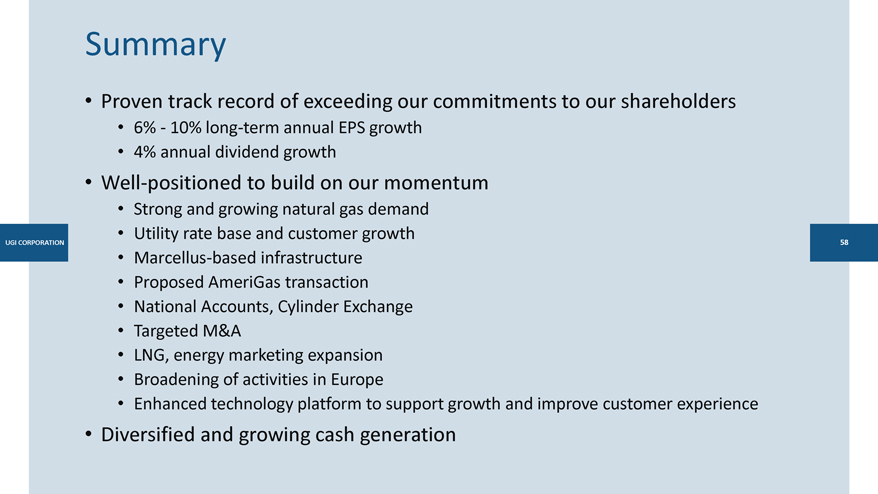
Summary • Proven track record of exceeding our commitments to our shareholders • 6%—10% long-term annual EPS growth • 4% annual dividend growth • Well-positioned to build on our momentum • Strong and growing natural gas demand UGI CORPORATION • Utility rate base and customer growth • Marcellus-based infrastructure • Proposed AmeriGas transaction • National Accounts, Cylinder Exchange • Targeted M&A • LNG, energy marketing expansion • Broadening of activities in Europe • Enhanced technology platform to support growth and improve customer experience • Diversified and growing cash generation
Appendix
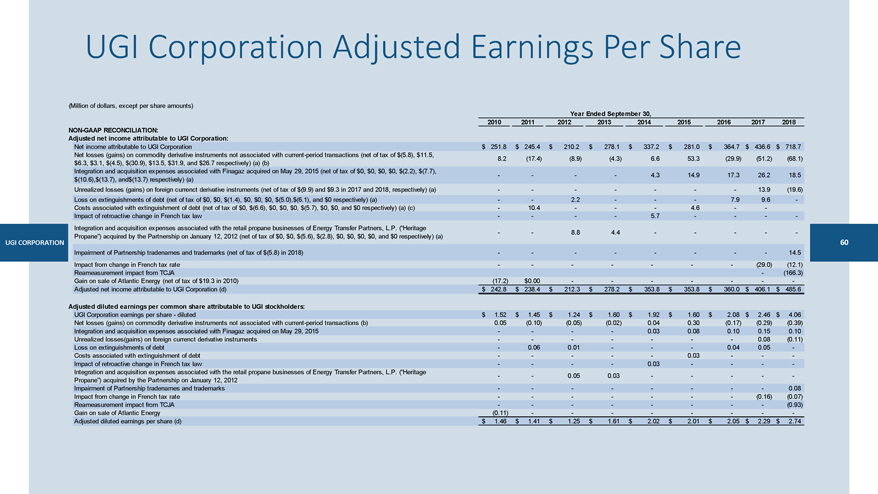
UGI Corporation Adjusted Earnings Per Share (Million of dollars, except per share amounts) Year Ended September 30, 2010 2011 2012 2013 2014 2015 2016 2017 2018NON-GAAP RECONCILIATION: Adjusted net income attributable to UGI Corporation: Net income attributable to UGI Corporation $ 251.8 $ 245.4 $ 210.2 $ 278.1 $ 337.2 $ 281.0 $ 364.7 $ 436.6 $ 718.7 Net losses (gains) on commodity derivative instruments not associated with current-period transactions (net of tax of $(5.8), $11.5, 8.2 (17.4) (8.9) (4.3) 6.6 53.3 (29.9) (51.2) (68.1) $6.3, $3.1, $(4.5), $(30.9), $13.5, $31.9, and $26.7 respectively) (a) (b) Integration and acquisition expenses associated with Finagaz acquired on May 29, 2015 (net of tax of $0, $0, $0, $0, $(2.2), $(7.7), 4.3 14.9 17.3 26.2 18.5 $(10.6),$(13.7), and$(13.7) respectively) (a) Unrealized losses (gains) on foreign currenct derivative instruments (net of tax of $(9.9) and $9.3 in 2017 and 2018, respectively) (a) 13.9 (19.6) Loss on extinguishments of debt (net of tax of $0, $0, $(1.4), $0, $0, $0, $(5.0),$(6.1), and $0 respectively) (a) - 2.2 - 7.9 9.6 -Costs associated with extinguishment of debt (net of tax of $0, $(6.6), $0, $0, $0, $(5.7), $0, $0, and $0 respectively) (a) (c) 0.4 - - - 4.6 - -Impact of retroactive change in French tax law - 5.7 - - - - Integration and acquisition expenses associated with the retail propane businesses of Energy Transfer Partners, L.P. (“Heritage — 8.8 4.4 - Propane”) acquired by the Partnership on January 12, 2012 (net of tax of $0, $0, $(5.6), $(2.8), $0, $0, $0, $0, and $0 respectively) (a) UGI CORPORATION Impairment of Partnership tradenames and trademarks (net of tax of $(5.8) in 2018 14.5 Impact from change in French tax (29.0) (12.1) Reameasurement impact from TCJA (166.3) Gain on sale of Atlantic Energy (net of tax of $19.3 in 2010) (17.2) $0.00 -Adjusted net income attributable to UGI Corporation (d) $ 242.8 $ 238.4 $ 212.3 $ 278.2 $ 353.8 $ 353.8 $ 360.0 $ 406.1 $ 485.6 Adjusted diluted earnings per common share attributable to UGI stockholders: UGI Corporation earnings per share—diluted $ 1.52 $ 1.45 $ 1.24 $ 1.60 $ 1.92 $ 1.60 $ 2.08 $ 2.46 $ 4.06 Net losses (gains) on commodity derivative instruments not associated with current-period transactions (b) 0.05 (0.10) (0.05) (0.02) 0.04 0.30 (0.17) (0.29) (0.39) Integration and acquisition expenses associated with Finagaz acquired on May 29, 2015 0.03 0.08 0.10 0.15 0.10 Unrealized losses(gains) on foreign currenct derivative instruments 0.08 (0.11) Loss on extinguishments of debt 0.06 0.01 - - - 0.04 0.05 -Costs associated with extinguishment of debt - - 0.03 -Impact of retroactive change in French tax law - 0.03 — Integration and acquisition expenses associated with the retail propane businesses of Energy Transfer Partners, L.P. (“Heritage — - 0.05 0.03 — Propane”) acquired by the Partnership on January 12, 2012 Impairment of Partnership tradenames and trademarks 0.08 Impact from change in French tax rate (0.16) (0.07) Reameasurement impact from TCJA (0.93) Gain on sale of Atlantic Energy (0.11) -Adjusted diluted earnings per share (d) $ 1.46 $ 1.41 $ 1.25 $ 1.61 $ 2.02 $ 2.01 $ 2.05 $ 2.29 $ 2.74
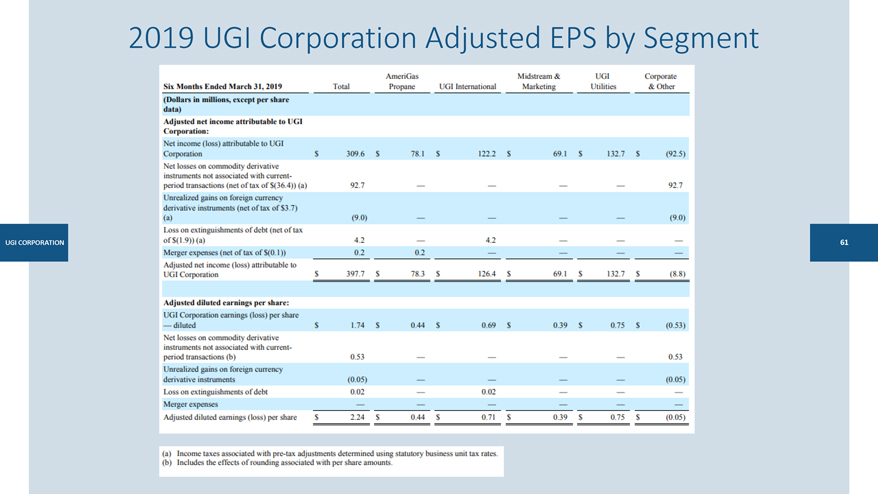
2019 UGI Corporation Adjusted EPS by Segment UGI CORPORATION America MidsLtem & UGI Corporate Six Months Ended March 31, 2019 Total Propane UGI International Midstream & Marketing UGI Utilities & Other (Dollars in millions, except per Share data) Adjusted net income attributable to UGJ Corporation: Net income (loss) attributable to UGI Corporation ) 309.6 ) 78.1 $ 122.2 $ 69.1 $ 132.7 $ (92.5) Net losses on commodity derivative instruments not associated with current-period transactions (net of tax of $(36.4)) (a) 92.7 92.7 Unrealized gains on foreign currency derivative instruments (net of tax of $3.7) (a) (9.0) (9.0) Loss on extinguishments of debt (net of tax of $(1.9)) (a) 4.2 4.2 Merger expenses (net of tax of $(0.1 )I 0.2 0.2 Adjusted net income (loss) attributable to UGI Corporation $ 397.7 78.3 $ 126.4 $ 69.1 132.7 $ (8.8} Adjusted diluted earning ll per share: UGI Corporation earnings (loss) per are adjusted $ 1.74 $ 0.44 $ 0.69 $ 0..39 :s 0.75 $ (0.53) Net losses on commodiry derivative instruments not associated with current-period transactions (b) 053 0.53 Unrealized gains on foreign currency deriva1ive instruments (0.05) (0.05} Loss on extinguishments of debt 0.02 0.02 Merger expenses Adjusted diluted earings (loss) per share $ 2.24 s 0. 44 s 0.71 $ 0..39 :s 0. 75 $ (0.05) (a) Income taxes associated withpre-lalt adjustments determined. using statutory business unit tax rates. (b) Includes the effects of rounding associated with per share amounts.
Transaction Value ($69.2MM x 0.500) X $55.39 = $1.92BN Equity Converted AmeriGas units times UGI’s current stock price + + Cash $7.63 X 69.2MM = $528MM Cash consideration for each common unit of AmeriGas + UGI CORPORATION + Debt $2.9BN X 0.74 = $2.15BN = Proportion of total debt related to 74% ownership not held by UGI Transaction Value affiliates = $1.92BN + $528MM + 2.15BN = $4.6BN Total Transaction Value
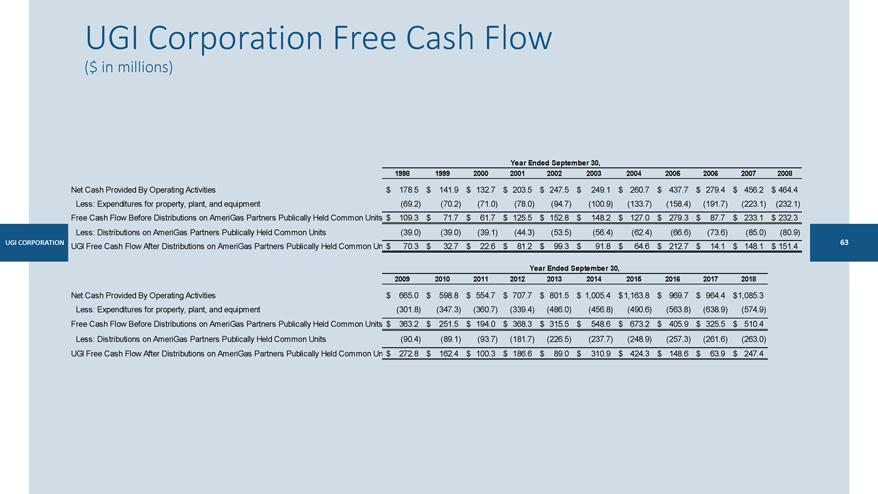
UGI Corporation Free Cash Flow ($ in millions) Year Ended September 30, 1998 1999 2000 2001 2002 2003 2004 2005 2006 2007 2008 Net Cash Provided By Operating Activities $ 178.5 $ 141.9 $ 132.7 $ 203.5 $ 247.5 $ 249.1 $ 260.7 $ 437.7 $ 279.4 $ 456.2 $ 464.4 Less: Expenditures for property, plant, and equipment (69.2) (70.2) (71.0) (78.0) (94.7) (100.9) (133.7) (158.4) (191.7) (223.1) (232.1) Free Cash Flow Before Distributions on AmeriGas Partners Publically Held Common Units $ 109.3 $ 71.7 $ 61.7 $ 125.5 $ 152.8 $ 148.2 $ 127.0 $ 279.3 $ 87.7 $ 233.1 $ 232.3 Less: Distributions on AmeriGas Partners Publically Held Common Units (39.0) (39.0) (39.1) (44.3) (53.5) (56.4) (62.4) (66.6) (73.6) (85.0) (80.9) UGI CORPORATION UGI Free Cash Flow After Distributions on AmeriGas Partners Publically Held Common Un $ 70.3 $ 32.7 $ 22.6 $ 81.2 $ 99.3 $ 91.8 $ 64.6 $ 212.7 $ 14.1 $ 148.1 $ 151.4 Year Ended September 30, 2009 2010 2011 2012 2013 2014 2015 2016 2017 2018 Net Cash Provided By Operating Activities $ 665.0 $ 598.8 $ 554.7 $ 707.7 $ 801.5 $ 1,005.4 $ 1,163.8 $ 969.7 $ 964.4 $ 1,085.3 Less: Expenditures for property, plant, and equipment (301.8) (347.3) (360.7) (339.4) (486.0) (456.8) (490.6) (563.8) (638.9) (574.9) Free Cash Flow Before Distributions on AmeriGas Partners Publically Held Common Units $ 363.2 $ 251.5 $ 194.0 $ 368.3 $ 315.5 $ 548.6 $ 673.2 $ 405.9 $ 325.5 $ 510.4 Less: Distributions on AmeriGas Partners Publically Held Common Units (90.4) (89.1) (93.7) (181.7) (226.5) (237.7) (248.9) (257.3) (261.6) (263.0) UGI Free Cash Flow After Distributions on AmeriGas Partners Publically Held Common Un $ 272.8 $ 162.4 $ 100.3 $ 186.6 $ 89.0 $ 310.9 $ 424.3 $ 148.6 $ 63.9 $ 247.4
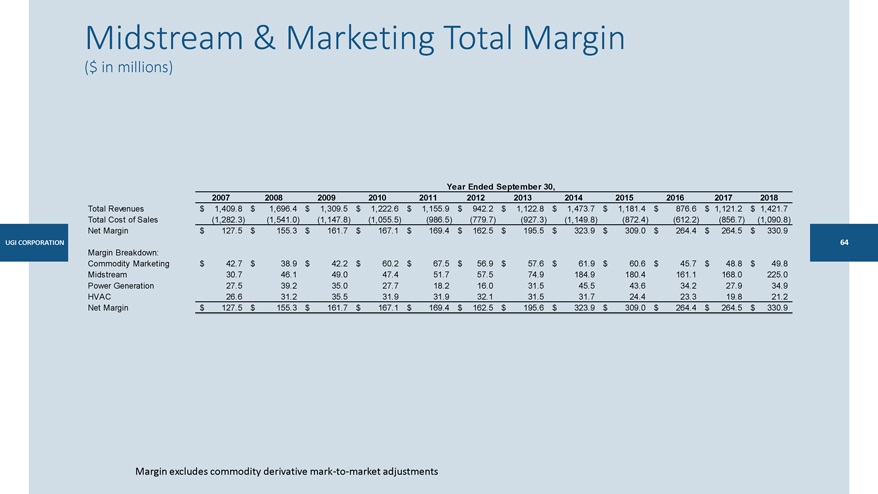
Midstream & Marketing Total Margin ($ in millions) Year Ended September 30, 2007 2008 2009 2010 2011 2012 2013 2014 2015 2016 2017 2018 Total Revenues $ 1,409.8 $ 1,696.4 $ 1,309.5 $ 1,222.6 $ 1,155.9 $ 942.2 $ 1,122.8 $ 1,473.7 $ 1,181.4 $ 876.6 $ 1,121.2 $ 1,421.7 Total Cost of Sales (1,282.3) (1,541.0) (1,147.8) (1,055.5) (986.5) (779.7) (927.3) (1,149.8) (872.4) (612.2) (856.7) (1,090.8) Net Margin $ 127.5 $ 155.3 $ 161.7 $ 167.1 $ 169.4 $ 162.5 $ 195.5 $ 323.9 $ 309.0 $ 264.4 $ 264.5 $ 330.9 UGI CORPORATION Margin Breakdown: Commodity Marketing $ 42.7 $ 38.9 $ 42.2 $ 60.2 $ 67.5 $ 56.9 $ 57.6 $ 61.9 $ 60.6 $ 45.7 $ 48.8 $ 49.8 Midstream 0.7 46.1 49.0 47.4 51.7 57.5 74.9 184.9 180.4 161.1 168.0 225.0 Power Generation 27.5 39.2 35.0 27.7 18.2 16.0 31.5 45.5 43.6 34.2 27.9 34.9 HVAC 26.6 31.2 35.5 31.9 31.9 32.1 31.5 31.7 24.4 23.3 19.8 21.2 Net Margin $ 127.5 $ 155.3 $ 161.7 $ 167.1 $ 169.4 $ 162.5 $ 195.6 $ 323.9 $ 309.0 $ 264.4 $ 264.5 $ 330.9 Margin excludes commodity derivativemark-to-market adjustments
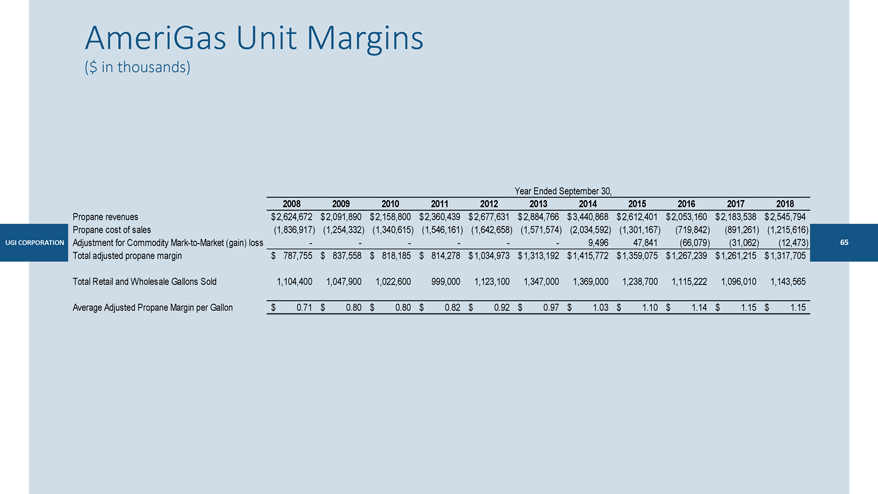
AmeriGas Unit Margins ($ in thousands) Year Ended September 30, 2008 2009 2010 2011 2012 2013 2014 2015 2016 2017 2018 Propane revenues $ 2,624,672 $ 2,091,890 $ 2,158,800 $ 2,360,439 $ 2,677,631 $ 2,884,766 $ 3,440,868 $ 2,612,401 $ 2,053,160 $ 2,183,538 $ 2,545,794 Propane cost of sales (1,836,917) (1,254,332) (1,340,615) (1,546,161) (1,642,658) (1,571,574) (2,034,592) (1,301,167) (719,842) (891,261) (1,215,616) UGI CORPORATION Adjustment for CommodityMark-to-Market (gain) loss 9,496 47,841 (66,079) (31,062) (12,473) Total adjusted propane margin $ 787,755 $ 837,558 $ 818,185 $ 814,278 $ 1,034,973 $ 1,313,192 $ 1,415,772 $ 1,359,075 $ 1,267,239 $ 1,261,215 $ 1,317,705 Total Retail and Wholesale Gallons Sold 1,104,400 1,047,900 1,022,600 999,000 1,123,100 1,347,000 1,369,000 1,238,700 1,115,222 1,096,010 1,143,565 Average Adjusted Propane Margin per Gallon $ 0.71 $ 0.80 $ 0.80 $ 0.82 $ 0.92 $ 0.97 $ 1.03 $ 1.10 $ 1.14 $ 1.15 $ 1.15
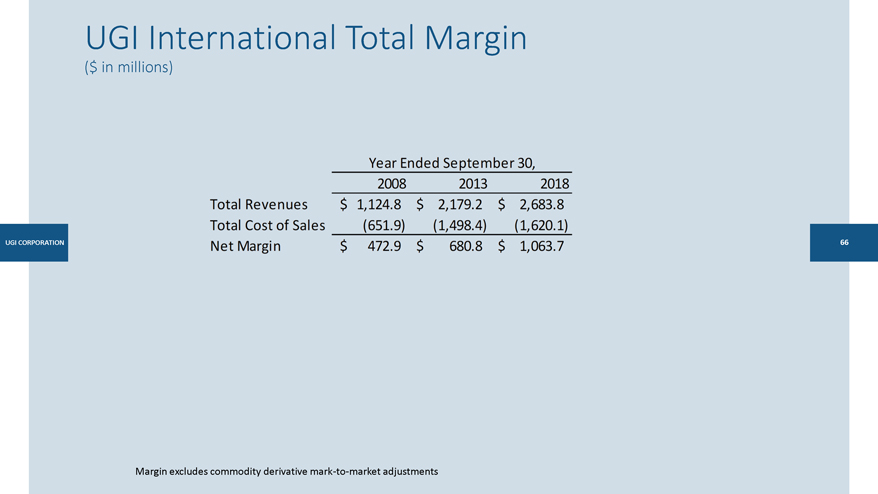
UGI International Total Margin ($ in millions) UGI CORPORATION Margin excludes commodity derivativemark-to-market adjustments Year Ended September 30, 2008 2013 2018 Total Revenues $ 1,124.8 $ 2,179.2 $ 2,683.8 Total Cost of Sales (651.9) (1,498.4) ( 1,620.1} Net Margin $ 472.9 $ 680.8 $ 1,063.7
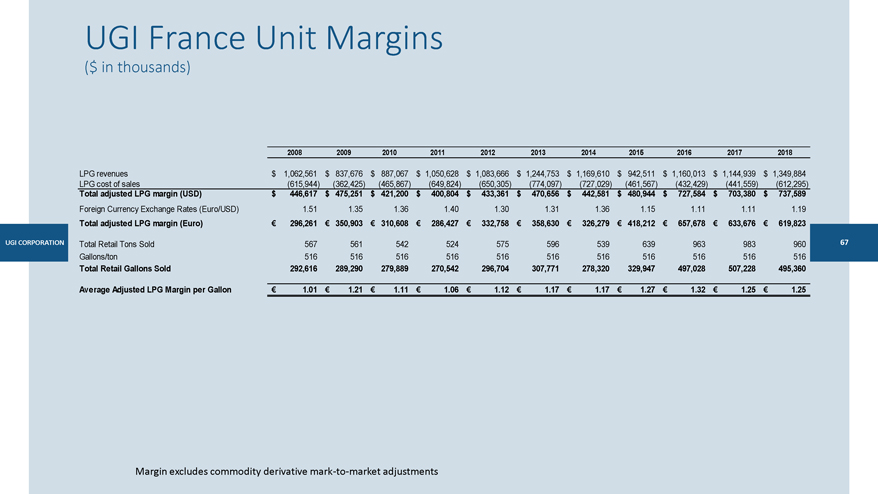
UGI France Unit Margins ($ in thousands) 2008 2009 2010 2011 2012 2013 2014 2015 2016 2017 2018 LPG revenues $ 1,062,561 $ 837,676 $ 887,067 $ 1,050,628 $ 1,083,666 $ 1,244,753 $ 1,169,610 $ 942,511 $ 1,160,013 $ 1,144,939 $ 1,349,884 LPG cost of sales (615,944) (362,425) (465,867) (649,824) (650,305) (774,097) (727,029) (461,567) (432,429) (441,559) (612,295) Total adjusted LPG margin (USD) $ 446,617 $ 475,251 $ 421,200 $ 400,804 $ 433,361 $ 470,656 $ 442,581 $ 480,944 $ 727,584 $ 703,380 $ 737,589 Foreign Currency Exchange Rates (Euro/USD) 1.51 1.35 1.36 1.40 1.30 1.31 1.36 1.15 1.11 1.11 1.19 Total adjusted LPG margin (Euro) € 296,261 € 350,903 € 310,608 € 286,427 € 332,758 € 358,630 € 326,279 € 418,212 € 657,678 € 633,676 € 619,823 UGI CORPORATION Total Retail Tons Sold 567 561 542 524 575 596 539 639 963 983 960 Gallons/ton 516 516 516 516 516 516 516 516 516 516 516 Total Retail Gallons Sold 292,616 289,290 279,889 270,542 296,704 307,771 278,320 329,947 497,028 507,228 495,360 Average Adjusted LPG Margin per Gallon € 1.01 € 1.21 € 1.11 € 1.06 € 1.12 € 1.17 € 1.17 € 1. 27 € 1.32 € 1.25 € 1.25 Margin excludes commodity derivativemark-to-market adjustments
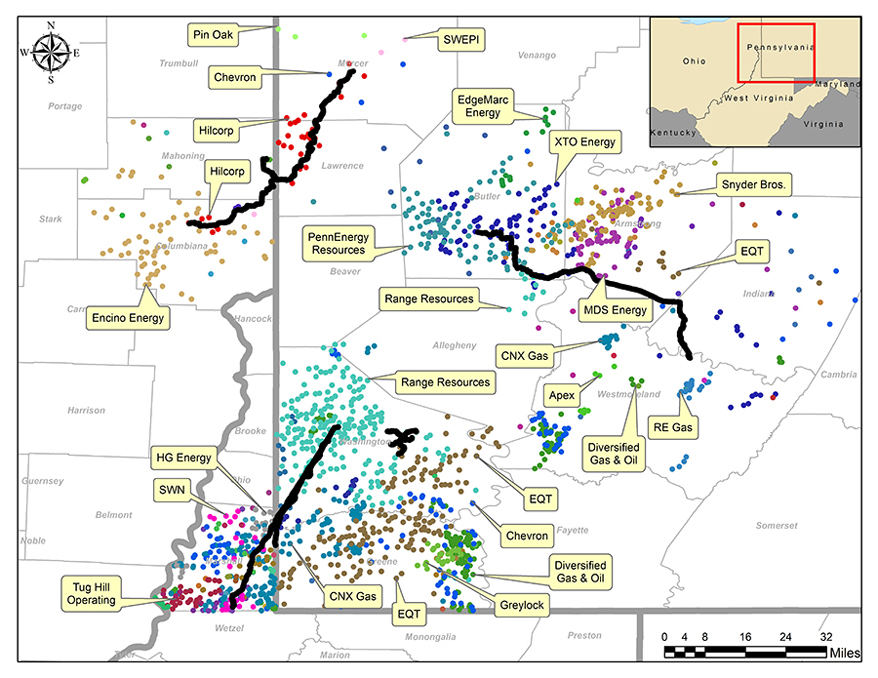
N W*. E • 4swEP1 ] • Venango s rtage • .m... m 6 c , Lawrence PennEnergy Resources ,:::11 m s: N 0 <.0 0 m t1h Harrison t1ti Beaver lndianffl Allegheny Belmont Somerset Tug Hill . Operating L.::1 N ‘Wetzel Preston0--4-8 16 24 32