Exhibit 99.4 UGI Energy Services Lenders’ Presentation $700mm Senior Secured Term Loan B July 2019Exhibit 99.4 UGI Energy Services Lenders’ Presentation $700mm Senior Secured Term Loan B July 2019
DISCLAIMER About this Presentation This presentation contains certain forward-looking statements that management believes to be reasonable as of today’s date only. Forward-looking statements should not be read as a guarantee of future performance or results, and will not necessarily be accurate indications of the times at, or by which, such performance or results will be achieved. Forward-looking information is based on information available at the time and/or management’s good faith belief with respect to future events, and is subject to risks and uncertainties, some or all of which are not predictable or within the control of UGI Energy Services, LLC (“UGIES” or the Company ), that could cause actual performance or results to differ materially from those expressed in the statements. All estimates, projections, opinions, and statements speak only as of the date of the document and may be subject to change without notice. Changes to assumptions may have a material impact on any estimates, opinions or statements included herein. The Company assumes no obligation to update forward-looking statements to reflect actual results, changes in assumptions or changes in other factors affecting forward looking information. If the Company does update one or more forward-looking statements, no inference should be drawn that the Company will make additional updates with respect thereto or with respect to other forward-looking statements. The Company undertakes no obligation to release revisions to its forward- looking statements to reflect events or circumstances occurring after today. Actual results may differ significantly because of risks and uncertainties that are difficult to predict and many of which are beyond management’s control. You should read UGI Corporation’s Annual Report on Form 10-K for a more extensive list of factors that could affect the Company’s results. Among them are adverse weather conditions, cost volatility and availability of all energy products, the impact of pending and future legal proceedings, continued analysis of recent tax legislation, liability for uninsured claims and for claims in excess of insurance coverage, domestic and international political, regulatory and economic conditions, changes in Marcellus Shale gas production, the availability, timing and success of our acquisitions, commercial initiatives and investments to grow our business, our ability to successfully integrate acquired businesses and achieve anticipated synergies, including with respect to the Company’s proposed acquisition of the Columbia Midstream Group, LLC, the interruption, disruption, failure, malfunction or breach of our information technology systems, including due to cyber- attack. This presentation does not constitute an offer to sell any securities of UGIES or its respective affiliates or a solicitation of an offer to buy any securities of UGIES or its respective affiliates. Use of Non-GAAP Measures In this presentation, Management uses certain non-GAAP financial measures, including UGI Corporation adjusted earnings per share, UGI Corporation Free Cash Flow, UGI Energy Services Margin and UGI Energy Services earnings before interest, income taxes, depreciation and amortization (“EBITDA”). These financial measures are not in accordance with, or an alternative to, GAAP and should be considered in addition to, and not as a substitute for, the comparable GAAP measures. Management believes the presentation of these non-GAAP financial measures provide useful information to investors to more effectively evaluate period-over-period earnings, profitability and cash flow generation of the Company’s businesses. Reconciliations of these non-GAAP financial measures to the most directly comparable financial measure calculated and presented in accordance with GAAP are presented in the Appendix of this presentation. 2DISCLAIMER About this Presentation This presentation contains certain forward-looking statements that management believes to be reasonable as of today’s date only. Forward-looking statements should not be read as a guarantee of future performance or results, and will not necessarily be accurate indications of the times at, or by which, such performance or results will be achieved. Forward-looking information is based on information available at the time and/or management’s good faith belief with respect to future events, and is subject to risks and uncertainties, some or all of which are not predictable or within the control of UGI Energy Services, LLC (“UGIES” or the Company ), that could cause actual performance or results to differ materially from those expressed in the statements. All estimates, projections, opinions, and statements speak only as of the date of the document and may be subject to change without notice. Changes to assumptions may have a material impact on any estimates, opinions or statements included herein. The Company assumes no obligation to update forward-looking statements to reflect actual results, changes in assumptions or changes in other factors affecting forward looking information. If the Company does update one or more forward-looking statements, no inference should be drawn that the Company will make additional updates with respect thereto or with respect to other forward-looking statements. The Company undertakes no obligation to release revisions to its forward- looking statements to reflect events or circumstances occurring after today. Actual results may differ significantly because of risks and uncertainties that are difficult to predict and many of which are beyond management’s control. You should read UGI Corporation’s Annual Report on Form 10-K for a more extensive list of factors that could affect the Company’s results. Among them are adverse weather conditions, cost volatility and availability of all energy products, the impact of pending and future legal proceedings, continued analysis of recent tax legislation, liability for uninsured claims and for claims in excess of insurance coverage, domestic and international political, regulatory and economic conditions, changes in Marcellus Shale gas production, the availability, timing and success of our acquisitions, commercial initiatives and investments to grow our business, our ability to successfully integrate acquired businesses and achieve anticipated synergies, including with respect to the Company’s proposed acquisition of the Columbia Midstream Group, LLC, the interruption, disruption, failure, malfunction or breach of our information technology systems, including due to cyber- attack. This presentation does not constitute an offer to sell any securities of UGIES or its respective affiliates or a solicitation of an offer to buy any securities of UGIES or its respective affiliates. Use of Non-GAAP Measures In this presentation, Management uses certain non-GAAP financial measures, including UGI Corporation adjusted earnings per share, UGI Corporation Free Cash Flow, UGI Energy Services Margin and UGI Energy Services earnings before interest, income taxes, depreciation and amortization (“EBITDA”). These financial measures are not in accordance with, or an alternative to, GAAP and should be considered in addition to, and not as a substitute for, the comparable GAAP measures. Management believes the presentation of these non-GAAP financial measures provide useful information to investors to more effectively evaluate period-over-period earnings, profitability and cash flow generation of the Company’s businesses. Reconciliations of these non-GAAP financial measures to the most directly comparable financial measure calculated and presented in accordance with GAAP are presented in the Appendix of this presentation. 2
Table of Contents 1. Transaction Overview 2. Company Overview 3. Key Credit Highlights 4. Syndication Details Appendix 3Table of Contents 1. Transaction Overview 2. Company Overview 3. Key Credit Highlights 4. Syndication Details Appendix 3
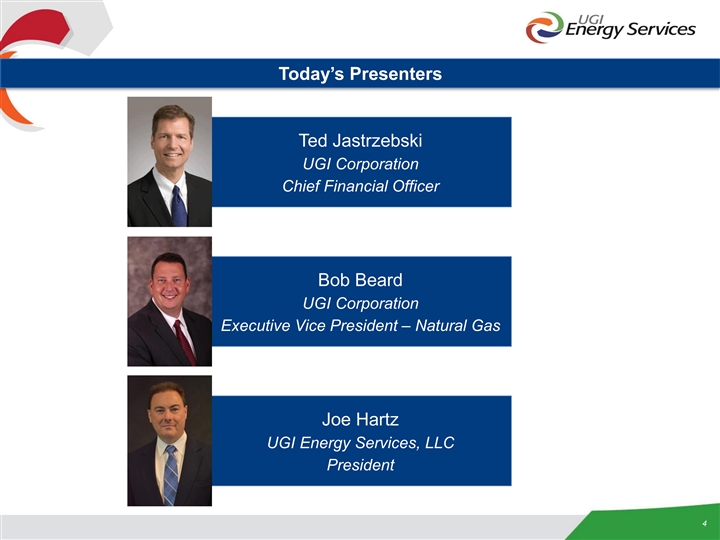
Today’s Presenters Ted Jastrzebski UGI Corporation Chief Financial Officer Bob Beard UGI Corporation Executive Vice President – Natural Gas Joe Hartz UGI Energy Services, LLC President 4Today’s Presenters Ted Jastrzebski UGI Corporation Chief Financial Officer Bob Beard UGI Corporation Executive Vice President – Natural Gas Joe Hartz UGI Energy Services, LLC President 4
1. Transaction Overview 51. Transaction Overview 5
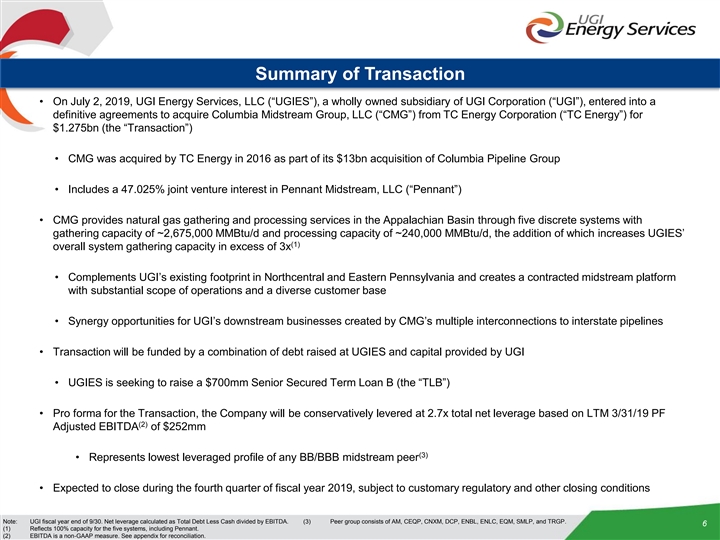
Summary of Transaction • On July 2, 2019, UGI Energy Services, LLC (“UGIES”), a wholly owned subsidiary of UGI Corporation (“UGI”), entered into a definitive agreements to acquire Columbia Midstream Group, LLC (“CMG”) from TC Energy Corporation (“TC Energy”) for $1.275bn (the “Transaction”) • CMG was acquired by TC Energy in 2016 as part of its $13bn acquisition of Columbia Pipeline Group • Includes a 47.025% joint venture interest in Pennant Midstream, LLC (“Pennant”) • CMG provides natural gas gathering and processing services in the Appalachian Basin through five discrete systems with gathering capacity of ~2,675,000 MMBtu/d and processing capacity of ~240,000 MMBtu/d, the addition of which increases UGIES’ (1) overall system gathering capacity in excess of 3x • Complements UGI’s existing footprint in Northcentral and Eastern Pennsylvania and creates a contracted midstream platform with substantial scope of operations and a diverse customer base • Synergy opportunities for UGI’s downstream businesses created by CMG’s multiple interconnections to interstate pipelines • Transaction will be funded by a combination of debt raised at UGIES and capital provided by UGI • UGIES is seeking to raise a $700mm Senior Secured Term Loan B (the “TLB”) • Pro forma for the Transaction, the Company will be conservatively levered at 2.7x total net leverage based on LTM 3/31/19 PF (2) Adjusted EBITDA of $252mm (3) • Represents lowest leveraged profile of any BB/BBB midstream peer • Expected to close during the fourth quarter of fiscal year 2019, subject to customary regulatory and other closing conditions Note: UGI fiscal year end of 9/30. Net leverage calculated as Total Debt Less Cash divided by EBITDA. (3) Peer group consists of AM, CEQP, CNXM, DCP, ENBL, ENLC, EQM, SMLP, and TRGP. 6 (1) Reflects 100% capacity for the five systems, including Pennant. (2) EBITDA is a non-GAAP measure. See appendix for reconciliation.Summary of Transaction • On July 2, 2019, UGI Energy Services, LLC (“UGIES”), a wholly owned subsidiary of UGI Corporation (“UGI”), entered into a definitive agreements to acquire Columbia Midstream Group, LLC (“CMG”) from TC Energy Corporation (“TC Energy”) for $1.275bn (the “Transaction”) • CMG was acquired by TC Energy in 2016 as part of its $13bn acquisition of Columbia Pipeline Group • Includes a 47.025% joint venture interest in Pennant Midstream, LLC (“Pennant”) • CMG provides natural gas gathering and processing services in the Appalachian Basin through five discrete systems with gathering capacity of ~2,675,000 MMBtu/d and processing capacity of ~240,000 MMBtu/d, the addition of which increases UGIES’ (1) overall system gathering capacity in excess of 3x • Complements UGI’s existing footprint in Northcentral and Eastern Pennsylvania and creates a contracted midstream platform with substantial scope of operations and a diverse customer base • Synergy opportunities for UGI’s downstream businesses created by CMG’s multiple interconnections to interstate pipelines • Transaction will be funded by a combination of debt raised at UGIES and capital provided by UGI • UGIES is seeking to raise a $700mm Senior Secured Term Loan B (the “TLB”) • Pro forma for the Transaction, the Company will be conservatively levered at 2.7x total net leverage based on LTM 3/31/19 PF (2) Adjusted EBITDA of $252mm (3) • Represents lowest leveraged profile of any BB/BBB midstream peer • Expected to close during the fourth quarter of fiscal year 2019, subject to customary regulatory and other closing conditions Note: UGI fiscal year end of 9/30. Net leverage calculated as Total Debt Less Cash divided by EBITDA. (3) Peer group consists of AM, CEQP, CNXM, DCP, ENBL, ENLC, EQM, SMLP, and TRGP. 6 (1) Reflects 100% capacity for the five systems, including Pennant. (2) EBITDA is a non-GAAP measure. See appendix for reconciliation.
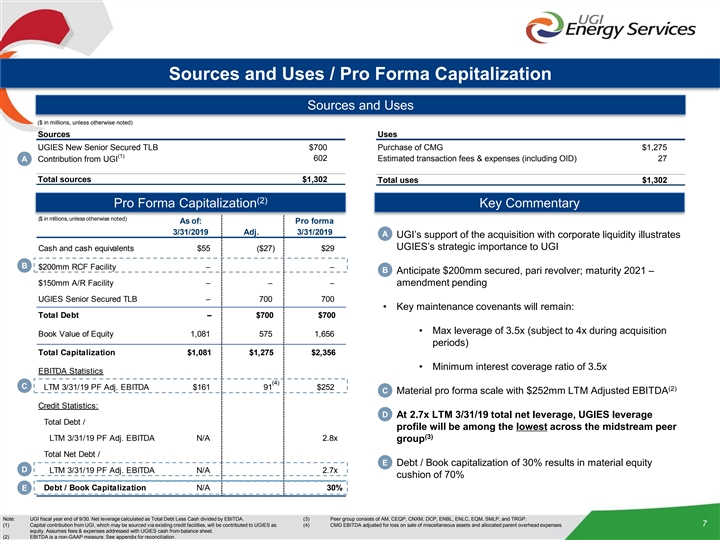
Sources and Uses / Pro Forma Capitalization Sources and Uses ($ in millions, unless otherwise noted) ($ in millions, unless otherwise noted) Sources Uses UGIES New Senior Secured TLB $700 Purchase of CMG $1,275 (1) 602 Estimated transaction fees & expenses (including OID) 27 A Contribution from UGI Total sources $1,302 Total uses $1,302 (2) Pro Forma Capitalization Key Commentary ($ in millions, unless otherwise noted) As of: Pro forma 3/31/2019 Adj. 3/31/2019 A • UGI’s support of the acquisition with corporate liquidity illustrates UGIES’s strategic importance to UGI Cash and cash equivalents $55 ($27) $29 B $200mm RCF Facility – – B • Anticipate $200mm secured, pari revolver; maturity 2021 – $150mm A/R Facility – – – amendment pending UGIES Senior Secured TLB – 700 700 • Key maintenance covenants will remain: Total Debt – $700 $700 • Max leverage of 3.5x (subject to 4x during acquisition Book Value of Equity 1,081 575 1,656 periods) Total Capitalization $1,081 $1,275 $2,356 • Minimum interest coverage ratio of 3.5x EBITDA Statistics (4) C LTM 3/31/19 PF Adj. EBITDA $161 91 $252 (2) C • Material pro forma scale with $252mm LTM Adjusted EBITDA Credit Statistics: D • At 2.7x LTM 3/31/19 total net leverage, UGIES leverage Total Debt / profile will be among the lowest across the midstream peer (3) LTM 3/31/19 PF Adj. EBITDA N/A 2.8x group Total Net Debt / E • Debt / Book capitalization of 30% results in material equity D LTM 3/31/19 PF Adj. EBITDA N/A 2.7x cushion of 70% E Debt / Book Capitalization N/A 30% Note: UGI fiscal year end of 9/30. Net leverage calculated as Total Debt Less Cash divided by EBITDA. (3) Peer group consists of AM, CEQP, CNXM, DCP, ENBL, ENLC, EQM, SMLP, and TRGP. 7 (1) Capital contribution from UGI, which may be sourced via existing credit facilities, will be contributed to UGIES as (4) CMG EBITDA adjusted for loss on sale of miscellaneous assets and allocated parent overhead expenses. equity. Assumes fees & expenses addressed with UGIES cash from balance sheet. (2) EBITDA is a non-GAAP measure. See appendix for reconciliation. Sources and Uses / Pro Forma Capitalization Sources and Uses ($ in millions, unless otherwise noted) ($ in millions, unless otherwise noted) Sources Uses UGIES New Senior Secured TLB $700 Purchase of CMG $1,275 (1) 602 Estimated transaction fees & expenses (including OID) 27 A Contribution from UGI Total sources $1,302 Total uses $1,302 (2) Pro Forma Capitalization Key Commentary ($ in millions, unless otherwise noted) As of: Pro forma 3/31/2019 Adj. 3/31/2019 A • UGI’s support of the acquisition with corporate liquidity illustrates UGIES’s strategic importance to UGI Cash and cash equivalents $55 ($27) $29 B $200mm RCF Facility – – B • Anticipate $200mm secured, pari revolver; maturity 2021 – $150mm A/R Facility – – – amendment pending UGIES Senior Secured TLB – 700 700 • Key maintenance covenants will remain: Total Debt – $700 $700 • Max leverage of 3.5x (subject to 4x during acquisition Book Value of Equity 1,081 575 1,656 periods) Total Capitalization $1,081 $1,275 $2,356 • Minimum interest coverage ratio of 3.5x EBITDA Statistics (4) C LTM 3/31/19 PF Adj. EBITDA $161 91 $252 (2) C • Material pro forma scale with $252mm LTM Adjusted EBITDA Credit Statistics: D • At 2.7x LTM 3/31/19 total net leverage, UGIES leverage Total Debt / profile will be among the lowest across the midstream peer (3) LTM 3/31/19 PF Adj. EBITDA N/A 2.8x group Total Net Debt / E • Debt / Book capitalization of 30% results in material equity D LTM 3/31/19 PF Adj. EBITDA N/A 2.7x cushion of 70% E Debt / Book Capitalization N/A 30% Note: UGI fiscal year end of 9/30. Net leverage calculated as Total Debt Less Cash divided by EBITDA. (3) Peer group consists of AM, CEQP, CNXM, DCP, ENBL, ENLC, EQM, SMLP, and TRGP. 7 (1) Capital contribution from UGI, which may be sourced via existing credit facilities, will be contributed to UGIES as (4) CMG EBITDA adjusted for loss on sale of miscellaneous assets and allocated parent overhead expenses. equity. Assumes fees & expenses addressed with UGIES cash from balance sheet. (2) EBITDA is a non-GAAP measure. See appendix for reconciliation.
Key Investment Highlights Critical midstream infrastructure serving high-demand markets Strategically located in the core regions of the Marcellus & Utica Stable cash flows derived from long-term contracts with substantial take-or-pay component Diverse customer base of high quality, well-capitalized producers and end users of scale Low opening leverage when in comparison to industry peers Strategic relationship with UGI family of companies Experienced management team with proven track record 8Key Investment Highlights Critical midstream infrastructure serving high-demand markets Strategically located in the core regions of the Marcellus & Utica Stable cash flows derived from long-term contracts with substantial take-or-pay component Diverse customer base of high quality, well-capitalized producers and end users of scale Low opening leverage when in comparison to industry peers Strategic relationship with UGI family of companies Experienced management team with proven track record 8
2. Company Overview 92. Company Overview 9
UGI Corporation 10UGI Corporation 10
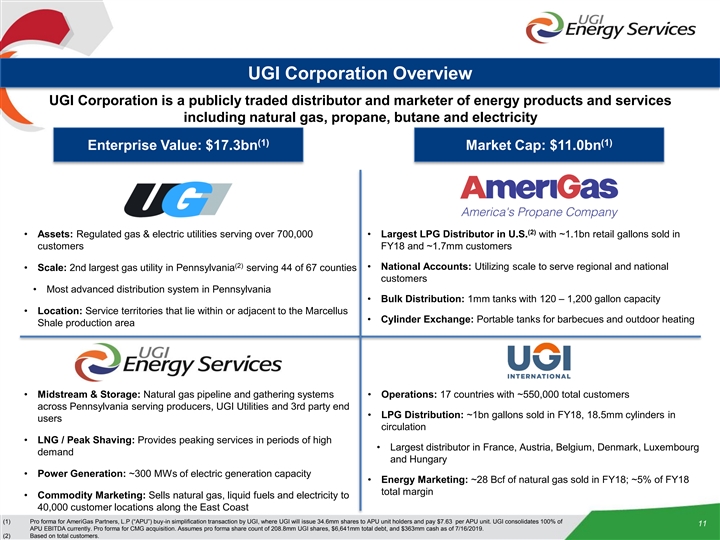
UGI Corporation Overview UGI Corporation is a publicly traded distributor and marketer of energy products and services including natural gas, propane, butane and electricity (1) (1) Enterprise Value: $17.3bn Market Cap: $11.0bn (2) • Assets: Regulated gas & electric utilities serving over 700,000 • Largest LPG Distributor in U.S. with ~1.1bn retail gallons sold in customers FY18 and ~1.7mm customers (2) • National Accounts: Utilizing scale to serve regional and national • Scale: 2nd largest gas utility in Pennsylvania serving 44 of 67 counties customers • Most advanced distribution system in Pennsylvania • Bulk Distribution: 1mm tanks with 120 – 1,200 gallon capacity • Location: Service territories that lie within or adjacent to the Marcellus • Cylinder Exchange: Portable tanks for barbecues and outdoor heating Shale production area • Midstream & Storage: Natural gas pipeline and gathering systems • Operations: 17 countries with ~550,000 total customers across Pennsylvania serving producers, UGI Utilities and 3rd party end • LPG Distribution: ~1bn gallons sold in FY18, 18.5mm cylinders in users circulation • LNG / Peak Shaving: Provides peaking services in periods of high • Largest distributor in France, Austria, Belgium, Denmark, Luxembourg demand and Hungary • Power Generation: ~300 MWs of electric generation capacity • Energy Marketing: ~28 Bcf of natural gas sold in FY18; ~5% of FY18 total margin • Commodity Marketing: Sells natural gas, liquid fuels and electricity to 40,000 customer locations along the East Coast (1) Pro forma for AmeriGas Partners, L.P (“APU”) buy-in simplification transaction by UGI, where UGI will issue 34.6mm shares to APU unit holders and pay $7.63 per APU unit. UGI consolidates 100% of 11 APU EBITDA currently. Pro forma for CMG acquisition. Assumes pro forma share count of 208.8mm UGI shares, $6,641mm total debt, and $363mm cash as of 7/16/2019. (2) Based on total customers.UGI Corporation Overview UGI Corporation is a publicly traded distributor and marketer of energy products and services including natural gas, propane, butane and electricity (1) (1) Enterprise Value: $17.3bn Market Cap: $11.0bn (2) • Assets: Regulated gas & electric utilities serving over 700,000 • Largest LPG Distributor in U.S. with ~1.1bn retail gallons sold in customers FY18 and ~1.7mm customers (2) • National Accounts: Utilizing scale to serve regional and national • Scale: 2nd largest gas utility in Pennsylvania serving 44 of 67 counties customers • Most advanced distribution system in Pennsylvania • Bulk Distribution: 1mm tanks with 120 – 1,200 gallon capacity • Location: Service territories that lie within or adjacent to the Marcellus • Cylinder Exchange: Portable tanks for barbecues and outdoor heating Shale production area • Midstream & Storage: Natural gas pipeline and gathering systems • Operations: 17 countries with ~550,000 total customers across Pennsylvania serving producers, UGI Utilities and 3rd party end • LPG Distribution: ~1bn gallons sold in FY18, 18.5mm cylinders in users circulation • LNG / Peak Shaving: Provides peaking services in periods of high • Largest distributor in France, Austria, Belgium, Denmark, Luxembourg demand and Hungary • Power Generation: ~300 MWs of electric generation capacity • Energy Marketing: ~28 Bcf of natural gas sold in FY18; ~5% of FY18 total margin • Commodity Marketing: Sells natural gas, liquid fuels and electricity to 40,000 customer locations along the East Coast (1) Pro forma for AmeriGas Partners, L.P (“APU”) buy-in simplification transaction by UGI, where UGI will issue 34.6mm shares to APU unit holders and pay $7.63 per APU unit. UGI consolidates 100% of 11 APU EBITDA currently. Pro forma for CMG acquisition. Assumes pro forma share count of 208.8mm UGI shares, $6,641mm total debt, and $363mm cash as of 7/16/2019. (2) Based on total customers.

Business Segment Snapshot (1) (1) New $550mm Term Loan A UGI Corporation (1) Enterprise Value: $17.3bn New $300mm Revolving Credit Facility Market Cap: $11.0bn LTM PF Revenue: $7.6bn UGI International AmeriGas UGI Utilities UGI Energy Services Ratings: Ba1 / BB+ Ratings: Ba2 / BB Ratings: A2 / A- (Moody’s / Fitch) (Moody’s / Fitch) (Moody’s / Fitch) CMG Acquiring Entity & TLB Borrower (2) $200mm Revolving Credit Facility Revenue Contribution: 33% Revenue Contribution: 37% Revenue Contribution: 13% $150mm A/R Facility New $700mm Term Loan B Revenue Contribution: 18% Areas of operation: Gas Utility UGI Utilities (gas, ~642,000 customers) Electric Utility LPG Distribution & LPG Distribution UGI Electric (electric, ~62,000 customers) Energy Marketing Source: Company filings and FactSet as of 7/16/2019. (2) Amendment pending. 12 Note: Debt balances as of Q2 2019 (quarter ending 3/31/2019). Fiscal year ending 9/30/2019. LTM as of 3/31/19. (1) Pro forma for AmeriGas Partners, L.P (“APU”) buy-in simplification transaction by UGI, where UGI will issue 34.6mm shares to APU unit holders and pay $7.63 per APU unit. UGI consolidates 100% of APU EBITDA currently. Pro forma for CMG acquisition. Assumes pro forma share count of 208.8mm UGI shares, $6,641mm total debt, and $363mm cash as of 7/16/2019.Business Segment Snapshot (1) (1) New $550mm Term Loan A UGI Corporation (1) Enterprise Value: $17.3bn New $300mm Revolving Credit Facility Market Cap: $11.0bn LTM PF Revenue: $7.6bn UGI International AmeriGas UGI Utilities UGI Energy Services Ratings: Ba1 / BB+ Ratings: Ba2 / BB Ratings: A2 / A- (Moody’s / Fitch) (Moody’s / Fitch) (Moody’s / Fitch) CMG Acquiring Entity & TLB Borrower (2) $200mm Revolving Credit Facility Revenue Contribution: 33% Revenue Contribution: 37% Revenue Contribution: 13% $150mm A/R Facility New $700mm Term Loan B Revenue Contribution: 18% Areas of operation: Gas Utility UGI Utilities (gas, ~642,000 customers) Electric Utility LPG Distribution & LPG Distribution UGI Electric (electric, ~62,000 customers) Energy Marketing Source: Company filings and FactSet as of 7/16/2019. (2) Amendment pending. 12 Note: Debt balances as of Q2 2019 (quarter ending 3/31/2019). Fiscal year ending 9/30/2019. LTM as of 3/31/19. (1) Pro forma for AmeriGas Partners, L.P (“APU”) buy-in simplification transaction by UGI, where UGI will issue 34.6mm shares to APU unit holders and pay $7.63 per APU unit. UGI consolidates 100% of APU EBITDA currently. Pro forma for CMG acquisition. Assumes pro forma share count of 208.8mm UGI shares, $6,641mm total debt, and $363mm cash as of 7/16/2019.
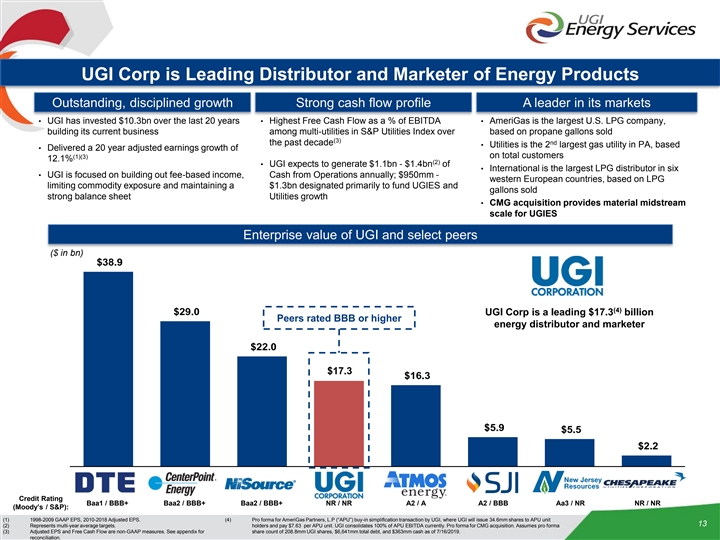
UGI Corp is Leading Distributor and Marketer of Energy Products Outstanding, disciplined growth Strong cash flow profile A leader in its markets • UGI has invested $10.3bn over the last 20 years • Highest Free Cash Flow as a % of EBITDA • AmeriGas is the largest U.S. LPG company, building its current business among multi-utilities in S&P Utilities Index over based on propane gallons sold (3) the past decade nd • Utilities is the 2 largest gas utility in PA, based • Delivered a 20 year adjusted earnings growth of on total customers (1)(3) 12.1% (2) • UGI expects to generate $1.1bn - $1.4bn of • International is the largest LPG distributor in six • UGI is focused on building out fee-based income, Cash from Operations annually; $950mm - western European countries, based on LPG limiting commodity exposure and maintaining a $1.3bn designated primarily to fund UGIES and gallons sold strong balance sheet Utilities growth • CMG acquisition provides material midstream scale for UGIES Enterprise value of UGI and select peers ($ in bn) $38.9 (4) $29.0 UGI Corp is a leading $17.3 billion Peers rated BBB or higher energy distributor and marketer $22.0 $17.3 $17.1 $16.3 $5.9 $5.5 $2.2 Credit Rating Baa1 / BBB+ Baa2 / BBB+ Baa2 / BBB+ NR / NR A2 / A A2 / BBB Aa3 / NR NR / NR (Moody’s / S&P): (1) 1998-2009 GAAP EPS, 2010-2018 Adjusted EPS. (4) Pro forma for AmeriGas Partners, L.P (“APU”) buy-in simplification transaction by UGI, where UGI will issue 34.6mm shares to APU unit 13 (2) Represents multi-year average targets. holders and pay $7.63 per APU unit. UGI consolidates 100% of APU EBITDA currently. Pro forma for CMG acquisition. Assumes pro forma (3) Adjusted EPS and Free Cash Flow are non-GAAP measures. See appendix for share count of 208.8mm UGI shares, $6,641mm total debt, and $363mm cash as of 7/16/2019. reconciliation.UGI Corp is Leading Distributor and Marketer of Energy Products Outstanding, disciplined growth Strong cash flow profile A leader in its markets • UGI has invested $10.3bn over the last 20 years • Highest Free Cash Flow as a % of EBITDA • AmeriGas is the largest U.S. LPG company, building its current business among multi-utilities in S&P Utilities Index over based on propane gallons sold (3) the past decade nd • Utilities is the 2 largest gas utility in PA, based • Delivered a 20 year adjusted earnings growth of on total customers (1)(3) 12.1% (2) • UGI expects to generate $1.1bn - $1.4bn of • International is the largest LPG distributor in six • UGI is focused on building out fee-based income, Cash from Operations annually; $950mm - western European countries, based on LPG limiting commodity exposure and maintaining a $1.3bn designated primarily to fund UGIES and gallons sold strong balance sheet Utilities growth • CMG acquisition provides material midstream scale for UGIES Enterprise value of UGI and select peers ($ in bn) $38.9 (4) $29.0 UGI Corp is a leading $17.3 billion Peers rated BBB or higher energy distributor and marketer $22.0 $17.3 $17.1 $16.3 $5.9 $5.5 $2.2 Credit Rating Baa1 / BBB+ Baa2 / BBB+ Baa2 / BBB+ NR / NR A2 / A A2 / BBB Aa3 / NR NR / NR (Moody’s / S&P): (1) 1998-2009 GAAP EPS, 2010-2018 Adjusted EPS. (4) Pro forma for AmeriGas Partners, L.P (“APU”) buy-in simplification transaction by UGI, where UGI will issue 34.6mm shares to APU unit 13 (2) Represents multi-year average targets. holders and pay $7.63 per APU unit. UGI consolidates 100% of APU EBITDA currently. Pro forma for CMG acquisition. Assumes pro forma (3) Adjusted EPS and Free Cash Flow are non-GAAP measures. See appendix for share count of 208.8mm UGI shares, $6,641mm total debt, and $363mm cash as of 7/16/2019. reconciliation.
UGI Energy Services 14UGI Energy Services 14
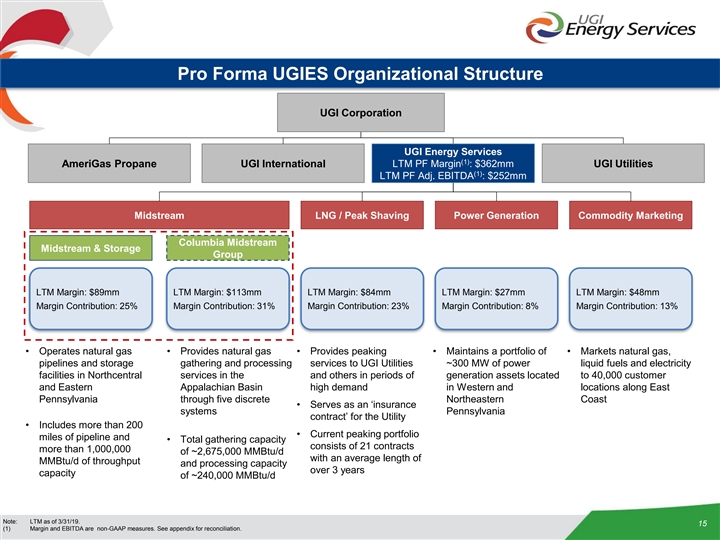
Pro Forma UGIES Organizational Structure UGI Corporation UGI Energy Services (1) AmeriGas Propane UGI International LTM PF Margin : $362mm UGI Utilities (1) LTM PF Adj. EBITDA : $252mm Midstream LNG / Peak Shaving Power Generation Commodity Marketing Columbia Midstream Midstream & Storage Group LTM Margin: $89mm LTM Margin: $113mm LTM Margin: $84mm LTM Margin: $27mm LTM Margin: $48mm Margin Contribution: 25% Margin Contribution: 31% Margin Contribution: 23% Margin Contribution: 8% Margin Contribution: 13% • Operates natural gas • Provides natural gas • Provides peaking • Maintains a portfolio of • Markets natural gas, pipelines and storage gathering and processing services to UGI Utilities ~300 MW of power liquid fuels and electricity facilities in Northcentral services in the and others in periods of generation assets located to 40,000 customer and Eastern Appalachian Basin high demand in Western and locations along East Pennsylvania through five discrete Northeastern Coast • Serves as an ‘insurance systems Pennsylvania contract’ for the Utility • Includes more than 200 • Current peaking portfolio miles of pipeline and • Total gathering capacity consists of 21 contracts more than 1,000,000 of ~2,675,000 MMBtu/d with an average length of MMBtu/d of throughput and processing capacity over 3 years capacity of ~240,000 MMBtu/d Note: LTM as of 3/31/19. 15 (1) Margin and EBITDA are non-GAAP measures. See appendix for reconciliation.Pro Forma UGIES Organizational Structure UGI Corporation UGI Energy Services (1) AmeriGas Propane UGI International LTM PF Margin : $362mm UGI Utilities (1) LTM PF Adj. EBITDA : $252mm Midstream LNG / Peak Shaving Power Generation Commodity Marketing Columbia Midstream Midstream & Storage Group LTM Margin: $89mm LTM Margin: $113mm LTM Margin: $84mm LTM Margin: $27mm LTM Margin: $48mm Margin Contribution: 25% Margin Contribution: 31% Margin Contribution: 23% Margin Contribution: 8% Margin Contribution: 13% • Operates natural gas • Provides natural gas • Provides peaking • Maintains a portfolio of • Markets natural gas, pipelines and storage gathering and processing services to UGI Utilities ~300 MW of power liquid fuels and electricity facilities in Northcentral services in the and others in periods of generation assets located to 40,000 customer and Eastern Appalachian Basin high demand in Western and locations along East Pennsylvania through five discrete Northeastern Coast • Serves as an ‘insurance systems Pennsylvania contract’ for the Utility • Includes more than 200 • Current peaking portfolio miles of pipeline and • Total gathering capacity consists of 21 contracts more than 1,000,000 of ~2,675,000 MMBtu/d with an average length of MMBtu/d of throughput and processing capacity over 3 years capacity of ~240,000 MMBtu/d Note: LTM as of 3/31/19. 15 (1) Margin and EBITDA are non-GAAP measures. See appendix for reconciliation.
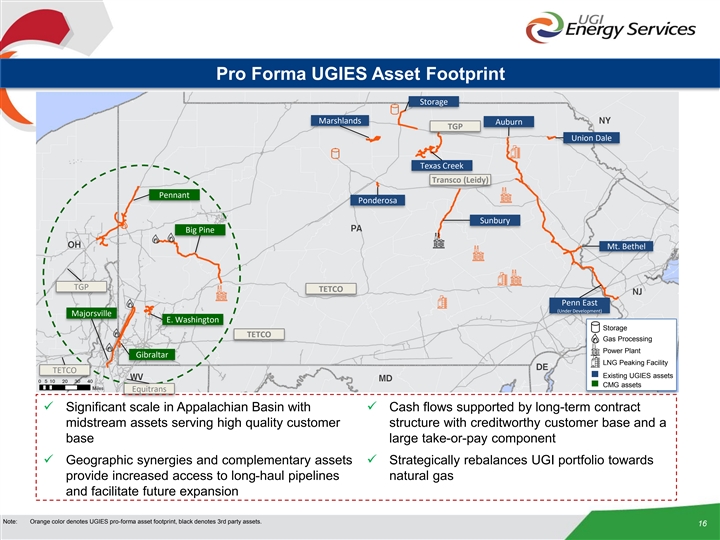
Pro Forma UGIES Asset Footprint Storage Marshlands Auburn TGP Union Dale Texas Creek Transco (Leidy) Pennant Ponderosa Sunbury Big Pine Mt. Bethel TGP TETCO Penn East (Under Development) Majorsville E. Washington Storage TETCO Gas Processing Power Plant Gibraltar LNG Peaking Facility TETCO Existing UGIES assets CMG assets Equitrans ü Significant scale in Appalachian Basin with ü Cash flows supported by long-term contract midstream assets serving high quality customer structure with creditworthy customer base and a base large take-or-pay component ü Geographic synergies and complementary assets ü Strategically rebalances UGI portfolio towards provide increased access to long-haul pipelines natural gas and facilitate future expansion Note: Orange color denotes UGIES pro-forma asset footprint, black denotes 3rd party assets. 16Pro Forma UGIES Asset Footprint Storage Marshlands Auburn TGP Union Dale Texas Creek Transco (Leidy) Pennant Ponderosa Sunbury Big Pine Mt. Bethel TGP TETCO Penn East (Under Development) Majorsville E. Washington Storage TETCO Gas Processing Power Plant Gibraltar LNG Peaking Facility TETCO Existing UGIES assets CMG assets Equitrans ü Significant scale in Appalachian Basin with ü Cash flows supported by long-term contract midstream assets serving high quality customer structure with creditworthy customer base and a base large take-or-pay component ü Geographic synergies and complementary assets ü Strategically rebalances UGI portfolio towards provide increased access to long-haul pipelines natural gas and facilitate future expansion Note: Orange color denotes UGIES pro-forma asset footprint, black denotes 3rd party assets. 16
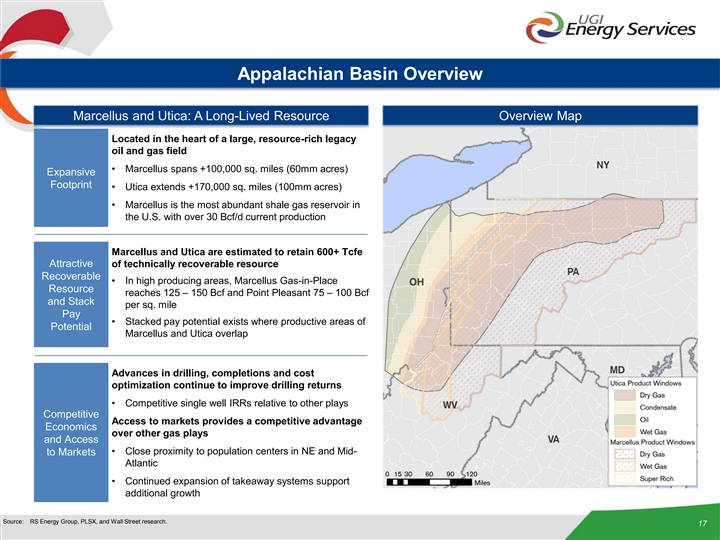
Appalachian Basin Overview Marcellus and Utica: A Long-Lived Resource Overview Map Located in the heart of a large, resource-rich legacy oil and gas field • Marcellus spans +100,000 sq. miles (60mm acres) Expansive Footprint • Utica extends +170,000 sq. miles (100mm acres) • Marcellus is the most abundant shale gas reservoir in the U.S. with over 30 Bcf/d current production Marcellus and Utica are estimated to retain 600+ Tcfe Attractive of technically recoverable resource Recoverable • In high producing areas, Marcellus Gas-in-Place Resource reaches 125 – 150 Bcf and Point Pleasant 75 – 100 Bcf and Stack per sq. mile Pay • Stacked pay potential exists where productive areas of Potential Marcellus and Utica overlap Advances in drilling, completions and cost optimization continue to improve drilling returns • Competitive single well IRRs relative to other plays Competitive Access to markets provides a competitive advantage Economics over other gas plays and Access • Close proximity to population centers in NE and Mid- to Markets Atlantic • Continued expansion of takeaway systems support additional growth Source: RS Energy Group, PLSX, and Wall Street research. 17Appalachian Basin Overview Marcellus and Utica: A Long-Lived Resource Overview Map Located in the heart of a large, resource-rich legacy oil and gas field • Marcellus spans +100,000 sq. miles (60mm acres) Expansive Footprint • Utica extends +170,000 sq. miles (100mm acres) • Marcellus is the most abundant shale gas reservoir in the U.S. with over 30 Bcf/d current production Marcellus and Utica are estimated to retain 600+ Tcfe Attractive of technically recoverable resource Recoverable • In high producing areas, Marcellus Gas-in-Place Resource reaches 125 – 150 Bcf and Point Pleasant 75 – 100 Bcf and Stack per sq. mile Pay • Stacked pay potential exists where productive areas of Potential Marcellus and Utica overlap Advances in drilling, completions and cost optimization continue to improve drilling returns • Competitive single well IRRs relative to other plays Competitive Access to markets provides a competitive advantage Economics over other gas plays and Access • Close proximity to population centers in NE and Mid- to Markets Atlantic • Continued expansion of takeaway systems support additional growth Source: RS Energy Group, PLSX, and Wall Street research. 17
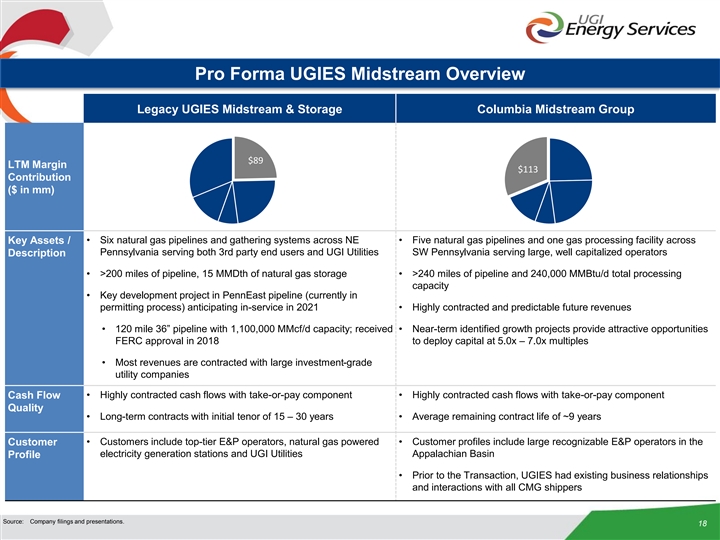
Pro Forma UGIES Midstream Overview Legacy UGIES Midstream & Storage Columbia Midstream Group $89 LTM Margin $113 Contribution ($ in mm) • Six natural gas pipelines and gathering systems across NE • Five natural gas pipelines and one gas processing facility across Key Assets / Pennsylvania serving both 3rd party end users and UGI Utilities SW Pennsylvania serving large, well capitalized operators Description • >200 miles of pipeline, 15 MMDth of natural gas storage • >240 miles of pipeline and 240,000 MMBtu/d total processing capacity • Key development project in PennEast pipeline (currently in permitting process) anticipating in-service in 2021 • Highly contracted and predictable future revenues • 120 mile 36” pipeline with 1,100,000 MMcf/d capacity; received • Near-term identified growth projects provide attractive opportunities FERC approval in 2018 to deploy capital at 5.0x – 7.0x multiples • Most revenues are contracted with large investment-grade utility companies • Highly contracted cash flows with take-or-pay component • Highly contracted cash flows with take-or-pay component Cash Flow Quality • Long-term contracts with initial tenor of 15 – 30 years • Average remaining contract life of ~9 years • Customers include top-tier E&P operators, natural gas powered • Customer profiles include large recognizable E&P operators in the Customer electricity generation stations and UGI Utilities Appalachian Basin Profile • Prior to the Transaction, UGIES had existing business relationships and interactions with all CMG shippers Source: Company filings and presentations. 18Pro Forma UGIES Midstream Overview Legacy UGIES Midstream & Storage Columbia Midstream Group $89 LTM Margin $113 Contribution ($ in mm) • Six natural gas pipelines and gathering systems across NE • Five natural gas pipelines and one gas processing facility across Key Assets / Pennsylvania serving both 3rd party end users and UGI Utilities SW Pennsylvania serving large, well capitalized operators Description • >200 miles of pipeline, 15 MMDth of natural gas storage • >240 miles of pipeline and 240,000 MMBtu/d total processing capacity • Key development project in PennEast pipeline (currently in permitting process) anticipating in-service in 2021 • Highly contracted and predictable future revenues • 120 mile 36” pipeline with 1,100,000 MMcf/d capacity; received • Near-term identified growth projects provide attractive opportunities FERC approval in 2018 to deploy capital at 5.0x – 7.0x multiples • Most revenues are contracted with large investment-grade utility companies • Highly contracted cash flows with take-or-pay component • Highly contracted cash flows with take-or-pay component Cash Flow Quality • Long-term contracts with initial tenor of 15 – 30 years • Average remaining contract life of ~9 years • Customers include top-tier E&P operators, natural gas powered • Customer profiles include large recognizable E&P operators in the Customer electricity generation stations and UGI Utilities Appalachian Basin Profile • Prior to the Transaction, UGIES had existing business relationships and interactions with all CMG shippers Source: Company filings and presentations. 18
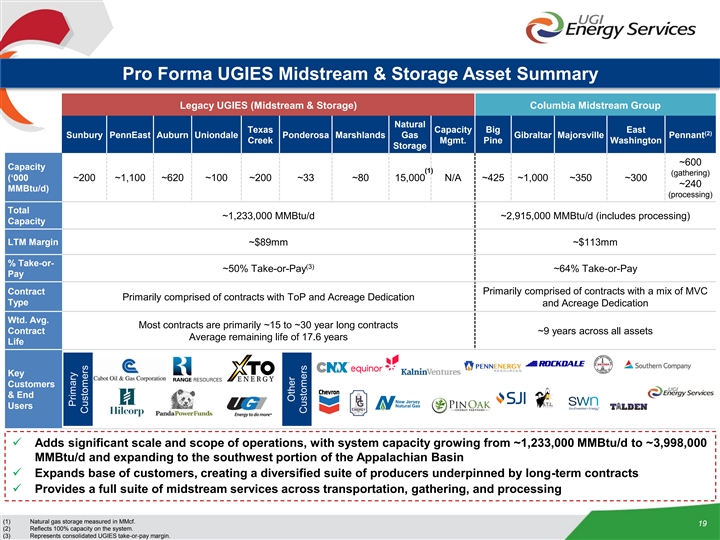
Pro Forma UGIES Midstream & Storage Asset Summary Legacy UGIES (Midstream & Storage) Columbia Midstream Group Natural Texas Capacity Big East (2) Sunbury PennEast Auburn Uniondale Ponderosa Marshlands Gas Gibraltar Majorsville Pennant Creek Mgmt. Pine Washington Storage ~600 Capacity (1) (gathering) (‘000 ~200 ~1,100 ~620 ~100 ~200 ~33 ~80 15,000 N/A ~425 ~1,000 ~350 ~300 ~240 MMBtu/d) (processing) Total ~1,233,000 MMBtu/d ~2,915,000 MMBtu/d (includes processing) Capacity LTM Margin ~$89mm ~$113mm % Take-or- (3) ~50% Take-or-Pay ~64% Take-or-Pay Pay Primarily comprised of contracts with a mix of MVC Contract Primarily comprised of contracts with ToP and Acreage Dedication Type and Acreage Dedication Wtd. Avg. Most contracts are primarily ~15 to ~30 year long contracts Contract ~9 years across all assets Average remaining life of 17.6 years Life Key Customers & End Users ü Adds significant scale and scope of operations, with system capacity growing from ~1,233,000 MMBtu/d to ~3,998,000 MMBtu/d and expanding to the southwest portion of the Appalachian Basin ü Expands base of customers, creating a diversified suite of producers underpinned by long-term contracts ü Provides a full suite of midstream services across transportation, gathering, and processing (1) Natural gas storage measured in MMcf. 19 (2) Reflects 100% capacity on the system. (3) Represents consolidated UGIES take-or-pay margin. Primary Customers Other CustomersPro Forma UGIES Midstream & Storage Asset Summary Legacy UGIES (Midstream & Storage) Columbia Midstream Group Natural Texas Capacity Big East (2) Sunbury PennEast Auburn Uniondale Ponderosa Marshlands Gas Gibraltar Majorsville Pennant Creek Mgmt. Pine Washington Storage ~600 Capacity (1) (gathering) (‘000 ~200 ~1,100 ~620 ~100 ~200 ~33 ~80 15,000 N/A ~425 ~1,000 ~350 ~300 ~240 MMBtu/d) (processing) Total ~1,233,000 MMBtu/d ~2,915,000 MMBtu/d (includes processing) Capacity LTM Margin ~$89mm ~$113mm % Take-or- (3) ~50% Take-or-Pay ~64% Take-or-Pay Pay Primarily comprised of contracts with a mix of MVC Contract Primarily comprised of contracts with ToP and Acreage Dedication Type and Acreage Dedication Wtd. Avg. Most contracts are primarily ~15 to ~30 year long contracts Contract ~9 years across all assets Average remaining life of 17.6 years Life Key Customers & End Users ü Adds significant scale and scope of operations, with system capacity growing from ~1,233,000 MMBtu/d to ~3,998,000 MMBtu/d and expanding to the southwest portion of the Appalachian Basin ü Expands base of customers, creating a diversified suite of producers underpinned by long-term contracts ü Provides a full suite of midstream services across transportation, gathering, and processing (1) Natural gas storage measured in MMcf. 19 (2) Reflects 100% capacity on the system. (3) Represents consolidated UGIES take-or-pay margin. Primary Customers Other Customers

Other UGIES Business Overview LNG / Peak Shaving Commodity Marketing Power Generation LTM Margin Contribution ($ in mm) $84 $48 $27 Key Assets / • Two LNG liquefaction plants with up to • Markets and sells natural gas, liquid • Approximately 300 MW of power Description 25,000 Dth/d of capacity fuels, and electricity along the East Coast generation including: • Six propane air peak shaving facilities • Strong synergies with Midstream • Hunlock Creek: Gas-fired plant with up to 95,000 Dth/d of capacity and segment • Landfill gas facility 5 million gallons of propane storage • Complementary asset portfolio, large • Conemaugh: Coal plant • Three large scale LNG peak shaving natural gas supply purchases, and • Distributed solar plants and two portable LNG peak management of regional supply shaving units with combined capacity of infrastructure 295,000 Dth/d and over 17 million gallons of LNG storage Cash Flow • Margin derived from demand charges • Fixed-price contracts & back-to-back • Substantial contribution from fixed Quality under term contracts hedges executed at inception of contract capacity payments and renewable energy credits • Portfolio includes 21 contracts with 3+ • Remarkable track record of consistent years of remaining tenor margin (does not speculate on prices) Customer • High quality gas utilities • 40,000 customer locations • Operates within established PJM Profile Interconnection market • Critical in serving customers on high- • Small-to-medium commercial and demand days industrial customers with high customer retention rate Source: Company filings and presentations. 20Other UGIES Business Overview LNG / Peak Shaving Commodity Marketing Power Generation LTM Margin Contribution ($ in mm) $84 $48 $27 Key Assets / • Two LNG liquefaction plants with up to • Markets and sells natural gas, liquid • Approximately 300 MW of power Description 25,000 Dth/d of capacity fuels, and electricity along the East Coast generation including: • Six propane air peak shaving facilities • Strong synergies with Midstream • Hunlock Creek: Gas-fired plant with up to 95,000 Dth/d of capacity and segment • Landfill gas facility 5 million gallons of propane storage • Complementary asset portfolio, large • Conemaugh: Coal plant • Three large scale LNG peak shaving natural gas supply purchases, and • Distributed solar plants and two portable LNG peak management of regional supply shaving units with combined capacity of infrastructure 295,000 Dth/d and over 17 million gallons of LNG storage Cash Flow • Margin derived from demand charges • Fixed-price contracts & back-to-back • Substantial contribution from fixed Quality under term contracts hedges executed at inception of contract capacity payments and renewable energy credits • Portfolio includes 21 contracts with 3+ • Remarkable track record of consistent years of remaining tenor margin (does not speculate on prices) Customer • High quality gas utilities • 40,000 customer locations • Operates within established PJM Profile Interconnection market • Critical in serving customers on high- • Small-to-medium commercial and demand days industrial customers with high customer retention rate Source: Company filings and presentations. 20

Legacy UGI Energy Services 21Legacy UGI Energy Services 21

Legacy UGIES Midstream and Storage Asset Summary FERC Transmission Trunkline Gathering Infield Gathering Other Natural Gas Capacity Sunbury PennEast Auburn Uniondale Texas Creek Ponderosa Marshlands Storage Management Capacity Services Provided Pipeline Pipeline Gathering Gathering Gathering Gathering Gathering Storage Management Length 35 120 46 7 60 4 21 20 N/A (miles) Diameter 20 36 12, 20, 24 12 6, 8, 12, 16 6 4, 8, 10 8, 14 N/A (in) Capacity (1) ~200,000 ~1,100,000 ~620,000 ~100,000 ~200,000 ~33,000 ~80,000 ~15,000 N/A (MMBtu/d) LTM Volumes Approximately 0.5 Bcf/d LTM Margin Total Margin: ~$89mm ($ in mm) # of Shippers 2 12 3 1 1 1 1 N/A N/A Acreage Acreage Acreage Annual Contract Type ToP ToP ToP ToP Dedication w/ Dedication w/ Dedication w/ Contract Opportunistic MVC MVC MVC Renewal (2) % Take-or-Pay ~50% Weighted Average Most contracts are primarily ~15 to ~30 year long contracts Average remaining life of 17.6 years Contract Life Key Customers & End Users (1) Natural gas storage measured in MMcf. 22 (2) Represents consolidated UGIES take-or-pay margin.Legacy UGIES Midstream and Storage Asset Summary FERC Transmission Trunkline Gathering Infield Gathering Other Natural Gas Capacity Sunbury PennEast Auburn Uniondale Texas Creek Ponderosa Marshlands Storage Management Capacity Services Provided Pipeline Pipeline Gathering Gathering Gathering Gathering Gathering Storage Management Length 35 120 46 7 60 4 21 20 N/A (miles) Diameter 20 36 12, 20, 24 12 6, 8, 12, 16 6 4, 8, 10 8, 14 N/A (in) Capacity (1) ~200,000 ~1,100,000 ~620,000 ~100,000 ~200,000 ~33,000 ~80,000 ~15,000 N/A (MMBtu/d) LTM Volumes Approximately 0.5 Bcf/d LTM Margin Total Margin: ~$89mm ($ in mm) # of Shippers 2 12 3 1 1 1 1 N/A N/A Acreage Acreage Acreage Annual Contract Type ToP ToP ToP ToP Dedication w/ Dedication w/ Dedication w/ Contract Opportunistic MVC MVC MVC Renewal (2) % Take-or-Pay ~50% Weighted Average Most contracts are primarily ~15 to ~30 year long contracts Average remaining life of 17.6 years Contract Life Key Customers & End Users (1) Natural gas storage measured in MMcf. 22 (2) Represents consolidated UGIES take-or-pay margin.
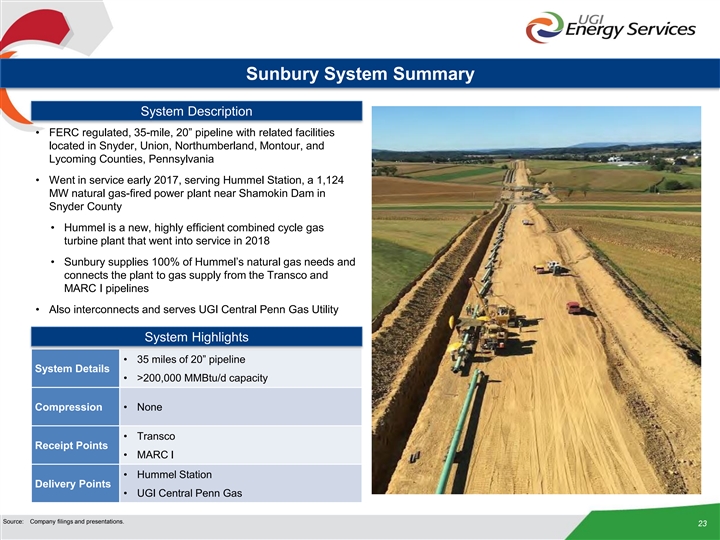
Sunbury System Summary System Description • FERC regulated, 35-mile, 20” pipeline with related facilities located in Snyder, Union, Northumberland, Montour, and Lycoming Counties, Pennsylvania • Went in service early 2017, serving Hummel Station, a 1,124 MW natural gas-fired power plant near Shamokin Dam in Snyder County • Hummel is a new, highly efficient combined cycle gas turbine plant that went into service in 2018 • Sunbury supplies 100% of Hummel’s natural gas needs and connects the plant to gas supply from the Transco and MARC I pipelines • Also interconnects and serves UGI Central Penn Gas Utility System Highlights • 35 miles of 20” pipeline System Details • >200,000 MMBtu/d capacity Compression • None • Transco Receipt Points • MARC I • Hummel Station Delivery Points • UGI Central Penn Gas Source: Company filings and presentations. 23Sunbury System Summary System Description • FERC regulated, 35-mile, 20” pipeline with related facilities located in Snyder, Union, Northumberland, Montour, and Lycoming Counties, Pennsylvania • Went in service early 2017, serving Hummel Station, a 1,124 MW natural gas-fired power plant near Shamokin Dam in Snyder County • Hummel is a new, highly efficient combined cycle gas turbine plant that went into service in 2018 • Sunbury supplies 100% of Hummel’s natural gas needs and connects the plant to gas supply from the Transco and MARC I pipelines • Also interconnects and serves UGI Central Penn Gas Utility System Highlights • 35 miles of 20” pipeline System Details • >200,000 MMBtu/d capacity Compression • None • Transco Receipt Points • MARC I • Hummel Station Delivery Points • UGI Central Penn Gas Source: Company filings and presentations. 23
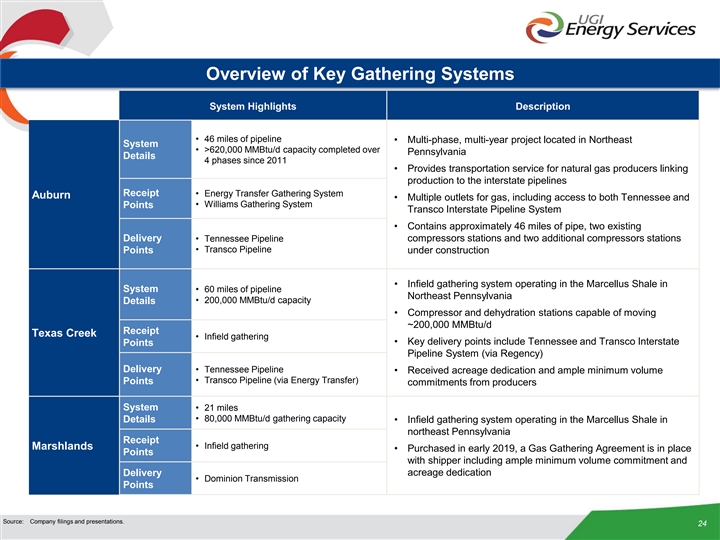
Overview of Key Gathering Systems System Highlights Description • 46 miles of pipeline • Multi-phase, multi-year project located in Northeast System • >620,000 MMBtu/d capacity completed over Pennsylvania Details 4 phases since 2011 • Provides transportation service for natural gas producers linking production to the interstate pipelines Receipt • Energy Transfer Gathering System Auburn • Multiple outlets for gas, including access to both Tennessee and • Williams Gathering System Points Transco Interstate Pipeline System • Contains approximately 46 miles of pipe, two existing Delivery • Tennessee Pipeline compressors stations and two additional compressors stations Points • Transco Pipeline under construction • Infield gathering system operating in the Marcellus Shale in System • 60 miles of pipeline Northeast Pennsylvania • 200,000 MMBtu/d capacity Details • Compressor and dehydration stations capable of moving ~200,000 MMBtu/d Receipt Texas Creek • Infield gathering • Key delivery points include Tennessee and Transco Interstate Points Pipeline System (via Regency) Delivery • Tennessee Pipeline • Received acreage dedication and ample minimum volume • Transco Pipeline (via Energy Transfer) Points commitments from producers System • 21 miles • 80,000 MMBtu/d gathering capacity Details • Infield gathering system operating in the Marcellus Shale in northeast Pennsylvania Receipt • Infield gathering Marshlands • Purchased in early 2019, a Gas Gathering Agreement is in place Points with shipper including ample minimum volume commitment and Delivery acreage dedication • Dominion Transmission Points Source: Company filings and presentations. 24Overview of Key Gathering Systems System Highlights Description • 46 miles of pipeline • Multi-phase, multi-year project located in Northeast System • >620,000 MMBtu/d capacity completed over Pennsylvania Details 4 phases since 2011 • Provides transportation service for natural gas producers linking production to the interstate pipelines Receipt • Energy Transfer Gathering System Auburn • Multiple outlets for gas, including access to both Tennessee and • Williams Gathering System Points Transco Interstate Pipeline System • Contains approximately 46 miles of pipe, two existing Delivery • Tennessee Pipeline compressors stations and two additional compressors stations Points • Transco Pipeline under construction • Infield gathering system operating in the Marcellus Shale in System • 60 miles of pipeline Northeast Pennsylvania • 200,000 MMBtu/d capacity Details • Compressor and dehydration stations capable of moving ~200,000 MMBtu/d Receipt Texas Creek • Infield gathering • Key delivery points include Tennessee and Transco Interstate Points Pipeline System (via Regency) Delivery • Tennessee Pipeline • Received acreage dedication and ample minimum volume • Transco Pipeline (via Energy Transfer) Points commitments from producers System • 21 miles • 80,000 MMBtu/d gathering capacity Details • Infield gathering system operating in the Marcellus Shale in northeast Pennsylvania Receipt • Infield gathering Marshlands • Purchased in early 2019, a Gas Gathering Agreement is in place Points with shipper including ample minimum volume commitment and Delivery acreage dedication • Dominion Transmission Points Source: Company filings and presentations. 24
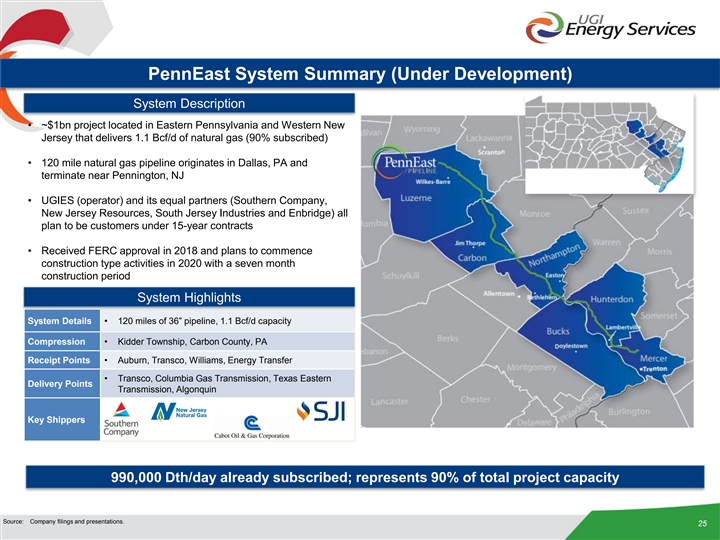
PennEast System Summary (Under Development) System Description • ~$1bn project located in Eastern Pennsylvania and Western New Jersey that delivers 1.1 Bcf/d of natural gas (90% subscribed) • 120 mile natural gas pipeline originates in Dallas, PA and terminate near Pennington, NJ • UGIES (operator) and its equal partners (Southern Company, New Jersey Resources, South Jersey Industries and Enbridge) all plan to be customers under 15-year contracts • Received FERC approval in 2018 and plans to commence construction type activities in 2020 with a seven month construction period System Highlights System Details • 120 miles of 36” pipeline, 1.1 Bcf/d capacity Compression • Kidder Township, Carbon County, PA Receipt Points • Auburn, Transco, Williams, Energy Transfer • Transco, Columbia Gas Transmission, Texas Eastern Delivery Points Transmission, Algonquin Key Shippers 990,000 Dth/day already subscribed; represents 90% of total project capacity Source: Company filings and presentations. 25PennEast System Summary (Under Development) System Description • ~$1bn project located in Eastern Pennsylvania and Western New Jersey that delivers 1.1 Bcf/d of natural gas (90% subscribed) • 120 mile natural gas pipeline originates in Dallas, PA and terminate near Pennington, NJ • UGIES (operator) and its equal partners (Southern Company, New Jersey Resources, South Jersey Industries and Enbridge) all plan to be customers under 15-year contracts • Received FERC approval in 2018 and plans to commence construction type activities in 2020 with a seven month construction period System Highlights System Details • 120 miles of 36” pipeline, 1.1 Bcf/d capacity Compression • Kidder Township, Carbon County, PA Receipt Points • Auburn, Transco, Williams, Energy Transfer • Transco, Columbia Gas Transmission, Texas Eastern Delivery Points Transmission, Algonquin Key Shippers 990,000 Dth/day already subscribed; represents 90% of total project capacity Source: Company filings and presentations. 25
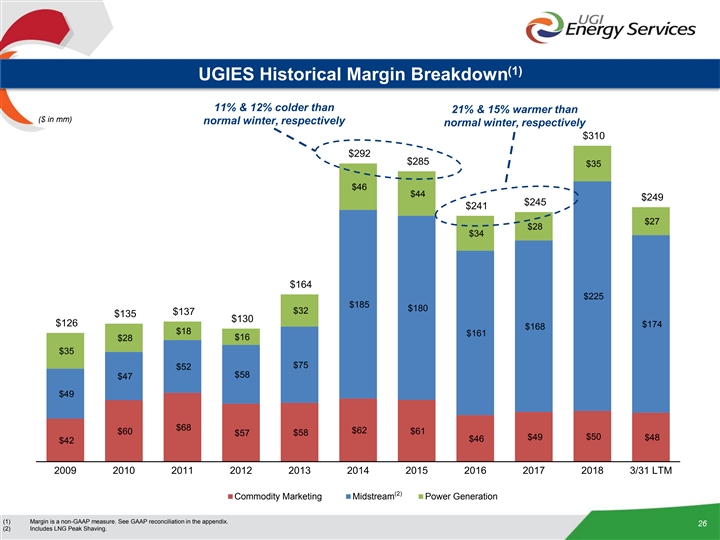
(1) UGIES Historical Margin Breakdown 11% & 12% colder than 21% & 15% warmer than ($ in mm) normal winter, respectively normal winter, respectively $310 $292 $285 $35 $46 $44 $249 $245 $241 $27 $28 $34 $164 $225 $185 $180 $32 $137 $135 $130 $126 $174 $168 $18 $161 $16 $28 $35 $75 $52 $58 $47 $49 $68 $60 $62 $61 $57 $58 $49 $50 $48 $46 $42 2009 2010 2011 2012 2013 2014 2015 2016 2017 2018 3/31 LTM (2) Commodity Marketing Midstream Power Generation (1) Margin is a non-GAAP measure. See GAAP reconciliation in the appendix. 26 (2) Includes LNG Peak Shaving.(1) UGIES Historical Margin Breakdown 11% & 12% colder than 21% & 15% warmer than ($ in mm) normal winter, respectively normal winter, respectively $310 $292 $285 $35 $46 $44 $249 $245 $241 $27 $28 $34 $164 $225 $185 $180 $32 $137 $135 $130 $126 $174 $168 $18 $161 $16 $28 $35 $75 $52 $58 $47 $49 $68 $60 $62 $61 $57 $58 $49 $50 $48 $46 $42 2009 2010 2011 2012 2013 2014 2015 2016 2017 2018 3/31 LTM (2) Commodity Marketing Midstream Power Generation (1) Margin is a non-GAAP measure. See GAAP reconciliation in the appendix. 26 (2) Includes LNG Peak Shaving.
Columbia Midstream Group 27Columbia Midstream Group 27
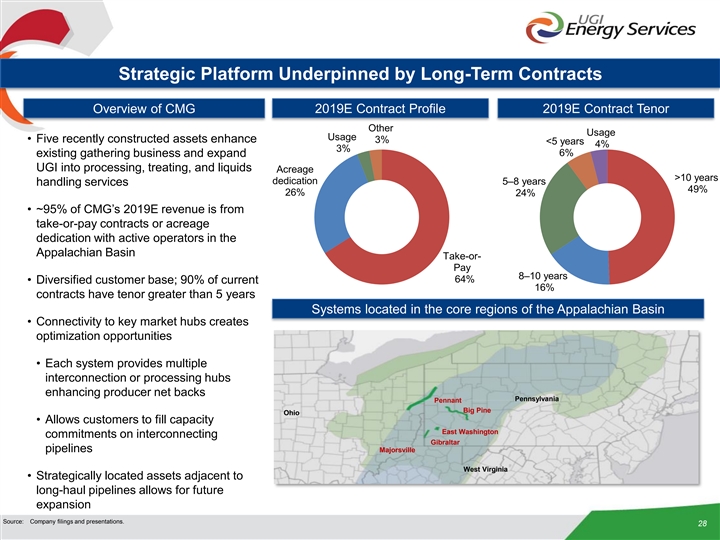
Strategic Platform Underpinned by Long-Term Contracts Overview of CMG 2019E Contract Profile 2019E Contract Tenor Other Usage Usage • Five recently constructed assets enhance 3% <5 years 4% 3% 6% existing gathering business and expand UGI into processing, treating, and liquids Acreage >10 years dedication 5–8 years handling services 49% 26% 24% • ~95% of CMG’s 2019E revenue is from take-or-pay contracts or acreage dedication with active operators in the Appalachian Basin Take-or- Pay 8–10 years 64% • Diversified customer base; 90% of current 16% contracts have tenor greater than 5 years Systems located in the core regions of the Appalachian Basin • Connectivity to key market hubs creates optimization opportunities • Each system provides multiple interconnection or processing hubs enhancing producer net backs Pennsylvania Pennant Big Pine Ohio • Allows customers to fill capacity East Washington commitments on interconnecting Gibraltar pipelines Majorsville West Virginia • Strategically located assets adjacent to long-haul pipelines allows for future expansion Source: Company filings and presentations. 28Strategic Platform Underpinned by Long-Term Contracts Overview of CMG 2019E Contract Profile 2019E Contract Tenor Other Usage Usage • Five recently constructed assets enhance 3% <5 years 4% 3% 6% existing gathering business and expand UGI into processing, treating, and liquids Acreage >10 years dedication 5–8 years handling services 49% 26% 24% • ~95% of CMG’s 2019E revenue is from take-or-pay contracts or acreage dedication with active operators in the Appalachian Basin Take-or- Pay 8–10 years 64% • Diversified customer base; 90% of current 16% contracts have tenor greater than 5 years Systems located in the core regions of the Appalachian Basin • Connectivity to key market hubs creates optimization opportunities • Each system provides multiple interconnection or processing hubs enhancing producer net backs Pennsylvania Pennant Big Pine Ohio • Allows customers to fill capacity East Washington commitments on interconnecting Gibraltar pipelines Majorsville West Virginia • Strategically located assets adjacent to long-haul pipelines allows for future expansion Source: Company filings and presentations. 28
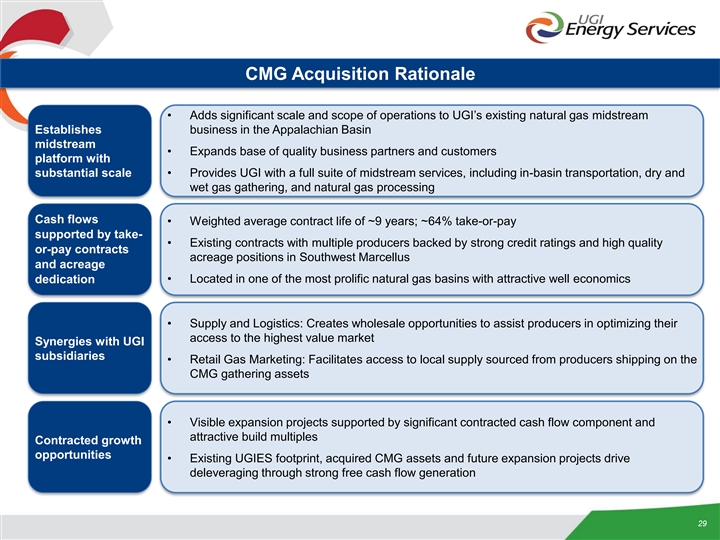
CMG Acquisition Rationale • Adds significant scale and scope of operations to UGI’s existing natural gas midstream Establishes business in the Appalachian Basin midstream • Expands base of quality business partners and customers platform with substantial scale • Provides UGI with a full suite of midstream services, including in-basin transportation, dry and wet gas gathering, and natural gas processing Cash flows • Weighted average contract life of ~9 years; ~64% take-or-pay supported by take- • Existing contracts with multiple producers backed by strong credit ratings and high quality or-pay contracts acreage positions in Southwest Marcellus and acreage dedication • Located in one of the most prolific natural gas basins with attractive well economics • Supply and Logistics: Creates wholesale opportunities to assist producers in optimizing their access to the highest value market Synergies with UGI subsidiaries • Retail Gas Marketing: Facilitates access to local supply sourced from producers shipping on the CMG gathering assets • Visible expansion projects supported by significant contracted cash flow component and attractive build multiples Contracted growth opportunities • Existing UGIES footprint, acquired CMG assets and future expansion projects drive deleveraging through strong free cash flow generation 29CMG Acquisition Rationale • Adds significant scale and scope of operations to UGI’s existing natural gas midstream Establishes business in the Appalachian Basin midstream • Expands base of quality business partners and customers platform with substantial scale • Provides UGI with a full suite of midstream services, including in-basin transportation, dry and wet gas gathering, and natural gas processing Cash flows • Weighted average contract life of ~9 years; ~64% take-or-pay supported by take- • Existing contracts with multiple producers backed by strong credit ratings and high quality or-pay contracts acreage positions in Southwest Marcellus and acreage dedication • Located in one of the most prolific natural gas basins with attractive well economics • Supply and Logistics: Creates wholesale opportunities to assist producers in optimizing their access to the highest value market Synergies with UGI subsidiaries • Retail Gas Marketing: Facilitates access to local supply sourced from producers shipping on the CMG gathering assets • Visible expansion projects supported by significant contracted cash flow component and attractive build multiples Contracted growth opportunities • Existing UGIES footprint, acquired CMG assets and future expansion projects drive deleveraging through strong free cash flow generation 29
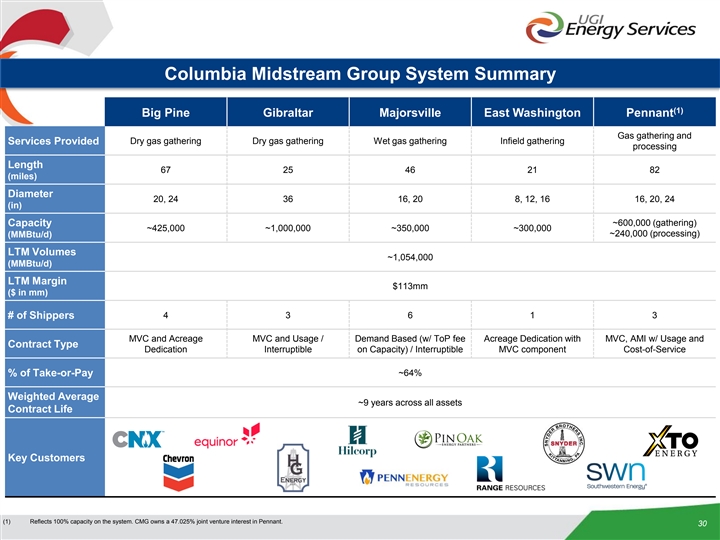
Columbia Midstream Group System Summary (1) Big Pine Gibraltar Majorsville East Washington Pennant Gas gathering and Dry gas gathering Dry gas gathering Wet gas gathering Infield gathering Services Provided processing Length 67 25 46 21 82 (miles) Diameter 20, 24 36 16, 20 8, 12, 16 16, 20, 24 (in) Capacity ~600,000 (gathering) ~425,000 ~1,000,000 ~350,000 ~300,000 ~240,000 (processing) (MMBtu/d) LTM Volumes ~1,054,000 (MMBtu/d) LTM Margin $113mm ($ in mm) 4 3 6 1 3 # of Shippers MVC and Acreage MVC and Usage / Demand Based (w/ ToP fee Acreage Dedication with MVC, AMI w/ Usage and Contract Type Dedication Interruptible on Capacity) / Interruptible MVC component Cost-of-Service % of Take-or-Pay ~64% Weighted Average ~9 years across all assets Contract Life Key Customers (1) Reflects 100% capacity on the system. CMG owns a 47.025% joint venture interest in Pennant. 30Columbia Midstream Group System Summary (1) Big Pine Gibraltar Majorsville East Washington Pennant Gas gathering and Dry gas gathering Dry gas gathering Wet gas gathering Infield gathering Services Provided processing Length 67 25 46 21 82 (miles) Diameter 20, 24 36 16, 20 8, 12, 16 16, 20, 24 (in) Capacity ~600,000 (gathering) ~425,000 ~1,000,000 ~350,000 ~300,000 ~240,000 (processing) (MMBtu/d) LTM Volumes ~1,054,000 (MMBtu/d) LTM Margin $113mm ($ in mm) 4 3 6 1 3 # of Shippers MVC and Acreage MVC and Usage / Demand Based (w/ ToP fee Acreage Dedication with MVC, AMI w/ Usage and Contract Type Dedication Interruptible on Capacity) / Interruptible MVC component Cost-of-Service % of Take-or-Pay ~64% Weighted Average ~9 years across all assets Contract Life Key Customers (1) Reflects 100% capacity on the system. CMG owns a 47.025% joint venture interest in Pennant. 30
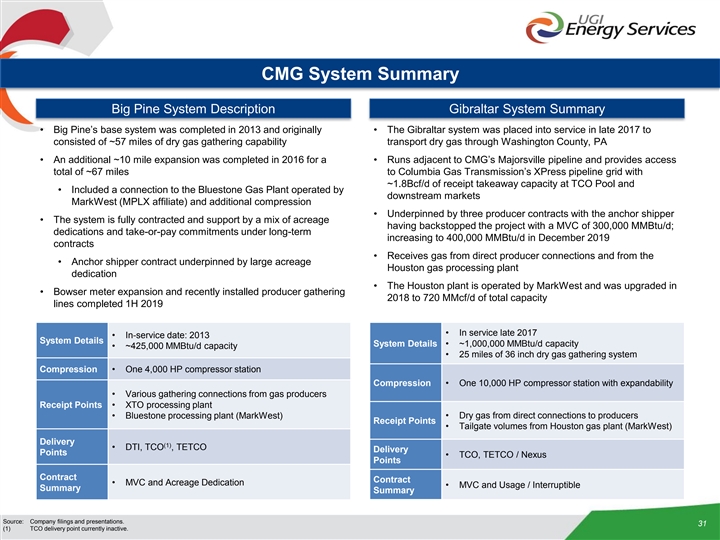
CMG System Summary Big Pine System Description Gibraltar System Summary • Big Pine’s base system was completed in 2013 and originally • The Gibraltar system was placed into service in late 2017 to consisted of ~57 miles of dry gas gathering capability transport dry gas through Washington County, PA • An additional ~10 mile expansion was completed in 2016 for a • Runs adjacent to CMG’s Majorsville pipeline and provides access total of ~67 miles to Columbia Gas Transmission’s XPress pipeline grid with ~1.8Bcf/d of receipt takeaway capacity at TCO Pool and • Included a connection to the Bluestone Gas Plant operated by downstream markets MarkWest (MPLX affiliate) and additional compression • Underpinned by three producer contracts with the anchor shipper • The system is fully contracted and support by a mix of acreage having backstopped the project with a MVC of 300,000 MMBtu/d; dedications and take-or-pay commitments under long-term increasing to 400,000 MMBtu/d in December 2019 contracts • Receives gas from direct producer connections and from the • Anchor shipper contract underpinned by large acreage Houston gas processing plant dedication • The Houston plant is operated by MarkWest and was upgraded in • Bowser meter expansion and recently installed producer gathering 2018 to 720 MMcf/d of total capacity lines completed 1H 2019 • In service late 2017 • In-service date: 2013 System Details System Details • ~1,000,000 MMBtu/d capacity • ~425,000 MMBtu/d capacity • 25 miles of 36 inch dry gas gathering system Compression • One 4,000 HP compressor station Compression • One 10,000 HP compressor station with expandability • Various gathering connections from gas producers Receipt Points • XTO processing plant • Bluestone processing plant (MarkWest) • Dry gas from direct connections to producers Receipt Points • Tailgate volumes from Houston gas plant (MarkWest) Delivery (1) • DTI, TCO , TETCO Delivery Points • TCO, TETCO / Nexus Points Contract Contract • MVC and Acreage Dedication • MVC and Usage / Interruptible Summary Summary Source: Company filings and presentations. 31 (1) TCO delivery point currently inactive.CMG System Summary Big Pine System Description Gibraltar System Summary • Big Pine’s base system was completed in 2013 and originally • The Gibraltar system was placed into service in late 2017 to consisted of ~57 miles of dry gas gathering capability transport dry gas through Washington County, PA • An additional ~10 mile expansion was completed in 2016 for a • Runs adjacent to CMG’s Majorsville pipeline and provides access total of ~67 miles to Columbia Gas Transmission’s XPress pipeline grid with ~1.8Bcf/d of receipt takeaway capacity at TCO Pool and • Included a connection to the Bluestone Gas Plant operated by downstream markets MarkWest (MPLX affiliate) and additional compression • Underpinned by three producer contracts with the anchor shipper • The system is fully contracted and support by a mix of acreage having backstopped the project with a MVC of 300,000 MMBtu/d; dedications and take-or-pay commitments under long-term increasing to 400,000 MMBtu/d in December 2019 contracts • Receives gas from direct producer connections and from the • Anchor shipper contract underpinned by large acreage Houston gas processing plant dedication • The Houston plant is operated by MarkWest and was upgraded in • Bowser meter expansion and recently installed producer gathering 2018 to 720 MMcf/d of total capacity lines completed 1H 2019 • In service late 2017 • In-service date: 2013 System Details System Details • ~1,000,000 MMBtu/d capacity • ~425,000 MMBtu/d capacity • 25 miles of 36 inch dry gas gathering system Compression • One 4,000 HP compressor station Compression • One 10,000 HP compressor station with expandability • Various gathering connections from gas producers Receipt Points • XTO processing plant • Bluestone processing plant (MarkWest) • Dry gas from direct connections to producers Receipt Points • Tailgate volumes from Houston gas plant (MarkWest) Delivery (1) • DTI, TCO , TETCO Delivery Points • TCO, TETCO / Nexus Points Contract Contract • MVC and Acreage Dedication • MVC and Usage / Interruptible Summary Summary Source: Company filings and presentations. 31 (1) TCO delivery point currently inactive.
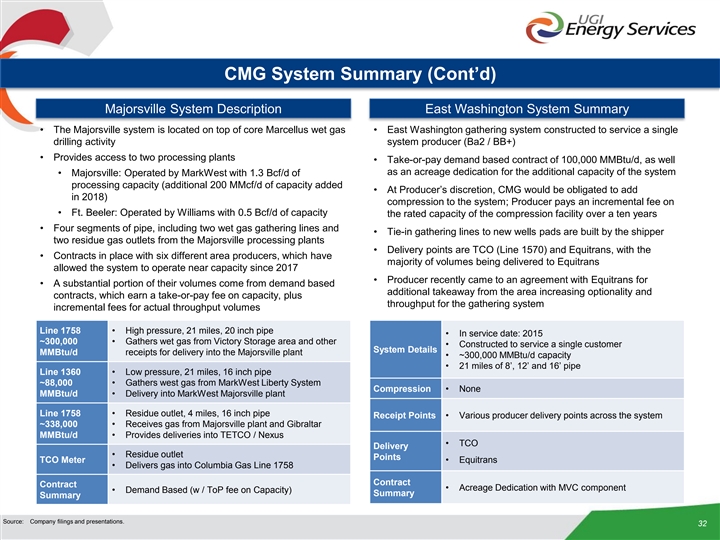
CMG System Summary (Cont’d) Majorsville System Description East Washington System Summary • The Majorsville system is located on top of core Marcellus wet gas • East Washington gathering system constructed to service a single drilling activity system producer (Ba2 / BB+) • Provides access to two processing plants • Take-or-pay demand based contract of 100,000 MMBtu/d, as well as an acreage dedication for the additional capacity of the system • Majorsville: Operated by MarkWest with 1.3 Bcf/d of processing capacity (additional 200 MMcf/d of capacity added • At Producer’s discretion, CMG would be obligated to add in 2018) compression to the system; Producer pays an incremental fee on • Ft. Beeler: Operated by Williams with 0.5 Bcf/d of capacity the rated capacity of the compression facility over a ten years • Four segments of pipe, including two wet gas gathering lines and • Tie-in gathering lines to new wells pads are built by the shipper two residue gas outlets from the Majorsville processing plants • Delivery points are TCO (Line 1570) and Equitrans, with the • Contracts in place with six different area producers, which have majority of volumes being delivered to Equitrans allowed the system to operate near capacity since 2017 • Producer recently came to an agreement with Equitrans for • A substantial portion of their volumes come from demand based additional takeaway from the area increasing optionality and contracts, which earn a take-or-pay fee on capacity, plus throughput for the gathering system incremental fees for actual throughput volumes Line 1758 • High pressure, 21 miles, 20 inch pipe • In service date: 2015 ~300,000 • Gathers wet gas from Victory Storage area and other • Constructed to service a single customer System Details MMBtu/d receipts for delivery into the Majorsville plant • ~300,000 MMBtu/d capacity • 21 miles of 8’, 12’ and 16’ pipe Line 1360 • Low pressure, 21 miles, 16 inch pipe ~88,000 • Gathers west gas from MarkWest Liberty System Compression • None MMBtu/d • Delivery into MarkWest Majorsville plant Line 1758 • Residue outlet, 4 miles, 16 inch pipe Receipt Points • Various producer delivery points across the system ~338,000 • Receives gas from Majorsville plant and Gibraltar MMBtu/d • Provides deliveries into TETCO / Nexus • TCO Delivery • Residue outlet Points TCO Meter • Equitrans • Delivers gas into Columbia Gas Line 1758 Contract Contract • Acreage Dedication with MVC component • Demand Based (w / ToP fee on Capacity) Summary Summary Source: Company filings and presentations. 32CMG System Summary (Cont’d) Majorsville System Description East Washington System Summary • The Majorsville system is located on top of core Marcellus wet gas • East Washington gathering system constructed to service a single drilling activity system producer (Ba2 / BB+) • Provides access to two processing plants • Take-or-pay demand based contract of 100,000 MMBtu/d, as well as an acreage dedication for the additional capacity of the system • Majorsville: Operated by MarkWest with 1.3 Bcf/d of processing capacity (additional 200 MMcf/d of capacity added • At Producer’s discretion, CMG would be obligated to add in 2018) compression to the system; Producer pays an incremental fee on • Ft. Beeler: Operated by Williams with 0.5 Bcf/d of capacity the rated capacity of the compression facility over a ten years • Four segments of pipe, including two wet gas gathering lines and • Tie-in gathering lines to new wells pads are built by the shipper two residue gas outlets from the Majorsville processing plants • Delivery points are TCO (Line 1570) and Equitrans, with the • Contracts in place with six different area producers, which have majority of volumes being delivered to Equitrans allowed the system to operate near capacity since 2017 • Producer recently came to an agreement with Equitrans for • A substantial portion of their volumes come from demand based additional takeaway from the area increasing optionality and contracts, which earn a take-or-pay fee on capacity, plus throughput for the gathering system incremental fees for actual throughput volumes Line 1758 • High pressure, 21 miles, 20 inch pipe • In service date: 2015 ~300,000 • Gathers wet gas from Victory Storage area and other • Constructed to service a single customer System Details MMBtu/d receipts for delivery into the Majorsville plant • ~300,000 MMBtu/d capacity • 21 miles of 8’, 12’ and 16’ pipe Line 1360 • Low pressure, 21 miles, 16 inch pipe ~88,000 • Gathers west gas from MarkWest Liberty System Compression • None MMBtu/d • Delivery into MarkWest Majorsville plant Line 1758 • Residue outlet, 4 miles, 16 inch pipe Receipt Points • Various producer delivery points across the system ~338,000 • Receives gas from Majorsville plant and Gibraltar MMBtu/d • Provides deliveries into TETCO / Nexus • TCO Delivery • Residue outlet Points TCO Meter • Equitrans • Delivers gas into Columbia Gas Line 1758 Contract Contract • Acreage Dedication with MVC component • Demand Based (w / ToP fee on Capacity) Summary Summary Source: Company filings and presentations. 32
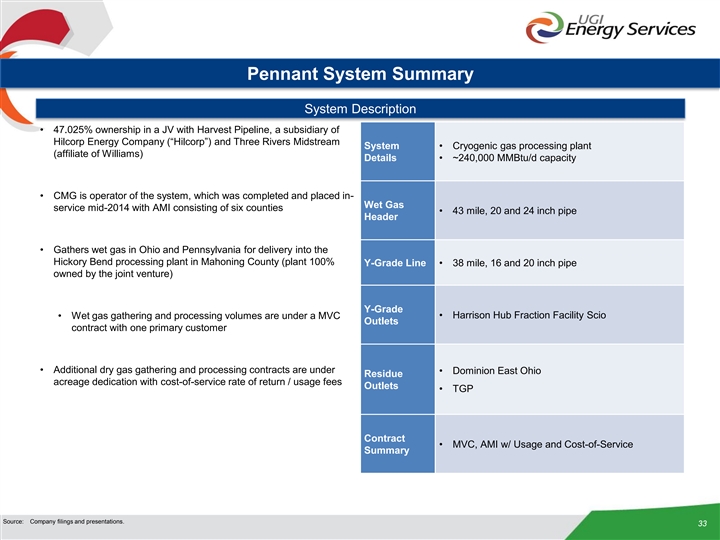
Pennant System Summary System Description • 47.025% ownership in a JV with Harvest Pipeline, a subsidiary of Hilcorp Energy Company (“Hilcorp”) and Three Rivers Midstream System • Cryogenic gas processing plant (affiliate of Williams) Details • ~240,000 MMBtu/d capacity • CMG is operator of the system, which was completed and placed in- Wet Gas service mid-2014 with AMI consisting of six counties • 43 mile, 20 and 24 inch pipe Header • Gathers wet gas in Ohio and Pennsylvania for delivery into the Hickory Bend processing plant in Mahoning County (plant 100% Y-Grade Line • 38 mile, 16 and 20 inch pipe owned by the joint venture) Y-Grade • Wet gas gathering and processing volumes are under a MVC • Harrison Hub Fraction Facility Scio Outlets contract with one primary customer • Additional dry gas gathering and processing contracts are under • Dominion East Ohio Residue acreage dedication with cost-of-service rate of return / usage fees Outlets • TGP Contract • MVC, AMI w/ Usage and Cost-of-Service Summary Source: Company filings and presentations. 33Pennant System Summary System Description • 47.025% ownership in a JV with Harvest Pipeline, a subsidiary of Hilcorp Energy Company (“Hilcorp”) and Three Rivers Midstream System • Cryogenic gas processing plant (affiliate of Williams) Details • ~240,000 MMBtu/d capacity • CMG is operator of the system, which was completed and placed in- Wet Gas service mid-2014 with AMI consisting of six counties • 43 mile, 20 and 24 inch pipe Header • Gathers wet gas in Ohio and Pennsylvania for delivery into the Hickory Bend processing plant in Mahoning County (plant 100% Y-Grade Line • 38 mile, 16 and 20 inch pipe owned by the joint venture) Y-Grade • Wet gas gathering and processing volumes are under a MVC • Harrison Hub Fraction Facility Scio Outlets contract with one primary customer • Additional dry gas gathering and processing contracts are under • Dominion East Ohio Residue acreage dedication with cost-of-service rate of return / usage fees Outlets • TGP Contract • MVC, AMI w/ Usage and Cost-of-Service Summary Source: Company filings and presentations. 33
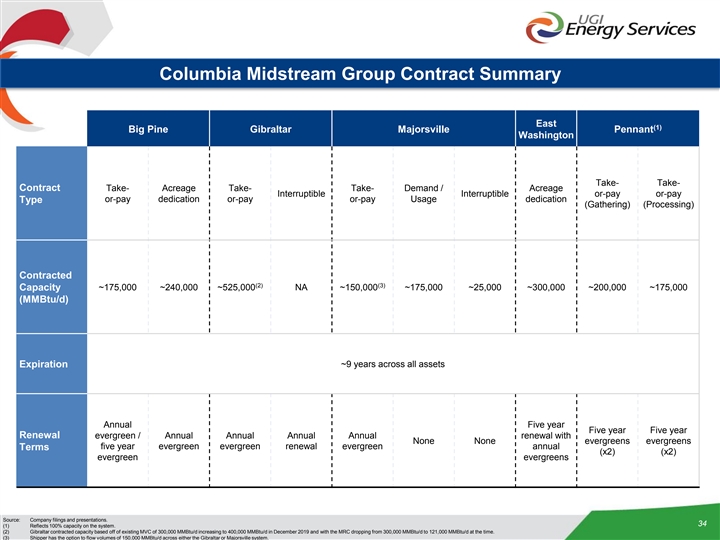
Columbia Midstream Group Contract Summary East (1) Big Pine Gibraltar Majorsville Pennant Washington Take- Take- Contract Take- Acreage Take- Take- Demand / Acreage Interruptible Interruptible or-pay or-pay or-pay dedication or-pay or-pay Usage dedication Type (Gathering) (Processing) Contracted (2) (3) ~175,000 ~240,000 ~525,000 NA ~150,000 ~175,000 ~25,000 ~300,000 ~200,000 ~175,000 Capacity (MMBtu/d) ~9 years across all assets Expiration Annual Five year Five year Five year Renewal evergreen / Annual Annual Annual Annual renewal with None None evergreens evergreens five year evergreen evergreen renewal evergreen annual Terms (x2) (x2) evergreen evergreens Source: Company filings and presentations. 34 (1) Reflects 100% capacity on the system. (2) Gibraltar contracted capacity based off of existing MVC of 300,000 MMBtu/d increasing to 400,000 MMBtu/d in December 2019 and with the MRC dropping from 300,000 MMBtu/d to 121,000 MMBtu/d at the time. (3) Shipper has the option to flow volumes of 150,000 MMBtu/d across either the Gibraltar or Majorsville system. Columbia Midstream Group Contract Summary East (1) Big Pine Gibraltar Majorsville Pennant Washington Take- Take- Contract Take- Acreage Take- Take- Demand / Acreage Interruptible Interruptible or-pay or-pay or-pay dedication or-pay or-pay Usage dedication Type (Gathering) (Processing) Contracted (2) (3) ~175,000 ~240,000 ~525,000 NA ~150,000 ~175,000 ~25,000 ~300,000 ~200,000 ~175,000 Capacity (MMBtu/d) ~9 years across all assets Expiration Annual Five year Five year Five year Renewal evergreen / Annual Annual Annual Annual renewal with None None evergreens evergreens five year evergreen evergreen renewal evergreen annual Terms (x2) (x2) evergreen evergreens Source: Company filings and presentations. 34 (1) Reflects 100% capacity on the system. (2) Gibraltar contracted capacity based off of existing MVC of 300,000 MMBtu/d increasing to 400,000 MMBtu/d in December 2019 and with the MRC dropping from 300,000 MMBtu/d to 121,000 MMBtu/d at the time. (3) Shipper has the option to flow volumes of 150,000 MMBtu/d across either the Gibraltar or Majorsville system.
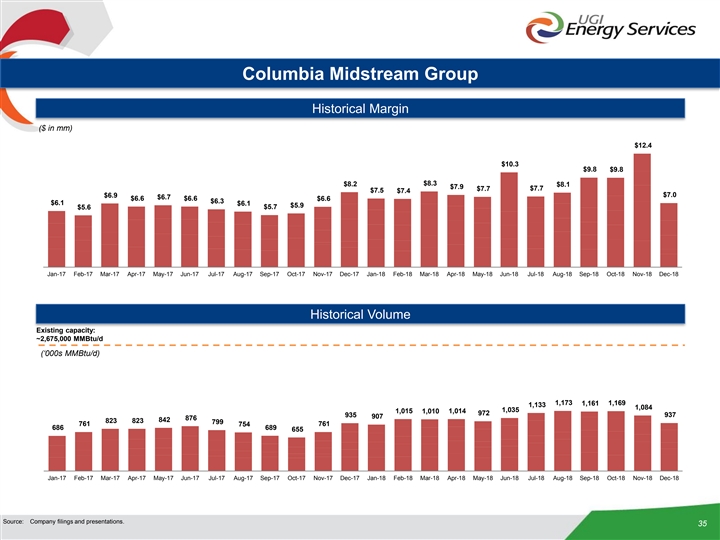
Columbia Midstream Group Historical Margin ($ in mm) $12.4 $10.3 $9.8 $9.8 $8.2 $8.3 $8.1 $7.9 $7.7 $7.7 $7.5 $7.4 $7.0 $6.9 $6.7 $6.6 $6.6 $6.6 $6.3 $6.1 $6.1 $5.9 $5.7 $5.6 Jan-17 Feb-17 Mar-17 Apr-17 May-17 Jun-17 Jul-17 Aug-17 Sep-17 Oct-17 Nov-17 Dec-17 Jan-18 Feb-18 Mar-18 Apr-18 May-18 Jun-18 Jul-18 Aug-18 Sep-18 Oct-18 Nov-18 Dec-18 Historical Volume Existing capacity: ~2,675,000 MMBtu/d (‘000s MMBtu/d) 1,173 1,169 1,161 1,133 1,084 1,035 1,015 1,014 1,010 972 935 937 907 876 842 823 823 799 761 761 754 686 689 655 Jan-17 Feb-17 Mar-17 Apr-17 May-17 Jun-17 Jul-17 Aug-17 Sep-17 Oct-17 Nov-17 Dec-17 Jan-18 Feb-18 Mar-18 Apr-18 May-18 Jun-18 Jul-18 Aug-18 Sep-18 Oct-18 Nov-18 Dec-18 Source: Company filings and presentations. 35Columbia Midstream Group Historical Margin ($ in mm) $12.4 $10.3 $9.8 $9.8 $8.2 $8.3 $8.1 $7.9 $7.7 $7.7 $7.5 $7.4 $7.0 $6.9 $6.7 $6.6 $6.6 $6.6 $6.3 $6.1 $6.1 $5.9 $5.7 $5.6 Jan-17 Feb-17 Mar-17 Apr-17 May-17 Jun-17 Jul-17 Aug-17 Sep-17 Oct-17 Nov-17 Dec-17 Jan-18 Feb-18 Mar-18 Apr-18 May-18 Jun-18 Jul-18 Aug-18 Sep-18 Oct-18 Nov-18 Dec-18 Historical Volume Existing capacity: ~2,675,000 MMBtu/d (‘000s MMBtu/d) 1,173 1,169 1,161 1,133 1,084 1,035 1,015 1,014 1,010 972 935 937 907 876 842 823 823 799 761 761 754 686 689 655 Jan-17 Feb-17 Mar-17 Apr-17 May-17 Jun-17 Jul-17 Aug-17 Sep-17 Oct-17 Nov-17 Dec-17 Jan-18 Feb-18 Mar-18 Apr-18 May-18 Jun-18 Jul-18 Aug-18 Sep-18 Oct-18 Nov-18 Dec-18 Source: Company filings and presentations. 35
UGI Energy Services Pro Forma 36UGI Energy Services Pro Forma 36
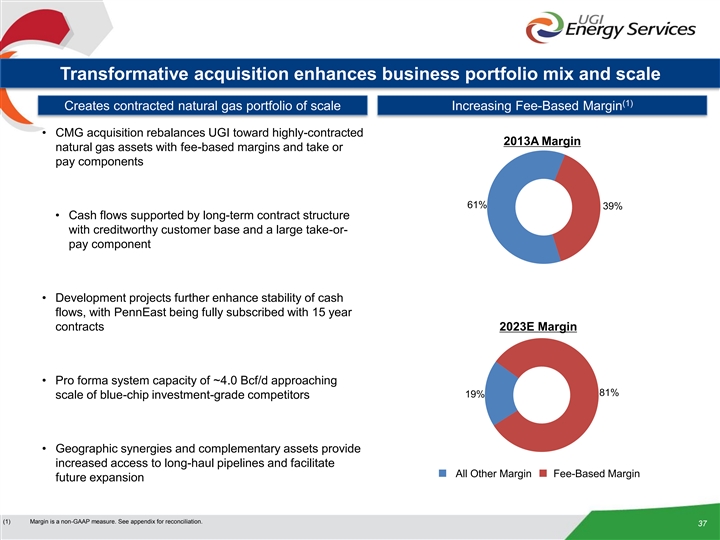
Transformative acquisition enhances business portfolio mix and scale (1) Creates contracted natural gas portfolio of scale Increasing Fee-Based Margin • CMG acquisition rebalances UGI toward highly-contracted 2013A Margin natural gas assets with fee-based margins and take or pay components 61% 39% • Cash flows supported by long-term contract structure with creditworthy customer base and a large take-or- pay component • Development projects further enhance stability of cash flows, with PennEast being fully subscribed with 15 year contracts 2023E Margin • Pro forma system capacity of ~4.0 Bcf/d approaching 81% 19% scale of blue-chip investment-grade competitors • Geographic synergies and complementary assets provide increased access to long-haul pipelines and facilitate All Other Margin Fee-Based Margin future expansion (1) Margin is a non-GAAP measure. See appendix for reconciliation. 37Transformative acquisition enhances business portfolio mix and scale (1) Creates contracted natural gas portfolio of scale Increasing Fee-Based Margin • CMG acquisition rebalances UGI toward highly-contracted 2013A Margin natural gas assets with fee-based margins and take or pay components 61% 39% • Cash flows supported by long-term contract structure with creditworthy customer base and a large take-or- pay component • Development projects further enhance stability of cash flows, with PennEast being fully subscribed with 15 year contracts 2023E Margin • Pro forma system capacity of ~4.0 Bcf/d approaching 81% 19% scale of blue-chip investment-grade competitors • Geographic synergies and complementary assets provide increased access to long-haul pipelines and facilitate All Other Margin Fee-Based Margin future expansion (1) Margin is a non-GAAP measure. See appendix for reconciliation. 37
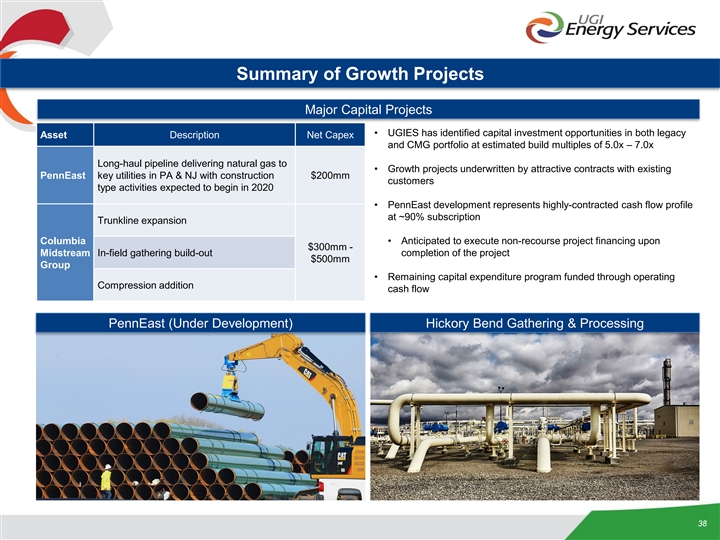
Summary of Growth Projects Major Capital Projects • UGIES has identified capital investment opportunities in both legacy Asset Description Net Capex and CMG portfolio at estimated build multiples of 5.0x – 7.0x Long-haul pipeline delivering natural gas to • Growth projects underwritten by attractive contracts with existing PennEast key utilities in PA & NJ with construction $200mm customers type activities expected to begin in 2020 • PennEast development represents highly-contracted cash flow profile at ~90% subscription Trunkline expansion Columbia • Anticipated to execute non-recourse project financing upon $300mm - Midstream In-field gathering build-out completion of the project $500mm Group • Remaining capital expenditure program funded through operating Compression addition cash flow PennEast (Under Development) Hickory Bend Gathering & Processing 38Summary of Growth Projects Major Capital Projects • UGIES has identified capital investment opportunities in both legacy Asset Description Net Capex and CMG portfolio at estimated build multiples of 5.0x – 7.0x Long-haul pipeline delivering natural gas to • Growth projects underwritten by attractive contracts with existing PennEast key utilities in PA & NJ with construction $200mm customers type activities expected to begin in 2020 • PennEast development represents highly-contracted cash flow profile at ~90% subscription Trunkline expansion Columbia • Anticipated to execute non-recourse project financing upon $300mm - Midstream In-field gathering build-out completion of the project $500mm Group • Remaining capital expenditure program funded through operating Compression addition cash flow PennEast (Under Development) Hickory Bend Gathering & Processing 38
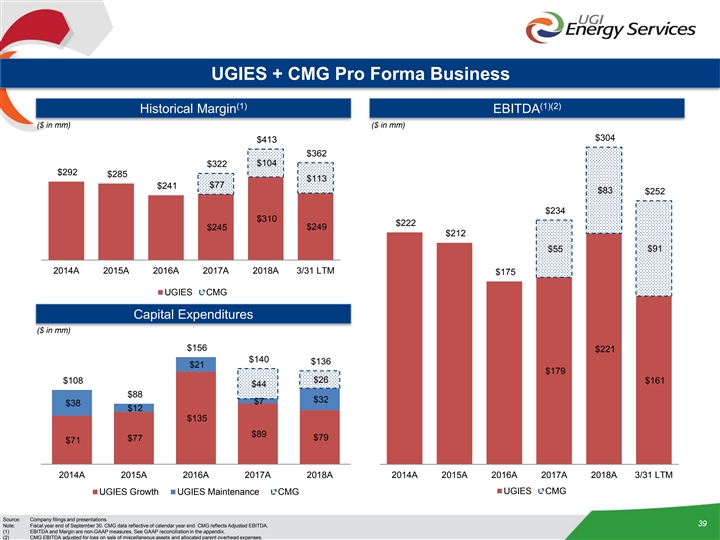
UGIES + CMG Pro Forma Business (1) (1)(2) Historical Margin EBITDA ($ in mm) ($ in mm) $304 $413 $362 $104 $322 $292 $285 $113 $77 $241 $83 $252 $234 $310 $222 $249 $245 $212 $55 $91 2014A 2015A 2016A 2017A 2018A 3/31 LTM $175 UGIES CMG Capital Expenditures ($ in mm) $156 $221 $140 $136 $21 $179 $26 $108 $161 $44 $88 $32 $7 $38 $12 $135 $89 $77 $79 $71 2014A 2015A 2016A 2017A 2018A 2014A 2015A 2016A 2017A 2018A 3/31 LTM UGIES CMG UGIES Growth UGIES Maintenance CMG Source: Company filings and presentations. 39 Note: Fiscal year end of September 30. CMG data reflective of calendar year end. CMG reflects Adjusted EBITDA. (1) EBITDA and Margin are non-GAAP measures. See GAAP reconciliation in the appendix. (2) CMG EBITDA adjusted for loss on sale of miscellaneous assets and allocated parent overhead expenses.UGIES + CMG Pro Forma Business (1) (1)(2) Historical Margin EBITDA ($ in mm) ($ in mm) $304 $413 $362 $104 $322 $292 $285 $113 $77 $241 $83 $252 $234 $310 $222 $249 $245 $212 $55 $91 2014A 2015A 2016A 2017A 2018A 3/31 LTM $175 UGIES CMG Capital Expenditures ($ in mm) $156 $221 $140 $136 $21 $179 $26 $108 $161 $44 $88 $32 $7 $38 $12 $135 $89 $77 $79 $71 2014A 2015A 2016A 2017A 2018A 2014A 2015A 2016A 2017A 2018A 3/31 LTM UGIES CMG UGIES Growth UGIES Maintenance CMG Source: Company filings and presentations. 39 Note: Fiscal year end of September 30. CMG data reflective of calendar year end. CMG reflects Adjusted EBITDA. (1) EBITDA and Margin are non-GAAP measures. See GAAP reconciliation in the appendix. (2) CMG EBITDA adjusted for loss on sale of miscellaneous assets and allocated parent overhead expenses.
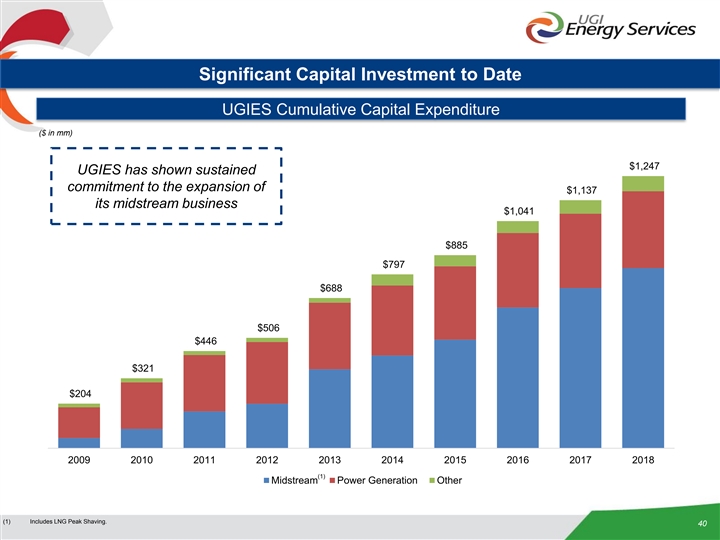
Significant Capital Investment to Date UGIES Cumulative Capital Expenditure ($ in mm) $1,247 UGIES has shown sustained commitment to the expansion of $1,137 its midstream business $1,041 $885 $797 $688 $506 $446 $321 $204 2009 2010 2011 2012 2013 2014 2015 2016 2017 2018 (1) Midstream Power Generation Other (1) Includes LNG Peak Shaving. 40Significant Capital Investment to Date UGIES Cumulative Capital Expenditure ($ in mm) $1,247 UGIES has shown sustained commitment to the expansion of $1,137 its midstream business $1,041 $885 $797 $688 $506 $446 $321 $204 2009 2010 2011 2012 2013 2014 2015 2016 2017 2018 (1) Midstream Power Generation Other (1) Includes LNG Peak Shaving. 40

3. Key Credit Highlights 413. Key Credit Highlights 41

Key Highlights Critical midstream infrastructure serving high-demand markets 1 Strategically located in the core regions of the Marcellus & Utica 2 Stable cash flows derived from long-term contracts with substantial take-or-pay component 3 Diverse customer base of high quality, well-capitalized producers and end users of scale 4 Low opening leverage when in comparison to industry peers 5 Strategic relationship with UGI family of companies 6 Experienced management team with proven track record 7 42Key Highlights Critical midstream infrastructure serving high-demand markets 1 Strategically located in the core regions of the Marcellus & Utica 2 Stable cash flows derived from long-term contracts with substantial take-or-pay component 3 Diverse customer base of high quality, well-capitalized producers and end users of scale 4 Low opening leverage when in comparison to industry peers 5 Strategic relationship with UGI family of companies 6 Experienced management team with proven track record 7 42

Critical midstream infrastructure serving high-demand markets 1 Asset Highlights Pro Forma Asset Footprint • UGIES pipelines serve some of the basin’s Storage Auburn largest public and private oil and gas producers Union Dale Marshlands Texas Creek • Legacy business provides dry gas gathering and storage services to key shippers in NE Pennant Pennsylvania • Critical gas supplier for LDCs serving large Mt. Ponderosa Big Pine Bethel population centers along the East Coast Sunbury • CMG acquisition diversifies into wet-gas Majorsville gathering and processing in SW Marcellus Penn East with attractive growth potential (Under Development) E. Washington • Midstream system functions as an intra-basin Storage Gibraltar Gas Processing transportation system, connecting critical pieces Power Plant of infrastructure LNG Peaking Facility • LNG peaking provides steady & predictable stream of cash flows with A-rated counterparty • Power generation assets include baseload capacity in the PJM market UGIES operates a diversified, integrated midstream platform with complementary businesses across the energy value chain Note: Orange color denotes UGIES owned assets, black denotes 3rd party assets 43Critical midstream infrastructure serving high-demand markets 1 Asset Highlights Pro Forma Asset Footprint • UGIES pipelines serve some of the basin’s Storage Auburn largest public and private oil and gas producers Union Dale Marshlands Texas Creek • Legacy business provides dry gas gathering and storage services to key shippers in NE Pennant Pennsylvania • Critical gas supplier for LDCs serving large Mt. Ponderosa Big Pine Bethel population centers along the East Coast Sunbury • CMG acquisition diversifies into wet-gas Majorsville gathering and processing in SW Marcellus Penn East with attractive growth potential (Under Development) E. Washington • Midstream system functions as an intra-basin Storage Gibraltar Gas Processing transportation system, connecting critical pieces Power Plant of infrastructure LNG Peaking Facility • LNG peaking provides steady & predictable stream of cash flows with A-rated counterparty • Power generation assets include baseload capacity in the PJM market UGIES operates a diversified, integrated midstream platform with complementary businesses across the energy value chain Note: Orange color denotes UGIES owned assets, black denotes 3rd party assets 43
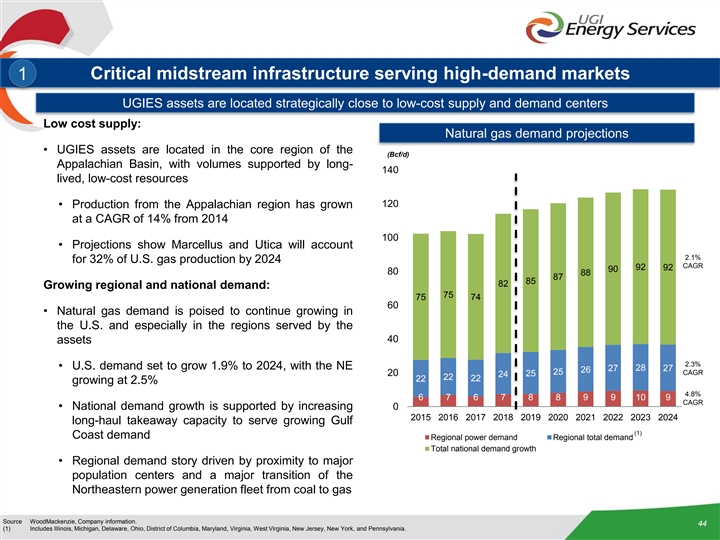
Critical midstream infrastructure serving high-demand markets 1 UGIES assets are located strategically close to low-cost supply and demand centers Low cost supply: Natural gas demand projections • UGIES assets are located in the core region of the (Bcf/d) Appalachian Basin, with volumes supported by long- 140 lived, low-cost resources 120 • Production from the Appalachian region has grown at a CAGR of 14% from 2014 100 • Projections show Marcellus and Utica will account 2.1% for 32% of U.S. gas production by 2024 CAGR 92 92 90 80 88 87 85 82 Growing regional and national demand: 75 75 74 60 • Natural gas demand is poised to continue growing in the U.S. and especially in the regions served by the 40 assets 2.3% • U.S. demand set to grow 1.9% to 2024, with the NE 27 28 27 26 25 CAGR 20 25 24 22 22 22 growing at 2.5% 4.8% 6 7 6 7 8 8 9 9 10 9 CAGR • National demand growth is supported by increasing 0 2015 2016 2017 2018 2019 2020 2021 2022 2023 2024 long-haul takeaway capacity to serve growing Gulf (1) Coast demand Regional power demand Regional total demand Total national demand growth • Regional demand story driven by proximity to major population centers and a major transition of the Northeastern power generation fleet from coal to gas Source WoodMackenzie, Company information. 44 (1) Includes Illinois, Michigan, Delaware, Ohio, District of Columbia, Maryland, Virginia, West Virginia, New Jersey, New York, and Pennsylvania.Critical midstream infrastructure serving high-demand markets 1 UGIES assets are located strategically close to low-cost supply and demand centers Low cost supply: Natural gas demand projections • UGIES assets are located in the core region of the (Bcf/d) Appalachian Basin, with volumes supported by long- 140 lived, low-cost resources 120 • Production from the Appalachian region has grown at a CAGR of 14% from 2014 100 • Projections show Marcellus and Utica will account 2.1% for 32% of U.S. gas production by 2024 CAGR 92 92 90 80 88 87 85 82 Growing regional and national demand: 75 75 74 60 • Natural gas demand is poised to continue growing in the U.S. and especially in the regions served by the 40 assets 2.3% • U.S. demand set to grow 1.9% to 2024, with the NE 27 28 27 26 25 CAGR 20 25 24 22 22 22 growing at 2.5% 4.8% 6 7 6 7 8 8 9 9 10 9 CAGR • National demand growth is supported by increasing 0 2015 2016 2017 2018 2019 2020 2021 2022 2023 2024 long-haul takeaway capacity to serve growing Gulf (1) Coast demand Regional power demand Regional total demand Total national demand growth • Regional demand story driven by proximity to major population centers and a major transition of the Northeastern power generation fleet from coal to gas Source WoodMackenzie, Company information. 44 (1) Includes Illinois, Michigan, Delaware, Ohio, District of Columbia, Maryland, Virginia, West Virginia, New Jersey, New York, and Pennsylvania.
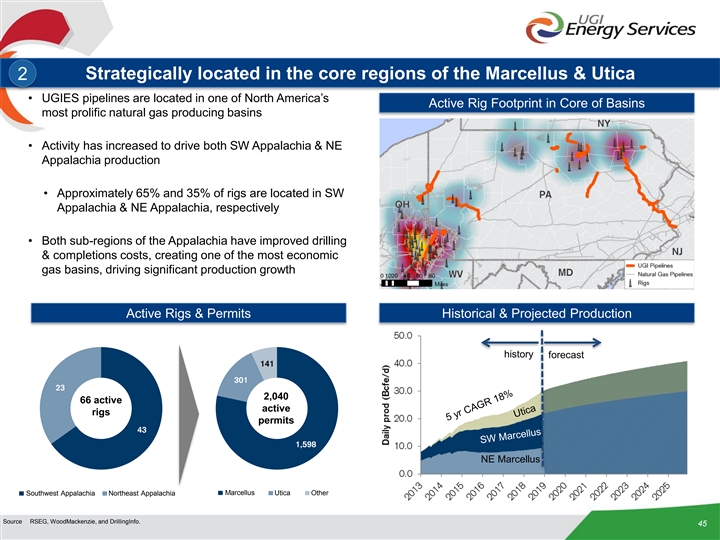
Strategically located in the core regions of the Marcellus & Utica 2 • UGIES pipelines are located in one of North America’s Active Rig Footprint in Core of Basins most prolific natural gas producing basins • Activity has increased to drive both SW Appalachia & NE Appalachia production • Approximately 65% and 35% of rigs are located in SW Appalachia & NE Appalachia, respectively • Both sub-regions of the Appalachia have improved drilling & completions costs, creating one of the most economic gas basins, driving significant production growth Active Rigs & Permits Historical & Projected Production history forecast 141 301 23 2,040 66 active active rigs permits 43 1,598 NE Marcellus Marcellus Utica Other Southwest Appalachia Northeast Appalachia Marcellus Utica Marcellus Utica Other Source RSEG, WoodMackenzie, and DrillingInfo. 45Strategically located in the core regions of the Marcellus & Utica 2 • UGIES pipelines are located in one of North America’s Active Rig Footprint in Core of Basins most prolific natural gas producing basins • Activity has increased to drive both SW Appalachia & NE Appalachia production • Approximately 65% and 35% of rigs are located in SW Appalachia & NE Appalachia, respectively • Both sub-regions of the Appalachia have improved drilling & completions costs, creating one of the most economic gas basins, driving significant production growth Active Rigs & Permits Historical & Projected Production history forecast 141 301 23 2,040 66 active active rigs permits 43 1,598 NE Marcellus Marcellus Utica Other Southwest Appalachia Northeast Appalachia Marcellus Utica Marcellus Utica Other Source RSEG, WoodMackenzie, and DrillingInfo. 45
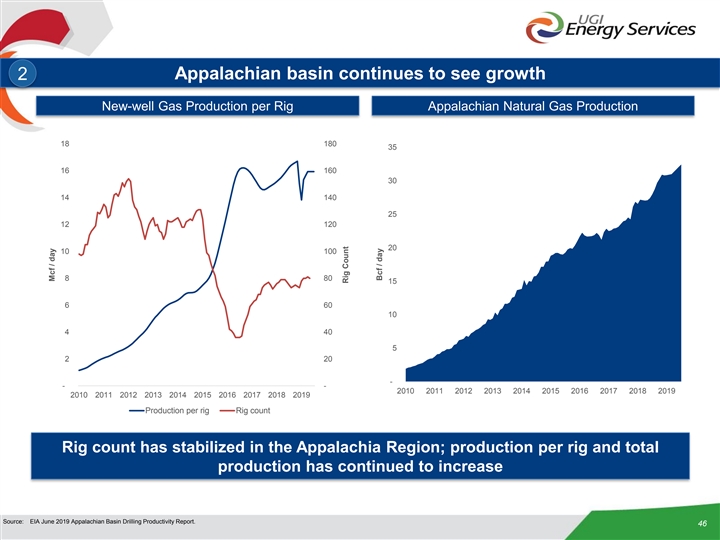
Appalachian basin continues to see growth 2 New-well Gas Production per Rig Appalachian Natural Gas Production 18 180 35 16 160 30 14 140 25 12 120 20 10 100 8 80 15 6 60 10 4 40 5 2 20 - - - 2010 2011 2012 2013 2014 2015 2016 2017 2018 2019 2010 2011 2012 2013 2014 2015 2016 2017 2018 2019 Production per rig Rig count Rig count has stabilized in the Appalachia Region; production per rig and total production has continued to increase Source: EIA June 2019 Appalachian Basin Drilling Productivity Report. 46 Mcf / day Rig Count Bcf / dayAppalachian basin continues to see growth 2 New-well Gas Production per Rig Appalachian Natural Gas Production 18 180 35 16 160 30 14 140 25 12 120 20 10 100 8 80 15 6 60 10 4 40 5 2 20 - - - 2010 2011 2012 2013 2014 2015 2016 2017 2018 2019 2010 2011 2012 2013 2014 2015 2016 2017 2018 2019 Production per rig Rig count Rig count has stabilized in the Appalachia Region; production per rig and total production has continued to increase Source: EIA June 2019 Appalachian Basin Drilling Productivity Report. 46 Mcf / day Rig Count Bcf / day

Stable cash flows derived from long-term contracts with take-or-pay component 3 (1) Cash Flow Highlights Pro Forma Take or Pay Margin Expect greater future Pro Forma • UGIES operates a diverse asset portfolio with limited ToP take-or-pay contribution 54% direct commodity exposure from: • Columbia Midstream Group average remaining contract • Contracted growth life of ~9 years, with UGIES remaining average contract projects life of ~18 years • MVC step-ups with • Stable base business supports leverage profile existing customers Merchant & • Growth and expansion plans are underpinned by take- • Increased demand for Other or-pay contract component 46% LNG capacity (2) Stable Margin Performance During Volatile Commodity Price Environment $310 $292 $285 $249 $245 $241 (7%) CAGR since Q1 2009 $164 $6.48/MMBtu $137 $135 $130 $126 $2.14/MMBtu 2009 2010 2011 2012 2013 2014 2015 2016 2017 2018 3/31 LTM (2) Midstream Commodity Marketing Power Generation TETCO M3 Spot Price (1) Represents weighted average ToP percentage based on ~50% of UGIES $249mm LTM margin and 64% of CMG $113mm LTM margin. 47 (2) Includes LNG / Peak Shaving. Margin is a non-GAAP measure. See GAAP reconciliation in the appendix.Stable cash flows derived from long-term contracts with take-or-pay component 3 (1) Cash Flow Highlights Pro Forma Take or Pay Margin Expect greater future Pro Forma • UGIES operates a diverse asset portfolio with limited ToP take-or-pay contribution 54% direct commodity exposure from: • Columbia Midstream Group average remaining contract • Contracted growth life of ~9 years, with UGIES remaining average contract projects life of ~18 years • MVC step-ups with • Stable base business supports leverage profile existing customers Merchant & • Growth and expansion plans are underpinned by take- • Increased demand for Other or-pay contract component 46% LNG capacity (2) Stable Margin Performance During Volatile Commodity Price Environment $310 $292 $285 $249 $245 $241 (7%) CAGR since Q1 2009 $164 $6.48/MMBtu $137 $135 $130 $126 $2.14/MMBtu 2009 2010 2011 2012 2013 2014 2015 2016 2017 2018 3/31 LTM (2) Midstream Commodity Marketing Power Generation TETCO M3 Spot Price (1) Represents weighted average ToP percentage based on ~50% of UGIES $249mm LTM margin and 64% of CMG $113mm LTM margin. 47 (2) Includes LNG / Peak Shaving. Margin is a non-GAAP measure. See GAAP reconciliation in the appendix.
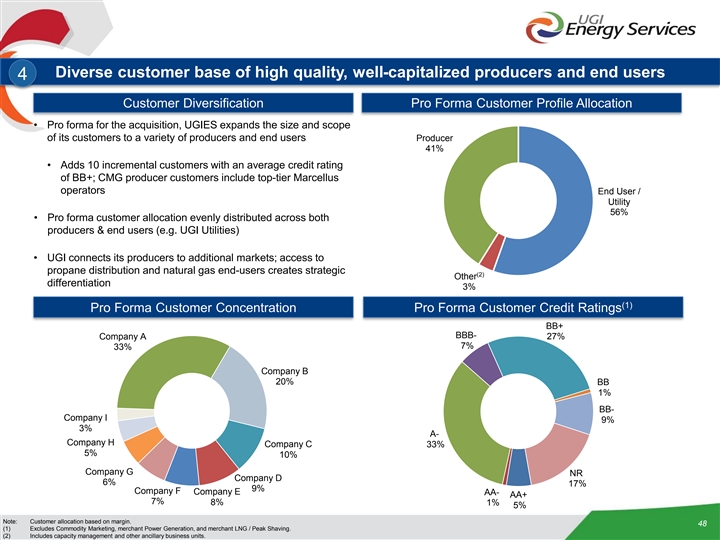
Diverse customer base of high quality, well-capitalized producers and end users 4 Customer Diversification Pro Forma Customer Profile Allocation • Pro forma for the acquisition, UGIES expands the size and scope of its customers to a variety of producers and end users Producer 41% • Adds 10 incremental customers with an average credit rating of BB+; CMG producer customers include top-tier Marcellus operators End User / Utility 56% • Pro forma customer allocation evenly distributed across both producers & end users (e.g. UGI Utilities) • UGI connects its producers to additional markets; access to propane distribution and natural gas end-users creates strategic (2) Other differentiation 3% (1) Pro Forma Customer Concentration Pro Forma Customer Credit Ratings BB+ BBB- 27% Company A 7% 33% Company B 20% BB 1% BB- Company I 9% 3% A- Company H Company C 33% 5% 10% Company G NR Company D 6% 17% 9% Company F Company E AA- AA+ 7% 8% 1% 5% Note: Customer allocation based on margin. 48 (1) Excludes Commodity Marketing, merchant Power Generation, and merchant LNG / Peak Shaving. (2) Includes capacity management and other ancillary business units.Diverse customer base of high quality, well-capitalized producers and end users 4 Customer Diversification Pro Forma Customer Profile Allocation • Pro forma for the acquisition, UGIES expands the size and scope of its customers to a variety of producers and end users Producer 41% • Adds 10 incremental customers with an average credit rating of BB+; CMG producer customers include top-tier Marcellus operators End User / Utility 56% • Pro forma customer allocation evenly distributed across both producers & end users (e.g. UGI Utilities) • UGI connects its producers to additional markets; access to propane distribution and natural gas end-users creates strategic (2) Other differentiation 3% (1) Pro Forma Customer Concentration Pro Forma Customer Credit Ratings BB+ BBB- 27% Company A 7% 33% Company B 20% BB 1% BB- Company I 9% 3% A- Company H Company C 33% 5% 10% Company G NR Company D 6% 17% 9% Company F Company E AA- AA+ 7% 8% 1% 5% Note: Customer allocation based on margin. 48 (1) Excludes Commodity Marketing, merchant Power Generation, and merchant LNG / Peak Shaving. (2) Includes capacity management and other ancillary business units.
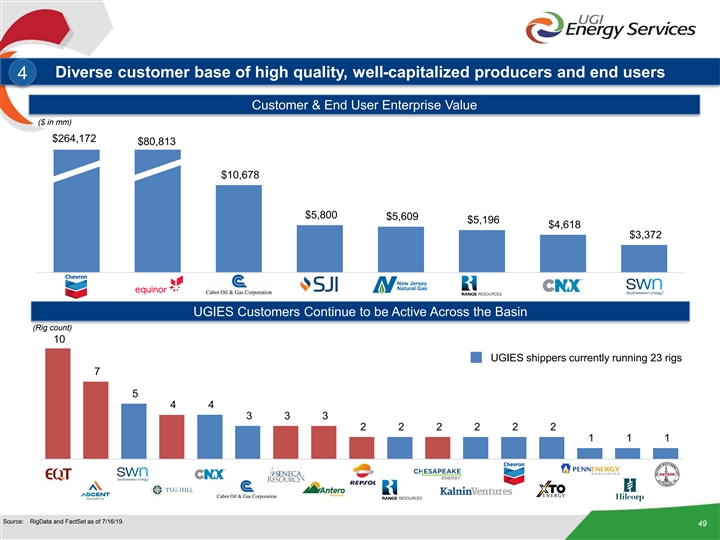
Diverse customer base of high quality, well-capitalized producers and end users 4 Customer & End User Enterprise Value ($ in mm) $264,172 $80,813 $10,678 $5,800 $5,609 $5,196 $4,618 $3,372 CVX EQNR COG SJI NJR RRC CNX SWN UGIES Customers Continue to be Active Across the Basin (Rig count) 10 UGIES shippers currently running 23 rigs 7 5 4 4 3 3 3 2 2 2 2 2 2 1 1 1 EQT ASC SWN Tug CNX COG Sen Ant REP RRC CHK BKV Chev XTO PENN HIL SNY Source: RigData and FactSet as of 7/16/19. 49Diverse customer base of high quality, well-capitalized producers and end users 4 Customer & End User Enterprise Value ($ in mm) $264,172 $80,813 $10,678 $5,800 $5,609 $5,196 $4,618 $3,372 CVX EQNR COG SJI NJR RRC CNX SWN UGIES Customers Continue to be Active Across the Basin (Rig count) 10 UGIES shippers currently running 23 rigs 7 5 4 4 3 3 3 2 2 2 2 2 2 1 1 1 EQT ASC SWN Tug CNX COG Sen Ant REP RRC CHK BKV Chev XTO PENN HIL SNY Source: RigData and FactSet as of 7/16/19. 49
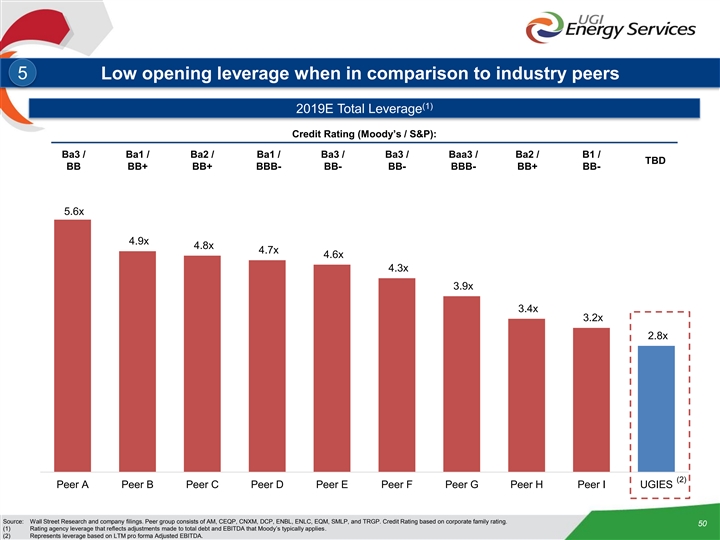
5 Low opening leverage when in comparison to industry peers (1) 2019E Total Leverage Credit Rating (Moody’s / S&P): Ba3 / Ba1 / Ba2 / Ba1 / Ba3 / Ba3 / Baa3 / Ba2 / B1 / TBD BB BB+ BB+ BBB- BB- BB- BBB- BB+ BB- 5.6x 4.9x 4.8x 4.7x 4.6x 4.3x 3.9x 3.4x 3.2x 2.8x (2) Peer A Peer B Peer C Peer D Peer E Peer F Peer G Peer H Peer I UGIES Source: Wall Street Research and company filings. Peer group consists of AM, CEQP, CNXM, DCP, ENBL, ENLC, EQM, SMLP, and TRGP. Credit Rating based on corporate family rating. 50 (1) Rating agency leverage that reflects adjustments made to total debt and EBITDA that Moody’s typically applies. (2) Represents leverage based on LTM pro forma Adjusted EBITDA.5 Low opening leverage when in comparison to industry peers (1) 2019E Total Leverage Credit Rating (Moody’s / S&P): Ba3 / Ba1 / Ba2 / Ba1 / Ba3 / Ba3 / Baa3 / Ba2 / B1 / TBD BB BB+ BB+ BBB- BB- BB- BBB- BB+ BB- 5.6x 4.9x 4.8x 4.7x 4.6x 4.3x 3.9x 3.4x 3.2x 2.8x (2) Peer A Peer B Peer C Peer D Peer E Peer F Peer G Peer H Peer I UGIES Source: Wall Street Research and company filings. Peer group consists of AM, CEQP, CNXM, DCP, ENBL, ENLC, EQM, SMLP, and TRGP. Credit Rating based on corporate family rating. 50 (1) Rating agency leverage that reflects adjustments made to total debt and EBITDA that Moody’s typically applies. (2) Represents leverage based on LTM pro forma Adjusted EBITDA.
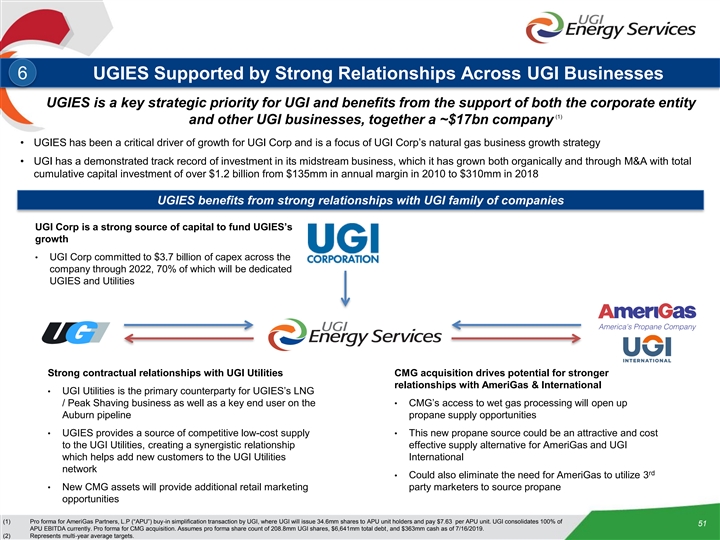
6 UGIES Supported by Strong Relationships Across UGI Businesses UGIES is a key strategic priority for UGI and benefits from the support of both the corporate entity (1) and other UGI businesses, together a ~$17bn company • UGIES has been a critical driver of growth for UGI Corp and is a focus of UGI Corp’s natural gas business growth strategy • UGI has a demonstrated track record of investment in its midstream business, which it has grown both organically and through M&A with total cumulative capital investment of over $1.2 billion from $135mm in annual margin in 2010 to $310mm in 2018 UGIES benefits from strong relationships with UGI family of companies UGI Corp is a strong source of capital to fund UGIES’s growth • UGI Corp committed to $3.7 billion of capex across the company through 2022, 70% of which will be dedicated UGIES and Utilities Strong contractual relationships with UGI Utilities CMG acquisition drives potential for stronger relationships with AmeriGas & International • UGI Utilities is the primary counterparty for UGIES’s LNG / Peak Shaving business as well as a key end user on the • CMG’s access to wet gas processing will open up Auburn pipeline propane supply opportunities • UGIES provides a source of competitive low-cost supply • This new propane source could be an attractive and cost to the UGI Utilities, creating a synergistic relationship effective supply alternative for AmeriGas and UGI which helps add new customers to the UGI Utilities International network rd • Could also eliminate the need for AmeriGas to utilize 3 • New CMG assets will provide additional retail marketing party marketers to source propane opportunities (1) Pro forma for AmeriGas Partners, L.P (“APU”) buy-in simplification transaction by UGI, where UGI will issue 34.6mm shares to APU unit holders and pay $7.63 per APU unit. UGI consolidates 100% of 51 APU EBITDA currently. Pro forma for CMG acquisition. Assumes pro forma share count of 208.8mm UGI shares, $6,641mm total debt, and $363mm cash as of 7/16/2019. (2) Represents multi-year average targets.6 UGIES Supported by Strong Relationships Across UGI Businesses UGIES is a key strategic priority for UGI and benefits from the support of both the corporate entity (1) and other UGI businesses, together a ~$17bn company • UGIES has been a critical driver of growth for UGI Corp and is a focus of UGI Corp’s natural gas business growth strategy • UGI has a demonstrated track record of investment in its midstream business, which it has grown both organically and through M&A with total cumulative capital investment of over $1.2 billion from $135mm in annual margin in 2010 to $310mm in 2018 UGIES benefits from strong relationships with UGI family of companies UGI Corp is a strong source of capital to fund UGIES’s growth • UGI Corp committed to $3.7 billion of capex across the company through 2022, 70% of which will be dedicated UGIES and Utilities Strong contractual relationships with UGI Utilities CMG acquisition drives potential for stronger relationships with AmeriGas & International • UGI Utilities is the primary counterparty for UGIES’s LNG / Peak Shaving business as well as a key end user on the • CMG’s access to wet gas processing will open up Auburn pipeline propane supply opportunities • UGIES provides a source of competitive low-cost supply • This new propane source could be an attractive and cost to the UGI Utilities, creating a synergistic relationship effective supply alternative for AmeriGas and UGI which helps add new customers to the UGI Utilities International network rd • Could also eliminate the need for AmeriGas to utilize 3 • New CMG assets will provide additional retail marketing party marketers to source propane opportunities (1) Pro forma for AmeriGas Partners, L.P (“APU”) buy-in simplification transaction by UGI, where UGI will issue 34.6mm shares to APU unit holders and pay $7.63 per APU unit. UGI consolidates 100% of 51 APU EBITDA currently. Pro forma for CMG acquisition. Assumes pro forma share count of 208.8mm UGI shares, $6,641mm total debt, and $363mm cash as of 7/16/2019. (2) Represents multi-year average targets.
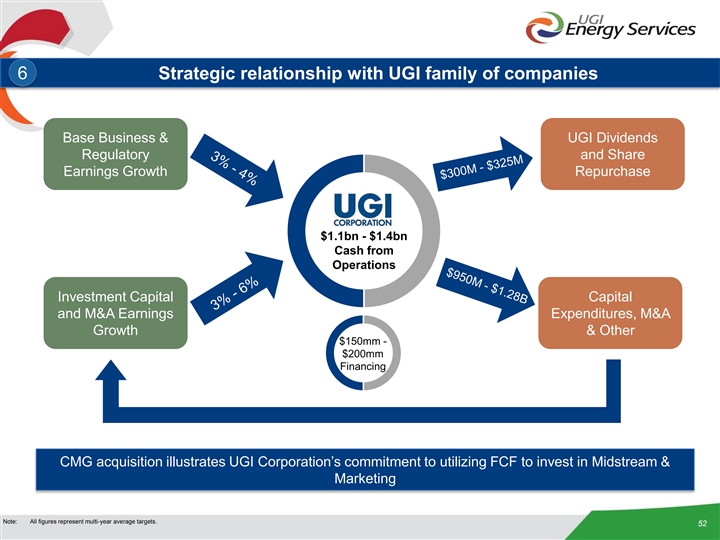
6 Strategic relationship with UGI family of companies Base Business & UGI Dividends Regulatory and Share Earnings Growth Repurchase $1.1bn - $1.4bn Cash from Operations Investment Capital Capital and M&A Earnings Expenditures, M&A Growth & Other $150mm - $200mm Financing CMG acquisition illustrates UGI Corporation’s commitment to utilizing FCF to invest in Midstream & Marketing Note: All figures represent multi-year average targets. 526 Strategic relationship with UGI family of companies Base Business & UGI Dividends Regulatory and Share Earnings Growth Repurchase $1.1bn - $1.4bn Cash from Operations Investment Capital Capital and M&A Earnings Expenditures, M&A Growth & Other $150mm - $200mm Financing CMG acquisition illustrates UGI Corporation’s commitment to utilizing FCF to invest in Midstream & Marketing Note: All figures represent multi-year average targets. 52
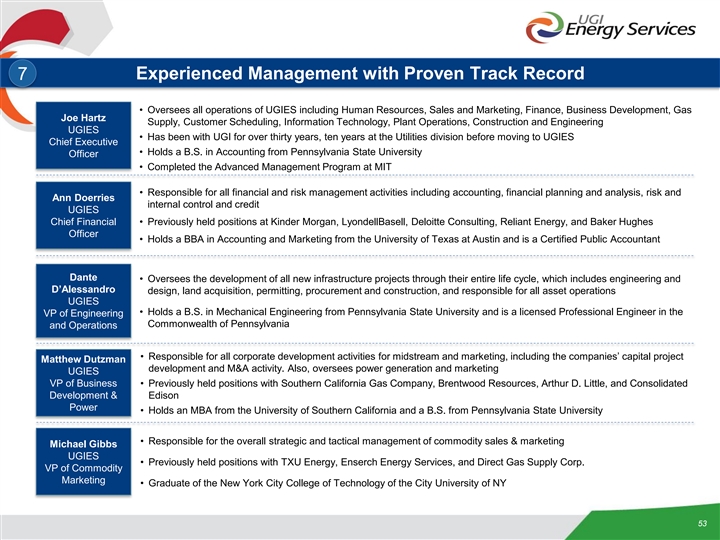
Experienced Management with Proven Track Record 7 • Oversees all operations of UGIES including Human Resources, Sales and Marketing, Finance, Business Development, Gas Joe Hartz Supply, Customer Scheduling, Information Technology, Plant Operations, Construction and Engineering UGIES • Has been with UGI for over thirty years, ten years at the Utilities division before moving to UGIES Chief Executive • Holds a B.S. in Accounting from Pennsylvania State University Officer • Completed the Advanced Management Program at MIT • Responsible for all financial and risk management activities including accounting, financial planning and analysis, risk and Ann Doerries internal control and credit UGIES Chief Financial • Previously held positions at Kinder Morgan, LyondellBasell, Deloitte Consulting, Reliant Energy, and Baker Hughes Officer • Holds a BBA in Accounting and Marketing from the University of Texas at Austin and is a Certified Public Accountant Dante • Oversees the development of all new infrastructure projects through their entire life cycle, which includes engineering and D’Alessandro design, land acquisition, permitting, procurement and construction, and responsible for all asset operations UGIES • Holds a B.S. in Mechanical Engineering from Pennsylvania State University and is a licensed Professional Engineer in the VP of Engineering Commonwealth of Pennsylvania and Operations • Responsible for all corporate development activities for midstream and marketing, including the companies’ capital project Matthew Dutzman development and M&A activity. Also, oversees power generation and marketing UGIES VP of Business • Previously held positions with Southern California Gas Company, Brentwood Resources, Arthur D. Little, and Consolidated Development & Edison Power • Holds an MBA from the University of Southern California and a B.S. from Pennsylvania State University • Responsible for the overall strategic and tactical management of commodity sales & marketing Michael Gibbs UGIES • Previously held positions with TXU Energy, Enserch Energy Services, and Direct Gas Supply Corp. VP of Commodity Marketing • Graduate of the New York City College of Technology of the City University of NY 53Experienced Management with Proven Track Record 7 • Oversees all operations of UGIES including Human Resources, Sales and Marketing, Finance, Business Development, Gas Joe Hartz Supply, Customer Scheduling, Information Technology, Plant Operations, Construction and Engineering UGIES • Has been with UGI for over thirty years, ten years at the Utilities division before moving to UGIES Chief Executive • Holds a B.S. in Accounting from Pennsylvania State University Officer • Completed the Advanced Management Program at MIT • Responsible for all financial and risk management activities including accounting, financial planning and analysis, risk and Ann Doerries internal control and credit UGIES Chief Financial • Previously held positions at Kinder Morgan, LyondellBasell, Deloitte Consulting, Reliant Energy, and Baker Hughes Officer • Holds a BBA in Accounting and Marketing from the University of Texas at Austin and is a Certified Public Accountant Dante • Oversees the development of all new infrastructure projects through their entire life cycle, which includes engineering and D’Alessandro design, land acquisition, permitting, procurement and construction, and responsible for all asset operations UGIES • Holds a B.S. in Mechanical Engineering from Pennsylvania State University and is a licensed Professional Engineer in the VP of Engineering Commonwealth of Pennsylvania and Operations • Responsible for all corporate development activities for midstream and marketing, including the companies’ capital project Matthew Dutzman development and M&A activity. Also, oversees power generation and marketing UGIES VP of Business • Previously held positions with Southern California Gas Company, Brentwood Resources, Arthur D. Little, and Consolidated Development & Edison Power • Holds an MBA from the University of Southern California and a B.S. from Pennsylvania State University • Responsible for the overall strategic and tactical management of commodity sales & marketing Michael Gibbs UGIES • Previously held positions with TXU Energy, Enserch Energy Services, and Direct Gas Supply Corp. VP of Commodity Marketing • Graduate of the New York City College of Technology of the City University of NY 53
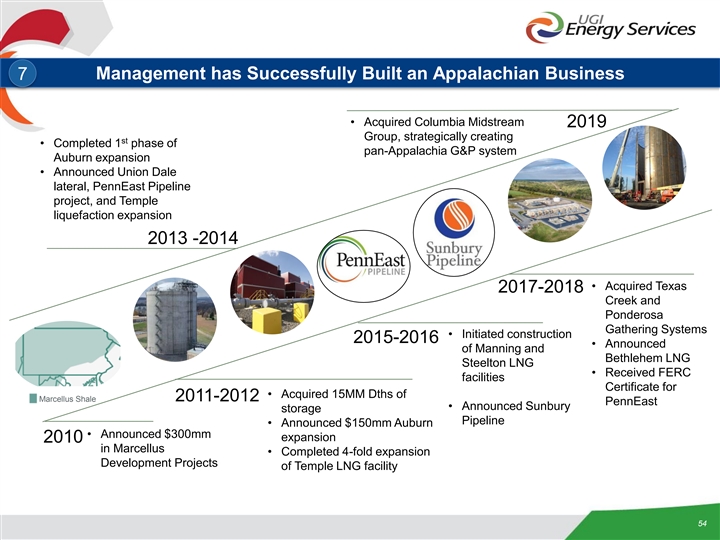
Management has Successfully Built an Appalachian Business 7 • Acquired Columbia Midstream 2019 Group, strategically creating st • Completed 1 phase of pan-Appalachia G&P system Auburn expansion • Announced Union Dale lateral, PennEast Pipeline project, and Temple liquefaction expansion 2013 -2014 • Acquired Texas 2017-2018 Creek and Ponderosa Gathering Systems • Initiated construction 2015-2016 • Announced of Manning and Bethlehem LNG Steelton LNG • Received FERC facilities Certificate for • Acquired 15MM Dths of 2011-2012 Marcellus Shale PennEast • Announced Sunbury storage Pipeline • Announced $150mm Auburn • Announced $300mm expansion 2010 in Marcellus • Completed 4-fold expansion Development Projects of Temple LNG facility 54Management has Successfully Built an Appalachian Business 7 • Acquired Columbia Midstream 2019 Group, strategically creating st • Completed 1 phase of pan-Appalachia G&P system Auburn expansion • Announced Union Dale lateral, PennEast Pipeline project, and Temple liquefaction expansion 2013 -2014 • Acquired Texas 2017-2018 Creek and Ponderosa Gathering Systems • Initiated construction 2015-2016 • Announced of Manning and Bethlehem LNG Steelton LNG • Received FERC facilities Certificate for • Acquired 15MM Dths of 2011-2012 Marcellus Shale PennEast • Announced Sunbury storage Pipeline • Announced $150mm Auburn • Announced $300mm expansion 2010 in Marcellus • Completed 4-fold expansion Development Projects of Temple LNG facility 54
4. Syndication Details 554. Syndication Details 55
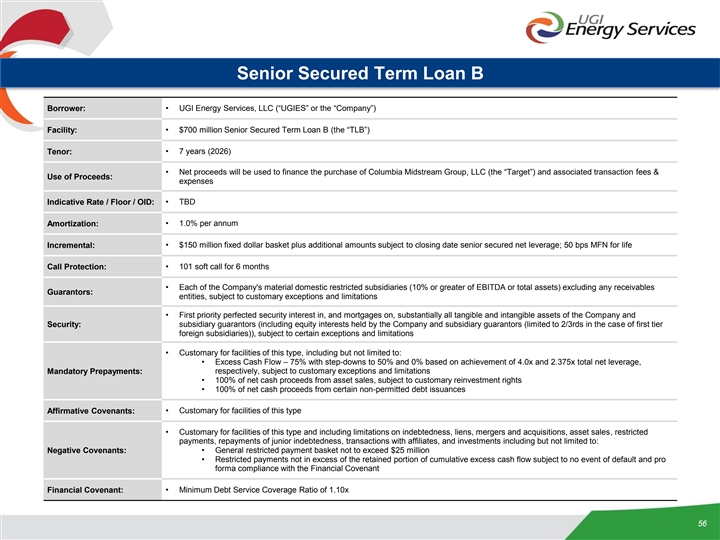
Senior Secured Term Loan B Borrower: • UGI Energy Services, LLC (“UGIES” or the “Company”) Facility: • $700 million Senior Secured Term Loan B (the “TLB”) Tenor: • 7 years (2026) • Net proceeds will be used to finance the purchase of Columbia Midstream Group, LLC (the “Target”) and associated transaction fees & Use of Proceeds: expenses Indicative Rate / Floor / OID: • TBD Amortization: • 1.0% per annum Incremental: • $150 million fixed dollar basket plus additional amounts subject to closing date senior secured net leverage; 50 bps MFN for life • 101 soft call for 6 months Call Protection: • Each of the Company's material domestic restricted subsidiaries (10% or greater of EBITDA or total assets) excluding any receivables Guarantors: entities, subject to customary exceptions and limitations • First priority perfected security interest in, and mortgages on, substantially all tangible and intangible assets of the Company and Security: subsidiary guarantors (including equity interests held by the Company and subsidiary guarantors (limited to 2/3rds in the case of first tier foreign subsidiaries)), subject to certain exceptions and limitations • Customary for facilities of this type, including but not limited to: • Excess Cash Flow – 75% with step-downs to 50% and 0% based on achievement of 4.0x and 2.375x total net leverage, Mandatory Prepayments: respectively, subject to customary exceptions and limitations • 100% of net cash proceeds from asset sales, subject to customary reinvestment rights • 100% of net cash proceeds from certain non-permitted debt issuances • Customary for facilities of this type Affirmative Covenants: • Customary for facilities of this type and including limitations on indebtedness, liens, mergers and acquisitions, asset sales, restricted payments, repayments of junior indebtedness, transactions with affiliates, and investments including but not limited to: Negative Covenants: • General restricted payment basket not to exceed $25 million • Restricted payments not in excess of the retained portion of cumulative excess cash flow subject to no event of default and pro forma compliance with the Financial Covenant Financial Covenant: • Minimum Debt Service Coverage Ratio of 1.10x 56Senior Secured Term Loan B Borrower: • UGI Energy Services, LLC (“UGIES” or the “Company”) Facility: • $700 million Senior Secured Term Loan B (the “TLB”) Tenor: • 7 years (2026) • Net proceeds will be used to finance the purchase of Columbia Midstream Group, LLC (the “Target”) and associated transaction fees & Use of Proceeds: expenses Indicative Rate / Floor / OID: • TBD Amortization: • 1.0% per annum Incremental: • $150 million fixed dollar basket plus additional amounts subject to closing date senior secured net leverage; 50 bps MFN for life • 101 soft call for 6 months Call Protection: • Each of the Company's material domestic restricted subsidiaries (10% or greater of EBITDA or total assets) excluding any receivables Guarantors: entities, subject to customary exceptions and limitations • First priority perfected security interest in, and mortgages on, substantially all tangible and intangible assets of the Company and Security: subsidiary guarantors (including equity interests held by the Company and subsidiary guarantors (limited to 2/3rds in the case of first tier foreign subsidiaries)), subject to certain exceptions and limitations • Customary for facilities of this type, including but not limited to: • Excess Cash Flow – 75% with step-downs to 50% and 0% based on achievement of 4.0x and 2.375x total net leverage, Mandatory Prepayments: respectively, subject to customary exceptions and limitations • 100% of net cash proceeds from asset sales, subject to customary reinvestment rights • 100% of net cash proceeds from certain non-permitted debt issuances • Customary for facilities of this type Affirmative Covenants: • Customary for facilities of this type and including limitations on indebtedness, liens, mergers and acquisitions, asset sales, restricted payments, repayments of junior indebtedness, transactions with affiliates, and investments including but not limited to: Negative Covenants: • General restricted payment basket not to exceed $25 million • Restricted payments not in excess of the retained portion of cumulative excess cash flow subject to no event of default and pro forma compliance with the Financial Covenant Financial Covenant: • Minimum Debt Service Coverage Ratio of 1.10x 56
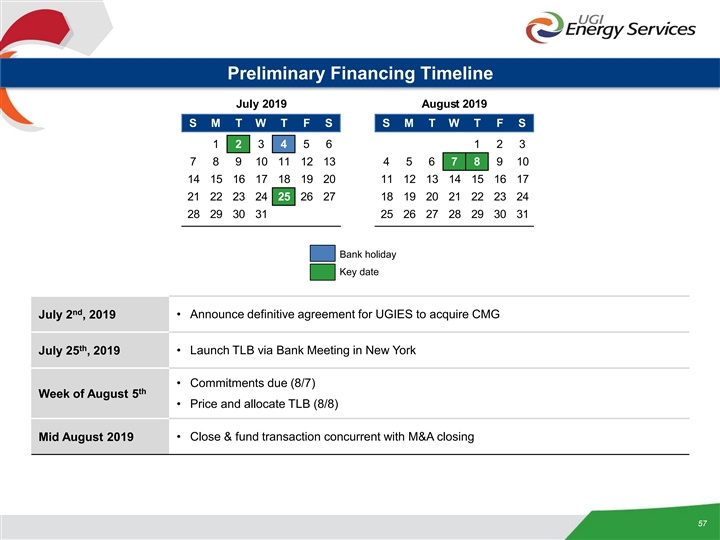
Preliminary Financing Timeline July 2019 August 2019 S M T W T F S S M T W T F S 1 2 3 4 5 6 1 2 3 7 8 9 10 11 12 13 4 5 6 7 8 9 10 14 15 16 17 18 19 20 11 12 13 14 15 16 17 21 22 23 24 25 26 27 18 19 20 21 22 23 24 28 29 30 31 25 26 27 28 29 30 31 Bank holiday Key date nd • Announce definitive agreement for UGIES to acquire CMG July 2 , 2019 th • Launch TLB via Bank Meeting in New York July 25 , 2019 • Commitments due (8/7) th Week of August 5 • Price and allocate TLB (8/8) Mid August 2019 • Close & fund transaction concurrent with M&A closing 57Preliminary Financing Timeline July 2019 August 2019 S M T W T F S S M T W T F S 1 2 3 4 5 6 1 2 3 7 8 9 10 11 12 13 4 5 6 7 8 9 10 14 15 16 17 18 19 20 11 12 13 14 15 16 17 21 22 23 24 25 26 27 18 19 20 21 22 23 24 28 29 30 31 25 26 27 28 29 30 31 Bank holiday Key date nd • Announce definitive agreement for UGIES to acquire CMG July 2 , 2019 th • Launch TLB via Bank Meeting in New York July 25 , 2019 • Commitments due (8/7) th Week of August 5 • Price and allocate TLB (8/8) Mid August 2019 • Close & fund transaction concurrent with M&A closing 57
Appendix 58Appendix 58
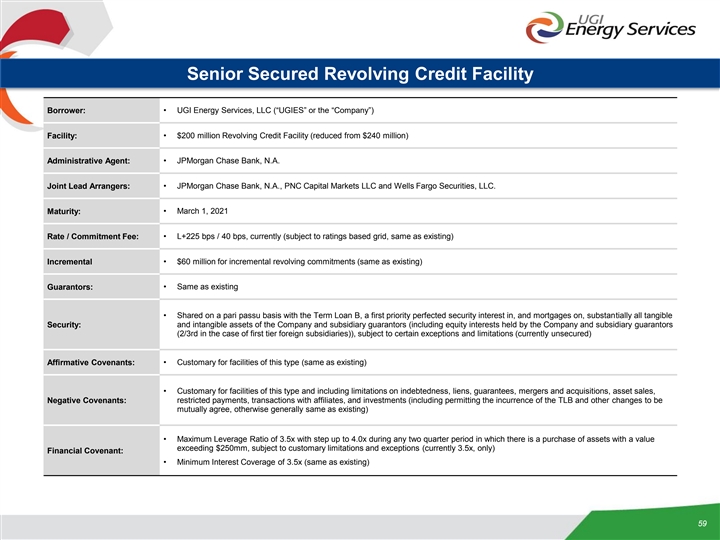
Senior Secured Revolving Credit Facility Borrower: • UGI Energy Services, LLC (“UGIES” or the “Company”) • $200 million Revolving Credit Facility (reduced from $240 million) Facility: • JPMorgan Chase Bank, N.A. Administrative Agent: Joint Lead Arrangers: • JPMorgan Chase Bank, N.A., PNC Capital Markets LLC and Wells Fargo Securities, LLC. Maturity: • March 1, 2021 Rate / Commitment Fee: • L+225 bps / 40 bps, currently (subject to ratings based grid, same as existing) • $60 million for incremental revolving commitments (same as existing) Incremental Guarantors: • Same as existing • Shared on a pari passu basis with the Term Loan B, a first priority perfected security interest in, and mortgages on, substantially all tangible and intangible assets of the Company and subsidiary guarantors (including equity interests held by the Company and subsidiary guarantors Security: (2/3rd in the case of first tier foreign subsidiaries)), subject to certain exceptions and limitations (currently unsecured) Affirmative Covenants: • Customary for facilities of this type (same as existing) • Customary for facilities of this type and including limitations on indebtedness, liens, guarantees, mergers and acquisitions, asset sales, Negative Covenants: restricted payments, transactions with affiliates, and investments (including permitting the incurrence of the TLB and other changes to be mutually agree, otherwise generally same as existing) • Maximum Leverage Ratio of 3.5x with step up to 4.0x during any two quarter period in which there is a purchase of assets with a value exceeding $250mm, subject to customary limitations and exceptions (currently 3.5x, only) Financial Covenant: • Minimum Interest Coverage of 3.5x (same as existing) 59Senior Secured Revolving Credit Facility Borrower: • UGI Energy Services, LLC (“UGIES” or the “Company”) • $200 million Revolving Credit Facility (reduced from $240 million) Facility: • JPMorgan Chase Bank, N.A. Administrative Agent: Joint Lead Arrangers: • JPMorgan Chase Bank, N.A., PNC Capital Markets LLC and Wells Fargo Securities, LLC. Maturity: • March 1, 2021 Rate / Commitment Fee: • L+225 bps / 40 bps, currently (subject to ratings based grid, same as existing) • $60 million for incremental revolving commitments (same as existing) Incremental Guarantors: • Same as existing • Shared on a pari passu basis with the Term Loan B, a first priority perfected security interest in, and mortgages on, substantially all tangible and intangible assets of the Company and subsidiary guarantors (including equity interests held by the Company and subsidiary guarantors Security: (2/3rd in the case of first tier foreign subsidiaries)), subject to certain exceptions and limitations (currently unsecured) Affirmative Covenants: • Customary for facilities of this type (same as existing) • Customary for facilities of this type and including limitations on indebtedness, liens, guarantees, mergers and acquisitions, asset sales, Negative Covenants: restricted payments, transactions with affiliates, and investments (including permitting the incurrence of the TLB and other changes to be mutually agree, otherwise generally same as existing) • Maximum Leverage Ratio of 3.5x with step up to 4.0x during any two quarter period in which there is a purchase of assets with a value exceeding $250mm, subject to customary limitations and exceptions (currently 3.5x, only) Financial Covenant: • Minimum Interest Coverage of 3.5x (same as existing) 59
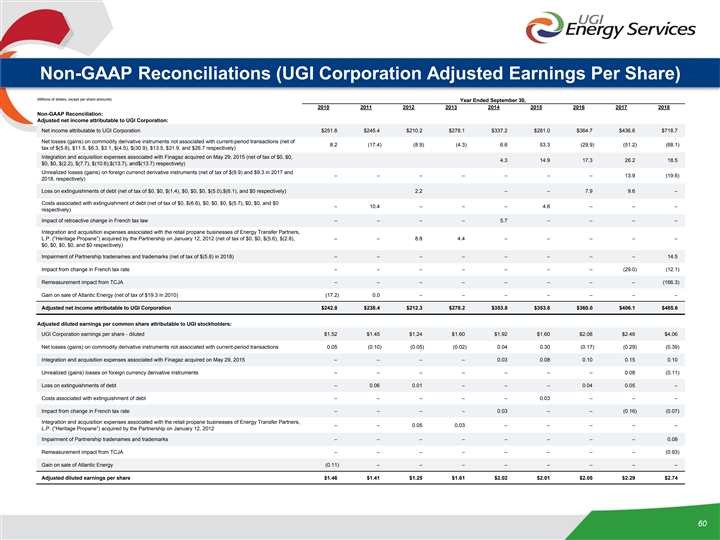
Non-GAAP Reconciliations (UGI Corporation Adjusted Earnings Per Share) (Millions of dollars, except per share amounts) Year Ended September 30, 2010 2011 2012 2013 2014 2015 2016 2017 2018 Non-GAAP Reconciliation: Adjusted net income attributable to UGI Corporation: Net income attributable to UGI Corporation $251.8 $245.4 $210.2 $278.1 $337.2 $281.0 $364.7 $436.6 $718.7 Net losses (gains) on commodity derivative instruments not associated with current-period transactions (net of 8.2 (17.4) (8.9) (4.3) 6.6 53.3 (29.9) (51.2) (68.1) tax of $(5.8), $11.5, $6.3, $3.1, $(4.5), $(30.9), $13.5, $31.9, and $26.7 respectively) Integration and acquisition expenses associated with Finagaz acquired on May 29, 2015 (net of tax of $0, $0, 4.3 14.9 17.3 26.2 18.5 $0, $0, $(2.2), $(7.7), $(10.6),$(13.7), and$(13.7) respectively) Unrealized losses (gains) on foreign currenct derivative instruments (net of tax of $(9.9) and $9.3 in 2017 and – – – – – – – 13.9 (19.6) 2018, respectively) Loss on extinguishments of debt (net of tax of $0, $0, $(1.4), $0, $0, $0, $(5.0),$(6.1), and $0 respectively) 2.2 – – 7.9 9.6 – Costs associated with extinguishment of debt (net of tax of $0, $(6.6), $0, $0, $0, $(5.7), $0, $0, and $0 – 10.4 – – – 4.6 – – – respectively) Impact of retroactive change in French tax law – – – – 5.7 – – – – Integration and acquisition expenses associated with the retail propane businesses of Energy Transfer Partners, L.P. (“Heritage Propane”) acquired by the Partnership on January 12, 2012 (net of tax of $0, $0, $(5.6), $(2.8), – – 8.8 4.4 – – – – – $0, $0, $0, $0, and $0 respectively) Impairment of Partnership tradenames and trademarks (net of tax of $(5.8) in 2018) – – – – – – – – 14.5 Impact from change in French tax rate – – – – – – – (29.0) (12.1) Remeasurement impact from TCJA – – – – – – – – (166.3) Gain on sale of Atlantic Energy (net of tax of $19.3 in 2010) (17.2) 0.0 – – – – – – – Adjusted net income attributable to UGI Corporation $242.8 $238.4 $212.3 $278.2 $353.8 $353.8 $360.0 $406.1 $485.6 Adjusted diluted earnings per common share attributable to UGI stockholders: UGI Corporation earnings per share - diluted $1.52 $1.45 $1.24 $1.60 $1.92 $1.60 $2.08 $2.46 $4.06 Net losses (gains) on commodity derivative instruments not associated with current-period transactions 0.05 (0.10) (0.05) (0.02) 0.04 0.30 (0.17) (0.29) (0.39) Integration and acquisition expenses associated with Finagaz acquired on May 29, 2015 – – – – 0.03 0.08 0.10 0.15 0.10 Unrealized (gains) losses on foreign currency derivative instruments – – – – – – – 0.08 (0.11) Loss on extinguishments of debt – 0.06 0.01 – – – 0.04 0.05 – Costs associated with extinguishment of debt – – – – – 0.03 – – – Impact from change in French tax rate – – – – 0.03 – – (0.16) (0.07) Integration and acquisition expenses associated with the retail propane businesses of Energy Transfer Partners, – – 0.05 0.03 – – – – – L.P. (“Heritage Propane”) acquired by the Partnership on January 12, 2012 Impairment of Partnership tradenames and trademarks – – – – – – – – 0.08 Remeasurement impact from TCJA – – – – – – – – (0.93) Gain on sale of Atlantic Energy (0.11) – – – – – – – – Adjusted diluted earnings per share $1.46 $1.41 $1.25 $1.61 $2.02 $2.01 $2.05 $2.29 $2.74 60Non-GAAP Reconciliations (UGI Corporation Adjusted Earnings Per Share) (Millions of dollars, except per share amounts) Year Ended September 30, 2010 2011 2012 2013 2014 2015 2016 2017 2018 Non-GAAP Reconciliation: Adjusted net income attributable to UGI Corporation: Net income attributable to UGI Corporation $251.8 $245.4 $210.2 $278.1 $337.2 $281.0 $364.7 $436.6 $718.7 Net losses (gains) on commodity derivative instruments not associated with current-period transactions (net of 8.2 (17.4) (8.9) (4.3) 6.6 53.3 (29.9) (51.2) (68.1) tax of $(5.8), $11.5, $6.3, $3.1, $(4.5), $(30.9), $13.5, $31.9, and $26.7 respectively) Integration and acquisition expenses associated with Finagaz acquired on May 29, 2015 (net of tax of $0, $0, 4.3 14.9 17.3 26.2 18.5 $0, $0, $(2.2), $(7.7), $(10.6),$(13.7), and$(13.7) respectively) Unrealized losses (gains) on foreign currenct derivative instruments (net of tax of $(9.9) and $9.3 in 2017 and – – – – – – – 13.9 (19.6) 2018, respectively) Loss on extinguishments of debt (net of tax of $0, $0, $(1.4), $0, $0, $0, $(5.0),$(6.1), and $0 respectively) 2.2 – – 7.9 9.6 – Costs associated with extinguishment of debt (net of tax of $0, $(6.6), $0, $0, $0, $(5.7), $0, $0, and $0 – 10.4 – – – 4.6 – – – respectively) Impact of retroactive change in French tax law – – – – 5.7 – – – – Integration and acquisition expenses associated with the retail propane businesses of Energy Transfer Partners, L.P. (“Heritage Propane”) acquired by the Partnership on January 12, 2012 (net of tax of $0, $0, $(5.6), $(2.8), – – 8.8 4.4 – – – – – $0, $0, $0, $0, and $0 respectively) Impairment of Partnership tradenames and trademarks (net of tax of $(5.8) in 2018) – – – – – – – – 14.5 Impact from change in French tax rate – – – – – – – (29.0) (12.1) Remeasurement impact from TCJA – – – – – – – – (166.3) Gain on sale of Atlantic Energy (net of tax of $19.3 in 2010) (17.2) 0.0 – – – – – – – Adjusted net income attributable to UGI Corporation $242.8 $238.4 $212.3 $278.2 $353.8 $353.8 $360.0 $406.1 $485.6 Adjusted diluted earnings per common share attributable to UGI stockholders: UGI Corporation earnings per share - diluted $1.52 $1.45 $1.24 $1.60 $1.92 $1.60 $2.08 $2.46 $4.06 Net losses (gains) on commodity derivative instruments not associated with current-period transactions 0.05 (0.10) (0.05) (0.02) 0.04 0.30 (0.17) (0.29) (0.39) Integration and acquisition expenses associated with Finagaz acquired on May 29, 2015 – – – – 0.03 0.08 0.10 0.15 0.10 Unrealized (gains) losses on foreign currency derivative instruments – – – – – – – 0.08 (0.11) Loss on extinguishments of debt – 0.06 0.01 – – – 0.04 0.05 – Costs associated with extinguishment of debt – – – – – 0.03 – – – Impact from change in French tax rate – – – – 0.03 – – (0.16) (0.07) Integration and acquisition expenses associated with the retail propane businesses of Energy Transfer Partners, – – 0.05 0.03 – – – – – L.P. (“Heritage Propane”) acquired by the Partnership on January 12, 2012 Impairment of Partnership tradenames and trademarks – – – – – – – – 0.08 Remeasurement impact from TCJA – – – – – – – – (0.93) Gain on sale of Atlantic Energy (0.11) – – – – – – – – Adjusted diluted earnings per share $1.46 $1.41 $1.25 $1.61 $2.02 $2.01 $2.05 $2.29 $2.74 60
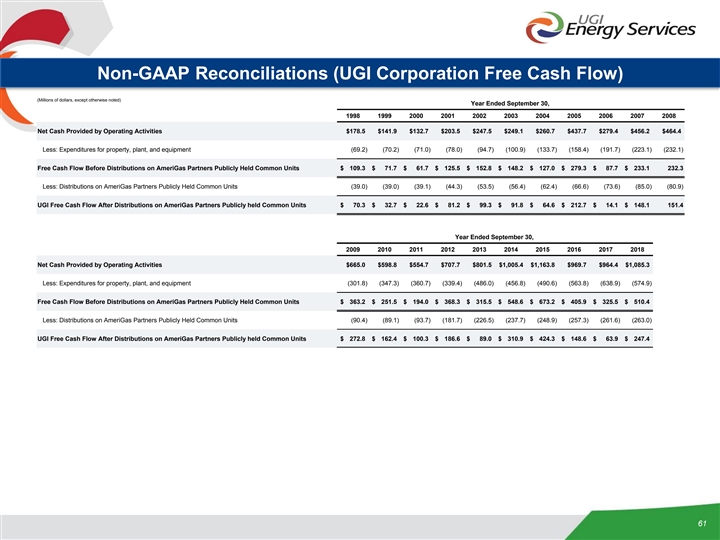
Non-GAAP Reconciliations (UGI Corporation Free Cash Flow) (Millions of dollars, except otherwise noted) Year Ended September 30, 1998 1999 2000 2001 2002 2003 2004 2005 2006 2007 2008 Net Cash Provided by Operating Activities $178.5 $141.9 $132.7 $203.5 $247.5 $249.1 $260.7 $437.7 $279.4 $456.2 $464.4 Less: Expenditures for property, plant, and equipment (69.2) (70.2) (71.0) (78.0) (94.7) (100.9) (133.7) (158.4) (191.7) (223.1) (232.1) Free Cash Flow Before Distributions on AmeriGas Partners Publicly Held Common Units $ 109.3 $ 71.7 $ 61.7 $ 125.5 $ 152.8 $ 148.2 $ 127.0 $ 279.3 $ 87.7 $ 233.1 232.3 Less: Distributions on AmeriGas Partners Publicly Held Common Units (39.0) (39.0) (39.1) (44.3) (53.5) (56.4) (62.4) (66.6) (73.6) (85.0) (80.9) UGI Free Cash Flow After Distributions on AmeriGas Partners Publicly held Common Units $ 70.3 $ 32.7 $ 22.6 $ 81.2 $ 99.3 $ 91.8 $ 64.6 $ 212.7 $ 14.1 $ 148.1 151.4 Year Ended September 30, 2009 2010 2011 2012 2013 2014 2015 2016 2017 2018 Net Cash Provided by Operating Activities $665.0 $598.8 $554.7 $707.7 $801.5 $1,005.4 $1,163.8 $969.7 $964.4 $1,085.3 Less: Expenditures for property, plant, and equipment (301.8) (347.3) (360.7) (339.4) (486.0) (456.8) (490.6) (563.8) (638.9) (574.9) Free Cash Flow Before Distributions on AmeriGas Partners Publicly Held Common Units $ 363.2 $ 251.5 $ 194.0 $ 368.3 $ 315.5 $ 548.6 $ 673.2 $ 405.9 $ 325.5 $ 510.4 Less: Distributions on AmeriGas Partners Publicly Held Common Units (90.4) (89.1) (93.7) (181.7) (226.5) (237.7) (248.9) (257.3) (261.6) (263.0) UGI Free Cash Flow After Distributions on AmeriGas Partners Publicly held Common Units $ 272.8 $ 162.4 $ 100.3 $ 186.6 $ 89.0 $ 310.9 $ 424.3 $ 148.6 $ 63.9 $ 247.4 61Non-GAAP Reconciliations (UGI Corporation Free Cash Flow) (Millions of dollars, except otherwise noted) Year Ended September 30, 1998 1999 2000 2001 2002 2003 2004 2005 2006 2007 2008 Net Cash Provided by Operating Activities $178.5 $141.9 $132.7 $203.5 $247.5 $249.1 $260.7 $437.7 $279.4 $456.2 $464.4 Less: Expenditures for property, plant, and equipment (69.2) (70.2) (71.0) (78.0) (94.7) (100.9) (133.7) (158.4) (191.7) (223.1) (232.1) Free Cash Flow Before Distributions on AmeriGas Partners Publicly Held Common Units $ 109.3 $ 71.7 $ 61.7 $ 125.5 $ 152.8 $ 148.2 $ 127.0 $ 279.3 $ 87.7 $ 233.1 232.3 Less: Distributions on AmeriGas Partners Publicly Held Common Units (39.0) (39.0) (39.1) (44.3) (53.5) (56.4) (62.4) (66.6) (73.6) (85.0) (80.9) UGI Free Cash Flow After Distributions on AmeriGas Partners Publicly held Common Units $ 70.3 $ 32.7 $ 22.6 $ 81.2 $ 99.3 $ 91.8 $ 64.6 $ 212.7 $ 14.1 $ 148.1 151.4 Year Ended September 30, 2009 2010 2011 2012 2013 2014 2015 2016 2017 2018 Net Cash Provided by Operating Activities $665.0 $598.8 $554.7 $707.7 $801.5 $1,005.4 $1,163.8 $969.7 $964.4 $1,085.3 Less: Expenditures for property, plant, and equipment (301.8) (347.3) (360.7) (339.4) (486.0) (456.8) (490.6) (563.8) (638.9) (574.9) Free Cash Flow Before Distributions on AmeriGas Partners Publicly Held Common Units $ 363.2 $ 251.5 $ 194.0 $ 368.3 $ 315.5 $ 548.6 $ 673.2 $ 405.9 $ 325.5 $ 510.4 Less: Distributions on AmeriGas Partners Publicly Held Common Units (90.4) (89.1) (93.7) (181.7) (226.5) (237.7) (248.9) (257.3) (261.6) (263.0) UGI Free Cash Flow After Distributions on AmeriGas Partners Publicly held Common Units $ 272.8 $ 162.4 $ 100.3 $ 186.6 $ 89.0 $ 310.9 $ 424.3 $ 148.6 $ 63.9 $ 247.4 61
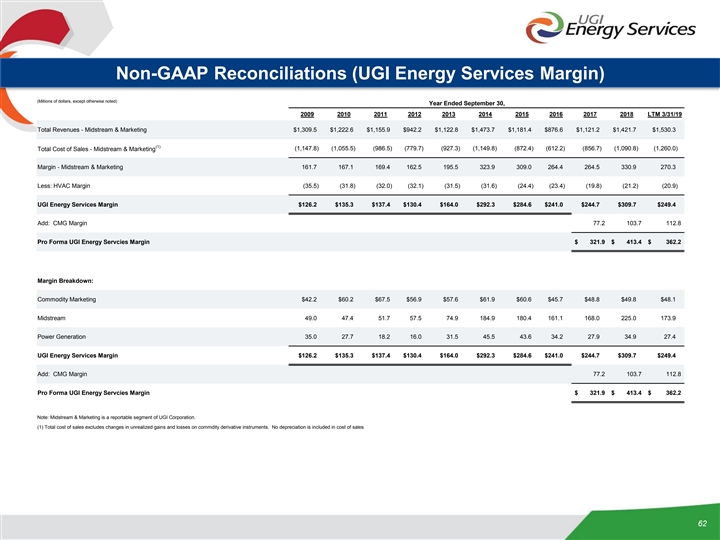
Non-GAAP Reconciliations (UGI Energy Services Margin) (Millions of dollars, except otherwise noted) Year Ended September 30, 2009 2010 2011 2012 2013 2014 2015 2016 2017 2018 LTM 3/31/19 Total Revenues - Midstream & Marketing $1,309.5 $1,222.6 $1,155.9 $942.2 $1,122.8 $1,473.7 $1,181.4 $876.6 $1,121.2 $1,421.7 $1,530.3 (1) Total Cost of Sales - Midstream & Marketing (1,147.8) (1,055.5) (986.5) (779.7) (927.3) (1,149.8) (872.4) (612.2) (856.7) (1,090.8) (1,260.0) Margin - Midstream & Marketing 161.7 167.1 169.4 162.5 195.5 323.9 309.0 264.4 264.5 330.9 270.3 Less: HVAC Margin (35.5) (31.8) (32.0) (32.1) (31.5) (31.6) (24.4) (23.4) (19.8) (21.2) (20.9) UGI Energy Services Margin $126.2 $135.3 $137.4 $130.4 $164.0 $292.3 $284.6 $241.0 $244.7 $309.7 $249.4 Add: CMG Margin 77.2 103.7 112.8 Pro Forma UGI Energy Servcies Margin $ 321.9 $ 413.4 $ 362.2 Margin Breakdown: Commodity Marketing $42.2 $60.2 $67.5 $56.9 $57.6 $61.9 $60.6 $45.7 $48.8 $49.8 $48.1 Midstream 49.0 47.4 51.7 57.5 74.9 184.9 180.4 161.1 168.0 225.0 173.9 Power Generation 35.0 27.7 18.2 16.0 31.5 45.5 43.6 34.2 27.9 34.9 27.4 UGI Energy Services Margin $126.2 $135.3 $137.4 $130.4 $164.0 $292.3 $284.6 $241.0 $244.7 $309.7 $249.4 Add: CMG Margin 77.2 103.7 112.8 Pro Forma UGI Energy Servcies Margin $ 321.9 $ 413.4 $ 362.2 Note: Midstream & Marketing is a reportable segment of UGI Corporation. (1) Total cost of sales excludes changes in unrealized gains and losses on commdity derivative instruments. No depreciation is included in cost of sales 62Non-GAAP Reconciliations (UGI Energy Services Margin) (Millions of dollars, except otherwise noted) Year Ended September 30, 2009 2010 2011 2012 2013 2014 2015 2016 2017 2018 LTM 3/31/19 Total Revenues - Midstream & Marketing $1,309.5 $1,222.6 $1,155.9 $942.2 $1,122.8 $1,473.7 $1,181.4 $876.6 $1,121.2 $1,421.7 $1,530.3 (1) Total Cost of Sales - Midstream & Marketing (1,147.8) (1,055.5) (986.5) (779.7) (927.3) (1,149.8) (872.4) (612.2) (856.7) (1,090.8) (1,260.0) Margin - Midstream & Marketing 161.7 167.1 169.4 162.5 195.5 323.9 309.0 264.4 264.5 330.9 270.3 Less: HVAC Margin (35.5) (31.8) (32.0) (32.1) (31.5) (31.6) (24.4) (23.4) (19.8) (21.2) (20.9) UGI Energy Services Margin $126.2 $135.3 $137.4 $130.4 $164.0 $292.3 $284.6 $241.0 $244.7 $309.7 $249.4 Add: CMG Margin 77.2 103.7 112.8 Pro Forma UGI Energy Servcies Margin $ 321.9 $ 413.4 $ 362.2 Margin Breakdown: Commodity Marketing $42.2 $60.2 $67.5 $56.9 $57.6 $61.9 $60.6 $45.7 $48.8 $49.8 $48.1 Midstream 49.0 47.4 51.7 57.5 74.9 184.9 180.4 161.1 168.0 225.0 173.9 Power Generation 35.0 27.7 18.2 16.0 31.5 45.5 43.6 34.2 27.9 34.9 27.4 UGI Energy Services Margin $126.2 $135.3 $137.4 $130.4 $164.0 $292.3 $284.6 $241.0 $244.7 $309.7 $249.4 Add: CMG Margin 77.2 103.7 112.8 Pro Forma UGI Energy Servcies Margin $ 321.9 $ 413.4 $ 362.2 Note: Midstream & Marketing is a reportable segment of UGI Corporation. (1) Total cost of sales excludes changes in unrealized gains and losses on commdity derivative instruments. No depreciation is included in cost of sales 62
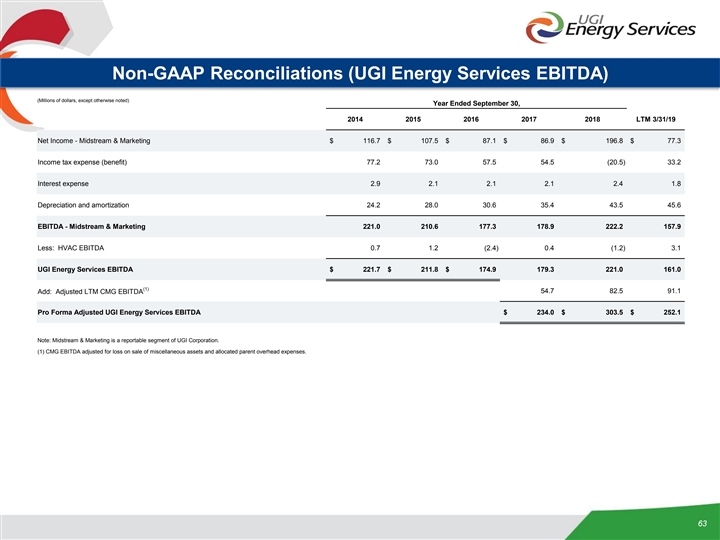
Non-GAAP Reconciliations (UGI Energy Services EBITDA) (Millions of dollars, except otherwise noted) Year Ended September 30, 2014 2015 2016 2017 2018 LTM 3/31/19 Net Income - Midstream & Marketing $ 116.7 $ 107.5 $ 87.1 $ 86.9 $ 196.8 $ 77.3 Income tax expense (benefit) 77.2 73.0 57.5 54.5 ( 20.5) 33.2 Interest expense 2.9 2.1 2.1 2.1 2.4 1.8 Depreciation and amortization 24.2 28.0 30.6 35.4 43.5 45.6 EBITDA - Midstream & Marketing 221.0 210.6 177.3 178.9 222.2 157.9 Less: HVAC EBITDA 0.7 1.2 (2.4) 0.4 ( 1.2) 3.1 UGI Energy Services EBITDA $ 221.7 $ 211.8 $ 174.9 179.3 221.0 161.0 (1) 54.7 82.5 91.1 Add: Adjusted LTM CMG EBITDA Pro Forma Adjusted UGI Energy Services EBITDA $ 234.0 $ 303.5 $ 252.1 Note: Midstream & Marketing is a reportable segment of UGI Corporation. (1) CMG EBITDA adjusted for loss on sale of miscellaneous assets and allocated parent overhead expenses. 63Non-GAAP Reconciliations (UGI Energy Services EBITDA) (Millions of dollars, except otherwise noted) Year Ended September 30, 2014 2015 2016 2017 2018 LTM 3/31/19 Net Income - Midstream & Marketing $ 116.7 $ 107.5 $ 87.1 $ 86.9 $ 196.8 $ 77.3 Income tax expense (benefit) 77.2 73.0 57.5 54.5 ( 20.5) 33.2 Interest expense 2.9 2.1 2.1 2.1 2.4 1.8 Depreciation and amortization 24.2 28.0 30.6 35.4 43.5 45.6 EBITDA - Midstream & Marketing 221.0 210.6 177.3 178.9 222.2 157.9 Less: HVAC EBITDA 0.7 1.2 (2.4) 0.4 ( 1.2) 3.1 UGI Energy Services EBITDA $ 221.7 $ 211.8 $ 174.9 179.3 221.0 161.0 (1) 54.7 82.5 91.1 Add: Adjusted LTM CMG EBITDA Pro Forma Adjusted UGI Energy Services EBITDA $ 234.0 $ 303.5 $ 252.1 Note: Midstream & Marketing is a reportable segment of UGI Corporation. (1) CMG EBITDA adjusted for loss on sale of miscellaneous assets and allocated parent overhead expenses. 63