Exhibit 99.1 UGI Energy Services Information Addendum $700mm Senior Secured Term Loan B July 2019Exhibit 99.1 UGI Energy Services Information Addendum $700mm Senior Secured Term Loan B July 2019
DISCLAIMER About this Presentation This presentation contains certain forward-looking statements that management believes to be reasonable as of today’s date only. Forward-looking statements should not be read as a guarantee of future performance or results, and will not necessarily be accurate indications of the times at, or by which, such performance or results will be achieved. Forward-looking information is based on information available at the time and/or management’s good faith belief with respect to future events, and is subject to risks and uncertainties, some or all of which are not predictable or within the control of UGI Energy Services, LLC (“UGIES” or the Company ), that could cause actual performance or results to differ materially from those expressed in the statements. All estimates, projections, opinions, and statements speak only as of the date of the document and may be subject to change without notice. Changes to assumptions may have a material impact on any estimates, opinions or statements included herein. The Company assumes no obligation to update forward-looking statements to reflect actual results, changes in assumptions or changes in other factors affecting forward looking information. If the Company does update one or more forward-looking statements, no inference should be drawn that the Company will make additional updates with respect thereto or with respect to other forward-looking statements. The Company undertakes no obligation to release revisions to its forward- looking statements to reflect events or circumstances occurring after today. Actual results may differ significantly because of risks and uncertainties that are difficult to predict and many of which are beyond management’s control. You should read UGI Corporation’s Annual Report on Form 10-K for a more extensive list of factors that could affect the Company’s results. Among them are adverse weather conditions, cost volatility and availability of all energy products, the impact of pending and future legal proceedings, continued analysis of recent tax legislation, liability for uninsured claims and for claims in excess of insurance coverage, domestic and international political, regulatory and economic conditions, changes in Marcellus Shale gas production, the availability, timing and success of our acquisitions, commercial initiatives and investments to growour business, our ability to successfully integrate acquired businesses and achieve anticipated synergies, including with respect to the Company’s proposed acquisition of the Columbia Midstream Group, LLC, the interruption, disruption, failure, malfunction or breach of our information technology systems, including due to cyber- attack. This presentation does not constitute an offer to sell any securities of UGIES or its respective affiliates or a solicitation of an offer to buy any securities of UGIES or its respective affiliates. Use of Non-GAAP Measures In this presentation, Management uses certain non-GAAP financial measures, including UGI Corporation adjusted earnings per share, UGI CorporationFreeCashFlow, UGI Energy Services Margin and UGI Energy Services earnings before interest, income taxes, depreciation and amortization (“EBITDA”). These financial measures are not in accordance with, or an alternative to, GAAP and should be considered in addition to, and not as a substitute for, the comparable GAAP measures. Management believes the presentation of these non-GAAP financial measures provide useful information to investors to more effectively evaluate period-over-period earnings, profitability and cash flow generation of the Company’s businesses. Reconciliations of these non-GAAP financial measures to the most directly comparable financial measure calculated and presented in accordance with GAAP are presented in the Appendix of this presentation. 2DISCLAIMER About this Presentation This presentation contains certain forward-looking statements that management believes to be reasonable as of today’s date only. Forward-looking statements should not be read as a guarantee of future performance or results, and will not necessarily be accurate indications of the times at, or by which, such performance or results will be achieved. Forward-looking information is based on information available at the time and/or management’s good faith belief with respect to future events, and is subject to risks and uncertainties, some or all of which are not predictable or within the control of UGI Energy Services, LLC (“UGIES” or the Company ), that could cause actual performance or results to differ materially from those expressed in the statements. All estimates, projections, opinions, and statements speak only as of the date of the document and may be subject to change without notice. Changes to assumptions may have a material impact on any estimates, opinions or statements included herein. The Company assumes no obligation to update forward-looking statements to reflect actual results, changes in assumptions or changes in other factors affecting forward looking information. If the Company does update one or more forward-looking statements, no inference should be drawn that the Company will make additional updates with respect thereto or with respect to other forward-looking statements. The Company undertakes no obligation to release revisions to its forward- looking statements to reflect events or circumstances occurring after today. Actual results may differ significantly because of risks and uncertainties that are difficult to predict and many of which are beyond management’s control. You should read UGI Corporation’s Annual Report on Form 10-K for a more extensive list of factors that could affect the Company’s results. Among them are adverse weather conditions, cost volatility and availability of all energy products, the impact of pending and future legal proceedings, continued analysis of recent tax legislation, liability for uninsured claims and for claims in excess of insurance coverage, domestic and international political, regulatory and economic conditions, changes in Marcellus Shale gas production, the availability, timing and success of our acquisitions, commercial initiatives and investments to growour business, our ability to successfully integrate acquired businesses and achieve anticipated synergies, including with respect to the Company’s proposed acquisition of the Columbia Midstream Group, LLC, the interruption, disruption, failure, malfunction or breach of our information technology systems, including due to cyber- attack. This presentation does not constitute an offer to sell any securities of UGIES or its respective affiliates or a solicitation of an offer to buy any securities of UGIES or its respective affiliates. Use of Non-GAAP Measures In this presentation, Management uses certain non-GAAP financial measures, including UGI Corporation adjusted earnings per share, UGI CorporationFreeCashFlow, UGI Energy Services Margin and UGI Energy Services earnings before interest, income taxes, depreciation and amortization (“EBITDA”). These financial measures are not in accordance with, or an alternative to, GAAP and should be considered in addition to, and not as a substitute for, the comparable GAAP measures. Management believes the presentation of these non-GAAP financial measures provide useful information to investors to more effectively evaluate period-over-period earnings, profitability and cash flow generation of the Company’s businesses. Reconciliations of these non-GAAP financial measures to the most directly comparable financial measure calculated and presented in accordance with GAAP are presented in the Appendix of this presentation. 2
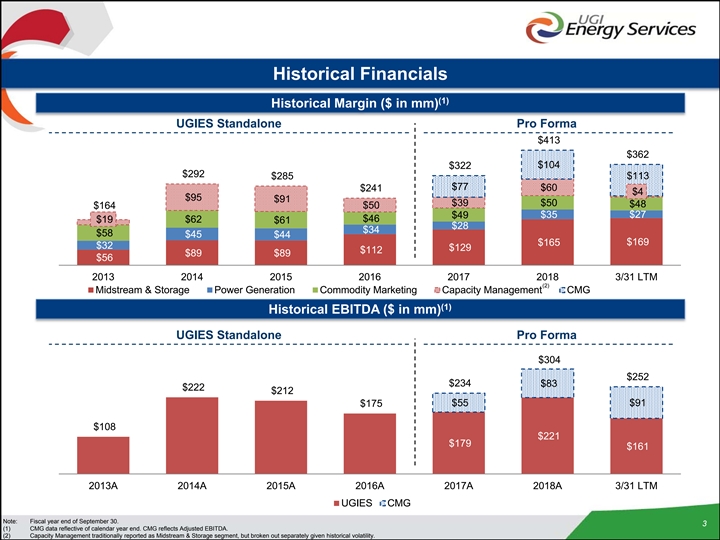
Historical Financials (1) Historical Margin ($ in mm) UGIES Standalone Pro Forma $413 $362 $104 $322 $292 $285 $113 $77 $60 $241 $4 $95 $91 $39 $50 $48 $164 $50 $49 $35 $27 $46 $19 $62 $61 $28 $34 $58 $45 $44 $169 $165 $32 $129 $112 $89 $89 $56 2013 2014 2015 2016 2017 2018 3/31 LTM (2) Midstream & Storage Power Generation Commodity Marketing Capacity Management CMG (1) Historical EBITDA ($ in mm) UGIES Standalone Pro Forma $304 $252 $234 $83 $222 $212 $55 $91 $175 $108 $221 $179 $161 2013A 2014A 2015A 2016A 2017A 2018A 3/31 LTM UGIES CMG Note: Fiscal year end of September 30. 3 (1) CMG data reflective of calendar year end. CMG reflects Adjusted EBITDA. (2) Capacity Management traditionally reported as Midstream & Storage segment, but broken out separately given historical volatility.Historical Financials (1) Historical Margin ($ in mm) UGIES Standalone Pro Forma $413 $362 $104 $322 $292 $285 $113 $77 $60 $241 $4 $95 $91 $39 $50 $48 $164 $50 $49 $35 $27 $46 $19 $62 $61 $28 $34 $58 $45 $44 $169 $165 $32 $129 $112 $89 $89 $56 2013 2014 2015 2016 2017 2018 3/31 LTM (2) Midstream & Storage Power Generation Commodity Marketing Capacity Management CMG (1) Historical EBITDA ($ in mm) UGIES Standalone Pro Forma $304 $252 $234 $83 $222 $212 $55 $91 $175 $108 $221 $179 $161 2013A 2014A 2015A 2016A 2017A 2018A 3/31 LTM UGIES CMG Note: Fiscal year end of September 30. 3 (1) CMG data reflective of calendar year end. CMG reflects Adjusted EBITDA. (2) Capacity Management traditionally reported as Midstream & Storage segment, but broken out separately given historical volatility.
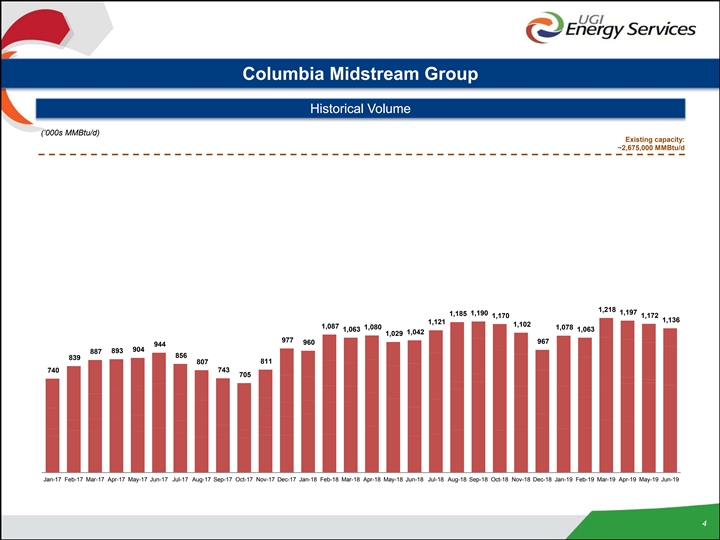
Columbia Midstream Group Historical Volume (‘000s MMBtu/d) Existing capacity: ~2,675,000 MMBtu/d 1,218 1,197 1,185 1,190 1,170 1,172 1,136 1,121 1,102 1,087 1,080 1,078 1,063 1,063 1,042 1,029 977 967 960 944 904 893 887 856 839 807 811 743 740 705 Jan-17 Feb-17 Mar-17 Apr-17 May-17 Jun-17 Jul-17 Aug-17 Sep-17 Oct-17 Nov-17 Dec-17 Jan-18 Feb-18 Mar-18 Apr-18 May-18 Jun-18 Jul-18 Aug-18 Sep-18 Oct-18 Nov-18 Dec-18 Jan-19 Feb-19 Mar-19 Apr-19 May-19 Jun-19 4Columbia Midstream Group Historical Volume (‘000s MMBtu/d) Existing capacity: ~2,675,000 MMBtu/d 1,218 1,197 1,185 1,190 1,170 1,172 1,136 1,121 1,102 1,087 1,080 1,078 1,063 1,063 1,042 1,029 977 967 960 944 904 893 887 856 839 807 811 743 740 705 Jan-17 Feb-17 Mar-17 Apr-17 May-17 Jun-17 Jul-17 Aug-17 Sep-17 Oct-17 Nov-17 Dec-17 Jan-18 Feb-18 Mar-18 Apr-18 May-18 Jun-18 Jul-18 Aug-18 Sep-18 Oct-18 Nov-18 Dec-18 Jan-19 Feb-19 Mar-19 Apr-19 May-19 Jun-19 4
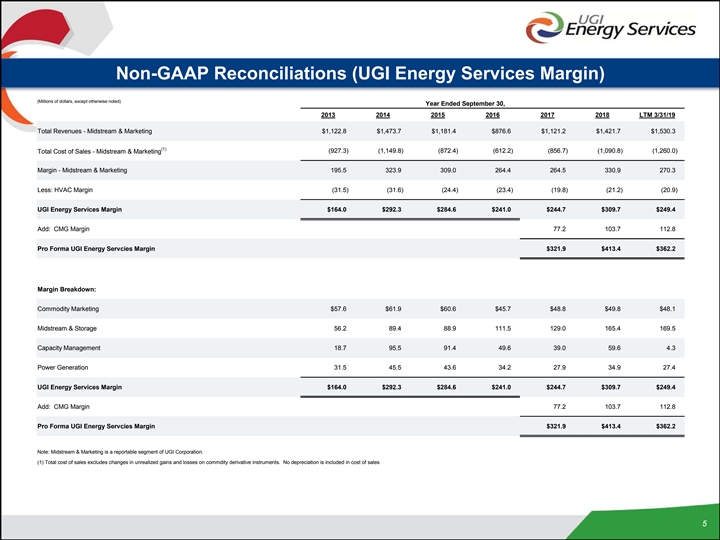
Non-GAAP Reconciliations (UGI Energy Services Margin) (Millions of dollars, except otherwise noted) Year Ended September 30, 2013 2014 2015 2016 2017 2018 LTM 3/31/19 Total Revenues - Midstream & Marketing $1,122.8 $1,473.7 $1,181.4 $876.6 $1,121.2 $1,421.7 $1,530.3 (1) (927.3) (1,149.8) (872.4) (612.2) (856.7) (1,090.8) (1,260.0) Total Cost of Sales - Midstream & Marketing Margin - Midstream & Marketing 195.5 323.9 309.0 264.4 264.5 330.9 270.3 Less: HVAC Margin (31.5) (31.6) (24.4) (23.4) (19.8) (21.2) (20.9) UGI Energy Services Margin $164.0 $292.3 $284.6 $241.0 $244.7 $309.7 $249.4 Add: CMG Margin 77.2 103.7 112.8 Pro Forma UGI Energy Servcies Margin $321.9 $413.4 $362.2 Margin Breakdown: Commodity Marketing $57.6 $61.9 $60.6 $45.7 $48.8 $49.8 $48.1 Midstream & Storage 56.2 89.4 88.9 111.5 129.0 165.4 169.5 Capacity Management 18.7 95.5 91.4 49.6 39.0 59.6 4.3 Power Generation 31.5 45.5 43.6 34.2 27.9 34.9 27.4 UGI Energy Services Margin $164.0 $292.3 $284.6 $241.0 $244.7 $309.7 $249.4 Add: CMG Margin 77.2 103.7 112.8 Pro Forma UGI Energy Servcies Margin $321.9 $413.4 $362.2 Note: Midstream & Marketing is a reportable segment of UGI Corporation. (1) Total cost of sales excludes changes in unrealized gains and losses on commdity derivative instruments. No depreciation is included in cost of sales 5Non-GAAP Reconciliations (UGI Energy Services Margin) (Millions of dollars, except otherwise noted) Year Ended September 30, 2013 2014 2015 2016 2017 2018 LTM 3/31/19 Total Revenues - Midstream & Marketing $1,122.8 $1,473.7 $1,181.4 $876.6 $1,121.2 $1,421.7 $1,530.3 (1) (927.3) (1,149.8) (872.4) (612.2) (856.7) (1,090.8) (1,260.0) Total Cost of Sales - Midstream & Marketing Margin - Midstream & Marketing 195.5 323.9 309.0 264.4 264.5 330.9 270.3 Less: HVAC Margin (31.5) (31.6) (24.4) (23.4) (19.8) (21.2) (20.9) UGI Energy Services Margin $164.0 $292.3 $284.6 $241.0 $244.7 $309.7 $249.4 Add: CMG Margin 77.2 103.7 112.8 Pro Forma UGI Energy Servcies Margin $321.9 $413.4 $362.2 Margin Breakdown: Commodity Marketing $57.6 $61.9 $60.6 $45.7 $48.8 $49.8 $48.1 Midstream & Storage 56.2 89.4 88.9 111.5 129.0 165.4 169.5 Capacity Management 18.7 95.5 91.4 49.6 39.0 59.6 4.3 Power Generation 31.5 45.5 43.6 34.2 27.9 34.9 27.4 UGI Energy Services Margin $164.0 $292.3 $284.6 $241.0 $244.7 $309.7 $249.4 Add: CMG Margin 77.2 103.7 112.8 Pro Forma UGI Energy Servcies Margin $321.9 $413.4 $362.2 Note: Midstream & Marketing is a reportable segment of UGI Corporation. (1) Total cost of sales excludes changes in unrealized gains and losses on commdity derivative instruments. No depreciation is included in cost of sales 5
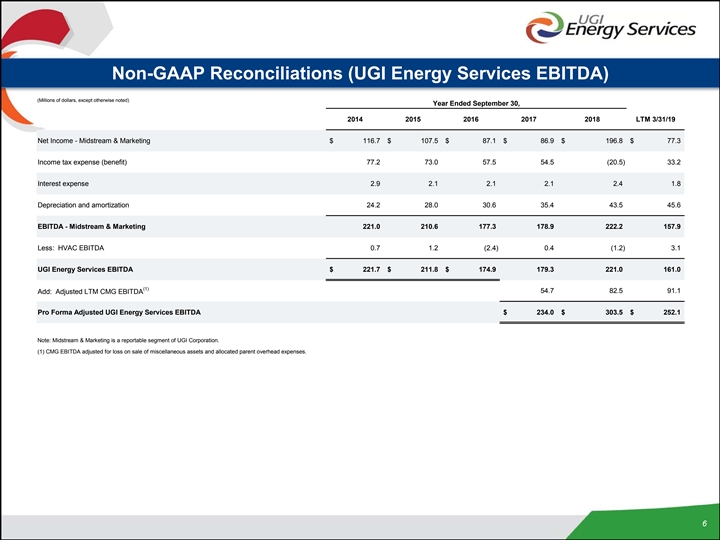
Non-GAAP Reconciliations (UGI Energy Services EBITDA) (Millions of dollars, except otherwise noted) Year Ended September 30, 2014 2015 2016 2017 2018 LTM 3/31/19 Net Income - Midstream & Marketing $ 116.7 $ 107.5 $ 87.1 $ 86.9 $ 196.8 $ 77.3 Income tax expense (benefit) 77.2 73.0 57.5 54.5 ( 20.5) 33.2 Interest expense 2.9 2.1 2.1 2.1 2.4 1.8 Depreciation and amortization 24.2 28.0 30.6 35.4 43.5 45.6 EBITDA - Midstream & Marketing 221.0 210.6 177.3 178.9 222.2 157.9 Less: HVAC EBITDA 0.7 1.2 (2.4) 0.4 (1.2) 3.1 UGI Energy Services EBITDA $ 221.7 $ 211.8 $ 174.9 179.3 221.0 161.0 (1) 54.7 82.5 91.1 Add: Adjusted LTM CMG EBITDA Pro Forma Adjusted UGI Energy Services EBITDA $ 234.0 $ 303.5 $ 252.1 Note: Midstream & Marketing is a reportable segment of UGI Corporation. (1) CMG EBITDA adjusted for loss on sale of miscellaneous assets and allocated parent overhead expenses. 6Non-GAAP Reconciliations (UGI Energy Services EBITDA) (Millions of dollars, except otherwise noted) Year Ended September 30, 2014 2015 2016 2017 2018 LTM 3/31/19 Net Income - Midstream & Marketing $ 116.7 $ 107.5 $ 87.1 $ 86.9 $ 196.8 $ 77.3 Income tax expense (benefit) 77.2 73.0 57.5 54.5 ( 20.5) 33.2 Interest expense 2.9 2.1 2.1 2.1 2.4 1.8 Depreciation and amortization 24.2 28.0 30.6 35.4 43.5 45.6 EBITDA - Midstream & Marketing 221.0 210.6 177.3 178.9 222.2 157.9 Less: HVAC EBITDA 0.7 1.2 (2.4) 0.4 (1.2) 3.1 UGI Energy Services EBITDA $ 221.7 $ 211.8 $ 174.9 179.3 221.0 161.0 (1) 54.7 82.5 91.1 Add: Adjusted LTM CMG EBITDA Pro Forma Adjusted UGI Energy Services EBITDA $ 234.0 $ 303.5 $ 252.1 Note: Midstream & Marketing is a reportable segment of UGI Corporation. (1) CMG EBITDA adjusted for loss on sale of miscellaneous assets and allocated parent overhead expenses. 6