Fourth Quarter and Full Year 2019 Results February 20, 2020 Exhibit 99.2
Safe Harbor Statements Forward Looking Statements: This presentation contains forward-looking statements within the meaning of Section 27A of the Securities Act of 1933, Section 21E of the Securities Exchange Act of 1934 and applicable Canadian securities laws conveying management's expectations as to the future based on plans, estimates and projections at the time the Company makes the statements. Forward-looking statements involve inherent risks and uncertainties and the Company cautions you that a number of important factors could cause actual results to differ materially from those contained in any such forward-looking statement. The forward looking statements in this presentation include but are not limited to statements regarding estimated revenues and free cash flows. The forward-looking statements are based on assumptions regarding management’s current plans and estimates. Factors that could cause actual results to differ materially from those described in this presentation include, among others: risks relating to any unforeseen changes to or effects on liabilities, future capital expenditures, revenues, expenses, earnings, synergies, indebtedness, financial condition, losses and future prospects; and the effect of economic, competitive, legal, governmental and technological factors on Cott’s business. The foregoing list of factors is not exhaustive. Readers are cautioned not to place undue reliance on these forward-looking statements, which speak only as of the date hereof. Readers are urged to carefully review and consider the various disclosures, including but not limited to risk factors contained in the Company's Annual Report in the Form 10-K and its quarterly reports on Form 10-Q, as well as other periodic reports filed with the securities commissions. The Company does not, except as expressly required by applicable law, undertake to update or revise any of these statements in light of new information or future events. Non-GAAP Measures: The Company routinely supplements its reporting of GAAP measures by utilizing certain non-GAAP measures to separate the impact of certain items from its underlying business results. Since the Company uses these non-GAAP measures in the management of its business, management believes this supplemental information, including on a pro forma basis, is useful to investors for their independent evaluation and understanding of Cott’s business. The non-GAAP financial measures described above are in addition to, and not meant to be considered superior to, or a substitute for, the Company's financial statements prepared in accordance with GAAP. In addition, the non-GAAP financial measures included in this presentation reflect management's judgment of particular items, and may be different from, and therefore may not be comparable to, similarly titled measures reported by other companies. A copy of this presentation may be found on www.cott.com. Please see Appendix to this presentation and the exhibits to the earnings release for the fourth quarter and year ended December 28, 2019 for reconciliations to the most directly comparable GAAP measures.
2020 Key Focus Areas Agenda 2019 Operating Segment Results 2019 Financial Results Key Takeaways and 2019 Highlights 2020 Full Year Expectations 2019 Primo Water Update
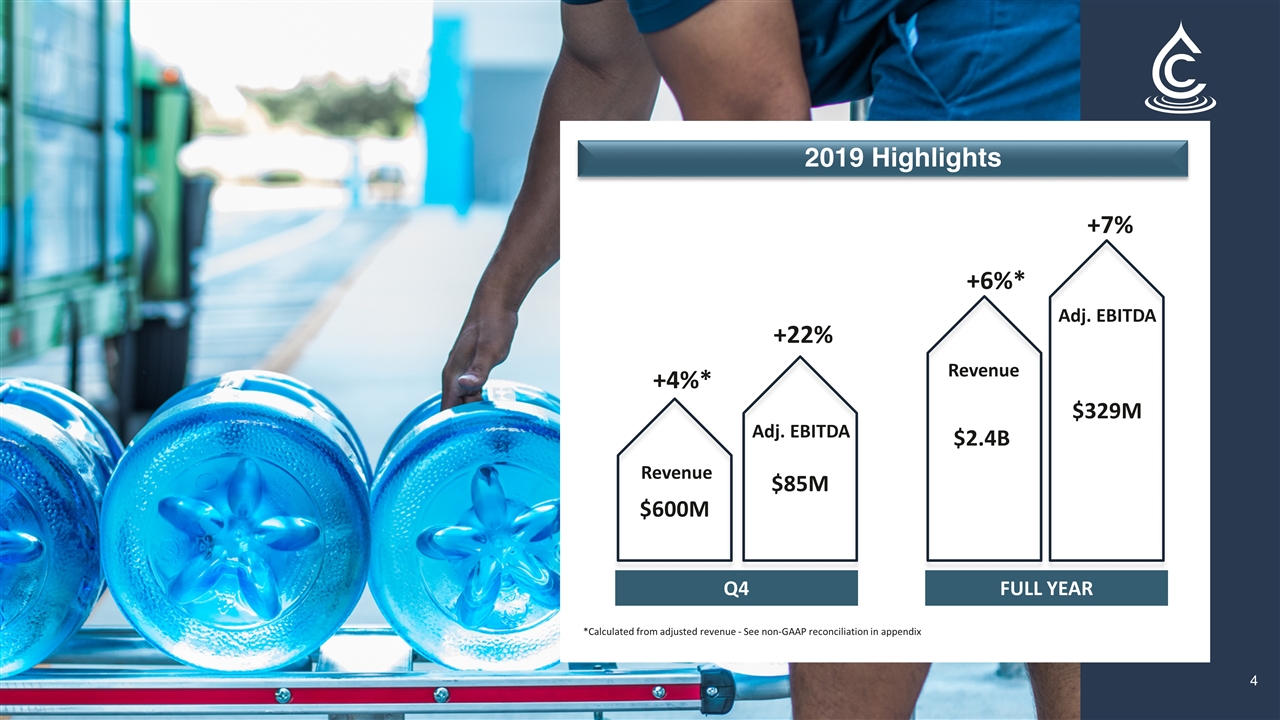
2019 Highlights $600M +4%* Adj. EBITDA +22% $85M *Calculated from adjusted revenue - See non-GAAP reconciliation in appendix $2.4B +6%* $329M +7% Revenue Q4 FULL YEAR Revenue Adj. EBITDA
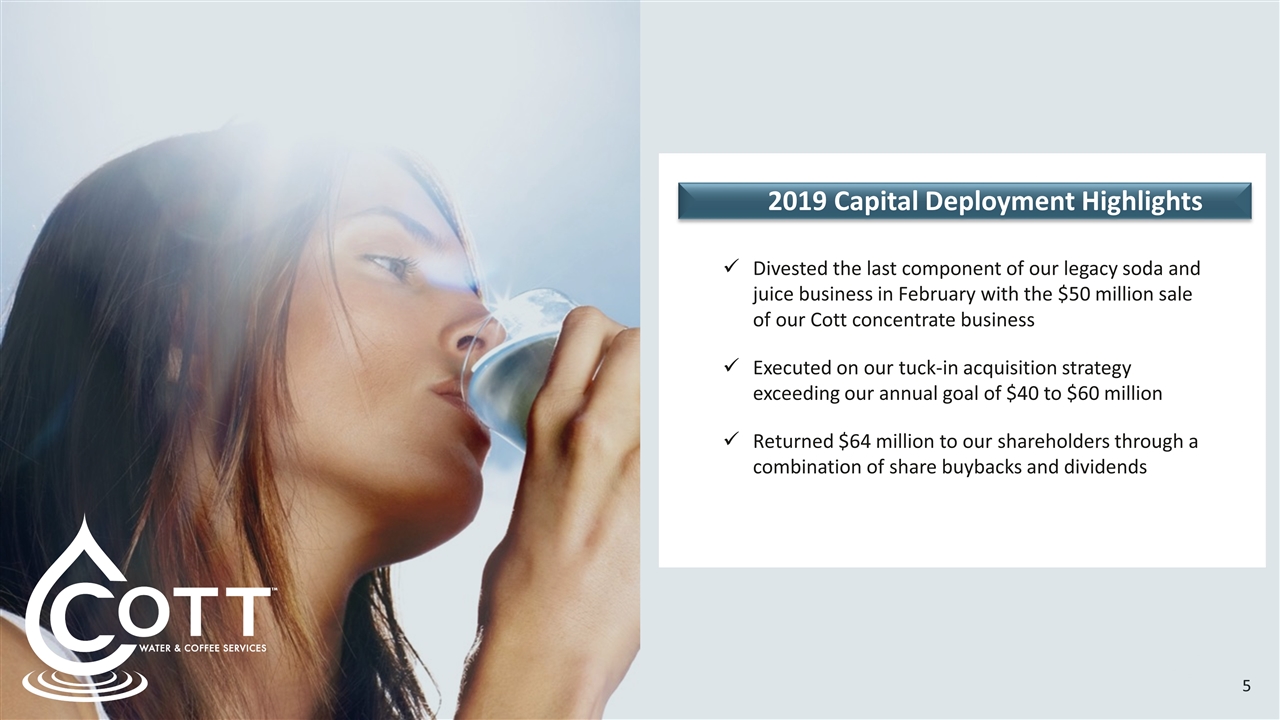
18 2019 Capital Deployment Highlights Divested the last component of our legacy soda and juice business in February with the $50 million sale of our Cott concentrate business Executed on our tuck-in acquisition strategy exceeding our annual goal of $40 to $60 million Returned $64 million to our shareholders through a combination of share buybacks and dividends
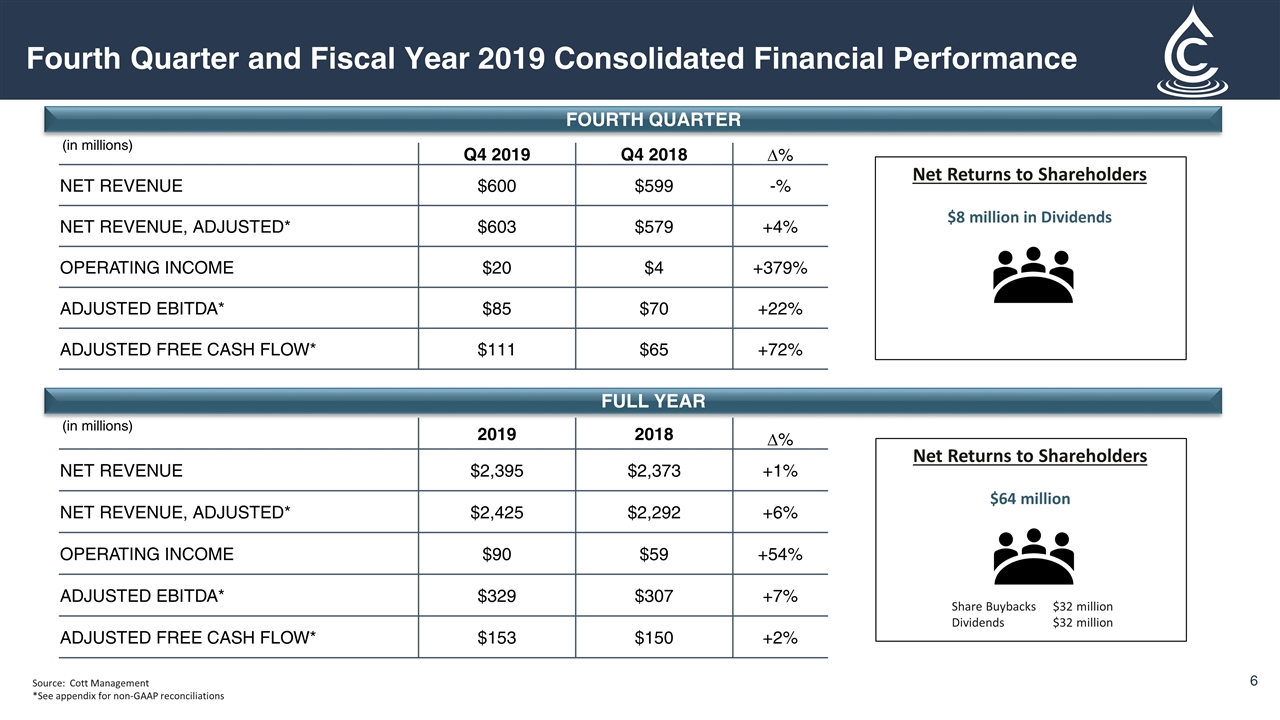
Fourth Quarter and Fiscal Year 2019 Consolidated Financial Performance Source: Cott Management *See appendix for non-GAAP reconciliations Net Returns to Shareholders $8 million in Dividends Q4 2019 Q4 2018 ∆% NET REVENUE $600 $599 -% NET REVENUE, ADJUSTED* $603 $579 +4% OPERATING INCOME $20 $4 +379% ADJUSTED EBITDA* $85 $70 +22% ADJUSTED FREE CASH FLOW* $111 $65 +72% FOURTH QUARTER FULL YEAR 2019 2018 ∆% NET REVENUE $2,395 $2,373 +1% NET REVENUE, ADJUSTED* $2,425 $2,292 +6% OPERATING INCOME $90 $59 +54% ADJUSTED EBITDA* $329 $307 +7% ADJUSTED FREE CASH FLOW* $153 $150 +2% Net Returns to Shareholders $64 million Share Buybacks Dividends $32 million $32 million (in millions) (in millions)
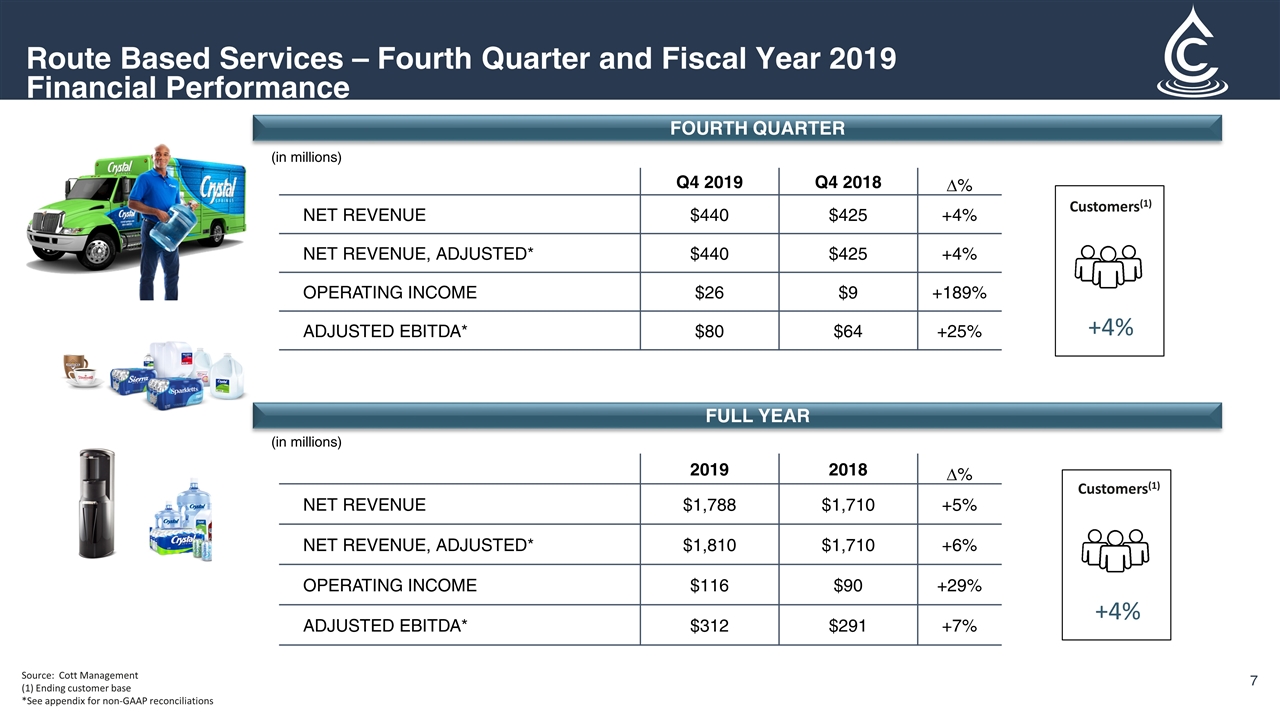
Source: Cott Management (1) Ending customer base *See appendix for non-GAAP reconciliations $293M $309M Route Based Services – Fourth Quarter and Fiscal Year 2019 Financial Performance Q4 2019 Q4 2018 ∆% NET REVENUE $440 $425 +4% NET REVENUE, ADJUSTED* $440 $425 +4% OPERATING INCOME $26 $9 +189% ADJUSTED EBITDA* $80 $64 +25% FOURTH QUARTER FULL YEAR 2019 2018 ∆% NET REVENUE $1,788 $1,710 +5% NET REVENUE, ADJUSTED* $1,810 $1,710 +6% OPERATING INCOME $116 $90 +29% ADJUSTED EBITDA* $312 $291 +7% Customers(1) +4% +4% Customers(1) (in millions) (in millions)
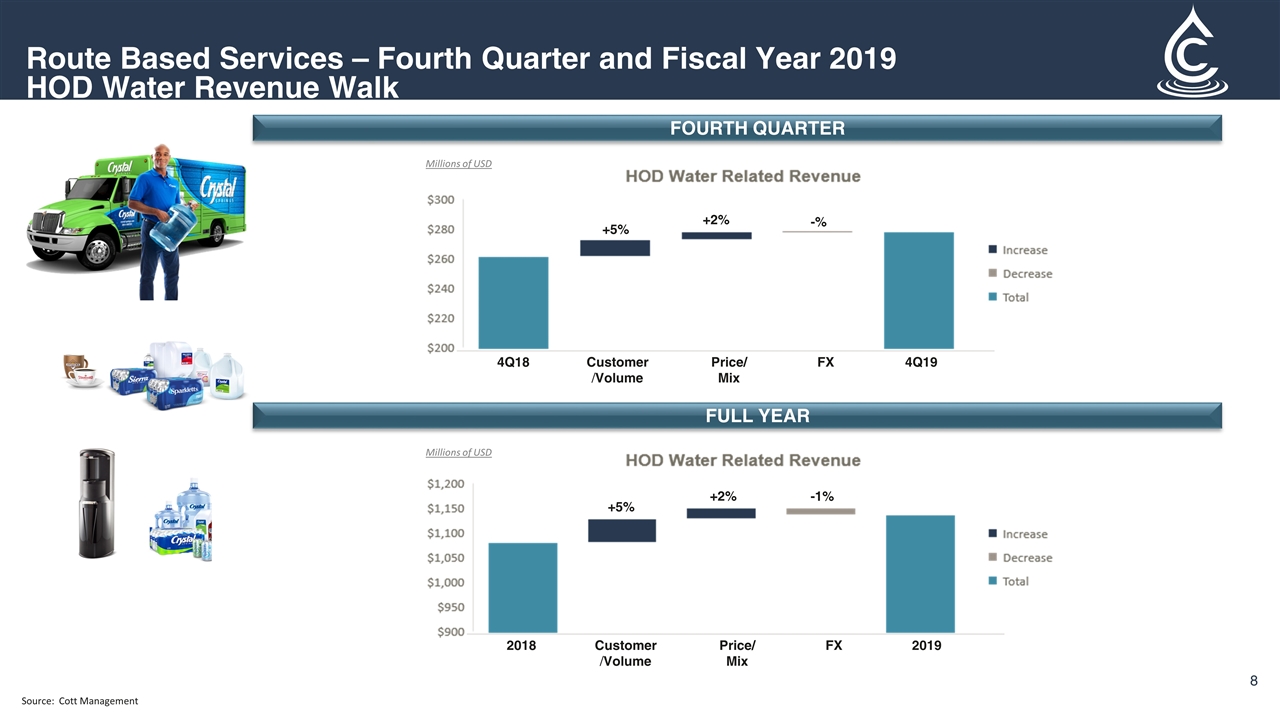
Source: Cott Management $293M +5% +2% -% Route Based Services – Fourth Quarter and Fiscal Year 2019 HOD Water Revenue Walk Millions of USD FOURTH QUARTER FULL YEAR +5% +2% -1% Customer/Volume Price/Mix FX 2018 2019 Millions of USD Customer/Volume Price/Mix FX 4Q18 4Q19
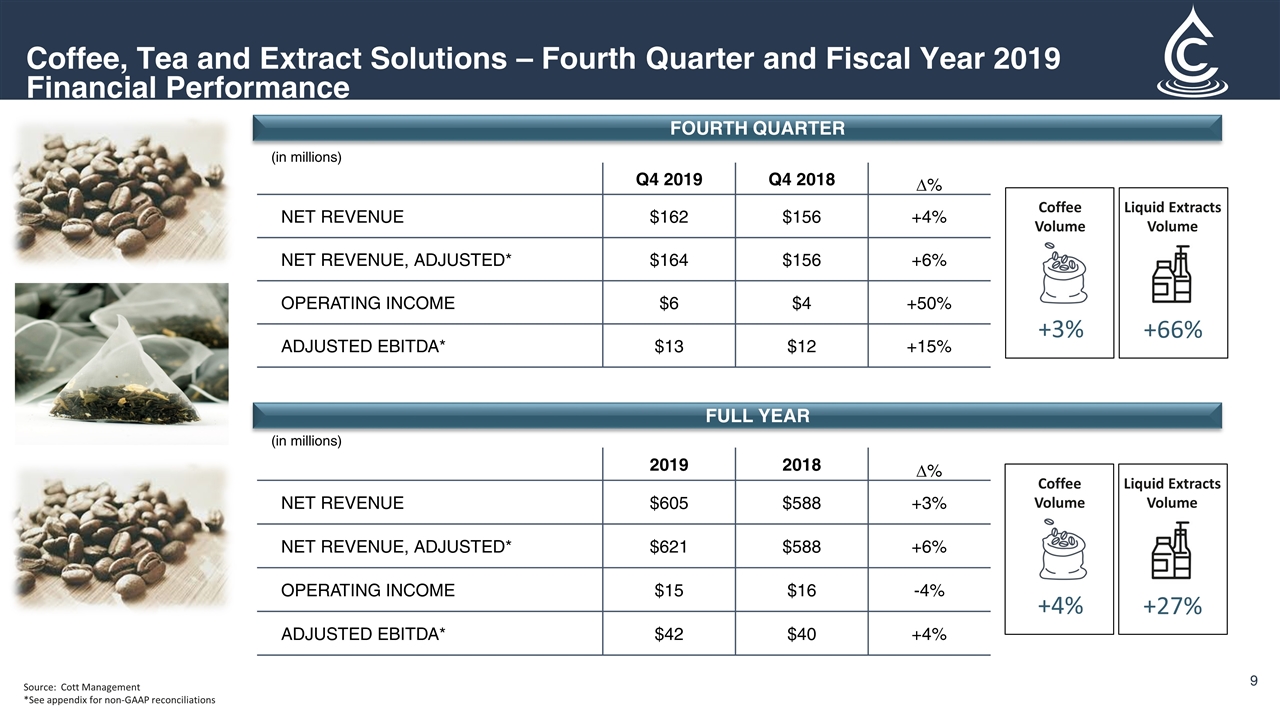
Source: Cott Management *See appendix for non-GAAP reconciliations Coffee, Tea and Extract Solutions – Fourth Quarter and Fiscal Year 2019 Financial Performance FOURTH QUARTER FULL YEAR Q4 2019 Q4 2018 ∆% NET REVENUE $162 $156 +4% NET REVENUE, ADJUSTED* $164 $156 +6% OPERATING INCOME $6 $4 +50% ADJUSTED EBITDA* $13 $12 +15% Liquid Extracts Volume +66% Coffee Volume +3% 2019 2018 ∆% NET REVENUE $605 $588 +3% NET REVENUE, ADJUSTED* $621 $588 +6% OPERATING INCOME $15 $16 -4% ADJUSTED EBITDA* $42 $40 +4% Liquid Extracts Volume +27% Coffee Volume +4% (in millions) (in millions)
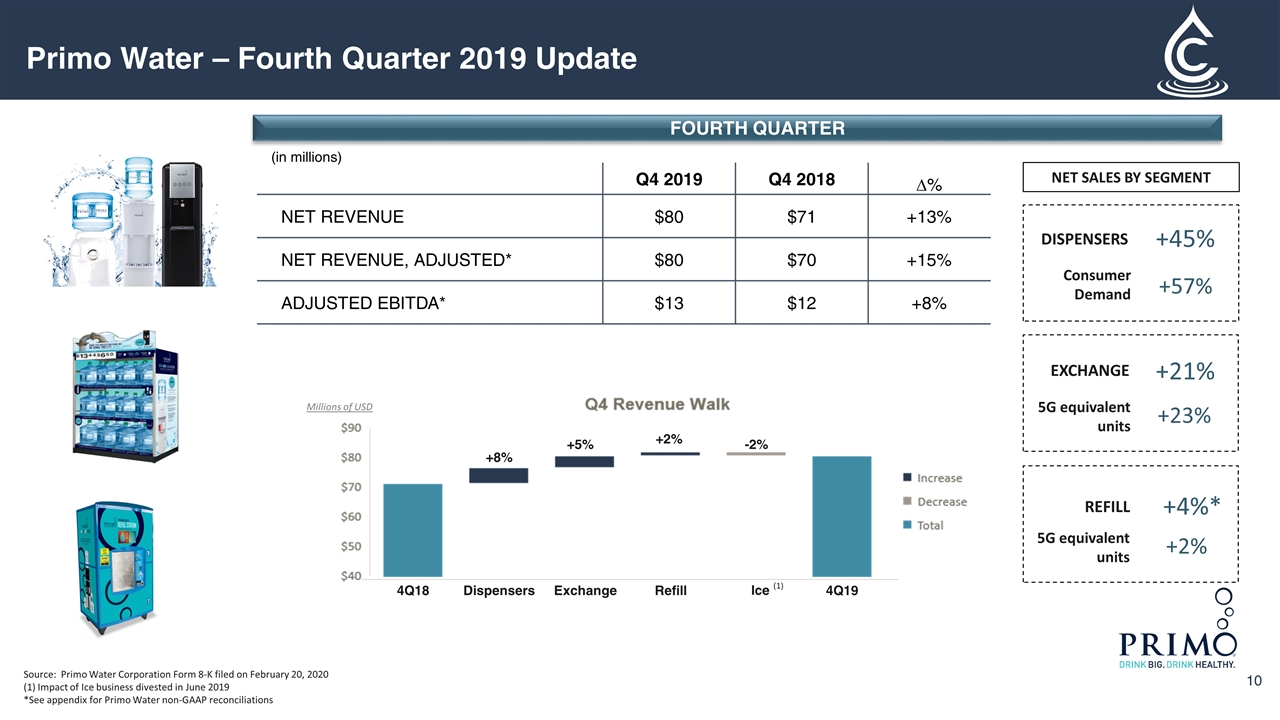
Source: Primo Water Corporation Form 8-K filed on February 20, 2020 (1) Impact of Ice business divested in June 2019 *See appendix for Primo Water non-GAAP reconciliations Primo Water – Fourth Quarter 2019 Update FOURTH QUARTER Q4 2019 Q4 2018 ∆% NET REVENUE $80 $71 +13% NET REVENUE, ADJUSTED* $80 $70 +15% ADJUSTED EBITDA* $13 $12 +8% (in millions) Dispensers Exchange Refill 4Q18 4Q19 Ice +8% +5% +2% -2% Millions of USD DISPENSERS +45% Consumer Demand +57% EXCHANGE +21% 5G equivalent units +23% REFILL +4%* 5G equivalent units +2% NET SALES BY SEGMENT (1)
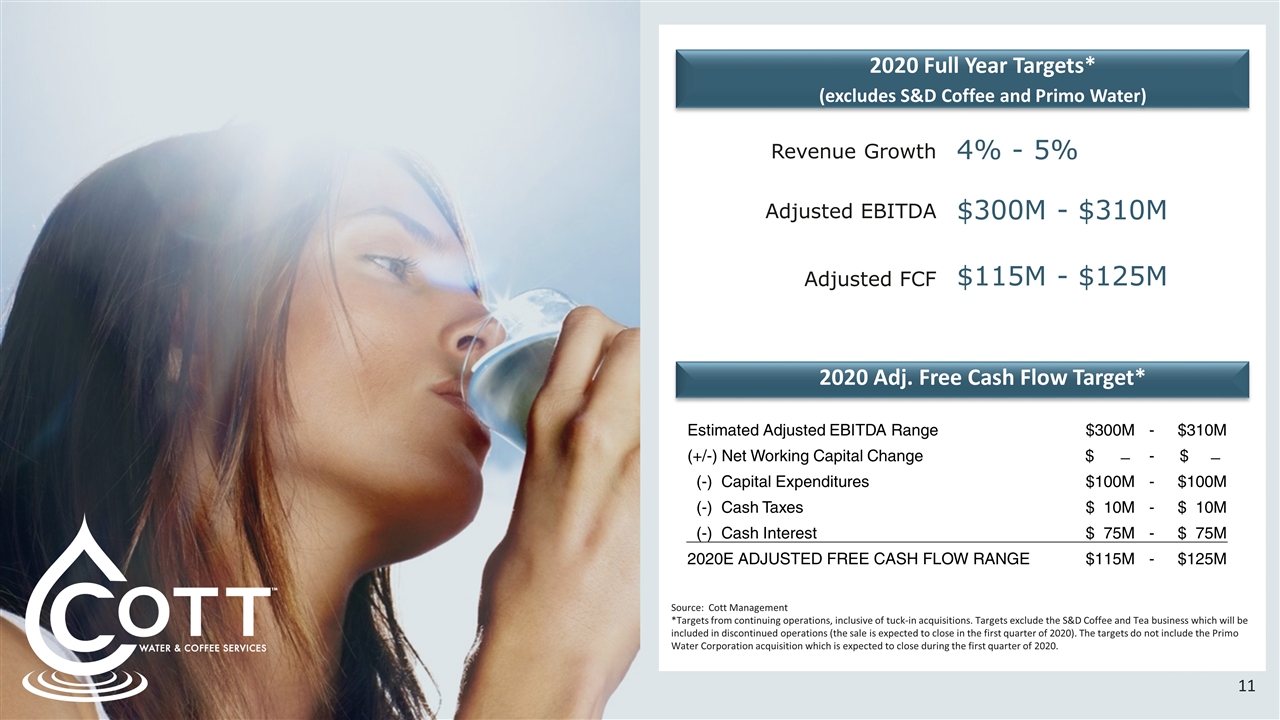
18 Revenue Growth 4% - 5% Adjusted FCF $115M - $125M Adjusted EBITDA $300M - $310M 2020 Full Year Targets* (excludes S&D Coffee and Primo Water) 2020 Adj. Free Cash Flow Target* Estimated Adjusted EBITDA Range $300M - $310M (+/-) Net Working Capital Change $ ̶ - $ ̶ (-) Capital Expenditures $100M - $100M (-) Cash Taxes $ 10M - $ 10M (-) Cash Interest $ 75M - $ 75M 2020E ADJUSTED FREE CASH FLOW RANGE $115M - $125M Source: Cott Management *Targets from continuing operations, inclusive of tuck-in acquisitions. Targets exclude the S&D Coffee and Tea business which will be included in discontinued operations (the sale is expected to close in the first quarter of 2020). The targets do not include the Primo Water Corporation acquisition which is expected to close during the first quarter of 2020.

ENVIRONMENTAL, SOCIAL AND GOVERNANCE – ESG TRANSITION TO A PURE-PLAY WATER PROVIDER ONGOING INITIATIVES Customers Pricing Enhanced footprint Customer satisfaction and service levels Customer experience – mobile app. Channel penetration and expansion 2020 Key Focus Areas Complete the acquisition of Primo Water Divestiture of S&D Coffee and Tea Integrate Primo Water successfully Capture of synergies Synergistic Tuck-in Acquisitions STATE OF THE ART EQUIPMENT Aqua Barista Pureflo IOT Filtration technology Primo Dispensing Solutions Alliance for Water Stewardship Carbon Neutral in Europe Carbon Neutral in North America Convert Fleet to Propane Fuel
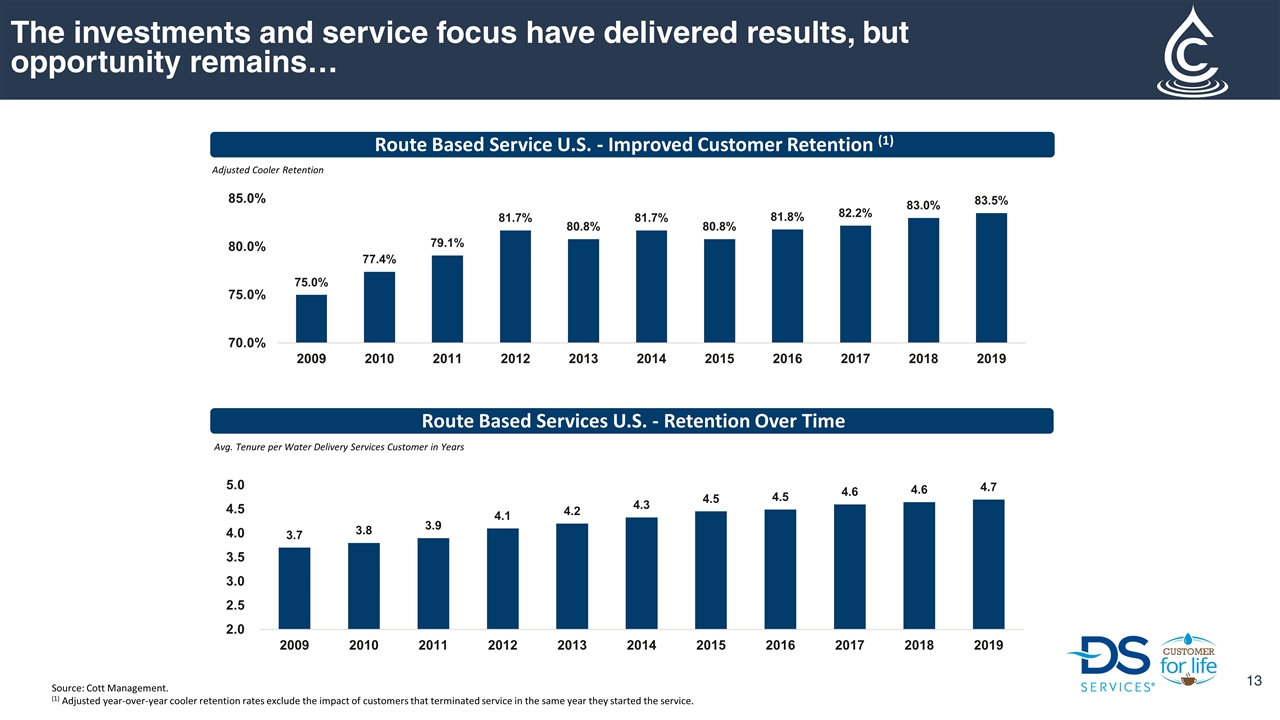
The investments and service focus have delivered results, but opportunity remains… Route Based Service U.S. - Improved Customer Retention (1) Route Based Services U.S. - Retention Over Time Adjusted Cooler Retention Avg. Tenure per Water Delivery Services Customer in Years Source: Cott Management. (1) Adjusted year-over-year cooler retention rates exclude the impact of customers that terminated service in the same year they started the service.
Appendix
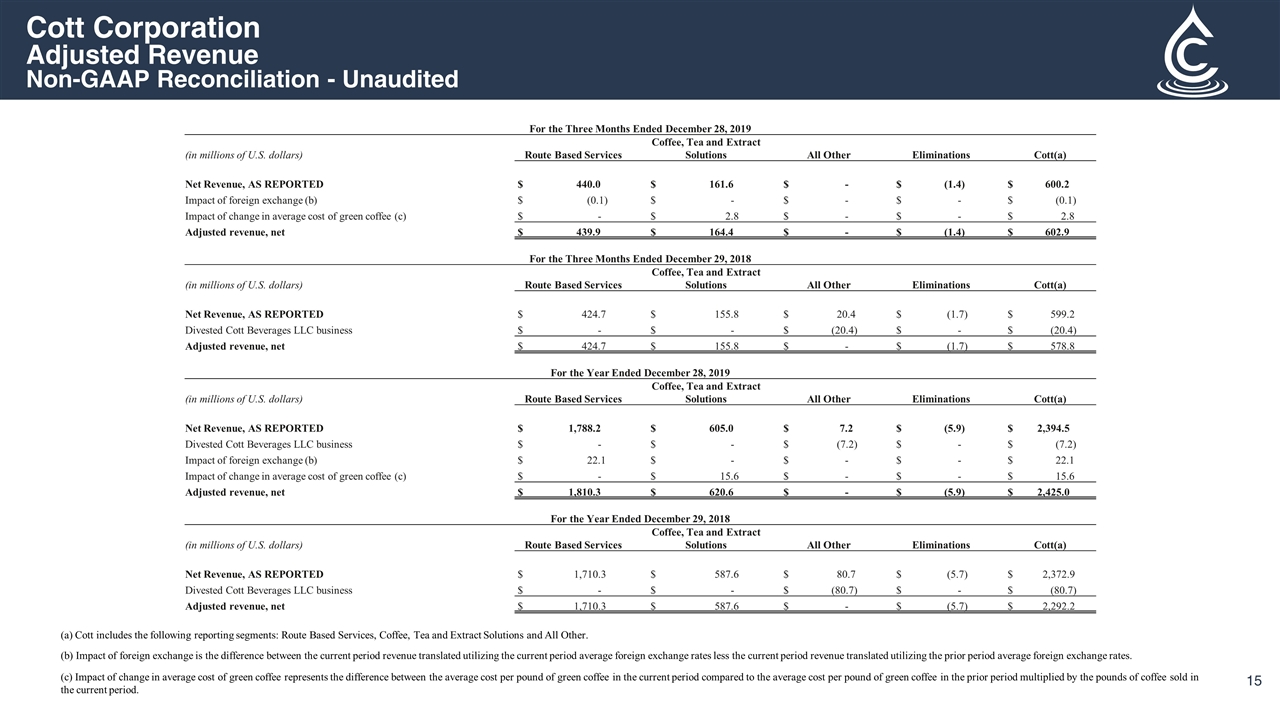
(a) Cott includes the following reporting segments: Route Based Services, Coffee, Tea and Extract Solutions and All Other. (b) Impact of foreign exchange is the difference between the current period revenue translated utilizing the current period average foreign exchange rates less the current period revenue translated utilizing the prior period average foreign exchange rates. (c) Impact of change in average cost of green coffee represents the difference between the average cost per pound of green coffee in the current period compared to the average cost per pound of green coffee in the prior period multiplied by the pounds of coffee sold in the current period. Cott Corporation Adjusted Revenue Non-GAAP Reconciliation - Unaudited For the Three Months Ended December 28, 2019 (in millions of U.S. dollars) Route Based Services Coffee, Tea and Extract Solutions All Other Eliminations Cott(a) Net Revenue, AS REPORTED $ 440.0 $ 161.6 $ - $ (1.4) $ 600.2 Impact of foreign exchange (b) $ (0.1) $ - $ - $ - $ (0.1) Impact of change in average cost of green coffee (c) $ - $ 2.8 $ - $ - $ 2.8 Adjusted revenue, net $ 439.9 $ 164.4 $ - $ (1.4) $ 602.9 For the Three Months Ended December 29, 2018 (in millions of U.S. dollars) Route Based Services Coffee, Tea and Extract Solutions All Other Eliminations Cott(a) Net Revenue, AS REPORTED $ 424.7 $ 155.8 $ 20.4 $ (1.7) $ 599.2 Divested Cott Beverages LLC business $ - $ - $ (20.4) $ - $ (20.4) Adjusted revenue, net $ 424.7 $ 155.8 $ - $ (1.7) $ 578.8 For the Year Ended December 28, 2019 (in millions of U.S. dollars) Route Based Services Coffee, Tea and Extract Solutions All Other Eliminations Cott(a) Net Revenue, AS REPORTED $ 1,788.2 $ 605.0 $ 7.2 $ (5.9) $ 2,394.5 Divested Cott Beverages LLC business $ - $ - $ (7.2) $ - $ (7.2) Impact of foreign exchange (b) $ 22.1 $ - $ - $ - $ 22.1 Impact of change in average cost of green coffee (c) $ - $ 15.6 $ - $ - $ 15.6 Adjusted revenue, net $ 1,810.3 $ 620.6 $ - $ (5.9) $ 2,425.0 For the Year Ended December 29, 2018 (in millions of U.S. dollars) Route Based Services Coffee, Tea and Extract Solutions All Other Eliminations Cott(a) Net Revenue, AS REPORTED $ 1,710.3 $ 587.6 $ 80.7 $ (5.7) $ 2,372.9 Divested Cott Beverages LLC business $ - $ - $ (80.7) $ - $ (80.7) Adjusted revenue, net $ 1,710.3 $ 587.6 $ - $ (5.7) $ 2,292.2
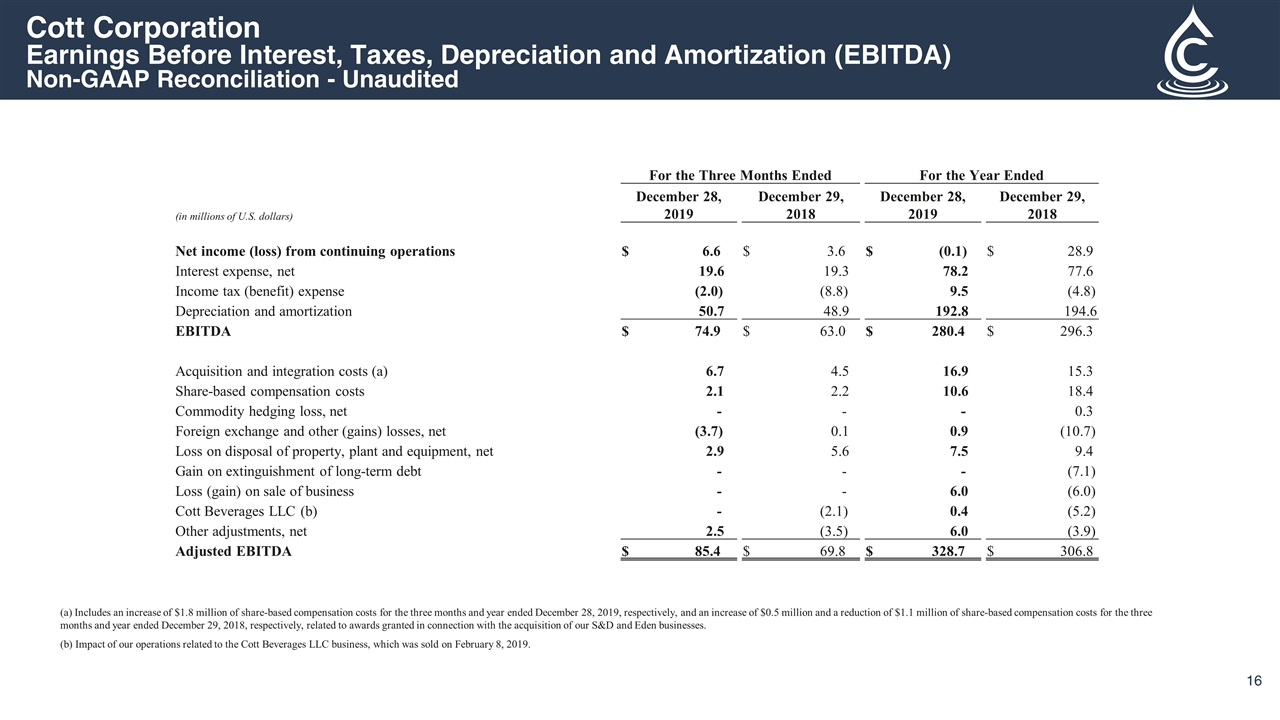
Cott Corporation Earnings Before Interest, Taxes, Depreciation and Amortization (EBITDA) Non-GAAP Reconciliation - Unaudited For the Three Months Ended For the Year Ended (in millions of U.S. dollars) December 28, 2019 December 29, 2018 December 28, 2019 December 29, 2018 Net income (loss) from continuing operations $ 6.6 $ 3.6 $ (0.1) $ 28.9 Interest expense, net 19.6 19.3 78.2 77.6 Income tax (benefit) expense (2.0) (8.8) 9.5 (4.8) Depreciation and amortization 50.7 48.9 192.8 194.6 EBITDA $ 74.9 $ 63.0 $ 280.4 $ 296.3 Acquisition and integration costs (a) 6.7 4.5 16.9 15.3 Share-based compensation costs 2.1 2.2 10.6 18.4 Commodity hedging loss, net - - - 0.3 Foreign exchange and other (gains) losses, net (3.7) 0.1 0.9 (10.7) Loss on disposal of property, plant and equipment, net 2.9 5.6 7.5 9.4 Gain on extinguishment of long-term debt - - - (7.1) Loss (gain) on sale of business - - 6.0 (6.0) Cott Beverages LLC (b) - (2.1) 0.4 (5.2) Other adjustments, net 2.5 (3.5) 6.0 (3.9) Adjusted EBITDA $ 85.4 $ 69.8 $ 328.7 $ 306.8 (a) Includes an increase of $1.8 million of share-based compensation costs for the three months and year ended December 28, 2019, respectively, and an increase of $0.5 million and a reduction of $1.1 million of share-based compensation costs for the three months and year ended December 29, 2018, respectively, related to awards granted in connection with the acquisition of our S&D and Eden businesses. (b) Impact of our operations related to the Cott Beverages LLC business, which was sold on February 8, 2019.
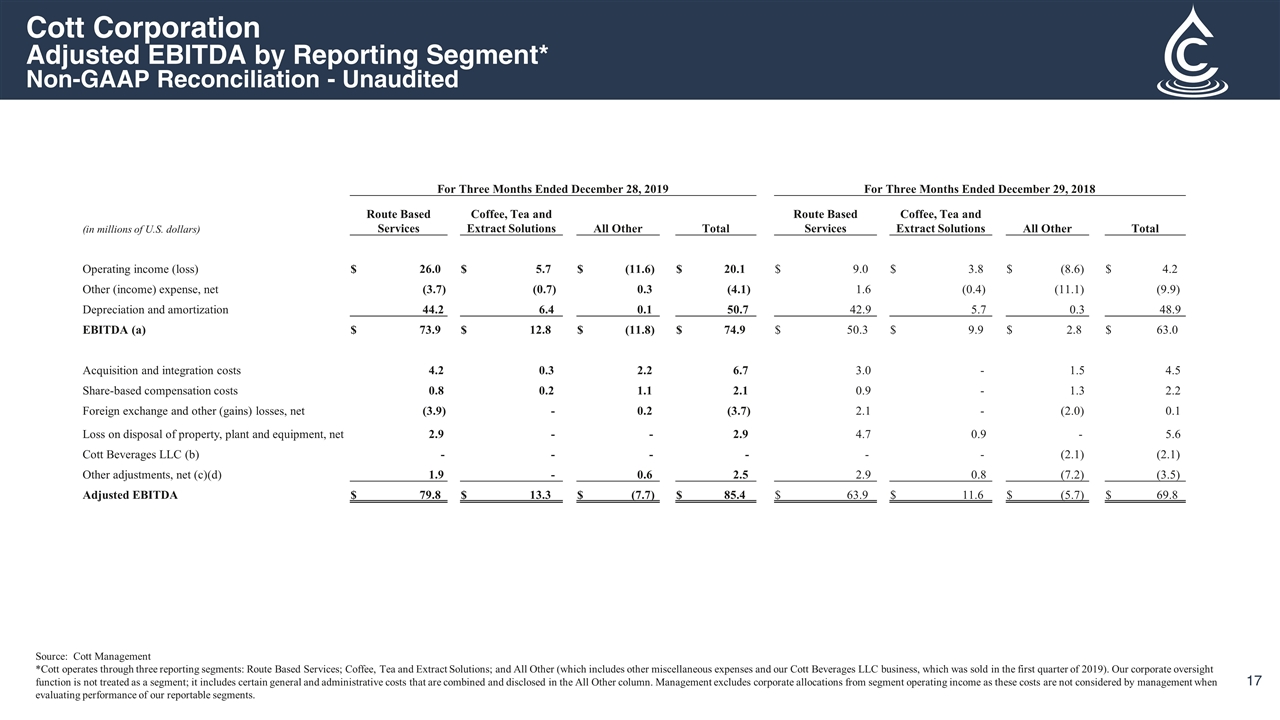
Cott Corporation Adjusted EBITDA by Reporting Segment* Non-GAAP Reconciliation - Unaudited For Three Months Ended December 28, 2019 For Three Months Ended December 29, 2018 (in millions of U.S. dollars) Route Based Services Coffee, Tea and Extract Solutions All Other Total Route Based Services Coffee, Tea and Extract Solutions All Other Total Operating income (loss) $ 26.0 $ 5.7 $ (11.6) $ 20.1 $ 9.0 $ 3.8 $ (8.6) $ 4.2 Other (income) expense, net (3.7) (0.7) 0.3 (4.1) 1.6 (0.4) (11.1) (9.9) Depreciation and amortization 44.2 6.4 0.1 50.7 42.9 5.7 0.3 48.9 EBITDA (a) $ 73.9 $ 12.8 $ (11.8) $ 74.9 $ 50.3 $ 9.9 $ 2.8 $ 63.0 Acquisition and integration costs 4.2 0.3 2.2 6.7 3.0 - 1.5 4.5 Share-based compensation costs 0.8 0.2 1.1 2.1 0.9 - 1.3 2.2 Foreign exchange and other (gains) losses, net (3.9) - 0.2 (3.7) 2.1 - (2.0) 0.1 Loss on disposal of property, plant and equipment, net 2.9 - - 2.9 4.7 0.9 - 5.6 Cott Beverages LLC (b) - - - - - - (2.1) (2.1) Other adjustments, net (c)(d) 1.9 - 0.6 2.5 2.9 0.8 (7.2) (3.5) Adjusted EBITDA $ 79.8 $ 13.3 $ (7.7) $ 85.4 $ 63.9 $ 11.6 $ (5.7) $ 69.8 Source: Cott Management *Cott operates through three reporting segments: Route Based Services; Coffee, Tea and Extract Solutions; and All Other (which includes other miscellaneous expenses and our Cott Beverages LLC business, which was sold in the first quarter of 2019). Our corporate oversight function is not treated as a segment; it includes certain general and administrative costs that are combined and disclosed in the All Other column. Management excludes corporate allocations from segment operating income as these costs are not considered by management when evaluating performance of our reportable segments.
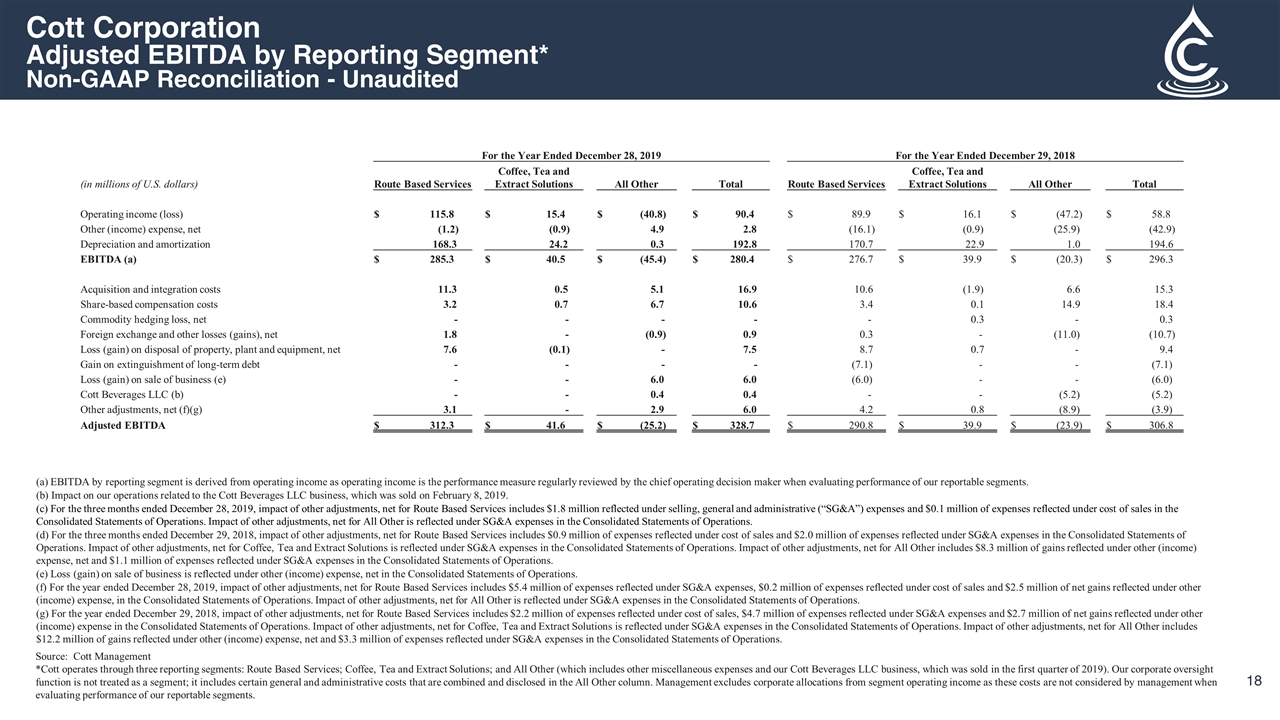
Source: Cott Management *Cott operates through three reporting segments: Route Based Services; Coffee, Tea and Extract Solutions; and All Other (which includes other miscellaneous expenses and our Cott Beverages LLC business, which was sold in the first quarter of 2019). Our corporate oversight function is not treated as a segment; it includes certain general and administrative costs that are combined and disclosed in the All Other column. Management excludes corporate allocations from segment operating income as these costs are not considered by management when evaluating performance of our reportable segments. Cott Corporation Adjusted EBITDA by Reporting Segment* Non-GAAP Reconciliation - Unaudited For the Year Ended December 28, 2019 For the Year Ended December 29, 2018 (in millions of U.S. dollars) Route Based Services Coffee, Tea and Extract Solutions All Other Total Route Based Services Coffee, Tea and Extract Solutions All Other Total Operating income (loss) $ 115.8 $ 15.4 $ (40.8) $ 90.4 $ 89.9 $ 16.1 $ (47.2) $ 58.8 Other (income) expense, net (1.2) (0.9) 4.9 2.8 (16.1) (0.9) (25.9) (42.9) Depreciation and amortization 168.3 24.2 0.3 192.8 170.7 22.9 1.0 194.6 EBITDA (a) $ 285.3 $ 40.5 $ (45.4) $ 280.4 $ 276.7 $ 39.9 $ (20.3) $ 296.3 Acquisition and integration costs 11.3 0.5 5.1 16.9 10.6 (1.9) 6.6 15.3 Share-based compensation costs 3.2 0.7 6.7 10.6 3.4 0.1 14.9 18.4 Commodity hedging loss, net - - - - - 0.3 - 0.3 Foreign exchange and other losses (gains), net 1.8 - (0.9) 0.9 0.3 - (11.0) (10.7) Loss (gain) on disposal of property, plant and equipment, net 7.6 (0.1) - 7.5 8.7 0.7 - 9.4 Gain on extinguishment of long-term debt - - - - (7.1) - - (7.1) Loss (gain) on sale of business (e) - - 6.0 6.0 (6.0) - - (6.0) Cott Beverages LLC (b) - - 0.4 0.4 - - (5.2) (5.2) Other adjustments, net (f)(g) 3.1 - 2.9 6.0 4.2 0.8 (8.9) (3.9) Adjusted EBITDA $ 312.3 $ 41.6 $ (25.2) $ 328.7 $ 290.8 $ 39.9 $ (23.9) $ 306.8 (a) EBITDA by reporting segment is derived from operating income as operating income is the performance measure regularly reviewed by the chief operating decision maker when evaluating performance of our reportable segments. (b) Impact on our operations related to the Cott Beverages LLC business, which was sold on February 8, 2019. (c) For the three months ended December 28, 2019, impact of other adjustments, net for Route Based Services includes $1.8 million reflected under selling, general and administrative (“SG&A”) expenses and $0.1 million of expenses reflected under cost of sales in the Consolidated Statements of Operations. Impact of other adjustments, net for All Other is reflected under SG&A expenses in the Consolidated Statements of Operations. (d) For the three months ended December 29, 2018, impact of other adjustments, net for Route Based Services includes $0.9 million of expenses reflected under cost of sales and $2.0 million of expenses reflected under SG&A expenses in the Consolidated Statements of Operations. Impact of other adjustments, net for Coffee, Tea and Extract Solutions is reflected under SG&A expenses in the Consolidated Statements of Operations. Impact of other adjustments, net for All Other includes $8.3 million of gains reflected under other (income) expense, net and $1.1 million of expenses reflected under SG&A expenses in the Consolidated Statements of Operations. (e) Loss (gain) on sale of business is reflected under other (income) expense, net in the Consolidated Statements of Operations. (f) For the year ended December 28, 2019, impact of other adjustments, net for Route Based Services includes $5.4 million of expenses reflected under SG&A expenses, $0.2 million of expenses reflected under cost of sales and $2.5 million of net gains reflected under other (income) expense, in the Consolidated Statements of Operations. Impact of other adjustments, net for All Other is reflected under SG&A expenses in the Consolidated Statements of Operations. (g) For the year ended December 29, 2018, impact of other adjustments, net for Route Based Services includes $2.2 million of expenses reflected under cost of sales, $4.7 million of expenses reflected under SG&A expenses and $2.7 million of net gains reflected under other (income) expense in the Consolidated Statements of Operations. Impact of other adjustments, net for Coffee, Tea and Extract Solutions is reflected under SG&A expenses in the Consolidated Statements of Operations. Impact of other adjustments, net for All Other includes $12.2 million of gains reflected under other (income) expense, net and $3.3 million of expenses reflected under SG&A expenses in the Consolidated Statements of Operations.
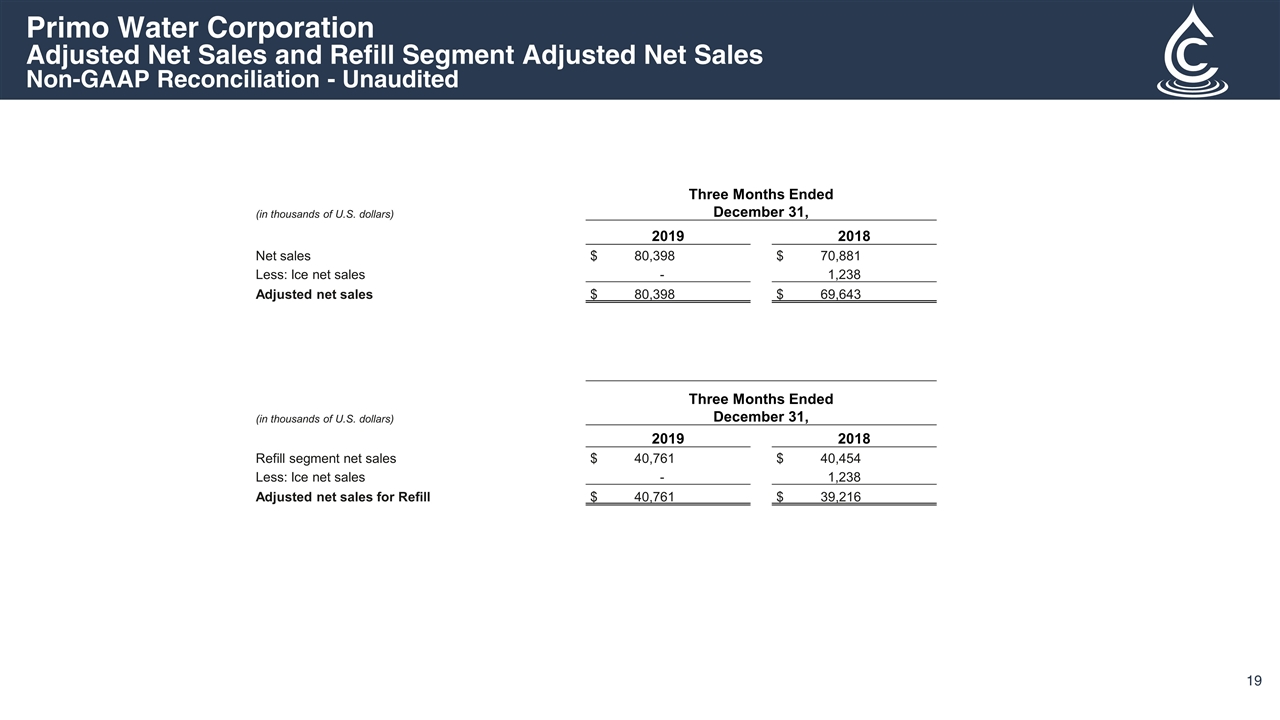
Primo Water Corporation Adjusted Net Sales and Refill Segment Adjusted Net Sales Non-GAAP Reconciliation - Unaudited (in thousands of U.S. dollars) Three Months Ended December 31, 2019 2018 Net sales $ 80,398 $ 70,881 Less: Ice net sales - 1,238 Adjusted net sales $ 80,398 $ 69,643 (in thousands of U.S. dollars) Three Months Ended December 31, 2019 2018 Refill segment net sales $ 40,761 $ 40,454 Less: Ice net sales - 1,238 Adjusted net sales for Refill $ 40,761 $ 39,216
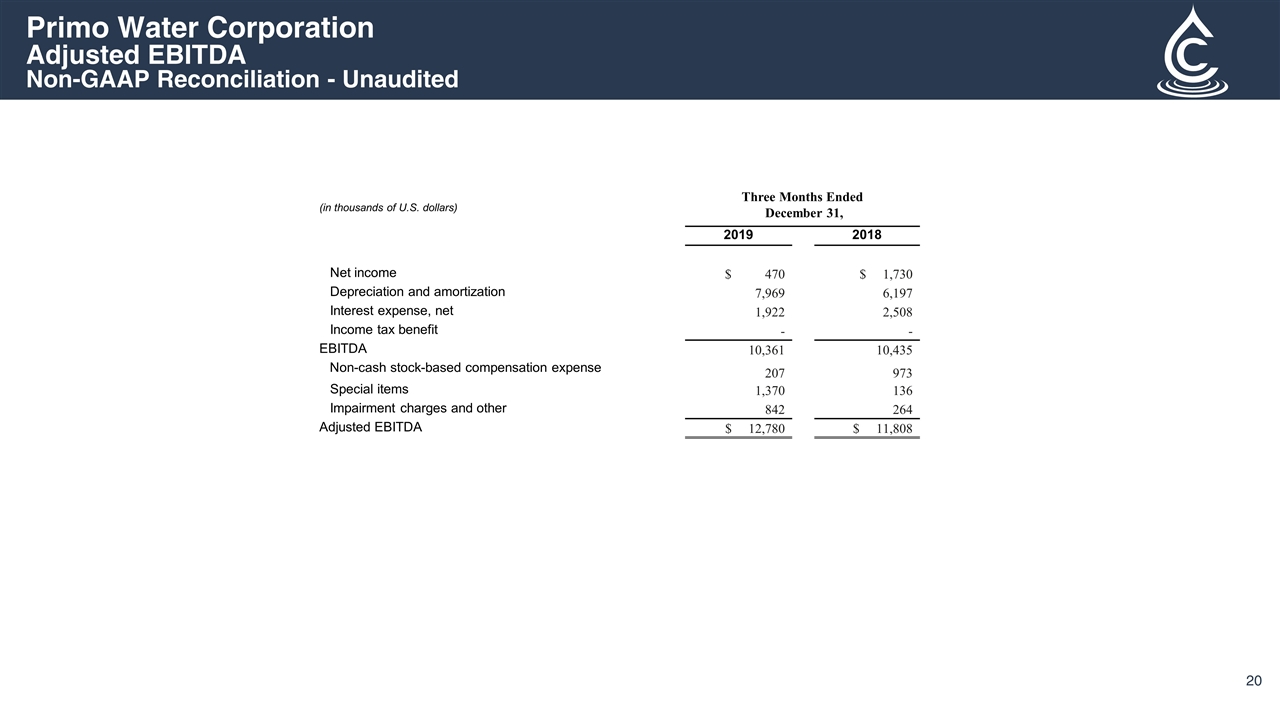
Primo Water Corporation Adjusted EBITDA Non-GAAP Reconciliation - Unaudited (in thousands of U.S. dollars) Three Months Ended December 31, 2019 2018 Net income $ 470 $ 1,730 Depreciation and amortization 7,969 6,197 Interest expense, net 1,922 2,508 Income tax benefit ‑ ‑ EBITDA 10,361 10,435 Non-cash stock-based compensation expense 207 973 Special items 1,370 136 Impairment charges and other 842 264 Adjusted EBITDA $ 12,780 $ 11,808

thank you www.cott.com


