SECURITY EQUITY FUND
SEPTEMBER 30, 2003
ANNUAL REPORT
TABLE OF CONTENTS
Security Equity Fund
Alpha Opportunity Series .............................................3
Enhanced Index Series ................................................6
Equity Series .......................................................16
Global Series .......................................................20
International Series ................................................25
Large Cap Growth Series .............................................29
Mid Cap Value Series ................................................33
Select 25(R)Series ..................................................38
Small Cap Growth Series .............................................41
Social Awareness Series .............................................46
Technology Series ...................................................50
Security Large Cap Value Fund .........................................53
Security Mid Cap Growth Fund ..........................................57
Statements of Assets and Liabilities ..................................61
Statements of Operations ..............................................64
Statements of Changes in Net Assets ...................................67
Financial Highlights ..................................................73
Notes to Financial Statements ........................................100
Report of Independent Auditors .......................................111
Special Shareholder Meeting ..........................................112
Director Disclosure ..................................................113
- --------------------------------------------------------------------------------
2
SCHEDULE OF INVESTMENTS
SEPTEMBER 30, 2003
- --------------------------------------------------------------------------------
SECURITY EQUITY FUND -
ALPHA OPPORTUNITY SERIES
- --------------------------------------------------------------------------------
NUMBER MARKET
COMMON STOCKS OF SHARES VALUE
- --------------------------------------------------------------------------------
AGRICULTURAL PRODUCTS - 0.9%
Bunge, Ltd. .......................... 300 $ 8,250
Delta & Pine Land Company ............ 2,100 48,321
----------
56,571
ALUMINUM - 1.7%
Alcoa, Inc. .......................... 2,700 70,632
Imco Recycling, Inc.* ................ 6,000 36,900
----------
107,532
APPAREL, ACCESSORIES & LUXURY GOODS - 1.3%
Columbia Sportswear Company* ......... 1,100 58,025
Kellwood Company ..................... 700 23,415
----------
81,440
CATALOG RETAIL - 0.6%
InterActiveCorp* ..................... 1,200 39,660
COMMODITY CHEMICALS - 0.4%
NL Industries, Inc. .................. 1,700 27,659
COMMUNICATIONS EQUIPMENT - 0.1%
3Com Corporation* .................... 700 4,130
ADC Telecommunications, Inc. ......... 700 1,631
----------
5,761
CONSTRUCTION & ENGINEERING - 2.3%
Chicago Bridge & Iron
Company N.V. ...................... 1,200 32,592
Fluor Corporation .................... 3,100 115,723
----------
148,315
CONSTRUCTION & FARM MACHINERY & HEAVY TRUCKS - 5.8%
Agco Corporation* .................... 100 1,714
Caterpillar, Inc. .................... 2,000 137,680
CNH Global N.V. ...................... 1,500 19,230
Cummins, Inc. ........................ 1,000 44,430
Deere & Company ...................... 1,400 74,634
Lindsay Manufacturing Company ........ 1,300 26,130
Navistar International Corporation* .. 1,200 44,736
Volvo AB ADR ......................... 1,000 23,280
----------
371,834
CONSTRUCTION MATERIALS - 0.6%
LaFarge S.A. ADR ..................... 2,200 35,970
DIVERSIFIED CAPITAL MARKETS - 0.8%
J.P. Morgan Chase & Company .......... 1,500 51,495
DIVERSIFIED CHEMICALS - 0.7%
Eastman Chemical Company ............. 1,200 40,200
Engelhard Corporation ................ 200 5,534
----------
45,734
NUMBER MARKET
COMMON STOCKS (CONTINUED) OF SHARES VALUE
- --------------------------------------------------------------------------------
DIVERSIFIED METALS & MINING - 2.6%
Anglo American plc ADR ............... 400 $ 7,260
Arch Coal, Inc. ...................... 1,200 26,652
Consol Energy, Inc. .................. 600 11,148
Massey Energy Company ................ 400 5,320
Noranda, Inc. ........................ 9,000 92,340
Peabody Energy Corporation ........... 300 9,411
Penn Virginia Resource Partners,
L.P. .............................. 100 2,989
Rio Tinto plc ADR .................... 100 8,775
----------
163,895
ELECTRICAL COMPONENTS & EQUIPMENT - 1.7%
Emerson Electric Company ............. 600 31,590
Rockwell Automation, Inc. ............ 3,000 78,750
----------
110,340
ELECTRONIC EQUIPMENT MANUFACTURERS - 0.1%
Thermo Electron Corporation* ......... 400 8,680
ELECTRONIC MANUFACTURING SERVICES - 0.6%
Molex, Inc. .......................... 1,300 37,167
FERTILIZERS & AGRICULTURAL CHEMICALS - 1.2%
Monsanto Company ..................... 3,200 76,608
FOOD RETAIL - 0.1%
Wild Oats Markets, Inc.* ............. 600 6,558
FOREST PRODUCTS - 2.5%
Louisiana-Pacific Corporation* ....... 3,800 52,364
Rayonier, Inc. ....................... 400 16,240
Weyerhaeuser Company ................. 1,500 87,675
----------
156,279
GOLD - 1.4%
Placer Dome, Inc. .................... 6,400 88,000
HOME FURNISHINGS - 1.5%
Furniture Brands International,
Inc.* ............................. 1,100 26,510
Kimball International, Inc. (Cl. B) .. 4,800 70,368
----------
96,878
HOTELS, RESORTS & CRUISE LINES - 0.4%
Fairmont Hotels & Resorts, Inc. ...... 900 23,175
HOUSEHOLD APPLIANCES - 0.6%
Snap-On Inc. ......................... 1,300 35,945
INDUSTRIAL CONGLOMERATES - 1.0%
Carlisle Companies, Inc. ............. 1,500 65,430
INDUSTRIAL GASES - 0.9%
Praxair, Inc. ........................ 900 55,755
- --------------------------------------------------------------------------------
3 SEE ACCOMPANYING NOTES.
SCHEDULE OF INVESTMENTS (CONTINUED)
SEPTEMBER 30, 2003
- --------------------------------------------------------------------------------
SECURITY EQUITY FUND -
ALPHA OPPORTUNITY SERIES (CONTINUED)
- --------------------------------------------------------------------------------
NUMBER MARKET
COMMON STOCKS (CONTINUED) OF SHARES VALUE
- --------------------------------------------------------------------------------
INDUSTRIAL MACHINERY - 5.6%
Flowserve Corporation* ............... 300 $ 6,090
Gardner Denver, Inc.* ................ 400 8,404
Harsco Corporation ................... 600 23,082
Idex Corporation ..................... 900 32,796
Ingersoll-Rand Company ............... 1,400 74,816
Joy Global, Inc.* .................... 2,000 31,400
Kennametal, Inc. ..................... 1,300 48,620
Lincoln Electric Holdings, Inc. ...... 1,400 31,094
Manitowoc Company, Inc. .............. 900 19,521
Metso Corporation ADR ................ 800 8,112
SPX Corporation* ..................... 900 40,752
Watts Industries, Inc. ............... 1,700 29,954
----------
354,641
INTEGRATED OIL & GAS - 1.4%
Norsk Hydro ASA ADR .................. 1,532 78,684
Tesoro Petroleum Corporation* ........ 1,200 10,152
----------
88,836
INTERNET SOFTWARE & SERVICES - 0.3%
Covad Communications Group,
Inc.* ............................. 3,700 20,461
LEISURE FACILITIES - 0.1%
Vail Resorts, Inc.* .................. 600 8,580
LEISURE PRODUCTS - 0.4%
Brunswick Corporation ................ 900 23,112
MARINE - 2.1%
Alexander & Baldwin, Inc. ............ 4,756 133,548
OIL & GAS DRILLING - 1.1%
Pride International, Inc.* ........... 600 10,170
Rowan Companies, Inc.* ............... 2,400 58,992
----------
69,162
OIL & GAS EQUIPMENT & SERVICES - 0.7%
Halliburton Company .................. 1,800 43,650
OIL & GAS REFINING, MARKETING & TRANSPORTATION - 1.9%
Premcor, Inc.* ....................... 500 11,585
Sunoco, Inc. ......................... 1,000 40,220
Valero Energy Corporation ............ 1,900 72,713
----------
124,518
OTHER DIVERSIFIED FINANCIAL SERVICES - 0.8%
Brascan Corporation .................. 1,700 42,857
St. Joe Company ...................... 300 9,624
----------
52,481
NUMBER MARKET
COMMON STOCKS (CONTINUED) OF SHARES VALUE
- --------------------------------------------------------------------------------
PACKAGED FOODS & MEATS - 0.4%
Cresud S.A. ADR* ..................... 2,400 $ 21,624
Pilgrims Pride Corporation (Cl. B) ... 500 6,250
----------
27,874
PAPER PACKAGING - 0.9%
Longview Fibre Company ............... 1,600 15,632
Smurfit-Stone Container
Corporation* ...................... 2,800 41,944
----------
57,576
PAPER PRODUCTS - 2.2%
International Paper Company .......... 3,600 140,472
RAILROADS - 2.6%
CSX Corporation ...................... 1,500 43,875
Kansas City Southern* ................ 600 6,642
Union Pacific Corporation ............ 2,000 116,340
----------
166,857
REAL ESTATE INVESTMENT TRUSTS - 0.3%
Plum Creek Timber Company, Inc. ...... 800 20,352
SEMICONDUCTOR EQUIPMENT - 0.1%
Mykrolis Corporation* ................ 600 7,284
SPECIALTY CHEMICALS - 0.8%
Minerals Technologies, Inc. .......... 801 40,771
RPM International, Inc. .............. 1,000 13,060
----------
53,831
SPECIALTY STORES - 0.3%
Barnes & Noble, Inc.* ............ 700 17,787
STEEL - 1.6%
AK Steel Holding Corporation* ........ 1,100 2,200
Metal Management, Inc.* .............. 2,100 40,950
NN, Inc. ............................. 4,704 60,493
----------
103,643
TRADING COMPANIES & DISTRIBUTORS - 0.7%
Applied Industrial Technology, Inc. .. 500 9,935
W.W. Grainger, Inc. .................. 700 33,285
----------
43,220
TRUCKING - 1.3%
Heartland Express, Inc. .............. 1,700 40,834
Knight Transportation, Inc. .......... 1,600 40,112
----------
80,946
----------
Total common stocks - 55.4% ........................... 3,535,512
- --------------------------------------------------------------------------------
4 SEE ACCOMPANYING NOTES.
SCHEDULE OF INVESTMENTS (CONTINUED)
SEPTEMBER 30, 2003
- --------------------------------------------------------------------------------
SECURITY EQUITY FUND -
ALPHA OPPORTUNITY SERIES (CONTINUED)
- --------------------------------------------------------------------------------
PRINCIPAL
AMOUNT OR
NUMBER MARKET
U.S. GOVERNMENT & AGENCIES OF SHARES VALUE
- --------------------------------------------------------------------------------
Federal Home Loan Bank,
1.017%, 11-05-03 .................. $375,000 $ 374,639
Federal Home Loan Mortgage Corporation:
0.98%, 10-02-03 ................... $150,000 149,996
1.098%, 12-04-03 .................. $250,000 249,538
----------
399,534
Federal National Mortgage Association:
1.00%, 10-15-03 ................... $275,000 274,890
1.07%, 11-13-03 ................... $125,000 124,846
1.06%, 12-10-03 ................... $450,000 449,090
----------
848,826
----------
Total U.S. government & agencies - 25.4% .............. 1,622,999
ASSET BACKED SECURITIES
- -----------------------
AUTO - 6.3%
Ford Credit Auto Owner Trust,
1.24% - 2006(1) ................... $400,000 400,570
CREDIT CARDS - 6.2%
First USA Credit Card Master Trust,
1.25% - 2007(1) ................... $400,000 400,213
----------
Total asset backed securities -12.5% .................. 800,783
REPURCHASE AGREEMENT - 3.4%
- ---------------------------
State Street, 10-01-03
(Collateralized by FHLMC, 1.25%,
08-27-04 with a value of $225,430
and a repurchase amount
of $219,501) ...................... $219,499 219,499
----------
Total investments - 96.7% ............................. 6,178,793
SHORT POSITIONS
- ---------------
BREWERS - (0.8%)
Anheuser-Busch Companies, Inc. ....... (1,100) (54,274)
DISTILLERS & VINTERS - (0.2%)
Brown-Forman Corporation (CI. B) ..... (200) (15,824)
DIVERSIFIED COMMERCIAL SERVICES -(0.2%)
DeVry, Inc.* ......................... (500) (11,830)
HEALTH CARE DISTRIBUTORS - (0.2%)
Cardinal Health, Inc. ................ (200) (11,678)
HEALTH CARE SERVICES - (0.2%)
Express Scripts, Inc.* ............... (200) (12,230)
INTEGRATED TELECOMMUNICATION SERVICES - (0.3%)
Alltel Corporation ................... (400) (18,536)
LIFE & HEALTH INSURANCE - (0.3%)
Aflac, Inc. .......................... (200) (6,460)
MetLife, Inc. ........................ (400) (11,220)
----------
(17,680)
MULTI-UTILITIES & UNREGULATED POWER - (0.1%)
Questar Corporation .................. (200) (6,162)
PRINCIPAL
AMOUNT OR
NUMBER MARKET
SHORT POSITIONS (CONTINUED) OF SHARES VALUE
- --------------------------------------------------------------------------------
PERSONAL PRODUCTS - (0.1%)
Chattem, Inc. ........................ (300) $ (4,164)
UNIT INVESTMENT TRUST - (0.1%)
iShares Lehman 20+ Year Treasury
Bond Fund ......................... (100) (8,822)
----------
Total short positions - (2.5%) ........................ (161,200)
Cash & other assets, less liabilities - 5.8% .......... 371,618
----------
Total net assets - 100.0% ............................. $6,389,211
==========
For federal income tax purposes, the identified cost of investments owned at
September 30, 2003 was $6,262,835.
* Non-income producing security
(1) Variable rate security. Rate indicated is rate effective at September 30,
2003.
ADR (American Depositary Receipt)
plc (public limited company)
The Alpha Opportunity Fund's hybrid structure combines an actively managed
long/short component with a passively managed Standard & Poor's 500 Composite
Stock Price Index component. Approximately 50 percent of the portfolio is
invested in a long/short strategy managed by Mainstream Investment Advisers,
LLC; the remainder is independently invested in an index strategy managed by
Security Management Company, LLC.
- --------------------------------------------------------------------------------
5 SEE ACCOMPANYING NOTES.
MANAGER'S COMMENTARY
SECURITY EQUITY FUND - ENHANCED INDEX SERIES
NOVEMBER 15, 2003

SUBADVISOR, NORTHERN TRUST

TO OUR SHAREHOLDERS:

The Enhanced Index Series of Security Equity Fund began operations January 29,
1999. The core portfolio is designed to outperform the S&P 500 Index while
retaining similar risk characteristics as the Index. Through the use of a
proprietary multi-factor model, stocks which in our view have above-average
potential for appreciation are overweighted, while stocks that have less than
average potential are underweighted. During the one year period ended September
30, 2003, the portfolio was up 22.06% versus 24.40% for the benchmark, the
Standard and Poor's 500 Stock Index. Since the inception of the series on
January 29, 1999, the fund is down 5.08% versus a negative 3.87% for the
benchmark.1

OPERATION OF THE PROPRIETARY SCREENS

The Northern Trust Investments Quantitative Management group uses a proprietary
model to overweight or underweight stocks relative to the index. Based on our
model, stocks are overweighted when: the company reports a positive earnings
surprise, the company becomes an acquisition target, it is announced that the
company will be added to the S&P Index, the stock has a high dividend yield or a
zero dividend yield (if further research shows that the company uses the funds
for internal investment).

Conversely, stocks are underweighted if there is a negative earnings surprise,
negative financial statement trends, negative price downward price momentum, or
it is announced that the company will be deleted from the S&P 500 Index. If none
of these positive or negative factors apply, we will hold a neutral position in
the stock.

The Fund underperformed its benchmark during the 12 months ended September 30,
2003. The performance of most of the model's quantitative factors was weak this
past year. Factors based on valuation and earnings characteristics tended to
underperform this year as the market rewarded higher priced, smaller companies
with weaker historical fundamentals. Earnings announcements did not elicit much
market reaction for either positive or negative news as skepticism of earnings
estimates continued to affect investor behavior. Indeed, companies with higher
expected, but not necessarily realized growth, outperformed more value oriented
stocks; a sharp contrast to prior years and most longer-term periods.

Quickly changing market conditions resulted in mid- and long-term momentum
strategies' weaker performance through most of the year. Effective trading of
index changes, though, boosted performance in the past year; however, this
year's changes were few and small relative to the index capitalization.
Similarly, the relative scarcity of companies engaging in merger and acquisition
activity resulted in few opportunities to benefit from trading in these stocks,
although some benefit was captured through the year.

MARKET OUTLOOK

While as index fund managers we don't manage the portfolio according to a given
outlook for the equity markets or the economy, we do monitor economic conditions
and how they affect the financial markets.

Global equity markets performed well in the third quarter, building on their
strong gains of the previous three months. While the rally has been fueled in
part by an improvement in investor sentiment, it also appears to have a sound
basis in fundamentals.

First, economic growth may be gathering momentum now that the concerns over
corporate governance abuses, geopolitical tensions and the aftereffects of the
bubble in technology stocks may be dissipating. Additionally, the benefits of
low interest rates, tax reductions and increased government spending are being
felt. A positive trend has become visible in some key measurements of the
economy, and indicators of future activity may be pointing to a strong second
half.

Second, there appears to be an improvement in corporate profits, with the S&P
500 operating earnings growing by about 10 percent in the second quarter and
beating analysts' reduced expectations. Third quarter and full-year estimates
are now generally holding, and in some instances, increasing. Cost-cutting
initiatives could produce strong profits if the economy accelerates.

Sincerely,

Enhanced Index Team

(1)Performance figures are based on Class A shares and do not reflect deduction
of the sales charges or taxes that a shareholder would pay on distributions or
the redemption of shares. Fee waivers and/or reimbursements reduced Fund
expenses and in the absence of such waivers, the performance quoted would be
reduced.

- --------------------------------------------------------------------------------
                                        6


MANAGER'S COMMENTARY (CONTINUED)

SECURITY EQUITY FUND - ENHANCED INDEX SERIES

NOVEMBER 15, 2003

================================= PERFORMANCE ==================================
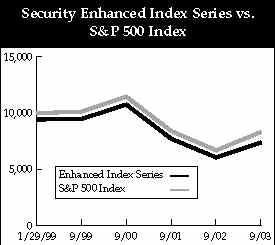
$10,000 SINCE INCEPTION
This chart assumes a $10,000 investment in Class A shares of Enhanced Index
Series on January 29, 1999, and reflects deduction of the 5.75% sales load. On
September30, 2003, the value of your investment in Class A shares of the Series
(with dividends reinvested) would have been $7,388. By comparison, the same
$10,000 investment would have been $8,319, based on the S&P 500 Index
performance. The chart does not reflect the deduction of taxes that a
shareholder would pay on distributions or the redemption of fund shares.
- --------------------------------------------------------------------------------
TOP 5 EQUITY HOLDINGS*
% OF
NET ASSETS
----------
Microsoft Corporation 3.1%
General Electric Company 3.1%
Wal-Mart Stores, Inc. 2.6%
Exxon Mobil Corporation 2.6%
Pfizer, Inc. 2.5%
*At September 30, 2003
- --------------------------------------------------------------------------------
- --------------------------------------------------------------------------------
AVERAGE ANNUAL RETURNS
AS OF SEPTEMBER 30, 2003
1 YEAR SINCE INCEPTION
------ ---------------
A Shares 22.06% (5.08%) (1-29-99)
A Shares with sales charge 15.12% (6.28%) (1-29-99)
B Shares 21.11% (5.85%) (1-29-99)
B Shares with CDSC 16.11% (6.26%) (1-29-99)
C Shares 21.24% (5.80%) (1-29-99)
C Shares with CDSC 20.24% (5.80%) (1-29-99)
- --------------------------------------------------------------------------------
The performance data above represents past performance that is not predictive of
future results. The investment return and principal value of an investment in
the fund will fluctuate so that an investor's shares, when redeemed, may be
worth more or less than their original cost. The figures above do not reflect
deduction of the maximum front-end sales charge of 5.75% for Class A shares or
the contingent deferred sales charge of 5% for Class B shares and 1% for Class C
shares, as applicable, except where noted. The figures do not reflect the
deduction of taxes that a shareholder would pay on distributions or redemption
of fund shares. Such figures would be lower if the maximum sales charge and any
applicable taxes were deducted. Fee waivers reduced expenses of the Fund and in
the absence of such waiver, the performance quoted would be reduced.
- --------------------------------------------------------------------------------
7
SCHEDULE OF INVESTMENTS
SEPTEMBER 30, 2003
- --------------------------------------------------------------------------------
SECURITY EQUITY FUND -
ENHANCED INDEX SERIES
- --------------------------------------------------------------------------------
NUMBER MARKET
COMMON STOCKS OF SHARES VALUE
- --------------------------------------------------------------------------------
ADVERTISING - 0.2%
Interpublic Group of Companies,
Inc. .............................. 557 $ 7,865
Omnicom Group, Inc. .................. 279 20,046
----------
27,911
AEROSPACE & DEFENSE - 1.6%
Boeing Company ....................... 1,475 50,637
General Dynamics Corporation ......... 282 22,013
Goodrich Corporation ................. 138 3,345
Honeywell International, Inc. ........ 1,242 32,727
Lockheed Martin Corporation .......... 651 30,044
Northrop Grumman Corporation ......... 88 7,587
Raytheon Company ..................... 605 16,940
Rockwell Collins ..................... 264 6,666
United Technologies Corporation ...... 715 55,255
----------
225,214
AGRICULTURAL PRODUCTS - 0.1%
Archer-Daniels-Midland Company ....... 1,030 13,503
AIR FREIGHT & LOGISTICS - 1.0%
FedEx Corporation .................... 467 30,089
Ryder System, Inc. ................... 75 2,199
United Parcel Service, Inc. .......... 1,700 108,460
----------
140,748
AIRLINES - 0.2%
Delta Air Lines, Inc. ................ 148 1,968
Southwest Airlines Company ........... 1,099 19,452
----------
21,420
ALUMINUM - 0.2%
Alcoa, Inc. .......................... 1,233 32,255
APPAREL RETAIL - 0.3%
Gap, Inc. ............................ 1,348 23,078
Limited Brands ....................... 1,300 19,604
TJX Companies, Inc. .................. 157 3,049
----------
45,731
APPAREL, ACCESSORIES & LUXURY GOODS - 0.3%
Jones Apparel Group, Inc. ............ 474 14,187
Liz Claiborne, Inc. .................. 168 5,720
V.F. Corporation ..................... 390 15,175
----------
35,082
NUMBER MARKET
COMMON STOCKS (CONTINUED) OF SHARES VALUE
- --------------------------------------------------------------------------------
APPLICATION SOFTWARE - 0.4%
AutoDesk, Inc. ....................... 52 $ 885
Citrix Systems, Inc.* ................ 247 5,454
Compuware Corporation* ............... 516 2,766
Intuit, Inc.* ........................ 528 25,470
Mercury Interactive Corporation* ..... 134 6,085
Parametric Technology
Corporation* ...................... 315 983
PeopleSoft, Inc.* .................... 547 9,950
Siebel Systems, Inc.* ................ 724 7,037
----------
58,630
ASSET MANAGEMENT & CUSTODY BANKS - 0.8%
Bank of New York Company, Inc. ....... 1,126 32,778
Federated Investors, Inc. (Cl. B) .... 144 3,989
Franklin Resources, Inc. ............. 366 16,181
Janus Capital Group, Inc. ............ 322 4,498
Mellon Financial Corporation ......... 622 18,747
T. Rowe Price Group, Inc. ............ 168 6,932
State Street Corporation ............. 710 31,950
----------
115,075
AUTO PARTS & EQUIPMENT - 0.2%
Dana Corporation ..................... 195 3,009
Delphi Corporation ................... 807 7,303
Johnson Controls, Inc. ............... 236 22,326
Visteon Corporation .................. 200 1,320
----------
33,958
AUTOMOBILE MANUFACTURERS - 0.4%
Ford Motor Company ................... 2,716 29,251
General Motors Corporation ........... 833 34,095
----------
63,346
BIOTECHNOLOGY - 1.2%
Amgen, Inc.* ......................... 1,901 122,747
Biogen, Inc.* ........................ 221 8,449
Chiron Corporation* .................. 282 14,577
Genzyme Corporation* ................. 317 14,661
MedImmune, Inc.* ..................... 383 12,643
----------
173,077
BREWERS - 0.5%
Anheuser-Busch Companies, Inc. ....... 1,265 62,415
Adolph Coors Company ................. 65 3,494
----------
65,909
BROADCASTING & CABLE TV - 1.0%
Clear Channel Communications,
Inc. .............................. 906 34,700
Comcast Corporation* ................. 3,366 103,942
Univision Communications,
Inc.* ............................. 334 10,665
----------
149,307
- --------------------------------------------------------------------------------
8 SEE ACCOMPANYING NOTES.
SCHEDULE OF INVESTMENTS (CONTINUED)
SEPTEMBER 30, 2003
- --------------------------------------------------------------------------------
SECURITY EQUITY FUND -
ENHANCED INDEX SERIES (CONTINUED)
- --------------------------------------------------------------------------------
NUMBER MARKET
COMMON STOCKS (CONTINUED OF SHARES VALUE
- --------------------------------------------------------------------------------
BUILDING PRODUCTS - 0.3%
American Standard Companies,
Inc.* ............................. 238 $ 20,051
Masco Corporation .................... 708 17,332
----------
37,383
CASINOS & GAMING - 0.2%
Harrah's Entertainment, Inc. ......... 156 6,569
International Game Technology ........ 873 24,575
----------
31,144
COMMERCIAL PRINTING - 0.0%
R. R. Donnelley & Sons Company ....... 191 4,750
COMMUNICATIONS EQUIPMENT - 2.5%
ADC Telecommunications,
Inc.* ............................. 1,093 2,547
Andrew Corporation* .................. 182 2,237
Avaya, Inc.* ......................... 454 4,949
Ciena Corporation* ................... 700 4,137
Cisco Systems, Inc.* ................. 10,550 206,147
Comverse Technology, Inc.* ........... 856 12,806
Corning, Inc.* ....................... 1,840 17,333
JDS Uniphase Corporation* ............ 2,047 7,369
Lucent Technologies, Inc.* ........... 6,067 13,105
Motorola, Inc. ....................... 1,891 22,635
Qlogic Corporation* .................. 146 6,863
Qualcomm, Inc. ....................... 1,190 49,552
Scientific-Atlanta, Inc. ............. 236 7,351
Tellabs, Inc.* ....................... 618 4,196
----------
361,227
COMPUTER & ELECTRONICS RETAIL - 0.3%
Best Buy Company, Inc.* .............. 474 22,524
Circuit City Stores, Inc. ............ 1,182 11,264
RadioShack Corporation ............... 250 7,103
----------
40,891
COMPUTER HARDWARE - 3.3%
Apple Computer, Inc.* ................ 531 10,954
Dell, Inc.* .......................... 3,854 128,685
Gateway, Inc.* ....................... 400 2,264
Hewlett-Packard Company .............. 4,555 88,185
International Business Machines
Corporation ....................... 2,575 227,450
NCR Corporation* 131 4,151
Sun Microsystems, Inc.* .............. 4,764 15,769
----------
477,458
COMPUTER STORAGE & PERIPHERALS - 0.5%
EMC Corporation* ..................... 3,300 41,679
Lexmark International, Inc.* ......... 194 12,224
Network Appliance, Inc.* ............. 506 10,388
----------
64,291
NUMBER MARKET
COMMON STOCKS (CONTINUED) OF SHARES VALUE
- --------------------------------------------------------------------------------
CONSTRUCTION & ENGINEERING - 0.0%
Fluor Corporation .................... 53 $ 1,978
CONSTRUCTION & FARM MACHINERY - 0.5%
Caterpillar, Inc. .................... 665 45,779
Cummins, Inc. ........................ 49 2,177
Deere & Company ...................... 94 5,011
Navistar International Corporation* .. 80 2,982
Paccar, Inc. ......................... 191 14,266
----------
70,215
CONSTRUCTION MATERIALS - 0.0%
Vulcan Materials Company ............. 138 5,508
CONSUMER FINANCE - 1.3%
American Express Company ............. 1,964 88,498
Capital One Financial Corporation .... 327 18,652
MBNA Corporation ..................... 2,271 51,779
Providian Financial Corporation* ..... 484 5,706
SLM Corporation ...................... 692 26,960
----------
191,595
DATA PROCESSING & OUTSOURCED SERVICE - 1.1%
Automatic Data Processing, Inc. ...... 887 31,799
Computer Sciences Corporation* ....... 274 10,294
Concord EFS, Inc.* ................... 718 9,815
Convergys Corporation* ............... 712 13,058
Electronic Data Systems
Corporation ....................... 129 2,606
First Data Corporation ............... 1,114 44,515
Fiserv, Inc.* ........................ 281 10,181
Paychex, Inc. ........................ 121 4,105
Sabre Holdings Corporation ........... 202 4,341
Sungard Data Systems, Inc.* .......... 731 19,233
----------
149,947
DEPARTMENT STORES - 0.6%
Federated Department Stores, Inc. .... 274 11,481
J.C. Penney Company, Inc. ............ 383 8,185
Kohl's Corporation* .................. 501 26,804
May Department Stores Company ........ 73 1,798
Nordstrom, Inc. ...................... 544 13,497
Sears, Roebuck & Company ............. 462 20,203
----------
81,968
DISTILLERS & VINTNERS - 0.1%
Brown-Forman Corporation (Cl. B) 82 .. 6,488
DISTRIBUTORS - 0.0%
Genuine Parts Company ................ 60 1,919
- --------------------------------------------------------------------------------
9 SEE ACCOMPANYING NOTES.
SCHEDULE OF INVESTMENTS (CONTINUED)
SEPTEMBER 30, 2003
- --------------------------------------------------------------------------------
SECURITY EQUITY FUND -
ENHANCED INDEX SERIES (CONTINUED)
- --------------------------------------------------------------------------------
NUMBER MARKET
COMMON STOCKS (CONTINUED) OF SHARES VALUE
- --------------------------------------------------------------------------------
DIVERSIFIED BANKS - 4.2%
Bank of America Corporation .......... 2,368 $ 184,799
Bank One Corporation ................. 1,736 67,096
Comerica, Inc. ....................... 251 11,697
Fleetboston Financial
Corporation ....................... 1,556 46,913
U.S. Bancorp ......................... 2,894 69,427
Wachovia Corporation ................. 2,029 83,574
Wells Fargo & Company ................ 2,523 129,935
----------
593,441
DIVERSIFIED CAPITAL MARKETS - 0.7%
J.P. Morgan Chase & Company .......... 3,015 103,505
DIVERSIFIED CHEMICALS - 0.9%
Dow Chemical Company ................. 1,394 45,361
E.I. du Pont de Nemours &
Company ........................... 1,136 45,451
Eastman Chemical Company ............. 100 3,350
Engelhard Corporation ................ 211 5,838
Hercules, Inc.* ...................... 129 1,462
PPG Industries, Inc. ................. 424 22,141
----------
123,603
DIVERSIFIED COMMERCIAL SERVICES - 0.6%
Apollo Group, Inc.* .................. 411 27,138
Cendant Corporation* ................. 2,022 37,791
Cintas Corporation ................... 43 1,584
Deluxe Corporation ................... 73 2,930
Equifax, Inc. ........................ 220 4,899
H&R Block, Inc. ...................... 260 11,219
----------
85,561
DIVERSIFIED METALS & MINING - 0.1%
Freeport-McMoran Copper &
Gold, Inc. (Cl. B) ................ 239 7,911
Phelps Dodge Corporation* ............ 148 6,926
----------
14,837
DRUG RETAIL - 0.2%
CVS Corporation ...................... 97 3,013
Walgreen Company ..................... 824 25,247
----------
28,260
ELECTRIC UTILITIES - 2.3%
Allegheny Energy, Inc.* .............. 50 457
Ameren Corporation ................... 238 10,213
American Electric Power
Company, Inc. ..................... 590 17,700
CMS Energy Corporation ............... 214 1,577
CenterPoint Energy, Inc. ............. 1,527 14,003
Cinergy Corporation .................. 259 9,505
Consolidated Edison, Inc. ............ 329 13,410
DTE Energy Company ................... 248 9,149
Dominion Resources, Inc. ............. 465 28,784
NUMBER MARKET
COMMON STOCKS (CONTINUED) OF SHARES VALUE
- --------------------------------------------------------------------------------
ELECTRIC UTILITIES (CONTINUED)
Edison International* ................ 963 $ 18,393
Entergy Corporation .................. 336 18,194
Exelon Corporation ................... 635 40,323
FPL Group, Inc. ...................... 274 17,317
FirstEnergy Corporation .............. 446 14,227
PG&E Corporation* .................... 607 14,507
PPL Corporation ...................... 252 10,319
Pinnacle West Capital Corporation .... 134 4,757
Progress Energy, Inc. ................ 359 15,961
Progress Energy, Inc. - Contingent
Value Obligation* ................. 400 64
Public Service Enterprise
Group, Inc ........................ 547 22,974
Southern Company ..................... 1,078 31,607
Teco Energy, Inc. .................... 261 3,607
TXU Corporation ...................... 485 11,427
Xcel Energy, Inc. .................... 118 1,825
----------
330,300
ELECTRICAL COMPONENTS & EQUIPMENT - 0.4%
American Power Conversion
Corporation ....................... 355 6,085
Cooper Industries, Inc. .............. 167 8,021
Emerson Electric Company ............. 811 42,699
Power-One, Inc.* ..................... 100 1,029
Rockwell Automation, Inc. ............ 100 2,625
Thomas & Betts Corporation* .......... 71 1,125
----------
61,584
ELECTRONIC EQUIPMENT MANUFACTURERS - 0.3%
Agilent Technologies, Inc.* .......... 1,059 23,414
PerkinElmer, Inc. .................... 167 2,557
Symbol Technologies, Inc. ............ 424 5,067
Tektronix, Inc.* ..................... 126 3,119
Thermo Electron Corporation* ......... 290 6,293
Waters Corporation* .................. 186 5,102
----------
45,552
ELECTRONIC MANUFACTURING SERVICES - 0.1%
Jabil Circuit, Inc.* ................. 249 6,486
Sanmina-Sci Corporation* ............. 607 5,888
Solectron Corporation* ............... 985 5,762
----------
18,136
EMPLOYMENT SERVICES - 0.1%
Monster Worldwide, Inc.* ............. 166 4,180
Robert Half International, Inc.* ..... 241 4,700
----------
8,880
ENVIRONMENTAL SERVICES - 0.2%
Allied Waste Industries, Inc.* ....... 248 2,678
Waste Management, Inc. ............... 843 22,061
----------
24,739
- --------------------------------------------------------------------------------
10 SEE ACCOMPANYING NOTES.
SCHEDULE OF INVESTMENTS (CONTINUED)
SEPTEMBER 30, 2003
- --------------------------------------------------------------------------------
SECURITY EQUITY FUND -
ENHANCED INDEX SERIES (CONTINUED)
- --------------------------------------------------------------------------------
NUMBER MARKET
COMMON STOCKS (CONTINUED) OF SHARES VALUE
- --------------------------------------------------------------------------------
FERTILIZERS & AGRICULTURAL CHEMICALS - 0.1%
Monsanto Company ..................... 742 $ 17,763
FOOD DISTRIBUTORS - 0.2%
Sysco Corporation .................... 965 31,565
FOOD RETAIL - 0.3%
Albertson's, Inc. .................... 87 1,790
Kroger Company* ...................... 1,114 19,907
Safeway, Inc.* ....................... 647 14,842
Supervalu, Inc. ...................... 53 1,265
----------
37,804
FOOTWEAR - 0.2%
Nike, Inc. (Cl. B) ................... 400 24,328
Reebok International, Ltd. ........... 90 3,009
----------
27,337
FOREST PRODUCTS - 0.2%
Louisiana-Pacific Corporation* ....... 211 2,908
Weyerhaeuser Company ................. 470 27,472
----------
30,380
GAS UTILITIES - 0.3%
KeySpan Corporation .................. 234 8,209
Kinder Morgan, Inc. .................. 223 12,044
Nicor, Inc. .......................... 53 1,862
NiSource, Inc. ....................... 385 7,692
Peoples Energy Corporation ........... 73 3,021
Sempra Energy ........................ 307 9,014
----------
41,842
GENERAL MERCHANDISE STORES - 0.5%
Big Lots, Inc.* ...................... 156 2,466
Dollar General Corporation ........... 480 9,600
Family Dollar Stores, Inc. ........... 262 10,451
Target Corporation ................... 1,362 51,252
----------
73,769
GOLD - 0.2%
Newmont Mining Corporation
Holding Company ................... 618 24,158
HEALTH CARE DISTRIBUTORS - 0.4%
AmerisourceBergen Corporation ........ 174 9,405
Cardinal Health, Inc. ................ 661 38,596
McKesson Corporation ................. 426 14,182
----------
62,183
HEALTH CARE EQUIPMENT - 1.8%
Applera Corporation - Applied
Biosystems Group .................. 338 7,541
Baxter International, Inc. ........... 281 8,166
Becton, Dickinson & Company .......... 384 13,870
Biomet, Inc. ......................... 392 13,175
Boston Scientific Corporation* ....... 617 39,365
C.R. Bard, Inc. ...................... 85 6,035
NUMBER MARKET
COMMON STOCKS (CONTINUED) OF SHARES VALUE
- --------------------------------------------------------------------------------
HEALTH CARE EQUIPMENT (CONTINUED)
Guidant Corporation .................. 468 $ 21,926
Medtronic, Inc. ...................... 1,831 85,911
St. Jude Medical, Inc.* .............. 262 14,088
Stryker Corporation .................. 323 24,325
Zimmer Holdings, Inc.* ............... 294 16,199
----------
250,601
HEALTH CARE FACILITIES - 0.2%
HCA, Inc. ............................ 312 11,500
Health Management
Association, Inc. ................. 373 8,135
Manor Care, Inc. ..................... 143 4,290
Tenet Healthcare Corporation* ........ 683 9,890
----------
33,815
HEALTH CARE SERVICES - 0.3%
Express Scripts, Inc.* ............... 100 6,115
IMS Health, Inc. ..................... 377 7,955
Medco Health Solutions, Inc.* ........ 401 10,398
Quest Diagnostics, Inc. .............. 304 18,435
----------
42,903
HEALTH CARE SUPPLIES - 0.1%
Bausch & Lomb, Inc. .............. 86 3,797
Millipore Corporation* ............... 59 2,718
----------
6,515
HOME ENTERTAINMENT SOFTWARE - 0.1%
Electonic Arts, Inc.* ................ 222 20,475
HOME FURNISHINGS - 0.0%
Leggett & Platt, Inc. ............ 275 5,948
HOME IMPROVEMENT RETAIL - 1.3%
Home Depot, Inc. ..................... 3,439 109,532
Lowe's Companies, Inc. ............... 1,328 68,923
Sherwin-Williams Company ............. 221 6,500
----------
184,955
HOMEBUILDING - 0.2%
Centex Corporation ................... 96 7,476
KB Home .............................. 231 13,781
Pulte Homes, Inc. .................... 92 6,257
----------
27,514
HOTELS, RESORTS & CRUISE LINES - 0.3%
Carnival Corporation ................. 316 10,393
Hilton Hotels Corporation ............ 538 8,726
Marriott International, Inc. ......... 340 14,630
Starwood Hotels & Resorts
Worldwide, Inc. ................... 300 10,440
----------
44,189
- --------------------------------------------------------------------------------
11 SEE ACCOMPANYING NOTES.
SCHEDULE OF INVESTMENTS (CONTINUED)
SEPTEMBER 30, 2003
- --------------------------------------------------------------------------------
SECURITY EQUITY FUND -
ENHANCED INDEX SERIES (CONTINUED)
- --------------------------------------------------------------------------------
NUMBER MARKET
COMMON STOCKS (CONTINUED OF SHARES VALUE
- --------------------------------------------------------------------------------
HOUSEHOLD APPLIANCES - 0.1%
Black & Decker Corporation ........... 112 $ 4,542
Snap-On, Inc. ........................ 86 2,378
Whirlpool Corporation ................ 104 7,048
----------
13,968
HOUSEHOLD PRODUCTS - 1.8%
Clorox Company ....................... 337 15,458
Colgate-Palmolive Company ............ 816 45,606
Kimberly-Clark Corporation ........... 423 21,708
Procter & Gamble Company ............. 1,934 179,514
----------
262,286
HOUSEWARES & SPECIALTIES - 0.1%
American Greetings Corporation* ...... 113 2,196
Fortune Brands, Inc. ................. 207 11,747
Newell Rubbermaid, Inc. .............. 71 1,539
Tupperware Corporation ............... 100 1,338
----------
16,820
HYPERMARKETS & SUPERCENTERS - 2.7%
Costco Wholesale Corporation* ........ 674 20,948
Wal-Mart Stores, Inc. ................ 6562 366,488
----------
387,436
INDUSTRIAL CONGLOMERATES - 4.2%
General Electric Company ............. 14,944 445,481
3M Company ........................... 1,190 82,193
Textron, Inc. ........................ 200 7,890
Tyco International, Ltd. ............. 2,987 61,024
----------
596,588
INDUSTRIAL GASES - 0.2%
Air Products & Chemicals, Inc. ....... 359 16,191
Praxair, Inc. ........................ 252 15,611
----------
31,802
INDUSTRIAL MACHINERY - 0.8%
Crane Company ........................ 69 1,615
Danaher Corporation .................. 244 18,022
Dover Corporation .................... 267 9,444
Eaton Corporation .................... 124 10,989
Illinois Tool Works, Inc. ............ 477 31,606
Ingersoll-Rand Company ............... 228 12,184
ITT Industries, Inc. ................. 121 7,241
Pall Corporation ..................... 515 11,557
Parker-Hannifin Corporation .......... 200 8,940
----------
111,598
INSURANCE BROKERS - 0.3%
Aon Corporation ...................... 435 9,070
Marsh & McLennan
Companies, Inc. ................... 812 38,659
----------
47,729
NUMBER MARKET
COMMON STOCKS (CONTINUED) OF SHARES VALUE
- --------------------------------------------------------------------------------
INTEGRATED OIL & GAS - 3.9%
ChevronTexaco Corporation ............ 1,585 $113,248
ConocoPhillips ....................... 1,022 55,955
Exxon Mobil Corporation .............. 9,982 365,341
Marathon Oil Corporation ............. 51 1,454
Occidental Petroleum Corporation 598 21,068
----------
557,066
INTEGRATED TELECOMMUNICATION SERVICES - 2.8%
Alltel Corporation ................... 488 22,614
AT&T Corporation ..................... 1,118 24,093
BellSouth Corporation ................ 2,728 64,599
CenturyTel, Inc. ..................... 496 16,809
Citizens Communications Company* ..... 337 3,778
Qwest Communications
International, Inc.* .............. 2,370 8,058
SBC Communications, Inc. ............. 4,940 109,915
Sprint Corporation (FON Group) ....... 1,286 19,419
Verizon Communications, Inc. ......... 4,091 132,712
----------
401,997
INTERNET RETAIL - 0.4%
Ebay, Inc.* .......................... 1,096 58,417
INTERNET SOFTWARE & SERVICES - 0.2%
Yahoo!, Inc.* ........................ 898 31,771
INVESTMENT BANKING & BROKERAGE - 2.0%
Bear Stearns Companies, Inc. ......... 282 21,094
Charles Schwab Corporation ........... 1965 23,403
Goldman Sachs Group, Inc. ............ 812 68,127
Lehman Brothers Holdings, Inc. ....... 505 34,885
Merrill Lynch & Company, Inc. ........ 1573 84,203
Morgan Stanley ....................... 1178 59,442
----------
291,154
IT CONSULTING & OTHER SERVICES - 0.1%
Unisys Corporation* .................. 492 6,657
LEISURE PRODUCTS - 0.1%
Brunswick Corporation ................ 122 3,133
Hasbro, Inc. ......................... 68 1,270
Mattel, Inc. ......................... 142 2,692
----------
7,095
LIFE & HEALTH INSURANCE - 1.0%
Aflac, Inc. .......................... 794 25,646
Jefferson-Pilot Corporation .......... 225 9,986
John Hancock Financial
Services, Inc. .................... 414 13,993
Lincoln National Corporation ......... 250 8,845
MetLife, Inc. ........................ 1,561 43,786
Prudential Financial, Inc. ........... 828 30,934
Torchmark Corporation ................ 190 7,722
UNUMProvident Corporation ............ 125 1,846
----------
142,758
- --------------------------------------------------------------------------------
12 SEE ACCOMPANYING NOTES.
SCHEDULE OF INVESTMENTS (CONTINUED)
SEPTEMBER 30, 2003
- --------------------------------------------------------------------------------
SECURITY EQUITY FUND -
ENHANCED INDEX SERIES (CONTINUED)
- --------------------------------------------------------------------------------
NUMBER MARKET
COMMON STOCKS (CONTINUED) OF SHARES VALUE
- --------------------------------------------------------------------------------
MANAGED HEALTH CARE - 0.9%
Aetna, Inc. .......................... 237 $ 14,464
Anthem, Inc.* ........................ 206 14,694
Humana, Inc.* ........................ 774 13,971
UnitedHealth Group, Inc. 1,078 54,245
WellPoint Health Networks,
Inc.* ............................. 338 26,053
----------
123,427
METAL & GLASS CONTAINERS - 0.2%
Ball Corporation ..................... 289 15,606
Pactiv Corporation* .................. 741 15,027
----------
30,633
MOTORCYCLE MANUFACTURERS - 0.2%
Harley-Davidson, Inc. ................ 459 22,124
MOVIES & ENTERTAINMENT - 1.9%
AOL Time Warner, Inc.* ............... 7,259 109,683
Viacom, Inc. (Cl. B) ................. 2,623 100,461
Walt Disney Company .................. 3,032 61,155
----------
271,299
MULTI-LINE INSURANCE - 1.7%
American International Group, Inc. ... 3,890 224,453
Hartford Financial Group, Inc. ....... 71 3,737
Loews Corporation .................... 287 11,586
----------
239,776
MULTI-UTILITIES & UNREGULATED POWER - 0.4%
AES Corporation* ..................... 735 5,454
Calpine Corporation* ................. 452 2,210
Constellation Energy Group,
Inc. .............................. 496 17,747
Duke Energy Corporation .............. 1,345 23,954
Dynegy, Inc.* ........................ 443 1,595
Williams Companies, Inc. ............. 614 5,784
----------
56,744
OFFICE ELECTRONICS - 0.1%
Xerox Corporation .................... 1,146 11,758
OFFICE SERVICES & SUPPLIES - 0.1%
Avery Dennison Corporation ........... 52 2,627
Pitney Bowes, Inc. ................... 381 14,600
----------
17,227
OIL & GAS DRILLING - 0.2%
Nabors Industries, Inc.* ............. 241 8,980
Noble Corporation* ................... 229 7,784
Rowan Companies, Inc.* ............... 172 4,228
Transocean, Inc. ..................... 441 8,820
----------
29,812
NUMBER MARKET
COMMON STOCKS (CONTINUED) OF SHARES VALUE
- --------------------------------------------------------------------------------
OIL & GAS EQUIPMENT & SERVICES - 0.5%
Baker Hughes, Inc. ................... 536 $ 15,860
BJ Services Company* ................. 264 9,021
Halliburton Company .................. 174 4,220
Schlumberger, Ltd. ................... 853 41,285
----------
70,386
OIL & GAS EXPLORATION & PRODUCTION - 0.8%
Anadarko Petroleum Corporation ....... 398 16,620
Apache Corporation ................... 258 17,890
Burlington Resources, Inc. ........... 318 15,328
Devon Energy Corporation ............. 365 17,589
EOG Resources, Inc. .................. 409 17,072
Kerr-McGee Group ..................... 335 14,954
Unocal Corporation ................... 356 11,221
----------
110,674
OIL & GAS REFINING,MARKETING & TRANSPORTATION - 0.0%
Ashland, Inc. ........................ 45 1,478
Sunoco, Inc. ......................... 45 1,810
----------
3,288
OTHER DIVERSIFIED FINANCIAL SERVICES - 2.6%
Citigroup, Inc. ...................... 7,714 351,064
Principal Financial Group, Inc. ...... 486 15,061
----------
366,125
PACKAGED FOODS & MEATS - 1.0%
Campbell Soup Company ................ 588 15,582
ConAgra Foods, Inc. .................. 780 16,567
General Mills, Inc. .................. 564 26,547
H.J. Heinz Company ................... 510 17,483
Hershey Foods Corporation ............ 48 3,489
Kellogg Company ...................... 594 19,810
McCormick & Company, Inc. ............ 199 5,457
Sara Lee Corporation ................. 1,178 21,628
Wm. Wrigley Jr. Company .............. 341 18,857
----------
145,420
PAPER PACKAGING - 0.1%
Sealed Air Corporation* .............. 149 7,037
Temple-Inland, Inc. .................. 68 3,301
----------
10,338
PAPER PRODUCTS - 0.3%
Boise Cascade Corporation ............ 69 1,904
Georgia-Pacific Corporation .......... 341 8,266
International Paper Company .......... 715 27,899
----------
38,069
PERSONAL PRODUCTS - 0.5%
Alberto-Culver Company (Cl. B) ....... 97 5,706
Avon Products, Inc. .................. 360 23,242
Gillette Company ..................... 1,518 48,546
----------
77,494
- --------------------------------------------------------------------------------
13 SEE ACCOMPANYING NOTES.
SCHEDULE OF INVESTMENTS (CONTINUED)
SEPTEMBER 30, 2003
- --------------------------------------------------------------------------------
SECURITY EQUITY FUND -
ENHANCED INDEX SERIES (CONTINUED)
- --------------------------------------------------------------------------------
NUMBER MARKET
COMMON STOCKS (CONTINUED) OF SHARES VALUE
- --------------------------------------------------------------------------------
PHARMACEUTICALS - 8.3%
Abbott Laboratories .................. 2,324 $ 98,886
Allergan, Inc. ....................... 200 15,746
Bristol-Myers Squibb Company ......... 2,889 74,132
Eli Lilly & Company .................. 1,685 100,089
Forest Laboratories, Inc.* ........... 548 28,195
Johnson & Johnson .................... 4,116 203,824
King Pharmaceuticals, Inc.* .......... 339 5,136
Merck & Company, Inc. ................ 3,363 170,235
Pfizer, Inc. ......................... 11,847 359,912
Schering-Plough Corporation .......... 1,089 16,596
Watson Pharmaceuticals, Inc.* ........ 166 6,921
Wyeth ................................ 2,187 100,821
----------
1,180,493
PHOTOGRAPHIC PRODUCTS - 0.1%
Eastman Kodak Company ................ 756 15,831
PROPERTY & CASUALTY INSURANCE - 1.4%
Ace, Ltd. ............................ 397 13,133
Allstate Corporation ................. 1,074 39,233
Ambac Financial Group, Inc. .......... 171 10,944
Chubb Corporation .................... 393 25,498
Cincinnati Financial Corporation ..... 256 10,230
MBIA, Inc. ........................... 225 12,368
Progressive Corporation .............. 334 23,083
Safeco Corporation ................... 220 7,757
St. Paul Companies, Inc. ............. 322 11,924
Travelers Property Casualty
Corporation (Cl. B) ............... 1,504 23,884
XL Capital, Ltd. ..................... 202 15,643
----------
193,697
PUBLISHING & PRINTING - 0.6%
Dow Jones & Company, Inc. ............ 126 5,966
Gannett Company, Inc. ................ 406 31,489
Knight-Ridder, Inc. .................. 126 8,404
McGraw-Hill Companies, Inc. .......... 279 17,334
Meredith Corporation ................. 67 3,093
Tribune Company ...................... 461 21,160
----------
87,446
RAILROADS - 0.5%
Burlington Northern Santa Fe Corporation 604 17,437
CSX Corporation ...................... 358 10,472
Norfolk Southern Corporation ......... 645 11,933
Union Pacific Corporation ............ 544 31,644
----------
71,486
NUMBER MARKET
COMMON STOCKS (CONTINUED) OF SHARES VALUE
- --------------------------------------------------------------------------------
REAL ESTATE INVESTMENT TRUSTS - 0.4%
Apartment Investment & Management
Company ........................... 117 $ 4,605
Equity Office Properties Trust ....... 635 17,482
Equity Residential ................... 427 12,503
Plum Creek Timber Company, Inc. ...... 251 6,385
Prologis ............................. 267 8,077
Simon Property Group, Inc. ........... 292 12,725
----------
61,777
REGIONAL BANKS - 1.7%
Amsouth Bancorporation ............... 562 11,926
BB&T Corporation ..................... 832 29,877
Charter One Financial, Inc. .......... 600 18,360
Fifth Third Bancorp .................. 569 31,449
First Tennessee National
Corporation ....................... 201 8,534
Huntington Bancshares, Inc. .......... 366 7,243
Keycorp .............................. 654 16,723
Marshall & Ilsley Corporation ........ 319 10,055
National City Corporation ............ 930 27,398
PNC Financial Services ............... 412 19,603
Regions Financial Corporation ........ 348 11,919
Southtrust Corporation ............... 529 15,547
Suntrust Banks, Inc. ................. 142 8,573
Synovus Financial Corporation ........ 434 10,846
Union Planters Corporation ........... 312 9,872
Zions Bancorporation ................. 124 6,925
----------
244,850
RESTAURANTS - 0.4%
Darden Restaurants, Inc. ............. 226 4,294
McDonald's Corporation ............... 1,147 27,000
Starbucks Corporation* ............... 595 17,136
Wendy's International, Inc. .......... 43 1,389
Yum! Brands, Inc.* ................... 430 12,737
----------
62,556
SEMICONDUCTOR EQUIPMENT - 0.5%
Applied Materials, Inc.* ............. 2,461 44,643
KLA-Tencor Corporation* .............. 291 14,957
Novellus Systems, Inc.* .............. 217 7,324
Teradyne, Inc.* ...................... 273 5,078
----------
72,002
- --------------------------------------------------------------------------------
14 SEE ACCOMPANYING NOTES.
SCHEDULE OF INVESTMENTS (CONTINUED)
SEPTEMBER 30, 2003
- --------------------------------------------------------------------------------
SECURITY EQUITY FUND -
ENHANCED INDEX SERIES (CONTINUED)
- --------------------------------------------------------------------------------
NUMBER MARKET
COMMON STOCKS (CONTINUED) OF SHARES VALUE
- --------------------------------------------------------------------------------
SEMICONDUCTORS - 3.3%
Advanced Micro Devices, Inc.* ........ 475 $ 5,277
Altera Corporation* .................. 559 10,565
Analog Devices, Inc.* ................ 540 20,531
Applied Micro Circuits Corporation* .. 400 1,948
Broadcom Corporation* ................ 756 20,125
Intel Corporation .................... 9,793 269,405
LSI Logic Corporation* ............... 1,322 11,885
Linear Technology Corporation ........ 461 16,508
Maxim Integrated Products, Inc. ...... 479 18,921
Micron Technology, Inc.* ............. 1,536 20,613
National Semiconductor Corporation* .. 259 8,363
Nvidia Corporation* .................. 224 3,564
PMC-Sierra, Inc.* .................... 227 2,994
Texas Instruments, Inc. .............. 1,860 42,408
Xilinx, Inc.* ........................ 504 14,369
----------
467,476
SOFT DRINKS - 2.0%
Coca-Cola Company .................... 3,305 141,983
Coca-Cola Enterprises, Inc. .......... 707 13,475
Pepsi Bottling Group, Inc. ........... 435 8,952
PepsiCo, Inc. ........................ 2,581 118,287
----------
282,697
SPECIALIZED FINANCE - 0.1%
Moody's Corporation .................. 388 21,328
SPECIALTY CHEMICALS - 0.2%
Ecolab, Inc. ......................... 409 10,327
International Flavors &
Fragrances, Inc. .................. 45 1,489
Rohm & Haas Company .................. 348 11,641
Sigma-Aldrich Corporation ............ 115 5,973
----------
29,430
SPECIALTY STORES - 0.7%
AutoNation, Inc.* .................... 880 15,435
AutoZone, Inc.* ...................... 138 12,355
Bed Bath & Beyond, Inc.* ............. 449 17,143
Office Depot, Inc.* .................. 949 13,333
Staples, Inc.* ....................... 1,101 26,149
Tiffany & Company .................... 446 16,649
Toys 'R' Us, Inc.* ................... 316 3,801
----------
104,865
STEEL - 0.0%
Allegheny Technologies, Inc. ......... 97 635
Worthington Industries, Inc. ......... 162 2,035
----------
2,670
SYSTEMS SOFTWARE - 4.4%
Adobe Systems, Inc. .................. 355 13,937
BMC Software, Inc.* .................. 365 5,084
Computer Associates
International, Inc. ............... 855 22,324
NUMBER MARKET
COMMON STOCKS (CONTINUED) OF SHARES VALUE
- --------------------------------------------------------------------------------
SYSTEMS SOFTWARE (CONTINUED)
Microsoft Corporation ................ 16,066 $ 446,474
Novell, Inc.* ........................ 470 2,505
Oracle Corporation* .................. 7,874 88,346
Symantec Corporation* ................ 385 24,263
Veritas Software Corporation* ........ 888 27,883
----------
630,816
THIRFTS & MORTGAGE FINANCE - 1.7%
Countrywide Financial Corporation .... 201 15,734
Freddie Mac .......................... 1,022 53,502
Fannie Mae ........................... 1,463 102,703
Golden West Financial Corporation .... 234 20,945
Washington Mutual, Inc. .............. 1,411 55,551
----------
248,435
TIRES & RUBBER - 0.0%
Cooper Tire & Rubber Company ......... 93 1,476
Goodyear Tire & Rubber Company ....... 221 1,452
----------
2,928
TOBACCO - 1.1%
Alteria Group, Inc. .................. 3251 142,394
UST, Inc. ............................ 530 18,645
----------
161,039
TRADING COMPANIES & DISTRIBUTORS - 0.1%
W.W. Grainger, Inc. .................. 142 6,752
UNIT INVESTMENT TRUST - 1.0%
S&P Depositary Receipts .............. 1460 145,883
WIRELESS TELECOMMUNICATION SERVICES - 0.5%
AT&T Wireless Services* .............. 3,920 32,066
Nextel Communications, Inc.* ......... 1,591 31,327
Sprint Corporation (PCS Group)* ...... 1,344 7,701
----------
71,094
-----------
Total common stocks - 97.1% ........................... 13,885,329
U.S. GOVERNMENT SECURITIES - 0.4%
- ---------------------------------
U.S. Treasury Bill, 1.175%, 10-16-03(1) $50,000 49,984
REPURCHASE AGREEMENT - 3.6%
- ---------------------------
United Missouri Bank, 0.65%,
10-01-03 (Collateralized by FNMA,
10-01-03 with a value
of $529,000 and a repurchase
amount of $518,010) ............... $518,000 518,000
----------
Total investments - 101.1% ............................ 14,453,313
Liabilities, less cash & other assets - (1.1%) ........ (155,934)
-----------
Total net assets - 100.0% ............................. $14,297,379
===========
For federal income tax purposes, the identified cost of investments owned at
September 30, 2003 was $15,511,420.
*Non-income producing security
(1) Security is segregated as collateral for futures, options or forward
exchange contracts.
- --------------------------------------------------------------------------------
15 SEE ACCOMPANYING NOTES.
MANAGER'S COMMENTARY
SECURITY EQUITY FUND - EQUITY SERIES
NOVEMBER 15, 2003

Terry Milberger
Senior Portfolio Manager | 
Advisor, Security
Management Company, LLC |
TO OUR SHAREHOLDERS:
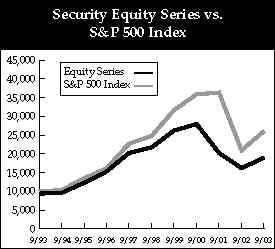
Following the most severe bear market since the early 1970s, equity investors
were finally rewarded with positive returns for the one-year period ended
September 30, 2003. Security Equity Fund returned a positive 17.49% for the
period, lagging the benchmark S&P 500 index's return of 24.40% and the Fund's
peer group median return of 20.72% for the period.1
Our strategy for Equity Fund continues to be one of owning a mixture of growth
and value stocks, skewing the mix based upon the relative value of growth and
value categories. When this fiscal year began, the Fund emphasized consistent
growth names with visibility given our view that the economy would be slow to
recover. With the majority of the market falling into this line of thinking, the
valuation gap between quality names with consistent growth prospects and
cyclical names with earnings leverage became stretched to extremes, especially
around the start of the Iraqi war. While in hindsight this created an
opportunity to skew the portfolio to more cyclical and value names, we kept the
Fund focused on growth given our views that the economic recovery would be
muted. This is the main reason the Fund underperformed versus its benchmark
during the period.
INDUSTRIALS AND ENERGY STOCKS BOOST PERFORMANCE
Despite a slightly underweighted position to its benchmark, the industrials
sector returned 23% for the Fund compared to a 21% return for the benchmark.
United Technologies, a diversified industrial company that makes Otis elevators,
helicopters and aircraft engines among other products, benefited from the
economic recovery. The stock returned 38% for the period. General Electric,
another good performer, gained 24%.
Stock selection in energy helped the Fund return 20% compared to a 16% return
for the benchmark. Apache, an exploration and production company, returned 23%.
Halliburton, an energy equipment and service firm, advanced 57%.
HEALTH CARE AND TECHNOLOGY DAMPEN TOTAL RETURN
An overweighted position in health care hurt the Fund's performance with the
exception of a strong performance by Amgen, a leading biotech company with
important new drugs to treat rheumatoid arthritis and cancer. The stock gained
54% for the period. Expectations were that health care stocks would grow
earnings between 10% and 15% during 2003. However, with a muted economic
recovery and political uncertainty surrounding the health care industry, the
health care sector did not look as interesting to investors.
An underweight position in the information technology sector relative to the
index also dampened overall performance. The technology sector returned 59% for
the benchmark compared to 48% for the Fund. Technology stocks are typically
cyclical by nature and tend to outperform as investors perceive the economy is
recovering. In reality, the economic recovery has been moderate due to a lack of
corporate spending.
GREAT COMPANIES MAKE GREAT STOCKS OVER TIME
Looking forward, we expect cyclical stocks to cool down and the economic
recovery to moderate. Driven primarily by the mortgage refinancing boom and
federal tax cuts, we anticipate that for a strong economic recovery to continue,
it will require corporate capital spending to drive job growth and manufacturing
orders.
With this outlook and the performance of cyclicals during the last six months,
we are holding our course by continuing our ownership of consistent growth
names. While this approach underperformed over the last six months, we believe
it will offer outperformance in the future.
As always, we remain convinced that long-term investing in equities is the best
way for investors to meet their financial goals. We believe that patience will
be rewarded.
Sincerely,
Terry Milberger
Senior Portfolio Manager
(1)Performance figures are based on Class A shares and do not reflect deduction
of the sales charges or taxes that a shareholder would pay on distributions or
redemptions of shares.
- --------------------------------------------------------------------------------
16
MANAGER'S COMMENTARY (CONTINUED)
SECURITY EQUITY FUND - EQUITY SERIES
NOVEMBER 15, 2003
================================= PERFORMANCE ==================================
$10,000 OVER TEN YEARS
This chart assumes a $10,000 investment in Class A shares of Equity Series on
September 30, 1993, and reflects deduction of the 5.75% sales load. On September
30, 2003, the value of your investment in Class A shares of the Series (with
dividends reinvested) would have grown to $19,035. By comparison, the same
$10,000 investment would have grown to $26,072 based on the S&P 500 Index's
performance. The chart does not reflect the deduction of taxes that a
shareholder would pay on distributions or the redemption of fund shares.
- --------------------------------------------------------------------------------
TOP 5 EQUITY HOLDINGS*
% OF
NET ASSETS
----------
Microsoft Corporation 4.5%
General Electric Company 4.2%
Pfizer, Inc. 4.1%
S&P Depositary Receipts 3.9%
Citigroup, Inc. 3.7%
*At September 30, 2003
- --------------------------------------------------------------------------------
- --------------------------------------------------------------------------------
AVERAGE ANNUAL RETURNS
AS OF SEPTEMBER 30, 2003
SINCE
1 YEAR 5 YEARS 10 YEARS INCEPTION
---------------------------------------
A Shares 17.49% (2.63%) 7.28% N/A
A Shares with
sales charge 10.74% (3.78%) 6.65% N/A
B Shares 16.59% (3.57%) N/A 6.34%
(10-19-93)
B Shares
with CDSC 11.59% (3.96%) N/A 6.34%
(10-19-93)
C Shares 16.60% N/A N/A (7.89%)
(1-29-99)
C Shares
with CDSC 15.60% N/A N/A (7.89%)
(1-29-99)
- --------------------------------------------------------------------------------
The performance data above represents past performance that is not predictive of
future results. The investment return and principal value of an investment in
the fund will fluctuate so that an investor's shares, when redeemed, may be
worth more or less than their original cost. The figures above do not reflect
deduction of the maximum front-end sales charge of 5.75% for Class A shares or
the contingent deferred sales charge of 5% for Class B shares and 1% for Class C
shares, as applicable, except where noted. The figures do not reflect the
deduction of taxes that a shareholder would pay on distributions or redemption
of fund shares. Such figures would be lower if the maximum sales charge and any
applicable taxes were deducted.
- --------------------------------------------------------------------------------
17
SCHEDULE OF INVESTMENTS
SEPTEMBER 30, 2003
- --------------------------------------------------------------------------------
SECURITY EQUITY FUND -
EQUITY SERIES
- --------------------------------------------------------------------------------
NUMBER MARKET
COMMON STOCKS OF SHARES VALUE
- --------------------------------------------------------------------------------
ADVERTISING - 1.1%
Omnicom Group, Inc. .................. 80,000 $ 5,748,000
AEROSPACE & DEFENSE - 2.3%
General Dynamics Corporation ......... 60,000 4,683,600
United Technologies Corporation ...... 90,400 6,986,112
-----------
11,669,712
ALUMINUM - 0.8%
Alcoa, Inc. .......................... 145,000 3,793,200
APPLICATIONS SOFTWARE - 1.4%
Intuit, Inc.* ........................ 140,000 6,753,600
ASSET MANAGEMENT & CUSTODY BANKS - 0.9%
Bank of New York Company, Inc. ....... 150,000 4,366,500
BIOTECHNOLOGY - 1.3%
Amgen, Inc.* ......................... 100,000 6,457,000
BREWERS - 1.2%
Anheuser-Busch Companies, Inc. ....... 120,000 5,920,800
BROADCASTING & CABLE TV - 2.2%
Comcast Corporation* ................. 350,000 10,808,000
COMMUNICATIONS EQUIPMENT - 2.7%
Cisco Systems, Inc.* ................. 500,000 9,770,000
Nokia OYJ ADR ........................ 225,000 3,510,000
-----------
13,280,000
COMPUTER HARDWARE - 3.5%
Dell, Inc.* .......................... 200,900 6,708,051
International Business Machines
Corporation ....................... 120,000 10,599,600
-----------
17,307,651
CONSUMER FINANCE - 0.8%
MBNA Corporation ..................... 180,900 4,124,520
DATA PROCESSING & OUTSOURCED SERVICE - 1.3%
First Data Corporation 165,000 6,593,400
DIVERSIFIED BANKS - 2.7%
Bank of America Corporation .......... 70,000 5,462,800
Wells Fargo & Company ................ 160,000 8,240,000
-----------
13,702,800
DRUG RETAIL - 0.4%
Walgreen Company ..................... 65,000 1,991,600
ELECTRONIC MANUFACTURING SERVICES - 0.6%
Molex, Inc. .......................... 100,000 2,859,000
GENERAL MERCHANDISE STORES - 1.1%
Target Corporation ................... 150,000 5,644,500
HEALTH CARE DISTRIBUTORS - 1.9%
Cardinal Health, Inc. ................ 160,000 9,342,400
HEALTH CARE EQUIPMENT - 1.7%
Medtronic, Inc. ...................... 175,800 8,248,536
NUMBER MARKET
COMMON STOCKS (CONTINUED) OF SHARES VALUE
- --------------------------------------------------------------------------------
HOME IMPROVEMENT RETAIL - 2.1%
Home Depot, Inc. ..................... 240,000 $ 7,644,000
Lowe's Companies, Inc. ............... 50,000 2,595,000
-----------
10,239,000
HOTELS, RESORTS & CRUISE LINES - 0.8%
Carnival Corporation ................. 120,000 3,946,800
HOUSEHOLD PRODUCTS - 3.2%
Colgate-Palmolive Company ............ 100,000 5,589,000
Procter & Gamble Company ............. 110,000 10,210,200
-----------
15,799,200
HYPERMARKETS & SUPERCENTERS - 2.5%
Wal-Mart Store, Inc. ................. 220,000 12,287,000
INDUSTRIAL CONGLOMERATES - 5.6%
3M Company ........................... 100,000 6,907,000
General Electric Company ............. 700,000 20,867,000
-----------
27,774,000
INDUSTRIAL GASES - 1.0%
Praxair, Inc. ........................ 80,000 4,956,000
INSURANCE BROKERS - 0.7%
Marsh & McLennan Companies,
Inc. .............................. 70,000 3,332,700
INTEGRATED OIL & GAS - 3.6%
ChevronTexaco Corporation ............ 70,000 5,001,500
Exxon Mobil Corporation .............. 350,000 12,810,000
-----------
17,811,500
INTEGRATED TELECOMMUNICATIONS SERVICES - 1.5%
SBC Communications, Inc. ............. 200,000 4,450,000
Verizon Communications, Inc. ......... 100,000 3,244,000
-----------
7,694,000
INVESTMENT BANKING & BROKERAGE - 2.7%
Goldman Sachs Group, Inc. ............ 50,000 4,195,000
Merrill Lynch & Company, Inc. ........ 90,500 4,844,465
Morgan Stanley ....................... 90,000 4,541,400
-----------
13,580,865
LEISURE PRODUCTS - 0.8%
Mattel, Inc. ......................... 200,000 3,792,000
LIFE & HEALTH INSURANCE - 1.9%
Aflac, Inc. .......................... 160,000 5,168,000
MetLife, Inc. ........................ 160,000 4,488,000
-----------
9,656,000
MANAGED HEALTH CARE - 0.7%
UnitedHealth Group, Inc. ............. 70,000 3,522,400
MOTORCYCLE MANUFACTURERS - 1.9%
Harley-Davidson, Inc. ................ 198,000 9,543,600
- --------------------------------------------------------------------------------
18 SEE ACCOMPANYING NOTES.
SCHEDULE OF INVESTMENTS (CONTINUED)
SEPTEMBER 30, 2003
- --------------------------------------------------------------------------------
SECURITY EQUITY FUND -
EQUITY SERIES (CONTINUED)
- --------------------------------------------------------------------------------
NUMBER MARKET
COMMON STOCKS (CONTINUED) OF SHARES VALUE
- --------------------------------------------------------------------------------
MOVIES & ENTERTAINMENT - 2.9%
Time Warner, Inc* .................... 440,000 $6,648,400
Viacom, Inc. (Cl. B) ................. 200,000 7,660,000
-----------
14,308,400
MULTI-LINE INSURANCE - 2.5%
American International
Group, Inc. ....................... 220,000 12,694,000
OIL & GAS EQUIPMENT & SERVICES - 1.3%
BJ Services Company* ................. 50,000 1,708,500
Halliburton Company .................. 200,000 4,850,000
-----------
6,558,500
OIL & GAS EXPLORATION & PRODUCTION - 1.8%
Apache Corporation ................... 70,000 4,853,800
Devon Energy Corporation ............. 90,000 4,337,100
-----------
9,190,900
OTHER DIVERSIFIED FINANCIAL SERVICES - 3.7%
Citigroup, Inc. ...................... 401,766 18,284,371
PHARMACEUTICALS - 10.4%
Abbott Laboratories .................. 140,000 5,957,000
Eli Lilly & Company .................. 50,000 2,970,000
Johnson & Johnson .................... 240,000 11,884,800
Merck & Company, Inc. ................ 120,000 6,074,400
Pfizer, Inc. ......................... 668,840 20,319,359
Wyeth ................................ 100,000 4,610,000
-----------
51,815,559
PROPERTY & CASUALTY INSURANCE - 1.0%
Chubb Corporation .................... 80,000 5,190,400
PUBLISHING - 1.1%
Belo Corporation ..................... 110,000 2,667,500
Gannett Company, Inc ................. 40,000 3,102,400
-----------
5,769,900
SEMICONDUCTOR EQUIPMENT - 0.6%
Applied Materials, Inc.* ............. 181,000 3,283,340
SEMICONDUCTORS - 2.4%
Analog Devices, Inc.* ................ 65,000 2,471,300
Intel Corporation .................... 350,000 9,628,500
-----------
12,099,800
SOFT DRINKS - 2.7%
Coca-Cola Company .................... 100,000 4,296,000
PepsiCo, Inc. ........................ 200,000 9,166,000
-----------
13,462,000
SYSTEMS SOFTWARE - 4.5%
Microsoft Corporation ................ 810,000 22,509,900
THRIFTS & MORTGAGE FINANCE - 1.6%
Fannie Mae ........................... 115,000 8,073,000
NUMBER MARKET
COMMON STOCKS (CONTINUED) OF SHARES VALUE
- --------------------------------------------------------------------------------
UNIT INVESTMENT TRUST - 3.9%
S&P Depositary Receipts Trust ........ 194,200 $ 19,404,464
------------
Total common stocks - 97.3% ....... 485,190,818
U. S. GOVERNMENT & AGENCIES
- -------------------------------
Federal Home Loan Bank:
1.0%, 10-17-03 .................... $1,100,000 1,099,511
Federal Home Loan Mortgage Corporation:
1.03%, 10-28-03 ................... $3,600,000 3,597,219
Federal National Mortgage Association:
1.01%, 10-03-03 ................... $2,300,000 2,299,871
1.03%, 10-06-03 ................... $1,700,000 1,699,761
1.02%, 10-09-03 ................... $1,400,000 1,399,683
1.03%, 10-22-03 ................... $1,700,000 1,698,979
------------
7,098,294
------------
Total U. S. government & agencies - 2.4% .............. 11,795,024
------------
Total investments - 99.7% ............................. 496,985,842
Cash & other assets, less liabilities - 0.3% .......... 1,559,108
------------
Total net assets - 100.0% ............................. $498,544,950
============
The identified cost of investments owned at September 30, 2003 was the same for
federal income tax and financial statement purposes.
*Non-income producing security
ADR (American Depositary Receipt)
- --------------------------------------------------------------------------------
19 SEE ACCOMPANYING NOTES.
MANAGER'S COMMENTARY
SECURITY EQUITY FUND - GLOBAL SERIES
NOVEMBER 15, 2003

William L. Wilby
Portfolio Manager | 
Subadvisor
OppenheimerFunds, Inc. |
TO OUR SHAREHOLDERS:

Over the last 12 months, the Security Global Fund continued to seek to
capitalize on global growth trends of mass affluence, new technologies,
corporate restructuring and aging populations. Within each trend, we looked for
reasonably priced companies with strong growth prospects. Our contrarian stock
selection process often led us to out of favor, but well-managed companies whose
stock price had declined in the marketplace. The Fund returned 23.08% for the
12-month period ended September 30, 2003, versus 26.07% for the Fund's
benchmark, the MSCI World Index1.

During the period, the Fund benefited from its selective investments in the
technology and consumer staples sectors. KDDI Corp., the number two wireless
carrier in Japan, was the Fund's best performing stock during the period on
strong demand for wireless products. National Semiconductor Corp. also performed
very well after completing a long restructuring, as the company was able to
focus on higher-margin segments of its product line. In addition, the Fund
received favorable performance from its holdings in Qualcomm, Inc., Vodafone
Group plc and Yahoo Japan Corp. During the latter half of the period, we sold
portions of the Fund's holdings in Ericsson and National Semiconductor,
replacing them with more stable growth companies.

In consumer staples, Reckitt Benckiser plc and Wella AG performed very well as
consumer spending continued to be strong. However, we did trim these holdings as
the markets declined in the first quarter of 2003.

Two companies in particular detracted from the Fund's overall return. Although
we had sold most of our position, Sony Corp. detracted from performance due to
management's inability to turn around a slide in the brand quality and
reputation. Tandberg ASA, a carrier in video conferencing, had disappointing
earnings during the year and was punished in the marketplace.

The financial services sector as a whole was a slight drag on the Fund's
relative performance. Financial stocks were hit very hard during the bear
market, particularly in Europe, where many of the insurance companies held large
equity portfolios that declined in the first half of the period.

One area in which we drastically reduced the Fund's investment over the last
12-months was video games. As the product cycle for video game software ended,
we believed it was a good idea to decrease weightings in this sector. Throughout
2002 and into early 2003, Electronic Arts, Inc. was our largest holding in video
game software, but that position was trimmed back during the period.

From a country perspective, the United States was the biggest contributor to
performance as most of the Fund's technology holdings were based there. The Fund
also did well in Japan, where we generally kept a market weight throughout the
period, but solid stock selection led to good performance in the country versus
the benchmark. Finally, the Fund received positive returns from Brazil, which is
not part of the MSCI World Index, where we have a holding in Empresa Brasileira
de Aeronautica SA (Embraer), the regional jet manufacturer.

Please remember, country, sector and market capitalization weightings were the
result of individual stock selection and do not reflect predetermined target
allocations. The Fund's holdings, allocations, management and strategies are
subject to change. Investing in foreign securities poses additional risks, such
as currency fluctuations and higher expenses.


Sincerely,


William L. Wilby
Portfolio Manager

(1)Performance figures are based on Class A shares and do not reflect deduction
of the sales charge or taxes that a shareholder would pay on distributions or
the redemption of shares.

- --------------------------------------------------------------------------------
                                       20


MANAGER'S COMMENTARY (CONTINUED)

SECURITY EQUITY FUND - GLOBAL SERIES

NOVEMBER 15, 2003

- --------------------------------- PERFORMANCE ----------------------------------
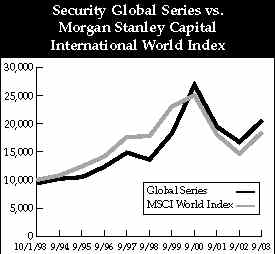
$10,000 OVER TEN YEARS
This chart assumes a $10,000 investment in Class A shares of Global Series on
October 31, 1993, and reflects deduction of the 5.75% sales load. On September
30, 2003, the value of your investment in Class A shares of the Series (with
dividends reinvested) would have grown to $20,596. By comparison, the same
$10,000 investment would have grown to $18,462 based on the MSCI World Index's
performance. The chart does not reflect the deduction of taxes that a
shareholder would pay on distributions or the redemption of fund shares.
- --------------------------------------------------------------------------------
TOP 5
EQUITY HOLDINGS*
% OF
NET ASSETS
----------
Sirius Satellite Radio, Inc. 3.4%
KDDICorporation 2.8%
Cadence Design Systems, Inc. 2.8%
Qualcomm, Inc. 2.2%
Reckitt Benckiser plc 2.1%
*At September 30, 2003
- --------------------------------------------------------------------------------
- --------------------------------------------------------------------------------
AVERAGE ANNUAL RETURNS
AS OF SEPTEMBER 30, 2003
SINCE
1 YEAR 5 YEARS 10 YEARS INCEPTION
----------------------------------------
A Shares 23.08% 8.64% 8.13% N/A
A Shares with
sales charge 15.99% 7.35% 7.49% N/A
B Shares 22.95% 8.17% N/A 7.48%
(10-19-93)
B Shares with
CDSC 17.95% 7.87% N/A 7.48%
(10-19-93)
C Shares 22.21% N/A N/A 3.88%
(1-29-99)
C Shares with
CDSC 21.21% N/A N/A 3.88%
(1-29-99)
- --------------------------------------------------------------------------------
The performance data above represents past performance that is not predictive of
future results. The investment return and principal value of an investment in
the fund will fluctuate so that an investor's shares, when redeemed, may be
worth more or less than their original cost. The figures above do not reflect
deduction of the maximum front-end sales charge of 5.75% for Class A shares or
the contingent deferred sales charge of 5% for Class B shares and 1% for Class C
shares, as applicable, except where noted. The figures do not reflect the
deduction of taxes that a shareholder would pay on distributions or redemption
of fund shares. Such figures would be lower if the maximum sales charge and any
applicable taxes were deducted.
- --------------------------------------------------------------------------------
21
SCHEDULE OF INVESTMENTS
SEPTEMBER 30, 2003
- --------------------------------------------------------------------------------
SECURITY EQUITY FUND -
GLOBAL SERIES
- --------------------------------------------------------------------------------
PRINCIPAL
AMOUNT OR
NUMBER MARKET
CONVERTIBLE BOND OF SHARES VALUE
- --------------------------------------------------------------------------------
HEALTH CARE EQUIPMENT & SUPPLIES - 0.2%
Nektar Therapeutics, 3.00% - 2010 .... $ 117,000 $ 149,029
FOREIGN BOND
- ------------
INDIA - 0.0%
Hindustan Lever, Ltd., 9.00% - 2005(1) 1,036,800 1,448
COMMON STOCKS
- -------------
AUSTRALIA - 0.5%
Australia & New Zealand
Banking Group, Ltd. ............... 25,920 314,914
BERMUDA - 0.8%
Ace, Ltd. ............................ 15,990 528,949
BRAZIL - 1.6%
Companhia de Bebidas
das Americas ADR .................. 17,857 386,604
Empresa Brasileira de
Aeronautica S.A. ADR .............. 29,468 621,775
----------
1,008,379
CANADA - 2.5%
Bombardier, Inc. (Cl. B) ............. 48,300 202,943
EnCana Corporation ................... 11,208 406,144
Husky Energy, Inc. ................... 43,390 659,154
Manulife Financial Corporation ....... 11,773 340,509
----------
1,608,750
FRANCE - 8.0%
Alcatel S.A.* ........................ 33,770 399,954
Aventis S.A. ......................... 8,850 459,144
Carrefour S.A. ....................... 5,890 296,317
Essilor International S.A. ........... 5,620 243,073
France Telecom S.A.* ................. 23,650 543,947
JC Decaux S.A.* ...................... 15,530 218,291
Orange S.A.* ......................... 33,380 340,136
Sanofi-Synthelabo S.A. ............... 19,564 1,189,286
Societe BIC S.A. ..................... 7,420 316,259
Societe Generale ..................... 13,040 868,624
Total S.A. ........................... 1,880 283,740
----------
5,158,771
GERMANY - 1.3%
Allianz AG ........................... 7,191 634,770
MLP AG*,** ........................... 12,703 193,792
----------
828,562
HONG KONG - 2.4%
Hong Kong & China Gas
Company, Ltd. ..................... 293,400 394,039
Hutchison Whampoa, Ltd. .............. 52,000 379,400
Television Broadcasts, Ltd. .......... 169,991 763,926
----------
1,537,365
NUMBER MARKET
COMMON STOCKS (CONTINUED) OF SHARES VALUE
- --------------------------------------------------------------------------------
INDIA - 3.5%
Hindustan Lever, Ltd. ................ 143,300 $ 574,014
Icici Bank, Ltd. ADR ................. 55,050 581,328
Infosys Technologies, Ltd. ........... 6,508 643,433
Zee Telefilms, Ltd. .................. 161,300 434,974
----------
2,233,749
ISRAEL - 0.5%
TEVA PHARMACEUTICAL
Industries, Ltd. ADR .............. 5,700 325,755
ITALY - 0.4%
Eni SpA .............................. 17,400 265,853
JAPAN - 11.1%
Canon, Inc. .......................... 8,000 390,995
Chugai Pharmaceutical
Company, Ltd. ..................... 8,500 105,988
Credit Saison Company, Ltd.** ........ 17,600 367,077
KDDI Corporation ..................... 355 1,798,595
Keyence Corporation .................. 1,100 233,559
Murata Manufacturing
Company, Ltd. ..................... 7,800 402,166
Resona Holdings, Inc.* ............... 402,000 564,955
Seven-Eleven Japan
Company, Ltd. ..................... 12,000 383,476
Sharp Corporation .................... 45,000 658,596
Shionogi & Company, Ltd. ............. 46,000 798,818
Shiseido Company, Ltd. ............... 26,000 296,504
Trend Micro, Inc.* ................... 19,000 387,772
Yahoo Japan Corporation* ............. 56 792,015
----------
7,180,516
KOREA - 1.9%
SK Telecom Company, Ltd. ............. 1,590 254,367
SK Telecom Company, Ltd. ADR ......... 12,400 221,216
Samsung Electronics
Company, Ltd. ..................... 2,300 783,898
----------
1,259,481
MEXICO - 1.8%
Fomento Economico Mexicano
S.A. de C.V. ...................... 90,100 342,865
Grupo Modelo, S.A.
de C.V. (Cl. C) ................... 121,400 299,733
Grupo Televisa S.A. ADR .............. 13,464 492,648
----------
1,135,246
NETHERLANDS - 3.3%
ABN Amro Holding N.V. ................ 47,700 880,452
Aegon N.V. ........................... 53,402 621,271
Qiagen N.V.* ......................... 26,761 291,077
Wolters Kluwer N.V. .................. 23,788 341,293
----------
2,134,093
- --------------------------------------------------------------------------------
22 SEE ACCOMPANYING NOTES.
SCHEDULE OF INVESTMENTS (CONTINUED)
SEPTEMBER 30, 2003
- --------------------------------------------------------------------------------
SECURITY EQUITY FUND -
GLOBAL SERIES (CONTINUED)
- --------------------------------------------------------------------------------
NUMBER MARKET
COMMON STOCKS (CONTINUED) OF SHARES VALUE
- --------------------------------------------------------------------------------
NORWAY - 0.8%
Tandberg ASA* ........................ 85,200 $ 505,943
SINGAPORE - 0.8%
Singapore Press Holdings, Ltd. ....... 49,729 526,476
SPAIN - 0.4%
Amadeus Global Travel
Distribution S.A. ................. 46,572 292,871
SWEDEN - 0.9%
Hennes & Mauritz AB (Cl. B) .......... 13,100 297,211
Telefonaktiebolaget LM
Ericsson (Cl. B)* ................. 209,100 305,457
----------
602,668
SWITZERLAND - 2.1%
Novartis AG .......................... 12,991 502,681
Roche Holding AG ..................... 10,198 845,586
----------
1,348,267
UNITED KINGDOM - 11.4%
3i Group plc** ....................... 29,420 291,437
Amersham plc ......................... 28,880 248,783
Boots Group plc ...................... 31,572 339,376
BP plc ADR ........................... 13,167 554,331
Cadbury Schweppes plc ................ 46,937 288,725
Diageo plc ........................... 13,030 140,604
Dixons Group plc ..................... 287,970 643,493
Pearson plc .......................... 63,430 603,052
Reckitt Benckiser plc ................ 65,820 1,326,456
Reed Elsevier plc .................... 65,305 510,482
Rentokil Initial plc ................. 94,947 336,785
Royal Bank of Scotland
Group plc ......................... 29,809 758,718
Smith & Nephew plc ................... 42,970 282,706
Vodafone Group plc ................... 353,720 706,674
WPP Group plc ........................ 35,470 299,069
----------
7,330,691
UNITED STATES - 42.5%
Advanced Micro Devices, Inc.* ........ 62,200 691,042
Affymetrix, Inc.* .................... 13,500 283,365
Amdocs, Ltd.* ........................ 13,300 250,040
American Express Company ............. 13,600 612,816
Amgen, Inc.* ......................... 8,800 568,216
Applera Corporation - Applied
Biosystems Group .................. 15,700 350,267
Bank One Corporation ................. 30,459 1,177,240
Berkshire Hathaway, Inc. (Cl. B)* .... 230 574,080
Boeing Company ....................... 9,100 312,403
Broadcom Corporation* ................ 11,500 306,130
Burlington Resources, Inc. ........... 5,300 255,460
Cadence Design Systems, Inc.* ........ 134,164 1,797,798
Charles Schwab Corporation ........... 28,900 344,199
ChevronTexaco Corporation ............ 7,583 541,805
NUMBER MARKET
COMMON STOCKS (CONTINUED) OF SHARES VALUE
- --------------------------------------------------------------------------------
UNITED STATES (CONTINUED)
Circuit City Stores, Inc. ............ 41,271 $ 393,313
Cisco Systems, Inc.* ................. 17,500 341,950
Citigroup, Inc. ...................... 6,466 294,268
Electronic Arts, Inc.* ............... 4,064 374,823
Everest Re Group, Ltd. ............... 4,100 308,156
Express Scripts, Inc.* ............... 5,300 324,095
Fannie Mae ........................... 3,800 266,760
Gap, Inc. ............................ 17,100 292,752
Genentech, Inc.* ..................... 2,100 168,294
Gilead Sciences, Inc.* ............... 11,400 637,602
Gillette Company ..................... 16,800 537,264
Human Genome Sciences, Inc.* ......... 9,900 135,234
IDEC Pharmaceuticals Corporation* .... 6,200 205,530
IMS Health, Inc. ..................... 17,200 362,920
International Business Machines
Corporation ....................... 3,867 341,572
International Flavors &
Fragrances, Inc. .................. 10,202 337,482
International Game Technology ........ 20,000 563,000
JDS Uniphase Corporation* ............ 147,100 529,560
Johnson & Johnson .................... 10,352 512,631
Juniper Networks, Inc.* .............. 10,300 153,676
Lockheed Martin Corporation .......... 7,700 355,355
MBNA Corporation ..................... 13,800 314,640
Millennium Pharmaceuticals, Inc.* .... 9,500 146,205
Mylan Laboratories, Inc. ............. 9,400 363,310
National Semiconductor
Corporation* ...................... 28,800 929,952
Northern Trust Corporation ........... 3,700 157,028
Northrop Grumman Corporation ......... 4,100 353,502
Novellus Systems, Inc.* .............. 8,000 270,000
Nvidia Corporation* .................. 5,800 92,284
Oxford Health Plans, Inc.* ........... 7,000 289,170
Panera Bread Company* ................ 4,100 167,936
Pfizer, Inc. ......................... 16,938 514,576
Qualcomm, Inc. ....................... 34,120 1,420,757
Quest Diagnostics, Inc.* ............. 8,900 539,696
RadioShack Corporation ............... 10,100 286,941
Raytheon Company ..................... 18,900 529,200
SanDisk Corporation* ................. 4,100 261,334
Schering-Plough Corporation .......... 26,800 408,432
Scientific-Atlanta, Inc. ............. 10,200 317,730
Sirius Satellite Radio, Inc. ......... 1,186,296 2,170,922
Starbucks Corporation* ............... 10,900 313,920
Sybase, Inc.* ........................ 18,562 315,740
Symantec Corporation* ................ 2,200 138,644
Synopsys, Inc.* ...................... 19,370 596,015
Veritas Software Corporation* ........ 5,900 185,260
Wachovia Corporation ................. 19,408 799,415
-----------
27,383,707
-----------
Total common stocks - 98.5% ........................... 63,511,006
- --------------------------------------------------------------------------------
23 SEE ACCOMPANYING NOTES.
SCHEDULE OF INVESTMENTS (CONTINUED)
SEPTEMBER 30, 2003
- --------------------------------------------------------------------------------
SECURITY EQUITY FUND -
GLOBAL SERIES (CONTINUED)
- --------------------------------------------------------------------------------
NUMBER MARKET
PREFERRED STOCKS OF SHARES VALUE
- --------------------------------------------------------------------------------
BRAZIL - 1.0%
Tele Norte Leste Participacoes S.A. .. 45,176,222 $ 624,983
GERMANY - 1.6%
Fresenius AG ......................... 6,022 383,957
Porsche AG ........................... 1,566 659,116
-----------
1,043,073
-----------
Total preferred stocks - 2.6% ......................... 1,668,056
-----------
Total investments - 101.3% ............................ 65,329,539
Liabilities, less cash & other assets - (1.3%) ........ (832,136)
-----------
Total net assets - 100.0% ............................. $64,497,403
===========
INVESTMENT CONCENTRATION
- --------------------------------------------------------------------------------
At September 30, 2003, Global Series' investment concentration by industry was
as follows:
Aerospace/Defense ..................................... 0.3%
Air Freight & Logistics ............................... 3.4%
Automobiles ........................................... 1.0%
Beverages ............................................. 2.3%
Biotechnology ......................................... 3.8%
Capital Markets ....................................... 1.2%
Chemicals ............................................. 0.5%
Commercial Banks ...................................... 2.3%
Commercial Services & Supplies ........................ 1.4%
Communications Equipment .............................. 6.2%
Computers & Peripherals ............................... 0.9%
Consumer Finance ...................................... 2.0%
Diversified Financial Services ........................ 8.5%
Diversified Telecommunications ........................ 4.6%
Electrical Equipment .................................. 0.2%
Electronic Equipment & Instruments .................... 1.0%
Food & Staples Retailing .............................. 1.6%
Gas Utilities ......................................... 0.6%
Health Care Equipment & Services ...................... 1.6%
Health Care Providers & Services ...................... 2.3%
Hotels, Restaurants & Leisure Products ................ 2.1%
Household Durables .................................... 3.2%
Household Products .................................... 2.1%
IT Services ........................................... 1.0%
Insurance ............................................. 4.7%
Internet Software & Services .......................... 1.8%
Media ................................................. 10.2%
Oil & Gas ............................................. 4.6%
Personal Products ..................................... 2.2%
Pharmaceuticals ....................................... 9.8%
Semiconductors & Semiconductor Equipment .............. 3.5%
Software .............................................. 5.7%
Specialty Retail ...................................... 1.0%
Textiles, Apparel & Luxury Goods ...................... 0.9%
Thrifts & Mortgage Finance ............................ 0.4%
Wireless Telecommunications ........................... 2.4%
Liabilities, less cash & other assets ................. (1.3%)
-------
100.0%
=======
For federal income tax purposes, the identified cost of investments owned at
September 30, 2003 was $60,937,121.
*Non-income producing security
**Passive Foreign Investment Company
ADR (American Depositary Receipt)
plc (public limited company)
(1)Principal amount on foreign bond is reflected in local currency (e.g. Indian
Rupee)while market value is reflected in U.S. dollars.
- --------------------------------------------------------------------------------
24 SEE ACCOMPANYING NOTES.
MANAGER'S COMMENTARY
SECURITY EQUITY FUND - INTERNATIONAL SERIES
NOVEMBER 15, 2003

Tony Docal
Portfolio Manager |  |
TO OUR SHAREHOLDERS:

In the belief that tomorrow should be better than yesterday, optimistic
investors propelled global stock prices to a 16-month high by the end of
September. Most local stock market indices delivered double-digit gains since
the rally in global equities began in March of this year. As of September 30,
2003, the one-year total return for the Security Equity Fund - International
Series was 17.54% versus the MSCI All Country World Free ex U.S. Index return of
29.04% and the MSCI EAFE Index return of 26.64%(1). The strong performance in
equity markets reflects investors' improved expectations and confidence in a
global economic recovery.

Global equity markets rallied in the last few months of 2002. The Fund benefited
on absolute terms from a pick-up in the materials and industrials sectors, which
traditionally have performed well during cyclical recoveries and which have
remained overweight within the Fund. Global equity markets continued to be
volatile in the first quarter of 2003, primarily due to investor anxiety about
the war in Iraq, particularly its potential destabilizing effect on the global
economic recovery. An uncertain employment outlook and the rise in oil and
gasoline prices complicated the situation. A drop in confidence led consumers
and corporations to postpone major purchases. On a sector basis, we believe that
the strong relative performance of utility stocks, during this first quarter,
demonstrated the markets' risk-averse sentiment. Attractive dividends and
relatively predictable earnings growth have traditionally made utilities sought
after investments during periods of uncertainty. The underperformance of sectors
closely tied to the economic cycle such as materials and industrials confirmed
the predominantly cautionary investment outlook of the first quarter. The net
relative effect was detrimental to the Fund, which maintained overweight
positions in these sectors. However, we remained comfortable with the Fund's
sector overweights. These relative exposures were the result of our bottom-up
search for undervalued securities.

All sectors within the Fund had a positive impact on performance during the
second quarter. Our holdings in the industrials and materials sectors, which had
detracted from the Fund's performance in the first quarter of the year, produced
strong absolute returns that outperformed the Fund's benchmark. The better
returns can be attributed to investor expectations that an economic rebound
would improve both the extremely low valuations accorded to the stocks as well
as their earnings and cash flow prospects. For the third quarter, information
technology, materials, and industrials led the rally. This is consistent with a
cyclical rebound, as high-beta, cyclical stocks typically are regarded as early
beneficiaries during an economic upturn. The Fund maintained overweight
positions versus its MSCI benchmark in materials and industrials stocks and as a
result benefited from the strong performance in these sectors. We believe that
after three years of intense restructuring, many companies in cyclical areas
such as chemicals, pulp and paper, construction materials, metals and mining,
and industrial machinery are well positioned to benefit from the cyclical
rebound. Although we believe the potential for improvement in operating leverage
and EPS growth is on the horizon, this potential might take longer to
materialize than some investors may be anticipating. On a micro level, we view
these comments as an indication that the economy is still in the early, uneven
stages of recovery.


Sincerely,


Tony Docal
Portfolio Manager

(1)Performance figures are based on Class A shares and do not reflect deduction
of the sales charges or taxes that a shareholder would pay on distributions or
the redemption of shares. Fee waivers and/or reimbursements reduced Fund
expenses and in the absence of such waivers the performance quoted would be
reduced. Investing in foreign countries may involve risks, such as non-uniform
accounting practices and political instability, not associated with investing
exclusively in the U.S.

- --------------------------------------------------------------------------------
                                       25


MANAGER'S COMMENTARY (CONTINUED)

SECURITY EQUITY FUND - INTERNATIONAL SERIES

NOVEMBER 15, 2003

================================= PERFORMANCE ==================================
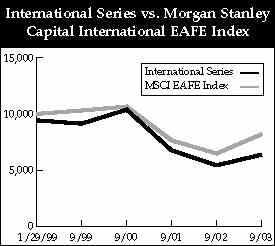
                            $10,000 SINCE INCEPTION

This chart assumes a $10,000 investment in Class A shares of International
Series on January 29, 1999, and reflects deduction of the 5.75% sales load. On
September30, 2003, the value of your investment in Class A shares of the Series
(with dividends reinvested) would have been $6,381. By comparison, the same
$10,000 investment would have been $8,194, based on the Morgan Stanley Capital
International EAFE Index's performance. The chart does not reflect the deduction
of taxes that a shareholder would pay on distributions or the redemption of fund
shares.

- --------------------------------------------------------------------------------
                             TOP 5 EQUITY HOLDINGS*

                                                       % OF
                                                    NET ASSETS
                                                    ----------
                   Telefonica S.A.                     2.4%
                   Nestle S.A.                         2.1%
                   ENI SpA                             2.0%
                   Unilever N.V. CVA                   2.0%
                   Deutsche Post AG                    1.9%
                   *At September 30, 2003
- --------------------------------------------------------------------------------

- --------------------------------------------------------------------------------
                             AVERAGE ANNUAL RETURNS
                            AS OF SEPTEMBER 30, 2003

                                         1 YEAR      SINCE INCEPTION
                                         -----------------------------
         A Shares                        17.54%     (8.01%)  (1-29-99)
         A Shares with sales charge      10.73%     (9.17%)  (1-29-99)
         B Shares                        16.91%     (8.65%)  (1-29-99)
         B Shares with CDSC              11.91%     (9.04%)  (1-29-99)
         C Shares                        16.85%     (8.59%)  (1-29-99)
         C Shares with CDSC              15.85%     (8.59%)  (1-29-99)
- --------------------------------------------------------------------------------

The performance data above represents past performance that is not predictive of
future results. The investment return and principal value of an investment in
the fund will fluctuate so that an investor's shares, when redeemed, may be
worth more or less than their original cost. The figures above do not reflect
deduction of the maximum front-end sales charge of 5.75% for Class A shares or
the contingent deferred sales charge of 5% for Class B shares and 1% for Class C
shares, as applicable, except where noted. The figures do not reflect the
deduction of taxes that a shareholder would pay on distributions or redemption
of fund shares. Such figures would be lower if the maximum sales charge and any
applicable taxes were deducted. Fee waivers reduced expenses of the Fund and in
the absence of such waiver, the performance quoted would be reduced.

- --------------------------------------------------------------------------------
                                       26


SCHEDULE OF INVESTMENTS

SEPTEMBER 30, 2003

- --------------------------------------------------------------------------------
SECURITY EQUITY FUND -
INTERNATIONAL SERIES
- --------------------------------------------------------------------------------

                                                   NUMBER          MARKET
FOREIGN STOCKS                                   OF SHARES          VALUE
- --------------------------------------------------------------------------------
AUSTRALIA - 1.1%
Australia & New Zealand
   Banking Group, Ltd. ...............               8,725    $   106,004

BERMUDA - 2.6%
Ace, Ltd. ............................               4,050        133,974
XL Capital, Ltd. .....................               1,345        104,157
                                                              -----------
                                                                  238,131
CANADA - 1.2%
Husky Energy, Inc. ...................               7,490        113,783

FINLAND - 1.5%
Stora Enso Oyj .......................              11,180        138,399

FRANCE - 5.3%
Aventis S.A. .........................               3,020        156,680
Axa                                                  6,750        113,744

PECHINEY S.A. ........................               1,264         69,551
Total S.A. ...........................                 945        142,625
                                                              -----------
                                                                  482,600

GERMANY - 4.0%
BASF AG ..............................               2,885        126,662
Deutsche Post AG .....................              10,396        177,605
Muenchener Rueckversicherungs-
   Gesellschaft AG ...................                 600         59,609
                                                              -----------
                                                                  363,876
HONG KONG - 1.4%
Hutchison Whampoa, Ltd. ..............              18,082        131,929

ISRAEL - 1.2%
Teva Pharmaceutical
   Industries, Ltd. ADR ..............               1,870        106,871

ITALY - 2.0%
Eni SpA ..............................              12,089        184,706

JAPAN - 4.0%
NEC Corporation* .....................              16,750        125,945
Nippon Telegraph & Telephone
   Corporation .......................                  28        126,823
Sony Corporation .....................               3,200        111,713
                                                              -----------
                                                                  364,481
KOREA - 1.7%
Samsung Electronics Company, Ltd. ....                 447        152,349

MEXICO - 1.6%
Cemex S.A. de C.V. ADR ...............                   1             25
Telefonos de Mexico S.A.
   de C.V. ADR .......................               4,850        148,168
                                                              -----------
                                                                  148,193

                                                 PRINCIPAL
                                                 AMOUNT OR
                                                  NUMBER           MARKET
FOREIGN STOCKS (CONTINUED)                       OF SHARES          VALUE
- --------------------------------------------------------------------------------
NETHERLANDS - 6.6%
ING Groep N.V. .......................               7,142      $ 130,830
Koninklijke (Royal) Philips
 Electronics N.V. ....................               7,680        174,045
Unilever N.V. ........................               3,140        184,663
Wolters Kluwer N.V. ..................               7,740        111,048
                                                              -----------
                                                                  600,586
SPAIN - 4.8%
Endesa S.A. ..........................               6,380         98,594
Iberdrola S.A. .......................               7,380        124,189
Telefonica S.A. ......................              18,503        218,493
                                                              -----------
                                                                  441,276
SWITZERLAND - 3.6%
Nestle S.A. ..........................                 851        196,221
Swiss Re .............................               2,061        130,939
                                                              -----------
                                                                  327,160
UNITED KINGDOM - 6.3%
Amersham plc .........................              13,880        119,567
BAE Systems plc ......................              52,255        146,069
Cable & Wireless plc .................              40,260         76,085
Lloyds TSB Group plc .................              14,880        102,347
Shell Transport & Trading
   Company plc .......................              21,262        131,319
                                                              -----------
                                                                  575,387
                                                              -----------
   Total foreign stocks - 48.9%                                 4,475,731

U.S. GOVERNMENT & AGENCIES - 47.6%
- ----------------------------------
Federal National Mortgage Association,
   0.97%, 10-01-03 ...................          $4,360,000      4,360,000
                                                              -----------
   Total investments - 96.5%                                    8,835,731
   Cash & other assets, less liabilities - 3.5%                   323,362
                                                              -----------
   Total net assets - 100.0% .............................     $9,159,093
                                                              ===========

For federal income tax purposes, the identified cost of investments owned at
 September 30, 2003 was $8,722,687.
*Non-income producing security
ADR (American Depositary Receipt)
plc (public limited company)

- --------------------------------------------------------------------------------
                           27  SEE ACCOMPANYING NOTES.


SCHEDULE OF INVESTMENTS (CONTINUED)

SEPTEMBER 30, 2003

- --------------------------------------------------------------------------------
SECURITY EQUITY FUND -
INTERNATIONAL SERIES (CONTINUED)
- --------------------------------------------------------------------------------

INVESTMENT CONCENTRATION
- --------------------------------------------------------------------------------
At September 30, 2003, International Series' investment concentration, by
   industry, was as follows:

   Aerospace/Defense .....................................           1.6%
   Air Freight & Logistics ...............................           1.9%
   Chemicals .............................................           1.4%
   Communications Equipment ..............................           1.6%
   Diversified Financial Services ........................           5.1%
   Diversified Telecommunication Services ................           4.6%
   Electronic Equipment & Instruments ....................           1.4%
   Electric Utilities ....................................           2.4%
   Food Products .........................................           4.2%
   Health Care Equipment & Supplies ......................           1.3%
   Household Durables ....................................           4.8%
   Insurance .............................................           5.9%
   Media .................................................           1.2%
   Metals & Mining .......................................           0.8%
   Oil & Gas .............................................           6.3%
   Paper & Forest Products ...............................           1.5%
   Pharmaceuticals .......................................           2.9%
   U.S. Government & Agencies ............................          47.6%
   Cash & other assets, less liabilities .................           3.5%
                                                                  -------
                                                                   100.0%
                                                                  =======


- --------------------------------------------------------------------------------
                           28  SEE ACCOMPANYING NOTES.


MANAGER'S COMMENTARY

SECURITY EQUITY FUND - LARGE CAP GROWTH SERIES

NOVEMBER 15, 2003

Mark Mitchell
Portfolio Manager |
Advisor, Security
Management Company, LLC |
TO OUR SHAREHOLDERS:

Fiscal 2003 marked the first positive year for most growth investors since 2000.
The Security Large Cap Growth Fund's performance for the one-year period ended
September 30, 2003, was positive with the Fund returning 22.17%.(1) Although the
Fund outperformed its peer group's median return of 20.00%, it lagged its
benchmark, the S&P Barra Growth Index's return of 25.92%.

Throughout this difficult period in the equity market, we have remained focused
on our strategy. Our strategy involves identifying good companies whose growth
prospects we believe are currently being mispriced by the market. Over the long
term, we believe that companies with good management teams, access to resources
and strong opportunities for growth in their industries, outperform. While over
the longer term this strategy has been successful, the market has favored lower
quality names over the last six months; the rationale being that lower quality
names had more leverage to an economic recovery and were mispriced relative to
higher quality companies with more visibility. This focus dampened the Fund's
total return for the one-year period.

INDUSTRIALS AND CONSUMER STOCKS TOP PERFORMERS

The Fund's industrial holdings were up 29% compared to 22% for the index.
Overweighted positions compared to the benchmark in United Technologies, General
Dynamics, and General Electric gave the Fund a boost as they benefited from a
recovering U.S. economy and strong defense-related spending.

The Fund's consumer discretionary stocks also turned in a solid performance and
were roughly in line with the benchmark's return of 27%. Key holdings Target and
Home Depot advanced 25% and 23% respectively. Hit hard by concerns about future
growth, Target and Home Depot are representative of our "bottom-up" analysis to
identify high quality companies whose growth prospects we believe have been
misjudged by the market. Additionally, Harley-Davidson, Carnival (cruise lines),
and Omnicom (advertising) all contributed gains we believe were driven in part
by the recovering economy.

TECHNOLOGY AND TELECOMMUNICATIONS DISAPPOINT

Technology stocks led the market's recovery over the last 12 months, just as
they led the market decline over the last few years. Our strategy of focusing on
paying the right price for potential growth led us to bypass many of the most
recent outperformers. Although up substantially, the Fund's technology stocks
returned 53% compared to 59% returned by the index. Positions in Cisco,
Microsoft, Analog Devices, Oracle, and Molex all contributed strong performance,
but were unable to offset equally strong or better results from a majority of
technology companies. Our slightly underweighted position in the sector relative
to the benchmark somewhat hindered the Fund's performance.

The Fund's underweighting in telecommunications stocks also had a negative
impact on performance. The lower-quality, higher-risk nature of these companies
does not conform to our investment discipline of buying high-quality companies
with good growth prospects at attractive valuations. After a prolonged period of
decline, telecommunication companies such as Nextel Communications surprisingly
rose 161% and AT&T wireless gained 99%. While we believe conceptually in the
future of wireless, we have significant near-term concerns about weak balance
sheets, substantial customer penetration levels, aggressive pricing, and
uncertainty over the technology platform that will ultimately prevail in the
telecommunications industry.

LONG-TERM INVESTING GOOD STRATEGY

Patience is key to successful long-term investing. After three years of market
declines, many long-term investors were rewarded in 2003 with positive returns.
Although evidence of a strong economic recovery is mixed, ongoing negatives such
as high unemployment and wavering consumer confidence should be offset by
positives such as an improved GDP, favorable fiscal and monetary policies, and
improved corporate earnings.

Although there will always be uncertainties surrounding the equity markets, we
believe that over time, equities present the best opportunity for investors to
grow their assets. We also continue to believe in a disciplined dollar cost

- --------------------------------------------------------------------------------
                                       29


MANAGER'S COMMENTARY (CONTINUED)

SECURITY EQUITY FUND - LARGE CAP GROWTH SERIES

NOVEMBER 15, 2003


averaging strategy. While it does not assure profits or protect against losses
in a declining market, we believe it is the best way to take advantage of the
natural highs and lows in a market cycle. We look forward to helping you meet
your financial goals in the future.


Sincerely,


Mark Mitchell
Portfolio Manager

(1)Performance figures are based on Class A shares and do not reflect deduction
of the sales charges or taxes that a shareholder would pay on distributions or
redemptions of shares.

================================= PERFORMANCE ==================================
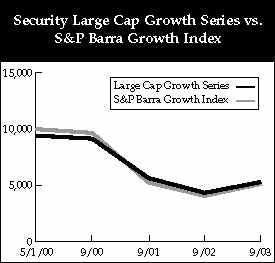
                            $10,000 SINCE INCEPTION

This chart assumes a $10,000 investment in Class A shares of Large Cap Growth
Series on May 1, 2000, and reflects deduction of the 5.75% sales load. On
September30, 2003, the value of your investment in Class A shares of the Series
(with dividends reinvested) would have been $5,297. By comparison, the same
$10,000 investment would have been $5,128, based on the S&P Barra Growth Index
performance. The chart does not reflect the deduction of taxes that a
shareholder would pay on distributions or the redemption of fund shares.

- --------------------------------------------------------------------------------
                             TOP 5 EQUITY HOLDINGS*

                                                           % OF
                                                        NET ASSETS
                                                        ----------
               Pfizer, Inc.                                7.1%
               General Electric Company                    6.3%
               Microsoft Corporation                       5.6%
               Cisco Systems, Inc.                         4.1%
               Johnson & Johnson                           3.5%
               *At September 30, 2003
- --------------------------------------------------------------------------------

- --------------------------------------------------------------------------------
                             AVERAGE ANNUAL RETURNS
                            AS OF SEPTEMBER 30, 2003

                                           1 YEAR      SINCE INCEPTION
                                           ---------------------------
           A Shares                        22.17%    (15.51%)  (5-1-00)
           A Shares with sales charge      15.16%    (16.96%)  (5-1-00)
           B Shares                        21.11%    (16.27%)  (5-1-00)
           B Shares with CDSC              16.11%    (17.01%)  (5-1-00)
           C Shares                        21.24%    (16.13%)  (5-1-00)
           C Shares with CDSC              20.24%    (16.13%)  (5-1-00)
- --------------------------------------------------------------------------------

The performance data above represents past performance that is not predictive of
future results. The investment return and principal value of an investment in
the fund will fluctuate so that an investor's shares, when redeemed, may be
worth more or less than their original cost. The figures above do not reflect
deduction of the maximum front-end sales charge of 5.75% for Class A shares or
the contingent deferred sales charge of 5% for Class B shares and 1% for Class C
shares, as applicable, except where noted. The figures do not reflect the
deduction of taxes that a shareholder would pay on distributions or redemption
of fund shares. Such figures would be lower if the maximum sales charge and any
applicable taxes were deducted.

- --------------------------------------------------------------------------------
                                       30


SCHEDULE OF INVESTMENTS

SEPTEMBER 30, 2003

- --------------------------------------------------------------------------------
SECURITY EQUITY FUND -
LARGE CAP GROWTH SERIES
- --------------------------------------------------------------------------------

                                                  NUMBER           MARKET
COMMON STOCKS                                    OF SHARES          VALUE
- --------------------------------------------------------------------------------
ADVERTISING - 1.3%
Omnicom Group, Inc. ..................               4,700     $  337,695

AEROSPACE & DEFENSE - 3.7%
General Dynamics Corporation .........               3,500        273,210
United Technologies Corporation ......               9,000        695,520
                                                               ----------
                                                                  968,730
APPLICATION SOFTWARE - 1.9%
Intuit, Inc.* ........................              10,100        487,224

BIOTECHNOLOGY - 2.5%
Amgen, Inc.* .........................              10,200        658,614

BREWERS - 1.4%
Anheuser-Busch Companies, Inc. .......               7,300        360,182

BROADCASTING & CABLE TV - 2.3%
Comcast Corporation* .................              19,700        608,336

COMMUNICATIONS EQUIPMENT - 6.1%
ADC Telecommunications, Inc.* ........             121,500        283,095
Cisco Systems, Inc.* .................              54,900      1,072,746
Nokia OYJ ADR ........................               7,100        110,760
Qualcomm, Inc. .......................               3,200        133,248
                                                               ----------
                                                                1,599,849
COMPUTER HARDWARE - 3.2%
Dell, Inc.* ..........................              14,400        480,816
International Business
   Machines Corporation ..............               4,000        353,320
                                                               ----------
                                                                  834,136
CONSUMER FINANCE - 0.8%
MBNA Corporation .....................               8,800        200,640

DATA PROCESSING & OUTSOURCED SERVICE - 2.5%
Concord EFS, Inc.* ...................              11,100        151,737
First Data Corporation ...............              12,400        495,504
                                                               ----------
                                                                  647,241
DEPARTMENT STORES - 0.6%

KOHL'S CORPORATION* ..................               3,150        168,525

DIVERSIFIED BANKS - 0.7%
Wells Fargo & Company ................               3,700        190,550

DRUG RETAIL - 0.3%
Walgreen Company .....................               2,500         76,600

ELECTRONIC MANUFACTURING SERVICES - 1.1%
Molex, Inc. ..........................              10,500        300,195

GENERAL MERCHANDISE STORES - 2.7%
Target Corporation ...................              18,800        707,444

HEALTH CARE DISTRIBUTORS - 2.8%
Cardinal Health, Inc. ................              12,800        747,392

HEALTH CARE EQUIPMENT - 2.2%
Medtronic, Inc. ......................              12,600        591,192

                                                  NUMBER           MARKET
COMMON STOCKS (CONTINUED)                        OF SHARES          VALUE
- --------------------------------------------------------------------------------
HOME IMPROVEMENT RETAIL - 3.6%
Home Depot, Inc. .....................              22,500     $  716,625
Lowe's Companies, Inc. ...............               4,200        217,980
                                                               ----------
                                                                  934,605
HOTELS, RESORTS & CRUISE LINES - 1.1%
Carnival Corporation .................               8,800        289,432

HOUSEHOLD PRODUCTS - 1.7%
Colgate-Palmolive Company ............               4,200        234,738
Procter & Gamble Company .............               2,200        204,204
                                                               ----------
                                                                  438,942
HYPERMARKETS & SUPERCENTERS - 2.8%
Wal-Mart Stores, Inc. ................              13,100        731,635

INDUSTRIAL CONGLOMERATES - 7.3%
3M Company ...........................               3,600        248,652
General Electric Company .............              55,600      1,657,436
                                                               ----------
                                                                1,906,088
INSURANCE BROKERS - 1.4%
Marsh & McLennan Companies, Inc. .....               7,600        361,836

INVESTMENT BANKING & BROKERAGE - 0.9%
Goldman Sachs Group, Inc. ............               3,000        251,700

LIFE & HEALTH INSURANCE - 1.0%
Aflac, Inc. ..........................               8,100        261,630

MOTORCYCLE MANUFACTURERS - 2.3%
Harley-Davidson, Inc. ................              12,500        602,500

MOVIES & ENTERTAINMENT - 1.7%
Time Warner, Inc.* ...................               5,000         75,550
Viacom, Inc. (Cl. B) .................               9,400        360,020
                                                               ----------
                                                                  435,570
MULTI-LINE INSURANCE - 2.4%
American International Group, Inc. ...              11,000        634,700

OIL & GAS EQUIPMENT & SERVICES - 1.2%
BJ Services Company* .................               9,200        314,364
OIL & GAS EXPLORATION & PRODUCTION - 1.0%
Devon Energy Corporation .............               5,200        250,588

OTHER DIVERSIFIED FINANCIAL SERVICES - 1.0%
Citigroup, Inc. ......................               5,600        254,856

PERSONAL PRODUCTS - 0.9%
Avon Products, Inc. ..................               3,600        232,416

PHARMACEUTICALS - 16.0%
Abbott Laboratories ..................              10,700        455,285
Eli Lilly & Company ..................               4,900        291,060
Johnson & Johnson ....................              18,500        916,120
Merck & Company, Inc. ................               8,700        440,394
Pfizer, Inc. .........................              61,300      1,862,294
Wyeth ................................               5,100        235,110
                                                               ----------
                                                                4,200,263

- --------------------------------------------------------------------------------
                           31  SEE ACCOMPANYING NOTES.


SCHEDULE OF INVESTMENTS (CONTINUED)

SEPTEMBER 30, 2003

- --------------------------------------------------------------------------------
SECURITY EQUITY FUND -
LARGE CAP GROWTH SERIES (CONTINUED)
- --------------------------------------------------------------------------------
                                                 PRINCIPAL
                                                 AMOUNT OR
                                                  NUMBER           MARKET
COMMON STOCKS (CONTINUED)                        OF SHARES          VALUE
- --------------------------------------------------------------------------------
SEMICONDUCTOR EQUIPMENT - 0.4%
Applied Materials, Inc.* .............               5,500    $    99,770

SEMICONDUCTORS - 4.0%

ANALOG DEVICES, INC.* ................               8,600        326,972
Intel Corporation ....................              20,200        555,702
Texas Instruments, Inc. ..............               7,200        164,160
                                                              -----------
                                                                1,046,834
SOFT DRINKS - 4.4%
Coca-Cola Company ....................               9,500        408,120
PepsiCo, Inc. ........................              16,200        742,446
                                                              -----------
                                                                1,150,566
SYSTEMS SOFTWARE - 6.2%
Microsoft Corporation ................              53,000      1,472,870
Oracle Corporation* ..................              12,400        139,128
                                                              -----------
                                                                1,611,998
THRIFTS & MORTGAGE FINANCE - 1.6%
Fannie Mae ...........................               5,800        407,160
                                                              -----------
   Total common stocks - 99.0%                                 25,901,998

REPURCHASE AGREEMENT - 1.8%
- ---------------------------
State Street, 0.25%, 10-01-03
   (Collateralized by FHLB, 1.435%, 06-03-05 with
   a value of $481,825 and a repurchase amount of
   $469,210) .........................            $469,207        469,207
                                                              -----------
   Total investments - 100.8% ............................     26,371,205
   Liabilities, less cash & other assets - (0.8%) ........       (204,050)
                                                              -----------
   Total net assets - 100.0% .............................    $26,167,155
                                                              ===========

For federal income tax purposes, the identified cost of investments owned at
 September 30, 2003 was $26,147,055.
* Non-income producing security
ADR (American Depositary Receipt)

- --------------------------------------------------------------------------------
                           32  SEE ACCOMPANYING NOTES.


MANAGER'S COMMENTARY

SECURITY EQUITY FUND - MID CAP VALUE SERIES

NOVEMBER 15, 2003

James P. Schier
Senior Portfolio Manager |
Advisor, Security
Management Company, LLC |
TO OUR SHAREHOLDERS:

Capitalizing on selecting the right stocks and taking positions in outperforming
sectors, the year ended September 30, 2003, proved to be a positive one for the
Security Mid Cap Value Fund. Posting a 44.85% return for the period, the Fund
outperformed the 28.23% return by its benchmark, the S&P Mid Cap Value Index, as
well as the 26.44% median return of its peer group.(1)

Our strategy is to seek appreciable securities of companies that are able to
grow and/or reinvest in increasingly profitable ventures and hold them over
three to five years to capture the best part of the improvements in profits or
profitability. This strategy continues to work. We are focused on investing in
securities when we find opportunities, with our individual position sizes
reflecting the magnitude and the confidence in the opportunity.

HEALTH CARE AND TECHNOLOGY LED RETURNS

Among the health care holdings, the top performers were biotech companies. We
participated in a few of these names through buying their convertible debt.
Hollis Eden Pharmaceutical gained 98% for the period and Ligand Pharmaceuticals
advanced 146%. Other companies such as Inamed, a company that manufactures
breast implants, rose 137%. The company just launched Lap-Ban, which is a
non-invasive device to treat obesity in lieu of stomach stapling.

Once considered growth stocks by the market, technology stocks over the last few
years have contracted to the point that many of the value indices are well
represented with these names. Regardless of investing style, technology exposure
and stock selection contributed significantly to the Fund's performance in this
sector, returning 72% for the period. Specific names that helped the Fund
include Avanex, Ixys, and Keane. We purchased Avanex, an optical components
company, throughout the year when it was trading at 75% of cash value. Following
Avanex's purchase of two competitors' optical component divisions, the stock
price rose from less than $1 to $4 in one month, posting a 247% return for the
period. Ixys, a major supplier of power semiconductors to the communications
industry, rose 86% for the period. Likewise, business consulting and application
development outsourcing firm, Keane, gained 86%.

FINANCIAL STOCKS BOOST PERFORMANCE

While underweight in financials, superior stock selection drove the Fund's
performance in this sector. W. R. Berkley, a property and casualty insurance
company that benefited from rate increases, returned 52% for the period.
American Capital and Jefferies Group, providers of financing to small and mid
capitalization companies, also contributed gains, advancing 47% and 56%
respectively.

UTILITIES AND ENERGY STOCKS CONTRIBUTE

The Fund was underweight in utilities relative to its benchmark but stock
selection benefited the Fund overall. A 266% gain by Williams Companies helped
the sector return 55% for the Fund compared to 22% for the benchmark. Stock
selection versus the benchmark in the energy sector also helped the Fund, as the
sector generated a 24% return, double the benchmark's return.

FOCUSED ON SMALLER, NIMBLE COMPANIES

Small and medium sized companies continue to outperform larger companies. In
2000, the valuation gap between these categories was stretched to an extreme
level as investors were willing to pay approximately more than two times the
multiple for smaller companies than for larger companies. We believe this was
the result of structural changes in the way people invest. The proliferation of
large defined contribution plans and large mutual fund complexes produced an
environment in which fund managers were willing to pay a premium for liquidity.
Given this, it created an investment opportunity in smaller and mid cap stocks.
Since smaller and mid cap securities have outperformed larger cap stocks since
2000, this valuation gap has returned to a more normal level recently. While
historically there have been periods where the market has paid a premium for
smaller and medium sized companies, it is unclear today whether we will enter
one of these periods now.

- --------------------------------------------------------------------------------
                                       33


MANAGER'S COMMENTARY (CONTINUED)

SECURITY EQUITY FUND - MID CAP VALUE SERIES

NOVEMBER 15, 2003


Nonetheless, there is still a valuation gap that does favor investing in smaller
companies and our work still continues to uncover opportunities. The economic
environment could possibly provide a better backdrop for continued smaller
company performance. In a slower economic environment, large cap companies will
find it ever more difficult to grow large revenue bases in a meaningful way. If
this is the case, the market could place greater emphasis on smaller, more
nimble companies. And finally, if the dollar continues to weaken and foreign
investors decide to reduce their dollar denominated financial investments, large
capitalization stocks could face a more challenging environment. To the extent
that foreign investors hold equities, they tend to be oriented to the biggest
blue chip equities.


Sincerely,


James P. Schier
Senior Portfolio Manager

(1)Performance figures are based on Class A shares and do not reflect deduction
of the sales charges or taxes that a shareholder would pay on distributions or
redemptions of shares.

================================= PERFORMANCE ==================================
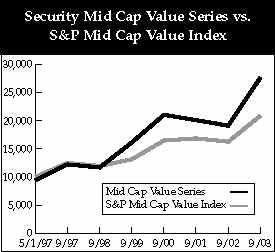
$10,000 SINCE INCEPTION
This chart assumes a $10,000 investment in Class A shares of Mid Cap Value
Series on May 1, 1997, and reflects deduction of the 5.75% sales load. On
September30, 2003, the value of your investment in Class A shares of the Series
(with dividends reinvested) would have grown to $27,665. By comparison, the same
$10,000 investment would have grown to $20,863, based on the S&P Mid Cap Value
Index's performance. The chart does not reflect the deduction of taxes that a
shareholder would pay on distributions or the redemption of fund shares.
- --------------------------------------------------------------------------------
TOP 5 EQUITY HOLDINGS*
% OF
NET ASSETS
----------
Avanex Corporation 3.9%
Chicago Bridge & Iron Company N.V. 3.3%
W.R. Berkley Corporation 3.1%
Computer Sciences Corporation 2.5%
Transocean, Inc. 2.3%
*At September 30, 2003
- --------------------------------------------------------------------------------
- --------------------------------------------------------------------------------
AVERAGE ANNUAL RETURNS
AS OF SEPTEMBER 30, 2003
1 YEAR 5 YEARS SINCE INCEPTION
---------------------------------------
A Shares 44.85% 18.82% 18.26% (5-1-97)
A Shares with
sales charge 36.53% 17.42% 17.18% (5-1-97)
B Shares 43.78% 17.71% 17.14% (5-1-97)
B Shares with
CDSC 38.78% 17.50% 17.14% (5-1-97)
C Shares 43.73% N/A 14.40% (1-29-99)
C Shares with
CDSC 42.73% N/A 14.40% (1-29-99)
- --------------------------------------------------------------------------------
The performance data above represents past performance that is not predictive of
future results. The investment return and principal value of an investment in
the fund will fluctuate so that an investor's shares, when redeemed, may be
worth more or less than their original cost. The figures above do not reflect
deduction of the maximum front-end sales charge of 5.75% for Class A shares or
the contingent deferred sales charge of 5% for Class B shares and 1% for Class C
shares, as applicable, except where noted. The figures do not reflect the
deduction of taxes that a shareholder would pay on distributions or redemption
of fund shares.
- --------------------------------------------------------------------------------
34
SCHEDULE OF INVESTMENTS
September 30, 2003
SECURITY EQUITY FUND -
MID CAP VALUE SERIES
PRINCIPAL
AMOUNT OR
NUMBER MARKET
CONVERTIBLE BONDS OF SHARES VALUE
- --------------------------------------------------------------------------------
PHARMACEUTICALS - 1.4%
Ligand Pharmaceuticals,
6.00% - 2007 ...................... $1,250,000 $2,800,000
TELECOMMUNICATIONS - 0.9%
Ciena Corporation, 3.75% - 2008 ...... $2,250,000 1,904,063
---------
Total convertible bonds - 2.3% 4,704,063
PREFERRED STOCK
- ---------------
DIVERSIFIED METALS & MINING - 0.2%
Arch Coal, Inc. ...................... 4,600 298,402
COMMON STOCKS
- -------------
AGRICULTURAL PRODUCTS - 1.8%
ARCHER-DANIELS-MIDLAND COMPANY ....... 280,000 3,670,800
AIR FREIGHT & LOGISTICS - 0.9%
AirNet Systems, Inc.* ................ 168,000 675,360
Stonepath Group, Inc.* ............... 480,000 1,224,000
---------
1,899,360
APPAREL RETAIL - 0.8%
Wet Seal, Inc.* ...................... 154,000 1,547,700
APPLICATION SOFTWARE - 0.8%
Lightspan, Inc.* ..................... 53,355 562,362
Ulticom, Inc.* ....................... 97,000 1,021,410
---------
1,583,772
AUTO PARTS & EQUIPMENT - 0.1%
Motorcar Parts & Accessories, Inc.* .. 50,000 180,500
BIOTECHNOLOGY - 0.7%
Protein Design Labs, Inc.*(1) ........ 81,000 1,122,660
Serologicals Corporation* ............ 21,300 280,095
---------
1,402,755
BROADCASTING & CABLE TV - 0.1%
Cinar Corporation (Cl. B)* ........... 86,000 258,000
BUILDING PRODUCTS - 0.1%
Griffon Corporation* ................. 7,500 134,700
CATALOG RETAIL - 2.1%
Coldwater Creek, Inc.* ............... 438,000 4,301,160
COMMUNICATIONS EQUIPMENT - 9.0%
Adaptec, Inc.* ....................... 484,000 3,659,040
Advanced Fibre Communications,
Inc.* ............................. 148,000 3,103,560
Arris Group, Inc.* ................... 364,000 2,093,000
Avanex Corporation* .................. 1,600,100 7,760,485
Ciena Corporation .................... 250,000 1,477,500
---------
18,093,585
NUMBER MARKET
COMMON STOCKS (CONTINUED) OF SHARES VALUE
- --------------------------------------------------------------------------------
CONSTRUCTION & ENGINEERING - 7.7%
Chicago Bridge & Iron Company N.V. ... 240,000 $ 6,518,400
Dycom Industries, Inc.* .............. 100,000 2,039,000
Quanta Services, Inc.* ............... 340,000 2,811,800
Shaw Group, Inc.* .................... 394,000 4,140,940
----------
15,510,140
DATA PROCESSING & OUTSOURCED SERVICES - 2.5%
Computer Sciences Corporation* ....... 135,000 5,071,950
DIVERSIFIED COMMERCIAL SERVICES - 1.6%
Angelica Corporation ................. 99,300 1,886,700
FTI Consulting, Inc.* ................ 80,000 1,388,000
----------
3,274,700
DIVERSIFIED METALS & MINING - 3.3%
Arch Coal, Inc. ...................... 185,100 4,111,071
Phelps Dodge Corporation* ............ 50,000 2,340,000
Usec, Inc. ........................... 24,600 160,638
----------
6,611,709
ELECTRIC UTILITES - 5.5%
Black Hills Corporation .............. 91,400 2,820,604
KFx, Inc.* ........................... 760,000 3,815,200
PNM Resources, Inc. .................. 11,500 322,460
Unisource Energy Corporation ......... 217,200 4,131,144
----------
11,089,408
ELECTRONIC EQUIPMENT & INSTRUMENTS - 2.4%
Maxwell Technologies, Inc.* .......... 330,000 3,012,900
Powell Industries, Inc.* ............. 105,300 1,769,040
----------
4,781,940
EMPLOYMENT SERVICES - 1.1%
Labor Ready, Inc.* ................... 226,000 2,271,300
ENVIRONMENTAL SERVICES - 1.7%
Republic Services, Inc. .............. 59,000 1,335,760
TRC Companies, Inc.* ................. 120,000 1,975,200
----------
3,310,960
FERTILIZERS & AGRICULTURAL CHEMICALS - 1.6%
Potash Corporation of
Saskatchewan, Inc. ................ 45,000 3,174,750
FOOTWEAR - 1.8%
Brown Shoe Company, Inc. ............. 115,000 3,645,500
HEALTH CARE DISTRIBUTORS & SERVICES - 0.7%
NDCHealth Corporation ................ 62,600 1,311,470
HOME ENTERTAINMENT SOFTWARE - 0.3%
Midway Games, Inc.* .................. 173,000 512,080
- --------------------------------------------------------------------------------
35 SEE ACCOMPANYING NOTES.
SCHEDULE OF INVESTMENTS (CONTINUED)
SEPTEMBER 30, 2003
SECURITY EQUITY FUND -
MID CAP VALUE SERIES (CONTINUED)
NUMBER MARKET
COMMON STOCKS (CONTINUED) OF SHARES VALUE
- --------------------------------------------------------------------------------
HOME FURNISHINGS - 3.1%
Furniture Brands International, Inc.* 29,800 $ 718,180
La-Z-Boy, Inc. ....................... 100,000 2,220,000
Mohawk Industries, Inc.* ............. 18,000 1,283,760
Stanley Furniture Company, Inc. ...... 63,000 1,922,130
----------
6,144,070
INDUSTRIAL MACHINERY - 1.5%
SPX Corporation* ..................... 62,000 2,807,360
Valmont Industries, Inc. ............. 12,900 255,291
----------
3,062,651
INTEGRATED OIL & GAS - 2.2%
Murphy Oil Corporation ............... 74,000 4,347,500
INVESTMENT BANKING & BROKERAGE - 3.5%
A.G. Edwards, Inc. ................... 66,000 2,535,060
American Capital Strategies, Ltd. .... 106,600 2,650,076
Jefferies Group, Inc. ................ 66,000 1,897,500
----------
7,082,636
IT CONSULTING & OTHER SERVICES - 3.0%
Acxiom Corporation* .................. 274,500 4,326,120
Keane, Inc.* ......................... 125,000 1,597,500
----------
5,923,620
MARINE - 0.4%
Frontline, Ltd. ...................... 53,000 887,750
MULTI-UTILITIES & UNREGULATED POWER - 2.0%
Williams Companies, Inc. ............. 428,000 4,031,760
OIL & GAS DRILLING - 3.8%
Nabors Industries, Ltd.* ............. 53,000 1,974,780
Pride International, Inc.* ........... 60,000 1,017,000
Transocean, Inc.* .................... 235,000 4,700,000
----------
7,691,780
OIL & GAS EQUIPMENT & SERVICES - 3.8%
Key Energy Services, Inc.* ........... 330,000 3,184,500
Newpark Resources, Inc.* ............. 300,000 1,290,000
Tidewater, Inc. ...................... 108,000 3,056,400
----------
7,530,900
OIL & GAS EXPLORATION & PRODUCTION - 2.3%
Devon Energy Corporation ............. 22,770 1,097,286
Evergreen Resources, Inc.* ........... 130,000 3,510,000
----------
4,607,286
OIL & GAS REFINING, MARKETING & TRANSPORTATION - 0.2%
TransMontaigne, Inc.* ................ 70,000 417,200
PACKAGED FOODS - 3.3%
Hain Celestial Group, Inc.* .......... 110,000 1,994,300
Hormel Foods Corporation ............. 200,000 4,596,000
----------
6,590,300
NUMBER MARKET
COMMON STOCKS (CONTINUED) OF SHARES VALUE
- --------------------------------------------------------------------------------
PAPER PACKAGING - 1.6%
Sonoco Products Company .............. 145,000 $ 3,182,750
PHARMACEUTICALS - 3.8%
Hollis-Eden Pharmaceuticals, Inc.* ... 192,403 4,686,937
Ligand Pharmaceuticals, Inc.
(Cl. B)* .......................... 226,800 2,923,452
-----------
7,610,389
PROPERTY & CASUALTY INSURANCE - 3.6%
MBIA, Inc. ........................... 18,750 1,030,688
W.R. Berkley Corporation ............. 180,000 6,166,800
-----------
7,197,488
REGIONAL BANKS - 3.8%
Corus Bankshares, Inc. ............... 6,800 363,800
Iberiabank Corporation ............... 20,100 1,057,662
Mercantile Bankshares Corporation .... 67,000 2,680,000
Wilmington Trust Corporation ......... 48,200 1,482,632
Zions Bankcorporation ................ 38,000 2,122,300
-----------
7,706,394
SEMICONDUCTORS - 2.0%
IXYS Corporation* .................... 282,000 2,642,340
MIPS Technologies, Inc.* ............. 6,300 25,011
Monolithic System Technology,
Inc.* ............................. 170,000 1,429,700
-----------
4,097,051
SPECIALTY CHEMICALS - 0.8%
Material Sciences Corporation ........ 85,700 875,854
Minerals Technologies, Inc. .......... 15,000 763,500
-----------
1,639,354
SPECIALTY STORES - 1.3%
Linens 'n Things, Inc.* .............. 110,000 2,615,800
TRUCKING - 0.5%
SCS Transportation, Inc.* ............ 11,000 166,100
Swift Transportation Company,
Inc.* ............................. 36,000 816,840
-----------
982,940
-----------
Total common stocks - 93.1% ........................... 186,987,858
WARRANTS - 0.2%
- ---------------
KFX, Inc. ............................ 152,000 441,669
- --------------------------------------------------------------------------------
36 SEE ACCOMPANYING NOTES.
SCHEDULE OF INVESTMENTS (CONTINUED)
SEPTEMBER 30, 2003
SECURITY EQUITY FUND -
MID CAP VALUE SERIES (CONTINUED)
PRINCIPAL MARKET
U.S. GOVERNMENT & AGENCIES AMOUNT VALUE
- --------------------------------------------------------------------------------
Federal Home Loan Bank,
1.00%, 10-10-03 ................... $2,300,000 $ 2,299,425
Federal National Mortgage Association:
1.04%, 10-01-03 ................... 2,600,000 2,600,000
1.01%, 10-03-03 ................... 2,300,000 2,299,871
1.03%, 10-06-03 ................... 1,300,000 1,299,821
1.03%, 10-08-03 ................... 1,700,000 1,699,666
-------------
7,899,358
-------------
Total U.S. government & agencies - 5.1% 10,198,783
REPURCHASE AGREEMENT - 0.3%
- ---------------------------
United Missouri Bank, 0.65%, 10-01-03
(Collateralized by FNMA, 10-01-03 with a
value of $525,000 and a repurchase amount of
$514,009) ......................... 514,000 514,000
-------------
Total investments - 101.2% ........ ................... 203,144,775
Liabilities, less cash & other assets - (1.2%) ........ (2,377,019)
-------------
Total net assets - 100.0% ............................. $200,767,756
=============
For federal income tax purposes, the identified cost of investments owned at
September 30, 2003 was $166,196,085.
*Non-income producing security
(1)Security is segregated as collateral for futures, forward contracts or
options.
- --------------------------------------------------------------------------------
37 SEE ACCOMPANYING NOTES.
MANAGER'S COMMENTARY
SECURITY EQUITY FUND - SELECT 25(R) SERIES
NOVEMBER 15, 2003
Terry Milberger
Senior Portfolio Manager |
Advisor, Security
Management Company, LLC |
TO OUR SHAREHOLDERS:

The combination of a cyclical stock rebound and moderate economic recovery
marked the end of a far more positive 12-month period for many equity investors
than we have experienced since 2000. The Security Select 25 Fund returned a
positive 11.50% for the one-year period ended September 30, 2003; however, the
Fund lagged its benchmark's return of 24.40%, as well as its peer group's median
return of 20.00% over the same period.(1)

Believing that great companies make great stocks over time, the Select 25 Fund
concentrates on owning 25-30 high-quality growth stocks for the long term. To
meet the Fund's criteria, a company must occupy a competitive position in its
market and have a good growth outlook over the next three to five years. Other
criteria include an experienced management team, financial strength, a good
business model, and an ability to improve profitability over time. The
concentrated nature of the Fund and its buy-hold strategy can prevent the Fund
from fully participating in cyclical rebounds but should provide a cushion
during market declines.

SELECTED CONSUMER DISCRETIONARY STOCKS BOOST PERFORMANCE

Household retail names such as Home Depot, Wal Mart and Target all performed
well for the period. Target was up 25% for the year and Home Depot gained 23%.
Although Kohl's Corporation was down 12% for the period, our outlook for the
department store chain is positive, as we believe it is one of the few companies
in its industry that can continue to grow its square footage. Advertising giant
Omnicom also performed nicely, gaining 30% for the period.


LOW WEIGHTING IN TECHNOLOGY

As a concentrated Fund, Select 25 does not mirror the sector weightings of any
particular index. Stocks are selected based upon their ability to meet the
definition of great companies over the longer term. As most technology company
earnings are cyclical in nature and benefit during periods when customer
spending increases, many of these companies do not meet our focus of finding
consistent growth. In addition, technology companies have a relatively short
life cycle that averages less than three years. This makes it difficult to
identify over the long term those names that will evolve into great companies.
Therefore, the Select 25 Fund has generally had a sector exposure below its S&P
500 benchmark.

HEALTH CARE STOCKS DISAPPOINT

Because many health care stocks have the potential to be great companies over
the long term, Select 25 had almost a fourth of the Fund in this sector.
Expectations were that health care stocks would grow earnings between 10% and
15% during 2003. However, more cyclical areas of the market benefited from a
recovering U.S. economy. One exception, Amgen, a biotech company with important
new drugs to treat rheumatoid arthritis and cancer, gained 51% for the period.

GREAT COMPANIES MAKE GREAT STOCKS OVER TIME

Looking forward, we expect cyclical stocks to cool down and the economic
recovery to moderate. Driven primarily by the mortgage refinancing boom and
federal tax cuts, we anticipate that for a strong economic recovery to continue,
it will require corporate capital spending to drive job growth and manufacturing
orders.

With this outlook and the performance of cyclical stocks during the last six
months, we are holding our course by continuing to own consistent growth names.
While this approach underperformed over the last six months, we believe it will
outperform in the future.

As always, we remain convinced that long-term investing in equities is the best
way for investors to meet their financial goals. We believe that patience will
be rewarded.


Sincerely,


Terry Milberger
Senior Portfolio Manager

(1)Performance figures are based on Class A shares and do not reflect deduction
of the sales charges or taxes that a shareholder would pay on distributions or
redemptions of shares.

- --------------------------------------------------------------------------------
                                       38


MANAGER'S COMMENTARY (CONTINUED)

SECURITY EQUITY FUND - SELECT 25(R) SERIES

NOVEMBER 15, 2003

================================= PERFORMANCE ==================================
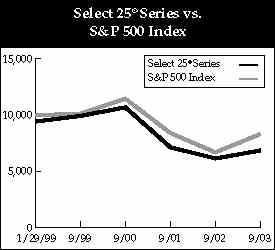
                            $10,000 SINCE INCEPTION

This chart assumes a $10,000 investment in Class A shares of Select 25(R) Series
on January 29, 1999, and reflects deduction of the 5.75% sales load. On
September30, 2003, the value of your investment in Class A shares of the Series
(with dividends reinvested) would have been $6,852. By comparison, the same
$10,000 investment would have been $8,319, based on the S&P 500 Index
performance. The chart does not reflect the deduction of taxes that a
shareholder would pay on distributions or the redemption of fund shares.

- --------------------------------------------------------------------------------
                             TOP 5 EQUITY HOLDINGS*

                                                           % OF
                                                        NET ASSETS
                                                        ----------
            Citigroup, Inc.                                4.2%
            Apache Corporation                             4.2%
            Cisco Systems, Inc.                            4.2%
            Harley-Davidson, Inc.                          3.9%
            American International Group, Inc.             3.7%
            *At September 30, 2003
- --------------------------------------------------------------------------------

- --------------------------------------------------------------------------------
                             AVERAGE ANNUAL RETURNS
                            AS OF SEPTEMBER 30, 2003

                                          1 YEAR      SINCE INCEPTION
                                          ---------------------------
          A Shares                        11.50%     (6.60%) (1-29-99)
          A Shares with sales charge       5.06%     (7.77%) (1-29-99)
          B Shares                        10.69%     (7.24%) (1-29-99)
          B Shares with CDSC               5.69%     (7.64%) (1-29-99)
          C Shares                        10.66%     (7.18%) (1-29-99)
          C Shares with CDSC               9.66%     (7.18%) (1-29-99)
- --------------------------------------------------------------------------------

The performance data above represents past performance that is not predictive of
future results. The investment return and principal value of an investment in
the fund will fluctuate so that an investor's shares, when redeemed, may be
worth more or less than their original cost. The figures above do not reflect
deduction of the maximum front-end sales charge of 5.75% for Class A shares or
the contingent deferred sales charge of 5% for Class B shares and 1% for Class C
shares, as applicable, except where noted. The figures do not reflect the
deduction of taxes that a shareholder would pay on distributions or redemption
of fund shares. Such figures would be lower if the maximum sales charge and any
applicable taxes were deducted.

- --------------------------------------------------------------------------------
                                       39


SCHEDULE OF INVESTMENTS

SEPTEMBER 30, 2003

- --------------------------------------------------------------------------------
SECURITY EQUITY FUND -
SELECT 25(R) SERIES
- --------------------------------------------------------------------------------

                                                   NUMBER          MARKET
COMMON STOCKS                                    OF SHARES          VALUE
- --------------------------------------------------------------------------------
ADVERTISING - 3.5%
Omnicom Group, Inc. ..................              12,000      $ 862,200

APPLICATION SOFTWARE - 2.9%
Intuit, Inc.* ........................              15,000        723,600

BIOTECHNOLOGY - 3.6%
Amgen, Inc.* .........................              14,000        903,980

BREWERS - 3.6%
Anheuser-Busch Companies,
   Inc. ..............................              18,000        888,120

BROADCASTING & CABLE TV - 3.1%
Comcast Corporation* .................              25,000        772,000

COMMUNICATIONS EQUIPMENT - 6.1%
Cisco Systems, Inc.* .................              53,000      1,035,620
Nokia OYJ ADR ........................              30,000        468,000
                                                                ---------
                                                                1,503,620
DATA PROCESSING & OUTSOURCED SERVICE - 3.7%
First Data Corporation ...............              23,000        919,080

DEPARTMENT STORES - 1.7%
Kohl's Corporation* ..................               8,000        428,000

DRUG RETAIL - 3.2%
Walgreen Company .....................              26,000        796,640

GENERAL MERCHANDISE STORES - 1.8%
Target Corporation ...................              12,000        451,560

HEALTH CARE DISTRIBUTORS - 3.5%
Cardinal Health, Inc. ................              15,000        875,850

HEALTH CARE EQUIPMENT - 3.4%
Medtronic, Inc. ......................              18,000        844,560

HOME IMPROVEMENT RETAIL - 1.9%
Home Depot, Inc. .....................              15,000        477,750

HYPERMARKETS & SUPERCENTERS - 2.9%
Wal-Mart Stores, Inc. ................              13,000        726,050

INDUSTRIAL CONGLOMERATES - 6.9%
3M Company ...........................              12,000        828,840
General Electric Company .............              30,000        894,300
                                                                ---------
                                                                1,723,140

INDUSTRIAL GASSES - 2.5%
Praxair, Inc. ........................              10,000        619,500

LIFE & HEALTH INSURANCE - 3.7%
Aflac, Inc. ..........................              28,000        904,400

MOTORCYCLE MANUFACTURERS - 3.9%
Harley-Davidson, Inc. ................              20,000        964,000

MOVIES & ENTERTAINMENT - 3.2%
Viacom, Inc. (Cl. B) .................              21,000        804,300

MULTI-LINE INSURANCE - 3.7%
American International Group, Inc. ...              16,000        923,200

- --------------------------------------------------------------------------------

                                                   NUMBER          MARKET
COMMON STOCKS                                    OF SHARES          VALUE
- --------------------------------------------------------------------------------

OIL & GAS EQUIPMENT & SERVICES - 2.8%
BJ Services Company* .................              20,000      $ 683,400

OIL & GAS EXPLORATION & PRODUCTION - 4.2%
Apache Corporation ...................              15,000      1,040,100

OTHER DIVERSIFIED FINANCIAL SERVICES - 4.2%
Citigroup, Inc. ......................              23,000      1,046,730

PHARMACEUTICALS - 6.1%
Johnson & Johnson ....................              15,000        742,800
Pfizer, Inc. .........................              25,000        759,500
                                                              -----------
                                                                1,502,300
SEMICONDUCTORS - 2.3%
Analog Devices, Inc.* ................              15,000        570,300

SOFT DRINKS - 3.7%
Pepsico, Inc. ........................              20,000        916,600

SYSTEMS SOFTWARE - 3.6%
Microsoft Corporation ................              32,000        889,280
                                                              -----------
   Total common stocks - 95.7% .......                         23,760,260

REPURCHASE AGREEMENT - 4.5%
- ---------------------------
United Missouri Bank, 0.65%, 10-01-03
   (Collateralized by FNMA, 10-01-03
   with a value of $1,150,000 and a
   repurchase amount of $1,127,021) ..          $1,127,000      1,127,000
                                                              -----------
   Total investments - 100.3% ............................     24,887,260
   Liabilities, less cash & other assets - (0.3%) ........        (63,598)
                                                              -----------
   Total net assets - 100.0% .............................    $24,823,662
                                                              ===========

The identified cost of investments owned at September 30, 2003 was the same for
 federal income tax and financial statement purposes.
*Non-income producing security
ADR (American Depositary Receipt)

- --------------------------------------------------------------------------------
                           40  SEE ACCOMPANYING NOTES.


MANAGER'S COMMENTARY

SECURITY EQUITY FUND - SMALL CAP GROWTH SERIES

NOVEMBER 15, 2003

Bill Wolfenden
Portfolio Manager |  |
TO OUR SHAREHOLDERS:

The Small Cap Growth Series of Security Equity Fund produced a strong year of
performance ended September 30, 2003. The Fund was up 47.59%, significantly
outpacing the 41.72% return from the benchmark Russell 2000 Growth.(1)

Volatile trading characterized the early months of the year as portfolio
managers kept one eye on their Quotron and the other eye on CNN. In general, the
small cap market traded on news, not on fundamentals.

As U.S. forces gained the upper hand toward regime change in Iraq, investors
extended their investment horizons. With interest rates at historic lows,
investors favored growth equities, particularly smaller cap companies. From our
view, this trend helped drive up prices of companies that we have long
maintained possessed attractive and dependable growth characteristics, and are
often less expensive than larger cap companies.

The Fund continues to benefit from a tailwind behind small stocks. Since this
market advance began in the 4th quarter of 2002, the Russell 2000 is up 36.50%,
the Russell 2000 Growth is up 41.72%, while the large cap S&P 500 is up 24.30%.
Back in late 2002, we suggested small cap growth stocks were historically very
cheap. That valuation opportunity, combined with small caps' historical pattern
of strong returns coming out of a recession, helped to fuel the rally.

The recent strong performance was driven by very good stock selection across
most sectors. We maintained an approximate market weight to technology
throughout the year, with about an average 22% of portfolio assets invested in
this sector. Approximately half of that was invested in software companies. We
continued to recognize very strong performance from a number of specialty
semiconductor equipment manufacturers as well.

Health care represented an average 21% of portfolio assets, again in line with
the benchmark weighting. Our approach in health care is to spread our positions
across this broad and diverse sector. A basket of biotech stocks helped
performance, as did a number of medical device companies. Weakness in a number
of health care management service stocks was one of the few detractors of
performance.

Finally, the broad consumer sector accounted for 20%, on average, of portfolio
assets. We enjoyed great success in this area as direct consumer related stocks
posted strong gains, as did nearly all of our Internet related companies. The
Internet group is one of the few areas where we have made a bet in excess of the
benchmark this year. That bet has proven to be a good one as strong stock
selection has contributed meaningful returns to date.

As we discussed previously this year, we have been very diligent about
harvesting gains as stocks approach their upside target price. This has
increased the portfolio's turnover. Nonetheless, we want to reiterate how
important it is to us to adhere to this risk control tool.

Looking ahead, while many small stocks have experienced rapid price
appreciation, earnings growth has been strong, supporting an attractive price to
earnings ratio* (P/E) expansion. The Fund's forward P/E is 23.7x the forward
12-month earnings estimates. That 24x is not as cheap as it was a year ago when
small caps were at their bottom, but it is only modestly richer than the
benchmark's forward multiple of 22.8x. We are optimistic we can continue to draw
on our fundamental research strength and identify the most attrac-tive small
company growth stocks as we close the year.


Sincerely,


Bill Wolfenden
Portfolio Manager

(1)Performance figures are based on Class A shares and do not reflect deduction
of the sales charges or taxes that a shareholder would pay on distributions or
the redemption of shares. Fee waivers and/or reimbursements reduced Fund
expenses and in the absence of such waivers the performance quoted would be
reduced. Investments in small company stocks may present additional risks such
as less predictable earnings, higher volatility and less liquidity than larger,
more established companies.

*The P/E ratio shows the weighted average of the price/earnings ratio of the
stocks in a Fund's portfolio. The P/E ratio of a stock is calculated by dividing
the current price of the stock by its 12 months' earnings per share. A higher
"multiple" means investors have higher expectations for future growth and have
bid up the stock's price.

- --------------------------------------------------------------------------------
                                       41


MANAGER'S COMMENTARY (CONTINUED)

SECURITY EQUITY FUND - SMALL CAP GROWTH SERIES

NOVEMBER 15, 2003

================================= PERFORMANCE ==================================
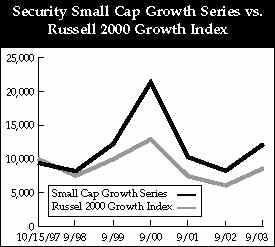
$10,000 SINCE INCEPTION
This chart assumes a $10,000 investment in Class A shares of Small Cap Growth
Series on October 15, 1997, and reflects deduction of the 5.75% sales load. On
September30, 2003, the value of your investment in Class A shares of the Series
(with dividends reinvested) would have been $12,189. By comparison, the same
$10,000 investment would have been $8,618, based on the Russell 2000 Growth
Index performance. The chart does not reflect the deduction of taxes that a
shareholder would pay on distributions or the redemption of fund shares.
- --------------------------------------------------------------------------------
TOP 5 EQUITY HOLDINGS*
% OF
NET ASSETS
----------
Scientific Games Corporation 1.4%
Infinity Property & Casualty Corporation 1.3%
Embarcadero Technologies, Inc. 1.3%
Scottish Re Group, Ltd. 1.3%
Casual Male Retail Group, Inc. 1.3%
*At September 30, 2003
- --------------------------------------------------------------------------------
- --------------------------------------------------------------------------------
AVERAGE ANNUAL RETURNS
AS OF SEPTEMBER 30, 2003
1 YEAR 5 YEARS SINCE INCEPTION
----------------------------------------
A Shares 47.59% 8.24% 4.41% (10-15-97)
A Shares with
sales charge 39.11% 6.97% 3.38% (10-15-97)
B Shares 46.45% 7.17% 3.40% (10-15-97)
B Shares with
CDSC 41.45% 6.87% 3.40% (10-15-97)
C Shares 46.52% N/A 2.30% (1-29-99)
C Shares with
CDSC 45.52% N/A 2.30% (1-29-99)
- --------------------------------------------------------------------------------
The performance data above represents past performance that is not predictive of
future results. The investment return and principal value of an investment in
the fund will fluctuate so that an investor's shares, when redeemed, may be
worth more or less than their original cost. The figures above do not reflect
deduction of the maximum front-end sales charge of 5.75% for Class A shares or
the contingent deferred sales charge of 5% for Class B shares and 1% for Class C
shares, as applicable, except where noted. The figures do not reflect the
deduction of taxes that a shareholder would pay on distributions or redemption
of fund shares. Such figures would be lower if the maximum sales charge and any
applicable taxes were deducted. Fee waivers reduced expenses for the Fund and in
the absence of such waiver, the performance quoted would be reduced.
- --------------------------------------------------------------------------------
42
SCHEDULE OF INVESTMENTS
SEPTEMBER 30, 2003
- --------------------------------------------------------------------------------
SECURITY EQUITY FUND -
SMALL CAP GROWTH SERIES
- --------------------------------------------------------------------------------
NUMBER MARKET
COMMON STOCKS OF SHARES VALUE
- --------------------------------------------------------------------------------
AIR FREIGHT & LOGISTICS - 1.7%
Forward Air Corporation* ............. 7,900 $ 218,435
Pacer International, Inc.* ........... 10,500 209,265
----------
427,700
APPAREL RETAIL - 2.6%
Bebe Stores, Inc.* ................... 7,200 195,120
Casual Male Retail Group, Inc.* ...... 41,800 308,902
Hot Topic, Inc.* ..................... 6,900 155,526
----------
659,548
APPAREL, ACCESSORIES & LUXURY GOODS - 2.2%
Ashworth, Inc.* ...................... 25,600 177,408
Guess?, Inc.* ........................ 22,400 199,360
Oxford Industries, Inc. .............. 2,550 163,710
----------
540,478
APPLICATION SOFTWARE - 2.0%
Intervideo, Inc.* .................... 7,500 160,875
Opnet Technologies, Inc.* ............ 16,500 205,920
Ultimate Software Group, Inc.* ....... 16,900 142,805
----------
509,600
BIOTECHNOLOGY - 2.0%
Alexion Pharmaceuticals, Inc.* ....... 8,300 136,701
Harvard Bioscience, Inc.* ............ 28,000 207,760
Telik, Inc.* ......................... 7,900 158,395
----------
502,856
CASINOS & GAMING - 1.4%
Scientific Games Corporation* ........ 29,600 337,736
COMMUNICATIONS EQUIPMENT - 2.3%
Centillium Communications, Inc.* ..... 27,100 191,597
PC-Tel, Inc* ......................... 14,900 158,983
Stratex Networks, Inc.* .............. 54,700 210,595
----------
561,175
COMPUTER STORAGE & PERIPHERALS - 0.8%
Applied Films Corporation* ........... 6,600 196,218
DATA PROCESSING & OUTSOURCED SERVICE - 1.6%
Espeed, Inc.* ........................ 8,300 187,663
Per-Se Technologies, Inc.* ........... 13,000 208,000
----------
395,663
DIVERSIFIED BANKS - 0.8%
Net.Bank, Inc. ....................... 15,500 192,975
DIVERSIFIED COMMERCIAL SERVICES - 1.5%
Bright Horizons Family
Solutions, Inc.* .................. 5,200 207,740
Sylvan Learning Systems, Inc.* ....... 5,900 160,952
----------
368,692
ELECTRONIC EQUIPMENT MANUFACTURERS - 1.5%
Eplus, Inc.* ......................... 11,000 171,600
Veeco Instruments Inc.* .............. 9,500 189,620
----------
361,220
NUMBER MARKET
COMMON STOCKS (CONTINUED) OF SHARES VALUE
- --------------------------------------------------------------------------------
FOOD RETAIL - 0.7%
Wild Oats Market, Inc.* .............. 16,800 $ 183,624
HEALTH CARE EQUIPMENT - 8.0%
Abaxis, Inc.* ........................ 14,000 194,600
Analogic Corporation ................. 5,700 273,600
Biosite, Inc.* ....................... 4,300 122,034
Conceptus, Inc.* ..................... 10,900 142,790
Dade Behring Hldgs, Inc.* ............ 5,300 148,453
Epix Medical, Inc.* .................. 11,300 192,326
I-Flow Corporation* .................. 7,300 76,650
Inamed Corporation* .................. 2,430 178,484
Intuitive Surgical, Inc.* ............ 14,700 245,196
Laserscope* .......................... 17,400 204,450
Ventana Medical Systems, Inc.* ....... 5,210 209,963
----------
1,988,546
HEALTH CARE FACILITIES - 1.9%
Kindred Health Care, Inc.* ........... 4,600 172,270
Labone, Inc.* ........................ 12,500 291,625
----------
463,895
HEALTH CARE SERVICES - 3.5%
Icon plc* ............................ 5,700 215,916
Inveresk Research Group, Inc.* ....... 11,700 232,245
Merge Technologies* .................. 10,700 180,188
Providence Service Corporation* ...... 14,300 225,940
----------
854,289
HEALTH CARE SUPPLIES - 2.0%
Polymedica Corporation ............... 11,200 296,800
Tripath Imaging, Inc.* ............... 22,200 193,140
----------
489,940
HOME FURNISHINGS - 1.0%
Kirkland's, Inc.* .................... 15,700 251,671
INSURANCE BROKERS - 0.9%
Healthextras Inc.* ................... 26,800 230,748
INTERNET SOFTWARE & SERVICES - 9.5%
Altiris, Inc.* ....................... 7,500 197,100
Autobytel, Inc.* ..................... 14,800 140,896
Cnet Networks, Inc.* ................. 22,400 158,592
Digitas, Inc.* ....................... 39,700 288,222
DoubleClick, Inc.* ................... 8,900 95,853
Ebookers plc ADR* .................... 8,600 157,466
Embarcadero Technologies, Inc.* ...... 31,100 312,244
Infospace, Inc.* ..................... 13,200 269,412
Kana Software, Inc.* ................. 41,000 160,720
Radware Ltd.* ........................ 11,100 201,465
Tumbleweed Communications
Corporation* ...................... 30,600 169,861
ValueClick, Inc.* .................... 23,400 196,794
----------
2,348,625
- --------------------------------------------------------------------------------
43 SEE ACCOMPANYING NOTES.
SCHEDULE OF INVESTMENTS (CONTINUED)
SEPTEMBER 30, 2003
- --------------------------------------------------------------------------------
SECURITY EQUITY FUND -
SMALL CAP GROWTH SERIES (CONTINUED)
- --------------------------------------------------------------------------------
NUMBER MARKET
COMMON STOCKS (CONTINUED) OF SHARES VALUE
- --------------------------------------------------------------------------------
IT CONSULTING & OTHER SERVICES - 1.7%
Forrester Research Inc.* ............. 12,200 $ 174,826
Lionbridge Technologies, Inc.* ....... 33,150 248,957
----------
423,783
LEISURE PRODUCTS - 0.8%
K2, Inc.* ............................ 13,000 193,050
MANAGED HEALTH CARE - 1.1%
American Medical Security
Group* ............................ 13,600 276,216
METAL & GLASS CONTAINERS - 0.7%
Jarden Corporation* .................. 4,600 173,650
OIL & GAS DRILLING - 1.4%
Grey Wolf, Inc.* ..................... 57,200 199,056
Unit Corporation* .................... 8,400 158,256
----------
357,312
OIL & GAS EQUIPMENT & SERVICES - 3.3%
Cal Dive International, Inc.* ........ 10,300 200,232
Maverick Tube Corporation* ........... 10,900 169,168
Oil States International, Inc.* ...... 17,700 224,613
Superior Energy Services, Inc.* ...... 22,100 216,580
----------
810,593
PACKAGED FOODS & MEATS - 0.8%
Peets Coffee & Tea, Inc.* ............ 10,100 197,455
PHARMACEUTICALS - 7.0%
Able Laboratories, Inc.* ............. 8,200 153,422
Angiotech Pharmaceuticals, Inc.* ..... 500 21,825
Atherogenics, Inc.* .................. 13,000 217,620
Bradley Pharmaceuticals, Inc. ........ 6,600 179,850
Collagenex Pharmaceuticals, Inc. ..... 9,800 105,154
Durect Corporation* .................. 47,100 158,256
Esperion Therapeutics, Inc.* ......... 9,900 192,951
Penwest Pharmaceuticals,
Company* .......................... 8,900 189,748
Pozen, Inc.* ......................... 10,500 188,790
Salix Pharmaceuticals, Ltd.* ......... 8,370 161,206
Vicuron Pharmaceuticals, Inc.* ....... 9,900 175,230
----------
1,744,052
PROPERTY & CASUALTY INSURANCE - 2.2%
Infinity Property & Casualty
Corporation ....................... 11,750 330,292
ProAssurance Corporation* ............ 8,400 216,972
----------
547,264
PUBLISHING - 0.6%
Information Holdings, Inc.* .......... 6,900 138,207
REGIONAL BANKS - 0.8%
First Community Bancorp .............. 5,600 187,544
NUMBER MARKET
COMMON STOCKS (CONTINUED) OF SHARES VALUE
- --------------------------------------------------------------------------------
REINSURANCE - 1.3%
Scottish Reinsurance Group, Ltd. ..... 12,900 $ 311,535
RESTAURANTS - 1.5%
Chicago Pizza & Brewery, Inc.* ....... 13,800 162,150
Rare Hospitality International,
Inc.* ............................. 8,700 216,717
----------
378,867
SEMICONDUCTOR EQUIPMENT - 3.7%
ASE Test Limited* .................... 16,100 139,909
Genus, Inc.* ......................... 50,600 208,472
Logicvision, Inc.* ................... 56,100 184,569
Mykrolis Corporation* ................ 15,700 190,598
UltraTech Stepper, Inc.* ............. 6,600 186,252
----------
909,800
SEMICONDUCTORS - 8.2%
Actel Corporation* ................... 7,700 184,569
DSP Group, Inc.* ..................... 7,400 184,334
Exar Corporation* .................... 15,100 213,363
IXYS Corporation* .................... 17,400 163,038
Kopin Corporation* ................... 23,700 164,241
O2Micro International Ltd.* .......... 12,800 184,960
PLX Technology, Inc.* ................ 33,900 214,790
Power Integrations, Inc.* ............ 5,300 176,172
Quicklogic Corporation* .............. 17,800 118,370
White Electronics Designs
Corporation* ...................... 12,300 132,225
Xicor, Inc.* ......................... 10,700 99,403
Zoran Corporation* ................... 10,600 206,700
----------
2,042,165
SPECIALTY STORES - 7.2%
Aaron Rents, Inc. .................... 13,200 276,540
Cost Plus, Inc.* ..................... 4,500 166,140
Friedman's, Inc. ..................... 11,200 156,240
Guitar Center, Inc.* ................. 7,100 228,336
Jo-Ann Stores, Inc.* ................. 8,000 223,200
Movie Gallery, Inc.* ................. 12,500 245,625
Regis Corporation .................... 5,700 182,970
TBC Corporation* ..................... 12,300 308,115
----------
1,787,166
STEEL - 0.3%
GrafTech International, Ltd.* ........ 10,400 83,200
SYSTEMS SOFTWARE - 0.5%
ClickSoftware Company* ............... 58,500 114,660
TRUCKING - 1.7%
Marten Transport, Ltd.* .............. 6,600 172,260
Vitran Corporation, Inc.* ............ 24,000 249,840
----------
422,100
----------
Total common stocks - 92.7% 22,963,818
- --------------------------------------------------------------------------------
44 SEE ACCOMPANYING NOTES.
SCHEDULE OF INVESTMENTS (CONTINUED)
SEPTEMBER 30, 2003
- --------------------------------------------------------------------------------
SECURITY EQUITY FUND -
SMALL CAP GROWTH SERIES (CONTINUED)
- --------------------------------------------------------------------------------
PRINCIPAL MARKET
AMOUNT VALUE
- --------------------------------------------------------------------------------
REPURCHASE AGREEMENT - 12.1%
- ----------------------------
United Missouri Bank, 0.65%, 10-01-03
(Collateralized by FNMA, 10-01-03 with
a value of $3,061,000 and a repurchase
amount of $3,000,054) ............ $3,000,000 $ 3,000,000
------------
Total investments - 104.8% ............................ 25,963,818
Liabilities, less cash & other assets - (4.8%) ........ (1,186,771)
------------
Total net assets - 100.0% ............................. $24,777,047
============
For federal income tax purposes, the identified cost of investments owned at
September 30, 2003 was $21,202,375.
*Non-income producing security
ADR (American Depositary Receipt)
plc (public limited company)
- --------------------------------------------------------------------------------
45
MANAGER'S COMMENTARY
SECURITY EQUITY FUND - SOCIAL AWARENESS SERIES
NOVEMBER 15, 2003
Mark Mitchell
Portfolio Manager |
Advisor, Security
Management Company, LLC |
TO OUR SHAREHOLDERS:

Fiscal 2003 marked the first positive year for most equity investors since 2000.
The Security Social Awareness Fund's performance for the period was positive
with the Fund returning 20.95%.(1) Although the Fund outperformed its peer
group's median return of 20.72%, it lagged its benchmark, the Domini Social
Index's return of 25.97%.

Throughout this difficult period in the equity market, we have remained focused
on our strategy. Our strategy involves identifying good companies meeting our
social criteria whose growth prospects we believe the market is currently
mispricing. Over the long term, we believe companies with good management teams,
access to resources and strong opportunities for growth in their industries,
outperform. While over the longer term this strategy has been successful, the
market has favored lower-quality names over the last six months; the rationale
being that lower quality names had more leverage to an economic recovery and
were mispriced relative to higher quality companies with more visibility. This
focus dampened the Fund's total return for the one-year period.

INDUSTRIALS AND FINANCIAL STOCKS TOP PERFORMERS

The Fund's industrial holdings were up 28% compared to 17% for the index. An
overweighted position in Paychex, up 43% due to an improving economy and the
assumption by many that it is a technology company, helped boost performance.
Small positions in Southwest Airlines and Fedex also contributed positively to
performance.

The Fund's financial stocks also contributed gains and were up 23% vs. 21% for
the benchmark. Benefiting from declining interest rates, increased stock and
bond activity and strong mortgage loan demand, our overweighted positions in
J.P. Morgan Chase, MBNA, American Express, Goldman Sachs and Bank of New York
helped boost performance.

TELECOMMUNICATIONS AND CONSUMER DISCRETIONARY DISAPPOINT

The Fund's underweighting in telecommunications stocks relative to the benchmark
dampened overall performance. The lower-quality, higher-risk nature of these
companies does not conform to our investment discipline of buying high-quality
companies with good prospects at attractive valuations. But after a prolonged
period of decline, telecommunication companies such as AT&T Wireless surprised
many by rising 99% while Sprint gained 72%. While we believe conceptually in the
future of wireless, we have significant near-term concerns about weak balance
sheets, substantial customer penetration levels, aggressive pricing, and
uncertainty over the technology platform that will ultimately prevail in the
telecommunications industry. Consistent with our investing strategy, the Fund
held positions in larger, more stable telecommunications stocks such as SBC.

While specific consumer discretionary names helped the Fund, our emphasis on
paying the right price for growth kept us from outperforming in this sector as
we avoided highly-valued names such as Ebay. Large active weights in the names
that recovered from concerns about their future growth contributed strong
performance. Examples of these include retailers Target and Home Depot.

LONG-TERM INVESTING GOOD STRATEGY

Patience is key to successful long-term investing. After three years of market
declines, many long-term investors were rewarded in 2003 with positive returns.
Although evidence of a strong economic recovery is mixed, ongoing negatives such
as high unemployment and wavering consumer confidence should be offset by
positives such as an improved GDP, favorable fiscal and monetary policies, and
improved corporate earnings.

Although there will always be uncertainties surrounding the equity markets, we
believe that over time, equities present the best opportunity for investors to
grow their assets. We also continue to believe in a disciplined dollar cost
averaging strategy. While it does not assure profits or protect against losses
in a declining market, we believe it is the best way to take advantage of the
natural highs and lows in a market cycle. We look forward to helping you meet
your financial goals in the future.


Sincerely,


Mark Mitchell
Portfolio Manager

(1)Performance figures are based on Class A shares and do not reflect deduction
of the sales charges or taxes that a shareholder would pay on distributions or
redemptions of shares.

- --------------------------------------------------------------------------------
                                       46


MANAGER'S COMMENTARY (CONTINUED)

SECURITY EQUITY FUND - SOCIAL AWARENESS SERIES

NOVEMBER 15, 2003

================================= PERFORMANCE ==================================
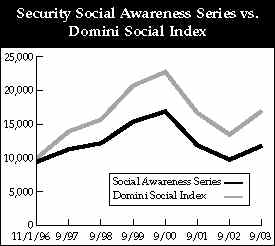
                             $10,000 SINCE INCEPTION

This chart assumes a $10,000 investment in Class A shares of Social Awareness
Series on November 1, 1996, and reflects deduction of the 5.75% sales load. On
September30, 2003, the value of your investment in Class A shares of the Series
(with dividends reinvested) would have been to $11,803. By comparison, the same
$10,000 investment would have grown to $16,969 based on the Domini Social
Index's performance. The chart does not reflect the deduction of taxes that a
shareholder would pay on distributions or the redemption of fund shares.

- --------------------------------------------------------------------------------
                             TOP 5 EQUITY HOLDINGS*

                                                           % OF
                                                        NET ASSETS
                                                        ----------
              Microsoft Corporation                        6.3%
              American International Group, Inc.           4.3%
              Cisco Systems, Inc.                          3.8%
              Johnson & Johnson                            3.7%
              Comcast Corporation                          3.4%
              *At September 30, 2003
- --------------------------------------------------------------------------------

- --------------------------------------------------------------------------------
                             AVERAGE ANNUAL RETURNS
                            AS OF SEPTEMBER 30, 2003

                            1 YEAR       5 YEARS     SINCE INCEPTION
                            ----------------------------------------
         A  Shares          20.95%       (0.65%)     3.31%  (11-1-96)
         A  Shares with
            sales charge    13.99%       (1.81%)     2.43%  (11-1-96)
         B  Shares          20.07%       (1.63%)     2.26%  (11-1-96)
         B  Shares with
            CDSC            15.07%       (2.03%)     2.26%  (11-1-96)
         C  Shares          20.04%         N/A      (6.80%) (1-29-99)
         C  Shares with
            CDSC            19.04%         N/A      (6.80%) (1-29-99)
- --------------------------------------------------------------------------------

The performance data above represents past performance that is not predictive of
future results. The investment return and principal value of an investment in
the fund will fluctuate so that an investor's shares, when redeemed, may be
worth more or less than their original cost. The figures above do not reflect
deduction of the maximum front-end sales charge of 5.75% for Class A shares or
the contingent deferred sales charge of 5% for Class B shares and 1% for Class C
shares, as applicable, except where noted. The figures do not reflect the
deduction of taxes that a shareholder would pay on distributions or redemption
of fund shares. Such figures would be lower if the maximum sales charge and any
applicable taxes were deducted.

- --------------------------------------------------------------------------------
                                       47


SCHEDULE OF INVESTMENTS

SEPTEMBER 30, 2003

- --------------------------------------------------------------------------------
SECURITY EQUITY FUND -
SOCIAL AWARENESS SERIES
- --------------------------------------------------------------------------------

                                                   NUMBER          MARKET
COMMON STOCKS                                    OF SHARES         VALUE
- --------------------------------------------------------------------------------
ADVERTISING - 1.5%
Omnicom Group, Inc. ...................              3,500     $  251,475

APPLICATION SOFTWARE - 1.6%
Intuit, Inc.* .........................              5,800        279,792

ASSET MANAGEMENT & CUSTODY BANKS - 0.7%
Bank of New York Company, Inc. ........              4,200        122,262

BIOTECHNOLOGY - 2.3%
Amgen, Inc.* ..........................              6,000        387,420

BROADCASTING & CABLE TV - 3.4%
Comcast Corporation* ..................             18,637        575,510

COMMUNICATIONS EQUIPMENT - 6.0%
ADC Telecommunications, Inc.* .........             77,500        180,575
Cisco Systems, Inc.* ..................             32,500        635,050
Nokia OYJ ADR .........................              4,700         73,320
Qualcomm, Inc. ........................              2,900        120,756
                                                               ----------
                                                                1,009,701
COMPUTER HARDWARE - 2.0%
Dell, Inc.* ...........................             10,100        337,239

CONSUMER FINANCE - 3.2%
American Express Company ..............              6,200        279,372
MBNA Corporation ......................             11,900        271,320
                                                               ----------
                                                                  550,692
DATA PROCESSING & OUTSOURCED SERVICE - 1.4%
Paychex, Inc. .........................              7,000        237,510

DEPARTMENT STORES - 0.5%
Kohl's Corporation* ...................              1,500         80,250

DIVERSIFIED BANKS - 4.8%
Bank of America Corporation ...........              5,000        390,200
Wells Fargo & Company .................              8,200        422,300
                                                               ----------
                                                                  812,500
DIVERSIFIED CAPITAL MARKETS - 1.2%
J.P. Morgan Chase & Company ...........              6,000        205,980
DRUG RETAIL - 1.1%
CVS Corporation .......................              4,600        142,876
Walgreen Company ......................              1,200         36,768
                                                               ----------
                                                                  179,644
ELECTRONIC MANUFACTURING SERVICES - 1.5%
Molex, Inc. ...........................              8,700        248,733

GENERAL MERCHANDISE STORES - 2.7%
Target Corporation ....................             12,200        459,086

HEALTH CARE DISTRIBUTORS - 1.8%
Cardinal Health, Inc. .................              5,112        298,490

HEALTH CARE EQUIPMENT - 2.8%
Medtronic, Inc. .......................             10,200        478,584


                                                   NUMBER        MARKET
COMMON STOCKS (CONTINUED)                        OF SHARES       VALUE
- --------------------------------------------------------------------------------
HOME IMPROVEMENT RETAIL - 3.2%
Home Depot, Inc. ......................             12,600     $  401,310
Lowe's Companies, Inc. ................              2,800        145,320
                                                               ----------
                                                                  546,630
HOUSEHOLD PRODUCTS - 4.9%
Colgate-Palmolive Company .............              5,300        296,217
Procter & Gamble Company ..............              5,700        529,074
                                                               ----------
                                                                  825,291
INDUSTRIAL CONGLOMERATES - 1.5%
3M Company ............................              3,600        248,652

INDUSTRIAL GASES - 1.3%
Praxair, Inc. .........................              3,700        229,215

INSURANCE BROKERS - 1.3%
Marsh & McLennan Companies, Inc. ......              4,600        219,006

INTEGRATED TELECOMMUNICATION SERVICES - 3.3%
SBC Communications, Inc. ..............             19,348        430,493
Verizon Communications, Inc. ..........              4,200        136,248
                                                               ----------
                                                                  566,741
INVESTMENT BANKING & BROKERAGE - 1.7%
Goldman Sachs Group, Inc. .............              1,800        151,020
Merrill Lynch & Company, Inc. .........              2,500        133,825
                                                               ----------
                                                                  284,845
LIFE & HEALTH INSURANCE - 1.2%
Aflac, Inc. ...........................              6,200        200,260

MOTORCYCLE MANUFACTURERS - 2.1%
Harley-Davidson, Inc. .................              7,500        361,500

MOVIES & ENTERTAINMENT - 3.2%
Time Warner, Inc.* ....................             15,500        234,205
Walt Disney Company ...................              4,300         86,731
Viacom, Inc. (Cl. B) ..................              5,900        225,970
                                                               ----------
                                                                  546,906
MULTI-LINE INSURANCE - 4.3%
American International Group, Inc. ....             12,654        730,136

OIL & GAS EQUIPMENT & SERVICES - 1.2%
BJ Services Company* ..................              6,100        208,437

OIL & GAS EXPLORATION & PRODUCTION - 1.0%
Devon Energy Corporation ..............              3,700        178,303

PERSONAL PRODUCTS - 0.5%
Avon Products, Inc. ...................              1,400         90,384

PHARMACEUTICALS - 6.6%
Johnson & Johnson .....................             12,704        629,102
Merck & Company, Inc. .................              9,600        485,952
                                                               ----------
                                                                1,115,054

- --------------------------------------------------------------------------------
                           48  SEE ACCOMPANYING NOTES.


SCHEDULE OF INVESTMENTS (CONTINUED)

SEPTEMBER 30, 2003

- --------------------------------------------------------------------------------
SECURITY EQUITY FUND -
SOCIAL AWARENESS SERIES (CONTINUED)
- --------------------------------------------------------------------------------

                                                 PRINCIPAL
                                                 AMOUNT OR
                                                   NUMBER          MARKET
COMMON STOCKS (CONTINUED)                        OF SHARES         VALUE
- --------------------------------------------------------------------------------
PROPERTY & CASUALTY INSURANCE - 1.6%
Chubb Corporation .....................              4,100   $    266,008

PUBLISHING - 0.6%
McGraw-Hill Companies, Inc. ...........              1,700        105,621

REGIONAL BANKS - 0.7%
Fifth Third Bancorp ...................              2,100        116,067

SEMICONDUCTOR EQUIPMENT - 0.6%
Applied Materials, Inc.* ..............              5,400         97,956

SEMICONDUCTORS - 3.9%
Analog Devices, Inc.* .................              4,900        186,298
Intel Corporation .....................             13,600        374,136
Texas Instruments, Inc. ...............              4,200         95,760
                                                             ------------
                                                                  656,194
SOFT DRINKS - 5.5%
Coca-Cola Company .....................             10,600        455,376
PepsiCo, Inc. .........................             10,300        472,049
                                                             ------------
                                                                  927,425
SYSTEMS SOFTWARE - 6.3%
Microsoft Corporation .................             38,200      1,061,578

THRIFTS & MORTGAGE FINANCE - 1.7%
Fannie Mae ............................              4,200        294,840
                                                             ------------
   Total common stocks - 96.7%                                 16,391,917

REPURCHASE AGREEMENT - 4.8%
- ---------------------------
United Missouri Bank, 0.65%, 10-01-03
   (Collateralized by FNMA, 10-01-03,
   amount of a value of $824,000 and a
   with repurchase amount of $807,015)            $807,000        807,000
                                                             ------------
   Total investments - 101.5% ............................     17,198,917
   Liabilities, less cash & other assets - (1.5%) ........       (253,929)
                                                             ------------
   Total net assets - 100.0% .............................    $16,944,988
                                                             ============

For federal income tax purposes, the identified cost of investments owned at
 September 30, 2003 was $18,873,277.
*Non-income producing security
ADR (American Depositary Receipt)

- --------------------------------------------------------------------------------
                           49  SEE ACCOMPANYING NOTES.


MANAGER'S COMMENTARY

SECURITY EQUITY FUND - TECHNOLOGY SERIES
NOVEMBER 15, 2003

Subadvisor, Wellington Management Company, LLC
TO OUR SHAREHOLDERS:

REVIEW
The rebound in the technology sector that began during the fourth quarter of
2002 was sustained for the twelve months ended September 30, 2003. The stellar
performance of the technology sector for the twelve-month period was slightly
abated in late March when the Iraqi conflict and SARS dominated the news.
However, investors' optimism quickly returned as the US economy began showing
signs of a rebound and the fundamentals of technology stocks began improving.

The Security Technology Fund returned 67.93% for the 12-month period ended
September 30, 2003, versus 65.99% for the Fund's benchmark, the Goldman Sachs
Technology Index(1). The Fund slightly outperformed the Goldman Sachs Technology
Composite for the same time period. In particular, the Fund's overweight in the
semiconductor sub-sector was additive to performance as semiconductor stocks led
the rebound in the technology sector. Global chip sales have improved thanks to
increased demand from telecom companies for products like camera-enabled phones.
Further, semiconductor unit sales and prices have begun rising and should
continue to contribute to investors' bullish stance on this sub-sector. Strong
performers for the twelve-month period for the Fund include Agere and Fairchild
Semiconductor. Another strong sub-sector for the period was computer storage.
The Fund's sizeable overweight in Maxtor Corp. had significant positive impact
on performance.

In the software sub-sector, our top holding, Microsoft, has lagged the overall
technology sector, but continues to deliver steady performance. The company
recently doubled its annual dividend, but the yield remains low at 16 cents per
share (about 0.6%), suggesting management is waiting to see how the European
Union antitrust case is resolved before making more dramatic changes to its
dividend policy. Elsewhere, the recent hostile bid by Oracle for PeopleSoft
probably marks the start of a period of consolidation for software.

The competitive landscape for hardware is tougher, however, as it is quickly
becoming a commodity. That said, companies like Dell and IBM are well positioned
against these trends. In the case of the technology equipment providers like
Cisco, Nokia and Samsung, stocks have been buoyed by strong sales trends.
Looking into next year, the launch of new high-end phones should continue to
make these stocks attractive.

On the negative side, the benchmark relative performance of the Fund was
affected. This ocurred by missing the speculative run up of the Internet
software and services related stocks that had been beaten down dramatically in
2002, yet had a surprising rebound in 2003.

OUTLOOK
The technology slump is clearly behind us. The industry is giving clear signs of
stabilization, with a pickup in new equipment orders, and sales of server
computers on the rise. Additionally, demand for technology should strengthen
aided by the substantial fiscal and monetary stimuli. However, cautious stock
picking will be key to investing in this sector in the months ahead, as many
technology stocks may have become stretched from a valuation standpoint.


Sincerely,


The Global Technology Portfolio Management Team
Wellington Management Company, LLP

(1)Performance figures are based on Class A shares and do not reflect deduction
of the sales charges or taxes that a shareholder would pay on distributions or
the redemption of shares. Fee waivers and/or reimbursements reduced Fund
expenses and in the absence of such waivers, the performance quoted would be
reduced. Investments in technology stocks may be subject to additional risks
such as increased price volatility and lack of diversification.

- --------------------------------------------------------------------------------
                                       50


MANAGER'S COMMENTARY (CONTINUED)

SECURITY EQUITY FUND - TECHNOLOGY SERIES
NOVEMBER 15, 2003

================================= PERFORMANCE ==================================
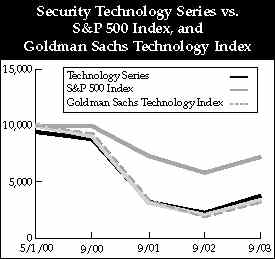
                            $10,000 SINCE INCEPTION

This chart assumes a $10,000 investment in Class A shares of Technology Series
on May 1, 2000, and reflects deduction of the 5.75% sales load. On September30,
2003, the value of your investment in Class A shares of the Series (with
dividends reinvested) would have been $3,751. By comparison, the same $10,000
investment would have been $7,218, based on the S&P 500 Index's performance and
$3,388 based on the Goldman Sachs Technology Index. The chart does not reflect
the deduction of taxes that a shareholder would pay on distributions or the
redemption of fund shares.

- --------------------------------------------------------------------------------
                             TOP 5 EQUITY HOLDINGS*

                                                               % OF
                                                            NET ASSETS
                                                            ----------
          Microsoft Corporation                                 9.9%
          Cisco Systems, Inc.                                   6.8%
          First Data Corporation                                4.9%
          Maxtor Corporation                                    4.2%
          St Microelectronics N.V.                              4.1%
          *At September 30, 2003
- --------------------------------------------------------------------------------

- --------------------------------------------------------------------------------
                             AVERAGE ANNUAL RETURNS
                            AS OF SEPTEMBER 30, 2003

                                         1 YEAR       SINCE INCEPTION
                                         ----------------------------
          A Shares                       67.93%    (23.62%)  (5-01-00)
          A Shares with sales charge     58.57%    (24.93%)  (5-01-00)
          B Shares                       67.11%    (24.59%)  (5-01-00)
          B Shares with CDSC             62.11%    (25.26%)  (5-01-00)
          C Shares                       66.67%    (24.65%)  (5-01-00)
          C Shares with CDSC             65.67%    (24.65%)  (5-01-00)
- --------------------------------------------------------------------------------

The performance data above represents past performance that is not predictive of
future results. The investment return and principal value of an investment in
the fund will fluctuate so that an investor's shares, when redeemed, may be
worth more or less than their original cost. The figures above do not reflect
deduction of the maximum front-end sales charge of 5.75% for Class A shares or
the contingent deferred sales charge of 5% for Class B shares and 1% for Class C
shares, as applicable, except where noted. The figures do not reflect the
deduction of taxes that a shareholder would pay on distributions or redemption
of fund shares. Such figures would be lower if the maximum sales charge and any
applicable taxes were deducted. Fee waivers reduced expenses of the Fund and in
the absence of such waiver, the performance quoted would be reduced.

- --------------------------------------------------------------------------------
                                       51


SCHEDULE OF INVESTMENTS

SEPTEMBER 30, 2003

- --------------------------------------------------------------------------------
SECURITY EQUITY FUND -
TECHNOLOGY SERIES
- --------------------------------------------------------------------------------

                                                   NUMBER          MARKET
COMMON STOCKS                                    OF SHARES         VALUE
- --------------------------------------------------------------------------------
APPLICATION SOFTWARE - 1.1%
Cognos, Inc.* .........................              4,100     $  127,182

COMMUNICATIONS EQUIPMENT - 15.5%
Avaya, Inc.* ..........................             13,900        151,510
Brocade Communications Systems,
   Inc.* ..............................             29,800        155,556
Cisco Systems, Inc.* ..................             39,700        775,738
Nokia OYJ ADR .........................             27,600        430,560
Nortel Networks Corporation* ..........             36,100        148,010
Polycom, Inc.* ........................              5,900         97,999
                                                               ----------
                                                                1,759,373
COMPUTER HARDWARE - 5.6%
Dell, Inc.* ...........................             13,400        447,426
International Business Machines
   Corporation ........................              2,100        185,493
                                                               ----------
                                                                  632,919
COMPUTER STORAGE & PERIPHERALS - 4.1%
Maxtor Corporation* ...................             38,867        473,011

DATA PROCESSING & OUTSOURCED SERVICE - 9.8%
Alliance Data Systems
   Corporation* .......................              2,600         68,640
Bisys Group, Inc.* ....................             13,000        170,950
Computer Sciences Corporation* ........              4,500        169,065
First Data Corporation ................             14,000        559,440
Sabre Holdings Corporation ............              6,700        143,983
                                                               ----------
                                                                1,112,078

DIVERSIFIED COMMERCIAL SERVICES - 3.3%
Cendant Corporation* ..................             20,000        373,800

ELECTRICAL COMPONENTS & EQUIPMENT - 0.4%
American Power Conversion
   Corporation ........................              2,600         44,564

ELECTRONIC EQUIPMENT MANUFACTURERS - 1.0%
Nanya Technologies* ...................             14,800        114,419

INTERNET SOFTWARE & SERVICES - 5.0%
Verisign, Inc.* .......................             13,200        177,804
Yahoo!, Inc.* .........................             11,200        396,256
                                                               ----------
                                                                  574,060
IT CONSULTING & SERVICES - 2.0%
Accenture, Ltd.* ......................             10,300        230,102

MOVIES & ENTERTAINMENT - 1.3%
Time Warner, Inc.* ....................              9,600        145,056


                                                 PRINCIPAL
                                                 AMOUNT OR
                                                   NUMBER          MARKET
COMMON STOCKS (CONTINUED)                        OF SHARES         VALUE
- --------------------------------------------------------------------------------
SEMICONDUCTOR EQUIPMENT - 7.8%
Applied Materials, Inc.* ..............              7,900    $   143,306
ASE Test Limited* .....................             15,700        136,433
ASM Lithography Holding N.V.* .........             14,054        184,529
Kla-Tencor Corporation* ...............              2,200        113,080
Mindspeed Technologies, Inc.* .........             19,300        104,027
Novellus Systems, Inc.* ...............              3,000        101,250
Varian Semiconductor Equipment
   Associates, Inc.* ..................              2,800        104,860
                                                              -----------
                                                                  887,485
SEMICONDUCTORS - 19.2%
Agere Systems, Inc.* ..................             41,300        126,791
Analog Devices, Inc.* .................              8,800        334,576
Fairchild Semiconductor
   International, Inc.* ...............             16,600        275,228
Intel Corporation .....................              8,300        228,333
Nvidia Corporation* ...................              6,500        103,422
STMicroelectronics N.V. ...............             19,252        463,011
Taiwan Semiconductor
   Manufacturing Company, Ltd. ........             11,663        126,310
Texas Instruments, Inc. ...............             20,000        456,000
United Microelectronics
   Corporation ADR ....................             14,800         66,748
                                                              -----------
                                                                2,180,419
SYSTEMS SOFTWARE - 12.7%
Microsoft Corporation .................             40,400      1,122,716
Network Associates, Inc.* .............              8,100        111,456
Oracle Corporation* ...................              3,200         35,904
Red Hat, Inc.* ........................             17,000        171,700
                                                              -----------
                                                                1,441,776
TECHNOLOGY DISTRIBUTORS - 1.5%
Ingram Micro, Inc.* ...................             12,800        167,040
                                                              -----------
   Total common stocks - 90.3%                                 10,263,284

REPURCHASE AGREEMENT - 1.4%
- ---------------------------
State Street, 0.25%, 10-01-03
   (Collateralized by FHLMC, 1.25%,
   8-27-04, with a value of $160,305
   and a repurchase amount of $154,937)           $154,936        154,936
                                                              -----------
   Total investments - 91.7% .............................     10,418,220
   Cash & other assets, less liabilites - 8.3% ...........        941,960
                                                              -----------
   Total net assets - 100.0% .............................    $11,360,180
                                                              ===========

For federal income tax purposes, the identified cost of investments owned at
 September 30, 2003 was $9,573,680.
* Non income producing security
  ADR (American Depositary Receipt)

- --------------------------------------------------------------------------------
                           52  SEE ACCOMPANYING NOTES.


MANAGER'S COMMENTARY

SECURITY LARGE CAP VALUE FUND

NOVEMBER 15, 2003

Valerie Sill
Senior Portfolio Manager | 
Advisor,
The Dreyfus Corporation |
TO OUR SHAREHOLDERS:

We are pleased to present this Annual Report for the Security Large Cap Value
Fund, covering the 12-month period from October 1, 2002 through September 30,
2003. For the twelve-month period ended September 30, 2003, the Fund produced a
total return of 20.24%.(1) In comparison, the Fund's benchmark, the S&P Barra
Value Index, produced a total return of 26.55%.

We are pleased that the Fund generated strong absolute returns. While the Fund
trailed its benchmark during this time period, it performed in line versus its
peer group of large cap value funds.

Fundamental support for this year's stock market rally can be seen in corporate
profits that are recovering very well from their lows in early 2002. For the S&P
500 Index, earnings for the first six months of 2003 increased 9.1% relative to
the same period in 2002, and for the second half of this year the increase is
expected to be over 14%. However, the strong profit gains are due more to
corporate cost cutting than to improved sales. Productivity is improving as
companies are maintaining or slowly increasing production with fewer workers,
leading to what some are calling a "jobless recovery." Looking across several
measures of employment, the labor plight seems to have stabilized, though it is
not yet demonstrably improving. The best hint of forthcoming expansion can be
found in the increase in temporary jobs, a practice used by many firms before
they commit to offering permanent employment. For the large majority of workers
with jobs, the recent income tax cuts have boosted take-home pay and helped
retail sales. The economy should also get another boost early next year from
larger income tax refunds.

The Fund's pro-cyclical positioning has led to a substantial improvement in
performance during this period. The Fund's holdings in capital goods, basic
materials, technology, advertising, and brokerage have been significant
contributors to the Fund's performance.

The Fund's strongest performing sectors included financial services, capital
goods, and energy. The top five performing securities during this time period
were Corning, McDonald's, Koninklijke Philips Electronics, J.P.Morgan Chase, and
Intel. The Fund's weakest performing sectors were utilities, consumer
non-durables, and health care. The five weakest securities in the Fund were
American International Group, Nokia, Schering-Plough, AT&T, and Motorola.

The Fund adheres to an investment philosophy that is value-oriented, research
driven, and risk averse. We attribute the Fund's relatively strong performance
primarily to our stock selection strategy, which emphasizes large capitalization
value stocks that possess strong business fundamentals and have a catalyst in
place to generate capital appreciation. The catalyst may take many forms,
including accelerating sales and earnings growth, improving balance sheet
trends, new management, and restructuring. The overall risk and valuation
characteristics of the Fund are carefully monitored to help ensure adequate
diversification and low volatility of returns.


Sincerely,


Valerie J. Sill
Portfolio Manager

(1)Performance figures are based on Class A shares and do not reflect deduction
of the sales charges or taxes that a shareholder would pay on distributions or
the redemption of shares.

- --------------------------------------------------------------------------------
                                       53


MANAGER'S COMMENTARY (CONTINUED)

SECURITY LARGE CAP VALUE FUND
NOVEMBER 15, 2003

================================= PERFORMANCE ==================================

$10,000 OVER TEN YEARS
This chart assumes a $10,000 investment in Class A shares of Large Cap Value
Fund on September 30, 1993, and reflects deduction of the 5.75% sales load. On
September 30, 2003, the value of your investment in Class A shares of the fund
(with dividends reinvested) would have grown to $13,057. By comparison, the same
$10,000 investment would have grown to $23,910 based on the S&P Barra Value
Index's performance. The chart does not reflect the deduction of taxes that a
shareholder would pay on distributions or the redemption of fund shares.
- --------------------------------------------------------------------------------
TOP 5 EQUITY HOLDINGS*
% OF
NET ASSETS
----------
Citigroup, Inc. 5.0%
Koninklijke (Royal) Philips Electronics N.V. ADR 3.4%
Morgan Stanley 3.2%
Goldman Sachs Group, Inc. 3.1%
United Technologies Corporation 3.0%
*At September 30, 2003
- --------------------------------------------------------------------------------
- --------------------------------------------------------------------------------
AVERAGE ANNUAL RETURNS
AS OF SEPTEMBER 30, 2003
SINCE
1 YEAR 5 YEARS 10 YEARS INCEPTION
----------------------------------------
A Shares 20.24% (3.50%) 3.37% N/A
A Shares with
sales charge 13.30% (4.64%) 2.75% N/A
B Shares 19.36% (4.43%) N/A 2.60%
(10-19-93)
B Shares with
CDSC 14.36% (4.82%) N/A 2.60%
(10-19-93)
C Shares 19.23% N/A N/A (6.07%)
(1-29-99)
C Shares with
CDSC 18.23% N/A N/A (6.07%)
(1-29-99)
- --------------------------------------------------------------------------------
The performance data above represents past performance that is not predictive of
future results. The investment return and principal value of an investment in
the fund will fluctuate so that an investor's shares, when redeemed, may be
worth more or less than their original cost. The figures above do not reflect
deduction of the maximum front-end sales charge of 5.75% for Class A shares or
the contingent deferred sales charge of 5% for Class B shares and 1% for Class C
shares, as applicable, except where noted. The figures do not reflect the
deduction of taxes that a shareholder would pay on distributions or redemption
of fund shares. Such figures would be lower if the maximum sales charge and any
applicable taxes were deducted.
- --------------------------------------------------------------------------------
54
SCHEDULE OF INVESTMENTS
SEPTEMBER 30, 2003
- --------------------------------------------------------------------------------
SECURITY LARGE CAP VALUE FUND
- --------------------------------------------------------------------------------
PRINCIPAL AMOUNT
OR NUMBER MARKET
CORPORATE BONDS OF SHARES VALUE
- --------------------------------------------------------------------------------
HEALTH CARE - 0.0%
Alderwoods Group, Inc.:
12.25% - 2009 ........................ $10,200 11,297
Multicare Companies, Inc.,
0.00% - 2007*(1) ................... $200,000 --
----------
11,297
REFINING - 0.2%
Crown Central Petroleum,
10.875% - 2005 ..................... $200,000 128,000
SERVICES - 0.0%
American Eco Corporation,
9.625% - 2008* ..................... $125,000 12
----------
Total corporate bonds - 0.2% 139,309
PREFERRED STOCK
- ---------------
MOVIES & ENTERTAINMENT - 2.2%
News Corporation, Ltd. ADR ............ 47,600 1,299,004
COMMON STOCK
- ------------
AEROSPACE & DEFENSE - 3.7%
Rockwell Collins, Inc. ................ 15,600 393,900
United Technologies Corporation ....... 23,300 1,800,624
----------
2,194,524
ALUMINUM - 1.0%
Alcoa, Inc. ........................... 23,800 622,608
APPAREL, ACCESSORIES & LUXURY GOODS - 0.5%
Jones Apparel Group, Inc. ............. 10,300 308,279
APPLICATION SOFTWARE - 0.2%
Cadence Design Systems, Inc.* ......... 9,700 129,980
BROADCASTING & CABLE TV - 1.8%
Liberty Media Corporation* ............ 106,400 1,060,808
COMMUNICATIONS EQUIPMENT - 7.3%
Comverse Technology, Inc.* ............ 18,100 270,776
Corning, Inc.* ........................ 165,100 1,555,242
Telefonaktiebolaget LM Ericsson
ADR* ............................... 45,800 672,344
Nokia OYJ ADR ......................... 88,000 1,372,800
Nortel Networks Corporation* .......... 71,800 294,380
3Com Corporation* ..................... 36,800 217,120
----------
4,382,662
COMPUTER HARDWARE - 1.3%
International Business Machines
Corporation ........................ 8,600 759,638
CONSTRUCTION & FARM MACHINERY - 0.6%
Deere & Company ....................... 6,500 346,515
NUMBER MARKET
COMMON STOCKS (CONTINUED) OF SHARES VALUE
- --------------------------------------------------------------------------------
CONSUMER ELECTRONICS - 4.2%
Koninklijke (Royal) Philips Electronics
N.V. ADR ........................... 89,600 $2,053,632
Sony Corporation ADR .................. 13,000 452,400
----------
2,506,032
CONSUMER FINANCE - 0.9%
American Express Company .............. 12,300 554,238
DATA PROCESSING & OUTSOURCED SERVICE - 2.0%
Automatic Data Processing, Inc. ....... 16,900 605,865
Sungard Data Systems, Inc.* ........... 23,000 605,130
----------
1,210,995
DIVERSIFIED BANKS - 4.7%
Bank of America Corporation ........... 12,000 936,480
Comerica, Inc ......................... 6,600 307,560
Fleetboston Financial Corporation ..... 31,300 943,695
U.S. Bancorp .......................... 24,800 594,952
----------
2,782,687
DIVERSIFIED CAPITAL MARKETS - 2.2%
J.P. Morgan Chase & Company ........... 37,900 1,301,107
ELECTRICAL COMPONENTS & EQUIPMENT - 1.0%
Emerson Electric Company .............. 11,400 600,210
FOOD RETAIL - 1.0%
Kroger Company* ....................... 17,500 312,725
Safeway, Inc* ......................... 12,700 291,338
----------
604,063
HEALTH CARE DISTRIBUTORS - 1.0%
McKesson Corporation .................. 18,000 599,220
HEALTH CARE EQUIPMENT - 3.4%
C.R. Bard, Inc. ....................... 6,200 440,200
Baxter International, Inc. ............ 33,700 979,322
Becton, Dickinson & Company ........... 16,500 595,980
----------
2,015,502
HEALTH CARE SERVICES - 0.0%
Genesis Health Ventures, Inc.* ........ 227 5,505
HOUSEHOLD APPLIANCES - 0.5%
Black & Decker Corporation ............ 7,000 283,850
INDUSTRIAL MACHINERY - 1.2%
Eaton Corporation ..................... 7,900 700,098
INSURANCE BROKERS - 0.9%
Marsh & McLennan Companies, Inc. ...... 11,900 566,559
INTEGRATED OIL & GAS - 4.8%
BP plc ADR ............................ 19,200 808,320
Exxon Mobil Corporation ............... 31,600 1,156,560
Royal Dutch Petroleum Company ......... 20,000 884,000
----------
2,848,880
- --------------------------------------------------------------------------------
55 SEE ACCOMPANYING NOTES.
SCHEDULE OF INVESTMENTS (CONTINUED)
SEPTEMBER 30, 2003
- --------------------------------------------------------------------------------
SECURITY LARGE CAP VALUE FUND (CONTINUED)
- --------------------------------------------------------------------------------
NUMBER MARKET
COMMON STOCKS (CONTINUED) OF SHARES VALUE
- --------------------------------------------------------------------------------
INTEGRATED TELECOMMUNICATION SERVICES - 1.5%
Sprint Corporation (FON Group) ........ 24,300 $ 366,930
Verizon Communications, Inc. .......... 15,900 515,796
----------
882,726
INVESTMENT BANKING & BROKERAGE - 9.9%
Goldman Sachs Group, Inc. ............. 22,100 1,854,190
Lehman Brothers Holdings, Inc. ........ 9,800 676,984
Merrill Lynch & Company, Inc. ......... 27,900 1,493,487
Morgan Stanley ........................ 37,400 1,887,204
----------
5,911,865
LIFE & HEALTH INSURANCE - 1.2%
John Hancock Financial
Services, Inc. ..................... 20,500 692,900
MANAGED HEALTHCARE - 1.3%
Aetna, Inc. ........................... 13,100 799,493
MOVIES & ENTERTAINMENT - 1.7%
Viacom, Inc. (Cl. B) .................. 27,000 1,034,100
MULTI-LINE INSURANCE - 2.7%
American International Group, Inc. .... 14,500 836,650
Hartford Financial Services
Group, Inc. ........................ 5,800 305,254
Loews Corporation ..................... 11,200 452,144
----------
1,594,048
OFFICE ELECTRONICS - 1.0%
Xerox Corporation* .................... 59,900 614,574
OFFICE SERVICES & SUPPLIES - 0.7%
Pitney Bowes, Inc. .................... 10,600 406,192
OIL & GAS EQUIPMENT & SERVICES - 1.4%
Schlumberger, Ltd. .................... 16,900 817,960
OIL & GAS EXPLORATION & PRODUCTION - 0.9%
Anadarko Petroleum Corporation ........ 13,400 559,584
OTHER DIVERSIFIED FINANACIAL SERVICES - 5.9%
Citigroup, Inc. ....................... 64,966 2,956,602
Principal Financial Group, Inc. ....... 18,900 585,711
----------
3,542,313
PACKAGED FOODS & MEATS - 2.0%
H. J. Heinz Company ................... 16,900 579,332
Nestle SA ............................. 10,600 611,015
----------
1,190,347
PAPER PRODUCTS - 0.5%
International Paper Company ........... 7,300 284,846
PHARMACEUTICALS - 3.2%
Johnson & Johnson ..................... 12,100 599,192
Pfizer, Inc. .......................... 23,260 706,639
Wyeth ................................. 12,800 590,080
----------
1,895,911
PRINCIPAL
AMOUNT OR
NUMBER MARKET
COMMON STOCKS (CONTINUED) OF SHARES VALUE
- --------------------------------------------------------------------------------
PROPERTY & CASUALTY INSURANCE - 2.7%
Allstate Corporation .................. 29,200 $ 1,066,676
Travelers Property Casualty
Corporation ........................ 35,000 555,800
----------
1,622,476
PUBLISHING - 2.3%
Gannett Company, Inc .................. 12,200 946,232
Knight-Ridder, Inc. ................... 6,000 400,200
------------
1,346,432
RAILROADS - 1.0%
Union Pacific Corporation ............. 10,700 622,419
RESTAURANTS - 2.6%
McDonald's Corporation ................ 65,700 1,546,578
SEMICONDUCTORS - 2.7%
Agere Systems, Inc.* .................. 138,500 425,195
Intel Corporation ..................... 42,400 1,166,424
------------
1,591,619
SYSTEMS SOFTWARE - 2.9%
BMC Software, Inc.* ................... 16,000 222,880
Microsoft Corporation ................. 53,700 1,492,323
------------
1,715,203
THRIFTS & MORTGAGE FINANCE - 1.2%
Fannie Mae ............................ 10,400 730,080
WIRELESS TELECOMMUNICATION SERVICES - 0.5%
Sprint Corporation (PCS Group)* ....... 50,900 291,657
------------
Total common stocks - 94.0% 56,077,283
U.S. GOVERNMENT & AGENCIES - 2.2%
Federal Farm Credit Bank,
1.00%, 10-01-03 .................... $1,318,000 1,318,000
------------
Total investments - 98.6% ............................. 58,833,596
Cash & other assets, less liabilities - 1.4% .......... 841,170
------------
Total net assets - 100.0% ............................. $59,674,766
============
For federal income tax purposes, the identified cost of investments owned at
September 30, 2003 was $57,832,944.
* Non-income producing security
ADR (American Depositary Receipt)
plc (public limited company)
(1) Security is fair valued
- --------------------------------------------------------------------------------
56 SEE ACCOMPANYING NOTES.
MANAGER'S COMMENTARY
SECURITY MID CAP GROWTH FUND
NOVEMBER 15, 2003
James P. Schier
Senior Portfolio Manager |
Advisor, Security
Management Company, LLC |
TO OUR SHAREHOLDERS:

Capitalizing on selecting the right stocks and taking positions in outperforming
sectors, the year ended September 30, 2003, proved to be a positive one for the
Security Mid Cap Growth Fund. For the period, the Fund returned 54.20% compared
to its benchmark, the S&P Mid Cap Growth Index, which was up only 25.36%.(1) The
Security Mid Cap Growth Fund outperformed its benchmark index by nearly 30% and
its peer group's median return by approximately 27%.

Our strategy, to seek appreciable securities of companies that are able to grow
and/or reinvest in increasingly profitable ventures and hold them over three to
five years to capture the best part of the improvements in profits or
profitability, continues to work. We are focused on investing in securities when
we find opportunities, with our individual position sizes reflecting the
magnitude and the confidence in the opportunity.

OVERWEIGHT POSITION AND STOCK SELECTION CONTRIBUTE GAINS

An overweight position of 36% in the information technology sector compared to
15% for the index boosted the Fund's performance. Moreover, stock selection
added value as 14 of the Fund's stocks were up 60%, with five of the 14 doubling
in price.

Looking back, technology was very much the place to be in the market prior to
2000. However, since the tech bubble burst in early 2000, technology stocks have
done so poorly for so long that valuations got to a level where they started to
look interesting. Although there is only an emerging demonstration of increasing
orders, there has been much anticipation that companies would begin to increase
capital expenditures. It is this anticipation that has caused technology stocks
to rally.

The portfolio's best technology performers included mostly niche companies.
These include business intelligence software provider Hyperion, a beneficiary of
the rash of national corporate scandals. Hyperion was up 58% for the year.
Increased focus on the infrastructure and energy efficiency issues boosted
clean-coal technology company KFX to post a 79% return. Microsemiconductor, a
provider of missile defense systems and aerospace applications, benefited
greatly from increased spending by the defense industry. The stock gained 172%
for the period.

HEALTH CARE SELECTION ALSO STRONG

While the Fund was underweight in the health care sector relative to its
benchmark, the sector returned 68% compared to 27% for the index. Owning the
right stocks was key, evidenced by nine of the Fund's holdings being up 50% or
more. The Fund was overweight the benchmark in biotech stocks which was the
sector's top performer. While most of biotech company's products are in the
conceptual stage and are not as yet profitable, the market revalued them as
their products passed key development hurdles on the way to getting FDA
approval. The portfolio's top performers in the health care sector included
Esperion Therapeutic, a company focused on cholesterol-treating drugs that was
founded by the developer of Lipitor.

STOCK SELECTION KEY TO INDUSTRIAL RETURN

The industrial sector contributed to the Fund's performance primarily due to
Power-One, a leading power semiconductor supplier to the communications
industry. The stock had an amazing run, advancing 246% during the period. Of the
holdings in this sector, four rose 50% and three of the four doubled in price.

FOCUSED ON SMALLER, NIMBLE COMPANIES

Small and medium sized companies continue to outperform larger companies. In
2000, the valuation gap between these categories was stretched to an extreme
level as investors were willing to pay approximately more than two times the
multiple for smaller companies than for larger companies. We believe this was
the result of structural changes in the way people invest. The proliferation of
large defined contribution plans and large mutual fund complexes produced an
environment in which fund managers were willing to pay a premium for liquidity.
Given this, it created an investment opportunity in smaller and mid cap stocks.

Since small and mid cap securities have outperformed larger cap stocks since
2000, this valuation gap has returned to a more normal level recently. While
historically there have been periods where the market has paid a premium for
smaller and medium sized companies, it is unclear today whether we will enter
one of those periods now.

- --------------------------------------------------------------------------------
                                       57


MANAGER'S COMMENTARY (CONTINUED)

SECURITY MID CAP GROWTH FUND

NOVEMBER 15, 2003

Nonetheless, there is still a valuation gap that does favor investing in smaller
companies and our work still continues to uncover opportunities. The economic
environment could possibly provide a better backdrop for continued smaller
company performance. In a slower economic environment, large cap companies will
find it ever more difficult to grow large revenue bases in a meaningful way. If
this is the case, the market could place greater emphasis on smaller, more
nimble companies. Lastly, if the dollar continues to weaken and should foreign
investors decide to reduce their dollar denominated financial investments, large
capitalization  stocks could face a more challenging environment. To the extent
foreign investors hold equities, they tend to be oriented to the biggest blue
chip equities.

Sincerely,

James P. Schier
Senior Portfolio Manager

(1) Performance figures are based on Class A shares and do not reflect deduction
    of the sales charges or taxes that a shareholder would pay on distributions
    or the redemption of shares.


================================= PERFORMANCE ==================================
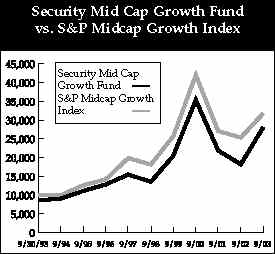
$10,000 OVER TEN YEARS
This chart assumes a $10,000 investment in Class A shares of Mid Cap Growth Fund
on September 30, 1993, and reflects deduction of the 5.75% sales load. On
September 30, 2003, the value of your investment in Class A shares of the fund
(with dividends reinvested) would have grown to $28,108. In comparison, the same
$10,000 investment would have grown to $31,808 based on the S&P Mid Cap Growth
Index's performance. The chart does not reflect the deduction of taxes that a
shareholder would pay on distributions or the redemption of fund shares.
- --------------------------------------------------------------------------------
TOP 5 EQUITY HOLDINGS*
% OF
NET ASSETS
----------
Hollis Eden Pharmaceuticals 3.7%
Axciom Corporation 3.5%
@Road, Inc. 3.0%
Power-One, Inc. 2.8%
Ligand Pharmaceuticals, Inc. (CI. B) 2.8%
*At September 30, 2003
- --------------------------------------------------------------------------------
- --------------------------------------------------------------------------------
AVERAGE ANNUAL RETURNS
AS OF SEPTEMBER 30, 2003
SINCE
1 YEAR 5 YEARS 10 YEARS INCEPTION
-----------------------------------------------------------
A Shares 54.20% 15.68% 11.55% N/A
A Shares with
sales charge 45.31% 14.31% 10.89% N/A
B Shares 52.88% 14.60% N/A 10.56%
(10-19-93)
B Shares with
CDSC 47.88% 14.37% N/A 10.56%
(10-19-93)
C Shares 52.96% N/A N/A 8.63%
(1-29-99)
C Shares with
CDSC 51.96% N/A N/A 8.63%
(1-29-99)
The performance data above represents past performance that is not predictive of
future results. The investment return and principal value of an investment in
the fund will fluctuate so that an investor's shares, when redeemed, may be
worth more or less than their original cost. The figures above do not reflect
deduction of the maximum front-end sales charge of 5.75% for Class A shares or
the contingent deferred sales charge of 5% for Class B shares and 1% for Class C
shares, as applicable, except where noted. The figures do not reflect the
deduction of taxes that a shareholder would pay on distributions or redemption
of fund shares. Such figures would be lower if the maximum sales charge and any
applicable taxes were deducted.
- --------------------------------------------------------------------------------
58
SCHEDULE OF INVESTMENTS
SEPTEMBER 30, 2003
- --------------------------------------------------------------------------------
SECURITY MID CAP GROWTH FUND
- --------------------------------------------------------------------------------
NUMBER MARKET
COMMON STOCKS OF SHARES VALUE
- --------------------------------------------------------------------------------
APPLICATION SOFTWARE - 2.4%
Hyperion Solutions Corporation* ....... 50,000 $ 1,443,500
Intelidata Technologies Corporation* .. 517,500 1,221,300
Tibco Software, Inc.* ................. 289,600 1,549,360
------------
4,214,160
ASSET MANAGEMENT & CUSTODY BANKS - 2.2%
Northern Trust Corporation ............ 49,000 2,079,560
Waddell & Reed Financial, Inc. ........ 70,000 1,649,900
------------
3,729,460
BIOTECHNOLOGY - 4.5%
Cell Genesys, Inc.* ................... 54,000 679,320
Exact Sciences Corporation* ........... 56,800 766,800
Genvec, Inc.* ......................... 330,000 973,500
Novavax, Inc.* ........................ 126,000 924,840
Sciclone Pharmaceuticals, Inc.* ....... 339,367 2,680,999
Strategic Diagnostics, Inc.* .......... 206,300 856,145
Vical, Inc.* .......................... 156,000 907,920
------------
7,789,524
BROADCASTING & CABLE TV - 1.8%
Cinar Corporation (Cl. B)* ............ 349,600 1,048,800
Salem Communications Corporation* ..... 103,600 2,008,804
------------
3,057,604
COMMUNICATIONS EQUIPMENT - 13.1%
ADC Telecommunications, Inc.* ......... 1,035,000 2,411,550
Adaptec Telecommunications,
Inc.* .............................. 430,000 3,250,800
Arris Group, Inc.* .................... 364,000 2,093,000
Ciena Corporation* .................... 280,000 1,654,800
Commscope, Inc.* ...................... 160,000 1,929,600
EFJ, Inc.* ............................ 255,650 997,035
Extreme Networks, Inc.* ............... 250,000 1,577,500
Finisar Corporation* .................. 1,000,000 2,250,000
Harris Corporation .................... 53,700 1,921,923
Sonus Networks, Inc.* ................. 300,000 2,079,000
Symmetricom, Inc.* .................... 44,900 284,217
Terayon Communication Systems,
Inc.* .............................. 371,100 2,133,825
------------
22,583,250
COMPUTER STORAGE & PERIPHERALS - 1.0%
Drexler Technology Corporation* ....... 117,400 1,645,948
CONSTRUCTION & ENGINEERING - 1.5%
Shaw Group, Inc.* ..................... 253,700 2,666,387
DATA PROCESSING & OUTSOURCED SERVICE - 2.4%
Computer Sciences Corporation* ........ 60,000 2,254,200
Fiserv, Inc.* ......................... 50,000 1,811,500
------------
4,065,700
DIVERSIFIED COMMERCIAL SERVICES - 0.5%
Navigant Consulting, Inc.* ............ 64,800 797,688
NUMBER MARKET
COMMON STOCKS (CONTINUED) OF SHARES VALUE
- --------------------------------------------------------------------------------
ELECTRIC UTILITIES - 2.1%
KFx, Inc.* ............................ 720,000 $ 3,614,400
ELECTRICAL COMPONENTS & EQUIPMENT - 3.5%
Energy Conversion Devices, Inc.* ...... 111,000 1,166,610
Power-One, Inc.* ...................... 470,000 4,836,300
------------
6,002,910
ELECTRONIC EQUIPMENT MANUFACTURERS - 3.7%
Aeroflex, Inc.* ....................... 180,000 1,593,000
Identix, Inc.* ........................ 77,000 402,710
Maxwell Technologies, Inc.* ........... 277,000 2,529,010
Universal Display Corporation* ........ 168,800 1,753,832
------------
6,278,552
HEALTH CARE EQUIPMENT - 1.7%
Bioject Medical Technologies, Inc.* ... 300,000 1,050,000
Closure Medical Corporation* .......... 35,000 853,650
Micro Therapeutics, Inc.* ............. 204,000 1,079,160
------------
2,982,810
HEALTH CARE FACILITIES - 3.2%
Amsurg Corporation* ................... 55,300 1,824,347
Lifepoint Hospitals, Inc.* ............ 48,000 1,154,400
U.S. Physical Therapy, Inc.* .......... 97,000 1,186,407
United Surgical Partners
International, Inc.* ............... 50,000 1,415,000
------------
5,580,154
HEALTH CARE SERVICES - 3.5%
Hooper Holmes, Inc. ................... 568,000 3,777,200
NDCHealth Corporation ................. 59,400 1,244,430
Providence Service Corporation* ....... 62,900 993,820
------------
6,015,450
HEALTH CARE SUPPLIES - 0.9%
Orthovita, Inc* ....................... 375,000 1,462,500
INDUSTRIAL MACHINERY - 1.7%
Flowserve Corporation* ................ 72,000 1,461,600
Quixote Corporation ................... 35,700 897,855
Tennant Company ....................... 17,100 629,964
------------
2,989,419
INSURANCE BROKERS - 3.1%
Arthur J. Gallagher & Company ......... 120,000 3,393,600
Hilb, Rogal & Hamilton Company ........ 60,000 1,862,400
------------
5,256,000
INTERNET SOFTWARE & SERVICES - 3.0%
@Road, Inc.* .......................... 380,000 5,111,000
IT CONSULTING & OTHER SERVICES - 4.9%
Acxiom Corporation* ................... 383,800 6,048,688
Keane, Inc.* .......................... 182,000 2,325,960
------------
8,374,648
- --------------------------------------------------------------------------------
59 SEE ACCOMPANYING NOTES.
SCHEDULE OF INVESTMENTS (CONTINUED)
SEPTEMBER 30, 2003
- --------------------------------------------------------------------------------
SECURITY MID CAP GROWTH FUND (CONTINUED)
- --------------------------------------------------------------------------------
NUMBER MARKET
COMMON STOCKS OF SHARES VALUE
- --------------------------------------------------------------------------------
LEISURE PRODUCTS - 2.4%
Mattel, Inc. .......................... 215,000 $ 4,076,400
MOVIES & ENTERTAINMENT - 0.5%
Lions Gate Entertainment
Corporation* ....................... 308,300 921,817
MULTI-UTILITIES & UNREGULATED POWER - 1.0%
Williams Companies, Inc. .............. 190,000 1,789,800
OIL & GAS DRILLING - 2.1%
Ensco International, Inc. ............. 82,300 2,207,286
Rowan Companies, Inc.* ................ 60,000 1,474,800
------------
3,682,086
OIL & GAS EQUIPMENT & SERVICES - 2.8%
Cooper Cameron Corporation* ........... 42,000 1,940,820
Grant Prideco, Inc.* .................. 165,000 1,681,350
Tidewater, Inc. ....................... 44,000 1,245,200
------------
4,867,370
OIL & GAS EXPLORATION & PRODUCTION - 4.3%
Devon Energy Corporation .............. 22,770 1,097,286
EOG Resources, Inc. ................... 44,000 1,836,560
Evergreen Resources, Inc.* ............ 162,000 4,374,000
Syntroleum Corporation* ............... 35,350 142,107
------------
7,449,953
OIL & GAS REFINING, MARKETING & TRANSPORT - 0.9%
Western Gas Resources, Inc. ........... 40,000 1,520,000
PACKAGED FOODS & MEATS - 0.3%
Monterey Pasta Company* ............... 156,000 577,200
PHARMACEUTICALS - 8.8%
Esperion Therapeutics, Inc.* .......... 208,000 4,053,920
Hollis Eden Pharmaceuticals* .......... 257,744 6,278,644
Ligand Pharmaceuticals, Inc. (Cl. B)*.. 368,800 4,753,832
------------
15,086,396
PUBLISHING - 2.1%
E.W. Scripps Company .................. 43,000 3,659,300
REGIONAL BANKS - 0.9%
Boston Private Financial
Holdings, Inc. ..................... 65,000 1,531,400
RESTAURANTS - 0.9%
Rare Hospitality International, Inc.*.. 60,000 1,494,600
SEMICONDUCTORS - 7.3%
Applied Micro Circuits Corporation* ... 500,000 2,435,000
Hi/Fn, Inc.* .......................... 151,300 1,114,173
Ixys Corporation* ..................... 285,600 2,676,072
LSI Logic Corporation* ................ 173,300 1,557,967
Microsemiconductor
Corporation* ....................... 160,000 2,438,400
Monolithic System
Technology, Inc.* .................. 146,800 1,234,588
Xicor, Inc.* .......................... 116,950 1,086,466
------------
12,542,666
NUMBER MARKET
COMMON STOCKS (CONTINUED) OF SHARES VALUE
- --------------------------------------------------------------------------------
SPECIALTY CHEMICALS - 0.4%
Rentech, Inc.* ........................ 1,139,300 $ 751,938
SPECIALTY STORES - 2.3%
Cost Plus, Inc.* ...................... 62,250 2,298,270
Hibbett Sporting Goods, Inc.* ......... 69,000 1,650,480
------------
3,948,750
TRADING COMPANIES & DISTRIBUTORS - 1.6%
MSC Industrial Direct Company, Inc. ... 130,000 2,710,500
------------
Total common stocks - 99.3% ........................... 170,827,740
WARRANTS - 0.4%
- ---------------
Bioject Medical Technology, Inc. ...... 5,625 2,038
Hollis Eden Pharmaceuticals ........... 8,143 132,615
KFx, Inc. ............................. 144,000 418,424
Orthovita, Inc. ....................... 75,000 135,444
------------
688,521
------------
Total investments - 99.7% ............................. 171,516,261
Cash & other assets, less liabilities - 0.3% .......... 430,903
------------
Total net assets - 100.0% ............................. $171,947,164
============
For federal income tax purposes, the identified cost of investments owned at
September 30, 2003 was $142,618,798.
* Non-income producing security
- --------------------------------------------------------------------------------
60 SEE ACCOMPANYING NOTES.
STATEMENTS OF ASSETS AND LIABILITIES
SEPTEMBER 30, 2003 SECURITY EQUITY FUND
------------------------------------------------------------
SECURITY SOCIAL MID CAP
LARGE CAP EQUITY GLOBAL AWARENESS VALUE
VALUE FUND SERIES SERIES SERIES SERIES
------------ ------------ ------------ ------------ ------------
ASSETS
Investments, at value(1) .......................... $ 58,833,596 $496,985,842 $ 65,329,539 $ 16,391,917 $202,630,775
Repurchase agreements, at value(1) ................ -- -- -- 807,000 514,000
Cash .............................................. 733 -- -- 1,512 9,140
Cash denominated in a foreign currency, at value(2) -- -- 160,781 -- --
Receivables:
Fund shares sold ............................... 3,476 101,785 454,622 3,785 674,017
Securities sold ................................ 1,596,195 2,015,204 2,279,326 32,974 --
Interest ....................................... 3,660 -- 1,297 -- 42,111
Dividends ...................................... 50,710 426,382 97,409 11,214 134,690
Foreign taxes recoverable ......................... -- -- 12,523 -- --
Prepaid expenses .................................. 17,933 19,339 14,656 8,856 22,019
------------ ------------ ------------ ------------ ------------
Total assets ................................. $ 60,506,303 $499,548,552 $ 68,350,153 $ 17,257,258 $204,026,752
------------ ------------ ------------ ------------ ------------
LIABILITIES
Cash overdraft .................................... $ -- $ 74,522 $ 3,017,047 $ -- $ --
Payable for:
Securities purchased ........................... 728,908 -- 249,188 267,198 2,558,964
Fund shares redeemed ........................... 1,965 274,695 414,364 3,437 293,304
Written options, at value ...................... -- -- -- -- 20,250
Management fees ................................ 37,596 318,763 56,357 14,261 169,348
Custodian fees ................................. 1,626 3,732 12,013 551 2,436
Transfer and administration fees ............... 18,695 85,357 30,556 5,522 46,073
Professional fees .............................. 6,030 33,530 6,530 6,030 12,030
12b-1distribution plan fees .................... 29,301 149,467 57,004 13,333 140,521
Other .......................................... 7,416 63,536 9,691 1,938 16,070
------------ ------------ ------------ ------------ ------------
Total liabilities ............................ 831,537 1,003,602 3,852,750 312,270 3,258,996
------------ ------------ ------------ ------------ ------------
NET ASSETS ........................................ $ 59,674,766 $498,544,950 $ 64,497,403 $ 16,944,988 $200,767,756
============ ============ ============ ============ ============
NET ASSETS CONSIST OF:
Paid in capital ................................... $ 78,791,466 $456,279,041 $ 78,441,929 $ 20,862,241 $161,566,056
Accumulated undistributed net investment income
(loss) ......................................... 154,396 607,081 (277,637) -- 146,960
Accumulated undistributed net realized gain (loss)
on sale of investments, futures, options and
foreign currency transactions .................. (20,555,442) (24,856,591) (19,332,287) (2,260,264) 2,149,182
Net unrealized appreciation (depreciation)
in value of investments, futures, options and
translation of assets and liabilities in
foreign currency ............................... 1,284,346 66,515,419 5,665,398 (1,656,989) 36,905,558
------------ ------------ ------------ ------------ ------------
Total net assets ............................. $ 59,674,766 $498,544,950 $ 64,497,403 $ 16,944,988 $200,767,756
============ ============ ============ ============ ============
CLASS "A" SHARES
Capital shares outstanding ........................ 8,981,434 71,940,041 3,656,551 518,254 4,650,488
Net assets ........................................ $ 45,857,845 $430,161,012 $ 42,711,153 $ 9,243,299 $113,821,878
Net asset value per share ......................... $ 5.11 $ 5.98 $ 11.68 $ 17.84 $ 24.48
============ ============ ============ ============ ============
Offering price per share (net asset value
divided by 94.25%) ............................. $ 5.42 $ 6.34 $ 12.39 $ 18.93 $ 25.97
============ ============ ============ ============ ============
CLASS "B" SHARES
Capital shares outstanding ........................ 2,400,720 11,408,430 1,506,317 370,029 2,346,824
Net assets ........................................ $ 11,687,089 $ 61,732,808 $ 16,460,701 $ 6,153,243 $ 53,947,123
Net asset value per share ......................... $ 4.87 $ 5.41 $ 10.93 $ 16.63 $ 22.99
============ ============ ============ ============ ============
CLASS "C" SHARES
Capital shares outstanding ........................ 429,828 1,168,145 476,822 91,028 1,411,917
Net assets ........................................ $ 2,129,832 $ 6,651,130 $ 5,325,549 $ 1,548,446 $ 32,998,755
Net asset value per share ......................... $ 4.96 $ 5.69 $ 11.17 $ 17.01 $ 23.37
============ ============ ============ ============ ============
(1) Investments, including repurchase agreements,
at cost ....................................... $ 57,549,250 $430,470,423 $ 59,670,931 $ 18,855,906 $166,343,045
(2) Cash denominated in a foreign currency, at cost -- -- 160,706 -- --
- --------------------------------------------------------------------------------
61 SEE ACCOMPANYING NOTES.
STATEMENTS OF ASSETS AND LIABILITIES (CONTINUED)
SEPTEMBER 30, 2003 SECURITY EQUITY FUND
-----------------------------------------------------------------------
SMALL CAP ENHANCED LARGE CAP
GROWTH INDEX INTERNATIONAL SELECT 25(R) GROWTH
SERIES SERIES SERIES SERIES SERIES
----------- ----------- ----------- ----------- -----------
ASSETS
Investments, at value(1) ................................ $22,963,818 $13,935,313 $ 8,835,731 $23,760,260 $25,901,998
Repurchase agreements, at value(1) ...................... 3,000,000 518,000 -- 1,127,000 469,207
Cash .................................................... 543,950 909 315 1,241 --
Cash denominated in a foreign currency, at value(2) ..... -- -- 141,729 -- --
Receivables:
Fund shares sold ..................................... 5,866 13,853 4,820 2,857 1,846
Securities sold ...................................... 288,943 -- 754,313 -- --
Dividends ............................................ 155 15,915 14,393 10,270 20,417
Security Management Company .......................... -- -- 4,434 -- --
Foreign taxes recoverable ............................... -- -- 2,865 -- --
Prepaid expenses ........................................ 8,022 10,006 10,339 10,169 12,240
----------- ----------- ----------- ----------- -----------
Total assets ....................................... $26,810,754 $14,493,996 $ 9,768,939 $24,911,797 $26,405,708
----------- ----------- ----------- ----------- -----------
LIABILITIES
Payable for:
Securities purchased ................................. $ 1,938,139 $ 5,935 $ 375,605 $ -- $ 136,408
Fund shares redeemed ................................. 25,592 30,217 135,142 41,201 419
Variation margin ..................................... -- 4,080 -- -- --
Management fees ...................................... 20,171 5,952 9,295 15,769 23,645
Custodian fees ....................................... 4,207 410 3,395 638 599
Transfer and administration fees ..................... 14,057 7,895 9,653 6,880 11,949
Professional fees .................................... 6,030 6,030 5,956 6,030 6,030
12b-1distribution plan fees .......................... 21,689 134,103 69,867 14,401 57,781
Other ................................................ 3,822 1,995 933 3,216 1,722
----------- ----------- ----------- ----------- -----------
Total liabilities .................................. 2,033,707 196,617 609,846 88,135 238,553
----------- ----------- ----------- ----------- -----------
NET ASSETS .............................................. $24,777,047 $14,297,379 $ 9,159,093 $24,823,662 $26,167,155
=========== =========== =========== =========== ===========
NET ASSETS CONSIST OF:
Paid in capital ......................................... $33,102,017 $21,129,913 $11,913,420 $37,650,495 $29,602,336
Accumulated undistributed net investment income (loss) .. -- -- 14,667 -- --
Accumulated undistributed net realized gain (loss)
on sale of investments, futures and foreign
currency transactions ................................ (13,109,316) (6,963,604) (3,019,816) (12,372,632) (4,020,066)
Net unrealized appreciation (depreciation)
in value of investments, futures and translation
of assets and liabilities in foreign currency ........ 4,784,346 131,070 250,822 (454,201) 584,885
----------- ----------- ----------- ----------- -----------
Total net assets ................................... $24,777,047 $14,297,379 $ 9,159,093 $24,823,662 $26,167,155
=========== =========== =========== =========== ===========
CLASS "A" SHARES
Capital shares outstanding .............................. 1,238,546 829,322 670,896 1,429,316 2,879,226
Net assets .............................................. $14,406,465 $ 6,377,355 $ 4,360,931 $10,396,185 $16,178,610
Net asset value per share ............................... $ 11.63 $ 7.69 $ 6.50 $ 7.27 $ 5.62
=========== =========== =========== =========== ===========
Offering price per share (net asset value
divided by 94.25%) ................................... $ 12.34 $ 8.16 $ 6.90 $ 7.71 $ 5.96
=========== =========== =========== =========== ===========
CLASS "B" SHARES
Capital Shares Outstanding .............................. 624,863 666,135 350,617 1,165,971 1,202,382
Net assets .............................................. $ 6,837,641 $ 4,928,764 $ 2,204,127 $ 8,202,874 $ 6,556,703
Net asset value per share ............................... $ 10.94 $ 7.40 $ 6.29 $ 7.04 $ 5.45
=========== =========== =========== =========== ===========
CLASS "C" SHARES
Capital shares outstanding .............................. 316,907 403,160 411,071 882,149 626,244
Net assets .............................................. $ 3,532,941 $ 2,991,260 $ 2,594,035 $ 6,224,603 $ 3,431,842
Net asset value per share ............................... $ 11.15 $ 7.42 $ 6.31 $ 7.06 $ 5.48
=========== =========== =========== =========== ===========
(1) Investments, including repurchase agreements, at cost $21,179,472 $14,314,090 $ 8,588,329 $25,341,461 $25,786,320
(2) Cash denominated in a foreign currency, at cost ..... -- -- 141,685 -- --
- --------------------------------------------------------------------------------
62 SEE ACCOMPANYING NOTES.
STATEMENTS OF ASSETS AND LIABILITIES (CONTINUED)
SEPTEMBER 30, 2003 SECURITY EQUITY FUND
-------------------------
ALPHA SECURITY
TECHNOLOGY OPPORTUNITY MID CAP
SERIES SERIES GROWTH FUND
----------- ----------- -----------
ASSETS
Investments, at value(1) ....................................... $10,263,284 $ 5,959,294 $171,516,261
Repurchase agreements, at value(1) ............................. 154,936 219,499 --
Cash ........................................................... -- 35,454 --
Restricted cash ................................................ -- 30,000 --
Receivables:
Fund shares sold ............................................ 4,597 70,724 159,033
Securities sold ............................................. 987,827 415,054 2,997,037
Deposit for short sales ..................................... -- 106,123 --
Due from broker for proceeds on securities sold short ....... -- 162,723 --
Interest .................................................... -- 415 --
Dividends ................................................... 354 2,282 31,930
Security Management Company .................................... -- 1,611 --
Prepaid expenses ............................................... 15,429 38,084 17,120
----------- ----------- ------------
Total assets .............................................. $11,426,427 $ 7,041,263 $174,721,381
----------- ----------- ------------
LIABILITIES
Cash overdraft ................................................. $ -- $ -- $ 937,346
Securities sold short, at value(2) ............................. -- 161,200 --
Payable for:
Securities purchased ........................................ -- 437,516 1,476,598
Fund shares redeemed ........................................ 6,190 -- 66,649
Variation margin ............................................ -- 30,300 --
Management fees ............................................. 9,854 10,325 114,686
Custodian fees .............................................. 1,581 2,516 1,674
Transfer and administration fees ............................ 7,572 1,979 51,390
Professional fees ........................................... 6,064 2,030 10,530
12b-1distribution plan fees ................................. 34,251 5,907 98,253
Other ....................................................... 735 279 17,091
----------- ----------- ------------
Total liabilities ......................................... 66,247 652,052 2,774,217
----------- ----------- ------------
NET ASSETS ..................................................... $11,360,180 $ 6,389,211 $171,947,164
=========== =========== ============
NET ASSETS CONSIST OF:
Paid in capital ................................................ $17,716,499 $ 6,272,737 $136,622,561
Accumulated undistributed net investment income (loss) ......... (643) (78) --
Accumulated undistributed net realized gain (loss)
on sale of investments, futures, options and foreign
currency transactions ....................................... (7,449,016) 282,350 5,544,268
Net unrealized appreciation (depreciation)
in value of investments, short positions, futures, options
and translation of assets and liabilities in foreign currency 1,093,340 (165,798) 29,780,335
----------- ----------- ------------
Total net assets .......................................... $11,360,180 $ 6,389,211 $171,947,164
=========== =========== ============
CLASS "A" SHARES
Capital shares outstanding ..................................... 1,858,866 287,405 12,378,557
Net assets ..................................................... $ 7,397,737 $ 2,935,062 $134,208,368
Net asset value per share ...................................... $ 3.98 $ 10.21 $ 10.84
=========== =========== ============
Offering price per share (net asset value
divided by 94.25%) .......................................... $ 4.22 $ 10.83 $ 11.50
=========== =========== ============
CLASS "B" SHARES
Capital shares outstanding ..................................... 439,521 169,772 2,763,750
Net assets ..................................................... $ 1,676,201 $ 1,731,067 $ 26,459,428
Net asset value per share ...................................... $ 3.81 $ 10.20 $ 9.57
=========== =========== ============
CLASS "C" SHARES
Capital shares outstanding ..................................... 601,280 168,989 1,090,411
Net assets ..................................................... $ 2,286,242 $ 1,723,082 $ 11,279,368
Net asset value per share ...................................... $ 3.80 $ 10.20 $ 10.34
=========== =========== ============
(1) Investments, including repurchase agreements, at cost ...... $ 9,324,649 $ 6,256,036 $141,735,926
(2) Securites sold short, at proceeds .......................... $ -- $ 162,723 $ --
- --------------------------------------------------------------------------------
63 SEE ACCOMPANYING NOTES.
STATEMENTS OF OPERATIONS
FOR THE YEAR ENDED SEPTEMBER 30, 2003 SECURITY EQUITY FUND
--------------------------------------------------------
SECURITY SOCIAL MID CAP
LARGE CAP EQUITY GLOBAL AWARENESS VALUE
VALUE FUND SERIES SERIES SERIES SERIES
----------- ----------- ----------- ----------- -----------
INVESTMENT INCOME:
Dividends ....................................... $ 821,430 $ 7,166,396 $ 1,180,677 $ 201,393 $ 1,544,909
Securities lending .............................. -- -- 17,349 -- --
Interest ........................................ 50,745 400,926 6,318 5,402 436,043
----------- ----------- ----------- ----------- -----------
872,175 7,567,322 1,204,344 206,795 1,980,952
Less: Foreign tax expense ....................... -- -- (102,210) -- --
----------- ----------- ----------- ----------- -----------
Total investment income ....................... 872,175 7,567,322 1,102,134 206,795 1,980,952
EXPENSES:
Management fees ................................. 354,074 3,835,089 629,134 160,322 1,497,711
Custodian fees .................................. 8,095 21,237 105,821 4,011 13,556
Transfer/maintenance fees ....................... 92,052 612,267 200,737 49,798 308,021
Administration fees ............................. 45,668 463,638 100,851 16,543 138,120
Directors' fees ................................. 17,956 11,425 1,426 352 2,895
Professional fees ............................... 11,888 42,141 17,330 7,452 19,422
Reports to shareholders ......................... 4,968 75,855 12,560 3,410 27,391
Registration fees ............................... 28,605 50,501 32,941 45,203 84,070
Other expenses .................................. 3,563 16,423 3,642 1,687 9,561
12b-1 distribution plan fees - Class A .......... 94,698 1,093,930 106,808 20,938 207,824
12b-1 distribution plan fees - Class B .......... 74,903 677,023 66,303 62,625 429,679
12b-1 distribution plan fees - Class C .......... 18,403 60,712 44,545 13,945 236,732
----------- ----------- ----------- ----------- -----------
Total expenses .................................. 754,873 6,960,241 1,322,098 386,286 2,974,982
----------- ----------- ----------- ----------- -----------
Net investment income (loss) .................... 117,302 607,081 (219,964) (179,491) (994,030)
NET REALIZED AND UNREALIZED GAIN (LOSS):
Net realized gain (loss) during the period on:
Investments ..................................... (4,625,189) (5,174,059) (8,664,059) (902,119) 2,127,626
Futures ......................................... -- (2,897,731) -- -- --
Options written and purchased ................... -- -- -- -- 727,251
Foreign currency transactions ................... -- -- (204,772) -- --
----------- ----------- ----------- ----------- -----------
Net realized gain (loss) ...................... (4,625,189) (8,071,790) (8,868,831) (902,119) 2,854,877
Net change in unrealized appreciation (depreciation)
during the period on:
Investments ..................................... 12,145,945 89,930,127 22,332,949 3,990,064 52,397,006
Options written and purchased ................... -- -- -- -- 603,941
Translation of assets and liabilities
in foreign currencies ......................... -- -- 4,106 -- --
----------- ----------- ----------- ----------- -----------
Net unrealized appreciation (depreciation) ...... 12,145,945 89,930,127 22,337,055 3,990,064 53,000,947
----------- ----------- ----------- ----------- -----------
Net gain (loss) .............................. 7,520,756 81,858,337 13,468,224 3,087,945 55,855,824
----------- ----------- ----------- ----------- -----------
Net increase (decrease) in net assets
resulting from operations ................. $ 7,638,058 $82,465,418 $13,248,260 $ 2,908,454 $54,861,794
=========== =========== =========== =========== ===========
- --------------------------------------------------------------------------------
64 SEE ACCOMPANYING NOTES.
STATEMENTS OF OPERATIONS (CONTINUED)
FOR THE YEAR ENDED SEPTEMBER 30, 2003 SECURITY EQUITY FUND
------------------------------------------------------------------
SMALL CAP ENHANCED LARGE CAP
GROWTH INDEX INTERNATIONAL SELECT 25(R) GROWTH
SERIES SERIES SERIES SERIES SERIES
---------- ---------- ---------- ---------- ----------
INVESTMENT INCOME:
Dividends ....................................... $ 19,456 $ 230,672 $ 235,095 $ 214,089 $ 208,294
Securities lending .............................. -- -- 6,804 -- 1,390
Interest ........................................ 20,889 6,093 8,445 20,228 2,473
---------- ---------- ---------- ---------- ----------
40,345 236,765 250,344 234,317 212,157
Less: Foreign tax expense ....................... -- -- (27,197) -- --
---------- ---------- ---------- ---------- ----------
Total investment income ....................... 40,345 236,765 223,147 234,317 212,157
EXPENSES:
Management fees ................................. 176,598 102,732 86,416 190,086 189,339
Custodian fees .................................. 23,979 13,324 36,230 3,438 7,358
Transfer/maintenance fees ....................... 133,811 30,519 14,990 66,347 44,343
Administration fees ............................. 19,303 28,493 71,987 23,736 18,791
Directors' fees ................................. 303 307 145 512 365
Professional fees ............................... 7,468 7,370 7,668 7,788 7,427
Reports to shareholders ......................... 1,031 1,512 907 8,289 2,518
Registration fees ............................... 29,712 30,758 31,066 46,337 29,021
Other expenses .................................. 1,937 1,398 1,100 2,205 1,234
12b-1 distribution plan fees - Class A .......... 24,763 15,265 9,742 28,913 31,488
12b-1 distribution plan fees - Class B .......... 50,789 48,693 18,706 85,228 33,083
12b-1 distribution plan fees - Class C .......... 26,758 27,223 20,886 52,567 30,303
---------- ---------- ---------- ---------- ----------
Total expenses .................................. 496,452 307,594 299,843 515,446 395,270
Less: Reimbursement of expenses - Class A ....... (22,997) (6,378) (35,720) -- --
Reimbursement of expenses - Class B ....... (12,489) (4,987) (18,007) -- --
Reimbursement of expenses - Class C ....... (6,507) (2,833) (19,821) -- --
---------- ---------- ---------- ---------- ----------
Net expenses .................................... 454,459 293,396 226,295 515,446 395,270
---------- ---------- ---------- ---------- ----------
Net investment income (loss) .................... (414,114) (56,631) (3,148) (281,129) (183,113)
NET REALIZED AND UNREALIZED GAIN (LOSS):
Net realized gain (loss) during the period on:
Investments ..................................... 2,366,986 (2,955,929) 395,092 (3,750,965) (2,266,684)
Futures ......................................... -- 25,649 -- -- --
Foreign currency transactions ................... -- -- 17,815 -- --
---------- ---------- ---------- ---------- ----------
Net realized gain (loss) ...................... 2,366,986 (2,930,280) 412,907 (3,750,965) (2,266,684)
Net change in unrealized appreciation (depreciation)
during the period on:
Investments ..................................... 5,227,406 6,020,571 1,053,713 6,658,939 5,276,183
Futures ......................................... -- 100,000 -- -- --
Translation of assets and liabilities
in foreign currencies ......................... -- -- 2,979 -- --
---------- ---------- ---------- ---------- ----------
Net unrealized appreciation (depreciation) ...... 5,227,406 6,120,571 1,056,692 6,658,939 5,276,183
---------- ---------- ---------- ---------- ----------
Net gain (loss) .............................. 7,594,392 3,190,291 1,469,599 2,907,974 3,009,499
---------- ---------- ---------- ---------- ----------
Net increase (decrease) in net assets
resulting from operations ................. $7,180,278 $3,133,660 $1,466,451 $2,626,845 $2,826,386
========== ========== ========== ========== ==========
- --------------------------------------------------------------------------------
65 SEE ACCOMPANYING NOTES.
STATEMENTS OF OPERATIONS (CONTINUED)
FOR THE YEAR ENDED SEPTEMBER 30, 2003 SECURITY EQUITY FUND
(EXCEPT AS NOTED) --------------------------
ALPHA SECURITY
TECHNOLOGY OPPORTUNITY MID CAP
SERIES SERIES *GROWTH FUND
----------- ----------- ------------
INVESTMENT INCOME:
Dividends ...................................... $ 16,300 $ 11,974 $ 304,968
Securities lending ............................. 1,585 -- --
Interest ....................................... 834 6,886 69,048
----------- ----------- -----------
18,719 18,860 374,016
Less: Foreign tax expense ...................... (248) -- --
----------- ----------- -----------
Total investment income ...................... 18,471 18,860 374,016
EXPENSES:
Management fees ................................ 73,680 27,342 1,031,797
Custodian fees ................................. 12,464 2,833 10,634
Transfer/maintenance fees ...................... 21,188 142 337,371
Administration fees ............................ 64,764 3,115 126,910
Directors' fees ................................ 115 47 16,949
Professional fees .............................. 8,783 4,483 20,645
Reports to shareholders ........................ 688 233 18,543
Registration fees .............................. 29,043 3,446 32,600
Other expenses ................................. 1,339 268 6,936
12b-1 distribution plan fees -- Class A ........ 10,971 1,449 273,976
12b-1 distribution plan fees -- Class B ........ 12,341 3,940 198,176
12b-1 distribution plan fees -- Class C ........ 17,458 3,936 81,644
----------- ----------- -----------
Total expenses ................................. 252,834 51,234 2,156,181
Less: Reimbursement of expenses -- Class A ..... (23,623) (3,076) --
Reimbursement of expenses -- CLASS B ..... (9,092) (2,177) --
Reimbursement of expenses -- Class C ..... (13,034) (2,177) --
----------- ----------- -----------
Net expenses ................................... 207,085 43,804 2,156,181
----------- ----------- -----------
Net investment income (loss) ................... (188,614) (24,944) (1,782,165)
NET REALIZED AND UNREALIZED GAIN (LOSS):
Net realized gain (loss) during the period on:
Investments .................................... 566,589 250,884 7,618,758
Futures ........................................ -- 56,332 --
Options written and purchased .................. -- -- 367,114
Foreign currency transactions .................. (643) -- --
----------- ----------- -----------
Net realized gain (loss) ..................... 565,946 307,216 7,985,872
Net change in unrealized appreciation
(depreciation) during the period on:
Investments .................................... 3,081,011 (77,243) 52,055,563
Securities sold short .......................... -- 1,523 --
Futures ........................................ -- (90,078) --
Options written and purchased .................. -- -- 230,934
Translation of assets and liabilities
in foreign currencies ........................ (231) -- --
----------- ----------- -----------
Net unrealized appreciation (depreciation) 3,080,780 (165,798) 52,286,497
----------- ----------- -----------
Net gain (loss) ............................. 3,646,726 141,418 60,272,369
----------- ----------- -----------
Net increase (decrease) in net assets
resulting from operations ................ $ 3,458,112 $ 116,474 $58,490,204
=========== =========== ===========
*For the period beginning July 7, 2003 (commencement of operations) to September 30, 2003.
- --------------------------------------------------------------------------------
66 SEE ACCOMPANYING NOTES.
STATEMENTS OF CHANGES IN NET ASSETS
FOR THE YEAR ENDED SEPTEMBER 30, 2003 SECURITY EQUITY FUND
---------------------------------------------------------
SECURITY SOCIAL MID CAP
LARGE CAP EQUITY GLOBAL AWARENESS VALUE
VALUE FUND SERIES SERIES SERIES SERIES
----------- ----------- ----------- ----------- ------------
INCREASE (DECREASE) IN NET ASSETS
FROM OPERATIONS:
Net investment income (loss) ..................... $ 117,302 $ 607,081 $ (219,964) $ (179,491) $ (994,030)
Net realized gain (loss) during the period on
investments, futures, options written and
purchased and foreign currency transactions .... (4,625,189) (8,071,790) (8,868,831) (902,119) 2,854,877
Net change in unrealized appreciation
(depreciation) during the period on investments,
options written and purchased and translation
of assets and liabilities in foreign currencies 12,145,945 89,930,127 22,337,055 3,990,064 53,000,947
----------- ------------ ----------- ----------- ------------
Net increase (decrease) in net assets resulting
from operations ............................. 7,638,058 82,465,418 13,248,260 2,908,454 54,861,794
NET INCREASE (DECREASE) FROM CAPITAL
SHARE TRANSACTIONS (NOTE 6) ...................... 12,624,901 (67,957,739) (22,741,341) (440,061) 21,441,016
----------- ------------ ----------- ----------- ------------
Total increase (decrease) in net assets ........ 20,262,959 14,507,679 (9,493,081) 2,468,393 76,302,810
----------- ------------ ----------- ----------- ------------
NET ASSETS:
Beginning of period .............................. 39,411,807 484,037,271 73,990,484 14,476,595 124,464,946
----------- ------------ ----------- ----------- ------------
End of period .................................... $59,674,766 $498,544,950 $64,497,403 $16,944,988 $200,767,756
=========== ============ =========== =========== ============
Undistributed net investment income (loss)
at end of period ............................... $ 154,396 $ 607,081 $ (277,637) $ -- $ 146,960
=========== ============ =========== =========== ============
- --------------------------------------------------------------------------------
67 SEE ACCOMPANYING NOTES.
STATEMENTS OF CHANGES IN NET ASSETS (CONTINUED)
FOR THE YEAR ENDED SEPTEMBER 30, 2003 SECURITY EQUITY FUND
-----------------------------------------------------------------------
SMALL CAP ENHANCED LARGE CAP
GROWTH INDEX INTERNATIONAL SELECT 25(R) GROWTH
SERIES SERIES SERIES SERIES SERIES
----------- ----------- ----------- ----------- -----------
INCREASE (DECREASE) IN NET ASSETS
FROM OPERATIONS:
Net investment income (loss) ..................... $ (414,114) $ (56,631) $ (3,148) $ (281,129) $ (183,113)
Net realized gain (loss) during the period on
investments, futures, and foreign currency
transactions ................................... 2,366,986 (2,930,280) 412,907 (3,750,965) (2,266,684)
Net change in unrealized appreciation
(depreciation) during the period on investments,
futures, and translation of assets and
liabilities in foreign currencies .............. 5,227,406 6,120,571 1,056,692 6,658,939 5,276,183
----------- ----------- ----------- ----------- -----------
Net increase (decrease) in net assets resulting
from operations ............................. 7,180,278 3,133,660 1,466,451 2,626,845 2,826,386
NET INCREASE (DECREASE) FROM CAPITAL
SHARE TRANSACTIONS (NOTE 6) ...................... 2,791,333 (6,261,504) 1,094,684 (2,256,498) 9,601,678
----------- ----------- ----------- ----------- -----------
Total increase (decrease) in net assets ........ 9,971,611 (3,127,844) 2,561,135 370,347 12,428,064
----------- ----------- ----------- ----------- -----------
NET ASSETS:
Beginning of period .............................. 14,805,436 17,425,223 6,597,958 24,453,315 13,739,091
----------- ----------- ----------- ----------- -----------
End of period .................................... $24,777,047 $14,297,379 $ 9,159,093 $24,823,662 $26,167,155
=========== =========== =========== =========== ===========
Undistributed net investment income (loss)
at end of period ............................... $ -- $ -- $ 14,667 $ -- $ --
=========== =========== =========== =========== ===========
- --------------------------------------------------------------------------------
68 SEE ACCOMPANYING NOTES.
STATEMENTS OF CHANGES IN NET ASSETS (CONTINUED)
FOR THE YEAR ENDED SEPTEMBER 30, 2003
(EXCEPT AS NOTED) SECURITY EQUITY FUND
----------------------------
ALPHA SECURITY
TECHNOLOGY OPPORTUNITY MID CAP
SERIES SERIES* GROWTH FUND
------------ ------------ ------------
INCREASE (DECREASE) IN NET ASSETS
FROM OPERATIONS:
Net investment income (loss) .................... $ (188,614) $ (24,944) $ (1,782,165)
Net realized gain (loss) during the period on
investments, futures, options written and
purchased and foreign currency transactions ... 565,946 307,216 7,985,872
Net change in unrealized appreciation
(depreciation) during the period on
investments, securities sold short, futures,
options written and purchased and translation
of assets and liabilities in foreign currencies 3,080,780 (165,798) 52,286,497
------------ ------------ ------------
Net increase (decrease) in net assets resulting
from operations ............................ 3,458,112 116,474 58,490,204
NET INCREASE (DECREASE) FROM CAPITAL
SHARE TRANSACTIONS (NOTE 6) ..................... 3,725,058 6,272,737 (876,048)
------------ ------------ ------------
Total increase (decrease) in net assets ....... 7,183,170 6,389,211 57,614,156
------------ ------------ ------------
NET ASSETS:
Beginning of period ............................. 4,177,010 -- 114,333,008
------------ ------------ ------------
End of period ................................... $ 11,360,180 $ 6,389,211 $171,947,164
============ ============ ============
Undistributed net investment income (loss)
at end of period .............................. $ (643) $ (78) $ --
============ ============ ============
*For the period beginning July 7, 2003 (commencement of operations) to September 30, 2003.
- --------------------------------------------------------------------------------
69 SEE ACCOMPANYING NOTES.
STATEMENTS OF CHANGES IN NET ASSETS
FOR THE YEAR ENDED SEPTEMBER 30, 2002 SECURITY EQUITY FUND
------------------------------------------------------------
SECURITY SOCIAL MID CAP
LARGE CAP EQUITY GLOBAL AWARENESS VALUE
VALUE FUND SERIES SERIES SERIES SERIES
------------ ------------ ------------ ------------ ------------
INCREASE (DECREASE) IN NET ASSETS
FROM OPERATIONS:
Net investment income (loss) ..................... $ 32,704 $ (24,412) $ (544,758) $ (217,011) $ (819,153)
Net realized gain (loss) during the period on
investments, futures, options written and
purchased and foreign currency transactions .... (7,301,261) 552,790 (6,024,553) (479,572) 122,959
Net change in unrealized depreciation during
the period on investments, translation of assets
and liabilities in foreign currencies .......... (3,019,290) (123,520,914) (4,151,411) (3,022,750) (16,612,323)
------------ ------------ ------------ ------------ ------------
Net decrease in net assets resulting
from operations ............................. (10,287,847) (122,992,536) (10,720,722) (3,719,333) (17,308,517)
DISTRIBUTIONS TO SHAREHOLDERS FROM:
Net investment income:
Class A ........................................ (215,293) -- -- -- --
Class B ........................................ -- -- -- -- --
Class C ........................................ -- -- -- -- --
Net realized gain:
Class A ........................................ -- -- -- -- (633,247)
Class B ........................................ -- -- -- -- (370,068)
Class C ........................................ -- -- -- -- (166,431)
Return of Capital:
Class A ........................................ -- -- -- -- (325,873)
Class B ........................................ -- -- -- -- (189,772)
Class C ........................................ -- -- -- -- (85,729)
------------ ------------ ------------ ------------ ------------
Total distributions to shareholders ......... (215,293) -- -- -- (1,771,120)
TOTAL RETURN MERGER (COMPONENTS OF
NET ASSETS OF TOTAL RETURN AS OF DATE
OF EXCHANGE) (NOTE 9)
Capital Stock .................................... -- 4,486,653 -- -- --
Accumulated net investment loss .................. -- (56,623) -- -- --
Accumulated loss on sale of investments .......... -- (1,503,978) -- -- --
Net unrealized depreciation in value of
investments .................................... -- (504,764) -- -- --
------------ ------------ ------------ ------------ ------------
-- 2,421,288 -- -- --
NET INCREASE (DECREASE) FROM CAPITAL
SHARE TRANSACTIONS (NOTE 6) ...................... (1,693,088) (59,353,916) 9,461,531 (2,830,762) 52,685,173
------------ ------------ ------------ ------------ ------------
Total increase (decrease) in net assets ........ (12,196,228) (179,925,164) (1,259,191) (6,550,095) 33,605,536
------------ ------------ ------------ ------------ ------------
NET ASSETS:
Beginning of period .............................. 51,608,035 663,962,435 75,249,675 21,026,690 90,859,410
------------ ------------ ------------ ------------ ------------
End of period .................................... $ 39,411,807 $484,037,271 $ 73,990,484 $ 14,476,595 $124,464,946
============ ============ ============ ============ ============
Undistributed net investment income (loss)
at end of period ............................... $ 29,748 $ -- $ (145,355) $ -- $ --
============ ============ ============ ============ ============
- --------------------------------------------------------------------------------
70 SEE ACCOMPANYING NOTES.
STATEMENTS OF CHANGES IN NET ASSETS (CONTINUED)
FOR THE YEAR ENDED SEPTEMBER 30, 2002 SECURITY EQUITY FUND
--------------------------------------------------------
SMALL CAP ENHANCED
GROWTH INDEX INTERNATIONAL SELECT 25(R)
SERIES SERIES SERIES SERIES
----------- ----------- ----------- -----------
INCREASE (DECREASE) IN NET ASSETS
FROM OPERATIONS:
Net investment loss .............................. $ (515,568) $ (114,019) $ (87,936) $ (387,288)
Net realized loss during the period on
investments, futures, options written and
purchased and foreign currency transactions .... (2,151,075) (2,711,134) (1,599,756) (2,630,186)
Net change in unrealized appreciation
(depreciation) during the period on investments,
translation of assets and liabilities
in foreign currencies .......................... (565,535) (1,783,160) 260,949 (1,051,332)
----------- ----------- ----------- -----------
Net decrease in net assets resulting
from operations ............................. (3,232,178) (4,608,313) (1,426,743) (4,068,806)
DISTRIBUTIONS TO SHAREHOLDERS FROM:
Net investment income:
Class A ........................................ -- -- -- --
Class B ........................................ -- -- -- --
Class C ........................................ -- -- -- --
Class S ........................................ -- -- -- --
Net realized gain:
Class A ........................................ -- -- -- --
Class B ........................................ -- -- -- --
Class C ........................................ -- -- -- --
Class S ........................................ -- -- -- --
----------- ----------- ----------- -----------
Total distributions to shareholders
transactions .............................. -- -- -- --
NET INCREASE (DECREASE) FROM CAPITAL
SHARE TRANSACTIONS (NOTE 6) ...................... (7,765,681) 3,131,699 1,161,346 (1,886,756)
----------- ----------- ----------- -----------
Total decrease in net assets ................... (10,997,859) (1,476,614) (265,397) (5,955,562)
----------- ----------- ----------- -----------
NET ASSETS:
Beginning of period .............................. 25,803,295 18,901,837 6,863,355 30,408,877
----------- ----------- ----------- -----------
End of period .................................... $14,805,436 $17,425,223 $ 6,597,958 $24,453,315
=========== =========== =========== ===========
Undistributed net investment loss
at end of period ............................... $ -- $ -- $ -- $ --
=========== =========== =========== ===========
- --------------------------------------------------------------------------------
71 SEE ACCOMPANYING NOTES.
STATEMENTS OF CHANGES IN NET ASSETS (CONTINUED)
FOR THE YEAR ENDED SEPTEMBER 30, 2002 SECURITY EQUITY FUND
---------------------------
LARGE CAP SECURITY
GROWTH TECHNOLOGY MID CAP
SERIES SERIES GROWTH FUND
------------ ------------ ------------
INCREASE (DECREASE) IN NET ASSETS
FROM OPERATIONS:
Net investment loss .............................. $ (134,837) $ (175,277) $ (1,908,354)
Net realized loss during the period on
investments, futures, options written and
purchased and foreign currency transactions .... (1,399,190) (3,516,067) (1,451,172)
Net change in unrealized appreciation
(depreciation) during the period on investments,
translation of assets and liabilities
in foreign currencies .......................... (1,410,681) 1,640,321 (14,895,843)
------------ ------------ ------------
Net decrease in net assets resulting
from operations ............................. (2,944,708) (2,051,023) (18,255,369)
DISTRIBUTIONS TO SHAREHOLDERS FROM:
Net investment income:
Class A ........................................ -- -- --
Class B ........................................ -- -- --
Class C ........................................ -- -- --
Net realized gain:
Class A ........................................ -- -- (865,421)
Class B ........................................ -- -- (192,238)
Class C ........................................ -- -- (41,711)
------------ ------------ ------------
Total distributions to shareholders ......... -- -- (1,099,370)
NET INCREASE (DECREASE) FROM CAPITAL
SHARE TRANSACTIONS (NOTE 6) ...................... 9,713,609 855,932 (32,083,452)
------------ ------------ ------------
Total increase (decrease) in net assets ........ 6,768,901 (1,195,091) (51,438,191)
------------ ------------ ------------
NET ASSETS:
Beginning of period .............................. 6,970,190 5,372,101 165,771,199
------------ ------------ ------------
End of period .................................... $ 13,739,091 $ 4,177,010 $114,333,008
============ ============ ============
Undistributed net investment loss
at end of period ............................... $ -- $ -- $ --
============ ============ ============
- --------------------------------------------------------------------------------
72 SEE ACCOMPANYING NOTES.
FINANCIAL HIGHLIGHTS
SELECTED DATA FOR EACH SHARE OF CAPITAL STOCK OUTSTANDING THROUGHOUT EACH PERIOD
SECURITY LARGE CAP VALUE FUND (CLASS A)
FISCAL PERIOD ENDED SEPTEMBER 30
---------------------------------------------------------------------
2003(C) 2002(C)(I)(N) 2001(C)(H) 2000(C) 1999(C)
---------- ------------- ---------- ---------- ----------
PER SHARE DATA
NET ASSET VALUE BEGINNING OF PERIOD ............ $ 4.25 $ 5.37 $ 6.42 $ 7.17 $ 7.68
INCOME FROM INVESTMENT OPERATIONS:
Net Investment Income (Loss) ................... 0.02 0.01 0.03 0.07 0.12
Net Gain (Loss) on Securities
(realized and unrealized) ..................... 0.84 (1.10) (1.03) (0.58) 0.75
---------- ---------- ---------- ---------- ----------
Total from Investment Operations ............... 0.86 (1.09) (1.00) (0.51) 0.87
LESS DISTRIBUTIONS:
Dividends (from Net Investment Income) ......... -- (0.03) (0.05) (0.13) (0.04)
Distributions (from Realized Gains) ............ -- -- -- (0.11) (1.34)
---------- ---------- ---------- ---------- ----------
Total Distributions ......................... -- (0.03) (0.05) (0.24) (1.38)
---------- ---------- ---------- ---------- ----------
NET ASSET VALUE END OF PERIOD .................. $ 5.11 $ 4.25 $ 5.37 $ 6.42 $ 7.17
========== ========== ========== ========== ==========
TOTAL RETURN (a) ............................... 20.24% (20.51%) (15.68%) (7.28%) 12.00%
RATIOS/SUPPLEMENTAL DATA
Net Assets End of Period (thousands) ........... $ 45,858 $ 32,997 $ 45,006 $ 60,448 $ 74,796
Ratio of Expenses to Average Net Assets ........ 1.45% 1.37% 1.32% 1.27% 1.22%
Ratio of Net Investment Income (Loss) to Average
Net Assets ................................... 0.41% 0.20% 0.49% 0.99% 1.63%
Portfolio Turnover Rate ........................ 76% 68% 180% 144% 98%
SECURITY LARGE CAP VALUE FUND (CLASS B)
FISCAL PERIOD ENDED SEPTEMBER 30
----------------------------------------------------------------------
2003(C) 2002(C)(I)(N) 2001(C)(H) 2000(C) 1999(C)
---------- ---------- ---------- ---------- ----------
PER SHARE DATA
NET ASSET VALUE BEGINNING OF PERIOD ............ $ 4.08 $ 5.18 $ 6.21 $ 6.95 $ 7.54
INCOME FROM INVESTMENT OPERATIONS:
Net Investment Income (Loss) ................... (0.02) (0.04) (0.03) -- 0.05
Net Gain (Loss) on Securities
(realized and unrealized) ..................... 0.81 (1.06) (1.00) (0.58) 0.73
---------- ---------- ---------- ---------- ----------
Total from Investment Operations ............... 0.79 (1.10) (1.03) (0.58) 0.78
LESS DISTRIBUTIONS:
Dividends (from Net Investment Income) ......... -- -- -- (0.05) (0.03)
Distributions (from Realized Gains) ............ -- -- -- (0.11) (1.34)
---------- ---------- ---------- ---------- ----------
Total Distributions ......................... -- -- -- (0.16) (1.37)
---------- ---------- ---------- ---------- ----------
NET ASSET VALUE END OF PERIOD .................. $ 4.87 $ 4.08 $ 5.18 $ 6.21 $ 6.95
========== ========== ========== ========== ==========
TOTAL RETURN (a) ............................... 19.36% (21.24%) (16.59%) (8.36%) 10.93%
RATIOS/SUPPLEMENTAL DATA
Net Assets End of Period (thousands) ........... $ 11,687 $ 4,905 $ 5,657 $ 7,152 $ 9,829
Ratio of Expenses to Average Net Assets ........ 2.20% 2.27% 2.32% 2.27% 2.22%
Ratio of Net Investment Income (Loss) to Average
Net Assets ................................... (0.42%) (0.71%) (0.51%) 0.01% 0.63%
Portfolio Turnover Rate ........................ 76% 68% 180% 144% 98%
- --------------------------------------------------------------------------------
73 SEE ACCOMPANYING NOTES.
FINANCIAL HIGHLIGHTS (CONTINUED)
SELECTED DATA FOR EACH SHARE OF CAPITAL STOCK OUTSTANDING THROUGHOUT EACH PERIOD
SECURITY LARGE CAP VALUE FUND (CLASS C)
FISCAL PERIOD ENDED SEPTEMBER 30
----------------------------------------------------------------------
2003(C) 2002(C)(I)(K)(N) 2001(C)(H) 2000(C) 1999(C)(E)
---------- ---------------- ---------- ---------- ----------
PER SHARE DATA
NET ASSET VALUE BEGINNING OF PERIOD ............ $ 4.16 $ 5.28 $ 6.32 $ 7.11 $ 6.87
INCOME FROM INVESTMENT OPERATIONS:
Net Investment Income (Loss) ................... (0.02) (0.04) (0.03) (0.01) 0.03
Net Gain (Loss) on Securities
(realized and unrealized) ..................... 0.82 (1.08) (1.01) (0.56) 0.21
---------- ---------- ---------- ---------- ----------
Total from Investment Operations ............... 0.80 (1.12) (1.04) (0.57) 0.24
LESS DISTRIBUTIONS:
Dividends (from Net Investment Income) ......... -- -- -- (0.11) --
Distributions (from Realized Gains) ............ -- -- -- (0.11) --
---------- ---------- ---------- ---------- ----------
Total Distributions ......................... -- -- -- (0.22) --
---------- ---------- ---------- ---------- ----------
NET ASSET VALUE END OF PERIOD .................. $ 4.96 $ 4.16 $ 5.28 $ 6.32 $ 7.11
========== ========== ========== ========== ==========
TOTAL RETURN (a) ............................... 19.23% (21.21%) (16.46%) (8.10%) 3.49%
RATIOS/SUPPLEMENTAL DATA
Net Assets End of Period (thousands) ........... $ 2,130 $ 1,510 $ 904 $ 483 $ 297
Ratio of Expenses to Average Net Assets ........ 2.20% 2.25% 2.33% 2.28% 2.22%
Ratio of Net Investment Income (Loss) to Average
Net Assets ................................... (0.33%) (0.72%) (0.55%) (0.10%) 0.62%
Portfolio Turnover Rate ........................ 76% 68% 180% 144% 90%
- --------------------------------------------------------------------------------
74 SEE ACCOMPANYING NOTES.
FINANCIAL HIGHLIGHTS (CONTINUED)
SELECTED DATA FOR EACH SHARE OF CAPITAL STOCK OUTSTANDING THROUGHOUT EACH PERIOD
SECURITY EQUITY FUND - EQUITY SERIES (CLASS A)
FISCAL PERIOD ENDED SEPTEMBER 30
-------------------------------------------------------------------------
2003(C) 2002(C)(J)(N) 2001(C) 2000(C) 1999(C)
---------- ---------- ---------- ---------- ----------
PER SHARE DATA
NET ASSET VALUE BEGINNING OF PERIOD ............ $ 5.09 $ 6.36 $ 10.26 $ 9.96 $ 8.86
INCOME FROM INVESTMENT OPERATIONS:
Net Investment Income (Loss) ................... 0.01 0.01 -- -- 0.02
Net Gain (Loss) on Securities
(realized and unrealized) ..................... 0.88 (1.28) (2.49) 0.66 1.80
---------- ---------- ---------- ---------- ----------
Total from Investment Operations ............... 0.89 (1.27) (2.49) 0.66 1.82
LESS DISTRIBUTIONS:
Dividends (from Net Investment Income) ......... -- -- -- -- (0.04)
Distributions (from Realized Gains) ............ -- -- (1.40) (0.36) (0.68)
Return of Capital .............................. -- -- (0.01) -- --
---------- ---------- ---------- ---------- ----------
Total Distributions ......................... -- -- (1.41) (0.36) (0.72)
---------- ---------- ---------- ---------- ----------
NET ASSET VALUE END OF PERIOD .................. $ 5.98 $ 5.09 $ 6.36 $ 10.26 $ 9.96
========== ========== ========== ========== ==========
TOTAL RETURN (a) ............................... 17.49% (19.97%) (27.66%) 6.64% 20.66%
RATIOS/SUPPLEMENTAL DATA
Net Assets End of Period (thousands) ........... $ 430,161 $ 412,791 $ 563,553 $ 853,126 $ 917,179
Ratio of Expenses to Average Net Assets ........ 1.25% 1.11% 1.02% 1.02% 1.02%
Ratio of Net Investment Income (Loss) to Average
Net Assets ................................... 0.23% 0.13% 0.03% 0.03% 0.19%
Portfolio Turnover Rate ........................ 54% 30% 23% 54% 36%
SECURITY EQUITY FUND - EQUITY SERIES (CLASS B)
FISCAL PERIOD ENDED SEPTEMBER 30
----------------------------------------------------------------------
2003(C) 2002(C)(J)(N) 2001(C) 2000(C) 1999(C)
---------- ------------- ---------- ---------- ----------
PER SHARE DATA
NET ASSET VALUE BEGINNING OF PERIOD ............ $ 4.64 $ 5.86 $ 9.65 $ 9.47 $ 8.52
INCOME FROM INVESTMENT OPERATIONS:
Net Investment Income (Loss) ................... (0.03) (0.05) (0.07) (0.10) (0.08)
Net Gain (Loss) on Securities
(realized and unrealized) ..................... 0.80 (1.17) (2.31) 0.64 1.71
---------- ---------- ---------- ---------- ----------
Total from Investment Operations ............... 0.77 (1.22) (2.38) 0.54 1.63
LESS DISTRIBUTIONS:
Dividends (from Net Investment Income) ......... -- -- -- -- --
Distributions (from Realized Gains) ............ -- -- (1.40) (0.36) (0.68)
Return of Capital .............................. -- -- (0.01) -- --
---------- ---------- ---------- ---------- ----------
Total Distributions ......................... -- -- (1.41) (0.36) (0.68)
---------- ---------- ---------- ---------- ----------
NET ASSET VALUE END OF PERIOD .................. $ 5.41 $ 4.64 $ 5.86 $ 9.65 $ 9.47
========== ========== ========== ========== ==========
TOTAL RETURN (a) ............................... 16.59% (20.82%) (28.34%) 5.69% 19.23%
RATIOS/SUPPLEMENTAL DATA
Net Assets End of Period (thousands) ........... $ 61,733 $ 66,267 $ 96,067 $ 156,633 $ 159,872
Ratio of Expenses to Average Net Assets ........ 2.00% 2.02% 2.02% 2.02% 2.02%
Ratio of Net Investment Income (Loss) to Average
Net Assets ................................... (0.52%) (0.78%) (0.97%) (0.97%) (0.82%)
Portfolio Turnover Rate ........................ 54% 30% 23% 54% 36%
- --------------------------------------------------------------------------------
75 SEE ACCOMPANYING NOTES.
FINANCIAL HIGHLIGHTS (CONTINUED)
SELECTED DATA FOR EACH SHARE OF CAPITAL STOCK OUTSTANDING THROUGHOUT EACH PERIOD
SECURITY EQUITY FUND - EQUITY SERIES (CLASS C)
FISCAL PERIOD ENDED SEPTEMBER 30
----------------------------------------------------------------------
2003(C) 2002(C)(J)(K)(N) 2001(C) 2000(C) 1999(C)(E)
---------- ---------------- ---------- ---------- ----------
PER SHARE DATA
NET ASSET VALUE BEGINNING OF PERIOD ............ $ 4.88 $ 6.16 $ 10.07 $ 9.89 $ 10.13
INCOME FROM INVESTMENT OPERATIONS:
Net Investment Income (Loss) ................... (0.03) (0.05) (0.07) (0.10) (0.05)
Net Gain (Loss) on Securities
(realized and unrealized) ..................... 0.84 (1.23) (2.43) 0.64 (0.19)
---------- ---------- ---------- ---------- ----------
Total from Investment Operations ............... 0.81 (1.28) (2.50) 0.54 (0.24)
LESS DISTRIBUTIONS:
Dividends (from Net Investment Income) ......... -- -- -- -- --
Distributions (from Realized Gains) ............ -- -- (1.40) (0.36) --
Return of Capital .............................. -- -- (0.01) -- --
---------- ---------- ---------- ---------- ----------
Total Distributions ......................... -- -- (1.41) (0.36) --
---------- ---------- ---------- ---------- ----------
NET ASSET VALUE END OF PERIOD .................. $ 5.69 $ 4.88 $ 6.16 $ 10.07 $ 9.89
========== ========== ========== ========== ==========
TOTAL RETURN (a) ............................... 16.60% (20.78%) (28.35%) 5.55% (2.37%)
RATIOS/SUPPLEMENTAL DATA
Net Assets End of Period (thousands) ........... $ 6,651 $ 4,979 $ 4,230 $ 5,426 $ 4,507
Ratio of Expenses to Average Net Assets ........ 2.00% 2.02% 2.02% 2.02% 2.02%
Ratio of Net Investment Income (Loss) to Average
Net Assets ................................... (0.52%) (0.76%) (0.97%) (0.96%) (0.89%)
Portfolio Turnover Rate ........................ 54% 30% 23% 54% 45%
- --------------------------------------------------------------------------------
76 SEE ACCOMPANYING NOTES.
FINANCIAL HIGHLIGHTS (CONTINUED)
SELECTED DATA FOR EACH SHARE OF CAPITAL STOCK OUTSTANDING THROUGHOUT EACH PERIOD
SECURITY EQUITY FUND - GLOBAL SERIES (CLASS A)
FISCAL PERIOD ENDED SEPTEMBER 30
----------------------------------------------------------------------
2003(C) 2002(C)(I)(N) 2001(C) 2000(C) 1999(C)
---------- ------------- ---------- ---------- ----------
PER SHARE DATA
NET ASSET VALUE BEGINNING OF PERIOD ............ $ 9.49 $ 11.04 $ 18.86 $ 13.99 $ 11.23
INCOME FROM INVESTMENT OPERATIONS:
Net Investment Income (Loss) ................... (0.03) (0.05) (0.08) (0.11) 0.01
Net Gain (Loss) on Securities
(realized and unrealized) ..................... 2.22 (1.50) (4.33) 6.47 3.71
---------- ---------- ---------- ---------- ----------
Total from Investment Operations ............... 2.19 (1.55) (4.41) 6.36 3.72
LESS DISTRIBUTIONS:
Dividends (from Net Investment Income) ......... -- -- -- -- (0.01)
Distributions (from Realized Gains) ............ -- -- (3.41) (1.49) (0.91)
In Excess of Net Investment Income ............. -- -- -- -- (0.04)
---------- ---------- ---------- ---------- ----------
Total Distributions ......................... -- -- (3.41) (1.49) (0.96)
---------- ---------- ---------- ---------- ----------
NET ASSET VALUE END OF PERIOD .................. $ 11.68 $ 9.49 $ 11.04 $ 18.86 $ 13.99
========== ========== ========== ========== ==========
TOTAL RETURN (a) ............................... 23.08% (14.04%) (27.60%) 47.04% 34.39%
RATIOS/SUPPLEMENTAL DATA
Net Assets End of Period (thousands) ........... $ 42,711 $ 50,893 $ 48,089 $ 60,909 $ 28,292
Ratio of Expenses to Average Net Assets ........ 2.00% 1.85% 1.90% 1.92% 2.00%
Ratio of Net Investment Income (Loss) to Average
Net Assets ................................... (0.26%) (0.46%) (0.57%) (0.62%) 0.11%
Portfolio Turnover Rate ........................ 62% 36% 38% 92% 141%
SECURITY EQUITY FUND - GLOBAL SERIES (CLASS B)
FISCAL PERIOD ENDED SEPTEMBER 30
----------------------------------------------------------------------
2003(C) 2002(C)(I)(N) 2001(C) 2000(C) 1999(C)
---------- ------------- ---------- ---------- ----------
PER SHARE DATA
NET ASSET VALUE BEGINNING OF PERIOD ............ $ 8.89 $ 10.38 $ 18.00 $ 13.45 $ 10.89
INCOME FROM INVESTMENT OPERATIONS:
Net Investment Income (Loss) ................... (0.04) (0.10) (0.14) (0.17) (0.11)
Net Gain (Loss) on Securities
(realized and unrealized) ..................... 2.08 (1.39) (4.07) 6.21 3.58
---------- ---------- ---------- ---------- ----------
Total from Investment Operations ............... 2.04 (1.49) (4.21) 6.04 3.47
LESS DISTRIBUTIONS:
Dividends (from Net Investment Income) ......... -- -- -- -- --
Distributions (from Realized Gains) ............ -- -- (3.41) (1.49) (0.91)
---------- ---------- ---------- ---------- ----------
Total Distributions ......................... -- -- (3.41) (1.49) (0.91)
---------- ---------- ---------- ---------- ----------
NET ASSET VALUE END OF PERIOD .................. $ 10.93 $ 8.89 $ 10.38 $ 18.00 $ 13.45
========== ========== ========== ========== ==========
TOTAL RETURN (a) ............................... 22.95% (14.35%) (27.86%) 46.53% 33.04%
RATIOS/SUPPLEMENTAL DATA
Net Assets End of Period (thousands) ........... $ 16,461 $ 19,021 $ 23,533 $ 30,951 $ 20,591
Ratio of Expenses to Average Net Assets ........ 2.18% 2.28% 2.39% 2.29% 3.00%
Ratio of Net Investment Income (Loss) to Average
Net Assets ................................... 0.42% (0.89%) (1.07%) (0.96%) (0.87%)
Portfolio Turnover Rate ........................ 62% 36% 38% 92% 141%
- --------------------------------------------------------------------------------
77 SEE ACCOMPANYING NOTES.
FINANCIAL HIGHLIGHTS (CONTINUED)
SELECTED DATA FOR EACH SHARE OF CAPITAL STOCK OUTSTANDING THROUGHOUT EACH PERIOD
SECURITY EQUITY FUND - GLOBAL SERIES (CLASS C)
FISCAL PERIOD ENDED SEPTEMBER 30
----------------------------------------------------------------------
2003(C) 2002(C)(I)(K)(N) 2001(C) 2000(C) 1999(C)(E)
---------- ---------------- ---------- ---------- ----------
PER SHARE DATA
NET ASSET VALUE BEGINNING OF PERIOD ............ $ 9.14 $ 10.72 $ 18.55 $ 13.90 $ 12.68
INCOME FROM INVESTMENT OPERATIONS:
Net Investment Income (Loss) ................... (0.09) (0.15) (0.21) (0.26) (0.03)
Net Gain (Loss) on Securities
(realized and unrealized) ..................... 2.12 (1.43) (4.21) 6.40 1.25
---------- ---------- ---------- ---------- ----------
Total from Investment Operations ............... 2.03 (1.58) (4.42) 6.14 1.22
LESS DISTRIBUTIONS:
Dividends (from Net Investment Income) ......... -- -- -- -- --
Distributions (from Realized Gains) ............ -- -- (3.41) (1.49) --
---------- ---------- ---------- ---------- ----------
Total Distributions .......................... -- -- (3.41) (1.49) --
---------- ---------- ---------- ---------- ----------
NET ASSET VALUE END OF PERIOD .................. $ 11.17 $ 9.14 $ 10.72 $ 18.55 $ 13.90
========== ========== ========== ========== ==========
TOTAL RETURN (a) ............................... 22.21% (14.74%) (28.20%) 45.67% 9.62%
RATIOS/SUPPLEMENTAL DATA
Net Assets End of Period (thousands) ........... $ 5,326 $ 4,076 $ 3,569 $ 2,691 $ 202
Ratio of Expenses to Average Net Assets ........ 2.77% 2.74% 2.91% 2.92% 3.00%
Ratio of Net Investment Income (Loss) to Average
Net Assets ................................... (0.96%) (1.33%) (1.57%) (1.53%) (0.49%)
Portfolio Turnover Rate ........................ 62% 36% 38% 92% 90%
- --------------------------------------------------------------------------------
78 SEE ACCOMPANYING NOTES.
FINANCIAL HIGHLIGHTS (CONTINUED)
SELECTED DATA FOR EACH SHARE OF CAPITAL STOCK OUTSTANDING THROUGHOUT EACH PERIOD
SECURITY EQUITY FUND - SOCIAL AWARENESS SERIES (CLASS A)
FISCAL PERIOD ENDED SEPTEMBER 30
----------------------------------------------------------------------
2003(C) 2002(C) 2001(C) 2000(C) 1999(C)
---------- ---------- ---------- ---------- ----------
PER SHARE DATA
NET ASSET VALUE BEGINNING OF PERIOD ............ $ 14.75 $ 17.95 $ 26.04 $ 24.05 $ 19.37
INCOME FROM INVESTMENT OPERATIONS:
Net Investment Income (Loss) ................... (0.13) (0.11) (0.07) (0.13) (0.05)
Net Gain (Loss) on Securities
(realized and unrealized) ..................... 3.22 (3.09) (7.55) 2.50 5.09
---------- ---------- ---------- ---------- ----------
Total from Investment Operations ............... 3.09 (3.20) (7.62) 2.37 5.04
LESS DISTRIBUTIONS:
Dividends (from Net Investment Income) ......... -- -- -- -- --
Distributions (from Realized Gains) ............ -- -- (0.47) (0.38) (0.36)
---------- ---------- ---------- ---------- ----------
Total Distributions ......................... -- -- (0.47) (0.38) (0.36)
---------- ---------- ---------- ---------- ----------
NET ASSET VALUE END OF PERIOD .................. $ 17.84 $ 14.75 $ 17.95 $ 26.04 $ 24.05
========== ========== ========== ========== ==========
TOTAL RETURN (a) ............................... 20.95% (17.83%) (29.71%) 9.88% 26.12%
RATIOS/SUPPLEMENTAL DATA
Net Assets End of Period (thousands) ........... $ 9,243 $ 7,355 $ 10,909 $ 17,702 $ 13,403
Ratio of Expenses to Average Net Assets ........ 2.05% 1.66% 1.43% 1.42% 1.42%
Ratio of Net Investment Income (Loss) to Average
Net Assets ................................... (0.76%) (0.58%) (0.30%) (0.51%) (0.22%)
Portfolio Turnover Rate ........................ 26% 3% 17% 26% 26%
SECURITY EQUITY FUND - SOCIAL AWARENESS SERIES (CLASS B)
FISCAL PERIOD ENDED SEPTEMBER 30
----------------------------------------------------------------------
2003(C) 2002(C) 2001(C) 2000(C) 1999(C)
---------- ---------- ---------- ---------- ----------
PER SHARE DATA
NET ASSET VALUE BEGINNING OF PERIOD ............ $ 13.85 $ 17.01 $ 24.96 $ 23.35 $ 19.01
INCOME FROM INVESTMENT OPERATIONS:
Net Investment Income (Loss) ................... (0.24) (0.26) (0.28) (0.38) (0.30)
Net Gain (Loss) on Securities
(realized and unrealized) ..................... 3.02 (2.90) (7.20) 2.37 5.00
---------- ---------- ---------- ---------- ----------
Total from Investment Operations ............... 2.78 (3.16) (7.48) 1.99 4.70
LESS DISTRIBUTIONS:
Dividends (from Net Investment Income) ......... -- -- -- -- --
Distributions (from Realized Gains) ............ -- -- (0.47) (0.38) (0.36)
---------- ---------- ---------- ---------- ----------
Total Distributions ......................... -- -- (0.47) (0.38) (0.36)
---------- ---------- ---------- ---------- ----------
NET ASSET VALUE END OF PERIOD .................. $ 16.63 $ 13.85 $ 17.01 $ 24.96 $ 23.35
========== ========== ========== ========== ==========
TOTAL RETURN (a) ............................... 20.07% (18.58%) (30.44%) 8.53% 24.81%
RATIOS/SUPPLEMENTAL DATA
Net Assets End of Period (thousands) ........... $ 6,153 $ 5,999 $ 8,969 $ 12,633 $ 9,136
Ratio of Expenses to Average Net Assets ........ 2.80% 2.57% 2.43% 2.43% 2.51%
Ratio of Net Investment Income (Loss) to Average
Net Assets ................................... (1.51%) (1.49%) (1.31%) (1.52%) (1.30%)
Portfolio Turnover Rate ........................ 26% 3% 17% 26% 26%
- --------------------------------------------------------------------------------
79 SEE ACCOMPANYING NOTES.
FINANCIAL HIGHLIGHTS (CONTINUED)
SELECTED DATA FOR EACH SHARE OF CAPITAL STOCK OUTSTANDING THROUGHOUT EACH PERIOD
SECURITY EQUITY FUND - SOCIAL AWARENESS SERIES (CLASS C)
FISCAL PERIOD ENDED SEPTEMBER 30
----------------------------------------------------------------
2003(C) 2002(C)(K) 2001(C) 2000(C) 1999(C)(E)
---------- ---------- ---------- ---------- ----------
PER SHARE DATA
NET ASSET VALUE BEGINNING OF PERIOD ............ $ 14.17 $ 17.40 $ 25.50 $ 23.87 $ 24.47
INCOME FROM INVESTMENT OPERATIONS:
Net Investment Income (Loss) ................... (0.24) (0.26) (0.28) (0.41) (0.22)
Net Gain (Loss) on Securities
(realized and unrealized) ..................... 3.08 (2.97) (7.35) 2.42 (0.38)
---------- ---------- ---------- ---------- ----------
Total from Investment Operations ............... 2.84 (3.23) (7.63) 2.01 (0.60)
LESS DISTRIBUTIONS:
Dividends (from Net Investment Income) ......... -- -- -- -- --
Distributions (from Realized Gains) ............ -- -- (0.47) (0.38) --
---------- ---------- ---------- ---------- ----------
Total Distributions ......................... -- -- (0.47) (0.38) --
---------- ---------- ---------- ---------- ----------
NET ASSET VALUE END OF PERIOD .................. $ 17.01 $ 14.17 $ 17.40 $ 25.50 $ 23.87
========== ========== ========== ========== ==========
TOTAL RETURN (a) ............................... 20.04% (18.56%) (30.39%) 8.43% (2.45%)
RATIOS/SUPPLEMENTAL DATA
Net Assets End of Period (thousands) ........... $ 1,548 $ 1,123 $ 1,126 $ 918 $ 405
Ratio of Expenses to Average Net Assets ........ 2.80% 2.57% 2.45% 2.55% 2.66%
Ratio of Net Investment Income (Loss) to Average
Net Assets ................................... (1.51%) (1.48%) (1.33%) (1.64%) (1.46%)
Portfolio Turnover Rate ........................ 26% 3% 17% 26% 33%
- --------------------------------------------------------------------------------
80 SEE ACCOMPANYING NOTES.
FINANCIAL HIGHLIGHTS (CONTINUED)
SELECTED DATA FOR EACH SHARE OF CAPITAL STOCK OUTSTANDING THROUGHOUT EACH PERIOD
SECURITY EQUITY FUND - MID CAP VALUE SERIES (CLASS A)
FISCAL PERIOD ENDED SEPTEMBER 30
----------------------------------------------------------------------
2003(C) 2002(C) 2001(C) 2000(C) 1999(C)
---------- ---------- ---------- ---------- ----------
PER SHARE DATA
NET ASSET VALUE BEGINNING OF PERIOD ............ $ 16.90 $ 18.04 $ 20.75 $ 16.60 $ 12.07
INCOME FROM INVESTMENT OPERATIONS:
Net Investment Income (Loss) ................... (0.07) (0.04) -- (0.04) (0.07)
Net Gain (Loss) on Securities
(realized and unrealized) ..................... 7.65 (0.78) (0.90) 4.89 4.65
---------- ---------- ---------- ---------- ----------
Total from Investment Operations ............... 7.58 (0.82) (0.90) 4.85 4.58
LESS DISTRIBUTIONS:
Dividends (from Net Investment Income) ......... -- -- -- -- --
Distributions (from Realized Gains) ............ -- (0.21) (1.81) (0.70) (0.05)
Return of Capital .............................. -- (0.11) -- -- --
---------- ---------- ---------- ---------- ----------
Total Distributions ......................... -- (0.32) (1.81) (0.70) (0.05)
---------- ---------- ---------- ---------- ----------
NET ASSET VALUE END OF PERIOD .................. $ 24.48 $ 16.90 $ 18.04 $ 20.75 $ 16.60
========== ========== ========== ========== ==========
TOTAL RETURN (a) ............................... 44.85% (4.89%) (4.54%) 30.46% 38.06%
RATIOS/SUPPLEMENTAL DATA
Net Assets End of Period (thousands) ........... $ 113,822 $ 68,544 $ 50,541 $ 34,458 $ 22,804
Ratio of Expenses to Average Net Assets ........ 1.65% 1.45% 1.30% 1.29% 1.33%
Ratio of Net Investment Income (Loss) to Average
Net Assets ................................... (0.33%) (0.20%) 0.01% (0.25%) (0.44%)
Portfolio Turnover Rate ........................ 52% 51% 55% 69% 79%
SECURITY EQUITY FUND - MID CAP VALUE SERIES (CLASS B)
FISCAL PERIOD ENDED SEPTEMBER 30
----------------------------------------------------------------------
2003(C) 2002(C) 2001(C) 2000(C) 1999(C)
---------- ---------- ---------- ---------- ----------
PER SHARE DATA
NET ASSET VALUE BEGINNING OF PERIOD ............ $ 15.99 $ 17.26 $ 20.11 $ 16.26 $ 11.94
INCOME FROM INVESTMENT OPERATIONS:
Net Investment Income (Loss) ................... (0.20) (0.21) (0.19) (0.22) (0.22)
Net Gain (Loss) on Securities
(realized and unrealized) ..................... 7.20 (0.74) (0.85) 4.77 4.59
---------- ---------- ---------- ---------- ----------
Total from Investment Operations ............... 7.00 (0.95) (1.04) 4.55 4.37
LESS DISTRIBUTIONS:
Dividends (from Net Investment Income) ......... -- -- -- -- --
Distributions (from Realized Gains) ............ -- (0.21) (1.81) (0.70) (0.05)
Return of Capital .............................. -- (0.11) -- -- --
---------- ---------- ---------- ---------- ----------
Total Distributions ......................... -- (0.32) (1.81) (0.70) (0.05)
---------- ---------- ---------- ---------- ----------
NET ASSET VALUE END OF PERIOD .................. $ 22.99 $ 15.99 $ 17.26 $ 20.11 $ 16.26
========== ========== ========== ========== ==========
TOTAL RETURN (a) ............................... 43.78% (5.88%) (5.45%) 29.21% 36.71%
RATIOS/SUPPLEMENTAL DATA
Net Assets End of Period (thousands) ........... $ 53,947 $ 37,136 $ 26,967 $ 14,041 $ 9,682
Ratio of Expenses to Average Net Assets ........ 2.40% 2.34% 2.30% 2.32% 2.37%
Ratio of Net Investment Income (Loss) to Average
Net Assets ................................... (1.08%) (1.09%) (0.98%) (1.27%) (1.50%)
Portfolio Turnover Rate ........................ 52% 51% 55% 69% 79%
- --------------------------------------------------------------------------------
81 SEE ACCOMPANYING NOTES.
FINANCIAL HIGHLIGHTS (CONTINUED)
SELECTED DATA FOR EACH SHARE OF CAPITAL STOCK OUTSTANDING THROUGHOUT EACH PERIOD
SECURITY EQUITY FUND - MID CAP VALUE SERIES (CLASS C)
FISCAL PERIOD ENDED SEPTEMBER 30
----------------------------------------------------------------------
2003(C) 2002(C)(K) 2001(C) 2000(C) 1999(C)(E)
---------- ---------- ---------- ---------- ----------
PER SHARE DATA
NET ASSET VALUE BEGINNING OF PERIOD ............ $ 16.26 $ 17.53 $ 20.39 $ 16.51 $ 14.54
INCOME FROM INVESTMENT OPERATIONS:
Net Investment Income (Loss) ................... (0.21) (0.21) (0.19) (0.22) (0.13)
Net Gain (Loss) on Securities
(realized and unrealized) ..................... 7.32 (0.74) (0.86) 4.80 2.10
---------- ---------- ---------- ---------- ----------
Total from Investment Operations ............... 7.11 (0.95) (1.05) 4.58 1.97
LESS DISTRIBUTIONS:
Dividends (from Net Investment Income) ......... -- -- -- -- --
Distributions (from Realized Gains) ............ -- (0.21) (1.81) (0.70) --
Return of Capital .............................. -- (0.11) -- -- --
---------- ---------- ---------- ---------- ----------
Total Distributions ......................... -- (0.32) (1.81) (0.70) --
---------- ---------- ---------- ---------- ----------
NET ASSET VALUE END OF PERIOD .................. $ 23.37 $ 16.26 $ 17.53 $ 20.39 $ 16.51
========== ========== ========== ========== ==========
TOTAL RETURN (a) ............................... 43.73% (5.79%) (5.42%) 28.93% 13.55%
RATIOS/SUPPLEMENTAL DATA
Net Assets End of Period (thousands) ........... $ 32,999 $ 18,785 $ 6,976 $ 3,069 $ 1,138
Ratio of Expenses to Average Net Assets ........ 2.40% 2.35% 2.30% 2.36% 2.38%
Ratio of Net Investment Income (Loss) to Average
Net Assets ................................... (1.08%) (1.06%) (0.98%) (1.28%) (1.36%)
Portfolio Turnover Rate ........................ 52% 51% 55% 69% 92%
- --------------------------------------------------------------------------------
82 SEE ACCOMPANYING NOTES.
FINANCIAL HIGHLIGHTS (CONTINUED)
SELECTED DATA FOR EACH SHARE OF CAPITAL STOCK OUTSTANDING THROUGHOUT EACH PERIOD
SECURITY EQUITY FUND - SMALL CAP GROWTH SERIES (CLASS A)
FISCAL PERIOD ENDED SEPTEMBER 30
----------------------------------------------------------------------
2003(B)(C) 2002(C)(L) 2001(C) 2000(B)(C) 1999(B)(C)
---------- ---------- ---------- ---------- ----------
PER SHARE DATA
NET ASSET VALUE BEGINNING OF PERIOD ............ $ 7.88 $ 9.80 $ 22.08 $ 12.98 $ 8.70
INCOME FROM INVESTMENT OPERATIONS:
Net Investment Income (Loss) ................... (0.18) (0.20) (0.18) (0.19) --
Net Gain (Loss) on Securities
(realized and unrealized) ..................... 3.93 (1.72) (10.78) 9.75 4.28
---------- ---------- ---------- ---------- ----------
Total from Investment Operations ............... 3.75 (1.92) (10.96) 9.56 4.28
LESS DISTRIBUTIONS:
Dividends (from Net Investment Income) ......... -- -- -- -- --
Distributions (from Realized Gains) ............ -- -- (1.32) (0.46) --
---------- ---------- ---------- ---------- ----------
Total Distributions ......................... -- -- (1.32) (0.46) --
---------- ---------- ---------- ---------- ----------
NET ASSET VALUE END OF PERIOD .................. $ 11.63 $ 7.88 $ 9.80 $ 22.08 $ 12.98
========== ========== ========== ========== ==========
TOTAL RETURN (a) ............................... 47.59% (19.59%) (51.94%) 74.58% 49.20%
RATIOS/SUPPLEMENTAL DATA
Net Assets End of Period (thousands) ........... $ 14,406 $ 8,350 $ 17,235 $ 38,172 $ 16,877
Ratio of Expenses to Average Net Assets ........ 2.25% 2.14% 1.91% 1.55% 0.49%
Ratio of Net Investment Income (Loss) to Average
Net Assets ................................... (2.01%) (1.93%) (1.32%) (0.97%) 0.03%
Portfolio Turnover Rate ........................ 206% 302% 394% 318% 361%
SECURITY EQUITY FUND - SMALL CAP GROWTH SERIES (CLASS B)
FISCAL PERIOD ENDED SEPTEMBER 30
----------------------------------------------------------------------
2003(B)(C) 2002(C)(L) 2001(C) 2000(B)(C) 1999(B)(C)
---------- ---------- ---------- ---------- ----------
PER SHARE DATA
NET ASSET VALUE BEGINNING OF PERIOD ............ $ 7.47 $ 9.37 $ 21.34 $ 12.69 $ 8.63
INCOME FROM INVESTMENT OPERATIONS:
Net Investment Income (Loss) ................... (0.24) (0.26) (0.28) (0.31) (0.14)
Net Gain (Loss) on Securities
(realized and unrealized) ..................... 3.71 (1.64) (10.37) 9.42 4.20
---------- ---------- ---------- ---------- ----------
Total from Investment Operations ............ 3.47 (1.90) (10.65) 9.11 4.06
LESS DISTRIBUTIONS:
Dividends (from Net Investment Income) ......... -- -- -- -- --
Distributions (from Realized Gains) ............ -- -- (1.32) (0.46) --
---------- ---------- ---------- ---------- ----------
Total Distributions ......................... -- -- (1.32) (0.46) --
---------- ---------- ---------- ---------- ----------
NET ASSET VALUE END OF PERIOD .................. $ 10.94 $ 7.47 $ 9.37 $ 21.34 $ 12.69
========== ========== ========== ========== ==========
TOTAL RETURN (a) ............................... 46.45% (20.28%) (52.31%) 72.70% 47.05%
RATIOS/SUPPLEMENTAL DATA
Net Assets End of Period (thousands) ........... $ 6,838 $ 4,292 $ 6,173 $ 11,688 $ 2,430
Ratio of Expenses to Average Net Assets ........ 3.00% 2.90% 2.67% 2.44% 1.94%
Ratio of Net Investment Income (Loss) to Average
Net Assets ................................... (2.76%) (2.69%) (2.07%) (1.81%) (1.41%)
Portfolio Turnover Rate ........................ 206% 302% 394% 318% 361%
- --------------------------------------------------------------------------------
83 SEE ACCOMPANYING NOTES.
FINANCIAL HIGHLIGHTS (CONTINUED)
SELECTED DATA FOR EACH SHARE OF CAPITAL STOCK OUTSTANDING THROUGHOUT EACH PERIOD
SECURITY EQUITY FUND - SMALL CAP GROWTH SERIES (CLASS C)
FISCAL PERIOD ENDED SEPTEMBER 30
-------------------------------------------------------------------
2003(B)(C) 2002(C)(K)(L) 2001(C) 2000(B)(C) 1999(B)(C)(E)
---------- ------------ ---------- ---------- -------------
PER SHARE DATA
NET ASSET VALUE BEGINNING OF PERIOD ............ $ 7.61 $ 9.53 $ 21.74 $ 12.86 $ 11.16
INCOME FROM INVESTMENT OPERATIONS:
Net Investment Income (Loss) ................... (0.24) (0.26) (0.28) (0.35) (0.07)
Net Gain (Loss) on Securities
(realized and unrealized) ..................... 3.78 (1.66) (10.61) 9.69 1.77
---------- ---------- ---------- ---------- ----------
Total from Investment Operations ............... 3.54 (1.92) (10.89) 9.34 1.70
LESS DISTRIBUTIONS:
Dividends (from Net Investment Income) ......... -- -- -- -- --
Distributions (from Realized Gains) ............ -- -- (1.32) (0.46) --
---------- ---------- ---------- ---------- ----------
Total Distributions ......................... -- -- (1.32) (0.46) --
---------- ---------- ---------- ---------- ----------
NET ASSET VALUE END OF PERIOD .................. $ 11.15 $ 7.61 $ 9.53 $ 21.74 $ 12.86
========== ========== ========== ========== ==========
TOTAL RETURN (a) ............................... 46.52% (20.15%) (52.46%) 73.54% 15.23%
RATIOS/SUPPLEMENTAL DATA
Net Assets End of Period (thousands) ........... $ 3,533 $ 2,164 $ 2,339 $ 3,741 $ 890
Ratio of Expenses to Average Net Assets ........ 3.00% 2.91% 2.68% 2.39% 1.47%
Ratio of Net Investment Income (Loss) to Average
Net Assets ................................... (2.76%) (2.69%) (2.09%) (1.81%) (0.95%)
Portfolio Turnover Rate ........................ 206% 302% 394% 318% 374%
- --------------------------------------------------------------------------------
84 SEE ACCOMPANYING NOTES.
FINANCIAL HIGHLIGHTS (CONTINUED)
SELECTED DATA FOR EACH SHARE OF CAPITAL STOCK OUTSTANDING THROUGHOUT EACH PERIOD
SECURITY EQUITY FUND - ENHANCED INDEX SERIES (CLASS A)
FISCAL PERIOD ENDED SEPTEMBER 30
---------------------------------------------------------------------
2003(b)(c)(p) 2002(c) 2001(c) 2000(c) 1999(c)(d)
------------- --------- --------- --------- ----------
PER SHARE DATA
NET ASSET VALUE BEGINNING OF PERIOD ............ $ 6.30 $ 8.03 $ 11.29 $ 10.04 $ 10.00
INCOME FROM INVESTMENT OPERATIONS:
Net Investment Income (Loss) ................... -- (0.01) -- -- 0.03
Net Gain (Loss) on Securities
(realized and unrealized) ..................... 1.39 (1.72) (3.17) 1.37 0.01
--------- --------- --------- --------- ---------
Total from Investment Operations ............... 1.39 (1.73) (3.17) 1.37 0.04
LESS DISTRIBUTIONS:
Dividends (from Net Investment Income) ......... -- -- -- -- --
Distributions (from Realized Gains) ............ -- -- (0.09) (0.12) --
--------- --------- --------- --------- ---------
Total Distributions ......................... -- -- (0.09) (0.12) --
--------- --------- --------- --------- ---------
NET ASSET VALUE END OF PERIOD .................. $ 7.69 $ 6.30 $ 8.03 $ 11.29 $ 10.04
========= ========= ========= ========= =========
TOTAL RETURN (A) ............................... 22.06% (21.54%) (28.27%) 13.65% 0.40%
RATIOS/SUPPLEMENTAL DATA
Net Assets End of Period (thousands) ........... $ 6,377 $ 7,171 $ 6,699 $ 8,219 $ 7,589
Ratio of Expenses to Average Net Assets ........ 1.73% 1.61% 1.42% 1.44% 1.48%
Ratio of Net Investment Income (Loss) to Average
Net Assets ................................... 0.00% (0.10%) 0.02% (0.05%) 0.39%
Portfolio Turnover Rate ........................ 60% 62% 40% 73% 68%
SECURITY EQUITY FUND - ENHANCED INDEX SERIES (CLASS B)
FISCAL PERIOD ENDED SEPTEMBER 30
-------------------------------------------------------------------
2003(b)(c)(p) 2002(c) 2001(c) 2000(c) 1999(c)(d)
------------- --------- --------- ---------- ----------
PER SHARE DATA
NET ASSET VALUE BEGINNING OF PERIOD ............ $ 6.11 $ 7.87 $ 11.15 $ 9.99 $ 10.00
INCOME FROM INVESTMENT OPERATIONS:
Net Investment Income (Loss) ................... (0.05) (0.07) (0.08) (0.09) (0.02)
Net Gain (Loss) on Securities
(realized and unrealized) ..................... 1.34 (1.69) (3.11) 1.37 0.01
--------- --------- --------- ---------- ---------
Total from Investment Operations ............... 1.29 (1.76) (3.19) 1.28 (0.01)
LESS DISTRIBUTIONS:
Dividends (from Net Investment Income) ......... -- -- -- -- --
Distributions (from Realized Gains) ............ -- -- (0.09) (0.12) --
--------- --------- --------- ---------- ---------
Total Distributions ......................... -- -- (0.09) (0.12) --
--------- --------- --------- ---------- ---------
NET ASSET VALUE END OF PERIOD .................. $ 7.40 $ 6.11 $ 7.87 $ 11.15 $ 9.99
========= ========= ========= ========== =========
TOTAL RETURN (A) ............................... 21.11% (22.36%) (28.81%) 12.82% (0.10%)
RATIOS/SUPPLEMENTAL DATA
Net Assets End of Period (thousands) ........... $ 4,929 $ 6,125 $ 7,360 $ 10,960 $ 9,591
Ratio of Expenses to Average Net Assets ........ 2.48% 2.35% 2.17% 2.18% 2.20%
Ratio of Net Investment Income (Loss) to Average
Net Assets ................................... (0.75%) (0.84%) (0.74%) (0.79%) (0.33%)
Portfolio Turnover Rate ........................ 60% 62% 40% 73% 68%
- --------------------------------------------------------------------------------
85 SEE ACCOMPANYING NOTES.
FINANCIAL HIGHLIGHTS (CONTINUED)
SELECTED DATA FOR EACH SHARE OF CAPITAL STOCK OUTSTANDING THROUGHOUT EACH PERIOD
SECURITY EQUITY FUND - ENHANCED INDEX SERIES (CLASS C)
FISCAL PERIOD ENDED SEPTEMBER 30
--------------------------------------------------------------------
2003(b)(c)(p) 2002(c)(k) 2001(c) 2000(c) 1999(c)(d)
------------- ----------- --------- ---------- ----------
PER SHARE DATA
NET ASSET VALUE BEGINNING OF PERIOD ............ $ 6.12 $ 7.88 $ 11.16 $ 10.00 $ 10.00
INCOME FROM INVESTMENT OPERATIONS:
Net Investment Income (Loss) ................... (0.05) (0.07) (0.08) (0.09) (0.01)
Net Gain (Loss) on Securities
(realized and unrealized) ..................... 1.35 (1.69) (3.11) 1.37 0.01
--------- --------- --------- --------- ---------
Total from Investment Operations ............... 1.30 (1.76) (3.19) 1.28 --
LESS DISTRIBUTIONS:
Dividends (from Net Investment Income) ......... -- -- -- -- --
Distributions (from Realized Gains) ............ -- -- (0.09) (0.12) --
--------- --------- --------- --------- ---------
Total Distributions ......................... -- -- (0.09) (0.12) --
--------- --------- --------- --------- ---------
NET ASSET VALUE END OF PERIOD .................. $ 7.42 $ 6.12 $ 7.88 $ 11.16 $ 10.00
========= ========= ========= ========= =========
TOTAL RETURN (A) ............................... 21.24% (22.34%) (28.78%) 12.69% 0.00%
RATIOS/SUPPLEMENTAL DATA
Net Assets End of Period (thousands) ........... $ 2,991 $ 4,129 $ 4,840 $ 7,092 $ 5,205
Ratio of Expenses to Average Net Assets ........ 2.47% 2.35% 2.17% 2.15% 2.05%
Ratio of Net Investment Income (Loss) to Average
Net Assets ................................... (0.74%) (0.85%) (0.74%) (0.77%) (0.18%)
Portfolio Turnover Rate ........................ 60% 62% 40% 73% 68%
- --------------------------------------------------------------------------------
86 SEE ACCOMPANYING NOTES.
FINANCIAL HIGHLIGHTS (CONTINUED)
SELECTED DATA FOR EACH SHARE OF CAPITAL STOCK OUTSTANDING THROUGHOUT EACH PERIOD
SECURITY EQUITY FUND - INTERNATIONAL SERIES (CLASS A)
FISCAL PERIOD ENDED SEPTEMBER 30
-------------------------------------------------------------------
2003(b)(c) 2002(b)(c)(m) 2001(b)(c)(g) 2000(b)(c) 1999(b)(c)(d)
---------- ------------- ------------- ---------- -------------
PER SHARE DATA
NET ASSET VALUE BEGINNING OF PERIOD ............ $ 5.53 $ 6.87 $ 11.01 $ 9.69 $ 10.00
INCOME FROM INVESTMENT OPERATIONS:
Net Investment Income (Loss) ................... 0.02 (0.06) (0.09) (0.13) (0.03)
Net Gain (Loss) on Securities
(realized and unrealized) ..................... 0.95 (1.28) (3.65) 1.45 (0.28)
--------- --------- --------- --------- ---------
Total from Investment Operations ............... 0.97 (1.34) (3.74) 1.32 (0.31)
LESS DISTRIBUTIONS:
Dividends (from Net Investment Income) ......... -- -- -- -- --
Distributions (from Realized Gains) ............ -- -- (0.40) -- --
--------- --------- --------- --------- ---------
Total Distributions ......................... -- -- (0.40) -- --
--------- --------- --------- --------- ---------
NET ASSET VALUE END OF PERIOD .................. $ 6.50 $ 5.53 $ 6.87 $ 11.01 $ 9.69
========= ========= ========= ========= =========
TOTAL RETURN (A) ............................... 17.54% (19.51%) (35.01%) 13.62% (3.10%)
RATIOS/SUPPLEMENTAL DATA
Net Assets End of Period (thousands) ........... $ 4,361 $ 3,093 $ 2,934 $ 4,414 $ 2,928
Ratio of Expenses to Average Net Assets ........ 2.50% 2.50% 2.51% 2.46% 2.50%
Ratio of Net Investment Income (Loss) to Average
Net Assets ................................... 0.33% (0.82%) (0.98%) (1.08%) (0.41%)
Portfolio Turnover Rate ........................ 55% 252% 170% 116% 115%
SECURITY EQUITY FUND - INTERNATIONAL SERIES (CLASS B)
FISCAL PERIOD ENDED SEPTEMBER 30
-------------------------------------------------------------------
2003(b)(c) 2002(b)(c)(m) 2001(b)(c)(g) 2000(b)(c) 1999(b)(c)(d)
---------- ------------- ------------- ---------- -------------
PER SHARE DATA
NET ASSET VALUE BEGINNING OF PERIOD ............ $ 5.38 $ 6.74 $ 10.88 $ 9.65 $ 10.00
INCOME FROM INVESTMENT OPERATIONS:
Net Investment Income (Loss) ................... (0.02) (0.10) (0.15) (0.22) (0.07)
Net Gain (Loss) on Securities
(realized and unrealized) ..................... 0.93 (1.26) (3.59) 1.45 (0.28)
--------- --------- --------- --------- ---------
Total from Investment Operations ............... 0.91 (1.36) (3.74) 1.23 (0.35)
LESS DISTRIBUTIONS:
Dividends (from Net Investment Income) ......... -- -- -- -- --
Distributions (from Realized Gains) ............ -- -- (0.40) -- --
--------- --------- --------- --------- ---------
Total Distributions ......................... -- -- (0.40) -- --
--------- --------- --------- --------- ---------
NET ASSET VALUE END OF PERIOD .................. $ 6.29 $ 5.38 $ 6.74 $ 10.88 $ 9.65
========= ========= ========= ========= =========
TOTAL RETURN (A) ............................... 16.91% (20.18%) (35.45%) 12.75% (3.50%)
RATIOS/SUPPLEMENTAL DATA
Net Assets End of Period (thousands) ........... $ 2,204 $ 1,696 $ 1,685 $ 2,520 $ 2,028
Ratio of Expenses to Average Net Assets ........ 3.25% 3.25% 3.25% 3.26% 3.19%
Ratio of Net Investment Income (Loss) to Average
Net Assets ................................... (0.39%) (1.55%) (1.73%) (1.92%) (1.09%)
Portfolio Turnover Rate ........................ 55% 252% 170% 116% 115%
- --------------------------------------------------------------------------------
87 SEE ACCOMPANYING NOTES.
FINANCIAL HIGHLIGHTS (CONTINUED)
SELECTED DATA FOR EACH SHARE OF CAPITAL STOCK OUTSTANDING THROUGHOUT EACH PERIOD
SECURITY EQUITY FUND - INTERNATIONAL SERIES (CLASS C)
FISCAL PERIOD ENDED SEPTEMBER 30
----------------------------------------------------------------------
2003(b)(c) 2002(b)(c)(k)(m) 2001(b)(c)(g) 2000(b)(c) 1999(b)(c)(d)
---------- ---------------- ------------- ---------- -------------
PER SHARE DATA
NET ASSET VALUE BEGINNING OF PERIOD ............ $ 5.40 $ 6.76 $ 10.92 $ 9.68 $ 10.00
INCOME FROM INVESTMENT OPERATIONS:
Net Investment Income (Loss) ................... (0.02) (0.11) (0.15) (0.21) (0.04)
Net Gain (Loss) on Securities
(realized and unrealized) ..................... 0.93 (1.25) (3.61) 1.45 (0.28)
--------- --------- --------- --------- ---------
Total from Investment Operations ............... 0.91 (1.36) (3.76) 1.24 (0.32)
LESS DISTRIBUTIONS:
Dividends (from Net Investment Income) ......... -- -- -- -- --
Distributions (from Realized Gains) ............ -- -- (0.40) -- --
--------- --------- --------- --------- ---------
Total Distributions ......................... -- -- (0.40) -- --
--------- --------- --------- --------- ---------
NET ASSET VALUE END OF PERIOD .................. $ 6.31 $ 5.40 $ 6.76 $ 10.92 $ 9.68
========= ========= ========= ========= =========
TOTAL RETURN (A) ............................... 16.85% (20.12%) (35.50%) 12.81% (3.20%)
RATIOS/SUPPLEMENTAL DATA
Net Assets End of Period (thousands) ........... $ 2,594 $ 1,809 $ 2,244 $ 3,564 $ 2,493
Ratio of Expenses to Average Net Assets ........ 3.25% 3.25% 3.25% 3.11% 2.78%
Ratio of Net Investment Income (Loss) to Average
Net Assets ................................... (0.42%) (1.57%) (1.75%) (1.76%) (0.71%)
Portfolio Turnover Rate ........................ 55% 252% 170% 116% 115%
- --------------------------------------------------------------------------------
88 SEE ACCOMPANYING NOTES.
FINANCIAL HIGHLIGHTS (CONTINUED)
SELECTED DATA FOR EACH SHARE OF CAPITAL STOCK OUTSTANDING THROUGHOUT EACH PERIOD
SECURITY EQUITY FUND - SELECT 25(R) SERIES (CLASS A)
FISCAL PERIOD ENDED SEPTEMBER 30
----------------------------------------------------------------------
2003(c) 2002(c) 2001(c) 2000(c) 1999(c)(d)
---------- ---------- ---------- ---------- ----------
PER SHARE DATA
NET ASSET VALUE BEGINNING OF PERIOD ............ $ 6.52 $ 7.58 $ 11.34 $ 10.53 $ 10.00
INCOME FROM INVESTMENT OPERATIONS:
Net Investment Income (Loss) ................... (0.05) (0.07) (0.06) (0.09) (0.05)
Net Gain (Loss) on Securities
(realized and unrealized) ..................... 0.80 (0.99) (3.70) 0.90 0.58
---------- ---------- ---------- ---------- ----------
Total from Investment Operations ............... 0.75 (1.06) (3.76) 0.81 0.53
LESS DISTRIBUTIONS:
Dividends (from Net Investment Income) ......... -- -- -- -- --
Distributions (from Realized Gains) ............ -- -- -- -- --
---------- ---------- ---------- ---------- ----------
Total Distributions ......................... -- -- -- -- --
---------- ---------- ---------- ---------- ----------
NET ASSET VALUE END OF PERIOD .................. $ 7.27 $ 6.52 $ 7.58 $ 11.34 $ 10.53
========== ========== ========== ========== ==========
TOTAL RETURN (A) ............................... 11.50% (13.98%) (33.16%) 7.69% 5.30%
RATIOS/SUPPLEMENTAL DATA
Net Assets End of Period (thousands) ........... $ 10,396 $ 11,933 $ 14,347 $ 22,006 $ 13,975
Ratio of Expenses to Average Net Assets ........ 1.63% 1.46% 1.39% 1.35% 1.48%
Ratio of Net Investment Income (Loss) to Average
Net Assets ................................... (0.70%) (0.81%) (0.60%) (0.74%) (0.75%)
Portfolio Turnover Rate ........................ 54% 33% 44% 89% 14%
SECURITY EQUITY FUND - SELECT 25(R) SERIES (CLASS B)
FISCAL PERIOD ENDED SEPTEMBER 30
----------------------------------------------------------------------
2003(c) 2002(c) 2001(c) 2000(c) 1999(c)(d)
---------- ---------- ---------- ---------- ----------
PER SHARE DATA
NET ASSET VALUE BEGINNING OF PERIOD ............ $ 6.36 $ 7.44 $ 11.22 $ 10.52 $ 10.00
INCOME FROM INVESTMENT OPERATIONS:
Net Investment Income (Loss) ................... (0.10) (0.13) (0.13) (0.17) (0.09)
Net Gain (Loss) on Securities
(realized and unrealized) ..................... 0.78 (0.95) (3.65) 0.87 0.61
---------- ---------- ---------- ---------- ----------
Total from Investment Operations ............... 0.68 (1.08) (3.78) 0.70 0.52
LESS DISTRIBUTIONS:
Dividends (from Net Investment Income) ......... -- -- -- -- --
Distributions (from Realized Gains) ............ -- -- -- -- --
---------- ---------- ---------- ---------- ----------
Total Distributions ......................... -- -- -- -- --
---------- ---------- ---------- ---------- ----------
NET ASSET VALUE END OF PERIOD .................. $ 7.04 $ 6.36 $ 7.44 $ 11.22 $ 10.52
========== ========== ========== ========== ==========
TOTAL RETURN (A) ............................... 10.69% (14.52%) (33.69%) 6.65% 5.20%
RATIOS/SUPPLEMENTAL DATA
Net Assets End of Period (thousands) ........... $ 8,203 $ 8,566 $ 11,519 $ 18,199 $ 12,938
Ratio of Expenses to Average Net Assets ........ 2.38% 2.21% 2.14% 2.11% 2.19%
Ratio of Net Investment Income (Loss) to Average
Net Assets ................................... (1.45%) (1.56%) (1.35%) (1.49%) (1.47%)
Portfolio Turnover Rate ........................ 54% 33% 44% 89% 14%
- --------------------------------------------------------------------------------
89 SEE ACCOMPANYING NOTES.
FINANCIAL HIGHLIGHTS (CONTINUED)
SELECTED DATA FOR EACH SHARE OF CAPITAL STOCK OUTSTANDING THROUGHOUT EACH PERIOD
SECURITY EQUITY FUND - SELECT 25(R) SERIES (CLASS C)
FISCAL PERIOD ENDED SEPTEMBER 30
-----------------------------------------------------------------
2003(c) 2002(c)(k) 2001(c) 2000(c) 1999(c)(d)
--------- ---------- --------- --------- ---------
PER SHARE DATA
NET ASSET VALUE BEGINNING OF PERIOD ............ $ 6.38 $ 7.47 $ 11.26 $ 10.55 $ 10.00
INCOME FROM INVESTMENT OPERATIONS:
Net Investment Income (Loss) ................... (0.10) (0.13) (0.13) (0.17) (0.09)
Net Gain (Loss) on Securities
(realized and unrealized) ..................... 0.78 (0.96) (3.66) 0.88 0.64
--------- --------- --------- --------- ---------
Total from Investment Operations ............... 0.68 (1.09) (3.79) 0.71 0.55
LESS DISTRIBUTIONS:
Dividends (from Net Investment Income) ......... -- -- -- -- --
Distributions (from Realized Gains) ............ -- -- -- -- --
--------- --------- --------- --------- ---------
Total Distributions ......................... -- -- -- -- --
--------- --------- --------- --------- ---------
NET ASSET VALUE END OF PERIOD .................. $ 7.06 $ 6.38 $ 7.47 $ 11.26 $ 10.55
========= ========= ========= ========= =========
TOTAL RETURN (A) ............................... 10.66% (14.59%) (33.66%) 6.73% 5.50%
RATIOS/SUPPLEMENTAL DATA
Net Assets End of Period (thousands) ........... $ 6,225 $ 3,954 $ 4,531 $ 7,294 $ 4,442
Ratio of Expenses to Average Net Assets ........ 2.37% 2.21% 2.14% 2.10% 2.07%
Ratio of Net Investment Income (Loss) to Average
Net Assets ................................... (1.44%) (1.56%) (1.35%) (1.49%) (1.34%)
Portfolio Turnover Rate ........................ 54% 33% 44% 89% 14%
- --------------------------------------------------------------------------------
90 SEE ACCOMPANYING NOTES.
FINANCIAL HIGHLIGHTS (CONTINUED)
SELECTED DATA FOR EACH SHARE OF CAPITAL STOCK OUTSTANDING THROUGHOUT EACH PERIOD
SECURITY EQUITY FUND - LARGE CAP GROWTH SERIES (CLASS A)
FISCAL PERIOD ENDED SEPTEMBER 30
---------------------------------------------------------
2003(c) 2002(c) 2001(b)(c)(g) 2000(c)(f)(g)
---------- --------- ------------- -------------
PER SHARE DATA
NET ASSET VALUE BEGINNING OF PERIOD ............ $ 4.60 $ 6.00 $ 9.71 $ 10.00
INCOME FROM INVESTMENT OPERATIONS:
Net Investment Income (Loss) ................... (0.04) (0.05) (0.08) (0.05)
Net Gain (Loss) on Securities
(realized and unrealized) ..................... 1.06 (1.35) (3.63) (0.24)
---------- --------- --------- ---------
Total from Investment Operations ............... 1.02 (1.40) (3.71) (0.29)
LESS DISTRIBUTIONS:
Dividends (from Net Investment Income) ......... -- -- -- --
Distributions (from Realized Gains) ............ -- -- -- --
---------- --------- --------- ---------
Total Distributions ......................... -- -- -- --
---------- --------- --------- ---------
NET ASSET VALUE END OF PERIOD .................. $ 5.62 $ 4.60 $ 6.00 $ 9.71
========== ========= ========= =========
TOTAL RETURN (A) ............................... 22.17% (23.33%) (38.21%) (2.90%)
RATIOS/SUPPLEMENTAL DATA
Net Assets End of Period (thousands) ........... $ 16,179 $ 9,243 $ 2,436 $ 2,405
Ratio of Expenses to Average Net Assets ........ 1.83% 1.99% 2.00% 1.92%
Ratio of Net Investment Income (Loss) to Average
Net Assets ................................... (0.71%) (1.00%) (1.10%) (1.25%)
Portfolio Turnover Rate ........................ 39% 12% 6% 5%
SECURITY EQUITY FUND - LARGE CAP GROWTH SERIES (CLASS B)
FISCAL PERIOD ENDED SEPTEMBER 30
---------------------------------------------------------
2003(c) 2002(c) 2001(b)(c) 2000(c)(f)(g)
---------- --------- ------------- -------------
PER SHARE DATA
NET ASSET VALUE BEGINNING OF PERIOD ............ $ 4.50 $ 5.92 $ 9.65 $ 10.00
INCOME FROM INVESTMENT OPERATIONS:
Net Investment Income (Loss) ................... (0.07) (0.11) (0.14) (0.08)
Net Gain (Loss) on Securities
(realized and unrealized) ..................... 1.02 (1.31) (3.59) (0.27)
---------- --------- --------- ---------
Total from Investment Operations ............... 0.95 (1.42) (3.73) (0.35)
LESS DISTRIBUTIONS:
Dividends (from Net Investment Income) ......... -- -- -- --
Distributions (from Realized Gains) ............ -- -- -- --
---------- --------- --------- ---------
Total Distributions ......................... -- -- -- --
---------- --------- --------- ---------
NET ASSET VALUE END OF PERIOD .................. $ 5.45 $ 4.50 $ 5.92 $ 9.65
========== ========= ========= =========
TOTAL RETURN (A) ............................... 21.11% (23.99%) (38.65%) (3.50%)
RATIOS/SUPPLEMENTAL DATA
Net Assets End of Period (thousands) ........... $ 6,557 $ 1,949 $ 1,955 $ 2,039
Ratio of Expenses to Average Net Assets ........ 2.59% 2.82% 2.75% 2.68%
Ratio of Net Investment Income (Loss) to Average
Net Assets ................................... (1.49%) (1.88%) (1.85%) (2.02%)
Portfolio Turnover Rate ........................ 39% 12% 6% 5%
- --------------------------------------------------------------------------------
91 SEE ACCOMPANYING NOTES.
FINANCIAL HIGHLIGHTS (CONTINUED)
SELECTED DATA FOR EACH SHARE OF CAPITAL STOCK OUTSTANDING THROUGHOUT EACH PERIOD
SECURITY EQUITY FUND - LARGE CAP GROWTH SERIES (CLASS C)
FISCAL PERIOD ENDED SEPTEMBER 30
------------------------------------------------------
2003(c) 2002(c)(k) 2001(b)(c) 2000(c)(f)(g)
--------- ---------- ---------- -------------
PER SHARE DATA
NET ASSET VALUE BEGINNING OF PERIOD ............ $ 4.52 $ 5.93 $ 9.65 $ 10.00
INCOME FROM INVESTMENT OPERATIONS:
Net Investment Income (Loss) ................... (0.07) (0.11) (0.13) (0.08)
Net Gain (Loss) on Securities
(realized and unrealized) ..................... 1.03 (1.30) (3.59) (0.27)
--------- --------- --------- ---------
Total from Investment Operations ............... 0.96 (1.41) (3.72) (0.35)
LESS DISTRIBUTIONS:
Dividends (from Net Investment Income) ......... -- -- -- --
Distributions (from Realized Gains) ............ -- -- -- --
--------- --------- --------- ---------
Total Distributions ......................... -- -- -- --
--------- --------- --------- ---------
NET ASSET VALUE END OF PERIOD .................. $ 5.48 $ 4.52 $ 5.93 $ 9.65
========= ========= ========= =========
TOTAL RETURN (A) ............................... 21.24% (23.78%) (38.55%) (3.50%)
RATIOS/SUPPLEMENTAL DATA
Net Assets End of Period (thousands) ........... $ 3,432 $ 2,547 $ 2,577 $ 2,102
Ratio of Expenses to Average Net Assets ........ 2.58% 2.82% 2.75% 2.66%
Ratio of Net Investment Income (Loss) to Average
Net Assets ................................... (1.44%) (1.88%) (1.85%) (2.00%)
Portfolio Turnover Rate ........................ 39% 12% 6% 5%
- --------------------------------------------------------------------------------
92 SEE ACCOMPANYING NOTES.
FINANCIAL HIGHLIGHTS (CONTINUED)
SELECTED DATA FOR EACH SHARE OF CAPITAL STOCK OUTSTANDING THROUGHOUT EACH PERIOD
SECURITY EQUITY FUND - TECHNOLOGY SERIES (CLASS A)
FISCAL PERIOD ENDED SEPTEMBER 30
---------------------------------------------------------------
2003(b)(c) 2002(b)(c) 2001(b)(c)(g) 2000(b)(c)(f)(g)
---------- ---------- ------------- ----------------
PER SHARE DATA
NET ASSET VALUE BEGINNING OF PERIOD ............ $ 2.37 $ 3.41 $ 9.33 $ 10.00
INCOME FROM INVESTMENT OPERATIONS:
Net Investment Income (Loss) ................... (0.08) (0.09) (0.11) (0.08)
Net Gain (Loss) on Securities
(realized and unrealized) ..................... 1.69 (0.95) (5.81) (0.59)
--------- --------- --------- ---------
Total from Investment Operations ............... 1.61 (1.04) (5.92) (0.67)
LESS DISTRIBUTIONS:
Dividends (from Net Investment Income) ......... -- -- -- --
Distributions (from Realized Gains) ............ -- -- -- --
--------- --------- --------- ---------
Total Distributions ......................... -- -- -- --
--------- --------- --------- ---------
NET ASSET VALUE END OF PERIOD .................. $ 3.98 $ 2.37 $ 3.41 $ 9.33
========= ========= ========= =========
TOTAL RETURN (A) ............................... 67.93% (30.50%) (63.45%) (6.70%)
RATIOS/SUPPLEMENTAL DATA
Net Assets End of Period (thousands) ........... $ 7,398 $ 2,272 $ 3,023 $ 4,340
Ratio of Expenses to Average Net Assets ........ 2.50% 2.50% 2.26% 2.28%
Ratio of Net Investment Income (Loss) to Average
Net Assets ................................... (2.27%) (2.28%) (2.01%) (2.05%)
Portfolio Turnover Rate ........................ 181% 166% 240% 148%
SECURITY EQUITY FUND - TECHNOLOGY SERIES (CLASS B)
FISCAL PERIOD ENDED SEPTEMBER 30
--------------------------------------------------------------
2003(b)(c) 2002(b)(c) 2001(b)(c)(g) 2000(b)(c)(f)(g)
---------- ---------- ------------- ----------------
PER SHARE DATA
NET ASSET VALUE BEGINNING OF PERIOD ............... $ 2.28 $ 3.30 $ 9.21 $ 10.00
INCOME FROM INVESTMENT OPERATIONS:
Net Investment Income (Loss) ...................... (0.09) (0.11) (0.16) (0.11)
Net Gain (Loss) on Securities
(realized and unrealized) ........................ 1.62 (0.91) (5.75) (0.68)
--------- --------- --------- ---------
Total from Investment Operations .................. 1.53 (1.02) (5.91) (0.79)
LESS DISTRIBUTIONS:
Dividends (from Net Investment Income) ............ -- -- -- --
Distributions (from Realized Gains) ............... -- -- -- --
--------- --------- --------- ---------
Total Distributions ............................ -- -- -- --
--------- --------- --------- ---------
NET ASSET VALUE END OF PERIOD ..................... $ 3.81 $ 2.28 $ 3.30 $ 9.21
========= ========= ========= =========
TOTAL RETURN (A) .................................. 67.11% (30.91%) (64.17%) (7.90%)
RATIOS/SUPPLEMENTAL DATA
Net Assets End of Period (thousands) .............. $ 1,676 $ 737 $ 870 $ 1,971
Ratio of Expenses to Average Net Assets ........... 3.25% 3.25% 3.01% 3.03%
Ratio of Net Investment Income (Loss) to Average
Net Assets ...................................... (2.97%) (3.02%) (2.76%) (2.79%)
Portfolio Turnover Rate ........................... 181% 166% 240% 148%
- --------------------------------------------------------------------------------
93 SEE ACCOMPANYING NOTES.
FINANCIAL HIGHLIGHTS (CONTINUED)
SELECTED DATA FOR EACH SHARE OF CAPITAL STOCK OUTSTANDING THROUGHOUT EACH PERIOD
SECURITY EQUITY FUND - TECHNOLOGY SERIES (CLASS C)
FISCAL PERIOD ENDED SEPTEMBER 30
----------------------------------------------------------------
2003(b)(c) 2002(b)(c)(k) 2001(b)(c)(g) 2000(b)(c)(f)(g)
---------- ------------- ------------- ----------------
PER SHARE DATA
NET ASSET VALUE BEGINNING OF PERIOD ............ $ 2.28 $ 3.30 $ 9.21 $ 10.00
INCOME FROM INVESTMENT OPERATIONS:
Net Investment Income (Loss) ................... (0.09) (0.11) (0.16) (0.11)
Net Gain (Loss) on Securities
(realized and unrealized) ..................... 1.61 (0.91) (5.75) (0.68)
--------- --------- --------- ---------
Total from Investment Operations ............... 1.52 (1.02) (5.91) (0.79)
LESS DISTRIBUTIONS:
Dividends (from Net Investment Income) ......... -- -- -- --
Distributions (from Realized Gains) ............ -- -- -- --
--------- --------- --------- ---------
Total Distributions ......................... -- -- -- --
--------- --------- --------- ---------
NET ASSET VALUE END OF PERIOD .................. $ 3.80 $ 2.28 $ 3.30 $ 9.21
========= ========= ========= =========
TOTAL RETURN (A) ............................... 66.67% (30.91%) (64.17%) (7.90%)
RATIOS/SUPPLEMENTAL DATA
Net Assets End of Period (thousands) ........... $ 2,286 $ 1,168 $ 1,348 $ 2,276
Ratio of Expenses to Average Net Assets ........ 3.25% 3.25% 3.01% 3.03%
Ratio of Net Investment Income (Loss) to Average
Net Assets ................................... (2.97%) (3.02%) (2.77%) (2.79%)
Portfolio Turnover Rate ........................ 181% 166% 240% 148%
- --------------------------------------------------------------------------------
94 SEE ACCOMPANYING NOTES.
FINANCIAL HIGHLIGHTS (CONTINUED)
SELECTED DATA FOR EACH SHARE OF CAPITAL STOCK OUTSTANDING THROUGHOUT EACH PERIOD
SECURITY EQUITY FUND - ALPHA OPPORTUNITY SERIES (CLASS A)
FISCAL PERIOD ENDED SEPTEMBER 30
2003(b)(c)(o)
--------------------------------
PER SHARE DATA
NET ASSET VALUE BEGINNING OF PERIOD ..................... $ 10.00
INCOME FROM INVESTMENT OPERATIONS:
Net Investment Income (Loss) ............................ (0.03)
Net Gain (Loss) on Securities
(realized and unrealized) .............................. 0.24
---------
Total from Investment Operations ........................ 0.21
LESS DISTRIBUTIONS:
Dividends (from Net Investment Income) .................. --
Distributions (from Realized Gains) ..................... --
---------
Total Distributions .................................. --
---------
NET ASSET VALUE END OF PERIOD ........................... $ 10.21
=========
TOTAL RETURN (A) ........................................ 2.10%
RATIOS/SUPPLEMENTAL DATA
Net Assets End of Period (thousands) .................... $ 2,935
Ratio of Expenses to Average Net Assets ................. 2.75%
Ratio of Net Investment Income (Loss) to Average
Net Assets ............................................ (1.35%)
Portfolio Turnover Rate ................................. 867%
SECURITY EQUITY FUND - ALPHA OPPORTUNITY SERIES (CLASS B)
FISCAL PERIOD ENDED SEPTEMBER 30
2003(b)(c)(o)
--------------------------------
PER SHARE DATA
NET ASSET VALUE BEGINNING OF PERIOD..................... $ 10.00
INCOME FROM INVESTMENT OPERATIONS:
Net Investment Income (Loss)............................ (0.05)
Net Gain (Loss) on Securities
(realized and unrealized).............................. 0.25
--------
Total from Investment Operations........................ 0.20
LESS DISTRIBUTIONS:
Dividends (from Net Investment Income).................. --
Distributions (from Realized Gains)..................... --
--------
Total Distributions.................................. --
--------
NET ASSET VALUE END OF PERIOD........................... $ 10.20
========
TOTAL RETURN (A)........................................ 2.00%
RATIOS/SUPPLEMENTAL DATA
Net Assets End of Period (thousands).................... $ 1,731
Ratio of Expenses to Average Net Assets................. 3.50%
Ratio of Net Investment Income (Loss) to Average
Net Assets............................................ (2.11%)
Portfolio Turnover Rate................................. 867%
- --------------------------------------------------------------------------------
95 SEE ACCOMPANYING NOTES.
FINANCIAL HIGHLIGHTS (CONTINUED)
SELECTED DATA FOR EACH SHARE OF CAPITAL STOCK OUTSTANDING THROUGHOUT EACH PERIOD
SECURITY EQUITY FUND - ALPHA OPPORTUNITY SERIES (CLASS C)
FISCAL PERIOD ENDED SEPTEMBER 30
2003(b)(c)(o)
--------------------------------
PER SHARE DATA
NET ASSET VALUE BEGINNING OF PERIOD..................... $ 10.00
INCOME FROM INVESTMENT OPERATIONS:
Net Investment Income (Loss)............................ (0.05)
Net Gain (Loss) on Securities
(realized and unrealized).............................. 0.25
--------
Total from Investment Operations........................ 0.20
LESS DISTRIBUTIONS:
Dividends (from Net Investment Income).................. --
Distributions (from Realized Gains)..................... --
--------
Total Distributions.................................. --
--------
NET ASSET VALUE END OF PERIOD........................... $ 10.20
========
TOTAL RETURN (A)........................................ 2.00%
RATIOS/SUPPLEMENTAL DATA
Net Assets End of Period (thousands).................... $ 1,723
Ratio of Expenses to Average Net Assets................. 3.50%
Ratio of Net Investment Income (Loss) to Average
Net Assets............................................ (2.11%)
Portfolio Turnover Rate................................. 867%
- --------------------------------------------------------------------------------
96 SEE ACCOMPANYING NOTES.
FINANCIAL HIGHLIGHTS (CONTINUED)
SELECTED DATA FOR EACH SHARE OF CAPITAL STOCK OUTSTANDING THROUGHOUT EACH PERIOD
SECURITY MID CAP GROWTH FUND (CLASS A)
FISCAL PERIOD ENDED SEPTEMBER 30
--------------------------------------------------------------------------
2003(c) 2002(c)(n) 2001(c) 2000(c) 1999(c)
----------- ----------- ----------- ----------- -----------
PER SHARE DATA
NET ASSET VALUE BEGINNING OF PERIOD ............ $ 7.03 $ 8.48 $ 15.28 $ 9.19 $ 7.65
INCOME FROM INVESTMENT OPERATIONS:
Net Investment Income (Loss) ................... (0.10) (0.09) (0.07) (0.08) (0.06)
Net Gain (Loss) on Securities
(realized and unrealized) ..................... 3.91 (1.30) (5.38) 6.60 3.51
----------- ----------- ----------- ----------- -----------
Total from Investment Operations ............... 3.81 (1.39) (5.45) 6.52 3.45
LESS DISTRIBUTIONS:
Dividends (from Net Investment Income) ......... -- -- -- -- --
Distributions (from Realized Gains) ............ -- (0.06) (1.35) (0.43) (1.91)
----------- ----------- ----------- ----------- -----------
Total Distributions ......................... -- (0.06) (1.35) (0.43) (1.91)
----------- ----------- ----------- ----------- -----------
NET ASSET VALUE END OF PERIOD .................. $ 10.84 $ 7.03 $ 8.48 $ 15.28 $ 9.19
=========== =========== =========== =========== ===========
TOTAL RETURN (A) ............................... 54.20% (16.64%) (38.19%) 72.82% 50.91%
RATIOS/SUPPLEMENTAL DATA
Net Assets End of Period (thousands) ........... $ 134,208 $ 90,948 $ 131,498 $ 204,787 $ 96,238
Ratio of Expenses to Average Net Assets ........ 1.41% 1.20% 1.09% 1.11% 1.21%
Ratio of Net Investment Income (Loss) to Average
Net Assets ................................... (1.14%) (0.92%) (0.64%) (0.62%) (0.77%)
Portfolio Turnover Rate ........................ 57% 47% 48% 35% 54%
SECURITY MID CAP GROWTH FUND (CLASS B)
FISCAL PERIOD ENDED SEPTEMBER 30
----------------------------------------------------------------------
2003(c) 2002(c)(n) 2001(c) 2000(c) 1999(c)
---------- ---------- ---------- ---------- ----------
PER SHARE DATA
NET ASSET VALUE BEGINNING OF PERIOD ............ $ 6.26 $ 7.62 $ 14.02 $ 8.54 $ 7.28
INCOME FROM INVESTMENT OPERATIONS:
Net Investment Income (Loss) ................... (0.15) (0.16) (0.17) (0.19) (0.14)
Net Gain (Loss) on Securities
(realized and unrealized) ..................... 3.46 (1.14) (4.88) 6.10 3.31
---------- ---------- ---------- ---------- ----------
Total from Investment Operations ............... 3.31 (1.30) (5.05) 5.91 3.17
LESS DISTRIBUTIONS:
Dividends (from Net Investment Income) ......... -- -- -- -- --
Distributions (from Realized Gains) ............ -- (0.06) (1.35) (0.43) (1.91)
---------- ---------- ---------- ---------- ----------
Total Distributions ......................... -- (0.06) (1.35) (0.43) (1.91)
---------- ---------- ---------- ---------- ----------
NET ASSET VALUE END OF PERIOD .................. $ 9.57 $ 6.26 $ 7.62 $ 14.02 $ 8.54
========== ========== ========== ========== ==========
TOTAL RETURN (A) ............................... 52.88% (17.35%) (38.83%) 71.17% 49.39%
RATIOS/SUPPLEMENTAL DATA
Net Assets End of Period (thousands) ........... $ 26,459 $ 17,502 $ 28,580 $ 38,812 $ 7,818
Ratio of Expenses to Average Net Assets ........ 2.16% 2.11% 2.09% 2.11% 2.21%
Ratio of Net Investment Income (Loss) to Average
Net Assets ................................... (1.89%) (1.84%) (1.64%) (1.61%) (1.77%)
Portfolio Turnover Rate ........................ 57% 47% 48% 35% 54%
- --------------------------------------------------------------------------------
97 SEE ACCOMPANYING NOTES.
FINANCIAL HIGHLIGHTS (CONTINUED)
SELECTED DATA FOR EACH SHARE OF CAPITAL STOCK OUTSTANDING THROUGHOUT EACH PERIOD
SECURITY MID CAP GROWTH FUND (CLASS C)
FISCAL PERIOD ENDED SEPTEMBER 30
---------------------------------------------------------------------
2003(c) 2002(c)(k)(n) 2001(c) 2000(c) 1999(c)(e)
---------- ------------- ---------- ---------- ----------
PER SHARE DATA
NET ASSET VALUE BEGINNING OF PERIOD ............ $ 6.76 $ 8.22 $ 14.99 $ 9.11 $ 8.20
INCOME FROM INVESTMENT OPERATIONS:
Net Investment Income (Loss) ................... (0.16) (0.16) (0.18) (0.20) (0.07)
Net Gain (Loss) on Securities
(realized and unrealized) ..................... 3.74 (1.24) (5.24) 6.51 0.98
---------- ---------- ---------- ---------- ----------
Total from Investment Operations ............... 3.58 (1.40) (5.42) 6.31 0.91
LESS DISTRIBUTIONS:
Dividends (from Net Investment Income) ......... -- -- -- -- --
Distributions (from Realized Gains) ............ -- (0.06) (1.35) (0.43) --
---------- ---------- ---------- ---------- ----------
Total Distributions ......................... -- (0.06) (1.35) (0.43) --
---------- ---------- ---------- ---------- ----------
NET ASSET VALUE END OF PERIOD .................. $ 10.34 $ 6.76 $ 8.22 $ 14.99 $ 9.11
========== ========== ========== ========== ==========
TOTAL RETURN (A) ............................... 52.96% (17.30%) (38.78%) 71.10% 11.10%
RATIOS/SUPPLEMENTAL DATA
Net Assets End of Period (thousands) ........... $ 11,279 $ 5,883 $ 4,194 $ 3,017 $ 95
Ratio of Expenses to Average Net Assets ........ 2.16% 2.12% 2.09% 2.11% 2.21%
Ratio of Net Investment Income (Loss) to Average
Net Assets ................................... (1.89%) (1.85%) (1.66%) (1.61%) (1.75%)
Portfolio Turnover Rate ........................ 57% 47% 48% 35% 54%
- --------------------------------------------------------------------------------
98 SEE ACCOMPANYING NOTES.
FINANCIAL HIGHLIGHTS (CONTINUED)
SELECTED DATA FOR EACH SHARE OF CAPITAL STOCK OUTSTANDING THROUGHOUT EACH PERIOD
(a) Total return information does not reflect deduction of any sales
charges imposed at the time of purchase for Class A shares or upon
redemption for Class B and C.
(b) Fund expenses were reduced by the Investment Manager during the period
and expense ratios absent such reimbursement would have been as
follows:
2003 2002 2001 2000 1999
Small Cap Growth Series Class A 2.5% N/A N/A 1.6% 1.5%
Class B 3.2% N/A N/A 2.5% 2.9%
Class C 3.2% N/A N/A 2.5% 2.5%
International Series Class A 3.4% 4.2% 3.8% 3.5% 4.7%
Class B 4.2% 5.0% 4.5% 4.3% 5.4%
Class C 4.2% 5.0% 4.5% 4.1% 5.0%
Large Cap Growth Series Class A N/A N/A 2.2% N/A N/A
Class B N/A N/A 2.9% N/A N/A
Class C N/A N/A 2.9% N/A N/A
Technology Series Class A 3.0% 3.2% 2.7% 2.3% N/A
Class B 4.0% 3.9% 3.4% 3.0% N/A
Class C 4.0% 3.9% 3.5% 3.0% N/A
Enhanced Index Series Class A 1.8% N/A N/A N/A N/A
Class B 2.6% N/A N/A N/A N/A
Class C 2.6% N/A N/A N/A N/A
Alpha Opportunity Series Class A 3.3% N/A N/A N/A N/A
Class B 4.0% N/A N/A N/A N/A
Class C 4.0% N/A N/A N/A N/A
(c) Net investment income (loss) was computed using average shares
outstanding throughout the period.
(d) Security Enhanced Index Series, Security International Series and
Security Select 25(R) Series were initially capitalized on January 29,
1999, with a net asset value of $10 per share. Percentage amounts for
the period, except for total return, have been annualized.
(e) Class "C" Shares were initially offered for sale on January 29, 1999.
Percentage amounts for the period, except total return, have been
annualized.
(f) Security Large Cap Growth Series and Security Technology Series were
initially capitalized on May 1, 2000, with a net asset value of $10 per
share. Percentage amounts for the period, except total return, have
been annualized.
(g) Expense ratios, including reimbursements, were calculated without the
reduction for custodian fees earnings credits beginning May 1, 2000 for
Security Large Cap Growth Series, Security Technology Series and
Security International Series. Expense ratios with such reductions
would have been as follows:
2003 2002 2001 2000
International Series Class A N/A N/A 2.49% N/A
Class B N/A N/A 3.23% N/A
Class C N/A N/A 3.23% N/A
Large Cap Growth Series Class A N/A N/A 1.99% 1.85%
Class B N/A N/A N/A 2.61%
Class C N/A N/A N/A 2.60%
Technology Series Class A N/A N/A 2.25% 2.25%
Class B N/A N/A 3.00% 3.00%
Class C N/A N/A 3.00% 3.00%
(h) The Dreyfus Corporation became sub-advisor of Security Large Cap Value
Fund effective January 1, 2001. Prior to January 1, 2001, advisory
services were provided by the Investment Manager.
(i) As required, effective October 1, 2001, the Funds adopted the
provisions of the AICPA Audit and Accounting Guide for Investment
Companies and began amortizing premiums on fixed income securities. The
effect of this change for the period ended September 30, 2002, was to
increase net investment income per share by less than 1/2 of a cent,
decrease net realized and unrealized gains and losses per share by less
than 1/2 of a cent and increase the ratio of net investment income to
average net assets from 0.06% to 0.07%. Per share, ratios and
supplemental data for periods prior to October 1, 2001 have not been
restated to reflect this change in presentation.
(j) The financial highlights for the Equity Series as set forth herein
exclude the historical financial highlights of the Total Return Series
Class A, B and C shares. The assets of the Total Return Series were
acquired by theEquity Series on August 27, 2002.
(k) The financial highlights for the Class C shares exclude the historical
financial highlights of the Class S shares. Class S shares were
exchanged for Class C shares on June 3, 2002.
(l) RS Investments, Inc., became the sub-advisor of SmallCap Growth Series
effective September 3, 2002. Prior to September 3, 2002, Security
Management Company, LLC (SMC) paid Strong Capital Management, Inc., for
sub-advisory services.
(m) Templeton/Franklin Investment Services, Inc., became the sub-advisor of
International Series effective September 3, 2002. Prior to September 3,
2002, Security Management Company, LLC (SMC) paid Deutsche Asset
Management, Inc., for sub-advisory services.
(n) Effective May 1, 2002 the fee structure for Security Large Cap Value
Fund, Equity, Global Series and Security Mid Cap Growth Fund changed.
Per share information reflects this change.
(o) Security Alpha Opportunity Series was initially capitalized on July 7,
2003, with a net asset value of $10 per share. Percentage amounts for
the period, except for total return, have been annualized.
(p) Northern Trust became the subadvisor of Enhanced Index effective May 1,
2003. Prior to May 1, 2003 Security Management Company, LLC(SMC) paid
Deutsche Asset Management, Inc. for subadvisory services.
- --------------------------------------------------------------------------------
99 SEE ACCOMPANYING NOTES.
NOTES TO FINANCIAL STATEMENTS
SEPTEMBER 30, 2003
1. SIGNIFICANT ACCOUNTING POLICIES
Security Large Cap Value, Equity and Mid Cap Growth Funds (the Funds) are
registered under the Investment Company Act of 1940, as amended, as open-end
management investment companies. The shares of Security Equity Fund are
currently issued in multiple Series, with each Series, in effect, representing a
separate fund. The Fund is required to account for the assets of each Series
separately and to allocate general liabilities of the Fund to each Series based
on the relative net assets of each Series. Class "A" shares are generally sold
with a sales charge at the time of purchase. Class "A" shares are not subject to
a sales charge when they are redeemed, except that purchases of Class "A" shares
of $1 million or more sold without a front-end sales charge are subject to a
contingent deferred sales charge if redeemed within one year of purchase. Class
"B" shares are offered without a front-end sales charge but incur additional
class-specific expenses. Class B shares may be subject to a contingent deferred
sales charge for six years and automatically convert to Class A shares after
eight years. Redemptions of the shares within five years of acquisition incur a
contingent deferred sales charge. Class "C" shares are offered without a
front-end sales charge but incur additional class-specific expenses. Redemptions
of the shares within one year of acquisition incur a contingent deferred sales
charge. The following is a summary of the significant accounting policies
followed by the Funds in the preparation of their financial statements.
A. SECURITY VALUATION - Valuations of the Fund's securities are supplied by
pricing services approved by the Board of Directors. The Fund's officers, under
the general supervision of the Board of Directors, regularly review procedures
used by, and valuations provided by, the pricing services. Each security owned
by a Fund that is listed on a securities exchange is valued at its last sale
price on that exchange on the date as of which assets are valued. Where the
security is listed on more than one exchange, the Fund will use the price of
that exchange that it generally considers to be the principal exchange on which
the stock is traded. Fund securities listed on the Nasdaq Stock Market, Inc.
("Nasdaq") will be valued at the Nasdaq Official Closing Price, which may not
necessarily represent the last sale price. If there has been no sale on such
exchange or Nasdaq on such day, the security is valued at the closing bid price
on such day. If there is no bid or if the bid price is deemed to be
unsatisfactory by the Board of Directors or by the Fund's investment manager,
then the securities are valued in good faith by such method as the Board of
Directors determines will reflect the fair value. If events occur that will
affect the value of a fund's portfolio securities before the NAV has been
calculated (a "significant event"), the security will generally be priced using
a fair value procedure. If the Valuation Committee determines a significant
event has occurred, it will evaluate the impact of that event on an affected
security or securities, to determine whether a fair value adjustment would
materially affect the fund's NAV per share. The Fund generally will value
short-term debt securities at prices based on market quotations for such
securities or securities of similar type, yield, quality and duration, except
those securities purchased with 60 days or less to maturity are valued on the
basis of amortized cost which approximates market value.
Generally, trading in foreign securities markets is substantially completed
each day at various times prior to the close of the New York Stock Exchange. The
values of foreign securities are determined as of the close of such foreign
markets or the close of the New York Stock Exchange, if earlier. All investments
quoted in foreign currency are valued in U.S. dollars on the basis of the
foreign currency exchange rates prevailing at the close of business. The Global
Series', International Series' and Technology Series' investments in foreign
securities may involve risks not present in domestic investments. Since foreign
securities may be denominated in a foreign currency and involve settlement and
pay interest or dividends in foreign currencies, changes in the relationship of
these foreign currencies to the U.S. dollar can significantly affect the value
of the investments and earnings of the Funds. Foreign investments may also
subject the these Series to foreign government exchange restrictions,
expropriation, taxation or other political, social or economic developments, all
of which could affect the market and/or credit risk of the investments.
B. REPURCHASE AGREEMENTS - In connection with transactions in repurchase
agreements, it is the Funds' policy that its custodian take possession of the
underlying collateral securities, the fair value of which exceeds the principal
amount of the repurchase transaction, including accrued interest, at all times.
If the seller defaults, and the fair value of the collateral declines,
realization of the collateral by the Funds may be delayed or limited.
C. FOREIGN CURRENCY TRANSACTIONS - The accounting records of the Funds are
maintained in U.S. dollars. All assets and liabilities initially expressed in
foreign currencies are converted into U.S. dollars at prevailing exchange rates.
Purchases and sales of investment securities, dividend and interest income, and
certain expenses are translated at the rates of exchange prevailing on the
respective dates of such transactions.
The Funds do not isolate that portion of the results of operations resulting
from changes in the foreign exchange rates on investments from the fluctuations
arising from changes in the market prices of securities held. Such fluctuations
are included with the net realized and unrealized gain or loss on investments.
Net realized foreign exchange gains or losses arise from sales of portfolio
securities, sales of foreign currencies, and the difference between asset and
liability amounts initially stated in foreign currencies and the U.S. dollar
value of the amounts actually received or paid. Net unrealized foreign exchange
gains or losses arise from changes in the value of portfolio securities and
other assets and liabilities at the end of the reporting period, resulting from
changes in the exchange rates.
D. FORWARD FOREIGN CURRENCY EXCHANGE CONTRACTS - Global Series and
International Series may enter into forward foreign exchange contracts in order
to manage foreign currency risk from purchase or sale of securities denominated
in foreign currency. These funds may also enter into such contracts to manage
changes in foreign currency exchange rates on portfolio positions. These
contracts are marked to market daily, by recognizing the difference between the
contract exchange rate and the current market rate as unrealized gains or
losses. Realized gains or losses are recognized when contracts are settled and
are reflected in the statement of operations. These contracts involve market
risk in excess of the amount reflected in the statement of assets and
liabilities. The face or contract amount in U.S. dollars reflects the total
exposure these funds have in that particular currency contract. Losses may arise
due to changes in the value of the foreign currency or if the counterparty does
not perform under the contract.
- --------------------------------------------------------------------------------
100
NOTES TO FINANCIAL STATEMENTS (CONTINUED)
SEPTEMBER 30, 2003
E. FUTURES - Large Cap Value Fund, Equity Series, Social Awareness Series,
Small Cap Growth Series, Enhanced Index Series, International Series, Alpha
Opportunity Series and Mid Cap Growth Fund utilize futures contracts to a
limited extent, with the objectives of maintaining full exposure to the
underlying stock market, enhancing returns, maintaining liquidity, and
minimizing transaction costs. These Funds or Series, as applicable, may purchase
futures contracts to immediately position incoming cash in the market, thereby
simulating a fully invested position in the underlying index while maintaining a
cash balance for liquidity. In the event of redemptions, the Funds or Series, as
applicable, may pay departing shareholders from its cash balances and reduce
their futures positions accordingly. Returns may be enhanced by purchasing
futures contracts instead of the underlying securities when futures are believed
to be priced more attractively than the underlying securities. The primary risks
associated with the use of futures contracts are imperfect correlation between
changes in market values of stocks contained in the indexes and the prices of
futures contracts, and the possibility of an illiquid market. Futures contracts
are valued based upon their quoted daily settlement prices. Upon entering into a
futures contract, the Funds are required to deposit and maintain as collateral
either cash or securities, representing the initial margin, equal to a certain
percentage of the contract value. Cash deposits are shown as restricted cash on
the Statement of Assets and Liabilities; securities are noted in the Schedule of
Investments. Subsequent changes in the value of the contract, or variation
margin, are recorded as unrealized gains or losses. The variation margin is paid
or received in cash daily by the Funds. The Funds realize a gain or loss when
the contract is closed or expires.
F. OPTIONS WRITTEN -The Fund may purchase put and call options and write such
options on a covered basis on securities that are traded on recognized
securities exchanges and over-the-counter markets. Call and put options on
securities give the holder the right to purchase or sell, respectively, (and the
writer the obligation to sell or purchase)a security at a specified price, until
a certain date. Options may be used to hedge the Fund's portfolio, to increase
returns or to maintain exposure to the equity markets. The primary risks
associated with the use of options are an imperfect correlation between the
change in market value of the securities held by the series and the price of the
option, the possibility of an illiquid market, and the inability of the
counterparty to meet the terms of the contract.
The premium received for a written option is recorded as an asset with an
equal liability which is marked to market based on the option's quoted daily
settlement price. Fluctuations in the value of such instruments are recorded as
unrealized appreciation (depreciation) until terminated, at which time realized
gains and losses are recognized.
G. SECURITY TRANSACTIONS AND INVESTMENT INCOME - Security transactions are
accounted for on the date the securities are purchased or sold (trade date).
Realized gains and losses are reported on an identified cost basis. Dividend
income less foreign taxes withheld (if any) plus foreign taxes recoverable (if
any) are recorded on the ex-dividend date. Interest income is recognized on the
accrual basis including amortization of premiums and accretion of discounts.
H. EXPENSES - Expenses that are directly related to one of the Funds are
charged directly to that Fund. Other operating expenses are allocated to the
Funds on the basis of relative net assets. Class specific expenses, such as
12b-1 fees, are borne by that class. Income, other expenses and realized and
unrealized gains and losses of a Fund are allocated to each respective class in
proportion to the relative net assets of each class.
I. DISTRIBUTIONS TO SHAREHOLDERS - Distributions to shareholders are recorded
on the ex-dividend date. The character of distributions made during the year
from net investment income or net realized gains may differ from their ultimate
characterization for federal income tax purposes.
J. TAXES - The Funds complied with the requirements of the Internal Revenue
Code applicable to regulated investment companies and distributed all of their
taxable net income and net realized gains sufficient to relieve them from all,
or substantially all, federal income, excise and state income taxes. Therefore,
no provision for federal or state income tax is required.
K. USE OF ESTIMATES - The preparation of financial statements in conformity
with accounting principles generally accepted in the United States requires
management to make estimates and assumptions that affect the reported amounts of
assets and liabilities at the date of the financial statements and the reported
amounts of increases and decreases in net assets from operations during the
reporting period. Actual results could differ from those estimates.
L. SECURITIES LENDING - Certain of the Series may lend up to 33 1/3% of the
value of total assets to broker/dealers, banks, or other institutional borrowers
of securities in order to earn additional income. Each Series' policy is to
maintain collateral in the form of cash, U.S. Government securities, letters of
credit or such other collateral as may be permitted under its investment program
equal to at least 100% of the value of securities loaned. The collateral is then
"marked-to-market" daily until the securities are returned. No securities were
loaned as of September 30, 2003.
M. SHORT SALES - Certain Funds may make short sales "against the box," in
which the Fund enters into a short sale of a security it owns. At no time will
more than 15% of the value of the Funds' net assets be in deposits on short
sales against the box. In a short sale that is not "against the box," a Fund
sells a security which it does not own, in anticipation of a decline in the
market value of the security. To complete the sale, the Fund must borrow the
security generally from the broker through which the short sale is made in order
to make delivery to the buyer. The Fund must replace the security borrowed by
purchasing it at the market price at the time of replacement. The Fund is said
to have a "short position" in securities sold until it delivers them to the
broker. For financial statement purposes, an amount equal to the settlement
amount is included in the Statement of Assets and Liabilities as an asset and an
equivalent liability. The amount of the liability is subsequently
marked-to-market to reflect the current value of the short position. Subsequent
fluctuations in the market prices of securities sold, but not yet purchased, may
require purchasing the securities at prices which differ from the market value
reflected on the Statement of Assets and Liabilities. The Funds are liable for
any dividends or interest payable on securities while those securities are in a
short position. As collateral for its short positions, the Funds are required
under the Investment Company Act of 1940 to maintain segregated assets
consisting of cash, cash equivalents or liquid securities. These segregated
assets are valued consistent with Note 1a above. These segregated assets are
required to be adjusted daily to reflect changes in the market value of the
securities sold short.
- --------------------------------------------------------------------------------
101
NOTES TO FINANCIAL STATEMENTS (CONTINUED)
SEPTEMBER 30, 2003
2. MANAGEMENT FEES AND OTHER TRANSACTIONS WITH AFFILIATES
Management fees are payable to Security Management Company, LLC (SMC) at an
annual rate of 0.75% of the average daily net assets for Security Large Cap
Value Fund, Equity, Enhanced Index, Select 25 Series and Security Mid Cap Growth
Fund, 1.00% for Global, Social Awareness, Mid Cap Value, Small Cap Growth, Large
Cap Growth and Technology Series, and 1.10% for International Series.
SMC receives a management fee from Alpha Opportunity Fund that is composed of
two components. The first component is an annual base fee equal to 2.00% of
Alpha Opportunity Fund's average daily net assets. The second component is a
performance adjustment that either increases or decreases the base fee,
depending on how Alpha Opportunity Fund performed relative to the S&P 500 Index.
The illustration below demonstrates how the performance adjustment may affect
the Investment Manager's fee. The Investment Manager will receive the 2.00%
annual base fee for the first year of the Fund's investment operations, and
thereafter if the Fund's investment performance matches the investment record of
the S&P 500 Index over the prior 12 month period. If the investment performance
of the Fund's Class A shares exceeds the investment record of the S&P500 Index,
the performance adjustment increases the fee paid to the Investment Manager
proportionately, reaching a maximum annual fee of 2.75% if the Fund outperforms
the investment record of the S&P500 Index by 15 percentage points over the
measuring period. If the investment performance of the Fund's Class A shares
trails the investment record of the S&P500 Index, the performance adjustment
decreases the fee paid to the Investment Manager proportionately, reaching a
minimum annual fee of 1.25% if the Fund underperforms the investment record of
the S&P 500 Index by 15 percentage points over the measuring period. The
performance adjustment is calculated on the basis of a "rolling" 12 month
measuring period, so that a fee rate calculated on the basis of investment
performance over a 12 month period will apply only for the next succeeding
month, and then will be subject to recalculation for the following month on the
basis of the Fund's investment performance over the prior 12 month period.
Performance adjustments will begin on August 1, 2004 based upon Alpha
Opportunity Fund's performance during the 12 months ended July 1, 2004.
SMC also acts as the administrative agent and transfer agent for the Funds,
and as such performs administrative functions, transfer agency and dividend
disbursing services, and the bookkeeping, accounting and pricing functions for
each fund. For these services, the Investment Manager receives, from the Global,
International, and Technology Series an administrative fee equal to .045% of the
average daily net assets of the series plus the greater of .10% of the average
net assets or $60,000. For administrative services provided to the Security
Large Cap Value Fund, the Equity, Social Awareness, Mid Cap Value, Small Cap
Growth, Enhanced Index, Select 25, Large Cap Growth Series and the Security Mid
Cap Growth Fund, SMC receives an administrative fee equal to .09% of the average
daily net assets of each series. For Alpha Opportunity Series, SMC receives an
administrative fee equal to .145% of the average daily net assets of the Alpha
Opportunity Fund. For transfer agent services, SMC is paid an annual fixed
charge per account as well as a transaction fee for all shareholder and dividend
payments.
SMC pays the Dreyfus Corporation an annual fee equal to .25% of the average
daily closing value of the combined net assets of Large Cap Value Fund and
another fund managed by SMC, SBL Series B, computed on a daily basis. Beginning
January 1, 2002, the Dreyfus Corporation agreed to waive .10% of the average
daily closing value of the combined net assets of these funds, computed on a
daily basis until December 31, 2006.
SMC pays OppenheimerFunds, Inc. an annual fee equal to a percentage of the
average daily closing value of the combined average daily net assets of Global
Series and another fund managed by SMC, SBL Series D, computed on a daily basis
as follows:
Combined Average Daily Net Assets Annual Fees
- --------------------------------- -----------
$0 to $300 Million .................................................. .35%
$300 Million to $750 Million ........................................ .30%
$750 Million or more ................................................ .25%
SMC pays RS Investments, an annual fee equal to a percentage of the average
daily closing value of the combined net assets of SmallCap Growth Series and
another fund managed by SMC, SBL Series X, computed on a daily basis as follows:
Combined Average Daily Net Assets Annual Fees
- --------------------------------- -----------
$0 to $100 Million .................................................. 0.55%
$100 Million to $400 Million ........................................ 0.50%
Over $400 Million ................................................... 0.45%
Prior to May 1, 2003, SMCpaid Deutsche Asset Management, Inc. an annual fee
equal to a percentage of the average daily closing value of the combined net
assets of Enhanced Index Series and another fund managed by SMC, SBL Series H,
computed on a daily basis as follows:
Combined Average Daily Net Assets Annual Fees
- --------------------------------- -----------
$0 to $100 Million .................................................. .20%
$100 Million to $300 Million ........................................ .15%
$300 Million or more ................................................ .13%
Effective May 1, 2003, Northern Trust began providing investment advisory
services to Enhanced Index and another fund managed by SMC, SBL Series H. For
the services provided to Enhanced Index, SMC pays Northern Trust an annual fee
equal to a percentage of the average daily closing value of the combined net
assets of Security Equity Fund Enhanced Index Series and SBL Series H, computed
on a daily basis as follows:
- --------------------------------------------------------------------------------
102
NOTES TO FINANCIAL STATEMENTS (CONTINUED)
SEPTEMBER 30, 2003
Combined Average Daily Net Assets Annual Fees
- --------------------------------- -----------
$0 to $100 Million .................................................. .20%
$100 Million to $300 Million ........................................ .15%
$300 Million or more ................................................ .13%
In addition, SMC has voluntarily agreed to waive .25% of the management fees
for Enhanced Index effective 05/01/03.
SMC pays Templeton Investment Counsel an annual fee equal to a percentage of
the average daily closing value of the combined net assets of International
Series and another fund managed by SMC, SBL Series I, computed on a daily basis
as follows:
Combined Average Daily Net Assets Annual Fees
- --------------------------------- -----------
$0 to $50 Million ................................................... .625%
$50 Million to $200 Million ......................................... .465%
$200 Million to $500 Million ........................................ .375%
Over $500 Million ................................................... .350%
Wellington Management Company, LLP furnishes investment advisory services to
the Technology Series. For such services, SMC pays Wellington an annual fee
equal to .50% of the average daily closing value of the combined net assets of
Technology Series and another fund managed by SMC, SBL Series T.
SMC pays Mainstream Investment Advisers, LLC an annual fee equal to 2.50% of
that portion of the Alpha Opportunity Fund's assets managed by Mainstream. The
sub-advisory fee will be adjusted upward or downward, depending on how that
portion of Alpha Opportunity Fund's assets performed relative to the S&P 500
Index.
The pro rata adjustment upward or downward will be determined based upon the
investment performance of that portion of Alpha Opportunity Fund's assets
managed by Mainstream relative to the investment record of the S&P 500 Index.
The amount of any upward adjustment in the Base Fee will be equal to 1.50%
multiplied by the ratio of the number of percentage points by which the
investment performance of the Alpha Opportunity Fund assets managed by
Mainstream exceeds the investment record of the S&P500 Index as compared to 30
percentage points.
The maximum performance adjustment upward or downward is 1.50% annually.
Depending on the performance of that portion of the Fund's assets managed by
Mainstream, the Investment Manager may pay Mainstream a maximum of 4.00% or a
minimum of 1.00% in annual sub-advisory fees.
During its first 12 months of operations, the Investment Manager will pay
Mainstream the base fee of 2.50% without any adjustment for performance.
Performance adjustments will being on August 1, 2004 based upon the performance
during the 12 months ended July 1, 2004 of that portion of Alpha Opportunity
Fund's assets managed by Mainstream. Thereafter, the Investment Manager will
calculate the performance adjustment at the end of each calendar month based
upon the investment performance of the assets managed by Mainstream during the
twelve-month period ending on the last day of the prior month compared to the
investment record of the S&P 500 Index during the same period.
The Alpha Opportunity Fund's assets are reallocated between Mainstream and
the Investment Manager on a monthly basis to an approximately equal allocation.
This procedure ensures that the Investment Manager cannot make allocation
decisions that favor the Investment Manager over Mainstream.
SMC has agreed to limit the total expenses of the Enhanced Index and Select
25 Series to 1.75%, Social Awareness, Mid Cap Value, Small Cap Growth and Large
Cap Growth Series to 2.00%, International and Technology Series to 2.25% in each
case exclusive of interest, taxes, extraordinary expenses, brokerage fees and
commissions and 12b-1 fees. SMC has agreed to limit the total other expenses for
Alpha Opportunity to 0.50%. The expense limits other than those for Enhanced
Index, Select 25 and International Series are voluntary limits which may be
terminated at any time without notice to shareholders.
The Funds have adopted Distribution Plans related to the offering of Class A,
Class B and Class C shares pursuant to Rule 12b-1 under the Investment Company
Act of 1940. The plans provide for payments at an annual rate of 1.00% of the
average daily net assets of each Fund's Class B, Class C, and 0.25% of the
average daily net assets of each Fund's Class A shares.
Security Distributors, Inc. (SDI), a wholly-owned subsidiary of Security
Benefit Group, Inc. and the national distributor of the Funds, received net
underwriting commissions on sales of shares after allowances to brokers and
dealers. The net underwriting commissions received are presented in the
following table:
SDI UNDERWRITING COMMISSIONS
----------------------------
Large Cap Value Fund .................. $ 2,794
Security Equity Fund:
Equity Series ....................... 11,113
Global Series ....................... 6,828
Social Awareness Series ............. 2,384
Mid Cap Value Series ................ 4,950
Small Cap Growth Series ............. 2,909
Enhanced Index Series ............... 2,241
International Series ................ (389)
Select 25 Series .................... 3,396
Large Cap Growth Series ............. 843
Technology Series ................... 866
Alpha Opportunity Series ............ 300
Security Mid Cap Growth Fund .......... 14,544
Certain officers and directors of the Funds are also officers and/or
directors of Security Benefit Life Insurance Company and its subsidiaries,
which include SMC and SDI.
- --------------------------------------------------------------------------------
103
NOTES TO FINANCIAL STATEMENTS (CONTINUED)
SEPTEMBER 30, 2003
3. UNREALIZED APPRECIATION/DEPRECIATION FOR FEDERAL INCOME TAX PURPOSES
For federal income tax purposes, the amounts of unrealized appreciation
(depreciation) on investments at September 30, 2003, were as follows:
GROSS GROSS NET UNREALIZED
UNREALIZED UNREALIZED APPRECIATION
APPRECIATION DEPRECIATION (DEPRECIATION)
------------ ------------ --------------
Large Cap Value Fund ..................................................... $ 3,390,919 $ (2,390,267) $ 1,000,652
Security Equity Fund:
Equity Series .......................................................... 95,452,327 (28,936,908) 66,515,419
Global Series .......................................................... 9,655,969 (5,263,551) 4,392,418
Social Awareness Series ................................................ 1,456,036 (3,130,396) (1,674,360)
Mid Cap Value Series ................................................... 45,080,344 (8,131,654) 36,948,690
Small Cap Growth Series ................................................ 5,128,859 (367,416) 4,761,443
Enhanced Index Series .................................................. 1,173,422 (2,231,529) (1,058,107)
International Series ................................................... 413,926 (300,882) 113,044
Select 25 Series ....................................................... 1,637,961 (2,092,162) (454,201)
Large Cap Growth Series ................................................ 1,571,222 (1,347,072) 224,150
Technology Series ...................................................... 1,259,833 (415,293) 844,540
Alpha Opportunity Series ............................................... 36,389 (120,431) (84,042)
Security Mid Cap Growth Fund ............................................. 45,156,326 (16,258,863) 28,897,463
4. INVESTMENT TRANSACTIONS
Investment transactions for the year ended September 30, 2003, (excluding
overnight investments and short-term commercial paper) were as follows:
PROCEEDS
PURCHASES FROM SALES
--------- ----------
Large Cap Value Fund ...................................................................... $ 47,431,658 $ 34,732,238
Security Equity Fund:
Equity Series ........................................................................... 257,020,919 294,835,728
Global Series ........................................................................... 38,225,014 51,110,524
Social Awareness Series ................................................................. 4,024,372 4,902,283
Mid Cap Value Series .................................................................... 90,565,488 77,427,255
Small Cap Growth Series ................................................................. 38,565,710 32,712,180
Enhanced Index Series ................................................................... 7,875,827 13,516,218
International Series .................................................................... 3,739,060 6,709,316
Select 25 Series ........................................................................ 13,464,498 12,492,632
Large Cap Growth Series ................................................................. 17,233,805 7,183,569
Technology Series ....................................................................... 15,170,906 12,726,302
Alpha Opportunity Series ................................................................ 10,667,243 6,667,210
Security Mid Cap Growth Fund .............................................................. 78,056,223 77,459,013
5. OPEN FUTURES CONTRACTS
NUMBER OF CONTRACT MARKET UNREALIZED
POSITION CONTRACTS EXPIRATION DATE AMOUNT VALUE LOSS
-------- --------- --------------- ------ ----- ----
ALPHA OPPORTUNITY SERIES
S&P 500 Future Long 12 12/18/2003 $3,072,378 $2,982,300 $(90,078)
ENHANCED INDEX SERIES
S&P 500 E-Mini Future Long 8 12/19/2003 $ 405,753 $ 397,600 $ (8,153)
- --------------------------------------------------------------------------------
104
NOTES TO FINANCIAL STATEMENTS (CONTINUED)
SEPTEMBER 30, 2003
6. CAPITAL SHARE TRANSACTIONS
The Funds are authorized to issue an unlimited number of shares in an
unlimited number of classes. Transactions in the capital shares of the Funds for
the years ended September 30, 2003 and 2002 (except as noted), respectively,
were as follows:
2003 Total 2003 Total
2003 2003 2003 2003 Increase/ Increase/
Shares Amount Shares Amount (Decrease) (Decrease)
Sold Sold Redeemed Redeemed Shares Amount
---------- ------------- ----------- ------------- ----------- -------------
Security Large Cap Value Fund:
Class A shares ............ 3,275,684 $ 15,980,582 (2,059,730) $ (9,542,638) 1,215,954 $ 6,437,944
Class B shares ............ 1,770,126 8,414,192 (571,007) (2,539,716) 1,199,119 5,874,476
Class C shares ............ 207,972 955,668 (141,469) (643,187) 66,503 312,481
---------- ------------- ----------- ------------- ----------- -------------
Total .................... 5,253,782 $ 25,350,442 (2,772,206) $ (12,725,541) 2,481,576 $ 12,624,901
========== ============= =========== ============= =========== =============
Security Equity Fund:
Equity Series
Class A shares ............ 9,525,481 $ 52,599,625 (18,674,422) $(105,856,454) (9,148,941) $ (53,256,829)
Class B shares ............ 3,963,505 19,942,502 (6,830,650) (35,443,343) (2,867,145) (15,500,841)
Class C shares ............ 647,916 3,455,973 (499,324) (2,656,042) 148,592 799,931
---------- ------------- ----------- ------------- ----------- -------------
Total .................... 14,136,902 $ 75,998,100 (26,004,396) $(143,955,839) (11,867,494) $ (67,957,739)
========== ============= =========== ============= =========== =============
Global Series
Class A shares ............ 17,102,956 $ 170,505,008 (18,807,897) $(187,958,287) (1,704,941) $ (17,453,279)
Class B shares ............ 259,359 2,446,819 (891,673) (8,037,983) (632,314) (5,591,164)
Class C shares ............ 135,732 1,296,276 (104,715) (993,174) 31,017 303,102
---------- ------------- ----------- ------------- ----------- -------------
Total .................... 17,498,047 $ 174,248,103 (19,804,285) $(196,989,444) (2,306,238) $ (22,741,341)
========== ============= =========== ============= =========== =============
Social Awareness Series
Class A shares ............ 169,124 $ 2,824,966 (149,561) $ (2,475,626) 19,563 $ 349,340
Class B shares ............ 44,117 681,521 (107,048) (1,664,723) (62,931) (983,202)
Class C shares ............ 30,846 489,488 (19,076) (295,687) 11,770 193,801
---------- ------------- ----------- ------------- ----------- -------------
Total .................... 244,087 $ 3,995,975 (275,685) $ (4,436,036) (31,598) $ (440,061)
========== ============= =========== ============= =========== =============
Mid Cap Value Series
Class A shares ............ 3,192,088 $ 65,771,619 (2,597,504) $ (51,319,933) 594,584 $ 14,451,686
Class B shares ............ 756,268 14,474,911 (731,230) (13,136,730) 25,038 1,338,181
Class C shares ............ 540,730 10,825,157 (284,240) (5,174,008) 256,490 5,651,149
---------- ------------- ----------- ------------- ----------- -------------
Total .................... 4,489,086 $ 91,071,687 (3,612,974) $ (69,630,671) 876,112 $ 21,441,016
========== ============= =========== ============= =========== =============
Small Cap Growth Series
Class A shares ............ 655,128 $ 6,184,996 (476,304) $ (4,215,103) 178,824 $ 1,969,893
Class B shares ............ 304,029 2,757,770 (253,852) (2,226,918) 50,177 530,852
Class C shares ............ 130,394 1,133,518 (97,903) (842,930) 32,491 290,588
---------- ------------- ----------- ------------- ----------- -------------
Total .................... 1,089,551 $ 10,076,284 (828,059) $ (7,284,951) 261,492 $ 2,791,333
========== ============= =========== ============= =========== =============
Enhanced Index Series
Class A shares ............ 333,447 $ 2,367,320 (642,114) $ (4,508,312) (308,667) $ (2,140,992)
Class B shares ............ 177,203 1,206,524 (513,292) (3,498,690) (336,089) (2,292,166)
Class C shares ............ 159,884 1,120,893 (430,959) (2,949,239) (271,075) (1,828,346)
---------- ------------- ----------- ------------- ----------- -------------
Total .................... 670,534 $ 4,694,737 (1,586,365) $ (10,956,241) (915,831) $ (6,261,504)
========== ============= =========== ============= =========== =============
International Series
Class A shares ............ 3,921,675 $ 23,481,092 (3,810,566) $ (23,039,489) 111,109 $ 441,603
Class B shares ............ 105,672 613,054 (70,072) (403,596) 35,600 209,458
Class C shares ............ 864,642 4,785,963 (788,631) (4,342,340) 76,011 443,623
---------- ------------- ----------- ------------- ----------- -------------
Total .................... 4,891,989 $ 28,880,109 (4,669,269) $ (27,785,425) 222,720 $ 1,094,684
========== ============= =========== ============= =========== =============
Select 25 Series
Class A shares ............ 308,267 $ 2,124,128 (707,984) $ (4,949,490) (399,717) $ (2,825,362)
Class B shares ............ 129,196 870,627 (310,636) (2,109,351) (181,440) (1,238,724)
Class C shares ............ 368,021 2,518,754 (105,802) (711,166) 262,219 1,807,588
---------- ------------- ----------- ------------- ----------- -------------
Total .................... 805,484 $ 5,513,509 (1,124,422) $ (7,770,007) (318,938) $ (2,256,498)
========== ============= =========== ============= =========== =============
Large Cap Growth Series
Class A shares ............ 1,662,989 $ 9,276,514 (793,945) $ (4,326,342) 869,044 $ 4,950,172
Class B shares ............ 1,088,511 5,959,453 (319,346) (1,646,003) 769,165 4,313,450
Class C shares ............ 152,477 790,028 (89,726) (451,972) 62,751 338,056
---------- ------------- ----------- ------------- ----------- -------------
Total .................... 2,903,977 $ 16,025,995 (1,203,017) (6,424,317) 1,700,960 $ 9,601,678
========== ============= =========== ============= =========== =============
Technology Series
Class A shares ............ 1,700,337 $ 5,685,197 (799,732) $ (2,642,434) 900,605 $ 3,042,763
Class B shares ............ 270,397 872,164 (153,878) (486,253) 116,519 385,911
Class C shares ............ 148,413 480,116 (59,020) (183,732) 89,393 296,384
---------- ------------- ----------- ------------- ----------- -------------
Total .................... 2,119,147 $ 7,037,477 (1,012,630) $ (3,312,419) 1,106,517 $ 3,725,058
========== ============= =========== ============= =========== =============
Alpha Opportunity Series*
Class A shares ............ 318,546 $ 3,210,618 (31,141) $ (327,957) 287,405 $ 2,882,661
Class B shares ............ 169,772 1,699,668 -- -- 169,772 1,699,668
Class C shares ............ 168,989 1,690,408 -- -- 168,989 1,690,408
---------- ------------- ----------- ------------- ----------- -------------
Total .................... 657,307 $ 6,600,694 (31,141) $ (327,957) 626,166 $ 6,272,737
========== ============= =========== ============= =========== =============
Security Mid Cap Growth Fund
Class A shares ............ 4,578,400 $ 40,656,683 (5,138,315) $ (44,459,945) (559,915) $ (3,803,262)
Class B shares ............ 1,135,067 9,427,357 (1,168,642) (8,552,708) (33,575) 874,649
Class C shares ............ 497,073 4,322,997 (277,157) (2,270,432) 219,916 2,052,565
---------- ------------- ----------- ------------- ----------- -------------
Total .................... 6,210,540 $ 54,407,037 (6,584,114) $ (55,283,085) (373,574) $ (876,048)
========== ============= =========== ============= =========== =============
*For the period beginning July 7, 2003 (commencement of operations) to September 30, 2003.
- --------------------------------------------------------------------------------
105
NOTES TO FINANCIAL STATEMENTS (CONTINUED)
SEPTEMBER 30, 2003
6. CAPITAL SHARE TRANSACTIONS (CONTINUED)
2002 Total 2002 Total
2002 2002 2002 2002 2002 2002 Increase/ Increase/
Shares Amount Shares Amount Shares Amount (Decrease) (Decrease)
Sold Sold Reinvested Reinvested Redeemed Redeemed Shares Amount
--------- ------------ ----------- ---------- ----------- ------------- ----------- ------------
Large Cap Value Fund
Class A shares ............. 1,193,136 $ 6,466,262 33,045 $ 197,941 (1,840,565) $ (10,034,941) (614,384) $ (3,370,738)
Class B shares ............. 547,656 2,868,781 -- -- (437,132) (2,202,677) 110,524 666,104
Class C shares ............. 322,760 1,700,069 -- -- (130,743) (646,451) 192,017 1,053,618
Class S shares ............. 3,996 22,400 -- -- (11,632) (64,472) (7,636) (42,072)
---------- ------------ ------- ---------- ----------- ------------- ---------- ------------
Total ..................... 2,067,548 $ 11,057,512 33,045 $ 197,941 (2,420,072) $ (12,948,541) (319,479) $ (1,693,088)
========== ============ ======= ========== =========== ============= ========== ============
Security Equity Fund:
Equity Series
Class A shares ............. 12,042,285 $ 76,351,535 -- $ -- (19,759,506) $(125,366,721) (7,717,221) $(49,015,186)
Class B shares ............. 3,848,604 24,139,027 -- -- (6,134,349) (36,063,969) (2,285,745) (11,924,942)
Class C shares ............. 557,043 3,487,971 -- -- (297,814) (1,792,974) 259,229 1,694,997
Class S shares ............. 5,465 36,817 -- -- (23,193) (145,602) (17,728) (108,785)
---------- ------------ ------- ---------- ----------- ------------- ---------- ------------
Total ..................... 16,453,397 $104,015,350 -- $ -- (26,214,862) $(163,369,266) (9,761,465) $(59,353,916)
========== ============ ======= ========== =========== ============= ========== ============
Global Series
Class A shares ............. 17,098,344 $193,880,867 -- $ -- (16,093,291) $(184,491,678) 1,005,053 $ 9,389,189
Class B shares ............. 527,452 5,999,231 -- -- (657,013) (7,220,612) (129,561) (1,221,381)
Class C shares ............. 345,302 3,864,735 -- -- (232,364) (2,506,573) 112,938 1,358,162
Class S shares ............. 1,324 16,796 -- -- (6,659) (81,235) (5,335) (64,439)
---------- ------------ ------- ---------- ----------- ------------- ---------- ------------
Total ..................... 17,972,422 $203,761,629 -- $ -- (16,989,327) $(194,300,098) 983,095 $ 9,461,531
========== ============ ======= ========== =========== ============= ========== ============
Social Awareness Series
Class A shares ............. 193,611 $ 3,565,917 -- $ -- (302,641) $ (5,161,031) (109,030) $ (1,595,114)
Class B shares ............. 83,304 1,442,914 -- -- (177,436) (2,916,322) (94,132) (1,473,408)
Class C shares ............. 31,525 558,479 -- -- (16,985) (296,994) 14,540 261,485
Class S shares ............. --- -- -- -- (1,307) (23,725) (1,307) (23,725)
---------- ------------ ------- ---------- ----------- ------------- ---------- ------------
Total ..................... 308,440 $ 5,567,310 -- $ -- (498,369) $ (8,398,072) (189,929) $ (2,830,762)
========== ============ ======= ========== =========== ============= ========== ============
Mid Cap Value Series
Class A shares ............. 2,681,687 $ 57,296,305 43,856 $ 908,701 (1,470,203) $ (30,981,343) 1,255,340 $ 27,223,663
Class B shares ............. 1,538,369 31,715,651 27,649 546,059 (807,313) (15,601,038) 758,705 16,660,672
Class C shares ............. 1,079,682 22,853,396 6,475 130,026 (328,860) (6,235,819) 757,297 16,747,603
Class S shares ............. 24,373 546,845 5,427 111,634 (385,002) (8,605,244) (355,202) (7,946,765)
---------- ------------ ------- ---------- ----------- ------------- ---------- ------------
Total ..................... 5,324,111 $112,412,197 83,407 $1,696,420 (2,991,378) $ (61,423,444) 2,416,140 $ 52,685,173
========== ============ ======= ========== =========== ============= ========== ============
Small Cap Growth Series
Class A shares ............. 532,394 $5,349,414 -- $ -- (1,230,400) $ (12,729,785) (698,006) $ (7,380,371)
Class B shares ............. 356,036 3,562,949 -- -- (440,539) (4,272,369) (84,503) (709,420)
Class C shares ............. 171,086 1,682,678 -- -- (131,917) (1,304,989) 39,169 377,689
Class S shares ............. 2,828 32,238 -- -- (8,608) (85,817) (5,780) (53,579)
---------- ------------ ------- ---------- ----------- ------------- ---------- ------------
Total ..................... 1,062,344 $ 10,627,279 -- $ -- (1,811,464) $ (18,392,960) (749,120) $ (7,765,681)
========== ============ ======= ========== =========== ============= ========== ============
Enhanced Index Series
Class A shares ............. 636,383 $ 4,828,573 -- $ -- (332,010) $ (2,584,386) 304,373 $ 2,244,187
Class B shares ............. 285,356 2,127,224 -- -- (218,166) (1,721,386) 67,190 405,838
Class C shares ............. 161,948 1,271,028 -- -- (101,409) (786,653) 60,539 484,375
Class S shares ............. -- -- -- -- (339) (2,701) (339) (2,701)
---------- ------------ ------- ---------- ----------- ------------- ---------- ------------
Total ..................... 1,083,687 $ 8,226,825 -- $ -- (651,924) $ (5,095,126) 431,763 $ 3,131,699
========== ============ ======= ========== =========== ============= ========== ============
International Series
Class A shares ............. 826,825 $ 5,286,550 -- $ -- (694,269) $ (4,477,761) 132,556 $ 808,789
Class B shares ............. 85,295 542,278 -- -- (20,331) (135,521) 64,964 406,757
Class C shares ............. 1,031,609 6,362,667 -- -- (1,028,566) (6,416,855) 3,043 (54,188)
Class S shares ............. 29 200 -- -- (29) (212) -- (12)
---------- ------------ ------- ---------- ----------- ------------- ---------- ------------
Total ..................... 1,943,758 $ 12,191,695 -- $ -- (1,743,195) $ (11,030,349) 200,563 $ 1,161,346
========== ============ ======= ========== =========== ============= ========== ============
Select 25 Series
Class A shares ............. 449,230 $ 3,730,554 -- $ -- (513,090) $ (4,190,883) (63,860) $ (460,329)
Class B shares ............. 286,019 2,292,073 -- -- (486,519) (3,816,980) (200,500) (1,524,907)
Class C shares ............. 129,055 1,038,746 -- -- (115,709) (927,139) 13,346 111,607
Class S shares ............. 553 4,800 -- -- (2,221) (17,927) (1,668) (13,127)
---------- ------------ ------- ---------- ----------- ------------- ---------- ------------
Total ..................... 864,857 $ 7,066,173 -- $ -- (1,117,539) $ (8,952,929) (252,682) $ (1,886,756)
========== ============ ======= ========== =========== ============= ========== ============
Large Cap Growth Series
Class A shares ............. 1,949,955 $ 10,239,483 -- $ -- (345,765) $ (1,849,654) 1,604,190 $ 8,389,829
Class B shares ............. 273,903 1,520,855 -- -- (171,225) (939,344) 102,678 581,511
Class C shares ............. 226,975 1,307,126 -- -- (98,345) (563,377) 128,630 743,749
Class S shares ............. 390 2,480 -- -- (707) (3,960) (317) (1,480)
---------- ------------ ------- ---------- ----------- ------------- ---------- ------------
Total ..................... 2,451,223 $ 13,069,944 -- $ -- (616,042) $ (3,356,335) 1,835,181 $ 9,713,609
========== ============ ======= ========== =========== ============= ========== ============
Technology Series
Class A shares ............. 452,192 $ 1,871,160 -- $ -- (381,209) $ (1,484,392) 70,983 $ 386,768
Class B shares ............. 77,250 287,638 -- -- (17,657) (60,216) 59,593 227,422
Class C shares ............. 188,074 685,197 -- -- (84,120) (303,103) 103,954 382,094
Class S shares ............. 64 280 -- -- (38,526) (140,632) (38,462) (140,352)
---------- ------------ ------- ---------- ----------- ------------- ---------- ------------
Total ..................... 717,580 $ 2,844,275 -- $ -- (521,512) $ (1,988,343) 196,068 $ 855,932
========== ============ ======= ========== =========== ============= ========== ============
Security Mid Cap Growth Fund
Class A shares ............. 5,544,892 $ 54,000,517 79,784 $ 829,746 (8,196,903) $ (80,140,831) (2,572,227) $(25,310,568)
Class B shares ............. 910,549 7,745,638 20,366 189,811 (1,886,546) (16,408,348) (955,631) (8,472,899)
Class C shares ............. 589,690 5,405,335 3,053 30,713 (232,494) (2,003,670) 360,249 3,432,378
Class S shares ............. 22,162 227,995 982 10,135 (200,953) (1,970,493) (177,809) (1,732,363)
---------- ------------ ------- ---------- ----------- ------------- ---------- ------------
Total ..................... 7,067,293 $ 67,379,485 104,185 $1,060,405 (10,516,896) $(100,523,342) (3,345,418) $(32,083,452)
========== ============ ======= ========== =========== ============= ========== ============
- --------------------------------------------------------------------------------
106
NOTES TO FINANCIAL STATEMENTS (CONTINUED)
SEPTEMBER 30, 2003
7. OPTIONS WRITTEN
The following call options written were outstanding for Mid Cap Value Series as
of September 30, 2003:
CALL OPTIONS WRITTEN
EXPIRATION EXERCISE NUMBER OF MARKET
COMMON STOCK DATE PRICE CONTRACTS VALUE
--------- -------- --------- ---------
Protein Design Labs, Inc. ................................................. 11/21/03 $17.50 810 $20,250
------ ---------
Total call options outstanding (premiums received, $124,078) 810 $20,250
====== =========
Transactions in options written for Mid Cap Value Series for the period ended
September 30, 2003 were as follows:
PUT OPTIONS WRITTEN
NUMBER OF PREMIUM
CONTRACTS AMOUNT
--------- ---------
Balance at September 30, 2002 ......................................................................... 1,814 $ 301,480
Opened ................................................................................................ 3,872 515,559
Bought Back ........................................................................................... (74) (46,137)
Expired ............................................................................................... (3,506) (461,927)
Exercised ............................................................................................. (2,106) (308,975)
--------- ---------
Balance at September 30, 2003 ......................................................................... -- $ --
========= =========
CALL OPTIONS WRITTEN
NUMBER OF PREMIUM
CONTRACTS AMOUNT
--------- ---------
Balance at September 30, 2002 ......................................................................... 420 $ 68,337
Opened ................................................................................................ 4,529 489,859
Bought Back ........................................................................................... -- --
Expired ............................................................................................... (2,410) (265,324)
Exercised ............................................................................................. (1,729) (168,794)
--------- ---------
Balance at September 30, 2003 ......................................................................... 810 $ 124,078
========= =========
Transactions in options written for Security Mid Cap Growth Fund for the period
ended September 30, 2003 were as follows:
PUT OPTIONS WRITTEN
NUMBER OF PREMIUM
CONTRACTS AMOUNT
--------- ---------
Balance at September 30, 2002 ......................................................................... 1,304 $ 198,586
Opened ................................................................................................ 2,343 325,550
Bought Back ........................................................................................... (314) (63,296)
Expired ............................................................................................... (1,737) (210,327)
Exercised ............................................................................................. (1,596) (250,513)
--------- ---------
Balance at September 30, 2003 ......................................................................... -- $ --
========= =========
CALL OPTIONS WRITTEN
NUMBER OF PREMIUM
CONTRACTS AMOUNT
--------- ---------
Balance at September 30, 2002 ......................................................................... 889 $ 221,450
Opened ................................................................................................ 430 90,399
Bought Back ........................................................................................... -- --
Expired ............................................................................................... (800) (156,786)
Exercised ............................................................................................. (519) (155,063)
--------- ---------
Balance at September 30, 2003 ......................................................................... -- $ --
========= =========
- --------------------------------------------------------------------------------
107
NOTES TO FINANCIAL STATEMENTS (CONTINUED)
SEPTEMBER 30, 2003
8. FEDERAL TAX MATTERS
The tax character of distributions paid during the fiscal years ended
September 30, 2002 and 2003, was the same as that reported in the Statement of
Changes in Net Assets, except as follows:
ORDINARY CAPITAL RETURN OF
INCOME GAIN CAPITAL TOTAL
-------- ---------- --------- ----------
2002
- ----
Security Large Cap Value Fund $209,686 $ -- $ 5,607 $ 215,293
Security Mid Cap Growth Fund -- 1,079,682 19,688 1,099,370
As of September 30, 2003 the components of accumulated earnings/(deficit) on a
tax basis were the same as those reported in the Statement of Assets and
Liabilities, except as follows:
UNDISTRIBUTED UNDISTRIBUTED ACCUMULATED UNREALIZED TOTAL
ORDINARY LONG-TERM ACCUMULATED CAPITAL AND APPRECIATION ACCUMULATED
INCOME GAIN EARNINGS OTHER LOSSES* (DEPRECIATION)** EARNINGS/(DEFICIT)
------------- ------------- ----------- ------------- ---------------- ------------------
Security Large Cap Value Fund $108,075 $ -- $ 108,075 $(20,225,427) $ 1,000,652 $(19,116,700)
Security Equity Fund:
Global Series --- -- -- (18,343,725) 4,392,418 (13,951,307)
Social Awareness Series -- -- -- (2,242,893) (1,674,360) (3,917,253)
Mid Cap Value Series -- 2,149,183 2,149,183 -- 37,052,517 39,201,700
SmallCap Growth Series -- -- -- (13,086,413) 4,761,443 (8,324,970)
Enhanced Index Series -- -- -- (5,774,426) (1,058,107) (6,832,533)
International Series 14,667 -- 14,667 (2,885,458) 113,044 (2,757,747)
Large Cap Growth Series -- -- -- (3,659,331) 224,150 (3,435,181)
Technology Series -- -- -- (7,199,986) 844,540 (6,355,446)
Alpha Opportunity Series 219,240 -- 219,240 (20,248) (84,042) 114,950
Security Mid Cap Growth Fund -- 6,427,140 6,427,140 -- 28,897,463 35,324,603
* Certain Funds had net capital loss carryovers and deferred post October
losses as identified elsewhere in the Notes.
** The differences between book-basis and tax-basis unrealized appreciation
(depreciation) is attributable primarily to the tax deferral of wash sale
losses and the differences between book and tax basis passive foreign
investment companies and bond discount accretion.
In accordance with the provisions of the Internal Revenue Code, the percentage
of ordinary dividends (including short-term capital gains) attributable to the
fiscal year ended September 30, 2003, which qualify for the dividends received
deduction for corporate shareholders is 100% for the Security Large Cap Value
Fund, 96% for the International Series and 5% for the Alpha Opportunity Series.
- --------------------------------------------------------------------------------
108
NOTES TO FINANCIAL STATEMENTS (CONTINUED)
SEPTEMBER 30, 2003
As of September 30, 2003, the accumulated net realized loss on sales of
investments for federal income tax purposes which are available to offset future
taxable gains and post-October capital losses that are deferred to the first day
of the next fiscal year are as follows:
DEFERRED
CAPITAL LOSS POST-OCTOBER
CARRYOVERS EXPIRES IN LOSSES
------------ ---------- ------------
Security Large Cap Value Fund $ 727,563 2008 $3,023,584
7,265,289 2009
56,003 2010
9,152,988 2011
-----------
17,201,843
Security Equity Fund:
Equity Series 1,653,201 2009 8,324,394
14,878,996 2010
-----------
16,532,197
Global Series 28,793 2009 6,638,758
4,986,902 2010
6,689,272 2011
-----------
11,704,967
Social Awareness Series 817,736 2009 274,407
132,011 2010
1,018,739 2011
-----------
1,968,486
SmallCap Growth Series 13,086,413 2010 --
Enhanced Index Series 138,713 2009 3,067,270
976,489 2010
1,591,954 2011
-----------
2,707,156
International Series 286,251 2009 --
1,690,567 2010
908,640 2011
-----------
2,885,458
Select 25 Series 368,467 2008 3,420,733
2,259,072 2009
3,363,943 2010
2,960,418 2011
-----------
8,951,900
Large Cap Growth Series 58,405 2009 1,568,317
296,393 2010
1,736,216 2011
-----------
2,091,014
Technology Series 78,037 2009 24,110
4,005,352 2010
3,092,993 2011
-----------
7,176,382
Alpha Opportunity Series -- N/A 20,248
The Security Equity Fund - Equity Series inherited approximately $1,504,000 of
capital losses (included above) from its merger with Security Equity Fund -
Total Return Series (see Note 9), which may be applied against any realized net
taxable capital gains in future years or until September 30, 2009, the
respective date, whichever occurs first, subject to certain limitations imposed
by Section 382 of
- --------------------------------------------------------------------------------
109
NOTES TO FINANCIAL STATEMENTS (CONTINUED)
SEPTEMBER 30, 2003
the Internal Revenue Code.
Net investment income and net realized gains (losses) may differ for financial
statement and tax purposes because of temporary or permanent book/tax
differences. These differences are primarily due to post-October losses, losses
deferred due to wash sales, proceeds from securities litigation, foreign
currency gains and losses, investments in limited partnerships and REITs, and
the "mark-to-market" of certain Passive Foreign Investment Companies (PFIC's)
for tax purposes. To the extent these differences are permanent,
reclassifications are made to the appropriate equity accounts in the period that
the difference arises.
On the Statements of Assets and Liabilities, the following adjustments were made
for permanent tax adjustments:
ACCUMULATED UNDISTRIBUTED
NET REALIZED NET INVESTMENT
GAIN (LOSS) INCOME PAID-IN-CAPITAL
------------ -------------- ---------------
Security Large Cap Value Fund $ (7,346) $ 7,346 $ --
Security EquityFund:
Global Series 204,857 87,682 (292,539)
Social Awareness Series (776,651) 179,491 597,160
Mid Cap Value Series -- 1,140,990 (1,140,990)
SmallCap Growth Series -- 414,114 (414,114)
Enhanced Index Series -- 56,631 (56,631)
International Series (17,815) 17,815 --
Select 25 -- 281,129 (281,129)
Large Cap Growth Series -- 183,113 (183,113)
Technology Series -- 188,614 (188,614)
Alpha Opportunity Series (24,865) 24,865 --
Security Mid Cap Growth Fund -- 1,782,165 (1,782,165)
9. ACQUISITION OF SECURITY EQUITY FUND - TOTAL RETURN SERIES
Pursuant to a plan of reorganization approved by Security Equity Fund Total
Return Series shareholders, Security Equity Fund Equity Series acquired all the
net assets of Total Return Series, which totalled $2,421,288 on the closing date
of the reorganization, August 27, 2002. A total of 208,971 Class A shares,
153,617 Class B shares and 73,895 Class C shares were issued in exchange for
Total Return Series' Class A, B and C shares. In exchange for the assets of
Total Return Series 436,483 shares of Equity Series were distributed to Total
Return shareholders of record as of immediately after the closing date. A total
of $1,203,652 in assets for Class A shares, $808,176 in assets for Class B
shares and $409,460 in assets for Class C shares were received in exchange for
Total Return Series' assets. This exchange qualified as a tax-free
reorganization under Section 368(a)(1)(C) of the Internal Revenue Code. Total
Return's net assets included $504,764 of unrealized depreciation, $56,623 of
accumulated net investment loss and $1,503,978 of accumulated realized loss on
sale of investments. The aggregate net assets of Equity Series immediately
before the acquisition totalled $552,921,881. Following the acquisition, the
combined net assets of Equity Series totalled $555,343,169.
10. SUBSEQUENT EVENT
The shareholders of the Security Equity Fund, International and Technology
Series approved a plan of reorganization on September 30, 2003. The
reorganization took place on October 3, 2003. The assets and liabilities of the
International Series were merged into the Security Equity Fund - Global Series.
The assets and liabilities of the Technology Series were merged into the
Security Mid Cap Growth Fund.
- --------------------------------------------------------------------------------
110
REPORT OF INDEPENDENT AUDITORS
THE SHAREHOLDERS AND BOARD OF DIRECTORS
SECURITY LARGE CAP VALUE FUND, SECURITY EQUITY FUND AND SECURITY
MID CAP GROWTH FUND
We have audited the accompanying statements of assets and liabilities, including
the schedules of investments, of Security Large Cap Value Fund, Security Equity
Fund (comprised of the Equity, Global, Social Awareness, MidCap Value,SmallCap
Growth, Enhanced Index, International, Select 25(R), Large Cap Growth,
Technology and Alpha Opportunity Series) and Security Mid Cap Growth Fund (the
Funds) as of September 30, 2003, and the related statements of operations,
changes in net assets and financial highlights for the periods indicated
therein. These financial statements and financial highlights are the
responsibility of the Funds' management. Our responsibility is to express an
opinion on these financial statements and financial highlights based on our
audits.
We conducted our audits in accordance with auditing standards generally accepted
in the United States. Those standards require that we plan and perform the audit
to obtain reasonable assurance about whether the financial statements and
financial highlights are free of material misstatement. An audit includes
examining, on a test basis, evidence supporting the amounts and disclosures in
the financial statements and financial highlights. Our procdures included
confirmation of securities owned as of September 30, 2003, by correspondence
with the custodians and brokers or by other appropriate auditing procedures
where replies from brokers were not received. An audit also includes assessing
the accounting principles used and significant estimates made by management, as
well as evaluating the overall financial statement presentation. We believe that
our audits provide a reasonable basis for our opinion.
In our opinion, the financial statements and financial highlights referred to
above present fairly, in all material respects, the financial position of each
of the respective entities/series constituting the Funds at September 30, 2003,
and the results of their operations, the changes in their net assets and their
financial highlights for the periods indicated above in conformity with
accounting principles generally accepted in the United States.

Kansas City Missouri
November 7, 2003

- --------------------------------------------------------------------------------
                                      111


SPECIAL SHAREHOLDER MEETING (UNAUDITED)

A special meeting of the Security Equity Fund-International Series and
Technology Series was held on September 30, 2003. Each matter voted upon at the
meeting, as well as the number of votes cast for, against or withheld, and the
number of abstentions with respect to such matters are set forth below:

          (1)  The approval of a plan of reorganization providing for the
               acquisition of all of the assets and liabilities of Security
               Equity Fund, International Series ("International Fund") by
               Security Equity Fund, Global Series ("Global Fund") solely in
               exchange for shares of the Global Fund, followed by the complete
               liquidation of the International Fund. The following votes were
               cast regarding this matter:

                                                                          VOTES FOR            VOTES AGAINST/ABSTENTIONS
               Security Equity Fund, International Series                  889,209                      15,742

          (2)  The approval of a plan of reorganization providing for the
               acquisition of all of the assets and liabilities of Security
               Equity Fund, Technology Series ("Technology Fund") by Security
               Mid Cap Growth Fund, solely in exchange for shares of the Mid Cap
               Growth Fund, followed by the complete liquidation of the
               Technology Fund.

                                                                          VOTES FOR            VOTES AGAINST/ABSTENTIONS
               Security Equity Fund, Technology Series                    1,627,616                     44,010


- --------------------------------------------------------------------------------
                                      112


DIRECTOR DISCLOSURE

SEPTEMBER 30, 2003

                                                                                                                                          NUMBER OF
                                                                                     PRINCIPAL                                            PORTFOLIOS IN
NAME,                         POSITION(S)                                            OCCUPATION(S)                                        FUND COMPLEX
ADDRESS AND                   HELD WITH                 TERM OF OFFICE AND           DURING THE PAST                                      OVERSEEN BY
DATE OF BIRTH                 THE FUND                  LENGTH OF TIME SERVED        5 YEARS                                              THE DIRECTOR
- --------------------------------------------------------------------------------------------------------------------------------------------------------
Donald A. Chubb, Jr.          Director**                1994 to present***           Business broker,                                           38
One Security Benefit Place                                                             Griffith & Blair Realtors
Topeka, KS 66636-0001                                                                Manager, Star Sign,Inc.
12/14/46

Penny A. Lumpkin              Director**                1993 to present***           President, Vivian's Gift Shop                              38
One Security Benefit Place                                                           Vice President, Palmer Companies, Inc.
Topeka, KS 66636-0001                                                                Vice President, Bellairre Shopping Center
08/20/39                                                                             Partner, Goodwin Ent.
                                                                                     Partner, PLB
                                                                                     Partner, Town Crier
                                                                                     Vice President and Treasurer, Palmer News, Inc.
                                                                                     Vice President, M/S News, Inc.
                                                                                     Secretary, Kansas City Periodicals

Mark L. Morris, Jr., D.V.M.   Director**                1991 to present***           Independent Investor, Morris Co.                           38
One Security Benefit Place                                                           Partner, Mark Morris Associates
Topeka, KS 66636-0001
02/03/34

Maynard F. Oliverius          Director**                1998 to present***           President & CEO, Stormont Vail HealthCare                  38
One Security Benefit Place
Topeka, KS 66636-0001
12/18/43

John D. Cleland               Chairman of the Board     February 2000 to present     Sr. Vice President and Managing Member                     38
One Security Benefit Place    Director*                 1991 to present***           Representative, Security Management Company, LLC
Topeka, KS 66636-0001                                                                Sr. Vice President, Security Benefit Group, Inc.
05/01/36                                                                             Sr. Vice President, Security Benefit Life Insurance Co.
                                                                                     Director & Vice President, Security Distributors, Inc.

James R. Schmank              President                 February 2000 to present     President and Managing Member Representative,              38
One Security Benefit Place    Director*                 1997 to present***           Security Management Company, LLC
Topeka, KS 66636-0001                                                                Sr. Vice President, Security Benefit Group, Inc.
02/21/53                                                                             Sr. Vice President, Security Benefit Life Insurance Co.
                                                                                     Director, Security Distributors, Inc.

*    These directors are deemed to be "interested persons" of the Funds under
     the Investment Company Act of 1940, as amended, by reason of their
     positions with the Funds' Investment Manager and/or the parent of the
     Investment Manager.
**   These directors serve on the Funds' joint audit committee, the purpose of
     which is to meet with the independent auditors, to review the work of the
     auditors, and to oversee the handling by Security Management Company, LLC
     of the accounting function for the Funds.
***  Term is until the next annual meeting, or until their successors shall have
     been duly elected and qualified.


The statement of additional information ("SAI") includes additional information
about the Fund Directors and is available upon request without charge by calling
1-800-888-2461.

- --------------------------------------------------------------------------------
                                      113


THE SECURITY GROUP
OF MUTUAL FUNDS
- ---------------------------------------
Security Large Cap Value Fund
Security Equity Fund
    o  Equity Series
    o  Global Series
    o Social Awareness Series
    o Mid Cap Value Series
    o Small Cap Growth Series
    o Enhanced Index Series
    o International Series
    o Select 25 Series
    o Large Cap Growth Series
    o Technology Series
    o Alpha Opportunity Series
Security Mid Cap Growth Fund
Security Income Fund
    o  Diversified Income Series
    o  High Yield Series
    o  Capital Preservation Series
Security Municipal Bond Fund
Security Cash Fund

This report is submitted for the general information of the shareholders of the
Funds. The report is not authorized for distribution to prospective investors in
the Funds unless preceded or accompanied by an effective prospectus which
contains details concerning the sales charges and other pertinent
information.

One Security Benefit Place
Topeka, KS 66636-0001


SECURITY FUNDS
OFFICERS AND DIRECTORS
- ---------------------------------------
DIRECTORS
- ---------
Donald A. Chubb, Jr.
John D. Cleland
Penny A. Lumpkin
Mark L. Morris, Jr., D.V.M.
Maynard F. Oliverius
James R. Schmank
OFFICERS
- --------
John D. Cleland, CHAIRMAN OF THE BOARD
James R. Schmank, PRESIDENT
Steve M. Bowser, VICE PRESIDENT, EQUITY FUND
Mark Lamb,VICE PRESIDENT, EQUITY FUND
Terry A. Milberger, VICE PRESIDENT, EQUITY FUND
Mark Mitchell, VICE PRESIDENT, EQUITY FUND
James P. Schier, VICE PRESIDENT, EQUITY AND MID CAP GROWTH FUND
Cindy L. Shields, VICE PRESIDENT, EQUITY FUND
Amy J. Lee, SECRETARY
Christopher D. Swickard, ASSISTANT SECRETARY
Brenda M. Harwood, TREASURER


SDI 604 (R9-03)                                                     46-06045-00


ITEM 2.  CODE OF ETHICS.

The Registrant has adopted a code of ethics that applies to its principal
executive officer and principal financial officer. A copy of the Registrant's
code of ethics is filed herewith as Exhibit 10(a)(1). No amendments were made to
the provisions of the code of ethics during the period covered by this report.
No implicit or explicit waivers to the provisions of the code of ethics were
granted during the period covered by this report.

ITEM 3.  AUDIT COMMITTEE FINANCIAL EXPERT.

The Registrant's Board of Directors has determined that Maynard Oliverius, a
member of the Audit Committee of the Board, is an audit committee financial
expert. Mr. Oliverius is "independent" for purposes of this item.

ITEM 4.  PRINCIPAL ACCOUNTANT FEES AND SERVICES.

         Not required at this time.

ITEM 5.  AUDIT COMMITTEE OF LISTED REGISTRANTS.

         Not applicable.

ITEM 6.  RESERVED.


ITEM 7.  DISCLOSURE OF PROXY VOTING POLICIES AND PROCEDURES FOR CLOSED-END
         MANAGEMENT INVESTMENT COMPANIES.

         Not applicable.

ITEM 8.  RESERVED.


ITEM 9.  CONTROLS AND PROCEDURES.

         (a)      The registrant's President and Treasurer have concluded that
                  the registrant's disclosure controls and procedures (as
                  defined in rule 30a-3(c) under the Investment Company Act of
                  1940) are effective based on their evaluation of these
                  disclosure controls and procedures within 90 days of the
                  filing date of this report on Form N-CSR.


         (b)      There were no significant changes in the registrant's internal
                  controls, or in other factors that could significantly affect
                  these controls subsequent to the date of their evaluation,
                  including any corrective actions with regard to significant
                  deficiencies and material weaknesses.

ITEM 10. EXHIBITS.

         (a)      (1)      Code of Ethics pursuant to Item 2 above.

                  (2)      Certifications pursuant to Section 302 of the
                           Sarbanes-Oxley Act of 2002 and required by Rule
                           30a-2(a) under the Investment Company Act of 1940,
                           are attached hereto.

         (b)      Certifications pursuant to Section 906 of the Sarbanes-Oxley
                  Act of 2002 and required by Rule 30a-2(a) under the Investment
                  Company Act of 1940, are attached hereto.


                                   SIGNATURES


Pursuant to the requirements of the Securities Exchange Act of 1934 and the
Investment Company Act of 1940, the registrant has duly caused this report to be
signed on its behalf by the undersigned, thereunto duly authorized.

                                   SECURITY EQUITY FUND

                                   By:    /s/ JAMES R. SCHMANK
                                          --------------------------------------
                                          James R. Schmank, President

                                   Date:  December 1, 2003

Pursuant to the requirements of the Securities Exchange Act of 1934 and the
Investment Company Act of 1940, this report has been signed below by the
following persons on behalf of the registrant and in the capacities and on the
dates indicated.

                                   By:    /s/ JAMES R. SCHMANK
                                          --------------------------------------
                                          James R. Schmank, President

                                   Date:  December 1, 2003


                                   By:    /s/ BRENDA M. HARWOOD
                                          --------------------------------------
                                          Brenda M. Harwood, Treasurer

                                   Date:  December 1, 2003