UNITED STATES
SECURITIES AND EXCHANGE COMMISSION
Washington, D.C. 20549
FORM N-CSR
CERTIFIED SHAREHOLDER REPORT OF REGISTERED
MANAGEMENT INVESTMENT COMPANIES
Investment Company Act file number 811-01136
SECURITY EQUITY FUND
(Exact name of registrant as specified in charter)
ONE SECURITY BENEFIT PLACE, TOPEKA, KANSAS 66636-0001
(Address of principal executive offices) (Zip code)
THOMAS A. SWANK, PRESIDENT
SECURITY EQUITY FUND
ONE SECURITY BENEFIT PLACE
TOPEKA, KANSAS 66636-0001
(Name and address of agent for service)
Registrant’s telephone number, including area code: (785) 438-3000
Date of fiscal year end: September 30
Date of reporting period: September 30, 2007
Form N-CSR is to be used by management investment companies to file reports with the Commission not later than 10 days after the transmission to stockholders of any report that is required to be transmitted to stockholders under Rule 30e-1 under the Investment Company Act of 1940 (17 CFR 270.30e-1). The Commission may use the information provided on Form N-CSR in its regulatory, disclosure review, inspection, and policymaking roles.
A registrant is required to disclose the information specified by Form N-CSR, and the Commission will make this information public. A registrant is not required to respond to the collection of information contained in Form N-CSR unless the Form displays a currently valid Office of Management and Budget (“OMB”) control number. Please direct comments concerning the accuracy of the information collection burden estimate and any suggestions for reducing the burden to Secretary, Securities and Exchange Commission, 450 Fifth Street, NW, Washington, DC 20549-0609. The OMB has reviewed this collection of information under the clearance requirements of 44 U.S.C. §3507.
| Item 1. | Reports to Stockholders. |

Security Equity Fund®
Security Large Cap Value Fund
Security Mid Cap Growth Fund
September 30, 2007
Annual Report
Table of Contents
Security Global Investors refers to the asset management arm of Security Benefit Corporation (“Security Benefit”) that consists of Security Investors, LLC, and for global investing, Security Global Investors, LLC. Security Distributors, Inc., Security Investors, LLC and Security Global Investors, LLC are subsidiaries of Security Benefit.
1
This page left blank intentionally.
2
| | |
| | Security Equity Fund |
| Managers’ Commentary | | Alpha Opportunity Series |
| November 15, 2007 | | (unaudited) |
| | | | | | | | |
Advised by: | |  | | and | |  | | Subadviser, Mainstream |
| | | | | | | | Investment Advisers |
| | | | |
 | |  | |  |
Bill Jenkins Co-Portfolio Manager | | Mark Lamb Co-Portfolio Manager | | Steve Bowser Co-Portfolio Manager |
To Our Shareholders:
Performance
The performance of the Security Equity Fund Alpha Opportunity Series was very strong in the 12 months ended September 30, 2007, returning 26.10% compared to 16.44% for the S&P 500 Index. Since inception on July 7, 2003, the Series has outperformed the benchmark by more than 300 basis points, 16.21% to 13.18% on an annualized basis. The performance of the portfolio more than doubled that of other long/short equity managers when using the Credit Suisse/Tremont Long/Short Equity Index for the same period. The favorable comparisons to the S&P 500 index can be principally attributed to the portfolio’s emphasis on the energy, materials and industrial sectors of the market. Results were enhanced versus other long/short managers due to the relatively low level of short positions in the portfolio.
Investment Philosophy
We are active managers, as that style and approach plays well to our strengths of portfolio management experience and discipline. Our fundamental philosophy rests first upon the belief that it is critical to identify the long-term investment theme governing the equity markets. These themes may persist for 15 to 20 years. Second, while we also believe that valuation adds important perspective to investment decisions, it is not an efficient means of timing purchase and sale decisions. Those decisions are best made using technical analysis, a practice that uses the movement of security prices to indicate possible future price behavior. The third tenet of our philosophy is that changes in stock prices can lead changes in fundamental corporate developments. A proactive asset management approach helps to keep our investment themes fresh and our risk levels moderate.
Sector Performance
Our current theme can best be described as a global infrastructure one. When using the performance of the S&P 500 sectors as an indicator, our theme sectors performed very well. Energy (+41%), materials (+33%) and industrials (+22%) all handily outperformed the S&P 500 Index. In the energy sector, one of the better performing companies was Schlumberger, Ltd., which rose 71% in the last year. In the materials sector, Freeport-McMoRan contributed strongly to our results with the stock rising 106% in the last 12 months. Within industrials, Deere’s common equity returned approximately 80% in the last year. Technology was a good sector for us with the stock of Cisco Systems rising 44% over the last twelve months, thereby contributing to our theme of global infrastructure build out. By the same token, those sectors that we have traditionally viewed as short candidates were weak. Financials (-0.1%), consumer durables (+5%) and consumer staples (+11) all underperformed the S&P 500 Index.
Market Outlook
We continue to be positive in our outlook for the equity markets over the long term. We view overall valuation to be fair and the fundamentals for global economies and markets to be positive. As such, we do not expect that shorting will become a significant part of our strategy in the near future. In addition to the principal theme sectors mentioned above, we are increasingly more optimistic toward technology stocks, which were up 22% in the trailing twelve months that ended in September. Many of the companies in this sector are well positioned to benefit from our global infrastructure investment theme.
Sincerely,
Bill Jenkins, Portfolio Manager (Mainstream Investment Advisers)
Mark Lamb, Portfolio Manager (Security Investors)
Steve Bowser, Portfolio Manager (Security Investors)
1 | Performance figures are based on Class A shares and do not reflect deduction of the sales charges or taxes that a shareholder would pay on distributions or the redemption of shares. Fee waivers and/or reimbursements reduce Fund expenses and in the absence of such waivers, the performance quoted would be reduced. |
3
| | |
| | Security Equity Fund |
| Performance Summary | | Alpha Opportunity Series |
| September 30, 2007 | | (unaudited) |
PERFORMANCE
Security Alpha Opportunity Series vs. S&P 500 Index
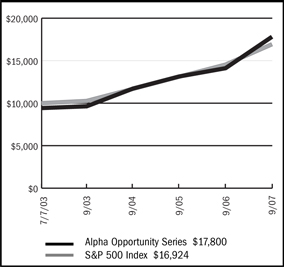
$10,000 Since Inception
This chart assumes a $10,000 investment in Class A shares of Alpha Opportunity Series on July 7, 2003 (date of inception), reflects deduction of the 5.75% sales load and assumes all dividends reinvested. The chart does not reflect the deduction of taxes that a shareholder would pay on distributions or the redemption of fund shares. The S&P 500 Index is a capitalization weighted index composed of 500 selected common stocks that represent the broad domestic economy and is a widely recognized unmanaged index of market performance.
Average Annual Returns
| | | | | | |
Periods Ended 9-30-07 | | 1 Year | | | Since Inception
(7-07-03) | |
A Shares | | 26.10 | % | | 16.21 | % |
| | |
A Shares with sales charge | | 18.81 | % | | 14.59 | % |
| | |
B Shares | | 25.14 | % | | 15.32 | % |
| | |
B Shares with CDSC | | 20.14 | % | | 15.02 | % |
| | |
C Shares | | 25.24 | % | | 15.34 | % |
| | |
C Shares with CDSC | | 24.24 | % | | 15.34 | % |
The performance data above represents past performance that is not predictive of future results. The investment return and principal value of an investment in the Series will fluctuate so that an investor’s shares, when redeemed, may be worth more or less than their original cost. The figures above do not reflect deduction of the maximum front-end sales charge of 5.75% for Class A shares or the contingent deferred sales charge of 5% for Class B shares and 1% for Class C shares, as applicable, except where noted. The figures do not reflect the deduction of taxes that a shareholder would pay on distributions or redemption of shares. Such figures would be lower if the maximum sales charge and any applicable taxes were deducted. Fee waivers and/or reimbursements reduced expenses of the Series and in the absence of such waiver, the performance quoted would be reduced.
Portfolio Composition by Sector as of 9-30-07*
| | | |
Consumer Discretionary | | 0.33 | % |
| |
Consumer Staples | | 0.73 | |
| |
Energy | | 9.30 | |
| |
Financials | | 1.13 | |
| |
Health Care | | 0.09 | |
| |
Industrials | | 25.42 | |
| |
Information Technology | | 12.67 | |
| |
Materials | | 6.87 | |
| |
Telecommunication Services | | 0.27 | |
| |
Utilities | | 0.14 | |
| |
Exchange Traded Funds | | (0.80 | ) |
| |
U.S. Government Sponsored Agencies | | 39.55 | |
| |
Other assets in excess of liabilities | | 4.30 | |
| |
Total net assets | | 100.00 | % |
| | | |
| * | Securities sold short are netted with long positions in common stocks in the appropriate sectors. |
The accompanying notes are an integral part of the financial statements
4
| | |
| | Security Equity Fund |
| Performance Summary | | Alpha Opportunity Series |
| September 30, 2007 | | (unaudited) |
PERFORMANCE
Information About Your Series Expenses
Calculating your ongoing Series expenses
Example
As a shareholder of the Series, you incur two types of costs: (1) transaction costs, which may include sales charges (loads) on purchase payments; contingent deferred sales charges on redemptions; and redemption fees, if any; and (2) ongoing costs, including management fees; distribution and/or service fees (12b-1); and other Series expenses. This example is intended to help you understand your ongoing costs (in dollars) of investing in the Series and to compare these costs with ongoing costs of investing in other mutual funds. The example is based on an investment of $1,000 invested at the beginning of the period and held for the entire period, April 1, 2007 – September 30, 2007.
Actual Expenses
The first line for each class of shares in the table provides information about actual account values and actual expenses. You may use the information in this table, together with the amount you invested, to estimate the expenses that you paid over the period. Simply divide your account value by $1,000 (for example, an $8,600 account value divided by $1,000 = 8.6), then multiply the result by the number in the table under the heading entitled “Expenses Paid During Period” to estimate the expenses you paid on your account during this period.
Hypothetical Example for Comparison Purposes
The second line for each class of shares in the table provides information about hypothetical account values and hypothetical expenses based on the Series actual expense ratio and an assumed rate of return of 5% per year before expenses, which is not the Series actual return. The hypothetical account values and expenses may not be used to estimate the actual ending account balance or expenses you paid for the period. You may use this information to compare the ongoing costs of investing in the Series and other funds. To do so, compare this 5% hypothetical example with the 5% hypothetical examples that appear in the shareholder reports of the other mutual funds.
Please note that the expenses shown in the table are meant to highlight your ongoing costs only and do not reflect any transactional costs, such as sales charges (loads) on purchase payments, contingent deferred sales charges on redemptions, and redemption fees, if any. Therefore, the second line for each class of shares is useful in comparing ongoing costs only, and will not help you determine the relative total costs of owning different funds. In addition, if these transactional costs were included, your costs would have been higher.
Series Expenses
| | | | | | | | | |
| | | Beginning
Account Value
04-01-07 | | Ending
Account Value
09-30-071 | | Expenses Paid
During
Period2 |
Alpha Opportunity | | | | | | | | | |
Series—Class A | | | | | | | | | |
Actual | | $ | 1,000.00 | | $ | 1,130.60 | | $ | 14.74 |
Hypothetical | | | 1,000.00 | | | 1,011.17 | | | 13.92 |
| | | |
Alpha Opportunity | | | | | | | | | |
Series—Class B | | | | | | | | | |
Actual | | | 1,000.00 | | | 1,125.80 | | | 18.28 |
Hypothetical | | | 1,000.00 | | | 1,007.83 | | | 17.26 |
| | | |
Alpha Opportunity | | | | | | | | | |
Series—Class C | | | | | | | | | |
Actual | | | 1,000.00 | | | 1,126.70 | | | 18.39 |
Hypothetical | | | 1,000.00 | | | 1,007.73 | | | 17.36 |
1 | The actual ending account value is based on the actual total return of the Series for the period from April 1, 2007 to September 30, 2007 after actual expenses and will differ from the hypothetical ending account value which is based on the Series expense ratio and a hypothetical annual return of 5% before expenses. The actual cumulative return at net asset value for the period from April 1, 2007 to September 30, 2007 was 13.06%, 12.58% and 12.67%, for Class A, B and C shares, respectively. |
2 | Expenses are equal to the Series annualized expense ratio (2.76%, 3.43% and 3.45% for Class A, B and C shares, respectively), net of any applicable fee waivers or earnings credits, multiplied by the average account value over the period, multiplied by 183/365 (to reflect the one-half year period). |
5
| | |
| Schedule of Investments | | Security Equity Fund - Alpha Opportunity Series |
| September 30, 2007 | | |
|
| | | | | |
| | | Shares | | Value |
COMMON STOCK - 57.2% | | | | | |
Agricultural Products - 0.2% | | | | | |
Cresud S.A. ADR | | 3,103 | | $ | 70,500 |
| | | | | |
Airlines - 1.3% | | | | | |
UAL Corporation * | | 8,686 | | | 404,160 |
| | | | | |
Aluminum - 0.5% | | | | | |
Aluminum Corporation of China, Ltd. ADR | | 569 | | | 39,847 |
Century Aluminum Company * | | 2,555 | | | 134,521 |
| | | | | |
| | | | | 174,368 |
| | | | | |
Application Software - 1.3% | | | | | |
Ado be Systems, Inc. * | | 1,533 | | | 66,931 |
Autodesk, Inc. * | | 6,642 | | | 331,901 |
Business Objects S.A. ADR* | | 511 | | | 22,928 |
| | | | | |
| | | | | 421,760 |
| | | | | |
Coal & Consumable Fuels - 0.6% | | | | | |
Consol Energy, Inc. | | 1,533 | | | 71,438 |
International Coal Group, Inc. * | | 23,776 | | | 105,565 |
| | | | | |
| | | | | 177,003 |
| | | | | |
Commodity Chemicals - 0.3% | | | | | |
Braskem S.A. ADR | | 5,109 | | | 96,202 |
| | | | | |
Communications Equipment - 3.3% | | | | | |
Black Box Corporation | | 12,111 | | | 517,867 |
CommScope Inc. * | | 6,642 | | | 333,694 |
Telefonaktiebolaget LM Ericsson ADR * | | 5,474 | | | 217,865 |
| | | | | |
| | | | | 1,069,426 |
| | | | | |
Computer Hardware - 2.7% | | | | | |
Hewlett-Packard Company | | 8,176 | | | 407,083 |
International Business Machines Corporation | | 4,087 | | | 481,449 |
| | | | | |
| | | | | 888,532 |
| | | | | |
Computer Storage & Peripherals - 0.5% | | | | | |
Seagate Technology | | 6,496 | | | 166,168 |
| | | | | |
Construction & Engineering - 5.1% | | | | | |
Chicago Bridge & Iron Company N.V. | | 9,314 | | | 401,061 |
KHD Humboldt Wedag International, Ltd. * | | 1,284 | | | 39,162 |
Quanta Services, Inc. * (1) | | 32,798 | | | 867,507 |
URS Corporation * | | 6,131 | | | 346,095 |
| | | | | |
| | | | | 1,653,825 |
| | | | | |
Construction & Farm Machinery & Heavy Trucks - 1.4% | | | | | |
Caterpillar, Inc. | | 1,533 | | | 120,233 |
Cummins, Inc. | | 511 | | | 65,352 |
Lindsay Corporation | | 1,431 | | | 62,649 |
Toro Company | | 3,577 | | | 210,435 |
| | | | | |
| | | | | 458,669 |
| | | | | |
Diversified Banks - 0.6% | | | | | |
Banco Santander Chile S.A. ADR | | 781 | | | 39,495 |
Wells Fargo & Company | | 4,598 | | | 163,781 |
| | | | | |
| | | | | 203,276 |
| | | | | |
Diversified Commercial & Professional Services - 0.7% | | | | | |
Pike Electric Corporation * | | 9,510 | | | 178,407 |
Ritchie Bros Auctioneers, Inc. | | 967 | | | 62,952 |
| | | | | |
| | | | | 241,359 |
| | | | | |
Diversified Metals & Mining - 0.6% | | | | | |
AMCOL International Corporation | | 4,110 | | | 136,000 |
Idaho General Mines, Inc. * | | 8,532 | | | 56,652 |
| | | | | |
| | | | | 192,652 |
| | | | | |
Electric Utilities - 0.1% | | | | | |
Korea Electric Power Corporation ADR | | 1,825 | | | 42,249 |
| | | | | |
Electrical Components & Equipment - 7.4% | | | | | |
American Superconductor Corporation * | | 4,087 | | | 83,702 |
Belden, Inc. | | 2,044 | | | 95,884 |
Cooper Industries, Ltd. | | 1,022 | | | 52,214 |
Evergreen Solar, Inc. * | | 2,846 | | | 25,415 |
General Cable Corporation * | | 3,577 | | | 240,088 |
GrafTech International, Ltd. * | | 8,781 | | | 156,653 |
Hubbell, Inc. (CI.B) | | 744 | | | 42,497 |
Powell Industries, Inc. * | | 6,519 | | | 247,005 |
Rockwell Automation, Inc. | | 6,642 | | | 461,685 |
Roper Industries, Inc. | | 6,627 | | | 434,069 |
Suntech Power Holdings Company, Ltd. ADR * | | 1,460 | | | 58,254 |
Thomas & Betts Corporation * | | 8,438 | | | 494,804 |
| | | | | |
| | | | | 2,392,270 |
| | | | | |
Electronic Equipment Manufacturers - 0.5% | | | | | |
Agilent Technologies, Inc. * | | 2,044 | | | 75,383 |
Itron, Inc. * | | 511 | | | 47,559 |
TDK Corporation ADR | | 511 | | | 44,712 |
| | | | | |
| | | | | 167,654 |
| | | | | |
Electronic Manufacturing Services - 0.4% | | | | | |
Flextronics International, Ltd. * | | 11,751 | | | 131,376 |
| | | | | |
Environmental & Facilities Services - 0.1% | | | | | |
Waste Management, Inc. | | 1,022 | | | 38,570 |
| | | | | |
Fertilizers & Agricultural Chemicals - 0.8% | | | | | |
Terra Nitrogen Company, LP | | 2,044 | | | 259,241 |
| | | | | |
The accompanying notes are an integral part of the financial statements
6
| | |
| Schedule of Investments | | Security Equity Fund - Alpha Opportunity Series |
September 30, 2007 - continued | | |
| | | | | |
| | | Shares | | Value |
COMMON STOCK (continued) | | | | | |
Food Distributors - 0.2% | | | | | |
Andersons, Inc. | | 1,022 | | $ | 49,076 |
| | | | | |
Food Retail - 0.4% | | | | | |
Kroger Company | | 4,087 | | | 116,561 |
| | | | | |
Gold - 1.0% | | | | | |
Newmont Mining Corporation | | 7,153 | | | 319,954 |
| | | | | |
Independent Power Producers & Energy Traders - 0.0% | | | | | |
Ormat Technologies, Inc. | | 59 | | | 2,734 |
| | | | | |
Industrial Conglomerates - 2.5% | | | | | |
Carlisle Companies, Inc. | | 4,161 | | | 202,225 |
General Electric Company | | 7,153 | | | 296,134 |
Teleflex, Inc. | | 1,715 | | | 133,633 |
Textron, Inc. | | 182 | | | 11,322 |
Walter Industries, Inc. | | 6,131 | | | 164,924 |
| | | | | |
| | | | | 808,238 |
| | | | | |
Industrial Machinery - 6.9% | | | | | |
Donaldson Company, Inc. | | 4,445 | | | 185,623 |
Dover Corporation | | 2,664 | | | 135,731 |
Dynamic Materials Corporation | | 4,824 | | | 231,022 |
Hardinge, Inc. | | 1,022 | | | 35,596 |
Harsco Corporation | | 3,493 | | | 207,030 |
IDEX Corporation | | 3,065 | | | 111,535 |
Ingersoll-Rand Company, Ltd. | | 511 | | | 27,834 |
ITT Corporation | | 153 | | | 10,393 |
Kennametal, Inc. | | 3,540 | | | 297,289 |
Lincoln Electric Holdings, Inc. | | 2,170 | | | 168,414 |
Parker Hannifin Corporation | | 2,044 | | | 228,581 |
Timken Company | | 4,161 | | | 154,581 |
Valmont Industries, Inc. | | 5,365 | | | 455,220 |
| | | | | |
| | | | | 2,248,849 |
| | | | | |
Integrated Oil & Gas - 0.8% | | | | | |
InterOil Corporation * | | 7,153 | | | 226,035 |
Sasol, Ltd. ADR | | 511 | | | 21,968 |
| | | | | |
| | | | | 248,003 |
| | | | | |
Internet Software & Services - 0.7% | | | | | |
Vignette Corporation * | | 11,401 | | | 228,818 |
| | | | | |
Metal & Glass Containers - 2.0% | | | | | |
Owens-Illinois, Inc. * (1) | | 15,627 | | | 647,739 |
| | | | | |
Oil &Gas Equipment & Services - 4.1% | | | | | |
Dril-Quip, Inc. * | | 5,620 | | | 277,347 |
Grant Prideco, Inc.* | | 5,620 | | | 306,402 |
Mitcham Industries, Inc. * | | 4,888 | | | 94,241 |
Schlumberger, Ltd. | | 6,131 | | | 643,755 |
| | | | | |
| | | | | 1,321,745 |
| | | | | |
Oil & Gas Exploration & Production - 2.1% | | | | | |
Denbury Resources, Inc. * | | 4,357 | | | 194,714 |
Forest Oil Corporation * | | 1,562 | | | 67,229 |
Harvest Natural Resources, Inc. * | | 14,744 | | | 176,043 |
Newfield Exploration Company * | | 1,022 | | | 49,220 |
PetroHawk Energy Corporation * | | 11,751 | | | 192,951 |
| | | | | |
| | | | | 680,157 |
| | | | | |
Oil & Gas Refining & Marketing - 1.0% | | | | | |
Valero Energy Corporation | | 4,598 | | | 308,894 |
| | | | | |
Oil & Gas Storage & Transportation - 0.9% | | | | | |
El Paso Corporation | | 14,306 | | | 242,773 |
Knightsbridge Tankers, Ltd. | | 1,448 | | | 38,951 |
| | | | | |
| | | | | 281,724 |
| | | | | |
Pharmaceuticals - 0.1% | | | | | |
Dr Reddys Laboratories, Ltd. ADR | | 1,825 | | | 29,857 |
| | | | | |
Semiconductor Equipment - 0.9% | | | | | |
ASM International N.V. | | 1,364 | | | 38,983 |
MEMC Electronic Materials, Inc. * | | 4,087 | | | 240,561 |
| | | | | |
| | | | | 279,544 |
| | | | | |
Semiconductors - 2.3% | | | | | |
Intel Corporation | | 11,167 | | | 288,779 |
ON Semiconductor Corporation * | | 37,297 | | | 468,450 |
| | | | | |
| | | | | 757,229 |
| | | | | |
Specialized REIT’s - 0.7% | | | | | |
Plum Creek Timber Company, Inc. | | 5,109 | | | 228,679 |
| | | | | |
Specialty Chemicals - 0.4% | | | | | |
Cytec Industries, Inc. | | 2,044 | | | 139,789 |
| | | | | |
Specialty Stores - 0.3% | | | | | |
Cabela’s, Inc. * | | 4,598 | | | 108,743 |
| | | | | |
Steel - 1.2% | | | | | |
Commercial Metals Company | | 2,533 | | | 80,169 |
Haynes International, Inc. * | | 1,533 | | | 130,872 |
Metal Management, Inc. | | 3,478 | | | 188,508 |
| | | | | |
| | | | | 399,549 |
| | | | | |
Wireless Telecommunication Services - 0.3% | | | | | |
Rogers Communications, Inc. (CI.B) | | 1,825 | | | 83,092 |
Telemig Celular Participacoes S.A. ADR | | 73 | | | 4,278 |
| | | | | |
| | | | | 87,370 |
| | | | | |
TOTAL COMMON STOCK (Cost $18,436,661) | | | | $ | 18,542,512 |
| | | | | |
The accompanying notes are an integral part of the financial statements
| | |
| Schedule of Investments | | Security Equity Fund - Alpha Opportunity Series |
September 30, 2007 - continued | | |
| | | | | | |
| | | Principal
Amount | | Value |
U.S. GOVERNMENT SPONSORED AGENCY BONDS & NOTES - 39.5% | | | | | | |
Federal Farm Credit Discount Note | | | | | | |
5.13% - 2007 (1) | | $ | 275,000 | | $ | 274,412 |
Federal Home Loan Bank | | | | | | |
4.705% - 2007 (1) | | | 1,050,000 | | | 1,044,225 |
4.84% - 2007 (1) | | | 1,050,000 | | | 1,043,306 |
4.93% - 2007 (1) | | | 750,000 | | | 744,469 |
5.11% - 2007 (1) | | | 950,000 | | | 946,414 |
5.13% - 2007 (1) | | | 200,000 | | | 199,723 |
Federal Home Loan Mortgage Corporation | | | | | | |
4.52% - 2007 (1) | | | 650,000 | | | 644,338 |
4.52% - 2007 (1) | | | 1,000,000 | | | 989,547 |
4.72% - 2007 (1) | | | 500,000 | | | 500,000 |
5.09% - 2007 (1) | | | 750,000 | | | 745,406 |
5.12% - 2007 (2) | | | 1,175,000 | | | 1,171,894 |
5.14% - 2007 (1) | | | 700,000 | | | 699,295 |
Federal National Mortgage Association | | | | | | |
4.52% - 2007 (1) | | | 1,000,000 | | | 991,040 |
4.53% - 2007 (1) | | | 1,000,000 | | | 990,169 |
4.59% - 2007 (1) | | | 350,000 | | | 349,643 |
4.72% - 2007 (1) | | | 250,000 | | | 249,937 |
4.77% - 2007 (1) | | | 225,000 | | | 224,100 |
5.11% - 2007 (1) | | | 725,000 | | | 722,902 |
5.115% - 2007 (1) | | | 300,000 | | | 298,613 |
| | | | | | |
TOTAL U.S. GOVERNMENT SPONSORED AGENCY BONDS & NOTES (Cost $12,825,566) | | | | | $ | 12,829,433 |
| | | | | | |
Total Investments (Security Equity Fund - Alpha Opportunity Series) | | | | | $ | 31,371,945 |
(Cost $31,262,227) - 96.7% | | | | | | |
Other Assets in Excess of Liabilities - 3.3% | | | | | | 1,069,668 |
| | | | | | |
TOTAL NET ASSETS - 100.0% | | | | | $ | 32,441,613 |
| | | | | | |
Schedule of Securities Sold Short
September 30, 2007
Security Equity Fund - Alpha Opportunity Series
| | | | | | | |
| | | Shares | | | Value | |
COMMON STOCK - (1.0)% | | (2,017 | ) | | $ | (179,110 | ) |
Exchange Traded Funds - (0.8)% | | | | | | | |
iShares Lehman 20+ Year Treasury | | | | | | | |
Retail HOLDRs Trust * | | (807 | ) | | | (80,829 | ) |
| | | | | | | |
| | | | | | (259,939 | ) |
| | | | | | | |
Life & Health Insurance - (0.1)% | | | | | | | |
Nationwide Financial Services | | (403 | ) | | | (21,689 | ) |
| | | | | | | |
Thrifts & Mortgage Finance - (0.1)% | | | | | | | |
Washington Mutual, Inc. | | (1,210 | ) | | | (42,725 | ) |
| | | | | | | |
TOTAL COMMON STOCK (Proceeds $326,738) | | | | | $ | (324,353 | ) |
| | | | | | | |
Total Securities Sold Short (Security Equity Fund - Alpha Opportunity Series) (Proceeds $326,738) | | | | | $ | (324,353 | ) |
| | | | | | | |
Footnotes
Percentages are stated as a percent of net assets.
For federal income tax purposes the identified cost of investments owned at 9/30/2007 was $31,357,765.
| | |
| * | | - Non-income producing security |
| 1 | | - Security is segregated as collateral for open futures contracts. |
| 2 | | - Security is segregated as collateral for short positions. |
|
| Glossary: |
| ADR | | - American Depositary Receipt |
See notes to financial statements.
The accompanying notes are an integral part of the financial statements
8
Security Equity Fund
Alpha Opportunity Series
Statement of Assets and Liabilities
September 30, 2007
| | | |
Assets: | | | |
Investments, at value* | | $ | 31,371,945 |
Cash | | | 4,085,343 |
Receivables: | | | |
Fund shares sold | | | 39,911 |
Securities sold | | | 5,526,687 |
Dividends | | | 7,417 |
Prepaid expenses | | | 13,796 |
| | | |
Total assets | | | 41,045,099 |
| | | |
Liabilities: | | | |
Common stock sold short, at value** | | | 324,353 |
Payable for: | | | |
Securities purchased | | | 7,891,828 |
Fund shares redeemed | | | 232,918 |
Variation margin | | | 55,250 |
Dividends on short sales | | | 266 |
Management fees | | | 56,179 |
Custodian fees | | | 2,771 |
Transfer agent/maintenance fees | | | 2,444 |
Administration fees | | | 4,549 |
Professional fees | | | 17,390 |
12b-1 distribution plan fees | | | 10,835 |
Directors’ fees | | | 632 |
Other | | | 4,071 |
| | | |
Total liabilities | | | 8,603,486 |
| | | |
Net assets | | $ | 32,441,613 |
| | | |
Net assets consist of: | | | |
Paid in capital | | $ | 26,303,979 |
Undistributed net realized gain on sale of investments | | | 5,486,189 |
Net unrealized appreciation in value of investments | | | 651,445 |
| | | |
Net assets | | $ | 32,441,613 |
| | | |
Class A: | | | |
Capital shares outstanding (unlimited number of shares authorized) | | | 1,798,732 |
Net assets | | $ | 25,071,508 |
Net asset value and redemption price per share | | $ | 13.94 |
| | | |
Maximum offering price per share (net asset value divided by 94.25%) | | $ | 14.79 |
| | | |
Class B: | | | |
Capital shares outstanding (unlimited number of shares authorized) | | | 235,002 |
Net assets | | $ | 3,154,103 |
Net asset value, offering and redemption price per share (excluding any applicable contingent deferred sales charge) | | $ | 13.42 |
| | | |
Class C: | | | |
Capital shares outstanding (unlimited number of shares authorized) | | | 314,027 |
Net assets | | $ | 4,216,002 |
Net asset value, offering and redemption price per share (excluding any applicable contingent deferred sales charge) | | $ | 13.43 |
| | | |
| | | |
* Investments, at cost | | $ | 31,262,227 |
** Common stock sold short, at proceeds | | | 326,738 |
Statement of Operations
For the Year Ended September 30, 2007
| | | | |
Investment Income: | | | | |
Dividends (net of foreign withholding tax of $166) | | $ | 134,761 | |
Interest | | | 732,597 | |
| | | | |
Total investment income | | | 867,358 | |
| | | | |
Expenses: | | | | |
Management fees | | | 631,487 | |
Transfer agent/maintenance fees | | | 33,875 | |
Administration fees | | | 53,900 | |
Custodian fees | | | 69,711 | |
Directors’ fees | | | 2,160 | |
Professional fees | | | 18,759 | |
Reports to shareholders | | | 4,605 | |
Registration fees | | | 31,933 | |
Other expenses | | | 3,110 | |
Dividends on short sales | | | 20,518 | |
12b-1 distribution fees - Class A | | | 56,852 | |
12b-1 distribution fees - Class B | | | 48,780 | |
12b-1 distribution fees - Class C | | | 55,922 | |
| | | | |
Total expenses | | | 1,031,612 | |
Less: | | | | |
Earnings credits applied | | | (65,972 | ) |
| | | | |
Net expenses | | | 965,640 | |
| | | | |
Net investment loss | | | (98,282 | ) |
| | | | |
Net Realized and Unrealized Gain (Loss): | | | | |
Net realized gain (loss) during the year on: | | | | |
Investments | | | 6,298,596 | |
Securities sold short | | | (375,652 | ) |
Futures | | | 950,617 | |
| | | | |
Net realized gain | | | 6,873,561 | |
| | | | |
Net unrealized appreciation (depreciation) during the year on: | | | | |
Investments | | | 445,928 | |
Securities sold short | | | 96,394 | |
Futures | | | 355,739 | |
| | | | |
Net unrealized appreciation | | | 898,061 | |
| | | | |
Net realized and unrealized gain | | | 7,771,622 | |
| | | | |
Net increase in net assets resulting from operations | | $ | 7,673,340 | |
| | | | |
The accompanying notes are an integral part of the financial statements
9
| | |
| | | Security Equity Fund |
| Statement of Changes in Net Assets | | Alpha Opportunity Series |
| | | | | | | | |
| | | Year Ended
September 30, 2007 | | | Year Ended
September 30, 2006 | |
Increase (decrease) in net assets from operations: | | | | | | | | |
Net investment loss | | $ | (98,282 | ) | | $ | (212,445 | ) |
Net realized gain during the year on investments | | | 6,873,561 | | | | 2,290,275 | |
Net unrealized appreciation (depreciation) during the year on investments | | | 898,061 | | | | (514,291 | ) |
| | | | | | | | |
Net increase in net assets resulting from operations | | | 7,673,340 | | | | 1,563,539 | |
| | | | | | | | |
Distributions to shareholders from: | | | | | | | | |
Net realized gain | | | | | | | | |
Class A | | | (2,136,563 | ) | | | (1,193,077 | ) |
Class B | | | (523,991 | ) | | | (346,675 | ) |
Class C | | | (617,311 | ) | | | (438,798 | ) |
| | | | | | | | |
Total distributions to shareholders | | | (3,277,865 | ) | | | (1,978,550 | ) |
| | | | | | | | |
Capital share transactions: | | | | | | | | |
Proceeds from sale of shares | | | | | | | | |
Class A | | | 10,352,391 | | | | 7,974,133 | |
Class B | | | 1,279,776 | | | | 988,390 | |
Class C | | | 1,430,285 | | | | 1,340,669 | |
Distributions reinvested | | | | | | | | |
Class A | | | 2,077,296 | | | | 1,170,685 | |
Class B | | | 522,694 | | | | 343,297 | |
Class C | | | 556,963 | | | | 380,745 | |
Cost of shares redeemed | | | | | | | | |
Class A | | | (11,078,834 | ) | | | (2,922,942 | ) |
Class B | | | (4,098,624 | ) | | | (512,280 | ) |
Class C | | | (4,012,623 | ) | | | (3,871,410 | ) |
| | | | | | | | |
Net increase (decrease) from capital share transactions | | | (2,970,676 | ) | | | 4,891,287 | |
| | | | | | | | |
Net increase in net assets | | | 1,424,799 | | | | 4,476,276 | |
| | | | | | | | |
Net assets: | | | | | | | | |
Beginning of year | | | 31,016,814 | | | | 26,540,538 | |
| | | | | | | | |
End of year | | $ | 32,441,613 | | | $ | 31,016,814 | |
| | | | | | | | |
Accumulated net investment loss at end of year | | $ | — | | | $ | (103 | ) |
| | | | | | | | |
Capital share activity: | | | | | | | | |
Shares sold | | | | | | | | |
Class A | | | 802,495 | | | | 641,932 | |
Class B | | | 104,269 | | | | 81,728 | |
Class C | | | 114,901 | | | | 110,434 | |
Shares reinvested | | | | | | | | |
Class A | | | 174,124 | | | | 99,888 | |
Class B | | | 45,216 | | | | 29,904 | |
Class C | | | 48,180 | | | | 33,166 | |
Shares redeemed | | | | | | | | |
Class A | | | (862,512 | ) | | | (239,609 | ) |
Class B | | | (321,701 | ) | | | (42,378 | ) |
Class C | | | (317,535 | ) | | | (318,091 | ) |
The accompanying notes are an integral part of the financial statements
10
| | |
| Financial Highlights | | Security Equity Fund |
| Selected data for each share of capital stock outstanding throughout each year | | Alpha Opportunity Series |
|
| | | | | | | | | | | | | | | | | | | | |
Class A | | 2007 | | | 2006 | | | 2005 | | | 2004 | | | Year Ended
September 30,
2003a | |
Per Share Data | | | | | | | | | | | | | | | | | | | | |
Net asset value, beginning of period | | $ | 12.23 | | | $ | 12.37 | | | $ | 11.79 | | | $ | 10.21 | | | $ | 10.00 | |
| | | | | | | | | | | | | | | | | | | | |
Income (loss) from investment operations: | | | | | | | | | | | | | | | | | | | | |
Net investment lossb | | | (0.01 | ) | | | (0.06 | ) | | | (0.10 | ) | | | (0.16 | ) | | | (0.03 | ) |
Net gain on securities (realized and unrealized) | | | 2.99 | | | | 0.93 | | | | 1.50 | | | | 2.33 | | | | 0.24 | |
| | | | | | | | | | | | | | | | | | | | |
Total from investment operations | | | 2.98 | | | | 0.87 | | | | 1.40 | | | | 2.17 | | | | 0.21 | |
| | | | | | | | | | | | | | | | | | | | |
Less distributions: | | | | | | | | | | | | | | | | | | | | |
Distributions from realized gains | | | (1.27 | ) | | | (1.01 | ) | | | (0.82 | ) | | | (0.59 | ) | | | — | |
| | | | | | | | | | | | | | | | | | | | |
Total distributions | | | (1.27 | ) | | | (1.01 | ) | | | (0.82 | ) | | | (0.59 | ) | | | — | |
| | | | | | | | | | | | | | | | | | | | |
Net asset value, end of period | | $ | 13.94 | | | $ | 12.23 | | | $ | 12.37 | | | $ | 11.79 | | | $ | 10.21 | |
| | | | | | | | | | | | | | | | | | | | |
Total Returnc | | | 26.10 | % | | | 7.39 | % | | | 12.26 | % | | | 21.68 | % | | | 2.10 | % |
| | | | | | | | | | | | | | | | | | | | |
Ratios/Supplemental Data | | | | | | | | | | | | | | | | | | | | |
Net assets, end of period (in thousands) | | $ | 25,072 | | | $ | 20,595 | | | $ | 14,622 | | | $ | 6,556 | | | $ | 2,935 | |
| | | | | | | | | | | | | | | | | | | | |
Ratios to average net assets: | | | | | | | | | | | | | | | | | | | | |
Net investment loss | | | (0.08 | )% | | | (0.50 | )% | | | (0.83 | )% | | | (1.48 | )% | | | (1.35 | )% |
Total expensesd | | | 2.88 | % | | | 3.20 | % | | | 2.94 | % | | | 3.57 | % | | | 3.25 | % |
Net expensese | | | 2.68 | % | | | 3.01 | % | | | 2.86 | % | | | 2.78 | % | | | 2.75 | % |
Net expenses prior to custodian earning credits and net of expense waivers | | | 2.88 | % | | | 3.10 | % | | | 2.86 | % | | | 2.79 | % | | | 2.75 | % |
Net expenses prior to performance fee adjustmentf | | | 2.77 | % | | | 2.82 | % | | | 2.78 | % | | | 2.78 | % | | | 2.75 | % |
| | | | | | | | | | | | | | | | | | | | |
Portfolio turnover rate | | | 1,697 | % | | | 1,302 | % | | | 1,502 | % | | | 1,175 | % | | | 867 | % |
| | | | | |
Class B | | 2007 | | | 2006 | | | 2005 | | | 2004 | | | Year Ended
September 30,
2003a | |
Per Share Data | | | | | | | | | | | | | | | | | | | | |
Net asset value, beginning of period | | $ | 11.90 | | | $ | 12.15 | | | $ | 11.68 | | | $ | 10.20 | | | $ | 10.00 | |
| | | | | | | | | | | | | | | | | | | | |
Income (loss) from investment operations: | | | | | | | | | | | | | | | | | | | | |
Net investment lossb | | | (0.09 | ) | | | (0.15 | ) | | | (0.18 | ) | | | (0.25 | ) | | | (0.05 | ) |
Net gain on securities (realized and unrealized) | | | 2.88 | | | | 0.91 | | | | 1.47 | | | | 2.32 | | | | 0.25 | |
| | | | | | | | | | | | | | | | | | | | |
Total from investment operations | | | 2.79 | | | | 0.76 | | | | 1.29 | | | | 2.07 | | | | 0.20 | |
| | | | | | | | | | | | | | | | | | | | |
Less distributions: | | | | | | | | | | | | | | | | | | | | |
Distributions from realized gains | | | (1.27 | ) | | | (1.01 | ) | | | (0.82 | ) | | | (0.59 | ) | | | — | |
| | | | | | | | | | | | | | | | | | | | |
Total distributions | | | (1.27 | ) | | | (1.01 | ) | | | (0.82 | ) | | | (0.59 | ) | | | — | |
| | | | | | | | | | | | | | | | | | | | |
Net asset value, end of period | | $ | 13.42 | | | $ | 11.90 | | | $ | 12.15 | | | $ | 11.68 | | | $ | 10.20 | |
| | | | | | | | | | | | | | | | | | | | |
Total Returnc | | | 25.14 | % | | | 6.56 | % | | | 11.39 | % | | | 20.68 | % | | | 2.00 | % |
| | | | | | | | | | | | | | | | | | | | |
Ratios/Supplemental Data | | | | | | | | | | | | | | | | | | | | |
Net assets, end of period (in thousands) | | $ | 3,154 | | | $ | 4,846 | | | $ | 4,106 | | | $ | 2,324 | | | $ | 1,731 | |
| | | | | | | | | | | | | | | | | | | | |
Ratios to average net assets: | | | | | | | | | | | | | | | | | | | | |
Net investment loss | | | (0.77 | )% | | | (1.24 | )% | | | (1.60 | )% | | | (2.25 | )% | | | (2.11 | )% |
Total expensesd | | | 3.59 | % | | | 3.95 | % | | | 3.69 | % | | | 4.29 | % | | | 4.01 | % |
Net expensese | | | 3.39 | % | | | 3.76 | % | | | 3.61 | % | | | 3.53 | % | | | 3.50 | % |
Net expenses prior to custodian earning credits and net of expense waivers | | | 3.59 | % | | | 3.85 | % | | | 3.61 | % | | | 3.53 | % | | | 3.50 | % |
Net expenses prior to performance fee adjustmentf | | | 3.51 | % | | | 3.57 | % | | | 3.53 | % | | | 3.53 | % | | | 3.50 | % |
| | | | | | | | | | | | | | | | | | | | |
Portfolio turnover rate | | | 1,697 | % | | | 1,302 | % | | | 1,502 | % | | | 1,175 | % | | | 867 | % |
The accompanying notes are an integral part of the financial statements
11
| | |
| Financial Highlights | | Security Equity Fund |
Selected data for each share of capital stock outstanding throughout each year | | Alpha Opportunity Series |
| | | | | | | | | | | | | | | | | | | | |
Class C | | 2007 | | | 2006 | | | 2005 | | | 2004 | | | Year Ended
September 30,
2003a | |
Per Share Data | | | | | | | | | | | | | | | | | | | | |
Net asset value, beginning of period | | $ | 11.90 | | | $ | 12.15 | | | $ | 11.68 | | | $ | 10.20 | | | $ | 10.00 | |
| | | | | | | | | | | | | | | | | | | | |
Income (loss) from investment operations: | | | | | | | | | | | | | | | | | | | | |
Net investment lossb | | | (0.10 | ) | | | (0.15 | ) | | | (0.18 | ) | | | (0.25 | ) | | | (0.05 | ) |
Net gain on securities (realized and unrealized) | | | 2.90 | | | | 0.91 | | | | 1.47 | | | | 2.32 | | | | 0.25 | |
| | | | | | | | | | | | | | | | | | | | |
Total from investment operations | | | 2.80 | | | | 0.76 | | | | 1.29 | | | | 2.07 | | | | 0.20 | |
| | | | | | | | | | | | | | | | | | | | |
Less distributions: | | | | | | | | | | | | | | | | | | | | |
Distributions from realized gains | | | (1.27 | ) | | | (1.01 | ) | | | (0.82 | ) | | | (0.59 | ) | | | — | |
| | | | | | | | | | | | | | | | | | | | |
Total distributions | | | (1.27 | ) | | | (1.01 | ) | | | (0.82 | ) | | | (0.59 | ) | | | — | |
| | | | | | | | | | | | | | | | | | | | |
Net asset value, end of period | | $ | 13.43 | | | $ | 11.90 | | | $ | 12.15 | | | $ | 11.68 | | | $ | 10.20 | |
| | | | | | | | | | | | | | | | | | | | |
Total Returnc | | | 25.24 | % | | | 6.56 | % | | | 11.39 | % | | | 20.68 | % | | | 2.00 | % |
| | | | | | | | | | | | | | | | | | | | |
Ratios/Supplemental Data | | | | | | | | | | | | | | | | | | | | |
Net assets, end of period (in thousands) | | $ | 4,216 | | | $ | 5,576 | | | $ | 7,813 | | | $ | 3,143 | | | $ | 1,723 | |
| | | | | | | | | | | | | | | | | | | | |
Ratios to average net assets: | | | | | | | | | | | | | | | | | | | | |
Net investment loss | | | (0.77 | )% | | | (1.18 | )% | | | (1.58 | )% | | | (2.24 | )% | | | (2.11 | )% |
Total expensesd | | | 3.60 | % | | | 3.95 | % | | | 3.68 | % | | | 4.30 | % | | | 4.01 | % |
Net expensese | | | 3.40 | % | | | 3.75 | % | | | 3.61 | % | | | 3.53 | % | | | 3.50 | % |
Net expenses prior to custodian earning credits and net of expense waivers | | | 3.60 | % | | | 3.83 | % | | | 3.61 | % | | | 3.53 | % | | | 3.50 | % |
Net expenses prior to performance fee adjustmentf | | | 3.51 | % | | | 3.57 | % | | | 3.53 | % | | | 3.53 | % | | | 3.50 | % |
| | | | | | | | | | | | | | | | | | | | |
Portfolio turnover rate | | | 1,697 | % | | | 1,302 | % | | | 1,502 | % | | | 1,175 | % | | | 867 | % |
a | Security Alpha Opportunity Series was initially capitalized on July 7, 2003 with a net asset value of $10 per share. Percentage amounts for the period, except total return have been annualized. |
b | Net investment income (loss) was computed using average shares outstanding throughout the period. |
c | Total return information does not reflect deduction of any sales charges imposed at the time of purchase for Class A shares or upon redemption for Class B and C shares. |
d | Total expense information reflects expense ratios absent expense reductions by the Investment Manager and custodian earnings credits, as applicable. |
e | Net expense information reflects the expense ratios after voluntary expense waivers, reimbursements and custodian earnings credits, as applicable. |
f | Net expenses prior to performance fee adjustment reflect ratios after voluntary expense waivers, reimbursements, custodian earnings credits, and before performance fees adjustments, as applicable. |
The accompanying notes are an integral part of the financial statements
12
| | |
| | Security Equity Fund |
| Manager’s Commentary | | Equity Series |
| November 15, 2007 | | (unaudited) |
Adviser, Security Global Investors

Mark Mitchell
Senior Portfolio Manager
To Our Shareholders:
Security Equity Fund Equity Series returned 10.33%1 in the period, lagging the benchmark S&P 500 Index’s return of 16.44% and the Series’ peer group median return of 15.92%. While disappointed in relative performance in fiscal 2007, we believe that our approach will deliver good performance over a long-term investment horizon.
Our strategy is to buy companies that are trading at a significant discount to their intrinsic value. Our investment approach is a defined and disciplined process of three clear philosophical tenants that drive our investment decisions: a valuation focus, a long-term perspective and an opportunistic approach.
This investment process is fundamentally driven and quantitatively aided. We use proprietary screens to identify potential companies for investment and then perform rigorous fundamental analysis to identify the best ideas. Through this fundamental research, we determine an estimate of intrinsic value and thus a valuation target for each idea. We construct the portfolios based on the level of conviction generated by this bottom-up analysis and the upside/downside profile associated with each company.
Health Care Stocks Top Performers
The Series’ health care holdings were up 15% compared to 9% for the index. Medco Health Solutions, Inc., was up 50%, driven by increasing mail order business and higher generic prescription penetration. Both Zimmer Holdings, up 16%, and Hospira, up 22%, contributed positive performance in the health care sector and the portfolio overall. Solid execution in each business helped drive their results.
Energy and Consumer Discretionary Disappointing
Energy sector holdings in the portfolio detracted even with an overweight in an outperforming sector due to stock selection. The sector returned 20% for the portfolio versus 43% for the S&P 500 Index. Evergreen Energy, Inc., down 51% (previously known as KFx) and BJ Services Company, down 11%, both contributed negatively to the Series performance. Evergreen Energy was hurt by concerns over the viability of the initial production results of its proprietary clean coal technology. BJ Services was impacted more generally by industry challenges in its core North American pressure pumping business.
The consumer discretionary sector in general experienced a difficult environment in fiscal 2007. The Series return was flat in the sector versus a gain of 6% for the Index. Home Depot, Inc., was the largest detractor, falling nearly 8% over the period, due to the impact of a slowing housing market. We feel confident that Home Depot still enjoys a solid competitive position and will benefit once the housing market improves.
2008 Market Outlook
Our bottom-up approach looks at market uncertainty in the context of the potential long-term impact on individual companies. Oftentimes, volatility provides opportunity. We are maintaining flexibility in the portfolios to take advantage of these opportunities as they arise. Our focus is on identifying companies with the ability to be substantially better over the next three to five years or have the potential to maintain their return on capital at current levels in a difficult economic environment. We are confident in our ability to find these companies and we are pleased with the positions we own today.
We believe that investing is a long-term pursuit that requires patience and a consistent approach. Dollar cost averaging is a sound way to build long-term value. We recognize there are many investment fund alternatives available today and thank you for your business and the confidence you place in us.
Sincerely,
Mark Mitchell
Senior Portfolio Manager
| 1 | Performance figures are based on Class A shares and do not reflect deduction of the sales charges or taxes that a shareholder would pay on distributions or the redemption of shares. |
13
| | |
| | Security Equity Fund |
| Performance Summary | | Equity Series |
| September 30, 2007 | | (unaudited) |
PERFORMANCE
Security Equity Series vs. S&P 500 Index
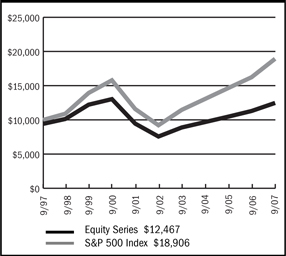
$10,000 Over Ten Years
This chart assumes a $10,000 investment in Class A shares of Equity Series on September 30, 1997, reflects deduction of the 5.75% sales load and assumes all dividends reinvested. The chart does not reflect the deduction of taxes that a shareholder would pay on distributions or the redemption of fund shares. The S&P 500 Index is a capitalization weighted index composed of 500 selected common stocks that represent the broad domestic economy and is a widely recognized unmanaged index of market performance.
Average Annual Returns
| | | | | | | | | | | | |
Periods Ended 9-30-07 | | 1 Year | | | 5 Years | | | 10 Years | | | Since
Inception | |
A Shares | | 10.33 | % | | 10.50 | % | | 2.83 | % | | — | |
| | | | |
A Shares with sales charge | | 3.96 | % | | 9.20 | % | | 2.23 | % | | — | |
| | | | |
B Shares | | 9.33 | % | | 9.66 | % | | 2.09 | % | | — | |
| | | | |
B Shares with CDSC | | 4.45 | % | | 9.38 | % | | 2.09 | % | | — | |
| | | | |
C Shares | | 9.45 | % | | 9.69 | % | | — | | | (0.86
(1-29-99 | )%
) |
| | | | |
C Shares with CDSC | | 8.47 | % | | 9.69 | % | | — | | | (0.86
(1-29-99 | )%
) |
The performance data above represents past performance that is not predictive of future results. The investment return and principal value of an investment in the Series will fluctuate so that an investor’s shares, when redeemed, may be worth more or less than their original cost. The figures above do not reflect deduction of the maximum front-end sales charge of 5.75% for Class A shares or the contingent deferred sales charge of 5% for Class B shares and 1% for Class C shares, as applicable, except where noted. The figures do not reflect the deduction of taxes that a shareholder would pay on distributions or redemption of shares. Such figures would be lower if the maximum sales charge and any applicable taxes were deducted.
Portfolio Composition by Sector as of 9-30-07
| | | |
| |
Consumer Discretionary | | 10.20 | % |
| |
Consumer Staples | | 8.00 | |
| |
Energy | | 12.42 | |
| |
Financials | | 27.97 | |
| |
Health Care | | 9.37 | |
| |
Industrials | | 16.35 | |
| |
Information Technology | | 11.08 | |
| |
Telecommunication Services | | 2.63 | |
| |
Commercial Paper | | 1.98 | |
| |
Repurchase Agreement | | 0.10 | |
| |
Liabilities in excess of other assets | | (0.10 | ) |
| |
Total net assets | | 100.00 | % |
| | | |
The accompanying notes are an integral part of the financial statements
14
| | |
| | Security Equity Fund |
| Performance Summary | | Equity Series |
| September 30, 2007 | | (unaudited) |
PERFORMANCE
Information About Your Series Expenses
Calculating your ongoing Series expenses
Example
As a shareholder of the Series, you incur two types of costs: (1) transaction costs, which may include sales charges (loads) on purchase payments; contingent deferred sales charges on redemptions; and redemption fees, if any; and (2) ongoing costs, including management fees; distribution and/or service fees (12b-1); and other Series expenses. This example is intended to help you understand your ongoing costs (in dollars) of investing in the Series and to compare these costs with ongoing costs of investing in other mutual funds. The example is based on an investment of $1,000 invested at the beginning of the period and held for the entire period, April 1, 2007 – September 30, 2007.
Actual Expenses
The first line for each class of shares in the table provides information about actual account values and actual expenses. You may use the information in this table, together with the amount you invested, to estimate the expenses that you paid over the period. Simply divide your account value by $1,000 (for example, an $8,600 account value divided by $1,000 = 8.6), then multiply the result by the number in the table under the heading entitled “Expenses Paid During Period” to estimate the expenses you paid on your account during this period.
Hypothetical Example for Comparison Purposes
The second line for each class of shares in the table provides information about hypothetical account values and hypothetical expenses based on the Series actual expense ratio and an assumed rate of return of 5% per year before expenses, which is not the Series actual return. The hypothetical account values and expenses may not be used to estimate the actual ending account balance or expenses you paid for the period. You may use this information to compare the ongoing costs of investing in the Series and other funds. To do so, compare this 5% hypothetical example with the 5% hypothetical examples that appear in the shareholder reports of the other mutual funds.
Please note that the expenses shown in the table are meant to highlight your ongoing costs only and do not reflect any transactional costs, such as sales charges (loads) on purchase payments, contingent deferred sales charges on redemptions, and redemption fees, if any. Therefore, the second line for each class of shares is useful in comparing ongoing costs only, and will not help you determine the relative total costs of owning different funds. In addition, if these transactional costs were included, your costs would have been higher.
Series Expenses
| | | | | | | | | |
| | | Beginning
Account Value
04-01-07 | | Ending
Account Value
09-30-071 | | Expenses Paid
During
Period2 |
Equity Series - Class A | | | | | | | | | |
Actual | | $ | 1,000.00 | | $ | 1,047.50 | | $ | 6.88 |
Hypothetical | | | 1,000.00 | | | 1,018.25 | | | 6.78 |
| | | |
Equity Series - Class B | | | | | | | | | |
Actual | | | 1,000.00 | | | 1,042.50 | | | 10.65 |
Hypothetical | | | 1,000.00 | | | 1,014.56 | | | 10.50 |
| | | |
Equity Series - Class C | | | | | | | | | |
Actual | | | 1,000.00 | | | 1,043.20 | | | 10.65 |
Hypothetical | | | 1,000.00 | | | 1,014.56 | | | 10.50 |
1 | The actual ending account value is based on the actual total return of the Series for the period from April 1, 2007 to September 30, 2007 after actual expenses and will differ from the hypothetical ending account value which is based on the Series expense ratio and a hypothetical annual return of 5% before expenses. The actual cumulative return at net asset value for the period from April 1, 2007 to September 30, 2007 was 4.75%, 4.25% and 4.32%, for Class A, B and C shares, respectively. |
2 | Expenses are equal to the Series annualized expense ratio (1.34%, 2.08% and 2.08% for Class A, B and C shares, respectively), net of earnings credits, multiplied by the average account value over the period, multiplied by 183/365 (to reflect the one-half year period). |
15
| | |
| Schedule of Investments | | Security Equity Fund - Equity Series |
| September 30, 2007 | | |
| | | | | |
| | | Shares | | Value |
COMMON STOCK - 98.0% | | | | | |
Aerospace & Defense - 3.3% | | | | | |
General Dynamics Corporation | | 135,800 | | $ | 11,471,026 |
| | | | | |
Air Freight & Logistics - 3.3% | | | | | |
FedEx Corporation | | 107,700 | | | 11,281,575 |
| | | | | |
Broadcasting & Cable TV - 1.4% | | | | | |
CBS Corporation (CI.B) | | 158,100 | | | 4,980,150 |
| | | | | |
Building Products - 1.8% | | | | | |
USG Corporation * | | 167,000 | | | 6,270,850 |
| | | | | |
Coal & Consumable Fuels - 1.4% | | | | | |
Evergreen Energy, Inc. * | | 979,800 | | | 4,996,980 |
| | | | | |
Communications Equipment - 2.5% | | | | | |
ADC Telecommunications, Inc. * | | 447,757 | | | 8,780,515 |
| | | | | |
Consumer Finance - 12.7% | | | | | |
American Express Company | | 193,850 | | | 11,508,874 |
Capital One Financial Corporation | | 167,600 | | | 11,133,668 |
Discover Financial Services | | 199,000 | | | 4,139,200 |
First Marblehead Corporation | | 461,350 | | | 17,499,006 |
| | | | | |
| | | | | 44,280,748 |
| | | | | |
Data Processing & Outsourced Services - 2.8% | | | | | |
Western Union Company | | 456,400 | | | 9,570,708 |
| | | | | |
Drug Retail - 2.5% | | | | | |
CVS Caremark Corporation | | 217,600 | | | 8,623,488 |
| | | | | |
Electronic Manufacturing Services - 1.0% | | | | | |
Tyco Electronics, Ltd. | | 98,575 | | | 3,492,512 |
| | | | | |
Health Care Equipment - 3.3% | | | | | |
Covidien, Ltd. | | 98,575 | | | 4,090,863 |
Hospira, Inc. * | | 175,700 | | | 7,282,765 |
| | | | | |
| | | | | 11,373,628 |
| | | | | |
Health Care Services - 2.5% | | | | | |
Medco Health Solutions, Inc. * | | 97,250 | | | 8,790,427 |
| | | | | |
Home Improvement Retail - 3.9% | | | | | |
Home Depot, Inc. | | 421,700 | | | 13,679,948 |
| | | | | |
Hotels, Resorts & Cruise Lines - 2.2% | | | | | |
Carnival Corporation | | 158,800 | | | 7,690,684 |
| | | | | |
Hypermarkets & Super Centers - 5.5% | | | | | |
Costco Wholesale Corporation | | 122,800 | | | 7,536,236 |
Wal-Mart Stores, Inc. | | 267,000 | | | 11,654,550 |
| | | | | |
| | | | | 19,190,786 |
| | | | | |
Industrial Conglomerates - 8.0% | | | | | |
General Electric Company | | 451,400 | | | 18,687,960 |
McDermott International, Inc. * | | 89,000 | | | 4,813,120 |
Tyco International, Ltd. | | 98,575 | | | 4,370,815 |
| | | | | |
| | | | | 27,871,895 |
| | | | | |
Integrated Oil & Gas - 7.6% | | | | | |
Chevron Corporation | | 128,500 | | | 12,025,030 |
Exxon Mobil Corporation | | 153,700 | | | 14,226,472 |
| | | | | |
| | | | | 26,251,502 |
| | | | | |
IT Consulting & Other Services - 0.5% | | | | | |
Unisys Corporation * | | 277,000 | | | 1,833,740 |
| | | | | |
Movies & Entertainment - 2.6% | | | | | |
Time Warner, Inc. | | 498,000 | | | 9,143,280 |
| | | | | |
Multi-Line Insurance - 5.3% | | | | | |
American International Group, Inc. | | 274,400 | | | 18,563,160 |
| | | | | |
Oil & Gas Drilling - 1.2% | | | | | |
Transocean, Inc. * | | 36,200 | | | 4,092,410 |
| | | | | |
Oil & Gas Equipment & Services - 2.3% | | | | | |
Baker Hughes, Inc. | | 30,300 | | | 2,738,211 |
BJ Services Company | | 53,900 | | | 1,431,045 |
Halliburton Company | | 95,600 | | | 3,671,040 |
| | | | | |
| | | | | 7,840,296 |
| | | | | |
Other Diversified Financial Services - 5.3% | | | | | |
Citigroup, Inc. | | 244,600 | | | 11,415,482 |
JPMorgan Chase & Company | | 150,600 | | | 6,900,492 |
| | | | | |
| | | | | 18,315,974 |
| | | | | |
Pharmaceuticals - 3.6% | | | | | |
Johnson & Johnson | | 189,000 | | | 12,417,300 |
| | | | | |
Property & Casualty Insurance - 4.6% | | | | | |
Berkshire Hathaway, Inc. * | | 136 | | | 16,117,360 |
| | | | | |
Systems Software - 4.3% | | | | | |
Microsoft Corporation | | 505,300 | | | 14,886,138 |
| | | | | |
Wireless Telecommunication Services - 2.6% | | | | | |
Sprint Nextel Corporation | | 480,600 | | | 9,131,400 |
| | | | | |
TOTAL COMMON STOCK (Cost $278,832,0 51) | | | | $ | 340,938,480 |
| | | | | |
| | |
| | | Principal
Amount | | Value |
COMMERCIAL PAPER - 2.0% | | | | | |
Banking - 0.4% | | | | | |
UBS Finance (DE) LLC | | | | | |
4.68%, 10/10/2007 | | 1,500,000 | | | 1,498,245 |
| | | | | |
Brokerage - 0.6% | | | | | |
JP Morgan Chase & Company | | | | | |
4.70%, 10/3/2007 | | 2,000,000 | | | 1,999,478 |
| | | | | |
Financial Companies - Captive - 1.0% | | | | | |
General Electric Capital Corporation | | | | | |
4.60%, 10/1/2007 | | 1,400,000 | | | 1,400,000 |
The accompanying notes are an integral part of the financial statements
16
| | |
| Schedule of Investments | | Security Equity Fund - Equity Series |
September 30, 2007 - continued | | |
| | | | | | | |
| | | Principal
Amount | | Value | |
COMMERCIAL PAPER (continued) | | | | | | | |
Financial Companies - Captive (continued) | | | | | | | |
General Electric Capital Corporation (continued) | | | | | | | |
4.65%, 10/4/2007 | | | 2,000,000 | | $ | 1,999,225 | |
| | | | | | | |
| | | | | | 3,399,225 | |
| | | | | | | |
TOTAL COMMERCIAL PAPER (Cost $6,896,948) | | | | | $ | 6,896,948 | |
| | | | | | | |
REPURCHASE AGREEMENT - 0.1% | | | | | | | |
United Missouri Bank, 4.53%, dated 9/28/07; repurchase amount $333,126 (Collateralized by U.S. Treasury Note, 3.625%, 1/15/10 with a value of $339,930) | | $ | 333,000 | | $ | 333,000 | |
| | | | | | | |
TOTAL REPURCHASE AGREEMENT (Cost $333,000) | | | | | $ | 333,000 | |
| | | | | | | |
Total Investments (Security Equity Fund - Equity Series) | | | | | $ | 348,168,428 | |
(Cost $286,061,999) - 100.1% | | | | | | | |
Liabilities in Excess of Other Assets - (0.1)% | | | | | | (342,680 | ) |
| | | | | | | |
TOTAL NET ASSETS - 100.0% | | | | | $ | 347,825,748 | |
| | | | | | | |
Footnotes
Percentages are stated as a percent of net assets.
For federal income tax purposes the identified cost of investments owned at 9/30/2007 was $286,061,999.
| | |
| * | | - Non-income producing security |
See notes to financial statements.
The accompanying notes are an integral part of the financial statements
17
Security Equity Fund
Equity Series
Statement of Assets & Liabilities
September 30, 2007
| | | |
| Assets: | | |
Investments, at value* | | $ | 348,168,428 |
Cash | | | 251 |
Receivables: | | | |
Fund shares sold | | | 27,765 |
Dividends | | | 207,969 |
Prepaid expenses | | | 22,541 |
| | | |
Total assets | | | 348,426,954 |
| | | |
Liabilities: | | | |
Payable for: | | | |
Fund shares redeemed | | | 157,477 |
Management fees | | | 212,890 |
Custodian fees | | | 1,109 |
Transfer agent/maintenance fees | | | 31,895 |
Administration fees | | | 27,066 |
Professional fees | | | 40,885 |
12b-1 distribution plan fees | | | 86,356 |
Directors’ fees | | | 3,927 |
Other | | | 39,601 |
| | | |
Total liabilities | | | 601,206 |
| | | |
Net assets | | $ | 347,825,748 |
| | | |
Net assets consist of: | | | |
Paid in capital | | $ | 241,559,371 |
Undistributed net realized gain on sale of investments | | | 44,159,948 |
Net unrealized appreciation in value of investments | | | 62,106,429 |
| | | |
Net assets | | $ | 347,825,748 |
| | | |
Class A: | | | |
Capital shares outstanding (unlimited number of shares authorized) | | | 47,222,052 |
Net assets | | $ | 322,849,641 |
Net asset value and redemption price per share | | $ | 6.84 |
| | | |
Maximum offering price per share (net asset value divided by 94.25%) | | $ | 7.26 |
| | | |
Class B: | | | |
Capital shares outstanding (unlimited number of shares authorized) | | | 3,381,623 |
Net assets | | $ | 19,927,697 |
Net asset value, offering and redemption price per share (excluding any applicable contingent deferred sales charge) | | $ | 5.89 |
| | | |
Class C: | | | |
Capital shares outstanding (unlimited number of shares authorized) | | | 804,291 |
Net assets | | $ | 5,048,410 |
Net asset value, offering and redemption price per share (excluding any applicable contingent deferred sales charge) | | $ | 6.28 |
| | | |
* Investments, at cost | | $ | 286,061,999 |
Statement of Operations
For the Year Ended September 30, 2007
| | | | |
| Investment Income: | | | |
Dividends | | $ | 4,888,681 | |
Interest | | | 484,701 | |
| | | | |
Total investment income | | | 5,373,382 | |
| | | | |
Expenses: | | | | |
Management fees | | | 2,970,576 | |
Transfer agent/maintenance fees | | | 768,683 | |
Administration fees | | | 376,938 | |
Custodian fees | | | 29,163 | |
Directors’ fees | | | 20,917 | |
Professional fees | | | 37,799 | |
Reports to shareholders | | | 42,998 | |
Registration fees | | | 41,709 | |
Other expenses | | | 27,983 | |
12b-1 distribution fees - Class A | | | 915,806 | |
12b-1 distribution fees - Class B | | | 240,835 | |
12b-1 distribution fees - Class C | | | 56,710 | |
| | | | |
Total expenses | | | 5,530,117 | |
Less: | | | | |
Earnings credits applied | | | (8 | ) |
| | | | |
Net expenses | | | 5,530,109 | |
| | | | |
Net investment loss | | | (156,727 | ) |
| | | | |
Net Realized and Unrealized Gain (Loss): | | | | |
Net realized gain (loss) during the year on: | | | | |
Investments | | | 50,914,314 | |
Options written | | | 693,378 | |
| | | | |
Net realized gain | | | 51,607,692 | |
| | | | |
Net unrealized appreciation (depreciation) during the year on: | | | | |
Investments | | | (11,688,583 | ) |
Options written | | | 164,800 | |
| | | | |
Net unrealized depreciation | | | (11,523,783 | ) |
| | | | |
Net realized and unrealized gain | | | 40,083,909 | |
| | | | |
Net increase in net assets resulting from operations | | $ | 39,927,182 | |
| | | | |
The accompanying notes are an integral part of the financial statements
18
| | |
| | | Security Equity Fund |
| Statement of Changes in Net Assets | | Equity Series |
| | | | | | | | |
| | | Year Ended
September 30, 2007 | | | Year Ended
September 30, 2006 | |
Increase (decrease) in net assets from operations: | | | | | | | | |
Net investment loss | | $ | (156,727 | ) | | $ | (625,371 | ) |
Net realized gain during the year on investments | | | 51,607,692 | | | | 41,580,103 | |
Net unrealized depreciation during the year on investments | | | (11,523,783 | ) | | | (9,213,626 | ) |
| | | | | | | | |
Net increase in net assets resulting from operations | | | 39,927,182 | | | | 31,741,106 | |
| | | | | | | | |
Distributions to shareholders from: | | | | | | | | |
Net investment income | | | | | | | | |
Class A | | | — | | | | (2,147,421 | ) |
Net realized gain | | | | | | | | |
Class A | | | (36,813,817 | ) | | | (11,068,277 | ) |
Class B | | | (2,833,129 | ) | | | (1,320,160 | ) |
Class C | | | (617,995 | ) | | | (182,232 | ) |
| | | | | | | | |
Total distributions to shareholders | | | (40,264,941 | ) | | | (14,718,090 | ) |
| | | | | | | | |
Capital share transactions: | | | | | | | | |
Proceeds from sale of shares | | | | | | | | |
Class A | | | 22,425,266 | | | | 52,710,115 | |
Class B | | | 4,149,590 | | | | 7,159,305 | |
Class C | | | 664,065 | | | | 1,001,095 | |
Distributions reinvested | | | | | | | | |
Class A | | | 33,789,629 | | | | 12,004,929 | |
Class B | | | 2,766,531 | | | | 1,296,700 | |
Class C | | | 607,148 | | | | 180,424 | |
Cost of shares redeemed | | | | | | | | |
Class A | | | (104,634,399 | ) | | | (84,851,352 | ) |
Class B | | | (14,318,878 | ) | | | (21,542,434 | ) |
Class C | | | (1,927,297 | ) | | | (1,287,944 | ) |
| | | | | | | | |
Net decrease from capital share transactions | | | (56,478,345 | ) | | | (33,329,162 | ) |
| | | | | | | | |
Net decrease in net assets | | | (56,816,104 | ) | | | (16,306,146 | ) |
| | | | | | | | |
Net assets: | | | | | | | | |
Beginning of year | | | 404,641,852 | | | | 420,947,998 | |
| | | | | | | | |
End of year | | $ | 347,825,748 | | | $ | 404,641,852 | |
| | | | | | | | |
Accumulated net investment income at end of year | | $ | — | | | $ | — | |
| | | | | | | | |
Capital share activity: | | | | | | | | |
Shares sold | | | | | | | | |
Class A | | | 3,287,276 | | | | 8,042,578 | |
Class B | | | 699,825 | | | | 1,205,513 | |
Class C | | | 105,654 | | | | 160,281 | |
Shares reinvested | | | | | | | | |
Class A | | | 5,073,518 | | | | 1,816,177 | |
Class B | | | 479,468 | | | | 221,280 | |
Class C | | | 98,723 | | | | 29,101 | |
Shares redeemed | | | | | | | | |
Class A | | | (15,274,912 | ) | | | (12,720,895 | ) |
Class B | | | (2,408,381 | ) | | | (3,666,875 | ) |
Class C | | | (307,016 | ) | | | (208,581 | ) |
The accompanying notes are an integral part of the financial statements
19
| | |
| Financial Highlights | | Security Equity Fund |
| Selected data for each share of capital stock outstanding throughout each year | | Equity Series |
| | | | | | | | | | | | | | | | | | | | |
Class A | | 2007 | | | 2006 | | | 2005 | | | 2004 | | | Year Ended
September 30, 2003 | |
Per Share Data | | | | | | | | | | | | | | | | | | | | |
Net asset value, beginning of period | | $ | 6.85 | | | $ | 6.58 | | | $ | 6.50 | | | $ | 5.98 | | | $ | 5.09 | |
| | | | | | | | | | | | | | | | | | | | |
Income (loss) from investment operations: | | | | | | | | | | | | | | | | | | | | |
Net investment income (loss)a | | | — | | | | (0.01 | ) | | | 0.04 | | | | 0.01 | | | | 0.01 | |
Net gain on securities (realized and unrealized) | | | 0.69 | | | | 0.52 | | | | 0.49 | | | | 0.52 | | | | 0.88 | |
| | | | | | | | | | | | | | | | | | | | |
Total from investment operations | | | 0.69 | | | | 0.51 | | | | 0.53 | | | | 0.53 | | | | 0.89 | |
| | | | | | | | | | | | | | | | | | | | |
Less distributions: | | | | | | | | | | | | | | | | | | | | |
Dividends from net investment income | | | — | | | | (0.04 | ) | | | — | | | | (0.01 | ) | | | — | |
Distributions from realized gains | | | (0.70 | ) | | | (0.20 | ) | | | (0.45 | ) | | | — | | | | — | |
| | | | | | | | | | | | | | | | | | | | |
Total distributions | | | (0.70 | ) | | | (0.24 | ) | | | (0.45 | ) | | | (0.01 | ) | | | — | |
| | | | | | | | | | | | | | | | | | | | |
Net asset value, end of period | | $ | 6.84 | | | $ | 6.85 | | | $ | 6.58 | | | $ | 6.50 | | | $ | 5.98 | |
| | | | | | | | | | | | | | | | | | | | |
Total Returnb | | | 10.33 | % | | | 7.88 | % | | | 8.20 | % | | | 8.87 | % | | | 17.49 | % |
| | | | | | | | | | | | | | | | | | | | |
Ratios/Supplemental Data | | | | | | | | | | | | | | | | | | | | |
Net assets, end of period (in thousands) | | $ | 322,850 | | | $ | 371,006 | | | $ | 375,280 | | | $ | 391,384 | | | $ | 430,161 | |
| | | | | | | | | | | | | | | | | | | | |
Ratios to average net assets: | | | | | | | | | | | | | | | | | | | | |
Net investment income (loss) | | | 0.02 | % | | | (0.08 | )% | | | 0.57 | % | | | 0.08 | % | | | 0.23 | % |
Total expensesc | | | 1.34 | % | | | 1.34 | % | | | 1.30 | % | | | 1.28 | % | | | 1.25 | % |
Net expensesd | | | 1.34 | % | | | 1.34 | % | | | 1.30 | % | | | 1.28 | % | | | 1.25 | % |
Net expenses prior to custodian earning credits and net of expense waivers | | | 1.34 | % | | | 1.34 | % | | | 1.30 | % | | | 1.28 | % | | | 1.25 | % |
| | | | | | | | | | | | | | | | | | | | |
Portfolio turnover rate | | | 20 | % | | | 34 | % | | | 32 | % | | | 28 | % | | | 54 | % |
| | | | | |
Class B | | 2007 | | | 2006 | | | 2005 | | | 2004 | | | Year Ended
September 30, 2003 | |
Per Share Data | | | | | | | | | | | | | | | | | | | | |
Net asset value, beginning of period | | $ | 6.04 | | | $ | 5.83 | | | $ | 5.85 | | | $ | 5.41 | | | $ | 4.64 | |
| | | | | | | | | | | | | | | | | | | | |
Income (loss) from investment operations: | | | | | | | | | | | | | | | | | | | | |
Net investment lossa | | | (0.04 | ) | | | (0.05 | ) | | | (0.01 | ) | | | (0.04 | ) | | | (0.03 | ) |
Net gain on securities (realized and unrealized) | | | 0.59 | | | | 0.46 | | | | 0.44 | | | | 0.48 | | | | 0.80 | |
| | | | | | | | | | | | | | | | | | | | |
Total from investment operations | | | 0.55 | | | | 0.41 | | | | 0.43 | | | | 0.44 | | | | 0.77 | |
| | | | | | | | | | | | | | | | | | | | |
Less distributions: | | | | | | | | | | | | | | | | | | | | |
Distributions from realized gains | | | (0.70 | ) | | | (0.20 | ) | | | (0.45 | ) | | | — | | | | — | |
| | | | | | | | | | | | | | | | | | | | |
Total distributions | | | (0.70 | ) | | | (0.20 | ) | | | (0.45 | ) | | | — | | | | — | |
| | | | | | | | | | | | | | | | | | | | |
Net asset value, end of period | | $ | 5.89 | | | $ | 6.04 | | | $ | 5.83 | | | $ | 5.85 | | | $ | 5.41 | |
| | | | | | | | | | | | | | | | | | | | |
Total Returnb | | | 9.33 | % | | | 7.16 | % | | | 7.35 | % | | | 8.13 | % | | | 16.59 | % |
| | | | | | | | | | | | | | | | | | | | |
Ratios/Supplemental Data | | | | | | | | | | | | | | | | | | | | |
Net assets, end of period (in thousands) | | $ | 19,928 | | | $ | 27,842 | | | $ | 39,962 | | | $ | 49,600 | | | $ | 61,733 | |
| | | | | | | | | | | | | | | | | | | | |
Ratios to average net assets: | | | | | | | | | | | | | | | | | | | | |
Net investment loss | | | (0.74 | )% | | | (0.83 | )% | | | (0.16 | )% | | | (0.67 | )% | | | (0.52 | )% |
Total expensesc | | | 2.09 | % | | | 2.09 | % | | | 2.05 | % | | | 2.03 | % | | | 2.00 | % |
Net expensesd | | | 2.09 | % | | | 2.09 | % | | | 2.05 | % | | | 2.03 | % | | | 2.00 | % |
Net expenses prior to custodian earning credits and net of expense waivers | | | 2.09 | % | | | 2.09 | % | | | 2.05 | % | | | 2.03 | % | | | 2.00 | % |
| | | | | | | | | | | | | | | | | | | | |
Portfolio turnover rate | | | 20 | % | | | 34 | % | | | 32 | % | | | 28 | % | | | 54 | % |
The accompanying notes are an integral part of the financial statements
20
| | |
| Financial Highlights | | Security Equity Fund |
| Selected data for each share of capital stock outstanding throughout each year | | Equity Series |
| | | | | | | | | | | | | | | | | | | | |
Class C | | 2007 | | | 2006 | | | 2005 | | | 2004 | | | Year Ended
September 30, 2003 | |
Per Share Data | | | | | | | | | | | | | | | | | | | | |
Net asset value, beginning of period | | $ | 6.39 | | | $ | 6.16 | | | $ | 6.16 | | | $ | 5.69 | | | $ | 4.88 | |
| | | | | | | | | | | | | | | | | | | | |
Income (loss) from investment operations: | | | | | | | | | | | | | | | | | | | | |
Net investment lossa | | | (0.05 | ) | | | (0.05 | ) | | | (0.01 | ) | | | (0.04 | ) | | | (0.03 | ) |
Net gain on securities (realized and unrealized) | | | 0.64 | | | | 0.48 | | | | 0.46 | | | | 0.51 | | | | 0.84 | |
| | | | | | | | | | | | | | | | | | | | |
Total from investment operations | | | 0.59 | | | | 0.43 | | | | 0.45 | | | | 0.47 | | | | 0.81 | |
| | | | | | | | | | | | | | | | | | | | |
Less distributions: | | | | | | | | | | | | | | | | | | | | |
Distributions from realized gains | | | (0.70 | ) | | | (0.20 | ) | | | (0.45 | ) | | | — | | | | — | |
| | | | | | | | | | | | | | | | | | | | |
Total distributions | | | (0.70 | ) | | | (0.20 | ) | | | (0.45 | ) | | | — | | | | — | |
| | | | | | | | | | | | | | | | | | | | |
Net asset value, end of period | | $ | 6.28 | | | $ | 6.39 | | | $ | 6.16 | | | $ | 6.16 | | | $ | 5.69 | |
| | | | | | | | | | | | | | | | | | | | |
Total Returnb | | | 9.45 | % | | | 7.10 | % | | | 7.32 | % | | | 8.26 | % | | | 16.60 | % |
| | | | | | | | | | | | | | | | | | | | |
Ratios/Supplemental Data | | | | | | | | | | | | | | | | | | | | |
Net assets, end of period (in thousands) | | $ | 5,048 | | | $ | 5,794 | | | $ | 5,706 | | | $ | 6,329 | | | $ | 6,651 | |
| | | | | | | | | | | | | | | | | | | | |
Ratios to average net assets: | | | | | | | | | | | | | | | | | | | | |
Net investment loss | | | (0.73 | %) | | | (0.83 | %) | | | (0.18 | %) | | | (0.67 | %) | | | (0.52 | %) |
Total expensesc | | | 2.09 | % | | | 2.09 | % | | | 2.05 | % | | | 2.03 | % | | | 2.00 | % |
Net expensesd | | | 2.09 | % | | | 2.09 | % | | | 2.05 | % | | | 2.03 | % | | | 2.00 | % |
Net expenses prior to custodian earning credits and net of expense waivers | | | 2.09 | % | | | 2.09 | % | | | 2.05 | % | | | 2.03 | % | | | 2.00 | % |
| | | | | | | | | | | | | | | | | | | | |
Portfolio turnover rate | | | 20 | % | | | 34 | % | | | 32 | % | | | 28 | % | | | 54 | % |
a | Net investment income (loss) was computed using average shares outstanding throughout the period. |
b | Total return information does not reflect deduction of any sales charges imposed at the time of purchase for Class A shares or upon redemption for Class B and C shares. |
c | Total expense information reflects expense ratios absent expense reductions by the Investment Manager and custodian earnings credits, as applicable. |
d | Net expense information reflects the expense ratios after voluntary expense waivers, reimbursements and custodian earnings credits, as applicable. |
The accompanying notes are an integral part of the financial statements
21
This page left blank intentionally.
22
| | |
| | | Security Equity Fund |
| Manager’s Commentary | | Global Series |
| November 15, 2007 | | (unaudited) |
Sub-adviser, Security Global Investors, LLC
To Our Shareholders:
For the October 1, 2006 through September 30, 2007 reporting period, the Security Equity Fund Global Series Class A shares underperformed its benchmark, the MSCI World Index, 20.07%1 to 21.09%. From October 1, 2006 through August 1, 2007, OppenheimerFunds, Inc. managed the Series in a sub-advised capacity. During the 10-month period, the Series returned 13.80% compared to 15.68% for the Index. Investment management now resides with Security Global Investors’ global equities team. During the final two months of the reporting period, the new management team outperformed the MSCI World Index 5.51% to 4.68%.
At the core of the new investment management team’s philosophy is the idea that excess return opportunities exist in global stock markets and can be identified and captured at the security level, regardless of country, region, or sector. Portfolio managers John Boich, Scott Klimo, and David Whittall lead Security Global Investors’ global equities team. In addition to the team’s extensive experience, other competitive advantages include the execution of in-depth fundamental research using a proprietary database that provides a unique perspective of the world, a proprietary risk management module, and a well-defined and disciplined investment process.
The most significant contribution to the underperformance of the Series was the lack of holdings of metals and mining stocks and the relative underweight in energy and utilities stocks. The Series substantial position in technology stocks hurt relative performance while the relative underweight in financials, especially U.S. based companies, helped returns.
Portfolio holdings that worked over the reporting period included Hyundai Heavy Industries Company Ltd., which benefited from a strong shipbuilding order book and rising prices, and Nintendo Company Ltd., which had a blockbuster release of its new Wii gaming platform and continued its dominance of the handheld electronic games business. Juniper Networks, Inc., one of the world’s leading network equipment providers, gained as evidence of the need to increase network capacity in telecom networks mounted. Some success was achieved in the past year with Vodafone Group plc and Porsche AG, among the long-term holdings, and Tiffany & Company, one of the more recent purchases.
There was a notable lack of success in the purchase of Getty Images, Inc., which continued to disappoint in terms of earnings growth. The same held true for Nuvelo, Inc. and AtheroGenics, Inc., two small biotechnology companies whose front line drug candidates showed no particular efficacy in treating the problems they were designed to ameliorate. Both positions were exited.
Geographically, Japan was the location of many of the poor performers. The lack of growth in the Japanese domestic economy hurt holdings of Japanese banks. A dramatic reduction in the maximum interest chargeable by finance companies in Japan through a change in regulation hurt the holding in Credit Saison Company Ltd. Regulatory changes in gaming laws affected the sales of pachinko and pachislot machines which substantially reduced Sega Sammy Holdings, Inc.’s profit and stock price.
Security Global Investors’ global equities investment professionals will manage the Series going forward as an autonomous team with an entrepreneurial culture and the singular focus on global opportunities that has characterized John Boich’s investment approach for more than 17 years.
Sincerely,
John Boich, Portfolio Manager
David Whittall, Portfolio Manager
Scott Klimo, Portfolio Manager
| 1 | Performance figures are based on Class A shares and do not reflect deduction of the sales charges or taxes that a shareholder would pay on distributions or redemptions of shares. Investment in international securities entail greater risks than investment in domestic securities. |
23
| | |
| | | Security Equity Fund |
| Performance Summary | | Global Series |
| September 30, 2007 | | (unaudited) |
PERFORMANCE
Security Global Series vs. Morgan Stanley Capital International World Index
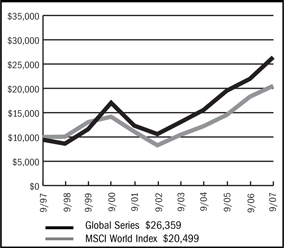
$10,000 Over Ten Years
This chart assumes a $10,000 investment in Class A shares of Global Series on September 30, 1997, reflects deduction of the 5.75% sales load and assumes all dividends reinvested. The chart does not reflect the deduction of taxes that a shareholder would pay on distributions or the redemption of fund shares. The MSCI World Index is an unmanaged capitalization-weighted index that is designed to measure global developed market equity performance.
Portfolio Composition by Sector as of 9-30-07
| | | |
Consumer Discretionary | | 14.02 | % |
| |
Consumer Staples | | 10.58 | |
| |
Energy | | 11.08 | |
| |
Financials | | 16.65 | |
| |
Health Care | | 8.43 | |
| |
Industrials | | 9.85 | |
| |
Information Technology | | 8.77 | |
| |
Materials | | 6.54 | |
| |
Telecommunication Services | | 5.59 | |
| |
Utilities | | 3.06 | |
| |
Short Term Investments | | 0.68 | |
| |
Other assets in excess of liabilities | | 4.75 | |
| |
Total net assets | | 100.00 | % |
| | | |
Average Annual Returns
| | | | | | | | | | | | |
Periods Ended 9-30-07 | | 1 Year | | | 5 Years | | | 10 Years | | | Since
Inception | |
A Shares | | 20.07 | % | | 19.98 | % | | 10.83 | % | | — | |
| | | | |
A Shares with sales charge | | 13.16 | % | | 18.56 | % | | 10.18 | % | | — | |
| | | | |
B Shares | | 20.36 | % | | 19.73 | % | | 10.32 | % | | — | |
| | | | |
B Shares with CDSC | | 15.36 | % | | 19.53 | % | | 10.32 | % | | — | |
| | | | |
C Shares | | 19.14 | % | | 19.08 | % | | — | | | 10.31
(1-29-99 | %
) |
| | | | |
C Shares with CDSC | | 18.14 | % | | 19.08 | % | | — | | | 10.31
(1-29-99 | %
) |
The performance data above represents past performance that is not predictive of future results. The investment return and principal value of an investment in the Series will fluctuate so that an investor’s shares, when redeemed, may be worth more or less than their original cost. The figures above do not reflect deduction of the maximum front-end sales charge of 5.75% for Class A shares or the contingent deferred sales charge of 5% for Class B shares and 1% for Class C shares, as applicable, except where noted. The figures do not reflect the deduction of taxes that a shareholder would pay on distributions or redemption of shares. Such figures would be lower if the maximum sales charge and any applicable taxes were deducted. Fee waivers and/or reimbursements reduced expenses of the Series and in the absence of such waiver, the performance quoted would be reduced.
The accompanying notes are an integral part of the financial statements
24
| | |
| | | Security Equity Fund |
| Performance Summary | | Global Series |
| September 30, 2007 | | (unaudited) |
PERFORMANCE
Information About Your Series Expenses
Calculating your ongoing Series expenses
Example
As a shareholder of the Series, you incur two types of costs: (1) transaction costs, which may include sales charges (loads) on purchase payments; contingent deferred sales charges on redemptions; and redemption fees, if any; and (2) ongoing costs, including management fees; distribution and/or service fees (12b-1); and other Series expenses. This example is intended to help you understand your ongoing costs (in dollars) of investing in the Series and to compare these costs with ongoing costs of investing in other mutual funds. The example is based on an investment of $1,000 invested at the beginning of the period and held for the entire period, April 1, 2007 – September 30, 2007.
Actual Expenses
The first line for each class of shares in the table provides information about actual account values and actual expenses. You may use the information in this table, together with the amount you invested, to estimate the expenses that you paid over the period. Simply divide your account value by $1,000 (for example, an $8,600 account value divided by $1,000 = 8.6), then multiply the result by the number in the table under the heading entitled “Expenses Paid During Period” to estimate the expenses you paid on your account during this period.
Hypothetical Example for Comparison Purposes
The second line for each class of shares in the table provides information about hypothetical account values and hypothetical expenses based on the Series actual expense ratio and an assumed rate of return of 5% per year before expenses, which is not the Series actual return. The hypothetical account values and expenses may not be used to estimate the actual ending account balance or expenses you paid for the period. You may use this information to compare the ongoing costs of investing in the Series and other funds. To do so, compare this 5% hypothetical example with the 5% hypothetical examples that appear in the shareholder reports of the other mutual funds.
Please note that the expenses shown in the table are meant to highlight your ongoing costs only and do not reflect any transactional costs, such as sales charges (loads) on purchase payments, contingent deferred sales charges on redemptions, and redemption fees, if any. Therefore, the second line for each class of shares is useful in comparing ongoing costs only, and will not help you determine the relative total costs of owning different funds. In addition, if these transactional costs were included, your costs would have been higher.
Series Expenses
| | | | | | | | | |
| | | Beginning
Account Value
04-01-07 | | Ending
Account Value
09-30-071 | | Expenses Paid
During
Period2 |
Global Series - Class A | | | | | | | | | |
Actual | | $ | 1,000.00 | | $ | 1,099.90 | | $ | 8.69 |
Hypothetical | | | 1,000.00 | | | 1,016.70 | | | 8.34 |
| | | |
Global Series - Class B | | | | | | | | | |
Actual | | | 1,000.00 | | | 1,100.40 | | | 7.37 |
Hypothetical | | | 1,000.00 | | | 1,017.95 | | | 7.08 |
| | | |
Global Series - Class C | | | | | | | | | |
Actual | | | 1,000.00 | | | 1,095.10 | | | 12.61 |
Hypothetical | | | 1,000.00 | | | 1,012.96 | | | 12.11 |
1 | The actual ending account value is based on the actual total return of the Series for the period from April 1, 2007 to September 30, 2007 after actual expenses and will differ from the hypothetical ending account value which is based on the Series expense ratio and a hypothetical annual return of 5% before expenses. The actual cumulative return at net asset value for the period from April 1, 2007 to September 30, 2007 was 9.99%, 10.04% and 9.51%, for Class A, B and C shares, respectively. |
2 | Expenses are equal to the Series annualized expense ratio (1.65%, 1.40% and 2.40% for Class A, B and C shares, respectively), net of any applicable fee waivers and earnings credits, multiplied by the average account value over the period, multiplied by 183/365 (to reflect the one-half year period). |
25
| | |
| Schedule of Investments | | Security Equity Fund - Global Series |
September 30, 2007 | | |
| | | | | |
| | | Shares | | Value |
COMMON STOCK - 94.5% | | | | | |
Australia - 0.9% | | | | | |
Incitec Pivot, Ltd. | | 22,324 | | $ | 1,694,556 |
| | | | | |
Bermuda - 2.9% | | | | | |
Accenture, Ltd. | | 70,470 | | | 2,836,417 |
Hiscox, Ltd. | | 446,017 | | | 2,555,187 |
| | | | | |
| | | | | 5,391,604 |
| | | | | |
Canada - 2.2% | | | | | |
Onex Corporation | | 36,200 | | | 1,330,160 |
Research In Motion, Ltd. * | | 29,450 | | | 2,902,297 |
| | | | | |
| | | | | 4,232,457 |
| | | | | |
China - 3.5% | | | | | |
China BlueChemical, Ltd. | | 4,929,000 | | | 3,259,011 |
China Petroleum & Chemical Corporation | | 2,606,000 | | | 3,255,048 |
| | | | | |
| | | | | 6,514,059 |
| | | | | |
Finland - 1.6% | | | | | |
Nokia Oyj ADR | | 77,290 | | | 2,931,610 |
| | | | | |
Germany - 1.1% | | | | | |
Allianz AG | | 8,665 | | | 2,024,614 |
| | | | | |
Hong Kong - 3.3% | | | | | |
CLP Holdings, Ltd. | | 194,500 | | | 1,346,064 |
HongKong Electric Holdings | | 178,600 | | | 928,168 |
New World Development, Ltd. | | 674,700 | | | 1,866,006 |
Sun Hung Kai Properties, Ltd. | | 119,800 | | | 2,018,794 |
| | | | | |
| | | | | 6,159,032 |
| | | | | |
Indonesia - 0.8% | | | | | |
Bumi Resources Tbk PT | | 3,750,000 | | | 1,466,286 |
| | | | | |
Italy - 4.0% | | | | | |
Unione di Banche ltaliane SCPA | | 279,675 | | | 7,517,823 |
| | | | | |
Japan - 12.1% | | | | | |
Bridgestone Corporation | | 89,560 | | | 1,980,433 |
Central Japan Railway Company | | 335 | | | 3,558,090 |
Chiba Bank, Ltd. | | 127,120 | | | 982,741 |
Meiji Dairies Corporation | | 228,000 | | | 1,288,225 |
NHK Spring Company, Ltd. | | 100,000 | | | 762,634 |
Nintendo Company, Ltd. | | 7,815 | | | 4,068,576 |
Nippon Suisan Kaisha, Ltd. | | 291,300 | | | 1,539,365 |
Nitori Company, Ltd. | | 40,118 | | | 1,896,494 |
Ricoh Company, Ltd. | | 45,490 | | | 962,353 |
SBI Holdings, Inc. | | 10,929 | | | 2,868,666 |
Showa Denko KK | | 747,000 | | | 2,828,930 |
| | | | | |
| | | | | 22,736,507 |
| | | | | |
Marshall Islands - 0.5% | | | | | |
Diana Shipping, Inc. | | 36,100 | | | 1,028,850 |
| | | | | |
Singapore - 4.3% | | | | | |
Singapore Airlines, Ltd. | | 359,000 | | | 4,495,052 |
Singapore Petroleum Company, Ltd. | | 389,000 | | | 1,780,680 |
Singapore Press Holdings, Ltd. | | 605,848 | | | 1,761,874 |
| | | | | |
| | | | | 8,037,606 |
| | | | | |
Spain - 0.8% | | | | | |
Gestevision Telecinco S.A. | | 55,379 | | | 1,453,871 |
| | | | | |
Sweden - 0.5% | | | | | |
Swedish Match AB | | 47,700 | | | 991,946 |
| | | | | |
Switzerland - 2.0% | | | | | |
Swiss Reinsurance | | 41,566 | | | 3,702,293 |
| | | | | |
United Kingdom - 9.9% | | | | | |
Enterprise Inns plc | | 174,894 | | | 2,120,198 |
Game Group plc | | 719,789 | | | 2,827,611 |
HSBC Holdings plc | | 198,532 | | | 3,676,143 |
Imperial Tobacco Group plc | | 75,893 | | | 3,479,820 |
Kelda Group plc | | 55,100 | | | 971,789 |
Rio Tinto plc ADR | | 13,000 | | | 4,464,200 |
United Utilities plc | | 74,395 | | | 1,065,504 |
| | | | | |
| | | | | 18,605,265 |
| | | | | |
United States - 44.1% | | | | | |
Alberto-Culver Company | | 74,200 | | | 1,839,418 |
Altria Group, Inc. | | 108,400 | | | 7,537,052 |
Amgen, Inc. * | | 21,200 | | | 1,199,284 |
Anadarko Petroleum Corporation | | 106,500 | | | 5,724,375 |
AT&T, Inc. | | 113,300 | | | 4,793,723 |
Cadence Design Systems, Inc. * | | 128,100 | | | 2,842,539 |
Charles River Laboratories International, Inc. * | | 25,500 | | | 1,431,825 |
Citizens Communications Company | | 253,800 | | | 3,634,416 |
Comcast Corporation * | | 72,312 | | | 1,748,504 |
Coventry Health Care, Inc. * | | 23,900 | | | 1,486,819 |
DRS Technologies, Inc. | | 17,400 | | | 959,088 |
EMCOR Group, Inc. * | | 8,483 | | | 266,027 |
Estee Lauder Companies, Inc. | | 22,200 | | | 942,612 |
Express Scripts, Inc. * | | 27,600 | | | 1,540,632 |
Genworth Financial, Inc. | | 43,700 | | | 1,342,901 |
Gilead Sciences, Inc. * | | 23,380 | | | 955,540 |
Gymboree Corporation * | | 23,370 | | | 823,559 |
HCC Insurance Holdings, Inc. | | 45,200 | | | 1,294,528 |
Hewlett-Packard Company | | 79,200 | | | 3,943,368 |
Humana, Inc. * | | 19,100 | | | 1,334,708 |
Idearc, Inc. | | 26,830 | | | 844,340 |
Integrys Energy Group, Inc. | | 17,800 | | | 911,894 |
Invitrogen Corporation * | | 17,400 | | | 1,422,102 |
Lockheed Martin Corporation | | 48,620 | | | 5,274,784 |
Longs Drug Stores Corporation | | 17,100 | | | 849,357 |
Marvel Entertainment, Inc. * | | 109,100 | | | 2,557,304 |
Merck & Company, Inc. | | 25,000 | | | 1,292,250 |
News Corporation | | 155,000 | | | 3,408,450 |
OSI Pharmaceuticals, Inc. * | | 33,600 | | | 1,142,064 |
The accompanying notes are an integral part of the financial statements
26
| | |
| Schedule of Investments | | Security Equity Fund - Global Series |
September 30, 2007 - continued | | |
| | | | | | |
| | | Shares | | Value |
COMMON STOCK (continued) | | | | | | |
United States (continued) | | | | | | |
Overseas Shipholding Group, Inc. | | | 53,000 | | $ | 4,071,990 |
Pepco Holdings, Inc. | | | 49,520 | | | 1,341,002 |
Tesoro Corporation | | | 53,000 | | | 2,439,060 |
Unisource Energy Corporation | | | 40,500 | | | 1,210,545 |
UST, Inc. | | | 27,010 | | | 1,339,696 |
Wabtec Corporation | | | 76,600 | | | 2,869,436 |
WellCare Health Plans, Inc. * | | | 37,700 | | | 3,974,711 |
Whiting Petroleum Corporation * | | | 45,200 | | | 2,009,140 |
| | | | | | |
| | | | | | 82,599,043 |
| | | | | | |
TOTAL COMMON STOCK (Cost $168,221,941) | | | | | $ | 177,087,422 |
| | | | | | |
| | |
| | | Principal
Amount | | Value |
SHORT TERM INVESTMENTS - 0.7% | | | | | | |
SSGA Prime Money Market | | $ | 1,277,356 | | $ | 1,277,356 |
| | | | | | |
TOTAL SHORT TERM INVESTMENTS (Cost $1,277,356) | | | | | $ | 1,277,356 |
| | | | | | |
Total Investments (Security Equity Fund - Global Series) | | | | | $ | 178,364,778 |
(Cost $169,499,297) - 95.2% | | | | | | |
Other Assets in Excess of Liabilities - 4.8% | | | | | | 8,901,580 |
| | | | | | |
TOTAL NET ASSETS - 100.0% | | | | | $ | 187,266,358 |
| | | | | | |
INVESTMENT CONCENTRATION
At September 30, 2007, the investment diversification of the fund was as follows:
| | | | | | |
Industry | | % of
Net Assets | | | Value |
Tobacco | | 7.0 | % | | $ | 13,348,514 |
Diversified Banks | | 6.0 | | | | 11,193,966 |
Integrated Telecommunication Services | | 4.5 | | | | 8,428,139 |
Oil & Gas Exploration & Production | | 4.1 | | | | 7,733,515 |
Managed Health Care | | 3.6 | | | | 6,796,238 |
Aerospace & Defense | | 3.3 | | | | 6,233,872 |
Movies & Entertainment | | 3.2 | | | | 5,965,754 |
Communications Equipment | | 3.1 | | | | 5,833,907 |
Fertilizers & Agricultural Chemicals | | 2.7 | | | | 4,953,567 |
Electric Utilities | | 2.6 | | | | 4,825,779 |
Multi-Line Insurance | | 2.5 | | | | 4,662,042 |
Airlines | | 2.4 | | | | 4,495,052 |
Diversified Metals & Mining | | 2.4 | | | | 4,464,200 |
Oil & Gas Refining & Marketing | | 2.3 | | | | 4,219,740 |
Oil & Gas Storage & Transportation | | 2.2 | | | | 4,071,990 |
Home Entertainment Software | | 2.2 | | | | 4,068,576 |
Computer Hardware | | 2.1 | | | | 3,943,368 |
Real Estate Management & Development | | 2.1 | | | | 3,884,800 |
Reinsurance | | 2.0 | | | | 3,702,293 |
Railroads | | 1.9 | | | | 3,558,090 |
Biotechnology | | 1.7 | | | | 3,296,888 |
Integrated Oil & Gas | | 1.7 | | | | 3,255,048 |
Broadcasting & Cable TV | | 1.7 | | | | 3,202,375 |
Construction & Farm Machinery & Heavy Trucks | | 1.5 | | | | 2,869,436 |
Asset Management & Custody Banks | | 1.5 | | | | 2,868,666 |
Life Sciences Tools & Services | | 1.6 | | | | 2,853,927 |
Application Software | | 1.5 | | | | 2,842,539 |
IT Consulting & Other Services | | 1.5 | | | | 2,836,418 |
Diversified Chemicals | | 1.5 | | | | 2,828,930 |
Computer & Electronics Retail | | 1.5 | | | | 2,827,611 |
Packaged Foods & Meats | | 1.5 | | | | 2,827,590 |
Personal Products | | 1.5 | | | | 2,782,030 |
Publishing | | 1.4 | | | | 2,606,214 |
Property & Casualty Insurance | | 1.4 | | | | 2,555,187 |
Restaurants | | 1.1 | | | | 2,120,198 |
Tires & Rubber | | 1.1 | | | | 1,980,433 |
Multi-Utilities | | 1.1 | | | | 1,977,398 |
Homefurnishing Retail | | 1.0 | | | | 1,896,494 |
Health Care Services | | 0.8 | | | | 1,540,632 |
Coal & Consumable Fuels | | 0.8 | | | | 1,466,286 |
Multi-Sector Holdings | | 0.7 | | | | 1,330,160 |
Pharmaceuticals | | 0.7 | | | | 1,292,250 |
Money Markets | | 0.7 | | | | 1,277,356 |
Marine | | 0.5 | | | | 1,028,850 |
Regional Banks | | 0.5 | | | | 982,741 |
Water Utilities | | 0.5 | | | | 971,789 |
Office Electronics | | 0.5 | | | | 962,353 |
Drug Retail | | 0.5 | | | | 849,357 |
Apparel Retail | | 0.4 | | | | 823,559 |
Auto Parts & Equipment | | 0.4 | | | | 762,634 |
Construction & Engineering | | 0.2 | | | | 266,027 |
| | | | | | |
Total Investments | | 95.2 | | | | 178,364,778 |
Other Assets and Liabilities, Net | | 4.8 | | | | 8,901,580 |
| | | | | | |
Net Assets | | 100 | % | | $ | 187,266,358 |
| | | | | | |
Footnotes
Percentages are stated as a percent of net assets.
For federal income tax purposes the identified cost of investments owned at 9/30/2007 was $169,669,138.
| | |
| * | | - Non-income producing security |
| |
| Glossary: | | |
| ADR | | - American Depositary Receipt |
| plc | | - Public Limited Company |
See notes to financial statements.
The accompanying notes are an integral part of the financial statements
27
Security Equity Fund
Global Series
Statement of Assets and Liabilities
September 30, 2007
| | | | |
Assets: | | | | |
Investments, at value* | | $ | 178,364,778 | |
Cash | | | 5,787,408 | |
Cash denominated in a foreign currency, at value** | | | 222,652 | |
Receivables: | | | | |
Fund shares sold | | | 151,922 | |
Securities sold | | | 3,081,725 | |
Interest | | | 5,958 | |
Dividends | | | 330,797 | |
Foreign taxes recoverable | | | 38,396 | |
Prepaid expenses | | | 23,984 | |
| | | | |
Total assets | | | 188,007,620 | |
| | | | |
Liabilities: | | | | |
Payable for: | | | | |
Securities purchased | | | 266,211 | |
Fund shares redeemed | | | 186,471 | |
Management fees | | | 149,458 | |
Custodian fees | | | 21,597 | |
Transfer agent/maintenance fees | | | 14,221 | |
Administration fees | | | 24,819 | |
Professional fees | | | 23,450 | |
12b-1 distribution plan fees | | | 38,874 | |
Directors’ fees | | | 1,785 | |
Other | | | 14,376 | |
| | | | |
Total liabilities | | | 741,262 | |
| | | | |
Net assets | | $ | 187,266,358 | |
| | | | |
Net assets consist of: | | | | |
Paid in capital | | $ | 122,702,912 | |
Accumulated net investment loss | | | (282,912 | ) |
Undistributed net realized gain on sale of investments and foreign currency transactions | | | 55,973,944 | |
Net unrealized appreciation in value of investments and translation of assets and liabilities in foreign currencies | | | 8,872,414 | |
| | | | |
Net assets | | $ | 187,266,358 | |
| | | | |
Class A: | | | | |
Capital shares outstanding (unlimited number of shares authorized) | | | 7,017,299 | |
Net assets | | $ | 145,158,071 | |
Net asset value and redemption price per share | | $ | 20.69 | |
| | | | |
Maximum offering price per share (net asset value divided by 94.25%) | | $ | 21.95 | |
| | | | |
Class B: | | | | |
Capital shares outstanding (unlimited number of shares authorized) | | | 1,563,936 | |
Net assets | | $ | 29,659,152 | |
Net asset value, offering and redemption price per share (excluding any applicable contingent deferred sales charge) | | $ | 18.96 | |
| | | | |
Class C: | | | | |
Capital shares outstanding (unlimited number of shares authorized) | | | 655,104 | |
Net assets | | $ | 12,449,135 | |
Net asset value, offering and redemption price per share (excluding any applicable contingent deferred sales charge) | | $ | 19.00 | |
| | | | |
* Investments, at cost | | $ | 169,499,297 | |
** Cash denominated in a foreign currency, at cost | | | 220,161 | |
Statement of Operations
For the Year Ended September 30, 2007
| | | | |
Investment Income: | | | | |
Dividends (net of foreign withholding tax of $247,839) | | $ | 3,509,970 | |
Interest | | | 72,392 | |
| | | | |
Total investment income | | | 3,582,362 | |
| | | | |
Expenses: | | | | |
Management fees | | | 1,823,568 | |
Transfer agent/maintenance fees | | | 303,171 | |
Administration fees | | | 286,573 | |
Custodian fees | | | 89,315 | |
Directors’ fees | | | 10,396 | |
Professional fees | | | 31,495 | |
Reports to shareholders | | | 22,063 | |
Registration fees | | | 42,206 | |
Other expenses | | | 11,852 | |
12b-1 distribution fees - Class A | | | 353,099 | |
12b-1 distribution fees - Class C | | | 118,613 | |
| | | | |
Total expenses | | | 3,092,351 | |
Less: | | | | |
Earnings credits applied | | | (4,166 | ) |
| | | | |
Net expenses | | | 3,088,185 | |
| | | | |
Net investment income | | | 494,177 | |
| | | | |
Net Realized and Unrealized Gain (Loss): | | | | |
Net realized gain (loss) during the year on: | | | | |
Investments | | | 60,577,904 | |
Foreign currency transactions | | | (291,626 | ) |
| | | | |
Net realized gain | | | 60,286,278 | |
| | | | |
Net unrealized appreciation (depreciation) during the year on: | | | | |
Investments | | | (28,631,027 | ) |
Translation of assets and liabilities in foreign currencies | | | 7,990 | |
| | | | |
Net unrealized depreciation | | | (28,623,037 | ) |
| | | | |
Net realized and unrealized gain | | | 31,663,241 | |
| | | | |
Net increase in net assets resulting from operations | | $ | 32,157,418 | |
| | | | |
The accompanying notes are an integral part of the financial statements
28
| | |
| | Security Equity Fund |
| Statement of Changes in Net Assets | | Global Series |
| | | | | | | | |
| | | Year Ended
September 30,
2007 | | | Year Ended
September 30,
2006 | |
Increase (decrease) in net assets from operations: | | | | | | | | |
Net investment income (loss) | | $ | 494,177 | | | $ | (254,402 | ) |
Net realized gain during the year on investments and foreign currency transactions | | | 60,286,278 | | | | 21,748,719 | |
Net unrealized depreciation during the year on investments and translation of assets and liabilities in foreign currencies | | | (28,623,037 | ) | | | (2,331,105 | ) |
| | | | | | | | |
Net increase in net assets resulting from operations | | | 32,157,418 | | | | 19,163,212 | |
| | | | | | | | |
Distributions to shareholders from: | | | | | | | | |
Net realized gain | | | | | | | | |
Class A | | | (17,339,157 | ) | | | — | |
Class B | | | (3,994,738 | ) | | | — | |
Class C | | | (1,528,583 | ) | | | — | |
| | | | | | | | |
Total distributions to shareholders . | | | (22,862,478 | ) | | | — | |
| | | | | | | | |
Capital share transactions: | | | | | | | | |
Proceeds from sale of shares | | | | | | | | |
Class A | | | 48,735,358 | | | | 38,473,976 | |
Class B | | | 5,700,956 | | | | 4,863,534 | |
Class C | | | 2,621,539 | | | | 2,579,360 | |
Distributions reinvested | | | | | | | | |
Class A | | | 17,194,918 | | | | — | |
Class B | | | 3,949,911 | | | | — | |
Class C | | | 1,493,247 | | | | — | |
Cost of shares redeemed | | | | | | | | |
Class A | | | (47,413,380 | ) | | | (62,028,224 | ) |
Class B | | | (8,829,233 | ) | | | (9,756,709 | ) |
Class C | | | (2,513,425 | ) | | | (2,073,631 | ) |
| | | | | | | | |
Net increase (decrease) from capital share transactions | | | 20,939,891 | | | | (27,941,694 | ) |
| | | | | | | | |
Net increase (decrease) in net assets | | | 30,234,831 | | | | (8,778,482 | ) |
| | | | | | | | |
Net assets: | | | | | | | | |
Beginning of year | | | 157,031,527 | | | | 165,810,009 | |
| | | | | | | | |
End of year | | $ | 187,266,358 | | | $ | 157,031,527 | |
| | | | | | | | |
Accumulated net investment loss at end of year | | $ | (282,912 | ) | | $ | (4,979,244 | ) |
| | | | | | | | |
Capital share activity: | | | | | | | | |
Shares sold | | | | | | | | |
Class A | | | 2,436,280 | | | | 2,071,616 | |
Class B | | | 311,989 | | | | 283,447 | |
Class C | | | 144,145 | | | | 146,502 | |
Shares reinvested | | | | | | | | |
Class A | | | 922,474 | | | | — | |
Class B | | | 231,666 | | | | — | |
Class C | | | 86,716 | | | | — | |
Shares redeemed | | | | | | | | |
Class A | | | (2,406,454 | ) | | | (3,331,473 | ) |
Class B | | | (492,573 | ) | | | (569,781 | ) |
Class C | | | (139,656 | ) | | | (119,789 | ) |
The accompanying notes are an integral part of the financial statements
29
| | |
| Financial Highlights | | Security Equity Fund |
| Selected data for each share of capital stock outstanding throughout each year | | Global Series |
| | | | | | | | | | | | | | | | | | | | |
| | | | | | | | | | | | | | | Year Ended
September 30, | |
Class A | | 2007a | | | 2006 | | | 2005 | | | 2004b | | | 2003 | |
Per Share Data | | | | | | | | | | | | | | | | | | | | |
Net asset value, beginning of period | | $ | 19.65 | | | $ | 17.47 | | | $ | 13.93 | | | $ | 11.68 | | | $ | 9.49 | |
| | | | | | | | | | | | | | | | | | | | |
Income (loss) from investment operations: | | | | | | | | | | | | | | | | | | | | |
Net investment income (loss)c | | | 0.06 | | | | (0.03 | ) | | | (0.02 | ) | | | (0.03 | ) | | | (0.03 | ) |
Net gain on securities (realized and unrealized) | | | 3.60 | | | | 2.21 | | | | 3.56 | | | | 2.28 | | | | 2.22 | |
| | | | | | | | | | | | | | | | | | | | |
Total from investment operations | | | 3.66 | | | | 2.18 | | | | 3.54 | | | | 2.25 | | | | 2.19 | |
| | | | | | | | | | | | | | | | | | | | |
Less distributions: | | | | | | | | | | | | | | | | | | | | |
Distributions from realized gains | | | (2.62 | ) | | | — | | | | — | | | | — | | | | — | |
| | | | | | | | | | | | | | | | | | | | |
Total distributions | | | (2.62 | ) | | | — | | | | — | | | | — | | | | — | |
| | | | | | | | | | | | | | | | | | | | |
Net asset value, end of period | | $ | 20.69 | | | $ | 19.65 | | | $ | 17.47 | | | $ | 13.93 | | | $ | 11.68 | |
| | | | | | | | | | | | | | | | | | | | |
Total Returnd | | | 20.07 | % | | | 12.48 | % | | | 25.41 | % | | | 19.26 | % | | | 23.08 | % |
| | | | | | | | | | | | | | | | | | | | |
Ratios/Supplemental Data | | | | | | | | | | | | | | | | | | | | |
Net assets, end of period (in thousands) | | $ | 145,158 | | | $ | 119,176 | | | $ | 127,970 | | | $ | 98,450 | | | $ | 42,711 | |
| | | | | | | | | | | | | | | | | | | | |
Ratios to average net assets: | | | | | | | | | | | | | | | | | | | | |
Net investment income (loss) | | | 0.29 | % | | | (0.17 | )% | | | (0.14 | )% | | | (0.20 | )% | | | (0.26 | )% |
Total expensese | | | 1.69 | % | | | 1.75 | % | | | 1.73 | % | | | 1.79 | % | | | 2.00 | % |
Net expensesf | | | 1.69 | % | | | 1.75 | % | | | 1.73 | % | | | 1.79 | % | | | 2.00 | % |
Net expenses prior to custodian earning credits and net of expense waivers | | | 1.69 | % | | | 1.75 | % | | | 1.73 | % | | | 1.79 | % | | | 2.00 | % |
| | | | | | | | | | | | | | | | | | | | |
Portfolio turnover rate | | | 162 | % | | | 28 | % | | | 31 | % | | | 25 | % | | | 62 | % |
| | | | | |
| | | | | | | | | | | | | | | Year Ended
September 30, | |
Class B | | 2007a,g | | | 2006g | | | 2005g | | | 2004b | | | 2003 | |
Per Share Data | | | | | | | | | | | | | | | | | | | | |
Net asset value, beginning of period | | $ | 18.17 | | | $ | 16.12 | | | $ | 12.93 | | | $ | 10.93 | | | $ | 8.89 | |
| | | | | | | | | | | | | | | | | | | | |
Income (loss) from investment operations: | | | | | | | | | | | | | | | | | | | | |
Net investment income (loss)c | | | 0.09 | | | | 0.02 | | | | (0.12 | ) | | | (0.13 | ) | | | (0.04 | ) |
Net gain on securities (realized and unrealized) | | | 3.32 | | | | 2.03 | | | | 3.31 | | | | 2.13 | | | | 2.08 | |
| | | | | | | | | | | | | | | | | | | | |
Total from investment operations | | | 3.41 | | | | 2.05 | | | | 3.19 | | | | 2.00 | | | | 2.04 | |
| | | | | | | | | | | | | | | | | | | | |
Less distributions: | | | | | | | | | | | | | | | | | | | | |
Distributions from realized gains | | | (2.62 | ) | | | — | | | | — | | | | — | | | | — | |
| | | | | | | | | | | | | | | | | | | | |
Total distributions | | | (2.62 | ) | | | — | | | | — | | | | — | | | | — | |
| | | | | | | | | | | | | | | | | | | | |
Net asset value, end of period | | $ | 18.96 | | | $ | 18.17 | | | $ | 16.12 | | | $ | 12.93 | | | $ | 10.93 | |
| | | | | | | | | | | | | | | | | | | | |
Total Returnd | | | 20.36 | % | | | 12.72 | % | | | 24.67 | % | | | 18.30 | % | | | 22.95 | % |
| | | | | | | | | | | | | | | | | | | | |
Ratios/Supplemental Data | | | | | | | | | | | | | | | | | | | | |
Net assets, end of period (in thousands) | | $ | 29,659 | | | $ | 27,494 | | | $ | 28,999 | | | $ | 28,360 | | | $ | 16,461 | |
| | | | | | | | | | | | | | | | | | | | |
Ratios to average net assets: | | | | | | | | | | | | | | | | | | | | |
Net investment income (loss) | | | 0.50 | % | | | 0.11 | % | | | (0.80 | )% | | | (1.00 | )% | | | (0.42 | )% |
Total expensese | | | 1.44 | % | | | 1.50 | % | | | 2.38 | % | | | 2.54 | % | | | 2.18 | % |
Net expensesf | | | 1.44 | % | | | 1.50 | % | | | 2.38 | % | | | 2.54 | % | | | 2.18 | % |
Net expenses prior to custodian earning credits and net of expense waivers | | | 1.44 | % | | | 1.50 | % | | | 2.38 | % | | | 2.54 | % | | | 2.18 | % |
| | | | | | | | | | | | | | | | | | | | |
Portfolio turnover rate | | | 162 | % | | | 28 | % | | | 31 | % | | | 25 | % | | | 62 | % |
The accompanying notes are an integral part of the financial statements
30
| | |
| Financial Highlights | | Security Equity Fund |
| Selected data for each share of capital stock outstanding throughout each year | | Global Series |
| | | | | | | | | | | | | | | | | | | | |
| | | | | | | | | | | | | | | Year Ended
September 30, | |
Class C | | 2007a | | | 2006 | | | 2005 | | | 2004b | | | 2003 | |
Per Share Data | | | | | | | | | | | | | | | | | | | | |
Net asset value, beginning of period | | $ | 18.37 | | | $ | 16.46 | | | $ | 13.22 | | | $ | 11.17 | | | $ | 9.14 | |
Income (loss) from investment operations: | | | | | | | | | | | | | | | | | | | | |
Net investment lossc | | | (0.09 | ) | | | (0.15 | ) | | | (0.13 | ) | | | (0.13 | ) | | | (0.09 | ) |
Net gain on securities (realized and unrealized) | | | 3.34 | | | | 2.06 | | | | 3.37 | | | | 2.18 | | | | 2.12 | |
| | | | | | | | | | | | | | | | | | | | |
Total from investment operations | | | 3.25 | | | | 1.91 | | | | 3.24 | | | | 2.05 | | | | 2.03 | |
| | | | | | | | | | | | | | | | | | | | |
Less distributions: | | | | | | | | | | | | | | | | | | | | |
Distributions from realized gains | | | (2.62 | ) | | | — | | | | — | | | | — | | | | — | |
| | | | | | | | | | | | | | | | | | | | |
Total distributions | | | (2.62 | ) | | | — | | | | — | | | | — | | | | — | |
| | | | | | | | | | | | | | | | | | | | |
Net asset value, end of period | | $ | 19.00 | | | $ | 18.37 | | | $ | 16.46 | | | $ | 13.22 | | | $ | 11.17 | |
| | | | | | | | | | | | | | | | | | | | |
Total Returnd | | | 19.14 | % | | | 11.60 | % | | | 24.51 | % | | | 18.35 | % | | | 22.21 | % |
| | | | | | | | | | | | | | | | | | | | |
Ratios/Supplemental Data | | | | | | | | | | | | | | | | | | | | |
Net assets, end of period (in thousands) | | $ | 12,449 | | | $ | 10,361 | | | $ | 8,841 | | | $ | 7,557 | | | $ | 5,326 | |
| | | | | | | | | | | | | | | | | | | | |
Ratios to average net assets: | | | | | | | | | | | | | | | | | | | | |
Net investment loss | | | (0.48 | )% | | | (0.87 | )% | | | (0.90 | )% | | | (1.02 | )% | | | (0.96 | )% |
Total expensese | | | 2.44 | % | | | 2.51 | % | | | 2.48 | % | | | 2.54 | % | | | 2.77 | % |
Net expensesf | | | 2.44 | % | | | 2.50 | % | | | 2.48 | % | | | 2.54 | % | | | 2.77 | % |
Net expenses prior to custodian earning credits and net of expense waivers | | | 2.44 | % | | | 2.51 | % | | | 2.48 | % | | | 2.54 | % | | | 2.77 | % |
| | | | | | | | | | | | | | | | | | | | |
Portfolio turnover rate | | | 162 | % | | | 28 | % | | | 31 | % | | | 25 | % | | | 62 | % |
a | Security Global Investors, LLC (SGI) became the sub-advisor of the Global Series effective August 1, 2007. Prior to August 1, 2007, Security Investors (SI) paid Oppenheimer Funds for sub-advisory services. |
b | The financial highlights for the Global Series exclude the historical financial highlights of the International Series Class A, B and C shares. The assets of the International Series were acquired by the Global Series on October 3, 2003. |
c | Net investment income (loss) was computed using average shares outstanding throughout the period. |
d | Total return information does not reflect deduction of any sales charges imposed at the time of purchase for Class A shares or upon redemption for Class B and C shares. |
e | Total expense information reflects expense ratios absent expense reductions by the Investment Manager and custodian earnings credits, as applicable. |
f | Net expense information reflects the expense ratios after voluntary expense waivers, reimbursements and custodian earnings credits, as applicable. |
g | Effective August 25, 2005, Class B shares ceased charging 12b-1 fees in accordance with the NASD sales cap regulations. Per share information reflects this change. This fee may be reinstated at any time. |
The accompanying notes are an integral part of the financial statements
31
| | |
| | Security Equity Fund |
| Manager’s Commentary | | Mid Cap Value Series |
| November 15, 2007 | | (unaudited) |
Adviser, Security Global Investors

James P. Schier
Senior Portfolio Manager
To Our Shareholders:
For the year ended September 30, 2007, the Security Equity Fund Mid Cap Value Series gained 12.96%1. This exceeded the 8.79% return of the Series’ benchmark, the Russell 2500 Value Index, but trailed the 15.19% median return of the peer group.
Our approach with the Mid Cap Value Series is to seek companies that can increase shareholders’ return on capital. We hold such companies over three to five years to capture long-term improvements in profitability.
The investment process is fundamentally driven and quantitatively aided. We use proprietary screens to identify potential companies for investment and then perform rigorous fundamental analysis to identify the best ideas. Through this fundamental research, we determine an estimate of intrinsic value and thus a valuation target for each idea. We construct the portfolios based on the level of conviction generated by this bottom-up analysis and the upside/downside profile associated with each company.
Industrials and Energy Were Positive Contributors
Superior stock selection and a significant overweight in the industrials sector accounted for more than half of the portfolio’s outperformance of the benchmark. The Series’ performance in the industrials sector was up 55% during the period.
Leading the portfolio’s holdings in the sector were the top three stocks with the greatest absolute impact in the Series. McDermott International, Inc., gained 159% during the 12 months ended September 30, 2007, while Shaw Group, Inc., contributed 146% and Quanta Services, Inc., 57%. All of these companies provide energy, engineering, and construction services to the energy and power industries.
Management’s conviction in the leading companies and the industrials sector led to an average weight in the portfolio of nearly 21% compared to just 11% for the Index.
While stock selection did not perform as expected, the large overweight positioning in the energy sector, 19% in the Series to 4% for the benchmark, was a positive contributor for the Series. Williams Companies, Inc., was the most notable energy name in the portfolio, but Murphy Oil Corporation and Helmerich & Payne, Inc., were also in the top 10 with returns of 49% and 43%, respectively.
Materials and Utilities Disappoint
The Series’ stock selection in the materials sector weighed on portfolio performance. The Series had a weighting of approximately half of the index at the same time that the benchmark returns for the sector outperformed the portfolio’s return by 35% to 2%. Materials sector holdings that had a negative affect on the portfolio included Bemis Company, Inc., and Sonoco Products Company. Unlike most stocks in the sector, higher prices of input costs such as paper and petrochemicals, impact packaging stocks. Packaging stocks had difficulty passing along the rapid inflation of the inputs. On an absolute basis, Bemis and Sonoco each declined less than 10%.
A similar situation was the cause of portfolio underperformance in the utilities sector. While the portfolio was slightly underweight the index in the sector, 8% to 10%, stocks in the portfolio underperformed those in the benchmark, 3% to 14%. Dragging down returns in the utilities sector were Great Plains Energy, Inc., and TECO Energy, Inc.
Outlook for 2008
We continue to be surprised by the strength of the markets and maintain our cautious stance for U.S. equities in general. Despite the higher levels of short-
| 1 | Performance figures are based on Class A shares and do not reflect deduction of the sales charges or taxes that a shareholder would pay on distributions or the redemption of shares. |
32
| | |
| | Security Equity Fund |
| Manager’s Commentary | | Mid Cap Value Series |
| November 15, 2007 | | (unaudited) |
term interest rates earlier in the year, high energy costs, a tentative consumer, housing related debt uncertainty, and an increasingly unpredictable geopolitical environment, the broad market averages have continued to advance in 2007.
The current environment suggests that there is more risk than the financial markets want to reflect. Regardless of the economic outlook, the sectors that contain the most opportunity still exist in the energy and industrial sectors. However, given the sizeable advances in many of these holdings in the portfolio, the series has been reducing its exposure while still being over weight. Outside of these sectors, the Series has deployed most new money in the utilities and staples sectors and in the slightly larger companies in the mid-cap spectrum.
On behalf of Security Global Investors, I would like to thank you for trusting your funds with us. We are excited to see what opportunities will be available in the future. As always, we continue to do our best to seek the potential available in small and mid capitalization companies.
Sincerely,
James P. Schier
Senior Portfolio Manager
| | |
| | Security Equity Fund |
| Performance Summary | | Mid Cap Value Series |
September 30, 2007 | | (unaudited) |
PERFORMANCE
Security Mid Cap Value Series vs. Russell 2500 Value Index
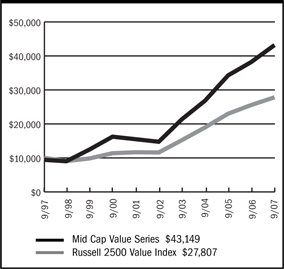
$10,000 Over 10 Years
This chart assumes a $10,000 investment in Class A shares of Mid Cap Value Series on September 30, 1997, reflects deduction of the 5.75% sales load and assumes all dividends reinvested. The chart does not reflect the deduction of taxes that a shareholder would pay on distributions or the redemption of fund shares. The Russell 2500 Value Index is an unmanaged index that measures the performance of securities of small-to-mid cap U.S. companies with greater-than-average value orientation.
Average Annual Returns
| | | | | | | | | | | | |
Periods Ended 9-30-07 | | 1 Year | | | 5 Years | | | 10 Years | | | Since Inception | |
A Shares | | 12.96 | % | | 23.95 | % | | 16.43 | % | | — | |
| | | | |
A Shares with sales charge | | 6.48 | % | | 22.49 | % | | 15.74 | % | | — | |
| | | | |
B Shares | | 12.10 | % | | 23.03 | % | | 15.58 | % | | — | |
| | | | |
B Shares with CDSC | | 7.10 | % | | 22.85 | % | | 15.58 | % | | — | |
| | | | |
C Shares | | 12.13 | % | | 23.03 | % | | — | | | 16.20 | % |
| | | | | | | | | | | (1-29-99 | ) |
| | | | |
C Shares with CDSC | | 11.13 | % | | 23.03 | % | | — | | | 16.20 | % |
| | | | | | | | | | | (1-29-99 | ) |
The performance data above represents past performance that is not predictive of future results. The investment return and principal value of an investment in the Series will fluctuate so that an investor’s shares, when redeemed, may be worth more or less than their original cost. The figures above do not reflect deduction of the maximum front-end sales charge of 5.75% for Class A shares or the contingent deferred sales charge of 5% for Class B shares and 1% for Class C shares, as applicable, except where noted. The figures do not reflect the deduction of taxes that a shareholder would pay on distributions or redemption of shares. Such figures would be lower if the maximum sales charge and any applicable taxes were deducted.
Portfolio Composition by Sector as of 9-30-07
| | | |
Consumer Discretionary | | 6.10 | % |
| |
Consumer Staples | | 9.07 | |
| |
Energy | | 17.98 | |
| |
Financials | | 16.75 | |
| |
Health Care | | 0.60 | |
| |
Industrials | | 14.98 | |
| |
Information Technology | | 13.86 | |
| |
Materials | | 3.86 | |
| |
Utilities | | 10.16 | |
| |
Exchange Traded Funds | | 3.20 | |
| |
Commercial Paper | | 2.59 | |
| |
Warrants | | 0.14 | |
| |
U.S. Government Sponsored Agencies | | 1.44 | |
| |
Repurchase Agreement | | 0.05 | |
| |
Liabilities in excess of other assets | | (0.78 | ) |
| |
Total net assets | | 100.00 | % |
| | | |
The accompanying notes are an integral part of the financial statements
| | |
| | Security Equity Fund |
| Performance Summary | | Mid Cap Value Series |
| September 30, 2007 | | (unaudited) |
PERFORMANCE
Information About Your Series Expenses
Calculating your ongoing Series expenses
Example
As a shareholder of the Series, you incur two types of costs: (1) transaction costs, which may include sales charges (loads) on purchase payments; contingent deferred sales charges on redemptions; and redemption fees, if any; and (2) ongoing costs, including management fees; distribution and/or service fees (12b-1); and other Series expenses. This example is intended to help you understand your ongoing costs (in dollars) of investing in the Series and to compare these costs with ongoing costs of investing in other mutual funds. The example is based on an investment of $1,000 invested at the beginning of the period and held for the entire period, April 1, 2007 – September 30, 2007.
Actual Expenses
The first line for each class of shares in the table provides information about actual account values and actual expenses. You may use the information in this table, together with the amount you invested, to estimate the expenses that you paid over the period. Simply divide your account value by $1,000 (for example, an $8,600 account value divided by $1,000 = 8.6), then multiply the result by the number in the table under the heading entitled “Expenses Paid During Period” to estimate the expenses you paid on your account during this period.
Hypothetical Example for Comparison Purposes
The second line for each class of shares in the table provides information about hypothetical account values and hypothetical expenses based on the Series actual expense ratio and an assumed rate of return of 5% per year before expenses, which is not the Series actual return. The hypothetical account values and expenses may not be used to estimate the actual ending account balance or expenses you paid for the period. You may use this information to compare the ongoing costs of investing in the Series and other funds. To do so, compare this 5% hypothetical example with the 5% hypothetical examples that appear in the shareholder reports of the other mutual funds.
Please note that the expenses shown in the table are meant to highlight your ongoing costs only and do not reflect any transactional costs, such as sales charges (loads) on purchase payments, contingent deferred sales charges on redemptions, and redemption fees, if any. Therefore, the second line for each class of shares is useful in comparing ongoing costs only, and will not help you determine the relative total costs of owning different funds. In addition, if these transactional costs were included, your costs would have been higher.
Series Expenses
| | | | | | | | | |
| | | Beginning
Account Value
04-01-07 | | Ending
Account Value
09-30-071 | | Expenses Paid
During
Period2 |
Mid Cap Value | | | | | | | | | |
Series - Class A | | | | | | | | | |
Actual | | $ | 1,000.00 | | $ | 1,028.00 | | $ | 6.66 |
Hypothetical | | | 1,000.00 | | | 1,018.40 | | | 6.63 |
| | | |
Mid Cap Value | | | | | | | | | |
Series - Class B | | | | | | | | | |
Actual | | | 1,000.00 | | | 1,023.90 | | | 10.40 |
Hypothetical | | | 1,000.00 | | | 1,014.71 | | | 10.35 |
| | | |
Mid Cap Value | | | | | | | | | |
Series - Class C | | | | | | | | | |
Actual | | | 1,000.00 | | | 1,024.00 | | | 10.40 |
Hypothetical | | | 1,000.00 | | | 1,014.71 | | | 10.35 |
1 | The actual ending account value is based on the actual total return of the Series for the period from April 1, 2007 to September 30, 2007 after actual expenses and will differ from the hypothetical ending account value which is based on the Series expense ratio and a hypothetical annual return of 5% before expenses. The actual cumulative return at net asset value for the period from April 1, 2007 to September 30, 2007 was 2.80%, 2.39% and 2.40%, for Class A, B and C shares, respectively. |
2 | Expenses are equal to the Series annualized expense ratio (1.31%, 2.05% and 2.05% for Class A, B and C shares, respectively), net of earnings credits, multiplied by the average account value over the period, multiplied by 183/365 (to reflect the one-half year period). |
35
| | |
| Schedule of Investments | | Security Equity Fund - Mid Cap Value Series |
| September 30, 2007 | | |
| | | | | |
| | | Shares | | Value |
COMMON STOCK - 95.1% | | | | | |
Aerospace & Defense - 1.7% | | | | | |
Orbital Sciences Corporation * | | 762,000 | | $ | 16,946,880 |
| | | | | |
Agricultural Products - 0.6% | | | | | |
Corn Products International, Inc. (1) | | 124,000 | | | 5,687,880 |
| | | | | |
Apparel Retail - 2.4% | | | | | |
Collective Brands, Inc. * | | 567,300 | | | 12,514,638 |
Stein Mart, Inc. | | 570,000 | | | 4,337,700 |
Talbots, Inc. | | 359,300 | | | 6,467,400 |
| | | | | |
| | | | | 23,319,738 |
| | | | | |
Apparel, Accessories & Luxury Goods - 0.8% | | | | | |
Oxford Industries, Inc. | | 215,000 | | | 7,765,800 |
| | | | | |
Application Software - 1.5% | | | | | |
EPIQ Systems, Inc. * | | 588,250 | | | 11,070,865 |
PLATO Learning, Inc. * (2) | | 895,000 | | | 3,383,100 |
| | | | | |
| | | | | 14,453,965 |
| | | | | |
Auto Parts & Equipment - 0.3% | | | | | |
HydroGen Corporation * (2)(3) | | 840,300 | | | 2,520,900 |
| | | | | |
Building Products - 0.3% | | | | | |
Trex Company, Inc. * | | 250,000 | | | 2,780,000 |
| | | | | |
Coal & Consumable Fuels - 6.9% | | | | | |
Arch Coal, Inc. | | 620,000 | | | 20,918,800 |
Consol Energy, Inc. | | 298,700 | | | 13,919,420 |
Evergreen Energy, Inc. * | | 3,106,000 | | | 15,840,600 |
USEC, Inc. * (1) | | 1,580,000 | | | 16,195,000 |
| | | | | |
| | | | | 66,873,820 |
| | | | | |
Communications Equipment - 2.6% | | | | | |
EFJ, Inc. * (2) | | 870,000 | | | 5,046,000 |
MasTec, Inc. * | | 1,100,000 | | | 15,477,000 |
MRV Communications, Inc. * | | 227,600 | | | 564,448 |
Symmetricom, Inc. * | | 960,000 | | | 4,512,000 |
| | | | | |
| | | | | 25,599,448 |
| | | | | |
Computer Storage & Peripherals - 0.2% | | | | | |
STEC, Inc. * | | 307,300 | | | 2,344,699 |
| | | | | |
Construction & Engineering - 5.6% | | | | | |
Insituform Technologies, Inc. * | | 423,600 | | | 6,451,428 |
Quanta Services, Inc. * | | 1,225,000 | | | 32,401,250 |
Shaw Group, Inc. * (1) | | 267,900 | | | 15,564,990 |
| | | | | |
| | | | | 54,417,668 |
| | | | | |
Consumer Finance - 2.2% | | | | | |
First Marblehead Corporation | | 570,000 | | | 21,620,100 |
| | | | | |
Data Processing & Outsourced Services - 5.5% | | | | | |
Affiliated Computer Services, Inc. * | | 495,000 | | | 24,868,800 |
Computer Sciences Corporation * | | 516,300 | | | 28,861,170 |
| | | | | |
| | | | | 53,729,970 |
| | | | | |
Diversified Commercial & Professional Services - 3.6% | | | | | |
FTI Consulting, Inc. * | | 432,400 | | | 21,754,044 |
Navigant Consulting, Inc. * | | 1,020,000 | | | 12,913,200 |
| | | | | |
| | | | | 34,667,244 |
| | | | | |
Drug Retail - 1.3% | | | | | |
Longs Drug Stores Corporation | | 258,400 | | | 12,834,728 |
| | | | | |
Electric Utilities - 7.1% | | | | | |
Allete, Inc. | | 180,600 | | | 8,083,656 |
Empire District Electric Company | | 96,600 | | | 2,182,194 |
Great Plains Energy, Inc. | | 1,610,000 | | | 46,384,100 |
Northeast Utilities | | 250,500 | | | 7,156,785 |
Westar Energy, Inc. | | 200,000 | | | 4,912,000 |
| | | | | |
| | | | | 68,718,735 |
| | | | | |
Electrical Components & Equipment - 1.4% | | | | | |
Lime Energy Company * | | 65,750 | | | 107,173 |
Power-One, Inc. * | | 2,648,800 | | | 13,508,880 |
| | | | | |
| | | | | 13,616,053 |
| | | | | |
Electronic Manufacturing Services - 1.6% | | | | | |
Maxwell Technologies, Inc. * | | 789,400 | | | 9,180,722 |
Merix Corporation * (3) | | 1,049,250 | | | 5,938,755 |
| | | | | |
| | | | | 15,119,477 |
| | | | | |
Exchange Traded Funds - 3.2% | | | | | |
iShares Russell 2000 Value Index Fund | | 202,000 | | | 15,493,400 |
iShares S&P MidCap 400 | | 185,000 | | | 15,551,100 |
| | | | | |
| | | | | 31,044,500 |
| | | | | |
Gas Utilities - 1.0% | | | | | |
Atmos Energy Corporation | | 335,000 | | | 9,487,200 |
| | | | | |
Health Care Facilities - 0.6% | | | | | |
Community Health Systems, Inc. * | | 185,000 | | | 5,816,400 |
| | | | | |
Highways & Railtracks - 1.0% | | | | | |
Quixote Corporation (2)(3) | | 479,100 | | | 9,486,180 |
| | | | | |
Home Furnishings - 1.5% | | | | | |
Leggett & Platt, Inc. | | 737,800 | | | 14,136,248 |
| | | | | |
Industrial Conglomerates - 1.3% | | | | | |
McDermott International, Inc. * (1) | | 232,000 | | | 12,546,560 |
| | | | | |
Integrated Oil & Gas - 2.0% | | | | | |
Murphy Oil Corporation | | 279,000 | | | 19,499,310 |
| | | | | |
Life & Health Insurance - 0.6% | | | | | |
KMG America Corporation * | | 905,400 | | | 5,359,968 |
| | | | | |
The accompanying notes are an integral part of the financial statements
36
| | |
| Schedule of Investments | | Security Equity fund - Mid Cap Value Series |
| September 30, 2007 - continued | | |
| | | | | | |
| | | Shares | | Value |
COMMON STOCK (continued) | | | | | | |
Mortgage REIT’s - 2.8% | | | | | | |
Bimini Capital Management, Inc. (3) | | | 1,474,400 | | $ | 1,946,208 |
Luminent Mortgage Capital, Inc. | | | 750,000 | | | 1,252,500 |
MFA Mortgage Investments, Inc. | | | 1,200,000 | | | 9,624,000 |
Redwood Trust, Inc. | | | 440,000 | | | 14,616,800 |
| | | | | | |
| | | | | | 27,439,508 |
| | | | | | |
Multi-Line Insurance - 1.1% | | | | | | |
American Financial Group, Inc. | | | 382,500 | | | 10,897,425 |
| | | | | | |
Multi-Utilities - 2.1% | | | | | | |
SCANA Corporation | | | 400,000 | | | 15,496,000 |
TECO Energy, Inc. | | | 300,000 | | | 4,929,000 |
| | | | | | |
| | | | | | 20,425,000 |
| | | | | | |
Oil & Gas Drilling - 2.4% | | | | | | |
Helmerich & Payne, Inc. | | | 709,100 | | | 23,279,753 |
| | | | | | |
Oil & Gas Equipment & Services - 1.4% | | | | | | |
Key Energy Services, Inc. * | | | 780,000 | | | 13,252,200 |
| | | | | | |
Oil & Gas Exploration & Production - 2.1% | | | | | | |
Edge Petroleum Corporation * | | | 39,900 | | | 512,316 |
Gulfport Energy Corporation * | | | 329,900 | | | 7,805,434 |
Newfield Exploration Company * | | | 260,000 | | | 12,521,600 |
| | | | | | |
| | | | | | 20,839,350 |
| | | | | | |
Oil & Gas Refining & Marketing - 0.4% | | | | | | |
Nova Biosource Fuels, Inc. * | | | 1,354,900 | | | 3,807,269 |
| | | | | | |
Oil & Gas Storage & Transportation - 1.5% | | | | | | |
Williams Companies, Inc. (1) | | | 433,000 | | | 14,747,980 |
| | | | | | |
Packaged Foods & Meats - 5.1% | | | | | | |
Hormel Foods Corporation | | | 502,300 | | | 17,972,294 |
JM Smucker Company | | | 305,000 | | | 16,293,100 |
Smithfield Foods, Inc. * | | | 480,000 | | | 15,120,000 |
| | | | | | |
| | | | | | 49,385,394 |
| | | | | | |
Paper Packaging - 2.8% | | | | | | |
Bemis Company, Inc. | | | 510,000 | | | 14,846,100 |
Sonoco Products Company | | | 410,000 | | | 12,373,800 |
| | | | | | |
| | | | | | 27,219,900 |
| | | | | | |
Personal Products - 2.1% | | | | | | |
Playtex Products, Inc. * (1) | | | 1,102,700 | | | 20,157,356 |
| | | | | | |
Property & Casualty Insurance - 4.5% | | | | | | |
Alleghany Corporation * | | | 28,196 | | | 11,447,519 |
Employers Holdings, Inc. | | | 271,100 | | | 5,587,371 |
Hanover Insurance Group, Inc. | | | 212,000 | | | 9,368,280 |
North Pointe Holdings Corporation * (2)(3) | | | 525,000 | | | 5,706,750 |
United America Indemnity, Ltd. * | | | 154,500 | | | 3,323,295 |
W.R. Berkley Corporation | | | 282,500 | | | 8,370,475 |
| | | | | | |
| | | | | | 43,803,690 |
| | | | | | |
Regional Banks - 5.0% | | | | | | |
Commerce Bancshares, Inc. | | | 340,000 | | | 15,602,600 |
Whitney Holding Corporation | | | 580,000 | | | 15,300,400 |
Wilmington Trust Corporation | | | 462,000 | | | 17,971,800 |
| | | | | | |
| | | | | | 48,874,800 |
| | | | | | |
Semiconductor Equipment - 0.7% | | | | | | |
Ultratech, Inc. * | | | 476,200 | | | 6,600,132 |
| | | | | | |
Semiconductors - 1.7% | | | | | | |
Applied Micro Circuits Corporation * | | | 850,000 | | | 2,686,000 |
IXYS Corporation * (2) | | | 1,335,400 | | | 13,928,222 |
| | | | | | |
| | | | | | 16,614,222 |
| | | | | | |
Specialized Consumer Services - 1.0% | | | | | | |
Regis Corporation | | | 309,200 | | | 9,866,572 |
| | | | | | |
Specialty Chemicals - 0.9% | | | | | | |
Minerals Technologies, Inc. | | | 134,100 | | | 8,984,700 |
| | | | | | |
Specialty Stores - 0.2% | | | | | | |
Sally Beauty Holdings, Inc. * | | | 180,000 | | | 1,521,000 |
| | | | | | |
Thrifts & Mortgage Finance - 0.5% | | | | | | |
Clayton Holdings, Inc. * | | | 569,100 | | | 4,558,491 |
| | | | | | |
TOTAL COMMON STOCK (Cost $808,869,252) | | | | | $ | 922,668,213 |
| | | | | | |
PREFERRED STOCK - 0.2% | | | | | | |
Diversified Metals & Mining - 0.1% | | | | | | |
Arch Coal, Inc. | | | 4,600 | | | 753,825 |
| | | | | | |
Environmental & Facilities Services - 0.1% | | | | | | |
ThermoEnergy Corporation PIPE * (2)(3)(4)(5) | | | 1,745,000 | | | 898,675 |
| | | | | | |
Metal & Glass Containers - 0.0% | | | | | | |
Owens-Illinois, Inc. | | | 11,000 | | | 495,000 |
| | | | | | |
TOTAL PREFERRED STOCK (Cost $2,281,297) | | | | | $ | 2,147,500 |
| | | | | | |
WARRANTS - 0.1% | | | | | | |
Warrants - 0.1% | | | | | | |
Lime Energy Company | | | | | | |
$1.00, 3/19/2009 | | | 29,517 | | | 28,772 |
Nova Biosource Fuels, Inc. | | | | | | |
$2.40, 7/5/2011 | | | 677,450 | | | 1,141,442 |
ThermoEnergy Corporation | | | | | | |
$0.75, 7/14/2008 (2)(3)(4) | | | 1,745,000 | | | 171,359 |
| | | | | | |
| | | | | | 1,341,573 |
| | | | | | |
TOTAL WARRANTS (Cost $1,561,837) | | | | | $ | 1,341,573 |
| | | | | | |
| | |
| | | Principal
Amount | | Value |
CONVERTIBLE BOND - 1.3% | | | | | | |
Natural Gas - 0.4% | | | | | | |
Hanover Compressor Company | | | | | | |
4.75%, 2008 | | $ | 4,000,000 | | | 3,950,000 |
| | | | | | |
The accompanying notes are an integral part of the financial statements
| | |
Schedule of Investments | | Security Equity Fund - Mid Cap Value Series |
September 30, 2007 - continued | | |
| | | | | | | |
| | | Principal
Amount | | Value | |
CONVERTIBLE BOND (continued) | | | | | | | |
Petroleum - 0.9% | | | | | | | |
USEC, Inc. | | | | | | | |
3.00%, 2014 | | $ | 7,600,000 | | $ | 8,284,000 | |
| | | | | | | |
TOTAL CONVERTIBLE BOND (Cost $11,578,401) | | | | | $ | 12,234,000 | |
| | | | | | | |
U.S. GOVERNMENT SPONSORED AGENCY BONDS & NOTES - 1.4% | | | | | | | |
Federal Home Loan Bank | | | | | | | |
4.428% - 2007 | | | 1,000,000 | | | 999,472 | |
4.55% - 2007 | | | 1,000,000 | | | 999,747 | |
4.55% - 2007 | | | 2,000,000 | | | 1,997,978 | |
4.70% - 2007 | | | 2,000,000 | | | 1,999,739 | |
Federal Home Loan Mortgage Corporation | | | | | | | |
4.72% - 2007 | | | 3,500,000 | | | 3,500,000 | |
4.73% - 2007 | | | 1,625,000 | | | 1,624,359 | |
Federal National Mortgage Association | | | | | | | |
4.72% - 2007 | | | 2,900,000 | | | 2,899,240 | |
| | | | | | | |
TOTAL U.S. GOVERNMENT SPONSORED AGENCY BONDS & NOTES (Cost $14,020,535) | | | | | $ | 14,020,535 | |
| | | | | | | |
COMMERCIAL PAPER - 2.6% | | | | | | | |
Banking - 0.4% | | | | | | | |
Bank of America | | | | | | | |
4.80%, 10/9/2007 | | | 1,340,000 | | | 1,338,571 | |
UBS Finance (DE) LLC | | | | | | | |
4.90%, 10/15/2007 | | | 2,600,000 | | | 2,595,045 | |
| | | | | | | |
| | | | | | 3,933,616 | |
| | | | | | | |
Brokerage - 0.2% | | | | | | | |
JP Morgan Chase & Company | | | | | | | |
4.65%, 10/12/2007 | | | 2,000,000 | | | 1,997,158 | |
| | | | | | | |
Consumer Products - 0.4% | | | | | | | |
Procter & Gamble International Funding | | | | | | | |
4.77%, 10/17/2007 | | | 4,000,000 | | | 3,991,520 | |
| | | | | | | |
Electric - 0.8% | | | | | | | |
Florida Power & Light Company | | | | | | | |
4.77%, 10/11/2007 | | | 3,100,000 | | | 3,095,893 | |
Southern Company | | | | | | | |
4.80%, 10/19/2007 | | | 3,800,000 | | | 3,790,880 | |
4.80%, 10/22/2007 | | | 1,000,000 | | | 997,200 | |
| | | | | | | |
| | | | | | 7,883,973 | |
| | | | | | | |
Financial Companies - Captive - 0.5% | | | | | | | |
General Electric Capital Corporation | | | | | | | |
4.76%, 10/16/2007 | | | 4,300,000 | | | 4,291,472 | |
| | | | | | | |
Non U.S. Banking - 0.3% | | | | | | | |
Danske Corporation | | | | | | | |
5.00%, 10/12/2007 | | | 1,500,000 | | | 1,497,708 | |
Westpac Banking Corporation | | | | | | | |
5.00%, 10/15/2007 | | | 1,500,000 | | | 1,497,083 | |
| | | | | | | |
| | | | | | 2,994,791 | |
| | | | | | | |
TOTAL COMMERCIAL PAPER (Cost $25,092,530) | | | | | $ | 25,092,530 | |
| | | | | | | |
REPURCHASE AGREEMENT - 0.1% | | | | | | | |
United Missouri Bank, 4.53%, dated 9/28/07, matures 10/01/07; repurchase amount $454,171 (Collateralized by U.S. Treasury Note, 3.625%, 1/15/10 with a value of $463,904) | | $ | 454,000 | | $ | 454,000 | |
| | | | | | | |
TOTAL REPURCHASE AGREEMENT (Cost $454,000) | | | | | $ | 454,000 | |
| | | | | | | |
Total Investments (Security Equity Fund - Mid Cap Value Series) | | | | | $ | 977,958,351 | |
(Cost $863,857,852) - 100.8% | | | | | | | |
Liabilities in Excess of Other Assets - (0.8)% | | | | | | (7,549,501 | ) |
| | | | | | | |
TOTAL NET ASSETS - 100.0% | | | | | $ | 970,408,850 | |
| | | | | | | |
Footnotes
Percentages are stated as a percent of net assets.
For federal income tax purposes the identified cost of investments owned at 9/30/2007 was $863,857,852.
| | |
| * | | - Non-income producing security |
| 1 | | - Security is segregated as collateral for open written option contracts. |
| 2 | | - Security is deemed illiquid. See Note 8 in notes to financial statements. |
| 3 | | - Investment in an affiliated issuer. See Note 10 in notes to financial statements. |
| 4 | | - Security is restricted from resale. See Note 6 in notes to financial statements. |
| 5 | | - PIPE (Private Investment in Public Equity) - Stock issued by a company in the secondary market as a means of raising capital more quickly and less expensively than through registration of a secondary public offering. |
See notes to financial statements.
The accompanying notes are an integral part of the financial statements
Security Equity Fund
Mid Cap Value Series
Statement of Assets and Liabilities
September 30, 2007
| | | |
Assets: | | | |
Investments in unaffiliated issues, at value* | | $ | 951,289,524 |
Investments in affiliated issues, at value** | | | 26,668,827 |
| | | |
Total investments | | | 977,958,351 |
Cash | | | 98 |
Receivables: | | | |
Fund shares sold | | | 2,220,552 |
Securities sold | | | 1,559,552 |
Interest | | | 10,252 |
Dividends | | | 998,179 |
Prepaid expenses | | | 43,115 |
| | | |
Total assets | | | 982,790,099 |
| | | |
Liabilities: | | | |
Payable for: | | | |
Fund shares redeemed | | | 3,557,409 |
Written options, at value (premiums received, $2,685,538) | | | 7,536,185 |
Management fees | | | 636,765 |
Custodian fees | | | 1,770 |
Transfer agent/maintenance fees | | | 73,961 |
Administration fees | | | 76,200 |
Professional fees | | | 72,545 |
12b-1 distribution plan fees | | | 372,433 |
Directors’ fees | | | 11,000 |
Other | | | 42,981 |
| | | |
Total liabilities | | | 12,381,249 |
| | | |
Net assets | | $ | 970,408,850 |
| | | |
Net assets consist of: | | | |
Paid in capital | | $ | 709,427,458 |
Undistributed net investment income | | | 231,432 |
Undistributed net realized gain on sale of investments | | | 151,500,108 |
Net unrealized appreciation in value of investments | | | 109,249,852 |
| | | |
Net assets | | $ | 970,408,850 |
| | | |
Class A: | | | |
Capital shares outstanding (unlimited number of shares authorized) | | | 16,856,046 |
Net assets | | $ | 687,484,443 |
Net asset value and redemption price per share | | $ | 40.79 |
| | | |
Maximum offering price per share (net asset value divided by 94.25%) | | $ | 43.28 |
| | | |
Class B: | | | |
Capital shares outstanding (unlimited number of shares authorized) | | | 2,887,111 |
Net assets | | $ | 106,178,655 |
Net asset value, offering and redemption price per share (excluding any applicable contingent deferred sales charge) | | $ | 36.78 |
| | | |
Class C: | | | |
Capital shares outstanding (unlimited number of shares authorized) | | | 4,708,468 |
Net assets | | $ | 176,745,752 |
Net asset value, offering and redemption price per share (excluding any applicable contingent deferred sales charge) | | $ | 37.54 |
| | | |
* Investments in unaffiliated issues, at cost | | $ | 814,405,010 |
** Investments in affiliated issues, at cost | | | 49,452,842 |
| | | |
Total cost | | | 863,857,852 |
Statement of Operations
For the Year Ended September 30, 2007
| | | | |
Investment Income: | | | | |
Dividends from securities of unaffiliated issuers | | $ | 14,668,003 | |
Dividends from securities of affiliated issuers | | | 136,562 | |
Interest | | | 3,968,052 | |
| | | | |
Total investment income | | | 18,772,617 | |
| | | | |
Expenses: | | | | |
Management fees | | | 7,741,531 | |
Transfer agent/maintenance fees | | | 1,269,715 | |
Administration fees | | | 921,724 | |
Custodian fees | | | 45,034 | |
Directors’ fees | | | 56,441 | |
Professional fees | | | 112,490 | |
Reports to shareholders | | | 81,246 | |
Registration fees | | | 87,316 | |
Other expenses | | | 55,841 | |
12b-1 distribution fees - Class A | | | 1,693,092 | |
12b-1 distribution fees - Class B | | | 1,131,075 | |
12b-1 distribution fees - Class C | | | 1,751,934 | |
| | | | |
Total expenses | | | 14,947,439 | |
Less: | | | | |
Earnings credits applied | | | (246 | ) |
| | | | |
Net expenses | | | 14,947,193 | |
| | | | |
Net investment income | | | 3,825,424 | |
| | | | |
Net Realized and Unrealized Gain (Loss): | | | | |
Net realized gain (loss) during the year on: | | | | |
Investment transactions of unaffiliated issuers | | | 152,545,556 | |
Investment transactions of affiliated issuers | | | 933,667 | |
Options written | | | 1,340,418 | |
| | | | |
Net realized gain | | | 154,819,641 | |
| | | | |
Net unrealized appreciation (depreciation) during the year on: | | | | |
Investments | | | (43,462,348 | ) |
Options written | | | (4,097,592 | ) |
| | | | |
Net unrealized depreciation | | | (47,559,940 | ) |
| | | | |
Net realized and unrealized gain | | | 107,259,701 | |
| | | | |
Net increase in net assets resulting from operations | | $ | 111,085,125 | |
| | | | |
The accompanying notes are an integral part of the financial statements
| | |
| | Security Equity Fund |
| Statement of Changes in Net Assets | | Mid Cap Value Series |
| | | | | | | | |
| | | Year Ended
September 30, 2007 | | | Year Ended
September 30, 2006 | |
Increase (decrease) in net assets from operations: | | | | | | | | |
Net investment income (loss) | | $ | 3,825,424 | | | $ | (1,056,502 | ) |
Net realized gain during the year on investments | | | 154,819,641 | | | | 53,841,896 | |
Net unrealized appreciation (depreciation) during the year on investments | | | (47,559,940 | ) | | | 8,972,790 | |
| | | | | | | | |
Net increase in net assets resulting from operations | | | 111,085,125 | | | | 61,758,184 | |
| | | | | | | | |
Distributions to shareholders from: | | | | | | | | |
Net investment income | | | | | | | | |
Class A | | | (3,593,992 | ) | | | — | |
Net realized gain | | | | | | | | |
Class A | | | (32,960,688 | ) | | | (21,770,226 | ) |
Class B | | | (6,506,572 | ) | | | (5,997,235 | ) |
Class C | | | (9,330,424 | ) | | | (6,154,241 | ) |
| | | | | | | | |
Total distributions to shareholders | | | (52,391,676 | ) | | | (33,921,702 | ) |
| | | | | | | | |
Capital share transactions: | | | | | | | | |
Proceeds from sale of shares | | | | | | | | |
Class A | | | 245,384,311 | | | | 336,551,934 | |
Class B | | | 14,976,325 | | | | 24,068,613 | |
Class C | | | 39,616,310 | | | | 66,012,687 | |
Distributions reinvested | | | | | | | | |
Class A | | | 32,588,871 | | | | 20,081,172 | |
Class B | | | 6,199,597 | | | | 5,715,437 | |
Class C | | | 8,812,100 | | | | 5,766,876 | |
Cost of shares redeemed | | | | | | | | |
Class A | | | (228,752,745 | ) | | | (153,088,973 | ) |
Class B | | | (30,375,678 | ) | | | (22,952,102 | ) |
Class C | | | (34,170,836 | ) | | | (17,136,873 | ) |
| | | | | | | | |
Net increase from capital share transactions | | | 54,278,255 | | | | 265,018,771 | |
| | | | | | | | |
Net increase in net assets | | | 112,971,704 | | | | 292,855,253 | |
| | | | | | | | |
Net assets: | | | | | | | | |
Beginning of year | | | 857,437,146 | | | | 564,581,893 | |
| | | | | | | | |
End of year | | $ | 970,408,850 | | | $ | 857,437,146 | |
| | | | | | | | |
Accumulated net investment income at end of year | | $ | 231,432 | | | $ | — | |
| | | | | | | | |
Capital share activity: | | | | | | | | |
Shares sold | | | | | | | | |
Class A | | | 6,118,943 | | | | 8,840,332 | |
Class B | | | 409,793 | | | | 695,272 | |
Class C | | | 1,071,179 | | | | 1,858,360 | |
Shares reinvested | | | | | | | | |
Class A | | | 840,418 | | | | 565,349 | |
Class B | | | 176,275 | | | | 176,130 | |
Class C | | | 245,462 | | | | 174,331 | |
Shares redeemed | | | | | | | | |
Class A | | | (5,679,660 | ) | | | (4,094,527 | ) |
Class B | | | (828,980 | ) | | | (663,202 | ) |
Class C | | | (914,344 | ) | | | (485,231 | ) |
The accompanying notes are an integral part of the financial statements
| | |
| Financial Highlights | | Security Equity Fund |
| Selected data for each share of capital stock outstanding throughout each year | | Mid Cap Value Series |
| | | | | | | | | | | | | | | | | | | | |
| | | | | | | | | | | | | | | Year Ended
September 30, | |
Class A | | 2007 | | | 2006 | | | 2005 | | | 2004 | | | 2003 | |
Per Share Data | | | | | | | | | | | | | | | | | | | | |
Net asset value, beginning of period | | $ | 38.27 | | | $ | 36.34 | | | $ | 30.45 | | | $ | 24.48 | | | $ | 16.90 | |
| | | | | | | | | | | | | | | | | | | | |
Income (loss) from investment operations: | | | | | | | | | | | | | | | | | | | | |
Net investment income (loss)a | | | 0.25 | | | | 0.04 | | | | 0.01 | | | | (0.09) | | | | (0.07) | |
Net gain on securities (realized and unrealized) | | | 4.59 | | | | 3.96 | | | | 8.16 | | | | 6.32 | | | | 7.65 | |
| | | | | | | | | | | | | | | | | | | | |
Total from investment operations | | | 4.84 | | | | 4.00 | | | | 8.17 | | | | 6.23 | | | | 7.58 | |
| | | | | | | | | | | | | | | | | | | | |
Less distributions: | | | | | | | | | | | | | | | | | | | | |
Dividends from net investment income | | | (0.23) | | | | — | | | | — | | | | — | | | | — | |
Distributions from realized gains | | | (2.09) | | | | (2.07) | | | | (2.28) | | | | (0.26) | | | | — | |
| | | | | | | | | | | | | | | | | | | | |
Total distributions | | | (2.32) | | | | (2.07) | | | | (2.28) | | | | (0.26) | | | | — | |
| | | | | | | | | | | | | | | | | | | | |
Net asset value, end of period | | $ | 40.79 | | | $ | 38.27 | | | $ | 36.34 | | | $ | 30.45 | | | $ | 24.48 | |
| | | | | | | | | | | | | | | | | | | | |
Total Returnb | | | 12.96 | % | | | 11.44 | % | | | 27.77 | % | | | 25.59 | % | | | 44.85 | % |
| | | | | | | | | | | | | | | | | | | | |
Ratios/Supplemental Data | | | | | | | | | | | | | | | | | | | | |
Net assets, end of period (in thousands) | | $ | 687,484 | | | $ | 596,074 | | | $ | 373,031 | | | $ | 215,659 | | | $ | 113,822 | |
| | | | | | | | | | | | | | | | | | | | |
Ratios to average net assets: | | | | | | | | | | | | | | | | | | | | |
Net investment income (loss) | | | 0.61 | % | | | 0.10 | % | | | 0.04 | % | | | (0.31) | % | | | (0.33) | % |
Total expensesc | | | 1.32 | % | | | 1.36 | % | �� | | 1.41 | % | | | 1.48 | % | | | 1.65 | % |
Net expensesd | | | 1.32 | % | | | 1.36 | % | | | 1.41 | % | | | 1.48 | % | | | 1.65 | % |
Net expenses prior to custodian earning credits and net of expense waivers | | | 1.32 | % | | | 1.36 | % | | | 1.41 | % | | | 1.48 | % | | | 1.65 | % |
| | | | | | | | | | | | | | | | | | | | |
Portfolio turnover rate | | | 44 | % | | | 33 | % | | | 19 | % | | | 45 | % | | | 52 | % |
| | | | | |
| | | | | | | | | | | | | | | Year Ended
September 30, | |
Class B | | 2007 | | | 2006 | | | 2005 | | | 2004 | | | 2003 | |
Per Share Data | | | | | | | | | | | | | | | | | | | | |
Net asset value, beginning of period | | $ | 34.76 | | | $ | 33.43 | | | $ | 28.37 | | | $ | 22.99 | | | $ | 15.99 | |
| | | | | | | | | | | | | | | | | | | | |
Income (loss) from investment operations: | | | | | | | | | | | | | | | | | | | | |
Net investment lossa | | | (0.04) | | | | (0.23) | | | | (0.22) | | | | (0.28) | | | | (0.20) | |
Net gain on securities (realized and unrealized) | | | 4.15 | | | | 3.63 | | | | 7.56 | | | | 5.92 | | | | 7.20 | |
| | | | | | | | | | | | | | | | | | | | |
Total from investment operations | | | 4.11 | | | | 3.40 | | | | 7.34 | | | | 5.64 | | | | 7.00 | |
| | | | | | | | | | | | | | | | | | | | |
Less distributions: | | | | | | | | | | | | | | | | | | | | |
Distributions from realized gains | | | (2.09) | | | | (2.07) | | | | (2.28) | | | | (0.26) | | | | — | |
| | | | | | | | | | | | | | | | | | | | |
Total distributions | | | (2.09) | | | | (2.07) | | | | (2.28) | | | | (0.26) | | | | — | |
| | | | | | | | | | | | | | | | | | | | |
Net asset value, end of period | | $ | 36.78 | | | $ | 34.76 | | | $ | 33.43 | | | $ | 28.37 | | | $ | 22.99 | |
| | | | | | | | | | | | | | | | | | | | |
Total Returnb | | | 12.10 | % | | | 10.60 | % | | | 26.83 | % | | | 24.67 | % | | | 43.78 | % |
| | | | | | | | | | | | | | | | | | | | |
Ratios/Supplemental Data | | | | | | | | | | | | | | | | | | | | |
Net assets, end of period (in thousands) | | $ | 106,179 | | | $ | 108,784 | | | $ | 97,664 | | | $ | 74,650 | | | $ | 53,947 | |
| | | | | | | | | | | | | | | | | | | | |
Ratios to average net assets: | | | | | | | | | | | | | | | | | | | | |
Net investment loss | | | (0.10) | % | | | (0.68) | % | | | (0.72) | % | | | (1.07) | % | | | (1.08) | % |
Total expensesc | | | 2.07 | % | | | 2.11 | % | | | 2.16 | % | | | 2.23 | % | | | 2.40 | % |
Net expensesd | | | 2.07 | % | | | 2.11 | % | | | 2.16 | % | | | 2.23 | % | | | 2.40 | % |
Net expenses prior to custodian earning credits and net of expense waivers | | | 2.07 | % | | | 2.11 | % | | | 2.16 | % | | | 2.23 | % | | | 2.40 | % |
| | | | | | | | | | | | | | | | | | | | |
Portfolio turnover rate | | | 44 | % | | | 33 | % | | | 19 | % | | | 45 | % | | | 52 | % |
The accompanying notes are an integral part of the financial statements
41
| | |
| Financial Highlights | | Security Equity Fund |
| Selected data for each share of capital stock outstanding throughout each year | | Mid Cap Value Series |
| | | | | | | | | | | | | | | | | | | | |
| | | | | | | | | | | | | | | Year Ended
September 30, | |
Class C | | 2007 | | | 2006 | | | 2005 | | | 2004 | | | 2003 | |
Per Share Data | | | | | | | | | | | | | | | | | | | | |
Net asset value, beginning of period | | $ | 35.43 | | | $ | 34.03 | | | $ | 28.85 | | | $ | 23.37 | | | $ | 16.26 | |
| | | | | | | | | | | | | | | | | | | | |
Income (loss) from investment operations: | | | | | | | | | | | | | | | | | | | | |
Net investment lossa | | | (0.05) | | | | (0.22) | | | | (0.21) | | | | (0.29) | | | | (0.21) | |
Net gain on securities (realized and unrealized) | | | 4.25 | | | | 3.69 | | | | 7.67 | | | | 6.03 | | | | 7.32 | |
| | | | | | | | | | | | | | | | | | | | |
Total from investment operations | | | 4.20 | | | | 3.47 | | | | 7.46 | | | | 5.74 | | | | 7.11 | |
| | | | | | | | | | | | | | | | | | | | |
Less distributions: | | | | | | | | | | | | | | | | | | | | |
Distributions from realized gains | | | (2.09) | | | | (2.07) | | | | (2.28) | | | | (0.26) | | | | — | |
| | | | | | | | | | | | | | | | | | | | |
Total distributions | | | (2.09) | | | | (2.07) | | | | (2.28) | | | | (0.26) | | | | — | |
| | | | | | | | | | | | | | | | | | | | |
Net asset value, end of period | | $ | 37.54 | | | $ | 35.43 | | | $ | 34.03 | | | $ | 28.85 | | | $ | 23.37 | |
| | | | | | | | | | | | | | | | | | | | |
Total Returnb | | | 12.13 | % | | | 10.62 | % | | | 26.80 | % | | | 24.70 | % | | | 43.73 | % |
| | | | | | | | | | | | | | | | | | | | |
Ratios/Supplemental Data | | | | | | | | | | | | | | | | | | | | |
Net assets, end of period (in thousands) | | $ | 176,746 | | | $ | 152,579 | | | $ | 93,887 | | | $ | 54,133 | | | $ | 32,999 | |
| | | | | | | | | | | | | | | | | | | | |
Ratios to average net assets: | | | | | | | | | | | | | | | | | | | | |
Net investment loss | | | (0.12) | % | | | (0.65) | % | | | (0.71) | % | | | (1.06) | % | | | (1.08) | % |
Total expensesc | | | 2.07 | % | | | 2.11 | % | | | 2.16 | % | | | 2.23 | % | | | 2.40 | % |
Net expensesd | | | 2.07 | % | | | 2.11 | % | | | 2.16 | % | | | 2.23 | % | | | 2.40 | % |
Net expenses prior to custodian earning credits and net of expense waivers | | | 2.07 | % | | | 2.11 | % | | | 2.16 | % | | | 2.23 | % | | | 2.40 | % |
| | | | | | | | | | | | | | | | | | | | |
Portfolio turnover rate | | | 44 | % | | | 33 | % | | | 19 | % | | | 45 | % | | | 52 | % |
a | Net investment income (loss) was computed using average shares outstanding throughout the period. |
b | Total return information does not reflect deduction of any sales charges imposed at the time of purchase for Class A shares or upon redemption for Class B and C shares. |
c | Total expense information reflects expense ratios absent expense reductions by the Investment Manager and custodian earnings credits, as applicable. |
d | Net expense information reflects the expense ratios after voluntary expense waivers, reimbursements and custodian earnings credits, as applicable. |
The accompanying notes are an integral part of the financial statements
42
| | |
| | Security Equity Fund |
| Manager’s Commentary | | Select 25 Series |
| November 15, 2007 | | (unaudited) |
Adviser, Security Global Investors
Mark Mitchell
Senior Portfolio Manager
To Our Shareholders:
Security Equity Fund Select 25 Series returned 8.11%1 in the period, lagging the benchmark Russell 1000 Growth Index’s return of 19.35% and trailing the Series’ peer group median return of 19.95%. While disappointed results were below the benchmark, we believe that our approach delivers performance over the long-term.
Our strategy is to buy companies that are trading at a significant discount to their intrinsic value. Our investment approach is a defined and disciplined process of three clear philosophical tenants that drive our investment decisions: a valuation focus, a long-term perspective and an opportunistic approach.
The investment process is fundamentally driven and quantitatively aided. We use proprietary screens to identify potential companies for investment and then perform rigorous fundamental analysis to identify the best ideas. Through this fundamental research, we determine an estimate of intrinsic value and thus a valuation target for each idea. We construct the portfolios based on the level of conviction generated by this bottom-up analysis and the upside/downside profile associated with each company.
We ultimately structure the portfolio with 25-30 names. This philosophy is applied to a broad range of growth names.
Industrials Stocks Top Performers
The Series’ industrials holdings were up 32% compared to up 24% for the Russell 1000 Growth Index. Three of the top 10 portfolio performers were in the industrials sector: Shaw Group (+144%), W.W. Grainger, Inc. (+38%), and L-3 Communications (+28%). Both Shaw and Grainger benefited from a strong global economy, while L-3 experienced solid defense-related spending.
The strong performance from the industrials sectors in general and the specific stock selection was not enough to close the gap among the other sectors of the portfolio and the index.
Energy and Financials Sectors Disappoint
Energy sector holdings in the portfolio detracted even with an overweight in an outperforming sector due to stock selection. The sector returned 3% for the portfolio versus 44% for the index. The weight in the portfolio for energy stocks was more than double the index weight. Evergreen Energy, Inc., down 51% (previously known as KFx) and BJ Services Company, down 11%, both contributed negatively to the Series. Evergreen Energy was hurt by concerns over the viability of the initial production results of its proprietary clean coal technology. BJ Services was impacted more generally by industry challenges in its core North American pressure pumping business.
Financial holdings in the portfolio were down over 3%, compared to the index financial sector return of up 10%. An overweight sector position and poor stock selection led to the negative results. Capital One Financial Corporation, First Marblehead Corporation, American Express Company, and Citigroup, Inc., were all down for the fiscal year. Each company is unique; however, a common theme is poor market sentiment about their business prospects. We are very confident in the viability and return potential of these four companies. We continually assess each holding and make changes when our investment thesis is no longer valid.
2008 Market Outlook
Our bottom-up approach looks at market uncertainty in the context of the potential long-term impact on individual companies. Often times, volatility provides opportunity. We are maintaining flexibility in the portfolios to take advantage of these opportunities as they arise. Our focus is on identifying companies with the ability to be substantially better over the next three to five years or have the potential to maintain their return on capital at current levels in a difficult economic environment. We are confident in our ability to find these companies and we are pleased with the positions we own today.
We believe that investing is a long-term pursuit that requires patience and a consistent approach. Dollar cost averaging is a sound way to build long-term value. We recognize there are many investment fund alternatives available today and thank you for your business and the confidence you place in us.
Sincerely,
Mark Mitchell
Senior Portfolio Manager
| 1 | Performance figures are based on Class A shares and do not reflect deductions of the sales charges or taxes that a shareholder would pay on distributions or the redemption of shares. |
43
| | |
| | Security Equity Fund |
| Performance Summary | | Select 25 Series |
| September 30, 2007 | | (unaudited) |
PERFORMANCE
Security Select 25 Series vs. Russell 1000 Growth Index
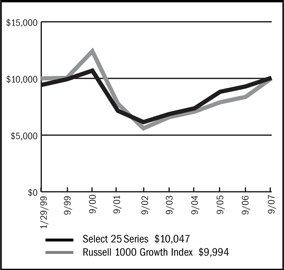
$10,000 Since Inception
This chart assumes a $10,000 investment in Class A shares of Select 25 Series on January 29, 1999 (date of inception), reflects deduction of the 5.75% sales load and assumes all dividends are reinvested. The chart does not reflect the deduction of taxes that a shareholder would pay on distributions or the redemption of fund shares. The Russell 1000 Growth Index is an unmanaged capitalization-weighted index which includes stocks incorporated in the United States and its territories and measures the performance of the Russell 1000 companies with higher price-to-book ratios and higher forecasted growth values.
Average Annual Returns
| | | | | | | | |
Periods Ended 9-30-07 | | 1 Year | | | 5 Years | | | Since Inception |
A Shares | | 8.11 | % | | 10.33 | % | | 0.74% (1-29-99) |
| | | |
A Shares with sales charge | | 1.91 | % | | 9.03 | % | | 0.05% (1-29-99) |
| | | |
B Shares | | 7.29 | % | | 9.50 | % | | 0.07% (1-29-99) |
| | | |
B Shares with CDSC | | 2.29 | % | | 9.22 | % | | 0.07% (1-29-99) |
| | | |
C Shares | | 7.26 | % | | 9.49 | % | | 0.05% (1-29-99) |
| | | |
C Shares with CDSC | | 6.26 | % | | 9.49 | % | | 0.05% (1-29-99) |
The performance data above represents past performance that is not predictive of future results. The investment return and principal value of an investment in the Series will fluctuate so that an investor’s shares, when redeemed, may be worth more or less than their original cost. The figures above do not reflect deduction of the maximum front-end sales charge of 5.75% for Class A shares or the contingent deferred sales charge of 5% for Class B shares and 1% for Class C shares, as applicable, except where noted. The figures do not reflect the deduction of taxes that a shareholder would pay on distributions or redemption of shares. Such figures would be lower if the maximum sales charge and any applicable taxes were deducted.
Portfolio Composition by Sector as of 9-30-07
| | | |
Consumer Discretionary | | 10.34 | % |
| |
Consumer Staples | | 6.79 | |
| |
Energy | | 10.34 | |
| |
Financials | | 21.08 | |
| |
Health Care | | 11.80 | |
| |
Industrials | | 11.69 | |
| |
Information Technology | | 13.96 | |
| |
Materials | | 1.45 | |
| |
Exchange Traded Funds | | 7.97 | |
| |
Commercial Paper | | 4.76 | |
| |
Repurchase Agreement | | 0.65 | |
| |
Liabilities in excess of other assets | | (0.83 | ) |
| |
Total net assets | | 100.00 | % |
| | | |
The accompanying notes are an integral part of the financial statements
44
| | |
| | Security Equity Fund |
| Performance Summary | | Select 25 Series |
| September 30, 2007 | | (unaudited) |
PERFORMANCE
Information About Your Series Expenses
Calculating your ongoing Series expenses
Example
As a shareholder of the Series, you incur two types of costs: (1) transaction costs, which may include sales charges (loads) on purchase payments; contingent deferred sales charges on redemptions; and redemption fees, if any; and (2) ongoing costs, including management fees; distribution and/or service fees (12b-1); and other Series expenses. This example is intended to help you understand your ongoing costs (in dollars) of investing in the Series and to compare these costs with ongoing costs of investing in other mutual funds. The example is based on an investment of $1,000 invested at the beginning of the period and held for the entire period, April 1, 2007 – September 30, 2007.
Actual Expenses
The first line for each class of shares in the table provides information about actual account values and actual expenses. You may use the information in this table, together with the amount you invested, to estimate the expenses that you paid over the period. Simply divide your account value by $1,000 (for example, an $8,600 account value divided by $1,000 = 8.6), then multiply the result by the number in the table under the heading entitled “Expenses Paid During Period” to estimate the expenses you paid on your account during this period.
Hypothetical Example for Comparison Purposes
The second line for each class of shares in the table provides information about hypothetical account values and hypothetical expenses based on the Series actual expense ratio and an assumed rate of return of 5% per year before expenses, which is not the Series actual return. The hypothetical account values and expenses may not be used to estimate the actual ending account balance or expenses you paid for the period. You may use this information to compare the ongoing costs of investing in the Series and other funds. To do so, compare this 5% hypothetical example with the 5% hypothetical examples that appear in the shareholder reports of the other mutual funds.
Please note that the expenses shown in the table are meant to highlight your ongoing costs only and do not reflect any transactional costs, such as sales charges (loads) on purchase payments, contingent deferred sales charges on redemptions, and redemption fees, if any. Therefore, the second line for each class of shares is useful in comparing ongoing costs only, and will not help you determine the relative total costs of owning different funds. In addition, if these transactional costs were included, your costs would have been higher.
Series Expenses
| | | | | | | | | |
| | | Beginning
Account Value
04-01-07 | | Ending
Account Value
09-30-071 | | Expenses
Paid During
Period2 |
Select 25 | | | | | | | | | |
Series - Class A | | | | | | | | | |
Actual | | $ | 1,000.00 | | $ | 1,059.60 | | $ | 6.40 |
Hypothetical | | | 1,000.00 | | | 1,018.75 | | | 6.28 |
| | | |
Select 25 | | | | | | | | | |
Series - Class B | | | | | | | | | |
Actual | | | 1,000.00 | | | 1,055.90 | | | 10.05 |
Hypothetical | | | 1,000.00 | | | 1,015.21 | | | 9.85 |
| | | |
Select 25 | | | | | | | | | |
Series - Class C | | | | | | | | | |
Actual | | | 1,000.00 | | | 1,055.70 | | | 10.15 |
Hypothetical | | | 1,000.00 | | | 1,015.11 | | | 9.95 |
1 | The actual ending account value is based on the actual total return of the Series for the period from April 1, 2007 to September 30, 2007 after actual expenses and will differ from the hypothetical ending account value which is based on the Series expense ratio and a hypothetical annual return of 5% before expenses. The actual cumulative return at net asset value for the period from April 1, 2007 to September 30, 2007 was 5.96%, 5.59% and 5.57%, for Class A, B and C shares, respectively. |
2 | Expenses are equal to the Series annualized expense ratio (1.24%, 1.95% and 1.97% for Class A, B and C shares, respectively), net of expense reimbursements and earnings credits, multiplied by the average account value over the period, multiplied by 183/365 (to reflect the one-half year period). |
45
| | |
| Schedule of Investments | | Security Equity Fund – Select 25 Series |
| September 30, 2007 | | |
| | | | | | | |
| | | Shares | | Value | |
COMMON STOCK - 95.4% | | | | | | | |
Air Freight & Logistics - 5.0% | | | | | | | |
FedEx Corporation | | | 24,943 | | $ | 2,612,779 | |
| | | | | | | |
Broadcasting & Cable TV - 1.5% | | | | | | | |
CBS Corporation (CI.B) | | | 25,626 | | | 807,219 | |
| | | | | | | |
Coal & Consumable Fuels - 1.7% | | | | | | | |
Evergreen Energy, Inc. * | | | 172,100 | | | 877,710 | |
| | | | | | | |
Communications Equipment - 8.0% | | | | | | | |
ADC Telecommunications, Inc. * | | | 110,374 | | | 2,164,434 | |
Cisco Systems, Inc. * | | | 61,000 | | | 2,019,710 | |
| | | | | | | |
| | | | | | 4,184,144 | |
| | | | | | | |
Consumer Finance - 11.4% | | | | | | | |
American Express Company | | | 22,500 | | | 1,335,825 | |
Capital One Financial Corporation | | | 28,600 | | | 1,899,898 | |
First Marblehead Corporation | | | 72,613 | | | 2,754,211 | |
| | | | | | | |
| | | | | | 5,989,934 | |
| | | | | | | |
Data Processing & Outsourced Services - 3.2% | | | | | | | |
Western Union Company | | | 80,800 | | | 1,694,376 | |
| | | | | | | |
Exchange Traded Funds - 8.0% | | | | | | | |
iShares Russell 1000 Growth Index Fund | | | 33,886 | | | 2,088,055 | |
iShares S&P 500 Growth Index Fund | | | 29,500 | | | 2,093,615 | |
| | | | | | | |
| | | | | | 4,181,670 | |
| | | | | | | |
Home Improvement Retail - 5.0% | | | | | | | |
Home Depot, Inc. | | | 80,372 | | | 2,607,268 | |
| | | | | | | |
Hotels, Resorts & Cruise Lines - 2.8% | | | | | | | |
Carnival Corporation | | | 30,333 | | | 1,469,027 | |
| | | | | | | |
Hypermarkets & Super Centers - 4.3% | | | | | | | |
Wal-Mart Stores, Inc. | | | 51,296 | | | 2,239,070 | |
| | | | | | | |
Industrial Gases - 1.4% | | | | | | | |
Praxair, Inc. | | | 9,101 | | | 762,300 | |
| | | | | | | |
Life Sciences Tools & Services - 6.5% | | | | | | | |
Covance, Inc. * | | | 43,592 | | | 3,395,817 | |
| | | | | | | |
Movies & Entertainment - 1.0% | | | | | | | |
Viacom, Inc. (CI.B) * | | | 13,953 | | | 543,748 | |
| | | | | | | |
Multi-Line Insurance - 6.5% | | | | | | | |
American International Group, Inc. | | | 50,634 | | | 3,425,390 | |
| | | | | | | |
Oil &Gas Equipment & Services - 4.3% | | | | | | | |
Baker Hughes, Inc. | | | 4,200 | | | 379,554 | |
BJ Services Company | | | 70,477 | | | 1,871,164 | |
| | | | | | | |
| | | | | | 2,250,718 | |
| | | | | | | |
Oil & Gas Storage & Transportation - 4.4% | | | | | | | |
Williams Companies, Inc. | | | 67,459 | | | 2,297,654 | |
| | | | | | | |
Other Diversified Financial | | | | | | | |
Services - 3.1% | | | | | | | |
Citigroup, Inc. | | | 35,323 | | | 1,648,525 | |
| | | | | | | |
Pharmaceuticals - 5.3% | | | | | | | |
Johnson & Johnson | | | 42,617 | | | 2,799,937 | |
| | | | | | | |
Soft Drinks - 2.5% | | | | | | | |
PepsiCo, Inc. | | | 18,095 | | | 1,325,640 | |
| | | | | | | |
Systems Software - 2.8% | | | | | | | |
Microsoft Corporation | | | 49,100 | | | 1,446,486 | |
| | | | | | | |
Trading Companies & Distributors - 6.7% | | | | | | | |
W.W. Grainger, Inc. | | | 38,653 | | | 3,524,767 | |
| | | | | | | |
TOTAL COMMON STOCK (Cost $45,279,743) | | | | | $ | 50,084,179 | |
| | | | | | | |
| | |
| | | Principal Amount | | Value | |
COMMERCIAL PAPER - 4.8% | | | | | | | |
Banking - 2.3% | | | | | | | |
UBS Finance (DE) LLC | | | | | | | |
4.65%, 10/2/2007 | | | 1,200,000 | | | 1,199,845 | |
| | | | | | | |
Financial Companies - Captive - 2.5% | | | | | | | |
General Electric Capital Corporation | | | | | | | |
4.65%, 10/4/2007 | | | 1,300,000 | | | 1,299,496 | |
| | | | | | | |
TOTAL COMMERCIAL PAPER (Cost $2,499,341) | | | | | $ | 2,499,341 | |
| | | | | | | |
REPURCHASE AGREEMENT - 0.6% | | | | | | | |
United Missouri Bank, 4.53%, dated 9/28/07, matures 10/01/07; repurchase amount $341,129 (Collateralized by U.S. Treasury Note, 3.625%, 1/15/10 with a value of $347,928) | | $ | 341,000 | | $ | 341,000 | |
| | | | | | | |
TOTAL REPURCHASE AGREEMENT (Cost $341,000) | | | | | $ | 341,000 | |
| | | | | | | |
Total Investments (Security Equity Fund - Select 25 Series) | | | | | $ | 52,924,520 | |
(Cost $48,120,084) - 100.8% | | | | | | | |
Liabilities in Excess of Other Assets - (0.8)% | | | | | | (437,366 | ) |
| | | | | | | |
TOTAL NET ASSETS - 100.0% | | | | | $ | 52,487,154 | |
| | | | | | | |
Footnotes
Percentages are stated as a percent of net assets.
For federal income tax purposes the identified cost of investments owned at 9/30/2007 was $48,214,609.
| | |
| * | | - Non-income producing security |
See notes to financial statements.
The accompanying notes are an integral part of the financial statements
46
Security Equity Fund
Select 25 Series
Statement of Assets and Liabilities
September 30, 2007
| | | | |
Assets: | | | | |
Investments, at value* | | $ | 52,924,520 | |
Cash | | | 555 | |
Receivables: | | | | |
Fund shares sold | | | 17,759 | |
Dividends | | | 22,717 | |
Security Investors | | | 7,610 | |
Prepaid expenses | | | 14,005 | |
| | | | |
Total assets | | | 52,987,166 | |
| | | | |
Liabilities: | | | | |
Payable for: | | | | |
Securities purchased | | | 383,761 | |
Fund shares redeemed | | | 30,239 | |
Management fees | | | 31,799 | |
Custodian fees | | | 907 | |
Transfer agent/maintenance fees | | | 10,244 | |
Administration fees | | | 4,073 | |
Professional fees | | | 10,465 | |
12b-1 distribution plan fees | | | 24,057 | |
Directors’ fees | | | 953 | |
Other | | | 3,514 | |
| | | | |
Total liabilities | | | 500,012 | |
| | | | |
Net assets | | $ | 52,487,154 | |
| | | | |
Net assets consist of: | | | | |
Paid in capital | | $ | 52,177,313 | |
Accumulated net realized loss on sale of investments | | | (4,494,595 | ) |
Net unrealized appreciation in value of investments | | | 4,804,436 | |
| | | | |
Net assets | | $ | 52,487,154 | |
| | | | |
Class A: | | | | |
Capital shares outstanding (unlimited number of shares authorized) | | | 2,849,221 | |
Net assets | | $ | 30,374,657 | |
Net asset value and redemption price per share | | $ | 10.66 | |
| | | | |
Maximum offering price per share (net asset value divided by 94.25%) | | $ | 11.31 | |
| | | | |
Class B: | | | | |
Capital shares outstanding (unlimited number of shares authorized) | | | 1,085,436 | |
Net assets | | $ | 10,867,748 | |
Net asset value, offering and redemption price per share (excluding any applicable contingent deferred sales charge) | | $ | 10.01 | |
| | | | |
Class C: | | | | |
Capital shares outstanding (unlimited number of shares authorized) | | | 1,119,527 | |
Net assets | | $ | 11,244,749 | |
Net asset value, offering and redemption price per share (excluding any applicable contingent deferred sales charge) | | $ | 10.04 | |
| | | | |
* Investments, at cost | | $ | 48,120,084 | |
Statement of Operations
For the Year Ended September 30, 2007
| | | | |
Investment Income: | | | | |
Dividends | | $ | 627,618 | |
Interest | | | 101,442 | |
| | | | |
Total investment income | | | 729,060 | |
| | | | |
Expenses: | | | | |
Management fees | | | 424,975 | |
Transfer agent/maintenance fees | | | 203,281 | |
Administration fees | | | 54,158 | |
Custodian fees | | | 5,100 | |
Directors’ fees | | | 3,585 | |
Professional fees | | | 18,202 | |
Registration fees | | | 35,295 | |
Other expenses | | | 4,445 | |
12b-1 distribution fees - Class A | | | 76,418 | |
12b-1 distribution fees - Class B | | | 139,305 | |
12b-1 distribution fees - Class C | | | 121,659 | |
| | | | |
Total expenses | | | 1,086,423 | |
Less: | | | | |
Reimbursement of expenses - Class A | | | (54,228 | ) |
Reimbursement of expenses - Class B | | | (23,676 | ) |
Reimbursement of expenses - Class C | | | (21,587 | ) |
Earnings credits applied | | | (2 | ) |
| | | | |
Net expenses | | | 986,930 | |
| | | | |
Net investment loss | | | (257,870 | ) |
| | | | |
Net Realized and Unrealized Gain (Loss): | | | | |
Net realized gain (loss) during the year on: | | | | |
Investments | | | 7,775,711 | |
Options written | | | 77,651 | |
| | | | |
Net realized gain | | | 7,853,362 | |
| | | | |
Net unrealized appreciation (depreciation) during the year on: | | | | |
Investments | | | (3,272,865 | ) |
Options written | | | 28,626 | |
| | | | |
Net unrealized depreciation | | | (3,244,239 | ) |
| | | | |
Net realized and unrealized gain | | | 4,609,123 | |
| | | | |
Net increase in net assets resulting from operations | | | $4,351,253 | |
| | | | |
The accompanying notes are an integral part of the financial statements
47
| | |
| | Security Equity Fund |
| Statement of Changes in Net Assets | | Select 25 Series |
| | | | | | | | |
| | | Year Ended
September 30, 2007 | | | Year Ended
September 30, 2006 | |
Increase (decrease) in net assets from operations: | | | | | | | | |
Net investment loss | | $ | (257,870 | ) | | $ | (376,395 | ) |
Net realized gain during the year on investments | | | 7,853,362 | | | | 1,021,606 | |
Net unrealized appreciation (depreciation) during the year on investments | | | (3,244,239 | ) | | | 3,322,165 | |
| | | | | | | | |
Net increase in net assets resulting from operations | | | 4,351,253 | | | | 3,967,376 | |
| | | | | | | | |
Capital share transactions: | | | | | | | | |
Proceeds from sale of shares | | | | | | | | |
Class A | | | 10,493,477 | | | | 7,864,377 | |
Class B | | | 1,517,578 | | | | 4,340,849 | |
Class C | | | 1,462,460 | | | | 2,041,112 | |
Issuance of shares in connection with the acquisition of Enhanced Index Series, Large Cap Growth Series & Social Awareness Series (Note 11) | | | | | | | | |
Class A | | | — | | | | 15,062,441 | |
Class B | | | — | | | | 9,166,885 | |
Class C | | | — | | | | 8,374,157 | |
Cost of shares redeemed | | | | | | | | |
Class A | | | (12,657,596 | ) | | | (6,429,656 | ) |
Class B | | | (7,738,929 | ) | | | (4,179,088 | ) |
Class C | | | (3,869,582 | ) | | | (2,220,890 | ) |
| | | | | | | | |
Net increase (decrease) from capital share transactions | | | (10,792,592 | ) | | | 34,020,187 | |
| | | | | | | | |
Net increase (decrease) in net assets | | | (6,441,339 | ) | | | 37,987,563 | |
| | | | | | | | |
Net assets: | | | | | | | | |
Beginning of year | | | 58,928,493 | | | | 20,940,930 | |
| | | | | | | | |
End of year | | $ | 52,487,154 | | | $ | 58,928,493 | |
| | | | | | | | |
Accumulated net investment income at end of year | | $ | — | | | $ | — | |
| | | | | | | | |
Capital share activity: | | | | | | | | |
Shares sold | | | | | | | | |
Class A | | | 1,014,621 | | | | 806,448 | |
Class B | | | 155,252 | | | | 468,049 | |
Class C | | | 148,937 | | | | 220,684 | |
Issuance of shares in connection with the acquisition of Enhanced Index Series, Large Cap Growth Series & Social Awareness Series (Note 11) | | | | | | | | |
Class A | | | — | | | | 1,968,338 | |
Class B | | | — | | | | 929,480 | |
Class C | | | — | | | | 826,684 | |
Shares redeemed | | | | | | | | |
Class A | | | (1,216,006 | ) | | | (676,660 | ) |
Class B | | | (792,758 | ) | | | (459,639 | ) |
Class C | | | (394,683 | ) | | | (244,326 | ) |
The accompanying notes are an integral part of the financial statements
48
| | |
| Financial Highlights | | Security Equity Fund |
Selected data for each share of capital stock outstanding throughout each year | | Select 25 Series |
| | | | | | | | | | | | | | | | | | | | |
Class A | | 2007 | | | 2006a | | | 2005 | | | 2004 | | | Year Ended
September 30,
2003 | |
Per Share Data | | | | | | | | | | | | | | | | | | | | |
Net asset value, beginning of period | | $ | 9.86 | | | $ | 9.36 | | | $ | 7.81 | | | $ | 7.27 | | | $ | 6.52 | |
| | | | | | | | | | | | | | | | | | | | |
Income (loss) from investment operations: | | | | | | | | | | | | | | | | | | | | |
Net investment lossb | | | (0.01 | ) | | | (0.06 | ) | | | (0.07 | ) | | | (0.06 | ) | | | (0.05 | ) |
Net gain on securities (realized and unrealized) | | | 0.81 | | | | 0.56 | | | | 1.62 | | | | 0.60 | | | | 0.80 | |
| | | | | | | | | | | | | | | | | | | | |
Total from investment operations | | | 0.80 | | | | 0.50 | | | | 1.55 | | | | 0.54 | | | | 0.75 | |
| | | | | | | | | | | | | | | | | | | | |
Net asset value, end of period | | $ | 10.66 | | | $ | 9.86 | | | $ | 9.36 | | | $ | 7.81 | | | $ | 7.27 | |
| | | | | | | | | | | | | | | | | | | | |
Total Returnc | | | 8.11 | % | | | 5.34 | % | | | 19.85 | % | | | 7.43 | % | | | 11.50 | % |
| | | | | | | | | | | | | | | | | | | | |
Ratios/Supplemental Data | | | | | | | | | | | | | | | | | | | | |
Net assets, end of period (in thousands) | | $ | 30,375 | | | $ | 30,078 | | | $ | 8,912 | | | $ | 9,228 | | | $ | 10,396 | |
| | | | | | | | | | | | | | | | | | | | |
Ratios to average net assets: | | | | | | | | | | | | | | | | | | | | |
Net investment loss | | | (0.10 | )% | | | (0.68 | )% | | | (0.79 | )% | | | (0.75 | )% | | | (0.70 | )% |
Total expensesd | | | 1.57 | % | | | 1.76 | % | | | 1.67 | % | | | 1.56 | % | | | 1.63 | % |
Net expensese | | | 1.40 | % | | | 1.76 | % | | | 1.67 | % | | | 1.56 | % | | | 1.63 | % |
Net expenses prior to custodian earning credits and net of expense waivers | | | 1.40 | % | | | 1.76 | % | | | 1.67 | % | | | 1.56 | % | | | 1.63 | % |
| | | | | | | | | | | | | | | | | | | | |
Portfolio turnover rate | | | 21 | % | | | 39 | % | | | 13 | % | | | 44 | % | | | 54 | % |
| | | | | |
Class B | | 2007 | | | 2006a | | | 2005 | | | 2004 | | | Year Ended
September 30,
2003 | |
Per Share Data | | | | | | | | | | | | | | | | | | | | |
Net asset value, beginning of period | | $ | 9.33 | | | $ | 8.92 | | | $ | 7.50 | | | $ | 7.04 | | | $ | 6.36 | |
| | | | | | | | | | | | | | | | | | | | |
Income (loss) from investment operations: | | | | | | | | | | | | | | | | | | | | |
Net investment lossb | | | (0.09 | ) | | | (0.13 | ) | | | (0.13 | ) | | | (0.11 | ) | | | (0.10 | ) |
Net gain on securities (realized and unrealized) | | | 0.77 | | | | 0.54 | | | | 1.55 | | | | 0.57 | | | | 0.78 | |
| | | | | | | | | | | | | | | | | | | | |
Total from investment operations | | | 0.68 | | | | 0.41 | | | | 1.42 | | | | 0.46 | | | | 0.68 | |
| | | | | | | | | | | | | | | | | | | | |
Net asset value, end of period | | $ | 10.01 | | | $ | 9.33 | | | $ | 8.92 | | | $ | 7.50 | | | $ | 7.04 | |
| | | | | | | | | | | | | | | | | | | | |
Total Returnc | | | 7.29 | % | | | 4.60 | % | | | 18.93 | % | | | 6.53 | % | | | 10.69 | % |
| | | | | | | | | | | | | | | | | | | | |
Ratios/Supplemental Data | | | | | | | | | | | | | | | | | | | | |
Net assets, end of period (in thousands) | | $ | 10,868 | | | $ | 16,073 | | | $ | 7,000 | | | $ | 7,333 | | | $ | 8,203 | |
| | | | | | | | | | | | | | | | | | | | |
Ratios to average net assets: | | | | | | | | | | | | | | | | | | | | |
Net investment loss | | | (0.88 | )% | | | (1.46 | )% | | | (1.54 | )% | | | (1.50 | )% | | | (1.45 | )% |
Total expensesd | | | 2.32 | % | | | 2.53 | % | | | 2.42 | % | | | 2.31 | % | | | 2.38 | % |
Net expensese | | | 2.15 | % | | | 2.53 | % | | | 2.42 | % | | | 2.31 | % | | | 2.38 | % |
Net expenses prior to custodian earning credits and net of expense waivers | | | 2.15 | % | | | 2.53 | % | | | 2.42 | % | | | 2.31 | % | | | 2.38 | % |
| | | | | | | | | | | | | | | | | | | | |
Portfolio turnover rate | | | 21 | % | | | 39 | % | | | 13 | % | | | 44 | % | | | 54 | % |
The accompanying notes are an integral part of the financial statements
49
| | |
| Financial Highlights | | Security Equity Fund |
| Selected data for each share of capital stock outstanding throughout each year | | Select 25 Series |
| | | | | | | | | | | | | | | | | | | | |
Class C | | 2007 | | | 2006a | | | 2005 | | | 2004 | | | Year Ended
September 30,
2003 | |
Per Share Data | | | | | | | | | | | | | | | | | | | | |
Net asset value, beginning of period | | $ | 9.36 | | | $ | 8.94 | | | $ | 7.52 | | | $ | 7.06 | | | $ | 6.38 | |
| | | | | | | | | | | | | | | | | | | | |
Income (loss) from investment operations: | | | | | | | | | | | | | | | | | | | | |
Net investment lossb | | | (0.08 | ) | | | (0.13 | ) | | | (0.13 | ) | | | (0.11 | ) | | | (0.10 | ) |
Net gain on securities (realized and unrealized) | | | 0.76 | | | | 0.55 | | | | 1.55 | | | | 0.57 | | | | 0.78 | |
| | | | | | | | | | | | | | | | | | | | |
Total from investment operations | | | 0.68 | | | | 0.42 | | | | 1.42 | | | | 0.46 | | | | 0.68 | |
| | | | | | | | | | | | | | | | | | | | |
Net asset value, end of period | | $ | 10.04 | | | $ | 9.36 | | | $ | 8.94 | | | $ | 7.52 | | | $ | 7.06 | |
| | | | | | | | | | | | | | | | | | | | |
Total Returnc | | | 7.26 | % | | | 4.70 | % | | | 18.88 | % | | | 6.52 | % | | | 10.66 | % |
| | | | | | | | | | | | | | | | | | | | |
Ratios/Supplemental Data | | | | | | | | | | | | | | | | | | | | |
Net assets, end of period (in thousands) | | $ | 11,245 | | | $ | 12,777 | | | $ | 5,029 | | | $ | 5,866 | | | $ | 6,225 | |
| | | | | | | | | | | | | | | | | | | | |
Ratios to average net assets: | | | | | | | | | | | | | | | | | | | | |
Net investment loss | | | (0.86 | )% | | | (1.44 | )% | | | (1.54 | )% | | | (1.50 | )% | | | (1.44 | )% |
Total expensesd | | | 2.32 | % | | | 2.52 | % | | | 2.42 | % | | | 2.31 | % | | | 2.37 | % |
Net expensese | | | 2.15 | % | | | 2.52 | % | | | 2.42 | % | | | 2.31 | % | | | 2.37 | % |
Net expenses prior to custodian earning credits and net of expense waivers | | | 2.15 | % | | | 2.52 | % | | | 2.42 | % | | | 2.31 | % | | | 2.37 | % |
| | | | | | | | | | | | | | | | | | | | |
Portfolio turnover rate | | | 21 | % | | | 39 | % | | | 13 | % | | | 44 | % | | | 54 | % |
a | The financial highlights for the Select 25 Series exclude the historical financial highlights of the Enhanced Index Series, Class A, B and C shares, the Large Cap Growth Series, Class A, B and C shares and the Social Awareness Series, Class A, B and C shares. A total of $29,412,366 was excluded from purchases in the portfolio turnover calculation. This was the cost of the securities Select 25 received as a result of the merger. The assets of the Enhanced Index, Large Cap Growth and Social Awareness Series’ were acquired by the Select 25 Series on June 16, 2006. |
b | Net investment income (loss) was computed using average shares outstanding throughout the period. |
c | Total return information does not reflect deduction of any sales charges imposed at the time of purchase for Class A shares or upon redemption for Class B and C shares. |
d | Total expense information reflects expense ratios absent expense reductions by the Investment Manager and custodian earnings credits, as applicable. |
e | Net expense information reflects the expense ratios after voluntary expense waivers, reimbursements and custodian earnings credits, as applicable. |
The accompanying notes are an integral part of the financial statements
50
| | |
| | | Security Equity Fund |
| Manager’s Commentary | | Small Cap Growth Series |
| November 15, 2007 | | (unaudited) |
| | | | |
 | |  | |  |
Bill Wolfenden Co-Portfolio Manager | | Scott Tracy Co-Portfolio Manager | | Subadviser, RS Investments |
To Our Shareholders:
The Security Equity Fund Small Cap Growth Series gained 18.55% for the fiscal year ended September 30, 2007, versus the Russell 2000 Growth Index, which returned 18.94% for the period.
The Series performed roughly in line with the benchmark in a time of significant market volatility. We took advantage of the market swings by selectively adding to positions and initiating investments in several attractive new opportunities. Our positions in producer durables, energy, and technology contributed to the portfolio’s relative outperformance, while our exposure to the consumer and health care sectors detracted from relative performance.
Solid stock picking across the producer durables sector contributed to the Series’ outperformance. We benefited from strong returns in the aerospace industry, with long-time favorite Heico Corporation contributing a 44% return for the year. Heico is a leading low-cost aerospace parts supplier that is benefiting from increased outsourcing trends as well as cost-cutting initiatives by commercial airlines. The products that Heico manufactures are replacement parts that are consumed as a result of global air traffic (as compared with the building of new aircraft). We continue to remain excited about Heico’s prospects and the resiliency of its business model. We believe that the company is well insulated from any global industry headwinds that may arise in the future.
Energy was another strong sector for the Series over the year as our stock picks outpaced the benchmark handily. Core Laboratories N.V., a provider of oil-field reservoir management services, is benefiting from strong cash flow from its customer base. The company is also experiencing an increased demand for more efficient and cost-effective ways to extract product from oil and gas reservoirs. Core Labs continues to be a significant position in the portfolio. At current valuations, we believe the growth prospects continue to be intriguing.
The consumer discretionary sector contributed strong relative performance for the portfolio over the first nine months of the fiscal year. However, these gains were overcome by poor performance in the latest quarter. NutriSystem, Inc., a big winner in the previous quarter, gave back all of its gains during the last three months as third calendar quarter 2007 enrollments disappointed investors. However, we are encouraged by the company’s solid fundamentals and believe that the long-term prospects remain favorable for NutriSystem.
Early in the year we decided to avoid interest rate and credit sensitive stocks which helped performance but the recent perfect storm of a credit crunch and a seizure of activity in the commercial paper markets overflowed into some of our adjacent financial holdings. Security Capital Assurance, Ltd., which is a financial guarantor, was dragged down by the credit turmoil due to its exposure to subprime bonds. While it did not write any business in the troubled 2006 vintage, the stock declined during the period. Other than this one casualty, we suffered more from the malaise in the financial sector due to the credit crisis than any fundamental shortfalls. We took advantage of some price dislocations to add to some of our core holdings.
With the backdrop of a slowing U.S. economy due to a recession in the housing market, we are cautiously optimistic about the remainder of calendar year 2007. We expect the consumer to pull back on spending in a moderate way without disrupting the multi-year economic expansion. Simply put, we are not in the recession camp and therefore have positioned the portfolio (as we have for years) for a moderately growing domestic economy that can benefit from conservative growth and withstand potential economic shocks.
The shocks we saw in recent months stemming from credit market turmoil and the portfolio’s resiliency gave us more confidence in our investment process and asset class. We think that a slowing growth environment favors small-cap growth stocks that can sustain high-profit growth rates. Our biggest holdings have business models that are either impervious to economic cycles or have fast-growing market niches that are well insulated against economic disruptions. As fellow investors in the strategy, we are ever mindful of the importance of taking a three-to five-year investment horizon and we hope to continue to earn your trust in the coming years.
Sincerely,
Bill Wolfenden, Co-Portfolio Manager
D. Scott Tracy, Co-Portfolio Manager
1 | Performance figures are based on Class A shares and do not reflect deduction of the sales charges or taxes that a shareholder would pay on distributions or the redemption of shares. |
51
| | |
| | | Security Equity Fund |
| Performance Summary | | Small Cap Growth Series |
| September 30, 2007 | | (unaudited) |
PERFORMANCE
Security Small Cap Growth Series vs. Russell 2000 Growth Index
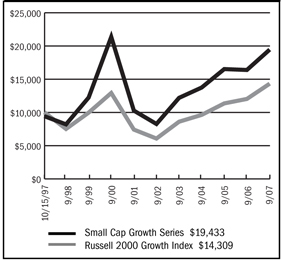
$10,000 Since Inception
This chart assumes a $10,000 investment in Class A shares of Small Cap Growth Series on October 15, 1997 (date of inception), reflects deduction of the 5.75% sales load and assumes all dividends reinvested. The chart does not reflect the deduction of taxes that a shareholder would pay on distributions or the redemption of fund shares. The Russell 2000 Growth Index measures the performance of those Russell 2000 companies with higher price-to-book ratios and higher forecasted growth values.
Average Annual Returns
| | | | | | | | |
Periods Ended 9-30-07 | | 1 Year | | | 5 Years | | | Since Inception |
A Shares | | 18.55 | % | | 18.65 | % | | 7.54% (10-15-97) |
| | | |
A Shares with sales charge | | 11.76 | % | | 17.26 | % | | 6.90% (10-15-97) |
| | | |
B Shares | | 17.66 | % | | 17.76 | % | | 6.74% (10-15-97) |
| | | |
B Shares with CDSC | | 12.66 | % | | 17.56 | % | | 6.74% (10-15-97) |
| | | |
C Shares | | 17.69 | % | | 17.76 | % | | 6.45% (1-29-99) |
| | | |
C Shares with CDSC | | 16.69 | % | | 17.76 | % | | 6.45% (1-29-99) |
The performance data above represents past performance that is not predictive of future results. The investment return and principal value of an investment in the Series will fluctuate so that an investor’s shares, when redeemed, may be worth more or less than their original cost. The figures above do not reflect deduction of the maximum front-end sales charge of 5.75% for Class A shares or the contingent deferred sales charge of 5% for Class B shares and 1% for Class C shares, as applicable, except where noted. The figures do not reflect the deduction of taxes that a shareholder would pay on distributions or redemption of shares. Such figures would be lower if the maximum sales charge and any applicable taxes were deducted. Fee waivers reduced expenses of the Series and in the absence of such waiver, the performance quoted would be reduced.
Portfolio Composition by Sector as of 9-30-07
| | | |
Consumer Discretionary | | 17.21 | % |
| |
Consumer Staples | | 1.70 | |
| |
Energy | | 5.61 | |
| |
Financials | | 8.43 | |
| |
Health Care | | 18.35 | |
| |
Industrials | | 13.44 | |
| |
Information Technology | | 24.24 | |
| |
Materials | | 1.77 | |
| |
Telecommunication Services | | 1.70 | |
| |
Repurchase Agreement | | 7.18 | |
| |
Other assets in excess of liabilities | | 0.37 | |
| |
Total net assets | | 100.00 | % |
| | | |
The accompanying notes are an integral part of the financial statements
52
| | |
| | | Security Equity Fund |
| Performance Summary | | Small Cap Growth Series |
| September 30, 2007 | | (unaudited) |
PERFORMANCE
Information About Your Series Expenses
Calculating your ongoing Series expenses
Example
As a shareholder of the Series, you incur two types of costs: (1) transaction costs, which may include sales charges (loads) on purchase payments; contingent deferred sales charges on redemptions; and redemption fees, if any; and (2) ongoing costs, including management fees; distribution and/or service fees (12b-1); and other Series expenses. This example is intended to help you understand your ongoing costs (in dollars) of investing in the Series and to compare these costs with ongoing costs of investing in other mutual funds. The example is based on an investment of $1,000 invested at the beginning of the period and held for the entire period, April 1, 2007 – September 30, 2007.
Actual Expenses
The first line for each class of shares in the table provides information about actual account values and actual expenses. You may use the information in this table, together with the amount you invested, to estimate the expenses that you paid over the period. Simply divide your account value by $1,000 (for example, an $8,600 account value divided by $1,000 = 8.6), then multiply the result by the number in the table under the heading entitled “Expenses Paid During Period” to estimate the expenses you paid on your account during this period.
Hypothetical Example for Comparison Purposes
The second line for each class of shares in the table provides information about hypothetical account values and hypothetical expenses based on the Series actual expense ratio and an assumed rate of return of 5% per year before expenses, which is not the Series actual return. The hypothetical account values and expenses may not be used to estimate the actual ending account balance or expenses you paid for the period. You may use this information to compare the ongoing costs of investing in the Series and other funds. To do so, compare this 5% hypothetical example with the 5% hypothetical examples that appear in the shareholder reports of the other mutual funds.
Please note that the expenses shown in the table are meant to highlight your ongoing costs only and do not reflect any transactional costs, such as sales charges (loads) on purchase payments, contingent deferred sales charges on redemptions, and redemption fees, if any. Therefore, the second line for each class of shares is useful in comparing ongoing costs only, and will not help you determine the relative total costs of owning different funds. In addition, if these transactional costs were included, your costs would have been higher.
Series Expenses
| | | | | | | | | |
| | | Beginning
Account Value
04-01-07 | | Ending
Account Value
09-30-071 | | Expenses Paid
During
Period2 |
Small Cap Growth | | | | | | | | | |
Series - Class A | | | | | | | | | |
Actual | | $ | 1,000.00 | | $ | 1,091.90 | | $ | 9.39 |
Hypothetical | | | 1,000.00 | | | 1,016.01 | | | 9.05 |
| | | |
Small Cap Growth | | | | | | | | | |
Series - Class B | | | | | | | | | |
Actual | | | 1,000.00 | | | 1,087.40 | | | 13.24 |
Hypothetical | | | 1,000.00 | | | 1,012.32 | | | 12.76 |
| | | |
Small Cap Growth | | | | | | | | | |
Series - Class C | | | | | | | | | |
Actual | | | 1,000.00 | | | 1,087.10 | | | 13.24 |
Hypothetical | | | 1,000.00 | | | 1,012.32 | | | 12.76 |
1 | The actual ending account value is based on the actual total return of the Series for the period from April 1, 2007 to September 30, 2007 after actual expenses and will differ from the hypothetical ending account value which is based on the Series expense ratio and a hypothetical annual return of 5% before expenses. The actual cumulative return at net asset value for the period from April 1, 2007 to September 30, 2007 was 9.19%, 8.74% and 8.71%, for Class A, B and C shares, respectively. |
2 | Expenses are equal to the Series annualized expense ratio (1.79%, 2.53% and 2.53% for Class A, B and C shares, respectively), net of any applicable fee waivers or earnings credits, multiplied by the average account value over the period, multiplied by 183/365 (to reflect the one-half year period). |
53
| | |
| Schedule of Investments | | Security Equity Fund - Small Cap Growth Series |
| September 30, 2007 | | |
| | | | | |
| | | Shares | | Value |
COMMON STOCK - 92.4% | | | | | |
Aerospace & Defense - 5.8% | | | | | |
BE Aerospace, Inc. * | | 24,600 | | $ | 1,021,638 |
Ceradyne, Inc. * | | 5,761 | | | 436,338 |
Heico Corporation | | 16,550 | | | 816,908 |
Ladish Company, Inc. * | | 6,650 | | | 368,942 |
Orbital Sciences Corporation * | | 25,050 | | | 557,112 |
| | | | | |
| | | | | 3,200,938 |
| | | | | |
Airlines - 1.5% | | | | | |
Allegiant Travel Company * | | 26,940 | | | 816,821 |
| | | | | |
| | |
Apparel Retail - 1.8% | | | | | |
Jos A. Bank Clothiers, Inc. * | | 14,566 | | | 486,796 |
Tween Brands, Inc. * | | 14,980 | | | 491,943 |
| | | | | |
| | | | | 978,739 |
| | | | | |
Apparel, Accessories & Luxury | | | | | |
Goods - 1.5% | | | | | |
Volcom, Inc. * | | 19,490 | | | 828,715 |
| | | | | |
Application Software - 4.0% | | | | | |
Advent Software, Inc. * | | 12,720 | | | 597,458 |
Concur Technologies, Inc. * | | 13,580 | | | 428,042 |
Nuance Communications, Inc. * | | 37,520 | | | 724,511 |
PROS Holdings, Inc. * | | 40,340 | | | 486,904 |
| | | | | |
| | | | | 2,236,915 |
| | | | | |
Asset Management & Custody | | | | | |
Banks - 1.9% | | | | | |
Affiliated Managers Group, Inc. * | | 8,080 | | | 1,030,281 |
| | | | | |
Auto Parts & Equipment - 0.8% | | | | | |
Amerigon, Inc. * | | 25,000 | | | 432,750 |
| | | | | |
Broadcasting & Cable TV - 1.6% | | | | | |
DG FastChannel, Inc. * | | 36,950 | | | 871,281 |
| | | | | |
Casinos & Gaming - 3.0% | | | | | |
Century Casinos, Inc. * | | 56,940 | | | 347,049 |
Scientific Games Corporation * | | 34,780 | | | 1,307,728 |
| | | | | |
| | | | | 1,654,777 |
| | | | | |
Communications Equipment - 0.5% | | | | | |
Aruba Networks, Inc. * | | 14,800 | | | 296,000 |
| | | | | |
Computer Storage & Peripherals - 1.0% | | | | | |
Synaptics, Inc. * | | 11,520 | | | 550,195 |
| | | | | |
Construction & Engineering - 1.0% | | | | | |
Granite Construction, Inc. | | 10,250 | | | 543,455 |
| | | | | |
Education Services - 1.6% | | | | | |
DeVry, Inc. | | 23,700 | | | 877,137 |
| | | | | |
Environmental & Facilities | | | | | |
Services - 2.1% | | | | | |
Rollins, Inc. | | 21,160 | | | 564,761 |
Team, Inc. * | | 22,490 | | | 615,776 |
| | | | | |
| | | | | 1,180,537 |
| | | | | |
Footwear - 1.6% | | | | | |
Iconix Brand Group, Inc. * | | 37,350 | | | 888,556 |
| | | | | |
Health Care Equipment - 7.6% | | | | | |
Insulet Corporation * | | 3,900 | | | 84,825 |
Integra LifeSciences Holdings Corporation * | | 11,070 | | | 537,781 |
LeMaitre Vascular, Inc. * | | 93,190 | | | 702,653 |
Micrus Endovascular Corporation * | | 43,070 | | | 786,889 |
NuVasive, Inc. * | | 20,350 | | | 731,175 |
Resmed, Inc. * | | 12,800 | | | 548,736 |
Spectranetics Corporation * | | 59,400 | | | 800,712 |
| | | | | |
| | | | | 4,192,771 |
| | | | | |
Health Care Facilities - 0.8% | | | | | |
NovaMed, Inc. * | | 97,240 | | | 422,994 |
| | | | | |
Health Care Services - 3.9% | | | | | |
Healthways, Inc. * | | 16,210 | | | 874,854 |
HMS Holdings Corporation * | | 16,970 | | | 417,631 |
Pediatrix Medical Group, Inc. * | | 12,940 | | | 846,535 |
| | | | | |
| | | | | 2,139,020 |
| | | | | |
Health Care Supplies - 1.2% | | | | | |
PolyMedica Corporation | | 12,642 | | | 663,958 |
| | | | | |
Health Care Technology - 3.1% | | | | | |
Phase Forward, Inc. * | | 29,460 | | | 589,495 |
SXC Health Solutions Corporation * | | 25,950 | | | 415,719 |
Trizetto Group * | | 39,310 | | | 688,318 |
| | | | | |
| | | | | 1,693,532 |
| | | | | |
Home Entertainment Software - 2.3% | | | | | |
The9, Ltd. ADR * | | 20,470 | | | 706,010 |
THQ, Inc. * | | 23,390 | | | 584,282 |
| | | | | |
| | | | | 1,290,292 |
| | | | | |
Hotels, Resorts & Cruise Lines - 1.3% | | | | | |
Home Inns & Hotels Management, Inc. ADR * | | 20,410 | | | 710,268 |
| | | | | |
Human Resource & Employment | | | | | |
Services - 1.2% | | | | | |
Barrett Business Services, Inc. | | 26,920 | | | 641,504 |
| | | | | |
Industrial Machinery - 1.9% | | | | | |
Dynamic Materials Corporation | | 10,380 | | | 497,098 |
Flow International Corporation * | | 61,300 | | | 540,666 |
| | | | | |
| | | | | 1,037,764 |
| | | | | |
Insurance Brokers - 0.3% | | | | | |
eHealth, Inc. * | | 5,500 | | | 152,350 |
| | | | | |
Integrated Telecommunication | | | | | |
Services - 1.7% | | | | | |
Cbeyond, Inc. * | | 22,980 | | | 937,354 |
| | | | | |
The accompanying notes are an integral part of the financial statements
54
| | |
| Schedule of Investments | | Security Equity Fund - Small Cap Growth Series |
September 30, 2007 - continued | | |
| | | | | | |
| | | Shares | | Value |
COMMON STOCK (continued) | | | | | | |
Internet Retail - 1.9% | | | | | | |
NutriSystem, Inc. * | | | 22,470 | | $ | 1,053,618 |
| | | | | | |
Internet Software & Services - 12.6% | | | | | | |
Cybersource Corporation * | | | 91,360 | | | 1,067,998 |
DealerTrack Holdings, Inc. * | | | 14,330 | | | 600,141 |
Digital River, Inc. * | | | 15,460 | | | 691,835 |
Equinix, Inc. * | | | 9,085 | | | 805,749 |
j2 Global Communications, Inc. * | | | 33,030 | | | 1,081,072 |
LoopNet, Inc. * | | | 16,410 | | | 337,061 |
NaviSite, Inc. * | | | 74,630 | | | 655,998 |
Online Resources Corporation * | | | 49,510 | | | 625,806 |
Perficient, Inc. * | | | 20,590 | | | 450,303 |
Valueclick, Inc. * | | | 28,350 | | | 636,741 |
| | | | | | |
| | | | | | 6,952,704 |
| | | | | | |
Investment Banking & Brokerage - 2.5% | | | | | | |
Investment Technology Group, Inc.* | | | 19,440 | | | 835,531 |
optionsXpress Holdings, Inc. | | | 21,780 | | | 569,329 |
| | | | | | |
| | | | | | 1,404,860 |
| | | | | | |
Leisure Facilities - 1.2% | | | | | | |
Life Time Fitness, Inc. * | | | 11,270 | | | 691,302 |
| | | | | | |
Oil & Gas Equipment & Services - 5.6% | | | | | | |
Core Laboratories N.V. * | | | 7,320 | | | 932,495 |
Dril-Quip, Inc. * | | | 12,420 | | | 612,927 |
Oil States International, Inc. * | | | 18,400 | | | 888,720 |
Superior Energy Services, Inc. * | | | 18,750 | | | 664,500 |
| | | | | | |
| | | | | | 3,098,642 |
| | | | | | |
Packaged Foods & Meats - 0.9% | | | | | | |
SunOpta, Inc. * | | | 35,250 | | | 510,772 |
| | | | | | |
Personal Products - 0.8% | | | | | | |
Bare Escentuals, Inc. * | | | 17,040 | | | 423,785 |
| | | | | | |
Pharmaceuticals - 1.8% | | | | | | |
KV Pharmaceutical Company * | | | 35,530 | | | 1,016,158 |
| | | | | | |
Property & Casualty Insurance - 1.8% | | | | | | |
Amtrust Financial Services, Inc. | | | 38,130 | | | 578,432 |
Security Capital Assurance, Ltd. | | | 18,070 | | | 412,719 |
| | | | | | |
| | | | | | 991,151 |
| | | | | | |
Real Estate Management & | | | | | | |
Development - 0.8% | | | | | | |
FirstService Corporation * | | | 14,410 | | | 447,863 |
| | | | | | |
Semiconductors - 2.7% | | | | | | |
Atheros Communications, Inc. * | | | 19,190 | | | 575,124 |
02Micro International, Ltd. ADR * | | | 9,700 | | | 150,059 |
Silicon Motion Technology Corporation ADR * | | | 32,900 | | | 740,579 |
| | | | | | |
| | | | | | 1,465,762 |
| | | | | | |
Specialized Consumer Services - 0.9% | | | | | | |
Steiner Leisure, Ltd. * | | | 11,880 | | | 515,592 |
| | | | | | |
Specialized Finance - 1.1% | | | | | | |
Portfolio Recovery Associates, Inc. | | | 11,770 | | | 624,634 |
| | | | | | |
Steel - 1.8% | | | | | | |
AM Castle & Company | | | 16,790 | | | 547,354 |
Haynes International, Inc. * | | | 5,010 | | | 427,704 |
| | | | | | |
| | | | | | 975,058 |
| | | | | | |
Technology Distributors - 1.0% | | | | | | |
Mellanox Technologies, Ltd. * | | | 29,600 | | | 578,088 |
| | | | | | |
TOTAL COMMON STOCK (Cost $41,813,353) | | | | | $ | 51,018,893 |
| | | | | | |
| | |
| | | Principal
Amount | | Value |
REPURCHASE AGREEMENT - 7.2% | | | | | | |
United Missouri Bank, 4.53%, dated 9/28/07, matures 10/01/07; repurchase amount $3,966,497 (Collateralized by FHLB, 10/03/07 with a value of $4,044,374) | | $ | 3,965,000 | | $ | 3,965,000 |
| | | | | | |
TOTAL REPURCHASE AGREEMENT (Cost $3,965,000) | | | | | $ | 3,965,000 |
| | | | | | |
Total Investments (Security Equity Fund - Small Cap Growth Series) | | | | | $ | 54,983,893 |
(Cost $45,778,353) - 99.6% | | | | | | |
Other Assets in Excess of Liabilities - 0. 4% | | | | | | 201.980 |
| | | | | | |
TOTAL NET ASSETS - 100.0% | | | | | $ | 55,185,873 |
| | | | | | |
Footnotes
Percentages are stated as a percent of net assets.
For federal income tax purposes the identified cost of investments owned at 9/30/2007 was $46,017,679.
| | |
| * | | -Non-income producing security |
|
| Glossary: |
| |
| ADR | | -American Depositary Receipt |
See notes to financial statements.
The accompanying notes are an integral part of the financial statements
55
Security Equity Fund
Small Cap Growth Series
Statement of Assets and Liabilities
September 30, 2007
| | | |
Assets: | | | |
Investments, at value* | | $ | 54,983,893 |
Receivables: | | | |
Fund shares sold | | | 26,157 |
Securities sold | | | 678,887 |
Dividends | | | 1,957 |
Prepaid expenses | | | 19,299 |
| | | |
Total assets | | | 55,710,193 |
| | | |
Liabilities: | | | |
Cash overdraft | | | 7,055 |
Payable for: | | | |
Securities purchased | | | 422,829 |
Fund shares redeemed | | | 4,880 |
Management fees | | | 44,344 |
Custodian fees | | | 2,653 |
Transfer agent/maintenance fees | | | 7,882 |
Administration fees | | | 4,573 |
Professional fees | | | 10,300 |
12b-1 distribution plan fees | | | 16,954 |
Directors’ fees | | | 650 |
Other | | | 2,200 |
| | | |
Total liabilities | | | 524,320 |
| | | |
Net assets | | $ | 55,185,873 |
| | | |
Net assets consist of: | | | |
Paid in capital | | $ | 42,576,602 |
Undistributed net realized gain on sale of investments | | | 3,403,731 |
Net unrealized appreciation in value of investments | | | 9,205,540 |
| | | |
Net assets | | $ | 55,185,873 |
| | | |
Class A: | | | |
Capital shares outstanding (unlimited number of shares authorized) | | | 2,451,776 |
Net assets | | $ | 45,429,971 |
Net asset value and redemption price per share | | $ | 18.53 |
| | | |
Maximum offering price per share (net asset value divided by 94.25%) | | $ | 19.66 |
| | | |
Class B: | | | |
Capital shares outstanding (unlimited number of shares authorized) | | | 342,335 |
Net assets | | $ | 5,791,981 |
Net asset value, offering and redemption price per share (excluding any applicable contingent deferred sales charge) | | $ | 16.92 |
| | | |
Class C: | | | |
Capital shares outstanding (unlimited number of shares authorized) | | | 230,033 |
Net assets | | $ | 3,963,921 |
Net asset value, offering and redemption price per share (excluding any applicable contingent deferred sales charge) | | $ | 17.23 |
| | | |
* Investments, at cost | | $ | 45,778,353 |
Statement of Operations
For the Year Ended September 30, 2007
| | | | |
Investment Income: | | | | |
Dividends | | $ | 107,596 | |
Interest | | | 158,674 | |
| | | | |
Total investment income | | | 266,270 | |
| | | | |
Expenses: | | | | |
Management fees | | | 552,516 | |
Transfer agent/maintenance fees | | | 159,307 | |
Administration fees | | | 54,448 | |
Custodian fees | | | 25,727 | |
Directors’ fees | | | 3,198 | |
Professional fees | | | 18,140 | |
Reports to shareholders | | | 5,906 | |
Registration fees | | | 35,729 | |
Other expenses | | | 4,220 | |
12b-1 distribution fees - Class A | | | 113,733 | |
12b-1 distribution fees - Class B | | | 56,731 | |
12b-1 distribution fees - Class C | | | 40,850 | |
| | | | |
Total expenses | | | 1,070,505 | |
Less: | | | | |
Earnings credits applied | | | (2,380 | ) |
| | | | |
Net expenses | | | 1,068,125 | |
| | | | |
Net investment loss | | | (801,855 | ) |
| | | | |
Net Realized and Unrealized Gain (Loss): | | | | |
Net realized gain (loss) during the year on: | | | | |
Investments | | | 6,497,308 | |
| | | | |
Net realized gain | | | 6,497,308 | |
| | | | |
Net unrealized appreciation (depreciation) during the year on: | | | | |
Investments | | | 3,680,497 | |
| | | | |
Net unrealized appreciation | | | 3,680,497 | |
| | | | |
Net realized and unrealized gain | | | 10,177,805 | |
| | | | |
Net increase in net assets resulting from operations | | $ | 9,375,950 | |
| | | | |
The accompanying notes are an integral part of the financial statements
56
| | |
| | | Security Equity Fund |
| Statement of Changes in Net Assets | | Small Cap Growth Series |
| | | | | | | | |
| | | Year Ended
September 30, 2007 | | | Year Ended
September 30, 2006 | |
Increase (decrease) in net assets from operations: | | | | | | | | |
Net investment loss | | $ | (801,855 | ) | | $ | (722,692 | ) |
Net realized gain during the year on investments | | | 6,497,308 | | | | 1,764,643 | |
Net unrealized appreciation (depreciation) during the year on investments | | | 3,680,497 | | | | (1,130,941 | ) |
| | | | | | | | |
Net increase (decrease) in net assets resulting from operations | | | 9,375,950 | | | | (88,990 | ) |
| | | | | | | | |
Capital share transactions: | | | | | | | | |
Proceeds from sale of shares | | | | | | | | |
Class A | | | 12,762,020 | | | | 34,591,629 | |
Class B | | | 823,764 | | | | 2,145,297 | |
Class C | | | 685,312 | | | | 1,341,687 | |
Cost of shares redeemed | | | | | | | | |
Class A | | | (20,550,155 | ) | | | (11,879,893 | ) |
Class B | | | (1,886,074 | ) | | | (4,367,496 | ) |
Class C | | | (1,699,480 | ) | | | (1,407,378 | ) |
| | | | | | | | |
Net increase (decrease) from capital share transactions | | | (9,864,613 | ) | | | 20,423,846 | |
| | | | | | | | |
Net increase (decrease) in net assets | | | (488,663 | ) | | | 20,334,856 | |
| | | | | | | | |
Net assets: | | | | | | | | |
Beginning of year | | | 55,674,536 | | | | 35,339,680 | |
| | | | | | | | |
End of year | | $ | 55,185,873 | | | $ | 55,674,536 | |
| | | | | | | | |
Accumulated net investment income at end of year | | $ | — | | | $ | — | |
| | | | | | | | |
Capital share activity: | | | | | | | | |
Shares sold | | | | | | | | |
Class A | | | 750,895 | | | | 2,223,136 | |
Class B | | | 52,173 | | | | 141,177 | |
Class C | | | 43,122 | | | | 87,821 | |
Shares redeemed | | | | | | | | |
Class A | | | (1,207,342 | ) | | | (751,218 | ) |
Class B | | | (121,516 | ) | | | (296,698 | ) |
Class C | | | (107,023 | ) | | | (90,959 | ) |
The accompanying notes are an integral part of the financial statements
57
| | |
| Financial Highlights | | Security Equity Fund |
| Selected data for each share of capital stock outstanding throughout each year | | Small Cap Growth Series |
| | | | | | | | | | | | | | | | | | | | |
Class A | | 2007 | | | 2006 | | | 2005 | | | 2004 | | | Year Ended
September 30, 2003 | |
| | | | | |
Per Share Data | | | | | | | | | | | | | | | | | | | | |
Net asset value, beginning of period | | $ | 15.63 | | | $ | 15.76 | | | $ | 13.11 | | | $ | 11.63 | | | $ | 7.88 | |
| | | | | | | | | | | | | | | | | | | | |
Income (loss) from investment operations: | | | | | | | | | | | | | | | | | | | | |
Net investment lossa | | | (0.23 | ) | | | (0.23 | ) | | | (0.24 | ) | | | (0.25 | ) | | | (0.18 | ) |
Net gain on securities (realized and unrealized) | | | 3.13 | | | | 0.10 | | | | 2.89 | | | | 1.73 | | | | 3.93 | |
| | | | | | | | | | | | | | | | | | | | |
Total from investment operations | | | 2.90 | | | | (0.13 | ) | | | 2.65 | | | | 1.48 | | | | 3.75 | |
| | | | | | | | | | | | | | | | | | | | |
Net asset value, end of period | | $ | 18.53 | | | $ | 15.63 | | | $ | 15.76 | | | $ | 13.11 | | | $ | 11.63 | |
| | | | | | | | | | | | | | | | | | | | |
Total Returnb | | | 18.55 | % | | | (0.82 | )% | | | 20.21 | % | | | 12.73 | % | | | 47.59 | % |
| | | | | | | | | | | | | | | | | | | | |
Ratios/Supplemental Data | | | | | | | | | | | | | | | | | | | | |
Net assets, end of period (in thousands) | | $ | 45,430 | | | $ | 45,451 | | | $ | 22,637 | | | $ | 21,443 | | | $ | 14,406 | |
| | | | | | | | | | | | | | | | | | | | |
Ratios to average net assets: | | | | | | | | | | | | | | | | | | | | |
Net investment loss | | | (1.32 | )% | | | (1.46 | )% | | | (1.67 | )% | | | (1.95 | )% | | | (2.01 | )% |
Total expensesc | | | 1.80 | % | | | 2.01 | % | | | 2.10 | % | | | 2.09 | % | | | 2.51 | % |
Net expensesd | | | 1.80 | % | | | 2.01 | % | | | 2.10 | % | | | 2.09 | % | | | 2.25 | % |
Net expenses prior to custodian earning credits and net of expense waivers | | | 1.80 | % | | | 2.01 | % | | | 2.10 | % | | | 2.09 | % | | | 2.25 | % |
| | | | | | | | | | | | | | | | | | | | |
Portfolio turnover rate | | | 145 | % | | | 136 | % | | | 134 | % | | | 157 | % | | | 206 | % |
| | | | | |
Class B | | 2007 | | | 2006 | | | 2005 | | | 2004 | | | Year Ended September 30, 2003 | |
Per Share Data | | | | | | | | | | | | | | | | | | | | |
Net asset value, beginning of period | | $ | 14.38 | | | $ | 14.60 | | | $ | 12.24 | | | $ | 10.94 | | | $ | 7.47 | |
| | | | | | | | | | | | | | | | | | | | |
Income (loss) from investment operations: | | | | | | | | | | | | | | | | | | | | |
Net investment lossa | | | (0.33 | ) | | | (0.36 | ) | | | (0.33 | ) | | | (0.33 | ) | | | (0.24 | ) |
Net gain on securities (realized and unrealized) | | | 2.87 | | | | 0.14 | | | | 2.69 | | | | 1.63 | | | | 3.71 | |
| | | | | | | | | | | | | | | | | | | | |
Total from investment operations | | | 2.54 | | | | (0.22 | ) | | | 2.36 | | | | 1.30 | | | | 3.47 | |
| | | | | | | | | | | | | | | | | | | | |
Net asset value, end of period | | $ | 16.92 | | | $ | 14.38 | | | $ | 14.60 | | | $ | 12.24 | | | $ | 10.94 | |
| | | | | | | | | | | | | | | | | | | | |
Total Returnb | | | 17.66 | % | | | (1.51 | )% | | | 19.28 | % | | | 11.88 | % | | | 46.45 | % |
| | | | | | | | | | | | | | | | | | | | |
Ratios/Supplemental Data | | | | | | | | | | | | | | | | | | | | |
Net assets, end of period (in thousands) | | $ | 5,792 | | | $ | 5,919 | | | $ | 8,283 | | | $ | 9,218 | | | $ | 6,838 | |
| | | | | | | | | | | | | | | | | | | | |
Ratios to average net assets: | | | | | | | | | | | | | | | | | | | | |
Net investment loss | | | (2.07 | )% | | | (2.31 | )% | | | (2.41 | )% | | | (2.69 | )% | | | (2.76 | )% |
Total expensesc | | | 2.56 | % | | | 2.79 | % | | | 2.85 | % | | | 2.84 | % | | | 3.23 | % |
Net expensesd | | | 2.55 | % | | | 2.79 | % | | | 2.85 | % | | | 2.83 | % | | | 3.00 | % |
Net expenses prior to custodian earning credits and net of expense waivers | | | 2.56 | % | | | 2.79 | % | | | 2.85 | % | | | 2.84 | % | | | 3.00 | % |
| | | | | | | | | | | | | | | | | | | | |
Portfolio turnover rate | | | 145 | % | | | 136 | % | | | 134 | % | | | 157 | % | | | 206 | % |
The accompanying notes are integral part of the financial statements
58
| | |
| Financial Highlights | | Security Equity Fund |
Selected data for each share of capital stock outstanding throughout each year | | Small Cap Growth Series |
| | | | | | | | | | | | | | | | | | | | |
Class C | | 2007 | | | 2006 | | | 2005 | | | 2004 | | | Year Ended
September 30, 2003 | |
Per Share Data | | | | | | | | | | | | | | | | | | | | |
Net asset value, beginning of period | | $ | 14.64 | | | $ | 14.88 | | | $ | 12.47 | | | $ | 11.15 | | | $ | 7.61 | |
| | | | | | | | | | | | | | | | | | | | |
Income (loss) from investment operations: | | | | | | | | | | | | | | | | | | | | |
Net investment lossa | | | (0.33 | ) | | | (0.35 | ) | | | (0.33 | ) | | | (0.33 | ) | | | (0.24 | ) |
Net gain on securities (realized and unrealized) | | | 2.92 | | | | 0.11 | | | | 2.74 | | | | 1.65 | | | | 3.78 | |
| | | | | | | | | | | | | | | | | | | | |
Total from investment operations | | | 2.59 | | | | (0.24 | ) | | | 2.41 | | | | 1.32 | | | | 3.54 | |
| | | | | | | | | | | | | | | | | | | | |
Net asset value, end of period | | $ | 17.23 | | | $ | 14.64 | | | $ | 14.88 | | | $ | 12.47 | | | $ | 11.15 | |
| | | | | | | | | | | | | | | | | | | | |
Total Returnb | | | 17.69 | % | | | (1.61 | )% | | | 19.33 | % | | | 11.84 | % | | | 46.52 | % |
| | | | | | | | | | | | | | | | | | | | |
Ratios/Supplemental Data | | | | | | | | | | | | | | | | | | | | |
Net assets, end of period (in thousands) | | $ | 3,964 | | | $ | 4,304 | | | $ | 4,420 | | | $ | 4,160 | | | $ | 3,533 | |
| | | | | | | | | | | | | | | | | | | | |
Ratios to average net assets: | | | | | | | | | | | | | | | | | | | | |
Net investment loss | | | (2.07 | )% | | | (2.29 | )% | | | (2.42 | )% | | | (2.69 | )% | | | (2.76 | )% |
Total expensesc | | | 2.56 | % | | | 2.79 | % | | | 2.85 | % | | | 2.83 | % | | | 3.23 | % |
Net expensesd | | | 2.55 | % | | | 2.79 | % | | | 2.85 | % | | | 2.82 | % | | | 3.00 | % |
Net expenses prior to custodian earning credits and net of expense waivers | | | 2.56 | % | | | 2.79 | % | | | 2.85 | % | | | 2.83 | % | | | 3.00 | % |
| | | | | | | | | | | | | | | | | | | | |
Portfolio turnover rate | | | 145 | % | | | 136 | % | | | 134 | % | | | 157 | % | | | 206 | % |
a | Net investment income (loss) was computed using average shares outstanding throughout the period. |
b | Total return information does not reflect deduction of any sales charges imposed at the time of purchase for Class A shares or upon redemption for Class B and C shares. |
c | Total expense information reflects expense ratios absent expense reductions by the Investment Manager and custodian earnings credits, as applicable. |
d | Net expense information reflects the expense ratios after voluntary expense waivers, reimbursements and custodian earnings credits, as applicable. |
The accompanying notes are an integral part of the financial statements
59
This page left blank intentionally.
60
| | |
| | Security |
| Manager’s Commentary | | Large Cap Value Fund |
| November 15, 2007 | | (unaudited) |
Adviser, Security Global Investors

Mark Mitchell
Senior Portfolio Manager
To Our Shareholders:
Security Large Cap Value Fund returned 20.04%1 in the period, outperforming the benchmark Russell 1000 Value Index’s return of 14.45% and the Fund’s peer group median return of 14.49%. Good individual stock selection was balanced by sector weighting contributions in fiscal 2007.
Our strategy is to buy companies that are trading at a significant discount to their intrinsic value. Our investment approach is a defined and disciplined process of three clear philosophical tenants that drive our investment decisions: a valuation focus, a long-term perspective and an opportunistic approach.
The investment process is fundamentally driven and quantitatively aided. We use proprietary screens to identify potential companies for investment and then perform rigorous fundamental analysis to identify the best ideas. Through this fundamental research, we determine an estimate of intrinsic value and thus a valuation target for each idea. We construct the portfolios based on the level of conviction generated by this bottom-up analysis and the upside/downside profile associated with each company.
Industrials and Health Care Stocks Top Performers
The Fund’s industrials holdings were up 47% compared to 27% for the index. In addition to superior stock selection, the portfolio was overweight in the sector, 19% relative to 8% for the index. McDermott International, Inc., returned 158% during the period while Shaw Group, Inc., was up 143%. Both companies benefited from strong demand in the global infrastructure market.
The health care sector provided the portfolio with a large relative gain against the benchmark, returning 23% vs. 5%. The portfolio was slightly underweight the index in the sector. Medco Health Solutions, Inc., was up 50%, driven by increasing mail order business and higher generic prescription penetration.
Telecommunications and Consumer Discretionary Disappointing
The largest sector detractor from the portfolio was telecommunications due mostly to stock selection although an underweight position also contributed to the relative underperformance. The portfolio’s telecommunications sector holdings returned over 17%; however, the index holdings returned greater than 29%. More traditional companies like AT&T and Verizon per formed better than our holdings in Sprint Nextel Corporation and Windstream Corporation.
The consumer discretionary sector in general experienced a difficult environment in fiscal 2007. The Fund returned 5% in the sector versus 7% for the Russell 1000 Value Index. Home Depot, Inc., was the largest detractor, sliding nearly 17% over the period. This was caused by the impact of a slowing housing market. We feel confident that Home Depot still enjoys a solid competitive position and will benefit once the housing market improves.
2008 Market Outlook
Our bottom-up approach looks at market uncertainty in the context of the potential long-term impact on individual companies. Often times, volatility provides opportunity. We are maintaining flexibility in the portfolios to take advantage of these opportunities as they arise. Our focus is on identifying companies with the ability to be substantially better over the next three to five years or have the potential to maintain their return on capital at current levels in a difficult economic environment. We are confident in our ability to find these companies and we are pleased with the positions we own today.
We believe that investing is a long-term pursuit that requires patience and a consistent approach. Dollar cost averaging is a sound way to build long-term value. We recognize there are many investment fund alternatives available today and thank you for your business and the confidence you place in us.
Sincerely,
Mark Mitchell
Senior Portfolio Manager
| 1 | Performance figures are based on Class A shares and do not reflect deduction of the sales charges or taxes that a shareholder would pay on distributions or the redemption of shares. |
61
| | |
| | Security |
| Performance Summary | | Large Cap Value Fund |
| September 30, 2007 | | (unaudited) |
PERFORMANCE
Security Large Cap Value Fund vs. Russell 1000 Value Index
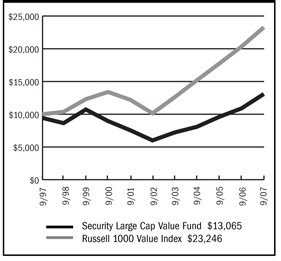
$10,000 Over Ten Years
This chart assumes a $10,000 investment in Class A shares of Large Cap Value Fund on September 30, 1997, reflects deduction of the 5.75% sales load and assumes all dividends reinvested. The chart does not reflect the deduction of taxes that a shareholder would pay on distributions or the redemption of fund shares. The Russell 1000 Value Index is an unmanaged index representing the performance of those Russell 1000 Index companies with lower price-to-book ratios and lower forecasted growth values.
Average Annual Returns
| | | | | | | | | | | | |
Periods Ended 9-30-07 | | 1 Year | | | 5 Years | | | 10 Years | | | Since
Inception | |
A Shares | | 20.04 | % | | 16.84 | % | | 3.32 | % | | — | |
| | | | |
A Shares with sales charge | | 13.10 | % | | 15.46 | % | | 2.71 | % | | — | |
| | | | |
B Shares | | 19.50 | % | | 16.03 | % | | 2.56 | % | | — | |
| | | | |
B Shares with CDSC | | 14.50 | % | | 15.81 | % | | 2.56 | % | | — | |
| | | | |
C Shares | | 19.29 | % | | 15.95 | % | | — | | | 3.18 | % |
| | | | | | | | | | | (1-29-99 | ) |
| | | | |
C Shares with CDSC | | 18.29 | % | | 15.95 | % | | — | | | 3.18 | % |
| | | | | | | | | | | (1-29-99 | ) |
The performance data above represents past performance that is not predictive of future results. The investment return and principal value of an investment in the Fund will fluctuate so that an investor’s shares, when redeemed, may be worth more or less than their original cost. The figures above do not reflect deduction of the maximum front-end sales charge of 5.75% for Class A shares or the contingent deferred sales charge of 5% for Class B shares and 1% for Class C shares, as applicable, except where noted. The figures do not reflect the deduction of taxes that a shareholder would pay on distributions or redemption of Fund shares. Such figures would be lower if the maximum sales charge and any applicable taxes were deducted.
Portfolio Composition by Sector as of 9-30-07
| | | |
Consumer Discretionary | | 9.00 | % |
| |
Consumer Staples | | 10.30 | |
| |
Energy | | 14.08 | |
| |
Financials | | 22.91 | |
| |
Health Care | | 4.21 | |
| |
Industrials | | 18.29 | |
| |
Information Technology | | 3.42 | |
| |
Materials | | 2.88 | |
| |
Telecommunication Services | | 3.70 | |
| |
Utilities | | 1.63 | |
| |
Exchange Traded Funds | | 5.52 | |
| |
Commercial Paper | | 4.22 | |
| |
Repurchase Agreement | | 0.57 | |
| |
Liabilities in excess of other assets | | (0.73 | ) |
| |
Total net assets | | 100.00 | % |
| | | |
The accompanying notes are an integral part of the financial statements
62
| | |
| | Security |
| Performance Summary | | Large Cap Value Fund |
| September 30, 2007 | | (unaudited) |
PERFORMANCE
Information About Your Fund’s Expenses
Calculating your ongoing Fund expenses
Example
As a shareholder of the Fund, you incur two types of costs: (1) transaction costs, which may include sales charges (loads) on purchase payments; contingent deferred sales charges on redemptions; and redemption fees, if any; and (2) ongoing costs, including management fees; distribution and/or service fees (12b-1); and other Fund expenses. This example is intended to help you understand your ongoing costs (in dollars) of investing in the Fund and to compare these costs with ongoing costs of investing in other mutual funds. The example is based on an investment of $1,000 invested at the beginning of the period and held for the entire period, April 1, 2007 – September 30, 2007.
Actual Expenses
The first line for each class of shares in the table provides information about actual account values and actual expenses. You may use the information in this table, together with the amount you invested, to estimate the expenses that you paid over the period. Simply divide your account value by $1,000 (for example, an $8,600 account value divided by $1,000 = 8.6), then multiply the result by the number in the table under the heading entitled “Expenses Paid During Period” to estimate the expenses you paid on your account during this period.
Hypothetical Example for Comparison Purposes
The second line for each class of shares in the table provides information about hypothetical account values and hypothetical expenses based on the Fund’s actual expense ratio and an assumed rate of return of 5% per year before expenses, which is not the Fund’s actual return. The hypothetical account values and expenses may not be used to estimate the actual ending account balance or expenses you paid for the period. You may use this information to compare the ongoing costs of investing in the Fund and other funds. To do so, compare this 5% hypothetical example with the 5% hypothetical examples that appear in the shareholder reports of the other mutual funds.
Please note that the expenses shown in the table are meant to highlight your ongoing costs only and do not reflect any transactional costs, such as sales charges (loads) on purchase payments, contingent deferred sales charges on redemptions, and redemption fees, if any. Therefore, the second line for each class of shares is useful in comparing ongoing costs only, and will not help you determine the relative total costs of owning different funds. In addition, if these transactional costs were included, your costs would have been higher.
Fund Expenses
| | | | | | | | | |
| | | Beginning
Account Value
04-01-07 | | Ending
Account Value
09-30-071 | | Expenses Paid
During
Period2 |
Large Cap Value Fund | | | | | | | | | |
- Class A | | | | | | | | | |
Actual | | $ | 1,000.00 | | $ | 1,091.60 | | $ | 6.08 |
Hypothetical | | | 1,000.00 | | | 1,019.15 | | | 5.87 |
| | | |
Large Cap Value Fund | | | | | | | | | |
- Class B | | | | | | | | | |
Actual | | | 1,000.00 | | | 1,090.20 | | | 8.33 |
Hypothetical | | | 1,000.00 | | | 1,017.00 | | | 8.04 |
| | | |
Large Cap Value Fund | | | | | | | | | |
- Class C | | | | | | | | | |
Actual | | | 1,000.00 | | | 1,088.60 | | | 10.00 |
Hypothetical | | | 1,000.00 | | | 1,015.41 | | | 9.65 |
1 | The actual ending account value is based on the actual total return of the Fund for the period from April 1, 2007 to September 30, 2007 after actual expenses and will differ from the hypothetical ending account value which is based on the Fund expense ratio and a hypothetical annual return of 5% before expenses. The actual cumulative return at net asset value for the period from April 1, 2007 to September 30, 2007 was 9.16%, 9.02% and 8.86%, for Class A, B and C shares, respectively. |
2 | Expenses are equal to the Fund’s annualized expense ratio (1.16%, 1.59% and 1.91% for Class A, B and C shares, respectively), net of any applicable fee waivers or earnings credits, multiplied by the average account value over the period, multiplied by 183/365 (to reflect the one-half year period). |
63
| | |
| Schedule of Investments | | Security Large Cap Value Fund |
| September 30, 2007 | | |
| | | | | |
| | | Shares | | Value |
COMMON STOCK - 95.9% | | | | | |
Aerospace & Defense - 3.4% | | | | | |
United Technologies Corporation | | 42,400 | | $ | 3,412,352 |
| | | | | |
Agricultural Products - 1.7% | | | | | |
Archer-Daniels-Midland Company | | 51,500 | | | 1,703,620 |
| | | | | |
Broadcasting & Cable TV - 2.8% | | | | | |
CBS Corporation (CI.B) | | 88,200 | | | 2,778,300 |
| | | | | |
Building Products - 3.0% | | | | | |
USG Corporation * | | 80,400 | | | 3,019,020 |
| | | | | |
Computer Hardware - 2.3% | | | | | |
Hewlett-Packard Company | | 46,500 | | | 2,315,235 |
| | | | | |
Consumer Finance - 9.9% | | | | | |
Capital One Financial Corporation | | 53,200 | | | 3,534,076 |
Discover Financial Services | | 55,000 | | | 1,144,000 |
First Marblehead Corporation (1) | | 135,850 | | | 5,152,790 |
| | | | | |
| | | | | 9,830,866 |
| | | | | |
Diversified Chemicals - 1.3% | | | | | |
Dow Chemical Company | | 30,100 | | | 1,296,106 |
| | | | | |
Drug Retail - 2.2% | | | | | |
CVS Caremark Corporation | | 54,100 | | | 2,143,983 |
| | | | | |
Electric Utilities - 1.6% | | | | | |
Edison International | | 29,300 | | | 1,624,685 |
| | | | | |
Electronic Manufacturing Services - 0.6% | | | | | |
Tyco Electronics, Ltd. | | 18,150 | | | 643,055 |
| | | | | |
Exchange Traded Funds - 5.5% | | | | | |
iShares Russell 1000 Value Index Fund | | 31,600 | | | 2,716,652 |
iShares S&P 500 Value Index Fund | | 34,100 | | | 2,776,081 |
| | | | | |
| | | | | 5,492,733 |
| | | | | |
Health Care Equipment - 2.3% | | | | | |
Covidien, Ltd. | | 18,150 | | | 753,225 |
Hospira, Inc. * | | 36,500 | | | 1,512,925 |
| | | | | |
| | | | | 2,266,150 |
| | | | | |
Health Care Services - 1.9% | | | | | |
Medco Health Solutions, Inc. * | | 21,200 | | | 1,916,268 |
| | | | | |
Home Improvement Retail - 3.0% | | | | | |
Home Depot, Inc. | | 91,200 | | | 2,958,528 |
| | | | | |
Hypermarkets & Super Centers - 4.3% | | | | | |
Costco Wholesale Corporation | | 48,900 | | | 3,000,993 |
Wal-Mart Stores, Inc. | | 28,500 | | | 1,244,025 |
| | | | | |
| | | | | 4,245,018 |
| | | | | |
Industrial Conglomerates - 8.9% | | | | | |
General Electric Company | | 77,400 | | | 3,204,360 |
McDermott International, Inc. * | | 90,300 | | | 4,883,424 |
Tyco International, Ltd. | | 18,150 | | | 804,771 |
| | | | | |
| | | | | 8,892,555 |
| | | | | |
Integrated Oil & Gas - 9.6% | | | | | |
Chevron Corporation | | 22,400 | | | 2,096,192 |
Conoco Phillips | | 20,300 | | | 1,781,731 |
Exxon Mobil Corporation | | 33,000 | | | 3,054,480 |
Sasol, Ltd. ADR | | 59,800 | | | 2,570,802 |
| | | | | |
| | | | | 9,503,205 |
| | | | | |
Integrated Telecommunication Services - 0.9% | | | | | |
Windstream Corporation | | 61,476 | | | 868,041 |
| | | | | |
IT Consulting & Other Services - 0.4% | | | | | |
Unisys Corporation * | | 66,400 | | | 439,568 |
| | | | | |
Movies & Entertainment - 3.2% | | | | | |
News Corporation | | 52,500 | | | 1,154,475 |
Time Warner, Inc. | | 112,500 | | | 2,065,500 |
| | | | | |
| | | | | 3,219,975 |
| | | | | |
Multi-Line Insurance - 4.3% | | | | | |
American International Group, Inc. | | 63,100 | | | 4,268,715 |
| | | | | |
Oil & Gas Drilling - 0.6% | | | | | |
Transocean, Inc. * | | 5,500 | | | 621,775 |
| | | | | |
Oil & Gas Equipment & Services - 1.7% | | | | | |
Halliburton Company | | 43,100 | | | 1,655,040 |
| | | | | |
Oil & Gas Storage & Transportation - 2.2% | | | | | |
Williams Companies, Inc. | | 65,500 | | | 2,230,930 |
| | | | | |
Other Diversified Financial Services - 4.5% | | | | | |
Citigroup, Inc. | | 58,000 | | | 2,706,860 |
JPMorgan Chase & Company | | 37,600 | | | 1,722,832 |
| | | | | |
| | | | | 4,429,692 |
| | | | | |
Property & Casualty Insurance - 4.3% | | | | | |
Berkshire Hathaway, Inc. * | | 36 | | | 4,266,360 |
| | | | | |
Railroads - 2.9% | | | | | |
Union Pacific Corporation | | 25,400 | | | 2,871,724 |
| | | | | |
Specialty Chemicals - 1.6% | | | | | |
Rohm & Haas Company | | 28,100 | | | 1,564,327 |
| | | | | |
Tobacco - 2.2% | | | | | |
Altria Group, Inc. | | 31,100 | | | 2,162,383 |
| | | | | |
Wireless Telecommunication Services - 2.8% | | | | | |
Alltel Corporation | | 11,100 | | | 773,448 |
Sprint Nextel Corporation | | 107,700 | | | 2,046,300 |
| | | | | |
| | | | | 2,819,748 |
| | | | | |
TOTAL COMMON STOCK (Cost $76,055,371) | | | | $ | 95,459,957 |
| | | | | |
The accompanying notes are an integral part of the financial statements
64
| | |
| Schedule of Investments | | Security Large Cap Value Fund |
September 30, 2007 - continued | | |
| | | | | | | |
| | | Principal
Amount | | Value | |
CORPORATE BOND - 0.0% | | | | | | | |
Services - 0.0% | | | | | | | |
American ECO Corporation | | | | | | | |
9.63%, 2008 (2)(3)(4)(5) | | $ | 125,000 | | $ | — | |
| | | | | | | |
TOTAL CORPORATE BOND (Cost $125,000) | | | | | $ | — | |
| | | | | | | |
COMMERCIAL PAPER - 4.2% | | | | | | | |
Banking - 2.4% | | | | | | | |
UBS Finance (DE) LLC | | | | | | | |
4.65%, 10/2/2007 | | | 1,400,000 | | | 1,399,819 | |
4.64%, 10/4/2007 | | | 1,000,000 | | | 999,614 | |
| | | | | | | |
| | | | | | 2,399,433 | |
| | | | | | | |
Brokerage - 1.8% | | | | | | | |
JP Morgan Chase & Company | | | | | | | |
4.70%, 10/3/2007 | | | 1,800,000 | | | 1,799,530 | |
| | | | | | | |
TOTAL COMMERCIAL PAPER (Cost $4,198,963) | | | | | $ | 4,198,963 | |
| | | | | | | |
REPURCHASE AGREEMENT - 0.6% | | | | | | | |
United Missouri Bank, 4.53%, dated 9/28/07, matures 10/01/07; repurchase amount $566,214 (Collateralized by FHLMC, 3.50%, 10/19/07 with a value of $577,628) | | $ | 566,000 | | $ | 566,000 | |
| | | | | | | |
TOTAL REPURCHASE AGREEMENT (Cost $566,000) | | | | | $ | 566,000 | |
| | | | | | | |
Total Investments (Security Large Cap Value Fund) | | | | | | | |
(Cost $80,945,334) - 100.7% | | | | | $ | 100,224,920 | |
Liabilities in Excess of Other Assets - (0.7%) | | | | | | (726.137 | ) |
| | | | | | | |
TOTAL NET ASSETS - 100.0% | | | | | $ | 99,498,783 | |
| | | | | | | |
Footnotes
Percentages are stated as a percent of net assets.
For federal income tax purposes the identified cost of investments owned at 9/30/2007 was $81,014,754.
| | |
* | | - Non-income producing security |
1 | | - Security is segregated as collateral for open written option contracts. |
2 | | - Security is deemed illiquid. See Note 8 in notes to financial statements. |
3 | | - Security is in default of interest and/or principal obligations. |
4 | | - Security was acquired through a private placement. |
5 | | - Security is fair valued by the Board of Directors. See Note 7 in notes to financial statements. |
| |
| Glossary: | | |
ADR | | - American Depositary Receipt |
See notes to financial statements.
The accompanying notes are an integral part of the financial statements
Security
Large Cap Value Fund
Statement of Assets and Liabilities
September 30, 2007
| | | |
Assets: | | | |
Investments, at value* | | $ | 100,224,920 |
Cash | | | 892 |
Receivables: | | | |
Fund shares sold | | | 48,200 |
Dividends | | | 158,183 |
Prepaid expenses | | | 26,573 |
| | | |
Total assets | | | 100,458,768 |
| | | |
Liabilities: | | | |
Payable for: | | | |
Securities purchased | | | 808,703 |
Fund shares redeemed | | | 29,547 |
Written options, at value (premiums received, $ 19,504) | | | 3,525 |
Security Investors | | | 6,844 |
Management fees | | | 53,601 |
Custodian fees | | | 418 |
Transfer agent/maintenance fees | | | 10,502 |
Administration fees | | | 7,934 |
Professional fees | | | 10,737 |
12b-1 distribution plan fees | | | 21,124 |
Directors’ fees | | | 2,956 |
Other | | | 4,094 |
| | | |
Total liabilities | | | 959,985 |
| | | |
Net assets | | $ | 99,498,783 |
| | | |
Net assets consist of: | | | |
Paid in capital | | $ | 78,880,865 |
Undistributed net investment income | | | 343,898 |
Undistributed net realized gain on sale of investments | | | 978,455 |
Net unrealized appreciation in value of investments | | | 19,295,565 |
| | | |
Net assets | | $ | 99,498,783 |
| | | |
Class A: | | | |
Capital shares outstanding (unlimited number of shares authorized) | | | 8,709,977 |
Net assets | | $ | 79,997,814 |
Net asset value and redemption price per share. | | $ | 9.18 |
| | | |
Maximum offering price per share (net asset value divided by 94.25%) | | $ | 9.74 |
| | | |
Class B: | | | |
Capital shares outstanding (unlimited number of shares authorized) | | | 1,607,220 |
Net assets | | $ | 13,783,749 |
Net asset value, offering and redemption price per share (excluding any applicable contingent deferred sales charge) | | $ | 8.58 |
| | | |
Class C: | | | |
Capital shares outstanding (unlimited number of shares authorized) | | | 655,613 |
Net assets | | $ | 5,717,220 |
Net asset value, offering and redemption price per share (excluding any applicable contingent deferred sales charge) | | $ | 8.72 |
| | | |
* Investments, at cost | | $ | 80,945,334 |
Statement of Operations
For the Year Ended September 30, 2007
| | | | |
Investment Income: | | | | |
Dividends | | $ | 1,399,448 | |
Interest | | | 234,518 | |
| | | | |
Total investment income | | | 1,633,966 | |
| | | | |
| |
Expenses: | | | | |
Management fees | | | 596,521 | |
Transfer agent/maintenance fees | | | 221,765 | |
Administration fees | | | 87,826 | |
Custodian fees | | | 6,579 | |
Directors’ fees | | | 1,568 | |
Professional fees | | | 11,344 | |
Reports to shareholders | | | 9,794 | |
Registration fees | | | 48,623 | |
Other expenses | | | 25,344 | |
12b-1 distribution fees - Class A | | | 181,655 | |
12b-1 distribution fees - Class B | | | 115,315 | |
12b-1 distribution fees - Class C | | | 51,468 | |
| | | | |
Total expenses | | | 1,357,802 | |
Less: | | | | |
Reimbursement of expenses - Class A | | | (56,683 | ) |
Reimbursement of expenses - Class B | | | (10,766 | ) |
Reimbursement of expenses - Class C | | | (4,189 | ) |
Earnings credits applied | | | (11 | ) |
| | | | |
Net expenses | | | 1,286,153 | |
| | | | |
Net investment income | | | 347,813 | |
| | | | |
| |
Net Realized and Unrealized Gain (Loss): | | | | |
Net realized gain (loss) during the year on: | | | | |
Investments | | | 6,337,792 | |
Options written | | | 126,033 | |
| | | | |
Net realized gain | | | 6,463,825 | |
| | | | |
| |
Net unrealized appreciation (depreciation) during the year on: | | | | |
Investments | | | 9,441,340 | |
Options written | | | 8,554 | |
| | | | |
Net unrealized appreciation | | | 9,449,894 | |
| | | | |
Net realized and unrealized gain | | | 15,913,719 | |
| | | | |
Net increase in net assets resulting from operations | | $ | 16,261,532 | |
| | | | |
The accompanying notes are an integral part of the financial statements
66
| | |
| | Security |
| Statements of Changes in Net Assets | | Large Cap Value Fund |
| | | | | | | | |
| | | Year Ended
September 30,
2007 | | | Year Ended
September 30,
2006 | |
Increase (decrease) in net assets from operations: | | | | | | | | |
Net investment income | | $ | 347,813 | | | $ | 26,815 | |
Net realized gain during the year on investments | | | 6,463,825 | | | | 2,351,724 | |
Net unrealized appreciation during the year on investments | | | 9,449,894 | | | | 4,881,917 | |
| | | | | | | | |
Net increase in net assets resulting from operations | | | 16,261,532 | | | | 7,260,456 | |
| | | | | | | | |
Distributions to shareholders from: | | | | | | | | |
Net investment income | | | | | | | | |
Class A | | | (25,136 | ) | | | (232,389 | ) |
| | | | | | | | |
Total distributions to shareholders | | | (25,136 | ) | | | (232,389 | ) |
| | | | | | | | |
Capital share transactions: | | | | | | | | |
Proceeds from sale of shares | | | | | | | | |
Class A | | | 30,239,174 | | | | 52,794,309 | |
Class B | | | 5,176,235 | | | | 8,335,522 | |
Class C | | | 2,465,830 | | | | 2,030,893 | |
Distributions reinvested | | | | | | | | |
Class A | | | 23,953 | | | | 214,200 | |
Cost of shares redeemed | | | | | | | | |
Class A | | | (28,048,187 | ) | | | (39,239,195 | ) |
Class B | | | (6,549,458 | ) | | | (5,067,244 | ) |
Class C | | | (1,128,054 | ) | | | (1,707,635 | ) |
| | | | | | | | |
Net increase from capital share transactions | | | 2,179,493 | | | | 17,360,850 | |
| | | | | | | | |
Net increase in net assets | | | 18,415,889 | | | | 24,388,917 | |
| | | | | | | | |
Net assets: | | | | | | | | |
Beginning of year | | | 81,082,894 | | | | 56,693,977 | |
| | | | | | | | |
End of year | | $ | 99,498,783 | | | $ | 81,082,894 | |
| | | | | | | | |
Accumulated net investment income at end of year | | $ | 343,898 | | | $ | 21,221 | |
| | | | | | | | |
Capital share activity: | | | | | | | | |
Shares sold | | | | | | | | |
Class A | | | 3,513,517 | | | | 7,129,132 | |
Class B | | | 644,129 | | | | 1,198,221 | |
Class C | | | 309,682 | | | | 287,449 | |
Shares reinvested | | | | | | | | |
Class A | | | 2,882 | | | | 30,999 | |
Shares redeemed | | | | | | | | |
Class A | | | (3,278,710 | ) | | | (5,369,253 | ) |
Class B | | | (814,025 | ) | | | (753,462 | ) |
Class C | | | (137,551 | ) | | | (250,401 | ) |
The accompanying notes are an integral part of the financial statements
67
| | |
| Financial Highlights | | Security |
| Selected data for each share of capital stock outstanding throughout each year | | Large Cap Value Fund |
| | | | | | | | | | | | | | | | | | | | |
| | | | | | | | | | | | | | | Year Ended
September 30, | |
Class A | | 2007 | | | 2006 | | | 2005a | | | 2004 | | | 2003 | |
Per Share Data | | | | | | | | | | | | | | | | | | | | |
Net asset value, beginning of period | | $ | 7.65 | | | $ | 6.78 | | | $ | 5.71 | | | $ | 5.11 | | | $ | 4.25 | |
| | | | | | | | | | | | | | | | | | | | |
Income (loss) from investment operations: | | | | | | | | | | | | | | | | | | | | |
Net investment incomeb | | | 0.04 | | | | 0.01 | | | | 0.03 | | | | 0.01 | | | | 0.02 | |
Net gain on securities (realized and unrealized) | | | 1.49 | | | | 0.90 | | | | 1.04 | | | | 0.60 | | | | 0.84 | |
| | | | | | | | | | | | | | | | | | | | |
Total from investment operations | | | 1.53 | | | | 0.91 | | | | 1.07 | | | | 0.61 | | | | 0.86 | |
| | | | | | | | | | | | | | | | | | | | |
Less distributions: | | | | | | | | | | | | | | | | | | | | |
Dividends from net investment income | | | — | | | | (0.04) | | | | — | | | | (0.01) | | | | — | |
| | | | | | | | | | | | | | | | | | | | |
Total distributions | | | — | | | | (0.04) | | | | — | | | | (0.01) | | | | — | |
| | | | | | | | | | | | | | | | | | | | |
Net asset value, end of period | | $ | 9.18 | | | $ | 7.65 | | | $ | 6.78 | | | $ | 5.71 | | | $ | 5.11 | |
| | | | | | | | | | | | | | | | | | | | |
Total Returnc | | | 20.04 | % | | | 13.45 | % | | | 18.74 | % | | | 11.98 | % | | | 20.24 | % |
| | | | | | | | | | | | | | | | | | | | |
Ratios/Supplemental Data | | | | | | | | | | | | | | | | | | | | |
Net assets, end of period (in thousands) | | $ | 79,998 | | | $ | 64,786 | | | $ | 45,295 | | | $ | 43,071 | | | $ | 45,858 | |
| | | | | | | | | | | | | | | | | | | | |
Ratios to average net assets: | | | | | | | | | | | | | | | | | | | | |
Net investment income | | | 0.51 | % | | | 0.17 | % | | | 0.56 | % | | | 0.19 | % | | | 0.41 | % |
Total expensesd | | | 1.35 | % | | | 1.49 | % | | | 1.61 | % | | | 1.52 | % | | | 1.45 | % |
Net expensese | | | 1.27 | % | | | 1.49 | % | | | 1.61 | % | | | 1.52 | % | | | 1.45 | % |
Net expenses prior to custodian earning credits and net of expense waivers | | | 1.27 | % | | | 1.49 | % | | | 1.61 | % | | | 1.52 | % | | | 1.45 | % |
| | | | | | | | | | | | | | | | | | | | |
Portfolio turnover rate | | | 25 | % | | | 54 | % | | | 110 | % | | | 75 | % | | | 76 | % |
| | | | | |
| | | | | | | | | | | | | | | Year Ended September 30, | |
Class B | | 2007f | | | 2006 | | | 2005a | | | 2004 | | | 2003 | |
Per Share Data | | | | | | | | | | | | | | | | | | | | |
Net asset value, beginning of period | | $ | 7.18 | | | $ | 6.38 | | | $ | 5.42 | | | $ | 4.87 | | | $ | 4.08 | |
| | | | | | | | | | | | | | | | | | | | |
Income (loss) from investment operations: | | | | | | | | | | | | | | | | | | | | |
Net investment lossb | | | (0.01) | | | | (0.04) | | | | (0.01) | | | | (0.03) | | | | (0.02) | |
Net gain on securities (realized and unrealized) | | | 1.41 | | | | 0.84 | | | | 0.97 | | | | 0.58 | | | | 0.81 | |
| | | | | | | | | | | | | | | | | | | | |
Total from investment operations | | | 1.40 | | | | 0.80 | | | | 0.96 | | | | 0.55 | | | | 0.79 | |
| | | | | | | | | | | | | | | | | | | | |
Net asset value, end of period | | $ | 8.58 | | | $ | 7.18 | | | $ | 6.38 | | | $ | 5.42 | | | $ | 4.87 | |
| | | | | | | | | | | | | | | | | | | | |
Total Returnc | | | 19.50 | % | | | 12.54 | % | | | 17.71 | % | | | 11.29 | % | | | 19.36 | % |
| | | | | | | | | | | | | | | | | | | | |
Ratios/Supplemental Data | | | | | | | | | | | | | | | | | | | | |
Net assets, end of period (in thousands) | | $ | 13,784 | | | $ | 12,761 | | | $ | 8,500 | | | $ | 10,164 | | | $ | 11,687 | |
| | | | | | | | | | | | | | | | | | | | |
Ratios to average net assets: | | | | | | | | | | | | | | | | | | | | |
Net investment loss | | | (0.08) | % | | | (0.58) | % | | | (0.16) | % | | | (0.57) | % | | | (0.42) | % |
Total expensesd | | | 1.92 | % | | | 2.26 | % | | | 2.36 | % | | | 2.27 | % | | | 2.20 | % |
Net expensese | | | 1.85 | % | | | 2.26 | % | | | 2.36 | % | | | 2.27 | % | | | 2.20 | % |
Net expenses prior to custodian earning credits and net of expense waivers | | | 1.85 | % | | | 2.26 | % | | | 2.36 | % | | | 2.27 | % | | | 2.20 | % |
| | | | | | | | | | | | | | | | | | | | |
Portfolio turnover rate | | | 25 | % | | | 54 | % | | | 110 | % | | | 75 | % | | | 76 | % |
The accompanying notes are an integral part of the financial statements
68
| | |
| Financial Highlights | | Security |
| Selected data for each share of capital stock outstanding throughout each year | | Large Cap Value Fund |
| | | | | | | | | | | | | | | | | | | | |
| | | | | | | | | | | | | | | Year Ended
September 30, | |
Class C | | 2007 | | | 2006 | | | 2005a | | | 2004 | | | 2003 | |
Per Share Data | | | | | | | | | | | | | | | | | | | | |
Net asset value, beginning of period | | $ | 7.31 | | | $ | 6.49 | | | $ | 5.52 | | | $ | 4.96 | | | $ | 4.16 | |
| | | | | | | | | | | | | | | | | | | | |
Income (loss) from investment operations: | | | | | | | | | | | | | | | | | | | | |
Net investment lossb | | | (0.02 | ) | | | (0.04 | ) | | | (0.01 | ) | | | (0.03 | ) | | | (0.02 | ) |
Net gain on securities (realized and unrealized) | | | 1.43 | | | | 0.86 | | | | 0.98 | | | | 0.59 | | | | 0.82 | |
| | | | | | | | | | | | | | | | | | | | |
Total from investment operations | | | 1.41 | | | | 0.82 | | | | 0.97 | | | | 0.56 | | | | 0.80 | |
| | | | | | | | | | | | | | | | | | | | |
Net asset value, end of period | | $ | 8.72 | | | $ | 7.31 | | | $ | 6.49 | | | $ | 5.52 | | | $ | 4.96 | |
| | | | | | | | | | | | | | | | | | | | |
Total Returnc | | | 19.29 | % | | | 12.63 | % | | | 17.57 | % | | | 11.29 | % | | | 19.23 | % |
| | | | | | | | | | | | | | | | | | | | |
Ratios/Supplemental Data | | | | | | | | | | | | | | | | | | | | |
Net assets, end of period (in thousands) | | $ | 5,717 | | | $ | 3,536 | | | $ | 2,899 | | | $ | 2,561 | | | $ | 2,130 | |
| | | | | | | | | | | | | | | | | | | | |
Ratios to average net assets: | | | | | | | | | | | | | | | | | | | | |
Net investment loss | | | (0.23 | )% | | | (0.60 | )% | | | (0.18 | )% | | | (0.57 | )% | | | (0.33 | )% |
Total expensesd | | | 2.10 | % | | | 2.25 | % | | | 2.36 | % | | | 2.28 | % | | | 2.20 | % |
Net expensese | | | 2.02 | % | | | 2.25 | % | | | 2.36 | % | | | 2.28 | % | | | 2.20 | % |
Net expenses prior to custodian earning credits and net of expense waivers | | | 2.02 | % | | | 2.25 | % | | | 2.36 | % | | | 2.28 | % | | | 2.20 | % |
| | | | | | | | | | | | | | | | | | | | |
Portfolio turnover rate | | | 25 | % | | | 54 | % | | | 110 | % | | | 75 | % | | | 76 | % |
a | Security Investors (SI) became the advisor of Security Large Cap Value Fund effective June 30, 2005. Prior to June 30, 2005, SI paid Dreyfus Corporation for sub-advisory services. |
b | Net investment income (loss) was computed using average shares outstanding throughout the period. |
c | Total return information does not reflect deduction of any sales charges imposed at the time of purchase for Class A shares or upon redemption for Class B and C shares. |
d | Total expense information reflects expense ratios absent expense reductions by the Investment Manager and custodian earnings credits, as applicable. |
e | Net expense information reflects the expense ratios after voluntary expense waivers, reimbursements and custodian earnings credits, as applicable. |
f | Effective August 1, 2007, Class B shares ceased charging 12b-1 fees in accordance with the NASD sales cap regulations. Per share information reflects this change. This fee may be reinstated at any time. |
The accompanying notes are an integral part of the financial statements
69
This page left blank intentionally.
70
| | |
| | Security |
Manager’s Commentary | | Mid Cap Growth Fund |
November 15, 2007 | | (unaudited) |
Adviser, Security Global Investors

James P. Schier
Senior Portfolio Manager
To Our Shareholders:
For the year ended September 30, 2007, the Security Mid Cap Growth Fund returned 2.10%1, lagging the benchmark Russell 2500 Growth Index’s return of 21.27%. The Fund also lagged its peer group median return of 25.05%.
Our approach with the Mid Cap Growth Fund is to seek securities of companies that are able to grow and/or reinvest in increasingly profitable ventures and hold them over three to five years to capture the best part of the improvements in profits or profitability. We are focused on investing in securities of companies that appear likely to generate above average profitability at prices that, as of yet, do not reflect that potential.
Health Care and Utilities Sectors Positive Contributors
Positive sector contributors to the Fund include health care and utilities. While the portfolio weight of the health care sector was 12% versus 18% for the index, a significant underweight, the stocks in the Fund were able to outperform those in the benchmark.
Even with a low weighting in the portfolio and Index, 1.02% to 0.66%, utilities was the other sector that contributed to positive performance for the Fund. Portfolio holdings in the sector gained 38%, nearly 7% more than the benchmark. Top performing securities in the sector for the portfolio include Questar and Alliant.
Energy and Information Technology Prove Difficult
The portfolio was hit hard by security selection in the energy sector even though the Fund had nearly a triple weight in one of the best performing sectors, 18% to 7%. Three of the portfolio’s four largest detractors were in the energy sector. Syntroleum lost 61% of its value, Rentech gave back 53%, and Evergreen Energy slid 51%. As a whole, the energy sector in the portfolio lost 18%. In contrast, the energy sector in the index returned a positive 34%. All of these companies are involved in alternative energy production. Rentech is commercializing a coal-to-liquids technology while Evergreen is in the process of bringing a clean coal technology to market. Both companies were tarnished by the carbon dioxide controversy since CO2 is a significant byproduct of each firm’s process. These issues are more perceptual than material as Evergreen can reduce CO2 from coal. Rentech has CO2 sequestration and disposal plans for the projects under development.
Stock selection was also the culprit in the Information technology sector for the portfolio. A 5% overweight in the portfolio relative to the benchmark, 26% versus 21%, had little effect on the outcome. The information technology sector in the index leapt by 21% as the holdings in the portfolio dropped 0.42%. Two of the sectors holdings were some of the lowest performers in the portfolio. Maxwell Technologies, Inc., lost 43% and Symmetricom, Inc., declined 42% during the period as business developed at a slower pace than anticipated.
Outlook for 2008
We continue to be surprised by the strength of the markets and maintain our cautious stance for U.S. equities in general. Despite the higher levels of short-term interest rates earlier in the year, high energy costs, a tentative consumer, housing related debt uncertainty, and an increasingly unpredictable geopolitical environment, the broad market averages have continued to advance in 2007.
The current environment suggests that there is more risk than the financial markets want to reflect. Regardless of the economic outlook, the sectors that contain the most opportunity still exist in the energy and industrial sectors. However, given the sizeable advances in many of these holdings in the portfolio, the Fund has been reducing its exposure while still being overweight. New money is being committed evenly across other sectors.
On behalf of Security Global Investors, I would like to thank you for trusting your funds with us. We are excited to see what opportunities will be available in the future. As always, we continue to do our best to seek the potential available in small and mid capitalization companies.
Sincerely,
James P. Schier, Senior Portfolio Manager
1 | Performance figures are based on Class A shares and do not reflect deduction of the sales charges or taxes that a shareholder would pay on distributions or redemptions of shares. |
71
| | |
| | Security |
Performance Summary | | Mid Cap Growth Fund |
September 30, 2007 | | (unaudited) |
PERFORMANCE
Security Mid Cap Growth Fund vs. Russell 2500 Growth Index
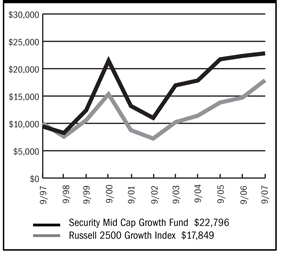
$10,000 Over Ten Years
This chart assumes a $10,000 investment in Class A shares of Security Mid Cap Growth Fund on September 30, 1997, reflects deduction of the 5.75% sales load and assumes all dividends reinvested. The chart does not reflect the deduction of taxes that a shareholder would pay on distributions of the redemption of fund shares. The Russell 2500 Growth Index is an unmanaged index that measures this performance of securities of small-to-mid U.S. companies with greater-than-average growth orientation.
Average Annual Returns
| | | | | | | | | | | | |
Periods Ended 9-30-07 | | 1 Year | | | 5 Years | | | 10 Years | | | Since
Inception | |
A Shares | | 2.10 | % | | 15.70 | % | | 9.23 | % | | — | |
| | | | |
A Shares with sales charge | | (3.74 | )% | | 14.34 | % | | 8.59 | % | | — | |
| | | | |
B Shares | | 1.34 | % | | 14.85 | % | | 8.44 | % | | — | |
| | | | |
B Shares with CDSC | | (3.15 | )% | | 14.62 | % | | 8.44 | % | | — | |
| | | | |
C Shares | | 1.31 | % | | 14.89 | % | | — | | | 7.86 | % |
| | | | | | | | | | | (1-29-99 | ) |
C Shares with CDSC | | 0.40 | % | | 14.89 | % | | — | | | 7.86 | % |
| | | | | | | | | | | (1-29-99 | ) |
The performance data above represents past performance that is not predictive of future results. The investment return and principal value of an investment in the Fund will fluctuate so that an investor’s shares, when redeemed, may be worth more or less than their original cost. The figures above do not reflect deduction of the maximum front-end sales charge of 5.75% for Class A shares or the contingent deferred sales charge of 5% for Class B shares and 1% for Class C shares, as applicable, except where noted. The figures do not reflect the deduction of taxes that a shareholder would pay on distributions or redemption of shares. Such figures would be lower if the maximum sales charge and any applicable taxes were deducted.
Portfolio Composition by Sector as of 9-30-07
| | | |
Consumer Discretionary | | 4.23 | % |
| |
Consumer Staples | | 4.28 | |
| |
Energy | | 14.21 | |
| |
Financials | | 10.67 | |
| |
Health Care | | 11.43 | |
| |
Industrials | | 17.22 | |
| |
Information Technology | | 16.59 | |
| |
Materials | | 1.31 | |
| |
Utilities | | 2.63 | |
| |
Exchange Traded Funds | | 8.57 | |
| |
Warrants | | 0.25 | |
| |
Commercial Paper | | 9.22 | |
| |
Repurchase Agreement | | 0.16 | |
| |
Liabilities in excess of other assets | | (0.77 | ) |
| |
Total net assets | | 100.00 | % |
| |
| | | |
The accompanying notes are an integral part of the financial statements
72
| | |
| | Security |
Performance Summary | | Mid Cap Growth Fund |
September 30, 2007 | | (unaudited) |
PERFORMANCE
Information About Your Fund’s Expenses
Calculating your ongoing Fund expenses
Example
As a shareholder of the Fund, you incur two types of costs: (1) transaction costs, which may include sales charges (loads) on purchase payments; contingent deferred sales charges on redemptions; and redemption fees, if any; and (2) ongoing costs, including management fees; distribution and/or service fees (12b-1); and other Fund expenses. This example is intended to help you understand your ongoing costs (in dollars) of investing in the Fund and to compare these costs with ongoing costs of investing in other mutual funds. The example is based on an investment of $1,000 invested at the beginning of the period and held for the entire period, April 1, 2007 – September 30, 2007.
Actual Expenses
The first line for each class of shares in the table provides information about actual account values and actual expenses. You may use the information in this table, together with the amount you invested, to estimate the expenses that you paid over the period. Simply divide your account value by $1,000 (for example, an $8,600 account value divided by $1,000 = 8.6), then multiply the result by the number in the table under the heading entitled “Expenses Paid During Period” to estimate the expenses you paid on your account during this period.
Hypothetical Example for Comparison Purposes
The second line for each class of shares in the table provides information about hypothetical account values and hypothetical expenses based on the Fund’s actual expense ratio and an assumed rate of return of 5% per year before expenses, which is not the Fund’s actual return. The hypothetical account values and expenses may not be used to estimate the actual ending account balance or expenses you paid for the period. You may use this information to compare the ongoing costs of investing in the Fund and other funds. To do so, compare this 5% hypothetical example with the 5% hypothetical examples that appear in the shareholder reports of the other mutual funds.
Please note that the expenses shown in the table are meant to highlight your ongoing costs only and do not reflect any transactional costs, such as sales charges (loads) on purchase payments, contingent deferred sales charges on redemptions, and redemption fees, if any. Therefore, the second line for each class of shares is useful in comparing ongoing costs only, and will not help you determine the relative total costs of owning different funds. In addition, if these transactional costs were included, your costs would have been higher.
Fund Expenses
| | | | | | | | | |
| | | Beginning
Account Value
04-01-07 | | Ending
Account Value
09-30-071 | | Expenses Paid
During
Period2 |
Mid Cap Growth Fund | | | | | | | | | |
- Class A | | | | | | | | | |
Actual | | $ | 1,000.00 | | $ | 982.30 | | $ | 6.91 |
Hypothetical | | | 1,000.00 | | | 1,018.00 | | | 7.03 |
| | | |
Mid Cap Growth Fund | | | | | | | | | |
- Class B | | | | | | | | | |
Actual | | | 1,000.00 | | | 979.50 | | | 10.62 |
Hypothetical | | | 1,000.00 | | | 1,014.26 | | | 10.81 |
| | | |
Mid Cap Growth Fund | | | | | | | | | |
- Class C | | | | | | | | | |
Actual | | | 1,000.00 | | | 978.70 | | | 10.62 |
Hypothetical | | | 1,000.00 | | | 1,014.26 | | | 10.81 |
1 | The actual ending account value is based on the actual total return of the Fund for the period from April 1, 2007 to September 30, 2007 after actual expenses and will differ from the hypothetical ending account value which is based on the Fund’s expense ratio and a hypothetical annual return of 5% before expenses. The actual cumulative return at net asset value for the period from April 1, 2007 to September 30, 2007 was (1.77%), (2.05%) and (2.13%), for Class A, B and C shares, respectively. |
2 | Expenses are equal to the Fund’s annualized expense ratio (1.39%, 2.14% and 2.14% for Class A, B and C shares, respectively), net of earnings credits, multiplied by the average account value over the period, multiplied by 183/365 (to reflect the one-half year period). |
73
| | |
Schedule of Investments | | Security Mid Cap Growth Fund |
September 30, 2007 | | |
| | | | | |
| | | Shares | | Value |
COMMON STOCK - 90.9% | | | | | |
Aerospace & Defense - 1.2% | | | | | |
Argon ST, Inc. * | | 114,100 | | $ | 2,259,180 |
| | | | | |
Apparel Retail - 0.9% | | | | | |
Chico’s FAS, Inc. * | | 49,000 | | | 688,450 |
Collective Brands, Inc. * | | 47,000 | | | 1,036,820 |
| | | | | |
| | | | | 1,725,270 |
| | | | | |
Apparel, Accessories & Luxury | | | | | |
Goods - 0.7% | | | | | |
Maidenform Brands, Inc. * | | 87,500 | | | 1,389,500 |
| | | | | |
Application Software - 0.6% | | | | | |
TIBCO Software, Inc. * | | 150,000 | | | 1,108,500 |
| | | | | |
Asset Management & Custody | | | | | |
Banks - 3.2% | | | | | |
Northern Trust Corporation | | 90,000 | | | 5,964,300 |
| | | | | |
Auto Parts & Equipment - 0.4% | | | | | |
HydroGen Corporation * (1) | | 253,722 | | | 761,166 |
| | | | | |
Automotive Retail - 0.3% | | | | | |
O’Reilly Automotive, Inc. * | | 16,200 | | | 541,242 |
| | | | | |
Biotechnology - 4.5% | | | | | |
Combinatorx, Inc. * | | 176,800 | | | 1,092,624 |
Human Genome Sciences, Inc. * | | 183,800 | | | 1,891,302 |
Incyte Corporation * | | 362,600 | | | 2,592,590 |
lomai Corporation * | | 206,400 | | | 392,160 |
Isis Pharmaceuticals, Inc. * | | 100,000 | | | 1,497,000 |
Zymogenetics, Inc. * | | 64,000 | | | 835,200 |
| | | | | |
| | | | | 8,300,876 |
| | | | | |
Broadcasting & Cable TV - 1.2% | | | | | |
Salem Communications Corporation | | 195,000 | | | 1,560,000 |
WorldSpace, Inc. * | | 154,300 | | | 614,114 |
| | | | | |
| | | | | 2,174,114 |
| | | | | |
Coal & Consumable Fuels - 4.3% | | | | | |
Arch Coal, Inc. | | 52,900 | | | 1,784,846 |
Evergreen Energy, Inc. * | | 1,206,000 | | | 6,150,600 |
| | | | | |
| | | | | 7,935,446 |
| | | | | |
Communications Equipment - 3.4% | | | | | |
Finisar Corporation * | | 555,500 | | | 1,555,400 |
PC-Tel, Inc. * | | 349,400 | | | 2,651,946 |
Symmetricom, Inc. * | | 436,000 | | | 2,049,200 |
| | | | | |
| | | | | 6,256,546 |
| | | | | |
Construction & Engineering - 2.4% | | | | | |
Insituform Technologies, Inc. * | | 192,000 | | | 2,924,160 |
Shaw Group, Inc. * | | 25,400 | | | 1,475,740 |
| | | | | |
| | | | | 4,399,900 |
| | | | | |
Consumer Finance - 2.3% | | | | | |
First Marblehead Corporation | | 112,700 | | | 4,274,711 |
| | | | | |
Data Processing & Outsourced Services - 1.4% | | | | | |
Euronet Worldwide, Inc. * | | 90,000 | | | 2,679,300 |
| | | | | |
Diversified Commercial & Professional Services - 1.4% | | | | | |
ChoicePoint, Inc. * | | 9,300 | | | 352,656 |
Navigant Consulting, Inc. * | | 180,000 | | | 2,278,800 |
| | | | | |
| | | | | 2,631,456 |
| | | | | |
Electrical Components & Equipment - 9.3% | | | | | |
Brady Corporation | | 30,000 | | | 1,076,400 |
Power-One, Inc. * | | 1,406,400 | | | 7,172,640 |
Roper Industries, Inc. | | 108,700 | | | 7,119,850 |
UQM Technologies, Inc. * (1) | | 525,216 | | | 1,943,299 |
| | | | | |
| | | | | 17,312,189 |
| | | | | |
Electronic Manufacturing Services - 2.2% | | | | | |
Maxwell Technologies, Inc. * | | 360,000 | | | 4,186,800 |
| | | | | |
Exchange Traded Funds - 8.6% | | | | | |
iShares Russell 2000 Growth Index Fund | | 91,000 | | | 7,796,880 |
iShares S&P MidCap 400 Growth Index Fund | | 90,000 | | | 8,155,800 |
| | | | | |
| | | | | 15,952,680 |
| | | | | |
Gas Utilities - 1.6% | | | | | |
Questar Corporation | | 58,000 | | | 3,046,740 |
| | | | | |
Health Care Distributors - 0.9% | | | | | |
Henry Schein, Inc. * | | 27,700 | | | 1,685,268 |
| | | | | |
Health Care Equipment - 0.6% | | | | | |
Orthovita, Inc. * | | 375,000 | | | 1,136,250 |
| | | | | |
Health Care Facilities - 0.8% | | | | | |
US Physical Therapy, Inc. * | | 97,000 | | | 1,435,600 |
| | | | | |
Health Care Services - 2.4% | | | | | |
Hythiam, Inc. * | | 129,350 | | | 962,364 |
Providence Service Corporation * | | 122,000 | | | 3,581,920 |
| | | | | |
| | | | | 4,544,284 |
| | | | | |
Health Care Supplies - 1.6% | | | | | |
Dentsply International, Inc. | | 46,000 | | | 1,915,440 |
Regeneration Technologies, Inc. * | | 97,000 | | | 1,039,840 |
| | | | | |
| | | | | 2,955,280 |
| | | | | |
Heavy Electrical Equipment - 0.3% | | | | | |
Plug Power, Inc. * | | 151,200 | | | 468,720 |
| | | | | |
Human Resource & Employment Services - 0.5% | | | | | |
Administaff, Inc. | | 23,500 | | | 853,050 |
| | | | | |
Industrial Machinery - 1.5% | | | | | |
Basin Water, Inc. * | | 199,900 | | | 2,364,817 |
The accompanying notes are an integral part of the financial statements
74
| | |
Schedule of Investments | | Security Mid Cap Growth Fund |
September 30, 2007 - continued | | |
| | | | | |
| | | Shares | | Value |
COMMON STOCK (continued) | | | | | |
Industrial Machinery (continued) | | | | | |
Donaldson Company, Inc. | | 11,100 | | $ | 463,536 |
| | | | | |
| | | | | 2,828,353 |
| | | | | |
Life Sciences Tools & Services - 0.3% | | | | | |
Millipore Corporation * | | 8,000 | | | 606,400 |
| | | | | |
Marine Ports & Services - 0.1% | | | | | |
Aegean Marine Petroleum Network, Inc. | | 3,800 | | | 137,788 |
| | | | | |
Metal & Glass Containers - 1.3% | | | | | |
Pactiv Corporation * | | 85,000 | | | 2,436,100 |
| | | | | |
Multi-Line Insurance - 0.5% | | | | | |
Assurant, Inc. | | 17,500 | | | 936,250 |
| | | | | |
Multi-Utilities - 1.0% | | | | | |
Alliant Energy Corporation | | 48,000 | | | 1,839,360 |
| | | | | |
Oil & Gas Drilling - 3.3% | | | | | |
ENSCO International, Inc. | | 16,300 | | | 914,430 |
Helmerich & Payne, Inc. | | 157,400 | | | 5,167,442 |
| | | | | |
| | | | | 6,081,872 |
| | | | | |
Oil & Gas Equipment & Services - 1.5% | | | | | |
BJ Services Company | | 82,200 | | | 2,182,410 |
Superior Energy Services, Inc. * | | 15,700 | | | 556,408 |
| | | | | |
| | | | | 2,738,818 |
| | | | | |
Oil & Gas Refining & Marketing - 3.6% | | | | | |
Nova Biosource Fuels, Inc. * | | 416,100 | | | 1,169,241 |
Rentech, Inc. * | | 2,247,500 | | | 4,854,600 |
Syntroleum Corporation * | | 320,000 | | | 601,600 |
| | | | | |
| | | | | 6,625,441 |
| | | | | |
Oil & Gas Storage & Transportation - 1.6% | | | | | |
Williams Companies, Inc. | | 90,000 | | | 3,065,400 |
| | | | | |
Packaged Foods & Meats - 4.3% | | | | | |
Hormel Foods Corporation | | 126,000 | | | 4,508,280 |
Smithfield Foods, Inc. * | | 110,000 | | | 3,465,000 |
| | | | | |
| | | | | 7,973,280 |
| | | | | |
Pharmaceuticals - 0.3% | | | | | |
Artes Medical, Inc. * | | 24,100 | | | 95,436 |
Mylan Laboratories, Inc. | | 31,700 | | | 505,932 |
| | | | | |
| | | | | 601,368 |
| | | | | |
Railroads - 0.4% | | | | | |
Kansas City Southern * | | 25,000 | | | 804,250 |
| | | | | |
Real Estate Management & Development - 0.5% | | | | | |
Forest City Enterprises, Inc. | | 9,200 | | | 507,472 |
Jones Lang LaSalle, Inc. | | 4,800 | | | 493,248 |
| | | | | |
| | | | | 1,000,720 |
| | | | | |
Regional Banks - 1.2% | | | | | |
Boston Private Financial Holdings, Inc. | | 80,000 | | | 2,227,200 |
| | | | | |
Residential REIT’s - 0.2% | | | | | |
UDR, Inc. | | 17,500 | | | 425,600 |
| | | | | |
Retail REIT’s - 1.1% | | | | | |
Macerich Company | | 24,000 | | | 2,101,920 |
| | | | | |
Semiconductors - 7.5% | | | | | |
Applied Micro Circuits Corporation * | | 1,100,000 | | | 3,476,000 |
IXYS Corporation * | | 630,000 | | | 6,570,900 |
Mindspeed Technologies, Inc. * | | 1,549,200 | | | 2,571,672 |
QuickLogic Corporation * | | 401,900 | | | 1,310,194 |
| | | | | |
| | | | | 13,928,766 |
| | | | | |
Specialized REIT’s - 0.2% | | | | | |
Ventas, Inc. | | 11,100 | | | 459,540 |
| | | | | |
Specialty Stores - 0.7% | | | | | |
PetSmart, Inc. | | 39,700 | | | 1,266,430 |
| | | | | |
Systems Software - 1.5% | | | | | |
Progress Software Corporation * | | 90,000 | | | 2,727,000 |
| | | | | |
Thrifts & Mortgage Finance - 1.3% | | | | | |
Clayton Holdings, Inc. * | | 307,500 | | | 2,463,075 |
| | | | | |
TOTAL COMMON STOCK (Cost $165,772,499) | | | | $ | 169,253,299 |
| | | | | |
PREFERRED STOCK - 0.2% | | | | | |
Environmental & Facilities Services - 0.2% | | | | | |
ThermoEnergy Corporation PIPE * (1)(2)(3) | | 745,000 | | | 383,675 |
| | | | | |
TOTAL PREFERRED STOCK (Cost $702,947) | | | | $ | 383,675 |
| | | | | |
WARRANTS - 0.3% | | | | | |
Warrants - 0.3% | | | | | |
Lime Energy Company $ 1.00, 3/19/2009 | | 20,767 | | | 20,243 |
Nova Biosource Fuels, Inc. $ 2.40, 7/5/2011 | | 208,050 | | | 350,545 |
Orthovita, Inc. $ 4.00, 6/26/2008 | | 75,000 | | | 8,715 |
Syntroleum Corporation $ 7.60, 5/26/2008 | | 14,100 | | | 5,499 |
ThermoEnergy Corporation $ 0.75, 7/14/2008 (1)(2) | | 745,000 | | | 73,159 |
| | | | | |
| | | | | 458,161 |
| | | | | |
TOTAL WARRANTS (Cost $802,989) | | | | $ | 458,161 |
| | | | | |
The accompanying notes are an Integral part of the financial statements
75
| | |
Schedule of Investments | | Security Mid Cap Growth Fund |
September 30, 2007 - continued | | |
| | | | | | | |
| | | Principal
Amount | | Value | |
COMMERCIAL PAPER - 9.2% | | | | | | | |
Banking - 1.7% | | | | | | | |
UBS Finance (DE) LLC | | | | | | | |
4.65%, 10/2/2007 | | | 2,000,000 | | $ | 1,999,736 | |
5.00%, 10/16/2007 | | | 1,200,000 | | | 1,197,500 | |
| | | | | | | |
| | | | | | 3,197,236 | |
| | | | | | | |
Brokerage - 0.8% | | | | | | | |
JP Morgan Chase & Company | | | | | | | |
4.45%, 10/11/2007 | | | 1,500,000 | | | 1,498,146 | |
| | | | | | | |
Electric - 0.9% | | | | | | | |
Florida Power & Light Company | | | | | | | |
4.75%, 10/3/2007 | | | 1,700,000 | | | 1,699,551 | |
| | | | | | | |
Financial Companies - Captive - 2.5% | | | | | | | |
General Electric Capital Corporation | | | | | | | |
4.65%, 10/4/2007 | | | 2,400,000 | | | 2,399,080 | |
4.70%, 10/5/2007 | | | 2,300,000 | | | 2,298,812 | |
| | | | | | | |
| | | | | | 4,697,892 | |
| | | | | | | |
Non U.S. Banking - 3.3% | | | | | | | |
Danske Corporation | | | | | | | |
5.05%, 10/10/2007 | | | 1,900,000 | | | 1,897,601 | |
Societe Generale | | | | | | | |
4.84%, 10/1/2007 | | | 2,000,000 | | | 2,000,000 | |
4.90%, 10/9/2007 | | | 2,200,000 | | | 2,197,605 | |
| | | | | | | |
| | | | | | 6,095,206 | |
| | | | | | | |
TOTAL COMMERCIAL PAPER (Cost $17,188,031) | | | | | $ | 17,188,031 | |
| | | | | | | |
REPURCHASE AGREEMENT - 0.2% | | | | | | | |
United Missouri Bank, 4.53%, dated 9/28/07, matures 10/01/07; repurchase amount $297,112 (Collateralized by U.S. Treasury Note, 4.50%, 2/15/09 with a value of $303,716) | | $ | 297,000 | | $ | 297,000 | |
| | | | | | | |
TOTAL REPURCHASE AGREEMENT (Cost $297,000) | | | | | $ | 297,000 | |
| | | | | | | |
Total Investments (Security Mid Cap Growth Fund) | | | | | | | |
(Cost $184,763,466) - 100.8% | | | | | $ | 187,580,166 | |
Liabilities in Excess of Other Assets - (0.8)% | | | | | | (1 442 339 | ) |
| | | | | | | |
TOTAL NET ASSETS - 100.0% | | | | | $ | 186,137,827 | |
| | | | | | | |
Footnotes
Percentages are stated as a percent of net assets.
For federal income tax purposes the identified cost of investments owned at 9/30/2007 was $184,763,466.
| * | - Non-income producing security |
| 1 | - Security is deemed illiquid. See Note 8 in notes to financial statements. |
| 2 | - Security is restricted from resale. See Note 6 in notes to financial statements. |
| 3 | - PIPE (Private Investment in Public Equity) - Stock issued by a company in the secondary market as a means of raising capital more quickly and less expensively than through registration of a secondary public offering. |
See notes to financial statements.
The accompanying notes are an integral part of the financial statements
76
| | |
| | Security |
| | Mid Cap Growth Fund |
Statement of Assets and Liabilities
September 30, 2007
| | | |
Assets: | | | |
Investments, at value* | | $ | 187,580,166 |
| |
Receivables: | | | |
Fund shares sold | | | 80,926 |
Securities sold | | | 596,469 |
Dividends | | | 53,703 |
Prepaid expenses | | | 31,893 |
| | | |
Total assets | | | 188,343,157 |
| | | |
Liabilities: | | | |
Cash overdraft | | | 30 |
Payable for: | | | |
Securities purchased | | | 1,782,029 |
Fund shares redeemed | | | 178,574 |
Management fees | | | 113,388 |
Custodian fees | | | 2,487 |
Transfer agent/maintenance fees | | | 19,979 |
Administration fees | | | 14,762 |
Professional fees | | | 21,550 |
12b-1 distribution plan fees | | | 53,481 |
Directors’ fees | | | 2,500 |
Other | | | 16,550 |
| | | |
Total liabilities | | | 2,205,330 |
| | | |
Net assets | | $ | 186,137,827 |
| | | |
Net assets consist of: | | | |
Paid in capital | | $ | 151,255,870 |
Undistributed net realized gain on sale of investments | | | 32,065,257 |
Net unrealized appreciation in value of investments | | | 2,816,700 |
| | | |
Net assets | | $ | 186,137,827 |
| | | |
Class A: | | | |
Capital shares outstanding (unlimited number of shares authorized) | | | 14,448,409 |
Net assets | | $ | 160,543,740 |
Net asset value and redemption price per share | | $ | 11.11 |
| | | |
Maximum offering price per share (net asset value divided by 94.25%) | | $ | 11.79 |
| | | |
Class B: | | | |
Capital shares outstanding (unlimited number of shares authorized) | | | 1,637,457 |
Net assets | | $ | 14,876,609 |
Net asset value, offering and redemption price per share (excluding any applicable contingent deferred sales charge) | | $ | 9.09 |
| | | |
Class C: | | | |
Capital shares outstanding (unlimited number of shares authorized) | | | 1,060,204 |
Net assets | | $ | 10,717,478 |
Net asset value, offering and redemption price per share (excluding any applicable contingent deferred sales charge) | | $ | 10.11 |
| | | |
* Investments, at cost | | $ | 184,763,466 |
Statement of Operations
For the Year Ended September 30, 2007
| | | | |
Investment Income: | | | | |
Dividends | | $ | 860,751 | |
Interest | | | 732,749 | |
| | | | |
Total investment income | | | 1,593,500 | |
| | | | |
Expenses: | | | | |
Management fees | | | 1,632,227 | |
Transfer agent/maintenance fees | | | 499,924 | |
Administration fees | | | 208,997 | |
Custodian fees | | | 17,543 | |
Directors’ fees | | | 7,354 | |
Professional fees | | | 27,695 | |
Reports to shareholders | | | 25,957 | |
Registration fees | | | 62,600 | |
Other expenses | | | 32,037 | |
12b-1 distribution fees - Class A | | | 462,147 | |
12b-1 distribution fees - Class B | | | 191,270 | |
12b-1 distribution fees - Class C | | | 136,445 | |
| | | | |
Total expenses | | | 3,304,196 | |
Less: | | | | |
Earnings credits applied | | | (96 | ) |
| | | | |
Net expenses | | | 3,304,100 | |
| | | | |
Net investment loss | | | (1,710,600 | ) |
| | | | |
Net Realized and Unrealized Gain (Loss): | | | | |
Net realized gain (loss) during the year on: | | | | |
Investments | | | 36,424,226 | |
Options written | | | 219,597 | |
| | | | |
Net realized gain | | | 36,643,823 | |
| | | | |
Net unrealized appreciation (depreciation) during the year on: | | | | |
Investments | | | (29,725,347 | ) |
Options written | | | 204,335 | |
| | | | |
Net unrealized depreciation | | | (29,521,012 | ) |
| | | | |
Net realized and unrealized gain | | | 7,122,811 | |
| | | | |
Net increase in net assets resulting from operations | | $ | 5,412,211 | |
| | | | |
The accompanying notes are an integral part of the financial statements
77
| | |
| | Security |
Statement of Changes in Net Assets | | Mid Cap Growth Fund |
| | | | | | | | |
| | | Year Ended
September 30, 2007 | | | Year Ended
September 30, 2006 | |
Increase (decrease) in net assets from operations: | | | | | | | | |
Net investment loss | | $ | (1,710,600 | ) | | $ | (2,484,452 | ) |
Net realized gain during the year on investments | | | 36,643,823 | | | | 31,881,628 | |
Net unrealized depreciation during the year on investments | | | (29,521,012 | ) | | | (24,964,195 | ) |
| | | | | | | | |
Net increase in net assets resulting from operations | | | 5,412,211 | | | | 4,432,981 | |
| | | | | | | | |
Distributions to shareholders from: | | | | | | | | |
Net realized gain | | | | | | | | |
Class A | | | (19,776,158 | ) | | | (13,404,927 | ) |
Class B | | | (2,496,080 | ) | | | (2,137,907 | ) |
Class C | | | (1,608,868 | ) | | | (1,288,551 | ) |
| | | | | | | | |
Total distributions to shareholders | | | (23,881,106 | ) | | | (16,831,385 | ) |
| | | | | | | | |
Capital share transactions: | | | | | | | | |
Proceeds from sale of shares | | | | | | | | |
Class A | | | 48,235,738 | | | | 64,440,077 | |
Class B | | | 1,357,847 | | | | 3,192,315 | |
Class C | | | 1,704,430 | | | | 3,755,889 | |
Distributions reinvested | | | | | | | | |
Class A | | | 19,133,742 | | | | 12,899,625 | |
Class B | | | 2,453,633 | | | | 2,106,540 | |
Class C | | | 1,496,764 | | | | 1,195,749 | |
Cost of shares redeemed | | | | | | | | |
Class A | | | (83,873,354 | ) | | | (58,969,056 | ) |
Class B | | | (8,893,103 | ) | | | (8,845,377 | ) |
Class C | | | (6,683,210 | ) | | | (4,824,246 | ) |
| | | | | | | | |
Net increase (decrease) from capital share transactions | | | (25,067,513 | ) | | | 14,951,516 | |
| | | | | | | | |
Net increase (decrease) in net assets | | | (43,536,408 | ) | | | 2,553,112 | |
| | | | | | | | |
Net assets: | | | | | | | | |
Beginning of year | | | 229,674,235 | | | | 227,121,123 | |
| | | | | | | | |
End of year | | $ | 186,137,827 | | | $ | 229,674,235 | |
| | | | | | | | |
Accumulated net investment income at end of year | | $ | — | | | $ | — | |
| | | | | | | | |
Capital share activity: | | | | | | | | |
Shares sold | | | | | | | | |
Class A | | | 4,072,151 | | | | 5,111,243 | |
Class B | | | 142,975 | | | | 297,700 | |
Class C | | | 160,950 | | | | 323,232 | |
Shares reinvested | | | | | | | | |
Class A | | | 1,702,290 | | | | 1,075,865 | |
Class B | | | 265,258 | | | | 207,746 | |
Class C | | | 145,458 | | | | 107,242 | |
Shares redeemed | | | | | | | | |
Class A | | | (7,294,430 | ) | | | (4,738,606 | ) |
Class B | | | (946,339 | ) | | | (827,165 | ) |
Class C | | | (639,771 | ) | | | (415,740 | ) |
The accompanying notes are an integral part of the financial statements
78
| | |
| Financial Highlights | | Security |
| Selected data for each share of capital stock outstanding throughout each year | | Mid Cap Growth Fund |
| | | | | | | | | | | | | | | | | | | | |
| | | | | | | | | | | | | | | Year Ended
September 30, | |
Class A | | 2007 | | | 2006 | | | 2005 | | | 2004a | | | 2003 | |
Per Share Data | | | | | | | | | | | | | | | | | | | | |
Net asset value, beginning of period | | $ | 12.03 | | | $ | 12.65 | | | $ | 11.02 | | | $ | 10.84 | | | $ | 7.03 | |
| | | | | | | | | | | | | | | | | | | | |
Income (loss) from investment operations: | | | | | | | | | | | | | | | | | | | | |
Net investment lossb | | | (0.08 | ) | | | (0.12 | ) | | | (0.10 | ) | | | (0.13 | ) | | | (0.10 | ) |
Net gain on securities (realized and unrealized) | | | 0.35 | | | | 0.47 | | | | 2.46 | | | | 0.71 | | | | 3.91 | |
| | | | | | | | | | | | | | | | | | | | |
Total from investment operations | | | 0.27 | | | | 0.35 | | | | 2.36 | | | | 0.58 | | | | 3.81 | |
| | | | | | | | | | | | | | | | | | | | |
Less distributions: | | | | | | | | | | | | | | | | | | | | |
Distributions from realized gains | | | (1.19 | ) | | | (0.97 | ) | | | (0.73 | ) | | | (0.40 | ) | | | — | |
| | | | | | | | | | | | | | | | | | | | |
Total distributions | | | (1.19 | ) | | | (0.97 | ) | | | (0.73 | ) | | | (0.40 | ) | | | — | |
| | | | | | | | | | | | | | | | | | | | |
Net asset value, end of period | | $ | 11.11 | | | $ | 12.03 | | | $ | 12.65 | | | $ | 11.02 | | | $ | 10.84 | |
| | | | | | | | | | | | | | | | | | | | |
Total Returnc | | | 2.10 | % | | | 2.81 | % | | | 21.76 | % | | | 5.23 | % | | | 54.20 | % |
| | | | | | | | | | | | | | | | | | | | |
Ratios/Supplemental Data | | | | | | | | | | | | | | | | | | | | |
Net assets, end of period (in thousands) | | $ | 160,544 | | | $ | 192,159 | | | $ | 183,676 | | | $ | 149,715 | | | $ | 134,208 | |
| | | | | | | | | | | | | | | | | | | | |
Ratios to average net assets: | | | | | | | | | | | | | | | | | | | | |
Net investment loss | | | (0.67 | )% | | | (0.93 | )% | | | (0.85 | )% | | | (1.11 | )% | | | (1.14 | )% |
Total expensesd | | | 1.41 | % | | | 1.40 | % | | | 1.42 | % | | | 1.41 | % | | | 1.41 | % |
Net expensese | | | 1.41 | % | | | 1.40 | % | | | 1.42 | % | | | 1.41 | % | | | 1.41 | % |
Net expenses prior to custodian earning credits and net of expense waivers | | | 1.41 | % | | | 1.40 | % | | | 1.42 | % | | | 1.41 | % | | | 1.41 | % |
| | | | | | | | | | | | | | | | | | | | |
Portfolio turnover rate | | | 34 | % | | | 41 | % | | | 31 | % | | | 50 | % | | | 57 | % |
| | | | | |
| | | | | | | | | | | | | | | Year Ended
September 30, | |
Class B | | 2007 | | | 2006 | | | 2005 | | | 2004a | | | 2003 | |
Per Share Data | | | | | | | | | | | | | | | | | | | | |
Net asset value, beginning of period | | $ | 10.12 | | | $ | 10.86 | | | $ | 9.61 | | | $ | 9.57 | | | $ | 6.26 | |
| | | | | | | | | | | | | | | | | | | | |
Income (loss) from investment operations: | | | | | | | | | | | | | | | | | | | | |
Net investment lossb | | | (0.14 | ) | | | (0.18 | ) | | | (0.16 | ) | | | (0.19 | ) | | | (0.15 | ) |
Net gain on securities (realized and unrealized) | | | 0.30 | | | | 0.41 | | | | 2.14 | | | | 0.63 | | | | 3.46 | |
| | | | | | | | | | | | | | | | | | | | |
Total from investment operations | | | 0.16 | | | | 0.23 | | | | 1.98 | | | | 0.44 | | | | 3.31 | |
| | | | | | | | | | | | | | | | | | | | |
Less distributions: | | | | | | | | | | | | | | | | | | | | |
Distributions from realized gains | | | (1.19 | ) | | | (0.97 | ) | | | (0.73 | ) | | | (0.40 | ) | | | — | |
| | | | | | | | | | | | | | | | | | | | |
Total distributions | | | (1.19 | ) | | | (0.97 | ) | | | (0.73 | ) | | | (0.40 | ) | | | — | |
| | | | | | | | | | | | | | | | | | | | |
Net asset value, end of period | | $ | 9.09 | | | $ | 10.12 | | | $ | 10.86 | | | $ | 9.61 | | | $ | 9.57 | |
| | | | | | | | | | | | | | | | | | | | |
Total Returnc | | | 1.34 | % | | | 2.12 | % | | | 20.95 | % | | | 4.44 | % | | | 52.88 | % |
| | | | | | | | | | | | | | | | | | | | |
Ratios/Supplemental Data | | | | | | | | | | | | | | | | | | | | |
Net assets, end of period (in thousands) | | $ | 14,877 | | | $ | 22,010 | | | $ | 27,115 | | | $ | 26,578 | | | $ | 26,459 | |
| | | | | | | | | | | | | | | | | | | | |
Ratios to average net assets: | | | | | | | | | | | | | | | | | | | | |
Net investment loss | | | (1.43 | )% | | | (1.68 | )% | | | (1.61 | )% | | | (1.86 | )% | | | (1.89 | )% |
Total expensesd | | | 2.16 | % | | | 2.15 | % | | | 2.17 | % | | | 2.16 | % | | | 2.16 | % |
Net expensese | | | 2.16 | % | | | 2.15 | % | | | 2.17 | % | | | 2.16 | % | | | 2.16 | % |
Net expenses prior to custodian earning credits and net of expense waivers | | | 2.16 | % | | | 2.15 | % | | | 2.17 | % | | | 2.16 | % | | | 2.16 | % |
| | | | | | | | | | | | | | | | | | | | |
Portfolio turnover rate | | | 34 | % | | | 41 | % | | | 31 | % | | | 50 | % | | | 57 | % |
The accompanying notes are an integral part of the financial statements
79
| | |
| Financial Highlights | | Security |
| Selected data for each share of capital stock outstanding throughout each year | | Mid Cap Growth Fund |
| | | | | | | | | | | | | | | | | | | | |
| | | | | | | | | | | | | | | Year Ended
September 30, | |
Class C | | 2007 | | | 2006 | | | 2005 | | | 2004a | | | 2003 | |
Per Share Data | | | | | | | | | | | | | | | | | | | | |
Net asset value, beginning of period | | $ | 11.13 | | | $ | 11.84 | | | $ | 10.43 | | | $ | 10.34 | | | $ | 6.76 | |
| | | | | | | | | | | | | | | | | | | | |
Income (loss) from investment operations: | | | | | | | | | | | | | | | | | | | | |
Net investment lossb | | | (0.15 | ) | | | (0.19 | ) | | | (0.18 | ) | | | (0.21 | ) | | | (0.16 | ) |
Net gain on securities (realized and unrealized) | | | 0.32 | | | | 0.45 | | | | 2.32 | | | | 0.70 | | | | 3.74 | |
| | | | | | | | | | | | | | | | | | | | |
Total from investment operations | | | 0.17 | | | | 0.26 | | | | 2.14 | | | | 0.49 | | | | 3.58 | |
| | | | | | | | | | | | | | | | | | | | |
Less distributions: | | | | | | | | | | | | | | | | | | | | |
Distributions from realized gains | | | (1.19 | ) | | | (0.97 | ) | | | (0.73 | ) | | | (0.40 | ) | | | — | |
| | | | | | | | | | | | | | | | | | | | |
Total distributions | | | (1.19 | ) | | | (0.97 | ) | | | (0.73 | ) | | | (0.40 | ) | | | — | |
| | | | | | | | | | | | | | | | | | | | |
Net asset value, end of period | | $ | 10.11 | | | $ | 11.13 | | | $ | 11.84 | | | $ | 10.43 | | | $ | 10.34 | |
| | | | | | | | | | | | | | | | | | | | |
Total Returnc | | | 1.31 | % | | | 2.20 | % | | | 20.83 | % | | | 4.59 | % | | | 52.96 | % |
| | | | | | | | | | | | | | | | | | | | |
Ratios/Supplemental Data | | | | | | | | | | | | | | | | | | | | |
Net assets, end of period (in thousands) | | $ | 10,717 | | | $ | 15,505 | | | $ | 16,330 | | | $ | 14,759 | | | $ | 11,279 | |
| | | | | | | | | | | | | | | | | | | | |
Ratios to average net assets: | | | | | | | | | | | | | | | | | | | | |
Net investment loss | | | (1.43 | )% | | | (1.68 | )% | | | (1.60 | )% | | | (1.86 | )% | | | (1.89 | )% |
Total expensesd | | | 2.16 | % | | | 2.15 | % | | | 2.17 | % | | | 2.16 | % | | | 2.16 | % |
Net expensese | | | 2.16 | % | | | 2.15 | % | | | 2.17 | % | | | 2.16 | % | | | 2.16 | % |
Net expenses prior to custodian earning credits and net of expense waivers | | | 2.16 | % | | | 2.15 | % | | | 2.17 | % | | | 2.16 | % | | | 2.16 | % |
| | | | | | | | | | | | | | | | | | | | |
Portfolio turnover rate | | | 34 | % | | | 41 | % | | | 31 | % | | | 50 | % | | | 57 | % |
a | The financial highlights for the Security Mid Cap Growth Fund exclude the historical financial highlights of the Technology Series Class, A, B and C shares. The assets of the Technology Series were acquired by the Security Mid Cap Growth Fund on October 3, 2003. |
b | Net investment income (loss) was computed using average shares outstanding throughout the period. |
c | Total return information does not reflect deduction of any sales charges imposed at the time of purchase for Class A shares or upon redemption for Class B and C shares. |
d | Total expense information reflects expense ratios absent expense reductions by the Investment Manager and custodian earnings credits, as applicable. |
e | Net expense information reflects the expense ratios after voluntary expense waivers, reimbursements and custodian earnings credits, as applicable. |
The accompanying notes are an integral part of the financial statements
80
Notes to Financial Statements
September 30, 2007
1. Significant Accounting Policies
Security Large Cap Value, Equity and Mid Cap Growth Funds (the Funds) are registered under the Investment Company Act of 1940, as amended, as open-end management investment companies. The shares of Security Equity Fund are currently issued in multiple series, with each series, in effect, representing a separate fund. The Equity Fund accounts for the assets of each series separately. Class “A” shares are generally sold with a sales charge at the time of purchase. Class “A” shares are not subject to a sales charge when they are redeemed, except for purchases of $1 million or more sold without a front-end sales charge are subject to a contingent deferred sales charge if redeemed within one year of purchase. Class “B” shares may be subject to a contingent deferred sales charge for six years and automatically convert to Class A shares after eight years. Redemptions of Class “B” shares within five years of acquisition incur a contingent deferred sales charge. Class “C” shares are offered without a front-end sales charge but incur additional class-specific expenses. Redemptions of Class “C” shares within one year of acquisition incur a contingent deferred sales charge. The following is a summary of the significant accounting policies followed by the Funds in the preparation of their financial statements.
A. Security Valuation – Valuations of the Funds’ or Series’ securities are supplied by pricing services approved by the Board of Directors. The Funds’ officers, under the general supervision of the Board of Directors, regularly review procedures used by, and valuations provided by, the pricing services. Each security owned by the Funds or Series that is listed on a securities exchange is valued at its last sale price on that exchange on the date as of which assets are valued. Where the security is listed on more than one exchange, the Fund or Series will use the price of that exchange that it generally considers to be the principal exchange on which the stock is traded. Securities listed on the Nasdaq Stock Market, Inc. (“Nasdaq”) will be valued at the Nasdaq Official Closing Price, which may not necessarily represent the last sale price. If there has been no sale on such exchange or NASDAQ on such day, the security is valued at the closing bid price on such day. Securities for which market quotations are not readily available are valued by a pricing service considering securities with similar yields, quality, type of issue, coupon, duration and rating. If there is no bid price or if the bid price is deemed to be unsatisfactory by the Board of Directors or by the Funds’ or Series’ investment manager, then the securities are valued in good faith by such method as the Board of Directors determines will reflect the fair value. If events occur after the close of a foreign exchange that will affect the value of a Fund or Series portfolio securities before the time as of which the NAV is calculated (a “significant event”), the security will generally be priced using a fair value procedure. If the Valuation Committee determines a significant event has occurred, it will evaluate the impact of that event on an affected security or securities, to determine whether a fair value adjustment would materially affect the Fund or Series net asset value per share. Some of the factors which may be considered by the Board of Directors in determining fair value are fundamental analytical data relating to the investment; the nature and duration of any restrictions on disposition; trading in similar securities of the same issuer or comparable companies; information from broker-dealers; and an evaluation of the forces that influence the market in which the securities are purchased and sold. The Funds or Series generally will value short-term debt securities at prices based on market quotations for such securities or securities of similar type, yield, quality and duration, except those securities purchased with 60 days or less to maturity are valued on the basis of amortized cost which approximates market value.
Generally, trading in foreign securities markets is substantially completed each day at various times prior to the close of the New York Stock Exchange. The values of foreign securities are determined as of the close of such foreign markets or the close of the New York Stock Exchange, if earlier. All investments quoted in foreign currency are valued in U.S. dollars on the basis of the foreign currency exchange rates prevailing at the close of business. Investments in foreign securities may involve risks not present in domestic investments. The Valuation Committee will determine the current value of such foreign securities by taking into consideration certain factors which may include those discussed above, as well as the following factors, among others: the value of the securities traded on other foreign markets, ADR trading, closed-end fund trading, foreign currency exchange activity, and the trading prices of financial products that are tied to foreign securities such as WEBS®. In addition, the Board of Directors has authorized the Valuation Committee and Administrator to use prices and other information supplied by Interactive Data Corporation’s Fair Value Information Service in valuing foreign securities.
B. Repurchase Agreements – In connection with transactions in repurchase agreements, it is the Funds’ or Series’ policy that their custodian take possession of the underlying collateral and that the fair value of the collateral exceed the principal amount of the repurchase transaction, including accrued interest, at all times. If the seller defaults, and the fair value of the collateral declines, realization of the collateral by the Fund or Series may be delayed or limited.
C. Foreign Currency Transactions – The accounting records of the Funds or Series are maintained in U.S. dollars. All assets and liabilities initially expressed in foreign currencies are converted into U.S. dollars at prevailing exchange rates. Purchases and sales of investment securities, dividend and interest income, and certain expenses are translated at the rates of exchange prevailing on the respective dates of such transactions. Changes in the relationship of these foreign currencies to the U.S. dollar can significantly affect the value of the investments and earnings of the Funds or Series. Foreign investments may also subject the Fund or Series to foreign government exchange restrictions, expropriation, taxation or other political, social or economic developments, all of which could affect the market and/or credit risk of the investments.
The Funds or Series do not isolate that portion of the results of operations resulting from changes in the foreign exchange rates on investments from the fluctuations arising from changes in the market prices of securities held. Such fluctuations are included with the net realized and unrealized gain or loss on investments.
Net realized foreign exchange gains or losses arise from sales of portfolio securities, sales of foreign currencies, and the difference between asset and liability amounts initially stated in
81
Notes to Financial Statements
September 30, 2007
foreign currencies and the U.S. dollar value of the amounts actually received or paid. Net unrealized foreign exchange gains or losses arise from changes in the value of portfolio securities and other assets and liabilities at the end of the reporting period, resulting from changes in the exchange rates.
D. Forward Foreign Currency Exchange Contracts – Global Series of the Security Equity Fund may enter into forward foreign exchange contracts in order to manage foreign currency risk from purchase or sale of securities denominated in foreign currency. The Series may also enter into such contracts to manage the effect of changes in foreign currency exchange rates on portfolio positions. These contracts are marked to market daily, by recognizing the difference between the contract exchange rate and the current market rate as unrealized gains or losses. Realized gains or losses are recognized when contracts are settled and are reflected in the Statement of Operations. These contracts involve market risk in excess of the amount reflected in the Statement of Assets and Liabilities. The face or contract amount in U.S. dollars reflects the total exposure these funds have in that particular currency contract. Losses may arise due to changes in the value of the foreign currency or if the counterparty does not perform under the contract.
E. Futures – The Funds or Series may utilize futures contracts to a limited extent, with the objectives of maintaining full exposure to the underlying stock market, enhancing returns, maintaining liquidity minimizing transaction costs and hedging possible variations in foreign exchange values. The Funds or Series, as applicable, may purchase or sell financial and foreign currency futures contracts to immediately position incoming cash in the market, thereby simulating a fully invested position in the underlying index while maintaining a cash balance for liquidity. In the event of redemptions, the Fund or Series, as applicable, may pay from its cash balances and reduce its future positions accordingly. Returns may be enhanced by purchasing futures contracts instead of the underlying securities when futures are believed to be priced more attractively than the underlying securities. The primary risks associated with the use of futures contracts are imperfect correlation between changes in market values of stocks contained in the indexes and the prices of futures contracts, and the possibility of an illiquid market. Futures contracts are valued based upon their quoted daily settlement prices. Upon entering into a futures contract, the Funds or Series are required to deposit and maintain as collateral either cash or securities, representing the initial margin, equal to a certain percentage of the contract value. Cash deposits are shown as restricted cash on the Statement of Assets and Liabilities; securities held as collateral are noted in the Schedule of Investments. Subsequent changes in the value of the contract are recorded as unrealized gains or losses. The variation margin is paid or received in cash daily by the Funds or Series. The Funds or Series realize a gain or loss when the contract is closed or expires.
F. Options Purchased and Written – The Funds or Series may purchase put and call options and write such options on a covered basis on securities that are traded on recognized securities exchanges and over-the-counter markets. Call and put options on securities give the holder the right to purchase or sell (and the writer the obligation to sell or purchase), respectively, a security at a specified price, until a certain date. Options may be used to hedge the Funds’ or Series’ portfolio, to increase returns or to maintain exposure to the equity markets. The primary risks associated with the use of options are an imperfect correlation between the change in market value of the securities held by the Fund or Series and the price of the option, the possibility of an illiquid market, and the inability of the counterparty to meet the terms of the contract.
The premium received for a written option is recorded as an asset with an equal liability which is marked to market based on the option’s quoted daily settlement price. Fluctuations in the value of such instruments are recorded as unrealized appreciation (depreciation) until terminated, at which time realized gains and losses are recognized.
G. Securities Sold Short – Certain Funds or Series may make short sales “against the box,” in which the Fund or Series enters into a short sale of a security it owns. At no time will more than 15% of the value of the Funds’ or Series’ net assets be in deposits on short sales against the box. If a Fund or Series makes a short sale, the Fund or Series does not immediately deliver from its own account the securities sold and does not receive the proceeds from the sale. To complete the sale, the Fund or Series must borrow the security (generally from the broker through which the short sale is made) in order to make delivery to the buyer. The Fund or Series must replace the security borrowed by purchasing it at the market price at the time of replacement or delivering the security from its own portfolio. The Fund or Series is said to have a “short position” in securities sold until it delivers them to the broker, at which time it receives the proceeds of the sale. Certain Funds or Series may make short sales that are not “against the box,” which create opportunities to increase the Fund’s or Series’ return but, at the same time, involve specific risk considerations and may be considered a speculative technique. Such short sales theoretically involve unlimited loss potential, as the market price of securities sold short may continually increase, although a Fund or Series may mitigate such losses by replacing the securities sold short before the market price has increased significantly. For financial statement purposes, an amount equal to the settlement amount is included in the Statement of Assets and Liabilities as an asset and an equivalent liability. The amount of the liability is subsequently marked-to-market to reflect the current value of the short position. Subsequent fluctuations in the market prices of securities sold, but not yet purchased, may require purchasing the securities at prices which differ from the market value reflected on the Statement of Assets and Liabilities. The Fund or Series are liable for any dividends or interest payable on securities while those securities are in a short position. As collateral for its short positions, the Fund or Series are required under the Investment Company Act of 1940 to maintain segregated assets consisting of cash, cash equivalents or liquid securities. These segregated assets are valued consistent with Note 1a above. These segregated assets are required to be adjusted daily to reflect changes in the market value of the securities sold short.
H. Security Transactions and Investment Income – Security transactions are accounted for on the date the securities are purchased or sold (trade date). Realized gains and losses are
82
Notes to Financial Statements
September 30, 2007
reported on an identified cost basis. Dividend income is accrued as of ex-dividend date, except that certain dividends for foreign securities where the ex-dividend date may have passed are recorded as soon as the Fund or Series is informed of the dividend in the exercise of reasonable diligence. Interest income is recognized on the accrual basis including the amortization of premiums and accretion of discounts on debt securities.
I. Expenses – Expenses that are directly related to one of the Funds or Series are charged directly to that Fund or Series. Other operating expenses are allocated to the Funds or Series on the basis of relative net assets. Class specific expenses, such as 12b-1 fees, are borne by that class. Income, other expenses and realized and unrealized gains and losses of a Fund or Series are allocated to each respective class in proportion to the relative net assets of each class.
J. Distributions to Shareholders – Distributions to shareholders are recorded on the ex-dividend date. The character of distributions made during the year from net investment income or net realized gains may differ from their ultimate characterization for federal income tax purposes.
K. Taxes – The Funds or Series intend to comply with the requirements of the Internal Revenue Code applicable to regulated investment companies and distribute all of their taxable net income and net realized gains sufficient to relieve them from all, or substantially all, federal income, excise and state income taxes. Therefore, no provision for federal or state income tax is required.
L. Earnings Credits – Under the fee agreement with the custodian, the Funds or Series may earn credits based on overnight custody cash balances. These credits are utilized to reduce related custodial expenses. The custodian fees disclosed in the Statement of Operations are before the reduction in expense from the related earnings credits.
M. Use of Estimates – The preparation of financial statements in conformity with U.S. generally accepted accounting principles requires management to make estimates and assumptions that affect the reported amounts of assets and liabilities and disclosure of contingent assets and liabilities at the date of the financial statements and the reported amounts of increases and decreases in net assets from operations during the reporting period. Actual results could differ from those estimates.
N. Indemnifications – Under the Funds’ or Series’ organizational documents, its Officers and Directors are indemnified against certain liabilities arising out of the performance of their duties to the Funds or Series. In addition, in the normal course of business, the Funds or Series enter into contracts that provide general indemnification to other parties. The Funds’ or Series’ maximum exposure under these arrangements is unknown as this would involve future claims that may be made against the Funds or Series that have not yet occurred, and may not occur. However, the Funds have not had prior claims or losses pursuant to these contracts and expect the risk of loss to be remote.
O. Recent Accounting Pronouncements – On July 13, 2006, the Financial Accounting Standards Board (FASB) released FASB Interpretation No. 48 “Accounting for Uncertainty in Income Taxes” (FIN 48). FIN 48 provides guidance for how uncertain tax positions should be recognized, measured, presented and disclosed in the financial statements. FIN 48 requires the evaluation of tax positions taken or expected to be taken in the course of preparing the Fund’s tax returns to determine whether the tax positions are “more-likely-than-not” to be sustained by the applicable tax authority. Tax positions not deemed to meet a more-likely-than-not threshold would be deemed to be uncertain and would be recorded as tax expense in the current year. Adoption of FIN 48 is required for fiscal years beginning after December 15, 2006 and is to be applied to all open tax years as of the effective date. Recent SEC guidance allows implementing FIN 48 in Fund NAV calculations as late as the fund’s last NAV calculation in the first required financial statement reporting period. As a result, the Funds will incorporate FIN 48 in its semi-annual report on March 31, 2008. As of the date of this report, management is evaluating the implications of FIN 48 and its impact to the financial statements has not yet been determined.
In September 2006, FASB issued Statement on Financial Accounting Standards No. 157, “Fair Value Measurements” (FAS 157). This standard clarifies the definition of fair value for financial reporting, establishes a framework for measuring fair value and requires additional disclosure about the use of fair value requirements. FAS 157 is effective for financial statements issued for fiscal years beginning after November 15, 2007 and interim periods within those fiscal years. As of September 30, 2007, the Funds do not believe the adoption of FAS 157 will impact the amounts reported in the financial statements, however, additional disclosures will be required about the inputs used to develop the measurements of fair value and the effect of certain of the measurements reported in the statement of operations for a fiscal period.
2. Management Fees and Other Transactions with Affiliates
Management fees are paid monthly to Security Investors (SI), (formerly known as Security Management Company) based on the following annual rates for the year ended September 30, 2007:
| | | |
| | | Management
Fees (as a %
of net assets) | |
Security Equity Fund: | | | |
Alpha Opportunity Series* | | 1.90 | %1 |
Equity Series | | 0.75 | % |
Global Series | | 1.00 | % |
Mid Cap Value Series | | 0.80 | %2 |
Select 25 Series | | 0.75 | % |
Small Cap Growth Series | | 1.00 | % |
Security Large Cap Value Fund | | 0.65 | % |
Security Mid Cap Growth Fund | | 0.75 | % |
| * | Alpha Opportunity Series’ management fee will range from 1.25% to 2.75% of average daily net assets as discussed below. |
1 | SI receives a management fee from the Alpha Opportunity Series that consists of two components. The first component is an annual base fee equal to 2.00% of Alpha Opportunity Series average daily net assets. The second component is a base fee adjustment that either increases or decreases the base fee, depending on how Alpha Opportunity Series (calculated by reference to its Class |
83
Notes to Financial Statements
September 30, 2007
| | A shares) performed relative to the S&P 500 Index over the prior 12-month period (the “Measuring Period”). SI will receive the base fee of 2.00% without adjustment if the performance of Alpha Opportunity Series (calculated by reference to its Class A shares) matches the performance of the S&P 500 Index. The maximum base fee adjustment at each calculation period is 0.75% up or down in the event that Alpha Opportunity Series outperforms or underperforms the S&P 500 Index by 15% or more. SI calculates the base fee adjustment each month based upon Alpha Opportunity Series’ performance relative to the S&P 500 Index during the Measuring Period ending on the last day of the month. If Alpha Opportunity Series outperforms the S&P 500 Index over the Measuring Period, the base fee is adjusted upward. The upward adjustment is equal to the amount by which Alpha Opportunity Series’ performance exceeds that of the S&P 500 Index divided by 15 and multiplied by the average daily net assets of Alpha Opportunity Series during the Measuring Period to determine the base fee adjustment for the month. If Alpha Opportunity Series underperforms the Index, the base fee is adjusted downward on the same basis. SI will determine the dollar amount of any performance adjustment each month by multiplying the adjustment percentage by the average daily net assets of the Alpha Opportunity Series during the Measuring Period and dividing that number by the number of days in the Measuring Period and then multiplying that amount by the number of days in the current month. |
2 | Management fees are payable at an annual rate of 1.00% of the average daily net assets of $200 million or less, and 0.75% of the average daily net assets of the Mid Cap Value Series in excess of $200 million. |
SI also acts as the administrative agent and transfer agent for the Funds, and as such performs administrative functions, transfer agency and dividend disbursing services, and the bookkeeping, accounting and pricing functions for each Fund or Series. For these services, the Investment Manager receives the following:
| | |
| | | Administrative Fees
(as a % of net assets) |
Security Equity Fund: | | |
Alpha Opportunity Series | | 0.15% |
Equity Series | | 0.095% |
Global Series | | 0.05% + greater of 0.10% or $ 60,000 |
Mid Cap Value Series | | 0.095% |
Select 25 Series | | 0.095% |
Small Cap Growth Series | | 0.095% |
Security Large Cap Value Fund | | 0.095% |
Security Mid Cap Growth Fund | | 0.095% |
Minimum charge per Series or Fund | | $25,000 |
Certain out-of-pocket charges | | Varies |
SI is paid the following for providing transfer agent services to the Funds:
| | | |
Annual per account charge | | $ | 5.00 - $8.00 |
Transaction fee | | $ | 0.60 - $1.10 |
Annual minimum charge (per Series or Fund) | | $ | 25,000 |
Certain out-of-pocket charges | | | Varies |
Effective January 1, 2007, the investment advisory contract for Security Large Cap Value Fund provides that the total expenses be limited to 1.25% of average net assets for Class A shares and 2.00% of average net assets for both Class B and Class C shares, exclusive of interest, taxes, extraordinary expenses and brokerage fees and commissions. Effective January 1, 2007, the investment advisory contract for the Select 25 Series provides that the total expenses be limited to 1.35% of average net assets for Class A shares and 2.10% of average net assets for both Class B and C shares, exclusive of interest, taxes, extraordinary expenses and brokerage fees and commissions. Effective January 1, 2007, the investment advisory contract for the Alpha Opportunity Series provides that the total other expenses be limited to 0.50% of average net assets for each class of shares, exclusive of interest, taxes, extraordinary expenses, brokerage fees and commissions, 12b-1 fees and dividends on short sales. These contracts are in effect through December 31, 2008. SMC has agreed to limit the total expenses for each class of the Mid Cap Value Series and the Small Cap Growth Series to 2.00% of average net assets, exclusive of interest, taxes, extraordinary expenses, brokerage fees and commissions and 12-1 fees for the aforementioned Series. The expense limits are voluntary and may be terminated at any time without notice to shareholders.
The Funds have adopted Distribution Plans related to the offering of Class A, Class B and Class C shares pursuant to Rule 12b-1 under the Investment Company Act of 1940. The plans provide for payments at an annual rate of 1.00% of the average daily net assets of each Fund’s or Series’ Class B and Class C shares, and 0.25% of the average daily net assets of each Fund’s or Series’ Class A shares. Effective August 25, 2005, Global Series ceased charging 12b-1 fees on Class B shares in accordance with the NASD sales cap regulations. Effective August 1, 2007, the Security Large Cap Value Fund ceased charging 12b-1 fees on Class B shares in accordance with the NASD sales cap regulations. These fees may be reinstated at any time.
Security Distributors, Inc. (SDI), a wholly-owned subsidiary of Security Benefit Corporation and the distributor of the Funds or Series, received net underwriting commissions on sales of shares after allowances to brokers and dealers as follows:
| | | |
| | | SDI
Underwriting
Commissions |
Security Equity Fund: | | | |
Alpha Opportunity Series | | $ | 18,132 |
Equity Series | | | 13,374 |
Global Series | | | 163,550 |
Mid Cap Value Series | | | 419,852 |
Select 25 Series | | | 12,933 |
Security Large Cap Value Fund | | | 44,697 |
Security Mid Cap Growth Fund | | | 45,957 |
In connection with the change in sub-advisors of the Global Series, SI reimbursed the Series for a portion of the commissions resulting from transition costs. Such commissions, which are included in realized gains, amounted to $97,172.
84
Notes to Financial Statements
September 30, 2007
Certain officers and directors of the Funds are also officers and/or directors of Security Benefit Life Insurance Company, a subsidiary of Security Benefit Corporation, and its affiliates, which include Security Global Investors (SGI) and SDI.
At September 30, 2007, Security Benefit Corporation and its subsidiaries owned over five percent of the outstanding shares of the Funds or Series, as follows:
| | | |
Fund or Series | | Percent of outstanding shares owned | |
Security Equity Fund: | | | |
Alpha Opportunity Series | | 20.34 | % |
Equity Series | | 15.48 | % |
Global Series | | 8.78 | % |
Select 25 Series | | 17.29 | % |
Small Cap Growth Series | | 14.78 | % |
Security Large Cap Value Fund | | 19.25 | % |
Security Mid Cap Growth Fund | | 6.25 | % |
3. Investment Transactions
Investment transactions for the year ended September 30, 2007, (excluding overnight investments and short-term commercial paper) were as follows:
| | | | | | |
| | | Purchases | | Proceeds from Sales |
Security Equity Fund: | | | | | | |
Alpha Opportunity Series | | $ | 276,165,272 | | $ | 282,514,691 |
Equity Series | | | 77,804,125 | | | 172,856,906 |
Global Series | | | 287,889,987 | | | 298,780,302 |
Mid Cap Value Series | | | 407,619,138 | | | 392,553,314 |
Select 25 Series | | | 11,417,213 | | | 22,346,554 |
Small Cap Growth Series | | | 74,558,792 | | | 84,428,722 |
Security Large Cap Value Fund | | | 24,038,476 | | | 21,403,185 |
Security Mid Cap Growth Fund | | | 68,348,029 | | | 124,118,468 |
4. Open Futures Contracts
Open futures contracts for Alpha Opportunity Series as of September 30, 2007, were as follows:
| | | |
| | | Alpha Opportunity Series |
| | | S&P 500 Index Futures |
Position | | | Long |
Number of Contracts | | | 34 |
Expiration Date | | | 12-21-07 |
Contract Amount | | $ | 12,534,508 |
Market Value | | $ | 13,073,850 |
Unrealized Gain | | $ | 539,342 |
5. Options Written
Information as to options written by the Fund or Series during the year ended September 30, 2007, and options outstanding at period end is provided below:
Equity Series Call Options Written
| | | | | | | |
| | | Number of
Contracts | | | Premium
Amount | |
Balance at September 30, 2006 | | 1,968 | | | $ | 320,690 | |
Opened | | 5,253 | | | | 498,794 | |
Expired | | (6,135 | ) | | | (643,232 | ) |
Exercised | | (1,086 | ) | | | (176,252 | ) |
| | | | | | | |
Balance at September 30, 2007 | | — | | | $ | — | |
| | | | | | | |
Equity Series Put Options Written
| | | | | | | |
| | | Number of
Contracts | | | Premium
Amount | |
Balance at September 30, 2006 | | 980 | | | $ | 142,320 | |
Opened | | 1,902 | | | | 461,545 | |
Exercised | | (474 | ) | | | (86,740 | ) |
Expired | | (2,408 | ) | | | (517,125 | ) |
| | | | | | | |
Balance at September 30, 2007 | | — | | | $ | — | |
| | | | | | | |
Mid Cap Value Series Call Options Written Outstanding
| | | | | | | | | | |
Common Stock | | Expiration
Date | | Exercise
Price | | Number of
Contracts | | Market
Value |
Corn Products International | | 10-19-07 | | $ | 45.00 | | 1,240 | | $ | 241,800 |
McDermott International | | 10-19-07 | | | 45.00 | | 1,160 | | | 1,044,000 |
| | 10-19-07 | | | 47.50 | | 1,160 | | | 788,800 |
Playtex Products, Inc. | | 10-19-07 | | | 15.00 | | 3,800 | | | 1,216,000 |
Shaw Group, Inc. | | 10-19-07 | | | 35.00 | | 1,767 | | | 3,675,360 |
USEC, Inc. | | 10-19-07 | | | 22.50 | | 2,505 | | | 12,525 |
Williams Companies, Inc. | | 01-18-08 | | | 32.50 | | 1,430 | | | 557,700 |
| | | | | | | | | | |
Total call options outstanding (premiums received, $2,685,538) | | | | | | | 13,062 | | $ | 7,536,185 |
| | | | | | | | | | |
Mid Cap Value Series Call Options Written
| | | | | | | |
| | | Number of
Contracts | | | Premium
Amount | |
Balance at September 30, 2006 | | 6,254 | | | $ | 1,118,959 | |
Opened | | 27,926 | | | | 5,022,292 | |
Bought Back | | (260 | ) | | | (18,979 | ) |
Expired | | (6,444 | ) | | | (1,073,309 | ) |
Exercised | | (14,414 | ) | | | (2,363,425 | ) |
| | | | | | | |
Balance at September 30, 2007 | | 13,062 | | | $ | 2,685,538 | |
| | | | | | | |
Mid Cap Value Series Put Options Written
| | | | | | | |
| | | Number of
Contracts | | | Premium
Amount | |
Balance at September 30, 2006 | | 1,200 | | | $ | 129,596 | |
Opened | | 1,125 | | | | 165,854 | |
Expired | | (2,325 | ) | | | (295,450 | ) |
| | | | | | | |
Balance at September 30, 2007 | | — | | | $ | — | |
| | | | | | | |
85
Notes to Financial Statements
September 30, 2007
Select 25 Series Call Options Written
| | | | | | | |
| | | Number of
Contracts | | | Premium
Amount | |
Balance at September 30, 2006 | | 237 | | | $ | 41,934 | |
Opened | | 650 | | | | 72,927 | |
Expired | | (162 | ) | | | (30,497 | ) |
Exercised | | (725 | ) | | | (84,364 | ) |
| | | | | | | |
Balance at September 30, 2007 | | — | | | $ | — | |
| | | | | | | |
Select 25 Series Put Options Written
| | | | | | | |
| | | Number of
Contracts | | | Premium
Amount | |
Balance at September 30, 2006 | | — | | | $ | — | |
Opened | | 222 | | | | 61,427 | |
Expired | | (144 | ) | | | (47,153 | ) |
Exercised | | (78 | ) | | | (14,274 | ) |
| | | | | | | |
Balance at September 30, 2007 | | — | | | $ | — | |
| | | | | | | |
Security Large Cap Value Fund Put Options Written Outstanding
| | | | | | | | | | |
Common Stock | | Expiration
Date | | Exercise
Price | | Number of
Contracts | | Market
Value |
First Marblehead Corporation | | 10-19-07 | | $ | 30.00 | | 235 | | $ | 3,525 |
| | | | | | | | | | |
Total call options outstanding (premiums received, $19,504) | | | | | | | 235 | | $ | 3,525 |
| | | | | | | | | | |
Security Large Cap Value Fund Call Options Written
| | | | | | | |
| | | Number of
Contracts | | | Premium
Amount | |
Balance at September 30, 2006 | | 518 | | | $ | 67,841 | |
Opened | | 1,181 | | | | 127,607 | |
Expired | | (369 | ) | | | (43,708 | ) |
Exercised | | (1,330 | ) | | | (151,740 | ) |
| | | | | | | |
Balance at September 30, 2007 | | — | | | $ | — | |
| | | | | | | |
Security Large Cap Value Fund Put Options Written
| | | | | | | |
| | | Number of
Contracts | | | Premium
Amount | |
Balance at September 30, 2006 | | — | | | $ | — | |
Opened | | 675 | | | | 121,592 | |
Expired | | (332 | ) | | | (82,324 | ) |
Exercised | | (108 | ) | | | (19,764 | ) |
| | | | | | | |
Balance at September 30, 2007 | | 235 | | | $ | 19,504 | |
| | | | | | | |
Security Mid Cap Growth Fund Call Options Written
| | | | | | | |
| | | Number of
Contracts | | | Premium
Amount | |
Balance at September 30, 2006 | | 1,313 | | | $ | 258,245 | |
Opened | | 2,524 | | | | 384,574 | |
Bought Back | | (589 | ) | | | (42,996 | ) |
Expired | | (1,535 | ) | | | (266,129 | ) |
Exercised | | (1,713 | ) | | | (333,694 | ) |
| | | | | | | |
Balance at September 30, 2007 | | — | | | $ | — | |
| | | | | | | |
86
Notes to Financial Statements
September 30, 2007
6. Restricted Securities
As of September 30, 2007, the following Funds or Series contained restricted securities. Market value, cost, percentage of total net assets and acquisition dates are as follows:
| | | | | | | | | | | | | | | | |
| | | Number of
Shares | | Price Per
Share | | Market
Value | | Cost | | % of
Net Assets | | | Acquisition
Dates |
Security Equity Fund: | | | | | | | | | | | | | | | | |
Mid Cap Value Series | | | | | | | | | | | | | | | | |
ThermoEnergy Corporation PIPE | | 1,745,000 | | $ | 0.515 | | $ | 898,675 | | $ | 1,646,500 | | 0.1 | % | | 07-14-05 |
ThermoEnery Corporation Warrant | | 1,745,000 | | | 0.0982 | | | 171,359 | | | 447,500 | | 0.0 | % | | 07-14-05 |
| | | | | | |
Security Mid Cap Growth Fund | | | | | | | | | | | | | | | | |
ThermoEnergy Corporation PIPE | | 745,000 | | | 0.515 | | | 383,675 | | | 702,947 | | 0.2 | % | | 07-14-05 |
ThermoEnergy Corporation Warrant | | 745,000 | | | 0.0982 | | | 73,159 | | | 191,053 | | 0.0 | % | | 07-14-05 |
These securities have been valued after considering certain pertinent factors including the results of operations since the date of purchase, and the recent sales price of its common stock. No quoted market price exists for these shares. It is possible that the estimated fair value may differ significantly from the amount that might ultimately be realized in the near term.
7. Fair Valued Securities
As of September 30, 2007, the following Funds contained securities that were fair valued by the Board of Directors. Market value, cost and percentage of total net assets are as follows:
| | | | | | | | | |
| | | Market Value | | Cost | | % of
Net Assets | |
Security Large Cap Value Fund | | $ | — | | $ | 125,000 | | 0.0 | % |
8. Illiquid Securities
As of September 30, 2007, the following Funds or Series contained securities that were considered illiquid. Market value, cost and percentage of total net assets are as follows:
| | | | | | | | | |
| | | Market Value | | Cost | | % of
Net Assets | |
Security Equity Fund: | | | | | | | | | |
Mid Cap Value Series | | $ | 41,141,186 | | $ | 44,645,386 | | 4.2 | % |
Security Large Cap Value Fund | | | — | | | 125,000 | | 0.0 | % |
Security Mid Cap Growth Fund | | | 3,161,299 | | | 3,591,972 | | 1.7 | % |
9. Federal Tax Matters
For federal income tax purposes, the amounts of unrealized appreciation (depreciation) on investments at September 30, 2007, were as follows:
| | | | | | | | | | |
| | | Gross
unrealized
appreciation | | Gross
unrealized
(depreciation) | | | Net unrealized
appreciation
(depreciation) |
Security Equity Fund: | | | | | | | | | | |
Alpha Opportunity Series | | $ | 328,903 | | $ | (314,723 | ) | | $ | 14,180 |
Equity Series | | | 83,774,889 | | | (21,668,460 | ) | | | 62,106,429 |
Global Series | | | 10,962,001 | | | (2,266,361 | ) | | | 8,695,640 |
Mid Cap Value Series | | | 186,156,902 | | | (72,056,403 | ) | | | 114,100,499 |
Select 25 Series | | | 7,191,037 | | | (2,481,126 | ) | | | 4,709,911 |
Small Cap Growth Series | | | 10,648,586 | | | (1,682,372 | ) | | | 8,966,214 |
Security Large Cap | | | | | | | | | | |
Value Fund | | | 21,319,703 | | | (2,109,537 | ) | | | 19,210,166 |
Security Mid Cap | | | | | | | | | | |
Growth Fund | | | 23,925,006 | | | (21,108,305 | ) | | | 2,816,701 |
87
Notes to Financial Statements
September 30, 2007
The tax character of distributions paid during the fiscal years ended September 30, 2007 and 2006 are as follows:
| | | | | | | | | |
2007 | | Ordinary
Income | | Capital Gain | | Total |
Security Equity Fund: | | | | | | | | | |
Alpha Opportunity Series | | $ | 2,569,557 | | $ | 708,308 | | $ | 3,277,865 |
Equity Series | | | 9,735,014 | | | 30,529,927 | | | 40,264,941 |
Global Series | | | 68,515 | | | 22,793,963 | | | 22,862,478 |
Mid Cap Value Series | | | 15,495,867 | | | 36,895,809 | | | 52,391,676 |
Security Large Cap Value Fund | | | 25,136 | | | — | | | 25,136 |
Security MidCap Growth Fund | | | 1,583,425 | | | 22,297,681 | | | 23,881,106 |
| | | |
2006 | | | | | | |
Security Equity Fund: | | | | | | | | | |
Alpha Opportunity Series | | $ | 1,674,911 | | $ | 303,639 | | $ | 1,978,550 |
Equity Series | | | 2,147,421 | | | 12,570,669 | | | 14,718,090 |
Mid Cap Value Series | | | — | | | 33,921,702 | | | 33,921,702 |
Security Large Cap Value Fund | | | 232,389 | | | — | | | 232,389 |
Security Mid Cap Growth Fund | | | — | | | 16,831,385 | | | 16,831,385 |
Note: For federal income tax purposes, short term capital gain distributions are treated as ordinary income distributions.
As of September 30, 2007, the components of distributable earnings on a tax basis were:
| | | | | | | | | | | | | | | | |
| | | Undistributed
Ordinary
Income | | Undistributed
Long-Term
Gain | | Accumulated
Capital and
Other Losses* | | | Unrealized
Appreciation
(Depreciation)** | | Total
Accumulated
Earnings/(Deficit) |
Security Equity Fund: | | | | | | | | | | | | | | | | |
Alpha Opportunity Series | | $ | 5,671,129 | | $ | 449,941 | | $ | — | | | $ | 16,564 | | $ | 6,137,634 |
Equity Series | | | 4,553,171 | | | 39,606,777 | | | — | | | | 62,106,429 | | | 106,266,377 |
Global Series | | | — | | | 57,260,972 | | | (1,400,099 | ) | | | 8,702,573 | | | 64,563,446 |
Mid Cap Value Series | | | 7,481,260 | | | 144,250,280 | | | — | | | | 109,249,852 | | | 260,981,392 |
Select 25 Series | | | — | | | 4,184,456 | | | (8,584,526 | ) | | | 4,709,911 | | | 309,841 |
Small Cap Growth Series | | | 841,392 | | | 2,801,665 | | | — | | | | 8,966,214 | | | 12,609,271 |
Security Large Cap Value Fund | | | 343,898 | | | 1,047,876 | | | — | | | | 19,226,145 | | | 20,617,919 |
Security Mid Cap Growth Fund | | | 6,035,045 | | | 27,748,261 | | | (1,718,049 | ) | | | 2,816,700 | | | 34,881,957 |
| * | Certain Funds had net capital loss carryovers and deferred post October losses as identified elsewhere in the Notes. |
| ** | The differences between book-basis and tax-basis unrealized appreciation (depreciation) are attributable primarily to the tax deferral of wash sale losses, the differences between book and tax basis passive foreign investment companies and bond discount accretion. |
88
Notes to Financial Statements
September 30, 2007
As of September 30, 2007, the capital loss carryovers utilized and expired in 2007 and the accumulated net realized loss on sales of investments for federal income tax purposes which are available to offset future taxable gains and post-October losses that are deferred to the first day of the next fiscal year are as follows:
| | | | | | | | | | | | | | |
| | | Capital Loss
Carryovers
Utilized in 2007 | | Capital Loss
Carryovers
Expired In 2007 | | Capital Loss
Carryovers
at 9/30/07 | | Expires In | | Deferred
Post-
October
Losses |
Security Equity Fund: | | | | | | | | | | | | | | |
Global Series | | $ | 442,978 | | $ | — | | $ | 208,547 | | 2009 | | $ | 282,912 |
| | | — | | | — | | | 908,640 | | 2010 | | | |
| | | | | | | | | | | | | | |
| | $ | 442,978 | | $ | — | | $ | 1,117,187 | | | | | |
| | | | | | | | | | | | | | |
Select 25 Series* | | $ | 1,707,436 | | $ | — | | $ | 159,999 | | 2008 | | $ | — |
| | | 132,011 | | | 951,007 | | | 2,412,936 | | 2009 | | | |
| | | 1,824,532 | | | 1,673,951 | | | 2,582,076 | | 2010 | | | |
| | | — | | | 2,429,063 | | | 3,390,876 | | 2011 | | | |
| | | — | | | — | | | 38,639 | | 2012 | | | |
| | | | | | | | | | | | | | |
| | $ | 3,663,979 | | $ | 5,054,021 | | $ | 8,584,526 | | | | | |
| | | | | | | | | | | | | | |
Small Cap Growth Series | | $ | 2,060,375 | | $ | — | | $ | — | | | | $ | — |
| | | | | | | | | | | | | | |
Security Large Cap | | | | | | | | | | | | | | |
Value Fund | | $ | 5,372,763 | | $ | — | | $ | — | | | | $ | — |
| | | | | | | | | | | | | | |
Security Mid Cap | | | | | | | | | | | | | | |
Growth Fund | | $ | 567,035 | | $ | — | | $ | 1,134,070 | | 2009 | | $ | — |
| | | — | | | — | | | 567,035 | | 2010 | | | |
| | | — | | | — | | | 16,944 | | 2011 | | | |
| | | | | | | | | | | | | | |
| | $ | 567,035 | | $ | — | | $ | 1,718,049 | | | | | |
| | | | | | | | | | | | | | |
| * | The Security Equity Fund—Select 25 Series obtained approximately $1,236,753, $3,140,789 and $1,728,838 of capital losses (included above) from its merger with Security Equity Fund—Social Awareness Series, Enhanced Index Series and Large Cap Growth Series, respectively, on June 16, 2006 (see Note 11). Certain of these capital losses expired (as shown above) due to limitations imposed by Section 382 of the Internal Revenue Code. The remaining capital losses may be applied against future realized capital gains subject to annual limitations. |
89
Notes to Financial Statements
September 30, 2007
Net investment income and net realized gains (losses) may differ for financial statement and tax purposes because of temporary or permanent book/tax differences. These differences are primarily due to post-October losses, losses deferred due to wash sales, foreign currency gains and losses, and the “mark-to-market” of certain passive foreign investment companies (PFICs) for tax purposes. To the extent these differences are permanent, reclassifications are made to the appropriate equity accounts in the period that the differences arise.
On the Statement of Assets and Liabilities the following adjustments were made for permanent book tax differences:
| | | | | | | | | | | |
| | | Accumulated
Net Realized
Gain/(Loss) | | | Undistributed
Net Investment
Income | | Paid-in-
Capital | |
Security Equity Fund: | | | | | | | | | | | |
Alpha Opportunity Series | | $ | (98,385 | ) | | $ | 98,385 | | $ | — | |
Equity Series | | | (156,727 | ) | | | 156,727 | | | — | |
Global Series | | | (1,957,585 | ) | | | 4,202,155 | | | (2,244,570 | ) |
Select 25 Series | | | 5,054,021 | | | | 257,870 | | | (5,311,891 | ) |
Small Cap Growth Series | | | (801,856 | ) | | | 801,856 | | | — | |
Security Mid Cap | | | | | | | | | | | |
Growth Fund | | | (1,710,600 | ) | | | 1,710,600 | | | — | |
10. Affiliated Transactions*
Investments representing 5% or more of the outstanding voting securities of a portfolio company of a fund result in that portfolio company being considered an affiliated company of such fund, as defined in the 1940 Act. The aggregate market value of all securities of affiliated companies held in the Mid Cap Value Series of the Security Equity Fund as of September 30, 2007 amounted to $26,668,827 which represents 2.7% of net assets. There were no affiliated companies held in any other Fund or Series. Transactions in the Mid Cap Value Series during the year ended September 30, 2007, in which the portfolio company is an “affiliated person” are as follows:
| | | | | | | | | | | | | | | | | | | |
| | | Balance
9-30-06 | | Gross
Additions | | Gross
Reductions | | | Balance
9-30-07 | | Realized
Gain/(Loss) | | Investment
Income |
Bimini Capital Management, Inc. (Shares) | | | — | | | 1,474,400 | | | — | | | | 1,474,400 | | | — | | | — |
Bimini Capital Management, Inc. (Cost) | | $ | — | | $ | 16,310,457 | | $ | — | | | $ | 16,310,457 | | $ | — | | $ | — |
| | | | | | |
Hydrogen Corporation (Shares) | | | 732,850 | | | 107,450 | | | — | | | | 840,300 | | | — | | | — |
Hydrogen Corporation (Cost) | | $ | 3,536,282 | | $ | 518,083 | | $ | — | | | $ | 4,054,365 | | $ | — | | $ | — |
| | | | | | |
Merix Corporation (Shares) | | | 1,476,000 | | | — | | | (426,750 | ) | | | 1,049,250 | | | — | | | — |
Merix Corporation (Cost) | | $ | 15,588,034 | | $ | — | | $ | (4,321,027 | ) | | $ | 11,267,007 | | $ | 933,667 | | $ | — |
| | | | | | |
North Pointe Holdings Corporation (Shares) | | | 470,000 | | | 55,000 | | | — | | | | 525,000 | | | — | | | — |
North Pointe Holdings Corporation (Cost) | | $ | 5,861,235 | | $ | 547,750 | | $ | — | | | $ | 6,408,985 | | $ | — | | $ | — |
| | | | | | |
Quixote Coproration (Shares) | | | 239,650 | | | 239,450 | | | — | | | | 479,100 | | | — | | | — |
Quixote Corporation (Cost) | | $ | 4,601,123 | | $ | 4,716,905 | | $ | — | | | $ | 9,318,028 | | $ | — | | $ | 136,563 |
| | | | | | |
ThermoEnergy Corporation PIPE (Shares) | | | 1,745,000 | | | — | | | — | | | | 1,745,000 | | | — | | | — |
ThermoEnergy Corporation PIPE (cost) | | $ | 1,646,500 | | $ | — | | $ | — | | | $ | 1,646,500 | | $ | — | | $ | — |
| | | | | | |
ThermoEnergy Corporation Warrant (Shares) | | | 1,745,000 | | | — | | | — | | | | 1,745,000 | | | — | | | — |
ThermoEnergy Corporation Warrant (Cost) | | $ | 447,500 | | $ | — | | $ | — | | | $ | 447,500 | | $ | — | | $ | — |
| * | As a result of the Security Mid Cap Values Series’ beneficial ownership of the common stock of these portfolio companies, applicable regulations require that the Series state that it may be deemed an affiliate of the respective portfolio company. The Series disclaims that the “affiliated persons” are affiliates of the Distributor, Advisor, Series or any other client of the Advisor. |
90
Notes to Financial Statements
September 30, 2007
11. Acquisition of the Enhanced Index Series, Large Cap Growth Series and Social Awareness Series of Security Equity Fund
Pursuant to a plan of reorganization approved by the shareholders of the Enhanced Index Series, Large Cap Growth Series and Social Awareness Series of Security Equity Fund, Select 25 Series of Security Equity Fund acquired all of the net assets of Enhanced Index Series, Large Cap Growth Series and Social Awareness Series on June 16, 2006 which totaled $10,521,264, $9,349,430 and $15,026,332, respectively. A total of 1,113,825 shares of Enhanced Index Series, 1,516,468 shares of Large Cap Growth Series and 734,975 shares of Social Awareness Series were exchanged for 1,136,596 shares, 995,315 shares and 1,592,592 shares, respectively of Select 25 Series immediately after the closing date. This exchange qualified as a tax-free reorganization under Section 368(a)(1)(c) of the Internal Revenue Code. Enhanced Index Series’ net assets included $134,643 of unrealized appreciation and $3,166,376 of accumulated realized loss on investments. Large Cap Growth Series’ net assets included $950,756 of unrealized appreciation and $1,763,332 of accumulated realized loss on investments. Social Awareness Series’ net assets included $1,208,145 of unrealized appreciation and $2,034,274 of accumulated realized loss. The aggregate net assets of Select 25 Series immediately before the acquisition totaled $28,909,382 and following the acquisition, the combined net assets of Select 25 Series totaled $63,806,408.
91
Report of Independent Registered Public Accounting Firm
To the Board of Directors and Shareholders
Security Equity Fund, Security Large Cap Value Fund and Security Mid Cap Growth Fund
We have audited the accompanying statements of assets and liabilities, including the schedules of investments, of Security Equity Fund (comprised of Alpha Opportunity, Equity, Global, Mid Cap Value, Select 25 and Small Cap Growth Series), Security Large Cap Value Fund and Security Mid Cap Growth Fund (the Funds) as of September 30, 2007, and the related statements of operations for the year then ended, the statements of changes in net assets for each of the two years in the period then ended, and the financial highlights for the periods indicated therein. These financial statements and financial highlights are the responsibility of the Funds’ management. Our responsibility is to express an opinion on these financial statements and financial highlights based on our audits.
We conducted our audits in accordance with the standards of the Public Company Accounting Oversight Board (United States). Those standards require that we plan and perform the audit to obtain reasonable assurance about whether the financial statements and financial highlights are free of material misstatement. We were not engaged to perform an audit of the Funds’ internal control over financial reporting. Our audits included consideration of internal control over financial reporting as a basis for designing audit procedures that are appropriate in the circumstances, but not for the purpose of expressing an opinion on the effectiveness of the Funds’ internal control over financial reporting. Accordingly, we express no such opinion. An audit also includes examining, on a test basis, evidence supporting the amounts and disclosures in the financial statements and financial highlights, assessing the accounting principles used and significant estimates made by management, and evaluating the overall financial statement presentation. Our procedures included confirmation of securities owned as of September 30, 2007, by correspondence with the custodians and brokers or by other appropriate auditing procedures where replies from brokers were not received. We believe that our audits provide a reasonable basis for our opinion.
In our opinion, the financial statements and financial highlights referred to above present fairly, in all material respects, the financial position of each of the respective entities/series constituting the Funds at September 30, 2007, and the results of their operations for the year then ended, changes in their net assets for each of the two years in the period then ended, and financial highlights for the periods indicated therein, in conformity with U.S. generally accepted accounting principles.

Kansas City, Missouri
November 21, 2007
92
Special Shareholders’ Meeting
(unaudited)
A special meeting of the shareholders of the Global Series of Security Equity Fund was held on July 27, 2007. Each matter voted upon at the meeting, as well as the number of votes cast for, against, withheld or abstentions with respect to such matters are set forth below:
| | (1) | The approval of an investment sub-advisory agreement between Security Investors and Security Global Investors, LLC pursuant to which Security Global Investors, LLC will be appointed as an investment sub-adviser to the Global Series of Security Equity Fund. The following votes were cast regarding this matter: |
| | | | |
| | | Votes For | | Votes Against/Abstentions |
Security Equity Fund, | | | | |
Global Series | | 3,642,165 | | 1,405,675 |
93
Directors (unaudited)
The business address of each director is One Security Benefit Place, Topeka, KS 66636-0001
| | |
Name (Date of Birth) Year Elected*** | | Principal Occupation(s) During Past 5 Years |
| Donald A. Chubb, Jr.** | | Business Broker - Griffith & Blair Realtors |
| (12-14-46) | | Director - Jayhawk Area Boy Scouts Council |
| 1994 | | |
| |
| Harry W. Craig, Jr.** | | Chairman, CEO, Secretary & Director - The Martin Tractor Company, Inc. |
| (05-11-39) | | Director - Stormont-Vail Corporation |
| 2004 | | Director - Concerned Citizens for Topeka |
| | Director - Oscar S. Stauffer Executive in Residence |
| |
| Jerry B. Farley** | | President - Washburn University |
| (09-20-46) | | President - J&J Bonanza |
| 2005 | | |
| |
| Penny A. Lumpkin** | | Partner – Vivian’s Gift Shop (Corporate Retail) |
| (08-20-39) | | Vice President - Palmer Companies, Inc.(Small Business and Shopping |
| 1993 | | Center Development) |
| | Vice President - PLB (Real Estate Equipment Leasing) |
| | Vice President - Town Crier (Retail) |
| | Prior to 2002: |
| | Vice President - Bellaire Shopping Center (Managing and Leasing) |
| | Partner - Goodwin Enterprises (Retail) |
| |
| Maynard F. Oliverius** | | President & Chief Executive Officer - Stormont-Vail HealthCare |
| (12-18-43) | | Director - VHA Mid-America |
| 1998 | | Director - Go Topeka |
| |
| Thomas A. Swank* | | Senior Vice President - Security Benefit Corporation and |
| (01-10-60) | | Security Benefit Life Insurance Company |
| 2007 (President, Director & | | Chief Operating Officer - Security Benefit Life Insurance Company |
| Chairman of the Board) | | President - First Security Benefit Life Insurance & Annuity Company of New York |
| | Chief Financial Officer & Treasurer - Security Benefit Corporation, Security |
| | Benefit Life Insurance Company and First Security Benefit Life Insurance & |
| | Annuity Company of New York |
| * | This director is deemed to be an “interested person” of the Funds under the Investment Company Act of 1940, as amended, by reason of his position with the Funds’ Investment Manager and/or the parent of the Investment Manager. |
| ** | These directors serve on the Fund’s joint audit committee, the purpose of which is to meet with the independent registered public accounting firm, to review the work of the independent registered public accounting firm, and to oversee the handling by Security Investors of the accounting function for the Funds. |
| *** | Each director oversees 28 Security Funds portfolios and serves until the next annual meeting, or until a successor has been duly elected and qualified. |
Effective August 17, 2007, Michael Odlum resigned his position as President and Acting Chairman of the Board of the Security Funds.
94
Officers (unaudited)
The business address of each officer is One Security Benefit Place, Topeka, KS 66636-0001
| | |
Name (Date of Birth) Title - Year Elected | | Principal Occupation(s) During Past 5 Years |
| Steven M. Bowser | | Vice President & Senior Portfolio Manager - Security Investors, LLC; |
| (02-11-60) | | Vice President & Senior Portfolio Manager - Security Benefit Life Insurance |
| Vice President – 2003 | | Company |
| |
| Christina Fletcher | | Vice President & Portfolio Manager - Security Investors, LLC |
| (07-25-72) | | Credit Analyst/Portfolio Manager - Horizon Cash Management |
| Vice President – 2005 | | Senior Money Market Trader - Scudder Investments |
| |
| Brenda M. Harwood | | Vice President, Chief Compliance Officer & Treasurer - Security Global |
| (11-03-63) | | Investors, LLC |
| Chief Compliance Officer – 2004 | | Assistant Vice President - Security Benefit Life Insurance Company |
| Treasurer – 1988 | | Vice President, Assistant Treasurer & Director - Security Distributors, Inc. |
| |
| Mark Lamb | | Vice President - Security Investors, LLC, |
| (02-03-60) | | Vice President - Security Benefit Life Insurance Company |
| Vice President – 2003 | | |
| |
| Amy J. Lee | | Secretary - Security Investors, LLC |
| (06-05-61) | | Secretary & Chief Compliance Officer - Security Distributors, Inc. |
| Secretary – 1987 | | Vice President, Associate General Counsel & Assistant Secretary -Security Benefit |
| | Corporation & Security Benefit Life Insurance Company |
| | Director - Brecek & Young Advisors, Inc. |
| |
| Mark Mitchell | | Vice President & Portfolio Manager - Security Investors, LLC |
| (08-24-64) | | Vice President & Portfolio Manager - Security Benefit Life Insurance Company |
| Vice President – 2003 | | |
| |
| Christopher Phalen | | Vice President & Head of Fixed Income - Security Global Investors, LLC; |
| (11-9-70) | | Assistant Vice President & Head of Fixed Income - Security Benefit Life Insurance |
| Vice President – 2002 | | Company |
| | Vice President & Portfolio Manager - Security Investors, LLC |
| | Vice President & Portfolio Manager - Security Benefit Life Insurance Company |
| |
| James P. Schier | | Vice President & Senior Portfolio Manager - Security Investors, LLC; |
| (12-28-57) | | Vice President & Senior Portfolio Manager - Security Benefit Life Insurance |
| Vice President – 1998 | | Company |
| |
| Cindy L. Shields | | Vice President & Head of Operations - Security Global Investors |
| (06-05-67) | | Vice President & Head of Equity Asset Management - Security Investors, LLC |
| Vice President – 1988 | | Vice President & Head of Equity Asset Management - Security Benefit Life |
| | Insurance Company |
| |
| Christopher D. Swickard | | Assistant Secretary - Security Investors, LLC |
| (10-09-65) | | Second Vice President & Assistant General Counsel - Security Benefit |
| Assistant Secretary – 1996 | | Corporation and Security Benefit Life Insurance Company |
| | Assistant Secretary - Security Distributors, Inc. |
| |
| David G. Toussaint | | Vice President & Portfolio Manager - Security Investors, LLC |
| (10-10-66) | | Assistant Vice President & Portfolio Manager - Security Benefit Life Insurance |
| Vice President – 2001 | | Company |
| * | Officers serve until the next annual meeting or until a successor has been duly elected and qualified. |
95
This page left blank intentionally.
96
Tax Information (unaudited)
In accordance with the provisions of the Internal Revenue Code, the percentage of ordinary dividends (including short-term capital gains) attributable to the fiscal year ended September 30, 2007, which qualify for the dividends received deduction for corporate shareholders is 2% for the Alpha Opportunity Series, 72% for the Equity Series, 100% for the Global Series, 83% for the Mid Cap Value Series, 100% for the Large Cap Value Fund and 48% for the Mid Cap Growth Fund.
Certain dividends paid by the Funds may be subject to a maximum tax rate of 15%, as provided by the Jobs and Growth Tax Relief Reconciliation Act of 2003. The percentage of ordinary income distributions for the fiscal year ended September 30, 2007, taxed at the maximum rate of 15% is 4% for the Alpha Opportunity Series, 72% for the Equity Series, 83% for the Mid Cap Value Series, 100% for the Large Cap Value Fund and 48% for the Mid Cap Growth Fund.
For federal income tax purposes, the Funds designate capital gain dividends for the fiscal year ended September 30, 2007 as follows:
| | | |
Security Equity Fund: | | | |
Alpha Opportunity Series | | $ | 708,308 |
Equity Series | | | 30,529,927 |
Global Series | | | 22,793,963 |
Mid Cap Value Series | | | 36,895,809 |
Security Mid Cap Growth Fund | | | 22,297,681 |
Additional information for foreign shareholders only:
For the year ended September 30, 2007, the following ordinary distributions paid qualified as interest related dividends under the Internal Revenue Code Section 871(k)(1)(C):
| | | |
Security Equity Fund: | | | |
Alpha Opportunity Series | | 16 | % |
Equity Series | | 3 | % |
Global Series | | 3 | % |
Mid Cap Value Series | | 9 | % |
Security Large Cap Value Fund | | 11 | % |
Security Mid Cap Growth Fund | | 7 | % |
For the year ended September 30, 2007, the following ordinary distributions paid qualified as short term capital gain dividends under the Internal Revenue Code Section 871(k)(2)(C):
| | | |
Security Equity Fund: | | | |
Alpha Opportunity Series | | 100 | % |
Equity Series | | 99 | % |
Global Series | | 100 | % |
Mid Cap Value Series | | 91 | % |
Security Mid Cap Growth Fund | | 100 | % |
Other Information
Each of the Security Funds files a complete schedule of portfolio holdings with the U.S. Securities and Exchange Commission for the first and third quarters of each fiscal year on Form N-Q. The Forms N-Q of each such Fund are available on the Commission’s website at www.sec.gov. The Forms N-Q may be reviewed and copied at the Commission’s Public Reference Room in Washington, DC. Information on the operation of the Public Reference Room may be obtained by calling 1-800-SEC-0330. The portfolio holdings of each of the Security Funds are available on their website, www.securitybenefit.com or by calling 1-800-888-2461.
A description of the policies and procedures that the Security Funds use to determine how to vote proxies relating to portfolio securities is available upon request, free of charge by calling 1-800-888-2461, or accessing the U.S. Securities and Exchange Commission website at www.sec.gov. Information regarding how the Security Funds voted proxies relating to portfolio securities during the 12 month period ended June 30, 2007 is available upon request, free of charge by calling 1-800-888-2461, or accessing the U.S. Securities and Exchange Commission website at www.sec.gov.
The statement of additional information (“SAI”) includes additional information about the Funds’ Directors and is available upon request without charge by calling 1-800-888-2461.
97
The Security Group of Mutual Funds
Security Equity Fund
| | • | | Alpha Opportunity Series |
| | • | | Small Cap Growth Series |
Security Large Cap Value Fund
Security Mid Cap Growth Fund
Security Income Fund
| | • | | Capital Preservation Series |
| | • | | Diversified Income Series |
| | • | | Income Opportunity Series |
Security Cash Fund
Security Funds Officers and Directors
Directors
Donald A. Chubb, Jr.
Harry W. Craig, Jr.
Jerry B. Farley
Penny A. Lumpkin
Maynard F. Oliverius
Thomas A. Swank
Officers
Thomas A. Swank, President
Steve M. Bowser, Vice President
Christina Fletcher, Vice President
Mark Lamb, Vice President
Mark Mitchell, Vice President
Christopher Phalen, Vice President
James P. Schier, Vice President
Cindy L. Shields, Vice President
David G. Toussaint, Vice President
Amy J. Lee, Secretary
Christopher D. Swickard, Assistant Secretary
Brenda M. Harwood, Chief Compliance Officer & Treasurer
This report is submitted for the general information of the shareholders of the Funds. The report is not authorized for distribution to prospective investors in the Funds unless preceded or accompanied by an effective prospectus which contains details concerning the sales charges and other pertinent information.

One Security Benefit Place • Topeka, Kansas 66636-0001 • securitybenefit.com
The Registrant has adopted a code of ethics that applies to its principal executive officer and principal financial officer. A copy of the Registrant’s code of ethics is filed herewith as Exhibit 10(a)(1). No amendments were made to the provisions of the code of ethics during the period covered by this report. No implicit or explicit waivers to the provisions of the code of ethics were granted during the period covered by this report. The Registrant hereby undertakes to provide any person without charge, upon request, a copy of its Code by calling the Registrant at 1-800-888-2461.
| Item 3. | Audit Committee Financial Expert. |
The Registrant’s Board of Directors has determined that Maynard Oliverius, a member of the Audit Committee of the Board, is an audit committee financial expert. Mr. Oliverius is “independent” for purposes of this item.
| Item 4. | Principal Accountant Fees and Services. |
| (a) | Audit Fees. The aggregate fees billed for each of the last two fiscal years (the “Reporting Periods”) for professional services rendered by the Registrant’s principal accountant (the “Auditor”) for the audit of the Registrant’s annual financial statements, or services that are normally provided by the Auditor in connection with the statutory and regulatory filings or engagements for the Reporting Periods, were $118,500 in 2006 and $146,500 in 2007. |
| (b) | Audit-Related Fees. The aggregate fees billed in the Reporting Periods for assurance and related services by the Auditor that are reasonably related to the performance of the audit of the Registrant’s financial statements and are not reported under paragraph (a) of this Item 4 were $3,300 in 2006 and $3,600 in 2007. These services consisted of a review of the Registrant’s semi-annual financial statements. |
The aggregate fees billed in the Reporting Periods for assurance and related services by the Auditor to the Registrant’s investment adviser (not including any sub-investment adviser whose role is primarily portfolio management and is subcontracted with or overseen by another investment adviser), and any entity controlling, controlled by or under common control with the investment adviser that provides ongoing services to the Registrant (“Service Affiliates”) which required pre-approval by the Audit Committee were $18,000 in 2006 and $20,000 in 2007, which related to the review of the transfer agent function.
| (c) | Tax Fees. The aggregate fees billed to the Registrant in the Reporting Periods for professional services rendered by the Auditor for tax compliance, tax advice and tax planning (“Tax Services”) were $20,000 in 2006 and $20,000 in 2007. These services consisted of (i) preparation of U.S. federal, state and excise tax returns; (ii) U.S. federal and state tax planning, advice and assistance regarding statutory, regulatory or administrative developments, (iii) tax advice regarding tax qualification matters and/or treatment of various financial instruments held or proposed to be acquired and (iv) review of U.S. federal excise distribution calculations. |
The aggregate fees billed in the Reporting Periods for Tax Services by the Auditor to Service Affiliates which required pre-approval by the Audit Committee were $0 in 2006 and $0 in 2007.
| (d) | All Other Fees. The aggregate fees billed to the Registrant in the Reporting Periods for products and services provided by the Auditor, other than the services reported in paragraphs (a) through (c) of this Item, were $0 in 2006 and $0 in 2007. |
The aggregate fees billed in the Reporting Periods for Non-Audit Services by the Auditor to Service Affiliates, other than the services reported in paragraphs (b) through (d) of this Item, which required pre-approval by the Audit Committee were $0 in 2006 and $0 in 2007.
| | |
| (e) (1) | | Audit Committee Pre-Approval Policies and Procedures. The Registrant’s Audit Committee has established policies and procedures for pre-approval of the auditor’s engagements for audit and non-audit services to the Registrant. Pre-approval considerations include whether the proposed services are compatible with maintaining the auditor’s independence as specified in applicable rules. |
| |
| (e) (2) | | Percentage of Non-Audit Services Approved under (c)(7)(i)(C). The percentage of the services described in each of (b) through (d) of this Item 4 (only those that relate to the Registrant) that were approved by the Audit Committee pursuant to paragraph (c)(7)(i)(C) of Rule 2-01 of Regulation S-X was 0%, 0% and 0%, respectively. |
| (g) | Non-Audit Fees. The aggregate non-audit fees billed by the Auditor for services rendered to the Registrant, and rendered to Service Affiliates, for the Reporting Periods were $41,300 in 2006 and $43,200 in 2007. |
| (h) | Auditor Independence. The Registrant’s Audit Committee was provided with information relating to the provision of non-audit services by Ernst & Young, LLP to the Registrant (and its affiliates) that were not pre-approved by the Audit Committee so that a determination could be made whether the provision of such services is compatible with maintaining Ernst & Young, LLP’s independence. |
| Item 5. | Audit Committee of Listed Registrants. |
Not applicable.
| Item 6. | Schedule of Investments. |
The Schedule of Investments is included under Item 1 of this form.
| Item 7. | Disclosure of Proxy Voting Policies and Procedures for Closed-End Management Investment Companies. |
Not applicable.
| Item 8. | Portfolio Managers of Closed-End Management Investment Companies. |
Not applicable.
| Item 9. | Purchases of Equity Securities by Closed-End Management Investment Company and Affiliated Purchasers. |
Not applicable.
| Item 10. | Submission of Matters to a Vote of Security Holders. |
The registrant does not currently have in place procedures by which shareholders may recommend nominees to the registrant’s board.
There have been no changes to the procedures by which shareholders may recommend nominees to the registrant’s board.
| Item 11. | Controls and Procedures. |
| (a) | The registrant’s President and Treasurer have concluded that the registrant’s disclosure controls and procedures (as defined in rule 30a-3(c) under the Investment Company Act of 1940) are effective based on their evaluation of these disclosure controls and procedures within 90 days of the filing date of this report on Form N-CSR. |
| (b) | There were no significant changes in the registrant’s internal controls, or in other factors that could significantly affect these controls subsequent to the date of their evaluation, including any corrective actions with regard to significant deficiencies and material weaknesses. |
| | |
| (a) (1) | | Code of Ethics pursuant to Item 2 above. |
| |
| (2) | | Certifications pursuant to Section 302 of the Sarbanes-Oxley Act of 2002 and required by Rule 30a-2(a) under the Investment Company Act of 1940, are attached hereto. |
| (b) | Certifications pursuant to Section 906 of the Sarbanes-Oxley Act of 2002 and required by Rule 30a-2(a) under the Investment Company Act of 1940, are attached hereto. |
SIGNATURES
Pursuant to the requirements of the Securities Exchange Act of 1934 and the Investment Company Act of 1940, the registrant has duly caused this report to be signed on its behalf by the undersigned, thereunto duly authorized.
| | |
| SECURITY EQUITY FUND |
| |
| By: | | /s/ THOMAS A. SWANK |
| | Thomas A. Swank, President |
| |
| Date: | | December 6, 2007 |
Pursuant to the requirements of the Securities Exchange Act of 1934 and the Investment Company Act of 1940, this report has been signed below by the following persons on behalf of the registrant and in the capacities and on the dates indicated.
| | |
| By: | | /s/ THOMAS A. SWANK |
| | Thomas A. Swank, President |
| |
| Date: | | December 6, 2007 |
| |
| By: | | /s/ BRENDA M. HARWOOD |
| | Brenda M. Harwood, Treasurer |
| |
| Date: | | December 6, 2007 |