UNITED STATES
SECURITIES AND EXCHANGE COMMISSION
Washington, D.C. 20549
FORM N-CSR
CERTIFIED SHAREHOLDER REPORT OF REGISTERED MANAGEMENT
INVESTMENT COMPANIES
Investment Company Act file number 811- 01136
Guggenheim Funds Trust
(Exact name of registrant as specified in charter)
702 King Farm Boulevard, Suite 200
Rockville, Maryland 20850
(Address of principal executive offices) (Zip code)
Amy J. Lee
Guggenheim Funds Trust
702 King Farm Boulevard, Suite 200
Rockville, Maryland 20850
(Name and address of agent for service)
Registrant's telephone number, including area code: 1-301-296-5100
Date of fiscal year end: September 30
Date of reporting period: March 29, 2018
Form N-CSR is to be used by management investment companies to file reports with the Commission not later than 10 days after the transmission to stockholders of any report that is required to be transmitted to stockholders under Rule 30e-1 under the Investment Company Act of 1940 (17 CFR 270.30e-1). The Commission may use the information provided on Form N-CSR in its regulatory, disclosure review, inspection, and policymaking roles.
A registrant is required to disclose the information specified by Form N-CSR, and the Commission will make this information public. A registrant is not required to respond to the collection of information contained in Form N-CSR unless the Form displays a currently valid Office of Management and Budget (“OMB”) control number. Please direct comments concerning the accuracy of the information collection burden estimate and any suggestions for reducing the burden to Secretary, Securities and Exchange Commission, 450 Fifth Street, NW, Washington, DC 20549-0609. The OMB has reviewed this collection of information under the clearance requirements of 44 U.S.C. §3507.
| Item 1. | Reports to Stockholders. |
The registrant’s semi-annual report transmitted to shareholders pursuant to Rule 30e-1 under the Investment Company Act of 1940, as amended (the “Investment Company Act”), is as follows:
3.29.2018
Guggenheim Funds Semi-Annual Report
| Guggenheim Funds Trust-Equity |
| Guggenheim Alpha Opportunity Fund | | |
| Guggenheim Large Cap Value Fund | | |
| Guggenheim Market Neutral Real Estate Fund | | |
| Guggenheim Risk Managed Real Estate Fund | | |
| Guggenheim Small Cap Value Fund | | |
| Guggenheim StylePlus—Large Core Fund | | |
| Guggenheim StylePlus—Mid Growth Fund | | |
| Guggenheim World Equity Income Fund | | |
| GuggenheimInvestments.com | SBE-SEMI-0318x0918 |

| DEAR SHAREHOLDER | 2 |
| ECONOMIC AND MARKET OVERVIEW | 4 |
| ABOUT SHAREHOLDERS’ FUND EXPENSES | 6 |
| ALPHA OPPORTUNITY FUND | 9 |
| LARGE CAP VALUE FUND | 23 |
| MARKET NEUTRAL REAL ESTATE FUND | 33 |
| RISK MANAGED REAL ESTATE FUND | 41 |
| SMALL CAP VALUE FUND | 54 |
| STYLEPLUS—LARGE CORE FUND | 65 |
| STYLEPLUS—MID GROWTH FUND | 77 |
| WORLD EQUITY INCOME FUND | 89 |
| NOTES TO FINANCIAL STATEMENTS | 100 |
| OTHER INFORMATION | 113 |
| INFORMATION ON BOARD OF TRUSTEES AND OFFICERS | 114 |
| GUGGENHEIM INVESTMENTS PRIVACY NOTICE | 118 |
| | THE GUGGENHEIM FUNDS SEMI-ANNUAL REPORT | 1 |
Dear Shareholder:
Security Investors, LLC, and Guggenheim Partners Investment Management, LLC (“GPIM”) (together, “Investment Advisers”) are pleased to present the shareholder report for a selection of our Funds (the “Funds”) for the semiannual fiscal period ended March 29, 2018.
The Investment Advisers are part of Guggenheim Investments, which represents the investment management businesses of Guggenheim Partners, LLC, (“Guggenheim”) a global, diversified financial services firm.
Guggenheim Funds Distributors, LLC is the distributor of the Fund. Guggenheim Funds Distributors, LLC is affiliated with Guggenheim and the Investment Advisers.
We encourage you to read the Economic and Market Overview section of the report, which follows this letter.
We are committed to providing innovative investment solutions and appreciate the trust you place in us.
Sincerely,
Security Investors, LLC
Guggenheim Partners Investment Management, LLC
April 30, 2018
Read a prospectus and summary prospectus (if available) carefully before investing. It contains the investment objectives, risks, charges, expenses and other information, which should be considered carefully before investing. Obtain a prospectus and summary prospectus (if available) at guggenheiminvestments.com or call 800.820.0888.
This material is not intended as a recommendation or as investment advice of any kind, including in connection with rollovers, transfers, and distributions. Such material is not provided in a fiduciary capacity, may not be relied upon for or in connection with the making of investment decisions, and does not constitute a solicitation of an offer to buy or sell securities. All content has been provided for informational or educational purposes only and is not intended to be and should not be construed as legal or tax advice and/or a legal opinion. Always consult a financial, tax and/or legal professional regarding your specific situation.
Alpha Opportunity Fund is subject to a number of risks and is not suitable for all investors. ● Investments in securities and derivatives, in general, are subject to market risks that may cause their prices to fluctuate over time. An investment in the Fund may lose money. There can be no guarantee the Fund will achieve its investment objective. ●The Fund’s use of derivatives such as futures, options and swap agreements may expose the Fund to additional risks that it would not be subject to if it invested directly in the securities underlying those derivatives. ● Certain of the derivative instruments, such as swaps and structured notes, are also subject to the risks of counterparty default and adverse tax treatment. ●The more the Fund invests in leveraged instruments, the more the leverage will magnify any gains or losses on those investments. ● The Fund’s use of short selling involves increased risk and costs, including paying more for a security than it received from its sale and the risk of unlimited losses. ●In certain circumstances the Fund may be subject to liquidity risk and it may be difficult for the fund to purchase and sell particular investments within a reasonable time at a fair price. ●In certain circumstances, it may be difficult for the Fund to purchase and sell particular investments within a reasonable time at a fair price. ●The Fund’s fixed income investments will change in value in response to interest rate changes and other factors. ● See the prospectus for more information on these and additional risks.
Large Cap Value Fund may not be suitable for all investors. ● An investment in the Fund will fluctuate and is subject to investment risks, which means an investor could lose money. ● The intrinsic value of the underlying stocks may never be realized, or the stock may decline in value. The Fund is subject to risk that large-capitalization stocks may underperform other segments of the equity market or the equity markets as a whole.
Market Neutral Real Estate Fund may not be suitable for all investors. ● Investing involves risk, including the possible loss of principal. ● There are no assurances that the Fund will achieve its objective and/or strategy. ● The Fund’s investments in real estate securities subject the Fund to the same risks as direct investments in real estate, which is particularly sensitive to economic downturns. ● The Fund’s use of derivatives such as futures, options, and swap agreements may expose the Fund to additional risks that it would not be subject to if it invested directly in the securities underlying those derivatives. ● When market conditions are deemed appropriate, the fund may leverage to the full extent permitted by its investment policies and restrictions and applicable law. Leveraging will exaggerate the effect on net asset value of any increase or decrease in the market value of the Fund’s portfolio. ● The more the Fund invests in leveraged instruments, the more the leverage will magnify any gains or losses on those investments. ● The Fund’s use of short selling involves increased risk and costs. The Fund risks paying more for a security than it received from its sale. ● The Fund’s investments in other investment vehicles subject the fund to those risks and expenses affecting the investment vehicle. ● The Fund’s investments in foreign securities carry additional risks when compared to U.S. securities, due to the impact of diplomatic, political, or economic developments in the country in question (investments in emerging markets securities are generally subject to an even greater level of risks). ● The Fund may invest in derivative instruments, which may be more volatile and less liquid, increasing the risk of loss when compared to traditional securities. Certain of the derivative instruments are also subject to the risks of counterparty default and adverse tax treatment. ● Investing in sector funds is more volatile than investing in broadly diversified funds, as there is a greater risk due to the concentration of the Funds’ holdings in issuers of the same or similar offerings. ● This Fund is considered non-diversified and can invest a greater portion of its assets in securities of
| 2 | THE GUGGENHEIM FUNDS SEMI-ANNUAL REPORT | |
individual issuers than a diversified fund. As a result, changes in the market value of a single security could cause greater fluctuations in the value of fund shares than would occur in a more diversified fund. ● Short selling involves increased risks and costs. You risk paying more for a security than you received from its sale. This strategy may not be suitable for all investors. ● The Fund is subject to active trading risks that may increase volatility and impact its ability to achieve its investment objective. ● You may have a gain or loss when you sell your shares. ● It is important to note that the Fund is not guaranteed by the U.S. government. ● Please read the prospectus for more detailed information regarding these and other risks.
Risk Managed Real Estate Fund may not be suitable for all investors. ● Investments in securities in general are subject to market risks that may cause their prices to fluctuate over time ● Investing involves risk, including the possible loss of principal. ● There are no assurances that the fund will achieve its objective and/or strategy. ● The Fund’s investments in real estate securities subject the Fund to the same risks as direct investments in real estate, which is particularly sensitive to economic downturns. ● The Fund’s use of derivatives such as futures, options and swap agreements may expose the fund to additional risks that it would not be subject to if it invested directly in the securities underlying those derivatives. ● When market conditions are deemed appropriate, the Fund may leverage to the full extent permitted by its investment policies and restrictions and applicable law. Leveraging will exaggerate the effect on net asset value of any increase or decrease in the market value of the Fund’s portfolio. ● The more the Fund invests in leveraged instruments, the more the leverage will magnify any gains or losses on those investments. ● The Fund’s use of short selling involves increased risk and costs. The Fund risks paying more for a security than it received from its sale. ● The Fund’s investments in other investment vehicles subject the Fund to those risks and expenses affecting the investment vehicle. ● The Fund’s investments in foreign securities carry additional risks when compared to U.S. securities, due to the impact of diplomatic, political or economic developments in the country in question (investments in emerging markets securities are generally subject to an even greater level of risks). ● The Fund may invest in derivative instruments, which may be more volatile and less liquid, increasing the risk of loss when compared to traditional securities. Certain of the derivative instruments are also subject to the risks of counterparty default and adverse tax treatment. ● Investing in sector funds is more volatile than investing in broadly diversified funds, as there is a greater risk due to the concentration of the funds’ holdings in issuers of the same or similar offerings. ● This Fund is considered non-diversified and can invest a greater portion of its assets in securities of individual issuers than a diversified fund. As a result, changes in the market value of a single security could cause greater fluctuations in the value of fund shares than would occur in a more diversified fund. ● Short selling involves increased risks and costs. You risk paying more for a security than you received from its sale. This strategy may not be suitable for all investors. ● The Fund is subject to active trading risks that may increase volatility and impact its ability to achieve its investment objective. ● You may have a gain or loss when you sell you shares. ● It is important to note that the Fund is not guaranteed by the U.S. government. ● Please read the prospectus for more detailed information regarding these and other risks.
Small Cap Value Fund may not be suitable for all investors. ● An investment in the Fund will fluctuate and is subject to investment risks, which means investors could lose money. ● The intrinsic value of the underlying stocks may never be realized, or the stock may decline in value. ● Investing in securities of small-capitalization companies may involve a greater risk of loss and more abrupt fluctuations in market price than investments in larger-capitalization companies.
StylePlus—Large Core Fund may not be suitable for all investors. ● Investments in large capitalization stocks may underperform other segments of the equity market or the equity market as a whole. ● Growth stocks may be more volatile than other stocks because they are more sensitive to investor perceptions regarding the growth potential of the issuing companies. Value stocks are subject to the risk that the intrinsic value of the stock may never be realized by the market or that the price goes down.● The Fund may invest in derivative instruments, which may be more volatile and less liquid, increasing the risk of loss when compared to traditional securities. Certain of the derivative instruments are also subject to the risks of counterparty default and adverse tax treatment. ● The Fund’s use of leverage, through borrowings or instruments such as derivatives, may cause the Fund to be more volatile than if it had not been leveraged. ● The Fund’s investments in other investment vehicles subject the Fund to those risks and expenses affecting the investment vehicle. ● The Fund may invest in foreign securities which carry additional risks when compared to U.S. securities, due to the impact of diplomatic, political or economic developments in the country in question (investments in emerging markets securities are generally subject to an even greater level of risks). ● The Fund may invest in fixed income securities whose market value will change in response to interest rate changes and market conditions among other factors. In general, bond prices rise when interest rates fall and vice versa. ● The Fund’s exposure to high yield securities may subject the Fund to greater volatility. ● The Fund may invest in bank loans and asset-backed securities, including mortgage backed, which involve special types of risks. ● The Fund may invest in restricted securities which may involve financial and liquidity risk. ● You may have a gain or loss when you sell your shares. ● It is important to note that the Fund is not guaranteed by the U.S. government. ● Please read the prospectus for more detailed information regarding these and other risks.
StylePlus—Mid Growth Fund may not be suitable for all investors. ● Investments in mid-sized company securities may present additional risks such as less predictable earnings, higher volatility and less liquidity than larger, more established companies. ● Growth stocks may be more volatile than other stocks because they are more sensitive to investor perceptions regarding the growth potential of the issuing companies. ● The Fund may invest in derivative instruments, which may be more volatile and less liquid, increasing the risk of loss when compared to traditional securities. Certain of the derivative instruments are also subject to the risks of counterparty default and adverse tax treatment. ● The Fund’s use of leverage, through borrowings or instruments such as derivatives, may cause the Fund to be more volatile than if it had not been leveraged. ● The Fund’s investments in other investment vehicles subject the Fund to those risks and expenses affecting the investment vehicle. ● The Fund may invest in foreign securities which carry additional risks when compared to U.S. securities, due to the impact of diplomatic, political or economic developments in the country in question (investments in emerging markets securities are generally subject to an even greater level of risks). ● The Fund may invest in fixed income securities whose market value will change in response to interest rate changes and market conditions, among other factors. In general, bond prices rise when interest rates fall and vice versa. ● The Fund’s exposure to high yield securities may subject the Fund to greater volatility. ● The Fund may invest in bank loans and asset-backed securities, including mortgage backed, which involve special types of risks. ● The Fund may invest in restricted securities which may involve financial and liquidity risk. ● You may have a gain or loss when you sell your shares. ● It is important to note that the Fund is not guaranteed by the U.S. government. ● Please read the prospectus for more detailed information regarding these and other risks.
World Equity Income Fund may not be suitable for all investors. ● Investments in securities in general are subject to market risks that may cause their prices to fluctuate over time. ●The Fund’s investments in foreign securities carry additional risks when compared to U.S. securities, due to the impact of diplomatic, political or economic developments in the country in question (investments in emerging markets are generally subject to an even greater level of risks). Additionally, the Fund’s exposure to foreign currencies subjects the Fund to the risk that those currencies will decline in value relative to the U.S. Dollar. ● The Fund’s investments in derivatives may pose risks in addition to those associated with investing directly in securities or other investments, including illiquidity of the derivatives, imperfect correlations with underlying investments or the Fund’s other portfolio holdings, lack of availability and counterparty risk. ●The Fund’s use of leverage, through instruments such as derivatives, may cause the Fund to be more volatile than if it had not been leveraged. ●The Fund’s investments in other investment vehicles subject the Fund to those risks and expenses affecting the investment vehicle. ●The Fund may have significant exposure to securities in a particular capitalization range e.g., large-, mid- or small-cap securities. As a result, the Fund may be subject to the risk that the pre-denominate capitalization range may underperform other segments of the equity market or the equity market as a whole. ● Please read the prospectus for more detailed information regarding these and other risks.
| | THE GUGGENHEIM FUNDS SEMI-ANNUAL REPORT | 3 |
| ECONOMIC AND MARKET OVERVIEW (Unaudited) | March 29, 2018 |
As we enter the ninth year of the current expansion, one of the most important new developments to evaluate is the impact of the corporate tax cuts passed into law at the end of 2017. Guggenheim’s concern is that the substantial late-cycle fiscal easing in the pipeline will prompt more restrictive monetary policy, which increases the risk that the economy will experience a boom-bust cycle that ends in a recession.
With the unemployment rate at 4.1% and core inflation rising, fiscal policy should be leaning against the economy to prevent overheating, not providing further stimulus. Faster wage growth, rising core inflation, and an unsustainably low unemployment rate underpin our longstanding view that the U.S. Federal Reserve (the “Fed”) will raise interest rates four times in 2018. Fed funds futures show the market is now pricing in nearly three rate hikes for 2018, up from two at the beginning of the year, which contributed to a pickup in first-quarter market volatility. Tighter fiscal and monetary policy, along with rising policy uncertainty ahead of the 2018 mid-terms and 2020 presidential election, could prove to be too much for an overextended economy to bear.
Further complicating the story is the risk of a global trade war sparked by protectionist actions taken by the Trump administration. We now have new steel and aluminum tariffs in place that are likely to have some modest inflationary impact while hurting almost 20% of U.S. corporates, according to our estimates. We expect more protectionist trade and investment policies in place by year end.
Over the six months ended March 29, 2018, the bear flattening (the condition in which short-term rates rise faster than long-term rates) of the U.S. Treasury curve continued with Treasury yields higher across the curve. Yields increased the most in the belly and front end of the curve. The 2-year Treasury ended the period at 2.27%, while the 10-year finished the period at 2.74%.
For the six months ended March 29, 2018, the Standard & Poor’s 500® (“S&P 500”) Index* returned 5.84%. The MSCI Europe-Australasia-Far East (“EAFE”) Index* returned 2.80%. The return of the MSCI Emerging Markets Index* was 9.08%.
In the bond market, the Bloomberg Barclays U.S. Aggregate Bond Index* posted a -1.08% return for the period, while the Bloomberg Barclays U.S. Corporate High Yield Index* returned -0.39%. The return of the ICE Bank of America (“BofA”) Merrill Lynch 3-Month U.S. Treasury Bill Index* was 0.64% for the six-month period.
The opinions and forecasts expressed may not actually come to pass. This information is subject to change at any time, based on market and other conditions, and should not be construed as a recommendation of any specific security or strategy.
*Index Definitions:
The following indices are referenced throughout this report. Indices are unmanaged and not available for direct investment. Index performance does not reflect transaction costs, fees, or expenses.
Bloomberg Barclays U.S. Aggregate Bond Index is a broad-based flagship benchmark that measures the investment grade, U.S. dollar-denominated, fixed-rate taxable bond market, including U.S. Treasuries, government-related and corporate securities, mortgage-backed securities or “MBS” (agency fixed-rate and hybrid adjustable-rate mortgage, or “ARM”, pass-throughs), asset-backed securities (“ABS”), and commercial mortgage-backed securities (“CMBS”) (agency and non-agency).
Bloomberg Barclays U.S. Corporate High Yield Index measures the U.S. dollar-denominated, high yield, fixed-rate corporate bond market. Securities are classified as high yield if the middle rating of Moody’s, Fitch, and S&P is Ba1/BB +/BB + or below.
FTSE NAREIT Equity REITs Index is one of the FTSE NAREIT US Real Estate Index Series that contains all Equity REITs not designated as Timber REITs or Infrastructure REITs. FTSE NAREIT US Real Estate Index Series is designed to present investors with a comprehensive family of REIT performance indexes that spans the commercial real estate space across the US economy. The index series provides investors with exposure to all investment and property sectors. In addition, the more narrowly focused property sector and sub-sector indexes provide the facility to concentrate commercial real estate exposure in more selected markets. The National Association of Real Estate Investment Trusts (NAREIT) is the trade association for REITs and publicly traded real estate companies with an interest in the US property and investment markets.
| 4 | THE GUGGENHEIM FUNDS SEMI-ANNUAL REPORT | |
| ECONOMIC AND MARKET OVERVIEW (Unaudited)(concluded) | March 29, 2018 |
ICE BofA Merrill Lynch 3-Month U.S. Treasury Bill Index is an unmanaged market index of U.S. Treasury securities maturing in 90 days that assumes reinvestment of all income.
MSCI EAFE Index is a free float-adjusted market capitalization index that is designed to measure the equity market performance of developed markets, excluding the U.S. & Canada.
MSCI Emerging Markets Index is a free float-adjusted market capitalization weighted index that is designed to measure equity market performance in the global emerging markets.
MSCI World Index (Net) is calculated with net dividends reinvested. It is a free float-adjusted market capitalization weighted index that is designed to measure the equity market performance of developed markets.
Morningstar Long/Short Equity Category Average is the average return of funds Morningstar places in a given category based on their portfolio statistics and compositions over the past three years. Long-short portfolios hold sizeable stakes in both long and short positions in equities, exchange traded funds, and related derivatives. Some funds that fall into this category will shift their exposure to long and short positions depending on their macro outlook or the opportunities they uncover through bottom-up research. At least 75% of the assets are in equity securities or derivatives, and funds in the category will typically have beta values to relevant benchmarks of between 0.3 and 0.8 over a three-year period.
Russell 1000® Value Index is a measure of the performance for the large-cap value segment of the U.S. equity universe. It includes those Russell 1000 companies with lower price-to-book ratios and lower expected growth values.
Russell 2000® Value Index measures the performance of the small-cap value segment of the U.S. equity universe. It includes those Russell 2000 companies with lower price-to-book ratios and lower forecasted growth values.
Russell 3000® Index measures the performance of the largest 3,000 U.S. companies, representing approximately 98% of the investable U.S. equity market.
Russell Midcap Growth® Index measures the performance of the mid-cap growth segment of the U.S. equity universe. It includes those Russell Midcap Index companies with higher price-to-book ratios and higher forecasted growth values.
S&P 500® Index is a broad-based index, the performance of which is based on the performance of 500 widely held common stocks chosen for market size, liquidity, and industry group representation.
| | THE GUGGENHEIM FUNDS SEMI-ANNUAL REPORT | 5 |
| ABOUT SHAREHOLDERS’ FUND EXPENSES (Unaudited) | |
All mutual funds have operating expenses, and it is important for our shareholders to understand the impact of costs on their investments. Shareholders of a fund incur two types of costs: (i) transaction costs, including sales charges (loads) on purchase payments, reinvested dividends, other distributions, and exchange fees, and (ii) ongoing costs, including management fees, administrative services, and shareholder reports, among others. These ongoing costs, or operating expenses, are deducted from a fund’s gross income and reduce the investment return of the fund.
A fund’s expenses are expressed as a percentage of its average net assets, which is known as the expense ratio. The following examples are intended to help investors understand the ongoing costs (in dollars) of investing in a fund and to compare these costs with the ongoing costs of investing in other mutual funds.
The examples are based on an investment of $1,000 made at the beginning of the period and held for the entire six-month period beginning September 30, 2017 and ending March 29, 2018 are for actual Fund returns. Hypothetical Fund returns are for the period beginning September 30, 2017 and ending March 31, 2018.
The following tables illustrate the Funds’ costs in two ways:
Table 1. Based on actual Fund return: This section helps investors estimate the actual expenses paid over the period. The “Ending Account Value” shown is derived from the Fund’s actual return, and the fifth column shows the dollar amount that would have been paid by an investor who started with $1,000 in the Fund. Investors may use the information here, together with the amount invested, to estimate the expenses paid over the period. Simply divide the Fund’s account value by $1,000 (for example, an $8,600 account value divided by $1,000 = 8.6), then multiply the result by the number provided under the heading “Expenses Paid During Period.”
Table 2. Based on hypothetical 5% return: This section is intended to help investors compare a fund’s cost with those of other mutual funds. The table provides information about hypothetical account values and hypothetical expenses based on the Fund’s actual expense ratio and an assumed rate of return of 5% per year before expenses, which is not the Fund’s actual return. The hypothetical account values and expenses may not be used to estimate the actual ending account balance or expenses paid during the period. The example is useful in making comparisons because the U.S. Securities and Exchange Commission (the “SEC”) requires all mutual funds to calculate expenses based on the 5% return. Investors can assess a fund’s costs by comparing this hypothetical example with the hypothetical examples that appear in shareholder reports of other funds.
The calculations illustrated above assume no shares were bought or sold during the period. Actual costs may have been higher or lower, depending on the amount of investment and the timing of any purchases or redemptions.
Please note that the expenses shown in the table are meant to highlight your ongoing costs only and do not reflect any transactional costs, such as sales charges (loads) on purchase payments, and contingent deferred sales charges (“CDSC”) on redemptions, if any. Therefore, the second table is useful in comparing ongoing costs only, and will not help you determine the relative total costs of owning different funds. In addition, if these transactional costs were included, your costs would have been higher.
More information about the Funds’ expenses, including annual expense ratios for periods up to five years (subject to the Fund’s inception date), can be found in the Financial Highlights section of this report. For additional information on operating expenses and other shareholder costs, please refer to the appropriate Fund prospectus.
| 6 | THE GUGGENHEIM FUNDS SEMI-ANNUAL REPORT | |
| ABOUT SHAREHOLDERS’ FUND EXPENSES (Unaudited)(continued) | |
| | Expense
Ratio1 | Fund
Return | Beginning
Account Value
September 30, 2017 | Ending
Account Value
March 29, 2018 | Expenses
Paid During
Period2 |
| Table 1. Based on actual Fund return3 | | | | | |
| Alpha Opportunity Fund | | | | | |
| A-Class | 1.57% | (0.31%) | $ 1,000.00 | $ 996.90 | $ 7.73 |
| C-Class | 2.31% | (0.69%) | 1,000.00 | 993.10 | 11.35 |
| P-Class | 1.58% | (0.30%) | 1,000.00 | 997.00 | 7.78 |
| Institutional Class | 1.11% | (0.08%) | 1,000.00 | 999.20 | 5.47 |
| Large Cap Value Fund | | | | | |
| A-Class | 1.15% | 3.51% | 1,000.00 | 1,035.10 | 5.77 |
| C-Class | 1.90% | 3.13% | 1,000.00 | 1,031.30 | 9.52 |
| P-Class | 1.15% | 3.51% | 1,000.00 | 1,035.10 | 5.77 |
| Institutional Class | 0.90% | 3.60% | 1,000.00 | 1,036.00 | 4.52 |
| Market Neutral Real Estate Fund | | | | | |
| A-Class | 1.60% | 4.07% | 1,000.00 | 1,040.70 | 8.05 |
| C-Class | 2.35% | 3.72% | 1,000.00 | 1,037.20 | 11.80 |
| P-Class | 1.64% | 4.03% | 1,000.00 | 1,040.30 | 8.25 |
| Institutional Class | 1.40% | 4.17% | 1,000.00 | 1,041.70 | 7.05 |
| Risk Managed Real Estate Fund | | | | | |
| A-Class | 1.36% | (2.49%) | 1,000.00 | 975.10 | 6.62 |
| C-Class | 2.10% | (2.81%) | 1,000.00 | 971.90 | 10.21 |
| P-Class | 1.36% | (2.49%) | 1,000.00 | 975.10 | 6.62 |
| Institutional Class | 1.08% | (2.34%) | 1,000.00 | 976.60 | 5.26 |
| Small Cap Value Fund | | | | | |
| A-Class | 1.30% | (0.45%) | 1,000.00 | 995.50 | 6.40 |
| C-Class | 2.05% | (0.86%) | 1,000.00 | 991.40 | 10.07 |
| P-Class | 1.30% | (0.46%) | 1,000.00 | 995.40 | 6.40 |
| Institutional Class | 1.05% | (0.33%) | 1,000.00 | 996.70 | 5.17 |
| StylePlus—Large Core Fund | | | | | |
| A-Class | 1.27% | 5.69% | 1,000.00 | 1,056.90 | 6.44 |
| C-Class | 2.15% | 5.20% | 1,000.00 | 1,052.00 | 10.88 |
| P-Class | 1.42% | 5.55% | 1,000.00 | 1,055.50 | 7.20 |
| Institutional Class | 0.98% | 5.86% | 1,000.00 | 1,058.60 | 4.97 |
| StylePlus—Mid Growth Fund | | | | | |
| A-Class | 1.43% | 8.21% | 1,000.00 | 1,082.10 | 7.34 |
| C-Class | 2.22% | 7.82% | 1,000.00 | 1,078.20 | 11.38 |
| P-Class | 1.51% | 8.12% | 1,000.00 | 1,081.20 | 7.75 |
| Institutional Class | 1.10% | 8.39% | 1,000.00 | 1,083.90 | 5.65 |
| World Equity Income Fund | | | | | |
| A-Class | 1.22% | 3.08% | 1,000.00 | 1,030.80 | 6.11 |
| C-Class | 1.97% | 2.70% | 1,000.00 | 1,027.00 | 9.85 |
| P-Class | 1.22% | 3.05% | 1,000.00 | 1,030.50 | 6.11 |
| Institutional Class | 0.97% | 3.21% | 1,000.00 | 1,032.10 | 4.86 |
| | THE GUGGENHEIM FUNDS SEMI-ANNUAL REPORT | 7 |
| ABOUT SHAREHOLDERS’ FUND EXPENSES (Unaudited)(concluded) | |
| | Expense
Ratio1 | Fund
Return | Beginning
Account Value
September 30, 2017 | Ending
Account Value
March 31, 2018 | Expenses
Paid During
Period4 |
| Table 2. Based on hypothetical 5% return (before expenses)5 | | | | |
| Alpha Opportunity Fund | | | | | |
| A-Class | 1.57% | 5.00% | $ 1,000.00 | $ 1,017.10 | $ 7.90 |
| C-Class | 2.31% | 5.00% | 1,000.00 | 1,013.41 | 11.60 |
| P-Class | 1.58% | 5.00% | 1,000.00 | 1,017.05 | 7.95 |
| Institutional Class | 1.11% | 5.00% | 1,000.00 | 1,019.40 | 5.59 |
| Large Cap Value Fund | | | | | |
| A-Class | 1.15% | 5.00% | 1,000.00 | 1,019.20 | 5.79 |
| C-Class | 1.90% | 5.00% | 1,000.00 | 1,015.46 | 9.55 |
| P-Class | 1.15% | 5.00% | 1,000.00 | 1,019.20 | 5.79 |
| Institutional Class | 0.90% | 5.00% | 1,000.00 | 1,020.44 | 4.53 |
| Market Neutral Real Estate Fund | | | | | |
| A-Class | 1.60% | 5.00% | 1,000.00 | 1,016.95 | 8.05 |
| C-Class | 2.35% | 5.00% | 1,000.00 | 1,013.21 | 11.80 |
| P-Class | 1.64% | 5.00% | 1,000.00 | 1,016.75 | 8.25 |
| Institutional Class | 1.40% | 5.00% | 1,000.00 | 1,017.95 | 7.04 |
| Risk Managed Real Estate Fund | | | | | |
| A-Class | 1.36% | 5.00% | 1,000.00 | 1,018.15 | 6.84 |
| C-Class | 2.10% | 5.00% | 1,000.00 | 1,014.46 | 10.55 |
| P-Class | 1.36% | 5.00% | 1,000.00 | 1,018.15 | 6.84 |
| Institutional Class | 1.08% | 5.00% | 1,000.00 | 1,019.55 | 5.44 |
| Small Cap Value Fund | | | | | |
| A-Class | 1.30% | 5.00% | 1,000.00 | 1,018.45 | 6.54 |
| C-Class | 2.05% | 5.00% | 1,000.00 | 1,014.71 | 10.30 |
| P-Class | 1.30% | 5.00% | 1,000.00 | 1,018.45 | 6.54 |
| Institutional Class | 1.05% | 5.00% | 1,000.00 | 1,019.70 | 5.29 |
| StylePlus—Large Core Fund | | | | | |
| A-Class | 1.27% | 5.00% | 1,000.00 | 1,018.60 | 6.39 |
| C-Class | 2.15% | 5.00% | 1,000.00 | 1,014.21 | 10.80 |
| P-Class | 1.42% | 5.00% | 1,000.00 | 1,017.85 | 7.14 |
| Institutional Class | 0.98% | 5.00% | 1,000.00 | 1,020.04 | 4.94 |
| StylePlus—Mid Growth Fund | | | | | |
| A-Class | 1.43% | 5.00% | 1,000.00 | 1,017.80 | 7.19 |
| C-Class | 2.22% | 5.00% | 1,000.00 | 1,013.86 | 11.15 |
| P-Class | 1.51% | 5.00% | 1,000.00 | 1,017.40 | 7.59 |
| Institutional Class | 1.10% | 5.00% | 1,000.00 | 1,019.45 | 5.54 |
| World Equity Income Fund | | | | | |
| A-Class | 1.22% | 5.00% | 1,000.00 | 1,018.85 | 6.14 |
| C-Class | 1.97% | 5.00% | 1,000.00 | 1,015.11 | 9.90 |
| P-Class | 1.22% | 5.00% | 1,000.00 | 1,018.85 | 6.14 |
| Institutional Class | 0.97% | 5.00% | 1,000.00 | 1,020.09 | 4.89 |
| 1 | This ratio represents annualized net expenses, which may include short dividend and interest expenses. Excluding these expenses, the operating expense ratio for the Alpha Opportunity Fund would be 1.51%, 2.19%, 1.50% and 1.10% and the Risk Managed Real Estate Fund would be 1.25%, 2.04%, 1.29% and 1.00% for the A-Class, C-Class, P-Class and Institutional Class, respectively. Excludes expenses of the underlying funds in which the Funds invest. |
| 2 | Expenses in table 1 are equal to the Fund's annualized expense ratio, net of any applicable fee waivers, multiplied by the average account value over the period, multiplied by 180/365 (to reflect the one-half year period). |
| 3 | Actual cumulative return at net asset value for the period September 30, 2017 to March 29, 2018. |
| 4 | Expenses in table 2 are equal to the Fund's annualized expense ratio, net of any applicable fee waivers, multiplied by the average account value over the period, multiplied by 182/365 (to reflect the one-half year period). |
| 5 | Hypothetical return for the period September 30, 2017 to March 31, 2018. |
| 8 | THE GUGGENHEIM FUNDS SEMI-ANNUAL REPORT | |
| PERFORMANCE REPORT AND FUND PROFILE (Unaudited) | March 29, 2018 |
ALPHA OPPORTUNITY FUND
OBJECTIVE: Seeks long-term growth of capital.
Holdings Diversification (Market Exposure as % of Net Assets)
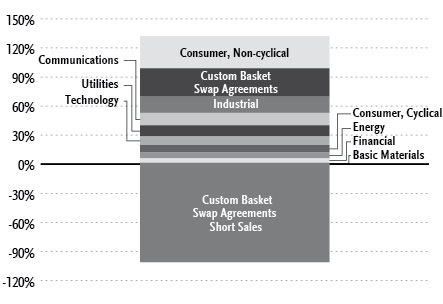
“Holdings Diversification (Market Exposure as % of Net Assets)” excludes any temporary cash investments.
| Inception Dates: |
| A-Class | July 7, 2003 |
| C-Class | July 7, 2003 |
| P-Class | May 1, 2015 |
| Institutional Class | November 7, 2008 |
| Ten Largest Holdings (% of Total Net Assets) |
| General Mills, Inc. | 1.6% |
| Edgewell Personal Care Co. | 1.2% |
| El Paso Electric Co. | 1.2% |
| CenterPoint Energy, Inc. | 1.2% |
| Archer-Daniels-Midland Co. | 1.2% |
| Consolidated Edison, Inc. | 1.2% |
| Kimberly-Clark Corp. | 1.2% |
| National Fuel Gas Co. | 1.2% |
| Verizon Communications, Inc. | 1.2% |
| Portland General Electric Co. | 1.2% |
| Top Ten Total | 12.4% |
“Ten Largest Holdings” excludes any temporary cash or derivative investments.
| | THE GUGGENHEIM FUNDS SEMI-ANNUAL REPORT | 9 |
| PERFORMANCE REPORT AND FUND PROFILE (Unaudited)(concluded) | March 29, 2018 |
Average Annual Returns*
Periods Ended March 29, 2018
| | 6 month† | 1 Year | 5 Year | 10 Year |
| A-Class Shares | (0.31%) | (0.20%) | 7.61% | 7.48% |
| A-Class Shares with sales charge‡ | (5.04%) | (4.93%) | 6.56% | 6.85% |
| C-Class Shares | (0.69%) | (0.93%) | 6.82% | 6.64% |
| C-Class Shares with CDSC§ | (1.61%) | (1.85%) | 6.82% | 6.64% |
| Morningstar Long/Short Equity Category Average | 2.98% | 6.93% | 4.32% | 4.59% |
| S&P 500 Index | 5.84% | 13.99% | 13.31% | 9.49% |
| S&P 500 Index - Blended** | 0.64% | 1.11% | 10.71% | 8.23% |
| ICE BofA Merrill Lynch 3-Month U.S. Treasury Bill Index | 0.64% | 1.11% | 0.34% | 0.34% |
| | 6 month† | 1 Year | Since Inception
(05/01/15) |
| P-Class Shares | (0.30%) | (0.05%) | 3.51% |
| Morningstar Long/Short Equity Category Average | 2.98% | 6.93% | 2.31% |
| S&P 500 Index | 5.84% | 13.99% | 10.32% |
| S&P 500 Index - Blended** | 0.64% | 1.11% | 6.04% |
| ICE BofA Merrill Lynch 3-Month U.S. Treasury Bill Index | 0.64% | 1.11% | 0.54% |
| | 6 month† | 1 Year | 5 Year | Since Inception
(11/07/08) |
| Institutional Class Shares | (0.08%) | 0.37% | 8.04% | 12.35% |
| Morningstar Long/Short Equity Category Average | 2.98% | 6.93% | 4.32% | 6.12% |
| S&P 500 Index | 5.84% | 13.99% | 13.31% | 14.16% |
| S&P 500 Index - Blended** | 0.64% | 1.11% | 10.71% | 12.76% |
| ICE BofA Merrill Lynch 3-Month U.S. Treasury Bill Index | 0.64% | 1.11% | 0.34% | 0.25% |
| * | The performance data above represents past performance that is not predictive of future results. The investment return and principal value of an investment in the Fund will fluctuate so that an investor’s shares, when redeemed, may be worth more or less than their original cost. Returns are historical and include changes in principal and reinvested dividends and capital gains and do not reflect the effect of taxes. The ICE BofA Merrill Lynch 3-Month U.S. Treasury Bill Index, S&P 500 Index and the Morningstar Long/Short Equity Category Average are unmanaged indices and, unlike the Fund, have no management fees or operating expenses to reduce their reported returns. |
| ** | Effective March 13, 2017, the Fund changed its principal investment strategy. As a result of the investment strategy change, the Fund’s new benchmark is the ICE BofA Merrill Lynch 3-Month U.S. Treasury Bill Index. The Fund’s performance was previously compared to the S&P 500 Index. The S&P 500 Index-Blended uses performance data for the S&P 500 Index from 09/30/03 to 03/12/17, and the ICE BofA Merrill Lynch 3-Month U.S. Treasury Bill Index from 03/13/17 to 03/29/18. |
| † | 6 month returns are not annualized. |
| ‡ | Effective February 22, 2011, the maximum sales charge decreased from 5.75% to 4.75%. A 5.75% maximum sales charge is used in the calculation of the 1 Year, 5 Year and 10 Year average annual returns (based on subscriptions made prior to February 22, 2011), and a 4.75% maximum sales charge will be used to calculate performance for periods based on subscriptions made on or after February 22, 2011. |
| § | Fund returns include a CDSC of 1% if redeemed within 12 months of purchase. |
| 10 | THE GUGGENHEIM FUNDS SEMI-ANNUAL REPORT | |
| SCHEDULE OF INVESTMENTS (Unaudited) | March 29, 2018 |
| ALPHA OPPORTUNITY FUND | |
| | | Shares | | | Value | |
| | | | | | | |
| COMMON STOCKS† - 103.3% | | | | | | |
| | | | | | | |
| Consumer, Non-cyclical - 33.4% | | | | | | |
| General Mills, Inc.1 | | | 76,323 | | | $ | 3,439,114 | |
| Edgewell Personal Care Co.* | | | 54,561 | | | | 2,663,668 | |
| Archer-Daniels-Midland Co.1 | | | 60,121 | | | | 2,607,448 | |
| Kimberly-Clark Corp.1 | | | 23,632 | | | | 2,602,592 | |
| Molson Coors Brewing Co. — Class B1 | | | 33,686 | | | | 2,537,566 | |
| Johnson & Johnson1 | | | 19,529 | | | | 2,502,641 | |
| Merck & Company, Inc.1 | | | 43,716 | | | | 2,381,210 | |
| Tyson Foods, Inc. — Class A1 | | | 32,451 | | | | 2,375,089 | |
| Ingredion, Inc. | | | 18,359 | | | | 2,366,842 | |
| Celgene Corp.*,1 | | | 26,520 | | | | 2,365,849 | |
| Biogen, Inc.*,1 | | | 8,624 | | | | 2,361,424 | |
| Gilead Sciences, Inc.1 | | | 31,264 | | | | 2,356,993 | |
| Amgen, Inc.1 | | | 13,170 | | | | 2,245,222 | |
| Pilgrim’s Pride Corp.* | | | 90,772 | | | | 2,233,899 | |
| Sanderson Farms, Inc. | | | 18,718 | | | | 2,227,816 | |
| Pfizer, Inc.1 | | | 61,227 | | | | 2,172,946 | |
| Mylan N.V.* | | | 46,083 | | | | 1,897,237 | |
| Western Union Co. | | | 95,471 | | | | 1,835,907 | |
| US Foods Holding Corp.* | | | 55,271 | | | | 1,811,231 | |
| Zimmer Biomet Holdings, Inc.1 | | | 15,264 | | | | 1,664,387 | |
| United Therapeutics Corp.* | | | 14,666 | | | | 1,647,872 | |
| Prestige Brands Holdings, Inc.* | | | 47,666 | | | | 1,607,298 | |
| CVS Health Corp.1 | | | 20,526 | | | | 1,276,922 | |
| McKesson Corp.1 | | | 8,965 | | | | 1,262,900 | |
| Cardinal Health, Inc.1 | | | 19,504 | | | | 1,222,511 | |
| Performance Food Group Co.* | | | 40,902 | | | | 1,220,925 | |
| Travelport Worldwide Ltd. | | | 62,856 | | | | 1,027,067 | |
| Darling Ingredients, Inc.* | | | 57,308 | | | | 991,428 | |
| AmerisourceBergen Corp. — Class A1 | | | 11,452 | | | | 987,277 | |
| Conagra Brands, Inc.1 | | | 24,566 | | | | 905,994 | |
| Boston Beer Company, Inc. — Class A* | | | 4,682 | | | | 885,132 | |
| CoreLogic, Inc.* | | | 19,258 | | | | 871,039 | |
| Charles River Laboratories International, Inc.* | | | 8,114 | | | | 866,088 | |
| United Natural Foods, Inc.* | | | 19,876 | | | | 853,476 | |
| Perrigo Company plc | | | 10,187 | | | | 848,985 | |
| Eli Lilly & Co.1 | | | 10,327 | | | | 799,000 | |
| Medtronic plc | | | 9,933 | | | | 796,825 | |
| TreeHouse Foods, Inc.* | | | 20,111 | | | | 769,648 | |
| USANA Health Sciences, Inc.* | | | 8,481 | | | | 728,518 | |
| WellCare Health Plans, Inc.* | | | 3,605 | | | | 698,036 | |
| Quanta Services, Inc.* | | | 20,226 | | | | 694,763 | |
| Sabre Corp. | | | 29,766 | | | | 638,481 | |
| Dean Foods Co. | | | 73,749 | | | | 635,716 | |
| Kroger Co.1 | | | 23,254 | | | | 556,701 | |
| Horizon Pharma plc* | | | 37,875 | | | | 537,825 | |
| Allergan plc1 | | | 3,145 | | | | 529,272 | |
| SpartanNash Co. | | | 29,632 | | | | 509,967 | |
| Eagle Pharmaceuticals, Inc.* | | | 9,459 | | | | 498,395 | |
| Cardtronics plc — Class A* | | | 20,544 | | | | 458,337 | |
| Versartis, Inc.* | | | 267,550 | | | | 441,457 | |
| Total Consumer, Non-cyclical | | | | | | | 72,416,936 | |
| | | | | | | | | |
| Industrial - 17.0% | | | | | | | | |
| Greenbrier Companies, Inc. | | | 46,391 | | | | 2,331,148 | |
| Cummins, Inc.1 | | | 13,751 | | | | 2,228,900 | |
| Regal Beloit Corp. | | | 30,213 | | | | 2,216,124 | |
| Owens Corning | | | 27,513 | | | | 2,212,045 | |
| Genesee & Wyoming, Inc. — Class A* | | | 27,831 | | | | 1,970,156 | |
| Tech Data Corp.* | | | 18,380 | | | | 1,564,689 | |
| Carlisle Companies, Inc. | | | 14,916 | | | | 1,557,379 | |
| Fluor Corp. | | | 26,232 | | | | 1,500,995 | |
| Jabil, Inc. | | | 50,832 | | | | 1,460,403 | |
| Vishay Intertechnology, Inc. | | | 74,531 | | | | 1,386,277 | |
| Snap-on, Inc. | | | 9,245 | | | | 1,364,007 | |
| Benchmark Electronics, Inc. | | | 44,164 | | | | 1,318,295 | |
| EnerSys | | | 18,949 | | | | 1,314,492 | |
| KBR, Inc. | | | 78,703 | | | | 1,274,202 | |
| AGCO Corp. | | | 19,360 | | | | 1,255,496 | |
| EMCOR Group, Inc. | | | 14,918 | | | | 1,162,560 | |
| Energizer Holdings, Inc. | | | 15,714 | | | | 936,240 | |
| Spirit AeroSystems Holdings, Inc. — Class A | | | 10,503 | | | | 879,101 | |
| Owens-Illinois, Inc.* | | | 34,728 | | | | 752,209 | |
| Evoqua Water Technologies Corp.* | | | 32,805 | | | | 698,418 | |
| Crane Co. | | | 7,458 | | | | 691,655 | |
| Coherent, Inc.* | | | 3,652 | | | | 684,385 | |
| Gibraltar Industries, Inc.* | | | 18,729 | | | | 633,977 | |
| Acuity Brands, Inc. | | | 4,359 | | | | 606,729 | |
| Belden, Inc. | | | 8,045 | | | | 554,623 | |
| Rexnord Corp.* | | | 18,497 | | | | 548,991 | |
| Masco Corp.1 | | | 13,165 | | | | 532,392 | |
| AECOM* | | | 14,883 | | | | 530,281 | |
| Trinity Industries, Inc. | | | 16,214 | | | | 529,063 | |
| Kansas City Southern1 | | | 4,665 | | | | 512,450 | |
| Louisiana-Pacific Corp. | | | 17,666 | | | | 508,251 | |
| Norfolk Southern Corp.1 | | | 3,675 | | | | 498,992 | |
| Applied Optoelectronics, Inc.* | | | 19,220 | | | | 481,653 | |
| Sanmina Corp.* | | | 5,583 | | | | 145,996 | |
| Total Industrial | | | | | | | 36,842,574 | |
| | | | | | | | | |
| Communications - 12.7% | | | | | | | | |
| Verizon Communications, Inc.1 | | | 54,196 | | | | 2,591,653 | |
| Omnicom Group, Inc.1 | | | 35,370 | | | | 2,570,338 | |
| Comcast Corp. — Class A1 | | | 74,293 | | | | 2,538,592 | |
| Juniper Networks, Inc.1 | | | 91,266 | | | | 2,220,502 | |
| Cisco Systems, Inc.1 | | | 48,263 | | | | 2,070,000 | |
| Telephone & Data Systems, Inc. | | | 72,331 | | | | 2,027,438 | |
| Gannett Company, Inc. | | | 153,703 | | | | 1,533,956 | |
| InterDigital, Inc. | | | 20,238 | | | | 1,489,517 | |
| News Corp. — Class A | | | 87,053 | | | | 1,375,437 | |
| ARRIS International plc* | | | 47,879 | | | | 1,272,145 | |
| Sprint Corp.*,1 | | | 200,039 | | | | 976,190 | |
| Nexstar Media Group, Inc. — Class A | | | 14,303 | | | | 951,150 | |
| AMC Networks, Inc. — Class A* | | | 17,066 | | | | 882,312 | |
| TEGNA, Inc. | | | 73,103 | | | | 832,643 | |
| Interpublic Group of Companies, Inc. | | | 34,570 | | | | 796,147 | |
| Scholastic Corp. | | | 16,389 | | | | 636,549 | |
| Motorola Solutions, Inc.1 | | | 5,778 | | | | 608,423 | |
| Gray Television, Inc.* | | | 47,220 | | | | 599,694 | |
| SEE NOTES TO FINANCIAL STATEMENTS. | THE GUGGENHEIM FUNDS SEMI-ANNUAL REPORT | 11 |
| SCHEDULE OF INVESTMENTS (Unaudited)(continued) | March 29, 2018 |
| ALPHA OPPORTUNITY FUND | |
| | | Shares | | | Value | |
| | | | | | | |
| New Media Investment Group, Inc. | | | 33,738 | | | $ | 578,269 | |
| F5 Networks, Inc.* | | | 3,441 | | | | 497,603 | |
| MSG Networks, Inc. — Class A* | | | 21,862 | | | | 494,081 | |
| Total Communications | | | | | | | 27,542,639 | |
| | | | | | | | | |
| Utilities - 11.5% | | | | | | | | |
| El Paso Electric Co. | | | 51,870 | | | | 2,645,370 | |
| CenterPoint Energy, Inc.1 | | | 95,462 | | | | 2,615,659 | |
| Consolidated Edison, Inc.1 | | | 33,418 | | | | 2,604,599 | |
| National Fuel Gas Co. | | | 50,543 | | | | 2,600,438 | |
| Portland General Electric Co. | | | 63,820 | | | | 2,585,348 | |
| Ameren Corp.1 | | | 45,018 | | | | 2,549,369 | |
| PNM Resources, Inc. | | | 64,636 | | | | 2,472,327 | |
| Exelon Corp.1 | | | 53,827 | | | | 2,099,791 | |
| FirstEnergy Corp.1 | | | 60,174 | | | | 2,046,518 | |
| UGI Corp. | | | 43,127 | | | | 1,915,701 | |
| PG&E Corp.1 | | | 18,125 | | | | 796,231 | |
| Total Utilities | | | | | | | 24,931,351 | |
| | | | | | | | | |
| Technology - 9.1% | | | | | | | | |
| DXC Technology Co.1 | | | 19,261 | | | | 1,936,308 | |
| HP, Inc.1 | | | 88,045 | | | | 1,929,946 | |
| Cirrus Logic, Inc.* | | | 44,697 | | | | 1,816,039 | |
| NetApp, Inc.1 | | | 27,566 | | | | 1,700,546 | |
| Western Digital Corp.1 | | | 15,807 | | | | 1,458,512 | |
| Convergys Corp. | | | 63,091 | | | | 1,427,118 | |
| Dell Technologies Incorporated Class V — Class V* | | | 16,879 | | | | 1,235,712 | |
| MAXIMUS, Inc. | | | 16,197 | | | | 1,080,988 | |
| ON Semiconductor Corp.*,1 | | | 41,600 | | | | 1,017,536 | |
| International Business Machines Corp.1 | | | 5,318 | | | | 815,941 | |
| CA, Inc.1 | | | 23,721 | | | | 804,142 | |
| Micron Technology, Inc.*,1 | | | 15,092 | | | | 786,897 | |
| Xerox Corp. | | | 23,450 | | | | 674,891 | |
| KLA-Tencor Corp.1 | | | 5,786 | | | | 630,732 | |
| Seagate Technology plc | | | 10,563 | | | | 618,147 | |
| Kulicke & Soffa Industries, Inc.* | | | 23,751 | | | | 594,012 | |
| Oracle Corp.1 | | | 12,716 | | | | 581,757 | |
| NCR Corp.* | | | 16,153 | | | | 509,143 | |
| Icad, Inc.* | | | 71,645 | | | | 220,667 | |
| Total Technology | | | | | | | 19,839,034 | |
| | | | | | | | | |
| Consumer, Cyclical - 7.4% | | | | | | | | |
| Southwest Airlines Co.1 | | | 42,806 | | | | 2,451,928 | |
| Allison Transmission Holdings, Inc. | | | 56,535 | | | | 2,208,257 | |
| Alaska Air Group, Inc.1 | | | 31,863 | | | | 1,974,231 | |
| Lions Gate Entertainment Corp. — Class A | | | 68,653 | | | | 1,773,307 | |
| PACCAR, Inc.1 | | | 19,333 | | | | 1,279,265 | |
| Meritor, Inc.* | | | 46,074 | | | | 947,282 | |
| Delta Air Lines, Inc.1 | | | 15,639 | | | | 857,173 | |
| Copa Holdings S.A. — Class A | | | 6,446 | | | | 829,149 | |
| Tailored Brands, Inc. | | | 31,156 | | | | 780,769 | |
| Ralph Lauren Corp. — Class A | | | 6,242 | | | | 697,856 | |
| Toll Brothers, Inc. | | | 13,287 | | | | 574,663 | |
| Taylor Morrison Home Corp. — Class A* | | | 24,565 | | | | 571,873 | |
| Cooper-Standard Holdings, Inc.* | | | 4,652 | | | | 571,312 | |
| Hawaiian Holdings, Inc. | | | 14,344 | | | | 555,113 | |
| Total Consumer, Cyclical | | | | | | | 16,072,178 | |
| | | | | | | | | |
| Energy - 6.1% | | | | | | | | |
| Chevron Corp.1 | | | 21,886 | | | | 2,495,880 | |
| Valero Energy Corp.1 | | | 26,840 | | | | 2,489,947 | |
| Occidental Petroleum Corp.1 | | | 36,350 | | | | 2,361,296 | |
| Marathon Petroleum Corp.1 | | | 21,330 | | | | 1,559,436 | |
| Exxon Mobil Corp.1 | | | 20,858 | | | | 1,556,215 | |
| HollyFrontier Corp. | | | 24,791 | | | | 1,211,288 | |
| PBF Energy, Inc. — Class A | | | 31,771 | | | | 1,077,037 | |
| Williams Companies, Inc.1 | | | 19,083 | | | | 474,403 | |
| Total Energy | | | | | | | 13,225,502 | |
| | | | | | | | | |
| Financial - 4.6% | | | | | | | | |
| VEREIT, Inc. REIT | | | 301,813 | | | | 2,100,618 | |
| Senior Housing Properties Trust REIT | | | 129,072 | | | | 2,021,267 | |
| Principal Financial Group, Inc.1 | | | 33,148 | | | | 2,019,045 | |
| Prudential Financial, Inc.1 | | | 13,176 | | | | 1,364,375 | |
| Park Hotels & Resorts, Inc. REIT | | | 42,445 | | | | 1,146,864 | |
| Mack-Cali Realty Corp. REIT | | | 48,149 | | | | 804,570 | |
| Summit Hotel Properties, Inc. REIT | | | 45,006 | | | | 612,532 | |
| Total Financial | | | | | | | 10,069,271 | |
| | | | | | | | | |
| Basic Materials - 1.5% | | | | | | | | |
| LyondellBasell Industries N.V. — Class A1 | | | 10,676 | | | | 1,128,240 | |
| Huntsman Corp. | | | 22,353 | | | | 653,825 | |
| Coeur Mining, Inc.* | | | 65,875 | | | | 527,000 | |
| Domtar Corp. | | | 11,338 | | | | 482,319 | |
| Alcoa Corp.* | | | 10,688 | | | | 480,532 | |
| Total Basic Materials | | | | | | | 3,271,916 | |
| | | | | | | | | |
| Total Common Stocks | | | | | | | | |
| (Cost $225,966,709) | | | | | | | 224,211,401 | |
| | | | | | | | | |
| MONEY MARKET FUND† - 3.0% | | | | | | | | |
| Goldman Sachs Financial Square Treasury Instruments Fund - Institutional Class 1.54%2 | | | 6,605,970 | | | | 6,605,970 | |
| Total Money Market Fund | | | | | | | | |
| (Cost $6,605,970) | | | | | | | 6,605,970 | |
| | | | | | | | | |
| Total Investments - 106.3% | | | | | | | | |
| (Cost $232,572,679) | | | | | | $ | 230,817,371 | |
| Other Assets & Liabilities, net - (6.3)% | | | | | | | (13,766,570 | ) |
| Total Net Assets - 100.0% | | | | | | $ | 217,050,801 | |
| 12 | THE GUGGENHEIM FUNDS SEMI-ANNUAL REPORT | SEE NOTES TO FINANCIAL STATEMENTS. |
| SCHEDULE OF INVESTMENTS (Unaudited)(continued) | March 29, 2018 |
| ALPHA OPPORTUNITY FUND | |
| Custom Basket Swap Agreements |
| Counterparty | | Index | | Financing
Rate Pay | | Payment
Frequency | | Maturity
Date | | Notional
Amount | | | Value and
Unrealized
Loss | |
| OTC Custom Basket Swap Agreements Sold Short†† | | | | | | | | | | |
| Morgan Stanley | | Alpha Opportunity Portfolio Short Custom Basket Swap3 | | 1.30% | | At Maturity | | 02/06/19 | | $ | 219,255,978 | | | $ | (11,291,541 | ) |
| OTC Custom Basket Swap Agreements†† | | | | | | | | | | | | | | |
| Morgan Stanley | | Alpha Opportunity Portfolio Long Custom Basket Swap4 | | 2.05% | | At Maturity | | 02/06/19 | | | 63,003,846 | | | | (970,323 | ) |
| | | Shares | | | Percentage
Value | | | Unrealized
Gain (Loss) | |
| | | | | | | | | | |
| CUSTOM BASKET OF LONG SECURITIES4 |
| Cisco Systems, Inc. | | | 13,778 | | | | (9.8 | %) | | $ | 94,620 | |
| Telephone & Data Systems, Inc. | | | 20,650 | | | | (7.3 | %) | | | 70,927 | |
| Archer-Daniels-Midland Co. | | | 17,164 | | | | (6.4 | %) | | | 62,213 | |
| Marathon Petroleum Corp. | | | 6,089 | | | | (4.9 | %) | | | 47,829 | |
| Jabil, Inc. | | | 14,512 | | | | (4.9 | %) | | | 47,387 | |
| PNM Resources, Inc. | | | 18,453 | | | | (4.7 | %) | | | 45,210 | |
| EMCOR Group, Inc. | | | 4,259 | | | | (4.6 | %) | | | 44,845 | |
| HollyFrontier Corp. | | | 7,077 | | | | (3.9 | %) | | | 38,039 | |
| Travelport Worldwide Ltd. | | | 17,944 | | | | (3.8 | %) | | | 36,875 | |
| PBF Energy, Inc. — Class A | | | 9,070 | | | | (3.8 | %) | | | 36,507 | |
| CenterPoint Energy, Inc. | | | 27,253 | | | | (3.3 | %) | | | 31,551 | |
| Dell Technologies Incorporated Class V — Class V* | | | 4,818 | | | | (3.1 | %) | | | 30,364 | |
| Boston Beer Company, Inc. — Class A* | | | 1,336 | | | | (2.8 | %) | | | 27,690 | |
| Energizer Holdings, Inc. | | | 4,363 | | | | (2.6 | %) | | | 25,533 | |
| PG&E Corp. | | | 5,174 | | | | (2.6 | %) | | | 24,806 | |
| Ameren Corp. | | | 12,852 | | | | (2.3 | %) | | | 22,427 | |
| USANA Health Sciences, Inc.* | | | 2,421 | | | | (2.3 | %) | | | 21,971 | |
| FirstEnergy Corp. | | | 17,179 | | | | (2.3 | %) | | | 21,903 | |
| El Paso Electric Co. | | | 14,808 | | | | (2.1 | %) | | | 20,458 | |
| National Fuel Gas Co. | | | 14,429 | | | | (1.9 | %) | | | 18,397 | |
| Western Digital Corp. | | | 4,513 | | | | (1.9 | %) | | | 18,233 | |
| Mylan N.V.* | | | 13,156 | | | | (1.5 | %) | | | 15,043 | |
| Consolidated Edison, Inc. | | | 9,540 | | | | (1.5 | %) | | | 14,980 | |
| Tailored Brands, Inc. | | | 8,894 | | | | (1.4 | %) | | | 14,008 | |
| Carlisle Companies, Inc. | | | 4,258 | | | | (1.4 | %) | | | 13,925 | |
| Delta Air Lines, Inc. | | | 4,464 | | | | (1.4 | %) | | | 13,448 | |
| Comcast Corp. — Class A | | | 21,210 | | | | (1.3 | %) | | | 12,240 | |
| Allison Transmission Holdings, Inc. | | | 16,140 | | | | (1.1 | %) | | | 10,426 | |
| Hawaiian Holdings, Inc. | | | 4,095 | | | | (1.1 | %) | | | 10,340 | |
| Celgene Corp.* | | | 7,571 | | | | (1.0 | %) | | | 9,493 | |
| Allergan plc | | | 897 | | | | (0.9 | %) | | | 9,226 | |
| Kulicke & Soffa Industries, Inc.* | | | 6,780 | | | | (0.9 | %) | | | 9,119 | |
| ARRIS International plc* | | | 13,669 | | | | (0.9 | %) | | | 9,090 | |
| Kimberly-Clark Corp. | | | 6,746 | | | | (0.9 | %) | | | 9,005 | |
| Ralph Lauren Corp. — Class A | | | 1,782 | | | | (0.9 | %) | | | 8,580 | |
| Gray Television, Inc.* | | | 13,481 | | | | (0.8 | %) | | | 7,468 | |
| Acuity Brands, Inc. | | | 1,244 | | | | (0.6 | %) | | | 5,767 | |
| VEREIT, Inc. | | | 86,165 | | | | (0.6 | %) | | | 5,601 | |
| Valero Energy Corp. | | | 7,662 | | | | (0.5 | %) | | | 5,248 | |
| Chevron Corp. | | | 6,248 | | | | (0.5 | %) | | | 5,186 | |
| Gilead Sciences, Inc. | | | 8,925 | | | | (0.5 | %) | | | 5,181 | |
| UGI Corp. | | | 12,312 | | | | (0.5 | %) | | | 4,925 | |
| Dean Foods Co. | | | 21,054 | | | | (0.5 | %) | | | 4,805 | |
| Portland General Electric Co. | | | 18,220 | | | | (0.4 | %) | | | 4,191 | |
| Summit Hotel Properties, Inc. | | | 12,849 | | | | (0.4 | %) | | | 3,790 | |
| Conagra Brands, Inc. | | | 7,013 | | | | (0.4 | %) | | | 3,777 | |
| Vishay Intertechnology, Inc. | | | 21,278 | | | | (0.4 | %) | | | 3,724 | |
| Interpublic Group of Companies, Inc. | | | 9,869 | | | | (0.4 | %) | | | 3,595 | |
| SpartanNash Co. | | | 8,459 | | | | (0.3 | %) | | | 3,257 | |
| Rexnord Corp.* | | | 5,280 | | | | (0.3 | %) | | | 3,036 | |
| Medtronic plc | | | 2,835 | | | | (0.3 | %) | | | 2,840 | |
| Perrigo Company plc | | | 2,908 | | | | (0.3 | %) | | | 2,798 | |
| Exelon Corp. | | | 15,367 | | | | (0.3 | %) | | | 2,493 | |
| NetApp, Inc. | | | 7,870 | | | | (0.2 | %) | | | 2,282 | |
| Exxon Mobil Corp. | | | 5,954 | | | | (0.2 | %) | | | 2,064 | |
| ON Semiconductor Corp.* | | | 11,876 | | | | (0.2 | %) | | | 1,841 | |
| Park Hotels & Resorts, Inc. | | | 12,117 | | | | (0.2 | %) | | | 1,734 | |
| TreeHouse Foods, Inc.* | | | 5,741 | | | | (0.1 | %) | | | 1,263 | |
| Kansas City Southern | | | 1,331 | | | | (0.1 | %) | | | 1,229 | |
| Coeur Mining, Inc.* | | | 18,807 | | | | (0.1 | %) | | | 1,211 | |
| Louisiana-Pacific Corp. | | | 5,043 | | | | (0.1 | %) | | | 804 | |
| KBR, Inc. | | | 22,469 | | | | (0.1 | %) | | | 763 | |
| Genesee & Wyoming, Inc. — Class A* | | | 7,945 | | | | (0.1 | %) | | | 516 | |
| Scholastic Corp. | | | 188 | | | | (0.0 | %) | | | 320 | |
| MAXIMUS, Inc. | | | 4,624 | | | | 0.0 | % | | | (51 | ) |
| Verizon Communications, Inc. | | | 15,472 | | | | 0.0 | % | | | (172 | ) |
| Norfolk Southern Corp. | | | 1,049 | | | | 0.1 | % | | | (1,095 | ) |
| United Natural Foods, Inc.* | | | 5,674 | | | | 0.1 | % | | | (1,163 | ) |
| Cooper-Standard Holdings, Inc.* | | | 1,328 | | | | 0.1 | % | | | (1,228 | ) |
| WellCare Health Plans, Inc.* | | | 1,029 | | | | 0.1 | % | | | (1,310 | ) |
| Eli Lilly & Co. | | | 2,948 | | | | 0.1 | % | | | (1,312 | ) |
| Crane Co. | | | 2,129 | | | | 0.1 | % | | | (1,320 | ) |
| Owens-Illinois, Inc.* | | | 9,914 | | | | 0.2 | % | | | (1,438 | ) |
| SEE NOTES TO FINANCIAL STATEMENTS. | THE GUGGENHEIM FUNDS SEMI-ANNUAL REPORT | 13 |
| SCHEDULE OF INVESTMENTS (Unaudited)(continued) | March 29, 2018 |
| ALPHA OPPORTUNITY FUND | |
| | | Shares | | | Percentage
Value | | | Unrealized
Gain (Loss) | |
| | | | | | | | | | |
| New Media Investment Group, Inc. | | | 9,632 | | | | 0.2 | % | | $ | (1,493 | ) |
| Seagate Technology plc | | | 3,015 | | | | 0.2 | % | | | (1,741 | ) |
| Trinity Industries, Inc. | | | 4,629 | | | | 0.2 | % | | | (1,944 | ) |
| Regal Beloit Corp. | | | 8,625 | | | | 0.2 | % | | | (2,372 | ) |
| Kroger Co. | | | 6,638 | | | | 0.3 | % | | | (2,578 | ) |
| Merck & Company, Inc. | | | 12,480 | | | | 0.3 | % | | | (3,053 | ) |
| Charles River Laboratories International, Inc.* | | | 2,316 | | | | 0.3 | % | | | (3,103 | ) |
| Oracle Corp. | | | 3,630 | | | | 0.3 | % | | | (3,139 | ) |
| F5 Networks, Inc.* | | | 982 | | | | 0.4 | % | | | (3,482 | ) |
| Cardtronics plc — Class A* | | | 5,865 | | | | 0.4 | % | | | (3,666 | ) |
| Quanta Services, Inc.* | | | 5,774 | | | | 0.4 | % | | | (3,840 | ) |
| Fluor Corp. | | | 7,489 | | | | 0.4 | % | | | (3,894 | ) |
| Eagle Pharmaceuticals, Inc.* | | | 2,700 | | | | 0.4 | % | | | (3,929 | ) |
| Alcoa Corp.* | | | 3,051 | | | | 0.4 | % | | | (4,008 | ) |
| NCR Corp.* | | | 4,611 | | | | 0.4 | % | | | (4,013 | ) |
| Nexstar Media Group, Inc. — Class A | | | 4,083 | | | | 0.4 | % | | | (4,266 | ) |
| Masco Corp. | | | 3,758 | | | | 0.5 | % | | | (4,336 | ) |
| CoreLogic, Inc.* | | | 5,498 | | | | 0.5 | % | | | (4,811 | ) |
| Motorola Solutions, Inc. | | | 1,649 | | | | 0.5 | % | | | (5,188 | ) |
| Benchmark Electronics, Inc. | | | 12,608 | | | | 0.6 | % | | | (5,358 | ) |
| Occidental Petroleum Corp. | | | 10,377 | | | | 0.6 | % | | | (5,742 | ) |
| MSG Networks, Inc. — Class A* | | | 6,241 | | | | 0.6 | % | | | (5,813 | ) |
| Toll Brothers, Inc. | | | 3,793 | | | | 0.6 | % | | | (6,075 | ) |
| International Business Machines Corp. | | | 1,518 | | | | 0.6 | % | | | (6,247 | ) |
| AMC Networks, Inc. — Class A* | | | 4,872 | | | | 0.7 | % | | | (6,261 | ) |
| Taylor Morrison Home Corp. — Class A* | | | 7,013 | | | | 0.7 | % | | | (6,344 | ) |
| Applied Optoelectronics, Inc.* | | | 5,487 | | | | 0.8 | % | | | (7,310 | ) |
| Horizon Pharma plc* | | | 10,813 | | | | 0.8 | % | | | (7,731 | ) |
| Gannett Company, Inc. | | | 43,881 | | | | 0.8 | % | | | (7,855 | ) |
| Domtar Corp. | | | 3,237 | | | | 0.9 | % | | | (8,230 | ) |
| Gibraltar Industries, Inc.* | | | 5,347 | | | | 0.9 | % | | | (8,555 | ) |
| KLA-Tencor Corp. | | | 1,652 | | | | 0.9 | % | | | (8,838 | ) |
| EnerSys | | | 5,409 | | | | 1.0 | % | | | (9,303 | ) |
| Senior Housing Properties Trust | | | 36,849 | | | | 1.0 | % | | | (9,949 | ) |
| Copa Holdings S.A. — Class A | | | 1,352 | | | | 1.2 | % | | | (11,377 | ) |
| US Foods Holding Corp.* | | | 15,779 | | | | 1.2 | % | | | (11,440 | ) |
| CA, Inc. | | | 6,772 | | | | 1.2 | % | | | (11,885 | ) |
| LyondellBasell Industries N.V. — Class A | | | 3,048 | | | | 1.2 | % | | | (11,933 | ) |
| Icad, Inc.* | | | 28,684 | | | | 1.3 | % | | | (12,191 | ) |
| Prestige Brands Holdings, Inc.* | | | 13,608 | | | | 1.3 | % | | | (12,519 | ) |
| Xerox Corp. | | | 6,694 | | | | 1.3 | % | | | (12,685 | ) |
| Belden, Inc. | | | 2,296 | | | | 1.3 | % | | | (12,708 | ) |
| Ingredion, Inc. | | | 5,241 | | | | 1.3 | % | | | (12,840 | ) |
| Southwest Airlines Co. | | | 12,221 | | | | 1.4 | % | | | (13,443 | ) |
| Convergys Corp. | | | 18,012 | | | | 1.4 | % | | | (13,959 | ) |
| AECOM* | | | 4,249 | | | | 1.5 | % | | | (14,205 | ) |
| United Therapeutics Corp.* | | | 4,187 | | | | 1.5 | % | | | (14,320 | ) |
| Performance Food Group Co.* | | | 11,677 | | | | 1.5 | % | | | (14,888 | ) |
| News Corp. — Class A | | | 24,853 | | | | 1.6 | % | | | (15,928 | ) |
| Tyson Foods, Inc. — Class A | | | 9,264 | | | | 1.7 | % | | | (16,166 | ) |
| Cummins, Inc. | | | 3,925 | | | | 1.7 | % | | | (16,254 | ) |
| Johnson & Johnson | | | 5,575 | | | | 1.7 | % | | | (16,614 | ) |
| AGCO Corp. | | | 5,527 | | | | 1.7 | % | | | (16,774 | ) |
| Meritor, Inc.* | | | 13,153 | | | | 1.8 | % | | | (17,027 | ) |
| Williams Companies, Inc. | | | 5,448 | | | | 1.8 | % | | | (17,733 | ) |
| Sabre Corp. | | | 8,498 | | | | 1.9 | % | | | (17,973 | ) |
| Prudential Financial, Inc. | | | 3,761 | | | | 1.9 | % | | | (18,786 | ) |
| DXC Technology Co. | | | 5,498 | | | | 2.0 | % | | | (18,996 | ) |
| Owens Corning | | | 7,855 | | | | 2.0 | % | | | (19,559 | ) |
| Edgewell Personal Care Co.* | | | 15,577 | | | | 2.3 | % | | | (22,119 | ) |
| Amgen, Inc. | | | 3,759 | | | | 2.3 | % | | | (22,421 | ) |
| Sprint Corp.* | | | 57,109 | | | | 2.3 | % | | | (22,558 | ) |
| Western Union Co. | | | 27,256 | | | | 2.4 | % | | | (23,663 | ) |
| Spirit AeroSystems Holdings, Inc. — Class A | | | 2,998 | | | | 2.5 | % | | | (23,825 | ) |
| Greenbrier Companies, Inc. | | | 13,244 | | | | 2.5 | % | | | (24,501 | ) |
| Huntsman Corp. | | | 6,381 | | | | 2.5 | % | | | (24,503 | ) |
| Pfizer, Inc. | | | 17,480 | | | | 2.5 | % | | | (24,559 | ) |
| Darling Ingredients, Inc.* | | | 16,361 | | | | 2.6 | % | | | (24,705 | ) |
| Alaska Air Group, Inc. | | | 9,096 | | | | 2.7 | % | | | (25,924 | ) |
| Coherent, Inc.* | | | 1,042 | | | | 2.8 | % | | | (26,837 | ) |
| Pilgrim's Pride Corp.* | | | 25,914 | | | | 2.8 | % | | | (26,951 | ) |
| PACCAR, Inc. | | | 5,519 | | | | 3.2 | % | | | (30,741 | ) |
| Micron Technology, Inc.* | | | 4,308 | | | | 3.2 | % | | | (31,003 | ) |
| McKesson Corp. | | | 2,559 | | | | 3.2 | % | | | (31,213 | ) |
| AmerisourceBergen Corp. — Class A | | | 3,269 | | | | 3.4 | % | | | (33,393 | ) |
| Snap-on, Inc. | | | 2,639 | | | | 3.4 | % | | | (33,410 | ) |
| Sanderson Farms, Inc. | | | 5,344 | | | | 3.5 | % | | | (33,774 | ) |
| CVS Health Corp. | | | 5,860 | | | | 3.6 | % | | | (35,219 | ) |
| Versartis, Inc.* | | | 76,383 | | | | 3.7 | % | | | (35,746 | ) |
| Zimmer Biomet Holdings, Inc. | | | 4,357 | | | | 3.8 | % | | | (37,300 | ) |
| Cardinal Health, Inc. | | | 5,568 | | | | 4.0 | % | | | (39,032 | ) |
| Juniper Networks, Inc. | | | 26,055 | | | | 4.0 | % | | | (39,220 | ) |
| Cirrus Logic, Inc.* | | | 12,760 | | | | 4.1 | % | | | (40,109 | ) |
| Omnicom Group, Inc. | | | 10,097 | | | | 4.6 | % | | | (44,881 | ) |
| TEGNA, Inc. | | | 20,870 | | | | 4.6 | % | | | (45,042 | ) |
| InterDigital, Inc. | | | 5,777 | | | | 4.7 | % | | | (45,104 | ) |
| Molson Coors Brewing Co. — Class B | | | 9,617 | | | | 4.7 | % | | | (45,572 | ) |
| HP, Inc. | | | 25,136 | | | | 4.8 | % | | | (46,627 | ) |
| Principal Financial Group, Inc. | | | 9,463 | | | | 5.4 | % | | | (52,562 | ) |
| Lions Gate Entertainment Corp. — Class A | | | 19,600 | | | | 5.9 | % | | | (57,134 | ) |
| Tech Data Corp.* | | | 5,247 | | | | 10.6 | % | | | (103,208 | ) |
| General Mills, Inc. | | | 14,844 | | | | 15.2 | % | | | (147,727 | ) |
| Biogen, Inc.* | | | 2,462 | | | | 15.7 | % | | | (152,398 | ) |
| Total Custom Basket of Long Securities | | | | | | | | | | | (970,323 | ) |
| 14 | THE GUGGENHEIM FUNDS SEMI-ANNUAL REPORT | SEE NOTES TO FINANCIAL STATEMENTS. |
| SCHEDULE OF INVESTMENTS (Unaudited)(continued) | March 29, 2018 |
| ALPHA OPPORTUNITY FUND | |
| | | Shares | | | Percentage
Value | | | Unrealized
Gain (Loss) | |
| | | | | | | |
| CUSTOM BASKET OF SHORT SECURITIES3 | | | | | | |
| Albemarle Corp. | | | (6,805 | ) | | | (2.4 | %) | | $ | 272,710 | |
| Education Realty Trust, Inc. REIT | | | (37,504 | ) | | | (2.3 | %) | | | 262,414 | |
| Covanta Holding Corp. | | | (202,289 | ) | | | (2.3 | %) | | | 256,497 | |
| NewMarket Corp. | | | (6,134 | ) | | | (1.8 | %) | | | 205,531 | |
| Healthcare Services Group, Inc. | | | (73,968 | ) | | | (1.7 | %) | | | 191,769 | |
| Camden Property Trust REIT | | | (28,197 | ) | | | (1.5 | %) | | | 164,079 | |
| Compass Minerals International, Inc. | | | (37,028 | ) | | | (1.4 | %) | | | 159,800 | |
| Vulcan Materials Co. | | | (25,448 | ) | | | (1.4 | %) | | | 158,522 | |
| Capitol Federal Financial, Inc. | | | (143,173 | ) | | | (1.2 | %) | | | 138,300 | |
| Sensient Technologies Corp. | | | (12,942 | ) | | | (1.2 | %) | | | 135,708 | |
| Extraction Oil & Gas, Inc.* | | | (60,989 | ) | | | (1.1 | %) | | | 129,103 | |
| Terreno Realty Corp. | | | (64,403 | ) | | | (1.1 | %) | | | 126,479 | |
| Martin Marietta Materials, Inc. | | | (12,691 | ) | | | (1.0 | %) | | | 109,479 | |
| Tesla, Inc.* | | | (2,069 | ) | | | (0.9 | %) | | | 101,622 | |
| Charles Schwab Corp. | | | (44,807 | ) | | | (0.9 | %) | | | 96,729 | |
| Advanced Micro Devices, Inc.* | | | (68,582 | ) | | | (0.7 | %) | | | 82,493 | |
| Flagstar Bancorp, Inc.* | | | (21,214 | ) | | | (0.7 | %) | | | 74,916 | |
| White Mountains Insurance Group Ltd. | | | (3,384 | ) | | | (0.6 | %) | | | 71,586 | |
| Balchem Corp. | | | (23,847 | ) | | | (0.6 | %) | | | 67,340 | |
| CyrusOne, Inc. | | | (21,862 | ) | | | (0.5 | %) | | | 56,156 | |
| Air Products & Chemicals, Inc. | | | (19,906 | ) | | | (0.4 | %) | | | 49,514 | |
| Netflix, Inc.* | | | (3,021 | ) | | | (0.4 | %) | | | 41,973 | |
| Align Technology, Inc.* | | | (2,452 | ) | | | (0.3 | %) | | | 36,819 | |
| Amazon.com, Inc.* | | | (1,203 | ) | | | (0.3 | %) | | | 34,905 | |
| Inphi Corp.* | | | (20,654 | ) | | | (0.3 | %) | | | 33,106 | |
| South Jersey Industries, Inc. | | | (28,854 | ) | | | (0.3 | %) | | | 29,951 | |
| Tetra Tech, Inc. | | | (15,630 | ) | | | (0.2 | %) | | | 26,668 | |
| Workday, Inc. — Class A* | | | (5,494 | ) | | | (0.2 | %) | | | 26,365 | |
| First Data Corp. — Class A* | | | (39,144 | ) | | | (0.2 | %) | | | 25,287 | |
| ServiceNow, Inc.* | | | (3,901 | ) | | | (0.2 | %) | | | 21,534 | |
| Gartner, Inc.* | | | (6,290 | ) | | | (0.2 | %) | | | 20,948 | |
| Republic Services, Inc. — Class A | | | (14,803 | ) | | | (0.2 | %) | | | 19,362 | |
| Rexford Industrial Realty, Inc. REIT | | | (50,011 | ) | | | (0.1 | %) | | | 14,666 | |
| National Instruments Corp. | | | (12,577 | ) | | | (0.1 | %) | | | 14,457 | |
| Aon plc | | | (21,050 | ) | | | (0.1 | %) | | | 12,991 | |
| Nabors Industries Ltd. | | | (284,461 | ) | | | (0.1 | %) | | | 11,472 | |
| Intercontinental Exchange, Inc. | | | (23,253 | ) | | | (0.1 | %) | | | 10,896 | |
| Dominion Energy, Inc. | | | (9,786 | ) | | | (0.1 | %) | | | 9,014 | |
| Ashland Global Holdings, Inc. | | | (9,523 | ) | | | (0.1 | %) | | | 8,501 | |
| Equity LifeStyle Properties, Inc. | | | (31,084 | ) | | | (0.1 | %) | | | 8,300 | |
| Cboe Global Markets, Inc. | | | (14,488 | ) | | | (0.1 | %) | | | 7,669 | |
| CME Group, Inc. — Class A | | | (5,482 | ) | | | (0.1 | %) | | | 7,075 | |
| ABM Industries, Inc. | | | (96,090 | ) | | | 0.0 | % | | | 2,151 | |
| CarMax, Inc.* | | | (35,436 | ) | | | 0.0 | % | | | 363 | |
| People's United Financial, Inc. | | | (33,882 | ) | | | 0.0 | % | | | (747 | ) |
| Equifax, Inc. | | | (17,497 | ) | | | 0.0 | % | | | (1,004 | ) |
| Equinix, Inc. REIT | | | (2,895 | ) | | | 0.0 | % | | | (3,393 | ) |
| KAR Auction Services, Inc. | | | (30,256 | ) | | | 0.0 | % | | | (4,011 | ) |
| Essex Property Trust, Inc. REIT | | | (2,815 | ) | | | 0.1 | % | | | (6,537 | ) |
| Royal Gold, Inc. | | | (22,717 | ) | | | 0.1 | % | | | (6,729 | ) |
| Washington Federal, Inc. | | | (19,682 | ) | | | 0.1 | % | | | (10,752 | ) |
| Hudson Pacific Properties, Inc. | | | (68,494 | ) | | | 0.1 | % | | | (11,959 | ) |
| Federal Realty Investment Trust REIT | | | (12,676 | ) | | | 0.1 | % | | | (12,654 | ) |
| Wendy's Co. | | | (65,505 | ) | | | 0.1 | % | | | (13,069 | ) |
| Cornerstone OnDemand, Inc.* | | | (17,619 | ) | | | 0.1 | % | | | (13,799 | ) |
| Alliant Energy Corp. | | | (19,321 | ) | | | 0.1 | % | | | (15,681 | ) |
| Whiting Petroleum Corp.* | | | (19,694 | ) | | | 0.1 | % | | | (15,881 | ) |
| Realty Income Corp. | | | (13,265 | ) | | | 0.2 | % | | | (17,501 | ) |
| Equity Commonwealth* | | | (68,052 | ) | | | 0.2 | % | | | (23,008 | ) |
| Sun Communities, Inc. | | | (29,537 | ) | | | 0.2 | % | | | (24,985 | ) |
| EastGroup Properties, Inc. REIT | | | (25,094 | ) | | | 0.2 | % | | | (27,524 | ) |
| Alexandria Real Estate Equities, Inc. REIT | | | (17,599 | ) | | | 0.3 | % | | | (29,774 | ) |
| AvalonBay Communities, Inc. REIT | | | (5,407 | ) | | | 0.3 | % | | | (33,985 | ) |
| Goldman Sachs Group, Inc. | | | (7,302 | ) | | | 0.3 | % | | | (34,564 | ) |
| Ellie Mae, Inc.* | | | (8,384 | ) | | | 0.3 | % | | | (35,988 | ) |
| Healthcare Trust of America, Inc. — Class A | | | (60,730 | ) | | | 0.3 | % | | | (37,136 | ) |
| Aspen Insurance Holdings Ltd. | | | (29,781 | ) | | | 0.3 | % | | | (38,748 | ) |
| Vail Resorts, Inc. | | | (3,419 | ) | | | 0.4 | % | | | (38,990 | ) |
| Team, Inc.* | | | (64,071 | ) | | | 0.4 | % | | | (41,664 | ) |
| Mobile Mini, Inc. | | | (31,569 | ) | | | 0.4 | % | | | (47,000 | ) |
| Robert Half International, Inc. | | | (11,117 | ) | | | 0.4 | % | | | (47,217 | ) |
| Redwood Trust, Inc. | | | (57,970 | ) | | | 0.4 | % | | | (48,158 | ) |
| Investors Bancorp, Inc. | | | (86,537 | ) | | | 0.5 | % | | | (55,268 | ) |
| Shake Shack, Inc. — Class A* | | | (41,266 | ) | | | 0.5 | % | | | (55,362 | ) |
| Glacier Bancorp, Inc. | | | (18,204 | ) | | | 0.5 | % | | | (59,583 | ) |
| Duke Realty Corp. REIT | | | (42,398 | ) | | | 0.6 | % | | | (70,682 | ) |
| SL Green Realty Corp. REIT | | | (15,937 | ) | | | 0.6 | % | | | (71,520 | ) |
| Cannae Holdings, Inc.* | | | (50,986 | ) | | | 0.7 | % | | | (73,017 | ) |
| FireEye, Inc.* | | | (45,964 | ) | | | 0.7 | % | | | (76,543 | ) |
| SEI Investments Co. | | | (11,651 | ) | | | 0.7 | % | | | (79,900 | ) |
| Allegheny Technologies, Inc.* | | | (48,386 | ) | | | 0.8 | % | | | (87,939 | ) |
| Equity Residential REIT | | | (14,678 | ) | | | 0.8 | % | | | (88,671 | ) |
| Eaton Vance Corp. | | | (12,775 | ) | | | 0.9 | % | | | (98,782 | ) |
| SPS Commerce, Inc.* | | | (13,369 | ) | | | 0.9 | % | | | (102,640 | ) |
| Semtech Corp.* | | | (21,307 | ) | | | 1.0 | % | | | (107,405 | ) |
| FMC Corp. | | | (10,745 | ) | | | 1.0 | % | | | (109,556 | ) |
| American Tower Corp. — Class A REIT | | | (15,499 | ) | | | 1.0 | % | | | (113,043 | ) |
| RLI Corp. | | | (28,086 | ) | | | 1.0 | % | | | (114,290 | ) |
| Domino's Pizza, Inc. | | | (5,097 | ) | | | 1.0 | % | | | (114,325 | ) |
| SEE NOTES TO FINANCIAL STATEMENTS. | THE GUGGENHEIM FUNDS SEMI-ANNUAL REPORT | 15 |
| SCHEDULE OF INVESTMENTS (Unaudited)(continued) | March 29, 2018 |
| ALPHA OPPORTUNITY FUND | |
| | | Shares | | | Percentage
Value | | | Unrealized
Gain (Loss) | |
| | | | | | | | | | |
| Kilroy Realty Corp. REIT | | | (21,895 | ) | | | 1.1 | % | | $ | (120,830 | ) |
| LendingTree, Inc.* | | | (2,576 | ) | | | 1.1 | % | | | (122,698 | ) |
| WD-40 Co. | | | (5,063 | ) | | | 1.1 | % | | | (126,809 | ) |
| TransUnion* | | | (55,892 | ) | | | 1.1 | % | | | (128,728 | ) |
| Ultimate Software Group, Inc.* | | | (3,941 | ) | | | 1.3 | % | | | (143,988 | ) |
| Booking Holdings, Inc.* | | | (590 | ) | | | 1.3 | % | | | (147,358 | ) |
| FactSet Research Systems, Inc. | | | (9,222 | ) | | | 1.3 | % | | | (148,648 | ) |
| DCT Industrial Trust, Inc. REIT | | | (53,625 | ) | | | 1.3 | % | | | (151,205 | ) |
| Ingevity Corp.* | | | (10,798 | ) | | | 1.4 | % | | | (158,997 | ) |
| Boston Properties, Inc. REIT | | | (24,837 | ) | | | 1.5 | % | | | (164,208 | ) |
| Crown Castle International Corp. REIT | | | (20,504 | ) | | | 1.5 | % | | | (165,152 | ) |
| Markel Corp.* | | | (2,451 | ) | | | 1.7 | % | | | (189,481 | ) |
| Exponent, Inc. | | | (41,377 | ) | | | 1.7 | % | | | (190,388 | ) |
| UDR, Inc. REIT | | | (87,186 | ) | | | 1.8 | % | | | (197,999 | ) |
| International Flavors & Fragrances, Inc. | | | (21,112 | ) | | | 1.8 | % | | | (206,325 | ) |
| Insperity, Inc. | | | (20,250 | ) | | | 1.9 | % | | | (212,983 | ) |
| Pool Corp. | | | (8,152 | ) | | | 1.9 | % | | | (215,762 | ) |
| Pegasystems, Inc. | | | (16,134 | ) | | | 1.9 | % | | | (216,534 | ) |
| Callon Petroleum Co.* | | | (70,833 | ) | | | 2.0 | % | | | (227,902 | ) |
| SBA Communications Corp.* | | | (11,998 | ) | | | 2.3 | % | | | (254,989 | ) |
| Howard Hughes Corp.* | | | (14,714 | ) | | | 2.3 | % | | | (256,281 | ) |
| Diamondback Energy, Inc.* | | | (17,042 | ) | | | 2.3 | % | | | (263,320 | ) |
| Southern Copper Corp. | | | (59,254 | ) | | | 2.4 | % | | $ | (272,773 | ) |
| RSP Permian, Inc.* | | | (34,883 | ) | | | 2.5 | % | | | (277,097 | ) |
| Axis Capital Holdings Ltd. | | | (41,715 | ) | | | 2.6 | % | | | (295,052 | ) |
| Ollie's Bargain Outlet Holdings, Inc.* | | | (18,001 | ) | | | 2.6 | % | | | (298,646 | ) |
| Ecolab, Inc. | | | (24,259 | ) | | | 2.8 | % | | | (310,033 | ) |
| Parsley Energy, Inc. — Class A* | | | (101,913 | ) | | | 2.8 | % | | | (315,996 | ) |
| Monolithic Power Systems, Inc. | | | (22,757 | ) | | | 2.9 | % | | | (326,671 | ) |
| Tyler Technologies, Inc.* | | | (9,035 | ) | | | 3.0 | % | | | (334,681 | ) |
| MSCI, Inc. — Class A | | | (15,576 | ) | | | 3.0 | % | | | (342,834 | ) |
| MarketAxess Holdings, Inc. | | | (12,840 | ) | | | 3.2 | % | | | (360,532 | ) |
| CoStar Group, Inc.* | | | (6,337 | ) | | | 3.3 | % | | | (370,911 | ) |
| PTC, Inc.* | | | (18,866 | ) | | | 3.3 | % | | | (374,797 | ) |
| Cintas Corp. | | | (19,098 | ) | | | 3.4 | % | | | (381,901 | ) |
| Verisk Analytics, Inc. — Class A* | | | (31,503 | ) | | | 3.6 | % | | | (405,864 | ) |
| S&P Global, Inc. | | | (13,661 | ) | | | 3.7 | % | | | (416,796 | ) |
| Rollins, Inc. | | | (63,887 | ) | | | 3.7 | % | | | (417,685 | ) |
| Five Below, Inc.* | | | (14,016 | ) | | | 3.9 | % | | | (438,219 | ) |
| Moody's Corp. | | | (16,419 | ) | | | 3.9 | % | | | (444,851 | ) |
| On Assignment, Inc.* | | | (38,692 | ) | | | 5.0 | % | | | (568,750 | ) |
| Crocs, Inc.* | | | (62,956 | ) | | | 5.1 | % | | | (580,546 | ) |
| Copart, Inc.* | | | (64,573 | ) | | | 8.5 | % | | | (960,557 | ) |
| Total Custom Basket of Short Securities | | | | | | | | | | | (11,291,541 | ) |
| * | Non-income producing security. |
| † | Value determined based on Level 1 inputs — See Note 4. |
| †† | Value determined based on Level 2 inputs — See Note 4. |
| 1 | All or a portion of this security is pledged as custom basket swap collateral at March 29, 2018. |
| 2 | Rate indicated is the 7 day yield as of March 29, 2018. |
| 3 | Total Return based on the return of the custom short basket of securities +/- financing at a variable rate. Rate indicated is rate effective at March 29, 2018. |
| 4 | Total Return based on the return of the custom long basket of securities +/- financing at a variable rate. Rate indicated is rate effective at March 29, 2018. |
| | plc — Public Limited Company |
| | REIT — Real Estate Investment Trust |
| | |
| | See Sector Classification in Other Information section. |
| 16 | THE GUGGENHEIM FUNDS SEMI-ANNUAL REPORT | SEE NOTES TO FINANCIAL STATEMENTS. |
| SCHEDULE OF INVESTMENTS (Unaudited)(concluded) | March 29, 2018 |
| ALPHA OPPORTUNITY FUND | |
The following table summarizes the inputs used to value the Fund’s investments at March 29, 2018 (See Note 4 in the Notes to Financial Statements):
| Investments in Securities (Assets) | | Level 1
Quoted
Prices | | | Level 2
Significant
Observable
Inputs | | | Level 2 -
Other* | | | Level 3
Significant
Unobservable
Inputs | | | Total | |
| Common Stocks | | $ | 224,211,401 | | | $ | — | | | $ | — | | | $ | — | | | $ | 224,211,401 | |
| Money Market Fund | | | 6,605,970 | | | | — | | | | — | | | | — | | | | 6,605,970 | |
| Total Assets | | $ | 230,817,371 | | | $ | — | | | $ | — | | | $ | — | | | $ | 230,817,371 | |
| Investments in Securities (Liabilities) | | Level 1
Quoted
Prices | | | Level 2
Significant
Observable
Inputs | | | Level 2 -
Other* | | | Level 3
Significant
Unobservable
Inputs | | | Total | |
| Custom Basket Swap Agreements | | $ | — | | | $ | — | | | $ | 12,261,864 | | | $ | — | | | $ | 12,261,864 | |
| * | Other financial instruments include swaps, which are reported as unrealized gain/loss at period end. |
Transfers between investment levels may occur as the markets fluctuate and/or the availability of data used in an investment’s valuation changes. Transfers between valuation levels, if any, are in comparison to the valuation levels at the end of the previous fiscal year, and are effective using the fair value as of the end of the current fiscal period.
For the period ended March 29, 2018, there were no transfers between levels.
| SEE NOTES TO FINANCIAL STATEMENTS. | THE GUGGENHEIM FUNDS SEMI-ANNUAL REPORT | 17 |
| STATEMENT OF ASSETS AND LIABILITIES (Unaudited) |
| March 29, 2018 |
| Assets: |
| Investments, at value (cost $232,572,679) | | $ | 230,817,371 | |
| Cash | | | 42,785 | |
| Prepaid expenses | | | 62,855 | |
| Receivables: |
| Securities sold | | | 486,933 | |
| Dividends | | | 261,215 | |
| Fund shares sold | | | 14,092 | |
| Interest | | | 8,753 | |
| Total assets | | | 231,694,004 | |
| | | | | |
| Liabilities: |
| Unrealized depreciation on swap agreements | | | 12,261,864 | |
| Payable for: |
| Securities purchased | | | 1,070,476 | |
| Swap settlement | | | 862,898 | |
| Fund shares redeemed | | | 203,545 | |
| Management fees | | | 170,891 | |
| Fund accounting/administration fees | | | 15,190 | |
| Transfer agent/maintenance fees | | | 12,213 | |
| Distribution and service fees | | | 7,243 | |
| Trustees’ fees* | | | 293 | |
| Miscellaneous | | | 38,590 | |
| Total liabilities | | | 14,643,203 | |
| Net assets | | $ | 217,050,801 | |
| | | | | |
| Net assets consist of: |
| Paid in capital | | $ | 222,247,848 | |
| Undistributed net investment income | | | 920,061 | |
| Accumulated net realized gain on investments | | | 7,900,064 | |
| Net unrealized depreciation on investments | | | (14,017,172 | ) |
| Net assets | | $ | 217,050,801 | |
| | | | | |
| A-Class: |
| Net assets | | $ | 12,960,880 | |
| Capital shares outstanding | | | 659,115 | |
| Net asset value per share | | $ | 19.66 | |
| Maximum offering price per share (Net asset value divided by 95.25%) | | $ | 20.64 | |
| | | | | |
| C-Class: |
| Net assets | | $ | 2,469,161 | |
| Capital shares outstanding | | | 144,232 | |
| Net asset value per share | | $ | 17.12 | |
| | | | | |
| P-Class: |
| Net assets | | $ | 8,869,712 | |
| Capital shares outstanding | | | 449,179 | |
| Net asset value per share | | $ | 19.75 | |
| | | | | |
| Institutional Class: |
| Net assets | | $ | 192,751,048 | |
| Capital shares outstanding | | | 6,771,589 | |
| Net asset value per share | | $ | 28.46 | |
| STATEMENT OF OPERATIONS (Unaudited) |
| Period Ended March 29, 2018 |
| Investment Income: |
| Dividends (net of foreign withholding tax of $927) | | $ | 2,198,815 | |
| Interest | | | 38,545 | |
| Total investment income | | | 2,237,360 | |
| | | | | |
| Expenses: |
| Management fees | | | 1,012,806 | |
| Distribution and service fees: |
| A-Class | | | 17,623 | |
| C-Class | | | 12,990 | |
| P-Class | | | 11,321 | |
| Recoupment of previously waived fees: |
| A-Class | | | 3,302 | |
| C-Class | | | 1,441 | |
| P-Class | | | 3,124 | |
| Transfer agent/maintenance fees: |
| A-Class | | | 13,333 | |
| C-Class | | | 1,636 | |
| P-Class | | | 9,139 | |
| Institutional Class | | | 19,240 | |
| Fund accounting/administration fees | | | 90,028 | |
| Line of credit fees | | | 12,896 | |
| Custodian fees | | | 6,483 | |
| Trustees’ fees* | | | 5,694 | |
| Miscellaneous | | | 98,125 | |
| Total expenses | | | 1,319,181 | |
| Less: |
| Expenses reimbursed by Adviser: |
| A-Class | | | (583 | ) |
| C-Class | | | (185 | ) |
| P-Class | | | (1,114 | ) |
| Total reimbursed expenses | | | (1,882 | ) |
| Net expenses | | | 1,317,299 | |
| Net investment income | | | 920,061 | |
| | | | | |
| Net Realized and Unrealized Gain (Loss): |
| Net realized gain (loss) on: |
| Investments | | | 17,364,804 | |
| Swap agreements | | | (8,943,191 | ) |
| Net realized gain | | | 8,421,613 | |
| Net change in unrealized appreciation (depreciation) on: |
| Investments | | | (7,608,688 | ) |
| Swap agreements | | | (2,218,561 | ) |
| Net change in unrealized appreciation (depreciation) | | | (9,827,249 | ) |
| Net realized and unrealized loss | | | (1,405,636 | ) |
| Net decrease in net assets resulting from operations | | $ | (485,575 | ) |
| * | Relates to Trustees not deemed “interested persons” within the meaning of Section 2(a)(19) of the 1940 Act. |
| 18 | THE GUGGENHEIM FUNDS SEMI-ANNUAL REPORT | SEE NOTES TO FINANCIAL STATEMENTS. |
| STATEMENTS OF CHANGES IN NET ASSETS |
| | | Period Ended
March 29,
2018
(Unaudited) | | | Year Ended
September 30,
2017 | |
| Increase (Decrease) in Net Assets from Operations: | | | | | | |
| Net investment income | | $ | 920,061 | | | $ | 825,143 | |
| Net realized gain on investments | | | 8,421,613 | | | | 13,611,432 | |
| Net change in unrealized appreciation (depreciation) on investments | | | (9,827,249 | ) | | | (3,954,711 | ) |
| Net increase (decrease) in net assets resulting from operations | | | (485,575 | ) | | | 10,481,864 | |
| | | | | | | | | |
| Distributions to shareholders from: | | | | | | | | |
| Net realized gains | | | | | | | | |
| A-Class | | | (950,491 | ) | | | (9,722 | ) |
| C-Class | | | (199,304 | ) | | | (1,227 | ) |
| P-Class | | | (527,188 | ) | | | (3,342 | ) |
| Institutional Class | | | (9,428,285 | ) | | | (43,388 | ) |
| Total distributions to shareholders | | | (11,105,268 | ) | | | (57,679 | ) |
| | | | | | | | | |
| Capital share transactions: | | | | | | | | |
| Proceeds from sale of shares | | | | | | | | |
| A-Class | | | 1,170,915 | | | | 10,194,828 | |
| C-Class | | | 281,089 | | | | 1,157,811 | |
| P-Class | | | 7,060,387 | | | | 14,180,540 | |
| Institutional Class | | | 3,907,046 | | | | 136,905,494 | |
| Distributions reinvested | | | | | | | | |
| A-Class | | | 925,939 | | | | 9,070 | |
| C-Class | | | 194,318 | | | | 1,192 | |
| P-Class | | | 527,187 | | | | 3,342 | |
| Institutional Class | | | 9,428,285 | | | | 43,369 | |
| Cost of shares redeemed | | | | | | | | |
| A-Class | | | (3,197,750 | ) | | | (13,021,740 | ) |
| C-Class | | | (299,062 | ) | | | (368,114 | ) |
| P-Class | | | (5,592,084 | ) | | | (11,532,946 | ) |
| Institutional Class | | | (7,183,450 | ) | | | (5,173,092 | ) |
| Net increase from capital share transactions | | | 7,222,820 | | | | 132,399,754 | |
| Net increase (decrease) in net assets | | | (4,368,023 | ) | | | 142,823,939 | |
| | | | | | | | | |
| Net assets: | | | | | | | | |
| Beginning of period | | | 221,418,824 | | | | 78,594,885 | |
| End of period | | $ | 217,050,801 | | | $ | 221,418,824 | |
| Undistributed net investment income at end of period | | $ | 920,061 | | | $ | — | |
| | | | | | | | | |
| Capital share activity: | | | | | | | | |
| Shares sold | | | | | | | | |
| A-Class | | | 56,183 | | | | 500,937 | |
| C-Class | | | 15,142 | | | | 63,585 | |
| P-Class | | | 331,577 | | | | 683,702 | |
| Institutional Class | | | 129,657 | | | | 4,636,032 | |
| Shares issued from reinvestment of distributions | | | | | | | | |
| A-Class | | | 44,581 | | | | 447 | |
| C-Class | | | 10,724 | | | | 66 | |
| P-Class | | | 25,285 | | | | 163 | |
| Institutional Class | | | 313,962 | | | | 1,492 | |
| Shares redeemed | | | | | | | | |
| A-Class | | | (152,954 | ) | | | (630,915 | ) |
| C-Class | | | (16,351 | ) | | | (20,327 | ) |
| P-Class | | | (271,956 | ) | | | (552,657 | ) |
| Institutional Class | | | (240,929 | ) | | | (177,256 | ) |
| Net increase in shares | | | 244,921 | | | | 4,505,269 | |
| SEE NOTES TO FINANCIAL STATEMENTS. | THE GUGGENHEIM FUNDS SEMI-ANNUAL REPORT | 19 |
This table is presented to show selected data for a share outstanding throughout each period and to assist shareholders in evaluating a Fund’s performance for the periods presented.
| A-Class | | Period Ended
March 29,
2018a | | | Year Ended
September 30,
2017 | | | Year Ended
September 30,
2016 | | | Year Ended
September 30,
2015 | | | Year Ended
September 30,
2014 | | | Year Ended
September 30,
2013 | |
| Per Share Data | | | | | | | | | | | | | | | | | | |
| Net asset value, beginning of period | | $ | 21.10 | | | $ | 19.08 | | | $ | 18.39 | | | $ | 18.01 | | | $ | 16.22 | | | $ | 13.33 | |
| Income (loss) from investment operations: |
| Net investment income (loss)b | | | .04 | | | | .31 | | | | (.19 | ) | | | (.35 | ) | | | (.13 | ) | | | .03 | |
| Net gain (loss) on investments (realized and unrealized) | | | (.03 | ) | | | 1.72 | | | | .88 | | | | .73 | | | | 1.92 | | | | 2.86 | |
| Total from investment operations | | | .01 | | | | 2.03 | | | | .69 | | | | .38 | | | | 1.79 | | | | 2.89 | |
| Less distributions from: |
| Net investment income | | | — | | | | — | | | | — | | | | (— | )c | | | — | | | | — | |
| Net realized gains | | | (1.45 | ) | | | (.01 | ) | | | — | | | | — | | | | — | | | | — | |
| Total distributions | | | (1.45 | ) | | | (.01 | ) | | | — | | | | (— | )c | | | — | | | | — | |
| Net asset value, end of period | | $ | 19.66 | | | $ | 21.10 | | | $ | 19.08 | | | $ | 18.39 | | | $ | 18.01 | | | $ | 16.22 | |
| |
| Total Returnd | | | (0.31 | %) | | | 10.70 | % | | | 3.70 | % | | | 2.13 | % | | | 11.04 | % | | | 21.38 | % |
| Ratios/Supplemental Data |
| Net assets, end of period (in thousands) | | $ | 12,961 | | | $ | 15,011 | | | $ | 16,041 | | | $ | 11,485 | | | $ | 7,989 | | | $ | 7,749 | |
| Ratios to average net assets: |
| Net investment income (loss) | | | 0.41 | % | | | (1.49 | %) | | | (1.02 | %) | | | (1.88 | %) | | | (0.73 | %) | | | 0.19 | % |
| Total expensesh | | | 1.58 | % | | | 2.21 | % | | | 2.69 | % | | | 3.92 | % | | | 3.25 | % | | | 3.99 | % |
| Net expensese,f,i | | | 1.57 | % | | | 2.17 | % | | | 2.69 | % | | | 2.94 | % | | | 2.12 | % | | | 2.14 | % |
| Portfolio turnover rate | | | 163 | % | | | 92 | % | | | 235 | % | | | 124 | % | | | — | | | | 488 | % |
| C-Class | | Period Ended
March 29,
2018a | | | Year Ended
September 30,
2017 | | | Year Ended
September 30,
2016 | | | Year Ended
September 30,
2015 | | | Year Ended
September 30,
2014 | | | Year Ended
September 30,
2013 | |
| Per Share Data | | | | | | | | | | | | | | | | | | |
| Net asset value, beginning of period | | $ | 18.62 | | | $ | 16.96 | | | $ | 16.47 | | | $ | 16.25 | | | $ | 14.74 | | | $ | 12.21 | |
| Income (loss) from investment operations: |
| Net investment income (loss)b | | | (.03 | ) | | | .09 | | | | (.29 | ) | | | (.44 | ) | | | (.23 | ) | | | (.07 | ) |
| Net gain (loss) on investments (realized and unrealized) | | | (.02 | ) | | | 1.58 | | | | .78 | | | | .66 | | | | 1.74 | | | | 2.60 | |
| Total from investment operations | | | (.05 | ) | | | 1.67 | | | | .49 | | | | .22 | | | | 1.51 | | | | 2.53 | |
| Less distributions from: |
| Net investment income | | | — | | | | — | | | | — | | | | (— | )c | | | — | | | | — | |
| Net realized gains | | | (1.45 | ) | | | (.01 | ) | | | — | | | | — | | | | — | | | | — | |
| Total distributions | | | (1.45 | ) | | | (.01 | ) | | | — | | | | (— | )c | | | — | | | | — | |
| Net asset value, end of period | | $ | 17.12 | | | $ | 18.62 | | | $ | 16.96 | | | $ | 16.47 | | | $ | 16.25 | | | $ | 14.74 | |
| |
| Total Returnd | | | (0.69 | %) | | | 9.91 | % | | | 2.91 | % | | | 1.38 | % | | | 10.24 | % | | | 20.48 | % |
| Ratios/Supplemental Data |
| Net assets, end of period (in thousands) | | $ | 2,469 | | | $ | 2,508 | | | $ | 1,550 | | | $ | 1,203 | | | $ | 1,117 | | | $ | 1,206 | |
| Ratios to average net assets: |
| Net investment income (loss) | | | (0.33 | %) | | | (0.47 | %) | | | (1.72 | %) | | | (2.64 | %) | | | (1.46 | %) | | | (0.56 | %) |
| Total expensesh | | | 2.33 | % | | | 2.94 | % | | | 3.91 | % | | | 4.81 | % | | | 4.11 | % | | | 4.84 | % |
| Net expensese,f,i | | | 2.31 | % | | | 2.88 | % | | | 3.46 | % | | | 3.68 | % | | | 2.87 | % | | | 2.89 | % |
| Portfolio turnover rate | | | 163 | % | | | 92 | % | | | 235 | % | | | 124 | % | | | — | | | | 488 | % |
| 20 | THE GUGGENHEIM FUNDS SEMI-ANNUAL REPORT | SEE NOTES TO FINANCIAL STATEMENTS. |
| FINANCIAL HIGHLIGHTS (continued) |
This table is presented to show selected data for a share outstanding throughout each period and to assist shareholders in evaluating a Fund’s performance for the periods presented.
| P-Class | | Period Ended
March 29,
2018a | | | Year Ended
September 30,
2017 | | | Year Ended
September 30,
2016 | | | Period Ended
September 30,
2015g | |
| Per Share Data | | | | | | | | | | | | |
| Net asset value, beginning of period | | $ | 21.19 | | | $ | 19.11 | | | $ | 18.39 | | | $ | 19.11 | |
| Income (loss) from investment operations: |
| Net investment income (loss)b | | | .05 | | | | (.06 | ) | | | (.12 | ) | | | (.13 | ) |
| Net gain (loss) on investments (realized and unrealized) | | | (.04 | ) | | | 2.15 | | | | .84 | | | | (.59 | ) |
| Total from investment operations | | | .01 | | | | 2.09 | | | | .72 | | | | (.72 | ) |
| Less distributions from: |
| Net realized gains | | | (1.45 | ) | | | (.01 | ) | | | — | | | | — | |
| Total distributions | | | (1.45 | ) | | | (.01 | ) | | | — | | | | — | |
| Net asset value, end of period | | $ | 19.75 | | | $ | 21.19 | | | $ | 19.11 | | | $ | 18.39 | |
| |
| Total Returnd | | | (0.30 | %) | | | 11.00 | % | | | 3.86 | % | | | (3.77 | %) |
| Ratios/Supplemental Data |
| Net assets, end of period (in thousands) | | $ | 8,870 | | | $ | 7,720 | | | $ | 4,453 | | | $ | 134 | |
| Ratios to average net assets: |
| Net investment income (loss) | | | 0.48 | % | | | (0.31 | %) | | | (0.65 | %) | | | (1.77 | %) |
| Total expensesh | | | 1.61 | % | | | 1.75 | % | | | 2.44 | % | | | 3.31 | % |
| Net expensese,f,i | | | 1.58 | % | | | 1.72 | % | | | 2.44 | % | | | 2.87 | % |
| Portfolio turnover rate | | | 163 | % | | | 92 | % | | | 235 | % | | | 124 | % |
| SEE NOTES TO FINANCIAL STATEMENTS. | THE GUGGENHEIM FUNDS SEMI-ANNUAL REPORT | 21 |
| FINANCIAL HIGHLIGHTS (concluded) |
This table is presented to show selected data for a share outstanding throughout each period and to assist shareholders in evaluating a Fund’s performance for the periods presented.
| Institutional Class | | Period Ended
March 29,
2018a | | | Year Ended
September 30,
2017 | | | Year Ended
September 30,
2016 | | | Year Ended
September 30,
2015 | | | Year Ended
September 30,
2014 | | | Year Ended
September 30,
2013 | |
| Per Share Data | | | | | | | | | | | | | | | | | | |
| Net asset value, beginning of period | | $ | 29.86 | | | $ | 26.82 | | | $ | 25.73 | | | $ | 25.13 | | | $ | 22.58 | | | $ | 18.52 | |
| Income (loss) from investment operations: |
| Net investment income (loss)b | | | .13 | | | | .12 | | | | (.13 | ) | | | (.40 | ) | | | (.12 | ) | | | .09 | |
| Net gain (loss) on investments (realized and unrealized) | | | (.08 | ) | | | 2.93 | | | | 1.22 | | | | 1.00 | | | | 2.67 | | | | 3.97 | |
| Total from investment operations | | | .05 | | | | 3.05 | | | | 1.09 | | | | .60 | | | | 2.55 | | | | 4.06 | |
| Less distributions from: |
| Net investment income | | | — | | | | — | | | | — | | | | (— | )c | | | — | | | | — | |
| Net realized gains | | | (1.45 | ) | | | (.01 | ) | | | — | | | | — | | | | — | | | | — | |
| Total distributions | | | (1.45 | ) | | | (.01 | ) | | | — | | | | (— | )c | | | — | | | | — | |
| Net asset value, end of period | | $ | 28.46 | | | $ | 29.86 | | | $ | 26.82 | | | $ | 25.73 | | | $ | 25.13 | | | $ | 22.58 | |
| |
| Total Returnd | | | (0.08 | %) | | | 11.42 | % | | | 4.20 | % | | | 2.41 | % | | | 11.29 | % | | | 21.60 | % |
| Ratios/Supplemental Data |
| Net assets, end of period (in thousands) | | $ | 192,751 | | | $ | 196,180 | | | $ | 56,550 | | | $ | 50,304 | | | $ | 1,645 | | | $ | 1,740 | |
| Ratios to average net assets: |
| Net investment income (loss) | | | 0.88 | % | | | 0.40 | % | | | (0.49 | %) | | | (1.55 | %) | | | (0.48 | %) | | | 0.43 | % |
| Total expensesh | | | 1.11 | % | | | 1.38 | % | | | 2.23 | % | | | 2.80 | % | | | 2.90 | % | | | 3.67 | % |
| Net expensese,i | | | 1.11 | % | | | 1.37 | % | | | 2.23 | % | | | 2.80 | % | | | 1.87 | % | | | 1.90 | % |
| Portfolio turnover rate | | | 163 | % | | | 92 | % | | | 235 | % | | | 124 | % | | | — | | | | 488 | % |
| a | Unaudited figures for the period ended March 29, 2018. Percentage amounts for the period, except total return and portfolio turnover rate, have been annualized. |
| b | Net investment income (loss) per share was computed using average shares outstanding throughout the period. |
| c | Distributions from net investment income are less than $0.01 per share. |
| d | Total return does not reflect the impact of any applicable sales charges and has not been annualized. |
| e | Net expense information reflects the expense ratios after expense waivers and reimbursements, as applicable. |
| f | The portion of the ratios of net expenses to average net assets attributable to recoupments of prior fee reductions or expense reimbursements for the periods presented would be: |
| | | 03/29/18 | 09/30/17 |
| | A-Class | 0.05% | 0.32% |
| | C-Class | 0.11% | 0.64% |
| | P-Class | 0.07% | — |
| | Institutional Class | — | 0.01% |
| g | Since commencement of operations: May 1, 2015. Percentage amounts for the period, except total return and portfolio turnover rate, have been annualized. |
| h | Does not include expenses of the underlying funds in which the Fund invests. |
| i | Net expenses may include expenses that are excluded from the expense limitation agreement and recouped amounts. Excluding these expenses, the operating expense ratios for the periods presented would be: |
| | | 03/29/18 | 09/30/17 | 09/30/16 | 09/30/15 | 09/30/14 | 09/30/13 |
| | A-Class | 1.51% | 2.00% | 2.11% | 2.11% | 2.11% | 2.11% |
| | C-Class | 2.19% | 2.71% | 2.86% | 2.86% | 2.86% | 2.86% |
| | P-Class | 1.50% | 1.68% | 1.87% | 2.10% | — | — |
| | Institutional Class | 1.10% | 1.28% | 1.63% | 1.86% | 1.86% | 1.86% |
| 22 | THE GUGGENHEIM FUNDS SEMI-ANNUAL REPORT | SEE NOTES TO FINANCIAL STATEMENTS. |
| PERFORMANCE REPORT AND FUND PROFILE (Unaudited) | March 29, 2018 |
LARGE CAP VALUE FUND
OBJECTIVE: Seeks long-term growth of capital.
Holdings Diversification (Market Exposure as % of Net Assets)
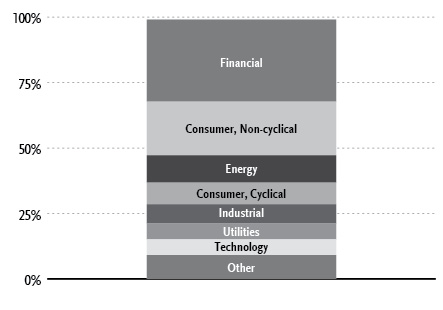
“Holdings Diversification (Market Exposure as % of Net Assets)” excludes any temporary cash investments.
| Inception Dates: |
| A-Class | August 7, 1944 |
| C-Class | January 29, 1999 |
| P-Class | May 1, 2015 |
| Institutional Class | June 7, 2013 |
| Ten Largest Holdings (% of Total Net Assets) |
| JPMorgan Chase & Co. | 4.0% |
| Bank of America Corp. | 3.1% |
| Exxon Mobil Corp. | 2.7% |
| Chevron Corp. | 2.6% |
| Berkshire Hathaway, Inc. — Class B | 2.6% |
| Intel Corp. | 2.5% |
| Citigroup, Inc. | 2.3% |
| Cisco Systems, Inc. | 2.1% |
| Wells Fargo & Co. | 1.9% |
| Pfizer, Inc. | 1.9% |
| Top Ten Total | 25.7% |
“Ten Largest Holdings” excludes any temporary cash investments.
| | THE GUGGENHEIM FUNDS SEMI-ANNUAL REPORT | 23 |
| PERFORMANCE REPORT AND FUND PROFILE (Unaudited)(concluded) | March 29, 2018 |
Average Annual Returns*
Periods Ended March 29, 2018
| | 6 month† | 1 Year | 5 Year | 10 Year |
| A-Class Shares | 3.51% | 8.05% | 10.34% | 6.96% |
| A-Class Shares with sales charge‡ | (1.40%) | 2.92% | 9.27% | 6.33% |
| C-Class Shares | 3.13% | 7.24% | 9.51% | 6.11% |
| C-Class Shares with CDSC§ | 2.18% | 6.25% | 9.51% | 6.11% |
| Russell 1000 Value Index | 2.34% | 6.95% | 10.78% | 7.78% |
| | 6 month† | 1 Year | Since
Inception
(05/01/15) |
| P-Class Shares | 3.51% | 8.04% | 8.36% |
| Russell 1000 Value Index | 2.34% | 6.95% | 7.44% |
| | 6 month† | 1 Year | Since
Inception
(06/07/13) |
| Institutional Class Shares | 3.60% | 8.30% | 10.03% |
| Russell 1000 Value Index | 2.34% | 6.95% | 10.10% |
| * | The performance data above represents past performance that is not predictive of future results. The investment return and principal value of an investment in the Fund will fluctuate so that an investor’s shares, when redeemed, may be worth more or less than their original cost. Returns are historical and include changes in principal and reinvested dividends and capital gains and do not reflect the effect of taxes. The Russell 1000 Value Index is an unmanaged index and, unlike the Fund, has no management fees or operating expenses to reduce its reported return. |
| † | 6 month returns are not annualized. |
| ‡ | Effective February 22, 2011, the maximum sales charge decreased from 5.75% to 4.75%. A 5.75% maximum sales charge is used in the calculation of the 1 Year, 5 Year and 10 Year average annual returns (based on subscriptions made prior to February 22, 2011), and a 4.75% maximum sales charge will be used to calculate performance for periods based on subscriptions made on or after February 22, 2011. |
| § | Fund returns include a CDSC of 1% if redeemed within 12 months of purchase. |
| 24 | THE GUGGENHEIM FUNDS SEMI-ANNUAL REPORT | |
| SCHEDULE OF INVESTMENTS (Unaudited) | March 29, 2018 |
| LARGE CAP VALUE FUND | |
| | | Shares | | | Value | |
| | | | | | | |
| COMMON STOCKS† - 99.1% |
| | | | | | | |
| Financial - 31.4% |
| JPMorgan Chase & Co. | | | 23,403 | | | $ | 2,573,628 | |
| Bank of America Corp. | | | 67,490 | | | | 2,024,025 | |
| Berkshire Hathaway, Inc. — Class B* | | | 8,254 | | | | 1,646,508 | |
| Citigroup, Inc. | | | 22,081 | | | | 1,490,467 | |
| Wells Fargo & Co. | | | 23,115 | | | | 1,211,457 | |
| BB&T Corp. | | | 16,038 | | | | 834,618 | |
| Zions Bancorporation | | | 15,175 | | | | 800,178 | |
| SunTrust Banks, Inc. | | | 11,705 | | | | 796,408 | |
| Allstate Corp. | | | 6,063 | | | | 574,772 | |
| Charles Schwab Corp. | | | 10,258 | | | | 535,673 | |
| Unum Group | | | 10,634 | | | | 506,285 | |
| T. Rowe Price Group, Inc. | | | 4,643 | | | | 501,305 | |
| Leucadia National Corp. | | | 21,600 | | | | 490,968 | |
| E*TRADE Financial Corp.* | | | 8,709 | | | | 482,566 | |
| Loews Corp. | | | 9,321 | | | | 463,533 | |
| Welltower, Inc. REIT | | | 8,467 | | | | 460,859 | |
| Morgan Stanley | | | 8,519 | | | | 459,685 | |
| Piedmont Office Realty Trust, Inc. — Class A REIT | | | 26,043 | | | | 458,096 | |
| Principal Financial Group, Inc. | | | 7,462 | | | | 454,511 | |
| Liberty Property Trust REIT | | | 10,615 | | | | 421,734 | |
| Assured Guaranty Ltd. | | | 11,627 | | | | 420,897 | |
| Omega Healthcare Investors, Inc. REIT | | | 15,231 | | | | 411,846 | |
| Regions Financial Corp. | | | 19,250 | | | | 357,665 | |
| Realogy Holdings Corp. | | | 12,908 | | | | 352,130 | |
| KeyCorp | | | 17,002 | | | | 332,389 | |
| American International Group, Inc. | | | 5,449 | | | | 296,535 | |
| Federated Investors, Inc. — Class B | | | 7,699 | | | | 257,146 | |
| Rayonier, Inc. REIT | | | 5,647 | | | | 198,662 | |
| Equity Commonwealth REIT* | | | 6,130 | | | | 188,007 | |
| Host Hotels & Resorts, Inc. REIT | | | 9,023 | | | | 168,189 | |
| Total Financial | | | | | | | 20,170,742 | |
| | | | | | | | | |
| Consumer, Non-cyclical - 20.5% |
| Pfizer, Inc. | | | 33,904 | | | | 1,203,253 | |
| Merck & Company, Inc. | | | 20,983 | | | | 1,142,944 | |
| Johnson & Johnson | | | 8,480 | | | | 1,086,712 | |
| Procter & Gamble Co. | | | 9,976 | | | | 790,897 | |
| Amgen, Inc. | | | 4,319 | | | | 736,303 | |
| HCA Healthcare, Inc. | | | 6,588 | | | | 639,036 | |
| Hormel Foods Corp. | | | 18,163 | | | | 623,354 | |
| Tyson Foods, Inc. — Class A | | | 7,904 | | | | 578,494 | |
| Bunge Ltd. | | | 6,688 | | | | 494,511 | |
| Archer-Daniels-Midland Co. | | | 11,173 | | | | 484,573 | |
| Express Scripts Holding Co.* | | | 6,678 | | | | 461,316 | |
| Quest Diagnostics, Inc. | | | 4,537 | | | | 455,061 | |
| UnitedHealth Group, Inc. | | | 2,051 | | | | 438,914 | |
| CVS Health Corp. | | | 6,851 | | | | 426,201 | |
| United Therapeutics Corp.* | | | 3,707 | | | | 416,519 | |
| Zimmer Biomet Holdings, Inc. | | | 3,805 | | | | 414,897 | |
| Humana, Inc. | | | 1,394 | | | | 374,749 | |
| DaVita, Inc.* | | | 5,093 | | | | 335,832 | |
| Philip Morris International, Inc. | | | 3,338 | | | | 331,797 | |
| AmerisourceBergen Corp. — Class A | | | 3,822 | | | | 329,495 | |
| Medtronic plc | | | 3,728 | | | | 299,060 | |
| Mylan N.V.* | | | 4,959 | | | | 204,162 | |
| JM Smucker Co. | | | 1,604 | | | | 198,912 | |
| Henry Schein, Inc.* | | | 2,841 | | | | 190,944 | |
| Ingredion, Inc. | | | 1,421 | | | | 183,195 | |
| TreeHouse Foods, Inc.* | | | 4,777 | | | | 182,816 | |
| Patterson Companies, Inc. | | | 5,669 | | | | 126,022 | |
| Total Consumer, Non-cyclical | | | | | | | 13,149,969 | |
| | | | | | | | | |
| Energy - 10.4% |
| Exxon Mobil Corp. | | | 23,361 | | | | 1,742,964 | |
| Chevron Corp. | | | 14,694 | | | | 1,675,704 | |
| Marathon Oil Corp. | | | 39,981 | | | | 644,894 | |
| Kinder Morgan, Inc. | | | 36,145 | | | | 544,344 | |
| Hess Corp. | | | 10,503 | | | | 531,662 | |
| Whiting Petroleum Corp.* | | | 12,796 | | | | 433,017 | |
| Diamondback Energy, Inc.* | | | 3,347 | | | | 423,462 | |
| Concho Resources, Inc.* | | | 2,644 | | | | 397,472 | |
| Range Resources Corp. | | | 21,765 | | | | 316,463 | |
| Total Energy | | | | | | | 6,709,982 | |
| | | | | | | | | |
| Consumer, Cyclical - 8.3% |
| Walmart, Inc. | | | 8,195 | | | | 729,109 | |
| Lear Corp. | | | 3,679 | | | | 684,625 | |
| Southwest Airlines Co. | | | 11,939 | | | | 683,866 | |
| Target Corp. | | | 7,523 | | | | 522,322 | |
| PVH Corp. | | | 3,280 | | | | 496,690 | |
| JetBlue Airways Corp.* | | | 21,229 | | | | 431,373 | |
| Carnival Corp. | | | 6,345 | | | | 416,105 | |
| MGM Resorts International | | | 10,869 | | | | 380,632 | |
| DR Horton, Inc. | | | 8,326 | | | | 365,012 | |
| PACCAR, Inc. | | | 5,153 | | | | 340,974 | |
| Goodyear Tire & Rubber Co. | | | 9,894 | | | | 262,983 | |
| Total Consumer, Cyclical | | | | | | | 5,313,691 | |
| | | | | | | | | |
| Industrial - 7.3% |
| Republic Services, Inc. — Class A | | | 8,692 | | | | 575,671 | |
| Corning, Inc. | | | 20,220 | | | | 563,734 | |
| WestRock Co. | | | 8,779 | | | | 563,348 | |
| Owens Corning | | | 6,735 | | | | 541,494 | |
| Crown Holdings, Inc.* | | | 9,105 | | | | 462,079 | |
| Carlisle Companies, Inc. | | | 4,273 | | | | 446,144 | |
| Eaton Corporation plc | | | 4,622 | | | | 369,344 | |
| General Electric Co. | | | 26,811 | | | | 361,412 | |
| Jabil, Inc. | | | 11,304 | | | | 324,764 | |
| Timken Co. | | | 5,146 | | | | 234,658 | |
| Honeywell International, Inc. | | | 1,555 | | | | 224,713 | |
| Total Industrial | | | | | | | 4,667,361 | |
| | | | | | | | | |
| Utilities - 6.1% |
| Public Service Enterprise Group, Inc. | | | 14,367 | | | | 721,798 | |
| Exelon Corp. | | | 18,280 | | | | 713,103 | |
| Ameren Corp. | | | 10,541 | | | | 596,937 | |
| OGE Energy Corp. | | | 15,287 | | | | 500,955 | |
| Edison International | | | 6,979 | | | | 444,283 | |
| Duke Energy Corp. | | | 4,390 | | | | 340,093 | |
| UGI Corp. | | | 7,532 | | | | 334,571 | |
| SEE NOTES TO FINANCIAL STATEMENTS. | THE GUGGENHEIM FUNDS SEMI-ANNUAL REPORT | 25 |
| SCHEDULE OF INVESTMENTS (Unaudited)(concluded) | March 29, 2018 |
| LARGE CAP VALUE FUND | |
| | | Shares | | | Value | |
| | | | | | | |
| SCANA Corp. | | | 8,068 | | | $ | 302,954 | |
| Total Utilities | | | | | | | 3,954,694 | |
| | | | | | | | | |
| Technology - 6.0% |
| Intel Corp. | | | 30,932 | | | | 1,610,939 | |
| Xerox Corp. | | | 19,021 | | | | 547,424 | |
| Apple, Inc. | | | 2,826 | | | | 474,146 | |
| VMware, Inc. — Class A* | | | 2,972 | | | | 360,415 | |
| Oracle Corp. | | | 7,552 | | | | 345,504 | |
| Qorvo, Inc.* | | | 4,000 | | | | 281,800 | |
| QUALCOMM, Inc. | | | 4,123 | | | | 228,455 | |
| Total Technology | | | | | | | 3,848,683 | |
| | | | | | | | | |
| Communications - 4.6% |
| Cisco Systems, Inc. | | | 30,723 | | | | 1,317,709 | |
| AT&T, Inc. | | | 17,095 | | | | 609,437 | |
| Verizon Communications, Inc. | | | 11,964 | | | | 572,119 | |
| Time Warner, Inc. | | | 5,163 | | | | 488,316 | |
| Total Communications | | | | | | | 2,987,581 | |
| | | | | | | | | |
| Basic Materials - 4.5% |
| Nucor Corp. | | | 9,897 | | | | 604,608 | |
| Reliance Steel & Aluminum Co. | | | 6,421 | | | | 550,536 | |
| Steel Dynamics, Inc. | | | 12,114 | | | | 535,681 | |
| DowDuPont, Inc. | | | 7,680 | | | | 489,293 | |
| Cabot Corp. | | | 8,706 | | | | 485,098 | |
| Freeport-McMoRan, Inc.* | | | 13,123 | | | | 230,571 | |
| Total Basic Materials | | | | | | | 2,895,787 | |
| | | | | | | | | |
| Total Common Stocks | | | | | | | | |
| (Cost $53,661,822) | | | | | | | 63,698,490 | |
| | | | | | | | | |
| MONEY MARKET FUND† - 0.8% |
| Dreyfus Treasury Securities Cash Management Institutional Shares 1.46%1 | | | 513,484 | | | | 513,484 | |
| Total Money Market Fund | | | | | | | | |
| (Cost $513,484) | | | | | | | 513,484 | |
| | | | | | | | | |
| Total Investments - 99.9% | | | | | | | | |
| (Cost $54,175,306) | | | | | | $ | 64,211,974 | |
| Other Assets & Liabilities, net - 0.1% | | | | | | | 46,113 | |
| Total Net Assets - 100.0% | | | | | | $ | 64,258,087 | |
| * | Non-income producing security. |
| † | Value determined based on Level 1 inputs — See Note 4. |
| 1 | Rate indicated is the 7 day yield as of March 29, 2018. |
| | plc — Public Limited Company |
| | REIT — Real Estate Investment Trust |
| | |
| | See Sector Classification in Other Information section. |
The following table summarizes the inputs used to value the Fund’s investments at March 29, 2018 (See Note 4 in the Notes to Financial Statements):
| Investments in Securities (Assets) | | Level 1
Quoted
Prices | | | Level 2
Significant
Observable
Inputs | | | Level 3
Significant
Unobservable
Inputs | | | Total | |
| Common Stocks | | $ | 63,698,490 | | | $ | — | | | $ | — | | | $ | 63,698,490 | |
| Money Market Fund | | | 513,484 | | | | — | | | | — | | | | 513,484 | |
| Total Assets | | $ | 64,211,974 | | | $ | — | | | $ | — | | | $ | 64,211,974 | |
Transfers between investment levels may occur as the markets fluctuate and/or the availability of data used in an investment’s valuation changes. Transfers between valuation levels, if any, are in comparison to the valuation levels at the end of the previous fiscal year, and are effective using the fair value as of the end of the current fiscal period.
For the period ended March 29, 2018, there were no transfers between levels.
| 26 | THE GUGGENHEIM FUNDS SEMI-ANNUAL REPORT | SEE NOTES TO FINANCIAL STATEMENTS. |
| STATEMENT OF ASSETS AND LIABILITIES (Unaudited) |
| March 29, 2018 |
| Assets: |
| Investments, at value (cost $54,175,306) | | $ | 64,211,974 | |
| Cash | | | 22,676 | |
| Prepaid expenses | | | 38,986 | |
| Receivables: |
| Dividends | | | 64,294 | |
| Fund shares sold | | | 51,771 | |
| Interest | | | 645 | |
| Total assets | | | 64,390,346 | |
| | | | | |
| Liabilities: |
| Payable for: |
| Direct shareholders expense | | | 43,632 | |
| Fund shares redeemed | | | 21,796 | |
| Management fees | | | 20,379 | |
| Distribution and service fees | | | 15,969 | |
| Professional fees | | | 10,001 | |
| Transfer agent/maintenance fees | | | 7,069 | |
| Fund accounting/administration fees | | | 4,443 | |
| Miscellaneous | | | 8,970 | |
| Total liabilities | | | 132,259 | |
| Net assets | | $ | 64,258,087 | |
| | | | | |
| Net assets consist of: |
| Paid in capital | | $ | 52,042,748 | |
| Undistributed net investment income | | | 154,928 | |
| Accumulated net realized gain on investments | | | 2,023,743 | |
| Net unrealized appreciation on investments | | | 10,036,668 | |
| Net assets | | $ | 64,258,087 | |
| | | | | |
| A-Class: |
| Net assets | | $ | 60,302,518 | |
| Capital shares outstanding | | | 1,342,748 | |
| Net asset value per share | | $ | 44.91 | |
| Maximum offering price per share (Net asset value divided by 95.25%) | | $ | 47.15 | |
| | | | | |
| C-Class: |
| Net assets | | $ | 3,378,960 | |
| Capital shares outstanding | | | 81,840 | |
| Net asset value per share | | $ | 41.29 | |
| | | | | |
| P-Class: |
| Net assets | | $ | 88,551 | |
| Capital shares outstanding | | | 1,975 | |
| Net asset value per share | | $ | 44.84 | |
| | | | | |
| Institutional Class: |
| Net assets | | $ | 488,058 | |
| Capital shares outstanding | | | 10,989 | |
| Net asset value per share | | $ | 44.41 | |
| STATEMENT OF OPERATIONS (Unaudited) |
| Period Ended March 29, 2018 |
| Investment Income: |
| Dividends | | $ | 717,105 | |
| Interest | | | 5,570 | |
| Total investment income | | | 722,675 | |
| | | | | |
| Expenses: |
| Management fees | | | 217,777 | |
| Distribution and service fees: |
| A-Class | | | 77,586 | |
| C-Class | | | 17,548 | |
| P-Class | | | 156 | |
| Transfer agent/maintenance fees: |
| A-Class | | | 20,104 | |
| C-Class | | | 1,867 | |
| P-Class | | | 188 | |
| Institutional Class | | | 512 | |
| Printing expenses | | | 46,242 | |
| Registration fees | | | 38,350 | |
| Fund accounting/administration fees | | | 26,803 | |
| Trustees’ fees* | | | 4,090 | |
| Custodian fees | | | 1,647 | |
| Line of credit fees | | | 747 | |
| Miscellaneous | | | 25,011 | |
| Total expenses | | | 478,628 | |
| Less: |
| Expenses waived by Adviser | | | (56,457 | ) |
| Expenses reimbursed by Adviser: |
| A-Class | | | (21,887 | ) |
| C-Class | | | (1,968 | ) |
| P-Class | | | (192 | ) |
| Institutional Class | | | (549 | ) |
| Total waived/reimbursed expenses | | | (81,053 | ) |
| Net expenses | | | 397,575 | |
| Net investment income | | | 325,100 | |
| | | | | |
| Net Realized and Unrealized Gain (Loss): |
| Net realized gain (loss) on: |
| Investments | | | 2,100,184 | |
| Net realized gain | | | 2,100,184 | |
| Net change in unrealized appreciation (depreciation) on: |
| Investments | | | (61,049 | ) |
| Net change in unrealized appreciation (depreciation) | | | (61,049 | ) |
| Net realized and unrealized gain | | | 2,039,135 | |
| Net increase in net assets resulting from operations | | $ | 2,364,235 | |
| * | Relates to Trustees not deemed “interested persons” within the meaning of Section 2(a)(19) of the 1940 Act. |
| SEE NOTES TO FINANCIAL STATEMENTS. | THE GUGGENHEIM FUNDS SEMI-ANNUAL REPORT | 27 |
| STATEMENTS OF CHANGES IN NET ASSETS |
| | | Period Ended
March 29,
2018
(Unaudited) | | | Year Ended
September 30,
2017 | |
| Increase (Decrease) in Net Assets from Operations: | | | | | | |
| Net investment income | | $ | 325,100 | | | $ | 515,155 | |
| Net realized gain on investments | | | 2,100,184 | | | | 5,373,662 | |
| Net change in unrealized appreciation (depreciation) on investments | | | (61,049 | ) | | | 4,482,466 | |
| Net increase in net assets resulting from operations | | | 2,364,235 | | | | 10,371,283 | |
| | | | | | | | | |
| Distributions to shareholders from: | | | | | | | | |
| Net investment income | | | | | | | | |
| A-Class | | | (648,213 | ) | | | (784,293 | ) |
| C-Class | | | (12,727 | ) | | | (25,737 | ) |
| P-Class | | | (1,858 | ) | | | (1,769 | ) |
| Institutional Class | | | (22,529 | ) | | | (1,859 | ) |
| Net realized gains | | | | | | | | |
| A-Class | | | (4,186,166 | ) | | | (1,894,547 | ) |
| C-Class | | | (258,046 | ) | | | (126,909 | ) |
| P-Class | | | (11,682 | ) | | | (4,388 | ) |
| Institutional Class | | | (116,339 | ) | | | (2,387 | ) |
| Total distributions to shareholders | | | (5,257,560 | ) | | | (2,841,889 | ) |
| | | | | | | | | |
| Capital share transactions: | | | | | | | | |
| Proceeds from sale of shares | | | | | | | | |
| A-Class | | | 2,946,683 | | | | 6,416,240 | |
| C-Class | | | 192,110 | | | | 878,834 | |
| P-Class | | | 19,302 | | | | 38,483 | |
| Institutional Class | | | 453,781 | | | | 2,658,884 | |
| Distributions reinvested | | | | | | | | |
| A-Class | | | 4,749,467 | | | | 2,617,497 | |
| C-Class | | | 268,713 | | | | 151,423 | |
| P-Class | | | 13,540 | | | | 6,157 | |
| Institutional Class | | | 138,868 | | | | 4,245 | |
| Cost of shares redeemed | | | | | | | | |
| A-Class | | | (4,842,415 | ) | | | (11,197,321 | ) |
| C-Class | | | (384,359 | ) | | | (1,032,598 | ) |
| P-Class | | | (96,987 | ) | | | (25,961 | ) |
| Institutional Class | | | (1,764,080 | ) | | | (1,150,836 | ) |
| Net increase (decrease) from capital share transactions | | | 1,694,623 | | | | (634,953 | ) |
| Net increase (decrease) in net assets | | | (1,198,702 | ) | | | 6,894,441 | |
| | | | | | | | | |
| Net assets: | | | | | | | | |
| Beginning of period | | | 65,456,789 | | | | 58,562,348 | |
| End of period | | $ | 64,258,087 | | | $ | 65,456,789 | |
| Undistributed net investment income at end of period | | $ | 154,928 | | | $ | 515,155 | |
| 28 | THE GUGGENHEIM FUNDS SEMI-ANNUAL REPORT | SEE NOTES TO FINANCIAL STATEMENTS. |
| STATEMENTS OF CHANGES IN NET ASSETS (concluded) |
| | | Period Ended
March 29,
2018
(Unaudited) | | | Year Ended
September 30,
2017 | |
| Capital share activity: | | | | | | |
| Shares sold | | | | | | |
| A-Class | | | 61,146 | | | | 147,814 | |
| C-Class | | | 4,455 | | | | 21,698 | |
| P-Class | | | 408 | | | | 871 | |
| Institutional Class | | | 9,562 | | | | 60,669 | |
| Shares issued from reinvestment of distributions | | | | | | | | |
| A-Class | | | 102,359 | | | | 61,879 | |
| C-Class | | | 6,287 | | | | 3,857 | |
| P-Class | | | 292 | | | | 146 | |
| Institutional Class | | | 3,028 | | | | 101 | |
| Shares redeemed | | | | | | | | |
| A-Class | | | (101,705 | ) | | | (252,786 | ) |
| C-Class | | | (8,837 | ) | | | (25,122 | ) |
| P-Class | | | (2,093 | ) | | | (586 | ) |
| Institutional Class | | | (37,715 | ) | | | (25,603 | ) |
| Net increase (decrease) in shares | | | 37,187 | | | | (7,062 | ) |
| SEE NOTES TO FINANCIAL STATEMENTS. | THE GUGGENHEIM FUNDS SEMI-ANNUAL REPORT | 29 |
This table is presented to show selected data for a share outstanding throughout each period and to assist shareholders in evaluating a Fund’s performance for the periods presented.
| A-Class | | Period Ended
March 29,
2018a | | | Year Ended
September 30,
2017 | | | Year Ended
September 30,
2016 | | | Year Ended
September 30,
2015 | | | Year Ended
September 30,
2014 | | | Year Ended
September 30,
2013 | |
| Per Share Data | | | | | | | | | | | | | | | | | | |
| Net asset value, beginning of period | | $ | 46.96 | | | $ | 41.78 | | | $ | 39.11 | | | $ | 43.80 | | | $ | 38.28 | | | $ | 31.25 | |
| Income (loss) from investment operations: |
| Net investment income (loss)b | | | .24 | | | | .37 | | | | .58 | | | | .36 | | | | .30 | | | | .29 | |
| Net gain (loss) on investments (realized and unrealized) | | | 1.53 | | | | 6.80 | | | | 5.23 | | | | (3.36 | ) | | | 5.51 | | | | 7.03 | |
| Total from investment operations | | | 1.77 | | | | 7.17 | | | | 5.81 | | | | (3.00 | ) | | | 5.81 | | | | 7.32 | |
| Less distributions from: |
| Net investment income | | | (.51 | ) | | | (.58 | ) | | | (.37 | ) | | | (.35 | ) | | | (.29 | ) | | | (.29 | ) |
| Net realized gains | | | (3.31 | ) | | | (1.41 | ) | | | (2.77 | ) | | | (1.34 | ) | | | — | | | | — | |
| Total distributions | | | (3.82 | ) | | | (1.99 | ) | | | (3.14 | ) | | | (1.69 | ) | | | (.29 | ) | | | (.29 | ) |
| Net asset value, end of period | | $ | 44.91 | | | $ | 46.96 | | | $ | 41.78 | | | $ | 39.11 | | | $ | 43.80 | | | $ | 38.28 | |
| |
| Total Returnc | | | 3.51 | % | | | 17.68 | % | | | 15.69 | % | | | (7.19 | %) | | | 15.25 | % | | | 23.62 | % |
| Ratios/Supplemental Data |
| Net assets, end of period (in thousands) | | $ | 60,303 | | | $ | 60,157 | | | $ | 55,325 | | | $ | 45,318 | | | $ | 60,281 | | | $ | 47,307 | |
| Ratios to average net assets: |
| Net investment income (loss) | | | 1.01 | % | | | 0.83 | % | | | 1.48 | % | | | 0.85 | % | | | 0.72 | % | | | 0.82 | % |
| Total expensesd | | | 1.39 | % | | | 1.30 | % | | | 1.34 | % | | | 1.35 | % | | | 1.48 | % | | | 1.48 | % |
| Net expensese | | | 1.15 | %h,i | | | 1.17 | %h,i | | | 1.17 | %i | | | 1.16 | %i | | | 1.17 | %i | | | 1.15 | % |
| Portfolio turnover rate | | | 14 | % | | | 40 | % | | | 56 | % | | | 60 | % | | | 40 | % | | | 43 | % |
| C-Class | | Period Ended
March 29,
2018a | | | Year Ended
September 30,
2017 | | | Year Ended
September 30,
2016 | | | Year Ended
September 30,
2015 | | | Year Ended
September 30,
2014 | | | Year Ended
September 30,
2013 | |
| Per Share Data | | | | | | | | | | | | | | | | | | |
| Net asset value, beginning of period | | $ | 43.29 | | | $ | 38.68 | | | $ | 36.38 | | | $ | 40.91 | | | $ | 35.86 | | | $ | 29.30 | |
| Income (loss) from investment operations: |
| Net investment income (loss)b | | | .06 | | | | .03 | | | | .27 | | | | .04 | | | | (.02 | ) | | | .02 | |
| Net gain (loss) on investments (realized and unrealized) | | | 1.41 | | | | 6.28 | | | | 4.87 | | | | (3.13 | ) | | | 5.16 | | | | 6.62 | |
| Total from investment operations | | | 1.47 | | | | 6.31 | | | | 5.14 | | | | (3.09 | ) | | | 5.14 | | | | 6.64 | |
| Less distributions from: |
| Net investment income | | | (.16 | ) | | | (.29 | ) | | | (.07 | ) | | | (.10 | ) | | | (.09 | ) | | | (.08 | ) |
| Net realized gains | | | (3.31 | ) | | | (1.41 | ) | | | (2.77 | ) | | | (1.34 | ) | | | — | | | | — | |
| Total distributions | | | (3.47 | ) | | | (1.70 | ) | | | (2.84 | ) | | | (1.44 | ) | | | (.09 | ) | | | (.08 | ) |
| Net asset value, end of period | | $ | 41.29 | | | $ | 43.29 | | | $ | 38.68 | | | $ | 36.38 | | | $ | 40.91 | | | $ | 35.86 | |
| |
| Total Returnc | | | 3.13 | % | | | 16.74 | % | | | 14.87 | % | | | (7.89 | %) | | | 14.35 | % | | | 22.73 | % |
| Ratios/Supplemental Data |
| Net assets, end of period (in thousands) | | $ | 3,379 | | | $ | 3,461 | | | $ | 3,075 | | | $ | 3,345 | | | $ | 3,963 | | | $ | 3,494 | |
| Ratios to average net assets: |
| Net investment income (loss) | | | 0.26 | % | | | 0.08 | % | | | 0.75 | % | | | 0.10 | % | | | (0.04 | %) | | | 0.08 | % |
| Total expensesd | | | 2.18 | % | | | 2.09 | % | | | 2.18 | % | | | 2.16 | % | | | 2.33 | % | | | 2.47 | % |
| Net expensese | | | 1.90 | %h,i | | | 1.92 | %h,i | | | 1.92 | %i | | | 1.91 | %i | | | 1.92 | %i | | | 1.90 | % |
| Portfolio turnover rate | | | 14 | % | | | 40 | % | | | 56 | % | | | 60 | % | | | 40 | % | | | 43 | % |
| 30 | THE GUGGENHEIM FUNDS SEMI-ANNUAL REPORT | SEE NOTES TO FINANCIAL STATEMENTS. |
| FINANCIAL HIGHLIGHTS (continued) |
This table is presented to show selected data for a share outstanding throughout each period and to assist shareholders in evaluating a Fund’s performance for the periods presented.
| P-Class | | Period Ended
March 29,
2018a | | | Year Ended
September 30,
2017 | | | Year Ended
September 30,
2016 | | | Period Ended
September 30,
2015f | |
| Per Share Data | | | | | | | | | | | | |
| Net asset value, beginning of period | | $ | 46.91 | | | $ | 41.74 | | | $ | 39.13 | | | $ | 43.64 | |
| Income (loss) from investment operations: |
| Net investment income (loss)b | | | .23 | | | | .37 | | | | 1.40 | | | | .22 | |
| Net gain (loss) on investments (realized and unrealized) | | | 1.54 | | | | 6.78 | | | | 4.44 | | | | (4.73 | ) |
| Total from investment operations | | | 1.77 | | | | 7.15 | | | | 5.84 | | | | (4.51 | ) |
| Less distributions from: |
| Net investment income | | | (.53 | ) | | | (.57 | ) | | | (.46 | ) | | | — | |
| Net realized gains | | | (3.31 | ) | | | (1.41 | ) | | | (2.77 | ) | | | — | |
| Total distributions | | | (3.84 | ) | | | (1.98 | ) | | | (3.23 | ) | | | — | |
| Net asset value, end of period | | $ | 44.84 | | | $ | 46.91 | | | $ | 41.74 | | | $ | 39.13 | |
| |
| Total Returnc | | | 3.51 | % | | | 17.63 | % | | | 15.83 | % | | | (10.38 | %) |
| Ratios/Supplemental Data |
| Net assets, end of period (in thousands) | | $ | 89 | | | $ | 158 | | | $ | 123 | | | $ | 9 | |
| Ratios to average net assets: |
| Net investment income (loss) | | | 0.99 | % | | | 0.83 | % | | | 3.61 | % | | | 1.21 | % |
| Total expensesd | | | 1.65 | % | | | 1.69 | % | | | 1.41 | % | | | 3.29 | % |
| Net expensese | | | 1.15 | %h,i | | | 1.17 | %h,i | | | 1.17 | %i | | | 1.16 | %i |
| Portfolio turnover rate | | | 14 | % | | | 40 | % | | | 56 | % | | | 60 | % |
| SEE NOTES TO FINANCIAL STATEMENTS. | THE GUGGENHEIM FUNDS SEMI-ANNUAL REPORT | 31 |
| FINANCIAL HIGHLIGHTS (concluded) |
This table is presented to show selected data for a share outstanding throughout each period and to assist shareholders in evaluating a Fund’s performance for the periods presented.
| Institutional Class | | Period Ended
March 29,
2018a | | | Year Ended
September 30,
2017 | | | Year Ended
September 30,
2016 | | | Year Ended
September 30,
2015 | | | Year Ended
September 30,
2014 | | | Period Ended
September 30,
2013g | |
| Per Share Data | | | | | | | | | | | | | | | | | | |
| Net asset value, beginning of period | | $ | 46.56 | | | $ | 41.84 | | | $ | 39.17 | | | $ | 43.87 | | | $ | 38.32 | | | $ | 36.84 | |
| Income (loss) from investment operations: |
| Net investment income (loss)b | | | .28 | | | | .51 | | | | .83 | | | | .47 | | | | .40 | | | | .13 | |
| Net gain (loss) on investments (realized and unrealized) | | | 1.52 | | | | 6.72 | | | | 5.10 | | | | (3.37 | ) | | | 5.51 | | | | 1.35 | |
| Total from investment operations | | | 1.80 | | | | 7.23 | | | | 5.93 | | | | (2.90 | ) | | | 5.91 | | | | 1.48 | |
| Less distributions from: |
| Net investment income | | | (.64 | ) | | | (1.10 | ) | | | (.49 | ) | | | (.46 | ) | | | (.36 | ) | | | — | |
| Net realized gains | | | (3.31 | ) | | | (1.41 | ) | | | (2.77 | ) | | | (1.34 | ) | | | — | | | | — | |
| Total distributions | | | (3.95 | ) | | | (2.51 | ) | | | (3.26 | ) | | | (1.80 | ) | | | (.36 | ) | | | — | |
| Net asset value, end of period | | $ | 44.41 | | | $ | 46.56 | | | $ | 41.84 | | | $ | 39.17 | | | $ | 43.87 | | | $ | 38.32 | |
| |
| Total Returnc | | | 3.60 | % | | | 17.96 | % | | | 15.98 | % | | | (6.97 | %) | | | 15.52 | % | | | 4.02 | % |
| Ratios/Supplemental Data |
| Net assets, end of period (in thousands) | | $ | 488 | | | $ | 1,681 | | | $ | 40 | | | $ | 2,544 | | | $ | 3,339 | | | $ | 2,831 | |
| Ratios to average net assets: |
| Net investment income (loss) | | | 1.17 | % | | | 1.13 | % | | | 2.13 | % | | | 1.09 | % | | | 0.96 | % | | | 1.12 | % |
| Total expensesd | | | 1.15 | % | | | 1.07 | % | | | 1.04 | % | | | 0.98 | % | | | 1.08 | % | | | 1.12 | % |
| Net expensese | | | 0.90 | %h,i | | | 0.92 | %h,i | | | 0.92 | %i | | | 0.91 | %i | | | 0.92 | %i | | | 0.89 | % |
| Portfolio turnover rate | | | 14 | % | | | 40 | % | | | 56 | % | | | 60 | % | | | 40 | % | | | 43 | % |
| a | Unaudited figures for the period ended March 29, 2018. Percentage amounts for the period, except total return and portfolio turnover rate, have been annualized. |
| b | Net investment income (loss) per share was computed using average shares outstanding throughout the period. |
| c | Total return does not reflect the impact of any applicable sales charges and has not been annualized. |
| d | Does not include expenses of the underlying funds in which the Fund invests. |
| e | Net expense information reflects the expense ratios after expense waivers and reimbursements as applicable. |
| f | Since commencement of operations: May 1, 2015. Percentage amounts for the period, except total return and portfolio turnover rate, have been annualized. |
| g | Since commencement of operations: June 7, 2013. Percentage amounts for the period, except total return and portfolio turnover rate, have been annualized. |
| h | The portion of the ratios of net expenses to average net assets attributable to recoupments of prior fee reductions or expense reimbursements for the periods presented would be: |
| | | 03/29/18 | 09/30/17 |
| | A-Class | — | 0.01% |
| | C-Class | — | 0.01% |
| | P-Class | — | 0.00% |
| | Institutional Class | — | 0.02% |
| i | Net expenses may include expenses that are excluded from the expense limitation agreement. Excluding these expenses, the operating expense ratios for the periods presented would be: |
| | | 03/29/18 | 09/30/17 | 09/30/16 | 09/30/15 | 09/30/14 |
| | A-Class | 1.15% | 1.15% | 1.15% | 1.15% | 1.15% |
| | C-Class | 1.90% | 1.90% | 1.90% | 1.90% | 1.90% |
| | P-Class | 1.15% | 1.15% | 1.15% | 1.15% | — |
| | Institutional Class | 0.90% | 0.90% | 0.90% | 0.90% | 0.90% |
| 32 | THE GUGGENHEIM FUNDS SEMI-ANNUAL REPORT | SEE NOTES TO FINANCIAL STATEMENTS. |
| PERFORMANCE REPORT AND FUND PROFILE (Unaudited) | March 29, 2018 |
MARKET NEUTRAL REAL ESTATE FUND
OBJECTIVE: Seeks to provide capital appreciation, while limiting exposure to general stock market risk.
Holdings Diversification (Market Exposure as % of Net Assets)
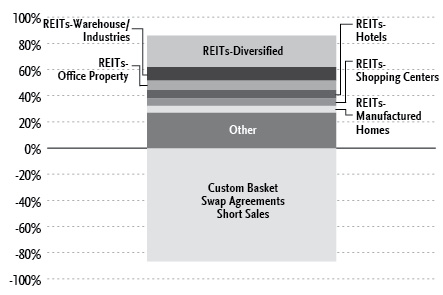
“Holdings Diversification (Market Exposure as % of Net Assets)” excludes any temporary cash investments.
| Inception Dates: |
| A-Class | February 26, 2016 |
| C-Class | February 26, 2016 |
| P-Class | February 26, 2016 |
| Institutional Class | February 26, 2016 |
| Ten Largest Holdings (% of Total Net Assets) |
| Rayonier, Inc. | 3.8% |
| New Residential Investment Corp. | 3.7% |
| Invitation Homes, Inc. | 3.5% |
| Weyerhaeuser Co. | 3.4% |
| Crown Castle International Corp. | 3.4% |
| Alexandria Real Estate Equities, Inc. | 3.3% |
| American Tower Corp. — Class A | 3.2% |
| Sun Communities, Inc. | 3.1% |
| EastGroup Properties, Inc. | 3.0% |
| Rexford Industrial Realty, Inc. | 3.0% |
| Top Ten Total | 33.4% |
“Ten Largest Holdings” excludes any temporary cash or derivative investments.
Average Annual Returns*
Periods Ended March 29, 2018
| | 6 month† | 1 Year | Since Inception
(02/26/16) |
| A-Class Shares | 4.07% | 7.73% | 4.80% |
| A-Class Shares with sales charge‡ | (0.87%) | 2.60% | 2.39% |
| C-Class Shares | 3.72% | 6.95% | 4.05% |
| C-Class Shares with CDSC§ | 2.74% | 5.95% | 4.05% |
| P-Class Shares | 4.03% | 7.65% | 4.76% |
| Institutional Class Shares | 4.17% | 7.94% | 5.04% |
| ICE BofA Merrill Lynch 3-Month U.S. Treasury Bill Index | 0.64% | 1.11% | 0.72% |
| * | The performance data above represents past performance that is not predictive of future results. The investment return and principal value of an investment in the Fund will fluctuate so that an investor’s shares, when redeemed, may be worth more or less than their original cost. Returns are historical and include changes in principal and reinvested dividends and capital gains and do not reflect the effect of taxes. The ICE BofA Merrill Lynch 3-Month U.S. Treasury Bill Index is an unmanaged index and, unlike the Fund, has no management fees or operating expenses to reduce its reported return. |
| † | 6 month returns are not annualized. |
| ‡ | Fund returns are calculated using the maximum sales charge of 4.75%. |
| § | Fund returns include a CDSC of 1% if redeemed within 12 months of purchase. |
| | THE GUGGENHEIM FUNDS SEMI-ANNUAL REPORT | 33 |
| SCHEDULE OF INVESTMENTS (Unaudited) | March 29, 2018 |
| MARKET NEUTRAL REAL ESTATE FUND | |
| | | Shares | | | Value | |
| | | | | | | |
| COMMON STOCKS† - 86.0% | | | | | | |
| | | | | | | |
| REITs - 76.1% | | | | | | |
| REITs-DIVERSIFIED - 24.2% | | | | | | |
| Rayonier, Inc. | | | 6,653 | | | $ | 234,052 | |
| New Residential Investment Corp. | | | 14,024 | | | | 230,695 | |
| Weyerhaeuser Co. | | | 6,014 | | | | 210,490 | |
| Crown Castle International Corp. | | | 1,894 | | | | 207,601 | |
| American Tower Corp. — Class A | | | 1,368 | | | | 198,825 | |
| Equinix, Inc. | | | 427 | | | | 178,546 | |
| Cousins Properties, Inc. | | | 13,673 | | | | 118,682 | |
| Gaming and Leisure Properties, Inc. | | | 3,432 | | | | 114,869 | |
| Total REITs-Diversified | | | | | | | 1,493,760 | |
| | | | | | | | | |
| REITs-WAREHOUSE/INDUSTRIES - 10.2% | | | | | | | | |
| EastGroup Properties, Inc. | | | 2,280 | | | | 188,465 | |
| Rexford Industrial Realty, Inc. | | | 6,526 | | | | 187,883 | |
| Prologis, Inc. | | | 2,030 | | | | 127,870 | |
| QTS Realty Trust, Inc. — Class A | | | 3,467 | | | | 125,575 | |
| Total REITs-Warehouse/Industries | | | | | | | 629,793 | |
| | | | | | | | | |
| REITs-OFFICE PROPERTY - 7.3% | | | | | | | | |
| Alexandria Real Estate Equities, Inc. | | | 1,624 | | | | 202,821 | |
| Highwoods Properties, Inc. | | | 3,019 | | | | 132,292 | |
| Tier REIT, Inc. | | | 6,436 | | | | 118,937 | |
| Total REITs-Office Property | | | | | | | 454,050 | |
| | | | | | | | | |
| REITs-HOTELS - 6.3% | | | | | | | | |
| RLJ Lodging Trust | | | 8,482 | | | | 164,890 | |
| MGM Growth Properties LLC — Class A | | | 4,328 | | | | 114,865 | |
| Summit Hotel Properties, Inc. | | | 7,898 | | | | 107,492 | |
| Total REITs-Hotels | | | | | | | 387,247 | |
| | | | | | | | | |
| REITs-SHOPPING CENTERS - 5.7% | | | | | | | | |
| Retail Opportunity Investments Corp. | | | 7,258 | | | | 128,249 | |
| Regency Centers Corp. | | | 1,915 | | | | 112,947 | |
| Federal Realty Investment Trust | | | 971 | | | | 112,743 | |
| Total REITs-Shopping Centers | | | | | | | 353,939 | |
| | | | | | | | | |
| REITs-MANUFACTURED HOMES - 5.5% | | | | | | | | |
| Sun Communities, Inc. | | | 2,102 | | | | 192,060 | |
| Equity LifeStyle Properties, Inc. | | | 1,712 | | | | 150,262 | |
| Total REITs-Manufactured Homes | | | | | | | 342,322 | |
| | | | | | | | | |
| REITs-HEALTH CARE - 4.7% | | | | | | | | |
| HCP, Inc. | | | 8,004 | | | | 185,933 | |
| Healthcare Trust of America, Inc. — Class A | | | 4,060 | | | | 107,387 | |
| Total REITs-Health Care | | | | | | | 293,320 | |
| | | | | | | | | |
| REITs-APARTMENTS - 3.5% | | | | | | | | |
| Invitation Homes, Inc. | | | 9,373 | | | | 213,986 | |
| | | | | | | | | |
| REITs-MORTGAGE - 3.0% | | | | | | | | |
| Blackstone Mortgage Trust, Inc. — Class A | | | 5,938 | | | | 186,572 | |
| | | | | | | | | |
| REITs-STORAGE - 2.9% | | | | | | | | |
| National Storage Affiliates Trust | | | 7,201 | | | | 180,601 | |
| | | | | | | | | |
| REITs-REGIONAL MALLS - 2.8% | | | | | | | | |
| GGP, Inc. | | | 8,282 | | | | 169,450 | |
| Total REITs | | | | | | | 4,705,040 | |
| | | | | | | | | |
| LODGING - 5.7% | | | | | | | | |
| CASINO HOTELS - 3.7% | | | | | | | | |
| Boyd Gaming Corp. | | | 3,627 | | | | 115,556 | |
| Caesars Entertainment Corp.* | | | 10,060 | | | | 113,175 | |
| Total Casino Hotels | | | | | | | 228,731 | |
| | | | | | | | | |
| HOTELS & MOTELS - 2.0% | | | | | | | | |
| Hilton Worldwide Holdings, Inc. | | | 1,546 | | | | 121,763 | |
| Total Lodging | | | | | | | 350,494 | |
| | | | | | | | | |
| REAL ESTATE - 2.6% | | | | | | | | |
| REAL ESTATE OPERATIONS/DEVELOPMENT - 2.6% | | | | | | | | |
| VICI Properties, Inc. | | | 8,781 | | | | 160,868 | |
| | | | | | | | | |
| TELECOMMUNICATIONS - 1.6% | | | | | | | | |
| TELECOMMUNICATION SERVICES - 1.6% | | | | | | | | |
| GDS Holdings Ltd. ADR* | | | 3,567 | | | | 97,914 | |
| | | | | | | | | |
| Total Common Stocks | | | | | | | | |
| (Cost $5,049,096) | | | | | | | 5,314,316 | |
| | | | | | | | | |
| MONEY MARKET FUND† - 8.5% | | | | | | | | |
| Goldman Sachs Financial Square Treasury Instruments Fund - Institutional Class 1.54%1 | | | 526,759 | | | | 526,759 | |
| Total Money Market Fund | | | | | | | | |
| (Cost $526,759) | | | | | | | 526,759 | |
| | | | | | | | | |
| Total Investments - 94.5% | | | | | | | | |
| (Cost $5,575,855) | | | | | | $ | 5,841,075 | |
| Other Assets & Liabilities, net - 5.5% | | | | | | | 342,656 | |
| Total Net Assets - 100.0% | | | | | | $ | 6,183,731 | |
| Custom Basket Swap Agreements |
| Counterparty | | Index | | Financing
Rate Pay | | Payment
Frequency | | Maturity
Date | | Notional
Amount | | | Value and
Unrealized
Gain | |
| OTC Custom Basket Swap Agreements Sold Short†† | | | | | | | | | | |
| Morgan Stanley | | Market Neutral Real Estate Portfolio Short Custom Basket Swap2 | | 1.09% | | At Maturity | | 07/25/19 | | $ | 5,364,087 | | | $ | 345,580 | |
| 34 | THE GUGGENHEIM FUNDS SEMI-ANNUAL REPORT | SEE NOTES TO FINANCIAL STATEMENTS. |
| SCHEDULE OF INVESTMENTS (Unaudited)(concluded) | March 29, 2018 |
| MARKET NEUTRAL REAL ESTATE FUND | |
| | | Shares | | | Percentage
Value | | | Unrealized
Gain | |
| | | | | | | |
| CUSTOM BASKET OF SHORT SECURITIES2 | | | | | | |
| iShares U.S. Real Estate ETF | | | (21,215 | ) | | | 19.7 | % | | $ | 68,255 | |
| Government Properties Income Trust | | | (10,985 | ) | | | 12.9 | % | | | 44,538 | |
| Senior Housing Properties Trust | | | (11,994 | ) | | | 10.9 | % | | | 37,819 | |
| VEREIT, Inc. | | | (26,505 | ) | | | 9.9 | % | | | 34,053 | |
| Lexington Realty Trust | | | (12,961 | ) | | | 8.5 | % | | | 29,263 | |
| Omega Healthcare Investors, Inc. | | | (8,208 | ) | | | 7.9 | % | | | 27,351 | |
| Piedmont Office Realty Trust, Inc. — Class A | | | (9,152 | ) | | | 7.5 | % | | | 25,963 | |
| Brixmor Property Group, Inc. | | | (7,290 | ) | | | 7.0 | % | | | 24,324 | |
| Weingarten Realty Investors | | | (4,649 | ) | | | 4.1 | % | | | 14,242 | |
| CYS Investments, Inc. | | | (28,264 | ) | | | 3.9 | % | | | 13,390 | |
| Realty Income Corp. | | | (3,384 | ) | | | 3.0 | % | | | 10,502 | |
| Tanger Factory Outlet Centers, Inc. | | | (8,100 | ) | | | 2.5 | % | | | 8,522 | |
| Chatham Lodging Trust | | | (9,630 | ) | | | 2.3 | % | | | 7,866 | |
| Liberty Property Trust | | | (4,516 | ) | | | 2.2 | % | | | 7,547 | |
| SL Green Realty Corp. | | | (1,831 | ) | | | 2.1 | % | | | 7,175 | |
| National Retail Properties, Inc. | | | (5,155 | ) | | | 1.9 | % | | | 6,558 | |
| STAG Industrial, Inc. | | | (6,619 | ) | | | 1.9 | % | | | 6,436 | |
| Public Storage | | | (663 | ) | | | 1.3 | % | | | 4,359 | |
| Brandywine Realty Trust | | | (8,143 | ) | | | 0.5 | % | | | 1,867 | |
| Digital Realty Trust, Inc. | | | (1,166 | ) | | | 0.0 | % | | | 118 | |
| Medical Properties Trust, Inc. | | | (9,544 | ) | | | (0.3 | %) | | | (972 | ) |
| Hersha Hospitality Trust | | | (5,383 | ) | | | (1.0 | %) | | | (3,496 | ) |
| Hospitality Properties Trust | | | (3,849 | ) | | | (1.4 | %) | | | (4,993 | ) |
| Acadia Realty Trust | | | (8,880 | ) | | | (3.0 | %) | | | (10,385 | ) |
| Chesapeake Lodging Trust | | | (5,304 | ) | | | (4.3 | %) | | | (14,722 | ) |
| Total Custom Basket of Short Securities | | | | | | | | | | | 345,580 | |
| * | Non-income producing security. |
| † | Value determined based on Level 1 inputs — See Note 4. |
| †† | Value determined based on Level 2 inputs — See Note 4. |
| 1 | Rate indicated is the 7 day yield as of March 29, 2018. |
| 2 | Total Return based on the return of the custom short basket of securities +/- financing at a variable rate. Rate indicated is rate effective at March 29, 2018. |
| | ADR — American Depositary Receipt |
| | REIT — Real Estate Investment Trust |
| | |
| | See Sector Classification in Other Information section. |
The following table summarizes the inputs used to value the Fund’s investments at March 29, 2018 (See Note 4 in the Notes to Financial Statements):
| Investments in Securities (Assets) | | Level 1
Quoted
Prices | | | Level 2
Significant Observable
Inputs | | | Level 2 -
Other* | | | Level 3
Significant
Unobservable
Inputs | | | Total | |
| Common Stocks | | $ | 5,314,316 | | | $ | — | | | $ | — | | | $ | — | | | $ | 5,314,316 | |
| Money Market Fund | | | 526,759 | | | | — | | | | — | | | | — | | | | 526,759 | |
| Custom Basket Swap Agreements | | | — | | | | — | | | | 345,580 | | | | — | | | | 345,580 | |
| Total Assets | | $ | 5,841,075 | | | $ | — | | | $ | 345,580 | | | $ | — | | | $ | 6,186,655 | |
| * | Other financial instruments include swaps, which are reported as unrealized gain/loss at period end. |
Transfers between investment levels may occur as the markets fluctuate and/or the availability of data used in an investment’s valuation changes. Transfers between valuation levels, if any, are in comparison to the valuation levels at the end of the previous fiscal year, and are effective using the fair value as of the end of the current fiscal period.
For the period ended March 29, 2018, there were no transfers between levels.
| SEE NOTES TO FINANCIAL STATEMENTS. | THE GUGGENHEIM FUNDS SEMI-ANNUAL REPORT | 35 |
| MARKET NEUTRAL REAL ESTATE FUND | |
| STATEMENT OF ASSETS AND LIABILITIES (Unaudited) |
| March 29, 2018 |
| Assets: |
| Investments, at value (cost $5,575,855) | | $ | 5,841,075 | |
| Cash | | | 3,448 | |
| Unrealized appreciation on swap agreements | | | 345,580 | |
| Prepaid expenses | | | 55,285 | |
| Receivables: |
| Fund shares sold | | | 40,560 | |
| Dividends | | | 24,463 | |
| Investment adviser | | | 6,835 | |
| Interest | | | 441 | |
| Total assets | | | 6,317,687 | |
| | | | | |
| Liabilities: |
| Payable for: |
| Swap settlement | | | 123,433 | |
| Transfer agent/maintenance fees | | | 4,456 | |
| Distribution and service fees | | | 257 | |
| Trustees’ fees* | | | 177 | |
| Miscellaneous | | | 5,633 | |
| Total liabilities | | | 133,956 | |
| Net assets | | $ | 6,183,731 | |
| | | | | |
| Net assets consist of: |
| Paid in capital | | $ | 5,579,061 | |
| Undistributed net investment income | | | 39,906 | |
| Accumulated net realized loss on investments | | | (46,036 | ) |
| Net unrealized appreciation on investments | | | 610,800 | |
| Net assets | | $ | 6,183,731 | |
| | | | | |
| A-Class: |
| Net assets | | $ | 113,402 | |
| Capital shares outstanding | | | 4,337 | |
| Net asset value per share | | $ | 26.15 | |
| Maximum offering price per share (Net asset value divided by 95.25%) | | $ | 27.45 | |
| | | | | |
| C-Class: |
| Net assets | | $ | 124,916 | |
| Capital shares outstanding | | | 4,853 | |
| Net asset value per share | | $ | 25.74 | |
| | | | | |
| P-Class: |
| Net assets | | $ | 655,989 | |
| Capital shares outstanding | | | 25,102 | |
| Net asset value per share | | $ | 26.13 | |
| | | | | |
| Institutional Class: |
| Net assets | | $ | 5,289,424 | |
| Capital shares outstanding | | | 201,248 | |
| Net asset value per share | | $ | 26.28 | |
| STATEMENT OF OPERATIONS (Unaudited) |
| Period Ended March 29, 2018 |
| Investment Income: |
| Dividends | | $ | 79,227 | |
| Interest | | | 2,266 | |
| Total investment income | | | 81,493 | |
| | | | | |
| Expenses: |
| Management fees | | | 31,742 | |
| Distribution and service fees: |
| A-Class | | | 140 | |
| C-Class | | | 558 | |
| P-Class | | | 487 | |
| Transfer agent/maintenance fees: |
| A-Class | | | 272 | |
| C-Class | | | 281 | |
| P-Class | | | 967 | |
| Institutional Class | | | 10,986 | |
| Registration fees | | | 33,385 | |
| Professional fees | | | 30,549 | |
| Fund accounting/administration fees | | | 12,465 | |
| Trustees’ fees* | | | 5,371 | |
| Custodian fees | | | 2,239 | |
| Line of credit fees | | | 90 | |
| Miscellaneous | | | 2,437 | |
| Total expenses | | | 131,969 | |
| Less: |
| Expenses waived by Adviser | | | (31,333 | ) |
| Expenses reimbursed by Adviser: |
| A-Class | | | (1,194 | ) |
| C-Class | | | (1,214 | ) |
| P-Class | | | (3,952 | ) |
| Institutional Class | | | (52,689 | ) |
| Total waived/reimbursed expenses | | | (90,382 | ) |
| Net expenses | | | 41,587 | |
| Net investment income | | | 39,906 | |
| | | | | |
| Net Realized and Unrealized Gain (Loss): |
| Net realized gain (loss) on: |
| Investments | | | 21,186 | |
| Swap agreements | | | (67,048 | ) |
| Net realized loss | | | (45,862 | ) |
| Net change in unrealized appreciation (depreciation) on: |
| Investments | | | (148,830 | ) |
| Swap agreements | | | 387,395 | |
| Net change in unrealized appreciation (depreciation) | | | 238,565 | |
| Net realized and unrealized gain | | | 192,703 | |
| Net increase in net assets resulting from operations | | $ | 232,609 | |
| * | Relates to Trustees not deemed “interested persons” within the meaning of Section 2(a)(19) of the 1940 Act. |
| 36 | THE GUGGENHEIM FUNDS SEMI-ANNUAL REPORT | SEE NOTES TO FINANCIAL STATEMENTS. |
| MARKET NEUTRAL REAL ESTATE FUND | |
| STATEMENTS OF CHANGES IN NET ASSETS |
| | | Period Ended
March 29,
2018
(Unaudited) | | | Year Ended
September 30,
2017 | |
| Increase (Decrease) in Net Assets from Operations: | | | | | | |
| Net investment income | | $ | 39,906 | | | $ | 27,490 | |
| Net realized gain (loss) on investments | | | (45,862 | ) | | | 24,187 | |
| Net change in unrealized appreciation (depreciation) on investments | | | 238,565 | | | | 365,882 | |
| Net increase in net assets resulting from operations | | | 232,609 | | | | 417,559 | |
| | | | | | | | | |
| Distributions to shareholders from: | | | | | | | | |
| Net realized gains | | | | | | | | |
| A-Class | | | (5,777 | ) | | | — | |
| C-Class | | | (5,619 | ) | | | — | |
| P-Class | | | (17,831 | ) | | | — | |
| Institutional Class | | | (264,679 | ) | | | — | |
| Total distributions to shareholders | | | (293,906 | ) | | | — | |
| | | | | | | | | |
| Capital share transactions: | | | | | | | | |
| Proceeds from sale of shares | | | | | | | | |
| A-Class | | | — | | | | 784 | |
| C-Class | | | 16,544 | | | | 36,949 | |
| P-Class | | | 323,521 | | | | 193,721 | |
| Institutional Class | | | 80,115 | | | | — | |
| Distributions reinvested | | | | | | | | |
| A-Class | | | 5,777 | | | | — | |
| C-Class | | | 5,619 | | | | — | |
| P-Class | | | 17,831 | | | | — | |
| Institutional Class | | | 264,679 | | | | — | |
| Cost of shares redeemed | | | | | | | | |
| C-Class | | | (38,218 | ) | | | — | |
| P-Class | | | (1,523 | ) | | | (3,606 | ) |
| Net increase from capital share transactions | | | 674,345 | | | | 227,848 | |
| Net increase in net assets | | | 613,048 | | | | 645,407 | |
| | | | | | | | | |
| Net assets: | | | | | | | | |
| Beginning of period | | | 5,570,683 | | | | 4,925,276 | |
| End of period | | $ | 6,183,731 | | | $ | 5,570,683 | |
| Undistributed net investment income at end of period | | $ | 39,906 | | | $ | — | |
| | | | | | | | | |
| Capital share activity: | | | | | | | | |
| Shares sold | | | | | | | | |
| A-Class | | | — | | | | 30 | |
| C-Class | | | 632 | | | | 1,459 | |
| P-Class | | | 12,217 | | | | 7,329 | |
| Institutional Class | | | 3,009 | | | | — | |
| Shares issued from reinvestment of distributions | | | | | | | | |
| A-Class | | | 225 | | | | — | |
| C-Class | | | 221 | | | | — | |
| P-Class | | | 693 | | | | — | |
| Institutional Class | | | 10,239 | | | | — | |
| Shares redeemed | | | | | | | | |
| C-Class | | | (1,459 | ) | | | — | |
| P-Class | | | (57 | ) | | | (139 | ) |
| Net increase in shares | | | 25,720 | | | | 8,679 | |
| SEE NOTES TO FINANCIAL STATEMENTS. | THE GUGGENHEIM FUNDS SEMI-ANNUAL REPORT | 37 |
| MARKET NEUTRAL REAL ESTATE FUND | |
This table is presented to show selected data for a share outstanding throughout each period and to assist shareholders in evaluating a Fund’s performance for the periods presented.
| A-Class | | Period Ended
March 29,
2018a | | | Year Ended
September 30,
2017 | | | Period Ended
September 30,
2016b | |
| Per Share Data | | | | | | | | | |
| Net asset value, beginning of period | | $ | 26.47 | | | $ | 24.45 | | | $ | 25.00 | |
| Income (loss) from investment operations: |
| Net investment income (loss)c | | | .16 | | | | .08 | | | | .24 | |
| Net gain (loss) on investments (realized and unrealized) | | | .92 | | | | 1.94 | | | | (.79 | ) |
| Total from investment operations | | | 1.08 | | | | 2.02 | | | | (.55 | ) |
| Less distributions from: |
| Net realized gains | | | (1.40 | ) | | | — | | | | — | |
| Total distributions | | | (1.40 | ) | | | — | | | | — | |
| Net asset value, end of period | | $ | 26.15 | | | $ | 26.47 | | | $ | 24.45 | |
| |
| Total Returnf | | | 4.07 | % | | | 8.38 | % | | | (2.20 | %) |
| Ratios/Supplemental Data |
| Net assets, end of period (in thousands) | | $ | 113 | | | $ | 109 | | | $ | 100 | |
| Ratios to average net assets: |
| Net investment income (loss) | | | 1.18 | % | | | 0.31 | % | | | 1.66 | % |
| Total expenses | | | 4.84 | % | | | 4.88 | % | | | 3.74 | % |
| Net expensesd,e,g | | | 1.60 | % | | | 1.65 | % | | | 1.64 | % |
| Portfolio turnover rate | | | 54 | % | | | 145 | % | | | 135 | % |
| C-Class | | Period Ended
March 29,
2018a | | | Year Ended
September 30,
2017 | | | Period Ended
September 30,
2016b | |
| Per Share Data | | | | | | | | | |
| Net asset value, beginning of period | | $ | 26.16 | | | $ | 24.35 | | | $ | 25.00 | |
| Income (loss) from investment operations: |
| Net investment income (loss)c | | | .06 | | | | (.11 | ) | | | .12 | |
| Net gain (loss) on investments (realized and unrealized) | | | .92 | | | | 1.92 | | | | (.77 | ) |
| Total from investment operations | | | .98 | | | | 1.81 | | | | (.65 | ) |
| Less distributions from: |
| Net realized gains | | | (1.40 | ) | | | — | | | | — | |
| Total distributions | | | (1.40 | ) | | | — | | | | — | |
| Net asset value, end of period | | $ | 25.74 | | | $ | 26.16 | | | $ | 24.35 | |
| |
| Total Returnf | | | 3.72 | % | | | 7.56 | % | | | (2.60 | %) |
| Ratios/Supplemental Data |
| Net assets, end of period (in thousands) | | $ | 125 | | | $ | 143 | | | $ | 97 | |
| Ratios to average net assets: |
| Net investment income (loss) | | | 0.50 | % | | | (0.52 | %) | | | 0.93 | % |
| Total expenses | | | 5.64 | % | | | 5.70 | % | | | 4.47 | % |
| Net expensesd,e,g | | | 2.35 | % | | | 2.40 | % | | | 2.38 | % |
| Portfolio turnover rate | | | 54 | % | | | 145 | % | | | 135 | % |
| 38 | THE GUGGENHEIM FUNDS SEMI-ANNUAL REPORT | SEE NOTES TO FINANCIAL STATEMENTS. |
| MARKET NEUTRAL REAL ESTATE FUND | |
| FINANCIAL HIGHLIGHTS (continued) |
This table is presented to show selected data for a share outstanding throughout each period and to assist shareholders in evaluating a Fund’s performance for the periods presented.
| P-Class | | Period Ended
March 29,
2018a | | | Year Ended
September 30,
2017 | | | Period Ended
September 30,
2016b | |
| Per Share Data | | | | | | | | | |
| Net asset value, beginning of period | | $ | 26.48 | | | $ | 24.45 | | | $ | 25.00 | |
| Income (loss) from investment operations: |
| Net investment income (loss)c | | | .21 | | | | .16 | | | | .26 | |
| Net gain (loss) on investments (realized and unrealized) | | | .84 | | | | 1.87 | | | | (.81 | ) |
| Total from investment operations | | | 1.05 | | | | 2.03 | | | | (.55 | ) |
| Less distributions from: |
| Net realized gains | | | (1.40 | ) | | | — | | | | — | |
| Total distributions | | | (1.40 | ) | | | — | | | | — | |
| Net asset value, end of period | | $ | 26.13 | | | $ | 26.48 | | | $ | 24.45 | |
| |
| Total Returnf | | | 4.03 | % | | | 8.34 | % | | | (2.20 | %) |
| Ratios/Supplemental Data |
| Net assets, end of period (in thousands) | | $ | 656 | | | $ | 324 | | | $ | 124 | |
| Ratios to average net assets: |
| Net investment income (loss) | | | 1.62 | % | | | 0.52 | % | | | 1.64 | % |
| Total expenses | | | 4.76 | % | | | 5.18 | % | | | 3.65 | % |
| Net expensesd,e,g | | | 1.64 | % | | | 1.65 | % | | | 1.66 | % |
| Portfolio turnover rate | | | 54 | % | | | 145 | % | | | 135 | % |
| SEE NOTES TO FINANCIAL STATEMENTS. | THE GUGGENHEIM FUNDS SEMI-ANNUAL REPORT | 39 |
| MARKET NEUTRAL REAL ESTATE FUND | |
| FINANCIAL HIGHLIGHTS (concluded) |
This table is presented to show selected data for a share outstanding throughout each period and to assist shareholders in evaluating a Fund’s performance for the periods presented.
| Institutional Class | | Period Ended
March 29,
2018a | | | Year Ended
September 30,
2017 | | | Period Ended
September 30,
2016b | |
| Per Share Data | | | | | | | | | |
| Net asset value, beginning of period | | $ | 26.57 | | | $ | 24.49 | | | $ | 25.00 | |
| Income (loss) from investment operations: |
| Net investment income (loss)c | | | .18 | | | | .14 | | | | .28 | |
| Net gain (loss) on investments (realized and unrealized) | | | .93 | | | | 1.94 | | | | (.79 | ) |
| Total from investment operations | | | 1.11 | | | | 2.08 | | | | (.51 | ) |
| Less distributions from: |
| Net realized gains | | | (1.40 | ) | | | — | | | | — | |
| Total distributions | | | (1.40 | ) | | | — | | | | — | |
| Net asset value, end of period | | $ | 26.28 | | | $ | 26.57 | | | $ | 24.49 | |
| |
| Total Returnf | | | 4.17 | % | | | 8.62 | % | | | (2.04 | %) |
| Ratios/Supplemental Data |
| Net assets, end of period (in thousands) | | $ | 5,289 | | | $ | 4,995 | | | $ | 4,604 | |
| Ratios to average net assets: |
| Net investment income (loss) | | | 1.39 | % | | | 0.55 | % | | | 1.92 | % |
| Total expenses | | | 4.53 | % | | | 4.52 | % | | | 3.41 | % |
| Net expensesd,e,g | | | 1.40 | % | | | 1.40 | % | | | 1.39 | % |
| Portfolio turnover rate | | | 54 | % | | | 145 | % | | | 135 | % |
| a | Unaudited figures for the period ended March 29, 2018. Percentage amounts for the period, except total return and portfolio turnover rate, have been annualized. |
| b | Since commencement of operations: February 26, 2016. Percentage amounts for the period, except total return and portfolio turnover rate, have been annualized. |
| c | Net investment income (loss) per share was computed using average shares outstanding throughout the period. |
| d | Net expense information reflects the expense ratios after expense waivers and reimbursements, as applicable. |
| e | The portion of the ratios of net expenses to average net assets attributable to recoupments of prior fee reductions or expense reimbursements for the periods presented would be: |
| | | 03/29/18 | 09/30/17 |
| | A-Class | — | 0.22% |
| | C-Class | — | 0.22% |
| | P-Class | — | 0.16% |
| | Institutional Class | — | 0.18% |
| f | Total return does not reflect the impact of any applicable sales charges and has not been annualized. |
| g | Net expenses may include expenses that are excluded from the expense limitation agreement and recouped amounts excluding those expenses, the operating expense ratios for the periods presented would be: |
| | | 03/29/18 | 09/30/17 | 09/30/16 |
| | A-Class | 1.60% | 1.63% | 1.63% |
| | C-Class | 2.35% | 2.37% | 2.37% |
| | P-Class | 1.64% | 1.63% | 1.65% |
| | Institutional Class | 1.40% | 1.38% | 1.38% |
| 40 | THE GUGGENHEIM FUNDS SEMI-ANNUAL REPORT | SEE NOTES TO FINANCIAL STATEMENTS. |
| PERFORMANCE REPORT AND FUND PROFILE (Unaudited) | March 29, 2018 |
RISK MANAGED REAL ESTATE FUND
OBJECTIVE: Seeks to provide total return, comprised of capital appreciation and current income.
Holdings Diversification (Market Exposure as % of Net Assets)
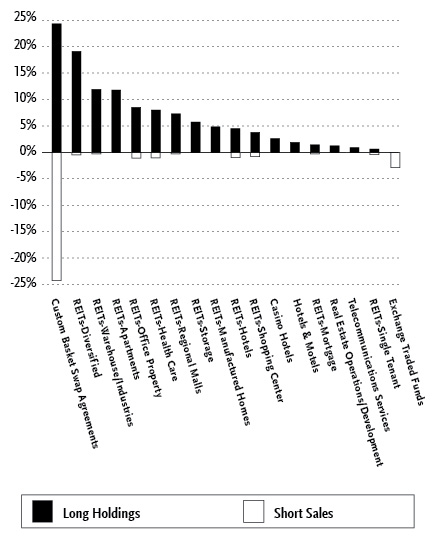
“Holdings Diversification (Market Exposure as % of Net Assets)” excludes any temporary cash investments.
| Inception Dates: |
| A-Class | March 28, 2014 |
| C-Class | March 28, 2014 |
| P-Class | May 1, 2015 |
| Institutional Class | March 28, 2014 |
| Ten Largest Holdings (% of Total Net Assets) |
| Prologis, Inc. | 5.4% |
| Simon Property Group, Inc. | 5.2% |
| Equinix, Inc. | 4.9% |
| Equity Residential | 2.8% |
| Alexandria Real Estate Equities, Inc. | 2.7% |
| Sun Communities, Inc. | 2.6% |
| Invitation Homes, Inc. | 2.6% |
| HCP, Inc. | 2.4% |
| AvalonBay Communities, Inc. | 2.4% |
| Equity LifeStyle Properties, Inc. | 2.2% |
| Top Ten Total | 33.2% |
“Ten Largest Holdings” excludes any temporary cash or derivative investments.
| | THE GUGGENHEIM FUNDS SEMI-ANNUAL REPORT | 41 |
| PERFORMANCE REPORT AND FUND PROFILE (Unaudited)(concluded) | March 29, 2018 |
Average Annual Returns*
Periods Ended March 29, 2018
| | 6 month† | 1 Year | Since Inception
(03/28/14) |
| A-Class Shares | (2.49%) | 2.78% | 9.68% |
| A-Class Shares with sales charge‡ | (7.11%) | (2.11%) | 8.35% |
| C-Class Shares | (2.81%) | 2.04% | 8.86% |
| C-Class Shares with CDSC§ | (3.74%) | 1.06% | 8.86% |
| Institutional Class Shares | (2.34%) | 3.05% | 10.00% |
| FTSE NAREIT Equity REITs Index | (6.82%) | (4.51%) | 6.56% |
| | 6 month† | 1 Year | Since Inception
(05/01/15) |
| P-Class Shares | (2.49%) | 2.76% | 5.24% |
| FTSE NAREIT Equity REITs Index | (6.82%) | (4.51%) | 2.80% |
| * | The performance data above represents past performance that is not predictive of future results. The investment return and principal value of an investment in the Fund will fluctuate so that an investor’s shares, when redeemed, may be worth more or less than their original cost. Returns are historical and include changes in principal and reinvested dividends and capital gains and do not reflect the effect of taxes. The FTSE NAREIT Equity REITs Index is an unmanaged index and, unlike the Fund, has no management fees or operating expenses to reduce its reported return. |
| † | 6 month returns are not annualized. |
| ‡ | Fund returns are calculated using the maximum sales charge of 4.75%. |
| § | Fund returns include a CDSC of 1% if redeemed within 12 months of purchase. |
| 42 | THE GUGGENHEIM FUNDS SEMI-ANNUAL REPORT | |
| SCHEDULE OF INVESTMENTS (Unaudited) | March 29, 2018 |
| RISK MANAGED REAL ESTATE FUND | |
| | | Shares | | | Value | |
| | | | | | | |
| COMMON STOCKS† - 95.2% | | | | | | |
| | | | | | | |
| REITs - 88.6% | | | | | | |
| REITs-DIVERSIFIED - 19.4% | | | | | | |
| Equinix, Inc. | | | 18,511 | | | $ | 7,740,190 | |
| Gaming and Leisure Properties, Inc. | | | 90,625 | | | | 3,033,219 | |
| Digital Realty Trust, Inc. | | | 28,099 | | | | 2,961,073 | |
| Weyerhaeuser Co. | | | 76,226 | | | | 2,667,910 | |
| Rayonier, Inc. | | | 75,671 | | | | 2,662,106 | |
| American Tower Corp. — Class A | | | 18,205 | | | | 2,645,915 | |
| Crown Castle International Corp. | | | 24,034 | | | | 2,634,367 | |
| Cousins Properties, Inc. | | | 255,632 | | | | 2,218,886 | |
| New Residential Investment Corp. | | | 121,783 | | | | 2,003,330 | |
| Vornado Realty Trust | | | 20,287 | | | | 1,365,315 | |
| Duke Realty Corp. | | | 34,572 | | | | 915,467 | |
| Total REITs-Diversified | | | | | | | 30,847,778 | |
| | | | | | | | | |
| REITs-WAREHOUSE/INDUSTRIES - 11.9% | | | | | | | | |
| Prologis, Inc. | | | 137,129 | | | | 8,637,756 | |
| Rexford Industrial Realty, Inc. | | | 106,225 | | | | 3,058,218 | |
| EastGroup Properties, Inc. | | | 33,992 | | | | 2,809,779 | |
| QTS Realty Trust, Inc. — Class A | | | 47,092 | | | | 1,705,672 | |
| CyrusOne, Inc. | | | 28,210 | | | | 1,444,634 | |
| Gramercy Property Trust | | | 57,190 | | | | 1,242,739 | |
| Total REITs-Warehouse/Industries | | | | | | | 18,898,798 | |
| | | | | | | | | |
| REITs-APARTMENTS - 11.8% | | | | | | | | |
| Equity Residential | | | 71,490 | | | | 4,405,214 | |
| Invitation Homes, Inc. | | | 178,716 | | | | 4,080,086 | |
| AvalonBay Communities, Inc.1 | | | 22,974 | | | | 3,778,304 | |
| American Homes 4 Rent — Class A | | | 104,825 | | | | 2,104,886 | |
| Camden Property Trust | | | 20,653 | | | | 1,738,570 | |
| Mid-America Apartment Communities, Inc. | | | 15,785 | | | | 1,440,223 | |
| Essex Property Trust, Inc. | | | 5,088 | | | | 1,224,580 | |
| Total REITs-Apartments | | | | | | | 18,771,863 | |
| | | | | | | | | |
| REITs-OFFICE PROPERTY - 8.8% | | | | | | | | |
| Alexandria Real Estate Equities, Inc. | | | 34,365 | | | | 4,291,845 | |
| Boston Properties, Inc.1 | | | 21,147 | | | | 2,605,733 | |
| Highwoods Properties, Inc. | | | 51,862 | | | | 2,272,593 | |
| Douglas Emmett, Inc. | | | 35,254 | | | | 1,295,937 | |
| Tier REIT, Inc. | | | 67,551 | | | | 1,248,342 | |
| SL Green Realty Corp. | | | 9,736 | | | | 942,737 | |
| Kilroy Realty Corp. | | | 12,138 | | | | 861,312 | |
| Hudson Pacific Properties, Inc. | | | 16,266 | | | | 529,133 | |
| Total REITs-Office Property | | | | | | | 14,047,632 | |
| | | | | | | | | |
| REITs-HEALTH CARE - 8.0% | | | | | | | | |
| HCP, Inc. | | | 167,319 | | | | 3,886,820 | |
| Ventas, Inc. | | | 63,674 | | | | 3,153,773 | |
| Healthcare Trust of America, Inc. — Class A | | | 111,687 | | | | 2,954,121 | |
| Welltower, Inc. | | | 51,767 | | | | 2,817,678 | |
| Total REITs-Health Care | | | | | | | 12,812,392 | |
| | | | | | | | | |
| REITs-REGIONAL MALLS - 7.3% | | | | | | | | |
| Simon Property Group, Inc. | | | 53,828 | | | | 8,308,352 | |
| GGP, Inc. | | | 130,216 | | | | 2,664,219 | |
| Taubman Centers, Inc. | | | 10,617 | | | | 604,213 | |
| Total REITs-Regional Malls | | | | | | | 11,576,784 | |
| | | | | | | | | |
| REITs-STORAGE - 5.9% | | | | | | | | |
| Public Storage | | | 17,960 | | | | 3,599,004 | |
| National Storage Affiliates Trust | | | 84,005 | | | | 2,106,845 | |
| Iron Mountain, Inc. | | | 57,205 | | | | 1,879,756 | |
| Extra Space Storage, Inc. | | | 21,456 | | | | 1,874,396 | |
| Total REITs-Storage | | | | | | | 9,460,001 | |
| | | | | | | | | |
| REITs-MANUFACTURED HOMES - 4.8% | | | | | | | | |
| Sun Communities, Inc. | | | 45,174 | | | | 4,127,548 | |
| Equity LifeStyle Properties, Inc.1 | | | 39,406 | | | | 3,458,665 | |
| Total REITs-Manufactured Homes | | | | | | | 7,586,213 | |
| | | | | | | | | |
| REITs-HOTELS - 4.5% | | | | | | | | |
| Summit Hotel Properties, Inc. | | | 142,599 | | | | 1,940,772 | |
| MGM Growth Properties LLC — Class A | | | 71,505 | | | | 1,897,743 | |
| RLJ Lodging Trust | | | 87,211 | | | | 1,695,382 | |
| Host Hotels & Resorts, Inc. | | | 90,793 | | | | 1,692,382 | |
| Total REITs-Hotels | | | | | | | 7,226,279 | |
| | | | | | | | | |
| REITs-SHOPPING CENTERS - 3.8% | | | | | | | | |
| Regency Centers Corp. | | | 42,945 | | | | 2,532,896 | |
| Federal Realty Investment Trust | | | 21,430 | | | | 2,488,237 | |
| Retail Opportunity Investments Corp. | | | 58,052 | | | | 1,025,779 | |
| Total REITs-Shopping Centers | | | | | | | 6,046,912 | |
| | | | | | | | | |
| REITs-MORTGAGE - 1.4% | | | | | | | | |
| Blackstone Mortgage Trust, Inc. — Class A | | | 73,425 | | | | 2,307,013 | |
| | | | | | | | | |
| REITs-SINGLE TENANT - 1.0% | | | | | | | | |
| Realty Income Corp. | | | 29,837 | | | | 1,543,468 | |
| Total REITs | | | | | | | 141,125,133 | |
| | | | | | | | | |
| LODGING - 4.5% | | | | | | | | |
| CASINO HOTELS - 2.6% | | | | | | | | |
| Caesars Entertainment Corp.* | | | 205,987 | | | | 2,317,354 | |
| Boyd Gaming Corp. | | | 55,017 | | | | 1,752,842 | |
| Total Casino Hotels | | | | | | | 4,070,196 | |
| | | | | | | | | |
| HOTELS & MOTELS - 1.9% | | | | | | | | |
| Hilton Worldwide Holdings, Inc. | | | 21,408 | | | | 1,686,094 | |
| Extended Stay America, Inc. | | | 69,138 | | | | 1,366,858 | |
| Total Hotels & Motels | | | | | | | 3,052,952 | |
| Total Lodging | | | | | | | 7,123,148 | |
| | | | | | | | | |
| REAL ESTATE - 1.2% | | | | | | | | |
| REAL ESTATE OPERATIONS/DEVELOPMENT - 1.2% | | | | | | | | |
| VICI Properties, Inc. | | | 106,276 | | | | 1,946,976 | |
| | | | | | | | | |
| TELECOMMUNICATIONS - 0.9% | | | | | | | | |
| TELECOMMUNICATION SERVICES - 0.9% | | | | | | | | |
| GDS Holdings Ltd. ADR* | | | 54,682 | | | | 1,501,021 | |
| | | | | | | | | |
| Total Common Stocks | | | | | | | | |
| (Cost $152,191,655) | | | | | | | 151,696,278 | |
| SEE NOTES TO FINANCIAL STATEMENTS. | THE GUGGENHEIM FUNDS SEMI-ANNUAL REPORT | 43 |
| SCHEDULE OF INVESTMENTS (Unaudited)(continued) | March 29, 2018 |
| RISK MANAGED REAL ESTATE FUND | |
| | | Shares | | | Value | |
| | | | | | | |
| MONEY MARKET FUND† - 4.7% | | | | | | |
| Dreyfus Treasury Securities Cash Management Institutional Shares 1.46%2 | | | 7,524,733 | | | $ | 7,524,733 | |
| Total Money Market Fund | | | | | | | | |
| (Cost $7,524,733) | | | | | | | 7,524,733 | |
| Total Investments - 99.9% | | | | | | | | |
| (Cost $159,716,388) | | | | | | | 159,221,011 | |
| | | | | | | | | |
| COMMON STOCKS SOLD SHORT† - (6.9)% | | | | | | | | |
| | | | | | | | | |
| REITs - (6.9)% | | | | | | | | |
| REITs-STORAGE - (0.3)% | | | | | | | | |
| Public Storage | | | (1,991 | ) | | | (398,976 | ) |
| | | | | | | | | |
| REITs-REGIONAL MALLS - (0.3)% | | | | | | | | |
| Tanger Factory Outlet Centers, Inc. | | | (23,411 | ) | | | (515,042 | ) |
| | | | | | | | | |
| REITs-WAREHOUSE/INDUSTRIES - (0.3)% | | | | | | | | |
| Liberty Property Trust | | | (13,049 | ) | | | (518,437 | ) |
| | | | | | | | | |
| REITs-MORTGAGE - (0.4)% | | | | | | | | |
| CYS Investments, Inc. | | | (82,891 | ) | | | (557,028 | ) |
| | | | | | | | | |
| REITs-SINGLE TENANT - (0.7)% | | | | | | | | |
| Realty Income Corp. | | | (9,793 | ) | | | (506,592 | ) |
| National Retail Properties, Inc. | | | (14,869 | ) | | | (583,757 | ) |
| Total REITs-Single Tenant | | | | | | | (1,090,349 | ) |
| | | | | | | | | |
| REITs-DIVERSIFIED - (0.7)% | | | | | | | | |
| Lexington Realty Trust | | | (37,373 | ) | | | (294,126 | ) |
| Digital Realty Trust, Inc. | | | (3,514 | ) | | | (370,305 | ) |
| STAG Industrial, Inc. | | | (18,872 | ) | | | (451,418 | ) |
| Total REITs-Diversified | | | | | | | (1,115,849 | ) |
| | | | | | | | | |
| REITs-SHOPPING CENTERS - (0.8)% | | | | | | | | |
| Brixmor Property Group, Inc. | | | (21,329 | ) | | | (325,267 | ) |
| Weingarten Realty Investors | | | (13,182 | ) | | | (370,151 | ) |
| Acadia Realty Trust | | | (25,624 | ) | | | (630,350 | ) |
| Total REITs-Shopping Centers | | | | | | | (1,325,768 | ) |
| | | | | | | | | |
| REITs-HOTELS - (1.0)% | | | | | | | | |
| Hersha Hospitality Trust | | | (15,808 | ) | | | (282,963 | ) |
| Hospitality Properties Trust | | | (11,335 | ) | | | (287,229 | ) |
| Chesapeake Lodging Trust | | | (15,196 | ) | | | (422,601 | ) |
| Chatham Lodging Trust | | | (28,838 | ) | | | (552,248 | ) |
| Total REITs-Hotels | | | | | | | (1,545,041 | ) |
| | | | | | | | | |
| REITs-HEALTH CARE - (1.0)% | | | | | | | | |
| Medical Properties Trust, Inc. | | | (28,683 | ) | | | (372,879 | ) |
| Senior Housing Properties Trust | | | (34,255 | ) | | | (536,433 | ) |
| Omega Healthcare Investors, Inc. | | | (23,642 | ) | | | (639,280 | ) |
| Total REITs-Health Care | | | | | | | (1,548,592 | ) |
| | | | | | | | | |
| REITs-OFFICE PROPERTY - (1.4)% | | | | | | | | |
| Brandywine Realty Trust | | | (23,421 | ) | | | (371,925 | ) |
| Government Properties Income Trust | | | (29,680 | ) | | | (405,429 | ) |
| Piedmont Office Realty Trust, Inc. — Class A | | | (25,904 | ) | | | (455,651 | ) |
| SL Green Realty Corp. | | | (5,521 | ) | | | (534,598 | ) |
| VEREIT, Inc. | | | (77,776 | ) | | | (541,321 | ) |
| Total REITs-Office Property | | | | | | | (2,308,924 | ) |
| Total REITs | | | | | | | (10,924,006 | ) |
| | | | | | | | | |
| Total Common Stocks Sold Short | | | | | | | | |
| (Cost $11,716,869) | | | | | | | (10,924,006 | ) |
| | | | | | | | | |
| EXCHANGE-TRADED FUNDS SOLD SHORT† - (2.9)% |
| iShares U.S. Real Estate ETF | | | 62,045 | | | | (4,682,536 | ) |
| Total Exchange-Traded Funds Sold Short | | | | | | | | |
| (Proceeds $4,862,302) | | | | | | | (4,682,536 | ) |
| Total Securities Sold Short - (9.8)% | | | | | | | | |
| (Proceeds $16,579,171) | | | | | | $ | (15,606,542 | ) |
| Other Assets & Liabilities, net - 9.9% | | | | | | | 15,811,645 | |
| Total Net Assets - 100.0% | | | | | | $ | 159,426,114 | |
| Custom Basket Swap Agreements |
| Counterparty | | Index | | Financing
Rate Pay | | Payment
Frequency | | Maturity
Date | | Notional
Amount | | | Value and
Unrealized
Gain (Loss) | |
| OTC Custom Basket Swap Agreements Sold Short†† | | | | | | | | | | |
| Morgan Stanley | | Risk Managed Real Estate Portfolio Short Custom Basket Swap3 | | 1.13% | | At Maturity | | 06/17/19 | | $ | 38,822,596 | | | $ | 2,961,947 | |
| OTC Custom Basket Swap Agreements†† | | | | | | | | | | | | | | |
| Morgan Stanley | | Risk Managed Real Estate Portfolio Long Custom Basket Swap4 | | 2.08% | | At Maturity | | 06/17/19 | | | 38,756,413 | | | | (203,135 | ) |
| 44 | THE GUGGENHEIM FUNDS SEMI-ANNUAL REPORT | SEE NOTES TO FINANCIAL STATEMENTS. |
| SCHEDULE OF INVESTMENTS (Unaudited)(continued) | March 29, 2018 |
| RISK MANAGED REAL ESTATE FUND | |
| | | Shares | | | Percentage
Value | | | Unrealized
Gain (Loss) | |
| | | | | | | |
| CUSTOM BASKET OF LONG SECURITIES4 | | | | | | |
| Rayonier, Inc. | | | 49,172 | | | | (120.3 | %) | | $ | 244,458 | |
| Boyd Gaming Corp. | | | 27,132 | | | | (80.9 | %) | | | 164,255 | |
| American Tower Corp. — Class A | | | 10,157 | | | | (67.8 | %) | | | 137,726 | |
| Crown Castle International Corp. | | | 14,109 | | | | (44.3 | %) | | | 89,913 | |
| Invitation Homes, Inc. | | | 67,834 | | | | (42.3 | %) | | | 85,875 | |
| Alexandria Real Estate Equities, Inc. | | | 11,826 | | | | (31.5 | %) | | | 64,028 | |
| Prologis, Inc. | | | 14,715 | | | | (27.3 | %) | | | 55,491 | |
| National Storage Affiliates Trust | | | 51,566 | | | | (17.9 | %) | | | 36,302 | |
| Tier REIT, Inc. | | | 46,023 | | | | (17.2 | %) | | | 34,969 | |
| HCP, Inc. | | | 59,529 | | | | (16.6 | %) | | | 33,779 | |
| Sun Communities, Inc. | | | 15,010 | | | | (16.2 | %) | | | 32,959 | |
| Equity LifeStyle Properties, Inc. | | | 12,339 | | | | (13.7 | %) | | | 27,844 | |
| Rexford Industrial Realty, Inc. | | | 47,060 | | | | (13.7 | %) | | | 27,837 | |
| Weyerhaeuser Co. | | | 44,358 | | | | (11.5 | %) | | | 23,273 | |
| Highwoods Properties, Inc. | | | 21,822 | | | | (9.8 | %) | | | 19,858 | |
| GDS Holdings Ltd. ADR* | | | 26,262 | | | | (7.2 | %) | | | 14,568 | |
| QTS Realty Trust, Inc. — Class A | | | 25,818 | | | | (6.6 | %) | | | 13,431 | |
| Retail Opportunity Investments Corp. | | | 52,744 | | | | (6.2 | %) | | | 12,585 | |
| Blackstone Mortgage Trust, Inc. — Class A | | | 43,016 | | | | (3.1 | %) | | | 6,264 | |
| Hilton Worldwide Holdings, Inc. | | | 11,557 | | | | (0.9 | %) | | | 1,890 | |
| Cousins Properties, Inc. | | | 97,828 | | | | 18.1 | % | | | (36,678 | ) |
| Equinix, Inc. | | | 3,099 | | | | 23.2 | % | | | (47,189 | ) |
| EastGroup Properties, Inc. | | | 16,317 | | | | 31.4 | % | | | (63,862 | ) |
| Regency Centers Corp. | | | 13,922 | | | | 32.4 | % | | | (65,896 | ) |
| Gaming and Leisure Properties, Inc. | | | 24,643 | | | | 32.8 | % | | | (66,547 | ) |
| MGM Growth Properties LLC — Class A | | | 30,316 | | | | 33.2 | % | | | (67,445 | ) |
| RLJ Lodging Trust | | | 61,026 | | | | 39.1 | % | | | (79,322 | ) |
| Federal Realty Investment Trust | | | 7,034 | | | | 39.5 | % | | | (80,223 | ) |
| Caesars Entertainment Corp.* | | | 74,589 | | | | 41.9 | % | | | (85,199 | ) |
| New Residential Investment Corp. | | | 106,362 | | | | 55.8 | % | | | (113,259 | ) |
| Summit Hotel Properties, Inc. | | | 56,212 | | | | 62.3 | % | | | (126,591 | ) |
| Healthcare Trust of America, Inc. — Class A | | | 28,707 | | | | 72.3 | % | | | (146,901 | ) |
| VICI Properties, Inc. | | | 63,193 | | | | 85.2 | % | | | (173,060 | ) |
| GGP, Inc. | | | 62,281 | | | | 87.8 | % | | | (178,268 | ) |
| Total Custom Basket of Long Securities | | | | | | | | | | | (203,135 | ) |
| | | | | | | | | | | | | |
| CUSTOM BASKET OF SHORT SECURITIES3 |
| iShares U.S. Real Estate ETF | | | (154,874 | ) | | | 20.1 | % | | | 595,857 | |
| Senior Housing Properties Trust | | | (83,974 | ) | | | 14.1 | % | | | 418,970 | |
| Government Properties Income Trust | | | (73,029 | ) | | | 11.2 | % | | | 330,537 | |
| VEREIT, Inc. | | | (191,229 | ) | | | 8.4 | % | | | 248,202 | |
| Lexington Realty Trust | | | (94,083 | ) | | | 7.7 | % | | | 229,109 | |
| Piedmont Office Realty Trust, Inc. — Class A | | | (65,199 | ) | | | 7.7 | % | | | 226,955 | |
| Brixmor Property Group, Inc. | | | (53,664 | ) | | | 7.0 | % | | | 206,595 | |
| Omega Healthcare Investors, Inc. | | | (59,572 | ) | | | 5.5 | % | | | 163,504 | |
| Weingarten Realty Investors | | | (33,575 | ) | | | 4.2 | % | | | 124,313 | |
| CYS Investments, Inc. | | | (204,181 | ) | | | 3.7 | % | | | 109,465 | |
| SL Green Realty Corp. | | | (13,220 | ) | | | 3.4 | % | | | 101,165 | |
| Chatham Lodging Trust | | | (70,033 | ) | | | 3.4 | % | | | 99,854 | |
| Liberty Property Trust | | | (32,352 | ) | | | 2.9 | % | | | 87,586 | |
| Realty Income Corp. | | | (24,337 | ) | | | 2.9 | % | | | 85,791 | |
| Tanger Factory Outlet Centers, Inc. | | | (59,529 | ) | | | 2.2 | % | | | 64,144 | |
| STAG Industrial, Inc. | | | (46,384 | ) | | | 1.8 | % | | | 54,321 | |
| Public Storage | | | (4,764 | ) | | | 1.5 | % | | | 43,842 | |
| National Retail Properties, Inc. | | | (37,526 | ) | | | 0.6 | % | | | 18,368 | |
| Brandywine Realty Trust | | | (58,264 | ) | | | 0.5 | % | | | 13,965 | |
| Digital Realty Trust, Inc. | | | (8,650 | ) | | | 0.0 | % | | | 877 | |
| Medical Properties Trust, Inc. | | | (71,184 | ) | | | (0.2 | %) | | | (7,249 | ) |
| Hersha Hospitality Trust | | | (39,458 | ) | | | (0.9 | %) | | | (25,626 | ) |
| Hospitality Properties Trust | | | (28,292 | ) | | | (1.2 | %) | | | (36,704 | ) |
| Acadia Realty Trust | | | (64,850 | ) | | | (2.8 | %) | | | (82,373 | ) |
| Chesapeake Lodging Trust | | | (38,333 | ) | | | (3.7 | %) | | | (109,521 | ) |
| Total Custom Basket of Short Securities | | | | | | | | | | | 2,961,947 | |
| * | Non-income producing security. |
| † | Value determined based on Level 1 inputs — See Note 4. |
| †† | Value determined based on Level 2 inputs — See Note 4. |
| 1 | All or a portion of this security is pledged as short security collateral at March 29, 2018. |
| 2 | Rate indicated is the 7 day yield as of March 29, 2018. |
| 3 | Total Return based on the return of the custom short basket of securities +/- financing at a variable rate. Rate indicated is rate effective at March 29, 2018. |
| 4 | Total Return based on the return of the custom long basket of securities +/- financing at a variable rate. Rate indicated is rate effective at March 29, 2018. |
| | ADR — American Depositary Receipt |
| | REIT — Real Estate Investment Trust |
| | |
| | See Sector Classification in Other Information section. |
| SEE NOTES TO FINANCIAL STATEMENTS. | THE GUGGENHEIM FUNDS SEMI-ANNUAL REPORT | 45 |
| SCHEDULE OF INVESTMENTS (Unaudited)(concluded) | March 29, 2018 |
| RISK MANAGED REAL ESTATE FUND | |
The following table summarizes the inputs used to value the Fund’s investments at March 29, 2018 (See Note 4 in the Notes to Financial Statements):
| Investments in Securities (Assets) | | Level 1
Quoted
Prices | | | Level 2
Significant
Observable
Inputs | | | Level 2 -
Other* | | | Level 3
Significant
Unobservable
Inputs | | | Total | |
| Common Stocks | | $ | 151,696,278 | | | $ | — | | | $ | — | | | $ | — | | | $ | 151,696,278 | |
| Money Market Fund | | | 7,524,733 | | | | — | | | | — | | | | — | | | | 7,524,733 | |
| Custom Basket Swap Agreements | | | — | | | | — | | | | 2,961,947 | | | | — | | | | 2,961,947 | |
| Total Assets | | $ | 159,221,011 | | | $ | — | | | $ | 2,961,947 | | | $ | — | | | $ | 162,182,958 | |
| | | | | | | | | | | | | | | | | | | | | |
| Investments in Securities (Liabilities) | | | Level 1
Quoted
Prices | | | | Level 2
Significant
Observable
Inputs | | | | Level 2 -
Other* | | | | Level 3
Significant
Unobservable
Inputs | | | | Total | |
| Common Stocks | | $ | 10,924,006 | | | $ | — | | | $ | — | | | $ | — | | | $ | 10,924,006 | |
| Exchange-Traded Funds | | | 4,682,536 | | | | — | | | | — | | | | — | | | | 4,682,536 | |
| Custom Basket Swap Agreements | | | — | | | | — | | | | 203,135 | | | | — | | | | 203,135 | |
| Total Liabilities | | $ | 15,606,542 | | | $ | — | | | $ | 203,135 | | | $ | — | | | $ | 15,809,677 | |
| * | Other financial instruments include swaps, which are reported as unrealized gain/loss at period end. |
Transfers between investment levels may occur as the markets fluctuate and/or the availability of data used in an investment’s valuation changes. Transfers between valuation levels, if any, are in comparison to the valuation levels at the end of the previous fiscal year, and are effective using the fair value as of the end of the current fiscal period.
For the period ended March 29, 2018, there were no transfers between levels.
| 46 | THE GUGGENHEIM FUNDS SEMI-ANNUAL REPORT | SEE NOTES TO FINANCIAL STATEMENTS. |
| RISK MANAGED REAL ESTATE FUND | |
| STATEMENT OF ASSETS AND LIABILITIES (Unaudited) |
| March 29, 2018 |
| Assets: |
| Investments, at value (cost $159,716,388) | | $ | 159,221,011 | |
| Cash | | | 15,197,604 | |
| Unrealized appreciation on swap agreements | | | 2,961,947 | |
| Prepaid expenses | | | 65,850 | |
| Receivables: |
| Dividends | | | 544,357 | |
| Fund shares sold | | | 108,407 | |
| Interest | | | 8,432 | |
| Investment Adviser | | | 14 | |
| Other assets | | | 8,684 | |
| Total assets | | | 178,116,306 | |
| | | | | |
| Liabilities: |
| Securities sold short, at value (proceeds $16,579,171) | | | 15,606,542 | |
| Segregated cash due to broker | | | 1,950,000 | |
| Unrealized depreciation on swap agreements | | | 203,135 | |
| Payable for: |
| Swap settlement | | | 531,241 | |
| Fund shares redeemed | | | 162,697 | |
| Management fees | | | 97,895 | |
| Fund accounting/administration fees | | | 10,662 | |
| Distribution and service fees | | | 4,941 | |
| Trustees’ fees* | | | 1,589 | |
| Transfer agent/maintenance fees | | | 1,331 | |
| Miscellaneous | | | 120,159 | |
| Total liabilities | | | 18,690,192 | |
| Net assets | | $ | 159,426,114 | |
| | | | | |
| Net assets consist of: |
| Paid in capital | | $ | 158,969,970 | |
| Accumulated net investment loss | | | (879,203 | ) |
| Accumulated net realized loss on investments | | | (1,900,717 | ) |
| Net unrealized appreciation on investments | | | 3,236,064 | |
| Net assets | | $ | 159,426,114 | |
| | | | | |
| A-Class: |
| Net assets | | $ | 16,948,326 | |
| Capital shares outstanding | | | 610,698 | |
| Net asset value per share | | $ | 27.75 | |
| Maximum offering price per share (Net asset value divided by 95.25%) | | $ | 29.13 | |
| | | | | |
| C-Class: |
| Net assets | | $ | 776,667 | |
| Capital shares outstanding | | | 28,167 | |
| Net asset value per share | | $ | 27.57 | |
| | | | | |
| P-Class: |
| Net assets | | $ | 4,318,073 | |
| Capital shares outstanding | | | 154,795 | |
| Net asset value per share | | $ | 27.90 | |
| | | | | |
| Institutional Class: |
| Net assets | | $ | 137,383,048 | |
| Capital shares outstanding | | | 4,895,058 | |
| Net asset value per share | | $ | 28.07 | |
| * | Relates to Trustees not deemed “interested persons” within the meaning of Section 2(a)(19) of the 1940 Act. |
| SEE NOTES TO FINANCIAL STATEMENTS. | THE GUGGENHEIM FUNDS SEMI-ANNUAL REPORT | 47 |
| RISK MANAGED REAL ESTATE FUND | |
| STATEMENT OF OPERATIONS (Unaudited) |
| Period Ended March 29, 2018 |
| Investment Income: |
| Dividends | | $ | 1,869,645 | |
| Interest | | | 87,609 | |
| Total investment income | | | 1,957,254 | |
| | | | | |
| Expenses: |
| Management fees | | | 539,377 | |
| Distribution and service fees: |
| A-Class | | | 13,888 | |
| C-Class | | | 4,291 | |
| P-Class | | | 4,821 | |
| Recoupment of previously waived fees: |
| A-Class | | | 2,475 | |
| P-Class | | | 226 | |
| Institutional Class | | | 12,944 | |
| Transfer agent/maintenance fees: |
| A-Class | | | 2,088 | |
| C-Class | | | 1,009 | |
| P-Class | | | 1,926 | |
| Institutional Class | | | 15,261 | |
| Fund accounting/administration fees | | | 57,534 | |
| Short sales dividend expense | | | 29,745 | |
| Prime broker interest expense | | | 13,173 | |
| Custodian fees | | | 8,146 | |
| Trustees’ fees* | | | 5,953 | |
| Line of credit fees | | | 2,489 | |
| Miscellaneous | | | 89,581 | |
| Total expenses | | | 804,927 | |
| Less: |
| Expenses reimbursed by Adviser: |
| A-Class | | | (387 | ) |
| C-Class | | | (720 | ) |
| P-Class | | | (694 | ) |
| Institutional Class | | | (1,426 | ) |
| Total reimbursed expenses | | | (3,227 | ) |
| Net expenses | | | 801,700 | |
| Net investment income | | | 1,155,554 | |
| | | | | |
| Net Realized and Unrealized Gain (Loss): |
| Net realized gain (loss) on: |
| Investments | | $ | (31,511 | ) |
| Securities sold short | | | 447,944 | |
| Swap agreements | | | (482,336 | ) |
| Net realized gain | | | (65,903 | ) |
| Net change in unrealized appreciation (depreciation) on: |
| Investments | | | (7,943,087 | ) |
| Securities sold short | | | 933,009 | |
| Swap agreements | | | 2,243,008 | |
| Net change in unrealized appreciation (depreciation) | | | (4,767,070 | ) |
| Net realized and unrealized loss | | | (4,832,973 | ) |
| Net decrease in net assets resulting from operations | | $ | (3,677,419 | ) |
| * | Relates to Trustees not deemed “interested persons” within the meaning of Section 2(a)(19) of the 1940 Act. |
| 48 | THE GUGGENHEIM FUNDS SEMI-ANNUAL REPORT | SEE NOTES TO FINANCIAL STATEMENTS. |
| RISK MANAGED REAL ESTATE FUND | |
| STATEMENTS OF CHANGES IN NET ASSETS |
| | | Period Ended
March 29,
2018
(Unaudited) | | | Year Ended
September 30,
2017 | |
| Increase (Decrease) in Net Assets from Operations: | | | | | | |
| Net investment income | | $ | 1,155,554 | | | $ | 432,593 | |
| Net realized gain on investments | | | (65,903 | ) | | | 7,307,808 | |
| Net change in unrealized appreciation (depreciation) on investments | | | (4,767,070 | ) | | | 819,439 | |
| Net increase (decrease) in net assets resulting from operations | | | (3,677,419 | ) | | | 8,559,840 | |
| | | | | | | | | |
| Distributions to shareholders from: | | | | | | | | |
| Net investment income | | | | | | | | |
| A-Class | | | (118,998 | ) | | | (18,998 | ) |
| C-Class | | | (4,580 | ) | | | (7,861 | ) |
| P-Class | | | (35,586 | ) | | | (16,196 | ) |
| Institutional Class | | | (1,323,316 | ) | | | (2,441,728 | ) |
| Net realized gains | | | | | | | | |
| A-Class | | | (472,219 | ) | | | (14,684 | ) |
| C-Class | | | (32,529 | ) | | | (13,682 | ) |
| P-Class | | | (153,203 | ) | | | (2,734 | ) |
| Institutional Class | | | (4,326,067 | ) | | | (2,669,186 | ) |
| Total distributions to shareholders | | | (6,466,498 | ) | | | (5,185,069 | ) |
| | | | | | | | | |
| Capital share transactions: | | | | | | | | |
| Proceeds from sale of shares | | | | | | | | |
| A-Class | | | 16,908,544 | | | | 2,398,594 | |
| C-Class | | | 389,174 | | | | 224,935 | |
| P-Class | | | 4,073,223 | | | | 3,554,742 | |
| Institutional Class | | | 28,763,961 | | | | 11,786,247 | |
| Distributions reinvested | | | | | | | | |
| A-Class | | | 587,343 | | | | 31,571 | |
| C-Class | | | 37,109 | | | | 18,354 | |
| P-Class | | | 177,730 | | | | 18,640 | |
| Institutional Class | | | 4,620,716 | | | | 4,051,720 | |
| Cost of shares redeemed | | | | | | | | |
| A-Class | | | (1,529,913 | ) | | | (1,017,535 | ) |
| C-Class | | | (308,350 | ) | | | (50,198 | ) |
| P-Class | | | (2,147,581 | ) | | | (1,121,507 | ) |
| Institutional Class | | | (10,523,199 | ) | | | (7,914,904 | ) |
| Net increase from capital share transactions | | | 41,048,757 | | | | 11,980,659 | |
| Net increase in net assets | | | 30,904,840 | | | | 15,355,430 | |
| | | | | | | | | |
| Net assets: | | | | | | | | |
| Beginning of period | | | 128,521,274 | | | | 113,165,844 | |
| End of period | | $ | 159,426,114 | | | $ | 128,521,274 | |
| Accumulated net investment loss at end of period | | $ | (879,203 | ) | | $ | (552,277 | ) |
| SEE NOTES TO FINANCIAL STATEMENTS. | THE GUGGENHEIM FUNDS SEMI-ANNUAL REPORT | 49 |
| RISK MANAGED REAL ESTATE FUND | |
| STATEMENTS OF CHANGES IN NET ASSETS (concluded) |
| | | Period Ended
March 29,
2018
(Unaudited) | | | Year Ended
September 30,
2017 | |
| Capital share activity: | | | | | | |
| Shares sold | | | | | | |
| A-Class | | | 568,003 | | | | 81,880 | |
| C-Class | | | 13,191 | | | | 7,646 | |
| P-Class | | | 137,110 | | | | 120,023 | |
| Institutional Class | | | 996,424 | | | | 395,502 | |
| Shares issued from reinvestment of distributions | | | | | | | | |
| A-Class | | | 20,108 | | | | 1,101 | |
| C-Class | | | 1,274 | | | | 652 | |
| P-Class | | | 6,045 | | | | 633 | |
| Institutional Class | | | 156,555 | | | | 140,819 | |
| Shares redeemed | | | | | | | | |
| A-Class | | | (51,355 | ) | | | (34,776 | ) |
| C-Class | | | (10,840 | ) | | | (1,759 | ) |
| P-Class | | | (74,249 | ) | | | (37,602 | ) |
| Institutional Class | | | (353,344 | ) | | | (273,671 | ) |
| Net increase in shares | | | 1,408,922 | | | | 400,448 | |
| 50 | THE GUGGENHEIM FUNDS SEMI-ANNUAL REPORT | SEE NOTES TO FINANCIAL STATEMENTS. |
| RISK MANAGED REAL ESTATE FUND | |
This table is presented to show selected data for a share outstanding throughout each period and to assist shareholders in evaluating a Fund’s performance for the periods presented.
| A-Class | | Period Ended
March 29,
2018a | | | Year Ended
September 30,
2017 | | | Year Ended
September 30,
2016 | | | Year Ended
September 30,
2015 | | | Period Ended
September 30,
2014b | |
| Per Share Data | | | | | | | | | | | | | | | |
| Net asset value, beginning of period | | $ | 29.70 | | | $ | 28.87 | | | $ | 29.77 | | | $ | 26.99 | | | $ | 25.00 | |
| Income (loss) from investment operations: |
| Net investment income (loss)c | | | .25 | | | | .03 | | | | .19 | | | | (.21 | ) | | | .02 | |
| Net gain (loss) on investments (realized and unrealized) | | | (.93 | ) | | | 2.08 | | | | 3.84 | | | | 3.18 | | | | 2.06 | |
| Total from investment operations | | | (.68 | ) | | | 2.11 | | | | 4.03 | | | | 2.97 | | | | 2.08 | |
| Less distributions from: |
| Net investment income | | | (.23 | ) | | | (.57 | ) | | | (1.12 | ) | | | (.05 | ) | | | (.09 | ) |
| Net realized gains | | | (1.04 | ) | | | (.71 | ) | | | (3.81 | ) | | | (.14 | ) | | | — | |
| Total distributions | | | (1.27 | ) | | | (1.28 | ) | | | (4.93 | ) | | | (.19 | ) | | | (.09 | ) |
| Net asset value, end of period | | $ | 27.75 | | | $ | 29.70 | | | $ | 28.87 | | | $ | 29.77 | | | $ | 26.99 | |
| |
| Total Returnh | | | (2.49 | %) | | | 7.54 | % | | | 14.88 | % | | | 10.97 | % | | | 8.35 | % |
| Ratios/Supplemental Data |
| Net assets, end of period (in thousands) | | $ | 16,948 | | | $ | 2,196 | | | $ | 743 | | | $ | 366 | | | $ | 107 | |
| Ratios to average net assets: |
| Net investment income (loss) | | | 1.73 | % | | | 0.09 | % | | | 0.66 | % | | | (0.67 | %) | | | 0.16 | % |
| Total expensesd | | | 1.37 | % | | | 1.45 | % | | | 1.93 | % | | | 3.41 | % | | | 4.22 | %i |
| Net expensese,f,j | | | 1.36 | % | | | 1.33 | % | | | 1.78 | % | | | 3.04 | % | | | 3.32 | % |
| Portfolio turnover rate | | | 35 | % | | | 85 | % | | | 133 | % | | | 214 | % | | | 57 | % |
| C-Class | | Period Ended
March 29,
2018a | | | Year Ended
September 30,
2017 | | | Year Ended
September 30,
2016 | | | Year Ended
September 30,
2015 | | | Period Ended
September 30,
2014b | |
| Per Share Data | | | | | | | | | | | | | | | |
| Net asset value, beginning of period | | $ | 29.54 | | | $ | 28.77 | | | $ | 29.56 | | | $ | 26.95 | | | $ | 25.00 | |
| Income (loss) from investment operations: |
| Net investment income (loss)c | | | .08 | | | | (.19 | ) | | | .02 | | | | (.43 | ) | | | (.23 | ) |
| Net gain (loss) on investments (realized and unrealized) | | | (.86 | ) | | | 2.06 | | | | 3.77 | | | | 3.18 | | | | 2.19 | |
| Total from investment operations | | | (.78 | ) | | | 1.87 | | | | 3.79 | | | | 2.75 | | | | 1.96 | |
| Less distributions from: |
| Net investment income | | | (.15 | ) | | | (.39 | ) | | | (.77 | ) | | | — | | | | (.01 | ) |
| Net realized gains | | | (1.04 | ) | | | (.71 | ) | | | (3.81 | ) | | | (.14 | ) | | | — | |
| Total distributions | | | (1.19 | ) | | | (1.10 | ) | | | (4.58 | ) | | | (.14 | ) | | | (.01 | ) |
| Net asset value, end of period | | $ | 27.57 | | | $ | 29.54 | | | $ | 28.77 | | | $ | 29.56 | | | $ | 26.95 | |
| |
| Total Returnh | | | (2.81 | %) | | | 6.71 | % | | | 14.00 | % | | | 10.20 | % | | | 7.85 | % |
| Ratios/Supplemental Data |
| Net assets, end of period (in thousands) | | $ | 777 | | | $ | 725 | | | $ | 518 | | | $ | 95 | | | $ | 52 | |
| Ratios to average net assets: |
| Net investment income (loss) | | | 0.57 | % | | | (0.66 | %) | | | 0.08 | % | | | (1.42 | %) | | | (1.60 | %) |
| Total expensesd | | | 2.27 | % | | | 2.27 | % | | | 3.32 | % | | | 5.76 | % | | | 9.33 | %i |
| Net expensese,j | | | 2.10 | % | | | 2.08 | % | | | 2.53 | % | | | 3.76 | % | | | 2.67 | % |
| Portfolio turnover rate | | | 35 | % | | | 85 | % | | | 133 | % | | | 214 | % | | | 57 | % |
| SEE NOTES TO FINANCIAL STATEMENTS. | THE GUGGENHEIM FUNDS SEMI-ANNUAL REPORT | 51 |
| RISK MANAGED REAL ESTATE FUND | |
| FINANCIAL HIGHLIGHTS (continued) |
This table is presented to show selected data for a share outstanding throughout each period and to assist shareholders in evaluating a Fund’s performance for the periods presented.
| P-Class | | Period Ended
March 29,
2018a | | | Year Ended
September 30,
2017 | | | Year Ended
September 30,
2016 | | | Period Ended
September 30,
2015g | |
| Per Share Data | | | | | | | | | | | | |
| Net asset value, beginning of period | | $ | 29.85 | | | $ | 29.01 | | | $ | 29.77 | | | $ | 30.89 | |
| Income (loss) from investment operations: |
| Net investment income (loss)c | | | .20 | | | | .13 | | | | .16 | | | | .04 | |
| Net gain (loss) on investments (realized and unrealized) | | | (.87 | ) | | | 1.98 | | | | 3.88 | | | | (1.16 | ) |
| Total from investment operations | | | (.67 | ) | | | 2.11 | | | | 4.04 | | | | (1.12 | ) |
| Less distributions from: |
| Net investment income | | | (.24 | ) | | | (.56 | ) | | | (.99 | ) | | | — | |
| Net realized gains | | | (1.04 | ) | | | (.71 | ) | | | (3.81 | ) | | | — | |
| Total distributions | | | (1.28 | ) | | | (1.27 | ) | | | (4.80 | ) | | | — | |
| Net asset value, end of period | | $ | 27.90 | | | $ | 29.85 | | | $ | 29.01 | | | $ | 29.77 | |
| |
| Total Returnh | | | (2.49 | %) | | | 7.53 | % | | | 14.87 | % | | | (3.63 | %) |
| Ratios/Supplemental Data |
| Net assets, end of period (in thousands) | | $ | 4,318 | | | $ | 2,564 | | | $ | 82 | | | $ | 30 | |
| Ratios to average net assets: |
| Net investment income (loss) | | | 1.39 | % | | | 0.42 | % | | | 0.56 | % | | | 0.30 | % |
| Total expensesd | | | 1.40 | % | | | 1.51 | % | | | 1.88 | % | | | 4.04 | %i |
| Net expensese,f,j | | | 1.36 | % | | | 1.30 | % | | | 1.78 | % | | | 2.94 | % |
| Portfolio turnover rate | | | 35 | % | | | 85 | % | | | 133 | % | | | 214 | % |
| 52 | THE GUGGENHEIM FUNDS SEMI-ANNUAL REPORT | SEE NOTES TO FINANCIAL STATEMENTS. |
| RISK MANAGED REAL ESTATE FUND | |
| FINANCIAL HIGHLIGHTS (concluded) |
This table is presented to show selected data for a share outstanding throughout each period and to assist shareholders in evaluating a Fund’s performance for the periods presented.
| Institutional Class | | Period Ended
March 29,
2018a | | | Year Ended
September 30,
2017 | | | Year Ended
September 30,
2016 | | | Year Ended
September 30,
2015 | | | Period Ended
September 30,
2014b | |
| Per Share Data | | | | | | | | | | | | | | | |
| Net asset value, beginning of period | | $ | 30.04 | | | $ | 29.18 | | | $ | 29.90 | | | $ | 27.00 | | | $ | 25.00 | |
| Income (loss) from investment operations: |
| Net investment income (loss)c | | | .24 | | | | .11 | | | | .26 | | | | (.11 | ) | | | .02 | |
| Net gain (loss) on investments (realized and unrealized) | | | (.87 | ) | | | 2.10 | | | | 3.89 | | | | 3.18 | | | | 2.09 | |
| Total from investment operations | | | (.63 | ) | | | 2.21 | | | | 4.15 | | | | 3.07 | | | | 2.11 | |
| Less distributions from: |
| Net investment income | | | (.30 | ) | | | (.64 | ) | | | (1.06 | ) | | | (.03 | ) | | | (.11 | ) |
| Net realized gains | | | (1.04 | ) | | | (.71 | ) | | | (3.81 | ) | | | (.14 | ) | | | — | |
| Total distributions | | | (1.34 | ) | | | (1.35 | ) | | | (4.87 | ) | | | (.17 | ) | | | (.11 | ) |
| Net asset value, end of period | | $ | 28.07 | | | $ | 30.04 | | | $ | 29.18 | | | $ | 29.90 | | | $ | 27.00 | |
| |
| Total Returnh | | | (2.34 | %) | | | 7.87 | % | | | 15.20 | % | | | 11.36 | % | | | 8.44 | % |
| Ratios/Supplemental Data |
| Net assets, end of period (in thousands) | | $ | 137,383 | | | $ | 123,037 | | | $ | 111,823 | | | $ | 105,882 | | | $ | 103,993 | |
| Ratios to average net assets: |
| Net investment income (loss) | | | 1.61 | % | | | 0.38 | % | | | 0.91 | % | | | (0.35 | %) | | | 0.11 | % |
| Total expensesd | | | 1.08 | % | | | 1.02 | % | | | 1.50 | % | | | 2.70 | % | | | 2.69 | %i |
| Net expensese,f,j | | | 1.08 | % | | | 1.01 | % | | | 1.50 | % | | | 2.70 | % | | | 2.58 | % |
| Portfolio turnover rate | | | 35 | % | | | 85 | % | | | 133 | % | | | 214 | % | | | 57 | % |
| a | Unaudited figures for the period ended March 29, 2018. Percentage amounts for the period, except total return and portfolio turnover rate, have been annualized. |
| b | Since commencement of operations: March 28, 2014. Percentage amounts for the period, except total return and portfolio turnover rate, have been annualized. |
| c | Net investment income (loss) per share was computed using average shares outstanding throughout the period. |
| d | Does not include expenses of the underlying funds in which the Fund invests. |
| e | Net expense information reflects the expense ratios after expense waivers and reimbursements, as applicable. |
| f | The portion of the ratios of net expenses to average net assets attributable to recoupments of prior fee reductions or expense reimbursements for the periods presented would be: |
| | | 03/29/18 | 09/30/17 |
| | A-Class | 0.04% | 0.02% |
| | C-Class | — | 0.00% |
| | P-Class | 0.01% | 0.00% |
| | Institutional Class | 0.02% | 0.00% |
| g | Since commencement of operations: May 1, 2015. Percentage amounts for the period, except total return and portfolio turnover rate, have been annualized. |
| h | Total return does not reflect the impact of any applicable sales charges and has not been annualized. |
| i | Due to limited length of Fund operations, ratios for this periods are not indicative of future performance. |
| j | Net expenses may include expenses that are excluded from the expense limitation agreement and recouped amounts excluding these expense, the operating expense ratios for the periods presented would be: |
| | | 03/29/18 | 09/30/17 | 09/30/16 | 09/30/15 | 09/30/14 |
| | A-Class | 1.26% | 1.30% | 1.29% | 1.30% | 1.30% |
| | C-Class | 2.04% | 2.04% | 2.03% | 2.05% | 2.05% |
| | P-Class | 1.29% | 1.29% | 1.28% | 1.30% | — |
| | Institutional Class | 1.00% | 0.97% | 1.00% | 0.99% | 1.10% |
| SEE NOTES TO FINANCIAL STATEMENTS. | THE GUGGENHEIM FUNDS SEMI-ANNUAL REPORT | 53 |
| PERFORMANCE REPORT AND FUND PROFILE (Unaudited) | March 29, 2018 |
SMALL CAP VALUE FUND
OBJECTIVE: Seeks long-term capital appreciation.
Holdings Diversification (Market Exposure as % of Net Assets)

“Holdings Diversification (Market Exposure as % of Net Assets)” excludes any temporary cash investments.
| Inception Dates: |
| A-Class | July 11, 2008 |
| C-Class | July 11, 2008 |
| P-Class | May 1, 2015 |
| Institutional Class | July 11, 2008 |
| Ten Largest Holdings (% of Total Net Assets) |
| Portland General Electric Co. | 1.7% |
| Spire, Inc. | 1.7% |
| First Citizens BancShares, Inc. — Class A | 1.6% |
| UniFirst Corp. | 1.6% |
| Berkshire Hills Bancorp, Inc. | 1.6% |
| Wintrust Financial Corp. | 1.5% |
| Cathay General Bancorp | 1.5% |
| Fulton Financial Corp. | 1.5% |
| International Speedway Corp. — Class A | 1.4% |
| Hawaiian Holdings, Inc. | 1.4% |
| Top Ten Total | 15.5% |
“Ten Largest Holdings” excludes any temporary cash investments.
| 54 | THE GUGGENHEIM FUNDS SEMI-ANNUAL REPORT | |
| PERFORMANCE REPORT AND FUND PROFILE (Unaudited)(concluded) | March 29, 2018 |
Average Annual Returns*
Periods Ended March 29, 2018
| | 6 month† | 1 Year | 5 Year | Since Inception
(07/11/08) |
| A-Class Shares | (0.45%) | 2.28% | 7.11% | 12.75% |
| A-Class Shares with sales charge‡ | (5.15%) | (2.55%) | 6.08% | 12.07% |
| C-Class Shares | (0.86%) | 1.45% | 6.29% | 11.92% |
| C-Class Shares with CDSC§ | (1.78%) | 0.50% | 6.29% | 11.92% |
| Institutional Class Shares | (0.33%) | 2.49% | 7.35% | 13.02% |
| Russell 2000 Value Index | (0.65%) | 5.13% | 9.96% | 9.51% |
| | 6 month† | 1 Year | Since Inception
(05/01/15) |
| P-Class Shares | (0.46%) | 2.27% | 6.04% |
| Russell 2000 Value Index | (0.65%) | 5.13% | 8.78% |
| * | The performance data above represents past performance that is not predictive of future results. The investment return and principal value of an investment in the Fund will fluctuate so that an investor’s shares, when redeemed, may be worth more or less than their original cost. Returns are historical and include changes in principal and reinvested dividends and capital gains and do not reflect the effect of taxes. The Russell 2000 Value Index is an unmanaged index and, unlike the Fund, has no management fees or operating expenses to reduce its reported return. |
| † | 6 month returns are not annualized. |
| ‡ | Effective February 22, 2011, the maximum sales charge decreased from 5.75% to 4.75%. A 5.75% maximum sales charge is used in the calculation of the 1 Year, 5 Year and 10 Year average annual returns (based on subscriptions made prior to February 22, 2011), and a 4.75% maximum sales charge will be used to calculate performance for periods based on subscriptions made on or after February 22, 2011. |
| § | Fund returns include a CDSC of 1% if redeemed within 12 months of purchase. |
| | THE GUGGENHEIM FUNDS SEMI-ANNUAL REPORT | 55 |
| SCHEDULE OF INVESTMENTS (Unaudited) | March 29, 2018 |
| SMALL CAP VALUE FUND | |
| | | Shares | | | Value | |
| | | | | | | |
| COMMON STOCKS† - 97.3% |
| | | | | | | |
| Financial - 38.0% |
| First Citizens BancShares, Inc. — Class A | | | 699 | | | $ | 288,855 | |
| Berkshire Hills Bancorp, Inc. | | | 7,211 | | | | 273,657 | |
| Wintrust Financial Corp. | | | 3,135 | | | | 269,767 | |
| Cathay General Bancorp | | | 6,730 | | | | 269,066 | |
| Fulton Financial Corp. | | | 15,044 | | | | 267,031 | |
| Umpqua Holdings Corp. | | | 11,449 | | | | 245,123 | |
| BancorpSouth Bank | | | 7,664 | | | | 243,715 | |
| Federal Agricultural Mortgage Corp. — Class C | | | 2,752 | | | | 239,479 | |
| Hanmi Financial Corp. | | | 7,494 | | | | 230,441 | |
| Argo Group International Holdings Ltd. | | | 3,919 | | | | 224,951 | |
| Radian Group, Inc. | | | 10,825 | | | | 206,108 | |
| Investors Bancorp, Inc. | | | 14,843 | | | | 202,458 | |
| Trustmark Corp. | | | 6,268 | | | | 195,311 | |
| Beneficial Bancorp, Inc. | | | 12,538 | | | | 194,966 | |
| TriCo Bancshares | | | 5,072 | | | | 188,780 | |
| Redwood Trust, Inc. REIT | | | 12,088 | | | | 187,001 | |
| Hersha Hospitality Trust REIT | | | 9,361 | | | | 167,562 | |
| MBIA, Inc.* | | | 17,570 | | | | 162,698 | |
| Flagstar Bancorp, Inc.* | | | 4,160 | | | | 147,264 | |
| Valley National Bancorp | | | 11,655 | | | | 145,221 | |
| Hancock Holding Co. | | | 2,772 | | | | 143,312 | |
| Tier REIT, Inc. | | | 7,598 | | | | 140,411 | |
| RLJ Lodging Trust REIT | | | 7,155 | | | | 139,093 | |
| Invesco Mortgage Capital, Inc. REIT | | | 7,794 | | | | 127,666 | |
| iStar, Inc. REIT* | | | 12,518 | | | | 127,308 | |
| Cousins Properties, Inc. REIT | | | 13,568 | | | | 117,770 | |
| Old National Bancorp | | | 6,516 | | | | 110,120 | |
| Sunstone Hotel Investors, Inc. REIT | | | 6,800 | | | | 103,496 | |
| LaSalle Hotel Properties REIT | | | 3,537 | | | | 102,609 | |
| MB Financial, Inc. | | | 2,354 | | | | 95,290 | |
| Equity Commonwealth REIT* | | | 3,062 | | | | 93,912 | |
| Cowen, Inc. — Class A* | | | 7,041 | | | | 92,941 | |
| Summit Hotel Properties, Inc. REIT | | | 6,592 | | | | 89,717 | |
| Cohen & Steers, Inc. | | | 2,197 | | | | 89,330 | |
| Stifel Financial Corp. | | | 1,429 | | | | 84,640 | |
| Lexington Realty Trust REIT | | | 10,690 | | | | 84,130 | |
| Physicians Realty Trust REIT | | | 5,376 | | | | 83,704 | |
| Hilltop Holdings, Inc. | | | 3,521 | | | | 82,603 | |
| Washington Federal, Inc. | | | 2,343 | | | | 81,068 | |
| 1st Source Corp. | | | 1,539 | | | | 77,904 | |
| IBERIABANK Corp. | | | 974 | | | | 75,972 | |
| Genworth Financial, Inc. — Class A* | | | 26,042 | | | | 73,699 | |
| Customers Bancorp, Inc.* | | | 2,429 | | | | 70,805 | |
| ARMOUR Residential REIT, Inc. | | | 2,214 | | | | 51,542 | |
| Total Financial | | | | | | | 6,688,496 | |
| | | | | | | | | |
| Industrial - 13.8% | | | | | | | | |
| Louisiana-Pacific Corp. | | | 7,351 | | | | 211,488 | |
| Plexus Corp.* | | | 3,365 | | | | 200,991 | |
| GATX Corp. | | | 2,653 | | | | 181,704 | |
| Trinseo S.A. | | | 2,334 | | | | 172,833 | |
| Marten Transport Ltd. | | | 7,523 | | | | 171,524 | |
| TriMas Corp.* | | | 5,906 | | | | 155,033 | |
| Sanmina Corp.* | | | 5,237 | | | | 136,948 | |
| Crane Co. | | | 1,433 | | | | 132,896 | |
| Worthington Industries, Inc. | | | 2,733 | | | | 117,300 | |
| ITT, Inc. | | | 2,389 | | | | 117,013 | |
| Methode Electronics, Inc. | | | 2,915 | | | | 113,977 | |
| GasLog Ltd. | | | 6,686 | | | | 109,985 | |
| KEMET Corp.* | | | 6,019 | | | | 109,124 | |
| Greenbrier Companies, Inc. | | | 2,043 | | | | 102,661 | |
| Matson, Inc. | | | 3,376 | | | | 96,689 | |
| Esterline Technologies Corp.* | | | 1,190 | | | | 87,048 | |
| Apogee Enterprises, Inc. | | | 1,920 | | | | 83,232 | |
| Argan, Inc. | | | 1,902 | | | | 81,691 | |
| Scorpio Tankers, Inc. | | | 23,024 | | | | 45,127 | |
| Total Industrial | | | | | | | 2,427,264 | |
| | | | | | | | | |
| Consumer, Cyclical - 13.6% | | | | | | | | |
| UniFirst Corp. | | | 1,721 | | | | 278,200 | |
| International Speedway Corp. — Class A | | | 5,685 | | | | 250,708 | |
| Hawaiian Holdings, Inc. | | | 6,334 | | | | 245,126 | |
| Wabash National Corp. | | | 10,879 | | | | 226,392 | |
| Tenneco, Inc. | | | 3,482 | | | | 191,058 | |
| MDC Holdings, Inc. | | | 6,339 | | | | 176,985 | |
| Meritage Homes Corp.* | | | 3,838 | | | | 173,669 | |
| Cooper Tire & Rubber Co. | | | 5,541 | | | | 162,351 | |
| Unifi, Inc.* | | | 3,345 | | | | 121,256 | |
| Century Communities, Inc.* | | | 3,961 | | | | 118,632 | |
| Asbury Automotive Group, Inc.* | | | 1,697 | | | | 114,548 | |
| La-Z-Boy, Inc. | | | 2,887 | | | | 86,466 | |
| Deckers Outdoor Corp.* | | | 736 | | | | 66,262 | |
| Caleres, Inc. | | | 1,955 | | | | 65,688 | |
| Cheesecake Factory, Inc. | | | 1,327 | | | | 63,988 | |
| DSW, Inc. — Class A | | | 1,916 | | | | 43,033 | |
| Total Consumer, Cyclical | | | | | | | 2,384,362 | |
| | | | | | | | | |
| Consumer, Non-cyclical - 10.5% | | | | | | | | |
| Encompass Health Corp. | | | 2,916 | | | | 166,708 | |
| Lannett Company, Inc.* | | | 9,865 | | | | 158,333 | |
| Fresh Del Monte Produce, Inc. | | | 3,454 | | | | 156,259 | |
| Emergent BioSolutions, Inc.* | | | 2,915 | | | | 153,475 | |
| AMN Healthcare Services, Inc.* | | | 2,405 | | | | 136,484 | |
| Innoviva, Inc.* | | | 7,605 | | | | 126,775 | |
| Carriage Services, Inc. — Class A | | | 4,493 | | | | 124,276 | |
| Dean Foods Co. | | | 14,355 | | | | 123,740 | |
| FTI Consulting, Inc.* | | | 2,433 | | | | 117,782 | |
| Navigant Consulting, Inc.* | | | 5,680 | | | | 109,283 | |
| AMAG Pharmaceuticals, Inc.* | | | 5,351 | | | | 107,823 | |
| Cambrex Corp.* | | | 1,775 | | | | 92,832 | |
| Premier, Inc. — Class A* | | | 2,781 | | | | 87,073 | |
| Universal Corp. | | | 1,432 | | | | 69,452 | |
| Boston Beer Company, Inc. — Class A* | | | 289 | | | | 54,636 | |
| Community Health Systems, Inc.* | | | 12,248 | | | | 48,502 | |
| Total Consumer, Non-cyclical | | | | | | | 1,833,433 | |
| | | | | | | | | |
| Utilities - 7.5% | | | | | | | | |
| Portland General Electric Co. | | | 7,324 | | | | 296,695 | |
| Spire, Inc. | | | 4,016 | | | | 290,357 | |
| PNM Resources, Inc. | | | 5,914 | | | | 226,211 | |
| 56 | THE GUGGENHEIM FUNDS SEMI-ANNUAL REPORT | SEE NOTES TO FINANCIAL STATEMENTS. |
| SCHEDULE OF INVESTMENTS (Unaudited)(continued) | March 29, 2018 |
| SMALL CAP VALUE FUND | |
| | | Shares | | | Value | |
| | | | | | | |
| Black Hills Corp. | | | 3,651 | | | $ | 198,249 | |
| ONE Gas, Inc. | | | 2,265 | | | | 149,535 | |
| ALLETE, Inc. | | | 1,330 | | | | 96,092 | |
| Southwest Gas Holdings, Inc. | | | 955 | | | | 64,587 | |
| Total Utilities | | | | | | | 1,321,726 | |
| |
| Communications - 5.1% |
| Viavi Solutions, Inc.* | | | 24,477 | | | | 237,917 | |
| Ciena Corp.* | | | 6,557 | | | | 169,826 | |
| Infinera Corp.* | | | 11,666 | | | | 126,693 | |
| NeoPhotonics Corp.* | | | 16,386 | | | | 112,244 | |
| Scholastic Corp. | | | 2,561 | | | | 99,469 | |
| InterDigital, Inc. | | | 1,200 | | | | 88,320 | |
| Finisar Corp.* | | | 3,638 | | | | 57,517 | |
| Total Communications | | | | | | | 891,986 | |
| | | | | | | | | |
| Energy - 4.8% |
| Rowan Companies plc — Class A* | | | 18,063 | | | | 208,447 | |
| Delek US Holdings, Inc. | | | 4,172 | | | | 169,800 | |
| Oasis Petroleum, Inc.* | | | 19,261 | | | | 156,014 | |
| Laredo Petroleum, Inc.* | | | 11,367 | | | | 99,007 | |
| MRC Global, Inc.* | | | 5,072 | | | | 83,384 | |
| Oceaneering International, Inc. | | | 4,054 | | | | 75,161 | |
| Gulfport Energy Corp.* | | | 5,339 | | | | 51,521 | |
| Total Energy | | | | | | | 843,334 | |
| | | | | | | | | |
| Technology - 2.8% |
| Photronics, Inc.* | | | 13,666 | | | | 112,744 | |
| ManTech International Corp. — Class A | | | 2,004 | | | | 111,162 | |
| Cray, Inc.* | | | 5,127 | | | | 106,129 | |
| MicroStrategy, Inc. — Class A* | | | 819 | | | | 105,643 | |
| InnerWorkings, Inc.* | | | 5,365 | | | | 48,553 | |
| Total Technology | | | | | | | 484,231 | |
| | | | | | | | | |
| Basic Materials - 1.2% |
| Kaiser Aluminum Corp. | | | 2,065 | | | | 208,359 | |
| | | | | | | | | |
| Total Common Stocks | | | | | | | | |
| (Cost $15,662,752) | | | | | | | 17,083,191 | |
| | | | | | | | | |
| CONVERTIBLE PREFERRED STOCKS††† - 0.0% |
| Thermoenergy Corp.*,1,2,4 | | | 6,250 | | | | 2 | |
| Total Convertible Preferred Stocks | | | | | | | | |
| (Cost $5,968) | | | | | | | 2 | |
| | | | | | | | | |
| EXCHANGE-TRADED FUNDS† - 1.0% |
| iShares Russell 2000 Value ETF | | | 1,435 | | | | 174,898 | |
| Total Exchange-Traded Funds | | | | | | | | |
| (Cost $172,995) | | | | | | | 174,898 | |
| | | | | | | | | |
| MONEY MARKET FUND† - 2.2% |
| Dreyfus Treasury Securities Cash Management Institutional Shares 1.46%3 | | | 392,537 | | | | 392,537 | |
| Total Money Market Fund | | | | | | | | |
| (Cost $392,537) | | | | | | | 392,537 | |
| | | | | | | | | |
| Total Investments - 100.5% | | | | | | | | |
| (Cost $16,234,252) | | | | | | $ | 17,650,628 | |
| Other Assets & Liabilities, net - (0.5)% | | | | | | | (94,588 | ) |
| Total Net Assets - 100.0% | | | | | | $ | 17,556,040 | |
| * | Non-income producing security. |
| † | Value determined based on Level 1 inputs — See Note 4. |
| ††† | Value determined based on Level 3 inputs — See Note 4. |
| 1 | Security was fair valued by the Valuation Committee at March 29, 2018. The total market value of fair valued securities amounts to $2, (cost $5,968) or 0.0% of total net assets. |
| 2 | PIPE (Private Investment in Public Equity) — Stock issued by a company in the secondary market as a means of raising capital more quickly and less expensively than through registration of a secondary public offering. |
| 3 | Rate indicated is the 7 day yield as of March 29, 2018. |
| 4 | Illiquid security. |
| | plc — Public Limited Company |
| | REIT — Real Estate Investment Trust |
| | |
| | See Sector Classification in Other Information section. |
| SEE NOTES TO FINANCIAL STATEMENTS. | THE GUGGENHEIM FUNDS SEMI-ANNUAL REPORT | 57 |
| SCHEDULE OF INVESTMENTS (Unaudited)(concluded) | March 29, 2018 |
| SMALL CAP VALUE FUND | |
The following table summarizes the inputs used to value the Fund’s investments at March 29, 2018 (See Note 4 in the Notes to Financial Statements):
| Investments in Securities (Assets) | | Level 1
Quoted
Prices | | | Level 2
Significant
Observable
Inputs | | | Level 3
Significant
Unobservable
Inputs | | | Total | |
| Common Stocks | | $ | 17,083,191 | | | $ | — | | | $ | — | | | $ | 17,083,191 | |
| Convertible Preferred Stocks | | | — | | | | — | | | | 2 | | | | 2 | |
| Exchanged Traded Funds | | | 174,898 | | | | — | | | | — | | | | 174,898 | |
| Money Market Fund | | | 392,537 | | | | — | | | | — | | | | 392,537 | |
| Total Assets | | $ | 17,650,626 | | | $ | — | | | $ | 2 | | | $ | 17,650,628 | |
Transfers between investment levels may occur as the markets fluctuate and/or the availability of data used in an investment’s valuation changes. Transfers between valuation levels, if any, are in comparison to the valuation levels at the end of the previous fiscal year, and are effective using the fair value as of the end of the current fiscal period.
For the period ended March 29, 2018, there were no transfers between levels.
| 58 | THE GUGGENHEIM FUNDS SEMI-ANNUAL REPORT | SEE NOTES TO FINANCIAL STATEMENTS. |
| STATEMENT OF ASSETS AND LIABILITIES (Unaudited) |
| March 29, 2018 |
| Assets: |
| Investments, at value (cost $16,234,252) | | $ | 17,650,628 | |
| Cash | | | 4,973 | |
| Prepaid expenses | | | 40,234 | |
| Receivables: |
| Dividends | | | 25,891 | |
| Fund shares sold | | | 4,351 | |
| Interest | | | 311 | |
| Total assets | | | 17,726,388 | |
| | | | | |
| Liabilities: |
| Payable for: |
| Fund shares redeemed | | | 140,513 | |
| Transfer agent/maintenance fees | | | 6,791 | |
| Distribution and service fees | | | 5,180 | |
| Management fees | | | 2,076 | |
| Trustees’ fees* | | | 116 | |
| Miscellaneous | | | 15,672 | |
| Total liabilities | | | 170,348 | |
| Net assets | | $ | 17,556,040 | |
| | | | | |
| Net assets consist of: |
| Paid in capital | | $ | 15,147,048 | |
| Accumulated net investment loss | | | (160,615 | ) |
| Accumulated net realized gain on investments | | | 1,153,231 | |
| Net unrealized appreciation on investments | | | 1,416,376 | |
| Net assets | | $ | 17,556,040 | |
| | | | | |
| A-Class: |
| Net assets | | $ | 11,062,558 | |
| Capital shares outstanding | | | 759,454 | |
| Net asset value per share | | $ | 14.57 | |
| Maximum offering price per share (Net asset value divided by 95.25%) | | $ | 15.30 | |
| | | | | |
| C-Class: |
| Net assets | | $ | 3,249,547 | |
| Capital shares outstanding | | | 241,906 | |
| Net asset value per share | | $ | 13.43 | |
| | | | | |
| P-Class: |
| Net assets | | $ | 13,869 | |
| Capital shares outstanding | | | 942 | |
| Net asset value per share | | $ | 14.72 | |
| | | | | |
| Institutional Class: |
| Net assets | | $ | 3,230,066 | |
| Capital shares outstanding | | | 242,635 | |
| Net asset value per share | | $ | 13.31 | |
| STATEMENT OF OPERATIONS (Unaudited) |
| Period Ended March 29, 2018 |
| Investment Income: |
| Dividends | | $ | 150,479 | |
| Interest | | | 1,153 | |
| Total investment income | | | 151,632 | |
| | | | | |
| Expenses: |
| Management fees | | | 74,824 | |
| Distribution and service fees: |
| A-Class | | | 14,561 | |
| C-Class | | | 19,153 | |
| P-Class | | | 18 | |
| Transfer agent/maintenance fees: |
| A-Class | | | 7,838 | |
| C-Class | | | 4,740 | |
| P-Class | | | 92 | |
| Institutional Class | | | 5,053 | |
| Registration fees | | | 33,584 | |
| Professional fees | | | 22,493 | |
| Fund accounting/administration fees | | | 12,465 | |
| Trustees’ fees* | | | 3,989 | |
| Custodian fees | | | 1,743 | |
| Line of credit fees | | | 137 | |
| Miscellaneous | | | 8,497 | |
| Total expenses | | | 209,187 | |
| Less: |
| Expenses waived by Adviser | | | (49,180 | ) |
| Expenses reimbursed by Adviser: |
| A-Class | | | (9,973 | ) |
| C-Class | | | (5,438 | ) |
| P-Class | | | (94 | ) |
| Institutional Class | | | (5,880 | ) |
| Total waived/reimbursed expenses | | | (70,565 | ) |
| Net expenses | | | 138,622 | |
| Net investment income | | | 13,010 | |
| | | | | |
| Net Realized and Unrealized Gain (Loss): |
| Net realized gain (loss) on: |
| Investments | | | 1,267,410 | |
| Net realized gain | | | 1,267,410 | |
| Net change in unrealized appreciation (depreciation) on: |
| Investments | | | (1,346,316 | ) |
| Net change in unrealized appreciation (depreciation) | | | (1,346,316 | ) |
| Net realized and unrealized loss | | | (78,906 | ) |
| Net decrease in net assets resulting from operations | | $ | (65,896 | ) |
| * | Relates to Trustees not deemed “interested persons” within the meaning of Section 2(a)(19) of the 1940 Act. |
| SEE NOTES TO FINANCIAL STATEMENTS. | THE GUGGENHEIM FUNDS SEMI-ANNUAL REPORT | 59 |
| STATEMENTS OF CHANGES IN NET ASSETS |
| | | Period Ended
March 29,
2018
(Unaudited) | | | Year Ended
September 30,
2017 | |
| Increase (Decrease) in Net Assets from Operations: | | | | | | |
| Net investment income | | $ | 13,010 | | | $ | 670 | |
| Net realized gain on investments | | | 1,267,410 | | | | 1,796,559 | |
| Net change in unrealized appreciation (depreciation) on investments | | | (1,346,316 | ) | | | 1,216,874 | |
| Net increase (decrease) in net assets resulting from operations | | | (65,896 | ) | | | 3,014,103 | |
| | | | | | | | | |
| Distributions to shareholders from: | | | | | | | | |
| Net investment income | | | | | | | | |
| A-Class | | | (108,637 | ) | | | (88,266 | ) |
| P-Class | | | — | | | | (72 | ) |
| Institutional Class | | | (64,988 | ) | | | (3,955 | ) |
| Net realized gains | | | | | | | | |
| A-Class | | | (735,814 | ) | | | — | |
| C-Class | | | (259,677 | ) | | | — | |
| P-Class | | | (861 | ) | | | — | |
| Institutional Class | | | (338,745 | ) | | | — | |
| Total distributions to shareholders | | | (1,508,722 | ) | | | (92,293 | ) |
| | | | | | | | | |
| Capital share transactions: | | | | | | | | |
| Proceeds from sale of shares | | | | | | | | |
| A-Class | | | 665,010 | | | | 3,674,284 | |
| C-Class | | | 114,465 | | | | 200,371 | |
| P-Class | | | 128 | | | | 10,168 | |
| Institutional Class | | | 803,049 | | | | 6,004,088 | |
| Distributions reinvested | | | | | | | | |
| A-Class | | | 831,363 | | | | 86,816 | |
| C-Class | | | 254,977 | | | | — | |
| P-Class | | | 861 | | | | 72 | |
| Institutional Class | | | 397,704 | | | | 3,294 | |
| Cost of shares redeemed | | | | | | | | |
| A-Class | | | (1,490,704 | ) | | | (7,098,702 | ) |
| C-Class | | | (1,115,997 | ) | | | (1,377,815 | ) |
| P-Class | | | — | | | | (8,947 | ) |
| Institutional Class | | | (2,357,519 | ) | | | (1,724,934 | ) |
| Net decrease from capital share transactions | | | (1,896,663 | ) | | | (231,305 | ) |
| Net increase (decrease) in net assets | | | (3,471,281 | ) | | | 2,690,505 | |
| | | | | | | | | |
| Net assets: | | | | | | | | |
| Beginning of period | | | 21,027,321 | | | | 18,336,816 | |
| End of period | | $ | 17,556,040 | | | $ | 21,027,321 | |
| Accumulated net investment loss at end of period | | $ | (160,615 | ) | | $ | — | |
| 60 | THE GUGGENHEIM FUNDS SEMI-ANNUAL REPORT | SEE NOTES TO FINANCIAL STATEMENTS. |
| STATEMENTS OF CHANGES IN NET ASSETS (concluded) |
| | | Period Ended
March 29,
2018
(Unaudited) | | | Year Ended
September 30,
2017 | |
| Capital share activity: | | | | | | |
| Shares sold | | | | | | |
| A-Class | | | 43,212 | | | | 251,276 | |
| C-Class | | | 7,992 | | | | 14,374 | |
| P-Class | | | 8 | | | | 675 | |
| Institutional Class | | | 57,135 | | | | 430,431 | |
| Shares issued from reinvestment of distributions | | | | | | | | |
| A-Class | | | 55,684 | | | | 5,894 | |
| C-Class | | | 18,477 | | | | — | |
| P-Class | | | 58 | | | | 5 | |
| Institutional Class | | | 29,157 | | | | 243 | |
| Shares redeemed | | | | | | | | |
| A-Class | | | (98,324 | ) | | | (474,537 | ) |
| C-Class | | | (79,633 | ) | | | (98,332 | ) |
| P-Class | | | — | | | | (581 | ) |
| Institutional Class | | | (173,872 | ) | | | (122,880 | ) |
| Net increase (decrease) in shares | | | (140,106 | ) | | | 6,568 | |
| SEE NOTES TO FINANCIAL STATEMENTS. | THE GUGGENHEIM FUNDS SEMI-ANNUAL REPORT | 61 |
This table is presented to show selected data for a share outstanding throughout each period and to assist shareholders in evaluating a Fund’s performance for the periods presented.
| A-Class | | Period Ended
March 29,
2018a | | | Year Ended
September 30,
2017 | | | Year Ended
September 30,
2016 | | | Year Ended
September 30,
2015 | | | Year Ended
September 30,
2014 | | | Year Ended
September 30,
2013 | |
| Per Share Data | | | | | | | | | | | | | | | | | | |
| Net asset value, beginning of period | | $ | 15.74 | | | $ | 13.61 | | | $ | 12.78 | | | $ | 16.82 | | | $ | 17.81 | | | $ | 15.04 | |
| Income (loss) from investment operations: |
| Net investment income (loss)b | | | .02 | | | | .02 | | | | .01 | | | | .02 | | | | (.03 | ) | | | (— | )c |
| Net gain (loss) on investments (realized and unrealized) | | | (.06 | ) | | | 2.20 | | | | 1.81 | | | | (.60 | ) | | | .26 | | | | 4.05 | |
| Total from investment operations | | | (.04 | ) | | | 2.22 | | | | 1.82 | | | | (.58 | ) | | | .23 | | | | 4.05 | |
| Less distributions from: |
| Net investment income | | | (.15 | ) | | | (.09 | ) | | | — | | | | (.09 | ) | | | (.03 | ) | | | (.01 | ) |
| Net realized gains | | | (.98 | ) | | | — | | | | (.99 | ) | | | (3.37 | ) | | | (1.19 | ) | | | (1.27 | ) |
| Total distributions | | | (1.13 | ) | | | (.09 | ) | | | (.99 | ) | | | (3.46 | ) | | | (1.22 | ) | | | (1.28 | ) |
| Net asset value, end of period | | $ | 14.57 | | | $ | 15.74 | | | $ | 13.61 | | | $ | 12.78 | | | $ | 16.82 | | | $ | 17.81 | |
| |
| Total Returnd | | | (0.45 | %) | | | 16.41 | % | | | 14.81 | % | | | (5.23 | %) | | | 1.07 | % | | | 29.39 | % |
| Ratios/Supplemental Data |
| Net assets, end of period (in thousands) | | $ | 11,063 | | | $ | 11,943 | | | $ | 13,283 | | | $ | 12,866 | | | $ | 17,342 | | | $ | 16,487 | |
| Ratios to average net assets: |
| Net investment income (loss) | | | 0.43 | % | | | 0.15 | % | | | 0.12 | % | | | 0.13 | % | | | (0.14 | %) | | | (0.02 | %) |
| Total expensese | | | 1.96 | % | | | 1.87 | % | | | 2.29 | % | | | 1.99 | % | | | 1.85 | % | | | 1.91 | % |
| Net expensesf | | | 1.30 | %h,i | | | 1.32 | %h,i | | | 1.32 | %i | | | 1.32 | %i | | | 1.32 | %i | | | 1.30 | % |
| Portfolio turnover rate | | | 10 | % | | | 48 | % | | | 64 | % | | | 62 | % | | | 45 | % | | | 34 | % |
| C-Class | | Period Ended
March 29,
2018a | | | Year Ended
September 30,
2017 | | | Year Ended
September 30,
2016 | | | Year Ended
September 30,
2015 | | | Year Ended
September 30,
2014 | | | Year Ended
September 30,
2013 | |
| Per Share Data | | | | | | | | | | | | | | | | | | |
| Net asset value, beginning of period | | $ | 14.51 | | | $ | 12.57 | | | $ | 11.95 | | | $ | 15.96 | | | $ | 17.05 | | | $ | 14.54 | |
| Income (loss) from investment operations: |
| Net investment income (loss)b | | | (.04 | ) | | | (.08 | ) | | | (.08 | ) | | | (.09 | ) | | | (.15 | ) | | | (.12 | ) |
| Net gain (loss) on investments (realized and unrealized) | | | (.06 | ) | | | 2.02 | | | | 1.69 | | | | (.55 | ) | | | .25 | | | | 3.90 | |
| Total from investment operations | | | (.10 | ) | | | 1.94 | | | | 1.61 | | | | (.64 | ) | | | .10 | | | | 3.78 | |
| Less distributions from: |
| Net realized gains | | | (.98 | ) | | | — | | | | (.99 | ) | | | (3.37 | ) | | | (1.19 | ) | | | (1.27 | ) |
| Total distributions | | | (.98 | ) | | | — | | | | (.99 | ) | | | (3.37 | ) | | | (1.19 | ) | | | (1.27 | ) |
| Net asset value, end of period | | $ | 13.43 | | | $ | 14.51 | | | $ | 12.57 | | | $ | 11.95 | | | $ | 15.96 | | | $ | 17.05 | |
| |
| Total Returnd | | | (0.86 | %) | | | 15.53 | % | | | 14.02 | % | | | (5.97 | %) | | | 0.30 | % | | | 28.34 | % |
| Ratios/Supplemental Data |
| Net assets, end of period (in thousands) | | $ | 3,250 | | | $ | 4,281 | | | $ | 4,762 | | | $ | 5,173 | | | $ | 8,527 | | | $ | 5,885 | |
| Ratios to average net assets: |
| Net investment income (loss) | | | (0.36 | %) | | | (0.60 | %) | | | (0.64 | %) | | | (0.65 | %) | | | (0.87 | %) | | | (0.75 | %) |
| Total expensese | | | 2.83 | % | | | 2.71 | % | | | 3.04 | % | | | 2.72 | % | | | 2.51 | % | | | 2.58 | % |
| Net expensesf | | | 2.05 | %h,i | | | 2.07 | %h,i | | | 2.07 | %i | | | 2.08 | %i | | | 2.07 | %i | | | 2.05 | % |
| Portfolio turnover rate | | | 10 | % | | | 48 | % | | | 64 | % | | | 62 | % | | | 45 | % | | | 34 | % |
| 62 | THE GUGGENHEIM FUNDS SEMI-ANNUAL REPORT | SEE NOTES TO FINANCIAL STATEMENTS. |
| FINANCIAL HIGHLIGHTS (continued) |
This table is presented to show selected data for a share outstanding throughout each period and to assist shareholders in evaluating a Fund’s performance for the periods presented.
| P-Class | | Period Ended
March 29,
2018a | | | Year Ended
September 30,
2017 | | | Year Ended
September 30,
2016 | | | Period Ended
September 30,
2015g | |
| Per Share Data | | | | | | | | | | | | |
| Net asset value, beginning of period | | $ | 15.76 | | | $ | 13.60 | | | $ | 12.77 | | | $ | 14.33 | |
| Income (loss) from investment operations: |
| Net investment income (loss)b | | | .02 | | | | .01 | | | | .02 | | | | .04 | |
| Net gain (loss) on investments (realized and unrealized) | | | (.08 | ) | | | 2.22 | | | | 1.80 | | | | (1.60 | ) |
| Total from investment operations | | | (.06 | ) | | | 2.23 | | | | 1.82 | | | | (1.56 | ) |
| Less distributions from: |
| Net investment income | | | — | | | | (.07 | ) | | | — | | | | — | |
| Net realized gains | | | (.98 | ) | | | — | | | | (.99 | ) | | | — | |
| Total distributions | | | (.98 | ) | | | (.07 | ) | | | (.99 | ) | | | — | |
| Net asset value, end of period | | $ | 14.72 | | | $ | 15.76 | | | $ | 13.60 | | | $ | 12.77 | |
| |
| Total Returnd | | | (0.46 | %) | | | 16.35 | % | | | 14.88 | % | | | (10.82 | %) |
| Ratios/Supplemental Data |
| Net assets, end of period (in thousands) | | $ | 14 | | | $ | 14 | | | $ | 11 | | | $ | 9 | |
| Ratios to average net assets: |
| Net investment income (loss) | | | 0.44 | % | | | 0.09 | % | | | 0.13 | % | | | 0.60 | % |
| Total expensese | | | 3.15 | % | | | 3.60 | % | | | 2.50 | % | | | 4.04 | % |
| Net expensesf | | | 1.30 | %h,i | | | 1.32 | %i | | | 1.32 | %i | | | 1.31 | %i |
| Portfolio turnover rate | | | 10 | % | | | 48 | % | | | 64 | % | | | 62 | % |
| SEE NOTES TO FINANCIAL STATEMENTS. | THE GUGGENHEIM FUNDS SEMI-ANNUAL REPORT | 63 |
| FINANCIAL HIGHLIGHTS (concluded) |
This table is presented to show selected data for a share outstanding throughout each period and to assist shareholders in evaluating a Fund’s performance for the periods presented.
| Institutional Class | | Period Ended
March 29,
2018a | | | Year Ended
September 30,
2017 | | | Year Ended
September 30,
2016 | | | Year Ended
September 30,
2015 | | | Year Ended
September 30,
2014 | | | Year Ended
September 30,
2013 | |
| Per Share Data | | | | | | | | | | | | | | | | | | |
| Net asset value, beginning of period | | $ | 14.50 | | | $ | 12.54 | | | $ | 11.82 | | | $ | 17.04 | | | $ | 18.04 | | | $ | 15.21 | |
| Income (loss) from investment operations: |
| Net investment income (loss)b | | | .03 | | | | .04 | | | | .04 | | | | .05 | | | | .01 | | | | .04 | |
| Net gain (loss) on investments (realized and unrealized) | | | (.05 | ) | | | 2.04 | | | | 1.67 | | | | (.49 | ) | | | .25 | | | | 4.10 | |
| Total from investment operations | | | (.02 | ) | | | 2.08 | | | | 1.71 | | | | (.44 | ) | | | .26 | | | | 4.14 | |
| Less distributions from: |
| Net investment income | | | (.19 | ) | | | (.12 | ) | | | — | | | | (1.41 | ) | | | (.07 | ) | | | (.04 | ) |
| Net realized gains | | | (.98 | ) | | | — | | | | (.99 | ) | | | (3.37 | ) | | | (1.19 | ) | | | (1.27 | ) |
| Total distributions | | | (1.17 | ) | | | (.12 | ) | | | (.99 | ) | | | (4.78 | ) | | | (1.26 | ) | | | (1.31 | ) |
| Net asset value, end of period | | $ | 13.31 | | | $ | 14.50 | | | $ | 12.54 | | | $ | 11.82 | | | $ | 17.04 | | | $ | 18.04 | |
| |
| Total Returnd | | | (0.33 | %) | | | 16.65 | % | | | 15.18 | % | | | (5.01 | %) | | | 1.21 | % | | | 29.74 | % |
| Ratios/Supplemental Data |
| Net assets, end of period (in thousands) | | $ | 3,230 | | | $ | 4,790 | | | $ | 281 | | | $ | 459 | | | $ | 753 | | | $ | 22,315 | |
| Ratios to average net assets: |
| Net investment income (loss) | | | 0.61 | % | | | 0.30 | % | | | 0.30 | % | | | 0.33 | % | | | 0.05 | % | | | 0.23 | % |
| Total expensese | | | 1.81 | % | | | 1.56 | % | | | 2.09 | % | | | 1.70 | % | | | 1.33 | % | | | 1.34 | % |
| Net expensesf | | | 1.05 | %h,i | | | 1.07 | %i | | | 1.07 | %i | | | 1.07 | %i | | | 1.07 | %i | | | 1.05 | % |
| Portfolio turnover rate | | | 10 | % | | | 48 | % | | | 64 | % | | | 62 | % | | | 45 | % | | | 34 | % |
| a | Unaudited figures for the period ended March 29, 2018. Percentage amounts for the period, except total return and portfolio turnover rate, have been annualized. |
| b | Net investment income (loss) per share was computed using average shares outstanding throughout the period. |
| c | Net investment income is less than $0.01 per share. |
| d | Total return does not reflect the impact of any applicable sales charges and has not been annualized. |
| e | Does not include expenses of the underlying funds in which the Fund invests. |
| f | Net expense information reflects the expense ratios after expense waivers and reimbursements as applicable. |
| g | Since commencement of operations: May 1, 2015. Percentage amounts for the period, except total return and portfolio turnover rate, have been annualized. |
| h | The portion of the ratios of net expenses to average net assets attributable to recoupments of prior fee reductions or expense reimbursements for the periods presented would be: |
| | | 03/29/18 | 09/30/17 |
| | A-Class | — | 0.00% |
| | C-Class | — | 0.01% |
| | P-Class | — | 0.74% |
| | Institutional Class | — | 0.00% |
| i | Net expenses may include expenses that are excluded from the expense limitation agreement. Excluding these expenses, the operating expense ratios for the periods presented would be: |
| | | 03/29/18 | 09/30/17 | 09/30/16 | 09/30/15 | 09/30/14 |
| | A-Class | 1.30% | 1.30% | 1.30% | 1.30% | 1.30% |
| | C-Class | 2.05% | 2.05% | 2.05% | 2.05% | 2.05% |
| | P-Class | 1.30% | 1.30% | 1.30% | 1.30% | — |
| | Institutional Class | 1.05% | 1.05% | 1.05% | 1.05% | 1.05% |
| 64 | THE GUGGENHEIM FUNDS SEMI-ANNUAL REPORT | SEE NOTES TO FINANCIAL STATEMENTS. |
| PERFORMANCE REPORT AND FUND PROFILE (Unaudited) | March 29, 2018 |
STYLEPLUS—LARGE CORE FUND
OBJECTIVE: Seeks long-term growth of capital.
Holdings Diversification (Market Exposure as % of Net Assets)
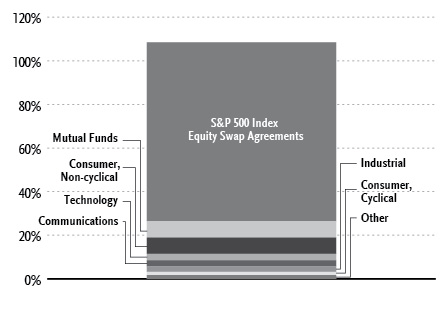
“Holdings Diversification (Market Exposure as % of Net Assets)” excludes any temporary cash investments or investments in Guggenheim Strategy Funds Trust mutual funds.
| Inception Dates: |
| A-Class | September 10, 1962 |
| C-Class | January 29, 1999 |
| P-Class | May 1, 2015 |
| Institutional Class | March 1, 2012 |
| Ten Largest Holdings (% of Total Net Assets) |
| Guggenheim Strategy Fund III | 35.8% |
| Guggenheim Strategy Fund II | 30.1% |
| Guggenheim Limited Duration Fund - Institutional Class | 7.6% |
| Guggenheim Strategy Fund I | 5.4% |
| Apple, Inc. | 0.8% |
| Johnson & Johnson | 0.5% |
| Alphabet, Inc. — Class C | 0.4% |
| Microsoft Corp. | 0.4% |
| Pfizer, Inc. | 0.4% |
| Cisco Systems, Inc. | 0.4% |
| Top Ten Total | 81.8% |
“Ten Largest Holdings” excludes any temporary cash or derivative investments.
| | THE GUGGENHEIM FUNDS SEMI-ANNUAL REPORT | 65 |
| PERFORMANCE REPORT AND FUND PROFILE (Unaudited)(concluded) | March 29, 2018 |
Average Annual Returns*
Periods Ended March 29, 2018
| | 6 month† | 1 Year | 5 Year | 10 Year |
| A-Class Shares | 5.69% | 13.61% | 13.23% | 8.11% |
| A-Class Shares with sales charge‡ | 0.66% | 8.22% | 12.13% | 7.48% |
| C-Class Shares | 5.20% | 12.62% | 12.18% | 7.21% |
| C-Class Shares with CDSC§ | 4.35% | 11.71% | 12.18% | 7.21% |
| S&P 500 Index | 5.84% | 13.99% | 13.31% | 9.49% |
| | 6 month† | 1 Year | Since Inception
(05/01/15) |
| P-Class Shares | 5.55% | 13.48% | 10.12% |
| S&P 500 Index | 5.84% | 13.99% | 10.32% |
| | 6 month† | 1 Year | 5 Year | Since Inception
(03/01/12) |
| Institutional Class Shares | 5.86% | 13.92% | 13.52% | 12.82% |
| S&P 500 Index | 5.84% | 13.99% | 13.31% | 13.71% |
| * | The performance data above represents past performance that is not predictive of future results. The investment return and principal value of an investment in the Fund will fluctuate so that an investor’s shares, when redeemed, may be worth more or less than their original cost. Returns are historical and include changes in principal and reinvested dividends and capital gains and do not reflect the effect of taxes. The S&P 500 Index is an unmanaged index and, unlike the Fund, has no management fees or operating expenses to reduce its reported return. |
| † | 6 month returns are not annualized. |
| ‡ | Effective February 22, 2011, the maximum sales charge decreased from 5.75% to 4.75%. A 5.75% maximum sales charge is used in the calculation of the 1 Year, 5 Year and 10 Year average annual returns (based on subscriptions made prior to February 22, 2011), and a 4.75% maximum sales charge will be used to calculate performance for periods based on subscriptions made on or after February 22, 2011. |
| § | Fund returns include a CDSC of 1% if redeemed within 12 months of purchase. |
| 66 | THE GUGGENHEIM FUNDS SEMI-ANNUAL REPORT | |
| SCHEDULE OF INVESTMENTS (Unaudited) | March 29, 2018 |
| STYLEPLUS—LARGE CORE FUND | |
| | | Shares | | | Value | |
| | | | | | | |
| COMMON STOCKS† - 18.9% |
| | | | | | | |
| Consumer, Non-cyclical - 7.5% |
| Johnson & Johnson | | | 8,289 | | | $ | 1,062,235 | |
| Pfizer, Inc. | | | 22,742 | | | | 807,114 | |
| Procter & Gamble Co. | | | 10,071 | | | | 798,429 | |
| Amgen, Inc. | | | 3,601 | | | | 613,898 | |
| Gilead Sciences, Inc. | | | 7,699 | | | | 580,428 | |
| Celgene Corp.* | | | 6,199 | | | | 553,013 | |
| Biogen, Inc.* | | | 1,929 | | | | 528,199 | |
| Anthem, Inc. | | | 2,390 | | | | 525,083 | |
| PepsiCo, Inc. | | | 4,698 | | | | 512,786 | |
| General Mills, Inc. | | | 11,225 | | | | 505,799 | |
| Kimberly-Clark Corp. | | | 4,533 | | | | 499,219 | |
| Humana, Inc. | | | 1,827 | | | | 491,152 | |
| Archer-Daniels-Midland Co. | | | 10,992 | | | | 476,723 | |
| Mylan N.V.* | | | 11,458 | | | | 471,726 | |
| McKesson Corp. | | | 3,329 | | | | 468,956 | |
| Sysco Corp. | | | 7,818 | | | | 468,767 | |
| JM Smucker Co. | | | 3,746 | | | | 464,541 | |
| Conagra Brands, Inc. | | | 12,528 | | | | 462,033 | |
| Tyson Foods, Inc. — Class A | | | 6,302 | | | | 461,243 | |
| Molson Coors Brewing Co. — Class B | | | 5,966 | | | | 449,419 | |
| AmerisourceBergen Corp. — Class A | | | 4,956 | | | | 427,257 | |
| Kellogg Co. | | | 6,477 | | | | 421,070 | |
| Perrigo Company plc | | | 4,853 | | | | 404,449 | |
| AbbVie, Inc. | | | 3,729 | | | | 352,950 | |
| IQVIA Holdings, Inc.* | | | 3,575 | | | | 350,743 | |
| Kroger Co. | | | 13,764 | | | | 329,510 | |
| Western Union Co. | | | 15,985 | | | | 307,392 | |
| CVS Health Corp. | | | 4,892 | | | | 304,331 | |
| DaVita, Inc.* | | | 4,539 | | | | 299,302 | |
| Centene Corp.* | | | 2,719 | | | | 290,580 | |
| Zimmer Biomet Holdings, Inc. | | | 2,332 | | | | 254,281 | |
| Eli Lilly & Co. | | | 3,081 | | | | 238,377 | |
| Merck & Company, Inc. | | | 4,251 | | | | 231,552 | |
| Quanta Services, Inc.* | | | 6,098 | | | | 209,466 | |
| Cardinal Health, Inc. | | | 3,275 | | | | 205,277 | |
| Allergan plc | | | 945 | | | | 159,034 | |
| Becton Dickinson and Co. | | | 581 | | | | 125,903 | |
| Cigna Corp. | | | 654 | | | | 109,702 | |
| Total Consumer, Non-cyclical | | | | | | | 16,221,939 | |
| | | | | | | | | |
| Technology - 2.9% |
| Apple, Inc. | | | 9,924 | | | | 1,665,049 | |
| Microsoft Corp. | | | 9,704 | | | | 885,684 | |
| Oracle Corp. | | | 14,728 | | | | 673,806 | |
| NetApp, Inc. | | | 7,231 | | | | 446,080 | |
| HP, Inc. | | | 17,971 | | | | 393,924 | |
| Micron Technology, Inc.* | | | 7,435 | | | | 387,661 | |
| DXC Technology Co. | | | 3,781 | | | | 380,104 | |
| Western Digital Corp. | | | 3,869 | | | | 356,993 | |
| Applied Materials, Inc. | | | 5,621 | | | | 312,584 | |
| Intel Corp. | | | 4,829 | | | | 251,494 | |
| International Business Machines Corp. | | | 1,294 | | | | 198,538 | |
| QUALCOMM, Inc. | | | 3,116 | | | | 172,658 | |
| CA, Inc. | | | 3,719 | | | | 126,074 | |
| Total Technology | | | | | | | 6,250,649 | |
| | | | | | | | | |
| Communications - 2.8% |
| Alphabet, Inc. — Class C* | | | 897 | | | | 925,516 | |
| Cisco Systems, Inc. | | | 18,694 | | | | 801,786 | |
| Comcast Corp. — Class A | | | 21,307 | | | | 728,060 | |
| Amazon.com, Inc.* | | | 473 | | | | 684,592 | |
| Omnicom Group, Inc. | | | 6,336 | | | | 460,437 | |
| Facebook, Inc. — Class A* | | | 2,427 | | | | 387,810 | |
| AT&T, Inc. | | | 10,660 | | | | 380,029 | |
| Motorola Solutions, Inc. | | | 3,030 | | | | 319,059 | |
| DISH Network Corp. — Class A* | | | 8,182 | | | | 310,016 | |
| Juniper Networks, Inc. | | | 12,452 | | | | 302,957 | |
| Verizon Communications, Inc. | | | 6,092 | | | | 291,319 | |
| News Corp. — Class A | | | 15,151 | | | | 239,386 | |
| Walt Disney Co. | | | 2,079 | | | | 208,815 | |
| Total Communications | | | | | | | 6,039,782 | |
| | | | | | | | | |
| Industrial - 2.5% |
| Caterpillar, Inc. | | | 3,996 | | | | 588,930 | |
| Norfolk Southern Corp. | | | 3,652 | | | | 495,869 | |
| Eaton Corporation plc | | | 6,085 | | | | 486,252 | |
| Parker-Hannifin Corp. | | | 2,627 | | | | 449,296 | |
| Kansas City Southern | | | 4,051 | | | | 445,002 | |
| Honeywell International, Inc. | | | 2,794 | | | | 403,761 | |
| Cummins, Inc. | | | 2,413 | | | | 391,123 | |
| Ingersoll-Rand plc | | | 4,356 | | | | 372,482 | |
| Textron, Inc. | | | 6,263 | | | | 369,329 | |
| Lockheed Martin Corp. | | | 1,090 | | | | 368,344 | |
| Arconic, Inc. | | | 12,135 | | | | 279,591 | |
| Fluor Corp. | | | 4,833 | | | | 276,544 | |
| Snap-on, Inc. | | | 1,813 | | | | 267,490 | |
| Acuity Brands, Inc. | | | 1,510 | | | | 210,177 | |
| United Technologies Corp. | | | 1,209 | | | | 152,116 | |
| Total Industrial | | | | | | | 5,556,306 | |
| | | | | | | | | |
| Consumer, Cyclical - 1.5% |
| Walmart, Inc. | | | 6,021 | | | | 535,689 | |
| Delta Air Lines, Inc. | | | 8,848 | | | | 484,959 | |
| Southwest Airlines Co. | | | 8,334 | | | | 477,372 | |
| American Airlines Group, Inc. | | | 8,788 | | | | 456,624 | |
| PACCAR, Inc. | | | 6,584 | | | | 435,663 | |
| Alaska Air Group, Inc. | | | 6,888 | | | | 426,780 | |
| Ralph Lauren Corp. — Class A | | | 2,477 | | | | 276,929 | |
| Walgreens Boots Alliance, Inc. | | | 3,158 | | | | 206,754 | |
| Total Consumer, Cyclical | | | | | | | 3,300,770 | |
| | | | | | | | | |
| Financial - 1.1% |
| Prudential Financial, Inc. | | | 4,775 | | | | 494,452 | |
| Principal Financial Group, Inc. | | | 7,488 | | | | 456,094 | |
| Berkshire Hathaway, Inc. — Class B* | | | 1,494 | | | | 298,023 | |
| JPMorgan Chase & Co. | | | 2,680 | | | | 294,720 | |
| Capital One Financial Corp. | | | 2,907 | | | | 278,549 | |
| Wells Fargo & Co. | | | 4,779 | | | | 250,467 | |
| Bank of America Corp. | | | 4,379 | | | | 131,326 | |
| SEE NOTES TO FINANCIAL STATEMENTS. | THE GUGGENHEIM FUNDS SEMI-ANNUAL REPORT | 67 |
| SCHEDULE OF INVESTMENTS (Unaudited)(continued) | March 29, 2018 |
| STYLEPLUS—LARGE CORE FUND | |
| | | Shares | | | Value | |
| | | | | | | |
| Visa, Inc. — Class A | | | 1,026 | | | $ | 122,730 | |
| Total Financial | | | | | | | 2,326,361 | |
| | | | | | | | | |
| Energy - 0.5% |
| Exxon Mobil Corp. | | | 4,418 | | | | 329,627 | |
| Occidental Petroleum Corp. | | | 4,576 | | | | 297,257 | |
| Chevron Corp. | | | 1,399 | | | | 159,542 | |
| ConocoPhillips | | | 2,261 | | | | 134,055 | |
| Apache Corp. | | | 3,366 | | | | 129,523 | |
| Total Energy | | | | | | | 1,050,004 | |
| | | | | | | | | |
| Basic Materials - 0.1% |
| DowDuPont, Inc. | | | 3,465 | | | | 220,755 | |
| | | | | | | | | |
| Total Common Stocks | | | | | | | | |
| (Cost $39,434,236) | | | | | | | 40,966,566 | |
| | | | | | | | | |
| MUTUAL FUNDS† - 78.9% |
| Guggenheim Strategy Fund III1 | | | 3,100,088 | | | | 77,595,212 | |
| Guggenheim Strategy Fund II1 | | | 2,608,752 | | | | 65,244,878 | |
| Guggenheim Limited Duration Fund - Institutional Class1 | | | 663,389 | | | | 16,418,883 | |
| Guggenheim Strategy Fund I1 | | | 469,567 | | | | 11,762,665 | |
| Total Mutual Funds | | | | | | | | |
| (Cost $170,126,372) | | | | | | | 171,021,638 | |
| | | | | | | | | |
| Total Investments - 97.8% | | | | | | | | |
| (Cost $209,560,608) | | | | | | $ | 211,988,204 | |
| Other Assets & Liabilities, net - 2.2% | | | | | | | 4,789,498 | |
| Total Net Assets - 100.0% | | | | | | $ | 216,777,702 | |
| Futures Contracts |
| Description | | Contracts | | Expiration
Date | | Notional
Amount | | | Value and
Unrealized
Loss | |
| Equity Futures Contracts Purchased† | | | | | | | | | | |
| S&P 500 Index Mini Futures Contracts | | 1 | | Jun 2018 | | $ | 132,063 | | | $ | (7,396 | ) |
| Total Return Swap Agreements |
| Counterparty | | Index | | Financing
Rate Pay
(Receive) | | Payment
Frequency | | Maturity
Date | | Units | | Notional
Amount | | | Value and
Unrealized
Gain | |
| OTC Equity Index Swap Agreements†† | | | | | | | | | | | | |
| Deutsche Bank | | S&P 500 Index | | 2.09% | | At Maturity | | 09/06/18 | | 34,349 | | $ | 177,690,812 | | | $ | 13,689,450 | |
| * | Non-income producing security. |
| † | Value determined based on Level 1 inputs — See Note 4. |
| †† | Value determined based on Level 2 inputs — See Note 4. |
| 1 | Affiliated issuer. |
| | plc — Public Limited Company |
| | |
| | See Sector Classification in Other Information section. |
| 68 | THE GUGGENHEIM FUNDS SEMI-ANNUAL REPORT | SEE NOTES TO FINANCIAL STATEMENTS. |
| SCHEDULE OF INVESTMENTS (Unaudited)(concluded) | March 29, 2018 |
| STYLEPLUS—LARGE CORE FUND | |
The following table summarizes the inputs used to value the Fund’s investments at March 29, 2018 (See Note 4 in the Notes to Financial Statements):
Investments in Securities
(Assets) | | Level 1
Quoted
Prices | | | Level 1 -
Other* | | | Level 2
Significant
Observable
Inputs | | | Level 2 -
Other* | | | Level 3
Significant
Unobservable
Inputs | | | Total | |
| Common Stocks | | $ | 40,966,566 | | | $ | — | | | $ | — | | | $ | — | | | $ | — | | | $ | 40,966,566 | |
| Equity Index Swap Agreements | | | — | | | | — | | | | — | | | | 13,689,450 | | | | — | | | | 13,689,450 | |
| Mutual Funds | | | 171,021,638 | | | | — | | | | — | | | | — | | | | — | | | | 171,021,638 | |
| Total Assets | | $ | 211,988,204 | | | $ | — | | | $ | — | | | $ | 13,689,450 | | | $ | — | | | $ | 225,677,654 | |
| | | | | | | | | | | | | | | | | | | | | | | | | |
| Investments in Securities (Liabilities) | | | Level 1
Quoted
Prices | | | | Level 1 -
Other* | | | | Level 2
Significant
Observable
Inputs | | | | Level 2 -
Other* | | | | Level 3
Significant
Unobservable
Inputs | | | | Total | |
| Equity Futures Contracts | | $ | — | | | $ | 7,396 | | | $ | — | | | $ | — | | | $ | — | | | $ | 7,396 | |
| * | Other financial instruments include futures contracts and swaps, which are reported as unrealized gain/loss at period end. |
Transfers between investment levels may occur as the markets fluctuate and/or the availability of data used in an investment’s valuation changes. Transfers between valuation levels, if any, are in comparison to the valuation levels at the end of the previous fiscal year, and are effective using the fair value as of the end of the current fiscal period.
For the period ended March 29, 2018, there were no transfers between levels.
Affiliated Transactions
Investments representing 5% or more of the outstanding voting shares of a portfolio company of a fund, or control of or by, or common control under the Guggenheim Investments (“GI”), result in that portfolio company being considered an affiliated company of such fund, as defined in the 1940 Act.
The Fund may invest in certain of the underlying series of Guggenheim Strategy Funds Trust including Guggenheim Strategy Fund I, Guggenheim Strategy Fund II and Guggenheim Strategy Fund III (collectively, the “Cash Management Funds”), each of which are open-end management investment companies managed by GI. The Cash Management Funds, which launched on March 11, 2014, are offered as cash management options only to mutual funds, trusts, and other accounts managed by GI and/or its affiliates, and are not available to the public. The Cash Management Funds pay no investment management fees. The Cash Management Funds’ annual report on Form N-CSR dated September 30, 2017, is available publicly or upon request. This information is available from the EDGAR database on the SEC’s website at https://www.sec.gov/Archives/edgar/data/1601445/000089180417000715/gug72218.htm.
Transactions during the period ended March 29, 2018, in which the portfolio company is an “affiliated person”, were as follows:
| Security Name | | Value
09/30/17 | | | Additions | | | Reductions | | | Realized
Gain | | | Change in
Unrealized | | | Value
03/29/18 | | | Shares
03/29/18 | | | Investment
Income | | | Capital
Gain
Distributions | |
| Mutual Funds | | | | | | | | | | | | | | | | | | | | | | | | | | | |
| Guggenheim Limited Duration Fund - Institutional Class | | $ | 16,275,156 | | | $ | 209,566 | | | $ | — | | | $ | — | | | $ | (65,839 | ) | | $ | 16,418,883 | | | | 663,389 | | | $ | 208,221 | | | $ | — | |
| Guggenheim Strategy Fund I | | | 20,183,661 | | | | 5,239,983 | | | | (13,616,106 | ) | | | 99,156 | | | | (144,029 | ) | | | 11,762,665 | | | | 469,567 | | | | 232,656 | | | | 7,672 | |
| Guggenheim Strategy Fund II | | | 61,428,415 | | | | 6,641,936 | | | | (2,700,000 | ) | | | 8,637 | | | | (134,110 | ) | | | 65,244,878 | | | | 2,608,752 | | | | 837,977 | | | | 32,875 | |
| Guggenheim Strategy Fund III | | | 69,197,325 | | | | 8,431,706 | | | | — | | | | — | | | | (33,819 | ) | | | 77,595,212 | | | | 3,100,088 | | | | 897,496 | | | | 18,764 | |
| | | $ | 167,084,557 | | | $ | 20,523,191 | | | $ | (16,316,106 | ) | | $ | 107,793 | | | $ | (377,797 | ) | | $ | 171,021,638 | | | | | | | $ | 2,176,350 | | | $ | 59,311 | |
| SEE NOTES TO FINANCIAL STATEMENTS. | THE GUGGENHEIM FUNDS SEMI-ANNUAL REPORT | 69 |
| STYLEPLUS—LARGE CORE FUND | |
| STATEMENT OF ASSETS AND LIABILITIES (Unaudited) |
| March 29, 2018 |
| Assets: |
| Investments in unaffiliated issuers, at value (cost $39,434,236) | | $ | 40,966,566 | |
| Investments in affiliated issuers, at value (cost $170,126,372) | | | 171,021,638 | |
| Segregated cash with broker | | | 230,000 | |
| Unrealized appreciation on swap agreements | | | 13,689,450 | |
| Prepaid expenses | | | 99,480 | |
| Receivables: |
| Securities sold | | | 2,861,994 | |
| Dividends | | | 374,616 | |
| Fund shares sold | | | 4,932 | |
| Interest | | | 3,951 | |
| Variation margin | | | 1,682 | |
| Total assets | | | 229,254,309 | |
| | | | | |
| Liabilities: |
| Overdraft due to custodian bank | | | 209,361 | |
| Segregated cash due to broker | | | 9,390,000 | |
| Payable for: |
| Swap settlement | | | 1,919,451 | |
| Securities purchased | | | 548,407 | |
| Management fees | | | 135,104 | |
| Fund shares redeemed | | | 71,444 | |
| Distribution and service fees | | | 47,054 | |
| Transfer agent/maintenance fees | | | 32,980 | |
| Fund accounting/administration fees | | | 15,079 | |
| Trustees’ fees* | | | 8,997 | |
| Miscellaneous | | | 98,730 | |
| Total liabilities | | | 12,476,607 | |
| Net assets | | $ | 216,777,702 | |
| | | | | |
| Net assets consist of: |
| Paid in capital | | $ | 198,614,831 | |
| Undistributed net investment income | | | 991,306 | |
| Accumulated net realized gain on investments | | | 1,061,915 | |
| Net unrealized appreciation on investments | | | 16,109,650 | |
| Net assets | | $ | 216,777,702 | |
| | | | | |
| A-Class: |
| Net assets | | $ | 207,238,249 | |
| Capital shares outstanding | | | 9,225,829 | |
| Net asset value per share | | $ | 22.46 | |
| Maximum offering price per share (Net asset value divided by 95.25%) | | $ | 23.58 | |
| | | | | |
| C-Class: |
| Net assets | | $ | 2,233,210 | |
| Capital shares outstanding | | | 133,210 | |
| Net asset value per share | | $ | 16.76 | |
| | | | | |
| P-Class: |
| Net assets | | $ | 192,347 | |
| Capital shares outstanding | | | 8,648 | |
| Net asset value per share | | $ | 22.24 | |
| | | | | |
| Institutional Class: |
| Net assets | | $ | 7,113,896 | |
| Capital shares outstanding | | | 318,812 | |
| Net asset value per share | | $ | 22.31 | |
| * | Relates to Trustees not deemed “interested persons” within the meaning of Section 2(a)(19) of the 1940 Act. |
| 70 | THE GUGGENHEIM FUNDS SEMI-ANNUAL REPORT | SEE NOTES TO FINANCIAL STATEMENTS. |
| STYLEPLUS—LARGE CORE FUND | |
| STATEMENT OF OPERATIONS (Unaudited) |
| Period Ended March 29, 2018 |
| Investment Income: |
| Dividends from securities of unaffiliated issuers | | $ | 411,096 | |
| Dividends from securities of affiliated issuers | | | 2,176,350 | |
| Interest | | | 42,758 | |
| Total investment income | | | 2,630,204 | |
| | | | | |
| Expenses: |
| Management fees | | | 830,932 | |
| Distribution and service fees: |
| A-Class | | | 265,805 | |
| C-Class | | | 11,810 | |
| P-Class | | | 470 | |
| Transfer agent/maintenance fees: |
| A-Class | | | 81,077 | |
| C-Class | | | 2,472 | |
| P-Class | | | 463 | |
| Institutional Class | | | 834 | |
| Fund accounting/administration fees | | | 88,634 | |
| Custodian fees | | | 8,557 | |
| Trustees’ fees* | | | 5,269 | |
| Line of credit fees | | | 2,278 | |
| Miscellaneous | | | 149,449 | |
| Total expenses | | | 1,448,050 | |
| Less: |
| Expenses waived by Adviser | | | (36,570 | ) |
| Net expenses | | | 1,411,480 | |
| Net investment income | | | 1,218,724 | |
| | | | | |
| Net Realized and Unrealized Gain (Loss): |
| Net realized gain (loss) on: |
| Investments in unaffiliated issuers | | $ | 3,187,572 | |
| Investments in affiliated issuers | | | 107,793 | |
| Distributions received from affiliated investment company shares | | | 59,311 | |
| Swap agreements | | | (1,316,086 | ) |
| Futures contracts | | | 178,935 | |
| Net realized gain | | | 2,217,525 | |
| Net change in unrealized appreciation (depreciation) on: |
| Investments in unaffiliated issuers | | | (795,115 | ) |
| Investments in affiliated issuers | | | (377,797 | ) |
| Swap agreements | | | 10,085,609 | |
| Futures contracts | | | (32,536 | ) |
| Net change in unrealized appreciation (depreciation) | | | 8,880,161 | |
| Net realized and unrealized gain | | | 11,097,686 | |
| Net increase in net assets resulting from operations | | $ | 12,316,410 | |
| * | Relates to Trustees not deemed “interested persons” within the meaning of Section 2(a)(19) of the 1940 Act. |
| SEE NOTES TO FINANCIAL STATEMENTS. | THE GUGGENHEIM FUNDS SEMI-ANNUAL REPORT | 71 |
| STYLEPLUS—LARGE CORE FUND | |
| STATEMENTS OF CHANGES IN NET ASSETS |
| | | Period Ended
March 29,
2018
(Unaudited) | | | Year Ended
September 30,
2017 | |
| Increase (Decrease) in Net Assets from Operations: | | | | | | |
| Net investment income | | $ | 1,218,724 | | | $ | 2,129,585 | |
| Net realized gain on investments | | | 2,217,525 | | | | 33,817,237 | |
| Net change in unrealized appreciation (depreciation) on investments | | | 8,880,161 | | | | (740,352 | ) |
| Net increase in net assets resulting from operations | | | 12,316,410 | | | | 35,206,470 | |
| | | | | | | | | |
| Distributions to shareholders from: | | | | | | | | |
| Net investment income | | | | | | | | |
| A-Class | | | (1,947,854 | ) | | | (1,414,912 | ) |
| C-Class | | | (6,303 | ) | | | — | |
| P-Class | | | (4,538 | ) | | | (3,434 | ) |
| Institutional Class | | | (75,219 | ) | | | (47,453 | ) |
| Net realized gains | | | | | | | | |
| A-Class | | | (32,216,634 | ) | | | (3,716,323 | ) |
| C-Class | | | (468,921 | ) | | | (65,682 | ) |
| P-Class | | | (82,728 | ) | | | (7,548 | ) |
| Institutional Class | | | (923,741 | ) | | | (86,390 | ) |
| Total distributions to shareholders | | | (35,725,938 | ) | | | (5,341,742 | ) |
| | | | | | | | | |
| Capital share transactions: | | | | | | | | |
| Proceeds from sale of shares | | | | | | | | |
| A-Class | | | 3,660,297 | | | | 11,047,318 | |
| C-Class | | | 148,532 | | | | 660,113 | |
| P-Class | | | 13,833 | | | | 384,046 | |
| Institutional Class | | | 1,576,753 | | | | 1,495,515 | |
| Distributions reinvested | | | | | | | | |
| A-Class | | | 31,962,892 | | | | 4,827,591 | |
| C-Class | | | 467,557 | | | | 63,911 | |
| P-Class | | | 87,266 | | | | 10,982 | |
| Institutional Class | | | 922,633 | | | | 133,180 | |
| Cost of shares redeemed | | | | | | | | |
| A-Class | | | (12,074,652 | ) | | | (27,532,534 | ) |
| C-Class | | | (412,740 | ) | | | (1,359,150 | ) |
| P-Class | | | (367,781 | ) | | | (364,348 | ) |
| Institutional Class | | | (345,153 | ) | | | (964,398 | ) |
| Net increase (decrease) from capital share transactions | | | 25,639,437 | | | | (11,597,774 | ) |
| Net increase in net assets | | | 2,229,909 | | | | 18,266,954 | |
| | | | | | | | | |
| Net assets: | | | | | | | | |
| Beginning of period | | | 214,547,793 | | | | 196,280,839 | |
| End of period | | $ | 216,777,702 | | | $ | 214,547,793 | |
| Undistributed net investment income at end of period | | $ | 991,306 | | | $ | 1,806,496 | |
| 72 | THE GUGGENHEIM FUNDS SEMI-ANNUAL REPORT | SEE NOTES TO FINANCIAL STATEMENTS. |
| STYLEPLUS—LARGE CORE FUND | |
| STATEMENTS OF CHANGES IN NET ASSETS (concluded) |
| | | Period Ended
March 29,
2018
(Unaudited) | | | Year Ended
September 30,
2017 | |
| Capital share activity: | | | | | | |
| Shares sold | | | | | | |
| A-Class | | | 149,648 | | | | 482,212 | |
| C-Class | | | 8,005 | | | | 36,211 | |
| P-Class | | | 559 | | | | 16,486 | |
| Institutional Class | | | 68,080 | | | | 64,115 | |
| Shares issued from reinvestment of distributions | | | | | | | | |
| A-Class | | | 1,401,881 | | | | 223,506 | |
| C-Class | | | 27,407 | | | | 3,755 | |
| P-Class | | | 3,861 | | | | 513 | |
| Institutional Class | | | 40,770 | | | | 6,203 | |
| Shares redeemed | | | | | | | | |
| A-Class | | | (491,608 | ) | | | (1,183,096 | ) |
| C-Class | | | (22,574 | ) | | | (73,493 | ) |
| P-Class | | | (16,056 | ) | | | (15,340 | ) |
| Institutional Class | | | (14,100 | ) | | | (41,235 | ) |
| Net increase (decrease) in shares | | | 1,155,873 | | | | (480,163 | ) |
| SEE NOTES TO FINANCIAL STATEMENTS. | THE GUGGENHEIM FUNDS SEMI-ANNUAL REPORT | 73 |
| STYLEPLUS—LARGE CORE FUND | |
This table is presented to show selected data for a share outstanding throughout each period and to assist shareholders in evaluating a Fund’s performance for the periods presented.
| A-Class | | Period Ended
March 29,
2018a | | | Year Ended
September 30,
2017 | | | Year Ended
September 30,
2016 | | | Year Ended
September 30,
2015 | | | Year Ended
September 30,
2014 | | | Year Ended
September 30,
2013 | |
| Per Share Data | | | | | | | | | | | �� | | | | | | | |
| Net asset value, beginning of period | | $ | 25.23 | | | $ | 21.86 | | | $ | 21.14 | | | $ | 24.53 | | | $ | 24.27 | | | $ | 21.25 | |
| Income (loss) from investment operations: |
| Net investment income (loss)b | | | .13 | | | | .24 | | | | .16 | | | | .11 | | | | .20 | | | | .06 | |
| Net gain (loss) on investments (realized and unrealized) | | | 1.37 | | | | 3.72 | | | | 3.04 | | | | (.12 | ) | | | 4.45 | | | | 3.04 | |
| Total from investment operations | | | 1.50 | | | | 3.96 | | | | 3.20 | | | | (.01 | ) | | | 4.65 | | | | 3.10 | |
| Less distributions from: |
| Net investment income | | | (.24 | ) | | | (.16 | ) | | | (.13 | ) | | | (.22 | ) | | | (.06 | ) | | | (.08 | ) |
| Net realized gains | | | (4.03 | ) | | | (.43 | ) | | | (2.35 | ) | | | (3.16 | ) | | | (4.33 | ) | | | — | |
| Total distributions | | | (4.27 | ) | | | (.59 | ) | | | (2.48 | ) | | | (3.38 | ) | | | (4.39 | ) | | | (.08 | ) |
| Net asset value, end of period | | $ | 22.46 | | | $ | 25.23 | | | $ | 21.86 | | | $ | 21.14 | | | $ | 24.53 | | | $ | 24.27 | |
| |
| Total Returnc | | | 5.69 | % | | | 18.58 | % | | | 16.13 | % | | | (0.84 | %) | | | 21.59 | % | | | 14.64 | % |
| Ratios/Supplemental Data |
| Net assets, end of period (in thousands) | | $ | 207,238 | | | $ | 206,033 | | | $ | 188,979 | | | $ | 177,748 | | | $ | 192,850 | | | $ | 175,601 | |
| Ratios to average net assets: |
| Net investment income (loss) | | | 1.10 | % | | | 1.03 | % | | | 0.79 | % | | | 0.48 | % | | | 0.86 | % | | | 0.26 | % |
| Total expensesd | | | 1.31 | % | | | 1.38 | % | | | 1.33 | % | | | 1.32 | % | | | 1.41 | % | | | 1.37 | % |
| Net expensese | | | 1.27 | % | | | 1.34 | % | | | 1.31 | % | | | 1.32 | % | | | 1.39 | % | | | 1.37 | % |
| Portfolio turnover rate | | | 30 | % | | | 30 | % | | | 50 | % | | | 65 | % | | | 107 | % | | | 217 | % |
| C-Class | | Period Ended
March 29,
2018a | | | Year Ended
September 30,
2017 | | | Year Ended
September 30,
2016 | | | Year Ended
September 30,
2015 | | | Year Ended
September 30,
2014 | | | Year Ended
September 30,
2013 | |
| Per Share Data | | | | | | | | | | | | | | | | | | |
| Net asset value, beginning of period | | $ | 19.74 | | | $ | 17.22 | | | $ | 17.17 | | | $ | 20.55 | | | $ | 21.12 | | | $ | 18.60 | |
| Income (loss) from investment operations: |
| Net investment income (loss)b | | | .02 | | | | .03 | | | | (.02 | ) | | | (.08 | ) | | | (.02 | ) | | | (.15 | ) |
| Net gain (loss) on investments (realized and unrealized) | | | 1.08 | | | | 2.92 | | | | 2.42 | | | | (.06 | ) | | | 3.78 | | | | 2.67 | |
| Total from investment operations | | | 1.10 | | | | 2.95 | | | | 2.40 | | | | (.14 | ) | | | 3.76 | | | | 2.52 | |
| Less distributions from: |
| Net investment income | | | (.05 | ) | | | — | | | | — | | | | (.08 | ) | | | — | | | | — | |
| Net realized gains | | | (4.03 | ) | | | (.43 | ) | | | (2.35 | ) | | | (3.16 | ) | | | (4.33 | ) | | | — | |
| Total distributions | | | (4.08 | ) | | | (.43 | ) | | | (2.35 | ) | | | (3.24 | ) | | | (4.33 | ) | | | — | |
| Net asset value, end of period | | $ | 16.76 | | | $ | 19.74 | | | $ | 17.22 | | | $ | 17.17 | | | $ | 20.55 | | | $ | 21.12 | |
| |
| Total Returnc | | | 5.20 | % | | | 17.59 | % | | | 15.00 | % | | | (1.72 | %) | | | 20.40 | % | | | 13.55 | % |
| Ratios/Supplemental Data |
| Net assets, end of period (in thousands) | | $ | 2,233 | | | $ | 2,376 | | | $ | 2,650 | | | $ | 2,767 | | | $ | 3,042 | | | $ | 2,275 | |
| Ratios to average net assets: |
| Net investment income (loss) | | | 0.22 | % | | | 0.19 | % | | | (0.14 | %) | | | (0.44 | %) | | | (0.08 | %) | | | (0.77 | %) |
| Total expensesd | | | 2.19 | % | | | 2.23 | % | | | 2.27 | % | | | 2.25 | % | | | 2.36 | % | | | 2.34 | % |
| Net expensese | | | 2.15 | % | | | 2.20 | % | | | 2.25 | % | | | 2.25 | % | | | 2.34 | % | | | 2.34 | % |
| Portfolio turnover rate | | | 30 | % | | | 30 | % | | | 50 | % | | | 65 | % | | | 107 | % | | | 217 | % |
| 74 | THE GUGGENHEIM FUNDS SEMI-ANNUAL REPORT | SEE NOTES TO FINANCIAL STATEMENTS. |
| STYLEPLUS—LARGE CORE FUND | |
| FINANCIAL HIGHLIGHTS (continued) |
This table is presented to show selected data for a share outstanding throughout each period and to assist shareholders in evaluating a Fund’s performance for the periods presented.
| P-Class | | Period Ended
March 29,
2018a | | | Year Ended
September 30,
2017 | | | Year Ended
September 30,
2016 | | | Period Ended
September 30,
2015f | |
| Per Share Data | | | | | | | | | | | | |
| Net asset value, beginning of period | | $ | 25.03 | | | $ | 21.75 | | | $ | 21.11 | | | $ | 23.12 | |
| Income (loss) from investment operations: |
| Net investment income (loss)b | | | .13 | | | | .22 | | | | .21 | | | | .03 | |
| Net gain (loss) on investments (realized and unrealized) | | | 1.33 | | | | 3.68 | | | | 2.97 | | | | (2.04 | ) |
| Total from investment operations | | | 1.46 | | | | 3.90 | | | | 3.18 | | | | (2.01 | ) |
| Less distributions from: |
| Net investment income | | | (.22 | ) | | | (.19 | ) | | | (.19 | ) | | | — | |
| Net realized gains | | | (4.03 | ) | | | (.43 | ) | | | (2.35 | ) | | | — | |
| Total distributions | | | (4.25 | ) | | | (.62 | ) | | | (2.54 | ) | | | — | |
| Net asset value, end of period | | $ | 22.24 | | | $ | 25.03 | | | $ | 21.75 | | | $ | 21.11 | |
| |
| Total Returnc | | | 5.55 | % | | | 18.43 | % | | | 16.08 | % | | | (8.69 | %) |
| Ratios/Supplemental Data |
| Net assets, end of period (in thousands) | | $ | 192 | | | $ | 508 | | | $ | 405 | | | $ | 14 | |
| Ratios to average net assets: |
| Net investment income (loss) | | | 1.04 | % | | | 0.93 | % | | | 1.02 | % | | | 0.31 | % |
| Total expensesd | | | 1.46 | % | | | 1.47 | % | | | 1.22 | % | | | 1.38 | % |
| Net expensese | | | 1.42 | % | | | 1.44 | % | | | 1.19 | % | | | 1.38 | % |
| Portfolio turnover rate | | | 30 | % | | | 30 | % | | | 50 | % | | | 65 | % |
| SEE NOTES TO FINANCIAL STATEMENTS. | THE GUGGENHEIM FUNDS SEMI-ANNUAL REPORT | 75 |
| STYLEPLUS—LARGE CORE FUND | |
| FINANCIAL HIGHLIGHTS (concluded) |
This table is presented to show selected data for a share outstanding throughout each period and to assist shareholders in evaluating a Fund’s performance for the periods presented.
| Institutional Class | | Period Ended
March 29,
2018a | | | Year Ended
September 30,
2017 | | | Year Ended
September 30,
2016 | | | Year Ended
September 30,
2015 | | | Year Ended
September 30,
2014 | | | Year Ended
September 30,
2013 | |
| Per Share Data | | | | | | | | | | | | | | | | | | |
| Net asset value, beginning of period | | $ | 25.13 | | | $ | 21.78 | | | $ | 21.00 | | | $ | 24.42 | | | $ | 24.25 | | | $ | 21.28 | |
| Income (loss) from investment operations: |
| Net investment income (loss)b | | | .17 | | | | .32 | | | | .24 | | | | .12 | | | | .23 | | | | .06 | |
| Net gain (loss) on investments (realized and unrealized) | | | 1.37 | | | | 3.69 | | | | 3.10 | | | | (.10 | ) | | | 4.38 | | | | 3.06 | |
| Total from investment operations | | | 1.54 | | | | 4.01 | | | | 3.34 | | | | .02 | | | | 4.61 | | | | 3.12 | |
| Less distributions from: |
| Net investment income | | | (.33 | ) | | | (.23 | ) | | | (.21 | ) | | | (.28 | ) | | | (.11 | ) | | | (.15 | ) |
| Net realized gains | | | (4.03 | ) | | | (.43 | ) | | | (2.35 | ) | | | (3.16 | ) | | | (4.33 | ) | | | — | |
| Total distributions | | | (4.36 | ) | | | (.66 | ) | | | (2.56 | ) | | | (3.44 | ) | | | (4.44 | ) | | | (.15 | ) |
| Net asset value, end of period | | $ | 22.31 | | | $ | 25.13 | | | $ | 21.78 | | | $ | 21.00 | | | $ | 24.42 | | | $ | 24.25 | |
| |
| Total Returnc | | | 5.86 | % | | | 18.96 | % | | | 17.00 | % | | | (0.75 | %) | | | 21.50 | % | | | 14.79 | % |
| Ratios/Supplemental Data |
| Net assets, end of period (in thousands) | | $ | 7,114 | | | $ | 5,631 | | | $ | 4,247 | | | $ | 303 | | | $ | 80 | | | $ | 26 | |
| Ratios to average net assets: |
| Net investment income (loss) | | | 1.40 | % | | | 1.35 | % | | | 1.11 | % | | | 0.52 | % | | | 0.97 | % | | | 0.26 | % |
| Total expensesd | | | 1.01 | % | | | 1.05 | % | | | 0.99 | % | | | 1.25 | % | | | 1.39 | % | | | 1.25 | % |
| Net expensese | | | 0.98 | % | | | 1.01 | % | | | 0.97 | % | | | 1.25 | % | | | 1.37 | % | | | 1.25 | % |
| Portfolio turnover rate | | | 30 | % | | | 30 | % | | | 50 | % | | | 65 | % | | | 107 | % | | | 217 | % |
| a | Unaudited figures for the period ended March 29, 2018. Percentage amounts for the period, except total return and portfolio turnover rate, have been annualized. |
| b | Net investment income (loss) per share was computed using average shares outstanding throughout the period. |
| c | Total return does not reflect the impact of any applicable sales charges and has not been annualized. |
| d | Does not include expenses of the underlying funds in which the Fund invests. |
| e | Net expense information reflects the expense ratios after expense waivers. |
| f | Since commencement of operations: May 1, 2015. Percentage amounts for the period, except total return and portfolio turnover rate, have been annualized. |
| 76 | THE GUGGENHEIM FUNDS SEMI-ANNUAL REPORT | SEE NOTES TO FINANCIAL STATEMENTS. |
| PERFORMANCE REPORT AND FUND PROFILE (Unaudited) | March 29, 2018 |
STYLEPLUS—MID GROWTH FUND
OBJECTIVE: Seeks long-term growth of capital.
Holdings Diversification (Market Exposure as % of Net Assets)
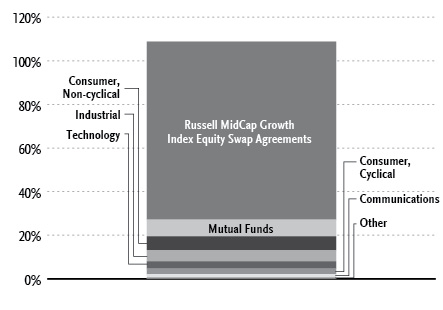
“Holdings Diversification (Market Exposure as % of Net Assets)” excludes any temporary cash investments or investments in Guggenheim Strategy Funds Trust mutual funds.
| Inception Dates: |
| A-Class | September 17, 1969 |
| C-Class | January 29, 1999 |
| P-Class | May 1, 2015 |
| Institutional Class | March 1, 2012 |
| Ten Largest Holdings (% of Total Net Assets) |
| Guggenheim Strategy Fund III | 34.6% |
| Guggenheim Strategy Fund II | 28.8% |
| Guggenheim Limited Duration Fund - Institutional Class | 7.6% |
| Guggenheim Strategy Fund I | 7.2% |
| Parker-Hannifin Corp. | 0.3% |
| Fidelity National Information Services, Inc. | 0.3% |
| Omnicom Group, Inc. | 0.3% |
| Rockwell Automation, Inc. | 0.3% |
| DXC Technology Co. | 0.3% |
| Clorox Co. | 0.3% |
| Top Ten Total | 80.0% |
“Ten Largest Holdings” excludes any temporary cash or derivative investments.
| | THE GUGGENHEIM FUNDS SEMI-ANNUAL REPORT | 77 |
| PERFORMANCE REPORT AND FUND PROFILE (Unaudited)(concluded) | March 29, 2018 |
Average Annual Returns*
Periods Ended March 29, 2018
| | 6 month† | 1 Year | 5 Year | 10 Year |
| A-Class Shares | 8.21% | 17.87% | 12.76% | 9.51% |
| A-Class Shares with sales charge‡ | 3.07% | 12.26% | 11.67% | 8.86% |
| C-Class Shares | 7.82% | 16.94% | 11.77% | 8.60% |
| C-Class Shares with CDSC§ | 6.90% | 15.94% | 11.77% | 8.60% |
| Russell Midcap Growth Index | 9.13% | 19.74% | 13.31% | 10.61% |
| | 6 month† | 1 Year | Since Inception
(05/01/15) |
| P-Class Shares | 8.12% | 17.73% | 8.66% |
| Russell Midcap Growth Index | 9.13% | 19.74% | 9.31% |
| | 6 month† | 1 Year | 5 Year | Since Inception
(03/01/12) |
| Institutional Class Shares | 8.39% | 18.23% | 12.86% | 12.16% |
| Russell Midcap Growth Index | 9.13% | 19.74% | 13.31% | 13.27% |
| * | The performance data above represents past performance that is not predictive of future results. The investment return and principal value of an investment in the Fund will fluctuate so that an investor’s shares, when redeemed, may be worth more or less than their original cost. Returns are historical and include changes in principal and reinvested dividends and capital gains and do not reflect the effect of taxes. The Russell Midcap Growth Index is an unmanaged index and, unlike the Fund, has no management fees or operating expenses to reduce its reported return. |
| † | 6 month returns are not annualized. |
| ‡ | Effective February 22, 2011, the maximum sales charge decreased from 5.75% to 4.75%. A 5.75% maximum sales charge is used in the calculation of the 1 Year, 5 Year and 10 Year average annual returns (based on subscriptions made prior to February 22, 2011), and a 4.75% maximum sales charge will be used to calculate performance for periods based on subscriptions made on or after February 22, 2011. |
| § | Fund returns include a CDSC of 1% if redeemed within 12 months of purchase. |
| 78 | THE GUGGENHEIM FUNDS SEMI-ANNUAL REPORT | |
| SCHEDULE OF INVESTMENTS (Unaudited) | March 29, 2018 |
| STYLEPLUS—MID GROWTH FUND | |
| | | Shares | | | Value | |
| | | | | | | |
| COMMON STOCKS† - 19.5% |
| | | | | | | |
| Consumer, Non-cyclical - 6.3% |
| Clorox Co. | | | 2,036 | | | $ | 271,012 | |
| Kellogg Co. | | | 4,088 | | | | 265,761 | |
| Hershey Co. | | | 2,543 | | | | 251,655 | |
| Varian Medical Systems, Inc.* | | | 1,858 | | | | 227,884 | |
| Edwards Lifesciences Corp.* | | | 1,447 | | | | 201,885 | |
| General Mills, Inc. | | | 4,360 | | | | 196,462 | |
| Zoetis, Inc. | | | 2,348 | | | | 196,082 | |
| Western Union Co. | | | 10,017 | | | | 192,627 | |
| CoreLogic, Inc.* | | | 4,251 | | | | 192,273 | |
| Kimberly-Clark Corp. | | | 1,673 | | | | 184,247 | |
| QIAGEN N.V.* | | | 5,695 | | | | 184,005 | |
| AmerisourceBergen Corp. — Class A | | | 2,119 | | | | 182,679 | |
| Vector Group Ltd. | | | 8,911 | | | | 181,695 | |
| Sysco Corp. | | | 3,000 | | | | 179,880 | |
| IQVIA Holdings, Inc.* | | | 1,813 | | | | 177,873 | |
| Baxter International, Inc. | | | 2,718 | | | | 176,779 | |
| McCormick & Company, Inc. | | | 1,600 | | | | 170,224 | |
| Total System Services, Inc. | | | 1,958 | | | | 168,897 | |
| Pilgrim’s Pride Corp.* | | | 6,044 | | | | 148,743 | |
| Teleflex, Inc. | | | 565 | | | | 144,064 | |
| Quanta Services, Inc.* | | | 3,778 | | | | 129,774 | |
| McKesson Corp. | | | 847 | | | | 119,317 | |
| Performance Food Group Co.* | | | 3,900 | | | | 116,415 | |
| Illumina, Inc.* | | | 449 | | | | 106,153 | |
| Global Payments, Inc. | | | 844 | | | | 94,123 | |
| Worldpay, Inc. — Class A* | | | 1,049 | | | | 86,270 | |
| Sabre Corp. | | | 3,921 | | | | 84,106 | |
| TreeHouse Foods, Inc.* | | | 2,130 | | | | 81,515 | |
| Hill-Rom Holdings, Inc. | | | 909 | | | | 79,083 | |
| Kroger Co. | | | 3,221 | | | | 77,111 | |
| Boston Scientific Corp.* | | | 2,805 | | | | 76,633 | |
| Euronet Worldwide, Inc.* | | | 958 | | | | 75,605 | |
| Alexion Pharmaceuticals, Inc.* | | | 676 | | | | 75,347 | |
| Intuitive Surgical, Inc.* | | | 163 | | | | 67,291 | |
| Herbalife Ltd.* | | | 647 | | | | 63,063 | |
| Alnylam Pharmaceuticals, Inc.* | | | 495 | | | | 58,954 | |
| Catalent, Inc.* | | | 1,351 | | | | 55,472 | |
| Incyte Corp.* | | | 643 | | | | 53,581 | |
| Sprouts Farmers Market, Inc.* | | | 2,209 | | | | 51,845 | |
| Total Consumer, Non-cyclical | | | | | | | 5,446,385 | |
| | | | | | | | | |
| Industrial - 5.2% |
| Parker-Hannifin Corp. | | | 1,674 | | | | 286,304 | |
| Rockwell Automation, Inc. | | | 1,575 | | | | 274,365 | |
| Waters Corp.* | | | 1,312 | | | | 260,629 | |
| Expeditors International of Washington, Inc. | | | 3,585 | | | | 226,930 | |
| Agilent Technologies, Inc. | | | 3,110 | | | | 208,059 | |
| Hubbell, Inc. | | | 1,678 | | | | 204,347 | |
| Ingersoll-Rand plc | | | 2,386 | | | | 204,027 | |
| Fortune Brands Home & Security, Inc. | | | 3,334 | | | | 196,339 | |
| Cummins, Inc. | | | 1,198 | | | | 194,184 | |
| Stanley Black & Decker, Inc. | | | 1,120 | | | | 171,584 | |
| Masco Corp. | | | 4,149 | | | | 167,786 | |
| Xylem, Inc. | | | 2,143 | | | | 164,839 | |
| Snap-on, Inc. | | | 1,085 | | | | 160,081 | |
| Roper Technologies, Inc. | | | 543 | | | | 152,415 | |
| Barnes Group, Inc. | | | 2,357 | | | | 141,161 | |
| Emerson Electric Co. | | | 1,798 | | | | 122,803 | |
| Tech Data Corp.* | | | 1,417 | | | | 120,629 | |
| PerkinElmer, Inc. | | | 1,537 | | | | 116,382 | |
| Harris Corp. | | | 721 | | | | 116,283 | |
| AMETEK, Inc. | | | 1,519 | | | | 115,398 | |
| Zebra Technologies Corp. — Class A* | | | 791 | | | | 110,099 | |
| Energizer Holdings, Inc. | | | 1,717 | | | | 102,299 | |
| Mettler-Toledo International, Inc.* | | | 165 | | | | 94,880 | |
| MasTec, Inc.* | | | 1,685 | | | | 79,279 | |
| TransDigm Group, Inc. | | | 238 | | | | 73,052 | |
| Acuity Brands, Inc. | | | 493 | | | | 68,621 | |
| SYNNEX Corp. | | | 556 | | | | 65,830 | |
| Corning, Inc. | | | 2,344 | | | | 65,351 | |
| Amphenol Corp. — Class A | | | 648 | | | | 55,812 | |
| EMCOR Group, Inc. | | | 707 | | | | 55,097 | |
| Coherent, Inc.* | | | 265 | | | | 49,661 | |
| Total Industrial | | | | | | | 4,424,526 | |
| | | | | | | | | |
| Technology - 3.3% |
| Fidelity National Information Services, Inc. | | | 2,909 | | | | 280,136 | |
| DXC Technology Co. | | | 2,709 | | | | 272,336 | |
| Citrix Systems, Inc.* | | | 2,770 | | | | 257,056 | |
| NetApp, Inc. | | | 4,152 | | | | 256,137 | |
| Lam Research Corp. | | | 953 | | | | 193,611 | |
| Dell Technologies Incorporated — Class V* | | | 2,606 | | | | 190,785 | |
| KLA-Tencor Corp. | | | 1,382 | | | | 150,652 | |
| ON Semiconductor Corp.* | | | 5,317 | | | | 130,054 | |
| Western Digital Corp. | | | 1,323 | | | | 122,073 | |
| Synopsys, Inc.* | | | 1,359 | | | | 113,123 | |
| Microchip Technology, Inc. | | | 1,192 | | | | 108,901 | |
| Teradyne, Inc. | | | 2,170 | | | | 99,191 | |
| Skyworks Solutions, Inc. | | | 860 | | | | 86,224 | |
| First Data Corp. — Class A* | | | 5,298 | | | | 84,768 | |
| MAXIMUS, Inc. | | | 1,146 | | | | 76,484 | |
| Qorvo, Inc.* | | | 1,000 | | | | 70,450 | |
| Autodesk, Inc.* | | | 467 | | | | 58,646 | |
| SS&C Technologies Holdings, Inc. | | | 1,028 | | | | 55,142 | |
| Cerner Corp.* | | | 938 | | | | 54,404 | |
| Analog Devices, Inc. | | | 595 | | | | 54,222 | |
| Cirrus Logic, Inc.* | | | 1,314 | | | | 53,388 | |
| Cadence Design Systems, Inc.* | | | 1,408 | | | | 51,772 | |
| Paychex, Inc. | | | 830 | | | | 51,120 | |
| Total Technology | | | | | | | 2,870,675 | |
| | | | | | | | | |
| Consumer, Cyclical - 2.5% |
| Alaska Air Group, Inc. | | | 3,421 | | | | 211,965 | |
| Allison Transmission Holdings, Inc. | | | 4,386 | | | | 171,317 | |
| American Airlines Group, Inc. | | | 3,260 | | | | 169,390 | |
| Live Nation Entertainment, Inc.* | | | 3,932 | | | | 165,695 | |
| Toll Brothers, Inc. | | | 3,831 | | | | 165,691 | |
| HD Supply Holdings, Inc.* | | | 4,264 | | | | 161,776 | |
| Southwest Airlines Co. | | | 2,524 | | | | 144,575 | |
| SEE NOTES TO FINANCIAL STATEMENTS. | THE GUGGENHEIM FUNDS SEMI-ANNUAL REPORT | 79 |
| SCHEDULE OF INVESTMENTS (Unaudited)(continued) | March 29, 2018 |
| STYLEPLUS—MID GROWTH FUND | |
| | | Shares | | | Value | |
| | | | | | | |
| Copa Holdings S.A. — Class A | | | 1,118 | | | $ | 143,808 | |
| Hanesbrands, Inc. | | | 7,725 | | | | 142,294 | |
| Lions Gate Entertainment Corp. — Class A | | | 4,380 | | | | 113,135 | |
| WW Grainger, Inc. | | | 273 | | | | 77,060 | |
| WABCO Holdings, Inc.* | | | 553 | | | | 74,030 | |
| BorgWarner, Inc. | | | 1,371 | | | | 68,865 | |
| Harley-Davidson, Inc. | | | 1,533 | | | | 65,735 | |
| Under Armour, Inc. — Class C* | | | 3,936 | | | | 56,482 | |
| Aptiv plc | | | 649 | | | | 55,146 | |
| Tenneco, Inc. | | | 1,001 | | | | 54,925 | |
| PulteGroup, Inc. | | | 1,860 | | | | 54,851 | |
| Whirlpool Corp. | | | 342 | | | | 52,364 | |
| Total Consumer, Cyclical | | | | | | | 2,149,104 | |
| | | | | | | | | |
| Communications - 1.6% |
| Omnicom Group, Inc. | | | 3,845 | | | | 279,416 | |
| Motorola Solutions, Inc. | | | 1,427 | | | | 150,263 | |
| AMC Networks, Inc. — Class A* | | | 2,254 | | | | 116,532 | |
| Symantec Corp. | | | 3,937 | | | | 101,772 | |
| Expedia Group, Inc. | | | 914 | | | | 100,915 | |
| DISH Network Corp. — Class A* | | | 2,645 | | | | 100,219 | |
| Palo Alto Networks, Inc.* | | | 529 | | | | 96,024 | |
| Interpublic Group of Companies, Inc. | | | 4,074 | | | | 93,824 | |
| F5 Networks, Inc.* | | | 640 | | | | 92,550 | |
| CDW Corp. | | | 1,316 | | | | 92,528 | |
| Nexstar Media Group, Inc. — Class A | | | 1,350 | | | | 89,775 | |
| CommScope Holding Company, Inc.* | | | 1,443 | | | | 57,677 | |
| Total Communications | | | | | | | 1,371,495 | |
| | | | | | | | | |
| Financial - 0.5% |
| Alliance Data Systems Corp. | | | 920 | | | | 195,831 | |
| Air Lease Corp. — Class A | | | 2,214 | | | | 94,361 | |
| Digital Realty Trust, Inc. REIT | | | 523 | | | | 55,113 | |
| Progressive Corp. | | | 874 | | | | 53,253 | |
| Total Financial | | | | | | | 398,558 | |
| | | | | | | | | |
| Basic Materials - 0.1% |
| International Paper Co. | | | 1,048 | | | | 55,995 | |
| | | | | | | | | |
| Total Common Stocks | | | | | | | | |
| (Cost $16,420,025) | | | | | | | 16,716,738 | |
| | | | | | | | | |
| MUTUAL FUNDS† - 78.2% |
| Guggenheim Strategy Fund III1 | | | 1,183,544 | | | | 29,624,113 | |
| Guggenheim Strategy Fund II1 | | | 988,041 | | | | 24,710,908 | |
| Guggenheim Limited Duration Fund - Institutional Class1 | | | 263,838 | | | | 6,529,982 | |
| Guggenheim Strategy Fund I1 | | | 245,127 | | | | 6,140,431 | |
| Total Mutual Funds | | | | | | | | |
| (Cost $66,686,970) | | | | | | | 67,005,434 | |
| | | | | | | | | |
| MONEY MARKET FUND† - 1.7% |
| Dreyfus Treasury Securities Cash Management Institutional Shares 1.46%2 | | | 1,474,303 | | | | 1,474,303 | |
| Total Money Market Fund | | | | | | | | |
| (Cost $1,474,303) | | | | | | | 1,474,303 | |
| | | | | | | | | |
| Total Investments - 99.4% | | | | | | | | |
| (Cost $84,581,298) | | | | | | $ | 85,196,475 | |
| Other Assets & Liabilities, net - 0.6% | | | | | | | 511,586 | |
| Total Net Assets - 100.0% | | | | | | $ | 85,708,061 | |
| Total Return Swap Agreements |
| Counterparty | | Index | | Financing
Rate Pay
(Receive) | | Payment
Frequency | | Maturity
Date | | Units | | Notional
Amount | | | Value and
Unrealized
Gain | |
| OTC Equity Index Swap Agreements†† | | | | | | | | | | | | |
Morgan Stanley
Capital Services, Inc. | | Russell Midcap Growth Index | | 1.98% | | At Maturity | | 09/06/18 | | 24,181 | | $ | 70,018,262 | | | $ | 8,073,252 | |
| * | Non-income producing security. |
| † | Value determined based on Level 1 inputs — See Note 4. |
| †† | Value determined based on Level 2 inputs — See Note 4. |
| 1 | Affiliated issuer. |
| 2 | Rate indicated is the 7 day yield as of March 29, 2018. |
| | plc — Public Limited Company |
| | REIT — Real Estate Investment Trust |
| | |
| | See Sector Classification in Other Information section. |
| 80 | THE GUGGENHEIM FUNDS SEMI-ANNUAL REPORT | SEE NOTES TO FINANCIAL STATEMENTS. |
| SCHEDULE OF INVESTMENTS (Unaudited)(concluded) | March 29, 2018 |
| STYLEPLUS—MID GROWTH FUND | |
The following table summarizes the inputs used to value the Fund’s investments at March 29, 2018 (See Note 4 in the Notes to Financial Statements):
| Investments in Securities (Assets) | | Level 1
Quoted
Prices | | | Level 2
Significant
Observable
Inputs | | | Level 2 -
Other* | | | Level 3
Significant
Unobservable
Inputs | | | Total | |
| Common Stocks | | $ | 16,716,738 | | | $ | — | | | $ | — | | | $ | — | | | $ | 16,716,738 | |
| Equity Index Swap Agreements | | | — | | | | — | | | | 8,073,252 | | | | — | | | | 8,073,252 | |
| Money Market Fund | | | 1,474,303 | | | | — | | | | — | | | | — | | | | 1,474,303 | |
| Mutual Funds | | | 67,005,434 | | | | — | | | | — | | | | — | | | | 67,005,434 | |
| Total Assets | | $ | 85,196,475 | | | $ | — | | | $ | 8,073,252 | | | $ | — | | | $ | 93,269,727 | |
| * | Other financial instruments include swaps, which are reported as unrealized gain/loss at period end. |
Transfers between investment levels may occur as the markets fluctuate and/or the availability of data used in an investment’s valuation changes. Transfers between valuation levels, if any, are in comparison to the valuation levels at the end of the previous fiscal year, and are effective using the fair value as of the end of the current fiscal period.
For the period ended March 29, 2018, there were no transfers between levels.
Affiliated Transactions
Investments representing 5% or more of the outstanding voting shares of a portfolio company of a fund, or control of or by, or common control under the Guggenheim Investments (“GI”), result in that portfolio company being considered an affiliated company of such fund, as defined in the 1940 Act.
The Fund may invest in certain of the underlying series of Guggenheim Strategy Funds Trust including Guggenheim Strategy Fund I, Guggenheim Strategy Fund II and Guggenheim Strategy Fund III (collectively, the “Cash Management Funds”), each of which are open-end management investment companies managed by GI. The Cash Management Funds, which launched on March 11, 2014, are offered as cash management options only to mutual funds, trusts, and other accounts managed by GI and/or its affiliates, and are not available to the public. The Cash Management Funds pay no investment management fees. The Cash Management Funds’ annual report on Form N-CSR dated September 30, 2017, is available publicly or upon request. This information is available from the EDGAR database on the SEC’s website at https://www.sec.gov/Archives/edgar/data/1601445/000089180417000715/gug72218.htm.
Transactions during the period ended March 29, 2018, in which the portfolio company is an “affiliated person”, were as follows:
| Security Name | | Value
09/30/17 | | | Additions | | | Reductions | | | Realized
Gain | | | Change in
Unrealized | | | Value
03/29/18 | | | Shares
03/29/18 | | | Investment
Income | | | Capital
Gain
Distributions | |
| Mutual Funds | | | | | | | | | | | | | | | | | | | | | | | | | | | |
| Guggenheim Limited Duration Fund - Institutional Class | | $ | 6,472,821 | | | $ | 83,346 | | | $ | — | | | $ | — | | | $ | (26,185 | ) | | $ | 6,529,982 | | | | 263,838 | | | $ | 82,812 | | | $ | — | |
| Guggenheim Strategy Fund I | | | 7,911,590 | | | | 5,078,448 | | | | (6,829,664 | ) | | | 36,334 | | | | (56,277 | ) | | | 6,140,431 | | | | 245,127 | | | | 100,240 | | | | 3,292 | |
| Guggenheim Strategy Fund II | | | 20,821,922 | | | | 4,475,841 | | | | (538,595 | ) | | | 2,152 | | | | (50,412 | ) | | | 24,710,908 | | | | 988,041 | | | | 312,805 | | | | 12,719 | |
| Guggenheim Strategy Fund III | | | 27,334,521 | | | | 2,301,362 | | | | — | | | | — | | | | (11,770 | ) | | | 29,624,113 | | | | 1,183,544 | | | | 344,314 | | | | 6,969 | |
| | | $ | 62,540,854 | | | $ | 11,938,997 | | | $ | (7,368,259 | ) | | $ | 38,486 | | | $ | (144,644 | ) | | $ | 67,005,434 | | | | | | | $ | 840,171 | | | $ | 22,980 | |
| SEE NOTES TO FINANCIAL STATEMENTS. | THE GUGGENHEIM FUNDS SEMI-ANNUAL REPORT | 81 |
| STYLEPLUS—MID GROWTH FUND | |
| STATEMENT OF ASSETS AND LIABILITIES (Unaudited) |
| March 29, 2018 |
| Assets: |
| Investments in unaffiliated issuers, at value (cost $17,894,328) | | $ | 18,191,041 | |
| Investments in affiliated issuers, at value (cost $66,686,970) | | | 67,005,434 | |
| Unrealized appreciation on swap agreements | | | 8,073,252 | |
| Prepaid expenses | | | 43,942 | |
| Receivables: |
| Dividends | | | 140,283 | |
| Securities sold | | | 115,731 | |
| Interest | | | 2,606 | |
| Fund shares sold | | | 380 | |
| Total assets | | | 93,572,669 | |
| | | | | |
| Liabilities: |
| Overdraft due to custodian bank | | | 389,739 | |
| Segregated cash due to broker | | | 6,375,813 | |
| Payable for: |
| Swap settlement | | | 684,224 | |
| Securities purchased | | | 217,200 | |
| Management fees | | | 53,058 | |
| Fund shares redeemed | | | 47,918 | |
| Distribution and service fees | | | 20,823 | |
| Transfer agent/maintenance fees | | | 14,750 | |
| Fund accounting/administration fees | | | 5,925 | |
| Trustees’ fees* | | | 37 | |
| Miscellaneous | | | 55,121 | |
| Total liabilities | | | 7,864,608 | |
| Net assets | | $ | 85,708,061 | |
| | | | | |
| Net assets consist of: |
| Paid in capital | | $ | 76,000,985 | |
| Undistributed net investment income | | | 319,875 | |
| Accumulated net realized gain on investments | | | 698,772 | |
| Net unrealized appreciation on investments | | | 8,688,429 | |
| Net assets | | $ | 85,708,061 | |
| | | | | |
| A-Class: |
| Net assets | | $ | 80,640,186 | |
| Capital shares outstanding | | | 1,776,836 | |
| Net asset value per share | | $ | 45.38 | |
| Maximum offering price per share (Net asset value divided by 95.25%) | | $ | 47.64 | |
| | | | | |
| C-Class: |
| Net assets | | $ | 3,906,582 | |
| Capital shares outstanding | | | 119,002 | |
| Net asset value per share | | $ | 32.83 | |
| | | | | |
| P-Class: |
| Net assets | | $ | 110,044 | |
| Capital shares outstanding | | | 2,450 | |
| Net asset value per share | | $ | 44.92 | |
| | | | | |
| Institutional Class: |
| Net assets | | $ | 1,051,249 | |
| Capital shares outstanding | | | 23,131 | |
| Net asset value per share | | $ | 45.45 | |
| * | Relates to Trustees not deemed “interested persons” within the meaning of Section 2(a)(19) of the 1940 Act. |
| 82 | THE GUGGENHEIM FUNDS SEMI-ANNUAL REPORT | SEE NOTES TO FINANCIAL STATEMENTS. |
| STYLEPLUS—MID GROWTH FUND | |
| STATEMENT OF OPERATIONS (Unaudited) |
| Period Ended March 29, 2018 |
| Investment Income: |
| Dividends from securities of unaffiliated issuers (net of foreign withholding tax of $59) | | $ | 93,750 | |
| Dividends from securities of affiliated issuers | | | 840,171 | |
| Interest | | | 17,421 | |
| Total investment income | | | 951,342 | |
| | | | | |
| Expenses: |
| Management fees | | | 323,570 | |
| Distribution and service fees: |
| A-Class | | | 100,592 | |
| C-Class | | | 20,047 | |
| P-Class | | | 241 | |
| Transfer agent/maintenance fees: |
| A-Class | | | 50,624 | |
| C-Class | | | 3,337 | |
| P-Class | | | 175 | |
| Institutional Class | | | 324 | |
| Registration fees | | | 42,650 | |
| Printing expenses | | | 37,602 | |
| Fund accounting/administration fees | | | 34,515 | |
| Custodian fees | | | 9,528 | |
| Trustees’ fees* | | | 4,550 | |
| Line of credit fees | | | 1,380 | |
| Miscellaneous | | | 16,875 | |
| Total expenses | | | 646,010 | |
| Less: |
| Expenses waived by Adviser | | | (14,544 | ) |
| Net expenses | | | 631,466 | |
| Net investment income | | | 319,876 | |
| | | | | |
| Net Realized and Unrealized Gain (Loss): |
| Net realized gain (loss) on: |
| Investments in unaffiliated issuers | | $ | 1,543,471 | |
| Investments in affiliated issuers | | | 38,486 | |
| Distributions received from affiliated investment company shares | | | 22,980 | |
| Swap agreements | | | (684,224 | ) |
| Futures contracts | | | 278,777 | |
| Net realized gain | | | 1,199,490 | |
| Net change in unrealized appreciation (depreciation) on: |
| Investments in unaffiliated issuers | | | (555,782 | ) |
| Investments in affiliated issuers | | | (144,644 | ) |
| Swap agreements | | | 6,032,464 | |
| Futures contracts | | | (75,509 | ) |
| Net change in unrealized appreciation (depreciation) | | | 5,256,529 | |
| Net realized and unrealized gain | | | 6,456,019 | |
| Net increase in net assets resulting from operations | | $ | 6,775,895 | |
| * | Relates to Trustees not deemed “interested persons” within the meaning of Section 2(a)(19) of the 1940 Act. |
| SEE NOTES TO FINANCIAL STATEMENTS. | THE GUGGENHEIM FUNDS SEMI-ANNUAL REPORT | 83 |
| STYLEPLUS—MID GROWTH FUND | |
| STATEMENTS OF CHANGES IN NET ASSETS |
| | | Period Ended
March 29,
2018
(Unaudited) | | | Year Ended
September 30,
2017 | |
| Increase (Decrease) in Net Assets from Operations: | | | | | | |
| Net investment income | | $ | 319,876 | | | $ | 588,488 | |
| Net realized gain on investments | | | 1,199,490 | | | | 11,928,136 | |
| Net change in unrealized appreciation on investments | | | 5,256,529 | | | | 428,088 | |
| Net increase in net assets resulting from operations | | | 6,775,895 | | | | 12,944,712 | |
| | | | | | | | | |
| Distributions to shareholders from: | | | | | | | | |
| Net investment income | | | | | | | | |
| A-Class | | | (394,290 | ) | | | (439,170 | ) |
| P-Class | | | (286 | ) | | | (843 | ) |
| Institutional Class | | | (16,278 | ) | | | (931 | ) |
| Net realized gains | | | | | | | | |
| A-Class | | | (8,876,662 | ) | | | — | |
| C-Class | | | (593,301 | ) | | | — | |
| P-Class | | | (12,191 | ) | | | — | |
| Institutional Class | | | (221,490 | ) | | | — | |
| Total distributions to shareholders | | | (10,114,498 | ) | | | (440,944 | ) |
| | | | | | | | | |
| Capital share transactions: | | | | | | | | |
| Proceeds from sale of shares | | | | | | | | |
| A-Class | | | 1,702,941 | | | | 5,856,314 | |
| C-Class | | | 78,812 | | | | 312,663 | |
| P-Class | | | 1,580,939 | | | | 28,177 | |
| Institutional Class | | | 1,662,139 | | | | 1,622,366 | |
| Distributions reinvested | | | | | | | | |
| A-Class | | | 8,840,748 | | | | 412,205 | |
| C-Class | | | 587,100 | | | | — | |
| P-Class | | | 12,477 | | | | 843 | |
| Institutional Class | | | 232,834 | | | | 872 | |
| Cost of shares redeemed | | | | | | | | |
| A-Class | | | (3,982,904 | ) | | | (13,228,907 | ) |
| C-Class | | | (455,364 | ) | | | (677,278 | ) |
| P-Class | | | (1,603,016 | ) | | | (27,021 | ) |
| Institutional Class | | | (2,506,222 | ) | | | (62,579 | ) |
| Net increase (decrease) from capital share transactions | | | 6,150,484 | | | | (5,762,345 | ) |
| Net increase in net assets | | | 2,811,881 | | | | 6,741,423 | |
| | | | | | | | | |
| Net assets: | | | | | | | | |
| Beginning of period | | | 82,896,180 | | | | 76,154,757 | |
| End of period | | $ | 85,708,061 | | | $ | 82,896,180 | |
| Undistributed net investment income at end of period | | $ | 319,875 | | | $ | 410,853 | |
| 84 | THE GUGGENHEIM FUNDS SEMI-ANNUAL REPORT | SEE NOTES TO FINANCIAL STATEMENTS. |
| STYLEPLUS—MID GROWTH FUND | |
| STATEMENTS OF CHANGES IN NET ASSETS (concluded) |
| | | Period Ended
March 29,
2018
(Unaudited) | | | Year Ended
September 30,
2017 | |
| Capital share activity: | | | | | | |
| Shares sold | | | | | | |
| A-Class | | | 35,910 | | | | 142,987 | |
| C-Class | | | 2,253 | | | | 9,803 | |
| P-Class | | | 32,420 | | | | 630 | |
| Institutional Class | | | 36,319 | | | | 35,348 | |
| Shares issued from reinvestment of distributions | | | | | | | | |
| A-Class | | | 197,822 | | | | 10,323 | |
| C-Class | | | 18,125 | | | | — | |
| P-Class | | | 282 | | | | 21 | |
| Institutional Class | | | 5,208 | | | | 22 | |
| Shares redeemed | | | | | | | | |
| A-Class | | | (84,511 | ) | | | (306,993 | ) |
| C-Class | | | (13,186 | ) | | | (20,979 | ) |
| P-Class | | | (32,825 | ) | | | (607 | ) |
| Institutional Class | | | (55,103 | ) | | | (1,458 | ) |
| Net increase (decrease) in shares | | | 142,714 | | | | (130,903 | ) |
| SEE NOTES TO FINANCIAL STATEMENTS. | THE GUGGENHEIM FUNDS SEMI-ANNUAL REPORT | 85 |
| STYLEPLUS—MID GROWTH FUND | |
This table is presented to show selected data for a share outstanding throughout each period and to assist shareholders in evaluating a Fund’s performance for the periods presented.
| A-Class | | Period Ended
March 29,
2018a | | | Year Ended
September 30,
2017 | | | Year Ended
September 30,
2016 | | | Year Ended
September 30,
2015 | | | Year Ended
September 30,
2014 | | | Year Ended
September 30,
2013 | |
| Per Share Data | | | | | | | | | | | | | | | | | | |
| Net asset value, beginning of period | | $ | 47.34 | | | $ | 40.52 | | | $ | 41.49 | | | $ | 45.82 | | | $ | 43.54 | | | $ | 36.40 | |
| Income (loss) from investment operations: |
| Net investment income (loss)b | | | .18 | | | | .34 | | | | .19 | | | | .07 | | | | .16 | | | | (.16 | ) |
| Net gain (loss) on investments (realized and unrealized) | | | 3.61 | | | | 6.72 | | | | 4.25 | | | | .63 | | | | 6.21 | | | | 7.30 | |
| Total from investment operations | | | 3.79 | | | | 7.06 | | | | 4.44 | | | | .70 | | | | 6.37 | | | | 7.14 | |
| Less distributions from: |
| Net investment income | | | (.24 | ) | | | (.24 | ) | | | (.05 | ) | | | — | | | | — | | | | — | |
| Net realized gains | | | (5.51 | ) | | | — | | | | (5.36 | ) | | | (5.03 | ) | | | (4.09 | ) | | | — | |
| Total distributions | | | (5.75 | ) | | | (.24 | ) | | | (5.41 | ) | | | (5.03 | ) | | | (4.09 | ) | | | — | |
| Net asset value, end of period | | $ | 45.38 | | | $ | 47.34 | | | $ | 40.52 | | | $ | 41.49 | | | $ | 45.82 | | | $ | 43.54 | |
| |
| Total Returnc | | | 8.21 | % | | | 17.54 | % | | | 11.55 | % | | | 1.04 | % | | | 15.61 | % | | | 19.62 | % |
| Ratios/Supplemental Data |
| Net assets, end of period (in thousands) | | $ | 80,640 | | | $ | 77,049 | | | $ | 72,179 | | | $ | 73,178 | | | $ | 77,363 | | | $ | 70,767 | |
| Ratios to average net assets: |
| Net investment income (loss) | | | 0.77 | % | | | 0.78 | % | | | 0.48 | % | | | 0.16 | % | | | 0.36 | % | | | (0.40 | %) |
| Total expensesd | | | 1.47 | % | | | 1.45 | % | | | 1.45 | % | | | 1.47 | % | | | 1.67 | % | | | 1.57 | % |
| Net expensese | | | 1.43 | % | | | 1.42 | % | | | 1.43 | % | | | 1.47 | % | | | 1.65 | % | | | 1.57 | % |
| Portfolio turnover rate | | | 32 | % | | | 43 | % | | | 61 | % | | | 75 | % | | | 112 | % | | | 214 | % |
| C-Class | | Period Ended
March 29 ,
2018a | | | Year Ended
September 30,
2017 | | | Year Ended
September 30,
2016 | | | Year Ended
September 30,
2015 | | | Year Ended
September 30,
2014 | | | Year Ended
September 30,
2013 | |
| Per Share Data | | | | | | | | | | | | | | | | | | |
| Net asset value, beginning of period | | $ | 35.64 | | | $ | 30.58 | | | $ | 32.78 | | | $ | 37.48 | | | $ | 36.63 | | | $ | 30.92 | |
| Income (loss) from investment operations: |
| Net investment income (loss)b | | | — | f | | | (.03 | ) | | | (.12 | ) | | | (.25 | ) | | | (.20 | ) | | | (.45 | ) |
| Net gain (loss) on investments (realized and unrealized) | | | 2.70 | | | | 5.09 | | | | 3.28 | | | | .58 | | | | 5.14 | | | | 6.16 | |
| Total from investment operations | | | 2.70 | | | | 5.06 | | | | 3.16 | | | | .33 | | | | 4.94 | | | | 5.71 | |
| Less distributions from: |
| Net realized gains | | | (5.51 | ) | | | — | | | | (5.36 | ) | | | (5.03 | ) | | | (4.09 | ) | | | — | |
| Total distributions | | | (5.51 | ) | | | — | | | | (5.36 | ) | | | (5.03 | ) | | | (4.09 | ) | | | — | |
| Net asset value, end of period | | $ | 32.83 | | | $ | 35.64 | | | $ | 30.58 | | | $ | 32.78 | | | $ | 37.48 | | | $ | 36.63 | |
| |
| Total Returnc | | | 7.82 | % | | | 16.55 | % | | | 10.55 | % | | | 0.20 | % | | | 14.56 | % | | | 18.47 | % |
| Ratios/Supplemental Data |
| Net assets, end of period (in thousands) | | $ | 3,907 | | | $ | 3,984 | | | $ | 3,760 | | | $ | 4,762 | | | $ | 4,329 | | | $ | 4,103 | |
| Ratios to average net assets: |
| Net investment income (loss) | | | (0.02 | %) | | | (0.08 | %) | | | (0.42 | %) | | | (0.68 | %) | | | (0.55 | %) | | | (1.36 | %) |
| Total expensesd | | | 2.26 | % | | | 2.31 | % | | | 2.34 | % | | | 2.31 | % | | | 2.57 | % | | | 2.53 | % |
| Net expensese | | | 2.22 | % | | | 2.27 | % | | | 2.32 | % | | | 2.31 | % | | | 2.55 | % | | | 2.53 | % |
| Portfolio turnover rate | | | 32 | % | | | 43 | % | | | 61 | % | | | 75 | % | | | 112 | % | | | 214 | % |
| 86 | THE GUGGENHEIM FUNDS SEMI-ANNUAL REPORT | SEE NOTES TO FINANCIAL STATEMENTS. |
| STYLEPLUS—MID GROWTH FUND | |
| FINANCIAL HIGHLIGHTS (continued) |
This table is presented to show selected data for a share outstanding throughout each period and to assist shareholders in evaluating a Fund’s performance for the periods presented.
| P-Class | | Period Ended
March 29 ,
2018a | | | Year Ended
September 30,
2017 | | | Year Ended
September 30,
2016 | | | Period Ended
September 30,
2015g | |
| Per Share Data | | | | | | | | | | | | |
| Net asset value, beginning of period | | $ | 46.83 | | | $ | 40.27 | | | $ | 41.48 | | | $ | 45.96 | |
| Income (loss) from investment operations: |
| Net investment income (loss)b | | | .16 | | | | .24 | | | | .26 | | | | — | f |
| Net gain (loss) on investments (realized and unrealized) | | | 3.57 | | | | 6.65 | | | | 4.09 | | | | (4.48 | ) |
| Total from investment operations | | | 3.73 | | | | 6.89 | | | | 4.35 | | | | (4.48 | ) |
| Less distributions from: |
| Net investment income | | | (.13 | ) | | | (.33 | ) | | | (.20 | ) | | | — | |
| Net realized gains | | | (5.51 | ) | | | — | | | | (5.36 | ) | | | — | |
| Total distributions | | | (5.64 | ) | | | (.33 | ) | | | (5.56 | ) | | | — | |
| Net asset value, end of period | | $ | 44.92 | | | $ | 46.83 | | | $ | 40.27 | | | $ | 41.48 | |
| |
| Total Returnc | | | 8.12 | % | | | 17.27 | % | | | 11.36 | % | | | (9.75 | %) |
| Ratios/Supplemental Data |
| Net assets, end of period (in thousands) | | $ | 110 | | | $ | 121 | | | $ | 102 | | | $ | 11 | |
| Ratios to average net assets: |
| Net investment income (loss) | | | 0.66 | % | | | 0.55 | % | | | 0.69 | % | | | 0.00 | % |
| Total expensesd | | | 1.54 | % | | | 1.66 | % | | | 1.39 | % | | | 1.49 | % |
| Net expensese | | | 1.51 | % | | | 1.63 | % | | | 1.35 | % | | | 1.49 | % |
| Portfolio turnover rate | | | 32 | % | | | 43 | % | | | 61 | % | | | 75 | % |
| SEE NOTES TO FINANCIAL STATEMENTS. | THE GUGGENHEIM FUNDS SEMI-ANNUAL REPORT | 87 |
| STYLEPLUS—MID GROWTH FUND | |
| FINANCIAL HIGHLIGHTS (concluded) |
This table is presented to show selected data for a share outstanding throughout each period and to assist shareholders in evaluating a Fund’s performance for the periods presented.
| Institutional Class | | Period Ended
March 29 ,
2018a | | | Year Ended
September 30,
2017 | | | Year Ended
September 30,
2016 | | | Year Ended
September 30,
2015 | | | Year Ended
September 30,
2014 | | | Year Ended
September 30,
2013 | |
| Per Share Data | | | | | | | | | | | | | | | | | | |
| Net asset value, beginning of period | | $ | 47.48 | | | $ | 40.59 | | | $ | 41.64 | | | $ | 45.96 | | | $ | 43.72 | | | $ | 36.46 | |
| Income (loss) from investment operations: |
| Net investment income (loss)b | | | .27 | | | | .42 | | | | .19 | | | | .11 | | | | .11 | | | | (.07 | ) |
| Net gain (loss) on investments (realized and unrealized) | | | 3.62 | | | | 6.78 | | | | 4.25 | | | | .60 | | | | 6.22 | | | | 7.33 | |
| Total from investment operations | | | 3.89 | | | | 7.20 | | | | 4.44 | | | | .71 | | | | 6.33 | | | | 7.26 | |
| Less distributions from: |
| Net investment income | | | (.41 | ) | | | (.31 | ) | | | (.13 | ) | | | — | | | | — | | | | — | |
| Net realized gains | | | (5.51 | ) | | | — | | | | (5.36 | ) | | | (5.03 | ) | | | (4.09 | ) | | | — | |
| Total distributions | | | (5.92 | ) | | | (.31 | ) | | | (5.49 | ) | | | (5.03 | ) | | | (4.09 | ) | | | — | |
| Net asset value, end of period | | $ | 45.45 | | | $ | 47.48 | | | $ | 40.59 | | | $ | 41.64 | | | $ | 45.96 | | | $ | 43.72 | |
| |
| Total Returnc | | | 8.39 | % | | | 17.88 | % | | | 11.50 | % | | | 1.08 | % | | | 15.42 | % | | | 19.91 | % |
| Ratios/Supplemental Data |
| Net assets, end of period (in thousands) | | $ | 1,051 | | | $ | 1,743 | | | $ | 113 | | | $ | 54 | | | $ | 30 | | | $ | 21 | |
| Ratios to average net assets: |
| Net investment income (loss) | | | 1.14 | % | | | 0.95 | % | | | 0.48 | % | | | 0.23 | % | | | 0.24 | % | | | (0.17 | %) |
| Total expensesd | | | 1.13 | % | | | 1.26 | % | | | 1.46 | % | | | 1.41 | % | | | 1.81 | % | | | 1.33 | % |
| Net expensese | | | 1.10 | % | | | 1.22 | % | | | 1.44 | % | | | 1.41 | % | | | 1.79 | % | | | 1.33 | % |
| Portfolio turnover rate | | | 32 | % | | | 43 | % | | | 61 | % | | | 75 | % | | | 112 | % | | | 214 | % |
| a | Unaudited figures for the period ended March 29, 2018. Percentage amounts for the period, except total return and portfolio turnover rate, have been annualized. |
| b | Net investment income (loss) per share was computed using average shares outstanding throughout the period. |
| c | Total return does not reflect the impact of any applicable sales charges and has not been annualized. |
| d | Does not include expenses of the underlying funds in which the Fund invests. |
| e | Net expense information reflects the expense ratios after expense waivers. |
| f | Net investment income (loss) is less than $0.01 per share. |
| g | Since commencement of operations: May 1, 2015. Percentage amounts for the period, except total return and portfolio turnover rate, have been annualized. |
| 88 | THE GUGGENHEIM FUNDS SEMI-ANNUAL REPORT | SEE NOTES TO FINANCIAL STATEMENTS. |
| PERFORMANCE REPORT AND FUND PROFILE (Unaudited) | March 29, 2018 |
WORLD EQUITY INCOME FUND
OBJECTIVE: Seeks to provide total return, comprised of capital appreciation and income.
Holdings Diversification (Market Exposure as % of Net Assets)
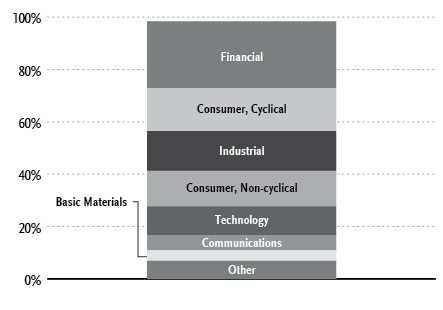
“Holdings Diversification (Market Exposure as % of Net Assets)” excludes any temporary cash investments.
COUNTRY DIVERSIFICATION
| Country | % of Long Term
Investments |
| United States | 54.1% |
| Canada | 6.3% |
| France | 5.8% |
| Japan | 5.8% |
| Australia | 4.2% |
| Switzerland | 3.7% |
| United Kingdom | 3.3% |
| Other | 16.8% |
| Total Long Term Investments | 100.0% |
| Inception Dates: |
| A-Class | October 1, 1993 |
| C-Class | January 29, 1999 |
| P-Class | May 1, 2015 |
| Institutional Class | May 2, 2011 |
| Ten Largest Holdings (% of Total Net Assets) |
| Apple, Inc. | 1.5% |
| Johnson & Johnson | 1.4% |
| Home Depot, Inc. | 1.3% |
| NVIDIA Corp. | 1.2% |
| Pfizer, Inc. | 1.1% |
| Honeywell International, Inc. | 1.1% |
| Mastercard, Inc. — Class A | 1.1% |
| International Business Machines Corp. | 1.1% |
| Texas Instruments, Inc. | 1.0% |
| 3M Co. | 1.0% |
| Top Ten Total | 11.8% |
“Ten Largest Holdings” excludes any temporary cash or derivative investments.
| | THE GUGGENHEIM FUNDS SEMI-ANNUAL REPORT | 89 |
| PERFORMANCE REPORT AND FUND PROFILE (Unaudited)(concluded) | March 29, 2018 |
Average Annual Returns*
Periods Ended March 29, 2018
| | 6 month† | 1 Year | 5 Year | 10 Year |
| A-Class Shares | 3.08% | 9.99% | 8.06% | 3.61% |
| A-Class Shares with sales charge‡ | (1.81%) | 4.79% | 7.01% | 2.99% |
| C-Class Shares | 2.70% | 9.13% | 7.23% | 2.83% |
| C-Class Shares with CDSC§ | 1.70% | 8.13% | 7.23% | 2.83% |
| MSCI World Index | 4.09% | 13.52% | 9.69% | 5.89% |
| | 6 month† | 1 Year | Since Inception
(05/01/15) |
| P-Class Shares | 3.05% | 10.01% | 6.53% |
| MSCI World Index | 4.09% | 13.52% | 7.14% |
| | 6 month† | 1 Year | 5 Year | Since Inception
(05/02/11) |
| Institutional Class Shares | 3.21% | 10.21% | 8.36% | 5.25% |
| MSCI World Index | 4.09% | 13.52% | 9.69% | 8.06% |
| * | The performance data above represents past performance that is not predictive of future results. The investment return and principal value of an investment in the Fund will fluctuate so that an investor’s shares, when redeemed, may be worth more or less than their original cost. Returns are historical and include changes in principal and reinvested dividends and capital gains and do not reflect the effect of taxes. The MSCI World Index is an unmanaged index and, unlike the Fund, has no management fees or operating expenses to reduce its reported return. |
| † | 6 month returns are not annualized. |
| ‡ | Effective February 22, 2011, the maximum sales charge decreased from 5.75% to 4.75%. A 5.75% maximum sales charge is used in the calculation of the 1 Year, 5 Year and 10 Year average annual returns (based on subscriptions made prior to February 22, 2011), and a 4.75% maximum sales charge will be used to calculate performance for periods based on subscriptions made on or after February 22, 2011. |
| § | Fund returns include a CDSC of 1% if redeemed within 12 months of purchase. |
| 90 | THE GUGGENHEIM FUNDS SEMI-ANNUAL REPORT | |
| SCHEDULE OF INVESTMENTS (Unaudited) | March 29, 2018 |
| WORLD EQUITY INCOME FUND | |
| | | Shares | | | Value | |
| | | | | | | |
| COMMON STOCKS† - 98.4% | | | | | | |
| | | | | | | |
| Financial - 25.6% | | | | | | |
| Mastercard, Inc. — Class A | | | 5,500 | | | $ | 963,380 | |
| Allianz AG | | | 3,600 | | | | 812,403 | |
| Mizuho Financial Group, Inc. | | | 449,800 | | | | 809,517 | |
| BNP Paribas S.A. | | | 10,500 | | | | 777,390 | |
| JPMorgan Chase & Co. | | | 7,000 | | | | 769,790 | |
| ING Groep N.V. | | | 45,000 | | | | 758,582 | |
| T. Rowe Price Group, Inc. | | | 6,800 | | | | 734,196 | |
| DNB ASA | | | 37,000 | | | | 718,152 | |
| MetLife, Inc. | | | 15,300 | | | | 702,117 | |
| Credit Suisse Group AG* | | | 40,000 | | | | 669,059 | |
| Bank of Montreal | | | 8,400 | | | | 634,563 | |
| Kinnevik Investment AB — Class B | | | 17,200 | | | | 618,937 | |
| Everest Re Group Ltd. | | | 2,300 | | | | 590,686 | |
| Prudential plc | | | 23,500 | | | | 586,428 | |
| Bank Leumi Le-Israel BM | | | 97,200 | | | | 584,885 | |
| Henderson Land Development Company Ltd. | | | 86,240 | | | | 561,514 | |
| PNC Financial Services Group, Inc. | | | 3,700 | | | | 559,588 | |
| Barclays plc | | | 185,300 | | | | 536,764 | |
| Canadian Imperial Bank of Commerce | | | 6,000 | | | | 529,640 | |
| Hysan Development Company Ltd. — Class A* | | | 98,500 | | | | 520,853 | |
| Bank Hapoalim BM | | | 75,900 | | | | 520,106 | |
| Lloyds Banking Group plc | | | 547,500 | | | | 496,722 | |
| ASX Ltd. | | | 11,500 | | | | 495,078 | |
| Chubb Ltd. | | | 3,600 | | | | 492,372 | |
| Swiss Re AG | | | 4,700 | | | | 478,275 | |
| SmartCentres Real Estate Investment Trust REIT | | | 20,700 | | | | 467,741 | |
| Hongkong Land Holdings Ltd. | | | 67,700 | | | | 466,453 | |
| First Capital Realty, Inc. | | | 28,200 | | | | 445,458 | |
| RioCan Real Estate Investment Trust REIT | | | 23,400 | | | | 429,395 | |
| H&R Real Estate Investment Trust REIT | | | 25,200 | | | | 411,370 | |
| Visa, Inc. — Class A | | | 3,400 | | | | 406,708 | |
| Assurant, Inc. | | | 4,300 | | | | 393,063 | |
| Toronto-Dominion Bank | | | 6,900 | | | | 391,579 | |
| Power Financial Corp. | | | 13,700 | | | | 343,066 | |
| SEI Investments Co. | | | 4,400 | | | | 329,604 | |
| American Express Co. | | | 3,500 | | | | 326,480 | |
| Travelers Companies, Inc. | | | 1,900 | | | | 263,834 | |
| IGM Financial, Inc. | | | 8,200 | | | | 239,774 | |
| Unibail-Rodamco SE REIT | | | 1,000 | | | | 228,436 | |
| Tokio Marine Holdings, Inc. | | | 5,000 | | | | 224,285 | |
| Cincinnati Financial Corp. | | | 3,000 | | | | 222,780 | |
| Great Western Bancorp, Inc. | | | 8,200 | | | | 209,285 | |
| CI Financial Corp. | | | 9,600 | | | | 205,671 | |
| BB&T Corp. | | | 3,800 | | | | 197,752 | |
| Prudential Financial, Inc. | | | 1,900 | | | | 196,745 | |
| Wells Fargo & Co. | | | 3,500 | | | | 183,435 | |
| Progressive Corp. | | | 3,000 | | | | 182,790 | |
| U.S. Bancorp | | | 3,300 | | | | 166,650 | |
| Goldman Sachs Group, Inc. | | | 600 | | | | 151,116 | |
| Total Financial | | | | | | | 23,004,467 | |
| | | | | | | | | |
| Consumer, Cyclical - 16.3% | | | | | | | | |
| Home Depot, Inc. | | | 6,500 | | | | 1,158,560 | |
| LVMH Moet Hennessy Louis Vuitton SE | | | 2,800 | | | | 862,016 | |
| WW Grainger, Inc. | | | 2,800 | | | | 790,356 | |
| Kohl’s Corp. | | | 11,900 | | | | 779,569 | |
| Cie Generale des Etablissements Michelin — Class B* | | | 5,200 | | | | 767,171 | |
| Ford Motor Co. | | | 64,900 | | | | 719,092 | |
| Target Corp. | | | 9,900 | | | | 687,357 | |
| Las Vegas Sands Corp. | | | 8,800 | | | | 632,720 | |
| Macy’s, Inc. | | | 20,900 | | | | 621,566 | |
| TJX Companies, Inc. | | | 7,600 | | | | 619,856 | |
| Berkeley Group Holdings plc | | | 11,500 | | | | 611,225 | |
| Carnival plc | | | 8,400 | | | | 539,689 | |
| L Brands, Inc. | | | 13,500 | | | | 515,835 | |
| Iida Group Holdings Company Ltd. | | | 26,900 | | | | 496,514 | |
| Hugo Boss AG | | | 5,600 | | | | 487,579 | |
| Bandai Namco Holdings, Inc. | | | 15,200 | | | | 485,692 | |
| Tractor Supply Co. | | | 6,900 | | | | 434,838 | |
| Crown Resorts Ltd. | | | 44,000 | | | | 428,782 | |
| Li & Fung Ltd. | | | 873,400 | | | | 427,342 | |
| Sekisui House Ltd. | | | 22,000 | | | | 399,455 | |
| Fastenal Co. | | | 5,900 | | | | 322,081 | |
| Harvey Norman Holdings Ltd. | | | 111,500 | | | | 315,954 | |
| Ralph Lauren Corp. — Class A | | | 2,600 | | | | 290,680 | |
| Dollar General Corp. | | | 2,700 | | | | 252,585 | |
| ITOCHU Corp. | | | 12,200 | | | | 235,217 | |
| Domino’s Pizza, Inc. | | | 1,000 | | | | 233,560 | |
| Best Buy Company, Inc. | | | 2,900 | | | | 202,971 | |
| Polaris Industries, Inc. | | | 1,400 | | | | 160,328 | |
| McDonald’s Corp. | | | 1,000 | | | | 156,380 | |
| Total Consumer, Cyclical | | | | | | | 14,634,970 | |
| | | | | | | | | |
| Industrial - 15.2% | | | | | | | | |
| Honeywell International, Inc. | | | 6,800 | | | | 982,668 | |
| 3M Co. | | | 4,100 | | | | 900,032 | |
| Lockheed Martin Corp. | | | 2,640 | | | | 892,135 | |
| Deere & Co. | | | 5,400 | | | | 838,728 | |
| Raytheon Co. | | | 3,800 | | | | 820,116 | |
| TE Connectivity Ltd. | | | 8,000 | | | | 799,200 | |
| Cummins, Inc. | | | 4,600 | | | | 745,614 | |
| FUJIFILM Holdings Corp. | | | 18,300 | | | | 721,647 | |
| Vinci S.A. | | | 7,200 | | | | 707,863 | |
| United Parcel Service, Inc. — Class B | | | 6,500 | | | | 680,290 | |
| FedEx Corp. | | | 2,700 | | | | 648,297 | |
| SKF AB — Class B | | | 29,400 | | | | 600,468 | |
| Emerson Electric Co. | | | 8,300 | | | | 566,890 | |
| Rockwell Automation, Inc. | | | 3,000 | | | | 522,600 | |
| Skanska AB — Class B | | | 24,600 | | | | 502,874 | |
| Boeing Co. | | | 1,300 | | | | 426,244 | |
| Avnet, Inc. | | | 9,800 | | | | 409,248 | |
| Parker-Hannifin Corp. | | | 2,100 | | | | 359,163 | |
| Makita Corp. | | | 7,100 | | | | 346,976 | |
| Illinois Tool Works, Inc. | | | 2,000 | | | | 313,320 | |
| CH Robinson Worldwide, Inc. | | | 2,900 | | | | 271,759 | |
| United Technologies Corp. | | | 1,800 | | | | 226,476 | |
| Hexagon AB — Class B | | | 3,700 | | | | 219,837 | |
| SEE NOTES TO FINANCIAL STATEMENTS. | THE GUGGENHEIM FUNDS SEMI-ANNUAL REPORT | 91 |
| SCHEDULE OF INVESTMENTS (Unaudited)(continued) | March 29, 2018 |
| WORLD EQUITY INCOME FUND | |
| | | Shares | | | Value | |
| | | | | | | |
| L3 Technologies, Inc. | | | 1,000 | | | $ | 208,000 | |
| Total Industrial | | | | | | | 13,710,445 | |
| | | | | | | | | |
| Consumer, Non-cyclical - 13.6% | | | | | | | | |
| Johnson & Johnson | | | 10,100 | | | | 1,294,315 | |
| Pfizer, Inc. | | | 28,400 | | | | 1,007,916 | |
| Roche Holding AG | | | 3,800 | | | | 870,927 | |
| AbbVie, Inc. | | | 8,600 | | | | 813,990 | |
| Gilead Sciences, Inc. | | | 10,700 | | | | 806,673 | |
| Woolworths Group Ltd. | | | 38,500 | | | | 777,273 | |
| UnitedHealth Group, Inc. | | | 3,500 | | | | 749,000 | |
| Procter & Gamble Co. | | | 8,548 | | | | 677,685 | |
| Western Union Co. | | | 34,700 | | | | 667,281 | |
| Amgen, Inc. | | | 3,114 | | | | 530,875 | |
| Danone S.A. | | | 5,600 | | | | 452,920 | |
| Swedish Match AB | | | 9,900 | | | | 447,683 | |
| ManpowerGroup, Inc. | | | 3,800 | | | | 437,380 | |
| Coca-Cola Amatil Ltd. | | | 60,200 | | | | 400,809 | |
| Wesfarmers Ltd. | | | 12,100 | | | | 386,174 | |
| George Weston Ltd. | | | 4,700 | | | | 378,402 | |
| Novo Nordisk A/S — Class B | | | 7,700 | | | | 378,100 | |
| Automatic Data Processing, Inc. | | | 3,100 | | | | 351,788 | |
| L’Oreal S.A. | | | 1,100 | | | | 248,167 | |
| Robert Half International, Inc. | | | 3,800 | | | | 219,982 | |
| Remy Cointreau S.A. | | | 1,500 | | | | 213,732 | |
| Diageo plc | | | 4,600 | | | | 155,679 | |
| Total Consumer, Non-cyclical | | | | | | | 12,266,751 | |
| | | | | | | | | |
| Technology - 11.0% | | | | | | | | |
| Apple, Inc. | | | 8,000 | | | | 1,342,240 | |
| NVIDIA Corp. | | | 4,500 | | | | 1,042,155 | |
| International Business Machines Corp. | | | 6,200 | | | | 951,266 | |
| Texas Instruments, Inc. | | | 9,100 | | | | 945,399 | |
| Microsoft Corp. | | | 9,700 | | | | 885,319 | |
| Accenture plc — Class A | | | 4,400 | | | | 675,400 | |
| Lam Research Corp. | | | 3,200 | | | | 650,112 | |
| Xilinx, Inc. | | | 8,000 | | | | 577,920 | |
| Paychex, Inc. | | | 9,100 | | | | 560,469 | |
| CA, Inc. | | | 15,200 | | | | 515,280 | |
| Seagate Technology plc | | | 7,100 | | | | 415,492 | |
| Canon, Inc. | | | 11,200 | | | | 405,244 | |
| Western Digital Corp. | | | 4,000 | | | | 369,080 | |
| Intel Corp. | | | 4,900 | | | | 255,192 | |
| Cognizant Technology Solutions Corp. — Class A | | | 2,000 | | | | 161,000 | |
| Skyworks Solutions, Inc. | | | 1,300 | | | | 130,338 | |
| Total Technology | | | | | | | 9,881,906 | |
| | | | | | | | | |
| Communications - 5.8% | | | | | | | | |
| Alphabet, Inc. — Class C* | | | 800 | | | | 825,432 | |
| TDC A/S* | | | 77,700 | | | | 642,778 | |
| Cisco Systems, Inc. | | | 13,500 | | | | 579,015 | |
| Amazon.com, Inc.* | | | 400 | | | | 578,936 | |
| Verizon Communications, Inc. | | | 11,500 | | | | 549,930 | |
| AT&T, Inc. | | | 14,700 | | | | 524,055 | |
| BCE, Inc. | | | 11,500 | | | | 494,896 | |
| TELUS Corp. | | | 11,900 | | �� | | 417,891 | |
| Yahoo Japan Corp. | | | 67,500 | | | | 313,378 | |
| Facebook, Inc. — Class A* | | | 1,700 | | | | 271,643 | |
| Total Communications | | | | | | | 5,197,954 | |
| | | | | | | | | |
| Basic Materials - 4.0% | | | | | | | | |
| DowDuPont, Inc. | | | 14,100 | | | | 898,311 | |
| LyondellBasell Industries N.V. — Class A | | | 7,800 | | | | 824,304 | |
| Umicore S.A.* | | | 12,900 | | | | 681,429 | |
| Mitsubishi Chemical Holdings Corp. | | | 68,400 | | | | 655,683 | |
| BHP Billiton Ltd.* | | | 14,300 | | | | 309,786 | |
| Eastman Chemical Co. | | | 2,000 | | | | 211,160 | |
| Total Basic Materials | | | | | | | 3,580,673 | |
| | | | | | | | | |
| Energy - 3.7% | | | | | | | | |
| Total S.A. | | | 15,100 | | | | 857,097 | |
| Valero Energy Corp. | | | 7,900 | | | | 732,883 | |
| Neste Oyj | | | 9,500 | | | | 661,622 | |
| Woodside Petroleum Ltd. | | | 28,800 | | | | 646,684 | |
| Phillips 66 | | | 2,500 | | | | 239,800 | |
| Exxon Mobil Corp. | | | 2,200 | | | | 164,142 | |
| Total Energy | | | | | | | 3,302,228 | |
| | | | | | | | | |
| Utilities - 2.5% | | | | | | | | |
| CLP Holdings Ltd. | | | 68,137 | | | | 693,683 | |
| Duke Energy Corp. | | | 8,373 | | | | 648,656 | |
| Dominion Energy, Inc. | | | 5,568 | | | | 375,450 | |
| Hong Kong & China Gas Company Ltd. | | | 168,000 | | | | 345,068 | |
| PPL Corp. | | | 8,754 | | | | 247,651 | |
| Total Utilities | | | | | | | 2,310,508 | |
| | | | | | | | | |
| Diversified - 0.7% | | | | | | | | |
| Jardine Matheson Holdings Ltd. | | | 10,700 | | | | 659,334 | |
| | | | | | | | | |
| Total Common Stocks | | | | | | | | |
| (Cost $83,374,338) | | | | | | | 88,549,236 | |
| | | | | | | | | |
| MONEY MARKET FUND† - 0.8% | | | | | | | | |
| Goldman Sachs Financial Square Treasury Instruments Fund - Institutional Class 1.54%1 | | | 714,049 | | | | 714,049 | |
| Total Money Market Fund | | | | | | | | |
| (Cost $714,049) | | | | | | | 714,049 | |
| | | | | | | | | |
| Total Investments - 99.2% | | | | | | | | |
| (Cost $84,088,387) | | | | | | $ | 89,263,285 | |
| Other Assets & Liabilities, net - 0.8% | | | | | | | 685,453 | |
| Total Net Assets - 100.0% | | | | | | $ | 89,948,738 | |
| 92 | THE GUGGENHEIM FUNDS SEMI-ANNUAL REPORT | SEE NOTES TO FINANCIAL STATEMENTS. |
| SCHEDULE OF INVESTMENTS (Unaudited)(concluded) | March 29, 2018 |
| WORLD EQUITY INCOME FUND | |
| Futures Contracts |
| Description | | Number of
Contracts | | Expiration
Date | | Notional
Amount | | | Value and
Unrealized
Loss | |
| Currency Futures Contracts Sold Short† |
| Canadian Dollar Futures Contracts | | 73 | | Jun 2018 | | $ | 5,674,290 | | | $ | (81,906 | ) |
| * | Non-income producing security. |
| † | Value determined based on Level 1 inputs — See Note 4. |
| 1 | Rate indicated is the 7 day yield as of March 29, 2018. |
| | plc — Public Limited Company |
| | REIT — Real Estate Investment Trust |
| | |
| | See Sector Classification in Other Information section. |
The following table summarizes the inputs used to value the Fund’s investments at March 29, 2018 (See Note 4 in the Notes to Financial Statements):
| Investments in Securities (Assets) | | Level 1
Quoted
Prices | | | Level 1 -
Other* | | | Level 2
Significant
Observable
Inputs | | | Level 3
Significant
Unobservable
Inputs | | | Total | |
| Common Stocks | | $ | 88,549,236 | | | $ | — | | | $ | — | | | $ | — | | | $ | 88,549,236 | |
| Money Market Fund | | | 714,049 | | | | — | | | | — | | | | — | | | | 714,049 | |
| Total Assets | | $ | 89,263,285 | | | $ | — | | | $ | — | | | $ | — | | | $ | 89,263,285 | |
| | | | | | | | | | | | | | | | | | | | | |
| Investments in Securities (Liabilities) | | | Level 1
Quoted
Prices | | | | Level 1 -
Other* | | | | Level 2
Significant
Observable
Inputs | | | | Level 3
Significant
Unobservable
Inputs | | | | Total | |
| Currency Futures Contracts | | $ | — | | | $ | 81,906 | | | $ | — | | | $ | — | | | $ | 81,906 | |
| * | Other financial instruments include futures contracts, which are reported as unrealized gain/loss at period end. |
Transfers between investment levels may occur as the markets fluctuate and/or the availability of data used in an investment’s valuation changes. Transfers between valuation levels, if any, are in comparison to the valuation levels at the end of the previous fiscal year, and are effective using the fair value as of the end of the current fiscal period.
For the period ended March 29, 2018, there were no transfers between levels.
| SEE NOTES TO FINANCIAL STATEMENTS. | THE GUGGENHEIM FUNDS SEMI-ANNUAL REPORT | 93 |
| STATEMENT OF ASSETS AND LIABILITIES (Unaudited) |
| March 29, 2018 |
| Assets: |
| Investments, at value (cost $84,088,387) | | $ | 89,263,285 | |
| Foreign currency, at value (cost $50,165) | | | 50,162 | |
| Cash | | | 32,505 | |
| Segregated cash with broker | | | 95,000 | |
| Prepaid expenses | | | 45,267 | |
| Receivables: |
| Dividends | | | 239,713 | |
| Fund shares sold | | | 233,739 | |
| Foreign taxes reclaim | | | 232,803 | |
| Interest | | | 1,394 | |
| Total assets | | | 90,193,868 | |
| | | | | |
| Liabilities: |
| Payable for: |
| Fund shares redeemed | | | 56,366 | |
| Direct shareholders expense | | | 42,396 | |
| Management fees | | | 42,201 | |
| Distribution and service fees | | | 22,476 | |
| Transfer agent/maintenance fees | | | 20,407 | |
| Professional fees | | | 13,462 | |
| Variation margin | | | 12,775 | |
| Fund accounting/administration fees | | | 6,215 | |
| Miscellaneous | | | 28,832 | |
| Total liabilities | | | 245,130 | |
| Net assets | | $ | 89,948,738 | |
| | | | | |
| Net assets consist of: |
| Paid in capital | | $ | 86,060,469 | |
| Accumulated net investment loss | | | (90,031 | ) |
| Accumulated net realized loss on investments | | | (1,125,769 | ) |
| Net unrealized appreciation on investments | | | 5,104,069 | |
| Net assets | | $ | 89,948,738 | |
| | | | | |
| A-Class: |
| Net assets | | $ | 78,619,115 | |
| Capital shares outstanding | | | 5,172,322 | |
| Net asset value per share | | $ | 15.20 | |
| Maximum offering price per share (Net asset value divided by 95.25%) | | $ | 15.96 | |
| | | | | |
| C-Class: |
| Net assets | | $ | 6,235,366 | |
| Capital shares outstanding | | | 478,606 | |
| Net asset value per share | | $ | 13.03 | |
| | | | | |
| P-Class: |
| Net assets | | $ | 320,934 | |
| Capital shares outstanding | | | 20,789 | |
| Net asset value per share | | $ | 15.44 | |
| | | | | |
| Institutional Class: |
| Net assets | | $ | 4,773,323 | |
| Capital shares outstanding | | | 316,083 | |
| Net asset value per share | | $ | 15.10 | |
| STATEMENT OF OPERATIONS (Unaudited) |
| Period Ended March 29, 2018 |
| Investment Income: |
| Dividends (net of foreign withholding tax of $85,005) | | $ | 1,075,930 | |
| Interest | | | 3,676 | |
| Total investment income | | | 1,079,606 | |
| | | | | |
| Expenses: |
| Management fees | | | 320,900 | |
| Distribution and service fees: |
| A-Class | | | 100,429 | |
| C-Class | | | 32,690 | |
| P-Class | | | 447 | |
| Recoupment of previously waived fees: |
| C-Class | | | 1 | |
| Institutional Class | | | 42 | |
| Transfer agent/maintenance fees: |
| A-Class | | | 26,622 | |
| C-Class | | | 3,705 | |
| P-Class | | | 130 | |
| Institutional Class | | | 488 | |
| Printing expenses | | | 47,805 | |
| Registration fees | | | 39,450 | |
| Fund accounting/administration fees | | | 36,675 | |
| Custodian fees | | | 7,742 | |
| Trustees’ fees* | | | 4,987 | |
| Line of credit fees | | | 1,672 | |
| Miscellaneous | | | 50,578 | |
| Total expenses | | | 674,363 | |
| Less: |
| Expenses waived by Adviser | | | (64,707 | ) |
| Expenses reimbursed by Adviser: |
| A-Class | | | (26,205 | ) |
| C-Class | | | (3,675 | ) |
| P-Class | | | (127 | ) |
| Institutional Class | | | (495 | ) |
| Total waived/reimbursed expenses | | | (95,209 | ) |
| Net expenses | | | 579,154 | |
| Net investment income | | | 500,452 | |
| | | | | |
| Net Realized and Unrealized Gain (Loss): |
| Net realized gain (loss) on: |
| Investments | | | 4,446,431 | |
| Futures contracts | | | (3,170 | ) |
| Foreign currency transactions | | | (1,516 | ) |
| Net realized gain | | | 4,441,745 | |
| Net change in unrealized appreciation (depreciation) on: |
| Investments | | | (2,102,854 | ) |
| Futures contracts | | | (81,906 | ) |
| Foreign currency translations | | | 7,176 | |
| Net change in unrealized appreciation (depreciation) | | | (2,177,584 | ) |
| Net realized and unrealized gain | | | 2,264,161 | |
| Net increase in net assets resulting from operations | | $ | 2,764,613 | |
| * | Relates to Trustees not deemed “interested persons” within the meaning of Section 2(a)(19) of the 1940 Act. |
| 94 | THE GUGGENHEIM FUNDS SEMI-ANNUAL REPORT | SEE NOTES TO FINANCIAL STATEMENTS. |
| STATEMENTS OF CHANGES IN NET ASSETS |
| | | Period Ended
March 29,
2018
(Unaudited) | | | Year Ended
September 30,
2017 | |
| Increase (Decrease) in Net Assets from Operations: | | | | | | |
| Net investment income | | $ | 500,452 | | | $ | 1,962,451 | |
| Net realized gain on investments | | | 4,441,745 | | | | 5,683,972 | |
| Net change in unrealized appreciation (depreciation) on investments | | | (2,177,584 | ) | | | 2,701,224 | |
| Net increase in net assets resulting from operations | | | 2,764,613 | | | | 10,347,647 | |
| | | | | | | | | |
| Distributions to shareholders from: | | | | | | | | |
| Net investment income | | | | | | | | |
| A-Class | | | (505,521 | ) | | | (1,967,488 | ) |
| C-Class | | | (16,646 | ) | | | (114,346 | ) |
| P-Class | | | (2,180 | ) | | | (4,295 | ) |
| Institutional Class | | | (33,962 | ) | | | (76,242 | ) |
| Total distributions to shareholders | | | (558,309 | ) | | | (2,162,371 | ) |
| | | | | | | | | |
| Capital share transactions: | | | | | | | | |
| Proceeds from sale of shares | | | | | | | | |
| A-Class | | | 2,824,556 | | | | 13,238,403 | |
| C-Class | | | 466,496 | | | | 1,571,277 | |
| P-Class | | | 49,013 | | | | 257,778 | |
| Institutional Class | | | 1,926,795 | | | | 2,745,914 | |
| Distributions reinvested | | | | | | | | |
| A-Class | | | 501,636 | | | | 1,954,121 | |
| C-Class | | | 16,071 | | | | 105,916 | |
| P-Class | | | 2,180 | | | | 4,295 | |
| Institutional Class | | | 31,672 | | | | 64,249 | |
| Cost of shares redeemed | | | | | | | | |
| A-Class | | | (7,263,780 | ) | | | (22,525,744 | ) |
| C-Class | | | (865,211 | ) | | | (1,219,393 | ) |
| P-Class | | | (93,833 | ) | | | (59,428 | ) |
| Institutional Class | | | (988,598 | ) | | | (2,173,544 | ) |
| Net decrease from capital share transactions | | | (3,393,003 | ) | | | (6,036,156 | ) |
| Net increase (decrease) in net assets | | | (1,186,699 | ) | | | 2,149,120 | |
| | | | | | | | | |
| Net assets: | | | | | | | | |
| Beginning of period | | | 91,135,437 | | | | 88,986,317 | |
| End of period | | $ | 89,948,738 | | | $ | 91,135,437 | |
| Accumulated net investment loss at end of period | | $ | (90,031 | ) | | $ | (32,174 | ) |
| SEE NOTES TO FINANCIAL STATEMENTS. | THE GUGGENHEIM FUNDS SEMI-ANNUAL REPORT | 95 |
| STATEMENTS OF CHANGES IN NET ASSETS (concluded) |
| | | Period Ended
March 29,
2018
(Unaudited) | | | Year Ended
September 30,
2017 | |
| Capital share activity: | | | | | | |
| Shares sold | | | | | | |
| A-Class | | | 183,288 | | | | 954,221 | |
| C-Class | | | 35,375 | | | | 129,787 | |
| P-Class | | | 3,118 | | | | 17,585 | |
| Institutional Class | | | 125,425 | | | | 194,275 | |
| Shares issued from reinvestment of distributions | | | | | | | | |
| A-Class | | | 32,852 | | | | 136,806 | |
| C-Class | | | 1,231 | | | | 8,654 | |
| P-Class | | | 141 | | | | 295 | |
| Institutional Class | | | 2,088 | | | | 4,518 | |
| Shares redeemed | | | | | | | | |
| A-Class | | | (473,609 | ) | | | (1,611,230 | ) |
| C-Class | | | (64,915 | ) | | | (100,543 | ) |
| P-Class | | | (5,987 | ) | | | (4,084 | ) |
| Institutional Class | | | (64,661 | ) | | | (155,571 | ) |
| Net decrease in shares | | | (225,654 | ) | | | (425,287 | ) |
| 96 | THE GUGGENHEIM FUNDS SEMI-ANNUAL REPORT | SEE NOTES TO FINANCIAL STATEMENTS. |
This table is presented to show selected data for a share outstanding throughout each period and to assist shareholders in evaluating a Fund’s performance for the periods presented.
| A-Class | | Period Ended
March 29,
2018a | | | Year Ended
September 30,
2017 | | | Year Ended
September 30,
2016 | | | Year Ended
September 30,
2015 | | | Year Ended
September 30,
2014 | | | Year Ended
September 30,
2013 | |
| Per Share Data | | | | | | | | | | | | | | | | | | |
| Net asset value, beginning of period | | $ | 14.84 | | | $ | 13.54 | | | $ | 12.28 | | | $ | 13.51 | | | $ | 12.60 | | | $ | 10.55 | |
| Income (loss) from investment operations: |
| Net investment income (loss)b | | | .09 | | | | .31 | | | | .31 | | | | .29 | | | | .38 | | | | .18 | |
| Net gain (loss) on investments (realized and unrealized) | | | .37 | | | | 1.34 | | | | 1.26 | | | | (1.18 | ) | | | .95 | | | | 2.16 | |
| Total from investment operations | | | .46 | | | | 1.65 | | | | 1.57 | | | | (.89 | ) | | | 1.33 | | | | 2.34 | |
| Less distributions from: |
| Net investment income | | | (.10 | ) | | | (.35 | ) | | | (.31 | ) | | | (.34 | ) | | | (.42 | ) | | | (.29 | ) |
| Total distributions | | | (.10 | ) | | | (.35 | ) | | | (.31 | ) | | | (.34 | ) | | | (.42 | ) | | | (.29 | ) |
| Net asset value, end of period | | $ | 15.20 | | | $ | 14.84 | | | $ | 13.54 | | | $ | 12.28 | | | $ | 13.51 | | | $ | 12.60 | |
| |
| Total Returnc | | | 3.08 | % | | | 12.31 | % | | | 12.85 | % | | | (6.70 | %) | | | 10.62 | % | | | 22.58 | % |
| Ratios/Supplemental Data |
| Net assets, end of period (in thousands) | | $ | 78,619 | | | $ | 80,598 | | | $ | 80,575 | | | $ | 73,568 | | | $ | 78,783 | | | $ | 65,966 | |
| Ratios to average net assets: |
| Net investment income (loss) | | | 1.13 | % | | | 2.23 | % | | | 2.36 | % | | | 2.21 | % | | | 2.81 | % | | | 1.59 | % |
| Total expensesd | | | 1.43 | % | | | 1.34 | % | | | 1.48 | % | | | 1.48 | % | | | 1.66 | % | | | 1.93 | % |
| Net expensese | | | 1.22 | %h,i | | | 1.24 | %h,i | | | 1.48 | %i | | | 1.43 | %i | | | 1.49 | %i | | | 1.59 | % |
| Portfolio turnover rate | | | 58 | % | | | 94 | % | | | 51 | % | | | 131 | % | | | 131 | % | | | 154 | % |
| C-Class | | Period Ended
March 29,
2018a | | | Year Ended
September 30,
2017 | | | Year Ended
September 30,
2016 | | | Year Ended
September 30,
2015 | | | Year Ended
September 30,
2014 | | | Year Ended
September 30,
2013 | |
| Per Share Data | | | | | | | | | | | | | | | | | | |
| Net asset value, beginning of period | | $ | 12.72 | | | $ | 11.63 | | | $ | 10.55 | | | $ | 11.61 | | | $ | 10.79 | | | $ | 9.01 | |
| Income (loss) from investment operations: |
| Net investment income (loss)b | | | .02 | | | | .19 | | | | .18 | | | | .17 | | | | .25 | | | | .08 | |
| Net gain (loss) on investments (realized and unrealized) | | | .32 | | | | 1.13 | | | | 1.09 | | | | (1.02 | ) | | | .81 | | | | 1.84 | |
| Total from investment operations | | | .34 | | | | 1.32 | | | | 1.27 | | | | (.85 | ) | | | 1.06 | | | | 1.92 | |
| Less distributions from: |
| Net investment income | | | (.03 | ) | | | (.23 | ) | | | (.19 | ) | | | (.21 | ) | | | (.24 | ) | | | (.14 | ) |
| Total distributions | | | (.03 | ) | | | (.23 | ) | | | (.19 | ) | | | (.21 | ) | | | (.24 | ) | | | (.14 | ) |
| Net asset value, end of period | | $ | 13.03 | | | $ | 12.72 | | | $ | 11.63 | | | $ | 10.55 | | | $ | 11.61 | | | $ | 10.79 | |
| |
| Total Returnc | | | 2.70 | % | | | 11.46 | % | | | 12.05 | % | | | (7.40 | %) | | | 9.79 | % | | | 21.57 | % |
| Ratios/Supplemental Data |
| Net assets, end of period (in thousands) | | $ | 6,235 | | | $ | 6,449 | | | $ | 5,455 | | | $ | 5,936 | | | $ | 5,337 | | | $ | 3,377 | |
| Ratios to average net assets: |
| Net investment income (loss) | | | 0.37 | % | | | 1.53 | % | | | 1.59 | % | | | 1.50 | % | | | 2.13 | % | | | 0.80 | % |
| Total expensesd | | | 2.23 | % | | | 2.19 | % | | | 2.35 | % | | | 2.28 | % | | | 2.62 | % | | | 2.89 | % |
| Net expensese,f | | | 1.97 | %h,i | | | 1.99 | %h,i | | | 2.23 | %i | | | 2.23 | %i | | | 2.24 | %h | | | 2.35 | % |
| Portfolio turnover rate | | | 58 | % | | | 94 | % | | | 51 | % | | | 131 | % | | | 131 | % | | | 154 | % |
| SEE NOTES TO FINANCIAL STATEMENTS. | THE GUGGENHEIM FUNDS SEMI-ANNUAL REPORT | 97 |
| FINANCIAL HIGHLIGHTS (continued) |
This table is presented to show selected data for a share outstanding throughout each period and to assist shareholders in evaluating a Fund’s performance for the periods presented.
| P-Class | | Period Ended
March 29,
2018a | | | Year Ended
September 30,
2017 | | | Year Ended
September 30,
2016 | | | Period Ended
September 30,
2015g | |
| Per Share Data | | | | | | | | | | | | |
| Net asset value, beginning of period | | $ | 15.08 | | | $ | 13.73 | | | $ | 12.33 | | | $ | 13.62 | |
| Income (loss) from investment operations: |
| Net investment income (loss)b | | | .09 | | | | .33 | | | | .33 | | | | .12 | |
| Net gain (loss) on investments (realized and unrealized) | | | .37 | | | | 1.35 | | | | 1.35 | | | | (1.29 | ) |
| Total from investment operations | | | .46 | | | | 1.68 | | | | 1.68 | | | | (1.17 | ) |
| Less distributions from: |
| Net investment income | | | (.10 | ) | | | (.33 | ) | | | (.28 | ) | | | (.12 | ) |
| Total distributions | | | (.10 | ) | | | (.33 | ) | | | (.28 | ) | | | (.12 | ) |
| Net asset value, end of period | | $ | 15.44 | | | $ | 15.08 | | | $ | 13.73 | | | $ | 12.33 | |
| |
| Total Returnc | | | 3.05 | % | | | 12.32 | % | | | 13.73 | % | | | (8.64 | %) |
| Ratios/Supplemental Data |
| Net assets, end of period (in thousands) | | $ | 321 | | | $ | 355 | | | $ | 133 | | | $ | 9 | |
| Ratios to average net assets: |
| Net investment income (loss) | | | 1.09 | % | | | 2.28 | % | | | 2.58 | % | | | 2.14 | % |
| Total expensesd | | | 1.43 | % | | | 1.76 | % | | | 1.33 | % | | | 3.54 | % |
| Net expensese | | | 1.22 | %h,i | | | 1.24 | %h,i | | | 1.33 | %i | | | 1.48 | %i |
| Portfolio turnover rate | | | 58 | % | | | 94 | % | | | 51 | % | | | 131 | % |
| 98 | THE GUGGENHEIM FUNDS SEMI-ANNUAL REPORT | SEE NOTES TO FINANCIAL STATEMENTS. |
| FINANCIAL HIGHLIGHTS (concluded) |
This table is presented to show selected data for a share outstanding throughout each period and to assist shareholders in evaluating a Fund’s performance for the periods presented.
| Institutional Class | | Period Ended
March 29,
2018a | | | Year Ended
September 30,
2017 | | | Year Ended
September 30,
2016 | | | Year Ended
September 30,
2015 | | | Year Ended
September 30,
2014 | | | Year Ended
September 30,
2013 | |
| Per Share Data | | | | | | | | | | | | | | | | | | |
| Net asset value, beginning of period | | $ | 14.74 | | | $ | 13.44 | | | $ | 12.23 | | | $ | 13.45 | | | $ | 12.53 | | | $ | 10.50 | |
| Income (loss) from investment operations: |
| Net investment income (loss)b | | | .11 | | | | .35 | | | | .31 | | | | .36 | | | | .44 | | | | .28 | |
| Net gain (loss) on investments (realized and unrealized) | | | .36 | | | | 1.33 | | | | 1.28 | | | | (1.21 | ) | | | .90 | | | | 2.10 | |
| Total from investment operations | | | .47 | | | | 1.68 | | | | 1.59 | | | | (.85 | ) | | | 1.34 | | | | 2.38 | |
| Less distributions from: |
| Net investment income | | | (.11 | ) | | | (.38 | ) | | | (.38 | ) | | | (.37 | ) | | | (.42 | ) | | | (.35 | ) |
| Total distributions | | | (.11 | ) | | | (.38 | ) | | | (.38 | ) | | | (.37 | ) | | | (.42 | ) | | | (.35 | ) |
| Net asset value, end of period | | $ | 15.10 | | | $ | 14.74 | | | $ | 13.44 | | | $ | 12.23 | | | $ | 13.45 | | | $ | 12.53 | |
| |
| Total Returnc | | | 3.21 | % | | | 12.61 | % | | | 13.11 | % | | | (6.42 | %) | | | 10.83 | % | | | 23.17 | % |
| Ratios/Supplemental Data |
| Net assets, end of period (in thousands) | | $ | 4,773 | | | $ | 3,734 | | | $ | 2,824 | | | $ | 4,541 | | | $ | 911 | | | $ | 252 | |
| Ratios to average net assets: |
| Net investment income (loss) | | | 1.41 | % | | | 2.50 | % | | | 2.42 | % | | | 2.70 | % | | | 3.27 | % | | | 2.42 | % |
| Total expensesd | | | 1.13 | % | | | 1.09 | % | | | 1.30 | % | | | 1.23 | % | | | 1.33 | % | | | 1.73 | % |
| Net expensese,f | | | 0.97 | %h,i | | | 0.98 | %h,i | | | 1.22 | %i | | | 1.23 | %i | | | 1.23 | %i | | | 1.26 | % |
| Portfolio turnover rate | | | 58 | % | | | 94 | % | | | 51 | % | | | 131 | % | | | 131 | % | | | 154 | % |
| a | Unaudited figures for the period ended March 29, 2018. Percentage amounts for the period, except total return and portfolio turnover rate, have been annualized. |
| b | Net investment income (loss) per share was computed using average shares outstanding throughout the period. |
| c | Total return does not reflect the impact of any applicable sales charges and has not been annualized. |
| d | Does not include expenses of the underlying funds in which the Fund invests. |
| e | Net expense information reflects the expense ratios after expense waivers and reimbursements, as applicable. |
| f | The portion of the ratios of net expenses to average net assets attributable to recoupments of prior fee reductions or expense reimbursements is 0.00% for C-Class and 0.00% for Institutional Class. |
| g | Since commencement of operations: May 1, 2015. Percentage amounts for the period, except total return and portfolio turnover rate, have been annualized. |
| h | The portion of the ratios of net expenses to average net assets attributable to recoupments of prior fee reductions or expense reimbursements for the periods presented would be: |
| | | 03/29/18 | 09/30/17 |
| | A-Class | — | 0.01% |
| | C-Class | — | 0.01% |
| | P-Class | — | — |
| | Institutional Class | — | 0.03% |
| i | Net expenses may include expenses that are excluded from the expense limitation agreement and recouped amounts. Excluding these expenses, the operating expense ratios for the periods presented would be: |
| | | 03/29/18 | 09/30/17 | 09/30/16 | 09/30/15 | 09/30/14 |
| | A-Class | 1.22% | 1.22% | 1.46% | 1.46% | 1.46% |
| | C-Class | 1.97% | 1.97% | 2.21% | 2.21% | 2.21% |
| | P-Class | 1.22% | 1.22% | 1.32% | 1.46% | — |
| | Institutional Class | 0.97% | 0.96% | 1.21% | 1.21% | 1.21% |
| SEE NOTES TO FINANCIAL STATEMENTS. | THE GUGGENHEIM FUNDS SEMI-ANNUAL REPORT | 99 |
| NOTES TO FINANCIAL STATEMENTS (Unaudited) |
Note 1 – Organization and Significant Accounting Policies
Organization
Guggenheim Funds Trust (the “Trust”), a Delaware statutory trust, is registered with the SEC under the Investment Company Act of 1940 (“1940 Act”), as an open-ended investment company of the series type. Each series, in effect, is representing a separate Fund. The Trust is authorized to issue an unlimited number of shares. The Trust accounts for the assets of each Fund separately.
The Trust offers a combination of five separate classes of shares, A-Class shares, C-Class shares, P-Class shares, R6-Class shares and Institutional Class shares. Sales of shares of each Class are made without a front-end sales charge at the net asset value per share (“NAV”), with the exception of A-Class shares. A-Class shares are sold at the NAV, plus the applicable front-end sales charge. The sales charge varies depending on the amount purchased. A-Class share purchases of $1 million or more are exempt from the front-end sales charge but have a 1% contingent deferred sales charge (“CDSC”), if shares are redeemed within 12 months of purchase. C-Class shares have a 1% CDSC if shares are redeemed within 12 months of purchase. Institutional Class shares are offered primarily for direct investment by institutions such as pension and profit sharing plans, endowments, foundations and corporations. Institutional Class shares require a minimum initial investment of $2 million and a minimum account balance of $1 million. At March 29, 2018, the Trust consisted of nineteen funds.
This report covers the Alpha Opportunity Fund, Large Cap Value Fund, Market Neutral Real Estate Fund, Risk Managed Real Estate Fund, Small Cap Value Fund, StylePlus—Large Core Fund, StylePlus—Mid Growth Fund, and World Equity Income Fund (the “Funds”), each a diversified investment company with the exception of the Large Cap Value Fund, Market Neutral Real Estate Fund and Risk Managed Real Estate Fund, which are each a non-diversified investment company. Only A-Class, C-Class, P-Class and Institutional Class shares had been issued by the Funds.
Security Investors, LLC, which operates under the name Guggenheim Investments (“GI”) and Guggenheim Partners Investment Management, LLC (“GPIM”), provide advisory services. Guggenheim Funds Distributors, LLC (“GFD” or the “Distributor”) acts as principal underwriter for the Trust. GI, GPIM and GFD are affiliated entities.
Significant Accounting Policies
March 29, 2018 represents the last day during the Funds’ semi-annual period on which the New York Stock Exchange (“NYSE”) was open for trading. The Funds’ financial statements have been presented through that date to maintain consistency with the Funds’ net asset value calculations used for shareholder transactions.
The Funds operate as investment companies and, accordingly, follow the investment company accounting and reporting guidance of the Financial Accounting Standards Board (“FASB”) Accounting Standards Codification Topic 946 Financial Services – Investment Companies.
The following significant accounting policies are in conformity with U.S. generally accepted accounting principles (“U.S. GAAP”) and are consistently followed by the Trust. This requires management to make estimates and assumptions that affect the reported amount of assets and liabilities, contingent assets and liabilities at the date of the financial statements, and the reported amounts of revenues and expenses during the reporting period. Actual results could differ from these estimates. All time references are based on Eastern Time.
The NAV of each Class of a fund is calculated by dividing the market value of a fund’s securities and other assets, less all liabilities, attributable to the Class by the number of outstanding shares of the Class.
(a) Valuation of Investments
The Board of Trustees of the Funds (the “Board”) has adopted policies and procedures for the valuation of the Funds’ investments (the “Valuation Procedures”). Pursuant to the Valuation Procedures, the Board has delegated to a valuation committee, consisting of representatives from Guggenheim’s investment management, fund administration, legal and compliance departments (the “Valuation Committee”), the day-to-day responsibility for implementing the Valuation Procedures, including, under most circumstances, the responsibility for determining the fair value of the Funds’ securities and/or other assets.
Valuations of the Funds’ securities are supplied primarily by pricing services appointed pursuant to the processes set forth in the Valuation Procedures. The Valuation Committee convenes monthly, or more frequently as needed, to review the valuation of all assets which have been fair valued for reasonableness. The Funds’ officers, through the Valuation Committee and consistent with the monitoring and review responsibilities set forth in the Valuation Procedures, regularly review procedures used and valuations provided by the pricing services.
If the pricing service cannot or does not provide a valuation for a particular investment or such valuation is deemed unreliable, such investment is fair valued by the Valuation Committee.
Equity securities listed on an exchange (NYSE or American Stock Exchange) are valued at the last quoted sale price as of the close of business on the NYSE, usually 4:00 p.m. on the valuation date. Equity securities listed on the NASDAQ market system are valued
| 100 | THE GUGGENHEIM FUNDS SEMI-ANNUAL REPORT | |
| NOTES TO FINANCIAL STATEMENTS (Unaudited)(continued) |
at the NASDAQ Official Closing Price on the valuation date, which may not necessarily represent the last sale price. If there has been no sale on such exchange or NASDAQ on a given day, the security is valued at the closing bid price on that day.
Generally, trading in foreign securities markets is substantially completed each day at various times prior to the close of the NYSE. The values of foreign securities are determined as of the close of such foreign markets or the close of the NYSE, if earlier. All investments quoted in foreign currencies are valued in U.S. dollars on the basis of the foreign currency exchange rates prevailing at the close of U.S. business at 4:00pm. Investments in foreign securities may involve risks not present in domestic investments. The Valuation Committee will determine the current value of such foreign securities by taking into consideration certain factors which may include those discussed above, as well as the following factors, among others: the value of the securities traded on other foreign markets, ADR trading, closed-end fund trading, foreign currency exchange activity, and the trading prices of financial products that are tied to foreign securities. In addition, under the Valuation Procedures, the Valuation Committee and GI are authorized to use prices and other information supplied by a third party pricing vendor in valuing foreign securities.
Open-end investment companies (“mutual funds”) are valued at their NAV as of the close of business, on the valuation date.
Exchange-traded funds (“ETFs”) and closed-end investment companies (“CEFs”) are valued at the last quoted sale price.
The value of futures contracts is accounted for using the unrealized gain or loss on the contracts that is determined by marking the contracts to their current realized settlement prices. Financial futures contracts are valued at the 4:00 p.m. price on the valuation date. In the event that the exchange for a specific futures contract closes earlier than 4:00 p.m., the futures contract is valued at the Official Settlement Price of the exchange. However, the underlying securities from which the futures contract value is derived are monitored until 4:00 p.m. to determine if fair valuation would provide a more accurate valuation.
The values of over-the-counter (“OTC”) swap agreements entered into by a Fund are accounted for using the unrealized gains or losses on the agreements that are determined by marking the agreements to the last quoted value of the index that the swaps pertain to at the close of the NYSE. The value of interest rate swap agreements entered into by a Fund is accounted for using the unrealized gain or loss on the agreements that is determined using the spread priced off the previous day’s Chicago Mercantile Exchange (“CME”) price.
Investments for which market quotations are not readily available are fair-valued as determined in good faith by GI and GPIM, subject to review and approval by the Valuation Committee, pursuant to methods established or ratified by the Board. Valuations in accordance with these methods are intended to reflect each security’s (or asset’s) “fair value”. Each such determination is based on a consideration of all relevant factors, which are likely to vary from one pricing context to another. Examples of such factors may include, but are not limited to market prices; sale prices; broker quotes; and models which derive prices based on inputs such as prices of securities with comparable maturities and characteristics, or based on inputs such as anticipated cash flows or collateral, spread over Treasuries, and other information analysis.
In connection with futures contracts and other derivative investments, such factors may include obtaining information as to how (a) these contracts and other derivative investments trade in the futures or other derivative markets, respectively, and (b) the securities underlying these contracts and other derivative investments trade in the cash market.
(b) Short Sales
When a Fund engages in a short sale of a security, an amount equal to the proceeds is reflected as an asset and an equivalent liability. The amount of the liability is subsequently marked-to-market to reflect the market value of the short sale. The Fund maintains a segregated account of cash and/or securities as collateral for short sales.
Fees, if any, paid to brokers to borrow securities in connection with short sales are recorded as interest expense. In addition, the Fund must pay out the dividend rate of the equity or coupon rate of the obligation to the lender and record this as an expense. Short dividend or interest expense is a cost associated with the investment objective of short sales transactions, rather than an operational cost associated with the day-to-day management of any mutual fund. The Fund may also receive rebate income from the broker resulting from the investment of the proceeds from securities sold short.
(c) Futures Contracts
Upon entering into a futures contract, a Fund deposits and maintains as collateral such initial margin as required by the exchange on which the transaction is affected. Pursuant to the contract, the Fund agrees to receive from or pay to the broker an amount of cash equal to the daily fluctuation in value of the contract. Such receipts or payments are known as variation margin and are recorded by the Fund as unrealized gains or losses. When the contract is closed, the Fund records a realized gain or loss equal to the difference between the value of the contract at the time it was opened and the value at the time it was closed.
| | THE GUGGENHEIM FUNDS SEMI-ANNUAL REPORT | 101 |
| NOTES TO FINANCIAL STATEMENTS (Unaudited)(continued) |
(d) Swap Agreements
Swap agreements are marked-to-market daily and the change, if any, is recorded as unrealized gain or loss. Payments received or made as a result of an agreement or termination of an agreement are recognized as realized gains or losses.
(e) Foreign Taxes
The Funds may be subject to foreign taxes (a portion of which may be reclaimable) on income, stock dividends, capital gains on investments or certain foreign currency transactions. All foreign taxes are recorded in accordance with the applicable foreign tax regulations and rates that exist in the foreign jurisdictions in which the Funds invest. These foreign taxes, if any, are paid by the Funds and reflected in their Statement of Operations as follows: foreign taxes withheld at source are presented as a reduction of income and foreign taxes on capital gains from sales of investments are included with the net realized gain (loss) on investments. Foreign taxes payable or deferred as of March 29, 2018, if any, are disclosed in the Funds’ Statements of Assets and Liabilities.
(f) Security Transactions
Security transactions are recorded on the trade date for financial reporting purposes. Realized gains and losses from securities transactions are recorded using the identified cost basis. Proceeds from lawsuits related to investment holdings are recorded as realized gains in the respective Fund. Dividend income is recorded on the ex-dividend date, net of applicable taxes withheld by foreign countries. Taxable non-cash dividends are recorded as dividend income. Interest income, including amortization of premiums and accretion of discounts, is accrued on a daily basis. Amendment fees are earned as compensation for evaluating and accepting changes to the original loan agreement and are recognized when received. Dividend income from Real Estate Investment Trusts (“REITs”) is recorded based on the income included in the distributions received from the REIT investments using published REIT classifications, including some management estimates when actual amounts are not available. Distributions received in excess of this estimated amount are recorded as a reduction of the cost of investments or reclassified to capital gains. The actual amounts of income, return of capital, and capital gains are only determined by each REIT after its fiscal year-end, and may differ from the estimated amounts.
(g) Distributions
Dividends from net investment income are declared quarterly in the World Equity Income Fund and Risk Managed Real Estate Fund. Dividends are reinvested in additional shares unless shareholders request payment in cash. Distributions of net investment income in the remaining Funds and distributions of net realized gains, if any, in all Funds are declared at least annually and recorded on the ex-dividend date and are determined in accordance with income tax regulations which may differ from U.S. GAAP.
(h) Class Allocations
Interest and dividend income, most expenses, all realized gains and losses, and all unrealized gains and losses are allocated to the classes based upon the value of the outstanding shares in each Class. Certain costs, such as distribution and service fees are charged directly to specific classes. In addition, certain expenses have been allocated to the individual Funds in the Trust on a pro rata basis upon the respective aggregate net assets of each Fund included in the Trust.
(i) Earnings Credits
Under the fee arrangement with the custodian, the Funds may earn credits based on overnight custody cash balances. These credits are utilized to reduce related custodial expenses. The custodian fees disclosed in the Statement of Operations are before the reduction in expense from the related earnings credits, if any. For the period ended March 29, 2018, there were no earnings credits received.
(j) Cash
The Funds may leave cash overnight in their cash account with the custodian. Periodically, a Fund may have cash due to the custodian bank as an overdraft balance. A fee is incurred on this overdraft, calculated by multiplying the overdraft by a rate based on the federal funds rate, which was 1.68% at March 29, 2018.
(k) Currency Translations
The accounting records of the Funds are maintained in U.S. dollars. All assets and liabilities initially expressed in foreign currencies are converted into U.S. dollars at prevailing exchange rates. Purchases and sales of investment securities, dividend and interest income, and certain expenses are translated at the rates of exchange prevailing on the respective dates of such transactions.
Changes in the relationship of these foreign currencies to the U.S. dollar can significantly affect the value of the investments and earnings of the Funds. Foreign investments may also subject the Funds to foreign government exchange restrictions, expropriation, taxation or other political, social or economic developments, all of which could affect the market and/or credit risk of the investments.
The Funds do not isolate that portion of the results of operations resulting from changes in the foreign exchange rates on investments from the fluctuations arising from changes in the market prices of securities held. Such fluctuations are included with the net realized and unrealized gain or loss on investments.
| 102 | THE GUGGENHEIM FUNDS SEMI-ANNUAL REPORT | |
| NOTES TO FINANCIAL STATEMENTS (Unaudited)(continued) |
Reported net realized foreign exchange gains and losses arise from sales of foreign currencies and currency gains or losses realized between the trade and settlement dates on investment transactions. Net unrealized exchange gains and losses arise from changes in the fair values of assets and liabilities other than investments in securities at the fiscal period end, resulting from changes in exchange rates.
(l) Indemnifications
Under the Funds’ organizational documents, the Trustees and Officers are indemnified against certain liabilities arising out of the performance of their duties to the Trust. In addition, throughout the normal course of business, the Funds enter into contracts that contain a variety of representations and warranties which provide general indemnifications. The Funds’ maximum exposure under these arrangements is unknown, as this would involve future claims that may be made against the Funds and/or their affiliates that have not yet occurred. However, based on experience, the Funds expect the risk of loss to be remote.
Note 2 – Financial Instruments and Derivatives
As part of their investment strategy, the Funds utilize short sales and a variety of derivative instruments. These investments involve, to varying degrees, elements of market risk and risks in excess of the amounts recognized in the Statements of Assets and Liabilities. Valuation and accounting treatment of these instruments can be found under Significant Accounting Policies in Note 1 of these Notes to Financial Statements.
Short Sales
A short sale is a transaction in which a Fund sells a security it does not own. If the security sold short decreases in price between the time the Fund sells the security and closes its short position, the Fund will realize a gain on the transaction. Conversely, if the security increases in price during the period, the Fund will realize a loss on the transaction. The risk of such price increases is the principal risk of engaging in short sales.
Derivatives
Derivatives are instruments whose values depend on, or are derived from, in whole or in part, the value of one or more other assets, such as securities, currencies, commodities or indices. Derivative instruments may be used to increase investment flexibility (including to maintain cash reserves while maintaining exposure to certain other assets), for risk management (hedging) purposes, to facilitate trading, to reduce transaction costs and to pursue higher investment returns. Derivative instruments may also be used to mitigate certain investment risks, such as foreign currency exchange rate risk, interest rate risk and credit risk. U.S. GAAP requires disclosures to enable investors to better understand how and why a Fund uses derivative instruments, how these derivative instruments are accounted for and their effects on the Fund’s financial position and results of operations.
The Funds may utilize derivatives for the following purposes:
Hedge: an investment made in order to reduce the risk of adverse price movements in a security, by taking an offsetting position to protect against broad market moves.
Index Exposure: the use of an instrument to obtain exposure to a listed or other type of index.
Leverage: gaining total exposure to equities or other assets on the long and short sides at greater than 100% of invested capital.
For any Fund whose investment strategy consistently involves applying leverage, the value of the Fund’s shares will tend to increase or decrease more than the value of any increase or decrease in the underlying index or other asset. In addition, because an investment in derivative instruments generally requires a small investment relative to the amount of investment exposure assumed, an opportunity for increased net income is created; but, at the same time, leverage risk will increase. The Fund’s use of leverage, through borrowings or instruments such as derivatives, may cause the Fund to be more volatile and riskier than if they had not been leveraged.
Futures
A futures contract is an agreement to purchase (long) or sell (short) an agreed amount of securities or other instruments at a set price for delivery at a future date. There are significant risks associated with a Fund’s use of futures contracts, including (i) there may be an imperfect or no correlation between the changes in market value of the underlying asset and the prices of futures contracts; (ii) there may not be a liquid secondary market for a futures contract; (iii) trading restrictions or limitations may be imposed by an exchange; and (iv) government regulations may restrict trading in futures contracts. When investing in futures, there is minimal counterparty credit risk to a Fund because futures are exchange-traded and the exchange’s clearinghouse, as counterparty to all exchange-traded futures, guarantees against default. Cash deposits are shown as segregated cash with broker on the Statements of Assets and Liabilities; securities held as collateral are noted on the Schedules of Investments.
| | THE GUGGENHEIM FUNDS SEMI-ANNUAL REPORT | 103 |
| NOTES TO FINANCIAL STATEMENTS (Unaudited)(continued) |
The following table represents the Funds’ use and volume of futures on a quarterly basis:
| | | | | Average Notional Amount | |
| Fund | | Use | | Long | | | Short | |
| StylePlus—Large Core Fund | | Index exposure | | $ | 1,271,019 | | | $ | — | |
| StylePlus—Mid Growth Fund | | Index exposure | | | 963,859 | | | | — | |
| World Equity Income Fund | | Hedge | | | — | | | | 2,837,145 | |
Swaps
A swap is an agreement that obligates two parties to exchange a series of cash flows at specified intervals based upon or calculated by reference to changes in specified prices or rates for a specified amount of an underlying asset. A Fund utilizing OTC swaps bears the risk of loss of the amount expected to be received under a swap agreement in the event of the default or bankruptcy of a swap agreement counterparty or if the underlying asset declines in value. Certain standardized swaps are subject to mandatory central clearing and are executed on a multi-lateral or other trade facility platform such as a registered exchange. There is limited counterparty credit risk with respect to centrally-cleared swaps as the transaction is facilitated through a central clearinghouse, much like an exchange-traded futures contract. Upon entering into certain centrally-cleared swap transactions, a Fund is required to deposit with its clearing broker an amount of cash or securities as an initial margin. Subsequent variation margin payments or receipts are made or received by the Fund, depending on fluctuations in the fair value of the reference entity. The exchange bears the risk of loss for interest rate swaps.
Total return swaps and custom basket swaps involve commitments where single or multiple cash flows are exchanged based on the price of an underlying reference asset (such as index or basket) or a fixed or variable interest rate. Index swaps will usually be computed based on the current index value as of the close of regular trading on the NYSE or other exchange. A fund utilizing a total return index swap bears the risk of loss of the amount expected to be received under a swap agreement in the event of the default or bankruptcy of a swap agreement counterparty or if the underlying index declines in value.
The following table represents the Funds’ use and volume of total return and custom basket swaps on a quarterly basis:
| | | | | Average Notional Amount | |
| Fund | | Use | | Long | | | Short | |
| Alpha Opportunity Fund | | Hedge, Leverage | | $ | 71,273,454 | | | $ | 221,674,743 | |
| Market Neutral Real Estate Fund | | Leverage | | | — | | | | 5,231,014 | |
| Risk Managed Real Estate Fund | | Leverage | | | 40,194,536 | | | | 39,773,320 | |
| StylePlus—Large Core Fund | | Index exposure | | | 178,364,739 | | | | — | |
| StylePlus—Mid Growth Fund | | Index exposure | | | 69,262,968 | | | | — | |
Derivative Investment Holdings Categorized by Risk Exposure
The following is a summary of the location of derivative investments on the Funds’ Statements of Assets and Liabilities as of March 29, 2018:
| Derivative Investment Type | Asset Derivatives | Liability Derivatives |
| Equity/Currency contracts | Variation margin | Variation margin |
| | Unrealized appreciation on swap agreements | Unrealized depreciation on swap agreements |
| 104 | THE GUGGENHEIM FUNDS SEMI-ANNUAL REPORT | |
| NOTES TO FINANCIAL STATEMENTS (Unaudited)(continued) |
The following table sets forth the fair value of the Funds’ derivative investments categorized by primary risk exposure at March 29, 2018:
| Asset Derivative Investments Value |
| Fund | | Futures
Equity
Risk* | | | Swaps
Equity
Risk | | | Futures
Currency
Risk* | | | Total Value at
March 29, 2018 | |
| Market Neutral Real Estate Fund | | $ | — | | | $ | 345,580 | | | $ | — | | | $ | 345,580 | |
| Risk Managed Real Estate Fund | | | — | | | | 2,961,947 | | | | — | | | | 2,961,947 | |
| StylePlus—Large Core Fund | | | — | | | | 13,689,450 | | | | — | | | | 13,689,450 | |
| StylePlus—Mid Growth Fund | | | — | | | | 8,073,252 | | | | — | | | | 8,073,252 | |
| Liability Derivative Investments Value |
| Fund | | Futures
Equity
Risk* | | | Swaps
Equity
Risk | | | Futures
Currency
Risk* | | | Total Value at
March 29, 2018 | |
| Alpha Opportunity Fund | | $ | — | | | $ | 12,261,864 | | | $ | — | | | $ | 12,261,864 | |
| Risk Managed Real Estate Fund | | | — | | | | 203,135 | | | | — | | | | 203,135 | |
| StylePlus—Large Core Fund | | | 7,396 | | | | — | | | | — | | | | 7,396 | |
| World Equity Income Fund | | | — | | | | — | | | | 81,906 | | | | 81,906 | |
| * | Includes cumulative appreciation (depreciation) of futures contracts as reported on the Schedules of Investments. Only current day’s variation margin is reported within the Statements of Assets and Liabilities. |
The following is a summary of the location of derivative investments on the Funds’ Statements of Operations for the period ended March 29, 2018:
| Derivative Investment Type | Location of Gain (Loss) on Derivatives |
| Equity/Currency contracts | Net realized gain (loss) on futures contracts |
| | Net change in unrealized appreciation (depreciation) on futures contracts |
| | Net realized gain (loss) on swap agreements |
| | Net change in unrealized appreciation (depreciation) on swap agreements |
The following is a summary of the Funds’ realized gain (loss) and change in unrealized appreciation (depreciation) on derivative investments recognized on the Statements of Operations categorized by primary risk exposure for the period ended March 29, 2018:
| Realized Gain (Loss) on Derivative Investments Recognized on the Statements of Operations |
| Fund | | Futures
Equity
Risk | | | Swaps
Equity
Risk | | | Futures
Currency
Risk | | | Total | |
| Alpha Opportunity Fund | | $ | — | | | $ | (8,943,191 | ) | | $ | — | | | $ | (8,943,191 | ) |
| Market Neutral Real Estate Fund | | | — | | | | (67,048 | ) | | | — | | | | (67,048 | ) |
| Risk Managed Real Estate Fund | | | — | | | | (482,336 | ) | | | — | | | | (482,336 | ) |
| StylePlus—Large Core Fund | | | 178,935 | | | | (1,316,086 | ) | | | — | | | | (1,137,151 | ) |
| StylePlus—Mid Growth Fund | | | 278,777 | | | | (684,224 | ) | | | — | | | | (405,447 | ) |
| World Equity Income Fund | | | — | | | | — | | | | (3,170 | ) | | | (3,170 | ) |
| | THE GUGGENHEIM FUNDS SEMI-ANNUAL REPORT | 105 |
| NOTES TO FINANCIAL STATEMENTS (Unaudited)(continued) |
| Change in Unrealized Appreciation (Depreciation) on Derivative Investments Recognized on the Statements of Operations |
| Fund | | Futures
Equity
Risk | | | Swaps
Equity
Risk | | | Futures
Currency
Risk | | | Forward
Foreign
Currency
Exchange
Contracts
Risk | | | Total | |
| Alpha Opportunity Fund | | $ | — | | | $ | (2,218,561 | ) | | $ | — | | | | — | | | $ | (2,218,561 | ) |
| Market Neutral Real Estate Fund | | | — | | | | 387,395 | | | | — | | | | — | | | | 387,395 | |
| Risk Managed Real Estate Fund | | | — | | | | 2,243,008 | | | | — | | | | — | | | | 2,243,008 | |
| StylePlus—Large Core Fund | | | (32,536 | ) | | | 10,085,609 | | | | — | | | | — | | | | 10,053,073 | |
| StylePlus—Mid Growth Fund | | | (75,509 | ) | | | 6,032,464 | | | | — | | | | — | | | | 5,956,955 | |
| World Equity Income Fund | | | — | | | | — | | | | (81,906 | ) | | | 7,176 | | | | (74,730 | ) |
In conjunction with the use of short sales and derivative instruments, the Funds are required to maintain collateral in various forms. The Funds use, where appropriate, depending on the financial instrument utilized and the broker involved, margin deposits at the broker, cash and/or securities segregated at the custodian bank, discount notes or repurchase agreements allocated to the Funds.
There are several risks associated with exposure to foreign currencies, foreign issuers and emerging markets. A Fund’s indirect and direct exposure to foreign currencies subjects the Fund to the risk that those currencies will decline in value relative to the U.S. dollar, or in the case of short positions, that the U.S. dollar will decline in value relative to the currency being hedged. Currency rates in foreign countries may fluctuate significantly over short periods of time for a number of reasons, including changes in interest rates and the imposition of currency controls or other political developments in the U.S. or abroad. In addition, the Fund may incur transaction costs in connection with conversions between various currencies. The Fund may, but is not obligated to, engage in currency hedging transactions, which generally involve buying currency forward, options or futures contracts. However, not all currency risks may be effectively hedged, and in some cases the costs of hedging techniques may outweigh expected benefits. In such instances, the value of securities denominated in foreign currencies can change significantly when foreign currencies strengthen or weaken relative to the U.S. dollar.
Certain Funds may invest in securities of foreign companies directly, or in financial instruments, such as ADRs and exchange-traded funds, which are indirectly linked to the performance of foreign issuers. Foreign markets can be more volatile than the U.S. market due to increased risks of adverse issuer, political, regulatory, market, or economic developments and can perform differently from the U.S. market. Investing in securities of foreign companies directly, or in financial instruments that are indirectly linked to the performance of foreign issuers, may involve risks not typically associated with investing in U.S. issuers. The value of securities denominated in foreign currencies, and of dividends from such securities, can change significantly when foreign currencies strengthen or weaken relative to the U.S. dollar. Foreign securities markets generally have less trading volume and less liquidity than U.S. markets, and prices in some foreign markets may fluctuate more than those of securities traded on U.S. markets. Many foreign countries lack accounting and disclosure standards comparable to those that apply to U.S. companies, and it may be more difficult to obtain reliable information regarding a foreign issuer’s financial condition and operations. Transaction costs and costs associated with custody services are generally higher for foreign securities than they are for U.S. securities. Some foreign governments levy withholding taxes against dividend and interest income. Although in some countries portions of these taxes are recoverable, the non-recovered portion will reduce the income received by the Fund.
The Trust has established counterparty credit guidelines and enters into transactions only with financial institutions of investment grade or better. The Trust monitors the counterparty credit risk.
Note 3 – Offsetting
In the normal course of business, the Funds enter into transactions subject to enforceable master netting arrangements or other similar arrangements. Generally, the right to offset in those agreements allows the Funds to counteract the exposure to a specific counterparty with collateral received from or delivered to that counterparty based on the terms of the arrangements. These arrangements provide for the right to liquidate upon the occurrence of an event of default, credit event upon merger or additional termination event.
In order to better define their contractual rights and to secure rights that will help the Funds mitigate their counterparty risk, the Funds may enter into an International Swaps and Derivatives Association, Inc. Master Agreement (“ISDA Master Agreement”) or similar agreement with their derivative contract counterparties. An ISDA Master Agreement is a bilateral agreement between a fund and a counterparty that governs
| 106 | THE GUGGENHEIM FUNDS SEMI-ANNUAL REPORT | |
| NOTES TO FINANCIAL STATEMENTS (Unaudited)(continued) |
OTC derivatives, including foreign exchange contracts, and typically contains, among other things, collateral posting terms and netting provisions in the event of a default and/or termination event. The provisions of the ISDA Master Agreement typically permit a single net payment in the event of a default (close-out netting) or similar event, including the bankruptcy or insolvency of the counterparty.
For derivatives traded under an ISDA Master Agreement, the collateral requirements are typically calculated by netting the mark-to-market amount for each transaction under such agreement and comparing that amount to the value of any collateral currently pledged by the Funds and the counterparty. For financial reporting purposes, cash collateral that has been pledged to cover obligations of the Funds and cash collateral received from the counterparty, if any, are reported separately on the Statements of Assets and Liabilities as segregated cash with broker/receivable for variation margin, or payable for swap settlement/variation margin. Cash and/or securities pledged or received as collateral by the Funds in connection with OTC derivative subject to an ISDA Master Agreement generally may not be invested, sold or rehypothicated by the counterparty of the Funds, as applicable, absent an event of default under such agreement, in which case such collateral generally may be applied towards obligations due to and payable by such counterparty or the Funds, as applicable. Generally, the amount of collateral due from or to a counterparty must exceed a minimum transfer amount threshold (e.g., $300,000) before a transfer is required to be made. To the extent amounts due to the Funds from their counterparties are not fully collateralized, contractually or otherwise, the Funds bear the risk of loss from counterparty nonperformance. The Funds attempt to mitigate counterparty risk by only entering into agreements with counterparties that they believe to be of good standing and by monitoring the financial stability of those counterparties.
For financial reporting purposes, the Funds do not offset derivative assets and derivative liabilities that are subject to netting arrangements in the Statements of Assets and Liabilities.
The following tables present derivative financial instruments and secured financing transactions that are subject to enforceable netting arrangements and offset in the Statements of Assets and Liabilities in conformity with U.S. GAAP:
| | | | | | | | | | | | | Gross Amounts Not Offset
in the Statements of
Assets and Liabilities | | | | |
| Fund | Instrument | | Gross
Amounts of
Recognized
Assets | | | Gross
Amounts
Offset In the
Statements
of Assets and
Liabilities | | | Net Amount
of Assets
Presented on
the Statements
of Assets and
Liabilities | | | Financial
Instruments | | | Cash
Collateral
Received | | | Net Amount | |
| Market Neutral Real Estate Fund | Swap equity contracts | | $ | 345,580 | | | $ | — | | | $ | 345,580 | | | $ | — | | | $ | — | | | $ | 345,580 | |
| Risk Managed Real Estate Fund | Swap equity contracts | | | 2,961,947 | | | | — | | | | 2,961,947 | | | | 203,135 | | | | 1,950,000 | | | | 808,812 | |
| StylePlus—Large Core Fund | Swap equity contracts | | | 13,689,450 | | | | — | | | | 13,689,450 | | | | — | | | | 9,390,000 | | | | 4,299,450 | |
| StylePlus—Mid Growth Fund | Swap equity contracts | | | 8,073,252 | | | | — | | | | 8,073,252 | | | | — | | | | 6,375,813 | | | | 1,697,439 | |
| | | | | | | | | | | | | Gross Amounts Not Offset
in the Statements of
Assets and Liabilities | | | | |
| Fund | Instrument | | Gross
Amounts of
Recognized
Liabilities | | | Gross
Amounts
Offset In the
Statements
of Assets and
Liabilities | | | Net Amount
of Liabilities
Presented on
the Statements
of Assets and
Liabilities | | | Financial
Instruments | | | Cash
Collateral
Received | | | Net Amount | |
| Alpha Opportunity Fund | Swap equity contracts | | $ | 12,261,864 | | | $ | — | | | $ | 12,261,864 | | | $ | 12,261,864 | | | $ | — | | | $ | — | |
| Risk Managed Real Estate Fund | Swap equity contracts | | | 203,135 | | | | — | | | | 203,135 | | | | 203,135 | | | | — | | | | — | |
| | THE GUGGENHEIM FUNDS SEMI-ANNUAL REPORT | 107 |
| NOTES TO FINANCIAL STATEMENTS (Unaudited)(continued) |
The following table presents deposits held by others in connection with derivative investments as of March 29, 2018. The derivatives tables following the Schedules of Investments list each counterparty for which cash collateral may have been pledged or received at period end. The Funds have the right to offset these deposits against any related liabilities outstanding with each counterparty.
| Fund | | Counterparty/
Clearing Agent | | Asset Type | | Cash Pledged | | | Cash Received | |
| Risk Managed Real Estate Fund | | Morgan Stanley | | Custom Basket swap agreements | | $ | — | | | $ | 1,950,000 | |
| StylePlus—Large Core Fund | | Deutsche Bank | | Total Return swap agreements | | | — | | | | 9,390,000 | |
| | | Morgan Stanley | | Futures Contracts | | | 230,000 | | | | — | |
| StylePlus—Large Core Fund Total | | | | | | | 230,000 | | | | 9,390,000 | |
| StylePlus—Mid Growth Fund | | Morgan Stanley | | Total Return swap agreements | | | — | | | | 6,375,813 | |
| World Equity Income Fund | | Bank of America
Merrill Lynch | | Futures Contracts | | | 95,000 | | | | — | |
Note 4 – Fair Value Measurement
In accordance with U.S. GAAP, fair value is defined as the price that the Funds would receive to sell an investment or pay to transfer a liability in an orderly transaction with an independent buyer in the principal market, or in the absence of a principal market, the most advantageous market for the investment or liability. U.S. GAAP establishes a three-tier fair value hierarchy based on the types of inputs used to value assets and liabilities and requires corresponding disclosure. The hierarchy and the corresponding inputs are summarized below:
| Level 1 — | quoted prices in active markets for identical assets or liabilities. |
| Level 2 — | significant other observable inputs (for example quoted prices for securities that are similar based on characteristics such as interest rates, prepayment speeds, credit risk, etc.). |
| Level 3 — | significant unobservable inputs based on the best information available under the circumstances, to the extent observable inputs are not available, which may include assumptions. |
The types of inputs available depend on a variety of factors, such as the type of security and the characteristics of the markets in which it trades, if any. Fair valuation determinations that rely on fewer or no observable inputs require greater judgment. Accordingly, fair value determinations for Level 3 securities require the greatest amount of judgment.
The inputs or methodologies used for valuing securities are not necessarily an indication of the risk associated with investing in those securities. The suitability of the techniques and sources employed to determine fair valuation are regularly monitored and subject to change.
Note 5 – Investment Advisory Agreement and Other Agreements
Under the terms of an investment advisory contract, the Funds pay GI investment advisory fees calculated at the annualized rates below, based on the average daily net assets of the Funds:
| Fund | Management Fees
(as a % of Net Assets) |
| Alpha Opportunity Fund | 0.90% |
| Large Cap Value Fund | 0.65% |
| Market Neutral Real Estate Fund | 1.10% |
| Risk Managed Real Estate Fund | 0.75% |
| Small Cap Value Fund | 0.75% |
| StylePlus—Large Core Fund | 0.75% |
| StylePlus—Mid Growth Fund | 0.75% |
| World Equity Income Fund | 0.70% |
| 108 | THE GUGGENHEIM FUNDS SEMI-ANNUAL REPORT | |
| NOTES TO FINANCIAL STATEMENTS (Unaudited)(continued) |
GI engages external service providers to perform other necessary services for the Trust, such as audit and accounting related services, legal services, custody, printing and mailing, etc., on a pass-through basis. Such expenses are allocated to various Funds within the complex based on relative net assets.
The Funds have adopted Distribution Plans related to the offering of A-Class, C-Class and P-Class shares pursuant to Rule 12b-1 under the 1940 Act. The plans provide for payments at an annual rate of 0.25% of the average daily net assets of each Fund’s A-Class and P-Class shares, and 1.00% of the average daily net assets of each Fund’s C-Class shares.
Contractual expense limitation agreements for the following Funds provide that the total expenses be limited to a percentage of average net assets for each class of shares, exclusive of brokerage costs, dividends on securities sold short, expenses of other investment companies in which a Fund invests, interest, taxes, litigation, indemnification and extraordinary expenses. The limits are listed below:
| | Limit | Effective
Date | Contract
End Date |
| Alpha Opportunity Fund – A-Class | 1.76% | 05/31/17 | 02/01/19 |
| Alpha Opportunity Fund – C-Class | 2.51% | 05/31/17 | 02/01/19 |
| Alpha Opportunity Fund – P-Class | 1.76% | 05/31/17 | 02/01/19 |
| Alpha Opportunity Fund – Institutional Class | 1.51% | 05/31/17 | 02/01/19 |
| Large Cap Value Fund – A-Class | 1.15% | 11/30/12 | 02/01/19 |
| Large Cap Value Fund – C-Class | 1.90% | 11/30/12 | 02/01/19 |
| Large Cap Value Fund – P-Class | 1.15% | 05/01/15 | 02/01/19 |
| Large Cap Value Fund – Institutional Class | 0.90% | 06/05/13 | 02/01/19 |
| Market Neutral Real Estate Fund – A-Class | 1.65% | 02/26/16 | 02/01/19 |
| Market Neutral Real Estate Fund – C-Class | 2.40% | 02/26/16 | 02/01/19 |
| Market Neutral Real Estate Fund – P-Class | 1.65% | 02/26/16 | 02/01/19 |
| Market Neutral Real Estate Fund – Institutional Class | 1.40% | 02/26/16 | 02/01/19 |
| Risk Managed Real Estate Fund – A-Class | 1.30% | 03/26/14 | 02/01/19 |
| Risk Managed Real Estate Fund – C-Class | 2.05% | 03/26/14 | 02/01/19 |
| Risk Managed Real Estate Fund – P-Class | 1.30% | 05/01/15 | 02/01/19 |
| Risk Managed Real Estate Fund – Institutional Class | 1.10% | 03/26/14 | 02/01/19 |
| Small Cap Value Fund – A-Class | 1.30% | 11/30/12 | 02/01/19 |
| Small Cap Value Fund – C-Class | 2.05% | 11/30/12 | 02/01/19 |
| Small Cap Value Fund – P-Class | 1.30% | 05/01/15 | 02/01/19 |
| Small Cap Value Fund – Institutional Class | 1.05% | 11/30/12 | 02/01/19 |
| World Equity Income Fund – A-Class | 1.22% | 08/15/13 | 02/01/19 |
| World Equity Income Fund – C-Class | 1.97% | 08/15/13 | 02/01/19 |
| World Equity Income Fund – P-Class | 1.22% | 05/01/15 | 02/01/19 |
| World Equity Income Fund – Institutional Class | 0.97% | 08/15/13 | 02/01/19 |
| | THE GUGGENHEIM FUNDS SEMI-ANNUAL REPORT | 109 |
| NOTES TO FINANCIAL STATEMENTS (Unaudited)(continued) |
GI and GPIM are entitled to reimbursement by the Funds for fees waived or expenses reimbursed during any of the previous 36 months, beginning on the date of the expense limitation agreement, if on any day the estimated operating expenses are less than the indicated percentages. For purposes of this arrangement, GI and GPIM are entitled to recoupment of previously waived fees or reimbursed expenses for 36 months from the date of the waiver or reimbursement by GI or GPIM. At March 29, 2018, the amount of fees waived or expenses reimbursed that are subject to recoupment are presented in the following table:
| Fund | | Expires
2018 | | | Expires
2019 | | | Expires
2020 | | | Expires
2021 | | | Fund
Total | |
| Alpha Opportunity Fund | | | | | | | | | | | | | | | |
| A-Class | | $ | 92,503 | | | $ | — | | | $ | 7,212 | | | $ | 583 | | | $ | 100,298 | |
| C-Class | | | 12,810 | | | | 7,081 | | | | 1,244 | | | | 185 | | | | 21,320 | |
| P-Class | | | — | | | | — | | | | 2,915 | | | | 1,114 | | | | 4,029 | |
| Institutional Class | | | — | | | | — | | | | 7,310 | | | | — | | | | 7,310 | |
| Large Cap Value Fund | | | | | | | | | | | | | | | | | | | | |
| A-Class | | | 95,743 | | | | 87,212 | | | | 78,038 | | | | 74,160 | | | | 335,153 | |
| C-Class | | | 9,943 | | | | 9,306 | | | | 6,283 | | | | 4,941 | | | | 30,473 | |
| P-Class | | | 79 | | | | 338 | | | | 762 | | | | 308 | | | | 1,487 | |
| Institutional Class | | | 2,123 | | | | 1,129 | | | | 1,773 | | | | 1,644 | | | | 6,669 | |
| Market Neutral Real Estate Fund | | | | | | | | | | | | | | | | | | | | |
| A-Class | | | — | | | | 997 | | | | 3,417 | | | | 1,813 | | | | 6,227 | |
| C-Class | | | — | | | | 905 | | | | 4,410 | | | | 1,832 | | | | 7,147 | |
| P-Class | | | — | | | | 979 | | | | 5,860 | | | | 6,080 | | | | 12,919 | |
| Institutional Class | | | — | | | | 45,647 | | | | 151,686 | | | | 80,657 | | | | 277,990 | |
| Risk Managed Real Estate Fund | | | | | | | | | | | | | | | | | | | | |
| A-Class | | | 2,334 | | | | 918 | | | | 1,219 | | | | 387 | | | | 4,858 | |
| C-Class | | | 2,095 | | | | 2,257 | | | | 1,084 | | | | 720 | | | | 6,156 | |
| P-Class | | | 81 | | | | 58 | | | | 1,443 | | | | 694 | | | | 2,276 | |
| Institutional Class | | | — | | | | — | | | | 12,943 | | | | 1,426 | | | | 14,369 | |
| Small Cap Value Fund | | | | | | | | | | | | | | | | | | | | |
| A-Class | | | 105,165 | | | | 123,706 | | | | 71,327 | | | | 38,516 | | | | 338,714 | |
| C-Class | | | 44,550 | | | | 49,668 | | | | 29,869 | | | | 14,910 | | | | 138,997 | |
| P-Class | | | 2 | | | | 116 | | | | 336 | | | | 129 | | | | 583 | |
| Institutional Class | | | 4,007 | | | | 4,063 | | | | 15,554 | | | | 17,010 | | | | 40,634 | |
| World Equity Income Fund | | | | | | | | | | | | | | | | | | | | |
| A-Class | | | — | | | | — | | | | 85,342 | | | | 83,036 | | | | 168,378 | |
| C-Class | | | 2,930 | | | | 7,207 | | | | 12,042 | | | | 8,358 | | | | 30,537 | |
| P-Class | | | — | | | | — | | | | 896 | | | | 373 | | | | 1,269 | |
| Institutional Class | | | — | | | | 1,831 | | | | 2,937 | | | | 3,442 | | | | 8,210 | |
During the period ended March 29, 2018, GI and GPIM recouped amounts from the Funds as follows:
| Alpha Opportunity Fund | | $ | 7,867 | |
| Risk Managed Real Estate Fund | | | 15,645 | |
| World Equity Income Fund | | | 43 | |
If a Fund invests in an affiliated fund, the investing Fund’s adviser has agreed to waive fees at the investing fund level. Fee waivers will be calculated at the investing Fund level without regard to any expense cap, if any, in effect for the investing Fund. Fees waived under this arrangement are not subject to reimbursement to GI or GPIM. For the period ended March 29, 2018, the following Funds waived fees related to investments in affiliated funds:
| Fund | | Amount | |
| StylePlus—Large Core Fund | | $ | 36,570 | |
| StylePlus—Mid Growth Fund | | | 14,544 | |
For the period ended March 29, 2018, GFD retained sales charges of $252,432 relating to sales of A-Class shares of the Trust.
| 110 | THE GUGGENHEIM FUNDS SEMI-ANNUAL REPORT | |
| NOTES TO FINANCIAL STATEMENTS (Unaudited)(continued) |
Certain officers and trustees of the Trust are also officers of GI, GPIM and/or GFD. The Trust does not compensate its officers or trustees who are officers, directors and/or employees of GI, GPIM and GFD.
MUFG Investor Services (US), LLC (“MUIS”) acts as the Trust’s administrator, transfer agent and accounting agent. As administrator, transfer agent and accounting agent, MUIS is responsible for maintaining the books and records of the Trust’s securities and cash. The Bank of New York Mellon Corp. (“BNY”) acts as the Funds’ custodian. As custodian, BNY is responsible for the custody of the Funds’ assets. For providing the aforementioned administrative and accounting services, MUIS is entitled to receive a monthly fee equal to a percentage of the Funds’ fees and out of pocket expenses. For providing the aforementioned transfer agent and custodian services, MUIS and BNY are entitled to receive a monthly fee based on the number of transactions during the month and the number of accounts under management subject to certain minimum monthly fees and out of pocket expenses.
At March 29, 2018, GI and GPIM and its affiliates owned over twenty percent of the outstanding shares of the Funds, as follows:
| Fund | Percent of outstanding
shares owned |
| Alpha Opportunity Fund | 73% |
| Market Neutral Real Estate Fund | 90% |
Note 6 – Federal Income Tax Information
The Funds intend to comply with the provisions of Subchapter M of the Internal Revenue Code applicable to regulated investment companies and will distribute substantially all taxable net investment income and capital gains sufficient to relieve the Funds from all, or substantially all, federal income, excise and state income taxes. Therefore, no provision for federal or state income tax is required.
Tax positions taken or expected to be taken in the course of preparing the Funds’ tax returns are evaluated to determine whether the tax positions are “more-likely-than-not” of being sustained by the applicable tax authority. Tax positions not deemed to meet the more-likely-than-not threshold would be recorded as a tax benefit or expense in the current year. Management has analyzed the Funds’ tax positions taken, or to be taken, on federal income tax returns for all open tax years, and has concluded that no provision for income tax is required in the Funds’ financial statements. The Funds’ federal tax returns are subject to examination by the Internal Revenue Service for a period of three years after they are filed.
At March 29, 2018, the cost of securities for federal income tax purposes, the aggregate gross unrealized gain for all securities for which there was an excess of value over tax cost, and the aggregate gross unrealized loss for all securities for which there was an excess of tax cost over value were as follows:
| Fund | | Tax
Cost | | | Tax
Unrealized
Gain | | | Tax
Unrealized
Loss | | | Net
Unrealized
Gain/(Loss) | |
| Alpha Opportunity Fund | | $ | 235,718,943 | | | $ | 4,822,048 | | | $ | (21,985,484 | ) | | $ | (17,163,436 | ) |
| Large Cap Value Fund | | | 54,217,621 | | | | 12,202,260 | | | | (2,207,907 | ) | | | 9,994,353 | |
| Market Neutral Real Estate Fund | | | 5,584,477 | | | | 756,330 | | | | (154,152 | ) | | | 602,178 | |
| Risk Managed Real Estate Fund | | | 144,587,310 | | | | 10,696,537 | | | | (8,910,566 | ) | | | 1,785,971 | |
| Small Cap Value Fund | | | 16,263,221 | | | | 2,887,299 | | | | (1,499,892 | ) | | | 1,387,407 | |
| StylePlus—Large Core Fund | | | 209,762,427 | | | | 16,831,866 | | | | (924,035 | ) | | | 15,907,831 | |
| StylePlus—Mid Growth Fund | | | 84,655,673 | | | | 9,118,054 | | | | (504,000 | ) | | | 8,614,054 | |
| World Equity Income Fund | | | 84,261,124 | | | | 7,006,694 | | | | (2,086,439 | ) | | | 4,920,255 | |
| | THE GUGGENHEIM FUNDS SEMI-ANNUAL REPORT | 111 |
| NOTES TO FINANCIAL STATEMENTS (Unaudited)(concluded) |
Note 7 – Securities Transactions
For the period ended March 29, 2018, the cost of purchases and proceeds from sales of investment securities, excluding government securities, short-term investments and derivatives, were as follows:
| Fund | | Purchases | | | Sales | |
| Alpha Opportunity Fund | | $ | 373,780,421 | | | $ | 377,081,373 | |
| Large Cap Value Fund | | | 9,566,470 | | | | 12,862,794 | |
| Market Neutral Real Estate Fund | | | 3,200,481 | | | | 2,838,715 | |
| Risk Managed Real Estate Fund | | | 86,322,338 | | | | 52,557,002 | |
| Small Cap Value Fund | | | 1,882,983 | | | | 5,277,585 | |
| StylePlus—Large Core Fund | | | 68,329,686 | | | | 63,950,612 | |
| StylePlus—Mid Growth Fund | | | 31,012,908 | | | | 26,439,878 | |
| World Equity Income Fund | | | 53,041,330 | | | | 56,325,615 | |
Note 8 – Line of Credit
The Trust, with the exception of the Capital Stewardship Fund, along with certain affiliated funds, secured a 364-day committed, $1,000,000,000 line of credit from Citibank, N.A., which was in place through October 6, 2017, at which time the line of credit was renewed, with an increased commitment amount to $1,065,000,000. A Fund may draw (borrow) from the line of credit as a temporary measure for emergency purposes, to facilitate redemption requests, or for other short-term liquidity purposes consistent with the Fund’s investment objective and program. For example, it may be advantageous for the Fund to borrow money rather than sell existing portfolio positions to meet redemption requests. Fees related to borrowings, if any, vary under this arrangement between the greater of Citibank’s “base rate”, LIBOR plus 1%, or the federal funds rate (1.68% at March 29, 2018), plus 1/2 of 1%. The Funds that participate in the line of credit paid upfront costs of $982,952 to renew the line of credit. The Funds did not have any borrowings under this agreement as of and for the period ended March 29, 2018.
The commitment fee that may be paid by the Funds is at an annualized rate of 0.15% of the average daily amount of their unused commitment amount. The Funds did not have any borrowings under this agreement as of and for the year ended March 29, 2018.
The allocated commitment fee amount for each Fund is referenced in the Statement of Operations under “Line of credit fees” and the effect on the expense ratio is included in the Financial Highlights.
Note 9 – Other Liabilities
StylePlus—Large Core Fund wrote put option contracts through Lehman Brothers Inc., (“LBI”) that were exercised prior to the option contracts’ expiration and prior to the bankruptcy filing by LBI, during September, 2008. However, these transactions have not settled and the securities have not been delivered to the Fund as of March 29, 2018.
Although the ultimate resolution of these transactions is uncertain, the Fund has recorded a liability equal to the difference between the strike price on the put options and the market price of the underlying security on the exercise date. The amount of the liability recorded in miscellaneous payables by the Fund as of March 29, 2018, was $18,615.
Note 10 – Large Shareholder Risk
As of March 29, 2018, 73.3% of the Alpha Opportunity Fund (the “Fund”) was held by Macro Opportunities Fund. The Fund may experience adverse effects if a large number of shares of the Fund are held by a single shareholder (e.g., an institutional investor, financial intermediary or another GI Fund). The Fund is subject to the risk that a redemption by those shareholders of all or a large portion of the Fund could cause the Fund to liquidate its assets at inopportune times, or at a loss or depressed value, which could adversely impact the Fund’s performance and cause the value of a shareholder’s investment to decline. Redemptions of a large number of shares also may increase transaction costs or, by necessitating a sale of portfolio securities, have adverse tax consequences for shareholders. They also potentially limit the use of any capital loss carryforwards and certain other losses to offset future realized capital gains (if any) and may limit or prevent a Fund’s use of tax equalization.
| 112 | THE GUGGENHEIM FUNDS SEMI-ANNUAL REPORT | |
| OTHER INFORMATION (Unaudited) |
Proxy Voting Information
A description of the policies and procedures that the Trust uses to determine how to vote proxies relating to securities held in the Funds’ portfolios is available, without charge and upon request, by calling 800.820.0888. This information is also available from the EDGAR database on the SEC’s website at https://www.sec.gov.
Information regarding how the Funds voted proxies relating to portfolio securities during the most recent 12-month period ended June 30 is available without charge, upon request, by calling 800.820.0888. This information is also available from the EDGAR database on the SEC’s website at https://www.sec.gov.
Sector Classification
Information in the “Schedule of Investments” is categorized by sectors using sector-level Classifications defined by the Bloomberg Industry Classification System, a widely recognized industry classification system provider. Each Fund’s registration statement has investment policies relating to concentration in specific sectors/industries. For purposes of these investment policies, the Funds usually classify sectors/industries based on industry-level Classifications used by widely recognized industry classification system providers such as Bloomberg Industry Classification System, Global Industry Classification Standards and Barclays Global Classification Scheme.
Quarterly Portfolio Schedules Information
The Trust files its complete schedule of portfolio holdings with the SEC for the first and third quarters of each fiscal year on Form N-Q; which are available on the SEC’s website at https://www.sec.gov. The Funds’ Forms N-Q may be reviewed and copied at the SEC’s Public Reference Room in Washington, DC, and that information on the operation of the Public Reference Room may be obtained by calling 800-SEC-0330. Copies of the portfolio holdings are also available to shareholders, without charge and upon request, by calling 800.820.0888.
| | THE GUGGENHEIM FUNDS SEMI-ANNUAL REPORT | 113 |
| INFORMATION ON BOARD OF TRUSTEES AND OFFICERS (Unaudited) |
Name, Address*
and Year of Birth | Position(s)
Held with
the Trust | Term of Office
and Length of
Time Served** | Principal Occupation(s)
During Past Five Years | Number of
Portfolios
in Fund
Complex
Overseen | Other Directorships
Held by Trustees |
| INDEPENDENT TRUSTEES | | | |
Randall C. Barnes
(1951) | Trustee | Since 2014 | Current: Private Investor (2001-present). Former: Senior Vice President and Treasurer, PepsiCo, Inc. (1993-1997); President, Pizza Hut International (1991-1993); Senior Vice President, Strategic Planning and New Business Development, PepsiCo, Inc. (1987-1990). | 51 | Current: Trustee, Purpose Investments Funds (2014-Present). |
Donald A. Chubb, Jr.
(1946) | Trustee and Chairman of the Valuation Oversight Committee | Since 1994 | Current: Retired. Former: Business broker and manager of commercial real estate, Griffith & Blair, Inc. (1997-2017). | 48 | Former: Midland Care, Inc. (2011-2016). |
Jerry B. Farley
(1946) | Trustee and Chairman of the Audit Committee | Since 2005 | Current: President, Washburn University (1997-present). | 48 | Current: Westar Energy, Inc. (2004-present); CoreFirst Bank & Trust (2000-present). |
Roman Friedrich III
(1946) | Trustee and Chairman of the Contracts Review Committee | Since 2014 | Current: Founder and Managing Partner, Roman Friedrich & Company (1998-present). Former: Senior Managing Director, MLV & Co. LLC (2010-2011). | 48 | Current: Zincore Metals, Inc. (2009-present). Former: Axiom Gold and Silver Corp. (2011-2012). |
Ronald A. Nyberg
(1953) | Trustee and Chairman of the Nominating and Governance Committee | Since 2014 | Current: Partner, Momkus McCluskey LLC (2016-present). Former: Partner, Nyberg & Cassioppi, LLC (2000-2016); Executive Vice President, General Counsel, and Corporate Secretary, Van Kampen Investments (1982-1999). | 51 | Current: PPM Funds (February 2018-present); Edward-Elmhurst Healthcare System (2012-present); Western Asset Inflation-Linked Opportunities & Income Fund (2004-present); Western Asset Inflation-Linked Income Fund (2003-present). |
Maynard F. Oliverius
(1943)
| Trustee | Since 1998 | Current: Retired. Former: President and CEO, Stormont-Vail HealthCare (1996-2012). | 48 | Current: Robert J. Dole Institute of Politics (2016-present); Stormont-Vail Foundation (2013-present); University of Minnesota MHA Alumni Philanthropy Committee (2009-present); Fort Hays State University Foundation (1999-present). Former: Topeka Community Foundation (2009-2014). |
| 114 | THE GUGGENHEIM FUNDS SEMI-ANNUAL REPORT | |
| INFORMATION ON BOARD OF TRUSTEES AND OFFICERS (Unaudited)(continued) |
Name, Address*
and Year of Birth | Position(s)
Held with
the Trust | Term of Office
and Length of
Time Served** | Principal Occupation(s)
During Past Five Years | Number of
Portfolios
in Fund
Complex
Overseen | Other Directorships
Held by Trustees |
| INDEPENDENT TRUSTEES - concluded | |
Ronald E. Toupin, Jr.
(1958)
| Trustee and Chairman of the Board | Since 2014 | Current: Portfolio Consultant (2010-present); Member, Governing Council (2003-present) and Executive Committee (2016-present), Independent Directors Council. Former: Vice President, Manager and Portfolio Manager, Nuveen Asset Management (1998-1999); Vice President, Nuveen Investment Advisory Corp. (1992-1999); Vice President and Manager, Nuveen Unit Investment Trusts (1991-1999); and Assistant Vice President and Portfolio Manager, Nuveen Unit Investment Trusts (1988-1999), each of John Nuveen & Co., Inc. (1982-1999). | 48 | Current: Western Asset Inflation-Linked Opportunities & Income Fund (2004-present); Western Asset Inflation- Linked Income Fund (2003-present) Former: Bennett Group of Funds (2011-2013). |
| INTERESTED TRUSTEE | |
Amy J. Lee***
(1961) | Trustee, Vice President and Chief Legal Officer | Since February 2018 (Trustee) Since 2014 (Chief Legal Officer) Since 2007 (Vice President) | Current: Interested Trustee, certain other funds in the Fund Complex (February 2018-present); President, certain other funds in the Fund Complex (2017-present); Chief Legal Officer, certain other funds in the Fund Complex (2014-present); Vice President, certain other funds in the Fund Complex (2007-present); Senior Managing Director, Guggenheim Investments (2012-present). Former: President and Chief Executive Officer (2017- February 2018); Vice President, Associate General Counsel and Assistant Secretary, Security Benefit Life Insurance Company and Security Benefit Corporation (2004-2012). | 158 | None. |
| * | The business address of each Trustee is c/o Guggenheim Investments, 227 West Monroe Street, Chicago, Illinois 60606. |
| ** | Each Trustee serves an indefinite term, until his or her successor is elected and qualified. Time served includes time served in the respective position for the Predecessor Corporation. |
| *** | This Trustee is deemed to be an "interested person" of the Funds under the 1940 Act by reason of her position with the Funds' Investment Manager and/or the parent of the Investment Manager. |
| | THE GUGGENHEIM FUNDS SEMI-ANNUAL REPORT | 115 |
| INFORMATION ON BOARD OF TRUSTEES AND OFFICERS (Unaudited)(continued) |
Name, Address*
and Year of Birth | Position(s)
Held with
the Trust | Term of Office
and Length of
Time Served** | Principal Occupations
During Past Five Years |
| OFFICERS | | | |
Brian E. Binder
(1972) | President and Chief Executive Officer | Since February 2018 | Current: President and Chief Executive Officer, certain other funds in the Fund Complex (February 2018-present); President and Chief Executive Officer, Guggenheim Funds Investment Advisors, LLC and Security Investors, LLC (January 2018-present); Senior Managing Director and Chief Administrative Officer, Guggenheim Investments (January 2018-present). Former: Managing Director and President, Deutsche Funds, and Head of US Product, Trading and Fund Administration, Deutsche Asset Management (2013-January 2018); Managing Director, Head of Business Management and Consulting, Invesco Ltd. (2010-2012). |
James M. Howley
(1972) | Assistant Treasurer | Since 2014 | Current: Managing Director, Guggenheim Investments (2004-present); Assistant Treasurer, certain other funds in the Fund Complex (2006-present). Former: Manager, Mutual Fund Administration of Van Kampen Investments, Inc. (1996-2004). |
Keith D. Kemp
(1960) | Assistant Treasurer | Since 2016 | Current: Treasurer and Assistant Treasurer, certain other funds in the Fund Complex (2010-present); Managing Director, Guggenheim Investments (2015-present). Former: Chief Financial Officer, Guggenheim Specialized Products, LLC (2016-April 2018); Managing Director and Director, Transparent Value, LLC (2010-2016); Director, Guggenheim Partners Investment Management, LLC (2010-2015); Chief Operating Officer, Macquarie Capital Investment Management (2007-2009). |
Mark E. Mathiasen
(1978) | Secretary | Since 2014 | Current: Secretary, certain other funds in the Fund Complex (2007-present); Managing Director, Guggenheim Investments (2007-present). |
Glenn McWhinnie
(1969) | Assistant Treasurer | Since 2016 | Current: Vice President, Guggenheim Investments (2009-present); Assistant Treasurer, certain other funds in the Fund complex (2016-present). |
Michael P. Megaris
(1984) | Assistant Secretary | Since 2014 | Current: Assistant Secretary, certain other funds in the Fund Complex (2014-present); Director, Guggenheim Investments (2012-present). |
Elisabeth Miller
(1968) | Chief Compliance Officer | Since 2012 | Current: CCO, certain other funds in the Fund Complex (2012-present); Managing Director, Guggenheim Investments (2012-present); Vice President, Guggenheim Funds Distributors, LLC (2014-present). Former: CCO, Security Investors, LLC (2012-2018); CCO, Guggenheim Funds Investment Advisors, LLC (2012-2018); CCO, Guggenheim Distributors, LLC (2009-2014); Senior Manager, Security Investors, LLC (2004-2009); Senior Manager, Guggenheim Distributors, LLC (2004-2009). |
| 116 | THE GUGGENHEIM FUNDS SEMI-ANNUAL REPORT | |
| INFORMATION ON BOARD OF TRUSTEES AND OFFICERS (Unaudited)(concluded) |
Name, Address*
and Year of Birth | Position(s)
Held with
the Trust | Term of Office
and Length of
Time Served** | Principal Occupations
During Past Five Years |
| OFFICERS - concluded | |
Adam J. Nelson
(1979) | Assistant Treasurer | Since 2015 | Current: Vice President, Guggenheim Investments (2015-present); Assistant Treasurer, certain other funds in the Fund Complex (2015-present). Former: Assistant Vice President and Fund Administration Director, State Street Corporation (2013-2015); Fund Administration Assistant Director, State Street (2011-2013); Fund Administration Manager, State Street (2009-2011). |
Kimberly J. Scott
(1974) | Assistant Treasurer | Since 2014 | Current: Director, Guggenheim Investments (2012-present); Assistant Treasurer, certain other funds in the Fund Complex (2012-present). Former: Financial Reporting Manager, Invesco, Ltd. (2010-2011); Vice President/Assistant Treasurer, Mutual Fund Administration for Van Kampen Investments, Inc./Morgan Stanley Investment Management (2009-2010); Manager of Mutual Fund Administration, Van Kampen Investments, Inc./Morgan Stanley Investment Management (2005-2009). |
Bryan Stone
(1979) | Vice President | Since 2014 | Current: Vice President, certain other funds in the Fund Complex (2014-present); Managing Director, Guggenheim Investments (2013-present). Former: Senior Vice President, Neuberger Berman Group LLC (2009-2013); Vice President, Morgan Stanley (2002-2009). |
John L. Sullivan
(1955) | Chief Financial Officer, Chief Accounting Officer and Treasurer | Since 2014 | Current: CFO, Chief Accounting Officer and Treasurer, certain other funds in the Fund Complex (2010-present); Senior Managing Director, Guggenheim Investments (2010-present). Former: Managing Director and CCO, each of the funds in the Van Kampen Investments fund complex (2004-2010); Managing Director and Head of Fund Accounting and Administration, Morgan Stanley Investment Management (2002-2004); CFO and Treasurer, Van Kampen Funds (1996-2004). |
Jon Szafran (1989) | Assistant Treasurer | Since 2017 | Current: Vice President, Guggenheim Investments (2017-present); Assistant Treasurer, certain other funds in the Fund Complex (2017-present). Former: Assistant Treasurer of Henderson Global Funds and Manager of US Fund Administration, Henderson Global Investors (North America) Inc. ("HGINA"), (2017); Senior Analyst of US Fund Administration, HGINA (2014-2017); Senior Associate of Fund Administration, Cortland Capital Market Services, LLC (2013-2014); Experienced Associate, PricewaterhouseCoopers LLP (2012-2013). |
| * | The business address of each officer is c/o Guggenheim Investments, 227 West Monroe Street, Chicago, Illinois 60606. |
| ** | Each officer serves an indefinite term, until his or her successor is duly elected and qualified. Time served includes time served in the respective position for the Predecessor Corporation. |
| | THE GUGGENHEIM FUNDS SEMI-ANNUAL REPORT | 117 |
| GUGGENHEIM INVESTMENTS PRIVACY NOTICE (Unaudited) |
Who We Are
This Privacy Notice describes the data protection practices of Guggenheim Investments. Guggenheim Investments as used herein refers to the affiliated investment management businesses of Guggenheim Partners, LLC: Guggenheim Funds Investment Advisors, LLC, Guggenheim Partners Investment Management, LLC, Guggenheim Funds Distributors, LLC, Security Investors, LLC, Guggenheim Investment Advisors (Europe) Limited, Guggenheim Real Estate, LLC, GS Gamma Advisors, LLC, Guggenheim Partners India Management, LLC, Guggenheim Partners Europe Limited, as well as the funds in the Guggenheim Funds complex (the “Funds”) (“Guggenheim Investments,” “we,” “us,” or “our”).
Guggenheim Partners Investment Management Holdings, LLC, located at 330 Madison Avenue, New York, New York 10017 is the data controller for your information. The Affiliates who are also controllers of certain of your information are: Guggenheim Investment Advisors (Europe) Limited, Guggenheim Partners Europe Limited, Guggenheim Partners, LLC, Guggenheim Funds Investment Advisors, LLC, Guggenheim Partners Investment Management, LLC, Guggenheim Funds Distributors, LLC and Security Investors, LLC, as well as the Funds.
Our Commitment to You
Guggenheim Investments considers your privacy our utmost concern. When you become our client or investor, you entrust us with not only your hard-earned money but also with your personal and financial information. Because we have access to your private information, we hold ourselves to the highest standards in its safekeeping and use. We strictly limit how we share your information with others, whether you are a current or former Guggenheim Investments client or investor.
The Information We Collect About You
We collect certain nonpublic personal information about you from information you provide on applications, other forms, our website, and/or from third parties including investment advisors. This information includes Social Security or other tax identification number, assets, income, tax information, retirement and estate plan information, transaction history, account balance, payment history, bank account information, marital status, family relationships, information that we collect on our website through the use of “cookies,” and other personal information that you or others provide to us. We may also collect such information through your inquiries by mail, e-mail or telephone. We may also collect customer due diligence information, as required by applicable law and regulation, through third party service providers.
How We Handle Your Personal Information
The legal basis for using your information as set out in this Privacy Notice is as follows: (a) use of your personal data is necessary to perform our obligations under any contract with you (such as a contract for us to provide financial services to you); or (b) where use of your personal data is not necessary for performance of a contract, use of your personal data is necessary for our legitimate interests or the legitimate interests of others (for example, to enforce the legal terms governing our services, operate and market our website and other services we offer, ensure safe environments for our personnel and others, make and receive payments, prevent fraud and to know the customer to whom we are providing the services). Some processing is done to comply with applicable law.
In addition to the specific uses described above, we also use your information in the following manner:
| | ● | We use your information in connection with servicing your accounts. |
| | ● | We use information to respond to your requests or questions. For example, we might use your information to respond to your customer feedback. |
| | ● | We use information to improve our products and services. We may use your information to make our website and products better. We may use your information to customize your experience with us. |
| | ● | We use information for security purposes. We may use your information to protect our company and our customers. |
| | ● | We use information to communicate with you. For example, we will communicate with you about your account or our relationship. We may contact you about your feedback. We might also contact you about this Privacy Notice. We may also enroll you in our email newsletter. |
| 118 | THE GUGGENHEIM FUNDS SEMI-ANNUAL REPORT | |
| GUGGENHEIM INVESTMENTS PRIVACY NOTICE (Unaudited)(continued) |
| | ● | We use information as otherwise permitted by law, as we may notify you. |
| | ● | Aggregate/Anonymous Data. We may aggregate and/or anonymize any information collected through the website so that such information can no longer be linked to you or your device (“Aggregate/Anonymous Information”). We may use Aggregate/Anonymous Information for any purpose, including without limitation for research and marketing purposes, and may also share such data with any third parties, including advertisers, promotional partners, and sponsors. |
We do not sell information about current or former clients or their accounts to third parties. Nor do we share this information, except when necessary to complete transactions at your request, to make you aware of investment products and services that we or our affiliates offer, or as permitted or required by law.
We provide information about you to companies and individuals not affiliated with Guggenheim Investments to complete certain transactions or account changes, or to perform services for us related to your account. For example, if you ask to transfer assets from another financial institution to Guggenheim Investments, we must provide certain information about you to that company to complete the transaction. We provide the third party with only the information necessary to carry out its responsibilities and only for that purpose. And we require these third parties to treat your private information with the same high degree of confidentiality that we do. To alert you to other Guggenheim Investments products and services, we share your information within our family of affiliated companies. You may limit our sharing with affiliated companies as set out below. We may also share information with any successor to all or part of our business, or in connection with steps leading up to a merger or acquisition. For example, if part of our business was sold we may give customer information as part of that transaction. We may also share information about you with your consent.
We will release information about you if you direct us to do so, if we are compelled by law to do so, or in other circumstances as permitted by law (for example, to protect your account from fraud).
If you close your account(s) or become an inactive client or investor, we will continue to adhere to the privacy policies and practices described in this notice.
Opt-Out Provisions and Your Data Choices
The law allows you to “opt out” of certain kinds of information sharing with third parties. We do not share personal information about you with any third parties that triggers this opt-out right. This means YOU ARE ALREADY OPTED OUT.
When you are no longer our client or investor, we continue to share your information as described in this notice, and you may contact us at any time to limit our sharing by sending an email to CorporateDataPrivacy@GuggenheimPartners.com.
European Union Data Subjects and certain others: In addition to the choices set forth above, residents of the European Union and certain other jurisdictions have certain rights to (1) request access to or rectification or deletion of information we collect about them, (2) request a restriction on the processing of their information, (3) object to the processing of their information, or (4) request the portability of certain information. To exercise these or other rights, please contact us using the contact information below. We will consider all requests and provide our response within the time period stated by applicable law. Please note, however, that certain information may be exempt from such requests in some circumstances, which may include if we need to keep processing your information for our legitimate interests or to comply with a legal obligation. We may request you provide us with information necessary to confirm your identity before responding to your request.
Residents of France and certain other jurisdictions may also provide us with instructions regarding the manner in which we may continue to store, erase and share your information after your death, and where applicable, the person you have designated to exercise these rights after your death.
| | THE GUGGENHEIM FUNDS SEMI-ANNUAL REPORT | 119 |
| GUGGENHEIM INVESTMENTS PRIVACY NOTICE (Unaudited)(concluded) |
How We Protect Privacy Online
We take steps to protect your privacy when you use our web site – www.guggenheiminvestments.com – by using secure forms of online communication, including encryption technology, Secure Socket Layer (SSL) protocol, firewalls and user names and passwords. These safeguards vary based on the sensitivity of the information that we collect and store. However, we cannot and do not guarantee that these measures will prevent every unauthorized attempt to access, use, or disclose your information since despite our efforts, no Internet and/or other electronic transmissions can be completely secure. Our web site uses “http cookies”—tiny pieces of information that we ask your browser to store. We use cookies for session management and security features on the Guggenheim Investments web site. We do not use them to pull data from your hard drive, to learn your e-mail address, or to view data in cookies created by other web sites. We will not share the information in our cookies or give others access to it. See the legal information area on our web site for more details about web site security and privacy features.
How We Safeguard Your Personal Information and Data Retention
We restrict access to nonpublic personal information about you to our employees and in some cases to third parties (for example, the service providers described above) as permitted by law. We maintain strict physical, electronic and procedural safeguards that comply with federal standards to guard your nonpublic personal information.
We keep your information for no longer than necessary for the purposes for which it is processed. The length of time for which we retain information depends on the purposes for which we collected and use it and/or as required to comply with applicable laws. Information may persist in copies made for backup and business continuity purposes for additional time.
International Visitors
If you are not a resident of the United States, please be aware that your information may be transferred to, stored and processed in the United States where our servers are located and our databases are operated. The data protection and other laws of the United States and other countries might not be as comprehensive as those in your country.
In such cases, we ensure that a legal basis for such a transfer exists and that adequate protection is provided as required by applicable law, for example, by using standard contractual clauses or by transferring your data to a jurisdiction that has obtained an adequacy finding. Individuals whose data may be transferred on the basis of standard contractual clauses may contact us as described below.
We’ll Keep You Informed
If you have any questions or concerns about how we treat your personal data, we encourage you to consult with us first. You may also contact the relevant supervisory authority.
We reserve the right to modify this policy at any time and will inform you promptly of material changes. You may access our privacy policy from our web site at www.guggenheiminvestments.com. Should you have any questions regarding our privacy policy, contact us by email at CorporateDataPrivacy@GuggenheimPartners.com.
| 120 | THE GUGGENHEIM FUNDS SEMI-ANNUAL REPORT | |
This page intentionally left blank.
This page intentionally left blank.
This page intentionally left blank.
This page intentionally left blank.
This page intentionally left blank.
3.29.2018
Guggenheim Funds Semi-Annual Report
| |
| Guggenheim Diversified Income Fund | | |
| Guggenheim High Yield Fund | | |
| Guggenheim Investment Grade Bond Fund | | |
| Guggenheim Limited Duration Fund | | |
| Guggenheim Municipal Income Fund | | |
| GuggenheimInvestments.com | SBINC-SEMI-0318x0918 |
| DEAR SHAREHOLDER | 2 |
| ECONOMIC AND MARKET OVERVIEW | 4 |
| ABOUT SHAREHOLDERS’ FUND EXPENSES | 6 |
| DIVERSIFIED INCOME FUND | 9 |
| HIGH YIELD FUND | 18 |
| INVESTMENT GRADE BOND FUND | 38 |
| LIMITED DURATION FUND | 58 |
| MUNICIPAL INCOME FUND | 83 |
| NOTES TO FINANCIAL STATEMENTS | 94 |
| OTHER INFORMATION | 112 |
| INFORMATION ON BOARD OF TRUSTEES AND OFFICERS | 113 |
| GUGGENHEIM INVESTMENTS PRIVACY NOTICE | 117 |
| | THE GUGGENHEIM FUNDS SEMI-ANNUAL REPORT | 1 |
Dear Shareholder:
Security Investors, LLC and Guggenheim Partners Investment Management, LLC (the “Investment Advisers”) are pleased to present the shareholder report for a selection of our Funds (the “Funds”) for the semi-annual fiscal period ended March 29, 2018.
The Investment Advisers are part of Guggenheim Investments, which represents the investment management businesses of Guggenheim Partners, LLC, (“Guggenheim”), a global, diversified financial services firm.
Guggenheim Funds Distributors, LLC is the distributor of the Funds. Guggenheim Funds Distributors, LLC is also affiliated with Guggenheim and the Investment Advisers.
We encourage you to read the Economic and Market Overview section of the report, which follows this letter.
We are committed to providing innovative investment solutions and appreciate the trust you place in us.
Sincerely,
Security Investors, LLC,
Guggenheim Partners Investment Management, LLC
April 30, 2018
Read a prospectus and summary prospectus (if available) carefully before investing. It contains the investment objectives, risks, charges, expenses and other information, which should be considered carefully before investing. Obtain a prospectus and summary prospectus (if available) at guggenheiminvestments.com or call 800.820.0888.
This material is not intended as a recommendation or as investment advice of any kind, including in connection with rollovers, transfers, and distributions. Such material is not provided in a fiduciary capacity, may not be relied upon for or in connection with the making of investment decisions, and does not constitute a solicitation of an offer to buy or sell securities. All content has been provided for informational or educational purposes only and is not intended to be and should not be construed as legal or tax advice and/or a legal opinion. Always consult a financial, tax and/or legal professional regarding your specific situation.
Diversified Income Fund may not be suitable for all investors. ● The Fund’s market value will change in response to interest rate changes and market conditions among other factors. In general, bond prices rise when interest rates fall and vice versa. ● The Fund’s exposure to high yield securities may subject the Fund to greater volatility. ● Derivatives may pose risks in addition to and greater than those associated with investing directly in securities or other investments, including risks relating to leverage, imperfect correlations with underlying investments or the Fund’s other portfolio holdings, high price volatility, lack of availability, counterparty credit, liquidity, valuation and legal restrictions. ● Stock prices, especially stock prices of smaller companies, can be volatile as they reflect changes in the issuing company’s financial conditions and changes in the overall market ● Some asset-backed securities, including mortgage-backed securities, may have structures that make their reaction to interest rates and other factors difficult to predict, making their prices very volatile and they are subject to liquidity risk.● The Fund’s investments in other investment vehicles subject the Fund to those risks and expenses affecting the investment vehicle. ● The Fund’s investments in foreign securities carry additional risks when compared to U.S. securities, due to the impact of diplomatic, political or economic developments in the country in question (investments in emerging markets securities are generally subject to an even greater level of risks). ● Investments in syndicated bank loans generally offer a floating interest rate and involve special types of risks. ● Master limited partnerships (“MLPs”) are subject to certain risks inherent in the structure of MLPs, including tax risks, limited control and voting rights and potential conflicts of interest. MLPs that concentrate in a particular industry or a particular geographic region are subject to risks associated with such industry or region. ● The Fund’s investments in real estate securities subject the Fund to the same risks as direct investments in real estate, which is particularly sensitive to economic downturns. ● The Fund’s investments and investment strategies, including investments in MLPs and certain investment vehicles, may be subject to special and complex federal income tax provisions that may adversely affect the Fund and its distributions to shareholders. ● Leveraging will exaggerate the effect on NAV of any increase or decrease in the market value of the Fund’s portfolio. ● Please read the prospectus for more detailed information regarding these and other risks.
| 2 | THE GUGGENHEIM FUNDS SEMI-ANNUAL REPORT | |
High Yield Fund may not be suitable for all investors. ● The Fund’s market value will change in response to interest rate changes and market conditions among other factors. In general, bond prices rise when interest rates fall and vice versa. ● The Fund’s exposure to high yield securities may subject the Fund to greater volatility. ● The Fund may invest in derivative instruments, which may be more volatile and less liquid, increasing the risk of loss when compared to traditional securities. Certain of the derivative instruments are also subject to the risks of counterparty default and adverse tax treatment. ●The Fund’s use of leverage, through borrowings or instruments such as derivatives, may cause the Fund to be more volatile than if it had not been leveraged. ● Instruments and strategies (such as borrowing transactions and reverse repurchase agreements) may provide leveraged exposure to a particular investment, which will magnify any gains or losses on those investments. ● The Fund may invest in foreign securities which carry additional risks when compared to U.S. securities, due to the impact of diplomatic, political, or economic developments in the country in question (investments in emerging markets securities are generally subject to an even greater level of risks). ● Investments in syndicated bank loans generally offer a floating interest rate and involve special types of risks. ● The Fund’s investments in other investment vehicles subject the Fund to those risks and expenses affecting the investment vehicle. ● The Fund’s investments in restricted securities may involve financial and liquidity risk. ● You may have a gain or loss when you sell your shares. ● It is important to note that the Fund is not guaranteed by the U.S. government. ● Please read the prospectus for more detailed information regarding these and other risks.
Investment Grade Bond Fund may not be suitable for all investors. ● The Fund’s market value will change in response to interest rate changes and market conditions among other factors. In general, bond prices rise when interest rates fall and vice versa. ● The Fund’s exposure to high yield securities may subject the Fund to greater volatility. ● When market conditions are deemed appropriate, the Fund may use leverage to the full extent permitted by its investment policies and restrictions and applicable law. Leveraging will exaggerate the effect on net asset value of any increase or decrease in the market value of the Fund’s portfolio. ● The Fund may invest in derivative instruments, which may be more volatile and less liquid, increasing the risk of loss when compared to traditional securities. Certain of the derivative instruments are also subject to the risks of counterparty default and adverse tax treatment. ● Instruments and strategies (such as borrowing transactions and reverse repurchase agreements) may provide leveraged exposure to a particular investment, which will magnify any gains or losses on those investments. ● Investments in reverse repurchase agreements expose the Fund to the many of the same risks as investments in derivatives. ● The Fund’s investments in other investment vehicles subject the Fund to those risks and expenses affecting the investment vehicle. ● The Fund’s investments in foreign securities carry additional risks when compared to U.S. securities, due to the impact of diplomatic, political or economic developments in the country in question (investments in emerging markets securities are generally subject to an even greater level of risks). ● Investments in syndicated bank loans generally offer a floating interest rate and involve special types of risks. ● The Fund’s investments in municipal securities can be affected by events that affect the municipal bond market. ● The Fund’s investments in real estate securities subject the Fund to the same risks as direct investments in real estate, which is particularly sensitive to economic downturns. ● The Fund’s investments in restricted securities may involve financial and liquidity risk. ● You may have a gain or loss when you sell your shares. ● It is important to note that the Fund is not guaranteed by the U.S. government. ● Please read the prospectus for more detailed information regarding these and other risks.
Limited Duration Fund may not be suitable for all investors. ● The Fund’s market value will change in response to interest rate changes and market conditions among other factors. In general, bond prices rise when interest rates fall and vice versa. ● The Fund’s exposure to high yield securities may subject the Fund to greater volatility. ● When market conditions are deemed appropriate, the Fund may use leverage to the full extent permitted by its investment policies and restrictions and applicable law. Leveraging will exaggerate the effect on net asset value of any increase or decrease in the market value of the Fund’s portfolio. ● The Fund may invest in derivative instruments, which may be more volatile and less liquid, increasing the risk of loss when compared to traditional securities. Certain of the derivative instruments are also subject to the risks of counterparty default and adverse tax treatment. ● Instruments and strategies (such as borrowing transactions and reverse repurchase agreements) may provide leveraged exposure to a particular investment, which will magnify any gains or losses on those investments. ● Investments in reverse repurchase agreements expose the Fund to the many of the same risks as investments in derivatives. ● The Fund’s investments in other investment vehicles subject the Fund to those risks and expenses affecting the investment vehicle. ● The Fund’s investments in foreign securities carry additional risks when compared to U.S. securities, due to the impact of diplomatic, political or economic developments in the country in question (investments in emerging markets securities are generally subject to an even greater level of risks). ● Investments in syndicated bank loans generally offer a floating interest rate and involve special types of risks. ● The Fund’s investments in municipal securities can be affected by events that affect the municipal bond market. ● The Fund’s investments in real estate securities subject the Fund to the same risks as direct investments in real estate, which is particularly sensitive to economic downturns. ● The Fund’s investments in restricted securities may involve financial and liquidity risk. ● You may have a gain or loss when you sell your shares. ● It is important to note that the Fund is not guaranteed by the U.S. government. ● Please read the prospectus for more detailed information regarding these and other risks.
Municipal Income Fund may not be suitable for all investors. ● The Fund will be significantly affected by events that affect the municipal bond market, which could include unfavorable legislative or political developments and adverse changes in the financial conditions of state and municipal issuers or the federal government in case it provides financial support to the municipality. Income from municipal bonds held by the Fund could be declared taxable because of changes in tax laws. The Fund may invest in securities that generate taxable income. A portion of the Fund’s otherwise tax-exempt dividends may be taxable to those shareholders subject to the alternative minimum tax. ● Certain sectors of the municipal bond market have special risks that can affect them more significantly than the market as a whole. Because many municipal instruments are issued to finance similar projects, conditions in these industries can significantly affect the Fund and the overall municipal market. ● Municipalities currently experience budget shortfalls, which could cause them to default on their debt and thus subject the Fund to unforeseen losses. ● Like other funds that hold bonds and other fixed-income investments, the Fund’s market value will change in response to interest rate changes and market conditions, among other factors. In general, bond prices rise when interest rates fall and vice versa. ● The Fund’s exposure to high-yield securities may subject the Fund to greater volatility. ● When market conditions are deemed appropriate, the Fund may leverage to the full extent permitted by its investment policies and restrictions and applicable law. Leveraging will exaggerate the effect on net asset value of any increase or decrease in the market value of the Fund’s portfolio. ● The Fund may invest in derivative instruments, which may be more volatile and less liquid, increasing the risk of loss when compared to traditional securities. Certain of the derivative instruments are also subject to the risks of counterparty default and adverse tax treatment. ● Instruments and strategies (such as reverse repurchase agreements, unfunded commitments, tender option bonds, and borrowings) may expose the Fund to many of the same risks as investments in derivatives and may provide leveraged exposure to a particular investment, which will magnify any gains or losses on those investments. ● The Fund’s investments in other investment vehicles subject the Fund to those risks and expenses affecting the investment vehicle. ● The Fund’s investments in foreign securities carry additional risks when compared to U.S. securities, due to the impact of diplomatic, political, or economic developments in the country in question (investments in emerging markets securities are generally subject to an even greater level of risks). ● Investments in syndicated bank loans generally offer a floating interest rate and involve special types of risks. ● The Fund is subject to active trading risks that may increase volatility and impact its ability to achieve its investment objective. ● You may have a gain or loss when you sell your shares. ● It is important to note that the Fund is not guaranteed by the U.S. government. ● Please read the prospectus for more detailed information regarding these and other risks.
| | THE GUGGENHEIM FUNDS SEMI-ANNUAL REPORT | 3 |
| ECONOMIC AND MARKET OVERVIEW (Unaudited) | March 29, 2018 |
As we enter the ninth year of the current expansion, one of the most important new developments to evaluate is the impact of the corporate tax cuts passed into law at the end of 2017. Guggenheim’s concern is that the substantial late-cycle fiscal easing in the pipeline will prompt more restrictive monetary policy, which increases the risk that the economy will experience a boom-bust cycle that ends in a recession.
With the unemployment rate at 4.1% and core inflation rising, fiscal policy should be leaning against the economy to prevent overheating, not providing further stimulus. Faster wage growth, rising core inflation, and an unsustainably low unemployment rate underpin our longstanding view that the U.S. Federal Reserve (the “Fed”) will raise interest rates four times in 2018. Fed funds futures show the market is now pricing in nearly three rate hikes for 2018, up from two at the beginning of the year, which contributed to a pickup in first-quarter market volatility. Tighter fiscal and monetary policy, along with rising policy uncertainty ahead of the 2018 mid-terms and 2020 presidential election, could prove to be too much for an overextended economy to bear.
Further complicating the story is the risk of a global trade war sparked by protectionist actions taken by the Trump administration. We now have new steel and aluminum tariffs in place that are likely to have some modest inflationary impact while hurting almost 20% of U.S. corporates, according to our estimates. We expect more protectionist trade and investment policies in place by year end.
Over the six months ended March 29, 2018, the bear flattening (the condition in which short-term rates rise faster than long-term rates) of the U.S. Treasury curve continued with Treasury yields higher across the curve. Yields increased the most in the belly and front end of the curve. The 2-year Treasury ended the period at 2.27%, while the 10-year finished the period at 2.74%.
For the six months ended March 29, 2018, the Standard & Poor’s 500® (“S&P 500”) Index* returned 5.84%. The MSCI Europe-Australasia-Far East (“EAFE”) Index* returned 2.80%. The return of the MSCI Emerging Markets Index* was 9.08%.
In the bond market, the Bloomberg Barclays U.S. Aggregate Bond Index* posted a -1.08% return for the period, while the Bloomberg Barclays U.S. Corporate High Yield Index* returned -0.39%. The return of the ICE Bank of America (“BofA”) Merrill Lynch 3-Month U.S. Treasury Bill Index* was 0.64% for the six-month period.
The opinions and forecasts expressed may not actually come to pass. This information is subject to change at any time, based on market and other conditions, and should not be construed as a recommendation of any specific security or strategy.
*Index Definitions:
The following indices are referenced throughout this report. Indices are unmanaged and not available for direct investment. Index performance does not reflect transaction costs, fees, or expenses.
Bloomberg Barclays U.S. Aggregate Bond Index is a broad-based flagship benchmark that measures the investment grade, U.S. dollar-denominated, fixed-rate taxable bond market, including U.S. Treasuries, government-related and corporate securities, mortgage-backed securities or “MBS” (agency fixed-rate and hybrid adjustable-rate mortgage, or “ARM”, pass-throughs), asset-backed securities (“ABS”), and commercial mortgage-backed securities (“CMBS”) (agency and non-agency).
Bloomberg Barclays U.S. Aggregate Bond 1-3 Year Total Return Index measures the performance of publicly issued investment grade corporate, U.S. Treasury and government agency securities with remaining maturities of one to three years.
| 4 | THE GUGGENHEIM FUNDS SEMI-ANNUAL REPORT | |
| ECONOMIC AND MARKET OVERVIEW (Unaudited)(concluded) | March 29, 2018 |
Bloomberg Barclays U.S. Corporate High Yield Index measures the U.S. dollar-denominated, high yield, fixed-rate corporate bond market. Securities are classified as high yield if the middle rating of Moody’s, Fitch, and S&P is Ba1/BB +/BB + or below.
Bloomberg Barclays Municipal Bond Index is a broad market performance benchmark for the tax-exempt bond market. The bonds included in this index must have a minimum credit rating of at least Baa.
ICE BofA Merrill Lynch 3-Month U.S. Treasury Bill Index is an unmanaged market index of U.S. Treasury securities maturing in 90 days that assumes reinvestment of all income.
MSCI EAFE Index is a free float-adjusted market capitalization index that is designed to measure the equity market performance of developed markets, excluding the U.S. & Canada.
MSCI Emerging Markets Index is a free float-adjusted market capitalization weighted index that is designed to measure equity market performance in the global emerging markets.
S&P 500® Index is a broad-based index, the performance of which is based on the performance of 500 widely held common stocks chosen for market size, liquidity, and industry group representation.
| | THE GUGGENHEIM FUNDS SEMI-ANNUAL REPORT | 5 |
| ABOUT SHAREHOLDERS’ FUND EXPENSES (Unaudited) | |
All mutual funds have operating expenses, and it is important for our shareholders to understand the impact of costs on their investments. Shareholders of a fund incur two types of costs: (i) transaction costs, including sales charges (loads) on purchase payments, reinvested dividends, other distributions, and exchange fees, and (ii) ongoing costs, including management fees, administrative services, and shareholder reports, among others. These ongoing costs, or operating expenses, are deducted from a fund’s gross income and reduce the investment return of the fund.
A fund’s expenses are expressed as a percentage of its average net assets, which is known as the expense ratio. The following examples are intended to help investors understand the ongoing costs (in dollars) of investing in a fund and to compare these costs with the ongoing costs of investing in other mutual funds.
The examples are based on an investment of $1,000 made at the beginning of the period and held for the entire six-month period beginning September 30, 2017 and ending March 29, 2018 for actual Fund returns. Hypothetical Fund returns are for the period beginning September 30, 2017 and ending March 31, 2018.
The following tables illustrate the Funds’ costs in two ways:
Table 1. Based on actual Fund return: This section helps investors estimate the actual expenses paid over the period. The “Ending Account Value” shown is derived from the Fund’s actual return, and the fifth column shows the dollar amount that would have been paid by an investor who started with $1,000 in the Fund. Investors may use the information here, together with the amount invested, to estimate the expenses paid over the period. Simply divide the Fund’s account value by $1,000 (for example, an $8,600 account value divided by $1,000 = 8.6), then multiply the result by the number provided under the heading “Expenses Paid During Period.”
Table 2. Based on hypothetical 5% return: This section is intended to help investors compare a fund’s cost with those of other mutual funds. The table provides information about hypothetical account values and hypothetical expenses based on the Fund’s actual expense ratio and an assumed rate of return of 5% per year before expenses, which is not the Fund’s actual return. The hypothetical account values and expenses may not be used to estimate the actual ending account balance or expenses paid during the period. The example is useful in making comparisons because the U.S. Securities and Exchange Commission (the “SEC”) requires all mutual funds to calculate expenses based on the 5% return. Investors can assess a fund’s costs by comparing this hypothetical example with the hypothetical examples that appear in shareholder reports of other funds.
The calculations illustrated above assume no shares were bought or sold during the period. Actual costs may have been higher or lower, depending on the amount of investment and the timing of any purchases or redemptions.
Please note that the expenses shown in the table are meant to highlight your ongoing costs only and do not reflect any transactional costs, such as sales charges (loads) on purchase payments, and contingent deferred sales charges (“CDSC”) on redemptions, if any. Therefore, the second table is useful in comparing ongoing costs only, and will not help you determine the relative total costs of owning different funds. In addition, if these transactional costs were included, your costs would have been higher.
More information about the Funds’ expenses, including annual expense ratios for periods up to five years (subject to the Fund’s inception date), can be found in the Financial Highlights section of this report. For additional information on operating expenses and other shareholder costs, please refer to the appropriate Fund prospectus.
| 6 | THE GUGGENHEIM FUNDS SEMI-ANNUAL REPORT | |
| ABOUT SHAREHOLDERS’ FUND EXPENSES (Unaudited)(continued) | |
| | Expense
Ratio1 | Fund
Return | Beginning
Account Value
September 30, 2017 | Ending
Account Value
March 29, 2018 | Expenses
Paid During
Period2 |
| Table 1. Based on actual Fund return3 | | | | | |
| Diversified Income Fund | | | | | |
| A-Class | 0.82% | (1.10%) | $ 1,000.00 | $ 989.00 | $ 4.02 |
| C-Class | 1.56% | (1.43%) | 1,000.00 | 985.70 | 7.64 |
| P-Class | 0.82% | (1.07%) | 1,000.00 | 989.30 | 4.02 |
| Institutional Class | 0.57% | (0.95%) | 1,000.00 | 990.50 | 2.80 |
| High Yield Fund | | | | | |
| A-Class | 1.26% | (0.27%) | 1,000.00 | 997.30 | 6.21 |
| C-Class | 2.03% | (0.62%) | 1,000.00 | 993.80 | 9.98 |
| P-Class | 1.32% | (0.30%) | 1,000.00 | 997.00 | 6.50 |
| Institutional Class | 1.00% | (0.11%) | 1,000.00 | 998.90 | 4.93 |
| R6 Class | 0.93% | (0.11%) | 1,000.00 | 998.90 | 4.58 |
| Investment Grade Bond Fund | | | | | |
| A-Class | 0.85% | 0.94% | 1,000.00 | 1,009.40 | 4.21 |
| C-Class | 1.60% | 0.57% | 1,000.00 | 1,005.70 | 7.91 |
| P-Class | 0.83% | 0.99% | 1,000.00 | 1,009.90 | 4.11 |
| Institutional Class | 0.56% | 1.14% | 1,000.00 | 1,011.40 | 2.78 |
| Limited Duration Fund | | | | | |
| A-Class | 0.76% | 0.72% | 1,000.00 | 1,007.20 | 3.76 |
| C-Class | 1.51% | 0.38% | 1,000.00 | 1,003.80 | 7.46 |
| P-Class | 0.76% | 0.72% | 1,000.00 | 1,007.20 | 3.76 |
| Institutional Class | 0.51% | 0.88% | 1,000.00 | 1,008.80 | 2.53 |
| Municipal Income Fund | | | | | |
| A-Class | 0.81% | (0.04%) | 1,000.00 | 999.60 | 3.99 |
| C-Class | 1.56% | (0.41%) | 1,000.00 | 995.90 | 7.68 |
| P-Class | 0.81% | (0.04%) | 1,000.00 | 999.60 | 3.99 |
| Institutional Class | 0.56% | 0.01% | 1,000.00 | 1,000.10 | 2.76 |
| | THE GUGGENHEIM FUNDS SEMI-ANNUAL REPORT | 7 |
| ABOUT SHAREHOLDERS’ FUND EXPENSES (Unaudited)(concluded) | |
| | Expense
Ratio1 | Fund
Return | Beginning
Account Value
September 30, 2017 | Ending
Account Value
March 31, 2018 | Expenses
Paid During
Period4 |
| Table 2. Based on hypothetical 5% return (before expenses)5 | | | | |
| Diversified Income Fund | | | | | |
| A-Class | 0.82% | 5.00% | $ 1,000.00 | $ 1,020.84 | $ 4.13 |
| C-Class | 1.56% | 5.00% | 1,000.00 | 1,017.15 | 7.85 |
| P-Class | 0.82% | 5.00% | 1,000.00 | 1,020.84 | 4.13 |
| Institutional Class | 0.57% | 5.00% | 1,000.00 | 1,022.09 | 2.87 |
| High Yield Fund | | | | | |
| A-Class | 1.26% | 5.00% | 1,000.00 | 1,018.65 | 6.34 |
| C-Class | 2.03% | 5.00% | 1,000.00 | 1,014.81 | 10.20 |
| P-Class | 1.32% | 5.00% | 1,000.00 | 1,018.35 | 6.64 |
| Institutional Class | 1.00% | 5.00% | 1,000.00 | 1,019.95 | 5.04 |
| R6 Class | 0.93% | 5.00% | 1,000.00 | 1,020.29 | 4.68 |
| Investment Grade Bond Fund | | | | | |
| A-Class | 0.85% | 5.00% | 1,000.00 | 1,020.69 | 4.28 |
| C-Class | 1.60% | 5.00% | 1,000.00 | 1,016.95 | 8.05 |
| P-Class | 0.83% | 5.00% | 1,000.00 | 1,020.79 | 4.18 |
| Institutional Class | 0.56% | 5.00% | 1,000.00 | 1,022.14 | 2.82 |
| Limited Duration Fund | | | | | |
| A-Class | 0.76% | 5.00% | 1,000.00 | 1,021.14 | 3.83 |
| C-Class | 1.51% | 5.00% | 1,000.00 | 1,017.40 | 7.59 |
| P-Class | 0.76% | 5.00% | 1,000.00 | 1,021.14 | 3.83 |
| Institutional Class | 0.51% | 5.00% | 1,000.00 | 1,022.39 | 2.57 |
| Municipal Income Fund | | | | | |
| A-Class | 0.81% | 5.00% | 1,000.00 | 1,020.89 | 4.08 |
| C-Class | 1.56% | 5.00% | 1,000.00 | 1,017.15 | 7.85 |
| P-Class | 0.81% | 5.00% | 1,000.00 | 1,020.89 | 4.08 |
| Institutional Class | 0.56% | 5.00% | 1,000.00 | 1,022.14 | 2.82 |
| 1 | Annualized and excludes expenses of the underlying funds in which the Funds invest, if any. |
| 2 | Expenses in table 1 are equal to the Fund’s annualized expense ratio, net of any applicable fee waivers, multiplied by the average account value over the period, multiplied by 180/365 (to reflect the one-half year period). |
| 3 | Actual cumulative return at net asset value for the period September 30, 2017 to March 29, 2018. |
| 4 | Expenses in table 2 are equal to the Fund’s annualized expense ratio, net of any applicable fee waivers, multiplied by the average account value over the period, multiplied by 182/365 (to reflect the one-half year period). |
| 5 | Hypothetical return for the period September 30, 2017 to March 31, 2018. |
| 8 | THE GUGGENHEIM FUNDS SEMI-ANNUAL REPORT | |
| PERFORMANCE REPORT AND FUND PROFILE (Unaudited) | March 29, 2018 |
DIVERSIFIED INCOME FUND
OBJECTIVE: Seeks to achieve high current income with consideration for capital appreciation.
Holdings Diversification (Market Exposure as % of Net Assets)
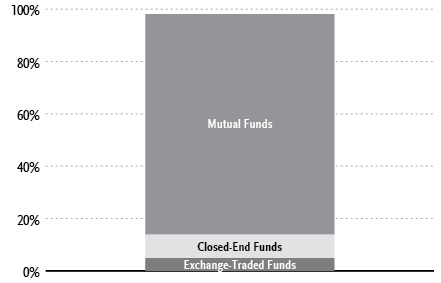
“Holdings Diversification (Market Exposure as % of Net Assets)” excludes any temporary cash investments.
| Inception Dates: |
| A-Class | January 29, 2016 |
| C-Class | January 29, 2016 |
| P-Class | January 29, 2016 |
| Institutional Class | January 29, 2016 |
| Ten Largest Holdings (% of Total Net Assets) |
| Guggenheim Limited Duration Fund - Institutional Class | 28.0% |
| Guggenheim High Yield Fund - Institutional Class | 20.9% |
| Guggenheim Investment Grade Bond Fund - Institutional Class | 20.4% |
| Guggenheim World Equity Income Fund - Institutional Class | 9.9% |
| Guggenheim Risk Managed Real Estate Fund - Institutional Class | 5.0% |
| Guggenheim S&P High Income Infrastructure ETF | 4.9% |
| BlackRock Enhanced Capital and Income Fund, Inc. | 0.3% |
| Aberdeen Income Credit Strategies Fund | 0.3% |
| Royce Value Trust, Inc. | 0.3% |
| Neuberger Berman High Yield Strategies Fund, Inc. | 0.2% |
| Top Ten Total | 90.2% |
“Ten Largest Holdings” excludes any temporary cash investments.
Average Annual Returns*
Periods Ended March 29, 2018
| | 6 month† | 1 Year | Since Inception
(01/29/16) |
| A-Class Shares | (1.10%) | 2.62% | 7.83% |
| A-Class Shares with sales charge‡ | (5.06%) | (1.50%) | 5.83% |
| C-Class Shares | (1.43%) | 1.87% | 7.04% |
| C-Class Shares with CDSC§ | (2.39%) | 0.88% | 7.04% |
| P-Class Shares | (1.07%) | 2.60% | 7.83% |
| Institutional Class Shares | (0.95%) | 2.90% | 8.11% |
| Bloomberg Barclays U.S. Aggregate Bond Index | (1.08%) | 1.20% | 1.51% |
| * | The performance data above represents past performance that is not predictive of future results. The investment return and principal value of an investment in the Fund will fluctuate so that an investor’s shares, when redeemed, may be worth more or less than their original cost. Returns are historical and include changes in principal and reinvested dividends and capital gains and do not reflect the effect of taxes. The Bloomberg Barclays U.S. Aggregate Bond Index is an unmanaged index and, unlike the Fund, has no management fees or operating expenses to reduce its reported return. |
| † | 6 month returns are not annualized. |
| ‡ | Fund returns are calculated using the maximum sales charge of 4.00%. |
| § | Fund returns include a CDSC of 1% if redeemed within 12 months of purchase. |
| | THE GUGGENHEIM FUNDS SEMI-ANNUAL REPORT | 9 |
| SCHEDULE OF INVESTMENTS (Unaudited) | March 29, 2018 |
| DIVERSIFIED INCOME FUND | |
| | | Shares | | | Value | |
| | | | | | | |
| EXCHANGE-TRADED FUNDS† - 4.9% |
| Guggenheim S&P High Income Infrastructure ETF1 | | | 11,652 | | | $ | 295,728 | |
| Total Exchange-Traded Funds | | | | | | | | |
| (Cost $244,920) | | | | | | | 295,728 | |
| | | | | | | | | |
| MUTUAL FUNDS† - 84.3% |
| Guggenheim Limited Duration Fund - Institutional Class1 | | | 68,501 | | | | 1,695,403 | |
| Guggenheim High Yield Fund - Institutional Class1 | | | 139,288 | | | | 1,266,131 | |
| Guggenheim Investment Grade Bond Fund - Institutional Class1 | | | 66,954 | | | | 1,235,974 | |
| Guggenheim World Equity Income Fund - Institutional Class1 | | | 39,721 | | | | 599,780 | |
| Guggenheim Risk Managed Real Estate Fund - Institutional Class1 | | | 10,753 | | | | 301,738 | |
| Total Mutual Funds | | | | | | | | |
| (Cost $4,913,402) | | | | | | | 5,099,026 | |
| | | | | | | | | |
| CLOSED-END FUNDS† - 8.9% |
| BlackRock Enhanced Capital and Income Fund, Inc. | | | 1,076 | | | | 16,947 | |
| Aberdeen Income Credit Strategies Fund | | | 1,134 | | | | 15,581 | |
| Royce Value Trust, Inc. | | | 1,000 | | | | 15,560 | |
| Neuberger Berman High Yield Strategies Fund, Inc. | | | 1,346 | | | | 14,994 | |
| Eaton Vance Enhanced Equity Income Fund II | | | 946 | | | | 14,909 | |
| AllianzGI Diversified Income & Convertible Fund | | | 650 | | | | 14,735 | |
| Eaton Vance Tax-Managed Diversified Equity Income Fund | | | 1,250 | | | | 14,462 | |
| PIMCO Income Strategy Fund II | | | 1,364 | | | | 14,227 | |
| Eaton Vance Tax-Advantaged Global Dividend Income Fund | | | 850 | | | | 14,204 | |
| Western Asset High Income Fund II, Inc. | | | 2,108 | | | | 13,828 | |
| PIMCO Dynamic Credit and Mortgage Income Fund | | | 600 | | | | 13,728 | |
| First Trust Strategic High Income Fund II | | | 1,100 | | | | 13,420 | |
| John Hancock Investors Trust | | | 798 | | | | 13,263 | |
| PIMCO Corporate & Income Strategy Fund | | | 800 | | | | 13,256 | |
| New America High Income Fund, Inc. | | | 1,517 | | | | 13,198 | |
| Reaves Utility Income Fund | | | 467 | | | | 13,183 | |
| Invesco Dynamic Credit Opportunities Fund | | | 1,120 | | | | 13,138 | |
| Brookfield Real Assets Income Fund, Inc. | | | 600 | | | | 13,062 | |
| DoubleLine Income Solutions Fund | | | 650 | | | | 13,052 | |
| Calamos Strategic Total Return Fund | | | 1,100 | | | | 13,013 | |
| Ares Dynamic Credit Allocation Fund, Inc. | | | 800 | | | | 12,992 | |
| BlackRock Multi-Sector Income Trust | | | 766 | | | | 12,861 | |
| KKR Income Opportunities Fund | | | 800 | | | | 12,704 | |
| Pioneer High Income Trust | | | 1,350 | | | | 12,677 | |
| Ivy High Income Opportunities Fund | | | 890 | | | | 12,620 | |
| BlackRock Floating Rate Income Trust | | | 900 | | | | 12,582 | |
| Western Asset Global Corporate Defined Opportunity Fund, Inc. | | | 750 | | | | 12,548 | |
| Voya Global Advantage and Premium Opportunity Fund | | | 1,150 | | | | 12,547 | |
| AllianceBernstein Global High Income Fund, Inc. | | | 1,050 | | | | 12,484 | |
| Barings Global Short Duration High Yield Fund | | | 665 | | | | 12,409 | |
| BlackRock Credit Allocation Income Trust | | | 978 | | | | 12,391 | |
| Western Asset Premier Bond Fund | | | 951 | | | | 12,296 | |
| BlackRock Corporate High Yield Fund, Inc. | | | 1,150 | | | | 12,178 | |
| Flaherty & Crumrine Total Return Fund, Inc. | | | 600 | | | | 11,886 | |
| Cohen & Steers Total Return Realty Fund, Inc. | | | 1,000 | | | | 11,850 | |
| Nuveen Short Duration Credit Opportunities Fund | | | 700 | | | | 11,823 | |
| BrandywineGLOBAL Global Income Opportunities Fund, Inc. | | | 900 | | | | 11,601 | |
| Alpine Global Dynamic Dividend Fund | | | 1,100 | | | | 11,550 | |
| Tortoise Energy Infrastructure Corp. | | | 450 | | | | 11,264 | |
| Eaton Vance Tax-Managed Buy-Write Income Fund | | | 700 | | | | 10,913 | |
| First Trust Energy Income and Growth Fund | | | 450 | | | | 9,788 | |
| General American Investors Company, Inc. | | | 23 | | | | 770 | |
| Total Closed-End Funds | | | | | | | | |
| (Cost $522,950) | | | | | | | 536,494 | |
| | | | | | | | | |
| MONEY MARKET FUND† - 1.0% |
| Goldman Sachs Financial Square Treasury Instruments Fund - Institutional Class 1.54%2 | | | 63,425 | | | | 63,425 | |
| Total Money Market Fund | | | | | | | | |
| (Cost $63,425) | | | | | | | 63,425 | |
| | | | | | | | | |
| Total Investments - 99.1% | | | | | | | | |
| (Cost $5,744,697) | | | | | | $ | 5,994,673 | |
| Other Assets & Liabilities, net - 0.9% | | | | | | | 55,946 | |
| Total Net Assets - 100.0% | | | | | | $ | 6,050,619 | |
| † | Value determined based on Level 1 inputs — See Note 4. |
| 1 | Affiliated issuer. |
| 2 | Rate indicated is the 7 day yield as of March 29, 2018. |
| | |
| | See Sector Classification in Other Information section. |
| 10 | THE GUGGENHEIM FUNDS SEMI-ANNUAL REPORT | SEE NOTES TO FINANCIAL STATEMENTS. |
| SCHEDULE OF INVESTMENTS (Unaudited)(concluded) | March 29, 2018 |
| DIVERSIFIED INCOME FUND | |
The following table summarizes the inputs used to value the Fund’s investments at March 29, 2018 (See Note 4 in the Notes to Financial Statements):
| Investments in Securities (Assets) | | Level 1
Quoted
Prices | | | Level 2
Significant
Observable
Inputs | | | Level 3
Significant
Unobservable
Inputs | | | Total | |
| Closed-End Funds | | $ | 536,494 | | | $ | — | | | $ | — | | | $ | 536,494 | |
| Exchange-Traded Funds | | | 295,728 | | | | — | | | | — | | | | 295,728 | |
| Money Market Fund | | | 63,425 | | | | — | | | | — | | | | 63,425 | |
| Mutual Funds | | | 5,099,026 | | | | — | | | | — | | | | 5,099,026 | |
| Total Assets | | $ | 5,994,673 | | | $ | — | | | $ | — | | | $ | 5,994,673 | |
Transfers between investment levels may occur as the markets fluctuate and/or the availability of data used in an investment’s valuation changes. Transfers between valuation levels, if any, are in comparison to the valuation levels at the end of the previous fiscal year, and are effective using the fair value as of the end of the current fiscal period.
For the period ended March 29, 2018, there were no transfers between levels.
Affiliated Transactions
Investments representing 5% or more of the outstanding voting shares of a portfolio company of a fund, or control of or by, or common control under Guggenheim Investments (“GI”), result in that portfolio company being considered an affiliated company of such fund, as defined in the 1940 Act.
Transactions during the period ended March 29, 2018, in which the portfolio company is an “affiliated person”, were as follows:
| Security Name | | Value
09/30/17 | | | Additions | | | Reductions | | | Realized
Gain (Loss) | | | Change in
Unrealized | | | Value
03/29/18 | | | Shares
03/29/18 | | | Investment
Income | | | Capital
Gain
Distributions | |
| Mutual Funds | | | | | | | | | | | | | | | | | | | | | | | | | | | | | | | | | | | | |
| Guggenheim High Yield Fund - Institutional Class | | $ | 2,038,895 | | | $ | 107,761 | | | $ | (815,000 | ) | | $ | (13,578 | ) | | $ | (51,947 | ) | | $ | 1,266,131 | | | | 139,288 | | | $ | 62,144 | | | $ | — | |
| Guggenheim Investment Grade Bond Fund - Institutional Class | | | 407,346 | | | | 830,010 | | | | — | | | | — | | | | (1,382 | ) | | | 1,235,974 | | | | 66,954 | | | | 6,064 | | | | — | |
| Guggenheim Limited Duration Fund - Institutional Class | | | 1,605,844 | | | | 96,243 | | | | — | | | | — | | | | (6,684 | ) | | | 1,695,403 | | | | 68,501 | | | | 21,103 | | | | — | |
| Guggenheim Risk Managed Real Estate Fund - Institutional Class | | | 283,359 | | | | 37,694 | | | | — | | | | — | | | | (19,315 | ) | | | 301,738 | | | | 10,753 | | | | 2,854 | | | | 9,841 | |
| Guggenheim World Equity Income Fund - Institutional Class | | | 367,974 | | | | 222,832 | | | | — | | | | — | | | | 8,974 | | | | 599,780 | | | | 39,721 | | | | 2,832 | | | | — | |
| Exchange-Traded Funds | | | | | | | | | | | | | | | | | | | | | | | | | | | | | | | | | | | | |
| Guggenheim S&P High Income Infrastructure ETF | | | 612,720 | | | | — | | | | (243,855 | ) | | | 41,584 | | | | (114,721 | ) | | | 295,728 | | | | 11,652 | | | | 13,922 | | | | 6,282 | |
| | | $ | 5,316,138 | | | $ | 1,294,540 | | | $ | (1,058,855 | ) | | $ | 28,006 | | | $ | (185,075 | ) | | $ | 5,394,754 | | | | | | | $ | 108,919 | | | $ | 16,123 | |
| SEE NOTES TO FINANCIAL STATEMENTS. | THE GUGGENHEIM FUNDS SEMI-ANNUAL REPORT | 11 |
| STATEMENT OF ASSETS AND LIABILITIES (Unaudited) |
| March 29, 2018 |
| Assets: |
| Investments in unaffiliated issuers, at value (cost $586,375) | | $ | 599,919 | |
| Investments in affiliated issuers, at value (cost $5,158,322) | | | 5,394,754 | |
| Cash | | | 306 | |
| Prepaid expenses | | | 45,908 | |
| Receivables: |
| Securities sold | | | 1,058,856 | |
| Investment adviser | | | 19,373 | |
| Dividends | | | 17,949 | |
| Interest | | | 12 | |
| Total assets | | | 7,137,077 | |
| | | | | |
| Liabilities: |
| Payable for: |
| Securities purchased | | | 1,077,679 | |
| Transfer agent/maintenance fees | | | 4,580 | |
| Distribution and service fees | | | 170 | |
| Trustees’ fees* | | | 135 | |
| Fund shares redeemed | | | 9 | |
| Miscellaneous | | | 3,885 | |
| Total liabilities | | | 1,086,458 | |
| Net assets | | $ | 6,050,619 | |
| | | | | |
| Net assets consist of: |
| Paid in capital | | $ | 5,741,168 | |
| Undistributed net investment income | | | 13,850 | |
| Accumulated net realized gain on investments | | | 45,625 | |
| Net unrealized appreciation on investments | | | 249,976 | |
| Net assets | | $ | 6,050,619 | |
| | | | | |
| A-Class: |
| Net assets | | $ | 136,058 | |
| Capital shares outstanding | | | 5,119 | |
| Net asset value per share | | $ | 26.58 | |
| Maximum offering price per share (Net asset value divided by 96.00%) | | $ | 27.69 | |
| | | | | |
| C-Class: |
| Net assets | | $ | 144,630 | |
| Capital shares outstanding | | | 5,444 | |
| Net asset value per share | | $ | 26.57 | |
| | | | | |
| P-Class: |
| Net assets | | $ | 128,188 | |
| Capital shares outstanding | | | 4,822 | |
| Net asset value per share | | $ | 26.58 | |
| | | | | |
| Institutional Class: |
| Net assets | | $ | 5,641,743 | |
| Capital shares outstanding | | | 212,153 | |
| Net asset value per share | | $ | 26.59 | |
| STATEMENT OF OPERATIONS (Unaudited) |
| Period Ended March 29, 2018 |
| Investment Income: |
| Dividends from securities of unaffiliated issuers | | $ | 22,938 | |
| Dividends from securities of affiliated issuers | | | 108,919 | |
| Interest | | | 345 | |
| Total investment income | | | 132,202 | |
| | | | | |
| Expenses: |
| Management fees | | | 22,720 | |
| Distribution and service fees: |
| A-Class | | | 171 | |
| C-Class | | | 676 | |
| P-Class | | | 158 | |
| Transfer agent/maintenance fees: |
| A-Class | | | 369 | |
| C-Class | | | 458 | |
| P-Class | | | 330 | |
| Institutional Class | | | 11,295 | |
| Registration fees | | | 49,455 | |
| Legal fees | | | 18,740 | |
| Professional fees | | | 18,348 | |
| Fund accounting/administration fees | | | 12,465 | |
| Trustees’ fees* | | | 4,907 | |
| Custodian fees | | | 364 | |
| Line of credit fees | | | 119 | |
| Miscellaneous | | | 192 | |
| Total expenses | | | 140,767 | |
| Less: |
| Expenses reimbursed by Adviser: |
| A-Class | | | (2,029 | ) |
| C-Class | | | (2,096 | ) |
| P-Class | | | (1,848 | ) |
| Institutional Class | | | (79,424 | ) |
| Expenses waived by Adviser | | | (37,054 | ) |
| Total waived/reimbursed expenses | | | (122,451 | ) |
| Net expenses | | | 18,316 | |
| Net investment income | | | 113,886 | |
| | | | | |
| Net Realized and Unrealized Gain (Loss): |
| Net realized gain (loss) on: |
| Investments in unaffiliated issuers | | | 5,244 | |
| Investments in affiliated issuers | | | 28,006 | |
| Distributions received from affiliated investment company shares | | | 16,123 | |
| Net realized gain | | | 49,373 | |
| Net change in unrealized appreciation (depreciation) on: |
| Investments in unaffiliated issuers | | | (37,969 | ) |
| Investments in affiliated issuers | | | (185,075 | ) |
| Net change in unrealized appreciation (depreciation) | | | (223,044 | ) |
| Net realized and unrealized loss | | | (173,671 | ) |
| Net decrease in net assets resulting from operations | | $ | (59,785 | ) |
| * | Relates to Trustees not deemed “interested persons” within the meaning of Section 2(a)(19) of the 1940 Act. |
| 12 | THE GUGGENHEIM FUNDS SEMI-ANNUAL REPORT | SEE NOTES TO FINANCIAL STATEMENTS. |
| STATEMENTS OF CHANGES IN NET ASSETS |
| | | Period Ended
March 29,
2018
(Unaudited) | | | Year Ended
September 30,
2017 | |
| Increase (Decrease) in Net Assets from Operations: | | | | | | |
| Net investment income | | $ | 113,886 | | | $ | 216,782 | |
| Net realized gain on investments | | | 49,373 | | | | 77,873 | |
| Net change in unrealized appreciation (depreciation) on investments | | | (223,044 | ) | | | 111,045 | |
| Net increase (decrease) in net assets resulting from operations | | | (59,785 | ) | | | 405,700 | |
| | | | | | | | | |
| Distributions to shareholders from: | | | | | | | | |
| Net investment income | | | | | | | | |
| A-Class | | | (2,595 | ) | | | (4,691 | ) |
| C-Class | | | (2,093 | ) | | | (3,496 | ) |
| P-Class | | | (2,385 | ) | | | (4,011 | ) |
| Institutional Class | | | (113,929 | ) | | | (198,735 | ) |
| Net realized gains | | | | | | | | |
| A-Class | | | (959 | ) | | | (2,257 | ) |
| C-Class | | | (965 | ) | | | (1,912 | ) |
| P-Class | | | (877 | ) | | | (1,799 | ) |
| Institutional Class | | | (39,691 | ) | | | (84,531 | ) |
| Total distributions to shareholders | | | (163,494 | ) | | | (301,432 | ) |
| | | | | | | | | |
| Capital share transactions: | | | | | | | | |
| Proceeds from sale of shares | | | | | | | | |
| A-Class | | | — | | | | 17,750 | |
| C-Class | | | 25,491 | | | | 11,405 | |
| P-Class | | | 8,272 | | | | 11,813 | |
| Institutional Class | | | 77,521 | | | | — | |
| Distributions reinvested | | | | | | | | |
| A-Class | | | 3,554 | | | | 6,948 | |
| C-Class | | | 3,058 | | | | 5,408 | |
| P-Class | | | 3,262 | | | | 5,810 | |
| Institutional Class | | | 153,620 | | | | 283,266 | |
| Cost of shares redeemed | | | | | | | | |
| A-Class | | | — | | | | (21,762 | ) |
| C-Class | | | (15,347 | ) | | | (338 | ) |
| P-Class | | | (1,800 | ) | | | (7,955 | ) |
| Institutional Class | | | — | | | | — | |
| Net increase from capital share transactions | | | 257,631 | | | | 312,345 | |
| Net increase in net assets | | | 34,352 | | | | 416,613 | |
| | | | | | | | | |
| Net assets: | | | | | | | | |
| Beginning of period | | | 6,016,267 | | | | 5,599,654 | |
| End of period | | $ | 6,050,619 | | | $ | 6,016,267 | |
| Undistributed net investment income at end of period | | $ | 13,850 | | | $ | 20,966 | |
| SEE NOTES TO FINANCIAL STATEMENTS. | THE GUGGENHEIM FUNDS SEMI-ANNUAL REPORT | 13 |
| STATEMENTS OF CHANGES IN NET ASSETS (concluded) |
| | | Period Ended
March 29,
2018
(Unaudited) | | | Year Ended
September 30,
2017 | |
| Capital share activity: | | | | | | |
| Shares sold | | | | | | |
| A-Class | | | — | | | | 655 | |
| C-Class | | | 951 | | | | 421 | |
| P-Class | | | 302 | | | | 430 | |
| Institutional Class | | | 2,813 | | | | — | |
| Shares issued from reinvestment of distributions | | | | | | | | |
| A-Class | | | 131 | | | | 258 | |
| C-Class | | | 113 | | | | 201 | |
| P-Class | | | 120 | | | | 215 | |
| Institutional Class | | | 5,651 | | | | 10,492 | |
| Shares redeemed | | | | | | | | |
| A-Class | | | — | | | | (794 | ) |
| C-Class | | | (576 | ) | | | (13 | ) |
| P-Class | | | (65 | ) | | | (288 | ) |
| Institutional Class | | | — | | | | — | |
| Net increase in shares | | | 9,440 | | | | 11,577 | |
| 14 | THE GUGGENHEIM FUNDS SEMI-ANNUAL REPORT | SEE NOTES TO FINANCIAL STATEMENTS. |
This table is presented to show selected data for a share outstanding throughout each period and to assist shareholders in evaluating a Fund’s performance for the periods presented.
| A-Class | | Period Ended
March 29,
2018a | | | Year Ended
September 30,
2017 | | | Period Ended
September 30,
2016b | |
| Per Share Data | | | | | | | | | |
| Net asset value, beginning of period | | $ | 27.58 | | | $ | 27.12 | | | $ | 25.00 | |
| Income (loss) from investment operations: |
| Net investment income (loss)c | | | .48 | | | | .96 | | | | .76 | |
| Net gain (loss) on investments (realized and unrealized) | | | (.77 | ) | | | .89 | | | | 2.03 | |
| Total from investment operations | | | (.29 | ) | | | 1.85 | | | | 2.79 | |
| Less distributions from: |
| Net investment income | | | (.52 | ) | | | (.95 | ) | | | (.67 | ) |
| Net realized gains | | | (.19 | ) | | | (.44 | ) | | | — | |
| Total distributions | | | (.71 | ) | | | (1.39 | ) | | | (.67 | ) |
| Net asset value, end of period | | $ | 26.58 | | | $ | 27.58 | | | $ | 27.12 | |
| |
| Total Returng | | | (1.10 | %) | | | 7.00 | % | | | 11.29 | % |
| Ratios/Supplemental Data |
| Net assets, end of period (in thousands) | | $ | 136 | | | $ | 138 | | | $ | 132 | |
| Ratios to average net assets: |
| Net investment income (loss) | | | 3.54 | % | | | 3.53 | % | | | 4.35 | % |
| Total expensesd | | | 5.00 | % | | | 4.16 | % | | | 3.31 | % |
| Net expensese,f,h | | | 0.82 | % | | | 0.85 | % | | | 0.77 | % |
| Portfolio turnover rate | | | 20 | % | | | 44 | % | | | 83 | % |
| C-Class | | Period Ended
March 29,
2018a | | | Year Ended
September 30,
2017 | | | Period Ended
September 30,
2016b | |
| Per Share Data | | | | | | | | | |
| Net asset value, beginning of period | | $ | 27.56 | | | $ | 27.11 | | | $ | 25.00 | |
| Income (loss) from investment operations: |
| Net investment income (loss)c | | | .38 | | | | .76 | | | | .63 | |
| Net gain (loss) on investments (realized and unrealized) | | | (.76 | ) | | | .87 | | | | 2.03 | |
| Total from investment operations | | | (.38 | ) | | | 1.63 | | | | 2.66 | |
| Less distributions from: |
| Net investment income | | | (.42 | ) | | | (.74 | ) | | | (.55 | ) |
| Net realized gains | | | (.19 | ) | | | (.44 | ) | | | — | |
| Total distributions | | | (.61 | ) | | | (1.18 | ) | | | (.55 | ) |
| Net asset value, end of period | | $ | 26.57 | | | $ | 27.56 | | | $ | 27.11 | |
| |
| Total Returng | | | (1.43 | %) | | | 6.17 | % | | | 10.74 | % |
| Ratios/Supplemental Data |
| Net assets, end of period (in thousands) | | $ | 145 | | | $ | 137 | | | $ | 118 | |
| Ratios to average net assets: |
| Net investment income (loss) | | | 2.83 | % | | | 2.78 | % | | | 3.58 | % |
| Total expensesd | | | 5.89 | % | | | 5.13 | % | | | 4.05 | % |
| Net expensese,f,h | | | 1.56 | % | | | 1.60 | % | | | 1.52 | % |
| Portfolio turnover rate | | | 20 | % | | | 44 | % | | | 83 | % |
| SEE NOTES TO FINANCIAL STATEMENTS. | THE GUGGENHEIM FUNDS SEMI-ANNUAL REPORT | 15 |
| FINANCIAL HIGHLIGHTS (continued) |
This table is presented to show selected data for a share outstanding throughout each period and to assist shareholders in evaluating a Fund’s performance for the periods presented.
| P-Class | | Period Ended
March 29,
2018a | | | Year Ended
September 30,
2017 | | | Period Ended
September 30,
2016b | |
| Per Share Data | | | | | | | | | |
| Net asset value, beginning of period | | $ | 27.58 | | | $ | 27.11 | | | $ | 25.00 | |
| Income (loss) from investment operations: |
| Net investment income (loss)c | | | .48 | | | | .95 | | | | .74 | |
| Net gain (loss) on investments (realized and unrealized) | | | (.77 | ) | | | .89 | | | | 2.05 | |
| Total from investment operations | | | (.29 | ) | | | 1.84 | | | | 2.79 | |
| Less distributions from: |
| Net investment income | | | (.52 | ) | | | (.93 | ) | | | (.68 | ) |
| Net realized gains | | | (.19 | ) | | | (.44 | ) | | | — | |
| Total distributions | | | (.71 | ) | | | (1.37 | ) | | | (.68 | ) |
| Net asset value, end of period | | $ | 26.58 | | | $ | 27.58 | | | $ | 27.11 | |
| |
| Total Returng | | | (1.07 | %) | | | 7.00 | % | | | 11.27 | % |
| Ratios/Supplemental Data |
| Net assets, end of period (in thousands) | | $ | 128 | | | $ | 123 | | | $ | 111 | |
| Ratios to average net assets: |
| Net investment income (loss) | | | 3.54 | % | | | 3.51 | % | | | 4.32 | % |
| Total expensesd | | | 4.97 | % | | | 4.23 | % | | | 3.21 | % |
| Net expensese,f,h | | | 0.82 | % | | | 0.85 | % | | | 0.80 | % |
| Portfolio turnover rate | | | 20 | % | | | 44 | % | | | 83 | % |
| 16 | THE GUGGENHEIM FUNDS SEMI-ANNUAL REPORT | SEE NOTES TO FINANCIAL STATEMENTS. |
| FINANCIAL HIGHLIGHTS (concluded) |
This table is presented to show selected data for a share outstanding throughout each period and to assist shareholders in evaluating a Fund’s performance for the periods presented.
| Institutional Class | | Period Ended
March 29,
2018a | | | Year Ended
September 30,
2017 | | | Period Ended
September 30,
2016b | |
| Per Share Data | | | | | | | | | |
| Net asset value, beginning of period | | $ | 27.59 | | | $ | 27.11 | | | $ | 25.00 | |
| Income (loss) from investment operations: |
| Net investment income (loss)c | | | .52 | | | | 1.03 | | | | .79 | |
| Net gain (loss) on investments (realized and unrealized) | | | (.78 | ) | | | .89 | | | | 2.04 | |
| Total from investment operations | | | (.26 | ) | | | 1.92 | | | | 2.83 | |
| Less distributions from: |
| Net investment income | | | (.55 | ) | | | (1.00 | ) | | | (.72 | ) |
| Net realized gains | | | (.19 | ) | | | (.44 | ) | | | — | |
| Total distributions | | | (.74 | ) | | | (1.43 | ) | | | (.72 | ) |
| Net asset value, end of period | | $ | 26.59 | | | $ | 27.59 | | | $ | 27.11 | |
| |
| Total Returng | | | (0.95 | %) | | | 7.30 | % | | | 11.44 | % |
| Ratios/Supplemental Data |
| Net assets, end of period (in thousands) | | $ | 5,642 | | | $ | 5,619 | | | $ | 5,239 | |
| Ratios to average net assets: |
| Net investment income (loss) | | | 3.79 | % | | | 3.78 | % | | | 4.57 | % |
| Total expensesd | | | 4.60 | % | | | 3.83 | % | | | 2.93 | % |
| Net expensese,f,h | | | 0.57 | % | | | 0.59 | % | | | 0.54 | % |
| Portfolio turnover rate | | | 20 | % | | | 44 | % | | | 83 | % |
| a | Unaudited figures for the period ended March 29, 2018. Percentage amounts for the period, except total return and portfolio turnover rate, have been annualized. |
| b | Since commencement of operations: January 29, 2016. Percentage amounts for the period, except total return and portfolio turnover rate, have been annualized. |
| c | Net investment income (loss) per share was computed using average shares outstanding throughout the period. |
| d | Does not include expenses of the underlying funds in which the Fund invests. |
| e | Net expense information reflects the expense ratios after expense waivers. |
| f | Net expenses may include expenses that are excluded from the expense limitation agreement and affiliated fund waivers. Excluding these expenses, the operating expense ratios for the periods would be: |
| | | 03/29/18 | 09/30/17 | 09/30/16 |
| | A-Class | 0.81% | 0.82% | 0.76% |
| | C-Class | 1.55% | 1.57% | 1.52% |
| | P-Class | 0.82% | 0.82% | 0.79% |
| | Institutional Class | 0.56% | 0.57% | 0.54% |
| g | Total return does not reflect the impact of any applicable sales charges and has not been annualized. |
| h | The portion of the ratios of net expenses to average net assets attribute to recoupments of prior fee reductions or expense reimbursements for the periods presented would be: |
| | | 03/29/18 | 09/30/17 |
| | A-Class | 0.00% | 0.19% |
| | C-Class | 0.00% | 0.19% |
| | P-Class | 0.00% | 0.16% |
| | Institutional Class | 0.00% | 0.16% |
| SEE NOTES TO FINANCIAL STATEMENTS. | THE GUGGENHEIM FUNDS SEMI-ANNUAL REPORT | 17 |
| PERFORMANCE REPORT AND FUND PROFILE (Unaudited) | March 29, 2018 |
HIGH YIELD FUND
OBJECTIVE: Seeks high current income. Capital appreciation is a secondary objective.
Holdings Diversification (Market Exposure as % of Net Assets)
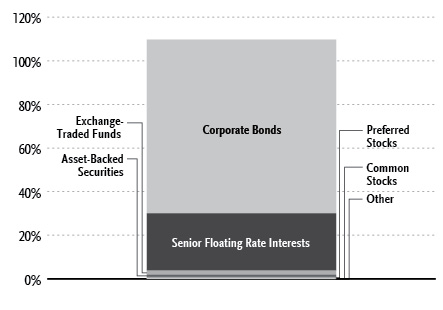
“Holdings Diversification (Market Exposure as % of Net Assets)” excludes any temporary cash investments.
| Inception Dates: |
| A-Class | August 5, 1996 |
| C-Class | May 1, 2000 |
| P-Class | May 1, 2015 |
| Institutional Class | July 11, 2008 |
| R6-Class | May 15, 2017 |
| Ten Largest Holdings (% of Total Net Assets) |
| Vector Group Ltd., 6.13% | 2.0% |
| MDC Partners, Inc., 6.50% | 2.0% |
| LBC Tank Terminals Holding Netherlands BV, 6.88% | 1.8% |
| Unit Corp., 6.63% | 1.6% |
| FBM Finance, Inc., 8.25% | 1.6% |
| Grinding Media Inc. / MC Grinding Media Canada Inc., 7.38% | 1.6% |
| Eldorado Gold Corp., 6.13% | 1.5% |
| EIG Investors Corp., 10.88% | 1.5% |
| SFR Group S.A., 7.38% | 1.4% |
| Kennedy-Wilson, Inc., 5.88% | 1.4% |
| Top Ten Total | 16.4% |
“Ten Largest Holdings” excludes any temporary cash or derivative investments.
| 18 | THE GUGGENHEIM FUNDS SEMI-ANNUAL REPORT | |
| PERFORMANCE REPORT AND FUND PROFILE (Unaudited)(concluded) | March 29, 2018 |
Average Annual Returns*
Periods Ended March 29, 2018
| | 6 month† | 1 Year | 5 Year | 10 Year |
| A-Class Shares | (0.27%) | 3.42% | 5.36% | 7.86% |
| A-Class Shares with sales charge‡ | (4.27%) | (0.68%) | 4.34% | 7.34% |
| C-Class Shares | (0.62%) | 2.77% | 4.58% | 7.08% |
| C-Class Shares with CDSC§ | (1.59%) | 1.79% | 4.58% | 7.08% |
| Bloomberg Barclays U.S. Corporate High Yield Index | (0.39%) | 3.78% | 4.99% | 8.27% |
| | | 6 month† | 1 Year | Since Inception
(05/01/15) |
| P-Class Shares | | (0.30%) | 3.42% | 5.13% |
| Bloomberg Barclays U.S. Corporate High Yield Index | | (0.39%) | 3.78% | 4.88% |
| | 6 month† | 1 Year | 5 Year | Since Inception
(07/11/08) |
| Institutional Class Shares | (0.11%) | 3.76% | 5.66% | 8.35% |
| Bloomberg Barclays U.S. Corporate High Yield Index | (0.39%) | 3.78% | 4.99% | 8.50% |
| | | | 6 month† | Since Inception
(05/15/17) |
| R6-Class Shares | | | (0.11%) | 2.72% |
| Bloomberg Barclays U.S. Corporate High Yield Index | | | (0.39%) | 2.56% |
| Portfolio Composition by Quality Rating1 |
| Rating | % of Total
Investments |
| Fixed Income Instruments | |
| AAA | 0.1% |
| A | 0.1% |
| BBB | 4.0% |
| BB | 40.9% |
| B | 41.5% |
| CCC | 6.8% |
| NR2 | 3.9% |
| Other Instruments | 2.7% |
| Total Investments | 100.0% |
| * | The performance data above represents past performance that is not predictive of future results. The investment return and principal value of an investment in the Fund will fluctuate so that an investor’s shares, when redeemed, may be worth more or less than their original cost. Returns are historical and include changes in principal and reinvested dividends and capital gains and do not reflect the effect of taxes. The Bloomberg Barclays U.S. Corporate High Yield Index is an unmanaged index and, unlike the Fund, has no management fees or operating expenses to reduce its reported return. |
| † | 6 month returns are not annualized. |
| ‡ | Effective October 1, 2015, the maximum sales charge decreased from 4.75% to 4.00%. A 4.75% maximum sales charge is used in the calculation of the Average Annual Returns (based on subscriptions made prior to October 1, 2015), and a 4.00% maximum sales charge is used to calculate performance for periods based on subscriptions made on or after October 1, 2015. |
| § | Fund returns include a CDSC of 1% if redeemed within 12 months of purchase. |
| 1 | Source: BlackRock Solutions. Credit quality ratings are measured on a scale that generally ranges from AAA (highest) to D (lowest). All securities except for those labeled “NR” have been rated by Moody’s, Standard & Poor’s (“S&P”), or Fitch, each of which is a Nationally Recognized Statistical Rating Organization (“NRSRO”). For purposes of this presentation, when ratings are available from more than one agency, the highest rating is used. Guggenheim Investments has converted ratings to the equivalent S&P rating. Security ratings are determined at the time of purchase and may change thereafter. |
| 2 | NR securities do not necessarily indicate low credit quality. |
| | THE GUGGENHEIM FUNDS SEMI-ANNUAL REPORT | 19 |
| SCHEDULE OF INVESTMENTS (Unaudited) | March 29, 2018 |
| HIGH YIELD FUND | |
| | | Shares | | | Value | |
| | | | | | | |
| COMMON STOCKS† - 0.4% |
| | | | | | | |
| ENERGY - 0.2% |
| SandRidge Energy, Inc.* | | | 51,923 | | | $ | 753,403 | |
| Approach Resources, Inc.* | | | 26,183 | | | | 68,338 | |
| Titan Energy LLC* | | | 17,186 | | | | 18,904 | |
| Total Energy | | | | | | | 840,645 | |
| | | | | | | | | |
| Consumer, Cyclical - 0.1% |
| Metro-Goldwyn-Mayer, Inc.*,†† | | | 7,040 | | | | 682,880 | |
| | | | | | | | | |
| Technology - 0.1% |
| Aspect Software Parent, Inc.*,†††,1,2 | | | 64,681 | | | | 317,584 | |
| Total Technology | | | | | | | 317,584 | |
| | | | | | | | | |
| Consumer, Non-cyclical - 0.0% |
| Targus Group International Equity, Inc.*,†††,1,2 | | | 12,825 | | | | 30,826 | |
| Crimson Wine Group Ltd.* | | | 8 | | | | 79 | |
| Total Consumer, Non-cyclical | | | | | | | 30,905 | |
| | | | | | | | | |
| Communications - 0.0% |
| Cengage Learning Acquisitions, Inc.*,†† | | | 2,107 | | | | 11,237 | |
| | | | | | | | | |
| Financial - 0.0% |
| Leucadia National Corp. | | | 81 | | | | 1,841 | |
| | | | | | | | | |
| Total Common Stocks | | | | | | | | |
| (Cost $3,937,088) | | | | | | | 1,885,092 | |
| | | | | | | | | |
| PREFERRED STOCKS†† - 0.5% |
| Financial - 0.3% |
| Morgan Stanley 6.38%3,4 | | | 46,000 | | | | 1,247,520 | |
| | | | | | | | | |
| Industrial - 0.2% |
| Seaspan Corp. 6.38% due 04/30/19 | | | 31,805 | | | | 809,119 | |
| U.S. Shipping Corp.*,††† | | | 14,718 | | | | — | |
| Total Industrial | | | | | | | 809,119 | |
| | | | | | | | | |
| Communications - 0.0% |
| Medianews Group, Inc.* | | | 11,074 | | | | 166,110 | |
| Total Preferred Stocks | | | | | | | | |
| (Cost $2,483,757) | | | | | | | 2,222,749 | |
| | | | | | | | | |
| WARRANTS† - 0.0% |
| SandRidge Energy, Inc. | | | | | | | | |
| $42.03, 10/04/22 | | | 205 | | | | 103 | |
| SandRidge Energy, Inc. | | | | | | | | |
| $41.34, 10/04/22 | | | 488 | | | | 73 | |
| Total Warrants | | | | | | | | |
| (Cost $43,811) | | | | | | | 176 | |
| | | | | | | | | |
| EXCHANGE-TRADED FUNDS† - 2.0% |
| SPDR Bloomberg Barclays High Yield Bond ETF | | | 159,765 | | | | 5,727,575 | |
| iShares iBoxx $ High Yield Corporate Bond ETF | | | 30,750 | | | | 2,633,430 | |
| SPDR Bloomberg Barclays Short Term High Yield Bond ETF | | | 44,814 | | | | 1,226,559 | |
| Total Exchange-Traded Funds | | | | | | | | |
| (Cost $9,858,904) | | | | | | | 9,587,564 | |
| | | | | | | | | |
| MONEY MARKET FUND† - 0.1% |
| Dreyfus Treasury Securities Cash Management - Institutional Shares 1.46%5 | | | 327,216 | | | | 327,216 | |
| Total Money Market Fund | | | | | | | | |
| (Cost $327,216) | | | | | | | 327,216 | |
| | | | | | | | | |
| | | | Face
Amount~ | | | | | |
| | | | | | | | | |
| CORPORATE BONDS†† - 79.7% |
| Communications - 18.4% |
| MDC Partners, Inc. | | | | | | | | |
| 6.50% due 05/01/246 | | | 9,755,000 | | | | 9,486,737 | |
| SFR Group S.A. | | | | | | | | |
| 7.38% due 05/01/266 | | | 7,200,000 | | | | 6,858,000 | |
| 6.00% due 05/15/226 | | | 1,600,000 | | | | 1,563,968 | |
| 6.25% due 05/15/246 | | | 1,050,000 | | | | 989,625 | |
| CCO Holdings LLC / CCO Holdings Capital Corp. | | | | | | | | |
| 5.00% due 02/01/287 | | | 5,250,000 | | | | 4,921,875 | |
| 5.13% due 05/01/277 | | | 4,550,000 | | | | 4,319,770 | |
| EIG Investors Corp. | | | | | | | | |
| 10.88% due 02/01/24 | | | 6,350,000 | | | | 6,926,770 | |
| DISH DBS Corp. | | | | | | | | |
| 5.88% due 11/15/247 | | | 6,150,000 | | | | 5,481,188 | |
| 7.75% due 07/01/26 | | | 960,000 | | | | 900,240 | |
| McGraw-Hill Global Education Holdings LLC / McGraw-Hill Global Education Finance | | | | | | | | |
| 7.88% due 05/15/246,7 | | | 6,569,000 | | | | 6,280,095 | |
| Cengage Learning, Inc. | | | | | | | | |
| 9.50% due 06/15/246,7 | | | 7,650,000 | | | | 5,871,375 | |
| Level 3 Financing, Inc. | | | | | | | | |
| 5.38% due 01/15/24 | | | 1,700,000 | | | | 1,656,446 | |
| 5.38% due 08/15/22 | | | 900,000 | | | | 900,000 | |
| 5.25% due 03/15/26 | | | 950,000 | | | | 895,375 | |
| 5.63% due 02/01/23 | | | 874,000 | | | | 874,830 | |
| Inmarsat Finance plc | | | | | | | | |
| 4.88% due 05/15/226 | | | 3,275,000 | | | | 3,184,938 | |
| 6.50% due 10/01/246 | | | 650,000 | | | | 659,750 | |
| Telenet Finance Lux Note | | | | | | | | |
| 3.50% due 03/01/28 | | | EUR | 2,500,000 | | | | 3,015,750 | |
| 5.50% due 03/01/28 | | | 800,000 | | | | 769,000 | |
| Virgin Media Finance plc | | | | | | | | |
| 5.00% due 04/15/27 | | | GBP | 2,000,000 | | | | 2,775,106 | |
| UPCB Finance VII Ltd. | | | | | | | | |
| 3.62% due 06/15/29 | | | EUR | 2,600,000 | | | | 3,116,481 | |
| CSC Holdings LLC | | | | | | | | |
| 5.25% due 06/01/24 | | | 2,050,000 | | | | 1,950,062 | |
| 5.50% due 04/15/276 | | | 550,000 | | | | 526,625 | |
| 20 | THE GUGGENHEIM FUNDS SEMI-ANNUAL REPORT | SEE NOTES TO FINANCIAL STATEMENTS. |
| SCHEDULE OF INVESTMENTS (Unaudited)(continued) | March 29, 2018 |
| HIGH YIELD FUND | |
| | | Face
Amount~ | | | Value | |
| | | | | | | |
| Ziggo Secured Finance BV | | | | | | |
| 5.50% due 01/15/276 | | | 2,625,000 | | | $ | 2,466,739 | |
| Virgin Media Secured Finance plc | | | | | | | | |
| 5.00% due 04/15/27 | | | GBP | 1,600,000 | | | | 2,220,085 | |
| 5.25% due 01/15/266 | | | 250,000 | | | | 240,625 | |
| Zayo Group LLC / Zayo Capital, Inc. | | | | | | | | |
| 5.75% due 01/15/276 | | | 1,975,000 | | | | 1,930,563 | |
| Altice Financing S.A. | | | | | | | | |
| 6.63% due 02/15/236 | | | 1,700,000 | | | | 1,683,000 | |
| Charter Communications Operating LLC | | | | | | | | |
| 4.20% due 03/15/287 | | | 1,300,000 | | | | 1,244,400 | |
| Videotron Ltd. | | | | | | | | |
| 5.13% due 04/15/276 | | | 1,100,000 | | | | 1,078,000 | |
| Sprint Communications, Inc. | | | | | | | | |
| 9.00% due 11/15/186 | | | 1,000,000 | | | | 1,031,250 | |
| Univision Communications, Inc. | | | | | | | | |
| 5.13% due 05/15/236 | | | 1,000,000 | | | | 952,600 | |
| Match Group, Inc. | | | | | | | | |
| 6.38% due 06/01/24 | | | 500,000 | | | | 531,875 | |
| T-Mobile USA, Inc. | | | | | | | | |
| 6.63% due 04/01/23 | | | 300,000 | | | | 309,939 | |
| Total Communications | | | | | | | 87,613,082 | |
| | | | | | | | | |
| Financial - 14.4% |
| Jefferies Finance LLC / JFIN Company-Issuer Corp. | | | | | | | | |
| 6.88% due 04/15/226 | | | 3,865,000 | | | | 3,826,350 | |
| 7.38% due 04/01/206,7 | | | 3,700,000 | | | | 3,737,000 | |
| 7.25% due 08/15/246 | | | 2,500,000 | | | | 2,467,250 | |
| 7.50% due 04/15/216 | | | 1,800,000 | | | | 1,820,250 | |
| FBM Finance, Inc. | | | | | | | | |
| 8.25% due 08/15/216 | | | 7,102,000 | | | | 7,421,590 | |
| Kennedy-Wilson, Inc. | | | | | | | | |
| 5.88% due 04/01/247 | | | 6,765,000 | | | | 6,705,806 | |
| Icahn Enterprises, LP / Icahn Enterprises Finance Corp. | | | | | | | | |
| 5.88% due 02/01/22 | | | 4,225,000 | | | | 4,235,563 | |
| Quicken Loans, Inc. | | | | | | | | |
| 5.25% due 01/15/286,7 | | | 4,350,000 | | | | 4,067,250 | |
| Hunt Companies, Inc. | | | | | | | | |
| 6.25% due 02/15/266 | | | 3,825,000 | | | | 3,692,541 | |
| Citigroup, Inc. | | | | | | | | |
| 6.25% 3,4 | | | 1,900,000 | | | | 2,006,875 | |
| 5.95% 3,4 | | | 850,000 | | | | 873,800 | |
| 6.30% 3,4 | | | 700,000 | | | | 730,625 | |
| GEO Group, Inc. | | | | | | | | |
| 5.88% due 10/15/24 | | | 2,000,000 | | | | 1,980,000 | |
| 6.00% due 04/15/26 | | | 900,000 | | | | 879,750 | |
| Greystar Real Estate Partners LLC | | | | | | | | |
| 5.75% due 12/01/256 | | | 2,550,000 | | | | 2,543,625 | |
| CoreCivic, Inc. | | | | | | | | |
| 4.75% due 10/15/27 | | | 2,500,000 | | | | 2,350,000 | |
| American Equity Investment Life Holding Co. | | | | | | | | |
| 5.00% due 06/15/27 | | | 2,050,000 | | | | 2,077,699 | |
| Oxford Finance LLC / Oxford Finance Company-Issuer II, Inc. | | | | | | | | |
| 6.38% due 12/15/226 | | | 1,850,000 | | | | 1,891,625 | |
| JPMorgan Chase & Co. | | | | | | | | |
| 6.13% 3,4 | | | 1,250,000 | | | | 1,309,375 | |
| 6.00% 3,4 | | | 500,000 | | | | 515,535 | |
| Lincoln Finance Ltd. | | | | | | | | |
| 7.38% due 04/15/216 | | | 1,700,000 | | | | 1,755,250 | |
| LoanCore Capital Markets LLC / JLC Finance Corp. | | | | | | | | |
| 6.88% due 06/01/206 | | | 1,700,000 | | | | 1,721,250 | |
| NFP Corp. | | | | | | | | |
| 6.88% due 07/15/256 | | | 1,675,000 | | | | 1,662,437 | |
| Fidelity & Guaranty Life Holdings, Inc. | | | | | | | | |
| 6.38% due 04/01/216 | | | 1,520,000 | | | | 1,537,100 | |
| Goldman Sachs Group, Inc. | | | | | | | | |
| 5.30% 3,4 | | | 1,100,000 | | | | 1,102,750 | |
| USIS Merger Sub, Inc. | | | | | | | | |
| 6.88% due 05/01/256 | | | 1,100,000 | | | | 1,100,000 | |
| Assurant, Inc. | | | | | | | | |
| 7.00% due 03/27/484 | | | 950,000 | | | | 971,121 | |
| Bank of America Corp. | | | | | | | | |
| 6.10% 3,4 | | | 700,000 | | | | 736,750 | |
| Wilton Re Finance LLC | | | | | | | | |
| 5.88% due 03/30/334,6 | | | 650,000 | | | | 680,875 | |
| iStar, Inc. | | | | | | | | |
| 5.25% due 09/15/22 | | | 575,000 | | | | 556,313 | |
| Hospitality Properties Trust | | | | | | | | |
| 4.95% due 02/15/277 | | | 500,000 | | | | 508,554 | |
| EPR Properties | | | | | | | | |
| 5.75% due 08/15/227 | | | 450,000 | | | | 480,789 | |
| CIT Group, Inc. | | | | | | | | |
| 6.13% due 03/09/28 | | | 400,000 | | | | 415,000 | |
| Wells Fargo & Co. | | | | | | | | |
| 5.90% 3,4 | | | 250,000 | | | | 257,525 | |
| Travelport Corporate Finance plc | | | | | | | | |
| 6.00% due 03/15/266 | | | 200,000 | | | | 200,750 | |
| Total Financial | | | | | | | 68,818,973 | |
| | | | | | | | | |
| ENERGY - 11.6% |
| Unit Corp. | | | | | | | | |
| 6.63% due 05/15/21 | | | 7,750,000 | | | | 7,750,000 | |
| American Midstream Partners Limited Partnership / American Midstream Finance Corp. | | | | | | | | |
| 8.50% due 12/15/21 | | | 6,240,000 | | | | 6,286,800 | |
| Exterran Energy Solutions Limited Partnership / EES Finance Corp. | | | | | | | | |
| 8.13% due 05/01/25 | | | 4,417,000 | | | | 4,682,020 | |
| Covey Park Energy LLC / Covey Park Finance Corp. | | | | | | | | |
| 7.50% due 05/15/256,7 | | | 3,999,000 | | | | 3,959,010 | |
| Moss Creek Resources Holdings, Inc. | | | | | | | | |
| 7.50% due 01/15/266 | | | 3,800,000 | | | | 3,832,110 | |
| PDC Energy, Inc. | | | | | | | | |
| 5.75% due 05/15/26 | | | 3,250,000 | | | | 3,193,125 | |
| Comstock Resources, Inc. | | | | | | | | |
| 10.00% due 03/15/20 | | | 2,750,000 | | | | 2,825,625 | |
| Indigo Natural Resources LLC | | | | | | | | |
| 6.88% due 02/15/266 | | | 2,700,000 | | | | 2,544,750 | |
| SEE NOTES TO FINANCIAL STATEMENTS. | THE GUGGENHEIM FUNDS SEMI-ANNUAL REPORT | 21 |
| SCHEDULE OF INVESTMENTS (Unaudited)(continued) | March 29, 2018 |
| HIGH YIELD FUND | |
| | | Face
Amount~ | | | Value | |
| | | | | | | |
| CNX Resources Corp. | | | | | | |
| 8.00% due 04/01/23 | | | 1,300,000 | | | $ | 1,378,000 | |
| 5.88% due 04/15/22 | | | 1,050,000 | | | | 1,056,562 | |
| Gibson Energy, Inc. | | | | | | | | |
| 5.25% due 07/15/246 | | | CAD | 3,100,000 | | | | 2,412,344 | |
| Parkland Fuel Corp. | | | | | | | | |
| 6.00% due 04/01/266 | | | 2,400,000 | | | | 2,412,000 | |
| Legacy Reserves Limited Partnership / Legacy Reserves Finance Corp. | | | | | | | | |
| 6.63% due 12/01/21 | | | 1,090,000 | | | | 795,700 | |
| 8.00% due 12/01/20 | | | 965,000 | | | | 779,237 | |
| Pattern Energy Group, Inc. | | | | | | | | |
| 5.88% due 02/01/246 | | | 1,375,000 | | | | 1,405,938 | |
| SRC Energy, Inc. | | | | | | | | |
| 6.25% due 12/01/25 | | | 1,375,000 | | | | 1,378,438 | |
| QEP Resources, Inc. | | | | | | | | |
| 5.38% due 10/01/22 | | | 1,325,000 | | | | 1,323,344 | |
| Callon Petroleum Co. | | | | | | | | |
| 6.13% due 10/01/24 | | | 1,050,000 | | | | 1,073,940 | |
| Cheniere Corpus Christi Holdings LLC | | | | | | | | |
| 5.88% due 03/31/25 | | | 1,000,000 | | | | 1,046,250 | |
| Murphy Oil USA, Inc. | | | | | | | | |
| 5.63% due 05/01/27 | | | 1,000,000 | | | | 1,002,500 | |
| Trinidad Drilling Ltd. | | | | | | | | |
| 6.63% due 02/15/256 | | | 1,075,000 | | | | 1,002,438 | |
| Summit Midstream Holdings LLC / Summit Midstream Finance Corp. | | | | | | | | |
| 5.75% due 04/15/25 | | | 1,000,000 | | | | 952,500 | |
| Alta Mesa Holdings Limited Partnership / Alta Mesa Finance Services Corp. | | | | | | | | |
| 7.88% due 12/15/24 | | | 752,000 | | | | 783,020 | |
| Murphy Oil Corp. | | | | | | | | |
| 5.75% due 08/15/25 | | | 625,000 | | | | 615,625 | |
| NuStar Logistics, LP | | | | | | | | |
| 5.63% due 04/28/27 | | | 550,000 | | | | 533,500 | |
| EP Energy LLC / Everest Acquisition Finance, Inc. | | | | | | | | |
| 8.00% due 02/15/256 | | | 370,000 | | | | 246,975 | |
| 9.38% due 05/01/246 | | | 77,000 | | | | 54,766 | |
| Schahin II Finance Co. SPV Ltd. | | | | | | | | |
| 5.88% due 09/25/228,11 | | | 217,167 | | | | 26,603 | |
| BreitBurn Energy Partners Limited Partnership / BreitBurn Finance Corp. | | | | | | | | |
| 7.88% due 04/15/228 | | | 1,750,000 | | | | 10,937 | |
| SandRidge Energy, Inc. | | | | | | | | |
| 7.50% due 09/06/18†††,1,8 | | | 250,000 | | | | 25 | |
| Total Energy | | | | | | | 55,364,082 | |
| | | | | | | | | |
| Consumer, Non-cyclical - 10.8% |
| Vector Group Ltd. | | | | | | | | |
| 6.13% due 02/01/256 | | | 9,735,000 | | | | 9,735,000 | |
| Valeant Pharmaceuticals International, Inc. | | | | | | | | |
| 7.00% due 03/15/246,7 | | | 6,150,000 | | | | 6,411,375 | |
| 5.50% due 11/01/256,7 | | | 1,200,000 | | | | 1,168,200 | |
| 6.50% due 03/15/226 | | | 1,000,000 | | | | 1,032,500 | |
| Great Lakes Dredge & Dock Corp. | | | | | | | | |
| 8.00% due 05/15/22 | | | 6,102,000 | | | | 6,254,550 | |
| Midas Intermediate Holdco II LLC | | | | | | | | |
| 7.88% due 10/01/226 | | | 4,927,000 | | | | 4,939,318 | |
| FAGE International S.A./ FAGE USA Dairy Industry, Inc. | | | | | | | | |
| 5.63% due 08/15/266 | | | 4,265,000 | | | | 3,966,450 | |
| Post Holdings, Inc. | | | | | | | | |
| 5.63% due 01/15/286 | | | 3,550,000 | | | | 3,390,250 | |
| Avantor, Inc. | | | | | | | | |
| 4.75% due 10/01/24 | | | EUR | 1,150,000 | | | | 1,404,653 | |
| 6.00% due 10/01/246 | | | 900,000 | | | | 895,500 | |
| Endo Dac / Endo Finance LLC / Endo Finco, Inc. | | | | | | | | |
| 5.88% due 10/15/246 | | | 1,918,000 | | | | 1,889,230 | |
| Hologic, Inc. | | | | | | | | |
| 4.63% due 02/01/286 | | | 1,500,000 | | | | 1,440,000 | |
| 4.38% due 10/15/256 | | | 455,000 | | | | 439,075 | |
| KeHE Distributors LLC / KeHE Finance Corp. | | | | | | | | |
| 7.63% due 08/15/216 | | | 1,470,000 | | | | 1,436,925 | |
| Albertsons Companies LLC / Safeway Incorporated | | | | | | | | |
| 6.63% due 06/15/24 | | | 1,175,000 | | | | 1,053,094 | |
| 5.75% due 03/15/25 | | | 450,000 | | | | 383,760 | |
| Beverages & More, Inc. | | | | | | | | |
| 11.50% due 06/15/226 | | | 1,550,000 | | | | 1,426,000 | |
| Endo Finance LLC / Endo Finco, Inc. | | | | | | | | |
| 7.25% due 01/15/226 | | | 775,000 | | | | 672,312 | |
| 5.38% due 01/15/23 | | | 825,000 | | | | 624,938 | |
| Central Garden & Pet Co. | | | | | | | | |
| 5.13% due 02/01/28 | | | 900,000 | | | | 855,000 | |
| Acadia Healthcare Company, Inc. | | | | | | | | |
| 6.50% due 03/01/24 | | | 600,000 | | | | 624,000 | |
| TreeHouse Foods, Inc. | | | | | | | | |
| 6.00% due 02/15/246 | | | 500,000 | | | | 503,125 | |
| DaVita, Inc. | | | | | | | | |
| 5.00% due 05/01/25 | | | 450,000 | | | | 434,947 | |
| Flexi-Van Leasing, Inc. | | | | | | | | |
| 10.00% due 02/15/236 | | | 325,000 | | | | 322,562 | |
| Total Consumer, Non-cyclical | | | | | | | 51,302,764 | |
| | | | | | | | | |
| Consumer, Cyclical - 9.5% |
| Seminole Hard Rock Entertainment Inc. / Seminole Hard Rock International LLC | | | | | | | | |
| 5.88% due 05/15/216 | | | 4,293,000 | | | | 4,293,000 | |
| Ferrellgas, LP / Ferrellgas Finance Corp. | | | | | | | | |
| 6.75% due 01/15/22 | | | 4,493,000 | | | | 4,257,118 | |
| AMC Entertainment Holdings, Inc. | | | | | | | | |
| 6.13% due 05/15/277 | | | 3,150,000 | | | | 3,103,065 | |
| 5.88% due 11/15/267 | | | 500,000 | | | | 491,250 | |
| Carrols Restaurant Group, Inc. | | | | | | | | |
| 8.00% due 05/01/22 | | | 3,050,000 | | | | 3,172,000 | |
| Nathan’s Famous, Inc. | | | | | | | | |
| 6.63% due 11/01/256 | | | 3,050,000 | | | | 3,065,250 | |
| Wynn Las Vegas LLC / Wynn Las Vegas Capital Corp. | | | | | | | | |
| 5.50% due 03/01/256 | | | 3,000,000 | | | | 3,015,000 | |
| 22 | THE GUGGENHEIM FUNDS SEMI-ANNUAL REPORT | SEE NOTES TO FINANCIAL STATEMENTS. |
| SCHEDULE OF INVESTMENTS (Unaudited)(continued) | March 29, 2018 |
| HIGH YIELD FUND | |
| | | Face
Amount~ | | | Value | |
| | | | | | | |
| Suburban Propane Partners Limited Partnership/Suburban Energy Finance Corp. | | | | | | |
| 5.88% due 03/01/27 | | | 1,800,000 | | | $ | 1,705,500 | |
| 5.75% due 03/01/25 | | | 1,350,000 | | | | 1,296,000 | |
| VOC Escrow Ltd. | | �� | | | | | | |
| 5.00% due 02/15/286 | | | 2,325,000 | | | | 2,208,750 | |
| Titan International, Inc. | | | | | | | | |
| 6.50% due 11/30/23 | | | 2,000,000 | | | | 2,060,000 | |
| Delphi Technologies plc | | | | | | | | |
| 5.00% due 10/01/256 | | | 2,080,000 | | | | 1,994,200 | |
| Ferrellgas Limited Partnership / Ferrellgas Finance Corp. | | | | | | | | |
| 6.75% due 06/15/237 | | | 1,800,000 | | | | 1,638,000 | |
| L Brands, Inc. | | | | | | | | |
| 6.75% due 07/01/36 | | | 950,000 | | | | 912,000 | |
| 7.60% due 07/15/37 | | | 700,000 | | | | 698,250 | |
| Williams Scotsman International, Inc. | | | | | | | | |
| 7.88% due 12/15/226 | | | 1,450,000 | | | | 1,499,844 | |
| Tesla, Inc. | | | | | | | | |
| 5.30% due 08/15/256,7 | | | 1,625,000 | | | | 1,417,812 | |
| Wyndham Hotels & Resorts, Inc. | | | | | | | | |
| 5.38% due 04/15/266 | | | 1,300,000 | | | | 1,313,000 | |
| PetSmart, Inc. | | | | | | | | |
| 5.88% due 06/01/256 | | | 1,800,000 | | | | 1,300,500 | |
| Suburban Propane Partners, LP / Suburban Energy Finance Corp. | | | | | | | | |
| 5.50% due 06/01/24 | | | 1,200,000 | | | | 1,155,000 | |
| Lennar Corp. | | | | | | | | |
| 5.00% due 06/15/27 | | | 980,000 | | | | 955,500 | |
| Mattel, Inc. | | | | | | | | |
| 6.75% due 12/31/256 | | | 884,000 | | | | 864,110 | |
| Wabash National Corp. | | | | | | | | |
| 5.50% due 10/01/256 | | | 825,000 | | | | 804,375 | |
| Allison Transmission, Inc. | | | | | | | | |
| 4.75% due 10/01/276 | | | 600,000 | | | | 565,500 | |
| Beacon Escrow Corp. | | | | | | | | |
| 4.88% due 11/01/256 | | | 590,000 | | | | 561,975 | |
| TVL Finance plc | | | | | | | | |
| 8.50% due 05/15/23 | | | GBP | 320,000 | | | | 483,749 | |
| QVC, Inc. | | | | | | | | |
| 4.85% due 04/01/24 | | | 400,000 | | | | 407,133 | |
| Total Consumer, Cyclical | | | | | | | 45,237,881 | |
| | | | | | | | | |
| Industrial - 7.9% |
| Grinding Media Inc. / MC Grinding Media Canada Inc. | | | | | | | | |
| 7.38% due 12/15/236,7 | | | 7,050,000 | | | | 7,402,500 | |
| Reynolds Group Issuer Incorporated / Reynolds Group Issuer LLC / Reynolds Group Issuer Luxembourg | | | | | | | | |
| 5.75% due 10/15/207 | | | 4,457,895 | | | | 4,513,619 | |
| Standard Industries, Inc. | | | | | | | | |
| 4.75% due 01/15/286,7 | | | 4,645,000 | | | | 4,370,713 | |
| Amsted Industries, Inc. | | | | | | | | |
| 5.38% due 09/15/246 | | | 2,398,000 | | | | 2,398,000 | |
| 5.00% due 03/15/226 | | | 500,000 | | | | 501,250 | |
| Cleaver-Brooks, Inc. | | | | | | | | |
| 7.88% due 03/01/236 | | | 2,775,000 | | | | 2,882,531 | |
| Novelis Corp. | | | | | | | | |
| 5.88% due 09/30/266 | | | 2,600,000 | | | | 2,548,000 | |
| Tutor Perini Corp. | | | | | | | | |
| 6.88% due 05/01/256 | | | 2,009,000 | | | | 2,069,270 | |
| LKQ European Holdings BV | | | | | | | | |
| 4.12% due 04/01/28 | | | EUR | 1,650,000 | | | | 2,032,016 | |
| Jeld-Wen, Inc. | | | | | | | | |
| 4.88% due 12/15/276 | | | 1,500,000 | | | | 1,417,500 | |
| Berry Global, Inc. | | | | | | | | |
| 4.50% due 02/15/266 | | | 1,250,000 | | | | 1,182,813 | |
| Ardagh Packaging Finance plc | | | | | | | | |
| 6.75% due 05/15/24 | | | EUR | 850,000 | | | | 1,137,247 | |
| Summit Materials LLC / Summit Materials Finance Corp. | | | | | | | | |
| 8.50% due 04/15/22 | | | 955,000 | | | | 1,029,012 | |
| Itron, Inc. | | | | | | | | |
| 5.00% due 01/15/266 | | | 950,000 | | | | 936,035 | |
| StandardAero Aviation Holdings, Inc. | | | | | | | | |
| 10.00% due 07/15/236 | | | 840,000 | | | | 912,450 | |
| Kratos Defense & Security Solutions, Inc. | | | | | | | | |
| 6.50% due 11/30/256 | | | 750,000 | | | | 776,250 | |
| New Enterprise Stone & Lime Company, Inc. | | | | | | | | |
| 6.25% due 03/15/266 | | | 575,000 | | | | 575,719 | |
| Wrangler Buyer Corp. | | | | | | | | |
| 6.00% due 10/01/256 | | | 540,000 | | | | 530,550 | |
| Ardagh Packaging Finance plc / Ardagh Holdings USA, Inc. | | | | | | | | |
| 7.25% due 05/15/246 | | | 375,000 | | | | 398,906 | |
| Total Industrial | | | | | | | 37,614,381 | |
| | | | | | | | | |
| Basic Materials - 3.2% |
| Eldorado Gold Corp. | | | | | | | | |
| 6.13% due 12/15/206 | | | 7,460,000 | | | | 7,087,000 | |
| Clearwater Paper Corp. | | | | | | | | |
| 4.50% due 02/01/23 | | | 1,450,000 | | | | 1,392,000 | |
| 5.38% due 02/01/256 | | | 1,100,000 | | | | 1,045,000 | |
| Big River Steel LLC / BRS Finance Corp. | | | | | | | | |
| 7.25% due 09/01/256 | | | 2,050,000 | | | | 2,126,875 | |
| Yamana Gold, Inc. | | | | | | | | |
| 4.95% due 07/15/24 | | | 1,625,000 | | | | 1,671,719 | |
| 4.63% due 12/15/27 | | | 300,000 | | | | 295,416 | |
| GCP Applied Technologies, Inc. | | | | | | | | |
| 9.50% due 02/01/236 | | | 1,248,000 | | | | 1,373,923 | |
| Mirabela Nickel Ltd. | | | | | | | | |
| 9.50% due 06/24/19 | | | 278,115 | | | | 59,795 | |
| Total Basic Materials | | | | | | | 15,051,728 | |
| | | | | | | | | |
| Utilities - 3.1% |
| LBC Tank Terminals Holding Netherlands BV | | | | | | | | |
| 6.88% due 05/15/236 | | | 8,315,000 | | | | 8,543,663 | |
| Terraform Global Operating LLC | | | | | | | | |
| 6.13% due 03/01/266 | | | 2,725,000 | | | | 2,745,437 | |
| AmeriGas Partners Limited Partnership / AmeriGas Finance Corp. | | | | | | | | |
| 5.50% due 05/20/257 | | | 2,200,000 | | | | 2,123,000 | |
| SEE NOTES TO FINANCIAL STATEMENTS. | THE GUGGENHEIM FUNDS SEMI-ANNUAL REPORT | 23 |
| SCHEDULE OF INVESTMENTS (Unaudited)(continued) | March 29, 2018 |
| HIGH YIELD FUND | |
| | | Face
Amount~ | | | Value | |
| | | | | | | |
| AmeriGas Partners, LP / AmeriGas Finance Corp. | | | | | | |
| 5.75% due 05/20/27 | | | 1,250,000 | | | $ | 1,195,312 | |
| Total Utilities | | | | | | | 14,607,412 | |
| | | | | | | | | |
| Technology - 0.8% |
| TIBCO Software, Inc. | | | | | | | | |
| 11.38% due 12/01/216 | | | 800,000 | | | | 871,000 | |
| Micron Technology, Inc. | | | | | | | | |
| 5.25% due 01/15/246 | | | 750,000 | | | | 775,312 | |
| Ascend Learning LLC | | | | | | | | |
| 6.88% due 08/01/256 | | | 650,000 | | | | 667,875 | |
| Infor US, Inc. | | | | | | | | |
| 6.50% due 05/15/22 | | | 600,000 | | | | 610,500 | |
| CDK Global, Inc. | | | | | | | | |
| 4.88% due 06/01/27 | | | 550,000 | | | | 529,375 | |
| Microsoft Corp. | | | | | | | | |
| 4.20% due 11/03/35 | | | 450,000 | | | | 482,257 | |
| Total Technology | | | | | | | 3,936,319 | |
| Total Corporate Bonds | | | | | | | | |
| (Cost $388,971,444) | | | | | | | 379,546,622 | |
| | | | | | | | | |
| SENIOR FLOATING RATE INTERESTS†† - 26.3% |
| Industrial - 5.9% |
| Resource Label Group LLC | | | | | | | | |
| 6.80% (3 Month USD LIBOR + 4.50%) due 05/26/2310 | | | 1,878,985 | | | | 1,841,405 | |
| 10.80% (1 Month USD LIBOR + 8.50%) due 11/26/2310 | | | 1,500,000 | | | | 1,485,000 | |
| Diversitech Holdings, Inc. | | | | | | | | |
| 9.81% (3 Month USD LIBOR + 7.50%) due 06/02/2510 | | | 2,650,000 | | | | 2,669,875 | |
| Hayward Industries, Inc. | | | | | | | | |
| 10.13% (3 Month USD LIBOR + 8.25%) due 08/04/2510 | | | 2,325,000 | | | | 2,307,563 | |
| Travelport Finance (Luxembourg) S.A.R.L. | | | | | | | | |
| 4.40% (3 Month USD LIBOR + 2.50%) due 03/17/2510 | | | 2,150,000 | | | | 2,153,763 | |
| Arctic Long Carriers | | | | | | | | |
| 6.38% (3 Month USD LIBOR + 4.50%) due 05/18/2310 | | | 1,538,375 | | | | 1,549,913 | |
| DAE Aviation | | | | | | | | |
| 5.63% (3 Month USD LIBOR + 3.75%) due 07/07/2210 | | | 1,442,602 | | | | 1,454,100 | |
| Filtration Group Corp. | | | | | | | | |
| 3.00% (3 Month USD LIBOR + 3.00%) due 03/27/2510 | | | 1,400,000 | | | | 1,403,500 | |
| CPG International LLC | | | | | | | | |
| 5.59% (3 Month USD LIBOR + 3.75%) due 05/05/2410 | | | 1,290,250 | | | | 1,299,385 | |
| ProAmpac PG Borrower LLC | | | | | | | | |
| 5.30% (3 Month USD LIBOR + 3.50%) due 11/20/2310 | | | 921,895 | | | | 928,118 | |
| 10.35% (3 Month USD LIBOR + 8.50%) due 11/18/2410 | | | 350,000 | | | | 355,688 | |
| Recess Holdings, Inc. | | | | | | | | |
| 6.20% (3 Month USD LIBOR + 3.75%) due 09/30/2410 | | | 1,230,250 | | | | 1,234,863 | |
| Titan Acquisition Ltd. (Husky) | | | | | | | | |
| 3.00% (3 Month USD LIBOR + 3.00%) due 03/15/2510 | | | 1,100,000 | | | | 1,098,317 | |
| Imagine Print Solutions LLC | | | | | | | | |
| 7.06% (3 Month USD LIBOR + 4.75%) due 06/21/2210 | | | 1,089,000 | | | | 1,012,770 | |
| Dimora Brands, Inc. | | | | | | | | |
| 5.38% (3 Month USD LIBOR + 3.50%) due 08/24/2410 | | | 997,500 | | | | 997,500 | |
| SRS Distribution, Inc. | | | | | | | | |
| 10.63% (3 Month USD LIBOR + 8.75%) due 02/24/2310 | | | 950,000 | | | | 974,937 | |
| American Bath Group LLC | | | | | | | | |
| 7.55% (6 Month USD LIBOR + 5.25%) due 09/30/2310 | | | 938,095 | | | | 947,082 | |
| Advanced Integration Technology LP | | | | | | | | |
| 6.73% (6 Month USD LIBOR + 4.75%) due 04/03/2310 | | | 873,416 | | | | 877,783 | |
| Bioplan USA, Inc. | | | | | | | | |
| 6.63% (3 Month USD LIBOR + 4.75%) due 09/23/2110 | | | 782,101 | | | | 747,884 | |
| ILPEA Parent, Inc. | | | | | | | | |
| 6.63% (1 Month USD LIBOR + 4.75%) due 03/02/2310 | | | 636,299 | | | | 639,480 | |
| CPM Holdings, Inc. | | | | | | | | |
| 5.38% (1 Month USD LIBOR + 3.50%) due 04/11/2210 | | | 573,855 | | | | 580,488 | |
| Hardware Holdings LLC | | | | | | | | |
| 8.38% (3 Month USD LIBOR + 6.50%) due 03/30/2010 | | | 481,500 | | | | 467,055 | |
| Hillman Group, Inc. | | | | | | | | |
| 6.81% (Commercial Prime Lending Rate + 2.25%) due 06/28/19†††,1,10 | | | 450,000 | | | | 437,625 | |
| Wencor Group | | | | | | | | |
| 5.38% (1 Month USD LIBOR + 3.50%) due 06/19/19†††,1,10 | | | 380,000 | | | | 369,105 | |
| Kuehg Corp. - Kindercare | | | | | | | | |
| 6.05% (3 Month USD LIBOR + 3.75%) due 08/12/2210 | | | 318,388 | | | | 319,681 | |
| Total Industrial | | | | | | | 28,152,880 | |
| | | | | | | | | |
| Technology - 5.3% |
| Camelia Bidco Banc Civica | | | | | | | | |
| 5.46% (1 Month USD LIBOR + 4.75%) due 10/14/2410 | | | GBP | 2,000,000 | | | | 2,808,559 | |
| MRI Software LLC | | | | | | | | |
| 8.56% (3 Month USD LIBOR + 6.25%) due 06/30/2310 | | | 2,410,724 | | | | 2,386,617 | |
| 8.36% (3 Month USD LIBOR + 6.25%) due 06/30/2310 | | | 117,760 | | | | 116,583 | |
| 8.02% (2 Month USD LIBOR + 6.00%) due 06/30/23†††,1,10 | | | 17,472 | | | | 16,018 | |
| Lytx, Inc. | | | | | | | | |
| 8.63% (3 Month USD LIBOR + 6.75%) due 08/31/23†††,1,10 | | | 2,312,663 | | | | 2,260,969 | |
| 24 | THE GUGGENHEIM FUNDS SEMI-ANNUAL REPORT | SEE NOTES TO FINANCIAL STATEMENTS. |
| SCHEDULE OF INVESTMENTS (Unaudited)(continued) | March 29, 2018 |
| HIGH YIELD FUND | |
| | | Face
Amount~ | | | Value | |
| | | | | | | |
| Park Place Technologies LLC | | | | | | |
| 8.75% (3 Month USD LIBOR + 4.00%) due 03/22/2510 | | | 2,100,000 | | | $ | 2,094,750 | |
| Bullhorn, Inc. | | | | | | | | |
| 8.64% (3 Month USD LIBOR + 6.75%) due 11/21/22†††,1,10 | | | 1,507,203 | | | | 1,497,692 | |
| 8.62% (1 Month USD LIBOR + 6.75%) due 11/21/22†††,1,10 | | | 313,698 | | | | 311,885 | |
| Viewpoint, Inc. | | | | | | | | |
| 6.55% (3 Month USD LIBOR + 4.25%) due 07/19/24 | | | 1,592,000 | | | | 1,593,990 | |
| SS&C Technologies, Inc. | | | | | | | | |
| 7.25% (3 Month USD LIBOR + 2.50%) due 02/27/2510 | | | 1,105,597 | | | | 1,110,550 | |
| 7.25% (3 Month USD LIBOR + 2.50%) due 02/28/2510 | | | 394,403 | | | | 396,170 | |
| Advanced Computer Software | | | | | | | | |
| 11.37% (6 Month USD LIBOR + 9.50%) due 01/31/2310 | | | 800,000 | | | | 784,000 | |
| 7.52% (6 Month USD LIBOR + 5.50%) due 03/18/2210 | | | 530,425 | | | | 530,866 | |
| Planview, Inc. | | | | | | | | |
| 7.13% (3 Month USD LIBOR + 5.25%) due 01/27/23†††,1,10 | | | 1,188,000 | | | | 1,176,829 | |
| Cvent, Inc. | | | | | | | | |
| 5.63% (3 Month USD LIBOR + 3.75%) due 11/29/2410 | | | 1,100,000 | | | | 1,105,500 | |
| AVSC Holding Corp. | | | | | | | | |
| 5.10% (3 Month USD LIBOR + 3.25%) due 03/03/2510 | | | 1,000,000 | | | | 1,002,190 | |
| Project Ruby Ultimate Parent Corp. | | | | | | | | |
| 5.38% (3 Month USD LIBOR + 3.50%) due 02/09/2410 | | | 890,387 | | | | 897,626 | |
| EIG Investors Corp. | | | | | | | | |
| 5.96% (3 Month USD LIBOR + 4.00%) due 02/09/2310 | | | 803,034 | | | | 808,053 | |
| Optiv, Inc. | | | | | | | | |
| 5.13% (1 Month USD LIBOR + 3.25%) due 02/01/2410 | | | 823,560 | | | | 793,706 | |
| Masergy Holdings, Inc. | | | | | | | | |
| 5.55% (3 Month USD LIBOR + 3.25%) due 12/15/2310 | | | 721,673 | | | | 722,575 | |
| Sarbacane Bidco, Inc. | | | | | | | | |
| 4.77% (3 Month USD LIBOR + 3.00%) due 01/29/2510 | | | 700,000 | | | | 703,941 | |
| Aspect Software, Inc. | | | | | | | | |
| 12.38% (1 Month USD LIBOR + 10.50%) due 05/25/202,10 | | | 647,685 | | | | 644,854 | |
| OEConnection LLC | | | | | | | | |
| 6.46% (Commercial Prime Lending Rate + 3.00%) and (3 Month USD LIBOR + 4.00%) due 11/22/2410 | | | 548,625 | | | | 552,062 | |
| Project Alpha (Qlik) | | | | | | | | |
| 5.04% (3 Month USD LIBOR + 3.50%) due 04/26/2410 | | | 513,226 | | | | 505,954 | |
| GlobalLogic Holdings, Inc. | | | | | | | | |
| 6.05% (3 Month USD LIBOR + 3.75%) due 06/20/2210 | | | 274,924 | | | | 276,299 | |
| Quorum Business Solutions | | | | | | | | |
| 6.52% (3 Month USD LIBOR + 4.75%) due 08/07/2110 | | | 205,088 | | | | 202,524 | |
| Total Technology | | | | | | | 25,300,762 | |
| | | | | | | | | |
| Consumer, Non-cyclical - 4.9% |
| CTI Foods Holding Co. LLC | | | | | | | | |
| 5.38% (1 Month USD LIBOR + 3.50%) due 06/29/2010 | | | 2,160,000 | | | | 1,949,400 | |
| 9.13% (3 Month USD LIBOR + 7.25%) due 06/28/2110 | | | 590,000 | | | | 436,600 | |
| Immucor, Inc. | | | | | | | | |
| 7.30% (3 Month USD LIBOR + 5.00%) due 06/15/2110 | | | 2,089,500 | | | | 2,136,514 | |
| Equian LLC | | | | | | | | |
| 5.15% (3 Month USD LIBOR + 3.25%) due 05/20/2410 | | | 2,088,988 | | | | 2,098,556 | |
| Gem Acquisitions, Inc. (Genex) | | | | | | | | |
| due 03/02/259 | | | 1,550,000 | | | | 1,549,349 | |
| Alegeus Technologies LLC | | | | | | | | |
| 7.31% (6 Month USD LIBOR + 5.00%) due 04/28/23†††,1,10 | | | 1,393,000 | | | | 1,381,211 | |
| Endo Luxembourg Finance Co. | | | | | | | | |
| 6.19% (3 Month USD LIBOR + 4.25%) due 04/29/2410 | | | 1,290,250 | | | | 1,286,482 | |
| Albertson’s LLC | | | | | | | | |
| 4.63% (6 Month USD LIBOR + 2.75%) due 08/25/2110 | | | 1,250,135 | | | | 1,234,083 | |
| ScribeAmerica Intermediate Holdco LLC (Healthchannels) | | | | | | | | |
| 4.50% (3 Month USD LIBOR + 4.25%) due 03/22/2510 | | | 1,200,000 | | | | 1,200,000 | |
| American Tire Distributors, Inc. | | | | | | | | |
| 6.24% (6 Month USD LIBOR + 4.25%) due 09/01/2110 | | | 1,119,701 | | | | 1,133,697 | |
| Lineage Logistics LLC | | | | | | | | |
| 4.88% (3 Month USD LIBOR + 3.00%) due 02/16/2510 | | | 1,100,000 | | | | 1,096,788 | |
| ADMI Corp. | | | | | | | | |
| 5.59% (6 Month USD LIBOR + 3.75%) due 04/29/2210 | | | 987,310 | | | | 989,778 | |
| Smart & Final Stores LLC | | | | | | | | |
| 5.38% (1 Month USD LIBOR + 3.50%) due 11/15/2210 | | | 1,000,000 | | | | 984,380 | |
| Reddy Ice Holdings, Inc. | | | | | | | | |
| 7.26% (Commercial Prime Lending Rate + 4.50%) and (3 Month USD LIBOR + 5.50%) due 05/01/1910 | | | 965,298 | | | | 962,885 | |
| IHC Holding Corp. | | | | | | | | |
| 8.74% (1 Month USD LIBOR + 6.75%) due 04/30/21†††,1,10 | | | 806,772 | | | | 800,542 | |
| 8.93% (1 Month USD LIBOR + 6.75%) due 04/30/21†††,1,10 | | | 153,421 | | | | 152,236 | |
| Avantor, Inc. | | | | | | | | |
| 5.88% (3 Month USD LIBOR + 4.00%) due 11/21/2410 | | | 897,750 | | | | 906,916 | |
| SEE NOTES TO FINANCIAL STATEMENTS. | THE GUGGENHEIM FUNDS SEMI-ANNUAL REPORT | 25 |
| SCHEDULE OF INVESTMENTS (Unaudited)(continued) | March 29, 2018 |
| HIGH YIELD FUND | |
| | | Face
Amount~ | | | Value | |
| | | | | | | |
| Arctic Glacier Group Holdings, Inc. | | | | | | |
| 5.38% (3 Month USD LIBOR + 3.50%) due 03/20/2410 | | | 769,188 | | | $ | 775,195 | |
| JBS USA Lux SA | | | | | | | | |
| 4.68% (Commercial Prime Lending Rate + 2.50%) and (1 Month USD LIBOR + 2.50%) due 10/30/2210 | | | 645,125 | | | | 642,841 | |
| Give and Go Prepared Foods Corp. | | | | | | | | |
| 6.19% (3 Month USD LIBOR + 4.25%) due 07/29/2310 | | | 497,500 | | | | 499,987 | |
| Packaging Coordinators Midco, Inc. | | | | | | | | |
| 5.78% (3 Month USD LIBOR + 4.00%) due 06/30/2310 | | | 478,785 | | | | 480,283 | |
| NES Global Talent | | | | | | | | |
| 7.27% (3 Month USD LIBOR + 5.50%) due 10/03/1910 | | | 421,812 | | | | 415,485 | |
| RESIC Enterprises, LLC (Lyons Magnus, Inc.) | | | | | | | | |
| 6.13% (3 Month USD LIBOR + 4.25%) due 11/11/2410 | | | 374,063 | | | | 375,465 | |
| Targus Group International, Inc. | | | | | | | | |
| due 05/24/16†††,1,2,8 | | | 153,489 | | | | — | |
| Total Consumer, Non-cyclical | | | | | | | 23,488,673 | |
| | | | | | | | | |
| Consumer, Cyclical - 4.5% |
| Mavis Tire Express Services Corp. | | | | | | | | |
| 5.07% (3 Month USD LIBOR + 3.25%) due 02/28/2510 | | | 2,499,807 | | | | 2,499,807 | |
| Toys ‘R’ Us, Inc. | | | | | | | | |
| 10.50% (Commercial Prime Lending Rate + 5.75%) due 01/18/1910 | | | 2,500,000 | | | | 2,495,825 | |
| Men’s Wearhouse | | | | | | | | |
| 5.20% (1 Month USD LIBOR + 3.50%) and (3 Month USD LIBOR + 3.50%) due 06/18/2110 | | | 1,450,179 | | | | 1,450,179 | |
| Truck Hero, Inc. | | | | | | | | |
| 6.22% (1 Month USD LIBOR + 4.00%) due 04/22/2410 | | | 1,434,958 | | | | 1,441,416 | |
| BC Equity Ventures LLC | | | | | | | | |
| 8.49% (3 Month USD LIBOR + 6.50%) due 08/31/2210 | | | 1,425,255 | | | | 1,439,507 | |
| Leslie’s Poolmart, Inc. | | | | | | | | |
| 5.28% (3 Month USD LIBOR + 3.50%) due 08/16/2310 | | | 1,398,994 | | | | 1,407,738 | |
| Crown Finance US, Inc. | | | | | | | | |
| 4.38% (1 Month USD LIBOR + 2.50%) due 02/28/2510 | | | 1,400,000 | | | | 1,397,620 | |
| BBB Industries, LLC | | | | | | | | |
| 6.38% (1 Month USD LIBOR + 4.50%) due 11/03/2110 | | | 994,320 | | | | 1,001,777 | |
| 5.65% (1 Month USD LIBOR + 4.00%) and (3 Month USD LIBOR + 4.00%) due 11/04/19†††,1,10 | | | 385,714 | | | | 368,480 | |
| LegalZoom.com, Inc. | | | | | | | | |
| 6.34% (1 Month USD LIBOR + 4.50%) due 11/21/2410 | | | 1,097,250 | | | | 1,102,736 | |
| Learning Care Group (US), Inc. | | | | | | | | |
| 5.11% (3 Month USD LIBOR + 3.25%) due 03/13/2510 | | | 1,000,000 | | | | 1,007,500 | |
| EG Finco Ltd. | | | | | | | | |
| due 02/07/259 | | | 1,000,000 | | | | 997,250 | |
| Accuride Corp. | | | | | | | | |
| 7.55% (3 Month USD LIBOR + 5.25%) due 11/17/2310 | | | 986,008 | | | | 995,868 | |
| Talbots, Inc. | | | | | | | | |
| 6.38% (3 Month USD LIBOR + 4.50%) due 03/19/2010 | | | 901,603 | | | | 890,333 | |
| Amaya Holdings B.V. (Stars Group Holdings B.V.) | | | | | | | | |
| 3.00% (3 Month USD LIBOR + 3.00%) due 04/04/2510 | | | 750,000 | | | | 753,000 | |
| Blue Nile, Inc. | | | | | | | | |
| 8.80% (3 Month USD LIBOR + 6.50%) due 02/17/2310 | | | 745,938 | | | | 749,667 | |
| USIC Holding, Inc. | | | | | | | | |
| 5.80% (3 Month USD LIBOR + 3.50%) due 12/08/2310 | | | 549,524 | | | | 553,646 | |
| Belk, Inc. | | | | | | | | |
| 6.46% (3 Month USD LIBOR + 4.75%) due 12/12/2210 | | | 546,255 | | | | 472,510 | |
| Acosta, Inc. | | | | | | | | |
| 5.30% (Commercial Prime Lending Rate + 2.25%) and (3 Month USD LIBOR + 3.25%) due 09/26/1910 | | | 377,778 | | | | 315,698 | |
| 5.40% (1 Month USD LIBOR + 3.25%) due 09/26/1910 | | | 111,111 | | | | 92,852 | |
| Sears Roebuck Acceptance Corp. | | | | | | | | |
| 6.20% (1 Month USD LIBOR + 4.50%) due 01/20/1910 | | | 397,276 | | | | 394,627 | |
| SMG US Midco 2, Inc. | | | | | | | | |
| 8.88% (1 Month USD LIBOR + 7.00%) due 01/23/2610 | | | 300,000 | | | | 306,000 | |
| Total Consumer, Cyclical | | | | | | | 22,134,036 | |
| | | | | | | | | |
| Communications - 1.8% |
| Market Track LLC | | | | | | | | |
| 6.55% (1 Month USD LIBOR + 4.25%) due 06/05/2410 | | | 2,487,500 | | | | 2,481,281 | |
| Cengage Learning Acquisitions, Inc. | | | | | | | | |
| 6.04% (1 Month USD LIBOR + 4.25%) due 06/07/2310 | | | 2,375,080 | | | | 2,157,000 | |
| Mcgraw-Hill Global Education Holdings LLC | | | | | | | | |
| 5.88% (3 Month USD LIBOR + 4.00%) due 05/04/2210 | | | 1,931,978 | | | | 1,906,379 | |
| Houghton Mifflin Co. | | | | | | | | |
| 4.88% (1 Month USD LIBOR + 3.00%) due 05/28/2110 | | | 1,335,003 | | | | 1,216,522 | |
| Anaren, Inc. | | | | | | | | |
| 10.55% (6 Month USD LIBOR + 8.25%) due 08/18/2110 | | | 500,000 | | | | 500,000 | |
| Liberty Cablevision of Puerto Rico LLC | | | | | | | | |
| 5.22% (2 Month USD LIBOR + 3.50%) due 01/07/2210 | | | 300,000 | | | | 290,562 | |
| 26 | THE GUGGENHEIM FUNDS SEMI-ANNUAL REPORT | SEE NOTES TO FINANCIAL STATEMENTS. |
| SCHEDULE OF INVESTMENTS (Unaudited)(continued) | March 29, 2018 |
| HIGH YIELD FUND | |
| | | Face
Amount~ | | | Value | |
| | | | | | | |
| Neustar, Inc. | | | | | | |
| 5.38% (1 Month USD LIBOR + 3.50%) due 08/08/2410 | | | 248,894 | | | $ | 249,621 | |
| Total Communications | | | | | | | 8,801,365 | |
| | | | | | | | | |
| Utilities - 1.6% |
| Bhi Investments LLC | | | | | | | | |
| 10.59% (3 Month USD LIBOR + 8.75%) due 02/28/2510 | | | 1,500,000 | | | | 1,485,000 | |
| 6.80% (Commercial Prime Lending Rate + 3.50%) and (3 Month USD LIBOR + 4.50) due 08/28/2410 | | | 1,416,450 | | | | 1,402,285 | |
| Invenergy Thermal Operating I, LLC | | | | | | | | |
| 7.80% (3 Month USD LIBOR + 5.50%) due 10/19/2210 | | | 958,859 | | | | 908,518 | |
| Panda Power | | | | | | | | |
| 8.80% (1 Month USD LIBOR + 6.50%) due 08/21/2010 | | | 970,786 | | | | 902,103 | |
| Exgen Texas Power LLC | | | | | | | | |
| due 09/18/219 | | | 1,344,814 | | | | 819,772 | |
| MRP Generation Holding | | | | | | | | |
| 9.30% (3 Month USD LIBOR + 7.00%) due 10/18/2210 | | | 715,938 | | | | 689,985 | |
| Terraform AP Acquisition Holdings LLC | | | | | | | | |
| 6.55% (3 Month USD LIBOR + 4.25%) due 06/27/2210 | | | 427,227 | | | | 429,765 | |
| Viva Alamo LLC | | | | | | | | |
| 6.01% (1 Month USD LIBOR + 4.25%) due 02/22/2110 | | | 374,978 | | | | 371,580 | |
| Panda Temple II Power | | | | | | | | |
| 8.30% (3 Month USD LIBOR + 6.00%) due 04/03/1910 | | | 346,621 | | | | 318,891 | |
| Stonewall | | | | | | | | |
| 7.80% (3 Month USD LIBOR + 5.50%) due 11/13/2110 | | | 288,276 | | | | 282,150 | |
| Total Utilities | | | | | | | 7,610,049 | |
| | | | | | | | | |
| Basic Materials - 1.3% |
| A-Gas Ltd. | | | | | | | | |
| 7.05% (3 Month USD LIBOR + 4.75%) due 08/11/24†††,1,10 | | | 2,615,757 | | | | 2,568,185 | |
| EP Minerals LLC | | | | | | | | |
| 6.48% (3 Month USD LIBOR + 4.50%) due 08/20/2010 | | | 1,596,778 | | | | 1,598,773 | |
| ICP Industrial, Inc. | | | | | | | | |
| 5.88% (1 Month USD LIBOR + 4.00%) due 11/03/2310 | | | 989,657 | | | | 984,709 | |
| Big River Steel LLC | | | | | | | | |
| 7.30% (1 Month USD LIBOR + 5.00%) due 08/23/2310 | | | 895,500 | | | | 906,694 | |
| Total Basic Materials | | | | | | | 6,058,361 | |
| | | | | | | | | |
| Financial - 0.5% |
| Jane Street Group LLC | | | | | | | | |
| 5.63% (3 Month USD LIBOR + 3.75%) due 08/25/2210 | | | 1,234,375 | | | | 1,239,387 | |
| York Risk Services | | | | | | | | |
| 5.63% (3 Month USD LIBOR + 3.75%) due 10/01/2110 | | | 723,750 | | | | 707,466 | |
| American Stock Transfer & Trust | | �� | | | | | | |
| 6.81% (3 Month USD LIBOR + 4.50%) due 06/26/2010 | | | 548,294 | | | | 547,838 | |
| Total Financial | | | | | | | 2,494,691 | |
| | | | | | | | | |
| ENERGY - 0.3% |
| PSS Companies | | | | | | | | |
| 6.34% (3 Month USD LIBOR + 4.50%) due 01/28/2010 | | | 525,768 | | | | 508,681 | |
| Riverstone Utopia Member LLC | | | | | | | | |
| 6.04% (3 Month USD LIBOR + 4.25%) due 10/17/2410 | | | 400,000 | | | | 401,000 | |
| Summit Midstream Partners, LP | | | | | | | | |
| 7.88% (6 Month USD LIBOR + 6.00%) due 05/13/2210 | | | 308,000 | | | | 311,080 | |
| Total Energy | | | | | | | 1,220,761 | |
| Total Senior Floating Rate Interests | | | | | | | | |
| (Cost $125,441,732) | | | | | | | 125,261,578 | |
| | | | | | | | | |
| ASSET-BACKED SECURITIES††,10 - 0.8% |
| Collateralized Loan Obligations - 0.8% |
| WhiteHorse X Ltd. | | | | | | | | |
| 2015-10A, 7.03% (3 Month USD LIBOR + 5.30%) due 04/17/276 | | | 750,000 | | | | 724,777 | |
| WhiteHorse VII Ltd. | | | | | | | | |
| 2013-1A, 6.74% (3 Month USD LIBOR + 4.80%) due 11/24/256 | | | 600,000 | | | | 596,855 | |
| Eaton Vance CLO Ltd. | | | | | | | | |
| 2014-1A, 6.75% (3 Month USD LIBOR + 5.03%) due 07/15/266, | | | 600,000 | | | | 587,984 | |
| Jamestown CLO III Ltd. | | | | | | | | |
| 2013-3A, 6.32% (3 Month USD LIBOR + 4.60%) due 01/15/266 | | | 500,000 | | | | 500,328 | |
| KVK CLO Ltd. | | | | | | | | |
| 2015-1A, 7.63% (3 Month USD LIBOR + 5.75%) due 05/20/276 | | | 500,000 | | | | 500,297 | |
| Regatta IV Funding Ltd. | | | | | | | | |
| 2014-1A, 6.70% (3 Month USD LIBOR + 4.95%) due 07/25/266 | | | 500,000 | | | | 497,356 | |
| NewMark Capital Funding CLO Ltd. | | | | | | | | |
| 2014-2A, 7.11% (3 Month USD LIBOR + 4.80%) due 06/30/266 | | | 500,000 | | | | 491,685 | |
| Shackleton CLO | | | | | | | | |
| 2014-6A, 7.48% (3 Month USD LIBOR + 5.75%) due 07/17/266 | | | 250,000 | | | | 233,388 | |
| Total Collateralized Loan Obligations | | | | | | | 4,132,670 | |
| Total Asset-Backed Securities | | | | | | | | |
| (Cost $3,463,358) | | | | | | | 4,132,670 | |
| | | | | | | | | |
| Total Investments - 109.8% | | | | | | | | |
| (Cost $534,527,310) | | | | | | $ | 522,963,667 | |
| Other Assets & Liabilities, net - (9.8)% | | | | | | | (46,649,061 | ) |
| Total Net Assets - 100.0% | | | | | | $ | 476,314,606 | |
| SEE NOTES TO FINANCIAL STATEMENTS. | THE GUGGENHEIM FUNDS SEMI-ANNUAL REPORT | 27 |
| SCHEDULE OF INVESTMENTS (Unaudited)(continued) | March 29, 2018 |
| HIGH YIELD FUND | |
| FORWARD FOREIGN CURRENCY EXCHANGE CONTRACTS†† |
| Counterparty | | Contracts to
Sell | | Currency | | Settlement
Date | | Settlement
Value | | | Value at
March 29,
2018 | | | Net Unrealized Appreciation/
(Depreciation) | |
| BofA Merrill Lynch | | 9,806,000 | | EUR | | 04/10/18 | | $ | 12,104,820 | | | $ | 12,072,714 | | | $ | 32,106 | |
| Goldman Sachs | | 154,000 | | EUR | | 04/10/18 | | | 192,041 | | | | 189,598 | | | | 2,443 | |
| JPMorgan Chase & Co. | | 2,275,000 | | CAD | | 04/10/18 | | | 1,758,298 | | | | 1,766,298 | | | | (8,000 | ) |
| Barclays | | 862,000 | | CAD | | 04/10/18 | | | 659,264 | | | | 669,253 | | | | (9,989 | ) |
| Barclays | | 6,084,000 | | GBP | | 04/10/18 | | | 8,420,237 | | | | 8,539,165 | | | | (118,928 | ) |
| | | | | | | | | | | | | | | | | $ | (102,368 | ) |
| ~ | The face amount is denominated in U.S. dollars unless otherwise indicated. |
| * | Non-income producing security. |
| † | Value determined based on Level 1 inputs, unless otherwise noted — See Note 4. |
| †† | Value determined based on Level 2 inputs, unless otherwise noted — See Note 4. |
| ††† | Value determined based on Level 3 inputs — See Note 4. |
| 1 | Security was fair valued by the Valuation Committee at March 29, 2018. The total market value of fair valued securities amounts to $11,689,212, (cost $13,099,348) or 2.5% of total net assets. |
| 2 | Affiliated issuer. |
| 3 | Perpetual maturity. |
| 4 | Security has a fixed rate coupon which will convert to a floating or variable rate coupon on a future date. |
| 5 | Rate indicated is the 7 day yield as of March 29, 2018. |
| 6 | Security is a 144A or Section 4(a)(2) security. These securities have been determined to be liquid under guidelines established by the Board of Trustees. The total market value of 144A or Section 4(a)(2) securities is $252,889,000 (cost $258,863,648), or 53.1% of total net assets. |
| 7 | All or a portion of this security is pledged as reverse repurchase agreements collateral at March 29, 2018 — See Note 6. |
| 8 | Security is in default of interest and/or principal obligations. |
| 9 | Term loan interests in the Fund’s portfolio generally have variable rates. All or a portion of this security represents unsettled loan positions and may not have a stated coupon rate. |
| 10 | Variable rate security. Rate indicated is the rate effective at March 29, 2018. In some instances, the underlying reference rate shown was below the minimum rate earned by the security or has been adjusted by a predetermined factor. The settlement status of a position may also impact the effective rate indicated. In instances where multiple underlying reference rates and spread amounts are shown, the effective rate is based on a weighted average. |
| 11 | Security is a 144A or Section 4(a)(2) security. These securities have been determined to be illiquid and restricted under guidelines established by the Board of Trustees. The total market value of 144A or Section 4(a)(2) illiquid and restricted securities is $26,603 (cost $139,296), or less than 0.01% of total net assets — See Note 10. |
| | CAD — Canadian Dollar |
| | EUR — Euro |
| | GBP — British Pound |
| | LIBOR — London Interbank Offered Rate |
| | plc — Public Limited Company |
| | |
| | See Sector Classification in Other Information section. |
| 28 | THE GUGGENHEIM FUNDS SEMI-ANNUAL REPORT | SEE NOTES TO FINANCIAL STATEMENTS. |
| SCHEDULE OF INVESTMENTS (Unaudited)(continued) | March 29, 2018 |
| HIGH YIELD FUND | |
The following table summarizes the inputs used to value the Fund’s investments at March 29, 2018 (See Note 4 in the Notes to Financial Statements):
| Investments in Securities (Assets) | | Level 1
Quoted
Prices | | | Level 2
Significant
Observable
Inputs | | | Level 2 -
Other* | | | Level 3
Significant
Unobservable
Inputs | | | Total | |
| Asset Backed Securities | | $ | — | | | $ | 4,132,670 | | | $ | — | | | $ | — | | | $ | 4,132,670 | |
| Common Stocks | | | 842,565 | | | | 694,117 | | | | — | | | | 348,410 | | | | 1,885,092 | |
| Corporate Bonds | | | — | | | | 379,546,597 | | | | — | | | | 25 | | | | 379,546,622 | |
| Forward Foreign Currency Exchange Contracts | | | — | | | | — | | | | 34,549 | | | | — | | | | 34,549 | |
| Exchange-Traded Funds | | | 9,587,564 | | | | — | | | | — | | | | — | | | | 9,587,564 | |
| Money Market Fund | | | 327,216 | | | | — | | | | — | | | | — | | | | 327,216 | |
| Preferred Stocks | | | — | | | | 2,222,749 | | | | — | | | | — | ** | | | 2,222,749 | |
| Senior Floating Rate Interests | | | — | | | | 113,920,801 | | | | — | | | | 11,340,777 | | | | 125,261,578 | |
| Warrants | | | 176 | | | | — | | | | — | | | | — | | | | 176 | |
| Total Assets | | $ | 10,757,521 | | | $ | 500,516,934 | | | $ | 34,549 | | | $ | 11,689,212 | | | $ | 522,998,216 | |
| | | | | | | | | | | | | | | | | | | | | |
| Investments in Securities (Liabilities) | | | Level 1
Quoted
Prices | | | | Level 2
Significant
Observable
Inputs | | | | Level 2 -
Other* | | | | Level 3
Significant
Unobservable
Inputs | | | | Total | |
| Forward Foreign Currency Exchange Contracts | | $ | — | | | $ | — | | | $ | 136,917 | | | $ | — | | | $ | 136,917 | |
| Unfunded Loan Commitments (Note 9) | | | — | | | | — | | | | — | | | | 625,089 | ** | | | 625,089 | |
| Total Liabilities | | $ | — | | | $ | — | | | $ | 136,917 | | | $ | 625,089 | | | $ | 762,006 | |
| * | Other financial instruments include forward foreign currency exchange contracts, which are reported as unrealized gain/loss at period end. |
| ** | Includes securities with a market value of $0. |
The Fund may hold assets and/or liabilities in which the fair value approximates the carrying amount for financial statement purposes. As of period end, reverse repurchase agreements of $41,126,852 are categorized as Level 2 within the disclosure hierarchy.
The following is a summary of significant unobservable inputs used in the fair valuation of assets and liabilities categorized within Level 3 of the fair value hierarchy:
| Category | | Ending Balance at
March 29, 2018 | | | Valuation Technique | | Unobservable Inputs | | Input Range | | Weighted
Average |
| Assets: | | | | | | | | | | | | |
| Common Stocks | | $ | 348,410 | | | Enterprise Value | | Valuation Multiple | | 6.9x-7.6x | | 7.5x |
| Senior Floating Rate Interests | | | 10,143,132 | | | Yield Analysis | | Yield | | 5.1%-8.3% | | 6.9% |
| Senior Floating Rate Interests | | | 1,197,645 | | | Model Price | | Purchase Price | | — | | — |
| Total Assets | | $ | 11,689,187 | | | | | | | | | |
| Liabilities: | | | | | | | | | | | | |
| Unfunded Loan Commitments | | $ | 625,089 | | | Model Price | | Purchase Price | | — | | — |
Any remaining Level 3 securities held by the Funds and excluded from the table above, were not considered material to the Fund.
Transfers between investment levels may occur as the markets fluctuate and/or the availability of data used in an investment’s valuation changes. Transfers between valuation levels, if any, are in comparison to the valuation levels at the end of the previous fiscal year, and are effective using the fair value as of the end of the current fiscal period.
For the period ended March 29, 2018, the Fund has securities with a total value of $408,550 transfer out of Level 3 into Level 2 and securities with a total value of $25 transfer out of Level 2 into Level 3 due to changes in securities valuation methods based on availability of observable market inputs. There were no other securities that transferred between levels.
| SEE NOTES TO FINANCIAL STATEMENTS. | THE GUGGENHEIM FUNDS SEMI-ANNUAL REPORT | 29 |
| SCHEDULE OF INVESTMENTS (Unaudited)(concluded) | March 29, 2018 |
| HIGH YIELD FUND | |
Summary of Fair Value Level 3 Activity
Following is a reconciliation of Level 3 assets for which significant unobservable inputs were used to determine fair value for the period ended March 29, 2018.
| | | Assets | | | | | | Liabilities | |
| | | Senior
Floating Rate
Interests | | | Common
Stocks | | | Preferred
Stocks | | | Corporate
Bonds | | | Total Assets | | | Unfunded
Loan
Commitments | |
| Beginning Balance | | $ | 11,511,139 | | | $ | 691,043 | | | $ | — | | | $ | 1,954,000 | | | $ | 14,156,182 | | | $ | (779,130 | ) |
| Purchases/Receipts | | | 4,584,040 | | | | — | | | | — | | | | — | | | | 4,584,040 | | | | (232,336 | ) |
| Sales, maturities and paydowns/Fundings | | | (4,751,084 | ) | | | (1,798 | ) | | | — | | | | (2,009,856 | ) | | | (6,762,738 | ) | | | 301,247 | |
| Total realized gains or losses included in earnings | | | 90,626 | | | | (147,368 | ) | | | — | | | | 46,831 | | | | (9,911 | ) | | | 144,195 | |
| Total change in unrealized gains or losses included in earnings | | | 314,606 | | | | (193,467 | ) | | | — | | | | 9,025 | | | | 130,614 | | | | (24,548 | ) |
| Transfers into Level 3 | | | — | | | | — | | | | — | | | | 25 | | | | 25 | | | | (34,517 | ) |
| Transfers out of Level 3 | | | (408,550 | ) | | | — | | | | — | | | | — | | | | (408,550 | ) | | | — | |
| Ending Balance | | $ | 11,340,777 | | | $ | 348,410 | | | $ | — | | | $ | 25 | | | $ | 11,689,212 | | | $ | (625,089 | ) |
Net Change in unrealized
appreciation (depreciation) for investments in Level 3 securities still held at March 29, 2018 | | $ | 79,650 | | | $ | (336,933 | ) | | $ | — | | | $ | — | | | $ | (257,283 | ) | | $ | 8,119 | |
Affiliated Transactions
Investments representing 5% or more of the outstanding voting shares of a portfolio company of a fund, or control of or by, or common control under GI, result in that portfolio company being considered an affiliated company of such fund, as defined in the 1940 Act.
Transactions during the period ended March 29, 2018, in which the portfolio company is an “affiliated person”, were as follows:
| Security Name | | Value
09/30/17 | | | Additions | | | Reductions | | | Realized
Gain | | | Change in
Unrealized | | | Value
03/29/18 | | | Shares/Par
03/29/18 | | | Investment
Income | |
| Common Stocks | | | | | | | | | | | | | | | | | | | | | | | | |
| Aspect Software Parent, Inc.1,2 | | $ | 666,215 | | | $ | — | | | $ | — | | | $ | — | | | $ | (348,631 | ) | | $ | 317,584 | | | | 64,681 | | | $ | — | |
| Targus Group International Equity, Inc.1,2 | | | 19,667 | | | | — | | | | (1,005 | ) | | | 467 | | | | 11,697 | | | | 30,826 | | | | 12,825 | | | | — | |
| Senior Floating Rate Interests | | | | | | | | | | | | | | | | | | | | | | | | | | | | | | | | |
| Aspect Software, Inc. 12.38% (1 Month USD LIBOR + 10.50%) due 05/25/204 | | | 645,489 | | | | — | | | | (8,190 | ) | | | — | | | | 7,555 | | | | 644,854 | | | | 647,685 | | | | 38,963 | |
| Targus Group International, Inc. due 05/24/162,3 | | | — | | | | — | | | | — | | | | — | | | | — | | | | — | | | | 153,489 | | | | — | |
| | | $ | 1,331,371 | | | $ | — | | | $ | (9,195 | ) | | $ | 467 | | | $ | (329,379 | ) | | $ | 993,264 | | | | | | | $ | 38,963 | |
| 1 | Non-income producing security. |
| 2 | Security was fair valued by the Valuation Committee at March 29, 2018. |
| 3 | Security is in default of interest and/or principal obligations. |
| 4 | Variable rate security. Rate indicated is the rate effective at March 29, 2018. In some instances, the underlying reference rate shown was below the minimum rate earned by the security or has been adjusted by a predetermined factor. The settlement status of a position may also impact the effective rate indicated. Instances where multiple underlying reference rates and spread amounts are shown, the effective rate is based on a weighted average. |
| 30 | THE GUGGENHEIM FUNDS SEMI-ANNUAL REPORT | SEE NOTES TO FINANCIAL STATEMENTS. |
| STATEMENT OF ASSETS AND LIABILITIES (Unaudited) |
| March 29, 2018 |
| Assets: |
| Investments in unaffiliated issuers, at value (cost $532,036,773) | | $ | 521,970,403 | |
| Investments in affiliated issuers, at value (cost $2,490,537) | | | 993,264 | |
| Cash | | | 247,104 | |
| Prepaid expenses | | | 88,199 | |
| Unrealized appreciation on forward foreign currency exchange contracts | | | 34,549 | |
| Receivables: |
| Interest | | | 8,006,815 | |
| Securities sold | | | 6,258,746 | |
| Fund shares sold | | | 1,009,721 | |
| Foreign taxes reclaim | | | 34,419 | |
| Dividends | | | 4,343 | |
| Total assets | | | 538,647,563 | |
| | | | | |
| Liabilities: |
| Unfunded loan commitments, at value (Note 9) (proceeds $1,321,788) | | | 625,089 | |
| Reverse Repurchase Agreements | | | 41,126,852 | |
| Unrealized depreciation on forward foreign currency exchange contracts | | | 136,917 | |
| Payable for: |
| Securities purchased | | | 17,494,647 | |
| Fund shares redeemed | | | 2,389,976 | |
| Management fees | | | 214,311 | |
| Distribution and service fees | | | 45,817 | |
| Fund accounting/administration fees | | | 32,648 | |
| Transfer agent/maintenance fees | | | 9,223 | |
| Trustees’ fees* | | | 430 | |
| Due to advisor | | | 335 | |
| Miscellaneous | | | 256,712 | |
| Total liabilities | | | 62,332,957 | |
| Net assets | | $ | 476,314,606 | |
| | | | | |
| Net assets consist of: |
| Paid in capital | | $ | 487,136,923 | |
| Accumulated net investment loss | | | (831,543 | ) |
| Accumulated net realized gain on investments | | | 897,005 | |
| Net unrealized depreciation on investments | | | (10,887,779 | ) |
| Net assets | | $ | 476,314,606 | |
| | | | | |
| A-Class: |
| Net assets | | $ | 98,286,290 | |
| Capital shares outstanding | | | 8,820,365 | |
| Net asset value per share | | $ | 11.14 | |
| Maximum offering price per share (Net asset value divided by 96.00%) | | $ | 11.60 | |
| | | | | |
| C-Class: |
| Net assets | | $ | 25,409,319 | |
| Capital shares outstanding | | | 2,261,380 | |
| Net asset value per share | | $ | 11.24 | |
| | | | | |
| P-Class: |
| Net assets | | $ | 13,171,571 | |
| Capital shares outstanding | | | 1,181,422 | |
| Net asset value per share | | $ | 11.15 | |
| | | | | |
| Institutional Class: |
| Net assets | | $ | 138,318,132 | |
| Capital shares outstanding | | | 15,223,068 | |
| Net asset value per share | | $ | 9.09 | |
| | | | | |
| R6-Class: |
| Net assets | | $ | 201,129,294 | |
| Capital shares outstanding | | | 18,070,141 | |
| Net asset value per share | | $ | 11.13 | |
| * | Relates to Trustees not deemed “interested persons” within the meaning of Section 2(a)(19) of the 1940 Act. |
| SEE NOTES TO FINANCIAL STATEMENTS. | THE GUGGENHEIM FUNDS SEMI-ANNUAL REPORT | 31 |
| STATEMENT OF OPERATIONS (Unaudited) |
| Period Ended March 29, 2018 |
| Investment Income: |
| Dividends from securities of unaffiliated issuers | | $ | 230,459 | |
| Interest from securities of affiliated issuers | | | 38,963 | |
| Interest from securities of unaffiliated issuers | | | 18,553,555 | |
| Other income | | | 232 | |
| Total investment income | | | 18,823,209 | |
| | | | | |
| Expenses: |
| Management fees | | | 1,591,043 | |
| Distribution and service fees: |
| A-Class | | | 138,989 | |
| C-Class | | | 139,210 | |
| P-Class | | | 18,490 | |
| Recoupment of previously waived fees: |
| P-Class | | | 2,364 | |
| Transfer agent/maintenance fees: |
| A-Class | | | 60,330 | |
| C-Class | | | 14,531 | |
| P-Class | | | 12,161 | |
| Institutional Class | | | 84,180 | |
| R6-Class | | | 254 | |
| Interest expense | | | 411,940 | |
| Fund accounting/administration fees | | | 212,141 | |
| Custodian fees | | | 28,006 | |
| Line of credit fees | | | 10,040 | |
| Trustees’ fees* | | | 7,933 | |
| Miscellaneous | | | 207,834 | |
| Total expenses | | | 2,939,446 | |
| Less: |
| Expenses reimbursed by Adviser: |
| A-Class | | | (13,716 | ) |
| C-Class | | | (1,232 | ) |
| P-Class | | | (4,376 | ) |
| Institutional Class | | | (21,695 | ) |
| Total reimbursed expenses | | | (41,019 | ) |
| Net expenses | | | 2,898,427 | |
| Net investment income | | | 15,924,782 | |
| | | | | |
| Net Realized and Unrealized Gain (Loss): |
| Net realized gain (loss) on: |
| Investments in unaffiliated issuers | | $ | 3,403,906 | |
| Investments in affiliated issuers | | | 467 | |
| Foreign currency transactions | | | (247 | ) |
| Forward foreign currency exchange contracts | | | (530,732 | ) |
| Net realized gain | | | 2,873,394 | |
| Net change in unrealized appreciation (depreciation) on: |
| Investments in unaffiliated issuers | | | (18,591,020 | ) |
| Investments in affiliated issuers | | | (329,379 | ) |
| Foreign currency translations | | | 57,841 | |
| Forward foreign currency exchange contracts | | | (157,598 | ) |
| Net change in unrealized appreciation (depreciation) | | | (19,020,156 | ) |
| Net realized and unrealized loss | | | (16,146,762 | ) |
| Net decrease in net assets resulting from operations | | $ | (221,980 | ) |
| * | Relates to Trustees not deemed “interested persons” within the meaning of Section 2(a)(19) of the 1940 Act. |
| 32 | THE GUGGENHEIM FUNDS SEMI-ANNUAL REPORT | SEE NOTES TO FINANCIAL STATEMENTS. |
| STATEMENTS OF CHANGES IN NET ASSETS |
| | | Period Ended
March 29,
2018
(Unaudited) | | | Year Ended
September 30,
2017 | |
| Increase (Decrease) in Net Assets from Operations: | | | | | | |
| Net investment income | | $ | 15,924,782 | | | $ | 22,021,007 | |
| Net realized gain on investments | | | 2,873,394 | | | | 2,785,333 | |
| Net change in unrealized appreciation (depreciation) on investments | | | (19,020,156 | ) | | | 6,117,290 | |
| Net increase (decrease) in net assets resulting from operations | | | (221,980 | ) | | | 30,923,630 | |
| | | | | | | | | |
| Distributions to shareholders from: | | | | | | | | |
| Net investment income | | | | | | | | |
| A-Class | | | (3,246,604 | ) | | | (6,233,282 | ) |
| C-Class | | | (705,522 | ) | | | (1,438,731 | ) |
| P-Class | | | (426,632 | ) | | | (655,980 | ) |
| Institutional Class | | | (5,070,852 | ) | | | (10,719,166 | ) |
| R6-Class | | | (6,474,255 | ) | | | (3,230,684 | ) |
| Total distributions to shareholders | | | (15,923,865 | ) | | | (22,277,843 | ) |
| | | | | | | | | |
| Capital share transactions: | | | | | | | | |
| Proceeds from sale of shares | | | | | | | | |
| A-Class | | | 15,033,978 | | | | 66,562,198 | |
| C-Class | | | 3,596,147 | | | | 9,648,007 | |
| P-Class | | | 3,678,927 | | | | 19,110,632 | |
| Institutional Class | | | 42,332,528 | | | | 188,107,688 | |
| R6-Class | | | 23,344,991 | | | | 210,426,419 | |
| Redemption fees collected | | | | | | | | |
| A-Class | | | 9,142 | | | | 36,722 | |
| C-Class | | | 2,294 | | | | 9,668 | |
| P-Class | | | 1,236 | | | | 4,063 | |
| Institutional Class | | | 13,835 | | | | 60,375 | |
| R6-Class | | | 17,402 | | | | 13,490 | |
| Distributions reinvested | | | | | | | | |
| A-Class | | | 2,814,571 | | | | 5,420,947 | |
| C-Class | | | 600,817 | | | | 1,180,598 | |
| P-Class | | | 425,762 | | | | 655,980 | |
| Institutional Class | | | 4,214,125 | | | | 8,878,248 | |
| R6-Class | | | 6,474,255 | | | | 3,230,684 | |
| Cost of shares redeemed | | | | | | | | |
| A-Class | | | (42,277,099 | ) | | | (35,911,466 | ) |
| C-Class | | | (8,397,339 | ) | | | (8,147,384 | ) |
| P-Class | | | (7,405,891 | ) | | | (6,298,525 | ) |
| Institutional Class | | | (97,661,438 | ) | | | (149,297,447 | ) |
| R6-Class | | | (22,177,608 | ) | | | (13,513,200 | ) |
| Net increase (decrease) from capital share transactions | | | (75,359,365 | ) | | | 300,177,697 | |
| Net increase (decrease) in net assets | | | (91,505,210 | ) | | | 308,823,484 | |
| | | | | | | | | |
| Net assets: | | | | | | | | |
| Beginning of period | | | 567,819,816 | | | | 258,996,332 | |
| End of period | | $ | 476,314,606 | | | $ | 567,819,816 | |
| Accumulated net investment loss at end of period | | $ | (831,543 | ) | | $ | (832,460 | ) |
| SEE NOTES TO FINANCIAL STATEMENTS. | THE GUGGENHEIM FUNDS SEMI-ANNUAL REPORT | 33 |
| STATEMENTS OF CHANGES IN NET ASSETS |
| | | Period Ended
March 29,
2018
(Unaudited) | | | Year Ended
September 30,
2017 | |
| Capital share activity: | | | | | | |
| Shares sold | | | | | | |
| A-Class | | | 1,318,868 | | | | 5,842,629 | |
| C-Class | | | 312,164 | | | | 839,412 | |
| P-Class | | | 323,795 | | | | 1,676,374 | |
| Institutional Class | | | 4,557,723 | | | | 20,277,090 | |
| R6-Class | | | 2,034,788 | | | | 18,310,251 | |
| Shares issued from reinvestment of distributions | | | | | | | | |
| A-Class | | | 247,333 | | | | 475,619 | |
| C-Class | | | 52,367 | | | | 102,774 | |
| P-Class | | | 37,374 | | | | 57,411 | |
| Institutional Class | | | 453,711 | | | | 955,818 | |
| R6-Class | | | 570,226 | | | | 284,121 | |
| Shares redeemed | | | | | | | | |
| A-Class | | | (3,707,180 | ) | | | (3,154,231 | ) |
| C-Class | | | (729,167 | ) | | | (709,632 | ) |
| P-Class | | | (646,619 | ) | | | (551,450 | ) |
| Institutional Class | | | (10,501,358 | ) | | | (16,097,185 | ) |
| R6-Class | | | (1,949,807 | ) | | | (1,179,438 | ) |
| Net increase (decrease) in shares | | | (7,625,782 | ) | | | 27,129,563 | |
| 34 | THE GUGGENHEIM FUNDS SEMI-ANNUAL REPORT | SEE NOTES TO FINANCIAL STATEMENTS. |
This table is presented to show selected data for a share outstanding throughout each period and to assist shareholders in evaluating a Fund’s performance for the periods presented.
| A-Class | | Period Ended
March 29,
2018a | | | Year Ended
September 30,
2017 | | | Year Ended
September 30,
2016 | | | Year Ended
September 30,
2015 | | | Year Ended
September 30,
2014 | | | Year Ended
September 30,
2013 | |
| Per Share Data | | | | | | | | | | | | | | | | | | |
| Net asset value, beginning of period | | $ | 11.50 | | | $ | 11.16 | | | $ | 10.79 | | | $ | 12.02 | | | $ | 11.85 | | | $ | 11.95 | |
| Income (loss) from investment operations: |
| Net investment income (loss)b | | | .33 | | | | .64 | | | | .67 | | | | .69 | | | | .72 | | | | .81 | |
| Net gain (loss) on investments (realized and unrealized) | | | (.36 | ) | | | .35 | | | | .41 | | | | (.97 | ) | | | .27 | | | | .27 | |
| Total from investment operations | | | (.03 | ) | | | .99 | | | | 1.08 | | | | (.28 | ) | | | .99 | | | | 1.08 | |
| Less distributions from: |
| Net investment income | | | (.33 | ) | | | (.65 | ) | | | (.72 | ) | | | (.74 | ) | | | (.83 | ) | | | (.90 | ) |
| Net realized gains | | | — | | | | — | | | | — | | | | (.22 | ) | | | — | | | | (.29 | ) |
| Total distributions | | | (.33 | ) | | | (.65 | ) | | | (.72 | ) | | | (.96 | ) | | | (.83 | ) | | | (1.19 | ) |
| Redemption fees collected | | | — | f | | | — | f | | | .01 | | | | .01 | | | | .01 | | | | .01 | |
| Net asset value, end of period | | $ | 11.14 | | | $ | 11.50 | | | $ | 11.16 | | | $ | 10.79 | | | $ | 12.02 | | | $ | 11.85 | |
| |
| Total Returni | | | (0.27 | %) | | | 9.11 | % | | | 10.71 | % | | | (2.40 | %) | | | 9.18 | % | | | 9.54 | % |
| Ratios/Supplemental Data |
| Net assets, end of period (in thousands) | | $ | 98,286 | | | $ | 126,097 | | | $ | 87,045 | | | $ | 73,236 | | | $ | 82,854 | | | $ | 70,451 | |
| Ratios to average net assets: |
| Net investment income (loss) | | | 5.84 | % | | | 5.63 | % | | | 6.32 | % | | | 6.01 | % | | | 5.91 | % | | | 6.84 | % |
| Total expensesc | | | 1.29 | % | | | 1.31 | % | | | 1.25 | % | | | 1.27 | % | | | 1.32 | % | | | 1.41 | % |
| Net expensesd,h,j | | | 1.26 | % | | | 1.29 | % | | | 1.23 | % | | | 1.20 | % | | | 1.26 | % | | | 1.18 | % |
| Portfolio turnover rate | | | 37 | % | | | 62 | % | | | 55 | % | | | 72 | % | | | 97 | % | | | 101 | % |
| C-Class | | Period Ended
March 29,
2018a | | | Year Ended
September 30,
2017 | | | Year Ended
September 30,
2016 | | | Year Ended
September 30,
2015 | | | Year Ended
September 30,
2014 | | | Year Ended
September 30,
2013 | |
| Per Share Data | | | | | | | | | | | | | | | | | | |
| Net asset value, beginning of period | | $ | 11.60 | | | $ | 11.26 | | | $ | 10.88 | | | $ | 12.12 | | | $ | 11.95 | | | $ | 12.03 | |
| Income (loss) from investment operations: |
| Net investment income (loss)b | | | .29 | | | | .56 | | | | .60 | | | | .61 | | | | .63 | | | | .73 | |
| Net gain (loss) on investments (realized and unrealized) | | | (.36 | ) | | | .35 | | | | .41 | | | | (.98 | ) | | | .27 | | | | .27 | |
| Total from investment operations | | | (.07 | ) | | | .91 | | | | 1.01 | | | | (.37 | ) | | | .90 | | | | 1.00 | |
| Less distributions from: |
| Net investment income | | | (.29 | ) | | | (.57 | ) | | | (.64 | ) | | | (.66 | ) | | | (.74 | ) | | | (.80 | ) |
| Net realized gains | | | — | | | | — | | | | — | | | | (.22 | ) | | | — | | | | (.29 | ) |
| Total distributions | | | (.29 | ) | | | (.57 | ) | | | (.64 | ) | | | (.88 | ) | | | (.74 | ) | | | (1.09 | ) |
| Redemption fees collected | | | — | f | | | — | f | | | .01 | | | | .01 | | | | .01 | | | | .01 | |
| Net asset value, end of period | | $ | 11.24 | | | $ | 11.60 | | | $ | 11.26 | | | $ | 10.88 | | | $ | 12.12 | | | $ | 11.95 | |
| |
| Total Returni | | | (0.62 | %) | | | 8.38 | % | | | 9.81 | % | | | (3.14 | %) | | | 8.46 | % | | | 8.69 | % |
| Ratios/Supplemental Data |
| Net assets, end of period (in thousands) | | $ | 25,409 | | | $ | 30,461 | | | $ | 26,941 | | | $ | 13,671 | | | $ | 14,674 | | | $ | 9,463 | |
| Ratios to average net assets: |
| Net investment income (loss) | | | 5.07 | % | | | 4.92 | % | | | 5.52 | % | | | 5.25 | % | | | 5.14 | % | | | 6.10 | % |
| Total expensesc | | | 2.04 | % | | | 2.05 | % | | | 2.01 | % | | | 2.01 | % | | | 2.09 | % | | | 2.17 | % |
| Net expensesd,h,j | | | 2.03 | % | | | 2.03 | % | | | 1.98 | % | | | 1.95 | % | | | 2.01 | % | | | 1.93 | % |
| Portfolio turnover rate | | | 37 | % | | | 62 | % | | | 55 | % | | | 72 | % | | | 97 | % | | | 101 | % |
| SEE NOTES TO FINANCIAL STATEMENTS. | THE GUGGENHEIM FUNDS SEMI-ANNUAL REPORT | 35 |
| FINANCIAL HIGHLIGHTS (continued) |
This table is presented to show selected data for a share outstanding throughout each period and to assist shareholders in evaluating a Fund’s performance for the periods presented.
| P-Class | | Period Ended
March 29,
2018a | | | Year Ended
September 30,
2017 | | | Year Ended
September 30,
2016 | | | Period Ended
September 30,
2015e | |
| Per Share Data | | | | | | | | | | | | |
| Net asset value, beginning of period | | $ | 11.51 | | | $ | 11.17 | | | $ | 10.80 | | | $ | 11.53 | |
| Income (loss) from investment operations: |
| Net investment income (loss)b | | | .33 | | | | .64 | | | | .67 | | | | .27 | |
| Net gain (loss) on investments (realized and unrealized) | | | (.36 | ) | | | .37 | | | | .42 | | | | (.73 | ) |
| Total from investment operations | | | (.03 | ) | | | 1.01 | | | | 1.09 | | | | (.46 | ) |
| Less distributions from: |
| Net investment income | | | (.33 | ) | | | (.67 | ) | | | (.72 | ) | | | (.27 | ) |
| Total distributions | | | (.33 | ) | | | (.67 | ) | | | (.72 | ) | | | (.27 | ) |
| Redemption fees collected | | | — | f | | | — | f | | | — | f | | | — | f |
| Net asset value, end of period | | $ | 11.15 | | | $ | 11.51 | | | $ | 11.17 | | | $ | 10.80 | |
| |
| Total Returni | | | (0.30 | %) | | | 9.24 | % | | | 10.74 | % | | | (4.06 | %) |
| Ratios/Supplemental Data |
| Net assets, end of period (in thousands) | | $ | 13,172 | | | $ | 16,883 | | | $ | 3,178 | | | $ | 10 | |
| Ratios to average net assets: |
| Net investment income (loss) | | | 5.77 | % | | | 5.58 | % | | | 6.20 | % | | | 5.76 | % |
| Total expensesc | | | 1.38 | % | | | 1.29 | % | | | 1.17 | % | | | 3.36 | % |
| Net expensesd,h,j | | | 1.32 | % | | | 1.22 | % | | | 1.17 | % | | | 1.19 | % |
| Portfolio turnover rate | | | 37 | % | | | 62 | % | | | 55 | % | | | 72 | % |
| Institutional Class | | Period Ended
March 29,
2018a | | | Year Ended
September 30,
2017 | | | Year Ended
September 30,
2016 | | | Year Ended
September 30,
2015 | | | Year Ended
September 30,
2014 | | | Year Ended
September 30,
2013 | |
| Per Share Data | | | | | | | | | | | | | | | | | | |
| Net asset value, beginning of period | | $ | 9.38 | | | $ | 9.11 | | | $ | 8.81 | | | $ | 9.87 | | | $ | 9.74 | | | $ | 9.90 | |
| Income (loss) from investment operations: |
| Net investment income (loss)b | | | .28 | | | | .56 | | | | .58 | | | | .58 | | | | .61 | | | | .70 | |
| Net gain (loss) on investments (realized and unrealized) | | | (.29 | ) | | | .28 | | | | .34 | | | | (.79 | ) | | | .23 | | | | .22 | |
| Total from investment operations | | | (.01 | ) | | | .84 | | | | .92 | | | | (.21 | ) | | | .84 | | | | .92 | |
| Less distributions from: |
| Net investment income | | | (.28 | ) | | | (.57 | ) | | | (.62 | ) | | | (.64 | ) | | | (.72 | ) | | | (.80 | ) |
| Net realized gains | | | — | | | | — | | | | — | | | | (.22 | ) | | | — | | | | (.29 | ) |
| Total distributions | | | (.28 | ) | | | (.57 | ) | | | (.62 | ) | | | (.86 | ) | | | (.72 | ) | | | (1.09 | ) |
| Redemption fees collected | | | — | f | | | — | f | | | — | f | | | .01 | | | | .01 | | | | .01 | |
| Net asset value, end of period | | $ | 9.09 | | | $ | 9.38 | | | $ | 9.11 | | | $ | 8.81 | | | $ | 9.87 | | | $ | 9.74 | |
| |
| Total Returni | | | (0.11 | %) | | | 9.56 | % | | | 10.95 | % | | | (2.21 | %) | | | 9.50 | % | | | 9.97 | % |
| Ratios/Supplemental Data |
| Net assets, end of period (in thousands) | | $ | 138,318 | | | $ | 194,280 | | | $ | 141,833 | | | $ | 75,167 | | | $ | 36,880 | | | $ | 18,755 | |
| Ratios to average net assets: |
| Net investment income (loss) | | | 6.09 | % | | | 6.00 | % | | | 6.58 | % | | | 6.21 | % | | | 6.12 | % | | | 7.12 | % |
| Total expensesc | | | 1.03 | % | | | 0.94 | % | | | 0.95 | % | | | 0.94 | % | | | 1.01 | % | | | 1.01 | % |
| Net expensesd,h,j | | | 1.00 | % | | | 0.93 | % | | | 0.94 | % | | | 0.94 | % | | | 1.01 | % | | | 0.93 | % |
| Portfolio turnover rate | | | 37 | % | | | 62 | % | | | 55 | % | | | 72 | % | | | 97 | % | | | 101 | % |
| 36 | THE GUGGENHEIM FUNDS SEMI-ANNUAL REPORT | SEE NOTES TO FINANCIAL STATEMENTS. |
| FINANCIAL HIGHLIGHTS (concluded) |
This table is presented to show selected data for a share outstanding throughout each period and to assist shareholders in evaluating a Fund’s performance for the periods presented.
| R6-Class | | Period Ended
March 29,
2018a | | | Period Ended
September 30,
2017g | |
| Per Share Data | | | | | | |
| Net asset value, beginning of period | | $ | 11.49 | | | $ | 11.45 | |
| Income (loss) from investment operations: |
| Net investment income (loss)b | | | .35 | | | | .24 | |
| Net gain (loss) on investments (realized and unrealized) | | | (.36 | ) | | | .04 | |
| Total from investment operations | | | (.01 | ) | | | .28 | |
| Less distributions from: |
| Net investment income | | | (.35 | ) | | | (.24 | ) |
| Net realized gains | | | — | | | | — | |
| Total distributions | | | (.35 | ) | | | (.24 | ) |
| Redemption fees collected | | | — | f | | | — | f |
| Net asset value, end of period | | $ | 11.13 | | | $ | 11.49 | |
| |
| Total Returni | | | (0.11 | %) | | | 2.49 | % |
| Ratios/Supplemental Data |
| Net assets, end of period (in thousands) | | $ | 201,129 | | | $ | 200,099 | |
| Ratios to average net assets: |
| Net investment income (loss) | | | 6.16 | % | | | 5.41 | % |
| Total expensesc | | | 0.93 | % | | | 0.82 | % |
| Net expensesd,h,j | | | 0.93 | % | | | 0.82 | % |
| Portfolio turnover rate | | | 37 | % | | | 62 | % |
| a | Unaudited figures for the period ended March 29, 2018. Percentage amounts for the period, except total return and portfolio turnover rate, have been annualized. |
| b | Net investment income (loss) per share was computed using average shares outstanding throughout the period. |
| c | Does not include expenses of the underlying funds in which the Fund invests. |
| d | Net expense information reflects the expense ratios after expense waivers. |
| e | Since commencement of operations: May 1, 2015. Percentage amounts for the period, except total return and portfolio turnover rate, have been annualized. |
| f | Redemption fees collected are less than $0.01 per share. |
| g | Since commencement of operations: May 15, 2017. Percentage amounts for the period, except total return and portfolio turnover rate, have been annualized. |
| h | The portion of the ratios of net expenses to average net assets attributable to recoupments of prior fee reductions or expense reimbursements for the periods presented would be: |
| | | 03/29/18 | 09/30/17 |
| | A-Class | 0.00% | 0.09% |
| | C-Class | 0.00% | 0.06% |
| | P-Class | 0.02% | 0.00% |
| | Institutional Class | 0.00% | 0.00% |
| i | Total return does not reflect the impact of any applicable sales charges and has not been annualized. |
| j | Net expenses may include expenses that are excluded from the expense limitation agreement. Excluding these expenses, the operating expense ratios for the periods would be: |
| | | 03/29/18 | 09/30/17 | 09/30/16 | 09/30/15 | 09/30/14 |
| | A-Class | 1.11% | 1.15% | 1.16% | 1.16% | 1.16% |
| | C-Class | 1.87% | 1.89% | 1.91% | 1.91% | 1.91% |
| | P-Class | 1.16% | 1.08% | 1.09% | 1.16% | N/A |
| | Institutional Class | 0.85% | 0.79% | 0.87% | 0.91% | 0.91% |
| | R6-Class | 0.77% | 0.79% | N/A | N/A | N/A |
| SEE NOTES TO FINANCIAL STATEMENTS. | THE GUGGENHEIM FUNDS SEMI-ANNUAL REPORT | 37 |
| PERFORMANCE REPORT AND FUND PROFILE (Unaudited) | March 29, 2018 |
INVESTMENT GRADE BOND FUND
OBJECTIVE: Seeks to provide current income.
Holdings Diversification (Market Exposure as % of Net Assets)
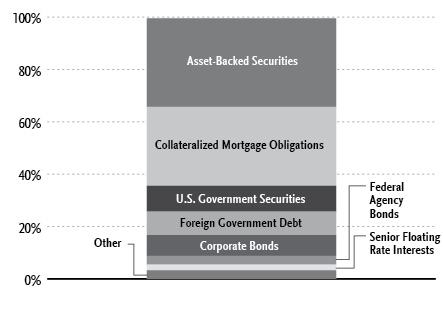
“Holdings Diversification (Market Exposure as % of Net Assets)” excludes any temporary cash investments.
| Inception Dates: |
| A-Class | August 15, 1985 |
| C-Class | May 1, 2000 |
| P-Class | May 1, 2015 |
| Institutional Class | January 29, 2013 |
| Ten Largest Holdings (% of Total Net Assets) |
| U.S. Treasury Bonds, 11/15/46 | 6.9% |
| U.S. Treasury Bonds, 11/15/44 | 2.9% |
| Republic of Portugal, 05/18/18 | 1.9% |
| Kingdom of Spain, 04/06/18 | 1.9% |
| Republic of Italy, 05/31/18 | 1.9% |
| Kingdom of Hungary, 4.00% | 1.2% |
| CIM Trust, 3.69% | 1.0% |
| Ladder Capital Commercial Mortgage 2017-FL1 Mortgage Trust, 2.67% | 1.0% |
| Golub Capital Partners CLO 36m Ltd., 3.39% | 0.9% |
| Home Equity Loan Trust, 2.06% | 0.9% |
| Top Ten Total | 20.5% |
“Ten Largest Holdings” excludes any temporary cash or derivative investments.
| 38 | THE GUGGENHEIM FUNDS SEMI-ANNUAL REPORT | |
| PERFORMANCE REPORT AND FUND PROFILE (Unaudited)(concluded) | March 29, 2018 |
Average Annual Returns*
Periods Ended March 29, 2018
| | 6 month† | 1 Year | 5 Year | 10 Year |
| A-Class Shares | 0.94% | 4.13% | 4.29% | 4.17% |
| A-Class Shares with sales charge‡ | (3.08%) | (0.03%) | 3.28% | 3.66% |
| C-Class Shares | 0.57% | 3.38% | 3.52% | 3.41% |
| C-Class Shares with CDSC§ | (0.43%) | 2.38% | 3.52% | 3.41% |
| Bloomberg Barclays U.S. Aggregate Bond Index | (1.08%) | 1.20% | 1.82% | 3.63% |
| | | 6 month† | 1 Year | Since Inception
(05/01/15) |
| P-Class Shares | | 0.99% | 4.17% | 3.65% |
| Bloomberg Barclays U.S. Aggregate Bond Index | | (1.08%) | 1.20% | 1.47% |
| | 6 month† | 1 Year | 5 Year | Since Inception
(01/29/13) |
| Institutional Class Shares | 1.14% | 4.48% | 4.56% | 4.61% |
| Bloomberg Barclays U.S. Aggregate Bond Index | (1.08%) | 1.20% | 1.82% | 1.88% |
| Portfolio Composition by Quality Rating1 |
| Rating | % of Total
Investments |
| Fixed Income Instruments | |
| AAA | 44.5% |
| AA | 10.8% |
| A | 12.5% |
| BBB | 16.2% |
| BB | 0.8% |
| B | 3.4% |
| CCC | 3.1% |
| CC | 0.1% |
| C | 0.4% |
| NR2 | 5.6% |
| Other Instruments | 2.6% |
| Total Investments | 100.0% |
| * | The performance data above represents past performance that is not predictive of future results. The investment return and principal value of an investment in the Fund will fluctuate so that an investor’s shares, when redeemed, may be worth more or less than their original cost. Returns are historical and include changes in principal and reinvested dividends and capital gains and do not reflect the effect of taxes. The Bloomberg Barclays U.S. Aggregate Bond Index is an unmanaged index and, unlike the Fund, has no management fees or operating expenses to reduce its reported return. |
| † | 6 month returns are not annualized. |
| ‡ | Effective October 1, 2015, the maximum sales charge decreased from 4.75% to 4.00%. A 4.75% maximum sales charge is used in the calculation of the Average Annual Returns (based on subscriptions made prior to October 1, 2015), and a 4.00% maximum sales charge is used to calculate performance for periods based on subscriptions made on or after October 1, 2015. |
| § | Fund returns include a CDSC of 1% if redeemed within 12 months of purchase. |
| 1 | Source: BlackRock Solutions. Credit quality ratings are measured on a scale that generally ranges from AAA (highest) to D (lowest). All securities except for those labeled “NR” have been rated by Moody’s, Standard & Poor’s (“S&P”), or Fitch, each of which is a Nationally Recognized Statistical Rating Organization (“NRSRO”). For purposes of this presentation, when ratings are available from more than one agency, the highest rating is used. Guggenheim Investments has converted ratings to the equivalent S&P rating. Security ratings are determined at the time of purchase and may change thereafter. |
| 2 | NR securities do not necessarily indicate low credit quality. |
| | THE GUGGENHEIM FUNDS SEMI-ANNUAL REPORT | 39 |
| SCHEDULE OF INVESTMENTS (Unaudited) | March 29, 2018 |
| INVESTMENT GRADE BOND FUND | |
| | | Shares | | | Value | |
| | | | | | | |
| COMMON STOCKS† - 0.0% |
| | | | | | | |
| Financial - 0.0% |
| Rescap Liquidating Trust* | | | 5,199 | | | $ | 26,515 | |
| | | | | | | | | |
| Industrial - 0.0% |
| Constar International Holdings LLC*,†††,1 | | | 68 | | | | — | |
| | | | | | | | | |
| Total Common Stocks | | | | | | | | |
| (Cost $262,501) | | | | | | | 26,515 | |
| | | | | | | | | |
| PREFERRED STOCKS†† - 0.7% |
| Financial - 0.7% |
| Woodbourne Capital Trust III 3.61% (1 Month USD LIBOR + 2.50%)*,†††,2,3,4 | | | 950,000 | | | | 736,442 | |
| Woodbourne Capital Trust IV 3.61% (1 Month USD LIBOR + 2.50%)*,†††,2,3,4 | | | 950,000 | | | | 736,442 | |
| Woodbourne Capital Trust I 3.61% (1 Month USD LIBOR + 2.50%)*,†††,2,3,4 | | | 950,000 | | | | 736,443 | |
| Woodbourne Capital Trust II 3.60% (1 Month USD LIBOR + 2.50%)*,†††,2,3,4 | | | 950,000 | | | | 736,443 | |
| Total Financial | | | | | | | 2,945,770 | |
| | | | | | | | | |
| Industrial - 0.0% |
| Seaspan Corp. 6.38% due 04/30/19 | | | 11,890 | | | | 302,481 | |
| Constar International Holdings LLC*,†††,1 | | | 7 | | | | — | |
| Total Industrial | | | | | | | 302,481 | |
| Total Preferred Stocks | | | | | | | | |
| (Cost $4,115,604) | | | | | | | 3,248,251 | |
| | | | | | | | | |
| MUTUAL FUNDS† - 0.5% |
| Guggenheim Floating Rate Strategies Fund - Institutional Class5 | | | 93,757 | | | | 2,438,623 | |
| Total Mutual Funds | | | | | | | | |
| (Cost $2,446,942) | | | | | | | 2,438,623 | |
| | | | | | | | | |
| MONEY MARKET FUND† - 0.4% |
| Dreyfus Treasury Securities Cash Management Institutional Shares 1.46%6 | | | 1,758,552 | | | | 1,758,552 | |
| Total Money Market Fund | | | | | | | | |
| (Cost $1,758,552) | | | | | | | 1,758,552 | |
| | | | | | | | | |
| | | | Face
Amount~ | | | | | |
| | | | | | | | | |
| ASSET-BACKED SECURITIES†† - 33.9% |
| Collateralized Loan Obligations - 22.4% |
| Ladder Capital Commercial Mortgage 2017-FL1 Mortgage Trust | | | | | | | | |
| 2017-FL1, 2.67% (1 Month USD LIBOR + 0.88%) due 09/15/342,7 | | | 4,300,000 | | | | 4,296,365 | |
| Golub Capital Partners CLO 36m Ltd. | | | | | | | | |
| 2018-36A, 3.39% (3 Month USD LIBOR + 1.30%) due 02/05/312,7 | | | 4,100,000 | | | | 4,098,590 | |
| Fortress Credit Opportunities IX CLO Ltd. | | | | | | |
| 2017-9A, 2.97% (3 Month USD LIBOR + 1.55%) due 11/15/292,7 | | 3,700,000 | | | 3,708,264 | |
| Venture XII CLO Ltd. | | | | | | |
| 2018-12A, 2.78% (3 Month USD LIBOR + 0.80%) due 02/28/262,7 | | | 2,100,000 | | | | 2,100,947 | |
| 2018-12A, 3.18% (3 Month USD LIBOR + 1.20%) due 02/28/262,7 | | | 1,300,000 | | | | 1,300,687 | |
| Fortress Credit Opportunities VII CLO Ltd. | | | | | | | | |
| 2016-7A, 4.17% (3 Month USD LIBOR + 2.05%) due 12/15/282,7 | | | 3,000,000 | | | | 3,017,990 | |
| TPG Real Estate Finance 2018-FL-1 Issuer Ltd. | | | | | | | | |
| 2018-FL1, 2.54% (1 Month USD LIBOR + 0.75%) due 10/15/192,7 | | | 3,000,000 | | | | 2,998,973 | |
| PFP Ltd. | | | | | | | | |
| 2017-3, 2.83% (1 Month USD LIBOR + 1.05%) due 01/14/352,7 | | | 1,614,217 | | | | 1,615,880 | |
| 2015-2, 3.79% (1 Month USD LIBOR + 2.00%) due 07/14/342,7 | | | 1,000,000 | | | | 999,808 | |
| Golub Capital Partners CLO Ltd. | | | | | | | | |
| 2015-25A, 3.59% (3 Month USD LIBOR + 1.80%) due 08/05/272,7 | | | 1,500,000 | | | | 1,502,210 | |
| 2016-33A, 4.36% (3 Month USD LIBOR + 2.48%) due 11/21/282,7 | | | 1,000,000 | | | | 1,003,874 | |
| WhiteHorse VI Ltd. | | | | | | | | |
| 2016-1A, 3.68% (3 Month USD LIBOR + 1.90%) due 02/03/252,7 | | | 1,500,000 | | | | 1,503,084 | |
| 2016-1A, 4.53% (3 Month USD LIBOR + 2.75%) due 02/03/252,7 | | | 1,000,000 | | | | 1,002,720 | |
| Fortress Credit Opportunities V CLO Ltd. | | | | | | | | |
| 2017-5A, 3.41% (3 Month USD LIBOR + 1.70%) due 10/15/262,7 | | | 1,500,000 | | | | 1,501,458 | |
| 2017-5A, 4.06% (3 Month USD LIBOR + 2.35%) due 10/15/262,7 | | | 1,000,000 | | | | 1,002,170 | |
| Shackleton CLO Ltd. | | | | | | | | |
| 2016-7A, 3.67% (3 Month USD LIBOR + 1.95%) due 04/15/272,7 | | | 1,500,000 | | | | 1,501,086 | |
| 2017-5A, 3.44% (3 Month USD LIBOR + 1.65%) due 05/07/262,7 | | | 1,000,000 | | | | 1,001,805 | |
| Dryden XXVI Senior Loan Fund | | | | | | | | |
| 2013-26A, 4.22% (3 Month USD LIBOR + 2.50%) due 07/15/252,7 | | | 2,250,000 | | | | 2,249,974 | |
| Venture XIX CLO Ltd. | | | | | | | | |
| 2016-19A, 3.72% (3 Month USD LIBOR + 2.00%) due 01/15/272,7 | | | 2,100,000 | | | | 2,102,755 | |
| BSPRT 2017-FL2 Issuer Ltd. | | | | | | | | |
| 2017-FL2, 2.60% (1 Month USD LIBOR + 0.82%) due 10/15/342,7 | | | 2,100,000 | | | | 2,099,038 | |
| KVK CLO Ltd. | | | | | | | | |
| 2017-1A, 3.64% (3 Month USD LIBOR + 1.80%) due 05/15/262,7 | | | 1,600,000 | | | | 1,603,332 | |
| 2013-1A, due 01/15/287,8 | | | 1,000,000 | | | | 481,867 | |
| TCP Waterman CLO Ltd. | | | | | | | | |
| 2016-1A, 4.42% (3 Month USD LIBOR + 2.30%) due 12/15/282,7 | | | 1,000,000 | | | | 1,009,799 | |
| 40 | THE GUGGENHEIM FUNDS SEMI-ANNUAL REPORT | SEE NOTES TO FINANCIAL STATEMENTS. |
| SCHEDULE OF INVESTMENTS (Unaudited)(continued) | March 29, 2018 |
| INVESTMENT GRADE BOND FUND | |
| | | Face
Amount~ | | | Value | |
| | | | | | | |
| 2016-1A, 4.17% (3 Month USD LIBOR + 2.05%) due 12/15/282,7 | | | 1,000,000 | | | $ | 1,006,344 | |
| Golub Capital Partners CLO 16 Ltd. | | | | | | | | |
| 2017-16A, 3.60% (3 Month USD LIBOR + 1.85%) due 07/25/292,7 | | | 2,000,000 | | | | 2,009,735 | |
| Cerberus Loan Funding XVII Ltd. | | | | | | | | |
| 2016-3A, 4.25% (3 Month USD LIBOR + 2.53%) due 01/15/282,7 | | | 2,000,000 | | | | 2,008,115 | |
| KKR CLO 21 Ltd. | | | | | | | | |
| 2018-21, % (3 Month USD LIBOR + 1.00%) due 04/15/312,7 | | | 2,000,000 | | | | 2,004,139 | |
| Madison Park Funding XVI Ltd. | | | | | | | | |
| 2016-16A, 3.64% (3 Month USD LIBOR + 1.90%) due 04/20/262,7 | | | 2,000,000 | | | | 2,001,904 | |
| FS Senior Funding Ltd. | | | | | | | | |
| 2015-1A, 3.52% (3 Month USD LIBOR + 1.80%) due 05/28/252,7 | | | 2,000,000 | | | | 2,001,706 | |
| Flagship CLO VIII Ltd. | | | | | | | | |
| 2017-8A, 3.42% (3 Month USD LIBOR + 1.70%) due 01/16/262,7 | | | 2,000,000 | | | | 2,001,443 | |
| Crown Point CLO III Ltd. | | | | | | | | |
| 2017-3A, 3.17% (3 Month USD LIBOR + 1.45%) due 12/31/272,7 | | | 2,000,000 | | | | 2,001,154 | |
| OZLM Funding II Ltd. | | | | | | | | |
| 2016-2A, 4.52% (3 Month USD LIBOR + 2.75%) due 10/30/272,7 | | | 2,000,000 | | | | 2,000,509 | |
| Fortress Credit Opportunities XI CLO Ltd. | | | | | | | | |
| 2018-11A, % (3 Month USD LIBOR + 1.30%) due 04/15/312,7 | | | 2,000,000 | | | | 2,000,000 | |
| TICP CLO II-2 Ltd. | | | | | | | | |
| 2018-IIA, % (3 Month USD LIBOR + 0.84%) due 04/20/282,7 | | | 2,000,000 | | | | 2,000,000 | |
| Hunt CRE Ltd. | | | | | | | | |
| 2017-FL1, 3.43% (1 Month USD LIBOR + 1.65%) due 08/15/342,7 | | | 1,000,000 | | | | 999,276 | |
| 2017-FL1, 2.78% (1 Month USD LIBOR + 1.00%) due 08/15/342,7 | | | 1,000,000 | | | | 999,190 | |
| NXT Capital CLO LLC | | | | | | | | |
| 2017-1A, 3.44% (3 Month USD LIBOR + 1.70%) due 04/20/292,7 | | | 1,800,000 | | | | 1,803,846 | |
| Steele Creek CLO 2014-1 Ltd. | | | | | | | | |
| 2018-1RA, 3.41% (3 Month USD LIBOR + 1.07%) due 04/21/312,7 | | | 1,500,000 | | | | 1,500,000 | |
| OZLM IX Ltd. | | | | | | | | |
| 2017-9A, 3.39% (3 Month USD LIBOR + 1.65%) due 01/20/272,7 | | | 1,400,000 | | | | 1,401,239 | |
| VMC Finance 2018-FL1 LLC | | | | | | | | |
| 2018-FL1, 2.60% (1 Month USD LIBOR + 0.82%) due 04/15/352,7 | | | 1,200,000 | | | | 1,198,959 | |
| Oaktree EIF II Series A2 Ltd. | | | | | | | | |
| 2017-A2, 3.54% (3 Month USD LIBOR + 1.70%) due 11/15/252,7 | | | 1,100,000 | | | | 1,102,141 | |
| Garrison Funding Ltd. | | | | | | | | |
| 2016-2A, 5.03% (3 Month USD LIBOR + 3.15%) due 09/29/272,7 | | | 1,000,000 | | | | 1,013,171 | |
| Cerberus Loan Funding XVI, LP | | | | | | | | |
| 2016-2A, 4.07% (3 Month USD LIBOR + 2.35%) due 11/15/272,7 | | | 1,000,000 | | | | 1,009,525 | |
| KKR CLO 15 Ltd. | | | | | | | | |
| 2016-15, 3.29% (3 Month USD LIBOR + 1.56%) due 10/18/282,7 | | | 1,000,000 | | | | 1,004,254 | |
| AMMC CLO 15 Ltd. | | | | | | | | |
| 2016-15A, 3.41% (3 Month USD LIBOR + 1.35%) due 12/09/262,7 | | | 1,000,000 | | | | 1,003,789 | |
| AMMC CLO XV Ltd. | | | | | | | | |
| 2016-15A, 3.96% (3 Month USD LIBOR + 1.90%) due 12/09/262,7 | | | 1,000,000 | | | | 1,003,736 | |
| Nelder Grove CLO Ltd. | | | | | | | | |
| 2017-1A, 3.78% (3 Month USD LIBOR + 1.80%) due 08/28/262,7 | | | 1,000,000 | | | | 1,002,626 | |
| Northwoods Capital XIV Ltd. | | | | | | | | |
| 2017-14A, 3.51% (3 Month USD LIBOR + 1.70%) due 11/12/252,7 | | | 1,000,000 | | | | 1,001,811 | |
| Atlas Senior Loan Fund IV Ltd. | | | | | | | | |
| 2017-2A, 3.29% (3 Month USD LIBOR + 1.45%) due 02/17/262,7 | | | 1,000,000 | | | | 1,001,704 | |
| Mountain Hawk I CLO Ltd. | | | | | | | | |
| 2013-1A, 3.92% (3 Month USD LIBOR + 2.18%) due 01/20/242,7 | | | 1,000,000 | | | | 1,001,450 | |
| Vibrant CLO II Ltd. | | | | | | | | |
| 2017-2A, 3.19% (3 Month USD LIBOR + 1.45%) due 07/24/242,7 | | | 1,000,000 | | | | 1,001,181 | |
| Vibrant CLO III Ltd. | | | | | | | | |
| 2016-3A, 3.79% (3 Month USD LIBOR + 2.05%) due 04/20/262,7 | | | 1,000,000 | | | | 1,001,005 | |
| Flatiron CLO Ltd. | | | | | | | | |
| 2017-1A, 3.38% (3 Month USD LIBOR + 1.65%) due 01/17/262,7 | | | 1,000,000 | | | | 1,000,852 | |
| Monroe Capital BSL CLO Ltd. | | | | | | | | |
| 2017-1A, 3.65% (3 Month USD LIBOR + 1.75%) due 05/22/272,7 | | | 1,000,000 | | | | 1,000,833 | |
| Betony CLO Ltd. | | | | | | | | |
| 2016-1A, 3.67% (3 Month USD LIBOR + 1.95%) due 04/15/272,7 | | | 1,000,000 | | | | 1,000,707 | |
| Eaton Vance CLO Ltd. | | | | | | | | |
| 2017-1A, 3.32% (3 Month USD LIBOR + 1.60%) due 07/15/262,7 | | | 1,000,000 | | | | 1,000,701 | |
| NXT Capital CLO 2015-1 LLC | | | | | | | | |
| 2018-1A, 3.34% (3 Month USD LIBOR + 1.60%) due 04/21/272,7 | | | 1,000,000 | | | | 1,000,181 | |
| Monroe Capital CLO 2014-1 Ltd. | | | | | | | | |
| 2017-1A, 3.09% (3 Month USD LIBOR + 1.35%) due 10/22/262,7 | | | 1,000,000 | | | | 1,000,100 | |
| Cerberus Loan Funding XXIII, LP | | | | | | | | |
| 2018-2A, % (3 Month USD LIBOR + 1.00%) due 04/15/282,7 | | | 1,000,000 | | | | 1,000,000 | |
| Avery Point V CLO Ltd. | | | | | | | | |
| 2017-5A, 2.71% (3 Month USD LIBOR + 0.98%) due 07/17/262,7 | | | 1,000,000 | | | | 999,985 | |
| FDF II Ltd. | | | | | | | | |
| 2016-2A, 4.29% due 05/12/317 | | | 1,000,000 | | | | 999,340 | |
| SEE NOTES TO FINANCIAL STATEMENTS. | THE GUGGENHEIM FUNDS SEMI-ANNUAL REPORT | 41 |
| SCHEDULE OF INVESTMENTS (Unaudited)(continued) | March 29, 2018 |
| INVESTMENT GRADE BOND FUND | |
| | | Face
Amount~ | | | Value | |
| | | | | | | |
| Dryden 37 Senior Loan Fund | | | | | | |
| 2015-37A, due 01/15/317,8 | | | 1,000,000 | | | $ | 911,109 | |
| ACIS CLO Ltd. | | | | | | | | |
| 2013-1A, 4.68% (3 Month USD LIBOR + 2.95%) due 04/18/242,7 | | | 500,000 | | | | 500,706 | |
| Cent CLO | | | | | | | | |
| 2014-16A, 4.02% (3 Month USD LIBOR + 2.25%) due 08/01/242,7 | | | 500,000 | | | | 500,473 | |
| Treman Park CLO Ltd. | | | | | | | | |
| 2015-1A, due 04/20/277,8 | | | 500,000 | | | | 429,379 | |
| Babson CLO Ltd. | | | | | | | | |
| 2014-IA, due 07/20/257,8 | | | 650,000 | | | | 299,822 | |
| 2012-2A, due 05/15/237,8 | | | 1,000,000 | | | | 43,389 | |
| NewStar Arlington Senior Loan Program LLC | | | | | | | | |
| 2014-1A, 5.05% (3 Month USD LIBOR + 3.30%) due 07/25/252,7 | | | 250,000 | | | | 250,331 | |
| Rockwall CDO II Ltd. | | | | | | | | |
| 2007-1A, 2.32% (3 Month USD LIBOR + 0.55%) due 08/01/242,7 | | | 185,419 | | | | 185,429 | |
| Copper River CLO Ltd. | | | | | | | | |
| 2007-1A, due 01/20/214,8 | | | 700,000 | | | | 89,110 | |
| Keuka Park CLO Ltd. | | | | | | | | |
| 2013-1A, due 10/21/247,8 | | | 250,000 | | | | 8,436 | |
| Total Collateralized Loan Obligations | | | | | | | 97,007,511 | |
| | | | | | | | | |
| Transport-Aircraft - 4.1% |
| Apollo Aviation Securitization Equity Trust | | | | | | | | |
| 2016-2, 4.21% due 11/15/41 | | | 2,561,860 | | | | 2,587,189 | |
| 2016-1A, 4.88% due 03/17/367 | | | 1,163,788 | | | | 1,191,913 | |
| Castlelake Aircraft Securitization Trust | | | | | | | | |
| 2017-1, 3.97% due 07/15/42 | | | 2,062,973 | | | | 2,040,087 | |
| 2015-1A, 4.70% due 12/15/407 | | | 950,041 | | | | 951,281 | |
| Sapphire Aviation Finance I Ltd. | | | | | | | | |
| 2018-1A, 4.25% due 03/15/407 | | | 2,000,000 | | | | 2,006,424 | |
| Willis Engine Securitization Trust II | | | | | | | | |
| 2012-A, 5.50% due 09/15/377 | | | 1,789,602 | | | | 1,770,546 | |
| Emerald Aviation Finance Ltd. | | | | | | | | |
| 2013-1, 4.65% due 10/15/387 | | | 848,708 | | | | 857,844 | |
| 2013-1, 6.35% due 10/15/387 | | | 169,742 | | | | 169,642 | |
| Falcon Aerospace Ltd. | | | | | | | | |
| 2017-1, 4.58% due 02/15/427 | | | 1,020,580 | | | | 1,024,817 | |
| ECAF I Ltd. | | | | | | | | |
| 2015-1A, 4.95% due 06/15/227 | | | 924,112 | | | | 938,477 | |
| AASET Trust | | | | | | | | |
| 2017-1A, 3.97% due 05/16/427 | | | 931,800 | | | | 928,847 | |
| Raspro Trust | | | | | | | | |
| 2005-1A, 2.37% (3 Month USD LIBOR + 0.63%) due 03/23/242,7 | | | 782,950 | | | | 747,717 | |
| Rise Ltd. | | | | | | | | |
| 2014-1A, 4.74% due 02/12/39 | | | 736,136 | | | | 737,240 | |
| AIM Aviation Finance Ltd. | | | | | | | | |
| 2015-1A, 4.21% due 02/15/407 | | | 724,392 | | | | 723,861 | |
| Diamond Head Aviation Ltd. | | | | | | | | |
| 2015-1, 3.81% due 07/14/287 | | | 537,938 | | | | 534,502 | |
| Turbine Engines Securitization Ltd. | | | | | | | | |
| 2013-1A, 5.13% due 12/13/484 | | | 495,220 | | | | 497,801 | |
| AABS Ltd. | | | | | | | | |
| 2013-1 A, 4.87% due 01/10/38 | | | 231,023 | | | | 231,023 | |
| Total Transport-Aircraft | | | | | | | 17,939,211 | |
| | | | | | | | | |
| Whole Business - 2.0% |
| Domino’s Pizza Master Issuer LLC | | | | | | | | |
| 2017-1A, 4.12% due 07/25/477 | | | 995,000 | | | | 1,005,686 | |
| 2017-1A, 3.00% (3 Month USD LIBOR + 1.25%) due 07/25/472,7 | | | 995,000 | | | | 1,003,239 | |
| 2017-1A, 3.08% due 07/25/477 | | | 995,000 | | | | 974,036 | |
| Taco Bell Funding LLC | | | | | | | | |
| 2016-1A, 4.97% due 05/25/467 | | | 1,925,625 | | | | 2,006,578 | |
| 2016-1A, 3.83% due 05/25/467 | | | 493,750 | | | | 496,500 | |
| Wendy’s Funding LLC | | | | | | | | |
| 2015-1A, 4.50% due 06/15/457 | | | 1,462,500 | | | | 1,492,204 | |
| Jimmy Johns Funding LLC | | | | | | | | |
| 2017-1A, 3.61% due 07/30/477 | | | 1,094,500 | | | | 1,093,274 | |
| Drug Royalty III Limited Partnership | | | | | | | | |
| 2016-1A, 3.98% due 04/15/277 | | | 594,585 | | | | 590,867 | |
| Total Whole Business | | | | | | | 8,662,384 | |
| | | | | | | | | |
| Collateralized Debt Obligations - 1.4% |
| Anchorage Credit Funding Ltd. | | | | | | | | |
| 2016-4A, 3.50% due 02/15/357 | | | 3,750,000 | | | | 3,736,708 | |
| 2016-3A, 3.85% due 10/28/337 | | | 1,000,000 | | | | 1,004,474 | |
| Putnam Structured Product Funding Ltd. | | | | | | | | |
| 2003-1A, 2.78% (1 Month USD LIBOR + 1.00%) due 10/15/382,7 | | | 552,791 | | | | 535,007 | |
| Highland Park CDO I Ltd. | | | | | | | | |
| 2006-1A, 2.34% (3 Month USD LIBOR + 0.40%) due 11/25/512,4 | | | 383,660 | | | | 368,304 | |
| N-Star REL CDO VIII Ltd. | | | | | | | | |
| 2006-8A, 2.02% (1 Month USD LIBOR + 0.36%) due 02/01/412,7 | | | 266,229 | | | | 264,749 | |
| Total Collateralized Debt Obligations | | | | | | | 5,909,242 | |
| | | | | | | | | |
| Net Lease - 1.3% |
| Capital Automotive LLC | | | | | | | | |
| 2017-1A, 3.87% due 04/15/477 | | | 2,972,500 | | | | 2,961,123 | |
| Store Master Funding I-VII | | | | | | | | |
| 2016-1A, 3.96% due 10/20/467 | | | 2,827,041 | | | | 2,743,785 | |
| Total Net Lease | | | | | | | 5,704,908 | |
| | | | | | | | | |
| Transport-Container - 1.3% |
| Textainer Marine Containers Ltd. | | | | | | | | |
| 2017-2A, 3.52% due 06/20/427 | | | 2,636,256 | | | | 2,614,238 | |
| CAL Funding III Ltd. | | | | | | | | |
| 2018-1A, 3.96% due 02/25/437 | | | 991,667 | | | | 1,000,144 | |
| Textainer Marine Containers V Ltd. | | | | | | | | |
| 2017-1A, 3.72% due 05/20/427 | | | 917,300 | | | | 916,572 | |
| Cronos Containers Program Ltd. | | | | | | | | |
| 2013-1A, 3.08% due 04/18/287 | | | 915,000 | | | | 902,496 | |
| Total Transport-Container | | | | | | | 5,433,450 | |
| | | | | | | | | |
| Automotive - 0.7% |
| Hertz Vehicle Financing II, LP | | | | | | | | |
| 2015-1A, 2.73% due 03/25/217 | | | 1,000,000 | | | | 992,244 | |
| 42 | THE GUGGENHEIM FUNDS SEMI-ANNUAL REPORT | SEE NOTES TO FINANCIAL STATEMENTS. |
| SCHEDULE OF INVESTMENTS (Unaudited)(continued) | March 29, 2018 |
| INVESTMENT GRADE BOND FUND | |
| | | Face
Amount~ | | | Value | |
| | | | | | | |
| 2017-1A, 2.96% due 10/25/217 | | | 1,000,000 | | | $ | 991,472 | |
| Hertz Vehicle Financing LLC | | | | | | | | |
| 2016-4A, 2.65% due 07/25/227 | | | 1,000,000 | | | | 976,803 | |
| Total Automotive | | | | | | | 2,960,519 | |
| | | | | | | | | |
| Diversified Payment Rights - 0.3% |
| Bib Merchant Voucher Receivables Ltd. | | | | | | | | |
| 4.18% due 04/07/28 | | | 1,000,000 | | | | 1,000,000 | |
| CIC Receivables Master Trust | | | | | | | | |
| 4.89% due 10/07/21††† | | | 213,093 | | | | 220,357 | |
| Total Diversified Payment Rights | | | | | | | 1,220,357 | |
| | | | | | | | | |
| Single Family Residence - 0.2% |
| CoreVest American Finance 2017-1 Trust | | | | | | | | |
| 2017-1, 3.36% due 10/15/497 | | | 1,000,000 | | | | 976,878 | |
| | | | | | | | | |
| Infrastructure - 0.1% |
| Vantage Data Centers Issuer LLC | | | | | | | | |
| 2018-1A, 4.07% due 02/16/437 | | | 499,583 | | | | 504,165 | |
| | | | | | | | | |
| Insurance - 0.1% |
| Chesterfield Financial Holdings LLC | | | | | | | | |
| 2014-1A, 4.50% due 12/15/347 | | | 495,000 | | | | 489,119 | |
| Total Asset-Backed Securities | | | | | | | | |
| (Cost $147,241,781) | | | | | | | 146,807,744 | |
| | | | | | | | | |
| COLLATERALIZED MORTGAGE OBLIGATIONS†† - 30.2% |
| Government Agency - 12.1% |
| Fannie Mae12 | | | | | | | | |
| 3.03% due 02/01/30 | | | 3,600,000 | | | | 3,498,755 | |
| 3.11% due 04/01/30 | | | 1,993,913 | | | | 1,958,737 | |
| 3.09% due 10/01/29 | | | 2,000,000 | | | | 1,946,683 | |
| 3.13% due 01/01/30 | | | 1,500,000 | | | | 1,472,840 | |
| 3.01% due 12/01/27 | | | 1,500,000 | | | | 1,469,286 | |
| 3.00% due 12/01/29 | | | 1,500,000 | | | | 1,452,871 | |
| 2.86% due 09/01/29 | | | 1,450,000 | | | | 1,386,858 | |
| 3.12% due 10/01/32 | | | 1,200,000 | | | | 1,158,858 | |
| 3.67% due 03/01/30 | | | 1,000,000 | | | | 1,032,727 | |
| 3.56% due 04/01/30 | | | 1,000,000 | | | | 1,026,756 | |
| 3.53% due 04/01/33 | | | 1,000,000 | | | | 1,019,091 | |
| 3.48% due 04/01/30 | | | 1,000,000 | | | | 1,018,824 | |
| 3.49% due 04/01/30 | | | 1,000,000 | | | | 1,018,745 | |
| 3.42% due 04/01/30 | | | 1,000,000 | | | | 1,012,031 | |
| 3.31% due 01/01/33 | | | 1,000,000 | | | | 996,954 | |
| 3.23% due 01/01/30 | | | 997,348 | | | | 993,871 | |
| 3.18% due 01/01/30 | | | 1,000,000 | | | | 986,031 | |
| 3.19% due 02/01/30 | | | 1,000,000 | | | | 986,029 | |
| 3.12% due 01/01/30 | | | 997,150 | | | | 984,134 | |
| 3.05% due 01/01/30 | | | 1,000,000 | | | | 973,153 | |
| 2.96% due 11/01/29 | | | 900,000 | | | | 865,413 | |
| 3.08% due 10/01/32 | | | 850,000 | | | | 825,330 | |
| 2.90% due 11/01/29 | | | 850,000 | | | | 812,092 | |
| 3.14% due 09/01/32 | | | 650,000 | | | | 628,427 | |
| 2.99% due 09/01/29 | | | 650,000 | | | | 626,570 | |
| 3.17% due 01/01/30 | | | 550,000 | | | | 541,859 | |
| 2.82% due 10/01/29 | | | 550,000 | | | | 524,367 | |
| 3.05% due 10/01/29 | | | 500,000 | | | | 485,082 | |
| 3.22% due 01/01/30 | | | 450,000 | | | | 445,457 | |
| Freddie Mac Multifamily Structured Pass Through Certificates12 | | | | | | | | |
| 2017-KGX1, 3.00% due 10/25/27 | | | 3,500,000 | | | | 3,440,653 | |
| 2017-KW03, 3.02% due 06/25/27 | | | 3,000,000 | | | | 2,955,033 | |
| 2018-K073, 3.45% due 01/25/282 | | | 1,200,000 | | | | 1,215,968 | |
| 2018-K074, 3.60% due 02/25/28 | | | 1,000,000 | | | | 1,023,306 | |
| 2017-K066, 3.20% due 06/25/27 | | | 1,000,000 | | | | 991,096 | |
| Freddie Mac Seasoned Credit Risk Transfer Trust Series12 | | | | | | | | |
| 2017-4, 2.25% due 06/25/57 | | | 1,914,237 | | | | 1,847,239 | |
| 2017-4, 3.50% due 06/25/57 | | | 1,742,666 | | | | 1,738,038 | |
| 2018-1, 2.00% due 05/25/57 | | | 1,700,000 | | | | 1,627,216 | |
| 2017-3, 2.25% due 07/25/56 | | | 957,779 | | | | 925,312 | |
| Fannie Mae-Aces12 | | | | | | | | |
| 2017-M11, 2.98% due 08/25/29 | | | 2,500,000 | | | | 2,417,198 | |
| Freddie Mac Seasoned Credit Risk Transfer12 | | | | | | | | |
| 2017-3, 3.00% due 07/25/56 | | | 2,275,335 | | | | 2,198,377 | |
| Total Government Agency | | | | | | | 52,527,267 | |
| | | | | | | | | |
| Residential Mortgage Backed Securities - 11.7% |
| CIM Trust | | | | | | | | |
| 3.69% due 08/25/57 | | | 4,300,000 | | | | 4,311,082 | |
| 2017-2, 3.66% (1 Month USD LIBOR + 2.00%) due 12/25/572,7 | | | 834,017 | | | | 843,087 | |
| Home Equity Loan Trust | | | | | | | | |
| 2007-FRE1, 2.06% (1 Month USD LIBOR + 0.19%) due 04/25/372 | | | 3,988,100 | | | | 3,790,457 | |
| Soundview Home Loan Trust | | | | | | | | |
| 2006-OPT5, 2.01% (1 Month USD LIBOR + 0.14%) due 07/25/362 | | | 3,442,524 | | | | 3,355,552 | |
| Towd Point Mortgage Trust | | | | | | | | |
| 2017-5, 2.47% (1 Month USD LIBOR + 0.60%) due 02/25/572,7 | | | 1,068,445 | | | | 1,072,284 | |
| 2018-1, 3.00% (WAC) due 01/25/582,7 | | | 982,493 | | | | 977,123 | |
| 2016-1, 2.75% (WAC) due 02/25/552,7 | | | 858,386 | | | | 851,617 | |
| GSAA Home Equity Trust | | | | | | | | |
| 2005-6, 2.30% (1 Month USD LIBOR + 0.43%) due 06/25/352 | | | 3,150,000 | | | | 2,898,692 | |
| American Home Mortgage Investment Trust | | | | | | | | |
| 2007-1, 2.08% due 05/25/479 | | | 10,395,004 | | | | 1,575,358 | |
| 2006-1, 2.27% (1 Month USD LIBOR + 0.40%) due 03/25/462 | | | 1,041,257 | | | | 1,007,255 | |
| NovaStar Mortgage Funding Trust Series | | | | | | | | |
| 2007-2, 2.07% (1 Month USD LIBOR + 0.20%) due 09/25/372 | | | 2,609,264 | | | | 2,534,149 | |
| IndyMac INDX Mortgage Loan Trust | | | | | | | | |
| 2006-AR6, 2.20% (1 Year CMT Rate + 0.92%) due 06/25/462 | | | 2,247,283 | | | | 2,084,955 | |
| Countrywide Asset-Backed Certificates | | | | | | | | |
| 2006-6, 2.04% (1 Month USD LIBOR + 0.17%) due 09/25/362 | | | 2,060,543 | | | | 2,016,584 | |
| Bayview Opportunity Master Fund IVa Trust | | | | | | | | |
| 2018-RN3, 3.67% due 03/28/337 | | | 2,000,000 | | | | 2,002,398 | |
| Structured Asset Securities Corporation Mortgage Loan Trust | | | | | | | | |
| 2006-BC3, 2.03% (1 Month USD LIBOR + 0.16%) due 10/25/362 | | | 1,159,298 | | | | 1,033,246 | |
| SEE NOTES TO FINANCIAL STATEMENTS. | THE GUGGENHEIM FUNDS SEMI-ANNUAL REPORT | 43 |
| SCHEDULE OF INVESTMENTS (Unaudited)(continued) | March 29, 2018 |
| INVESTMENT GRADE BOND FUND | |
| | | Face
Amount~ | | | Value | |
| | | | | | | |
| 2006-BC4, 2.04% (1 Month USD LIBOR + 0.17%) due 12/25/362 | | | 990,121 | | | $ | 956,865 | |
| Deephaven Residential Mortgage Trust | | | | | | | | |
| 2017-3A, 2.58% (WAC) due 10/25/472,7 | | | 1,627,275 | | | | 1,614,660 | |
| New Residential Mortgage Loan Trust | | | | | | | | |
| 2017-5A, 3.37% (1 Month USD LIBOR + 1.50%) due 06/25/572,7 | | | 1,512,523 | | | | 1,556,468 | |
| Structured Asset Investment Loan Trust | | | | | | | | |
| 2005-11, 2.59% (1 Month USD LIBOR + 0.72%) due 01/25/362 | | | 1,378,133 | | | | 1,364,470 | |
| Banc of America Funding Trust | | | | | | | | |
| 2015-R4, 1.79% (1 Month USD LIBOR + 0.17%) due 01/27/352,7 | | | 704,815 | | | | 669,430 | |
| 2014-R7, 2.01% (1 Month USD LIBOR + 0.14%) due 09/26/362,7 | | | 597,045 | | | | 582,471 | |
| Nationstar Home Equity Loan Trust | | | | | | | | |
| 2007-B, 2.09% (1 Month USD LIBOR + 0.22%) due 04/25/372 | | | 1,167,018 | | | | 1,155,672 | |
| CSMC Series | | | | | | | | |
| 2015-12R, 2.06% (1 Month USD LIBOR + 0.50%) due 11/30/372,7 | | | 1,086,385 | | | | 1,081,674 | |
| Angel Oak Mortgage Trust LLC | | | | | | | | |
| 2017-3, 2.71% (WAC) due 11/25/472,7 | | | 1,046,383 | | | | 1,046,330 | |
| ACE Securities Corporation Home Equity Loan Trust Series | | | | | | | | |
| 2006-HE4, 2.01% (1 Month USD LIBOR + 0.14%) due 10/25/362 | | | 1,491,324 | | | | 1,007,886 | |
| Park Place Securities Incorporated Asset Backed Pass Through Certificates Ser | | | | | | | | |
| 2005-WHQ3, 2.82% (1 Month USD LIBOR + 0.95%) due 06/25/352 | | | 1,000,000 | | | | 1,000,500 | |
| New Residential Mortgage Trust | | | | | | | | |
| 2018-1A, 4.00% due 12/25/572,7 | | | 970,494 | | | | 992,214 | |
| Bear Stearns Asset Backed Securities I Trust | | | | | | | | |
| 2006-HE9, 2.01% (1 Month USD LIBOR + 0.14%) due 11/25/362 | | | 944,543 | | | | 912,024 | |
| Luminent Mortgage Trust | | | | | | | | |
| 2006-2, 2.07% (1 Month USD LIBOR + 0.20%) due 02/25/462 | | | 1,115,646 | | | | 901,569 | |
| RALI Series Trust | | | | | | | | |
| 2006-QO2, 2.06% (1 Month USD LIBOR + 0.22%) due 02/25/462 | | | 1,995,786 | | | | 869,852 | |
| Deutsche Alt-A Securities Mortgage Loan Trust Series | | | | | | | | |
| 2007-OA2, 2.05% (1 Year CMT Rate + 0.77%) due 04/25/472 | | | 763,178 | | | | 703,499 | |
| CIT Mortgage Loan Trust | | | | | | | | |
| 2007-1, 3.32% (1 Month USD LIBOR + 1.45%) due 10/25/372,7 | | | 683,259 | | | | 686,606 | |
| MASTR Adjustable Rate Mortgages Trust | | | | | | | | |
| 2003-5, 2.93% (WAC) due 11/25/332 | | | 628,011 | | | | 602,078 | |
| American Home Mortgage Assets Trust | | | | | | | | |
| 2007-1, 1.98% (1 Year CMT Rate + 0.70%) due 02/25/472 | | | 914,939 | | | | 590,103 | |
| GCAT | | | | | | | | |
| 2017-1, 3.38% due 03/25/477 | | | 474,390 | | | | 471,226 | |
| Washington Mutual Mortgage Pass-Through Certificates WMALT Series Trust | | | | | | | | |
| 2006-AR9, 2.12% (1 Year CMT Rate + 0.84%) due 11/25/462 | | | 540,134 | | | | 454,454 | |
| Stanwich Mortgage Loan Company LLC | | | | | | | | |
| 2017-NPA1, 3.60% due 03/16/227 | | | 369,579 | | | | 369,579 | |
| Stanwich Mortgage Loan Co. | | | | | | | | |
| 2016-NPA1, 3.84% (WAC) due 10/16/462,7 | | | 351,472 | | | | 347,028 | |
| VOLT LIV LLC | | | | | | | | |
| 2017-NPL1, 3.50% due 02/25/477 | | | 299,584 | | | | 298,903 | |
| UCFC Manufactured Housing Contract | | | | | | | | |
| 1997-2, 7.38% due 10/15/28 | | | 168,172 | | | | 177,735 | |
| Total Residential Mortgage Backed Securities | | | | | | | 50,767,135 | |
| | | | | | | | | |
| Commercial Mortgage Backed Securities - 4.5% |
| Wells Fargo Commercial Mortgage Trust | | | | | | | | |
| 2017-SMP, 2.65% (1 Month USD LIBOR + 0.75%) due 12/15/192,7 | | | 2,000,000 | | | | 2,001,251 | |
| 2016-C32, 1.34% (WAC) due 01/15/592 | | | 6,335,799 | | | | 471,770 | |
| 2016-NXS5, 1.55% (WAC) due 01/15/592 | | | 4,907,687 | | | | 383,331 | |
| 2016-C37, 1.03% (WAC) due 12/15/492 | | | 3,846,417 | | | | 203,269 | |
| COMM Mortgage Trust | | | | | | | | |
| 2015-CR26, 4.49% (WAC) due 10/10/482 | | | 1,217,000 | | | | 1,191,145 | |
| 2015-CR26, 1.04% (WAC) due 10/10/482 | | | 10,018,579 | | | | 553,453 | |
| Hospitality Mortgage Trust | | | | | | | | |
| 2017-HIT, 2.56% (1 Month USD LIBOR + 0.85%) due 05/08/302,7 | | | 1,400,000 | | | | 1,402,629 | |
| Americold LLC Trust | | | | | | | | |
| 2010-ARTA, 7.44% due 01/14/297 | | | 1,250,000 | | | | 1,349,463 | |
| Morgan Stanley Capital I Trust | | | | | | | | |
| 2016-UB11, 1.66% (WAC) due 08/15/492 | | | 7,601,355 | | | | 706,018 | |
| 2017-H1, 1.46% (WAC) due 06/15/502 | | | 4,973,797 | | | | 453,856 | |
| SG Commercial Mortgage Securities Trust | | | | | | | | |
| 2016-C5, 2.01% (WAC) due 10/10/482 | | | 9,848,345 | | | | 1,112,520 | |
| GS Mortgage Securities Corporation Trust | | | | | | | | |
| 2017-STAY, 3.13% (1 Month USD LIBOR + 1.35%) due 07/15/322,7 | | | 1,000,000 | | | | 1,006,204 | |
| Bancorp Commercial Mortgage 2018-CRE3 Trust | | | | | | | | |
| 2018-CR3, 3.03% (1 Month USD LIBOR + 1.25%) due 01/15/332,7 | | | 1,000,000 | | | | 1,001,664 | |
| JP Morgan Chase Commercial Mortgage Securities Trust | | | | | | | | |
| 2014-CBM, 3.73% (1 Month USD LIBOR + 1.95%) due 10/15/292,7 | | | 1,000,000 | | | | 999,998 | |
| GAHR Commercial Mortgage Trust | | | | | | | | |
| 2015-NRF, 3.38% (WAC) due 12/15/342,7 | | | 1,000,000 | | | | 998,373 | |
| UBS Commercial Mortgage Trust | | | | | | | | |
| 2017-C2, 1.16% (WAC) due 08/15/502 | | | 11,948,381 | | | | 929,861 | |
| GE Business Loan Trust | | | | | | | | |
| 2007-1A, 1.95% (1 Month USD LIBOR + 0.17%) due 04/16/352,7 | | | 920,160 | | | | 895,200 | |
| Citigroup Commercial Mortgage Trust | | | | | | | | |
| 2016-GC37, 1.80% (WAC) due 04/10/492 | | | 3,804,183 | | | | 411,955 | |
| 2016-C2, 1.79% (WAC) due 08/10/262 | | | 2,475,603 | | | | 279,601 | |
| 44 | THE GUGGENHEIM FUNDS SEMI-ANNUAL REPORT | SEE NOTES TO FINANCIAL STATEMENTS. |
| SCHEDULE OF INVESTMENTS (Unaudited)(continued) | March 29, 2018 |
| INVESTMENT GRADE BOND FUND | |
| | | Face
Amount~ | | | Value | |
| | | | | | | |
| 2016-P5, 1.55% (WAC) due 10/10/492 | | | 1,976,647 | | | $ | 180,338 | |
| JPMDB Commercial Mortgage Securities Trust | | | | | | | | |
| 2016-C2, 1.70% (WAC) due 06/15/492 | | | 8,858,237 | | | | 775,741 | |
| LSTAR Commercial Mortgage Trust | | | | | | | | |
| 2014-2, 5.15% (WAC) due 01/20/412,7 | | | 500,000 | | | | 500,171 | |
| BANK | | | | | | | | |
| 2017-BNK4, 1.45% (WAC) due 05/15/502 | | | 4,963,947 | | | | 462,352 | |
| JPMCC Commercial Mortgage Securities Trust | | | | | | | | |
| 2017-JP5, 1.11% (WAC) due 03/15/502 | | | 6,945,594 | | | | 460,355 | |
| CFCRE Commercial Mortgage Trust | | | | | | | | |
| 2016-C3, 1.07% (WAC) due 01/10/482 | | | 5,889,661 | | | | 377,326 | |
| CD Mortgage Trust | | | | | | | | |
| 2016-CD1, 1.43% (WAC) due 08/10/492 | | | 2,570,273 | | | | 225,554 | |
| Total Commercial Mortgage Backed Securities | | | | | | | 19,333,398 | |
| | | | | | | | | |
| Military Housing - 1.9% |
| Freddie Mac Military Housing Bonds Resecuritization Trust Certificates | | | | | | | | |
| 2015-R1, 4.66% (WAC) due 11/25/552,7 | | | 4,000,886 | | | | 4,360,600 | |
| GMAC Commercial Mortgage Asset Corp. | | | | | | | | |
| 2007-HCKM, 6.11% due 08/10/527 | | | 1,500,303 | | | | 1,588,924 | |
| 2003-PRES, 6.24% due 10/10/417 | | | 1,375,772 | | | | 1,498,534 | |
| Capmark Military Housing Trust | | | | | | | | |
| 2007-ROBS, 6.06% due 10/10/524 | | | 476,815 | | | | 488,520 | |
| 2007-AETC, 5.75% due 02/10/524 | | | 332,222 | | | | 327,063 | |
| Total Military Housing | | | | | | | 8,263,641 | |
| Total Collateralized Mortgage Obligations | | | | | | | | |
| (Cost $132,205,010) | | | | | | | 130,891,441 | |
| | | | | | | | | |
| U.S. GOVERNMENT SECURITIES†† - 9.8% |
| U.S. Treasury Bonds | | | | | | | | |
| due 11/15/4610 | | | 70,917,000 | | | | 30,066,758 | |
| due 11/15/4410 | | | 27,374,600 | | | | 12,369,613 | |
| Total U.S. Treasury Bonds | | | | | | | 42,436,371 | |
| Total U.S. Government Securities | | | | | | | | |
| (Cost $42,727,559) | | | | | | | 42,436,371 | |
| | | | | | | | | |
| FOREIGN GOVERNMENT DEBT†† - 8.9% |
| Republic of Portugal | | | | | | | | |
| due 05/18/1810 | | | EUR | 6,750,000 | | | | 8,310,025 | |
| Kingdom of Spain | | | | | | | | |
| due 04/06/1810 | | | EUR | 6,710,000 | | | | 8,256,999 | |
| Republic of Italy | | | | | | | | |
| due 05/31/1810 | | | EUR | 6,630,000 | | | | 8,163,760 | |
| Kingdom of Hungary | | | | | | | | |
| 4.00% due 04/25/18 | | | HUF | 1,300,000,000 | | | | 5,131,859 | |
| Czech Republic | | | | | | | | |
| due 04/13/1810 | | | CZK | 37,000,000 | | | | 1,792,210 | |
| due 04/20/1810 | | | CZK | 22,000,000 | | | | 1,065,582 | |
| due 04/06/1810 | | | CZK | 11,000,000 | | | | 532,847 | |
| Total Czech Republic | | | | | | | 3,390,639 | |
| Denmark Treasury Bill | | | | | | | | |
| due 06/01/1810 | | | DKK | 18,900,000 | | | | 3,122,865 | |
| Republic of Hungary | | | | | | | | |
| 2.50% due 06/22/18 | | | HUF | 625,000,000 | | | | 2,474,870 | |
| Total Foreign Government Debt | | | | | | | | |
| (Cost $39,019,201) | | | | | | | 38,851,017 | |
| | | | | | | | | |
| CORPORATE BONDS†† - 7.9% |
| Financial - 5.8% |
| Station Place Securitization Trust | | | | | | | | |
| 2.50% (1 Month USD LIBOR + 0.90%) due 07/24/182,7 | | | 3,300,000 | | | | 3,300,000 | |
| 2.35% (1 Month USD LIBOR + 0.75%) due 08/24/182,7 | | | 1,300,000 | | | | 1,300,000 | |
| 2.88% (1 Month USD LIBOR + 1.00%) due 03/24/192,7 | | | 3,000,000 | | | | 3,000,000 | |
| 2.85% (1 Month USD LIBOR + 1.25%) due 11/24/182,7 | | | 1,500,000 | | | | 1,500,000 | |
| Macquarie Group Ltd. | | | | | | | | |
| 3.64% (3 Month USD LIBOR + 1.35%) due 03/27/242,7 | | | 2,100,000 | | | | 2,121,535 | |
| Bank of America Corp. | | | | | | | | |
| 6.30%3,11 | | | 1,925,000 | | | | 2,064,562 | |
| Citigroup, Inc. | | | | | | | | |
| 5.95%3,11 | | | 775,000 | | | | 796,700 | |
| 5.90%3,11 | | | 500,000 | | | | 515,625 | |
| 6.25%3,11 | | | 450,000 | | | | 475,313 | |
| American Equity Investment Life Holding Co. | | | | | | | | |
| 5.00% due 06/15/27 | | | 1,268,000 | | | | 1,285,133 | |
| Mid-Atlantic Military Family Communities LLC | | | | | | | | |
| 5.30% due 08/01/504 | | | 1,260,290 | | | | 1,275,569 | |
| Assurant, Inc. | | | | | | | | |
| 3.54% (3 Month USD LIBOR + 1.25%) due 03/26/212 | | | 1,150,000 | | | | 1,151,286 | |
| Senior Housing Properties Trust | | | | | | | | |
| 4.75% due 02/15/28 | | | 1,175,000 | | | | 1,151,223 | |
| Central Storage Safety Project Trust | | | | | | | | |
| 4.82% due 02/01/384 | | | 1,000,000 | | | | 1,037,460 | |
| Aurora Military Housing LLC | | | | | | | | |
| 6.89% due 01/15/47†††,4 | | | 750,000 | | | | 895,191 | |
| MetLife, Inc. | | | | | | | | |
| 10.75% due 08/01/39 | | | 500,000 | | | | 785,000 | |
| Enstar Group Ltd. | | | | | | | | |
| 4.50% due 03/10/22 | | | 535,000 | | | | 537,411 | |
| BBC Military Housing-Navy Northeast LLC | | | | | | | | |
| 6.30% due 10/15/49††† | | | 415,000 | | | | 437,577 | |
| Pacific Northwest Communities LLC | | | | | | | | |
| 5.91% due 06/15/504 | | | 400,000 | | | | 424,276 | |
| Atlantic Marine Corporations Communities LLC | | | | | | | | |
| 5.43% due 12/01/507 | | | 376,361 | | | | 371,803 | |
| Hospitality Properties Trust | | | | | | | | |
| 5.25% due 02/15/26 | | | 347,000 | | | | 361,220 | |
| SEE NOTES TO FINANCIAL STATEMENTS. | THE GUGGENHEIM FUNDS SEMI-ANNUAL REPORT | 45 |
| SCHEDULE OF INVESTMENTS (Unaudited)(continued) | March 29, 2018 |
| INVESTMENT GRADE BOND FUND | |
| | | Face
Amount~ | | | Value | |
| | | | | | | |
| ACC Group Housing LLC | | | | | | |
| 6.35% due 07/15/547 | | | 300,000 | | | $ | 360,527 | |
| Total Financial | | | | | | | 25,147,411 | |
| | | | | | | | | |
| Consumer, Non-cyclical - 0.9% |
| CVS Health Corp. | | | | | | | | |
| 2.69% (3 Month USD LIBOR + 0.63%) due 03/09/202 | | | 1,250,000 | | | | 1,254,688 | |
| 4.30% due 03/25/28 | | | 700,000 | | | | 702,982 | |
| Offutt AFB America First Community LLC | | | | | | | | |
| 5.46% due 09/01/504 | | | 1,900,081 | | | | 1,920,251 | |
| Total Consumer, Non-cyclical | | | | | | | 3,877,921 | |
| | | | | | | | | |
| Basic Materials - 0.6% |
| Yamana Gold, Inc. | | | | | | | | |
| 4.95% due 07/15/24 | | | 1,485,000 | | | | 1,527,694 | |
| BHP Billiton Finance USA Ltd. | | | | | | | | |
| 6.75% due 10/19/757,11 | | | 800,000 | | | | 898,000 | |
| Total Basic Materials | | | | | | | 2,425,694 | |
| | | | | | | | | |
| Consumer, Cyclical - 0.3% |
| Northern Group Housing LLC | | | | | | | | |
| 6.80% due 08/15/537 | | | 600,000 | | | | 745,206 | |
| HP Communities LLC | | | | | | | | |
| 5.78% due 03/15/464 | | | 500,000 | | | | 536,773 | |
| WMG Acquisition Corp. | | | | | | | | |
| 6.75% due 04/15/227 | | | 150,000 | | | | 155,062 | |
| Total Consumer, Cyclical | | | | | | | 1,437,041 | |
| | | | | | | | | |
| ENERGY - 0.2% |
| Hess Corp. | | | | | | | | |
| 5.60% due 02/15/41 | | | 500,000 | | | | 510,720 | |
| 7.30% due 08/15/31 | | | 300,000 | | | | 359,780 | |
| Total Energy | | | | | | | 870,500 | |
| | | | | | | | | |
| Communications - 0.1% |
| SFR Group S.A. | | | | | | | | |
| 7.38% due 05/01/267 | | | 350,000 | | | | 333,375 | |
| Total Corporate Bonds | | | | | | | | |
| (Cost $33,655,360) | | | | | | | 34,091,942 | |
| | | | | | | | | |
| FEDERAL AGENCY BONDS†† - 3.4% |
| Freddie Mac Principal Strips12 | | | | | | | | |
| due 03/15/3110 | | | 3,550,000 | | | | 2,301,545 | |
| due 09/15/2910 | | | 2,600,000 | | | | 1,788,438 | |
| due 07/15/3210 | | | 2,700,000 | | | | 1,673,880 | |
| Total Freddie Mac Principal Strips | | | | | | | 5,763,863 | |
| Fannie Mae Principal Strips12 | | | | | | | | |
| due 05/15/3010 | | | 3,150,000 | | | | 2,115,029 | |
| due 05/15/2910 | | | 1,750,000 | | | | 1,219,603 | |
| due 01/15/3010 | | | 1,100,000 | | | | 746,718 | |
| Total Fannie Mae Principal Strips | | | | | | | 4,081,350 | |
| Freddie Mac12 | | | | | | | | |
| due 12/14/2910 | | | 2,900,000 | | | | 1,976,887 | |
| due 01/02/3410 | | | 850,000 | | | | 500,283 | |
| Total Freddie Mac | | | | | | | 2,477,170 | |
| Tennessee Valley Authority | | | | | | | | |
| 4.25% due 09/15/65 | | | 1,300,000 | | | | 1,506,099 | |
| 5.38% due 04/01/56 | | | 600,000 | | | | 833,458 | |
| Total Tennessee Valley Authority | | | | | | | 2,339,557 | |
| Total Federal Agency Bonds | | | | | | | | |
| (Cost $15,109,275) | | | | | | | 14,661,940 | |
| | | | | | | | | |
| SENIOR FLOATING RATE INTERESTS††,2 - 2.2% |
| Technology - 0.7% |
| Misys Ltd. | | | | | | | | |
| 5.48% (2 Month USD LIBOR + 3.50%) and (3 Month USD LIBOR + 3.50%) due 06/13/24 | | | 1,243,750 | | | | 1,242,046 | |
| Epicor Software | | | | | | | | |
| 5.13% (1 Month USD LIBOR + 3.25%) due 06/01/22 | | | 563,188 | | | | 565,390 | |
| SS&C Technologies, Inc. | | | | | | | | |
| 7.25% (3 Month USD LIBOR + 2.50%) due 02/27/25 | | | 331,679 | | | | 333,165 | |
| 7.25% (3 Month USD LIBOR + 2.50%) due 02/28/25 | | | 118,321 | | | | 118,851 | |
| Internet Brands, Inc. | | | | | | | | |
| 5.53% (1 Month USD LIBOR + 3.75%) due 09/13/24 | | | 376,889 | | | | 376,821 | |
| EIG Investors Corp. | | | | | | | | |
| 5.96% (1 Month USD LIBOR + 4.00%) due 02/09/23 | | | 249,217 | | | | 250,775 | |
| Total Technology | | | | | | | 2,887,048 | |
| | | | | | | | | |
| Consumer, Non-cyclical - 0.5% |
| Packaging Coordinators Midco, Inc. | | | | | | | | |
| 5.78% (6 Month USD LIBOR + 4.00%) due 06/30/23 | | | 689,500 | | | | 691,658 | |
| DJO Finance LLC | | | | | | | | |
| 5.03% (1 Month USD LIBOR + 3.25%) and (3 Month USD LIBOR + 3.25%) due 06/08/20 | | | 491,184 | | | | 493,232 | |
| Diamond (BC) B.V. | | | | | | | | |
| 4.99% (3 Month USD LIBOR + 3.00%) due 09/06/24 | | | 400,000 | | | | 399,168 | |
| Lineage Logistics LLC | | | | | | | | |
| 4.88% (3 Month USD LIBOR + 3.00%) due 02/16/25 | | | 400,000 | | | | 398,832 | |
| Davis Vision | | | | | | | | |
| due 12/02/2413 | | | 200,000 | | | | 199,000 | |
| NES Global Talent | | | | | | | | |
| 7.27% (1 Month USD LIBOR + 5.50%) due 10/03/19 | | | 105,049 | | | | 103,473 | |
| Total Consumer, Non-cyclical | | | | | | | 2,285,363 | |
| | | | | | | | | |
| Consumer, Cyclical - 0.5% |
| Petco Animal Supplies, Inc. | | | | | | | | |
| 4.77% (3 Month USD LIBOR + 3.00%) due 01/26/23 | | | 1,178,947 | | | | 861,292 | |
| 46 | THE GUGGENHEIM FUNDS SEMI-ANNUAL REPORT | SEE NOTES TO FINANCIAL STATEMENTS. |
| SCHEDULE OF INVESTMENTS (Unaudited)(continued) | March 29, 2018 |
| INVESTMENT GRADE BOND FUND | |
| | | Face
Amount~ | | | Value | |
| | | | | | | |
| Mavis Tire Express Services Corp. | | | | | | |
| 5.07% (1 Month USD LIBOR + 3.25%) due 02/28/25 | | | 689,602 | | | $ | 689,602 | |
| Crown Finance US, Inc. | | | | | | | | |
| 4.38% (1 Month USD LIBOR + 2.50%) due 02/28/25 | | | 400,000 | | | | 399,320 | |
| Total Consumer, Cyclical | | | | | | | 1,950,214 | |
| | | | | | | | | |
| Communications - 0.4% |
| Cengage Learning Acquisitions, Inc. | | | | | | | | |
| 6.04% (2 Month USD LIBOR + 4.25%) due 06/07/23 | | | 1,563,830 | | | | 1,420,239 | |
| ProQuest LLC | | | | | | | | |
| 5.63% (3 Month USD LIBOR + 3.75%) due 10/24/21 | | | 487,276 | | | | 493,518 | |
| Total Communications | | | | | | | 1,913,757 | |
| | | | | | | | | |
| Industrial - 0.1% |
| Titan Acquisition Ltd. (Husky) | | | | | | | | |
| 3.00% (3 Month USD LIBOR + 3.00%) due 03/15/25 | | | 250,000 | | | | 249,618 | |
| | | | | | | | | |
| Financial - 0.0% |
| American Stock Transfer & Trust | | | | | | | | |
| 6.81% (3 Month USD LIBOR + 4.50%) due 06/26/20 | | | 93,169 | | | | 93,091 | |
| Total Senior Floating Rate Interests | | | | | | | | |
| (Cost $9,778,804) | | | | | | | 9,379,091 | |
| | | | | | | | | |
| MUNICIPAL BONDS†† - 0.8% |
| California - 0.5% |
| Newport Mesa Unified School District General Obligation Unlimited | | | | | | | | |
| due 08/01/4110 | | | 1,540,000 | | | | 619,203 | |
| due 08/01/4610 | | | 750,000 | | | | 243,773 | |
| Beverly Hills Unified School District California General Obligation Unlimited | | | | | | | | |
| due 08/01/3910 | | | 1,410,000 | | | | 596,641 | |
| Cypress School District General Obligation Unlimited | | | | | | | | |
| due 08/01/4810 | | | 1,000,000 | | | | 254,950 | |
| Total California | | | | | | | 1,714,567 | |
| | | | | | | | | |
| Illinois - 0.2% |
| State of Illinois General Obligation Unlimited | | | | | | | | |
| 5.65% due 12/01/38 | | | 500,000 | | | | 547,895 | |
| 5.10% due 06/01/33 | | | 500,000 | | | | 525,830 | |
| Total Illinois | | | | | | | 1,073,725 | |
| | | | | | | | | |
| Oklahoma - 0.1% |
| Oklahoma Development Finance Authority Revenue Bonds | | | | | | | | |
| 4.65% due 08/15/30 | | | 500,000 | | | | 531,525 | |
| Total Municipal Bonds | | | | | | | | |
| (Cost $3,260,544) | | | | | | | 3,319,817 | |
| | | | | | | | | |
| COMMERCIAL PAPER†† - 2.1% |
| Hewlett-Packard Co. | | | | | | | | |
| 2.39% due 04/06/1814 | | | 5,000,000 | | | | 4,998,340 | |
| Marsh & McLennan Companies, Inc. | | | | | | | | |
| 2.25% due 04/19/1814 | | | 4,000,000 | | | | 3,995,500 | |
| Total Commercial Paper | | | | | | | | |
| (Cost $8,993,840) | | | | | | | 8,993,840 | |
| | | | | | | | | |
| REPURCHASE AGREEMENT††,15 - 0.8% |
BNP Paribas
issued 03/06/18 at 1.90%
due 04/03/18 | | | 3,400,000 | | | | 3,400,000 | |
| Total Repurchase Agreement | | | | | | | | |
| (Cost $3,400,000) | | | | | | | 3,400,000 | |
| | | | | | | | | |
| | | | Contracts | | | | | |
| | | | | | | | | |
| OTC OPTIONS PURCHASED†† - 0.1% |
| Call options on: | | | | | | | | |
BofA Merrill Lynch
iShares MSCI Emerging Markets ETF
Expiring January 2019 with strike price
of $55.00 (Notional Value $12,547,972) | | | 2,599 | | | | 313,180 | |
BofA Merrill Lynch
S&P 500 Index
Expiring January 2019 with strike price
of $3,000.00 (Notional Value $15,052,959) | | | 57 | | | | 140,505 | |
| Total Call options | | | | | | | 453,685 | |
| Total OTC Options Purchased | | | | | | | | |
| (Cost $723,428) | | | | | | | 453,685 | |
| | | | | | | | | |
| Total Investments - 101.7% | | | | | | | | |
| (Cost $444,698,401) | | | | | | $ | 440,758,829 | |
| Other Assets & Liabilities, net - (1.7)% | | | | | | | (7,263,993 | ) |
| Total Net Assets - 100.0% | | | | | | $ | 433,494,836 | |
| SEE NOTES TO FINANCIAL STATEMENTS. | THE GUGGENHEIM FUNDS SEMI-ANNUAL REPORT | 47 |
| SCHEDULE OF INVESTMENTS (Unaudited)(continued) | March 29, 2018 |
| INVESTMENT GRADE BOND FUND | |
| CENTRALLY CLEARED INTEREST RATE SWAP AGREEMENTS†† | | | | | | | | | |
| Counterparty | | Exchange | | Floating
Rate Type | | Floating
Rate Index | | Fixed Rate | | Payment
Frequency | | Maturity
Date | | Notional
Amount | | | Market
Value | | | Premiums
Paid | | | Unrealized
Gain | |
| BofA Merrill Lynch | | CME | | Receive | | 3-Month USD-LIBOR | | 2.24% | | Quarterly | | 08/11/27 | | $ | (46,300,000 | ) | | $ | 2,149,155 | | | $ | 1,097,888 | | | $ | 1,051,267 | |
| BofA Merrill Lynch | | CME | | Receive | | 3-Month USD-LIBOR | | 1.67% | | Quarterly | | 08/16/20 | | | (39,400,000 | ) | | | 831,070 | | | | 394,926 | | | | 436,144 | |
| BofA Merrill Lynch | | CME | | Receive | | 3-Month USD-LIBOR | | 1.90% | | Quarterly | | 08/11/22 | | | (20,300,000 | ) | | | 667,983 | | | | 356,335 | | | | 311,648 | |
| BofA Merrill Lynch | | CME | | Receive | | 3-Month USD-LIBOR | | 1.99% | | Quarterly | | 08/22/24 | | | (5,200,000 | ) | | | 228,186 | | | | 89,794 | | | | 138,392 | |
| BofA Merrill Lynch | | CME | | Receive | | 3-Month USD-LIBOR | | 1.90% | | Quarterly | | 09/07/24 | | | (2,900,000 | ) | | | 143,947 | | | | 292 | | | | 143,655 | |
| BofA Merrill Lynch | | CME | | Receive | | 3-Month USD-LIBOR | | 2.59% | | Quarterly | | 11/13/47 | | | (1,900,000 | ) | | | 109,991 | | | | 329 | | | | 109,662 | |
| BofA Merrill Lynch | | CME | | Receive | | 3-Month USD-LIBOR | | 2.15% | | Quarterly | | 08/21/27 | | | (1,500,000 | ) | | | 80,268 | | | | 293 | | | | 79,975 | |
| BofA Merrill Lynch | | CME | | Receive | | 3-Month USD-LIBOR | | 2.24% | | Quarterly | | 08/17/27 | | | (1,300,000 | ) | | | 60,594 | | | | 192 | | | | 60,402 | |
| | | | | | | | | | | | | | | | | | | | | | | $ | 1,940,049 | | | $ | 2,331,145 | |
| FORWARD FOREIGN CURRENCY EXCHANGE CONTRACTS†† |
| Counterparty | | Contracts to Sell | | Currency | | Settlement
Date | | Settlement
Value | | | Value at
March 29,
2018 | | | Net
Unrealized
Appreciation/
(Depreciation) | |
| Goldman Sachs | | 1,352,000,000 | | HUF | | 04/25/18 | | $ | 5,466,982 | | | $ | 5,335,660 | | | $ | 131,322 | |
| Goldman Sachs | | 6,440,000 | | EUR | | 05/18/18 | | | 8,042,034 | | | | 7,952,031 | | | | 90,003 | |
| Goldman Sachs | | 12,880,000 | | BRL | | 04/02/18 | | | 3,961,899 | | | | 3,902,084 | | | | 59,815 | |
| Goldman Sachs | | 640,625,000 | | HUF | | 06/22/18 | | | 2,584,379 | | | | 2,539,336 | | | | 45,043 | |
| Deutsche Bank | | 6,710,000 | | EUR | | 04/06/18 | | | 8,295,271 | | | | 8,258,412 | | | | 36,859 | |
| JPMorgan Chase & Co. | | 22,000,000 | | CZK | | 04/20/18 | | | 1,085,803 | | | | 1,067,748 | | | | 18,055 | |
| Goldman Sachs | | 6,630,000 | | EUR | | 05/31/18 | | | 8,208,404 | | | | 8,194,490 | | | | 13,914 | |
| Citigroup | | 18,719,755 | | DKK | | 04/04/18 | | | 3,102,379 | | | | 3,090,026 | | | | 12,353 | |
| Citigroup | | 310,000 | | EUR | | 05/18/18 | | | 380,788 | | | | 382,784 | | | | (1,996 | ) |
| JPMorgan Chase & Co. | | 11,000,000 | | CZK | | 04/06/18 | | | 530,824 | | | | 533,031 | | | | (2,207 | ) |
| Goldman Sachs | | 37,000,000 | | CZK | | 04/13/18 | | | 1,786,922 | | | | 1,794,340 | | | | (7,418 | ) |
| JPMorgan Chase & Co. | | 37,600,000 | | DKK | | 06/01/18 | | | 6,207,796 | | | | 6,233,801 | | | | (26,005 | ) |
| | | | | | | | | | | | | | | | | $ | 369,738 | |
| | | | | | | | | | | | | | | | | | | |
| Counterparty | | Contracts to Buy | | Currency | | Settlement
Date | | | Settlement
Value | | | | Value at
March 29,
2018 | | | | Net
Unrealized
Appreciation/
(Depreciation) | |
| JPMorgan Chase & Co. | | 9,016,000 | | BRL | | 04/02/18 | | $ | 2,729,094 | | | $ | 2,731,459 | | | $ | 2,365 | |
| Citigroup | | 3,864,000 | | BRL | | 04/02/18 | | | 1,172,437 | | | | 1,170,625 | | | | (1,812 | ) |
| Citigroup | | 18,700,000 | | DKK | | 06/01/18 | | | 3,112,050 | | | | 3,100,321 | | | | (11,729 | ) |
| | | | | | | | | | | | | | | | | $ | (11,176 | ) |
| 48 | THE GUGGENHEIM FUNDS SEMI-ANNUAL REPORT | SEE NOTES TO FINANCIAL STATEMENTS. |
| SCHEDULE OF INVESTMENTS (Unaudited)(continued) | March 29, 2018 |
| INVESTMENT GRADE BOND FUND | |
| ~ | The face amount is denominated in U.S. dollars unless otherwise indicated. |
| * | Non-income producing security. |
| † | Value determined based on Level 1 inputs, unless otherwise noted — See Note 4. |
| †† | Value determined based on Level 2 inputs, unless otherwise noted — See Note 4. |
| ††† | Value determined based on Level 3 inputs — See Note 4. |
| 1 | Security was fair valued by the Valuation Committee at March 29, 2018. The total market value of fair valued securities amounts to $0, (cost $0) or less than 0.01% of total net assets. |
| 2 | Variable rate security. Rate indicated is the rate effective at March 29, 2018. In some instances, the underlying reference rate shown was below the minimum rate earned by the security or has been adjusted by a predetermined factor. The settlement status of a position may also impact the effective rate indicated. In instances where multiple underlying reference rates and spread amounts are shown, the effective rate is based on a weighted average. |
| 3 | Perpetual maturity. |
| 4 | Security is a 144A or Section 4(a)(2) security. These securities have been determined to be illiquid and restricted under guidelines established by the Board of Trustees. The total market value of 144A or Section 4(a)(2) illiquid and restricted securities is $10,806,088 (cost $11,742,045), or 2.5% of total net assets — See Note 10. |
| 5 | Affiliated issuer. |
| 6 | Rate indicated is the 7 day yield as of March 29, 2018. |
| 7 | Security is a 144A or Section 4(a)(2) security. These securities have been determined to be liquid under guidelines established by the Board of Trustees. The total market value of 144A or Section 4(a)(2) securities is $186,188,249 (cost $186,167,380), or 43.0% of total net assets. |
| 8 | Security has no stated coupon. However, it is expected to receive residual cash flow payments on defined deal dates. |
| 9 | Security is an interest-only strip. Rate indicated is effective yield at March 29, 2018. |
| 10 | Zero coupon rate security. |
| 11 | Security has a fixed rate coupon which will convert to a floating or variable rate coupon on a future date. |
| 12 | On September 7, 2008, the issuer was placed in conservatorship by the Federal Housing Finance Agency (FHFA). As conservator, the FHFA has full powers to control the assets and operations of the firm. |
| 13 | Term loan interests in the Fund’s portfolio generally have variable rates. All or a portion of this security represents unsettled loan positions and may not have a stated coupon rate. |
| 14 | Rate indicated is the effective yield at the time of purchase. |
| 15 | Repurchase Agreement — See additional disclosure on page 51 for more information on repurchase agreement. |
| | BofA — Bank of America |
| | BRL — Brazilian Real |
| | CME — Chicago Mercantile Exchange |
| | CMT — Constant Maturity Treasury |
| | CZK — Czech Koruna |
| | DKK — Danish Krone |
| | EUR — Euro |
| | HUF — Hungarian Forint |
| | LIBOR — London Interbank Offered Rate |
| | WAC — Weighted Average Coupon |
| | |
| | See Sector Classification in Other Information section. |
| SEE NOTES TO FINANCIAL STATEMENTS. | THE GUGGENHEIM FUNDS SEMI-ANNUAL REPORT | 49 |
| SCHEDULE OF INVESTMENTS (Unaudited)(continued) | March 29, 2018 |
| INVESTMENT GRADE BOND FUND | |
The following table summarizes the inputs used to value the Fund’s investments at March 29, 2018 (See Note 4 in the Notes to Financial Statements):
| Investments in Securities (Assets) | | Level 1
Quoted
Prices | | | Level 2
Significant
Observable
Inputs | | | Level 2 -
Other* | | | Level 3
Significant
Unobservable
Inputs | | | Total | |
| Asset Backed Securities | | $ | — | | | $ | 146,587,387 | | | $ | — | | | $ | 220,357 | | | $ | 146,807,744 | |
| Collateralized Mortgage Obligations | | | — | | | | 130,891,441 | | | | — | | | | — | | | | 130,891,441 | |
| Commercial Paper | | | — | | | | 8,993,840 | | | | — | | | | — | | | | 8,993,840 | |
| Common Stocks | | | 26,515 | | | | — | | | | — | | | | — | ** | | | 26,515 | |
| Corporate Bonds | | | — | | | | 32,759,174 | | | | — | | | | 1,332,768 | | | | 34,091,942 | |
| Forward Foreign Currency Exchange Contracts | | | — | | | | — | | | | 409,729 | | | | — | | | | 409,729 | |
| Federal Agency Bonds | | | — | | | | 14,661,940 | | | | — | | | | — | | | | 14,661,940 | |
| Foreign Government Debt | | | — | | | | 38,851,017 | | | | — | | | | — | | | | 38,851,017 | |
| Interest Rate Swap Agreements | | | — | | | | — | | | | 2,331,145 | | | | — | | | | 2,331,145 | |
| Money Market Fund | | | 1,758,552 | | | | — | | | | — | | | | — | | | | 1,758,552 | |
| Municipal Bonds | | | — | | | | 3,319,817 | | | | — | | | | — | | | | 3,319,817 | |
| Mutual Funds | | | 2,438,623 | | | | — | | | | — | | | | — | | | | 2,438,623 | |
| Options Purchased | | | — | | | | 453,685 | | | | — | | | | — | | | | 453,685 | |
| Preferred Stocks | | | — | | | | 302,481 | | | | — | | | | 2,945,770 | ** | | | 3,248,251 | |
| Repurchase Agreement | | | — | | | | 3,400,000 | | | | — | | | | — | | | | 3,400,000 | |
| Senior Floating Rate Interests | | | — | | | | 9,379,091 | | | | — | | | | — | | | | 9,379,091 | |
| U.S. Government Securities | | | — | | | | 42,436,371 | | | | — | | | | — | | | | 42,436,371 | |
| Total Assets | | $ | 4,223,690 | | | $ | 432,036,244 | | | $ | 2,740,874 | | | $ | 4,498,895 | | | $ | 443,499,703 | |
| | | | | | | | | | | | | | | | | | | | | |
| Investments in Securities (Liabilities) | | | Level 1
Quoted
Prices | | | | Level 2
Significant
Observable
Inputs | | | | Level 2 -
Other* | | | | Level 3
Significant
Unobservable
Inputs | | | | Total | |
| Forward Foreign Currency Exchange Contracts | | $ | — | | | $ | — | | | $ | 51,167 | | | $ | — | | | $ | 51,167 | |
| Unfunded Loan Commitments (Note 9) | | | — | | | | — | | | | — | | | | — | ** | | | — | |
| Total Liabilities | | $ | — | | | $ | — | | | $ | 51,167 | | | $ | — | | | $ | 51,167 | |
| * | Other financial instruments include forward foreign currency exchange contracts and swaps, which are reported as unrealized gain/loss at period end. |
| ** | Includes securities with a market value of $0. |
The following is a summary of significant unobservable inputs used in the fair valuation of assets and liabilities categorized within Level 3 of the fair value hierarchy:
| Category | | Ending Balance at
March 29, 2018 | | | Valuation Technique | | Unobservable
Inputs | | Input
Range | | Weighted
Average |
| Assets: | | | | | | | | | | | | |
| Asset-Backed Securities | | $ | 220,357 | | | Option Adjusted Spread off
prior month broker quote | | Indicative Quote | | — | | — |
| Corporate Bonds | | | 1,332,768 | | | Option Adjusted Spread off
prior month broker quote | | Indicative Quote | | — | | — |
| Preferred Stocks | | | 2,945,770 | | | Option Adjusted Spread off
prior month broker quote | | Indicative Quote | | — | | — |
| Total Assets | | $ | 4,498,895 | | | | | | | | | |
Any remaining Level 3 securities held by the Funds and excluded from the tables above, were not considered material to the Fund.
Transfers between investment levels may occur as the markets fluctuate and/or the availability of data used in an investment’s valuation changes. Transfers between valuation levels, if any, are in comparison to the valuation levels at the end of the previous fiscal year, and are effective using the fair value as of the end of the current fiscal period.
For the period ended March 29, 2018, the Fund has securities with a total value of $1,588,924 transfer out of Level 3 into Level 2 due to availability of vendor prices. There were no other securities that transferred between levels.
| 50 | THE GUGGENHEIM FUNDS SEMI-ANNUAL REPORT | SEE NOTES TO FINANCIAL STATEMENTS. |
| SCHEDULE OF INVESTMENTS (Unaudited)(concluded) | March 29, 2018 |
| INVESTMENT GRADE BOND FUND | |
Summary of Fair Value Level 3 Activity
Following is a reconciliation of Level 3 assets for which significant unobservable inputs were used to determine fair value for the period ended March 29, 2018:
| | | Assets | | | | |
| | | Collateralized
Mortgage
Obligations | | | Asset-Backed
Securities | | | Common
Stocks | | | Preferred
Stocks | | | Corporate Bonds | | | Total Assets | |
| Beginning Balance | | $ | 3,510,034 | | | $ | 245,278 | | | $ | — | | | $ | 2,865,891 | | | $ | 1,371,562 | | | $ | 7,992,765 | |
| Purchases/Receipts | | | — | | | | — | | | | — | | | | — | | | | — | | | | — | |
| Sales, maturities and paydowns/Fundings | | | (1,887,400 | ) | | | (25,589 | ) | | | — | | | | — | | | | — | | | | (1,912,989 | ) |
| Total realized gains or losses included in earnings | | | 22,628 | | | | — | | | | — | | | | — | | | | — | | | | 22,628 | |
| Total change in unrealized gains or losses included in earnings | | | (56,338 | ) | | | 668 | | | | — | | | | 79,879 | | | | (38,794 | ) | | | (14,585 | ) |
| Transfers into Level 3 | | | — | | | | — | | | | — | | | | — | | | | — | | | | — | |
| Transfers out of Level 3 | | | (1,588,924 | ) | | | — | | | | — | | | | — | | | | — | | | | (1,588,924 | ) |
| Ending Balance | | $ | — | | | $ | 220,357 | | | $ | — | | | $ | 2,945,770 | | | $ | 1,332,768 | | | $ | 4,498,895 | |
| Net Change in unrealized appreciation (depreciation) for investments in Level 3 securities still held at March 29, 2018 | | $ | — | | | $ | 668 | | | $ | — | | | $ | 79,879 | | | $ | (38,794 | ) | | $ | 41,753 | |
Repurchase Agreement
In connection with transactions in repurchase agreements, it is the Fund’s policy that its custodian take possession of the underlying collateral. The collateral is in the possession of the Fund’s custodian and is evaluated to ensure that its market value exceeds, at a minimum, 102% of the original face amount of the repurchase agreements.
Counterparty and
Terms of Agreement | | Face
Value | | | Repurchase
Price | | | Collateral | | Par
Value | | | Fair
Value | |
| BNP Paribas | | | | | | | | HSI Asset Securitization Corporation Trust | | | | | | |
| 1.90% | | | | | | | | 2.06% | | | | | | |
| 04/03/18 | | $ | 3,400,000 | | | $ | 3,404,845 | | | 01/25/37 | | $ | 5,500,000 | | | $ | 4,485,250 | |
In the event of counterparty default, the Fund has the right to collect the collateral to offset losses incurred. There is potential loss to the Fund in the event the Fund is delayed or prevented from exercising its rights to dispose of the collateral securities, including the risk of a possible decline in the value of the underlying securities during the period while the Fund seeks to assert its rights. The Fund’s investment adviser, acting under the supervision of the Board, reviews the value of the collateral and the creditworthiness of those banks and dealers with which the Fund enters into repurchase agreements to evaluate potential risks.
Affiliated Transactions
Investments representing 5% or more of the outstanding voting shares of a portfolio company of a fund, or control of or by, or common control under GI, result in that portfolio company being considered an affiliated company of such fund, as defined in the 1940 Act.
Transactions during the period ended March 29, 2018, in which the portfolio company is an “affiliated person”, were as follows:
| Security Name | | Value 09/30/17 | | | Additions | | | Reductions | | | Realized Loss | | | Change in Unrealized | | | Value 03/29/18 | | | Shares 03/29/18 | | | Investment Income | |
| Mutual Funds | | | | | | | | | | | | | | | | | | | | | | | | |
| Guggenheim Floating Rate Strategies Fund - Institutional Class | | $ | — | | | $ | 4,451,550 | | | $ | (2,000,000 | ) | | $ | (4,608 | ) | | $ | (8,319 | ) | | $ | 2,438,623 | | | | 93,757 | | | $ | 51,291 | |
| SEE NOTES TO FINANCIAL STATEMENTS. | THE GUGGENHEIM FUNDS SEMI-ANNUAL REPORT | 51 |
| INVESTMENT GRADE BOND FUND | |
| STATEMENT OF ASSETS AND LIABILITIES (Unaudited) |
| March 29, 2018 |
| Assets: |
| Investments in unaffiliated issuers, at value (cost $438,851,459) | | $ | 434,920,206 | |
| Investments in affiliated issuers, at value (cost $2,446,942) | | | 2,438,623 | |
| Repurchase agreements, at value (cost $3,400,000) | | | 3,400,000 | |
| Segregated cash with broker | | | 2,058,000 | |
| Unamortized upfront premiums paid on interest rate swap agreements | | | 1,940,049 | |
| Unrealized appreciation on forward foreign currency exchange contracts | | | 409,729 | |
| Prepaid expenses | | | 84,880 | |
| Receivables: |
| Securities sold | | | 5,337,687 | |
| Interest | | | 1,508,460 | |
| Fund shares sold | | | 1,421,286 | |
| Dividends | | | 6,719 | |
| Total assets | | | 453,525,639 | |
| | | | | |
| Liabilities: |
| Overdraft due to custodian bank | | | 89,382 | |
| Segregated cash due to broker | | | 2,623,717 | |
| Unrealized depreciation on forward foreign currency exchange contracts | | | 51,167 | |
| Unfunded loan commitments, at value (Note 9) (proceeds $0) | | | — | |
| Payable for: |
| Securities purchased | | | 16,684,381 | |
| Fund shares redeemed | | | 176,534 | |
| Variation margin on interest rate swap agreements | | | 78,153 | |
| Management fees | | | 74,618 | |
| Distribution and service fees | | | 65,329 | |
| Swap settlement | | | 46,374 | |
| Fund accounting/administration fees | | | 28,683 | |
| Transfer agent/maintenance fees | | | 11,384 | |
| Trustees’ fees* | | | 34 | |
| Miscellaneous | | | 101,047 | |
| Total liabilities | | | 20,030,803 | |
| Net assets | | $ | 433,494,836 | |
| | | | | |
| Net assets consist of: |
| Paid in capital | | $ | 437,252,898 | |
| Undistributed net investment income | | | 494,379 | |
| Accumulated net realized loss on investments | | | (2,998,606 | ) |
| Net unrealized depreciation on investments | | | (1,253,835 | ) |
| Net assets | | $ | 433,494,836 | |
| | | | | |
| A-Class: |
| Net assets | | $ | 178,581,380 | |
| Capital shares outstanding | | | 9,662,455 | |
| Net asset value per share | | $ | 18.48 | |
| Maximum offering price per share (Net asset value divided by 96.00%) | | $ | 19.25 | |
| | | | | |
| C-Class: |
| Net assets | | $ | 25,079,456 | |
| Capital shares outstanding | | | 1,362,657 | |
| Net asset value per share | | $ | 18.40 | |
| | | | | |
| P-Class: |
| Net assets | | $ | 32,566,290 | |
| Capital shares outstanding | | | 1,760,592 | |
| Net asset value per share | | $ | 18.50 | |
| | | | | |
| Institutional Class: |
| Net assets | | $ | 197,267,710 | |
| Capital shares outstanding | | | 10,688,334 | |
| Net asset value per share | | $ | 18.46 | |
| * | Relates to Trustees not deemed “interested persons” within the meaning of Section 2(a)(19) of the 1940 Act. |
| 52 | THE GUGGENHEIM FUNDS SEMI-ANNUAL REPORT | SEE NOTES TO FINANCIAL STATEMENTS. |
| INVESTMENT GRADE BOND FUND | |
| STATEMENT OF OPERATIONS (Unaudited) |
| Period Ended March 29, 2018 |
| Investment Income: |
| Dividends from securities of unaffiliated issuers | | $ | 93,945 | |
| Dividends from securities of affiliated issuers | | | 51,291 | |
| Interest | | | 6,703,161 | |
| Total investment income | | | 6,848,397 | |
| | | | | |
| Expenses: |
| Management fees | | | 810,577 | |
| Distribution and service fees: |
| A-Class | | | 217,149 | |
| C-Class | | | 130,473 | |
| P-Class | | | 29,746 | |
| Recoupment of previously waived fees: |
| A-Class | | | 5,107 | |
| C-Class | | | 699 | |
| P-Class | | | 1,494 | |
| Institutional Class | | | 8,164 | |
| Transfer agent/maintenance fees: |
| A-Class | | | 89,642 | |
| C-Class | | | 23,879 | |
| P-Class | | | 14,735 | |
| Institutional Class | | | 30,435 | |
| Fund accounting/administration fees | | | 155,031 | |
| Custodian fees | | | 13,294 | |
| Trustees’ fees* | | | 6,937 | |
| Line of credit fees | | | 5,947 | |
| Miscellaneous | | | 145,411 | |
| Total expenses | | | 1,688,720 | |
| Less: |
| Expenses reimbursed by Adviser: |
| A-Class | | | (52,825 | ) |
| C-Class | | | (18,509 | ) |
| P-Class | | | (10,388 | ) |
| Institutional Class | | | (25,066 | ) |
| Expenses waived by Adviser | | | (80,370 | ) |
| Total waived/reimbursed expenses | | | (187,158 | ) |
| Net expenses | | | 1,501,562 | |
| Net investment income | | | 5,346,835 | |
| | | | | |
| Net Realized and Unrealized Gain (Loss): |
| Net realized gain (loss) on: |
| Investments in unaffiliated issuers | | $ | 845,183 | |
| Investments in affiliated issuers | | | (4,608 | ) |
| Swap agreements | | | 943,214 | |
| Foreign currency transactions | | | (25,627 | ) |
| Forward foreign currency exchange contracts | | | (194,509 | ) |
| Options purchased | | | (550,095 | ) |
| Options written | | | 164,376 | |
| Net realized gain | | | 1,177,934 | |
| Net change in unrealized appreciation (depreciation) on: |
| Investments in unaffiliated issuers | | | (5,112,877 | ) |
| Investments in affiliated issuers | | | (8,319 | ) |
| Swap agreements | | | 1,978,009 | |
| Options purchased | | | 244,632 | |
| Options written | | | (156,385 | ) |
| Foreign currency translations | | | (3,970 | ) |
| Forward foreign currency exchange contracts | | | 342,543 | |
| Net change in unrealized appreciation (depreciation) | | | (2,716,367 | ) |
| Net realized and unrealized loss | | | (1,538,433 | ) |
| Net increase in net assets resulting from operations | | $ | 3,808,402 | |
| * | Relates to Trustees not deemed “interested persons” within the meaning of Section 2(a)(19) of the 1940 Act. |
| SEE NOTES TO FINANCIAL STATEMENTS. | THE GUGGENHEIM FUNDS SEMI-ANNUAL REPORT | 53 |
| INVESTMENT GRADE BOND FUND | |
| STATEMENTS OF CHANGES IN NET ASSETS |
| | | Period Ended
March 29,
2018
(Unaudited) | | | Year Ended
September 30,
2017 | |
| Increase (Decrease) in Net Assets from Operations: | | | | | | | | |
| Net investment income | | $ | 5,346,835 | | | $ | 10,160,909 | |
| Net realized gain on investments | | | 1,177,934 | | | | 1,038,292 | |
| Net change in unrealized appreciation (depreciation) on investments | | | (2,716,367 | ) | | | (191,264 | ) |
| Net increase in net assets resulting from operations | | | 3,808,402 | | | | 11,007,937 | |
| | | | | | | | | |
| Distributions to shareholders from: | | | | | | | | |
| Net investment income | | | | | | | | |
| A-Class | | | (2,284,267 | ) | | | (5,543,696 | ) |
| C-Class | | | (248,998 | ) | | | (809,552 | ) |
| P-Class | | | (303,458 | ) | | | (165,374 | ) |
| Institutional Class | | | (2,362,914 | ) | | | (4,160,219 | ) |
| Total distributions to shareholders | | | (5,199,637 | ) | | | (10,678,841 | ) |
| | | | | | | | | |
| Capital share transactions: | | | | | | | | |
| Proceeds from sale of shares | | | | | | | | |
| A-Class | | | 26,662,593 | | | | 68,572,987 | |
| C-Class | | | 2,470,052 | | | | 5,322,726 | |
| P-Class | | | 19,526,576 | | | | 18,599,465 | |
| Institutional Class | | | 67,903,455 | | | | 85,698,634 | |
| Distributions reinvested | | | | | | | | |
| A-Class | | | 2,077,301 | | | | 5,078,949 | |
| C-Class | | | 220,355 | | | | 705,067 | |
| P-Class | | | 303,458 | | | | 165,374 | |
| Institutional Class | | | 2,333,517 | | | | 4,051,788 | |
| Cost of shares redeemed | | | | | | | | |
| A-Class | | | (20,145,594 | ) | | | (61,989,844 | ) |
| C-Class | | | (5,597,623 | ) | | | (13,889,018 | ) |
| P-Class | | | (4,470,489 | ) | | | (4,553,931 | ) |
| Institutional Class | | | (14,421,760 | ) | | | (31,294,035 | ) |
| Net increase from capital share transactions | | | 76,861,841 | | | | 76,468,162 | |
| Net increase in net assets | | | 75,470,606 | | | | 76,797,258 | |
| | | | | | | | | |
| Net assets: | | | | | | | | |
| Beginning of period | | | 358,024,230 | | | | 281,226,972 | |
| End of period | | $ | 433,494,836 | | | $ | 358,024,230 | |
| Undistributed net investment income at end of period | | $ | 494,379 | | | $ | 347,181 | |
| | | | | | | | | |
| Capital share activity: | | | | | | | | |
| Shares sold | | | | | | | | |
| A-Class | | | 1,438,612 | | | | 3,734,365 | |
| C-Class | | | 133,826 | | | | 291,471 | |
| P-Class | | | 1,053,488 | | | | 1,004,493 | |
| Institutional Class | | | 3,675,884 | | | | 4,668,101 | |
| Shares issued from reinvestment of distributions | | | | | | | | |
| A-Class | | | 112,040 | | | | 276,636 | |
| C-Class | | | 11,931 | | | | 38,586 | |
| P-Class | | | 16,433 | | | | 8,989 | |
| Institutional Class | | | 126,046 | | | | 220,822 | |
| Shares redeemed | | | | | | | | |
| A-Class | | | (1,086,848 | ) | | | (3,377,947 | ) |
| C-Class | | | (303,469 | ) | | | (760,143 | ) |
| P-Class | | | (241,412 | ) | | | (247,641 | ) |
| Institutional Class | | | (780,516 | ) | | | (1,710,778 | ) |
| Net increase in shares | | | 4,156,015 | | | | 4,146,954 | |
| 54 | THE GUGGENHEIM FUNDS SEMI-ANNUAL REPORT | SEE NOTES TO FINANCIAL STATEMENTS. |
| INVESTMENT GRADE BOND FUND | |
This table is presented to show selected data for a share outstanding throughout each period and to assist shareholders in evaluating a Fund’s performance for the periods presented.
| A-Class | | Period Ended
March 29,
2018a | | | Year Ended
September 30,
2017 | | | Year Ended
September 30,
2016 | | | Year Ended
September 30,
2015 | | | Year Ended
September 30,
2014 | | | Year Ended
September 30,
2013 | |
| Per Share Data | | | | | | | | | | | | | | | | | | | | | | | | |
| Net asset value, beginning of period | | $ | 18.55 | | | $ | 18.55 | | | $ | 18.10 | | | $ | 18.50 | | | $ | 17.81 | | | $ | 17.92 | |
| Income (loss) from investment operations: |
| Net investment income (loss)b | | | .25 | | | | .59 | | | | .64 | | | | .69 | | | | .65 | | | | .61 | |
| Net gain (loss) on investments (realized and unrealized) | | | (.08 | ) | | | .02 | | | | .50 | | | | (.30 | ) | | | .83 | | | | (.04 | ) |
| Total from investment operations | | | .17 | | | | .61 | | | | 1.14 | | | | .39 | | | | 1.48 | | | | .57 | |
| Less distributions from: |
| Net investment income | | | (.24 | ) | | | (.61 | ) | | | (.69 | ) | | | (.79 | ) | | | (.79 | ) | | | (.68 | ) |
| Total distributions | | | (.24 | ) | | | (.61 | ) | | | (.69 | ) | | | (.79 | ) | | | (.79 | ) | | | (.68 | ) |
| Net asset value, end of period | | $ | 18.48 | | | $ | 18.55 | | | $ | 18.55 | | | $ | 18.10 | | | $ | 18.50 | | | $ | 17.81 | |
| |
| Total Returnh | | | 0.94 | % | | | 3.39 | % | | | 6.50 | % | | | 2.12 | % | | | 8.47 | % | | | 3.21 | % |
| Ratios/Supplemental Data |
| Net assets, end of period (in thousands) | | $ | 178,581 | | | $ | 170,624 | | | $ | 158,932 | | | $ | 115,019 | | | $ | 99,565 | | | $ | 83,642 | |
| Ratios to average net assets: |
| Net investment income (loss) | | | 2.71 | % | | | 3.19 | % | | | 3.55 | % | | | 3.72 | % | | | 3.55 | % | | | 3.40 | % |
| Total expensesc | | | 0.95 | % | | | 1.07 | % | | | 1.08 | % | | | 1.17 | % | | | 1.19 | % | | | 1.21 | % |
| Net expensesd,e,i | | | 0.85 | % | | | 1.02 | % | | | 1.03 | % | | | 1.07 | % | | | 1.05 | % | | | 1.04 | % |
| Portfolio turnover rate | | | 34 | % | | | 81 | % | | | 100 | % | | | 57 | % | | | 61 | % | | | 119 | % |
| C-Class | | Period Ended
March 29,
2018a | | | Year Ended
September 30,
2017 | | | Year Ended
September 30,
2016 | | | Year Ended
September 30,
2015 | | | Year Ended
September 30,
2014 | | | Year Ended
September 30,
2013 | |
| Per Share Data | | | | | | | | | | | | | | | | | | |
| Net asset value, beginning of period | | $ | 18.47 | | | $ | 18.48 | | | $ | 18.02 | | | $ | 18.42 | | | $ | 17.73 | | | $ | 17.82 | |
| Income (loss) from investment operations: |
| Net investment income (loss)b | | | .18 | | | | .45 | | | | .51 | | | | .55 | | | | .51 | | | | .48 | |
| Net gain (loss) on investments (realized and unrealized) | | | (.07 | ) | | | .02 | | | | .51 | | | | (.30 | ) | | | .83 | | | | (.05 | ) |
| Total from investment operations | | | .11 | | | | .47 | | | | 1.02 | | | | .25 | | | | 1.34 | | | | .43 | |
| Less distributions from: |
| Net investment income | | | (.18 | ) | | | (.48 | ) | | | (.56 | ) | | | (.65 | ) | | | (.65 | ) | | | (.52 | ) |
| Total distributions | | | (.18 | ) | | | (.48 | ) | | | (.56 | ) | | | (.65 | ) | | | (.65 | ) | | | (.52 | ) |
| Net asset value, end of period | | $ | 18.40 | | | $ | 18.47 | | | $ | 18.48 | | | $ | 18.02 | | | $ | 18.42 | | | $ | 17.73 | |
| |
| Total Returnh | | | 0.57 | % | | | 2.59 | % | | | 5.78 | % | | | 1.36 | % | | | 7.69 | % | | | 2.42 | % |
| Ratios/Supplemental Data |
| Net assets, end of period (in thousands) | | $ | 25,079 | | | $ | 28,083 | | | $ | 36,040 | | | $ | 24,111 | | | $ | 20,673 | | | $ | 17,876 | |
| Ratios to average net assets: |
| Net investment income (loss) | | | 1.99 | % | | | 2.47 | % | | | 2.81 | % | | | 3.00 | % | | | 2.80 | % | | | 2.65 | % |
| Total expensesc | | | 1.78 | % | | | 1.85 | % | | | 1.90 | % | | | 1.99 | % | | | 1.99 | % | | | 2.03 | % |
| Net expensesd,e,i | | | 1.60 | % | | | 1.77 | % | | | 1.77 | % | | | 1.82 | % | | | 1.80 | % | | | 1.79 | % |
| Portfolio turnover rate | | | 34 | % | | | 81 | % | | | 100 | % | | | 57 | % | | | 61 | % | | | 119 | % |
| SEE NOTES TO FINANCIAL STATEMENTS. | THE GUGGENHEIM FUNDS SEMI-ANNUAL REPORT | 55 |
| INVESTMENT GRADE BOND FUND | |
| FINANCIAL HIGHLIGHTS (continued) |
This table is presented to show selected data for a share outstanding throughout each period and to assist shareholders in evaluating a Fund’s performance for the periods presented.
| P-Class | | Period Ended
March 29,
2018a | | | Year Ended
September 30,
2017 | | | Year Ended
September 30,
2016 | | | Period Ended
September 30,
2015f | |
| Per Share Data | | | | | | | | | | | | |
| Net asset value, beginning of period | | $ | 18.56 | | | $ | 18.57 | | | $ | 18.12 | | | $ | 18.45 | |
| Income (loss) from investment operations: |
| Net investment income (loss)b | | | .24 | | | | .56 | | | | .59 | | | | .25 | |
| Net gain (loss) on investments (realized and unrealized) | | | (.06 | ) | | | .05 | | | | .55 | | | | (.26 | ) |
| Total from investment operations | | | .18 | | | | .61 | | | | 1.14 | | | | (.01 | ) |
| Less distributions from: |
| Net investment income | | | (.24 | ) | | | (.62 | ) | | | (.69 | ) | | | (.32 | ) |
| Total distributions | | | (.24 | ) | | | (.62 | ) | | | (.69 | ) | | | (.32 | ) |
| Net asset value, end of period | | $ | 18.50 | | | $ | 18.56 | | | $ | 18.57 | | | $ | 18.12 | |
| |
| Total Returnh | | | 0.99 | % | | | 3.33 | % | | | 6.51 | % | | | (0.11 | %) |
| Ratios/Supplemental Data |
| Net assets, end of period (in thousands) | | $ | 32,566 | | | $ | 17,303 | | | $ | 3,087 | | | $ | 10 | |
| Ratios to average net assets: |
| Net investment income (loss) | | | 2.62 | % | | | 3.06 | % | | | 3.25 | % | | | 3.25 | % |
| Total expensesc | | | 0.97 | % | | | 1.13 | % | | | 0.98 | % | | | 3.29 | % |
| Net expensesd,e,i | | | 0.83 | % | | | 1.01 | % | | | 0.98 | % | | | 1.09 | % |
| Portfolio turnover rate | | | 34 | % | | | 81 | % | | | 100 | % | | | 57 | % |
| 56 | THE GUGGENHEIM FUNDS SEMI-ANNUAL REPORT | SEE NOTES TO FINANCIAL STATEMENTS. |
| INVESTMENT GRADE BOND FUND | |
| FINANCIAL HIGHLIGHTS (concluded) |
This table is presented to show selected data for a share outstanding throughout each period and to assist shareholders in evaluating a Fund’s performance for the periods presented.
| Institutional Class | | Period Ended
March 29,
2018a | | | Year Ended
September 30,
2017 | | | Year Ended
September 30,
2016 | | | Year Ended
September 30,
2015 | | | Year Ended
September 30,
2014 | | | Period Ended
September 30,
2013g | |
| Per Share Data | | | | | | | | | | | | | | | | | | |
| Net asset value, beginning of period | | $ | 18.52 | | | $ | 18.53 | | | $ | 18.07 | | | $ | 18.47 | | | $ | 17.80 | | | $ | 18.00 | |
| Income (loss) from investment operations: |
| Net investment income (loss)b | | | .27 | | | | .64 | | | | .62 | | | | .74 | | | | .68 | | | | .46 | |
| Net gain (loss) on investments (realized and unrealized) | | | (.06 | ) | | | .02 | | | | .58 | | | | (.31 | ) | | | .83 | | | | (.21 | ) |
| Total from investment operations | | | .21 | | | | .66 | | | | 1.20 | | | | .43 | | | | 1.51 | | | | .25 | |
| Less distributions from: |
| Net investment income | | | (.27 | ) | | | (.67 | ) | | | (.74 | ) | | | (.83 | ) | | | (.84 | ) | | | (.45 | ) |
| Total distributions | | | (.27 | ) | | | (.67 | ) | | | (.74 | ) | | | (.83 | ) | | | (.84 | ) | | | (.45 | ) |
| Net asset value, end of period | | $ | 18.46 | | | $ | 18.52 | | | $ | 18.53 | | | $ | 18.07 | | | $ | 18.47 | | | $ | 17.80 | |
| |
| Total Returnh | | | 1.14 | % | | | 3.67 | % | | | 6.83 | % | | | 2.37 | % | | | 8.64 | % | | | 1.35 | % |
| Ratios/Supplemental Data |
| Net assets, end of period (in thousands) | | $ | 197,268 | | | $ | 142,014 | | | $ | 83,168 | | | $ | 6,910 | | | $ | 5,909 | | | $ | 174 | |
| Ratios to average net assets: |
| Net investment income (loss) | | | 2.96 | % | | | 3.51 | % | | | 3.41 | % | | | 4.01 | % | | | 3.72 | % | | | 3.85 | % |
| Total expensesc | | | 0.63 | % | | | 0.74 | % | | | 0.76 | % | | | 0.94 | % | | | 0.88 | % | | | 1.17 | % |
| Net expensesd,e,i | | | 0.56 | % | | | 0.70 | % | | | 0.76 | % | | | 0.82 | % | | | 0.78 | % | | | 0.82 | % |
| Portfolio turnover rate | | | 34 | % | | | 81 | % | | | 100 | % | | | 57 | % | | | 61 | % | | | 119 | % |
| a | Unaudited figures for the period ended March 29, 2018. Percentage amounts for the period, except total return and portfolio turnover rate, have been annualized. |
| b | Net investment income (loss) per share was computed using average shares outstanding throughout the period. |
| c | Does not include expenses of the underlying funds in which the Fund invests. |
| d | Net expense information reflects the expense ratios after expense waivers and reimbursements, as applicable. |
| e | The portion of the ratios of net expenses to average net assets attributable to recoupments of prior fee reductions or expense reimbursements for the periods presented would be: |
| | | 03/29/18 | 09/30/17 |
| | A-Class | 0.00% | 0.05% |
| | C-Class | 0.00% | 0.03% |
| | P-Class | 0.00% | 0.01% |
| | Institutional Class | 0.00% | 0.02% |
| f | Since commencement of operations: May 1, 2015. Percentage amounts for the period, except total return and portfolio turnover rate, have been annualized. |
| g | Since commencement of operations: January 29, 2013. Percentage amounts for the period, except total return and portfolio turnover rate, have been annualized. |
| h | Total return does not reflect the impact of any applicable sales charges and has not been annualized. |
| i | Net expenses may include expenses that are excluded from the expense limitation agreement. Excluding these expenses, the operating expense ratios for the periods would be: |
| | | 03/29/18 | 09/30/17 | 09/30/16 | 09/30/15 | 09/30/14 | 09/30/13 |
| | A-Class | 0.84% | 1.00% | 1.00% | 1.00% | 1.00% | 1.02% |
| | C-Class | 1.60% | 1.75% | 1.74% | 1.75% | 1.75% | 1.77% |
| | P-Class | 0.83% | 0.99% | 0.97% | 1.00% | N/A | N/A |
| | Institutional Class | 0.56% | 0.68% | 0.75% | 0.75% | 0.75% | 0.77% |
| SEE NOTES TO FINANCIAL STATEMENTS. | THE GUGGENHEIM FUNDS SEMI-ANNUAL REPORT | 57 |
| PERFORMANCE REPORT AND FUND PROFILE (Unaudited) | March 29, 2018 |
LIMITED DURATION FUND
OBJECTIVE: Seeks to provide a high level of income consistent with preservation of capital.
Holdings Diversification (Market Exposure as % of Net Assets)
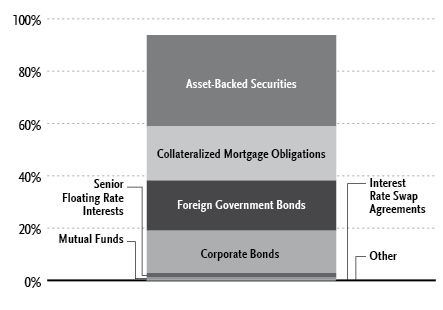
“Holdings Diversification (Market Exposure as % of Net Assets)” excludes any temporary cash investments or investments in Guggenheim Strategy Funds Trust mutual funds.
| Inception Dates: |
| A-Class | December 16, 2013 |
| C-Class | December 16, 2013 |
| P-Class | May 1, 2015 |
| Institutional Class | December 16, 2013 |
| Ten Largest Holdings (% of Total Net Assets) |
| Republic of Portugal, 05/18/18 | 2.0% |
| Denmark Treasury Bill, 06/01/18 | 2.0% |
| Government of Japan, 06/04/18 | 2.0% |
| Government of United Kingdom, 04/09/18 | 1.9% |
| Republic of Italy, 05/31/18 | 1.9% |
| Republic of France, 04/05/18 | 1.6% |
| CIM Trust, 3.69% | 1.5% |
| Kingdom of Spain, 04/06/18 | 1.2% |
| Ladder Capital Commercial Mortgage 2017-FL1 Mortgage Trust, 2.67% | 1.2% |
| Guggenheim Floating Rate Strategies Fund - Institutional Class | 1.1% |
| Top Ten Total | 16.4% |
“Ten Largest Holdings” excludes any temporary cash or derivative investments.
| 58 | THE GUGGENHEIM FUNDS SEMI-ANNUAL REPORT | |
| PERFORMANCE REPORT AND FUND PROFILE (Unaudited)(continued) | March 29, 2018 |
Average Annual Returns*
Periods Ended March 29, 2018
| | 6 month† | 1 Year | Since Inception
(12/16/13) |
| A-Class Shares | 0.72% | 2.17% | 2.50% |
| A-Class Shares with sales charge‡ | (1.54%) | (0.13%) | 1.95% |
| Bloomberg Barclays U.S. Aggregate Bond 1-3 Total Return Index | (0.40%) | 0.24% | 0.79% |
| | 6 month† | 1 Year | Since Inception
(12/16/13) |
| C-Class Shares | 0.38% | 1.45% | 1.74% |
| C-Class Shares with CDSC§ | (0.61%) | 0.45% | 1.74% |
| Bloomberg Barclays U.S. Aggregate Bond 1-3 Total Return Index | (0.40%) | 0.24% | 0.79% |
| | 6 month† | 1 Year | Since Inception
(05/01/15) |
| P-Class Shares | 0.72% | 2.17% | 2.44% |
| Bloomberg Barclays U.S. Aggregate Bond 1-3 Total Return Index | (0.40%) | 0.24% | 0.69% |
| | 6 month† | 1 Year | Since Inception
(12/16/13) |
| Institutional Class Shares | 0.88% | 2.47% | 2.78% |
| Bloomberg Barclays U.S. Aggregate Bond 1-3 Total Return Index | (0.40%) | 0.24% | 0.79% |
| Portfolio Composition by Quality Rating1 |
| Rating | % of Total
Investments |
| Fixed Income Instruments | |
| AAA | 32.0% |
| AA | 11.0% |
| A | 17.2% |
| BBB | 20.3% |
| BB | 1.2% |
| B | 3.4% |
| CCC | 1.8% |
| CC | 0.1% |
| NR2 | 6.6% |
| Other Instruments | 6.4% |
| Total Investments | 100.0% |
| * | The performance data above represents past performance that is not predictive of future results. The investment return and principal value of an investment in the Fund will fluctuate so that an investor’s shares, when redeemed, may be worth more or less than their original cost. Returns are historical and include changes in principal and reinvested dividends and capital gains and do not reflect the effect of taxes. The Bloomberg Barclays U.S. Aggregate Bond 1-3 Total Return Index is an unmanaged index and, unlike the Fund, has no management fees or operating expenses to reduce its reported return. |
| † | 6 month returns are not annualized. |
| ‡ | Fund returns are calculated using the maximum sales charge of 2.25%. |
| § | Fund returns include a CDSC of 1% if redeemed within 12 months of purchase. |
| 1 | Source: BlackRock Solutions. Credit quality ratings are measured on a scale that generally ranges from AAA (highest) to D (lowest). All securities except for those labeled “NR” have been rated by Moody’s, Standard & Poor’s (“S&P”), or Fitch, each of which is a Nationally Recognized Statistical Rating Organization (“NRSRO”). For purposes of this presentation, when ratings are available from more than one agency, the highest rating is used. Guggenheim Investments has converted ratings to the equivalent S&P rating. Security ratings are determined at the time of purchase and may change thereafter. |
| 2 | NR securities do not necessarily indicate low credit quality. |
| | THE GUGGENHEIM FUNDS SEMI-ANNUAL REPORT | 59 |
| SCHEDULE OF INVESTMENTS (Unaudited) | March 29, 2018 |
| LIMITED DURATION FUND | |
| | | Shares | | | Value | |
| | | | | | | |
| MUTUAL FUNDS† - 2.4% |
| Guggenheim Floating Rate Strategies Fund - Institutional Class1 | | | 1,287,342 | | | $ | 33,483,765 | |
| Guggenheim Strategy Fund II1 | | | 580,509 | | | | 14,518,541 | |
| Guggenheim Strategy Fund III1 | | | 479,688 | | | | 12,006,597 | |
| Guggenheim Strategy Fund I1 | | | 468,203 | | | | 11,728,479 | |
| Total Mutual Funds | | | | | | | | |
| (Cost $71,684,102) | | | | | | | 71,737,382 | |
| | | | | | | | | |
| MONEY MARKET FUND† - 1.9% |
| Dreyfus Treasury Securities Cash Management -Institutional Shares 1.46%2 | | | 55,419,001 | | | | 55,419,001 | |
| Total Money Market Fund | | | | | | | | |
| (Cost $55,419,001) | | | | | | | 55,419,001 | |
| | | | | | | | | |
| | | | Face
Amount~ | | | | | |
| | | | | | | | | |
| ASSET-BACKED SECURITIES†† - 34.9% |
| Collateralized Loan Obligations - 27.0% |
| Ladder Capital Commercial Mortgage 2017-FL1 Mortgage Trust | | | | | | | | |
| 2017-FL1, 2.67% (1 Month USD LIBOR + 0.88%) due 09/15/343,4 | | | 34,400,000 | | | | 34,370,922 | |
| Golub Capital Partners Clo 36m Ltd. | | | | | | | | |
| 2018-36A, 3.39% (3 Month USD LIBOR + 1.30%) due 02/05/313,4 | | | 29,300,000 | | | | 29,289,924 | |
| TICP CLO II-2 Ltd. | | | | | | | | |
| 2018-IIA, 3.07% (3 Month USD LIBOR + 0.84%) due 04/20/283,4 | | | 28,950,000 | | | | 28,950,000 | |
| Venture XII CLO Ltd. | | | | | | | | |
| 2018-12A, 2.78% (3 Month USD LIBOR + 0.80%) due 02/28/263,4 | | | 23,000,000 | | | | 23,010,373 | |
| 2018-12A, 3.18% (3 Month USD LIBOR + 1.20%) due 02/28/263,4 | | | 5,100,000 | | | | 5,102,694 | |
| West CLO 2014-1 Ltd. | | | | | | | | |
| 2017-1A, 2.65% (3 Month USD LIBOR + 0.92%) due 07/18/263,4 | | | 24,000,000 | | | | 23,994,996 | |
| Fortress Credit Opportunities IX CLO Ltd. | | | | | | | | |
| 2017-9A, 2.97% (3 Month USD LIBOR + 1.55%) due 11/15/293,4 | | | 23,800,000 | | | | 23,853,155 | |
| Shackleton 2015-VIII CLO Ltd. | | | | | | | | |
| 2017-8A, 2.66% (3 Month USD LIBOR + 0.92%) due 10/20/273,4 | | | 23,000,000 | | | | 23,006,527 | |
| Telos CLO Ltd. | | | | | | | | |
| 2017-6A, 3.00% (3 Month USD LIBOR + 1.27%) due 01/17/273,4 | | | 19,900,000 | | | | 19,898,527 | |
| CIFC Funding Ltd. | | | | | | | | |
| 2017-3A, 2.69% (3 Month USD LIBOR + 0.95%) due 07/22/263,4 | | | 14,500,000 | | | | 14,533,715 | |
| 2017-4A, 3.11% (3 Month USD LIBOR + 1.38%) due 10/17/263,4 | | | 5,000,000 | | | | 5,001,633 | |
| Fortress Credit Opportunities VII CLO Ltd. | | | | | | | | |
| 2016-7A, 4.17% (3 Month USD LIBOR + 2.05%) due 12/15/283,4 | | | 17,000,000 | | | | 17,101,942 | |
| Oaktree EIF II Series A2 Ltd. | | | | | | |
| 2017-A2, 2.99% (3 Month USD LIBOR + 1.15%) due 11/15/253,4 | | | 14,600,000 | | | | 14,615,149 | |
| Hunt CRE Ltd. | | | | | | | | |
| 2017-FL1, 2.78% (1 Month USD LIBOR + 1.00%) due 08/15/343,4 | | | 14,600,000 | | | | 14,588,168 | |
| Venture XVI CLO Ltd. | | | | | | | | |
| 2018-16A, 2.57% (3 Month USD LIBOR + 0.85%) due 01/15/283,4 | | | 14,550,000 | | | | 14,544,368 | |
| Golub Capital Partners CLO Ltd. | | | | | | | | |
| 2016-33A, 4.36% (3 Month USD LIBOR + 2.48%) due 11/21/283,4 | | | 9,000,000 | | | | 9,034,862 | |
| 2015-25A, 3.59% (3 Month USD LIBOR + 1.80%) due 08/05/273,4 | | | 5,000,000 | | | | 5,007,366 | |
| TPG Real Estate Finance 2018-FL-1 Issuer Ltd. | | | | | | | | |
| 2018-FL1, 2.54% (1 Month USD LIBOR + 0.75%) due 10/15/193,4 | | | 14,000,000 | | | | 13,995,208 | |
| BSPRT 2017-FL2 Issuer Ltd. | | | | | | | | |
| 2017-FL2, 2.60% (1 Month USD LIBOR + 0.82%) due 10/15/343,4 | | | 13,500,000 | | | | 13,493,814 | |
| Fortress Credit Opportunities XI CLO Ltd. | | | | | | | | |
| 2018-11A, % (3 Month USD LIBOR + 1.30%) due 04/15/313,4 | | | 13,450,000 | | | | 13,450,000 | |
| TICP CLO Ltd. | | | | | | | | |
| 2017-3A, 2.92% (3 Month USD LIBOR + 1.18%) due 01/20/273,4 | | | 13,350,000 | | | | 13,358,445 | |
| Vibrant CLO III Ltd. | | | | | | | | |
| 2016-3A, 3.22% (3 Month USD LIBOR + 1.48%) due 04/20/263,4 | | | 8,800,000 | | | | 8,809,771 | |
| 2016-3A, 3.79% (3 Month USD LIBOR + 2.05%) due 04/20/263,4 | | | 4,000,000 | | | | 4,004,021 | |
| Vibrant CLO II Ltd. | | | | | | | | |
| 2017-2A, 2.64% (3 Month USD LIBOR + 0.90%) due 07/24/243,4 | | | 7,247,490 | | | | 7,250,237 | |
| 2017-2A, 3.19% (3 Month USD LIBOR + 1.45%) due 07/24/243,4 | | | 4,850,000 | | | | 4,855,726 | |
| Atlas Senior Loan Fund III Ltd. | | | | | | | | |
| 2017-1A, 2.71% (3 Month USD LIBOR + 0.83%) due 11/17/273,4 | | | 12,000,000 | | | | 11,992,715 | |
| KVK CLO Ltd. | | | | | | | | |
| 2017-1A, 3.64% (3 Month USD LIBOR + 1.80%) due 05/15/263,4 | | | 5,600,000 | | | | 5,611,662 | |
| 2017-2A, 2.90% (3 Month USD LIBOR + 1.18%) due 07/15/263,4 | | | 5,000,000 | | | | 5,010,099 | |
| 2017-2A, 4.27% (3 Month USD LIBOR + 2.55%) due 07/15/263,4 | | | 1,000,000 | | | | 1,000,842 | |
| 2013-1A, due 01/15/284,5 | | | 750,000 | | | | 361,400 | |
| Marathon CLO V Ltd. | | | | | | | | |
| 2017-5A, 2.76% (3 Month USD LIBOR + 0.87%) due 11/21/273,4 | | | 12,000,000 | | | | 11,973,736 | |
| Fortress Credit Opportunities V CLO Ltd. | | | | | | | | |
| 2017-5A, 3.41% (3 Month USD LIBOR + 1.70%) due 10/15/263,4 | | | 5,200,000 | | | | 5,205,053 | |
| 2017-5A, 3.40% due 10/15/264 | | | 4,000,000 | | | | 4,015,387 | |
| 2017-5A, 4.06% (3 Month USD LIBOR + 2.35%) due 10/15/263,4 | | | 1,000,000 | | | | 1,002,170 | |
| 60 | THE GUGGENHEIM FUNDS SEMI-ANNUAL REPORT | SEE NOTES TO FINANCIAL STATEMENTS. |
| SCHEDULE OF INVESTMENTS (Unaudited)(continued) | March 29, 2018 |
| LIMITED DURATION FUND | |
| | | Face
Amount~ | | | Value | |
| | | | | | | |
| 2017-5A, 4.86% (3 Month USD LIBOR + 3.15%) due 10/15/263,4 | | | 1,000,000 | | | $ | 1,001,554 | |
| Steele Creek CLO 2014-1 Ltd. | | | | | | | | |
| 2018-1RA, 3.41% (3 Month USD LIBOR + 1.07%) due 04/21/313,4 | | | 10,550,000 | | | | 10,550,000 | |
| AIMCO CLO Series | | | | | | | | |
| 2018-AA, 2.57% (3 Month USD LIBOR + 0.85%) due 01/15/283,4 | | | 8,000,000 | | | | 7,991,924 | |
| 2017-AA, 2.84% (3 Month USD LIBOR + 1.10%) due 07/20/263,4 | | | 2,200,000 | | | | 2,200,793 | |
| Figueroa CLO Ltd. | | | | | | | | |
| 2017-2A, 3.45% (3 Month USD LIBOR + 1.25%) due 06/20/273,4 | | | 10,000,000 | | | | 10,020,024 | |
| Jamestown CLO III Ltd. | | | | | | | | |
| 2017-3A, 2.86% (3 Month USD LIBOR + 1.14%) due 01/15/263,4 | | | 9,400,000 | | | | 9,401,697 | |
| PFP Ltd. | | | | | | | | |
| 2017-3, 2.83% (1 Month USD LIBOR + 1.05%) due 01/14/353,4 | | | 6,226,266 | | | | 6,232,679 | |
| 2015-2, 3.79% (1 Month USD LIBOR + 2.00%) due 07/14/343,4 | | | 3,000,000 | | | | 2,999,425 | |
| Resource Capital Corporation Ltd. | | | | | | | | |
| 2017-CRE5, 2.59% (1 Month USD LIBOR + 0.80%) due 07/15/343,4 | | | 9,009,021 | | | | 9,011,750 | |
| Ares XXXIII CLO Ltd. | | | | | | | | |
| 2016-1A, 3.37% (3 Month USD LIBOR + 1.35%) due 12/05/253,4 | | | 8,800,000 | | | | 8,848,268 | |
| VMC Finance 2018-FL1 LLC | | | | | | | | |
| 2018-FL1, 2.60% (1 Month USD LIBOR + 0.82%) due 04/15/353,4 | | | 8,400,000 | | | | 8,392,714 | |
| Monroe Capital CLO 2014-1 Ltd. | | | | | | | | |
| 2017-1A, 3.09% (3 Month USD LIBOR + 1.35%) due 10/22/263,4 | | | 8,100,000 | | | | 8,100,808 | |
| ABPCI Direct Lending Fund CLO I LLC | | | | | | | | |
| 2016-1A, 4.44% (3 Month USD LIBOR + 2.70%) due 12/22/283,4 | | | 8,000,000 | | | | 8,029,344 | |
| NXT Capital CLO LLC | | | | | | | | |
| 2017-1A, 3.44% (3 Month USD LIBOR + 1.70%) due 04/20/293,4 | | | 7,700,000 | | | | 7,716,453 | |
| ABPCI Direct Lending Fund CLO II LLC | | | | | | | | |
| 2017-1A, 3.25% (3 Month USD LIBOR + 1.78%) due 07/20/293,4 | | | 7,500,000 | | | | 7,527,358 | |
| Seneca Park CLO Limited | | | | | | | | |
| 2017-1A, 3.23% (3 Month USD LIBOR + 1.50%) due 07/17/263,4 | | | 4,000,000 | | | | 4,003,101 | |
| 2017-1A, 2.85% (3 Month USD LIBOR + 1.12%) due 07/17/263,4 | | | 3,500,000 | | | | 3,507,095 | |
| TICP CLO II Ltd. | | | | | | | | |
| 2017-2A, 3.29% (3 Month USD LIBOR + 1.55%) due 07/20/263,4 | | | 4,000,000 | | | | 4,000,462 | |
| 2017-2A, 2.90% (3 Month USD LIBOR + 1.16%) due 07/20/263,4 | | | 3,500,000 | | | | 3,500,367 | |
| Crown Point CLO III Ltd. | | | | | | | | |
| 2017-3A, 2.63% (3 Month USD LIBOR + 0.91%) due 12/31/273,4 | | | 7,270,000 | | | | 7,267,895 | |
| Woodmont Trust | | | | | | | | |
| 2017-3A, 3.46% (3 Month USD LIBOR + 1.73%) due 10/18/293,4 | | | 4,700,000 | | | | 4,715,677 | |
| 2017-2A, 3.53% (3 Month USD LIBOR + 1.80%) due 07/18/283,4 | | | 2,500,000 | | | | 2,509,912 | |
| Flagship CLO VIII Ltd. | | | | | | | | |
| 2017-8A, 3.42% (3 Month USD LIBOR + 1.70%) due 01/16/263,4 | | | 6,900,000 | | | | 6,904,978 | |
| Cerberus Loan Funding XVII Ltd. | | | | | | | | |
| 2016-3A, 4.25% (3 Month USD LIBOR + 2.53%) due 01/15/283,4 | | | 6,500,000 | | | | 6,526,375 | |
| ACIS CLO Ltd. | | | | | | | | |
| 2014-4A, 3.19% (3 Month USD LIBOR + 1.42%) due 05/01/263,4 | | | 4,000,000 | | | | 4,000,323 | |
| 2013-1A, 2.60% (3 Month USD LIBOR + 0.87%) due 04/18/243,4 | | | 2,492,114 | | | | 2,492,160 | |
| A Voce CLO Ltd. | | | | | | | | |
| 2017-1A, 2.88% (3 Month USD LIBOR + 1.16%) due 07/15/263,4 | | | 6,400,000 | | | | 6,399,689 | |
| Avery Point V CLO Ltd. | | | | | | | | |
| 2017-5A, 2.71% (3 Month USD LIBOR + 0.98%) due 07/17/263,4 | | | 6,300,000 | | | | 6,299,907 | |
| Venture XIX CLO Ltd. | | | | | | | | |
| 2016-19A, 3.72% (3 Month USD LIBOR + 2.00%) due 01/15/273,4 | | | 6,100,000 | | | | 6,108,004 | |
| OCP CLO 2015-8 Ltd. | | | | | | | | |
| 2017-8A, 2.58% (3 Month USD LIBOR + 0.85%) due 04/17/273,4 | | | 6,000,000 | | | | 6,000,849 | |
| Northwoods Capital Ltd. | | | | | | | | |
| 2017-14A, 3.11% (3 Month USD LIBOR + 1.30%) due 11/12/253,4 | | | 5,700,000 | | | | 5,703,917 | |
| Cent CLO LP | | | | | | | | |
| 2017-21A, 2.97% (3 Month USD LIBOR + 1.21%) due 07/27/263,4 | | | 5,500,000 | | | | 5,510,953 | |
| AMMC CLO 15 Ltd. | | | | | | | | |
| 2016-15A, 3.41% (3 Month USD LIBOR + 1.35%) due 12/09/263,4 | | | 5,400,000 | | | | 5,420,463 | |
| KKR CLO 21 Ltd. | | | | | | | | |
| 2018-21, 3.15% (3 Month USD LIBOR + 1.00%) due 04/15/313,4 | | | 5,400,000 | | | | 5,411,175 | |
| Cent CLO 20 Ltd. | | | | | | | | |
| 2017-20A, 3.38% (3 Month USD LIBOR + 1.63%) due 01/25/263,4 | | | 3,250,000 | | | | 3,254,042 | |
| 2017-20A, 2.85% (3 Month USD LIBOR + 1.10%) due 01/25/263,4 | | | 2,100,000 | | | | 2,105,468 | |
| Galaxy XVIII CLO Ltd. | | | | | | | | |
| 2017-18A, 2.89% (3 Month USD LIBOR + 1.17%) due 10/15/263,4 | | | 5,300,000 | | | | 5,299,724 | |
| OZLM IX Ltd. | | | | | | | | |
| 2017-9A, 3.39% (3 Month USD LIBOR + 1.65%) due 01/20/273,4 | | | 5,100,000 | | | | 5,104,515 | |
| Cerberus Loan Funding XXIII, LP | | | | | | | | |
| 2018-2A, 3.31% (3 Month USD LIBOR + 1.00%) due 04/15/283,4 | | | 5,100,000 | | | | 5,100,000 | |
| Atlas Senior Loan Fund IV Ltd. | | | | | | | | |
| 2017-2A, 3.29% (3 Month USD LIBOR + 1.45%) due 02/17/263,4 | | | 5,000,000 | | | | 5,008,518 | |
| SEE NOTES TO FINANCIAL STATEMENTS. | THE GUGGENHEIM FUNDS SEMI-ANNUAL REPORT | 61 |
| SCHEDULE OF INVESTMENTS (Unaudited)(continued) | March 29, 2018 |
| LIMITED DURATION FUND | |
| | | Face
Amount~ | | | Value | |
| | | | | | | |
| Flagship CLO | | | | | | |
| 2017-8A, 2.97% (3 Month USD LIBOR + 1.25%) due 01/16/263,4 | | | 5,000,000 | | | $ | 5,004,316 | |
| Regatta V Funding Ltd. | | | | | | | | |
| 2017-1A, 2.91% (3 Month USD LIBOR + 1.16%) due 10/25/263,4 | | | 4,900,000 | | | | 4,904,163 | |
| Golub Capital Partners CLO 16 Ltd. | | | | | | | | |
| 2017-16A, 3.45% (3 Month USD LIBOR + 1.70%) due 07/25/293,4 | | | 4,700,000 | | | | 4,711,660 | |
| Symphony CLO XIV Ltd. | | | | | | | | |
| 2017-14A, 3.57% (3 Month USD LIBOR + 1.85%) due 07/14/263,4 | | | 4,700,000 | | | | 4,701,974 | |
| TICP CLO I Ltd. | | | | | | | | |
| 2017-1A, 3.35% (3 Month USD LIBOR + 1.60%) due 04/26/263,4 | | | 4,250,000 | | | | 4,255,492 | |
| Shackleton CLO Ltd. | | | | | | | | |
| 2016-7A, 3.67% (3 Month USD LIBOR + 1.95%) due 04/15/273,4 | | | 4,250,000 | | | | 4,253,077 | |
| NewStar Commercial Loan Funding LLC | | | | | | | | |
| 2017-1A, 4.13% (3 Month USD LIBOR + 2.50%) due 03/20/273,4 | | | 3,000,000 | | | | 3,027,067 | |
| 2016-1A, 5.69% (3 Month USD LIBOR + 3.75%) due 02/25/283,4 | | | 1,000,000 | | | | 1,004,088 | |
| TCP Waterman CLO Ltd. | | | | | | | | |
| 2016-1A, 4.17% (3 Month USD LIBOR + 2.05%) due 12/15/283,4 | | | 4,000,000 | | | | 4,025,377 | |
| Cerberus Loan Funding XVI, LP | | | | | | | | |
| 2016-2A, 3.77% (3 Month USD LIBOR + 2.05%) due 11/15/273,4 | | | 4,000,000 | | | | 4,021,084 | |
| WhiteHorse VI Ltd. | | | | | | | | |
| 2016-1A, 3.68% (3 Month USD LIBOR + 1.90%) due 02/03/253,4 | | | 4,000,000 | | | | 4,008,223 | |
| FS Senior Funding Ltd. | | | | | | | | |
| 2015-1A, 4.37% (3 Month USD LIBOR + 2.65%) due 05/28/253,4 | | | 2,000,000 | | | | 2,002,255 | |
| 2015-1A, 3.52% (3 Month USD LIBOR + 1.80%) due 05/28/253,4 | | | 2,000,000 | | | | 2,001,706 | |
| FDF II Ltd. | | | | | | | | |
| 2016-2A, 4.29% due 05/12/314 | | | 4,000,000 | | | | 3,997,358 | |
| Sound Point CLO IV Ltd. | | | | | | | | |
| 2017-3A, 2.84% (3 Month USD LIBOR + 1.10%) due 01/21/263,4 | | | 3,870,732 | | | | 3,871,946 | |
| Cent CLO Ltd. | | | | | | | | |
| 2013-19A, 3.09% (3 Month USD LIBOR + 1.33%) due 10/29/253,4 | | | 3,781,282 | | | | 3,784,011 | |
| Fortress Credit Opportunities VI CLO Ltd. | | | | | | | | |
| 2015-6A, 3.97% (3 Month USD LIBOR + 1.90%) due 10/10/263,4 | | | 2,750,000 | | | | 2,756,926 | |
| 2015-6A, 4.77% (3 Month USD LIBOR + 2.70%) due 10/10/263,4 | | | 1,000,000 | | | | 1,001,951 | |
| OZLM VIII Ltd. | | | | | | | | |
| 2017-8A, 2.86% (3 Month USD LIBOR + 1.13%) due 10/17/263,4 | | | 3,750,000 | | | | 3,756,608 | |
| Flagship VII Ltd. | | | | | | | | |
| 2017-7A, 2.86% (3 Month USD LIBOR + 1.12%) due 01/20/263,4 | | | 3,300,000 | | | | 3,300,261 | |
| GoldenTree Loan Opportunities VII Ltd. | | | | | | | | |
| 2013-7A, 2.90% (3 Month USD LIBOR + 1.15%) due 04/25/253,4 | | | 3,064,023 | | | | 3,064,945 | |
| Northwoods Capital XIV Ltd. | | | | | | | | |
| 2017-14A, 3.51% (3 Month USD LIBOR + 1.70%) due 11/12/253,4 | | | 3,000,000 | | | | 3,005,434 | |
| Marathon CLO VII Ltd. | | | | | | | | |
| 2017-7A, 3.41% (3 Month USD LIBOR + 1.65%) due 10/28/253,4 | | | 3,000,000 | | | | 3,004,333 | |
| Fifth Street SLF II Ltd. | | | | | | | | |
| 2015-2A, 3.68% (3 Month USD LIBOR + 1.92%) due 09/29/273,4 | | | 3,000,000 | | | | 3,002,412 | |
| Regatta IV Funding Ltd. | | | | | | | | |
| 2017-1A, 2.77% (3 Month USD LIBOR + 1.02%) due 07/25/263,4 | | | 3,000,000 | | | | 3,002,300 | |
| FDF I Ltd. | | | | | | | | |
| 2015-1A, 4.40% due 11/12/304 | | | 3,000,000 | | | | 2,965,134 | |
| Venture XVII CLO Ltd. | | | | | | | | |
| 2017-17A, 2.80% (3 Month USD LIBOR + 1.08%) due 07/15/263,4 | | | 2,800,000 | | | | 2,800,949 | |
| Bsprt Issuer Ltd. | | | | | | | | |
| 2017-FL1, 3.13% (1 Month USD LIBOR + 1.35%) due 06/15/273,4 | | | 2,700,000 | | | | 2,708,823 | |
| AMMC CLO XV Ltd. | | | | | | | | |
| 2016-15A, 3.96% (3 Month USD LIBOR + 1.90%) due 12/09/263,4 | | | 2,400,000 | | | | 2,408,968 | |
| Nelder Grove CLO Ltd. | | | | | | | | |
| 2017-1A, 3.78% (3 Month USD LIBOR + 1.80%) due 08/28/263,4 | | | 2,400,000 | | | | 2,406,301 | |
| KKR CLO 15 Ltd. | | | | | | | | |
| 2016-15, 3.29% (3 Month USD LIBOR + 1.56%) due 10/18/283,4 | | | 2,300,000 | | | | 2,309,784 | |
| Garrison Funding Ltd. | | | | | | | | |
| 2016-2A, 4.08% (3 Month USD LIBOR + 2.20%) due 09/29/273,4 | | | 2,000,000 | | | | 2,016,701 | |
| OCP CLO Ltd. | | | | | | | | |
| 2016-2A, 3.90% (3 Month USD LIBOR + 2.00%) due 11/22/253,4 | | | 2,000,000 | | | | 2,008,942 | |
| Denali Capital CLO X LLC | | | | | | | | |
| 2017-1A, 2.80% (3 Month USD LIBOR + 1.05%) due 10/26/273,4 | | | 2,000,000 | | | | 2,004,447 | |
| OHA Loan Funding Ltd. | | | | | | | | |
| 2017-1A, 3.19% (3 Month USD LIBOR + 1.45%) due 07/23/253,4 | | | 2,000,000 | | | | 2,002,207 | |
| Madison Park Funding XVI Ltd. | | | | | | | | |
| 2016-16A, 3.64% (3 Month USD LIBOR + 1.90%) due 04/20/263,4 | | | 2,000,000 | | | | 2,001,904 | |
| Recette CLO Ltd. | | | | | | | | |
| 2017-1A, 3.04% (3 Month USD LIBOR + 1.30%) due 10/20/273,4 | | | 2,000,000 | | | | 2,000,687 | |
| OZLM Funding II Ltd. | | | | | | | | |
| 2016-2A, 4.52% (3 Month USD LIBOR + 2.75%) due 10/30/273,4 | | | 2,000,000 | | | | 2,000,509 | |
| Regatta III Funding Ltd. | | | | | | | | |
| 2017-1A, 2.77% (3 Month USD LIBOR + 1.05%) due 04/15/263,4 | | | 2,000,000 | | | | 1,999,616 | |
| 62 | THE GUGGENHEIM FUNDS SEMI-ANNUAL REPORT | SEE NOTES TO FINANCIAL STATEMENTS. |
| SCHEDULE OF INVESTMENTS (Unaudited)(continued) | March 29, 2018 |
| LIMITED DURATION FUND | |
| | | Face
Amount~ | | | Value | |
| | | | | | | |
| Oaktree CLO 2015-1 Ltd. | | | | | | |
| 2017-1A, 2.61% (3 Month USD LIBOR + 0.87%) due 10/20/273,4 | | | 2,000,000 | | | $ | 1,997,583 | |
| Madison Park Funding XIV Ltd. | | | | | | | | |
| 2017-14A, 3.29% (3 Month USD LIBOR + 1.55%) due 07/20/263,4 | | | 1,600,000 | | | | 1,601,482 | |
| LCM XXII Ltd. | | | | | | | | |
| 2016-22A, 3.02% (3 Month USD LIBOR + 1.28%) due 10/20/283,4 | | | 1,533,333 | | | | 1,534,488 | |
| Betony CLO Ltd. | | | | | | | | |
| 2016-1A, 3.67% (3 Month USD LIBOR + 1.95%) due 04/15/273,4 | | | 1,500,000 | | | | 1,501,061 | |
| Dryden 37 Senior Loan Fund | | | | | | | | |
| 2015-37A, due 01/15/314,5 | | | 1,500,000 | | | | 1,366,664 | |
| Symphony CLO XII Ltd. | | | | | | | | |
| 2017-12A, 3.22% (3 Month USD LIBOR + 1.50%) due 10/15/253,4 | | | 1,250,000 | | | | 1,250,987 | |
| Cent CLO | | | | | | | | |
| 2014-16A, 4.97% (3 Month USD LIBOR + 3.20%) due 08/01/243,4 | | | 500,000 | | | | 501,557 | |
| 2014-16A, 4.02% (3 Month USD LIBOR + 2.25%) due 08/01/243,4 | | | 500,000 | | | | 500,473 | |
| Venture VII CDO Ltd. | | | | | | | | |
| 2006-7A, 1.97% (3 Month USD LIBOR + 0.23%) due 01/20/223,4 | | | 904,220 | | | | 904,214 | |
| OHA Credit Partners IX Ltd. | | | | | | | | |
| 2013-9A, due 10/20/254,5 | | | 1,000,000 | | | | 875,111 | |
| Treman Park CLO Ltd. | | | | | | | | |
| 2015-1A, due 04/20/274,5 | | | 1,000,000 | | | | 858,758 | |
| Cereberus ICQ Levered LLC | | | | | | | | |
| 2015-1A, 3.77% (3 Month USD LIBOR + 2.05%) due 11/06/253,4 | | | 668,690 | | | | 668,777 | |
| LMREC, Inc. | | | | | | | | |
| 2016-CRE2, 3.55% (1 Month USD LIBOR + 1.70%) due 11/24/313,4 | | | 534,000 | | | | 534,000 | |
| Halcyon Loan Advisors Funding Ltd. | | | | | | | | |
| 2012-1A, 4.84% (3 Month USD LIBOR + 3.00%) due 08/15/233,4 | | | 500,000 | | | | 501,989 | |
| NewStar Arlington Senior Loan Program LLC | | | | | | | | |
| 2014-1A, 5.05% (3 Month USD LIBOR + 3.30%) due 07/25/253,4 | | | 250,000 | | | | 250,331 | |
| 2014-1A, 6.00% (3 Month USD LIBOR + 4.25%) due 07/25/253,4 | | | 250,000 | | | | 250,239 | |
| Rockwall CDO II Ltd. | | | | | | | | |
| 2007-1A, 2.32% (3 Month USD LIBOR + 0.55%) due 08/01/243,4 | | | 168,562 | | | | 168,572 | |
| Copper River CLO Ltd. | | | | | | | | |
| 2007-1A, due 01/20/215,13 | | | 500,000 | | | | 63,650 | |
| Babson CLO Ltd. | | | | | | | | |
| 2012-2A, due 05/15/234,5 | | | 750,000 | | | | 32,542 | |
| Keuka Park CLO Ltd. | | | | | | | | |
| 2013-1A, due 10/21/244,5 | | | 500,000 | | | | 16,871 | |
| Total Collateralized Loan Obligations | | | | | | | 793,958,255 | |
| | | | | | | | | |
| Transport-Aircraft - 2.5% |
| Apollo Aviation Securitization Equity Trust | | | | | | | | |
| 2016-2, 4.21% due 11/15/41 | | | 12,544,280 | | | | 12,668,307 | |
| 2016-1A, 4.88% due 03/17/364 | | | 4,112,052 | | | | 4,211,427 | |
| SAPPHIRE AVIATION FINANCE I Ltd. | | | | | | | | |
| 2018-1A, 4.25% due 03/15/404 | | | 13,400,000 | | | | 13,443,041 | |
| KDAC Aviation Finance Ltd. | | | | | | | | |
| 2017-1A, 4.21% due 12/15/424 | | | 12,237,500 | | | | 12,214,692 | |
| Castlelake Aircraft Securitization Trust | | | | | | | | |
| 2017-1, 3.97% due 07/15/42 | | | 5,438,748 | | | | 5,378,411 | |
| 2015-1A, 4.70% due 12/15/404 | | | 3,800,164 | | | | 3,805,124 | |
| AASET Trust | | | | | | | | |
| 2017-1A, 3.97% due 05/16/424 | | | 7,454,400 | | | | 7,430,773 | |
| Raspro Trust | | | | | | | | |
| 2005-1A, 2.37% (3 Month USD LIBOR + 0.63%) due 03/23/243,4 | | | 4,697,699 | | | | 4,486,303 | |
| Falcon Aerospace Ltd. | | | | | | | | |
| 2017-1, 4.58% due 02/15/424 | | | 3,479,250 | | | | 3,493,696 | |
| AIM Aviation Finance Ltd. | | | | | | | | |
| 2015-1A, 4.21% due 02/15/404 | | | 1,448,785 | | | | 1,447,721 | |
| Emerald Aviation Finance Ltd. | | | | | | | | |
| 2013-1, 4.65% due 10/15/384 | | | 1,154,242 | | | | 1,166,668 | |
| ECAF I Ltd. | | | | | | | | |
| 2015-1A, 3.47% due 06/15/404 | | | 1,145,771 | | | | 1,135,732 | |
| Diamond Head Aviation Ltd. | | | | | | | | |
| 2015-1, 3.81% due 07/14/284 | | | 1,075,875 | | | | 1,069,004 | |
| Atlas Ltd. | | | | | | | | |
| 2014-1 A, 4.87% due 12/15/39 | | | 790,039 | | | | 790,039 | |
| AABS Ltd. | | | | | | | | |
| 2013-1 A, 4.87% due 01/10/38 | | | 462,045 | | | | 462,045 | |
| Rise Ltd. | | | | | | | | |
| 2014-1A, 4.74% due 02/12/39 | | | 294,454 | | | | 294,896 | |
| Total Transport-Aircraft | | | | | | | 73,497,879 | |
| | | | | | | | | |
| Transport-Container - 1.4% |
| Textainer Marine Containers Ltd. | | | | | | | | |
| 2017-2A, 3.52% due 06/20/424 | | | 13,275,432 | | | | 13,164,553 | |
| Global SC Finance II SRL | | | | | | | | |
| 2013-1A, 2.98% due 04/17/284 | | | 8,018,958 | | | | 7,899,681 | |
| 2013-2A, 3.67% due 11/17/284 | | | 1,646,100 | | | | 1,643,439 | |
| CAL Funding III Ltd. | | | | | | | | |
| 2018-1A, 3.96% due 02/25/434 | | | 6,644,167 | | | | 6,700,967 | |
| Textainer Marine Containers V Ltd. | | | | | | | | |
| 2017-1A, 3.72% due 05/20/424 | | | 5,412,070 | | | | 5,407,777 | |
| CLI Funding V LLC | | | | | | | | |
| 2013-1A, 2.83% due 03/18/284 | | | 2,680,333 | | | | 2,633,677 | |
| Cronos Containers Program Ltd. | | | | | | | | |
| 2013-1A, 3.08% due 04/18/284 | | | 2,246,833 | | | | 2,216,128 | |
| Total Transport-Container | | | | | | | 39,666,222 | |
| | | | | | | | | |
| Whole Business - 1.3% |
| Domino’s Pizza Master Issuer LLC | | | | | | | | |
| 2017-1A, 3.08% due 07/25/474 | | | 6,915,250 | | | | 6,769,546 | |
| 2017-1A, 3.00% (3 Month USD LIBOR + 1.25%) due 07/25/473,4 | | | 5,223,750 | | | | 5,267,002 | |
| 2015-1A, 3.48% due 10/25/454 | | | 1,965,000 | | | | 1,961,581 | |
| Taco Bell Funding LLC | | | | | | | | |
| 2016-1A, 4.38% due 05/25/464 | | | 3,653,750 | | | | 3,744,509 | |
| 2016-1A, 4.97% due 05/25/464 | | | 3,456,250 | | | | 3,601,551 | |
| SEE NOTES TO FINANCIAL STATEMENTS. | THE GUGGENHEIM FUNDS SEMI-ANNUAL REPORT | 63 |
| SCHEDULE OF INVESTMENTS (Unaudited)(continued) | March 29, 2018 |
| LIMITED DURATION FUND | |
| | | Face
Amount~ | | | Value | |
| | | | | | | |
| Jimmy Johns Funding LLC | | | | | | |
| 2017-1A, 3.61% due 07/30/474 | | | 6,169,000 | | | $ | 6,162,091 | |
| DB Master Finance LLC | | | | | | | | |
| 2015-1A, 3.98% due 02/20/454 | | | 3,792,700 | | | | 3,825,469 | |
| Sonic Capital LLC | | | | | | | | |
| 2016-1A, 4.47% due 05/20/464 | | | 3,310,882 | | | | 3,374,385 | |
| Miramax LLC | | | | | | | | |
| 2014-1A, 3.34% due 07/20/264 | | | 2,473,968 | | | | 2,464,824 | |
| Drug Royalty III Limited Partnership | | | | | | | | |
| 2016-1A, 3.98% due 04/15/274 | | | 1,189,169 | | | | 1,181,734 | |
| Wendy’s Funding LLC | | | | | | | | |
| 2015-1A, 4.08% due 06/15/454 | | | 760,500 | | | | 771,284 | |
| Drug Royalty II Limited Partnership 2 | | | | | | | | |
| 2014-1, 3.48% due 07/15/234 | | | 493,258 | | | | 490,244 | |
| Total Whole Business | | | | | | | 39,614,220 | |
| | | | | | | | | |
| Net Lease - 1.0% |
| Capital Automotive LLC | | | | | | | | |
| 2017-1A, 3.87% due 04/15/474 | | | 13,277,167 | | | | 13,226,350 | |
| Store Master Funding I LLC | | | | | | | | |
| 2015-1A, 4.17% due 04/20/454 | | | 10,543,958 | | | | 10,581,948 | |
| 2015-1A, 3.75% due 04/20/454 | | | 1,773,750 | | | | 1,752,451 | |
| Store Master Funding LLC | | | | | | | | |
| 2013-1A, 4.16% due 03/20/434 | | | 2,287,460 | | | | 2,277,629 | |
| Capital Automotive REIT | | | | | | | | |
| 2014-1A, 3.66% due 10/15/444 | | | 1,000,000 | | | | 988,652 | |
| Total Net Lease | | | | | | | 28,827,030 | |
| | | | | | | | | |
| Automotive - 0.7% |
| Hertz Vehicle Financing II, LP | | | | | | | | |
| 2015-1A, 2.73% due 03/25/214 | | | 9,700,000 | | | | 9,624,763 | |
| 2017-1A, 2.96% due 10/25/214 | | | 3,300,000 | | | | 3,271,857 | |
| Hertz Vehicle Financing LLC | | | | | | | | |
| 2016-4A, 2.65% due 07/25/224 | | | 4,500,000 | | | | 4,395,614 | |
| 2016-2A, 2.95% due 03/25/224 | | | 2,000,000 | | | | 1,979,634 | |
| Total Automotive | | | | | | | 19,271,868 | |
| | | | | | | | | |
| Collateralized Debt Obligations - 0.7% |
| Anchorage Credit Funding Ltd. | | | | | | | | |
| 2016-4A, 3.50% due 02/15/354 | | | 11,650,000 | | | | 11,608,708 | |
| 2016-3A, 3.85% due 10/28/334 | | | 1,500,000 | | | | 1,506,710 | |
| RB Commercial Trust | | | | | | | | |
| 2012-RS1, 5.35% due 01/26/224 | | | 3,330,300 | | | | 3,329,967 | |
| Putnam Structured Product Funding Ltd. | | | | | | | | |
| 2003-1A, 2.78% (1 Month USD LIBOR + 1.00%) due 10/15/383,4 | | | 1,658,372 | | | | 1,605,021 | |
| H2 Asset Funding Ltd. | | | | | | | | |
| 3.45% due 03/19/37 | | | 1,000,000 | | | | 1,006,944 | |
| Total Collateralized Debt Obligations | | | | | | | 19,057,350 | |
| | | | | | | | | |
| Single Family Residence - 0.2% |
| Colony American Finance 2016-1 Ltd. | | | | | | | | |
| 2016-1, 2.54% due 06/15/484 | | | 5,380,409 | | | | 5,288,572 | |
| CoreVest American Finance 2017-1 Trust | | | | | | | | |
| 2017-1, 2.97% due 10/15/494 | | | 1,977,816 | | | | 1,940,894 | |
| Total Single Family Residence | | | | | | | 7,229,466 | |
| | | | | | | | | |
| Transport-Rail - 0.1% |
| TRIP Rail Master Funding LLC | | | | | | | | |
| 2017-1A, 2.71% due 08/15/474 | | | 1,788,215 | | | | 1,766,826 | |
| | | | | | | | | |
| Infrastructure - 0.0% |
| Vantage Data Centers Issuer LLC | | | | | | | | |
| 2018-1A, 4.07% due 02/16/434 | | | 999,167 | | | | 1,008,330 | |
| | | | | | | | | |
| Insurance - 0.0% |
| Chesterfield Financial Holdings LLC | | | | | | | | |
| 2014-1A, 4.50% due 12/15/344 | | | 495,000 | | | | 489,119 | |
| Total Asset-Backed Securities | | | | | | | | |
| (Cost $1,024,726,728) | | | | | | | 1,024,386,565 | |
| | | | | | | | | |
| COLLATERALIZED MORTGAGE OBLIGATIONS†† - 20.7% |
| Residential Mortgage Backed Securities - 12.8% |
| CIM Trust | | | | | | | | |
| 2018-R2, 3.69% due 08/25/57 | | | 44,000,000 | | | | 44,113,402 | |
| 2017-2, 3.66% (1 Month USD LIBOR + 2.00%) due 12/25/573,4 | | | 4,170,087 | | | | 4,215,434 | |
| Soundview Home Loan Trust | | | | | | | | |
| 2006-OPT5, 2.01% (1 Month USD LIBOR + 0.14%) due 07/25/363 | | | 26,847,765 | | | | 26,169,486 | |
| 2005-OPT3, 2.34% (1 Month USD LIBOR + 0.47%) due 11/25/353 | | | 4,000,000 | | | | 3,956,558 | |
| 2003-1, 5.25% (1 Month USD LIBOR + 3.38%) due 08/25/313 | | | 95,883 | | | | 95,554 | |
| Towd Point Mortgage Trust | | | | | | | | |
| 2017-5, 2.47% (1 Month USD LIBOR + 0.60%) due 02/25/573,4 | | | 10,239,267 | | | | 10,276,058 | |
| 2018-1, 3.00% due 01/25/583,4 | | | 6,975,699 | | | | 6,937,574 | |
| 2017-6, 2.75% (WAC) due 10/25/573,4 | | | 5,710,632 | | | | 5,627,320 | |
| 2017-1, 2.75% (WAC) due 10/25/563,4 | | | 5,395,279 | | | | 5,334,674 | |
| 2016-1, 2.75% (WAC) due 02/25/553,4 | | | 1,565,292 | | | | 1,552,949 | |
| Home Equity Loan Trust | | | | | | | | |
| 2007-FRE1, 2.06% (1 Month USD LIBOR + 0.19%) due 04/25/373 | | | 27,459,047 | | | | 26,098,229 | |
| Structured Asset Securities Corporation Mortgage Loan Trust | | | | | | | | |
| 2008-BC4, 2.50% (1 Month USD LIBOR + 0.63%) due 11/25/373 | | | 14,267,776 | | | | 14,184,193 | |
| 2006-BC4, 2.04% (1 Month USD LIBOR + 0.17%) due 12/25/363 | | | 2,255,276 | | | | 2,179,526 | |
| 2006-BC3, 2.03% (1 Month USD LIBOR + 0.16%) due 10/25/363 | | | 2,183,344 | | | | 1,945,946 | |
| 2007-BC1, 2.00% (1 Month USD LIBOR + 0.13%) due 02/25/373 | | | 435,864 | | | | 429,917 | |
| NovaStar Mortgage Funding Trust Series | | | | | | | | |
| 2007-2, 2.07% (1 Month USD LIBOR + 0.20%) due 09/25/373 | | | 17,625,325 | | | | 17,117,929 | |
| CIT Mortgage Loan Trust | | | | | | | | |
| 2007-1, 3.22% (1 Month USD LIBOR + 1.35%) due 10/25/373,4 | | | 15,512,073 | | | | 15,588,410 | |
| 2007-1, 3.32% (1 Month USD LIBOR + 1.45%) due 10/25/373,4 | | | 1,098,398 | | | | 1,103,778 | |
| 64 | THE GUGGENHEIM FUNDS SEMI-ANNUAL REPORT | SEE NOTES TO FINANCIAL STATEMENTS. |
| SCHEDULE OF INVESTMENTS (Unaudited)(continued) | March 29, 2018 |
| LIMITED DURATION FUND | |
| | | Face
Amount~ | | | Value | |
| | | | | | | |
| IndyMac INDX Mortgage Loan Trust | | | | | | |
| 2006-AR6, 2.20% (1 Year CMT Rate + 0.92%) due 06/25/463 | | | 15,462,076 | | | $ | 14,345,201 | |
| Bear Stearns Asset Backed Securities I Trust | | | | | | | | |
| 2006-HE9, 2.01% (1 Month USD LIBOR + 0.14%) due 11/25/363 | | | 10,174,148 | | | | 9,848,568 | |
| 2006-HE3, 2.23% (1 Month USD LIBOR + 0.36%) due 04/25/363 | | | 4,000,000 | | | | 3,967,161 | |
| JP Morgan Mortgage Acquisition Trust | | | | | | | | |
| 2006-HE2, 2.01% (1 Month USD LIBOR + 0.14%) due 07/25/363 | | | 9,455,035 | | | | 9,349,806 | |
| FirstKey Master Funding | | | | | | | | |
| 2017-R1, 1.89% (1 Month USD LIBOR + 0.22%) due 11/03/41†††,3,4 | | | 9,416,683 | | | | 9,303,100 | |
| Fannie Mae Connecticut Avenue Securities | | | | | | | | |
| 2016-C01, 3.82% (1 Month USD LIBOR + 1.95%) due 08/25/283 | | | 4,979,403 | | | | 5,007,345 | |
| 2016-C02, 4.02% (1 Month USD LIBOR + 2.15%) due 09/25/283 | | | 3,980,770 | | | | 4,010,597 | |
| Freddie Mac Structured Agency Credit Risk Debt Notes | | | | | | | | |
| 2015-DNA1, 3.72% (1 Month USD LIBOR + 1.85%) due 10/25/273 | | | 5,000,000 | | | | 5,103,703 | |
| 2014-DN1, 4.07% (1 Month USD LIBOR + 2.20%) due 02/25/243 | | | 2,569,988 | | | | 2,645,925 | |
| 2015-DNA1, 2.77% (1 Month USD LIBOR + 0.90%) due 10/25/273 | | | 362,411 | | | | 362,637 | |
| Countrywide Asset-Backed Certificates | | | | | | | | |
| 2006-6, 2.04% (1 Month USD LIBOR + 0.17%) due 09/25/363 | | | 5,494,782 | | | | 5,377,558 | |
| 2006-5, 2.16% (1 Month USD LIBOR + 0.29%) due 08/25/363 | | | 2,396,180 | | | | 2,351,567 | |
| First NLC Trust | | | | | | | | |
| 2005-4, 2.26% (1 Month USD LIBOR + 0.39%) due 02/25/363 | | | 7,609,485 | | | | 7,477,113 | |
| Structured Asset Investment Loan Trust | | | | | | | | |
| 2006-3, 2.02% (1 Month USD LIBOR + 0.15%) due 06/25/363 | | | 6,343,501 | | | | 6,145,679 | |
| 2005-2, 2.61% (1 Month USD LIBOR + 0.74%) due 03/25/353 | | | 782,037 | | | | 783,234 | |
| 2005-1, 2.59% (1 Month USD LIBOR + 0.72%) due 02/25/353,4 | | | 367,584 | | | | 368,157 | |
| Bayview Opportunity Master Fund IVa Trust | | | | | | | | |
| 2018-RN3, 3.67% due 03/28/334 | | | 7,200,000 | | | | 7,208,632 | |
| Nationstar Home Equity Loan Trust | | | | | | | | |
| 2007-B, 2.09% (1 Month USD LIBOR + 0.22%) due 04/25/373 | | | 7,231,523 | | | | 7,161,213 | |
| Park Place Securities Incorporated Asset Backed Pass Through Certificates Ser | | | | | | | | |
| 2005-WHQ3, 2.82% (1 Month USD LIBOR + 0.95%) due 06/25/353 | | | 7,025,000 | | | | 7,028,514 | |
| Deephaven Residential Mortgage Trust | | | | | | | | |
| 2017-3A, 2.58% (WAC) due 10/25/473,4 | | | 6,834,556 | | | | 6,781,571 | |
| CSMC Series | | | | | | | | |
| 2015-12R, 2.06% (1 Month USD LIBOR + 0.50%) due 11/30/373,4 | | | 5,682,631 | | | | 5,657,988 | |
| 2014-2R, 1.82% (1 Month USD LIBOR + 0.20%) due 02/27/463,4 | | | 310,263 | | | | 293,016 | |
| New Residential Mortgage Trust | | | | | | | | |
| 2018-1A, 4.00% due 12/25/573,4 | | | 5,628,868 | | | | 5,754,844 | |
| CWABS Incorporated Asset-Backed Certificates Trust | | | | | | | | |
| 2004-4, 2.59% (1 Month USD LIBOR + 0.72%) due 07/25/343 | | | 5,315,705 | | | | 5,342,718 | |
| Credit-Based Asset Servicing & Securitization LLC | | | | | | | | |
| 2006-CB2, 2.06% (1 Month USD LIBOR + 0.19%) due 12/25/363 | | | 4,925,787 | | | | 4,903,731 | |
| GSMSC Resecuritization Trust | | | | | | | | |
| 2015-5R, 1.76% (1 Month USD LIBOR + 0.14%) due 02/26/373,4 | | | 2,609,911 | | | | 2,477,294 | |
| 2015-7R, 1.81% (1 Month USD LIBOR + 0.15%) due 09/26/373,4 | | | 2,447,456 | | | | 2,333,923 | |
| GSAMP TRUST | | | | | | | | |
| 2002-HE2, 2.86% (1 Month USD LIBOR + 1.04%) due 10/20/323,4 | | | 4,351,119 | | | | 4,377,038 | |
| Banc of America Funding Trust | | | | | | | | |
| 2015-R4, 1.79% (1 Month USD LIBOR + 0.17%) due 01/27/353,4 | | | 3,946,965 | | | | 3,748,810 | |
| LSTAR Securities Investment Limited | | | | | | | | |
| 2017-6, 3.41% (1 Month USD LIBOR + 1.75%) due 09/01/223,4 | | | 3,483,117 | | | | 3,485,295 | |
| New Residential Mortgage Loan Trust | | | | | | | | |
| 2017-5A, 3.37% (1 Month USD LIBOR + 1.50%) due 06/25/573,4 | | | 2,941,016 | | | | 3,026,466 | |
| Stanwich Mortgage Loan Co. | | | | | | | | |
| 2016-NPA1, 3.84% (WAC) due 10/16/463,4 | | | 2,811,773 | | | | 2,776,220 | |
| HSI Asset Securitization Corporation Trust | | | | | | | | |
| 2005-OPT1, 2.50% (1 Month USD LIBOR + 0.63%) due 11/25/353 | | | 2,556,297 | | | | 2,549,844 | |
| Popular ABS Mortgage Pass-Through Trust | | | | | | | | |
| 2005-2, 2.05% (1 Month USD LIBOR + 0.18%) due 04/25/353 | | | 2,440,157 | | | | 2,435,970 | |
| Ellington Loan Acquisition Trust | | | | | | | | |
| 2007-2, 2.82% (1 Month USD LIBOR + 0.95%) due 05/25/373,4 | | | 2,308,702 | | | | 2,311,699 | |
| Bayview Opportunity Master Fund IVb Trust | | | | | | | | |
| 2017-RPL1, 3.10% due 07/28/324 | | | 2,057,489 | | | | 2,058,664 | |
| ACE Securities Corporation Home Equity Loan Trust Series | | | | | | | | |
| 2005-HE2, 2.89% (1 Month USD LIBOR + 1.02%) due 04/25/353 | | | 2,000,000 | | | | 2,014,997 | |
| GCAT | | | | | | | | |
| 2017-1, 3.38% due 03/25/474 | | | 2,022,398 | | | | 2,008,911 | |
| Morgan Stanley Capital I Incorporated Trust | | | | | | | | |
| 2006-HE1, 2.16% (1 Month USD LIBOR + 0.29%) due 01/25/363 | | | 1,874,797 | | | | 1,856,598 | |
| Stanwich Mortgage Loan Company LLC | | | | | | | | |
| 2017-NPA1, 3.60% due 03/16/224 | | | 1,755,498 | | | | 1,755,498 | |
| First Franklin Mortgage Loan Trust | | | | | | | | |
| 2004-FF10, 3.15% (1 Month USD LIBOR + 1.28%) due 07/25/343 | | | 1,593,520 | | | | 1,615,830 | |
| SEE NOTES TO FINANCIAL STATEMENTS. | THE GUGGENHEIM FUNDS SEMI-ANNUAL REPORT | 65 |
| SCHEDULE OF INVESTMENTS (Unaudited)(continued) | March 29, 2018 |
| LIMITED DURATION FUND | |
| | | Face
Amount~ | | | Value | |
| | | | | | | |
| Deutsche Alt-A Securities Mortgage Loan Trust Series | | | | | | |
| 2006-AF1, 2.17% (1 Month USD LIBOR + 0.30%) due 04/25/363 | | | 1,687,359 | | | $ | 1,541,056 | |
| GE-WMC Asset-Backed Pass-Through Certificates Series | | | | | | | | |
| 2005-2, 2.12% (1 Month USD LIBOR + 0.25%) due 12/25/353 | | | 1,486,867 | | | | 1,494,897 | |
| Morgan Stanley ABS Capital I Incorporated Trust | | | | | | | | |
| 2006-NC1, 2.25% (1 Month USD LIBOR + 0.38%) due 12/25/353 | | | 1,500,000 | | | | 1,465,328 | |
| Nomura Resecuritization Trust | | | | | | | | |
| 2015-4R, 0.73% (1 Month USD LIBOR + 0.43%) due 03/26/363,4 | | | 1,344,535 | | | | 1,293,719 | |
| VOLT LIV LLC | | | | | | | | |
| 2017-NPL1, 3.50% due 02/25/474 | | | 1,273,230 | | | | 1,270,337 | |
| VOLT XL LLC | | | | | | | | |
| 2015-NP14, 4.38% due 11/27/454 | | | 1,101,149 | | | | 1,101,136 | |
| Encore Credit Receivables Trust | | | | | | | | |
| 2005-4, 2.31% (1 Month USD LIBOR + 0.44%) due 01/25/363 | | | 1,077,390 | | | | 1,073,228 | |
| Bayview Opportunity Master Fund IIIb Trust | | | | | | | | |
| 2017-RN3, 3.23% due 05/28/324 | | | 589,905 | | | | 587,165 | |
| UCFC Manufactured Housing Contract | | | | | | | | |
| 1997-2, 7.38% due 10/15/28 | | | 430,521 | | | | 455,003 | |
| GSAMP Trust | | | | | | | | |
| 2005-HE6, 2.31% (1 Month USD LIBOR + 0.44%) due 11/25/353 | | | 315,359 | | | | 316,282 | |
| First Franklin Mortgage Loan Trust | | | | | | | | |
| 2006-FF4, 2.06% (1 Month USD LIBOR + 0.19%) due 03/25/363 | | | 284,912 | | | | 284,666 | |
| BCAP LLC | | | | | | | | |
| 2014-RR3, 1.74% (WAC) due 10/26/363,4 | | | 231,078 | | | | 228,562 | |
| Accredited Mortgage Loan Trust | | | | | | | | |
| 2007-1, 2.00% (1 Month USD LIBOR + 0.13%) due 02/25/373 | | | 128,256 | | | | 127,672 | |
| Morgan Stanley Re-REMIC Trust | | | | | | | | |
| 2010-R5, 3.51% due 06/26/364 | | | 146,199 | | | | 123,475 | |
| GreenPoint Mortgage Funding Trust | | | | | | | | |
| 2005-HE4, 2.33% (1 Month USD LIBOR + 0.47%) due 07/25/303 | | | 33,354 | | | | 33,327 | |
| Total Residential Mortgage Backed Securities | | | | | | | 375,735,425 | |
| | | | | | | | | |
| Commercial Mortgage Backed Securities - 4.3% |
| Wells Fargo Commercial Mortgage Trust | | | | | | | | |
| 2017-SMP, 2.65% (1 Month USD LIBOR + 0.75%) due 12/15/193,4 | | | 9,000,000 | | | | 9,005,629 | |
| 2016-C37, 1.03% (WAC) due 12/15/493 | | | 38,316,231 | | | | 2,024,867 | |
| 2017-C38, 1.09% (WAC) due 07/15/503 | | | 25,877,976 | | | | 1,907,867 | |
| 2016-C32, 1.34% (WAC) due 01/15/593 | | | 22,936,575 | | | | 1,707,880 | |
| 2015-LC22, 0.89% (WAC) due 09/15/583 | | | 24,302,951 | | | | 1,180,919 | |
| 2017-C42, 0.90% (WAC) due 12/15/503 | | | 14,985,166 | | | | 1,039,355 | |
| 2017-RB1, 1.28% (WAC) due 03/15/503 | | | 9,966,238 | | | | 888,320 | |
| 2016-NXS5, 1.55% (WAC) due 01/15/593 | | | 6,870,761 | | | | 536,663 | |
| BHMS Mortgage Trust | | | | | | | | |
| 2014-ATLS, 4.24% due 07/05/334 | | | 15,000,000 | | | | 15,068,378 | |
| 2014-ATLS, 3.16% (1 Month USD LIBOR + 1.50%) due 07/05/333,4 | | | 1,300,000 | | | | 1,303,253 | |
| Hospitality Mortgage Trust | | | | | | | | |
| 2017-HIT, 2.56% (1 Month USD LIBOR + 0.85%) due 05/08/303,4 | | | 15,500,000 | | | | 15,529,106 | |
| GAHR Commercial Mortgage Trust | | | | | | | | |
| 2015-NRF, 3.38% (WAC) due 12/15/343,4 | | | 6,353,165 | | | | 6,287,295 | |
| 2015-NRF, 3.14% (1 Month USD LIBOR + 1.30%) due 12/15/263,4 | | | 286,710 | | | | 286,797 | |
| Americold LLC Trust | | | | | | | | |
| 2010-ARTA, 7.44% due 01/14/294 | | | 3,500,000 | | | | 3,778,495 | |
| 2010-ARTA, 6.81% due 01/14/294 | | | 2,605,000 | | | | 2,792,248 | |
| GS Mortgage Securities Corporation Trust | | | | | | | | |
| 2017-STAY, 2.63% (1 Month USD LIBOR + 0.85%) due 07/15/323,4 | | | 2,800,000 | | | | 2,803,447 | |
| 2017-STAY, 2.88% (1 Month USD LIBOR + 1.10%) due 07/15/323,4 | | | 2,300,000 | | | | 2,311,609 | |
| JP Morgan Chase Commercial Mortgage Securities Trust | | | | | | | | |
| 2016-WIKI, 4.01% (WAC) due 10/05/313,4 | | | 3,000,000 | | | | 2,918,331 | |
| 2014-CBM, 3.73% (1 Month USD LIBOR + 1.95%) due 10/15/293,4 | | | 1,100,000 | | | | 1,099,997 | |
| 2014-FL5, 3.69% (1 Month USD LIBOR + 2.10%) due 07/15/313,4 | | | 858,639 | | | | 858,227 | |
| JPMDB Commercial Mortgage Securities Trust | | | | | | | | |
| 2017-C5, 1.02% (WAC) due 03/15/503 | | | 57,721,057 | | | | 3,882,445 | |
| 2016-C2, 1.70% (WAC) due 06/15/493 | | | 8,858,237 | | | | 775,741 | |
| Banc of America Commercial Mortgage Trust | | | | | | | | |
| 2017-BNK3, 1.14% (WAC) due 02/15/503 | | | 33,676,869 | | | | 2,485,077 | |
| 2016-UB10, 1.99% (WAC) due 07/15/493 | | | 19,213,956 | | | | 1,978,125 | |
| DBJPM Mortgage Trust | | | | | | | | |
| 2017-C6, 1.04% (WAC) due 06/10/503 | | | 62,940,261 | | | | 4,301,803 | |
| BANK | | | | | | | | |
| 2017-BNK7, 0.82% (WAC) due 09/15/603 | | | 35,085,110 | | | | 1,984,530 | |
| 2017-BNK4, 1.45% (WAC) due 05/15/503 | | | 14,296,169 | | | | 1,331,575 | |
| 2017-BNK6, 0.88% (WAC) due 07/15/603 | | | 15,533,342 | | | | 921,408 | |
| Morgan Stanley Capital I Trust | | | | | | | | |
| 2017-H1, 1.46% (WAC) due 06/15/503 | | | 30,887,280 | | | | 2,818,446 | |
| 2015-XLF1, 3.98% (1 Month USD LIBOR + 2.20%) due 08/13/193,4 | | | 1,135,000 | | | | 1,140,498 | |
| BENCHMARK 2018-B2 Mortgage Trust | | | | | | | | |
| 2018-B2, 0.43% due 02/15/513 | | | 124,252,252 | | | | 3,935,789 | |
| UBS Commercial Mortgage Trust | | | | | | | | |
| 2017-C2, 1.16% (WAC) due 08/15/503 | | | 33,057,188 | | | | 2,572,616 | |
| 2017-C5, 1.03% (WAC) due 11/15/503 | | | 14,069,300 | | | | 975,987 | |
| Morgan Stanley Bank of America Merrill Lynch Trust | | | | | | | | |
| 2015-C27, 1.01% (WAC) due 12/15/473 | | | 36,563,810 | | | | 2,041,460 | |
| 2017-C34, 0.83% (WAC) due 11/15/523 | | | 24,784,203 | | | | 1,476,385 | |
| JPMCC Commercial Mortgage Securities Trust | | | | | | | | |
| 2017-JP5, 1.11% (WAC) due 03/15/503 | | | 48,073,429 | | | | 3,186,312 | |
| Citigroup Commercial Mortgage Trust | | | | | | | | |
| 2017-P7, 1.13% (WAC) due 04/14/503 | | | 23,233,437 | | | | 1,797,427 | |
| 66 | THE GUGGENHEIM FUNDS SEMI-ANNUAL REPORT | SEE NOTES TO FINANCIAL STATEMENTS. |
| SCHEDULE OF INVESTMENTS (Unaudited)(continued) | March 29, 2018 |
| LIMITED DURATION FUND | |
| | | Face
Amount~ | | | Value | |
| | | | | | | |
| 2016-C2, 1.79% (WAC) due 08/10/263 | | | 6,733,639 | | | $ | 760,515 | |
| 2016-GC37, 1.80% (WAC) due 04/10/493 | | | 3,804,183 | | | | 411,955 | |
| VSD | | | | | | | | |
| 2017-PLT1 A, 3.60% due 12/25/43 | | | 2,238,396 | | | | 2,235,163 | |
| Bancorp Commercial Mortgage 2018-CRE3 Trust | | | | | | | | |
| 2018-CR3, 3.03% (1 Month USD LIBOR + 1.25%) due 01/15/333,4 | | | 2,200,000 | | | | 2,203,661 | |
| CD Commercial Mortgage Trust | | | | | | | | |
| 2017-CD4, 1.33% (WAC) due 05/10/503 | | | 17,227,221 | | | | 1,468,276 | |
| CGMS Commercial Mortgage Trust | | | | | | | | |
| 2017-B1, 0.86% (WAC) due 08/15/503 | | | 22,442,666 | | | | 1,335,873 | |
| JPMBB Commercial Mortgage Securities Trust | | | | | | | | |
| 2013-C17, 0.85% (WAC) due 01/15/473 | | | 31,126,812 | | | | 1,106,449 | |
| CSAIL Commercial Mortgage Trust | | | | | | | | |
| 2016-C6, 1.81% (WAC) due 01/15/493 | | | 9,922,250 | | | | 994,875 | |
| CD 2017-CD6 Mortgage Trust | | | | | | | | |
| 2017-CD6, 0.98% (WAC) due 11/13/503 | | | 14,958,610 | | | | 968,205 | |
| GS Mortgage Securities Trust | | | | | | | | |
| 2017-GS6, 1.05% (WAC) due 05/10/503 | | | 11,577,944 | | | | 898,206 | |
| Americold LLC | | | | | | | | |
| 2010-ARTA, 4.95% due 01/14/294 | | | 840,000 | | | | 877,947 | |
| CD Mortgage Trust | | | | | | | | |
| 2016-CD1, 1.43% (WAC) due 08/10/493 | | | 7,018,824 | | | | 615,935 | |
| LSTAR Commercial Mortgage Trust | | | | | | | | |
| 2014-2, 4.21% (WAC) due 01/20/413,4 | | | 500,000 | | | | 497,411 | |
| GE Business Loan Trust | | | | | | | | |
| 2007-1A, 1.95% (1 Month USD LIBOR + 0.17%) due 04/16/353,4 | | | 310,554 | | | | 302,130 | |
| Total Commercial Mortgage Backed Securities | | | | | | | 125,610,908 | |
| | | | | | | | | |
| Government Agency - 3.6% |
| Freddie Mac Seasoned Credit Risk Transfer Trust Series14 | | | | | | | | |
| 2018-1, 2.00% due 05/25/57 | | | 28,900,000 | | | | 27,662,684 | |
| 2017-4, 2.25% due 06/25/57 | | | 19,573,074 | | | | 18,888,016 | |
| 2017-4, 3.50% due 06/25/57 | | | 9,633,072 | | | | 9,607,487 | |
| Freddie Mac Multifamily Structured Pass Through Certificates14 | | | | | | | | |
| 2018-K074, 3.60% due 02/25/28 | | | 14,000,000 | | | | 14,326,280 | |
| 2017-KGX1, 3.00% due 10/25/27 | | | 12,500,000 | | | | 12,288,047 | |
| 2013-K035, 0.41% (WAC) due 08/25/233 | | | 109,113,785 | | | | 1,999,314 | |
| Fannie Mae14 | | | | | | | | |
| 2.99% due 03/01/30 | | | 4,000,000 | | | | 3,870,939 | |
| 3.13% due 01/01/30 | | | 3,050,000 | | | | 2,994,775 | |
| 3.23% due 01/01/30 | | | 2,992,043 | | | | 2,981,613 | |
| 3.12% due 01/01/30 | | | 2,991,451 | | | | 2,952,403 | |
| 3.01% due 12/01/27 | | | 3,000,000 | | | | 2,944,416 | |
| 3.21% due 08/01/27 | | | 2,194,788 | | | | 2,201,691 | |
| 3.17% due 01/01/30 | | | 1,700,000 | | | | 1,674,838 | |
| 3.22% due 01/01/30 | | | 1,300,000 | | | | 1,286,874 | |
| Total Government Agency | | | | | | | 105,679,377 | |
| Total Collateralized Mortgage Obligations | | | | | | | | |
| (Cost $604,416,762) | | | | | | | 607,025,710 | |
| | | | | | | | | |
| FOREIGN GOVERNMENT DEBT†† - 19.1% |
| Republic of France | | | | | | | | |
| due 04/05/1813 | | | EUR | 37,865,000 | | | | 46,592,494 | |
| due 04/25/1813 | | | EUR | 14,310,000 | | | | 17,613,995 | |
| Total Republic of France | | | | | | | 64,206,489 | |
| Republic of Portugal | | | | | | | | |
| due 05/18/1813 | | | EUR | 47,410,000 | | | | 58,367,153 | |
| Denmark Treasury Bill | | | | | | | | |
| due 06/01/1813 | | | DKK | 352,600,000 | | | | 58,260,437 | |
| Government of Japan | | | | | | | | |
| due 06/04/1813 | | | JPY | 6,178,000,000 | | | | 58,077,148 | |
| Republic of Italy | | | | | | | | |
| due 05/31/1813 | | | EUR | 45,240,000 | | | | 55,705,653 | |
| due 04/13/1813 | | | EUR | 1,753,000 | | | | 2,157,316 | |
| Total Republic of Italy | | | | | | | 57,862,969 | |
| Government of United Kingdom | | | | | | | | |
| due 04/09/1813 | | | GBP | 40,500,000 | | | | 56,823,029 | |
| Republic of Hungary | | | | | | | | |
| due 06/13/1813 | | | HUF | 5,000,000,000 | | | | 19,689,595 | |
| 2.50% due 06/22/18 | | | HUF | 3,375,000,000 | | | | 13,364,301 | |
| due 05/23/1813 | | | HUF | 1,926,000,000 | | | | 7,584,811 | |
| 5.50% due 12/20/18 | | | HUF | 1,780,000,000 | | | | 7,285,865 | |
| due 04/11/1813 | | | HUF | 641,210,000 | | | | 2,525,331 | |
| due 04/18/1813 | | | HUF | 320,000,000 | | | | 1,260,239 | |
| due 05/30/1813 | | | HUF | 160,150,000 | | | | 630,683 | |
| Total Republic of Hungary | | | | | | | 52,340,825 | |
| Czech Republic | | | | | | | | |
| due 09/07/1813 | | | CZK | 480,000,000 | | | | 23,205,328 | |
| due 04/13/1813 | | | CZK | 184,000,000 | | | | 8,912,614 | |
| due 04/20/1813 | | | CZK | 112,000,000 | | | | 5,424,782 | |
| 4.60% due 08/18/18 | | | CZK | 80,000,000 | | | | 3,932,628 | |
| due 04/06/1813 | | | CZK | 52,000,000 | | | | 2,518,911 | |
| Total Czech Republic | | | | | | | 43,994,263 | |
| Kingdom of Spain | | | | | | | | |
| due 04/06/1813 | | | EUR | 28,283,000 | | | | 34,803,681 | |
| Kingdom of Hungary | | | | | | | | |
| 4.00% due 04/25/18 | | | HUF | 7,934,370,000 | | | | 31,321,590 | |
| United Mexican States | | | | | | | | |
| due 07/05/1813 | | | MXN | 50,000,000 | | | | 26,966,913 | |
| due 07/19/1813 | | | MXN | 3,080,000 | | | | 1,656,249 | |
| Total United Mexican States | | | | | | | 28,623,162 | |
| Kingdom of Sweden | | | | | | | | |
| due 05/16/1813 | | | SEK | 80,000,000 | | | | 9,592,297 | |
| due 04/18/1813 | | | SEK | 56,110,000 | | | | 6,723,516 | |
| Total Kingdom of Sweden | | | | | | | 16,315,813 | |
| Total Foreign Government Debt | | | | | | | | |
| (Cost $560,042,334) | | | | | | | 560,996,559 | |
| | | | | | | | | |
| CORPORATE BONDS†† - 16.3% |
| Financial - 10.9% |
| Station Place Securitization Trust | | | | | | | | |
| 2.35% (1 Month USD LIBOR + 0.75%) due 08/24/183,4 | | | 21,900,000 | | | | 21,900,000 | |
| 2.50% (1 Month USD LIBOR + 0.90%) due 07/24/183,4 | | | 19,600,000 | | | | 19,600,000 | |
| SEE NOTES TO FINANCIAL STATEMENTS. | THE GUGGENHEIM FUNDS SEMI-ANNUAL REPORT | 67 |
| SCHEDULE OF INVESTMENTS (Unaudited)(continued) | March 29, 2018 |
| LIMITED DURATION FUND | |
| | | Face
Amount~ | | | Value | |
| | | | | | | |
| 2.60% (1 Month USD LIBOR + 1.00%) due 08/24/183,4 | | | 6,550,000 | | | $ | 6,550,000 | |
| 2.85% (1 Month USD LIBOR + 1.25%) due 11/24/183,4 | | | 23,000,000 | | | | 23,000,000 | |
| 2.88% (1 Month USD LIBOR + 1.00%) due 03/24/193,4 | | | 14,000,000 | | | | 14,000,000 | |
| Capital One Financial Corp. | | | | | | | | |
| 2.57% (3 Month USD LIBOR + 0.76%) due 05/12/203 | | | 22,900,000 | | | | 22,967,234 | |
| 2.22% (3 Month USD LIBOR + 0.45%) due 10/30/203 | | | 1,200,000 | | | | 1,195,317 | |
| Sumitomo Mitsui Trust Bank Ltd. | | | | | | | | |
| 2.62% (3 Month USD LIBOR + 0.44%) due 09/19/193,4 | | | 14,350,000 | | | | 14,354,106 | |
| 2.64% (3 Month USD LIBOR + 0.91%) due 10/18/193,4 | | | 7,600,000 | | | | 7,657,309 | |
| Mitsubishi UFJ Financial Group, Inc. | | | | | | | | |
| 2.54% (3 Month USD LIBOR + 0.79%) due 07/25/223 | | | 14,650,000 | | | | 14,726,847 | |
| 3.15% (3 Month USD LIBOR + 1.06%) due 09/13/213 | | | 5,990,000 | | | | 6,078,132 | |
| 3.89% (3 Month USD LIBOR + 1.88%) due 03/01/213 | | | 453,000 | | | | 469,323 | |
| Citizens Bank North America/Providence RI | | | | | | | | |
| 2.75% (3 Month USD LIBOR + 0.81%) due 05/26/223 | | | 12,200,000 | | | | 12,270,977 | |
| 2.51% (3 Month USD LIBOR + 0.57%) due 05/26/203 | | | 8,050,000 | | | | 8,067,669 | |
| Citigroup, Inc. | | | | | | | | |
| 6.25%7,8 | | | 13,057,000 | | | | 13,791,456 | |
| 5.95%7,8 | | | 5,150,000 | | | | 5,294,200 | |
| Mizuho Financial Group, Inc. | | | | | | | | |
| 2.95% (3 Month USD LIBOR + 0.88%) due 09/11/223 | | | 16,450,000 | | | | 16,541,678 | |
| 3.23% (3 Month USD LIBOR + 1.14%) due 09/13/213 | | | 1,500,000 | | | | 1,523,592 | |
| Goldman Sachs Group, Inc. | | | | | | | | |
| 3.02% (3 Month USD LIBOR + 0.73%) due 12/27/203 | | | 15,700,000 | | | | 15,774,307 | |
| 3.32% (3 Month USD LIBOR + 1.20%) due 09/15/203 | | | 1,000,000 | | | | 1,015,789 | |
| Morgan Stanley | | | | | | | | |
| 2.63% (3 Month USD LIBOR + 0.80%) due 02/14/203 | | | 13,650,000 | | | | 13,691,409 | |
| 3.13% (3 Month USD LIBOR + 0.98%) due 06/16/203 | | | 1,650,000 | | | | 1,669,350 | |
| 2.67% (3 Month USD LIBOR + 0.93%) due 07/22/223 | | | 700,000 | | | | 702,653 | |
| Macquarie Group Ltd. | | | | | | | | |
| 3.64% (3 Month USD LIBOR + 1.35%) due 03/27/243,4 | | | 14,250,000 | | | | 14,396,131 | |
| Credit Agricole S.A. | | | | | | | | |
| 3.04% (3 Month USD LIBOR + 0.97%) due 06/10/203,4 | | | 11,550,000 | | | | 11,706,064 | |
| Bank of America Corp. | | | | | | | | |
| 6.30% 7,8 | | | 5,151,000 | | | | 5,524,447 | |
| 2.34% (3 Month USD LIBOR + 0.65%) due 04/15/263 | | | 4,200,000 | | | | 4,210,261 | |
| JPMorgan Chase & Co. | | | | | | | | |
| 2.69% (3 Month USD LIBOR + 0.68%) due 06/01/213 | | | 8,100,000 | | | | 8,144,499 | |
| Assurant, Inc. | | | | | | | | |
| 3.54% (3 Month USD LIBOR + 1.25%) due 03/26/213 | | | 7,900,000 | | | | 7,908,836 | |
| Sumitomo Mitsui Financial Group, Inc. | | | | | | | | |
| 2.67% (3 Month USD LIBOR + 0.97%) due 01/11/223 | | | 5,000,000 | | | | 5,049,702 | |
| 3.74% (3 Month USD LIBOR + 1.68%) due 03/09/213 | | | 1,000,000 | | | | 1,033,918 | |
| 2.88% (3 Month USD LIBOR + 1.14%) due 10/19/213 | | | 702,000 | | | | 713,431 | |
| UBS Group Funding Switzerland AG | | | | | | | | |
| 3.50% (3 Month USD LIBOR + 1.78%) due 04/14/213,4 | | | 5,700,000 | | | | 5,906,183 | |
| Credit Suisse Group AG | | | | | | | | |
| 3.31% (3 Month USD LIBOR + 1.20%) due 12/14/233,4 | | | 5,250,000 | | | | 5,322,159 | |
| Westpac Banking Corp. | | | | | | | | |
| 2.55% (3 Month USD LIBOR + 0.85%) due 01/11/223 | | | 5,000,000 | | | | 5,065,586 | |
| Wells Fargo & Co. | | | | | | | | |
| 5.88% 7,8 | | | 1,050,000 | | | | 1,104,600 | |
| American Equity Investment Life Holding Co. | | | | | | | | |
| 5.00% due 06/15/27 | | | 434,000 | | | | 439,864 | |
| Fidelity & Guaranty Life Holdings, Inc. | | | | | | | | |
| 6.38% due 04/01/214 | | | 330,000 | | | | 333,713 | |
| Lincoln Finance Ltd. | | | | | | | | |
| 7.38% due 04/15/214 | | | 100,000 | | | | 103,250 | |
| Total Financial | | | | | | | 319,803,992 | |
| | | | | | | | | |
| Consumer, Non-cyclical - 2.7% |
| Express Scripts Holding Co. | | | | | | | | |
| 2.76% (3 Month USD LIBOR + 0.75%) due 11/30/203 | | | 24,500,000 | | | | 24,529,419 | |
| CVS Health Corp. | | | | | | | | |
| 2.69% (3 Month USD LIBOR + 0.63%) due 03/09/203 | | | 8,950,000 | | | | 8,983,562 | |
| 2.78% (3 Month USD LIBOR + 0.72%) due 03/09/213 | | | 8,500,000 | | | | 8,563,869 | |
| Kraft Heinz Foods Co. | | | | | | | | |
| 2.38% (3 Month USD LIBOR + 0.57%) due 02/10/213 | | | 16,200,000 | | | | 16,155,760 | |
| Allergan Funding SCS | | | | | | | | |
| 3.33% (3 Month USD LIBOR + 1.26%) due 03/12/203 | | | 11,300,000 | | | | 11,433,713 | |
| Zimmer Biomet Holdings, Inc. | | | | | | | | |
| 2.93% (3 Month USD LIBOR + 0.75%) due 03/19/213 | | | 11,050,000 | | | | 11,063,393 | |
| Total Consumer, Non-cyclical | | | | | | | 80,729,716 | |
| | | | | | | | | |
| 68 | THE GUGGENHEIM FUNDS SEMI-ANNUAL REPORT | SEE NOTES TO FINANCIAL STATEMENTS. |
| SCHEDULE OF INVESTMENTS (Unaudited)(continued) | March 29, 2018 |
| LIMITED DURATION FUND | |
| | | Face
Amount~ | | | Value | |
| | | | | | | |
| Communications - 1.5% |
| AT&T, Inc. | | | | | | |
| 2.72% (3 Month USD LIBOR + 0.89%) due 02/14/233 | | | 20,500,000 | | | $ | 20,784,482 | |
| Discovery Communications LLC | | | | | | | | |
| 2.91% (3 Month USD LIBOR + 0.71%) due 09/20/193 | | | 11,000,000 | | | | 11,051,973 | |
| Deutsche Telekom International Finance BV | | | | | | | | |
| 2.31% (3 Month USD LIBOR + 0.58%) due 01/17/203,4 | | | 9,400,000 | | | | 9,433,823 | |
| Verizon Communications, Inc. | | | | | | | | |
| 3.15% (3 Month USD LIBOR + 1.00%) due 03/16/223 | | | 2,300,000 | | | | 2,343,962 | |
| Total Communications | | | | | | | 43,614,240 | |
| | | | | | | | | |
| ENERGY - 0.8% |
| Phillips 66 | | | | | | | | |
| 2.61% (3 Month USD LIBOR + 0.60%) due 02/26/213 | | | 8,700,000 | | | | 8,710,707 | |
| 2.37% (3 Month USD LIBOR + 0.65%) due 04/15/193 | | | 4,100,000 | | | | 4,101,131 | |
| Equities Corp. | | | | | | | | |
| 2.46% (3 Month USD LIBOR + 0.77%) due 10/01/203 | | | 11,450,000 | | | | 11,472,785 | |
| Schahin II Finance Co. SPV Ltd. | | | | | | | | |
| 5.88% due 09/25/229,12 | | | 390,900 | | | | 47,885 | |
| Total Energy | | | | | | | 24,332,508 | |
| | | | | | | | | |
| Industrial - 0.2% |
| Reynolds Group Issuer Incorporated / Reynolds Group Issuer LLC / Reynolds Group Issuer Luxembourg | | | | | | | | |
| 5.22% (3 Month USD LIBOR + 3.50%) due 07/15/213,4 | | | 5,500,000 | | | | 5,568,750 | |
| CNH Industrial Capital LLC | | | | | | | | |
| 3.63% due 04/15/18 | | | 850,000 | | | | 850,213 | |
| Total Industrial | | | | | | | 6,418,963 | |
| | | | | | | | | |
| Basic Materials - 0.2% |
| Yamana Gold, Inc. | | | | | | | | |
| 4.63% due 12/15/27 | | | 3,000,000 | | | | 2,954,164 | |
| 4.95% due 07/15/24 | | | 1,375,000 | | | | 1,414,531 | |
| Total Basic Materials | | | | | | | 4,368,695 | |
| | | | | | | | | |
| Consumer, Cyclical - 0.0% |
| WMG Acquisition Corp. | | | | | | | | |
| 6.75% due 04/15/224 | | | 1,200,000 | | | | 1,240,500 | |
| Total Corporate Bonds | | | | | | | | |
| (Cost $479,746,168) | | | | | | | 480,508,614 | |
| | | | | | | | | |
| SENIOR FLOATING RATE INTERESTS††,3 - 1.5% |
| Technology - 0.7% |
| Misys Ltd. | | | | | | | | |
| 5.48% (1 Month USD LIBOR + 3.50%) and (3 Month USD LIBOR + 3.50%) due 06/13/24 | | | 7,910,250 | | | | 7,899,413 | |
| MA FinanceCo. LLC | | | | | | | | |
| 4.38% (3 Month USD LIBOR + 2.50%) due 11/19/21 | | | 5,000,000 | | | | 4,937,500 | |
| Epicor Software Co. | | | | | | | | |
| 5.13% (6 Month USD LIBOR + 3.25%) due 06/01/22 | | | 4,223,337 | | | | 4,239,850 | |
| SS&C Technologies, Inc. | | | | | | | | |
| 7.25% (3 Month USD LIBOR + 2.50%) due 02/27/25 | | | 2,321,754 | | | | 2,332,156 | |
| 7.25% due 02/28/25 | | | 828,246 | | | | 831,956 | |
| Internet Brands, Inc. | | | | | | | | |
| 5.53% (3 Month USD LIBOR + 3.75%) due 09/13/24 | | | 1,090,150 | | | | 1,089,953 | |
| Total Technology | | | | | | | 21,330,828 | |
| | | | | | | | | |
| Consumer, Non-cyclical - 0.3% |
| DJO Finance LLC | | | | | | | | |
| 5.03% (1 Month USD LIBOR + 3.25%) due 06/08/20 | | | 3,989,792 | | | | 4,006,429 | |
| Diamond (BC) B.V. | | | | | | | | |
| 4.99% (3 Month USD LIBOR + 3.00%) due 09/06/24 | | | 2,200,000 | | | | 2,195,424 | |
| Smart & Final Stores LLC | | | | | | | | |
| 5.38% (3 Month USD LIBOR + 3.50%) due 11/15/22 | | | 1,695,796 | | | | 1,669,308 | |
| Albertson’s LLC | | | | | | | | |
| 5.29% (3 Month USD LIBOR + 3.00%) due 12/21/22 | | | 1,231,344 | | | | 1,217,836 | |
| Grocery Outlet, Inc. | | | | | | | | |
| 5.80% (3 Month USD LIBOR + 3.50%) due 10/21/21 | | | 663,260 | | | | 665,469 | |
| Total Consumer, Non-cyclical | | | | | | | 9,754,466 | |
| | | | | | | | | |
| Consumer, Cyclical - 0.2% |
| Mavis Tire Express Services Corp. | | | | | | | | |
| 5.07% (1 Month USD LIBOR + 3.25%) due 02/28/25 | | | 4,741,013 | | | | 4,741,013 | |
| PetSmart, Inc. | | | | | | | | |
| 4.68% (3 Month USD LIBOR + 3.00%) due 03/11/22 | | | 783,879 | | | | 627,370 | |
| Total Consumer, Cyclical | | | | | | | 5,368,383 | |
| | | | | | | | | |
| Communications - 0.2% |
| Cengage Learning Acquisitions, Inc. | | | | | | | | |
| 6.04% (1 Month USD LIBOR + 4.25%) due 06/07/23 | | | 4,298,301 | | | | 3,903,631 | |
| Neustar, Inc. | | | | | | | | |
| 4.80% (1 Month USD LIBOR + 2.50%) due 01/08/20 | | | 589,845 | | | | 591,692 | |
| WMG Acquisition Corp. | | | | | | | | |
| 4.13% (3 Month USD LIBOR + 2.25%) due 11/01/23 | | | 380,000 | | | | 381,109 | |
| Total Communications | | | | | | | 4,876,432 | |
| | | | | | | | | |
| Industrial - 0.1% |
| CHI Overhead Doors, Inc. | | | | | | | | |
| 5.13% (1 Month USD LIBOR + 3.25%) due 07/29/22 | | | 989,420 | | | | 989,420 | |
| SEE NOTES TO FINANCIAL STATEMENTS. | THE GUGGENHEIM FUNDS SEMI-ANNUAL REPORT | 69 |
| SCHEDULE OF INVESTMENTS (Unaudited)(continued) | March 29, 2018 |
| LIMITED DURATION FUND | |
| | | Face
Amount~ | | | Value | |
| | | | | | | |
| Engility Corp. | | | | | | |
| 4.13% (3 Month USD LIBOR + 2.25%) due 08/12/20 | | | 613,284 | | | $ | 613,671 | |
| Total Industrial | | | | | | | 1,603,091 | |
| | | | | | | | | |
| Financial - 0.0% |
| iStar, Inc. | | | | | | | | |
| 4.76% (3 Month USD LIBOR + 3.00%) due 10/01/21 | | | 283,211 | | | | 284,981 | |
| Total Senior Floating Rate Interests | | | | | | | | |
| (Cost $43,719,523) | | | | | | | 43,218,181 | |
| | | | | | | | | |
| COMMERCIAL PAPER†† - 2.5% |
| Hewlett-Packard Co. | | | | | | | | |
| 2.39% due 04/06/1810 | | | 15,000,000 | | | | 14,995,021 | |
| AutoZone, Inc. | | | | | | | | |
| 2.30% due 04/13/1810 | | | 15,000,000 | | | | 14,988,500 | |
| Tyson Foods, Inc. | | | | | | | | |
| 2.30% due 04/05/1810 | | | 12,545,000 | | | | 12,541,794 | |
| Molex Electronics Technologies, LLC. | | | | | | | | |
| 2.30% due 04/09/1810 | | | 10,000,000 | | | | 9,994,889 | |
| Marsh & McLennan Companies, Inc. | | | | | | | | |
| 2.25% due 04/19/1810 | | | 10,000,000 | | | | 9,988,750 | |
| Verizon Communications, Inc. | | | | | | | | |
| 2.25% due 04/09/1810 | | | 5,600,000 | | | | 5,597,200 | |
| Marriott International, Inc. | | | | | | | | |
| 2.04% due 04/04/1810 | | | 5,000,000 | | | | 4,999,150 | |
| Total Commercial Paper | | | | | | | | |
| (Cost $73,105,304) | | | | | | | 73,105,304 | |
| | | | | | | | | |
| REPURCHASE AGREEMENTS††,11 - 2.0% |
BNP Paribas
issued 03/06/18 at 1.90%
due 04/03/18 | | | 23,700,000 | | | | 23,700,000 | |
BofA Merrill Lynch
issued 02/15/18 at 2.24%
due 04/06/18 | | | 10,780,000 | | | | 10,780,000 | |
Jefferies & Company, Inc.
issued 03/14/18 at 3.28%
due 04/13/18 | | | 9,263,000 | | | | 9,263,000 | |
issued 03/28/18 at 2.70%
due 04/05/18 | | | 5,886,000 | | | | 5,886,000 | |
issued 03/22/18 at 2.70%
due 04/24/18 | | | 1,543,000 | | | | 1,543,000 | |
Barclays
issued 03/27/18 at 2.18%
open maturity | | | 5,566,955 | | | | 5,566,955 | |
Mizuho
issued 03/27/18 at 2.52%
due 04/27/18 | | | 2,956,000 | | | | 2,956,000 | |
| Total Repurchase Agreements | | | | | | | | |
| (Cost $59,694,955) | | | | | | | 59,694,955 | |
| | | | | | | | | |
| | | | Contracts | | | | | |
| | | | | | | | | |
| OTC OPTIONS PURCHASED†† - 0.1% |
| Call options on: | | | | | | | | |
BofA Merrill Lynch
iShares MSCI Emerging Markets ETF
Expiring January 2019 with strike price
of $55.00 (Notional Value $84,813,476) | | | 17,567 | | | | 2,116,823 | |
BofA Merrill Lynch
S&P 500 Index
Expiring January 2019 with
strike price of $3,000.00
(Notional Value $101,145,321) | | | 383 | | | | 944,095 | |
| Total Call options | | | | | | | 3,060,918 | |
| Total OTC Options Purchased | | | | | | | | |
| (Cost $4,875,424) | | | | | | | 3,060,918 | |
| | | | | | | | | |
| Total Investments - 101.4% | | | | | | | | |
| (Cost $2,977,430,301) | | | | | | $ | 2,979,153,189 | |
| Other Assets & Liabilities, net - (1.4)% | | | | | | | (41,785,173 | ) |
| Total Net Assets - 100.0% | | | | | | $ | 2,937,368,016 | |
| CENTRALLY CLEARED INTEREST RATE SWAP AGREEMENTS†† | | | | | | | | | |
| Counterparty | | Exchange | | Floating
Rate Type | | Floating
Rate Index | | Fixed Rate | | Payment
Frequency | | Maturity
Date | | Notional
Amount | | | Market
Value | | | Premiums
Paid | | | Unrealized
Gain (Loss) | |
| BofA Merrill Lynch | | CME | | Receive | | 3-Month USD-LIBOR | | 0.0224 | | Quarterly | | 08/11/27 | | $ | (69,000,000 | ) | | $ | 3,202,845 | | | $ | 2,193,567 | | | $ | 1,009,278 | |
| BofA Merrill Lynch | | CME | | Receive | | 3-Month USD-LIBOR | | 0.0259 | | Quarterly | | 11/13/47 | | | (9,500,000 | ) | | | 549,953 | | | | 867,910 | | | | (317,957 | ) |
| | | | | | | | | | | | | | | | | | | | | | | $ | 3,061,477 | | | $ | 691,321 | |
| 70 | THE GUGGENHEIM FUNDS SEMI-ANNUAL REPORT | SEE NOTES TO FINANCIAL STATEMENTS. |
| SCHEDULE OF INVESTMENTS (Unaudited)(continued) | March 29, 2018 |
| LIMITED DURATION FUND | |
| FORWARD FOREIGN CURRENCY EXCHANGE CONTRACTS†† |
| Counterparty | | Contracts to Sell | | Currency | | Settlement
Date | | Settlement
Value | | | Value at
March 29,
2018 | | | Net Unrealized
Appreciation/
(Depreciation) | |
| Goldman Sachs | | 44,000,000 | | EUR | | 05/18/18 | | $ | 54,945,864 | | | $ | 54,330,645 | | | $ | 615,219 | |
| Goldman Sachs | | 69,570,000 | | BRL | | 04/02/18 | | | 21,383,184 | | | | 21,076,709 | | | | 306,475 | |
| Morgan Stanley | | 6,178,000,000 | | JPY | | 06/04/18 | | | 58,499,578 | | | | 58,303,145 | | | | 196,433 | |
| Goldman Sachs | | 80,000,000 | | SEK | | 05/16/18 | | | 9,728,928 | | | | 9,615,421 | | | | 113,507 | |
| Goldman Sachs | | 45,240,000 | | EUR | | 05/31/18 | | | 56,010,287 | | | | 55,915,345 | | | | 94,942 | |
| Deutsche Bank | | 17,090,000 | | EUR | | 04/06/18 | | | 21,127,598 | | | | 21,033,720 | | | | 93,878 | |
| JPMorgan Chase & Co. | | 112,000,000 | | CZK | | 04/20/18 | | | 5,527,725 | | | | 5,435,810 | | | | 91,915 | |
| Goldman Sachs | | 5,000,000,000 | | HUF | | 06/13/18 | | | 19,873,604 | | | | 19,804,875 | | | | 68,729 | |
| Goldman Sachs | | 17,380,000 | | BRL | | 04/02/18 | | | 5,332,761 | | | | 5,265,390 | | | | 67,371 | |
| Deutsche Bank | | 15,365,000 | | EUR | | 04/05/18 | | | 18,971,473 | | | | 18,909,142 | | | | 62,331 | |
| Goldman Sachs | | 14,310,000 | | EUR | | 04/25/18 | | | 17,691,167 | | | | 17,638,982 | | | | 52,185 | |
| Goldman Sachs | | 56,110,000 | | SEK | | 04/18/18 | | | 6,777,634 | | | | 6,729,449 | | | | 48,185 | |
| Citigroup | | 1,676,000,000 | | HUF | | 05/23/18 | | | 6,663,501 | | | | 6,628,235 | | | | 35,266 | |
| Goldman Sachs | | 11,193,000 | | EUR | | 04/06/18 | | | 13,810,360 | | | | 13,775,917 | | | | 34,443 | |
| Goldman Sachs | | 1,877,900,000 | | HUF | | 12/20/18 | | | 7,582,267 | | | | 7,549,327 | | | | 32,940 | |
| JPMorgan Chase & Co. | | 83,680,000 | | CZK | | 08/20/18 | | | 4,126,640 | | | | 4,094,725 | | | | 31,915 | |
| Citigroup | | 987,165 | | CZK | | 04/06/18 | | | 47,656 | | | | 47,835 | | | | (179 | ) |
| Citigroup | | 183,185,600 | | HUF | | 04/25/18 | | | 721,362 | | | | 722,941 | | | | (1,579 | ) |
| Deutsche Bank | | 160,150,000 | | HUF | | 05/30/18 | | | 631,780 | | | | 633,661 | | | | (1,881 | ) |
| Citigroup | | 320,000,000 | | HUF | | 04/18/18 | | | 1,259,976 | | | | 1,262,054 | | | | (2,078 | ) |
| JPMorgan Chase & Co. | | 641,210,000 | | HUF | | 04/11/18 | | | 2,523,177 | | | | 2,527,230 | | | | (4,053 | ) |
| Goldman Sachs | | 250,000,000 | | HUF | | 05/23/18 | | | 978,588 | | | | 988,699 | | | | (10,111 | ) |
| JPMorgan Chase & Co. | | 52,000,000 | | CZK | | 04/06/18 | | | 2,509,350 | | | | 2,519,783 | | | | (10,433 | ) |
| Goldman Sachs | | 8,068,559,200 | | HUF | | 04/25/18 | | | 31,830,605 | | | | 31,842,520 | | | | (11,915 | ) |
| Citigroup | | 3,410,000 | | EUR | | 05/18/18 | | | 4,188,670 | | | | 4,210,625 | | | | (21,955 | ) |
| Goldman Sachs | | 184,000,000 | | CZK | | 04/13/18 | | | 8,886,313 | | | | 8,923,206 | | | | (36,893 | ) |
| Goldman Sachs | | 30,800,000 | | MXN | | 07/19/18 | | | 1,626,094 | | | | 1,666,237 | | | | (40,143 | ) |
| JPMorgan Chase & Co. | | 480,000,000 | | CZK | | 09/07/18 | | | 23,459,264 | | | | 23,513,054 | | | | (53,790 | ) |
| Goldman Sachs | | 1,753,000 | | EUR | | 04/13/18 | | | 2,102,643 | | | | 2,158,734 | | | | (56,091 | ) |
| Goldman Sachs | | 1,276,125,000 | | HUF | | 06/22/18 | | | 5,000,545 | | | | 5,058,357 | | | | (57,812 | ) |
| Barclays | | 2,183,250,000 | | HUF | | 06/22/18 | | | 8,525,323 | | | | 8,654,056 | | | | (128,733 | ) |
| Goldman Sachs | | 22,500,000 | | EUR | | 04/05/18 | | | 27,494,460 | | | | 27,689,925 | | | | (195,465 | ) |
| JPMorgan Chase & Co. | | 352,600,000 | | DKK | | 06/01/18 | | | 58,214,598 | | | | 58,458,458 | | | | (243,860 | ) |
| Barclays | | 40,500,000 | | GBP | | 04/09/18 | | | 56,360,205 | | | | 56,841,068 | | | | (480,863 | ) |
| Goldman Sachs | | 500,000,000 | | MXN | | 07/05/18 | | | 26,508,605 | | | | 27,108,611 | | | | (600,006 | ) |
| | | | | | | | | | | | | | | | | $ | (12,106 | ) |
| | | | | | | | | | | | | | | | | | | |
| Counterparty | | Contracts to Buy | | Currency | | Settlement
Date | | | Settlement
Value | | | | Value at
March 29,
2018 | | | | Net Unrealized
Appreciation/
(Depreciation) | |
| JPMorgan Chase & Co. | | 60,865,000 | | BRL | | 04/02/18 | | $ | 18,423,506 | | | $ | 18,439,469 | | | $ | 15,963 | |
| Citigroup | | 26,085,000 | | BRL | | 04/02/18 | | | 7,914,859 | | | | 7,902,630 | | | | (12,229 | ) |
| | | | | | | | | | | | | | | | | $ | 3,734 | |
| SEE NOTES TO FINANCIAL STATEMENTS. | THE GUGGENHEIM FUNDS SEMI-ANNUAL REPORT | 71 |
| SCHEDULE OF INVESTMENTS (Unaudited)(continued) | March 29, 2018 |
| LIMITED DURATION FUND | |
| ~ | The face amount is denominated in U.S. dollars unless otherwise indicated. |
| † | Value determined based on Level 1 inputs — See Note 4. |
| †† | Value determined based on Level 2 inputs, unless otherwise noted — See Note 4. |
| ††† | Value determined based on Level 3 inputs — See Note 4. |
| 1 | Affiliated issuer. |
| 2 | Rate indicated is the 7 day yield as of March 29, 2018. In some instances, the underlying reference rate shown was below the minimum rate earned by the security or has been adjusted by a predetermined factor. The settlement status of a position may also impact the effective rate indicated. Instances where multiple underlying reference rates and spread amounts are shown, the effective rate is based on a weighted average. |
| 3 | Variable rate security. Rate indicated is the rate effective at March 29, 2018. |
| 4 | Security is a 144A or Section 4(a)(2) security. These securities have been determined to be liquid under guidelines established by the Board of Trustees. The total market value of 144A or Section 4(a)(2) securities is $1,361,881,727 (cost $1,361,333,054), or 46.4% of total net assets. |
| 5 | Security has no stated coupon. However, it is expected to receive residual cash flow payments on defined deal dates. |
| 6 | Maturity date indicated is next interest reset date. |
| 7 | Perpetual maturity. |
| 8 | Security has a fixed rate coupon which will convert to a floating or variable rate coupon on a future date. |
| 9 | Security is in default of interest and/or principal obligations. |
| 10 | Rate indicated is the effective yield at the time of purchase. |
| 11 | Repurchase Agreements — See additional disclosure on pages 74-75 for more information on repurchase agreements. |
| 12 | Security is a 144A or Section 4(a)(2) security. These securities have been determined to be illiquid and restricted under guidelines established by the Board of Trustees. The total market value of 144A or Section 4(a)(2) illiquid and restricted securities is $111,535 (cost $647,969), or 0.0% of total net assets — See Note 10. |
| 13 | Zero coupon rate security. |
| 14 | On September 7, 2008, the issuer was placed in conservatorship by the Federal Housing Finance Agency (FHFA). As conservator, the FHFA has full powers to control the assets and operations of the firm. |
| | BofA — Bank of America |
| | BRL — Brazilian Real |
| | CME — Chicago Mercantile Exchange |
| | CMT — Constant Maturity Treasury |
| | CZK — Czech Koruna |
| | DKK — Danish Krone |
| | EURO — Euro |
| | GBP — British Pound |
| | HUF — Hungarian Forint |
| | JPY — Japanese Yen |
| | LIBOR — London Interbank Offered Rate |
| | MXN — Mexican Peso |
| | SEK — Swedish Krona |
| | WAC — Weighted Average Coupon |
| | |
| | See Sector Classification in Other Information section. |
| 72 | THE GUGGENHEIM FUNDS SEMI-ANNUAL REPORT | SEE NOTES TO FINANCIAL STATEMENTS. |
| SCHEDULE OF INVESTMENTS (Unaudited)(continued) | March 29, 2018 |
| LIMITED DURATION FUND | |
The following table summarizes the inputs used to value the Fund’s investments at March 29, 2018 (See Note 4 in the Notes to Financial Statements):
| Investments in Securities (Assets) | | Level 1
Quoted
Prices | | | Level 2
Significant
Observable
Inputs | | | Level 2 -
Other* | | | Level 3
Significant
Unobservable
Inputs | | | Total | |
| Asset Backed Securities | | $ | — | | | $ | 1,024,386,565 | | | $ | — | | | $ | — | | | $ | 1,024,386,565 | |
| Collateralized Mortgage Obligations | | | — | | | | 597,722,610 | | | | — | | | | 9,303,100 | | | | 607,025,710 | |
| Commercial Paper | | | — | | | | 73,105,304 | | | | — | | | | — | | | | 73,105,304 | |
| Corporate Bonds | | | — | | | | 480,508,614 | | | | — | | | | — | | | | 480,508,614 | |
| Forward Foreign Currency Exchange Contracts | | | — | | | | — | | | | 1,961,697 | | | | — | | | | 1,961,697 | |
| Foreign Government Debt | | | — | | | | 560,996,559 | | | | — | | | | — | | | | 560,996,559 | |
| Interest Rate Swap Agreements | | | — | | | | — | | | | 1,009,278 | | | | — | | | | 1,009,278 | |
| Money Market Fund | | | 55,419,001 | | | | — | | | | — | | | | — | | | | 55,419,001 | |
| Mutual Funds | | | 71,737,382 | | | | — | | | | — | | | | — | | | | 71,737,382 | |
| Options Purchased | | | — | | | | 3,060,918 | | | | — | | | | — | | | | 3,060,918 | |
| Repurchase Agreement | | | — | | | | 59,694,955 | | | | — | | | | — | | | | 59,694,955 | |
| Senior Floating Rate Interests | | | — | | | | 43,218,181 | | | | — | | | | — | | | | 43,218,181 | |
| Total Assets | | $ | 127,156,383 | | | $ | 2,842,693,706 | | | $ | 2,970,975 | | | $ | 9,303,100 | | | $ | 2,982,124,164 | |
| | | | | | | | | | | | | | | | | | | | | |
| Investments in Securities (Liabilities) | | | Level 1
Quoted
Prices | | | | Level 2
Significant
Observable
Inputs | | | | Level 2 -
Other* | | | | Level 3
Significant
Unobservable
Inputs | | | | Total | |
| Forward Foreign Currency Exchange Contracts | | $ | — | | | $ | — | | | $ | 1,970,069 | | | $ | — | | | $ | 1,970,069 | |
| Interest Rate Swap Agreements | | | — | | | | — | | | | 317,957 | | | | — | | | | 317,957 | |
| Unfunded Loan Commitments (Note 9) | | | — | | | | — | | | | — | | | | — | ** | | | — | |
| Total Liabilities | | $ | — | | | $ | — | | | $ | 2,288,026 | | | $ | — | | | $ | 2,288,026 | |
| * | Other financial instruments include forward foreign currency exchange contracts and swaps, which are reported as unrealized gain/loss at period end. |
| ** | Includes securities with a market value of $0. |
The following is a summary of significant unobservable inputs used in the fair valuation of assets and liabilities categorized within Level 3 of the fair value hierarchy:
| Category | | Ending Balance at
March 29, 2018 | | | Valuation Technique | | Unobservable
Inputs | | Input
Range | | Weighted
Average |
| Assets: | | | | | | | | | | | |
| Collateralized Mortgage Obligations | | $ | 9,303,100 | | | Option Adjusted Spread off
prior month broker quote | | Indicative Quote | | — | | — |
| Total Assets | | $ | 9,303,100 | | | | | | | | | |
Any remaining Level 3 securities held by the Funds and excluded from the tables above, were not considered material to the Fund.
Transfers between investment levels may occur as the markets fluctuate and/or the availability of data used in an investment’s valuation changes. Transfers between valuation levels, if any, are in comparison to the valuation levels at the end of the previous fiscal year, and are effective using the fair value as of the end of the current fiscal period.
For the period ended March 29, 2018, there were no transfers between levels.
| SEE NOTES TO FINANCIAL STATEMENTS. | THE GUGGENHEIM FUNDS SEMI-ANNUAL REPORT | 73 |
| SCHEDULE OF INVESTMENTS (Unaudited)(continued) | March 29, 2018 |
| LIMITED DURATION FUND | |
Summary of Fair Value Level 3 Activity
Following is a reconciliation of Level 3 assets for which significant unobservable inputs were used to determine fair value for the period ended March 29, 2018:
| | | Assets | | | | |
| | | Collateralized
Mortgage
Obligations | | | Total Assets | |
| Beginning Balance | | $ | 12,158,258 | | | $ | 12,158,258 | |
| Purchases/Receipts | | | — | | | | — | |
| Sales, maturities and paydowns/Fundings | | | (2,898,573 | ) | | | (2,898,573 | ) |
| Total realized gains or losses included in earnings | | | — | | | | — | |
| Total change in unrealized gains or losses included in earnings | | | 43,415 | | | | 43,415 | |
| Transfers into Level 3 | | | — | | | | — | |
| Transfers out of Level 3 | | | — | | | | — | |
| Ending Balance | | $ | 9,303,100 | | | $ | 9,303,100 | |
| Net Change in unrealized appreciation (depreciation) for investments in Level 3 securities still held at March 29, 2018 | | $ | 11,593 | | | $ | 11,593 | |
Repurchase Agreements
In connection with transactions in repurchase agreements, it is the Fund’s policy that its custodian take possession of the underlying collateral. The collateral is in the possession of the Fund’s custodian and is evaluated to ensure that its market value exceeds, at a minimum, 102% of the original face amount of the repurchase agreements.
Counterparty and
Terms of Agreement | | Face
Value | | | Repurchase
Price | | | Collateral | | Par
Value | | | Fair
Value | |
| BNP Paribas Securities Corp. | | | | | | | | HSI Asset Securitization Corporation Trust | | | | | | |
| 1.90% | | | | | | | | 2.06% | | | | | | |
| 04/03/18 | | $ | 23,700,000 | | | $ | 23,733,773 | | | 01/25/37 | | $ | 18,500,000 | | | $ | 15,086,750 | |
| | | | | | | | | | | | | | | | | | | |
| | | | | | | | | | | Freddie Mac Structured Agency Credit Risk Debt Notes | | | | | | | | |
| | | | | | | | | | | 7.42% | | | | | | | | |
| | | | | | | | | | | 07/25/28 | | | 11,150,000 | | | | 13,575,368 | |
| | | | | | | | | | | | | | 29,650,000 | | | | 28,662,118 | |
| | | | | | | | | | | | | | | | | | | |
| Jefferies & Company, Inc. | | | | | | | | | | Tall Three RR Issuer I, LLC | | | | | | | | |
| 2.70%-3.28% | | | | | | | | | | 2.72% | | | | | | | | |
| 04/05/18-04/24/18 | | | 16,692,000 | | | | 16,723,268 | | | 01/26/28 | | | 12,350,000 | | | | 12,350,000 | |
| | | | | | | | | | | | | | | | | | | |
| | | | | | | | | | | Hamburg Central School District | | | | | | | | |
| | | | | | | | | | | 2.75% | | | | | | | | |
| | | | | | | | | | | 03/20/19 | | | 6,925,000 | | | | 6,999,098 | |
| | | | | | | | | | | | | | | | | | | |
| | | | | | | | | | | Wyandotte County-Kansas City Unified Government | | | | | | | | |
| | | | | | | | | | | 0.00% | | | | | | | | |
| | | | | | | | | | | 09/01/34 | | | 6,635,000 | | | | 2,330,610 | |
| | | | | | | | | | | | | $ | 25,910,000 | | | $ | 21,679,708 | |
| | | | | | | | | | | | | | | | | | | |
| BofA Merrill Lynch | | | | | | | | | | BHMS Mortgage Trust | | | | | | | | |
| 2.24% | | | | | | | | | | 4.67% - 6.25% | | | | | | | | |
| 04/06/18 | | | 10,780,000 | | | | 10,813,537 | | | 07/05/21 - 07/05/33 | | | 13,400,367 | | | | 13,436,134 | |
| 74 | THE GUGGENHEIM FUNDS SEMI-ANNUAL REPORT | SEE NOTES TO FINANCIAL STATEMENTS. |
| SCHEDULE OF INVESTMENTS (Unaudited)(concluded) | March 29, 2018 |
| LIMITED DURATION FUND | |
Counterparty and
Terms of Agreement | | Face
Value | | | Repurchase
Price | | | Collateral | | Par
Value | | | Fair
Value | |
| Mizuho | | | | | | | | American Home Mortgage Investment Trust | | | | | | |
| 2.52% | | | | | | | | 2.77% | | | | | | |
| 04/27/18 | | $ | 2,956,000 | | | $ | 2,962,208 | | | 02/25/44 | | $ | 8,000,000 | | | $ | 7,384,800 | |
| | | | | | | | | | | | | | | | | | | |
| Barclays | | | | | | | | | | Netflix Inc. | | | | | | | | |
| 2.18% | | | | | | | | | | 4.88% | | | | | | | | |
| Open Maturity* | | | 5,566,955 | | | | 5,566,955 | | | 04/15/28 | | | 6,070,000 | | | | 5,836,912 | |
| * | Variable rate security. Rate indicated is the rate effective at March 29, 2018. In some instances, the underlying reference rate shown was below the minimum rate earned by the security or has been adjusted by a predetermined factor. The settlement status of a position may also impact the effective rate indicated. In instances where multiple underlying reference rates and spread amounts are shown, the effective rate is based on a weighted average. |
In the event of counterparty default, the Fund has the right to collect the collateral to offset losses incurred. There is potential loss to the Fund in the event the Fund is delayed or prevented from exercising its rights to dispose of the collateral securities, including the risk of a possible decline in the value of the underlying securities during the period while the Fund seeks to assert its rights. The Fund’s investment adviser, acting under the supervision of the Board, reviews the value of the collateral and the creditworthiness of those banks and dealers with which the Fund enters into repurchase agreements to evaluate potential risks.
Affiliated Transactions
Investments representing 5% or more of the outstanding voting shares of a portfolio company of a fund, or control of or by, or common control under GI, result in that portfolio company being considered an affiliated company of such fund, as defined in the 1940 Act.
The Fund may invest in certain of the underlying series of Guggenheim Strategy Funds Trust consisting of Guggenheim Strategy Fund I, Guggenheim Strategy Fund II and Guggenheim Strategy Fund III (collectively, the “Cash Management Funds”), each of which are open-end management investment companies managed by GI. The Cash Management Funds, which launched on March 11, 2014, are offered as cash management options only to mutual funds, trusts, and other accounts managed by GI and/or its affiliates, and are not available to the public. The Cash Management Funds pay no investment management fees. The Cash Management Funds’ annual report on Form N-CSR dated September 30, 2017, is available publicly or upon request. This information is available from the EDGAR database on the SEC’s website at https://www.sec.gov/Archives/edgar/data/1601445/000089180417000715/gug72218.htm.
Transactions during the period ended March 29, 2018, in which the portfolio company is an “affiliated person”, were as follows:
| Security Name | | Value 09/30/17 | | | Additions | | | Reductions | | | Realized Gain | | | Change in Unrealized | | | Value 03/29/18 | | | Shares 03/29/18 | | | Investment Income | | | Capital Gain Distributions | |
| Mutual Funds | | | | | | | | | | | | | | | | | | | | | | | | | | | | | | | | | | | | |
| Guggenheim Floating Rate Strategies Fund - Institutional Class | | $ | 27,278,433 | | | $ | 6,256,954 | | | $ | — | | | $ | — | | | $ | (51,622 | ) | | $ | 33,483,765 | | | | 1,287,342 | | | $ | 655,836 | | | $ | — | |
| Guggenheim Strategy Fund I | | | 12,599,724 | | | | 156,241 | | | | (1,000,000 | ) | | | 10,351 | | | | (37,837 | ) | | | 11,728,479 | | | | 468,203 | | | | 151,788 | | | | 4,411 | |
| Guggenheim Strategy Fund II | | | 14,349,646 | | | | 197,665 | | | | — | | | | — | | | | (28,770 | ) | | | 14,518,541 | | | | 580,509 | | | | 189,887 | | | | 7,679 | |
| Guggenheim Strategy Fund III | | | 9,381,097 | | | | 2,628,276 | | | | — | | | | — | | | | (2,776 | ) | | | 12,006,597 | | | | 479,688 | | | | 125,830 | | | | 2,296 | |
| | | $ | 63,608,900 | | | $ | 9,239,136 | | | $ | (1,000,000 | ) | | $ | 10,351 | | | $ | (121,005 | ) | | $ | 71,737,382 | | | | | | | $ | 1,123,341 | | | $ | 14,386 | |
| SEE NOTES TO FINANCIAL STATEMENTS. | THE GUGGENHEIM FUNDS SEMI-ANNUAL REPORT | 75 |
| STATEMENT OF ASSETS AND LIABILITIES (Unaudited) |
| March 29, 2018 |
| Assets: |
| Investments in unaffiliated issuers, at value (cost $2,846,051,244) | | $ | 2,847,720,852 | |
| Investments in affiliated issuers, at value (cost $71,684,102) | | | 71,737,382 | |
| Repurchase agreements, at value (cost $59,694,955) | | | 59,694,955 | |
| Foreign currency, at value (cost $47,585) | | | 47,819 | |
| Cash | | | 2,628,262 | |
| Segregated cash with broker | | | 6,402,000 | |
| Unamortized upfront premiums paid on interest rate swap agreements | | | 3,061,477 | |
| Unrealized appreciation on forward foreign currency exchange contracts | | | 1,961,697 | |
| Prepaid expenses | | | 273,811 | |
| Receivables: |
| Fund shares sold | | | 21,077,015 | |
| Securities sold | | | 16,396,474 | |
| Interest | | | 9,081,796 | |
| Dividends | | | 194,635 | |
| Total assets | | | 3,040,278,175 | |
| | | | | |
| Liabilities: |
| Segregated cash due to broker | | | 6,191,978 | |
| Unrealized depreciation on forward foreign currency exchange contracts | | | 1,970,069 | |
| Unfunded loan commitments, at value (Note 9) (proceeds $0) | | | — | |
| Payable for: |
| Securities purchased | | | 81,961,130 | |
| Fund shares redeemed | | | 10,842,179 | |
| Management fees | | | 598,215 | |
| Distribution and service fees | | | 223,486 | |
| Fund accounting/administration fees | | | 194,992 | |
| Swap settlement | | | 115,898 | |
| Variation margin on interest rate swap agreements | | | 125,397 | |
| Transfer agent/maintenance fees | | | 18,439 | |
| Trustees’ fees* | | | 1,173 | |
| Miscellaneous | | | 667,203 | |
| Total liabilities | | | 102,910,159 | |
| Net assets | | $ | 2,937,368,016 | |
| | | | | |
| Net assets consist of: |
| Paid in capital | | $ | 2,935,769,784 | |
| Accumulated net investment loss | | | (4,169,075 | ) |
| Accumulated net realized gain on investments | | | 3,354,599 | |
| Net unrealized appreciation on investments | | | 2,412,708 | |
| Net assets | | $ | 2,937,368,016 | |
| | | | | |
| A-Class: |
| Net assets | | $ | 660,828,692 | |
| Capital shares outstanding | | | 26,696,502 | |
| Net asset value per share | | $ | 24.75 | |
| Maximum offering price per share (Net asset value divided by 97.75%) | | $ | 25.32 | |
| | | | | |
| C-Class: |
| Net assets | | $ | 63,337,973 | |
| Capital shares outstanding | | | 2,560,422 | |
| Net asset value per share | | $ | 24.74 | |
| | | | | |
| P-Class: |
| Net assets | | $ | 167,325,904 | |
| Capital shares outstanding | | | 6,759,975 | |
| Net asset value per share | | $ | 24.75 | |
| | | | | |
| Institutional Class: |
| Net assets | | $ | 2,045,875,447 | |
| Capital shares outstanding | | | 82,674,835 | |
| Net asset value per share | | $ | 24.75 | |
| * | Relates to Trustees not deemed “interested persons” within the meaning of Section 2(a)(19) of the 1940 Act. |
| 76 | THE GUGGENHEIM FUNDS SEMI-ANNUAL REPORT | SEE NOTES TO FINANCIAL STATEMENTS. |
| STATEMENT OF OPERATIONS (Unaudited) |
| Period Ended March 29, 2018 |
| Investment Income: |
| Dividends from securities of unaffiliated issuers | | $ | 68,008 | |
| Dividends from securities of affiliated issuers | | | 1,123,341 | |
| Interest | | | 31,494,401 | |
| Total investment income | | | 32,685,750 | |
| | | | | |
| Expenses: |
| Management fees | | | 5,279,038 | |
| Distribution and service fees: | | | | |
| A-Class | | | 745,338 | |
| C-Class | | | 279,361 | |
| P-Class | | | 153,326 | |
| Recoupment of previously waived fees: |
| P-Class | | | 134 | |
| Institutional Class | | | 9 | |
| Transfer agent/maintenance fees: | | | | |
| A-Class | | | 143,150 | |
| C-Class | | | 25,807 | |
| P-Class | | | 58,582 | |
| Institutional Class | | | 433,681 | |
| Fund accounting/administration fees | | | 1,042,932 | |
| Line of credit fees | | | 32,184 | |
| Trustees’ fees* | | | 20,574 | |
| Custodian fees | | | 18,200 | |
| Miscellaneous | | | 306,903 | |
| Total expenses | | | 8,539,219 | |
| Less: | | | | |
| Expenses reimbursed by Adviser: | | | | |
| A-Class | | | (121,810 | ) |
| C-Class | | | (24,029 | ) |
| P-Class | | | (54,455 | ) |
| Institutional Class | | | (376,706 | ) |
| Expenses waived by Adviser | | | (175,683 | ) |
| Total waived/reimbursed expenses | | | (752,683 | ) |
| Net expenses | | | 7,786,536 | |
| Net investment income | | | 24,899,214 | |
| | | | | |
| Net Realized and Unrealized Gain (Loss): |
| Net realized gain (loss) on: |
| Investments in unaffiliated issuers | | $ | 12,395,845 | |
| Investments in affiliated issuers | | | 10,351 | |
| Distributions received from affiliated investment company shares | | | 14,386 | |
| Swap agreements | | | 2,925,445 | |
| Foreign currency transactions | | | 699,538 | |
| Forward foreign currency exchange contracts | | | (10,175,824 | ) |
| Options purchased | | | (1,062,040 | ) |
| Net realized gain | | | 4,807,701 | |
| Net change in unrealized appreciation (depreciation) on: |
| Investments in unaffiliated issuers | | | (6,783,803 | ) |
| Investments in affiliated issuers | | | (121,005 | ) |
| Swap agreements | | | 691,321 | |
| Options purchased | | | (845,395 | ) |
| Foreign currency translations | | | 13,928 | |
| Forward foreign currency exchange contracts | | | (1,742,976 | ) |
| Net change in unrealized appreciation (depreciation) | | | (8,787,930 | ) |
| Net realized and unrealized loss | | | (3,980,229 | ) |
| Net increase in net assets resulting from operations | | $ | 20,918,985 | |
| * | Relates to Trustees not deemed “interested persons” within the meaning of Section 2(a)(19) of the 1940 Act. |
| SEE NOTES TO FINANCIAL STATEMENTS. | THE GUGGENHEIM FUNDS SEMI-ANNUAL REPORT | 77 |
| STATEMENTS OF CHANGES IN NET ASSETS |
| | | Period Ended
March 29,
2018
(Unaudited) | | | Year Ended
September 30,
2017 | |
| Increase (Decrease) in Net Assets from Operations: | | | | | | |
| Net investment income | | $ | 24,899,214 | | | $ | 32,013,502 | |
| Net realized gain on investments | | | 4,807,701 | | | | 3,527,356 | |
| Net change in unrealized appreciation (depreciation) on investments | | | (8,787,930 | ) | | | 7,480,228 | |
| Net increase in net assets resulting from operations | | | 20,918,985 | | | | 43,021,086 | |
| | | | | | | | | |
| Distributions to shareholders from: | | | | | | | | |
| Net investment income | | | | | | | | |
| A-Class | | | (6,562,173 | ) | | | (7,270,962 | ) |
| C-Class | | | (402,048 | ) | | | (515,105 | ) |
| P-Class | | | (1,327,240 | ) | | | (748,808 | ) |
| Institutional Class | | | (22,309,897 | ) | | | (24,283,348 | ) |
| Net realized gains | | | | | | | | |
| A-Class | | | (360,305 | ) | | | (40,107 | ) |
| C-Class | | | (32,715 | ) | | | (4,814 | ) |
| P-Class | | | (68,213 | ) | | | (512 | ) |
| Institutional Class | | | (1,056,363 | ) | | | (103,662 | ) |
| Total distributions to shareholders | | | (32,118,954 | ) | | | (32,967,318 | ) |
| | | | | | | | | |
| Capital share transactions: | | | | | | | | |
| Proceeds from sale of shares | | | | | | | | |
| A-Class | | | 273,476,395 | | | | 442,378,068 | |
| C-Class | | | 19,938,065 | | | | 36,743,002 | |
| P-Class | | | 115,793,590 | | | | 103,833,454 | |
| Institutional Class | | | 953,059,075 | | | | 1,621,228,591 | |
| Distributions reinvested | | | | | | | | |
| A-Class | | | 5,529,879 | | | | 5,865,169 | |
| C-Class | | | 333,175 | | | | 373,493 | |
| P-Class | | | 1,394,941 | | | | 744,376 | |
| Institutional Class | | | 20,098,603 | | | | 21,805,737 | |
| Cost of shares redeemed | | | | | | | | |
| A-Class | | | (124,948,860 | ) | | | (156,887,800 | ) |
| C-Class | | | (7,437,616 | ) | | | (13,395,699 | ) |
| P-Class | | | (41,841,461 | ) | | | (14,043,133 | ) |
| Institutional Class | | | (556,992,725 | ) | | | (489,428,410 | ) |
| Net increase from capital share transactions | | | 658,403,061 | | | | 1,559,216,848 | |
| Net increase in net assets | | | 647,203,092 | | | | 1,569,270,616 | |
| | | | | | | | | |
| Net assets: | | | | | | | | |
| Beginning of period | | | 2,290,164,924 | | | | 720,894,308 | |
| End of period | | $ | 2,937,368,016 | | | $ | 2,290,164,924 | |
| Accumulated net investment loss/Undistributed net investment income at end of period | | $ | (4,169,075 | ) | | $ | 1,533,069 | |
| 78 | THE GUGGENHEIM FUNDS SEMI-ANNUAL REPORT | SEE NOTES TO FINANCIAL STATEMENTS. |
| STATEMENTS OF CHANGES IN NET ASSETS |
| | | Period Ended
March 29,
2018
(Unaudited) | | | Year Ended
September 30,
2017 | |
| Capital share activity: | | | | | | |
| Shares sold | | | | | | |
| A-Class | | | 11,020,059 | | | | 17,860,279 | |
| C-Class | | | 804,406 | | | | 1,483,714 | |
| P-Class | | | 4,670,762 | | | | 4,191,187 | |
| Institutional Class | | | 38,443,500 | | | | 65,477,150 | |
| Shares issued from reinvestment of distributions | | | | | | | | |
| A-Class | | | 223,053 | | | | 236,786 | |
| C-Class | | | 13,447 | | | | 15,094 | |
| P-Class | | | 56,273 | | | | 30,001 | |
| Institutional Class | | | 810,794 | | | | 880,322 | |
| Shares redeemed | | | | | | | | |
| A-Class | | | (5,039,306 | ) | | | (6,338,198 | ) |
| C-Class | | | (300,025 | ) | | | (541,349 | ) |
| P-Class | | | (1,688,431 | ) | | | (566,399 | ) |
| Institutional Class | | | (22,472,494 | ) | | | (19,752,906 | ) |
| Net increase in shares | | | 26,542,038 | | | | 62,975,681 | |
| SEE NOTES TO FINANCIAL STATEMENTS. | THE GUGGENHEIM FUNDS SEMI-ANNUAL REPORT | 79 |
This table is presented to show selected data for a share outstanding throughout each period and to assist shareholders in evaluating a Fund’s performance for the periods presented.
| A-Class | | Period Ended
March 29,
2018a | | | Year Ended
September 30,
2017 | | | Year Ended
September 30,
2016 | | | Year Ended
September 30,
2015 | | | Period Ended
September 30,
2014b | |
| Per Share Data | | | | | | | | | | | | | | | |
| Net asset value, beginning of period | | $ | 24.86 | | | $ | 24.71 | | | $ | 24.65 | | | $ | 24.97 | | | $ | 25.00 | |
| Income (loss) from investment operations: |
| Net investment income (loss)c | | | .22 | | | | .53 | | | | .67 | | | | .69 | | | | .52 | |
| Net gain (loss) on investments (realized and unrealized) | | | (.05 | ) | | | .20 | | | | .08 | | | | (.16 | ) | | | (.08 | ) |
| Total from investment operations | | | .17 | | | | .73 | | | | .75 | | | | .53 | | | | .44 | |
| Less distributions from: |
| Net investment income | | | (.27 | ) | | | (.58 | ) | | | (.69 | ) | | | (.84 | ) | | | (.47 | ) |
| Net realized gains | | | (.01 | ) | | | — | d | | | — | | | | (.01 | ) | | | — | |
| Total distributions | | | (.28 | ) | | | (.58 | ) | | | (.69 | ) | | | (.85 | ) | | | (.47 | ) |
| Net asset value, end of period | | $ | 24.75 | | | $ | 24.86 | | | $ | 24.71 | | | $ | 24.65 | | | $ | 24.97 | |
| |
| Total Returnj | | | 0.72 | % | | | 2.95 | % | | | 3.16 | % | | | 2.15 | % | | | 1.75 | % |
| Ratios/Supplemental Data |
| Net assets, end of period (in thousands) | | $ | 660,829 | | | $ | 509,410 | | | $ | 215,856 | | | $ | 117,628 | | | $ | 17,035 | |
| Ratios to average net assets: |
| Net investment income (loss) | | | 1.75 | % | | | 2.14 | % | | | 2.73 | % | | | 2.79 | % | | | 2.67 | % |
| Total expensese | | | 0.81 | % | | | 0.86 | % | | | 0.93 | % | | | 0.99 | % | | | 1.14 | % |
| Net expensesf,g,i | | | 0.76 | % | | | 0.81 | % | | | 0.84 | % | | | 0.87 | % | | | 0.83 | % |
| Portfolio turnover rate | | | 28 | % | | | 55 | % | | | 39 | % | | | 26 | % | | | 40 | % |
| C-Class | | Period Ended
March 29,
2018a | | | Year Ended
September 30,
2017 | | | Year Ended
September 30,
2016 | | | Year Ended
September 30,
2015 | | | Period Ended
September 30,
2014b | |
| Per Share Data | | | | | | | | | | | | | | | |
| Net asset value, beginning of period | | $ | 24.84 | | | $ | 24.70 | | | $ | 24.63 | | | $ | 24.96 | | | $ | 25.00 | |
| Income (loss) from investment operations: |
| Net investment income (loss)c | | | .12 | | | | .35 | | | | .48 | | | | .49 | | | | .38 | |
| Net gain (loss) on investments (realized and unrealized) | | | (.03 | ) | | | .18 | | | | .10 | | | | (.16 | ) | | | (.09 | ) |
| Total from investment operations | | | .09 | | | | .53 | | | | .58 | | | | .33 | | | | .29 | |
| Less distributions from: |
| Net investment income | | | (.18 | ) | | | (.39 | ) | | | (.51 | ) | | | (.65 | ) | | | (.33 | ) |
| Net realized gains | | | (.01 | ) | | | — | d | | | — | | | | (.01 | ) | | | — | |
| Total distributions | | | (.19 | ) | | | (.39 | ) | | | (.51 | ) | | | (.66 | ) | | | (.33 | ) |
| Net asset value, end of period | | $ | 24.74 | | | $ | 24.84 | | | $ | 24.70 | | | $ | 24.63 | | | $ | 24.96 | |
| |
| Total Returnj | | | 0.38 | % | | | 2.18 | % | | | 2.39 | % | | | 1.37 | % | | | 1.13 | % |
| Ratios/Supplemental Data |
| Net assets, end of period (in thousands) | | $ | 63,338 | | | $ | 50,743 | | | $ | 26,802 | | | $ | 10,323 | | | $ | 643 | |
| Ratios to average net assets: |
| Net investment income (loss) | | | 1.00 | % | | | 1.41 | % | | | 1.98 | % | | | 1.96 | % | | | 1.93 | % |
| Total expensese | | | 1.61 | % | | | 1.65 | % | | | 1.73 | % | | | 1.76 | % | | | 2.14 | % |
| Net expensesf,g,i | | | 1.51 | % | | | 1.56 | % | | | 1.58 | % | | | 1.62 | % | | | 1.56 | % |
| Portfolio turnover rate | | | 28 | % | | | 55 | % | | | 39 | % | | | 26 | % | | | 40 | % |
| 80 | THE GUGGENHEIM FUNDS SEMI-ANNUAL REPORT | SEE NOTES TO FINANCIAL STATEMENTS. |
| FINANCIAL HIGHLIGHTS (continued) |
This table is presented to show selected data for a share outstanding throughout each period and to assist shareholders in evaluating a Fund’s performance for the periods presented.
| P-Class | | Period Ended
March 29,
2018a | | | Year Ended
September 30,
2017 | | | Year Ended
September 30,
2016 | | | Period Ended
September 30,
2015h | |
| Per Share Data | | | | | | | | | | | | |
| Net asset value, beginning of period | | $ | 24.86 | | | $ | 24.72 | | | $ | 24.65 | | | $ | 24.86 | |
| Income (loss) from investment operations: |
| Net investment income (loss)c | | | .22 | | | | .47 | | | | .68 | | | | .25 | |
| Net gain (loss) on investments (realized and unrealized) | | | (.05 | ) | | | .24 | | | | .08 | | | | (.17 | ) |
| Total from investment operations | | | .17 | | | | .71 | | | | .76 | | | | .08 | |
| Less distributions from: |
| Net investment income | | | (.27 | ) | | | (.57 | ) | | | (.69 | ) | | | (.29 | ) |
| Net realized gains | | | (.01 | ) | | | — | d | | | — | | | | — | |
| Total distributions | | | (.28 | ) | | | (.57 | ) | | | (.69 | ) | | | (.29 | ) |
| Net asset value, end of period | | $ | 24.75 | | | $ | 24.86 | | | $ | 24.72 | | | $ | 24.65 | |
| |
| Total Returnj | | | 0.72 | % | | | 2.93 | % | | | 3.17 | % | | | 0.32 | % |
| Ratios/Supplemental Data |
| Net assets, end of period (in thousands) | | $ | 167,326 | | | $ | 92,503 | | | $ | 1,646 | | | $ | 2,736 | |
| Ratios to average net assets: |
| Net investment income (loss) | | | 1.75 | % | | | 1.89 | % | | | 2.76 | % | | | 2.39 | % |
| Total expensese | | | 0.86 | % | | | 0.92 | % | | | 0.94 | % | | | 0.94 | % |
| Net expensesf,g,i | | | 0.76 | % | | | 0.81 | % | | | 0.84 | % | | | 0.88 | % |
| Portfolio turnover rate | | | 28 | % | | | 55 | % | | | 39 | % | | | 26 | % |
| SEE NOTES TO FINANCIAL STATEMENTS. | THE GUGGENHEIM FUNDS SEMI-ANNUAL REPORT | 81 |
| FINANCIAL HIGHLIGHTS (concluded) |
This table is presented to show selected data for a share outstanding throughout each period and to assist shareholders in evaluating a Fund’s performance for the periods presented.
| Institutional Class | | Period Ended
March 29,
2018a | | | Year Ended
September 30,
2017 | | | Year Ended
September 30,
2016 | | | Year Ended
September 30,
2015 | | | Period Ended
September 30,
2014b | |
| Per Share Data | | | | | | | | | | | | | | | |
| Net asset value, beginning of period | | $ | 24.85 | | | $ | 24.71 | | | $ | 24.64 | | | $ | 24.96 | | | $ | 25.00 | |
| Income (loss) from investment operations: |
| Net investment income (loss)c | | | .25 | | | | .59 | | | | .73 | | | | .78 | | | | .57 | |
| Net gain (loss) on investments (realized and unrealized) | | | (.04 | ) | | | .19 | | | | .09 | | | | (.19 | ) | | | (.08 | ) |
| Total from investment operations | | | .21 | | | | .78 | | | | .82 | | | | .59 | | | | .49 | |
| Less distributions from: |
| Net investment income | | | (.30 | ) | | | (.64 | ) | | | (.75 | ) | | | (.90 | ) | | | (.53 | ) |
| Net realized gains | | | (.01 | ) | | | — | d | | | — | | | | (.01 | ) | | | — | |
| Total distributions | | | (.31 | ) | | | (.64 | ) | | | (.75 | ) | | | (.91 | ) | | | (.53 | ) |
| Net asset value, end of period | | $ | 24.75 | | | $ | 24.85 | | | $ | 24.71 | | | $ | 24.64 | | | $ | 24.96 | |
| |
| Total Returnj | | | 0.88 | % | | | 3.21 | % | | | 3.43 | % | | | 2.41 | % | | | 1.98 | % |
| Ratios/Supplemental Data |
| Net assets, end of period (in thousands) | | $ | 2,045,875 | | | $ | 1,637,509 | | | $ | 476,591 | | | $ | 176,322 | | | $ | 69,150 | |
| Ratios to average net assets: |
| Net investment income (loss) | | | 2.00 | % | | | 2.36 | % | | | 2.97 | % | | | 3.14 | % | | | 2.90 | % |
| Total expensese | | | 0.56 | % | | | 0.61 | % | | | 0.67 | % | | | 0.73 | % | | | 0.96 | % |
| Net expensesf,g,i | | | 0.51 | % | | | 0.56 | % | | | 0.58 | % | | | 0.62 | % | | | 0.57 | % |
| Portfolio turnover rate | | | 28 | % | | | 55 | % | | | 39 | % | | | 26 | % | | | 40 | % |
| a | Unaudited figures for the period ended March 29, 2018. Percentage amounts for the period, except total return and portfolio turnover rate, have been annualized. |
| b | Since commencement of operations: December 16, 2013. Percentage amounts for the period, except total return and portfolio turnover rate, have been annualized. |
| c | Net investment income (loss) per share was computed using average shares outstanding throughout the period. |
| d | Distributions from realized gains are less than $0.01 per share. |
| e | Does not include expenses of the underlying funds in which the Fund invests. |
| f | Net expense information reflects the expense ratios after expense waivers and reimbursements, as applicable. |
| g | The portion of the ratios of net expenses to average net assets attributable to recoupments of prior fee reductions or expense reimbursements for the periods presented would be: |
| | | 03/29/18 | 09/30/17 |
| | A-Class | 0.00% | 0.00% |
| | C-Class | 0.00% | 0.00% |
| | P-Class | 0.00% | 0.00% |
| | Institutional Class | 0.00% | 0.00% |
| h | Since commencement of operations: May 1, 2015. Percentage amounts for the period, except total return and portfolio turnover rate, have been annualized. |
| i | Net expense may include expenses that are excluded from the expense limitation agreement. Excluding these expenses, the net expense ratios for the periods would be: |
| | | 03/29/18 | 09/30/17 | 09/30/16 | 09/30/15 | 09/30/14 |
| | A-Class | 0.75% | 0.79% | 0.80% | 0.80% | 0.79% |
| | C-Class | 1.50% | 1.54% | 1.55% | 1.55% | 1.52% |
| | P-Class | 0.75% | 0.79% | 0.80% | 0.80% | N/A |
| | Institutional Class | 0.50% | 0.54% | 0.55% | 0.55% | 0.54% |
| j | Total return does not reflect the impact of any applicable sales charges and has not been annualized. |
| 82 | THE GUGGENHEIM FUNDS SEMI-ANNUAL REPORT | SEE NOTES TO FINANCIAL STATEMENTS. |
| PERFORMANCE REPORT AND FUND PROFILE (Unaudited) | March 29, 2018 |
MUNICIPAL INCOME FUND
OBJECTIVE: Seeks to provide current income with an emphasis on income exempt from federal income tax, while also considering capital appreciation.
Holdings Diversification (Market Exposure as % of Net Assets)
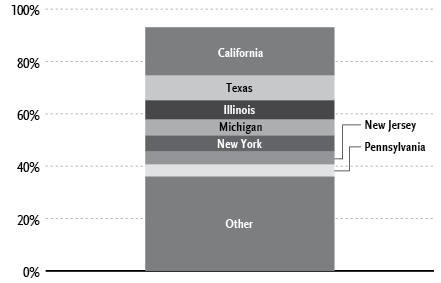
“Holdings Diversification (Market Exposure as % of Net Assets)” excludes any temporary cash investments.
| Inception Dates: |
| A-Class | April 28, 2004 |
| C-Class | January 13, 2012 |
| P-Class | May 1, 2015 |
| Institutional Class | January 13, 2012 |
| Ten Largest Holdings (% of Total Net Assets) |
| Detroit Wayne County Stadium Authority Revenue Bonds, 5.00% | 3.6% |
| Stockton Public Financing Authority Revenue Bonds, 6.25% | 2.7% |
| Tustin Unified School District General Obligation Unlimited, 6.00% | 2.6% |
| Hudson County Improvement Authority Revenue Bonds, 6.00% | 2.4% |
| Southern Illinois University Revenue Bonds, 5.00% | 2.3% |
| Puerto Rico Electric Power Authority Revenue Bonds, 1.65% | 2.0% |
| Massachusetts Development Finance Agency Revenue Bonds, 6.88% | 1.5% |
| College of the Sequoias Tulare Area Improvement District No. 3 General Obligation Unlimited, 6.85% | 1.4% |
| State of California General Obligation Unlimited, 5.00% | 1.3% |
| New York City Transitional Finance Authority Future Tax Secured Revenue Revenue Bonds, 5.00% | 1.3% |
| Top Ten Total | 21.1% |
“Ten Largest Holdings” excludes any temporary cash investments.
| | THE GUGGENHEIM FUNDS SEMI-ANNUAL REPORT | 83 |
| PERFORMANCE REPORT AND FUND PROFILE (Unaudited)(concluded) | March 29, 2018 |
Average Annual Returns*
Periods Ended March 29, 2018
| | 6 month† | 1 Year | 5 Year | 10 Year |
| A-Class Shares~ | (0.04%) | 3.36% | 2.48% | 3.96% |
| A-Class Shares with sales charge‡ | (4.04%) | (0.79%) | 1.48% | 3.45% |
| Bloomberg Barclays Municipal Bond Index | (0.37%) | 2.66% | 2.73% | 4.40% |
| | 6 month† | 1 Year | 5 Year | Since Inception
(01/13/12) |
| C-Class Shares | (0.41%) | 2.60% | 1.71% | 2.62% |
| C-Class Shares with CDSC§ | (1.40%) | 1.60% | 1.71% | 2.62% |
| | | 6 month† | 1 Year | Since Inception
(05/01/15) |
| P-Class Shares | | (0.04%) | 3.41% | 1.96% |
| Bloomberg Barclays Municipal Bond Index | | (0.37%) | 2.66% | 2.54% |
| | 6 month† | 1 Year | 5 Year | Since Inception
(01/13/12) |
| Institutional Class Shares | 0.01% | 3.62% | 2.73% | 3.65% |
| Bloomberg Barclays Municipal Bond Index | (0.37%) | 2.66% | 2.73% | 3.06% |
| Portfolio Composition by Quality Rating1 |
| Rating | % of Total
Investments |
| Fixed Income Instruments | |
| AAA | 9.6% |
| AA | 54.8% |
| A | 11.7% |
| BBB | 7.7% |
| BB | 5.3% |
| NR2 | 4.0% |
| Other Instruments | 7.2% |
| Total Investments | 100.3% |
| * | The performance data above represents past performance that is not predictive of future results. The investment return and principal value of an investment in the Fund will fluctuate so that an investor’s shares, when redeemed, may be worth more or less than their original cost. Returns are historical and include changes in principal and reinvested dividends and capital gains and do not reflect the effect of taxes. The Bloomberg Barclays Municipal Bond Index is an unmanaged index and, unlike the Fund, has no management fees or operating expenses to reduce its reported return. |
| † | 6 month returns are not annualized. |
| ‡ | Effective October 1, 2015, the maximum sales charge decreased from 4.75% to 4.00%. A 4.75% maximum sales charge is used in the calculation of the Average Annual Returns (based on subscriptions made prior to October 1, 2015), and a 4.00% maximum sales charge is used to calculate performance for periods based on subscriptions made on or after October 1, 2015. |
| § | Fund returns include a CDSC of 1% if redeemed within 12 months of purchase. |
| ~ | Effective January 13, 2012, the Fund acquired all of the assets and liabilities of the TS&W/Claymore Tax-Advantage Balanced Fund (“TYW”), a registered closed-end management investment company. The A-Class performance prior to that date reflects performance of TYW. |
| 1 | Source: BlackRock Solutions. Credit quality ratings are measured on a scale that generally ranges from AAA (highest) to D (lowest). All securities except for those labeled “NR” have been rated by Moody’s, Standard & Poor’s (“S&P”), or Fitch, each of which is a Nationally Recognized Statistical Rating Organization (“NRSRO”). For purposes of this presentation, when ratings are available from more than one agency, the highest rating is used. Guggenheim Investments has converted ratings to the equivalent S&P rating. Security ratings are determined at the time of purchase and may change thereafter. |
| 2 | NR securities do not necessarily indicate low credit quality. |
| 84 | THE GUGGENHEIM FUNDS SEMI-ANNUAL REPORT | |
| SCHEDULE OF INVESTMENTS (Unaudited) | March 29, 2018 |
| MUNICIPAL INCOME FUND | |
| | | Shares | | | Value | |
| | | | | | | |
| MONEY MARKET FUND† - 7.2% |
| Dreyfus AMT-Free Tax Exempt Cash Management Fund - Institutional Shares 1.18%1 | | | 3,172,582 | | | $ | 3,172,582 | |
| Total Money Market Fund | | | | | | | | |
| (Cost $3,172,582) | | | | | | | 3,172,582 | |
| | | | | | | | | |
| | | | Face
Amount | | | | | |
| | | | | | | | | |
| MUNICIPAL BONDS†† - 93.1% |
| California - 18.5% |
| Stockton Public Financing Authority Revenue Bonds | | | | | | | | |
| 6.25% due 10/01/38 | | $ | 1,000,000 | | | | 1,181,830 | |
| 6.25% due 10/01/40 | | | 250,000 | | | | 293,780 | |
| Tustin Unified School District General Obligation Unlimited | | | | | | | | |
| 6.00% due 08/01/21 | | | 1,000,000 | | | | 1,136,090 | |
| College of the Sequoias Tulare Area Improvement District No. 3 General Obligation Unlimited | | | | | | | | |
| 6.85% due 08/01/422 | | | 1,000,000 | | | | 637,200 | |
| State of California General Obligation Unlimited | | | | | | | | |
| 5.00% due 03/01/26 | | | 500,000 | | | | 583,365 | |
| Newport Mesa Unified School District General Obligation Unlimited | | | | | | | | |
| due 08/01/393 | | | 1,300,000 | | | | 573,690 | |
| Sacramento Municipal Utility District Revenue Bonds | | | | | | | | |
| 5.00% due 08/15/37 | | | 500,000 | | | | 556,285 | |
| Los Angeles Department of Water & Power Power System Revenue Revenue Bonds | | | | | | | | |
| 5.00% due 07/01/43 | | | 500,000 | | | | 549,810 | |
| Kings Canyon Unified School District General Obligation Unlimited | | | | | | | | |
| 5.00% due 08/01/28 | | | 445,000 | | | | 514,540 | |
| San Diego Unified School District General Obligation Unlimited | | | | | | | | |
| due 07/01/393 | | | 1,000,000 | | | | 422,410 | |
| Riverside County Public Financing Authority Tax Allocation | | | | | | | | |
| 5.00% due 10/01/28 | | | 300,000 | | | | 354,417 | |
| Oakland Unified School District/Alameda County General Obligation Unlimited | | | | | | | | |
| 5.00% due 08/01/22 | | | 300,000 | | | | 323,670 | |
| M-S-R Energy Authority Revenue Bonds | | | | | | | | |
| 6.13% due 11/01/29 | | | 200,000 | | | | 247,678 | |
| Riverside County Redevelopment Successor Agency Tax Allocation | | | | | | | | |
| due 10/01/372 | | | 250,000 | | | | 238,063 | |
| Alameda Corridor Transportation Authority Revenue Bonds | | | | | | | | |
| 5.00% due 10/01/35 | | | 200,000 | | | | 227,868 | |
| Stanton Redevelopment Agency Tax Allocation | | | | | | | | |
| 5.00% due 12/01/40 | | | 180,000 | | | | 203,170 | |
| Culver Redevelopment Agency Successor Agency Tax Allocation | | | | | | | | |
| due 11/01/233 | | | 195,000 | | | | 168,092 | |
| Total California | | | | | | | 8,211,958 | |
| | | | | | | | | |
| Texas - 9.4% |
| Dallas Area Rapid Transit Revenue Bonds | | | | | | | | |
| 5.00% due 12/01/35 | | | 500,000 | | | | 568,340 | |
| 5.00% due 12/01/41 | | | 200,000 | | | | 225,292 | |
| Texas Tech University Revenue Bonds | | | | | | | | |
| 5.00% due 08/15/32 | | | 500,000 | | | | 548,590 | |
| North Texas Tollway Authority Revenue Bonds | | | | | | | | |
| due 01/01/363 | | | 1,000,000 | | | | 518,140 | |
| Birdville Independent School District General Obligation Unlimited | | | | | | | | |
| 5.00% due 02/15/27 | | | 305,000 | | | | 354,919 | |
| Clint Independent School District General Obligation Unlimited | | | | | | | | |
| 5.00% due 08/15/31 | | | 300,000 | | | | 345,372 | |
| State of Texas General Obligation Unlimited | | | | | | | | |
| 5.00% due 10/01/29 | | | 250,000 | | | | 292,473 | |
| Texas Municipal Gas Acquisition & Supply Corporation I Revenue Bonds | | | | | | | | |
| 6.25% due 12/15/26 | | | 200,000 | | | | 234,188 | |
| Central Texas Regional Mobility Authority Revenue Bonds | | | | | | | | |
| 5.00% due 01/01/27 | | | 200,000 | | | | 228,938 | |
| Texas Water Development Board Revenue Bonds | | | | | | | | |
| 5.00% due 10/15/46 | | | 200,000 | | | | 228,782 | |
| Central Texas Turnpike System Revenue Bonds | | | | | | | | |
| 5.00% due 08/15/34 | | | 200,000 | | | | 219,132 | |
| Arlington Higher Education Finance Corp. Revenue Bonds | | | | �� | | | | |
| 5.00% due 12/01/46 | | | 200,000 | | | | 213,302 | |
| Harris County-Houston Sports Authority Revenue Bonds | | | | | | | | |
| due 11/15/533 | | | 1,000,000 | | | | 191,030 | |
| Total Texas | | | | | | | 4,168,498 | |
| | | | | | | | | |
| Illinois - 7.4% |
| Southern Illinois University Revenue Bonds | | | | | | | | |
| 5.00% due 04/01/32 | | | 1,000,000 | | | | 1,024,220 | |
| Will County Township High School District No. 204 Joliet General Obligation Ltd. | | | | | | | | |
| 6.25% due 01/01/31 | | | 500,000 | | | | 555,320 | |
| City of Chicago Illinois Wastewater Transmission Revenue Revenue Bonds | | | | | | | | |
| 5.25% due 01/01/42 | | | 400,000 | | | | 451,996 | |
| Chicago O’Hare International Airport Revenue Bonds | | | | | | | | |
| 5.00% due 01/01/34 | | | 300,000 | | | | 335,211 | |
| Chicago Board of Education General Obligation Unlimited | | | | | | | | |
| 5.25% due 12/01/26 | | | 320,000 | | | | 321,818 | |
| SEE NOTES TO FINANCIAL STATEMENTS. | THE GUGGENHEIM FUNDS SEMI-ANNUAL REPORT | 85 |
| SCHEDULE OF INVESTMENTS (Unaudited)(continued) | March 29, 2018 |
| MUNICIPAL INCOME FUND | |
| | | Face
Amount | | | Value | |
| | | | | | | |
| Metropolitan Water Reclamation District of Greater Chicago General Obligation Unlimited | | | | | | |
| 5.00% due 12/01/25 | | $ | 200,000 | | | $ | 232,086 | |
| University of Illinois Revenue Bonds | | | | | | | | |
| 6.00% due 10/01/29 | | | 200,000 | | | | 228,768 | |
| Metropolitan Pier & Exposition Authority Revenue Bonds | | | | | | | | |
| due 06/15/453 | | | 500,000 | | | | 143,590 | |
| Total Illinois | | | | | | | 3,293,009 | |
| | | | | | | | | |
| Michigan - 6.0% |
| Detroit Wayne County Stadium Authority Revenue Bonds | | | | | | | | |
| 5.00% due 10/01/26 | | | 1,490,000 | | | | 1,601,437 | |
| Detroit City School District General Obligation Unlimited | | | | | | | | |
| 5.00% due 05/01/32 | | | 500,000 | | | | 544,720 | |
| 5.00% due 05/01/30 | | | 300,000 | | | | 327,801 | |
| City of Detroit Michigan Water Supply System Revenue Revenue Bonds | | | | | | | | |
| 5.00% due 07/01/41 | | | 200,000 | | | | 211,634 | |
| Total Michigan | | | | | | | 2,685,592 | |
| | | | | | | | | |
| New York - 6.0% |
| New York State Dormitory Authority Revenue Bonds | | | | | | | | |
| 5.00% due 10/01/41 | | | 350,000 | | | | 378,990 | |
| 5.00% due 12/01/274 | | | 200,000 | | | | 222,998 | |
| New York City Transitional Finance Authority Future Tax Secured Revenue Revenue Bonds | | | | | | | | |
| 5.00% due 11/01/29 | | | 500,000 | | | | 579,805 | |
| City of New York New York General Obligation Unlimited | | | | | | | | |
| 5.00% due 08/01/28 | | | 500,000 | | | | 578,855 | |
| New York Transportation Development Corp. Revenue Bonds | | | | | | | | |
| 5.00% due 07/01/34 | | | 200,000 | | | | 219,390 | |
| 5.00% due 08/01/26 | | | 200,000 | | | | 212,440 | |
| New York State Urban Development Corp. Revenue Bonds | | | | | | | | |
| 5.00% due 03/15/35 | | | 250,000 | | | | 280,967 | |
| Westchester County Healthcare Corp. Revenue Bonds | | | | | | | | |
| 5.00% due 11/01/44 | | | 197,000 | | | | 210,508 | |
| Total New York | | | | | | | 2,683,953 | |
| | | | | | | | | |
| New Jersey - 5.1% |
| Hudson County Improvement Authority Revenue Bonds | | | | | | | | |
| 6.00% due 01/01/40 | | | 1,000,000 | | | | 1,068,920 | |
| New Jersey Health Care Facilities Financing Authority Revenue Bonds | | | | | | | | |
| 5.00% due 07/01/41 | | | 300,000 | | | | 322,182 | |
| 5.00% due 07/01/36 | | | 200,000 | | | | 215,372 | |
| New Jersey Turnpike Authority Revenue Bonds | | | | | | | | |
| 5.00% due 01/01/31 | | | 300,000 | | | | 352,020 | |
| New Jersey Economic Development Authority Revenue Bonds | | | | | | | | |
| 5.00% due 06/01/28 | | | 250,000 | | | | 288,482 | |
| Total New Jersey | | | | | | | 2,246,976 | |
| | | | | | | | | |
| Pennsylvania - 4.6% |
| Pennsylvania Economic Development Financing Authority Revenue Bonds | | | | | | | | |
| 5.00% due 03/15/31 | | | 500,000 | | | | 572,540 | |
| 5.00% due 02/01/27 | | | 500,000 | | | | 568,645 | |
| Pittsburgh Water & Sewer Authority Revenue Bonds | | | | | | | | |
| 5.25% due 09/01/36 | | | 500,000 | | | | 560,300 | |
| Reading School District General Obligation Unlimited | | | | | | | | |
| 5.00% due 02/01/27 | | | 300,000 | | | | 339,552 | |
| Total Pennsylvania | | | | | | | 2,041,037 | |
| | | | | | | | | |
| Washington - 4.2% |
| Greater Wenatchee Regional Events Center Public Facilities Dist Revenue Bonds | | | | | | | | |
| 5.00% due 09/01/27 | | | 500,000 | | | | 514,515 | |
| 5.25% due 09/01/32 | | | 500,000 | | | | 513,220 | |
| King County School District No. 409 Tahoma General Obligation Unlimited | | | | | | | | |
| 5.00% due 12/01/27 | | | 325,000 | | | | 379,837 | |
| Central Puget Sound Regional Transit Authority Revenue Bonds | | | | | | | | |
| 5.00% due 11/01/41 | | | 200,000 | | | | 230,050 | |
| State of Washington General Obligation Unlimited | | | | | | | | |
| 5.00% due 06/01/41 | | | 195,000 | | | | 209,660 | |
| Total Washington | | | | | | | 1,847,282 | |
| | | | | | | | | |
| District of Columbia - 3.2% |
| District of Columbia General Obligation Unlimited | | | | | | | | |
| 5.00% due 06/01/41 | | | 285,000 | | | | 325,313 | |
| 5.00% due 06/01/32 | | | 275,000 | | | | 311,003 | |
| 5.00% due 06/01/31 | | | 175,000 | | | | 205,746 | |
| District of Columbia Water & Sewer Authority Revenue Bonds | | | | | | | | |
| 5.00% due 10/01/45 | | | 500,000 | | | | 567,390 | |
| Total District of Columbia | | | | | | | 1,409,452 | |
| | | | | | | | | |
| Puerto Rico - 3.2% |
| Puerto Rico Electric Power Authority Revenue Bonds | | | | | | | | |
| 1.65% (3 Month USD LIBOR + 0.52%) due 07/01/295 | | | 1,000,000 | | | | 875,000 | |
| Puerto Rico Highway & Transportation Authority Revenue Bonds | | | | | | | | |
| 5.25% due 07/01/41 | | | 250,000 | | | | 267,612 | |
| 86 | THE GUGGENHEIM FUNDS SEMI-ANNUAL REPORT | SEE NOTES TO FINANCIAL STATEMENTS. |
| SCHEDULE OF INVESTMENTS (Unaudited)(continued) | March 29, 2018 |
| MUNICIPAL INCOME FUND | |
| | | Face
Amount | | | Value | |
| | | | | | | |
| Puerto Rico Public Buildings Authority Revenue Bonds | | | | | | |
| 6.00% due 07/01/23 | | $ | 250,000 | | | $ | 260,468 | |
| Total Puerto Rico | | | | | | | 1,403,080 | |
| | | | | | | | | |
| Florida - 2.8% |
| School Board of Miami-Dade County Certificate Of Participation | | | | | | | | |
| 5.00% due 05/01/27 | | | 500,000 | | | | 570,170 | |
| Miami Beach Redevelopment Agency Tax Allocation | | | | | | | | |
| 5.00% due 02/01/40 | | | 300,000 | | | | 336,279 | |
| City of Jacksonville Florida Revenue Bonds | | | | | | | | |
| 5.00% due 10/01/29 | | | 300,000 | | | | 330,891 | |
| Total Florida | | | | | | | 1,237,340 | |
| | | | | | | | | |
| Louisiana - 2.8% |
| Louisiana Local Government Environmental Facilities & Community Development Authority Revenue Bonds | | | | | | | | |
| 5.00% due 10/01/37 | | | 500,000 | | | | 556,030 | |
| 5.00% due 10/01/26 | | | 150,000 | | | | 175,041 | |
| City of Shreveport Louisiana Water & Sewer Revenue Revenue Bonds | | | | | | | | |
| 5.00% due 12/01/35 | | | 250,000 | | | | 285,348 | |
| Louisiana Public Facilities Authority Revenue Bonds | | | | | | | | |
| 5.00% due 07/01/39 | | | 200,000 | | | | 220,384 | |
| Total Louisiana | | | | | | | 1,236,803 | |
| | | | | | | | | |
| Massachusetts - 2.5% |
| Massachusetts Development Finance Agency Revenue Bonds | | | | | | | | |
| 6.88% due 01/01/21 | | | 600,000 | | | | 677,190 | |
| 6.88% due 01/01/41 | | | 400,000 | | | | 449,632 | |
| Total Massachusetts | | | | | | | 1,126,822 | |
| | | | | | | | | |
| Colorado - 2.2% |
| University of Colorado Revenue Bonds | | | | | | | | |
| 5.00% due 06/01/22 | | | 285,000 | | | | 319,176 | |
| 5.00% due 06/01/41 | | | 200,000 | | | | 228,912 | |
| Auraria Higher Education Center Revenue Bonds | | | | | | | | |
| 5.00% due 04/01/28 | | | 390,000 | | | | 446,023 | |
| Total Colorado | | | | | | | 994,111 | |
| | | | | | | | | |
| West Virginia - 2.0% |
| West Virginia Higher Education Policy Commission Revenue Bonds | | | | | | | | |
| 5.00% due 04/01/29 | | | 500,000 | | | | 546,640 | |
| West Virginia Hospital Finance Authority Revenue Bonds | | | | | | | | |
| 5.00% due 06/01/42 | | | 300,000 | | | | 329,322 | |
| Total West Virginia | | | | | | | 875,962 | |
| | | | | | | | | |
| Arizona - 1.8% |
| Arizona State University Revenue Bonds | | | | | | | | |
| 5.00% due 07/01/34 | | | 500,000 | | | | 571,300 | |
| Salt Verde Financial Corp. Revenue Bonds | | | | | | | | |
| 5.00% due 12/01/32 | | | 200,000 | | | | 234,670 | |
| Total Arizona | | | | | | | 805,970 | |
| | | | | | | | | |
| Georgia - 1.8% |
| City of Atlanta Georgia Water & Wastewater Revenue Revenue Bonds | | | | | | | | |
| 5.00% due 11/01/40 | | | 500,000 | | | | 566,395 | |
| Savannah Economic Development Authority Revenue Bonds | | | | | | | | |
| 5.00% due 12/01/28 | | | 200,000 | | | | 231,336 | |
| Total Georgia | | | | | | | 797,731 | |
| | | | | | | | | |
| Ohio - 1.8% |
| University of Cincinnati Revenue Bonds | | | | | | | | |
| 5.00% due 06/01/36 | | | 500,000 | | | | 563,490 | |
| American Municipal Power, Inc. Revenue Bonds | | | | | | | | |
| 5.00% due 02/15/41 | | | 200,000 | | | | 222,794 | |
| Total Ohio | | | | | | | 786,284 | |
| | | | | | | | | |
| Mississippi - 1.8% |
| Mississippi Development Bank Revenue Bonds | | | | | | | | |
| 6.50% due 10/01/31 | | | 500,000 | | | | 536,175 | |
| 6.25% due 10/01/26 | | | 230,000 | | | | 245,792 | |
| Total Mississippi | | | | | | | 781,967 | |
| | | | | | | | | |
| Virginia - 1.4% |
| County of Fairfax Virginia General Obligation Unlimited | | | | | | | | |
| 5.00% due 10/01/32 | | | 300,000 | | | | 352,380 | |
| Virginia College Building Authority Revenue Bonds | | | | | | | | |
| 5.00% due 02/01/25 | | | 250,000 | | | | 293,108 | |
| Total Virginia | | | | | | | 645,488 | |
| | | | | | | | | |
| Kentucky - 1.0% |
| Kentucky Economic Development Finance Authority Revenue Bonds | | | | | | | | |
| 5.00% due 07/01/37 | | | 200,000 | | | | 217,120 | |
| City of Ashland Kentucky Revenue Bonds | | | | | | | | |
| 5.00% due 02/01/22 | | | 200,000 | | | | 208,252 | |
| Total Kentucky | | | | | | | 425,372 | |
| | | | | | | | | |
| Oklahoma - 0.9% |
| Oklahoma Development Finance Authority Revenue Bonds | | | | | | | | |
| 5.00% due 08/15/28 | | | 350,000 | | | | 399,871 | |
| | | | | | | | | |
| South Carolina - 0.8% |
| Anderson County School District No. 5 General Obligation Unlimited | | | | | | | | |
| 5.00% due 03/01/27 | | | 300,000 | | | | 351,879 | |
| SEE NOTES TO FINANCIAL STATEMENTS. | THE GUGGENHEIM FUNDS SEMI-ANNUAL REPORT | 87 |
| SCHEDULE OF INVESTMENTS (Unaudited)(concluded) | March 29, 2018 |
| MUNICIPAL INCOME FUND | |
| | | Face
Amount | | | Value | |
| | | | | | | |
| North Carolina - 0.8% |
| North Carolina Turnpike Authority Revenue Bonds | | | | | | |
| 5.00% due 01/01/27 | | $ | 300,000 | | | $ | 349,347 | |
| | | | | | | | | |
| Nevada - 0.6% |
| Las Vegas Valley Water District General Obligation Ltd. | | | | | | | | |
| 5.00% due 06/01/27 | | | 230,000 | | | | 266,335 | |
| | | | | | | | | |
| Vermont - 0.5% |
| Vermont Educational & Health Buildings Financing Agency Revenue Bonds | | | | | | | | |
| 5.00% due 12/01/46 | | | 200,000 | | | | 220,830 | |
| Total Municipal Bonds | | | | | | | | |
| (Cost $40,687,647) | | | | | | | 41,292,949 | |
| | | | | | | | | |
| Total Investments - 100.3% | | | | | | | | |
| (Cost $43,860,229) | | | | | | $ | 44,465,531 | |
| Other Assets & Liabilities, net - (0.3)% | | | | | | | (121,543 | ) |
| Total Net Assets - 100.0% | | | | | | $ | 44,343,988 | |
| † | Value determined based on Level 1 inputs — See Note 4. |
| †† | Value determined based on Level 2 inputs — See Note 4. |
| 1 | Rate indicated is the 7 day yield as of March 29, 2018. |
| 2 | Security is a step up/step down bond. The coupon increases or decreases at regular intervals until the bond reaches full maturity. |
| 3 | Zero coupon rate security. |
| 4 | Security is a 144A or Section 4(a)(2) security. These securities have been determined to be liquid under guidelines established by the Board of Trustees. The total market value of 144A or Section 4(a)(2) securities is $222,998 (cost $217,617), or 0.5% of total net assets. |
| 5 | Variable rate security. Rate indicated is the rate effective at March 29, 2018. |
| | LIBOR — London Interbank Offered Rate |
| | |
| | See Sector Classification in Other Information section. |
The following table summarizes the inputs used to value the Fund’s investments at March 29, 2018 (See Note 4 in the Notes to Financial Statements):
| Investments in Securities (Assets) | | Level 1
Quoted
Prices | | | Level 2
Significant
Observable
Inputs | | | Level 3
Significant
Unobservable
Inputs | | | Total | |
| Money Market Fund | | $ | 3,172,582 | | | $ | — | | | $ | — | | | $ | 3,172,582 | |
| Municipal Bonds | | | — | | | | 41,292,949 | | | | — | | | | 41,292,949 | |
| Total Assets | | $ | 3,172,582 | | | $ | 41,292,949 | | | $ | — | | | $ | 44,465,531 | |
Transfers between investment levels may occur as the markets fluctuate and/or the availability of data used in an investment’s valuation changes. Transfers between valuation levels, if any, are in comparison to the valuation levels at the end of the previous fiscal year, and are effective using the fair value as of the end of the current fiscal period.
For the period ended March 29, 2018, there were no transfers between levels.
| 88 | THE GUGGENHEIM FUNDS SEMI-ANNUAL REPORT | SEE NOTES TO FINANCIAL STATEMENTS. |
| STATEMENT OF ASSETS AND LIABILITIES (Unaudited) |
| March 29, 2018 |
| Assets: |
| Investments, at value (cost $43,860,229) | | $ | 44,465,531 | |
| Cash | | | 12 | |
| Prepaid expenses | | | 46,922 | |
| Receivables: |
| Interest | | | 545,423 | |
| From adviser | | | 8,470 | |
| Fund shares sold | | | 4,054 | |
| Total assets | | | 45,070,412 | |
| | | | | |
| Liabilities: |
| Payable for: |
| Securities purchased | | | 395,941 | |
| Fund shares redeemed | | | 267,146 | |
| Transfer agent/maintenance fees | | | 12,153 | |
| Distribution and service fees | | | 8,844 | |
| Fund accounting/administration fees | | | 3,226 | |
| Trustees’ fees* | | | 503 | |
| Miscellaneous | | | 38,611 | |
| Total liabilities | | | 726,424 | |
| Net assets | | $ | 44,343,988 | |
| | | | | |
| Net assets consist of: |
| Paid in capital | | $ | 43,784,360 | |
| Accumulated net investment loss | | | (1 | ) |
| Accumulated net realized loss on investments | | | (45,673 | ) |
| Net unrealized appreciation on investments | | | 605,302 | |
| Net assets | | $ | 44,343,988 | |
| | | | | |
| A-Class: |
| Net assets | | $ | 28,169,399 | |
| Capital shares outstanding | | | 2,245,274 | |
| Net asset value per share | | $ | 12.55 | |
| Maximum offering price per share (Net asset value divided by 96.00%) | | $ | 13.07 | |
| | | | | |
| C-Class: |
| Net assets | | $ | 2,890,239 | |
| Capital shares outstanding | | | 230,532 | |
| Net asset value per share | | $ | 12.54 | |
| | | | | |
| P-Class: |
| Net assets | | $ | 33,751 | |
| Capital shares outstanding | | | 2,690 | |
| Net asset value per share | | $ | 12.55 | |
| | | | | |
| Institutional Class: |
| Net assets | | $ | 13,250,599 | |
| Capital shares outstanding | | | 1,055,916 | |
| Net asset value per share | | $ | 12.55 | |
| STATEMENT OF OPERATIONS (Unaudited) |
| Period Ended March 29, 2018 |
| Investment Income: |
| Interest | | $ | 781,987 | |
| Total investment income | | | 781,987 | |
| | | | | |
| Expenses: |
| Management fees | | | 125,719 | |
| Distribution and service fees: |
| A-Class | | | 39,577 | |
| C-Class | | | 17,435 | |
| P-Class | | | 128 | |
| Transfer agent/maintenance fees: |
| A-Class | | | 14,793 | |
| C-Class | | | 2,619 | |
| P-Class | | | 192 | |
| Institutional Class | | | 9,970 | |
| Registration fees | | | 42,850 | |
| Fund accounting/administration fees | | | 20,115 | |
| Trustees’ fees* | | | 4,211 | |
| Line of credit fees | | | 2,430 | |
| Custodian fees | | | 1,247 | |
| Miscellaneous | | | 34,520 | |
| Total expenses | | | 315,806 | |
| Less: |
| Expenses waived by Adviser | | | (83,364 | ) |
| Expenses reimbursed by Adviser: |
| A-Class | | | (19,213 | ) |
| C-Class | | | (3,106 | ) |
| P-Class | | | (202 | ) |
| Institutional Class | | | (12,060 | ) |
| Total waived/reimbursed expenses | | | (117,945 | ) |
| Net expenses | | | 197,861 | |
| Net investment income | | | 584,126 | |
| | | | | |
| Net Realized and Unrealized Gain (Loss): |
| Net realized gain (loss) on: |
| Investments | | | 174,691 | |
| Net realized gain | | | 174,691 | |
| Net change in unrealized appreciation (depreciation) on: |
| Investments | | | (791,931 | ) |
| Net change in unrealized appreciation (depreciation) | | | (791,931 | ) |
| Net realized and unrealized loss | | | (617,240 | ) |
| Net decrease in net assets resulting from operations | | $ | (33,114 | ) |
| * | Relates to Trustees not deemed “interested persons” within the meaning of Section 2(a)(19) of the 1940 Act. |
| SEE NOTES TO FINANCIAL STATEMENTS. | THE GUGGENHEIM FUNDS SEMI-ANNUAL REPORT | 89 |
| STATEMENTS OF CHANGES IN NET ASSETS |
| | | Period Ended
March 29,
2018
(Unaudited) | | | Year Ended
September 30,
2017 | |
| Increase (Decrease) in Net Assets from Operations: | | | | | | | | |
| Net investment income | | $ | 584,126 | | | $ | 1,254,911 | |
| Net realized gain on investments | | | 174,691 | | | | 97,853 | |
| Net change in unrealized appreciation (depreciation) on investments | | | (791,931 | ) | | | (1,468,356 | ) |
| Net decrease in net assets resulting from operations | | | (33,114 | ) | | | (115,592 | ) |
| | | | | | | | | |
| Distributions to shareholders from: | | | | | | | | |
| Net investment income | | | | | | | | |
| A-Class | | | (364,175 | ) | | | (738,549 | ) |
| C-Class | | | (27,091 | ) | | | (60,391 | ) |
| P-Class | | | (1,176 | ) | | | (3,433 | ) |
| Institutional Class | | | (191,684 | ) | | | (452,538 | ) |
| Total distributions to shareholders | | | (584,126 | ) | | | (1,254,911 | ) |
| | | | | | | | | |
| Capital share transactions: | | | | | | | | |
| Proceeds from sale of shares | | | | | | | | |
| A-Class | | | 1,282,892 | | | | 5,199,658 | |
| C-Class | | | 187,841 | | | | 635,500 | |
| P-Class | | | 5,343 | | | | 1,524,469 | |
| Institutional Class | | | 2,977,864 | | | | 8,142,777 | |
| Distributions reinvested | | | | | | | | |
| A-Class | | | 237,362 | | | | 452,402 | |
| C-Class | | | 18,819 | | | | 39,874 | |
| P-Class | | | 1,171 | | | | 3,433 | |
| Institutional Class | | | 149,232 | | | | 328,132 | |
| Cost of shares redeemed | | | | | | | | |
| A-Class | | | (6,479,475 | ) | | | (12,747,143 | ) |
| C-Class | | | (1,042,169 | ) | | | (1,820,406 | ) |
| P-Class | | | (82,171 | ) | | | (1,502,111 | ) |
| Institutional Class | | | (5,603,322 | ) | | | (16,080,038 | ) |
| Net decrease from capital share transactions | | | (8,346,613 | ) | | | (15,823,453 | ) |
| Net decrease in net assets | | | (8,963,853 | ) | | | (17,193,956 | ) |
| | | | | | | | | |
| Net assets: | | | | | | | | |
| Beginning of period | | | 53,307,841 | | | | 70,501,797 | |
| End of period | | $ | 44,343,988 | | | $ | 53,307,841 | |
| Accumulated net investment loss at end of period | | $ | (1 | ) | | $ | (1 | ) |
| | | | | | | | | |
| Capital share activity: | | | | | | | | |
| Shares sold | | | | | | | | |
| A-Class | | | 101,135 | | | | 409,886 | |
| C-Class | | | 14,811 | | | | 50,491 | |
| P-Class | | | 421 | | | | 122,127 | |
| Institutional Class | | | 235,334 | | | | 644,462 | |
| Shares issued from reinvestment of distributions | | | | | | | | |
| A-Class | | | 18,775 | | | | 36,078 | |
| C-Class | | | 1,489 | | | | 3,184 | |
| P-Class | | | 93 | | | | 274 | |
| Institutional Class | | | 11,802 | | | | 26,193 | |
| Shares redeemed | | | | | | | | |
| A-Class | | | (512,836 | ) | | | (1,016,892 | ) |
| C-Class | | | (82,628 | ) | | | (146,400 | ) |
| P-Class | | | (6,558 | ) | | | (120,222 | ) |
| Institutional Class | | | (443,623 | ) | | | (1,293,270 | ) |
| Net decrease in shares | | | (661,785 | ) | | | (1,284,089 | ) |
| 90 | THE GUGGENHEIM FUNDS SEMI-ANNUAL REPORT | SEE NOTES TO FINANCIAL STATEMENTS. |
This table is presented to show selected data for a share outstanding throughout each period and to assist shareholders in evaluating a Fund’s performance for the periods presented.
| A-Class | | Period Ended
March 29,
2018a | | | Year Ended
September 30,
2017 | | | Year Ended
September 30,
2016 | | | Year Ended
September 30,
2015 | | | Year Ended
September 30,
2014 | | | Year Ended
September 30,
2013 | |
| Per Share Data | | | | | | | | | | | | | | | | | | |
| Net asset value, beginning of period | | $ | 12.70 | | | $ | 12.86 | | | $ | 12.52 | | | $ | 12.51 | | | $ | 11.59 | | | $ | 12.59 | |
| Income (loss) from investment operations: |
| Net investment income (loss)b | | | .15 | | | | .27 | | | | .26 | | | | .29 | | | | .36 | | | | .38 | |
| Net gain (loss) on investments (realized and unrealized) | | | (.15 | ) | | | (.15 | ) | | | .34 | | | | .01 | | | | .92 | | | | (1.00 | ) |
| Total from investment operations | | | — | | | | .12 | | | | .60 | | | | .30 | | | | 1.28 | | | | (.62 | ) |
| Less distributions from: |
| Net investment income | | | (.15 | ) | | | (.28 | ) | | | (.26 | ) | | | (.29 | ) | | | (.36 | ) | | | (.38 | ) |
| Total distributions | | | (.15 | ) | | | (.28 | ) | | | (.26 | ) | | | (.29 | ) | | | (.36 | ) | | | (.38 | ) |
| Net asset value, end of period | | $ | 12.55 | | | $ | 12.70 | | | $ | 12.86 | | | $ | 12.52 | | | $ | 12.51 | | | $ | 11.59 | |
| |
| Total Returnf | | | (0.04 | %) | | | 0.94 | % | | | 4.85 | % | | | 2.39 | % | | | 11.20 | % | | | (5.09 | %) |
| Ratios/Supplemental Data |
| Net assets, end of period (in thousands) | | $ | 28,169 | | | $ | 33,515 | | | $ | 41,283 | | | $ | 49,086 | | | $ | 44,090 | | | $ | 50,463 | |
| Ratios to average net assets: |
| Net investment income (loss) | | | 2.30 | % | | | 2.19 | % | | | 2.06 | % | | | 2.28 | % | | | 3.00 | % | | | 3.04 | % |
| Total expenses | | | 1.26 | % | | | 1.20 | % | | | 1.18 | % | | | 1.17 | % | | | 1.29 | % | | | 1.14 | % |
| Net expensesc,e | | | 0.81 | % | | | 0.82 | % | | | 0.81 | % | | | 0.81 | % | | | 0.83 | % | | | 0.82 | % |
| Portfolio turnover rate | | | 5 | % | | | 31 | % | | | 61 | % | | | 80 | % | | | 173 | % | | | 91 | % |
| C-Class | | Period Ended
March 29,
2018a | | | Year Ended
September 30,
2017 | | | Year Ended
September 30,
2016 | | | Year Ended
September 30,
2015 | | | Year Ended
September 30,
2014 | | | Year Ended
September 30,
2013 | |
| Per Share Data | | | | | | | | | | | | | | | | | | |
| Net asset value, beginning of period | | $ | 12.69 | | | $ | 12.86 | | | $ | 12.52 | | | $ | 12.50 | | | $ | 11.59 | | | $ | 12.58 | |
| Income (loss) from investment operations: |
| Net investment income (loss)b | | | .10 | | | | .18 | | | | .16 | | | | .19 | | | | .27 | | | | .28 | |
| Net gain (loss) on investments (realized and unrealized) | | | (.15 | ) | | | (.17 | ) | | | .35 | | | | .02 | | | | .91 | | | | (.98 | ) |
| Total from investment operations | | | (.05 | ) | | | .01 | | | | .51 | | | | .21 | | | | 1.18 | | | | (.70 | ) |
| Less distributions from: |
| Net investment income | | | (.10 | ) | | | (.18 | ) | | | (.17 | ) | | | (.19 | ) | | | (.27 | ) | �� | | (.29 | ) |
| Total distributions | | | (.10 | ) | | | (.18 | ) | | | (.17 | ) | | | (.19 | ) | | | (.27 | ) | | | (.29 | ) |
| Net asset value, end of period | | $ | 12.54 | | | $ | 12.69 | | | $ | 12.86 | | | $ | 12.52 | | | $ | 12.50 | | | $ | 11.59 | |
| |
| Total Returnf | | | (0.41 | %) | | | 0.12 | % | | | 4.06 | % | | | 1.71 | % | | | 10.28 | % | | | (5.70 | %) |
| Ratios/Supplemental Data |
| Net assets, end of period (in thousands) | | $ | 2,890 | | | $ | 3,768 | | | $ | 5,008 | | | $ | 2,472 | | | $ | 1,082 | | | $ | 1,495 | |
| Ratios to average net assets: |
| Net investment income (loss) | | | 1.55 | % | | | 1.44 | % | | | 1.26 | % | | | 1.54 | % | | | 2.24 | % | | | 2.30 | % |
| Total expenses | | | 2.07 | % | | | 1.92 | % | | | 1.89 | % | | | 1.87 | % | | | 2.08 | % | | | 1.93 | % |
| Net expensesc,e | | | 1.56 | % | | | 1.57 | % | | | 1.56 | % | | | 1.56 | % | | | 1.58 | % | | | 1.57 | % |
| Portfolio turnover rate | | | 5 | % | | | 31 | % | | | 61 | % | | | 80 | % | | | 173 | % | | | 91 | % |
| SEE NOTES TO FINANCIAL STATEMENTS. | THE GUGGENHEIM FUNDS SEMI-ANNUAL REPORT | 91 |
| FINANCIAL HIGHLIGHTS (continued) |
This table is presented to show selected data for a share outstanding throughout each period and to assist shareholders in evaluating a Fund’s performance for the periods presented.
| P-Class | | Period Ended
March 29,
2018a | | | Year Ended
September 30,
2017 | | | Year Ended
September 30,
2016 | | | Period Ended
September 30,
2015d | |
| Per Share Data | | | | | | | | | | | | |
| Net asset value, beginning of period | | $ | 12.70 | | | $ | 12.86 | | | $ | 12.52 | | | $ | 12.64 | |
| Income (loss) from investment operations: |
| Net investment income (loss)b | | | .15 | | | | .25 | | | | .26 | | | | .13 | |
| Net gain (loss) on investments (realized and unrealized) | | | (.15 | ) | | | (.14 | ) | | | .34 | | | | (.12 | ) |
| Total from investment operations | | | — | | | | .11 | | | | .60 | | | | .01 | |
| Less distributions from: |
| Net investment income | | | (.15 | ) | | | (.27 | ) | | | (.26 | ) | | | (.13 | ) |
| Total distributions | | | (.15 | ) | | | (.27 | ) | | | (.26 | ) | | | (.13 | ) |
| Net asset value, end of period | | $ | 12.55 | | | $ | 12.70 | | | $ | 12.86 | | | $ | 12.52 | |
| |
| Total Returnf | | | (0.04 | %) | | | 0.89 | % | | | 4.86 | % | | | 0.06 | % |
| Ratios/Supplemental Data |
| Net assets, end of period (in thousands) | | $ | 34 | | | $ | 111 | | | $ | 84 | | | $ | 10 | |
| Ratios to average net assets: |
| Net investment income (loss) | | | 2.30 | % | | | 2.01 | % | | | 2.00 | % | | | 2.46 | % |
| Total expenses | | | 1.52 | % | | | 1.27 | % | | | 1.21 | % | | | 3.17 | % |
| Net expensesc,e | | | 0.81 | % | | | 0.82 | %d | | | 0.79 | % | | | 0.81 | % |
| Portfolio turnover rate | | | 5 | % | | | 31 | % | | | 61 | % | | | 80 | % |
| 92 | THE GUGGENHEIM FUNDS SEMI-ANNUAL REPORT | SEE NOTES TO FINANCIAL STATEMENTS. |
| FINANCIAL HIGHLIGHTS (concluded) |
This table is presented to show selected data for a share outstanding throughout each period and to assist shareholders in evaluating a Fund’s performance for the periods presented.
| Institutional Class | | Period Ended
March 29,
2018a | | | Year Ended
September 30,
2017 | | | Year Ended
September 30,
2016 | | | Year Ended
September 30,
2015 | | | Year Ended
September 30,
2014 | | | Year Ended
September 30,
2013 | |
| Per Share Data | | | | | | | | | | | | | | | | | | |
| Net asset value, beginning of period | | $ | 12.71 | | | $ | 12.87 | | | $ | 12.53 | | | $ | 12.51 | | | $ | 11.60 | | | $ | 12.59 | |
| Income (loss) from investment operations: |
| Net investment income (loss)b | | | .16 | | | | .30 | | | | .29 | | | | .32 | | | | .39 | | | | .40 | |
| Net gain (loss) on investments (realized and unrealized) | | | (.16 | ) | | | (.15 | ) | | | .34 | | | | .02 | | | | .91 | | | | (.98 | ) |
| Total from investment operations | | | — | | | | .15 | | | | .63 | | | | .34 | | | | 1.30 | | | | (.58 | ) |
| Less distributions from: |
| Net investment income | | | (.16 | ) | | | (.31 | ) | | | (.29 | ) | | | (.32 | ) | | | (.39 | ) | | | (.41 | ) |
| Total distributions | | | (.16 | ) | | | (.31 | ) | | | (.29 | ) | | | (.32 | ) | | | (.39 | ) | | | (.41 | ) |
| Net asset value, end of period | | $ | 12.55 | | | $ | 12.71 | | | $ | 12.87 | | | $ | 12.53 | | | $ | 12.51 | | | $ | 11.60 | |
| |
| Total Returnf | | | 0.01 | % | | | 1.19 | % | | | 5.11 | % | | | 2.73 | % | | | 11.38 | % | | | (4.76 | %) |
| Ratios/Supplemental Data |
| Net assets, end of period (in thousands) | | $ | 13,251 | | | $ | 15,914 | | | $ | 24,126 | | | $ | 8,564 | | | $ | 6,451 | | | $ | 6,343 | |
| Ratios to average net assets: |
| Net investment income (loss) | | | 2.55 | % | | | 2.43 | % | | | 2.24 | % | | | 2.53 | % | | | 3.23 | % | | | 3.35 | % |
| Total expenses | | | 1.05 | % | | | 0.88 | % | | | 0.84 | % | | | 0.89 | % | | | 0.97 | % | | | 0.93 | % |
| Net expensesc,e | | | 0.56 | % | | | 0.57 | % | | | 0.56 | % | | | 0.56 | % | | | 0.58 | % | | | 0.57 | % |
| Portfolio turnover rate | | | 5 | % | | | 31 | % | | | 61 | % | | | 80 | % | | | 173 | % | | | 91 | % |
| a | Unaudited figures for the period ended March 29, 2018. Percentage amounts for the period, except total return and portfolio turnover rate, have been annualized. |
| b | Net investment income (loss) per share was computed using average shares outstanding throughout the period. |
| c | Net expense information reflects the expense ratios after expense waivers and reimbursements, as applicable. |
| d | Since commencement of operations: May 1, 2015. Percentage amounts for the period, except total return and portfolio turnover rate, have been annualized. |
| e | Net expense may include expenses that are excluded from the expense limitation agreement. Excluding these expenses, the net expense ratios for the periods would be: |
| | | 03/29/18 | 09/30/17 | 09/30/16 | 09/30/15 | 09/30/14 |
| | A-Class | 0.80% | 0.80% | 0.80% | 0.80% | 0.80% |
| | C-Class | 1.55% | 1.55% | 1.55% | 1.55% | 1.54% |
| | P-Class | 0.80% | 0.80% | 0.78% | 0.81% | — |
| | Institutional Class | 0.55% | 0.55% | 0.55% | 0.55% | 0.55% |
| f | Total return does not reflect the impact of any applicable sales charges and has not been annualized. |
| SEE NOTES TO FINANCIAL STATEMENTS. | THE GUGGENHEIM FUNDS SEMI-ANNUAL REPORT | 93 |
| NOTES TO FINANCIAL STATEMENTS (Unaudited) |
Note 1 – Organization and Significant Accounting Policies
Organization
Guggenheim Funds Trust (the “Trust”), a Delaware statutory trust, is registered with the SEC under the Investment Company Act of 1940 (“1940 Act”), as an open-ended investment company of the series type. Each series, in effect, is representing a separate Fund. The Trust is authorized to issue an unlimited number of shares. The Trust accounts for the assets of each Fund separately.
The Trust offers a combination of five separate classes of shares, A-Class shares, C-Class shares, P-Class shares, R6-Class shares and Institutional Class shares. Sales of shares of each Class are made without a front-end sales charge at the net asset value per share (“NAV”), with the exception of A-Class shares. A-Class shares are sold at the NAV, plus the applicable front-end sales charge. The sales charge varies depending on the amount purchased. A-Class share purchases of $1 million or more are exempt from the front-end sales charge but have a 1% contingent deferred sales charge (“CDSC”), if shares are redeemed within 12 months of purchase. C-Class shares have a 1% CDSC if shares are redeemed within 12 months of purchase. Institutional Class shares are offered primarily for direct investment by institutions such as pension and profit sharing plans, endowments, foundations and corporations. Institutional Class shares require a minimum initial investment of $2 million and a minimum account balance of $1 million. R6-Class shares of the Fund are offered primarily through qualified retirement and benefit plans. R6-Class shares are also offered through certain other plans and platforms sponsored by financial intermediaries. Certain institutional investors and others deemed appropriate by the Investment Advisers may also be eligible to purchase R6-Class shares subject to a $2 million minimum initial investment. At March 29, 2018, the Trust consisted of nineteen funds.
As of January 1, 2012, A-Class, C-Class and Institutional Class shares of High Yield Fund are subject to a 2% redemption fee when shares are redeemed or exchanged within 90 days of purchase.
This report covers the Diversified Income Fund, High Yield Fund, Investment Grade Bond Fund, Limited Duration Fund and Municipal Income Fund (the “Funds”), each a diversified investment company. Only A-Class, C-Class, P-Class, and Institutional Class shares had been issued by the Funds. R6-Class shares had been issued by the High Yield Fund only.
Security Investors, LLC and Guggenheim Partners Investment Management, LLC (“GPIM”), which operate under Guggenheim Investments (“GI”), provide advisory services. Guggenheim Funds Distributors, LLC (“GFD” or the “Distributor”) acts as principal underwriter for the Trust. GI and GFD are affiliated entities.
GPIM, an affiliate of GI, serves as investment sub-advisor (the “Sub-Advisor”) to the Municipal Income Fund and is responsible for the day-to-day management of the Fund’s portfolio.
Significant Accounting Policies
March 29, 2018 represents the last day during the Funds’ semi-annual period on which the New York Stock Exchange (“NYSE”) was open for trading. The Funds’ financial statements have been presented through that date to maintain consistency with the Funds’ NAV calculations used for shareholder transactions.
The Funds operate as investment companies and, accordingly, follow the investment company accounting and reporting guidance of the Financial Accounting Standards Board (“FASB”) Accounting Standards Codification Topic 946 Financial Services – Investment Companies.
The following significant accounting policies are in conformity with U.S. generally accepted accounting principles (“U.S. GAAP”) and are consistently followed by the Trust. This requires management to make estimates and assumptions that affect the reported amount of assets and liabilities, contingent assets and liabilities at the date of the financial statements, and the reported amounts of revenues and expenses during the reporting period. Actual results could differ from these estimates. All time references are based on Eastern Time.
The NAV of each Class of a fund is calculated by dividing the market value of a fund’s securities and other assets, less all liabilities, attributable to the Class by the number of outstanding shares of the Class.
(a) Valuation of Investments
The Board of Trustees of the Funds (the “Board”) has adopted policies and procedures for the valuation of the Funds’ investments (the “Valuation Procedures”). Pursuant to the Valuation Procedures, the Board has delegated to a valuation committee, consisting of representatives from Guggenheim’s investment management, fund administration, legal and compliance departments (the “Valuation Committee”), the day-to-day responsibility for implementing the Valuation Procedures, including, under most circumstances, the responsibility for determining the fair value of the Funds’ securities and/or other assets.
Valuations of the Funds’ securities are supplied primarily by pricing services appointed pursuant to the processes set forth in the Valuation Procedures. The Valuation Committee convenes monthly, or more frequently as needed, to review the valuation of all assets which have been fair valued for reasonableness. The Funds’ officers, through the Valuation Committee and consistent with the monitoring and review responsibilities set forth in the Valuation Procedures, regularly review procedures used and valuations provided by the pricing services.
| 94 | THE GUGGENHEIM FUNDS SEMI-ANNUAL REPORT | |
| NOTES TO FINANCIAL STATEMENTS (Unaudited)(continued) |
If the pricing service cannot or does not provide a valuation for a particular investment or such valuation is deemed unreliable, such investment is fair valued by the Valuation Committee.
Equity securities listed on an exchange (NYSE or American Stock Exchange) are valued at the last quoted sale price as of the close of business on the NYSE, usually 4:00 p.m. on the valuation date. Equity securities listed on the NASDAQ market system are valued at the NASDAQ Official Closing Price on the valuation date, which may not necessarily represent the last sale price. If there has been no sale on such exchange or NASDAQ on a given day, the security is valued at the closing bid price on that day.
Generally, trading in foreign securities markets is substantially completed each day at various times prior to the close of the NYSE. The values of foreign securities are determined as of the close of such foreign markets or the close of the NYSE, if earlier. All investments quoted in foreign currencies are valued in U.S. dollars on the basis of the foreign currency exchange rates prevailing at the close of U.S. business at 4:00PM. Investments in foreign securities may involve risks not present in domestic investments. The Valuation Committee will determine the current value of such foreign securities by taking into consideration certain factors which may include those discussed above, as well as the following factors, among others: the value of the securities traded on other foreign markets, ADR trading, closed-end fund trading, foreign currency exchange activity, and the trading prices of financial products that are tied to foreign securities. In addition, under the Valuation Procedures, the Valuation Committee and GI are authorized to use prices and other information supplied by a third party pricing vendor in valuing foreign securities.
Open-end investment companies (“mutual funds”) are valued at their NAV as of the close of business, on the valuation date. Exchange-traded funds (“ETFs”) and closed-end investment companies (“CEFs”) are valued at the last quoted sale price.
U.S. Government securities are valued by either independent pricing services, the last traded fill price, or at the reported bid price at the close of business.
Debt securities with a maturity of greater than 60 days at acquisition are valued at prices that reflect broker-dealer supplied valuations or are obtained from independent pricing services, which may consider the trade activity, treasury spreads, yields or price of bonds of comparable quality, coupon, maturity, and type, as well as prices quoted by dealers who make markets in such securities. Short-term debt securities with a maturity of 60 days or less at acquisition are valued at amortized cost, provided such amount approximates market value. Money market funds are valued at net asset value.
Repurchase agreements are valued at amortized cost, provided such amounts approximate market value.
Typically, loans are valued using information provided by an independent third party pricing service which uses broker quotes in a non-active market. If the pricing service cannot or does not provide a valuation for a particular investment or such valuation is deemed unreliable, such investment is fair valued by the Valuation Committee.
Listed options are valued at the Official Settlement Price listed by the exchange, usually as of 4:00 p.m. Long options are valued using the bid price and short options are valued using the ask price. In the event that a settlement price is not available, fair valuation is enacted. Over-the-counter (“OTC”) options are valued using the average bid price (for long options) or average ask price (for short options) obtained from one or more security dealers.
The value of interest rate swap agreements entered into by a Fund is accounted for using the unrealized gain or loss on the agreements that is determined using the spread priced off the previous day’s Chicago Mercantile Exchange (“CME”) price.
Investments for which market quotations are not readily available are fair-valued as determined in good faith by GI, subject to review and approval by the Valuation Committee, pursuant to methods established or ratified by the Board. Valuations in accordance with these methods are intended to reflect each security’s (or asset’s or liabilities) “fair value”. Each such determination is based on a consideration of all relevant factors, which are likely to vary from one pricing context to another. Examples of such factors may include, but are not limited to market prices; sale prices; broker quotes; and models which derive prices based on inputs such as prices of securities with comparable maturities and characteristics, or based on inputs such as anticipated cash flows or collateral, spread over Treasuries, and other information analysis.
In connection with futures contracts and other derivative investments, such factors may include obtaining information as to how (a) these contracts and other derivative investments trade in the futures or other derivative markets, respectively, and (b) the securities underlying these contracts and other derivative investments trade in the cash market.
(b) U.S. Government and Agency Obligations
Certain U.S. Government and Agency Obligations are traded on a discount basis; the interest rates shown on the Schedules of Investments reflect the effective rates paid at the time of purchase by the Funds. Other securities bear interest at the rates shown, payable at fixed dates through maturity.
| | THE GUGGENHEIM FUNDS SEMI-ANNUAL REPORT | 95 |
| NOTES TO FINANCIAL STATEMENTS (Unaudited)(continued) |
(c) Senior Loans
Senior loans in which the Funds invest generally pay interest rates which are periodically adjusted by reference to a base short-term floating rate, plus a premium. These base lending rates are generally (i) the lending rate offered by one or more major European banks, such as the one-month or three-month London Inter-Bank Offered Rate (“LIBOR”), (ii) the prime rate offered by one or more major United States banks, or (iii) the bank’s certificate of deposit rate. Senior floating rate interests often require prepayments from excess cash flows or permit the borrower to repay at its election. The rate at which the borrower repays cannot be predicted with accuracy. As a result, the actual remaining maturity may be substantially less than the stated maturities shown. The interest rate indicated is the rate in effect at March 29, 2018.
(d) Interests in Securities
The Funds may purchase and sell interests in securities on a when-issued and delayed delivery basis, with payment and delivery scheduled for a future date. No income accrues to the Fund on such interests or securities in connection with such transactions prior to the date the Funds actually take delivery of such interests or securities. These transactions are subject to market fluctuations and are subject to the risk that the value at delivery may be more or less than the trade date purchase price. Although the Funds will generally purchase these securities with the intention of acquiring such securities, they may sell such securities before the settlement date.
(e) Swap Agreements
Swap agreements are marked-to-market daily and the change, if any, is recorded as unrealized gain or loss. Payments received or made as a result of an agreement or termination of an agreement are recognized as realized gains or losses.
(f) Options
Upon the purchase of an option, the premium paid is recorded as an investment, the value of which is marked-to-market daily. If a purchased option expires, the Fund realizes a loss in the amount of the cost of the option. When the Fund enters into a closing sale transaction, it realizes a gain or loss depending on whether the proceeds from the closing sale transaction are greater or less than the cost of the option. If the Fund exercises a put option, it realizes a gain or loss from the sale of the underlying security and the proceeds from such sale will be decreased by the premium originally paid. When the Fund exercises a call option, the cost of the security purchased by the Fund upon exercise increases by the premium originally paid.
When the Fund writes (sells) an option, an amount equal to the premium received is entered in that Fund’s accounting records as an asset and equivalent liability. The amount of the liability is subsequently marked-to-market to reflect the current value of the option written. When a written option expires, or if the Fund enters into a closing purchase transaction, it realizes a gain (or loss if the cost of a closing purchase transaction exceeds the premium received when the option was sold).
(g) Forward foreign currency exchange contracts
Forward foreign currency exchange contracts are valued daily based on the applicable exchange rate of the underlying currency. The change in value of the contract is recorded as unrealized appreciation or depreciation until the contract is closed. When the contract is closed, the Funds record a realized gain or loss equal to the difference between the value at the time the contract was opened and the value at the time it was closed.
(h) Foreign Taxes
The Funds may be subject to foreign taxes (a portion of which may be reclaimable) on income, stock dividends, capital gains on investments or certain foreign currency transactions. All foreign taxes are recorded in accordance with the applicable foreign tax regulations and rates that exist in the foreign jurisdictions in which the Funds invest. These foreign taxes, if any, are paid by the Funds and reflected in their Statement of Operations as follows: foreign taxes withheld at source are presented as a reduction of income and foreign taxes on capital gains from sales of investments are included with the net realized gain (loss) on investments. Foreign taxes payable or deferred as of March 29, 2018, if any, are disclosed in the Funds’ Statements of Assets and Liabilities.
(i) Security Transactions
Security transactions are recorded on the trade date for financial reporting purposes. Realized gains and losses from securities transactions are recorded using the identified cost basis. Proceeds from lawsuits related to investment holdings are recorded as realized gains in the respective Fund. Dividend income is recorded on the ex-dividend date, net of applicable taxes withheld by foreign countries. Taxable non-cash dividends are recorded as dividend income. Interest income, including amortization of premiums and accretion of discounts, is accrued on a daily basis. Interest income also includes paydown gains and losses on mortgage-backed and asset-backed securities and senior and subordinated loans. Amendment fees are earned as compensation for evaluating and accepting changes to the original loan agreement and are recognized when received. Dividend income from Real Estate Investment Trusts (“REITs”) is recorded based on the income included in the distributions received from the REIT investments using published REIT classifications, including some management estimates when actual amounts are not available. Distributions received in excess of this estimated amount are recorded as a reduction of the cost of investments or reclassified to capital gains. The actual amounts of income, return of capital, and capital gains are only determined by each REIT after its fiscal year-end, and may differ from the estimated amounts.
| 96 | THE GUGGENHEIM FUNDS SEMI-ANNUAL REPORT | |
| NOTES TO FINANCIAL STATEMENTS (Unaudited)(continued) |
Income from residual collateralized loan obligations is recognized using effective interest method. At the time of purchase, management estimates the future expected cash flows and determines the effective yield and estimated maturity date based on the estimated cash flows. Subsequent to the purchase, the estimated cash flows are updated periodically and a revised yield is calculated prospectively. Cash flows received in excess of the effective yield are reflected as a return of capital.
(j) Distributions
The Funds declare dividends from investment income daily, except for Diversified Income Fund, which declares monthly. Each Fund pays its shareholders from its net investment income monthly and distributes any net capital gains that it has realized, at least annually. Distributions to shareholders are recorded on the ex-dividend date. Dividends are reinvested in additional shares unless shareholders request payment in cash. The character of distributions made during the year from net investment income or net realized gains may differ from their ultimate characterization for federal income tax purposes.
(k) Class Allocations
Interest and dividend income, most expenses, all realized gains and losses, and all unrealized gains and losses are allocated to the classes based upon the value of the outstanding shares in each Class. Certain costs, such as distribution and service fees are charged directly to specific classes. In addition, certain expenses have been allocated to the individual Funds in the Trust on a pro rata basis upon the respective aggregate net assets of each Fund included in the Trust.
(l) Earnings Credits
Under the fee arrangement with the custodian, the Funds may earn credits based on overnight custody cash balances. These credits are utilized to reduce related custodial expenses. The custodian fees disclosed in the Statement of Operations are before the reduction in expense from the related earnings credits, if any. For the period ended March 29, 2018, there were no earnings credits received.
(m) Cash
The Funds may leave cash overnight in their cash account with the custodian. Periodically, a Fund may have cash due to the custodian bank as an overdraft balance. A fee is incurred on this overdraft, calculated by multiplying the overdraft by a rate based on the federal funds rate, which was 1.68% at March 29, 2018.
(n) Currency Translations
The accounting records of the Funds are maintained in U.S. dollars. All assets and liabilities initially expressed in foreign currencies are converted into U.S. dollars at prevailing exchange rates. Purchases and sales of investment securities, dividend and interest income, and certain expenses are translated at the rates of exchange prevailing on the respective dates of such transactions. Changes in the relationship of these foreign currencies to the U.S. dollar can significantly affect the value of the investments and earnings of the Funds. Foreign investments may also subject the Funds to foreign government exchange restrictions, expropriation, taxation or other political, social or economic developments, all of which could affect the market and/or credit risk of the investments.
The Funds do not isolate that portion of the results of operations resulting from changes in the foreign exchange rates on investments from the fluctuations arising from changes in the market prices of securities held. Such fluctuations are included with the net realized and unrealized gain or loss on investments.
Reported net realized foreign exchange gains and losses arise from sales of foreign currencies and currency gains or losses realized between the trade and settlement dates on investment transactions. Net unrealized exchange gains and losses arise from changes in the fair values of assets and liabilities other than investments in securities at the fiscal period end, resulting from changes in exchange rates.
(o) Indemnifications
Under the Funds’ organizational documents, the Trustees and Officers are indemnified against certain liabilities arising out of the performance of their duties to the Trust. In addition, throughout the normal course of business, the Funds enter into contracts that contain a variety of representations and warranties which provide general indemnifications. The Funds’ maximum exposure under these arrangements is unknown, as this would involve future claims that may be made against the Funds and/or their affiliates that have not yet occurred. However, based on experience, the Funds expect the risk of loss to be remote.
Note 2 – Financial Instruments and Derivatives
As part of their investment strategy, the Funds utilize a variety of derivative instruments. These investments involve, to varying degrees, elements of market risk and risks in excess of amounts recognized in the Statements of Assets and Liabilities. Valuation and accounting treatment of these instruments can be found under Significant Accounting Policies in Note 1 of these Notes to Financial Statements.
| | THE GUGGENHEIM FUNDS SEMI-ANNUAL REPORT | 97 |
| NOTES TO FINANCIAL STATEMENTS (Unaudited)(continued) |
Derivatives
Derivatives are instruments whose values depend on, or are derived from, in whole or in part, the value of one or more other assets, such as securities, currencies, commodities or indices. Derivative instruments may be used to increase investment flexibility (including to maintain cash reserves while maintaining exposure to certain other assets), for risk management (hedging) purposes, to facilitate trading, to reduce transaction costs and to pursue higher investment returns. Derivative instruments may also be used to mitigate certain investment risks, such as foreign currency exchange rate risk, interest rate risk and credit risk. U.S. GAAP requires disclosures to enable investors to better understand how and why a Fund uses derivative instruments, how these derivative instruments are accounted for and their effects on the Fund’s financial position and results of operations.
The Funds may utilize derivatives for the following purposes:
Duration: the use of an instrument to manage the interest rate risk of a portfolio.
Hedge: an investment made in order to reduce the risk of adverse price movements in a security, by taking an offsetting position to protect against broad market moves.
Income: the use of any instrument that distributes cash flows typically based upon some rate of interest.
Options Purchased and Written
A call option on a security gives the purchaser of the option the right to buy, and the writer of a call option the obligation to sell, the underlying security. The purchaser of a put option has the right to sell, and the writer of the put option the obligation to buy, the underlying security at any time during the option period. The risk associated with purchasing options is limited to the premium originally paid.
The risk in writing a call option is that a Fund may incur a loss if the market price of the underlying security increases and the option is exercised. The risk in writing a put option is that a Fund may incur a loss if the market price of the underlying security decreases and the option is exercised. In addition, there may be an imperfect correlation between the movement in prices of options and the underlying securities where a Fund may not be able to enter into a closing transaction because of an illiquid secondary market; or, for OTC options, a Fund may be at risk because of the counterparty’s inability to perform.
The following table represents the Funds’ use and volume of call/put options purchased on a quarterly basis:
| Fund | | Use | | Average Notional
Purchased | |
| Investment Grade Bond Fund | | Duration, Hedge | | | 13,800,466 | |
| Limited Duration Fund | | Hedge | | | 92,979,399 | |
Swaps
A swap is an agreement that obligates two parties to exchange a series of cash flows at specified intervals based upon or calculated by reference to changes in specified prices or rates for a specified amount of an underlying asset. A Fund utilizing OTC swaps bears the risk of loss of the amount expected to be received under a swap agreement in the event of the default or bankruptcy of a swap agreement counterparty or if the underlying asset declines in value. Certain standardized swaps are subject to mandatory central clearing and are executed on a multi-lateral or other trade facility platform, such as a registered exchange. There is limited counterparty credit risk with respect to centrally-cleared swaps as the transaction is facilitated through a central clearinghouse, much like an exchange-traded futures contract. Upon entering into a centrally cleared swap transaction, the Fund is required to deposit with its clearing broker an amount of cash or securities as an initial margin. Subsequent variation margin payments or receipts are made or received by the Fund, depending on fluctuations in the fair value of the reference entity. For Funds utilizing interest rate swaps, the exchange bears the risk of loss. Additionally, there is no guarantee that a Fund or an underlying fund could eliminate its exposure under an outstanding swap agreement by entering into an offsetting swap agreement with the same or another party.
| 98 | THE GUGGENHEIM FUNDS SEMI-ANNUAL REPORT | |
| NOTES TO FINANCIAL STATEMENTS (Unaudited)(continued) |
Interest rate swaps involve the exchange by the Funds with another party for their respective commitment to pay or receive a fixed or variable interest rate on a notional amount of principal. Interest rate swaps are generally centrally-cleared, but central clearing does not make interest rate swap transactions risk free.
The following table represents the Funds’ use and volume of interest rate swaps on a quarterly basis:
| | | | | Average Notional Amount | |
| Fund | | Use | | Long | | | Short | |
| Investment Grade Bond Fund | | Duration, Hedge | | $ | — | | | $ | 117,945,000 | |
| Limited Duration Fund | | Duration, Hedge | | | — | | | | 86,600,000 | |
Forward Foreign Currency Exchange Contracts
A forward foreign currency exchange contract is an agreement between two parties to exchange two designated currencies at a specific time in the future. Certain types of contracts may be cash settled, in an amount equal to the change in exchange rates during the term of the contract. The contracts can be used to hedge or manage exposure to foreign currency risks with portfolio investments or to gain exposure to foreign currencies.
The market value of a forward foreign currency exchange contract changes with fluctuations in foreign currency exchange rates. Furthermore, the Funds may be exposed to risk if the counterparties cannot meet the contract terms or if the currency value changes unfavorably as compared to the U.S. dollar.
The following table represents the Funds’ use, and volume of forward foreign currency exchange contracts on a quarterly basis:
| | | | | Average Value | |
| Fund | | Use | | Purchased | | | Sold | |
| High Yield Fund | | Hedge | | $ | 22,130,272 | | | $ | 49,966 | |
| Investment Grade Bond Fund | | Hedge, Income | | | 29,156,963 | | | | 4,103,186 | |
| Limited Duration Fund | | Hedge, Income | | | 552,741,410 | | | | 26,417,842 | |
Derivative Investment Holdings Categorized by Risk Exposure
The following is a summary of the location of derivative investments on the Funds’ Statements of Assets and Liabilities as of March 29, 2018:
| Derivative Investment Type | Asset Derivatives | Liability Derivatives |
| Currency contracts | Unrealized appreciation on forward foreign currency exchange contracts | Unrealized depreciation on forward foreign currency exchange contracts |
| Interest rate contracts | Unrealized appreciation on swap agreements | Unrealized depreciation on swap agreements |
| | Variation margin on interest rate swap agreements | Variation margin on interest rate swap agreements |
| Equity contracts | Investments in unaffiliated issuers, at value | |
The following table sets forth the fair value of the Funds’ derivative investments categorized by primary risk exposure at March 29, 2018:
| Asset Derivative Investments Value |
| Fund | | Swaps
Interest
Rate
Risk* | | | Options
Purchased
Equity
Risk | | | Forward
Foreign
Currency
Exchange
Contracts Risk | | | Total Value at
March 29,
2018 | |
| High Yield Fund | | $ | — | | | $ | — | | | $ | 34,549 | | | $ | 34,549 | |
| Investment Grade Bond Fund | | | 2,331,145 | | | | 453,685 | | | | 409,729 | | | | 3,194,559 | |
| Limited Duration Fund | | | 1,009,278 | | | | 3,060,918 | | | | 1,961,697 | | | | 6,031,893 | |
| | THE GUGGENHEIM FUNDS SEMI-ANNUAL REPORT | 99 |
| NOTES TO FINANCIAL STATEMENTS (Unaudited)(continued) |
| Liability Derivative Investments Value |
| Fund | | Swaps
Interest
Rate
Risk* | | | Options
Purchased
Equity
Risk | | | Forward
Foreign
Currency
Exchange
Contracts Risk | | | Total Value at
March 29,
2018 | |
| High Yield Fund | | $ | — | | | $ | — | | | $ | 136,917 | | | $ | 136,917 | |
| Investment Grade Bond Fund | | | — | | | | — | | | | 51,167 | | | | 51,167 | |
| Limited Duration Fund | | | 317,957 | | | | — | | | | 1,970,069 | | | | 2,288,026 | |
| * | Includes cumulative appreciation (depreciation) of centrally cleared interest rate swap agreements as reported on the Schedules of Investments. Only current day’s variation margin is reported within the Statements of Assets and Liabilities. |
The following is a summary of the location of derivative investments on the Funds’ Statements of Operations for the period ended March 29, 2018:
| Derivative Investment Type | Location of Gain (Loss) on Derivatives |
| Interest Rate contracts | Net realized gain (loss) on swap agreements |
| | Net change in unrealized appreciation (depreciation) on swap agreements |
| | Net realized gain (loss) on options written |
| | Net change in unrealized appreciation (depreciation) on options written |
| Equity contracts | Net realized gain (loss) on options purchased |
| | Net change in unrealized appreciation (depreciation) on options purchased |
| Currency contracts | Net change in unrealized appreciation (depreciation) on forward foreign currency exchange contracts |
| | Net realized gain (loss) on forward foreign currency exchange contracts |
The following is a summary of the Funds’ realized gain (loss) and change in unrealized appreciation (depreciation) on derivative investments recognized on the Statements of Operations categorized by primary risk exposure for the period ended March 29, 2018:
| Realized Gain (Loss) on Derivative Investments Recognized on the Statements of Operations |
| Fund | | Swaps
Interest
Rate
Risk | | | Options
Written
Interest Rate
Risk | | | Options
Purchased
Interest
Risk | | | Options
Purchased
Equity
Risk | | | Forward
Foreign
Currency
Exchange
Contracts Risk | | | Total | |
| High Yield Fund | | $ | — | | | $ | — | | | $ | — | | | $ | — | | | $ | (530,732 | ) | | $ | (530,732 | ) |
| Investment Grade Bond Fund | | | 943,214 | | | | 164,376 | | | | (550,095 | ) | | | — | | | | (194,509 | ) | | | 362,986 | |
| Limited Duration Fund | | | 2,925,445 | | | | — | | | | (1,062,040 | ) | | | — | | | | (10,175,824 | ) | | | (8,312,419 | ) |
| Change in Unrealized Appreciation (Depreciation) on Derivative Investments Recognized on the Statements of Operations |
| Fund | | Swaps
Interest
Rate
Risk | | | Options
Written
Interest Rate
Risk | | | Options
Purchased
Interest
Risk | | | Options
Purchased
Equity
Risk | | | Forward
Foreign
Currency
Exchange
Contracts Risk | | | Total | |
| High Yield Fund | | $ | — | | | $ | — | | | $ | — | | | $ | — | | | $ | (157,598 | ) | | $ | (157,598 | ) |
| Investment Grade Bond Fund | | | 1,978,009 | | | | (156,385 | ) | | | 514,375 | | | | (269,743 | ) | | | 342,543 | | | | 2,408,799 | |
| Limited Duration Fund | | | 691,321 | | | | — | | | | 969,111 | | | | (1,814,506 | ) | | | (1,742,976 | ) | | | (1,897,050 | ) |
In conjunction with the use of derivative instruments, the Funds are required to maintain collateral in various forms. The Funds use, where appropriate, depending on the financial instrument utilized and the broker involved, margin deposits at the broker, cash and/or securities segregated at the custodian bank, discount notes or repurchase agreements allocated to the Funds.
| 100 | THE GUGGENHEIM FUNDS SEMI-ANNUAL REPORT | |
| NOTES TO FINANCIAL STATEMENTS (Unaudited)(continued) |
The Trust has established counterparty credit guidelines and enters into transactions only with financial institutions of investment grade or better. The Trust monitors the counterparty credit risk.
Note 3 – Offsetting
In the normal course of business, the Funds enter into transactions subject to enforceable master netting arrangements or other similar arrangements. Generally, the right to offset in those agreements allows the Funds to counteract the exposure to a specific counterparty with collateral received from or delivered to that counterparty based on the terms of the arrangements. These arrangements provide for the right to liquidate upon the occurrence of an event of default, credit event upon merger or additional termination event.
In order to better define their contractual rights and to secure rights that will help the Funds mitigate their counterparty risk, the Funds may enter into an International Swaps and Derivatives Association, Inc. Master Agreement (“ISDA Master Agreement”) or similar agreement with their derivative contract counterparties. An ISDA Master Agreement is a bilateral agreement between a fund and a counterparty that governs OTC derivatives, including foreign exchange contracts, and typically contains, among other things, collateral posting terms and netting provisions in the event of a default and/or termination event. The provisions of the ISDA Master Agreement typically permit a single net payment in the event of a default (close-out netting) or similar event, including the bankruptcy or insolvency of the counterparty.
For derivatives traded under an ISDA Master Agreement, the collateral requirements are typically calculated by netting the mark-to-market amount for each transaction under such agreement and comparing that amount to the value of any collateral currently pledged by the Funds and the counterparty. For financial reporting purposes, cash collateral that has been pledged to cover obligations of the Funds and cash collateral received from the counterparty, if any, are reported separately on the Statements of Assets and Liabilities as segregated cash with broker/receivable for variation margin, or payable for swap settlement/variation margin. Cash and/or securities pledged or received as collateral by the Funds in connection with an OTC derivative subject to an ISDA Master Agreement generally may not be invested, sold or rehypotheticated by the counterparty or the Funds, as applicable, absent an event of default under such agreement, in which case such collateral generally may be applied towards obligations due to and payable by such counterparty or the Funds, as applicable. Generally, the amount of collateral due from or to a counterparty must exceed a minimum transfer amount threshold (e.g., $300,000) before a transfer is required to be made. To the extent amounts due to the Funds from their counterparties are not fully collateralized, contractually or otherwise, the Funds bear the risk of loss from counterparty nonperformance. The Funds attempt to mitigate counterparty risk by only entering into agreements with counterparties that they believe to be of good standing and by monitoring the financial stability of those counterparties.
For financial reporting purposes, the Funds do not offset derivative assets and derivative liabilities that are subject to netting arrangements in the Statements of Assets and Liabilities.
The following tables present derivative financial instruments and secured financing transactions that are subject to enforceable netting arrangements and offset in the Statements of Assets and Liabilities in conformity with U.S. GAAP:
| | | | Gross | | | Gross
Amounts
Offset In the | | | Net Amount
of Assets
Presented on | | | Gross Amounts Not Offset
in the Statements of
Assets and Liabilities | | | | |
| Fund | Instrument | | Amounts of
Recognized
Assets1 | | | Statements
of Assets and
Liabilities | | | the Statements
of Assets and
Liabilities | | | Financial
Instruments | | | Cash
Collateral
Received | | | Net
Amount | |
| High Yield Fund | Forward foreign currency exchange contracts | | $ | 34,549 | | | $ | — | | | $ | 34,549 | | | $ | — | | | $ | — | | | $ | 34,549 | |
| Investment Grade Bond Fund | Options contracts | | | 453,685 | | | | — | | | | 453,685 | | | | — | | | | (453,685 | ) | | | — | |
| | Forward foreign currency exchange contracts | | | 409,729 | | | | — | | | | 409,729 | | | | (40,191 | ) | | | (300,000 | ) | | | 69,538 | |
| Limited Duration Fund | Options contracts | | | 3,060,918 | | | | — | | | | 3,060,918 | | | | — | | | | (3,060,918 | ) | | | — | |
| | Forward foreign currency exchange contracts | | | 1,961,697 | | | | — | | | | 1,961,697 | | | | (1,185,376 | ) | | | (90,000 | ) | | | 686,321 | |
| | THE GUGGENHEIM FUNDS SEMI-ANNUAL REPORT | 101 |
| NOTES TO FINANCIAL STATEMENTS (Unaudited)(continued) |
| | | | Gross | | | Gross
Amounts
Offset In the | | | Net Amount
of Liabilities
Presented on | | | Gross Amounts Not Offset
in the Statements of
Assets and Liabilities | | | | |
| Fund | Instrument | | Amounts of
Recognized
Liabilities1 | | | Statements
of Assets and
Liabilities | | | the Statements
of Assets and
Liabilities | | | Financial
Instruments | | | Cash
Collateral
Pledged | | | Net
Amount | |
| High Yield Fund | Forward foreign currency exchange contracts | | $ | 136,917 | | | $ | — | | | $ | 136,917 | | | $ | — | | | $ | — | | | $ | 136,917 | |
| Investment Grade Bond Fund | Forward foreign currency exchange contracts | | | 51,167 | | | | — | | | | 51,167 | | | | (40,191 | ) | | | — | | | | 10,976 | |
| Limited Duration Fund | Forward foreign currency exchange contracts | | | 1,970,069 | | | | — | | | | 1,970,069 | | | | (1,185,376 | ) | | | (781,939 | ) | | | 2,754 | |
| 1 | Centrally cleared swaps are excluded from these reported amounts. |
The following table presents deposits held by others in connection with derivative investments as of March 29, 2018. The derivatives tables following the Schedule of Investments list each counterparty for which cash collateral may have been pledged or received at period end. The Funds have the right to offset these deposits against any related liabilities outstanding with each counterparty.
| Fund | | Counterparty/Clearing Agent | | Asset Type | | Cash Pledged | | | Cash Received | |
| Investment Grade Bond Fund | | Goldman Sachs | | Forward foreign currency exchange contracts | | $ | — | | | $ | 300,000 | |
| | | BofA Merrill Lynch | | Interest rate swaps agreements and options | | | 2,058,000 | | | | 2,323,717 | |
| Investment Grade Bond Fund Total | | | | | | | 2,058,000 | | | | 2,623,717 | |
| Limited Duration Fund | | Deutsche Bank | | Forward foreign currency exchange contracts | | | 320,000 | | | | — | |
| | | Morgan Stanley | | Forward foreign currency exchange contracts | | | — | | | | 90,000 | |
| | | Barclays | | Forward foreign currency exchange contracts | | | 910,000 | | | | — | |
| | | Goldman Sachs | | Forward foreign currency exchange contracts | | | 490,000 | | | | — | |
| | | BNP Paribas | | Repurchase agreements | | | 762,000 | | | | — | |
| | | BofA Merrill Lynch | | Interest rate swaps agreements and options | | | 2,610,000 | | | | 5,807,765 | |
| | | Citigroup | | Forward foreign currency exchange contracts | | | — | | | | 294,213 | |
| | | JPMorgan Chase and Co. | | Forward foreign currency exchange contracts | | | 1,310,000 | | | | — | |
| Limited Duration Fund Total | | | | | | | 6,402,000 | | | | 6,191,978 | |
Note 4 – Fair Value Measurement
In accordance with U.S. GAAP, fair value is defined as the price that the Funds would receive to sell an investment or pay to transfer a liability in an orderly transaction with an independent buyer in the principal market, or in the absence of a principal market, the most advantageous market for the investment or liability. U.S. GAAP establishes a three-tier fair value hierarchy based on the types of inputs used to value assets and liabilities and requires corresponding disclosure. The hierarchy and the corresponding inputs are summarized below:
| Level 1 — | quoted prices in active markets for identical assets or liabilities. |
| Level 2 — | significant other observable inputs (for example quoted prices for securities that are similar based on characteristics such as interest rates, prepayment speeds, credit risk, etc.). |
| 102 | THE GUGGENHEIM FUNDS SEMI-ANNUAL REPORT | |
| NOTES TO FINANCIAL STATEMENTS (Unaudited)(continued) |
| Level 3 — | significant unobservable inputs based on the best information available under the circumstances, to the extent observable inputs are not available, which may include assumptions. |
The types of inputs available depend on a variety of factors, such as the type of security and the characteristics of the markets in which it trades, if any. Fair valuation determinations that rely on fewer or no observable inputs require greater judgment. Accordingly, fair value determinations for Level 3 securities require the greatest amount of judgment.
Independent pricing services are used to value a majority of the Funds’ investments. When values are not available from a pricing service, they will be determined using a variety of sources and techniques, including: market prices; broker quotes; and models which derive prices based on inputs such as prices of securities with comparable maturities and characteristics or based on inputs such as anticipated cash flows or collateral, spread over Treasuries, and other information and analysis. A significant portion of the Funds’ assets and liabilities are categorized as Level 2 as indicated in this report.
Indicative quotes from broker-dealers, adjusted for fluctuations in criteria such as credit spreads and interest rates, may be also used to value the Funds’ assets and liabilities, i.e. prices provided by a broker-dealer or other market participant who has not committed to trade at that price. Although indicative quotes are typically received from established market participants, the Funds may not have the transparency to view the underlying inputs which support the market quotations. Significant changes in an indicative quote would generally result in significant changes in the fair value of the security.
Certain fixed income securities are valued by obtaining a monthly indicative quote from a broker-dealer, adjusted for fluctuations in criteria such as credit spreads and interest rates. The Funds’ fair valuation guidelines categorize these securities as Level 3.
The inputs or methodologies used for valuing securities are not necessarily an indication of the risk associated with investing in those securities. The suitability of the techniques and sources employed to determine fair valuation are regularly monitored and subject to change.
Note 5 – Investment Advisory Agreement and Other Agreements
Under the terms of an investment advisory contract, the Funds pay GI investment advisory fees calculated at the annualized rates below, based on the average daily net assets of the Funds:
| Fund | Management Fees
(as a % of Net Assets) |
| Diversified Income Fund | 0.75% |
| High Yield Fund | 0.60% |
| Investment Grade Bond Fund | 0.39%* |
| Limited Duration Fund | 0.39%** |
| Municipal Income Fund | 0.50% |
| * | Prior to November 20, 2017, the Fund’s advisory fee was 50 basis points (0.50%) and a breakpoint of 5 basis points (0.05%) on average daily net assets above $5 billion applied to the Fund’s advisory fees. |
| ** | Prior to November 20, 2017, the Fund’s advisory fee was 45 basis points (0.45%). |
GI engages external service providers to perform other necessary services for the Trust, such as audit and accounting related services, legal services, custody, printing and mailing, etc., on a pass-through basis. Such expenses are allocated to various Funds within the complex based on relative net assets.
The Funds have adopted Distribution Plans related to the offering of A-Class, C-Class and P-Class shares pursuant to Rule 12b-1 under the 1940 Act. The plans provide for payments at an annual rate of 0.25% of the average daily net assets of each Fund’s A-Class and P-Class shares, and 1.00% of the average daily net assets of each Fund’s C-Class shares.
| | THE GUGGENHEIM FUNDS SEMI-ANNUAL REPORT | 103 |
| NOTES TO FINANCIAL STATEMENTS (Unaudited)(continued) |
Contractual expense limitation agreements for the following Funds provide that the total expenses be limited to a percentage of average net assets for each class of shares, exclusive of brokerage costs, dividends on securities sold short, expenses of other investment companies in which a Fund invests, interest, taxes, litigation, indemnification and extraordinary expenses. The limits are listed below:
| | Limit | Effective
Date | Contract
End Date |
| Diversified Income Fund — A-Class | 1.30% | 01/29/16 | 02/01/19 |
| Diversified Income Fund — C-Class | 2.05% | 01/29/16 | 02/01/19 |
| Diversified Income Fund — P-Class | 1.30% | 01/29/16 | 02/01/19 |
| Diversified Income Fund — Institutional Class | 1.05% | 01/29/16 | 02/01/19 |
| High Yield Fund — A-Class | 1.16% | 11/30/12 | 02/01/19 |
| High Yield Fund — C-Class | 1.91% | 11/30/12 | 02/01/19 |
| High Yield Fund — P-Class | 1.16% | 05/01/15 | 02/01/19 |
| High Yield Fund — R6-Class* | 0.91% | 05/15/17 | 02/01/19 |
| High Yield Fund — Institutional Class | 0.91% | 11/30/12 | 02/01/19 |
| Investment Grade Bond Fund — A-Class | 0.79%** | 11/30/12 | 02/01/20 |
| Investment Grade Bond Fund — C-Class | 1.54%** | 11/30/12 | 02/01/20 |
| Investment Grade Bond Fund — P-Class | 0.79%** | 05/01/15 | 02/01/20 |
| Investment Grade Bond Fund — Institutional Class | 0.50%** | 11/30/12 | 02/01/20 |
| Limited Duration Fund — A-Class | 0.75%*** | 12/01/13 | 02/01/20 |
| Limited Duration Fund — C-Class | 1.50%*** | 12/01/13 | 02/01/20 |
| Limited Duration Fund — P-Class | 0.75%*** | 05/01/15 | 02/01/20 |
| Limited Duration Fund — Institutional Class | 0.50%*** | 12/01/13 | 02/01/20 |
| Municipal Income Fund — A-Class | 0.80% | 11/30/12 | 02/01/19 |
| Municipal Income Fund — C-Class | 1.55% | 11/30/12 | 02/01/19 |
| Municipal Income Fund — P-Class | 0.80% | 05/01/15 | 02/01/19 |
| Municipal Income Fund — Institutional Class | 0.55% | 11/30/12 | 02/01/19 |
| * | Since the commencement of operations: May 15, 2017 |
| ** | Prior to November 20, 2017, the Fund’s limits were 1.00% for A-Class, 1.75% for C-Class, 1.00% for P-Class and 0.75% for Institutional Class. |
| *** | Prior to November 20, 2017, the Fund’s limits were 0.80% for A-Class, 1.55% for C-Class, 0.80% for P-Class and 0.55% for Institutional Class. |
| 104 | THE GUGGENHEIM FUNDS SEMI-ANNUAL REPORT | |
| NOTES TO FINANCIAL STATEMENTS (Unaudited)(continued) |
GI is entitled to reimbursement by the Funds for fees waived or expenses reimbursed during any of the previous 36 months, beginning on the date of the expense limitation agreement, if on any day the estimated operating expenses are less than the indicated percentages. For purposes of this arrangement, GI is entitled to recoupment of previously waived fees or reimbursed expenses for 36 months from the date of the waiver or reimbursement by GI. At March 29, 2018, the amount of fees waived or expenses reimbursed that are subject to recoupment are presented in the following table:
| Fund | | Expires
2018 | | | Expires
2019 | | | Expires
2020 | | | Expires
2021 | | | Fund
Total | |
| Diversified Income Fund | | | | | | | | | | | | | | | |
| A-Class | | $ | — | | | $ | 1,312 | | | $ | 3,873 | | | $ | 2,537 | | | $ | 7,722 | |
| C-Class | | | — | | | | 1,196 | | | | 3,893 | | | | 2,599 | | | | 7,688 | |
| P-Class | | | — | | | | 1,156 | | | | 3,402 | | | | 2,316 | | | | 6,874 | |
| Institutional Class | | | — | | | | 53,207 | | | | 148,686 | | | | 100,389 | | | | 302,282 | |
| High Yield Fund | | | | | | | | | | | | | | | | | | | | |
| A-Class | | $ | 15,898 | | | $ | 12,450 | | | $ | 19,016 | | | $ | 13,716 | | | $ | 61,080 | |
| C-Class | | | 2,190 | | | | 4,537 | | | | 5,167 | | | | 1,232 | | | | 13,126 | |
| P-Class | | | — | | | | 7,071 | | | | 8,410 | | | | 4,376 | | | | 19,857 | |
| Institutional Class | | | — | | | | — | | | | 17,696 | | | | 21,695 | | | | 39,391 | |
| R-Class | | | — | | | | — | | | | — | | | | — | | | | — | |
| Investment Grade Bond Fund | | | | | | | | | | | | | | | | | | | | |
| A-Class | | $ | 109,791 | | | $ | 73,385 | | | $ | 77,376 | | | $ | 84,385 | | | $ | 344,937 | |
| C-Class | | | 40,125 | | | | 35,023 | | | | 25,128 | | | | 23,134 | | | | 123,410 | |
| P-Class | | | — | | | | — | | | | 5,909 | | | | 15,130 | | | | 21,039 | |
| Institutional Class | | | — | | | | — | | | | 26,962 | | | | 56,327 | | | | 83,289 | |
| Limited Duration Fund | | | | | | | | | | | | | | | | | | | | |
| A-Class | | $ | 66,925 | | | $ | 171,814 | | | $ | 152,459 | | | $ | 137,794 | | | $ | 528,992 | |
| C-Class | | | 5,382 | | | | 31,279 | | | | 31,774 | | | | 25,581 | | | | 94,016 | |
| P-Class | | | — | | | | 1,275 | | | | 41,567 | | | | 57,975 | | | | 100,817 | |
| Institutional Class | | | 107,741 | | | | 287,680 | | | | 442,161 | | | | 426,808 | | | | 1,264,390 | |
| Municipal Income Fund | | | | | | | | | | | | | | | | | | | | |
| A-Class | | $ | 181,845 | | | $ | 178,718 | | | $ | 125,964 | | | $ | 71,706 | | | $ | 558,233 | |
| C-Class | | | 6,114 | | | | 13,957 | | | | 14,699 | | | | 8,856 | | | | 43,626 | |
| P-Class | | | 22 | | | | 169 | | | | 758 | | | | 364 | | | | 1,313 | |
| Institutional Class | | | 26,091 | | | | 36,640 | | | | 58,021 | | | | 37,019 | | | | 157,771 | |
For the period ended March 29, 2018, GI recouped amounts from the Funds as follows:
| High Yield Fund | | $ | 2,364 | |
| Investment Grade Bond Fund | | | 15,464 | |
| Limited Duration Fund | | | 143 | |
If a Fund invests in an affiliated fund, the investing Fund’s adviser has agreed to waive fees at the investing fund level. Fee waivers will be calculated at the investing Fund level without regard to any expense cap, if any, in effect for the investing Fund. Fees waived under this arrangement are not subject to reimbursement to GI. For the period ended March 29, 2018, the Diversified Income Fund, Investment Grade Bond Fund and Limited Duration Fund waived $14,610, $8,182 and $104,525 respectively, related to investments in affiliated funds.
For the period ended March 29, 2018, GFD retained sales charges of $252,432 relating to sales of A-Class shares of the Trust.
Certain trustees and/or officers of the Trust are also officers of GI and GFD. The Trust does not compensate its officers or trustees who are officers, directors, and/or employees of GI or GFD.
At March 29, 2018, GI and its affiliates owned over twenty percent of the outstanding shares of the Funds, as follows:
| Fund | Percent of
Outstanding
Shares Owned |
| Diversified Income Fund | 98% |
| | THE GUGGENHEIM FUNDS SEMI-ANNUAL REPORT | 105 |
| NOTES TO FINANCIAL STATEMENTS (Unaudited)(continued) |
MUFG Investor Services (US), LLC (“MUIS”) acts as the Trust’s administrator, transfer agent and accounting agent. As administrator, transfer agent and accounting agent, MUIS is responsible for maintaining the books and records of the Fund’s securities and cash. Bank of New York Mellon Corp. (“BNY”) acts as the Funds’ custodian. As custodian, BNY is responsible for the custody of the Funds’ assets. For providing the aforementioned administrative and accounting services, MUIS is entitled to receive a monthly fee equal to a percentage of the Fund’s average daily net assets and out of pocket expenses. For providing the aforementioned services, MUIS and BNY are entitled to receive a monthly fee based on the number of transactions during the month and the number of accounts under management subject to certain minimum monthly fees and out of pocket expenses.
Note 6 – Reverse Repurchase Agreements
Each of the Funds may enter into reverse repurchase agreements. Under a reverse repurchase agreement, a Fund sells securities and agrees to repurchase them at a particular price at a future date. In the event the buyer of securities under a reverse repurchase agreement files for bankruptcy or becomes insolvent, such buyer or its trustee or receiver may receive an extension of time to determine whether to enforce the Fund’s obligation to repurchase the securities, and the Fund’s use of the proceeds of the reverse repurchase agreement may effectively be restricted pending such decision.
For the period ended March 29, 2018, the following Funds entered into reverse repurchase agreements:
| Fund | | Number
of Days
Outstanding | | Balance at
March 29,
2018 | | | Average
Balance
Outstanding | | | Average
Interest
Rate | |
| High Yield Fund | | 180 | | $ | 41,126,852 | | | $ | 46,271,655 | | | | 1.79 | % |
The following table presents reverse repurchase agreements that are subject to netting arrangements and offset in the Statements of Assets of Liabilities in conformity with U.S. GAAP:
| | | Gross | | | Gross
Amounts
Offset In the | | | Net Amount
of Liabilities
Presented on | | | Gross Amounts Not Offset
in the Statement of
Assets and Liabilities | | | | |
| Fund | | Amounts of
Recognized
Liabilities | | | Statement
of Assets and
Liabilities | | | the Statement
of Assets and
Liabilities | | | Financial
Instruments | | | Cash
Collateral
Pledged | | | Net
Amount | |
| High Yield Fund | | $ | 41,126,852 | | | $ | — | | | $ | 41,126,852 | | | $ | 41,126,852 | | | $ | — | | | $ | — | |
As of March 29, 2018, there was $41,044,235 in reverse repurchase agreements outstanding, exclusive of accrued interest. As of March 29,2018, High Yield Fund had outstanding reverse repurchase agreements with various counterparties. Details of the reverse repurchase agreements by counterparty are as follows:
| Counterparty | | Range of
Interest Rate | | Maturity
Dates | | Face
Value | |
| Barclays | | (0.75)%-1.50% | | Open Maturity | | $ | 6,708,281 | |
| BofA Merril Lynch | | 2.20% | | Open Maturity | | | 1,213,844 | |
| BNP Paribas | | 2.25%-2.41% | | 04/06/18-04/20/18 | | | 13,370,000 | |
| Royal Bank of Canada | | 2.28%-2.53% | | 04/06/18-04/27/18 | | | 12,139,875 | |
| Societe Generale | | 2.25% | | 04/12/18 | | | 7,612,235 | |
| | | | | | | $ | 41,044,235 | |
| 106 | THE GUGGENHEIM FUNDS SEMI-ANNUAL REPORT | |
| NOTES TO FINANCIAL STATEMENTS (Unaudited)(continued) |
The following is a summary of the remaining contractual maturities of the reverse repurchase agreements outstanding as of period-end, aggregated by asset class of the related collateral pledged by the Funds:
| Portfolio Name | | Asset
Type | | For disclosure
Overnight and
Continuous | | | Up to
30 days | | | Grand
Total | |
| High Yield Fund | | Corporate Bonds | | $ | 7,925,252 | | | $ | 33,201,600 | | | $ | 41,126,852 | |
| Gross amount of recognized liabilities for reverse repurchase agreements | | | | $ | 7,925,252 | | | $ | 33,201,600 | | | $ | 41,126,852 | |
Note 7 – Federal Income Tax Information
The Funds intend to comply with the provisions of Subchapter M of the Internal Revenue Code applicable to regulated investment companies and will distribute substantially all taxable net investment income and capital gains sufficient to relieve the Funds from all, or substantially all, federal income, excise and state income taxes. Therefore, no provision for federal or state income tax is required.
Tax positions taken or expected to be taken in the course of preparing the Funds’ tax returns are evaluated to determine whether the tax positions are “more-likely-than-not” of being sustained by the applicable tax authority. Tax positions not deemed to meet the more-likely-than-not threshold would be recorded as a tax benefit or expense in the current year. Management has analyzed the Funds’ tax positions taken, or to be taken, on federal income tax returns for all open tax years, and has concluded that no provision for income tax is required in the Funds’ financial statements. The Funds’ federal tax returns are subject to examination by the Internal Revenue Service for a period of three years after they are filed.
At March 29, 2018, the cost of securities for federal income tax purposes, the aggregate gross unrealized gain for all securities for which there was an excess of value over tax cost, and the aggregate gross unrealized loss for all securities for which there was an excess of tax cost over value were as follows:
| Fund | | Tax
Cost | | | Tax
Unrealized
Gain | | | Tax
Unrealized
Loss | | | Net
Unrealized
Gain/(Loss) | |
| Diversified Income Fund | | $ | 5,745,324 | | | $ | 263,444 | | | $ | (14,095 | ) | | $ | 249,349 | |
| High Yield Fund | | | 534,587,900 | | | | 6,185,642 | | | | (17,912,243 | ) | | | (11,726,601 | ) |
| Investment Grade Bond Fund | | | 445,716,512 | | | | 5,066,873 | | | | (7,334,849 | ) | | | (2,267,976 | ) |
| Limited Duration Fund | | | 2,977,440,993 | | | | 13,198,496 | | | | (10,803,351 | ) | | | 2,395,145 | |
| Municipal Income Fund | | | 43,860,229 | | | | 1,151,114 | | | | (545,812 | ) | | | 605,302 | |
Note 8 – Securities Transactions
For the period ended March 29, 2018, the cost of purchases and proceeds from sales of investment securities, excluding government securities, short-term investments and derivatives, were as follows:
| Fund | | Purchases | | | Sales | |
| Diversified Income Fund | | $ | 1,414,325 | | | $ | 1,166,072 | |
| High Yield Fund | | | 209,449,000 | | | | 271,030,262 | |
| Investment Grade Bond Fund | | | 168,384,398 | | | | 118,394,587 | |
| Limited Duration Fund | | | 995,144,010 | | | | 550,895,190 | |
| Municipal Income Fund | | | 2,435,319 | | | | 12,231,517 | |
The Funds are permitted to purchase or sell securities from or to certain affiliated funds under specified conditions outlined in procedures adopted by the Board. The procedures have been designed to ensure that any purchase or sale of securities by a Fund from or to another fund or portfolio that is or could be considered an affiliate by virtue of having a common investment adviser (or affiliated investment advisers), common
| | THE GUGGENHEIM FUNDS SEMI-ANNUAL REPORT | 107 |
| NOTES TO FINANCIAL STATEMENTS (Unaudited)(continued) |
Trustees and/or common officers complies with Rule 17a-7 of the 1940 Act. Further, as defined under these procedures, each transaction is effected at the current market price to save costs, where permissible. For the period ended March 29, 2018, the Funds engaged in purchases and sales of securities, pursuant to Rule 17a-7 of the 1940 Act.
| Fund | | Purchases | | | Sales | | | Realized
Gain | |
| High Yield Fund | | $ | 25,189,585 | | | $ | 20,018,141 | | | $ | 379,823 | |
| Investment Grade Bond Fund | | | 801,855 | | | | — | | | | — | |
| Limited Duration Fund | | | 1,947,618 | | | | 484,500 | | | | 3,628 | |
Note 9 – Loan Commitments
Pursuant to the terms of certain loan agreements, certain Funds held unfunded loan commitments as of March 29, 2018. The Funds are obligated to fund these loan commitments at the borrower’s discretion.
The unfunded loan commitments as of March 29, 2018, were as follows:
| Fund | Borrower | | Maturity Date | | Face Amount | | | Value | |
| Limited Duration Fund |
| | Mavis Tire Express Services Corp. | | 02/28/25 | | $ | 758,987 | | | $ | — | * |
| High Yield Fund |
| | Acosta, Inc. | | 09/26/19 | | | 511,111 | | | | 83,990 | |
| | Advantage Sales & Marketing LLC | | 07/25/19 | | | 1,100,000 | | | | 37,308 | |
| | BBB Industries, LLC | | 11/04/19 | | | 614,286 | | | | 26,866 | |
| | Boyne USA, Inc. | | 03/13/19 | | | 1,850,000 | | | | — | |
| | Bullhorn, Inc. | | 11/21/22 | | | 275,340 | | | | 9,377 | |
| | Cypress Intermediate Holdings III, Inc. | | 04/27/22 | | | 750,000 | | | | 75,911 | |
| | Epicor Software | | 06/01/20 | | | 1,000,000 | | | | 53,894 | |
| | Hillman Group, Inc. | | 06/28/19 | | | 550,000 | | | | 15,125 | |
| | ICP Industrial, Inc. | | 11/03/23 | | | 260,343 | | | | 1,197 | |
| | Learning Care Group (US), Inc. | | 05/05/19 | | | 500,000 | | | | 27,073 | |
| | Lytx, Inc. | | 08/31/22 | | | 105,263 | | | | 11,645 | |
| | Mavis Tire Express Services Corp. | | 02/28/25 | | | 400,193 | | | | — | |
| | MRI Software LLC | | 06/30/23 | | | 454,750 | | | | 11,911 | |
| | National Technical Systems | | 06/12/21 | | | 250,000 | | | | 16,687 | |
| | Packaging Coordinators Midco, Inc. | | 07/01/21 | | | 1,500,000 | | | | 122,122 | |
| | Recess Holdings, Inc. | | 09/30/24 | | | 166,667 | | | | 387 | |
| | Signode Industrial Group US, Inc. | | 05/01/19 | | | 1,800,000 | | | | 12,225 | |
| | Solera LLC | | 03/03/21 | | | 1,250,000 | | | | 103,029 | |
| | Wencor Group | | 06/19/19 | | | 570,000 | | | | 16,342 | |
| | | | | | $ | 13,907,953 | | | $ | 625,089 | |
| Investment Grade Bond Fund |
| | Mavis Tire Express Services Corp. | | 02/28/25 | | | 110,398 | | | | — | * |
| * | Security has a market value of $0. |
| 108 | THE GUGGENHEIM FUNDS SEMI-ANNUAL REPORT | |
| NOTES TO FINANCIAL STATEMENTS (Unaudited)(continued) |
Note 10 – Restricted Securities
The securities below are considered illiquid and restricted under guidelines established by the Board:
| Fund | Restricted Securities | | Acquisition Date | | Cost | | | Value | |
| Limited Duration Fund |
| | Copper River CLO Ltd. | | | | | | | | |
| | 2007-1A, due 01/20/212 | | 05/09/14 | | $ | 272,933 | | | $ | 63,650 | |
| | Schahin II Finance Co. SPV Ltd. | | | | | | | | | | |
| | 5.88% due 09/25/223 | | 01/08/14 | | | 375,036 | | | | 47,885 | |
| | | | | | | 647,969 | | | | 111,535 | |
| High Yield Fund | | | | | | | | | | |
| | Schahin II Finance Co. SPV Ltd. | | | | | | | | | | |
| | 5.88% due 09/25/223 | | 03/12/15 | | | 139,296 | | | | 26,603 | |
| | | | | | | 139,296 | | | | 26,603 | |
| Investment Grade Bond Fund | | | | | | | | | | |
| | Aurora Military Housing LLC | | | | | | | | | | |
| | 6.89% due 01/15/47 | | 12/02/15 | | | 833,166 | | | | 895,191 | |
| | Capmark Military Housing Trust | | | | | | | | | | |
| | 2007-ROBS, 6.06% due 10/10/52 | | 04/23/15 | | | 468,542 | | | | 488,520 | |
| | Capmark Military Housing Trust | | | | | | | | | | |
| | 2007-AETC, 5.75% due 02/10/52 | | 09/18/14 | | | 328,898 | | | | 327,063 | |
| | Central Storage Safety Project Trust | | | | | | | | | | |
| | 4.82% due 02/1/38 | | 03/20/18 | | | 1,026,737 | | | | 1,037,460 | |
| | Copper River CLO Ltd.2 | | | | | | | | | | |
| | 2007-1A, due 01/20/21 | | 05/09/14 | | | 382,098 | | | | 89,110 | |
| | Highland Park CDO I Ltd. | | | | | | | | | | |
| | 2006-1A, 2.34% (3 Month USD LIBOR + 0.40%) due 11/25/512,4 | | 07/01/16 | | | 358,469 | | | | 368,304 | |
| | HP Communities LLC | | | | | | | | | | |
| | 5.78% due 03/15/46 | | 08/23/16 | | | 591,752 | | | | 536,773 | |
| | Mid-Atlantic Military Family Communities LLC | | | | | | | | | | |
| | 5.30% due 08/1/50 | | 10/07/16 | | | 1,227,123 | | | | 1,275,569 | |
| | Offutt AFB America First Community LLC | | | | | | | | | | |
| | 5.46% due 09/1/50 | | 11/30/16 | | | 1,815,727 | | | | 1,920,251 | |
| | Pacific Northwest Communities LLC | | | | | | | | | | |
| | 5.91% due 06/15/50 | | 05/22/14 | | | 400,000 | | | | 424,276 | |
| | Turbine Engines Securitization Ltd. | | | | | | | | | | |
| | 2013-1A, 5.13% due 12/13/48 | | 11/27/13 | | | 491,179 | | | | 497,801 | |
| | Woodbourne Capital Trust I 3.61% (1 Month USD | | | | | | | | | | |
| | LIBOR + 2.50%)1,4,5 | | 01/20/06 | | | 954,588 | | | | 736,443 | |
| | Woodbourne Capital Trust II 3.60% (1 Month USD | | | | | | | | | | |
| | LIBOR + 2.50%)1,4,5 | | 01/20/06 | | | 954,588 | | | | 736,443 | |
| | Woodbourne Capital Trust III 3.61% (1 Month USD | | | | | | | | | | |
| | LIBOR + 2.50%)1,4,5 | | 01/20/06 | | | 954,589 | | | | 736,442 | |
| | Woodbourne Capital Trust IV 3.61% (1 Month USD | | | | | | | | | | |
| | LIBOR + 2.50%)1,4,5 | | 01/20/06 | | | 954,589 | | | | 736,442 | |
| | | | | | $ | 11,742,045 | | | $ | 10,806,088 | |
| 1 | Non-income producing security |
| 2 | Security has no stated coupon. However, it is expected to receive residual cash flow payments on defined deal dates. |
| 3 | Security is in default of interest and/or principal obligations. |
| 4 | Variable rate security. Rate indicated is the rate effective at March 29, 2018. In some instances, the underlying reference rate shown was below the minimum rate earned by the security or has been adjusted by a predetermined factor. The settlement status of a position may also impact the effective rate indicated. In instances where multiple underlying reference rates and spread amounts are shown, the effective rate is based on a weighted average. |
| 5 | Perpetual maturity. |
| | THE GUGGENHEIM FUNDS SEMI-ANNUAL REPORT | 109 |
| NOTES TO FINANCIAL STATEMENTS (Unaudited)(continued) |
Note 11 – Line of Credit
The Trust, with the exception of certain affiliated funds, secured a 364-day committed, $1,000,000,000 line of credit from Citibank, N.A., which was in place through October 6, 2017, at which time the line of credit was renewed with an increased commitment amount of $1,065,000,000. A Fund may draw (borrow) from the line of credit as a temporary measure for emergency purposes, to facilitate redemption requests, or for other short-term liquidity purposes consistent with the Fund’s investment objective and program. For example, it may be advantageous for the Fund to borrow money rather than sell existing portfolio positions to meet redemption requests. Fees related to borrowings, if any, vary under this arrangement between the greater of Citibank’s “base rate”, LIBOR plus 1%, or the federal funds rate 1.68% at March 29, 2018, plus 1/2 of 1%. The Funds paid upfront costs of $982,952 to renew the line of credit.
The commitment fee that may be paid by the Funds is at an annualized rate of 0.15% of the average daily amount of their unused commitment amount. The Funds did not have any borrowings under this agreement as of and for the period ended March 29, 2018.
The allocated commitment fee amount for the each Fund is referenced in the Statement of Operations under “Line of credit fees” and the effect on the expense ratio is included in the Financial Highlights.
Note 12 – Legal Proceedings
Motors Liquidation Company
On or about June of 2015, the Guggenheim High Yield Fund was served and became a party to the case entitled Official Committee of Unsecured Creditors of Motors Liquidation Company v. JPMorgan Chase Bank, N.A., et al., Adversary Proceeding No. 09-00504 (MG) (Bankr. S.D.N.Y.), brought by the Motors Liquidation Avoidance Action Trust (the “Motors Trust”). The lawsuit was initially filed in the United States Bankruptcy Court for the Southern District of New York on July 31, 2009 by the Official Committee of Unsecured Creditors of Motors Liquidation Company (f/k/a General Motors) against the former holders of an approximately $1.5 billion term loan issued pursuant to a term loan agreement, dated as of November 29, 2006 (the “Term Loan”), between General Motors, as borrower, JPMorgan Chase Bank, N.A., as administrative agent (“JPMorgan”), and various institutions as lenders, including the Guggenheim High Yield Fund (f/k/a Security Income Fund – High Yield Series). The Term Loan lenders received a full repayment of the Term Loan pursuant to a June 1, 2009 court order issued in connection with the General Motors chapter 11 bankruptcy filing. The plaintiff is seeking a court order that the lenders return at least a portion of the proceeds received in 2009 based on the contention that certain UCC financing statements securing the indebtedness due under the Term Loan were terminated (thus releasing collateral secured by the UCC financing statement), rendering the Term Loan under-secured or completely unsecured. As a result, the lawsuit alleges that the Term Loan lenders were at least partially unsecured creditors at the time General Motors filed for bankruptcy, and should not have been paid as fully secured creditors.
After being served, the Guggenheim High Yield Fund filed a motion to dismiss the lawsuit on November 19, 2015. On June 30, 2016, the Bankruptcy Court denied the motion to dismiss, holding that the orders extending the time to serve defendants were valid. On July 14, 2016, the Guggenheim High Yield Fund filed a motion for leave to file an interlocutory appeal of the Bankruptcy Court’s decision, which was denied on March 8, 2017.
On December 18, 2015, the Guggenheim High Yield Fund filed cross-claims against co-defendant JPMorgan related to JPMorgan’s actions as administrative agent in connection with the Term Loan and the termination of the UCC financing statements. Discovery is currently stayed pending the outcome of the below referenced mediation.
On November 10, 2016, the Motors Trust filed a stipulation and proposed order dismissing its third claim for relief as set forth in its amended complaint, which was so Ordered on November 17, 2016.
On April 24, 2017, a trial in commenced in the Bankruptcy Court for the Southern District of New York on the collateral status and valuation of 40 representative assets (the “Representative Asset Trial”). The evidentiary potion of the trial concluded on May 5, 2017, and closing arguments were held on June 5, 2017.
On September 26, 2017, the Bankruptcy Court issued its decision. The Court held that 33 of the 40 assets at issue (the “Representative Assets”) were fixtures and that the majority of the Representative Assets should be valued on a going concern basis. The Avoidance Trust sought leave to appeal portions of the decision on October 10, 2017.
| 110 | THE GUGGENHEIM FUNDS SEMI-ANNUAL REPORT | |
| NOTES TO FINANCIAL STATEMENTS (Unaudited)(concluded) |
The parties agreed to attend mediation in front of David Geronemus, Esq. in an attempt to consensually resolve the dispute. While no resolution has been reached yet, the mediation remains ongoing.
This lawsuit does not allege any wrongdoing on the part of the Guggenheim High Yield Fund and the Fund intends to vigorously defend the matter. If the plaintiff is successful, it is reasonably possible that the Guggenheim High Yield Fund will be required to make payments in some amount (but not likely to exceed approximately $1,000,000), although the Fund may recover some or all of this amount from its cross-claims against co-defendant JPMorgan. At this stage of the proceedings, the Guggenheim High Yield Fund is unable to make a reliable prediction as to the outcome of this lawsuit or the affect, if any, on the Fund’s net asset value.
| | THE GUGGENHEIM FUNDS SEMI-ANNUAL REPORT | 111 |
| OTHER INFORMATION (Unaudited) |
Proxy Voting Information
A description of the policies and procedures that the Trust uses to determine how to vote proxies relating to securities held in the Funds’ portfolios is available, without charge and upon request, by calling 800.820.0888. This information is also available from the EDGAR database on the SEC’s website at https://www.sec.gov.
Information regarding how the Funds voted proxies relating to portfolio securities during the most recent 12-month period ended June 30 is available without charge, upon request, by calling 800.820.0888. This information is also available from the EDGAR database on the SEC’s website at https://www.sec.gov.
Sector Classification
Information in the “Schedule of Investments” is categorized by sectors using sector-level Classifications defined by the Bloomberg Industry Classification System, a widely recognized industry classification system provider. Each Fund’s registration statement has investment policies relating to concentration in specific sectors/industries. For purposes of these investment policies, the Funds usually classify sectors/industries based on industry-level Classifications used by widely recognized industry classification system providers such as Bloomberg Industry Classification System, Global Industry Classification Standards and Barclays Global Classification Scheme.
Quarterly Portfolio Schedules Information
The Trust files its complete schedule of portfolio holdings with the SEC for the first and third quarters of each fiscal year on Form N-Q; which are available on the SEC’s website at https://www.sec.gov. The Funds’ Forms N-Q may be reviewed and copied at the SEC’s Public Reference Room in Washington, DC, and that information on the operation of the Public Reference Room may be obtained by calling 800-SEC-0330. Copies of the portfolio holdings are also available to shareholders, without charge and upon request, by calling 800.820.0888.
| 112 | THE GUGGENHEIM FUNDS SEMI-ANNUAL REPORT | |
| INFORMATION ON BOARD OF TRUSTEES AND OFFICERS (Unaudited) |
Name, Address*
and Year of Birth | Position(s) Held
with the Trust | Term of Office
and Length of
Time Served** | Principal Occupation(s)
During Past Five Years | Number of
Portfolios
in Fund
Complex
Overseen | Other Directorships
Held by Trustees |
| INDEPENDENT TRUSTEES | | | |
Randall C. Barnes (1951) | Trustee | Since 2014 | Current: Private Investor (2001-present). Former: Senior Vice President and Treasurer, PepsiCo, Inc. (1993-1997); President, Pizza Hut International (1991-1993); Senior Vice President, Strategic Planning and New Business Development, PepsiCo, Inc. (1987-1990). | 51 | Current: Trustee, Purpose Investments Funds (2014-Present). |
Donald A. Chubb, Jr. (1946 ) | Trustee and Chairman of the Valuation Oversight Committee | Since 1994 | Current: Retired. Former: Business broker and manager of commercial real estate, Griffith & Blair, Inc. (1997-2017). | 48 | Former: Midland Care, Inc. (2011-2016). |
Jerry B. Farley (1946) | Trustee and Chairman of the Audit Committee | Since 2005 | Current: President, Washburn University (1997-present). | 48 | Current: Westar Energy, Inc. (2004-present); CoreFirst Bank & Trust (2000-present). |
Roman Friedrich III (1946) | Trustee and Chairman of the Contracts Review Committee | Since 2014 | Current: Founder and Managing Partner, Roman Friedrich & Company (1998-present). Former: Senior Managing Director, MLV & Co. LLC (2010-2011). | 48 | Current: Zincore Metals, Inc. (2009-present). Former: Axiom Gold and Silver Corp. (2011-2012). |
Ronald A. Nyberg (1953) | Trustee and Chairman of the Nominating and Governance Committee | Since 2014 | Current: Partner, Momkus McCluskey LLC (2016-present). Former: Partner, Nyberg & Cassioppi, LLC (2000-2016); Executive Vice President, General Counsel, and Corporate Secretary, Van Kampen Investments (1982-1999). | 51 | Current: PPM Fund Board (February 2018-present); Edward-Elmhurst Healthcare System (2012-present); Western Asset Inflation-Linked Opportunities & Income Fund (2004-present); Western Asset Inflation-Linked Income Fund (2003-present). |
Maynard F. Oliverius (1943) | Trustee | Since 1998 | Current: Retired. Former: President and CEO, Stormont-Vail HealthCare (1996-2012). | 48 | Current: Robert J. Dole Institute of Politics (2016-present); Stormont-Vail Foundation (2013-present); University of Minnesota MHA Alumni Philanthropy Committee (2009-present); Fort Hays State University Foundation (1999-present). Former: Topeka Community Foundation (2009-2014). |
| | THE GUGGENHEIM FUNDS SEMI-ANNUAL REPORT | 113 |
| INFORMATION ON BOARD OF TRUSTEES AND OFFICERS (Unaudited)(continued) |
Name, Address*
and Year of Birth | Position(s) Held
with the Trust | Term of Office
and Length of
Time Served** | Principal Occupation(s)
During Past Five Years | Number of
Portfolios
in Fund
Complex
Overseen | Other Directorships
Held by Trustees |
| INDEPENDENT TRUSTEES - concluded | | |
Ronald E. Toupin, Jr. (1958) | Trustee and Chairman of the Board | Since 2014 | Current: Portfolio Consultant (2010-present); Member, Governing Council (2003-present) and Executive Committee (2016-present), Independent Directors Council. Former: Vice President, Manager and Portfolio Manager, Nuveen Asset Management (1998-1999); Vice President, Nuveen Investment Advisory Corp. (1992-1999); Vice President and Manager, Nuveen Unit Investment Trusts (1991-1999); and Assistant Vice President and Portfolio Manager, Nuveen Unit Investment Trusts (1988-1999), each of John Nuveen & Co., Inc. (1982-1999). | 48 | Current: Western Asset Inflation-Linked Opportunities & Income Fund (2004-present); Western Asset Inflation-Linked Income Fund (2003-present). Former: Bennett Group of Funds (2011-2013); |
| INTERESTED TRUSTEE |
Amy J. Lee*** (1961) | Trustee, Vice President and Chief Legal Officer | Since February 2018 (Trustee) Since 2014 (Chief Legal Officer) Since 2007 (Vice President) | Current: Interested Trustee, certain other funds in the Fund Complex (February 2018-present); President, certain other funds in the Fund Complex (2017-present); Chief Legal Officer, certain other funds in the Fund Complex (2014-present); Vice President, certain other funds in the Fund Complex (2007-present); Senior Managing Director, Guggenheim Investments (2012-present). Former: President and Chief executive Officer (2017-February 2018); Vice President, Associate General Counsel and Assistant Secretary, Security Benefit Life Insurance Company and Security Benefit Corporation (2004-2012). | 158 | None. |
| * | The business address of each Trustee is c/o Guggenheim Investments, 227 West Monroe Street, Chicago, Illinois 60606. |
| ** | Each Trustee serves an indefinite term, until his or her successor is elected and qualified. Time served includes time served in the respective position for the Predecessor Corporation. |
| *** | This Trustee is an “interested person” (as defined in Section 2(a)(1a) of the 1940 Act) (“Interested Trustee”) of the Trust because of her affiliation with Guggenheim Investments. |
| 114 | THE GUGGENHEIM FUNDS SEMI-ANNUAL REPORT | |
| INFORMATION ON BOARD OF TRUSTEES AND OFFICERS (Unaudited)(continued) |
Name, Address*
and Year of Birth | Position(s)
Held with
the Trust | Term of Office
and Length of
Time Served** | Principal Occupations
During Past Five Years |
| OFFICERS | | | |
Brian E. Binder (1972) | President and Chief Executive Officer | Since February 2018 | Current: President and Chief Executive Officer, certain other funds in the Fund Complex (February 2018-present); President and Chief Executive Officer, Guggenheim Funds Investment Advisors, LLC and Security Investors, LLC (January 2018-present); Senior Managing Director and Chief Administrative Officer, Guggenheim Investments (January 2018-present). Former: Managing Director and President, Deutsche Funds, and Head of US Product, Trading and Fund Administration, Deutsche Asset Management (2013-January 2018); Managing Director, Head of Business Management and Consulting, Invesco Ltd. (2010-2012). |
James M. Howley (1972) | Assistant Treasurer | Since 2014 | Current: Managing Director, Guggenheim Investments (2004-present); Assistant Treasurer, certain other funds in the Fund Complex (2006-present). Former: Manager of Mutual Fund Administration, Van Kampen Investments, Inc. (1996-2004). |
Keith D. Kemp (1960) | Assistant Treasurer | Since 2016 | Current: Treasurer and Assistant Treasurer, certain other funds in the Fund Complex (2010-present); Managing Director, Guggenheim Investments (2015-present); Chief Financial Officer, Guggenheim Specialized Products, LLC (2016-present). Former: Managing Director and Director, Transparent Value, LLC (2010-2016); Director, Guggenheim Partners Investment Management, LLC (2010-2015); Chief Operating Officer, Macquarie Capital Investment Management (2007-2009). |
Mark E. Mathiasen (1978) | Secretary | Since 2014 | Current: Secretary, certain other funds in the Fund Complex (2007-present); Managing Director, Guggenheim Investments (2007-present). |
Glenn McWhinnie (1969) | Assistant Treasurer | Since 2016 | Current: Vice President, Guggenheim Investments (2009-present); Assistant Treasurer, certain other funds in the Fund Complex (2016-present). |
Michael P. Megaris (1984) | Assistant Secretary | Since 2014 | Current: Assistant Secretary, certain other funds in the Fund Complex (2014-present); Director, Guggenheim Investments (2012-present). |
Elisabeth Miller (1968) | Chief Compliance Officer | Since 2012 | Current: CCO, certain other funds in the Fund Complex (2012-present); Managing Director, Guggenheim Investments (2012-present); Vice President, Guggenheim Funds Distributors, LLC (2014-present). Former: CCO, Security Investors, LLC (2012-2018); CCO, Guggenheim Funds Investment Advisors, LLC (2012-2018); CCO, Guggenheim Distributors, LLC (2009-2014); Senior Manager, Security Investors, LLC (2004-2009); Senior Manager, Guggenheim Distributors, LLC (2004-2009). |
Adam J. Nelson (1979) | Assistant Treasurer | Since 2015 | Current: Vice President, Guggenheim Investments (2015-present); Assistant Treasurer, certain other funds in the Fund Complex (2015-present). Former: Assistant Vice President and Fund Administration Director, State Street Corporation (2013-2015); Fund Administration Assistant Director, State Street (2011-2013); Fund Administration Manager, State Street (2009-2011). |
| | THE GUGGENHEIM FUNDS SEMI-ANNUAL REPORT | 115 |
| INFORMATION ON BOARD OF TRUSTEES AND OFFICERS (Unaudited)(concluded) |
Name, Address*
and Year of Birth | Position(s)
Held with
the Trust | Term of Office
and Length of
Time Served** | Principal Occupations
During Past Five Years |
| OFFICERS - concluded | |
Kimberly J. Scott (1974) | Assistant Treasurer | Since 2014 | Current: Director, Guggenheim Investments (2012-present); Assistant Treasurer, certain other funds in the Fund Complex (2012-present). Former: Financial Reporting Manager, Invesco, Ltd. (2010-2011); Vice President/Assistant Treasurer of Mutual Fund Administration, Van Kampen Investments, Inc./Morgan Stanley Investment Management (2009-2010); Manager of Mutual Fund Administration, Van Kampen Investments, Inc./Morgan Stanley Investment Management (2005-2009). |
Bryan Stone (1979) | Vice President | Since 2014 | Current: Vice President, certain other funds in the Fund Complex (2014-present); Managing Director, Guggenheim Investments (2013-present). Former: Senior Vice President, Neuberger Berman Group LLC (2009-2013); Vice President, Morgan Stanley (2002-2009). |
John L. Sullivan (1955) | Chief Financial Officer, Chief Accounting and Treasurer | Since 2014 | Current: CFO, Chief Accounting Officer and Treasurer, certain other funds in the Fund Complex (2010-present); Senior Managing Director, Guggenheim Investments (2010-present). Former: Managing Director and CCO, each of the funds in the Van Kampen Investments fund complex (2004-2010); Managing Director and Head of Fund Accounting and Administration, Morgan Stanley Investment Management (2002-2004); CFO and Treasurer, Van Kampen Funds (1996-2004). |
Jon Szafran (1989) | Assistant Treasurer | Since 2017 | Current: Vice President, Guggenheim Investments (2017-present); Assistant Treasurer, certain other funds in the Fund Complex (2017-present). Former: Assistant Treasurer of Henderson Global Funds and Manager of US Fund Administration, Henderson Global Investors (North America) Inc. (“HGINA”), (2017); Senior Analyst of US Fund Administration, HGINA (2014-2017); Senior Associate of Fund Administration, Cortland Capital Market Services, LLC (2013-2014); Experienced Associate, PricewaterhouseCoopers LLP (2012-2013). |
| * | The business address of each officer is c/o Guggenheim Investments, 227 West Monroe Street, Chicago, Illinois 60606. |
| ** | Each officer serves an indefinite term, until his or her successor is duly elected and qualified. Time served includes time served in the respective position for the Predecessor Corporation. |
| 116 | THE GUGGENHEIM FUNDS SEMI-ANNUAL REPORT | |
| GUGGENHEIM INVESTMENTS PRIVACY NOTICE (Unaudited) |
Who We Are
This Privacy Notice describes the data protection practices of Guggenheim Investments. Guggenheim Investments as used herein refers to the affiliated investment management businesses of Guggenheim Partners, LLC: Guggenheim Funds Investment Advisors, LLC, Guggenheim Partners Investment Management, LLC, Guggenheim Funds Distributors, LLC, Security Investors, LLC, Guggenheim Investment Advisors (Europe) Limited, Guggenheim Real Estate, LLC, GS Gamma Advisors, LLC, Guggenheim Partners India Management, LLC, Guggenheim Partners Europe Limited, as well as the funds in the Guggenheim Funds complex (the “Funds”) (“Guggenheim Investments,” “we,” “us,” or “our”).
Guggenheim Partners Investment Management Holdings, LLC, located at 330 Madison Avenue, New York, New York 10017 is the data controller for your information. The Affiliates who are also controllers of certain of your information are: Guggenheim Investment Advisors (Europe) Limited, Guggenheim Partners Europe Limited, Guggenheim Partners, LLC, Guggenheim Funds Investment Advisors, LLC, Guggenheim Partners Investment Management, LLC, Guggenheim Funds Distributors, LLC and Security Investors, LLC, as well as the Funds.
Our Commitment to You
Guggenheim Investments considers your privacy our utmost concern. When you become our client or investor, you entrust us with not only your hard-earned money but also with your personal and financial information. Because we have access to your private information, we hold ourselves to the highest standards in its safekeeping and use. We strictly limit how we share your information with others, whether you are a current or former Guggenheim Investments client or investor.
The Information We Collect About You
We collect certain nonpublic personal information about you from information you provide on applications, other forms, our website, and/or from third parties including investment advisors. This information includes Social Security or other tax identification number, assets, income, tax information, retirement and estate plan information, transaction history, account balance, payment history, bank account information, marital status, family relationships, information that we collect on our website through the use of “cookies,” and other personal information that you or others provide to us. We may also collect such information through your inquiries by mail, e-mail or telephone. We may also collect customer due diligence information, as required by applicable law and regulation, through third party service providers.
How We Handle Your Personal Information
The legal basis for using your information as set out in this Privacy Notice is as follows: (a) use of your personal data is necessary to perform our obligations under any contract with you (such as a contract for us to provide financial services to you); or (b) where use of your personal data is not necessary for performance of a contract, use of your personal data is necessary for our legitimate interests or the legitimate interests of others (for example, to enforce the legal terms governing our services, operate and market our website and other services we offer, ensure safe environments for our personnel and others, make and receive payments, prevent fraud and to know the customer to whom we are providing the services). Some processing is done to comply with applicable law.
In addition to the specific uses described above, we also use your information in the following manner:
| | ● | We use your information in connection with servicing your accounts. |
| | ● | We use information to respond to your requests or questions. For example, we might use your information to respond to your customer feedback. |
| | ● | We use information to improve our products and services. We may use your information to make our website and products better. We may use your information to customize your experience with us. |
| | ● | We use information for security purposes. We may use your information to protect our company and our customers. |
| | ● | We use information to communicate with you. For example, we will communicate with you about your account or our relationship. We may contact you about your feedback. We might also contact you about this Privacy Notice. We may also enroll you in our email newsletter. |
| | THE GUGGENHEIM FUNDS SEMI-ANNUAL REPORT | 117 |
| GUGGENHEIM INVESTMENTS PRIVACY NOTICE (Unaudited)(continued) |
| | ● | We use information as otherwise permitted by law, as we may notify you. |
| | ● | Aggregate/Anonymous Data. We may aggregate and/or anonymize any information collected through the website so that such information can no longer be linked to you or your device (“Aggregate/Anonymous Information”). We may use Aggregate/Anonymous Information for any purpose, including without limitation for research and marketing purposes, and may also share such data with any third parties, including advertisers, promotional partners, and sponsors. |
We do not sell information about current or former clients or their accounts to third parties. Nor do we share this information, except when necessary to complete transactions at your request, to make you aware of investment products and services that we or our affiliates offer, or as permitted or required by law.
We provide information about you to companies and individuals not affiliated with Guggenheim Investments to complete certain transactions or account changes, or to perform services for us related to your account. For example, if you ask to transfer assets from another financial institution to Guggenheim Investments, we must provide certain information about you to that company to complete the transaction. We provide the third party with only the information necessary to carry out its responsibilities and only for that purpose. And we require these third parties to treat your private information with the same high degree of confidentiality that we do. To alert you to other Guggenheim Investments products and services, we share your information within our family of affiliated companies. You may limit our sharing with affiliated companies as set out below. We may also share information with any successor to all or part of our business, or in connection with steps leading up to a merger or acquisition. For example, if part of our business was sold we may give customer information as part of that transaction. We may also share information about you with your consent.
We will release information about you if you direct us to do so, if we are compelled by law to do so, or in other circumstances as permitted by law (for example, to protect your account from fraud).
If you close your account(s) or become an inactive client or investor, we will continue to adhere to the privacy policies and practices described in this notice.
Opt-Out Provisions and Your Data Choices
The law allows you to “opt out” of certain kinds of information sharing with third parties. We do not share personal information about you with any third parties that triggers this opt-out right. This means YOU ARE ALREADY OPTED OUT.
When you are no longer our client or investor, we continue to share your information as described in this notice, and you may contact us at any time to limit our sharing by sending an email to CorporateDataPrivacy@GuggenheimPartners.com.
European Union Data Subjects and certain others: In addition to the choices set forth above, residents of the European Union and certain other jurisdictions have certain rights to (1) request access to or rectification or deletion of information we collect about them, (2) request a restriction on the processing of their information, (3) object to the processing of their information, or (4) request the portability of certain information. To exercise these or other rights, please contact us using the contact information below. We will consider all requests and provide our response within the time period stated by applicable law. Please note, however, that certain information may be exempt from such requests in some circumstances, which may include if we need to keep processing your information for our legitimate interests or to comply with a legal obligation. We may request you provide us with information necessary to confirm your identity before responding to your request.
Residents of France and certain other jurisdictions may also provide us with instructions regarding the manner in which we may continue to store, erase and share your information after your death, and where applicable, the person you have designated to exercise these rights after your death.
| 118 | THE GUGGENHEIM FUNDS SEMI-ANNUAL REPORT | |
| GUGGENHEIM INVESTMENTS PRIVACY NOTICE (Unaudited)(concluded) |
How We Protect Privacy Online
We take steps to protect your privacy when you use our web site – www.guggenheiminvestments.com – by using secure forms of online communication, including encryption technology, Secure Socket Layer (SSL) protocol, firewalls and user names and passwords. These safeguards vary based on the sensitivity of the information that we collect and store. However, we cannot and do not guarantee that these measures will prevent every unauthorized attempt to access, use, or disclose your information since despite our efforts, no Internet and/or other electronic transmissions can be completely secure. Our web site uses “http cookies”—tiny pieces of information that we ask your browser to store. We use cookies for session management and security features on the Guggenheim Investments web site. We do not use them to pull data from your hard drive, to learn your e-mail address, or to view data in cookies created by other web sites. We will not share the information in our cookies or give others access to it. See the legal information area on our web site for more details about web site security and privacy features.
How We Safeguard Your Personal Information and Data Retention
We restrict access to nonpublic personal information about you to our employees and in some cases to third parties (for example, the service providers described above) as permitted by law. We maintain strict physical, electronic and procedural safeguards that comply with federal standards to guard your nonpublic personal information.
We keep your information for no longer than necessary for the purposes for which it is processed. The length of time for which we retain information depends on the purposes for which we collected and use it and/or as required to comply with applicable laws. Information may persist in copies made for backup and business continuity purposes for additional time.
International Visitors
If you are not a resident of the United States, please be aware that your information may be transferred to, stored and processed in the United States where our servers are located and our databases are operated. The data protection and other laws of the United States and other countries might not be as comprehensive as those in your country.
In such cases, we ensure that a legal basis for such a transfer exists and that adequate protection is provided as required by applicable law, for example, by using standard contractual clauses or by transferring your data to a jurisdiction that has obtained an adequacy finding. Individuals whose data may be transferred on the basis of standard contractual clauses may contact us as described below.
We’ll Keep You Informed
If you have any questions or concerns about how we treat your personal data, we encourage you to consult with us first. You may also contact the relevant supervisory authority.
We reserve the right to modify this policy at any time and will inform you promptly of material changes. You may access our privacy policy from our web site at www.guggenheiminvestments.com. Should you have any questions regarding our privacy policy, contact us by email at CorporateDataPrivacy@GuggenheimPartners.com.
| | THE GUGGENHEIM FUNDS SEMI-ANNUAL REPORT | 119 |
This page intentionally left blank.
This page intentionally left blank.
This page intentionally left blank.
This page intentionally left blank.
This page intentionally left blank.
This page intentionally left blank.
3.29.2018
Guggenheim Funds Semi-Annual Report
| Guggenheim Mid Cap Value Fund | | |
| GuggenheimInvestments.com | SBMCV-SEMI-0318x0918 |
| DEAR SHAREHOLDER | 2 |
| ECONOMIC AND MARKET OVERVIEW | 3 |
| ABOUT SHAREHOLDERS’ FUND EXPENSES | 5 |
| MID CAP VALUE FUND | 8 |
| NOTES TO FINANCIAL STATEMENTS | 22 |
| OTHER INFORMATION | 30 |
| INFORMATION ON BOARD OF TRUSTEES AND OFFICERS | 31 |
| GUGGENHEIM INVESTMENTS PRIVACY NOTICE | 38 |
| | THE GUGGENHEIM FUNDS SEMI-ANNUAL REPORT | 1 |
Dear Shareholder:
Security Investors, LLC (the “Investment Adviser”) is pleased to present the shareholder report for Guggenheim Mid Cap Value Fund (the “Fund”) for the semi-annual fiscal period ended March 29, 2018.
The Investment Adviser is part of Guggenheim Investments, which represents the investment management businesses of Guggenheim Partners, LLC, (“Guggenheim”), a global, diversified financial services firm.
Guggenheim Funds Distributors, LLC is the distributor of the Fund. Guggenheim Funds Distributors, LLC is also affiliated with Guggenheim and the Investment Adviser.
We encourage you to read the Economic and Market Overview section of the report, which follows this letter.
We are committed to providing innovative investment solutions and appreciate the trust you place in us.
Sincerely,
Security Investors, LLC
April 30, 2018
Read a prospectus and summary prospectus (if available) carefully before investing. It contains the investment objectives, risks, charges, expenses and other information, which should be considered carefully before investing. Obtain a prospectus and summary prospectus (if available) at guggenheiminvestments.com or call 800.820.0888.
This material is not intended as a recommendation or as investment advice of any kind, including in connection with rollovers, transfers, and distributions. Such material is not provided in a fiduciary capacity, may not be relied upon for or in connection with the making of investment decisions, and does not constitute a solicitation of an offer to buy or sell securities. All content has been provided for informational or educational purposes only and is not intended to be and should not be construed as legal or tax advice and/or a legal opinion. Always consult a financial, tax and/or legal professional regarding your specific situation.
Mid Cap Value Fund may not be suitable for all investors. ● An investment in the Fund will fluctuate and is subject to investment risks, which means investors could lose money. ● The intrinsic value of the underlying stocks may never be realized, or the stock may decline in value. ● Investments in small- and/or mid-sized company securities may present additional risks such as less predictable earnings, higher volatility and less liquidity than larger, more established companies.
| 2 | THE GUGGENHEIM FUNDS SEMI-ANNUAL REPORT | |
| ECONOMIC AND MARKET OVERVIEW (Unaudited) | March 29, 2018 |
As we enter the ninth year of the current expansion, one of the most important new developments to evaluate is the impact of the corporate tax cuts passed into law at the end of 2017. Guggenheim’s concern is that the substantial late-cycle fiscal easing in the pipeline will prompt more restrictive monetary policy, which increases the risk that the economy will experience a boom-bust cycle that ends in a recession.
With the unemployment rate at 4.1% and core inflation rising, fiscal policy should be leaning against the economy to prevent overheating, not providing further stimulus. Faster wage growth, rising core inflation, and an unsustainably low unemployment rate underpin our longstanding view that the U.S. Federal Reserve (the “Fed”) will raise interest rates four times in 2018. Fed funds futures show the market is now pricing in nearly three rate hikes for 2018, up from two at the beginning of the year, which contributed to a pickup in first-quarter market volatility. Tighter fiscal and monetary policy, along with rising policy uncertainty ahead of the 2018 mid-terms and 2020 presidential election, could prove to be too much for an overextended economy to bear.
Further complicating the story is the risk of a global trade war sparked by protectionist actions taken by the Trump administration. We now have new steel and aluminum tariffs in place that are likely to have some modest inflationary impact while hurting almost 20% of U.S. corporates, according to our estimates. We expect more protectionist trade and investment policies in place by year end.
Over the six months ended March 29, 2018, the bear flattening (the condition in which short-term rates rise faster than long-term rates) of the U.S. Treasury curve continued with Treasury yields higher across the curve. Yields increased the most in the belly and front end of the curve. The 2-year Treasury ended the period at 2.27%, while the 10-year finished the period at 2.74%.
For the six months ended March 29, 2018, the Standard & Poor’s 500® (“S&P 500”) Index* returned 5.84%. The MSCI Europe-Australasia-Far East (“EAFE”) Index* returned 2.80%. The return of the MSCI Emerging Markets Index* was 9.08%.
In the bond market, the Bloomberg Barclays U.S. Aggregate Bond Index* posted a -1.08% return for the period, while the Bloomberg Barclays U.S. Corporate High Yield Index* returned -0.39%. The return of the ICE Bank of America (“BofA”) Merrill Lynch 3-Month U.S. Treasury Bill Index* was 0.64% for the six-month period.
The opinions and forecasts expressed may not actually come to pass. This information is subject to change at any time, based on market and other conditions, and should not be construed as a recommendation of any specific security or strategy.
| | THE GUGGENHEIM FUNDS SEMI-ANNUAL REPORT | 3 |
| ECONOMIC AND MARKET OVERVIEW (Unaudited)(concluded) | March 29, 2018 |
*Index Definitions:
The following indices are referenced throughout this report. Indices are unmanaged and not available for direct investment. Index performance does not reflect transaction costs, fees, or expenses.
Bloomberg Barclays U.S. Aggregate Bond Index is a broad-based flagship benchmark that measures the investment grade, U.S. dollar-denominated, fixed-rate taxable bond market, including U.S. Treasuries, government-related and corporate securities, mortgage-backed securities or “MBS” (agency fixed-rate and hybrid adjustable-rate mortgage, or “ARM”, pass-throughs), asset-backed securities (“ABS”), and commercial mortgage-backed securities (“CMBS”) (agency and non-agency).
Bloomberg Barclays U.S. Corporate High Yield Index measures the U.S. dollar-denominated, high yield, fixed-rate corporate bond market. Securities are classified as high yield if the middle rating of Moody’s, Fitch, and S&P is Ba1/BB +/BB + or below.
ICE BofA Merrill Lynch 3-Month U.S. Treasury Bill Index is an unmanaged market index of U.S. Treasury securities maturing in 90 days that assumes reinvestment of all income.
MSCI EAFE Index is a free float-adjusted market capitalization index that is designed to measure the equity market performance of developed markets, excluding the U.S. & Canada.
MSCI Emerging Markets Index is a free float-adjusted market capitalization weighted index that is designed to measure equity market performance in the global emerging markets.
Russell 2500® Value Index measures the performance of the small-to mid-cap value segment of the U.S. equity universe. It includes those Russell 2500 companies with lower price-to-book ratios and lower forecasted growth values.
S&P 500® Index is a broad-based index, the performance of which is based on the performance of 500 widely held common stocks chosen for market size, liquidity, and industry group representation.
| 4 | THE GUGGENHEIM FUNDS SEMI-ANNUAL REPORT | |
| ABOUT SHAREHOLDERS’ FUND EXPENSES (Unaudited) |
All mutual funds have operating expenses, and it is important for our shareholders to understand the impact of costs on their investments. Shareholders of a fund incur two types of costs: (i) transaction costs, including sales charges (loads) on purchase payments, reinvested dividends, other distributions, and exchange fees, and (ii) ongoing costs, including management fees, administrative services, and shareholder reports, among others. These ongoing costs, or operating expenses, are deducted from a fund’s gross income and reduce the investment return of the fund.
A fund’s expenses are expressed as a percentage of its average net assets, which is known as the expense ratio. The following examples are intended to help investors understand the ongoing costs (in dollars) of investing in a fund and to compare these costs with the ongoing costs of investing in other mutual funds.
The examples are based on an investment of $1,000 made at the beginning of the period and held for the entire six-month period beginning September 30, 2017 and ending March 29, 2018 for actual Fund returns. Hypothetical Fund returns are for the period beginning September 30, 2017 and ending March 31, 2018.
The following tables illustrate the Fund’s costs in two ways:
Table 1. Based on actual Fund return: This section helps investors estimate the actual expenses paid over the period. The “Ending Account Value” shown is derived from the Fund’s actual return, and the fifth column shows the dollar amount that would have been paid by an investor who started with $1,000 in the Fund. Investors may use the information here, together with the amount invested, to estimate the expenses paid over the period. Simply divide the Fund’s account value by $1,000 (for example, an $8,600 account value divided by $1,000 = 8.6), then multiply the result by the number provided under the heading “Expenses Paid During Period.”
Table 2. Based on hypothetical 5% return: This section is intended to help investors compare a fund’s cost with those of other mutual funds. The table provides information about hypothetical account values and hypothetical expenses based on the Fund’s actual expense ratio and an assumed rate of return of 5% per year before expenses, which is not the Fund’s actual return. The hypothetical account values and expenses may not be used to estimate the actual ending account balance or expenses paid during the period. The example is useful in making comparisons because the U.S. Securities and Exchange Commission (the “SEC”) requires all mutual funds to calculate expenses based on the 5% return. Investors can assess a fund’s costs by comparing this hypothetical example with the hypothetical examples that appear in shareholder reports of other funds.
The calculations illustrated above assume no shares were bought or sold during the period. Actual costs may have been higher or lower, depending on the amount of investment and the timing of any purchases or redemptions.
| | THE GUGGENHEIM FUNDS SEMI-ANNUAL REPORT | 5 |
| ABOUT SHAREHOLDERS’ FUND EXPENSES (Unaudited)(continued) |
Please note that the expenses shown in the table are meant to highlight your ongoing costs only and do not reflect any transactional costs, such as sales charges (loads) on purchase payments, and contingent deferred sales charges (“CDSC”) on redemptions, if any. Therefore, the second table is useful in comparing ongoing costs only, and will not help you determine the relative total costs of owning different funds. In addition, if these transactional costs were included, your costs would have been higher.
More information about the Fund’s expenses, including annual expense ratios for periods up to five years (subject to the Fund’s inception date), can be found in the Financial Highlights section of this report. For additional information on operating expenses and other shareholder costs, please refer to the Fund’s prospectus.
| 6 | THE GUGGENHEIM FUNDS SEMI-ANNUAL REPORT | |
| ABOUT SHAREHOLDERS’ FUND EXPENSES (Unaudited)(concluded) |
| | Expense
Ratio1 | Fund
Return | Beginning
Account Value
September 30,
2017 | Ending
Account Value
March 29,
2018 | Expenses
Paid During
Period2 |
| Table 1. Based on actual Fund return3 |
| Mid Cap Value Fund |
| A-Class | 1.27% | 2.57% | $ 1,000.00 | $ 1,025.70 | $ 6.34 |
| C-Class | 2.05% | 2.22% | 1,000.00 | 1,022.20 | 10.22 |
| P-Class | 1.26% | 2.62% | 1,000.00 | 1,026.20 | 6.30 |
| |
| | Expense
Ratio1 | Fund
Return | Beginning
Account Value
September 30,
2017 | Ending
Account Value
March 31,
2018 | Expenses
Paid During
Period4 |
| Table 2. Based on hypothetical 5% return (before expenses)5 |
| Mid Cap Value Fund |
| A-Class | 1.27% | 5.00% | $ 1,000.00 | $ 1,018.60 | $ 6.39 |
| C-Class | 2.05% | 5.00% | 1,000.00 | 1,014.71 | 10.30 |
| P-Class | 1.26% | 5.00% | 1,000.00 | 1,018.65 | 6.34 |
| 1 | Annualized and excludes expenses of the underlying funds in which the Fund invests, if any. |
| 2 | Expenses in table 1 are equal to the Fund's annualized expense ratio, net of any applicable fee waivers, multiplied by the average account value over the period, multiplied by 180/365 (to reflect the one-half year period). |
| 3 | Actual cumulative return at net asset value for the period September 30, 2017 to March 29, 2018. |
| 4 | Expenses in table 2 are equal to the Fund’s annualized expense ratio, net of any applicable fee waivers, multiplied by the average account value over the period, multiplied by 182/365 (to reflect the one-half year period). |
| 5 | Hypothetical return for the period September 30, 2017 to March 31, 2018. |
| | THE GUGGENHEIM FUNDS SEMI-ANNUAL REPORT | 7 |
| PERFORMANCE REPORT AND FUND PROFILE (Unaudited) | March 29, 2018 |
MID CAP VALUE FUND
OBJECTIVE: Seeks long-term growth of capital.
Holdings Diversification (Market Exposure as % of Net Assets)
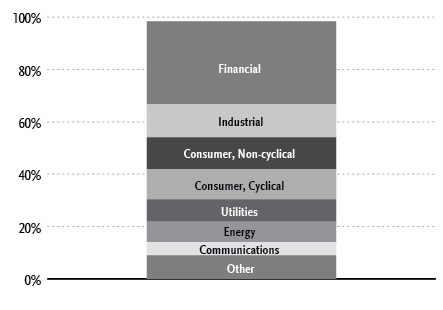
“Holdings Diversification (Market Exposure as % of Net Assets)” excludes any temporary cash investments.
| Inception Dates: |
| A-Class | May 1, 1997 |
| C-Class | January 29, 1999 |
| P-Class | May 1, 2015 |
| Ten Largest Holdings (% of Total Net Assets) |
| Zions Bancorporation | 2.8% |
| KeyCorp | 2.4% |
| E*TRADE Financial Corp. | 2.0% |
| PVH Corp. | 2.0% |
| Wintrust Financial Corp. | 2.0% |
| Huntington Bancshares, Inc. | 1.9% |
| DR Horton, Inc. | 1.8% |
| OGE Energy Corp. | 1.6% |
| UniFirst Corp. | 1.6% |
| Unum Group | 1.6% |
| Top Ten Total | 19.7% |
“Ten Largest Holdings” excludes any temporary cash investments.
| 8 | THE GUGGENHEIM FUNDS SEMI-ANNUAL REPORT | |
| PERFORMANCE REPORT AND FUND PROFILE (Unaudited)(concluded) | March 29, 2018 |
Average Annual Returns*
Periods Ended March 29, 2018
| | 6 month† | 1 Year | 5 Year | 10 Year |
| A-Class Shares | 2.57% | 8.65% | 8.66% | 9.51% |
| A-Class Shares with sales charge‡ | (2.29%) | 3.48% | 7.61% | 8.86% |
| C-Class Shares | 2.22% | 7.83% | 7.84% | 8.70% |
| C-Class Shares with CDSC§ | 1.29% | 6.85% | 7.84% | 8.70% |
| Russell 2500 Value Index | 1.49% | 5.72% | 9.88% | 9.34% |
| | | | | |
| | | 6 month† | 1 Year | Since Inception
(05/01/15) |
| P-Class Shares | | 2.62% | 8.68% | 9.35% |
| Russell 2500 Value Index | | 1.49% | 5.72% | 7.80% |
| * | The performance data above represents past performance that is not predictive of future results. The investment return and principal value of an investment in the Fund will fluctuate so that an investor’s shares, when redeemed, may be worth more or less than their original cost. Returns are historical and include changes in principal and reinvested dividends and capital gains and do not reflect the effect of taxes. The Russell 2500 Value Index is an unmanaged index and, unlike the Fund, has no management fees or operating expenses to reduce its reported return. |
| † | 6 month returns are not annualized. |
| ‡ | Effective February 22, 2011, the maximum sales charge decreased from 5.75% to 4.75%. A 5.75% maximum sales charge is used in the calculation of the 1 Year, 5 Year and 10 Year average annual returns (based on subscriptions made prior to February 22, 2011), and a 4.75% maximum sales charge will be used to calculate performance for periods based on subscriptions made on or after February 22, 2011. |
| § | Fund returns include a CDSC of 1% if redeemed within 12 months of purchase. |
| | THE GUGGENHEIM FUNDS SEMI-ANNUAL REPORT | 9 |
| SCHEDULE OF INVESTMENTS (Unaudited) | March 29, 2018 |
| MID CAP VALUE FUND | |
| | | Shares | | | Value | |
| | | | | | | |
| COMMON STOCKS† - 98.4% |
| | | | | | | |
| Financial - 31.7% |
| Zions Bancorporation | | | 247,593 | | | $ | 13,055,579 | |
| KeyCorp | | | 582,486 | | | | 11,387,601 | |
| E*TRADE Financial Corp.* | | | 171,255 | | | | 9,489,240 | |
| Wintrust Financial Corp. | | | 106,726 | | | | 9,183,772 | |
| Huntington Bancshares, Inc. | | | 573,274 | | | | 8,656,438 | |
| Unum Group | | | 152,454 | | | | 7,258,335 | |
| Radian Group, Inc. | | | 345,826 | | | | 6,584,527 | |
| Alleghany Corp. | | | 10,704 | | | | 6,576,965 | |
| Equity Commonwealth REIT* | | | 211,651 | | | | 6,491,336 | |
| Umpqua Holdings Corp. | | | 257,151 | | | | 5,505,603 | |
| Alexandria Real Estate Equities, Inc. REIT | | | 43,643 | | | | 5,450,574 | |
| Prosperity Bancshares, Inc. | | | 73,237 | | | | 5,319,203 | |
| Howard Hughes Corp.* | | | 37,553 | | | | 5,224,749 | |
| Sun Communities, Inc. REIT | | | 49,124 | | | | 4,488,460 | |
| Cousins Properties, Inc. REIT | | | 450,768 | | | | 3,912,666 | |
| IBERIABANK Corp. | | | 46,833 | | | | 3,652,974 | |
| Pinnacle Financial Partners, Inc. | | | 53,380 | | | | 3,426,996 | |
| National Storage Affiliates Trust REIT | | | 127,313 | | | | 3,193,010 | |
| CoreCivic, Inc. REIT | | | 153,736 | | | | 3,000,927 | |
| Redwood Trust, Inc. REIT | | | 183,428 | | | | 2,837,631 | |
| LaSalle Hotel Properties REIT | | | 88,742 | | | | 2,574,405 | |
| Camden Property Trust REIT | | | 30,148 | | | | 2,537,859 | |
| Customers Bancorp, Inc.* | | | 84,893 | | | | 2,474,631 | |
| Lexington Realty Trust REIT | | | 305,773 | | | | 2,406,434 | |
| Federal Agricultural Mortgage Corp. — Class C | | | 27,313 | | | | 2,376,777 | |
| Voya Financial, Inc. | | | 45,824 | | | | 2,314,112 | |
| Piedmont Office Realty Trust, Inc. — Class A REIT | | | 129,331 | | | | 2,274,932 | |
| Physicians Realty Trust REIT | | | 140,648 | | | | 2,189,889 | |
| EastGroup Properties, Inc. REIT | | | 14,469 | | | | 1,196,008 | |
| First Industrial Realty Trust, Inc. REIT | | | 40,407 | | | | 1,181,097 | |
| Seacoast Banking Corporation of Florida* | | | 42,723 | | | | 1,130,878 | |
| Total Financial | | | | | | | 147,353,608 | |
| | | | | | | | | |
| Industrial - 12.6% |
| Carlisle Companies, Inc. | | | 65,236 | | | | 6,811,291 | |
| FLIR Systems, Inc. | | | 100,054 | | | | 5,003,701 | |
| Crane Co. | | | 50,407 | | | | 4,674,745 | |
| WestRock Co. | | | 72,541 | | | | 4,654,956 | |
| Gentex Corp. | | | 141,289 | | | | 3,252,473 | |
| ITT, Inc. | | | 62,668 | | | | 3,069,479 | |
| Celadon Group, Inc. | | | 754,880 | | | | 2,793,056 | |
| KLX, Inc.* | | | 34,455 | | | | 2,448,372 | |
| Scorpio Tankers, Inc. | | | 1,225,835 | | | | 2,402,637 | |
| Oshkosh Corp. | | | 30,035 | | | | 2,320,805 | |
| Covenant Transportation Group, Inc. — Class A* | | | 75,370 | | | | 2,248,287 | |
| Jacobs Engineering Group, Inc. | | | 37,803 | | | | 2,236,048 | |
| GasLog Ltd. | | | 133,381 | | | | 2,194,117 | |
| Greif, Inc. — Class A | | | 41,821 | | | | 2,185,147 | |
| Hub Group, Inc. — Class A* | | | 51,283 | | | | 2,146,194 | |
| Fabrinet* | | | 60,659 | | | | 1,903,479 | |
| Park Electrochemical Corp. | | | 107,931 | | | | 1,817,558 | |
| Kirby Corp.* | | | 19,570 | | | | 1,505,911 | |
| TriMas Corp.* | | | 56,886 | | | | 1,493,257 | |
| Rexnord Corp.* | | | 42,906 | | | | 1,273,450 | |
| Valmont Industries, Inc. | | | 8,022 | | | | 1,173,619 | |
| Astec Industries, Inc. | | | 19,874 | | | | 1,096,647 | |
| Total Industrial | | | | | | | 58,705,229 | |
| 10 | THE GUGGENHEIM FUNDS SEMI-ANNUAL REPORT | SEE NOTES TO FINANCIAL STATEMENTS. |
| SCHEDULE OF INVESTMENTS (Unaudited)(continued) | March 29, 2018 |
| MID CAP VALUE FUND | |
| | | Shares | | | Value | |
| | | | | | | |
| Consumer, Non-cyclical - 12.2% |
| Ingredion, Inc. | | | 53,827 | | | $ | 6,939,377 | |
| Hormel Foods Corp. | | | 175,820 | | | | 6,034,142 | |
| Emergent BioSolutions, Inc.* | | | 113,927 | | | | 5,998,256 | |
| Bunge Ltd. | | | 79,882 | | | | 5,906,475 | |
| Premier, Inc. — Class A* | | | 124,090 | | | | 3,885,258 | |
| Encompass Health Corp. | | | 64,208 | | | | 3,670,771 | |
| Eagle Pharmaceuticals, Inc.* | | | 65,510 | | | | 3,451,722 | |
| Myriad Genetics, Inc.* | | | 113,534 | | | | 3,354,930 | |
| Hostess Brands, Inc.* | | | 178,559 | | | | 2,640,888 | |
| Perrigo Company plc | | | 30,037 | | | | 2,503,283 | |
| SP Plus Corp.* | | | 65,325 | | | | 2,325,570 | |
| Fresh Del Monte Produce, Inc. | | | 48,817 | | | | 2,208,481 | |
| ACCO Brands Corp. | | | 137,976 | | | | 1,731,599 | |
| Quest Diagnostics, Inc. | | | 13,575 | | | | 1,361,573 | |
| Inovio Pharmaceuticals, Inc.* | | | 285,661 | | | | 1,345,463 | |
| Dermira, Inc.* | | | 162,722 | | | | 1,300,149 | |
| Central Garden & Pet Co. — Class A* | | | 31,849 | | | | 1,261,539 | |
| Smart & Final Stores, Inc.* | | | 127,805 | | | | 709,318 | |
| Total Consumer, Non-cyclical | | | | | | | 56,628,794 | |
| | | | | | | | | |
| Consumer, Cyclical - 11.5% |
| PVH Corp. | | | 61,433 | | | | 9,302,799 | |
| DR Horton, Inc. | | | 189,635 | | | | 8,313,598 | |
| UniFirst Corp. | | | 45,058 | | | | 7,283,626 | |
| Caleres, Inc. | | | 114,701 | | | | 3,853,954 | |
| Lennar Corp. — Class A | | | 61,838 | | | | 3,644,732 | |
| American Eagle Outfitters, Inc. | | | 174,856 | | | | 3,484,880 | |
| GMS, Inc.* | | | 108,912 | | | | 3,328,351 | |
| PACCAR, Inc. | | | 40,635 | | | | 2,688,818 | |
| JetBlue Airways Corp.* | | | 126,845 | | | | 2,577,490 | |
| Unifi, Inc.* | | | 66,241 | | | | 2,401,236 | |
| Acushnet Holdings Corp. | | | 101,371 | | | | 2,340,656 | |
| Goodyear Tire & Rubber Co. | | | 70,824 | | | | 1,882,502 | |
| Movado Group, Inc. | | | 41,451 | | | | 1,591,718 | |
| Alaska Air Group, Inc. | | | 15,883 | | | | 984,111 | |
| Lennar Corp. — Class B | | | 1,265 | | | | 60,328 | |
| Total Consumer, Cyclical | | | | | | | 53,738,799 | |
| | | | | | | | | |
| Utilities - 8.5% |
| OGE Energy Corp. | | | 232,818 | | | | 7,629,446 | |
| Ameren Corp. | | | 107,391 | | | | 6,081,552 | |
| Portland General Electric Co. | | | 124,750 | | | | 5,053,622 | |
| Pinnacle West Capital Corp. | | | 59,980 | | | | 4,786,404 | |
| Black Hills Corp. | | | 75,090 | | | | 4,077,387 | |
| AES Corp. | | | 349,829 | | | | 3,977,556 | |
| UGI Corp. | | | 88,586 | | | | 3,934,990 | |
| ONE Gas, Inc. | | | 43,958 | | | | 2,902,107 | |
| Edison International | | | 18,189 | | | | 1,157,912 | |
| Total Utilities | | | | | | | 39,600,976 | |
| | | | | | | | | |
| Energy - 7.9% |
| Whiting Petroleum Corp.* | | | 176,404 | | | | 5,969,511 | |
| Marathon Oil Corp. | | | 339,473 | | | | 5,475,699 | |
| Rowan Companies plc — Class A* | | | 441,189 | | | | 5,091,321 | |
| Hess Corp. | | | 92,958 | | | | 4,705,534 | |
| Oasis Petroleum, Inc.* | | | 555,603 | | | | 4,500,384 | |
| Range Resources Corp. | | | 277,596 | | | | 4,036,246 | |
| Andeavor | | | 36,248 | | | | 3,645,099 | |
| WildHorse Resource Development Corp.* | | | 72,722 | | | | 1,388,263 | |
| MRC Global, Inc.* | | | 81,949 | | | | 1,347,242 | |
| Gulfport Energy Corp.* | | | 90,204 | | | | 870,469 | |
| Total Energy | | | | | | | 37,029,768 | |
| | | | | | | | | |
| Communications - 5.0% |
| Infinera Corp.* | | | 583,258 | | | | 6,334,182 | |
| Ciena Corp.* | | | 234,293 | | | | 6,068,189 | |
| Viavi Solutions, Inc.* | | | 347,381 | | | | 3,376,543 | |
| Finisar Corp.* | | | 204,886 | | | | 3,239,248 | |
| Oclaro, Inc.* | | | 319,424 | | | | 3,053,693 | |
| Acacia Communications, Inc.* | | | 33,521 | | | | 1,289,218 | |
| Total Communications | | | | | | | 23,361,073 | |
| SEE NOTES TO FINANCIAL STATEMENTS. | THE GUGGENHEIM FUNDS SEMI-ANNUAL REPORT | 11 |
| SCHEDULE OF INVESTMENTS (Unaudited)(continued) | March 29, 2018 |
| MID CAP VALUE FUND | |
| | | Shares | | | Value | |
| | | | | | | |
| Technology - 4.5% |
| Cray, Inc.* | | | 296,662 | | | $ | 6,140,904 | |
| Conduent, Inc.* | | | 233,622 | | | | 4,354,714 | |
| Qorvo, Inc.* | | | 60,690 | | | | 4,275,610 | |
| Maxwell Technologies, Inc.* | | | 578,897 | | | | 3,432,859 | |
| Super Micro Computer, Inc.* | | | 162,622 | | | | 2,764,574 | |
| Total Technology | | | | | | | 20,968,661 | |
| | | | | | | | | |
| Basic Materials - 4.5% |
| Reliance Steel & Aluminum Co. | | | 68,300 | | | | 5,856,042 | |
| Nucor Corp. | | | 90,486 | | | | 5,527,790 | |
| Westlake Chemical Corp. | | | 46,660 | | | | 5,186,259 | |
| Alcoa Corp.* | | | 49,864 | | | | 2,241,885 | |
| Tahoe Resources, Inc. | | | 447,792 | | | | 2,100,145 | |
| Total Basic Materials | | | | | | | 20,912,121 | |
| | | | | | | | | |
| Total Common Stocks | | | | | | | | |
| (Cost $397,967,510) | | | | | | | 458,299,029 | |
| | | | | | | | | |
| CONVERTIBLE PREFERRED STOCKS††† - 0.0% |
| Thermoenergy Corp.*,1,2,4 | | | 858,334 | | | | 251 | |
| Total Convertible Preferred Stocks | | | | | | | | |
| (Cost $819,654) | | | | | | | 251 | |
| | | | | | | | | |
| MONEY MARKET FUND† - 2.2% |
| Dreyfus Treasury Securities Cash Management Institutional Shares 1.46%3 | | | 10,050,907 | | | | 10,050,907 | |
| Total Money Market Fund | | | | | | | | |
| (Cost $10,050,907) | | | | | | | 10,050,907 | |
| | | | | | | | | |
| Total Investments - 100.6% | | | | | | | | |
| (Cost $408,838,071) | | | | | | $ | 468,350,187 | |
| Other Assets & Liabilities, net - (0.6)% | | | | | | | (3,003,258 | ) |
| Total Net Assets - 100.0% | | | | | | $ | 465,346,929 | |
| * | Non-income producing security. |
| † | Value determined based on Level 1 inputs — See Note 3. |
| ††† | Value determined based on Level 3 inputs — See Note 3. |
| 1 | Security was fair valued by the Valuation Committee at March 29, 2018. The total market value of fair valued securities amounts to $251, (cost $819,654) or 0.0% of total net assets. |
| 2 | PIPE (Private Investment in Public Equity) — Stock issued by a company in the secondary market as a means of raising capital more quickly and less expensively than through registration of a secondary public offering. |
| 3 | Rate indicated is the 7 day yield as of March 29, 2018. |
| 4 | Illiquid security. |
| | plc — Public Limited Company |
| | REIT — Real Estate Investment Trust |
| | |
| | See Sector Classification in Other Information section. |
| 12 | THE GUGGENHEIM FUNDS SEMI-ANNUAL REPORT | SEE NOTES TO FINANCIAL STATEMENTS. |
| SCHEDULE OF INVESTMENTS (Unaudited)(concluded) | March 29, 2018 |
| MID CAP VALUE FUND | |
The following table summarizes the inputs used to value the Fund’s investments at March 29, 2018 (See Note 3 in the Notes to Financial Statements):
| Investments in Securities (Assets) | | Level 1
Quoted
Prices | | | Level 2
Significant
Observable
Inputs | | | Level 3
Significant
Unobservable
Inputs | | | Total | |
| Common Stocks | | $ | 458,299,029 | | | $ | — | | | $ | — | | | $ | 458,299,029 | |
| Convertible Preferred Stocks | | | — | | | | — | | | | 251 | | | | 251 | |
| Money Market Fund | | | 10,050,907 | | | | — | | | | — | | | | 10,050,907 | |
| Total Assets | | $ | 468,349,936 | | | $ | — | | | $ | 251 | | | $ | 468,350,187 | |
Transfers between investment levels may occur as the markets fluctuate and/or the availability of data used in an investment’s valuation changes. Transfers between valuation levels, if any, are in comparison to the valuation levels at the end of the previous fiscal year, and are effective using the fair value as of the end of the current fiscal period.
For the period ended March 29, 2018, there were no transfers between levels.
| SEE NOTES TO FINANCIAL STATEMENTS. | THE GUGGENHEIM FUNDS SEMI-ANNUAL REPORT | 13 |
| STATEMENT OF ASSETS AND LIABILITIES (Unaudited) |
| MID CAP VALUE FUND |
March 29, 2018
| Assets: |
| Investments, at value (cost $408,838,071) | | $ | 468,350,187 | |
| Cash | | | 91,530 | |
| Prepaid expenses | | | 76,929 | |
| Receivables: |
| Dividends | | | 609,420 | |
| Fund shares sold | | | 73,675 | |
| Interest | | | 9,253 | |
| Total assets | | | 469,210,994 | |
| | | | | |
| Liabilities: |
| Payable for: |
| Securities purchased | | | 2,319,424 | |
| Fund shares redeemed | | | 349,728 | |
| Management fees | | | 293,552 | |
| Distribution and service fees | | | 152,049 | |
| Transfer agent/maintenance fees | | | 46,641 | |
| Trustees’ fees* | | | 37,951 | |
| Fund accounting/administration fees | | | 31,988 | |
| Miscellaneous | | | 632,732 | |
| Total liabilities | | | 3,864,065 | |
| Net assets | | $ | 465,346,929 | |
| | | | | |
| Net assets consist of: |
| Paid in capital | | $ | 376,975,185 | |
| Undistributed net investment income | | | 100,517 | |
| Accumulated net realized gain on investments | | | 28,759,111 | |
| Net unrealized appreciation on investments | | | 59,512,116 | |
| Net assets | | $ | 465,346,929 | |
| | | | | |
| A-Class: |
| Net assets | | $ | 363,246,489 | |
| Capital shares outstanding | | | 10,764,133 | |
| Net asset value per share | | $ | 33.75 | |
| Maximum offering price per share (Net asset value divided by 95.25%) | | $ | 35.43 | |
| | | | | |
| C-Class: |
| Net assets | | $ | 80,609,842 | |
| Capital shares outstanding | | | 3,306,558 | |
| Net asset value per share | | $ | 24.38 | |
| | | | | |
| P-Class |
| Net assets | | $ | 21,490,598 | |
| Capital shares outstanding | | | 641,098 | |
| Net asset value per share | | $ | 33.52 | |
| * | Relates to Trustees not deemed "interested persons" within the meaning of Section 2(a)(19) of the 1940 Act. |
| 14 | THE GUGGENHEIM FUNDS SEMI-ANNUAL REPORT | SEE NOTES TO FINANCIAL STATEMENTS. |
| STATEMENT OF OPERATIONS (Unaudited) |
| MID CAP VALUE FUND |
Period Ended March 29, 2018
| Investment Income: |
| Dividends | | $ | 3,525,580 | |
| Interest | | | 46,967 | |
| Total investment income | | | 3,572,547 | |
| | | | | |
| Expenses: |
| Management fees | | | 1,849,200 | |
| Distribution and service fees: |
| A-Class | | | 482,113 | |
| C-Class | | | 426,422 | |
| P-Class | | | 27,682 | |
| Transfer agent/maintenance fees: |
| A-Class | | | 206,490 | |
| C-Class | | | 57,083 | |
| P-Class | | | 16,921 | |
| Fund accounting/administration fees | | | 197,250 | |
| Trustees’ fees* | | | 13,546 | |
| Custodian fees | | | 8,466 | |
| Line of credit fees | | | 6,029 | |
| Recoupment of previously waived fees: |
| A-Class | | | 31,282 | |
| C-Class | | | 7,044 | |
| P-Class | | | 963 | |
| Miscellaneous | | | 162,958 | |
| Total expenses | | | 3,493,449 | |
| Less: |
| Expenses reimbursed by Adviser: |
| A Class | | | (11,926 | ) |
| C Class | | | (3,075 | ) |
| P Class | | | (6,418 | ) |
| Total reimbursed expenses | | | (21,419 | ) |
| Net expenses | | | 3,472,030 | |
| Net investment income | | | 100,517 | |
| | | | | |
| Net Realized and Unrealized Gain (Loss): |
| Net realized gain (loss) on: |
| Investments | | $ | 32,588,027 | |
| Net change in unrealized appreciation (depreciation) on: |
| Investments | | | (19,127,231 | ) |
| Net realized and unrealized gain | | | 13,460,796 | |
| Net increase in net assets resulting from operations | | $ | 13,561,313 | |
| * | Relates to Trustees not deemed "interested persons" within the meaning of Section 2(a)(19) of the 1940 Act. |
| SEE NOTES TO FINANCIAL STATEMENTS. | THE GUGGENHEIM FUNDS SEMI-ANNUAL REPORT | 15 |
| STATEMENTS OF CHANGES IN NET ASSETS |
| MID CAP VALUE FUND | |
| | | Period Ended
March 29,
2018
(Unaudited) | | | Year Ended
September 30,
2017 | |
| Increase (Decrease) in Net Assets from Operations: | | | | | | | | |
| Net investment income (loss) | | $ | 100,517 | | | $ | (194,678 | ) |
| Net realized gain on investments | | | 32,588,027 | | | | 81,130,196 | |
| Net change in unrealized appreciation (depreciation) on investments | | | (19,127,231 | ) | | | 16,183,764 | |
| Net increase in net assets resulting from operations | | | 13,561,313 | | | | 97,119,282 | |
| | | | | | | | | |
| Distributions to shareholders from: | | | | | | | | |
| Net investment income | | | | | | | | |
| A-Class | | | — | | | | (4,950,405 | ) |
| C-Class | | | — | | | | (780,189 | ) |
| P-Class | | | — | | | | (49,828 | ) |
| Net realized gains | | | | | | | | |
| A-Class | | | (28,138,220 | ) | | | (8,613,768 | ) |
| C-Class | | | (8,265,848 | ) | | | (2,669,531 | ) |
| P-Class | | | (1,646,381 | ) | | | (67,525 | ) |
| Total distributions to shareholders | | | (38,050,449 | ) | | | (17,131,246 | ) |
| | | | | | | | | |
| Capital share transactions: | | | | | | | | |
| Proceeds from sale of shares | | | | | | | | |
| A-Class | | | 7,519,686 | | | | 33,025,435 | |
| C-Class | | | 1,223,124 | | | | 5,060,778 | |
| P-Class | | | 2,667,384 | | | | 21,412,776 | |
| Distributions reinvested | | | | | | | | |
| A-Class | | | 27,178,864 | | | | 12,673,600 | |
| C-Class | | | 7,679,358 | | | | 3,069,526 | |
| P-Class | | | 1,641,967 | | | | 117,352 | |
| Cost of shares redeemed | | | | | | | | |
| A-Class | | | (50,659,623 | ) | | | (121,812,207 | ) |
| C-Class | | | (9,547,249 | ) | | | (32,586,919 | ) |
| P-Class | | | (3,986,806 | ) | | | (4,311,641 | ) |
| Net decrease from capital share transactions | | | (16,283,295 | ) | | | (83,351,300 | ) |
| Net decrease in net assets | | | (40,772,431 | ) | | | (3,363,264 | ) |
| | | | | | | | | |
| Net assets: | | | | | | | | |
| Beginning of period | | | 506,119,360 | | | | 509,482,624 | |
| End of period | | $ | 465,346,929 | | | $ | 506,119,360 | |
| Undistributed net investment income at end of period | | $ | 100,517 | | | $ | — | |
| 16 | THE GUGGENHEIM FUNDS SEMI-ANNUAL REPORT | SEE NOTES TO FINANCIAL STATEMENTS. |
| STATEMENTS OF CHANGES IN NET ASSETS (concluded) |
| MID CAP VALUE FUND | |
| | | Period Ended
March 29,
2018
(Unaudited) | | | Year Ended
September 30,
2017 | |
| Capital share activity: | | | | | | |
| Shares sold | | | | | | |
| A-Class | | | 215,492 | | | | 1,025,109 | |
| C-Class | | | 47,926 | | | | 210,740 | |
| P-Class | | | 76,520 | | | | 649,430 | |
| Shares issued from reinvestment of distributions | | | | | | | | |
| A-Class | | | 788,250 | | | | 398,539 | |
| C-Class | | | 307,667 | | | | 128,809 | |
| P-Class | | | 47,941 | | | | 3,715 | |
| Shares redeemed | | | | | | | | |
| A-Class | | | (1,448,133 | ) | | | (3,691,342 | ) |
| C-Class | | | (372,143 | ) | | | (1,325,827 | ) |
| P-Class | | | (115,114 | ) | | | (134,810 | ) |
| Net decrease in shares | | | (451,594 | ) | | | (2,735,637 | ) |
| SEE NOTES TO FINANCIAL STATEMENTS. | THE GUGGENHEIM FUNDS SEMI-ANNUAL REPORT | 17 |
| FINANCIAL HIGHLIGHTS |
| MID CAP VALUE FUND | |
This table is presented to show selected data for a share outstanding throughout each period and to assist shareholders in evaluating a Fund’s performance for the periods presented.
| A-Class | | Period
Ended
March 29,
2018a | | | Year
Ended
Sept. 30,
2017 | | | Year
Ended
Sept. 30,
2016 | | | Year
Ended
Sept. 30,
2015 | | | Year
Ended
Sept. 30,
2014 | | | Year
Ended
Sept. 30,
2013 | |
| Per Share Data | | | | | | | | | | | | | | | | | | |
| Net asset value, beginning of period | | $ | 35.37 | | | $ | 30.27 | | | $ | 30.86 | | | $ | 37.73 | | | $ | 38.15 | | | $ | 33.05 | |
| Income (loss) from investment operations: |
| Net investment income (loss)b | | | .03 | | | | .03 | | | | .30 | | | | .06 | | | | .03 | | | | .04 | |
| Net gain (loss) on investments (realized and unrealized) | | | .95 | | | | 6.09 | | | | 3.95 | | | | (2.24 | ) | | | 2.04 | | | | 8.59 | |
| Total from investment operations | | | .98 | | | | 6.12 | | | | 4.25 | | | | (2.18 | ) | | | 2.07 | | | | 8.63 | |
| Less distributions from: |
| Net investment income | | | — | | | | (.37 | ) | | | — | | | | — | | | | — | | | | — | |
| Net realized gains | | | (2.60 | ) | | | (.65 | ) | | | (4.84 | ) | | | (4.69 | ) | | | (2.49 | ) | | | (3.53 | ) |
| Total distributions | | | (2.60 | ) | | | (1.02 | ) | | | (4.84 | ) | | | (4.69 | ) | | | (2.49 | ) | | | (3.53 | ) |
| Net asset value, end of period | | $ | 33.75 | | | $ | 35.37 | | | $ | 30.27 | | | $ | 30.86 | | | $ | 37.73 | | | $ | 38.15 | |
| |
| Total Returnc | | | 2.57 | % | | | 20.62 | % | | | 15.51 | % | | | (6.83 | %) | | | 5.52 | % | | | 28.93 | % |
| Ratios/Supplemental Data |
| Net assets, end of period (in thousands) | | $ | 363,246 | | | $ | 396,408 | | | $ | 407,883 | | | $ | 476,792 | | | $ | 1,017,208 | | | $ | 1,038,762 | |
| Ratios to average net assets: |
| Net investment income (loss) | | | 0.17 | % | | | 0.11 | % | | | 1.04 | % | | | 0.18 | % | | | 0.08 | % | | | 0.11 | % |
| Total expensesg | | | 1.28 | %h | | | 1.27 | %h | | | 1.49 | % | | | 1.42 | % | | | 1.39 | % | | | 1.39 | % |
| Net expensesd | | | 1.27 | %e | | | 1.27 | %e | | | 1.49 | % | | | 1.42 | % | | | 1.39 | % | | | 1.39 | % |
| Portfolio turnover rate | | | 20 | % | | | 55 | % | | | 52 | % | | | 84 | % | | | 35 | % | | | 23 | % |
| 18 | THE GUGGENHEIM FUNDS SEMI-ANNUAL REPORT | SEE NOTES TO FINANCIAL STATEMENTS. |
| FINANCIAL HIGHLIGHTS (continued) |
| MID CAP VALUE FUND | |
This table is presented to show selected data for a share outstanding throughout each period and to assist shareholders in evaluating a Fund’s performance for the periods presented.
| C-Class | | Period Ended
March 29,
2018a | | | Year Ended
Sept. 30,
2017 | | | Year Ended
Sept. 30,
2016 | | | Year Ended
Sept. 30,
2015 | | | Year Ended
Sept. 30,
2014 | | | Year Ended
Sept. 30,
2013 | |
| Per Share Data | | | | | | | | | | | | | | | | | | |
| Net asset value, beginning of period | | $ | 26.33 | | | $ | 22.78 | | | $ | 24.54 | | | $ | 31.14 | | | $ | 32.13 | | | $ | 28.57 | |
| Income (loss) from investment operations: |
| Net investment income (loss)b | | | (.08 | ) | | | (.17 | ) | | | .06 | | | | (.15 | ) | | | (.21 | ) | | | (.18 | ) |
| Net gain (loss) on investments (realized and unrealized) | | | .73 | | | | 4.55 | | | | 3.02 | | | | (1.76 | ) | | | 1.71 | | | | 7.27 | |
| Total from investment operations | | | .65 | | | | 4.38 | | | | 3.08 | | | | (1.91 | ) | | | 1.50 | | | | 7.09 | |
| Less distributions from: |
| Net investment income | | | — | | | | (.18 | ) | | | — | | | | — | | | | — | | | | — | |
| Net realized gains | | | (2.60 | ) | | | (.65 | ) | | | (4.84 | ) | | | (4.69 | ) | | | (2.49 | ) | | | (3.53 | ) |
| Total distributions | | | (2.60 | ) | | | (.83 | ) | | | (4.84 | ) | | | (4.69 | ) | | | (2.49 | ) | | | (3.53 | ) |
| Net asset value, end of period | | $ | 24.38 | | | $ | 26.33 | | | $ | 22.78 | | | $ | 24.54 | | | $ | 31.14 | | | $ | 32.13 | |
| |
| Total Returnc | | | 2.22 | % | | | 19.63 | % | | | 14.64 | % | | | (7.49 | %) | | | 4.74 | % | | | 27.98 | % |
| Ratios/Supplemental Data |
| Net assets, end of period (in thousands) | | $ | 80,610 | | | $ | 87,508 | | | $ | 98,176 | | | $ | 126,047 | | | $ | 192,942 | | | $ | 219,695 | |
| Ratios to average net assets: |
| Net investment income (loss) | | | (0.60 | %) | | | (0.68 | %) | | | 0.27 | % | | | (0.53 | %) | | | (0.65 | %) | | | (0.62 | %) |
| Total expensesg | | | 2.06 | %h | | | 2.07 | %h | | | 2.27 | % | | | 2.12 | % | | | 2.12 | % | | | 2.12 | % |
| Net expensesd | | | 2.05 | %e | | | 2.06 | %e | | | 2.27 | % | | | 2.12 | % | | | 2.12 | % | | | 2.12 | % |
| Portfolio turnover rate | | | 20 | % | | | 55 | % | | | 52 | % | | | 84 | % | | | 35 | % | | | 23 | % |
| SEE NOTES TO FINANCIAL STATEMENTS. | THE GUGGENHEIM FUNDS SEMI-ANNUAL REPORT | 19 |
| FINANCIAL HIGHLIGHTS (continued) |
| MID CAP VALUE FUND |
This table is presented to show selected data for a share outstanding throughout each period and to assist shareholders in evaluating a Fund’s performance for the periods presented.
| P-Class | | Period Ended
March 29,
2018a | | | Year Ended
Sept. 30,
2017 | | | Year Ended
Sept. 30,
2016 | | | Period Ended
Sept. 30,
2015f | |
| Per Share Data | | | | | | | | | | | | |
| Net asset value, beginning of period | | $ | 35.15 | | | $ | 30.18 | | | $ | 30.77 | | | $ | 33.91 | |
| Income (loss) from investment operations: |
| Net investment income (loss)b | | | .03 | | | | (.01 | ) | | | .14 | | | | .10 | |
| Net gain (loss) on investments (realized and unrealized) | | | .94 | | | | 6.10 | | | | 4.11 | | | | (3.24 | ) |
| Total from investment operations | | | .97 | | | | 6.09 | | | | 4.25 | | | | (3.14 | ) |
| Less distributions from: |
| Net investment income | | | — | | | | (.47 | ) | | | — | | | | — | |
| Net realized gains | | | (2.60 | ) | | | (.65 | ) | | | (4.84 | ) | | | — | |
| Total distributions | | | (2.60 | ) | | | (1.12 | ) | | | (4.84 | ) | | | — | |
| Net asset value, end of period | | $ | 33.52 | | | $ | 35.15 | | | $ | 30.18 | | | $ | 30.77 | |
| |
| Total Returnc | | | 2.62 | % | | | 20.57 | % | | | 15.61 | % | | | (9.26 | %) |
| Ratios/Supplemental Data |
| Net assets, end of period (in thousands) | | $ | 21,491 | | | $ | 22,203 | | | $ | 3,423 | | | $ | 57 | |
| Ratios to average net assets: |
| Net investment income (loss) | | | 0.19 | % | | | 0.02 | % | | | 0.48 | % | | | 0.71 | % |
| Total expensesg | | | 1.32 | %h | | | 1.25 | %h | | | 1.32 | % | | | 1.32 | % |
| Net expensesd | | | 1.26 | %e | | | 1.23 | %e | | | 1.32 | % | | | 1.32 | % |
| Portfolio turnover rate | | | 20 | % | | | 55 | % | | | 52 | % | | | 84 | % |
| 20 | THE GUGGENHEIM FUNDS SEMI-ANNUAL REPORT | SEE NOTES TO FINANCIAL STATEMENTS. |
| FINANCIAL HIGHLIGHTS (concluded) |
| MID CAP VALUE FUND |
| a | Unaudited figures for the period ended March 29, 2018. Percentage amounts for the period, except total return and portfolio turnover rate, have been annualized. |
| b | Net investment income (loss) per share was computed using average shares outstanding throughout the period. |
| c | Total return does not reflect the impact of any applicable sales charges and has not been annualized. |
| d | Net expense information reflects the expense ratios after expense waivers and reimbursements, as applicable. |
| e | The portion of the ratios of net expenses to average net assets attributable to recoupments of prior fee reductions or expense reimbursements for the periods presented would be: |
| | | 03/29/18 | 09/30/17 |
| | A-Class | 0.01% | 0.00% |
| | C-Class | 0.01% | 0.00% |
| | P-Class | 0.00% | 0.00% |
| f | Since commencement of operations: May 1, 2015. Percentage amounts for the period, except total return and portfolio turnover rate, have been annualized. |
| g | Does not include expenses for the underlying funds in which the Fund invests. |
| h | Net expenses may include expenses that are excluded from the expense limitation agreement and affiliated fund waivers. Excluding these expenses, the net expense ratios for the periods would be: |
| | | 03/29/2018 | 09/30/2017 |
| | A-Class | 1.27% | 1.25% |
| | C-Class | 2.05% | 2.04% |
| | P-Class | 1.26% | 1.21% |
| SEE NOTES TO FINANCIAL STATEMENTS. | THE GUGGENHEIM FUNDS SEMI-ANNUAL REPORT | 21 |
| NOTES TO FINANCIAL STATEMENTS (Unaudited) |
Note 1 – Organization and Significant Accounting Policies
Organization
Guggenheim Funds Trust (the “Trust”), a Delaware statutory trust, is registered with the SEC under the Investment Company Act of 1940 (“1940 Act”), as an open-ended investment company of the series type. Each series, in effect, is representing a separate Fund. The Trust is authorized to issue an unlimited number of shares. The Trust accounts for the assets of each Fund separately.
The Trust offers a combination of five separate classes of shares, A-Class shares, C-Class shares, P-Class shares, R6-Class shares and Institutional Class shares. Sales of shares of each Class are made without a front-end sales charge at the net asset value per share (“NAV”), with the exception of A-Class shares. A-Class shares are sold at the NAV, plus the applicable front-end sales charge. The sales charge varies depending on the amount purchased. A-Class share purchases of $1 million or more are exempt from the front-end sales charge but have a 1% contingent deferred sales charge (“CDSC”), if shares are redeemed within 12 months of purchase. C-Class shares have a 1% CDSC if shares are redeemed within 12 months of purchase. Institutional Class shares are offered primarily for direct investment by institutions such as pension and profit sharing plans, endowments, foundations and corporations. Institutional Class shares require a minimum initial investment of $2 million and a minimum account balance of $1 million. At March 29, 2018, the Trust consisted of nineteen funds (the “Funds”).
This report covers the Mid Cap Value Fund (the “Fund”), a diversified investment company. Only A-Class, C-Class and P-Class shares had been issued by the Fund.
Security Investors, LLC which operates under the name Guggenheim Investments (“GI”), provides advisory services. Guggenheim Funds Distributors, LLC (“GFD”) acts as principal underwriter for the Trust. GI and GFD are affiliated entities.
Significant Accounting Policies
March 29, 2018 represents the last day during the Fund’s semi-annual period on which the New York Stock Exchange (“NYSE”) was open for trading. The Fund’s financial statements have been presented through that date to maintain consistency with the Fund’s NAV calculations used for shareholder transactions.
The Fund operates as an investment company and, accordingly, follows the investment company accounting and reporting guidance of the Financial Accounting Standards Board (“FASB”) Accounting Standards Codification Topic 946 Financial Services – Investment Companies.
The following significant accounting policies are in conformity with U.S. generally accepted accounting principles (“U.S. GAAP”) and are consistently followed by the Trust. This requires management to make estimates and assumptions that affect the reported amount of assets and liabilities, contingent assets and liabilities at the date of the financial statements, and the reported amounts of revenues and expenses during the reporting period. Actual results could differ from these estimates. All time references are based on Eastern Time.
| 22 | THE GUGGENHEIM FUNDS SEMI-ANNUAL REPORT | |
| NOTES TO FINANCIAL STATEMENTS (Unaudited)(continued) |
The NAV of each Class of the Fund is calculated by dividing the market value of the Fund’s securities and other assets, less all liabilities, attributable to the Class by the number of outstanding shares of the Class.
(a) Valuation of Investments
The Board of Trustees of the Fund (the “Board”) has adopted policies and procedures for the valuation of the Fund’s investments (the “Valuation Procedures”). Pursuant to the Valuation Procedures, the Board has delegated to a valuation committee, consisting of representatives from Guggenheim’s investment management, fund administration, legal and compliance departments (the “Valuation Committee”), the day-to-day responsibility for implementing the Valuation Procedures, including, under most circumstances, the responsibility for determining the fair value of the Fund’s securities and/or other assets.
Valuations of the Fund’s securities are supplied primarily by pricing services appointed pursuant to the processes set forth in the Valuation Procedures. The Valuation Committee convenes monthly, or more frequently as needed, to review the valuation of all assets which have been fair valued for reasonableness. The Fund’s officers, through the Valuation Committee and consistent with the monitoring and review responsibilities set forth in the Valuation Procedures, regularly review procedures used and valuations provided by the pricing services.
If the pricing service cannot or does not provide a valuation for a particular investment or such valuation is deemed unreliable, such investment is fair valued by the Valuation Committee.
Equity securities listed on an exchange (NYSE or American Stock Exchange) are valued at the last quoted sale price as of the close of business on the NYSE, usually 4:00 p.m. on the valuation date. Equity securities listed on the NASDAQ market system are valued at the NASDAQ Official Closing Price on the valuation date, which may not necessarily represent the last sale price. If there has been no sale on such exchange or NASDAQ on a given day, the security is valued at the closing bid price on that day.
Open-end investment companies (“mutual funds”) are valued at their NAV as of the close of business, on the valuation date.
Investments for which market quotations are not readily available are fair-valued as determined in good faith by GI, subject to review and approval by the Valuation Committee, pursuant to methods established or ratified by the Board. Valuations in accordance with these methods are intended to reflect each security’s (or asset’s or liability’s) “fair value”. Each such determination is based on a consideration of all relevant factors, which are likely to vary from one pricing context to another. Examples of such factors may include, but are not limited to market prices; sale prices; broker quotes; and models which derive prices based on inputs such as prices of securities with comparable maturities and characteristics, or based on inputs such as anticipated cash flows or collateral, spread over Treasuries, and other information analysis.
| | THE GUGGENHEIM FUNDS SEMI-ANNUAL REPORT | 23 |
| NOTES TO FINANCIAL STATEMENTS (Unaudited)(continued) |
(b) Foreign Taxes
The Fund may be subject to foreign taxes (a portion of which may be reclaimable) on income, stock dividends, capital gains on investments or certain foreign currency transactions. All foreign taxes are recorded in accordance with the applicable foreign tax regulations and rates that exist in the foreign jurisdictions in which the Fund invests. These foreign taxes, if any, are paid by the Fund and reflected in its Statement of Operations as follows: foreign taxes withheld at source are presented as a reduction of income and foreign taxes on capital gains from sales of investments are included with the net realized gain (loss) and unrealized gain (loss) on investments. Foreign taxes payable or deferred as of March 29, 2018, if any, are disclosed in the Fund’s Statement of Assets and Liabilities.
(c) Security Transactions
Security transactions are recorded on the trade date for financial reporting purposes. Realized gains and losses from securities transactions are recorded using the identified cost basis. Proceeds from lawsuits related to investment holdings are recorded as realized gains in the Fund. Dividend income is recorded on the ex-dividend date, net of applicable taxes withheld by foreign countries. Taxable non-cash dividends are recorded as dividend income. Interest income, including amortization of premiums and accretion of discounts, is accrued on a daily basis. Dividend income from Real Estate Investment Trusts (“REITs”) is recorded based on the income included in the distributions received from the REIT investments using published REIT classifications, including some management estimates when actual amounts are not available. Distributions received in excess of this estimated amount are recorded as a reduction of the cost of investments or reclassified to capital gains. The actual amounts of income, return of capital, and capital gains are only determined by each REIT after its fiscal year-end, and may differ from the estimated amounts.
(d) Distributions
Distributions of net investment income and net realized gains, if any, are declared and paid at least annually. Dividends are reinvested in additional shares unless shareholders request payment in cash. Distributions are recorded on the ex-dividend date and are determined in accordance with income tax regulations which may differ from U.S. GAAP.
(e) Class Allocations
Interest and dividend income, most expenses, all realized gains and losses, and all unrealized gains and losses are allocated to the classes based upon the value of the outstanding shares in each Class. Certain costs, such as distribution and service fees are charged directly to specific classes. In addition, certain expenses have been allocated to the individual Funds in the Trust on a pro rata basis upon the respective aggregate net assets of each Fund included in the Trust.
| 24 | THE GUGGENHEIM FUNDS SEMI-ANNUAL REPORT | |
| NOTES TO FINANCIAL STATEMENTS (Unaudited)(continued) |
(f) Earnings Credits
Under the fee arrangement with the custodian, the Fund may earn credits based on overnight custody cash balances. These credits are utilized to reduce related custodial expenses. The custodian fees disclosed in the Statement of Operations are before the reduction in expense from the related earnings credits, if any. For the period ended March 29, 2018, there were no earnings credits received.
(g) Cash
The Fund may leave cash overnight in its cash account with the custodian. Periodically, the Fund may have cash due to the custodian bank as an overdraft balance. A fee is incurred on this overdraft, calculated by multiplying the overdraft by a rate based on the federal funds rate, which was 1.68% at March 29, 2018.
(h) Indemnifications
Under the Fund’s organizational documents, its Trustees and Officers are indemnified against certain liabilities arising out of the performance of their duties to the Trust. In addition, throughout the normal course of business, the Fund enters into contracts that contain a variety of representations and warranties which provide general indemnifications. The Fund’s maximum exposure under these arrangements is unknown, as this would involve future claims that may be made against the Fund and/or its affiliates that have not yet occurred. However, based on experience, the Fund expects the risk of loss to be remote.
Note 2 – Investment Advisory Agreement and Other Agreements
Under the terms of an investment advisory contract, the Fund pays GI investment advisory fees calculated at an annualized rate of 0.75% of the average daily net assets of the Fund.
GI engages external service providers to perform other necessary services for the Trust, such as audit and accounting related services, legal services, custody, printing and mailing, etc., on a pass-through basis. Such expenses are allocated to various Funds within the complex based on relative net assets.
The Fund has adopted Distribution Plans related to the offering of A-Class, C-Class and P-Class shares pursuant to Rule 12b-1 under the 1940 Act. The plans provide for payments at an annual rate of 0.25% of the average daily net assets of the Fund’s A-Class and P-Class shares, and 1.00% of the average daily net assets of the Fund’s C-Class shares.
| | THE GUGGENHEIM FUNDS SEMI-ANNUAL REPORT | 25 |
| NOTES TO FINANCIAL STATEMENTS (Unaudited)(continued) |
Contractual expense limitation agreements for the Fund provides that the total expenses be limited to a percentage of average net assets for each class of shares, exclusive of brokerage costs, dividends on securities sold short, expenses of other investment companies in which the Fund invests, interest, taxes, litigation, indemnification and extraordinary expenses. The limits are listed below:
| | Limit | Effective
Date | Contract
End Date |
| Mid Cap Value Fund – A-Class | 1.42% | 01/30/17 | 02/01/19 |
| Mid Cap Value Fund – C-Class | 2.12% | 01/30/17 | 02/01/19 |
| Mid Cap Value Fund – P-Class | 1.32% | 01/30/17 | 02/01/19 |
GI is entitled to reimbursement by the Fund for fees waived or expenses reimbursed during any of the previous 36 months, beginning on the date of the expense limitation agreement, if on any day the estimated operating expenses are less than the indicated percentages. For purposes of this arrangement GI is entitled to recoupment of previously wavied fees or reimbursed expenses for 36 months from the date of the waiver or reimbursement by GI. At March 29, 2018, the amount of fees waived or expenses reimbursed that are subject to recoupment are presented in the following table:
| Fund | | Expires
2018 | | | Expires
2019 | | | Expires
2020 | | | Expires
2021 | | | Fund
Total | |
| Mid Cap Value Fund | | | | | | | | | | | | | | | |
| A-Class | | $ | — | | | $ | — | | | $ | 19,356 | | | $ | 11,926 | | | $ | 31,282 | |
| C-Class | | | — | | | | — | | | | 4,988 | | | | 3,075 | | | | 8,063 | |
| P-Class | | | — | | | | — | | | | 1,878 | | | | 6,418 | | | | 8,296 | |
For the period ended March 29, 2018, GI recouped $39,289 from the Fund.
For the period ended March 29, 2018, GFD retained sales charges of $252,432 relating to sales of A-Class shares of the Trust.
Certain trustees and officers of the Trust are also officers of GI and/or GFD. The Trust does not compensate its officers or trustees who are officers, directors, and/or employees of GI and GFD.
MUFG Investor Services (US), LLC (“MUIS”) acts as the Fund’s administrator, transfer agent and accounting agent. As administrator, transfer agent and accounting agent, MUIS is responsible for maintaining the books and records of the Fund’s securities and cash. Bank of New York Mellon Corp. (“BNY”) acts as the Fund’s custodian. As custodian, BNY is responsible for the custody of the Fund’s assets. For providing the aforementioned administrative and accounting services, MUIS is entitled to receive a monthly fee equal to a percentage of the Fund’s average daily net assets and out of pocket expenses. For providing the aforementioned transfer agent and custodian services, MUIS and BNY are entitled to receive a monthly fee based on the number of transactions during the month and the number of accounts under management subject to certain minimum monthly fees and out of pocket expenses.
| 26 | THE GUGGENHEIM FUNDS SEMI-ANNUAL REPORT | |
| NOTES TO FINANCIAL STATEMENTS (Unaudited)(continued) |
Note 3 – Fair Value Measurement
In accordance with U.S. GAAP, fair value is defined as the price that the Fund would receive to sell an investment or pay to transfer a liability in an orderly transaction with an independent buyer in the principal market, or in the absence of a principal market, the most advantageous market for the investment or liability. U.S. GAAP establishes a three-tier fair value hierarchy based on the types of inputs used to value assets and liabilities and requires corresponding disclosure. The hierarchy and the corresponding inputs are summarized below:
| Level 1 — | quoted prices in active markets for identical assets or liabilities. |
| Level 2 — | significant other observable inputs (for example quoted prices for securities that are similar based on characteristics such as interest rates, prepayment speeds, credit risk, etc.). |
| Level 3 — | significant unobservable inputs based on the best information available under the circumstances, to the extent observable inputs are not available, which may include assumptions. |
The types of inputs available depend on a variety of factors, such as the type of security and the characteristics of the markets in which it trades, if any. Fair valuation determinations that rely on fewer or no observable inputs require greater judgment. Accordingly, fair value determinations for Level 3 securities require the greatest amount of judgment.
The inputs or methodologies used for valuing securities are not necessarily an indication of the risk associated with investing in those securities. The suitability of the techniques and sources employed to determine fair valuation are regularly monitored and subject to change.
Note 4 – Federal Income Tax Information
The Fund intends to comply with the provisions of Subchapter M of the Internal Revenue Code applicable to regulated investment companies and will distribute substantially all taxable net investment income and capital gains sufficient to relieve the Fund from all, or substantially all, federal income, excise and state income taxes. Therefore, no provision for federal or state income tax is required.
Tax positions taken or expected to be taken in the course of preparing the Fund’s tax returns are evaluated to determine whether the tax positions are “more-likely-than-not” of being sustained by the applicable tax authority. Tax positions not deemed to meet the more-likely-than-not threshold would be recorded as a tax benefit or expense in the current year. Management has analyzed the Fund’s tax positions taken, or to be taken, on federal income tax returns for all open tax years, and has concluded that no provision for income tax is required in the Fund’s financial statements. The Fund’s federal tax returns are subject to examination by the Internal Revenue Service for a period of three years after they are filed.
| | THE GUGGENHEIM FUNDS SEMI-ANNUAL REPORT | 27 |
| NOTES TO FINANCIAL STATEMENTS (Unaudited)(continued) |
At March 29, 2018, the cost of securities for federal income tax purposes, the aggregate gross unrealized gain for all securities for which there was an excess of value over tax cost, and the aggregate gross unrealized loss for all securities for which there was an excess of tax cost over value were as follows:
| Fund | | Tax
Cost | | | Tax
Unrealized
Gain | | | Tax
Unrealized
Loss | | | Net
Unrealized
Gain | |
| Mid Cap Value Fund | | $ | 409,177,775 | | | $ | 88,057,994 | | | $ | (28,885,582 | ) | | $ | 59,172,412 | |
Note 5 – Securities Transactions
For the period ended March 29, 2018, the cost of purchases and proceeds from sales of investment securities, excluding government securities, short-term investments and derivatives, were as follows:
| Fund | | Purchases | | | Sales | |
| Mid Cap Value Fund | | $ | 97,645,471 | | | $ | 147,387,550 | |
The Fund is permitted to purchase or sell securities from or to certain affiliated funds under specified conditions outlined in procedures adopted by the Board. The procedures have been designed to ensure that any purchase or sale of securities by a Fund from or to another fund or portfolio that is or could be considered an affiliate by virtue of having a common investment adviser (or affiliated investment advisers), common Trustees and/or common officers complies with Rule 17a-7 of the 1940 Act. Further, as defined under these procedures, each transaction is effected at the current market price to save costs, where permissible. For the period ended March 29, 2018, the Fund did not engage in purchases and sales of securities, pursuant to Rule 17a-7 of the 1940 Act.
Note 6 – Line of Credit
The Trust, with the exception of certain affiliated funds, secured a 364-day committed, $1,000,000,000 line of credit from Citibank, N.A., which was in place through October 6, 2017, at which time the line of credit was renewed, with an increased commitment amount to $1,065,000,000. A Fund may draw (borrow) from the line of credit as a temporary measure for emergency purposes, to facilitate redemption requests, or for other short-term liquidity purposes consistent with the Fund’s investment objective and program. For example, it may be advantageous for the Fund to borrow money rather than sell existing portfolio positions to meet redemption requests. Fees related to borrowings, if any, vary under this arrangement between the greater of Citibank’s “base rate”, LIBOR plus 1%, or the federal funds rate 1.68% at March 29, 2018 plus 1/2 of 1%. The Funds paid upfront costs of $982,952 to renew the line of credit.
The Fund did not have any borrowings under this Agreement as of and for the period ended March 29, 2018.
| 28 | THE GUGGENHEIM FUNDS SEMI-ANNUAL REPORT | |
| NOTES TO FINANCIAL STATEMENTS (Unaudited)(concluded) |
Note 7 – Other Liabilities
The Fund wrote put option contracts through Lehman Brothers Inc., (“LBI”) that were exercised prior to the option contracts’ expiration and prior to the bankruptcy filing by LBI, during September, 2008. However, these transactions have not settled and the securities have not been delivered to the Fund as of March 29, 2018.
Although the ultimate resolution of these transactions is uncertain, the Fund has recorded a liability equal to the difference between the strike price on the put options and the market price of the underlying security on the exercise date. The amount of the liability recorded in miscellaneous payables by the Fund as of March 29, 2018, was $473,594.
| | THE GUGGENHEIM FUNDS SEMI-ANNUAL REPORT | 29 |
| OTHER INFORMATION (Unaudited) |
Proxy Voting Information
A description of the policies and procedures that the Trust uses to determine how to vote proxies relating to securities held in the Funds’ portfolios is available, without charge and upon request, by calling 800.820.0888. This information is also available from the EDGAR database on the SEC’s website at https://www.sec.gov.
Information regarding how the Funds voted proxies relating to portfolio securities during the most recent 12-month period ended June 30 is available without charge, upon request, by calling 800.820.0888. This information is also available from the EDGAR database on the SEC’s website at https://www.sec.gov.
Sector Classification
Information in the “Schedule of Investments” is categorized by sectors using sector-level Classifications defined by the Bloomberg Industry Classification System, a widely recognized industry classification system provider. Each Fund’s registration statement has investment policies relating to concentration in specific sectors/industries. For purposes of these investment policies, the Funds usually classify sectors/industries based on industry-level Classifications used by widely recognized industry classification system providers such as Bloomberg Industry Classification System, Global Industry Classification Standards and Barclays Global Classification Scheme.
Quarterly Portfolio Schedules Information
The Trust files its complete schedule of portfolio holdings with the SEC for the first and third quarters of each fiscal year on Form N-Q; which are available on the SEC’s website at https://www.sec.gov. The Funds’ Forms N-Q may be reviewed and copied at the SEC’s Public Reference Room in Washington, DC, and that information on the operation of the Public Reference Room may be obtained by calling 800-SEC-0330. Copies of the portfolio holdings are also available to shareholders, without charge and upon request, by calling 800.820.0888.
| 30 | THE GUGGENHEIM FUNDS SEMI-ANNUAL REPORT | |
| INFORMATION ON BOARD OF TRUSTEES AND OFFICERS (Unaudited) |
Name, Address*
and Year of Birth | Position(s)
Held with
the Trust | Term of Office
and Length of
Time Served** | Principal Occupation(s)
During Past Five Years | Number of
Portfolios
in Fund
Complex
Overseen | Other Directorships
Held by Trustees |
| INDEPENDENT TRUSTEES | | | |
Randall C. Barnes
(1951) | Trustee | Since 2014 | Current: Private Investor (2001-present). Former: Senior Vice President and Treasurer, PepsiCo, Inc. (1993-1997); President, Pizza Hut International (1991-1993); Senior Vice President, Strategic Planning and New Business Development, PepsiCo, Inc. (1987-1990). | 51 | Current: Trustee, Purpose Investments Funds (2014-Present). |
Donald A.
Chubb, Jr.
(1946 ) | Trustee and Chairman of the Valuation Oversight Committee | Since 1994 | Current: Retired. Former: Business broker and manager of commercial real estate, Griffith & Blair, Inc. (1997-2017). | 48 | Former: Midland Care, Inc. (2011-2016). |
Jerry B. Farley
(1946) | Trustee and Chairman of the Audit Committee | Since 2005 | Current: President, Washburn University (1997-present). | 48 | Current: Westar Energy, Inc. (2004-present); CoreFirst Bank & Trust (2000-present). |
Roman
Friedrich III
(1946) | Trustee and Chairman of the Contracts Review Committee | Since 2014 | Current: Founder and Managing Partner, Roman Friedrich & Company (1998-present). Former: Senior Managing Director, MLV & Co. LLC (2010-2011). | 48 | Current: Zincore Metals, Inc. (2009-present). Former: Axiom Gold and Silver Corp. (2011-2012). |
| | THE GUGGENHEIM FUNDS SEMI-ANNUAL REPORT | 31 |
| INFORMATION ON BOARD OF TRUSTEES AND OFFICERS (Unaudited)(continued) |
Name, Address*
and Year of Birth | Position(s)
Held with
the Trust | Term of Office
and Length of
Time Served** | Principal Occupation(s)
During Past Five Years | Number of
Portfolios
in Fund
Complex
Overseen | Other Directorships
Held by Trustees |
| INDEPENDENT TRUSTEES - continued | | |
Ronald A. Nyberg
(1953) | Trustee and Chairman of the Nominating and Governance Committee | Since 2014 | Current: Partner, Momkus McCluskey LLC (2016-present). Former: Partner, Nyberg & Cassioppi, LLC (2000-2016); Executive Vice President, General Counsel, and Corporate Secretary, Van Kampen Investments (1982-1999). | 51 | Current: PPM Fund Board (February 2018 – present); Edward-Elmhurst Healthcare System (2012-present); Western Asset Inflation-Linked Opportunities & Income Fund (2004-present); Western Asset Inflation-Linked Income Fund (2003-present). |
Maynard F. Oliverius
(1943) | Trustee | Since 1998 | Current: Retired. Former: President and CEO, Stormont-Vail HealthCare (1996-2012). | 48 | Current: Robert J. Dole Institute of Politics (2016-present); Stormont-Vail Foundation (2013-present); University of Minnesota MHA Alumni Philanthropy Committee (2009-present); Fort Hays State University Foundation (1999-present). Former: Topeka Community Foundation (2009-2014). |
| 32 | THE GUGGENHEIM FUNDS SEMI-ANNUAL REPORT | |
| INFORMATION ON BOARD OF TRUSTEES AND OFFICERS (Unaudited)(continued) |
Name, Address*
and Year of Birth | Position(s)
Held with
the Trust | Term of Office
and Length of
Time Served** | Principal Occupation(s)
During Past Five Years | Number of
Portfolios
in Fund
Complex
Overseen | Other Directorships
Held by Trustees |
| INDEPENDENT TRUSTEES - concluded | | |
Ronald E.
Toupin, Jr.
(1958) | Trustee and Chairman of the Board | Since 2014 | Current: Portfolio Consultant (2010-present); Member, Governing Council (2003-present) and Executive Committee (2016-present), Independent Directors Council. Former: Vice President, Manager and Portfolio Manager, Nuveen Asset Management (1998-1999); Vice President, Nuveen Investment Advisory Corp. (1992-1999); Vice President and Manager, Nuveen Unit Investment Trusts (1991-1999); and Assistant Vice President and Portfolio Manager, Nuveen Unit Investment Trusts (1988-1999), each of John Nuveen & Co., Inc. (1982-1999). | 48 | Current: Western Asset Inflation-Linked Opportunities & Income Fund (2004-present); Western Asset Inflation-Linked Income Fund (2003-present). Former: Bennett Group of Funds (2011-2013). |
| | THE GUGGENHEIM FUNDS SEMI-ANNUAL REPORT | 33 |
| INFORMATION ON BOARD OF TRUSTEES AND OFFICERS (Unaudited)(continued) |
Name, Address*
and Year of Birth | Position(s)
Held with
the Trust | Term of Office
and Length of
Time Served** | Principal Occupation(s)
During Past Five Years | Number of
Portfolios
in Fund
Complex
Overseen | Other Directorships
Held by Trustees |
| INTERESTED TRUSTEES | | |
Amy J. Lee***
(1961) | Trustee, Vice President and Chief Legal Officer | Since February 2018
(Trustee) Since 2014
(Chief Legal Officer) Since 2007
(Vice President) | Current: Interested Trustee, certain other funds in the Fund Complex (February 2018-present); President, certain other funds in the Fund Complex (2017-present); Chief Legal Officer, certain other funds in the Fund Complex (2014-present); Vice President, certain other funds in the Fund Complex (2007-present); Senior Managing Director, Guggenheim Investments (2012-present). Former: President and Chief Exceutive Officer (2017-February 2018); Vice President, Associate General Counsel and Assistant Secretary, Security Benefit Life Insurance Company and Security Benefit Corporation (2004-2012). | 158 | None. |
| * | The business address of each Trustee is c/o Guggenheim Investments, 227 West Monroe Street, Chicago, Illinois 60606. |
| ** | Each Trustee serves an indefinite term, until his or her successor is elected and qualified. Time served includes time served in the respective position for the Predecessor Corporation. |
| *** | This Trustee is an “interested person” (as defined in section 2(a)(19) of the 1940 Act)(“Interested Trustee”) of the Trust because of her affiliation with Guggenheim Investments. |
| 34 | THE GUGGENHEIM FUNDS SEMI-ANNUAL REPORT | |
| INFORMATION ON BOARD OF TRUSTEES AND OFFICERS (Unaudited)(continued) |
Name, Address*
and Year of Birth | Position(s)
Held with
the Trust | Term of Office
and Length of
Time Served** | Principal Occupations
During Past Five Years |
| OFFICERS | | | |
Brian E. Binder
(1972) | President and Chief Executive Officer | Since 2018 | Current: President and Chief Executive Officer, certain other funds in the Fund Complex (February 2018-present); President and Chief Executive Officer, Guggenheim Funds Investment Advisors, LLC and Security Investors, LLC (January 2018-present); Senior Managing Director and Chief Administrative Officer, Guggenheim Investments (January 2018-present). Former: Managing Director and President, Deutsche Funds, and Head of US Product, Trading and Fund Administration, Deutsche Asset Management (2013-January 2018); Managing Director, Head of Business Management and Consulting, Invesco Ltd. (2010-2012). |
James M. Howley
(1972) | Assistant Treasurer | Since 2014 | Current: Managing Director, Guggenheim Investments (2004-present); Assistant Treasurer, certain other funds in the Fund Complex (2006-present). Former: Manager of Mutual Fund Administration, Van Kampen Investments, Inc. (1996-2004). |
Keith D. Kemp
(1960) | Assistant Treasurer | Since 2016 | Current: Treasurer and Assistant Treasurer, certain other funds in the Fund Complex (2010-present); Managing Director of Guggenheim Investments (2015-present); Chief Financial Officer, Guggenheim Specialized Products, LLC (2016-present). Former: Managing Director and Director, Transparent Value, LLC (2010-2016); Director, Guggenheim Partners Investment Management, LLC (2010-2015); Chief Operating Officer, Macquarie Capital Investment Management (2007-2009). |
Mark E. Mathiasen
(1978) | Secretary | Since 2014 | Current: Secretary, certain other funds in the Fund Complex (2007-present); Managing Director, Guggenheim Investments (2007-present). |
Glenn McWhinnie
(1969) | Assistant Treasurer | Since 2016 | Current: Vice President, Guggenheim Investments (2009-present); Assistant Treasurer, certain other funds in the Fund Complex (2016-present). |
| | THE GUGGENHEIM FUNDS SEMI-ANNUAL REPORT | 35 |
| INFORMATION ON BOARD OF TRUSTEES AND OFFICERS (Unaudited)(continued) |
Name, Address*
and Year of Birth | Position(s)
Held with
the Trust | Term of Office
and Length of
Time Served** | Principal Occupations
During Past Five Years |
| OFFICERS - continued | |
Michael P. Megaris
(1984) | Assistant Secretary | Since 2014 | Current: Assistant Secretary, certain other funds in the Fund Complex (2014-present); Director, Guggenheim Investments (2012-present). |
Elisabeth Miller
(1968) | Chief Compliance Officer | Since 2012 | Current: CCO, certain other funds in the Fund Complex (2012-present); Managing Director, Guggenheim Investments (2012-present); Vice President, Guggenheim Funds Distributors, LLC (2014-present). Former: CCO, Security Investors, LLC (2012-2018); CCO, Guggenheim Funds Investment Advisors, LLC (2012-2018); CCO, Guggenheim Distributors, LLC (2009-2014); Senior Manager, Security Investors, LLC (2004-2009); Senior Manager, Guggenheim Distributors, LLC (2004-2009). |
Adam J. Nelson
(1979) | Assistant Treasurer | Since 2015 | Current: Vice President, Guggenheim Investments (2015-present); Assistant Treasurer, certain other funds in the Fund Complex (2015-present). Former: Assistant Vice President and Fund Administration Director, State Street Corporation (2013-2015); Fund Administration Assistant Director, State Street (2011-2013); Fund Administration Manager, State Street (2009-2011). |
Kimberly J. Scott
(1974) | Assistant Treasurer | Since 2014 | Current: Director, Guggenheim Investments (2012-present); Assistant Treasurer, certain other funds in the Fund Complex (2012-present). Former: Financial Reporting Manager, Invesco, Ltd. (2010-2011); Vice President/Assistant Treasurer of Mutual Fund Administration, Van Kampen Investments, Inc./Morgan Stanley Investment Management (2009-2010); Manager of Mutual Fund Administration, Van Kampen Investments, Inc./Morgan Stanley Investment Management (2005-2009). |
Bryan Stone
(1979) | Vice President | Since 2014 | Current: Vice President, certain other funds in the Fund Complex (2014-present); Managing Director, Guggenheim Investments (2013-present). Former: Senior Vice President, Neuberger Berman Group LLC (2009-2013); Vice President, Morgan Stanley (2002-2009). |
| 36 | THE GUGGENHEIM FUNDS SEMI-ANNUAL REPORT | |
| INFORMATION ON BOARD OF TRUSTEES AND OFFICERS (Unaudited)(concluded) |
Name, Address*
and Year of Birth | Position(s)
Held with
the Trust | Term of Office
and Length of
Time Served** | Principal Occupations
During Past Five Years |
| OFFICERS - concluded | |
John L. Sullivan
(1955) | Chief Financial Officer, Chief Accounting and Treasurer | Since 2014 | Current: CFO, Chief Accounting Officer and Treasurer, certain other funds in the Fund Complex (2010-present); Senior Managing Director, Guggenheim Investments (2010-present). Former: Managing Director and CCO, each of the funds in the Van Kampen Investments fund complex (2004-2010); Managing Director and Head of Fund Accounting and Administration, Morgan Stanley Investment Management (2002-2004); CFO and Treasurer, Van Kampen Funds (1996-2004). |
Jon Szafran
(1989) | Assistant Treasurer | Since 2017 | Current: Vice President, Guggenheim Investments (2017-present); Assistant Treasurer, certain other funds in the Fund Complex (2017-present). Former: Assistant Treasurer of Henderson Global Funds and Manager of US Fund Administration, Henderson Global Investors (North America) Inc. (“HGINA”), (2017); Senior Analyst of US Fund Administration, HGINA (2014-2017); Senior Associate of Fund Administration, Cortland Capital Market Services, LLC (2013-2014); Experienced Associate, PricewaterhouseCoopers LLP (2012-2013). |
| * | The business address of each officer is c/o Guggenheim Investments, 227 West Monroe Street, Chicago, Illinois 60606. |
| ** | Each officer serves an indefinite term, until his or her successor is duly elected and qualified. Time served includes time served in the respective position for the Predecessor Corporation. |
| | THE GUGGENHEIM FUNDS SEMI-ANNUAL REPORT | 37 |
| GUGGENHEIM INVESTMENTS PRIVACY NOTICE (Unaudited) |
Who We Are
This Privacy Notice describes the data protection practices of Guggenheim Investments. Guggenheim Investments as used herein refers to the affiliated investment management businesses of Guggenheim Partners, LLC: Guggenheim Funds Investment Advisors, LLC, Guggenheim Partners Investment Management, LLC, Guggenheim Funds Distributors, LLC, Security Investors, LLC, Guggenheim Investment Advisors (Europe) Limited, Guggenheim Real Estate, LLC, GS Gamma Advisors, LLC, Guggenheim Partners India Management, LLC, Guggenheim Partners Europe Limited, as well as the funds in the Guggenheim Funds complex (the “Funds”) (“Guggenheim Investments,” “we,” “us,” or “our”).
Guggenheim Partners Investment Management Holdings, LLC, located at 330 Madison Avenue, New York, New York 10017 is the data controller for your information. The Affiliates who are also controllers of certain of your information are: Guggenheim Investment Advisors (Europe) Limited, Guggenheim Partners Europe Limited, Guggenheim Partners, LLC, Guggenheim Funds Investment Advisors, LLC, Guggenheim Partners Investment Management, LLC, Guggenheim Funds Distributors, LLC and Security Investors, LLC, as well as the Funds.
Our Commitment to You
Guggenheim Investments considers your privacy our utmost concern. When you become our client or investor, you entrust us with not only your hard-earned money but also with your personal and financial information. Because we have access to your private information, we hold ourselves to the highest standards in its safekeeping and use. We strictly limit how we share your information with others, whether you are a current or former Guggenheim Investments client or investor.
The Information We Collect About You
We collect certain nonpublic personal information about you from information you provide on applications, other forms, our website, and/or from third parties including investment advisors. This information includes Social Security or other tax identification number, assets, income, tax information, retirement and estate plan information, transaction history, account balance, payment history, bank account information, marital status, family relationships, information that we collect on our website through the use of “cookies,” and other personal information that you or others provide to us. We may also collect such information through your inquiries by mail, e-mail or telephone. We may also collect customer due diligence information, as required by applicable law and regulation, through third party service providers.
How We Handle Your Personal Information
The legal basis for using your information as set out in this Privacy Notice is as follows: (a) use of your personal data is necessary to perform our obligations under any contract with you (such as a contract for us to provide financial services to you); or (b) where use of your personal data is not necessary for performance of a contract, use of your personal data is necessary for our
| 38 | THE GUGGENHEIM FUNDS SEMI-ANNUAL REPORT | |
| GUGGENHEIM INVESTMENTS PRIVACY NOTICE (Unaudited)(continued) |
legitimate interests or the legitimate interests of others (for example, to enforce the legal terms governing our services, operate and market our website and other services we offer, ensure safe environments for our personnel and others, make and receive payments, prevent fraud and to know the customer to whom we are providing the services). Some processing is done to comply with applicable law.
In addition to the specific uses described above, we also use your information in the following manner:
| | ● | We use your information in connection with servicing your accounts. |
| | ● | We use information to respond to your requests or questions. For example, we might use your information to respond to your customer feedback. |
| | ● | We use information to improve our products and services. We may use your information to make our website and products better. We may use your information to customize your experience with us. |
| | ● | We use information for security purposes. We may use your information to protect our company and our customers. |
| | ● | We use information to communicate with you. For example, we will communicate with you about your account or our relationship. We may contact you about your feedback. We might also contact you about this Privacy Notice. We may also enroll you in our email newsletter. |
| | ● | We use information as otherwise permitted by law, as we may notify you. |
| | ● | Aggregate/Anonymous Data. We may aggregate and/or anonymize any information collected through the website so that such information can no longer be linked to you or your device (“Aggregate/Anonymous Information”). We may use Aggregate/Anonymous Information for any purpose, including without limitation for research and marketing purposes, and may also share such data with any third parties, including advertisers, promotional partners, and sponsors. |
We do not sell information about current or former clients or their accounts to third parties. Nor do we share this information, except when necessary to complete transactions at your request, to make you aware of investment products and services that we or our affiliates offer, or as permitted or required by law.
We provide information about you to companies and individuals not affiliated with Guggenheim Investments to complete certain transactions or account changes, or to perform services for us related to your account. For example, if you ask to transfer assets from another financial institution to Guggenheim Investments, we must provide certain information about you to that company to complete the transaction. We provide the third party with only the information necessary to carry out its responsibilities and only for that purpose. And we require these third
| | THE GUGGENHEIM FUNDS SEMI-ANNUAL REPORT | 39 |
| GUGGENHEIM INVESTMENTS PRIVACY NOTICE (Unaudited)(continued) |
parties to treat your private information with the same high degree of confidentiality that we do. To alert you to other Guggenheim Investments products and services, we share your information within our family of affiliated companies. You may limit our sharing with affiliated companies as set out below. We may also share information with any successor to all or part of our business, or in connection with steps leading up to a merger or acquisition. For example, if part of our business was sold we may give customer information as part of that transaction. We may also share information about you with your consent.
We will release information about you if you direct us to do so, if we are compelled by law to do so, or in other circumstances as permitted by law (for example, to protect your account from fraud).
If you close your account(s) or become an inactive client or investor, we will continue to adhere to the privacy policies and practices described in this notice.
Opt-Out Provisions and Your Data Choices
The law allows you to “opt out” of certain kinds of information sharing with third parties. We do not share personal information about you with any third parties that triggers this opt-out right. This means YOU ARE ALREADY OPTED OUT.
When you are no longer our client or investor, we continue to share your information as described in this notice, and you may contact us at any time to limit our sharing by sending an email to CorporateDataPrivacy@GuggenheimPartners.com.
European Union Data Subjects and certain others: In addition to the choices set forth above, residents of the European Union and certain other jurisdictions have certain rights to (1) request access to or rectification or deletion of information we collect about them, (2) request a restriction on the processing of their information, (3) object to the processing of their information, or (4) request the portability of certain information. To exercise these or other rights, please contact us using the contact information below. We will consider all requests and provide our response within the time period stated by applicable law. Please note, however, that certain information may be exempt from such requests in some circumstances, which may include if we need to keep processing your information for our legitimate interests or to comply with a legal obligation. We may request you provide us with information necessary to confirm your identity before responding to your request.
Residents of France and certain other jurisdictions may also provide us with instructions regarding the manner in which we may continue to store, erase and share your information after your death, and where applicable, the person you have designated to exercise these rights after your death.
| 40 | THE GUGGENHEIM FUNDS SEMI-ANNUAL REPORT | |
| GUGGENHEIM INVESTMENTS PRIVACY NOTICE (Unaudited)(continued) |
How We Protect Privacy Online
We take steps to protect your privacy when you use our web site – www.guggenheiminvestments.com – by using secure forms of online communication, including encryption technology, Secure Socket Layer (SSL) protocol, firewalls and user names and passwords. These safeguards vary based on the sensitivity of the information that we collect and store. However, we cannot and do not guarantee that these measures will prevent every unauthorized attempt to access, use, or disclose your information since despite our efforts, no Internet and/or other electronic transmissions can be completely secure. Our web site uses “http cookies”—tiny pieces of information that we ask your browser to store. We use cookies for session management and security features on the Guggenheim Investments web site. We do not use them to pull data from your hard drive, to learn your e-mail address, or to view data in cookies created by other web sites. We will not share the information in our cookies or give others access to it. See the legal information area on our web site for more details about web site security and privacy features.
How We Safeguard Your Personal Information and Data Retention
We restrict access to nonpublic personal information about you to our employees and in some cases to third parties (for example, the service providers described above) as permitted by law. We maintain strict physical, electronic and procedural safeguards that comply with federal standards to guard your nonpublic personal information.
We keep your information for no longer than necessary for the purposes for which it is processed. The length of time for which we retain information depends on the purposes for which we collected and use it and/or as required to comply with applicable laws. Information may persist in copies made for backup and business continuity purposes for additional time.
International Visitors
If you are not a resident of the United States, please be aware that your information may be transferred to, stored and processed in the United States where our servers are located and our databases are operated. The data protection and other laws of the United States and other countries might not be as comprehensive as those in your country.
In such cases, we ensure that a legal basis for such a transfer exists and that adequate protection is provided as required by applicable law, for example, by using standard contractual clauses or by transferring your data to a jurisdiction that has obtained an adequacy finding. Individuals whose data may be transferred on the basis of standard contractual clauses may contact us as described below.
| | THE GUGGENHEIM FUNDS SEMI-ANNUAL REPORT | 41 |
| GUGGENHEIM INVESTMENTS PRIVACY NOTICE (Unaudited)(concluded) |
We’ll Keep You Informed
If you have any questions or concerns about how we treat your personal data, we encourage you to consult with us first. You may also contact the relevant supervisory authority.
We reserve the right to modify this policy at any time and will inform you promptly of material changes. You may access our privacy policy from our web site at www.guggenheiminvestments.com. Should you have any questions regarding our privacy policy, contact us by email at CorporateDataPrivacy@GuggenheimPartners.com.
| 42 | THE GUGGENHEIM FUNDS SEMI-ANNUAL REPORT | |
This page intentionally left blank.
This page intentionally left blank.
This page intentionally left blank.
This page intentionally left blank.
This page intentionally left blank.
This page intentionally left blank.
This page intentionally left blank.
3.29.2018
Guggenheim Funds Semi-Annual Report
| Guggenheim Mid Cap Value Institutional Fund | | |
| GuggenheimInvestments.com | SBMCVI-SEMI-0318x0918 |

| DEAR SHAREHOLDER | 2 |
| ECONOMIC AND MARKET OVERVIEW | 3 |
| ABOUT SHAREHOLDERS’ FUND EXPENSES | 5 |
| MID CAP VALUE INSTITUTIONAL FUND | 8 |
| NOTES TO FINANCIAL STATEMENTS | 18 |
| OTHER INFORMATION | 25 |
| INFORMATION ON BOARD OF TRUSTEES AND OFFICERS | 26 |
| GUGGENHEIM INVESTMENTS PRIVACY NOTICE | 33 |
| | THE GUGGENHEIM FUNDS SEMI-ANNUAL REPORT | 1 |
Dear Shareholder:
Security Investors, LLC (the “Investment Adviser”) is pleased to present the shareholder report for Guggenheim Mid Cap Value Fund Institutional (the “Fund”) for the semi-annual fiscal period ended March 29, 2018.
The Investment Adviser is part of Guggenheim Investments, which represents the investment management businesses of Guggenheim Partners, LLC, (“Guggenheim”) a global, diversified financial services firm.
Guggenheim Funds Distributors, LLC is the distributor of the Fund. Guggenheim Funds Distributors, LLC is affiliated with Guggenheim and the Investment Adviser.
We encourage you to read the Economic and Market Overview section of the report, which follows this letter.
We are committed to providing innovative investment solutions and appreciate the trust you place in us.
Sincerely,
Security Investors, LLC
April 30, 2018
Read a prospectus and summary prospectus (if available) carefully before investing. It contains the investment objectives, risks, charges, expenses and other information, which should be considered carefully before investing. Obtain a prospectus and summary prospectus (if available) at guggenheiminvestments.com or call 800.820.0888.
This material is not intended as a recommendation or as investment advice of any kind, including in connection with rollovers, transfers, and distributions. Such material is not provided in a fiduciary capacity, may not be relied upon for or in connection with the making of investment decisions, and does not constitute a solicitation of an offer to buy or sell securities. All content has been provided for informational or educational purposes only and is not intended to be and should not be construed as legal or tax advice and/or a legal opinion. Always consult a financial, tax and/or legal professional regarding your specific situation.
Mid Cap Value Fund Institutional may not be suitable for all investors. ● An investment in the Fund will fluctuate and is subject to investment risks, which means investors could lose money. ● The intrinsic value of the underlying stocks may never be realized, or the stock may decline in value. ● Investments in small- and/or mid-sized company securities may present additional risks such as less predictable earnings, higher volatility and less liquidity than larger, more established companies.
| 2 | THE GUGGENHEIM FUNDS SEMI-ANNUAL REPORT | |
| ECONOMIC AND MARKET OVERVIEW (Unaudited) | March 29, 2018 |
As we enter the ninth year of the current expansion, one of the most important new developments to evaluate is the impact of the corporate tax cuts passed into law at the end of 2017. Guggenheim’s concern is that the substantial late-cycle fiscal easing in the pipeline will prompt more restrictive monetary policy, which increases the risk that the economy will experience a boom-bust cycle that ends in a recession.
With the unemployment rate at 4.1% and core inflation rising, fiscal policy should be leaning against the economy to prevent overheating, not providing further stimulus. Faster wage growth, rising core inflation, and an unsustainably low unemployment rate underpin our longstanding view that the U.S. Federal Reserve (the “Fed”) will raise interest rates four times in 2018. Fed funds futures show the market is now pricing in nearly three rate hikes for 2018, up from two at the beginning of the year, which contributed to a pickup in first-quarter market volatility. Tighter fiscal and monetary policy, along with rising policy uncertainty ahead of the 2018 mid-terms and 2020 presidential election, could prove to be too much for an overextended economy to bear.
Further complicating the story is the risk of a global trade war sparked by protectionist actions taken by the Trump administration. We now have new steel and aluminum tariffs in place that are likely to have some modest inflationary impact while hurting almost 20% of U.S. corporates, according to our estimates. We expect more protectionist trade and investment policies in place by year end.
Over the six months ended March 29, 2018, the bear flattening (the condition in which short-term rates rise faster than long-term rates) of the U.S. Treasury curve continued with Treasury yields higher across the curve. Yields increased the most in the belly and front end of the curve. The 2-year Treasury ended the period at 2.27%, while the 10-year finished the period at 2.74%.
For the six months ended March 29, 2018, the Standard & Poor’s 500® (“S&P 500”) Index* returned 5.84%. The MSCI Europe-Australasia-Far East (“EAFE”) Index* returned 2.80%. The return of the MSCI Emerging Markets Index* was 9.08%.
In the bond market, the Bloomberg Barclays U.S. Aggregate Bond Index* posted a -1.08% return for the period, while the Bloomberg Barclays U.S. Corporate High Yield Index* returned -0.39%. The return of the ICE Bank of America (“BofA”) Merrill Lynch 3-Month U.S. Treasury Bill Index* was 0.64% for the six-month period.
The opinions and forecasts expressed may not actually come to pass. This information is subject to change at any time, based on market and other conditions, and should not be construed as a recommendation of any specific security or strategy.
| | THE GUGGENHEIM FUNDS SEMI-ANNUAL REPORT | 3 |
| ECONOMIC AND MARKET OVERVIEW (Unaudited)(concluded) | March 29, 2018 |
*Index Definitions:
The following indices are referenced throughout this report. Indices are unmanaged and not available for direct investment. Index performance does not reflect transaction costs, fees, or expenses.
Bloomberg Barclays U.S. Aggregate Bond Index is a broad-based flagship benchmark that measures the investment grade, U.S. dollar-denominated, fixed-rate taxable bond market, including U.S. Treasuries, government-related and corporate securities, mortgage-backed securities or “MBS” (agency fixed-rate and hybrid adjustable-rate mortgage, or “ARM”, pass-throughs), asset-backed securities (“ABS”), and commercial mortgage-backed securities (“CMBS”) (agency and non-agency).
Bloomberg Barclays U.S. Corporate High Yield Index measures the U.S. dollar-denominated, high yield, fixed-rate corporate bond market. Securities are classified as high yield if the middle rating of Moody’s, Fitch, and S&P is Ba1/BB +/BB + or below.
ICE BofA Merrill Lynch 3-Month U.S. Treasury Bill Index is an unmanaged market index of U.S. Treasury securities maturing in 90 days that assumes reinvestment of all income.
MSCI EAFE Index is a free float-adjusted market capitalization index that is designed to measure the equity market performance of developed markets, excluding the U.S. & Canada.
MSCI Emerging Markets Index is a free float-adjusted market capitalization weighted index that is designed to measure equity market performance in the global emerging markets.
Russell 2500® Value Index measures the performance of the small-to mid-cap value segment of the U.S. equity universe. It includes those Russell 2500 companies with lower price-to-book ratios and lower forecasted growth values.
S&P 500® Index is a broad-based index, the performance of which is based on the performance of 500 widely held common stocks chosen for market size, liquidity, and industry group representation.
| 4 | THE GUGGENHEIM FUNDS SEMI-ANNUAL REPORT | |
| ABOUT SHAREHOLDERS’ FUND EXPENSES (Unaudited) |
All mutual funds have operating expenses, and it is important for our shareholders to understand the impact of costs on their investments. Shareholders of a fund incur two types of costs: (i) transaction costs, including sales charges (loads) on purchase payments, reinvested dividends, other distributions, and exchange fees, and (ii) ongoing costs, including management fees, administrative services, and shareholder reports, among others. These ongoing costs, or operating expenses, are deducted from a fund’s gross income and reduce the investment return of the fund.
A fund’s expenses are expressed as a percentage of its average net assets, which is known as the expense ratio. The following examples are intended to help investors understand the ongoing costs (in dollars) of investing in a fund and to compare these costs with the ongoing costs of investing in other mutual funds.
The examples are based on an investment of $1,000 made at the beginning of the period and held for the entire six-month period beginning September 30, 2017 and ending March 29, 2018 for actual Fund returns. Hypothetical Fund returns are for the period beginning September 30, 2017 and ending March 31, 2018.
The following tables illustrate the Fund’s costs in two ways:
Table 1. Based on actual Fund return: This section helps investors estimate the actual expenses paid over the period. The “Ending Account Value” shown is derived from the Fund’s actual return, and the fifth column shows the dollar amount that would have been paid by an investor who started with $1,000 in the Fund. Investors may use the information here, together with the amount invested, to estimate the expenses paid over the period. Simply divide the Fund’s account value by $1,000 (for example, an $8,600 account value divided by $1,000 = 8.6), then multiply the result by the number provided under the heading “Expenses Paid During Period.”
Table 2. Based on hypothetical 5% return: This section is intended to help investors compare a fund’s cost with those of other mutual funds. The table provides information about hypothetical account values and hypothetical expenses based on the Fund’s actual expense ratio and an assumed rate of return of 5% per year before expenses, which is not the Fund’s actual return. The hypothetical account values and expenses may not be used to estimate the actual ending account balance or expenses paid during the period. The example is useful in making comparisons because the U.S. Securities and Exchange Commission (the “SEC”) requires all mutual funds to calculate expenses based on the 5% return. Investors can assess a fund’s costs by comparing this hypothetical example with the hypothetical examples that appear in shareholder reports of other funds.
The calculations illustrated above assume no shares were bought or sold during the period. Actual costs may have been higher or lower, depending on the amount of investment and the timing of any purchases or redemptions.
| | THE GUGGENHEIM FUNDS SEMI-ANNUAL REPORT | 5 |
| ABOUT SHAREHOLDERS’ FUND EXPENSES (Unaudited)(continued) |
Please note that the expenses shown in the table are meant to highlight your ongoing costs only and do not reflect any transactional costs, such as sales charges (loads) on purchase payments, and contingent deferred sales charges (“CDSC”) on redemptions, if any. Therefore, the second table is useful in comparing ongoing costs only, and will not help you determine the relative total costs of owning different funds. In addition, if these transactional costs were included, your costs would have been higher.
More information about the Fund’s expenses, including annual expense ratios for periods up to five years (subject to the Fund’s inception date), can be found in the Financial Highlights section of this report. For additional information on operating expenses and other shareholder costs, please refer to the Fund’s prospectus.
| 6 | THE GUGGENHEIM FUNDS SEMI-ANNUAL REPORT | |
| ABOUT SHAREHOLDERS’ FUND EXPENSES (Unaudited)(concluded) |
| | Expense
Ratio1 | Fund
Return | Beginning
Account Value
September 30,
2017 | Ending
Account Value
March 29,
2018 | Expenses
Paid During
Period2 |
| Table 1. Based on actual Fund return3 |
| Mid Cap Value Institutional Fund | 1.13% | 2.64% | $ 1,000.00 | $ 1,026.40 | $ 5.65 |
| |
| | Expense
Ratio1 | Fund
Return | Beginning
Account Value
September 30,
2017 | Ending
Account Value
March 31,
2018 | Expenses
Paid During
Period4 |
| Table 2. Based on hypothetical 5% return (before expenses)5 |
| Mid Cap Value Institutional Fund | 1.13% | 5.00% | $ 1,000.00 | $ 1,019.30 | $ 5.69 |
| 1 | Annualized and excludes expenses of the underlying funds in which the Fund invests, if any. |
| 2 | Expenses in table 1 are equal to the Fund’s annualized expense ratio, net of any applicable fee waivers, multiplied by the average account value over the period, multiplied by 180/365 (to reflect the one-half year period). |
| 3 | Actual cumulative return at net asset value for the period September 30, 2017 to March 29, 2018. |
| 4 | Expenses in table 3 are equal to the Fund’s annualized expense ratio, net of any applicable fee waivers, multiplied by the average account value over the period, multiplied by 182/365 (to reflect the one-half year period). |
| 5 | Hypothetical return for the period September 30, 2017 to March 31, 2018. |
| | THE GUGGENHEIM FUNDS SEMI-ANNUAL REPORT | 7 |
| PERFORMANCE REPORT AND FUND PROFILE (Unaudited) | March 29, 2018 |
MID CAP VALUE INSTITUTIONAL FUND
OBJECTIVE: Seeks long-term growth of capital.
Holdings Diversification (Market Exposure as % of Net Assets)
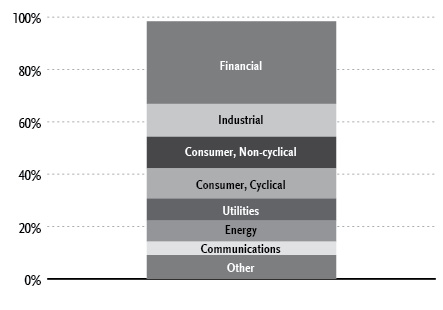
“Holdings Diversification (Market Exposure as % of Net Assets)” excludes any temporary cash investments.
Inception Date: July 11, 2008
| Ten Largest Holdings (% of Total Net Assets) |
| Zions Bancorporation | 2.8% |
| KeyCorp | 2.5% |
| E*TRADE Financial Corp. | 2.0% |
| Wintrust Financial Corp. | 2.0% |
| PVH Corp. | 2.0% |
| Huntington Bancshares, Inc. | 1.9% |
| DR Horton, Inc. | 1.8% |
| OGE Energy Corp. | 1.7% |
| Unum Group | 1.6% |
| UniFirst Corp. | 1.6% |
| Top Ten Total | 19.9% |
“Ten Largest Holdings” excludes any temporary cash investments.
| 8 | THE GUGGENHEIM FUNDS SEMI-ANNUAL REPORT | |
| PERFORMANCE REPORT AND FUND PROFILE (Unaudited)(concluded) | March 29, 2018 |
Average Annual Returns*
Periods Ended March 29, 2018
| | 6 month† | 1 Year | 5 Year | Since Inception
(07/11/08) |
| Mid Cap Value Institutional Fund | 2.64% | 8.56% | 8.96% | 10.56% |
| Russell 2500 Value Index | 1.49% | 5.72% | 9.88% | 10.18% |
| * | The performance data above represents past performance that is not predictive of future results. The investment return and principal value of an investment in the Fund will fluctuate so that an investor’s shares, when redeemed, may be worth more or less than their original cost. Returns are historical and include changes in principal and reinvested dividends and capital gains and do not reflect the effect of taxes. The Russell 2500 Value Index is an unmanaged index and, unlike the Fund, has no management fees or operating expenses to reduce its reported return. |
| † | 6 month returns are not annualized. |
| | |
| | THE GUGGENHEIM FUNDS SEMI-ANNUAL REPORT | 9 |
| SCHEDULE OF INVESTMENTS (Unaudited) | March 29, 2018 |
| MID CAP VALUE INSTITUTIONAL FUND | |
| | | Shares | | | Value | |
| | | | | | | |
| COMMON STOCKS† - 98.2% |
| | | | | | | |
| Financial - 31.5% |
| Zions Bancorporation | | | 40,154 | | | $ | 2,117,321 | |
| KeyCorp | | | 94,536 | | | | 1,848,179 | |
| E*TRADE Financial Corp.* | | | 27,451 | | | | 1,521,060 | |
| Wintrust Financial Corp. | | | 17,328 | | | | 1,491,074 | |
| Huntington Bancshares, Inc. | | | 92,835 | | | | 1,401,809 | |
| Unum Group | | | 25,053 | | | | 1,192,774 | |
| Alleghany Corp. | | | 1,714 | | | | 1,053,150 | |
| Radian Group, Inc. | | | 54,857 | | | | 1,044,477 | |
| Equity Commonwealth REIT* | | | 33,776 | | | | 1,035,910 | |
| Umpqua Holdings Corp. | | | 42,354 | | | | 906,799 | |
| Alexandria Real Estate Equities, Inc. REIT | | | 7,051 | | | | 880,599 | |
| Prosperity Bancshares, Inc. | | | 11,780 | | | | 855,581 | |
| Howard Hughes Corp.* | | | 5,992 | | | | 833,667 | |
| Sun Communities, Inc. REIT | | | 7,859 | | | | 718,077 | |
| Cousins Properties, Inc. REIT | | | 70,085 | | | | 608,338 | |
| IBERIABANK Corp. | | | 7,526 | | | | 587,028 | |
| Pinnacle Financial Partners, Inc. | | | 8,666 | | | | 556,357 | |
| National Storage Affiliates Trust REIT | | | 19,644 | | | | 492,672 | |
| CoreCivic, Inc. REIT | | | 24,695 | | | | 482,046 | |
| Redwood Trust, Inc. REIT | | | 29,386 | | | | 454,601 | |
| Camden Property Trust REIT | | | 4,922 | | | | 414,334 | |
| LaSalle Hotel Properties REIT | | | 13,698 | | | | 397,379 | |
| Lexington Realty Trust REIT | | | 48,777 | | | | 383,875 | |
| Federal Agricultural Mortgage Corp. — Class C | | | 4,361 | | | | 379,494 | |
| Customers Bancorp, Inc.* | | | 12,888 | | | | 375,685 | |
| Voya Financial, Inc. | | | 7,396 | | | | 373,498 | |
| Piedmont Office Realty Trust, Inc. — Class A REIT | | | 20,505 | | | | 360,683 | |
| Physicians Realty Trust REIT | | | 21,478 | | | | 334,412 | |
| EastGroup Properties, Inc. REIT | | | 2,336 | | | | 193,094 | |
| First Industrial Realty Trust, Inc. REIT | | | 6,524 | | | | 190,697 | |
| Seacoast Banking Corporation of Florida* | | | 6,936 | | | | 183,596 | |
| Total Financial | | | | | | | 23,668,266 | |
| | | | | | | | | |
| Industrial - 12.5% |
| Carlisle Companies, Inc. | | | 10,580 | | | | 1,104,658 | |
| FLIR Systems, Inc. | | | 16,462 | | | | 823,265 | |
| Crane Co. | | | 8,074 | | | | 748,783 | |
| WestRock Co. | | | 11,619 | | | | 745,591 | |
| Gentex Corp. | | | 22,479 | | | | 517,466 | |
| ITT, Inc. | | | 10,295 | | | | 504,249 | |
| Celadon Group, Inc. | | | 111,054 | | | | 410,900 | |
| KLX, Inc.* | | | 5,519 | | | | 392,180 | |
| Scorpio Tankers, Inc. | | | 194,987 | | | | 382,174 | |
| Oshkosh Corp. | | | 4,875 | | | | 376,692 | |
| Covenant Transportation Group, Inc. — Class A* | | | 12,236 | | | | 365,000 | |
| Greif, Inc. — Class A | | | 6,864 | | | | 358,644 | |
| Jacobs Engineering Group, Inc. | | | 6,055 | | | | 358,153 | |
| GasLog Ltd. | | | 21,395 | | | | 351,948 | |
| Hub Group, Inc. — Class A* | | | 8,214 | | | | 343,756 | |
| Fabrinet* | | | 9,748 | | | | 305,892 | |
| Park Electrochemical Corp. | | | 17,445 | | | | 293,774 | |
| TriMas Corp.* | | | 8,837 | | | | 231,971 | |
| Kirby Corp.* | | | 3,008 | | | | 231,466 | |
| Rexnord Corp.* | | | 6,958 | | | | 206,514 | |
| Valmont Industries, Inc. | | | 1,308 | | | | 191,360 | |
| Astec Industries, Inc. | | | 3,179 | | | | 175,417 | |
| Total Industrial | | | | | | | 9,419,853 | |
| 10 | THE GUGGENHEIM FUNDS SEMI-ANNUAL REPORT | SEE NOTES TO FINANCIAL STATEMENTS. |
| SCHEDULE OF INVESTMENTS (Unaudited)(continued) | March 29, 2018 |
| MID CAP VALUE INSTITUTIONAL FUND | |
| | | Shares | | | Value | |
| | | | | | | |
| Consumer, Non-cyclical - 12.1% |
| Ingredion, Inc. | | | 8,718 | | | $ | 1,123,925 | |
| Hormel Foods Corp. | | | 28,540 | | | | 979,493 | |
| Emergent BioSolutions, Inc.* | | | 18,500 | | | | 974,025 | |
| Bunge Ltd. | | | 12,970 | | | | 959,002 | |
| Premier, Inc. — Class A* | | | 20,044 | | | | 627,578 | |
| Encompass Health Corp. | | | 10,200 | | | | 583,134 | |
| Eagle Pharmaceuticals, Inc.* | | | 10,496 | | | | 553,034 | |
| Myriad Genetics, Inc.* | | | 18,402 | | | | 543,779 | |
| Hostess Brands, Inc.* | | | 28,960 | | | | 428,318 | |
| Perrigo Company plc | | | 4,617 | | | | 384,781 | |
| SP Plus Corp.* | | | 10,077 | | | | 358,741 | |
| Fresh Del Monte Produce, Inc. | | | 7,852 | | | | 355,224 | |
| ACCO Brands Corp. | | | 21,595 | | | | 271,017 | |
| Inovio Pharmaceuticals, Inc.* | | | 45,705 | | | | 215,271 | |
| Dermira, Inc.* | | | 26,562 | | | | 212,230 | |
| Quest Diagnostics, Inc. | | | 2,086 | | | | 209,226 | |
| Central Garden & Pet Co. — Class A* | | | 5,172 | | | | 204,863 | |
| Smart & Final Stores, Inc.* | | | 21,006 | | | | 116,583 | |
| Total Consumer, Non-cyclical | | | | | | | 9,100,224 | |
| | | | | | | | | |
| Consumer, Cyclical - 11.5% |
| PVH Corp. | | | 9,820 | | | | 1,487,043 | |
| DR Horton, Inc. | | | 30,313 | | | | 1,328,922 | |
| UniFirst Corp. | | | 7,202 | | | | 1,164,203 | |
| Caleres, Inc. | | | 18,143 | | | | 609,605 | |
| Lennar Corp. — Class A | | | 9,885 | | | | 582,622 | |
| American Eagle Outfitters, Inc. | | | 28,469 | | | | 567,387 | |
| GMS, Inc.* | | | 17,877 | | | | 546,321 | |
| PACCAR, Inc. | | | 6,504 | | | | 430,370 | |
| JetBlue Airways Corp.* | | | 20,989 | | | | 426,497 | |
| Acushnet Holdings Corp. | | | 16,367 | | | | 377,914 | |
| Unifi, Inc.* | | | 10,180 | | | | 369,025 | |
| Goodyear Tire & Rubber Co. | | | 11,486 | | | | 305,298 | |
| Movado Group, Inc. | | | 6,397 | | | | 245,645 | |
| Alaska Air Group, Inc. | | | 2,440 | | | | 151,182 | |
| Lennar Corp. — Class B | | | 208 | | | | 9,919 | |
| Total Consumer, Cyclical | | | | | | | 8,601,953 | |
| | | | | | | | | |
| Utilities - 8.5% |
| OGE Energy Corp. | | | 38,237 | | | | 1,253,026 | |
| Ameren Corp. | | | 17,167 | | | | 972,167 | |
| Portland General Electric Co. | | | 20,499 | | | | 830,414 | |
| Pinnacle West Capital Corp. | | | 9,762 | | | | 779,008 | |
| AES Corp. | | | 56,453 | | | | 641,871 | |
| Black Hills Corp. | | | 11,770 | | | | 639,111 | |
| UGI Corp. | | | 14,143 | | | | 628,232 | |
| ONE Gas, Inc. | | | 6,598 | | | | 435,600 | |
| Edison International | | | 2,935 | | | | 186,842 | |
| Total Utilities | | | | | | | 6,366,271 | |
| | | | | | | | | |
| Energy - 8.0% |
| Whiting Petroleum Corp.* | | | 28,957 | | | | 979,905 | |
| Marathon Oil Corp. | | | 55,646 | | | | 897,570 | |
| Rowan Companies plc — Class A* | | | 70,527 | | | | 813,882 | |
| Hess Corp. | | | 15,025 | | | | 760,566 | |
| Oasis Petroleum, Inc.* | | | 89,794 | | | | 727,331 | |
| Range Resources Corp. | | | 45,700 | | | | 664,478 | |
| Andeavor | | | 5,779 | | | | 581,136 | |
| WildHorse Resource Development Corp.* | | | 11,781 | | | | 224,899 | |
| MRC Global, Inc.* | | | 11,351 | | | | 186,611 | |
| Gulfport Energy Corp.* | | | 14,537 | | | | 140,282 | |
| HydroGen Corp.*,†††,1,2 | | | 1,265,700 | | | | 1 | |
| Total Energy | | | | | | | 5,976,661 | |
| | | | | | | | | |
| Communications - 5.1% |
| Infinera Corp.* | | | 93,313 | | | | 1,013,379 | |
| Ciena Corp.* | | | 38,593 | | | | 999,559 | |
| Viavi Solutions, Inc.* | | | 56,668 | | | | 550,813 | |
| Finisar Corp.* | | | 32,850 | | | | 519,359 | |
| Oclaro, Inc.* | | | 52,108 | | | | 498,152 | |
| Acacia Communications, Inc.* | | | 5,503 | | | | 211,645 | |
| Total Communications | | | | | | | 3,792,907 | |
| SEE NOTES TO FINANCIAL STATEMENTS. | THE GUGGENHEIM FUNDS SEMI-ANNUAL REPORT | 11 |
| SCHEDULE OF INVESTMENTS (Unaudited)(continued) | March 29, 2018 |
| MID CAP VALUE INSTITUTIONAL FUND | |
| | | Shares | | | Value | |
| | | | | | | |
| Basic Materials - 4.5% |
| Reliance Steel & Aluminum Co. | | | 11,181 | | | $ | 958,659 | |
| Nucor Corp. | | | 14,836 | | | | 906,331 | |
| Westlake Chemical Corp. | | | 7,626 | | | | 847,630 | |
| Alcoa Corp.* | | | 7,987 | | | | 359,095 | |
| Tahoe Resources, Inc. | | | 73,595 | | | | 345,161 | |
| Total Basic Materials | | | | | | | 3,416,876 | |
| | | | | | | | | |
| Technology - 4.5% |
| Cray, Inc.* | | | 47,465 | | | | 982,525 | |
| Conduent, Inc.* | | | 37,134 | | | | 692,178 | |
| Qorvo, Inc.* | | | 9,701 | | | | 683,435 | |
| Maxwell Technologies, Inc.* | | | 95,006 | | | | 563,386 | |
| Super Micro Computer, Inc.* | | | 26,697 | | | | 453,849 | |
| Total Technology | | | | | | | 3,375,373 | |
| | | | | | | | | |
| Total Common Stocks | | | | | | | | |
| (Cost $65,941,473) | | | | | | | 73,718,384 | |
| | | | | | | | | |
| CONVERTIBLE PREFERRED STOCKS††† - 0.0% |
| Preferred Stock - 0.0% |
| Thermoenergy Corp. due *,1,3,5 | | | 793,750 | | | | 231 | |
| Total Convertible Preferred Stocks | | | | | | | | |
| (Cost $757,980) | | | | | | | 231 | |
| | | | | | | | | |
| MONEY MARKET FUND† - 2.5% |
| Dreyfus Treasury Securities Cash Management Institutional Class 1.46%4 | | | 1,905,952 | | | | 1,905,952 | |
| Total Money Market Fund | | | | | | | | |
| (Cost $1,905,952) | | | | | | | 1,905,952 | |
| | | | | | | | | |
| Total Investments - 100.7% | | | | | | | | |
| (Cost $68,605,405) | | | | | | $ | 75,624,567 | |
| Other Assets & Liabilities, net - (0.7)% | | | | | | | (561,651 | ) |
| Total Net Assets - 100.0% | | | | | | $ | 75,062,916 | |
| * | Non-income producing security. |
| † | Value determined based on Level 1 inputs, unless otherwise noted — See Note 4. |
| ††† | Value determined based on Level 3 inputs — See Note 4. |
| 1 | Security was fair valued by the Valuation Committee at March 29, 2018. The total market value of fair valued securities amounts to $232, (cost $760,511) or 0.0% of total net assets. |
| 2 | Affiliated issuer. |
| 3 | PIPE (Private Investment in Public Equity) — Stock issued by a company in the secondary market as a means of raising capital more quickly and less expensively than through registration of a secondary public offering. |
| 4 | Rate indicated is the 7 day yield as of March 29, 2018. |
| 5 | Illiquid security. |
| | REIT — Real Estate Investment Trust |
| | plc — Public Limited Company |
| | |
| | See Sector Classification in Other Information section. |
| 12 | THE GUGGENHEIM FUNDS SEMI-ANNUAL REPORT | SEE NOTES TO FINANCIAL STATEMENTS. |
| SCHEDULE OF INVESTMENTS (Unaudited)(concluded) | March 29, 2018 |
| MID CAP VALUE INSTITUTIONAL FUND | |
The following table summarizes the inputs used to value the Fund’s investments at March 29, 2018 (See Note 4 in the Notes to Financial Statements):
| Investments in Securities (Assets) | | Level 1
Quoted
Prices | | | Level 2
Significant
Observable
Inputs | | | Level 3
Significant
Unobservable
Inputs | | | Total | |
| Common Stocks | | $ | 73,718,383 | | | $ | — | | | $ | 1 | | | $ | 73,718,384 | |
| Convertible Preferred Stock | | | — | | | | — | | | | 231 | | | | 231 | |
| Money Market Fund | | | 1,905,952 | | | | — | | | | — | | | | 1,905,952 | |
| Total Assets | | $ | 75,624,335 | | | $ | — | | | $ | 232 | | | $ | 75,624,567 | |
Transfers between investment levels may occur as the markets fluctuate and/or the availability of data used in an investment’s valuation changes. Transfers between valuation levels, if any, are in comparison to the valuation levels at the end of the previous fiscal year, and are effective using the fair value as of the end of the current fiscal period.
For the period ended March 29, 2018, there were no transfers between levels.
Affiliated Transactions
Investments representing 5% or more of the outstanding voting shares of a portfolio company of a fund, or control of or by, or common control under the Guggenheim Investments (“GI”), result in that portfolio company being considered an affiliated company of such fund, as defined in the 1940 Act.
Transactions during the period ended March 29, 2018, in which the portfolio company is an “affiliated person”, were as follows:
| Security Name | | Value 09/30/17 | | | Additions | | | Reductions | | | Realized Gain
(Loss) | | | Change in
Unrealized | | | Value
03/29/18 | | | Shares
03/29/18 | | | Investment
Income | | | Capital Gain Distributions | |
| Common Stock | | | | | | | | | | | | | | | | | | | | | | | | | | | |
| HydroGen Corp. | | $ | 1 | | | $ | — | | | $ | — | | | $ | — | | | $ | — | | | $ | 1 | | | | 1,265,700 | | | $ | — | | | $ | — | |
| SEE NOTES TO FINANCIAL STATEMENTS. | THE GUGGENHEIM FUNDS SEMI-ANNUAL REPORT | 13 |
| STATEMENT OF ASSETS AND LIABILITIES (Unaudited) |
| MID CAP VALUE INSTITUTIONAL FUND |
March 29, 2018
| Assets: |
| Investments in unaffiliated issuers, at value (cost $68,602,874) | | $ | 75,624,566 | |
| Investments in affiliated issuers, at value (cost $2,531) | | | 1 | |
| Prepaid expenses | | | 18,751 | |
| Receivables: |
| Dividends | | | 98,306 | |
| Fund shares sold | | | 32,765 | |
| Interest | | | 2,155 | |
| Total assets | | | 75,776,544 | |
| | | | | |
| Liabilities: |
| Overdraft due to custodian bank | | | 1,295 | |
| Payable for: |
| Securities purchased | | | 372,386 | |
| Fund shares redeemed | | | 194,419 | |
| Management fees | | | 48,617 | |
| Transfer agent/maintenance fees | | | 14,871 | |
| Trustees’ fees* | | | 12,407 | |
| Fund accounting/administration fees | | | 5,186 | |
| Miscellaneous | | | 64,447 | |
| Total liabilities | | | 713,628 | |
| Net assets | | $ | 75,062,916 | |
| | | | | |
| Net assets consist of: |
| Paid in capital | | $ | 64,882,341 | |
| Accumulated net investment loss | | | (220,715 | ) |
| Accumulated net realized gain on investments | | | 3,382,128 | |
| Net unrealized appreciation on investments | | | 7,019,162 | |
| Net assets | | $ | 75,062,916 | |
| Capital shares outstanding | | | 7,017,603 | |
| Net asset value per share | | $ | 10.70 | |
| * | Relates to Trustees not deemed “interested persons” within the meaning of Section 2(a)(19) of the 1940 Act. |
| 14 | THE GUGGENHEIM FUNDS SEMI-ANNUAL REPORT | SEE NOTES TO FINANCIAL STATEMENTS. |
| STATEMENT OF OPERATIONS (Unaudited) |
| MID CAP VALUE INSTITUTIONAL FUND |
Period Ended March 29, 2018
| Investment Income: |
| Dividends | | $ | 553,953 | |
| Interest from securities of unaffiliated issuers | | | 12,163 | |
| Total investment income | | | 566,116 | |
| | | | | |
| Expenses: |
| Management fees | | | 292,263 | |
| Transfer agent/maintenance fees | | | 64,159 | |
| Fund accounting/administration fees | | | 31,175 | |
| Custodian fees | | | 3,039 | |
| Line of credit fees | | | 1,007 | |
| Trustees’ fees* | | | 830 | |
| Miscellaneous | | | 49,077 | |
| Total expenses | | | 441,550 | |
| Net investment income | | | 124,566 | |
| | | | | |
| Net Realized and Unrealized Gain (Loss): |
| Net realized gain (loss) on: |
| Investments in unaffiliated issuers | | | 4,588,103 | |
| Net realized gain | | | 4,588,103 | |
| Net change in unrealized appreciation (depreciation) on: |
| Investments in unaffiliated issuers | | | (2,679,484 | ) |
| Net change in unrealized appreciation (depreciation) | | | (2,679,484 | ) |
| Net realized and unrealized gain | | | 1,908,619 | |
| Net increase in net assets resulting from operations | | $ | 2,033,185 | |
| * | Relates to Trustees not deemed “interested persons” within the meaning of Section 2(a)(19) of the 1940 Act. |
| SEE NOTES TO FINANCIAL STATEMENTS. | THE GUGGENHEIM FUNDS SEMI-ANNUAL REPORT | 15 |
| STATEMENTS OF CHANGES IN NET ASSETS |
| MID CAP VALUE INSTITUTIONAL FUND | |
| | | Period Ended
March 29,
2018
(Unaudited) | | | Year Ended
September 30,
2017 | |
| Increase (Decrease) in Net Assets from Operations: | | | | | | |
| Net investment income (loss) | | $ | 124,566 | | | $ | (54,816 | ) |
| Net realized gain on investments | | | 4,588,103 | | | | 10,956,696 | |
| Net change in unrealized appreciation (depreciation) on investments | | | (2,679,484 | ) | | | 2,379,915 | |
| Net increase in net assets resulting from operations | | | 2,033,185 | | | | 13,281,795 | |
| | | | | | | | | |
| Distributions to shareholders from: | | | | | | | | |
| Net investment income | | | (345,281 | ) | | | (3,140,884 | ) |
| Net realized gains | | | (8,596,497 | ) | | | (4,043,650 | ) |
| Total distributions to shareholders | | | (8,941,778 | ) | | | (7,184,534 | ) |
| | | | | | | | | |
| Capital share transactions: | | | | | | | | |
| Proceeds from sale of shares | | | 12,902,206 | | | | 26,427,689 | |
| Distributions reinvested | | | 5,265,056 | | | | 3,569,315 | |
| Cost of shares redeemed | | | (14,004,336 | ) | | | (29,095,222 | ) |
| Net increase from capital share transactions | | | 4,162,926 | | | | 901,782 | |
| Net increase (decrease) in net assets | | | (2,745,667 | ) | | | 6,999,043 | |
| | | | | | | | | |
| Net assets: | | | | | | | | |
| Beginning of period | | | 77,808,583 | | | | 70,809,540 | |
| End of period | | $ | 75,062,916 | | | $ | 77,808,583 | |
| Accumulated net investment loss at end of period | | $ | (220,715 | ) | | $ | — | |
| | | | | | | | | |
| Capital share activity: | | | | | | | | |
| Shares sold | | | 1,165,370 | | | | 2,400,920 | |
| Shares issued from reinvestment of distributions | | | 481,707 | | | | 337,685 | |
| Shares redeemed | | | (1,249,509 | ) | | | (2,617,531 | ) |
| Net increase in shares | | | 397,568 | | | | 121,074 | |
| 16 | THE GUGGENHEIM FUNDS SEMI-ANNUAL REPORT | SEE NOTES TO FINANCIAL STATEMENTS. |
| FINANCIAL HIGHLIGHTS |
| MID CAP VALUE INSTITUTIONAL FUND | |
This table is presented to show selected data for a share outstanding throughout each period and to assist shareholders in evaluating a Fund’s performance for the periods presented.
| Institutional Class | | Period Ended
March 29,
2018a | | | Year Ended
Sept. 30,
2017 | | | Year Ended
Sept. 30,
2016 | | | Year Ended
Sept. 30,
2015 | | | Year Ended
Sept. 30,
2014 | | | Year Ended
Sept. 30,
2013 | |
| Per Share Data | | | | | | | | | | | | | | | | | | |
| Net asset value, beginning of period | | $ | 11.75 | | | $ | 10.90 | | | $ | 10.41 | | | $ | 12.92 | | | $ | 13.09 | | | $ | 11.29 | |
| Income (loss) from investment operations: |
| Net investment income (loss)b | | | .02 | | | | (.01 | ) | | | .15 | | | | .06 | | | | .06 | | | | .06 | |
| Net gain (loss) on investments (realized and unrealized) | | | .32 | | | | 2.07 | | | | 1.43 | | | | (.66 | ) | | | .65 | | | | 2.90 | |
| Total from investment operations | | | .34 | | | | 2.06 | | | | 1.58 | | | | (.60 | ) | | | .71 | | | | 2.96 | |
| Less distributions from: |
| Net investment income | | | (.05 | ) | | | (.53 | ) | | | (.12 | ) | | | (.07 | ) | | | (.07 | ) | | | (.04 | ) |
| Net realized gains | | | (1.34 | ) | | | (.68 | ) | | | (.97 | ) | | | (1.84 | ) | | | (.81 | ) | | | (1.12 | ) |
| Total distributions | | | (1.39 | ) | | | (1.21 | ) | | | (1.09 | ) | | | (1.91 | ) | | | (.88 | ) | | | (1.16 | ) |
| Net asset value, end of period | | $ | 10.70 | | | $ | 11.75 | | | $ | 10.90 | | | $ | 10.41 | | | $ | 12.92 | | | $ | 13.09 | |
| |
| Total Returnc | | | 2.64 | % | | | 20.23 | % | | | 16.28 | % | | | (5.85 | %) | | | 5.53 | % | | | 28.89 | % |
| Ratios/Supplemental Data |
| Net assets, end of period (in thousands) | | $ | 75,063 | | | $ | 77,809 | | | $ | 70,810 | | | $ | 287,370 | | | $ | 598,101 | | | $ | 571,465 | |
| Ratios to average net assets: |
| Net investment income (loss) | | | 0.32 | % | | | (0.07 | %) | | | 1.52 | % | | | 0.52 | % | | | 0.42 | % | | | 0.51 | % |
| Total expensesd | | | 1.13 | % | | | 1.14 | % | | | 1.14 | % | | | 1.05 | % | | | 1.05 | % | | | 1.01 | % |
| Portfolio turnover rate | | | 26 | % | | | 72 | % | | | 149 | % | | | 95 | % | | | 41 | % | | | 24 | % |
| a | Unaudited figures for the period ended March 29, 2018. Percentage amounts for the period, except total return and portfolio turnover rate, have been annualized. |
| b | Net investment income (loss) per share was computed using average shares outstanding throughout the period. |
| c | Total return does not reflect the impact of any applicable sales charges and has not been annualized. |
| d | Does not include expenses of the underlying funds in which the Fund invests. |
| SEE NOTES TO FINANCIAL STATEMENTS. | THE GUGGENHEIM FUNDS SEMI-ANNUAL REPORT | 17 |
| NOTES TO FINANCIAL STATEMENTS (Unaudited) |
Note 1 – Organization and Significant Accounting Policies
Organization
Guggenheim Funds Trust (the “Trust”), a Delaware statutory trust, is registered with the SEC under the Investment Company Act of 1940 (“1940 Act”), as an open-ended investment company of the series type. Each series, in effect, is representing a separate Fund. The Trust is authorized to issue an unlimited number of shares. The Trust accounts for the assets of each Fund separately.
The Trust offers a combination of five separate classes of shares, A-Class shares, C-Class shares, P-Class shares, R6-Class shares and Institutional Class shares. Sales of shares of each Class are made without a front-end sales charge at the net asset value per share (“NAV”), with the exception of A-Class shares. A-Class shares are sold at the NAV, plus the applicable front-end sales charge. The sales charge varies depending on the amount purchased. A-Class share purchases of $1 million or more are exempt from the front-end sales charge but have a 1% contingent deferred sales charge (“CDSC”), if shares are redeemed within 12 months of purchase. C-Class shares have a 1% CDSC if shares are redeemed within 12 months of purchase. Institutional Class shares are offered primarily for direct investment by institutions such as pension and profit sharing plans, endowments, foundations and corporations. Institutional Class shares require a minimum initial investment of $2 million and a minimum account balance of $1 million. At March 29, 2018, the Trust consisted of nineteen funds (the “Funds”).
This report covers the Mid Cap Value Institutional Fund (the “Fund”), a diversified investment company. Only Institutional Class shares had been issued by the Fund.
Security Investors, LLC which operates under the name Guggenheim Investments (“GI”), provides advisory services. Guggenheim Funds Distributors, LLC (“GFD”) acts as principal underwriter for the Trust. GI and GFD are affiliated entities.
Significant Accounting Policies
March 29, 2018 represents the last day during the Funds’ annual period on which the New York Stock Exchange (“NYSE”) was open for trading. The Funds’ financial statements have been presented through that date to maintain consistency with the Funds’ net asset value calculations used for shareholder transactions.
The Fund operates as an investment company and, accordingly, follows the investment company accounting and reporting guidance of the Financial Accounting Standards Board (“FASB”) Accounting Standards Codification Topic 946 Financial Services – Investment Companies.
The following significant accounting policies are in conformity with U.S. generally accepted accounting principles (“U.S. GAAP”) and are consistently followed by the Trust. This requires management to make estimates and assumptions that affect the reported amount of assets and liabilities, contingent assets and liabilities at the date of the financial statements, and the reported amounts of revenues and expenses during the reporting period. Actual results could differ from these estimates. All time references are based on Eastern Time.
| 18 | THE GUGGENHEIM FUNDS SEMI-ANNUAL REPORT | |
| NOTES TO FINANCIAL STATEMENTS (Unaudited)(continued) |
The NAV of the Fund is calculated by dividing the market value of the Fund’s securities and other assets, less all liabilities, by the number of outstanding shares of the Fund.
(a) Valuation of Investments
The Board of Trustees of the Fund (the “Board”) has adopted policies and procedures for the valuation of the Fund’s investments (the “Valuation Procedures”). Pursuant to the Valuation Procedures, the Board has delegated to a valuation committee, consisting of representatives from Guggenheim’s investment management, fund administration, legal and compliance departments (the “Valuation Committee”), the day-to-day responsibility for implementing the Valuation Procedures, including, under most circumstances, the responsibility for determining the fair value of the Fund’s securities and/or other assets.
Valuations of the Fund’s securities are supplied primarily by pricing services appointed pursuant to the processes set forth in the Valuation Procedures. The Valuation Committee convenes monthly, or more frequently as needed, to review the valuation of all assets which have been fair valued for reasonableness. The Fund’s officers, through the Valuation Committee and consistent with the monitoring and review responsibilities set forth in the Valuation Procedures, regularly review procedures used and valuations provided by the pricing services.
If the pricing service cannot or does not provide a valuation for a particular investment or such valuation is deemed unreliable, such investment is fair valued by the Valuation Committee.
Equity securities listed on an exchange (NYSE or American Stock Exchange) are valued at the last quoted sale price as of the close of business on the NYSE, usually 4:00 p.m. on the valuation date. Equity securities listed on the NASDAQ market system are valued at the NASDAQ Official Closing Price on the valuation date, which may not necessarily represent the last sale price. If there has been no sale on such exchange or NASDAQ on a given day, the security is valued at the closing bid price on that day.
Open-end investment companies (“Mutual Funds”) are valued at their NAV as of the close of business, on the valuation date.
Investments for which market quotations are not readily available are fair-valued as determined in good faith by GI, subject to review and approval by the Valuation Committee, pursuant to methods established or ratified by the Board. Valuations in accordance with these methods are intended to reflect each security’s (or asset’s or liability’s) “fair value”. Each such determination is based on a consideration of all relevant factors, which are likely to vary from one pricing context to another. Examples of such factors may include, but are not limited to market prices; sale prices; broker quotes; and models which derive prices based on inputs such as prices of securities with comparable maturities and characteristics, or based on inputs such as anticipated cash flows or collateral, spread over Treasuries, and other information analysis.
| | THE GUGGENHEIM FUNDS SEMI-ANNUAL REPORT | 19 |
| NOTES TO FINANCIAL STATEMENTS (Unaudited)(continued) |
(b) Foreign Taxes
The Fund may be subject to foreign taxes (a portion of which may be reclaimable) on income, stock dividends, capital gains on investments or certain foreign currency transactions. All foreign taxes are recorded in accordance with the applicable foreign tax regulations and rates that exist in the foreign jurisdictions in which the Fund invests. These foreign taxes, if any, are paid by the Fund and reflected in its Statement of Operations as follows: foreign taxes withheld at source are presented as a reduction of income and foreign taxes on capital gains from sales of investments are included with the net realized gain (loss) on investments. Foreign taxes payable or deferred as of March 29, 2018, if any, are disclosed in the Fund’s Statement of Assets and Liabilities.
(c) Security Transactions
Security transactions are recorded on the trade date for financial reporting purposes. Realized gains and losses from securities transactions are recorded using the identified cost basis. Proceeds from lawsuits related to investment holdings are recorded as realized gains in the Fund.
Dividend income is recorded on the ex-dividend date, net of applicable taxes withheld by foreign countries. Taxable non-cash dividends are recorded as dividend income. Interest income, including amortization of premiums and accretion of discounts, is accrued on a daily basis. Dividend income from Real Estate Investment Trusts (“REITs”) is recorded based on the income included in the distributions received from the REIT investments using published REIT classifications, including some management estimates when actual amounts are not available. Distributions received in excess of this estimated amount are recorded as a reduction of the cost of investments or reclassified to capital gains. The actual amounts of income, return of capital, and capital gains are only determined by each REIT after its fiscal year-end, and may differ from the estimated amounts.
(d) Distributions
Distributions of net investment income and net realized gains, if any, are declared and paid at least annually. Dividends are reinvested in additional shares unless shareholders request payment in cash. Distributions are recorded on the ex-dividend date and are determined in accordance with income tax regulations which may differ from U.S. GAAP.
(e) Expenses
Certain expenses have been allocated to the individual Funds in the Trust on a pro rata basis upon the respective aggregate net assets of each Fund included in the Trust.
| 20 | THE GUGGENHEIM FUNDS SEMI-ANNUAL REPORT | |
| NOTES TO FINANCIAL STATEMENTS (Unaudited)(continued) |
(f) Earnings Credits
Under the fee arrangement with the custodian, the Fund may earn credits based on overnight custody cash balances. These credits are utilized to reduce related custodial expenses. The custodian fees disclosed in the Statement of Operations are before the reduction in expense from the related earnings credits, if any. For the period ended March 29, 2018, there were no earnings credits received.
(g) Cash
The Fund may leave cash overnight in its cash account with the custodian. Periodically, the Fund may have cash due to the custodian bank as an overdraft balance. A fee is incurred on this overdraft, calculated by multiplying the overdraft by a rate based on the federal funds rate, which was 1.68% at March 29, 2018.
(h) Indemnifications
Under the Fund’s organizational documents, its Trustees and Officers are indemnified against certain liabilities arising out of the performance of their duties to the Trust. In addition, throughout the normal course of business, the Fund enters into contracts that contain a variety of representations and warranties which provide general indemnifications. The Fund’s maximum exposure under these arrangements is unknown, as this would involve future claims that may be made against the Fund and/or its affiliates that have not yet occurred. However, based on experience, the Fund expects the risk of loss to be remote.
Note 2 – Fees and Other Transactions with Affiliates
Under the terms of an investment advisory contract, the Fund pays GI investment advisory fees calculated at an annualized rate of 0.75% of the average daily net assets of the Fund.
GI engages external service providers to perform other necessary services for the Trust, such as audit and accounting related services, legal services, custody, printing and mailing, etc., on a pass-through basis. Such expenses are allocated to various Funds within the complex based on relative net assets.
For the period ended March 29, 2018, GFD retained sales charges of $252,432 relating to sales of A-Class shares of the Trust.
Certain trustees and officers of the Trust are also officers of GI and/or GFD. The Trust does not compensate its officers or trustees who are officers, directors, and/or employees of GI and GFD.
MUFG Investor Services (US), LLC (“MUIS”) acts as the Trust’s administrator, transfer agent and accounting agent. As administrator, transfer agent and accounting agent, MUIS is responsible for maintaining the books and records of the Trust’s securities and cash. Bank of New York Mellon Corp. (“BNY”) acts as the Fund’s custodian. As custodian, BNY is responsible for the custody of the Fund’s assets. For providing the aforementioned administrative and accounting services,
| | THE GUGGENHEIM FUNDS SEMI-ANNUAL REPORT | 21 |
| NOTES TO FINANCIAL STATEMENTS (Unaudited)(continued) |
MUIS is entitled to receive a monthly fee equal to a percentage of the Fund’s average daily net assets and out of pocket expenses. For providing the aforementioned transfer agent and custodian services, MUIS and BNY are entitled to receive a monthly fee based on the number of transactions during the month and the number of accounts under management subject to certain minimum monthly fees and out of pocket expenses.
Note 3 – Federal Income Tax Information
The Fund intends to comply with the provisions of Subchapter M of the Internal Revenue Code applicable to regulated investment companies and will distribute substantially all taxable net investment income and capital gains sufficient to relieve the Fund from all, or substantially all, federal income, excise and state income taxes. Therefore, no provision for federal or state income tax is required.
Tax positions taken or expected to be taken in the course of preparing the Fund’s tax returns are evaluated to determine whether the tax positions are “more-likely-than-not” of being sustained by the applicable tax authority. Tax positions not deemed to meet the more-likely-than-not threshold would be recorded as a tax benefit or expense in the current year. Management has analyzed the Fund’s tax positions taken, or to be taken, on Federal income tax returns for all open tax years, and has concluded that no provision for income tax is required in the Fund’s financial statements. The Fund’s federal tax returns are subject to examination by the Internal Revenue Service for a period of three years after they are filed.
At March 29, 2018, the cost of securities for Federal income tax purposes, the aggregate gross unrealized gain for all securities for which there was an excess of value over tax cost, and the aggregate gross unrealized loss for all securities for which there was an excess of tax cost over value were as follows:
| | | Tax
Cost | | | Tax
Unrealized
Gain | | | Tax
Unrealized
Loss | | | Net
Unrealized
Gain | |
| Mid Cap Value Institutional Fund | | $ | 68,971,578 | | | $ | 11,267,396 | | | $ | (4,614,407 | ) | | $ | 6,652,989 | |
Note 4 – Fair Value Measurement
In accordance with U.S. GAAP, fair value is defined as the price that the Fund would receive to sell an investment or pay to transfer a liability in an orderly transaction with an independent buyer in the principal market, or in the absence of a principal market, the most advantageous market for the investment or liability. U.S. GAAP establishes a three-tier fair value hierarchy based on the types of inputs used to value assets and liabilities and requires corresponding disclosure. The hierarchy and the corresponding inputs are summarized below:
| Level 1 — | quoted prices in active markets for identical assets or liabilities. |
| 22 | THE GUGGENHEIM FUNDS SEMI-ANNUAL REPORT | |
| NOTES TO FINANCIAL STATEMENTS (Unaudited)(continued) |
| Level 2 — | significant other observable inputs (for example quoted prices for securities that are similar based on characteristics such as interest rates, prepayment speeds, credit risk, etc.). |
| Level 3 — | significant unobservable inputs based on the best information available under the circumstances, to the extent observable inputs are not available, which may include assumptions. |
The types of inputs available depend on a variety of factors, such as the type of security and the characteristics of the markets in which it trades, if any. Fair valuation determinations that rely on fewer or no observable inputs require greater judgment. Accordingly, fair value determinations for Level 3 securities require the greatest amount of judgment.
The inputs or methodologies used for valuing securities are not necessarily an indication of the risk associated with investing in those securities. The suitability of the techniques and sources employed to determine fair valuation are regularly monitored and subject to change.
Note 5 – Securities Transactions
For the period ended March 29, 2018, the cost of purchases and proceeds from sales of investment securities, excluding government securities, short-term investments and derivatives, were as follows:
| | | Purchases | | | Sales | |
| Mid Cap Value Institutional Fund | | $ | 19,973,884 | | | $ | 22,945,535 | |
Note 6 – Line of Credit
The Trust, with the exception of certain affiliated funds, secured a 364-day committed, $1,000,000,000 line of credit from Citibank, N.A., which was in place through October 6, 2017, at which time the line of credit was renewed, with an increased commitment amount to $1,065,000,000. A Fund may draw (borrow) from the line of credit as a temporary measure for emergency purposes, to facilitate redemption requests, or for other short-term liquidity purposes consistent with the Fund’s investment objective and program. For example, it may be advantageous for the Fund to borrow money rather than sell existing portfolio positions to meet redemption requests. Fees related to borrowings, if any, vary under this arrangement between the greater of Citibank’s “base rate”, LIBOR plus 1%, or the federal funds rate 1.68% at March 29, 2018 plus 1/2 of 1%.The Funds paid upfront costs of $982,952 to renew the line of credit.
The Fund did not have any borrowings under this agreement as of and for the period ended March 29, 2018.
| | THE GUGGENHEIM FUNDS SEMI-ANNUAL REPORT | 23 |
| NOTES TO FINANCIAL STATEMENTS (Unaudited)(concluded) |
Note 7 – Other Liabilities
The Fund wrote put option contracts through Lehman Brothers Inc., (“LBI”) that were exercised prior to the option contracts’ expiration and prior to the bankruptcy filing by LBI, during September 2008. However, these transactions have not settled and the securities have not been delivered to the Fund as of March 29, 2018.
Although the ultimate resolution of these transactions is uncertain, the Fund has recorded a liability on its books equal to the difference between the strike price on the put options and the market price of the underlying security on the exercise date. The amount of the liability recorded in miscellaneous payables by the Fund as of March 29, 2018 was $15,940.
| 24 | THE GUGGENHEIM FUNDS SEMI-ANNUAL REPORT | |
| OTHER INFORMATION (Unaudited) |
Proxy Voting Information
A description of the policies and procedures that the Trust uses to determine how to vote proxies relating to securities held in the Funds’ portfolios is available, without charge and upon request, by calling 800.820.0888. This information is also available from the EDGAR database on the SEC’s website at https://www.sec.gov.
Information regarding how the Funds voted proxies relating to portfolio securities during the most recent 12-month period ended June 30 is available without charge, upon request, by calling 800.820.0888. This information is also available from the EDGAR database on the SEC’s website at https://www.sec.gov.
Sector Classification
Information in the “Schedule of Investments” is categorized by sectors using sector-level Classifications defined by the Bloomberg Industry Classification System, a widely recognized industry classification system provider. Each Fund’s registration statement has investment policies relating to concentration in specific sectors/industries. For purposes of these investment policies, the Funds usually classify sectors/industries based on industry-level Classifications used by widely recognized industry classification system providers such as Bloomberg Industry Classification System, Global Industry Classification Standards and Barclays Global Classification Scheme.
Quarterly Portfolio Schedules Information
The Trust files its complete schedule of portfolio holdings with the SEC for the first and third quarters of each fiscal year on Form N-Q; which are available on the SEC’s website at https://www.sec.gov. The Funds’ Forms N-Q may be reviewed and copied at the SEC’s Public Reference Room in Washington, DC, and that information on the operation of the Public Reference Room may be obtained by calling 800-SEC-0330. Copies of the portfolio holdings are also available to shareholders, without charge and upon request, by calling 800.820.0888.
| | THE GUGGENHEIM FUNDS SEMI-ANNUAL REPORT | 25 |
| INFORMATION ON BOARD OF TRUSTEES AND OFFICERS (Unaudited) |
Name, Address*
and Year of Birth | Position(s)
Held with
the Trust | Term of Office
and Length of
Time Served** | Principal Occupation(s)
During Past Five Years | Number of
Portfolios
in Fund
Complex
Overseen | Other Directorships
Held by Trustees |
| INDEPENDENT TRUSTEES | | | |
Randall C. Barnes
(1951) | Trustee | Since 2014 | Current: Private Investor (2001-present). Former: Senior Vice President and Treasurer, PepsiCo, Inc. (1993-1997); President, Pizza Hut International (1991-1993); Senior Vice President, Strategic Planning and New Business Development, PepsiCo, Inc. (1987-1990). | 51 | Current: Trustee, Purpose Investments Funds (2014-Present). |
Donald A.
Chubb, Jr.
(1946 ) | Trustee and Chairman of the Valuation Oversight Committee | Since 1994 | Current: Retired. Former: Business broker and manager of commercial real estate, Griffith & Blair, Inc. (1997-2017). | 48 | Former: Midland Care, Inc. (2011-2016). |
Jerry B. Farley
(1946) | Trustee and Chairman of the Audit Committee | Since 2005 | Current: President, Washburn University (1997-present). | 48 | Current: Westar Energy, Inc. (2004-present); CoreFirst Bank & Trust (2000-present). |
Roman
Friedrich III
(1946) | Trustee and Chairman of the Contracts Review Committee | Since 2014 | Current: Founder and Managing Partner, Roman Friedrich & Company (1998-present). Former: Senior Managing Director, MLV & Co. LLC (2010-2011). | 48 | Current: Zincore Metals, Inc. (2009-present). Former: Axiom Gold and Silver Corp. (2011-2012). |
| 26 | THE GUGGENHEIM FUNDS SEMI-ANNUAL REPORT | |
| INFORMATION ON BOARD OF TRUSTEES AND OFFICERS (Unaudited)(continued) |
Name, Address*
and Year of Birth | Position(s)
Held with
the Trust | Term of Office
and Length of
Time Served** | Principal Occupation(s)
During Past Five Years | Number of
Portfolios
in Fund
Complex
Overseen | Other Directorships
Held by Trustees |
| INDEPENDENT TRUSTEES - continued | | |
Ronald A. Nyberg
(1953) | Trustee and Chairman of the Nominating and Governance Committee | Since 2014 | Current: Partner, Momkus McCluskey LLC (2016-present). Former: Partner, Nyberg & Cassioppi, LLC (2000-2016); Executive Vice President, General Counsel, and Corporate Secretary, Van Kampen Investments (1982-1999). | 51 | Current: PPM Fund Board (2018 – present); Edward-Elmhurst Healthcare System (2012-present); Western Asset Inflation-Linked Opportunities & Income Fund (2004-present); Western Asset Inflation-Linked Income Fund (2003-present). |
Maynard F. Oliverius
(1943)
| Trustee | Since 1998 | Current: Retired. Former: President and CEO, Stormont-Vail HealthCare (1996-2012). | 48 | Current: Robert J. Dole Institute of Politics (2016-present); Stormont-Vail Foundation (2013-present); University of Minnesota MHA Alumni Philanthropy Committee (2009-present); Fort Hays State University Foundation (1999-present). Former: Topeka Community Foundation (2009-2014). |
| | THE GUGGENHEIM FUNDS SEMI-ANNUAL REPORT | 27 |
| INFORMATION ON BOARD OF TRUSTEES AND OFFICERS (Unaudited)(continued) |
Name, Address*
and Year of Birth | Position(s)
Held with
the Trust | Term of Office
and Length of
Time Served** | Principal Occupation(s)
During Past Five Years | Number of
Portfolios
in Fund
Complex
Overseen | Other Directorships
Held by Trustees |
| INDEPENDENT TRUSTEES - concluded | | |
Ronald E.
Toupin, Jr.
(1958) | Trustee and Chairman of the Board | Since 2014 | Current: Portfolio Consultant (2010-present); Member, Governing Council (2003-present) and Executive Committee (2016-present), Independent Directors Council. Former: Vice President, Manager and Portfolio Manager, Nuveen Asset Management (1998-1999); Vice President, Nuveen Investment Advisory Corp. (1992-1999); Vice President and Manager, Nuveen Unit Investment Trusts (1991-1999); and Assistant Vice President and Portfolio Manager, Nuveen Unit Investment Trusts (1988-1999), each of John Nuveen & Co., Inc. (1982-1999). | 48 | Current: Western Asset Inflation-Linked Opportunities & Income Fund (2004-present); Western Asset Inflation-Linked Income Fund (2003-present). Former: Bennett Group of Funds (2011-2013). |
| 28 | THE GUGGENHEIM FUNDS SEMI-ANNUAL REPORT | |
| INFORMATION ON BOARD OF TRUSTEES AND OFFICERS (Unaudited)(continued) |
Name, Address*
and Year of Birth | Position(s)
Held with
the Trust | Term of Office
and Length of
Time Served** | Principal Occupation(s)
During Past Five Years | Number of
Portfolios
in Fund
Complex
Overseen | Other Directorships
Held by Trustees |
| INTERESTED TRUSTEES | | |
Amy J. Lee***
(1961) | Trustee, Vice President and Chief Legal Officer | Since February 2018
(Trustee)
Since 2014 (Chief Legal Officer)
Since 2007 (Vice President) | Current: Interested Trustee, certain other funds in the Fund Complex (February 2018-present); President, certain other funds in the Fund Complex (2017-present); Chief Legal Officer, certain other funds in the Fund Complex (2014-present); Vice President, certain other funds in the Fund Complex (2007-present); Senior Managing Director, Guggenheim Investments (2012-present). Former: President and Chief Exceutive Officer (2017-February 2018); Vice President, Associate General Counsel and Assistant Secretary, Security Benefit Life Insurance Company and Security Benefit Corporation (2004-2012). | 158 | None. |
| * | The business address of each Trustee is c/o Guggenheim Investments, 227 West Monroe Street, Chicago, Illinois 60606. |
| ** | Each Trustee serves an indefinite term, until his or her successor is elected and qualified. Time served includes time served in the respective position for the Predecessor Corporation. |
| *** | This Trustee is an “interested person” (as defined in section 2(a)(19) of the 1940 Act) (“Interested Trustee”) of the Trust because of her affiliation with Guggenheim Investments. |
| | THE GUGGENHEIM FUNDS SEMI-ANNUAL REPORT | 29 |
| INFORMATION ON BOARD OF TRUSTEES AND OFFICERS (Unaudited)(continued) |
Name, Address*
and Year of Birth | Position(s)
Held with
the Trust | Term of Office
and Length of
Time Served** | Principal Occupations
During Past Five Years |
| OFFICERS | | | |
Brian E. Binder
(1972) | President and Chief Executive Officer | Since 2018 | Current: President and Chief Executive Officer, certain other funds in the Fund Complex (February 2018-present); President and Chief Executive Officer, Guggenheim Funds Investment Advisors, LLC and Security Investors, LLC (January 2018-present); Senior Managing Director and Chief Administrative Officer, Guggenheim Investments (January 2018-present). Former: Managing Director and President, Deutsche Funds, and Head of US Product, Trading and Fund Administration, Deutsche Asset Management (2013-January 2018); Managing Director, Head of Business Management and Consulting, Invesco Ltd. (2010-2012). |
James M. Howley
(1972) | Assistant Treasurer | Since 2014 | Current: Managing Director, Guggenheim Investments (2004-present); Assistant Treasurer, certain other funds in the Fund Complex (2006-present). Former: Manager, Mutual Fund Administration of Van Kampen Investments, Inc. (1996-2004). |
Keith D. Kemp
(1960) | Assistant Treasurer | Since 2016 | Current: Treasurer and Assistant Treasurer, certain other funds in the Fund Complex (2010-present); Managing Director of Guggenheim Investments (2015-present); Chief Financial Officer, Guggenheim Specialized Products, LLC (2016-present). Former: Managing Director and Director, Transparent Value, LLC (2010-2016); Director, Guggenheim Partners Investment Management, LLC (2010-2015); Chief Operating Officer, Macquarie Capital Investment Management (2007-2009). |
Mark E. Mathiasen
(1978) | Secretary | Since 2014 | Current: Secretary, certain other funds in the Fund Complex (2007-present); Managing Director, Guggenheim Investments (2007-present). |
| 30 | THE GUGGENHEIM FUNDS SEMI-ANNUAL REPORT | |
| INFORMATION ON BOARD OF TRUSTEES AND OFFICERS (Unaudited)(continued) |
Name, Address*
and Year of Birth | Position(s)
Held with
the Trust | Term of Office
and Length of
Time Served** | Principal Occupations
During Past Five Years |
| OFFICERS - continued | |
Glenn McWhinnie
(1969) | Assistant Treasurer | Since 2016 | Current: Vice President, Guggenheim Investments (2009-present); Assistant Treasurer, certain other funds in the Fund Complex (2016 to present). |
Michael P. Megaris
(1984) | Assistant Secretary | Since 2014 | Current: Assistant Secretary, certain other funds in the Fund Complex (2014-present); Director, Guggenheim Investments (2012-present). |
Elisabeth Miller
(1968) | Chief Compliance Officer | Since 2012 | Current: CCO, certain other funds in the Fund Complex (2012-present); Managing Director, Guggenheim Investments (2012-present); Vice President, Guggenheim Funds Distributors, LLC (2014-present). Former: CCO, Security Investors, LLC (2012-2018); CCO, Guggenheim Funds Investment Advisors, LLC (2012-2018); CCO, Guggenheim Distributors, LLC (2009-2014); Senior Manager, Security Investors, LLC (2004-2009); Senior Manager, Guggenheim Distributors, LLC (2004-2009). |
Adam J. Nelson
(1979) | Assistant Treasurer | Since 2015 | Current: Vice President, Guggenheim Investments (2015-present); Assistant Treasurer, certain other funds in the Fund Complex (2015-present). Former: Assistant Vice President and Fund Administration Director, State Street Corporation (2013-2015); Fund Administration Assistant Director, State Street (2011-2013); Fund Administration Manager, State Street (2009-2011). |
Kimberly J. Scott
(1974) | Assistant Treasurer | Since 2014 | Current: Director, Guggenheim Investments (2012-present); Assistant Treasurer, certain other funds in the Fund Complex (2012-present). Former: Financial Reporting Manager, Invesco, Ltd. (2010-2011); Vice President/Assistant Treasurer, Mutual Fund Administration for Van Kampen Investments, Inc./Morgan Stanley Investment Management (2009-2010); Manager of Mutual Fund Administration, Van Kampen Investments, Inc./Morgan Stanley Investment Management (2005-2009). |
| | THE GUGGENHEIM FUNDS SEMI-ANNUAL REPORT | 31 |
| INFORMATION ON BOARD OF TRUSTEES AND OFFICERS (Unaudited)(concluded) |
Name, Address*
and Year of Birth | Position(s)
Held with
the Trust | Term of Office
and Length of
Time Served** | Principal Occupations
During Past Five Years |
| OFFICERS - concluded | |
Bryan Stone
(1979) | Vice President | Since 2014 | Current: Vice President, certain other funds in the Fund Complex (2014-present); Managing Director, Guggenheim Investments (2013-present). Former: Senior Vice President, Neuberger Berman Group LLC (2009-2013); Vice President, Morgan Stanley (2002-2009). |
John L. Sullivan
(1955) | Chief Financial Officer, Chief Accounting and Treasurer | Since 2014 | Current: CFO, Chief Accounting Officer and Treasurer, certain other funds in the Fund Complex (2010-present); Senior Managing Director, Guggenheim Investments (2010-present). Former: Managing Director and CCO, each of the funds in the Van Kampen Investments fund complex (2004-2010); Managing Director and Head of Fund Accounting and Administration, Morgan Stanley Investment Management (2002-2004); CFO and Treasurer, Van Kampen Funds (1996-2004). |
Jon Szafran
(1989) | Assistant Treasurer | Since 2017 | Current: Vice President, Guggenheim Investments (July 2017-present); Assistant Treasurer, certain other funds in the Fund Complex (2017-present). Former: Assistant Treasurer of Henderson Global Funds and Manager of US Fund Administration, Henderson Global Investors (North America) Inc. (“HGINA”), (2017); Senior Analyst of US Fund Administration, HGINA (2014-2017); Senior Associate of Fund Administration, Cortland Capital Market Services, LLC (2013-2014); Experienced Associate, PricewaterhouseCoopers LLP (2012-2013). |
| * | The business address of each officer is c/o Guggenheim Investments, 227 West Monroe Street, Chicago, Illinois 60606. |
| ** | Each officer serves an indefinite term, until his or her successor is duly elected and qualified. Time served includes time served in the respective position for the Predecessor Corporation. |
| 32 | THE GUGGENHEIM FUNDS SEMI-ANNUAL REPORT | |
| GUGGENHEIM INVESTMENTS PRIVACY NOTICE (Unaudited) |
Who We Are
This Privacy Notice describes the data protection practices of Guggenheim Investments. Guggenheim Investments as used herein refers to the affiliated investment management businesses of Guggenheim Partners, LLC: Guggenheim Funds Investment Advisors, LLC, Guggenheim Partners Investment Management, LLC, Guggenheim Funds Distributors, LLC, Security Investors, LLC, Guggenheim Investment Advisors (Europe) Limited, Guggenheim Real Estate, LLC, GS Gamma Advisors, LLC, Guggenheim Partners India Management, LLC, Guggenheim Partners Europe Limited, as well as the funds in the Guggenheim Funds complex (the “Funds”) (“Guggenheim Investments,” “we,” “us,” or “our”).
Guggenheim Partners Investment Management Holdings, LLC, located at 330 Madison Avenue, New York, New York 10017 is the data controller for your information. The Affiliates who are also controllers of certain of your information are: Guggenheim Investment Advisors (Europe) Limited, Guggenheim Partners Europe Limited, Guggenheim Partners, LLC, Guggenheim Funds Investment Advisors, LLC, Guggenheim Partners Investment Management, LLC, Guggenheim Funds Distributors, LLC and Security Investors, LLC, as well as the Funds.
Our Commitment to You
Guggenheim Investments considers your privacy our utmost concern. When you become our client or investor, you entrust us with not only your hard-earned money but also with your personal and financial information. Because we have access to your private information, we hold ourselves to the highest standards in its safekeeping and use. We strictly limit how we share your information with others, whether you are a current or former Guggenheim Investments client or investor.
The Information We Collect About You
We collect certain nonpublic personal information about you from information you provide on applications, other forms, our website, and/or from third parties including investment advisors. This information includes Social Security or other tax identification number, assets, income, tax information, retirement and estate plan information, transaction history, account balance, payment history, bank account information, marital status, family relationships, information that we collect on our website through the use of “cookies,” and other personal information that you or others provide to us. We may also collect such information through your inquiries by mail, e-mail or telephone. We may also collect customer due diligence information, as required by applicable law and regulation, through third party service providers.
How We Handle Your Personal Information
The legal basis for using your information as set out in this Privacy Notice is as follows: (a) use of your personal data is necessary to perform our obligations under any contract with you (such as a contract for us to provide financial services to you); or (b) where use of your personal data is not necessary for performance of a contract, use of your personal data is necessary for our
| | THE GUGGENHEIM FUNDS SEMI-ANNUAL REPORT | 33 |
| GUGGENHEIM INVESTMENTS PRIVACY NOTICE (Unaudited)(continued) |
legitimate interests or the legitimate interests of others (for example, to enforce the legal terms governing our services, operate and market our website and other services we offer, ensure safe environments for our personnel and others, make and receive payments, prevent fraud and to know the customer to whom we are providing the services). Some processing is done to comply with applicable law.
In addition to the specific uses described above, we also use your information in the following manner:
| | ● | We use your information in connection with servicing your accounts. |
| | ● | We use information to respond to your requests or questions. For example, we might use your information to respond to your customer feedback. |
| | ● | We use information to improve our products and services. We may use your information to make our website and products better. We may use your information to customize your experience with us. |
| | ● | We use information for security purposes. We may use your information to protect our company and our customers. |
| | ● | We use information to communicate with you. For example, we will communicate with you about your account or our relationship. We may contact you about your feedback. We might also contact you about this Privacy Notice. We may also enroll you in our email newsletter. |
| | ● | We use information as otherwise permitted by law, as we may notify you. |
| | ● | Aggregate/Anonymous Data. We may aggregate and/or anonymize any information collected through the website so that such information can no longer be linked to you or your device (“Aggregate/Anonymous Information”). We may use Aggregate/Anonymous Information for any purpose, including without limitation for research and marketing purposes, and may also share such data with any third parties, including advertisers, promotional partners, and sponsors. |
We do not sell information about current or former clients or their accounts to third parties. Nor do we share this information, except when necessary to complete transactions at your request, to make you aware of investment products and services that we or our affiliates offer, or as permitted or required by law.
We provide information about you to companies and individuals not affiliated with Guggenheim Investments to complete certain transactions or account changes, or to perform services for us related to your account. For example, if you ask to transfer assets from another financial institution to Guggenheim Investments, we must provide certain information about you to that company to complete the transaction. We provide the third party with only the information necessary to carry out its responsibilities and only for that purpose. And we require these third
| 34 | THE GUGGENHEIM FUNDS SEMI-ANNUAL REPORT | |
| GUGGENHEIM INVESTMENTS PRIVACY NOTICE (Unaudited)(continued) |
parties to treat your private information with the same high degree of confidentiality that we do. To alert you to other Guggenheim Investments products and services, we share your information within our family of affiliated companies. You may limit our sharing with affiliated companies as set out below. We may also share information with any successor to all or part of our business, or in connection with steps leading up to a merger or acquisition. For example, if part of our business was sold we may give customer information as part of that transaction. We may also share information about you with your consent.
We will release information about you if you direct us to do so, if we are compelled by law to do so, or in other circumstances as permitted by law (for example, to protect your account from fraud).
If you close your account(s) or become an inactive client or investor, we will continue to adhere to the privacy policies and practices described in this notice.
Opt-Out Provisions and Your Data Choices
The law allows you to “opt out” of certain kinds of information sharing with third parties. We do not share personal information about you with any third parties that triggers this opt-out right. This means YOU ARE ALREADY OPTED OUT.
When you are no longer our client or investor, we continue to share your information as described in this notice, and you may contact us at any time to limit our sharing by sending an email to CorporateDataPrivacy@GuggenheimPartners.com.
European Union Data Subjects and certain others: In addition to the choices set forth above, residents of the European Union and certain other jurisdictions have certain rights to (1) request access to or rectification or deletion of information we collect about them, (2) request a restriction on the processing of their information, (3) object to the processing of their information, or (4) request the portability of certain information. To exercise these or other rights, please contact us using the contact information below. We will consider all requests and provide our response within the time period stated by applicable law. Please note, however, that certain information may be exempt from such requests in some circumstances, which may include if we need to keep processing your information for our legitimate interests or to comply with a legal obligation. We may request you provide us with information necessary to confirm your identity before responding to your request.
Residents of France and certain other jurisdictions may also provide us with instructions regarding the manner in which we may continue to store, erase and share your information after your death, and where applicable, the person you have designated to exercise these rights after your death.
How We Protect Privacy Online
We take steps to protect your privacy when you use our web site – www.guggenheiminvestments.com – by using secure forms of online communication, including encryption technology, Secure Socket Layer (SSL) protocol, firewalls and user names and passwords. These safeguards vary
| | THE GUGGENHEIM FUNDS SEMI-ANNUAL REPORT | 35 |
| GUGGENHEIM INVESTMENTS PRIVACY NOTICE (Unaudited)(concluded) |
based on the sensitivity of the information that we collect and store. However, we cannot and do not guarantee that these measures will prevent every unauthorized attempt to access, use, or disclose your information since despite our efforts, no Internet and/or other electronic transmissions can be completely secure. Our web site uses “http cookies”—tiny pieces of information that we ask your browser to store. We use cookies for session management and security features on the Guggenheim Investments web site. We do not use them to pull data from your hard drive, to learn your e-mail address, or to view data in cookies created by other web sites. We will not share the information in our cookies or give others access to it. See the legal information area on our web site for more details about web site security and privacy features.
How We Safeguard Your Personal Information and Data Retention
We restrict access to nonpublic personal information about you to our employees and in some cases to third parties (for example, the service providers described above) as permitted by law. We maintain strict physical, electronic and procedural safeguards that comply with federal standards to guard your nonpublic personal information.
We keep your information for no longer than necessary for the purposes for which it is processed. The length of time for which we retain information depends on the purposes for which we collected and use it and/or as required to comply with applicable laws. Information may persist in copies made for backup and business continuity purposes for additional time.
International Visitors
If you are not a resident of the United States, please be aware that your information may be transferred to, stored and processed in the United States where our servers are located and our databases are operated. The data protection and other laws of the United States and other countries might not be as comprehensive as those in your country.
In such cases, we ensure that a legal basis for such a transfer exists and that adequate protection is provided as required by applicable law, for example, by using standard contractual clauses or by transferring your data to a jurisdiction that has obtained an adequacy finding. Individuals whose data may be transferred on the basis of standard contractual clauses may contact us as described below.
We’ll Keep You Informed
If you have any questions or concerns about how we treat your personal data, we encourage you to consult with us first. You may also contact the relevant supervisory authority.
We reserve the right to modify this policy at any time and will inform you promptly of material changes. You may access our privacy policy from our web site at www.guggenheiminvestments.com. Should you have any questions regarding our privacy policy, contact us by email at CorporateDataPrivacy@GuggenheimPartners.com.
| 36 | THE GUGGENHEIM FUNDS SEMI-ANNUAL REPORT | |
This page intentionally left blank.
This page intentionally left blank.
This page intentionally left blank.
This page intentionally left blank.
This page intentionally left blank.
3.29.2018
Guggenheim Funds Semi-Annual Report
| |
| Guggenheim Capital Stewardship Fund | | |
| GuggenheimInvestments.com | CSF-SEMI-0318x0918 |

| DEAR SHAREHOLDER | 2 |
| ECONOMIC AND MARKET OVERVIEW | 3 |
| ABOUT SHAREHOLDERS’ FUND EXPENSES | 4 |
| CAPITAL STEWARDSHIP FUND | 6 |
| NOTES TO FINANCIAL STATEMENTS | 13 |
| OTHER INFORMATION | 17 |
| INFORMATION ON BOARD OF TRUSTEES AND OFFICERS | 18 |
| GUGGENHEIM INVESTMENTS PRIVACY NOTICE | 22 |
| | THE GUGGENHEIM FUNDS SEMI-ANNUAL REPORT | 1 |
Dear Shareholder:
Guggenheim Partners Investment Management, LLC (“GPIM” or the “Investment Adviser”), is pleased to present the shareholder report for Guggenheim Capital Stewardship Fund (the “Fund”) for the semiannual fiscal period ended March 29, 2018.
Concinnity Advisors, LP, serves as the Fund’s sub-adviser (the “Sub-Adviser”).
The Investment Adviser is part of Guggenheim Investments, which represents the investment management businesses of Guggenheim Partners, LLC, (“Guggenheim”) a global, diversified financial services firm.
Guggenheim Funds Distributors, LLC is the distributor of the Fund. Guggenheim Funds Distributors, LLC is affiliated with Guggenheim and the Investment Adviser.
We encourage you to read the Economic and Market Overview section of the report, which follows this letter.
We are committed to providing innovative investment solutions and appreciate the trust you place in us.
Sincerely,
Guggenheim Partners Investment Management, LLC
April 30, 2018
Read a prospectus and summary prospectus (if available) carefully before investing. It contains the investment objectives, risks, charges, expenses and other information, which should be considered carefully before investing. Obtain a prospectus and summary prospectus (if available) at guggenheiminvestments.com or call 800.820.0888.
This material is not intended as a recommendation or as investment advice of any kind, including in connection with rollovers, transfers, and distributions. Such material is not provided in a fiduciary capacity, may not be relied upon for or in connection with the making of investment decisions, and does not constitute a solicitation of an offer to buy or sell securities. All content has been provided for informational or educational purposes only and is not intended to be and should not be construed as legal or tax advice and/or a legal opinion. Always consult a financial, tax and/or legal professional regarding your specific situation.
There can be no assurance that any investment product will achieve its investment objective(s). There are risks associated with investing, including the entire loss of principal invested. Investing involves market risks. The investment return and principal value of any investment product will fluctuate with changes in market conditions. Please read the prospectus for more detailed information regarding these and other risks.
| 2 | THE GUGGENHEIM FUNDS SEMI-ANNUAL REPORT | |
| ECONOMIC AND MARKET OVERVIEW (Unaudited) | March 29, 2018 |
As we enter the ninth year of the current expansion, one of the most important new developments to evaluate is the impact of the corporate tax cuts passed into law at the end of 2017. Guggenheim’s concern is that the substantial late-cycle fiscal easing in the pipeline will prompt more restrictive monetary policy, which increases the risk that the economy will experience a boom-bust cycle that ends in a recession.
With the unemployment rate at 4.1% and core inflation rising, fiscal policy should be leaning against the economy to prevent overheating, not providing further stimulus. Faster wage growth, rising core inflation, and an unsustainably low unemployment rate underpin our longstanding view that the U.S. Federal Reserve (the “Fed”) will raise interest rates four times in 2018. Fed funds futures show the market is now pricing in nearly three rate hikes for 2018, up from two at the beginning of the year, which contributed to a pickup in first-quarter market volatility. Tighter fiscal and monetary policy, along with rising policy uncertainty ahead of the 2018 mid-terms and 2020 presidential election, could prove to be too much for an overextended economy to bear.
Further complicating the story is the risk of a global trade war sparked by protectionist actions taken by the Trump administration. We now have new steel and aluminum tariffs in place that are likely to have some modest inflationary impact while hurting almost 20% of U.S. corporates, according to our estimates. We expect more protectionist trade and investment policies in place by year end.
Over the six months ended March 29, 2018, the bear flattening (the condition in which short-term rates rise faster than long-term rates) of the U.S. Treasury curve continued with Treasury yields higher across the curve. Yields increased the most in the belly and front end of the curve. The 2-year Treasury ended the period at 2.27%, while the 10-year finished the period at 2.74%.
For the six months ended March 29, 2018, the Standard & Poor’s 500® (“S&P 500”) Index* returned 5.84%. The MSCI Europe-Australasia-Far East (“EAFE”) Index* returned 2.80%. The return of the MSCI Emerging Markets Index* was 9.08%.
In the bond market, the Bloomberg Barclays U.S. Aggregate Bond Index* posted a -1.08% return for the period, while the Bloomberg Barclays U.S. Corporate High Yield Index* returned -0.39%. The return of the ICE Bank of America (“BofA”) Merrill Lynch 3-Month U.S. Treasury Bill Index* was 0.64% for the six-month period.
The opinions and forecasts expressed may not actually come to pass. This information is subject to change at any time, based on market and other conditions, and should not be construed as a recommendation of any specific security or strategy.
*Index Definitions:
The following indices are referenced throughout this report. Indices are unmanaged and not available for direct investment. Index performance does not reflect transaction costs, fees, or expenses.
Bloomberg Barclays U.S. Aggregate Bond Index is a broad-based flagship benchmark that measures the investment grade, U.S. dollar-denominated, fixed-rate taxable bond market, including U.S. Treasuries, government-related and corporate securities, mortgage-backed securities or “MBS” (agency fixed-rate and hybrid adjustable-rate mortgage, or “ARM”, pass-throughs), asset-backed securities (“ABS”), and commercial mortgage-backed securities (“CMBS”) (agency and non-agency).
Bloomberg Barclays U.S. Corporate High Yield Index measures the U.S. dollar-denominated, high yield, fixed-rate corporate bond market. Securities are classified as high yield if the middle rating of Moody’s, Fitch, and S&P is Ba1/BB +/BB + or below.
ICE BofA Merrill Lynch 3-Month U.S. Treasury Bill Index is an unmanaged market index of U.S. Treasury securities maturing in 90 days that assumes reinvestment of all income.
MSCI EAFE Index is a free float-adjusted market capitalization index that is designed to measure the equity market performance of developed markets, excluding the U.S. & Canada.
MSCI Emerging Markets Index is a free float-adjusted market capitalization weighted index that is designed to measure equity market performance in the global emerging markets.
S&P 500® Index is a broad-based index, the performance of which is based on the performance of 500 widely held common stocks chosen for market size, liquidity, and industry group representation.
| | THE GUGGENHEIM FUNDS SEMI-ANNUAL REPORT | 3 |
| ABOUT SHAREHOLDERS’ FUND EXPENSES (Unaudited) | |
All mutual funds have operating expenses, and it is important for our shareholders to understand the impact of costs on their investments. Shareholders of a fund incur two types of costs: (i) transaction costs, including sales charges (loads) on purchase payments, reinvested dividends, other distributions, and exchange fees, and (ii) ongoing costs, including management fees, administrative services, and shareholder reports, among others. These ongoing costs, or operating expenses, are deducted from a fund’s gross income and reduce the investment return of the fund.
A fund’s expenses are expressed as a percentage of its average net assets, which is known as the expense ratio. The following examples are intended to help investors understand the ongoing costs (in dollars) of investing in a fund and to compare these costs with the ongoing costs of investing in other mutual funds.
The examples are based on an investment of $1,000 made at the beginning of the period and held for the entire six-month period beginning September 30, 2017 and ending March 29, 2018 for actual Fund returns. Hypothetical Fund returns are for the period beginning September 30, 2017 and ending March 31, 2018.
The following tables illustrate the Fund’s costs in two ways:
Table 1. Based on actual Fund return: This section helps investors estimate the actual expenses paid over the period. The “Ending Account Value” shown is derived from the Fund’s actual return, and the fifth column shows the dollar amount that would have been paid by an investor who started with $1,000 in the Fund. Investors may use the information here, together with the amount invested, to estimate the expenses paid over the period. Simply divide the Fund’s account value by $1,000 (for example, an $8,600 account value divided by $1,000 = 8.6), then multiply the result by the number provided under the heading “Expenses Paid During Period.”
Table 2. Based on hypothetical 5% return: This section is intended to help investors compare a Fund’s cost with those of other mutual funds. The table provides information about hypothetical account values and hypothetical expenses based on the Fund’s actual expense ratio and an assumed rate of return of 5% per year before expenses, which is not the Fund’s actual return. The hypothetical account values and expenses may not be used to estimate the actual ending account balance or expenses paid during the period. The example is useful in making comparisons because the U.S. Securities and Exchange Commission (the “SEC”) requires all mutual funds to calculate expenses based on the 5% return. Investors can assess a Fund’s costs by comparing this hypothetical example with the hypothetical examples that appear in shareholder reports of other funds.
The calculations illustrated above assume no shares were bought or sold during the period. Actual costs may have been higher or lower, depending on the amount of investment and the timing of any purchases or redemptions.
Please note that the expenses shown in the table are meant to highlight your ongoing costs only and do not reflect any transactional costs, such as sales charges (loads) on purchase payments, and contingent deferred sales charges (“CDSC”) on redemptions, if any. Therefore, the second table is useful in comparing ongoing costs only, and will not help you determine the relative total costs of owning different funds. In addition, if these transactional costs were included, your costs would have been higher.
More information about the Fund’s expenses, including annual expense ratios for periods up to five years (subject to the Fund’s inception date), can be found in the Financial Highlights section of this report. For additional information on operating expenses and other shareholder costs, please refer to the Fund’s prospectus.
| 4 | THE GUGGENHEIM FUNDS SEMI-ANNUAL REPORT | |
| ABOUT SHAREHOLDERS’ FUND EXPENSES (Unaudited)(concluded) | |
| | Expense
Ratio1 | Fund
Return | Beginning
Account Value
September
30, 2017 | Ending
Account Value
March 29, 2018 | Expenses
Paid During
Period2 |
| Table 1. Based on actual Fund return3 | | | | |
| Capital Stewardship Fund | | | | | |
| Institutional Class | 1.05% | 6.99% | $ 1,000.00 | $ 1,069.90 | $ 5.36 |
| | | | | |
| | Expense
Ratio1 | Fund
Return | Beginning
Account Value
September
30, 2017 | Ending
Account Value
March 31, 2018 | Expenses
Paid During
Period4 |
| Table 2. Based on hypothetical 5% return (before expenses)5 | | | |
| Capital Stewardship Fund | | | | | |
| Institutional Class | 1.05% | 5.00% | $ 1,000.00 | $ 1,019.70 | $ 5.29 |
| 1 | Annualized and excludes expenses of the underlying funds in which the Funds invest, if any. |
| 2 | Expenses in table 1 are equal to the Fund's annualized expense ratio, net of any applicable fee waivers, multiplied by the average account value over the period, multiplied by 180/365 (to reflect the one-half year period). |
| 3 | Actual cumulative return at net asset value for the period September 30, 2017 to March 29, 2018. |
| 4 | Expenses in table 2 are equal to the Fund’s annualized expense ratio, net of any applicable fee waivers, multiplied by the average account value over the period, multiplied by 182/365 (to reflect the one-half year period). |
| 5 | Hypothetical return for the period September 30, 2017 to March 31, 2018. |
| | THE GUGGENHEIM FUNDS SEMI-ANNUAL REPORT | 5 |
| PERFORMANCE REPORT AND FUND PROFILE (Unaudited) | March 29, 2018 |
CAPITAL STEWARDSHIP FUND
OBJECTIVE: Seeks long-term capital appreciation.
Holdings Diversification (Market Exposure as % of Net Assets)
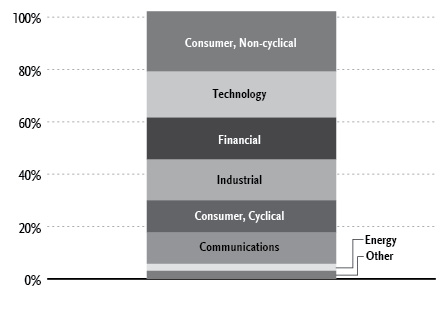
“Holdings Diversification (Market Exposure as % of Net Assets)” excludes any temporary cash investments.
Inception Date: September 26, 2014
| Ten Largest Holdings (% of Total Net Assets) |
| Johnson & Johnson | 2.9% |
| Cisco Systems, Inc. | 2.5% |
| Microsoft Corp. | 2.3% |
| Apple, Inc. | 2.2% |
| JPMorgan Chase & Co. | 2.1% |
| Alphabet, Inc. — Class A | 1.7% |
| Chevron Corp. | 1.6% |
| AbbVie, Inc. | 1.6% |
| SPDR S&P 500 ETF Trust | 1.6% |
| Mastercard, Inc. — Class A | 1.5% |
| Top Ten Total | 20.0% |
“Ten Largest Holdings” excludes any temporary cash investments.
Average Annual Returns*
Periods Ended March 29, 2018
| | 6 month† | 1 Year | Since Inception (09/26/14) |
| Guggenheim Capital Stewardship Fund | 6.99% | 13.71% | 8.89% |
| S&P 500 Index | 5.84% | 13.99% | 10.79% |
| * | The performance data above represents past performance that is not predictive of future results. The investment return and principal value of an investment in the Fund will fluctuate so that an investor’s shares, when redeemed, may be worth more or less than their original cost. Returns are historical and include changes in principal and reinvested dividends and capital gains and do not reflect the effect of taxes. The S&P 500 Index is an unmanaged index and, unlike the Fund, has no management fees or operating expenses to reduce its reported return. |
| † | 6 month returns are not annualized. |
| 6 | THE GUGGENHEIM FUNDS SEMI-ANNUAL REPORT | |
| SCHEDULE OF INVESTMENTS (Unaudited) | March 29, 2018 |
| CAPITAL STEWARDSHIP FUND | |
| | | Shares | | | Value | |
| | | | | | | |
| COMMON STOCKS† - 100.6% | | | | | | |
| | | | | | | |
| Consumer, Non-cyclical - 23.0% | | | | | | |
| Johnson & Johnson | | | 47,496 | | | $ | 6,086,612 | |
| AbbVie, Inc. | | | 35,782 | | | | 3,386,766 | |
| Procter & Gamble Co. | | | 36,325 | | | | 2,879,846 | |
| Pfizer, Inc. | | | 73,802 | | | | 2,619,233 | |
| Cigna Corp. | | | 14,734 | | | | 2,471,481 | |
| PepsiCo, Inc. | | | 21,726 | | | | 2,371,393 | |
| Sysco Corp. | | | 38,099 | | | | 2,284,416 | |
| Ingredion, Inc. | | | 17,196 | | | | 2,216,908 | |
| Amgen, Inc. | | | 12,706 | | | | 2,166,119 | |
| Humana, Inc. | | | 6,674 | | | | 1,794,172 | |
| Kimberly-Clark Corp. | | | 16,109 | | | | 1,774,084 | |
| Anthem, Inc. | | | 7,706 | | | | 1,693,008 | |
| Kellogg Co. | | | 25,300 | | | | 1,644,753 | |
| Molson Coors Brewing Co. — Class B | | | 21,714 | | | | 1,635,716 | |
| Allergan plc | | | 9,608 | | | | 1,616,930 | |
| Eli Lilly & Co. | | | 20,713 | | | | 1,602,565 | |
| General Mills, Inc. | | | 34,747 | | | | 1,565,700 | |
| Celgene Corp.* | | | 15,161 | | | | 1,352,513 | |
| Merck & Company, Inc. | | | 17,316 | | | | 943,203 | |
| Cardinal Health, Inc. | | | 14,960 | | | | 937,693 | |
| United Rentals, Inc.* | | | 4,307 | | | | 743,948 | |
| ManpowerGroup, Inc. | | | 6,228 | | | | 716,843 | |
| Estee Lauder Companies, Inc. — Class A | | | 4,563 | | | | 683,173 | |
| Abbott Laboratories | | | 10,410 | | | | 623,767 | |
| Biogen, Inc.* | | | 2,139 | | | | 585,701 | |
| CVS Health Corp. | | | 8,824 | | | | 548,941 | |
| Constellation Brands, Inc. — Class A | | | 2,121 | | | | 483,418 | |
| Robert Half International, Inc. | | | 6,887 | | | | 398,688 | |
| Becton Dickinson and Co. | | | 1,541 | | | | 333,935 | |
| ABIOMED, Inc.* | | | 956 | | | | 278,186 | |
| UnitedHealth Group, Inc. | | | 986 | | | | 211,004 | |
| Total Consumer, Non-cyclical | | | | | | | 48,650,715 | |
| | | | | | | | | |
| Technology - 17.6% | | | | | | | | |
| Microsoft Corp. | | | 52,509 | | | | 4,792,496 | |
| Apple, Inc. | | | 27,759 | | | | 4,657,405 | |
| Intel Corp. | | | 52,864 | | | | 2,753,157 | |
| NVIDIA Corp. | | | 10,616 | | | | 2,458,560 | |
| Lam Research Corp. | | | 11,208 | | | | 2,277,017 | |
| Texas Instruments, Inc. | | | 19,124 | | | | 1,986,792 | |
| NetApp, Inc. | | | 28,171 | | | | 1,737,869 | |
| HP, Inc. | | | 75,013 | | | | 1,644,285 | |
| DXC Technology Co. | | | 15,375 | | | | 1,545,649 | |
| CA, Inc. | | | 43,297 | | | | 1,467,768 | |
| Citrix Systems, Inc.* | | | 14,967 | | | | 1,388,938 | |
| Accenture plc — Class A | | | 8,258 | | | | 1,267,603 | |
| IPG Photonics Corp.* | | | 5,076 | | | | 1,184,637 | |
| Adobe Systems, Inc.* | | | 5,378 | | | | 1,162,078 | |
| Xilinx, Inc. | | | 14,385 | | | | 1,039,172 | |
| Applied Materials, Inc. | | | 16,765 | | | | 932,302 | |
| QUALCOMM, Inc. | | | 15,682 | | | | 868,940 | |
| Cognizant Technology Solutions Corp. — Class A | | | 10,715 | | | | 862,557 | |
| Oracle Corp. | | | 18,685 | | | | 854,839 | |
| VMware, Inc. — Class A* | | | 5,149 | | | | 624,419 | |
| Teradata Corp.* | | | 15,712 | | | | 623,295 | |
| Red Hat, Inc.* | | | 2,903 | | | | 434,028 | |
| KLA-Tencor Corp. | | | 3,686 | | | | 401,811 | |
| Intuit, Inc. | | | 1,252 | | | | 217,034 | |
| Total Technology | | | | | | | 37,182,651 | |
| | | | | | | | | |
| Financial - 16.0% | | | | | | | | |
| JPMorgan Chase & Co. | | | 41,035 | | | | 4,512,619 | |
| Mastercard, Inc. — Class A | | | 17,843 | | | | 3,125,380 | |
| Citigroup, Inc. | | | 43,936 | | | | 2,965,680 | |
| Prudential Financial, Inc. | | | 26,187 | | | | 2,711,664 | |
| Visa, Inc. — Class A | | | 17,019 | | | | 2,035,813 | |
| Principal Financial Group, Inc. | | | 28,050 | | | | 1,708,526 | |
| MetLife, Inc. | | | 30,141 | | | | 1,383,171 | |
| PNC Financial Services Group, Inc. | | | 8,864 | | | | 1,340,591 | |
| Capital One Financial Corp. | | | 12,700 | | | | 1,216,914 | |
| BlackRock, Inc. — Class A | | | 2,230 | | | | 1,208,036 | |
| SEI Investments Co. | | | 14,746 | | | | 1,104,623 | |
| Progressive Corp. | | | 18,079 | | | | 1,101,553 | |
| T. Rowe Price Group, Inc. | | | 10,147 | | | | 1,095,571 | |
| American Express Co. | | | 10,686 | | | | 996,790 | |
| Discover Financial Services | | | 12,475 | | | | 897,327 | |
| Aflac, Inc. | | | 19,532 | | | | 854,720 | |
| Alliance Data Systems Corp. | | | 3,922 | | | | 834,837 | |
| Comerica, Inc. | | | 8,330 | | | | 799,097 | |
| State Street Corp. | | | 6,271 | | | | 625,407 | |
| Bank of America Corp. | | | 18,065 | | | | 541,769 | |
| Lincoln National Corp. | | | 7,370 | | | | 538,452 | |
| Morgan Stanley | | | 9,249 | | | | 499,076 | |
| Travelers Companies, Inc. | | | 2,820 | | | | 391,585 | |
| Allstate Corp. | | | 3,569 | | | | 338,341 | |
| U.S. Bancorp | | | 6,121 | | | | 309,111 | |
| Hospitality Properties Trust REIT | | | 11,516 | | | | 291,815 | |
| KeyCorp | | | 10,091 | | | | 197,279 | |
| WP Carey, Inc. REIT | | | 2,908 | | | | 180,267 | |
| Total Financial | | | | | | | 33,806,014 | |
| | | | | | | | | |
| Industrial - 15.6% | | | | | | | | |
| FedEx Corp. | | | 12,507 | | | | 3,003,056 | |
| Cummins, Inc. | | | 16,964 | | | | 2,749,695 | |
| Lockheed Martin Corp. | | | 7,024 | | | | 2,373,620 | |
| Caterpillar, Inc. | | | 14,125 | | | | 2,081,742 | |
| 3M Co. | | | 9,228 | | | | 2,025,730 | |
| Boeing Co. | | | 5,862 | | | | 1,922,033 | |
| Johnson Controls International plc | | | 49,500 | | | | 1,744,380 | |
| Ingersoll-Rand plc | | | 20,155 | | | | 1,723,454 | |
| Fluor Corp. | | | 25,789 | | | | 1,475,647 | |
| Arconic, Inc. | | | 63,139 | | | | 1,454,722 | |
| Vishay Intertechnology, Inc. | | | 76,587 | | | | 1,424,518 | |
| Deere & Co. | | | 8,589 | | | | 1,334,043 | |
| Norfolk Southern Corp. | | | 9,112 | | | | 1,237,227 | |
| Union Pacific Corp. | | | 8,906 | | | | 1,197,234 | |
| Landstar System, Inc. | | | 9,430 | | | | 1,033,999 | |
| Raytheon Co. | | | 4,588 | | | | 990,182 | |
| United Parcel Service, Inc. — Class B | | | 8,880 | | | | 929,381 | |
| Rockwell Automation, Inc. | | | 5,259 | | | | 916,118 | |
| SEE NOTES TO FINANCIAL STATEMENTS. | THE GUGGENHEIM FUNDS SEMI-ANNUAL REPORT | 7 |
| SCHEDULE OF INVESTMENTS (Unaudited)(continued) | March 29, 2018 |
| CAPITAL STEWARDSHIP FUND | |
| | | Shares | | | Value | |
| | | | | | | |
| Oshkosh Corp. | | | 10,651 | | | $ | 823,003 | |
| Energizer Holdings, Inc. | | | 13,589 | | | | 809,633 | |
| Corning, Inc. | | | 25,820 | | | | 719,862 | |
| Northrop Grumman Corp. | | | 1,273 | | | | 444,430 | |
| Eaton Corporation plc | | | 4,102 | | | | 327,791 | |
| Universal Display Corp. | | | 3,176 | | | | 320,776 | |
| Total Industrial | | | | | | | 33,062,276 | |
| | | | | | | | | |
| Consumer, Cyclical - 12.3% | | | | | | | | |
| Home Depot, Inc. | | | 12,852 | | | | 2,290,740 | |
| Ford Motor Co. | | | 181,753 | | | | 2,013,823 | |
| Delta Air Lines, Inc. | | | 31,772 | | | | 1,741,423 | |
| WW Grainger, Inc. | | | 5,971 | | | | 1,685,434 | |
| Southwest Airlines Co. | | | 28,964 | | | | 1,659,058 | |
| Tupperware Brands Corp. | | | 28,009 | | | | 1,355,076 | |
| Pool Corp. | | | 8,428 | | | | 1,232,342 | |
| Lear Corp. | | | 6,444 | | | | 1,199,164 | |
| Las Vegas Sands Corp. | | | 16,526 | | | | 1,188,219 | |
| Alaska Air Group, Inc. | | | 19,133 | | | | 1,185,481 | |
| Best Buy Company, Inc. | | | 16,324 | | | | 1,142,517 | |
| Kohl’s Corp. | | | 15,556 | | | | 1,019,074 | |
| L Brands, Inc. | | | 25,465 | | | | 973,018 | |
| Tractor Supply Co. | | | 14,676 | | | | 924,882 | |
| Lowe’s Companies, Inc. | | | 10,442 | | | | 916,285 | |
| Darden Restaurants, Inc. | | | 10,707 | | | | 912,772 | |
| Nike, Inc. — Class B | | | 11,734 | | | | 779,607 | |
| Tapestry, Inc. | | | 13,368 | | | | 703,290 | |
| Ulta Beauty, Inc.* | | | 3,297 | | | | 673,478 | |
| Nordstrom, Inc. | | | 13,585 | | | | 657,650 | |
| Whirlpool Corp. | | | 3,164 | | | | 484,440 | |
| Casey’s General Stores, Inc. | | | 2,846 | | | | 312,405 | |
| Starbucks Corp. | | | 4,578 | | | | 265,020 | |
| Costco Wholesale Corp. | | | 1,341 | | | | 252,685 | |
| Aptiv plc | | | 2,863 | | | | 243,269 | |
| VF Corp. | | | 2,857 | | | | 211,761 | |
| Total Consumer, Cyclical | | | | | | | 26,022,913 | |
| | | | | | | | | |
| Communications - 12.0% | | | | | | | | |
| Cisco Systems, Inc. | | | 123,650 | | | | 5,303,348 | |
| Alphabet, Inc. — Class A* | | | 3,533 | | | | 3,664,216 | |
| Facebook, Inc. — Class A* | | | 17,396 | | | | 2,779,707 | |
| Amazon.com, Inc.* | | | 1,774 | | | | 2,567,581 | |
| AT&T, Inc. | | | 47,971 | | | | 1,710,166 | |
| Omnicom Group, Inc. | | | 22,703 | | | | 1,649,827 | |
| Juniper Networks, Inc. | | | 65,629 | | | | 1,596,754 | |
| Comcast Corp. — Class A | | | 36,712 | | | | 1,254,449 | |
| eBay, Inc.* | | | 29,810 | | | | 1,199,554 | |
| FactSet Research Systems, Inc. | | | 5,578 | | | | 1,112,365 | |
| Verizon Communications, Inc. | | | 19,977 | | | | 955,300 | |
| Walt Disney Co. | | | 8,516 | | | | 855,347 | |
| Interpublic Group of Companies, Inc. | | | 15,642 | | | | 360,235 | |
| Netflix, Inc.* | | | 1,145 | | | | 338,176 | |
| Total Communications | | | | | | | 25,347,025 | |
| | | | | | | | | |
| Energy - 2.7% | | | | | | | | |
| Chevron Corp. | | | 29,812 | | | | 3,399,761 | |
| Occidental Petroleum Corp. | | | 22,275 | | | | 1,446,984 | |
| ONEOK, Inc. | | | 7,835 | | | | 445,968 | |
| ConocoPhillips | | | 6,048 | | | | 358,586 | |
| Total Energy | | | | | | | 5,651,299 | |
| | | | | | | | | |
| Basic Materials - 1.2% | | | | | | | | |
| Eastman Chemical Co. | | | 9,922 | | | | 1,047,565 | |
| Praxair, Inc. | | | 6,705 | | | | 967,531 | |
| Air Products & Chemicals, Inc. | | | 3,864 | | | | 614,492 | |
| Total Basic Materials | | | | | | | 2,629,588 | |
| | | | | | | | | |
| Utilities - 0.2% | | | | | | | | |
| PG&E Corp. | | | 10,706 | | | | 470,315 | |
| | | | | | | | | |
| Total Common Stocks | | | | | | | | |
| (Cost $202,874,572) | | | | | | | 212,822,796 | |
| | | | | | | | | |
| EXCHANGE-TRADED FUNDS† - 1.5% | | | | | | | | |
| SPDR S&P 500 ETF Trust | | | 12,606 | | | | 3,317,269 | |
| Total Exchange-Traded Funds | | | | | | | | |
| (Cost $3,376,557) | | | | | | | 3,317,269 | |
| | | | | | | | | |
| MONEY MARKET FUND† - 0.8% | | | | | | | | |
| Dreyfus Treasury Securities Cash Management Institutional Shares 1.46%1 | | | 1,608,484 | | | | 1,608,484 | |
| Total Money Market Fund | | | | | | | | |
| (Cost $1,608,484) | | | | | | | 1,608,484 | |
| | | | | | | | | |
| Total Investments - 102.9% | | | | | | | | |
| (Cost $207,859,613) | | | | | | $ | 217,748,549 | |
| Other Assets & Liabilities, net - (2.9)% | | | | | | | (6,208,530 | ) |
| Total Net Assets - 100.0% | | | | | | $ | 211,540,019 | |
| * | Non-income producing security. |
| † | Value determined based on Level 1 inputs — See Note 4. |
| 1 | Rate indicated is the 7 day yield as of March 29, 2018. |
| | plc — Public Limited Company |
| | REIT— Real Estate Investment Trust |
| | |
| | See Sector Classification in Other Information section. |
| 8 | THE GUGGENHEIM FUNDS SEMI-ANNUAL REPORT | SEE NOTES TO FINANCIAL STATEMENTS. |
| SCHEDULE OF INVESTMENTS (Unaudited)(concluded) | March 29, 2018 |
| CAPITAL STEWARDSHIP FUND | |
The following table summarizes the inputs used to value the Fund’s investments at March 29, 2018 (See Note 4 in the Notes to Financial Statements):
| Investments in Securities (Assets) | | Level 1
Quoted
Prices | | | Level 2
Significant
Observable
Inputs | | | Level 3
Significant
Unobservable
Inputs | | | Total | |
| Common Stocks | | $ | 212,822,796 | | | $ | — | | | $ | — | | | $ | 212,822,796 | |
| Exchange-Traded Funds | | | 3,317,269 | | | | — | | | | — | | | | 3,317,269 | |
| Money Market Fund | | | 1,608,484 | | | | — | | | | — | | | | 1,608,484 | |
| Total Assets | | $ | 217,748,549 | | | $ | — | | | $ | — | | | $ | 217,748,549 | |
Transfers between investment levels may occur as the markets fluctuate and/or the availability of data used in an investment’s valuation changes. Transfers between valuation levels, if any, are in comparison to the valuation levels at the end of the previous fiscal year, and are effective using the fair value as of the end of the current fiscal period.
For the period ended March 29, 2018, there were no transfers between levels.
| SEE NOTES TO FINANCIAL STATEMENTS. | THE GUGGENHEIM FUNDS SEMI-ANNUAL REPORT | 9 |
| STATEMENT OF ASSETS AND LIABILITIES (Unaudited) |
| March 29, 2018 |
| Assets: |
| Investments, at value (cost $207,859,613) | | $ | 217,748,549 | |
| Cash | | | 43,620 | |
| Prepaid expenses | | | 12,450 | |
| Receivables: |
| Dividends | | | 187,010 | |
| Interest | | | 1,441 | |
| Total assets | | | 217,993,070 | |
| | | | | |
| Liabilities: |
| Payable for: |
| Fund shares redeemed | | | 6,246,512 | |
| Management fees | | | 170,152 | |
| Fund accounting/administration fees | | | 15,125 | |
| Transfer agent/maintenance fees | | | 3,141 | |
| Trustees’ fees* | | | 325 | |
| Miscellaneous | | | 17,796 | |
| Total liabilities | | | 6,453,051 | |
| Net assets | | $ | 211,540,019 | |
| | | | | |
| Net assets consist of: |
| Paid in capital | | $ | 183,695,269 | |
| Undistributed net investment income | | | 577,717 | |
| Accumulated net realized gain on investments | | | 17,378,097 | |
| Net unrealized appreciation on investments | | | 9,888,936 | |
| Net assets | | $ | 211,540,019 | |
| Capital shares outstanding | | | 7,376,071 | |
| Net asset value per share | | $ | 28.68 | |
| STATEMENT OF OPERATIONS (Unaudited) |
| Period Ended March 29, 2018 |
| Investment Income: |
| Dividends | | $ | 2,267,473 | |
| Interest | | | 5,975 | |
| Total investment income | | | 2,273,448 | |
| | | | | |
| Expenses: |
| Management fees | | | 1,013,917 | |
| Transfer agent/maintenance fees | | | 12,589 | |
| Fund accounting/administration fees | | | 90,127 | |
| Custodian fees | | | 9,566 | |
| Trustees’ fees* | | | 4,804 | |
| Miscellaneous | | | 48,085 | |
| Total expenses | | | 1,179,088 | |
| Net investment income | | | 1,094,360 | |
| | | | | |
| Net Realized and Unrealized Gain (Loss): |
| Net realized gain (loss) on: |
| Investments | | | 20,774,262 | |
| Net realized gain | | | 20,774,262 | |
| Net change in unrealized appreciation (depreciation) on: |
| Investments | | | (6,615,018 | ) |
| Net change in unrealized appreciation (depreciation) | | | (6,615,018 | ) |
| Net realized and unrealized gain | | | 14,159,244 | |
| Net increase in net assets resulting from operations | | $ | 15,253,604 | |
| * | Relates to Trustees not deemed “interested persons” within the meaning of Section 2(a)(19) of the 1940 Act. |
| 10 | THE GUGGENHEIM FUNDS SEMI-ANNUAL REPORT | SEE NOTES TO FINANCIAL STATEMENTS. |
| STATEMENTS OF CHANGES IN NET ASSETS |
| | | Period Ended
March 29,
2018
(Unaudited) | | | Year Ended
September 30,
2017 | |
| Increase (Decrease) in Net Assets from Operations: | | | | | | |
| Net investment income | | $ | 1,094,360 | | | $ | 2,650,541 | |
| Net realized gain on investments | | | 20,774,262 | | | | 16,369,733 | |
| Net change in unrealized appreciation (depreciation) on investments | | | (6,615,018 | ) | | | 11,150,223 | |
| Net increase in net assets resulting from operations | | | 15,253,604 | | | | 30,170,497 | |
| | | | | | | | | |
| Distributions to shareholders from: | | | | | | | | |
| Net investment income | | | (2,456,382 | ) | | | (2,861,435 | ) |
| Net realized gains | | | (15,814,766 | ) | | | (7,195,557 | ) |
| Total distributions to shareholders | | | (18,271,148 | ) | | | (10,056,992 | ) |
| | | | | | | | | |
| Capital share transactions: | | | | | | | | |
| Proceeds from sale of shares | | | 84,993,351 | | | | 5,207,987 | |
| Distributions reinvested | | | 18,250,767 | | | | 10,033,367 | |
| Cost of shares redeemed | | | (104,694,466 | ) | | | (28,213,603 | ) |
| Net decrease from capital share transactions | | | (1,450,348 | ) | | | (12,972,249 | ) |
| Net increase (decrease) in net assets | | | (4,467,892 | ) | | | 7,141,256 | |
| | | | | | | | | |
| Net assets: | | | | | | | | |
| Beginning of period | | | 216,007,911 | | | | 208,866,655 | |
| End of period | | $ | 211,540,019 | | | $ | 216,007,911 | |
| Undistributed net investment income at end of period | | $ | 577,717 | | | $ | 1,939,739 | |
| | | | | | | | | |
| Capital share activity: | | | | | | | | |
| Shares sold | | | 2,853,842 | | | | 200,616 | |
| Shares issued from reinvestment of distributions | | | 628,037 | | | | 382,515 | |
| Shares redeemed | | | (3,525,967 | ) | | | (1,028,694 | ) |
| Net decrease in shares | | | (44,088 | ) | | | (445,563 | ) |
| SEE NOTES TO FINANCIAL STATEMENTS. | THE GUGGENHEIM FUNDS SEMI-ANNUAL REPORT | 11 |
This table is presented to show selected data for a share outstanding throughout each period and to assist shareholders in evaluating a Fund’s performance for the periods presented.
| Institutional Class | | Period Ended
March 29,
2018a | | | Year Ended
September 30,
2017 | | | Year Ended
September 30,
2016 | | | Year Ended
September 30,
2015 | | | Period Ended
September 30,
2014b | |
| Per Share Data | | | | | | | | | | | | | | | |
| Net asset value, beginning of period | | $ | 29.11 | | | $ | 26.55 | | | $ | 23.69 | | | $ | 24.79 | | | $ | 25.00 | |
| Income (loss) from investment operations: |
| Net investment income (loss)c | | | .14 | | | | .34 | | | | .35 | | | | .31 | | | | — | d |
| Net gain (loss) on investments (realized and unrealized) | | | 1.93 | | | | 3.51 | | | | 3.22 | | | | (1.33 | ) | | | (.21 | ) |
| Total from investment operations | | | 2.07 | | | | 3.85 | | | | 3.57 | | | | (1.02 | ) | | | (.21 | ) |
| Less distributions from: |
| Net investment income | | | (.34 | ) | | | (.37 | ) | | | (.32 | ) | | | (.08 | ) | | | — | |
| Net realized gains | | | (2.16 | ) | | | (.92 | ) | | | (.39 | ) | | | — | | | | — | |
| Total distributions | | | (2.50 | ) | | | (1.29 | ) | | | (.71 | ) | | | (.08 | ) | | | — | |
| Net asset value, end of period | | $ | 28.68 | | | $ | 29.11 | | | $ | 26.55 | | | $ | 23.69 | | | $ | 24.79 | |
| |
| Total Returnf | | | 6.99 | % | | | 15.01 | % | | | 15.30 | % | | | (4.15 | %) | | | (0.84 | %) |
| Ratios/Supplemental Data |
| Net assets, end of period (in thousands) | | $ | 211,540 | | | $ | 216,008 | | | $ | 208,867 | | | $ | 189,668 | | | $ | 209,015 | |
| Ratios to average net assets: |
| Net investment income (loss) | | | 0.97 | % | | | 1.23 | % | | | 1.38 | % | | | 1.22 | % | | | 0.13 | % |
| Total expensese | | | 1.05 | % | | | 1.03 | % | | | 1.07 | % | | | 1.15 | % | | | 1.24 | % |
| Portfolio turnover rate | | | 96 | % | | | 156 | % | | | 209 | % | | | 221 | % | | | — | |
| a | Unaudited figures for the period ended March 29, 2018. Percentage amounts for the period, except total return and portfolio turnover rate, have been annualized. |
| b | Since commencement of operations: September 26, 2014. Percentage amounts for the period, except total return and portfolio turnover rate, have been annualized. |
| c | Net investment income (loss) per share was computed using average shares outstanding throughout the period. |
| d | Net investment income is less than $0.01 per share. |
| e | Does not include expenses of the underlying funds in which the Fund invests. |
| f | Total return does not reflect the impact of any applicable sales charges and has not been annualized. |
| 12 | THE GUGGENHEIM FUNDS SEMI-ANNUAL REPORT | SEE NOTES TO FINANCIAL STATEMENTS. |
| NOTES TO FINANCIAL STATEMENTS (Unaudited) |
Note 1 – Organization and Significant Accounting Policies
Organization
Guggenheim Funds Trust (the “Trust”), a Delaware statutory trust, is registered with the SEC under the Investment Company Act of 1940 (“1940 Act”), as an open-ended investment company of the series type. Each series, in effect, is representing a separate Fund. The Trust is authorized to issue an unlimited number of shares. The Trust accounts for the assets of each Fund separately.
The Trust offers a combination of five separate classes of shares, A-Class shares, C-Class shares, P-Class shares, R6-Class shares and Institutional Class shares. Sales of shares of each Class are made without a front-end sales charge at the net asset value per share (“NAV”), with the exception of A-Class shares. A-Class shares are sold at the NAV, plus the applicable front-end sales charge. The sales charge varies depending on the amount purchased. A-Class share purchases of $1 million or more are exempt from the front-end sales charge but have a 1% contingent deferred sales charge (“CDSC”), if shares are redeemed within 12 months of purchase. C-Class shares have a 1% CDSC if shares are redeemed within 12 months of purchase. Institutional Class shares are offered primarily for direct investment by institutions such as pension and profit sharing plans, endowments, foundations and corporations. Institutional Class shares require a minimum initial investment of $2 million and a minimum account balance of $1 million. At March 29, 2018, the Trust consisted of nineteen funds (the “Funds”).
This report covers the Capital Stewardship Fund (the “Fund”), a diversified investment company. As of March 29, 2018, only Institutional Class shares of the Fund were offered for subscription.
Guggenheim Partners Investment Management, LLC, (“GPIM”) which operates under the name Guggenheim Investments (“GI”), provides advisory services. Guggenheim Funds Distributors, LLC (“GFD”) acts as principal underwriter for the Trust. GI and GFD are affiliated entities.
Concinnity Advisors, LP (the “Sub-Adviser”) serves as the sub-adviser to the Fund and is responsible for the day-to-day management of the Fund’s portfolio.
Significant Accounting Policies
March 29, 2018 represents the last day during the Fund’s semi-annual period on which the New York Stock Exchange (“NYSE”) was open for trading. The Fund’s financial statements have been presented through that date to maintain consistency with the Fund’s NAV calculations used for shareholder transactions.
The Fund operates as an investment company and, accordingly, follows the investment company accounting and reporting guidance of the Financial Accounting Standards Board (“FASB”) Accounting Standards Codification Topic 946 Financial Services – Investment Companies.
The following significant accounting policies are in conformity with U.S. generally accepted accounting principles (“U.S. GAAP”) and are consistently followed by the Trust. This requires management to make estimates and assumptions that affect the reported amount of assets and liabilities, contingent assets and liabilities at the date of the financial statements, and the reported amounts of revenues and expenses during the reporting period. Actual results could differ from these estimates. All time references are based on Eastern Time.
The NAV of the Fund is calculated by dividing the market value of a fund’s securities and other assets, less all liabilities, attributable to the Class by the number of outstanding shares of a fund.
(a) Valuation of Investments
The Board of Trustees of the Fund (the “Board”) has adopted policies and procedures for the valuation of the Fund’s investments (the “Valuation Procedures”). Pursuant to the Valuation Procedures, the Board has delegated to a valuation committee, consisting of representatives from Guggenheim’s investment management, fund administration, legal and compliance departments (the “Valuation Committee”), the day-to-day responsibility for implementing the Valuation Procedures, including, under most circumstances, the responsibility for determining the fair value of the Fund’s securities and/or other assets.
Valuations of the Fund’s securities are supplied primarily by pricing services appointed pursuant to the processes set forth in the Valuation Procedures. The Valuation Committee convenes monthly, or more frequently as needed, to review the valuation of all assets which have been fair valued for reasonableness. The Fund’s officers, through the Valuation Committee and consistent with the monitoring and review responsibilities set forth in the Valuation Procedures, regularly review procedures used and valuations provided by the pricing services.
If the pricing service cannot or does not provide a valuation for a particular investment or such valuation is deemed unreliable, such investment is fair valued by the Valuation Committee.
Equity securities listed on an exchange (NYSE or American Stock Exchange) are valued at the last quoted sales price as of the close of business on the NYSE, usually 4:00 p.m. on the valuation date. Equity securities listed on the NASDAQ market system are valued at the NASDAQ Official Closing Price on the valuation date, which
| | THE GUGGENHEIM FUNDS SEMI-ANNUAL REPORT | 13 |
| NOTES TO FINANCIAL STATEMENTS (Unaudited)(continued) |
may not necessarily represent the last sale price. If there has been no sale on such exchange or NASDAQ on a given day, the security is valued at the closing bid price on that day.
Open-end investment companies (“mutual funds”) are valued at their NAV as of close of business, on the valuation date.
Exchange-traded funds (“ETFs”) are valued at the last quoted sales price.
Investments for which market quotations are not readily available are fair-valued as determined in good faith by GI, subject to review and approval by the Valuation Committee, pursuant to methods established or ratified by the Board. Valuations in accordance with these methods are intended to reflect each security’s (or asset’s/liability’s) “fair value”. Each such determination is based on a consideration of all relevant factors, which are likely to vary from one pricing context to another. Examples of such factors may include, but are not limited to market prices; sale prices; broker quotes; and models which derive prices based on inputs such as prices of securities with comparable maturities and characteristics, or based on inputs such as anticipated cash flows or collateral, spread over Treasuries, and other information analysis.
(b) Security Transactions
Security transactions are recorded on the trade date for financial reporting purposes. Realized gains and losses from securities transactions are recorded using the identified cost basis. Proceeds from lawsuits related to investment holdings are recorded as realized gains in the Fund. Dividend income is recorded on the ex-dividend date, net of applicable taxes withheld by foreign countries. Taxable non-cash dividends are recorded as dividend income. Interest income, including amortization of premiums and accretion of discounts, is accrued on a daily basis. Dividend income from Real Estate Investment Trusts (“REITs”) is recorded based on the income included in the distributions received from the REIT investments using published REIT classifications, including some management estimates when actual amounts are not available. Distributions received in excess of this estimated amount are recorded as a reduction of the cost of investments or reclassified to capital gains. The actual amounts of income, return of capital, and capital gains are only determined by each REIT after its fiscal year-end, and may differ from the estimated amounts.
(c) Distributions
Distributions of net investment income and net realized gains, if any, are declared and paid at least annually. Dividends are reinvested in additional shares unless shareholders request payment in cash. Distributions are recorded on the ex-dividend date and are determined in accordance with income tax regulations which may differ from U.S. GAAP.
(d) Expenses
Certain expenses have been allocated to the individual Funds in the Trust on a pro rata basis upon the respective aggregate net assets of each Fund included in the Trust.
(e) Earnings Credits
Under the fee arrangement with the custodian, the Fund may earn credits based on overnight custody cash balances. These credits are utilized to reduce related custodial expenses. The custodian fees disclosed in the Statement of Operations are before the reduction in expense from the related earnings credits, if any. For the period ended March 29, 2018, there were no earnings credits received.
(f) Cash
The Fund may leave cash overnight in its cash account with the custodian. Periodically, the Fund may have cash due to the custodian bank as an overdraft balance. A fee is incurred on this overdraft, calculated by multiplying the overdraft by a rate based on the federal funds rate, which was 1.68% at March 29, 2018.
(g) Indemnifications
Under the Fund’s organizational documents, its Trustees and Officers are indemnified against certain liabilities arising out of the performance of their duties to the Trust. In addition, throughout the normal course of business, the Fund enters into contracts that contain a variety of representations and warranties which provide general indemnifications. The Fund’s maximum exposure under these arrangements is unknown, as this would involve future claims that may be made against the Fund and/or its affiliates that have not yet occurred. However, based on experience, the Fund expects the risk of loss to be remote.
Note 2 – Investment Advisory Agreement and Other Agreements
Under the terms of an investment advisory contract, the Fund pays GI investment advisory fees calculated at an annualized rate of 0.90% of the average daily net assets of the Fund.
GI engages external service providers to perform other necessary services for the Trust, such as audit and accounting related services, legal services, custody, printing and mailing, etc., on a pass-through basis. Such expenses are allocated to various Funds within the complex based on relative net assets.
Certain trustees and officers of the Trust are also officers of GI and/or GFD. The trust does not compensate its officers or trustees who are officers, directors, and/or employees of GI and GFD.
| 14 | THE GUGGENHEIM FUNDS SEMI-ANNUAL REPORT | |
| NOTES TO FINANCIAL STATEMENTS (Unaudited)(continued) |
MUFG Investor Services (US), LLC (“MUIS”) acts as the Trust’s administrator, transfer agent and accounting agent. As administrator, transfer agent and accounting agent, MUIS is responsible for maintaining the books and records of the Trust’s securities and cash. The Bank of New York Mellon Corp. (“BNY”) acts as the Fund’s custodian. As custodian, BNY is responsible for the custody of the Funds’ assets. For providing the aforementioned administrative and accounting services, MUIS is entitled to receive a monthly fee equal to a percentage of the Fund’s average daily net assets and out of pocket expenses. For providing the aforementioned transfer agent and custodian services, MUIS and BNY are entitled to receive a monthly fee based on the number of transactions during the month and the number of accounts under management subject to certain minimum monthly fees and out of pocket expenses.
Note 3 – Federal Income Tax Information
The Fund intends to comply with the provisions of Subchapter M of the Internal Revenue Code applicable to regulated investment companies and will distribute substantially all taxable net investment income and capital gains sufficient to relieve the Fund from all, or substantially all, federal income, excise and state income taxes. Therefore, no provision for federal or state income tax is required.
Tax positions taken or expected to be taken in the course of preparing the Fund’s tax returns are evaluated to determine whether the tax positions are “more-likely-than-not” of being sustained by the applicable tax authority. Tax positions not deemed to meet the more-likely-than-not threshold would be recorded as a tax benefit or expense in the current year. Management has analyzed the Fund’s tax positions taken, or to be taken, on federal income tax returns for all open tax years, and has concluded that no provision for income tax is required in the Fund’s financial statements. The Fund’s federal tax returns are subject to examination by the Internal Revenue Service for a period of three years after they are filed.
At March 29, 2018, the cost of securities for Federal income tax purposes, the aggregate gross unrealized gain for all securities for which there was an excess of value over tax cost, and the aggregate gross unrealized loss for all securities for which there was an excess of tax cost over value were as follows:
| Fund | | Tax
Cost | | | Tax
Unrealized
Gain | | | Tax
Unrealized
Loss | | | Net
Unrealized
Gain | |
| Capital Stewardship Fund | | $ | 208,615,837 | | | $ | 15,897,740 | | | $ | (6,765,028 | ) | | $ | 9,132,712 | |
Note 4 – Fair Value Measurement
In accordance with U.S. GAAP, fair value is defined as the price that the Fund would receive to sell an investment or pay to transfer a liability in an orderly transaction with an independent buyer in the principal market, or in the absence of a principal market, the most advantageous market for the investment or liability. U.S. GAAP establishes a three-tier fair value hierarchy based on the types of inputs used to value assets and liabilities and requires corresponding disclosure. The hierarchy and the corresponding inputs are summarized below:
| Level 1 — | quoted prices in active markets for identical assets or liabilities. |
| Level 2 — | significant other observable inputs (for example quoted prices for securities that are similar based on characteristics such as interest rates, prepayment speeds, credit risk, etc.). |
| Level 3 — | significant unobservable inputs based on the best information available under the circumstances, to the extent observable inputs are not available, which may include assumptions. |
The types of inputs available depend on a variety of factors, such as the type of security and the characteristics of the markets in which it trades, if any. Fair valuation determinations that rely on fewer or no observable inputs require greater judgment. Accordingly, fair value determinations for Level 3 securities require the greatest amount of judgment.
The inputs or methodologies used for valuing securities are not necessarily an indication of the risk associated with investing in those securities. The suitability of the techniques and sources employed to determine fair valuation are regularly monitored and subject to change.
| | THE GUGGENHEIM FUNDS SEMI-ANNUAL REPORT | 15 |
| NOTES TO FINANCIAL STATEMENTS (Unaudited)(concluded) |
Note 5 – Securities Transactions
For the period ended March 29, 2018, the cost of purchases and proceeds from sales of investment securities, excluding government securities, short-term investments and derivatives, were as follows:
| Fund | | Purchases | | | Sales | |
| Capital Stewardship Fund | | $ | 216,800,303 | | | $ | 233,624,769 | |
Note 6 – Line of Credit
The Trust, with the exception of certain affiliated funds, secured a 364-day committed, $1,000,000,000 line of credit from Citibank, N.A., which was in place through October 6, 2017, at which time the line of credit was renewed, with an increased commitment amount to $1,065,000,000. A Fund may draw (borrow) from the line of credit as a temporary measure for emergency purposes, to facilitate redemption requests, or for other short-term liquidity purposes consistent with the Fund’s investment objective and program. For example, it may be advantageous for the Fund to borrow money rather than sell existing portfolio positions to meet redemption requests. Fees related to borrowings, if any, vary under this arrangement between the greater of Citibank’s “base rate”, LIBOR plus 1%, or the federal funds rate 1.68% at March 29, 2018 plus 1/2 of 1%.The Funds paid upfront costs of $982,952 to renew the line of credit.
| 16 | THE GUGGENHEIM FUNDS SEMI-ANNUAL REPORT | |
| OTHER INFORMATION (Unaudited) |
Proxy Voting Information
A description of the policies and procedures that the Trust uses to determine how to vote proxies relating to securities held in the Funds’ portfolios is available, without charge and upon request, by calling 800.820.0888. This information is also available from the EDGAR database on the SEC’s website at https://www.sec.gov.
Information regarding how the Funds voted proxies relating to portfolio securities during the most recent 12-month period ended June 30 is available without charge, upon request, by calling 800.820.0888. This information is also available from the EDGAR database on the SEC’s website at https://www.sec.gov.
Sector Classification
Information in the “Schedule of Investments” is categorized by sectors using sector-level Classifications defined by the Bloomberg Industry Classification System, a widely recognized industry classification system provider. Each Fund’s registration statement has investment policies relating to concentration in specific sectors/industries. For purposes of these investment policies, the Funds usually classify sectors/industries based on industry-level Classifications used by widely recognized industry classification system providers such as Bloomberg Industry Classification System, Global Industry Classification Standards and Barclays Global Classification Scheme.
Quarterly Portfolio Schedules Information
The Trust files its complete schedule of portfolio holdings with the SEC for the first and third quarters of each fiscal year on Form N-Q; which are available on the SEC’s website at https://www.sec.gov. The Fund’s Form N-Q may be reviewed and copied at the SEC’s Public Reference Room in Washington, DC, and that information on the operation of the Public Reference Room may be obtained by calling 800-SEC-0330. Copies of the portfolio holdings are also available to shareholders, without charge and upon request, by calling 800.820.0888.
| | THE GUGGENHEIM FUNDS SEMI-ANNUAL REPORT | 17 |
| INFORMATION ON BOARD OF TRUSTEES AND OFFICERS (Unaudited) |
Name, Address*
and Year of Birth | Position(s)
Held with
the Trust | Term of Office
and Length of
Time Served** | Principal Occupation(s)
During Past Five Years | Number of
Portfolios
in Fund
Complex
Overseen | Other Directorships
Held by Trustees |
| INDEPENDENT TRUSTEES | | | |
Randall C. Barnes
(1951) | Trustee | Since 2014 | Current: Private Investor (2001-present). Former: Senior Vice President and Treasurer, PepsiCo, Inc. (1993-1997); President, Pizza Hut International (1991-1993); Senior Vice President, Strategic Planning and New Business Development, PepsiCo, Inc. (1987-1990). | 51 | Current: Trustee, Purpose Investments Funds (2014-Present). |
Donald A. Chubb, Jr.
(1946) | Trustee and Chairman of the Valuation Oversight Committee | Since 1994 | Current: Retired. Former: Business broker and manager of commercial real estate, Griffith & Blair, Inc. (1997-2017). | 48 | Former: Midland Care, Inc. (2011-2016). |
Jerry B. Farley
(1946) | Trustee and Chairman of the Audit Committee | Since 2005 | Current: President, Washburn University (1997-present). | 48 | Current: Westar Energy, Inc. (2004-present); CoreFirst Bank & Trust (2000-present). |
Roman Friedrich III
(1946) | Trustee and Chairman of the Contracts Review Committee | Since 2014 | Current: Founder and Managing Partner, Roman Friedrich & Company (1998-present). Former: Senior Managing Director, MLV & Co. LLC (2010-2011). | 48 | Current: Zincore Metals, Inc. (2009-present). Former: Axiom Gold and Silver Corp. (2011-2012). |
Ronald A. Nyberg
(1953) | Trustee and Chairman of the Nominating and Governance Committee | Since 2014 | Current: Partner, Momkus McCluskey LLC (2016-present). Former: Partner, Nyberg & Cassioppi, LLC (2000-2016); Executive Vice President, General Counsel, and Corporate Secretary, Van Kampen Investments (1982-1999). | 51 | Current: PPM Funds (February 2018-present); Edward-Elmhurst Healthcare System (2012-present); Western Asset Inflation-Linked Opportunities & Income Fund (2004-present); Western Asset Inflation-Linked Income Fund (2003-present). |
Maynard F. Oliverius
(1943)
| Trustee | Since 1998 | Current: Retired. Former: President and CEO, Stormont-Vail HealthCare (1996-2012). | 48 | Current: Robert J. Dole Institute of Politics (2016-present); Stormont-Vail Foundation (2013-present); University of Minnesota MHA Alumni Philanthropy Committee (2009-present); Fort Hays State University Foundation (1999-present). Former: Topeka Community Foundation (2009-2014). |
| 18 | THE GUGGENHEIM FUNDS SEMI-ANNUAL REPORT | |
| INFORMATION ON BOARD OF TRUSTEES AND OFFICERS (Unaudited)(continued) |
Name, Address*
and Year of Birth | Position(s)
Held with
the Trust | Term of Office
and Length of
Time Served** | Principal Occupation(s)
During Past Five Years | Number of
Portfolios
in Fund
Complex
Overseen | Other Directorships
Held by Trustees |
| INDEPENDENT TRUSTEES - concluded | |
Ronald E. Toupin, Jr.
(1958) | Trustee and Chairman of the Board | Since 2014 | Current: Portfolio Consultant (2010-present); Member, Governing Council (2003-present) and Executive Committee (2016-present), Independent Directors Council. Former: Vice President, Manager and Portfolio Manager, Nuveen Asset Management (1998-1999); Vice President, Nuveen Investment Advisory Corp. (1992-1999); Vice President and Manager, Nuveen Unit Investment Trusts (1991-1999); and Assistant Vice President and Portfolio Manager, Nuveen Unit Investment Trusts (1988-1999), each of John Nuveen & Co., Inc. (1982-1999). | 48 | Current: Western Asset Inflation-Linked Opportunities & Income Fund (2004-present); Western Asset Inflation- Linked Income Fund (2003-present) Former: Bennett Group of Funds (2011-2013). |
| INTERESTED TRUSTEE | |
Amy J. Lee***
(1961) | Trustee, Vice President and Chief Legal Officer | Since
February 2018 (Trustee) Since 2014
(Chief Legal Officer) Since 2007
(Vice President) | Current: Interested Trustee, certain other funds in the Fund Complex (February 2018-present); President, certain other funds in the Fund Complex (2017-present); Chief Legal Officer, certain other funds in the Fund Complex (2014-present); Vice President, certain other funds in the Fund Complex (2007-present); Senior Managing Director, Guggenheim Investments (2012-present). Former: President and Chief Executive Officer (2017- February 2018); Vice President, Associate General Counsel and Assistant Secretary, Security Benefit Life Insurance Company and Security Benefit Corporation (2004-2012). | 158 | None. |
| * | The business address of each Trustee is c/o Guggenheim Investments, 227 West Monroe Street, Chicago, Illinois 60606. |
| ** | Each Trustee serves an indefinite term, until his or her successor is elected and qualified. Time served includes time served in the respective position for the Predecessor Corporation. |
| *** | This Trustee is deemed to be an "interested person" of the Funds under the 1940 Act by reason of her position with the Funds' Investment Manager and/or the parent of the Investment Manager. |
| | THE GUGGENHEIM FUNDS SEMI-ANNUAL REPORT | 19 |
| INFORMATION ON BOARD OF TRUSTEES AND OFFICERS (Unaudited)(continued) |
Name, Address*
and Year of Birth | Position(s)
Held with
the Trust | Term of Office
and Length of
Time Served** | Principal Occupations
During Past Five Years |
| OFFICERS | | | |
Brian E. Binder
(1972) | President and Chief Executive Officer | Since February 2018 | Current: President and Chief Executive Officer, certain other funds in the Fund Complex (February 2018-present); President and Chief Executive Officer, Guggenheim Funds Investment Advisors, LLC and Security Investors, LLC (January 2018-present); Senior Managing Director and Chief Administrative Officer, Guggenheim Investments (January 2018-present). Former: Managing Director and President, Deutsche Funds, and Head of US Product, Trading and Fund Administration, Deutsche Asset Management (2013-January 2018); Managing Director, Head of Business Management and Consulting, Invesco Ltd. (2010-2012). |
James M. Howley
(1972) | Assistant Treasurer | Since 2014 | Current: Managing Director, Guggenheim Investments (2004-present); Assistant Treasurer, certain other funds in the Fund Complex (2006-present). Former: Manager, Mutual Fund Administration of Van Kampen Investments, Inc. (1996-2004). |
Keith D. Kemp
(1960)
| Assistant Treasurer | Since 2016 | Current: Treasurer and Assistant Treasurer, certain other funds in the Fund Complex (2010-present); Managing Director, Guggenheim Investments (2015-present). Former: Chief Financial Officer, Guggenheim Specialized Products, LLC (2016-April 2018); Managing Director and Director, Transparent Value, LLC (2010-2016); Director, Guggenheim Partners Investment Management, LLC (2010-2015); Chief Operating Officer, Macquarie Capital Investment Management (2007-2009). |
Mark E. Mathiasen
(1978) | Secretary | Since 2014 | Current: Secretary, certain other funds in the Fund Complex (2007-present); Managing Director, Guggenheim Investments (2007-present). |
Glenn McWhinnie
(1969) | Assistant Treasurer | Since 2016 | Current: Vice President, Guggenheim Investments (2009-present); Assistant Treasurer, certain other funds in the Fund complex (2016-present). |
Michael P. Megaris
(1984) | Assistant Secretary | Since 2014 | Current: Assistant Secretary, certain other funds in the Fund Complex (2014-present); Director, Guggenheim Investments (2012-present). |
Elisabeth Miller
(1968) | Chief Compliance Officer | Since 2012 | Current: CCO, certain other funds in the Fund Complex (2012-present); Managing Director, Guggenheim Investments (2012-present); Vice President, Guggenheim Funds Distributors, LLC (2014-present). Former: CCO, Security Investors, LLC (2012-2018); CCO, Guggenheim Funds Investment Advisors, LLC (2012-2018); CCO, Guggenheim Distributors, LLC (2009-2014); Senior Manager, Security Investors, LLC (2004-2009); Senior Manager, Guggenheim Distributors, LLC (2004-2009). |
| 20 | THE GUGGENHEIM FUNDS SEMI-ANNUAL REPORT | |
| INFORMATION ON BOARD OF TRUSTEES AND OFFICERS (Unaudited)(concluded) |
Name, Address*
and Year of Birth | Position(s)
Held with
the Trust | Term of Office
and Length of
Time Served** | Principal Occupations
During Past Five Years |
| OFFICERS - concluded | |
Adam J. Nelson
(1979) | Assistant Treasurer | Since 2015 | Current: Vice President, Guggenheim Investments (2015-present); Assistant Treasurer, certain other funds in the Fund Complex (2015-present). Former: Assistant Vice President and Fund Administration Director, State Street Corporation (2013-2015); Fund Administration Assistant Director, State Street (2011-2013); Fund Administration Manager, State Street (2009-2011). |
Kimberly J. Scott
(1974) | Assistant Treasurer | Since 2014 | Current: Director, Guggenheim Investments (2012-present); Assistant Treasurer, certain other funds in the Fund Complex (2012-present). Former: Financial Reporting Manager, Invesco, Ltd. (2010-2011); Vice President/Assistant Treasurer, Mutual Fund Administration for Van Kampen Investments, Inc./Morgan Stanley Investment Management (2009-2010); Manager of Mutual Fund Administration, Van Kampen Investments, Inc./Morgan Stanley Investment Management (2005-2009). |
Bryan Stone
(1979) | Vice President | Since 2014 | Current: Vice President, certain other funds in the Fund Complex (2014-present); Managing Director, Guggenheim Investments (2013-present). Former: Senior Vice President, Neuberger Berman Group LLC (2009-2013); Vice President, Morgan Stanley (2002-2009). |
John L. Sullivan
(1955) | Chief Financial Officer, Chief Accounting Officer and Treasurer | Since 2014 | Current: CFO, Chief Accounting Officer and Treasurer, certain other funds in the Fund Complex (2010-present); Senior Managing Director, Guggenheim Investments (2010-present). Former: Managing Director and CCO, each of the funds in the Van Kampen Investments fund complex (2004-2010); Managing Director and Head of Fund Accounting and Administration, Morgan Stanley Investment Management (2002-2004); CFO and Treasurer, Van Kampen Funds (1996-2004). |
Jon Szafran (1989) | Assistant Treasurer | Since 2017 | Current: Vice President, Guggenheim Investments (2017-present); Assistant Treasurer, certain other funds in the Fund Complex (2017-present). Former: Assistant Treasurer of Henderson Global Funds and Manager of US Fund Administration, Henderson Global Investors (North America) Inc. ("HGINA"), (2017); Senior Analyst of US Fund Administration, HGINA (2014-2017); Senior Associate of Fund Administration, Cortland Capital Market Services, LLC (2013-2014); Experienced Associate, PricewaterhouseCoopers LLP (2012-2013). |
| * | The business address of each officer is c/o Guggenheim Investments, 227 West Monroe Street, Chicago, Illinois 60606. |
| ** | Each officer serves an indefinite term, until his or her successor is duly elected and qualified. Time served includes time served in the respective position for the Predecessor Corporation. |
| | THE GUGGENHEIM FUNDS SEMI-ANNUAL REPORT | 21 |
| GUGGENHEIM INVESTMENTS PRIVACY NOTICE (Unaudited) |
Who We Are
This Privacy Notice describes the data protection practices of Guggenheim Investments. Guggenheim Investments as used herein refers to the affiliated investment management businesses of Guggenheim Partners, LLC: Guggenheim Funds Investment Advisors, LLC, Guggenheim Partners Investment Management, LLC, Guggenheim Funds Distributors, LLC, Security Investors, LLC, Guggenheim Investment Advisors (Europe) Limited, Guggenheim Real Estate, LLC, GS Gamma Advisors, LLC, Guggenheim Partners India Management, LLC, Guggenheim Partners Europe Limited, as well as the funds in the Guggenheim Funds complex (the “Funds”) (“Guggenheim Investments,” “we,” “us,” or “our”).
Guggenheim Partners Investment Management Holdings, LLC, located at 330 Madison Avenue, New York, New York 10017 is the data controller for your information. The Affiliates who are also controllers of certain of your information are: Guggenheim Investment Advisors (Europe) Limited, Guggenheim Partners Europe Limited, Guggenheim Partners, LLC, Guggenheim Funds Investment Advisors, LLC, Guggenheim Partners Investment Management, LLC, Guggenheim Funds Distributors, LLC and Security Investors, LLC, as well as the Funds.
Our Commitment to You
Guggenheim Investments considers your privacy our utmost concern. When you become our client or investor, you entrust us with not only your hard-earned money but also with your personal and financial information. Because we have access to your private information, we hold ourselves to the highest standards in its safekeeping and use. We strictly limit how we share your information with others, whether you are a current or former Guggenheim Investments client or investor.
The Information We Collect About You
We collect certain nonpublic personal information about you from information you provide on applications, other forms, our website, and/or from third parties including investment advisors. This information includes Social Security or other tax identification number, assets, income, tax information, retirement and estate plan information, transaction history, account balance, payment history, bank account information, marital status, family relationships, information that we collect on our website through the use of “cookies,” and other personal information that you or others provide to us. We may also collect such information through your inquiries by mail, e-mail or telephone. We may also collect customer due diligence information, as required by applicable law and regulation, through third party service providers.
How We Handle Your Personal Information
The legal basis for using your information as set out in this Privacy Notice is as follows: (a) use of your personal data is necessary to perform our obligations under any contract with you (such as a contract for us to provide financial services to you); or (b) where use of your personal data is not necessary for performance of a contract, use of your personal data is necessary for our legitimate interests or the legitimate interests of others (for example, to enforce the legal terms governing our services, operate and market our website and other services we offer, ensure safe environments for our personnel and others, make and receive payments, prevent fraud and to know the customer to whom we are providing the services). Some processing is done to comply with applicable law.
In addition to the specific uses described above, we also use your information in the following manner:
| | ● | We use your information in connection with servicing your accounts. |
| | ● | We use information to respond to your requests or questions. For example, we might use your information to respond to your customer feedback. |
| | ● | We use information to improve our products and services. We may use your information to make our website and products better. We may use your information to customize your experience with us. |
| | ● | We use information for security purposes. We may use your information to protect our company and our customers. |
| | ● | We use information to communicate with you. For example, we will communicate with you about your account or our relationship. We may contact you about your feedback. We might also contact you about this Privacy Notice. We may also enroll you in our email newsletter. |
| 22 | THE GUGGENHEIM FUNDS SEMI-ANNUAL REPORT | |
| GUGGENHEIM INVESTMENTS PRIVACY NOTICE (Unaudited)(continued) |
| | ● | We use information as otherwise permitted by law, as we may notify you. |
| | ● | Aggregate/Anonymous Data. We may aggregate and/or anonymize any information collected through the website so that such information can no longer be linked to you or your device (“Aggregate/Anonymous Information”). We may use Aggregate/Anonymous Information for any purpose, including without limitation for research and marketing purposes, and may also share such data with any third parties, including advertisers, promotional partners, and sponsors. |
We do not sell information about current or former clients or their accounts to third parties. Nor do we share this information, except when necessary to complete transactions at your request, to make you aware of investment products and services that we or our affiliates offer, or as permitted or required by law.
We provide information about you to companies and individuals not affiliated with Guggenheim Investments to complete certain transactions or account changes, or to perform services for us related to your account. For example, if you ask to transfer assets from another financial institution to Guggenheim Investments, we must provide certain information about you to that company to complete the transaction. We provide the third party with only the information necessary to carry out its responsibilities and only for that purpose. And we require these third parties to treat your private information with the same high degree of confidentiality that we do. To alert you to other Guggenheim Investments products and services, we share your information within our family of affiliated companies. You may limit our sharing with affiliated companies as set out below. We may also share information with any successor to all or part of our business, or in connection with steps leading up to a merger or acquisition. For example, if part of our business was sold we may give customer information as part of that transaction. We may also share information about you with your consent.
We will release information about you if you direct us to do so, if we are compelled by law to do so, or in other circumstances as permitted by law (for example, to protect your account from fraud).
If you close your account(s) or become an inactive client or investor, we will continue to adhere to the privacy policies and practices described in this notice.
Opt-Out Provisions and Your Data Choices
The law allows you to “opt out” of certain kinds of information sharing with third parties. We do not share personal information about you with any third parties that triggers this opt-out right. This means YOU ARE ALREADY OPTED OUT.
When you are no longer our client or investor, we continue to share your information as described in this notice, and you may contact us at any time to limit our sharing by sending an email to CorporateDataPrivacy@GuggenheimPartners.com.
European Union Data Subjects and certain others: In addition to the choices set forth above, residents of the European Union and certain other jurisdictions have certain rights to (1) request access to or rectification or deletion of information we collect about them, (2) request a restriction on the processing of their information, (3) object to the processing of their information, or (4) request the portability of certain information. To exercise these or other rights, please contact us using the contact information below. We will consider all requests and provide our response within the time period stated by applicable law. Please note, however, that certain information may be exempt from such requests in some circumstances, which may include if we need to keep processing your information for our legitimate interests or to comply with a legal obligation. We may request you provide us with information necessary to confirm your identity before responding to your request.
Residents of France and certain other jurisdictions may also provide us with instructions regarding the manner in which we may continue to store, erase and share your information after your death, and where applicable, the person you have designated to exercise these rights after your death.
How We Protect Privacy Online
We take steps to protect your privacy when you use our web site – www.guggenheiminvestments.com – by using secure forms of online communication, including encryption technology, Secure Socket Layer (SSL) protocol, firewalls and user names and passwords. These safeguards vary based on the sensitivity of the information that we collect and store. However, we cannot and do not guarantee that these measures will prevent every unauthorized attempt to access, use, or disclose your information since despite our efforts, no Internet and/or other
| | THE GUGGENHEIM FUNDS SEMI-ANNUAL REPORT | 23 |
| GUGGENHEIM INVESTMENTS PRIVACY NOTICE (Unaudited)(concluded) |
electronic transmissions can be completely secure. Our web site uses “http cookies”—tiny pieces of information that we ask your browser to store. We use cookies for session management and security features on the Guggenheim Investments web site. We do not use them to pull data from your hard drive, to learn your e-mail address, or to view data in cookies created by other web sites. We will not share the information in our cookies or give others access to it. See the legal information area on our web site for more details about web site security and privacy features.
How We Safeguard Your Personal Information and Data Retention
We restrict access to nonpublic personal information about you to our employees and in some cases to third parties (for example, the service providers described above) as permitted by law. We maintain strict physical, electronic and procedural safeguards that comply with federal standards to guard your nonpublic personal information.
We keep your information for no longer than necessary for the purposes for which it is processed. The length of time for which we retain information depends on the purposes for which we collected and use it and/or as required to comply with applicable laws. Information may persist in copies made for backup and business continuity purposes for additional time.
International Visitors
If you are not a resident of the United States, please be aware that your information may be transferred to, stored and processed in the United States where our servers are located and our databases are operated. The data protection and other laws of the United States and other countries might not be as comprehensive as those in your country.
In such cases, we ensure that a legal basis for such a transfer exists and that adequate protection is provided as required by applicable law, for example, by using standard contractual clauses or by transferring your data to a jurisdiction that has obtained an adequacy finding. Individuals whose data may be transferred on the basis of standard contractual clauses may contact us as described below.
We’ll Keep You Informed
If you have any questions or concerns about how we treat your personal data, we encourage you to consult with us first. You may also contact the relevant supervisory authority.
We reserve the right to modify this policy at any time and will inform you promptly of material changes. You may access our privacy policy from our web site at www.guggenheiminvestments.com. Should you have any questions regarding our privacy policy, contact us by email at CorporateDataPrivacy@GuggenheimPartners.com.
| 24 | THE GUGGENHEIM FUNDS SEMI-ANNUAL REPORT | |
This page intentionally left blank.
This page intentionally left blank.
This page intentionally left blank.
This page intentionally left blank.
This page intentionally left blank.
3.29.2018
Guggenheim Funds Semi-Annual Report
| |
| Guggenheim Macro Opportunities Fund | | |
| GuggenheimInvestments.com | MO-SEMI-0318x0918 |

| DEAR SHAREHOLDER | 2 |
| ECONOMIC AND MARKET OVERVIEW | 4 |
| ABOUT SHAREHOLDERS’ FUND EXPENSES | 6 |
| MACRO OPPORTUNITIES FUND | 9 |
| NOTES TO CONSOLIDATED FINANCIAL STATEMENTS | 75 |
| OTHER INFORMATION | 100 |
| INFORMATION ON BOARD OF TRUSTEES AND OFFICERS | 101 |
| GUGGENHEIM INVESTMENTS PRIVACY NOTICE | 108 |
| | THE GUGGENHEIM FUNDS SEMI-ANNUAL REPORT | 1 |
Dear Shareholder:
Guggenheim Partners Investment Management, LLC (the “Investment Adviser”), is pleased to present the shareholder report for Guggenheim Macro Opportunities Fund (the “Fund”) for the semiannual fiscal period ended March 29, 2018.
The Investment Adviser is part of Guggenheim Investments, which represents the investment management businesses of Guggenheim Partners, LLC (“Guggenheim”), a global, diversified financial services firm.
Guggenheim Funds Distributors, LLC is the distributor of the Funds. Guggenheim Funds Distributors, LLC is affiliated with Guggenheim and the Investment Adviser.
We encourage you to read the Economic and Market Overview section of the report, which follows this letter.
We are committed to providing innovative investment solutions and appreciate the trust you place in us.
Sincerely,
Guggenheim Partners Investment Management, LLC
April 30, 2018
Read a prospectus and summary prospectus (if available) carefully before investing. It contains the investment objectives, risks, charges, expenses and other information, which should be considered carefully before investing. Obtain a prospectus and summary prospectus (if available) at guggenheiminvestments.com or call 800.820.0888.
This material is not intended as a recommendation or as investment advice of any kind, including in connection with rollovers, transfers, and distributions. Such material is not provided in a fiduciary capacity, may not be relied upon for or in connection with the making of investment decisions, and does not constitute a solicitation of an offer to buy or sell securities. All content has been provided for informational or educational purposes only and is not intended to be and should not be construed as legal or tax advice and/or a legal opinion. Always consult a financial, tax and/or legal professional regarding your specific situation.
| 2 | THE GUGGENHEIM FUNDS SEMI-ANNUAL REPORT | |
Macro Opportunities Fund may not be suitable for all investors. ● The Fund’s market value will change in response to interest rate changes and market conditions among other factors. In general, bond prices rise when interest rates fall and vice versa. ● The Fund’s exposure to high yield securities may subject the Fund to greater volatility. ● The intrinsic value of the underlying stocks in which the Fund invests may never be realized or the stock may decline in value. ● When market conditions are deemed appropriate, the Fund may use leverage to the full extent permitted by its investment policies and restrictions and applicable law. Leveraging will exaggerate the effect on net asset value of any increase or decrease in the market value of the Fund’s portfolio. ● The use of short selling involves increased risks and costs. You risk paying more for a security than you received from its sale. Theoretically, stocks sold short have the risk of unlimited losses. ● The Fund may invest in derivative instruments, which may be more volatile and less liquid, increasing the risk of loss when compared to traditional securities. Certain of the derivative instruments are also subject to the risks of counterparty default and adverse tax treatment. ● Instruments and strategies (such as borrowing transactions and reverse repurchase agreements) may provide leveraged exposure to a particular investment, which will magnify any gains or losses on those investments. ● Investments in reverse repurchase agreements expose the Fund to the many of the same risks as investments in derivatives. ● The Fund’s investments in other investment vehicles subject the Fund to those risks and expenses affecting the investment vehicle. ● The Fund’s investments in foreign securities carry additional risks when compared to U.S. securities, due to the impact of diplomatic, political or economic developments in the country in question (investments in emerging markets securities are generally subject to an even greater level of risks). ● Investments in syndicated bank loans generally offer a floating interest rate and involve special types of risks. ● A highly liquid secondary market may not exist for the commodity-linked structured notes the Fund invests in, and there can be no assurance that a highly liquid secondary market will develop. ● The Fund’s exposure to the commodity markets may subject the Fund to greater volatility as commodity-linked investments may be affected by changes in overall market movements, commodity index volatility, changes in interest rates or factors affecting a particular industry or commodity such as droughts, floods, weather, embargos, tariffs and international economic, political and regulatory developments. ● The Fund’s investments in municipal securities can be affected by events that affect the municipal bond market. ● The Fund’s investments in real estate securities subject the Fund to the same risks as direct investments in real estate, which is particularly sensitive to economic downturns. ● The Fund’s investments in restricted securities may involve financial and liquidity risk. ● You may have a gain or loss when you sell your shares. ● It is important to note that the Fund is not guaranteed by the U.S. government. ● This Fund is considered nondiversified and can invest a greater portion of its assets in securities of individual issuers than a diversified fund. As a result, changes in the market value of a single security could cause greater fluctuations in the value of fund shares than would occur in a more diversified fund. ● Please read the prospectus for more detailed information regarding these and other risks.
| | THE GUGGENHEIM FUNDS SEMI-ANNUAL REPORT | 3 |
| ECONOMIC AND MARKET OVERVIEW (Unaudited) | March 29, 2018 |
As we enter the ninth year of the current expansion, one of the most important new developments to evaluate is the impact of the corporate tax cuts passed into law at the end of 2017. Guggenheim’s concern is that the substantial late-cycle fiscal easing in the pipeline will prompt more restrictive monetary policy, which increases the risk that the economy will experience a boom-bust cycle that ends in a recession.
With the unemployment rate at 4.1% and core inflation rising, fiscal policy should be leaning against the economy to prevent overheating, not providing further stimulus. Faster wage growth, rising core inflation, and an unsustainably low unemployment rate underpin our longstanding view that the U.S. Federal Reserve (the “Fed”) will raise interest rates four times in 2018. Fed funds futures show the market is now pricing in nearly three rate hikes for 2018, up from two at the beginning of the year, which contributed to a pickup in first-quarter market volatility. Tighter fiscal and monetary policy, along with rising policy uncertainty ahead of the 2018 mid-terms and 2020 presidential election, could prove to be too much for an overextended economy to bear.
Further complicating the story is the risk of a global trade war sparked by protectionist actions taken by the Trump administration. We now have new steel and aluminum tariffs in place that are likely to have some modest inflationary impact while hurting almost 20% of U.S. corporates, according to our estimates. We expect more protectionist trade and investment policies in place by year end.
Over the six months ended March 29, 2018, the bear flattening (the condition in which short-term rates rise faster than long-term rates) of the U.S. Treasury curve continued with Treasury yields higher across the curve. Yields increased the most in the belly and front end of the curve. The 2-year Treasury ended the period at 2.27%, while the 10-year finished the period at 2.74%.
For the six months ended March 29, 2018, the Standard & Poor’s 500® (“S&P 500”) Index* returned 5.84%. The MSCI Europe-Australasia-Far East (“EAFE”) Index* returned 2.80%. The return of the MSCI Emerging Markets Index* was 9.08%.
In the bond market, the Bloomberg Barclays U.S. Aggregate Bond Index* posted a -1.08% return for the period, while the Bloomberg Barclays U.S. Corporate High Yield Index* returned -0.39%. The return of the ICE Bank of America (“BofA”) Merrill Lynch 3-Month U.S. Treasury Bill Index* was 0.64% for the six-month period.
The opinions and forecasts expressed may not actually come to pass. This information is subject to change at any time, based on market and other conditions, and should not be construed as a recommendation of any specific security or strategy.
| 4 | THE GUGGENHEIM FUNDS SEMI-ANNUAL REPORT | |
| ECONOMIC AND MARKET OVERVIEW (Unaudited)(concluded) | March 29, 2018 |
*Index Definitions:
The following indices are referenced throughout this report. Indices are unmanaged and not available for direct investment. Index performance does not reflect transaction costs, fees, or expenses.
Bloomberg Barclays U.S. Aggregate Bond Index is a broad-based flagship benchmark that measures the investment grade, U.S. dollar-denominated, fixed-rate taxable bond market, including U.S. Treasuries, government-related and corporate securities, mortgage-backed securities or “MBS” (agency fixed-rate and hybrid adjustable-rate mortgage, or “ARM”, pass-throughs), asset-backed securities (“ABS”), and commercial mortgage-backed securities (“CMBS”) (agency and non-agency).
Bloomberg Barclays U.S. Corporate High Yield Index measures the U.S. dollar-denominated, high yield, fixed-rate corporate bond market. Securities are classified as high yield if the middle rating of Moody’s, Fitch, and S&P is Ba1/BB +/BB + or below.
ICE BofA Merrill Lynch 3-Month U.S. Treasury Bill Index is an unmanaged market index of U.S. Treasury securities maturing in 90 days that assumes reinvestment of all income.
MSCI EAFE Index is a free float-adjusted market capitalization index that is designed to measure the equity market performance of developed markets, excluding the U.S. & Canada.
MSCI Emerging Markets Index is a free float-adjusted market capitalization weighted index that is designed to measure equity market performance in the global emerging markets.
S&P 500® Index is a broad-based index, the performance of which is based on the performance of 500 widely held common stocks chosen for market size, liquidity, and industry group representation.
| | THE GUGGENHEIM FUNDS SEMI-ANNUAL REPORT | 5 |
| ABOUT SHAREHOLDERS’ FUND EXPENSES (Unaudited) |
All mutual funds have operating expenses, and it is important for our shareholders to understand the impact of costs on their investments. Shareholders of a fund incur two types of costs: (i) transaction costs, including sales charges (loads) on purchase payments, reinvested dividends, other distributions, and exchange fees, and (ii) ongoing costs, including management fees, administrative services, and shareholder reports, among others. These ongoing costs, or operating expenses, are deducted from a fund’s gross income and reduce the investment return of the fund.
A fund’s expenses are expressed as a percentage of its average net assets, which is known as the expense ratio. The following examples are intended to help investors understand the ongoing costs (in dollars) of investing in a fund and to compare these costs with the ongoing costs of investing in other mutual funds.
The examples are based on an investment of $1,000 made at the beginning of the period and held for the entire six-month period beginning September 30, 2017 and ending March 29, 2018 for actual Fund returns. Hypothetical Fund returns are for the period beginning September 30, 2017 and ending March 31, 2018.
The following tables illustrate the Fund’s costs in two ways:
Table 1. Based on actual Fund return: This section helps investors estimate the actual expenses paid over the period. The “Ending Account Value” shown is derived from the Fund’s actual return, and the fifth column shows the dollar amount that would have been paid by an investor who started with $1,000 in the Fund. Investors may use the information here, together with the amount invested, to estimate the expenses paid over the period. Simply divide the Fund’s account value by $1,000 (for example, an $8,600 account value divided by $1,000 = 8.6), then multiply the result by the number provided under the heading “Expenses Paid During Period.”
Table 2. Based on hypothetical 5% return: This section is intended to help investors compare a fund’s cost with those of other mutual funds. The table provides information about hypothetical account values and hypothetical expenses based on the Fund’s actual expense ratio and an assumed rate of return of 5% per year before expenses, which is not the Fund’s actual return. The hypothetical account values and expenses may not be used to estimate the actual ending account balance or expenses paid during the period. The example is useful in making comparisons because the U.S. Securities and Exchange Commission (the “SEC”) requires all mutual funds to calculate expenses based on the 5% return. Investors can assess a fund’s costs by comparing this hypothetical example with the hypothetical examples that appear in shareholder reports of other funds.
The calculations illustrated above assume no shares were bought or sold during the period. Actual costs may have been higher or lower, depending on the amount of investment and the timing of any purchases or redemptions.
| 6 | THE GUGGENHEIM FUNDS SEMI-ANNUAL REPORT | |
| ABOUT SHAREHOLDERS’ FUND EXPENSES (Unaudited)(continued) |
Please note that the expenses shown in the table are meant to highlight your ongoing costs only and do not reflect any transactional costs, such as sales charges (loads) on purchase payments, and contingent deferred sales charges (“CDSC”) on redemptions, if any. Therefore, the second table is useful in comparing ongoing costs only, and will not help you determine the relative total costs of owning different funds. In addition, if these transactional costs were included, your costs would have been higher.
More information about the Fund’s expenses, including annual expense ratios for periods up to five years (subject to the Fund’s inception date), can be found in the Financial Highlights section of this report. For additional information on operating expenses and other shareholder costs, please refer to the Fund’s prospectus.
| | THE GUGGENHEIM FUNDS SEMI-ANNUAL REPORT | 7 |
| ABOUT SHAREHOLDERS’ FUND EXPENSES (Unaudited)(concluded) |
| | Expense
Ratio1 | Fund
Return | Beginning
Account Value
September 30,
2017 | Ending
Account Value
March 29,
2018 | Expenses
Paid During
Period2 |
| Table 1. Based on actual Fund return3 |
| Macro Opportunities Fund |
| A-Class | 1.30% | 1.33% | $ 1,000.00 | $ 1,013.30 | $ 6.45 |
| C-Class | 2.04% | 0.96% | 1,000.00 | 1,009.60 | 10.11 |
| P-Class | 1.30% | 1.33% | 1,000.00 | 1,013.30 | 6.45 |
| Institutional Class | 0.89% | 1.53% | 1,000.00 | 1,015.30 | 4.42 |
| | | | | | |
| | Expense
Ratio1 | Fund
Return | Beginning
Account Value
September 30,
2017 | Ending
Account Value
March 31,
2018 | Expenses
Paid During
Period4 |
| Table 2. Based on hypothetical 5% return (before expenses)5 |
| Macro Opportunities Fund |
| A-Class | 1.30% | 5.00% | $ 1,000.00 | $ 1,018.45 | $ 6.54 |
| C-Class | 2.04% | 5.00% | 1,000.00 | 1,014.76 | 10.25 |
| P-Class | 1.30% | 5.00% | 1,000.00 | 1,018.45 | 6.54 |
| Institutional Class | 0.89% | 5.00% | 1,000.00 | 1,020.49 | 4.48 |
| 1 | Annualized and excludes expenses of the underlying funds in which the Fund invests. |
| 2 | Expenses in table 1 are equal to the Fund's annualized expense ratio, net of any applicable fee waivers, multiplied by the average account value over the period, multiplied by 180/365 (to reflect the one-half year period). |
| 3 | Actual cumulative return at net asset value for the period September 30, 2017 to March 29, 2018. |
| 4 | Expenses in table 2 are equal to the Fund's annualized expense ratio, net of any applicable fee waivers, multiplied by the average account value over the period, multiplied by 182/365 (to reflect the one-half year period). |
| 5 | Actual cumulative return at net asset value for the period September 30, 2017 to March 31, 2018. |
| 8 | THE GUGGENHEIM FUNDS SEMI-ANNUAL REPORT | |
| PERFORMANCE REPORT AND FUND PROFILE (Unaudited) | March 29, 2018 |
MACRO OPPORTUNITIES FUND
OBJECTIVE: Seeks to provide total return, comprised of current income and capital appreciation.
Consolidated Holdings Diversification (Market Exposure as % of Net Assets)

“Consolidated Holdings Diversification (Market Exposure as % of Net Assets)” excludes any temporary cash investments or investments in Guggenheim Strategy Funds Trust mutual funds.
| | THE GUGGENHEIM FUNDS SEMI-ANNUAL REPORT | 9 |
| PERFORMANCE REPORT AND FUND PROFILE (Unaudited)(continued) | March 29, 2018 |
| Inception Dates: |
| A-Class | November 30, 2011 |
| C-Class | November 30, 2011 |
| P-Class | May 1, 2015 |
| Institutional Class | November 30, 2011 |
| Ten Largest Holdings (% of Total Net Assets) |
| Guggenheim Limited Duration Fund - Institutional Class | 4.3% |
| Guggenheim Alpha Opportunity Fund - Institutional Class | 2.4% |
| Guggenheim Strategy Fund II | 1.4% |
| Guggenheim Strategy Fund I | 1.3% |
| Guggenheim Strategy Fund III | 1.1% |
| LSTAR Securities Investment Limited 3.21% due 12/01/22 | 1.0% |
| KDAC Aviation Finance Ltd. 4.21% due 12/15/42 | 0.9% |
| Fortress Credit Opportunities IX CLO Ltd. 2.97% due 11/15/29 | 0.9% |
| AASET Trust 3.97% due 05/16/42 | 0.9% |
| Shackleton 2015-VIII CLO Ltd. 2.66% due 10/20/27 | 0.9% |
| Top Ten Total | 15.1% |
“Ten Largest Holdings” excludes any temporary cash or derivative investments.
| Portfolio Composition by Quality Rating1 |
| Rating | % of Total Investments |
| Fixed Income Instruments | |
| AAA | 7.7% |
| AA | 9.2% |
| A | 14.1% |
| BBB | 15.1% |
| BB | 3.8% |
| B | 10.7% |
| CCC | 7.0% |
| CC | 0.8% |
| NR2 | 11.1% |
| Other Instruments | 20.5% |
| Total Investments | 100.0% |
The chart above reflects percentages of the value of total investments.
| 1 | Source: BlackRock Solutions. Credit quality ratings are measured on a scale that generally ranges from AAA (highest) to D (lowest). All securities except for those labeled “NR” have been rated by a Nationally Recognized Statistical Rating Organization (“NRSRO”). For purposes of this presentation, when ratings are available from more than one agency, the highest rating is used. Guggenheim Investments converts ratings to the equivalent S&P rating. Security ratings are determined at the time of purchase and may change thereafter. |
| 2 | NR securities do not necessarily indicate low credit quality. |
| 10 | THE GUGGENHEIM FUNDS SEMI-ANNUAL REPORT | |
| PERFORMANCE REPORT AND FUND PROFILE (Unaudited)(concluded) | March 29, 2018 |
Average Annual Returns*
Periods Ended March 29, 2018
| | 6 month† | 1 Year | 5 Year | Since Inception
(11/30/11) |
| A-Class Shares | 1.33% | 3.25% | 3.88% | 5.80% |
| A-Class Shares with sales charge‡ | (2.72%) | (0.88%) | 2.88% | 4.99% |
| C-Class Shares | 0.96% | 2.46% | 3.12% | 5.03% |
| C-Class Shares with CDSC§ | (0.04%) | 1.46% | 3.12% | 5.03% |
| Institutional Class Shares | 1.53% | 3.64% | 4.25% | 6.18% |
| ICE BofA Merrill Lynch 3-Month U.S. Treasury Bill Index | 0.64% | 1.11% | 0.34% | 0.29% |
| | | | | |
| | | 6 month† | 1 Year | Since Inception
(05/01/15) |
| P-Class Shares | | 1.33% | 3.25% | 4.23% |
| ICE BofA Merrill Lynch 3-Month U.S. Treasury Bill Index | | 0.64% | 1.11% | 0.54% |
| * | The performance data above represents past performance that is not predictive of future results. The investment return and principal value of an investment in the Fund will fluctuate so that an investor’s shares, when redeemed, may be worth more or less than their original cost. Returns are historical and include changes in principal and reinvested dividends and capital gains and do not reflect the effect of taxes. The ICE BofA Merrill Lynch 3-Month U.S. Treasury Bill Index is an unmanaged index and, unlike the Fund, has no management fees or operating expenses to reduce its reported return. |
| † | 6 month returns are not annualized. |
| ‡ | Effective October 1, 2015, the maximum sales charge decreased from 4.75% to 4.00%. A 4.75% maximum sales charge is used in the calculation of the Average Annual Returns (based on subscriptions made prior to October 1, 2015), and a 4.00% maximum sales charge will be used to calculate performance for periods based on subscriptions made on or after October 1, 2015. |
| § | Fund returns include a CDSC of 1% if redeemed within 12 months of purchase. |
| | THE GUGGENHEIM FUNDS SEMI-ANNUAL REPORT | 11 |
| CONSOLIDATED SCHEDULE OF INVESTMENTS (Unaudited) | March 29, 2018 |
| MACRO OPPORTUNITIES FUND | |
| | | Shares | | | Value | |
| | | | | | | |
| COMMON STOCKS† - 2.7% |
| | | | | | | |
| Consumer, Non-cyclical - 0.8% |
| General Mills, Inc. | | | 60,156 | | | $ | 2,710,629 | |
| Edgewell Personal Care Co.* | | | 42,921 | | | | 2,095,403 | |
| Archer-Daniels-Midland Co. | | | 47,295 | | | | 2,051,184 | |
| Kimberly-Clark Corp. | | | 18,590 | | | | 2,047,317 | |
| Molson Coors Brewing Co. — Class B | | | 26,499 | | | | 1,996,170 | |
| Johnson & Johnson | | | 15,362 | | | | 1,968,640 | |
| Merck & Company, Inc. | | | 34,390 | | | | 1,873,223 | |
| Tyson Foods, Inc. — Class A | | | 25,528 | | | | 1,868,394 | |
| Ingredion, Inc. | | | 14,442 | | | | 1,861,863 | |
| Celgene Corp.* | | | 20,862 | | | | 1,861,099 | |
| Biogen, Inc.* | | | 6,784 | | | | 1,857,595 | |
| Gilead Sciences, Inc. | | | 24,593 | | | | 1,854,066 | |
| Amgen, Inc. | | | 10,360 | | | | 1,766,173 | |
| Pilgrim’s Pride Corp.* | | | 71,406 | | | | 1,757,302 | |
| Sanderson Farms, Inc. | | | 14,725 | | | | 1,752,569 | |
| Pfizer, Inc. | | | 48,164 | | | | 1,709,340 | |
| Mylan N.V.* | | | 36,252 | | | | 1,492,495 | |
| Western Union Co. | | | 75,102 | | | | 1,444,212 | |
| US Foods Holding Corp.* | | | 43,479 | | | | 1,424,807 | |
| Zimmer Biomet Holdings, Inc. | | | 12,007 | | | | 1,309,244 | |
| United Therapeutics Corp.* | | | 11,537 | | | | 1,296,297 | |
| Prestige Brands Holdings, Inc.* | | | 37,496 | | | | 1,264,365 | |
| CVS Health Corp. | | | 16,147 | | | | 1,004,505 | |
| McKesson Corp. | | | 7,044 | | | | 992,288 | |
| Cardinal Health, Inc. | | | 15,343 | | | | 961,699 | |
| Performance Food Group Co.* | | | 32,175 | | | | 960,424 | |
| Travelport Worldwide Ltd. | | | 49,445 | | | | 807,931 | |
| Darling Ingredients, Inc.* | | | 45,082 | | | | 779,919 | |
| AmerisourceBergen Corp. — Class A | | | 9,009 | | | | 776,666 | |
| Conagra Brands, Inc. | | | 19,325 | | | | 712,706 | |
| Boston Beer Company, Inc. — Class A* | | | 3,683 | | | | 696,271 | |
| CoreLogic, Inc.* | | | 15,149 | | | | 685,189 | |
| Charles River Laboratories International, Inc.* | | | 6,383 | | | | 681,321 | |
| United Natural Foods, Inc.* | | | 15,636 | | | | 671,410 | |
| Perrigo Company plc | | | 8,013 | | | | 667,804 | |
| Eli Lilly & Co. | | | 8,124 | | | | 628,554 | |
| Medtronic plc | | | 7,814 | | | | 626,839 | |
| TreeHouse Foods, Inc.* | | | 15,821 | | | | 605,470 | |
| USANA Health Sciences, Inc.* | | | 6,672 | | | | 573,125 | |
| WellCare Health Plans, Inc.* | | | 2,836 | | | | 549,135 | |
| Quanta Services, Inc.* | | | 15,911 | | | | 546,543 | |
| Sabre Corp. | | | 23,416 | | | | 502,273 | |
| Dean Foods Co. | | | 58,015 | | | | 500,089 | |
| Kroger Co. | | | 18,293 | | | | 437,934 | |
| Horizon Pharma plc* | | | 29,794 | | | | 423,075 | |
| Allergan plc | | | 2,474 | | | | 416,350 | |
| SpartanNash Co. | | | 23,310 | | | | 401,165 | |
| Eagle Pharmaceuticals, Inc.* | | | 7,441 | | | | 392,066 | |
| Cardtronics plc — Class A* | | | 16,161 | | | | 360,552 | |
| Versartis, Inc.* | | | 210,469 | | | | 347,274 | |
| Targus Group International Equity, Inc*,†††,1,2 | | | 12,773 | | | | 30,701 | |
| Total Consumer, Non-cyclical | | | | | | | 57,001,665 | |
| | | | | | | | | |
| Industrial - 0.4% |
| Greenbrier Companies, Inc. | | | 36,494 | | | | 1,833,823 | |
| Cummins, Inc. | | | 10,817 | | | | 1,753,328 | |
| Regal Beloit Corp. | | | 23,767 | | | | 1,743,310 | |
| Owens Corning | | | 21,643 | | | | 1,740,097 | |
| Genesee & Wyoming, Inc. — Class A* | | | 21,894 | | | | 1,549,876 | |
| Tech Data Corp.* | | | 14,458 | | | | 1,230,810 | |
| Carlisle Companies, Inc. | | | 11,733 | | | | 1,225,042 | |
| Fluor Corp. | | | 20,635 | | | | 1,180,735 | |
| Jabil, Inc. | | | 39,987 | | | | 1,148,826 | |
| 12 | THE GUGGENHEIM FUNDS SEMI-ANNUAL REPORT | SEE NOTES TO FINANCIAL STATEMENTS. |
| CONSOLIDATED SCHEDULE OF INVESTMENTS (Unaudited)(continued) | March 29, 2018 |
| MACRO OPPORTUNITIES FUND | |
| | | Shares | | | Value | |
| | | | | | | |
| Vishay Intertechnology, Inc. | | | 58,630 | | | $ | 1,090,518 | |
| Snap-on, Inc. | | | 7,273 | | | | 1,073,058 | |
| Benchmark Electronics, Inc. | | | 34,741 | | | | 1,037,019 | |
| EnerSys | | | 14,906 | | | | 1,034,029 | |
| KBR, Inc. | | | 61,912 | | | | 1,002,355 | |
| AGCO Corp. | | | 15,230 | | | | 987,665 | |
| EMCOR Group, Inc. | | | 11,735 | | | | 914,509 | |
| Energizer Holdings, Inc. | | | 12,323 | | | | 734,204 | |
| Spirit AeroSystems Holdings, Inc. — Class A | | | 8,262 | | | | 691,529 | |
| Owens-Illinois, Inc.* | | | 27,319 | | | | 591,729 | |
| Crane Co. | | | 5,867 | | | | 544,106 | |
| Evoqua Water Technologies Corp.* | | | 25,534 | | | | 543,619 | |
| Coherent, Inc.* | | | 2,872 | | | | 538,213 | |
| Gibraltar Industries, Inc.* | | | 14,733 | | | | 498,712 | |
| Acuity Brands, Inc. | | | 3,429 | | | | 477,283 | |
| Belden, Inc. | | | 6,328 | | | | 436,252 | |
| Rexnord Corp.* | | | 14,550 | | | | 431,844 | |
| Masco Corp. | | | 10,356 | | | | 418,797 | |
| AECOM* | | | 11,708 | | | | 417,156 | |
| Trinity Industries, Inc. | | | 12,755 | | | | 416,196 | |
| Kansas City Southern | | | 3,669 | | | | 403,040 | |
| Louisiana-Pacific Corp. | | | 13,897 | | | | 399,817 | |
| Norfolk Southern Corp. | | | 2,891 | | | | 392,540 | |
| Applied Optoelectronics, Inc.* | | | 15,119 | | | | 378,882 | |
| Sanmina Corp.* | | | 4,301 | | | | 112,471 | |
| Total Industrial | | | | | | | 28,971,390 | |
| | | | | | | | | |
| Communications - 0.3% |
| Verizon Communications, Inc. | | | 42,633 | | | | 2,038,710 | |
| Omnicom Group, Inc. | | | 27,824 | | | | 2,021,970 | |
| Comcast Corp. — Class A | | | 58,443 | | | | 1,996,997 | |
| Juniper Networks, Inc. | | | 71,795 | | | | 1,746,772 | |
| Cisco Systems, Inc. | | | 37,966 | | | | 1,628,362 | |
| Telephone & Data Systems, Inc. | | | 56,900 | | | | 1,594,907 | |
| Gannett Company, Inc. | | | 120,911 | | | | 1,206,692 | |
| InterDigital, Inc. | | | 15,920 | | | | 1,171,712 | |
| News Corp. — Class A | | | 68,481 | | | | 1,082,000 | |
| ARRIS International plc* | | | 37,664 | | | | 1,000,732 | |
| Sprint Corp.* | | | 157,361 | | | | 767,922 | |
| Nexstar Media Group, Inc. — Class A | | | 11,251 | | | | 748,192 | |
| AMC Networks, Inc. — Class A* | | | 13,425 | | | | 694,072 | |
| TEGNA, Inc. | | | 57,507 | | | | 655,005 | |
| Interpublic Group of Companies, Inc. | | | 27,194 | | | | 626,278 | |
| Scholastic Corp. | | | 12,892 | | | | 500,725 | |
| Motorola Solutions, Inc. | | | 4,545 | | | | 478,588 | |
| Gray Television, Inc.* | | | 37,146 | | | | 471,754 | |
| New Media Investment Group, Inc. | | | 26,540 | | | | 454,896 | |
| F5 Networks, Inc.* | | | 2,707 | | | | 391,459 | |
| MSG Networks, Inc. — Class A* | | | 17,198 | | | | 388,675 | |
| Cengage Learning Acquisitions, Inc.*,†† | | | 21,660 | | | | 115,513 | |
| Total Communications | | | | | | | 21,781,933 | |
| | | | | | | | | |
| Utilities - 0.3% |
| El Paso Electric Co. | | | 40,804 | | | | 2,081,004 | |
| CenterPoint Energy, Inc. | | | 75,096 | | | | 2,057,630 | |
| Consolidated Edison, Inc. | | | 26,289 | | | | 2,048,965 | |
| National Fuel Gas Co. | | | 39,760 | | | | 2,045,652 | |
| Portland General Electric Co. | | | 50,204 | | | | 2,033,764 | |
| Ameren Corp. | | | 35,413 | | | | 2,005,438 | |
| PNM Resources, Inc. | | | 50,846 | | | | 1,944,860 | |
| Exelon Corp. | | | 42,343 | | | | 1,651,800 | |
| FirstEnergy Corp. | | | 47,336 | | | | 1,609,897 | |
| UGI Corp. | | | 33,926 | | | | 1,506,993 | |
| PG&E Corp. | | | 14,258 | | | | 626,354 | |
| Total Utilities | | | | | | | 19,612,357 | |
| SEE NOTES TO FINANCIAL STATEMENTS. | THE GUGGENHEIM FUNDS SEMI-ANNUAL REPORT | 13 |
| CONSOLIDATED SCHEDULE OF INVESTMENTS (Unaudited)(continued) | March 29, 2018 |
| MACRO OPPORTUNITIES FUND | |
| | | Shares | | | Value | |
| | | | | | | |
| Energy - 0.3% |
| SandRidge Energy, Inc.* | | | 507,188 | | | $ | 7,359,298 | |
| Chevron Corp. | | | 17,216 | | | | 1,963,312 | |
| Valero Energy Corp. | | | 21,113 | | | | 1,958,653 | |
| Occidental Petroleum Corp. | | | 28,595 | | | | 1,857,531 | |
| Marathon Petroleum Corp. | | | 16,779 | | | | 1,226,713 | |
| Exxon Mobil Corp. | | | 16,408 | | | | 1,224,201 | |
| HollyFrontier Corp. | | | 19,502 | | | | 952,868 | |
| Approach Resources, Inc.* | | | 357,054 | | | | 931,911 | |
| PBF Energy, Inc. — Class A | | | 24,992 | | | | 847,229 | |
| Williams Companies, Inc. | | | 15,011 | | | | 373,173 | |
| Titan Energy LLC* | | | 35,116 | | | | 38,627 | |
| Total Energy | | | | | | | 18,733,516 | |
| | | | | | | | | |
| Technology - 0.2% |
| DXC Technology Co. | | | 15,152 | | | | 1,523,231 | |
| HP, Inc. | | | 69,261 | | | | 1,518,201 | |
| Cirrus Logic, Inc.* | | | 35,161 | | | | 1,428,591 | |
| NetApp, Inc. | | | 21,685 | | | | 1,337,748 | |
| Western Digital Corp. | | | 12,435 | | | | 1,147,377 | |
| Convergys Corp. | | | 49,631 | | | | 1,122,653 | |
| Dell Technologies Incorporated Class V — Class V* | | | 13,278 | | | | 972,082 | |
| MAXIMUS, Inc. | | | 12,741 | | | | 850,334 | |
| ON Semiconductor Corp.* | | | 32,725 | | | | 800,453 | |
| International Business Machines Corp. | | | 4,183 | | | | 641,798 | |
| CA, Inc. | | | 18,660 | | | | 632,574 | |
| Micron Technology, Inc.* | | | 11,872 | | | | 619,006 | |
| Xerox Corp. | | | 18,447 | | | | 530,905 | |
| KLA-Tencor Corp. | | | 4,552 | | | | 496,214 | |
| Seagate Technology plc | | | 8,310 | | | | 486,301 | |
| Kulicke & Soffa Industries, Inc.* | | | 18,684 | | | | 467,287 | |
| Oracle Corp. | | | 10,003 | | | | 457,637 | |
| NCR Corp.* | | | 12,707 | | | | 400,525 | |
| Qlik Technologies, Inc. - Class A*,†††,1 | | | 177 | | | | 180,638 | |
| Icad, Inc.* | | | 56,620 | | | | 174,390 | |
| Qlik Technologies, Inc. - Class B*,†††,1 | | | 43,738 | | | | 5 | |
| Qlik Technologies, Inc.*,†††,1 | | | 11,400 | | | | 1 | |
| Total Technology | | | | | | | 15,787,951 | |
| | | | | | | | | |
| Consumer, Cyclical - 0.2% |
| Southwest Airlines Co. | | | 33,674 | | | | 1,928,847 | |
| Allison Transmission Holdings, Inc. | | | 44,473 | | | | 1,737,115 | |
| Alaska Air Group, Inc. | | | 25,065 | | | | 1,553,027 | |
| Lions Gate Entertainment Corp. — Class A | | | 54,006 | | | | 1,394,975 | |
| PACCAR, Inc. | | | 15,208 | | | | 1,006,313 | |
| Meritor, Inc.* | | | 36,244 | | | | 745,177 | |
| Delta Air Lines, Inc. | | | 12,302 | | | | 674,272 | |
| Copa Holdings S.A. — Class A | | | 5,019 | | | | 645,594 | |
| Tailored Brands, Inc. | | | 24,509 | | | | 614,196 | |
| Ralph Lauren Corp. — Class A | | | 4,910 | | | | 548,938 | |
| Toll Brothers, Inc. | | | 10,452 | | | | 452,049 | |
| Taylor Morrison Home Corp. — Class A* | | | 19,324 | | | | 449,863 | |
| Cooper-Standard Holdings, Inc.* | | | 3,659 | | | | 449,362 | |
| Hawaiian Holdings, Inc. | | | 11,284 | | | | 436,691 | |
| Total Consumer, Cyclical | | | | | | | 12,636,419 | |
| | | | | | | | | |
| Financial - 0.1% |
| VEREIT, Inc. REIT | | | 237,422 | | | | 1,652,457 | |
| Senior Housing Properties Trust REIT | | | 101,535 | | | | 1,590,038 | |
| Principal Financial Group, Inc. | | | 26,076 | | | | 1,588,289 | |
| Prudential Financial, Inc. | | | 10,365 | | | | 1,073,296 | |
| Park Hotels & Resorts, Inc. REIT | | | 33,389 | | | | 902,171 | |
| Mack-Cali Realty Corp. REIT | | | 37,768 | | | | 631,103 | |
| Summit Hotel Properties, Inc. REIT | | | 35,404 | | | | 481,849 | |
| Total Financial | | | | | | | 7,919,203 | |
| 14 | THE GUGGENHEIM FUNDS SEMI-ANNUAL REPORT | SEE NOTES TO FINANCIAL STATEMENTS. |
| CONSOLIDATED SCHEDULE OF INVESTMENTS (Unaudited)(continued) | March 29, 2018 |
| MACRO OPPORTUNITIES FUND | |
| | | Shares | | | Value | |
| | | | | | | |
| Basic Materials - 0.1% |
| LyondellBasell Industries N.V. — Class A | | | 8,398 | | | $ | 887,501 | |
| Huntsman Corp. | | | 17,584 | | | | 514,332 | |
| Coeur Mining, Inc.* | | | 51,821 | | | | 414,568 | |
| Domtar Corp. | | | 8,919 | | | | 379,414 | |
| Alcoa Corp.* | | | 8,408 | | | | 378,024 | |
| Total Basic Materials | | | | | | | 2,573,839 | |
| | | | | | | | | |
| Total Common Stocks | | | | | | | | |
| (Cost $186,938,565) | | | | | | | 185,018,273 | |
| | | | | | | | | |
| PREFERRED STOCKS†† - 0.3% |
| Industrial - 0.2% |
| Seaspan Corp. 6.38% due 04/30/19 | | | 530,800 | | | | 13,503,552 | |
| | | | | | | | | |
| Financial - 0.1% |
| Cent CLO 16, LP due 08/1/24*,3 | | | 7,000 | | | | 3,814,580 | |
| BreitBurn Energy Partners 8.00%*,11 | | | 389,684 | | | | 38 | |
| Total Financial | | | | | | | 3,814,618 | |
| Total Preferred Stocks | | | | | | | | |
| (Cost $19,790,292) | | | | | | | 17,318,170 | |
| | | | | | | | | |
| EXCHANGE-TRADED FUNDS† - 0.9% |
| Guggenheim Solar ETF2 | | | 700,700 | | | | 17,209,192 | |
| iShares MSCI Brazil ETF | | | 362,454 | | | | 16,266,935 | |
| iShares MSCI Chile ETF | | | 306,440 | | | | 16,247,449 | |
| iShares China Large-Capital ETF | | | 331,449 | | | | 15,657,651 | |
| Total Exchange-Traded Funds | | | | | | | | |
| (Cost $60,226,352) | | | | | | | 65,381,227 | |
| | | | | | | | | |
| MUTUAL FUNDS† - 11.0% |
| Guggenheim Limited Duration Fund - Institutional Class2 | | | 12,125,299 | | | | 300,101,151 | |
| Guggenheim Alpha Opportunity Fund - Institutional Class2 | | | 5,863,072 | | | | 166,863,030 | |
| Guggenheim Strategy Fund II2 | | | 3,972,760 | | | | 99,358,732 | |
| Guggenheim Strategy Fund I2 | | | 3,540,658 | | | | 88,693,484 | |
| Guggenheim Strategy Fund III2 | | | 3,142,819 | | | | 78,664,762 | |
| Guggenheim Risk Managed Real Estate Fund - Institutional Class2 | | | 522,267 | | | | 14,654,804 | |
| Guggenheim Floating Rate Strategies Fund - Institutional Class2 | | | 506,537 | | | | 13,175,038 | |
| Total Mutual Funds | | | | | | | | |
| (Cost $760,193,630) | | | | | | | 761,511,001 | |
| | | | | | | | | |
| MONEY MARKET FUNDS† - 2.6% |
| Federated U.S. Treasury Cash Reserve Fund Instituional Shares 1.45%5 | | | 175,338,257 | | | | 175,338,257 | |
| Western Asset Institutional U.S. Treasury Reserves Institutional Shares 0.96%5 | | | 8,075,637 | | | | 8,075,637 | |
| Total Money Market Funds | | | | | | | | |
| (Cost $183,413,894) | | | | | | | 183,413,894 | |
| | | | | | | | | |
| | | | Face
Amount~ | | | | | |
| | | | | | | | | |
| ASSET-BACKED SECURITIES†† - 29.5% |
| Collateralized Loan Obligations - 20.8% |
| Fortress Credit Opportunities IX CLO Ltd. | | | | | | | | |
| 2017-9A, 2.97% (3 Month USD LIBOR + 1.55%) due 11/15/296,7 | | | 62,500,000 | | | | 62,639,587 | |
| SEE NOTES TO FINANCIAL STATEMENTS. | THE GUGGENHEIM FUNDS SEMI-ANNUAL REPORT | 15 |
| CONSOLIDATED SCHEDULE OF INVESTMENTS (Unaudited)(continued) | March 29, 2018 |
| MACRO OPPORTUNITIES FUND | |
| | | Face
Amount~ | | | Value | |
| | | | | | | |
| 2017-9A, 3.37% (3 Month USD LIBOR + 1.95%) due 11/15/296,7 | | | 34,300,000 | | | $ | 34,444,228 | |
| KVK CLO Ltd. | | | | | | | | |
| 2017-2A, 3.85% (3 Month USD LIBOR + 2.55%) due 01/15/266,7 | | | 22,350,000 | | | | 22,371,381 | |
| 2017-2A, 2.48% (3 Month USD LIBOR + 1.18%) due 07/15/266,7 | | | 18,300,000 | | | | 18,336,961 | |
| 2014-1A, 3.92% (3 Month USD LIBOR + 2.60%) due 05/15/266,7 | | | 13,250,000 | | | | 13,286,997 | |
| 2014-2A, 6.05% (3 Month USD LIBOR + 4.75%) due 07/15/266,7 | | | 7,200,000 | | | | 7,046,667 | |
| 2013-1A, due 01/15/283,7 | | | 11,900,000 | | | | 5,734,217 | |
| 2014-3A, due 10/15/263,7 | | | 2,500,000 | | | | 663,013 | |
| Shackleton 2015-VIII CLO Ltd. | | | | | | | | |
| 2017-8A, 2.66% (3 Month USD LIBOR + 0.92%) due 10/20/276,7 | | | 62,000,000 | | | | 62,017,596 | |
| Golub Capital Partners CLO Ltd. | | | | | | | | |
| 2017-16A, 3.56% (3 Month USD LIBOR + 2.25%) due 07/25/296,7 | | | 24,050,000 | | | | 24,218,699 | |
| 2016-33A, 4.36% (3 Month USD LIBOR + 2.48%) due 11/21/286,7 | | | 17,500,000 | | | | 17,567,786 | |
| 2015-25A, 3.96% (3 Month USD LIBOR + 2.65%) due 08/05/276,7 | | | 6,000,000 | | | | 6,014,982 | |
| 2015-25A, 4.96% (3 Month USD LIBOR + 3.65%) due 08/05/276,7 | | | 4,000,000 | | | | 4,010,130 | |
| Octagon Loan Funding Ltd. | | | | | | | | |
| 2014-1X, due 11/18/263 | | | 52,700,000 | | | | 45,754,035 | |
| Woodmont Trust | | | | | | | | |
| 2017-2A, 4.08% (3 Month USD LIBOR + 2.35%) due 07/18/286,7 | | | 28,600,000 | | | | 28,800,929 | |
| 2017-3A, 3.98% (3 Month USD LIBOR + 2.25%) due 10/18/296,7 | | | 7,400,000 | | | | 7,453,078 | |
| Cerberus Loan Funding XXIII, LP | | | | | | | | |
| 2018-2A, 3.31% (3 Month USD LIBOR + 1.00%) due 04/15/286,7 | | | 35,300,000 | | | | 35,300,000 | |
| OCP CLO 2015-8 Ltd. | | | | | | | | |
| 2017-8A, 3.18% (3 Month USD LIBOR + 1.45%) due 04/17/276,7 | | | 27,500,000 | | | | 27,505,473 | |
| 2017-8A, 2.58% (3 Month USD LIBOR + 0.85%) due 04/17/276,7 | | | 6,000,000 | | | | 6,000,849 | |
| Golub Capital Partners CLO 36m Ltd. | | | | | | | | |
| 2018-36A, 4.19% (3 Month USD LIBOR + 2.10%) due 02/05/316,7 | | | 20,000,000 | | | | 19,994,122 | |
| 2018-36A, 3.74% (3 Month USD LIBOR + 1.65%) due 02/05/316,7 | | | 13,200,000 | | | | 13,197,347 | |
| Tralee CLO III Ltd. | | | | | | | | |
| 2017-3A, 3.19% (3 Month USD LIBOR + 1.45%) due 10/20/276 | | | 31,000,000 | | | | 31,030,076 | |
| 16 | THE GUGGENHEIM FUNDS SEMI-ANNUAL REPORT | SEE NOTES TO FINANCIAL STATEMENTS. |
| CONSOLIDATED SCHEDULE OF INVESTMENTS (Unaudited)(continued) | March 29, 2018 |
| MACRO OPPORTUNITIES FUND | |
| | | Face
Amount~ | | | Value | |
| | | | | | | |
| Marathon CLO V Ltd. | | | | | | |
| 2017-5A, 2.76% (3 Month USD LIBOR + 0.87%) due 11/21/276,7 | | | 16,700,000 | | | $ | 16,663,449 | |
| 2017-5A, 3.34% (3 Month USD LIBOR + 1.45%) due 11/21/276,7 | | | 11,500,000 | | | | 11,501,902 | |
| 2013-5A, due 11/21/273,7 | | | 5,500,000 | | | | 2,530,000 | |
| ABPCI Direct Lending Fund CLO II LLC | | | | | | | | |
| 2017-1A, 3.25% (3 Month USD LIBOR + 1.78%) due 07/20/296,7 | | | 25,000,000 | | | | 25,091,195 | |
| 2017-1A, 3.19% (3 Month USD LIBOR + 2.35%) due 07/20/296,7 | | | 4,650,000 | | | | 4,669,087 | |
| Telos CLO Ltd. | | | | | | | | |
| 2017-6A, 3.00% (3 Month USD LIBOR + 1.27%) due 01/17/276,7 | | | 19,800,000 | | | | 19,798,535 | |
| 2017-6A, 4.33% (3 Month USD LIBOR + 2.60%) due 01/17/276,7 | | | 7,500,000 | | | | 7,507,108 | |
| BSPRT Issuer Ltd. | | | | | | | | |
| 2017-FL2, 5.23% (1 Month USD LIBOR + 3.45%) due 10/15/346,7 | | | 16,500,000 | | | | 16,489,463 | |
| 2017-FL2, 3.93% (1 Month USD LIBOR + 2.15%) due 10/15/346,7 | | | 9,000,000 | | | | 8,994,209 | |
| Treman Park CLO Ltd. | | | | | | | | |
| 2015-1A, due 04/20/273,7 | | | 32,400,000 | | | | 24,659,887 | |
| A Voce CLO Ltd. | | | | | | | | |
| 2017-1A, 2.88% (3 Month USD LIBOR + 1.16%) due 07/15/266,7 | | | 24,375,000 | | | | 24,373,815 | |
| ABPCI Direct Lending Fund CLO I LLC | | | | | | | | |
| 2016-1A, 4.44% (3 Month USD LIBOR + 2.70%) due 12/22/286,7 | | | 24,000,000 | | | | 24,088,032 | |
| OCP CLO 2014-7 Ltd. | | | | | | | | |
| 2017-7A, 3.14% (3 Month USD LIBOR + 1.40%) due 10/20/266,7 | | | 24,050,000 | | | | 24,051,159 | |
| Ares XXXIII CLO Ltd. | | | | | | | | |
| 2016-1A, 3.37% (3 Month USD LIBOR + 1.35%) due 12/05/256,7 | | | 18,250,000 | | | | 18,350,101 | |
| 2016-1A, 4.82% (3 Month USD LIBOR + 2.80%) due 12/05/256,7 | | | 5,000,000 | | | | 5,049,409 | |
| Monroe Capital CLO Ltd. | | | | | | | | |
| 2014-1A, 3.09% (3 Month USD LIBOR + 1.35%) due 10/22/266,7 | | | 18,500,000 | | | | 18,501,844 | |
| 2014-1A, 5.34% (3 Month USD LIBOR + 3.60%) due 10/22/266,7 | | | 3,000,000 | | | | 3,003,016 | |
| Crown Point CLO III Ltd. | | | | | | | | |
| 2017-3A, 3.17% (3 Month USD LIBOR + 1.45%) due 12/31/276,7 | | | 15,000,000 | | | | 15,008,653 | |
| 2017-3A, 2.63% (3 Month USD LIBOR + 0.91%) due 12/31/276,7 | | | 5,300,000 | | | | 5,298,466 | |
| SEE NOTES TO FINANCIAL STATEMENTS. | THE GUGGENHEIM FUNDS SEMI-ANNUAL REPORT | 17 |
| CONSOLIDATED SCHEDULE OF INVESTMENTS (Unaudited)(continued) | March 29, 2018 |
| MACRO OPPORTUNITIES FUND | |
| | | Face
Amount~ | | | Value | |
| | | | | | | |
| Denali Capital CLO X LLC | | | | | | |
| 2017-1A, 3.35% (3 Month USD LIBOR + 1.60%) due 10/26/276,7 | | | 19,400,000 | | | $ | 19,472,238 | |
| Regatta V Funding Ltd. | | | | | | | | |
| 2017-1A, 2.91% (3 Month USD LIBOR + 1.16%) due 10/25/266,7 | | | 19,400,000 | | | | 19,416,482 | |
| West CLO Ltd. | | | | | | | | |
| 2017-1A, 2.65% (3 Month USD LIBOR + 0.92%) due 07/18/266,7 | | | 17,475,000 | | | | 17,471,356 | |
| 2013-1A, due 11/07/253,7 | | | 5,300,000 | | | | 1,768,319 | |
| Galaxy XVIII CLO Ltd. | | | | | | | | |
| 2017-18A, 2.47% (3 Month USD LIBOR + 1.17%) due 10/15/266,7 | | | 19,000,000 | | | | 18,999,012 | |
| Cerberus Loan Funding XVII Ltd. | | | | | | | | |
| 2016-3A, 4.25% (3 Month USD LIBOR + 2.53%) due 01/15/286,7 | | | 18,000,000 | | | | 18,073,039 | |
| TICP CLO II Ltd. | | | | | | | | |
| 2017-2A, 2.90% (3 Month USD LIBOR + 1.16%) due 07/20/266,7 | | | 15,950,000 | | | | 15,951,673 | |
| 2017-2A, 3.29% (3 Month USD LIBOR + 1.55%) due 07/20/266,7 | | | 2,100,000 | | | | 2,100,243 | |
| Ladder Capital Commercial Mortgage 2017-FL1 Mortgage Trust | | | | | | | | |
| 2017-FL1, 4.04% (1 Month USD LIBOR + 2.25%) due 09/15/346,7 | | | 12,198,000 | | | | 12,183,504 | |
| 2017-FL1, 5.39% (1 Month USD LIBOR + 3.60%) due 09/15/346,7 | | | 5,750,000 | | | | 5,748,130 | |
| Voya CLO Ltd. | | | | | | | | |
| 2013-1X, due 10/15/303 | | | 20,000,000 | | | | 12,167,780 | |
| 2013-1A, due 10/15/303,7 | | | 8,970,307 | | | | 5,457,436 | |
| Resource Capital Corp. | | | | | | | | |
| 2015-CRE4, 4.79% (1 Month USD LIBOR + 3.00%) due 08/15/326,7 | | | 7,750,000 | | | | 7,672,500 | |
| 2017-CRE5, 3.79% (1 Month USD LIBOR + 2.00%) due 07/15/346,7 | | | 5,689,910 | | | | 5,687,716 | |
| 2015-CRE3, 5.79% (1 Month USD LIBOR + 4.00%) due 03/15/326,7 | | | 3,780,290 | | | | 3,764,915 | |
| Avery Point II CLO Ltd. | | | | | | | | |
| 2013-3X COM, due 01/18/253 | | | 19,800,000 | | | | 17,057,057 | |
| TICP CLO Ltd. | | | | | | | | |
| 2017-3A, 2.92% (3 Month USD LIBOR + 1.18%) due 01/20/276,7 | | | 16,850,000 | | | | 16,860,659 | |
| Fortress Credit Opportunities VII CLO Ltd. | | | | | | | | |
| 2016-7A, 5.07% (3 Month USD LIBOR + 2.95%) due 12/15/286,7 | | | 16,000,000 | | | | 16,109,605 | |
| Venture XIX CLO Ltd. | | | | | | | | |
| 2016-19A, 4.57% (3 Month USD LIBOR + 2.85%) due 01/15/276,7 | | | 14,350,000 | | | | 14,360,293 | |
| Seneca Park CLO Limited | | | | | | | | |
| 2017-1A, 2.85% (3 Month USD LIBOR + 1.12%) due 07/17/266,7 | | | 13,132,000 | | | | 13,158,621 | |
| 18 | THE GUGGENHEIM FUNDS SEMI-ANNUAL REPORT | SEE NOTES TO FINANCIAL STATEMENTS. |
| CONSOLIDATED SCHEDULE OF INVESTMENTS (Unaudited)(continued) | March 29, 2018 |
| MACRO OPPORTUNITIES FUND | |
| | | Face
Amount~ | | | Value | |
| | | | | | | |
| Fortress Credit Opportunities VI CLO Ltd. | | | | | | |
| 2015-6A, 7.32% (3 Month USD LIBOR + 5.25%) due 10/10/266,7 | | | 5,400,000 | | | $ | 5,411,355 | |
| 2015-6A, 4.77% (3 Month USD LIBOR + 2.70%) due 10/10/266,7 | | | 4,000,000 | | | | 4,007,803 | |
| 2015-6A, 5.72% (3 Month USD LIBOR + 3.65%) due 10/10/266,7 | | | 3,000,000 | | | | 3,003,424 | |
| NewStar Clarendon Fund CLO LLC | | | | | | | | |
| 2015-1A, 4.45% (3 Month USD LIBOR + 2.70%) due 01/25/276,7 | | | 7,000,000 | | | | 7,024,218 | |
| 2015-1A, 5.10% (3 Month USD LIBOR + 3.35%) due 01/25/276,7 | | | 4,000,000 | | | | 4,009,696 | |
| 2015-1A, 6.10% (3 Month USD LIBOR + 4.35%) due 01/25/276,7 | | | 1,300,000 | | | | 1,292,974 | |
| OHA Credit Partners IX Ltd. | | | | | | | | |
| 2013-9A, due 10/20/253,7 | | | 14,000,000 | | | | 12,251,554 | |
| Flagship VII Ltd. | | | | | | | | |
| 2017-7A, 2.86% (3 Month USD LIBOR + 1.12%) due 01/20/266,7 | | | 12,100,000 | | | | 12,100,956 | |
| Northwoods Capital XII Ltd. | | | | | | | | |
| 2017-12A, 4.03% (3 Month USD LIBOR + 2.45%) due 09/15/256,7 | | | 12,000,000 | | | | 12,043,944 | |
| FDF I Ltd. | | | | | | | | |
| 2015-1A, 5.50% due 11/12/307 | | | 12,000,000 | | | | 12,028,132 | |
| Octagon Investment Partners XIX Ltd. | | | | | | | | |
| 2017-1A, 2.82% (3 Month USD LIBOR + 1.10%) due 04/15/266,7 | | | 11,800,000 | | | | 11,803,588 | |
| Atlas Senior Loan Fund III Ltd. | | | | | | | | |
| 2017-1A, 2.71% (3 Month USD LIBOR + 0.83%) due 11/17/276,7 | | | 11,600,000 | | | | 11,592,958 | |
| TCP Waterman CLO LLC | | | | | | | | |
| 2016-1A, 5.12% (3 Month USD LIBOR + 3.00%) due 12/15/286,7 | | | 11,000,000 | | | | 11,051,928 | |
| Northwoods Capital XIV Ltd. | | | | | | | | |
| 2017-14A, 4.26% (3 Month USD LIBOR + 2.45%) due 11/12/256,7 | | | 10,750,000 | | | | 10,763,068 | |
| Flagship CLO VIII Ltd. | | | | | | | | |
| 2014-8A, 4.22% (3 Month USD LIBOR + 2.50%) due 01/16/266,7 | | | 9,825,000 | | | | 9,832,004 | |
| Babson CLO Ltd. | | | | | | | | |
| 2014-IA, due 07/20/253,7 | | | 11,900,000 | | | | 5,489,053 | |
| 2013-IIA, 4.98% (3 Month USD LIBOR + 3.25%) due 01/18/256,7 | | | 3,500,000 | | | | 3,502,491 | |
| 2012-2A, due 05/15/233,7 | | | 11,850,000 | | | | 514,160 | |
| NXT Capital CLO LLC | | | | | | | | |
| 2017-1A, 3.64% (3 Month USD LIBOR + 1.90%) due 04/23/266,7 | | | 3,600,000 | | | | 3,608,320 | |
| SEE NOTES TO FINANCIAL STATEMENTS. | THE GUGGENHEIM FUNDS SEMI-ANNUAL REPORT | 19 |
| CONSOLIDATED SCHEDULE OF INVESTMENTS (Unaudited)(continued) | March 29, 2018 |
| MACRO OPPORTUNITIES FUND | |
| | | Face
Amount~ | | | Value | |
| | | | | | | |
| 2017-1A, 4.09% (3 Month USD LIBOR + 2.35%) due 04/20/296,7 | | | 3,000,000 | | | $ | 3,020,051 | |
| 2018-1A, 5.04% (3 Month USD LIBOR + 3.30%) due 04/21/276,7 | | | 2,750,000 | | | | 2,750,605 | |
| Dryden 41 Senior Loan Fund | | | | | | | | |
| 2015-41A, due 04/15/313,7 | | | 10,500,000 | | | | 9,036,583 | |
| Benefit Street Partners CLO V Ltd. | | | | | | | | |
| 2017-VA, 4.24% (3 Month USD LIBOR + 2.50%) due 10/20/266,7 | | | 9,000,000 | | | | 9,009,612 | |
| Recette Clo Ltd. | | | | | | | | |
| 2017-1A, 3.04% (3 Month USD LIBOR + 1.30%) due 10/20/276,7 | | | 9,000,000 | | | | 9,003,093 | |
| MP CLO VII Ltd. | | | | | | | | |
| 2017-1A, 2.57% (3 Month USD LIBOR + 0.84%) due 04/18/276,7 | | | 9,000,000 | | | | 9,002,207 | |
| ACIS CLO Ltd. | | | | | | | | |
| 2014-4A, 4.32% (3 Month USD LIBOR + 2.55%) due 05/01/266,7 | | | 3,600,000 | | | | 3,606,557 | |
| 2015-6A, 5.14% (3 Month USD LIBOR + 3.37%) due 05/01/276,7 | | | 3,250,000 | | | | 3,258,492 | |
| 2013-1A, 6.23% (3 Month USD LIBOR + 4.50%) due 04/18/246,7 | | | 2,100,000 | | | | 2,100,456 | |
| Dryden 37 Senior Loan Fund | | | | | | | | |
| 2015-37A, due 01/15/313,7 | | | 9,500,000 | | | | 8,655,537 | |
| Carlyle Global Market Strategies CLO Ltd. | | | | | | | | |
| 2012-3A, due 10/04/283,7 | | | 6,400,000 | | | | 5,359,373 | |
| 2013-3X SUB, due 07/15/253 | | | 4,938,326 | | | | 2,912,743 | |
| Golub Capital BDC CLO 2014 LLC | | | | | | | | |
| 2018-1A, 3.54% (3 Month USD LIBOR + 1.40%) due 04/25/266,7 | | | 8,000,000 | | | | 8,009,444 | |
| Newstar Commercial Loan Funding 2017-1 LLC | | | | | | | | |
| 2017-1A, 5.13% (3 Month USD LIBOR + 3.50%) due 03/20/276,7 | | | 7,500,000 | | | | 7,577,397 | |
| Fortress Credit Opportunities V CLO Ltd. | | | | | | | | |
| 2014-5A, 5.96% (3 Month USD LIBOR + 4.25%) due 10/15/266,7 | | | 7,500,000 | | | | 7,507,644 | |
| Nelder Grove CLO Ltd. | | | | | | | | |
| 2017-1A, 4.58% (3 Month USD LIBOR + 2.60%) due 08/28/266,7 | | | 7,450,000 | | | | 7,479,738 | |
| Cent CLO | | | | | | | | |
| 2014-16A, 4.51% (3 Month USD LIBOR + 3.20%) due 08/01/246,7 | | | 7,250,000 | | | | 7,272,581 | |
| FS Senior Funding Ltd. | | | | | | | | |
| 2015-1A, 4.37% (3 Month USD LIBOR + 2.65%) due 05/28/256,7 | | | 7,200,000 | | | | 7,208,119 | |
| Blue Hill CLO Ltd. | | | | | | | | |
| 2017-1A, 4.12% (3 Month USD LIBOR + 2.40%) due 01/15/266,7 | | | 6,500,000 | | | | 6,506,419 | |
| 20 | THE GUGGENHEIM FUNDS SEMI-ANNUAL REPORT | SEE NOTES TO FINANCIAL STATEMENTS. |
| CONSOLIDATED SCHEDULE OF INVESTMENTS (Unaudited)(continued) | March 29, 2018 |
| MACRO OPPORTUNITIES FUND | |
| | | Face
Amount~ | | | Value | |
| | | | | | | |
| Venture XIII CLO Ltd. | | | | | | |
| 2013-13A, due 09/10/293,7 | | | 11,040,000 | | | $ | 6,406,048 | |
| OZLM VI Ltd. | | | | | | | | |
| 2017-6A, 4.43% (3 Month USD LIBOR + 2.70%) due 04/17/266,7 | | | 6,325,000 | | | | 6,324,920 | |
| Atlas Senior Loan Fund IX Ltd. | | | | | | | | |
| 2018-9A, due 04/20/283,7 | | | 9,600,000 | | | | 6,088,166 | |
| Shackleton VII CLO Ltd. | | | | | | | | |
| 2015-7A, 4.57% (3 Month USD LIBOR + 2.85%) due 04/15/276,7 | | | 6,000,000 | | | | 6,005,578 | |
| Hull Street CLO Ltd. | | | | | | | | |
| 2014-1A, 4.90% (3 Month USD LIBOR + 3.60%) due 10/18/266,7 | | | 5,785,000 | | | | 5,775,334 | |
| Silvermore CLO Ltd. | | | | | | | | |
| 2014-1A, 4.84% (3 Month USD LIBOR + 3.00%) due 05/15/266,7 | | | 5,500,000 | | | | 5,519,255 | |
| Betony CLO Ltd. | | | | | | | | |
| 2016-1A, 4.57% (3 Month USD LIBOR + 2.85%) due 04/15/276,7 | | | 5,450,000 | | | | 5,461,476 | |
| Dryden 50 Senior Loan Fund | | | | | | | | |
| 2017-50A, due 07/15/303,7 | | | 6,000,000 | | | | 5,384,592 | |
| BNPP IP CLO Ltd. | | | | | | | | |
| 2014-2A, 7.02% (3 Month USD LIBOR + 5.25%) due 10/30/256,7 | | | 5,500,000 | | | | 5,336,235 | |
| FDF II Ltd. | | | | | | | | |
| 2016-2A, 6.29% due 05/12/317 | | | 5,250,000 | | | | 5,246,639 | |
| Mountain Hawk II CLO Ltd. | | | | | | | | |
| 2013-2A, 4.89% (3 Month USD LIBOR + 3.15%) due 07/22/246,7 | | | 2,750,000 | | | | 2,651,573 | |
| 2013-2A, 4.34% (3 Month USD LIBOR + 2.60%) due 07/22/246,7 | | | 2,500,000 | | | | 2,503,431 | |
| Fifth Street SLF II Ltd. | | | | | | | | |
| 2015-2A, 4.57% (3 Month USD LIBOR + 2.81%) due 09/29/276,7 | | | 5,000,000 | | | | 5,012,036 | |
| Sudbury Mill CLO Ltd. | | | | | | | | |
| 2017-1A, 4.18% (3 Month USD LIBOR + 2.45%) due 01/17/266,7 | | | 5,000,000 | | | | 5,004,922 | |
| WhiteHorse X Ltd. | | | | | | | | |
| 2015-10A, 7.03% (3 Month USD LIBOR + 5.30%) due 04/17/276,7 | | | 4,980,000 | | | | 4,812,519 | |
| NewStar Arlington Senior Loan Program LLC | | | | | | | | |
| 2014-1A, 6.00% (3 Month USD LIBOR + 4.25%) due 07/25/256,7 | | | 2,750,000 | | | | 2,752,629 | |
| 2014-1A, 5.05% (3 Month USD LIBOR + 3.30%) due 07/25/256,7 | | | 2,000,000 | | | | 2,002,650 | |
| AMMC CLO XV Ltd. | | | | | | | | |
| 2016-15A, 4.86% (3 Month USD LIBOR + 2.80%) due 12/09/266,7 | | | 4,500,000 | | | | 4,537,145 | |
| Vibrant Clo III Ltd. | | | | | | | | |
| 2016-3A, 4.69% (3 Month USD LIBOR + 2.95%) due 04/20/266,7 | | | 4,500,000 | | | | 4,506,106 | |
| SEE NOTES TO FINANCIAL STATEMENTS. | THE GUGGENHEIM FUNDS SEMI-ANNUAL REPORT | 21 |
| CONSOLIDATED SCHEDULE OF INVESTMENTS (Unaudited)(continued) | March 29, 2018 |
| MACRO OPPORTUNITIES FUND | |
| | | Face
Amount~ | | | Value | |
| | | | | | | |
| KKR CLO 14 Ltd. | | | | | | |
| 2016-14, 6.07% (3 Month USD LIBOR + 4.35%) due 07/15/286,7 | | | 2,500,000 | | | $ | 2,512,063 | |
| 2016-14, 4.02% (3 Month USD LIBOR + 2.30%) due 07/15/286,7 | | | 1,750,000 | | | | 1,756,496 | |
| Halcyon Loan Advisors Funding Ltd. | | | | | | | | |
| 2012-2A, 4.18% (3 Month USD LIBOR + 2.85%) due 12/20/246,7 | | | 3,250,000 | | | | 3,253,594 | |
| 2012-1A, 4.32% (3 Month USD LIBOR + 3.00%) due 08/15/236,7 | | | 1,000,000 | | | | 1,003,978 | |
| OHA Loan Funding Ltd. | | | | | | | | |
| 2017-1A, 4.79% (3 Month USD LIBOR + 3.05%) due 07/23/256,7 | | | 4,100,000 | | | | 4,108,161 | |
| Symphony Clo V Ltd. | | | | | | | | |
| 2007-5A, 5.97% (3 Month USD LIBOR + 4.25%) due 01/15/246,7 | | | 4,000,000 | | | | 4,024,997 | |
| Madison Park Funding XVI Ltd. | | | | | | | | |
| 2016-16A, 4.39% (3 Month USD LIBOR + 2.65%) due 04/20/266,7 | | | 4,000,000 | | | | 4,004,093 | |
| MidOcean Credit CLO I | | | | | | | | |
| 2018-1A, 3.02% (3 Month USD LIBOR + 1.30%) due 01/15/246,7 | | | 4,000,000 | | | | 4,000,257 | |
| Adams Mill CLO Ltd. | | | | | | | | |
| 2014-1A, 6.72% (3 Month USD LIBOR + 5.00%) due 07/15/266,7 | | | 4,000,000 | | | | 3,951,855 | |
| Garrison Funding Ltd. | | | | | | | | |
| 2016-2A, 5.32% (3 Month USD LIBOR + 4.00%) due 09/29/276,7 | | | 3,700,000 | | | | 3,750,375 | |
| Jamestown CLO VI Ltd. | | | | | | | | |
| 2015-6A, 4.57% (3 Month USD LIBOR + 3.25%) due 02/20/276,7 | | | 3,750,000 | | | | 3,745,005 | |
| Fifth Street Senior Loan Fund I LLC | | | | | | | | |
| 2015-1A, 5.49% (3 Month USD LIBOR + 3.75%) due 01/20/276,7 | | | 3,500,000 | | | | 3,507,788 | |
| NewMark Capital Funding CLO Ltd. | | | | | | | | |
| 2014-2A, 5.81% (3 Month USD LIBOR + 3.50%) due 06/30/266,7 | | | 3,500,000 | | | | 3,504,363 | |
| OZLM IX Ltd. | | | | | | | | |
| 2017-9A, 4.09% (3 Month USD LIBOR + 2.35%) due 01/20/276,7 | | | 3,500,000 | | | | 3,503,435 | |
| Mountain Hawk I CLO Ltd. | | | | | | | | |
| 2013-1A, 4.46% (3 Month USD LIBOR + 2.72%) due 01/20/246,7 | | | 3,400,000 | | | | 3,406,697 | |
| Hunt CRE 2017-FL1 Ltd. | | | | | | | | |
| 2017-FL1, 3.63% (1 Month USD LIBOR + 2.40%) due 08/15/346,7 | | | 3,350,000 | | | | 3,347,540 | |
| PFP Ltd. | | | | | | | | |
| 2017-3, 4.28% (1 Month USD LIBOR + 2.50%) due 01/14/356,7 | | | 3,250,000 | | | | 3,269,262 | |
| Flatiron CLO Ltd. | | | | | | | | |
| 2013-1A, 5.33% (3 Month USD LIBOR + 3.60%) due 01/17/266,7 | | | 3,200,000 | | | | 3,206,242 | |
| 22 | THE GUGGENHEIM FUNDS SEMI-ANNUAL REPORT | SEE NOTES TO FINANCIAL STATEMENTS. |
| CONSOLIDATED SCHEDULE OF INVESTMENTS (Unaudited)(continued) | March 29, 2018 |
| MACRO OPPORTUNITIES FUND | |
| | | Face
Amount~ | | | Value | |
| | | | | | | |
| AMMC CLO XI Ltd. | | | | | | |
| 2012-11A, due 10/30/233,7 | | | 5,650,000 | | | $ | 3,192,250 | |
| Mountain Hawk III CLO Ltd. | | | | | | | | |
| 2014-3A, 4.53% (3 Month USD LIBOR + 2.80%) due 04/18/256,7 | | | 3,000,000 | | | | 3,001,033 | |
| TPG Real Estate Finance Issuer Ltd. | | | | | | | | |
| 2018-FL1, 3.69% (1 Month USD LIBOR + 1.90%) due 03/15/206,7 | | | 2,700,000 | | | | 2,698,003 | |
| Shackleton CLO Ltd. | | | | | | | | |
| 2014-6A, 5.33% (3 Month USD LIBOR + 3.60%) due 07/17/266,7 | | | 2,068,000 | | | | 2,071,675 | |
| Cent CLO 21 Ltd. | | | | | | | | |
| 2017-21A, 3.72% (3 Month USD LIBOR + 2.40%) due 07/27/266,7 | | | 2,000,000 | | | | 2,003,110 | |
| Great Lakes CLO Ltd. | | | | | | | | |
| 2014-1A, due 10/15/293,7 | | | 1,500,000 | | | | 1,307,101 | |
| Copper River CLO Ltd. | | | | | | | | |
| 2007-1A, due 01/20/213,8 | | | 8,150,000 | | | | 1,037,495 | |
| Northwoods Capital XI Ltd. | | | | | | | | |
| 2017-11A, 4.12% (3 Month USD LIBOR + 2.40%) due 04/15/256,7 | | | 1,000,000 | | | | 999,992 | |
| Keuka Park CLO Ltd. | | | | | | | | |
| 2013-1A, due 10/21/243,7 | | | 3,000,000 | | | | 101,226 | |
| Gramercy Park CLO Ltd. | | | | | | | | |
| 2012-1A, due 07/17/233,7 | | | 2,650,000 | | | | 59,726 | |
| 2012-1X, due 07/17/233 | | | 1,250,000 | | | | 28,172 | |
| Total Collateralized Loan Obligations | | | | | | | 1,440,793,576 | |
| | | | | | | | | |
| Transport-Aircraft - 6.4% |
| KDAC Aviation Finance Ltd. | | | | | | | | |
| 2017-1A, 4.21% due 12/15/427 | | | 64,711,900 | | | | 64,591,290 | |
| AASET Trust | | | | | | | | |
| 2017-1A, 3.97% due 05/16/427 | | | 62,803,320 | | | | 62,604,265 | |
| Raspro Trust | | | | | | | | |
| 2005-1A, 2.37% (3 Month USD LIBOR + 0.63%) due 03/23/246,7 | | | 54,297,571 | | | | 51,854,180 | |
| Castlelake Aircraft Securitization Trust | | | | | | | | |
| 2017-1, 3.97% due 07/15/42 | | | 34,648,573 | | | | 34,264,189 | |
| 2016-1, 4.45% due 08/15/41 | | | 26,608,022 | | | | 26,451,806 | |
| Falcon Aerospace Ltd. | | | | | | | | |
| 2017-1, 4.58% due 02/15/427 | | | 48,523,940 | | | | 48,725,411 | |
| Apollo Aviation Securitization Equity Trust | | | | | | | | |
| 2017-1A, 5.93% due 05/16/427 | | | 16,306,500 | | | | 16,340,998 | |
| 2016-2, 5.93% due 11/15/41 | | | 9,894,080 | | | | 10,071,560 | |
| 2016-2, 4.21% due 11/15/41 | | | 8,834,000 | | | | 8,921,343 | |
| 2016-1A, 6.50% due 03/17/367 | | | 6,029,975 | | | | 6,167,839 | |
| 2016-2, 7.87% due 11/15/41 | | | 3,611,520 | | | | 3,631,972 | |
| 2018-1A, 5.44% due 01/16/387 | | | 1,723,400 | | | | 1,706,339 | |
| SAPPHIRE AVIATION FINANCE I Ltd. | | | | | | | | |
| 2018-1A, 4.25% due 03/15/407 | | | 32,300,000 | | | | 32,403,748 | |
| AIM Aviation Finance Ltd. | | | | | | | | |
| 2015-1A, 5.07% due 02/15/407 | | | 13,365,037 | | | | 13,274,771 | |
| SEE NOTES TO FINANCIAL STATEMENTS. | THE GUGGENHEIM FUNDS SEMI-ANNUAL REPORT | 23 |
| CONSOLIDATED SCHEDULE OF INVESTMENTS (Unaudited)(continued) | March 29, 2018 |
| MACRO OPPORTUNITIES FUND | |
| | | Face
Amount~ | | | Value | |
| | | | | | | |
| Falcon Aerospace Limited | | | | | | |
| 2017-1, 6.30% due 02/15/427 | | | 10,901,650 | | | $ | 10,936,895 | |
| Rise Ltd. | | | | | | | | |
| 2014-1B, 6.50% due 02/12/39 | | | 5,298,595 | | | | 5,306,543 | |
| 2014-1A, 4.74% due 02/12/39 | | | 4,122,362 | | | | 4,128,546 | |
| Castle Aircraft SecuritizationTrust | | | | | | | | |
| 2015-1A, 5.75% due 12/15/407 | | | 8,102,927 | | | | 8,068,511 | |
| Stripes Aircraft Ltd. | | | | | | | | |
| 2013-1 A1, 5.32% due 03/20/23††† | | | 6,930,525 | | | | 6,871,896 | |
| Atlas Ltd. | | | | | | | | |
| 2014-1 A, 4.87% due 12/15/39 | | | 5,727,786 | | | | 5,727,786 | |
| Emerald Aviation Finance Ltd. | | | | | | | | |
| 2013-1, 6.35% due 10/15/387 | | | 4,752,763 | | | | 4,749,964 | |
| Eagle I Ltd. | | | | | | | | |
| 2014-1A, 5.29% due 12/15/397 | | | 4,183,594 | | | | 4,055,068 | |
| Turbine Engines Securitization Ltd. | | | | | | | | |
| 2013-1A, 5.13% due 12/13/488 | | | 2,311,467 | | | | 2,323,515 | |
| 2013-1A, 6.38% due 12/13/488 | | | 1,639,421 | | | | 1,549,253 | |
| Willis Engine Securitization Trust II | | | | | | | | |
| 2012-A, 5.50% due 09/15/377 | | | 3,904,586 | | | | 3,863,008 | |
| AABS Ltd. | | | | | | | | |
| 2013-1 A, 4.87% due 01/10/38 | | | 1,825,079 | | | | 1,825,079 | |
| Airplanes Pass Through Trust | | | | | | | | |
| 2001-1A, 2.33% (1 Month USD LIBOR + 0.55%) due 03/15/196,8,13 | | | 2,097,481 | | | | 94,387 | |
| Total Transport-Aircraft | | | | | | | 440,510,162 | |
| | | | | | | | | |
| Whole Business - 0.9% |
| TSGE | | | | | | | | |
| 2017-1, 6.25% due 09/25/31†††,1 | | | 42,550,000 | | | | 42,602,921 | |
| DB Master Finance LLC | | | | | | | | |
| 2015-1A, 3.98% due 02/20/457 | | | 13,337,500 | | | | 13,452,736 | |
| Drug Royalty III Limited Partnership 1 | | | | | | | | |
| 2017-1A, 4.22% (3 Month USD LIBOR + 2.50%) due 04/15/276,7 | | | 3,310,619 | | | | 3,310,560 | |
| Sonic Capital LLC | | | | | | | | |
| 2018-1A, 4.03% due 02/20/487 | | | 1,500,000 | | | | 1,492,185 | |
| Miramax LLC | | | | | | | | |
| 2014-1A, 3.34% due 07/20/267 | | | 955,200 | | | | 951,669 | |
| Total Whole Business | | | | | | | 61,810,071 | |
| | | | | | | | | |
| Collateralized Debt Obligations - 0.6% |
| N-Star REL CDO VIII Ltd. | | | | | | | | |
| 2006-8A, 2.02% (1 Month USD LIBOR + 0.36%) due 02/01/416,7 | | | 19,501,287 | | | | 19,392,860 | |
| Putnam Structured Product Funding Ltd. | | | | | | | | |
| 2003-1A, 2.78% (1 Month USD LIBOR + 1.00%) due 10/15/386,7 | | | 15,091,188 | | | | 14,605,689 | |
| Anchorage Credit Funding 4 Ltd. | | | | | | | | |
| 2016-4A, 4.50% due 02/15/357 | | | 5,000,000 | | | | 5,038,337 | |
| Highland Park CDO I Ltd. | | | | | | | | |
| 2006-1A, 2.34% (3 Month USD LIBOR + 0.40%) due 11/25/516,8 | | | 3,165,198 | | | | 3,038,511 | |
| Banco Bradesco SA | | | | | | | | |
| 2014-1, 5.43% due 03/12/26†††,8 | | | 2,654,360 | | | | 2,660,980 | |
| 24 | THE GUGGENHEIM FUNDS SEMI-ANNUAL REPORT | SEE NOTES TO FINANCIAL STATEMENTS. |
| CONSOLIDATED SCHEDULE OF INVESTMENTS (Unaudited)(continued) | March 29, 2018 |
| MACRO OPPORTUNITIES FUND | |
| | | Face
Amount~ | | | Value | |
| | | | | | | |
| Static Repackaging Trust Ltd. | | | | | | |
| 2004-1A, 2.86% (3 Month USD LIBOR + 1.05%) due 05/10/396,7 | | | 542,874 | | | $ | 541,532 | |
| Pasadena CDO Ltd. | | | | | | | | |
| 2002-1A, 3.05% (3 Month USD LIBOR + 0.85%) due 06/19/376,7 | | | 261,067 | | | | 259,696 | |
| Total Collateralized Debt Obligations | | | | | | | 45,537,605 | |
| | | | | | | | | |
| Diversified Payment Rights - 0.3% |
| Bib Merchant Voucher Receivables Ltd. | | | | | | | | |
| 2018-1, 4.18% due 04/07/28 | | | 15,300,000 | | | | 15,300,000 | |
| CIC Receivables Master Trust | | | | | | | | |
| 4.89% due 10/07/21††† | | | 4,617,004 | | | | 4,774,410 | |
| Total Diversified Payment Rights | | | | | | | 20,074,410 | |
| | | | | | | | | |
| Unsecured Consumer Loans - 0.3% |
| Sofi Consumer Loan Program 2017-6 LLC | | | | | | | | |
| 2017-6, 2.20% due 11/25/267 | | | 20,035,614 | | | | 19,936,165 | |
| | | | | | | | | |
| Transport-Container - 0.1% |
| Global SC Finance II SRL | | | | | | | | |
| 2013-1A, 2.98% due 04/17/287 | | | 10,675,000 | | | | 10,516,216 | |
| | | | | | | | | |
| Automotive - 0.1% |
| Hertz Vehicle Financing II, LP | | | | | | | | |
| 2015-1A, 3.52% due 03/25/217 | | | 4,600,000 | | | | 4,597,620 | |
| Total Asset-Backed Securities | | | | | | | | |
| (Cost $2,039,692,619) | | | | | | | 2,043,775,825 | |
| | | | | | | | | |
| COLLATERALIZED MORTGAGE OBLIGATIONS†† - 18.0% |
| Residential Mortgage Backed Securities - 15.4% |
| LSTAR Securities Investment Limited | | | | | | | | |
| 2017-9, 3.21% (1 Month USD LIBOR + 1.55%) due 12/01/226,7 | | | 66,096,678 | | | | 66,127,665 | |
| 2017-8, 3.31% (1 Month USD LIBOR + 1.65%) due 11/01/226,7 | | | 47,736,833 | | | | 47,895,963 | |
| 2017-6, 2.99% (1 Month USD LIBOR + 1.75%) due 09/01/226,7 | | | 39,500,452 | | | | 39,525,140 | |
| 2017-3, 3.24% (1 Month USD LIBOR + 2.00%) due 04/01/226,7 | | | 23,229,555 | | | | 23,258,592 | |
| CIM Trust | | | | | | | | |
| 2018-R2, 3.69% due 08/25/57 | | | 52,000,000 | | | | 52,134,021 | |
| 2017-2, 3.66% (1 Month USD LIBOR + 2.00%) due 12/25/576,7 | | | 49,448,887 | | | | 49,986,614 | |
| RALI Series Trust | | | | | | | | |
| 2007-QO2, 2.02% (1 Month USD LIBOR + 0.15%) due 02/25/476 | | | 21,467,530 | | | | 13,879,346 | |
| 2006-QO8, 2.07% (1 Month USD LIBOR + 0.20%) due 10/25/466 | | | 12,544,433 | | | | 11,608,324 | |
| 2006-QO10, 2.03% (1 Month USD LIBOR + 0.16%) due 01/25/376 | | | 8,898,760 | | | | 8,371,657 | |
| 2006-QO3, 2.08% (1 Month USD LIBOR + 0.21%) due 04/25/466 | | | 14,315,496 | | | | 7,077,392 | |
| 2006-QO2, 2.14% (1 Month USD LIBOR + 0.27%) due 02/25/466 | | | 12,402,514 | | | | 5,560,368 | |
| 2006-QO6, 2.10% (1 Month USD LIBOR + 0.23%) due 06/25/466 | | | 10,408,917 | | | | 4,642,888 | |
| 2006-QO2, 2.30% (1 Month USD LIBOR + 0.34%) due 02/25/466 | | | 7,779,895 | | | | 3,623,820 | |
| SEE NOTES TO FINANCIAL STATEMENTS. | THE GUGGENHEIM FUNDS SEMI-ANNUAL REPORT | 25 |
| CONSOLIDATED SCHEDULE OF INVESTMENTS (Unaudited)(continued) | March 29, 2018 |
| MACRO OPPORTUNITIES FUND | |
| | | Face
Amount~ | | | Value | |
| | | | | | | |
| 2006-QO6, 2.05% (1 Month USD LIBOR + 0.18%) due 06/25/466 | | | 6,134,841 | | | $ | 2,671,919 | |
| 2006-QO2, 2.06% (1 Month USD LIBOR + 0.22%) due 02/25/466 | | | 4,174,518 | | | | 1,819,440 | |
| Ameriquest Mortgage Securities Trust | | | | | | | | |
| 2006-M3, 2.05% (1 Month USD LIBOR + 0.18%) due 10/25/366 | | | 84,408,088 | | | | 56,981,402 | |
| LSTFV | | | | | | | | |
| 2017-1A, 4.16% due 04/01/20††† | | | 53,003,011 | | | | 53,040,957 | |
| Structured Asset Securities Corporation Mortgage Loan Trust | | | | | | | | |
| 2008-BC4, 2.50% (1 Month USD LIBOR + 0.63%) due 11/25/376 | | | 48,658,890 | | | | 48,373,836 | |
| FirstKey Master Funding | | | | | | | | |
| 2017-R1, 1.89% (1 Month USD LIBOR + 0.22%) due 11/03/41†††,6,7 | | | 43,750,000 | | | | 41,542,743 | |
| Lehman XS Trust Series | | | | | | | | |
| 2006-16N, 2.08% (1 Month USD LIBOR + 0.21%) due 11/25/466 | | | 27,111,280 | | | | 25,427,420 | |
| 2006-16N, 1.43% (1 Month USD LIBOR + 0.19%) due 11/25/466 | | | 9,112,653 | | | | 8,889,156 | |
| 2006-10N, 1.45% (1 Month USD LIBOR + 0.21%) due 07/25/466 | | | 6,571,813 | | | | 6,340,870 | |
| ACE Securities Corporation Home Equity Loan Trust Series | | | | | | | | |
| 2006-HE4, 2.01% (1 Month USD LIBOR + 0.14%) due 10/25/366 | | | 23,531,367 | | | | 15,903,272 | |
| 2007-HE1, 2.02% (1 Month USD LIBOR + 0.15%) due 01/25/376 | | | 21,068,198 | | | | 14,462,913 | |
| 2007-ASP1, 2.25% (1 Month USD LIBOR + 0.38%) due 03/25/376 | | | 15,256,739 | | | | 9,694,083 | |
| IndyMac INDX Mortgage Loan Trust | | | | | | | | |
| 2006-AR6, 2.20% (1 Year CMT Rate + 0.92%) due 06/25/466 | | | 37,762,040 | | | | 35,034,367 | |
| WaMu Asset-Backed Certificates WaMu Series 2007-HE2 Trust | | | | | | | | |
| 2007-HE2, 2.23% (1 Month USD LIBOR + 0.36%) due 04/25/376 | | | 31,673,942 | | | | 17,656,040 | |
| 2007-HE2, 2.06% (1 Month USD LIBOR + 0.19%) due 04/25/376 | | | 24,681,310 | | | | 13,525,583 | |
| Long Beach Mortgage Loan Trust | | | | | | | | |
| 2006-6, 2.12% (1 Month USD LIBOR + 0.25%) due 07/25/366 | | | 17,893,710 | | | | 9,502,000 | |
| 2006-8, 2.03% (1 Month USD LIBOR + 0.16%) due 09/25/366 | | | 20,817,510 | | | | 8,926,528 | |
| 2006-1, 2.06% (1 Month USD LIBOR + 0.19%) due 02/25/366 | | | 5,394,493 | | | | 4,529,297 | |
| 2006-6, 2.02% (1 Month USD LIBOR + 0.15%) due 07/25/366 | | | 5,571,885 | | | | 2,914,914 | |
| 2006-8, 1.96% (1 Month USD LIBOR + 0.09%) due 09/25/366 | | | 5,641,154 | | | | 2,397,509 | |
| 2006-6, 1.97% (1 Month USD LIBOR + 0.10%) due 07/25/366 | | | 3,225,446 | | | | 1,673,962 | |
| Morgan Stanley ABS Capital I Incorporated Trust | | | | | | | | |
| 2007-HE1, 2.10% (1 Month USD LIBOR + 0.23%) due 11/25/366 | | | 15,789,299 | | | | 10,947,613 | |
| 26 | THE GUGGENHEIM FUNDS SEMI-ANNUAL REPORT | SEE NOTES TO FINANCIAL STATEMENTS. |
| CONSOLIDATED SCHEDULE OF INVESTMENTS (Unaudited)(continued) | March 29, 2018 |
| MACRO OPPORTUNITIES FUND | |
| | | Face
Amount~ | | | Value | |
| | | | | | | |
| 2007-HE6, 2.12% (1 Month USD LIBOR + 0.25%) due 05/25/376 | | | 10,705,235 | | | $ | 9,840,261 | |
| 2006-HE8, 2.09% (1 Month USD LIBOR + 0.22%) due 10/25/366 | | | 9,517,502 | | | | 5,838,535 | |
| 2007-HE6, 2.01% (1 Month USD LIBOR + 0.14%) due 05/25/376 | | | 2,242,050 | | | | 2,039,610 | |
| IXIS Real Estate Capital Trust | | | | | | | | |
| 2007-HE1, 2.03% (1 Month USD LIBOR + 0.16%) due 05/25/376 | | | 28,077,231 | | | | 10,422,614 | |
| 2007-HE1, 2.10% (1 Month USD LIBOR + 0.23%) due 05/25/376 | | | 19,892,324 | | | | 7,439,303 | |
| 2007-HE1, 1.93% (1 Month USD LIBOR + 0.06%) due 05/25/376 | | | 17,696,314 | | | | 6,498,991 | |
| American Home Mortgage Assets Trust | | | | | | | | |
| 2007-1, 1.98% (1 Year CMT Rate + 0.70%) due 02/25/476 | | | 33,225,345 | | | | 21,429,175 | |
| GSAA Trust | | | | | | | | |
| 2007-3, 2.04% (1 Month USD LIBOR + 0.17%) due 03/25/476 | | | 26,145,981 | | | | 13,629,045 | |
| 2006-9, 1.48% (1 Month USD LIBOR + 0.24%) due 06/25/366 | | | 12,243,465 | | | | 6,929,811 | |
| Nationstar Home Equity Loan Trust | | | | | | | | |
| 2007-C, 2.05% (1 Month USD LIBOR + 0.18%) due 06/25/376 | | | 19,248,905 | | | | 18,565,900 | |
| Master Asset Backed Securities Trust | | | | | | | | |
| 2006-WMC3, 2.03% (1 Month USD LIBOR + 0.16%) due 08/25/366 | | | 13,199,939 | | | | 6,978,219 | |
| 2006-HE3, 1.97% (1 Month USD LIBOR + 0.10%) due 08/25/366 | | | 11,649,681 | | | | 5,518,903 | |
| 2006-HE3, 2.02% (1 Month USD LIBOR + 0.15%) due 08/25/366 | | | 9,794,599 | | | | 4,677,013 | |
| Bayview Opportunity Master Fund IVa Trust | | | | | | | | |
| 2018-RN3, 3.67% due 03/28/337 | | | 16,800,000 | | | | 16,820,143 | |
| GSAA Home Equity Trust | | | | | | | | |
| 2006-16, 2.04% (1 Month USD LIBOR + 0.17%) due 10/25/366 | | | 16,604,783 | | | | 8,770,884 | |
| 2006-3, 2.17% (1 Month USD LIBOR + 0.30%) due 03/25/366 | | | 4,521,261 | | | | 3,374,987 | |
| 2007-7, 1.51% (1 Month USD LIBOR + 0.27%) due 07/25/376 | | | 2,563,240 | | | | 2,437,894 | |
| 2006-14, 1.49% (1 Month USD LIBOR + 0.25%) due 09/25/366 | | | 3,622,174 | | | | 2,205,351 | |
| Home Equity Loan Trust | | | | | | | | |
| 2007-FRE1, 2.06% (1 Month USD LIBOR + 0.19%) due 04/25/376 | | | 17,096,526 | | | | 16,249,254 | |
| GSAMP TRUST | | | | | | | | |
| 2002-HE2, 2.86% (1 Month USD LIBOR + 1.04%) due 10/20/326,7 | | | 15,475,314 | | | | 15,567,496 | |
| Stanwich Mortgage Loan Company LLC | | | | | | | | |
| 2017-NPA1, 3.60% due 03/16/227 | | | 14,413,563 | | | | 14,413,563 | |
| HSI Asset Securitization Corporation Trust | | | | | | | | |
| 2007-HE1, 2.06% (1 Month USD LIBOR + 0.19%) due 01/25/376 | | | 9,184,691 | | | | 7,490,160 | |
| 2005-OPT1, 2.50% (1 Month USD LIBOR + 0.63%) due 11/25/356 | | | 6,237,365 | | | | 6,221,621 | |
| SEE NOTES TO FINANCIAL STATEMENTS. | THE GUGGENHEIM FUNDS SEMI-ANNUAL REPORT | 27 |
| CONSOLIDATED SCHEDULE OF INVESTMENTS (Unaudited)(continued) | March 29, 2018 |
| MACRO OPPORTUNITIES FUND | |
| | | Face
Amount~ | | | Value | |
| | | | | | | |
| Morgan Stanley IXIS Real Estate Capital Trust | | | | | | |
| 2006-2, 2.02% (1 Month USD LIBOR + 0.15%) due 11/25/366 | | | 21,411,829 | | | $ | 10,978,849 | |
| First NLC Trust | | | | | | | | |
| 2007-1, 2.15% (1 Month USD LIBOR + 0.28%) due 08/25/376,7 | | | 9,393,385 | | | | 6,039,955 | |
| 2007-1, 1.94% (1 Month USD LIBOR + 0.07%) due 08/25/376,7 | | | 7,123,305 | | | | 4,463,978 | |
| Merrill Lynch Alternative Note Asset Trust Series | | | | | | | | |
| 2007-OAR3, 1.81% (1 Month USD LIBOR + 0.19%) due 07/25/376 | | | 10,452,353 | | | | 9,481,600 | |
| Stanwich Mortgage Loan Co. | | | | | | | | |
| 2016-NPA1, 3.84% (WAC) due 10/16/466,7 | | | 9,489,734 | | | | 9,369,742 | |
| JP Morgan Mortgage Acquisition Trust | | | | | | | | |
| 2006-HE3, 2.03% (1 Month USD LIBOR + 0.16%) due 11/25/366 | | | 9,230,036 | | | | 8,343,358 | |
| Luminent Mortgage Trust | | | | | | | | |
| 2006-2, 2.07% (1 Month USD LIBOR + 0.20%) due 02/25/466 | | | 9,672,463 | | | | 7,816,448 | |
| GCAT | | | | | | | | |
| 2017-1, 3.38% due 03/25/477 | | | 7,465,397 | | | | 7,415,610 | |
| Washington Mutual Mortgage Pass-Through Certificates WMALT Series Trust | | | | | | | | |
| 2006-AR9, 2.12% (1 Year CMT Rate + 0.84%) due 11/25/466 | | | 8,480,104 | | | | 7,134,927 | |
| Bayview Opportunity Master Fund IIa Trust | | | | | | | | |
| 2017-RN5, 3.10% due 08/28/327 | | | 6,296,311 | | | | 6,223,519 | |
| GCAT LLC | | | | | | | | |
| 2017-4, 3.23% due 05/25/227 | | | 6,175,558 | | | | 6,133,144 | |
| Bayview Opportunity Master Fund IIIa Trust | | | | | | | | |
| 2017-RN7, 3.10% due 09/28/327 | | | 6,070,806 | | | | 6,046,736 | |
| Bayview Opportunity Master Fund IVb Trust | | | | | | | | |
| 2017-RPL1, 3.10% due 07/28/327 | | | 5,849,147 | | | | 5,852,487 | |
| WaMu Asset-Backed Certificates WaMu Series 2007-HE4 Trust | | | | | | | | |
| 2007-HE4, 2.04% (1 Month USD LIBOR + 0.17%) due 07/25/476 | | | 4,348,205 | | | | 3,162,199 | |
| 2007-HE4, 2.12% (1 Month USD LIBOR + 0.25%) due 07/25/476 | | | 3,104,618 | | | | 2,278,790 | |
| VOLT LIV LLC | | | | | | | | |
| 2017-NPL1, 3.50% due 02/25/477 | | | 5,392,503 | | | | 5,380,249 | |
| Nomura Resecuritization Trust | | | | | | | | |
| 2015-4R, 0.73% (1 Month USD LIBOR + 0.43%) due 03/26/366,7 | | | 5,192,348 | | | | 4,996,108 | |
| American Home Mortgage Investment Trust | | | | | | | | |
| 2006-1, 2.27% (1 Month USD LIBOR + 0.40%) due 03/25/466 | | | 5,055,305 | | | | 4,890,223 | |
| Alliance Bancorp Trust | | | | | | | | |
| 2007-OA1, 2.11% (1 Month USD LIBOR + 0.24%) due 07/25/376 | | | 3,777,559 | | | | 3,240,119 | |
| Bayview Opportunity Master Fund IIIb Trust | | | | | | | | |
| 2017-RN3, 3.23% due 05/28/327 | | | 1,966,349 | | | | 1,957,215 | |
| 28 | THE GUGGENHEIM FUNDS SEMI-ANNUAL REPORT | SEE NOTES TO FINANCIAL STATEMENTS. |
| CONSOLIDATED SCHEDULE OF INVESTMENTS (Unaudited)(continued) | March 29, 2018 |
| MACRO OPPORTUNITIES FUND | |
| | | Face
Amount~ | | | Value | |
| | | | | | | |
| Wachovia Asset Securitization Issuance II LLC Trust | | | | | | |
| 2007-HE1, 2.01% (1 Month USD LIBOR + 0.14%) due 07/25/376,7 | | | 1,916,721 | | | $ | 1,846,532 | |
| Morgan Stanley Re-REMIC Trust | | | | | | | | |
| 2010-R5, 3.51% due 06/26/367 | | | 1,589,912 | | | | 1,342,786 | |
| First Franklin Mortgage Loan Trust | | | | | | | | |
| 2006-FF1, 2.31% (1 Month USD LIBOR + 0.44%) due 01/25/366 | | | 1,225,000 | | | | 1,170,146 | |
| Asset Backed Securities Corporation Home Equity Loan Trust | | | | | | | | |
| 2006-HE5, 2.01% (1 Month USD LIBOR + 0.14%) due 07/25/366 | | | 1,008,813 | | | | 987,664 | |
| Total Residential Mortgage Backed Securities | | | | | | | 1,065,858,731 | |
| | | | | | | | | |
| Commercial Mortgage Backed Securities - 1.4% |
| GAHR Commercial Mortgage Trust | | | | | | | | |
| 2015-NRF, 3.38% (WAC) due 12/15/346,7 | | | 46,477,003 | | | | 45,463,935 | |
| Citigroup Commercial Mortgage Trust | | | | | | | | |
| 2016-SMPL, 4.51% due 09/10/317 | | | 22,450,000 | | | | 22,315,372 | |
| GS Mortgage Securities Corporation Trust | | | | | | | | |
| 2017-STAY, 3.38% (1 Month USD LIBOR + 2.15%) due 07/15/326,7 | | | 16,531,000 | | | | 16,454,952 | |
| GS Mortgage Securities Trust | | | | | | | | |
| 2014-GSFL, 5.13% (1 Month USD LIBOR + 3.90%) due 07/15/316,7 | | | 6,038,536 | | | | 6,058,531 | |
| GE Business Loan Trust | | | | | | | | |
| 2007-1A, 2.23% (1 Month USD LIBOR + 0.45%) due 04/16/356,7 | | | 2,070,359 | | | | 1,914,918 | |
| Total Commercial Mortgage Backed Securities | | | | | | | 92,207,708 | |
| | | | | | | | | |
| Government Agency - 1.0% |
| Fannie Mae20 | | | | | | | | |
| 3.00% due 02/01/57 | | | 28,965,901 | | | | 28,018,913 | |
| 2.99% due 02/01/28 | | | 19,400,000 | | | | 19,000,162 | |
| 3.10% due 02/01/28 | | | 11,000,000 | | | | 10,881,296 | |
| 3.11% due 02/01/28 | | | 5,900,000 | | | | 5,838,713 | |
| Freddie Mac Multifamily Structured Pass Through Certificates | | | | | | | | |
| 2018-K072, 3.50% (WAC) due 12/25/276,20 | | | 6,300,000 | | | | 6,390,986 | |
| Total Government Agency | | | | | | | 70,130,070 | |
| | | | | | | | | |
| Military Housing - 0.2% |
| GMAC Commercial Mortgage Asset Corp. | | | | | | | | |
| 2004-POKA, 6.36% due 09/10/448 | | | 9,000,000 | | | | 9,637,542 | |
| Capmark Military Housing Trust | | | | | | | | |
| 2007-AET2, 6.06% due 10/10/528 | | | 5,782,581 | | | | 5,925,584 | |
| Total Military Housing | | | | | | | 15,563,126 | |
| Total Collateralized Mortgage Obligations |
| (Cost $1,237,955,626) | | | | | | | 1,243,759,635 | |
| |
| FOREIGN GOVERNMENT DEBT†† - 13.1% |
| Republic of Portugal | | | | | | | | |
| due 05/18/184 | | | EUR | 109,850,000 | | | | 135,237,961 | |
| SEE NOTES TO FINANCIAL STATEMENTS. | THE GUGGENHEIM FUNDS SEMI-ANNUAL REPORT | 29 |
| CONSOLIDATED SCHEDULE OF INVESTMENTS (Unaudited)(continued) | March 29, 2018 |
| MACRO OPPORTUNITIES FUND | |
| | | Face
Amount~ | | | Value | |
| | | | | | | |
| Government of Japan | | | | | | |
| due 06/04/184 | | | JPY | 11,400,000,000 | | | $ | 107,167,285 | |
| due 04/05/184 | | | JPY | 1,700,000,000 | | | | 15,976,837 | |
| due 04/23/184 | | | JPY | 700,000,000 | | | | 6,579,092 | |
| due 04/16/184 | | | JPY | 500,000,000 | | | | 4,699,244 | |
| Total Government of Japan | | | | | | | 134,422,458 | |
| Republic of Italy | | | | | | | | |
| due 05/31/184 | | | EUR | 71,840,000 | | | | 88,459,199 | |
| due 04/13/184 | | | EUR | 37,080,000 | | | | 45,632,216 | |
| Total Republic of Italy | | | | | | | 134,091,415 | |
| Republic of Hungary | | | | | | | | |
| 4.00% due 04/25/18 | | | HUF | 9,198,000,000 | | | | 36,309,876 | |
| due 05/23/184 | | | HUF | 5,846,000,000 | | | | 23,022,225 | |
| 2.50% due 06/22/18 | | | HUF | 4,233,060,000 | | | | 16,762,041 | |
| due 11/21/184 | | | HUF | 3,100,000,000 | | | | 12,205,131 | |
| due 07/18/184 | | | HUF | 2,390,000,000 | | | | 9,411,137 | |
| due 04/11/184 | | | HUF | 2,202,240,000 | | | | 8,673,266 | |
| 5.50% due 12/20/18 | | | HUF | 1,500,000,000 | | | | 6,139,774 | |
| due 09/26/184 | | | HUF | 1,200,000,000 | | | | 4,724,732 | |
| Total Republic of Hungary | | | | | | | 117,248,182 | |
| Kingdom of Spain | | | | | | | | |
| due 04/06/184 | | | EUR | 91,650,000 | | | | 112,780,022 | |
| Czech Republic | | | | | | | | |
| 4.60% due 08/18/18 | | | CZK | 650,000,000 | | | | 31,952,605 | |
| due 04/13/184 | | | CZK | 620,000,000 | | | | 30,031,634 | |
| due 04/20/184 | | | CZK | 358,000,000 | | | | 17,339,928 | |
| due 08/31/184 | | | CZK | 238,000,000 | | | | 11,507,705 | |
| due 04/06/184 | | | CZK | 177,000,000 | | | | 8,573,984 | |
| Total Czech Republic | | | | | | | 99,405,856 | |
| Denmark Treasury Bill | | | | | | | | |
| due 06/01/184 | | | DKK | 417,900,000 | | | | 69,050,019 | |
| Republic of France | | | | | | | | |
| due 04/05/184 | | | EUR | 52,340,000 | | | | 64,403,832 | |
| Kingdom of Sweden | | | | | | | | |
| due 04/18/184 | | | SEK | 330,700,000 | | | | 39,626,924 | |
| Total Foreign Government Debt | | | | | | | | |
| (Cost $904,418,842) | | | | | | | 906,266,669 | |
| | | | | | | | | |
| SENIOR FLOATING RATE INTERESTS††,6 - 12.1% |
| Technology - 3.4% |
| Misys Ltd. | | | | | | |
| 5.48% (1 Month USD LIBOR + 3.50%) and (3 Month USD LIBOR + 3.50%) due 06/13/24 | | | 36,342,375 | | | | 36,292,586 | |
| Epicor Software | | | | | | | | |
| 5.13% (1 Month USD LIBOR + 3.25%) due 06/01/22 | | | 22,379,211 | | | | 22,466,713 | |
| EIG Investors Corp. | | | | | | | | |
| 5.96% (1 Month USD LIBOR + 4.00%) due 02/09/23 | | | 12,270,972 | | | | 12,347,665 | |
| TIBCO Software, Inc. | | | | | | | | |
| 5.38% (1 Month USD LIBOR + 3.50%) due 12/04/20 | | | 11,853,567 | | | | 11,885,690 | |
| Severin Acquisition LLC | | | | | | | | |
| 6.77% (3 Month USD LIBOR + 4.88%) due 07/30/21 | | | 3,421,250 | | | | 3,421,250 | |
| 6.64% (2 Month USD LIBOR + 4.75%) due 07/30/21 | | | 3,424,125 | | | | 3,415,565 | |
| 6.89% (3 Month USD LIBOR + 5.00%) due 07/30/21 | | | 2,608,360 | | | | 2,608,360 | |
| 7.27% (3 Month USD LIBOR + 5.38%) due 07/30/21 | | | 790,000 | | | | 793,950 | |
| Planview, Inc. | | | | | | | | |
| 7.13% (3 Month USD LIBOR + 5.25%) due 01/27/23†††,1 | | | 8,869,935 | | | | 8,786,528 | |
| Advanced Computer Software | | | | | | | | |
| 11.37% (3 Month USD LIBOR + 9.50%) due 01/31/23 | | | 5,000,000 | | | | 4,900,000 | |
| 7.52% (3 Month USD LIBOR + 5.50%) due 03/18/22 | | | 3,375,434 | | | | 3,378,235 | |
| 30 | THE GUGGENHEIM FUNDS SEMI-ANNUAL REPORT | SEE NOTES TO FINANCIAL STATEMENTS. |
| CONSOLIDATED SCHEDULE OF INVESTMENTS (Unaudited)(continued) | March 29, 2018 |
| MACRO OPPORTUNITIES FUND | |
| | | Face
Amount~ | | | Value | |
| | | | | | | |
| Lytx, Inc. | | | | | | |
| 8.63% (1 Month USD LIBOR + 6.75%) due 08/31/23†††,1 | | | 7,978,687 | | | $ | 7,800,342 | |
| IRIS Software Group Ltd. | | | | | | | | |
| 4.76% (3 Month USD LIBOR + 4.25%) due 08/23/21†††,1 | | | GBP | 5,450,000 | | | | 7,613,276 | |
| Optiv, Inc. | | | | | | | | |
| 5.13% (1 Month USD LIBOR + 3.25%) due 02/01/24 | | | 7,747,970 | | | | 7,467,106 | |
| SS&C Technologies, Inc. | | | | | | | | |
| 7.25% (3 Month USD LIBOR + 2.50%) due 02/27/25 | | | 5,380,573 | | | | 5,404,678 | |
| 7.25% (3 Month USD LIBOR + 2.50%) due 02/28/25 | | | 1,919,427 | | | | 1,928,026 | |
| Nimbus Acquisitions Bidco Ltd. | | | | | | | | |
| 7.25% (1 Month USD LIBOR + 6.25%) due 07/15/21†††,1 | | | GBP | 5,050,000 | | | | 7,020,863 | |
| Palermo Finance Corp. | | | | | | | | |
| 6.22% (1 Month USD LIBOR + 4.50%) due 04/17/23†††,1 | | | 6,417,750 | | | | 6,364,026 | |
| LANDesk Group, Inc. | | | | | | | | |
| 6.13% (3 Month USD LIBOR + 4.25%) due 01/20/24 | | | 6,414,750 | | | | 6,295,500 | |
| Bullhorn, Inc. | | | | | | | | |
| 8.64% (3 Month USD LIBOR + 6.75%) due 11/21/22†††,1 | | | 4,306,294 | | | | 4,279,121 | |
| 8.62% (3 Month USD LIBOR + 6.75%) due 11/21/22†††,1 | | | 896,280 | | | | 891,101 | |
| AVSC Holding Corp. | | | | | | | | |
| 5.10% (3 Month USD LIBOR + 3.25%) due 03/03/25 | | | 5,150,000 | | | | 5,161,279 | |
| Cvent, Inc. | | | | | | | | |
| 5.63% (3 Month USD LIBOR + 3.75%) due 11/29/24 | | | 5,000,000 | | | | 5,025,000 | |
| Peak 10 Holding Corp. | | | | | | | | |
| 5.80% (3 Month USD LIBOR + 3.50%) due 08/01/24 | | | 4,776,000 | | | | 4,787,176 | |
| Masergy Holdings, Inc. | | | | | | | | |
| 5.55% (3 Month USD LIBOR + 3.25%) due 12/15/23 | | | 4,775,654 | | | | 4,781,624 | |
| Kronos, Inc. | | | | | | | | |
| 4.88% (1 Month USD LIBOR + 3.00%) due 11/01/23 | | | 4,455,084 | | | | 4,481,414 | |
| Project Alpha (Qlik) | | | | | | | | |
| 5.04% (3 Month USD LIBOR + 3.50%) due 04/26/24 | | | 4,336,683 | | | | 4,275,232 | |
| Camelia Bidco Banc Civica | | | | | | | | |
| 5.46% (3 Month USD LIBOR + 4.75%) due 10/14/24 | | | GBP | 3,000,000 | | | | 4,212,839 | |
| Jaggaer | | | | | | | | |
| 5.88% (Commercial Prime Lending Rate + 3.00%) and (3 Month USD LIBOR + 4.00%) due 12/28/24 | | | 3,550,000 | | | | 3,550,000 | |
| Internet Brands, Inc. | | | | | | | | |
| 5.53% (3 Month USD LIBOR + 3.75%) due 09/13/24 | | | 3,369,854 | | | | 3,369,247 | |
| Ipreo Holdings | | | | | | | | |
| 5.30% (1 Month USD LIBOR + 3.00%) due 08/06/21 | | | 3,190,141 | | | | 3,190,141 | |
| Eiger Acquisition B.V. | | | | | | | | |
| 3.75% (1 Month EURIBOR + 3.75%) due 12/12/24 | | | EUR | 2,600,000 | | | | 3,189,231 | |
| Verisure Cayman 2 | | | | | | | | |
| due 10/21/229 | | | EUR | 2,300,000 | | | | 2,801,489 | |
| SEE NOTES TO FINANCIAL STATEMENTS. | THE GUGGENHEIM FUNDS SEMI-ANNUAL REPORT | 31 |
| CONSOLIDATED SCHEDULE OF INVESTMENTS (Unaudited)(continued) | March 29, 2018 |
| MACRO OPPORTUNITIES FUND | |
| | | Face
Amount~ | | | Value | |
| | | | | | | |
| CPI Acquisition, Inc. | | | | | | |
| 6.36% (3 Month USD LIBOR + 4.50%) due 08/17/22 | | | 3,822,372 | | | $ | 2,610,680 | |
| OEConnection LLC | | | | | | | | |
| 6.46% (Commercial Prime Lending Rate + 3.00%) and (3 Month USD LIBOR + 4.00%) due 11/22/24 | | | 2,500,000 | | | | 2,509,375 | |
| Ping Identity Corp. | | | | | | | | |
| 5.62% (3 Month USD LIBOR + 3.75%) due 01/24/25 | | | 2,100,000 | | | | 2,105,250 | |
| Viewpoint, Inc. | | | | | | | | |
| due 07/19/249 | | | 2,089,500 | | | | 2,092,112 | |
| Park Place Technologies LLC | | | | | | | | |
| 8.75% (3 Month USD LIBOR + 4.00%) due 03/22/25 | | | 1,800,000 | | | | 1,795,500 | |
| Flexera Software LLC | | | | | | | | |
| 5.13% (3 Month USD LIBOR + 3.25%) due 02/26/25 | | | 1,675,000 | | | | 1,681,985 | |
| Ministry Brands LLC | | | | | | | | |
| 6.88% (1 Month USD LIBOR + 5.00%) due 12/02/22 | | | 1,490,561 | | | | 1,483,109 | |
| 6.87% (3 Month USD LIBOR + 5.00%) due 12/02/22 | | | 187,585 | | | | 186,647 | |
| Project Accelerate Parent, LLC | | | | | | | | |
| 5.94% (2 Month USD LIBOR + 4.25%) due 01/02/25 | | | 1,500,000 | | | | 1,511,250 | |
| MRI Software LLC | | | | | | | | |
| 8.56% (3 Month USD LIBOR + 6.25%) due 06/30/23 | | | 1,276,266 | | | | 1,263,503 | |
| 8.36% (3 Month USD LIBOR + 6.25%) due 06/30/23 | | | 62,344 | | | | 61,720 | |
| 8.02% (2 Month USD LIBOR + 6.00%) due 06/30/23†††,1 | | | 9,250 | | | | 8,480 | |
| GlobalLogic Holdings, Inc. | | | | | | | | |
| 6.05% (3 Month USD LIBOR + 3.75%) due 06/20/22 | | | 1,229,300 | | | | 1,235,447 | |
| CogitalGroup | | | | | | | | |
| 4.50% (1 Month EURIBOR + 4.50%) due 11/25/23††† | | | EUR | 1,000,000 | | | | 1,218,162 | |
| Aspect Software, Inc. | | | | | | | | |
| 12.38% (1 Month USD LIBOR + 10.50%) due 05/25/202 | | | 1,025,411 | | | | 1,020,930 | |
| Wall Street Systems Delaware, Inc. | | | | | | | | |
| due 11/21/249 | | | EUR | 598,500 | | | | 738,886 | |
| Quorum Business Solutions | | | | | | | | |
| 6.52% (3 Month USD LIBOR + 4.75%) due 08/07/21 | | | 624,586 | | | | 616,779 | |
| Total Technology | | | | | | | 236,325,068 | |
| | | | | | | | | |
| Consumer, Non-cyclical - 2.5% |
| Diamond (BC) B.V. | | | | | | | | |
| 4.99% (3 Month USD LIBOR + 3.00%) due 09/06/24 | | | 10,439,408 | | | | 10,417,694 | |
| 3.25% (3 Month EURIBOR + 3.25%) due 09/06/24 | | | EUR | 3,391,500 | | | | 4,145,083 | |
| Sigma Holding BV (Flora Food) | | | | | | | | |
| 3.50% (3 Month USD LIBOR + 3.50%) due 03/07/25 | | | EUR 4,000,000 | | | | 4,868,168 | |
| 3.00% (3 Month USD LIBOR + 3.00%) due 03/07/25 | | | 3,300,000 | | | | 3,295,875 | |
| 4.00% (3 Month USD EURIBOR + 3.50%) due 03/07/25 | | | GBP 2,100,000 | | | | 2,916,339 | |
| 32 | THE GUGGENHEIM FUNDS SEMI-ANNUAL REPORT | SEE NOTES TO FINANCIAL STATEMENTS. |
| CONSOLIDATED SCHEDULE OF INVESTMENTS (Unaudited)(continued) | March 29, 2018 |
| MACRO OPPORTUNITIES FUND | |
| | | Face
Amount~ | | | Value | |
| | | | | | | |
| IHC Holding Corp. | | | | | | |
| 8.74% (3 Month USD LIBOR + 6.75%) due 04/30/21†††,1 | | | 7,118,577 | | | $ | 7,063,604 | |
| 8.93% (1 Month USD LIBOR + 6.75%) due 04/30/21†††,1 | | | 1,390,376 | | | | 1,379,638 | |
| Davis Vision | | | | | | | | |
| due 12/02/249 | | | 7,627,386 | | | | 7,589,249 | |
| Endo Luxembourg Finance Co. | | | | | | | | |
| 6.19% (3 Month USD LIBOR + 4.25%) due 04/29/24 | | | 7,605,366 | | | | 7,583,158 | |
| Affordable Care Holdings Corp. | | | | | | | | |
| 6.74% (1 Month USD LIBOR + 4.75%) due 10/24/22 | | | 7,086,875 | | | | 7,086,875 | |
| Hanger, Inc. | | | | | | | | |
| 5.38% (3 Month USD LIBOR + 3.50%) due 03/01/25 | | | 7,000,000 | | | | 7,000,000 | |
| Lineage Logistics LLC | | | | | | | | |
| 4.88% (3 Month USD LIBOR + 3.00%) due 02/16/25 | | | 6,900,000 | | | | 6,879,852 | |
| AI Aqua Zip Bidco Pty Ltd. | | | | | | | | |
| 5.13% (1 Month USD LIBOR + 3.25%) due 12/13/23 | | | 6,329,487 | | | | 6,352,331 | |
| Authentic Brands | | | | | | | | |
| 5.80% (3 Month USD LIBOR + 3.50%) due 09/27/24 | | | 5,870,500 | | | | 5,890,049 | |
| One Call Medical, Inc. | | | | | | | | |
| 6.03% (1 Month USD LIBOR + 4.00%) due 11/27/20 | | | 5,977,904 | | | | 5,708,898 | |
| Immucor, Inc. | | | | | | | | |
| 7.30% (3 Month USD LIBOR + 5.00%) due 06/15/21 | | | 5,522,250 | | | | 5,646,501 | |
| ScribeAmerica Intermediate Holdco LLC (Healthchannels) | | | | | | | | |
| 4.50% (3 Month USD LIBOR + 4.50%) due 03/22/25 | | | 5,250,000 | | | | 5,250,000 | |
| Springs Industries, Inc. | | | | | | | | |
| 8.38% (3 Month USD LIBOR + 6.50%) due 06/01/21†††,1 | | | 5,010,750 | | | | 5,010,750 | |
| IVC Acquisition Midco Ltd. | | | | | | | | |
| 5.21% (3 Month USD LIBOR + 4.50%) due 01/26/24 | | | GBP | 3,405,000 | | | | 4,777,606 | |
| Arctic Glacier Group Holdings, Inc. | | | | | | | | |
| 5.38% (3 Month USD LIBOR + 3.50%) due 03/20/24 | | | 4,417,872 | | | | 4,452,375 | |
| Grocery Outlet, Inc. | | | | | | | | |
| 5.80% (3 Month USD LIBOR + 3.50%) due 10/21/21 | | | 4,317,716 | | | | 4,332,094 | |
| DJO Finance LLC | | | | | | | | |
| 5.03% (1 Month USD LIBOR + 3.25%) and (3 Month USD LIBOR + 3.25%) due 06/08/20 | | | 3,677,676 | | | | 3,693,012 | |
| SHO Holding I Corp. | | | | | | | | |
| 6.79% (3 Month USD LIBOR + 5.00%) due 10/27/22 | | | 3,355,758 | | | | 3,187,970 | |
| Packaging Coordinators Midco, Inc. | | | | | | | | |
| 5.78% (3 Month USD LIBOR + 4.00%) due 06/30/23 | | | 3,152,000 | | | | 3,161,866 | |
| Smart & Final Stores LLC | | | | | | | | |
| 5.38% (1 Month USD LIBOR + 3.50%) due 11/15/22 | | | 3,200,000 | | | | 3,150,016 | |
| SEE NOTES TO FINANCIAL STATEMENTS. | THE GUGGENHEIM FUNDS SEMI-ANNUAL REPORT | 33 |
| CONSOLIDATED SCHEDULE OF INVESTMENTS (Unaudited)(continued) | March 29, 2018 |
| MACRO OPPORTUNITIES FUND | |
| | | Face
Amount~ | | | Value | |
| | | | | | | |
| Cidron New Bidco Limited (New Binding) | | | | | | |
| 3.50% due 03/28/259 | | | EUR | 2,500,000 | | | $ | 3,076,166 | |
| Avantor, Inc. | | | | | | | | |
| 5.88% (3 Month USD LIBOR + 4.00%) due 11/21/24 | | | 2,394,000 | | | | 2,418,443 | |
| 4.25% (1 Month EURIBOR + 4.25%) due 11/21/24 | | | EUR | 500,000 | | | | 617,159 | |
| BCPE Eagle Buyer LLC | | | | | | | | |
| 6.06% (3 Month USD LIBOR + 4.25%) due 03/18/24 | | | 2,876,970 | | | | 2,838,620 | |
| Chef’s Warehouse Parent LLC | | | | | | | | |
| 5.88% (1 Month USD LIBOR + 4.00%) due 06/22/22 | | | 2,570,791 | | | | 2,586,859 | |
| Equian LLC | | | | | | | | |
| 5.15% (3 Month USD LIBOR + 3.25%) due 05/20/24 | | | 2,495,477 | | | | 2,506,907 | |
| Nellson Nutraceutical (US) | | | | | | | | |
| 6.56% (Commercial Prime Lending Rate + 3.25%) and (3 Month USD LIBOR + 4.25%) due 12/23/21 | | | 2,429,477 | | | | 2,429,477 | |
| Gem Acquisitions, Inc. (Genex) | | | | | | | | |
| 3.25% (3 Month USD LIBOR + 3.25%) due 03/02/25 | | | 2,200,000 | | | | 2,199,076 | |
| Reddy Ice Holdings, Inc. | | | | | | | | |
| 11.20% (3 Month USD LIBOR + 9.50%) due 11/01/19 | | | 1,125,000 | | | | 1,047,184 | |
| 7.26% (Commercial Prime Lending Rate + 4.50%) and (3 Month USD LIBOR + 5.50%) due 05/01/19 | | | 1,048,227 | | | | 1,045,607 | |
| CTI Foods Holding Co. LLC | | | | | | | | |
| 5.38% (1 Month USD LIBOR + 3.50%) due 06/29/20 | | | 1,250,000 | | | | 1,128,125 | |
| 9.13% (3 Month USD LIBOR + 7.25%) due 06/28/21 | | | 1,035,000 | | | | 765,900 | |
| Certara, Inc. | | | | | | | | |
| 6.30% (3 Month USD LIBOR + 4.00%) due 08/15/24 | | | 1,564,195 | | | | 1,568,105 | |
| 3.50% (3 Month USD LIBOR + 3.50%) due 08/15/24 | | | 320,000 | | | | 320,800 | |
| Give and Go Prepared Foods Corp. | | | | | | | | |
| 6.19% (3 Month USD LIBOR + 4.25%) due 07/29/23 | | | 1,696,974 | | | | 1,705,459 | |
| NewCo Sab BidCo S.A.S. | | | | | | | | |
| 3.00% (3 Month EURIBOR + 3.00%) due 04/22/24 | | | EUR | 1,250,000 | | | | 1,517,903 | |
| Valeo Foods Group Ltd. | | | | | | | | |
| 3.75% (1 Month EURIBOR + 3.75%) due 08/27/24 | | | EUR | 1,225,000 | | | | 1,511,301 | |
| ADMI Corp. | | | | | | | | |
| 5.59% (1 Month USD LIBOR + 3.75%) and (3 Month USD LIBOR + 3.75%) due 04/29/22 | | | 1,283,503 | | | | 1,286,711 | |
| CPI Holdco LLC | | | | | | | | |
| 5.80% (1 Month USD LIBOR + 3.50%) due 03/21/24 | | | 1,188,003 | | | | 1,193,943 | |
| MDVIP LLC | | | | | | | | |
| 6.01% (3 Month USD LIBOR + 4.25%) due 11/14/24 | | | 1,000,000 | | | | 1,005,000 | |
| 34 | THE GUGGENHEIM FUNDS SEMI-ANNUAL REPORT | SEE NOTES TO FINANCIAL STATEMENTS. |
| CONSOLIDATED SCHEDULE OF INVESTMENTS (Unaudited)(continued) | March 29, 2018 |
| MACRO OPPORTUNITIES FUND | |
| | | Face
Amount~ | | | Value | |
| | | | | | | |
| Nellson Nutraceutical (CAD) | | | | | | |
| 6.56% (Commercial Prime Lending Rate + 3.25%) and (3 Month USD LIBOR + 4.25%) due 12/23/21 | | | 998,723 | | | $ | 998,723 | |
| Alegeus Technologies LLC | | | | | | | | |
| 7.31% (6 Month USD LIBOR + 5.00%) due 04/28/23†††,1 | | | 995,000 | | | | 986,579 | |
| NES Global Talent | | | | | | | | |
| 7.27% (3 Month USD LIBOR + 5.50%) due 10/03/19 | | | 913,926 | | | | 900,217 | |
| Waterlogic Holdings Ltd. | | | | | | | | |
| due 03/01/259 | | | EUR | 700,000 | | | | 861,326 | |
| Pelican Products, Inc. | | | | | | | | |
| 6.13% (3 Month USD LIBOR + 4.25%) due 04/10/20 | | | 494,845 | | | | 496,082 | |
| Examworks Group, Inc. | | | | | | | | |
| 5.13% (1 Month USD LIBOR + 3.25%) due 07/27/23 | | | 380,000 | | | | 382,375 | |
| Alpha BidCo SAS | | | | | | | | |
| 3.50% (3 Month EURIBOR + 3.50%) due 01/30/23 | | | EUR | 279,950 | | | | 345,847 | |
| WEI Sales LLC (Wells Enterprises) | | | | | | | | |
| due 03/20/259 | | | 300,000 | | | | 303,000 | |
| Cheese Bidco B.V. | | | | | | | | |
| 3.50% (3 Month EURIBOR + 3.50%) due 01/30/23 | | | EUR | 120,050 | | | | 148,309 | |
| Targus Group International, Inc. | | | | | | | | |
| due 05/24/16†††,1,2,9,10 | | | 152,876 | | | | — | |
| Total Consumer, Non-cyclical | | | | | | | 169,030,206 | |
| | | | | | | | | |
| Industrial - 1.9% |
| DAE Aviation | | | | | | | | |
| 5.63% (3 Month USD LIBOR + 3.75%) due 07/07/22 | | | 14,158,313 | | | | 14,271,155 | |
| Filtration Group Corp. | | | | | | | | |
| 3.00% (3 Month USD LIBOR + 3.00%) due 03/27/25 | | | 6,200,000 | | | | 6,215,500 | |
| 3.50% (3 Month USD LIBOR + 3.00%) due 03/27/25 | | | EUR | 1,000,000 | | | | 1,227,390 | |
| Tronair Parent, Inc. | | | | | | | | |
| 6.56% (3 Month USD LIBOR + 4.75%) due 09/08/23 | | | 6,684,968 | | | | 6,634,831 | |
| Hayward Industries, Inc. | | | | | | | | |
| 5.38% (3 Month USD LIBOR + 3.50%) due 08/05/24 | | | 3,930,250 | | | | 3,942,041 | |
| 10.13% (3 Month USD LIBOR + 8.25%) due 08/04/25 | | | 2,600,000 | | | | 2,580,500 | |
| Kuehg Corp. - Kindercare | | | | | | | | |
| 6.05% (3 Month USD LIBOR + 3.75%) and (6 Month USD LIBOR + 3.75%) due 08/12/22 | | | 5,591,923 | | | | 5,614,626 | |
| Arctic Long Carriers | | | | | | | | |
| 6.38% (3 Month USD LIBOR + 4.50%) due 05/18/23 | | | 5,359,500 | | | | 5,399,696 | |
| Pregis Holding I Corp. | | | | | | | | |
| 5.80% (1 Month USD LIBOR + 3.50%) due 05/20/21 | | | 5,175,481 | | | | 5,179,776 | |
| Diversitech Holdings, Inc. | | | | | | | | |
| 5.31% (3 Month USD LIBOR + 3.00%) due 06/03/24 | | | 4,108,894 | | | | 4,124,303 | |
| 9.81% (3 Month USD LIBOR + 7.50%) due 06/02/25 | | | 1,000,000 | | | | 1,007,500 | |
| Titan Acquisition Ltd. (Husky) | | | | | | | | |
| 3.00% (3 Month USD LIBOR + 3.00%) due 03/15/25 | | | 4,350,000 | | | | 4,343,345 | |
| SEE NOTES TO FINANCIAL STATEMENTS. | THE GUGGENHEIM FUNDS SEMI-ANNUAL REPORT | 35 |
| CONSOLIDATED SCHEDULE OF INVESTMENTS (Unaudited)(continued) | March 29, 2018 |
| MACRO OPPORTUNITIES FUND | |
| | | Face
Amount~ | | | Value | |
| | | | | | | |
| Travelport Finance (Luxembourg) S.A.R.L. | | | | | | |
| 4.40% (3 Month USD LIBOR + 2.50%) due 03/17/25 | | | 4,000,000 | | | $ | 4,007,000 | |
| SI Organization | | | | | | | | |
| 6.63% (1 Month USD LIBOR + 4.75%) due 11/23/19 | | | 3,641,119 | | | | 3,650,222 | |
| CHI Overhead Doors, Inc. | | | | | | | | |
| 5.13% (3 Month USD LIBOR + 3.25%) due 07/29/22 | | | 3,511,423 | | | | 3,511,423 | |
| Resource Label Group LLC | | | | | | | | |
| 6.80% (3 Month USD LIBOR + 4.50%) due 05/26/23 | | | 1,977,879 | | | | 1,938,321 | |
| 10.80% (1 Month USD LIBOR + 8.50%) due 11/26/23 | | | 1,500,000 | | | | 1,485,000 | |
| ICSH Parent, Inc. | | | | | | | | |
| 5.38% (1 Month USD LIBOR + 3.50%) and (3 Month USD LIBOR + 3.50%) due 04/29/24 | | | 3,162,635 | | | | 3,158,681 | |
| Advanced Integration Technology LP | | | | | | | | |
| 6.73% (3 Month USD LIBOR + 4.75%) due 04/03/23 | | | 2,998,725 | | | | 3,013,719 | |
| Argo Merchants | | | | | | | | |
| 6.05% (1 Month USD LIBOR + 3.75%) due 12/06/24 | | | 2,992,708 | | | | 3,011,413 | |
| CPG International LLC | | | | | | | | |
| 5.59% (3 Month USD LIBOR + 3.75%) due 05/05/24 | | | 2,804,061 | | | | 2,823,914 | |
| Vectra Co. | | | | | | | | |
| 4.96% (1 Month USD LIBOR + 3.25%) due 03/08/25 | | | 2,750,000 | | | | 2,744,857 | |
| Hardware Holdings LLC | | | | | | | | |
| 8.38% (1 Month USD LIBOR + 6.50%) due 03/30/20 | | | 2,808,750 | | | | 2,724,487 | |
| Bioplan USA, Inc. | | | | | | | | |
| 6.63% (1 Month USD LIBOR + 4.75%) due 09/23/21 | | | 2,736,018 | | | | 2,616,317 | |
| Hanjin International Corp. | | | | | | | | |
| 4.23% (3 Month USD LIBOR + 2.50%) due 10/19/20 | | | 2,600,000 | | | | 2,608,138 | |
| CPM Holdings, Inc. | | | | | | | | |
| 5.38% (1 Month USD LIBOR + 3.50%) due 04/11/22 | | | 2,241,400 | | | | 2,267,311 | |
| Hillman Group, Inc. | | | | | | | | |
| 5.80% (3 Month USD LIBOR + 3.50%) due 06/30/21 | | | 1,749,644 | | | | 1,767,140 | |
| 6.81% (Commercial Prime Lending Rate + 2.25%) due 06/28/19†††,1 | | | 450,000 | | | | 437,625 | |
| Capstone Logistics | | | | | | | | |
| 6.38% (3 Month USD LIBOR + 4.50%) due 10/07/21 | | | 2,154,557 | | | | 2,106,747 | |
| Thermasys Corp. | | | | | | | | |
| 5.70% (3 Month USD LIBOR + 4.00%) due 05/03/19 | | | 2,123,813 | | | | 2,053,026 | |
| Dimora Brands, Inc. | | | | | | | | |
| 5.38% (3 Month USD LIBOR + 3.50%) due 08/24/24 | | | 1,995,000 | | | | 1,995,000 | |
| Survitec | | | | | | | | |
| 5.28% (3 Month USD LIBOR + 4.75%) due 03/12/22 | | | GBP | 1,125,000 | | | | 1,522,278 | |
| 4.25% (3 Month EURIBOR + 4.25%) due 03/12/22 | | | EUR | 300,000 | | | | 361,296 | |
| 36 | THE GUGGENHEIM FUNDS SEMI-ANNUAL REPORT | SEE NOTES TO FINANCIAL STATEMENTS. |
| CONSOLIDATED SCHEDULE OF INVESTMENTS (Unaudited)(continued) | March 29, 2018 |
| MACRO OPPORTUNITIES FUND | |
| | | Face
Amount~ | | | Value | |
| | | | | | | |
| Fortis Solutions Group LLC | | | | | | |
| 6.29% (1 Month USD LIBOR + 4.50%) due 12/15/23†††,1 | | | 1,825,178 | | | $ | 1,825,178 | |
| 6.38% (1 Month USD LIBOR + 4.50%) due 12/15/23†††,1 | | | 40,294 | | | | 35,593 | |
| Zodiac Pool Solutions LLC | | | | | | | | |
| due 12/20/239 | | | 1,734,566 | | | | 1,735,659 | |
| National Technical Systems | | | | | | | | |
| 7.91% (3 Month USD LIBOR + 6.25%) due 06/12/21†††,1 | | | 1,569,444 | | | | 1,530,208 | |
| Imagine Print Solutions LLC | | | | | | | | |
| 7.06% (3 Month USD LIBOR + 4.75%) due 06/21/22 | | | 1,633,500 | | | | 1,519,155 | |
| Sapphire Bidco B.V. | | | | | | | | |
| 3.25% (3 Month USD LIBOR + 3.25%) due 12/06/24 | | | EUR | 1,200,000 | | | | 1,469,487 | |
| EXC Holdings III Corp. | | | | | | | | |
| 3.50% (1 Month EURIBOR + 3.50%) due 12/02/24 | | | EUR | 725,000 | | | | 893,203 | |
| 5.16% (6 Month USD LIBOR + 3.50%) due 12/02/24 | | | 500,000 | | | | 504,165 | |
| Klockner Pentaplast of America, Inc. | | | | | | | | |
| 4.75% (3 Month EURIBOR + 4.75%) due 06/30/22 | | | EUR | 1,100,000 | | | | 1,297,342 | |
| American Bath Group LLC | | | | | | | | |
| 7.55% (6 Month USD LIBOR + 5.25%) due 09/30/23 | | | 1,237,200 | | | | 1,249,053 | |
| Endries Acquisition Holdings, Inc. | | | | | | | | |
| 6.46% (1 Month USD LIBOR + 4.75%) due 06/01/23†††,1 | | | 1,243,750 | | | | 1,233,021 | |
| CCP Lux Holding SARL | | | | | | | | |
| 3.75% (3 Month USD LIBOR + 4.00%) due 02/08/25 | | | EUR | 1,000,000 | | | | 1,227,772 | |
| Shilton Bidco Ltd. | | | | | | | | |
| 3.25% (3 Month EURIBOR + 3.25%) due 07/12/24 | | | EUR | 1,000,000 | | | | 1,223,293 | |
| Safety Bidco Ltd. | | | | | | | | |
| 6.28% (3 Month USD LIBOR + 4.50%) due 11/06/24†††,1 | | | GBP | 850,000 | | | | 1,181,357 | |
| Swissport Investments S.A. | | | | | | | | |
| 4.75% (2 Month EURIBOR + 3.75%) due 02/08/22 | | | EUR | 972,222 | | | | 1,166,918 | |
| CEP IV Investment | | | | | | | | |
| 3.50% (1 Month EURIBOR + 3.50%), (2 Month EURIBOR + 3.50%) and (3 Month EURIBOR + 3.50%) due 10/03/24 | | | EUR | 900,000 | | | | 1,107,420 | |
| Amspec Services, Inc. | | | | | | | | |
| 6.17% (3 Month USD LIBOR + 4.50%) due 07/01/22 | | | 798,000 | | | | 794,010 | |
| Duran Group Holding GMBH | | | | | | | | |
| 4.00% (1 Month EURIBOR + 4.00%) due 03/29/24 | | | EUR | 439,412 | | | | 536,626 | |
| 4.00% (1 Month EURIBOR + 4.00%) due 12/20/24 | | | EUR | 150,000 | | | | 183,186 | |
| Recess Holdings, Inc. | | | | | | | | |
| 6.20% (3 Month USD LIBOR + 3.75%) due 09/30/24 | | | 703,000 | | | | 705,636 | |
| Transcendia Holdings, Inc. | | | | | | | | |
| 5.38% (3 Month USD LIBOR + 3.50%) due 05/30/24 | | | 648,375 | | | | 650,605 | |
| CAPRI ACQ BIDCO | | | | | | | | |
| 3.25% (3 Month EURIBOR + 3.25%) due 11/01/24 | | | EUR | 400,000 | | | | 492,187 | |
| SEE NOTES TO FINANCIAL STATEMENTS. | THE GUGGENHEIM FUNDS SEMI-ANNUAL REPORT | 37 |
| CONSOLIDATED SCHEDULE OF INVESTMENTS (Unaudited)(continued) | March 29, 2018 |
| MACRO OPPORTUNITIES FUND | |
| | | Face
Amount~ | | | Value | |
| | | | | | | |
| Tank Holdings Corp. | | | | | | |
| 5.20% (1 Month USD LIBOR + 3.50%) due 03/16/22 | | | 415,217 | | | $ | 417,165 | |
| Ceva Group Plc (United Kingdom) | | | | | | | | |
| 5.75% (3 Month USD LIBOR + 4.75%) due 03/19/19†††,1 | | | 280,000 | | | | 268,900 | |
| Wencor Group | | | | | | | | |
| due 06/19/19†††,1,9 | | | 200,000 | | | | 194,266 | |
| Total Industrial | | | | | | | 133,785,983 | |
| | | | | | | | | |
| Consumer, Cyclical - 1.9% |
| Mavis Tire Express Services Corp. | | | | | | | | |
| 5.07% (3 Month USD LIBOR + 3.25%) due 02/28/25 | | | 11,421,531 | | | | 11,421,531 | |
| Petco Animal Supplies, Inc. | | | | | | | | |
| 4.77% (3 Month USD LIBOR + 3.00%) due 01/26/23 | | | 15,165,807 | | | | 11,079,532 | |
| Navistar Inc. | | | | | | | | |
| 5.21% (3 Month USD LIBOR + 3.50%) due 11/06/24 | | | 8,300,000 | | | | 8,338,014 | |
| EG Finco Ltd. | | | | | | | | |
| 4.00% (3 Month USD LIBOR + 4.00%) due 02/07/25 | | | 5,059,021 | | | | 5,413,729 | |
| 4.75% (3 Month USD LIBOR + 4.00%) due 02/07/25 | | | GBP | 1,000,000 | | | | 1,394,345 | |
| 4.00% (3 Month USD LIBOR + 4.00%) due 02/01/25 | | | EUR | 900,000 | | | | 1,097,497 | |
| Accuride Corp. | | | | | | | | |
| 7.55% (3 Month USD LIBOR + 5.25%) due 11/17/23 | | | 7,747,125 | | | | 7,824,597 | |
| USIC Holding, Inc. | | | | | | | | |
| 5.80% (3 Month USD LIBOR + 3.50%) due 12/08/23 | | | 6,759,234 | | | | 6,809,928 | |
| Truck Hero, Inc. | | | | | | | | |
| 6.22% (3 Month USD LIBOR + 4.00%) due 04/22/24 | | | 5,610,734 | | | | 5,635,983 | |
| Peer Holding III BV | | | | | | | | |
| 3.50% (6 Month EURIBOR + 3.50%) due 03/08/25 | | | EUR | 4,050,000 | | | | 4,953,140 | |
| At Home Holding III Corp. | | | | | | | | |
| 5.27% (3 Month USD LIBOR + 3.50%) due 06/03/22 | | | 4,862,500 | | | | 4,880,734 | |
| Cyan Blue Holdco 3 Ltd. | | | | | | | | |
| 4.71% (1 Month USD LIBOR + 4.00%) due 08/23/24 | | | GBP | 3,404,366 | | | | 4,774,137 | |
| Leslie’s Poolmart, Inc. | | | | | | | | |
| 5.28% (3 Month USD LIBOR + 3.50%) due 08/16/23 | | | 4,678,141 | | | | 4,707,380 | |
| Acosta, Inc. | | | | | | | | |
| 5.13% (3 Month USD LIBOR + 3.25%) due 09/26/21 | | | 2,447,210 | | | | 2,045,060 | |
| 5.30% (Commercial Prime Lending Rate + 2.25%) and (3 Month USD LIBOR + 3.25%) due 09/26/19 | | | 2,266,667 | | | | 1,894,185 | |
| 5.40% (3 Month USD LIBOR + 3.25%) due 09/26/19 | | | 666,667 | | | | 557,113 | |
| BBB Industries, LLC | | | | | | | | |
| 6.38% (1 Month USD LIBOR + 4.50%) due 11/03/21 | | | 3,718,784 | | | | 3,746,675 | |
| 5.65% (1 Month USD LIBOR + 4.00%) due 11/04/19†††,1 | | | 675,000 | | | | 644,840 | |
| 38 | THE GUGGENHEIM FUNDS SEMI-ANNUAL REPORT | SEE NOTES TO FINANCIAL STATEMENTS. |
| CONSOLIDATED SCHEDULE OF INVESTMENTS (Unaudited)(continued) | March 29, 2018 |
| MACRO OPPORTUNITIES FUND | |
| | | Face
Amount~ | | | Value | |
| | | | | | | |
| Amaya Holdings B.V. | | | | | | |
| 5.80% (1 Month USD LIBOR + 3.50%) due 08/01/21 | | | 4,286,839 | | | $ | 4,303,986 | |
| Learning Care Group (US), Inc. | | | | | | | | |
| 5.11% (1 Month USD LIBOR + 3.25% and (3 Month USD LIBOR + 3.25%) due 03/13/25 | | | 4,200,000 | | | | 4,231,500 | |
| Neiman Marcus Group, Inc. | | | | | | | | |
| 4.94% (3 Month USD LIBOR + 3.25%) due 10/25/20 | | | 4,160,563 | | | | 3,585,532 | |
| Belk, Inc. | | | | | | | | |
| 6.46% (3 Month USD LIBOR + 4.75%) due 12/12/22 | | | 4,063,368 | | | | 3,514,813 | |
| Checkers Drive-In Restaurants, Inc. | | | | | | | | |
| 6.13% (3 Month USD LIBOR + 4.25%) due 04/25/24 | | | 3,425,617 | | | | 3,425,618 | |
| Blue Nile, Inc. | | | | | | | | |
| 8.80% (1 Month USD LIBOR + 6.50%) due 02/17/23 | | | 3,368,750 | | | | 3,385,594 | |
| Galls LLC | | | | | | | | |
| 8.02% (1 Month USD LIBOR + 6.25%) due 01/31/25†††,1 | | | 3,386,786 | | | | 3,349,534 | |
| Sears Roebuck Acceptance Corp. | | | | | | | | |
| 6.20% (1 Month USD LIBOR + 4.50%) due 01/20/19 | | | 3,052,185 | | | | 3,031,827 | |
| Men’s Wearhouse | | | | | | | | |
| 5.20% (1 Month USD LIBOR + 3.50%) due 06/18/21 | | | 2,734,594 | | | | 2,734,594 | |
| IRB Holding Corp. | | | | | | | | |
| 4.94% (3 Month USD LIBOR + 3.25%) due 02/05/25 | | | 2,500,000 | | | | 2,525,775 | |
| Dealer Tire LLC | | | | | | | | |
| 5.67% (1 Month USD LIBOR + 3.25%) and (3 Month USD LIBOR + 3.25%) due 12/22/21 | | | 2,072,208 | | | | 2,095,520 | |
| Toys ‘R’ US, Inc. | | | | | | | | |
| 10.50% (Commercial Prime Lending Rate + 5.75%) due 01/18/19 | | | 1,500,000 | | | | 1,497,495 | |
| GVC Holdings plc | | | | | | | | |
| 3.50% (3 Month USD LIBOR + 3.50%) due 03/15/24 | | | GBP | 1,000,000 | | | | 1,399,607 | |
| DG Investment Intermediate Holdings 2, Inc. | | | | | | | | |
| 5.30% (1 Month USD LIBOR + 3.00%) due 02/03/25 | | | 1,309,677 | | | | 1,306,403 | |
| Richmond UK Bidco Ltd. | | | | | | | | |
| 4.76% (3 Month USD LIBOR + 4.25%) due 03/03/24 | | | GBP | 777,012 | | | | 1,076,609 | |
| Gopher Resource LLC | | | | | | | | |
| 5.48% (3 Month USD LIBOR + 3.25%) due 03/06/25 | | | 1,000,000 | | | | 1,008,750 | |
| K & N Parent, Inc. | | | | | | | | |
| 6.63% (3 Month USD LIBOR + 4.75%) due 10/20/23 | | | 987,500 | | | | 987,500 | |
| LegalZoom.com, Inc. | | | | | | | | |
| 6.34% (1 Month USD LIBOR + 4.50%) due 11/21/24 | | | 897,750 | | | | 902,239 | |
| Amaya Holdings B.V. (Stars Group Holdings B.V.) | | | | | | | | |
| 3.00% (3 Month USD LIBOR + 3.00%) due 04/04/25 | | | 750,000 | | | | 753,000 | |
| SMG US Midco 2, Inc. | | | | | | | | |
| 8.88% (3 Month USD LIBOR + 7.00%) due 01/23/26 | | | 600,000 | | | | 612,000 | |
| SEE NOTES TO FINANCIAL STATEMENTS. | THE GUGGENHEIM FUNDS SEMI-ANNUAL REPORT | 39 |
| CONSOLIDATED SCHEDULE OF INVESTMENTS (Unaudited)(continued) | March 29, 2018 |
| MACRO OPPORTUNITIES FUND | |
| | | Face
Amount~ | | | Value | |
| | | | | | | |
| Safe Fleet Holdings LLC | | | | | | |
| 4.78% (1 Month USD LIBOR + 3.00%) due 02/03/25 | | | 500,000 | | | $ | 500,415 | |
| Packers Sanitation Services, Inc. | | | | | | | | |
| 4.94% (3 Month USD LIBOR + 3.25%) due 12/04/24 | | | 149,625 | | | | 149,812 | |
| Total Consumer, Cyclical | | | | | | | 133,596,543 | |
| | | | | | | | | |
| Communications - 0.9% |
| Cengage Learning Acquisitions, Inc. | | | | | | | | |
| 6.04% (3 Month USD LIBOR + 4.25%) due 06/07/23 | | | 27,770,052 | | | | 25,220,206 | |
| Mcgraw-Hill Global Education Holdings LLC | | | | | | | | |
| 5.88% (1 Month USD LIBOR + 4.00%) due 05/04/22 | | | 8,322,024 | | | | 8,211,757 | |
| Dominion Web Solutions LLC | | | | | | | | |
| 7.85% (3 Month USD LIBOR + 6.00%) due 06/15/24†††,1 | | | 7,500,769 | | | | 7,385,258 | |
| Market Track LLC | | | | | | | | |
| 6.55% (3 Month USD LIBOR + 4.25%) due 06/05/24 | | | 4,228,750 | | | | 4,218,178 | |
| Anaren, Inc. | | | | | | | | |
| 6.80% (3 Month USD LIBOR + 4.50%) due 02/18/21 | | | 1,834,527 | | | | 1,829,941 | |
| 10.55% (3 Month USD LIBOR + 8.25%) due 08/18/21 | | | 1,500,000 | | | | 1,500,000 | |
| Proquest LLC | | | | | | | | |
| 5.63% (3 Month USD LIBOR + 3.75%) due 10/24/21 | | | 2,967,499 | | | | 3,005,513 | |
| Neustar, Inc. | | | | | | | | |
| 5.38% (1 Month USD LIBOR + 3.50%) due 08/08/24 | | | 2,688,942 | | | | 2,696,794 | |
| Radiate HoldCo LLC | | | | | | | | |
| 4.88% (3 Month USD LIBOR + 3.00%) due 02/01/24 | | | 2,493,703 | | | | 2,478,117 | |
| Comet Bidco Ltd. | | | | | | | | |
| 6.00% (3 Month USD LIBOR + 5.00%) due 10/31/24 | | | 1,600,000 | | | | 1,578,000 | |
| SFR Group S.A. | | | | | | | | |
| 3.00% (3 Month EURIBOR + 3.00%) due 01/31/26 | | | EUR | 997,500 | | | | 1,177,350 | |
| 3.00% (3 Month EURIBOR + 3.00%) due 07/31/25 | | | EUR | 200,000 | | | | 236,205 | |
| Liberty Cablevision of Puerto Rico LLC | | | | | | | | |
| 5.22% (2 Month USD LIBOR + 3.50%) due 01/07/22 | | | 1,030,000 | | | | 997,596 | |
| TVC Albany, Inc. | | | | | | | | |
| 6.30% (1 Month USD LIBOR + 4.00%) due 09/18/24 | | | 847,701 | | | | 850,880 | |
| Total Communications | | | | | | | 61,385,795 | |
| | | | | | | | | |
| Financial - 0.5% |
| National Financial Partners Corp. | | | | | | | | |
| 4.88% (1 Month USD LIBOR + 3.00%) due 01/08/24 | | | 9,581,658 | | | | 9,599,672 | |
| USI, Inc. | | | | | | | | |
| 5.30% (1 Month USD LIBOR + 3.00%) due 05/16/24 | | | 8,777,945 | | | | 8,792,604 | |
| Misys Ltd. | | | | | | | | |
| 4.25% (3 Month EURIBOR + 3.25%) due 06/13/24 | | | EUR | 3,482,500 | | | | 4,293,798 | |
| 40 | THE GUGGENHEIM FUNDS SEMI-ANNUAL REPORT | SEE NOTES TO FINANCIAL STATEMENTS. |
| CONSOLIDATED SCHEDULE OF INVESTMENTS (Unaudited)(continued) | March 29, 2018 |
| MACRO OPPORTUNITIES FUND | |
| | | Face
Amount~ | | | Value | |
| | | | | | | |
| York Risk Services | | | | | | |
| 5.63% (2 Month USD LIBOR + 3.75%) and (3 Month USD LIBOR + 3.75) due 10/01/21 | | | 2,994,645 | | | $ | 2,927,266 | |
| PT Intermediate Holdings III LLC | | | | | | | | |
| 6.30% (1 Month USD LIBOR + 4.00%) due 12/09/24 | | | 2,493,750 | | | | 2,512,453 | |
| 10.30% (3 Month USD LIBOR + 8.00%) due 12/08/25 | | | 400,000 | | | | 402,000 | |
| Jane Street Group LLC | | | | | | | | |
| 5.63% (3 Month USD LIBOR + 3.75%) due 08/25/22 | | | 2,327,500 | | | | 2,336,950 | |
| Saphilux S.A.R.L (SGG) | | | | | | | | |
| 3.75% (3 Month EURIBOR + 3.75%) due 03/08/25 | | | EUR | 1,700,000 | | | | 2,090,747 | |
| American Stock Transfer & Trust | | | | | | | | |
| 6.81% (3 Month USD LIBOR + 4.50%) due 06/26/20 | | | 1,537,282 | | | | 1,536,005 | |
| Institutional Shareholder Services | | | | | | | | |
| 5.47% (1 Month USD LIBOR + 3.75%) due 10/16/24 | | | 733,333 | | | | 734,558 | |
| 5.80% (3 Month USD LIBOR + 3.75%) due 10/16/24 | | | 66,667 | | | | 66,778 | |
| Total Financial | | | | | | | 35,292,831 | |
| | | | | | | | | |
| Basic Materials - 0.5% |
| A-Gas Ltd. | | | | | | | | |
| 7.05% (3 Month USD LIBOR + 4.75%) due 08/11/24†††,1 | | | 6,587,833 | | | | 6,468,021 | |
| 4.75% due 07/25/249 | | | EUR | 2,750,000 | | | | 3,375,323 | |
| GrafTech Finance, Inc. | | | | | | | | |
| 5.24% (3 Month USD LIBOR + 3.50%) due 02/12/25 | | | 5,450,000 | | | | 5,450,000 | |
| Dubois Chemicals, Inc. | | | | | | | | |
| due 03/15/249 | | | 2,780,000 | | | | 2,780,000 | |
| 6.11% (Commercial Prime Lending Rate + 2.75%) and (3 Month USD LIBOR + 3.75%) due 03/15/24 | | | 200,000 | | | | 200,000 | |
| 4.25% due 03/15/249 | | | 50,000 | | | | 50,000 | |
| Hoffmaster Group, Inc. | | | | | | | | |
| 6.80% (3 Month USD LIBOR + 4.50%) due 11/21/23 | | | 2,419,375 | | | | 2,448,117 | |
| ICP Industrial, Inc. | | | | | | | | |
| 5.88% (1 Month USD LIBOR + 4.00%) due 11/03/23 | | | 1,979,314 | | | | 1,969,417 | |
| EP Minerals LLC | | | | | | | | |
| 6.48% (3 Month USD LIBOR + 4.50%) due 08/20/20 | | | 1,796,375 | | | | 1,798,620 | |
| ASP Chromaflo Dutch I B.V. | | | | | | | | |
| 5.38% (1 Month USD LIBOR + 3.50%) due 11/20/23 | | | 1,787,405 | | | | 1,798,577 | |
| Big River Steel LLC | | | | | | | | |
| 7.30% (3 Month USD LIBOR + 5.00%) due 08/23/23 | | | 1,691,500 | | | | 1,712,644 | |
| PMHC II, Inc. (Prince) | | | | | | | | |
| 4.50% (3 Month USD LIBOR + 3.50%) due 03/20/25 | | | 1,500,000 | | | | 1,508,445 | |
| ASP Chromaflo Intermediate Holdings, Inc. | | | | | | | | |
| 5.38% (1 Month USD LIBOR + 3.50%) due 11/20/23 | | | 1,374,589 | | | | 1,383,181 | |
| SEE NOTES TO FINANCIAL STATEMENTS. | THE GUGGENHEIM FUNDS SEMI-ANNUAL REPORT | 41 |
| CONSOLIDATED SCHEDULE OF INVESTMENTS (Unaudited)(continued) | March 29, 2018 |
| MACRO OPPORTUNITIES FUND | |
| | | Face
Amount~ | | | Value | |
| | | | | | | |
| Invictus MD Strategies Corp. | | | | | | |
| 3.00% due 02/14/259 | | | 1,300,000 | | | $ | 1,308,944 | |
| Ferro Corp. | | | | | | | | |
| 2.75% (1 Month EURIBOR + 2.75%) due 02/14/24 | | | EUR | 594,000 | | | | 731,964 | |
| Azelis Finance S.A. | | | | | | | | |
| 3.50% (3 Month USD LIBOR + 3.50%) due 12/16/22 | | | EUR | 250,000 | | | | 307,386 | |
| Nexeo Solutions LLC | | | | | | | | |
| 5.27% (1 Month USD LIBOR + 3.25%), (2 Month USD LIBOR + 3.25%) and (3 Month USD LIBOR + 3.25%) due 06/09/23 | | | 296,261 | | | | 299,040 | |
| Total Basic Materials | | | | | | | 33,589,679 | |
| | | | | | | | | |
| Utilities - 0.4% |
| Invenergy Thermal Operating I, LLC | | | | | | | | |
| 7.80% (3 Month USD LIBOR + 5.50%) due 10/19/22 | | | 11,547,468 | | | | 10,941,226 | |
| Exgen Texas Power LLC | | | | | | | | |
| due 09/18/219 | | | 7,940,977 | | | | 4,840,661 | |
| MRP Generation Holding | | | | | | | | |
| 9.30% (3 Month USD LIBOR + 7.00%) due 10/18/22 | | | 3,456,250 | | | | 3,330,961 | |
| Terraform AP Acquisition Holdings LLC | | | | | | | | |
| 6.55% (3 Month USD LIBOR + 4.25%) due 06/27/22 | | | 2,397,024 | | | | 2,411,262 | |
| Bhi Investments LLC | | | | | | | | |
| 6.80% (Commercial Prime Lending Rate + 3.50%) and (1 Month USD LIBOR + 4.50%) due 08/28/24 | | | 1,221,938 | | | | 1,209,718 | |
| Panda Power | | | | | | | | |
| 8.80% (3 Month USD LIBOR + 6.50%) due 08/21/20 | | | 1,301,813 | | | | 1,209,709 | |
| Viva Alamo LLC | | | | | | | | |
| due 02/22/219 | | | 1,011,823 | | | | 1,002,656 | |
| Panda Temple II Power | | | | | | | | |
| 8.30% (3 Month USD LIBOR + 6.00%) due 04/03/19 | | | 738,323 | | | | 679,257 | |
| Stonewall | | | | | | | | |
| 7.80% (1 Month USD LIBOR + 5.50%) due 11/13/21 | | | 367,826 | | | | 360,010 | |
| Total Utilities | | | | | | | 25,985,460 | |
| | | | | | | | | |
| Energy - 0.1% |
| Gavilan Resources LLC | | | | | | | | |
| 7.79% (1 Month USD LIBOR + 6.00%) due 03/01/24 | | | 2,050,000 | | | | 2,051,291 | |
| Summit Midstream Partners, LP | | | | | | | | |
| 7.88% (1 Month USD LIBOR + 6.00%) due 05/13/22 | | | 1,936,000 | | | | 1,955,360 | |
| Riverstone Utopia Member LLC | | | | | | | | |
| 6.04% (3 Month USD LIBOR + 4.25%) due 10/17/24 | | | 1,350,000 | | | | 1,353,375 | |
| Ultra Petroleum, Inc. | | | | | | | | |
| 4.76% (3 Month USD LIBOR + 3.00%) due 04/12/24 | | | 1,350,000 | | | | 1,334,812 | |
| Osmose Utility Services, Inc. | | | | | | | | |
| 6.05% (3 Month USD LIBOR + 3.75%) due 08/22/22 | | | 1,296,266 | | | | 1,305,988 | |
| 42 | THE GUGGENHEIM FUNDS SEMI-ANNUAL REPORT | SEE NOTES TO FINANCIAL STATEMENTS. |
| CONSOLIDATED SCHEDULE OF INVESTMENTS (Unaudited)(continued) | March 29, 2018 |
| MACRO OPPORTUNITIES FUND | |
| | | Face
Amount~ | | | Value | |
| | | | | | | |
| PSS Companies | | | | | | |
| 6.34% (1 Month USD LIBOR + 4.50%) due 01/28/20 | | | 841,422 | | | $ | 814,076 | |
| Total Energy | | | | | | | 8,814,902 | |
| Total Senior Floating Rate Interests | | | | | | | | |
| (Cost $841,276,412) | | | | | | | 837,806,467 | |
| | | | | | | | | |
| CORPORATE BONDS†† - 8.1% |
| Financial - 4.7% |
| Station Place Securitization Trust Series | | | | | | | | |
| 2.88% (1 Month USD LIBOR + 1.00%) due 03/24/196,7 | | | 48,000,000 | | | | 48,000,000 | |
| 2.85% (1 Month USD LIBOR + 1.25%) due 11/24/186,7 | | | 32,000,000 | | | | 32,000,000 | |
| Citigroup, Inc. | | | | | | | | |
| 6.25% 11,12 | | | 38,320,000 | | | | 40,475,500 | |
| 5.95% 11,12 | | | 16,615,000 | | | | 17,080,220 | |
| 5.90% 11,12 | | | 3,300,000 | | | | 3,403,125 | |
| Bank of America Corp. | | | | | | | | |
| 6.30% 11,12 | | | 31,944,000 | | | | 34,259,940 | |
| Wells Fargo & Co. | | | | | | | | |
| 5.88% 11,12 | | | 29,550,000 | | | | 31,086,600 | |
| American Equity Investment Life Holding Co. | | | | | | | | |
| 5.00% due 06/15/27 | | | 28,388,000 | | | | 28,771,578 | |
| MetLife, Inc. | | | | | | | | |
| 9.25% due 04/08/387 | | | 12,600,000 | | | | 17,136,000 | |
| 10.75% due 08/01/39 | | | 4,849,000 | | | | 7,612,930 | |
| Atlas Mara Ltd. | | | | | | | | |
| 8.00% due 12/31/20 | | | 14,400,000 | | | | 12,960,000 | |
| Assurant, Inc. | | | | | | | | |
| 4.90% due 03/27/28 | | | 11,500,000 | | | | 11,761,567 | |
| Jefferies Finance LLC / JFIN Company-Issuer Corp. | | | | | | | | |
| 7.25% due 08/15/247 | | | 11,150,000 | | | | 11,003,935 | |
| Hunt Companies, Inc. | | | | | | | | |
| 6.25% due 02/15/267 | | | 6,900,000 | | | | 6,661,053 | |
| FBM Finance, Inc. | | | | | | | | |
| 8.25% due 08/15/217 | | | 6,028,000 | | | | 6,299,260 | |
| Customers Bank | | | | | | | | |
| 6.13% due 06/26/298,12 | | | 4,500,000 | | | | 4,671,851 | |
| QBE Insurance Group Ltd. | | | | | | | | |
| 7.50% due 11/24/437,12 | | | 3,800,000 | | | | 4,269,072 | |
| Station Place Securitization Trust | | | | | | | | |
| 2.60% (1 Month USD LIBOR + 1.00%) due 08/24/186,7 | | | 3,900,000 | | | | 3,900,000 | |
| Univest Corporation of Pennsylvania | | | | | | | | |
| 5.10% due 03/30/2512 | | | 2,500,000 | | | | 2,539,565 | |
| Hospitality Properties Trust | | | | | | | | |
| 5.25% due 02/15/26 | | | 2,003,000 | | | | 2,085,085 | |
| Total Financial | | | | | | | 325,977,281 | |
| | | | | | | | | |
| Basic Materials - 1.0% |
| BHP Billiton Finance USA Ltd. | | | | | | | | |
| 6.75% due 10/19/757,12 | | | 33,075,000 | | | | 37,126,687 | |
| Yamana Gold, Inc. | | | | | | | | |
| 4.95% due 07/15/24 | | | 18,149,000 | | | | 18,670,784 | |
| 4.63% due 12/15/27 | | | 3,200,000 | | | | 3,151,108 | |
| Eldorado Gold Corp. | | | | | | | | |
| 6.13% due 12/15/207 | | | 7,175,000 | | | | 6,816,250 | |
| GCP Applied Technologies, Inc. | | | | | | | | |
| 9.50% due 02/01/237 | | | 1,475,000 | | | | 1,623,827 | |
| Mirabela Nickel Ltd. | | | | | | | | |
| 9.50% due 06/24/19 | | | 1,885,418 | | | | 405,365 | |
| New Day Aluminum | | | | | | | | |
| 10.00% due 10/28/20†††,1,10 | | | 50,332 | | | | 50,332 | |
| Total Basic Materials | | | | | | | 67,844,353 | |
| | | | | | | | | |
| Energy - 0.8% |
| Hess Corp. | | | | | | | | |
| 5.60% due 02/15/41 | | | 17,000,000 | | | | 17,364,461 | |
| 7.30% due 08/15/31 | | | 14,341,000 | | | | 17,198,688 | |
| 7.13% due 03/15/33 | | | 9,250,000 | | | | 11,097,274 | |
| 6.00% due 01/15/40 | | | 1,750,000 | | | | 1,847,621 | |
| SEE NOTES TO FINANCIAL STATEMENTS. | THE GUGGENHEIM FUNDS SEMI-ANNUAL REPORT | 43 |
| CONSOLIDATED SCHEDULE OF INVESTMENTS (Unaudited)(continued) | March 29, 2018 |
| MACRO OPPORTUNITIES FUND | |
| | | Face
Amount~ | | | Value | |
| | | | | | | |
| BreitBurn Energy Partners Limited Partnership / BreitBurn Operating LP / BreitBurn Finance Corp. | | | | | | |
| 9.25% due 05/18/20†††,13 | | | 5,037,000 | | | $ | 5,292,248 | |
| Indigo Natural Resources LLC | | | | | | | | |
| 6.88% due 02/15/267 | | | 2,000,000 | | | | 1,885,000 | |
| Schahin II Finance Co. SPV Ltd. | | | | | | | | |
| 5.88% due 09/25/228,13 | | | 7,557,400 | | | | 925,782 | |
| American Midstream Partners Limited Partnership / American Midstream Finance Corp. | | | | | | | | |
| 8.50% due 12/15/21 | | | 285,000 | | | | 287,137 | |
| Total Energy | | | | | | | 55,898,211 | |
| | | | | | | | | |
| Industrial - 0.7% |
| Encore Capital Group, Inc. | | | | | | | | |
| 5.62% due 08/11/24††† | | | 39,600,000 | | | | 38,928,766 | |
| Yamana Gold, Inc. | | | | | | | | |
| 4.76% due 03/23/22††† | | | 4,750,000 | | | | 4,770,003 | |
| Cleaver-Brooks, Inc. | | | | | | | | |
| 7.88% due 03/01/237 | | | 2,690,000 | | | | 2,794,237 | |
| StandardAero Aviation Holdings, Inc. | | | | | | | | |
| 10.00% due 07/15/237 | | | 1,670,000 | | | | 1,814,038 | |
| Princess Juliana International Airport Operating Company N.V. | | | | | | | | |
| 5.50% due 12/20/278 | | | 1,587,322 | | | | 1,475,924 | |
| Grinding Media Inc. / MC Grinding Media Canada Inc. | �� | | | | | | | |
| 7.38% due 12/15/237 | | | 600,000 | | | | 630,000 | |
| New Enterprise Stone & Lime Company, Inc. | | | | | | | | |
| 6.25% due 03/15/267 | | | 350,000 | | | | 350,437 | |
| Total Industrial | | | | | | | 50,763,405 | |
| | | | | | | | | |
| Consumer, Cyclical - 0.4% |
| Ferrellgas Limited Partnership / Ferrellgas Finance Corp. | | | | | | | | |
| 6.50% due 05/01/21 | | | 8,209,000 | | | | 7,860,118 | |
| 6.75% due 06/15/2314 | | | 4,361,000 | | | | 3,968,510 | |
| Ferrellgas, LP / Ferrellgas Finance Corp. | | | | | | | | |
| 6.75% due 01/15/22 | | | 8,863,500 | | | | 8,398,166 | |
| Carrols Restaurant Group, Inc. | | | | | | | | |
| 8.00% due 05/01/22 | | | 4,599,000 | | | | 4,782,960 | |
| Williams Scotsman International, Inc. | | | | | | | | |
| 7.88% due 12/15/227 | | | 2,532,000 | | | | 2,619,037 | |
| Total Consumer, Cyclical | | | | | | | 27,628,791 | |
| | | | | | | | | |
| Communications - 0.2% |
| SFR Group S.A. | | | | | | | | |
| 7.38% due 05/01/267 | | | 6,150,000 | | | | 5,857,875 | |
| Cengage Learning, Inc. | | | | | | | | |
| 9.50% due 06/15/247 | | | 7,525,000 | | | | 5,775,437 | |
| EIG Investors Corp. | | | | | | | | |
| 10.88% due 02/01/24 | | | 1,750,000 | | | | 1,908,953 | |
| MDC Partners, Inc. | | | | | | | | |
| 6.50% due 05/01/247 | | | 1,350,000 | | | | 1,312,875 | |
| McGraw-Hill Global Education Holdings LLC / McGraw-Hill Global Education Finance | | | | | | | | |
| 7.88% due 05/15/247 | | | 1,295,000 | | | | 1,238,046 | |
| Total Communications | | | | | | | 16,093,186 | |
| | | | | | | | | |
| Consumer, Non-cyclical - 0.2% |
| Offutt AFB America First Community LLC | | | | | | | | |
| 5.46% due 09/01/508 | | | 5,700,244 | | | | 5,760,754 | |
| Great Lakes Dredge & Dock Corp. | | | | | | | | |
| 8.00% due 05/15/22 | | | 2,667,000 | | | | 2,733,675 | |
| Beverages & More, Inc. | | | | | | | | |
| 11.50% due 06/15/227 | | | 1,600,000 | | | | 1,472,000 | |
| 44 | THE GUGGENHEIM FUNDS SEMI-ANNUAL REPORT | SEE NOTES TO FINANCIAL STATEMENTS. |
| CONSOLIDATED SCHEDULE OF INVESTMENTS (Unaudited)(continued) | March 29, 2018 |
| MACRO OPPORTUNITIES FUND | |
| | | Face
Amount~ | | | Value | |
| | | | | | | |
| Endo Finance LLC / Endo Finco, Inc. | | | | | | |
| 5.38% due 01/15/23 | | | 800,000 | | | $ | 606,000 | |
| 7.25% due 01/15/227 | | | 425,000 | | | | 368,688 | |
| Flexi-Van Leasing, Inc. | | | | | | | | |
| 10.00% due 02/15/237 | | | 350,000 | | | | 347,375 | |
| Total Consumer, Non-cyclical | | | | | | | 11,288,492 | |
| | | | | | | | | |
| Utilities - 0.1 | | | | | | | | |
| Terraform Global Operating LLC | | | | | | | | |
| 6.13% due 03/01/267 | | | 3,175,000 | | | | 3,198,812 | |
| | | | | | | | | |
| Technology - 0.0% |
| Epicor Software Corp. | | | | | | | | |
| 10.56% (3 Month USD LIBOR + 8.25%) due 06/21/23†††,1,6,8 | | | 1,580,000 | | | | 1,580,000 | |
| Total Corporate Bonds | | | | | | | | |
| (Cost $568,509,764) | | | | | | | 560,272,531 | |
| | | | | | | | | |
| MUNICIPAL BONDS†† - 0.0% |
| Puerto Rico - 0.0% |
| Puerto Rico Electric Power Authority Revenue Bonds | | | | | | | | |
| 1.65% (3 Month USD LIBOR + 0.52%) due 07/01/296 | | | 1,000,000 | | | | 875,000 | |
| Total Municipal Bonds | | | | | | | | |
| (Cost $844,842) | | | | | | | 875,000 | |
| | | | | | | | | |
| COMMERCIAL PAPER†† - 0.2% |
| EI du Pont de Nemours & Co. | | | | | | | | |
| 2.21% due 04/06/1815 | | | 17,500,000 | | | | 17,494,628 | |
| Total Commercial Paper | | | | | | | | |
| (Cost $17,494,628) | | | | | | | 17,494,628 | |
| | | | | | | | | |
| REPURCHASE AGREEMENTS††,16 - 2.2% |
| BNP Paribas | | | | | | | | |
| issued 03/07/18 at 1.90% due 04/03/18 | | | 38,489,000 | | | | 38,489,000 | |
| issued 03/21/18 at 1.90% due 04/03/18 | | | 14,842,000 | | | | 14,842,000 | |
| Deutsche Bank | | | | | | | | |
| issued 02/26/18 at 2.41% due 05/25/18 | | | 52,694,196 | | | | 52,694,196 | |
| Barclays | | | | | | | | |
| issued 03/28/18 at 2.18% open maturity6 | | | 12,862,500 | | | | 12,862,500 | |
| issued 10/03/17 at 1.30% open maturity6 | | | 4,719,750 | | | | 4,719,750 | |
| issued 10/05/17 at 1.30% open maturity6 | | | 3,299,750 | | | | 3,299,750 | |
| issued 11/22/17 at 1.30% open maturity6 | | | 1,912,969 | | | | 1,912,969 | |
| issued 08/11/17 at 1.30% open maturity6 | | | 1,078,365 | | | | 1,078,365 | |
| issued 12/21/17 at 1.30% open maturity6 | | | 811,875 | | | | 811,875 | |
| issued 09/08/17 at 0.50% open maturity6 | | | 499,375 | | | | 499,375 | |
| issued 12/07/17 at 0.00% open maturity6 | | | 494,375 | | | | 494,375 | |
| issued 09/27/17 at (0.75)% open maturity6 | | | 418,500 | | | | 418,500 | |
| issued 11/07/17 at 1.30% open maturity6 | | | 327,375 | | | | 327,375 | |
| issued 09/29/17 at (0.75)% open maturity6 | | | 313,875 | | | | 313,875 | |
| issued 08/31/17 at (0.75)% open maturity6 | | | 309,750 | | | | 309,750 | |
| issued 12/15/17 at 1.30% open maturity6 | | | 248,437 | | | | 248,437 | |
| issued 07/12/17 at 1.30% open maturity6 | | | 210,750 | | | | 210,750 | |
| issued 11/03/17 at 0.25% open maturity6 | | | 170,500 | | | | 170,500 | |
| issued 11/06/17 at 1.30% open maturity6 | | | 109,125 | | | | 109,125 | |
| issued 09/28/17 at (0.75)% open maturity6 | | | 104,250 | | | | 104,250 | |
| SEE NOTES TO FINANCIAL STATEMENTS. | THE GUGGENHEIM FUNDS SEMI-ANNUAL REPORT | 45 |
| CONSOLIDATED SCHEDULE OF INVESTMENTS (Unaudited)(continued) | March 29, 2018 |
| MACRO OPPORTUNITIES FUND | |
| | | Face
Amount~ | | | Value | |
| | | | | | | |
| issued 10/26/17 at 0.25% open maturity6 | | | 87,625 | | | $ | 87,625 | |
| issued 09/26/17 at 0.25% open maturity6 | | | 47,000 | | | | 47,000 | |
| Jefferies & Company, Inc. | | | | | | | | |
| issued 03/14/18 at 3.28% due 04/13/18 | | | 9,563,000 | | | | 9,563,000 | |
| issued 03/22/18 at 3.15% due 04/24/18 | | | 1,459,000 | | | | 1,459,000 | |
| issued 03/28/18 at 2.70% due 04/30/18 | | | 1,266,000 | | | | 1,266,000 | |
| Citigroup Global Markets | | | | | | | | |
| issued 01/08/18 at 1.37% open maturity6 | | | 755,000 | | | | 755,000 | |
| issued 01/05/18 at 1.37% open maturity6 | | | 662,000 | | | | 662,000 | |
| issued 01/29/18 at 1.20% open maturity6 | | | 542,000 | | | | 542,000 | |
| issued 01/17/18 at 1.37% open maturity6 | | | 470,000 | | | | 470,000 | |
| issued 03/23/18 at 1.00% open maturity6 | | | 346,000 | | | | 346,000 | |
| issued 02/15/18 at 1.35% open maturity6 | | | 313,000 | | | | 313,000 | |
| issued 02/27/18 at 0.25% open maturity6 | | | 269,000 | | | | 269,000 | |
| issued 03/28/18 at 1.35% open maturity6 | | | 263,000 | | | | 263,000 | |
| issued 01/10/18 at 1.37% open maturity6 | | | 219,000 | | | | 219,000 | |
| issued 03/19/18 at 1.37% open maturity6 | | | 175,000 | | | | 175,000 | |
| issued 03/07/18 at 1.30% open maturity6 | | | 173,000 | | | | 173,000 | |
| | | | | | | | | |
| Total Repurchase Agreements | | | | | | | | |
| (Cost $150,526,342) | | | | | | | 150,526,342 | |
| | | | | | | |
| | | Contracts | | | | |
| | | | | | | |
| LISTED OPTIONS PURCHASED† - 0.9% |
| Put options on: | | | | | | |
| Eurodollar Futures Expiring December 2018 with strike price of $97.87 (Notional Value $7,042,054,863) | | | 28,889 | | | | 28,889,000 | |
| Eurodollar Futures Expiring December 2019 with strike price of $97.62 (Notional Value $3,497,552,663) | | | 14,391 | | | | 19,967,513 | |
| Eurodollar Futures Expiring December 2018 with strike price of $97.62 (Notional Value $7,356,508,488) | | | 30,179 | | | | 15,655,356 | |
| Total Put options | | | | | | | 64,511,869 | |
| Total Listed Options Purchased | | | | | | | | |
| (Cost $30,473,749) | | | | | | | 64,511,869 | |
| OTC OPTIONS PURCHASED† - 0.2% |
| Call options on: | | | | | | |
| BofA Merrill Lynch iShares MSCI Emerging Markets ETF Expiring January 2019 with strike price of $55.00 (Notional Value $409,795,812) | | | 84,879 | | | | 10,227,919 | |
| BofA Merrill Lynch S&P 500 Index Expiring January 2019 with strike price of $3,000 (Notional Value $488,296,863) | | | 1,849 | | | | 4,557,785 | |
| Total Call options | | | | | | | 14,785,704 | |
| Total OTC Options Purchased | | | | | | | | |
| (Cost $23,574,172) | | | | | | | 14,785,704 | |
| Total Investments - 101.8% | | | | | | | | |
| (Cost $7,025,329,729) | | | | | | $ | 7,052,717,235 | |
| 46 | THE GUGGENHEIM FUNDS SEMI-ANNUAL REPORT | SEE NOTES TO FINANCIAL STATEMENTS. |
| CONSOLIDATED SCHEDULE OF INVESTMENTS (Unaudited)(continued) | March 29, 2018 |
| MACRO OPPORTUNITIES FUND | |
| | | Face
Amount | | | Value | |
| | | | | | | |
| CORPORATE BONDS SOLD SHORT†† - (0.3)% |
| Herc Rentals, Inc. | | | | | | |
| 7.75% due 06/01/247 | | $ | (200,000 | ) | | $ | (216,500 | ) |
| Envision Healthcare Corp. | | | | | | | | |
| 5.13% due 07/01/227 | | | (250,000 | ) | | | (248,750 | ) |
| Staples, Inc. | | | | | | | | |
| 8.50% due 09/15/257 | | | (300,000 | ) | | | (277,500 | ) |
| Monitronics International, Inc. | | | | | | | | |
| 9.13% due 04/01/20 | | | (650,000 | ) | | | (498,355 | ) |
| TMS International Corp. | | | | | | | | |
| 7.25% due 08/15/257 | | | (800,000 | ) | | | (834,000 | ) |
| Sprint Corp. | | | | | | | | |
| 7.88% due 09/15/23 | | | (900,000 | ) | | | (918,000 | ) |
| AK Steel Corp. | | | | | | | | |
| 6.38% due 10/15/25 | | | (1,000,000 | ) | | | (942,500 | ) |
| Wind Tre SpA | | | | | | | | |
| 5.00% due 01/20/267 | | | (1,200,000 | ) | | | (1,016,544 | ) |
| INEOS Group Holdings S.A. | | | | | | | | |
| 5.63% due 08/01/247 | | | (1,100,000 | ) | | | (1,112,375 | ) |
| Park-Ohio Industries, Inc. | | | | | | | | |
| 6.63% due 04/15/27 | | | (1,400,000 | ) | | | (1,449,000 | ) |
| Gogo Intermediate Holdings LLC / Gogo Finance Company, Inc. | | | | | | | | |
| 12.50% due 07/01/227 | | | (1,400,000 | ) | | | (1,575,000 | ) |
| Tenet Healthcare Corp. | | | | | | | | |
| 8.13% due 04/01/22 | | | (2,425,000 | ) | | | (2,528,063 | ) |
| Seagate HDD Cayman | | | | | | | | |
| 4.75% due 01/01/25 | | | (8,000,000 | ) | | | (7,792,084 | ) |
| Total Corporate Bonds Sold Short | | | | | | | | |
| (Cost $19,613,441) | | | | | | | (19,408,671 | ) |
| | | | | | | | | |
| | | |
Contracts | | | | | |
| | | | | | | | | |
| LISTED OPTIONS WRITTEN† - (0.5)% |
| Put options on: | | | | | | | | |
| Eurodollar Futures Expiring December 2019 with strike price of $97.00 (Notional Value $3,497,552,663) | | | 14,391 | | | | (7,195,500 | ) |
| Eurodollar Futures Expiring December 2018 with strike price of $97.50 (Notional Value $7,356,508,488) | | | 30,179 | | | | (9,996,793 | ) |
| Eurodollar Futures Expiring December 2018 with strike price of $97.75 (Notional Value $7,042,054,863) | | | 28,889 | | | | (21,486,194 | ) |
| Total Put options | | | | | | | (38,678,487 | ) |
| Total Listed Options Written | | | | | | | | |
| (Premiums received $13,231,660) | | | | | | | (38,678,487 | ) |
| Total Securities Sold Short - (0.8)% | | | | | | | | |
| (Proceeds $32,845,101) | | | | | | $ | (58,087,158 | ) |
| Other Assets & Liabilities, net - (1.0)% | | | | | | | (66,329,837 | ) |
| Total Net Assets - 100.0% | | | | | | $ | 6,928,300,240 | |
| Custom Basket Swap Agreements |
| Counterparty | | Index | | Financing
Rate Pay | | Payment
Frequency | | Maturity
Date | | Notional
Amount | | | Value and
Unrealized
Loss | |
| OTC Custom Basket Swap Agreements Sold Short†† |
| Morgan Stanley | | Macro Opportunities Portfolio Short Custom Basket Swap18 | | 1.30% | | At Maturity | | 07/25/19 | | $ | 172,972,650 | | | $ | (8,145,675 | ) |
| OTC Custom Basket Swap Agreements†† |
| Morgan Stanley | | Macro Opportunities Portfolio Long Custom Basket Swap19 | | 2.28% | | At Maturity | | 07/25/19 | | | 51,060,023 | | | | (906,285 | ) |
| SEE NOTES TO FINANCIAL STATEMENTS. | THE GUGGENHEIM FUNDS SEMI-ANNUAL REPORT | 47 |
| CONSOLIDATED SCHEDULE OF INVESTMENTS (Unaudited)(continued) | March 29, 2018 |
| MACRO OPPORTUNITIES FUND | |
| | | Shares | | | Percentage
Value | | | Unrealized
Gain | |
| | | | | | | | | | |
| CUSTOM BASKET OF LONG SECURITIES19 |
| Telephone & Data Systems, Inc. | | | 16,697 | | | | (6.3 | %) | | $ | 57,350 | |
| Archer-Daniels-Midland Co. | | | 13,878 | | | | (6.1 | %) | | | 54,912 | |
| FirstEnergy Corp. | | | 13,890 | | | | (6.0 | %) | | | 54,309 | |
| Marathon Petroleum Corp. | | | 4,924 | | | | (5.8 | %) | | | 52,603 | |
| PNM Resources, Inc. | | | 14,920 | | | | (4.0 | %) | | | 36,554 | |
| Jabil, Inc. | | | 11,734 | | | | (3.9 | %) | | | 35,747 | |
| HollyFrontier Corp. | | | 5,722 | | | | (3.4 | %) | | | 30,756 | |
| Ameren Corp. | | | 10,392 | | | | (3.3 | %) | | | 29,858 | |
| Travelport Worldwide Ltd. | | | 14,509 | | | | (3.3 | %) | | | 29,816 | |
| PBF Energy, Inc. — Class A | | | 7,334 | | | | (3.3 | %) | | | 29,519 | |
| Energizer Holdings, Inc. | | | 5,491 | | | | (3.2 | %) | | | 29,197 | |
| Boston Beer Company, Inc. — Class A* | | | 1,080 | | | | (2.4 | %) | | | 21,905 | |
| PG&E Corp. | | | 4,184 | | | | (2.2 | %) | | | 20,060 | |
| USANA Health Sciences, Inc.* | | | 1,958 | | | | (2.0 | %) | | | 17,769 | |
| El Paso Electric Co. | | | 11,973 | | | | (1.8 | %) | | | 16,367 | |
| Southwest Airlines Co. | | | 9,881 | | | | (1.8 | %) | | | 15,982 | |
| National Fuel Gas Co. | | | 11,667 | | | | (1.6 | %) | | | 14,779 | |
| Western Digital Corp. | | | 3,649 | | | | (1.6 | %) | | | 14,742 | |
| Consolidated Edison, Inc. | | | 7,714 | | | | (1.3 | %) | | | 11,833 | |
| Tailored Brands, Inc. | | | 7,192 | | | | (1.2 | %) | | | 11,327 | |
| Carlisle Companies, Inc. | | | 3,443 | | | | (1.2 | %) | | | 10,425 | |
| Comcast Corp. — Class A | | | 17,150 | | | | (1.1 | %) | | | 9,897 | |
| Allison Transmission Holdings, Inc. | | | 13,050 | | | | (1.1 | %) | | | 9,871 | |
| Hawaiian Holdings, Inc. | | | 3,311 | | | | (0.9 | %) | | | 8,360 | |
| Allergan plc | | | 726 | | | | (0.8 | %) | | | 7,467 | |
| Kulicke & Soffa Industries, Inc.* | | | 5,482 | | | | (0.8 | %) | | | 7,373 | |
| ARRIS International plc* | | | 11,052 | | | | (0.8 | %) | | | 7,350 | |
| Kimberly-Clark Corp. | | | 5,455 | | | | (0.8 | %) | | | 7,281 | |
| Ralph Lauren Corp. — Class A | | | 1,441 | | | | (0.8 | %) | | | 6,938 | |
| Gray Television, Inc.* | | | 10,900 | | | | (0.7 | %) | | | 6,039 | |
| Acuity Brands, Inc. | | | 1,006 | | | | (0.5 | %) | | | 4,664 | |
| VEREIT, Inc. | | | 69,671 | | | | (0.5 | %) | | | 4,529 | |
| CenterPoint Energy, Inc. | | | 22,036 | | | | (0.5 | %) | | | 4,297 | |
| Valero Energy Corp. | | | 6,195 | | | | (0.5 | %) | | | 4,244 | |
| UGI Corp. | | | 9,955 | | | | (0.4 | %) | | | 3,982 | |
| Dean Foods Co. | | | 17,024 | | | | (0.4 | %) | | | 3,885 | |
| Portland General Electric Co. | | | 14,732 | | | | (0.4 | %) | | | 3,388 | |
| Conagra Brands, Inc. | | | 5,671 | | | | (0.3 | %) | | | 3,098 | |
| Summit Hotel Properties, Inc. | | | 10,389 | | | | (0.3 | %) | | | 3,065 | |
| EMCOR Group, Inc. | | | 3,443 | | | | (0.3 | %) | | | 3,064 | |
| Vishay Intertechnology, Inc. | | | 17,205 | | | | (0.3 | %) | | | 3,011 | |
| Interpublic Group of Companies, Inc. | | | 7,980 | | | | (0.3 | %) | | | 2,907 | |
| Delta Air Lines, Inc. | | | 3,610 | | | | (0.3 | %) | | | 2,906 | |
| SpartanNash Co. | | | 6,840 | | | | (0.3 | %) | | | 2,633 | |
| 48 | THE GUGGENHEIM FUNDS SEMI-ANNUAL REPORT | SEE NOTES TO FINANCIAL STATEMENTS. |
| CONSOLIDATED SCHEDULE OF INVESTMENTS (Unaudited)(continued) | March 29, 2018 |
| MACRO OPPORTUNITIES FUND | |
| | | Shares | | | Percentage
Value | | | Unrealized
Gain (Loss) | |
| | | | | | | | | | |
| Rexnord Corp.* | | | 4,269 | | | | (0.3 | %) | | $ | 2,455 | |
| Medtronic plc | | | 2,293 | | | | (0.3 | %) | | | 2,297 | |
| Perrigo Company plc | | | 2,351 | | | | (0.2 | %) | | | 2,262 | |
| Exelon Corp. | | | 12,425 | | | | (0.2 | %) | | | 2,015 | |
| Mylan N.V.* | | | 10,638 | | | | (0.2 | %) | | | 1,968 | |
| NetApp, Inc. | | | 6,363 | | | | (0.2 | %) | | | 1,845 | |
| Chevron Corp. | | | 5,052 | | | | (0.2 | %) | | | 1,722 | |
| Exxon Mobil Corp. | | | 4,815 | | | | (0.2 | %) | | | 1,669 | |
| ON Semiconductor Corp.* | | | 9,603 | | | | (0.2 | %) | | | 1,488 | |
| Park Hotels & Resorts, Inc. | | | 9,798 | | | | (0.2 | %) | | | 1,402 | |
| TreeHouse Foods, Inc.* | | | 4,642 | | | | (0.1 | %) | | | 1,021 | |
| Kansas City Southern | | | 1,076 | | | | (0.1 | %) | | | 994 | |
| InterDigital, Inc. | | | 4,671 | | | | (0.1 | %) | | | 985 | |
| Coeur Mining, Inc.* | | | 15,206 | | | | (0.1 | %) | | | 979 | |
| Louisiana-Pacific Corp. | | | 4,078 | | | | (0.1 | %) | | | 650 | |
| Genesee & Wyoming, Inc. — Class A* | | | 6,424 | | | | (0.0 | %) | | | 418 | |
| Scholastic Corp. | | | 152 | | | | (0.0 | %) | | | 259 | |
| KBR, Inc. | | | 18,168 | | | | (0.0 | %) | | | 165 | |
| Verizon Communications, Inc. | | | 12,510 | | | | (0.0 | %) | | | 120 | |
| MAXIMUS, Inc. | | | 3,739 | | | | 0.0 | % | | | (41 | ) |
| Trinity Industries, Inc. | | | 3,742 | | | | 0.0 | % | | | (303 | ) |
| Norfolk Southern Corp. | | | 848 | | | | 0.1 | % | | | (885 | ) |
| Cooper-Standard Holdings, Inc.* | | | 1,073 | | | | 0.1 | % | | | (993 | ) |
| Eli Lilly & Co. | | | 2,384 | | | | 0.1 | % | | | (1,061 | ) |
| Crane Co. | | | 1,721 | | | | 0.1 | % | | | (1,067 | ) |
| Owens-Illinois, Inc.* | | | 8,016 | | | | 0.1 | % | | | (1,162 | ) |
| | | | | | | | | | | | | |
| | | | | | | | | | | | Unrealized
Loss | |
| | | | | | | | | | | | | |
| New Media Investment Group, Inc. | | | 7,788 | | | | 0.1 | % | | | (1,207 | ) |
| WellCare Health Plans, Inc.* | | | 832 | | | | 0.1 | % | | | (1,219 | ) |
| Seagate Technology plc | | | 2,438 | | | | 0.2 | % | | | (1,408 | ) |
| Regal Beloit Corp. | | | 6,974 | | | | 0.2 | % | | | (1,918 | ) |
| Merck & Company, Inc. | | | 10,091 | | | | 0.3 | % | | | (2,468 | ) |
| Charles River Laboratories International, Inc.* | | | 1,873 | | | | 0.3 | % | | | (2,510 | ) |
| Oracle Corp. | | | 2,935 | | | | 0.3 | % | | | (2,538 | ) |
| F5 Networks, Inc.* | | | 794 | | | | 0.3 | % | | | (2,815 | ) |
| Cardtronics plc — Class A* | | | 4,742 | | | | 0.3 | % | | | (2,964 | ) |
| Quanta Services, Inc.* | | | 4,669 | | | | 0.3 | % | | | (3,105 | ) |
| Fluor Corp. | | | 6,055 | | | | 0.3 | % | | | (3,149 | ) |
| Eagle Pharmaceuticals, Inc.* | | | 2,183 | | | | 0.4 | % | | | (3,176 | ) |
| Alcoa Corp.* | | | 2,467 | | | | 0.4 | % | | | (3,241 | ) |
| NCR Corp.* | | | 3,728 | | | | 0.4 | % | | | (3,244 | ) |
| Nexstar Media Group, Inc. — Class A | | | 3,301 | | | | 0.4 | % | | | (3,449 | ) |
| Masco Corp. | | | 3,039 | | | | 0.4 | % | | | (3,507 | ) |
| CoreLogic, Inc.* | | | 4,445 | | | | 0.4 | % | | | (3,889 | ) |
| Motorola Solutions, Inc. | | | 1,333 | | | | 0.5 | % | | | (4,194 | ) |
| Benchmark Electronics, Inc. | | | 10,194 | | | | 0.5 | % | | | (4,332 | ) |
| Occidental Petroleum Corp. | | | 8,391 | | | | 0.5 | % | | | (4,643 | ) |
| United Natural Foods, Inc.* | | | 4,588 | | | | 0.5 | % | | | (4,684 | ) |
| MSG Networks, Inc. — Class A* | | | 5,046 | | | | 0.5 | % | | | (4,700 | ) |
| Toll Brothers, Inc. | | | 3,067 | | | | 0.5 | % | | | (4,912 | ) |
| SEE NOTES TO FINANCIAL STATEMENTS. | THE GUGGENHEIM FUNDS SEMI-ANNUAL REPORT | 49 |
| CONSOLIDATED SCHEDULE OF INVESTMENTS (Unaudited)(continued) | March 29, 2018 |
| MACRO OPPORTUNITIES FUND | |
| | | Shares | | | Percentage
Value | | | Unrealized
Loss | |
| | | | | | | | | | |
| International Business Machines Corp. | | | 1,227 | | | | 0.6 | % | | $ | (5,049 | ) |
| AMC Networks, Inc. — Class A* | | | 3,939 | | | | 0.6 | % | | | (5,062 | ) |
| Taylor Morrison Home Corp. — Class A* | | | 5,670 | | | | 0.6 | % | | | (5,129 | ) |
| Dell Technologies Incorporated Class V — Class V* | | | 3,896 | | | | 0.6 | % | | | (5,552 | ) |
| Applied Optoelectronics, Inc.* | | | 4,436 | | | | 0.6 | % | | | (5,910 | ) |
| Horizon Pharma plc* | | | 8,743 | | | | 0.7 | % | | | (6,251 | ) |
| Gannett Company, Inc. | | | 35,481 | | | | 0.7 | % | | | (6,359 | ) |
| Domtar Corp. | | | 2,617 | | | | 0.7 | % | | | (6,654 | ) |
| Gibraltar Industries, Inc.* | | | 4,323 | | | | 0.8 | % | | | (6,917 | ) |
| KLA-Tencor Corp. | | | 1,335 | | | | 0.8 | % | | | (7,142 | ) |
| EnerSys | | | 4,374 | | | | 0.8 | % | | | (7,523 | ) |
| Senior Housing Properties Trust | | | 29,795 | | | | 0.9 | % | | | (8,045 | ) |
| Copa Holdings S.A. — Class A | | | 1,093 | | | | 1.0 | % | | | (9,198 | ) |
| US Foods Holding Corp.* | | | 12,759 | | | | 1.0 | % | | | (9,250 | ) |
| CA, Inc. | | | 5,476 | | | | 1.1 | % | | | (9,610 | ) |
| Icad, Inc.* | | | 23,169 | | | | 1.1 | % | | | (9,847 | ) |
| Prestige Brands Holdings, Inc.* | | | 11,003 | | | | 1.1 | % | | | (10,123 | ) |
| Xerox Corp. | | | 5,413 | | | | 1.1 | % | | | (10,258 | ) |
| Belden, Inc. | | | 1,857 | | | | 1.1 | % | | | (10,278 | ) |
| Ingredion, Inc. | | | 4,238 | | | | 1.1 | % | | | (10,383 | ) |
| Convergys Corp. | | | 14,564 | | | | 1.2 | % | | | (11,287 | ) |
| AECOM* | | | 3,435 | | | | 1.3 | % | | | (11,374 | ) |
| United Therapeutics Corp.* | | | 3,385 | | | | 1.3 | % | | | (11,577 | ) |
| Performance Food Group Co.* | | | 9,441 | | | | 1.3 | % | | | (12,037 | ) |
| Cummins, Inc. | | | 3,174 | | | | 1.3 | % | | | (12,202 | ) |
| News Corp. — Class A | | | 20,095 | | | | 1.4 | % | | | (12,879 | ) |
| Tyson Foods, Inc. — Class A | | | 7,491 | | | | 1.4 | % | | | (13,072 | ) |
| Johnson & Johnson | | | 4,508 | | | | 1.5 | % | | | (13,434 | ) |
| AGCO Corp. | | | 4,469 | | | | 1.5 | % | | | (13,563 | ) |
| Meritor, Inc.* | | | 10,635 | | | | 1.5 | % | | | (13,767 | ) |
| Williams Companies, Inc. | | | 4,405 | | | | 1.6 | % | | | (14,338 | ) |
| Sabre Corp. | | | 6,871 | | | | 1.6 | % | | | (14,532 | ) |
| Amgen, Inc. | | | 3,040 | | | | 1.6 | % | | | (14,712 | ) |
| Prudential Financial, Inc. | | | 3,041 | | | | 1.7 | % | | | (15,190 | ) |
| DXC Technology Co. | | | 4,446 | | | | 1.7 | % | | | (15,361 | ) |
| Owens Corning | | | 6,351 | | | | 1.7 | % | | | (15,814 | ) |
| Western Union Co. | | | 22,038 | | | | 1.9 | % | | | (16,859 | ) |
| Edgewell Personal Care Co.* | | | 12,595 | | | | 2.0 | % | | | (17,885 | ) |
| Sprint Corp.* | | | 46,177 | | | | 2.0 | % | | | (18,240 | ) |
| Spirit AeroSystems Holdings, Inc. — Class A | | | 2,424 | | | | 2.1 | % | | | (18,886 | ) |
| Principal Financial Group, Inc. | | | 7,652 | | | | 2.1 | % | | | (18,977 | ) |
| Kroger Co. | | | 5,368 | | | | 2.1 | % | | | (19,137 | ) |
| Huntsman Corp. | | | 5,160 | | | | 2.1 | % | | | (19,412 | ) |
| Greenbrier Companies, Inc. | | | 10,709 | | | | 2.2 | % | | | (19,812 | ) |
| Pfizer, Inc. | | | 14,133 | | | | 2.2 | % | | | (19,857 | ) |
| Darling Ingredients, Inc.* | | | 13,229 | | | | 2.2 | % | | | (19,976 | ) |
| AmerisourceBergen Corp. — Class A | | | 2,643 | | | | 2.3 | % | | | (20,563 | ) |
| 50 | THE GUGGENHEIM FUNDS SEMI-ANNUAL REPORT | SEE NOTES TO FINANCIAL STATEMENTS. |
| CONSOLIDATED SCHEDULE OF INVESTMENTS (Unaudited)(continued) | March 29, 2018 |
| MACRO OPPORTUNITIES FUND | |
| | | Shares | | | Percentage
Value | | | Unrealized
Loss | |
| | | | | | | | | | |
| Coherent, Inc.* | | | 843 | | | | 2.4 | % | | $ | (21,711 | ) |
| Pilgrim's Pride Corp.* | | | 20,954 | | | | 2.4 | % | | | (21,792 | ) |
| McKesson Corp. | | | 2,069 | | | | 2.5 | % | | | (22,304 | ) |
| LyondellBasell Industries N.V. — Class A | | | 2,464 | | | | 2.5 | % | | | (22,773 | ) |
| PACCAR, Inc. | | | 4,463 | | | | 2.7 | % | | | (24,859 | ) |
| Micron Technology, Inc.* | | | 3,483 | | | | 2.8 | % | | | (25,066 | ) |
| Cisco Systems, Inc. | | | 11,141 | | | | 2.8 | % | | | (25,283 | ) |
| TEGNA, Inc. | | | 16,875 | | | | 3.0 | % | | | (26,747 | ) |
| Snap-on, Inc. | | | 2,134 | | | | 3.0 | % | | | (27,016 | ) |
| Sanderson Farms, Inc. | | | 4,321 | | | | 3.0 | % | | | (27,309 | ) |
| CVS Health Corp. | | | 4,738 | | | | 3.1 | % | | | (28,475 | ) |
| Zimmer Biomet Holdings, Inc. | | | 3,523 | | | | 3.3 | % | | | (29,736 | ) |
| Versartis, Inc.* | | | 61,762 | | | | 3.4 | % | | | (30,586 | ) |
| Cardinal Health, Inc. | | | 4,502 | | | | 3.5 | % | | | (31,559 | ) |
| Cirrus Logic, Inc.* | | | 10,318 | | | | 3.5 | % | | | (32,140 | ) |
| Gilead Sciences, Inc. | | | 7,217 | | | | 3.7 | % | | | (33,667 | ) |
| Biogen, Inc.* | | | 1,990 | | | | 3.7 | % | | | (33,939 | ) |
| Molson Coors Brewing Co. — Class B | | | 7,776 | | | | 3.8 | % | | | (34,766 | ) |
| Omnicom Group, Inc. | | | 8,165 | | | | 4.0 | % | | | (36,293 | ) |
| HP, Inc. | | | 20,324 | | | | 4.2 | % | | | (37,701 | ) |
| Juniper Networks, Inc. | | | 21,068 | | | | 4.2 | % | | | (38,529 | ) |
| Lions Gate Entertainment Corp. — Class A | | | 15,848 | | | | 5.1 | % | | | (46,197 | ) |
| Celgene Corp.* | | | 6,122 | | | | 5.9 | % | | | (53,186 | ) |
| Alaska Air Group, Inc. | | | 7,355 | | | | 8.2 | % | | | (74,473 | ) |
| Tech Data Corp.* | | | 4,242 | | | | 9.2 | % | | | (83,440 | ) |
| General Mills, Inc. | | | 12,002 | | | | 13.2 | % | | | (119,444 | ) |
| Total Custom Basket of Long Securities | | | | | | | | | | $ | (906,285 | ) |
| | | | | | | | | | | | | |
| | | | | | | | | | | | Unrealized
Gain | |
| | | | | | | | | | | | | |
| CUSTOM BASKET OF SHORT SECURITIES18 |
| Healthcare Services Group, Inc. | | | (58,535 | ) | | | (5.4 | %) | | | 438,998 | |
| Albemarle Corp. | | | (5,385 | ) | | | (2.8 | %) | | | 226,520 | |
| Covanta Holding Corp. | | | (160,083 | ) | | | (2.5 | %) | | | 200,044 | |
| Education Realty Trust, Inc. | | | (29,679 | ) | | | (2.2 | %) | | | 177,360 | |
| Vulcan Materials Co. | | | (20,139 | ) | | | (2.0 | %) | | | 163,673 | |
| NewMarket Corp. | | | (3,515 | ) | | | (1.8 | %) | | | 145,485 | |
| Camden Property Trust | | | (22,314 | ) | | | (1.7 | %) | | | 135,681 | |
| Compass Minerals International, Inc. | | | (29,302 | ) | | | (1.6 | %) | | | 131,973 | |
| Capitol Federal Financial, Inc. | | | (113,301 | ) | | | (1.4 | %) | | | 114,232 | |
| CyrusOne, Inc. | | | (17,300 | ) | | | (1.4 | %) | | | 113,300 | |
| Sensient Technologies Corp. | | | (10,242 | ) | | | (1.3 | %) | | | 109,791 | |
| Extraction Oil & Gas, Inc.* | | | (48,264 | ) | | | (1.3 | %) | | | 103,702 | |
| Martin Marietta Materials, Inc. | | | (10,043 | ) | | | (1.3 | %) | | | 103,481 | |
| Terreno Realty Corp. | | | (50,966 | ) | | | (1.2 | %) | | | 99,173 | |
| Tesla, Inc.* | | | (1,637 | ) | | | (1.0 | %) | | | 80,403 | |
| Charles Schwab Corp. | | | (35,459 | ) | | | (0.9 | %) | | | 76,549 | |
| Advanced Micro Devices, Inc.* | | | (54,273 | ) | | | (0.8 | %) | | | 65,286 | |
| Flagstar Bancorp, Inc.* | | | (16,788 | ) | | | (0.7 | %) | | | 59,362 | |
| White Mountains Insurance Group Ltd. | | | (2,678 | ) | | | (0.7 | %) | | | 58,770 | |
| Air Products & Chemicals, Inc. | | | (15,753 | ) | | | (0.5 | %) | | | 38,353 | |
| Netflix, Inc.* | | | (2,391 | ) | | | (0.4 | %) | | | 33,220 | |
| Amazon.com, Inc.* | | | (952 | ) | | | (0.4 | %) | | | 29,141 | |
| SEE NOTES TO FINANCIAL STATEMENTS. | THE GUGGENHEIM FUNDS SEMI-ANNUAL REPORT | 51 |
| CONSOLIDATED SCHEDULE OF INVESTMENTS (Unaudited)(continued) | March 29, 2018 |
| MACRO OPPORTUNITIES FUND | |
| | | Shares | | | Percentage
Value | | | Unrealized
Gain (Loss) | |
| | | | | | | | | | |
| Align Technology, Inc.* | | | (1,940 | ) | | | (0.4 | %) | | $ | 29,130 | |
| Inphi Corp.* | | | (16,345 | ) | | | (0.3 | %) | | | 26,199 | |
| South Jersey Industries, Inc. | | | (22,834 | ) | | | (0.3 | %) | | | 22,893 | |
| Tetra Tech, Inc. | | | (12,368 | ) | | | (0.3 | %) | | | 21,102 | |
| Workday, Inc. — Class A* | | | (4,348 | ) | | | (0.3 | %) | | | 20,865 | |
| First Data Corp. — Class A* | | | (30,977 | ) | | | (0.2 | %) | | | 20,011 | |
| ServiceNow, Inc.* | | | (3,087 | ) | | | (0.2 | %) | | | 17,041 | |
| Gartner, Inc.* | | | (4,978 | ) | | | (0.2 | %) | | | 16,578 | |
| Republic Services, Inc. — Class A | | | (11,714 | ) | | | (0.2 | %) | | | 15,322 | |
| FMC Corp. | | | (8,504 | ) | | | (0.2 | %) | | | 14,245 | |
| Rexford Industrial Realty, Inc. | | | (39,577 | ) | | | (0.1 | %) | | | 11,818 | |
| National Instruments Corp. | | | (9,953 | ) | | | (0.1 | %) | | | 11,441 | |
| Aon plc | | | (16,658 | ) | | | (0.1 | %) | | | 10,819 | |
| Semtech Corp.* | | | (16,862 | ) | | | (0.1 | %) | | | 8,950 | |
| Intercontinental Exchange, Inc. | | | (18,402 | ) | | | (0.1 | %) | | | 8,623 | |
| Equity LifeStyle Properties, Inc. | | | (24,599 | ) | | | (0.1 | %) | | | 8,419 | |
| Dominion Energy, Inc. | | | (7,745 | ) | | | (0.1 | %) | | | 7,134 | |
| Ashland Global Holdings, Inc. | | | (7,536 | ) | | | (0.1 | %) | | | 6,727 | |
| CME Group, Inc. — Class A | | | (4,338 | ) | | | (0.1 | %) | | | 5,598 | |
| ABM Industries, Inc. | | | (76,041 | ) | | | 0.0 | % | | | 1,703 | |
| Alliant Energy Corp. | | | (15,290 | ) | | | 0.0 | % | | | 1,483 | |
| CarMax, Inc.* | | | (28,043 | ) | | | 0.0 | % | | | (515 | ) |
| Equifax, Inc. | | | (13,847 | ) | | | 0.0 | % | | | (709 | ) |
| Nabors Industries Ltd. | | | (225,110 | ) | | | 0.0 | % | | | (783 | ) |
| Equinix, Inc. | | | (2,291 | ) | | | 0.0 | % | | | (2,685 | ) |
| KAR Auction Services, Inc. | | | (23,943 | ) | | | 0.0 | % | | | (3,174 | ) |
| | | | | | | | | | | | | |
| | | | | | | | | | | | Unrealized
Loss | |
| | | | | | | | | | | | | |
| Cboe Global Markets, Inc. | | | (11,465 | ) | | | 0.0 | % | | | (3,878 | ) |
| Essex Property Trust, Inc. | | | (2,228 | ) | | | 0.1 | % | | | (5,174 | ) |
| Royal Gold, Inc. | | | (17,977 | ) | | | 0.1 | % | | | (8,138 | ) |
| Wendy's Co. | | | (51,838 | ) | | | 0.1 | % | | | (8,453 | ) |
| Hudson Pacific Properties, Inc. | | | (54,203 | ) | | | 0.1 | % | | | (9,464 | ) |
| Federal Realty Investment Trust | | | (10,032 | ) | | | 0.1 | % | | | (10,015 | ) |
| Cornerstone OnDemand, Inc.* | | | (13,943 | ) | | | 0.1 | % | | | (10,882 | ) |
| Whiting Petroleum Corp.* | | | (15,585 | ) | | | 0.2 | % | | | (12,568 | ) |
| Realty Income Corp. | | | (10,498 | ) | | | 0.2 | % | | | (13,850 | ) |
| Washington Federal, Inc. | | | (15,576 | ) | | | 0.2 | % | | | (14,761 | ) |
| Equity Commonwealth* | | | (53,854 | ) | | | 0.2 | % | | | (18,208 | ) |
| Sun Communities, Inc. | | | (23,374 | ) | | | 0.2 | % | | | (18,342 | ) |
| EastGroup Properties, Inc. | | | (19,859 | ) | | | 0.2 | % | | | (19,438 | ) |
| DCT Industrial Trust, Inc. | | | (42,436 | ) | | | 0.3 | % | | | (20,523 | ) |
| Alexandria Real Estate Equities, Inc. | | | (13,927 | ) | | | 0.3 | % | | | (23,564 | ) |
| People's United Financial, Inc. | | | (26,813 | ) | | | 0.3 | % | | | (26,718 | ) |
| AvalonBay Communities, Inc. | | | (4,279 | ) | | | 0.3 | % | | | (26,895 | ) |
| Ellie Mae, Inc.* | | | (6,635 | ) | | | 0.4 | % | | | (28,481 | ) |
| Healthcare Trust of America, Inc. — Class A | | | (48,059 | ) | | | 0.4 | % | | | (29,388 | ) |
| Aspen Insurance Holdings Ltd. | | | (23,568 | ) | | | 0.4 | % | | | (30,664 | ) |
| Vail Resorts, Inc. | | | (2,706 | ) | | | 0.4 | % | | | (30,859 | ) |
| 52 | THE GUGGENHEIM FUNDS SEMI-ANNUAL REPORT | SEE NOTES TO FINANCIAL STATEMENTS. |
| CONSOLIDATED SCHEDULE OF INVESTMENTS (Unaudited)(continued) | March 29, 2018 |
| MACRO OPPORTUNITIES FUND | |
| | | Shares | | | Percentage
Value | | | Unrealized
Loss | |
| | | | | | | | | | |
| Goldman Sachs Group, Inc. | | | (5,778 | ) | | | 0.4 | % | | $ | (31,769 | ) |
| Glacier Bancorp, Inc. | | | (14,406 | ) | | | 0.4 | % | | | (33,081 | ) |
| Mobile Mini, Inc. | | | (24,983 | ) | | | 0.4 | % | | | (35,713 | ) |
| Team, Inc.* | | | (50,703 | ) | | | 0.4 | % | | | (35,857 | ) |
| Robert Half International, Inc. | | | (8,798 | ) | | | 0.5 | % | | | (37,368 | ) |
| Redwood Trust, Inc. | | | (45,875 | ) | | | 0.5 | % | | | (38,081 | ) |
| Balchem Corp. | | | (18,872 | ) | | | 0.5 | % | | | (38,301 | ) |
| Shake Shack, Inc. — Class A* | | | (32,656 | ) | | | 0.5 | % | | | (43,811 | ) |
| Investors Bancorp, Inc. | | | (68,482 | ) | | | 0.5 | % | | | (44,052 | ) |
| Duke Realty Corp. | | | (33,552 | ) | | | 0.7 | % | | | (55,935 | ) |
| SL Green Realty Corp. | | | (12,612 | ) | | | 0.7 | % | | | (56,469 | ) |
| Cannae Holdings, Inc.* | | | (40,348 | ) | | | 0.7 | % | | | (56,851 | ) |
| International Flavors & Fragrances, Inc. | | | (16,708 | ) | | | 0.7 | % | | | (57,557 | ) |
| Ultimate Software Group, Inc.* | | | (3,119 | ) | | | 0.7 | % | | | (59,731 | ) |
| FireEye, Inc.* | | | (36,374 | ) | | | 0.7 | % | | | (60,090 | ) |
| SEI Investments Co. | | | (9,220 | ) | | | 0.8 | % | | | (64,208 | ) |
| Eaton Vance Corp. | | | (10,110 | ) | | | 0.8 | % | | | (66,719 | ) |
| Equity Residential | | | (11,615 | ) | | | 0.9 | % | | | (70,167 | ) |
| SPS Commerce, Inc.* | | | (10,580 | ) | | | 1.0 | % | | | (80,365 | ) |
| Crown Castle International Corp. | | | (16,226 | ) | | | 1.1 | % | | | (89,390 | ) |
| Ecolab, Inc. | | | (19,197 | ) | | | 1.1 | % | | | (91,735 | ) |
| American Tower Corp. — Class A | | | (12,265 | ) | | | 1.1 | % | | | (92,074 | ) |
| RLI Corp. | | | (22,226 | ) | | | 1.1 | % | | | (92,243 | ) |
| WD-40 Co. | | | (4,007 | ) | | | 1.2 | % | | | (93,793 | ) |
| Domino's Pizza, Inc. | | | (4,034 | ) | | | 1.2 | % | | | (94,568 | ) |
| Kilroy Realty Corp. | | | (17,327 | ) | | | 1.2 | % | | | (95,882 | ) |
| LendingTree, Inc.* | | | (2,038 | ) | | | 1.2 | % | | | (100,968 | ) |
| TransUnion* | | | (44,230 | ) | | | 1.3 | % | | | (105,951 | ) |
| Booking Holdings, Inc.* | | | (467 | ) | | | 1.4 | % | | | (116,347 | ) |
| FactSet Research Systems, Inc. | | | (7,298 | ) | | | 1.5 | % | | | (119,089 | ) |
| Monolithic Power Systems, Inc. | | | (18,009 | ) | | | 1.5 | % | | | (124,329 | ) |
| Boston Properties, Inc. | | | (19,655 | ) | | | 1.5 | % | | | (125,691 | ) |
| Ingevity Corp.* | | | (8,546 | ) | | | 1.6 | % | | | (130,844 | ) |
| Allegheny Technologies, Inc.* | | | (38,291 | ) | | | 1.7 | % | | | (134,985 | ) |
| Exponent, Inc. | | | (32,744 | ) | | | 1.8 | % | | | (148,288 | ) |
| Markel Corp.* | | | (1,940 | ) | | | 1.9 | % | | | (150,545 | ) |
| UDR, Inc. | | | (68,995 | ) | | | 1.9 | % | | | (156,683 | ) |
| Insperity, Inc. | | | (16,025 | ) | | | 2.1 | % | | | (169,122 | ) |
| Pegasystems, Inc. | | | (12,768 | ) | | | 2.1 | % | | | (171,233 | ) |
| Callon Petroleum Co.* | | | (56,054 | ) | | | 2.2 | % | | | (180,208 | ) |
| Tyler Technologies, Inc.* | | | (7,150 | ) | | | 2.4 | % | | | (196,297 | ) |
| Howard Hughes Corp.* | | | (11,644 | ) | | | 2.5 | % | | | (199,261 | ) |
| SBA Communications Corp.* | | | (9,495 | ) | | | 2.5 | % | | | (203,285 | ) |
| Diamondback Energy, Inc.* | | | (13,487 | ) | | | 2.6 | % | | | (212,506 | ) |
| RSP Permian, Inc.* | | | (27,605 | ) | | | 2.7 | % | | | (219,283 | ) |
| Axis Capital Holdings Ltd. | | | (32,992 | ) | | | 2.9 | % | | | (233,134 | ) |
| Ollie's Bargain Outlet Holdings, Inc.* | | | (14,245 | ) | | | 2.9 | % | | | (234,623 | ) |
| Parsley Energy, Inc. — Class A* | | | (80,650 | ) | | | 3.0 | % | | | (245,885 | ) |
| SEE NOTES TO FINANCIAL STATEMENTS. | THE GUGGENHEIM FUNDS SEMI-ANNUAL REPORT | 53 |
| CONSOLIDATED SCHEDULE OF INVESTMENTS (Unaudited)(continued) | March 29, 2018 |
| MACRO OPPORTUNITIES FUND | |
| | | Shares | | | Percentage
Value | | | Unrealized
Loss | |
| | | | | | | | | | |
| Pool Corp. | | | (6,452 | ) | | | 3.1 | % | | $ | (249,210 | ) |
| MarketAxess Holdings, Inc. | | | (10,161 | ) | | | 3.3 | % | | | (272,365 | ) |
| Five Below, Inc.* | | | (11,092 | ) | | | 3.4 | % | | | (273,918 | ) |
| MSCI, Inc. — Class A | | | (12,326 | ) | | | 3.4 | % | | | (278,276 | ) |
| CoStar Group, Inc.* | | | (5,015 | ) | | | 3.7 | % | | | (299,602 | ) |
| PTC, Inc.* | | | (14,930 | ) | | | 3.8 | % | | | (306,356 | ) |
| Cintas Corp. | | | (15,113 | ) | | | 3.8 | % | | | (307,774 | ) |
| Moody's Corp. | | | (12,994 | ) | | | 3.8 | % | | | (310,058 | ) |
| Verisk Analytics, Inc. — Class A* | | | (24,930 | ) | | | 4.0 | % | | | (325,025 | ) |
| S&P Global, Inc. | | | (10,811 | ) | | | 4.1 | % | | | (335,814 | ) |
| Rollins, Inc. | | | (50,557 | ) | | | 4.3 | % | | | (352,019 | ) |
| Crocs, Inc.* | | | (49,821 | ) | | | 5.1 | % | | | (414,228 | ) |
| On Assignment, Inc.* | | | (30,620 | ) | | | 5.6 | % | | | (458,249 | ) |
| Southern Copper Corp. | | | (46,891 | ) | | | 6.3 | % | | | (509,748 | ) |
| Copart, Inc.* | | | (51,100 | ) | | | 9.5 | % | | | (771,135 | ) |
| Total Custom Basket of Short Securities | | | | | | | | | | $ | (8,145,675 | ) |
| OTC Credit Default Swap Agreements††,17 |
| Counterparty | | Exchange | | Index | | Protection
Premium
Rate | | Payment
Frequency | | Maturity
Date | | Notional
Amount | |
| Barclays Bank plc | | ICE | | PizzaExpress Financing 1 plc 5% 06/20/23 | | 5.00% | | At Maturity | | 06/20/23 | | $ | 700,000 | |
| Counterparty | | Value | | | Upfront
Premiums
Paid | | | Unrealized
Gain | |
| Barclays Bank plc | | $ | 170,002 | | | $ | 136,008 | | | $ | 33,994 | |
| Centrally Cleared Interest Rate Swap Agreements†† |
| Counterparty | | Exchange | | Floating
Rate
Type | | Floating
Rate Index | | Fixed
Rate | | Payment
Frequency | | Maturity
Date | | Notional
Amount | |
| BofA Merrill Lynch | | CME | | Receive | | 3-Month USD-LIBOR | | 1.67% | | Quarterly | | 08/16/20 | | $ | (430,000,000 | ) |
| BofA Merrill Lynch | | CME | | Receive | | 3-Month USD-LIBOR | | 1.90% | | Quarterly | | 08/11/22 | | | (160,500,000 | ) |
| BofA Merrill Lynch | | CME | | Receive | | 3-Month USD-LIBOR | | 1.99% | | Quarterly | | 08/22/24 | | | (104,000,000 | ) |
| BofA Merrill Lynch | | CME | | Receive | | 3-Month USD-LIBOR | | 1.71% | | Quarterly | | 12/16/19 | | | (20,800,000 | ) |
| BofA Merrill Lynch | | CME | | Receive | | 3-Month USD-LIBOR | | 1.59% | | Quarterly | | 07/02/18 | | | (34,550,000 | ) |
| BofA Merrill Lynch | | CME | | Receive | | 3-Month USD-LIBOR | | 2.73% | | Quarterly | | 07/02/23 | | | (23,800,000 | ) |
| 54 | THE GUGGENHEIM FUNDS SEMI-ANNUAL REPORT | SEE NOTES TO FINANCIAL STATEMENTS. |
| CONSOLIDATED SCHEDULE OF INVESTMENTS (Unaudited)(continued) | March 29, 2018 |
| MACRO OPPORTUNITIES FUND | |
| Counterparty | | Market
Value | | | Premiums
Paid
(Received) | | | Unrealized
Gain (Loss) | |
| BofA Merrill Lynch | | $ | 9,070,055 | | | $ | 4,567,944 | | | $ | 4,502,111 | |
| BofA Merrill Lynch | | | 5,281,341 | | | | 1,545,330 | | | | 3,736,011 | |
| BofA Merrill Lynch | | | 4,563,722 | | | | 2,044,010 | | | | 2,519,712 | |
| BofA Merrill Lynch | | | 280,011 | | | | – | | | | 280,011 | |
| BofA Merrill Lynch | | | 66,378 | | | | – | | | | 66,378 | |
| BofA Merrill Lynch | | | (8,435 | ) | | | – | | | | (8,435 | ) |
| | | | | | | $ | 8,157,284 | | | $ | 11,095,788 | |
FORWARD FOREIGN CURRENCY EXCHANGE CONTRACTS††
| Counterparty | | Contracts
to Sell | | Currency | | Settlement
Date | | Settlement
Value | | | Value at
March 29,
2018 | | | Net
Unrealized
Appreciation/
(Depreciation) | |
| Goldman Sachs | | 107,420,000 | | EUR | | 05/18/18 | | $ | 134,142,810 | | | $ | 132,640,863 | | | $ | 1,501,947 | |
| Citigroup | | 171,400,000 | | BRL | | 04/02/18 | | | 52,681,052 | | | | 51,926,805 | | | | 754,247 | |
| Deutsche Bank | | 91,650,000 | | EUR | | 04/06/18 | | | 113,302,771 | | | | 112,799,323 | | | | 503,448 | |
| Morgan Stanley | | 11,400,000,000 | | JPY | | 06/04/18 | | | 107,946,777 | | | | 107,584,308 | | | | 362,469 | |
| JPMorgan Chase & Co. | | 358,000,000 | | CSK | | 04/20/18 | | | 17,668,978 | | | | 17,375,177 | | | | 293,801 | |
| Citigroup | | 409,532,170 | | DKK | | 04/04/18 | | | 67,870,761 | | | | 67,600,514 | | | | 270,247 | |
| JPMorgan Chase & Co. | | 200,000,000 | | SEK | | 04/18/18 | | | 24,240,585 | | | | 23,986,631 | | | | 253,954 | |
| Goldman Sachs | | 44,820,000 | | BRL | | 04/02/18 | | | 13,752,262 | | | | 13,578,526 | | | | 173,736 | |
| Citigroup | | 5,846,000,000 | | HUF | | 05/23/18 | | | 23,281,793 | | | | 23,119,726 | | | | 162,067 | |
| Goldman Sachs | | 71,840,000 | | EUR | | 05/31/18 | | | 88,942,949 | | | | 88,792,184 | | | | 150,765 | |
| BOA Merrill Lynch | | 1,582,500,000 | | HUF | | 12/20/18 | | | 6,492,307 | | | | 6,361,792 | | | | 130,515 | |
| Goldman Sachs | | 130,700,000 | | SEK | | 04/18/18 | | | 15,787,503 | | | | 15,675,263 | | | | 112,240 | |
| BOA Merrill Lynch | | 24,678,000 | | EUR | | 04/10/18 | | | 30,463,264 | | | | 30,382,464 | | | | 80,800 | |
| Morgan Stanley | | 1,700,000,000 | | JPY | | 04/05/18 | | | 16,045,229 | | | | 15,978,771 | | | | 66,458 | |
| JPMorgan Chase & Co. | | 679,900,000 | | CSK | | 08/20/18 | | | 33,307,206 | | | | 33,269,639 | | | | 37,567 | |
| Morgan Stanley | | 700,000,000 | | JPY | | 04/23/18 | | | 6,610,009 | | | | 6,587,195 | | | | 22,814 | |
| Morgan Stanley | | 500,000,000 | | JPY | | 04/16/18 | | | 4,721,890 | | | | 4,703,000 | | | | 18,890 | |
| JPMorgan Chase & Co. | | 238,000,000 | | CSK | | 08/31/18 | | | 11,664,951 | | | | 11,653,707 | | | | 11,244 | |
| Deutsche Bank | | 4,748,000 | | EUR | | 04/10/18 | | | 5,845,848 | | | | 5,845,528 | | | | 320 | |
| Barclays | | 480,000 | | GBP | | 04/10/18 | | | 668,602 | | | | 673,701 | | | | (5,098 | ) |
| Citigroup | | 2,430,000 | | EUR | | 05/18/18 | | | 2,984,888 | | | | 3,000,533 | | | | (15,645 | ) |
| Citigroup | | 447,690,000 | | HUF | | 04/11/18 | | | 1,745,227 | | | | 1,764,501 | | | | (19,274 | ) |
| Morgan Stanley | | 170,150,000 | | HUF | | 06/22/18 | | | 649,800 | | | | 674,448 | | | | (24,648 | ) |
| Goldman Sachs | | 381,800,000 | | HUF | | 04/11/18 | | | 1,475,214 | | | | 1,504,806 | | | | (29,592 | ) |
| JPMorgan Chase & Co. | | 177,000,000 | | CSK | | 04/06/18 | | | 8,541,440 | | | | 8,576,952 | | | | (35,512 | ) |
| BOA Merrill Lynch | | 1,200,000,000 | | HUF | | 09/26/18 | | | 4,742,904 | | | | 4,790,814 | | | | (47,910 | ) |
| Goldman Sachs | | 800,000,000 | | HUF | | 07/18/18 | | | 3,106,796 | | | | 3,177,389 | | | | (70,593 | ) |
| Citigroup | | 676,000,000 | | HUF | | 04/25/18 | | | 2,590,832 | | | | 2,667,830 | | | | (76,998 | ) |
| BOA Merrill Lynch | | 1,040,000,000 | | HUF | | 04/25/18 | | | 4,023,834 | | | | 4,104,354 | | | | (80,520 | ) |
| BOA Merrill Lynch | | 1,372,750,000 | | HUF | | 04/11/18 | | | 5,308,391 | | | | 5,410,481 | | | | (102,090 | ) |
| SEE NOTES TO FINANCIAL STATEMENTS. | THE GUGGENHEIM FUNDS SEMI-ANNUAL REPORT | 55 |
| CONSOLIDATED SCHEDULE OF INVESTMENTS (Unaudited)(continued) | March 29, 2018 |
| MACRO OPPORTUNITIES FUND | |
| Counterparty | | Contracts
to Sell | | Currency | | Settlement
Date | | Settlement
Value | | | Value at
March 29,
2018 | | | Net
Unrealized
Appreciation/
(Depreciation) | |
| Goldman Sachs | | 620,000,000 | | CSK | | 04/13/18 | | $ | 29,943,012 | | | $ | 30,067,325 | | | $ | (124,313 | ) |
| BOA Merrill Lynch | | 865,161,500 | | HUF | | 06/22/18 | | | 3,287,114 | | | | 3,429,363 | | | | (142,249 | ) |
| Goldman Sachs | | 3,100,000,000 | | HUF | | 11/21/18 | | | 12,249,575 | | | | 12,432,792 | | | | (183,217 | ) |
| Deutsche Bank | | 1,590,000,000 | | HUF | | 07/18/18 | | | 6,098,028 | | | | 6,315,060 | | | | (217,032 | ) |
| Goldman Sachs | | 3,303,575,000 | | HUF | | 06/22/18 | | | 12,771,209 | | | | 13,094,847 | | | | (323,638 | ) |
| Citigroup | | 22,715,000 | | GBP | | 04/10/18 | | | 31,428,474 | | | | 31,881,514 | | | | (453,040 | ) |
| Goldman Sachs | | 52,340,000 | | EUR | | 04/05/18 | | | 63,958,224 | | | | 64,412,919 | | | | (454,695 | ) |
| JPMorgan Chase & Co. | | 827,000,000 | | DKK | | 06/01/18 | | | 136,538,493 | | | | 137,110,451 | | | | (571,958 | ) |
| Goldman Sachs | | 7,849,920,000 | | HUF | | 04/25/18 | | | 30,275,539 | | | | 30,979,662 | | | | (704,123 | ) |
| Goldman Sachs | | 37,080,000 | | EUR | | 04/13/18 | | | 44,475,754 | | | | 45,662,215 | | | | (1,186,461 | ) |
| | | | | | | | | | | | | | | | | $ | 38,923 | |
| Counterparty | | Contracts
to Buy | | Currency | | Settlement
Date | | Settlement
Value | | | Value at
March 29,
2018 | | | Net
Unrealized
Appreciation/
(Depreciation) | |
| Goldman Sachs | | 151,354,000 | | BRL | | 04/02/18 | | $ | 45,814,036 | | | $ | 45,853,732 | | | $ | 39,696 | |
| JPMorgan Chase & Co. | | 64,866,000 | | BRL | | 04/02/18 | | | 19,682,010 | | | | 19,651,600 | | | | (30,410 | ) |
| Goldman Sachs | | 409,100,000 | | DKK | | 06/01/18 | | | 68,082,344 | | | | 67,825,738 | | | | (256,606 | ) |
| | | | | | | | | | | | | | | | | | (247,320 | ) |
| ~ | The face amount is denominated in U.S. dollars unless otherwise indicated. |
| * | Non-income producing security. |
| † | Value determined based on Level 1 inputs, unless otherwise noted. — See Note 4. |
| †† | Value determined based on Level 2 inputs, unless otherwise noted — See Note 4. |
| ††† | Value determined based on Level 3 inputs — See Note 4. |
| 1 | Security was fair valued by the Valuation Committee at March 29, 2018. The total market value of fair valued securities amounts to $126,202,707, (cost $125,008,843) or 1.8% of total net assets. |
| 2 | Affiliated issuer. |
| 3 | Security has no stated coupon. However, it is expected to receive residual cash flow payments on defined deal dates. |
| 4 | Zero coupon rate security. |
| 5 | Rate indicated is the 7 day yield as of March 29, 2018. |
| 6 | Variable rate security. Rate indicated is the rate effective at March 29, 2018. In some instances, the underlying reference rate shown was below the minimum rate earned by the security or has been adjusted by a predetermined factor. The settlement status of a position may also impact the effective rate indicated. In instances where multiple underlying reference rates and spread amounts are shown, the effective rate is based on a weighted average. |
| 7 | Security is a 144A or Section 4(a)(2) security. These securities have been determined to be liquid under guidelines established by the Board of Trustees. The total market value of 144A or Section 4(a)(2) securities is $2,431,920,975 (cost $2,424,722,761), or 35.1% of total net assets. |
| 56 | THE GUGGENHEIM FUNDS SEMI-ANNUAL REPORT | SEE NOTES TO FINANCIAL STATEMENTS. |
| CONSOLIDATED SCHEDULE OF INVESTMENTS (Unaudited)(continued) | March 29, 2018 |
| MACRO OPPORTUNITIES FUND | |
| 8 | Security is a 144A or Section 4(a)(2) security. These securities have been determined to be illiquid and restricted under guidelines established by the Board of Trustees. The total market value of 144A or Section 4(a)(2) illiquid and restricted securities is $40,681,578 (cost $48,822,617), or 0.6% of total net assets — See Note 10. |
| 9 | Term loan interests in the Fund’s portfolio generally have variable rates. All or a portion of this security represents unsettled loan positions and may not have a stated coupon rate. |
| 10 | Payment-in-kind security. |
| 11 | Perpetual maturity. |
| 12 | Security has a fixed rate coupon which will convert to a floating or variable rate coupon on a future date. |
| 13 | Security is in default of interest and/or principal obligations. |
| 14 | All or a portion of this security has been physically segregated in connection with reverse repurchase agreements. As of March 29, 2018, the total market value of segregated was $3,968,510. |
| 15 | Rate indicated is the effective yield at the time of purchase. |
| 16 | Repurchase Agreements — See additional disclosure on page 61 for more information on repurchase agreements. |
| 17 | Credit Default Swaps — See Note 2. |
| 18 | Total Return based on the return of the custom short basket of securities +/- financing at a variable rate. Rate indicated is rate effective at March 29, 2018. |
| 19 | Total Return based on the return of the custom long basket of securities +/- financing at a variable rate. Rate indicated is rate effective at March 29, 2018. |
| 20 | On September 7, 2008, the issuer was placed in conservatorship by the Federal Housing Finance Agency (FHFA). As conservator, the FHFA has full powers to control the assets and operations of the firm. |
| | BofA — Bank of America |
| | BRL — Brazilian Real |
| | CME — Chicago Mercantile Exchange |
| | CMT — Constant Maturity Treasury |
| | CZK — Czech Koruna |
| | DKK — Danish Krone |
| | EUR — Euro |
| | EURIBOR — European Interbank Offered Rate |
| | GBP — British Pound |
| | HUF — Hungarian Forint |
| | ICE — Intercontinental Exchange |
| | JPY — Japanese Yen |
| | LIBOR — London Interbank Offered Rate |
| | plc — Public Limited Company |
| | REIT — Real Estate Investment Trust |
| | SEK — Swedish Krona |
| | WAC — Weighted Average Coupon |
| | |
| | See Sector Classification in Other Information section. |
| SEE NOTES TO FINANCIAL STATEMENTS. | THE GUGGENHEIM FUNDS SEMI-ANNUAL REPORT | 57 |
| CONSOLIDATED SCHEDULE OF INVESTMENTS (Unaudited)(continued) | March 29, 2018 |
| MACRO OPPORTUNITIES FUND | |
The following table summarizes the inputs used to value the Fund’s investments at March 29, 2018 (See Note 4 in the Notes to Financial Statements):
| Investments in Securities (Assets) | | Level 1
Quoted
Prices | | | Level 2
Significant
Observable
Inputs | | | Level 2 -
Other* | | | Level 3
Significant
Unobservable
Inputs | | | Total | |
| Asset-Backed Securities | | $ | — | | | $ | 1,986,865,618 | | | $ | — | | | $ | 56,910,207 | | | $ | 2,043,775,825 | |
| Collateralized Mortgage Obligations | | | — | | | | 1,149,175,935 | | | | — | | | | 94,583,700 | | | | 1,243,759,635 | |
| Commercial Paper | | | — | | | | 17,494,628 | | | | — | | | | — | | | | 17,494,628 | |
| Common Stocks | | | 184,691,415 | | | | 115,513 | | | | — | | | | 211,345 | | | | 185,018,273 | |
| Corporate Bonds | | | — | | | | 509,651,182 | | | | — | | | | 50,621,349 | | | | 560,272,531 | |
| Credit Default Swap Agreements | | | — | | | | — | | | | 33,994 | | | | — | | | | 33,994 | |
| Forward Foreign Currency Exchange Contracts | | | — | | | | — | | | | 4,947,225 | | | | — | | | | 4,947,225 | |
| Exchange-Traded Funds | | | 65,381,227 | | | | — | | | | — | | | | — | | | | 65,381,227 | |
| Foreign Government Debt | | | — | | | | 906,266,669 | | | | — | | | | — | | | | 906,266,669 | |
| Interest Rate Swap Agreements | | | — | | | | — | | | | 11,104,223 | | | | — | | | | 11,104,223 | |
| Money Market Funds | | | 183,413,894 | | | | — | | | | — | | | | — | | | | 183,413,894 | |
| Municipal Bonds | | | — | | | | 875,000 | | | | — | | | | — | | | | 875,000 | |
| Mutual Funds | | | 761,511,001 | | | | — | | | | — | | | | — | | | | 761,511,001 | |
| Options Purchased | | | 79,297,573 | | | | — | | | | — | | | | — | | | | 79,297,573 | |
| Preferred Stocks | | | — | | | | 17,318,170 | | | | — | | | | — | | | | 17,318,170 | |
| Repurchase Agreements | | | — | | | | 150,526,342 | | | | — | | | | — | | | | 150,526,342 | |
| Senior Floating Rate Interests | | | — | | | | 754,830,196 | | | | — | | | | 82,976,271 | | | | 837,806,467 | |
| Total Assets | | $ | 1,274,295,110 | | | $ | 5,493,119,253 | | | $ | 16,085,442 | | | $ | 285,302,872 | | | $ | 7,068,802,677 | |
| | | | | | | | | | | | | | | | | | | | | |
| Investments in Securities (Liabilities) | | | Level 1
Quoted
Prices | | | | Level 2
Significant
Observable
Inputs | | | | Level 2 -
Other* | | | | Level 3
Significant
Unobservable
Inputs | | | | Total | |
| Corporate Bonds | | $ | — | | | $ | 19,408,671 | | | $ | — | | | $ | — | | | $ | 19,408,671 | |
| Forward Foreign Currency Exchange Contracts | | | — | | | | — | | | | 5,155,622 | | | | — | | | | 5,155,622 | |
| Interest Rate Swap Agreements | | | — | | | | — | | | | 8,435 | | | | — | | | | 8,435 | |
| Options Written | | | 38,678,487 | | | | — | | | | — | | | | — | | | | 38,678,487 | |
| Custom Basket Swap Agreements | | | — | | | | — | | | | 9,051,960 | | | | — | | | | 9,051,960 | |
| Unfunded Loan Commitments | | | — | | | | — | | | | — | | | | 1,693,857 | ** | | | 1,693,857 | |
| Total Liabilities | | $ | 38,678,487 | | | $ | 19,408,671 | | | $ | 14,216,017 | | | $ | 1,693,857 | | | $ | 73,997,032 | |
| * | Other financial instruments include forward foreign currency exchange contracts and/or swaps, which are reported as unrealized gain/loss at period end. |
| ** | Includes securities with a market value of $0. |
| 58 | THE GUGGENHEIM FUNDS SEMI-ANNUAL REPORT | SEE NOTES TO FINANCIAL STATEMENTS. |
| CONSOLIDATED SCHEDULE OF INVESTMENTS (Unaudited)(continued) | March 29, 2018 |
| MACRO OPPORTUNITIES FUND | |
The Fund may hold assets and/or liabilities in which the fair value approximates the carrying amount for financial statement purposes. As of period end, reverse repurchase agreements of $1,561,867 are categorized as Level 2 within the disclosure hierarchy.
The following is a summary of significant unobservable inputs used in the fair valuation of assets and liabilities categorized within Level 3 of the fair value hierarchy:
| Category | | Ending
Balance at
March 29, 2018 | | | Valuation Technique | | Unobservable
Inputs | | Input
Range | | Weighted
Average |
| Assets: | | | | | | | | | | | |
| Asset Backed Securities | | $ | 42,602,921 | | | Model Price | | Market Comparable Yield | | 6.3% | | — |
| Asset Backed Securities | | | 14,307,286 | | | Option Adjusted Spread
off the prior month
end broker mark over
the 3 month LIBOR | | Indicative Quote | | — | | — |
| Collateralized Mortgage Obligations | | | 94,583,700 | | | Option Adjusted Spread
off the prior month
end broker mark over
the 3 month LIBOR | | Indicative Quote | | — | | — |
| Common Stocks | | | 211,339 | | | Enterprise Value | | Valuation Multiple | | 6.9x-8.2x | | 8.0x |
| Corporate Bonds | | | 48,991,017 | | | Option Adjusted Spread
off the prior month
end broker mark over
the 3 month LIBOR | | Indicative Quote | | — | | — |
| Corporate Bonds | | | 1,580,000 | | | Model Price | | Market Comparable Yield | | 10.0% | | — |
| Corporate Bonds | | | 50,332 | | | Enterprise Value | | Valuation Multiple | | 5.8x | | — |
| Senior Floating Rate Interests | | | 71,783,935 | | | Yield Analysis | | Yield | | 4.4%-8.3% | | 6.7% |
| Senior Floating Rate Interests | | | 6,540,958 | | | Model Price | | Market Comparable Yields | | 5.8%-6.2% | | 5.9% |
| Senior Floating Rate Interests | | | 1,825,178 | | | Enterprise Value | | Valuation Multiple | | 11.4x | | — |
| Senior Floating Rate Interests | | | 1,608,038 | | | Model Price | | Purchase Price | | — | | — |
| Senior Floating Rate Interests | | | 1,218,162 | | | Option Adjusted Spread
off the prior month
end broker mark over
the 3 month LIBOR | | Indicative Quote | | — | | — |
| Total Assets | | $ | 285,302,866 | | | | | | | | | |
| | | | | | | | | | | | | |
| Liabilities: | | | | | | | | | | | | |
| Unfunded Loan Commitments | | $ | 1,693,857 | | | Model Price | | Purchase Price | | — | | — |
Significant changes in an indicative quote, yield, liquidation value, market comparable yield or valuation multiple would generally result in significant changes in the fair value of the security.
Any remaining Level 3 securities held by the Fund and excluded from the tables above, were not considered material to the Fund.
| SEE NOTES TO FINANCIAL STATEMENTS. | THE GUGGENHEIM FUNDS SEMI-ANNUAL REPORT | 59 |
| CONSOLIDATED SCHEDULE OF INVESTMENTS (Unaudited)(continued) | March 29, 2018 |
| MACRO OPPORTUNITIES FUND | |
Transfers between investment levels may occur as the markets fluctuate and/or the availability of data used in an investment’s valuation changes. Transfers between valuation levels, if any, are in comparison to the valuation levels at the end of the previous fiscal year, and are effective using the fair value as of the end of the current fiscal period.
For the period ended March 29, 2018, the Fund had securities with a total value of $268,900 transfer into Level 3 from Level 2 due to lack of observable inputs. Securities with a total value of $16,887,261 transferred out of Level 3 into Level 2 due to the availability of current and reliable market-based data provided by a third-party pricing service which utilizes significant observable inputs. There were no other securities that transferred between levels.
Summary of Fair Value Level 3 Activity
Following is a reconciliation of Level 3 assets for which significant unobservable inputs were used to determine fair value for the period ended March 29, 2018:
| | | Assets | | | | | | Liabilities | |
| | | Senior Floating/
Fixed Rate Interests | | | Asset Backed Securities | | | Corporate Bonds | | | Common Stocks | | | Collateralized Mortgage Obligations | | | Total
Assets | | | Unfunded Loan
Commitments | |
| Beginning Balance | | $ | 73,160,403 | | | $ | 59,045,623 | | | $ | 59,762,406 | | | $ | 296,976 | | | $ | 97,480,054 | | | $ | 289,745,462 | | | $ | (1,610,986 | ) |
| Purchases/Receipts | | | 28,217,616 | | | | — | | | | 4,768,139 | | | | — | | | | 850,468 | | | | 33,836,223 | | | | 1,091,383 | |
| Sales, maturities and paydowns/Fundings | | | (13,210,580 | ) | | | (1,270,649 | ) | | | (336,205 | ) | | | (999 | ) | | | (4,717,568 | ) | | | (19,536,001 | ) | | | (938,386 | ) |
| Total realized gains or losses included in earnings | | | 648,881 | | | | — | | | | 11,414 | | | | 442 | | | | — | | | | 660,737 | | | | 128,235 | |
| Total change in unrealized gains or losses included in earnings | | | (3,657,650 | ) | | | (864,767 | ) | | | 851,519 | | | | (85,036 | ) | | | 970,746 | | | | (2,785,188 | ) | | | (364,103 | ) |
| Transfers into Level 3 | | | 268,900 | | | | — | | | | — | | | | — | | | | — | | | | 268,900 | | | | — | |
| Transfers out of Level 3 | | | (2,451,299 | ) | | | — | | | | (14,435,924 | ) | | | (38 | ) | | | — | | | | (16,887,261 | ) | | | — | |
| Ending Balance | | $ | 82,976,271 | | | $ | 56,910,207 | | | $ | 50,621,349 | | | $ | 211,345 | | | $ | 94,583,700 | | | $ | 285,302,872 | | | $ | (1,693,857 | ) |
| Net Change in unrealized appreciation (depreciation) for investments in securities still held at March 29, 2018 | | $ | 164,374 | | | $ | (871,275 | ) | | $ | 27,332 | | | $ | (25,991 | ) | | $ | 604,051 | | | $ | (101,509 | ) | | $ | (100,749 | ) |
| 60 | THE GUGGENHEIM FUNDS SEMI-ANNUAL REPORT | SEE NOTES TO FINANCIAL STATEMENTS. |
| CONSOLIDATED SCHEDULE OF INVESTMENTS (Unaudited)(continued) | March 29, 2018 |
| MACRO OPPORTUNITIES FUND | |
Repurchase Agreements
In connection with transactions in repurchase agreements, it is the Fund’s policy that its custodian takes possession of the underlying collateral. For the following repurchase agreements, the collateral is in the possession of the Fund’s custodian and is evaluated to ensure that its market value exceeds, at a minimum, 102% of the original face amount of the repurchase agreements.
Counterparty and
Terms of Agreement | | Face
Value | | | Repurchase
Price | | | Collateral | | Par
Value | | | Fair
Value | |
| BNP Paribas | | | | | | | | Morgan Stanley Capital Inc | | | | | | |
| 1.90% | | | | | | | | 2.89% | | | | | | |
| 04/03/18 | | $ | 53,331,000 | | | $ | 53,396,030 | | | 10/25/33 | | $ | 56,315,000 | | | $ | 55,318,225 | |
| | | | | | | | | | | JP Morgan Mortgage Trust | | | | | | | | |
| | | | | | | | | | | 3.54% | | | | | | | | |
| | | | | | | | | | | 04/25/36 | | | 35,225,000 | | | | 35,010,128 | |
| | | | | | | | | | | HSI Asset Securitization Corp. | | | | | | | | |
| | | | | | | | | | | 2.06% | | | | | | | | |
| | | | | | | | | | | 01/25/37 | | | 20,000,000 | | | | 16,310,000 | |
| | | | | | | | | | | Securitized Asset Backed Receivables LLC Trust | | | | | | | | |
| | | | | | | | | | | 2.32% | | | | | | | | |
| | | | | | | | | | | 10/25/35 | | | 13,000,000 | | | | 12,193,511 | |
| | | | | | | | | | | Freddie Mac Structured Agency Credit Risk Debt Notes | | | | | | | | |
| | | | | | | | | | | 7.42% | | | | | | | | |
| | | | | | | | | | | 07/25/28 | | | 7,100,000 | | | | 8,644,405 | |
| | | | | | | | | | | | | $ | 131,640,000 | | | $ | 127,476,269 | |
| | | | | | | | | | | | | | | | | | | |
| Deutsche Bank | | | | | | | | | | Great Wolf Trust | | | | | | | | |
| 2.41% | | | | | | | | | | 6.12% | | | | | | | | |
| 05/25/18 | | | 52,694,196 | | | | 53,000,618 | | | 09/15/19 | | | 49,000,000 | | | | 49,308,700 | |
| | | | | | | | | | | COMM Mortgage Trust | | | | | | | | |
| | | | | | | | | | | 6.15% | | | | | | | | |
| | | | | | | | | | | 02/13/32 | | | 16,830,000 | | | | 16,833,366 | |
| | | | | | | | | | | | | $ | 65,830,000 | | | $ | 66,142,066 | |
| SEE NOTES TO FINANCIAL STATEMENTS. | THE GUGGENHEIM FUNDS SEMI-ANNUAL REPORT | 61 |
| CONSOLIDATED SCHEDULE OF INVESTMENTS (Unaudited)(continued) | March 29, 2018 |
| MACRO OPPORTUNITIES FUND | |
Counterparty and
Terms of Agreement | | Face
Value | | | Repurchase
Price | | | Collateral | | Par
Value | | | Fair
Value | |
| Barclays | | | | | | | | Standard Chartered PLC | | | | | | |
| (0.75)% - 2.18% | | | | | | | | 3.28% | | | | | | |
| Open Maturity* | | $ | 28,026,146 | | | $ | 28,026,146 | | | Perpetual Maturity | | $ | 14,700,000 | | | $ | 13,929,720 | |
| | | | | | | | | | | Seagate HDD Cayman | | | | | | | | |
| | | | | | | | | | | 4.75% | | | | | | | | |
| | | | | | | | | | | 01/01/25 | | | 8,000,000 | | | | 7,792,000 | |
| | | | | | | | | | | Tenet Healthcare Corp. | | | | | | | | |
| | | | | | | | | | | 8.13% | | | | | | | | |
| | | | | | | | | | | 04/01/22 | | | 1,925,000 | | | | 2,006,813 | |
| | | | | | | | | | | Park-Ohio Industries Inc. | | | | | | | | |
| | | | | | | | | | | 6.63% | | | | | | | | |
| | | | | | | | | | | 04/15/27 | | | 1,400,000 | | | | 1,449,000 | |
| | | | | | | | | | | INEOS Group Holdings SA | | | | | | | | |
| | | | | | | | | | | 5.63% | | | | | | | | |
| | | | | | | | | | | 08/01/24 | | | 1,100,000 | | | | 1,112,320 | |
| | | | | | | | | | | AK Steel Corp. | | | | | | | | |
| | | | | | | | | | | 6.38% | | | | | | | | |
| | | | | | | | | | | 10/15/25 | | | 1,000,000 | | | | 942,500 | |
| | | | | | | | | | | Gogo Intermediate Holdings LLC / Gogo Finance Co Inc. | | | | | | | | |
| | | | | | | | | | | 12.50% | | | | | | | | |
| | | | | | | | | | | 07/01/22 | | | 500,000 | | | | 562,500 | |
| | | | | | | | | | | Monitronics International Inc. | | | | | | | | |
| | | | | | | | | | | 9.13% | | | | | | | | |
| | | | | | | | | | | 04/01/20 | | | 350,000 | | | | 268,345 | |
| | | | | | | | | | | Envision Healthcare Corp. | | | | | | | | |
| | | | | | | | | | | 5.13% | | | | | | | | |
| | | | | | | | | | | 07/01/22 | | | 250,000 | | | | 248,750 | |
| | | | | | | | | | | Herc Rentals Inc. | | | | | | | | |
| | | | | | | | | | | 7.75% | | | | | | | | |
| | | | | | | | | | | 06/01/24 | | | 200,000 | | | | 216,500 | |
| | | | | | | | | | | Sprint Corp. | | | | | | | | |
| | | | | | | | | | | 7.88% | | | | | | | | |
| | | | | | | | | | | 09/15/23 | | | 200,000 | | | | 204,000 | |
| | | | | | | | | | | | | $ | 29,625,000 | | | $ | 28,732,448 | |
| 62 | THE GUGGENHEIM FUNDS SEMI-ANNUAL REPORT | SEE NOTES TO FINANCIAL STATEMENTS. |
| CONSOLIDATED SCHEDULE OF INVESTMENTS (Unaudited)(continued) | March 29, 2018 |
| MACRO OPPORTUNITIES FUND | |
Counterparty and
Terms of Agreement | | Face
Value | | | Repurchase
Price | | | Collateral | | Par
Value | | | Fair
Value | |
| Jefferies & Company, Inc. | | | | | | | | | | | | | | |
| 2.70% - 3.28% | | | | | | | | | | | | | | |
| 04/13/18 - 04/30/18 | | $ | 12,288,000 | | | $ | 12,320,486 | | | Citigroup Mortgage Loan Trust | | | | | | | | |
| | | | | | | | | | | 3.46% | | | | | | | | |
| | | | | | | | | | | 08/25/36 | | $ | 26,580,500 | | | $ | 26,541,618 | |
| | | | | | | | | | | Lockwood Grove CLO Ltd. | | | | | | | | |
| | | | | | | | | | | 3.46% | | | | | | | | |
| | | | | | | | | | | 01/26/30 | | | 12,750,000 | | | | 12,750,000 | |
| | | | | | | | | | | Public Finance Authority | | | | | | | | |
| | | | | | | | | | | 7.00% | | | | | | | | |
| | | | | | | | | | | 12/01/50 | | | 1,600,000 | | | | 1,850,656 | |
| | | | | | | | | | | | | $ | 40,930,500 | | | $ | 41,142,274 | |
| | | | | | | | | | | | | | | | | | | |
| Citigroup Global Markets | | | | | | | | | | | | | | | | | | |
| 0.25% - 1.37% | | | | | | | | | | | | | | | | | | |
| Open Maturity* | | | 4,187,000 | | | | 4,187,000 | | | Wind Tre SpA | | | | | | | | |
| | | | | | | | | | | 5.00% | | | | | | | | |
| | | | | | | | | | | 01/20/26 | | | 1,200,000 | | | | 1,016,520 | |
| | | | | | | | | | | TMS International Corp. | | | | | | | | |
| | | | | | | | | | | 7.25% | | | | | | | | |
| | | | | | | | | | | 08/15/25 | | | 800,000 | | | | 834,000 | |
| | | | | | | | | | | Sprint Corp. | | | | | | | | |
| | | | | | | | | | | 7.88% | | | | | | | | |
| | | | | | | | | | | 09/15/23 | | | 700,000 | | | | 714,000 | |
| | | | | | | | | | | Gogo Intermediate Holdings LLC / Gogo Finance Co Inc. | | | | | | | | |
| | | | | | | | | | | 12.50% | | | | | | | | |
| | | | | | | | | | | 07/01/22 | | | 600,000 | | | | 675,000 | |
| | | | | | | | | | | Tenet Healthcare Corp. | | | | | | | | |
| | | | | | | | | | | 8.13% | | | | | | | | |
| | | | | | | | | | | 04/01/22 | | | 500,000 | | | | 521,250 | |
| | | | | | | | | | | Monitronics International Inc. | | | | | | | | |
| | | | | | | | | | | 9.13% | | | | | | | | |
| | | | | | | | | | | 04/01/20 | | | 300,000 | | | | 230,010 | |
| | | | | | | | | | | | | $ | 4,100,000 | | | $ | 3,990,780 | |
| * | Variable rate security. Rate indicated is the rate effective at March 29, 2018. In some instances, the underlying reference rate shown was below the minimum rate earned by the security or has been adjusted by a predetermined factor. The settlement status of a position may also impact the effective rate indicated. In instances where multiple underlying reference rates and spread amounts are shown, the effective rate is based on a weighted average. |
| SEE NOTES TO FINANCIAL STATEMENTS. | THE GUGGENHEIM FUNDS SEMI-ANNUAL REPORT | 63 |
| CONSOLIDATED SCHEDULE OF INVESTMENTS (Unaudited)(continued) | March 29, 2018 |
| MACRO OPPORTUNITIES FUND | |
In the event of counterparty default, the Fund has the right to collect the collateral to offset losses incurred. There is potential loss to the Fund in the event the Fund is delayed or prevented from exercising its right to dispose of the collateral securities, including the risk of a possible decline in the value of the underlying securities during the period while the Fund seeks to assert its rights. The Fund’s investment adviser, acting under the supervision of the Board of Trustees, reviews the value of the collateral and the creditworthiness of those banks and dealers with which the Fund enters into repurchase agreements to evaluate potential risks.
Affiliated Transactions
Investments representing 5% or more of the outstanding voting shares of a portfolio company of a fund, or control of or by, or common control under the Guggenheim Investments (“GI”), result in that portfolio company being considered an affiliated company of such fund, as defined in the 1940 Act.
The Fund may invest in certain of the underlying series of Guggenheim Strategy Funds Trust consisting of Guggenheim Strategy Fund I, Guggenheim Strategy Fund II, and Guggenheim Strategy Fund III (collectively, the “Cash Management Funds”), each of which are open-end management investment companies managed by GI. The Cash Management Funds, which launched on March 11, 2014, are offered as cash management options only to mutual funds, trusts, and other accounts managed by GI and/or its affiliates, and are not available to the public. The Cash Management Funds pay no investment management fees. The Cash Management Funds’ annual report on Form N-CSR dated September 30, 2017, is available publicly or upon request. This information is available from the EDGAR database on the SEC’s website at https://www.sec.gov/Archives/edgar/data/1601445/000089180417000715/gug72218.htm.
Transactions during the period ended March 29, 2018, in which the portfolio company is an “affiliated person”, were as follows:
| Security Name | | Value
09/30/17 | | | Additions | | | Reductions | | | Realized Gain | | | Change in
Unrealized | | | Value 03/29/18 | |
| Mutual Funds | | | | | | | | | | | | | | | | | | | | | | | | |
| Guggenheim Alpha Opportunity Fund - Institutional Class | | $ | 166,996,450 | | | $ | 8,120,854 | | | $ | — | | | $ | — | | | $ | (8,254,274 | ) | | $ | 166,863,030 | |
| Guggenheim Floating Rate Strategies Fund - Institutional Class | | | 12,926,051 | | | | 264,245 | | | | — | | | | — | | | | (15,258 | ) | | | 13,175,038 | |
| Guggenheim Limited Duration Fund - Institutional Class | | | 297,474,146 | | | | 3,830,397 | | | | — | | | | — | | | | (1,203,392 | ) | | | 300,101,151 | |
| Guggenheim Risk Managed Real Estate Fund - Institutional Class | | | 15,005,412 | | | | 672,237 | | | | — | | | | — | | | | (1,022,845 | ) | | | 14,654,804 | |
| Guggenheim Strategy Fund I | | | 87,752,252 | | | | 1,152,100 | | | | — | | | | — | | | | (210,868 | ) | | | 88,693,484 | |
| Guggenheim Strategy Fund II | | | 98,202,891 | | | | 1,352,733 | | | | — | | | | — | | | | (196,892 | ) | | | 99,358,732 | |
| Guggenheim Strategy Fund III | | | — | | | | 78,727,063 | | | | — | | | | — | | | | (62,301 | ) | | | 78,664,762 | |
| Common Stock | | | | | | | | | | | | | | | | | | | | | | | | |
| Targus Group International Equity, Inc*,1 | | | 19,586 | | | | — | | | | (1,000 | ) | | | 442 | | | | 11,673 | | | | 30,701 | |
| Exchange-Traded Funds | | | | | | | | | | | | | | | | | | | | | | | | |
| Guggenheim Solar ETF | | | 15,170,155 | | | | — | | | | — | | | | — | | | | 2,039,037 | | | | 17,209,192 | |
| Senior Floating Rate Interests | | | | | | | | | | | | | | | | | | | | | | | | |
| Aspect Software, Inc. 12.38% (1 Month USD LIBOR + 10.50%) due 05/25/202 | | | 1,021,935 | | | | — | | | | (13,406 | ) | | | — | | | | 12,401 | | | | 1,020,930 | |
| Targus Group International, Inc. due 05/24/161,3,4 | | | — | ** | �� | | — | | | | — | | | | �� | | | | — | | | | — | ** |
| | | $ | 694,568,878 | | | $ | 94,119,629 | | | $ | (14,406 | ) | | $ | 442 | | | $ | (8,902,719 | ) | | $ | 779,771,824 | |
| 64 | THE GUGGENHEIM FUNDS SEMI-ANNUAL REPORT | SEE NOTES TO FINANCIAL STATEMENTS. |
| CONSOLIDATED SCHEDULE OF INVESTMENTS (Unaudited)(concluded) | March 29, 2018 |
| MACRO OPPORTUNITIES FUND | |
| Security Name | | Shares
03/29/18 | | | Investment
Income | | | Capital Gain
Distributions | |
| Mutual Funds | | | | | | | | | |
| Guggenheim Alpha Opportunity Fund - Institutional Class | | | 5,863,072 | | | $ | — | | | $ | 8,120,854 | |
| Guggenheim Floating Rate Strategies Fund - Institutional Class | | | 506,537 | | | | 264,002 | | | | — | |
| Guggenheim Limited Duration Fund - Institutional Class | | | 12,125,299 | | | | 3,805,820 | | | | — | |
| Guggenheim Risk Managed Real Estate Fund - Institutional Class | | | 522,267 | | | | 151,122 | | | | 521,113 | |
| Guggenheim Strategy Fund I | | | 3,540,658 | | | | 1,118,050 | | | | 33,358 | |
| Guggenheim Strategy Fund II | | | 3,972,760 | | | | 1,299,503 | | | | 52,555 | |
| Guggenheim Strategy Fund III | | | 3,142,819 | | | | 703,247 | | | | 19,023 | |
| Common Stock | | | | | | | | | | | | |
| Targus Group International Equity, Inc due*,1 | | | 12,773 | | | | — | | | | — | |
| Exchange-Traded Funds | | | | | | | | | | | | |
| Guggenheim Solar ETF | | | 700,700 | | | | 311,742 | | | | — | |
| Senior Floating Rate Interests | | | | | | | | | | | | |
| Aspect Software, Inc. 12.38% (1 Month USD LIBOR + 10.50%) due 05/25/202 | | | 1,025,411 | | | | 61,686 | | | | — | |
| Targus Group International, Inc. due 05/24/161,3,4 | | | 152,876 | | | | — | | | | — | |
| | | | | | | $ | 7,715,172 | | | $ | 8,746,903 | |
| * | Non-income producing security. |
| ** | Market value is less than $1. |
| 1 | Security was fair valued by the Valuation Committee at March 29, 2018. The total market value of affiliated securities which were fair valued amounts to $30,701, (cost $161,586) or less than 0.1% of total net assets. |
| 2 | Variable rate security. Rate indicated is the rate effective at March 29, 2018. In some instances, the underlying reference rate shown was below the minimum rate earned by the security or has been adjusted by a predetermined factor. The settlement status of a position may also impact the effective rate indicated. In instances where multiple underlying reference rates and spread amounts are shown, the effective rate is based on a weighted average. |
| 3 | Term loan interests in the Fund’s portfolio generally have variable rates. All or a portion of this security represents unsettled loan positions and may not have a stated coupon rate. |
| 4 | Payment-in-kind security. |
| SEE NOTES TO FINANCIAL STATEMENTS. | THE GUGGENHEIM FUNDS SEMI-ANNUAL REPORT | 65 |
| CONSOLIDATED STATEMENT OF ASSETS AND LIABILITIES (Unaudited) |
| MACRO OPPORTUNITIES FUND |
March 29, 2018
| Assets: |
| Investments in unaffiliated issuers, at value (cost $6,099,544,257) | | $ | 6,122,419,069 | |
| Investments in affiliated issuers, at value (cost $775,259,130) | | | 779,771,824 | |
| Repurchase agreements, at value (cost $150,526,342) | | | 150,526,342 | |
| Foreign currency, at value (cost $280,992) | | | 280,761 | |
| Segregated cash with broker | | | 26,710,613 | |
| Cash | | | 15,975,055 | |
| Upfront premiums paid on interest rate swap agreements | | | 8,157,284 | |
| Upfront premiums paid on credit default swap agreements | | | 136,008 | |
| Unrealized appreciation on forward foreign currency exchange contracts | | | 4,947,225 | |
| Unrealized appreciation on swap agreements | | | 33,994 | |
| Prepaid expenses | | | 523,443 | |
| Receivables: |
| Securities sold | | | 75,764,372 | |
| Interest | | | 24,325,292 | |
| Fund shares sold | | | 21,047,353 | |
| Dividends | | | 1,348,577 | |
| Foreign taxes reclaim | | | 71,526 | |
| Total assets | | | 7,232,038,738 | |
| | | | | |
| Liabilities: |
| Unfunded loan commitments, at value (Note 9) (proceeds $3,076,227) | | | 1,693,857 | |
| Reverse Repurchase Agreements | | | 1,561,867 | |
| Securities sold short, at value (proceeds $19,613,441) | | | 19,408,671 | |
| Options written, at value (premiums received $13,231,660) | | | 38,678,487 | |
| Segregated cash due to broker | | | 9,050,680 | |
| Unrealized depreciation on swap agreements | | | 9,051,960 | |
| Unrealized depreciation on forward foreign currency exchange contracts | | | 5,155,622 | |
| Payable for: |
| Securities purchased | | $ | 198,646,707 | |
| Fund shares redeemed | | | 12,729,125 | |
| Management fees | | | 3,647,469 | |
| Swap settlement | | | 912,432 | |
| Distribution and service fees | | | 606,416 | |
| Fund accounting/administration fees | | | 464,408 | |
| Variation margin on interest rate swap agreements | | | 68,071 | |
| Transfer agent/maintenance fees | | | 142,471 | |
| Due to Adviser | | | 77,836 | |
| Trustees’ fees* | | | 43,058 | |
| Miscellaneous | | | 1,799,361 | |
| Total liabilities | | | 303,738,498 | |
| Net assets | | $ | 6,928,300,240 | |
| | | | | |
| Net assets consist of: |
| Paid in capital | | $ | 6,973,461,363 | |
| Accumulated distributions in excess of net investment income | | | (13,069,403 | ) |
| Accumulated net realized loss on investments | | | (37,548,173 | ) |
| Net unrealized appreciation on investments | | | 5,456,453 | |
| Net assets | | $ | 6,928,300,240 | |
| | | | | |
| A-Class: |
| Net assets | | $ | 872,467,568 | |
| Capital shares outstanding | | | 32,697,997 | |
| Net asset value per share | | $ | 26.68 | |
| Maximum offering price per share (Net asset value divided by 96.00%) | | $ | 27.79 | |
| | | | | |
| C-Class: |
| Net assets | | $ | 454,781,151 | |
| Capital shares outstanding | | | 17,055,240 | |
| Net asset value per share | | $ | 26.67 | |
| | | | | |
| P-Class: |
| Net assets | | $ | 180,471,170 | |
| Capital shares outstanding | | | 6,761,470 | |
| Net asset value per share | | $ | 26.69 | |
| | | | | |
| Institutional Class: |
| Net assets | | $ | 5,420,580,351 | |
| Capital shares outstanding | | | 202,893,289 | |
| Net asset value per share | | $ | 26.72 | |
| * | Relates to Trustees not deemed "interested persons" within the meaning of Section 2(a)(19) of the 1940 Act. |
| 66 | THE GUGGENHEIM FUNDS SEMI-ANNUAL REPORT | SEE NOTES TO FINANCIAL STATEMENTS. |
| CONSOLIDATED STATEMENT OF OPERATIONS (Unaudited) |
| MACRO OPPORTUNITIES FUND |
Period Ended March 29, 2018
| Investment Income: |
| Dividends from securities of unaffiliated issuers (net of foreign withholding tax of $729) | | $ | 3,087,774 | |
| Dividends from securities of affiliated issuers | | | 7,715,172 | |
| Interest (net of foreign withholding tax of $1,459) | | | 116,030,023 | |
| Total investment income | | | 126,832,969 | |
| | | | | |
| Expenses: |
| Management fees | | | 28,504,523 | |
| Distribution and service fees: |
| A-Class | | | 1,074,565 | |
| C-Class | | | 2,224,542 | |
| P-Class | | | 229,175 | |
| Recoupment of previously waived fees: |
| A-Class | | | 132,553 | |
| C-Class | | | 229,381 | |
| P-Class | | | 40,570 | |
| Institutional Class | | | 16 | |
| Transfer agent/maintenance fees: |
| A-Class | | | 594,607 | |
| C-Class | | | 117,454 | |
| P-Class | | | 140,047 | |
| Institutional Class | | | 1,669,856 | |
| Fund accounting/administration fees | | | 2,592,619 | |
| Custodian fees | | | 115,493 | |
| Line of credit fees | | | 82,446 | |
| Trustees’ fees* | | | 13,521 | |
| Miscellaneous | | | 868,773 | |
| Total expenses | | | 38,630,141 | |
| Less: |
| Expenses waived by Adviser | | | (3,281,728 | ) |
| Expenses reimbursed by Adviser: |
| A-Class | | | (52,535 | ) |
| P-Class | | | (36,906 | ) |
| Institutional Class | | | (1,708,042 | ) |
| Total waived/reimbursed expenses | | | (5,079,211 | ) |
| Net expenses | | | 33,550,930 | |
| Net investment income | | | 93,282,039 | |
| |
| Net Realized and Unrealized Gain (Loss): |
| Net realized gain (loss) on: |
| Investments in unaffiliated issuers | | $ | 29,283,089 | |
| Investments in affiliated issuers | | | 442 | |
| Distributions received from affiliated investment company shares | | | 8,746,903 | |
| Swap agreements | | | (2,387,384 | ) |
| Foreign currency transactions | | | 38,059,137 | |
| Forward foreign currency exchange contracts | | | (34,220,268 | ) |
| Securities sold short | | | 276,952 | |
| Options purchased | | | (15,690,924 | ) |
| Options written | | | 2,713,392 | |
| Net realized gain | | | 26,781,339 | |
| Net change in unrealized appreciation (depreciation) on: |
| Investments in unaffiliated issuers | | | (44,866,804 | ) |
| Investments in affiliated issuers | | | (8,902,719 | ) |
| Securities sold short | | | 234,285 | |
| Swap agreements | | | 6,682,012 | |
| Options purchased | | | 46,868,856 | |
| Options written | | | (28,028,318 | ) |
| Foreign currency translations | | | 91,019 | |
| Forward foreign currency exchange contracts | | | (469,259 | ) |
| Net change in unrealized appreciation (depreciation) | | | (28,390,928 | ) |
| Net realized and unrealized loss | | | (1,609,589 | ) |
| Net increase in net assets resulting from operations | | $ | 91,672,450 | |
| * | Relates to Trustees not deemed "interested persons" within the meaning of Section 2(a)(19) of the 1940 Act. |
| SEE NOTES TO FINANCIAL STATEMENTS. | THE GUGGENHEIM FUNDS SEMI-ANNUAL REPORT | 67 |
| CONSOLIDATED STATEMENTS OF CHANGES IN NET ASSETS |
| MACRO OPPORTUNITIES FUND | |
| | | Period Ended
March 29,
2018
(Unaudited) | | | Year Ended
September 30,
2017 | |
| Increase (Decrease) in Net Assets from Operations: | | | | | | |
| Net investment income | | $ | 93,282,039 | | | $ | 178,908,439 | |
| Net realized gain on investments | | | 26,781,339 | | | | 64,276,159 | |
| Net change in unrealized appreciation (depreciation) on investments | | | (28,390,928 | ) | | | 40,465,593 | |
| Net increase in net assets resulting from operations | | | 91,672,450 | | | | 283,650,191 | |
| | | | | | | | | |
| Distributions to shareholders from: | | | | | | | | |
| Net investment income | | | | | | | | |
| A-Class | | | (11,045,403 | ) | | | (30,384,869 | ) |
| C-Class | | | (4,058,976 | ) | | | (11,057,083 | ) |
| P-Class | | | (2,356,745 | ) | | | (5,729,629 | ) |
| Institutional Class | | | (73,828,302 | ) | | | (133,534,525 | ) |
| Total distributions to shareholders | | | (91,289,426 | ) | | | (180,706,106 | ) |
| | | | | | | | | |
| Capital share transactions: | | | | | | | | |
| Proceeds from sale of shares | | | | | | | | |
| A-Class | | | 216,200,577 | | | | 483,524,829 | |
| C-Class | | | 61,376,200 | | | | 170,420,290 | |
| P-Class | | | 53,717,452 | | | | 199,175,124 | |
| Institutional Class | | | 1,622,545,526 | | | | 3,058,857,215 | |
| Distributions reinvested | | | | | | | | |
| A-Class | | | 9,019,945 | | | | 24,670,444 | |
| C-Class | | | 3,475,191 | | | | 9,315,475 | |
| P-Class | | | 2,356,745 | | | | 5,726,531 | |
| Institutional Class | | | 64,116,771 | | | | 114,415,649 | |
| Cost of shares redeemed | | | | | | | | |
| A-Class | | | (246,327,000 | ) | | | (362,235,603 | ) |
| C-Class | | | (44,834,970 | ) | | | (91,211,749 | ) |
| P-Class | | | (64,705,132 | ) | | | (82,662,396 | ) |
| Institutional Class | | | (857,165,463 | ) | | | (857,219,760 | ) |
| Net increase from capital share transactions | | | 819,775,842 | | | | 2,672,776,049 | |
| Net increase in net assets | | | 820,158,866 | | | | 2,775,720,134 | |
| | | | | | | | | |
| Net assets: | | | | | | | | |
| Beginning of period | | | 6,108,141,374 | | | | 3,332,421,240 | |
| End of period | | $ | 6,928,300,240 | | | $ | 6,108,141,374 | |
| Accumulated distributions in excess of net investment income at end of period | | $ | (13,069,403 | ) | | $ | (15,062,016 | ) |
| 68 | THE GUGGENHEIM FUNDS SEMI-ANNUAL REPORT | SEE NOTES TO FINANCIAL STATEMENTS. |
| CONSOLIDATED STATEMENTS OF CHANGES IN NET ASSETS (concluded) |
| MACRO OPPORTUNITIES FUND | |
| | | Period Ended
March 29,
2018
(Unaudited) | | | Year Ended
September 30,
2017 | |
| Capital share activity: | | | | | | |
| Shares sold | | | | | | |
| A-Class | | | 8,081,458 | | | | 18,254,924 | |
| C-Class | | | 2,296,211 | | | | 6,433,626 | |
| P-Class | | | 2,007,267 | | | | 7,529,638 | |
| Institutional Class | | | 60,559,635 | | | | 115,288,077 | |
| Shares issued from reinvestment of distributions | | | | | | | | |
| A-Class | | | 337,229 | | | | 931,159 | |
| C-Class | | | 129,992 | | | | 351,944 | |
| P-Class | | | 88,330 | | | | 215,727 | |
| Institutional Class | | | 2,393,042 | | | | 4,307,627 | |
| Shares redeemed | | | | | | | | |
| A-Class | | | (9,204,903 | ) | | | (13,675,512 | ) |
| C-Class | | | (1,677,097 | ) | | | (3,447,364 | ) |
| P-Class | | | (2,417,204 | ) | | | (3,109,430 | ) |
| Institutional Class | | | (31,985,785 | ) | | | (32,306,620 | ) |
| Net increase in shares | | | 30,608,175 | | | | 100,773,796 | |
| SEE NOTES TO FINANCIAL STATEMENTS. | THE GUGGENHEIM FUNDS SEMI-ANNUAL REPORT | 69 |
| FINANCIAL HIGHLIGHTS |
| MACRO OPPORTUNITIES FUND | |
This table is presented to show selected data for a share outstanding throughout each period and to assist shareholders in evaluating a Fund’s performance for the periods presented.
| A-Class | | Period Ended
March 29,
2018a,g | | | Year Ended
Sept. 30,
2017g | | | Year Ended
Sept. 30,
2016g | | | Year Ended
Sept. 30,
2015g | | | Year Ended
Sept. 30,
2014 | | | Year Ended
Sept. 30,
2013 | |
| Per Share Data | | | | | | | | | | | | | | | | | | |
| Net asset value, beginning of period | | $ | 26.67 | | | $ | 26.01 | | | $ | 26.07 | | | $ | 26.81 | | | $ | 26.31 | | | $ | 26.53 | |
| Income (loss) from investment operations: |
| Net investment income (loss)b | | | .34 | | | | .95 | | | | 1.16 | | | | .98 | | | | 1.10 | | | | 1.37 | |
| Net gain (loss) on investments (realized and unrealized) | | | .01 | | | | .68 | | | | .21 | | | | (.55 | ) | | | .69 | | | | (.04 | ) |
| Total from investment operations | | | .35 | | | | 1.63 | | | | 1.37 | | | | .43 | | | | 1.79 | | | | 1.33 | |
| Less distributions from: |
| Net investment income | | | (.34 | ) | | | (.97 | ) | | | (1.43 | ) | | | (1.17 | ) | | | (1.27 | ) | | | (1.43 | ) |
| Net realized gains | | | — | | | | — | | | | — | | | | — | | | | — | | | | (.12 | ) |
| Return of capital | | | — | | | | — | | | | — | | | | — | | | | (.02 | ) | | | — | |
| Total distributions | | | (.34 | ) | | | (.97 | ) | | | (1.43 | ) | | | (1.17 | ) | | | (1.29 | ) | | | (1.55 | ) |
| Net asset value, end of period | | $ | 26.68 | | | $ | 26.67 | | | $ | 26.01 | | | $ | 26.07 | | | $ | 26.81 | | | $ | 26.31 | |
| |
| Total Returnh | | | 1.33 | % | | | 6.33 | % | | | 5.57 | % | | | 1.59 | % | | | 6.88 | % | | | 5.01 | % |
| Ratios/Supplemental Data |
| Net assets, end of period (in thousands) | | $ | 872,468 | | | $ | 893,104 | | | $ | 727,602 | | | $ | 844,523 | | | $ | 357,765 | | | $ | 334,751 | |
| Ratios to average net assets: |
| Net investment income (loss) | | | 2.55 | % | | | 3.58 | % | | | 4.59 | % | | | 3.67 | % | | | 4.08 | % | | | 5.11 | % |
| Total expensesc | | | 1.41 | % | | | 1.42 | % | | | 1.65 | % | | | 1.52 | % | | | 1.51 | % | | | 1.56 | % |
| Net expensesd,e,i | | | 1.30 | % | | | 1.27 | % | | | 1.46 | % | | | 1.38 | % | | | 1.36 | % | | | 1.41 | % |
| Portfolio turnover rate | | | 41 | % | | | 61 | % | | | 61 | % | | | 40 | % | | | 54 | % | | | 84 | % |
| 70 | THE GUGGENHEIM FUNDS SEMI-ANNUAL REPORT | SEE NOTES TO FINANCIAL STATEMENTS. |
| FINANCIAL HIGHLIGHTS (continued) |
| MACRO OPPORTUNITIES FUND | |
This table is presented to show selected data for a share outstanding throughout each period and to assist shareholders in evaluating a Fund’s performance for the periods presented.
| C-Class | | Period Ended
March 29,
2018a,g | | | Year Ended
Sept. 30,
2017g | | | Year Ended
Sept. 30,
2016g | | | Year Ended
Sept. 30,
2015g | | | Year Ended
Sept. 30,
2014 | | | Year Ended
Sept. 30,
2013 | |
| Per Share Data | | | | | | | | | | | | | | | | | | |
| Net asset value, beginning of period | | $ | 26.65 | | | $ | 25.99 | | | $ | 26.05 | | | $ | 26.79 | | | $ | 26.29 | | | $ | 26.51 | |
| Income (loss) from investment operations: |
| Net investment income (loss)b | | | .24 | | | | .75 | | | | .98 | | | | .78 | | | | .90 | | | | 1.17 | |
| Net gain (loss) on investments (realized and unrealized) | | | .02 | | | | .68 | | | | .20 | | | | (.55 | ) | | | .69 | | | | (.03 | ) |
| Total from investment operations | | | .26 | | | | 1.43 | | | | 1.18 | | | | .23 | | | | 1.59 | | | | 1.14 | |
| Less distributions from: |
| Net investment income | | | (.24 | ) | | | (.77 | ) | | | (1.24 | ) | | | (.97 | ) | | | (1.07 | ) | | | (1.24 | ) |
| Net realized gains | | | — | | | | — | | | | — | | | | — | | | | — | | | | (.12 | ) |
| Return of capital | | | — | | | | — | | | | — | | | | — | | | | (.02 | ) | | | — | |
| Total distributions | | | (.24 | ) | | | (.77 | ) | | | (1.24 | ) | | | (.97 | ) | | | (1.09 | ) | | | (1.36 | ) |
| Net asset value, end of period | | $ | 26.67 | | | $ | 26.65 | | | $ | 25.99 | | | $ | 26.05 | | | $ | 26.79 | | | $ | 26.29 | |
| |
| Total Returnh | | | 0.96 | % | | | 5.55 | % | | | 4.79 | % | | | 0.84 | % | | | 6.10 | % | | | 4.26 | % |
| Ratios/Supplemental Data |
| Net assets, end of period (in thousands) | | $ | 454,781 | | | $ | 434,634 | | | $ | 337,075 | | | $ | 374,633 | | | $ | 248,359 | | | $ | 163,129 | |
| Ratios to average net assets: |
| Net investment income (loss) | | | 1.83 | % | | | 2.83 | % | | | 3.87 | % | | | 2.90 | % | | | 3.34 | % | | | 4.36 | % |
| Total expensesc | | | 2.15 | % | | | 2.14 | % | | | 2.36 | % | | | 2.24 | % | | | 2.22 | % | | | 2.29 | % |
| Net expensesd,e,i | | | 2.04 | % | | | 2.03 | % | | | 2.20 | % | | | 2.13 | % | | | 2.10 | % | | | 2.15 | % |
| Portfolio turnover rate | | | 41 | % | | | 61 | % | | | 61 | % | | | 40 | % | | | 54 | % | | | 84 | % |
| SEE NOTES TO FINANCIAL STATEMENTS. | THE GUGGENHEIM FUNDS SEMI-ANNUAL REPORT | 71 |
| FINANCIAL HIGHLIGHTS (continued) |
| MACRO OPPORTUNITIES FUND | |
This table is presented to show selected data for a share outstanding throughout each period and to assist shareholders in evaluating a Fund’s performance for the periods presented.
| P-Class | | Period Ended
March 29,
2018a,g | | | Year Ended
Sept. 30,
2017g | | | Year Ended
Sept. 30,
2016g | | | Period Ended
Sept. 30,
2015f,g | |
| Per Share Data | | | | | | | | | | | | |
| Net asset value, beginning of period | | $ | 26.68 | | | $ | 26.02 | | | $ | 26.07 | | | $ | 26.78 | |
| Income (loss) from investment operations: |
| Net investment income (loss)b | | | .35 | | | | .92 | | | | 1.20 | | | | .37 | |
| Net gain (loss) on investments (realized and unrealized) | | | — | | | | .71 | | | | .21 | | | | (.62 | ) |
| Total from investment operations | | | .35 | | | | 1.63 | | | | 1.41 | | | | (.25 | ) |
| Less distributions from: |
| Net investment income | | | (.34 | ) | | | (.97 | ) | | | (1.46 | ) | | | (.46 | ) |
| Total distributions | | | (.34 | ) | | | (.97 | ) | | | (1.46 | ) | | | (.46 | ) |
| Net asset value, end of period | | $ | 26.69 | | | $ | 26.68 | | | $ | 26.02 | | | $ | 26.07 | |
| |
| Total Returnh | | | 1.33 | % | | | 6.33 | % | | | 5.74 | % | | | (0.95 | %) |
| Ratios/Supplemental Data |
| Net assets, end of period (in thousands) | | $ | 180,471 | | | $ | 188,980 | | | $ | 63,665 | | | $ | 63,819 | |
| Ratios to average net assets: |
| Net investment income (loss) | | | 2.62 | % | | | 3.48 | % | | | 4.73 | % | | | 3.36 | % |
| Total expensesc | | | 1.44 | % | | | 1.44 | % | | | 1.49 | % | | | 1.43 | % |
| Net expensesd,e,i | | | 1.30 | % | | | 1.26 | % | | | 1.33 | % | | | 1.30 | % |
| Portfolio turnover rate | | | 41 | % | | | 61 | % | | | 61 | % | | | 40 | % |
| 72 | THE GUGGENHEIM FUNDS SEMI-ANNUAL REPORT | SEE NOTES TO FINANCIAL STATEMENTS. |
| FINANCIAL HIGHLIGHTS (continued) |
| MACRO OPPORTUNITIES FUND | |
This table is presented to show selected data for a share outstanding throughout each period and to assist shareholders in evaluating a Fund’s performance for the periods presented.
| Institutional Class | | Period Ended
March 29,
2018a,g | | | Year Ended
Sept. 30,
2017g | | | Year Ended
Sept. 30,
2016g | | | Year Ended
Sept. 30,
2015g | | | Year Ended
Sept. 30,
2014 | | | Year Ended
Sept. 30,
2013 | |
| Per Share Data | | | | | | | | | | | | | | | | | | |
| Net asset value, beginning of period | | $ | 26.71 | | | $ | 26.04 | | | $ | 26.10 | | | $ | 26.84 | | | $ | 26.34 | | | $ | 26.56 | |
| Income (loss) from investment operations: |
| Net investment income (loss)b | | | .41 | | | | 1.02 | | | | 1.26 | | | | 1.06 | | | | 1.18 | | | | 1.46 | |
| Net gain (loss) on investments (realized and unrealized) | | | — | | | | .71 | | | | .21 | | | | (.54 | ) | | | .70 | | | | (.04 | ) |
| Total from investment operations | | | .41 | | | | 1.73 | | | | 1.47 | | | | .52 | | | | 1.88 | | | | 1.42 | |
| Less distributions from: |
| Net investment income | | | (.40 | ) | | | (1.06 | ) | | | (1.53 | ) | | | (1.26 | ) | | | (1.36 | ) | | | (1.52 | ) |
| Net realized gains | | | — | | | | — | | | | — | | | | — | | | | — | | | | (.12 | ) |
| Return of capital | | | — | | | | — | | | | — | | | | — | | | | (.02 | ) | | | — | |
| Total distributions | | | (.40 | ) | | | (1.06 | ) | | | (1.53 | ) | | | (1.26 | ) | | | (1.38 | ) | | | (1.64 | ) |
| Net asset value, end of period | | $ | 26.72 | | | $ | 26.71 | | | $ | 26.04 | | | $ | 26.10 | | | $ | 26.84 | | | $ | 26.34 | |
| |
| Total Returnh | | | 1.53 | % | | | 6.73 | % | | | 5.97 | % | | | 1.92 | % | | | 7.23 | % | | | 5.35 | % |
| Ratios/Supplemental Data |
| Net assets, end of period (in thousands) | | $ | 5,420,580 | | | $ | 4,591,424 | | | $ | 2,204,079 | | | $ | 2,396,622 | | | $ | 914,366 | | | $ | 416,727 | |
| Ratios to average net assets: |
| Net investment income (loss) | | | 3.04 | % | | | 3.86 | % | | | 4.96 | % | | | 3.97 | % | | | 4.37 | % | | | 5.43 | % |
| Total expensesc | | | 1.06 | % | | | 1.06 | % | | | 1.29 | % | | | 1.20 | % | | | 1.18 | % | | | 1.23 | % |
| Net expensesd,e,i | | | 0.89 | % | | | 0.91 | % | | | 1.08 | % | | | 1.05 | % | | | 1.02 | % | | | 1.09 | % |
| Portfolio turnover rate | | | 41 | % | | | 61 | % | | | 61 | % | | | 40 | % | | | 54 | % | | | 84 | % |
| SEE NOTES TO FINANCIAL STATEMENTS. | THE GUGGENHEIM FUNDS SEMI-ANNUAL REPORT | 73 |
| FINANCIAL HIGHLIGHTS (concluded) |
| MACRO OPPORTUNITIES FUND |
| a | Unaudited figures for the period ended March 29, 2018. Percentage amounts for the period, except total return and portfolio turnover rate, have been annualized. |
| b | Net investment income (loss) per share was computed using average shares outstanding throughout the period. |
| c | Does not include expenses of the underlying funds in which the Fund invests. |
| d | Net expense information reflects the expense ratios after expense waivers and reimbursements, as applicable. |
| e | The portion of the ratios of net expenses to average net assets attributable to recoupments of prior fee reductions or expense reimbursements for the periods presented would be: |
| | | 03/29/18 | 09/30/17 | 09/30/16 | 09/30/15 | 09/30/14 | 09/30/13 |
| | A-Class | 0.03% | 0.02% | N/A | N/A | N/A | N/A |
| | C-Class | 0.10% | 0.04% | N/A | N/A | N/A | N/A |
| | P-Class | 0.04% | 0.02% | N/A | N/A | N/A | N/A |
| | Institutional Class | 0.00% | N/A | N/A | N/A | N/A | N/A |
| f | Since commencement of operations: May 1, 2015. Percentage amounts for the period, except total return and portfolio turnover rate, have been annualized. |
| g | Consolidated. |
| h | Total return does not reflect the impact of any applicable sales charges and has not been annualized. |
| i | Net expenses may include expenses that are excluded from the expense limitation agreement and affiliated fee waivers. Excluding these expenses, the net expense ratios for the periods would be: |
| | | 03/29/2018 | 09/30/2017 | 09/30/2016 | 09/30/2015 | 09/30/2014 | 09/30/2013 |
| | A-Class | 1.27% | 1.25% | 1.28% | 1.30% | 1.27% | 1.29% |
| | C-Class | 1.93% | 2.00% | 2.02% | 2.05% | 2.01% | 2.01% |
| | P-Class | 1.25% | 1.24% | 1.15% | 1.21% | N/A | N/A |
| | Institutional Class | 0.89% | 0.88% | 0.90% | 0.97% | 0.94% | 0.96% |
| 74 | THE GUGGENHEIM FUNDS SEMI-ANNUAL REPORT | SEE NOTES TO FINANCIAL STATEMENTS. |
| NOTES TO CONSOLIDATED FINANCIAL STATEMENTS (Unaudited) |
Note 1 – Organization, Conslidation of Subsidiary and Significant Accounting Policies
Organization
Guggenheim Funds Trust (the “Trust”), a Delaware statutory trust, is registered with the SEC under the Investment Company Act of 1940 (“1940 Act”), as an open-ended investment company of the series type. Each series, in effect, is representing a separate Fund. The Trust is authorized to issue an unlimited number of shares. The Trust accounts for the assets of each Fund separately.
The Trust offers a combination of five separate classes of shares, A-Class shares, C-Class shares, P-Class shares, R6-Class shares and Institutional Class shares. Sales of shares of each Class are made without a front-end sales charge at the net asset value per share (“NAV”), with the exception of A-Class shares. A-Class shares are sold at the NAV, plus the applicable front-end sales charge. The sales charge varies depending on the amount purchased. A-Class share purchases of $1 million or more are exempt from the front-end sales charge but have a 1% contingent deferred sales charge (“CDSC”), if shares are redeemed within 12 months of purchase. C-Class shares have a 1% CDSC if shares are redeemed within 12 months of purchase. Institutional Class shares are offered primarily for direct investment by institutions such as pension and profit sharing plans, endowments, foundations and corporations. Institutional Class shares require a minimum initial investment of $2 million and a minimum account balance of $1 million. At March 29, 2018, the Trust consisted of nineteen funds (the “Funds”).
This report covers the Macro Opportunities Fund (the “Fund”), a non-diversified investment company. Only A-Class, C-Class, P-Class, and Institutional Class shares had been issued by the Fund.
Security Investors, LLC which operates under the name Guggenheim Investments (“GI”), provides advisory services. Guggenheim Funds Distributors, LLC (“GFD” or the “Distributor”) acts as principal underwriter for the Trust. GI and GFD are affiliated entities.
Consolidation of Subsidiary
The consolidated financial statements of the Fund includes the accounts of a wholly-owned and controlled Cayman Islands subsidiary (the “Subsidiary”). Significant inter-company accounts and transactions have been eliminated in consoldidation for the Fund.
The Fund may invest up to 25% of its total assets in its Subsidiary which acts as an investment vehicle in order to effect certain investments consistent with the Fund’s investment objective and policies.
A summary of the Fund’s investment in its Subsidiary is as follows:
| | | Commencement
Date of
Subsidiary | | Subsidiary
Net Assets as
March 29,
2018 | | | % of Net Assets
of the Fund at
March 29,
2018 | |
| | | 01/08/15 | | $ | 8,029,199 | | | | 0.12 | % |
| | THE GUGGENHEIM FUNDS SEMI-ANNUAL REPORT | 75 |
| NOTES TO CONSOLIDATED FINANCIAL STATEMENTS (Unaudited)(continued) |
Significant Accounting Policies
March 29, 2018 represents the last day during the Fund’s semi-annual period on which the New York Stock Exchange (“NYSE”) was open for trading. The Fund’s financial statements have been presented through that date to maintain consistency with the Fund’s net asset value calculations used for shareholder transactions.
The Fund operates as an investment company and, accordingly, follows the investment company accounting and reporting guidance of the Financial Accounting Standards Board (“FASB”) Accounting Standards Codification Topic 946 Financial Services – Investment Companies.
The following significant accounting policies are in conformity with U.S. generally accepted accounting principles (“U.S. GAAP”) and are consistently followed by the Trust. This requires management to make estimates and assumptions that affect the reported amount of assets and liabilities, contingent assets and liabilities at the date of the financial statements, and the reported amounts of revenues and expenses during the reporting period. Actual results could differ from these estimates. All time references are based on Eastern Time.
The NAV of each Class of the Fund is calculated by dividing the market value of the Fund’s securities and other assets, less all liabilities, attributable to the Class by the number of outstanding shares of the Class.
(a) Valuation of Investments
The Board of Trustees of the Fund (the “Board”) has adopted policies and procedures for the valuation of the Fund’s investments (the “Valuation Procedures”). Pursuant to the Valuation Procedures, the Board has delegated to a valuation committee, consisting of representatives from Guggenheim’s investment management, fund administration, legal and compliance departments (the “Valuation Committee”), the day-to-day responsibility for implementing the Valuation Procedures, including, under most circumstances, the responsibility for determining the fair value of the Fund’s securities and/or other assets.
Valuations of the Fund’s securities are supplied primarily by pricing services appointed pursuant to the processes set forth in the Valuation Procedures. The Valuation Committee convenes monthly, or more frequently as needed, to review the valuation of all assets which have been fair valued for reasonableness. The Fund’s officers, through the Valuation Committee and consistent with the monitoring and review responsibilities set forth in the Valuation Procedures, regularly review procedures used and valuations provided by the pricing services.
If the pricing service cannot or does not provide a valuation for a particular investment or such valuation is deemed unreliable, such investment is fair valued by the Valuation Committee.
Equity securities listed on an exchange (NYSE or American Stock Exchange) are valued at the last quoted sale price as of the close of business on the NYSE, usually 4:00 p.m. on the valuation date. Equity securities listed on the NASDAQ market system are valued at the NASDAQ Official Closing
| 76 | THE GUGGENHEIM FUNDS SEMI-ANNUAL REPORT | |
| NOTES TO CONSOLIDATED FINANCIAL STATEMENTS (Unaudited)(continued) |
Price on the valuation date, which may not necessarily represent the last sale price. If there has been no sale on such exchange or NASDAQ on a given day, the security is valued at the closing bid price on that day.
Generally, trading in foreign securities markets is substantially completed each day at various times prior to the close of the NYSE. The values of foreign securities are determined as of the close of such foreign markets or the close of the NYSE, if earlier. All investments quoted in foreign currencies are valued in U.S. dollars on the basis of the foreign currency exchange rates prevailing at the close of U.S. business at 4:00pm. Investments in foreign securities may involve risks not present in domestic investments. The Valuation Committee will determine the current value of such foreign securities by taking into consideration certain factors which may include those discussed above, as well as the following factors, among others: the value of the securities traded on other foreign markets, ADR trading, closed-end fund trading, foreign currency exchange activity, and the trading prices of financial products that are tied to foreign securities. In addition, under the Valuation Procedures, the Valuation Committee and GI are authorized to use prices and other information supplied by a third party pricing vendor in valuing foreign securities.
Open-end investment companies (“mutual funds”) are valued at their NAV as of the close of business, on the valuation date. Exchange-traded funds (“ETFs”) and closed-end investment companies (“CEFs”) are valued at the last quoted sale price.
U.S. Government securities are valued by either independent pricing services, the last traded fill price, or at the reported bid price at the close of business.
Debt securities with a maturity of greater than 60 days at acquisition are valued at prices that reflect broker-dealer supplied valuations or are obtained from independent pricing services, which may consider the trade activity, treasury spreads, yields or price of bonds of comparable quality, coupon, maturity, and type, as well as prices quoted by dealers who make markets in such securities. Short-term debt securities with a maturity of 60 days or less at acquisition are valued at amortized cost, provided such amount approximates market value. Money market funds are valued at their NAV.
Repurchase agreements are valued at amortized cost, provided such amounts approximate market value.
Typically, loans are valued using information provided by an independent third party pricing service which uses broker quotes. If the pricing service cannot or does not provide a valuation for a particular investment or such valuation is deemed unreliable, such investment is fair valued by the Valuation Committee.
| | THE GUGGENHEIM FUNDS SEMI-ANNUAL REPORT | 77 |
| NOTES TO CONSOLIDATED FINANCIAL STATEMENTS (Unaudited)(continued) |
Listed options are valued at the Official Settlement Price listed by the exchange, usually as of 4:00 p.m. Long options are valued using the bid price and short options are valued using the ask price. In the event that a settlement price is not available, fair valuation is enacted. Over-the-counter (“OTC”) options are valued using the average bid price (for long options) or average ask price (for short options) obtained from one or more security dealers.
The value of interest rate swap agreements entered into by a Fund is accounted for using the unrealized gain or loss on the agreements that is determined using the spread priced off the previous day’s Chicago Mercantile Exchange (“CME”) price.
The value of equity swaps with custom portfolio baskets shall be computed by using the last exchange sale price for each underlying equity security within the swap agreement. A custom portfolio equity swap will be adjusted to include dividends accrued, financing charges and/or interest, as applicable, under the swap agreement.
Investments for which market quotations are not readily available are fair-valued as determined in good faith by GI, subject to review and approval by the Valuation Committee, pursuant to methods established or ratified by the Board. Valuations in accordance with these methods are intended to reflect each security’s (or asset’s or liability’s) “fair value”. Each such determination is based on a consideration of all relevant factors, which are likely to vary from one pricing context to another. Examples of such factors may include, but are not limited to market prices; sale prices; broker quotes; and models which derive prices based on inputs such as prices of securities with comparable maturities and characteristics, or based on inputs such as anticipated cash flows or collateral, spread over Treasuries, and other information analysis.
In connection with futures contracts and other derivative investments, such factors may include obtaining information as to how (a) these contracts and other derivative investments trade in the futures or other derivative markets, respectively, and (b) the securities underlying these contracts and other derivative investments trade in the cash market.
(b) Senior Loans
Senior loans in which the Fund invests generally pay interest rates which are periodically adjusted by reference to a base short-term floating rate, plus a premium. These base lending rates are generally (i) the lending rate offered by one or more major European banks, such as the one-month or three-month London Inter-Bank Offered Rate (“LIBOR”), (ii) the prime rate offered by one or more major United States banks, or (iii) the bank’s certificate of deposit rate. Senior floating rate interests often require prepayments from excess cash flows or permit the borrower to repay at its election. The rate at which the borrower repays cannot be predicted with accuracy. As a result, the actual remaining maturity may be substantially less than the stated maturities shown. The interest rate indicated is the rate in effect at March 29, 2018.
| 78 | THE GUGGENHEIM FUNDS SEMI-ANNUAL REPORT | |
| NOTES TO CONSOLIDATED FINANCIAL STATEMENTS (Unaudited)(continued) |
(c) Interests in Securities
The Fund may purchase and sell interests in securities on a when-issued and delayed delivery basis, with payment and delivery scheduled for a future date. No income accrues to the Fund on such interests or securities in connection with such transactions prior to the date the Fund actually take delivery of such interests or securities. These transactions are subject to market fluctuations and are subject to the risk that the value at delivery may be more or less than the trade date purchase price. Although the Fund will generally purchase these securities with the intention of acquiring such securities, they may sell such securities before the settlement date.
(d) Short Sales
When the Fund engages in a short sale of a security, an amount equal to the proceeds is reflected as an asset and an equivalent liability. The amount of the liability is subsequently marked-to-market to reflect the market value of the short sale. The Fund maintains a segregated account of cash and/or securities as collateral for short sales.
Fees, if any, paid to brokers to borrow securities in connection with short sales are recorded as interest expense. In addition, the Fund must pay out the dividend rate of the equity or coupon rate of the obligation to the lender and record this as an expense. Short dividend or interest expense is a cost associated with the investment objective of short sales transactions, rather than an operational cost associated with the day-to-day management of any mutual fund. The Fund may also receive rebate income from the broker resulting from the investment of the proceeds from securities sold short.
(e) Options
Upon the purchase of an option, the premium paid is recorded as an investment, the value of which is marked-to-market daily. If a purchased option expires, the Fund realizes a loss in the amount of the cost of the option. When the Fund enters into a closing sale transaction, it realizes a gain or loss depending on whether the proceeds from the closing sale transaction are greater or less than the cost of the option. If the Fund exercises a put option, it realizes a gain or loss from the sale of the underlying security and the proceeds from such sale will be decreased by the premium originally paid. When the Fund exercises a call option, the cost of the security purchased by the Fund upon exercise increases by the premium originally paid.
When the Fund writes (sells) an option, an amount equal to the premium received is entered in that Fund’s accounting records as an asset and equivalent liability. The amount of the liability is subsequently marked-to-market to reflect the current value of the option written. When a written option expires, or if the Fund enters into a closing purchase transaction, it realizes a gain (or loss if the cost of a closing purchase transaction exceeds the premium received when the option was sold).
| | THE GUGGENHEIM FUNDS SEMI-ANNUAL REPORT | 79 |
| NOTES TO CONSOLIDATED FINANCIAL STATEMENTS (Unaudited)(continued) |
(f) Swap Agreements
Swap agreements are marked-to-market daily and the change, if any, is recorded as unrealized gain or loss. Payments received or made as a result of an agreement or termination of an agreement are recognized as realized gains or losses.
Credit default swap agreements are marked-to-market daily and the change, if any, is recorded as unrealized gain or loss. Upfront payments received or made by a Fund on credit default swap agreements are amortized over the expected life of the agreement. Periodic payments received or paid by a Fund are recorded as realized gains or losses. Payments received or made as a result of a credit event or termination of the contract are recognized, net of a proportional amount of the upfront payment, as realized gains or losses.
(g) Currency Translations
The accounting records of the Fund are maintained in U.S. dollars. All assets and liabilities initially expressed in foreign currencies are converted into U.S. dollars at prevailing exchange rates. Purchases and sales of investment securities, dividend and interest income, and certain expenses are translated at the rates of exchange prevailing on the respective dates of such transactions. Changes in the relationship of these foreign currencies to the U.S. dollar can significantly affect the value of the investments and earnings of the Fund. Foreign investments may also subject the Fund to foreign government exchange restrictions, expropriation, taxation, or other political, social or economic developments, all of which could affect the market and/or credit risk of the investments.
The Fund does not isolate that portion of the results of operations resulting from changes in the foreign exchange rates on investments from the fluctuations arising from changes in the market prices of securities held. Such fluctuations are included with the net realized and unrealized gain or loss on investments.
Reported net realized foreign exchange gains and losses arise from sales of foreign currencies and currency gains or losses realized between the trade and settlement dates on investment transactions. Net unrealized exchange gains and losses arise from changes in the fair values of assets and liabilities other than investments in securities at the fi scal period end, resulting from changes in exchange rates.
(h) Forward Foreign Currency Exchange Contracts
Forward foreign currency exchange contracts are valued daily based on the applicable exchange rate of the underlying currency. The change in value of the contract is recorded as unrealized appreciation or depreciation until the contract is closed. When the contract is closed, the Fund records a realized gain or loss equal to the difference between the value at the time the contract was opened and the value at the time it was closed.
| 80 | THE GUGGENHEIM FUNDS SEMI-ANNUAL REPORT | |
| NOTES TO CONSOLIDATED FINANCIAL STATEMENTS (Unaudited)(continued) |
(i) Foreign Taxes
The Fund may be subject to foreign taxes (a portion of which may be reclaimable) on income, stock dividends, capital gains on investments or certain foreign currency transactions. All foreign taxes are recorded in accordance with the applicable foreign tax regulations and rates that exist in the foreign jurisdictions in which the Fund invests. These foreign taxes, if any, are paid by the Fund and reflected in its Consolidated Statement of Operations as follows: foreign taxes withheld at source are presented as a reduction of income and foreign taxes on capital gains from sales of investments are included with the net realized gain (loss) on investments. Foreign taxes payable or deferred as of March 29, 2018, if any, are disclosed in the Fund’s Consolidated Statement of Assets and Liabilities.
(j) Security Transactions
Security transactions are recorded on the trade date for financial reporting purposes. Realized gains and losses from securities transactions are recorded using the identified cost basis. Proceeds from lawsuits related to investment holdings are recorded as realized gains in the Fund. Dividend income is recorded on the ex-dividend date, net of applicable taxes withheld by foreign countries. Taxable non-cash dividends are recorded as dividend income. Interest income, including amortization of premiums and accretion of discounts, is accrued on a daily basis. Interest income also includes paydown gains and losses on mortgage-backed and asset-backed securities and senior and subordinated loans. Amendment fees are earned as compensation for evaluating and accepting changes to the original loan agreement and are recognized when received. Dividend income from Real Estate Investment Trusts (“REITs”) is recorded based on the income included in the distributions received from the REIT investments using published REIT classifications, including some management estimates when actual amounts are not available. Distributions received in excess of this estimated amount are recorded as a reduction of the cost of investments or reclassified to capital gains. The actual amounts of income, return of capital, and capital gains are only determined by each REIT after its fiscal year-end, and may differ from the estimated amounts.
Income from residual collateralized loan obligations is recognized using the effective interest method. At the time of purchase, management estimates the future expected cash flows and determines the effective yield and estimated maturity date based on the estimated cash flows. Subsequent to the purchase, the estimated cash flows are updated periodically and a revised yield is calculated prospectively. Cash flows received in excess of the effective yield are reflected as a return of capital.
(k) Distributions
The Fund declares dividends from investment income daily. The Fund pays its shareholders from its net investment income monthly and distributes any net capital gains that it has realized, at least annually. Distributions to shareholders are recorded on the ex-dividend date. Dividends are
| | THE GUGGENHEIM FUNDS SEMI-ANNUAL REPORT | 81 |
| NOTES TO CONSOLIDATED FINANCIAL STATEMENTS (Unaudited)(continued) |
reinvested in additional shares unless shareholders request payment in cash. The character of distributions made during the year from net investment income or net realized gains may differ from their ultimate characterization for federal income tax purposes.
(l) Class Allocations
Interest and dividend income, most expenses, all realized gains and losses, and all unrealized gains and losses are allocated to the classes based upon the value of the outstanding shares in each Class. Certain costs, such as distribution and service fees are charged directly to specific classes. In addition, certain expenses have been allocated to the individual Funds in the Trust on a pro rata basis upon the respective aggregate net assets of each Fund included in the Trust.
(m) Earnings Credits
Under the fee arrangement with the custodian, the Fund may earn credits based on overnight custody cash balances. These credits are utilized to reduce related custodial expenses. The custodian fees disclosed in the Statement of Operations are before the reduction in expense from the related earnings credits, if any. For the period ended March 29, 2018, there were no earnings credits received.
(n) Cash
The Fund may leave cash overnight in its cash account with the custodian. Periodically, the Fund may have cash due to the custodian bank as an overdraft balance. A fee is incurred on this overdraft, calculated by multiplying the overdraft by a rate based on the federal funds rate, which was 1.68% at March 29, 2018.
(o) Indemnifications
Under the Fund’s organizational documents, its Trustees and Officers are indemnified against certain liabilities arising out of the performance of their duties to the Trust. In addition, throughout the normal course of business, the Fund enters into contracts that contain a variety of representations and warranties which provide general indemnifications. The Fund’s maximum exposure under these arrangements is unknown, as this would involve future claims that may be made against the Fund and/or its affiliates that have not yet occurred. However, based on experience, the Fund expects the risk of loss to be remote.
Note 2 – Financial Instruments and Derivatives
As part of its investment strategy, the Fund utilizes short sales and a variety of derivative instruments. These investments involve, to varying degrees, elements of market risk and risks in excess of amounts recognized in the Statement of Assets and Liabilities. Valuation and accounting treatment of these instruments can be found under Significant Accounting Policies in Note 1 of these Notes to Financial Statements.
| 82 | THE GUGGENHEIM FUNDS SEMI-ANNUAL REPORT | |
| NOTES TO CONSOLIDATED FINANCIAL STATEMENTS (Unaudited)(continued) |
Short Sales
A short sale is a transaction in which a Fund sells a security it does not own. If the security sold short decreases in price between the time the Fund sells the security and closes its short position, the Fund will realize a gain on the transaction. Conversely, if the security increases in price during the period, the Fund will realize a loss on the transaction. The risk of such price increases is the principal risk of engaging in short sales.
Derivatives
Derivatives are instruments whose values depend on, or are derived from, in whole or in part, the value of one or more other assets, such as securities, currencies, commodities or indices. Derivative instruments may be used to increase investment flexibility (including to maintain cash reserves while maintaining exposure to certain other assets), for risk management (hedging) purposes, to facilitate trading, to reduce transaction costs and to pursue higher investment returns. Derivative instruments may also be used to mitigate certain investment risks, such as foreign currency exchange rate risk, interest rate risk and credit risk. U.S. GAAP requires disclosures to enable investors to better understand how and why a Fund uses derivative instruments, how these derivative instruments are accounted for and their effects on the Fund’s financial position and results of operations.
The Fund may utilize derivatives for the following purposes:
Duration: the use of an instrument to manage the interest rate risk of a portfolio.
Hedge: an investment made in order to reduce the risk of adverse price movements in a security, by taking an offsetting position to protect against broad market moves.
Income: the use of any instrument that distributes cash flows typically based upon some rate of interest.
Index Exposure: the use of an instrument to obtain exposure to a listed or other type of index.
Leverage: gaining total exposure to equities or other assets on the long and short sides at greater than 100% of invested capital.
Liquidity: the ability to buy or sell exposure with little price/market impact.
Speculation: the use of an instrument to express macro-economic and other investment views.
For any Fund whose investment strategy consistently involves applying leverage, the value of the Fund’s shares will tend to increase or decrease more than the value of any increase or decrease in the underlying index or other asset. In addition, because an investment in derivative instruments generally requires a small investment relative to the amount of investment exposure assumed, an opportunity for increased net income is created; but, at the same time, leverage risk will increase. The Fund’s use of leverage, through borrowings or instruments such as derivatives, may cause the Fund to be more volatile and riskier than if they had not been leveraged.
| | THE GUGGENHEIM FUNDS SEMI-ANNUAL REPORT | 83 |
| NOTES TO CONSOLIDATED FINANCIAL STATEMENTS (Unaudited)(continued) |
Options Purchased and Written
A call option on a security gives the purchaser of the option the right to buy, and the writer of a call option the obligation to sell, the underlying security. The purchaser of a put option has the right to sell, and the writer of the put option the obligation to buy, the underlying security at any time during the option period. The risk associated with purchasing options is limited to the premium originally paid.
The following table represents the Fund’s use and volume of call/put options purchased on a quarterly basis:
| Use | | Average
Notional Amount | |
| Duration, Hedge, Speculation | | $ | 14,687,731,926 | |
The risk in writing a call option is that a Fund may incur a loss if the market price of the underlying security increases and the option is exercised. The risk in writing a put option is that a Fund may incur a loss if the market price of the underlying security decreases and the option is exercised. In addition, there may be an imperfect correlation between the movement in prices of options and the underlying securities where a Fund may not be able to enter into a closing transaction because of an illiquid secondary market; or, for OTC options, a Fund may be at risk because of the counterparty’s inability to perform.
The following table represents the Fund’s use and volume of call/put options written on a quarterly basis:
| Use | | Average
Notional Amount | |
| Duration, Hedge, Speculation | | $ | 12,481,724,376 | |
Swaps
A swap is an agreement that obligates two parties to exchange a series of cash flows at specified intervals based upon or calculated by reference to changes in specified prices or rates for a specified amount of an underlying asset. A Fund utilizing OTC swaps bears the risk of loss of the amount expected to be received under a swap agreement in the event of the default or bankruptcy of a swap agreement counterparty or if the underlying asset declines in value. Certain standardized swaps are subject to mandatory central clearing and are executed on a multi-lateral or other trade facility platform, such as a registered exchange. There is little counterparty credit risk with respect to centrally-cleared swaps as the transaction is facilitated through a central clearinghouse, much like an exchange-traded futures contract. Upon entering into certain centrally-cleared swap transactions, a Fund is required to deposit with its clearing broker an amount of cash or securities as an initial margin, Subsequent variation margin payments or receipts are made or received by the Fund, depending on fluctuations in the fair value of the reference entity. Additionally, there is no
| 84 | THE GUGGENHEIM FUNDS SEMI-ANNUAL REPORT | |
| NOTES TO CONSOLIDATED FINANCIAL STATEMENTS (Unaudited)(continued) |
guarantee that a Fund or an underlying fund could eliminate its exposure under an outstanding swap agreement by entering into an offsetting swap agreement with the same or another party. For Funds utilizing interest rate swaps, the exchange bears the risk of loss.
Total return swaps and custom basket swaps involve commitments where single or multiple cash flows are exchanged based on the price of an underlying reference asset (such as index or basket) or a fixed or variable interest rate. Index swaps will usually be computed based on the current index value as of the close of regular trading on the NYSE or other exchange. A fund utilizing a total return index swap bears the risk of loss of the amount expected to be received under a swap agreement in the event of the default or bankruptcy of a swap agreement counterparty or if the underlying index declines in value.
The following table represents the Fund’s use and volume of custom basket swaps on a quarterly basis:
| | | Average Notional Amount | |
| Use | | Long | | | Short | |
| Hedge, Leverage, Speculation | | $ | 59,388,000 | | | $ | 174,465,939 | |
Interest rate swaps involve the exchange by the Fund with another party for its respective commitment to pay or receive a fixed or variable interest rate on a notional amount of principal. Interest rate swaps are generally centrally-cleared, but central clearing does not make interest rate swap transactions risk free.
The following table represents the Fund’s use and volume of interest rate swaps on a quarterly basis:
| Average Notional Amount | |
| Use | | Short | |
| Duration, Hedge | | $ | 773,650,000 | |
Credit default swaps are instruments which allow for the full or partial transfer of third party credit risk, with respect to a particular entity or entities, from one counterparty to the other. In accordance with its principal investment strategy, the Fund enters into credit default swaps as a seller of protection primarily to gain exposure similar to the high yield bond market. A seller of credit default swaps is selling credit protection or assuming credit risk with respect to the underlying entity or entities. If a credit event occurs, as defined under the terms of the swap agreement, the Fund will either (i) pay to the buyer of protection an amount equal to the notional amount of the swap and take delivery of the referenced obligation or underlying securities comprising the referenced index or (ii) pay a net settlement amount in the form of cash or securities equal to the notional amount of the swap less the recovery value of the referenced obligation or underlying securities comprising the referenced index. The Notional Principal reflects the maximum potential amount the Fund could be required to pay as a seller of credit protection if a credit event occurs. As the seller of protection, the Fund receives periodic premium
| | THE GUGGENHEIM FUNDS SEMI-ANNUAL REPORT | 85 |
| NOTES TO CONSOLIDATED FINANCIAL STATEMENTS (Unaudited)(continued) |
payments from the counterparty and may also receive or pay an upfront premium adjustment to the stated periodic premium. In the event a credit event occurs, an adjustment will be made to any upfront premiums that were received by a reduction of 1.00% per credit event.
The quoted market prices and resulting market values for credit default swap agreements on securities and credit indices serve as an indicator of the current status of the payment/performance risk and represent the likelihood of an expected liability (or profit) for the credit derivative had the notional amount of the swap agreement been closed/sold as of the period end. Increasing market values, in absolute terms when compared to the notional amount of the swap, represent a deterioration of the referenced entity’s credit soundness and a greater likelihood or risk of default or other credit event occurring as defined under the terms of the agreement.
The following table represents the Fund’s use and volume of credit default swaps on a quarterly basis:
| Average Notional Amount | |
| Use | | Short | |
| Hedge, Speculation | | $ | 700,000 | |
A credit default swap enables a Fund to buy or sell protection against a defined credit event of an issuer or a basket of securities. Generally, the seller of credit protection against an issuer or basket of securities receives a periodic payment from the buyer to compensate against potential default events. If a default event occurs, the seller must pay the buyer the full notional value of the reference obligation in exchange for the reference obligation. If no default occurs, the counterparty will pay the stream of payments and have no further obligations to the Fund selling the credit protection. A Fund bears the risk of loss of the amount expected to be received under a swap agreement in the event of the default or bankruptcy of a swap agreement counterparty, or in the case of a credit default swap in which the Fund is selling credit protection, the default of a third party issuer.
The table on page 54 included on the Consolidated Schedule of Investments summarizes the information with regard to sold protection on credit default swap contracts as of March 29, 2018.
Forward Foreign Currency Exchange Contracts
A forward foreign currency exchange contract is an agreement between two parties to exchange two designated currencies at a specific time in the future. Certain types of contracts may be cash settled, in an amount equal to the change in exchange rates during the term of the contract. The contracts can be used to hedge or manage exposure to foreign currency risks with portfolio investments or to gain exposure to foreign currencies.
The market value of a forward foreign currency exchange contract changes with fluctuations in foreign currency exchange rates. Furthermore, the Fund may be exposed to risk if the counterparties cannot meet the contract terms or if the currency value changes unfavorably as compared to the U.S. dollar.
| 86 | THE GUGGENHEIM FUNDS SEMI-ANNUAL REPORT | |
| NOTES TO CONSOLIDATED FINANCIAL STATEMENTS (Unaudited)(continued) |
The following table represents the Fund’s use, and volume of forward foreign currency exchange contracts on a quarterly basis:
| | | Average Value | |
| Use | | Purchased | | | Sold | |
| Hedge, Income | | $ | 66,665,535 | | | $ | 1,138,203,127 | |
Derivative Investment Holdings Categorized by Risk Exposure
The following is a summary of the location of derivative investments on the Fund’s Statement of Assets and Liabilities as of March 29, 2018:
| Derivative Investment Type | Asset Derivatives | Liability Derivatives |
| Equity/Credit/Interest Rate contracts | Unrealized appreciation on swap agreements | Unrealized depreciation on swap agreements |
| | | Variation margin on interest rate swap agreements |
| Currency contracts | Unrealized appreciation on forward foreign currency exchange contracts | Unrealized depreciation on forward foreign currency exchange contracts |
| Currency/Equity contracts | Investments in unaffiliated issuers, at value | Options written, at value |
The following table sets forth the fair value of the Fund’s derivative investments categorized by primary risk exposure at March 29, 2018:
| Asset Derivative Investments Value | |
Swaps
Equity
Risk | | | Swaps
Interest Rate
Risk* | | | Swaps
Credit
Default Risk | | | Options
Written
Currency Risk | | | Options
Purchased
Equity Risk | | | Options Purchased Currency Risk | | | Forward
Foreign
Currency
Exchange
Contracts Risk | | | Total Value at
March 29,
2018 | |
| $ | — | | | $ | 11,104,223 | | | $ | 33,994 | | | $ | — | | | $ | 14,785,704 | | | $ | 64,511,869 | | | $ | 4,947,225 | | | $ | 95,383,015 | |
| Liability Derivative Investments Value | |
Swaps
Equity
Risk | | | Swaps
Interest Rate
Risk* | | | Swaps
Credit
Default Risk | | | Options
Written
Currency Risk | | | Options
Purchased
Equity Risk | | | Options Purchased Currency Risk | | | Forward
Foreign
Currency
Exchange
Contracts Risk | | | Total Value at
March 29,
2018 | |
| $ | 9,051,960 | | | $ | 8,435 | | | $ | — | | | $ | 38,678,487 | | | $ | — | | | $ | — | | | $ | 5,155,622 | | | $ | 52,894,504 | |
| * | Includes fair value of centrally cleared interest rate swap agreements as reported on the Schedule of Investments. Only current day’s variation margin is reported within the Statement of Assets and Liabilities. |
| | THE GUGGENHEIM FUNDS SEMI-ANNUAL REPORT | 87 |
| NOTES TO CONSOLIDATED FINANCIAL STATEMENTS (Unaudited)(continued) |
The following is a summary of the location of derivative investments on the Fund’s Statement of Operations for the period ended March 29, 2018:
| Derivative Investment Type | Location of Gain (Loss) on Derivatives |
| Equity/Credit/Interest Rate contracts | Net realized gain (loss) on swap agreements |
| | Net change in unrealized appreciation (depreciation) on swap agreements |
| Currency/Equity contracts | Net realized gain (loss) on options purchased |
| | Net change in unrealized appreciation (depreciation) on options purchased |
| | Net realized gain (loss) on options written |
| | Net change in unrealized appreciation (depreciation) on options written |
| Currency contracts | Net realized gain (loss) on forward foreign currency exchange contracts |
| | Net change in unrealized appreciation (depreciation) on forward foreign currency exchange contracts |
The following is a summary of the Fund’s realized gain (loss) and change in unrealized appreciation (depreciation) on derivative investments recognized on the Statement of Operations categorized by primary risk exposure for the period ended March 29, 2018:
| Realized Gain (Loss) on Derivative Investments Recognized on the Statement of Operations | |
Swaps
Equity
Risk | | | Swaps
Interest Rate
Risk | | | Swaps
Credit
Default Risk | | | Options
Written
Equity Risk | | | Options
Purchased
Equity Risk | | | Options Purchased Currency Risk | | | Forward
Foreign
Currency
Exchange
Contracts Risk | | | Total | |
| $ | (5,668,347 | ) | | $ | 3,329,991 | | | $ | (49,028 | ) | | $ | 2,713,392 | | | $ | (9,083,270 | ) | | $ | (6,607,654 | ) | | $ | (34,220,268 | ) | | $ | (49,585,184 | ) |
| Change in Unrealized Appreciation (Depreciation) on Derivative Investments Recognized on the Statement of Operations | |
Swaps
Equity
Risk | | | Swaps
Interest Rate
Risk | | | Swaps
Credit
Default Risk | | | Options
Written
Equity Risk | | | Options
Purchased
Equity Risk | | | Options Purchased Currency Risk | | | Forward
Foreign
Currency
Exchange
Contracts Risk | | | Total | |
| $ | (5,313,384 | ) | | $ | 11,961,402 | | | $ | 33,994 | | | $ | (28,028,318 | ) | | $ | (295,067 | ) | | $ | 47,163,923 | | | $ | (469,259 | ) | | $ | 25,053,291 | |
| 88 | THE GUGGENHEIM FUNDS SEMI-ANNUAL REPORT | |
| NOTES TO CONSOLIDATED FINANCIAL STATEMENTS (Unaudited)(continued) |
In conjunction with the use short sales and of derivative instruments, the Fund is required to maintain collateral in various forms. The Fund uses, where appropriate, depending on the financial instrument utilized and the broker involved, margin deposits at the broker, cash and/or securities segregated at the custodian bank, discount notes or repurchase agreements allocated to the Fund.
The Trust has established counterparty credit guidelines and enters into transactions only with financial institutions of investment grade or better. The Trust monitors the counterparty credit risk.
Note 3 – Offsetting
In the normal course of business, the Fund enters into transactions subject to enforceable master netting arrangements or other similar arrangements. Generally, the right to offset in those agreements allows the Fund to counteract the exposure to a specific counterparty with collateral received from or delivered to that counterparty based on the terms of the arrangements. These arrangements provide for the right to liquidate upon the occurrence of an event of default, credit event upon merger or additional termination event.
In order to better define their contractual rights and to secure rights that will help the Fund mitigate its counterparty risk, the Fund may enter into an International Swaps and Derivatives Association, Inc. Master Agreement (“ISDA Master Agreement”) or similar agreement with its derivative contract counterparties. An ISDA Master Agreement is a bilateral agreement between a fund and a counterparty that governs OTC derivatives, including foreign exchange contracts, and typically contains, among other things, collateral posting terms and netting provisions in the event of a default and/or termination event. The provisions of the ISDA Master Agreement typically permit a single net payment in the event of a default (close-out netting) or similar event, including the bankruptcy or insolvency of the counterparty.
For derivatives traded under an ISDA Master Agreement, the collateral requirements are typically calculated by netting the mark-to-market amount for each transaction under such agreement and comparing that amount to the value of any collateral currently pledged by the Fund and the counterparty. For financial reporting purposes, cash collateral that has been pledged to cover obligations of the Fund and cash collateral received from the counterparty, if any, are reported separately on the Statement of Assets and Liabilities as segregated cash with broker/receivable for variation margin, or payable for swap settlement/variation margin. Cash and/or securities pledged or received as collateral by the Fund in connection with an OTC derivative subject to an ISDA Master Agreement generally may not be invested, sold or rehypothicated by the counterparty or the Fund, as applicable, absent an event of default under such agreement, in which case such collateral generally may be applied towards obligations due to and payable by such counterparty or the Fund, as applicable. Generally, the amount of collateral due from or to a counterparty must exceed a minimum transfer amount threshold (e.g., $300,000) before a transfer is required to be made. To the extent amounts due to the Fund from its counterparties are not fully collateralized, contractually or otherwise, the Fund bears the risk of loss from counterparty nonperformance. The
| | THE GUGGENHEIM FUNDS SEMI-ANNUAL REPORT | 89 |
| NOTES TO CONSOLIDATED FINANCIAL STATEMENTS (Unaudited)(continued) |
Fund attempts to mitigate counterparty risk by only entering into agreements with counterparties that they believe to be of good standing and by monitoring the financial stability of those counterparties.
For financial reporting purposes, the Fund does not offset derivative assets and derivative liabilities that are subject to netting arrangements in the Statement of Assets and Liabilities.
The following tables present derivative financial instruments and secured financing transactions that are subject to enforceable netting arrangements and offset in the Statement of Assets and Liabilities in conformity with U.S. GAAP:
| | | | | | | | | | | | Gross Amounts Not Offset
In the Statements of
Assets and Liabilities | | | | |
| Instrument | | Gross
Amounts of
Recognized
Assets1 | | | Gross
Amounts
Offset In the
Statement of
Assets and
Liabilities | | | Net Amount
of Assets
Presented on
the Statement
of Assets and
Liabilities | | | Financial
Instruments | | | Cash
Collateral
Received | | | Net
Amount | |
| Options equity contracts | | $ | 14,785,704 | | | $ | — | | | $ | 14,785,704 | | | $ | — | | | $ | — | | | $ | 14,785,704 | |
| Forward foreign currency exchange contracts | | | 4,947,225 | | | | — | | | | 4,947,225 | | | | (3,827,570 | ) | | | (447,158 | ) | | | 672,497 | |
| Credit default swap agreements | | | 33,994 | | | | — | | | | 33,994 | | | | (5,099 | ) | | | — | | | | 28,895 | |
| | | | | | | | | | | | Gross Amounts Not Offset
In the Statements of
Assets and Liabilities | | | | |
| Instrument | | Gross
Amounts of
Recognized
Liabilities1 | | | Gross
Amounts
Offset In the
Statement of
Assets and
Liabilities | | | Net Amount
of Liabilities
Presented on
the Statement
of Assets and
Liabilities | | | Financial
Instruments | | | Cash
Collateral
Pledged | | | Net
Amount | |
| Forward foreign currency exchange contracts | | $ | 5,155,622 | | | $ | — | | | $ | 5,155,622 | | | $ | (3,734,806 | ) | | $ | (1,420,816 | ) | | $ | — | |
| Custom basket swap agreements | | | 9,051,960 | | | | — | | | | 9,051,960 | | | | (470,631 | ) | | | (8,581,329 | ) | | | — | |
| 1 | Centrally cleared swaps and listed options are excluded from these reported amounts. |
| 90 | THE GUGGENHEIM FUNDS SEMI-ANNUAL REPORT | |
| NOTES TO CONSOLIDATED FINANCIAL STATEMENTS (Unaudited)(continued) |
The following table presents deposits held by others in connection with derivative investments as of March 29, 2018. The derivatives tables following the Schedule of Investments list each counterparty for which cash collateral may have been pledged or received at period end. The Fund has the right to offset these deposits against any related liabilities outstanding with each counterparty.
| Counterparty/Clearing Agent | | Asset Type | | Cash Pledged | | | Cash Received | |
| Deutsche Bank | | Forward Foreign Currency Exchange Contracts | | $ | 260,000 | | | $ | — | |
| Morgan Stanley | | Forward Foreign Currency Exchange Contracts, Custom Basket Swap Agreements | | | 9,960,000 | | | | — | |
| Barclays Bank plc | | Repurchase agreements | | | — | | | | 253,000 | |
| Goldman Sachs Group | | Forward Foreign Currency Exchange Contracts | | | 2,420,000 | | | | — | |
| BNP Paribas | | Repurchase agreements | | | 598,000 | | | | — | |
| BofA Merrill Lynch | | Interest Rate Swaps agreements | | | 10,512,613 | | | | 8,350,522 | |
| Citigroup | | Forward Foreign Currency Exchange Contracts | | | — | | | | 447,158 | |
| JPMorgan Chase & Co. | | Forward Foreign Currency Exchange Contracts | | | 2,960,000 | | | | — | |
| Total | | | | $ | 26,710,613 | | | $ | 9,050,680 | |
Note 4 – Fair Value Measurement
In accordance with U.S. GAAP, fair value is defined as the price that the Fund would receive to sell an investment or pay to transfer a liability in an orderly transaction with an independent buyer in the principal market, or in the absence of a principal market, the most advantageous market for the investment or liability. U.S. GAAP establishes a three-tier fair value hierarchy based on the types of inputs used to value assets and liabilities and requires corresponding disclosure. The hierarchy and the corresponding inputs are summarized below:
| Level 1 — | quoted prices in active markets for identical assets or liabilities. |
| Level 2 — | significant other observable inputs (for example quoted prices for securities that are similar based on characteristics such as interest rates, prepayment speeds, credit risk, etc.). |
| Level 3 — | significant unobservable inputs based on the best information available under the circumstances, to the extent observable inputs are not available, which may include assumptions. |
The types of inputs available depend on a variety of factors, such as the type of security and the characteristics of the markets in which it trades, if any. Fair valuation determinations that rely on fewer or no observable inputs require greater judgment. Accordingly, fair value determinations for Level 3 securities require the greatest amount of judgment.
| | THE GUGGENHEIM FUNDS SEMI-ANNUAL REPORT | 91 |
| NOTES TO CONSOLIDATED FINANCIAL STATEMENTS (Unaudited)(continued) |
Independent pricing services are used to value a majority of the Fund’s investments. When values are not available from a pricing service, they will be determined using a variety of sources and techniques, including: market prices; broker quotes; and models which derive prices based on inputs such as prices of securities with comparable maturities and characteristics or based on inputs such as anticipated cash flows or collateral, spread over Treasuries, and other information and analysis. A significant portion of the Fund’s assets and liabilities are categorized as Level 2, as indicated in this report.
Indicative quotes from broker-dealers, adjusted for fluctuations in criteria such as credit spreads and interest rates, may be also used to value the Fund’s assets and liabilities, i.e. prices provided by a broker-dealer or other market participant who has not committed to trade at that price. Although indicative quotes are typically received from established market participants, the Fund may not have the transparency to view the underlying inputs which support the market quotations. Significant changes in an indicative quote would generally result in significant changes in the fair value of the security.
Certain fixed income securities are valued by obtaining a monthly indicative quote from a broker-dealer, adjusted for fluctuations in criteria such as credit spreads and interest rates.
The inputs or methodologies used for valuing securities are not necessarily an indication of the risk associated with investing in those securities. The suitability of the techniques and sources employed to determine fair valuation are regularly monitored and subject to change.
Note 5 – Investment Advisory Agreement and Other Agreements
Under the terms of an investment advisory contract, the Fund pays GI investment advisory fees calculated at an annualized rate of 0.89% of the average daily net assets of the Fund. A breakpoint of 5 basis points (0.05%) on average daily net assets above $5 billion will apply to the Fund’s advisory fees.
GI has contractually agreed to waive the management fee it receives from the Subsidiary in an amount equal to the management fee paid to GI by the Subsidiary. This undertaking will continue in effect for so long as the Fund invests in the Subsidiary, and may not be terminated by GI unless GI obtains the prior approval of the Fund’s Board for such termination. For the period ended March 29, 2018, the Fund waived $35,650 related to advisory fees in the Subsidiary.
GI engages external service providers to perform other necessary services for the Trust, such as audit and accounting related services, legal services, custody, printing and mailing, etc., on a pass-through basis. Such expenses are allocated to various Funds within the complex based on relative net assets.
The Fund has adopted Distribution Plans related to the offering of A-Class, C-Class and P-Class shares pursuant to Rule 12b-1 under the 1940 Act. The plans provide for payments at an annual rate of 0.25% of the average daily net assets of the Fund’s A-Class and P-Class shares, and 1.00% of the average daily net assets of the Fund’s C-Class shares.
| 92 | THE GUGGENHEIM FUNDS SEMI-ANNUAL REPORT | |
| NOTES TO CONSOLIDATED FINANCIAL STATEMENTS (Unaudited)(continued) |
Contractual expense limitation agreements for the following Fund provides that the total expenses be limited to a percentage of average net assets for each class of shares, exclusive of brokerage costs, dividends on securities sold short, expenses of other investment companies in which a Fund invests, interest, taxes, litigation, indemnification and extraordinary expenses. The limits are listed below:
| | Limit | Effective
Date | Contract
End Date |
| Macro Opportunities Fund - A-Class | 1.36% | 11/30/12 | 02/01/19 |
| Macro Opportunities Fund - C-Class | 2.11% | 11/30/12 | 02/01/19 |
| Macro Opportunities Fund - P-Class | 1.36% | 05/01/15 | 02/01/19 |
| Macro Opportunities Fund - Institutional Class | 0.95% | 11/30/12 | 02/01/19 |
GI is entitled to reimbursement by the Fund for fees waived or expenses reimbursed during any of the previous 36 months, beginning on the date of the expense limitation agreement, if on any day the estimated operating expenses are less than the indicated percentages. For purposes of this arrangement, GI is entitled to recoupment of previously waived fees or reimbursed expenses for 36 months from the date of the waiver or reimbursement by GI. At March 29, 2018, the amount of fees waived or expenses reimbursed that are subject to recoupment are presented in the following table:
| | | Expires
2018 | | | Expires
2019 | | | Expires
2020 | | | Expires
2021 | | | Total | |
| A-Class | | $ | 863,800 | | | $ | 990,093 | | | $ | 698,565 | | | $ | 212,220 | | | $ | 2,764,678 | |
| C-Class | | | 287,650 | | | | 353,801 | | | | 203,863 | | | | 104,597 | | | | 949,911 | |
| P-Class | | | — | | | | 42,500 | | | | 192,533 | | | | 70,687 | | | | 305,720 | |
| Institutional Class | | | 2,185,566 | | | | 3,487,376 | | | | 2,955,151 | | | | 2,640,412 | | | | 11,268,505 | |
For the period ended March 29, 2018, GI recouped $402,520 from Macro Opportunities Fund.
If the Fund invests in an affiliated fund, the investing Fund’s adviser has agreed to waive fees at the investing fund level. Fee waivers will be calculated at the investing Fund level without regard to any expense cap, if any, in effect for the investing Fund. Fees waived under this arrangement are not subject to reimbursement to GI. For the period ended March 29, 2018, the Fund waived $2,015,645 related to investments in affiliated funds.
For the period ended March 29, 2018, GFD retained sales charges of $252,432 relating to sales of A-Class shares of the Trust.
Certain trustees and officers of the Trust are also officers of GI and/or GFD. The Trust does not compensate its officers or trustees who are officers, directors and/or employees of GI or GFD.
MUFG Investor Services (US), LLC (“MUIS”) acts as the Trust’s administrator, transfer agent and accounting agent. As administrator, transfer agent and accounting agent, MUIS is responsible for maintaining the books and records of the Trust’s securities and cash. The Bank of New York Mellon Corp. (“BNY”) acts as the Trust’s custodian. As custodian, BNY is responsible for the custody of the Trust’s assets. For providing the aforementioned administrative and accounting
| | THE GUGGENHEIM FUNDS SEMI-ANNUAL REPORT | 93 |
| NOTES TO CONSOLIDATED FINANCIAL STATEMENTS (Unaudited)(continued) |
services, MUIS is entitled to receive a monthly fee equal to a percentage of the Fund’s average daily net assets and out of pocket expenses. For providing the aforementioned transfer agent and custodian services, MUIS and BNY are entitled to receive a monthly fee based on the number of transactions during the month and the number of accounts under management subject to certain minimum monthly fees and out of pocket expenses.
Note 6 – Reverse Repurchase Agreements
The Fund may enter into reverse repurchase agreements. Under a reverse repurchase agreement, a Fund sells securities and agrees to repurchase them at a particular price at a future date. In the event the buyer of securities under a reverse repurchase agreement files for bankruptcy or becomes insolvent, such buyer or its trustee or receiver may receive an extension of time to determine whether to enforce the Fund’s obligation to repurchase the securities, and the Fund’s use of the proceeds of the reverse repurchase agreement may effectively be restricted pending such decision.
For the period ended March 29, 2018, the Fund entered into reverse repurchase agreements:
| | | Number of Days
Outstanding | | Balance at
March 29,
2018 | | | Average Balance
Outstanding | | | Average
Interest Rate | |
| | | 95 | | $ | 1,561,867 | | | $ | 2,840,993 | | | | (0.36 | )% |
The following table presents reverse repurchase agreements that are subject to netting arrangements and offset in the Statement of Assets of Liabilities in conformity with U.S. GAAP:
| | | | | | | | | | | | Gross Amounts Not Offset
in the Statement of
Assets and Liabilities | | | | |
| Instrument | | Gross
Amounts of
Recognized
Liabilities | | | Gross
Amounts
Offset in the
Statement of
Assets and
Liabilities | | | Net Amount
of Liabilities
Presented on
the Statement
of Assets and
Liabilities | | | Financial
Instruments | | | Cash
Collateral
Pledged | | | Net
Amount | |
| Reverse repurchase agreements | | $ | 1,561,867 | | | $ | — | | | $ | 1,561,867 | | | $ | 1,561,867 | | | $ | — | | | $ | — | |
As of March 29, 2018, there was $1,561,867 in reverse repurchase agreements outstanding. Details of the reverse repurchase agreement by counterparty are as follows:
| Counterparty | | Interest
Rate | | Maturity
Dates | | Face
Value | |
| Barclays Bank plc | | (0.25)% | | Open Maturity | | $ | 1,561,867 | |
| 94 | THE GUGGENHEIM FUNDS SEMI-ANNUAL REPORT | |
| NOTES TO CONSOLIDATED FINANCIAL STATEMENTS (Unaudited)(continued) |
The following is a summary of the remaining contractual maturities of the reverse repurchase agreements outstanding as of period-end, aggregated by asset class of the related collateral pledged by the Fund:
| | | Overnight and
Continuous | | | Up to
30 days | | | 31-90 days | | | Greater than
90 days | | | Total | |
| Corporate Bonds | | $ | 1,561,867 | | | $ | — | | | $ | — | | | $ | — | | | $ | 1,561,867 | |
| Total Borrowings | | $ | 1,561,867 | | | $ | — | | | $ | — | | | $ | — | | | $ | 1,561,867 | |
| Gross amount of recognized liabilities for reverse repurchase agreements | | $ | 1,561,867 | | | $ | — | | | $ | — | | | $ | — | | | $ | 1,561,867 | |
Note 7 – Federal Income Tax Information
The Fund intends to comply with the provisions of Subchapter M of the Internal Revenue Code applicable to regulated investment companies and will distribute substantially all taxable net investment income and capital gains sufficient to relieve the Fund from all, or substantially all, federal income, excise and state income taxes. Therefore, no provision for federal or state income tax is required.
Tax positions taken or expected to be taken in the course of preparing the Fund’s tax returns are evaluated to determine whether the tax positions are “more-likely-than-not” of being sustained by the applicable tax authority. Tax positions not deemed to meet the more-likely-than-not threshold would be recorded as a tax benefit or expense in the current year. Management has analyzed the Fund’s tax positions taken, or expected to be taken, on federal income tax returns for all open tax years, and has concluded that no provision for income tax is required in the Fund’s financial statements. The Fund’s federal tax returns are subject to examination by the Internal Revenue Service for a period of three years after they are filed.
| | THE GUGGENHEIM FUNDS SEMI-ANNUAL REPORT | 95 |
| NOTES TO CONSOLIDATED FINANCIAL STATEMENTS (Unaudited)(continued) |
At March 29, 2018, the cost of securities for federal income tax purposes, the aggregate gross unrealized gain for all securities for which there was an excess of value over tax cost, and the aggregate gross unrealized loss for all securities for which there was an excess of tax cost over value were as follows:
| | | Tax
Cost | | | Tax
Unrealized
Gain | | | Tax
Unrealized
Loss | | | Net
Unrealized
Loss | |
| | | $ | 6,999,987,967 | | | $ | 114,547,164 | | | $ | (118,035,630 | ) | | $ | (3,488,466 | ) |
Note 8 – Securities Transactions
For the period ended March 29, 2018, the cost of purchases and proceeds from sales of investment securities, excluding government securities, short-term investments and derivatives, were as follows:
| | | Purchases | | | Sales | |
| | | $ | 2,773,998,805 | | | $ | 2,221,400,489 | |
The Fund is permitted to purchase or sell securities from or to certain affiliated funds under specified conditions outlined in procedures adopted by the Board. The procedures have been designed to ensure that any purchase or sale of securities by a Fund from or to another fund or portfolio that is or could be considered an affiliate by virtue of having a common investment adviser (or affiliated investment advisers), common Trustees and/or common officers complies with Rule 17a-7 of the 1940 Act. Further, as defined under these procedures, each transaction is effected at the current market price to save costs, where permissible. For the period ended March 29, 2018, the Fund engaged in purchases and sales of securities, pursuant to Rule 17a-7 of the 1940 Act, as follows:
| | | Purchases | | | Sales | | | Realized
Gain | |
| | | $ | 8,929,298 | | | $ | 14,745,067 | | | $ | 217,123 | |
| 96 | THE GUGGENHEIM FUNDS SEMI-ANNUAL REPORT | |
| NOTES TO CONSOLIDATED FINANCIAL STATEMENTS (Unaudited)(continued) |
Note 9 – Unfunded Loan Commitments
Pursuant to the terms of certain loan agreements, the Fund held unfunded loan commitments as of March 29, 2018. The Fund is obligated to fund these loan commitments at the borrower’s discretion.
The unfunded loan commitments as of March 29, 2018, were as follows:
| Borrower | | Maturity
Date | | Face
Amount** | | | Value | |
| Acosta, Inc. | | 09/26/19 | | | 3,066,667 | | | $ | 503,945 | |
| Advantage Sales & Marketing LLC | | 07/25/19 | | | 1,500,000 | | | | 50,874 | |
| American Stock Transfer & Trust | | 06/26/18 | | | 400,000 | | | | 2,199 | |
| BBB Industries, LLC | | 11/04/19 | | | 1,075,000 | | | | 47,016 | |
| Boyne USA, Inc. | | 03/13/19 | | | 3,300,000 | | | | — | * |
| Bullhorn, Inc. | | 11/21/22 | | | 786,685 | | | | 26,791 | |
| Ceva Group Plc (United Kingdom) | | 03/19/19 | | | 718,461 | | | | 28,421 | |
| Ceva Logistics Holdings BV (Dutch) | | 03/19/19 | | | 1,538 | | | | 61 | |
| DG Investment Intermediate Holdings 2, Inc. | | 02/03/25 | | | 140,323 | | | | — | * |
| Dominion Web Solutions LLC | | 06/15/23 | | | 461,538 | | | | — | * |
| Dubois Chemicals, Inc. | | 03/15/24 | | | 300,000 | | | | — | * |
| EG Finco Ltd. | | 02/07/25 | | | EUR 840,979 | | | | — | * |
| Epicor Software | | 06/01/20 | | | 2,000,000 | | | | 107,788 | |
| Fortis Solutions Group LLC | | 12/15/23 | | | 291,757 | | | | 54,070 | |
| Galls LLC | | 01/31/25 | | | 2,047,346 | | | | 65,176 | |
| Hillman Group, Inc. | | 06/28/19 | | | 550,000 | | | | 15,125 | |
| ICP Industrial, Inc. | | 11/03/23 | | | 520,686 | | | | 2,394 | |
| ICSH Parent, Inc. | | 04/29/24 | | | 172,789 | | | | 216 | |
| Learning Care Group (US), Inc. | | 05/05/19 | | | 500,000 | | | | 27,073 | |
| Lytx, Inc. | | 08/31/22 | | | 363,158 | | | | 40,174 | |
| Mavis Tire Express Services Corp. | | 02/28/25 | | | 1,828,469 | | | | — | * |
| MRI Software LLC | | 06/30/23 | | | 240,750 | | | | 6,306 | |
| National Technical Systems | | 06/12/21 | | | 250,000 | | | | 16,688 | |
| Recess Holdings, Inc. | | 09/30/24 | | | 95,238 | | | | 221 | |
| Signode Industrial Group US, Inc. | | 05/01/19 | | | 3,400,000 | | | | 23,092 | |
| Solera LLC | | 03/03/21 | | | 8,100,000 | | | | 667,626 | |
| Wencor Group | | 06/19/19 | | | 300,000 | | | | 8,601 | |
| | | | | | | | | $ | 1,693,857 | |
| * | Security has a market value of $0. |
| ** | The face amount is denominated in U.S. dollars unless otherwise indicated. |
| | THE GUGGENHEIM FUNDS SEMI-ANNUAL REPORT | 97 |
| NOTES TO CONSOLIDATED FINANCIAL STATEMENTS (Unaudited)(continued) |
Note 10 – Restricted Securities
The securities below are considered illiquid and restricted under guidelines established by the Board:
Restricted
Securities | | Acquisition
Date | | Cost | | | Value | |
| Airplanes Pass Through Trust | | | | | | | | | | |
| 2001-1A, 2.33% (1 Month USD LIBOR + 0.55%) due 03/15/192,4 | | 01/18/12 | | $ | 1,691,717 | | | $ | 94,387 | |
| Banco Bradesco SA | | | | | | | | | | |
| 2014-1, 5.43% due 03/12/26 | | 11/19/14 | | | 2,654,360 | | | | 2,660,980 | |
| Capmark Military Housing Trust | | | | | | | | | | |
| 2007-AET2, 6.06% due 10/10/52 | | 04/23/15 | | | 5,792,736 | | | | 5,925,584 | |
| Copper River CLO Ltd. | | | | | | | | | | |
| 2007-1A, due 01/20/215 | | 05/09/14 | | | 4,448,681 | | | | 1,037,495 | |
| Customers Bank | | | | | | | | | | |
| 6.13% due 06/26/293 | | 06/24/14 | | | 4,500,000 | | | | 4,671,851 | |
| Epicor Software Corp. | | | | | | | | | | |
10.56% (3 Month USD
LIBOR + 8.25%) due 06/21/231,2 | | 05/21/15 | | | 1,545,275 | | | | 1,580,000 | |
| GMAC Commercial Mortgage Asset Corp. | | | | | | | | | | |
| 2004-POKA, 6.36% due 09/10/44 | | 05/11/17 | | | 10,060,562 | | | | 9,637,542 | |
| Highland Park CDO I Ltd. | | | | | | | | | | |
2006-1A, 2.34% (3 Month USD
LIBOR + 0.40%) due 11/25/512 | | 04/14/15 | | | 2,356,119 | | | | 3,038,511 | |
| Offutt AFB America First Community LLC | | | | | | | | | | |
| 5.46% due 09/01/50 | | 02/21/17 | | | 5,444,930 | | | | 5,760,754 | |
| Princess Juliana International Airport | | | | | | | | | | |
| Operating Company N.V. | | | | | | | | | | |
| 5.50% due 12/20/27 | | 12/17/12 | | | 1,581,474 | | | | 1,475,924 | |
| Schahin II Finance Co. SPV Ltd. | | | | | | | | | | |
| 5.88% due 09/25/224 | | 03/21/12 | | | 4,838,890 | | | | 925,782 | |
| Turbine Engines Securitization Ltd. | | | | | | | | | | |
| 2013-1A, 5.13% due 12/13/48 | | 11/27/13 | | | 2,292,604 | | | | 2,323,515 | |
| Turbine Engines Securitization Ltd. | | | | | | | | | | |
| 2013-1A, 6.38% due 12/13/48 | | 11/27/13 | | | 1,615,269 | | | | 1,549,253 | |
| | | | | $ | 48,822,617 | | | $ | 40,681,578 | |
| 1 | Security was fair valued by the Valuation Committee at March 29, 2018. The total market value of illiquid and restricted securities which were fair valued amounts to $1,580,000, (cost $1,545,275) or less than 0.1% of total net assets. |
| 2 | Variable rate security. Rate indicated is the rate effective at March 29, 2018. In some instances, the underlying reference rate shown was below the minimum rate earned by the security or has been adjusted by a predetermined factor. The settlement status of a position may also impact the effective rate indicated. In instances where multiple underlying reference rates and spread amounts are shown, the effective rate is based on a weighted average. |
| 3 | Security has a fixed rate coupon which will convert to a floating or variable rate coupon on a future date. |
| 4 | Security is in default of interest and/or principal obligations. |
| 5 | Security has no stated coupon. However, it is expected to receive residual cash flow payments on defined deal dates. |
| 98 | THE GUGGENHEIM FUNDS SEMI-ANNUAL REPORT | |
| NOTES TO CONSOLIDATED FINANCIAL STATEMENTS (Unaudited)(concluded) |
Note 11 – Line of Credit
The Trust, with the exception of certain affiliated funds, secured a 364-day committed, $1,000,000,000 line of credit from Citibank, N.A., which was in place through October 6, 2017, at which time the line of credit was renewed with an increased commitment amount of $1,065,000,000. A Fund may draw (borrow) from the line of credit as a temporary measure for emergency purposes, to facilitate redemption requests, or for other short-term liquidity purposes consistent with the Fund’s investment objective and program. For example, it may be advantageous for the Fund to borrow money rather than sell existing portfolio positions to meet redemption requests. Fees related to borrowings, if any, vary under this arrangement between the greater of Citibank’s “base rate”, LIBOR plus 1%, or the federal funds rate (1.68% at March 29, 2018), plus 1/2 of 1%. The Funds that participate in the line of credit paid upfront costs of $982,952 to renew the line of credit.
The commitment fee that may be paid by the Fund is at an annualized rate of 0.15% of the average daily amount of its unused commitment amount. The Fund did not have any borrowings under this agreement as of and for the period ended March 29, 2018.
The allocated commitment fee amount for the Fund is referenced in the Consolidated Statement of Operations under “Line of credit fees” and the effect on the expense ratio is included in the Financial Highlights.
| | THE GUGGENHEIM FUNDS SEMI-ANNUAL REPORT | 99 |
| OTHER INFORMATION (Unaudited) |
Proxy Voting Information
A description of the policies and procedures that the Trust uses to determine how to vote proxies relating to securities held in the Funds’ portfolios is available, without charge and upon request, by calling 800.820.0888. This information is also available from the EDGAR database on the SEC’s website at https://www.sec.gov.
Information regarding how the Funds voted proxies relating to portfolio securities during the most recent 12-month period ended June 30 is available without charge, upon request, by calling 800.820.0888. This information is also available from the EDGAR database on the SEC’s website at https://www.sec.gov.
Sector Classification
Information in the “Schedule of Investments” is categorized by sectors using sector-level Classifications defined by the Bloomberg Industry Classification System, a widely recognized industry classification system provider. Each Fund’s registration statement has investment policies relating to concentration in specific sectors/industries. For purposes of these investment policies, the Funds usually classify sectors/industries based on industry-level Classifications used by widely recognized industry classification system providers such as Bloomberg Industry Classification System, Global Industry Classification Standards and Barclays Global Classification Scheme.
Quarterly Portfolio Schedules Information
The Trust files its complete schedule of portfolio holdings with the SEC for the first and third quarters of each fiscal year on Form N-Q; which are available on the SEC’s website at https://www.sec.gov. The Funds’ Forms N-Q may be reviewed and copied at the SEC’s Public Reference Room in Washington, DC, and that information on the operation of the Public Reference Room may be obtained by calling 800-SEC-0330. Copies of the portfolio holdings are also available to shareholders, without charge and upon request, by calling 800.820.0888.
| 100 | THE GUGGENHEIM FUNDS SEMI-ANNUAL REPORT | |
| INFORMATION ON BOARD OF TRUSTEES AND OFFICERS (Unaudited) |
Name, Address*
and Year of Birth | Position(s)
Held with
the Trust | Term of Office
and Length of
Time Served** | Principal Occupation(s)
During Past Five Years | Number of
Portfolios
in Fund
Complex
Overseen | Other Directorships
Held by Trustees |
| INDEPENDENT TRUSTEES | | | |
Randall C. Barnes (1951) | Trustee | Since 2014 | Current: Private Investor (2001-present). Former: Senior Vice President and Treasurer, PepsiCo, Inc. (1993-1997); President, Pizza Hut International (1991-1993); Senior Vice President, Strategic Planning and New Business Development, PepsiCo, Inc. (1987-1990). | 51 | Current: Trustee, Purpose Investments Funds (2014-Present). |
Donald A.
Chubb, Jr. (1946) | Trustee and Chairman of the Valuation Oversight Committee | Since 1994 | Current: Retired. Former: Business broker and manager of commercial real estate, Griffith & Blair, Inc. (1997-2017). | 48 | Former: Midland Care, Inc. (2011-2016). |
Jerry B. Farley (1946) | Trustee and Chairman of the Audit Committee | Since 2005 | Current: President, Washburn University (1997-present). | 48 | Current: Westar Energy, Inc. (2004-present); CoreFirst Bank & Trust (2000-present). |
Roman
Friedrich III (1946) | Trustee and Chairman of the Contracts Review Committee | Since 2014 | Current: Founder and Managing Partner, Roman Friedrich & Company (1998-present). Former: Senior Managing Director, MLV & Co. LLC (2010-2011). | 48 | Current: Zincore Metals, Inc. (2009-present). Former: Axiom Gold and Silver Corp. (2011-2012). |
| | THE GUGGENHEIM FUNDS SEMI-ANNUAL REPORT | 101 |
| INFORMATION ON BOARD OF TRUSTEES AND OFFICERS (Unaudited)(continued) |
Name, Address*
and Year of Birth | Position(s)
Held with
the Trust | Term of Office
and Length of
Time Served** | Principal Occupation(s)
During Past Five Years | Number of
Portfolios
in Fund
Complex
Overseen | Other Directorships
Held by Trustees |
| INDEPENDENT TRUSTEES - continued | | |
Ronald A. Nyberg (1953) | Trustee and Chairman of the Nominating and Governance Committee | Since 2014 | Current: Partner, Momkus McCluskey LLC (2016-present). Former: Partner, Nyberg & Cassioppi, LLC (2000-2016); Executive Vice President, General Counsel, and Corporate Secretary, Van Kampen Investments (1982-1999). | 51 | Current: PPM Funds (February 2018-present); Edward-Elmhurst Healthcare System (2012-present); Western Asset Inflation-Linked Opportunities & Income Fund (2004-present); Western Asset Inflation-Linked Income Fund (2003-present). |
Maynard F. Oliverius (1943) | Trustee | Since 1998 | Current: Retired. Former: President and CEO, Stormont-Vail HealthCare (1996-2012). | 48 | Current: Robert J. Dole Institute of Politics (2016-present); Stormont-Vail Foundation (2013-present); University of Minnesota MHA Alumni Philanthropy Committee (2009-present); Fort Hays State University Foundation (1999-present). Former: Topeka Community Foundation (2009-2014). |
| 102 | THE GUGGENHEIM FUNDS SEMI-ANNUAL REPORT | |
| INFORMATION ON BOARD OF TRUSTEES AND OFFICERS (Unaudited)(continued) |
Name, Address*
and Year of Birth | Position(s)
Held with
the Trust | Term of Office
and Length of
Time Served** | Principal Occupation(s)
During Past Five Years | Number of
Portfolios
in Fund
Complex
Overseen | Other Directorships
Held by Trustees |
| INDEPENDENT TRUSTEES - concluded | | |
Ronald E.
Toupin, Jr. (1958) | Trustee and Chairman of the Board | Since 2014 | Current: Portfolio Consultant (2010-present); Member, Governing Council (2003-present) and Executive Committee (2016-present), Independent Directors Council. Former: Vice President, Manager and Portfolio Manager, Nuveen Asset Management (1998-1999); Vice President, Nuveen Investment Advisory Corp. (1992-1999); Vice President and Manager, Nuveen Unit Investment Trusts (1991-1999); and Assistant Vice President and Portfolio Manager, Nuveen Unit Investment Trusts (1988-1999), each of John Nuveen & Co., Inc. (1982-1999). | 48 | Current: Western Asset Inflation-Linked Opportunities & Income Fund (2004-present); Western Asset Inflation-Linked Income Fund (2003-present). Former: Bennett Group of Funds (2011-2013). |
| | THE GUGGENHEIM FUNDS SEMI-ANNUAL REPORT | 103 |
| INFORMATION ON BOARD OF TRUSTEES AND OFFICERS (Unaudited)(continued) |
Name, Address*
and Year of Birth | Position(s)
Held with
the Trust | Term of Office
and Length of
Time Served** | Principal Occupation(s)
During Past Five Years | Number of
Portfolios
in Fund
Complex
Overseen | Other Directorships
Held by Trustees |
| INTERESTED TRUSTEE | |
Amy J. Lee***
(1961) | Trustee, Vice President and Chief Legal Officer | Since February 2018 (Trustee) Since 2014 (Chief Legal Officer) Since 2007 (Vice President) | Current: Interested Trustee, certain other funds in the Fund Complex (February 2018-present); President, certain other funds in the Fund Complex (2017-present); Chief Legal Officer, certain other funds in the Fund Complex (2014-present); Vice President, certain other funds in the Fund Complex (2007-present); Senior Managing Director, Guggenheim Investments (2012-present). Former: President and Chief Executive Officer (2017- February 2018); Vice President, Associate General Counsel and Assistant Secretary, Security Benefit Life Insurance Company and Security Benefit Corporation (2004-2012). | 158 | None. |
| * | The business address of each Trustee is c/o Guggenheim Investments, 227 West Monroe Street, Chicago, Illinois 60606. |
| ** | Each Trustee serves an indefinite term, until his or her successor is elected and qualified. Time served includes time served in the respective position for the Predecessor Corporation. |
| *** | This Trustee is deemed to be an "interested person" of the Funds under the 1940 Act by reason of her position with the Fund’s Investment Manager and/or the parent of the Investment Manager. |
| 104 | THE GUGGENHEIM FUNDS SEMI-ANNUAL REPORT | |
| INFORMATION ON BOARD OF TRUSTEES AND OFFICERS (Unaudited)(continued) |
Name, Address*
and Year of Birth | Position(s)
Held with
the Trust | Term of Office
and Length of
Time Served** | Principal Occupations
During Past Five Years |
| OFFICERS | | | |
Brian E. Binder
(1972) | President and Chief Executive Officer | Since February 2018 | Current: President and Chief Executive Officer, certain other funds in the Fund Complex (February 2018-present); President and Chief Executive Officer, Guggenheim Funds Investment Advisors, LLC and Security Investors, LLC (January 2018-present); Senior Managing Director and Chief Administrative Officer, Guggenheim Investments (January 2018-present). Former: Managing Director and President, Deutsche Funds, and Head of US Product, Trading and Fund Administration, Deutsche Asset Management (2013-January 2018); Managing Director, Head of Business Management and Consulting, Invesco Ltd. (2010-2012). |
James M. Howley (1972) | Assistant Treasurer | Since 2014 | Current: Managing Director, Guggenheim Investments (2004-present); Assistant Treasurer, certain other funds in the Fund Complex (2006-present). Former: Manager, Mutual Fund Administration of Van Kampen Investments, Inc. (1996-2004). |
Keith D. Kemp (1960) | Assistant Treasurer | Since 2016 | Current: Treasurer and Assistant Treasurer, certain other funds in the Fund Complex (2010-present); Managing Director of Guggenheim Investments (2015-present). Former: Chief Financial Officer, Guggenheim Specialized Products, LLC (2016-April 2018); Managing Director and Director, Transparent Value, LLC (2010-2016); Director, Guggenheim Partners Investment Management, LLC (2010-2015); Chief Operating Officer, Macquarie Capital Investment Management (2007-2009). |
Mark E. Mathiasen (1978) | Secretary | Since 2014 | Current: Secretary, certain other funds in the Fund Complex (2007-present); Managing Director, Guggenheim Investments (2007-present). |
Glenn McWhinnie (1969) | Assistant Treasurer | Since 2016 | Current: Vice President, Guggenheim Investments (2009-present); Assistant Treasurer, certain other funds in the Fund Complex (2016-present). |
| | THE GUGGENHEIM FUNDS SEMI-ANNUAL REPORT | 105 |
| INFORMATION ON BOARD OF TRUSTEES AND OFFICERS (Unaudited)(continued) |
Name, Address*
and Year of Birth | Position(s)
Held with
the Trust | Term of Office
and Length of
Time Served** | Principal Occupations
During Past Five Years |
| OFFICERS - continued | |
Michael P. Megaris (1984) | Assistant Secretary | Since 2014 | Current: Assistant Secretary, certain other funds in the Fund Complex (2014-present); Director, Guggenheim Investments (2012-present). |
Elisabeth Miller (1968) | Chief Compliance Officer | Since 2012 | Current: CCO, certain other funds in the Fund Complex (2012-present); Managing Director, Guggenheim Investments (2012-present); Vice President, Guggenheim Funds Distributors, LLC (2014-present). Former: CCO, Security Investors, LLC (2012-2018); CCO, Guggenheim Funds Investment Advisors, LLC (2012-2018); CCO, Guggenheim Distributors, LLC (2009-2014); Senior Manager, Security Investors, LLC (2004-2009); Senior Manager, Guggenheim Distributors, LLC (2004-2009). |
Adam J. Nelson (1979) | Assistant Treasurer | Since 2015 | Current: Vice President, Guggenheim Investments (2015-present); Assistant Treasurer, certain other funds in the Fund Complex (2015-present). Former: Assistant Vice President and Fund Administration Director, State Street Corporation (2013-2015); Fund Administration Assistant Director, State Street (2011-2013); Fund Administration Manager, State Street (2009-2011). |
Kimberly J. Scott (1974) | Assistant Treasurer | Since 2014 | Current: Director, Guggenheim Investments (2012-present); Assistant Treasurer, certain other funds in the Fund Complex (2012-present). Former: Financial Reporting Manager, Invesco, Ltd. (2010-2011); Vice President/Assistant Treasurer, Mutual Fund Administration for Van Kampen Investments, Inc./Morgan Stanley Investment Management (2009-2010); Manager of Mutual Fund Administration, Van Kampen Investments, Inc./Morgan Stanley Investment Management (2005-2009). |
Bryan Stone (1979) | Vice President | Since 2014 | Current: Vice President, certain other funds in the Fund Complex (2014-present); Managing Director, Guggenheim Investments (2013-present). Former: Senior Vice President, Neuberger Berman Group LLC (2009-2013); Vice President, Morgan Stanley (2002-2009). |
| 106 | THE GUGGENHEIM FUNDS SEMI-ANNUAL REPORT | |
| INFORMATION ON BOARD OF TRUSTEES AND OFFICERS (Unaudited)(concluded) |
Name, Address*
and Year of Birth | Position(s)
Held with
the Trust | Term of Office
and Length of
Time Served** | Principal Occupations
During Past Five Years |
| OFFICERS - concluded | |
John L. Sullivan (1955) | Chief Financial Officer, Chief Accounting Officer and Treasurer | Since 2014 | Current: CFO, Chief Accounting Officer and Treasurer, certain other funds in the Fund Complex (2010-present); Senior Managing Director, Guggenheim Investments (2010-present). Former: Managing Director and CCO, each of the funds in the Van Kampen Investments fund complex (2004-2010); Managing Director and Head of Fund Accounting and Administration, Morgan Stanley Investment Management (2002-2004); CFO and Treasurer, Van Kampen Funds (1996-2004). |
Jon Szafran (1989) | Assistant Treasurer | Since 2017 | Current: Vice President, Guggenheim Investments (2017-present); Assistant Treasurer, certain other funds in the Fund Complex (2017-present). Former: Assistant Treasurer of Henderson Global Funds and Manager of US Fund Administration, Henderson Global Investors (North America) Inc. (“HGINA”), (2017); Senior Analyst of US Fund Administration, HGINA (2014-2017); Senior Associate of Fund Administration, Cortland Capital Market Services, LLC (2013-2014); Experienced Associate, PricewaterhouseCoopers LLP (2012-2013). |
| * | The business address of each officer is c/o Guggenheim Investments, 227 West Monroe Street, Chicago, Illinois 60606. |
| ** | Each officer serves an indefinite term, until his or her successor is duly elected and qualified. Time served includes time served in the respective position for the Predecessor Corporation. |
| | THE GUGGENHEIM FUNDS SEMI-ANNUAL REPORT | 107 |
| GUGGENHEIM INVESTMENTS PRIVACY NOTICE (Unaudited) |
Who We Are
This Privacy Notice describes the data protection practices of Guggenheim Investments. Guggenheim Investments as used herein refers to the affiliated investment management businesses of Guggenheim Partners, LLC: Guggenheim Funds Investment Advisors, LLC, Guggenheim Partners Investment Management, LLC, Guggenheim Funds Distributors, LLC, Security Investors, LLC, Guggenheim Investment Advisors (Europe) Limited, Guggenheim Real Estate, LLC, GS Gamma Advisors, LLC, Guggenheim Partners India Management, LLC, Guggenheim Partners Europe Limited, as well as the funds in the Guggenheim Funds complex (the “Funds”) (“Guggenheim Investments,” “we,” “us,” or “our”).
Guggenheim Partners Investment Management Holdings, LLC, located at 330 Madison Avenue, New York, New York 10017 is the data controller for your information. The Affiliates who are also controllers of certain of your information are: Guggenheim Investment Advisors (Europe) Limited, Guggenheim Partners Europe Limited, Guggenheim Partners, LLC, Guggenheim Funds Investment Advisors, LLC, Guggenheim Partners Investment Management, LLC, Guggenheim Funds Distributors, LLC and Security Investors, LLC, as well as the Funds.
Our Commitment to You
Guggenheim Investments considers your privacy our utmost concern. When you become our client or investor, you entrust us with not only your hard-earned money but also with your personal and financial information. Because we have access to your private information, we hold ourselves to the highest standards in its safekeeping and use. We strictly limit how we share your information with others, whether you are a current or former Guggenheim Investments client or investor.
The Information We Collect About You
We collect certain nonpublic personal information about you from information you provide on applications, other forms, our website, and/or from third parties including investment advisors. This information includes Social Security or other tax identification number, assets, income, tax information, retirement and estate plan information, transaction history, account balance, payment history, bank account information, marital status, family relationships, information that we collect on our website through the use of “cookies,” and other personal information that you or others provide to us. We may also collect such information through your inquiries by mail, e-mail or telephone. We may also collect customer due diligence information, as required by applicable law and regulation, through third party service providers.
How We Handle Your Personal Information
The legal basis for using your information as set out in this Privacy Notice is as follows: (a) use of your personal data is necessary to perform our obligations under any contract with you (such as a contract for us to provide financial services to you); or (b) where use of your personal data is not necessary for performance of a contract, use of your personal data is necessary for our
| 108 | THE GUGGENHEIM FUNDS SEMI-ANNUAL REPORT | |
| GUGGENHEIM INVESTMENTS PRIVACY NOTICE (Unaudited)(continued) |
legitimate interests or the legitimate interests of others (for example, to enforce the legal terms governing our services, operate and market our website and other services we offer, ensure safe environments for our personnel and others, make and receive payments, prevent fraud and to know the customer to whom we are providing the services). Some processing is done to comply with applicable law.
In addition to the specific uses described above, we also use your information in the following manner:
| | ● | We use your information in connection with servicing your accounts. |
| | ● | We use information to respond to your requests or questions. For example, we might use your information to respond to your customer feedback. |
| | ● | We use information to improve our products and services. We may use your information to make our website and products better. We may use your information to customize your experience with us. |
| | ● | We use information for security purposes. We may use your information to protect our company and our customers. |
| | ● | We use information to communicate with you. For example, we will communicate with you about your account or our relationship. We may contact you about your feedback. We might also contact you about this Privacy Notice. We may also enroll you in our email newsletter. |
| | ● | We use information as otherwise permitted by law, as we may notify you. |
| | ● | Aggregate/Anonymous Data. We may aggregate and/or anonymize any information collected through the website so that such information can no longer be linked to you or your device (“Aggregate/Anonymous Information”). We may use Aggregate/Anonymous Information for any purpose, including without limitation for research and marketing purposes, and may also share such data with any third parties, including advertisers, promotional partners, and sponsors. |
We do not sell information about current or former clients or their accounts to third parties. Nor do we share this information, except when necessary to complete transactions at your request, to make you aware of investment products and services that we or our affiliates offer, or as permitted or required by law.
We provide information about you to companies and individuals not affiliated with Guggenheim Investments to complete certain transactions or account changes, or to perform services for us related to your account. For example, if you ask to transfer assets from another financial institution to Guggenheim Investments, we must provide certain information about you to that company to complete the transaction. We provide the third party with only the information necessary to carry out its responsibilities and only for that purpose. And we require these third
| | THE GUGGENHEIM FUNDS SEMI-ANNUAL REPORT | 109 |
| GUGGENHEIM INVESTMENTS PRIVACY NOTICE (Unaudited)(continued) |
parties to treat your private information with the same high degree of confidentiality that we do. To alert you to other Guggenheim Investments products and services, we share your information within our family of affiliated companies. You may limit our sharing with affiliated companies as set out below. We may also share information with any successor to all or part of our business, or in connection with steps leading up to a merger or acquisition. For example, if part of our business was sold we may give customer information as part of that transaction. We may also share information about you with your consent.
We will release information about you if you direct us to do so, if we are compelled by law to do so, or in other circumstances as permitted by law (for example, to protect your account from fraud).
If you close your account(s) or become an inactive client or investor, we will continue to adhere to the privacy policies and practices described in this notice.
Opt-Out Provisions and Your Data Choices
The law allows you to “opt out” of certain kinds of information sharing with third parties. We do not share personal information about you with any third parties that triggers this opt-out right. This means YOU ARE ALREADY OPTED OUT.
When you are no longer our client or investor, we continue to share your information as described in this notice, and you may contact us at any time to limit our sharing by sending an email to CorporateDataPrivacy@GuggenheimPartners.com.
European Union Data Subjects and certain others: In addition to the choices set forth above, residents of the European Union and certain other jurisdictions have certain rights to (1) request access to or rectification or deletion of information we collect about them, (2) request a restriction on the processing of their information, (3) object to the processing of their information, or (4) request the portability of certain information. To exercise these or other rights, please contact us using the contact information below. We will consider all requests and provide our response within the time period stated by applicable law. Please note, however, that certain information may be exempt from such requests in some circumstances, which may include if we need to keep processing your information for our legitimate interests or to comply with a legal obligation. We may request you provide us with information necessary to confirm your identity before responding to your request.
Residents of France and certain other jurisdictions may also provide us with instructions regarding the manner in which we may continue to store, erase and share your information after your death, and where applicable, the person you have designated to exercise these rights after your death.
How We Protect Privacy Online
We take steps to protect your privacy when you use our web site – www.guggenheiminvestments.com – by using secure forms of online communication, including encryption technology, Secure Socket Layer (SSL) protocol, firewalls and user names and passwords. These safeguards vary based on the
| 110 | THE GUGGENHEIM FUNDS SEMI-ANNUAL REPORT | |
| GUGGENHEIM INVESTMENTS PRIVACY NOTICE (Unaudited)(concluded) |
sensitivity of the information that we collect and store. However, we cannot and do not guarantee that these measures will prevent every unauthorized attempt to access, use, or disclose your information since despite our efforts, no Internet and/or other electronic transmissions can be completely secure. Our web site uses “http cookies”—tiny pieces of information that we ask your browser to store. We use cookies for session management and security features on the Guggenheim Investments web site. We do not use them to pull data from your hard drive, to learn your e-mail address, or to view data in cookies created by other web sites. We will not share the information in our cookies or give others access to it. See the legal information area on our web site for more details about web site security and privacy features.
How We Safeguard Your Personal Information and Data Retention
We restrict access to nonpublic personal information about you to our employees and in some cases to third parties (for example, the service providers described above) as permitted by law. We maintain strict physical, electronic and procedural safeguards that comply with federal standards to guard your nonpublic personal information.
We keep your information for no longer than necessary for the purposes for which it is processed. The length of time for which we retain information depends on the purposes for which we collected and use it and/or as required to comply with applicable laws. Information may persist in copies made for backup and business continuity purposes for additional time.
International Visitors
If you are not a resident of the United States, please be aware that your information may be transferred to, stored and processed in the United States where our servers are located and our databases are operated. The data protection and other laws of the United States and other countries might not be as comprehensive as those in your country.
In such cases, we ensure that a legal basis for such a transfer exists and that adequate protection is provided as required by applicable law, for example, by using standard contractual clauses or by transferring your data to a jurisdiction that has obtained an adequacy finding. Individuals whose data may be transferred on the basis of standard contractual clauses may contact us as described below.
We’ll Keep You Informed
If you have any questions or concerns about how we treat your personal data, we encourage you to consult with us first. You may also contact the relevant supervisory authority.
We reserve the right to modify this policy at any time and will inform you promptly of material changes. You may access our privacy policy from our web site at www.guggenheiminvestments.com. Should you have any questions regarding our privacy policy, contact us by email at CorporateDataPrivacy@GuggenheimPartners.com.
| | THE GUGGENHEIM FUNDS SEMI-ANNUAL REPORT | 111 |
This page intentionally left blank.
This page intentionally left blank.
3.29.2018
Guggenheim Funds Semi-Annual Report
| |
| Guggenheim Floating Rate Strategies Fund | | |
| GuggenheimInvestments.com | FR-SEMI-0318x0918 |

| DEAR SHAREHOLDER | 2 |
| ECONOMIC AND MARKET OVERVIEW | 4 |
| ABOUT SHAREHOLDERS’ FUND EXPENSES | 6 |
| FLOATING RATE STRATEGIES FUND | 9 |
| NOTES TO FINANCIAL STATEMENTS | 43 |
| OTHER INFORMATION | 59 |
| INFORMATION ON BOARD OF TRUSTEES AND OFFICERS | 60 |
| GUGGENHEIM INVESTMENTS PRIVACY NOTICE | 67 |
| | THE GUGGENHEIM FUNDS SEMI-ANNUAL REPORT | 1 |
Dear Shareholder:
Guggenheim Partners Investment Management, LLC (the “Investment Adviser”), is pleased to present the shareholder report for Guggenheim Floating Rate Strategies Fund (the “Fund”) for the semi-annual fiscal period ended March 29, 2018.
The Investment Adviser is part of Guggenheim Investments, which represents the investment management businesses of Guggenheim Partners, LLC (“Guggenheim”), a global, diversified financial services firm.
Guggenheim Funds Distributors, LLC is the distributor of the Funds. Guggenheim Funds Distributors, LLC is also affiliated with Guggenheim and the Investment Adviser.
We encourage you to read the Economic and Market Overview section of the report, which follows this letter.
We are committed to providing innovative investment solutions and appreciate the trust you place in us.
Sincerely,
Guggenheim Partners Investment Management, LLC
April 30, 2018
Read a prospectus and summary prospectus (if available) carefully before investing. It contains the investment objectives, risks, charges, expenses and other information, which should be considered carefully before investing. Obtain a prospectus and summary prospectus (if available) at guggenheiminvestments.com or call 800.820.0888.
This material is not intended as a recommendation or as investment advice of any kind, including in connection with rollovers, transfers, and distributions. Such material is not provided in a fiduciary capacity, may not be relied upon for or in connection with the making of investment decisions, and does not constitute a solicitation of an offer to buy or sell securities. All content has been provided for informational or educational purposes only and is not intended to be and should not be construed as legal or tax advice and/or a legal opinion. Always consult a financial, tax and/or legal professional regarding your specific situation.
| 2 | THE GUGGENHEIM FUNDS SEMI-ANNUAL REPORT | |
Floating Rate Strategies Fund may not be suitable for all investors. ● Investments in floating rate senior secured syndicated bank loans and other floating rate securities involve special types of risks, including credit rate risk, interest rate risk, liquidity risk and prepayment risk. ● The Fund’s market value will change in response to interest rate changes and market conditions among other factors. In general, bond prices rise when interest rates fall and vice versa. ● The Fund’s exposure to high yield securities may subject the Fund to greater volatility. ● When market conditions are deemed appropriate, the Fund may leverage to the full extent permitted by its investment policies and restrictions and applicable law. Leveraging will exaggerate the effect on net asset value of any increase or decrease in the market value of the Fund’s portfolio. ● The Fund may invest in derivative instruments, which may be more volatile and less liquid, increasing the risk of loss when compared to traditional securities. Certain of the derivative instruments are also subject to the risks of counterparty default and adverse tax treatment. ● Instruments and strategies (such as borrowing transactions and reverse repurchase agreements) may provide leveraged exposure to a particular investment, which will magnify any gains or losses on those investments. ● Investments in reverse repurchase agreements and synthetic instruments (such as synthetic collateralized debt obligations) expose the Fund to the many of the same risks as investments in derivatives. ● The Fund’s investments in other investment vehicles subject the Fund to those risks and expenses affecting the investment vehicle. ● The Fund’s investments in foreign securities carry additional risks when compared to U.S. securities, due to the impact of diplomatic, political or economic developments in the country in question (investments in emerging markets securities are generally subject to an even greater level of risks). ● The Fund’s investments in real estate securities subject the Fund to the same risks as direct investments in real estate, which is particularly sensitive to economic downturns. ● The Fund’s investments in restricted securities may involve financial and liquidity risk. ● The Fund is subject to active trading risks that may increase volatility and impact its ability to achieve its investment objective. ● You may have a gain or loss when you sell your shares. ● It is important to note that the Fund is not guaranteed by the U.S. government. ● Please read the prospectus for more detailed information regarding these and other risks.
| | THE GUGGENHEIM FUNDS SEMI-ANNUAL REPORT | 3 |
| ECONOMIC AND MARKET OVERVIEW (Unaudited) | March 29, 2018 |
As we enter the ninth year of the current expansion, one of the most important new developments to evaluate is the impact of the corporate tax cuts passed into law at the end of 2017. Guggenheim’s concern is that the substantial late-cycle fiscal easing in the pipeline will prompt more restrictive monetary policy, which increases the risk that the economy will experience a boom-bust cycle that ends in a recession.
With the unemployment rate at 4.1% and core inflation rising, fiscal policy should be leaning against the economy to prevent overheating, not providing further stimulus. Faster wage growth, rising core inflation, and an unsustainably low unemployment rate underpin our longstanding view that the U.S. Federal Reserve (the “Fed”) will raise interest rates four times in 2018. Fed funds futures show the market is now pricing in nearly three rate hikes for 2018, up from two at the beginning of the year, which contributed to a pickup in first-quarter market volatility. Tighter fiscal and monetary policy, along with rising policy uncertainty ahead of the 2018 mid-terms and 2020 presidential election, could prove to be too much for an overextended economy to bear.
Further complicating the story is the risk of a global trade war sparked by protectionist actions taken by the Trump administration. We now have new steel and aluminum tariffs in place that are likely to have some modest inflationary impact while hurting almost 20% of U.S. corporates, according to our estimates. We expect more protectionist trade and investment policies in place by year end.
Over the six months ended March 29, 2018, the bear flattening (the condition in which short-term rates rise faster than long-term rates) of the U.S. Treasury curve continued with Treasury yields higher across the curve. Yields increased the most in the belly and front end of the curve. The 2-year Treasury ended the period at 2.27%, while the 10-year finished the period at 2.74%.
For the six months ended March 29, 2018, the Standard & Poor’s 500® (“S&P 500”) Index* returned 5.84%. The MSCI Europe-Australasia-Far East (“EAFE”) Index* returned 2.80%. The return of the MSCI Emerging Markets Index* was 9.08%.
In the bond market, the Bloomberg Barclays U.S. Aggregate Bond Index* posted a -1.08% return for the period, while the Bloomberg Barclays U.S. Corporate High Yield Index* returned -0.39%. The return of the ICE Bank of America (“BofA”) Merrill Lynch 3-Month U.S. Treasury Bill Index* was 0.64% for the six-month period.
The opinions and forecasts expressed may not actually come to pass. This information is subject to change at any time, based on market and other conditions, and should not be construed as a recommendation of any specific security or strategy.
| 4 | THE GUGGENHEIM FUNDS SEMI-ANNUAL REPORT | |
| ECONOMIC AND MARKET OVERVIEW (Unaudited)(concluded) | March 29, 2018 |
*Index Definitions:
The following indices are referenced throughout this report. Indices are unmanaged and not available for direct investment. Index performance does not reflect transaction costs, fees, or expenses.
Bloomberg Barclays U.S. Aggregate Bond Index is a broad-based flagship benchmark that measures the investment grade, U.S. dollar-denominated, fixed-rate taxable bond market, including U.S. Treasuries, government-related and corporate securities, mortgage-backed securities or “MBS” (agency fixed-rate and hybrid adjustable-rate mortgage, or “ARM”, pass-throughs), asset-backed securities (“ABS”), and commercial mortgage-backed securities (“CMBS”) (agency and non-agency).
Bloomberg Barclays U.S. Corporate High Yield Index measures the U.S. dollar-denominated, high yield, fixed-rate corporate bond market. Securities are classified as high yield if the middle rating of Moody’s, Fitch, and S&P is Ba1/BB +/BB + or below.
Credit Suisse Leveraged Loan Index tracks the investable market of the U.S. dollar denominated leveraged loan market. It consists of issues rated “5B” or lower, meaning that the highest rated issues included in this index are Moody’s/S&P ratings of Baa1/BB+ or Ba1/BBB+. All loans are funded term loans with a tenor of at least one year and are made by issuers domiciled in developed countries.
ICE BofA Merrill Lynch 3-Month U.S. Treasury Bill Index is an unmanaged market index of U.S. Treasury securities maturing in 90 days that assumes reinvestment of all income.
MSCI EAFE Index is a free float-adjusted market capitalization index that is designed to measure the equity market performance of developed markets, excluding the U.S. & Canada.
MSCI Emerging Markets Index is a free float-adjusted market capitalization weighted index that is designed to measure equity market performance in the global emerging markets.
S&P 500® Index is a broad-based index, the performance of which is based on the performance of 500 widely held common stocks chosen for market size, liquidity, and industry group representation.
| | THE GUGGENHEIM FUNDS SEMI-ANNUAL REPORT | 5 |
| ABOUT SHAREHOLDERS’ FUND EXPENSES (Unaudited) |
All mutual funds have operating expenses, and it is important for our shareholders to understand the impact of costs on their investments. Shareholders of a fund incur two types of costs: (i) transaction costs, including sales charges (loads) on purchase payments, reinvested dividends, other distributions, and exchange fees, and (ii) ongoing costs, including management fees, administrative services, and shareholder reports, among others. These ongoing costs, or operating expenses, are deducted from a fund’s gross income and reduce the investment return of the fund.
A fund’s expenses are expressed as a percentage of its average net assets, which is known as the expense ratio. The following examples are intended to help investors understand the ongoing costs (in dollars) of investing in a fund and to compare these costs with the ongoing costs of investing in other mutual funds.
The examples are based on an investment of $1,000 made at the beginning of the period and held for the entire six-month period beginning September 30, 2017 and ending March 29, 2018 for actual Fund returns. Hypothetical fund returns are for the period beginning September 30, 2017 and ending March 31, 2018.
The following tables illustrate the Fund’s costs in two ways:
Table 1. Based on actual Fund return: This section helps investors estimate the actual expenses paid over the period. The “Ending Account Value” shown is derived from the Fund’s actual return, and the fifth column shows the dollar amount that would have been paid by an investor who started with $1,000 in the Fund. Investors may use the information here, together with the amount invested, to estimate the expenses paid over the period. Simply divide the Fund’s account value by $1,000 (for example, an $8,600 account value divided by $1,000 = 8.6), then multiply the result by the number provided under the heading “Expenses Paid During Period.”
Table 2. Based on hypothetical 5% return: This section is intended to help investors compare a fund’s cost with those of other mutual funds. The table provides information about hypothetical account values and hypothetical expenses based on the Fund’s actual expense ratio and an assumed rate of return of 5% per year before expenses, which is not the Fund’s actual return. The hypothetical account values and expenses may not be used to estimate the actual ending account balance or expenses paid during the period. The example is useful in making comparisons because the U.S. Securities and Exchange Commission (the “SEC”) requires all mutual funds to calculate expenses based on the 5% return. Investors can assess a fund’s costs by comparing this hypothetical example with the hypothetical examples that appear in shareholder reports of other funds.
The calculations illustrated above assume no shares were bought or sold during the period. Actual costs may have been higher or lower, depending on the amount of investment and the timing of any purchases or redemptions.
| 6 | THE GUGGENHEIM FUNDS SEMI-ANNUAL REPORT | |
| ABOUT SHAREHOLDERS’ FUND EXPENSES (Unaudited)(continued) |
Please note that the expenses shown in the table are meant to highlight your ongoing costs only and do not reflect any transactional costs, such as sales charges (loads) on purchase payments, and contingent deferred sales charges (“CDSC”) on redemptions, if any. Therefore, the second table is useful in comparing ongoing costs only, and will not help you determine the relative total costs of owning different funds. In addition, if these transactional costs were included, your costs would have been higher.
More information about the Fund’s expenses, including annual expense ratios for periods up to five years (subject to the Fund’s inception date), can be found in the Financial Highlights section of this report. For additional information on operating expenses and other shareholder costs, please refer to the Fund’s prospectus.
| | THE GUGGENHEIM FUNDS SEMI-ANNUAL REPORT | 7 |
| ABOUT SHAREHOLDERS’ FUND EXPENSES (Unaudited)(concluded) |
| | Expense
Ratio1 | Fund
Return | Beginning
Account Value
September 30,
2017 | Ending
Account Value
March 29,
2018 | Expenses
Paid During
Period2 |
| Table 1. Based on actual Fund return3 |
| Floating Rate Strategies Fund |
| A-Class | 1.03% | 1.81% | $ 1,000.00 | $ 1,018.10 | $ 5.13 |
| C-Class | 1.77% | 1.43% | 1,000.00 | 1,014.30 | 8.74 |
| P-Class | 1.03% | 1.81% | 1,000.00 | 1,018.10 | 5.13 |
| Institutional Class | 0.79% | 1.93% | 1,000.00 | 1,019.30 | 3.93 |
| |
| | Expense
Ratio1 | Fund
Return | Beginning
Account Value
September 30,
2017 | Ending
Account Value
March 31,
2018 | Expenses
Paid During
Period4 |
| Table 2. Based on hypothetical 5% return (before expenses)5 |
| Floating Rate Strategies Fund |
| A-Class | 1.03% | 5.00% | $ 1,000.00 | $ 1,019.80 | $ 5.19 |
| C-Class | 1.77% | 5.00% | 1,000.00 | 1,016.16 | 8.85 |
| P-Class | 1.03% | 5.00% | 1,000.00 | 1,019.80 | 5.19 |
| Institutional Class | 0.79% | 5.00% | 1,000.00 | 1,020.99 | 3.98 |
| 1 | Annualized and excludes expenses of the underlying funds in which the Fund invests, if any. |
| 2 | Expenses in table 1 are equal to the Fund’s annualized expense ratio, net of any applicable fee waivers, multiplied by the average account value over the period, multiplied by 180/365 (to reflect the one-half year period). |
| 3 | Actual cumulative return at net asset value for the period September 30, 2017 to March 29, 2018. |
| 4 | Expenses in table 2 are equal to the Fund’s annualized expense ratio, net of any applicable fee waivers, multiplied by the average account value over the period, multiplied by 182/365 (to reflect the one-half year period). |
| 5 | Hypothetical return for the period September 30, 2017 to March 31, 2018. |
| 8 | THE GUGGENHEIM FUNDS SEMI-ANNUAL REPORT | |
| PERFORMANCE REPORT AND FUND PROFILE (Unaudited) | March 29, 2018 |
FLOATING RATE STRATEGIES FUND
OBJECTIVE: Seeks to provide a high level of current income while maximizing total return.
Holdings Diversification (Market Exposure as % of Net Assets)

“Holdings Diversification (Market Exposure as % of Net Assets)” excludes any temporary cash investments or investments in Guggenheim Strategy Funds Trust mutual funds. Investments in those Funds do not provide “market exposure” to meet the Fund’s investment objective, but will significantly increase the portfolio’s exposure to certain other asset categories (and their associated risks), which may cause the Fund to deviate from its principal investment strategy, including: (i) high yield, high risk debt securities rated below the top four long-term rating categories by a nationally recognized statistical rating organization (also known as “junk bonds”); (ii) securities issued by the U.S. government or its agencies and instrumentalities; (iii) CLOs, other asset-backed securities (including mortgage-backed securities) and similarly structured debt investments; and (iv) other short-term fixed income securities.
| Inception Dates: |
| A-Class | November 30, 2011 |
| C-Class | November 30, 2011 |
| P-Class | May 1, 2015 |
| Institutional Class | November 30, 2011 |
| Ten Largest Holdings (% of Total Net Assets) |
| Misys Ltd., 5.48% | 1.1% |
| Flex Acquisition Company, Inc., 4.69% | 1.0% |
| LPL Holdings, Inc., 4.56% | 1.0% |
| Examworks Group, Inc., 5.13% | 1.0% |
| MPH Acquisition Holdings LLC, 5.05% | 1.0% |
| VC GB Holdings, Inc., 5.13% | 1.0% |
| Equinox Holdings, Inc., 4.88% | 1.0% |
| National Financial Partners Corp., 4.88% | 1.0% |
| LANDesk Group, Inc., 6.13% | 1.0% |
| Altice US Finance I Corp., 4.13% | 1.0% |
| Top Ten Total | 10.1% |
“Ten Largest Holdings” excludes any temporary cash or derivative investments.
| | THE GUGGENHEIM FUNDS SEMI-ANNUAL REPORT | 9 |
| PERFORMANCE REPORT AND FUND PROFILE (Unaudited)(continued) | March 29, 2018 |
Average Annual Returns*
Periods Ended March 29, 2018
| | 6 month† | 1 Year | 5 Year | Since Inception
(11/30/11) |
| A-Class Shares | 1.81% | 3.50% | 3.80% | 5.21% |
| A-Class Shares with sales charge‡ | (1.23%) | 0.38% | 2.80% | 4.40% |
| C-Class Shares | 1.43% | 2.74% | 3.02% | 4.43% |
| C-Class Shares with CDSC§ | 0.44% | 1.75% | 3.02% | 4.43% |
| Institutional Class Shares | 1.93% | 3.75% | 4.04% | 5.45% |
| Credit Suisse Leveraged Loan Index | 2.79% | 4.64% | 4.17% | 5.23% |
| | | 6 month† | 1 Year | Since Inception
(05/01/15) |
| P-Class Shares | | 1.81% | 3.51% | 3.44% |
| Credit Suisse Leveraged Loan Index | | 2.79% | 4.64% | 4.13% |
| * | The performance data above represents past performance that is not predictive of future results. The investment return and principal value of an investment in the Fund will fluctuate so that an investor’s shares, when redeemed, may be worth more or less than their original cost. Returns are historical and include changes in principal and reinvested dividends and capital gains and do not reflect the effect of taxes. The Credit Suisse Leveraged Loan Index is an unmanaged index and, unlike the Fund, has no management fees or operating expenses to reduce its reported return. |
| † | 6 month returns are not annualized. |
| ‡ | Effective October 1, 2015, the maximum sales charge decreased from 4.75% to 3.00%. A 4.75% maximum sales charge is used in the calculation of the Average Annual Returns (based on subscriptions made prior to October 1, 2015), and a 3.00% maximum sales charge is used to calculate performance for periods based on subscriptions made on or after October 1, 2015. |
| § | Fund returns include a CDSC of 1% if redeemed within 12 months of purchase. |
| 10 | THE GUGGENHEIM FUNDS SEMI-ANNUAL REPORT | |
| PERFORMANCE REPORT AND FUND PROFILE (Unaudited)(concluded) | March 29, 2018 |
| Portfolio Composition by Quality Rating1 |
Rating | |
| Fixed Income Instruments | |
| AA | 0.4% |
| A | 1.6% |
| BBB | 8.0% |
| BB | 31.3% |
| B | 50.8% |
| CCC | 1.9% |
| CC | 0.1% |
| NR2 | 2.9% |
| Other Instruments | 3.0% |
| Total Investments | 100.0% |
The chart above reflects percentages of the value of total investments.
| 1 | Source: BlackRock Solutions. Credit quality ratings are measured on a scale that generally ranges from AAA (highest) to D (lowest). All securities except for those labeled “NR” have been rated by Moody’s, Standard & Poor’s (“S&P”), or Fitch, which are all a Nationally Recognized Statistical Rating Organization (“NRSRO”). For purposes of this presentation, when ratings are available from more than one agency, the highest rating is used. Guggenheim Investments has converted ratings to the equivalent S&P rating. Security ratings are determined at the time of purchase and may change thereafter. |
| 2 | NR securities do not necessarily indicate low credit quality. |
| | THE GUGGENHEIM FUNDS SEMI-ANNUAL REPORT | 11 |
| SCHEDULE OF INVESTMENTS (Unaudited) | March 29, 2018 |
| FLOATING RATE STRATEGIES FUND | |
| | | Shares | | | Value | |
| | | | | | | |
| COMMON STOCKS† - 0.0% |
| | | | | | | |
| Consumer, Non-cyclical - 0.0% |
| Targus Group International, Inc*,†††,1,2 | | | 12,773 | | | $ | 30,701 | |
| | | | | | | | | |
| Energy - 0.0% |
| Titan Energy LLC* | | | 10,110 | | | | 11,121 | |
| | | | | | | | | |
| Total Common Stocks | | | | | | | | |
| (Cost $317,262) | | | | | | | 41,822 | |
| | | | | | | | | |
| MUTUAL FUNDS† - 0.7% |
| Guggenheim Strategy Fund I2 | | | 758,814 | | | | 19,008,294 | |
| Guggenheim Strategy Fund II2 | | | 297,862 | | | | 7,449,539 | |
| Total Mutual Funds | | | | | | | | |
| (Cost $26,295,702) | | | | | | | 26,457,833 | |
| | | | | | | | | |
| MONEY MARKET FUND† - 2.3% |
| Federated U.S. Treasury Cash Reserve Fund Instituional Shares 1.45%3 | | | 80,322,683 | | | | 80,322,683 | |
| Total Money Market Fund | | | | | | | | |
| (Cost $80,322,683) | | | | | | | 80,322,683 | |
| | | | | | | | | |
| | | | Face
Amount~ | | | | | |
| | | | | | | | | |
| SENIOR FLOATING RATE INTERESTS††,8 - 87.5% |
| Industrial - 18.0% |
| Filtration Group Corp. | | | | | | | | |
| 4.98% (3 Month USD LIBOR + 3.00%) due 11/23/20 | | | 20,627,835 | | | | 20,739,638 | |
| 3.00% (3 Month USD LIBOR + 3.00%) due 03/27/2511 | | | 17,750,000 | | | | 17,794,375 | |
| Flex Acquisition Company, Inc. | | | | | | | | |
| 4.69% (1 Month USD LIBOR + 3.00%) due 12/29/23 | | | 36,485,009 | | | | 36,638,976 | |
| VC GB Holdings, Inc. | | | | | | | | |
| 5.13% (3 Month USD LIBOR + 3.25%) due 02/28/24 | | | 33,957,026 | | | | 34,041,918 | |
| Engineered Machinery Holdings, Inc. | | | | | | | | |
| 5.55% (3 Month USD LIBOR + 3.25%) due 07/19/24 | | | 29,876,153 | | | | 29,851,356 | |
| BWAY Holding Co. | | | | | | | | |
| 4.96% (1 Month USD LIBOR + 3.25%) due 04/03/24 | | | 27,562,744 | | | | 27,685,674 | |
| DAE Aviation | | | | | | | | |
| 5.63% (3 Month USD LIBOR + 3.75%) due 07/07/22 | | | 27,263,851 | | | | 27,481,144 | |
| Quikrete Holdings, Inc. | | | | | | | | |
| 4.63% (3 Month USD LIBOR + 2.75%) due 11/15/23 | | | 25,480,769 | | | | 25,579,125 | |
| TransDigm Group, Inc. | | | | | | | | |
| 4.63% (3 Month USD LIBOR + 2.75%) due 05/14/22 | | | 12,720,105 | | | | 12,749,615 | |
| 4.77% (1 Month USD LIBOR + 2.75%) due 06/09/23 | | | 11,481,998 | | | | 11,510,703 | |
| Cartrawler | | | | | | | | |
| 3.75% (1 Month EURIBOR + 3.75%) due 04/29/2111 | | EUR | 16,068,477 | | | | 19,574,003 | |
| Charter Nex US, Inc. | | | | | | | | |
| 4.88% (3 Month USD LIBOR + 3.00%) due 05/16/24 | | | 19,328,938 | | | | 19,357,931 | |
| GYP Holdings III Corp. | | | | | | | | |
| 4.77% (3 Month USD LIBOR + 3.00%) due 04/01/23 | | | 18,337,391 | | | | 18,406,156 | |
| Reynolds Group Holdings, Inc. | | | | | | | | |
| 4.63% (3 Month USD LIBOR + 2.75%) due 02/05/23 | | | 17,281,343 | | | | 17,361,529 | |
| 12 | THE GUGGENHEIM FUNDS SEMI-ANNUAL REPORT | SEE NOTES TO FINANCIAL STATEMENTS. |
| SCHEDULE OF INVESTMENTS (Unaudited)(continued) | March 29, 2018 |
| FLOATING RATE STRATEGIES FUND | |
| | | Face
Amount~ | | | Value | |
| | | | | | | |
| Advanced Disposal Services, Inc. | | | | | | |
| 3.98% (3 Month USD LIBOR + 2.25%) due 11/10/23 | | | 16,719,395 | | | $ | 16,756,010 | |
| Travelport Finance (Luxembourg) S.A.R.L. | | | | | | | | |
| 4.40% (3 Month USD LIBOR + 2.50%) due 03/17/25 | | | 16,600,000 | | | | 16,629,050 | |
| Brickman Group Holdings, Inc. | | | | | | | | |
| 4.85% (1 Month USD LIBOR + 3.00%) due 12/18/20 | | | 15,787,014 | | | | 15,867,686 | |
| Arctic Long Carriers | | | | | | | | |
| 6.38% (3 Month USD LIBOR + 4.50%) due 05/18/23 | | | 15,339,088 | | | | 15,454,131 | |
| Hayward Industries, Inc. | | | | | | | | |
| 5.38% (3 Month USD LIBOR + 3.50%) due 08/05/24 | | | 14,377,750 | | | | 14,420,883 | |
| 10.13% (3 Month USD LIBOR + 8.25%) due 08/04/25 | | | 500,000 | | | | 496,250 | |
| CHI Overhead Doors, Inc. | | | | | | | | |
| 5.13% (3 Month USD LIBOR + 3.25%) due 07/29/22 | | | 14,285,500 | | | | 14,285,500 | |
| Engility Corp. | | | | | | | | |
| 4.63% (3 Month USD LIBOR + 2.75%) due 08/14/23 | | | 13,671,594 | | | | 13,661,887 | |
| TMF Group Holding BV | | | | | | | | |
| 3.50% (3 Month EURIBOR + 3.50%) due 10/13/2311 | | EUR | 10,750,000 | | | | 13,180,026 | |
| RBS Global, Inc. | | | | | | | | |
| 4.11% (3 Month USD LIBOR + 2.25%) due 08/21/24 | | | 12,894,138 | | | | 12,961,832 | |
| American Builders & Contractors Supply Co., Inc. | | | | | | | | |
| 4.38% (1 Month USD LIBOR + 2.50%) due 10/31/23 | | | 11,909,774 | | | | 11,926,329 | |
| American Bath Group LLC | | | | | | | | |
| 7.55% (6 Month USD LIBOR + 5.25%) due 09/30/23 | | | 10,862,155 | | | | 10,966,215 | |
| Argo Merchants | | | | | | | | |
| 6.05% (1 Month USD LIBOR + 3.75%) due 12/06/24 | | | 10,723,872 | | | | 10,790,896 | |
| Titan Acquisition Ltd. (Husky) | | | | | | | | |
| 3.00% (3 Month USD LIBOR + 3.00%) due 03/15/2511 | | | 10,200,000 | | | | 10,184,394 | |
| Zodiac Pool Solutions LLC | | | | | | | | |
| due 12/20/234 | | | 10,005,352 | | | | 10,011,656 | |
| Sapphire Bidco B.V. | | | | | | | | |
| due 12/06/244 | | EUR | 8,100,000 | | | | 9,919,037 | |
| Imagine Print Solutions LLC | | | | | | | | |
| 7.06% (3 Month USD LIBOR + 4.75%) due 06/21/22 | | | 10,642,500 | | | | 9,897,525 | |
| Hanjin International Corp. | | | | | | | | |
| 4.23% (3 Month USD LIBOR + 2.50%) due 10/19/20 | | | 9,750,000 | | | | 9,780,518 | |
| Wrangler Buyer Corp. | | | | | | | | |
| due 09/27/244 | | | 9,326,625 | | | | 9,369,901 | |
| Befesa | | | | | | | | |
| 2.75% (3 Month EURIBOR + 2.75%) due 11/19/2211 | | EUR | 6,250,000 | | | | 7,719,254 | |
| CPG International LLC | | | | | | | | |
| 5.59% (3 Month USD LIBOR + 3.75%) due 05/05/24 | | | 6,699,375 | | | | 6,746,807 | |
| SEE NOTES TO FINANCIAL STATEMENTS. | THE GUGGENHEIM FUNDS SEMI-ANNUAL REPORT | 13 |
| SCHEDULE OF INVESTMENTS (Unaudited)(continued) | March 29, 2018 |
| FLOATING RATE STRATEGIES FUND | |
| | | Face
Amount~ | | | Value | |
| | | | | | | |
| CPM Holdings, Inc. | | | | | | |
| 5.38% (1 Month USD LIBOR + 3.50%) due 04/11/22 | | | 6,596,621 | | | $ | 6,672,878 | |
| Kuehg Corp. (Kindercare) | | | | | | | | |
| 6.05% (3 Month USD LIBOR + 3.75%) due 08/12/22 | | | 6,538,569 | | | | 6,565,116 | |
| Duran Group Holding GMBH | | | | | | | | |
| 4.00% (1 Month EURIBOR + 4.00%) due 03/29/2411 | | EUR | 4,003,529 | | | | 4,889,262 | |
| 4.00% (1 Month EURIBOR + 4.00%) due 12/20/2411 | | EUR | 1,350,000 | | | | 1,648,671 | |
| Corialis Group Ltd. | | | | | | | | |
| 3.50% (3 Month EURIBOR + 3.50%) due 03/29/2411 | | EUR | 5,075,000 | | | | 6,232,127 | |
| Thermasys Corp. | | | | | | | | |
| 5.70% (3 Month USD LIBOR + 4.00%) due 05/03/19 | | | 6,014,531 | | | | 5,814,067 | |
| Berlin Packaging LLC | | | | | | | | |
| 5.03% (3 Month USD LIBOR + 3.25%) due 10/01/21 | | | 5,580,146 | | | | 5,601,852 | |
| Recess Holdings, Inc. | | | | | | | | |
| 6.20% (3 Month USD LIBOR + 3.75%) due 09/30/24 | | | 5,096,750 | | | | 5,115,863 | |
| Hardware Holdings LLC | | | | | | | | |
| 8.38% (1 Month USD LIBOR + 6.50%) due 03/30/20 | | | 5,015,625 | | | | 4,865,156 | |
| Consolidated Container Co. LLC | | | | | | | | |
| 4.88% (1 Month USD LIBOR + 3.00%) due 05/22/24 | | | 3,740,625 | | | | 3,763,069 | |
| Hillman Group, Inc. | | | | | | | | |
| 5.80% (3 Month USD LIBOR + 3.50%) due 06/30/21 | | | 3,404,997 | | | | 3,439,047 | |
| Survitec | | | | | | | | |
| 4.25% (3 Month EURIBOR + 4.25%) due 03/12/2211 | | EUR | 2,700,000 | | | | 3,251,661 | |
| SIG Onex Wizard Acquisition | | | | | | | | |
| 4.63% (3 Month USD LIBOR + 2.75%) due 03/11/22 | | | 2,660,272 | | | | 2,673,574 | |
| SI Organization | | | | | | | | |
| 6.63% (1 Month USD LIBOR + 4.75%) due 11/23/19 | | | 2,379,460 | | | | 2,385,408 | |
| Signode Industrial Group US, Inc. | | | | | | | | |
| 5.42% (2 Month USD LIBOR + 2.75%) due 05/01/21 | | | 2,135,417 | | | | 2,132,747 | |
| EXC Holdings III Corp. | | | | | | | | |
| 5.16% (6 Month USD LIBOR + 3.50%) due 12/02/24 | | | 2,025,000 | | | | 2,041,868 | |
| Tank Holdings Corp. | | | | | | | | |
| 5.20% (1 Month USD LIBOR + 3.50%) due 03/16/22 | | | 1,660,870 | | | | 1,668,659 | |
| Wencor Group | | | | | | | | |
| due 06/19/19†††,1,4 | | | 1,140,000 | | | | 1,107,316 | |
| Ceva Group plc (United Kingdom) | | | | | | | | |
| 5.75% (3 Month USD LIBOR + 4.75%) due 03/19/19†††,1 | | | 840,000 | | | | 806,700 | |
| Total Industrial | | | | | | | 630,472,971 | |
| | | | | | | | | |
| Consumer, Non-cyclical - 16.8% |
| Examworks Group, Inc. | | | | | | | | |
| 5.13% (1 Month USD LIBOR + 3.25%) due 07/27/23 | | | 34,141,483 | | | | 34,354,867 | |
| MPH Acquisition Holdings LLC | | | | | | | | |
| 5.05% (1 Month USD LIBOR + 2.75%) due 06/07/23 | | | 34,027,730 | | | | 34,163,841 | |
| 14 | THE GUGGENHEIM FUNDS SEMI-ANNUAL REPORT | SEE NOTES TO FINANCIAL STATEMENTS. |
| SCHEDULE OF INVESTMENTS (Unaudited)(continued) | March 29, 2018 |
| FLOATING RATE STRATEGIES FUND | |
| | | Face
Amount~ | | | Value | |
| | | | | | | |
| Albertson’s LLC | | | | | | |
| 4.63% (6 Month USD LIBOR + 2.75%) due 08/25/21 | | | 21,752,564 | | | $ | 21,473,261 | |
| 5.29% (1 Month USD LIBOR + 3.00%) due 12/21/22 | | | 6,237,118 | | | | 6,168,697 | |
| 4.96% (3 Month USD LIBOR + 3.00%) due 06/22/23 | | | 3,473,750 | | | | 3,425,986 | |
| CHG Healthcare Services, Inc. | | | | | | | | |
| 4.77% (1 Month USD LIBOR + 3.00%) due 06/07/23 | | | 30,219,892 | | | | 30,427,805 | |
| Chobani LLC | | | | | | | | |
| 5.38% (1 Month USD LIBOR + 3.50%) due 10/10/23 | | | 28,007,455 | | | | 28,124,246 | |
| Sterigenics-Norion Holdings | | | | | | | | |
| 4.88% (1 Month USD LIBOR + 3.00%) due 05/15/22 | | | 27,354,513 | | | | 27,337,553 | |
| Smart & Final Stores LLC | | | | | | | | |
| 5.38% (1 Month USD LIBOR + 3.50%) due 11/15/22 | | | 27,326,939 | | | | 26,900,092 | |
| DJO Finance LLC | | | | | | | | |
| 5.03% (3 Month USD LIBOR + 3.25%) due 06/08/20 | | | 23,625,233 | | | | 23,723,750 | |
| Dole Food Company, Inc. | | | | | | | | |
| 4.81% (1 Month USD LIBOR + 3.00%) due 04/06/24 | | | 22,426,469 | | | | 22,454,502 | |
| Diamond (BC) B.V. | | | | | | | | |
| 3.25% (3 Month EURIBOR + 3.25%) due 09/06/2411 | | EUR | 9,077,250 | | | | 11,094,193 | |
| 4.99% (3 Month USD LIBOR + 3.00%) due 09/06/24 | | | 10,922,625 | | | | 10,899,906 | |
| PPDI LLC | | | | | | | | |
| 4.42% (3 Month USD LIBOR + 2.75%) due 08/18/22 | | | 21,824,397 | | | | 21,890,306 | |
| JBS USA Lux SA | | | | | | | | |
| 4.68% (Commercial Prime Lending Rate + 2.50%) due 10/30/22 | | | 21,011,225 | | | | 20,936,845 | |
| AI Aqua Zip Bidco Pty Ltd. | | | | | | | | |
| 5.13% (3 Month USD LIBOR + 3.25%) due 12/13/23 | | | 19,278,950 | | | | 19,332,599 | |
| Lineage Logistics LLC | | | | | | | | |
| 4.88% (3 Month USD LIBOR + 3.00%) due 02/16/25 | | | 18,275,000 | | | | 18,221,637 | |
| Hearthside Group Holdings LLC | | | | | | | | |
| 4.88% (1 Month USD LIBOR + 3.00%) due 06/02/21 | | | 17,363,408 | | | | 17,417,756 | |
| American Tire Distributors, Inc. | | | | | | | | |
| 6.24% (1 Month USD LIBOR + 4.25%) due 09/01/21 | | | 17,028,028 | | | | 17,240,878 | |
| Sigma Holding BV (Flora Food) | | | | | | | | |
| due 03/07/254 | | EUR | 14,000,000 | | | | 17,038,587 | |
| Endo Luxembourg Finance Co. | | | | | | | | |
| 6.19% (3 Month USD LIBOR + 4.25%) due 04/29/24 | | | 14,830,250 | | | | 14,786,946 | |
| US Foods, Inc. | | | | | | | | |
| 4.38% (1 Month USD LIBOR + 2.50%) due 06/27/23 | | | 13,184,852 | | | | 13,262,775 | |
| Hostess Brands LLC | | | | | | | | |
| 4.13% (2 Month USD LIBOR + 2.25%) due 08/03/22 | | | 12,321,423 | | | | 12,371,448 | |
| SEE NOTES TO FINANCIAL STATEMENTS. | THE GUGGENHEIM FUNDS SEMI-ANNUAL REPORT | 15 |
| SCHEDULE OF INVESTMENTS (Unaudited)(continued) | March 29, 2018 |
| FLOATING RATE STRATEGIES FUND | |
| | | Face
Amount~ | | | Value | |
| | | | | | | |
| Authentic Brands | | | | | | |
| 5.80% (3 Month USD LIBOR + 3.50%) due 09/27/24 | | | 11,989,750 | | | $ | 12,029,676 | |
| Grifols Worldwide Operations USA, Inc. | | | | | | | | |
| 3.99% (1 Month USD LIBOR + 2.25%) due 01/31/25 | | | 10,890,000 | | | | 10,926,699 | |
| Immucor, Inc. | | | | | | | | |
| 7.30% (3 Month USD LIBOR + 5.00%) due 06/15/21 | | | 10,497,250 | | | | 10,733,438 | |
| PAREXEL International Corp. | | | | | | | | |
| 4.63% (2 Month USD LIBOR + 2.75%) due 09/27/24 | | | 10,559,935 | | | | 10,559,935 | |
| Cidron New Bidco Limited (New Binding) | | | | | | | | |
| due 03/28/254 | | EUR | 8,125,000 | | | | 9,997,539 | |
| CPI Holdco LLC | | | | | | | | |
| 5.80% (1 Month USD LIBOR + 3.50%) due 03/21/24 | | | 9,058,525 | | | | 9,103,818 | |
| CTI Foods Holding Co. LLC | | | | | | | | |
| 9.13% (3 Month USD LIBOR + 7.25%) due 06/28/21 | | | 7,420,000 | | | | 5,490,800 | |
| 5.38% (1 Month USD LIBOR + 3.50%) due 06/29/20 | | | 3,662,453 | | | | 3,305,364 | |
| ADMI Corp. | | | | | | | | |
| 5.59% (6 Month USD LIBOR + 3.75%) due 04/29/22 | | | 7,898,477 | | | | 7,918,223 | |
| INC Research Holdings, Inc. | | | | | | | | |
| 4.02% (1 Month USD LIBOR + 2.25%) due 08/01/24 | | | 6,613,458 | | | | 6,633,100 | |
| Reddy Ice Holdings, Inc. | | | | | | | | |
| 7.26% (Commercial Prime Lending Rate + 4.50%) due 05/01/19 | | | 4,669,637 | | | | 4,657,963 | |
| 11.20% (3 Month USD LIBOR + 9.50%) due 11/01/19 | | | 2,000,000 | | | | 1,861,660 | |
| NVA Holdings, Inc | | | | | | | | |
| 5.05% (2 Month USD LIBOR + 2.75%) due 02/03/25 | | | 6,260,000 | | | | 6,265,196 | |
| Avantor, Inc. | | | | | | | | |
| 5.88% (3 Month USD LIBOR + 4.00%) due 11/21/24 | | | 4,638,375 | | | | 4,685,733 | |
| Equian LLC | | | | | | | | |
| 5.15% (3 Month USD LIBOR + 3.25%) due 05/20/24 | | | 4,292,563 | | | | 4,312,222 | |
| Nellson Nutraceutical (US) | | | | | | | | |
| 6.56% (Commercial Prime Lending Rate + 3.25%) due 12/23/21 | | | 4,076,472 | | | | 4,076,472 | |
| Grocery Outlet, Inc. | | | | | | | | |
| 5.80% (3 Month USD LIBOR + 3.50%) due 10/21/21 | | | 3,890,808 | | | | 3,903,764 | |
| Global Healthcare Exchange LLC | | | | | | | | |
| 5.30% (2 Month USD LIBOR + 3.00%) due 06/28/24 | | | 3,573,000 | | | | 3,581,933 | |
| Stratose Intermediate Holdings II LLC | | | | | | | | |
| 5.13% (3 Month USD LIBOR + 3.25%) due 06/22/23 | | | 3,283,500 | | | | 3,299,918 | |
| Arctic Glacier Group Holdings, Inc. | | | | | | | | |
| 5.38% (3 Month USD LIBOR + 3.50%) due 03/20/24 | | | 2,406,813 | | | | 2,425,610 | |
| 16 | THE GUGGENHEIM FUNDS SEMI-ANNUAL REPORT | SEE NOTES TO FINANCIAL STATEMENTS. |
| SCHEDULE OF INVESTMENTS (Unaudited)(continued) | March 29, 2018 |
| FLOATING RATE STRATEGIES FUND | |
| | | Face
Amount~ | | | Value | |
| | | | | | | |
| Valeant Pharmaceuticals International, Inc. | | | | | | |
| 5.24% (1 Month USD LIBOR + 3.50%) due 04/01/22 | | | 2,274,334 | | | $ | 2,297,509 | |
| BCPE Eagle Buyer LLC | | | | | | | | |
| 6.06% (3 Month USD LIBOR + 4.25%) due 03/18/24 | | | 2,139,196 | | | | 2,110,681 | |
| Nellson Nutraceutical (CAD) | | | | | | | | |
| 6.56% (Commercial Prime Lending Rate + 3.25%) due 12/23/21 | | | 1,675,778 | | | | 1,675,778 | |
| NES Global Talent | | | | | | | | |
| 7.27% (3 Month USD LIBOR + 5.50%) due 10/03/19 | | | 1,406,040 | | | | 1,384,949 | |
| Acadia Healthcare Co., Inc. | | | | | | | | |
| 4.38% (1 Month USD LIBOR + 2.50%) due 02/16/23 | | | 1,302,079 | | | | 1,312,391 | |
| Catalent Pharma Solutions, Inc. | | | | | | | | |
| 4.13% (3 Month USD LIBOR + 2.25%) due 05/20/24 | | | 1,019,969 | | | | 1,023,090 | |
| Jacobs Douwe Egberts | | | | | | | | |
| 4.06% (1 Month USD LIBOR + 2.25%) due 07/04/22 | | | 702,749 | | | | 705,385 | |
| Targus Group International, Inc. | | | | | | | | |
| due 05/24/16†††,1,2,4 | | | 152,876 | | | | — | |
| Total Consumer, Non-cyclical | | | | | | | 589,327,322 | |
| | | | | | | | | |
| Technology - 15.2% |
| Misys Ltd. | | | | | | | | |
| 5.48% (3 Month USD LIBOR + 3.50%) due 06/13/24 | | | 36,815,000 | | | | 36,764,563 | |
| LANDesk Group, Inc. | | | | | | | | |
| 6.13% (3 Month USD LIBOR + 4.25%) due 01/20/24 | | | 34,200,624 | | | | 33,564,834 | |
| Press Ganey Holdings Inc | | | | | | | | |
| 4.88% (2 Month USD LIBOR + 3.00%) due 10/23/23 | | | 32,599,728 | | | | 32,762,727 | |
| Optiv, Inc. | | | | | | | | |
| 5.13% (1 Month USD LIBOR + 3.25%) due 02/01/24 | | | 31,029,037 | | | | 29,904,234 | |
| Solera LLC | | | | | | | | |
| 4.63% (1 Month USD LIBOR + 2.75%) due 03/03/23 | | | 26,180,688 | | | | 26,225,195 | |
| First Data Corp. | | | | | | | | |
| 4.12% (1 Month USD LIBOR + 2.25%) due 04/26/24 | | | 14,205,407 | | | | 14,221,459 | |
| 4.12% (3 Month USD LIBOR + 2.25%) due 07/08/22 | | | 8,199,430 | | | | 8,210,499 | |
| Kronos, Inc. | | | | | | | | |
| 4.88% (1 Month USD LIBOR + 3.00%) due 11/01/23 | | | 20,513,715 | | | | 20,634,951 | |
| Seattle Spnco | | | | | | | | |
| 4.63% (3 Month USD LIBOR + 2.75%) due 06/21/24 | | | 19,489,112 | | | | 19,257,776 | |
| TIBCO Software, Inc. | | | | | | | | |
| 5.38% (1 Month USD LIBOR + 3.50%) due 12/04/20 | | | 19,155,381 | | | | 19,207,292 | |
| SS&C Technologies, Inc. | | | | | | | | |
| 7.25% (3 Month USD LIBOR + 2.50%) due 02/27/25 | | | 13,783,113 | | | | 13,844,861 | |
| 7.25% (3 Month USD LIBOR + 2.50%) due 02/28/25 | | | 4,916,887 | | | | 4,938,915 | |
| SEE NOTES TO FINANCIAL STATEMENTS. | THE GUGGENHEIM FUNDS SEMI-ANNUAL REPORT | 17 |
| SCHEDULE OF INVESTMENTS (Unaudited)(continued) | March 29, 2018 |
| FLOATING RATE STRATEGIES FUND | |
| | | Face
Amount~ | | | Value | |
| | | | | | | |
| Epicor Software | | | | | | |
| 5.13% (1 Month USD LIBOR + 3.25%) due 06/01/22 | | | 18,073,897 | | | $ | 18,144,566 | |
| Internet Brands, Inc. | | | | | | | | |
| 5.53% (3 Month USD LIBOR + 3.75%) due 09/13/24 | | | 17,695,539 | | | | 17,692,354 | |
| Go Daddy Operating Company LLC | | | | | | | | |
| 4.13% (3 Month USD LIBOR + 2.25%) due 02/15/24 | | | 17,523,462 | | | | 17,567,271 | |
| Peak 10 Holding Corp. | | | | | | | | |
| 5.80% (3 Month USD LIBOR + 3.50%) due 08/01/24 | | | 17,313,000 | | | | 17,353,512 | |
| Planview, Inc. | | | | | | | | |
| 7.13% (3 Month USD LIBOR + 5.25%) due 01/27/23†††,1 | | | 15,840,000 | | | | 15,691,052 | |
| Evergood 4 ApS (Nets) | | | | | | | | |
| 3.25% (3 Month EURIBOR + 3.25%) due 11/29/2411 | | EUR | 11,950,342 | | | | 14,656,705 | |
| Cypress Intermediate Holdings III, Inc. | | | | | | | | |
| 4.88% (3 Month USD LIBOR + 3.00%) due 04/29/24 | | | 13,200,250 | | | | 13,235,627 | |
| EIG Investors Corp. | | | | | | | | |
| 5.96% (1 Month USD LIBOR + 4.00%) due 02/09/23 | | | 11,994,393 | | | | 12,069,358 | |
| Cologix Holdings, Inc. | | | | | | | | |
| 4.86% (3 Month USD LIBOR + 3.00%) due 03/20/24 | | | 9,602,010 | | | | 9,596,057 | |
| 8.88% (1 Month USD LIBOR + 7.00%) due 03/20/25 | | | 1,900,000 | | | | 1,924,947 | |
| Advanced Computer Software | | | | | | | | |
| 7.52% (3 Month USD LIBOR + 5.50%) due 03/18/22 | | | 6,268,662 | | | | 6,273,865 | |
| 11.37% (3 Month USD LIBOR + 9.50%) due 01/31/23 | | | 4,490,000 | | | | 4,400,200 | |
| Infor (US), Inc. | | | | | | | | |
| 4.63% (1 Month USD LIBOR + 2.75%) due 02/01/22 | | | 9,985,534 | | | | 10,000,812 | |
| Eiger Acquisition B.V. | | | | | | | | |
| 3.75% (1 Month EURIBOR + 3.75%) due 12/12/2411 | | EUR | 7,400,000 | | | | 9,077,042 | |
| Informatica LLC | | | | | | | | |
| 5.13% (6 Month USD LIBOR + 3.25%) due 08/05/22 | | | 8,737,515 | | | | 8,783,912 | |
| Ipreo Holdings | | | | | | | | |
| 5.30% (1 Month USD LIBOR + 3.00%) due 08/06/21 | | | 8,684,553 | | | | 8,684,553 | |
| Jaggaer | | | | | | | | |
| 5.88% (3 Month USD LIBOR + 4.00%) due 12/28/24 | | | 8,200,000 | | | | 8,200,000 | |
| Camelia Bidco Banc Civica | | | | | | | | |
| 5.46% (3 Month USD LIBOR + 4.75%) due 10/14/24 | | GBP | 5,600,000 | | | | 7,863,965 | |
| GlobalLogic Holdings, Inc. | | | | | | | | |
| 6.05% (3 Month USD LIBOR + 3.75%) due 06/20/22 | | | 7,576,291 | | | | 7,614,173 | |
| Project Alpha (Qlik) | | | | | | | | |
| 5.04% (3 Month USD LIBOR + 3.50%) due 04/26/24 | | | 7,289,289 | | | | 7,185,999 | |
| Microsemi Corp. | | | | | | | | |
| 3.74% (1 Month USD LIBOR + 2.00%) due 01/15/23 | | | 6,639,244 | | | | 6,643,825 | |
| 18 | THE GUGGENHEIM FUNDS SEMI-ANNUAL REPORT | SEE NOTES TO FINANCIAL STATEMENTS. |
| SCHEDULE OF INVESTMENTS (Unaudited)(continued) | March 29, 2018 |
| FLOATING RATE STRATEGIES FUND | |
| | | Face
Amount~ | | | Value | |
| | | | | | | |
| Aspect Software, Inc. | | | | | | |
| 12.38% (1 Month USD LIBOR + 10.50%) due 05/25/202 | | | 6,672,695 | | | $ | 6,643,535 | |
| Park Place Technologies LLC | | | | | | | | |
| 8.75% (3 Month USD LIBOR + 4.00%) due 03/22/25 | | | 6,300,000 | | | | 6,284,250 | |
| 12.75% (3 Month USD LIBOR + 8.00%) due 03/20/26 | | | 300,000 | | | | 298,500 | |
| Palermo Finance Corp. | | | | | | | | |
| 6.22% (1 Month USD LIBOR + 4.50%) due 04/17/23†††,1 | | | 6,417,750 | | | | 6,364,026 | |
| MA Financeco LLC | | | | | | | | |
| 4.38% (3 Month USD LIBOR + 2.50%) due 11/19/21 | | | 6,275,000 | | | | 6,196,563 | |
| Switch Ltd. | | | | | | | | |
| 4.13% (1 Month USD LIBOR + 2.25%) due 06/27/24 | | | 5,955,000 | | | | 5,979,832 | |
| Cvent, Inc. | | | | | | | | |
| 5.63% (3 Month USD LIBOR + 3.75%) due 11/29/24 | | | 5,900,000 | | | | 5,929,500 | |
| Micron Technology, Inc. | | | | | | | | |
| 3.88% (3 Month USD LIBOR + 2.00%) due 04/26/22 | | | 5,716,489 | | | | 5,750,444 | |
| Miami Escrow Borrower LLC | | | | | | | | |
| 4.63% (3 Month USD LIBOR + 2.75%) due 06/21/24 | | | 2,885,888 | | | | 2,851,632 | |
| Sabre GLBL, Inc. | | | | | | | | |
| 3.88% (3 Month USD LIBOR + 2.00%) due 02/22/24 | | | 2,369,160 | | | | 2,375,415 | |
| Total Technology | | | | | | | 530,870,798 | |
| | | | | | | | | |
| Consumer, Cyclical - 15.0% |
| Gates Global LLC | | | | | | | | |
| 3.00% (3 Month EURIBOR + 3.00%) due 04/01/2411 | | EUR | 20,072,757 | | | | 24,624,755 | |
| 5.05% (1 Month USD LIBOR + 2.75%) due 04/01/24 | | | 17,215,399 | | | | 17,297,861 | |
| Equinox Holdings, Inc. | | | | | | | | |
| 4.88% (1 Month USD LIBOR + 3.00%) due 03/08/24 | | | 33,660,850 | | | | 33,857,093 | |
| AlixPartners, LLP | | | | | | | | |
| 5.05% (3 Month USD LIBOR + 2.75%) due 04/04/24 | | | 27,918,000 | | | | 28,030,510 | |
| USIC Holding, Inc. | | | | | | | | |
| 5.80% (3 Month USD LIBOR + 3.50%) due 12/08/23 | | | 26,867,871 | | | | 27,069,380 | |
| Party City Holdings, Inc. | | | | | | | | |
| 4.49% (1 Month USD LIBOR + 2.75%) due 08/19/22 | | | 23,649,435 | | | | 23,723,458 | |
| Mavis Tire Express Services Corp. | | | | | | | | |
| 5.07% (3 Month USD LIBOR + 3.25%) due 02/28/25 | | | 22,541,361 | | | | 22,541,361 | |
| Crown Finance US, Inc. | | | | | | | | |
| 4.38% (1 Month USD LIBOR + 2.50%) due 02/28/25 | | | 14,150,000 | | | | 14,125,945 | |
| 2.63% (1 Month EURIBOR + 2.63%) due 02/28/2511 | | EUR | 5,900,000 | | | | 7,241,602 | |
| Fitness International LLC | | | | | | | | |
| 5.38% (3 Month USD LIBOR + 3.50%) due 07/01/20 | | | 19,114,667 | | | | 19,258,027 | |
| Peer Holding III BV | | | | | | | | |
| 3.50% (6 Month EURIBOR + 3.50%) due 03/08/2511 | | EUR | 15,075,000 | | | | 18,436,686 | |
| SEE NOTES TO FINANCIAL STATEMENTS. | THE GUGGENHEIM FUNDS SEMI-ANNUAL REPORT | 19 |
| SCHEDULE OF INVESTMENTS (Unaudited)(continued) | March 29, 2018 |
| FLOATING RATE STRATEGIES FUND | |
| | | Face
Amount~ | | | Value | |
| | | | | | | |
| Greektown Holdings LLC | | | | | | |
| 4.88% (1 Month USD LIBOR + 3.00%) due 04/25/24 | | | 17,815,375 | | | $ | 17,824,283 | |
| PetSmart Inc | | | | | | | | |
| 4.68% (1 Month USD LIBOR + 3.00%) due 03/11/22 | | | 22,127,880 | | | | 17,709,827 | |
| Navistar Inc. | | | | | | | | |
| 5.21% (3 Month USD LIBOR + 3.50%) due 11/06/24 | | | 17,500,000 | | | | 17,580,150 | |
| BBB Industries, LLC | | | | | | | | |
| 6.38% (1 Month USD LIBOR + 4.50%) due 11/03/21 | | | 14,750,069 | | | | 14,860,695 | |
| Acosta, Inc. | | | | | | | | |
| 5.13% (3 Month USD LIBOR + 3.25%) due 09/26/21 | | | 17,744,817 | | | | 14,828,811 | |
| Eldorado Resorts, Inc. | | | | | | | | |
| 4.13% (1 Month USD LIBOR + 2.25%) due 04/17/24 | | | 13,394,500 | | | | 13,427,986 | |
| Petco Animal Supplies, Inc. | | | | | | | | |
| 4.77% (3 Month USD LIBOR + 3.00%) due 01/26/23 | | | 17,980,525 | | | | 13,135,853 | |
| At Home Holding III Corp. | | | | | | | | |
| 5.27% (3 Month USD LIBOR + 3.50%) due 06/03/22 | | | 12,156,250 | | | | 12,201,836 | |
| EG Finco Ltd. | | | | | | | | |
| due 02/07/254 | | | 6,550,000 | | | | 6,531,988 | |
| due 02/01/254 | | EUR | 1,858,104 | | | | 2,265,849 | |
| due 02/01/254 | | EUR | 2,700,000 | | | | 3,292,492 | |
| GVC Holdings plc | | | | | | | | |
| due 03/15/244 | | EUR | 9,050,000 | | | | 11,572,867 | |
| National Vision, Inc. | | | | | | | | |
| 4.63% (1 Month USD LIBOR + 2.75%) due 11/20/24 | | | 10,812,432 | | | | 10,875,468 | |
| Life Time Fitness, Inc. | | | | | | | | |
| 4.73% (1 Month USD LIBOR + 2.75%) due 06/10/22 | | | 10,805,800 | | | | 10,814,769 | |
| Burlington Stores, Inc. | | | | | | | | |
| 4.38% (3 Month USD LIBOR + 2.50%) due 11/17/24 | | | 10,074,750 | | | | 10,084,825 | |
| Deuce Acquisition | | | | | | | | |
| 5.76% (1 Month USD LIBOR + 5.25%) due 12/08/22 | | GBP | 7,100,000 | | | | 9,959,028 | |
| Leslie’s Poolmart, Inc. | | | | | | | | |
| 5.28% (3 Month USD LIBOR + 3.50%) due 08/16/23 | | | 9,007,425 | | | | 9,063,721 | |
| Trader Corp. | | | | | | | | |
| 5.29% (3 Month USD LIBOR + 3.00%) due 09/28/23 | | | 9,052,876 | | | | 9,037,758 | |
| Cyan Blue Holdco 3 Ltd. | | | | | | | | |
| 5.05% (2 Month USD LIBOR + 2.75%) due 08/23/24 | | | 9,031,864 | | | | 9,009,284 | |
| Sears Roebuck Acceptance Corp. | | | | | | | | |
| 6.20% (1 Month USD LIBOR + 4.50%) due 01/20/19 | | | 8,897,797 | | | | 8,838,448 | |
| Packers Sanitation Services, Inc. | | | | | | | | |
| 4.94% (3 Month USD LIBOR + 3.25%) due 12/04/24 | | | 8,693,867 | | | | 8,704,734 | |
| PTL Acqusition, Inc. | | | | | | | | |
| 4.13% (3 Month USD LIBOR + 2.25%) due 08/01/23 | | | 8,175,500 | | | | 8,206,158 | |
| Prime Security Services Borrower LLC | | | | | | | | |
| 4.63% (3 Month USD LIBOR + 2.75%) due 05/02/22 | | | 6,583,625 | | | | 6,630,039 | |
| 20 | THE GUGGENHEIM FUNDS SEMI-ANNUAL REPORT | SEE NOTES TO FINANCIAL STATEMENTS. |
| SCHEDULE OF INVESTMENTS (Unaudited)(continued) | March 29, 2018 |
| FLOATING RATE STRATEGIES FUND | |
| | | Face
Amount~ | | | Value | |
| | | | | | | |
| Wyndham Hotels & Resorts, Inc. | | | | | | |
| due 03/28/254 | | | 6,500,000 | | | $ | 6,516,250 | |
| Neiman Marcus Group, Inc. | | | | | | | | |
| 4.94% (3 Month USD LIBOR + 3.25%) due 10/25/20 | | | 6,946,900 | | | | 5,986,769 | |
| Toys ‘R’ US, Inc. | | | | | | | | |
| 10.50% (Commercial Prime Lending Rate + 5.75%) due 01/18/19 | | | 5,450,000 | | | | 5,440,898 | |
| Generac Holdings, Inc. | | | | | | | | |
| 3.69% (1 Month USD LIBOR + 2.00%) due 05/31/23 | | | 4,050,000 | | | | 4,059,112 | |
| Men’s Wearhouse | | | | | | | | |
| 5.20% (1 Month USD LIBOR + 3.50%) due 06/18/21 | | | 4,017,079 | | | | 4,017,079 | |
| Belmond Interfin Ltd. | | | | | | | | |
| 4.63% (3 Month USD LIBOR + 2.75%) due 07/03/24 | | | 3,970,000 | | | | 3,979,925 | |
| Belk, Inc. | | | | | | | | |
| 6.46% (3 Month USD LIBOR + 4.75%) due 12/12/22 | | | 4,483,667 | | | | 3,878,372 | |
| Amaya Holdings B.V. (Stars Group Holdings B.V.) | | | | | | | | |
| 3.00% (3 Month USD LIBOR + 3.00%) due 04/04/2511 | | | 2,250,000 | | | | 2,259,000 | |
| International Car Wash Group Ltd. | | | | | | | | |
| 5.29% (3 Month USD LIBOR + 3.50%) due 10/03/24 | | | 2,244,375 | | | | 2,248,594 | |
| Penn Engineering & Manufacturing Corp. | | | | | | | | |
| 4.63% (3 Month USD LIBOR + 2.75%) due 06/27/24 | | | 1,990,000 | | | | 1,991,990 | |
| Truck Hero, Inc. | | | | | | | | |
| 6.22% (3 Month USD LIBOR + 4.00%) due 04/22/24 | | | 1,783,271 | | | | 1,791,296 | |
| Total Consumer, Cyclical | | | | | | | 524,832,832 | |
| | | | | | | | | |
| Communications - 9.6% |
| Altice US Finance I Corp. | | | | | | | | |
| 4.13% (3 Month USD LIBOR + 2.25%) due 07/28/25 | | | 33,524,169 | | | | 33,448,739 | |
| Univision Communications, Inc. | | | | | | | | |
| 4.63% (1 Month USD LIBOR + 2.75%) due 03/15/24 | | | 33,822,647 | | | | 33,244,956 | |
| WMG Acquisition Corp. | | | | | | | | |
| due 11/01/234 | | | 31,944,713 | | | | 32,037,992 | |
| SFR Group S.A. | | | | | | | | |
| 4.72% (2 Month USD LIBOR + 3.00%) due 01/31/26 | | | 29,552,060 | | | | 28,665,498 | |
| 4.52% (2 Month USD LIBOR + 2.75%) due 07/31/25 | | | 497,677 | | | | 481,502 | |
| Sprint Communications, Inc. | | | | | | | | |
| 4.44% (3 Month USD LIBOR + 2.50%) due 02/02/24 | | | 23,883,750 | | | | 23,873,719 | |
| Cengage Learning Acquisitions, Inc. | | | | | | | | |
| 6.04% (3 Month USD LIBOR + 4.25%) due 06/07/23 | | | 24,791,080 | | | | 22,514,763 | |
| CSC Holdings, LLC | | | | | | | | |
| 4.04% (1 Month USD LIBOR + 2.25%) due 07/17/25 | | | 21,599,280 | | | | 21,522,819 | |
| Radiate HoldCo LLC | | | | | | | | |
| 4.88% (3 Month USD LIBOR + 3.00%) due 02/01/24 | | | 21,594,209 | | | | 21,459,245 | |
| SEE NOTES TO FINANCIAL STATEMENTS. | THE GUGGENHEIM FUNDS SEMI-ANNUAL REPORT | 21 |
| SCHEDULE OF INVESTMENTS (Unaudited)(continued) | March 29, 2018 |
| FLOATING RATE STRATEGIES FUND | |
| | | Face
Amount~ | | | Value | |
| | | | | | | |
| Telenet Financing USD LLC | | | | | | |
| 4.28% (6 Month USD LIBOR + 2.50%) due 03/01/26 | | | 20,670,000 | | | $ | 20,764,669 | |
| Mcgraw-Hill Global Education Holdings LLC | | | | | | | | |
| 5.88% (1 Month USD LIBOR + 4.00%) due 05/04/22 | | | 19,193,901 | | | | 18,939,582 | |
| Virgin Media Bristol LLC | | | | | | | | |
| due 01/15/264 | | | 16,500,000 | | | | 16,580,850 | |
| Market Track LLC | | | | | | | | |
| 6.55% (3 Month USD LIBOR + 4.25%) due 06/05/24 | | | 13,780,750 | | | | 13,746,298 | |
| Ziggo Secured Finance BV | | | | | | | | |
| due 04/15/254 | | | 13,550,000 | | | | 13,447,020 | |
| Charter Communications Operating, LLC | | | | | | | | |
| 3.88% (3 Month USD LIBOR + 2.00%) due 04/30/25 | | | 10,523,625 | | | | 10,558,669 | |
| Houghton Mifflin Co. | | | | | | | | |
| 4.88% (1 Month USD LIBOR + 3.00%) due 05/28/21 | | | 10,602,706 | | | | 9,661,716 | |
| Level 3 Financing, Inc. | | | | | | | | |
| 4.11% (1 Month USD LIBOR + 2.25%) due 02/22/24 | | | 4,450,000 | | | | 4,457,654 | |
| AMC Entertainment Holdings, Inc. | | | | | | | | |
| 4.03% (1 Month USD LIBOR + 2.25%) due 12/15/23 | | | 3,168,000 | | | | 3,174,589 | |
| Proquest LLC | | | | | | | | |
| 5.63% (3 Month USD LIBOR + 3.75%) due 10/24/21 | | | 2,664,910 | | | | 2,699,047 | |
| Match Group, Inc. | | | | | | | | |
| 4.29% (3 Month USD LIBOR + 2.50%) due 11/16/22 | | | 2,471,875 | | | | 2,484,234 | |
| Anaren, Inc. | | | | | | | | |
| 6.80% (3 Month USD LIBOR + 4.50%) due 02/18/21 | | | 1,467,621 | | | | 1,463,952 | |
| 10.55% (3 Month USD LIBOR + 8.25%) due 08/18/21 | | | 275,000 | | | | 275,000 | |
| GTT Communications, Inc. | | | | | | | | |
| 5.19% (3 Month USD LIBOR + 3.25%) due 01/09/24 | | | 248,116 | | | | 248,178 | |
| Total Communications | | | | | | | 335,750,691 | |
| | | | | | | | | |
| Financial - 7.0% |
| LPL Holdings, Inc. | | | | | | | | |
| 4.56% (3 Month USD LIBOR + 2.25%) due 09/23/24 | | | 34,883,198 | | | | 34,970,406 | |
| National Financial Partners Corp. | | | | | | | | |
| 4.88% (1 Month USD LIBOR + 3.00%) due 01/08/24 | | | 33,681,701 | | | | 33,745,023 | |
| Amwins Group LLC | | | | | | | | |
| 4.59% (3 Month USD LIBOR + 2.75%) due 01/25/24 | | | 25,502,188 | | | | 25,629,698 | |
| Avolon Luxembourg SARL | | | | | | | | |
| 4.07% (1 Week USD LIBOR + 2.25%) due 03/21/22 | | | 24,018,500 | | | | 24,025,946 | |
| HUB International Ltd. | | | | | | | | |
| 4.84% (3 Month USD LIBOR + 3.00%) due 10/02/20 | | | 19,716,239 | | | | 19,812,060 | |
| Alliant Holdings I L.P. | | | | | | | | |
| 5.13% (1 Month USD LIBOR + 3.25%) due 08/12/22 | | | 16,143,863 | | | | 16,233,623 | |
| TransUnion LLC | | | | | | | | |
| 3.88% (6 Month USD LIBOR + 2.00%) due 04/10/23 | | | 16,014,564 | | | | 16,051,237 | |
| 22 | THE GUGGENHEIM FUNDS SEMI-ANNUAL REPORT | SEE NOTES TO FINANCIAL STATEMENTS. |
| SCHEDULE OF INVESTMENTS (Unaudited)(continued) | March 29, 2018 |
| FLOATING RATE STRATEGIES FUND | |
| | | Face
Amount~ | | | Value | |
| | | | | | | |
| WEX, Inc. | | | | | | |
| due 06/30/234 | | | 11,790,997 | | | $ | 11,861,390 | |
| Vantiv LLC | | | | | | | | |
| 3.78% (1 Month USD LIBOR + 2.00%) due 08/09/24 | | | 11,650,000 | | | | 11,706,153 | |
| Delos Finance S.A.R.L (International Lease Finance) | | | | | | | | |
| 4.05% (1 Month USD LIBOR + 1.75%) due 10/06/23 | | | 11,250,000 | | | | 11,294,550 | |
| York Risk Services | | | | | | | | |
| due 10/01/214 | | | 11,260,389 | | | | 11,007,031 | |
| USI, Inc. | | | | | | | | |
| 5.30% (1 Month USD LIBOR + 3.00%) due 05/16/24 | | | 7,118,230 | | | | 7,130,117 | |
| American Stock Transfer & Trust | | | | | | | | |
| 6.81% (3 Month USD LIBOR + 4.50%) due 06/26/20 | | | 5,590,115 | | | | 5,585,475 | |
| Jefferies Finance LLC | | | | | | | | |
| 4.31% (2 Month USD LIBOR + 2.50%) due 08/02/24 | | | 5,486,250 | | | | 5,486,250 | |
| Capital Automotive L.P. | | | | | | | | |
| 4.38% (1 Month USD LIBOR + 2.50%) due 03/25/24 | | | 3,832,174 | | | | 3,841,754 | |
| Focus Financial Partners LLC | | | | | | | | |
| 5.05% (1 Month USD LIBOR + 2.75%) due 07/03/24 | | | 3,451,250 | | | | 3,459,878 | |
| Geo Group, Inc. | | | | | | | | |
| 4.13% (3 Month USD LIBOR + 2.25%) due 03/22/24 | | | 2,524,500 | | | | 2,530,180 | |
| Fly Leasing Ltd. | | | | | | | | |
| 3.80% (1 Month USD LIBOR + 2.00%) due 02/09/23 | | | 1,553,459 | | | | 1,553,459 | |
| Total Financial | | | | | | | 245,924,230 | |
| | | | | | | | | |
| Basic Materials - 2.4% |
| Alpha 3 B.V. | | | | | | | | |
| 5.30% (1 Month USD LIBOR + 3.00%) due 01/31/24 | | | 28,718,361 | | | | 28,926,569 | |
| PQ Corp. | | | | | | | | |
| 4.29% (1 Month USD LIBOR + 2.50%) due 02/08/25 | | | 19,236,007 | | | | 19,305,064 | |
| GrafTech Finance, Inc. | | | | | | | | |
| 5.24% (3 Month USD LIBOR + 3.50%) due 02/12/25 | | | 11,850,000 | | | | 11,850,000 | |
| Nexeo Solutions LLC | | | | | | | | |
| 5.27% (3 Month USD LIBOR + 3.25%) due 06/09/23 | | | 10,347,278 | | | | 10,444,336 | |
| Arch Coal, Inc. | | | | | | | | |
| 5.13% (3 Month USD LIBOR + 3.25%) due 03/07/24 | | | 6,801,626 | | | | 6,824,275 | |
| PMHC II, Inc. (Prince) | | | | | | | | |
| 4.50% (3 Month USD LIBOR + 3.50%) due 03/20/25 | | | 5,370,000 | | | | 5,400,233 | |
| Platform Specialty Products | | | | | | | | |
| 4.38% (1 Month USD LIBOR + 2.50%) due 06/07/20 | | | 1,746,624 | | | | 1,751,655 | |
| Minerals Technologies, Inc. | | | | | | | | |
| 4.19% (3 Month USD LIBOR + 2.25%) due 02/14/24 | | | 791,635 | | | | 796,092 | |
| Total Basic Materials | | | | | | | 85,298,224 | |
| | | | | | | | | |
| Utilities - 2.0% |
| Dynegy, Inc. | | | | | | | | |
| 4.60% (3 Month USD LIBOR + 2.75%) due 02/07/24 | | | 28,497,759 | | | | 28,659,341 | |
| Techem GmbH | | | | | | | | |
| 3.00% (3 Month EURIBOR + 3.00%) due 10/02/2411 | | EUR | 16,500,000 | | | | 20,286,453 | |
| SEE NOTES TO FINANCIAL STATEMENTS. | THE GUGGENHEIM FUNDS SEMI-ANNUAL REPORT | 23 |
| SCHEDULE OF INVESTMENTS (Unaudited)(continued) | March 29, 2018 |
| FLOATING RATE STRATEGIES FUND | |
| | | Face
Amount~ | | | Value | |
| | | | | | | |
| Helix Gen Funding LLC | | | | | | |
| 5.63% (1 Month USD LIBOR + 3.75%) due 06/03/24 | | | 9,869,185 | | | $ | 9,957,613 | |
| Stonewall | | | | | | | | |
| 7.80% (1 Month USD LIBOR + 5.50%) due 11/13/21 | | | 4,314,285 | | | | 4,222,606 | |
| Thor Bidco (Morrison Utility) | | | | | | | | |
| 5.52% (3 Month USD LIBOR + 5.00%) due 09/20/23 | | GBP | 2,550,000 | | | | 3,577,943 | |
| Panda Temple II Power | | | | | | | | |
| 8.30% (3 Month USD LIBOR + 6.00%) due 04/03/19 | | | 2,547,915 | | | | 2,344,082 | |
| Viva Alamo LLC | | | | | | | | |
| due 02/22/214 | | | 1,278,585 | | | | 1,267,001 | |
| Total Utilities | | | | | | | 70,315,039 | |
| | | | | | | | | |
| Energy - 1.5% |
| Ultra Petroleum, Inc. | | | | | | | | |
| 4.76% (3 Month USD LIBOR + 3.00%) due 04/12/24 | | | 19,890,000 | | | | 19,666,238 | |
| Veresen Midstream LP | | | | | | | | |
| 4.88% (3 Month USD LIBOR + 3.00%) due 03/31/22 | | | 15,388,880 | | | | 15,479,520 | |
| Penn Virginia Holding Corp. | | | | | | | | |
| 8.88% (3 Month USD LIBOR + 7.00%) due 09/29/22†††,1 | | | 10,890,000 | | | | 10,694,111 | |
| PSS Companies | | | | | | | | |
| 6.34% (1 Month USD LIBOR + 4.50%) due 01/28/20 | | | 5,521,530 | | | | 5,342,080 | |
| Summit Midstream Partners, LP | | | | | | | | |
| 7.88% (1 Month USD LIBOR + 6.00%) due 05/13/22 | | | 880,000 | | | | 888,800 | |
| Total Energy | | | | | | | 52,070,749 | |
| Total Senior Floating Rate Interests | | | | | | | | |
| (Cost $3,072,196,638) | | | | | | | 3,064,862,856 | |
| CORPORATE BONDS†† - 4.6% |
| Communications - 1.2% |
| Sprint Communications, Inc. | | | | | | | | |
| 9.00% due 11/15/186 | | | 12,700,000 | | | | 13,096,875 | |
| DISH DBS Corp. | | | | | | | | |
| 7.75% due 07/01/26 | | | 10,700,000 | | | | 10,033,925 | |
| Ziggo Secured Finance BV | | | | | | | | |
| 5.50% due 01/15/276 | | | 5,000,000 | | | | 4,698,550 | |
| Midcontinent Communications / Midcontinent Finance Corp. | | | | | | | | |
| 6.88% due 08/15/236 | | | 4,000,000 | | | | 4,205,000 | |
| Inmarsat Finance plc | | | | | | | | |
| 4.88% due 05/15/226 | | | 3,500,000 | | | | 3,403,750 | |
| Anixter, Inc. | | | | | | | | |
| 5.50% due 03/01/23 | | | 3,000,000 | | | | 3,105,000 | |
| Zayo Group LLC / Zayo Capital, Inc. | | | | | | | | |
| 5.75% due 01/15/276 | | | 2,000,000 | | | | 1,955,000 | |
| CCO Holdings LLC / CCO Holdings Capital Corp. | | | | | | | | |
| 5.25% due 09/30/22 | | | 1,890,000 | | | | 1,918,369 | |
| MDC Partners, Inc. | | | | | | | | |
| 6.50% due 05/01/246 | | | 1,700,000 | | | | 1,653,250 | |
| Total Communications | | | | | | | 44,069,719 | |
| | | | | | | | | |
| Energy - 1.0% |
| Sabine Pass Liquefaction LLC | | | | | | | | |
| 5.63% due 02/01/21 | | | 5,500,000 | | | | 5,782,703 | |
| 5.63% due 04/15/23 | | | 4,200,000 | | | | 4,485,524 | |
| CNX Resources Corp. | | | | | | | | |
| 5.88% due 04/15/22 | | | 6,750,000 | | | | 6,792,188 | |
| Cheniere Corpus Christi Holdings LLC | | | | | | | | |
| 5.88% due 03/31/25 | | | 5,200,000 | | | | 5,440,500 | |
| Moss Creek Resources Holdings, Inc. | | | | | | | | |
| 7.50% due 01/15/266 | | | 4,000,000 | | | | 4,033,800 | |
| Unit Corp. | | | | | | | | |
| 6.63% due 05/15/21 | | | 4,000,000 | | | | 4,000,000 | |
| 24 | THE GUGGENHEIM FUNDS SEMI-ANNUAL REPORT | SEE NOTES TO FINANCIAL STATEMENTS. |
| SCHEDULE OF INVESTMENTS (Unaudited)(continued) | March 29, 2018 |
| FLOATING RATE STRATEGIES FUND | |
| | | Face
Amount~ | | | Value | |
| | | | | | | |
| Legacy Reserves Limited Partnership / Legacy Reserves Finance Corp. | | | | | | |
| 8.00% due 12/01/20 | | | 2,750,000 | | | $ | 2,220,625 | |
| American Midstream Partners Limited Partnership / American Midstream Finance Corp. | | | | | | | | |
| 8.50% due 12/15/216 | | | 1,268,000 | | | | 1,277,510 | |
| BreitBurn Energy Partners Limited Partnership / BreitBurn Finance Corp. | | | | | | | | |
| 7.88% due 04/15/225 | | | 850,000 | | | | 5,312 | |
| Total Energy | | | | | | | 34,038,162 | |
| | | | | | | | | |
| Consumer, Non-cyclical - 0.6% |
| HCA, Inc. | | | | | | | | |
| 6.50% due 02/15/20 | | | 13,914,000 | | | | 14,592,307 | |
| 4.50% due 02/15/27 | | | 1,500,000 | | | | 1,447,500 | |
| ServiceMaster Co. LLC | | | | | | | | |
| 5.13% due 11/15/246 | | | 4,000,000 | | | | 3,870,000 | |
| AMN Healthcare, Inc. | | | | | | | | |
| 5.13% due 10/01/246 | | | 450,000 | | | | 448,875 | |
| Total Consumer, Non-cyclical | | | | | | | 20,358,682 | |
| | | | | | | | | |
| Financial - 0.5% |
| Kennedy-Wilson, Inc. | | | | | | | | |
| 5.88% due 04/01/24 | | | 9,730,000 | | | | 9,644,863 | |
| Icahn Enterprises, LP / Icahn Enterprises Finance Corp. | | | | | | | | |
| 5.88% due 02/01/22 | | | 5,000,000 | | | | 5,012,500 | |
| 6.00% due 08/01/20 | | | 1,700,000 | | | | 1,734,000 | |
| Jefferies Finance LLC / JFIN Company-Issuer Corp. | | | | | | | | |
| 7.38% due 04/01/206 | | | 1,050,000 | | | | 1,060,500 | |
| Fidelity & Guaranty Life Holdings, Inc. | | | | | | | | |
| 6.38% due 04/01/216 | | | 450,000 | | | | 455,062 | |
| FBM Finance, Inc. | | | | | | | | |
| 8.25% due 08/15/216 | | | 200,000 | | | | 209,000 | |
| Total Financial | | | | | | | 18,115,925 | |
| | | | | | | | | |
| Industrial - 0.4% |
| Reynolds Group Issuer Incorporated / Reynolds Group Issuer LLC / Reynolds Group Issuer Luxembourg | | | | | | | | |
| 5.22% (3 Month USD LIBOR + 3.50%) due 07/15/216,8 | | | 7,500,000 | | | | 7,593,750 | |
| Ardagh Packaging Finance plc / Ardagh Holdings USA, Inc. | | | | | | | | |
| 4.63% due 05/15/236 | | | 2,100,000 | | | | 2,107,875 | |
| 4.25% due 09/15/226 | | | 1,500,000 | | | | 1,492,500 | |
| Novelis Corp. | | | | | | | | |
| 6.25% due 08/15/246 | | | 3,000,000 | | | | 3,075,000 | |
| Grinding Media Inc. / MC Grinding Media Canada Inc. | | | | | | | | |
| 7.38% due 12/15/236 | | | 750,000 | | | | 787,500 | |
| StandardAero Aviation Holdings, Inc. | | | | | | | | |
| 10.00% due 07/15/236 | | | 70,000 | | | | 76,038 | |
| Total Industrial | | | | | | | 15,132,663 | |
| | | | | | | | | |
| Technology - 0.4% |
| First Data Corp. | | | | | | | | |
| 5.00% due 01/15/246 | | | 6,250,000 | | | | 6,250,000 | |
| 5.75% due 01/15/246 | | | 5,200,000 | | | | 5,232,500 | |
| NCR Corp. | | | | | | | | |
| 5.88% due 12/15/21 | | | 1,450,000 | | | | 1,475,375 | |
| 6.38% due 12/15/23 | | | 800,000 | | | | 830,000 | |
| Total Technology | | | | | | | 13,787,875 | |
| | | | | | | | | |
| Consumer, Cyclical - 0.4% |
| Ferrellgas Limited Partnership / Ferrellgas Finance Corp. | | | | | | | | |
| 6.50% due 05/01/21 | | | 4,615,000 | | | | 4,418,863 | |
| Nathan’s Famous, Inc. | | | | | | | | |
| 6.63% due 11/01/256 | | | 4,275,000 | | | | 4,296,375 | |
| WMG Acquisition Corp. | | | | | | | | |
| 6.75% due 04/15/226 | | | 2,280,000 | | | | 2,356,950 | |
| SEE NOTES TO FINANCIAL STATEMENTS. | THE GUGGENHEIM FUNDS SEMI-ANNUAL REPORT | 25 |
| SCHEDULE OF INVESTMENTS (Unaudited)(continued) | March 29, 2018 |
| FLOATING RATE STRATEGIES FUND | |
| | | Face
Amount~ | | | Value | |
| | | | | | | |
| Lennar Corp. | | | | | | |
| 4.13% due 01/15/22 | | | 1,500,000 | | | $ | 1,475,175 | |
| Total Consumer, Cyclical | | | | | | | 12,547,363 | |
| | | | | | | | | |
| Utilities - 0.1% |
| AES Corp. | | | | | | | | |
| 6.00% due 05/15/26 | | | 2,000,000 | | | | 2,105,000 | |
| 5.50% due 04/15/25 | | | 1,059,000 | | | | 1,094,741 | |
| LBC Tank Terminals Holding Netherlands BV | | | | | | | | |
| 6.88% due 05/15/236 | | | 630,000 | | | | 647,325 | |
| Total Utilities | | | | | | | 3,847,066 | |
| | | | | | | | | |
| Basic Materials - 0.0% |
| Mirabela Nickel Ltd. | | | | | | | | |
| 9.50% due 06/24/19 | | | 1,279,819 | | | | 275,161 | |
| Eldorado Gold Corp. | | | | | | | | |
| 6.13% due 12/15/206 | | | 265,000 | | | | 251,750 | |
| Total Basic Materials | | | | | | | 526,911 | |
| Total Corporate Bonds | | | | | | | | |
| (Cost $165,930,977) | | | | | | | 162,424,366 | |
| | | | | | | | | |
| ASSET-BACKED SECURITIES†† - 2.5% |
| Collateralized Loan Obligations - 2.4% |
| Golub Capital Partners CLO Ltd. | | | | | | | | |
| 2016-33A, 4.36% (3 Month USD LIBOR + 2.48%) due 11/21/286,8 | | | 12,500,000 | | | | 12,548,419 | |
| TICP CLO II Ltd. | | | | | | | | |
| 2014-2A, 6.49% (3 Month USD LIBOR + 4.75%) due 07/20/266,8 | | | 6,560,000 | | | | 6,560,526 | |
| OHA Credit Partners IX Ltd. | | | | | | | | |
| 2013-9A, due 10/20/256,9 | | | 6,000,000 | | | | 5,250,666 | |
| Fortress Credit Opportunities VII CLO Ltd. | | | | | | | | |
| 2016-7A, 5.07% (3 Month USD LIBOR + 2.95%) due 12/15/286,8 | | | 5,000,000 | | | | 5,034,252 | |
| Cerberus Loan Funding XVII Ltd. | | | | | | | | |
| 2016-3A, 4.25% (3 Month USD LIBOR + 2.53%) due 01/15/286,8 | | | 5,000,000 | | | | 5,020,288 | |
| PFP Ltd. | | | | | | | | |
| 2015-2, 4.49% (1 Month USD LIBOR + 2.70%) due 07/14/346,8 | | | 5,000,000 | | | | 5,002,156 | |
| Octagon Loan Funding Ltd., | | | | | | | | |
| due 11/18/269 | | | 5,600,000 | | | | 4,861,909 | |
| Jamestown CLO V Ltd. | | | | | | | | |
| 2014-5A, 6.83% (3 Month USD LIBOR + 5.10%) due 01/17/276,8 | | | 4,000,000 | | | | 3,987,929 | |
| OCP CLO Ltd. | | | | | | | | |
| 2012-2A, 4.75% (3 Month USD LIBOR + 2.85%) due 11/22/256,8 | | | 3,800,000 | | | | 3,826,652 | |
| Avery Point II CLO Ltd. | | | | | | | | |
| 2013-3X COM, due 01/18/259 | | | 4,300,020 | | | | 3,704,327 | |
| Fortress Credit Opportunities VI CLO Ltd. | | | | | | | | |
| 2015-6A, 5.72% (3 Month USD LIBOR + 3.65%) due 10/10/266,8 | | | 3,500,000 | | | | 3,503,994 | |
| ABPCI Direct Lending Fund CLO I LLC | | | | | | | | |
| 2016-1A, 4.44% (3 Month USD LIBOR + 2.70%) due 12/22/286,8 | | | 3,000,000 | | | | 3,011,004 | |
| 26 | THE GUGGENHEIM FUNDS SEMI-ANNUAL REPORT | SEE NOTES TO FINANCIAL STATEMENTS. |
| SCHEDULE OF INVESTMENTS (Unaudited)(continued) | March 29, 2018 |
| FLOATING RATE STRATEGIES FUND | |
| | | Face
Amount~ | | | Value | |
| | | | | | | |
| Flagship CLO VIII Ltd. | | | | | | |
| 2014-8A, 4.22% (3 Month USD LIBOR + 2.50%) due 01/16/266,8 | | | 3,000,000 | | | $ | 3,002,139 | |
| Halcyon Loan Advisors Funding Ltd. | | | | | | | | |
| 2012-1A, 4.84% (3 Month USD LIBOR + 3.00%) due 08/15/236,8 | | | 2,600,000 | | | | 2,610,343 | |
| Treman Park CLO Ltd. | | | | | | | | |
| 2015-1A, due 04/20/276,9 | | | 3,000,000 | | | | 2,576,274 | |
| Ares XXXIII CLO Ltd. | | | | | | | | |
| 2016-1A, 4.82% (3 Month USD LIBOR + 2.80%) due 12/05/256,8 | | | 2,500,000 | | | | 2,524,704 | |
| Fortress Credit Opportunities V CLO Ltd. | | | | | | | | |
| 2014-5A, 5.96% (3 Month USD LIBOR + 4.25%) due 10/15/266,8 | | | 2,500,000 | | | | 2,502,548 | |
| KVK CLO Ltd. | | | | | | | | |
| 2014-1A, 4.44% (3 Month USD LIBOR + 2.60%) due 05/15/266,8 | | | 2,000,000 | | | | 2,005,584 | |
| ACIS CLO Ltd. | | | | | | | | |
| 2015-6A, 5.14% (3 Month USD LIBOR + 3.37%) due 05/01/276,8 | | | 1,000,000 | | | | 1,002,613 | |
| 2013-1A, 6.23% (3 Month USD LIBOR + 4.50%) due 04/18/246,8 | | | 1,000,000 | | | | 1,000,217 | |
| Galaxy XVI CLO Ltd. | | | | | | | | |
| 2013-16A, 5.20% (3 Month USD LIBOR + 3.35%) due 11/16/256,8 | | | 2,000,000 | | | | 2,002,278 | |
| Cerberus Loan Funding XVI, LP | | | | | | | | |
| 2016-2A, 5.52% (3 Month USD LIBOR + 3.80%) due 11/15/276,8 | | | 1,000,000 | | | | 1,015,131 | |
| Newstar Commercial Loan Funding LLC | | | | | | | | |
| 2017-1A, 5.13% (3 Month USD LIBOR + 3.50%) due 03/20/276,8 | | | 1,000,000 | | | | 1,010,320 | |
| Shackleton VII CLO Ltd. | | | | | | | | |
| 2015-7A, 4.57% (3 Month USD LIBOR + 2.85%) due 04/15/276,8 | | | 1,000,000 | | | | 1,000,930 | |
| NewStar Arlington Senior Loan Program LLC | | | | | | | | |
| 2014-1A, 5.05% (3 Month USD LIBOR + 3.30%) due 07/25/256,8 | | | 600,000 | | | | 600,795 | |
| Ares XXVI CLO Ltd. | | | | | | | | |
| 2013-1A, due 04/15/256,9 | | | 1,250,000 | | | | 29,574 | |
| Total Collateralized Loan Obligations | | | | | | | 85,195,572 | |
| | | | | | | | | |
| Collateralized Debt Obligations - 0.1% |
| N-Star REL CDO VIII Ltd. | | | | | | | | |
| 2006-8A, 2.02% (1 Month USD LIBOR + 0.36%) due 02/01/416,8 | | | 1,730,490 | | | | 1,720,868 | |
| | | | | | | | | |
| Transport-Aircraft - 0.0% |
| Airplanes Pass Through Trust | | | | | | | | |
| 2001-1A, 2.33% (1 Month USD LIBOR + 0.55%) due 03/15/198,10 | | | 896,492 | | | | 40,342 | |
| Total Asset-Backed Securities | | | | | | | | |
| (Cost $85,641,089) | | | | | | | 86,956,782 | |
| SEE NOTES TO FINANCIAL STATEMENTS. | THE GUGGENHEIM FUNDS SEMI-ANNUAL REPORT | 27 |
| SCHEDULE OF INVESTMENTS (Unaudited)(continued) | March 29, 2018 |
| FLOATING RATE STRATEGIES FUND | |
| | | Face
Amount~ | | | Value | |
| | | | | | | |
| COLLATERALIZED MORTGAGE OBLIGATIONS†† - 1.6% |
| Residential Mortgage Backed Securities - 1.6% |
| RALI Series Trust | | | | | | |
| 2006-QO2, 2.06% (1 Month USD LIBOR + 0.22%) due 02/25/468 | | | 8,155,002 | | | $ | 3,554,310 | |
| 2007-QO4, 2.06% (1 Month USD LIBOR + 0.19%) due 05/25/478 | | | 2,951,043 | | | | 2,846,810 | |
| 2006-QO10, 2.03% (1 Month USD LIBOR + 0.16%) due 01/25/378 | | | 2,892,873 | | | | 2,721,518 | |
| Soundview Home Loan Trust | | | | | | | | |
| 2005-OPT3, 2.34% (1 Month USD LIBOR + 0.47%) due 11/25/358 | | | 6,000,000 | | | | 5,934,837 | |
| GSAA Home Equity Trust | | | | | | | | |
| 2006-14, 2.04% (1 Month USD LIBOR + 0.17%) due 09/25/368 | | | 10,230,822 | | | | 5,034,940 | |
| 2007-7, 2.14% (1 Month USD LIBOR + 0.27%) due 07/25/378 | | | 679,004 | | | | 645,800 | |
| American Home Mortgage Investment Trust | | | | | | | | |
| 2006-1, 2.27% (1 Month USD LIBOR + 0.40%) due 03/25/468 | | | 5,497,839 | | | | 5,318,306 | |
| IndyMac INDX Mortgage Loan Trust | | | | | | | | |
| 2006-AR4, 2.08% (1 Month USD LIBOR + 0.21%) due 05/25/468 | | | 4,902,550 | | | | 4,676,462 | |
| Washington Mutual Mortgage Pass-Through Certificates Trust | | | | | | | | |
| 2007-OA6, 2.01% (1 Year CMT Rate + 0.81%) due 07/25/478 | | | 4,681,945 | | | | 4,277,201 | |
| CIM Trust | | | | | | | | |
| 2017-2, 3.66% (1 Month USD LIBOR + 2.00%) due 12/25/576,8 | | | 4,170,087 | | | | 4,215,434 | |
| American Home Mortgage Assets Trust | | | | | | | | |
| 2006-4, 2.08% (1 Month USD LIBOR + 0.21%) due 10/25/468 | | | 4,224,630 | | | | 3,064,223 | |
| Washington Mutual Mortgage Pass-Through Certificates WMALT Series Trust | | | | | | | | |
| 2006-AR9, 2.12% (1 Year CMT Rate + 0.84%) due 11/25/468 | | | 3,483,864 | | | | 2,931,228 | |
| Lehman XS Trust Series | | | | | | | | |
| 2006-16N, 2.06% (1 Month USD LIBOR + 0.19%) due 11/25/468 | | | 2,554,023 | | | | 2,491,383 | |
| Wachovia Asset Securitization Issuance II LLC Trust | | | | | | | | |
| 2007-HE1, 2.01% (1 Month USD LIBOR + 0.14%) due 07/25/376,8 | | | 2,486,885 | | | | 2,395,816 | |
| Merrill Lynch Alternative Note Asset Trust Series | | | | | | | | |
| 2007-OAR3, 1.81% (1 Month USD LIBOR + 0.19%) due 07/25/378 | | | 2,321,199 | | | | 2,105,619 | |
| Nomura Resecuritization Trust | | | | | | | | |
| 2015-4R, 0.73% (1 Month USD LIBOR + 0.43%) due 03/26/366,8 | | | 2,016,802 | | | | 1,940,579 | |
| Morgan Stanley Re-REMIC Trust | | | | | | | | |
| 2010-R5, 3.51% due 06/26/366 | | | 822,368 | | | | 694,545 | |
| Alliance Bancorp Trust | | | | | | | | |
| 2007-OA1, 2.11% (1 Month USD LIBOR + 0.24%) due 07/25/378 | | | 686,829 | | | | 589,113 | |
| 28 | THE GUGGENHEIM FUNDS SEMI-ANNUAL REPORT | SEE NOTES TO FINANCIAL STATEMENTS. |
| SCHEDULE OF INVESTMENTS (Unaudited)(continued) | March 29, 2018 |
| FLOATING RATE STRATEGIES FUND | |
| | | Face
Amount~ | | | Value | |
| | | | | | | |
| New Century Home Equity Loan Trust | | | | | | |
| 2004-4, 2.67% (1 Month USD LIBOR + 0.80%) due 02/25/358 | | | 302,363 | | | $ | 291,904 | |
| Total Residential Mortgage Backed Securities | | | | | | | 55,730,028 | |
| Total Collateralized Mortgage Obligations |
| (Cost $52,168,574) | | | | | | | 55,730,028 | |
| | | | | | | | | |
| SENIOR FIXED RATE INTERESTS†† - 0.1% |
| Consumer, Cyclical - 0.1% |
| Men’s Wearhouse, Inc. | | | | | | | | |
| 5.00% due 06/18/21 | | | 4,700,000 | | | | 4,696,099 | |
| Total Senior Fixed Rate Interests | | | | | | | | |
| (Cost $4,700,000) | | | | | | | 4,696,099 | |
| |
| COMMERCIAL PAPER†† - 3.2% |
| AutoZone, Inc. | | | | | | | | |
| 2.20% due 04/12/187 | | | 25,000,000 | | | | 24,983,194 | |
| 2.30% due 04/13/187 | | | 10,000,000 | | | | 9,992,333 | |
| Total AutoZone, Inc. | | | | | | | 34,975,527 | |
| FedEx Corp. | | | | | | | | |
| 1.87% due 04/06/187 | | | 30,500,000 | | | | 30,492,079 | |
| Molex Electronics Technologies, LLC. | | | | | | | | |
| 2.25% due 04/10/187 | | | 20,000,000 | | | | 19,988,750 | |
| Waste Management, Inc. | | | | | | | | |
| 2.20% due 04/11/187 | | | 13,000,000 | | | | 12,992,056 | |
| Hewlett-Packard Co. | | | | | | | | |
| 2.39% due 04/06/187 | | | 12,500,000 | | | | 12,495,851 | |
| Total Commercial Paper | | | | | | | | |
| (Cost $110,944,263) | | | | | | | 110,944,263 | |
| | | | | | | | | |
| Total Investments - 102.5% | | | | | | | | |
| (Cost $3,598,517,188) | | | | | | $ | 3,592,436,732 | |
| Other Assets & Liabilities, net - (2.5)% | | | | | | | (89,035,610 | ) |
| Total Net Assets - 100.0% | | | | | | $ | 3,503,401,122 | |
| FORWARD FOREIGN CURRENCY EXCHANGE CONTRACTS†† |
| Counterparty | | Contracts
to Sell | | Currency | | Settlement
Date | | Settlement
Value | | | Value at
March 29,
2018 | | | Net
Unrealized
Appreciation/
(Depreciation) | |
| JPMorgan Chase & Co. | | 145,225,000 | | EUR | | 04/10/18 | | $ | 179,252,306 | | | $ | 178,794,605 | | | $ | 457,701 | |
| Goldman Sachs | | 1,306,000 | | EUR | | 04/10/18 | | | 1,628,604 | | | | 1,607,889 | | | | 20,715 | |
| Deutsche Bank | | 15,075,000 | | EUR | | 04/10/18 | | | 18,561,289 | | | | 18,559,674 | | | | 1,615 | |
| Citigroup | | 15,425,000 | | GBP | | 04/10/18 | | | 21,342,030 | | | | 21,649,674 | | | | (307,644 | ) |
| | | | | | | | | | | | | | | | | $ | 172,387 | |
| Counterparty | | Contracts
to Buy | | Currency | | Settlement
Date | | Settlement
Value | | | Value at
March 29,
2018 | | | Net
Unrealized
Appreciation/
(Depreciation) | |
| Barclays | | 19,800,000 | | EUR | | 04/10/18 | | $ | 24,301,403 | | | $ | 24,376,885 | | | $ | 75,482 | |
| Morgan Stanley | | 601,000 | | EUR | | 04/10/18 | | | 746,059 | | | | 739,925 | | | | (6,134 | ) |
| | | | | | | | | | | | | | | | | $ | 69,348 | |
| SEE NOTES TO FINANCIAL STATEMENTS. | THE GUGGENHEIM FUNDS SEMI-ANNUAL REPORT | 29 |
| SCHEDULE OF INVESTMENTS (Unaudited)(continued) | March 29, 2018 |
| FLOATING RATE STRATEGIES FUND | |
| ~ | The face amount is denominated in U.S. dollars unless otherwise indicated. |
| * | Non-income producing security. |
| † | Value determined based on Level 1 inputs, unless otherwise noted — See Note 4. |
| †† | Value determined based on Level 2 inputs, unless otherwise noted — See Note 4. |
| ††† | Value determined based on Level 3 inputs — See Note 4. |
| 1 | Security was fair valued by the Valuation Committee at March 29, 2018. The total market value of fair valued securities amounts to $34,693,906, (cost $34,596,554) or 1.0% of total net assets. |
| 2 | Affiliated issuer. |
| 3 | Rate indicated is the 7 day yield as of March 29, 2018. |
| 4 | Term loan interests in the Fund’s portfolio generally have variable rates. All or a portion of this security represents unsettled loan positions and may not have a stated coupon rate. |
| 5 | Security is in default of interest and/or principal obligations. |
| 6 | Security is a 144A or Section 4(a)(2) security. These securities have been determined to be liquid under guidelines established by the Board of Trustees. The total market value of 144A or Section 4(a)(2) securities is $162,131,313 (cost $159,632,169), or 4.6% of total net assets. |
| 7 | Rate indicated is the effective yield at the time of purchase. |
| 8 | Variable rate security. Rate indicated is the rate effective at March 29, 2018. In some instances, the underlying reference rate shown was below the minimum rate earned by the security or has been adjusted by a predetermined factor. The settlement status of a position may also impact the effective rate indicated. In instances where multiple underlying reference rates and spread amounts are shown, the effective rate is based on a weighted average. |
| 9 | Security has no stated coupon. However, it is expected to receive residual cash flow payments on defined deal dates. |
| 10 | Security is a 144A or Section 4(a)(2) security. These securities have been determined to be illiquid and restricted under guidelines established by the Board of Trustees. The total market value of 144A or Section 4(a)(2) illiquid and restricted securities is $40,342 (cost $723,184), or less than 0.1% of total net assets — See Note 9. |
| 11 | The underlying reference rate was negative at period end causing the effective rate to be equal to the spread amount listed. |
| | CMT — Constant Maturity Treasury |
| | EUR — Euro |
| | EURIBOR — European Interbank Offered Rate |
| | GBP — British Pound |
| | LIBOR — London Interbank Offered Rate |
| | plc — Public Limited Company |
| | |
| | See Sector Classification in Other Information section. |
| 30 | THE GUGGENHEIM FUNDS SEMI-ANNUAL REPORT | SEE NOTES TO FINANCIAL STATEMENTS. |
| SCHEDULE OF INVESTMENTS (Unaudited)(continued) | March 29, 2018 |
| FLOATING RATE STRATEGIES FUND | |
The following table summarizes the inputs used to value the Fund’s investments at March 29, 2018 (See Note 4 in the Notes to Financial Statements):
| Investments in Securities (Assets) | | Level 1
Quoted
Prices | | | Level 2
Significant
Observable
Inputs | | | Level 2 -
Other* | | | Level 3
Significant
Unobservable
Inputs | | | Total | |
| Asset-Backed Securities | | $ | — | | | $ | 86,956,782 | | | $ | — | | | $ | — | | | $ | 86,956,782 | |
| Collateralized Mortgage Obligations | | | — | | | | 55,730,028 | | | | — | | | | — | | | | 55,730,028 | |
| Commercial Paper | | | — | | | | 110,944,263 | | | | — | | | | — | | | | 110,944,263 | |
| Common Stocks | | | 11,121 | | | | — | | | | — | | | | 30,701 | | | | 41,822 | |
| Corporate Bonds | | | — | | | | 162,424,366 | | | | — | | | | — | | | | 162,424,366 | |
| Forward Foreign Currency Exchange Contracts | | | — | | | | — | | | | 555,513 | | | | — | | | | 555,513 | |
| Money Market Fund | | | 80,322,683 | | | | — | | | | — | | | | — | | | | 80,322,683 | |
| Mutual Funds | | | 26,457,833 | | | | — | | | | — | | | | — | | | | 26,457,833 | |
| Senior Fixed Rate Interests | | | — | | | | 4,696,099 | | | | — | | | | — | | | | 4,696,099 | |
| Senior Floating Rate Interests | | | — | | | | 3,030,199,651 | | | | — | | | | 34,663,205 | | | | 3,064,862,856 | |
| Total Assets | | $ | 106,791,637 | | | $ | 3,450,951,189 | | | $ | 555,513 | | | $ | 34,693,906 | | | $ | 3,592,992,245 | |
| | | | | | | | | | | | | | | | | | | | | |
| Investments in Securities (Liabilities) | | | Level 1
Quoted
Prices | | | | Level 2
Significant
Observable
Inputs | | | | Level 2 -
Other* | | | | Level 3
Significant
Unobservable
Inputs | | | | Total | |
| Forward Foreign Currency Exchange Contracts | | $ | — | | | $ | — | | | $ | 313,778 | | | $ | — | | | $ | 313,778 | |
| Unfunded Loan Commitments (Note 8) | | | — | | | | — | | | | — | | | | 489,226 | | | | 489,226 | |
| Total Liabilities | | $ | — | | | $ | — | | | $ | 313,778 | | | $ | 489,226 | | | $ | 803,004 | |
| * | Other financial instruments include forward foreign currency exchange contracts, which are reported as unrealized gain/loss at period end. |
| SEE NOTES TO FINANCIAL STATEMENTS. | THE GUGGENHEIM FUNDS SEMI-ANNUAL REPORT | 31 |
| SCHEDULE OF INVESTMENTS (Unaudited)(continued) | March 29, 2018 |
| FLOATING RATE STRATEGIES FUND | |
The following is a summary of significant unobservable inputs used in the fair valuation of assets and liabilities categorized within Level 3 of the fair value hierarchy:
| Category | | Ending Balance at March 29, 2018 | | | Valuation
Technique | | Unobservable
Inputs | | Input
Range | | Weighted Average |
| Assets: | | | | | | | | | | | |
| Common Stocks | | $ | 30,701 | | | Enterprise Value | | Valuation Multiple | | 6.9x | | — |
| Senior Floating Rate Interests | | | 32,749,189 | | | Yield Analysis | | Yield | | 5.7%-8.5% | | 7.0% |
| Senior Floating Rate Interests | | | 1,914,016 | | | Model Price | | Purchase Price | | — | | — |
| Total Assets | | $ | 34,693,906 | | | | | | | | | |
| | | | | | | | | | | | | |
| Liabilities: | | | | | | | | | | | | |
| Unfunded Loan Commitments | | $ | (489,226 | ) | | Model Price | | Purchase Price | | — | | — |
Transfers between investment levels may occur as the markets fluctuate and/or the availability of data used in an investment’s valuation changes. Transfers between valuation levels, if any, are in comparison to the valuation levels at the end of the previous fiscal year, and are effective using the fair value as of the end of the current fiscal period.
For the period ended March 29, 2018, the Fund had a total value of $806,700 transfer into Level 3 from Level 2 due to the lack of observable inputs. There were no other securities that transferred between levels.
Summary of Fair Value Level 3 Activity
Following is a reconciliation of Level 3 assets for which significant unobservable inputs were used to determine fair value for the period ended March 29, 2018:
| | | Assets | | | | | | Liabilities | |
| | | Senior
Floating Rate Interests | | | Common
Stocks | | | Total
Assets | | | Unfunded
Loan
Commitments | |
| Beginning Balance | | $ | 45,746,703 | | | $ | 19,586 | | | $ | 45,766,289 | | | $ | (1,036,307 | ) |
| Purchases/Funding | | | 12,030,334 | | | | — | | | | 12,030,334 | | | | 1,638,565 | |
| Sales, maturities and paydowns/Receipts | | | (24,180,023 | ) | | | (1,000 | ) | | | (24,181,023 | ) | | | (1,663,322 | ) |
| Total realized gains or losses included in earnings | | | (1,145,483 | ) | | | 442 | | | | (1,145,041 | ) | | | 68,361 | |
| Total change in unrealized gains or losses included in earnings | | | 1,404,974 | | | | 11,673 | | | | 1,416,647 | | | | 503,477 | |
| Transfers into Level 3 | | | 806,700 | | | | — | | | | 806,700 | | | | — | |
| Transfers out of Level 3 | | | — | | | | — | | | | — | | | | — | |
| Ending Balance | | $ | 34,663,205 | | | $ | 30,701 | | | $ | 34,693,906 | | | $ | (489,226 | ) |
| Net Change in unrealized appreciation (depreciation) for investments in securities still held at March 29, 2018 | | $ | 149,831 | | | $ | 11,673 | | | $ | 161,504 | | | $ | 503,509 | |
Affiliated Transactions
Investments representing 5% or more of the outstanding voting shares of a portfolio company of a fund, or control of or by, or common control under the Guggenheim Investments (“GI”), result in that portfolio company being considered an affiliated company of such fund, as defined in the 1940 Act.
| 32 | THE GUGGENHEIM FUNDS SEMI-ANNUAL REPORT | SEE NOTES TO FINANCIAL STATEMENTS. |
| SCHEDULE OF INVESTMENTS (Unaudited)(concluded) | March 29, 2018 |
| FLOATING RATE STRATEGIES FUND | |
The Fund may invest in certain of the underlying series of Guggenheim Strategy Funds Trust, including Guggenheim Strategy Fund I, Guggenheim Strategy Fund II, and Guggenheim Strategy Fund III (collectively, the “Cash Management Funds”), each of which are open-end management investment companies managed by GI. The Cash Management Funds, which launched on March 11, 2014, are offered as cash management options only to mutual funds, trusts, and other accounts managed by GI and/or its affiliates, and are not available to the public. The Cash Management Funds pay no investment management fees. The Cash Management Funds’ annual report on Form N-CSR dated September 30, 2017, is available publicly or upon request. This information is available from the EDGAR database on the SEC’s website at https://www.sec.gov/Archives/edgar/data/1601445/000089180417000715/gug72218.htm.
Transactions during the period ended March 29, 2018, in which the portfolio company is an “affiliated person”, were as follows:
| Security Name | | Value
09/30/17 | | | Additions | | | Reductions | | | Realized
Gain | | | Change in
Unrealized | | | Value
03/29/18 | |
| Mutual Funds | | | | | | | | | | | | | | | | | | |
| Guggenheim Strategy Fund I | | $ | 18,806,574 | | | $ | 246,912 | | | $ | — | | | $ | — | | | $ | (45,192 | ) | | $ | 19,008,294 | |
| Guggenheim Strategy Fund II | | | 7,362,879 | | | | 101,422 | | | | — | | | | — | | | | (14,762 | ) | | | 7,449,539 | |
| Common Stocks | | | | | | | | | | | | | | | | | | | | | | | | |
| Targus Group International, Inc .*,1 | | | 19,586 | | | | — | | | | (1,000 | ) | | | 442 | | | | 11,673 | | | | 30,701 | |
| Senior Floating Rate Interests | | | | | | | | | | | | | | | | | | | | | | | | |
| Aspect Software, Inc. 12.38% (1 Month USD LIBOR + 10.50%) due 05/25/202 | | | 6,650,071 | | | | — | | | | (87,224 | ) | | | — | | | | 80,688 | | | | 6,643,535 | |
Targus Group International, Inc.
due 05/24/161,3 | | | — | ** | | | — | | | | — | | | | — | | | | — | | | | — | ** |
| | | $ | 32,839,110 | | | $ | 348,334 | | | $ | (88,224 | ) | | $ | 442 | | | $ | 32,407 | | | $ | 33,132,069 | |
| Security Name | | Shares
03/29/18 | | | Investment
Income | | | Capital Gain
Distributions | |
| Mutual Funds | | | | | | | | | |
| Guggenheim Strategy Fund I | | | 758,814 | | | $ | 239,614 | | | $ | 7,149 | |
| Guggenheim Strategy Fund II | | | 297,862 | | | | 97,432 | | | | 3,940 | |
| Common Stocks | | | | | | | | | | | | |
| Targus Group International, Inc.*,1 | | | 12,773 | | | | — | | | | — | |
| Senior Floating Rate Interests | | | | | | | | | | | | |
| Aspect Software, Inc. 12.38% (1 Month USD LIBOR + 10.50%) due 05/25/202 | | | 6,672,695 | | | | 401,411 | | | | — | |
| Targus Group International, Inc. due 05/24/161,3 | | | 152,876 | | | | — | | | | — | |
| | | | | | | $ | 738,457 | | | $ | 11,089 | |
| * | Non-income producing security. |
| ** | Market value is less than $1. |
| 1 | Security was fair valued by the Valuation Committee at March 29, 2018. The total market value of fair valued securities amounts to $30,701, (cost $161,565) or 0.0% of total net assets. |
| 2 | Variable rate security. Rate indicated is the rate effective at March 29, 2018. In some instances, the underlying reference rate shown was below the minimum rate earned by the security or has been adjusted by a predetermined factor. The settlement status of a position may also impact the effective rate indicated. In instances where multiple underlying reference rates and spread amounts are shown, the effective rate is based on a weighted average. |
| 3 | Term loan interests in the Fund’s portfolio generally have variable rates. All or a portion of this security represents unsettled loan positions and may not have a stated coupon rate. |
| SEE NOTES TO FINANCIAL STATEMENTS. | THE GUGGENHEIM FUNDS SEMI-ANNUAL REPORT | 33 |
| STATEMENT OF ASSETS AND LIABILITIES (Unaudited) |
| FLOATING RATE STRATEGIES FUND |
March 29, 2018
| Assets: |
| Investments in unaffiliated issuers, at value (cost $3,565,387,225) | | $ | 3,559,304,663 | |
| Investments in affiliated issuers, at value (cost $33,129,963) | | | 33,132,069 | |
| Foreign currency, at value (cost $727,308) | | | 727,308 | |
| Cash | | | 40,396,366 | |
| Segregated cash with broker | | | 822,053 | |
| Unrealized appreciation on forward foreign currency exchange contracts | | | 555,513 | |
| Prepaid expenses | | | 401,619 | |
| Receivables: |
| Securities sold | | | 28,087,423 | |
| Interest | | | 11,435,009 | |
| Fund shares sold | | | 6,863,969 | |
| Foreign taxes reclaim | | | 61,408 | |
| Dividends | | | 57,887 | |
| Total assets | | | 3,681,845,287 | |
| | | | | |
| Liabilities: |
| Unfunded loan commitments, at value (Note 8) (proceeds $3,073,092) | | | 489,226 | |
| Segregated cash due to broker | | | 370,000 | |
| Unrealized depreciation on forward foreign currency exchange contracts | | | 313,778 | |
| Payable for: |
| Securities purchased | | | 160,320,728 | |
| Fund shares redeemed | | | 12,970,124 | |
| Distributions to shareholders | | | 1,721,706 | |
| Management fees | | | 1,494,584 | |
| Distribution and service fees | | | 332,655 | |
| Fund accounting/administration fees | | | 237,110 | |
| Transfer agent/maintenance fees | | | 63,685 | |
| Trustees’ fees* | | | 41,982 | |
| Miscellaneous | | | 88,587 | |
| Total liabilities | | | 178,444,165 | |
| Net assets | | $ | 3,503,401,122 | |
| | | | | |
| Net assets consist of: |
| Paid in capital | | $ | 3,535,895,034 | |
| Accumulated net investment loss | | | (16,262,674 | ) |
| Accumulated net realized loss on investments | | | (12,754,637 | ) |
| Net unrealized depreciation on investments | | | (3,476,601 | ) |
| Net assets | | $ | 3,503,401,122 | |
| | | | | |
| A-Class: |
| Net assets | | $ | 475,818,324 | |
| Capital shares outstanding | | | 18,312,926 | |
| Net asset value per share | | $ | 25.98 | |
| Maximum offering price per share (Net asset value divided by 97.00%) | | $ | 26.78 | |
| | | | | |
| C-Class: |
| Net assets | | $ | 185,947,473 | |
| Capital shares outstanding | | | 7,159,262 | |
| Net asset value per share | | $ | 25.97 | |
| | | | | |
| P-Class: |
| Net assets | | $ | 343,347,953 | |
| Capital shares outstanding | | | 13,208,510 | |
| Net asset value per share | | $ | 25.99 | |
| | | | | |
| Institutional Class: |
| Net assets | | $ | 2,498,287,372 | |
| Capital shares outstanding | | | 96,067,575 | |
| Net asset value per share | | $ | 26.01 | |
| * | Relates to Trustees not deemed "interested persons" within the meaning of Section 2(a)(19) of the 1940 Act. |
| 34 | THE GUGGENHEIM FUNDS SEMI-ANNUAL REPORT | SEE NOTES TO FINANCIAL STATEMENTS. |
| STATEMENT OF OPERATIONS (Unaudited) |
| FLOATING RATE STRATEGIES FUND |
Period Ended March 29, 2018
| Investment Income: |
| Interest from securities of affiliated issuers | | $ | 401,411 | |
| Dividends from securities of affiliated issuers | | | 337,046 | |
| Interest from securities of unaffiliated issuers (net of foreign withholding tax of $1,590) | | | 84,970,187 | |
| Total investment income | | | 85,708,644 | |
| | | | | |
| Expenses: |
| Management fees | | | 11,568,729 | |
| Distribution and service fees: |
| A-Class | | | 634,796 | |
| C-Class | | | 963,399 | |
| P-Class | | | 429,531 | |
| Recoupment of previously waived fees: |
| Institutional Class | | | 11 | |
| Transfer agent/maintenance fees: |
| A-Class | | | 343,032 | |
| C-Class | | | 82,438 | |
| P-Class | | | 216,901 | |
| Institutional Class | | | 920,941 | |
| Fund accounting/administration fees | | | 1,423,858 | |
| Line of credit fees | | | 89,617 | |
| Custodian fees | | | 32,671 | |
| Trustees’ fees* | | | 26,183 | |
| Miscellaneous | | | 438,967 | |
| Total expenses | | | 17,171,074 | |
| Less: |
| Expenses reimbursed by Adviser: |
| A-Class | | | (313,019 | ) |
| C-Class | | | (81,516 | ) |
| P-Class | | | (197,548 | ) |
| Institutional Class | | | (640,306 | ) |
| Total reimbursed expenses | | | (1,232,389 | ) |
| Net expenses | | | 15,938,685 | |
| Net investment income | | | 69,769,959 | |
| | | | | |
| Net Realized and Unrealized Gain (Loss): |
| Net realized gain (loss) on: |
| Investments in unaffiliated issuers | | $ | 6,361,939 | |
| Investments in affiliated issuers | | | 442 | |
| Distributions received from affiliated investment company shares | | | 11,089 | |
| Foreign currency transactions | | | (62,163 | ) |
| Forward foreign currency exchange contracts | | | (4,605,920 | ) |
| Net realized gain | | | 1,705,387 | |
| Net change in unrealized appreciation (depreciation) on: |
| Investments in unaffiliated issuers | | | (3,679,368 | ) |
| Investments in affiliated issuers | | | 32,407 | |
| Foreign currency translations | | | (156,974 | ) |
| Forward foreign currency exchange contracts | | | (1,223,615 | ) |
| Net change in unrealized appreciation (depreciation) | | | (5,027,550 | ) |
| Net realized and unrealized loss | | | (3,322,163 | ) |
| Net increase in net assets resulting from operations | | $ | 66,447,796 | |
| * | Relates to Trustees not deemed "interested persons" within the meaning of Section 2(a)(19) of the 1940 Act. |
| SEE NOTES TO FINANCIAL STATEMENTS. | THE GUGGENHEIM FUNDS SEMI-ANNUAL REPORT | 35 |
| STATEMENTS OF CHANGES IN NET ASSETS |
| FLOATING RATE STRATEGIES FUND | |
| | | Period Ended
March 29,
2018
(Unaudited) | | | Year Ended
September 30,
2017 | |
| Increase (Decrease) in Net Assets from Operations: | | | | | | |
| Net investment income | | $ | 69,769,959 | | | $ | 122,442,633 | |
| Net realized gain (loss) on investments | | | 1,705,387 | | | | (12,762,679 | ) |
| Net change in unrealized appreciation (depreciation) on investments | | | (5,027,550 | ) | | | 20,372,275 | |
| Net increase in net assets resulting from operations | | | 66,447,796 | | | | 130,052,229 | |
| | | | | | | | | |
| Distributions to shareholders from: | | | | | | | | |
| Net investment income | | | | | | | | |
| A-Class | | | (9,704,416 | ) | | | (18,831,467 | ) |
| C-Class | | | (2,972,912 | ) | | | (6,084,905 | ) |
| P-Class | | | (6,573,170 | ) | | | (9,380,954 | ) |
| Institutional Class | | | (51,072,826 | ) | | | (89,039,000 | ) |
| Total distributions to shareholders | | | (70,323,324 | ) | | | (123,336,326 | ) |
| | | | | | | | | |
| Capital share transactions: | | | | | | | | |
| Proceeds from sale of shares | | | | | | | | |
| A-Class | | | 88,173,996 | | | | 298,670,600 | |
| C-Class | | | 14,014,738 | | | | 66,783,552 | |
| P-Class | | | 76,685,967 | | | | 320,175,325 | |
| Institutional Class | | | 514,474,162 | | | | 1,832,796,630 | |
| Distributions reinvested | | | | | | | | |
| A-Class | | | 7,906,258 | | | | 15,548,327 | |
| C-Class | | | 2,336,638 | | | | 4,746,759 | |
| P-Class | | | 6,560,649 | | | | 9,376,862 | |
| Institutional Class | | | 41,617,266 | | | | 70,629,896 | |
| Cost of shares redeemed | | | | | | | | |
| A-Class | | | (154,680,319 | ) | | | (233,410,919 | ) |
| C-Class | | | (34,218,104 | ) | | | (65,504,737 | ) |
| P-Class | | | (100,360,234 | ) | | | (93,746,737 | ) |
| Institutional Class | | | (645,374,981 | ) | | | (961,454,365 | ) |
| Net increase (decrease) from capital share transactions | | | (182,863,964 | ) | | | 1,264,611,193 | |
| Net increase (decrease) in net assets | | | (186,739,492 | ) | | | 1,271,327,096 | |
| | | | | | | | | |
| Net assets: | | | | | | | | |
| Beginning of period | | | 3,690,140,614 | | | | 2,418,813,518 | |
| End of period | | $ | 3,503,401,122 | | | $ | 3,690,140,614 | |
| Accumulated net investment loss at end of period | | $ | (16,262,674 | ) | | $ | (15,709,309 | ) |
| 36 | THE GUGGENHEIM FUNDS SEMI-ANNUAL REPORT | SEE NOTES TO FINANCIAL STATEMENTS. |
| STATEMENTS OF CHANGES IN NET ASSETS (concluded) |
| FLOATING RATE STRATEGIES FUND | |
| | | Period Ended
March 29,
2018
(Unaudited) | | | Year Ended
September 30,
2017 | |
| Capital share activity: | | | | | | |
| Shares sold | | | | | | |
| A-Class | | | 3,388,854 | | | | 11,471,959 | |
| C-Class | | | 538,727 | | | | 2,566,645 | |
| P-Class | | | 2,944,982 | | | | 12,285,213 | |
| Institutional Class | | | 19,748,845 | | | | 70,326,314 | |
| Shares issued from reinvestment of distributions | | | | | | | | |
| A-Class | | | 303,828 | | | | 597,271 | |
| C-Class | | | 89,828 | | | | 182,421 | |
| P-Class | | | 252,357 | | | | 359,999 | |
| Institutional Class | | | 1,597,577 | | | | 2,710,743 | |
| Shares redeemed | | | | | | | | |
| A-Class | | | (5,944,460 | ) | | | (8,965,201 | ) |
| C-Class | | | (1,315,393 | ) | | | (2,517,107 | ) |
| P-Class | | | (3,854,246 | ) | | | (3,598,615 | ) |
| Institutional Class | | | (24,779,830 | ) | | | (36,900,597 | ) |
| Net increase (decrease) in shares | | | (7,028,931 | ) | | | 48,519,045 | |
| SEE NOTES TO FINANCIAL STATEMENTS. | THE GUGGENHEIM FUNDS SEMI-ANNUAL REPORT | 37 |
| FINANCIAL HIGHLIGHTS |
| FLOATING RATE STRATEGIES FUND | |
This table is presented to show selected data for a share outstanding throughout each period and to assist shareholders in evaluating a Fund’s performance for the periods presented.
| A-Class | | Period Ended
March 29,
2018a | | | Year Ended
Sept. 30,
2017 | | | Year Ended
Sept. 30,
2016 | | | Year Ended
Sept. 30,
2015 | | | Year Ended
Sept. 30,
2014 | | | Year Ended
Sept. 30,
2013 | |
| Per Share Data | | | | | | | | | | | | | | | | | | |
| Net asset value, beginning of period | | $ | 26.01 | | | $ | 25.92 | | | $ | 25.88 | | | $ | 26.52 | | | $ | 26.62 | | | $ | 26.10 | |
| Income (loss) from investment operations: |
| Net investment income (loss)b | | | .49 | | | | .93 | | | | .99 | | | | 1.04 | | | | 1.10 | | | | 1.30 | |
| Net gain (loss) on investments (realized and unrealized) | | | (.02 | ) | | | .10 | | | | .12 | | | | (.42 | ) | | | .05 | | | | .65 | |
| Total from investment operations | | | .47 | | | | 1.03 | | | | 1.11 | | | | .62 | | | | 1.15 | | | | 1.95 | |
| Less distributions from: |
| Net investment income | | | (.50 | ) | | | (.94 | ) | | | (1.07 | ) | | | (1.18 | ) | | | (1.20 | ) | | | (1.37 | ) |
| Net realized gains | | | — | | | | — | | | | — | | | | (.08 | ) | | | (.05 | ) | | | (.06 | ) |
| Total distributions | | | (.50 | ) | | | (.94 | ) | | | (1.07 | ) | | | (1.26 | ) | | | (1.25 | ) | | | (1.43 | ) |
| Net asset value, end of period | | $ | 25.98 | | | $ | 26.01 | | | $ | 25.92 | | | $ | 25.88 | | | $ | 26.52 | | | $ | 26.62 | |
| |
| Total Returnf | | | 1.81 | % | | | 4.03 | % | | | 4.47 | % | | | 2.36 | % | | | 4.42 | % | | | 7.61 | % |
| Ratios/Supplemental Data |
| Net assets, end of period (in thousands) | | $ | 475,818 | | | $ | 534,911 | | | $ | 452,611 | | | $ | 400,270 | | | $ | 365,207 | | | $ | 378,324 | |
| Ratios to average net assets: |
| Net investment income (loss) | | | 3.79 | % | | | 3.58 | % | | | 3.88 | % | | | 3.97 | % | | | 4.10 | % | | | 4.90 | % |
| Total expensesc | | | 1.15 | % | | | 1.13 | % | | | 1.20 | % | | | 1.19 | % | | | 1.18 | % | | | 1.19 | % |
| Net expensesd,g,h | | | 1.03 | % | | | 1.04 | % | | | 1.03 | % | | | 1.03 | % | | | 1.04 | % | | | 1.05 | % |
| Portfolio turnover rate | | | 16 | % | | | 44 | % | | | 35 | % | | | 44 | % | | | 58 | % | | | 50 | % |
| 38 | THE GUGGENHEIM FUNDS SEMI-ANNUAL REPORT | SEE NOTES TO FINANCIAL STATEMENTS. |
| FINANCIAL HIGHLIGHTS (continued) |
| FLOATING RATE STRATEGIES FUND | |
This table is presented to show selected data for a share outstanding throughout each period and to assist shareholders in evaluating a Fund’s performance for the periods presented.
| C-Class | | Period Ended
March 29,
2018a | | | Year Ended
Sept. 30,
2017 | | | Year Ended
Sept. 30,
2016 | | | Year Ended
Sept. 30,
2015 | | | Year Ended
Sept. 30,
2014 | | | Year Ended
Sept. 30,
2013 | |
| Per Share Data | | | | | | | | | | | | | | | | | | |
| Net asset value, beginning of period | | $ | 26.00 | | | $ | 25.91 | | | $ | 25.87 | | | $ | 26.51 | | | $ | 26.60 | | | $ | 26.09 | |
| Income (loss) from investment operations: |
| Net investment income (loss)b | | | .40 | | | | .74 | | | | .80 | | | | .85 | | | | .90 | | | | 1.11 | |
| Net gain (loss) on investments (realized and unrealized) | | | (.03 | ) | | | .10 | | | | .12 | | | | (.43 | ) | | | .06 | | | | .63 | |
| Total from investment operations | | | .37 | | | | .84 | | | | .92 | | | | .42 | | | | .96 | | | | 1.74 | |
| Less distributions from: |
| Net investment income | | | (.40 | ) | | | (.75 | ) | | | (.88 | ) | | | (.98 | ) | | | (1.00 | ) | | | (1.17 | ) |
| Net realized gains | | | — | | | | — | | | | — | | | | (.08 | ) | | | (.05 | ) | | | (.06 | ) |
| Total distributions | | | (.40 | ) | | | (.75 | ) | | | (.88 | ) | | | (1.06 | ) | | | (1.05 | ) | | | (1.23 | ) |
| Net asset value, end of period | | $ | 25.97 | | | $ | 26.00 | | | $ | 25.91 | | | $ | 25.87 | | | $ | 26.51 | | | $ | 26.60 | |
| |
| Total Returnf | | | 1.43 | % | | | 3.26 | % | | | 3.68 | % | | | 1.63 | % | | | 3.64 | % | | | 6.77 | % |
| Ratios/Supplemental Data |
| Net assets, end of period (in thousands) | | $ | 185,947 | | | $ | 204,008 | | | $ | 197,296 | | | $ | 145,808 | | | $ | 132,370 | | | $ | 120,606 | |
| Ratios to average net assets: |
| Net investment income (loss) | | | 3.05 | % | | | 2.83 | % | | | 3.13 | % | | | 3.23 | % | | | 3.35 | % | | | 4.19 | % |
| Total expensesc | | | 1.85 | % | | | 1.83 | % | | | 1.93 | % | | | 1.91 | % | | | 1.89 | % | | | 1.93 | % |
| Net expensesd,g,h | | | 1.77 | % | | | 1.79 | % | | | 1.78 | % | | | 1.78 | % | | | 1.79 | % | | | 1.81 | % |
| Portfolio turnover rate | | | 16 | % | | | 44 | % | | | 35 | % | | | 44 | % | | | 58 | % | | | 50 | % |
| SEE NOTES TO FINANCIAL STATEMENTS. | THE GUGGENHEIM FUNDS SEMI-ANNUAL REPORT | 39 |
| FINANCIAL HIGHLIGHTS (continued) |
| FLOATING RATE STRATEGIES FUND | |
This table is presented to show selected data for a share outstanding throughout each period and to assist shareholders in evaluating a Fund’s performance for the periods presented.
| P-Class | | Period Ended
March 29,
2018a | | | Year Ended
Sept. 30,
2017 | | | Year Ended
Sept. 30,
2016 | | | Period Ended
Sept. 30,
2015e | |
| Per Share Data | | | | | | | | | | | | |
| Net asset value, beginning of period | | $ | 26.02 | | | $ | 25.93 | | | $ | 25.89 | | | $ | 26.37 | |
| Income (loss) from investment operations: |
| Net investment income (loss)b | | | .49 | | | | .94 | | | | .99 | | | | .40 | |
| Net gain (loss) on investments (realized and unrealized) | | | (.02 | ) | | | .09 | | | | .12 | | | | (.46 | ) |
| Total from investment operations | | | .47 | | | | 1.03 | | | | 1.11 | | | | (.06 | ) |
| Less distributions from: |
| Net investment income | | | (.50 | ) | | | (.94 | ) | | | (1.07 | ) | | | (.42 | ) |
| Total distributions | | | (.50 | ) | | | (.94 | ) | | | (1.07 | ) | | | (.42 | ) |
| Net asset value, end of period | | $ | 25.99 | | | $ | 26.02 | | | $ | 25.93 | | | $ | 25.89 | |
| |
| Total Returnf | | | 1.81 | % | | | 4.03 | % | | | 4.46 | % | | | (0.24 | %) |
| Ratios/Supplemental Data |
| Net assets, end of period (in thousands) | | $ | 343,348 | | | $ | 360,829 | | | $ | 124,974 | | | $ | 20,536 | |
| Ratios to average net assets: |
| Net investment income (loss) | | | 3.79 | % | | | 3.59 | % | | | 3.86 | % | | | 3.68 | % |
| Total expensesc | | | 1.14 | % | | | 1.16 | % | | | 1.06 | % | | | 1.04 | % |
| Net expensesd,g,h | | | 1.03 | % | | | 1.03 | % | | | 1.03 | % | | | 1.02 | % |
| Portfolio turnover rate | | | 16 | % | | | 44 | % | | | 35 | % | | | 44 | % |
| 40 | THE GUGGENHEIM FUNDS SEMI-ANNUAL REPORT | SEE NOTES TO FINANCIAL STATEMENTS. |
| FINANCIAL HIGHLIGHTS (continued) |
| FLOATING RATE STRATEGIES FUND | |
This table is presented to show selected data for a share outstanding throughout each period and to assist shareholders in evaluating a Fund’s performance for the periods presented.
| Institutional Class | | Period Ended
March 29,
2018a | | | Year Ended
Sept. 30,
2017 | | | Year Ended
Sept. 30,
2016 | | | Year Ended
Sept. 30,
2015 | | | Year Ended
Sept. 30,
2014 | | | Year Ended
Sept. 30,
2013 | |
| Per Share Data | | | | | | | | | | | | | | | | | | |
| Net asset value, beginning of period | | $ | 26.03 | | | $ | 25.94 | | | $ | 25.90 | | | $ | 26.54 | | | $ | 26.64 | | | $ | 26.12 | |
| Income (loss) from investment operations: |
| Net investment income (loss)b | | | .52 | | | | 1.00 | | | | 1.05 | | | | 1.10 | | | | 1.16 | | | | 1.36 | |
| Net gain (loss) on investments (realized and unrealized) | | | (.01 | ) | | | .10 | | | | .12 | | | | (.42 | ) | | | .06 | | | | .65 | |
| Total from investment operations | | | .51 | | | | 1.10 | | | | 1.17 | | | | .68 | | | | 1.22 | | | | 2.01 | |
| Less distributions from: |
| Net investment income | | | (.53 | ) | | | (1.01 | ) | | | (1.13 | ) | | | (1.24 | ) | | | (1.27 | ) | | | (1.43 | ) |
| Net realized gains | | | — | | | | — | | | | — | | | | (.08 | ) | | | (.05 | ) | | | (.06 | ) |
| Total distributions | | | (.53 | ) | | | (1.01 | ) | | | (1.13 | ) | | | (1.32 | ) | | | (1.32 | ) | | | (1.49 | ) |
| Net asset value, end of period | | $ | 26.01 | | | $ | 26.03 | | | $ | 25.94 | | | $ | 25.90 | | | $ | 26.54 | | | $ | 26.64 | |
| |
| Total Returnf | | | 1.93 | % | | | 4.28 | % | | | 4.71 | % | | | 2.59 | % | | | 4.67 | % | | | 7.86 | % |
| Ratios/Supplemental Data |
| Net assets, end of period (in thousands) | | $ | 2,498,287 | | | $ | 2,590,393 | | | $ | 1,643,932 | | | $ | 1,231,352 | | | $ | 753,476 | | | $ | 457,813 | |
| Ratios to average net assets: |
| Net investment income (loss) | | | 4.03 | % | | | 3.83 | % | | | 4.11 | % | | | 4.18 | % | | | 4.32 | % | | | 5.12 | % |
| Total expensesc | | | 0.84 | % | | | 0.82 | % | | | 0.87 | % | | | 0.85 | % | | | 0.87 | % | | | 0.86 | % |
| Net expensesd,g,h | | | 0.79 | % | | | 0.79 | % | | | 0.79 | % | | | 0.79 | % | | | 0.80 | % | | | 0.81 | % |
| Portfolio turnover rate | | | 16 | % | | | 44 | % | | | 35 | % | | | 44 | % | | | 58 | % | | | 50 | % |
| SEE NOTES TO FINANCIAL STATEMENTS. | THE GUGGENHEIM FUNDS SEMI-ANNUAL REPORT | 41 |
| FINANCIAL HIGHLIGHTS (concluded) |
| FLOATING RATE STRATEGIES FUND |
| a | Unaudited figures for the period ended March 29, 2018. Percentage amounts for the period, except total return and portfolio turnover rate, have been annualized. |
| b | Net investment income (loss) per share was computed using average shares outstanding throughout the period. |
| c | Does not include expenses of the underlying funds in which the Fund invests. |
| d | Net expense information reflects the expense ratios after expense waivers and reimbursements, as applicable. |
| e | Since commencement of operations: May 1, 2015. Percentage amounts for the period, except total return and portfolio turnover rate, have been annualized. |
| f | Total return does not reflect the impact of any applicable sales charge and has not been annualized. |
| g | Net expenses may include expenses that are excluded from the expense limitation agreement. Excluding these expenses the operating expense ratios for the periods presented would be: |
| | | 03/29/18 | 09/30/17 | 09/30/16 | 09/30/15 | 09/30/14 | 09/30/13 |
| | A-Class | 1.02% | 1.02% | 1.02% | 1.02% | 1.02% | 1.03% |
| | C-Class | 1.77% | 1.77% | 1.77% | 1.77% | 1.77% | 1.78% |
| | P-Class | 1.02% | 1.02% | 1.02% | 1.01% | N/A | N/A |
| | Institutional Class | 0.78% | 0.78% | 0.78% | 0.78% | 0.78% | 0.79% |
| h | The portion of the ratios of net expenses to average net assets attributable to recoupments of prior fee reductions or expense reimbursements for the periods presented would be: |
| | | 03/29/18 | 09/30/17 |
| | A-Class | 0.00% | 0.00% |
| | C-Class | 0.00% | 0.00% |
| | P-Class | 0.00% | 0.00% |
| | Institutional Class | 0.00% | 0.01% |
| 42 | THE GUGGENHEIM FUNDS SEMI-ANNUAL REPORT | SEE NOTES TO FINANCIAL STATEMENTS. |
| NOTES TO FINANCIAL STATEMENTS (Unaudited) |
Note 1 – Organization and Significant Accounting Policies
Organization
Guggenheim Funds Trust (the “Trust”), a Delaware statutory trust, is registered with the SEC under the Investment Company Act of 1940 (“1940 Act”), as an open-ended investment company of the series type. Each series, in effect, is representing a separate Fund. The Trust is authorized to issue an unlimited number of shares. The Trust accounts for the assets of each Fund separately.
The Trust offers a combination of five separate classes of shares, A-Class shares, C-Class shares, P-Class shares, R6-Class shares and Institutional Class shares. Sales of shares of each Class are made without a front-end sales charge at the net asset value per share (“NAV”), with the exception of A-Class shares. A-Class shares are sold at the NAV, plus the applicable front-end sales charge. The sales charge varies depending on the amount purchased. A-Class share purchases of $1 million or more are exempt from the front-end sales charge but have a 1% contingent deferred sales charge (“CDSC”), if shares are redeemed within 12 months of purchase. C-Class shares have a 1% CDSC if shares are redeemed within 12 months of purchase. Institutional Class shares are offered primarily for direct investment by institutions such as pension and profit sharing plans, endowments, foundations and corporations. Institutional Class shares require a minimum initial investment of $2 million and a minimum account balance of $1 million. At March 29, 2018, the Trust consisted of nineteen funds (the “Funds”).
This report covers the Floating Rate Strategies Fund (the “Fund”), a diversified investment company. Only A-Class, C-Class, P-Class and Institutional Class shares had been issued by the Fund.
Security Investors, LLC and Guggenheim Partners Investment Management, LLC which operates under the name Guggenheim Investments (“GI”), provides advisory services. Guggenheim Funds Distributors, LLC (“GFD or the Distributor”) acts as principal underwriter for the Trust. GI and GFD are affiliated entities.
Significant Accounting Policies
March 29, 2018 represents the last day during the Fund’s semi-annual period on which the New York Stock Exchange (“NYSE”) was open for trading. The Fund’s financial statements have been presented through that date to maintain consistency with the Fund’s net asset value calculations used for shareholder transactions.
The Fund operates as an investment company and, accordingly, follows the investment company accounting and reporting guidance of the Financial Accounting Standards Board (“FASB”) Accounting Standards Codification Topic 946 Financial Services – Investment Companies.
The following significant accounting policies are in conformity with U.S. generally accepted accounting principles (“U.S. GAAP”) and are consistently followed by the Trust. This requires management to make estimates and assumptions that affect the reported amount of assets and
| | THE GUGGENHEIM FUNDS SEMI-ANNUAL REPORT | 43 |
| NOTES TO FINANCIAL STATEMENTS (Unaudited)(continued) |
liabilities, contingent assets and liabilities at the date of the financial statements, and the reported amounts of revenues and expenses during the reporting period. Actual results could differ from these estimates. All time references are based on Eastern Time.
The NAV of each Class of the Fund is calculated by dividing the market value of the Fund’s securities and other assets, less all liabilities, attributable to the Class by the number of outstanding shares of the Class.
(a) Valuation of Investments
The Board of Trustees of the Fund (the “Board”) has adopted policies and procedures for the valuation of the Fund’s investments (the “Valuation Procedures”). Pursuant to the Valuation Procedures, the Board has delegated to a valuation committee, consisting of representatives from Guggenheim’s investment management, fund administration, legal and compliance departments (the “Valuation Committee”), the day-to-day responsibility for implementing the Valuation Procedures, including, under most circumstances, the responsibility for determining the fair value of the Fund’s securities and/or other assets.
Valuations of the Fund’s securities are supplied primarily by pricing services appointed pursuant to the processes set forth in the Valuation Procedures. The Valuation Committee convenes monthly, or more frequently as needed, to review the valuation of all assets which have been fair valued for reasonableness. The Fund’s officers, through the Valuation Committee and consistent with the monitoring and review responsibilities set forth in the Valuation Procedures, regularly review procedures used and valuations provided by the pricing services.
If the pricing service cannot or does not provide a valuation for a particular investment or such valuation is deemed unreliable, such investment is fair valued by the Valuation Committee.
Equity securities listed on an exchange (NYSE or American Stock Exchange) are valued at the last quoted sale price as of the close of business on the NYSE, usually 4:00 p.m. on the valuation date. Equity securities listed on the NASDAQ market system are valued at the NASDAQ Official Closing Price on the valuation date, which may not necessarily represent the last sale price. If there has been no sale on such exchange or NASDAQ on a given day, the security is valued at the closing bid price on that day.
Generally, trading in foreign securities markets is substantially completed each day at various times prior to the close of the NYSE. The values of foreign securities are determined as of the close of such foreign markets or the close of the NYSE, if earlier. All investments quoted in foreign currencies are valued in U.S. dollars on the basis of the foreign currency exchange rates prevailing at the close of U.S. business. Investments in foreign securities may involve risks not present in domestic investments. The Valuation Committee will determine the current value of such foreign securities by taking into consideration certain factors which may include those discussed above, as well as the following factors, among others: the value of the securities traded on other foreign markets, ADR trading, closed-end fund trading, foreign currency exchange activity, and the
| 44 | THE GUGGENHEIM FUNDS SEMI-ANNUAL REPORT | |
| NOTES TO FINANCIAL STATEMENTS (Unaudited)(continued) |
trading prices of financial products that are tied to foreign securities. In addition, the Board has authorized the Valuation Committee and GI to use prices and other information supplied by a third party pricing vendor in valuing foreign securities.
Open-end investment companies (“mutual funds”) are valued at their NAV as of the close of business, on the valuation date. Exchange-traded funds (“ETFs”) and closed-end investment companies (“CEFs”) are valued at the last quoted sale price.
Debt securities with a maturity of greater than 60 days at acquisition are valued at prices that reflect broker-dealer supplied valuations or are obtained from independent pricing services, which may consider the trade activity, treasury spreads, yields or price of bonds of comparable quality, coupon, maturity, and type, as well as prices quoted by dealers who make markets in such securities. Short-term debt securities with a maturity of 60 days or less at acquisition are valued at amortized cost, provided such amount approximates market value. Money market funds are valued at their NAV.
Typically, loans are valued using information provided by an independent third party pricing service which uses broker quotes. If the pricing service cannot or does not provide a valuation for a particular investment or such valuation is deemed unreliable, such investment is fair valued by the Valuation Committee.
Investments for which market quotations are not readily available are fair-valued as determined in good faith by GI, under the direction of the Board, using methods established or ratified by the Board. Valuations in accordance with these methods are intended to reflect each security’s (or asset’s or liability’s) “fair value”. Each such determination is based on a consideration of all relevant factors, which are likely to vary from one pricing context to another. Examples of such factors may include, but are not limited to market prices; sale prices; broker quotes; and models which derive prices based on inputs such as prices of securities with comparable maturities and characteristics, or based on inputs such as anticipated cash flows or collateral, spread over Treasuries, and other information analysis.
In connection with futures contracts and other derivative investments, such factors may include obtaining information as to how (a) these contracts and other derivative investments trade in the futures or other derivative markets, respectively, and (b) the securities underlying these contracts and other derivative investments trade in the cash market.
(b)Senior Loans
Senior loans in which the Fund invests generally pay interest rates which are periodically adjusted by reference to a base short-term floating rate, plus a premium. These base lending rates are generally (i) the lending rate offered by one or more major European banks, such as the one-month or three-month London Inter-Bank Offered Rate (“LIBOR”), (ii) the prime rate offered by one or more major United States banks, or (iii) the bank’s certificate of deposit rate. Senior floating rate interests often require prepayments from excess cash flows or permit the borrower to
| | THE GUGGENHEIM FUNDS SEMI-ANNUAL REPORT | 45 |
| NOTES TO FINANCIAL STATEMENTS (Unaudited)(continued) |
repay at its election. The rate at which the borrower repays cannot be predicted with accuracy. As a result, the actual remaining maturity may be substantially less than the stated maturities shown. The interest rate indicated is the rate in effect at March 29, 2018.
(c) Interests in Securities
The Fund may purchase and sell interests in securities on a when-issued and delayed delivery basis, with payment and delivery scheduled for a future date. No income accrues to the Fund on such interests or securities in connection with such transactions prior to the date the Fund actually take delivery of such interests or securities. These transactions are subject to market fluctuations and are subject to the risk that the value at delivery may be more or less than the trade date purchase price. Although the Fund will generally purchase these securities with the intention of acquiring such securities, they may sell such securities before the settlement date.
(d) Foreign Taxes
The Fund may be subject to foreign taxes (a portion of which may be reclaimable) on income, stock dividends, capital gains on investments or certain foreign currency transactions. All foreign taxes are recorded in accordance with the applicable foreign tax regulations and rates that exist in the foreign jurisdictions in which the Fund invests. These foreign taxes, if any, are paid by the Fund and reflected in the Statement of Operations as follows: foreign taxes withheld at source are presented as a reduction of income and foreign taxes on capital gains from sales of investments are included with the net realized gain (loss) on investments. Foreign taxes payable or deferred as of March 29, 2018, if any, are disclosed in the Fund’s Statement of Assets and Liabilities.
(e) Security Transactions with paydowns
Security transactions are recorded on the trade date for financial reporting purposes. Realized gains and losses from securities transactions are recorded using the identified cost basis. Proceeds from lawsuits related to investment holdings are recorded as realized gains in the Fund. Dividend income is recorded on the ex-dividend date, net of applicable taxes withheld by foreign countries. Taxable non-cash dividends are recorded as dividend income. Interest income, including amortization of premiums and accretion of discounts, is accrued on a daily basis. Interest income also includes paydown gains and losses on mortgage-backed and asset-backed securities and senior and subordinated loans.
Amendment fees are earned as compensation for evaluating and accepting changes to the original loan agreement and are recognized when received. Dividend income from Real Estate Investment Trusts (“REITs”) is recorded based on the income included in the distributions received from the REIT investments using published REIT classifications, including some management estimates when actual amounts are not available. Distributions received in excess of this estimated amount are recorded as a reduction of the cost of investments or reclassified to capital gains. The actual amounts of income, return of capital, and capital gains are only determined by each REIT after its fiscal year-end, and may differ from the estimated amounts.
| 46 | THE GUGGENHEIM FUNDS SEMI-ANNUAL REPORT | |
| NOTES TO FINANCIAL STATEMENTS (Unaudited)(continued) |
Income from residual collateralized loan obligations is recognized using the effective interest method. At the time of purchase, management estimates the future expected cash flows and determines the effective yield and estimated maturity date based on the estimated cash flows. Subsequent to the purchase, the estimated cash flows are updated periodically and a revised yield is calculated prospectively. Cash flows received in excess of the effective yield are reflected as a return of capital.
(f) Distributions
The Fund declares dividends from investment income daily. The Fund pays its shareholders from its net investment income monthly and distributes any net capital gains that it has realized, at least annually. Distributions to shareholders are recorded on the ex-dividend date. Dividends are reinvested in additional shares unless shareholders request payment in cash. The character of distributions made during the year from net investment income or net realized gains may differ from their ultimate characterization for federal income tax purposes.
(g) Class Allocations
Interest and dividend income, most expenses, all realized gains and losses, and all unrealized gains and losses are allocated to the classes based upon the value of the outstanding shares in each Class. Certain costs, such as distribution and service fees are charged directly to specific classes. In addition, certain expenses have been allocated to the individual Funds in the Trust on a pro rata basis upon the respective aggregate net assets of each Fund included in the Trust.
(h) Earnings Credits
Under the fee arrangement with the custodian, the Fund may earn credits based on overnight custody cash balances. These credits are utilized to reduce related custodial expenses. The custodian fees disclosed in the Statement of Operations are before the reduction in expense from the related earnings credits, if any. For the period ended March 29, 2018, there were no earnings credits received.
(i) Cash
The Fund may leave cash overnight in its cash account with the custodian. Periodically, the Fund may have cash due to the custodian bank as an overdraft balance. A fee is incurred on this overdraft, calculated by multiplying the overdraft by a rate based on the federal funds rate, which was 1.68% at March 29, 2018.
(j) Indemnifications
Under the Fund’s organizational documents, its Trustees and Officers are indemnified against certain liabilities arising out of the performance of their duties to the Trust. In addition, throughout the normal course of business, the Fund enters into contracts that contain a variety of representations and warranties which provide general indemnifications. The Fund’s maximum
| | THE GUGGENHEIM FUNDS SEMI-ANNUAL REPORT | 47 |
| NOTES TO FINANCIAL STATEMENTS (Unaudited)(continued) |
exposure under these arrangements is unknown, as this would involve future claims that may be made against the Fund and/or its affiliates that have not yet occurred. However, based on experience, the Fund expects the risk of loss to be remote.
(k) Forward Foreign Currency Exchange Contracts
Forward foreign currency exchange contracts are valued daily based on the applicable exchange rate of the underlying currency. The change in value of the contract is recorded as unrealized appreciation or depreciation until the contract is closed. When the contract is closed, the Fund records a realized gain or loss equal to the difference between the value at the time the contract was opened and the value at the time it was closed.
(l) Currency Translations
The accounting records of the Fund are maintained in U.S. dollars. All assets and liabilities initially expressed in foreign currencies are converted into U.S. dollars at prevailing exchange rates.
Purchases and sales of investment securities, dividend and interest income, and certain expenses are translated at the rates of exchange prevailing on the respective dates of such transactions.
Changes in the relationship of these foreign currencies to the U.S. dollar can significantly affect the value of the investments and earnings of the Fund. Foreign investments may also subject the Fund to foreign government exchange restrictions, expropriation, taxation or other political, social or economic developments, all of which could affect the market and/or credit risk of the investments.
The Fund does not isolate that portion of the results of operations resulting from changes in the foreign exchange rates on investments from the fluctuations arising from changes in the market prices of securities held. Such fluctuations are included with the net realized and unrealized gain or loss on investments.
Reported net realized foreign exchange gains and losses arise from sales of foreign currencies and currency gains or losses realized between the trade and settlement dates on investment transactions. Net unrealized exchange gains and losses arise from changes in the fair values of assets and liabilities other than investments in securities at the fiscal period end, resulting from changes in exchange rates.
Note 2 – Financial Instruments and Derivatives
As part of its investment strategy, the Fund utilizes a variety of derivative instruments. These investments involve, to varying degrees, elements of market risk and risks in excess of the amounts recognized in the Statement of Assets and Liabilities. Valuation and accounting treatment of these instruments can be found under Significant Accounting Policies in Note 1 of these Notes to Financial Statements.
| 48 | THE GUGGENHEIM FUNDS SEMI-ANNUAL REPORT | |
| NOTES TO FINANCIAL STATEMENTS (Unaudited)(continued) |
Derivatives
Derivatives are instruments whose values depend on, or are derived from, in whole or in part, the value of one or more other assets, such as securities, currencies, commodities or indices. Derivative instruments may be used to increase investment flexibility (including to maintain cash reserves while maintaining exposure to certain other assets), for risk management (hedging) purposes, to facilitate trading, to reduce transaction costs and to pursue higher investment returns. Derivative instruments may also be used to mitigate certain investment risks, such as foreign currency exchange rate risk, interest rate risk and credit risk. U.S. GAAP requires disclosures to enable investors to better understand how and why a Fund uses derivative instruments, how these derivative instruments are accounted for and their effects on the Fund’s financial position and results of operations.
The Fund utilized derivatives for the following purpose:
Hedge: an investment made in order to reduce the risk of adverse price movements in a security, by taking an offsetting position to protect against broad market moves.
Forward Foreign Currency Exchange Contracts
A forward foreign currency exchange contract is an agreement between two parties to exchange two designated currencies at a specific time in the future. Certain types of contracts may be cash settled, in an amount equal to the change in exchange rates during the term of the contract. The contracts can be used to hedge or manage exposure to foreign currency risks with portfolio investments or to gain exposure to foreign currencies.
The market value of a forward foreign currency exchange contract changes with fluctuations in foreign currency exchange rates. Furthermore, the Fund may be exposed to risk if the counterparties cannot meet the contract terms or if the currency value changes unfavorably as compared to the U.S. dollar.
The following table represents the Fund’s use, and volume of forward foreign currency exchange contracts on a quarterly basis as of March 29, 2018 :
| | | Average Value | |
| Use | | Purchased | | | Sold | |
| Hedge | | $ | 111,146,178 | | | $ | 93,335,004 | |
| | THE GUGGENHEIM FUNDS SEMI-ANNUAL REPORT | 49 |
| NOTES TO FINANCIAL STATEMENTS (Unaudited)(continued) |
Derivative Investment Holdings Categorized by Risk Exposure
The following is a summary of the location of derivative investments on the Fund’s Statement of Assets and Liabilities as of March 29, 2018:
| Derivative Investment Type | Asset Derivatives | Liability Derivatives |
| Currency contracts | Unrealized appreciation on forward foreign currency exchange contracts | Unrealized depreciation on forward foreign currency exchange contracts |
The following table sets forth the fair value of the Fund’s derivative investments categorized by primary risk exposure at March 29, 2018:
| Asset Derivative Investments Value |
| Primary Risk Exposure | | Forward
Foreign Currency
Exchange Risk | |
| Foreign forward risk | | $ | 555,513 | |
| Liability Derivative Investments Value |
| Primary Risk Exposure | | Forward
Foreign Currency
Exchange Risk | |
| Foreign forward risk | | $ | 313,778 | |
The following is a summary of the location of derivative investments on the Fund’s Statement of Operations for the period ended March 29, 2018:
| Derivative Investment Type | Location of Gain (Loss) on Derivatives |
| Currency contracts | Net realized gain (loss) on forward foreign currency exchange contracts |
| | Net change in unrealized appreciation (depreciation) on forward foreign currency exchange contracts |
The following is a summary of the Fund’s realized gain (loss) and change in unrealized appreciation (depreciation) on derivative investments recognized on the Statement of Operations categorized by primary risk exposure for the period ended March 29, 2018:
| Realized Gain (Loss) on Derivative Investments Recognized on the Statement of Operations |
| Primary Risk Exposure | | Forward
Foreign Currency
Exchange Risk | |
| Foreign exchange risk | | $ | (4,605,920 | ) |
| 50 | THE GUGGENHEIM FUNDS SEMI-ANNUAL REPORT | |
| NOTES TO FINANCIAL STATEMENTS (Unaudited)(continued) |
Change in Unrealized Appreciation (Depreciation) on Derivative
Investments Recognized on the Statement of Operations |
| Primary Risk Exposure | | Forward
Foreign Currency
Exchange Risk | |
| Foreign exchange risk | | $ | (1,223,615 | ) |
In conjunction with the use of derivative instruments, the Fund is required to maintain collateral in various forms. The Fund uses, where appropriate, depending on the financial instrument utilized and the broker involved, margin deposits at the broker, cash and/or securities segregated at the custodian bank, discount notes or repurchase agreements allocated to the Fund.
The Trust has established counterparty credit guidelines and enters into transactions only with financial institutions of investment grade or better. The Trust monitors the counterparty credit risk.
Note 3 – Offsetting
In the normal course of business, the Fund enters into transactions subject to enforceable master netting arrangements or other similar arrangements. Generally, the right to offset in those agreements allows the Fund to counteract the exposure to a specific counterparty with collateral received from or delivered to that counterparty based on the terms of the arrangements. These arrangements provide for the right to liquidate upon the occurrence of an event of default, credit event upon merger or additional termination event.
In order to better define their contractual rights and to secure rights that will help the Fund mitigate its counterparty risk, the Fund may enter into an International Swaps and Derivatives Association, Inc. Master Agreement (“ISDA Master Agreement”) or similar agreement with its derivative contract counterparties. An ISDA Master Agreement is a bilateral agreement between a Fund and a counterparty that governs over-the-counter (“OTC”) derivatives, including foreign exchange contracts, and typically contains, among other things, collateral posting terms and netting provisions in the event of a default and/or termination event. The provisions of the ISDA Master Agreement typically permit a single net payment in the event of a default (close-out netting) or similar event, including the bankruptcy or insolvency of the counterparty.
For derivatives traded under an ISDA Master Agreement, the collateral requirements are typically calculated by netting the mark-to-market amount for each transaction under such agreement and comparing that amount to the value of any collateral currently pledged by the Fund and the counterparty. For financial reporting purposes, cash collateral that has been pledged to cover obligations of the Fund and cash collateral received from the counterparty, if any, is reported separately on the Statement of Assets and Liabilities as cash with broker/receivable for variation margin. Cash and/or securities pledged or received as collateral by the Fund in connection with an OTC derivative subject to an ISDA Master Agreement generally may not be invested, sold or rehypotheticated by the counterparty or the Fund, as applicable, absent an event of default under
| | THE GUGGENHEIM FUNDS SEMI-ANNUAL REPORT | 51 |
| NOTES TO FINANCIAL STATEMENTS (Unaudited)(continued) |
such agreement, in which case such collateral generally may be applied towards obligations due to and payable by such counterparty or the Fund, as applicable. Generally, the amount of collateral due from or to a counterparty must exceed a minimum transfer amount threshold (e.g., $300,000) before a transfer is required to be made. To the extent amounts due to the Fund from its counterparties are not fully collateralized, contractually or otherwise, the Fund bears the risk of loss from counterparty nonperformance. The Fund attempts to mitigate counterparty risk by only entering into agreements with counterparties that they believe to be of good standing and by monitoring the financial stability of those counterparties.
For financial reporting purposes, the Fund does not offset derivative assets and derivative liabilities that are subject to netting arrangements in the Statement of Assets and Liabilities.
The following tables present derivative financial instruments and secured financing transactions that are subject to enforceable netting arrangements and offset in the Statement of Assets and Liabilities in conformity with U.S. GAAP.
| | | | | | | | | | | | Gross Amounts Not
Offset in the Statement
of Assets and Liabilities | | | | |
| Instrument | | Gross
Amounts of
Recognized
Assets | | | Gross
Amounts
Offset In the
Statement of
Assets and
Liabilities | | | Net Amount
of Assets
Presented on
the Statement
of Assets and
Liabilities | | | Financial
Instruments | | | Cash
Collateral
Received | | | Net
Amount | |
| Forward foreign currency exchange contracts | | $ | 555,513 | | | $ | — | | | $ | 555,513 | | | $ | — | | | $ | (75,482 | ) | | $ | 480,031 | |
| | | | | | | | | | | | Gross Amounts Not
Offset in the Statement
of Assets and Liabilities | | | | |
| Instrument | | Gross
Amounts of
Recognized
Liabilities | | | Gross
Amounts
Offset In the
Statement of
Assets and Liabilities | | | Net Amount
of Liabilities
Presented on
the Statement
of Assets and
Liabilities | | | Financial
Instruments | | | Cash
Collateral
Pledged | | | Net
Amount | |
| Forward foreign currency exchange contracts | | $ | 313,778 | | | $ | — | | | $ | 313,778 | | | $ | — | | | $ | (307,644 | ) | | $ | 6,134 | |
The following table presents deposits held by others in connection with derivative investments as of March 29, 2018. The derivatives tables following the Schedule of Investments list each counterparty for which cash collateral may have been pledged or received at period end. The Fund has the right to offset these deposits against any related liabilities outstanding with each counterparty.
| 52 | THE GUGGENHEIM FUNDS SEMI-ANNUAL REPORT | |
| NOTES TO FINANCIAL STATEMENTS (Unaudited)(continued) |
| Counterparty | | Asset Type | | Cash Pledged | | | Cash Received | |
| Barclays Bank plc | | Forward Foreign Currency Exchange Contracts | | $ | — | | | $ | 370,000 | |
| Citigroup | | Forward Foreign Currency Exchange Contracts | | | 612,053 | | | | — | |
| JP Morgan Chase and Co. | | Forward Foreign Currency Exchange Contracts | | | 210,000 | | | | — | |
Note 4 – Fair Value Measurement
In accordance with U.S. GAAP, fair value is defined as the price that the Fund would receive to sell an investment or pay to transfer a liability in an orderly transaction with an independent buyer in the principal market, or in the absence of a principal market, the most advantageous market for the investment or liability. U.S. GAAP establishes a three-tier fair value hierarchy based on the types of inputs used to value assets and liabilities and requires corresponding disclosure. The hierarchy and the corresponding inputs are summarized below:
| Level 1 — | quoted prices in active markets for identical assets or liabilities. |
| Level 2 — | significant other observable inputs (for example quoted prices for securities that are similar based on characteristics such as interest rates, prepayment speeds, credit risk, etc.). |
| Level 3 — | significant unobservable inputs based on the best information available under the circumstances, to the extent observable inputs are not available, which may include assumptions. |
The types of inputs available depend on a variety of factors, such as the type of security and the characteristics of the markets in which it trades, if any. Fair valuation determinations that rely on fewer or no observable inputs require greater judgment. Accordingly, fair value determinations for Level 3 securities require the greatest amount of judgment.
Independent pricing services are used to value a majority of the Fund’s investments. When values are not available from a pricing service, they will be determined under the valuation policies that have been reviewed and approved by the Board. In any event, values are determined using a variety of sources and techniques, including: market prices; broker quotes; and models which derive prices based on inputs such as prices of securities with comparable maturities and characteristics or based on inputs such as anticipated cash flows or collateral spread over Treasuries, and other information and analysis. A significant portion of the Fund’s assets and liabilities are categorized as Level 2, as indicated in this report.
Indicative quotes from broker-dealers, adjusted for fluctuations in criteria such as credit spreads and interest rates, may be also used to value the Fund’s assets and liabilities, i.e. prices provided by a broker-dealer or other market participant who has not committed to trade at that price. Although indicative quotes are typically received from established market participants, the
| | THE GUGGENHEIM FUNDS SEMI-ANNUAL REPORT | 53 |
| NOTES TO FINANCIAL STATEMENTS (Unaudited)(continued) |
Fund may not have the transparency to view the underlying inputs which support the market quotations. Significant changes in an indicative quote would generally result in significant changes in the fair value of the security.
Certain fixed income securities are valued by obtaining a monthly indicative quote from a broker-dealer, adjusted for fluctuations in criteria such as credit spreads and interest rates. The Fund’s fair valuation guidelines categorize these securities as level 3.
The inputs or methodologies used for valuing securities are not necessarily an indication of the risk associated with investing in those securities. The suitability of the techniques and sources employed to determine fair valuation are regularly monitored and subject to change.
Note 5 – Investment Advisory Agreement and Other Agreements
Under the terms of an investment advisory contract, the Fund pays GI investment advisory fees calculated at an annualized rate of 0.65% of the average daily net assets of the Fund up to $5 billion; and 0.60% of the average daily net assets in excess of $5 billion of the Fund’s advisory fees.
GI engages external service providers to perform other necessary services for the Trust, such as audit and accounting related services, legal services, custody, printing and mailing, etc., on a pass-through basis. Such expenses are allocated to various Funds within the complex based on relative net assets.
The Fund has adopted Distribution Plans related to the offering of A-Class, C-Class and P-Class shares pursuant to Rule 12b-1 under the 1940 Act. The plans provide for payments at an annual rate of 0.25% of the average daily net assets of the Fund’s A-Class and P-Class shares, and 1.00% of the average daily net assets of the Fund’s C-Class shares.
Contractual expense limitation agreements for the following Fund provides that the total expenses be limited to a percentage of average net assets for each class of shares, exclusive of brokerage costs, dividends on securities sold short, expenses of other investment companies in which a Fund invests, interest, taxes, litigation, indemnification and extraordinary expenses. The limits are listed below:
| | Limit | Effective
Date | Contract
End Date |
| A-Class | 1.02% | 11/30/12 | 02/01/19 |
| C-Class | 1.77% | 11/30/12 | 02/01/19 |
| P-Class | 1.02% | 05/01/15 | 02/01/19 |
| Institutional Class | 0.78% | 11/30/12 | 02/01/19 |
| 54 | THE GUGGENHEIM FUNDS SEMI-ANNUAL REPORT | |
| NOTES TO FINANCIAL STATEMENTS (Unaudited)(continued) |
GI is entitled to reimbursement by the Fund for fees waived or expenses reimbursed during any of the previous 36 months, beginning on the date of the expense limitation agreement, if on any day the estimated operating expenses are less than the indicated percentages. For purposes of this arrangement, GI is entitled to recoupment of previously waived fees or reimbursed expenses for 36 months from the date of the waiver or reimbursement by GI. At March 29, 2018, the amount of fees waived or expenses reimbursed that are subject to recoupment are presented in the following table:
| | | Expires
2018 | | | Expires
2019 | | | Expires
2020 | | | Expires
2021 | | | Fund
Total | |
| A-Class | | $ | 521,200 | | | $ | 715,008 | | | $ | 506,871 | | | $ | 313,019 | | | $ | 2,056,098 | |
| C-Class | | | 164,290 | | | | 254,684 | | | | 104,116 | | | | 81,516 | | | | 604,606 | |
| P-Class | | | — | | | | 16,627 | | | | 320,727 | | | | 197,548 | | | | 534,902 | |
| Institutional Class | | | 538,037 | | | | 1,021,450 | | | | 819,172 | | | | 640,306 | | | | 3,018,965 | |
For the period ended March 29, 2018, $11 were recouped by GI.
If the Fund invests in an affiliated fund, the investing Fund’s adviser has agreed to waive fees at the investing fund level. Fee waivers will be calculated at the investing Fund level without regard to any expense cap, if any, in effect for the investing Fund. Fees waived under this arrangement are not subject to reimbursement to GI. For the period ended March 29, 2018, the Fund did not waive any fees related to investments in affiliated funds.
For the period ended March 29, 2018, GFD retained sales charges of $252,432 relating to sales of A-Class shares of the Trust.
Certain trustees and officers of the Trust are also officers of GI and/or GFD. The Trust does not compensate its officers or trustees who are officers, directors, and/or employees of GI and GFD.
MUFG Investor Services (US), LLC (“MUIS”) acts as the Fund’s administrator, transfer agent and accounting agent. As administrator, transfer agent and accounting agent, MUIS is responsible for maintaining the books and records of the Fund’s securities and cash. The Bank of New York Mellon Corp. (“BNY”) acts as the Fund’s custodian. As custodian, BNY is responsible for the custody of the Fund’s assets. For providing the aforementioned administrative and accounting services, MUIS is entitled to receive a monthly fee equal to a percentage of the Fund’s average daily net assets and out of pocket expenses. For providing the aforementioned transfer agent and custodian services, MUIS and BNY are entitled to receive a monthly fee based on the number of transactions during the month and the number of accounts under management subject to certain minimum monthly fees and out of pocket expenses.
| | THE GUGGENHEIM FUNDS SEMI-ANNUAL REPORT | 55 |
| NOTES TO FINANCIAL STATEMENTS (Unaudited)(continued) |
Note 6 – Federal Income Tax Information
The Fund intends to comply with the provisions of Subchapter M of the Internal Revenue Code applicable to regulated investment companies and will distribute substantially all taxable net investment income and capital gains sufficient to relieve the Fund from all, or substantially all, federal income, excise and state income taxes. Therefore, no provision for federal or state income tax is required.
Tax positions taken or expected to be taken in the course of preparing the Fund’s tax returns are evaluated to determine whether the tax positions are “more-likely-than-not” of being sustained by the applicable tax authority. Tax positions not deemed to meet the more-likely-than-not threshold would be recorded as a tax benefit or expense in the current year. Management has analyzed the Fund’s tax positions taken, or to be taken, on federal income tax returns for all open tax years, and has concluded that no provision for income tax is required in the Fund’s financial statements. The Fund’s federal tax returns are subject to examination by the Internal Revenue Service for a period of three years after they are filed.
At March 29, 2018, the cost of securities for federal income tax purposes, the aggregate gross unrealized gain for all securities for which there was an excess of value over tax cost, and the aggregate gross unrealized loss for all securities for which there was an excess of tax cost over value were as follows:
| | Tax
Cost | | | Tax
Unrealized
Gain | | | Tax
Unrealized
Loss | | | Net
Unrealized
Loss | |
| | $ | 3,598,601,611 | | | $ | 32,778,530 | | | $ | (38,701,674 | ) | | $ | (5,923,144 | ) |
Note 7 – Securities Transactions
For the period ended March 29, 2018, the cost of purchases and proceeds from sales of investment securities, excluding government securities, short-term investments and derivatives, were as follows:
| | Purchases | | | Sales | |
| | $ | 531,780,966 | | | $ | 665,426,988 | |
| 56 | THE GUGGENHEIM FUNDS SEMI-ANNUAL REPORT | |
| NOTES TO FINANCIAL STATEMENTS (Unaudited)(continued) |
The Fund is permitted to purchase or sell securities from or to certain affiliated funds under specified conditions outlined in procedures adopted by the Board of the Trust. The procedures have been designed to ensure that any purchase or sale of securities by a Fund from or to another fund or portfolio that is or could be considered an affiliate by virtue of having a common investment adviser (or affiliated investment advisers), common Trustees and/or common officers complies with Rule 17a-7 of the 1940 Act. Further, as defined under these procedures, each transaction is effected at the current market price to save costs, where permissible. For the period ended March 29, 2018, the Fund engaged in purchases and sales of securities, pursuant to Rule 17a-7 of the 1940 Act, as follows:
| | Purchases | | | Sales | | | Realized
Gain | |
| | $ | — | | | $ | 5,521,856 | | | $ | 566,542 | |
Note 8 – Unfunded Loan Commitments
Pursuant to the terms of certain loan agreements, the Fund held unfunded loan commitments as of March 29, 2018. The Fund is obligated to fund these loan commitments at the borrower’s discretion.
The unfunded loan commitments as of March 29, 2018, were as follows:
| Borrower | | Maturity Date | | Face Amount* | | | Value | |
| Advantage Sales & Marketing LLC | | 07/25/19 | | | 8,000,000 | | | $ | 271,329 | |
| American Stock Transfer & Trust | | 06/26/18 | | | 800,000 | | | | 4,398 | |
| Boyne USA, Inc. | | 03/13/19 | | | 7,500,000 | | | | — | ** |
| Ceva Group plc (United Kingdom) | | 03/19/19 | | | 2,155,383 | | | | 85,263 | |
| Ceva Logistics Holdings BV (Dutch) | | 03/19/19 | | | 4,614 | | | | 182 | |
| EG Finco Ltd. | | 02/07/25 | | | EUR 941,896 | | | | — | ** |
| Mavis Tire Express Services Corp. | | 02/28/25 | | | 3,608,639 | | | | — | ** |
| Recess Holdings, Inc. | | 09/30/24 | | | 690,476 | | | | 1,603 | |
| Signode Industrial Group US, Inc. | | 05/01/19 | | | 11,400,000 | | | | 77,426 | |
| Wencor Group | | 06/19/19 | | | 1,710,000 | | | | 49,025 | |
| | | | | | | | | $ | 489,226 | |
| * | The face amount is denominated in U.S. dollars unless otherwise indicated. |
| ** | Security has a market value of $0. |
| | THE GUGGENHEIM FUNDS SEMI-ANNUAL REPORT | 57 |
| NOTES TO FINANCIAL STATEMENTS (Unaudited)(concluded) |
Note 9 – Restricted Securities
The securities below are considered illiquid and restricted under guidelines established by the Board:
| Restricted Securities | | Acquisition
Date | | Amortized
Cost | | | Value | |
| Airplanes Pass Through Trust 2001-1A, 2.33% (1 Month USD LIBOR + 0.55%) due 3/15/191 | | 12/27/11 | | $ | 723,184 | | | $ | 40,342 | |
| 1 | Variable rate security. Rate indicated is the rate effective at March 29, 2018. In some instances, the underlying reference rate shown was below the minimum rate earned by the security or has been adjusted by a predetermined factor. The settlement status of a position may also impact the effective rate indicated. In instances where multiple underlying reference rates and spread amounts are shown, the effective rate is based on a weighted average. |
Note 10 – Line of Credit
The Trust, with the exception of certain affiliated funds, secured a 364-day committed, $1,000,000,000 line of credit from Citibank, N.A., which was in place through October 6, 2017, at which time the line of credit was renewed, with an increased commitment amount to $1,065,000,000. A Fund may draw (borrow) from the line of credit as a temporary measure for emergency purposes, to facilitate redemption requests, or for other short-term liquidity purposes consistent with the Fund’s investment objective and program. For example, it may be advantageous for the Fund to borrow money rather than sell existing portfolio positions to meet redemption requests. Fees related to borrowings, if any, vary under this arrangement between the greater of Citibank’s “base rate”, LIBOR plus 1%, or the federal funds rate 1.68% at March 29, 2018 plus 1/2 of 1%.The Funds paid upfront costs of $982,952 to renew the line of credit.
The commitment fee that may be paid by the Fund is at an annualized rate of 0.15% of the average daily amount of their unused commitment amount. The Fund did not have any borrowings under this agreement as of and for the period ended March 29, 2018.
The allocated commitment fee amount for the Fund is referenced in the Statement of Operations under “Line of credit fees” and the effect on the expense ratio is included in the Financial Highlights.
| 58 | THE GUGGENHEIM FUNDS SEMI-ANNUAL REPORT | |
| OTHER INFORMATION (Unaudited) |
Proxy Voting Information
A description of the policies and procedures that the Trust uses to determine how to vote proxies relating to securities held in the Funds’ portfolios is available, without charge and upon request, by calling 800.820.0888. This information is also available from the EDGAR database on the SEC’s website at https://www.sec.gov.
Information regarding how the Funds voted proxies relating to portfolio securities during the most recent 12-month period ended June 30 is available without charge, upon request, by calling 800.820.0888. This information is also available from the EDGAR database on the SEC’s website at https://www.sec.gov.
Sector Classification
Information in the “Schedule of Investments” is categorized by sectors using sector-level Classifications defined by the Bloomberg Industry Classification System, a widely recognized industry classification system provider. Each Fund’s registration statement has investment policies relating to concentration in specific sectors/industries. For purposes of these investment policies, the Funds usually classify sectors/industries based on industry-level Classifications used by widely recognized industry classification system providers such as Bloomberg Industry Classification System, Global Industry Classification Standards and Barclays Global Classification Scheme.
Quarterly Portfolio Schedules Information
The Trust files its complete schedule of portfolio holdings with the SEC for the first and third quarters of each fiscal year on Form N-Q; which are available on the SEC’s website at https://www.sec.gov. The Funds’ Forms N-Q may be reviewed and copied at the SEC’s Public Reference Room in Washington, DC, and that information on the operation of the Public Reference Room may be obtained by calling 800-SEC-0330. Copies of the portfolio holdings are also available to shareholders, without charge and upon request, by calling 800.820.0888.
| | THE GUGGENHEIM FUNDS SEMI-ANNUAL REPORT | 59 |
| INFORMATION ON BOARD OF TRUSTEES AND OFFICERS (Unaudited) |
Name, Address*
and Year of Birth | Position(s) Held
with the Trust | Term of Office
and Length of
Time Served** | Principal Occupation(s)
During Past Five Years | Number of
Portfolios
in Fund
Complex
Overseen | Other Directorships
Held by Trustees |
| INDEPENDENT TRUSTEES | | | |
Randall C. Barnes
(1951) | Trustee | Since 2014 | Current: Private Investor (2001-present). Former: Senior Vice President and Treasurer, PepsiCo, Inc. (1993-1997); President, Pizza Hut International (1991-1993); Senior Vice President, Strategic Planning and New Business Development, PepsiCo, Inc. (1987-1990). | 51 | Current: Trustee, Purpose Investments Funds (2014-Present). |
Donald A.
Chubb, Jr.
(1946 ) | Trustee and Chairman of the Valuation Oversight Committee | Since 1994 | Current: Retired. Former: Business broker and manager of commercial real estate, Griffith & Blair, Inc. (1997-2017). | 48 | Former: Midland Care, Inc. (2011-2016). |
Jerry B. Farley
(1946) | Trustee and Chair of the Audit Committee | Since 2005 | Current: President, Washburn University (1997-present). | 48 | Current: Westar Energy, Inc. (2004-present); CoreFirst Bank & Trust (2000-present). |
Roman
Friedrich III
(1946) | Trustee and Chairman of the Contracts Review Committee | Since 2014 | Current: Founder and Managing Partner, Roman Friedrich & Company (1998-present). Former: Senior Managing Director, MLV & Co. LLC (2010-2011). | 48 | Current: Zincore Metals, Inc. (2009-present). Former: Axiom Gold and Silver Corp. (2011-2012). |
| 60 | THE GUGGENHEIM FUNDS SEMI-ANNUAL REPORT | |
| INFORMATION ON BOARD OF TRUSTEES AND OFFICERS (Unaudited)(continued) |
Name, Address*
and Year of Birth | Position(s) Held
with the Trust | Term of Office
and Length of
Time Served** | Principal Occupation(s)
During Past Five Years | Number of
Portfolios
in Fund
Complex
Overseen | Other Directorships
Held by Trustees |
| INDEPENDENT TRUSTEES - continued | | |
Ronald A. Nyberg
(1953) | Trustee and Chairman of the Nominating and Governance Committee | Since 2014 | Current: Partner, Momkus McCluskey LLC (2016-present). Former: Partner, Nyberg & Cassioppi, LLC (2000-2016); Executive Vice President, General Counsel, and Corporate Secretary, Van Kampen Investments (1982-1999). | 51 | Current: PPM Funds (February 2018-present); Edward-Elmhurst Healthcare System (2012-present); Western Asset Inflation-Linked Opportunities & Income Fund (2004-present); Western Asset Inflation-Linked Income Fund (2003-present). |
Maynard F. Oliverius
(1943) | Trustee | Since 1998 | Current: Retired. Former: President and CEO, Stormont-Vail HealthCare (1996-2012). | 48 | Current: Robert J. Dole Institute of Politics (2016-present); Stormont-Vail Foundation (2013-present); University of Minnesota MHA Alumni Philanthropy Committee (2009-present); Fort Hays State University Foundation (1999-present). Former: Topeka Community Foundation (2009-2014). |
| | THE GUGGENHEIM FUNDS SEMI-ANNUAL REPORT | 61 |
| INFORMATION ON BOARD OF TRUSTEES AND OFFICERS (Unaudited)(continued) |
Name, Address*
and Year of Birth | Position(s) Held
with the Trust | Term of Office
and Length of
Time Served** | Principal Occupation(s)
During Past Five Years | Number of
Portfolios
in Fund
Complex
Overseen | Other Directorships
Held by Trustees |
| INDEPENDENT TRUSTEES - concluded | | |
Ronald E.
Toupin, Jr.
(1958) | Trustee and Chairman of the Board | Since 2014 | Current: Portfolio Consultant (2010-present); Member, Governing Council (2003–present) and Executive Committee (2016-present), Independent Directors Council. Former: Vice President, Manager and Portfolio Manager, Nuveen Asset Management (1998-1999); Vice President, Nuveen Investment Advisory Corp. (1992-1999); Vice President and Manager, Nuveen Unit Investment Trusts (1991-1999); and Assistant Vice President and Portfolio Manager, Nuveen Unit Investment Trusts (1988-1999), each of John Nuveen & Co., Inc. (1982-1999). | 48 | Current: Western Asset Inflation-Linked Opportunities & Income Fund (2004-present); Western Asset Inflation-Linked Income Fund (2003-present). Former: Bennett Group of Funds (2011-2013). |
| 62 | THE GUGGENHEIM FUNDS SEMI-ANNUAL REPORT | |
| INFORMATION ON BOARD OF TRUSTEES AND OFFICERS (Unaudited)(continued) |
Name, Address*
and Year of Birth | Position(s) Held
with the Trust | Term of Office
and Length of
Time Served** | Principal Occupation(s)
During Past Five Years | Number of
Portfolios
in Fund
Complex
Overseen | Other Directorships
Held by Trustees |
| INTERESTED TRUSTEE | | |
Amy J. Lee*** (1961) | Trustee, Vice President and Chief Legal Officer | Since February 2018 (Trustee) Since 2014 (Chief Legal Officer) Since 2007 (Vice President) | Current: Interested Trustee, certain other funds in the Fund Complex (February 2018-present); President, certain other funds in the Fund Complex (2017-present); Chief Legal Officer, certain other funds in the Fund Complex (2014-present); Vice President, certain other funds in the Fund Complex (2007-present); Senior Managing Director, Guggenheim Investments (2012-present). Former: President and Chief Executive Officer (2017-February 2018); Vice President, Associate General Counsel and Assistant Secretary, Security Benefit Life Insurance Company and Security Benefit Corporation (2004-2012). | 158 | None. |
| * | The business address of each Trustee is c/o Guggenheim Investments, 227 West Monroe Street, Chicago, Illinois 60606. |
| ** | Each Trustee serves an indefinite term, until his or her successor is elected and qualified. Time served includes time served in the respective position for the Predecessor Corporation. |
| *** | This Trustee is an “interested person” (as defined in Section 2(a)(19) of the 1940 Act) (“Interested Trustee”) of the Trust because of her affiliation with Guggenheim Investments. |
| | THE GUGGENHEIM FUNDS SEMI-ANNUAL REPORT | 63 |
| INFORMATION ON BOARD OF TRUSTEES AND OFFICERS (Unaudited)(continued) |
Name, Address*
and Year of Birth | Position(s) held
with the Trust | Term of Office
and Length of
Time Served** | Principal Occupations
During Past Five Years |
| OFFICERS | | | |
Brian E. Binder (1972) | President and Chief Executive Officer | Since February 2018 | Current: President and Chief Executive Officer, certain other funds in the Fund Complex (February 2018-present); President and Chief Executive Officer, Guggenheim Funds Investment Advisors, LLC and Security Investors, LLC (January 2018-present); Senior Managing Director and Chief Administrative Officer, Guggenheim Investments (January 2018-present). Former: Managing Director and President, Deutsche Funds, and Head of US Product, Trading and Fund Administration, Deutsche Asset Management (2013-January 2018); Managing Director, Head of Business Management and Consulting, Invesco Ltd. (2010-2012). |
James M. Howley
(1972) | Assistant Treasurer | Since 2014 | Current: Managing Director, Guggenheim Investments (2004-present); Assistant Treasurer, certain other funds in the Fund Complex (2006-present). Former: Manager of Mutual Fund Administration, Van Kampen Investments, Inc. (1996-2004). |
Keith D. Kemp
(1960) | Assistant Treasurer | Since 2016 | Current: Treasurer and Assistant Treasurer, certain other funds in the Fund Complex (2010-present); Managing Director, Guggenheim Investments (2015-present); Chief Financial Officer, Guggenheim Specialized Products, LLC (2016-present). Former: Managing Director and Director, Transparent Value, LLC (2010-2016); Director, Guggenheim Partners Investment Management, LLC (2010-2015); Chief Operating Officer, Macquarie Capital Investment Management (2007-2009). |
Mark E. Mathiasen
(1978) | Secretary | Since 2014 | Current: Secretary, certain other funds in the Fund Complex (2007-present); Managing Director, Guggenheim Investments (2007-present). |
Glenn McWhinnie
(1969) | Assistant Treasurer | Since 2016 | Current: Vice President, Guggenheim Investments (2009-present); Assistant Treasurer, certain other funds in the Fund Complex (2016-present). |
| 64 | THE GUGGENHEIM FUNDS SEMI-ANNUAL REPORT | |
| INFORMATION ON BOARD OF TRUSTEES AND OFFICERS (Unaudited)(continued) |
Name, Address*
and Year of Birth | Position(s) held
with the Trust | Term of Office
and Length of
Time Served** | Principal Occupations
During Past Five Years |
| OFFICERS - continued | |
Michael P. Megaris
(1984) | Assistant Secretary | Since 2014 | Current: Assistant Secretary, certain other funds in the Fund Complex (2014-present); Director, Guggenheim Investments (2012-present). |
Elisabeth Miller
(1968) | Chief Compliance Officer | Since 2012 | Current: CCO, certain other funds in the Fund Complex (2012-present); Managing Director, Guggenheim Investments (2012-present). Vice President, Guggenheim Funds Distributors, LLC (2014-present). Former: CCO, Security Investors, LLC (2012-2018); CCO, Guggenheim Funds Investment Advisors, LLC (2012-2018); CCO, Guggenheim Distributors, LLC (2009-2014); Senior Manager, Security Investors, LLC (2004-2009); Senior Manager, Guggenheim Distributors, LLC (2004-2009). |
Adam J. Nelson
(1979) | Assistant Treasurer | Since 2015 | Current: Vice President, Guggenheim Investments (2015-present); Assistant Treasurer, certain other funds in the Fund Complex (2015-present). Former: Assistant Vice President and Fund Administration Director, State Street Corporation (2013-2015); Fund Administration Assistant Director, State Street (2011-2013); Fund Administration Manager, State Street (2009-2011). |
Kimberly J. Scott
(1974) | Assistant Treasurer | Since 2014 | Current: Director, Guggenheim Investments (2012-present); Assistant Treasurer, certain other funds in the Fund Complex (2012-present). Former: Financial Reporting Manager, Invesco, Ltd. (2010-2011); Vice President/Assistant Treasurer of Mutual Fund Administration, Van Kampen Investments, Inc./Morgan Stanley Investment Management (2009-2010); Manager of Mutual Fund Administration, Van Kampen Investments, Inc./Morgan Stanley Investment Management (2005-2009). |
Bryan Stone
(1979) | Vice President | Since 2014 | Current: Vice President, certain other funds in the Fund Complex (2014-present); Managing Director, Guggenheim Investments (2013-present). Former: Senior Vice President, Neuberger Berman Group LLC (2009-2013); Vice President, Morgan Stanley (2002-2009). |
| | THE GUGGENHEIM FUNDS SEMI-ANNUAL REPORT | 65 |
| INFORMATION ON BOARD OF TRUSTEES AND OFFICERS (Unaudited)(concluded) |
Name, Address*
and Year of Birth | Position(s) held
with the Trust | Term of Office
and Length of
Time Served** | Principal Occupations
During Past Five Years |
| OFFICERS - concluded | |
John L. Sullivan
(1955) | Chief Financial Officer, Chief Accounting Officer and Treasurer | Since 2014 | Current: CFO, Chief Accounting Officer and Treasurer, certain other funds in the Fund Complex (2010-present); Senior Managing Director, Guggenheim Investments (2010-present). Former: Managing Director and CCO, each of the funds in the Van Kampen Investments fund complex (2004-2010); Managing Director and Head of Fund Accounting and Administration, Morgan Stanley Investment Management (2002-2004); CFO and Treasurer, Van Kampen Funds (1996-2004). |
Jon Szafran (1989) | Assistant Treasurer | Since 2017 | Current: Vice President, Guggenheim Investments (2017-present); Assistant Treasurer, certain other funds in the Fund Complex (2017-present). Former: Assistant Treasurer of Henderson Global Funds and Manager of US Fund Administration, Henderson Global Investors (North America) Inc. (“HGINA”), (2017); Senior Analyst of US Fund Administration, HGINA (2014-2017); Senior Associate of Fund Administration, Cortland Capital Market Services, LLC (2013-2014); Experienced Associate, PricewaterhouseCoopers LLP (2012-2013). |
| * | The business address of each officer is c/o Guggenheim Investments, 227 West Monroe Street, Chicago, Illinois 60606. |
| ** | Each officer serves an indefinite term, until his or her successor is duly elected and qualified. Time served includes time served in the respective position for the Predecessor Corporation. |
| 66 | THE GUGGENHEIM FUNDS SEMI-ANNUAL REPORT | |
| GUGGENHEIM INVESTMENTS PRIVACY NOTICE (Unaudited) |
Who We Are
This Privacy Notice describes the data protection practices of Guggenheim Investments. Guggenheim Investments as used herein refers to the affiliated investment management businesses of Guggenheim Partners, LLC: Guggenheim Funds Investment Advisors, LLC, Guggenheim Partners Investment Management, LLC, Guggenheim Funds Distributors, LLC, Security Investors, LLC, Guggenheim Investment Advisors (Europe) Limited, Guggenheim Real Estate, LLC, GS Gamma Advisors, LLC, Guggenheim Partners India Management, LLC, Guggenheim Partners Europe Limited, as well as the funds in the Guggenheim Funds complex (the “Funds”) (“Guggenheim Investments,” “we,” “us,” or “our”).
Guggenheim Partners Investment Management Holdings, LLC, located at 330 Madison Avenue, New York, New York 10017 is the data controller for your information. The Affiliates who are also controllers of certain of your information are: Guggenheim Investment Advisors (Europe) Limited, Guggenheim Partners Europe Limited, Guggenheim Partners, LLC, Guggenheim Funds Investment Advisors, LLC, Guggenheim Partners Investment Management, LLC, Guggenheim Funds Distributors, LLC and Security Investors, LLC, as well as the Funds.
Our Commitment to You
Guggenheim Investments considers your privacy our utmost concern. When you become our client or investor, you entrust us with not only your hard-earned money but also with your personal and financial information. Because we have access to your private information, we hold ourselves to the highest standards in its safekeeping and use. We strictly limit how we share your information with others, whether you are a current or former Guggenheim Investments client or investor.
The Information We Collect About You
We collect certain nonpublic personal information about you from information you provide on applications, other forms, our website, and/or from third parties including investment advisors. This information includes Social Security or other tax identification number, assets, income, tax information, retirement and estate plan information, transaction history, account balance, payment history, bank account information, marital status, family relationships, information that we collect on our website through the use of “cookies,” and other personal information that you or others provide to us. We may also collect such information through your inquiries by mail, e-mail or telephone. We may also collect customer due diligence information, as required by applicable law and regulation, through third party service providers.
How We Handle Your Personal Information
The legal basis for using your information as set out in this Privacy Notice is as follows: (a) use of your personal data is necessary to perform our obligations under any contract with you (such as a contract for us to provide financial services to you); or (b) where use of your personal data is not necessary for performance of a contract, use of your personal data is necessary for our
| | THE GUGGENHEIM FUNDS SEMI-ANNUAL REPORT | 67 |
| GUGGENHEIM INVESTMENTS PRIVACY NOTICE (Unaudited)(continued) |
legitimate interests or the legitimate interests of others (for example, to enforce the legal terms governing our services, operate and market our website and other services we offer, ensure safe environments for our personnel and others, make and receive payments, prevent fraud and to know the customer to whom we are providing the services). Some processing is done to comply with applicable law.
In addition to the specific uses described above, we also use your information in the following manner:
| | ● | We use your information in connection with servicing your accounts. |
| | ● | We use information to respond to your requests or questions. For example, we might use your information to respond to your customer feedback. |
| | ● | We use information to improve our products and services. We may use your information to make our website and products better. We may use your information to customize your experience with us. |
| | ● | We use information for security purposes. We may use your information to protect our company and our customers. |
| | ● | We use information to communicate with you. For example, we will communicate with you about your account or our relationship. We may contact you about your feedback. We might also contact you about this Privacy Notice. We may also enroll you in our email newsletter. |
| | ● | We use information as otherwise permitted by law, as we may notify you. |
| | ● | Aggregate/Anonymous Data. We may aggregate and/or anonymize any information collected through the website so that such information can no longer be linked to you or your device (“Aggregate/Anonymous Information”). We may use Aggregate/Anonymous Information for any purpose, including without limitation for research and marketing purposes, and may also share such data with any third parties, including advertisers, promotional partners, and sponsors. |
We do not sell information about current or former clients or their accounts to third parties. Nor do we share this information, except when necessary to complete transactions at your request, to make you aware of investment products and services that we or our affiliates offer, or as permitted or required by law.
We provide information about you to companies and individuals not affiliated with Guggenheim Investments to complete certain transactions or account changes, or to perform services for us related to your account. For example, if you ask to transfer assets from another financial institution to Guggenheim Investments, we must provide certain information about you to that company to complete the transaction. We provide the third party with only the information necessary to carry out its responsibilities and only for that purpose. And we require these third
| 68 | THE GUGGENHEIM FUNDS SEMI-ANNUAL REPORT | |
| GUGGENHEIM INVESTMENTS PRIVACY NOTICE (Unaudited)(continued) |
parties to treat your private information with the same high degree of confidentiality that we do. To alert you to other Guggenheim Investments products and services, we share your information within our family of affiliated companies. You may limit our sharing with affiliated companies as set out below. We may also share information with any successor to all or part of our business, or in connection with steps leading up to a merger or acquisition. For example, if part of our business was sold we may give customer information as part of that transaction. We may also share information about you with your consent.
We will release information about you if you direct us to do so, if we are compelled by law to do so, or in other circumstances as permitted by law (for example, to protect your account from fraud).
If you close your account(s) or become an inactive client or investor, we will continue to adhere to the privacy policies and practices described in this notice.
Opt-Out Provisions and Your Data Choices
The law allows you to “opt out” of certain kinds of information sharing with third parties. We do not share personal information about you with any third parties that triggers this opt-out right. This means YOU ARE ALREADY OPTED OUT.
When you are no longer our client or investor, we continue to share your information as described in this notice, and you may contact us at any time to limit our sharing by sending an email to CorporateDataPrivacy@GuggenheimPartners.com.
European Union Data Subjects and certain others: In addition to the choices set forth above, residents of the European Union and certain other jurisdictions have certain rights to (1) request access to or rectification or deletion of information we collect about them, (2) request a restriction on the processing of their information, (3) object to the processing of their information, or (4) request the portability of certain information. To exercise these or other rights, please contact us using the contact information below. We will consider all requests and provide our response within the time period stated by applicable law. Please note, however, that certain information may be exempt from such requests in some circumstances, which may include if we need to keep processing your information for our legitimate interests or to comply with a legal obligation. We may request you provide us with information necessary to confirm your identity before responding to your request.
Residents of France and certain other jurisdictions may also provide us with instructions regarding the manner in which we may continue to store, erase and share your information after your death, and where applicable, the person you have designated to exercise these rights after your death.
How We Protect Privacy Online
We take steps to protect your privacy when you use our web site – www.guggenheiminvestments.com – by using secure forms of online communication, including encryption technology, Secure Socket Layer (SSL) protocol, firewalls and user names and passwords. These safeguards vary based on the
| | THE GUGGENHEIM FUNDS SEMI-ANNUAL REPORT | 69 |
| GUGGENHEIM INVESTMENTS PRIVACY NOTICE (Unaudited)(concluded) |
sensitivity of the information that we collect and store. However, we cannot and do not guarantee that these measures will prevent every unauthorized attempt to access, use, or disclose your information since despite our efforts, no Internet and/or other electronic transmissions can be completely secure. Our web site uses “http cookies”—tiny pieces of information that we ask your browser to store. We use cookies for session management and security features on the Guggenheim Investments web site. We do not use them to pull data from your hard drive, to learn your e-mail address, or to view data in cookies created by other web sites. We will not share the information in our cookies or give others access to it. See the legal information area on our web site for more details about web site security and privacy features.
How We Safeguard Your Personal Information and Data Retention
We restrict access to nonpublic personal information about you to our employees and in some cases to third parties (for example, the service providers described above) as permitted by law. We maintain strict physical, electronic and procedural safeguards that comply with federal standards to guard your nonpublic personal information.
We keep your information for no longer than necessary for the purposes for which it is processed. The length of time for which we retain information depends on the purposes for which we collected and use it and/or as required to comply with applicable laws. Information may persist in copies made for backup and business continuity purposes for additional time.
International Visitors
If you are not a resident of the United States, please be aware that your information may be transferred to, stored and processed in the United States where our servers are located and our databases are operated. The data protection and other laws of the United States and other countries might not be as comprehensive as those in your country.
In such cases, we ensure that a legal basis for such a transfer exists and that adequate protection is provided as required by applicable law, for example, by using standard contractual clauses or by transferring your data to a jurisdiction that has obtained an adequacy finding. Individuals whose data may be transferred on the basis of standard contractual clauses may contact us as described below.
We’ll Keep You Informed
If you have any questions or concerns about how we treat your personal data, we encourage you to consult with us first. You may also contact the relevant supervisory authority.
We reserve the right to modify this policy at any time and will inform you promptly of material changes. You may access our privacy policy from our web site at www.guggenheiminvestments.com. Should you have any questions regarding our privacy policy, contact us by email at CorporateDataPrivacy@GuggenheimPartners.com.
| 70 | THE GUGGENHEIM FUNDS SEMI-ANNUAL REPORT | |
This page intentionally left blank.
This page intentionally left blank.
This page intentionally left blank.
3.29.2018
Guggenheim Funds Semi-Annual Report
| |
| Guggenheim Total Return Bond Fund | | |
| GuggenheimInvestments.com | TRB-SEMI-0318x0918 |
| DEAR SHAREHOLDER | 2 |
| ECONOMIC AND MARKET OVERVIEW | 4 |
| ABOUT SHAREHOLDERS’ FUND EXPENSES | 6 |
| TOTAL RETURN BOND FUND | 9 |
| NOTES TO FINANCIAL STATEMENTS | 66 |
| OTHER INFORMATION | 87 |
| INFORMATION ON BOARD OF TRUSTEES AND OFFICERS | 88 |
| GUGGENHEIM INVESTMENTS PRIVACY NOTICE | 95 |
| | THE GUGGENHEIM FUNDS SEMI-ANNUAL REPORT | 1 |
Dear Shareholder:
Guggenheim Partners Investment Management, LLC (the “Investment Adviser”), is pleased to present the shareholder report for Guggenheim Total Return Bond Fund (the “Fund”) for the semiannual fiscal period ended March 29, 2018.
The Investment Adviser is part of Guggenheim Investments, which represents the investment management businesses of Guggenheim Partners, LLC (“Guggenheim”), a global, diversified financial services firm.
Guggenheim Funds Distributors, LLC is the distributor of the Funds. Guggenheim Funds Distributors, LLC is affiliated with Guggenheim and the Investment Adviser.
We encourage you to read the Economic and Market Overview section of the report, which follows this letter.
We are committed to providing innovative investment solutions and appreciate the trust you place in us.
Sincerely,
Guggenheim Partners Investment Management, LLC
April 30, 2018
Read a prospectus and summary prospectus (if available) carefully before investing. It contains the investment objectives, risks, charges, expenses and other information, which should be considered carefully before investing. Obtain a prospectus and summary prospectus (if available) at guggenheiminvestments.com or call 800.820.0888.
This material is not intended as a recommendation or as investment advice of any kind, including in connection with rollovers, transfers, and distributions. Such material is not provided in a fiduciary capacity, may not be relied upon for or in connection with the making of investment decisions, and does not constitute a solicitation of an offer to buy or sell securities. All content has been provided for informational or educational purposes only and is not intended to be and should not be construed as legal or tax advice and/or a legal opinion. Always consult a financial, tax and/or legal professional regarding your specific situation.
| 2 | THE GUGGENHEIM FUNDS SEMI-ANNUAL REPORT | |
Total Return Bond Fund may not be suitable for all investors. ● Investments in fixed-income instruments are subject to the possibility that interest rates could rise, causing the value of the Fund’s holdings and share price to decline. ● Investors in asset-backed securities, including collateralized loan obligations (“CLOs”), generally receive payments that are part interest and part return of principal. These payments may vary based on the rate loans are repaid. Some asset-backed securities may have structures that make their reaction to interest rates and other factors difficult to predict, making their prices volatile and they are subject to liquidity and valuation risk. CLOs bear similar risks to investing in loans directly. ● Investments in loans involve special types of risks, including credit, interest rate, counterparty, prepayment, liquidity, and valuation risks. Loans are often below investment grade, may be unrated, and typically offer a fixed or floating interest rate. ● High yield and unrated debt securities are at a greater risk of default than investment grade bonds and may be less liquid, which may increase volatility. ● The Fund’s use of leverage, through borrowings or instruments such as derivatives, may cause the Fund to be more volatile and riskier than if it had not been leveraged. The more a Fund invests in leveraged instruments, the more the leverage will magnify any gains or losses on those investments. ● Investments in reverse repurchase agreements expose the Fund to many of the same risks as leveraged instruments, such as derivatives. ● You may have a gain or loss when you sell your shares. ● Please read the prospectus for more detailed information regarding these and other risks.
| | THE GUGGENHEIM FUNDS SEMI-ANNUAL REPORT | 3 |
| ECONOMIC AND MARKET OVERVIEW (Unaudited) | March 29, 2018 |
As we enter the ninth year of the current expansion, one of the most important new developments to evaluate is the impact of the corporate tax cuts passed into law at the end of 2017. Guggenheim’s concern is that the substantial late-cycle fiscal easing in the pipeline will prompt more restrictive monetary policy, which increases the risk that the economy will experience a boom-bust cycle that ends in a recession.
With the unemployment rate at 4.1% and core inflation rising, fiscal policy should be leaning against the economy to prevent overheating, not providing further stimulus. Faster wage growth, rising core inflation, and an unsustainably low unemployment rate underpin our longstanding view that the U.S. Federal Reserve (the “Fed”) will raise interest rates four times in 2018. Fed funds futures show the market is now pricing in nearly three rate hikes for 2018, up from two at the beginning of the year, which contributed to a pickup in first-quarter market volatility. Tighter fiscal and monetary policy, along with rising policy uncertainty ahead of the 2018 mid-terms and 2020 presidential election, could prove to be too much for an overextended economy to bear.
Further complicating the story is the risk of a global trade war sparked by protectionist actions taken by the Trump administration. We now have new steel and aluminum tariffs in place that are likely to have some modest inflationary impact while hurting almost 20% of U.S. corporates, according to our estimates. We expect more protectionist trade and investment policies in place by year end.
Over the six months ended March 29, 2018, the bear flattening (the condition in which short-term rates rise faster than long-term rates) of the U.S. Treasury curve continued with Treasury yields higher across the curve. Yields increased the most in the belly and front end of the curve. The 2-year Treasury ended the period at 2.27%, while the 10-year finished the period at 2.74%.
For the six months ended March 29, 2018, the Standard & Poor’s 500® (“S&P 500”) Index* returned 5.84%. The MSCI Europe-Australasia-Far East (“EAFE”) Index* returned 2.80%. The return of the MSCI Emerging Markets Index* was 9.08%.
In the bond market, the Bloomberg Barclays U.S. Aggregate Bond Index* posted a -1.08% return for the period, while the Bloomberg Barclays U.S. Corporate High Yield Index* returned -0.39%. The return of the ICE Bank of America (“BofA”) Merrill Lynch 3-Month U.S. Treasury Bill Index* was 0.64% for the six-month period.
The opinions and forecasts expressed may not actually come to pass. This information is subject to change at any time, based on market and other conditions, and should not be construed as a recommendation of any specific security or strategy.
| 4 | THE GUGGENHEIM FUNDS SEMI-ANNUAL REPORT | |
| ECONOMIC AND MARKET OVERVIEW (Unaudited)(concluded) | March 29, 2018 |
*Index Definitions:
The following indices are referenced throughout this report. Indices are unmanaged and not available for direct investment. Index performance does not reflect transaction costs, fees, or expenses.
Bloomberg Barclays U.S. Aggregate Bond Index is a broad-based flagship benchmark that measures the investment grade, U.S. dollar-denominated, fixed-rate taxable bond market, including U.S. Treasuries, government-related and corporate securities, mortgage-backed securities or “MBS” (agency fixed-rate and hybrid adjustable-rate mortgage, or “ARM”, pass-throughs), asset-backed securities (“ABS”), and commercial mortgage-backed securities (“CMBS”) (agency and non-agency).
Bloomberg Barclays U.S. Corporate High Yield Index measures the U.S. dollar-denominated, high yield, fixed-rate corporate bond market. Securities are classified as high yield if the middle rating of Moody’s, Fitch, and S&P is Ba1/BB +/BB + or below.
ICE BofA Merrill Lynch 3-Month U.S. Treasury Bill Index is an unmanaged market index of U.S. Treasury securities maturing in 90 days that assumes reinvestment of all income.
MSCI EAFE Index is a free float-adjusted market capitalization index that is designed to measure the equity market performance of developed markets, excluding the U.S. & Canada.
MSCI Emerging Markets Index is a free float-adjusted market capitalization weighted index that is designed to measure equity market performance in the global emerging markets.
S&P 500® Index is a broad-based index, the performance of which is based on the performance of 500 widely held common stocks chosen for market size, liquidity, and industry group representation.
| | THE GUGGENHEIM FUNDS SEMI-ANNUAL REPORT | 5 |
| ABOUT SHAREHOLDERS’ FUND EXPENSES (Unaudited) |
All mutual funds have operating expenses, and it is important for our shareholders to understand the impact of costs on their investments. Shareholders of a fund incur two types of costs: (i) transaction costs, including sales charges (loads) on purchase payments, reinvested dividends, other distributions, and exchange fees, and (ii) ongoing costs, including management fees, administrative services, and shareholder reports, among others. These ongoing costs, or operating expenses, are deducted from a fund’s gross income and reduce the investment return of the fund.
A fund’s expenses are expressed as a percentage of its average net assets, which is known as the expense ratio. The following examples are intended to help investors understand the ongoing costs (in dollars) of investing in a fund and to compare these costs with the ongoing costs of investing in other mutual funds.
The examples are based on an investment of $1,000 made at the beginning of the period and held for the entire six-month period beginning September 30, 2017 and ending March 29, 2018 for actual fund returns. Hypothetical fund returns are for the period beginning September 30, 2017 and ending March 31, 2018.
The following tables illustrate the Fund’s costs in two ways:
Table 1. Based on actual Fund return: This section helps investors estimate the actual expenses paid over the period. The “Ending Account Value” shown is derived from the Fund’s actual return, and the fifth column shows the dollar amount that would have been paid by an investor who started with $1,000 in the Fund. Investors may use the information here, together with the amount invested, to estimate the expenses paid over the period. Simply divide the Fund’s account value by $1,000 (for example, an $8,600 account value divided by $1,000 = 8.6), then multiply the result by the number provided under the heading “Expenses Paid During Period.”
Table 2. Based on hypothetical 5% return: This section is intended to help investors compare a fund’s cost with those of other mutual funds. The table provides information about hypothetical account values and hypothetical expenses based on the Fund’s actual expense ratio and an assumed rate of return of 5% per year before expenses, which is not the Fund’s actual return. The hypothetical account values and expenses may not be used to estimate the actual ending account balance or expenses paid during the period. The example is useful in making comparisons because the U.S. Securities and Exchange Commission (the “SEC”) requires all mutual funds to calculate expenses based on the 5% return. Investors can assess a fund’s costs by comparing this hypothetical example with the hypothetical examples that appear in shareholder reports of other funds.
The calculations illustrated above assume no shares were bought or sold during the period. Actual costs may have been higher or lower, depending on the amount of investment and the timing of any purchases or redemptions.
| 6 | THE GUGGENHEIM FUNDS SEMI-ANNUAL REPORT | |
| ABOUT SHAREHOLDERS’ FUND EXPENSES (Unaudited)(continued) |
Please note that the expenses shown in the table are meant to highlight your ongoing costs only and do not reflect any transactional costs, such as sales charges (loads) on purchase payments, and contingent deferred sales charges (“CDSC”) on redemptions, if any. Therefore, the second table is useful in comparing ongoing costs only, and will not help you determine the relative total costs of owning different funds. In addition, if these transactional costs were included, your costs would have been higher.
More information about the Fund’s expenses, including annual expense ratios for periods up to five years (subject to the Fund’s inception date), can be found in the Financial Highlights section of this report. For additional information on operating expenses and other shareholder costs, please refer to the Fund’s prospectus.
| | THE GUGGENHEIM FUNDS SEMI-ANNUAL REPORT | 7 |
| ABOUT SHAREHOLDERS’ FUND EXPENSES (Unaudited)(concluded) |
| | Expense
Ratio1 | Fund
Return | Beginning
Account Value
September 30,
2017 | Ending
Account Value
March 29,
2018 | Expenses
Paid During
Period2 |
| Table 1. Based on actual Fund return3 |
| Total Return Bond Fund |
| A-Class | 0.81% | 0.86% | $ 1,000.00 | $ 1,008.60 | $ 4.01 |
| C-Class | 1.57% | 0.48% | 1,000.00 | 1,004.80 | 7.76 |
| P-Class | 0.81% | 0.86% | 1,000.00 | 1,008.60 | 4.01 |
| R6-Class | 0.49% | 1.01% | 1,000.00 | 1,010.10 | 2.43 |
| Institutional Class | 0.50% | 1.02% | 1,000.00 | 1,010.20 | 2.48 |
| | | | | | |
| | Expense
Ratio1 | Fund
Return | Beginning
Account Value
September 30,
2017 | Ending
Account Value
March 31,
2018 | Expenses
Paid During
Period4 |
| Table 2. Based on hypothetical 5% return (before expenses)5 |
| Total Return Bond Fund |
| A-Class | 0.81% | 5.00% | $ 1,000.00 | $ 1,020.89 | $ 4.08 |
| C-Class | 1.57% | 5.00% | 1,000.00 | 1,017.10 | 7.90 |
| P-Class | 0.81% | 5.00% | 1,000.00 | 1,020.89 | 4.08 |
| R6-Class | 0.49% | 5.00% | 1,000.00 | 1,022.49 | 2.47 |
| Institutional Class | 0.50% | 5.00% | 1,000.00 | 1,022.44 | 2.52 |
| 1 | Annualized and excludes expenses of the underlying funds in which the Fund invests, if any. |
| 2 | Expenses in table 1 are equal to the Fund’s annualized expense ratio, net of any applicable fee waivers, multiplied by the average account value over the period, multiplied by 180/365 (to reflect the one-half year period). |
| 3 | Actual cumulative return at net asset value for the period September 30, 2017 to March 29, 2018. |
| 4 | Expenses in table 2 are equal to the Fund’s annualized expense ratio, net of any applicable fee waivers, multiplied by the average account value over the period, multiplied by 182/365 (to reflect the one-half year period). |
| 5 | Hypothetical return for the period September 30, 2017 to March 31, 2018. |
| 8 | THE GUGGENHEIM FUNDS SEMI-ANNUAL REPORT | |
| PERFORMANCE REPORT AND FUND PROFILE (Unaudited) | March 29, 2018 |
TOTAL RETURN BOND FUND
OBJECTIVE: Seeks to provide total return, comprised of current income and capital appreciation.
Holdings Diversification (Market Exposure as % of Net Assets)

“Holdings Diversification (Market Exposure as % of Net Assets)” excludes any temporary cash investments or investments in Guggenheim Strategy Funds Trust mutual funds.
| | THE GUGGENHEIM FUNDS SEMI-ANNUAL REPORT | 9 |
| PERFORMANCE REPORT AND FUND PROFILE (Unaudited)(continued) | March 29, 2018 |
| Inception Dates: |
| A-Class | November 30, 2011 |
| C-Class | November 30, 2011 |
| P-Class | May 1, 2015 |
| R6-Class | October 19, 2016 |
| Institutional Class | November 30, 2011 |
| Portfolio Composition by Quality Rating1 |
| Rating | % of Total Investments |
| Fixed Income Instruments | |
| AAA | 47.4% |
| AA | 12.7% |
| A | 9.9% |
| BBB | 10.3% |
| BB | 1.0% |
| B | 4.0% |
| CCC | 4.8% |
| CC | 0.5% |
| C | 0.3% |
| NR2 | 4.0% |
| Other Instruments | 5.1% |
| Total Investments | 100.0% |
| Ten Largest Holdings (% of Total Net Assets) |
| U.S. Treasury Bond, 11/15/46 | 4.1% |
| U.S. Treasury Bond, 11/15/44 | 3.0% |
| U.S. Treasury Bond, 02/15/47 | 2.8% |
| Home Equity Loan Trust, 2.06% | 1.3% |
| Guggenheim Floating Rate Strategies Fund - Institutional Class | 1.1% |
| Fortress Credit Opportunities IX CLO Ltd., 2.97% | 1.0% |
| Golub Capital Partners CLO 36m Ltd., 3.39% | 1.0% |
| Freddie Mac Multifamily Structured Pass Through Certificates, 3.28% | 1.0% |
| Soundview Home Loan Trust, 2.01% | 1.0% |
| Ladder Capital Commercial Mortgage 2017-FL1 Mortgage Trust, 2.67% | 0.9% |
| Top Ten Total | 17.2% |
“Ten Largest Holdings” excludes any temporary cash or derivative investments.
| 1 | Source: BlackRock Solutions. Credit quality ratings are measured on a scale that generally ranges from AAA (highest) to D (lowest). All securities except for those labeled “NR” have been rated by Moody’s, Standard & Poor’s (“S&P”), or Fitch, each of which is a Nationally Recognized Statistical Rating Organization (“NRSRO”). For purposes of this presentation, when ratings are available from more than one agency, the highest rating is used. Guggenheim Investments converts ratings to the equivalent S&P rating. Security ratings are determined at the time of purchase and may change thereafter. |
| 2 | NR securities do not necessarily indicate low credit quality. |
| 10 | THE GUGGENHEIM FUNDS SEMI-ANNUAL REPORT | |
| PERFORMANCE REPORT AND FUND PROFILE (Unaudited)(concluded) | March 29, 2018 |
Average Annual Returns*
Periods Ended March 29, 2018
| | 6 month† | 1 Year | 5 Year | Since Inception (11/30/11) |
| A-Class Shares | 0.86% | 3.99% | 3.95% | 5.53% |
| A-Class Shares with sales charge ‡ | (3.19%) | (0.17%) | 2.94% | 4.72% |
| C-Class Shares | 0.48% | 3.22% | 3.19% | 4.76% |
| C-Class Shares with CDSC§ | (0.51%) | 2.22% | 3.19% | 4.76% |
| Institutional Class Shares | 1.02% | 4.33% | 4.31% | 5.90% |
| Bloomberg Barclays U.S. Aggregate Bond Index | (1.08%) | 1.20% | 1.82% | 2.26% |
| | | | | |
| | | 6 month† | 1 Year | Since Inception (05/01/15) |
| P-Class Shares | | 0.86% | 3.99% | 3.72% |
| Bloomberg Barclays U.S. Aggregate Bond Index | | (1.08%) | 1.20% | 1.47% |
| | | | | |
| | | 6 month† | 1 Year | Since Inception (10/19/16) |
| R6-Class Shares | | 1.01% | 4.36% | 3.44% |
| Bloomberg Barclays U.S. Aggregate Bond Index | | (1.08%) | 1.20% | (0.43%) |
| * | The performance data above represents past performance that is not predictive of future results. The investment return and principal value of an investment in the Fund will fluctuate so that an investor’s shares, when redeemed, may be worth more or less than their original cost. Returns are historical and include changes in principal and reinvested dividends and capital gains and do not reflect the effect of taxes. The Bloomberg Barclays U.S. Aggregate Bond Index is an unmanaged index and, unlike the Fund, has no management fees or operating expenses to reduce its reported return. |
| † | 6 month returns are not annualized. |
| ‡ | Effective October 1, 2015, the maximum sales charge decreased from 4.75% to 4.00%. A 4.75% maximum sales charge is used in the calculation of the Average Annual Returns (based on subscriptions made prior to October 1, 2015), and a 4.00% maximum sales charge will be used to calculate performance for periods based on subscriptions made on or after October 1, 2015. |
| § | Fund returns include a CDSC of 1% if redeemed within 12 months of purchase. |
| | THE GUGGENHEIM FUNDS SEMI-ANNUAL REPORT | 11 |
| SCHEDULE OF INVESTMENTS (Unaudited) | March 29, 2018 |
| TOTAL RETURN BOND FUND | |
| | | Shares | | | Value | |
| | | | | | | |
| COMMON STOCKS† - 0.0% |
| | | | | | | |
| Energy - 0.0% |
| Titan Energy LLC* | | | 6,740 | | | $ | 7,414 | |
| | | | | | | | | |
| Total Common Stocks | | | | | | | | |
| (Cost $200,000) | | | | | | | 7,414 | |
| | | | | | | | | |
| PREFERRED STOCKS†† - 0.0% |
| Industrial - 0.0% |
| Seaspan Corp. 6.38% due 04/30/19 | | | 40,800 | | | | 1,037,952 | |
| Total Preferred Stocks | | | | | | | | |
| (Cost $1,020,000) | | | | | | | 1,037,952 | |
| | | | | | | | | |
| MUTUAL FUNDS† - 1.9% |
| Guggenheim Floating Rate Strategies Fund - Institutional Class1 | | | 4,191,406 | | | | 109,018,472 | |
| Guggenheim Strategy Fund I1 | | | 1,002,362 | | | | 25,109,156 | |
| Guggenheim Strategy Fund III1 | | | 1,002,458 | | | | 25,091,523 | |
| Guggenheim Strategy Fund II1 | | | 1,002,901 | | | | 25,082,564 | |
| Total Mutual Funds | | | | | | | | |
| (Cost $184,201,667) | | | | | | | 184,301,715 | |
| | | | | | | | | |
| MONEY MARKET FUND† - 2.9% |
| Federated U.S. Treasury Cash Reserve Fund Instituional Shares 1.45%2 | | | 279,006,141 | | | | 279,006,141 | |
| Total Money Market Fund | | | | | | | | |
| (Cost $279,006,141) | | | | | | | 279,006,141 | |
| | | | | | | | | |
| | | | Face
Amount~ | | | | | |
| |
| ASSET-BACKED SECURITIES†† - 35.1% |
| Collateralized Loan Obligations - 26.2% |
| Ladder Capital Commercial Mortgage Mortgage Trust | | | | | | | | |
| 2017-FL1, 2.67% (1 Month USD LIBOR + 0.88%) due 09/15/343,4 | | | 82,815,000 | | | | 82,744,996 | |
| 2017-FL1, 3.04% (1 Month USD LIBOR + 1.25%) due 09/15/343,4 | | | 22,477,000 | | | | 22,458,638 | |
| 2017-FL1, 3.29% (1 Month USD LIBOR + 1.50%) due 09/15/343,4 | | | 14,269,000 | | | | 14,208,334 | |
| Fortress Credit Opportunities IX CLO Ltd. | | | | | | | | |
| 2017-9A, 2.97% (3 Month USD LIBOR + 1.55%) due 11/15/293,4 | | | 95,150,000 | | | | 95,362,508 | |
| Golub Capital Partners CLO 36m Ltd. | | | | | | | | |
| 2018-36A, 3.39% (3 Month USD LIBOR + 1.30%) due 02/05/313,4 | | | 94,400,000 | | | | 94,367,536 | |
| Venture XII CLO Ltd. | | | | | | | | |
| 2018-12A, 2.78% (3 Month USD LIBOR + 0.80%) due 02/28/263,4 | | | 48,000,000 | | | | 48,021,648 | |
| 2018-12A, 3.18% (3 Month USD LIBOR + 1.20%) due 02/28/263,4 | | | 29,250,000 | | | | 29,265,450 | |
| 12 | THE GUGGENHEIM FUNDS SEMI-ANNUAL REPORT | SEE NOTES TO FINANCIAL STATEMENTS. |
| SCHEDULE OF INVESTMENTS (Unaudited)(continued) | March 29, 2018 |
| TOTAL RETURN BOND FUND | |
| | | Face
Amount~ | | | Value | |
| | | | | | | |
| Golub Capital Partners CLO Ltd. | | | | | | |
| 2016-33A, 4.36% (3 Month USD LIBOR + 2.48%) due 11/21/283,4 | | | 48,750,000 | | | $ | 48,938,833 | |
| 2015-25A, 3.59% (3 Month USD LIBOR + 1.80%) due 08/05/273,4 | | | 16,500,000 | | | | 16,524,308 | |
| BSPRT Issuer Ltd. | | | | | | | | |
| 2017-FL2, 2.60% (1 Month USD LIBOR + 0.82%) due 10/15/343,4 | | | 46,000,000 | | | | 45,978,923 | |
| 2017-FL2, 2.88% (1 Month USD LIBOR + 1.10%) due 10/15/343,4 | | | 11,000,000 | | | | 10,993,211 | |
| 2017-FL2, 3.18% (1 Month USD LIBOR + 1.40%) due 10/15/343,4 | | | 6,200,000 | | | | 6,195,992 | |
| KVK CLO Ltd. | | | | | | | | |
| 2017-1A, 3.64% (3 Month USD LIBOR + 1.80%) due 05/15/263,4 | | | 24,865,000 | | | | 24,916,781 | |
| 2017-2A, 3.47% (3 Month USD LIBOR + 1.75%) due 01/15/263,4 | | | 19,200,000 | | | | 19,217,432 | |
| 2017-2A, 3.37% (3 Month USD LIBOR + 1.65%) due 07/15/263,4 | | | 14,800,000 | | | | 14,810,945 | |
| 2013-1A, due 01/15/284,5 | | | 3,800,000 | | | | 1,831,095 | |
| Shackleton CLO Ltd. | | | | | | | | |
| 2016-7A, 3.67% (3 Month USD LIBOR + 1.95%) due 04/15/273,4 | | | 20,250,000 | | | | 20,264,661 | |
| 2017-5A, 3.44% (3 Month USD LIBOR + 1.65%) due 05/07/263,4 | | | 19,900,000 | | | | 19,935,914 | |
| 2017-4A, 3.22% (3 Month USD LIBOR + 1.50%) due 01/13/253,4 | | | 14,950,000 | | | | 14,959,948 | |
| Hunt CRE Ltd. | | | | | | | | |
| 2017-FL1, 2.78% (1 Month USD LIBOR + 1.00%) due 08/15/343,4 | | | 40,700,000 | | | | 40,667,017 | |
| 2017-FL1, 3.08% (1 Month USD LIBOR + 1.30%) due 08/15/343,4 | | | 8,730,500 | | | | 8,718,774 | |
| 2017-FL1, 3.43% (1 Month USD LIBOR + 1.65%) due 08/15/343,4 | | | 3,000,000 | | | | 2,997,828 | |
| CIFC Funding Ltd. | | | | | | | | |
| 2017-3A, 2.76% (3 Month USD LIBOR + 1.02%) due 10/24/253,4 | | | 22,638,632 | | | | 22,638,657 | |
| 2017-3A, 2.69% (3 Month USD LIBOR + 0.95%) due 07/22/263,4 | | | 12,100,000 | | | | 12,128,135 | |
| 2017-3A, 3.24% (3 Month USD LIBOR + 1.50%) due 10/24/253,4 | | | 11,500,000 | | | | 11,499,990 | |
| 2016-5A, 4.43% (3 Month USD LIBOR + 2.70%) due 01/17/273,4 | | | 3,750,000 | | | | 3,753,223 | |
| Fortress Credit Opportunities VII CLO Ltd. | | | | | | | | |
| 2016-7A, 4.17% (3 Month USD LIBOR + 2.05%) due 12/15/283,4 | | | 42,200,000 | | | | 42,453,057 | |
| SEE NOTES TO FINANCIAL STATEMENTS. | THE GUGGENHEIM FUNDS SEMI-ANNUAL REPORT | 13 |
| SCHEDULE OF INVESTMENTS (Unaudited)(continued) | March 29, 2018 |
| TOTAL RETURN BOND FUND | |
| | | Face
Amount~ | | | Value | |
| | | | | | | |
| 2016-7A, 5.07% (3 Month USD LIBOR + 2.95%) due 12/15/283,4 | | | 5,000,000 | | | $ | 5,034,251 | |
| Fortress Credit Opportunities V CLO Ltd. | | | | | | | | |
| 2017-5A, 3.41% (3 Month USD LIBOR + 1.70%) due 10/15/263,4 | | | 26,200,000 | | | | 26,225,461 | |
| 2017-5A, 3.40% due 10/15/264 | | | 16,000,000 | | | | 16,061,549 | |
| 2017-5A, 4.86% (3 Month USD LIBOR + 3.15%) due 10/15/263,4 | | | 1,750,000 | | | | 1,752,719 | |
| 2017-5A, 4.06% (3 Month USD LIBOR + 2.35%) due 10/15/263,4 | | | 1,500,000 | | | | 1,503,255 | |
| 2017-5A, 3.75% due 10/15/264 | | | 1,000,000 | | | | 1,005,332 | |
| PFP Ltd. | | | | | | | | |
| 2017-3, 2.83% (1 Month USD LIBOR + 1.05%) due 01/14/353,4 | | | 26,288,677 | | | | 26,315,755 | |
| 2015-2, 3.79% (1 Month USD LIBOR + 2.00%) due 07/14/343,4 | | | 16,500,000 | | | | 16,496,839 | |
| 2017-3, 3.53% (1 Month USD LIBOR + 1.75%) due 01/14/353,4 | | | 2,000,000 | | | | 2,006,045 | |
| Vibrant CLO II Ltd. | | | | | | | | |
| 2017-2A, 2.64% (3 Month USD LIBOR + 0.90%) due 07/24/243,4 | | | 26,672,449 | | | | 26,682,558 | |
| 2017-2A, 3.19% (3 Month USD LIBOR + 1.45%) due 07/24/243,4 | | | 17,750,000 | | | | 17,770,957 | |
| Fortress Credit Opportunities XI CLO Ltd. | | | | | | | | |
| 2018-11A, 3.61% (3 Month USD LIBOR + 1.30%) due 04/15/313,4 | | | 44,300,000 | | | | 44,300,000 | |
| Atlas Senior Loan Fund III Ltd. | | | | | | | | |
| 2017-1A, 3.18% (3 Month USD LIBOR + 1.30%) due 11/17/273,4 | | | 25,100,000 | | | | 25,096,473 | |
| 2017-1A, 2.71% (3 Month USD LIBOR + 0.83%) due 11/17/273,4 | | | 15,400,000 | | | | 15,390,651 | |
| Figueroa CLO Ltd. | | | | | | | | |
| 2017-2A, 3.45% (3 Month USD LIBOR + 1.25%) due 06/20/273,4 | | | 40,000,000 | | | | 40,080,096 | |
| VMC Finance LLC | | | | | | | | |
| 2018-FL1, 2.60% (1 Month USD LIBOR + 0.82%) due 04/15/353,4 | | | 28,400,000 | | | | 28,375,366 | |
| 2018-FL1, 3.38% (1 Month USD LIBOR + 1.60%) due 04/15/353,4 | | | 8,300,000 | | | | 8,355,233 | |
| 2018-FL1, 2.98% (1 Month USD LIBOR + 1.20%) due 04/15/353,4 | | | 2,500,000 | | | | 2,496,819 | |
| AIMCO CLO Series | | | | | | | | |
| 2018-AA, 2.57% (3 Month USD LIBOR + 0.85%) due 01/15/283,4 | | | 28,400,000 | | | | 28,371,330 | |
| 2017-AA, 2.84% (3 Month USD LIBOR + 1.10%) due 07/20/263,4 | | | 8,700,000 | | | | 8,703,135 | |
| 14 | THE GUGGENHEIM FUNDS SEMI-ANNUAL REPORT | SEE NOTES TO FINANCIAL STATEMENTS. |
| SCHEDULE OF INVESTMENTS (Unaudited)(continued) | March 29, 2018 |
| TOTAL RETURN BOND FUND | |
| | | Face
Amount~ | | | Value | |
| | | | | | | |
| Marathon CLO V Ltd. | | | | | | |
| 2017-5A, 2.76% (3 Month USD LIBOR + 0.87%) due 11/21/273,4 | | | 22,200,000 | | | $ | 22,151,411 | |
| 2017-5A, 3.34% (3 Month USD LIBOR + 1.45%) due 11/21/273,4 | | | 14,375,000 | | | | 14,377,378 | |
| Woodmont Trust | | | | | | | | |
| 2017-3A, 3.46% (3 Month USD LIBOR + 1.73%) due 10/18/293,4 | | | 16,000,000 | | | | 16,053,368 | |
| 2017-2A, 3.53% (3 Month USD LIBOR + 1.80%) due 07/18/283,4 | | | 10,100,000 | | | | 10,140,045 | |
| 2017-3A, 3.68% (3 Month USD LIBOR + 1.95%) due 10/18/293,4 | | | 9,800,000 | | | | 9,876,950 | |
| Steele Creek CLO | | | | | | | | |
| 2018-1RA, 3.41% (3 Month USD LIBOR + 1.07%) due 04/21/313,4 | | | 34,550,000 | | | | 34,550,000 | |
| Resource Capital Corporation Ltd. | | | | | | | | |
| 2017-CRE5, 2.59% (1 Month USD LIBOR + 0.80%) due 07/15/343,4 | | | 33,333,379 | | | | 33,343,476 | |
| NXT Capital CLO LLC | | | | | | | | |
| 2017-1A, 3.44% (3 Month USD LIBOR + 1.70%) due 04/20/293,4 | | | 33,000,000 | | | | 33,070,514 | |
| Telos CLO Ltd. | | | | | | | | |
| 2017-6A, 3.48% (3 Month USD LIBOR + 1.75%) due 01/17/273,4 | | | 32,000,000 | | | | 32,026,601 | |
| Cerberus Loan Funding XVII Ltd. | | | | | | | | |
| 2016-3A, 4.25% (3 Month USD LIBOR + 2.53%) due 01/15/283,4 | | | 31,500,000 | | | | 31,627,818 | |
| Flagship CLO VIII Ltd. | | | | | | | | |
| 2017-8A, 3.42% (3 Month USD LIBOR + 1.70%) due 01/16/263,4 | | | 30,900,000 | | | | 30,922,294 | |
| WhiteHorse VI Ltd. | | | | | | | | |
| 2016-1A, 3.68% (3 Month USD LIBOR + 1.90%) due 02/03/253,4 | | | 22,100,000 | | | | 22,145,431 | |
| 2016-1A, 4.53% (3 Month USD LIBOR + 2.75%) due 02/03/253,4 | | | 8,500,000 | | | | 8,523,117 | |
| ABPCI Direct Lending Fund CLO II LLC | | | | | | | | |
| 2017-1A, 3.25% (3 Month USD LIBOR + 1.78%) due 07/20/293,4 | | | 29,700,000 | | | | 29,808,340 | |
| Venture XIX CLO Ltd. | | | | | | | | |
| 2016-19A, 3.72% (3 Month USD LIBOR + 2.00%) due 01/15/273,4 | | | 29,450,000 | | | | 29,488,641 | |
| Monroe Capital CLO Ltd. | | | | | | | | |
| 2017-1A, 3.09% (3 Month USD LIBOR + 1.35%) due 10/22/263,4 | | | 18,300,000 | | | | 18,301,825 | |
| 2017-1A, 3.44% (3 Month USD LIBOR + 1.70%) due 10/22/263,4 | | | 10,100,000 | | | | 10,107,319 | |
| FDF II Ltd. | | | | | | | | |
| 2016-2A, 4.29% due 05/12/314 | | | 20,500,000 | | | | 20,486,460 | |
| SEE NOTES TO FINANCIAL STATEMENTS. | THE GUGGENHEIM FUNDS SEMI-ANNUAL REPORT | 15 |
| SCHEDULE OF INVESTMENTS (Unaudited)(continued) | March 29, 2018 |
| TOTAL RETURN BOND FUND | |
| | | Face
Amount~ | | | Value | |
| | | | | | | |
| 2016-2A, 5.29% due 05/12/314 | | | 5,000,000 | | | $ | 5,056,513 | |
| Cerberus Loan Funding XVI, LP | | | | | | | | |
| 2016-2A, 3.77% (3 Month USD LIBOR + 2.05%) due 11/15/273,4 | | | 15,500,000 | | | | 15,581,700 | |
| 2016-2A, 4.07% (3 Month USD LIBOR + 2.35%) due 11/15/273,4 | | | 9,350,000 | | | | 9,439,060 | |
| Golub Capital Partners CLO 16 Ltd. | | | | | | | | |
| 2017-16A, 3.45% (3 Month USD LIBOR + 1.70%) due 07/25/293,4 | | | 17,500,000 | | | | 17,543,414 | |
| 2017-16A, 3.60% (3 Month USD LIBOR + 1.85%) due 07/25/293,4 | | | 6,700,000 | | | | 6,732,612 | |
| A Voce CLO Ltd. | | | | | | | | |
| 2017-1A, 3.27% (3 Month USD LIBOR + 1.55%) due 07/15/263,4 | | | 23,200,000 | | | | 23,201,986 | |
| Shackleton CLO | | | | | | | | |
| 2017-6A, 3.33% (3 Month USD LIBOR + 1.60%) due 07/17/263,4 | | | 22,900,000 | | | | 22,918,171 | |
| Avery Point V CLO Ltd. | | | | | | | | |
| 2017-5A, 2.71% (3 Month USD LIBOR + 0.98%) due 07/17/263,4 | | | 22,700,000 | | | | 22,699,666 | |
| OZLM IX Ltd. | | | | | | | | |
| 2017-9A, 3.39% (3 Month USD LIBOR + 1.65%) due 01/20/273,4 | | | 22,550,000 | | | | 22,569,964 | |
| Cent CLO 20 Ltd. | | | | | | | | |
| 2017-20A, 3.38% (3 Month USD LIBOR + 1.63%) due 01/25/263,4 | | | 22,500,000 | | | | 22,527,981 | |
| Oaktree EIF II Series A2 Ltd. | | | | | | | | |
| 2017-A2, 3.54% (3 Month USD LIBOR + 1.70%) due 11/15/253,4 | | | 21,900,000 | | | | 21,942,617 | |
| Symphony CLO XIV Ltd. | | | | | | | | |
| 2017-14A, 3.57% (3 Month USD LIBOR + 1.85%) due 07/14/263,4 | | | 21,275,000 | | | | 21,283,933 | |
| Regatta V Funding Ltd. | | | | | | | | |
| 2017-1A, 3.35% (3 Month USD LIBOR + 1.60%) due 10/25/263,4 | | | 20,950,000 | | | | 20,972,077 | |
| West CLO Ltd. | | | | | | | | |
| 2017-1A, 2.65% (3 Month USD LIBOR + 0.92%) due 07/18/263,4 | | | 20,000,000 | | | | 19,995,830 | |
| Galaxy XVIII CLO Ltd. | | | | | | | | |
| 2017-18A, 3.22% (3 Month USD LIBOR + 1.50%) due 10/15/263,4 | | | 19,550,000 | | | | 19,562,866 | |
| Flagship VII Ltd. | | | | | | | | |
| 2017-7A, 3.29% (3 Month USD LIBOR + 1.55%) due 01/20/263,4 | | | 19,125,000 | | | | 19,127,546 | |
| TPG Real Estate Finance Issuer Ltd. | | | | | | | | |
| 2018-FL1, 2.54% (1 Month USD LIBOR + 0.75%) due 10/15/193,4 | | | 19,000,000 | | | | 18,993,496 | |
| 16 | THE GUGGENHEIM FUNDS SEMI-ANNUAL REPORT | SEE NOTES TO FINANCIAL STATEMENTS. |
| SCHEDULE OF INVESTMENTS (Unaudited)(continued) | March 29, 2018 |
| TOTAL RETURN BOND FUND | |
| | | Face
Amount~ | | | Value | |
| | | | | | | |
| Newstar Commercial Loan Funding LLC | | | | | | |
| 2017-1A, 4.13% (3 Month USD LIBOR + 2.50%) due 03/20/273,4 | | | 12,750,000 | | | $ | 12,865,033 | |
| 2016-1A, 5.69% (3 Month USD LIBOR + 3.75%) due 02/25/283,4 | | | 5,750,000 | | | | 5,773,504 | |
| Northwoods Capital XIV Ltd. | | | | | | | | |
| 2017-14A, 3.51% (3 Month USD LIBOR + 1.70%) due 11/12/253,4 | | | 18,450,000 | | | | 18,483,418 | |
| Atlas Senior Loan Fund IV Ltd. | | | | | | | | |
| 2017-2A, 3.29% (3 Month USD LIBOR + 1.45%) due 02/17/263,4 | | | 18,450,000 | | | | 18,481,431 | |
| KKR CLO 21 Ltd. | | | | | | | | |
| 2018-21, 3.15% (3 Month USD LIBOR + 1.00%) due 04/15/313,4 | | | 18,100,000 | | | | 18,137,458 | |
| York CLO 1 Ltd. | | | | | | | | |
| 2017-1A, 3.44% (3 Month USD LIBOR + 1.70%) due 01/22/273,4 | | | 17,800,000 | | | | 17,819,395 | |
| TICP CLO II-2 Ltd. | | | | | | | | |
| 2018-IIA, 3.07% (3 Month USD LIBOR + 0.84%) due 04/20/283,4 | | | 17,800,000 | | | | 17,800,000 | |
| AMMC CLO 15 Ltd. | | | | | | | | |
| 2016-15A, 3.41% (3 Month USD LIBOR + 1.35%) due 12/09/263,4 | | | 17,450,000 | | | | 17,516,125 | |
| TICP CLO I Ltd. | | | | | | | | |
| 2017-1A, 3.35% (3 Month USD LIBOR + 1.60%) due 04/26/263,4 | | | 17,250,000 | | | | 17,272,291 | |
| ABPCI Direct Lending Fund CLO I LLC | | | | | | | | |
| 2016-1A, 4.44% (3 Month USD LIBOR + 2.70%) due 12/22/283,4 | | | 17,000,000 | | | | 17,062,356 | |
| Cerberus Loan Funding XXIII, LP | | | | | | | | |
| 2018-2A, 3.31% (3 Month USD LIBOR + 1.00%) due 04/15/283,4 | | | 16,900,000 | | | | 16,900,000 | |
| Northwoods Capital XI Ltd. | | | | | | | | |
| 2017-11A, 3.32% (3 Month USD LIBOR + 1.60%) due 04/15/253,4 | | | 16,750,000 | | | | 16,749,978 | |
| MP CLO VI Ltd. | | | | | | | | |
| 2017-2A, 3.32% (3 Month USD LIBOR + 1.60%) due 01/15/273,4 | | | 14,500,000 | | | | 14,509,557 | |
| Marathon CLO VI Ltd. | | | | | | | | |
| 2017-6A, 3.42% (3 Month USD LIBOR + 1.60%) due 05/13/253,4 | | | 14,050,000 | | | | 14,075,827 | |
| TICP CLO II Ltd. | | | | | | | | |
| 2017-2A, 3.29% (3 Month USD LIBOR + 1.55%) due 07/20/263,4 | | | 14,000,000 | | | | 14,001,618 | |
| Golub Capital Partners CLO 36m Ltd. | | | | | | | | |
| 2018-36A, 3.74% (3 Month USD LIBOR + 1.65%) due 02/05/313,4 | | | 13,250,000 | | | | 13,247,337 | |
| SEE NOTES TO FINANCIAL STATEMENTS. | THE GUGGENHEIM FUNDS SEMI-ANNUAL REPORT | 17 |
| SCHEDULE OF INVESTMENTS (Unaudited)(continued) | March 29, 2018 |
| TOTAL RETURN BOND FUND | |
| | | Face
Amount~ | | | Value | |
| | | | | | | |
| Seneca Park CLO Limited | | | | | | |
| 2017-1A, 3.23% (3 Month USD LIBOR + 1.50%) due 07/17/263,4 | | | 12,900,000 | | | $ | 12,910,000 | |
| FDF I Ltd. | | | | | | | | |
| 2015-1A, 4.40% due 11/12/304 | | | 13,000,000 | | | | 12,848,914 | |
| Marathon CLO VII Ltd. | | | | | | | | |
| 2017-7A, 3.41% (3 Month USD LIBOR + 1.65%) due 10/28/253,4 | | | 12,600,000 | | | | 12,618,197 | |
| OZLM VIII Ltd. | | | | | | | | |
| 2017-8A, 2.86% (3 Month USD LIBOR + 1.13%) due 10/17/263,4 | | | 12,000,000 | | | | 12,021,146 | |
| Vibrant CLO III Ltd. | | | | | | | | |
| 2016-3A, 3.79% (3 Month USD LIBOR + 2.05%) due 04/20/263,4 | | | 12,000,000 | | | | 12,012,062 | |
| Sudbury Mill CLO Ltd. | | | | | | | | |
| 2017-1A, 3.38% (3 Month USD LIBOR + 1.65%) due 01/17/263,4 | | | 11,850,000 | | | | 11,860,328 | |
| AMMC CLO XV Ltd. | | | | | | | | |
| 2016-15A, 3.96% (3 Month USD LIBOR + 1.90%) due 12/09/263,4 | | | 11,600,000 | | | | 11,643,343 | |
| Madison Park Funding XIV Ltd. | | | | | | | | |
| 2017-14A, 3.29% (3 Month USD LIBOR + 1.55%) due 07/20/263,4 | | | 6,400,000 | | | | 6,405,929 | |
| 2017-14A, 2.86% (3 Month USD LIBOR + 1.12%) due 07/20/263,4 | | | 5,211,000 | | | | 5,216,874 | |
| TCP Waterman CLO Ltd. | | | | | | | | |
| 2016-1A, 4.17% (3 Month USD LIBOR + 2.05%) due 12/15/283,4 | | | 7,150,000 | | | | 7,195,362 | |
| 2016-1A, 4.42% (3 Month USD LIBOR + 2.30%) due 12/15/283,4 | | | 4,000,000 | | | | 4,039,197 | |
| Recette Clo Ltd. | | | | | | | | |
| 2017-1A, 3.04% (3 Month USD LIBOR + 1.30%) due 10/20/273,4 | | | 11,000,000 | | | | 11,003,781 | |
| Treman Park CLO Ltd. | | | | | | | | |
| 2015-1A, due 04/20/274,5 | | | 13,600,000 | | | | 10,760,565 | |
| Regatta IV Funding Ltd. | | | | | | | | |
| 2017-1A, 2.77% (3 Month USD LIBOR + 1.02%) due 07/25/263,4 | | | 10,500,000 | | | | 10,508,050 | |
| Venture XVII CLO Ltd. | | | | | | | | |
| 2017-17A, 2.80% (3 Month USD LIBOR + 1.08%) due 07/15/263,4 | | | 10,100,000 | | | | 10,103,424 | |
| Nelder Grove CLO Ltd. | | | | | | | | |
| 2017-1A, 3.78% (3 Month USD LIBOR + 1.80%) due 08/28/263,4 | | | 10,050,000 | | | | 10,076,387 | |
| Ares XXXIII CLO Ltd. | | | | | | | | |
| 2016-1A, 3.97% (3 Month USD LIBOR + 1.95%) due 12/05/253,4 | | | 9,800,000 | | | | 9,870,736 | |
| Bsprt Issuer Ltd. | | | | | | | | |
| 2017-FL1, 3.13% (1 Month USD LIBOR + 1.35%) due 06/15/273,4 | | | 9,690,000 | | | | 9,721,665 | |
| 18 | THE GUGGENHEIM FUNDS SEMI-ANNUAL REPORT | SEE NOTES TO FINANCIAL STATEMENTS. |
| SCHEDULE OF INVESTMENTS (Unaudited)(continued) | March 29, 2018 |
| TOTAL RETURN BOND FUND | |
| | | Face
Amount~ | | | Value | |
| | | | | | | |
| Shackleton 2015-VIII CLO Ltd. | | | | | | |
| 2017-8A, 2.66% (3 Month USD LIBOR + 0.92%) due 10/20/273,4 | | | 4,900,000 | | | $ | 4,901,391 | |
| 2017-8A, 3.04% (3 Month USD LIBOR + 1.30%) due 10/20/273,4 | | | 4,760,000 | | | | 4,762,958 | |
| Garrison Funding Ltd. | | | | | | | | |
| 2016-2A, 4.08% (3 Month USD LIBOR + 2.20%) due 09/29/273,4 | | | 7,000,000 | | | | 7,058,453 | |
| 2016-2A, 5.03% (3 Month USD LIBOR + 3.15%) due 09/29/273,4 | | | 2,250,000 | | | | 2,279,636 | |
| ACIS CLO Ltd. | | | | | | | | |
| 2015-6A, 4.25% (3 Month USD LIBOR + 2.48%) due 05/01/273,4 | | | 7,500,000 | | | | 7,514,089 | |
| 2013-1A, 4.68% (3 Month USD LIBOR + 2.95%) due 04/18/243,4 | | | 1,650,000 | | | | 1,652,331 | |
| Dryden 37 Senior Loan Fund | | | | | | | | |
| 2015-37A, due 01/15/314,5 | | | 10,000,000 | | | | 9,111,092 | |
| Crown Point CLO III Ltd. | | | | | | | | |
| 2017-3A, 3.17% (3 Month USD LIBOR + 1.45%) due 12/31/273,4 | | | 8,280,000 | | | | 8,284,777 | |
| Madison Park Funding XVI Ltd. | | | | | | | | |
| 2016-16A, 3.64% (3 Month USD LIBOR + 1.90%) due 04/20/263,4 | | | 8,250,000 | | | | 8,257,856 | |
| Betony CLO Ltd. | | | | | | | | |
| 2016-1A, 3.67% (3 Month USD LIBOR + 1.95%) due 04/15/273,4 | | | 8,250,000 | | | | 8,255,836 | |
| Jamestown CLO III Ltd. | | | | | | | | |
| 2017-3A, 3.47% (3 Month USD LIBOR + 1.75%) due 01/15/263,4 | | | 8,000,000 | | | | 8,007,603 | |
| Fifth Street SLF II Ltd. | | | | | | | | |
| 2015-2A, 3.68% (3 Month USD LIBOR + 1.92%) due 09/29/273,4 | | | 8,000,000 | | | | 8,006,432 | |
| KKR CLO 15 Ltd. | | | | | | | | |
| 2016-15, 3.29% (3 Month USD LIBOR + 1.56%) due 10/18/283,4 | | | 7,529,000 | | | | 7,561,026 | |
| Carlyle Global Market Strategies CLO Ltd. | | | | | | | | |
| 2012-3A, due 10/04/284,5 | | | 8,920,000 | | | | 7,469,626 | |
| Flatiron CLO Ltd. | | | | | | | | |
| 2017-1A, 3.38% (3 Month USD LIBOR + 1.65%) due 01/17/263,4 | | | 7,100,000 | | | | 7,106,049 | |
| Vibrant CLO IV Ltd. | | | | | | | | |
| 2016-4A, 4.14% (3 Month USD LIBOR + 2.40%) due 07/20/283,4 | | | 7,000,000 | | | | 7,060,305 | |
| Regatta III Funding Ltd. | | | | | | | | |
| 2017-1A, 2.77% (3 Month USD LIBOR + 1.05%) due 04/15/263,4 | | | 7,050,000 | | | | 7,048,648 | |
| Cent CLO 21 Ltd. | | | | | | | | |
| 2017-21A, 3.46% (3 Month USD LIBOR + 1.70%) due 07/27/263,4 | | | 7,000,000 | | | | 7,004,314 | |
| SEE NOTES TO FINANCIAL STATEMENTS. | THE GUGGENHEIM FUNDS SEMI-ANNUAL REPORT | 19 |
| SCHEDULE OF INVESTMENTS (Unaudited)(continued) | March 29, 2018 |
| TOTAL RETURN BOND FUND | |
| | | Face
Amount~ | | | Value | |
| | | | | | | |
| OCP CLO Ltd. | | | | | | |
| 2012-2A, 4.75% (3 Month USD LIBOR + 2.85%) due 11/22/253,4 | | | 6,500,000 | | | $ | 6,545,589 | |
| Avery Point II CLO Ltd. | | | | | | | | |
| 2013-3X COM, due 01/18/255 | | | 7,500,060 | | | | 6,461,058 | |
| Voya CLO Ltd. | | | | | | | | |
| 2013-1X, due 10/15/305 | | | 9,500,000 | | | | 5,779,696 | |
| 2013-1A, due 10/15/304,5 | | | 1,075,071 | | | | 654,061 | |
| Fifth Street Senior Loan Fund I LLC | | | | | | | | |
| 2015-1A, 3.74% (3 Month USD LIBOR + 2.00%) due 01/20/273,4 | | | 5,000,000 | | | | 5,013,058 | |
| 2015-1A, 4.74% (3 Month USD LIBOR + 3.00%) due 01/20/273,4 | | | 1,250,000 | | | | 1,251,728 | |
| Symphony CLO XII Ltd. | | | | | | | | |
| 2017-12A, 3.22% (3 Month USD LIBOR + 1.50%) due 10/15/253,4 | | | 5,750,000 | | | | 5,754,541 | |
| OHA Loan Funding Ltd. | | | | | | | | |
| 2017-1A, 3.79% (3 Month USD LIBOR + 2.05%) due 07/23/253,4 | | | 5,300,000 | | | | 5,303,838 | |
| OHA Credit Partners IX Ltd. | | | | | | | | |
| 2013-9A, due 10/20/254,5 | | | 6,000,000 | | | | 5,250,666 | |
| Fortress Credit Opportunities VI CLO Ltd. | | | | | | | | |
| 2015-6A, 4.77% (3 Month USD LIBOR + 2.70%) due 10/10/263,4 | | | 5,000,000 | | | | 5,009,753 | |
| Dryden XXV Senior Loan Fund | | | | | | | | |
| 2017-25A, 3.07% (3 Month USD LIBOR + 1.35%) due 10/15/273,4 | | | 5,000,000 | | | | 5,009,180 | |
| Mountain Hawk II CLO Ltd. | | | | | | | | |
| 2013-2A, 3.44% (3 Month USD LIBOR + 1.70%) due 07/22/243,4 | | | 5,000,000 | | | | 5,000,251 | |
| Golub Capital BDC CLO 2014 LLC | | | | | | | | |
| 2018-1A, 3.09% (3 Month USD LIBOR + 0.95%) due 04/25/263,4 | | | 4,500,000 | | | | 4,504,668 | |
| Benefit Street Partners CLO V Ltd. | | | | | | | | |
| 2017-VA, 3.39% (3 Month USD LIBOR + 1.65%) due 10/20/263,4 | | | 4,500,000 | | | | 4,504,035 | |
| Oaktree CLO Ltd. | | | | | | | | |
| 2017-1A, 2.61% (3 Month USD LIBOR + 0.87%) due 10/20/273,4 | | | 4,500,000 | | | | 4,494,561 | |
| Halcyon Loan Advisors Funding Ltd. | | | | | | | | |
| 2012-2A, 5.05% (3 Month USD LIBOR + 2.85%) due 12/20/243,4 | | | 4,000,000 | | | | 4,004,424 | |
| OZLM Funding II Ltd. | | | | | | | | |
| 2016-2A, 4.52% (3 Month USD LIBOR + 2.75%) due 10/30/273,4 | | | 3,750,000 | | | | 3,750,954 | |
| 20 | THE GUGGENHEIM FUNDS SEMI-ANNUAL REPORT | SEE NOTES TO FINANCIAL STATEMENTS. |
| SCHEDULE OF INVESTMENTS (Unaudited)(continued) | March 29, 2018 |
| TOTAL RETURN BOND FUND | |
| | | Face
Amount~ | | | Value | |
| | | | | | | |
| Cereberus ICQ Levered LLC | | | | | | |
| 2015-1A, 4.77% (3 Month USD LIBOR + 3.05%) due 11/06/253,4 | | | 2,250,000 | | | $ | 2,254,756 | |
| 2015-1A, 3.77% (3 Month USD LIBOR + 2.05%) due 11/06/253,4 | | | 1,337,381 | | | | 1,337,554 | |
| Cent CLO | | | | | | | | |
| 2014-16A, 4.97% (3 Month USD LIBOR + 3.20%) due 08/01/243,4 | | | 1,750,000 | | | | 1,755,451 | |
| 2014-16A, 4.02% (3 Month USD LIBOR + 2.25%) due 08/01/243,4 | | | 1,750,000 | | | | 1,751,656 | |
| Atrium XI | | | | | | | | |
| 2017-11A, 3.24% (3 Month USD LIBOR + 1.50%) due 10/23/253,4 | | | 3,500,000 | | | | 3,499,360 | |
| Eaton Vance CLO Ltd. | | | | | | | | |
| 2017-1A, 3.32% (3 Month USD LIBOR + 1.60%) due 07/15/263,4 | | | 3,400,000 | | | | 3,402,384 | |
| MONROE CAPITAL BSL CLO Ltd. | | | | | | | | |
| 2017-1A, 3.65% (3 Month USD LIBOR + 1.75%) due 05/22/273,4 | | | 3,000,000 | | | | 3,002,498 | |
| AMMC CLO XI Ltd. | | | | | | | | |
| 2016-11A, 4.62% (3 Month USD LIBOR + 2.85%) due 10/30/233,4 | | | 3,000,000 | | | | 3,000,262 | |
| Ocean Trails CLO IV | | | | | | | | |
| 2017-4A, 3.62% (3 Month USD LIBOR + 1.80%) due 08/13/253,4 | | | 2,500,000 | | | | 2,505,259 | |
| Octagon Investment Partners 24 Ltd. | | | | | | | | |
| 2017-1A, 3.24% (3 Month USD LIBOR + 1.35%) due 05/21/273,4 | | | 2,500,000 | | | | 2,504,052 | |
| Mountain Hawk I CLO Ltd. | | | | | | | | |
| 2013-1A, 3.92% (3 Month USD LIBOR + 2.18%) due 01/20/243,4 | | | 2,500,000 | | | | 2,503,624 | |
| FS Senior Funding Ltd. | | | | | | | | |
| 2015-1A, 3.52% (3 Month USD LIBOR + 1.80%) due 05/28/253,4 | | | 2,500,000 | | | | 2,502,133 | |
| NXT Capital CLO LLC | | | | | | | | |
| 2017-1A, 3.14% (3 Month USD LIBOR + 1.40%) due 04/23/263,4 | | | 2,300,000 | | | | 2,302,546 | |
| Venture XIII CLO Ltd. | | | | | | | | |
| 2013-13A, due 09/10/294,5 | | | 3,700,000 | | | | 2,146,955 | |
| NewStar Arlington Senior Loan Program LLC | | | | | | | | |
| 2014-1A, 4.35% (3 Month USD LIBOR + 2.60%) due 07/25/253,4 | | | 1,000,000 | | | | 1,002,619 | |
| 2014-1A, 4.76% due 07/25/254 | | | 700,000 | | | | 701,118 | |
| 2014-1A, 5.05% (3 Month USD LIBOR + 3.30%) due 07/25/253,4 | | | 400,000 | | | | 400,530 | |
| NewStar Clarendon Fund CLO LLC | | | | | | | | |
| 2015-1A, 5.10% (3 Month USD LIBOR + 3.35%) due 01/25/273,4 | | | 2,000,000 | | | | 2,004,848 | |
| SEE NOTES TO FINANCIAL STATEMENTS. | THE GUGGENHEIM FUNDS SEMI-ANNUAL REPORT | 21 |
| SCHEDULE OF INVESTMENTS (Unaudited)(continued) | March 29, 2018 |
| TOTAL RETURN BOND FUND | |
| | | Face
Amount~ | | | Value | |
| | | | | | | |
| Octagon Investment Partners XVI Ltd. | | | | | | |
| 2013-1A, 4.48% (3 Month USD LIBOR + 2.75%) due 07/17/253,4 | | | 2,000,000 | | | $ | 2,002,863 | |
| Ivy Hill Middle Market Credit Fund IX Ltd. | | | | | | | | |
| 2017-9A, 4.08% (3 Month USD LIBOR + 2.35%) due 01/18/303,4 | | | 1,000,000 | | | | 1,002,039 | |
| 2017-9A, 3.48% (3 Month USD LIBOR + 1.75%) due 01/18/303,4 | | | 1,000,000 | | | | 1,000,651 | |
| LMREC, Inc. | | | | | | | | |
| 2015-CRE1, 5.36% (1 Month USD LIBOR + 3.50%) due 02/22/323,4 | | | 2,000,000 | | | | 1,999,800 | |
| Dryden 38 Senior Loan Fund | | | | | | | | |
| 2015-38A, 3.72% (3 Month USD LIBOR + 2.00%) due 07/15/273,4 | | | 1,850,000 | | | | 1,855,460 | |
| Catamaran CLO Ltd. | | | | | | | | |
| 2016-2A, 3.78% (3 Month USD LIBOR + 2.05%) due 10/18/263,4 | | | 1,750,000 | | | | 1,759,965 | |
| Resource Capital Corp. | | | | | | | | |
| 2015-CRE3, 5.79% (1 Month USD LIBOR + 4.00%) due 03/15/323,4 | | | 1,080,083 | | | | 1,075,690 | |
| NXT Capital CLO LLC | | | | | | | | |
| 2018-1A, 3.94% (3 Month USD LIBOR + 2.20%) due 04/21/273,4 | | | 1,000,000 | | | | 1,000,338 | |
| Babson CLO Ltd. | | | | | | | | |
| 2014-IA, due 07/20/254,5 | | | 1,300,000 | | | | 599,644 | |
| 2012-2A, due 05/15/234,5 | | | 4,750,000 | | | | 206,098 | |
| Atlas Senior Loan Fund IX Ltd. | | | | | | | | |
| 2018-9A, due 04/20/284,5 | | | 1,200,000 | | | | 761,021 | |
| ING Investment Management CLO Ltd. | | | | | | | | |
| 2007-4A, 3.94% (3 Month USD LIBOR + 2.20%) due 06/14/223,4 | | | 739,315 | | | | 739,410 | |
| GoldenTree Credit Opportunities Financing Ltd. | | | | | | | | |
| 2012-1A, 6.37% (3 Month USD LIBOR + 4.25%) due 06/15/283,4 | | | 500,000 | | | | 505,014 | |
| Westchester CLO Ltd. | | | | | | | | |
| 2007-1A, 2.21% (3 Month USD LIBOR + 0.44%) due 08/01/223,4 | | | 459,187 | | | | 459,162 | |
| Great Lakes CLO Ltd. | | | | | | | | |
| 2014-1A, due 10/15/294,5 | | | 461,538 | | | | 402,185 | |
| Rockwall CDO II Ltd. | | | | | | | | |
| 2007-1A, 2.32% (3 Month USD LIBOR + 0.55%) due 08/01/243,4 | | | 353,981 | | | | 354,002 | |
| Copper River CLO Ltd. | | | | | | | | |
| 2007-1A, due 01/20/215,6 | | | 1,500,000 | | | | 190,950 | |
| Ares XXVI CLO Ltd. | | | | | | | | |
| 2013-1A, due 04/15/254,5 | | | 4,300,000 | | | | 101,734 | |
| Keuka Park CLO Ltd. | | | | | | | | |
| 2013-1A, due 10/21/244,5 | | | 1,000,000 | | | | 33,742 | |
| Total Collateralized Loan Obligations | | | | | | | 2,520,801,222 | |
| 22 | THE GUGGENHEIM FUNDS SEMI-ANNUAL REPORT | SEE NOTES TO FINANCIAL STATEMENTS. |
| SCHEDULE OF INVESTMENTS (Unaudited)(continued) | March 29, 2018 |
| TOTAL RETURN BOND FUND | |
| | | Face
Amount~ | | | Value | |
| | | | | | | |
| Transport-Aircraft - 3.0% |
| Apollo Aviation Securitization Equity Trust | | | | | | |
| 2016-2, 4.21% due 11/15/41 | | | 42,502,740 | | | $ | 42,922,969 | |
| 2016-1A, 4.88% due 03/17/364 | | | 18,077,511 | | | | 18,514,388 | |
| SAPPHIRE AVIATION FINANCE I Ltd. | | | | | | | | |
| 2018-1A, 4.25% due 03/15/404 | | | 44,800,000 | | | | 44,943,898 | |
| KDAC Aviation Finance Ltd. | | | | | | | | |
| 2017-1A, 4.21% due 12/15/424 | | | 44,055,000 | | | | 43,972,890 | |
| Castlelake Aircraft Securitization Trust | | | | | | | | |
| 2017-1, 3.97% due 07/15/42 | | | 20,160,875 | | | | 19,937,214 | |
| 2015-1A, 4.70% due 12/15/404 | | | 13,933,933 | | | | 13,952,123 | |
| AIM Aviation Finance Ltd. | | | | | | | | |
| 2015-1A, 4.21% due 02/15/404 | | | 23,904,945 | | | | 23,887,399 | |
| 2015-1A, 5.07% due 02/15/404 | | | 1,992,079 | | | | 1,978,625 | |
| Raspro Trust | | | | | | | | |
| 2005-1A, 2.37% (3 Month USD LIBOR + 0.63%) due 03/23/243,4 | | | 18,790,796 | | | | 17,945,210 | |
| ECAF I Ltd. | | | | | | | | |
| 2015-1A, 4.95% due 06/15/224 | | | 15,016,821 | | | | 15,250,251 | |
| 2015-1A, 3.47% due 06/15/404 | | | 1,145,771 | | | | 1,135,732 | |
| Falcon Aerospace Ltd. | | | | | | | | |
| 2017-1, 4.58% due 02/15/424 | | | 15,401,480 | | | | 15,465,427 | |
| AASET Trust | | | | | | | | |
| 2017-1A, 3.97% due 05/16/424 | | | 11,274,780 | | | | 11,239,045 | |
| Emerald Aviation Finance Ltd. | | | | | | | | |
| 2013-1, 4.65% due 10/15/384 | | | 3,496,676 | | | | 3,534,317 | |
| 2013-1, 6.35% due 10/15/384 | | | 305,535 | | | | 305,355 | |
| Diamond Head Aviation Ltd. | | | | | | | | |
| 2015-1, 3.81% due 07/14/284 | | | 3,496,595 | | | | 3,474,263 | |
| Rise Ltd. | | | | | | | | |
| 2014-1A, 4.74% due 02/12/39 | | | 3,268,444 | | | | 3,273,347 | |
| Atlas Ltd. | | | | | | | | |
| 2014-1 A, 4.87% due 12/15/39 | | | 3,160,158 | | | | 3,160,158 | |
| AABS Ltd. | | | | | | | | |
| 2013-1 A, 4.87% due 01/10/38 | | | 2,439,599 | | | | 2,439,599 | |
| Eagle I Ltd. | | | | | | | | |
| 2014-1A, 4.31% due 12/15/394 | | | 2,428,750 | | | | 2,381,692 | |
| Stripes Aircraft Ltd. | | | | | | | | |
| 2013-1 A1, 5.32% due 03/20/23†††,3 | | | 1,423,233 | | | | 1,411,193 | |
| Willis Engine Securitization Trust II | | | | | | | | |
| 2012-A, 5.50% due 09/15/374 | | | 976,146 | | | | 965,752 | |
| Turbine Engines Securitization Ltd. | | | | | | | | |
| 2013-1A, 5.13% due 12/13/486 | | | 825,806 | | | | 830,110 | |
| Airplanes Pass Through Trust | | | | | | | | |
| 2001-1A, 2.33% (1 Month USD LIBOR + 0.55%) due 03/15/193,6,12 | | | 409,604 | | | | 18,432 | |
| Total Transport-Aircraft | | | | | | | 292,939,389 | |
| SEE NOTES TO FINANCIAL STATEMENTS. | THE GUGGENHEIM FUNDS SEMI-ANNUAL REPORT | 23 |
| SCHEDULE OF INVESTMENTS (Unaudited)(continued) | March 29, 2018 |
| TOTAL RETURN BOND FUND | |
| | | Face
Amount~ | | | Value | |
| | | | | | | |
| Whole Business - 1.5% |
| Domino’s Pizza Master Issuer LLC | | | | | | |
| 2017-1A, 3.08% due 07/25/474 | | | 22,213,375 | | | $ | 21,745,339 | |
| 2017-1A, 4.12% due 07/25/474 | | | 17,253,300 | | | | 17,438,600 | |
| 2017-1A, 3.00% (3 Month USD LIBOR + 1.25%) due 07/25/473,4 | | | 17,114,000 | | | | 17,255,704 | |
| 2015-1A, 3.48% due 10/25/454 | | | 1,965,000 | | | | 1,961,581 | |
| Taco Bell Funding LLC | | | | | | | | |
| 2016-1A, 4.97% due 05/25/464 | | | 27,255,000 | | | | 28,400,800 | |
| 2016-1A, 4.38% due 05/25/464 | | | 5,233,750 | | | | 5,363,756 | |
| 2016-1A, 3.83% due 05/25/464 | | | 2,403,575 | | | | 2,416,963 | |
| Jimmy Johns Funding LLC | | | | | | | | |
| 2017-1A, 3.61% due 07/30/474 | | | 22,835,250 | | | | 22,809,675 | |
| Wendy’s Funding LLC | | | | | | | | |
| 2015-1A, 4.50% due 06/15/454 | | | 12,138,750 | | | | 12,385,288 | |
| DB Master Finance LLC | | | | | | | | |
| 2015-1A, 3.98% due 02/20/454 | | | 7,245,900 | | | | 7,308,505 | |
| Sonic Capital LLC | | | | | | | | |
| 2016-1A, 4.47% due 05/20/464 | | | 3,783,866 | | | | 3,856,440 | |
| 2018-1A, 4.03% due 02/20/484 | | | 1,300,000 | | | | 1,293,227 | |
| Drug Royalty III Limited Partnership | | | | | | | | |
| 2016-1A, 3.98% due 04/15/274 | | | 2,675,631 | | | | 2,658,903 | |
| Drug Royalty III Limited Partnership 1 | | | | | | | | |
| 2017-1A, 3.60% due 04/15/274 | | | 2,153,896 | | | | 2,123,032 | |
| Total Whole Business | | | | | | | 147,017,813 | |
| | | | | | | | | |
| Net Lease - 1.2% |
| Capital Automotive LLC | | | | | | | | |
| 2017-1A, 3.87% due 04/15/474 | | | 51,870,125 | | | | 51,671,597 | |
| Store Master Funding I-VII | | | | | | | | |
| 2016-1A, 3.96% due 10/20/464 | | | 30,415,067 | | | | 29,519,343 | |
| 2016-1A, 4.32% due 10/20/464 | | | 10,478,366 | | | | 10,672,216 | |
| Store Master Funding I LLC | | | | | | | | |
| 2015-1A, 4.17% due 04/20/454 | | | 7,833,077 | | | | 7,861,300 | |
| 2015-1A, 3.75% due 04/20/454 | | | 1,478,125 | | | | 1,460,376 | |
| Spirit Master Funding LLC | | | | | | | | |
| 2014-2A, 5.76% due 03/20/414 | | | 4,845,935 | | | | 5,004,484 | |
| 2014-4A, 4.63% due 01/20/454 | | | 4,176,168 | | | | 4,234,519 | |
| Capital Automotive REIT | | | | | | | | |
| 2014-1A, 3.66% due 10/15/444 | | | 4,500,000 | | | | 4,448,934 | |
| Store Master Funding LLC | | | | | | | | |
| 2013-1A, 4.16% due 03/20/434 | | | 1,692,721 | | | | 1,685,445 | |
| Total Net Lease | | | | | | | 116,558,214 | |
| | | | | | | | | |
| Collateralized Debt Obligations - 1.1% |
| Anchorage Credit Funding Ltd. | | | | | | | | |
| 2016-4A, 3.50% due 02/15/354 | | | 55,600,000 | | | | 55,402,931 | |
| 2016-3A, 3.85% due 10/28/334 | | | 7,500,000 | | | | 7,533,552 | |
| Putnam Structured Product Funding Ltd. | | | | | | | | |
| 2003-1A, 2.78% (1 Month USD LIBOR + 1.00%) due 10/15/383,4 | | | 19,513,514 | | | | 18,885,745 | |
| 24 | THE GUGGENHEIM FUNDS SEMI-ANNUAL REPORT | SEE NOTES TO FINANCIAL STATEMENTS. |
| SCHEDULE OF INVESTMENTS (Unaudited)(continued) | March 29, 2018 |
| TOTAL RETURN BOND FUND | |
| | | Face
Amount~ | | | Value | |
| | | | | | | |
| RB Commercial Trust | | | | | | |
| 2012-RS1, 5.35% due 01/26/224 | | | 15,699,986 | | | $ | 15,698,416 | |
| Anchorage Credit Funding 1 Ltd. | | | | | | | | |
| 2015-1A, 4.30% due 07/28/304 | | | 3,000,000 | | | | 3,081,961 | |
| Highland Park CDO I Ltd. | | | | | | | | |
| 2006-1A, 2.34% (3 Month USD LIBOR + 0.40%) due 11/25/513,6 | | | 2,877,453 | | | | 2,762,283 | |
| N-Star REL CDO VIII Ltd. | | | | | | | | |
| 2006-8A, 2.02% (1 Month USD LIBOR + 0.36%) due 02/01/413,4 | | | 1,943,473 | | | | 1,932,667 | |
| Total Collateralized Debt Obligations | | | | | | | 105,297,555 | |
| | | | | | | | | |
| Transport-Container - 1.0% |
| Textainer Marine Containers Ltd. | | | | | | | | |
| 2017-2A, 3.52% due 06/20/424 | | | 46,934,772 | | | | 46,542,763 | |
| CAL Funding III Ltd. | | | | | | | | |
| 2018-1A, 3.96% due 02/25/434 | | | 21,618,333 | | | | 21,803,146 | |
| Textainer Marine Containers V Ltd. | | | | | | | | |
| 2017-1A, 3.72% due 05/20/424 | | | 15,915,155 | | | | 15,902,530 | |
| Cronos Containers Program Ltd. | | | | | | | | |
| 2013-1A, 3.08% due 04/18/284 | | | 8,057,083 | | | | 7,946,977 | |
| CLI Funding V LLC | | | | | | | | |
| 2013-1A, 2.83% due 03/18/284 | | | 4,081,417 | | | | 4,010,372 | |
| 2013-2A, 3.22% due 06/18/284 | | | 1,150,560 | | | | 1,139,818 | |
| Total Transport-Container | | | | | | | 97,345,606 | |
| | | | | | | | | |
| Automotive - 0.5% |
| Hertz Vehicle Financing II, LP | | | | | | | | |
| 2015-1A, 2.73% due 03/25/214 | | | 20,550,000 | | | | 20,390,606 | |
| 2017-1A, 2.96% due 10/25/214 | | | 9,600,000 | | | | 9,518,129 | |
| Hertz Vehicle Financing LLC | | | | | | | | |
| 2016-4A, 2.65% due 07/25/224 | | | 17,150,000 | | | | 16,752,173 | |
| 2016-2A, 2.95% due 03/25/224 | | | 3,000,000 | | | | 2,969,452 | |
| Total Automotive | | | | | | | 49,630,360 | |
| | | | | | | | | |
| Diversified Payment Rights - 0.2% |
| Bib Merchant Voucher Receivables Ltd. | | | | | | | | |
| 4.18% due 04/07/28 | | | 21,400,000 | | | | 21,400,000 | |
| CCR Incorporated MT100 Payment Rights Master Trust | | | | | | | | |
| 2012-CA, 4.75% due 07/10/224 | | | 588,095 | | | | 588,113 | |
| CIC Receivables Master Trust | | | | | | | | |
| 4.89% due 10/07/21††† | | | 355,154 | | | | 367,262 | |
| Total Diversified Payment Rights | | | | | | | 22,355,375 | |
| | | | | | | | | |
| Single Family Residence - 0.1% |
| Colony American Finance 2016-1 Ltd. | | | | | | | | |
| 2016-1, 2.54% due 06/15/484 | | | 7,482,611 | | | | 7,354,892 | |
| CoreVest American Finance Trust | | | | | | | | |
| 2017-1, 3.36% due 10/15/494 | | | 2,250,000 | | | | 2,197,976 | |
| Total Single Family Residence | | | | | | | 9,552,868 | |
| | | | | | | | | |
| Transport-Rail - 0.1% |
| TRIP Rail Master Funding LLC | | | | | | | | |
| 2017-1A, 2.71% due 08/15/474 | | | 6,437,575 | | | | 6,360,575 | |
| SEE NOTES TO FINANCIAL STATEMENTS. | THE GUGGENHEIM FUNDS SEMI-ANNUAL REPORT | 25 |
| SCHEDULE OF INVESTMENTS (Unaudited)(continued) | March 29, 2018 |
| TOTAL RETURN BOND FUND | |
| | | Face
Amount~ | | | Value | |
| | | | | | | |
| NP SPE II LLC | | | | | | |
| 2017-1A, 3.37% due 10/21/474 | | | 2,653,765 | | | $ | 2,588,036 | |
| Total Transport-Rail | | | | | | | 8,948,611 | |
| | | | | | | | | |
| Industrial - 0.1% |
| Agnico-Eagle Mines Ltd. | | | | | | | | |
| 4.84% due 06/30/26††† | | | 6,000,000 | | | | 6,127,686 | |
| | | | | | | | | |
| Financial - 0.1% |
| Industrial DPR Funding Ltd. | | | | | | | | |
| 2016-1A, 5.24% due 04/15/26†††,4 | | | 4,000,000 | | | | 3,929,777 | |
| Hana Small Business Lending Loan Trust | | | | | | | | |
| 2014-2014, 4.50% (WAC) due 01/25/403,4 | | | 299,663 | | | | 298,224 | |
| Total Financial | | | | | | | 4,228,001 | |
| | | | | | | | | |
| Insurance - 0.0% |
| Chesterfield Financial Holdings LLC | | | | | | | | |
| 2014-1A, 4.50% due 12/15/344 | | | 4,125,000 | | | | 4,075,991 | |
| | | | | | | | | |
| Infrastructure - 0.0% |
| Vantage Data Centers Issuer LLC | | | | | | | | |
| 2018-1A, 4.07% due 02/16/434 | | | 999,167 | | | | 1,008,330 | |
| Total Asset-Backed Securities | | | | | | | | |
| (Cost $3,379,829,560) | | | | | | | 3,385,887,021 | |
| | | | | | | | | |
| COLLATERALIZED MORTGAGE OBLIGATIONS†† - 32.3% |
| Residential Mortgage Backed Securities - 14.6% |
| Home Equity Loan Trust | | | | | | | | |
| 2007-FRE1, 2.06% (1 Month USD LIBOR + 0.19%) due 04/25/373 | | | 129,081,710 | | | | 122,684,666 | |
| Soundview Home Loan Trust | | | | | | | | |
| 2006-OPT5, 2.01% (1 Month USD LIBOR + 0.14%) due 07/25/363 | | | 93,622,012 | | | | 91,256,755 | |
| 2005-OPT3, 2.34% (1 Month USD LIBOR + 0.47%) due 11/25/353 | | | 3,930,000 | | | | 3,887,318 | |
| 2007-1, 2.04% (1 Month USD LIBOR + 0.17%) due 03/25/373 | | | 3,669,788 | | | | 3,647,107 | |
| Towd Point Mortgage Trust | | | | | | | | |
| 2017-5, 2.47% (1 Month USD LIBOR + 0.60%) due 02/25/573,4 | | | 26,933,725 | | | | 27,030,501 | |
| 2018-1, 3.00% (WAC) due 01/25/583,4 | | | 23,530,704 | | | | 23,402,099 | |
| 2017-6, 2.75% (WAC) due 10/25/573,4 | | | 19,987,212 | | | | 19,695,620 | |
| 2017-1, 2.75% (WAC) due 10/25/563,4 | | | 18,883,475 | | | | 18,671,359 | |
| 2016-1, 2.75% (WAC) due 02/25/553,4 | | | 5,642,626 | | | | 5,598,131 | |
| RALI Series Trust | | | | | | | | |
| 2006-QO5, 2.09% (1 Month USD LIBOR + 0.22%) due 05/25/463 | | | 23,852,315 | | | | 22,398,288 | |
| 2006-QO10, 2.03% (1 Month USD LIBOR + 0.16%) due 01/25/373 | | | 14,083,030 | | | | 13,248,844 | |
| 2007-QO4, 2.06% (1 Month USD LIBOR + 0.19%) due 05/25/473 | | | 11,475,505 | | | | 11,070,182 | |
| 2006-QO2, 2.06% (1 Month USD LIBOR + 0.22%) due 02/25/463 | | | 22,190,918 | | | | 9,671,783 | |
| 26 | THE GUGGENHEIM FUNDS SEMI-ANNUAL REPORT | SEE NOTES TO FINANCIAL STATEMENTS. |
| SCHEDULE OF INVESTMENTS (Unaudited)(continued) | March 29, 2018 |
| TOTAL RETURN BOND FUND | |
| | | Face
Amount~ | | | Value | |
| | | | | | | |
| 2007-QO2, 2.02% (1 Month USD LIBOR + 0.15%) due 02/25/473 | | | 12,376,300 | | | $ | 8,001,617 | |
| 2007-QO4, 2.07% (1 Month USD LIBOR + 0.20%) due 05/25/473 | | | 5,337,915 | | | | 5,154,713 | |
| 2005-QO1, 2.22% (1 Month USD LIBOR + 0.30%) due 08/25/353 | | | 5,543,763 | | | | 4,912,847 | |
| 2005-QO1, 2.78% (1 Year CMT Rate + 1.50%) due 08/25/353 | | | 3,665,612 | | | | 3,476,280 | |
| 2006-QS8, 2.32% (1 Month USD LIBOR + 0.45%) due 08/25/363 | | | 4,533,537 | | | | 3,418,521 | |
| 2006-QO2, 2.14% (1 Month USD LIBOR + 0.27%) due 02/25/463 | | | 5,470,239 | | | | 2,452,450 | |
| 2007-QO3, 2.03% (1 Month USD LIBOR + 0.16%) due 03/25/473 | | | 2,161,213 | | | | 1,976,086 | |
| CIT Mortgage Loan Trust | | | | | | | | |
| 2007-1, 3.22% (1 Month USD LIBOR + 1.35%) due 10/25/373,4 | | | 67,974,253 | | | | 68,308,761 | |
| 2007-1, 3.32% (1 Month USD LIBOR + 1.45%) due 10/25/373,4 | | | 5,126,802 | | | | 5,151,911 | |
| Structured Asset Securities Corporation Mortgage Loan Trust | | | | | | | | |
| 2008-BC4, 2.50% (1 Month USD LIBOR + 0.63%) due 11/25/373 | | | 57,860,863 | | | | 57,521,903 | |
| 2006-BC4, 2.04% (1 Month USD LIBOR + 0.17%) due 12/25/363 | | | 7,975,977 | | | | 7,708,080 | |
| 2006-BC3, 2.03% (1 Month USD LIBOR + 0.16%) due 10/25/363 | | | 7,091,038 | | | | 6,320,019 | |
| 2006-BC6, 2.04% (1 Month USD LIBOR + 0.17%) due 01/25/373 | | | 921,293 | | | | 900,432 | |
| NovaStar Mortgage Funding Trust Series | | | | | | | | |
| 2007-2, 2.07% (1 Month USD LIBOR + 0.20%) due 09/25/373 | | | 61,701,427 | | | | 59,925,173 | |
| IndyMac INDX Mortgage Loan Trust | | | | | | | | |
| 2006-AR6, 2.20% (1 Year CMT Rate + 0.92%) due 06/25/463 | | | 52,154,640 | | | | 48,387,343 | |
| 2005-AR18, 2.65% (1 Month USD LIBOR + 0.78%) due 10/25/363 | | | 8,238,316 | | | | 7,072,788 | |
| CIM Trust | | | | | | | | |
| 2017-2, 3.66% (1 Month USD LIBOR + 2.00%) due 12/25/573,4 | | | 31,275,649 | | | | 31,615,753 | |
| 3.69% due 08/25/57 | | | 20,552,000 | | | | 20,604,969 | |
| American Home Mortgage Investment Trust | | | | | | | | |
| 2007-1, 2.08% due 05/25/477 | | | 204,901,518 | | | | 31,052,722 | |
| 2006-1, 2.15% (1 Month USD LIBOR + 0.28%) due 03/25/463 | | | 7,497,053 | | | | 7,196,801 | |
| SEE NOTES TO FINANCIAL STATEMENTS. | THE GUGGENHEIM FUNDS SEMI-ANNUAL REPORT | 27 |
| SCHEDULE OF INVESTMENTS (Unaudited)(continued) | March 29, 2018 |
| TOTAL RETURN BOND FUND | |
| | | Face
Amount~ | | | Value | |
| | | | | | | |
| 2006-1, 2.27% (1 Month USD LIBOR + 0.40%) due 03/25/463 | | | 3,363,261 | | | $ | 3,253,434 | |
| Bear Stearns Asset Backed Securities I Trust | | | | | | | | |
| 2006-HE9, 2.01% (1 Month USD LIBOR + 0.14%) due 11/25/363 | | | 33,923,649 | | | | 32,843,168 | |
| 2006-HE3, 2.23% (1 Month USD LIBOR + 0.36%) due 04/25/363 | | | 7,600,000 | | | | 7,537,607 | |
| FirstKey Master Funding | | | | | | | | |
| 2017-R1, 1.89% (1 Month USD LIBOR + 0.22%) due 11/03/41†††,3,4 | | | 38,889,167 | | | | 38,418,593 | |
| First NLC Trust | | | | | | | | |
| 2005-4, 2.26% (1 Month USD LIBOR + 0.39%) due 02/25/363 | | | 27,807,390 | | | | 27,323,661 | |
| 2005-1, 2.33% (1 Month USD LIBOR + 0.46%) due 05/25/353 | | | 3,102,899 | | | | 2,963,863 | |
| HSI Asset Securitization Corporation Trust | | | | | | | | |
| 2006-OPT2, 2.26% (1 Month USD LIBOR + 0.39%) due 01/25/363 | | | 29,140,000 | | | | 28,759,732 | |
| Countrywide Asset-Backed Certificates | | | | | | | | |
| 2006-6, 2.04% (1 Month USD LIBOR + 0.17%) due 09/25/363 | | | 27,373,729 | | | | 26,789,744 | |
| 2005-15, 2.32% (1 Month USD LIBOR + 0.45%) due 03/25/363 | | | 1,500,000 | | | | 1,440,671 | |
| ACE Securities Corporation Home Equity Loan Trust Series | | | | | | | | |
| 2006-HE4, 2.01% (1 Month USD LIBOR + 0.14%) due 10/25/363 | | | 32,688,381 | | | | 22,091,884 | |
| 2005-HE2, 2.89% (1 Month USD LIBOR + 1.02%) due 04/25/353 | | | 5,700,000 | | | | 5,742,741 | |
| Nationstar Home Equity Loan Trust | | | | | | | | |
| 2007-B, 2.09% (1 Month USD LIBOR + 0.22%) due 04/25/373 | | | 25,730,657 | | | | 25,480,485 | |
| Washington Mutual Mortgage Pass-Through Certificates WMALT Series Trust | | | | | | | | |
| 2006-AR9, 2.11% (1 Year CMT Rate + 0.83%) due 11/25/463 | | | 18,371,108 | | | | 15,719,886 | |
| 2006-AR9, 2.12% (1 Year CMT Rate + 0.84%) due 11/25/463 | | | 8,685,355 | | | | 7,307,620 | |
| 2006-7, 4.38% due 09/25/36 | | | 2,881,281 | | | | 1,451,331 | |
| 2006-8, 4.52% due 10/25/36 | | | 487,229 | | | | 298,006 | |
| Angel Oak Mortgage Trust LLC | | | | | | | | |
| 2017-3, 2.71% (WAC) due 11/25/473,4 | | | 23,369,216 | | | | 23,368,036 | |
| Freddie Mac Structured Agency Credit Risk Debt Notes | | | | | | | | |
| 2015-DNA1, 3.72% (1 Month USD LIBOR + 1.85%) due 10/25/273 | | | 21,760,000 | | | | 22,211,313 | |
| 28 | THE GUGGENHEIM FUNDS SEMI-ANNUAL REPORT | SEE NOTES TO FINANCIAL STATEMENTS. |
| SCHEDULE OF INVESTMENTS (Unaudited)(continued) | March 29, 2018 |
| TOTAL RETURN BOND FUND | |
| | | Face
Amount~ | | | Value | |
| | | | | | | |
| American Home Mortgage Assets Trust | | | | | | |
| 2006-4, 2.06% (1 Month USD LIBOR + 0.19%) due 10/25/463 | | | 13,007,866 | | | $ | 9,410,766 | |
| 2007-1, 1.98% (1 Year CMT Rate + 0.70%) due 02/25/473 | | | 11,098,766 | | | | 7,158,313 | |
| 2006-5, 2.20% (1 Year CMT Rate + 0.92%) due 11/25/463 | | | 4,843,715 | | | | 2,694,106 | |
| 2006-6, 2.06% (1 Month USD LIBOR + 0.19%) due 12/25/463 | | | 3,169,247 | | | | 2,658,119 | |
| Credit-Based Asset Servicing & Securitization LLC | | | | | | | | |
| 2006-CB2, 2.06% (1 Month USD LIBOR + 0.19%) due 12/25/363 | | | 21,990,122 | | | | 21,891,659 | |
| New Residential Mortgage Trust | | | | | | | | |
| 2018-1A, 4.00% (WAC) due 12/25/573,4 | | | 19,409,889 | | | | 19,844,291 | |
| Deutsche Alt-A Securities Mortgage Loan Trust Series | | | | | | | | |
| 2006-AF1, 2.17% (1 Month USD LIBOR + 0.30%) due 04/25/363 | | | 9,286,726 | | | | 8,481,517 | |
| 2006-OA1, 2.07% (1 Month USD LIBOR + 0.20%) due 02/25/473 | | | 6,483,747 | | | | 6,219,618 | |
| 2007-OA2, 2.05% (1 Year CMT Rate + 0.77%) due 04/25/473 | | | 4,590,199 | | | | 4,231,256 | |
| WaMu Mortgage Pass-Through Certificates Series Trust | | | | | | | | |
| 2007-OA6, 2.01% (1 Year CMT Rate + 0.81%) due 07/25/473 | | | 9,349,486 | | | | 8,541,244 | |
| 2007-OA3, 2.05% (1 Year CMT Rate + 0.77%) due 04/25/473 | | | 5,869,270 | | | | 5,231,278 | |
| 2006-AR13, 2.16% (1 Year CMT Rate + 0.88%) due 10/25/463 | | | 2,094,019 | | | | 1,876,698 | |
| 2006-AR11, 2.20% (1 Year CMT Rate + 0.92%) due 09/25/463 | | | 1,734,693 | | | | 1,595,759 | |
| CSMC Series | | | | | | | | |
| 2015-12R, 2.06% (1 Month USD LIBOR + 0.50%) due 11/30/373,4 | | | 16,688,551 | | | | 16,616,180 | |
| Lehman XS Trust Series | | | | | | | | |
| 2007-2N, 2.05% (1 Month USD LIBOR + 0.18%) due 02/25/373 | | | 10,085,400 | | | | 8,696,936 | |
| 2007-15N, 2.12% (1 Month USD LIBOR + 0.25%) due 08/25/373 | | | 5,015,353 | | | | 4,842,357 | |
| 2005-7N, 2.14% (1 Month USD LIBOR + 0.27%) due 12/25/353 | | | 2,655,508 | | | | 2,637,117 | |
| Impac Secured Assets CMN Owner Trust | | | | | | | | |
| 2005-2, 2.12% (1 Month USD LIBOR + 0.25%) due 03/25/363 | | | 15,261,730 | | | | 13,316,548 | |
| SEE NOTES TO FINANCIAL STATEMENTS. | THE GUGGENHEIM FUNDS SEMI-ANNUAL REPORT | 29 |
| SCHEDULE OF INVESTMENTS (Unaudited)(continued) | March 29, 2018 |
| TOTAL RETURN BOND FUND | |
| | | Face
Amount~ | | | Value | |
| | | | | | | |
| Wachovia Asset Securitization Issuance II LLC Trust | | | | | | |
| 2007-HE1, 2.01% (1 Month USD LIBOR + 0.14%) due 07/25/373,4 | | | 7,654,913 | | | $ | 7,374,593 | |
| 2007-HE2A, 2.00% (1 Month USD LIBOR + 0.13%) due 07/25/373,4 | | | 6,349,692 | | | | 5,892,397 | |
| Deephaven Residential Mortgage Trust | | | | | | | | |
| 2017-3A, 2.58% (WAC) due 10/25/473,4 | | | 12,855,474 | | | | 12,755,813 | |
| GSMSC Resecuritization Trust | | | | | | | | |
| 2015-5R, 1.76% (1 Month USD LIBOR + 0.14%) due 02/26/373,4 | | | 12,744,004 | | | | 12,096,444 | |
| Citigroup Mortgage Loan Trust, Inc. | | | | | | | | |
| 2005-HE3, 2.61% (1 Month USD LIBOR + 0.74%) due 09/25/353 | | | 11,687,000 | | | | 11,474,540 | |
| Stanwich Mortgage Loan Co. | | | | | | | | |
| 2016-NPA1, 3.84% (WAC) due 10/16/463,4 | | | 11,598,564 | | | | 11,451,907 | |
| Alternative Loan Trust | | | | | | | | |
| 2007-OA7, 2.05% (1 Month USD LIBOR + 0.18%) due 05/25/473 | | | 5,413,295 | | | | 5,261,586 | |
| 2005-38, 2.22% (1 Month USD LIBOR + 0.35%) due 09/25/353 | | | 4,378,529 | | | | 4,082,127 | |
| HarborView Mortgage Loan Trust | | | | | | | | |
| 2006-14, 1.96% (1 Month USD LIBOR + 0.15%) due 01/25/473 | | | 9,247,514 | | | | 8,601,244 | |
| GCAT | | | | | | | | |
| 2017-1, 3.38% due 03/25/474 | | | 8,489,080 | | | | 8,432,466 | |
| First Frankin Mortgage Loan Trust | | | | | | | | |
| 2006-FF3, 2.16% (1 Month USD LIBOR + 0.29%) due 02/25/363 | | | 8,616,000 | | | | 8,301,731 | |
| First Franklin Mortgage Loan Trust | | | | | | | | |
| 2004-FF10, 3.15% (1 Month USD LIBOR + 1.28%) due 07/25/343 | | | 8,134,922 | | | | 8,248,811 | |
| Banc of America Funding Trust | | | | | | | | |
| 2014-R7, 2.01% (1 Month USD LIBOR + 0.14%) due 09/26/363,4 | | | 5,116,677 | | | | 4,991,779 | |
| 2015-R4, 1.79% (1 Month USD LIBOR + 0.17%) due 01/27/353,4 | | | 3,101,187 | | | | 2,945,494 | |
| Morgan Stanley ABS Capital I Incorporated Trust | | | | | | | | |
| 2006-NC1, 2.25% (1 Month USD LIBOR + 0.38%) due 12/25/353 | | | 7,800,000 | | | | 7,619,705 | |
| Stanwich Mortgage Loan Company LLC | | | | | | | | |
| 2017-NPA1, 3.60% due 03/16/224 | | | 7,206,781 | | | | 7,206,781 | |
| 30 | THE GUGGENHEIM FUNDS SEMI-ANNUAL REPORT | SEE NOTES TO FINANCIAL STATEMENTS. |
| SCHEDULE OF INVESTMENTS (Unaudited)(continued) | March 29, 2018 |
| TOTAL RETURN BOND FUND | |
| | | Face
Amount~ | | | Value | |
| | | | | | | |
| ASG Resecuritization Trust | | | | | | |
| 2010-3, 1.91% (1 Month USD LIBOR + 0.29%) due 12/28/453,4 | | | 7,448,451 | | | $ | 6,944,201 | |
| Nomura Resecuritization Trust | | | | | | | | |
| 2016-1R, 4.62% (1 Month USD LIBOR + 3.00%) due 01/28/38†††,3,4 | | | 3,500,474 | | | | 3,516,246 | |
| 2015-4R, 0.73% (1 Month USD LIBOR + 0.43%) due 03/26/363,4 | | | 2,016,802 | | | | 1,940,579 | |
| 2015-4R, 2.90% (1 Month USD LIBOR + 0.39%) due 12/26/363,4 | | | 1,399,932 | | | | 1,381,809 | |
| Structured Asset Investment Loan Trust | | | | | | | | |
| 2005-11, 2.59% (1 Month USD LIBOR + 0.72%) due 01/25/363 | | | 6,597,811 | | | | 6,532,402 | |
| VOLT LIV LLC | | | | | | | | |
| 2017-NPL1, 3.50% due 02/25/474 | | | 5,916,775 | | | | 5,903,329 | |
| Morgan Stanley Resecuritization Trust | | | | | | | | |
| 2014-R9, 1.76% (1 Month USD LIBOR + 0.14%) due 11/26/463,4 | | | 5,921,985 | | | | 5,636,078 | |
| GE-WMC Asset-Backed Pass-Through Certificates Series | | | | | | | | |
| 2005-2, 2.12% (1 Month USD LIBOR + 0.25%) due 12/25/353 | | | 5,177,951 | | | | 5,205,913 | |
| New Residential Mortgage Loan Trust | | | | | | | | |
| 2017-5A, 3.37% (1 Month USD LIBOR + 1.50%) due 06/25/573,4 | | | 5,041,742 | | | | 5,188,228 | |
| Park Place Securities Incorporated Asset-Backed Pass-Through Certificates Series | | | | | | | | |
| 2005-WCW2, 2.67% (1 Month USD LIBOR + 0.80%) due 07/25/353 | | | 5,000,000 | | | | 5,016,176 | |
| Morgan Stanley Capital I Incorporated Trust | | | | | | | | |
| 2006-HE1, 2.16% (1 Month USD LIBOR + 0.29%) due 01/25/363 | | | 4,721,710 | | | | 4,675,877 | |
| JP Morgan Mortgage Acquisition Trust | | | | | | | | |
| 2006-HE2, 2.01% (1 Month USD LIBOR + 0.14%) due 07/25/363 | | | 4,130,358 | | | | 4,084,389 | |
| VOLT XL LLC | | | | | | | | |
| 2015-NP14, 4.38% due 11/27/454 | | | 4,074,251 | | | | 4,074,203 | |
| WaMu Asset-Backed Certificates WaMu Series Trust | | | | | | | | |
| 2007-HE4, 2.12% (1 Month USD LIBOR + 0.25%) due 07/25/473 | | | 5,254,081 | | | | 3,856,495 | |
| Luminent Mortgage Trust | | | | | | | | |
| 2006-2, 2.07% (1 Month USD LIBOR + 0.20%) due 02/25/463 | | | 4,530,623 | | | | 3,661,257 | |
| SEE NOTES TO FINANCIAL STATEMENTS. | THE GUGGENHEIM FUNDS SEMI-ANNUAL REPORT | 31 |
| SCHEDULE OF INVESTMENTS (Unaudited)(continued) | March 29, 2018 |
| TOTAL RETURN BOND FUND | |
| | | Face
Amount~ | | | Value | |
| | | | | | | |
| CWABS Asset-Backed Certificates Trust | | | | | | |
| 2004-15, 3.22% (1 Month USD LIBOR + 1.35%) due 04/25/353 | | | 3,490,000 | | | $ | 3,532,071 | |
| GSAA Trust | | | | | | | | |
| 2005-10, 2.52% (1 Month USD LIBOR + 0.65%) due 06/25/353 | | | 3,312,000 | | | | 3,199,110 | |
| GSAA Home Equity Trust | | | | | | | | |
| 2006-14, 2.04% (1 Month USD LIBOR + 0.17%) due 09/25/363 | | | 5,349,611 | | | | 2,632,728 | |
| 2007-7, 2.14% (1 Month USD LIBOR + 0.27%) due 07/25/373 | | | 339,502 | | | | 322,900 | |
| BCAP LLC | | | | | | | | |
| 2014-RR2, 2.97% (WAC) due 03/26/363,4 | | | 2,307,416 | | | | 2,228,986 | |
| 2014-RR3, 1.74% (WAC) due 10/26/363,4 | | | 392,440 | | | | 388,167 | |
| Impac Secured Assets Trust | | | | | | | | |
| 2006-2, 2.04% (1 Month USD LIBOR + 0.17%) due 08/25/363 | | | 2,289,956 | | | | 1,935,956 | |
| RFMSI Series Trust | | | | | | | | |
| 2006-S11, 6.00% due 11/25/36 | | | 1,832,182 | | | | 1,714,712 | |
| Alliance Bancorp Trust | | | | | | | | |
| 2007-OA1, 2.11% (1 Month USD LIBOR + 0.24%) due 07/25/373 | | | 1,030,243 | | | | 883,669 | |
| UCFC Manufactured Housing Contract | | | | | | | | |
| 1997-2, 7.38% due 10/15/28 | | | 726,505 | | | | 767,817 | |
| GSAMP Trust | | | | | | | | |
| 2005-HE6, 2.31% (1 Month USD LIBOR + 0.44%) due 11/25/353 | | | 560,638 | | | | 562,279 | |
| Irwin Home Equity Loan Trust | | | | | | | | |
| 2007-1, 5.85% due 08/25/374 | | | 426,050 | | | | 424,092 | |
| Morgan Stanley Re-REMIC Trust | | | | | | | | |
| 2010-R5, 3.51% due 06/26/364 | | | 365,497 | | | | 308,687 | |
| GreenPoint Mortgage Funding Trust | | | | | | | | |
| 2005-HE4, 2.33% (1 Month USD LIBOR + 0.47%) due 07/25/303 | | | 225,958 | | | | 225,779 | |
| Total Residential Mortgage Backed Securities | | | | | | | 1,405,848,912 | |
| | | | | | | | | |
| Government Agency - 12.9% |
| Fannie Mae13 | | | | | | | | |
| 2.89% due 10/01/29 | | | 38,458,000 | | | | 36,888,644 | |
| 3.01% due 09/01/29 | | | 36,899,000 | | | | 35,969,292 | |
| 3.40% due 02/01/33 | | | 25,000,000 | | | | 25,063,767 | |
| 3.12% due 10/01/32 | | | 24,800,000 | | | | 23,949,732 | |
| 3.23% due 01/01/33 | | | 23,730,770 | | | | 23,507,197 | |
| 3.56% due 04/01/30 | | | 19,684,000 | | | | 20,210,662 | |
| 2.90% due 11/01/29 | | | 21,078,000 | | | | 20,137,976 | |
| 2.87% due 09/01/29 | | | 20,000,000 | | | | 19,117,704 | |
| 3.49% due 04/01/30 | | | 18,643,000 | | | | 18,982,105 | |
| 3.17% due 02/01/28 | | | 18,350,000 | | | | 18,099,283 | |
| 2.96% due 11/01/29 | | | 18,620,000 | | | | 17,904,444 | |
| 3.19% due 02/01/30 | | | 13,834,944 | | | | 13,669,401 | |
| 3.07% due 01/01/28 | | | 13,100,000 | | | | 12,811,471 | |
| 3.42% due 09/01/47 | | | 13,304,741 | | | | 12,709,504 | |
| 2.82% due 10/01/29 | | | 12,100,000 | | | | 11,536,073 | |
| 3.59% due 04/01/33 | | | 11,280,000 | | | | 11,444,012 | |
| 3.03% due 12/01/27 | | | 10,900,000 | | | | 10,626,367 | |
| 3.41% due 02/01/33 | | | 10,250,000 | | | | 10,261,179 | |
| 3.08% due 10/01/32 | | | 10,250,000 | | | | 9,952,509 | |
| 3.42% due 04/01/30 | | | 9,800,000 | | | | 9,917,908 | |
| 3.31% due 01/01/33 | | | 9,700,000 | | | | 9,671,984 | |
| 32 | THE GUGGENHEIM FUNDS SEMI-ANNUAL REPORT | SEE NOTES TO FINANCIAL STATEMENTS. |
| SCHEDULE OF INVESTMENTS (Unaudited)(continued) | March 29, 2018 |
| TOTAL RETURN BOND FUND | |
| | | Face
Amount~ | | | Value | |
| | | | | | | |
| 3.05% due 10/01/29 | | | 9,100,000 | | | $ | 8,828,492 | |
| 3.06% due 12/01/27 | | | 9,000,000 | | | | 8,812,437 | |
| 3.04% due 01/01/28 | | | 8,900,000 | | | | 8,703,302 | |
| 3.60% due 03/01/30 | | | 8,341,000 | | | | 8,552,538 | |
| 2.94% due 10/01/32 | | | 8,686,388 | | | | 8,368,252 | |
| 3.08% due 01/01/30 | | | 8,500,000 | | | | 8,289,810 | |
| 3.43% due 03/01/33 | | | 8,100,000 | | | | 8,060,022 | |
| 3.50% due 12/01/45 | | | 7,198,144 | | | | 7,234,663 | |
| 3.48% due 04/01/30 | | | 7,000,000 | | | | 7,123,654 | |
| 3.14% due 01/01/28 | | | 6,900,000 | | | | 6,804,525 | |
| 3.56% due 02/01/38 | | | 6,689,245 | | | | 6,711,031 | |
| 2.99% due 09/01/29 | | | 6,800,000 | | | | 6,554,885 | |
| 3.29% due 03/01/33 | | | 6,700,000 | | | | 6,548,477 | |
| 3.13% due 02/01/28 | | | 5,900,000 | | | | 5,848,766 | |
| 3.60% due 04/01/33 | | | 5,600,000 | | | | 5,750,600 | |
| 3.21% due 01/01/33 | | | 5,500,000 | | | | 5,417,533 | |
| 3.39% due 02/01/30 | | | 4,800,000 | | | | 4,825,593 | |
| 3.10% due 01/01/33 | | | 4,800,000 | | | | 4,614,353 | |
| 3.22% due 01/01/30 | | | 4,650,000 | | | | 4,603,051 | |
| 3.11% due 01/01/28 | | | 4,600,000 | | | | 4,564,766 | |
| 3.39% due 02/01/33 | | | 4,300,000 | | | | 4,306,249 | |
| 3.33% due 04/01/30 | | | 4,295,483 | | | | 4,298,516 | |
| 3.50% due 02/01/48 | | | 3,993,762 | | | | 3,928,556 | |
| 3.65% due 03/01/33 | | | 3,600,000 | | | | 3,649,723 | |
| 4.00% due 01/01/46 | | | 3,385,137 | | | | 3,485,388 | |
| 3.11% due 11/01/27 | | | 3,500,000 | | | | 3,429,792 | |
| 3.18% due 01/01/30 | | | 3,000,000 | | | | 2,958,094 | |
| 3.16% due 01/01/30 | | | 2,900,000 | | | | 2,854,349 | |
| 3.12% due 02/01/28 | | | 2,600,000 | | | | 2,575,207 | |
| 3.53% due 04/01/33 | | | 2,500,000 | | | | 2,547,727 | |
| 4.00% due 08/01/47 | | | 2,393,252 | | | | 2,459,085 | |
| 3.26% due 11/01/46 | | | 2,590,629 | | | | 2,430,150 | |
| 3.55% due 04/01/33 | | | 2,150,000 | | | | 2,193,472 | |
| 3.51% due 11/01/37 | | | 2,150,000 | | | | 2,128,793 | |
| 3.00% due 07/01/46 | | | 2,094,921 | | | | 2,045,868 | |
| 3.50% due 11/01/47 | | | 1,978,016 | | | | 1,984,603 | |
| 3.14% due 12/01/32 | | | 1,600,000 | | | | 1,559,107 | |
| 2.97% due 11/01/25 | | | 1,397,968 | | | | 1,384,496 | |
| 3.27% due 01/01/30 | | | 1,350,000 | | | | 1,342,991 | |
| 3.74% due 02/01/48 | | | 1,323,100 | | | | 1,342,157 | |
| 3.27% due 08/01/34 | | | 1,362,804 | | | | 1,341,059 | |
| 4.50% due 02/01/45 | | | 1,265,531 | | | | 1,333,375 | |
| 3.02% due 11/01/27 | | | 1,300,000 | | | | 1,269,695 | |
| 5.00% due 05/01/44 | | | 949,175 | | | | 1,016,662 | |
| 3.13% due 01/01/30 | | | 1,000,000 | | | | 981,893 | |
| 3.60% due 10/01/47 | | | 993,734 | | | | 970,728 | |
| 4.50% due 10/01/43 | | | 795,529 | | | | 838,177 | |
| 5.00% due 12/01/44 | | | 708,016 | | | | 758,356 | |
| 3.63% due 01/01/37 | | | 741,497 | | | | 734,480 | |
| 3.50% due 08/01/43 | | | 708,896 | | | | 715,111 | |
| 2.75% due 11/01/31 | | | 666,149 | | | | 630,670 | |
| 3.50% due 06/01/46 | | | 88,846 | | | | 89,214 | |
| Freddie Mac Multifamily Structured Pass Through Certificates13 | | | | | | | | |
| 2017-KIR3, 3.28% due 08/25/27 | | | 91,932,800 | | | | 92,271,536 | |
| 2017-KGX1, 3.00% due 10/25/27 | | | 81,400,000 | | | | 80,019,765 | |
| 2017-KW03, 3.02% due 06/25/27 | | | 65,900,000 | | | | 64,912,218 | |
| 2018-K074, 3.60% due 02/25/28 | | | 34,823,000 | | | | 35,634,574 | |
| 2017-K066, 3.20% due 06/25/27 | | | 19,507,000 | | | | 19,333,318 | |
| 2017-K061, 3.44% (WAC) due 11/25/263 | | | 15,000,000 | | | | 15,194,963 | |
| 2016-K060, 3.30% (WAC) due 10/25/263 | | | 13,000,000 | | | | 13,044,403 | |
| 2018-K073, 3.45% due 01/25/283 | | | 11,600,000 | | | | 11,754,352 | |
| 2017-K069, 3.25% due 09/25/273 | | | 10,000,000 | | | | 9,937,159 | |
| 2016-K057, 2.62% due 08/25/26 | | | 10,000,000 | | | | 9,526,172 | |
| 2018-K154, 3.46% due 11/25/32 | | | 8,500,000 | | | | 8,527,300 | |
| 2016-K152, 3.08% due 01/25/31 | | | 7,090,000 | | | | 6,965,906 | |
| 2017-K070, 3.36% (WAC) due 12/25/273 | | | 6,000,000 | | | | 6,032,406 | |
| 2015-K151, 3.51% due 04/25/30 | | | 2,105,000 | | | | 2,159,612 | |
| 2015-K043, 0.55% (WAC) due 12/25/243 | | | 44,529,013 | | | | 1,401,902 | |
| SEE NOTES TO FINANCIAL STATEMENTS. | THE GUGGENHEIM FUNDS SEMI-ANNUAL REPORT | 33 |
| SCHEDULE OF INVESTMENTS (Unaudited)(continued) | March 29, 2018 |
| TOTAL RETURN BOND FUND | |
| | | Face
Amount~ | | | Value | |
| | | | | | | |
| 2014-K715, 2.86% due 01/25/21 | | | 450,000 | | | $ | 450,231 | |
| Freddie Mac Seasoned Credit Risk Transfer Trust Series | | | | | | | | |
| 2017-4, 2.25% due 06/25/57 | | | 68,338,263 | | | | 65,946,424 | |
| 2017-3, 3.00% due 07/25/56 | | | 63,080,037 | | | | 60,946,494 | |
| 2018-1, 2.00% due 05/25/57 | | | 45,225,000 | | | | 43,288,750 | |
| 2017-4, 3.50% due 06/25/57 | | | 33,643,142 | | | | 33,553,786 | |
| 2017-3, 2.25% due 07/25/56 | | | 9,577,787 | | | | 9,253,118 | |
| Fannie Mae-Aces13 | | | | | | | | |
| 2017-M11, 2.98% due 08/25/29 | | | 52,100,000 | | | | 50,374,406 | |
| 2018-M3, 3.19% due 02/25/30 | | | 7,800,000 | | | | 7,624,587 | |
| Freddie Mac13 | | | | | | | | |
| 3.55% due 10/01/33 | | | 4,727,359 | | | | 4,722,208 | |
| 4.00% due 02/01/46 | | | 3,089,200 | | | | 3,176,969 | |
| 3.50% due 01/01/44 | | | 2,886,918 | | | | 2,912,790 | |
| 4.00% due 11/01/45 | | | 2,373,283 | | | | 2,442,286 | |
| 3.00% due 08/01/46 | | | 2,123,750 | | | | 2,072,980 | |
| 3.50% due 12/01/47 | | | 1,970,874 | | | | 1,978,046 | |
| 3.26% due 09/01/45 | | | 1,982,335 | | | | 1,871,092 | |
| 3.40% due 04/01/31 | | | 1,000,000 | | | | 997,004 | |
| FREMF Mortgage Trust | | | | | | | | |
| 2013-K29, 0.13% due 05/25/464,8 | | | 801,787,861 | | | | 3,877,366 | |
| Total Government Agency | | | | | | | 1,244,435,830 | |
| | | | | | | | | |
| Commercial Mortgage Backed Securities - 3.0% |
| Wells Fargo Commercial Mortgage Trust | | | | | | | | |
| 2016-C32, 1.34% (WAC) due 01/15/593 | | | 124,063,788 | | | | 9,237,914 | |
| 2017-C38, 1.09% (WAC) due 07/15/503 | | | 74,648,009 | | | | 5,503,462 | |
| 2017-RB1, 1.28% (WAC) due 03/15/503 | | | 39,890,379 | | | | 3,555,545 | |
| 2016-C35, 1.99% (WAC) due 07/15/483 | | | 27,264,888 | | | | 3,294,174 | |
| 2017-C42, 0.90% (WAC) due 12/15/503 | | | 35,464,892 | | | | 2,459,806 | |
| 2016-NXS5, 1.55% (WAC) due 01/15/593 | | | 30,427,658 | | | | 2,376,653 | |
| 2015-NXS4, 0.95% (WAC) due 12/15/483 | | | 39,364,588 | | | | 2,112,430 | |
| 2017-RC1, 1.56% (WAC) due 01/15/603 | | | 21,204,910 | | | | 2,056,702 | |
| 2015-P2, 1.02% (WAC) due 12/15/483 | | | 34,591,162 | | | | 1,864,052 | |
| 2015-C30, 0.95% (WAC) due 09/15/583 | | | 32,424,527 | | | | 1,740,798 | |
| 2016-C32, 4.72% (WAC) due 01/15/593 | | | 1,400,000 | | | | 1,458,837 | |
| 2015-NXS1, 1.17% (WAC) due 05/15/483 | | | 11,688,627 | | | | 636,346 | |
| 2015-NXS4, 4.22% (WAC) due 12/15/483 | | | 64,000 | | | | 64,844 | |
| GAHR Commercial Mortgage Trust | | | | | | | | |
| 2015-NRF, 3.38% (WAC) due 12/15/343,4 | | | 23,829,324 | | | | 23,519,677 | |
| JP Morgan Chase Commercial Mortgage Securities Trust | | | | | | | | |
| 2016-WIKI, 4.01% (WAC) due 10/05/313,4 | | | 17,000,000 | | | | 16,537,211 | |
| 2016-JP3, 1.51% (WAC) due 08/15/493 | | | 74,265,015 | | | | 6,543,899 | |
| 34 | THE GUGGENHEIM FUNDS SEMI-ANNUAL REPORT | SEE NOTES TO FINANCIAL STATEMENTS. |
| SCHEDULE OF INVESTMENTS (Unaudited)(continued) | March 29, 2018 |
| TOTAL RETURN BOND FUND | |
| | | Face
Amount~ | | | Value | |
| | | | | | | |
| JPMDB Commercial Mortgage Securities Trust | | | | | | |
| 2017-C5, 1.02% (WAC) due 03/15/503 | | | 134,062,131 | | | $ | 9,017,314 | |
| 2017-C7, 0.92% (WAC) due 10/15/503 | | | 139,179,617 | | | | 9,011,379 | |
| 2016-C2, 1.70% (WAC) due 06/15/493 | | | 32,810,117 | | | | 2,873,274 | |
| 2016-C4, 0.84% (WAC) due 12/15/493 | | | 33,783,682 | | | | 1,876,977 | |
| Citigroup Commercial Mortgage Trust | | | | | | | | |
| 2017-P7, 1.13% (WAC) due 04/14/503 | | | 66,439,653 | | | | 5,140,024 | |
| 2016-C2, 1.79% (WAC) due 08/10/263 | | | 34,262,341 | | | | 3,869,678 | |
| 2016-P4, 2.00% (WAC) due 07/10/493 | | | 32,651,458 | | | | 3,836,569 | |
| 2016-P5, 1.55% (WAC) due 10/10/493 | | | 31,626,344 | | | | 2,885,401 | |
| 2016-GC37, 1.80% (WAC) due 04/10/493 | | | 19,155,296 | | | | 2,074,329 | |
| 2015-GC35, 0.89% (WAC) due 11/10/483 | | | 33,982,877 | | | | 1,530,507 | |
| 2015-GC29, 1.11% (WAC) due 04/10/483 | | | 24,097,063 | | | | 1,344,520 | |
| 2013-GC15, 4.37% (WAC) due 09/10/463 | | | 380,000 | | | | 400,427 | |
| Morgan Stanley Capital I Trust | | | | | | | | |
| 2017-H1, 1.46% (WAC) due 06/15/503 | | | 130,393,066 | | | | 11,898,289 | |
| 2015-XLF1, 3.98% (1 Month USD LIBOR + 2.20%) due 08/13/193,4 | | | 7,600,000 | | | | 7,636,813 | |
| 2016-UBS9, 4.54% (WAC) due 03/15/493 | | | 275,000 | | | | 279,300 | |
| JPMCC Commercial Mortgage Securities Trust | | | | | | | | |
| 2017-JP5, 1.11% (WAC) due 03/15/503 | | | 213,344,819 | | | | 14,140,516 | |
| 2017-JP6, 1.33% (WAC) due 07/15/503 | | | 69,852,918 | | | | 5,085,740 | |
| Hospitality Mortgage Trust | | | | | | | | |
| 2017-HIT, 3.06% (1 Month USD LIBOR + 1.35%) due 05/08/303,4 | | | 18,500,000 | | | | 18,534,898 | |
| COMM Mortgage Trust | | | | | | | | |
| 2015-CR26, 1.04% (WAC) due 10/10/483 | | | 92,131,638 | | | | 5,089,600 | |
| 2015-CR26, 4.49% (WAC) due 10/10/483 | | | 3,780,000 | | | | 3,699,693 | |
| 2015-CR23, 0.98% (WAC) due 05/10/483 | | | 48,766,160 | | | | 2,234,661 | |
| 2015-CR27, 1.15% (WAC) due 10/10/483 | | | 31,339,324 | | | | 1,785,279 | |
| 2013-CR13, 0.90% (WAC) due 12/10/233 | | | 51,234,708 | | | | 1,586,032 | |
| 2015-CR23, 3.80% due 05/10/48 | | | 700,000 | | | | 709,089 | |
| 2014-LC15, 1.31% (WAC) due 04/10/473 | | | 14,917,193 | | | | 697,868 | |
| GS Mortgage Securities Corporation Trust | | | | | | | | |
| 2017-STAY, 3.13% (1 Month USD LIBOR + 1.35%) due 07/15/323,4 | | | 6,694,000 | | | | 6,735,532 | |
| SEE NOTES TO FINANCIAL STATEMENTS. | THE GUGGENHEIM FUNDS SEMI-ANNUAL REPORT | 35 |
| SCHEDULE OF INVESTMENTS (Unaudited)(continued) | March 29, 2018 |
| TOTAL RETURN BOND FUND | |
| | | Face
Amount~ | | | Value | |
| | | | | | | |
| 2017-STAY, 2.88% (1 Month USD LIBOR + 1.10%) due 07/15/323,4 | | | 3,700,000 | | | $ | 3,718,675 | |
| VSD | | | | | | | | |
| 2017-PLT1 A, 3.60% due 12/25/43 | | | 9,792,982 | | | | 9,778,838 | |
| BANK | | | | | | | | |
| 2017-BNK4, 1.45% (WAC) due 05/15/503 | | | 56,688,280 | | | | 5,280,066 | |
| 2017-BNK6, 0.88% (WAC) due 07/15/603 | | | 44,210,280 | | | | 2,622,470 | |
| UBS Commercial Mortgage Trust | | | | | | | | |
| 2017-C5, 1.03% (WAC) due 11/15/503 | | | 54,630,793 | | | | 3,789,738 | |
| 2017-C2, 1.16% (WAC) due 08/15/503 | | | 46,100,838 | | | | 3,587,715 | |
| Bancorp Commercial Mortgage 2018-CRE3 Trust | | | | | | | | |
| 2018-CR3, 3.03% (1 Month USD LIBOR + 1.25%) due 01/15/333,4 | | | 7,075,000 | | | | 7,086,772 | |
| JPMBB Commercial Mortgage Securities Trust | | | | | | | | |
| 2015-C31, 4.62% (WAC) due 08/15/483 | | | 3,253,000 | | | | 3,216,509 | |
| 2013-C17, 4.88% (WAC) due 01/15/473 | | | 2,500,000 | | | | 2,560,244 | |
| 2013-C12, 0.65% (WAC) due 07/15/453 | | | 47,063,319 | | | | 894,834 | |
| CD Commercial Mortgage Trust | | | | | | | | |
| 2017-CD4, 1.33% (WAC) due 05/10/503 | | | 32,562,435 | | | | 2,775,296 | |
| 2017-CD3, 1.04% (WAC) due 02/10/503 | | | 34,917,705 | | | | 2,482,977 | |
| GS Mortgage Securities Trust | | | | | | | | |
| 2017-GS6, 1.05% (WAC) due 05/10/503 | | | 42,868,336 | | | | 3,325,687 | |
| 2015-GC28, 1.13% (WAC) due 02/10/483 | | | 21,361,084 | | | | 1,052,849 | |
| Morgan Stanley Bank of America Merrill Lynch Trust | | | | | | | | |
| 2015-C27, 1.01% (WAC) due 12/15/473 | | | 76,398,627 | | | | 4,265,549 | |
| BENCHMARK Mortgage Trust | | | | | | | | |
| 2018-B2, 0.43% due 02/15/513 | | | 133,148,833 | | | | 4,217,596 | |
| GE Business Loan Trust | | | | | | | | |
| 2007-1A, 1.95% (1 Month USD LIBOR + 0.17%) due 04/16/353,4 | | | 4,286,410 | | | | 4,170,142 | |
| CGMS Commercial Mortgage Trust | | | | | | | | |
| 2017-B1, 0.86% (WAC) due 08/15/503 | | | 66,729,526 | | | | 3,971,995 | |
| CD Mortgage Trust | | | | | | | | |
| 2016-CD1, 1.43% (WAC) due 08/10/493 | | | 35,687,259 | | | | 3,131,728 | |
| CD 2017-CD6 Mortgage Trust | | | | | | | | |
| 2017-CD6, 0.98% (WAC) due 11/13/503 | | | 47,867,551 | | | | 3,098,256 | |
| CSAIL Commercial Mortgage Trust | | | | | | | | |
| 2015-C1, 0.94% (WAC) due 04/15/503 | | | 57,519,798 | | | | 2,651,306 | |
| 36 | THE GUGGENHEIM FUNDS SEMI-ANNUAL REPORT | SEE NOTES TO FINANCIAL STATEMENTS. |
| SCHEDULE OF INVESTMENTS (Unaudited)(continued) | March 29, 2018 |
| TOTAL RETURN BOND FUND | |
| | | Face
Amount~ | | | Value | |
| | | | | | | |
| CFCRE Commercial Mortgage Trust | | | | | | |
| 2016-C3, 1.07% (WAC) due 01/10/483 | | | 40,246,020 | | | $ | 2,578,398 | |
| Banc of America Commercial Mortgage Trust | | | | | | | | |
| 2017-BNK3, 1.14% (WAC) due 02/15/503 | | | 24,438,082 | | | | 1,803,330 | |
| DBJPM Mortgage Trust | | | | | | | | |
| 2017-C6, 1.04% (WAC) due 06/10/503 | | | 25,036,459 | | | | 1,711,177 | |
| WFRBS Commercial Mortgage Trust | | | | | | | | |
| 2013-C12, 1.28% (WAC) due 03/15/483,4 | | | 11,635,589 | | | | 577,914 | |
| LSTAR Commercial Mortgage Trust | | | | | | | | |
| 2014-2, 5.15% (WAC) due 01/20/413,4 | | | 500,000 | | | | 500,171 | |
| GS Mortgage Securities Corporation II | | | | | | | | |
| 2013-GC10, 2.94% due 02/10/46 | | | 225,000 | | | | 222,097 | |
| Total Commercial Mortgage Backed Securities | | | | | | | 292,008,388 | |
| | | | | | | | | |
| Military Housing - 1.8% |
| Freddie Mac Military Housing Bonds Resecuritization Trust Certificates | | | | | | | | |
| 2015-R1, 4.66% (WAC) due 11/25/553,4 | | | 66,336,686 | | | | 72,296,534 | |
| 2015-R1, 4.11% (WAC) due 11/25/523,4 | | | 13,486,992 | | | | 14,119,194 | |
| 2015-R1, 4.10% (WAC) due 10/25/523,4 | | | 11,287,212 | | | | 11,696,374 | |
| GMAC Commercial Mortgage Asset Corp. | | | | | | | | |
| 2007-HCKM, 6.11% due 08/10/524 | | | 22,649,742 | | | | 23,987,626 | |
| 2003-PRES, 6.24% due 10/10/414 | | | 10,776,881 | | | | 11,738,515 | |
| 2005-DRUM, 5.47% due 05/10/50†††,6 | | | 4,660,542 | | | | 4,974,988 | |
| 2002-MEAD, 6.85% due 05/10/374 | | | 2,541,988 | | | | 2,997,513 | |
| 2005-BLIS, 5.25% due 07/10/50†††,6 | | | 2,500,000 | | | | 2,443,732 | |
| Capmark Military Housing Trust | | | | | | | | |
| 2008-AMCW, 6.90% due 07/10/55†††,6 | | | 8,389,644 | | | | 10,433,457 | |
| 2007-AETC, 5.75% due 02/10/526 | | | 8,210,627 | | | | 8,083,118 | |
| 2006-RILY, 2.11% (1 Month USD LIBOR + 0.37%) due 07/10/51†††,3,6 | | | 7,141,272 | | | | 4,895,208 | |
| 2007-ROBS, 6.06% due 10/10/526 | �� | | 4,768,147 | | | | 4,885,203 | |
| 2007-AET2, 6.06% due 10/10/526 | | | 2,168,468 | | | | 2,222,094 | |
| Total Military Housing | | | | | | | 174,773,556 | |
| Total Collateralized Mortgage Obligation | | | | | | | | |
| (Cost $3,127,982,728) | | | | | | | 3,117,066,686 | |
| | | | | | | | | |
| U.S. GOVERNMENT SECURITIES†† - 10.6% |
| U.S. Treasury Bonds | | | | | | | | |
| due 11/15/469 | | | 928,407,000 | | | | 393,617,728 | |
| due 11/15/449 | | | 647,591,400 | | | | 292,623,635 | |
| due 02/15/479 | | | 639,240,000 | | | | 269,864,403 | |
| 8.13% due 08/15/21 | | | 9,900,000 | | | | 11,718,352 | |
| 8.75% due 08/15/20 | | | 6,500,000 | | | | 7,459,766 | |
| 4.38% due 05/15/40 | | | 5,550,000 | | | | 6,880,049 | |
| 8.75% due 05/15/20 | | | 6,030,000 | | | | 6,845,463 | |
| 8.00% due 11/15/21 | | | 5,600,000 | | | | 6,670,562 | |
| 7.88% due 02/15/21 | | | 5,500,000 | | | | 6,341,973 | |
| 2.88% due 08/15/45 | | | 3,300,000 | | | | 3,240,703 | |
| 4.75% due 02/15/41 | | | 2,250,000 | | | | 2,937,920 | |
| 2.75% due 11/15/42 | | | 2,580,000 | | | | 2,490,305 | |
| Total U.S. Treasury Bonds | | | | | | | 1,010,690,859 | |
| U.S. Treasury Notes | | | | | | | | |
| 2.00% due 04/30/24 | | | 7,500,000 | | | | 7,226,074 | |
| SEE NOTES TO FINANCIAL STATEMENTS. | THE GUGGENHEIM FUNDS SEMI-ANNUAL REPORT | 37 |
| SCHEDULE OF INVESTMENTS (Unaudited)(continued) | March 29, 2018 |
| TOTAL RETURN BOND FUND | |
| | | Face
Amount~ | | | Value | |
| | | | | | | |
| 3.13% due 05/15/19 | | | 2,500,000 | | | $ | 2,525,781 | |
| Total U.S. Treasury Notes | | | | | | | 9,751,855 | |
| Total U.S. Government Securities | | | | | | | | |
| (Cost $1,026,926,874) | | | | | | | 1,020,442,714 | |
| | | | | | | | | |
| CORPORATE BONDS†† - 7.5% |
| Financial - 5.8% |
| Station Place Securitization Trust | | | | | | | | |
| 2.50% (1 Month USD LIBOR + 0.90%) due 07/24/183,4 | | | 71,550,000 | | | | 71,550,000 | |
| 2.35% (1 Month USD LIBOR + 0.75%) due 08/24/183,4 | | | 29,500,000 | | | | 29,500,000 | |
| 2.60% (1 Month USD LIBOR + 1.00%) due 08/24/183,4 | | | 23,200,000 | | | | 23,200,000 | |
| Station Place Securitization Trust Series | | | | | | | | |
| 2.88% (1 Month USD LIBOR + 1.00%) due 03/24/193,4 | | | 68,500,000 | | | | 68,500,000 | |
| 2.85% (1 Month USD LIBOR + 1.25%) due 11/24/183,4 | | | 31,000,000 | | | | 31,000,000 | |
| Citigroup, Inc. | | | | | | | | |
| 6.25% 10,11 | | | 41,340,000 | | | | 43,665,375 | |
| 5.95% 10,11 | | | 16,085,000 | | | | 16,535,380 | |
| Macquarie Group Ltd. | | | | | | | | |
| 3.64% (3 Month USD LIBOR + 1.35%) due 03/27/243,4 | | | 47,600,000 | | | | 48,088,128 | |
| American Equity Investment Life Holding Co. | | | | | | | | |
| 5.00% due 06/15/27 | | | 30,400,000 | | | | 30,810,765 | |
| Assurant, Inc. | | | | | | | | |
| 3.54% (3 Month USD LIBOR + 1.25%) due 03/26/213 | | | 26,050,000 | | | | 26,079,138 | |
| Bank of America Corp. | | | | | | | | |
| 6.30% 10,11 | | | 24,075,000 | | | | 25,820,438 | |
| Mid-Atlantic Military Family Communities LLC | | | | | | | | |
| 5.30% due 08/01/506 | | | 18,484,256 | | | | 18,708,343 | |
| Central Storage Safety Project Trust | | | | | | | | |
| 4.82% due 02/01/386 | | | 20,500,000 | | | | 21,267,926 | |
| MetLife, Inc. | | | | | | | | |
| 9.25% due 04/08/384 | | | 7,300,000 | | | | 9,928,000 | |
| 10.75% due 08/01/39 | | | 4,750,000 | | | | 7,457,500 | |
| Senior Housing Properties Trust | | | | | | | | |
| 4.75% due 02/15/28 | | | 13,275,000 | | | | 13,006,373 | |
| BBC Military Housing-Navy Northeast LLC | | | | | | | | |
| 6.30% due 10/15/49††† | | | 8,625,000 | | | | 9,094,216 | |
| Hospitality Properties Trust | | | | | | | | |
| 5.25% due 02/15/26 | | | 8,216,000 | | | | 8,552,700 | |
| Atlas Mara Ltd. | | | | | | | | |
| 8.00% due 12/31/20 | | | 6,600,000 | | | | 5,940,000 | |
| Fort Benning Family Communities LLC | | | | | | | | |
| 2.13% (1 Month USD LIBOR + 0.35%) due 01/15/36†††,3,6 | | | 6,000,000 | | | | 4,894,085 | |
| Lincoln Finance Ltd. | | | | | | | | |
| 7.38% due 04/15/214 | | | 4,580,000 | | | | 4,728,850 | |
| Navigators Group, Inc. | | | | | | | | |
| 5.75% due 10/15/23 | | | 4,050,000 | | | | 4,233,289 | |
| Fort Knox Military Housing Privatization Project | | | | | | | | |
| 5.82% due 02/15/526 | | | 1,949,671 | | | | 1,996,022 | |
| 2.12% (1 Month USD LIBOR + 0.34%) due 02/15/52†††,3,6 | | | 1,747,105 | | | | 1,138,715 | |
| Atlantic Marine Corporations Communities LLC | | | | | | | | |
| 5.43% due 12/01/504 | | | 1,411,352 | | | | 1,394,263 | |
| 5.37% due 12/01/50†††,4 | | | 799,181 | | | | 815,164 | |
| 5.38% due 02/15/48 | | | 542,552 | | | | 539,875 | |
| 38 | THE GUGGENHEIM FUNDS SEMI-ANNUAL REPORT | SEE NOTES TO FINANCIAL STATEMENTS. |
| SCHEDULE OF INVESTMENTS (Unaudited)(continued) | March 29, 2018 |
| TOTAL RETURN BOND FUND | |
| | | Face
Amount~ | | | Value | |
| | | | | | | |
| Fort Eustis/Fort Story Housing LLC | | | | | | |
| 5.51% due 12/15/406 | | | 2,000,000 | | | $ | 2,207,071 | |
| Army Hawaii Family Housing Trust Certificates | | | | | | | | |
| 5.52% due 06/15/504 | | | 1,853,147 | | | | 2,107,604 | |
| Customers Bank | | | | | | | | |
| 6.13% due 06/26/296,11 | | | 2,000,000 | | | | 2,076,378 | |
| Goldman Sachs Group, Inc. | | | | | | | | |
| 6.13% due 02/15/33 | | | 1,420,000 | | | | 1,706,656 | |
| First American Financial Corp. | | | | | | | | |
| 4.30% due 02/01/23 | | | 1,680,000 | | | | 1,699,029 | |
| Brookfield Finance, Inc. | | | | | | | | |
| 3.90% due 01/25/28 | | | 1,740,000 | | | | 1,688,708 | |
| Royal Bank of Scotland Group plc | | | | | | | | |
| 3.88% due 09/12/23 | | | 1,700,000 | | | | 1,678,853 | |
| Synchrony Financial | | | | | | | | |
| 4.50% due 07/23/25 | | | 1,650,000 | | | | 1,650,124 | |
| Enstar Group Ltd. | | | | | | | | |
| 4.50% due 03/10/22 | | | 1,610,000 | | | | 1,617,254 | |
| Jefferies Group LLC / Jefferies Group Capital Finance, Inc. | | | | | | | | |
| 4.15% due 01/23/30 | | | 1,730,000 | | | | 1,609,764 | |
| CBRE Services, Inc. | | | | | | | | |
| 5.25% due 03/15/25 | | | 1,500,000 | | | | 1,604,659 | |
| Barclays plc | | | | | | | | |
| 4.38% due 01/12/26 | | | 1,600,000 | | | | 1,601,659 | |
| Leucadia National Corp. | | | | | | | | |
| 5.50% due 10/18/23 | | | 1,500,000 | | | | 1,542,220 | |
| Morgan Stanley | | | | | | | | |
| 7.25% due 04/01/32 | | | 820,000 | | | | 1,086,913 | |
| Pacific Northwest Communities LLC | | | | | | | | |
| 5.91% due 06/15/506 | | | 1,000,000 | | | | 1,060,691 | |
| Univest Corporation of Pennsylvania | | | | | | | | |
| 5.10% due 03/30/2511 | | | 1,000,000 | | | | 1,015,826 | |
| Nationwide Mutual Insurance Co. | | | | | | | | |
| 9.38% due 08/15/394 | | | 530,000 | | | | 857,208 | |
| ACC Group Housing LLC | | | | | | | | |
| 6.35% due 07/15/544 | | | 625,000 | | | | 751,097 | |
| Hanover Insurance Group, Inc. | | | | | | | | |
| 4.50% due 04/15/26 | | | 650,000 | | | | 650,255 | |
| Pacific Beacon LLC | | | | | | | | |
| 5.51% due 07/15/366 | | | 500,000 | | | | 552,832 | |
| Total Financial | | | | | | | 557,209,346 | |
| | | | | | | | | |
| Consumer, Non-cyclical - 0.6% |
| CVS Health Corp. | | | | | | | | |
| 2.69% (3 Month USD LIBOR + 0.63%) due 03/09/203 | | | 28,950,000 | | | | 29,058,561 | |
| 4.30% due 03/25/28 | | | 16,550,000 | | | | 16,620,513 | |
| Offutt AFB America First Community LLC | | | | | | | | |
| 5.46% due 09/01/506 | | | 6,650,284 | | | | 6,720,879 | |
| United Communities LLC | | | | | | | | |
| 5.61% due 09/15/514 | | | 4,584,175 | | | | 4,811,373 | |
| AmerisourceBergen Corp. | | | | | | | | |
| 3.45% due 12/15/27 | | | 1,800,000 | | | | 1,712,627 | |
| Total Consumer, Non-cyclical | | | | | | | 58,923,953 | |
| | | | | | | | | |
| Basic Materials - 0.6% |
| Yamana Gold, Inc. | | | | | | | | |
| 4.95% due 07/15/24 | | | 23,370,000 | | | | 24,041,888 | |
| 4.63% due 12/15/274 | | | 6,300,000 | | | | 6,203,743 | |
| BHP Billiton Finance USA Ltd. | | | | | | | | |
| 6.75% due 10/19/754,11 | | | 17,500,000 | | | | 19,643,750 | |
| Southern Copper Corp. | | | | | | | | |
| 6.75% due 04/16/40 | | | 1,400,000 | | | | 1,729,626 | |
| Dow Chemical Co. | | | | | | | | |
| 9.40% due 05/15/39 | | | 1,000,000 | | | | 1,613,222 | |
| Barrick North America Finance LLC | | | | | | | | |
| 7.50% due 09/15/38 | | | 1,230,000 | | | | 1,609,984 | |
| Eldorado Gold Corp. | | | | | | | | |
| 6.13% due 12/15/204 | | | 1,250,000 | | | | 1,187,500 | |
| Total Basic Materials | | | | | | | 56,029,713 | |
| SEE NOTES TO FINANCIAL STATEMENTS. | THE GUGGENHEIM FUNDS SEMI-ANNUAL REPORT | 39 |
| SCHEDULE OF INVESTMENTS (Unaudited)(continued) | March 29, 2018 |
| TOTAL RETURN BOND FUND | |
| | | Face
Amount~ | | | Value | |
| | | | | | | |
| Energy - 0.2% |
| Hess Corp. | | | | | | |
| 7.30% due 08/15/31 | | | 7,600,000 | | | $ | 9,114,429 | |
| 7.88% due 10/01/29 | | | 1,497,000 | | | | 1,833,816 | |
| 7.13% due 03/15/33 | | | 1,250,000 | | | | 1,499,632 | |
| Andeavor Logistics Limited Partnership / Tesoro Logistics Finance Corp. | | | | | | | | |
| 4.25% due 12/01/27 | | | 1,700,000 | | | | 1,657,295 | |
| Plains All American Pipeline Limited Partnership / PAA Finance Corp. | | | | | | | | |
| 4.70% due 06/15/44 | | | 1,850,000 | | | | 1,651,700 | |
| Sabine Pass Liquefaction LLC | | | | | | | | |
| 5.88% due 06/30/26 | | | 1,500,000 | | | | 1,639,500 | |
| Marathon Petroleum Corp. | | | | | | | | |
| 6.50% due 03/01/41 | | | 1,300,000 | | | | 1,586,721 | |
| Schahin II Finance Co. SPV Ltd. | | | | | | | | |
| 5.88% due 09/25/226,12 | | | 781,800 | | | | 95,770 | |
| Total Energy | | | | | | | 19,078,863 | |
| | | | | | | | | |
| Consumer, Cyclical - 0.1% |
| HP Communities LLC | | | | | | | | |
| 5.78% due 03/15/466 | | | 2,150,000 | | | | 2,308,123 | |
| 5.86% due 09/15/536 | | | 1,420,000 | | | | 1,518,726 | |
| 5.62% due 09/15/326 | | | 1,000,000 | | | | 1,061,702 | |
| WMG Acquisition Corp. | | | | | | | | |
| 6.75% due 04/15/224 | | | 3,930,000 | | | | 4,062,638 | |
| Hasbro, Inc. | | | | | | | | |
| 6.35% due 03/15/40 | | | 1,500,000 | | | | 1,729,663 | |
| Northern Group Housing LLC | | | | | | | | |
| 6.80% due 08/15/534 | | | 1,200,000 | | | | 1,490,413 | |
| Ferrellgas Limited Partnership / Ferrellgas Finance Corp. | | | | | | | | |
| 6.50% due 05/01/21 | | | 1,531,000 | | | | 1,465,932 | |
| Total Consumer, Cyclical | | | | | | | 13,637,197 | |
| | | | | | | | | |
| Communications - 0.1% |
| SFR Group S.A. | | | | | | | | |
| 7.38% due 05/01/264 | | | 5,100,000 | | | | 4,857,750 | |
| AT&T, Inc. | | | | | | | | |
| 6.38% due 03/01/41 | | | 1,400,000 | | | | 1,626,027 | |
| 5.15% due 11/15/464 | | | 503,000 | | | | 514,075 | |
| Vodafone Group plc | | | | | | | | |
| 7.88% due 02/15/30 | | | 1,200,000 | | | | 1,563,253 | |
| MDC Partners, Inc. | | | | | | | | |
| 6.50% due 05/01/244 | | | 300,000 | | | | 291,750 | |
| Total Communications | | | | | | | 8,852,855 | |
| | | | | | | | | |
| Industrial - 0.1% |
| Princess Juliana International Airport Operating Company N.V. | | | | | | | | |
| 5.50% due 12/20/276 | | | 2,399,440 | | | | 2,231,048 | |
| Reynolds Group Issuer Incorporated / Reynolds Group Issuer LLC / Reynolds Group Issuer Luxembourg | | | | | | | | |
| 5.22% (3 Month USD LIBOR + 3.50%) due 07/15/213,4 | | | 1,875,000 | | | | 1,898,437 | |
| Reynolds Group Issuer Inc. / Reynolds Group Issuer LLC / Reynolds Group Issuer | | | | | | | | |
| 6.88% due 02/15/21 | | | 1,074,266 | | | | 1,089,037 | |
| Total Industrial | | | | | | | 5,218,522 | |
| | | | | | | | | |
| Technology - 0.0% |
| Citrix Systems, Inc. | | | | | | | | |
| 4.50% due 12/01/27 | | | 1,700,000 | | | | 1,688,807 | |
| | | | | | | | | |
| Utilities - 0.0% |
| Exelon Generation Company LLC | | | | | | | | |
| 6.25% due 10/01/39 | | | 670,000 | | | | 730,709 | |
| Total Corporate Bonds | | | | | | | | |
| (Cost $718,381,645) | | | | | | | 721,369,965 | |
| 40 | THE GUGGENHEIM FUNDS SEMI-ANNUAL REPORT | SEE NOTES TO FINANCIAL STATEMENTS. |
| SCHEDULE OF INVESTMENTS (Unaudited)(continued) | March 29, 2018 |
| TOTAL RETURN BOND FUND | |
| | | Face
Amount~ | | | Value | |
| | | | | | | |
| FEDERAL AGENCY BONDS†† - 4.0% |
| Fannie Mae Principal Strips | | | |
| due 01/15/309,13 | | | 87,915,000 | | | $ | 59,679,737 | |
| due 05/15/309,13 | | | 77,072,000 | | | | 51,749,066 | |
| due 05/15/299,13 | | | 33,900,000 | | | | 23,625,447 | |
| due 07/15/379,13 | | | 33,000,000 | | | | 17,102,969 | |
| due 11/15/309,13 | | | 17,570,000 | | | | 11,590,482 | |
| Total Fannie Mae Principal Strips | | | | | | | 163,747,701 | |
| Freddie Mac Principal Strips | | | | | | | | |
| due 03/15/319,13 | | | 71,507,000 | | | | 46,359,600 | |
| due 07/15/329,13 | | | 33,850,000 | | | | 20,985,492 | |
| Total Freddie Mac Principal Strips | | | | | | | 67,345,092 | |
| Tennessee Valley Authority | | | | | | | | |
| 4.25% due 09/15/65 | | | 32,550,000 | | | | 37,710,412 | |
| 5.38% due 04/01/56 | | | 8,360,000 | | | | 11,612,851 | |
| due 09/15/539 | | | 1,020,000 | | | | 291,840 | |
| due 09/15/549 | | | 1,020,000 | | | | 281,719 | |
| due 09/15/559 | | | 1,020,000 | | | | 271,949 | |
| due 09/15/569 | | | 1,020,000 | | | | 262,517 | |
| due 03/15/579 | | | 1,020,000 | | | | 257,925 | |
| due 09/15/579 | | | 1,020,000 | | | | 253,413 | |
| due 09/15/589 | | | 1,020,000 | | | | 244,624 | |
| due 03/15/599 | | | 1,020,000 | | | | 240,345 | |
| due 09/15/599 | | | 1,020,000 | | | | 236,141 | |
| due 09/15/609 | | | 1,020,000 | | | | 227,002 | |
| due 03/15/619 | | | 1,020,000 | | | | 223,020 | |
| due 09/15/619 | | | 1,020,000 | | | | 219,108 | |
| due 09/15/629 | | | 1,020,000 | | | | 211,489 | |
| due 03/15/639 | | | 1,020,000 | | | | 207,779 | |
| due 09/15/639 | | | 1,020,000 | | | | 204,134 | |
| due 09/15/649 | | | 1,020,000 | | | | 197,035 | |
| due 03/15/659 | | | 1,020,000 | | | | 193,579 | |
| due 09/15/659 | | | 1,020,000 | | | | 190,183 | |
| Total Tennessee Valley Authority | | | | | | | 53,537,065 | |
| Residual Funding Corporation Principal | | | | | | | | |
| due 04/15/309 | | | 43,639,000 | | | | 29,750,847 | |
| due 01/15/309 | | | 15,074,000 | | | | 10,345,873 | |
| Total Residual Funding Corporation Principal | | | | | | | 40,096,720 | |
| Freddie Mac | | | | | | | | |
| due 12/14/299,13 | | | 48,770,000 | | | | 33,245,782 | |
| 1.25% due 10/02/1913 | | | 2,500,000 | | | | 2,462,515 | |
| Total Freddie Mac | | | | | | | 35,708,297 | |
| Fannie Mae Interest Rate Strips | | | | | | | | |
| due 01/15/329,13 | | | 9,413,000 | | | | 5,944,377 | |
| due 01/15/309,13 | | | 5,900,000 | | | | 4,005,124 | |
| due 01/15/359,13 | | | 2,250,000 | | | | 1,277,637 | |
| due 07/15/329,13 | | | 1,963,000 | | | | 1,217,443 | |
| due 02/06/339,13 | | | 1,456,000 | | | | 884,773 | |
| due 01/15/339,13 | | | 1,450,000 | | | | 883,001 | |
| Total Fannie Mae Interest Rate Strips | | | | | | | 14,212,355 | |
| Freddie Mac Coupon Strips | | | | | | | | |
| due 01/15/319,13 | | | 6,500,000 | | | | 4,256,371 | |
| due 09/15/309,13 | | | 2,906,000 | | | | 1,920,506 | |
| due 03/15/319,13 | | | 2,500,000 | | | | 1,620,806 | |
| due 07/15/319,13 | | | 1,800,000 | | | | 1,154,038 | |
| Total Freddie Mac Coupon Strips | | | | | | | 8,951,721 | |
| Freddie Mac Interest Strips | | | | | | | | |
| due 03/15/309,13 | | | 7,250,000 | | | | 4,900,423 | |
| Total Federal Agency Bonds | | | | | | | | |
| (Cost $392,948,940) | | | | | | | 388,499,374 | |
| | | | | | | | | |
| FOREIGN GOVERNMENT BONDS†† - 3.1% |
| Republic of Hungary | | | | | | | | |
| due 12/27/189 | | HUF | 15,401,240,000 | | | | 60,620,933 | |
| 5.50% due 12/20/18 | | HUF | 11,344,560,000 | | | | 46,435,356 | |
| due 05/23/189 | | HUF | 8,800,000,000 | | | | 34,655,420 | |
| 2.50% due 06/22/18 | | HUF | 5,057,920,000 | | | | 20,028,315 | |
| 4.00% due 04/25/18 | | HUF | 1,700,000,000 | | | | 6,710,892 | |
| due 11/21/189 | | HUF | 520,000,000 | | | | 2,047,312 | |
| due 07/18/189 | | HUF | 280,120,000 | | | | 1,103,033 | |
| Total Republic of Hungary | | | | | | | 171,601,261 | |
| Czech Republic | | | | | | | | |
| due 04/13/189 | | CZK | 806,000,000 | | | | 39,041,124 | |
| due 04/20/189 | | CZK | 448,000,000 | | | | 21,699,127 | |
| due 04/06/189 | | CZK | 230,000,000 | | | | 11,141,336 | |
| Total Czech Republic | | | | | | | 71,881,587 | |
| Republic of Portugal | | | | | | | | |
| due 05/18/189 | | EUR | 13,800,000 | | | | 16,989,384 | |
| SEE NOTES TO FINANCIAL STATEMENTS. | THE GUGGENHEIM FUNDS SEMI-ANNUAL REPORT | 41 |
| SCHEDULE OF INVESTMENTS (Unaudited)(continued) | March 29, 2018 |
| TOTAL RETURN BOND FUND | |
| | | Face
Amount~ | | | Value | |
| | | | | | | |
| Government of Japan | | | | | | |
| due 06/04/189 | | JPY | 1,517,000,000 | | | $ | 14,260,770 | |
| Republic of France | | | | | | | | |
| due 04/05/189 | | EUR | 10,460,000 | | | | 12,870,923 | |
| Kingdom of Spain | | | | | | | | |
| due 04/06/189 | | EUR | 4,855,000 | | | | 5,974,326 | |
| Kingdom of Sweden | | | | | | | | |
| due 04/18/189 | | SEK | 29,700,000 | | | | 3,558,874 | |
| Total Foreign Government Bonds | | | | | | | | |
| (Cost $299,443,518) | | | | | | | 297,137,125 | |
| | | | | | | | | |
| SENIOR FLOATING RATE INTERESTS††,3 - 1.7% |
| Technology - 0.7% |
| Misys Ltd. | | | | | | | | |
| 5.48% (3 Month USD LIBOR + 3.50%) due 06/13/24 | | | 30,621,125 | | | | 30,579,174 | |
| Epicor Software | | | | | | | | |
| 5.13% (1 Month USD LIBOR + 3.25%) due 06/01/22 | | | 19,713,533 | | | | 19,790,613 | |
| EIG Investors Corp. | | | | | | | | |
| 5.96% (1 Month USD LIBOR + 4.00%) due 02/09/23 | | | 5,043,971 | | | | 5,075,496 | |
| Internet Brands, Inc. | | | | | | | | |
| 5.53% (3 Month USD LIBOR + 3.75%) due 09/13/24 | | | 3,463,354 | | | | 3,462,730 | |
| Advanced Computer Software | | | | | | | | |
| 11.37% (3 Month USD LIBOR + 9.50%) due 01/31/23 | | | 2,000,000 | | | | 1,960,000 | |
| TIBCO Software, Inc. | | | | | | | | |
| 5.38% (1 Month USD LIBOR + 3.50%) due 12/04/20 | | | 1,940,350 | | | | 1,945,608 | |
| Micron Technology, Inc. | | | | | | | | |
| 3.88% (3 Month USD LIBOR + 2.00%) due 04/26/22 | | | 644,714 | | | | 648,544 | |
| Kronos, Inc. | | | | | | | | |
| 4.88% (1 Month USD LIBOR + 3.00%) due 11/01/23 | | | 297,750 | | | | 299,510 | |
| Aspect Software, Inc. | | | | | | | | |
| 12.38% (1 Month USD LIBOR + 10.50%) due 05/25/201 | | | 14,536 | | | | 14,472 | |
| Total Technology | | | | | | | 63,776,147 | |
| |
| Industrial - 0.3% |
| Travelport Finance (Luxembourg) S.A.R.L. | | | | | | | | |
| 4.40% (3 Month USD LIBOR + 2.50%) due 03/17/25 | | | 5,500,000 | | | | 5,509,625 | |
| Hayward Industries, Inc. | | | | | | | | |
| 5.38% (3 Month USD LIBOR + 3.50%) due 08/05/24 | | | 5,223,750 | | | | 5,239,421 | |
| Engility Corp. | | | | | | | | |
| 4.63% (3 Month USD LIBOR + 2.75% and Commercial Prime Lending Rate + 1.75%) due 08/14/23 | | | 3,096,294 | | | | 3,094,096 | |
| VC GB Holdings, Inc. | | | | | | | | |
| 5.13% (3 Month USD LIBOR + 3.25%) due 02/28/24 | | | 2,303,169 | | | | 2,308,927 | |
| Fluidra Finco S.L.U. (Zodiac Pools) | | | | | | | | |
| due 03/07/2514 | | EUR | 1,800,000 | | | | 2,214,839 | |
| TMF Group Holding BV | | | | | | | | |
| 3.50% (3 Month EURIBOR + 3.50%) due 10/13/23 | | EUR | 1,750,000 | | | | 2,145,586 | |
| Zodiac Pool Solutions LLC | | | | | | | | |
| due 03/07/2514 | | | 1,300,000 | | | | 1,306,097 | |
| 42 | THE GUGGENHEIM FUNDS SEMI-ANNUAL REPORT | SEE NOTES TO FINANCIAL STATEMENTS. |
| SCHEDULE OF INVESTMENTS (Unaudited)(continued) | March 29, 2018 |
| TOTAL RETURN BOND FUND | |
| | | Face
Amount~ | | | Value | |
| | | | | | | |
| Hillman Group, Inc. | | | | | | |
| 5.80% (3 Month USD LIBOR + 3.50%) due 06/30/21 | | | 979,644 | | | $ | 989,440 | |
| Clean Harbors, Inc. | | | | | | | | |
| 3.88% (1 Month USD LIBOR + 2.00%) due 06/28/24 | | | 794,000 | | | | 797,311 | |
| Hardware Holdings LLC | | | | | | | | |
| 8.38% (1 Month USD LIBOR + 6.50%) due 03/30/20 | | | 682,125 | | | | 661,661 | |
| Engineered Machinery Holdings, Inc. | | | | | | | | |
| 5.55% (3 Month USD LIBOR + 3.25%) due 07/19/24 | | | 592,193 | | | | 591,702 | |
| CHI Overhead Doors, Inc. | | | | | | | | |
| 5.13% (3 Month USD LIBOR + 3.25%) due 07/29/22 | | | 493,447 | | | | 493,447 | |
| Wencor Group | | | | | | | | |
| 5.80% (2 month USD LIBOR + 3.50%)due 06/19/21 | | | 289,793 | | | | 281,824 | |
| Thermasys Corp. | | | | | | | | |
| 5.70% (3 Month USD LIBOR + 4.00%) due 05/03/19 | | | 88,125 | | | | 85,188 | |
| Total Industrial | | | | | | | 25,719,164 | |
| | | | | | | | | |
| Communications - 0.2% |
| Cengage Learning Acquisitions, Inc. | | | | | | | | |
| 6.04% (3 Month USD LIBOR + 4.25%) due 06/07/23 | | | 21,807,080 | | | | 19,804,754 | |
| Proquest LLC | | | | | | | | |
| 5.63% (3 Month USD LIBOR + 3.75%) due 10/24/21 | | | 1,335,699 | | | | 1,352,810 | |
| Houghton Mifflin Co. | | | | | | | | |
| 4.88% (1 Month USD LIBOR + 3.00%) due 05/28/21 | | | 734,887 | | | | 669,665 | |
| Cable One, Inc. | | | | | | | | |
| 4.56% (1 Month USD LIBOR + 2.25%) due 05/01/24 | | | 496,250 | | | | 497,491 | |
| Total Communications | | | | | | | 22,324,720 | |
| | | | | | | | | |
| Consumer, Non-cyclical - 0.2% |
| Diamond (BC) B.V. | | | | | | | | |
| 4.99% (3 Month USD LIBOR + 3.00%) due 09/06/24 | | | 7,298,750 | | | | 7,283,569 | |
| Packaging Coordinators Midco, Inc. | | | | | | | | |
| 5.78% (3 Month USD LIBOR + 4.00%) due 06/30/23 | | | 3,152,000 | | | | 3,161,866 | |
| Albertson’s LLC | | | | | | | | |
| 5.29% (1 Month USD LIBOR + 3.00%) due 12/21/22 | | | 2,735,374 | | | | 2,705,367 | |
| DJO Finance LLC | | | | | | | | |
| 5.03% (3 Month USD LIBOR + 3.25% and 3 Month USD LIBOR + 3.25%) due 06/08/20 | | | 2,342,755 | | | | 2,352,524 | |
| Grocery Outlet, Inc. | | | | | | | | |
| 5.80% (3 Month USD LIBOR + 3.50%) due 10/21/21 | | | 1,723,858 | | | | 1,729,599 | |
| Davis Vision | | | | | | | | |
| due 12/02/2414 | | | 1,709,000 | | | | 1,700,455 | |
| One Call Medical, Inc. | | | | | | | | |
| 6.03% (1 Month USD LIBOR + 4.00% and 3 Month USD LIBOR + 4.00%) due 11/27/20 | | | 1,641,766 | | | | 1,567,886 | |
| SEE NOTES TO FINANCIAL STATEMENTS. | THE GUGGENHEIM FUNDS SEMI-ANNUAL REPORT | 43 |
| SCHEDULE OF INVESTMENTS (Unaudited)(continued) | March 29, 2018 |
| TOTAL RETURN BOND FUND | |
| | | Face
Amount~ | | | Value | |
| | | | | | | |
| DaVita, Inc. | | | | | | |
| 4.63% (3 Month USD LIBOR + 2.75%) due 06/24/21 | | | 793,814 | | | $ | 800,268 | |
| JBS USA Lux SA | | | | | | | | |
| 4.68% (Commercial Prime Lending Rate + 2.50% and 3 Month USD LIBOR + 2.50%) due 10/30/22 | | | 297,750 | | | | 296,696 | |
| CTI Foods Holding Co. LLC | | | | | | | | |
| 5.38% (1 Month USD LIBOR + 3.50%) due 06/29/20 | | | 200,000 | | | | 180,500 | |
| Total Consumer, Non-cyclical | | | | | | | 21,778,730 | |
| | | | | | | | | |
| Consumer, Cyclical - 0.1% |
| Leslie’s Poolmart, Inc. | | | | | | | | |
| 5.28% (3 Month USD LIBOR + 3.50%) due 08/16/23 | | | 4,327,847 | | | | 4,354,896 | |
| PetSmart Inc | | | | | | | | |
| 4.68% (1 Month USD LIBOR + 3.00%) due 03/11/22 | | | 4,118,342 | | | | 3,296,074 | |
| GVC Holdings plc | | | | | | | | |
| due 03/15/2414 | | EUR | 1,500,000 | | | | 1,841,085 | |
| PTL Acqusition, Inc. | | | | | | | | |
| 4.13% (3 Month USD LIBOR + 2.25%) due 08/01/23 | | | 1,231,250 | | | | 1,235,867 | |
| BBB Industries, LLC | | | | | | | | |
| 6.38% (1 Month USD LIBOR + 4.50%) due 11/03/21 | | | 930,399 | | | | 937,377 | |
| Acosta, Inc. | | | | | | | | |
| 5.30% (1 Month USD LIBOR + 3.25%) due 09/26/19 | | | 831,111 | | | | 694,535 | |
| 5.40% (3 Month USD LIBOR + 3.25% and Commercial Prime Lending Rate + 2.25%) due 09/26/19 | | | 244,444 | | | | 204,275 | |
| Neiman Marcus Group, Inc. | | | | | | | | |
| 4.94% (3 Month USD LIBOR + 3.25%) due 10/25/20 | | | 516,000 | | | | 444,684 | |
| USIC Holding, Inc. | | | | | | | | |
| 5.80% (3 Month USD LIBOR + 3.50%) due 12/08/23 | | | 158,425 | | | | 159,613 | |
| Sears Roebuck Acceptance Corp. | | | | | | | | |
| 6.20% (1 Month USD LIBOR + 4.50%) due 01/20/19 | | | 100,970 | | | | 100,297 | |
| Total Consumer, Cyclical | | | | | | | 13,268,703 | |
| | | | | | | | | |
| Financial - 0.1% |
| USI, Inc. | | | | | | | | |
| 5.30% (1 Month USD LIBOR + 3.00%) due 05/16/24 | | | 4,200,000 | | | | 4,207,014 | |
| National Financial Partners Corp. | | | | | | | | |
| 4.88% (1 Month USD LIBOR + 3.00%) due 01/08/24 | | | 2,275,160 | | | | 2,279,437 | |
| HUB International Ltd. | | | | | | | | |
| 4.84% (3 Month USD LIBOR + 3.00%) due 10/02/20 | | | 1,139,343 | | | | 1,144,880 | |
| LPL Holdings, Inc. | | | | | | | | |
| 4.56% (3 Month USD LIBOR + 2.25% and 1 Month USD LIBOR + 2.25%) due 09/23/24 | | | 997,500 | | | | 999,994 | |
| 44 | THE GUGGENHEIM FUNDS SEMI-ANNUAL REPORT | SEE NOTES TO FINANCIAL STATEMENTS. |
| SCHEDULE OF INVESTMENTS (Unaudited)(continued) | March 29, 2018 |
| TOTAL RETURN BOND FUND | |
| | | Face
Amount~ | | | Value | |
| | | | | | | |
| American Stock Transfer & Trust | | | | | | |
| 6.81% (3 Month USD LIBOR + 4.50%) due 06/26/20 | | | 232,921 | | | $ | 232,728 | |
| Total Financial | | | | | | | 8,864,053 | |
| | | | | | | | | |
| Basic Materials - 0.1% |
| Road Infrastructure Investment | | | | | | | | |
| 5.38% (1 Month USD LIBOR + 3.50% and Commercial Prime Lending Rate + 2.50%) due 06/13/23 | | | 4,394,746 | | | | 4,402,086 | |
| Nexeo Solutions LLC | | | | | | | | |
| 5.27% (3 Month USD LIBOR + 3.25% and 1 Month USD LIBOR + 3.25%) due 06/09/23 | | | 1,670,420 | | | | 1,686,088 | |
| Total Basic Materials | | | | | | | 6,088,174 | |
| | | | | | | | | |
| Utilities - 0.0% |
| Invenergy Thermal Operating I, LLC | | | | | | | | |
| 7.80% (3 Month USD LIBOR + 5.50%) due 10/19/22 | | | 2,464,754 | | | | 2,335,354 | |
| Total Senior Floating Rate Interests | | | | | | | | |
| (Cost $166,397,411) | | | | | | | 164,155,045 | |
| | | | | | | | | |
| MUNICIPAL BONDS†† - 0.7% |
| California - 0.4% |
| Poway Unified School District General Obligation Unlimited | | | | | | | | |
| due 08/01/409 | | | 10,000,000 | | | | 4,184,700 | |
| due 08/01/389 | | | 8,460,000 | | | | 3,889,062 | |
| Newport Mesa Unified School District General Obligation Unlimited | | | | | | | | |
| due 08/01/459 | | | 8,565,000 | | | | 2,904,734 | |
| due 08/01/399 | | | 4,000,000 | | | | 1,765,200 | |
| due 08/01/409 | | | 2,500,000 | | | | 1,054,600 | |
| due 08/01/419 | | | 2,000,000 | | | | 804,160 | |
| due 08/01/439 | | | 1,900,000 | | | | 701,100 | |
| San Diego Unified School District General Obligation Unlimited | | | | | | | | |
| due 07/01/399 | | | 7,150,000 | | | | 3,213,639 | |
| due 07/01/469 | | | 2,200,000 | | | | 734,910 | |
| due 07/01/439 | | | 1,350,000 | | | | 511,704 | |
| Cypress School District General Obligation Unlimited | | | | | | | | |
| due 08/01/489 | | | 14,450,000 | | | | 3,684,027 | |
| Beverly Hills Unified School District California General Obligation Unlimited | | | | | | | | |
| due 08/01/349 | | | 5,295,000 | | | | 2,995,223 | |
| San Bernardino Community College District General Obligation Unlimited | | | | | | | | |
| due 08/01/449 | | | 4,750,000 | | | | 1,581,228 | |
| Antelope Valley Community College District General Obligation Unlimited | | | | | | | | |
| due 08/01/369 | | | 2,800,000 | | | | 1,314,572 | |
| San Marcos Unified School District General Obligation Unlimited | | | | | | | | |
| due 08/01/479 | | | 3,600,000 | | | | 1,089,108 | |
| Santa Cruz County Redevelopment Agency Tax Allocation | | | | | | | | |
| 3.75% due 09/01/32 | | | 850,000 | | | | 836,562 | |
| Wiseburn School District General Obligation Unlimited | | | | | | | | |
| due 08/01/349 | | | 900,000 | | | | 485,694 | |
| SEE NOTES TO FINANCIAL STATEMENTS. | THE GUGGENHEIM FUNDS SEMI-ANNUAL REPORT | 45 |
| SCHEDULE OF INVESTMENTS (Unaudited)(continued) | March 29, 2018 |
| TOTAL RETURN BOND FUND | |
| | | Face
Amount~ | | | Value | |
| | | | | | | |
| Santa Ana Unified School District General Obligation Unlimited | | | | | | |
| due 08/01/359 | | | 700,000 | | | $ | 367,717 | |
| Total California | | | | | | | 32,117,940 | |
| | | | | | | | | |
| Illinois - 0.2% |
| State of Illinois General Obligation Unlimited | | | | | | | | |
| 5.65% due 12/01/38 | | | 5,350,000 | | | | 5,862,476 | |
| 5.10% due 06/01/33 | | | 2,500,000 | | | | 2,629,150 | |
| 6.63% due 02/01/35 | | | 1,820,000 | | | | 2,129,382 | |
| City of Chicago Illinois General Obligation Unlimited | | | | | | | | |
| 6.31% due 01/01/44 | | | 4,500,000 | | | | 5,489,280 | |
| Total Illinois | | | | | | | 16,110,288 | |
| | | | | | | | | |
| Texas - 0.1% |
| Wylie Independent School District General Obligation Unlimited | | | | | | | | |
| due 08/15/469 | | | 10,000,000 | | | | 3,136,400 | |
| due 08/15/439 | | | 4,000,000 | | | | 1,431,360 | |
| Harris County-Houston Sports Authority Revenue Bonds | | | | | | | | |
| due 11/15/459 | | | 2,850,000 | | | | 834,109 | |
| due 11/15/419 | | | 1,500,000 | | | | 540,105 | |
| Total Texas | | | | | | | 5,941,974 | |
| | | | | | | | | |
| Oregon - 0.0% |
| Washington & Multnomah Counties School District No. 48J Beaverton General Obligation Unlimited | | | | | | | | |
| due 06/15/339 | | | 3,850,000 | | | | 2,145,336 | |
| | | | | | | | | |
| Puerto Rico - 0.0% |
| Puerto Rico Public Buildings Authority Revenue Bonds | | | | | | | | |
| 6.00% due 07/01/23 | | | 1,500,000 | | | | 1,562,805 | |
| | | | | | | | | |
| Florida - 0.0% |
| County of Miami-Dade Florida Revenue Bonds | | | | | | | | |
| due 10/01/419 | | | 4,100,000 | | | | 1,502,035 | |
| | | | | | | | | |
| Pennsylvania - 0.0% |
| Pennsylvania Economic Development Financing Authority Revenue Bonds | | | | | | | | |
| due 01/01/419 | | | 995,000 | | | | 386,587 | |
| due 01/01/379 | | | 570,000 | | | | 266,857 | |
| Total Pennsylvania | | | | | | | 653,444 | |
| Total Municipal Bonds | | | | | | | | |
| (Cost $59,042,321) | | | | | | | 60,033,822 | |
| | | | | | | | | |
| COMMERCIAL PAPER†† - 1.0% |
| Mondelez International, Inc. | | | | | | | | |
| 1.91% due 04/09/1815 | | | 36,000,000 | | | | 35,984,800 | |
| AutoZone, Inc. | | | | | | | | |
| 2.30% due 04/13/1815 | | | 25,000,000 | | | | 24,980,833 | |
| 2.20% due 04/09/1815 | | | 3,000,000 | | | | 2,998,533 | |
| Total AutoZone, Inc. | | | | | | | 27,979,366 | |
| Marriott International, Inc. | | | | | | | | |
| 2.04% due 04/04/1815 | | | 20,000,000 | | | | 19,996,600 | |
| Hershey Co. | | | | | | | | |
| 1.70% due 04/04/1815 | | | 4,000,000 | | | | 3,999,433 | |
| Intercontinental Exchange, Inc. | | | | | | | | |
| 1.80% due 04/10/1815 | | | 3,400,000 | | | | 3,398,470 | |
| Molex Electronics Technologies, LLC. | | | | | | | | |
| 2.20% due 04/03/1815 | | | 2,750,000 | | | | 2,749,664 | |
| Amphenol Corp. | | | | | | | | |
| 2.20% due 04/09/1815 | | | 2,700,000 | | | | 2,698,680 | |
| Unilever Capital Corp. | | | | | | | | |
| 1.78% due 04/09/1815 | | | 1,000,000 | | | | 999,605 | |
| Total Commercial Paper | | | | | | | | |
| (Cost $97,806,618) | | | | | | | 97,806,618 | |
| 46 | THE GUGGENHEIM FUNDS SEMI-ANNUAL REPORT | SEE NOTES TO FINANCIAL STATEMENTS. |
| SCHEDULE OF INVESTMENTS (Unaudited)(continued) | March 29, 2018 |
| TOTAL RETURN BOND FUND | |
| | | Face
Amount~ | | | Value | |
| | | | | | | |
| REPURCHASE AGREEMENT††,16 - 0.3% |
BNP Paribas
issued 03/06/18 at 1.90%
due 04/03/18 | | | 25,000,000 | | | $ | 25,000,000 | |
| Total Repurchase Agreement | | | | | | | | |
| (Cost $25,000,000) | | | | | | | 25,000,000 | |
| | | | | | | | | |
| | | | Contracts | | | | | |
| | | | | | | | | |
| OTC OPTIONS PURCHASED†† - 0.1% |
| Call options on: | | | | | | | | |
BofA Merrill Lynch
iShares MSCI
Emerging Markets ETF
Expiring January 2019
with strike price of
$55.00 (Notional
Value $284,634,740) | | | 58,955 | | | | 7,104,077 | |
BofA Merrill Lynch
S&P 500 Index
Expiring January 2019
with strike price of
$3,000 (Notional
Value $339,087,708) | | | 1,284 | | | | 3,165,060 | |
| Total OTC Options Purchased | | | | | | | | |
| (Cost $16,368,115) | | | | | | | 10,269,137 | |
| | | | | | | | | |
| Total Investments - 101.2% | | | | | | | | |
| (Cost $9,774,555,538) | | | | | | $ | 9,752,020,729 | |
| Other Assets & Liabilities, net - (1.2)% | | | | | | | (111,675,306 | ) |
| Total Net Assets - 100.0% | | | | | | $ | 9,640,345,423 | |
| SEE NOTES TO FINANCIAL STATEMENTS. | THE GUGGENHEIM FUNDS SEMI-ANNUAL REPORT | 47 |
| SCHEDULE OF INVESTMENTS (Unaudited)(continued) | March 29, 2018 |
| TOTAL RETURN BOND FUND | |
| CENTRALLY CLEARED INTEREST RATE SWAP AGREEMENTS†† |
| Counterparty | | Exchange | | Floating
Rate
Type | | Floating
Rate Index | | Fixed
Rate | | Payment
Frequency | | Maturity
Date | | Notional
Amount | |
| BofA Merrill Lynch | | CME | | Receive | | 3-Month USD-LIBOR | | 2.24% | | Quarterly | | 08/11/27 | | $ | (911,700,000 | ) |
| BofA Merrill Lynch | | CME | | Receive | | 3-Month USD-LIBOR | | 1.67% | | Quarterly | | 08/16/20 | | | (787,700,000 | ) |
| BofA Merrill Lynch | | CME | | Receive | | 3-Month USD-LIBOR | | 1.90% | | Quarterly | | 08/11/22 | | | (212,000,000 | ) |
| BofA Merrill Lynch | | CME | | Receive | | 3-Month USD-LIBOR | | 1.99% | | Quarterly | | 08/22/24 | | | (142,600,000 | ) |
| BofA Merrill Lynch | | CME | | Receive | | 3-Month USD-LIBOR | | 2.09% | | Quarterly | | 09/05/27 | | | (58,600,000 | ) |
| BofA Merrill Lynch | | CME | | Receive | | 3-Month USD-LIBOR | | 2.16% | | Quarterly | | 02/13/24 | | | (108,330,000 | ) |
| BofA Merrill Lynch | | CME | | Receive | | 3-Month USD-LIBOR | | 2.59% | | Quarterly | | 11/13/47 | | | (50,400,000 | ) |
| BofA Merrill Lynch | | CME | | Receive | | 3-Month USD-LIBOR | | 2.15% | | Quarterly | | 08/21/27 | | | (49,300,000 | ) |
| BofA Merrill Lynch | | CME | | Receive | | 3-Month USD-LIBOR | | 2.19% | | Quarterly | | 08/15/27 | | | (50,200,000 | ) |
| BofA Merrill Lynch | | CME | | Receive | | 3-Month USD-LIBOR | | 2.07% | | Quarterly | | 05/26/24 | | | (59,730,000 | ) |
| Counterparty | | Market
Value | | | Premiums
Paid | | | Unrealized
Gain | |
| BofA Merrill Lynch | | $ | 42,319,318 | | | $ | 18,082,354 | | | $ | 24,236,964 | |
| BofA Merrill Lynch | | | 16,615,075 | | | | 4,206,437 | | | | 12,408,638 | |
| BofA Merrill Lynch | | | 6,975,977 | | | | 1,576,828 | | | | 5,399,149 | |
| BofA Merrill Lynch | | | 6,257,564 | | | | 2,457,472 | | | | 3,800,092 | |
| BofA Merrill Lynch | | | 3,480,434 | | | | 725 | | | | 3,479,709 | |
| BofA Merrill Lynch | | | 3,350,601 | | | | — | | | | 3,350,601 | |
| BofA Merrill Lynch | | | 2,917,648 | | | | 73,287 | | | | 2,844,361 | |
| BofA Merrill Lynch | | | 2,638,139 | | | | 652 | | | | 2,637,487 | |
| BofA Merrill Lynch | | | 2,530,225 | | | | 702 | | | | 2,529,523 | |
| BofA Merrill Lynch | | | 2,233,145 | | | | 315 | | | | 2,232,830 | |
| | | $ | 89,318,126 | | | $ | 26,398,772 | | | $ | 62,919,354 | |
| 48 | THE GUGGENHEIM FUNDS SEMI-ANNUAL REPORT | SEE NOTES TO FINANCIAL STATEMENTS. |
| SCHEDULE OF INVESTMENTS (Unaudited)(continued) | March 29, 2018 |
| TOTAL RETURN BOND FUND | |
| FORWARD FOREIGN CURRENCY EXCHANGE CONTRACTS†† |
| Counterparty | | Contracts
to Sell | | Currency | | Settlement
Date | | Settlement
Value | | | Value at
March 29,
2018 | | | Net
Unrealized Appreciation/
(Depreciation) | |
| BofA Merrill Lynch | | 14,051,240,000 | | HUF | | 12/27/18 | | $ | 58,029,404 | | | $ | (56,519,511 | ) | | $ | 1,509,893 | |
| Citigroup | | 233,830,000 | | BRL | | 04/02/18 | | | 71,877,239 | | | | (70,840,402 | ) | | | 1,036,837 | |
| Goldman Sachs | | 64,000,000 | | BRL | | 04/02/18 | | | 19,637,323 | | | | (19,389,239 | ) | | | 248,084 | |
| BofA Merrill Lynch | | 6,030,527,700 | | HUF | | 12/20/18 | | | 24,683,156 | | | | (24,243,264 | ) | | | 439,892 | |
| J.P. Morgan Chase & Co. | | 448,000,000 | | CZK | | 04/20/18 | | | 22,110,900 | | | | (21,743,239 | ) | | | 367,661 | |
| Goldman Sachs | | 5,937,983,100 | | HUF | | 12/20/18 | | | 24,124,971 | | | | (23,871,226 | ) | | | 253,745 | |
| Citigroup | | 8,800,000,000 | | HUF | | 05/23/18 | | | 35,046,147 | | | | (34,802,187 | ) | | | 243,960 | |
| Deutsche Bank | | 1,537,500,000 | | HUF | | 06/22/18 | | | 6,256,104 | | | | (6,094,406 | ) | | | 161,698 | |
| BofA Merrill Lynch | | 1,845,000,000 | | HUF | | 06/22/18 | | | 7,460,575 | | | | (7,313,287 | ) | | | 147,288 | |
| Goldman Sachs | | 1,801,868,000 | | HUF | | 06/22/18 | | | 7,202,606 | | | | (7,142,318 | ) | | | 60,288 | |
| Goldman Sachs | | 1,560,000 | | HUF | | 04/25/18 | | | 6,200,729 | | | | (6,156,530 | ) | | | 44,199 | |
| Citigroup | | 208,000 | | HUF | | 04/25/18 | | | 827,498 | | | | (820,871 | ) | | | 6,627 | |
| Morgan Stanley | | 1,517,000,000 | | JPY | | 06/04/18 | | | 14,364,497 | | | | (14,316,263 | ) | | | 48,234 | |
| Deutsche Bank | | 4,855,000 | | EUR | | 04/06/18 | | | 6,002,018 | | | | (5,975,349 | ) | | | 26,669 | |
| Goldman Sachs | | 29,700,000 | | SEK | | 04/18/18 | | | 3,587,520 | | | | (3,562,015 | ) | | | 25,505 | |
| Morgan Stanley | | 520,000,000 | | HUF | | 11/21/18 | | | 2,099,399 | | | | (2,085,501 | ) | | | 13,898 | |
| Goldman Sachs | | 280,120,000 | | HUF | | 07/18/18 | | | 1,122,861 | | | | (1,112,563 | ) | | | 10,298 | |
| BofA Merrill Lynch | | 1,754,000 | | EUR | | 04/10/18 | | | 2,165,190 | | | | (2,159,447 | ) | | | 5,743 | |
| Citigroup | | 770,614 | | CZK | | 04/06/18 | | | 37,202 | | | | (37,342 | ) | | | (140 | ) |
| J.P. Morgan Chase & Co. | | 230,000,000 | | CZK | | 04/06/18 | | | 11,099,047 | | | | (11,145,192 | ) | | | (46,145 | ) |
| J.P. Morgan Chase & Co. | | 1,350,000,000 | | HUF | | 12/27/18 | | | 5,358,206 | | | | (5,430,221 | ) | | | (72,015 | ) |
| Citigroup | | 13,800,000 | | EUR | | 05/18/18 | | | 16,951,216 | | | | (17,040,066 | ) | | | (88,850 | ) |
| Goldman Sachs | | 10,460,000 | | EUR | | 04/05/18 | | | 12,781,869 | | | | (12,872,739 | ) | | | (90,870 | ) |
| Goldman Sachs | | 806,000,000 | | CZK | | 04/13/18 | | | 38,925,915 | | | | (39,087,522 | ) | | | (161,607 | ) |
| | | | | | | | | | | | | | | | | $ | 4,190,892 | |
| Counterparty | | Contracts
to Buy | | Currency | | Settlement
Date | | Settlement
Value | | | Value at
March 29,
2018 | | | Net
Unrealized Appreciation/
(Depreciation) | |
| J.P. Morgan Chase & Co. | | 208,481,000 | | BRL | | 04/02/18 | | $ | 63,106,070 | | | $ | 63,160,749 | | | $ | 54,679 | |
| Citigroup | | 89,349,000 | | BRL | | 04/02/18 | | | 27,110,781 | | | | 27,068,892 | | | | (41,889 | ) |
| | �� | | | | | | | | | | | | | | | $ | 12,790 | |
| SEE NOTES TO FINANCIAL STATEMENTS. | THE GUGGENHEIM FUNDS SEMI-ANNUAL REPORT | 49 |
| SCHEDULE OF INVESTMENTS (Unaudited)(continued) | March 29, 2018 |
| TOTAL RETURN BOND FUND | |
| ~ | The face amount is denominated in U.S. dollars unless otherwise indicated. |
| * | Non-income producing security. |
| † | Value determined based on Level 1 inputs — See Note 4. |
| †† | Value determined based on Level 2 inputs, unless otherwise noted — See Note 4. |
| ††† | Value determined based on Level 3 inputs — See Note 4. |
| 1 | Affiliated issuer. |
| 2 | Rate indicated is the 7 day yield as of March 29, 2018. |
| 3 | Variable rate security. Rate indicated is the rate effective at March 29, 2018. In some instances, the underlying reference rate shown was below the minimum rate earned by the security or has been adjusted by a predetermined factor. The settlement status of a position may also impact the effective rate indicated. In instances where multiple underlying reference rates and spread amounts are shown, the effective rate is based on a weighted average. |
| 4 | Security is a 144A or Section 4(a)(2) security. These securities have been determined to be liquid under guidelines established by the Board of Trustees. The total market value of 144A or Section 4(a)(2) securities is $4,244,721,248 (cost $4,246,274,825), or 44.0% of total net assets. |
| 5 | Security has no stated coupon. However, it is expected to receive residual cash flow payments on defined deal dates. |
| 6 | Security is a 144A or Section 4(a)(2) security. These securities have been determined to be illiquid and restricted under guidelines established by the Board of Trustees. The total market value of 144A or Section 4(a)(2) illiquid and restricted securities is $109,577,886 (cost $109,808,462), or 1.1% of total net assets — See Note 9. |
| 7 | Security is an interest-only strip. Rate indicated is effective yield at March 29, 2018. |
| 8 | Maturity date indicated is next interest reset date. |
| 9 | Zero coupon rate security. |
| 10 | Perpetual maturity. |
| 11 | Security has a fixed rate coupon which will convert to a floating or variable rate coupon on a future date. |
| 12 | Security is in default of interest and/or principal obligations. |
| 13 | On September 7, 2008, the issuer was placed in conservatorship by the Federal Housing Finance Agency (FHFA). As conservator, the FHFA has full powers to control the assets and operations of the firm. |
| 14 | Term loan interests in the Fund’s portfolio generally have variable rates. All or a portion of this security represents unsettled loan positions and may not have a stated coupon rate. |
| 15 | Rate indicated is the effective yield at the time of purchase. |
| 16 | Repurchase Agreement — See additional disclosure on page 54 for more information on repurchase agreements. |
| | BofA — Bank of America |
| | BRL — Brazilian Real |
| | CME — Chicago Mercantile Exchange |
| | CMT — Constant Maturity Treasury |
| | CZK — Czech Koruna |
| | EUR — Euro |
| | EURIBOR — European Interbank Offered Rate |
| | HUF — Hungarian Forint |
| | JPY — Japanese Yen |
| | LIBOR — London Interbank Offered Rate |
| | OTC — Over the Counter |
| | plc — Public Limited Company |
| | REIT — Real Estate Investment Trust |
| | REMIC — Real Estate Mortgage Investment Conduit |
| | SEK — Swedish Krona |
| | USD — United States Dollar |
| | WAC — Weighted Average Coupon |
| | |
| | See Sector Classification in Other Information section. |
| 50 | THE GUGGENHEIM FUNDS SEMI-ANNUAL REPORT | SEE NOTES TO FINANCIAL STATEMENTS. |
| SCHEDULE OF INVESTMENTS (Unaudited)(continued) | March 29, 2018 |
| TOTAL RETURN BOND FUND | |
The following table summarizes the inputs used to value the Fund’s investments at March 29, 2018 (See Note 4 in the Notes to Financial Statements):
| Investments in Securities (Assets) | | Level 1
Quoted
Prices | | | Level 2
Significant
Observable
Inputs | | | Level 2 -
Other* | | | Level 3
Significant
Unobservable
Inputs | | | Total | |
| Asset-Backed Securities | | $ | — | | | $ | 3,374,051,103 | | | $ | — | | | $ | 11,835,918 | | | $ | 3,385,887,021 | |
| Collateralized Mortgage Obligations | | | — | | | | 3,052,384,462 | | | | — | | | | 64,682,224 | | | | 3,117,066,686 | |
| Commercial Paper | | | — | | | | 97,806,618 | | | | — | | | | — | | | | 97,806,618 | |
| Common Stocks | | | 7,414 | | | | — | | | | — | | | | — | | | | 7,414 | |
| Corporate Bonds | | | — | | | | 705,427,785 | | | | — | | | | 15,942,180 | | | | 721,369,965 | |
| Forward Foreign Currency Exchange Contracts | | | — | | | | — | | | | 4,705,198 | | | | — | | | | 4,705,198 | |
| Federal Agency Bonds | | | — | | | | 388,499,374 | | | | — | | | | — | | | | 388,499,374 | |
| Foreign Government Bonds | | | — | | | | 297,137,125 | | | | — | | | | — | | | | 297,137,125 | |
| Interest Rate Swap Agreements | | | — | | | | — | | | | 62,919,354 | | | | — | | | | 62,919,354 | |
| Money Market Fund | | | 279,006,141 | | | | — | | | | — | | | | — | | | | 279,006,141 | |
| Municipal Bonds | | | — | | | | 60,033,822 | | | | — | | | | — | | | | 60,033,822 | |
| Mutual Funds | | | 184,301,715 | | | | — | | | | — | | | | — | | | | 184,301,715 | |
| Options Purchased | | | — | | | | 10,269,137 | | | | — | | | | — | | | | 10,269,137 | |
| Preferred Stocks | | | — | | | | 1,037,952 | | | | — | | | | — | | | | 1,037,952 | |
| Repurchase Agreement | | | — | | | | 25,000,000 | | | | — | | | | — | | | | 25,000,000 | |
| Senior Floating Rate Interests | | | — | | | | 164,155,045 | | | | — | | | | — | | | | 164,155,045 | |
| U.S. Government Securities | | | — | | | | 1,020,442,714 | | | | — | | | | — | | | | 1,020,442,714 | |
| Total Assets | | $ | 463,315,270 | | | $ | 9,196,245,137 | | | $ | 67,624,552 | | | $ | 92,460,322 | | | $ | 9,819,645,281 | |
| | | | | | | | | | | | | | | | | | | | | |
| Investments in Securities (Liabilities) | | | Level 1
Quoted
Prices | | | | Level 2
Significant
Observable
Inputs | | | | Level 2 -
Other* | | | | Level 3
Significant
Unobservable
Inputs | | | | Total | |
| Forward Foreign Currency Exchange Contracts | | $ | — | | | $ | — | | | $ | 501,516 | | | $ | — | | | $ | 501,516 | |
| Unfunded Loan Commitments (Note 8) | | | — | | | | — | | | | — | | | | 184,780 | | | | 184,780 | |
| Total Liabilities | | $ | — | | | $ | — | | | $ | 501,516 | | | $ | 184,780 | | | $ | 686,296 | |
| * | Other financial instruments include forward foreign currency exchange contracts and swap agreements, which are reported as unrealized gain/loss at period end. |
| SEE NOTES TO FINANCIAL STATEMENTS. | THE GUGGENHEIM FUNDS SEMI-ANNUAL REPORT | 51 |
| SCHEDULE OF INVESTMENTS (Unaudited)(continued) | March 29, 2018 |
| TOTAL RETURN BOND FUND | |
The following is a summary of significant unobservable inputs used in the fair valuation of assets and liabilities categorized within Level 3 of the fair value hierarchy:
| Category | | Ending
Balance at
03/29/18 | | | Valuation Technique | | Unobservable
Inputs |
| Assets: | | | | | | | |
| Asset-Backed Securities | | $ | 11,835,918 | | | Option Adjusted Spread off the prior month end broker mark over the 3 month LIBOR | | Indicative Quote |
| Collateralized Mortgage Obligations | | | 64,682,224 | | | Option Adjusted Spread off the prior month end broker mark over the 3 month LIBOR | | Indicative Quote |
| Corporate Bonds | | | 15,942,180 | | | Option Adjusted Spread off the prior month end broker mark over the 3 month LIBOR | | Indicative Quote |
| Total Assets | | $ | 92,460,322 | | | | | |
| | | | | | | | | |
| Liabilities: | | | | | | | | |
| Unfunded Loan Commitments | | $ | 184,780 | | | Model Price | | Purchase Price |
Any remaining Level 3 securities held by the Fund and excluded from the tables above, were not considered material to the Fund.
| 52 | THE GUGGENHEIM FUNDS SEMI-ANNUAL REPORT | SEE NOTES TO FINANCIAL STATEMENTS. |
| SCHEDULE OF INVESTMENTS (Unaudited)(continued) | March 29, 2018 |
| TOTAL RETURN BOND FUND | |
Transfers between investment levels may occur as the markets fluctuate and/or the availability of data used in an investment’s valuation changes. Transfers between valuation levels, if any, are in comparison to the valuation levels at the end of the previous fiscal year, and are effective using the fair value as of the end of the current fiscal period.
For the period ended March 29, 2018, the Fund had securities with a total value of $43,009,994 transfer out of level 3 into level 2 due to changes in the securities valuation method based on availability of observable market inputs. There were no other securities that transferred between levels.
Summary of Fair Value Level 3 Activity
Following is a reconciliation of Level 3 assets for which significant unobservable inputs were used to determine fair value for the period ended March 29, 2018:
LEVEL 3 - Fair value measurement using significant unobservable inputs
| | | Assets | | | | | | Liabilities | |
| | | Senior Floating Rate Interests | | | Asset-Backed Securities | | | Corporate Bonds | | | Collateralized Mortgage Obligations | | | Total Assets | | | Unfunded Loan Commitments | |
| TOTAL RETURN BOND | | | | | | | | | | | | | | | | | | |
| Beginning Balance | | $ | 1,064,875 | | | $ | 12,011,785 | | | $ | 24,125,526 | | | $ | 121,997,532 | | | $ | 159,199,718 | | | $ | (56,979 | ) |
| Purchases/Receipts | | | 1,048,178 | | | | — | | | | — | | | | — | | | | 1,048,178 | | | | (152,534 | ) |
| Sales, maturities and paydowns/Fundings | | | (1,090,711 | ) | | | (160,392 | ) | | | (203,869 | ) | | | (22,407,480 | ) | | | (23,862,452 | ) | | | 146,178 | |
| Total realized gains or losses included in earnings | | | 55,721 | | | | — | | | | (4,692 | ) | | | 140,506 | | | | 191,535 | | | | — | |
| Total change in unrealized gains or losses included in earnings | | | (179,253 | ) | | | (15,475 | ) | | | 196,263 | | | | (1,108,198 | ) | | | (1,106,663 | ) | | | (121,445 | ) |
| Transfers into Level 3 | | | — | | | | — | | | | — | | | | — | | | | — | | | | — | |
| Transfers out of Level 3 | | | (898,810 | ) | | | — | | | | (8,171,048 | ) | | | (33,940,136 | ) | | | (43,009,994 | ) | | | — | |
| Ending Balance | | $ | — | | | $ | 11,835,918 | | | $ | 15,942,180 | | | $ | 64,682,224 | | | $ | 92,460,322 | | | $ | (184,780 | ) |
| Net Change in unrealized appreciation (depreciation) for investments in securities still held at March 29, 2018 | | $ | — | | | $ | (16,827 | ) | | $ | (85,072 | ) | | $ | 8,103 | | | $ | (93,796 | ) | | $ | (121,445 | ) |
| SEE NOTES TO FINANCIAL STATEMENTS. | THE GUGGENHEIM FUNDS SEMI-ANNUAL REPORT | 53 |
| SCHEDULE OF INVESTMENTS (Unaudited)(continued) | March 29, 2018 |
| TOTAL RETURN BOND FUND | |
Repurchase Agreements
In connection with transactions in repurchase agreements, it is the Fund’s policy that its custodian takes possession of the underlying collateral. For the following repurchase agreements, the collateral is in the possession of the Fund’s custodian and is evaluated to ensure that its market value exceeds, at a minimum, 102% of the original face amount of the repurchase agreements.
At March 29, 2018, the repurchase agreements entered into by the Fund were as follows:
Counterparty and
Terms of Agreement | | Face
Value | | | Repurchase
Price | | | Collateral | | Par
Value | | | Fair
Value | |
| BNP Paribas Securities Corp. | | | | | | | | MASTR Adjustable Rate Mortgages Trust | | | | | | |
| 1.90% | | | | | | | | 2.07% | | | | | | |
| 04/03/18 | | $ | 25,000,000 | | | $ | 25,035,625 | | | 05/25/47 | | $ | 64,321,000 | | | $ | 51,077,306 | |
| | | | | | | | | | | | | | | | | | | |
| | | | | | | | | | | Fannie Mae Connecticut Avenue Securities | | | | | | | | |
| | | | | | | | | | | 4.47% | | | | | | | | |
| | | | | | | | | | | 05/25/24 | | | 10,200,000 | | | | 10,799,760 | |
| | | | | | | | | | | | | $ | 74,521,000 | | | $ | 61,877,066 | |
In the event of counterparty default, the Fund has the right to collect the collateral to offset losses incurred. There is potential loss to the Fund in the event the Fund is delayed or prevented from exercising its right to dispose of the collateral securities, including the risk of a possible decline in the value of the underlying securities during the period while the Fund seeks to assert its rights. The Fund’s investment adviser, acting under the supervision of the Board of Trustees, reviews the value of the collateral and the creditworthiness of those banks and dealers with which the Fund enters into repurchase agreements to evaluate potential risks.
| 54 | THE GUGGENHEIM FUNDS SEMI-ANNUAL REPORT | SEE NOTES TO FINANCIAL STATEMENTS. |
| SCHEDULE OF INVESTMENTS (Unaudited)(concluded) | March 29, 2018 |
| TOTAL RETURN BOND FUND | |
Affiliated Transactions
Investments representing 5% or more of the outstanding voting shares of a portfolio company of a fund, or control of or by, or common control under the Guggenheim Investments (“GI”), result in that portfolio company being considered an affiliated company of such fund, as defined in the 1940 Act.
The Fund may invest in certain of the underlying series of Guggenheim Strategy Funds Trust including Guggenheim Strategy Fund I, Guggenheim Strategy Fund II and Guggenheim Strategy Fund III (collectively, the “Cash Management Funds”), each of which are open-end management investment companies managed by GI. The Cash Management Funds, which launched on March 11, 2014, are offered as cash management options only to mutual funds, trusts, and other accounts managed by GI and/or its affiliates, and are not available to the public. The Cash Management Funds pay no investment management fees. The Cash Management Funds’ annual report on Form N-CSR dated September 30, 2017, is available publicly or upon request. This information is available from the EDGAR database on the SEC’s website at https://www.sec.gov/Archives/edgar/data/1601445/000089180417000715/gug72218.htm.
Transactions during the period ended March 29, 2018, in which the portfolio company is an “affiliated person”, were as follows:
| Security Name | | Value
09/30/17 | | | Additions | | | Reductions | | | Realized
Gain | | | Change in
Unrealized | | | Value
03/29/18 | |
| Mutual Funds | | | | | | | | | | | | | | | | | | |
| Guggenheim Floating Rate Strategies Fund - Institutional Class | | $ | 77,103,355 | | | $ | 33,112,484 | | | $ | (1,000,000 | ) | | $ | 5,376 | | | $ | (202,743 | ) | | $ | 109,018,472 | |
| Guggenheim Strategy Fund I | | | 12,326,353 | | | | 13,321,506 | | | | (500,000 | ) | | | 5,175 | | | | (43,878 | ) | | | 25,109,156 | |
| Guggenheim Strategy Fund II | | | 14,363,426 | | | | 10,747,950 | | | | — | | | | — | | | | (28,812 | ) | | | 25,082,564 | |
| Guggenheim Strategy Fund III | | | 9,347,011 | | | | 15,744,763 | | | | — | | | | — | | | | (251 | ) | | | 25,091,523 | |
| Senior Floating Rate Interests | | | | | | | | | | | | | | | | | | | | | | | | |
| Aspect Software, Inc. 12.38% (1 Month USD LIBOR + 10.50%) due 05/25/20 | | | 14,487 | | | | — | | | | (190 | ) | | | — | | | | 175 | | | | 14,472 | |
| Closed-End Funds | | | | | | | | | | | | | | | | | | | | | | | | |
| Guggenheim Strategic Opportunities Fund | | | 10,260,018 | | | | — | | | | (10,410,588 | ) | | | 1,932,361 | | | | (1,781,791 | ) | | | — | |
| | | $ | 123,414,650 | | | $ | 72,926,703 | | | $ | (11,910,778 | ) | | $ | 1,942,912 | | | $ | (2,057,300 | ) | | $ | 184,316,187 | |
| Security Name | | Shares
03/29/18 | | | Investment
Income | | | Capital Gain
Distributions | |
| Mutual Funds | | | | | | | | | |
| Guggenheim Floating Rate Strategies Fund - Institutional Class | | | 4,191,406 | | | $ | 2,095,400 | | | $ | — | |
| Guggenheim Strategy Fund I | | | 1,002,362 | | | | 216,194 | | | | 4,496 | |
| Guggenheim Strategy Fund II | | | 1,002,901 | | | | 239,528 | | | | 7,687 | |
| Guggenheim Strategy Fund III | | | 1,002,458 | | | | 190,977 | | | | 2,836 | |
| Senior Floating Rate Interests | | | | | | | | | | | | |
| Aspect Software, Inc. 12.38% (1 Month USD LIBOR + 10.50%) due 05/25/20 | | | 14,536 | | | | 875 | | | | — | |
| Closed-End Funds | | | | | | | | | | | | |
| Guggenheim Strategic Opportunities Fund | | | — | | | | 219,695 | | | | — | |
| | | | | | | $ | 2,962,669 | | | $ | 15,019 | |
| SEE NOTES TO FINANCIAL STATEMENTS. | THE GUGGENHEIM FUNDS SEMI-ANNUAL REPORT | 55 |
| STATEMENT OF ASSETS AND LIABILITIES (Unaudited) |
| TOTAL RETURN BOND FUND |
March 29, 2018
| Assets: |
| Investments in unaffiliated issuers (cost $9,565,339,335) | | $ | 9,542,704,542 | |
| Investments in affiliated issuers, at value (cost $184,216,203) | | | 184,316,187 | |
| Repurchase agreements, at value (cost $25,000,000) | | | 25,000,000 | |
| Foreign currency, at value (cost $43,511) | | | 43,400 | |
| Cash | | | 461,278 | |
| Segregated cash with broker | | | 42,715,000 | |
| Unamortized upfront premiums paid on interest rate swaps | | | 26,398,772 | |
| Unrealized appreciation on forward foreign currency exchange contracts | | | 4,705,198 | |
| Prepaid expenses | | | 606,999 | |
| Receivables: |
| Securities sold | | | 215,168,403 | |
| Interest | | | 31,368,732 | |
| Fund shares sold | | | 17,719,877 | |
| Dividends | | | 478,479 | |
| Total assets | | | 10,091,686,867 | |
| | | | | |
| Liabilities: |
| Unrealized depreciation on forward foreign currency exchange contracts | | | 501,516 | |
| Unfunded loan commitments, at value (Note 8) (proceeds $146,178) | | | 184,780 | |
| Segregated cash due to broker | | | 28,533,941 | |
| Payable for: |
| Securities purchased | | | 388,842,291 | |
| Fund shares redeemed | | | 23,477,268 | |
| Variation margin on swap agreements | | | 1,794,452 | |
| Management fees | | | 1,647,750 | |
| Swap settlement | | | 1,230,243 | |
| Fund accounting/administration fees | | | 645,481 | |
| Distribution and service fees | | | 558,458 | |
| Transfer agent/maintenance fees | | | 126,805 | |
| Trustees’ fees* | | | 1,768 | |
| Due to advisor | | | 261 | |
| Miscellaneous | | | 3,796,430 | |
| Total liabilities | | | 451,341,444 | |
| Net assets | | $ | 9,640,345,423 | |
| | | | | |
| Net assets consist of: |
| Paid in capital | | $ | 9,594,655,502 | |
| Accumulated net investment loss | | | (3,932,281 | ) |
| Accumulated net realized gain on investments | | | 5,085,474 | |
| Net unrealized appreciation on investments | | | 44,536,728 | |
| Net assets | | $ | 9,640,345,423 | |
| | | | | |
| A-Class: |
| Net assets | | $ | 815,197,730 | |
| Capital shares outstanding | | | 30,259,965 | |
| Net asset value per share | | $ | 26.94 | |
| Maximum offering price per share (Net asset value divided by 96.00%) | | $ | 28.06 | |
| | | | | |
| C-Class: |
| Net assets | | $ | 268,128,977 | |
| Capital shares outstanding | | | 9,952,145 | |
| Net asset value per share | | $ | 26.94 | |
| | | | | |
| P-Class: |
| Net assets | | $ | 736,981,234 | |
| Capital shares outstanding | | | 27,364,236 | |
| Net asset value per share | | $ | 26.93 | |
| | | | | |
| R6-Class: |
| Net assets | | $ | 30,255,466 | |
| Capital shares outstanding | | | 1,121,503 | |
| Net asset value per share | | $ | 26.98 | |
| | | | | |
| Institutional Class: |
| Net assets | | $ | 7,789,782,016 | |
| Capital shares outstanding | | | 288,920,515 | |
| Net asset value per share | | $ | 26.96 | |
| * | Relates to Trustees not deemed “interested persons” within the meaning of Section 2(a)(19) of the 1940 Act. |
| 56 | THE GUGGENHEIM FUNDS SEMI-ANNUAL REPORT | SEE NOTES TO FINANCIAL STATEMENTS. |
| STATEMENT OF OPERATIONS (Unaudited) |
| TOTAL RETURN BOND FUND |
Period Ended March 29, 2018
| Investment Income: |
| Dividends from securities of unaffiliated issuers | | $ | 149,334 | |
| Dividends from securities of affiliated issuers | | | 2,962,669 | |
| Interest | | | 147,602,716 | |
| Other income | | | 1,708 | |
| Total investment income | | | 150,716,427 | |
| | | | | |
| Expenses: |
| Management fees | | | 18,333,533 | |
| Distribution and service fees: |
| A-Class | | | 996,045 | |
| C-Class | | | 1,304,635 | |
| P-Class | | | 845,271 | |
| Transfer agent/maintenance fees: |
| A-Class | | | 540,699 | |
| C-Class | | | 155,613 | |
| P-Class | | | 404,041 | |
| R6-Class | | | 1,536 | |
| Institutional Class | | | 2,885,030 | |
| Recoupment of previously waived fees: |
| A-Class | | | 20,369 | |
| C-Class | | | 2,737 | |
| P-Class | | | 9,630 | |
| R6-Class | | | 262 | |
| Institutional Class | | | 4 | |
| Fund accounting/administration fees | | | 3,550,971 | |
| Line of credit fees | | | 175,798 | |
| Custodian fees | | | 77,272 | |
| Trustees’ fees* | | | 51,684 | |
| Miscellaneous | | | 1,200,631 | |
| Total expenses | | | 30,555,761 | |
| Less: |
| Expenses reimbursed by Adviser: |
| A-Class | | | (265,827 | ) |
| C-Class | | | (60,549 | ) |
| P-Class | | | (168,038 | ) |
| R6-Class | | | (996 | ) |
| Institutional Class | | | (2,670,486 | ) |
| Expenses waived by Adviser | | | (1,643,313 | ) |
| Total waived/reimbursed expenses | | | (4,809,209 | ) |
| Net expenses | | | 25,746,552 | |
| Net investment income | | | 124,969,875 | |
| |
| Net Realized and Unrealized Gain (Loss): |
| Net realized gain (loss) on: |
| Investments in unaffiliated issuers | | | 21,719,711 | |
| Investments in affiliated issuers | | | 1,942,912 | |
| Distributions received from affiliated investment company shares | | | 15,019 | |
| Swap agreements | | | 7,272,968 | |
| Foreign currency transactions | | | 307,576 | |
| Forward currency exchange contracts | | | (12,592,196 | ) |
| Options purchased | | | (759,886 | ) |
| Options written | | | 3,633,552 | |
| Net realized gain | | | 21,539,656 | |
| Net change in unrealized appreciation (depreciation) on: |
| Investments in unaffiliated issuers | | | (112,067,948 | ) |
| Investments in affiliated issuers | | | (2,057,300 | ) |
| Swap agreements | | | 53,611,340 | |
| Options purchased | | | (6,143,062 | ) |
| Options written | | | (3,456,921 | ) |
| Foreign currency translations | | | (15,156 | ) |
| Forward foreign currency exchange contracts | | | 6,306,173 | |
| Net change in unrealized appreciation (depreciation) | | | (63,822,874 | ) |
| Net realized and unrealized loss | | | (42,283,218 | ) |
| Net increase in net assets resulting from operations | | $ | 82,686,657 | |
| * | Relates to Trustees not deemed “interested persons” within the meaning of Section 2(a)(19) of the 1940 Act. |
| SEE NOTES TO FINANCIAL STATEMENTS. | THE GUGGENHEIM FUNDS SEMI-ANNUAL REPORT | 57 |
| STATEMENTS OF CHANGES IN NET ASSETS |
| TOTAL RETURN BOND FUND | |
| | | Period Ended
March 29,
2018
(Unaudited) | | | Year Ended
September 30,
2017 | |
| Increase (Decrease) in Net Assets from Operations: | | | | | | |
| Net investment income | | $ | 124,969,875 | | | $ | 193,285,181 | |
| Net realized gain on investments | | | 21,539,656 | | | | 5,193,919 | |
| Net change in unrealized appreciation (depreciation) on investments | | | (63,822,874 | ) | | | 43,798,164 | |
| Net increase in net assets resulting from operations | | | 82,686,657 | | | | 242,277,264 | |
| | | | | | | | | |
| Distributions to shareholders from: | | | | | | | | |
| Net investment income | | | | | | | | |
| A-Class | | | (10,054,059 | ) | | | (22,443,652 | ) |
| C-Class | | | (2,313,667 | ) | | | (6,346,353 | ) |
| P-Class | | | (8,522,256 | ) | | | (11,837,451 | ) |
| R6-Class | | | (355,010 | ) | | | (106,334 | )* |
| Institutional Class | | | (101,005,819 | ) | | | (170,419,239 | ) |
| Net realized gains | | | | | | | | |
| A-Class | | | — | | | | (2,595,729 | ) |
| C-Class | | | — | | | | (928,930 | ) |
| P-Class | | | — | | | | (771,149 | ) |
| R6-Class | | | — | | | | (418 | )* |
| Institutional Class | | | — | | | | (13,065,720 | ) |
| Total distributions to shareholders | | | (122,250,811 | ) | | | (228,514,975 | ) |
| | | | | | | | | |
| Capital share transactions: | | | | | | | | |
| Proceeds from sale of shares | | | | | | | | |
| A-Class | | | 246,240,569 | | | | 484,488,429 | |
| C-Class | | | 49,183,647 | | | | 101,568,902 | |
| P-Class | | | 307,321,085 | | | | 506,776,191 | |
| R6-Class | | | 24,679,413 | | | | 14,004,848 | * |
| Institutional Class | | | 2,569,881,853 | | | | 4,556,576,807 | |
| Distributions reinvested | | | | | | | | |
| A-Class | | | 8,314,190 | | | | 21,426,257 | |
| C-Class | | | 1,922,581 | | | | 5,774,378 | |
| P-Class | | | 8,490,610 | | | | 12,575,292 | |
| R6-Class | | | 318,774 | | | | 106,752 | * |
| Institutional Class | | | 82,712,537 | | | | 148,909,327 | |
| Cost of shares redeemed | | | | | | | | |
| A-Class | | | (180,709,013 | ) | | | (307,329,650 | ) |
| C-Class | | | (32,993,128 | ) | | | (71,178,051 | ) |
| P-Class | | | (148,152,845 | ) | | | (111,875,823 | ) |
| R6-Class | | | (8,324,983 | ) | | | (464,812 | )* |
| Institutional Class | | | (1,250,392,028 | ) | | | (1,325,029,178 | ) |
| Net increase from capital share transactions | | | 1,678,493,262 | | | | 4,036,329,669 | |
| Net increase in net assets | | | 1,638,929,108 | | | | 4,050,091,958 | |
| | | | | | | | | |
| Net assets: | | | | | | | | |
| Beginning of period | | | 8,001,416,315 | | | | 3,951,324,357 | |
| End of period | | $ | 9,640,345,423 | | | $ | 8,001,416,315 | |
| Accumulated net investment loss at end of period | | $ | (3,932,281 | ) | | $ | (6,651,345 | ) |
| 58 | THE GUGGENHEIM FUNDS SEMI-ANNUAL REPORT | SEE NOTES TO FINANCIAL STATEMENTS. |
| STATEMENTS OF CHANGES IN NET ASSETS (concluded) |
| TOTAL RETURN BOND FUND | |
| | | Period Ended
March 29,
2018
(Unaudited) | | | Year Ended
September 30,
2017 | |
| Capital share activity: | | | | | | |
| Shares sold | | | | | | |
| A-Class | | | 9,108,198 | | | | 18,097,238 | |
| C-Class | | | 1,817,763 | | | | 3,786,837 | |
| P-Class | | | 11,365,015 | | | | 18,936,622 | |
| R6-Class | | | 910,952 | | | | 519,216 | * |
| Institutional Class | | | 95,034,951 | | | | 170,061,911 | |
| Shares issued from reinvestment of distributions | | | | | | | | |
| A-Class | | | 307,553 | | | | 801,866 | |
| C-Class | | | 71,116 | | | | 216,143 | |
| P-Class | | | 314,218 | | | | 468,997 | |
| R6-Class | | | 11,777 | | | | 3,992 | * |
| Institutional Class | | | 3,057,373 | | | | 5,551,921 | |
| Shares redeemed | | | | | | | | |
| A-Class | | | (6,696,050 | ) | | | (11,494,371 | ) |
| C-Class | | | (1,221,308 | ) | | | (2,660,260 | ) |
| P-Class | | | (5,489,844 | ) | | | (4,177,643 | ) |
| R6-Class | | | (307,348 | ) | | | (17,086 | )* |
| Institutional Class | | | (46,266,443 | ) | | | (49,487,333 | ) |
| Net increase in shares | | | 62,017,923 | | | | 150,608,050 | |
| * | Since commencement of operations: October 19, 2016. |
| SEE NOTES TO FINANCIAL STATEMENTS. | THE GUGGENHEIM FUNDS SEMI-ANNUAL REPORT | 59 |
| FINANCIAL HIGHLIGHTS |
| TOTAL RETURN BOND FUND | |
This table is presented to show selected data for a share outstanding throughout each period and to assist shareholders in evaluating a Fund’s performance for the periods presented.
| A-Class | | Period Ended
March 29,
2018a | | | Year Ended
Sept. 30,
2017 | | | Year Ended
Sept. 30,
2016 | | | Year Ended
Sept. 30,
2015 | | | Year Ended
Sept. 30,
2014 | | | Year Ended
Sept. 30,
2013 | |
| Per Share Data | | | | | | | | | | | | | | | | | | |
| Net asset value, beginning of period | | $ | 27.05 | | | $ | 27.23 | | | $ | 26.50 | | | $ | 26.94 | | | $ | 26.16 | | | $ | 26.51 | |
| Income (loss) from investment operations: |
| Net investment income (loss)b | | | .35 | | | | .83 | | | | .96 | | | | .94 | | | | 1.01 | | | | 1.20 | |
| Net gain (loss) on investments (realized and unrealized) | | | (.12 | ) | | | .05 | | | | .81 | | | | (.25 | ) | | | 1.13 | | | | (.28 | ) |
| Total from investment operations | | | .23 | | | | .88 | | | | 1.77 | | | | .69 | | | | 2.14 | | | | .92 | |
| Less distributions from: |
| Net investment income | | | (.34 | ) | | | (.95 | ) | | | (1.04 | ) | | | (1.09 | ) | | | (1.36 | ) | | | (1.23 | ) |
| Net realized gains | | | — | | | | (.11 | ) | | | — | | | | (.04 | ) | | | — | | | | (.04 | ) |
| Total distributions | | | (.34 | ) | | | (1.06 | ) | | | (1.04 | ) | | | (1.13 | ) | | | (1.36 | ) | | | (1.27 | ) |
| Net asset value, end of period | | $ | 26.94 | | | $ | 27.05 | | | $ | 27.23 | | | $ | 26.50 | | | $ | 26.94 | | | $ | 26.16 | |
| |
| Total Returnh | | | 0.86 | % | | | 3.33 | % | | | 6.88 | % | | | 2.56 | % | | | 8.34 | % | | | 3.53 | % |
| Ratios/Supplemental Data |
| Net assets, end of period (in thousands) | | $ | 815,198 | | | $ | 744,989 | | | $ | 548,223 | | | $ | 435,760 | | | $ | 90,805 | | | $ | 74,328 | |
| Ratios to average net assets: |
| Net investment income (loss) | | | 2.58 | % | | | 3.08 | % | | | 3.63 | % | | | 3.50 | % | | | 3.80 | % | | | 4.47 | % |
| Total expensesc | | | 0.92 | % | | | 1.02 | % | | | 1.15 | % | | | 1.10 | % | | | 1.19 | % | | | 1.27 | % |
| Net expensesd,e,i | | | 0.81 | % | | | 0.87 | % | | | 0.97 | % | | | 0.91 | % | | | 0.94 | % | | | 0.98 | % |
| Portfolio turnover rate | | | 26 | % | | | 72 | % | | | 86 | % | | | 74 | % | | | 52 | % | | | 94 | % |
| 60 | THE GUGGENHEIM FUNDS SEMI-ANNUAL REPORT | SEE NOTES TO FINANCIAL STATEMENTS. |
| FINANCIAL HIGHLIGHTS (continued) |
| TOTAL RETURN BOND FUND | |
This table is presented to show selected data for a share outstanding throughout each period and to assist shareholders in evaluating a Fund’s performance for the periods presented.
| C-Class | | Period Ended
March 29,
2018a | | | Year Ended
Sept. 30,
2017 | | | Year Ended
Sept. 30,
2016 | | | Year Ended
Sept. 30,
2015 | | | Year Ended
Sept. 30,
2014 | | | Year Ended
Sept. 30,
2013 | |
| Per Share Data | | | | | | | | | | | | | | | | | | |
| Net asset value, beginning of period | | $ | 27.05 | | | $ | 27.23 | | | $ | 26.50 | | | $ | 26.94 | | | $ | 26.16 | | | $ | 26.50 | |
| Income (loss) from investment operations: |
| Net investment income (loss)b | | | .25 | | | | .65 | | | | .75 | | | | .74 | | | | .82 | | | | .99 | |
| Net gain (loss) on investments (realized and unrealized) | | | (.12 | ) | | | .03 | | | | .82 | | | | (.25 | ) | | | 1.12 | | | | (.27 | ) |
| Total from investment operations | | | .13 | | | | .68 | | | | 1.57 | | | | .49 | | | | 1.94 | | | | .72 | |
| Less distributions from: |
| Net investment income | | | (.24 | ) | | | (.75 | ) | | | (.84 | ) | | | (.89 | ) | | | (1.16 | ) | | | (1.02 | ) |
| Net realized gains | | | — | | | | (.11 | ) | | | — | | | | (.04 | ) | | | — | | | | (.04 | ) |
| Total distributions | | | (.24 | ) | | | (.86 | ) | | | (.84 | ) | | | (.93 | ) | | | (1.16 | ) | | | (1.06 | ) |
| Net asset value, end of period | | $ | 26.94 | | | $ | 27.05 | | | $ | 27.23 | | | $ | 26.50 | | | $ | 26.94 | | | $ | 26.16 | |
| |
| Total Returnh | | | 0.48 | % | | | 2.58 | % | | | 6.08 | % | | | 1.82 | % | | | 7.58 | % | | | 2.77 | % |
| Ratios/Supplemental Data |
| Net assets, end of period (in thousands) | | $ | 268,129 | | | $ | 251,177 | | | $ | 216,255 | | | $ | 89,320 | | | $ | 25,107 | | | $ | 15,654 | |
| Ratios to average net assets: |
| Net investment income (loss) | | | 1.83 | % | | | 2.44 | % | | | 2.82 | % | | | 2.75 | % | | | 3.10 | % | | | 3.70 | % |
| Total expensesc | | | 1.65 | % | | | 1.74 | % | | | 1.83 | % | | | 1.80 | % | | | 1.90 | % | | | 2.07 | % |
| Net expensesd,e,i | | | 1.57 | % | | | 1.60 | % | | | 1.69 | % | | | 1.63 | % | | | 1.66 | % | | | 1.77 | % |
| Portfolio turnover rate | | | 26 | % | | | 72 | % | | | 86 | % | | | 74 | % | | | 52 | % | | | 94 | % |
| SEE NOTES TO FINANCIAL STATEMENTS. | THE GUGGENHEIM FUNDS SEMI-ANNUAL REPORT | 61 |
| FINANCIAL HIGHLIGHTS (continued) |
| TOTAL RETURN BOND FUND | |
This table is presented to show selected data for a share outstanding throughout each period and to assist shareholders in evaluating a Fund’s performance for the periods presented.
| P-Class | | Period Ended
March 29,
2018a | | | Year Ended
Sept. 30,
2017 | | | Year Ended
Sept. 30,
2016 | | | Period Ended
Sept. 30,
2015f | |
| Per Share Data | | | | | | | | | | | | |
| Net asset value, beginning of period | | $ | 27.04 | | | $ | 27.23 | | | $ | 26.49 | | | $ | 26.98 | |
| Income (loss) from investment operations: |
| Net investment income (loss)b | | | .35 | | | | .85 | | | | .96 | | | | .36 | |
| Net gain (loss) on investments (realized and unrealized) | | | (.12 | ) | | | .03 | | | | .84 | | | | (.43 | ) |
| Total from investment operations | | | .23 | | | | .88 | | | | 1.80 | | | | (.07 | ) |
| Less distributions from: |
| Net investment income | | | (.34 | ) | | | (.96 | ) | | | (1.06 | ) | | | (.42 | ) |
| Net realized gains | | | — | | | | (.11 | ) | | | — | | | | — | |
| Total distributions | | | (.34 | ) | | | (1.07 | ) | | | (1.06 | ) | | | (.42 | ) |
| Net asset value, end of period | | $ | 26.93 | | | $ | 27.04 | | | $ | 27.23 | | | $ | 26.49 | |
| |
| Total Returnh | | | 0.86 | % | | | 3.34 | % | | | 6.97 | % | | | (0.21 | %) |
| Ratios/Supplemental Data |
| Net assets, end of period (in thousands) | | $ | 736,981 | | | $ | 572,644 | | | $ | 161,928 | | | $ | 12,509 | |
| Ratios to average net assets: |
| Net investment income (loss) | | | 2.59 | % | | | 3.14 | % | | | 3.58 | % | | | 3.20 | % |
| Total expensesc | | | 0.90 | % | | | 1.03 | % | | | 0.96 | % | | | 1.02 | % |
| Net expensesd,e,i | | | 0.81 | % | | | 0.86 | % | | | 0.82 | % | | | 0.84 | % |
| Portfolio turnover rate | | | 26 | % | | | 72 | % | | | 86 | % | | | 74 | % |
| 62 | THE GUGGENHEIM FUNDS SEMI-ANNUAL REPORT | SEE NOTES TO FINANCIAL STATEMENTS. |
| FINANCIAL HIGHLIGHTS (continued) |
| TOTAL RETURN BOND FUND | |
This table is presented to show selected data for a share outstanding throughout each period and to assist shareholders in evaluating a Fund’s performance for the periods presented.
| R6-Class | | Period Ended
March 29,
2018a | | | Period Ended
Sept. 30,
2017g | |
| Per Share Data | | | | | | |
| Net asset value, beginning of period | | $ | 27.09 | | | $ | 27.15 | |
| Income (loss) from investment operations: |
| Net investment income (loss)b | | | .39 | | | | .86 | |
| Net gain (loss) on investments (realized and unrealized) | | | (.12 | ) | | | .18 | |
| Total from investment operations | | | .27 | | | | 1.04 | |
| Less distributions from: |
| Net investment income | | | (.38 | ) | | | (.99 | ) |
| Net realized gains | | | — | | | | (.11 | ) |
| Total distributions | | | (.38 | ) | | | (1.10 | ) |
| Net asset value, end of period | | $ | 26.98 | | | $ | 27.09 | |
| |
| Total Returnh | | | 1.01 | % | | | 3.97 | % |
| Ratios/Supplemental Data |
| Net assets, end of period (in thousands) | | $ | 30,255 | | | $ | 13,709 | |
| Ratios to average net assets: |
| Net investment income (loss) | | | 2.92 | % | | | 3.35 | % |
| Total expensesc | | | 0.53 | % | | | 0.65 | % |
| Net expensesd,e,i | | | 0.49 | % | | | 0.51 | % |
| Portfolio turnover rate | | | 26 | % | | | 72 | % |
| SEE NOTES TO FINANCIAL STATEMENTS. | THE GUGGENHEIM FUNDS SEMI-ANNUAL REPORT | 63 |
| FINANCIAL HIGHLIGHTS (continued) |
| TOTAL RETURN BOND FUND |
This table is presented to show selected data for a share outstanding throughout each period and to assist shareholders in evaluating a Fund’s performance for the periods presented.
| Institutional Class | | Period Ended
March 29,
2018a | | | Year Ended
Sept. 30,
2017 | | | Year Ended
Sept. 30,
2016 | | | Year Ended
Sept. 30,
2015 | | | Year Ended
Sept. 30,
2014 | | | Year Ended
Sept. 30,
2013 | |
| Per Share Data | | | | | | | | | | | | | | | | | | |
| Net asset value, beginning of period | | $ | 27.07 | | | $ | 27.26 | | | $ | 26.53 | | | $ | 26.97 | | | $ | 26.19 | | | $ | 26.54 | |
| Income (loss) from investment operations: |
| Net investment income (loss)b | | | .39 | | | | .93 | | | | 1.05 | | | | 1.03 | | | | 1.09 | | | | 1.28 | |
| Net gain (loss) on investments (realized and unrealized) | | | (.12 | ) | | | .04 | | | | .82 | | | | (.25 | ) | | | 1.14 | | | | (.27 | ) |
| Total from investment operations | | | .27 | | | | .97 | | | | 1.87 | | | | .78 | | | | 2.23 | | | | 1.01 | |
| Less distributions from: |
| Net investment income | | | (.38 | ) | | | (1.05 | ) | | | (1.14 | ) | | | (1.18 | ) | | | (1.45 | ) | | | (1.32 | ) |
| Net realized gains | | | — | | | | (.11 | ) | | | — | | | | (.04 | ) | | | — | | | | (.04 | ) |
| Total distributions | | | (.38 | ) | | | (1.16 | ) | | | (1.14 | ) | | | (1.22 | ) | | | (1.45 | ) | | | (1.36 | ) |
| Net asset value, end of period | | $ | 26.96 | | | $ | 27.07 | | | $ | 27.26 | | | $ | 26.53 | | | $ | 26.97 | | | $ | 26.19 | |
| |
| Total Returnh | | | 1.02 | % | | | 3.68 | % | | | 7.26 | % | | | 2.91 | % | | | 8.74 | % | | | 3.88 | % |
| Ratios/Supplemental Data |
| Net assets, end of period (in thousands) | | $ | 7,789,782 | | | $ | 6,418,897 | | | $ | 3,024,918 | | | $ | 1,409,171 | | | $ | 270,668 | | | $ | 78,318 | |
| Ratios to average net assets: |
| Net investment income (loss) | | | 2.90 | % | | | 3.47 | % | | | 3.94 | % | | | 3.83 | % | | | 4.09 | % | | | 4.78 | % |
| Total expensesc | | | 0.61 | % | | | 0.68 | % | | | 0.79 | % | | | 0.76 | % | | | 0.81 | % | | | 0.89 | % |
| Net expensesd,e,i | | | 0.50 | % | | | 0.52 | % | | | 0.59 | % | | | 0.57 | % | | | 0.57 | % | | | 0.64 | % |
| Portfolio turnover rate | | | 26 | % | | | 72 | % | | | 86 | % | | | 74 | % | | | 52 | % | | | 94 | % |
| 64 | THE GUGGENHEIM FUNDS SEMI-ANNUAL REPORT | SEE NOTES TO FINANCIAL STATEMENTS. |
| FINANCIAL HIGHLIGHTS (concluded) |
| TOTAL RETURN BOND FUND |
| a | Unaudited figures for the period ended March 29, 2018. Percentage amounts for the period, except total return and portfolio turnover rate, have been annualized. |
| b | Net investment income (loss) per share was computed using average shares outstanding throughout the period. |
| c | Does not include expenses of the underlying funds in which the Fund invests. |
| d | Net expense information reflects the expense ratios after expense waivers and reimbursements, as applicable. |
| e | The portion of the ratios of total and net expenses before and after waivers/reimbursements to average net assets attributable to recoupments of prior fee reductions or expense reimbursements for the periods presented would be: |
| | | 03/29/18 | 09/30/17 |
| | A-Class | 0.01% | 0.01% |
| | C-Class | 0.00% | 0.01% |
| | P-Class | 0.00% | 0.01% |
| | R6-Class | 0.00% | 0.00% |
| | Institutional Class | 0.00% | 0.00% |
| f | Since commencement of operations: May 1, 2015. Percentage amounts for the period, except total return and portfolio turnover rate, have been annualized. |
| g | Since commencement of operations: October 19, 2016. Percentage amounts for the period, except total return and portfolio turnover rate, have been annualized. |
| h | Total return does not reflect the impact of any applicable sales charges and has not been annualized. |
| i | Net expenses may include expenses that are excluded from the expense limitation agreement. Excluding these expenses, the net expense ratio for the year would be: |
| | | 03/29/18 | 09/30/17 | 09/30/16 | 09/30/15 | 09/30/14 | 09/30/13 |
| | A-Class | 0.81% | 0.84% | 0.87% | 0.84% | 0.86% | 0.86% |
| | C-Class | 1.57% | 1.57% | 1.60% | 1.56% | 1.58% | 1.64% |
| | P-Class | 0.81% | 0.83% | 0.75% | 0.75% | N/A | N/A |
| | R6-Class | 0.49% | 0.48% | N/A | N/A | N/A | N/A |
| | Institutional Class | 0.49% | 0.49% | 0.49% | 0.50% | 0.50% | 0.52% |
| | THE GUGGENHEIM FUNDS SEMI-ANNUAL REPORT | 65 |
| NOTES TO FINANCIAL STATEMENTS (Unaudited) |
Note 1 – Organization and Significant Accounting Policies
Organization
Guggenheim Funds Trust (the “Trust”), a Delaware statutory trust, is registered with the SEC under the Investment Company Act of 1940 (“1940 Act”), as an open-ended investment company of the series type. Each series, in effect, is representing a separate Fund. The Trust is authorized to issue an unlimited number of shares. The Trust accounts for the assets of each Fund separately.
The Trust offers a combination of five separate classes of shares, A-Class shares, C-Class shares, P-Class shares, R6-Class shares and Institutional Class shares. Sales of shares of each Class are made without a front-end sales charge at the net asset value per share (“NAV”), with the exception of A-Class shares. A-Class shares are sold at the NAV, plus the applicable front-end sales charge. The sales charge varies depending on the amount purchased. A-Class share purchases of $1 million or more are exempt from the front-end sales charge but have a 1% contingent deferred sales charge (“CDSC”), if shares are redeemed within 12 months of purchase. C-Class shares have a 1% CDSC if shares are redeemed within 12 months of purchase. Institutional Class shares are offered primarily for direct investment by institutions such as pension and profit sharing plans, endowments, foundations and corporations. Institutional Class shares require a minimum initial investment of $2 million and a minimum account balance of $1 million. R6-Class shares of the Fund are offered primarily through qualified retirement and benefit plans. Class R6 shares are also offered through certain other plans and platforms sponsored by financial intermediaries. Certain institutional investors and others deemed appropriate by Guggenheim Investments (“GI”) may also be eligible to purchase Class R6 shares subject to a $2,000,000 minimum initial investment. At March 29, 2018, the Trust consisted of nineteen funds (the “Funds”).
This report covers the Total Return Bond Fund (the “Fund”), a diversified investment company. Only A-Class, C-Class, P-Class, R6-Class and Institutional Class shares had been issued by the Fund.
Guggenheim Partners Investment Management, LLC, which operates under the name Guggenheim Investments (“GI”), provides advisory services. Guggenheim Funds Distributors, LLC (“GFD” or the “Distributor”) acts as principal underwriter for the Trust. GI and GFD are affliated entities.
Significant Accounting Policies
March 29, 2018 represents the last day during the Fund’s semi-annual period on which the New York Stock Exchange (“NYSE”) was open for trading. The Fund’s financial statements have been presented through that date to maintain consistency with the Fund’s net asset value calculations used for shareholder transactions.
The Fund operates as an investment company and, accordingly, follows the investment company accounting and reporting guidance of the Financial Accounting Standards Board (“FASB”) Accounting Standards Codification Topic 946 Financial Services – Investment Companies.
| 66 | THE GUGGENHEIM FUNDS SEMI-ANNUAL REPORT | |
| NOTES TO FINANCIAL STATEMENTS (Unaudited)(continued) |
The following significant accounting policies are in conformity with U.S. generally accepted accounting principles (“U.S. GAAP”) and are consistently followed by the Fund. This requires management to make estimates and assumptions that affect the reported amount of assets and liabilities, contingent assets and liabilities at the date of the financial statements, and the reported amounts of revenues and expenses during the reporting period. Actual results could differ from these estimates. All time references are based on Eastern Time.
The NAV of each Class of a fund is calculated by dividing the market value of a fund’s securities and other assets, less all liabilities, attributable to the Class by the number of outstanding shares of the Class.
(a) Valuation of Investments
The Board of Trustees of the Fund (the “Board”) has adopted policies and procedures for the valuation of the Fund’s investments (the “Valuation Procedures”). Pursuant to the Valuation Procedures, the Board has delegated to a valuation committee, consisting of representatives from Guggenheim’s investment management, fund administration, legal and compliance departments (the “Valuation Committee”), the day-to-day responsibility for implementing the Valuation Procedures, including, under most circumstances, the responsibility for determining the fair value of the Fund’s securities and/or other assets.
Valuations of the Fund’s securities are supplied primarily by pricing services appointed pursuant to the processes set forth in the Valuation Procedures. The Valuation Committee convenes monthly, or more frequently as needed, to review the valuation of all assets which have been fair valued for reasonableness. The Fund’s officers, through the Valuation Committee and consistent with the monitoring and review responsibilities set forth in the Valuation Procedures, regularly review procedures used and valuations provided by the pricing services.
If the pricing service cannot or does not provide a valuation for a particular investment or such valuation is deemed unreliable, such investment is fair valued by the Valuation Committee.
Equity securities listed on an exchange (NYSE or American Stock Exchange) are valued at the last quoted sales price as of the close of business on the NYSE, usually 4:00 p.m. on the valuation date. Equity securities listed on the NASDAQ market system are valued at the NASDAQ Official Closing Price on the valuation date, which may not necessarily represent the last sale price. If there has been no sale on such exchange or NASDAQ on a given day, the security is valued at the closing bid price on that day.
Generally, trading in foreign securities markets is substantially completed each day at various times prior to the close of the NYSE. The values of foreign securities are determined as of the close of such foreign markets or the close of the NYSE, if earlier. All investments quoted in foreign currencies are valued in U.S. dollars on the basis of the foreign currency exchange rates prevailing at the close of U.S. business at 4:00 pm. Investments in foreign securities may involve risks not present in domestic investments. The Valuation Committee will determine the current
| | THE GUGGENHEIM FUNDS SEMI-ANNUAL REPORT | 67 |
| NOTES TO FINANCIAL STATEMENTS (Unaudited)(continued) |
value of such foreign securities by taking into consideration certain factors which may include those discussed above, as well as the following factors, among others: the value of the securities traded on other foreign markets, ADR trading, closed-end fund trading, foreign currency exchange activity, and the trading prices of financial products that are tied to foreign securities. In addition, the Board has authorized the Valuation Committee and GI to use prices and other information supplied by a third party pricing vendor in valuing foreign securities.
Open-end investment companies (“mutual funds”) are valued at their NAV as of the close of business, on the valuation date. Exchange-traded funds (“ETFs”) and closed-end investment companies (“CEFs”) are valued at the last quoted sale price.
U.S. Government securities are valued by either independent pricing services, the last traded fill price, or at the reported bid price at the close of business.
Debt securities with a maturity of greater than 60 days at acquisition are valued at prices that reflect broker-dealer supplied valuations or are obtained from independent pricing services, which may consider the trade activity, treasury spreads, yields or price of bonds of comparable quality, coupon, maturity, and type, as well as prices quoted by dealers who make markets in such securities. Short-term debt securities with a maturity of 60 days or less at acquisition are valued at amortized cost, provided such amount approximates market value. Money market funds are valued at their NAV.
Repurchase agreements are valued at amortized cost, provided such amounts approximate market value.
Typically, loans are valued using information provided by an independent third party pricing service which uses broker quotes. If the pricing service cannot or does not provide a valuation for a particular investment or such valuation is deemed unreliable, such investment is fair valued by the Valuation Committee.
Listed options are valued at the Official Settlement Price listed by the exchange, usually as of 4:00 p.m. Long options are valued using the bid price and short options are valued using the ask price. In the event that a settlement price is not available, fair valuation is enacted. Over-the-counter (“OTC”) options are valued using the average bid price (for long options) or average ask price (for short options) obtained from one or more security dealers.
The value of interest rate swap agreements entered into by a Fund is accounted for using the unrealized gain or loss on the agreements that is determined using the spread priced off the previous day’s Chicago Mercantile Exchange (“CME”) price.
Investments for which market quotations are not readily available are fair-valued as determined in good faith by GI, subject to review and approval by the Valuation Committee, pursuant to methods established or ratified by the Board. Valuations in accordance with these methods are intended to reflect each security’s (or asset’s or liability’s) “fair value”. Each such determination is based on a consideration of all relevant factors, which are likely to vary from one pricing context
| 68 | THE GUGGENHEIM FUNDS SEMI-ANNUAL REPORT | |
| NOTES TO FINANCIAL STATEMENTS (Unaudited)(continued) |
to another. Examples of such factors may include, but are not limited to market prices; sale prices; broker quotes; and models which derive prices based on inputs such as prices of securities with comparable maturities and characteristics, or based on inputs such as anticipated cash flows or collateral, spread over Treasuries, and other information analysis.
In connection with futures contracts and other derivative investments, such factors may include obtaining information as to how (a) these contracts and other derivative investments trade in the futures or other derivative markets, respectively, and (b) the securities underlying these contracts and other derivative investments trade in the cash market.
(b) U.S. Government and Agency Obligations
Certain U.S. Government and Agency Obligations are traded on a discount basis; the interest rates shown on the Schedule of Investments reflect the effective rates paid at the time of purchase by the Fund. Other securities bear interest at the rates shown, payable at fixed dates through maturity.
(c) Senior Loans
Senior loans in which the Fund invests generally pay interest rates which are periodically adjusted by reference to a base short-term floating rate, plus a premium. These base lending rates are generally (i) the lending rate offered by one or more major European banks, such as the one-month or three-month London Inter-Bank Offered Rate (“LIBOR”), (ii) the prime rate offered by one or more major United States banks, or (iii) the bank’s certificate of deposit rate. Senior floating rate interests often require prepayments from excess cash flows or permit the borrower to repay at its election. The rate at which the borrower repays cannot be predicted with accuracy. As a result, the actual remaining maturity may be substantially less than the stated maturities shown. The interest rate indicated is the rate in effect at March 29, 2018.
(d) Interests in Securities
The Fund may purchase and sell interests in securities on a when-issued and delayed delivery basis, with payment and delivery scheduled for a future date. No income accrues to the Fund on such interests or securities in connection with such transactions prior to the date the Fund actually take delivery of such interests or securities. These transactions are subject to market fluctuations and are subject to the risk that the value at delivery may be more or less than the trade date purchase price. Although the Fund will generally purchase these securities with the intention of acquiring such securities, they may sell such securities before the settlement date.
(e) Options
Upon the purchase of an option, the premium paid is recorded as an investment, the value of which is marked-to-market daily. If a purchased option expires, the Fund realizes a loss in the amount of the cost of the option. When the Fund enters into a closing sale transaction, it realizes a gain or loss depending on whether the proceeds from the closing sale transaction are greater
| | THE GUGGENHEIM FUNDS SEMI-ANNUAL REPORT | 69 |
| NOTES TO FINANCIAL STATEMENTS (Unaudited)(continued) |
or less than the cost of the option. If the Fund exercises a put option, it realizes a gain or loss from the sale of the underlying security and the proceeds from such sale will be decreased by the premium originally paid. When the Fund exercises a call option, the cost of the security purchased by the Fund upon exercise increases by the premium originally paid.
When the Fund writes (sells) an option, an amount equal to the premium received is entered in that Fund’s accounting records as an asset and equivalent liability. The amount of the liability is subsequently marked-to-market to reflect the current value of the option written. When a written option expires, or if the Fund enters into a closing purchase transaction, it realizes a gain (or loss if the cost of a closing purchase transaction exceeds the premium received when the option was sold).
(f) Swap Agreements
Swap agreements are marked-to-market daily and the change, if any, is recorded as unrealized gain or loss. Upfront payments received or made by a Fund on swap agreements are amortized over the expected life of the agreement. Periodic payments received or paid by a Fund are recorded as realized gains or losses. Payments received or made as a result of a credit event or termination of the contract are recognized, net of a proportional amount of the upfront payment, as realized gains or losses.
(g) Forward foreign currency exchange contracts
Forward foreign currency exchange contracts are valued daily based on the applicable exchange rate of the underlying currency. The change in value of the contract is recorded as unrealized appreciation or depreciation until the contract is closed. When the contract is closed, the Fund record a realized gain or loss equal to the difference between the value at the time the contract was opened and the value at the time it was closed.
(h) Currency Translations
The accounting records of the Fund are maintained in U.S. dollars. All assets and liabilities initially expressed in foreign currencies are converted into U.S. dollars at prevailing exchange rates. Purchases and sales of investment securities, dividend and interest income, and certain expenses are translated at the rates of exchange prevailing on the respective dates of such transactions. Changes in the relationship of these foreign currencies to the U.S. dollar can significantly affect the value of the investments and earnings of the Fund. Foreign investments may also subject the Fund to foreign government exchange restrictions, expropriation, taxation, or other political, social or economic developments, all of which could affect the market and/or credit risk of the investments.
The Fund does not isolate that portion of the results of operations resulting from changes in the foreign exchange rates on investments from the fluctuations arising from changes in the market prices of securities held. Such fluctuations are included with the net realized and unrealized gain or loss on investments.
| 70 | THE GUGGENHEIM FUNDS SEMI-ANNUAL REPORT | |
| NOTES TO FINANCIAL STATEMENTS (Unaudited)(continued) |
Reported net realized foreign exchange gains and losses arise from sales of foreign currencies and currency gains or losses realized between the trade and settlement dates on investment transactions. Net unrealized exchange gains and losses arise from changes in the fair values of assets and liabilities other than investments in securities at the fiscal period end, resulting from changes in exchange rates.
(i) Security Transactions
Security transactions are recorded on the trade date for financial reporting purposes. Realized gains and losses from securities transactions are recorded using the identified cost basis. Proceeds from lawsuits related to investment holdings are recorded as realized gains in the Fund. Dividend income is recorded on the ex-dividend date, net of applicable taxes withheld by foreign countries. Taxable non-cash dividends are recorded as dividend income. Interest income, including amortization of premiums and accretion of discounts, is accrued on a daily basis. Interest income, including amortization of premiums and accretion of discounts, is accrued on a daily basis. Interest income also includes paydown gains and losses on mortgage-backed and asset-backed securities and senior and subordinated loans. Amendment fees are earned as compensation for evaluating and accepting changes to the original loan agreement and are recognized when received. Dividend income from Real Estate Investment Trusts (“REITs”) is recorded based on the income included in the distributions received from the REIT investments using published REIT classifications, including some management estimates when actual amounts are not available. Distributions received in excess of this estimated amount are recorded as a reduction of the cost of investments or reclassified to capital gains. The actual amounts of income, return of capital, and capital gains are only determined by each REIT after its fiscal year-end, and may differ from the estimated amounts.
Income from residual collateralized loan obligations is recognized using the effective interest method. At the time of purchase, management estimates the future expected cash flows and determines the effective yield and estimated maturity date based on the estimated cash flows. Subsequent to the purchase, the estimated cash flows are updated periodically and a revised yield is calculated prospectively. Cash flows received in excess of the effective yield are reflected as a return of capital.
(j) Distributions
The Fund declares dividends from investment income daily. The Fund pays its shareholders from its net investment income monthly and distributes any net capital gains that it has realized, at least annually. Distributions to shareholders are recorded on the ex-dividend date. Dividends are reinvested in additional shares unless shareholders request payment in cash. The character of distributions made during the year from net investment income or net realized gains may differ from their ultimate characterization for federal income tax purposes.
| | THE GUGGENHEIM FUNDS SEMI-ANNUAL REPORT | 71 |
| NOTES TO FINANCIAL STATEMENTS (Unaudited)(continued) |
(k) Class Allocations
Interest and dividend income, most expenses, all realized gains and losses, and all unrealized gains and losses are allocated to the classes based upon the value of the outstanding shares in each Class. Certain costs, such as distribution and service fees are charged directly to specific classes. In addition, certain expenses have been allocated to the individual Funds in the Trust on a pro rata basis upon the respective aggregate net assets of each Fund included in the Trust.
(l) Earnings Credits
Under the fee arrangement with the custodian, the Fund may earn credits based on overnight custody cash balances. These credits are utilized to reduce related custodial expenses. The custodian fees disclosed in the Statement of Operations are before the reduction in expense from the related earnings credits, if any. For the period ended March 29, 2018, there were no earnings credits received.
(m) Cash
The Fund may leave cash overnight in its cash account with the custodian. Periodically, the Fund may have cash due to the custodian bank as an overdraft balance. A fee is incurred on this overdraft, calculated by multiplying the overdraft by a rate based on the federal funds rate, which was 1.68% at March 29, 2018.
(n) Indemnifications
Under the Fund’s organizational documents, its Trustees and Officers are indemnified against certain liabilities arising out of the performance of their duties to the Trust. In addition, throughout the normal course of business, the Fund enters into contracts that contain a variety of representations and warranties which provide general indemnifications. The Fund’s maximum exposure under these arrangements is unknown, as this would involve future claims that may be made against the Fund and/or its affiliates that have not yet occurred. However, based on experience, the Fund expects the risk of loss to be remote.
Note 2 – Financial Instruments and Derivatives
As part of its investment strategy, the Fund utilizes a variety of derivative instruments. These investments involve, to varying degrees, elements of market risk and risks in excess of the amounts recognized in the Statement of Assets and Liabilities. Valuation and accounting treatment of these instruments can be found under Significant Accounting Policies in Note 1 of these Notes to Financial Statements.
Derivatives
Derivatives are instruments whose values depend on, or are derived from, in whole or in part, the value of one or more other assets, such as securities, currencies, commodities or indices. Derivative instruments may be used to increase investment flexibility (including to maintain cash reserves while maintaining exposure to certain other assets), for risk management (hedging)
| 72 | THE GUGGENHEIM FUNDS SEMI-ANNUAL REPORT | |
| NOTES TO FINANCIAL STATEMENTS (Unaudited)(continued) |
purposes, to facilitate trading, to reduce transaction costs and to pursue higher investment returns. Derivative instruments may also be used to mitigate certain investment risks, such as foreign currency exchange rate risk, interest rate risk and credit risk. U.S. GAAP requires disclosures to enable investors to better understand how and why a Fund uses derivative instruments, how these derivative instruments are accounted for and their effects on the Fund’s financial position and results of operations.
The Fund may utilize derivatives for the following purposes:
Duration: the use of an instrument to manage the interest rate risk of a portfolio.
Hedge: an investment made in order to reduce the risk of adverse price movements in a security, by taking an offsetting position to protect against broad market moves.
Income: the use of any instrument that distributes cash flows typically based upon some rate of interest.
Options Purchased and Written
A call option on a security gives the purchaser of the option the right to buy, and the writer of a call option the obligation to sell, the underlying security. The purchaser of a put option has the right to sell, and the writer of the put option the obligation to buy, the underlying security at any time during the option period. The risk associated with purchasing options is limited to the premium originally paid.
The risk in writing a call option is that a Fund may incur a loss if the market price of the underlying security increases and the option is exercised. The risk in writing a put option is that a Fund may incur a loss if the market price of the underlying security decreases and the option is exercised. In addition, there may be an imperfect correlation between the movement in prices of options and the underlying securities where a Fund may not be able to enter into a closing transaction because of an illiquid secondary market; or, for OTC options, a Fund may be at risk because of the counterparty’s inability to perform.
The following table represents the Fund’s use and volume of call/put options purchased on a quarterly basis for the period ended March 29,2018:
| Use | | Average Notional Amount | |
| Duration, Hedge | | | 311,861,224 | |
Swaps
A swap is an agreement that obligates two parties to exchange a series of cash flows at specified intervals based upon or calculated by reference to changes in specified prices or rates for a specified amount of an underlying asset. A Fund utilizing OTC swaps bears the risk of loss of the amount expected to be received under a swap agreement in the event of the default or
| | THE GUGGENHEIM FUNDS SEMI-ANNUAL REPORT | 73 |
| NOTES TO FINANCIAL STATEMENTS (Unaudited)(continued) |
bankruptcy of a swap agreement counterparty or if the underlying asset declines in value. Certain standardized swaps are subject to mandatory central clearing and are executed on a multi-lateral or other trade facility platform, such as a registered exchange. There is limited counterparty credit risk with respect to centrally-cleared swaps as the transaction is facilitated through a central clearinghouse, much like an exchange-traded futures contract. Upon entering into a centrally cleared swap transaction, the Fund is required to deposit with its clearing broker an amount of cash or securities as an initial margin. Subsequent variation margin payments or receipts are made or received by the Fund, depending on fluctuations in the fair value of the reference entity. For Funds utilizing interest rate swaps, the exchange bears the risk of loss. Additionally, there is no guarantee that a Fund or an underlying fund could eliminate its exposure under an outstanding swap agreement by entering into an offsetting swap agreement with the same or another party.
Interest rate swaps involve the exchange by the Fund with another party for its respective commitment to pay or receive a fixed or variable interest rate on a notional amount of principal. Interest rate swaps are generally centrally-cleared. Central clearing generally reduces counterparty credit risk and increases liquidity, but central clearing does not make interest rate swap transactions risk free.
The following table represents the Fund’s use and volume of interest rate swaps on a quarterly basis for the period ended March 29, 2018 :
| | | Average Notional Amount | |
| Use | | Long | | | Short | |
| Duration, Hedge | | $ | — | | | $ | 2,425,560 | |
Forward Foreign Currency Exchange Contracts
A forward foreign currency exchange contract is an agreement between two parties to exchange two designated currencies at a specific time in the future. Certain types of contracts may be cash settled, in an amount equal to the change in exchange rates during the term of the contract. The contracts can be used to hedge or manage exposure to foreign currency risks with portfolio investments or to gain exposure to foreign currencies.
The market value of a forward foreign currency exchange contract changes with fluctuations in foreign currency exchange rates. Furthermore, the Fund may be exposed to risk if the counterparties cannot meet the contract terms or if the currency value changes unfavorably as compared to the U.S. dollar.
| 74 | THE GUGGENHEIM FUNDS SEMI-ANNUAL REPORT | |
| NOTES TO FINANCIAL STATEMENTS (Unaudited)(continued) |
The following table represents the Fund’s use, and volume of forward foreign currency exchange contracts on a quarterly basis for the period ended March 29,2018:
| | | Average Value | |
| Use | | Purchased | | | Sold | |
| Hedge, Income | | $ | 206,419,872 | | | $ | 22,557,410 | |
Derivative Investment Holdings Categorized by Risk Exposure
The following is a summary of the location of derivative investments on the Fund’s Statement of Assets and Liabilities as of March 29, 2018:
| Derivative Investment Type | Asset Derivatives | Liability Derivatives |
| Currency contracts | Unrealized appreciation on forward foreign currency exchange contracts | Unrealized depreciation on forward foreign currency exchange contracts |
| Interest Rate contracts | | Variation margin on swap agreements |
| Equity Contracts | Investments in unaffiliated issuers, at value | |
The following table sets forth the fair value of the Fund’s derivative investments categorized by primary risk exposure at March 29, 2018:
| Asset Derivative Investments Value |
| | Swaps
Interest
Rate
Contracts* | | | Options
Purchased
Equity
Contracts | | | Forward
Foreign
Currency
Exchange
Contracts | | | Total Value at
March 29,
2018 | |
| | $ | 62,919,354 | | | $ | 10,269,137 | | | $ | 4,705,198 | | | $ | 77,893,689 | |
| Liability Derivative Investments Value |
| | | | | | | | Forward
Foreign
Currency
Exchange
Contracts | | | Total Value at
March 29,
2018 | |
| | | | | | | | | | $ | 501,516 | | | $ | 501,516 | |
| * | Includes cumulative appreciation (depreciation) of swap agreements as reported on the Schedule of Investments. Only current days variation margin is reported within the Statement of Assets and Liabilities. |
| | THE GUGGENHEIM FUNDS SEMI-ANNUAL REPORT | 75 |
| NOTES TO FINANCIAL STATEMENTS (Unaudited)(continued) |
The following is a summary of the location of derivative investments on the Fund’s Statement of Operations for the period ended March 29, 2018:
| Derivative Investment Type | Location of Gain (Loss) on Derivatives |
| Currency contracts | Net realized gain (loss) on forward foreign currency exchange contracts |
| | Net change in unrealized appreciation (depreciation) on forward foreign currency exchange contracts |
| Equity/Interest Rate contracts | Net realized gain (loss) on options purchased |
| | Net realized gain (loss) on options written |
| | Net change in unrealized appreciation (depreciation) on options purchased |
| | Net change in unrealized appreciation (depreciation) on options written |
| | Net realized gain (loss) on swap agreements |
| | Net change in unrealized appreciation (depreciation) on swap agreements |
The following is a summary of the Fund’s realized gain (loss) and change in unrealized appreciation (depreciation) on derivative investments recognized on the Statement of Operations categorized by primary risk exposure for the period ended March 29, 2018:
| Realized Gain (Loss) on Derivative Investments Recognized on the Statement of Operations |
| | Swaps
Interest Rate
Risk | | | Options
Written
Interest Rate
Contracts | | | Options
Purchased
Interest Rate
Contracts | | | Forward
Foreign
Currency
Exchange
Contracts | | | Total | |
| | $ | 7,272,968 | | | $ | 3,633,552 | | | $ | (759,886 | ) | | $ | (12,592,196 | ) | | $ | (2,445,562 | ) |
| Change in Unrealized Appreciation (Depreciation) on Derivative Investments Recognized on the Statement of Operations |
Swaps
Interest Rate
Risk | | | Options
Written
Interest Rate
Contracts | | | Options
Purchased
Interest Rate
Contracts | | | Options
Purchased
Equity
Contracts | | | Forward
Foreign
Currency
Exchange
Contracts | | | Total | |
| $ | 53,611,340 | | | $ | (3,456,921 | ) | | $ | (44,084 | ) | | $ | (6,098,978 | ) | | $ | 6,306,173 | | | $ | 50,317,530 | |
In conjunction with the use of derivative instruments, the Fund is required to maintain collateral in various forms. The Fund uses, where appropriate, depending on the financial instrument utilized and the broker involved, margin deposits at the broker, cash and/or securities segregated at the custodian bank, discount notes or repurchase agreements allocated to the Fund.
| 76 | THE GUGGENHEIM FUNDS SEMI-ANNUAL REPORT | |
| NOTES TO FINANCIAL STATEMENTS (Unaudited)(continued) |
The Trust has established counterparty credit guidelines and enters into transactions only with financial institutions of investment grade or better. The Trust monitors the counterparty credit risk.
Note 3 – Offsetting
In the normal course of business, the Fund enters into transactions subject to enforceable master netting arrangements or other similar arrangements. Generally, the right to offset in those agreements allows the Fund to counteract the exposure to a specific counterparty with collateral received from or delivered to that counterparty based on the terms of the arrangements. These arrangements provide for the right to liquidate upon the occurrence of an event of default, credit event upon merger or additional termination event.
In order to better define their contractual rights and to secure rights that will help the Fund mitigate its counterparty risk, the Fund may enter into an International Swaps and Derivatives Association, Inc. Master Agreement (“ISDA Master Agreement”) or similar agreement with its derivative contract counterparties. An ISDA Master Agreement is a bilateral agreement between a fund and a counterparty that governs OTC derivatives, including foreign exchange contracts, and typically contains, among other things, collateral posting terms and netting provisions in the event of a default and/or termination event. The provisions of the ISDA Master Agreement typically permit a single net payment in the event of a default (close-out netting) or similar event, including the bankruptcy or insolvency of the counterparty.
For derivatives traded under an ISDA Master Agreement, the collateral requirements are typically calculated by netting the mark-to-market amount for each transaction under such agreement and comparing that amount to the value of any collateral currently pledged by the Fund and the counterparty. For financial reporting purposes, cash collateral that has been pledged to cover obligations of the Fund and cash collateral received from the counterparty, if any, are reported separately on the Statement of Assets and Liabilities as segregated cash with broker/receivable for variation margin, or payable for swap settlement/variation margin. Cash and/or securities pledged or received as collateral by the Funds in connection with an OTC derivative subject to an ISDA Master Agreement generally may not be invested, sold or rehypotheticated by the counterparty or the Funds, as applicable, absent an event of default under such agreement, in which case such collateral generally may be applied towards obligations due to and payable by such counterparty or the Funds, as applicable. Generally, the amount of collateral due from or to a counterparty must exceed a minimum transfer amount threshold (e.g., $300,000) before a transfer is required to be made. To the extent amounts due to the Fund from its counterparties are not fully collateralized, contractually or otherwise, the Fund bears the risk of loss from counterparty nonperformance. The Fund attempts to mitigate counterparty risk by only entering into agreements with counterparties that they believe to be of good standing and by monitoring the financial stability of those counterparties.
For financial reporting purposes, the Fund does not offset derivative assets and derivative liabilities that are subject to netting arrangements in the Statement of Assets and Liabilities.
| | THE GUGGENHEIM FUNDS SEMI-ANNUAL REPORT | 77 |
| NOTES TO FINANCIAL STATEMENTS (Unaudited)(continued) |
The following tables present derivative financial instruments and secured financing transactions that are subject to enforceable netting arrangements and offset in the Statement of Assets and Liabilities in conformity with U.S. GAAP:
| | | | | | | | | | | | Gross Amounts Not Offset
in the Statements of
Assets and Liabilities | | | | |
| Instrument | | Gross
Amounts of
Recognized
Assets1 | | | Gross
Amounts
Offset in the
Statements
of Assets and
Liabilities | | | Net Amount
of Assets
Presented
on the
Statements
of Assets and
Liabilities | | | Financial
Instruments | | | Cash
Collateral
Received | | | Net
Amount | |
| Options equity contracts | | $ | 10,269,137 | | | $ | — | | | $ | 10,269,137 | | | $ | — | | | $ | — | | | $ | 10,269,137 | |
| Forward foreign currency exchange contracts | | | 4,705,198 | | | | — | | | | 4,705,198 | | | | (501,516 | ) | | | (614,306 | ) | | | 3,589,376 | |
| | | | | | | | | | | | Gross Amounts Not Offset
in the Statements of
Assets and Liabilities | | | | |
| Instrument | | Gross
Amounts of
Recognized
Liabilities | | | Gross
Amounts
Offset in the
Statements
of Assets and
Liabilities | | | Net Amount
of Liabilities
Presented
on the
Statements
of Assets and
Liabilities | | | Financial
Instruments | | | Cash
Collateral
Pledged | | | Net
Amount | |
| Forward foreign currency exchange contracts | | $ | 501,516 | | | $ | — | | | $ | 501,516 | | | $ | (501,516 | ) | | $ | — | | | $ | — | |
| 1 | Exchanged traded and centrally cleared derivatives are excluded from these reported amounts. |
The centrally cleared swaps held in the fund are not subject to netting agreements.
| 78 | THE GUGGENHEIM FUNDS SEMI-ANNUAL REPORT | |
| NOTES TO FINANCIAL STATEMENTS (Unaudited)(continued) |
The following table presents deposits held by others in connection with derivative investments as of March 29, 2018. The derivatives tables following the Schedule of Investments list each counterparty for which cash collateral may have been pledged or received at period end. The Fund has the right to offset these deposits against any related liabilities outstanding with each counterparty.
| Counterparty | | Asset Type | | Cash Pledged | | | Cash Received | |
| Deutsche Bank | | Forward foreign currency contracts | | $ | — | | | $ | 270,000 | |
| Morgan Stanley | | Forward foreign currency contracts | | | — | | | | 10,000 | |
| Goldman Sachs Group | | Forward foreign currency contracts | | | — | | | | 410,000 | |
| BofA Merrill Lynch | | Interest rate swap agreements and options | | | 42,345,000 | | | | 26,363,171 | |
| Citigroup | | Forward foreign currency contracts | | | — | | | | 1,480,770 | |
| JPMorgan Chase & Co. | | Forward foreign currency contracts | | | 370,000 | | | | — | |
| Total | | | | $ | 42,715,000 | | | $ | 28,533,941 | |
Note 4 – Fair Value Measurement
In accordance with U.S. GAAP, fair value is defined as the price that the Fund would receive to sell an investment or pay to transfer a liability in an orderly transaction with an independent buyer in the principal market, or in the absence of a principal market, the most advantageous market for the investment or liability. U.S. GAAP establishes a three-tier fair value hierarchy based on the types of inputs used to value assets and liabilities and requires corresponding disclosure. The hierarchy and the corresponding inputs are summarized below:
| Level 1 — | quoted prices in active markets for identical assets or liabilities. |
| Level 2 — | significant other observable inputs (for example quoted prices for securities that are similar based on characteristics such as interest rates, prepayment speeds, credit risk, etc.). |
| Level 3 — | significant unobservable inputs based on the best information available under the circumstances, to the extent observable inputs are not available, which may include assumptions. |
The types of inputs available depend on a variety of factors, such as the type of security and the characteristics of the markets in which it trades, if any. Fair valuation determinations that rely on fewer or no observable inputs require greater judgment. Accordingly, fair value determinations for Level 3 securities require the greatest amount of judgment.
Independent pricing services are used to value a majority of the Fund’s investments. When values are not available from a pricing service, they may be determined using a variety of sources and techniques, including: market prices; broker quotes; and models which derive prices based on inputs such as prices of securities with comparable maturities and characteristics or based on inputs such as anticipated cash flows or collateral, spread over Treasuries, and other information
| | THE GUGGENHEIM FUNDS SEMI-ANNUAL REPORT | 79 |
| NOTES TO FINANCIAL STATEMENTS (Unaudited)(continued) |
and analysis. A significant portion of the Fund’s assets and liabilities are categorized as Level 2, as indicated in this report. Significant changes in an indicative quote would generally result in significant changes in the fair value of the security.
Indicative quotes from broker-dealers, adjusted for fluctuations in criteria such as credit spreads and interest rates, may be also used to value the Fund’s assets and liabilities, i.e. prices provided by a broker-dealer or other market participant who has not committed to trade at that price. Although indicative quotes are typically received from established market participants, the Fund may not have the transparency to view the underlying inputs which support the market quotations.
Certain fixed income securities are valued by obtaining a monthly indicative quote from a broker-dealer, adjusted for fluctuations in criteria such as credit spreads and interest rates. The Fund’s fair valuation guidelines categorize these securities as Level 3.
The inputs or methodologies used for valuing securities are not necessarily an indication of the risk associated with investing in those securities. The suitability of the techniques and sources employed to determine fair valuation are regularly monitored and subject to change.
Note 5 – Investment Advisory Agreement and Other Agreements
Under the terms of an investment advisory contract, the Fund pays GI investment advisory fees calculated at an annualized rate of 0.39% of the average daily net assets. Effective November 20, 2017, the advisory fee for the Fund was reduced from 0.50% to 0.39%. The advisory fee breakpoint of 5 basis points (0.05%) on average daily net assets above $5 billion for the Fund was removed as the breakpoint is no longer necessary or applicable in light of the aformentioned advisory fee reduction.
GI engages external service providers to perform other necessary services for the Trust, such as audit and accounting related services, legal services, custody, printing and mailing, etc., on a pass-through basis. Such expenses are allocated to various Funds within the complex based on relative net assets.
The Fund has adopted Distribution Plans related to the offering of A-Class, C-Class and P-Class shares pursuant to Rule 12b-1 under the 1940 Act. The plans provide for payments at an annual rate of 0.25% of the average daily net assets of the Fund’s A-Class and P-Class shares, and 1.00% of the average daily net assets of the Fund’s C-Class shares.
| 80 | THE GUGGENHEIM FUNDS SEMI-ANNUAL REPORT | |
| NOTES TO FINANCIAL STATEMENTS (Unaudited)(continued) |
The investment advisory contract for the Fund provides that the total expenses be limited to a percentage of average net assets for each class of shares, exclusive of brokerage costs, dividends on securities sold short, expenses of other investment companies in which a Fund invests, interest, taxes, litigation, indemnification and extraordinary expenses. The limits are listed below:
| | Limit | Effective
Date | Contract
End Date |
| Total Return Bond Fund - A-Class | 0.79% | 11/20/17 | 02/01/20 |
| Total Return Bond Fund - C-Class | 1.54% | 11/20/17 | 02/01/20 |
| Total Return Bond Fund -P-Class | 0.79% | 11/20/17 | 02/01/20 |
| Total Return Bond Fund - R6-Class | 0.50% | 10/19/16 | 02/01/20 |
| Total Return Bond Fund - Institutional Class | 0.50% | 11/30/12 | 02/01/20 |
Prior to November 20, 2017, the limits in effect were as follows:
| | Limit | Effective
Date | Contract
End Date |
| Total Return Bond Fund - A-Class | 0.90% | 11/30/12 | 02/01/19 |
| Total Return Bond Fund - C-Class | 1.65% | 11/30/12 | 02/01/19 |
| Total Return Bond Fund - P-Class | 0.90% | 05/01/15 | 02/01/19 |
| Total Return Bond Fund - R6-Class | 0.50% | 10/19/16 | 02/01/19 |
| Total Return Bond Fund - Institutional Class | 0.50% | 11/30/12 | 02/01/19 |
GI is entitled to reimbursement by the Fund for fees waived or expenses reimbursed during any of the previous 36 months, beginning on the date of the expense limitation agreement, if on any day the estimated operating expenses are less than the indicated percentages. For purposes of this arrangement, GI is entitled to recoupment of previously waived fees or reimbursed expenses for 36 months from the date of the waiver or reimbursement by GI. At March 29, 2018, the amount of fees waived or expenses reimbursed that are subject to recoupment are presented in the following table:
| Fund | | Expires
2018 | | | Expires
2019 | | | Expires
2020 | | | Expires
2021 | | | Total | |
| Total Return Bond Fund | | | | | | | | | | | | | | | |
| A-Class | | $ | 576,490 | | | $ | 886,912 | | | $ | 902,097 | | | $ | 383,594 | | | $ | 2,749,093 | |
| C-Class | | | 99,359 | | | | 201,092 | | | | 297,149 | | | | 99,756 | | | | 697,356 | |
| P-Class | | | — | | | | 66,723 | | | | 562,669 | | | | 261,550 | | | | 890,942 | |
| R6-Class | | | — | | | | — | | | | 4,225 | | | | 3,971 | | | | 8,196 | |
| Institutional Class | | | 1,646,773 | | | | 4,174,107 | | | | 6,941,687 | | | | 3,701,879 | | | | 16,464,446 | |
For the period ended March 29, 2018, GI recouped $33,002 from the Fund.
| | THE GUGGENHEIM FUNDS SEMI-ANNUAL REPORT | 81 |
| NOTES TO FINANCIAL STATEMENTS (Unaudited)(continued) |
If the Fund invests in an affiliated fund, the investing Fund’s adviser has agreed to waive fees at the investing fund level. Fee waivers will be calculated at the investing Fund level without regard to any expense cap, if any, in effect for the investing Fund. Fees waived under this arrangement are not subject to reimbursement to GI. For the period ended March 29, 2018, the Fund waived $358,459 related to investments in affiliated funds.
For the period ended March 29, 2018, GFD retained sales charges of $252,432 relating to sales of A-Class shares of the Trust.
Certain trustees and officers of the Trust are also officers of GI and/or GFD. The Trust does not compensate its officers or trustees who are officers, directors and/or employees of GI or GFD.
MUFG Investor Services (US), LLC (“MUIS”) acts as the Fund’s administrator, transfer agent and accounting agent. As administrator, transfer agent and accounting agent, MUIS is responsible for maintaining the books and records of the Fund’s securities and cash. The Bank of New York Mellon Corp. (“BNY”) acts as the Fund’s custodian. As custodian, BNY is responsible for the custody of the Fund’s assets. For providing the aforementioned administrative and accounting services, MUIS is entitled to receive a monthly fee equal to a percentage of the Fund’s average daily net assets and out of pocket expenses. For providing the aforementioned transfer agent and custodian services, MUIS and BNY are entitled to receive a monthly fee based on the number of transactions during the month and the number of accounts under management subject to certain minimum monthly fees and out of pocket expenses.
Note 6 – Federal Income Tax Information
The Fund intends to comply with the provisions of Subchapter M of the Internal Revenue Code applicable to regulated investment companies and will distribute substantially all taxable net investment income and capital gains sufficient to relieve the Fund from all, or substantially all, federal income, excise and state income taxes. Therefore, no provision for federal or state income tax is required.
Tax positions taken or expected to be taken in the course of preparing the Fund’s tax returns are evaluated to determine whether the tax positions are “more-likely-than-not” of being sustained by the applicable tax authority. Tax positions not deemed to meet the more-likely-than-not threshold would be recorded as a tax benefit or expense in the current year. Management has analyzed the Fund’s tax positions taken, or to be taken, on federal income tax returns for all open tax years, and has concluded that no provision for income tax is required in the Fund’s financial statements. The Fund’s federal tax returns are subject to examination by the Internal Revenue Service for a period of three years after they are filed.
| 82 | THE GUGGENHEIM FUNDS SEMI-ANNUAL REPORT | |
| NOTES TO FINANCIAL STATEMENTS (Unaudited)(continued) |
At March 29, 2018, the cost of securities for federal income tax purposes, the aggregate gross unrealized gain for all securities for which there was an excess of value over tax cost, and the aggregate gross unrealized loss for all securities for which there was an excess of tax cost over value were as follows:
| | | Tax
Cost | | | Tax
Unrealized
Gain | | | Tax
Unrealized
Loss | | | Net
Unrealized
Gain | |
| | | $ | 9,779,381,253 | | | $ | 140,848,577 | | | $ | (101,086,065 | ) | | $ | 39,762,512 | |
Note 7 – Securities Transactions
For the period ended March 29, 2018, the cost of purchases and proceeds from sales of investment securities, excluding government securities, short-term investments and derivatives, were as follows:
| | | Purchases | | | Sales | |
| | | $ | 3,698,335,148 | | | $ | 2,150,267,180 | |
For the period ended March 29, 2018, the cost of purchases and proceeds from sales of government securities were as follows:
| | | Purchases | | | Sales | |
| | | $ | 414,963,575 | | | $ | 117,811,485 | |
The Fund is permitted to purchase or sell securities from or to certain affiliated funds under specified conditions outlined in procedures adopted by the Board of the Trust. The procedures have been designed to ensure that any purchase or sale of securities by a Fund from or to another fund or portfolio that is or could be considered an affiliate by virtue of having a common investment adviser (or affiliated investment advisers), common Trustees and/or common officers complies with Rule 17a-7 of the 1940 Act. Further, as defined under these procedures, each transaction is effected at the current market price to save costs, where permissible. For the period ended March 29, 2018, the Fund engaged in purchases and sales of securities, pursuant to Rule 17a-7 of the 1940 Act, as follows:
| | Purchases | | | Sales | | | Realized
Gain | |
| | $ | 6,368,820 | | | $ | 2,082,611 | | | $ | 43,313 | |
Note 8 –Loan Commitments
Pursuant to the terms of certain loan agreements, the Fund held unfunded loan commitments as of March 29, 2018. The Fund is obligated to fund these loan commitments at the borrower’s discretion.
| | THE GUGGENHEIM FUNDS SEMI-ANNUAL REPORT | 83 |
| NOTES TO FINANCIAL STATEMENTS (Unaudited)(continued) |
The unfunded loan commitments as of March 29, 2018, were as follows:
| Borrower | | Maturity
Date | | Face
Amount | | | Value | |
| Acosta, Inc. | | 09/26/19 | | $ | 1,124,444 | | | $ | 184,780 | |
Note 9 – Restricted Securities
The securities below are considered illiquid and restricted under guidelines established by the Board:
Restricted
Securities | | Acquisition
Date | | Cost | | | Value | |
| Airplanes Pass Through Trust | | | | | | | | |
| 2001-1A, 2.33% (1 Month USD LIBOR + 0.55%) due 03/15/191,4 | | 11/30/11 | | $ | 335,966 | | | $ | 18,432 | |
| Capmark Military Housing Trust | | | | | | | | | | |
| 2007-ROBS, 6.06% due 10/10/52 | | 04/23/15 | | | 4,685,428 | | | | 4,885,203 | |
| Capmark Military Housing Trust | | | | | | | | | | |
| 2006-RILY, 2.11% (1 Month USD LIBOR + 0.37%) due 07/10/51†††,1 | | 10/11/16 | | | 4,284,042 | | | | 4,895,208 | |
| Capmark Military Housing Trust | | | | | | | | | | |
| 2007-AETC, 5.75% due 02/10/52 | | 09/18/14 | | | 8,225,685 | | | | 8,083,118 | |
| Capmark Military Housing Trust | | | | | | | | | | |
| 2008-AMCW, 6.90% due 07/10/55††† | | 05/20/16 | | | 10,701,468 | | | | 10,433,457 | |
| Capmark Military Housing Trust | | | | | | | | | | |
| 2007-AET2, 6.06% due 10/10/52 | | 10/16/15 | | | 2,141,207 | | | | 2,222,094 | |
| Central Storage Safety Project Trust | | | | | | | | | | |
| 4.82% due 02/01/38 | | 02/02/18 | | | 21,258,832 | | | | 21,267,926 | |
| Copper River CLO Ltd. | | | | | | | | | | |
| 2007-1A, due 01/20/212 | | 05/09/14 | | | 818,434 | | | | 190,950 | |
| Customers Bank | | | | | | | | | | |
| 6.13% due 06/26/293 | | 06/24/14 | | | 2,000,000 | | | | 2,076,378 | |
| Fort Benning Family Communities LLC | | | | | | | | | | |
| 2.13% (1 Month USD LIBOR + 0.35%) due 01/15/36†††,1 | | 03/27/15 | | | 4,821,403 | | | | 4,894,085 | |
| Fort Eustis/Fort Story Housing LLC | | | | | | | | | | |
| 5.51% due 12/15/40 | | 12/18/17 | | | 2,289,364 | | | | 2,207,071 | |
| Fort Knox Military Housing Privatization Project | | | | | | | | | | |
| 2.12% (1 Month USD LIBOR + 0.34%) due 02/15/52†††,1 | | 04/09/15 | | | 1,118,605 | | | | 1,138,715 | |
| Fort Knox Military Housing Privatization Project | | | | | | | | | | |
| 5.82% due 02/15/52 | | 04/09/15 | | | 1,947,745 | | | | 1,996,022 | |
| GMAC Commercial Mortgage Asset Corp. | | | | | | | | | | |
| 2005-DRUM, 5.47% due 05/10/50††† | | 05/20/16 | | | 4,978,653 | | | | 4,974,988 | |
| GMAC Commercial Mortgage Asset Corp. | | | | | | | | | | |
| 2005-BLIS, 5.25% due 07/10/50††† | | 05/20/16 | | | 2,593,170 | | | | 2,443,732 | |
| 84 | THE GUGGENHEIM FUNDS SEMI-ANNUAL REPORT | |
| NOTES TO FINANCIAL STATEMENTS (Unaudited)(continued) |
Restricted
Securities | | Acquisition
Date | | Cost | | | Value | |
| Highland Park CDO I Ltd. | | | | | | | | |
| 2006-1A, 2.34% (1 Month USD LIBOR + 0.40%) due 11/25/511 | | 04/14/15 | | $ | 2,688,521 | | | $ | 2,762,283 | |
| HP Communities LLC | | | | | | | | | | |
| 5.78% due 03/15/46 | | 08/23/16 | | | 2,542,719 | | | | 2,308,123 | |
| HP Communities LLC | | | | | | | | | | |
| 5.62% due 09/15/32 | | 06/09/14 | | | 1,009,721 | | | | 1,061,702 | |
| HP Communities LLC | | | | | | | | | | |
| 5.86% due 09/15/53 | | 10/06/16 | | | 1,614,184 | | | | 1,518,726 | |
| Mid-Atlantic Military Family Communities LLC | | | | | | | | | | |
| 5.30% due 08/01/50 | | 10/07/16 | | | 17,826,554 | | | | 18,708,343 | |
| Offutt AFB America First Community LLC | | | | | | | | | | |
| 5.46% due 09/01/50 | | 02/21/17 | | | 6,355,045 | | | | 6,720,879 | |
| Pacific Beacon LLC | | | | | | | | | | |
| 5.51% due 07/15/36 | | 08/23/17 | | | 584,541 | | | | 552,832 | |
| Pacific Northwest Communities LLC | | | | | | | | | | |
| 5.91% due 06/15/50 | | 05/22/14 | | | 1,000,000 | | | | 1,060,691 | |
| Princess Juliana International Airport Operating Company N.V. | | | | | | | | | | |
| 5.50% due 12/20/27 | | 12/17/12 | | | 2,390,603 | | | | 2,231,048 | |
| Schahin II Finance Co. SPV Ltd. | | | | | | | | | | |
| 5.88% due 09/25/224 | | 03/21/12 | | | 777,505 | | | | 95,770 | |
| Turbine Engines Securitization Ltd. | | | | | | | | | | |
| 2013-1A, 5.13% due 12/13/48 | | 11/27/13 | | | 819,067 | | | | 830,110 | |
| | | | | $ | 109,808,462 | | | $ | 109,577,886 | |
| ††† | Value determined based on Level 3 inputs. |
| 1 | Variable rate security. Rate indicated is the rate effective at March 29, 2018. In some instances, the underlying reference rate shown was below the minimum rate earned by the security or has been adjusted by a predetermined factor. The settlement status of a position may also impact the effective rate indicated. In instances where multiple underlying reference rates and spread amounts are shown, the effective rate is based on a weighted average. |
| 2 | Security has no stated coupon. However, it is expected to receive residual cash flow payments on defined deal dates. |
| 3 | Security has a fixed rate coupon which will convert to a floating or variable rate coupon on a future date. |
| 4 | Security is in default of interest and/or principal obligations. |
Note 10 – Line of Credit
The Trust, with the exception of certain affiliated funds, secured a 364-day committed, $1,000,000,000 line of credit from Citibank, N.A., which was in place through October 6, 2017, at which time the line of credit was renewed, with an increased commitment amount to $1,065,000,000. A Fund may draw (borrow) from the line of credit as a temporary measure for emergency purposes, to facilitate redemption requests, or for other short-term liquidity purposes consistent with the Fund’s investment objective and program. For example, it may be advantageous for the Fund to borrow money rather than sell existing portfolio positions to meet
| | THE GUGGENHEIM FUNDS SEMI-ANNUAL REPORT | 85 |
| NOTES TO FINANCIAL STATEMENTS (Unaudited)(concluded) |
redemption requests. Fees related to borrowings, if any, vary under this arrangement between the greater of Citibank’s “base rate”, LIBOR plus 1%, or the federal funds rate (1.68% at March 29, 2018) plus 1/2 of 1%.The Funds that participate in the line of credit paid upfront costs of $982,952 to renew the line of credit.
The commitment fee that may be paid by the Fund is at an annualized rate of 0.15% of the average daily amount of their unused commitment amount. The Fund did not have any borrowings under this agreement as of and for the period ended March 29, 2018.
The allocated commitment fee amount for the Fund is referenced in the Statement of Operations under “Line of credit fees” and the effect on the expense ratio is included in the Financial Highlights.
| 86 | THE GUGGENHEIM FUNDS SEMI-ANNUAL REPORT | |
| OTHER INFORMATION (Unaudited) |
Proxy Voting Information
A description of the policies and procedures that the Trust uses to determine how to vote proxies relating to securities held in the Funds’ portfolios is available, without charge and upon request, by calling 800.820.0888. This information is also available from the EDGAR database on the SEC’s website at https://www.sec.gov.
Information regarding how the Funds voted proxies relating to portfolio securities during the most recent 12-month period ended June 30 is available without charge, upon request, by calling 800.820.0888. This information is also available from the EDGAR database on the SEC’s website at https://www.sec.gov.
Sector Classification
Information in the “Schedule of Investments” is categorized by sectors using sector-level Classifications defined by the Bloomberg Industry Classification System, a widely recognized industry classification system provider. Each Fund’s registration statement has investment policies relating to concentration in specific sectors/industries. For purposes of these investment policies, the Funds usually classify sectors/industries based on industry-level Classifications used by widely recognized industry classification system providers such as Bloomberg Industry Classification System, Global Industry Classification Standards and Barclays Global Classification Scheme.
Quarterly Portfolio Schedules Information
The Trust files its complete schedule of portfolio holdings with the SEC for the first and third quarters of each fiscal year on Form N-Q; which are available on the SEC’s website at https://www.sec.gov. The Funds’ Forms N-Q may be reviewed and copied at the SEC’s Public Reference Room in Washington, DC, and that information on the operation of the Public Reference Room may be obtained by calling 800-SEC-0330. Copies of the portfolio holdings are also available to shareholders, without charge and upon request, by calling 800.820.0888.
| | THE GUGGENHEIM FUNDS SEMI-ANNUAL REPORT | 87 |
| INFORMATION ON BOARD OF TRUSTEES AND OFFICERS (Unaudited) |
Name, Address*
and Year of Birth | Position(s)
Held with
the Trust | Term of Office
and Length of
Time Served** | Principal Occupation(s)
During Past Five Years | Number of
Portfolios
in Fund
Complex
Overseen | Other Directorships
Held by Trustees |
| INDEPENDENT TRUSTEES | | | |
Randall C. Barnes (1951) | Trustee | Since 2014 | Current: Private Investor (2001-present). Former: Senior Vice President and Treasurer, PepsiCo, Inc. (1993-1997); President, Pizza Hut International (1991-1993); Senior Vice President, Strategic Planning and New Business Development, PepsiCo, Inc. (1987-1990). | 51 | Current: Trustee, Purpose Investments Funds (2014-Present). |
Donald A. Chubb, Jr. (1946) | Trustee and Chairman of the Valuation Oversight Committee | Since 1994 | Current: Retired. Former: Business broker and manager of commercial real estate, Griffith & Blair, Inc. (1997-2017). | 48 | Former: Midland Care, Inc. (2011-2016). |
Jerry B. Farley (1946) | Trustee and Chair of the Audit Committee | Since 2005 | Current: President, Washburn University (1997-present). | 48 | Current: Westar Energy, Inc. (2004-present); CoreFirst Bank & Trust (2000-present). |
Roman Friedrich III (1946) | Trustee and Chairman of the Contracts Review Committee | Since 2014 | Current: Founder and Managing Partner, Roman Friedrich & Company (1998-present). Former: Senior Managing Director, MLV & Co. LLC (2010-2011). | 48 | Current: Zincore Metals, Inc. (2009-present). Former: Axiom Gold and Silver Corp. (2011-2012). |
| 88 | THE GUGGENHEIM FUNDS SEMI-ANNUAL REPORT | |
| INFORMATION ON BOARD OF TRUSTEES AND OFFICERS (Unaudited)(continued) |
Name, Address*
and Year of Birth | Position(s)
Held with
the Trust | Term of Office
and Length of
Time Served** | Principal Occupation(s)
During Past Five Years | Number of
Portfolios
in Fund
Complex
Overseen | Other Directorships
Held by Trustees |
| INDEPENDENT TRUSTEES - continued | | |
Ronald A. Nyberg (1953) | Trustee and Chairman of the Nominating and Governance Committee | Since 2014 | Current: Partner, Momkus McCluskey LLC (2016-present). Former: Partner, Nyberg & Cassioppi, LLC (2000-2016); Executive Vice President, General Counsel, and Corporate Secretary, Van Kampen Investments (1982-1999). | 51 | Current: PPM Fund Board (February 2018-present); Edward-Elmhurst Healthcare System (2012-present); Western Asset Inflation-Linked Opportunities & Income Fund (2004-present); Western Asset Inflation-Linked Income Fund (2003-present) |
Maynard F. Oliverius (1943) | Trustee | Since 1998 | Current: Retired. Former: President and CEO, Stormont-Vail HealthCare (1996-2012). | 48 | Current: Robert J. Dole Institute of Politics (2016-present); Stormont-Vail Foundation (2013-present); University of Minnesota MHA Alumni Philanthropy Committee (2009-present); Fort Hays State University Foundation (1999-present). Former: Topeka Community Foundation (2009-2014). |
| | THE GUGGENHEIM FUNDS SEMI-ANNUAL REPORT | 89 |
| INFORMATION ON BOARD OF TRUSTEES AND OFFICERS (Unaudited)(continued) |
Name, Address*
and Year of Birth | Position(s)
Held with
the Trust | Term of Office
and Length of
Time Served** | Principal Occupation(s)
During Past Five Years | Number of
Portfolios
in Fund
Complex
Overseen | Other Directorships
Held by Trustees |
| INDEPENDENT TRUSTEES - concluded | | |
Ronald E. Toupin, Jr. (1958) | Trustee and Chairman of the Board | Since 2014 | Current: Portfolio Consultant (2010-present); Member, Governing Council (2003-present) and Executive Committee (2016-present), Independent Directors Council. Former: Vice President, Manager and Portfolio Manager, Nuveen Asset Management (1998-1999); Vice President, Nuveen Investment Advisory Corp. (1992-1999); Vice President and Manager, Nuveen Unit Investment Trusts (1991-1999); and Assistant Vice President and Portfolio Manager, Nuveen Unit Investment Trusts (1988-1999), each of John Nuveen & Co., Inc. (1982-1999). | 48 | Current: Western Asset Inflation-Linked Opportunities & income Fund (2014-present); Western Asset Inflation-Linked Income Fund (2003-present). Former: Bennett Group of Funds (2011-2013). |
| 90 | THE GUGGENHEIM FUNDS SEMI-ANNUAL REPORT | |
| INFORMATION ON BOARD OF TRUSTEES AND OFFICERS (Unaudited)(continued) |
Name, Address*
and Year of Birth | Position(s)
Held with
the Trust | Term of Office
and Length of
Time Served** | Principal Occupation(s)
During Past Five Years | Number of
Portfolios
in Fund
Complex
Overseen | Other Directorships
Held by Trustees |
| INTERESTED TRUSTEE | | |
Amy J. Lee*** (1961) | Trustee, Vice President and Chief Legal Officer | Since February 2018 (Trustee) Since 2014 (Chief Legal Officer) Since 2007 (Vice President) | Current: Interested Trustee, certain other funds in the Fund Complex (February 2018-present); President, certain other funds in the Fund Complex (2017-present); Chief Legal Officer, certain other funds in the Fund Complex (2014-present); Vice President, certain other funds in the Fund Complex (2007-present); Senior Managing Director, Guggenheim Investments (2012-present). Former: President and Chief Executive Officer (2017-February 2018); Vice President, Associate General Counsel and Assistant Secretary, Security Benefit Life Insurance Company and Security Benefit Corporation (2004-2012). | 158 | None. |
| * | The business address of each Trustee is c/o Guggenheim Investments, 227 West Monroe Street, Chicago, Illinois 60606. |
| ** | Each Trustee serves an indefinite term, until his or her successor is elected and qualified. Time served includes time served in the respective position for the Predecessor Corporation. |
| *** | Trustee is an “Interested person” (as defined in section 2(a) of the 1940 Act)(“Interested Trustee”) of the Trust because of her affiliation with Guggenheim Investments. |
| | THE GUGGENHEIM FUNDS SEMI-ANNUAL REPORT | 91 |
| INFORMATION ON BOARD OF TRUSTEES AND OFFICERS (Unaudited)(continued) |
Name, Address*
and Year of Birth | Position(s)
Held with
the Trust | Term of Office
and Length of
Time Served** | Principal Occupations
During Past Five Years |
| OFFICERS | | | |
Brian E. Binder (1972) | President and Chief Executive Officer | Since February 2018 | Current: President and Chief Executive Officer, certain other funds in the Fund Complex (February 2018-present); President and Chief Executive Officer, Guggenheim Funds Investment Advisors, LLC and Security Investors, LLC (January 2018-present); Senior Managing Director and Chief Administrative Officer, Guggenheim Investments (January 2018-present). Former: Managing Director and President, Deutsche Funds, and Head of US Product, Trading and Fund Administration, Deutsche Asset Management (2013-January 2018); Managing Director, Head of Business Management and Consulting, Invesco Ltd. (2010-2012). |
James M. Howley (1972) | Assistant Treasurer | Since 2014 | Current: Managing Director, Guggenheim Investments (2004-present) ; Assistant Treasurer, certain other funds in the Fund Complex (2006-present). Former: Manager of Mutual Fund Administration of Van Kampen Investments, Inc. (1996-2004). |
Keith D. Kemp (1960) | Assistant Treasurer | Since 2016 | Current: Treasurer and Assistant Treasurer, certain other funds in the Fund Complex (2010-present); Managing Director of Guggenheim Investments (2015-present); Chief Financial Officer, Guggenheim Specialized Products, LLC (2016-present). Former: Managing Director and Director, Transparent Value, LLC (2010-2016); Director, Guggenheim Partners Investment Management, LLC (2010-2015); Chief Operating Officer, Macquarie Capital Investment Management (2007-2009). |
Mark E. Mathiasen (1978) | Secretary | Since 2014 | Current: Secretary, certain other funds in the Fund Complex (2007-present); Managing Director, Guggenheim Investments (2007-present). |
Glenn McWhinnie (1969) | Assistant Treasurer | Since 2016 | Current: Vice President, Guggenheim Investments (2009-present). Assistant Treasurer, certain other funds in the Fund Complex (2016-present); Assistant Treasurer, certain other funds in the fund cmplex (2016-present). |
| 92 | THE GUGGENHEIM FUNDS SEMI-ANNUAL REPORT | |
| INFORMATION ON BOARD OF TRUSTEES AND OFFICERS (Unaudited)(continued) |
Name, Address*
and Year of Birth | Position(s)
Held with
the Trust | Term of Office
and Length of
Time Served** | Principal Occupations
During Past Five Years |
| OFFICERS - continued | |
Michael P. Megaris (1984) | Assistant Secretary | Since 2014 | Current: Assistant Secretary, certain other funds in the Fund Complex (2014-present); Director, Guggenheim Investments (2012-present). |
Elisabeth Miller (1968) | Chief Compliance Officer | Since 2012 | Current: CCO, certain other funds in the Fund Complex (2012-present); Managing Director, Guggenheim Investments (2012-present). Vice President, Guggenheim Funds Distributors, LLC (2014-present). Former: CCO, Security Investors, LLC (2012-2018); CCO, Guggenheim Funds Investment Advisors, LLC (2012-2018); CCO, Guggenheim Distributors, LLC (2009-March 2014); Senior Manager, Security Investors, LLC (2004-2009); Senior Manager, Guggenheim Distributors, LLC (2004-2009). |
Adam J. Nelson (1979) | Assistant Treasurer | Since 2015 | Current: Vice President, Guggenheim Investments (2015-present); Assistant Treasurer, certain other funds in the Fund Complex (2015-present). Former: Assistant Vice President and Fund Administration Director, State Street Corporation (2013-2015); Fund Administration Assistant Director, State Street (2011-2013); Fund Administration Manager, State Street (2009-2011). |
Kimberly J. Scott (1974) | Assistant Treasurer | Since 2014 | Current: Director, Guggenheim Investments (2012-present); Assistant Treasurer, certain other funds in the Fund Complex (2012-present). Former: Financial Reporting Manager, Invesco, Ltd. (2010-2011); Vice President/Assistant Treasurer, Mutual Fund Administration for Van Kampen Investments, Inc./Morgan Stanley Investment Management (2009-2010); Manager of Mutual Fund Administration, Van Kampen Investments, Inc./Morgan Stanley Investment Management (2005-2009). |
Bryan Stone (1979) | Vice President | Since 2014 | Current: Vice President, certain other funds in the Fund Complex (2014-present); Managing Director, Guggenheim Investments (2013-present). Former: Senior Vice President, Neuberger Berman Group LLC (2009-2013); Vice President, Morgan Stanley (2002-2009). |
| | THE GUGGENHEIM FUNDS SEMI-ANNUAL REPORT | 93 |
| INFORMATION ON BOARD OF TRUSTEES AND OFFICERS (Unaudited)(concluded) |
Name, Address*
and Year of Birth | Position(s)
Held with
the Trust | Term of Office
and Length of
Time Served** | Principal Occupations
During Past Five Years |
| OFFICERS - concluded | |
John L. Sullivan (1955) | Chief Financial Officer, Chief Accounting Officer and Treasurer | Since 2014 | Current: CFO, Chief Accounting Officer and Treasurer, certain other funds in the Fund Complex (2010-present); Senior Managing Director, Guggenheim Investments (2010-present). Former: Managing Director and CCO, each of the funds in the Van Kampen Investments fund complex (2004-2010); Managing Director and Head of Fund Accounting and Administration, Morgan Stanley Investment Management (2002-2004); CFO and Treasurer, Van Kampen Funds (1996-2004). |
Jon Szafran (1989) | Assistant Treasurer | Since 2017 | Current: Vice President, Guggenheim Investments (2017-present); Assistant Treasurer, certain other funds in the Fund Complex (2017-present). Former: Assistant Treasurer of Henderson Global Funds and Manager of US Fund Administration, Henderson Global Investors (North America) Inc. (“HGINA”), (February-June 2017); Senior Analyst of US Fund Administration, HGINA (2014-2017); Senior Associate of Fund Administration, Cortland Capital Market Services, LLC (2013-2014); Experienced Associate, PricewaterhouseCoopers LLP (2012-2013). |
| * | The business address of each officer is c/o Guggenheim Investments, 227 West Monroe Street, Chicago, Illinois 60606. |
| ** | Each officer serves an indefinite term, until his or her successor is duly elected and qualified. Time served includes time served in the respective position for the Predecessor Corporation. |
| 94 | THE GUGGENHEIM FUNDS SEMI-ANNUAL REPORT | |
| GUGGENHEIM INVESTMENTS PRIVACY NOTICE (Unaudited) |
Who We Are
This Privacy Notice describes the data protection practices of Guggenheim Investments. Guggenheim Investments as used herein refers to the affiliated investment management businesses of Guggenheim Partners, LLC: Guggenheim Funds Investment Advisors, LLC, Guggenheim Partners Investment Management, LLC, Guggenheim Funds Distributors, LLC, Security Investors, LLC, Guggenheim Investment Advisors (Europe) Limited, Guggenheim Real Estate, LLC, GS Gamma Advisors, LLC, Guggenheim Partners India Management, LLC, Guggenheim Partners Europe Limited, as well as the funds in the Guggenheim Funds complex (the “Funds”) (“Guggenheim Investments,” “we,” “us,” or “our”).
Guggenheim Partners Investment Management Holdings, LLC, located at 330 Madison Avenue, New York, New York 10017 is the data controller for your information. The Affiliates who are also controllers of certain of your information are: Guggenheim Investment Advisors (Europe) Limited, Guggenheim Partners Europe Limited, Guggenheim Partners, LLC, Guggenheim Funds Investment Advisors, LLC, Guggenheim Partners Investment Management, LLC, Guggenheim Funds Distributors, LLC and Security Investors, LLC, as well as the Funds.
Our Commitment to You
Guggenheim Investments considers your privacy our utmost concern. When you become our client or investor, you entrust us with not only your hard-earned money but also with your personal and financial information. Because we have access to your private information, we hold ourselves to the highest standards in its safekeeping and use. We strictly limit how we share your information with others, whether you are a current or former Guggenheim Investments client or investor.
The Information We Collect About You
We collect certain nonpublic personal information about you from information you provide on applications, other forms, our website, and/or from third parties including investment advisors. This information includes Social Security or other tax identification number, assets, income, tax information, retirement and estate plan information, transaction history, account balance, payment history, bank account information, marital status, family relationships, information that we collect on our website through the use of “cookies,” and other personal information that you or others provide to us. We may also collect such information through your inquiries by mail, e-mail or telephone. We may also collect customer due diligence information, as required by applicable law and regulation, through third party service providers.
How We Handle Your Personal Information
The legal basis for using your information as set out in this Privacy Notice is as follows: (a) use of your personal data is necessary to perform our obligations under any contract with you (such as a contract for us to provide financial services to you); or (b) where use of your personal data is not necessary for performance of a contract, use of your personal data is necessary for our
| | THE GUGGENHEIM FUNDS SEMI-ANNUAL REPORT | 95 |
| GUGGENHEIM INVESTMENTS PRIVACY NOTICE (Unaudited)(continued) |
legitimate interests or the legitimate interests of others (for example, to enforce the legal terms governing our services, operate and market our website and other services we offer, ensure safe environments for our personnel and others, make and receive payments, prevent fraud and to know the customer to whom we are providing the services). Some processing is done to comply with applicable law.
In addition to the specific uses described above, we also use your information in the following manner:
| | ● | We use your information in connection with servicing your accounts. |
| | ● | We use information to respond to your requests or questions. For example, we might use your information to respond to your customer feedback. |
| | ● | We use information to improve our products and services. We may use your information to make our website and products better. We may use your information to customize your experience with us. |
| | ● | We use information for security purposes. We may use your information to protect our company and our customers. |
| | ● | We use information to communicate with you. For example, we will communicate with you about your account or our relationship. We may contact you about your feedback. We might also contact you about this Privacy Notice. We may also enroll you in our email newsletter. |
| | ● | We use information as otherwise permitted by law, as we may notify you. |
| | ● | Aggregate/Anonymous Data. We may aggregate and/or anonymize any information collected through the website so that such information can no longer be linked to you or your device (“Aggregate/Anonymous Information”). We may use Aggregate/Anonymous Information for any purpose, including without limitation for research and marketing purposes, and may also share such data with any third parties, including advertisers, promotional partners, and sponsors. |
We do not sell information about current or former clients or their accounts to third parties. Nor do we share this information, except when necessary to complete transactions at your request, to make you aware of investment products and services that we or our affiliates offer, or as permitted or required by law.
We provide information about you to companies and individuals not affiliated with Guggenheim Investments to complete certain transactions or account changes, or to perform services for us related to your account. For example, if you ask to transfer assets from another financial institution to Guggenheim Investments, we must provide certain information about you to that company to complete the transaction. We provide the third party with only the information necessary to carry out its responsibilities and only for that purpose. And we require these third
| 96 | THE GUGGENHEIM FUNDS SEMI-ANNUAL REPORT | |
| GUGGENHEIM INVESTMENTS PRIVACY NOTICE (Unaudited)(continued) |
parties to treat your private information with the same high degree of confidentiality that we do. To alert you to other Guggenheim Investments products and services, we share your information within our family of affiliated companies. You may limit our sharing with affiliated companies as set out below. We may also share information with any successor to all or part of our business, or in connection with steps leading up to a merger or acquisition. For example, if part of our business was sold we may give customer information as part of that transaction. We may also share information about you with your consent.
We will release information about you if you direct us to do so, if we are compelled by law to do so, or in other circumstances as permitted by law (for example, to protect your account from fraud).
If you close your account(s) or become an inactive client or investor, we will continue to adhere to the privacy policies and practices described in this notice.
Opt-Out Provisions and Your Data Choices
The law allows you to “opt out” of certain kinds of information sharing with third parties. We do not share personal information about you with any third parties that triggers this opt-out right. This means YOU ARE ALREADY OPTED OUT.
When you are no longer our client or investor, we continue to share your information as described in this notice, and you may contact us at any time to limit our sharing by sending an email to CorporateDataPrivacy@GuggenheimPartners.com.
European Union Data Subjects and certain others: In addition to the choices set forth above, residents of the European Union and certain other jurisdictions have certain rights to (1) request access to or rectification or deletion of information we collect about them, (2) request a restriction on the processing of their information, (3) object to the processing of their information, or (4) request the portability of certain information. To exercise these or other rights, please contact us using the contact information below. We will consider all requests and provide our response within the time period stated by applicable law. Please note, however, that certain information may be exempt from such requests in some circumstances, which may include if we need to keep processing your information for our legitimate interests or to comply with a legal obligation. We may request you provide us with information necessary to confirm your identity before responding to your request.
Residents of France and certain other jurisdictions may also provide us with instructions regarding the manner in which we may continue to store, erase and share your information after your death, and where applicable, the person you have designated to exercise these rights after your death.
| | THE GUGGENHEIM FUNDS SEMI-ANNUAL REPORT | 97 |
| GUGGENHEIM INVESTMENTS PRIVACY NOTICE (Unaudited)(continued) |
How We Protect Privacy Online
We take steps to protect your privacy when you use our web site – www.guggenheiminvestments.com – by using secure forms of online communication, including encryption technology, Secure Socket Layer (SSL) protocol, firewalls and user names and passwords. These safeguards vary based on the sensitivity of the information that we collect and store. However, we cannot and do not guarantee that these measures will prevent every unauthorized attempt to access, use, or disclose your information since despite our efforts, no Internet and/or other electronic transmissions can be completely secure. Our web site uses “http cookies”—tiny pieces of information that we ask your browser to store. We use cookies for session management and security features on the Guggenheim Investments web site. We do not use them to pull data from your hard drive, to learn your e-mail address, or to view data in cookies created by other web sites. We will not share the information in our cookies or give others access to it. See the legal information area on our web site for more details about web site security and privacy features.
How We Safeguard Your Personal Information and Data Retention
We restrict access to nonpublic personal information about you to our employees and in some cases to third parties (for example, the service providers described above) as permitted by law. We maintain strict physical, electronic and procedural safeguards that comply with federal standards to guard your nonpublic personal information.
We keep your information for no longer than necessary for the purposes for which it is processed. The length of time for which we retain information depends on the purposes for which we collected and use it and/or as required to comply with applicable laws. Information may persist in copies made for backup and business continuity purposes for additional time.
International Visitors
If you are not a resident of the United States, please be aware that your information may be transferred to, stored and processed in the United States where our servers are located and our databases are operated. The data protection and other laws of the United States and other countries might not be as comprehensive as those in your country.
In such cases, we ensure that a legal basis for such a transfer exists and that adequate protection is provided as required by applicable law, for example, by using standard contractual clauses or by transferring your data to a jurisdiction that has obtained an adequacy finding. Individuals whose data may be transferred on the basis of standard contractual clauses may contact us as described below.
We’ll Keep You Informed
If you have any questions or concerns about how we treat your personal data, we encourage you to consult with us first. You may also contact the relevant supervisory authority.
| 98 | THE GUGGENHEIM FUNDS SEMI-ANNUAL REPORT | |
| GUGGENHEIM INVESTMENTS PRIVACY NOTICE (Unaudited)(concluded) |
We reserve the right to modify this policy at any time and will inform you promptly of material changes. You may access our privacy policy from our web site at www.guggenheiminvestments.com. Should you have any questions regarding our privacy policy, contact us by email at CorporateDataPrivacy@GuggenheimPartners.com.
| | THE GUGGENHEIM FUNDS SEMI-ANNUAL REPORT | 99 |
This page intentionally left blank.
This page intentionally left blank.
This page intentionally left blank.
This page intentionally left blank.
This page intentionally left blank.
This page intentionally left blank.
Not required at this time.
| Item 3. | Audit Committee Financial Expert. |
Not required at this time.
| Item 4. | Principal Accountant Fees and Services. |
Not required at this time.
| Item 5. | Audit Committee of Listed Registrants. |
Not applicable.
The Schedule of Investments is included under Item 1 of this form.
| Item 7. | Disclosure of Proxy Voting Policies and Procedures for Closed-End Management Investment Companies. |
Not applicable.
| Item 8. | Portfolio Mangers of Closed-end Management Investment Companies |
Not applicable
| Item 9. | Purchases of Equity Securities by Closed-End Management Investment Company and Affiliated Purchasers. |
Not applicable.
| Item 10. | Submission of Matters to a Vote of Security Holders. |
The registrant does not currently have in place procedures by which shareholders may recommend nominees to the registrant’s board.
There have been no changes to the procedures by which shareholders may recommend nominees to the registrant’s board.
| Item 11. | Controls and Procedures. |
| (a) | The registrant’s President (principal executive officer) and Treasurer (principal financial officer) have evaluated the registrant’s disclosure controls and procedures within 90 days of this filing and have concluded that the registrant’s disclosure controls and procedures were effective as of that date in ensuring that information required to be disclosed by the registrant in this Form N-CSR was recorded, processed, summarized, and reported timely. |
| (b) | The registrant’s principal executive officer and principal financial officer are aware of no change in the registrant’s internal control over financial reporting that occurred during the registrant’s second fiscal quarter covered by this report that has materially affected, or is reasonably likely to materially affect, the registrant’s internal control over financial reporting. |
| Item 12. | Disclosure of Securities Lending Activities for Closed End Management Investment Companies. |
Not Applicable
| (a)(2) | Separate certifications by the President (principal executive officer) and Treasurer (principal financial officer) of the registrant as required by Rule 30a-2(a) under the Act (17 CFR 270.30a-2(a)) are attached. |
| (b) | A certification by the registrant’s President (principal executive officer) and Treasurer (principal financial officer) as required by Rule 30a-2(b) under the Act (17 CFR 270.30a-2(b)) is attached. |
SIGNATURES
Pursuant to the requirements of the Securities Exchange Act of 1934 and the Investment Company Act of 1940, the registrant has duly caused this report to be signed on its behalf by the undersigned, thereunto duly authorized.
| (Registrant) | Guggenheim Funds Trust | |
| | | |
| By (Signature and Title)* | /s/ Brian E. Binder | |
| Brian E. Binder, President and Chief Executive Officer | |
| | | |
| Date | June 6, 2018 | |
Pursuant to the requirements of the Securities Exchange Act of 1934 and the Investment Company Act of 1940, this report has been signed below by the following persons on behalf of the registrant and in the capacities and on the dates indicated.
| By (Signature and Title)* | /s/ Brian E. Binder | |
| Brian E. Binder, President and Chief Executive Officer | |
| | | |
| Date | June 6, 2018 | |
| | | |
| By (Signature and Title)* | /s/ John L. Sullivan | |
| John L. Sullivan, Chief Financial Officer, Chief Accounting Officer and Treasurer | |
| | | |
| Date | June 6, 2018 | |
| * | Print the name and title of each signing officer under his or her signature. |


