UNITED STATES
SECURITIES AND EXCHANGE COMMISSION
Washington, D.C. 20549
FORM N-CSR
CERTIFIED SHAREHOLDER REPORT OF REGISTERED MANAGEMENT
INVESTMENT COMPANIES
Investment Company Act file number 811- 01136
Guggenheim Funds Trust
(Exact name of registrant as specified in charter)
702 King Farm Boulevard, Suite 200
Rockville, Maryland 20850
(Address of principal executive offices) (Zip code)
Amy J. Lee
Guggenheim Funds Trust
702 King Farm Boulevard, Suite 200
Rockville, Maryland 20850
(Name and address of agent for service)
Registrant's telephone number, including area code: (301) 296-5100
Date of fiscal year end: September 30
Date of reporting period: October 1, 2022 - September 30, 2023
| Item 1. | Reports to Stockholders. |
The registrant’s annual report transmitted to shareholders pursuant to Rule 30e-1 under the Investment Company Act of 1940, as amended (the “Investment Company Act”), is as follows:
9.30.2023
Guggenheim Funds Annual Report
Guggenheim Funds Trust-Equity |
Guggenheim Alpha Opportunity Fund | | |
Guggenheim Large Cap Value Fund | | |
Guggenheim Market Neutral Real Estate Fund | | |
Guggenheim Risk Managed Real Estate Fund | | |
Guggenheim Small Cap Value Fund | | |
Guggenheim StylePlus—Large Core Fund | | |
Guggenheim StylePlus—Mid Growth Fund | | |
Guggenheim World Equity Income Fund | | |
GuggenheimInvestments.com | SBE-ANN-0923x0924 |
| | |
DEAR SHAREHOLDER | 2 |
ECONOMIC AND MARKET OVERVIEW | 5 |
ABOUT SHAREHOLDERS’ FUND EXPENSES | 7 |
ALPHA OPPORTUNITY FUND | 10 |
LARGE CAP VALUE FUND | 30 |
MARKET NEUTRAL REAL ESTATE FUND | 41 |
RISK MANAGED REAL ESTATE FUND | 52 |
SMALL CAP VALUE FUND | 66 |
STYLEPLUS—LARGE CORE FUND | 77 |
STYLEPLUS—MID GROWTH FUND | 87 |
WORLD EQUITY INCOME FUND | 98 |
NOTES TO FINANCIAL STATEMENTS | 109 |
REPORT OF INDEPENDENT REGISTERED PUBLIC ACCOUNTING FIRM | 124 |
OTHER INFORMATION | 125 |
INFORMATION ON BOARD OF TRUSTEES AND OFFICERS | 134 |
GUGGENHEIM INVESTMENTS PRIVACY NOTICE | 140 |
LIQUIDITY RISK MANAGEMENT PROGRAM | 143 |
| | THE GUGGENHEIM FUNDS ANNUAL REPORT | 1 |
Dear Shareholder:
Security Investors, LLC and Guggenheim Partners Investment Management, LLC (“Investment Advisers”) are pleased to present the shareholder report for a selection of our Funds (“Funds”) for the annual fiscal period ended September 30, 2023 (“Reporting Period”).
The Investment Advisers are part of Guggenheim Investments, which represents the investment management businesses of Guggenheim Partners, LLC (“Guggenheim”), a global, diversified financial services firm.
Guggenheim Funds Distributors, LLC is the distributor of the Funds. Guggenheim Funds Distributors, LLC is affiliated with Guggenheim and the Investment Advisers.
We encourage you to read the Economic and Market Overview section of the report, which follows this letter, and then the Managers’ Commentary for each fund.
We are committed to providing innovative investment solutions and appreciate the trust you place in us.
Sincerely,
Security Investors, LLC,
Guggenheim Partners Investment Management, LLC,
October 31, 2023
Read a prospectus and summary prospectus (if available) carefully before investing. It contains the investment objectives, risks, charges, expenses and other information, which should be considered carefully before investing. Obtain a prospectus and summary prospectus (if available) at guggenheiminvestments.com or call 800.820.0888.
This material is not intended as a recommendation or as investment advice of any kind, including in connection with rollovers, transfers, and distributions. Such material is not provided in a fiduciary capacity, may not be relied upon for or in connection with the making of investment decisions, and does not constitute a solicitation of an offer to buy or sell securities. All content has been provided for informational or educational purposes only and is not intended to be and should not be construed as legal or tax advice and/or a legal opinion. Always consult a financial, tax and/ or legal professional regarding your specific situation.
Alpha Opportunity Fund is subject to a number of risks and is not suitable for all investors. ● Investments in securities and derivatives, in general, are subject to market risks that may cause their prices to fluctuate over time. The intrinsic value of the underlying stocks may never be realized, or the stock may decline in value. An investment in the Fund may lose money. There can be no guarantee the Fund will achieve it investment objective. ●The Fund’s use of derivatives such as futures, options and swap agreements may expose the Fund to additional risks that it would not be subject to if it invested directly in the securities underlying those derivatives. ● Certain of the derivative instruments, such as swaps and structured notes, are also subject to the risks of counterparty default and adverse tax treatment. ●The more the Fund invests in leveraged instruments, the more the leverage will magnify any gains or losses on those investments. ● The Fund’s use of short selling involves increased risk and costs, including paying more for a security than it received from its sale and the risk of unlimited losses. ●In certain circumstances the Fund may be subject to liquidity risk and it may be difficult for the Fund to purchase and sell particular investments within a reasonable time at a fair price. ●In certain circumstances, it may be difficult for the Fund to purchase and sell particular investments within a reasonable time at a fair price. ●The Fund’s fixed income investments will change in value in response to interest rate changes and other factors. ● It is important to note that the Fund is not guaranteed by the U.S. government. ● Please read the prospectus for more detailed information regarding these and other risks.
2 | THE GUGGENHEIM FUNDS ANNUAL REPORT | |
Large Cap Value Fund is subject to a number of risks and is not suitable for all investors. ● An investment in the Fund will fluctuate and is subject to investment risks, which means an investor could lose money. ● The intrinsic value of the underlying stocks may never be realized, or the stock may decline in value. The Fund is subject to risk that large-capitalization stocks may underperform other segments of the equity market or the equity markets as a whole. ● It is important to note that the Fund is not guaranteed by the U.S. government. ● Please read the prospectus for more detailed information regarding these and other risks.
Market Neutral Real Estate Fund is subject to a number of risks and is not suitable for all investors. ● Investing involves risk, including the possible loss of principal. ● There are no assurances that any fund will achieve its objective and/or strategy. ● The Fund’s investments in real estate securities subject the Fund to the same risks as direct investments in real estate, which is particularly sensitive to economic downturns. ● The Fund’s use of derivatives such as futures, options, and swap agreements may expose the Fund to additional risks that it would not be subject to if it invested directly in the securities underlying those derivatives. ● When market conditions are deemed appropriate, the Fund will leverage to the full extent permitted by its investment policies and restrictions and applicable law. Leveraging will exaggerate the effect on net asset value of any increase or decrease in the market value of the Fund’s portfolio. ● The more the Fund invests in leveraged instruments, the more the leverage will magnify any gains or losses on those investments. ● The Fund’s use of short selling involves increased risk and costs. The Fund risks paying more for a security than it received from its sale. ● The Fund’s investments in other investment vehicles subject the Fund to those risks and expenses affecting the investment vehicle. ● The Fund’s investments in foreign securities carry additional risks when compared to U.S. securities, due to the impact of diplomatic, political, or economic developments in the country in question (investments in emerging markets securities are generally subject to an even greater level of risk). ● The Fund may invest in derivative instruments, which may be more volatile and less liquid, increasing the risk of loss when compared to traditional securities. Certain of the derivative instruments are also subject to the risks of counterparty default and adverse tax treatment. ● Investing in sector funds is more volatile than investing in broadly diversified funds, as there is a greater risk due to the concentration of the funds’ holdings in issuers of the same or similar offerings. ● Short selling involves increased risks and costs. You risk paying more for a security than you received from its sale. This strategy may not be suitable for all investors. ● The Fund is subject to active trading risks that may increase volatility and impact its ability to achieve its investment objective. ● You may have a gain or loss when you sell your shares. ● It is important to note that the Fund is not guaranteed by the U.S. government. ● Please read the prospectus for more detailed information regarding these and other risks.
Risk Managed Real Estate Fund is subject to a number of risks and is not suitable for all investors. ● Investments in securities in general are subject to market risks that may cause their prices to fluctuate over time ● Investing involves risk, including the possible loss of principal. ● There are no assurances that any fund will achieve its objective and/or strategy. ● The Fund’s investments in real estate securities subject the Fund to the same risks as direct investments in real estate, which is particularly sensitive to economic downturns. ● The Fund’s use of derivatives such as futures, options and swap agreements may expose the Fund to additional risks that it would not be subject to if it invested directly in the securities underlying those derivatives. ● When market conditions are deemed appropriate, the Fund will leverage to the full extent permitted by its investment policies and restrictions and applicable law. Leveraging will exaggerate the effect on net asset value of any increase or decrease in the market value of the Fund’s portfolio. ● The more the Fund invests in leveraged instruments, the more the leverage will magnify any gains or losses on those investments. ● The Fund’s use of short selling involves increased risk and costs. The Fund risks paying more for a security than it received from its sale. ● The Fund’s investments in other investment vehicles subject the Fund to those risks and expenses affecting the investment vehicle. ● The Fund’s investments in foreign securities carry additional risks when compared to U.S. securities, due to the impact of diplomatic, political or economic developments in the country in question (investments in emerging markets securities are generally subject to an even greater level of risk). ● The Fund may invest in derivative instruments, which may be more volatile and less liquid, increasing the risk of loss when compared to traditional securities. Certain of the derivative instruments are also subject to the risks of counterparty default and adverse tax treatment. ● Investing in sector funds is more volatile than investing in broadly diversified funds, as there is a greater risk due to the concentration of the funds’ holdings in issuers of the same or similar offerings. ● Short selling involves increased risks and costs. You risk paying more for a security than you received from its sale. This strategy may not be suitable for all investors. ● The Fund is subject to active trading risks that may increase volatility and impact its ability to achieve its investment objective. ● You may have a gain or loss when you sell you shares. ● It is important to note that the Fund is not guaranteed by the U.S. government. ● Please read the prospectus for more detailed information regarding these and other risks.
Small Cap Value Fund is subject to a number of risks and is not suitable for all investors. ● An investment in the Fund will fluctuate and is subject to investment risks, which means investors could lose money. ● The intrinsic value of the underlying stocks may never be realized, or the stock may decline in value. ● Investing in securities of small-capitalization companies may involve a greater risk of loss and more abrupt fluctuations in market price than investments in larger-capitalization companies. ● It is important to note that the Fund is not guaranteed by the U.S. government. ● Please read the prospectus for more detailed information regarding these and other risks.
StylePlus—Large Core Fund is subject to a number of risks and is not suitable for all investors. ● Investments in large capitalization stocks may underperform other segments of the equity market or the equity market as a whole. ● Growth stocks may be more volatile than other stocks because they are more sensitive to investor perceptions regarding the growth potential of the issuing companies. Value stocks are subject to the risk that the intrinsic value of the stock may never be realized by the market or that the price goes down.● The Fund may invest in derivative instruments, which may be more volatile and less liquid, increasing the risk of loss when compared to traditional securities. Certain of the derivative instruments are also subject to the risks of counterparty default and adverse tax treatment. ● The Fund’s use of leverage, through borrowings or instruments such as derivatives, may cause the Fund to be more volatile than if it had not been leveraged. ● The Fund’s investments in other investment vehicles subject the Fund to those risks and expenses affecting the investment vehicle. ● The Fund may invest in foreign securities which carry additional risks when compared to U.S. securities, due to the impact of diplomatic, political or economic developments in the country in question (investments in emerging markets securities are generally subject to an even greater level of risk). ● The Fund may invest in fixed income securities whose market value will change in response to interest rate changes and market conditions among other factors. In general, bond prices rise when interest rates fall and vice versa. ● The Fund’s exposure to high yield securities may subject the Fund to greater volatility. ● The Fund may invest in bank loans and asset-backed securities, including mortgage backed, which involve special types of risks. ● The Fund may invest in restricted securities which may involve financial and liquidity risk. ● You may have a gain or loss when you sell your shares. ● It is important to note that the Fund is not guaranteed by the U.S. government. ● Please read the prospectus for more detailed information regarding these and other risks.
StylePlus—Mid Growth Fund is subject to a number of risks and is not suitable for all investors. ● Investments in mid-sized company securities may present additional risks such as less predictable earnings, higher volatility and less liquidity than larger, more established companies. ● Growth stocks may be more volatile than other stocks because they are more sensitive to investor perceptions regarding the growth potential of the issuing companies. ● The Fund may invest in derivative instruments, which may be more volatile and less liquid, increasing the risk of loss when compared to traditional securities. Certain of the derivative instruments are also subject to the risks of counterparty default and adverse tax treatment. ● The Fund’s use of leverage, through borrowings or instruments such as derivatives, may cause the Fund to be more volatile than if it had not been leveraged. ● The Fund’s investments in other investment vehicles subject the Fund to those risks and expenses affecting the investment vehicle. ● The Fund may invest in foreign securities which carry additional risks when compared to U.S. securities, due to the impact of diplomatic, political or economic developments in the country in question (investments in emerging markets securities are generally subject to an even greater level of risk). ● The Fund may invest in fixed
| | THE GUGGENHEIM FUNDS ANNUAL REPORT | 3 |
income securities whose market value will change in response to interest rate changes and market conditions, among other factors. In general, bond prices rise when interest rates fall and vice versa. ● The Fund’s exposure to high yield securities may subject the Fund to greater volatility. ● The Fund may invest in bank loans and asset-backed securities, including mortgage backed, which involve special types of risks. ● The Fund may invest in restricted securities which may involve financial and liquidity risk. ● You may have a gain or loss when you sell your shares. ● It is important to note that the Fund is not guaranteed by the U.S. government. ● Please read the prospectus for more detailed information regarding these and other risks.
World Equity Income Fund is subject to a number of risks and is not suitable for all investors. ●Investments in securities in general are subject to market risks that may cause their prices to fluctuate over time. ●The Fund’s investments in foreign securities carry additional risks when compared to U.S. securities, due to the impact of diplomatic, political or economic developments in the country in question (investments in emerging markets are generally subject to an even greater level of risk). Additionally, the Fund’s exposure to foreign currencies subjects the Fund to the risk that those currencies will decline in value relative to the U.S. Dollar. ● The Fund’s investments in derivatives may pose risks in addition to those associated with investing directly in securities or other investments, including illiquidity of the derivatives, imperfect correlations with underlying investments or the Fund’s other portfolio holdings, lack of availability and counterparty risk. ●The Fund’s use of leverage, through instruments such as derivatives, may cause the Fund to be more volatile than if it had not been leveraged. ●The Fund’s investments in other investment vehicles subject the Fund to those risks and expenses affecting the investment vehicle. ●The Fund may have significant exposure to securities in a particular capitalization range e.g., large-, mid- or small-cap securities. As a result, the Fund may be subject to the risk that the pre-denominate capitalization range may underperform other segments of the equity market or the equity market as a whole. ● It is important to note that the Fund is not guaranteed by the U.S. government. ● Please read the prospectus for more detailed information regarding these and other risks.
4 | THE GUGGENHEIM FUNDS ANNUAL REPORT | |
ECONOMIC AND MARKET OVERVIEW (Unaudited) | September 30, 2023 |
Faced with a series of strong economic data releases, the market increasingly appears to be coming to the conclusion that the economy is structurally better able to withstand higher interest rates than it really is. This dynamic can be seen by examining the move in Treasury yields, with the selloff almost entirely being due to real yields rather than inflation expectations, and with the move most pronounced at the long end of the yield curve. Digging further, however, a large portion of this shift is due to a rising term premium (the premium for unknown and unquantified risks in the future, beyond current assumptions on the path of inflation or policy rates), which is indicating greater uncertainty about the outlook.
Many forecasters are extrapolating the current year’s economic strength without recognizing the fact that growth has benefited from a number of factors this year that are unlikely to be repeated, namely an expansion of the fiscal deficit, a slowdown in inflation, and a rebound in labor supply. As these factors fade, the headwinds from tight monetary policy may be more apparent and pronounced. And the longer monetary conditions stay tight, the greater the risk of something breaking (banks and commercial real estate remain key risks). All of this suggests that the recent economic trajectory cannot be assumed to continue, especially given the substantial restraint that could be imposed by the recent rise in long-term borrowing costs.
Uncertainty is elevated given the diverging signals in the data and the fact that many traditional economic models are not “working” as they traditionally would. This uncertainty extends to the U.S. Federal Reserve, which looks set to hold off on further rate hikes while it waits to see if the data start to align with the softening conditions policymakers say they are hearing on the ground. We continue to think the gravitational pull of tight money and credit conditions could result in a slowing economy and cooler inflation over the next year, paving the way for more rate cuts than the market presently expects.
For the Reporting Period, the S&P 500® Index* returned 21.62%. The MSCI Europe-Australasia-Far East (“EAFE”) Index* returned 25.65%. The return of the MSCI Emerging Markets Index* was 11.70%.
In the bond market, the Bloomberg U.S. Aggregate Bond Index* posted a 0.64% return for the Reporting Period, while the Bloomberg U.S. Corporate High Yield Index* returned 10.28%. The return of the ICE Bank of America (“BofA”) 3-Month U.S. Treasury Bill Index* was 4.50% for the Reporting Period.
The opinions and forecasts expressed may not actually come to pass. This information is subject to change at any time, based on market and other conditions, and should not be construed as a recommendation of any specific security or strategy.
*Index Definitions:
The following indices are referenced throughout this report. Indices are unmanaged and not available for direct investment. Index performance does not reflect transaction costs, fees, or expenses.
Bloomberg U.S. Aggregate Bond Index is a broad-based flagship benchmark that measures the investment grade, U.S. dollar-denominated, fixed-rate taxable bond market, including U.S. Treasuries, government-related and corporate securities, mortgage-backed securities or “MBS” (agency fixed-rate and hybrid adjustable-rate mortgage, or “ARM”, pass-throughs), asset-backed securities (“ABS”), and commercial mortgage-backed securities (“CMBS”) (agency and non-agency).
Bloomberg U.S. Corporate High Yield Index measures the U.S. dollar-denominated, high yield, fixed-rate corporate bond market. Securities are classified as high yield if the middle rating of Moody’s, Fitch, and S&P is Ba1/BB +/BB + or below.
| | THE GUGGENHEIM FUNDS ANNUAL REPORT | 5 |
ECONOMIC AND MARKET OVERVIEW (Unaudited)(concluded) | September 30, 2023 |
FTSE NAREIT Equity REITs Total Return Index (“FNRE”) is one of the FTSE NAREIT U.S. Real Estate Index Series that contains all Equity REITs not designated as Timber REITs or Infrastructure REITs. FTSE NAREIT US Real Estate Index Series is designed to present investors with a comprehensive family of REIT performance indexes that spans the commercial real estate space across the U.S. economy. The index series provides investors with exposure to all investment and property sectors. In addition, the more narrowly focused property sector and sub-sector indexes provide the facility to concentrate commercial real estate exposure in more selected markets. The National Association of Real Estate Investment Trusts (NAREIT) is the trade association for REITs and publicly traded real estate companies with an interest in the U.S. property and investment markets.
ICE BofA 3-Month U.S. Treasury Bill Index is an unmanaged market index of U.S. Treasury securities maturing in 90 days that assumes reinvestment of all income.
Morningstar Long/Short Equity Category Average is the average return of funds Morningstar places in a given category based on their portfolio statistics and compositions over the past three years. Long-short portfolios hold sizeable stakes in both long and short positions in equities, exchange traded funds, and related derivatives. Some funds that fall into this category will shift their exposure to long and short positions depending on their macro outlook or the opportunities they uncover through bottom-up research. At least 75% of the assets are in equity securities or derivatives, and funds in the category will typically have beta values to relevant benchmarks of between 0.3 and 0.8 over a three-year period.
MSCI EAFE Index is a free float-adjusted market capitalization index that is designed to measure the equity market performance of developed markets, excluding the U.S. & Canada.
MSCI Emerging Markets Index is a free float-adjusted market capitalization weighted index that is designed to measure equity market performance in the global emerging markets.
MSCI World Index (Net) is calculated with net dividends reinvested. It is a free float-adjusted market capitalization weighted index that is designed to measure the equity market performance of developed markets.
Russell 1000® Value Index is a measure of the performance of the large-cap value segment of the U.S. equity universe. It includes those Russell 1000 companies with lower price-to-book ratios and lower expected growth values.
Russell 2000® Value Index measures the performance of the small-cap value segment of the U.S. equity universe. It includes those Russell 2000 companies with lower price-to-book ratios and lower forecasted growth values.
Russell Midcap Growth® Index measures the performance of the mid-cap growth segment of the U.S. equity universe. It includes those Russell Midcap Index companies with higher price-to-book ratios and higher forecasted growth values.
S&P 500® Index is a broad-based index, the performance of which is based on the performance of 500 widely held common stocks chosen for market size, liquidity, and industry group representation.
6 | THE GUGGENHEIM FUNDS ANNUAL REPORT | |
ABOUT SHAREHOLDERS’ FUND EXPENSES (Unaudited) | |
All mutual funds have operating expenses, and it is important for our shareholders to understand the impact of costs on their investments. Shareholders of a fund incur two types of costs: (i) transaction costs, including sales charges (loads) on purchase payments, reinvested dividends, other distributions, and exchange fees, and (ii) ongoing costs, including management fees, administrative services, and shareholder reports, among others. These ongoing costs, or operating expenses, are deducted from a fund’s gross income and reduce the investment return of the fund.
A fund’s expenses are expressed as a percentage of its average net assets, which is known as the expense ratio. The following examples are intended to help investors understand the ongoing costs (in dollars) of investing in a fund and to compare these costs with the ongoing costs of investing in other mutual funds.
The examples are based on an investment of $1,000 made at the beginning of the period and held for the entire six-month period beginning March 31, 2023 and ending September 30, 2023.
The following tables illustrate the Funds’ costs in two ways:
Table 1. Based on actual Fund return: This section helps investors estimate the actual expenses paid over the period. The “Ending Account Value” shown is derived from the Fund’s actual return, and the fifth column shows the dollar amount that would have been paid by an investor who started with $1,000 in the Fund. Investors may use the information here, together with the amount invested, to estimate the expenses paid over the period. Simply divide the Fund’s account value by $1,000 (for example, an $8,600 account value divided by $1,000 = 8.6), then multiply the result by the number provided under the heading “Expenses Paid During Period.”
Table 2. Based on hypothetical 5% return: This section is intended to help investors compare a fund’s cost with those of other mutual funds. The table provides information about hypothetical account values and hypothetical expenses based on the Fund’s actual expense ratio and an assumed rate of return of 5% per year before expenses, which is not the Fund’s actual return. The hypothetical account values and expenses may not be used to estimate the actual ending account balance or expenses paid during the period. The example is useful in making comparisons because the U.S. Securities and Exchange Commission (the “SEC”) requires all mutual funds to calculate expenses based on the 5% return. Investors can assess a fund’s costs by comparing this hypothetical example with the hypothetical examples that appear in shareholder reports of other funds.
The calculations illustrated above assume no shares were bought or sold during the period. Actual costs may have been higher or lower, depending on the amount of investment and the timing of any purchases or redemptions.
Please note that the expenses shown in the table are meant to highlight your ongoing costs only and do not reflect any transactional costs, such as sales charges (loads) on purchase payments, and contingent deferred sales charges (“CDSC”) on redemptions, if any. Therefore, the second table is useful in comparing ongoing costs only, and will not help you determine the relative total costs of owning different funds. In addition, if these transactional costs were included, your costs would have been higher.
More information about the Funds’ expenses, including annual expense ratios for periods up to five years (subject to the Fund’s inception date), can be found in the Financial Highlights section of this report. For additional information on operating expenses and other shareholder costs, please refer to the appropriate Fund prospectus.
| | THE GUGGENHEIM FUNDS ANNUAL REPORT | 7 |
ABOUT SHAREHOLDERS’ FUND EXPENSES (Unaudited)(continued) | |
| Expense
Ratio1 | Fund
Return | Beginning
Account Value
March 31, 2023 | Ending
Account Value
September 30, 2023 | Expenses
Paid During
Period2 |
Table 1. Based on actual Fund return3 | | | | | |
Alpha Opportunity Fund | | | | | |
A-Class | 1.74% | 5.33% | $ 1,000.00 | $ 1,053.30 | $ 8.96 |
C-Class | 2.50% | 4.91% | 1,000.00 | 1,049.10 | 12.84 |
P-Class | 1.74% | 5.34% | 1,000.00 | 1,053.40 | 8.96 |
Institutional Class | 1.49% | 5.43% | 1,000.00 | 1,054.30 | 7.67 |
Large Cap Value Fund | | | | | |
A-Class | 1.12% | 1.06% | 1,000.00 | 1,010.60 | 5.65 |
C-Class | 1.87% | 0.67% | 1,000.00 | 1,006.70 | 9.41 |
P-Class | 1.12% | 1.04% | 1,000.00 | 1,010.40 | 5.64 |
Institutional Class | 0.87% | 1.17% | 1,000.00 | 1,011.70 | 4.39 |
Market Neutral Real Estate Fund | | | | | |
A-Class | 1.57% | 0.04% | 1,000.00 | 1,000.40 | 7.87 |
C-Class | 2.32% | (0.35%) | 1,000.00 | 996.50 | 11.61 |
P-Class | 1.57% | 0.00% | 1,000.00 | 1,000.00 | 7.87 |
Institutional Class | 1.32% | 0.17% | 1,000.00 | 1,001.70 | 6.62 |
Risk Managed Real Estate Fund | | | | | |
A-Class | 1.45% | (5.39%) | 1,000.00 | 946.10 | 7.07 |
C-Class | 2.18% | (5.71%) | 1,000.00 | 942.90 | 10.62 |
P-Class | 1.52% | (5.39%) | 1,000.00 | 946.10 | 7.42 |
Institutional Class | 1.16% | (5.21%) | 1,000.00 | 947.90 | 5.66 |
Small Cap Value Fund | | | | | |
A-Class | 1.26% | (0.46%) | 1,000.00 | 995.40 | 6.30 |
C-Class | 2.01% | (0.80%) | 1,000.00 | 992.00 | 10.04 |
P-Class | 1.26% | (0.52%) | 1,000.00 | 994.80 | 6.30 |
Institutional Class | 1.01% | (0.37%) | 1,000.00 | 996.30 | 5.05 |
StylePlus—Large Core Fund | | | | | |
A-Class | 1.57% | 4.77% | 1,000.00 | 1,047.70 | 8.06 |
C-Class | 2.46% | 4.33% | 1,000.00 | 1,043.30 | 12.60 |
P-Class | 1.72% | 4.70% | 1,000.00 | 1,047.00 | 8.83 |
Institutional Class | 1.33% | 4.90% | 1,000.00 | 1,049.00 | 6.83 |
StylePlus—Mid Growth Fund | | | | | |
A-Class | 1.27% | 1.43% | 1,000.00 | 1,014.30 | 6.41 |
C-Class | 2.12% | 1.02% | 1,000.00 | 1,010.20 | 10.68 |
P-Class | 1.58% | 1.25% | 1,000.00 | 1,012.50 | 7.97 |
Institutional Class | 1.02% | 1.53% | 1,000.00 | 1,015.30 | 5.15 |
World Equity Income Fund | | | | | |
A-Class | 1.18% | 1.90% | 1,000.00 | 1,019.00 | 5.97 |
C-Class | 1.93% | 1.57% | 1,000.00 | 1,015.70 | 9.75 |
P-Class | 1.19% | 1.91% | 1,000.00 | 1,019.10 | 6.02 |
Institutional Class | 0.93% | 2.09% | 1,000.00 | 1,020.90 | 4.71 |
8 | THE GUGGENHEIM FUNDS ANNUAL REPORT | |
ABOUT SHAREHOLDERS’ FUND EXPENSES (Unaudited)(concluded) | |
| Expense
Ratio1 | Fund
Return | Beginning
Account Value
March 31, 2023 | Ending
Account Value
September 30, 2023 | Expenses
Paid During
Period2 |
Table 2. Based on hypothetical 5% return (before expenses) | | | | |
Alpha Opportunity Fund | | | | | |
A-Class | 1.74% | 5.00% | $ 1,000.00 | $ 1,016.34 | $ 8.80 |
C-Class | 2.50% | 5.00% | 1,000.00 | 1,012.53 | 12.61 |
P-Class | 1.74% | 5.00% | 1,000.00 | 1,016.34 | 8.80 |
Institutional Class | 1.49% | 5.00% | 1,000.00 | 1,017.60 | 7.54 |
Large Cap Value Fund | | | | | |
A-Class | 1.12% | 5.00% | 1,000.00 | 1,019.45 | 5.67 |
C-Class | 1.87% | 5.00% | 1,000.00 | 1,015.69 | 9.45 |
P-Class | 1.12% | 5.00% | 1,000.00 | 1,019.45 | 5.67 |
Institutional Class | 0.87% | 5.00% | 1,000.00 | 1,020.71 | 4.41 |
Market Neutral Real Estate Fund | | | | | |
A-Class | 1.57% | 5.00% | 1,000.00 | 1,017.20 | 7.94 |
C-Class | 2.32% | 5.00% | 1,000.00 | 1,013.44 | 11.71 |
P-Class | 1.57% | 5.00% | 1,000.00 | 1,017.20 | 7.94 |
Institutional Class | 1.32% | 5.00% | 1,000.00 | 1,018.45 | 6.68 |
Risk Managed Real Estate Fund | | | | | |
A-Class | 1.45% | 5.00% | 1,000.00 | 1,017.80 | 7.33 |
C-Class | 2.18% | 5.00% | 1,000.00 | 1,014.14 | 11.01 |
P-Class | 1.52% | 5.00% | 1,000.00 | 1,017.45 | 7.69 |
Institutional Class | 1.16% | 5.00% | 1,000.00 | 1,019.25 | 5.87 |
Small Cap Value Fund | | | | | |
A-Class | 1.26% | 5.00% | 1,000.00 | 1,018.75 | 6.38 |
C-Class | 2.01% | 5.00% | 1,000.00 | 1,014.99 | 10.15 |
P-Class | 1.26% | 5.00% | 1,000.00 | 1,018.75 | 6.38 |
Institutional Class | 1.01% | 5.00% | 1,000.00 | 1,020.00 | 5.11 |
StylePlus—Large Core Fund | | | | | |
A-Class | 1.57% | 5.00% | 1,000.00 | 1,017.20 | 7.94 |
C-Class | 2.46% | 5.00% | 1,000.00 | 1,012.73 | 12.41 |
P-Class | 1.72% | 5.00% | 1,000.00 | 1,016.44 | 8.69 |
Institutional Class | 1.33% | 5.00% | 1,000.00 | 1,018.40 | 6.73 |
StylePlus—Mid Growth Fund | | | | | |
A-Class | 1.27% | 5.00% | 1,000.00 | 1,018.70 | 6.43 |
C-Class | 2.12% | 5.00% | 1,000.00 | 1,014.44 | 10.71 |
P-Class | 1.58% | 5.00% | 1,000.00 | 1,017.15 | 7.99 |
Institutional Class | 1.02% | 5.00% | 1,000.00 | 1,019.95 | 5.16 |
World Equity Income Fund | | | | | |
A-Class | 1.18% | 5.00% | 1,000.00 | 1,019.15 | 5.97 |
C-Class | 1.93% | 5.00% | 1,000.00 | 1,015.39 | 9.75 |
P-Class | 1.19% | 5.00% | 1,000.00 | 1,019.10 | 6.02 |
Institutional Class | 0.93% | 5.00% | 1,000.00 | 1,020.41 | 4.71 |
1 | This ratio represents annualized net expenses, which may include short dividend and interest expense. Excluding these expenses, the operating expense ratio for the Risk Managed Real Estate Fund would be 1.27%, 1.91%, 1.27% and 0.90% for the A-Class, C-Class, P-Class and Institutional Class, respectively. Excludes expenses of the underlying funds in which the Funds invest, if any. |
2 | Expenses are equal to the Fund’s annualized expense ratio, net of any applicable fee waivers, multiplied by the average account value over the period, multiplied by 183/365 (to reflect the one-half year period). |
3 | Actual cumulative return at net asset value for the period March 31, 2023 to September 30, 2023. |
| | THE GUGGENHEIM FUNDS ANNUAL REPORT | 9 |
MANAGERS’ COMMENTARY (Unaudited) | September 30, 2023 |
To Our Shareholders
Security Investors, LLC (“SI”) serves as the investment adviser to Guggenheim Alpha Opportunity Fund (“Fund”).The Fund is managed by a team of seasoned professionals, including Farhan Sharaff, Senior Managing Director and Assistant Chief Investment Officer, Equities, and Portfolio Manager; Samir Sanghani, CFA, Managing Director and Portfolio Manager; and Burak Hurmeydan, Ph.D., Director and Portfolio Manager. In the subsequent paragraphs, the investment team discusses the Fund’s performance and the market environment for the 12-month period ended September 30, 2023 (the “Reporting Period”).
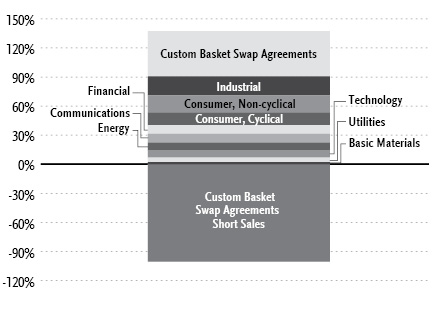
For the Reporting Period, the Fund provided a total return of 16.62%1, outperforming the ICE BofA 3-Month U.S. Treasury Bill Index, the Fund’s benchmark, which returned 4.50% for the same period.
What factors contributed or detracted from the Fund’s performance during the Reporting Period?
This Reporting Period, the broad market recovered from its October 2022 lows on the back of stable economic strength. While inflation moderated from its post-Covid highs, the U.S. Federal Reserve (“Fed”) continued aggressively hiking interest rates with its stated goal of getting price gains back down to 2% (which has yet to be achieved). The labor market remained strong, giving the Fed plenty of cover to raise its benchmark rates faster than any time since the 1980s. During the Reporting Period, the steady march of rates higher no longer caused all stocks to fall like the prior year. The market switched gears and began to anticipate a recession in the face of the monetary tightening. This impacted small caps and economically sensitive names more, as well as exposing low profitability or money-losing names. Mega-cap growth names had strong rebounds as their structural growth and balance sheet quality are prized during harder economic times. The market cap weighted S&P 500 gained 21.62% for the Reporting Period - driven mainly by a handful of the largest companies. Meanwhile, the Russell 2000 Value Index, composed of small caps with more economic beta, returned only 7.84%.
In this environment, the Fund ended the Reporting Period with a 16.62% return. The Fund’s realized beta (sensitivity of daily returns to broad stock benchmark moves) was about +0.21 for the period – positive, but lower than most long/short managers. That positive beta during a rising market contributed about +1.5% of return attribution. A bias towards small caps hurt the Fund by about 1.0%. Within sectors, lower valuation names performed much better than their expensive or money-losing counterparts. Our Value-style positioning paid off by about 12.8% of attribution for the period, while a higher profitability-style bias helped by an additional 4.4%.
The Fund’s industry tilts contributed about 2.1% for the Reporting Period. The overweight in Capital Goods and net short position in Real Estate both were key parts of that contribution. Security selection (the impact of returns within style and industry groups) was a drag this past year of about -1.3%.
How did the Fund use derivatives during the Reporting Period?
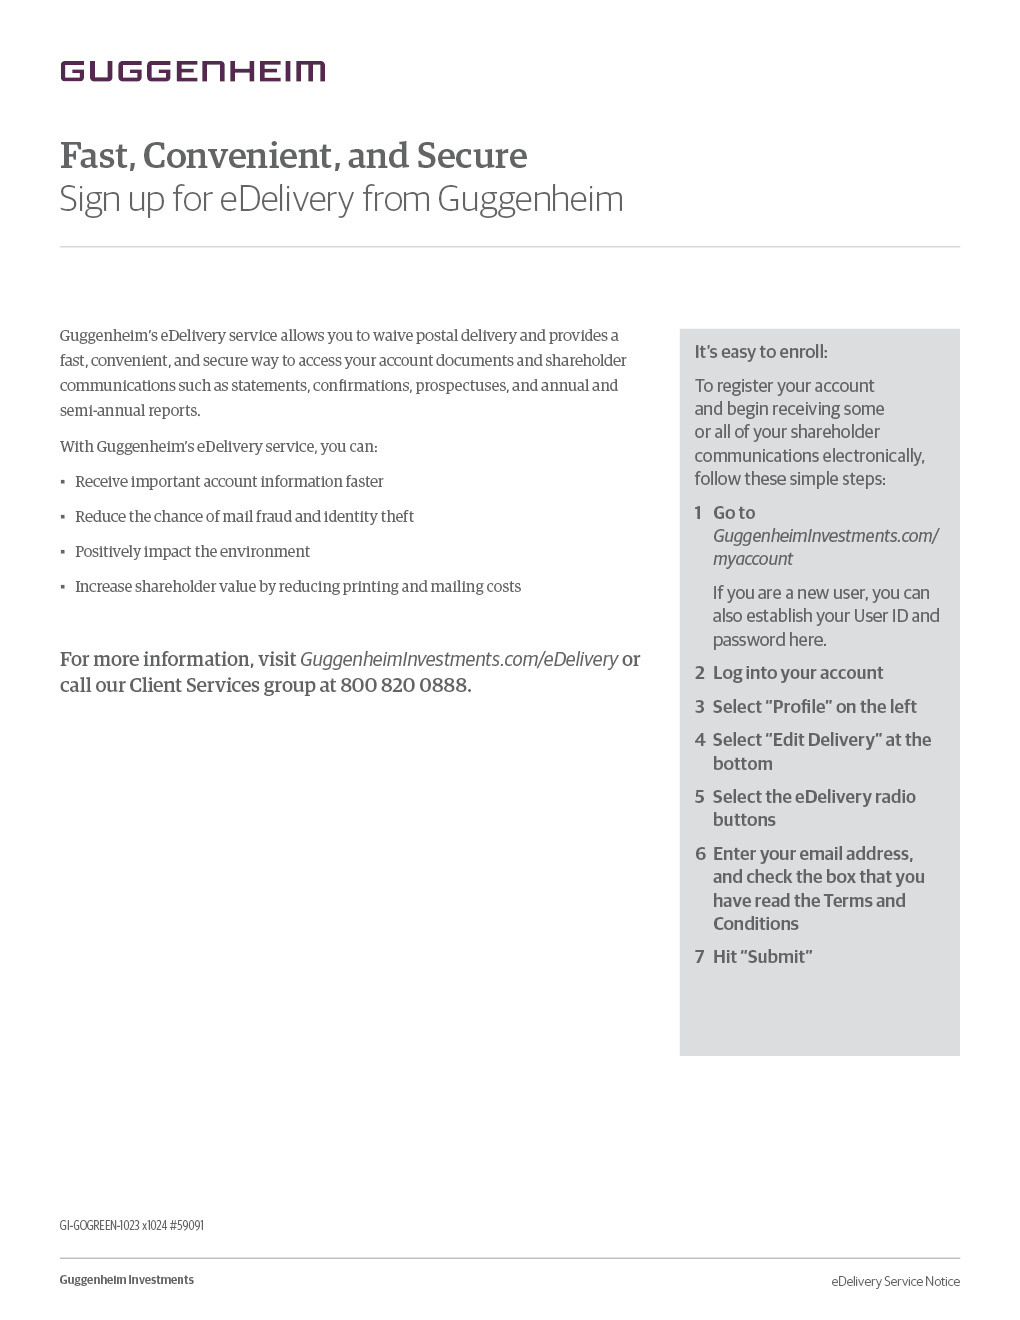
The Fund uses total return swaps to gain exposure to short positions and to attain some leverage on the long side when surpassing 100% long weights. In total, the derivatives have a net negative market exposure, creating a partial market hedge against assets that are invested in long stocks. The net performance impact of these derivatives was slightly positive this Reporting Period as the returns of the long positions on swaps was greater than the losses on the short positions on swaps.
How was the Fund positioned at the end of the Reporting Period?
At period end, the Fund held about 138% of assets in long securities, and 101% short, for a net-dollar exposure of 37%. Because the long side exposure holds higher-quality and more-defensive sectors, while the short side focuses on higher-risk names, the actual expected net ‘beta’ of the Fund is in the 0.10 to 0.16 range, on the low end of positioning for the Fund during the last few years.
The Fund maintains its style bias towards cheaper valuation names. It also maintains a bias towards higher quality—as defined by higher profitability within each sector, lower stock-volatility, and lower leverage. The Fund has a net short bias in the Growth style, where we are generally short stocks with the most growth bias within sectors where valuations remain stretched. The Fund remains slightly small- cap biased–a shift that first began about two years ago. While small caps are generally riskier than large caps, the additional risk appears to be compensated with a much wider expected return based on fundamentals and valuations.
10 | THE GUGGENHEIM FUNDS ANNUAL REPORT | |
MANAGERS’ COMMENTARY (Unaudited)(concluded) | September 30, 2023 |
From an industry perspective, the Fund’s largest net long sectors are Healthcare, Information Technology, and Consumer Discretionary. The largest net short exposures are the Real Estate and Financials sectors. During this Reporting Period, the Fund moved to a net short position in Staples and Utilities. Historically we had been long these defensive sectors, but changes in their fundamentals and valuations led to the dynamic rebalancing to other areas.
Performance displayed represents past performance which is no guarantee of future results.
1 | Performance figures are based on Class A shares and do not reflect taxes that a shareholder would pay on distributions or the redemption of shares. |
The opinions and forecast expressed may not actually come to pass. This information is subject to change at any time, based on market and other conditions, and should not be construed as a recommendation of any specific security or strategy.
| | THE GUGGENHEIM FUNDS ANNUAL REPORT | 11 |
PERFORMANCE REPORT AND FUND PROFILE (Unaudited) | September 30, 2023 |
ALPHA OPPORTUNITY FUND
OBJECTIVE: Seeks long-term growth of capital.
Holdings Diversification (Market Exposure as % of Net Assets)
“Holdings Diversification (Market Exposure as % of Net Assets)” excludes any temporary cash investments.
Inception Dates: |
A-Class | July 7, 2003 |
C-Class | July 7, 2003 |
P-Class | May 1, 2015 |
Institutional Class | November 7, 2008 |
Ten Largest Holdings | % of Total Net Assets |
Amgen, Inc. | 1.0% |
H&R Block, Inc. | 1.0% |
Humana, Inc. | 1.0% |
Exxon Mobil Corp. | 1.0% |
Gilead Sciences, Inc. | 1.0% |
United Therapeutics Corp. | 1.0% |
MSC Industrial Direct Company, Inc. — Class A | 1.0% |
OGE Energy Corp. | 1.0% |
National Fuel Gas Co. | 1.0% |
UFP Industries, Inc. | 1.0% |
Top Ten Total | 10.0% |
| | |
“Ten Largest Holdings” excludes any temporary cash or derivative investments. |
12 | THE GUGGENHEIM FUNDS ANNUAL REPORT | |
PERFORMANCE REPORT AND FUND PROFILE (Unaudited)(concluded) | September 30, 2023 |
Cumulative Fund Performance*
Average Annual Returns*
Periods Ended September 30, 2023
| 1 Year | 5 Year | 10 Year |
A-Class Shares | 16.62% | 1.20% | 3.01% |
A-Class Shares with sales charge† | 11.08% | 0.23% | 2.51% |
C-Class Shares | 15.70% | 0.40% | 2.22% |
C-Class Shares with CDSC‡ | 14.70% | 0.40% | 2.22% |
Institutional Class Shares | 16.89% | 1.50% | 3.37% |
Morningstar Long/Short Equity Category Average | 8.57% | 2.23% | 3.15% |
S&P 500 Index | 21.62% | 9.92% | 11.91% |
S&P 500 Index Blended** | 4.47% | 1.72% | 5.38% |
ICE BofA 3-Month U.S. Treasury Bill Index | 4.50% | 1.72% | 1.12% |
| 1 Year | 5 Year | Since
Inception
(05/01/15) |
P-Class Shares | 16.60% | 1.20% | 1.60% |
Morningstar Long/Short Equity Category Average | 8.57% | 2.23% | 4.16% |
S&P 500 Index | 21.62% | 9.92% | 10.71% |
S&P 500 Index Blended** | 4.47% | 1.72% | 8.56% |
ICE BofA 3-Month U.S. Treasury Bill Index | 4.50% | 1.72% | 4.56% |
* | The performance data above represents past performance that is not predictive of future results. The investment return and principal value of an investment in the Fund will fluctuate so that an investor’s shares, when redeemed, may be worth more or less than their original cost. Returns are historical and include changes in principal and reinvested dividends and capital gains and do not reflect the effect of taxes. The ICE BofA 3-Month U.S. Treasury Bill Index, S&P 500 Index and the Morningstar Long/Short Equity Category Average are unmanaged indices and, unlike the Fund, have no management fees or operating expenses to reduce their reported returns. The graph is based on A-Class shares only; performance for C-Class, P-Class and Institutional Class will vary due to differences in fee structures. |
** | Effective March 13, 2017, the Fund changed its principal investment strategy. As a result of the investment strategy change, the Fund’s new benchmark is the ICE BofA 3-Month U.S. Treasury Bill Index. The Fund’s performance was previously compared to the S&P 500 Index. The S&P 500 Index-Blended uses performance data for the S&P 500 Index from 09/30/13 to 03/12/17, and the ICE BofA 3-Month U.S. Treasury Bill index from 03/13/17 to 09/30/23. |
† | Fund returns are calculated using the maximum sales charge of 4.75%. |
‡ | Fund returns include a CDSC of 1% if redeemed within 12 months of purchase. |
| | THE GUGGENHEIM FUNDS ANNUAL REPORT | 13 |
SCHEDULE OF INVESTMENTS | September 30, 2023 |
ALPHA OPPORTUNITY FUND | |
| | Shares | | | Value | |
COMMON STOCKS† - 90.8% |
| | | | | | | | | |
Industrial - 19.6% |
UFP Industries, Inc. | | | 3,297 | | | $ | 337,613 | |
Schneider National, Inc. — Class B | | | 12,090 | | | | 334,772 | |
ITT, Inc. | | | 3,374 | | | | 330,348 | |
Apogee Enterprises, Inc.1 | | | 6,889 | | | | 324,334 | |
Watts Water Technologies, Inc. — Class A | | | 1,852 | | | | 320,063 | |
Donaldson Company, Inc.1 | | | 5,339 | | | | 318,418 | |
Boise Cascade Co.1 | | | 3,042 | | | | 313,448 | |
Snap-on, Inc.1 | | | 1,196 | | | | 305,052 | |
Hub Group, Inc. — Class A*,1 | | | 3,827 | | | | 300,573 | |
Acuity Brands, Inc.1 | | | 1,586 | | | | 270,111 | |
Mueller Industries, Inc. | | | 3,557 | | | | 267,344 | |
Sturm Ruger & Company, Inc. | | | 4,962 | | | | 258,619 | |
TE Connectivity Ltd. | | | 2,081 | | | | 257,066 | |
Simpson Manufacturing Company, Inc. | | | 1,697 | | | | 254,228 | |
Illinois Tool Works, Inc. | | | 1,096 | | | | 252,420 | |
Masco Corp.1 | | | 4,504 | | | | 240,739 | |
Valmont Industries, Inc. | | | 867 | | | | 208,262 | |
Argan, Inc.1 | | | 3,851 | | | | 175,297 | |
CH Robinson Worldwide, Inc. | | | 1,801 | | | | 155,120 | |
Encore Wire Corp. | | | 771 | | | | 140,677 | |
Teekay Corp.* | | | 22,349 | | | | 137,893 | |
Expeditors International of Washington, Inc.1 | | | 1,093 | | | | 125,291 | |
Insteel Industries, Inc. | | | 3,717 | | | | 120,654 | |
Ardmore Shipping Corp. | | | 8,810 | | | | 114,618 | |
Owens Corning | | | 832 | | | | 113,493 | |
Keysight Technologies, Inc.* | | | 855 | | | | 113,125 | |
Scorpio Tankers, Inc. | | | 2,006 | | | | 108,565 | |
Northrop Grumman Corp. | | | 240 | | | | 105,646 | |
International Seaways, Inc. | | | 2,346 | | | | 105,570 | |
Sanmina Corp.* | | | 1,736 | | | | 94,230 | |
Landstar System, Inc. | | | 529 | | | | 93,601 | |
Builders FirstSource, Inc.* | | | 676 | | | | 84,155 | |
Teekay Tankers Ltd. — Class A | | | 1,741 | | | | 72,478 | |
Fortune Brands Innovations, Inc. | | | 1,146 | | | | 71,235 | |
Lindsay Corp. | | | 552 | | | | 64,959 | |
Total Industrial | | | | | | | 6,890,017 | |
| | | | | | | | | |
Consumer, Non-cyclical - 18.1% |
Amgen, Inc.1 | | | 1,363 | | | | 366,320 | |
H&R Block, Inc.1 | | | 8,309 | | | | 357,785 | |
Humana, Inc.1 | | | 729 | | | | 354,673 | |
Gilead Sciences, Inc.1 | | | 4,631 | | | | 347,047 | |
United Therapeutics Corp.* | | | 1,522 | | | | 343,774 | |
Exelixis, Inc.* | | | 15,332 | | | | 335,004 | |
Merck & Company, Inc.1 | | | 3,222 | | | | 331,705 | |
Bristol-Myers Squibb Co.1 | | | 5,681 | | | | 329,725 | |
Pfizer, Inc. | | | 9,825 | | | | 325,895 | |
Hologic, Inc.*,1 | | | 4,600 | | | | 319,240 | |
Royalty Pharma plc — Class A | | | 11,580 | | | | 314,281 | |
Innoviva, Inc.*,1 | | | 23,751 | | | | 308,526 | |
Incyte Corp.*,1 | | | 5,113 | | | | 295,378 | |
Perdoceo Education Corp. | | | 14,163 | | | | 242,187 | |
Altria Group, Inc.1 | | | 5,189 | | | | 218,197 | |
Molina Healthcare, Inc.* | | | 659 | | | | 216,079 | |
Dynavax Technologies Corp.*,1 | | | 12,411 | | | | 183,311 | |
Elevance Health, Inc. | | | 304 | | | | 132,368 | |
Philip Morris International, Inc. | | | 1,208 | | | | 111,837 | |
PayPal Holdings, Inc.* | | | 1,797 | | | | 105,053 | |
Heidrick & Struggles International, Inc.1 | | | 4,064 | | | | 101,681 | |
Procter & Gamble Co. | | | 683 | | | | 99,622 | |
Hackett Group, Inc. | | | 4,018 | | | | 94,785 | |
Envista Holdings Corp.* | | | 3,194 | | | | 89,049 | |
John B Sanfilippo & Son, Inc. | | | 888 | | | | 87,734 | |
Organon & Co. | | | 4,890 | | | | 84,891 | |
Neurocrine Biosciences, Inc.* | | | 640 | | | | 72,000 | |
Alarm.com Holdings, Inc.* | | | 1,171 | | | | 71,595 | |
Voyager Therapeutics, Inc.* | | | 8,607 | | | | 66,704 | |
Alkermes plc* | | | 2,342 | | | | 65,600 | |
Total Consumer, Non-cyclical | | | | | | | 6,372,046 | |
| | | | | | | | | |
Consumer, Cyclical - 12.6% |
MSC Industrial Direct Company, Inc. — Class A1 | | | 3,477 | | | | 341,267 | |
Polaris, Inc. | | | 3,106 | | | | 323,459 | |
Home Depot, Inc.1 | | | 1,038 | | | | 313,642 | |
Allison Transmission Holdings, Inc.1 | | | 4,924 | | | | 290,811 | |
Lennar Corp. — Class A | | | 2,353 | | | | 264,077 | |
Boyd Gaming Corp.1 | | | 4,221 | | | | 256,764 | |
Tri Pointe Homes, Inc.* | | | 8,417 | | | | 230,205 | |
KB Home | | | 4,923 | | | | 227,837 | |
M/I Homes, Inc.* | | | 2,211 | | | | 185,812 | |
Ulta Beauty, Inc.* | | | 447 | | | | 178,554 | |
PulteGroup, Inc.1 | | | 2,318 | | | | 171,648 | |
Brunswick Corp.1 | | | 1,965 | | | | 155,235 | |
Monarch Casino & Resort, Inc. | | | 2,487 | | | | 154,443 | |
BorgWarner, Inc. | | | 3,743 | | | | 151,105 | |
Murphy USA, Inc. | | | 438 | | | | 149,678 | |
Steven Madden Ltd. | | | 4,659 | | | | 148,016 | |
Taylor Morrison Home Corp. — Class A* | | | 3,304 | | | | 140,783 | |
Ethan Allen Interiors, Inc. | | | 4,518 | | | | 135,088 | |
Meritage Homes Corp. | | | 1,016 | | | | 124,348 | |
Malibu Boats, Inc. — Class A* | | | 2,497 | | | | 122,403 | |
MasterCraft Boat Holdings, Inc.* | | | 4,043 | | | | 89,835 | |
Williams-Sonoma, Inc. | | | 477 | | | | 74,126 | |
Everi Holdings, Inc.* | | | 5,131 | | | | 67,832 | |
Cavco Industries, Inc.* | | | 248 | | | | 65,884 | |
DR Horton, Inc. | | | 595 | | | | 63,945 | |
Total Consumer, Cyclical | | | | | | | 4,426,797 | |
| | | | | | | | | |
Financial - 9.0% |
Equity Commonwealth REIT1 | | | 17,880 | | | | 328,456 | |
MGIC Investment Corp.1 | | | 19,659 | | | | 328,142 | |
Essent Group Ltd. | | | 6,846 | | | | 323,747 | |
Preferred Bank/Los Angeles CA | | | 4,131 | | | | 257,155 | |
Mr Cooper Group, Inc.* | | | 4,303 | | | | 230,469 | |
Western Union Co. | | | 16,717 | | | | 220,330 | |
Fulton Financial Corp. | | | 13,729 | | | | 166,258 | |
Enact Holdings, Inc. | | | 4,787 | | | | 130,350 | |
SouthState Corp. | | | 1,772 | | | | 119,362 | |
M&T Bank Corp. | | | 901 | | | | 113,931 | |
14 | THE GUGGENHEIM FUNDS ANNUAL REPORT | SEE NOTES TO FINANCIAL STATEMENTS. |
SCHEDULE OF INVESTMENTS (continued) | September 30, 2023 |
ALPHA OPPORTUNITY FUND | |
| | Shares | | | Value | |
NMI Holdings, Inc. — Class A* | | | 4,173 | | | $ | 113,047 | |
Globe Life, Inc. | | | 1,018 | | | | 110,687 | |
S&T Bancorp, Inc. | | | 4,033 | | | | 109,214 | |
Citizens Financial Group, Inc. | | | 3,896 | | | | 104,413 | |
Enova International, Inc.*,1 | | | 1,883 | | | | 95,788 | |
International Bancshares Corp. | | | 2,159 | | | | 93,571 | |
Capital One Financial Corp. | | | 907 | | | | 88,024 | |
FB Financial Corp. | | | 2,965 | | | | 84,087 | |
Independent Bank Corp. | | | 1,505 | | | | 73,881 | |
East West Bancorp, Inc. | | | 1,341 | | | | 70,684 | |
Total Financial | | | | | | | 3,161,596 | |
| | | | | | | | | |
Communications - 8.9% |
Verizon Communications, Inc.1 | | | 9,957 | | | | 322,706 | |
VeriSign, Inc.*,1 | | | 1,489 | | | | 301,567 | |
F5, Inc.* | | | 1,802 | | | | 290,374 | |
Yelp, Inc. — Class A* | | | 6,608 | | | | 274,827 | |
AT&T, Inc.1 | | | 15,540 | | | | 233,411 | |
Juniper Networks, Inc. | | | 8,073 | | | | 224,349 | |
A10 Networks, Inc.1 | | | 12,876 | | | | 193,526 | |
Booking Holdings, Inc.* | | | 61 | | | | 188,121 | |
InterDigital, Inc. | | | 2,340 | | | | 187,762 | |
Cisco Systems, Inc.1 | | | 3,202 | | | | 172,139 | |
IDT Corp. — Class B* | | | 7,432 | | | | 163,876 | |
Ziff Davis, Inc.* | | | 2,329 | | | | 148,334 | |
eBay, Inc. | | | 2,436 | | | | 107,403 | |
Gogo, Inc.* | | | 7,366 | | | | 87,876 | |
GoDaddy, Inc. — Class A* | | | 1,029 | | | | 76,640 | |
Ooma, Inc.* | | | 5,885 | | | | 76,564 | |
New York Times Co. — Class A | | | 1,687 | | | | 69,505 | |
Total Communications | | | | | | | 3,118,980 | |
| | | | | | | | | |
Energy - 8.4% |
Exxon Mobil Corp.1 | | | 2,984 | | | | 350,859 | |
Chord Energy Corp. | | | 2,069 | | | | 335,323 | |
Chesapeake Energy Corp. | | | 3,841 | | | | 331,209 | |
Occidental Petroleum Corp.1 | | | 3,930 | | | | 254,978 | |
Valero Energy Corp. | | | 1,614 | | | | 228,720 | |
CNX Resources Corp.* | | | 9,132 | | | | 206,201 | |
Magnolia Oil & Gas Corp. — Class A | | | 7,577 | | | | 173,589 | |
Cheniere Energy, Inc. | | | 989 | | | | 164,135 | |
Southwestern Energy Co.* | | | 24,133 | | | | 155,658 | |
Par Pacific Holdings, Inc.* | | | 4,083 | | | | 146,743 | |
Coterra Energy, Inc. — Class A | | | 5,202 | | | | 140,714 | |
Marathon Petroleum Corp.1 | | | 923 | | | | 139,687 | |
SandRidge Energy, Inc. | | | 6,574 | | | | 102,949 | |
PBF Energy, Inc. — Class A | | | 1,849 | | | | 98,977 | |
Range Resources Corp. | | | 2,232 | | | | 72,339 | |
Equities Corp. | | | 1,742 | | | | 70,690 | |
Total Energy | | | | | | | 2,972,771 | |
| | | | | | | | | |
Technology - 7.3% |
International Business Machines Corp. | | | 1,990 | | | | 279,197 | |
Hewlett Packard Enterprise Co.1 | | | 15,358 | | | | 266,768 | |
Dropbox, Inc. — Class A* | | | 8,768 | | | | 238,753 | |
Kulicke & Soffa Industries, Inc. | | | 4,905 | | | | 238,530 | |
Progress Software Corp. | | | 3,807 | | | | 200,172 | |
NetApp, Inc. | | | 2,045 | | | | 155,175 | |
NextGen Healthcare, Inc.* | | | 6,246 | | | | 148,218 | |
QUALCOMM, Inc. | | | 1,261 | | | | 140,047 | |
Veradigm, Inc.*,1 | | | 9,159 | | | | 120,349 | |
Photronics, Inc.* | | | 5,809 | | | | 117,400 | |
Synaptics, Inc.* | | | 1,228 | | | | 109,832 | |
Zoom Video Communications, Inc. — Class A* | | | 1,558 | | | | 108,966 | |
Intuit, Inc. | | | 206 | | | | 105,254 | |
Immersion Corp. | | | 11,269 | | | | 74,488 | |
Box, Inc. — Class A* | | | 2,878 | | | | 69,676 | |
Akamai Technologies, Inc.* | | | 651 | | | | 69,358 | |
Diodes, Inc.*,1 | | | 861 | | | | 67,881 | |
Autodesk, Inc.* | | | 309 | | | | 63,935 | |
Total Technology | | | | | | | 2,573,999 | |
| | | | | | | | | |
Utilities - 4.8% |
OGE Energy Corp. | | | 10,237 | | | | 341,199 | |
National Fuel Gas Co. | | | 6,567 | | | | 340,893 | |
Public Service Enterprise Group, Inc. | | | 5,776 | | | | 328,712 | |
Atmos Energy Corp.1 | | | 3,035 | | | | 321,497 | |
Chesapeake Utilities Corp.1 | | | 1,449 | | | | 141,640 | |
ONE Gas, Inc. | | | 1,628 | | | | 111,160 | |
Clearway Energy, Inc. — Class C1 | | | 4,459 | | | | 94,353 | |
Total Utilities | | | | | | | 1,679,454 | |
| | | | | | | | | |
Basic Materials - 2.1% |
NewMarket Corp. | | | 733 | | | | 333,544 | |
Olin Corp. | | | 6,418 | | | | 320,772 | |
CF Industries Holdings, Inc.1 | | | 1,172 | | | | 100,487 | |
Total Basic Materials | | | | | | | 754,803 | |
| | | | | | | | | |
Total Common Stocks | | | | |
(Cost $32,186,841) | | | | | | | 31,950,463 | |
| | | | | | | | | |
MONEY MARKET FUND† - 3.1% |
Goldman Sachs Financial Square Treasury Instruments Fund — Institutional Shares, 5.22%2 | | | 1,101,952 | | | | 1,101,952 | |
Total Money Market Fund | | | | |
(Cost $1,101,952) | | | | | | | 1,101,952 | |
| | | | | | | | | |
Total Investments - 93.9% | | | | |
(Cost $33,288,793) | | $ | 33,052,415 | |
Other Assets & Liabilities, net - 6.1% | | | 2,158,619 | |
Total Net Assets - 100.0% | | $ | 35,211,034 | |
SEE NOTES TO FINANCIAL STATEMENTS. | THE GUGGENHEIM FUNDS ANNUAL REPORT | 15 |
SCHEDULE OF INVESTMENTS (continued) | September 30, 2023 |
ALPHA OPPORTUNITY FUND | |
Custom Basket Swap Agreements |
Counterparty | Reference Obligation | Type | | Financing Rate | | Payment
Frequency | | | Maturity
Date | | | Notional
Amount | | | Value and
Unrealized
Appreciation | |
OTC Custom Basket Swap Agreements†† |
Goldman Sachs International | GS Equity Custom Basket | Pay | | 5.78% (Federal Funds Rate + 0.45%) | At Maturity | 05/06/24 | | $ | 8,231,038 | | | $ | 25,518 | |
Morgan Stanley Capital Services LLC | MS Equity Custom Basket | Pay | | 5.73% (Federal Funds Rate + 0.40%) | At Maturity | 02/01/24 | | | 8,231,037 | | | | 24,145 | |
| | | | | | | | | | | | | | | $ | 16,462,075 | | | $ | 49,663 | |
OTC Custom Basket Swap Agreements Sold Short†† |
Morgan Stanley Capital Services LLC | MS Equity Custom Basket | Receive | | 5.03% (Federal Funds Rate - 0.30%) | At Maturity | 02/01/24 | | $ | 17,749,024 | | | $ | 1,074,296 | |
Goldman Sachs International | GS Equity Custom Basket | Receive | | 5.13% (Federal Funds Rate - 0.20%) | At Maturity | 05/06/24 | | | 17,602,652 | | | | 1,056,830 | |
| | | | | | | | | | | | | | | $ | 35,351,676 | | | $ | 2,131,126 | |
| | Shares | | | Percentage
Notional
Amount | | | Value and
Unrealized
Appreciation
(Depreciation) | |
MS EQUITY LONG CUSTOM BASKET | | | | | | | | |
Communications | | | | | | | | | | | | |
Cisco Systems, Inc. | | | 825 | | | | 0.54 | % | | $ | 6,075 | |
Booking Holdings, Inc. | | | 16 | | | | 0.60 | % | | | 3,288 | |
A10 Networks, Inc. | | | 3,316 | | | | 0.61 | % | | | 416 | |
eBay, Inc. | | | 628 | | | | 0.34 | % | | | 186 | |
GoDaddy, Inc. — Class A | | | 265 | | | | 0.24 | % | | | (283 | ) |
F5, Inc. | | | 464 | | | | 0.91 | % | | | (527 | ) |
AT&T, Inc. | | | 4,003 | | | | 0.73 | % | | | (1,240 | ) |
New York Times Co. — Class A | | | 434 | | | | 0.22 | % | | | (1,416 | ) |
Ziff Davis, Inc. | | | 600 | | | | 0.46 | % | | | (1,473 | ) |
Juniper Networks, Inc. | | | 2,079 | | | | 0.70 | % | | | (2,487 | ) |
Ooma, Inc. | | | 1,516 | | | | 0.24 | % | | | (2,635 | ) |
IDT Corp. — Class B | | | 1,914 | | | | 0.51 | % | | | (2,814 | ) |
InterDigital, Inc. | | | 603 | | | | 0.59 | % | | | (2,958 | ) |
Yelp, Inc. — Class A | | | 1,702 | | | | 0.86 | % | | | (4,060 | ) |
VeriSign, Inc. | | | 384 | | | | 0.94 | % | | | (7,256 | ) |
Gogo, Inc. | | | 1,897 | | | | 0.27 | % | | | (8,963 | ) |
Verizon Communications, Inc. | | | 2,565 | | | | 1.01 | % | | | (9,513 | ) |
Total Communications | | | | | | | | | | | (35,660 | ) |
| | | | | | | | | | | | | |
Industrial | | | | | | | | | | | | |
Boise Cascade Co. | | | 784 | | | | 0.98 | % | | | 19,589 | |
UFP Industries, Inc. | | | 849 | | | | 1.06 | % | | | 12,685 | |
Simpson Manufacturing Company, Inc. | | | 437 | | | | 0.80 | % | | | 11,911 | |
Snap-on, Inc. | | | 308 | | | | 0.95 | % | | | 11,703 | |
ITT, Inc. | | | 869 | | | | 1.03 | % | | | 9,727 | |
Mueller Industries, Inc. | | | 916 | | | | 0.84 | % | | | 8,117 | |
International Seaways, Inc. | | | 604 | | | | 0.33 | % | | | 5,330 | |
Argan, Inc. | | | 992 | | | | 0.55 | % | | | 5,034 | |
Scorpio Tankers, Inc. | | | 517 | | | | 0.34 | % | | | 4,029 | |
Encore Wire Corp. | | | 199 | | | | 0.44 | % | | | 3,319 | |
Builders FirstSource, Inc. | | | 174 | | | | 0.26 | % | | | 2,326 | |
Ardmore Shipping Corp. | | | 2,269 | | | | 0.36 | % | | | 1,753 | |
Teekay Tankers Ltd. — Class A | | | 448 | | | | 0.23 | % | | | 1,136 | |
Northrop Grumman Corp. | | | 62 | | | | 0.33 | % | | | 924 | |
Sanmina Corp. | | | 447 | | | | 0.29 | % | | | 82 | |
Expeditors International of Washington, Inc. | | | 282 | | | | 0.39 | % | | | (27 | ) |
Landstar System, Inc. | | | 136 | | | | 0.29 | % | | | (139 | ) |
Donaldson Company, Inc. | | | 1,375 | | | | 1.00 | % | | | (194 | ) |
CH Robinson Worldwide, Inc. | | | 464 | | | | 0.49 | % | | | (712 | ) |
Teekay Corp. | | | 5,757 | | | | 0.43 | % | | | (737 | ) |
Acuity Brands, Inc. | | | 409 | | | | 0.85 | % | | | (927 | ) |
Owens Corning | | | 214 | | | | 0.35 | % | | | (1,177 | ) |
Schneider National, Inc. — Class B | | | 3,114 | | | | 1.05 | % | | | (1,243 | ) |
Insteel Industries, Inc. | | | 957 | | | | 0.38 | % | | | (1,416 | ) |
Apogee Enterprises, Inc. | | | 1,774 | | | | 1.01 | % | | | (1,804 | ) |
Fortune Brands Innovations, Inc. | | | 295 | | | | 0.22 | % | | | (2,231 | ) |
Masco Corp. | | | 1,160 | | | | 0.75 | % | | | (2,545 | ) |
Valmont Industries, Inc. | | | 223 | | | | 0.65 | % | | | (2,764 | ) |
TE Connectivity Ltd. | | | 536 | | | | 0.80 | % | | | (3,467 | ) |
Illinois Tool Works, Inc. | | | 282 | | | | 0.79 | % | | | (3,689 | ) |
Lindsay Corp. | | | 142 | | | | 0.20 | % | | | (4,468 | ) |
16 | THE GUGGENHEIM FUNDS ANNUAL REPORT | SEE NOTES TO FINANCIAL STATEMENTS. |
SCHEDULE OF INVESTMENTS (continued) | September 30, 2023 |
ALPHA OPPORTUNITY FUND | |
| | Shares | | | Percentage
Notional
Amount | | | Value and
Unrealized
Appreciation
(Depreciation) | |
Watts Water Technologies, Inc. — Class A | | | 477 | | | | 1.00 | % | | $ | (5,159 | ) |
Hub Group, Inc. — Class A | | | 986 | | | | 0.94 | % | | | (5,746 | ) |
Keysight Technologies, Inc. | | | 220 | | | | 0.35 | % | | | (5,963 | ) |
Sturm Ruger & Company, Inc. | | | 1,278 | | | | 0.81 | % | | | (6,540 | ) |
Total Industrial | | | | | | | | | | | 46,717 | |
| | | | | | | | | | | | | |
Technology | | | | | | | | | | | | |
NextGen Healthcare, Inc. | | | 1,609 | | | | 0.46 | % | | | 11,518 | |
NetApp, Inc. | | | 527 | | | | 0.49 | % | | | 7,358 | |
Akamai Technologies, Inc. | | | 168 | | | | 0.22 | % | | | 2,712 | |
Diodes, Inc. | | | 222 | | | | 0.21 | % | | | 2,369 | |
Veradigm, Inc. | | | 2,359 | | | | 0.38 | % | | | 1,005 | |
Synaptics, Inc. | | | 316 | | | | 0.34 | % | | | 379 | |
Autodesk, Inc. | | | 80 | | | | 0.20 | % | | | 274 | |
Dropbox, Inc. — Class A | | | 2,258 | | | | 0.75 | % | | | (642 | ) |
QUALCOMM, Inc. | | | 325 | | | | 0.44 | % | | | (1,016 | ) |
Immersion Corp. | | | 2,903 | | | | 0.23 | % | | | (1,187 | ) |
Hewlett Packard Enterprise Co. | | | 3,956 | | | | 0.83 | % | | | (1,321 | ) |
Zoom Video Communications, Inc. — Class A | | | 401 | | | | 0.34 | % | | | (1,436 | ) |
Intuit, Inc. | | | 53 | | | | 0.33 | % | | | (1,980 | ) |
International Business Machines Corp. | | | 513 | | | | 0.87 | % | | | (2,286 | ) |
Photronics, Inc. | | | 1,496 | | | | 0.37 | % | | | (2,332 | ) |
Kulicke & Soffa Industries, Inc. | | | 1,263 | | | | 0.75 | % | | | (3,490 | ) |
Progress Software Corp. | | | 980 | | | | 0.63 | % | | | (4,560 | ) |
Box, Inc. — Class A | | | 741 | | | | 0.22 | % | | | (4,579 | ) |
Total Technology | | | | | | | | | | | 786 | |
| | | | | | | | | | | | | |
Consumer, Non-cyclical | | | | | | | | | | | | |
H&R Block, Inc. | | | 2,140 | | | | 1.12 | % | | | 25,244 | |
Perdoceo Education Corp. | | | 3,648 | | | | 0.76 | % | | | 23,642 | |
Exelixis, Inc. | | | 3,949 | | | | 1.05 | % | | | 13,970 | |
Amgen, Inc. | | | 351 | | | | 1.15 | % | | | 11,920 | |
Dynavax Technologies Corp. | | | 3,197 | | | | 0.57 | % | | | 9,462 | |
Hackett Group, Inc. | | | 1,035 | | | | 0.30 | % | | | 4,551 | |
Humana, Inc. | | | 188 | | | | 1.11 | % | | | 3,632 | |
Innoviva, Inc. | | | 6,118 | | | | 0.97 | % | | | 3,383 | |
Molina Healthcare, Inc. | | | 170 | | | | 0.68 | % | | | 2,700 | |
United Therapeutics Corp. | | | 392 | | | | 1.08 | % | | | 952 | |
Alarm.com Holdings, Inc. | | | 302 | | | | 0.22 | % | | | 841 | |
Neurocrine Biosciences, Inc. | | | 165 | | | | 0.23 | % | | | 377 | |
Alkermes plc | | | 603 | | | | 0.21 | % | | | 203 | |
Philip Morris International, Inc. | | | 311 | | | | 0.35 | % | | | (322 | ) |
Procter & Gamble Co. | | | 176 | | | | 0.31 | % | | | (1,094 | ) |
PayPal Holdings, Inc. | | | 463 | | | | 0.33 | % | | | (1,220 | ) |
Elevance Health, Inc. | | | 78 | | | | 0.41 | % | | | (1,224 | ) |
John B Sanfilippo & Son, Inc. | | | 229 | | | | 0.27 | % | | | (1,231 | ) |
Altria Group, Inc. | | | 1,337 | | | | 0.68 | % | | | (2,169 | ) |
Heidrick & Struggles International, Inc. | | | 1,047 | | | | 0.32 | % | | | (2,431 | ) |
Envista Holdings Corp. | | | 823 | | | | 0.28 | % | | | (2,946 | ) |
Organon & Co. | | | 1,259 | | | | 0.27 | % | | | (3,359 | ) |
Voyager Therapeutics, Inc. | | | 2,217 | | | | 0.21 | % | | | (3,627 | ) |
Pfizer, Inc. | | | 2,531 | | | | 1.02 | % | | | (4,651 | ) |
Gilead Sciences, Inc. | | | 1,193 | | | | 1.09 | % | | | (5,042 | ) |
Bristol-Myers Squibb Co. | | | 1,463 | | | | 1.03 | % | | | (7,753 | ) |
Merck & Company, Inc. | | | 830 | | | | 1.04 | % | | | (7,872 | ) |
Hologic, Inc. | | | 1,185 | | | | 1.00 | % | | | (9,485 | ) |
Incyte Corp. | | | 1,317 | | | | 0.92 | % | | | (17,453 | ) |
Royalty Pharma plc — Class A | | | 2,983 | | | | 0.98 | % | | | (28,511 | ) |
Total Consumer, Non-cyclical | | | | | | | | | | | 487 | |
| | | | | | | | | | | | | |
Consumer, Cyclical | | | | | | | | | | | | |
Allison Transmission Holdings, Inc. | | | 1,268 | | | | 0.91 | % | | | 21,324 | |
MSC Industrial Direct Company, Inc. — Class A | | | 896 | | | | 1.07 | % | | | 9,330 | |
Murphy USA, Inc. | | | 113 | | | | 0.47 | % | | | 4,372 | |
Brunswick Corp. | | | 506 | | | | 0.49 | % | | | 3,256 | |
Taylor Morrison Home Corp. — Class A | | | 851 | | | | 0.44 | % | | | 2,925 | |
Williams-Sonoma, Inc. | | | 123 | | | | 0.23 | % | | | 1,778 | |
Boyd Gaming Corp. | | | 1,087 | | | | 0.80 | % | | | 1,197 | |
Ethan Allen Interiors, Inc. | | | 1,164 | | | | 0.42 | % | | | 850 | |
Cavco Industries, Inc. | | | 64 | | | | 0.21 | % | | | (137 | ) |
BorgWarner, Inc. | | | 964 | | | | 0.47 | % | | | (147 | ) |
Ulta Beauty, Inc. | | | 115 | | | | 0.56 | % | | | (1,151 | ) |
DR Horton, Inc. | | | 153 | | | | 0.20 | % | | | (1,213 | ) |
Everi Holdings, Inc. | | | 1,322 | | | | 0.21 | % | | | (1,801 | ) |
Steven Madden Ltd. | | | 1,200 | | | | 0.46 | % | | | (2,315 | ) |
Meritage Homes Corp. | | | 262 | | | | 0.39 | % | | | (2,886 | ) |
PulteGroup, Inc. | | | 597 | | | | 0.54 | % | | | (2,987 | ) |
Monarch Casino & Resort, Inc. | | | 641 | | | | 0.48 | % | | | (3,665 | ) |
Lennar Corp. — Class A | | | 606 | | | | 0.83 | % | | | (3,745 | ) |
KB Home | | | 1,268 | | | | 0.71 | % | | | (3,902 | ) |
Malibu Boats, Inc. — Class A | | | 643 | | | | 0.38 | % | | | (4,048 | ) |
Tri Pointe Homes, Inc. | | | 2,168 | | | | 0.72 | % | | | (4,550 | ) |
MasterCraft Boat Holdings, Inc. | | | 1,041 | | | | 0.28 | % | | | (4,901 | ) |
M/I Homes, Inc. | | | 570 | | | | 0.58 | % | | | (5,815 | ) |
Home Depot, Inc. | | | 267 | | | | 0.98 | % | | | (6,575 | ) |
Polaris, Inc. | | | 800 | | | | 1.01 | % | | | (12,459 | ) |
Total Consumer, Cyclical | | | | | | | | | | | (17,265 | ) |
SEE NOTES TO FINANCIAL STATEMENTS. | THE GUGGENHEIM FUNDS ANNUAL REPORT | 17 |
SCHEDULE OF INVESTMENTS (continued) | September 30, 2023 |
ALPHA OPPORTUNITY FUND | |
| | Shares | | | Percentage
Notional
Amount | | | Value and
Unrealized
Appreciation
(Depreciation) | |
Utilities | | | | | | | | | | | | |
ONE Gas, Inc. | | | 419 | | | | 0.35 | % | | $ | (1,996 | ) |
Public Service Enterprise Group, Inc. | | | 1,488 | | | | 1.03 | % | | | (3,354 | ) |
Clearway Energy, Inc. — Class C | | | 1,148 | | | | 0.30 | % | | | (4,164 | ) |
National Fuel Gas Co. | | | 1,692 | | | | 1.07 | % | | | (6,589 | ) |
Atmos Energy Corp. | | | 782 | | | | 1.01 | % | | | (6,898 | ) |
Chesapeake Utilities Corp. | | | 373 | | | | 0.44 | % | | | (7,178 | ) |
OGE Energy Corp. | | | 2,637 | | | | 1.07 | % | | | (13,409 | ) |
Total Utilities | | | | | | | | | | | (43,588 | ) |
| | | | | | | | | | | | | |
Basic Materials | | | | | | | | | | | | |
NewMarket Corp. | | | 189 | | | | 1.04 | % | | | 17,992 | |
CF Industries Holdings, Inc. | | | 302 | | | | 0.31 | % | | | 4,967 | |
Olin Corp. | | | 1,653 | | | | 1.00 | % | | | (10,278 | ) |
Total Basic Materials | | | | | | | | | | | 12,681 | |
| | | | | | | | | | | | | |
Energy | | | | | | | | | | | | |
Exxon Mobil Corp. | | | 769 | | | | 1.10 | % | | | 14,686 | |
Marathon Petroleum Corp. | | | 238 | | | | 0.44 | % | | | 12,748 | |
Valero Energy Corp. | | | 416 | | | | 0.72 | % | | | 11,686 | |
PBF Energy, Inc. — Class A | | | 476 | | | | 0.31 | % | | | 8,095 | |
Cheniere Energy, Inc. | | | 255 | | | | 0.51 | % | | | 5,639 | |
CNX Resources Corp. | | | 2,352 | | | | 0.65 | % | | | 705 | |
Par Pacific Holdings, Inc. | | | 1,052 | | | | 0.46 | % | | | 428 | |
Occidental Petroleum Corp. | | | 1,012 | | | | 0.80 | % | | | 287 | |
Range Resources Corp. | | | 575 | | | | 0.23 | % | | | 241 | |
Magnolia Oil & Gas Corp. — Class A | | | 1,952 | | | | 0.54 | % | | | (362 | ) |
Equities Corp. | | | 449 | | | | 0.22 | % | | | (769 | ) |
Chesapeake Energy Corp. | | | 989 | | | | 1.04 | % | | | (781 | ) |
Chord Energy Corp. | | | 533 | | | | 1.05 | % | | | (925 | ) |
SandRidge Energy, Inc. | | | 1,693 | | | | 0.32 | % | | | (1,001 | ) |
Southwestern Energy Co. | | | 6,216 | | | | 0.49 | % | | | (1,006 | ) |
Coterra Energy, Inc. — Class A | | | 1,340 | | | | 0.44 | % | | | (1,223 | ) |
Total Energy | | | | | | | | | | | 48,448 | |
| | | | | | | | | | | | | |
Financial | | | | | | | | | | | | |
MGIC Investment Corp. | | | 5,063 | | | | 1.03 | % | | | 11,428 | |
Preferred Bank/Los Angeles CA | | | 1,064 | | | | 0.80 | % | | | 10,248 | |
NMI Holdings, Inc. — Class A | | | 1,075 | | | | 0.35 | % | | | 7,628 | |
Essent Group Ltd. | | | 1,763 | | | | 1.01 | % | | | 6,445 | |
Mr Cooper Group, Inc. | | | 1,108 | | | | 0.72 | % | | | 4,488 | |
Western Union Co. | | | 4,306 | | | | 0.69 | % | | | 4,124 | |
M&T Bank Corp. | | | 232 | | | | 0.36 | % | | | 1,032 | |
SouthState Corp. | | | 457 | | | | 0.37 | % | | | 935 | |
East West Bancorp, Inc. | | | 345 | | | | 0.22 | % | | | (306 | ) |
International Bancshares Corp. | | | 556 | | | | 0.29 | % | | | (563 | ) |
Capital One Financial Corp. | | | 234 | | | | 0.28 | % | | | (824 | ) |
Enova International, Inc. | | | 485 | | | | 0.30 | % | | | (895 | ) |
Citizens Financial Group, Inc. | | | 1,004 | | | | 0.33 | % | | | (945 | ) |
Enact Holdings, Inc. | | | 1,233 | | | | 0.41 | % | | | (967 | ) |
Globe Life, Inc. | | | 262 | | | | 0.35 | % | | | (1,481 | ) |
S&T Bancorp, Inc. | | | 1,039 | | | | 0.34 | % | | | (1,619 | ) |
Independent Bank Corp. | | | 388 | | | | 0.23 | % | | | (3,977 | ) |
FB Financial Corp. | | | 764 | | | | 0.26 | % | | | (5,856 | ) |
Fulton Financial Corp. | | | 3,536 | | | | 0.52 | % | | | (7,705 | ) |
Equity Commonwealth | | | 4,605 | | | | 1.03 | % | | | (9,651 | ) |
Total Financial | | | | | | | | | | | 11,539 | |
Total MS Equity Long Custom Basket | | | | | | $ | 24,145 | |
| | | | | | | | | |
MS EQUITY SHORT CUSTOM BASKET | | | | | | | | |
Consumer, Non-cyclical | | | | | | | | | | | | |
Chefs’ Warehouse, Inc. | | | 4,128 | | | | (0.51 | )% | | $ | 33,519 | |
Utz Brands, Inc. | | | 9,476 | | | | (0.72 | )% | | | 26,081 | |
Cooper Companies, Inc. | | | 630 | | | | (1.13 | )% | | | 25,510 | |
TreeHouse Foods, Inc. | | | 5,053 | | | | (1.24 | )% | | | 19,141 | |
Equifax, Inc. | | | 852 | | | | (0.88 | )% | | | 18,331 | |
ICU Medical, Inc. | | | 653 | | | | (0.44 | )% | | | 13,841 | |
Bright Horizons Family Solutions, Inc. | | | 1,152 | | | | (0.53 | )% | | | 13,115 | |
Pilgrim’s Pride Corp. | | | 7,095 | | | | (0.91 | )% | | | 8,982 | |
ABM Industries, Inc. | | | 1,501 | | | | (0.34 | )% | | | 8,106 | |
Automatic Data Processing, Inc. | | | 684 | | | | (0.93 | )% | | | 6,883 | |
Cintas Corp. | | | 400 | | | | (1.08 | )% | | | 6,144 | |
Tyson Foods, Inc. — Class A | | | 3,059 | | | | (0.87 | )% | | | 3,020 | |
CBIZ, Inc. | | | 1,628 | | | | (0.48 | )% | | | 2,707 | |
Booz Allen Hamilton Holding Corp. | | | 1,682 | | | | (1.04 | )% | | | (1,116 | ) |
TransUnion | | | 2,105 | | | | (0.85 | )% | | | (1,847 | ) |
Neogen Corp. | | | 4,217 | | | | (0.44 | )% | | | (4,506 | ) |
RB Global, Inc. | | | 4,011 | | | | (1.41 | )% | | | (6,832 | ) |
ICF International, Inc. | | | 1,237 | | | | (0.84 | )% | | | (20,422 | ) |
Total Consumer, Non-cyclical | | | | | | | | | | | 150,657 | |
| | | | | | | | | | | | | |
Financial | | | | | | | | | | | | |
Sun Communities, Inc. | | | 2,151 | | | | (1.43 | )% | | | 89,705 | |
American Tower Corp. — Class A | | | 1,447 | | | | (1.34 | )% | | | 70,022 | |
Outfront Media, Inc. | | | 11,666 | | | | (0.66 | )% | | | 68,592 | |
Rexford Industrial Realty, Inc. | | | 3,712 | | | | (1.03 | )% | | | 44,059 | |
Kennedy-Wilson Holdings, Inc. | | | 15,938 | | | | (1.32 | )% | | | 40,890 | |
Healthcare Realty Trust, Inc. | | | 6,537 | | | | (0.56 | )% | | | 36,986 | |
Raymond James Financial, Inc. | | | 2,447 | | | | (1.38 | )% | | | 30,206 | |
18 | THE GUGGENHEIM FUNDS ANNUAL REPORT | SEE NOTES TO FINANCIAL STATEMENTS. |
SCHEDULE OF INVESTMENTS (continued) | September 30, 2023 |
ALPHA OPPORTUNITY FUND | |
| | Shares | | | Percentage
Notional
Amount | | | Value and
Unrealized
Appreciation
(Depreciation) | |
Americold Realty Trust, Inc. | | | 6,772 | | | | (1.16 | )% | | $ | 25,477 | |
UMH Properties, Inc. | | | 16,631 | | | | (1.31 | )% | | | 22,570 | |
TFS Financial Corp. | | | 17,710 | | | | (1.18 | )% | | | 21,663 | |
Equinix, Inc. | | | 329 | | | | (1.35 | )% | | | 19,324 | |
Jones Lang LaSalle, Inc. | | | 1,291 | | | | (1.03 | )% | | | 18,854 | |
Alexander & Baldwin, Inc. | | | 8,681 | | | | (0.82 | )% | | | 16,986 | |
SLM Corp. | | | 6,541 | | | | (0.50 | )% | | | 13,882 | |
Rayonier, Inc. | | | 2,482 | | | | (0.40 | )% | | | 13,194 | |
New York Mortgage Trust, Inc. | | | 15,717 | | | | (0.75 | )% | | | 11,763 | |
Pathward Financial, Inc. | | | 2,393 | | | | (0.62 | )% | | | 11,604 | |
Northern Trust Corp. | | | 1,735 | | | | (0.68 | )% | | | 9,590 | |
NU Holdings Limited/Cayman Islands — Class A | | | 18,031 | | | | (0.74 | )% | | | 9,122 | |
Stellar Bancorp, Inc. | | | 4,181 | | | | (0.50 | )% | | | 8,183 | |
Starwood Property Trust, Inc. | | | 8,394 | | | | (0.92 | )% | | | 8,037 | |
Popular, Inc. | | | 3,327 | | | | (1.18 | )% | | | 7,783 | |
Crown Castle, Inc. | | | 797 | | | | (0.41 | )% | | | 5,449 | |
BOK Financial Corp. | | | 1,878 | | | | (0.85 | )% | | | 4,120 | |
Annaly Capital Management, Inc. | | | 5,299 | | | | (0.56 | )% | | | 3,919 | |
Hanover Insurance Group, Inc. | | | 1,437 | | | | (0.90 | )% | | | 2,790 | |
PotlatchDeltic Corp. | | | 3,656 | | | | (0.93 | )% | | | 2,375 | |
Equity LifeStyle Properties, Inc. | | | 1,226 | | | | (0.44 | )% | | | 2,092 | |
Assured Guaranty Ltd. | | | 1,768 | | | | (0.60 | )% | | | 1,883 | |
AGNC Investment Corp. | | | 14,302 | | | | (0.76 | )% | | | 1,532 | |
Ventas, Inc. | | | 5,288 | | | | (1.26 | )% | | | 351 | |
Progressive Corp. | | | 582 | | | | (0.46 | )% | | | (409 | ) |
Apollo Global Management, Inc. | | | 1,127 | | | | (0.57 | )% | | | (2,929 | ) |
Carlyle Group, Inc. | | | 5,874 | | | | (1.00 | )% | | | (3,642 | ) |
Allstate Corp. | | | 1,931 | | | | (1.21 | )% | | | (6,749 | ) |
PennyMac Financial Services, Inc. | | | 2,851 | | | | (1.07 | )% | | | (10,149 | ) |
Brighthouse Financial, Inc. | | | 4,930 | | | | (1.36 | )% | | | (13,494 | ) |
Welltower, Inc. | | | 2,715 | | | | (1.25 | )% | | | (13,588 | ) |
Digital Realty Trust, Inc. | | | 882 | | | | (0.60 | )% | | | (22,002 | ) |
KKR & Company, Inc. — Class A | | | 4,195 | | | | (1.46 | )% | | | (22,488 | ) |
Iron Mountain, Inc. | | | 4,055 | | | | (1.36 | )% | | | (23,778 | ) |
Total Financial | | | | | | | | | | | 503,775 | |
| | | | | | | | | | | | | |
Utilities | | | | | | | | | | | | |
AES Corp. | | | 14,892 | | | | (1.28 | )% | | | 79,286 | |
Avista Corp. | | | 6,822 | | | | (1.24 | )% | | | 64,396 | |
Portland General Electric Co. | | | 5,997 | | | | (1.37 | )% | | | 37,013 | |
PG&E Corp. | | | 15,753 | | | | (1.43 | )% | | | 18,095 | |
Edison International | | | 3,811 | | | | (1.36 | )% | | | 16,918 | |
Exelon Corp. | | | 3,672 | | | | (0.78 | )% | | | 7,128 | |
Spire, Inc. | | | 3,067 | | | | (0.98 | )% | | | 5,143 | |
FirstEnergy Corp. | | | 5,150 | | | | (0.99 | )% | | | 4,146 | |
Duke Energy Corp. | | | 2,942 | | | | (1.46 | )% | | | (3,775 | ) |
Total Utilities | | | | | | | | | | | 228,350 | |
| | | | | | | | | | | | | |
Basic Materials | | | | | | | | | | | | |
Hecla Mining Co. | | | 32,657 | | | | (0.72 | )% | | | 50,865 | |
Piedmont Lithium, Inc. | | | 2,661 | | | | (0.60 | )% | | | 41,234 | |
Alcoa Corp. | | | 5,885 | | | | (0.96 | )% | | | 24,019 | |
Royal Gold, Inc. | | | 1,058 | | | | (0.63 | )% | | | 17,326 | |
Avient Corp. | | | 2,596 | | | | (0.52 | )% | | | 11,164 | |
Novagold Resources, Inc. | | | 37,575 | | | | (0.81 | )% | | | 9,760 | |
Ecolab, Inc. | | | 787 | | | | (0.75 | )% | | | 9,583 | |
Kaiser Aluminum Corp. | | | 2,314 | | | | (0.98 | )% | | | 4,101 | |
Century Aluminum Co. | | | 10,919 | | | | (0.44 | )% | | | 2,826 | |
Mercer International, Inc. | | | 12,729 | | | | (0.62 | )% | | | (861 | ) |
Carpenter Technology Corp. | | | 2,899 | | | | (1.10 | )% | | | (70,327 | ) |
Total Basic Materials | | | | | | | | | | | 99,690 | |
| | | | | | | | | | | | | |
Energy | | | | | | | | | | | | |
Baker Hughes Co. | | | 3,412 | | | | (0.68 | )% | | | 1,876 | |
Archrock, Inc. | | | 9,084 | | | | (0.64 | )% | | | (717 | ) |
Halliburton Co. | | | 5,085 | | | | (1.16 | )% | | | (1,509 | ) |
Expro Group Holdings N.V. | | | 4,383 | | | | (0.57 | )% | | | (1,861 | ) |
NOV, Inc. | | | 9,760 | | | | (1.15 | )% | | | (3,873 | ) |
Noble Corporation plc | | | 1,729 | | | | (0.49 | )% | | | (7,378 | ) |
TechnipFMC plc | | | 8,024 | | | | (0.92 | )% | | | (9,360 | ) |
Helix Energy Solutions Group, Inc. | | | 8,282 | | | | (0.52 | )% | | | (13,269 | ) |
Valaris Ltd. | | | 1,358 | | | | (0.57 | )% | | | (21,961 | ) |
Hess Corp. | | | 1,630 | | | | (1.41 | )% | | | (29,912 | ) |
Total Energy | | | | | | | | | | | (87,964 | ) |
| | | | | | | | | | | | | |
Consumer, Cyclical | | | | | | | | | | | | |
Walgreens Boots Alliance, Inc. | | | 9,089 | | | | (1.14 | )% | | | 42,955 | |
UniFirst Corp. | | | 1,024 | | | | (0.94 | )% | | | 36,314 | |
Topgolf Callaway Brands Corp. | | | 8,886 | | | | (0.69 | )% | | | 27,014 | |
Shake Shack, Inc. — Class A | | | 1,645 | | | | (0.54 | )% | | | 16,624 | |
Floor & Decor Holdings, Inc. — Class A | | | 1,559 | | | | (0.79 | )% | | | 9,136 | |
Life Time Group Holdings, Inc. | | | 5,291 | | | | (0.45 | )% | | | 8,911 | |
VF Corp. | | | 9,027 | | | | (0.90 | )% | | | 3,215 | |
OPENLANE, Inc. | | | 8,330 | | | | (0.70 | )% | | | 1,701 | |
Newell Brands, Inc. | | | 8,576 | | | | (0.44 | )% | | | (2,085 | ) |
Tesla, Inc. | | | 209 | | | | (0.29 | )% | | | (5,880 | ) |
Total Consumer, Cyclical | | | | | | | | | | | 137,905 | |
| | | | | | | | | | | | | |
Industrial | | | | | | | | | | | | |
MasTec, Inc. | | | 1,136 | | | | (0.46 | )% | | | 24,611 | |
3M Co. | | | 1,615 | | | | (0.85 | )% | | | 20,212 | |
SEE NOTES TO FINANCIAL STATEMENTS. | THE GUGGENHEIM FUNDS ANNUAL REPORT | 19 |
SCHEDULE OF INVESTMENTS (continued) | September 30, 2023 |
ALPHA OPPORTUNITY FUND | |
| | Shares | | | Percentage
Notional
Amount | | | Value and
Unrealized
Appreciation
(Depreciation) | |
GATX Corp. | | | 1,255 | | | | (0.77 | )% | | $ | 6,521 | |
Tetra Tech, Inc. | | | 672 | | | | (0.58 | )% | | | 4,042 | |
Republic Services, Inc. — Class A | | | 358 | | | | (0.29 | )% | | | 2,527 | |
Stericycle, Inc. | | | 2,358 | | | | (0.59 | )% | | | 587 | |
Jacobs Solutions, Inc. | | | 388 | | | | (0.30 | )% | | | (1,694 | ) |
Trinity Industries, Inc. | | | 5,314 | | | | (0.73 | )% | | | (2,667 | ) |
Casella Waste Systems, Inc. — Class A | | | 1,921 | | | | (0.83 | )% | | | (15,434 | ) |
MSA Safety, Inc. | | | 1,019 | | | | (0.91 | )% | | | (19,171 | ) |
Total Industrial | | | | | | | | | | | 19,534 | |
| | | | | | | | | | | | | |
Technology | | | | | | | | | | | | |
Science Applications International Corp. | | | 2,188 | | | | (1.30 | )% | | | 19,523 | |
Evolent Health, Inc. — Class A | | | 3,558 | | | | (0.55 | )% | | | 18,599 | |
KBR, Inc. | | | 3,514 | | | | (1.17 | )% | | | 8,189 | |
Privia Health Group, Inc. | | | 6,364 | | | | (0.82 | )% | | | 7,756 | |
Take-Two Interactive Software, Inc. | | | 912 | | | | (0.72 | )% | | | (176 | ) |
Paycor HCM, Inc. | | | 8,328 | | | | (1.07 | )% | | | (996 | ) |
Ceridian HCM Holding, Inc. | | | 2,441 | | | | (0.93 | )% | | | (18,201 | ) |
Total Technology | | | | | | | | | | | 34,694 | |
| | | | | | | | | | | | | |
Communications | | | | | | | | | | | | |
DoorDash, Inc. — Class A | | | 1,277 | | | | (0.57 | )% | | | (12,345 | ) |
Total MS Equity Short Custom Basket | | | | | | $ | 1,074,296 | |
| | | | | | | | | |
GS EQUITY LONG CUSTOM BASKET | | | | | | | | |
Communications | | | | | | | | | | | | |
Cisco Systems, Inc. | | | 825 | | | | 0.54 | % | | $ | 6,121 | |
Booking Holdings, Inc. | | | 16 | | | | 0.60 | % | | | 3,349 | |
A10 Networks, Inc. | | | 3,316 | | | | 0.61 | % | | | 359 | |
eBay, Inc. | | | 628 | | | | 0.34 | % | | | 161 | |
GoDaddy, Inc. — Class A | | | 265 | | | | 0.24 | % | | | (273 | ) |
F5, Inc. | | | 464 | | | | 0.91 | % | | | (451 | ) |
AT&T, Inc. | | | 4,003 | | | | 0.73 | % | | | (1,292 | ) |
New York Times Co. — Class A | | | 434 | | | | 0.22 | % | | | (1,380 | ) |
Ziff Davis, Inc. | | | 600 | | | | 0.46 | % | | | (1,446 | ) |
Juniper Networks, Inc. | | | 2,079 | | | | 0.70 | % | | | (2,587 | ) |
Ooma, Inc. | | | 1,516 | | | | 0.24 | % | | | (2,690 | ) |
IDT Corp. — Class B | | | 1,914 | | | | 0.51 | % | | | (2,856 | ) |
InterDigital, Inc. | | | 603 | | | | 0.59 | % | | | (2,902 | ) |
Yelp, Inc. — Class A | | | 1,702 | | | | 0.86 | % | | | (4,200 | ) |
VeriSign, Inc. | | | 384 | | | | 0.94 | % | | | (7,251 | ) |
Gogo, Inc. | | | 1,897 | | | | 0.27 | % | | | (8,999 | ) |
Verizon Communications, Inc. | | | 2,565 | | | | 1.01 | % | | | (9,688 | ) |
Total Communications | | | | | | | | | | | (36,025 | ) |
| | | | | | | | | | | | | |
Industrial | | | | | | | | | | | | |
Boise Cascade Co. | | | 784 | | | | 0.98 | % | | | 19,626 | |
UFP Industries, Inc. | | | 849 | | | | 1.06 | % | | | 12,674 | |
Simpson Manufacturing Company, Inc. | | | 437 | | | | 0.80 | % | | | 11,953 | |
Snap-on, Inc. | | | 308 | | | | 0.95 | % | | | 11,674 | |
ITT, Inc. | | | 869 | | | | 1.03 | % | | | 10,031 | |
Mueller Industries, Inc. | | | 916 | | | | 0.84 | % | | | 8,188 | |
International Seaways, Inc. | | | 604 | | | | 0.33 | % | | | 5,307 | |
Argan, Inc. | | | 992 | | | | 0.55 | % | | | 5,147 | |
Scorpio Tankers, Inc. | | | 517 | | | | 0.34 | % | | | 4,033 | |
Encore Wire Corp. | | | 199 | | | | 0.44 | % | | | 3,303 | |
Builders FirstSource, Inc. | | | 174 | | | | 0.26 | % | | | 2,437 | |
Ardmore Shipping Corp. | | | 2,269 | | | | 0.36 | % | | | 1,684 | |
Teekay Tankers Ltd. — Class A | | | 448 | | | | 0.23 | % | | | 1,102 | |
Northrop Grumman Corp. | | | 62 | | | | 0.33 | % | | | 919 | |
Sanmina Corp. | | | 447 | | | | 0.29 | % | | | 109 | |
Expeditors International of Washington, Inc. | | | 282 | | | | 0.39 | % | | | (30 | ) |
Donaldson Company, Inc. | | | 1,375 | | | | 1.00 | % | | | (99 | ) |
Landstar System, Inc. | | | 136 | | | | 0.29 | % | | | (167 | ) |
CH Robinson Worldwide, Inc. | | | 464 | | | | 0.49 | % | | | (699 | ) |
Acuity Brands, Inc. | | | 409 | | | | 0.85 | % | | | (794 | ) |
Teekay Corp. | | | 5,757 | | | | 0.43 | % | | | (914 | ) |
Owens Corning | | | 214 | | | | 0.35 | % | | | (1,065 | ) |
Schneider National, Inc. — Class B | | | 3,114 | | | | 1.05 | % | | | (1,165 | ) |
Insteel Industries, Inc. | | | 957 | | | | 0.38 | % | | | (1,482 | ) |
Apogee Enterprises, Inc. | | | 1,774 | | | | 1.01 | % | | | (1,854 | ) |
Fortune Brands Innovations, Inc. | | | 295 | | | | 0.22 | % | | | (2,272 | ) |
Masco Corp. | | | 1,160 | | | | 0.75 | % | | | (2,708 | ) |
Valmont Industries, Inc. | | | 223 | | | | 0.65 | % | | | (2,838 | ) |
TE Connectivity Ltd. | | | 536 | | | | 0.80 | % | | | (3,511 | ) |
Illinois Tool Works, Inc. | | | 282 | | | | 0.79 | % | | | (3,555 | ) |
Lindsay Corp. | | | 142 | | | | 0.20 | % | | | (4,444 | ) |
Watts Water Technologies, Inc. — Class A | | | 477 | | | | 1.00 | % | | | (5,123 | ) |
Hub Group, Inc. — Class A | | | 986 | | | | 0.94 | % | | | (5,768 | ) |
Keysight Technologies, Inc. | | | 220 | | | | 0.35 | % | | | (5,974 | ) |
Sturm Ruger & Company, Inc. | | | 1,278 | | | | 0.81 | % | | | (6,615 | ) |
Total Industrial | | | | | | | | | | | 47,110 | |
| | | | | | | | | | | | | |
Technology | | | | | | | | | | | | |
NextGen Healthcare, Inc. | | | 1,609 | | | | 0.46 | % | | | 11,520 | |
NetApp, Inc. | | | 527 | | | | 0.49 | % | | | 7,365 | |
Akamai Technologies, Inc. | | | 168 | | | | 0.22 | % | | | 2,708 | |
Diodes, Inc. | | | 222 | | | | 0.21 | % | | | 2,367 | |
Veradigm, Inc. | | | 2,359 | | | | 0.38 | % | | | 966 | |
Synaptics, Inc. | | | 316 | | | | 0.34 | % | | | 417 | |
Autodesk, Inc. | | | 80 | | | | 0.20 | % | | | 255 | |
20 | THE GUGGENHEIM FUNDS ANNUAL REPORT | SEE NOTES TO FINANCIAL STATEMENTS. |
SCHEDULE OF INVESTMENTS (continued) | September 30, 2023 |
ALPHA OPPORTUNITY FUND | |
| | Shares | | | Percentage
Notional
Amount | | | Value and
Unrealized
Appreciation
(Depreciation) | |
Dropbox, Inc. — Class A | | | 2,258 | | | | 0.75 | % | | $ | (685 | ) |
QUALCOMM, Inc. | | | 325 | | | | 0.44 | % | | | (1,026 | ) |
Hewlett Packard Enterprise Co. | | | 3,956 | | | | 0.83 | % | | | (1,157 | ) |
Immersion Corp. | | | 2,903 | | | | 0.23 | % | | | (1,192 | ) |
Zoom Video Communications, Inc. — Class A | | | 401 | | | | 0.34 | % | | | (1,448 | ) |
Intuit, Inc. | | | 53 | | | | 0.33 | % | | | (2,023 | ) |
Photronics, Inc. | | | 1,496 | | | | 0.37 | % | | | (2,270 | ) |
International Business Machines Corp. | | | 513 | | | | 0.87 | % | | | (2,346 | ) |
Kulicke & Soffa Industries, Inc. | | | 1,263 | | | | 0.75 | % | | | (3,458 | ) |
Box, Inc. — Class A | | | 741 | | | | 0.22 | % | | | (4,554 | ) |
Progress Software Corp. | | | 980 | | | | 0.63 | % | | | (4,601 | ) |
Total Technology | | | | | | | | | | | 838 | |
| | | | | | | | | | | | | |
Consumer, Non-cyclical | | | | | | | | | | | | |
H&R Block, Inc. | | | 2,140 | | | | 1.12 | % | | | 25,052 | |
Perdoceo Education Corp. | | | 3,648 | | | | 0.76 | % | | | 23,611 | |
Exelixis, Inc. | | | 3,949 | | | | 1.05 | % | | | 14,051 | |
Amgen, Inc. | | | 351 | | | | 1.15 | % | | | 12,131 | |
Dynavax Technologies Corp. | | | 3,197 | | | | 0.57 | % | | | 9,497 | |
Hackett Group, Inc. | | | 1,035 | | | | 0.30 | % | | | 4,539 | |
Innoviva, Inc. | | | 6,118 | | | | 0.97 | % | | | 3,423 | |
Humana, Inc. | | | 188 | | | | 1.11 | % | | | 3,153 | |
Molina Healthcare, Inc. | | | 170 | | | | 0.68 | % | | | 2,543 | |
United Therapeutics Corp. | | | 392 | | | | 1.08 | % | | | 1,103 | |
Alarm.com Holdings, Inc. | | | 302 | | | | 0.22 | % | | | 848 | |
Neurocrine Biosciences, Inc. | | | 165 | | | | 0.23 | % | | | 429 | |
Alkermes plc | | | 603 | | | | 0.21 | % | | | 193 | |
Philip Morris International, Inc. | | | 311 | | | | 0.35 | % | | | (272 | ) |
Procter & Gamble Co. | | | 176 | | | | 0.31 | % | | | (1,085 | ) |
John B Sanfilippo & Son, Inc. | | | 229 | | | | 0.27 | % | | | (1,123 | ) |
PayPal Holdings, Inc. | | | 463 | | | | 0.33 | % | | | (1,226 | ) |
Elevance Health, Inc. | | | 78 | | | | 0.41 | % | | | (1,318 | ) |
Altria Group, Inc. | | | 1,337 | | | | 0.68 | % | | | (2,121 | ) |
Heidrick & Struggles International, Inc. | | | 1,047 | | | | 0.32 | % | | | (2,372 | ) |
Envista Holdings Corp. | | | 823 | | | | 0.28 | % | | | (2,979 | ) |
Organon & Co. | | | 1,259 | | | | 0.27 | % | | | (3,499 | ) |
Voyager Therapeutics, Inc. | | | 2,217 | | | | 0.21 | % | | | (3,625 | ) |
Pfizer, Inc. | | | 2,531 | | | | 1.02 | % | | | (4,661 | ) |
Gilead Sciences, Inc. | | | 1,193 | | | | 1.09 | % | | | (4,731 | ) |
Bristol-Myers Squibb Co. | | | 1,463 | | | | 1.03 | % | | | (7,684 | ) |
Merck & Company, Inc. | | | 830 | | | | 1.04 | % | | | (7,839 | ) |
Hologic, Inc. | | | 1,185 | | | | 1.00 | % | | | (9,603 | ) |
Incyte Corp. | | | 1,317 | | | | 0.92 | % | | | (17,190 | ) |
Royalty Pharma plc — Class A | | | 2,983 | | | | 0.98 | % | | | (28,362 | ) |
Total Consumer, Non-cyclical | | | | | | | | | | | 883 | |
| | | | | | | | | | | | | |
Consumer, Cyclical | | | | | | | | | | | | |
Allison Transmission Holdings, Inc. | | | 1,268 | | | | 0.91 | % | | | 21,292 | |
MSC Industrial Direct Company, Inc. — Class A | | | 896 | | | | 1.07 | % | | | 9,291 | |
Murphy USA, Inc. | | | 113 | | | | 0.47 | % | | | 4,333 | |
Brunswick Corp. | | | 506 | | | | 0.49 | % | | | 3,290 | |
Taylor Morrison Home Corp. — Class A | | | 851 | | | | 0.44 | % | | | 2,978 | |
Williams-Sonoma, Inc. | | | 123 | | | | 0.23 | % | | | 1,703 | |
Boyd Gaming Corp. | | | 1,087 | | | | 0.80 | % | | | 1,290 | |
Ethan Allen Interiors, Inc. | | | 1,164 | | | | 0.42 | % | | | 789 | |
Cavco Industries, Inc. | | | 64 | | | | 0.21 | % | | | (142 | ) |
BorgWarner, Inc. | | | 964 | | | | 0.47 | % | | | (224 | ) |
Ulta Beauty, Inc. | | | 115 | | | | 0.56 | % | | | (1,157 | ) |
DR Horton, Inc. | | | 153 | | | | 0.20 | % | | | (1,199 | ) |
Everi Holdings, Inc. | | | 1,322 | | | | 0.21 | % | | | (1,805 | ) |
Steven Madden Ltd. | | | 1,200 | | | | 0.46 | % | | | (2,286 | ) |
Meritage Homes Corp. | | | 262 | | | | 0.39 | % | | | (2,761 | ) |
PulteGroup, Inc. | | | 597 | | | | 0.54 | % | | | (2,872 | ) |
Lennar Corp. — Class A | | | 606 | | | | 0.83 | % | | | (3,608 | ) |
Monarch Casino & Resort, Inc. | | | 641 | | | | 0.48 | % | | | (3,710 | ) |
KB Home | | | 1,268 | | | | 0.71 | % | | | (4,129 | ) |
Malibu Boats, Inc. — Class A | | | 643 | | | | 0.38 | % | | | (4,185 | ) |
Tri Pointe Homes, Inc. | | | 2,168 | | | | 0.72 | % | | | (4,286 | ) |
MasterCraft Boat Holdings, Inc. | | | 1,041 | | | | 0.28 | % | | | (4,910 | ) |
M/I Homes, Inc. | | | 570 | | | | 0.58 | % | | | (5,727 | ) |
Home Depot, Inc. | | | 267 | | | | 0.98 | % | | | (6,609 | ) |
Polaris, Inc. | | | 800 | | | | 1.01 | % | | | (12,514 | ) |
Total Consumer, Cyclical | | | | | | | | | | | (17,158 | ) |
| | | | | | | | | | | | | |
| | | | | | | | | | | | | |
Utilities | | | | | | | | | | | | |
ONE Gas, Inc. | | | 419 | | | | 0.35 | % | | | (1,913 | ) |
Public Service Enterprise Group, Inc. | | | 1,488 | | | | 1.03 | % | | | (3,227 | ) |
Clearway Energy, Inc. — Class C | | | 1,148 | | | | 0.30 | % | | | (4,184 | ) |
National Fuel Gas Co. | | | 1,692 | | | | 1.07 | % | | | (6,584 | ) |
Atmos Energy Corp. | | | 782 | | | | 1.01 | % | | | (6,803 | ) |
Chesapeake Utilities Corp. | | | 373 | | | | 0.44 | % | | | (7,199 | ) |
OGE Energy Corp. | | | 2,637 | | | | 1.07 | % | | | (13,233 | ) |
Total Utilities | | | | | | | | | | | (43,143 | ) |
| | | | | | | | | | | | | |
Basic Materials | | | | | | | | | | | | |
NewMarket Corp. | | | 189 | | | | 1.04 | % | | | 18,033 | |
SEE NOTES TO FINANCIAL STATEMENTS. | THE GUGGENHEIM FUNDS ANNUAL REPORT | 21 |
SCHEDULE OF INVESTMENTS (continued) | September 30, 2023 |
ALPHA OPPORTUNITY FUND | |
| | Shares | | | Percentage
Notional
Amount | | | Value and
Unrealized
Appreciation
(Depreciation) | |
CF Industries Holdings, Inc. | | | 302 | | | | 0.31 | % | | $ | 5,053 | |
Olin Corp. | | | 1,653 | | | | 1.00 | % | | | (10,226 | ) |
Total Basic Materials | | | | | | | | | | | 12,860 | |
| | | | | | | | | | | | | |
Energy | | | | | | | | | | | | |
Exxon Mobil Corp. | | | 769 | | | | 1.10 | % | | | 14,921 | |
Marathon Petroleum Corp. | | | 238 | | | | 0.44 | % | | | 12,773 | |
Valero Energy Corp. | | | 416 | | | | 0.72 | % | | | 11,681 | |
PBF Energy, Inc. — Class A | | | 476 | | | | 0.31 | % | | | 8,019 | |
Cheniere Energy, Inc. | | | 255 | | | | 0.51 | % | | | 5,559 | |
Par Pacific Holdings, Inc. | | | 1,052 | | | | 0.46 | % | | | 479 | |
CNX Resources Corp. | | | 2,352 | | | | 0.65 | % | | | 464 | |
Occidental Petroleum Corp. | | | 1,012 | | | | 0.80 | % | | | 342 | |
Range Resources Corp. | | | 575 | | | | 0.23 | % | | | 205 | |
Magnolia Oil & Gas Corp. — Class A | | | 1,952 | | | | 0.54 | % | | | (388 | ) |
Chesapeake Energy Corp. | | | 989 | | | | 1.04 | % | | | (871 | ) |
Equities Corp. | | | 449 | | | | 0.22 | % | | | (872 | ) |
SandRidge Energy, Inc. | | | 1,693 | | | | 0.32 | % | | | (980 | ) |
Chord Energy Corp. | | | 533 | | | | 1.05 | % | | | (1,039 | ) |
Coterra Energy, Inc. — Class A | | | 1,340 | | | | 0.44 | % | | | (1,210 | ) |
Southwestern Energy Co. | | | 6,216 | | | | 0.49 | % | | | (1,229 | ) |
Total Energy | | | | | | | | | | | 47,854 | |
| | | | | | | | | | | | | |
Financial | | | | | | | | | | | | |
MGIC Investment Corp. | | | 5,063 | | | | 1.03 | % | | | 11,440 | |
Preferred Bank/Los Angeles CA | | | 1,064 | | | | 0.80 | % | | | 10,326 | |
NMI Holdings, Inc. — Class A | | | 1,075 | | | | 0.35 | % | | | 7,666 | |
Essent Group Ltd. | | | 1,763 | | | | 1.01 | % | | | 6,511 | |
Mr Cooper Group, Inc. | | | 1,108 | | | | 0.72 | % | | | 4,599 | |
Western Union Co. | | | 4,306 | | | | 0.69 | % | | | 4,278 | |
SouthState Corp. | | | 457 | | | | 0.37 | % | | | 1,201 | |
M&T Bank Corp. | | | 232 | | | | 0.36 | % | | | 1,037 | |
East West Bancorp, Inc. | | | 345 | | | | 0.22 | % | | | (293 | ) |
International Bancshares Corp. | | | 556 | | | | 0.29 | % | | | (558 | ) |
Capital One Financial Corp. | | | 234 | | | | 0.28 | % | | | (797 | ) |
Citizens Financial Group, Inc. | | | 1,004 | | | | 0.33 | % | | | (906 | ) |
Enova International, Inc. | | | 485 | | | | 0.30 | % | | | (957 | ) |
Enact Holdings, Inc. | | | 1,233 | | | | 0.41 | % | | | (965 | ) |
Globe Life, Inc. | | | 262 | | | | 0.35 | % | | | (1,420 | ) |
S&T Bancorp, Inc. | | | 1,039 | | | | 0.34 | % | | | (1,614 | ) |
Independent Bank Corp. | | | 388 | | | | 0.23 | % | | | (3,998 | ) |
FB Financial Corp. | | | 764 | | | | 0.26 | % | | | (5,846 | ) |
Fulton Financial Corp. | | | 3,536 | | | | 0.52 | % | | | (7,698 | ) |
Equity Commonwealth | | | 4,605 | | | | 1.03 | % | | | (9,707 | ) |
Total Financial | | | | | | | | | | | 12,299 | |
Total GS Equity Long Custom Basket | | | | | | $ | 25,518 | |
GS EQUITY SHORT CUSTOM BASKET | | | | | | | | |
Consumer, Non-cyclical | | | | | | | | | | | | |
Chefs’ Warehouse, Inc. | | | 4,128 | | | | (0.48 | )% | | $ | 33,950 | |
Utz Brands, Inc. | | | 9,476 | | | | (0.72 | )% | | | 26,226 | |
Cooper Companies, Inc. | | | 630 | | | | (1.14 | )% | | | 26,007 | |
Equifax, Inc. | | | 852 | | | | (0.89 | )% | | | 19,051 | |
TreeHouse Foods, Inc. | | | 5,053 | | | | (1.25 | )% | | | 18,563 | |
ICU Medical, Inc. | | | 653 | | | | (0.44 | )% | | | 12,760 | |
Bright Horizons Family Solutions, Inc. | | | 1,152 | | | | (0.53 | )% | | | 12,137 | |
Pilgrim’s Pride Corp. | | | 7,095 | | | | (0.92 | )% | | | 8,848 | |
ABM Industries, Inc. | | | 1,501 | | | | (0.34 | )% | | | 8,029 | |
Automatic Data Processing, Inc. | | | 684 | | | | (0.93 | )% | | | 7,065 | |
Cintas Corp. | | | 400 | | | | (1.09 | )% | | | 6,338 | |
Tyson Foods, Inc. — Class A | | | 3,059 | | | | (0.88 | )% | | | 3,398 | |
CBIZ, Inc. | | | 1,628 | | | | (0.48 | )% | | | 2,573 | |
Booz Allen Hamilton Holding Corp. | | | 1,682 | | | | (1.04 | )% | | | (1,200 | ) |
TransUnion | | | 2,105 | | | | (0.86 | )% | | | (1,901 | ) |
Neogen Corp. | | | 4,217 | | | | (0.44 | )% | | | (4,556 | ) |
RB Global, Inc. | | | 4,011 | | | | (1.42 | )% | | | (7,278 | ) |
ICF International, Inc. | | | 1,237 | | | | (0.85 | )% | | | (20,418 | ) |
Total Consumer, Non-cyclical | | | | | | | | | | | 149,592 | |
| | | | | | | | | | | | | |
Financial | | | | | | | | | | | | |
Sun Communities, Inc. | | | 2,151 | | | | (1.43 | )% | | | 89,401 | |
American Tower Corp. — Class A | | | 1,447 | | | | (1.35 | )% | | | 70,164 | |
Outfront Media, Inc. | | | 11,666 | | | | (0.67 | )% | | | 68,874 | |
Rexford Industrial Realty, Inc. | | | 3,712 | | | | (1.04 | )% | | | 43,682 | |
Kennedy-Wilson Holdings, Inc. | | | 15,938 | | | | (1.33 | )% | | | 40,585 | |
Healthcare Realty Trust, Inc. | | | 6,537 | | | | (0.57 | )% | | | 37,106 | |
Raymond James Financial, Inc. | | | 2,447 | | | | (1.40 | )% | | | 29,859 | |
Americold Realty Trust, Inc. | | | 6,772 | | | | (1.17 | )% | | | 25,131 | |
UMH Properties, Inc. | | | 16,631 | | | | (1.32 | )% | | | 22,739 | |
TFS Financial Corp. | | | 17,710 | | | | (1.19 | )% | | | 21,532 | |
Equinix, Inc. | | | 329 | | | | (1.36 | )% | | | 19,160 | |
Jones Lang LaSalle, Inc. | | | 1,291 | | | | (1.04 | )% | | | 18,656 | |
Alexander & Baldwin, Inc. | | | 8,681 | | | | (0.83 | )% | | | 16,864 | |
SLM Corp. | | | 6,541 | | | | (0.51 | )% | | | 13,745 | |
Rayonier, Inc. | | | 2,482 | | | | (0.40 | )% | | | 13,303 | |
New York Mortgage Trust, Inc. | | | 15,717 | | | | (0.76 | )% | | | 11,648 | |
Pathward Financial, Inc. | | | 2,393 | | | | (0.63 | )% | | | 11,592 | |
Northern Trust Corp. | | | 1,735 | | | | (0.68 | )% | | | 9,482 | |
NU Holdings Limited/Cayman Islands — Class A | | | 18,031 | | | | (0.74 | )% | | | 9,302 | |
22 | THE GUGGENHEIM FUNDS ANNUAL REPORT | SEE NOTES TO FINANCIAL STATEMENTS. |
SCHEDULE OF INVESTMENTS (continued) | September 30, 2023 |
ALPHA OPPORTUNITY FUND | |
| | Shares | | | Percentage
Notional
Amount | | | Value and
Unrealized
Appreciation
(Depreciation) | |
Stellar Bancorp, Inc. | | | 4,181 | | | | (0.51 | )% | | $ | 8,240 | |
Starwood Property Trust, Inc. | | | 8,394 | | | | (0.92 | )% | | | 7,820 | |
Popular, Inc. | | | 3,327 | | | | (1.19 | )% | | | 7,426 | |
Crown Castle, Inc. | | | 797 | | | | (0.42 | )% | | | 5,435 | |
BOK Financial Corp. | | | 1,878 | | | | (0.85 | )% | | | 4,213 | |
Annaly Capital Management, Inc. | | | 5,299 | | | | (0.57 | )% | | | 3,937 | |
Hanover Insurance Group, Inc. | | | 1,437 | | | | (0.91 | )% | | | 2,736 | |
PotlatchDeltic Corp. | | | 3,656 | | | | (0.94 | )% | | | 2,353 | |
Equity LifeStyle Properties, Inc. | | | 1,226 | | | | (0.44 | )% | | | 2,098 | |
Assured Guaranty Ltd. | | | 1,768 | | | | (0.61 | )% | | | 1,885 | |
AGNC Investment Corp. | | | 14,302 | | | | (0.77 | )% | | | 957 | |
Progressive Corp. | | | 582 | | | | (0.46 | )% | | | (376 | ) |
Ventas, Inc. | | | 5,288 | | | | (1.27 | )% | | | (935 | ) |
Apollo Global Management, Inc. | | | 1,127 | | | | (0.57 | )% | | | (2,830 | ) |
Carlyle Group, Inc. | | | 5,874 | | | | (1.01 | )% | | | (4,428 | ) |
Allstate Corp. | | | 1,931 | | | | (1.22 | )% | | | (7,017 | ) |
PennyMac Financial Services, Inc. | | | 2,851 | | | | (1.08 | )% | | | (10,298 | ) |
Brighthouse Financial, Inc. | | | 4,930 | | | | (1.37 | )% | | | (13,743 | ) |
Welltower, Inc. | | | 2,715 | | | | (1.26 | )% | | | (13,766 | ) |
Digital Realty Trust, Inc. | | | 882 | | | | (0.61 | )% | | | (22,485 | ) |
KKR & Company, Inc. — Class A | | | 4,195 | | | | (1.47 | )% | | | (22,512 | ) |
Iron Mountain, Inc. | | | 4,055 | | | | (1.37 | )% | | | (23,690 | ) |
Total Financial | | | | | | | | | | | 497,845 | |
| | | | | | | | | | | | | |
Utilities | | | | | | | | | | | | |
AES Corp. | | | 14,892 | | | | (1.29 | )% | | | 80,809 | |
Avista Corp. | | | 6,822 | | | | (1.25 | )% | | | 64,287 | |
Portland General Electric Co. | | | 5,997 | | | | (1.38 | )% | | | 37,019 | |
PG&E Corp. | | | 15,753 | | | | (1.44 | )% | | | 18,299 | |
Edison International | | | 3,811 | | | | (1.37 | )% | | | 16,621 | |
Exelon Corp. | | | 3,672 | | | | (0.79 | )% | | | 7,021 | |
Spire, Inc. | | | 3,067 | | | | (0.99 | )% | | | 5,054 | |
FirstEnergy Corp. | | | 5,150 | | | | (1.00 | )% | | | 3,987 | |
Duke Energy Corp. | | | 2,942 | | | | (1.48 | )% | | | (4,560 | ) |
Total Utilities | | | | | | | | | | | 228,537 | |
| | | | | | | | | | | | | |
Basic Materials | | | | | | | | | | | | |
Hecla Mining Co. | | | 32,657 | | | | (0.71 | )% | | | 50,810 | |
Piedmont Lithium, Inc. | | | 2,661 | | | | (0.60 | )% | | | 40,853 | |
Alcoa Corp. | | | 5,885 | | | | (0.97 | )% | | | 23,655 | |
Royal Gold, Inc. | | | 1,058 | | | | (0.64 | )% | | | 17,286 | |
Avient Corp. | | | 2,596 | | | | (0.52 | )% | | | 11,416 | |
Novagold Resources, Inc. | | | 37,575 | | | | (0.82 | )% | | | 9,668 | |
Ecolab, Inc. | | | 787 | | | | (0.76 | )% | | | 9,594 | |
Kaiser Aluminum Corp. | | | 2,314 | | | | (0.99 | )% | | | 4,140 | |
Century Aluminum Co. | | | 10,919 | | | | (0.45 | )% | | | 2,356 | |
Mercer International, Inc. | | | 12,729 | | | | (0.62 | )% | | | (741 | ) |
Carpenter Technology Corp. | | | 2,899 | | | | (1.11 | )% | | | (70,285 | ) |
Total Basic Materials | | | | | | | | | | | 98,752 | |
| | | | | | | | | | | | | |
Energy | | | | | | | | | | | | |
Baker Hughes Co. | | | 3,412 | | | | (0.68 | )% | | | 2,319 | |
Halliburton Co. | | | 5,085 | | | | (1.17 | )% | | | (1,024 | ) |
Archrock, Inc. | | | 9,084 | | | | (0.65 | )% | | | (1,076 | ) |
Expro Group Holdings N.V. | | | 4,383 | | | | (0.58 | )% | | | (1,868 | ) |
NOV, Inc. | | | 9,760 | | | | (1.16 | )% | | | (3,561 | ) |
Noble Corporation plc | | | 1,729 | | | | (0.50 | )% | | | (7,602 | ) |
TechnipFMC plc | | | 8,024 | | | | (0.93 | )% | | | (9,147 | ) |
Helix Energy Solutions Group, Inc. | | | 8,282 | | | | (0.53 | )% | | | (13,125 | ) |
Valaris Ltd. | | | 1,358 | | | | (0.58 | )% | | | (22,096 | ) |
Hess Corp. | | | 1,630 | | | | (1.42 | )% | | | (29,712 | ) |
Total Energy | | | | | | | | | | | (86,892 | ) |
| | | | | | | | | | | | | |
Consumer, Cyclical | | | | | | | | | | | | |
Walgreens Boots Alliance, Inc. | | | 9,089 | | | | (1.15 | )% | | | 43,065 | |
UniFirst Corp. | | | 1,024 | | | | (0.95 | )% | | | 36,452 | |
Topgolf Callaway Brands Corp. | | | 8,886 | | | | (0.70 | )% | | | 26,576 | |
Shake Shack, Inc. — Class A | | | 1,645 | | | | (0.54 | )% | | | 16,196 | |
Floor & Decor Holdings, Inc. — Class A | | | 1,559 | | | | (0.80 | )% | | | 8,936 | |
Life Time Group Holdings, Inc. | | | 5,291 | | | | (0.46 | )% | | | 8,653 | |
VF Corp. | | | 9,027 | | | | (0.91 | )% | | | 3,229 | |
OPENLANE, Inc. | | | 8,330 | | | | (0.71 | )% | | | 1,708 | |
Newell Brands, Inc. | | | 8,576 | | | | (0.44 | )% | | | (1,734 | ) |
Tesla, Inc. | | | 209 | | | | (0.30 | )% | | | (5,953 | ) |
Total Consumer, Cyclical | | | | | | | | | | | 137,128 | |
| | | | | | | | | | | | | |
Industrial | | | | | | | | | | | | |
MasTec, Inc. | | | 1,136 | | | | (0.46 | )% | | | 24,779 | |
3M Co. | | | 1,615 | | | | (0.86 | )% | | | 19,858 | |
GATX Corp. | | | 1,255 | | | | (0.78 | )% | | | 6,312 | |
Tetra Tech, Inc. | | | 672 | | | | (0.58 | )% | | | 3,905 | |
Republic Services, Inc. — Class A | | | 358 | | | | (0.29 | )% | | | 2,517 | |
Stericycle, Inc. | | | 2,358 | | | | (0.60 | )% | | | 246 | |
Jacobs Solutions, Inc. | | | 388 | | | | (0.30 | )% | | | (1,692 | ) |
Trinity Industries, Inc. | | | 5,314 | | | | (0.74 | )% | | | (2,655 | ) |
Casella Waste Systems, Inc. — Class A | | | 1,921 | | | | (0.83 | )% | | | (15,416 | ) |
MSA Safety, Inc. | | | 1,019 | | | | (0.91 | )% | | | (19,139 | ) |
Total Industrial | | | | | | | | | | | 18,715 | |
SEE NOTES TO FINANCIAL STATEMENTS. | THE GUGGENHEIM FUNDS ANNUAL REPORT | 23 |
SCHEDULE OF INVESTMENTS (concluded) | September 30, 2023 |
ALPHA OPPORTUNITY FUND | |
| | Shares | | | Percentage
Notional
Amount | | | Value and
Unrealized
Appreciation
(Depreciation) | |
Technology | | | | | | | | | | | | |
Science Applications International Corp. | | | 2,188 | | | | (1.31 | )% | | $ | 19,600 | |
Evolent Health, Inc. — Class A | | | 3,558 | | | | (0.55 | )% | | | 17,993 | |
KBR, Inc. | | | 3,514 | | | | (1.18 | )% | | | 8,324 | |
Take-Two Interactive Software, Inc. | | | 912 | | | | (0.73 | )% | | | (235 | ) |
Paycor HCM, Inc. | | | 8,328 | | | | (1.08 | )% | | | (1,260 | ) |
Ceridian HCM Holding, Inc. | | | 2,441 | | | | (0.94 | )% | | | (18,796 | ) |
Total Technology | | | | | | | | | | | 25,626 | |
| | | | | | | | | | | | | |
Communications | | | | | | | | | | | | |
DoorDash, Inc. — Class A | | | 1,277 | | | | (0.58 | )% | | | (12,473 | ) |
Total GS Equity Short Custom Basket | | | | | | $ | 1,056,830 | |
* | Non-income producing security. |
† | Value determined based on Level 1 inputs — See Note 4. |
†† | Value determined based on Level 2 inputs — See Note 4. |
1 | All or a portion of this security is pledged as equity custom basket swap collateral at September 30, 2023. |
2 | Rate indicated is the 7-day yield as of September 30, 2023. |
| | GS — Goldman Sachs International |
| | MS — Morgan Stanley Capital Services LLC |
| | plc — Public Limited Company |
| | REIT — Real Estate Investment Trust |
| | |
| | See Sector Classification in Other Information section. |
The following table summarizes the inputs used to value the Fund’s investments at September 30, 2023 (See Note 4 in the Notes to Financial Statements):
Investments in Securities (Assets) | | Level 1
Quoted
Prices | | | Level 2
Significant
Observable
Inputs | | | Level 3
Significant
Unobservable
Inputs | | | Total | |
Common Stocks | | $ | 31,950,463 | | | $ | — | | | $ | — | | | $ | 31,950,463 | |
Money Market Fund | | | 1,101,952 | | | | — | | | | — | | | | 1,101,952 | |
Equity Custom Basket Swap Agreements** | | | — | | | | 2,180,789 | | | | — | | | | 2,180,789 | |
Total Assets | | $ | 33,052,415 | | | $ | 2,180,789 | | | $ | — | | | $ | 35,233,204 | |
** | This derivative is reported as unrealized appreciation/depreciation at period end. |
24 | THE GUGGENHEIM FUNDS ANNUAL REPORT | SEE NOTES TO FINANCIAL STATEMENTS. |
STATEMENT OF ASSETS AND LIABILITIES |
September 30, 2023 |
Assets: |
Investments, at value (cost $33,288,793) | | $ | 33,052,415 | |
Unrealized appreciation on OTC swap agreements | | | 2,180,789 | |
Prepaid expenses | | | 31,571 | |
Receivables: |
Dividends | | | 30,136 | |
Interest | | | 4,033 | |
Total assets | | | 35,298,944 | |
| | | | | |
Liabilities: |
Overdraft due to custodian bank | | | 3,814 | |
Payable for: |
Professional fees | | | 37,363 | |
Management fees | | | 24,174 | |
Swap settlement | | | 8,172 | |
Fund accounting and administration fees | | | 4,695 | |
Transfer agent fees | | | 2,704 | |
Distribution and service fees | | | 1,112 | |
Due to Investment Adviser | | | 1,106 | |
Trustees’ fees* | | | 673 | |
Fund shares redeemed | | | 46 | |
Miscellaneous | | | 4,051 | |
Total liabilities | | | 87,910 | |
Net assets | | $ | 35,211,034 | |
| | | | | |
Net assets consist of: |
Paid in capital | | $ | 60,038,036 | |
Total distributable earnings (loss) | | | (24,827,002 | ) |
Net assets | | $ | 35,211,034 | |
| | | | | |
A-Class: |
Net assets | | $ | 2,841,652 | |
Capital shares outstanding | | | 146,727 | |
Net asset value per share | | $ | 19.37 | |
Maximum offering price per share (Net asset value divided by 95.25%) | | $ | 20.34 | |
| | | | | |
C-Class: |
Net assets | | $ | 193,690 | |
Capital shares outstanding | | | 11,473 | |
Net asset value per share | | $ | 16.88 | |
| | | | | |
P-Class: |
Net assets | | $ | 1,880,180 | |
Capital shares outstanding | | | 96,297 | |
Net asset value per share | | $ | 19.52 | |
| | | | | |
Institutional Class: |
Net assets | | $ | 30,295,512 | |
Capital shares outstanding | | | 1,060,837 | |
Net asset value per share | | $ | 28.56 | |
STATEMENT OF OPERATIONS |
Year Ended September 30, 2023 |
Investment Income: |
Dividends | | $ | 653,416 | |
Interest | | | 51,773 | |
Total investment income | | | 705,189 | |
| | | | | |
Expenses: |
Management fees | | | 297,618 | |
Distribution and service fees: |
A-Class | | | 6,927 | |
C-Class | | | 2,067 | |
P-Class | | | 4,407 | |
Transfer agent fees: |
A-Class | | | 6,326 | |
C-Class | | | 636 | |
P-Class | | | 2,771 | |
Institutional Class | | | 19,246 | |
Registration fees | | | 68,229 | |
Professional fees | | | 46,983 | |
Fund accounting and administration fees | | | 22,722 | |
Custodian fees | | | 19,885 | |
Trustees’ fees* | | | 10,054 | |
Line of credit fees | | | 1,095 | |
Miscellaneous | | | 11,213 | |
Recoupment of previously waived fees: |
A-Class | | | 418 | |
C-Class | | | 36 | |
P-Class | | | 366 | |
Institutional Class | | | 12,371 | |
Total expenses | | | 533,370 | |
Less: |
Expenses reimbursed by Adviser | | | | |
A-Class | | | (4,349 | ) |
C-Class | | | (482 | ) |
P-Class | | | (1,607 | ) |
Institutional Class | | | (8,022 | ) |
Expenses waived by Adviser | | | (13,402 | ) |
Total waived/reimbursed expenses | | | (27,862 | ) |
Net expenses | | | 505,508 | |
Net investment income | | | 199,681 | |
| | | | | |
Net Realized and Unrealized Gain (Loss): |
Net realized gain (loss) on: |
Investments | | | 1,201,020 | |
Swap agreements | | | 1,169,204 | |
Net realized gain | | | 2,370,224 | |
Net change in unrealized appreciation (depreciation) on: |
Investments | | | 3,569,365 | |
Swap agreements | | | (1,078,261 | ) |
Net change in unrealized appreciation (depreciation) | | | 2,491,104 | |
Net realized and unrealized gain | | | 4,861,328 | |
Net increase in net assets resulting from operations | | $ | 5,061,009 | |
* | Relates to Trustees not deemed “interested persons” within the meaning of Section 2(a)(19) of the 1940 Act. |
SEE NOTES TO FINANCIAL STATEMENTS. | THE GUGGENHEIM FUNDS ANNUAL REPORT | 25 |
STATEMENTS OF CHANGES IN NET ASSETS |
| | Year Ended
September 30,
2023 | | | Year Ended
September 30,
2022 | |
Increase (Decrease) in Net Assets from Operations: | | | | | | | | |
Net investment income | | $ | 199,681 | | | $ | 205,930 | |
Net realized gain (loss) on investments | | | 2,370,224 | | | | (1,341,421 | ) |
Net change in unrealized appreciation (depreciation) on investments | | | 2,491,104 | | | | (830,642 | ) |
Net increase (decrease) in net assets resulting from operations | | | 5,061,009 | | | | (1,966,133 | ) |
| | | | | | | | | |
Distributions to shareholders: | | | | | | | | |
A-Class | | | (19,964 | ) | | | (25,810 | ) |
C-Class | | | — | | | | (554 | ) |
P-Class | | | (12,413 | ) | | | (17,637 | ) |
Institutional Class | | | (173,553 | ) | | | (238,313 | ) |
Total distributions to shareholders | | | (205,930 | ) | | | (282,314 | ) |
| | | | | | | | | |
Capital share transactions: | | | | | | | | |
Proceeds from sale of shares | | | | | | | | |
A-Class | | | 143,300 | | | | 166,738 | |
C-Class | | | 2,880 | | | | 980 | |
P-Class | | | 51,362 | | | | 150,241 | |
Institutional Class | | | 779,910 | | | | 458,517 | |
Distributions reinvested | | | | | | | | |
A-Class | | | 17,789 | | | | 22,964 | |
C-Class | | | — | | | | 525 | |
P-Class | | | 12,413 | | | | 17,637 | |
Institutional Class | | | 173,553 | | | | 234,219 | |
Cost of shares redeemed | | | | | | | | |
A-Class | | | (329,547 | ) | | | (413,839 | ) |
C-Class | | | (34,599 | ) | | | (70,209 | ) |
P-Class | | | (89,028 | ) | | | (245,270 | ) |
Institutional Class | | | (459,238 | ) | | | (2,939,045 | ) |
Net increase (decrease) from capital share transactions | | | 268,795 | | | | (2,616,542 | ) |
Net increase (decrease) in net assets | | | 5,123,874 | | | | (4,864,989 | ) |
| | | | | | | | | |
Net assets: | | | | | | | | |
Beginning of year | | | 30,087,160 | | | | 34,952,149 | |
End of year | | $ | 35,211,034 | | | $ | 30,087,160 | |
| | | | | | | | | |
Capital share activity: | | | | | | | | |
Shares sold | | | | | | | | |
A-Class | | | 7,772 | | | | 8,794 | |
C-Class | | | 179 | | | | 61 | |
P-Class | | | 2,642 | | | | 8,039 | |
Institutional Class | | | 28,646 | | | | 16,552 | |
Shares issued from reinvestment of distributions | | | | | | | | |
A-Class | | | 1,004 | | | | 1,171 | |
C-Class | | | — | | | | 31 | |
P-Class | | | 695 | | | | 892 | |
Institutional Class | | | 6,660 | | | | 8,141 | |
Shares redeemed | | | | | | | | |
A-Class | | | (18,034 | ) | | | (22,446 | ) |
C-Class | | | (2,086 | ) | | | (4,318 | ) |
P-Class | | | (4,858 | ) | | | (12,977 | ) |
Institutional Class | | | (16,727 | ) | | | (108,537 | ) |
Net increase (decrease) in shares | | | 5,893 | | | | (104,597 | ) |
26 | THE GUGGENHEIM FUNDS ANNUAL REPORT | SEE NOTES TO FINANCIAL STATEMENTS. |
This table is presented to show selected data for a share outstanding throughout each period and to assist shareholders in evaluating a Fund’s performance for the periods presented.
A-Class | | Year Ended
September 30,
2023 | | | Year Ended
September 30,
2022 | | | Year Ended
September 30,
2021 | | | Year Ended
September 30,
2020 | | | Year Ended
September 30,
2019 | |
Per Share Data |
Net asset value, beginning of period | | $ | 16.73 | | | $ | 18.05 | | | $ | 16.89 | | | $ | 17.42 | | | $ | 19.15 | |
Income (loss) from investment operations: |
Net investment income (loss)a | | | .07 | | | | .07 | | | | .10 | | | | .11 | | | | .12 | |
Net gain (loss) on investments (realized and unrealized) | | | 2.70 | | | | (1.23 | ) | | | 1.27 | | | | (.48 | ) | | | (1.64 | ) |
Total from investment operations | | | 2.77 | | | | (1.16 | ) | | | 1.37 | | | | (.37 | ) | | | (1.52 | ) |
Less distributions from: |
Net investment income | | | (.13 | ) | | | (.16 | ) | | | (.21 | ) | | | (.16 | ) | | | (.21 | ) |
Total distributions | | | (.13 | ) | | | (.16 | ) | | | (.21 | ) | | | (.16 | ) | | | (.21 | ) |
Net asset value, end of period | | $ | 19.37 | | | $ | 16.73 | | | $ | 18.05 | | | $ | 16.89 | | | $ | 17.42 | |
|
Total Returnb | | | 16.62 | % | | | (6.55 | %) | | | 8.17 | % | | | (2.15 | %) | | | (7.97 | %) |
Ratios/Supplemental Data |
Net assets, end of period (in thousands) | | $ | 2,842 | | | $ | 2,610 | | | $ | 3,042 | | | $ | 3,429 | | | $ | 7,326 | |
Ratios to average net assets: |
Net investment income (loss) | | | 0.39 | % | | | 0.39 | % | | | 0.56 | % | | | 0.65 | % | | | 0.64 | % |
Total expensesc | | | 1.94 | % | | | 1.91 | % | | | 1.94 | % | | | 1.73 | % | | | 1.65 | % |
Net expensesd,e,f | | | 1.74 | % | | | 1.76 | % | | | 1.76 | % | | | 1.69 | % | | | 1.64 | % |
Portfolio turnover rate | | | 309 | % | | | 283 | % | | | 169 | % | | | 209 | % | | | 126 | % |
C-Class | | Year Ended
September 30,
2023 | | | Year Ended
September 30,
2022 | | | Year Ended
September 30,
2021 | | | Year Ended
September 30,
2020 | | | Year Ended
September 30,
2019 | |
Per Share Data |
Net asset value, beginning of period | | $ | 14.59 | | | $ | 15.76 | | | $ | 14.71 | | | $ | 15.16 | | | $ | 16.61 | |
Income (loss) from investment operations: |
Net investment income (loss)a | | | (.06 | ) | | | (.06 | ) | | | (.03 | ) | | | (.02 | ) | | | (.03 | ) |
Net gain (loss) on investments (realized and unrealized) | | | 2.35 | | | | (1.08 | ) | | | 1.11 | | | | (.43 | ) | | | (1.42 | ) |
Total from investment operations | | | 2.29 | | | | (1.14 | ) | | | 1.08 | | | | (.45 | ) | | | (1.45 | ) |
Less distributions from: |
Net investment income | | | — | | | | (.03 | ) | | | (.03 | ) | | | — | | | | — | |
Total distributions | | | — | | | | (.03 | ) | | | (.03 | ) | | | — | | | | — | |
Net asset value, end of period | | $ | 16.88 | | | $ | 14.59 | | | $ | 15.76 | | | $ | 14.71 | | | $ | 15.16 | |
|
Total Returnb | | | 15.70 | % | | | (7.25 | %) | | | 7.37 | % | | | (2.97 | %) | | | (8.73 | %) |
Ratios/Supplemental Data |
Net assets, end of period (in thousands) | | $ | 194 | | | $ | 195 | | | $ | 277 | | | $ | 354 | | | $ | 702 | |
Ratios to average net assets: |
Net investment income (loss) | | | (0.36 | %) | | | (0.37 | %) | | | (0.19 | %) | | | (0.15 | %) | | | (0.20 | %) |
Total expensesc | | | 2.77 | % | | | 2.75 | % | | | 2.75 | % | | | 2.72 | % | | | 2.55 | % |
Net expensesd,e,f | | | 2.50 | % | | | 2.51 | % | | | 2.51 | % | | | 2.51 | % | | | 2.48 | % |
Portfolio turnover rate | | | 309 | % | | | 283 | % | | | 169 | % | | | 209 | % | | | 126 | % |
SEE NOTES TO FINANCIAL STATEMENTS. | THE GUGGENHEIM FUNDS ANNUAL REPORT | 27 |
FINANCIAL HIGHLIGHTS (continued) |
This table is presented to show selected data for a share outstanding throughout each period and to assist shareholders in evaluating a Fund’s performance for the periods presented.
P-Class | | Year Ended
September 30,
2023 | | | Year Ended
September 30,
2022 | | | Year Ended
September 30,
2021 | | | Year Ended
September 30,
2020 | | | Year Ended
September 30,
2019 | |
Per Share Data |
Net asset value, beginning of period | | $ | 16.87 | | | $ | 18.21 | | | $ | 17.06 | | | $ | 17.56 | | | $ | 19.23 | |
Income (loss) from investment operations: |
Net investment income (loss)a | | | .07 | | | | .07 | | | | .10 | | | | .12 | | | | .11 | |
Net gain (loss) on investments (realized and unrealized) | | | 2.71 | | | | (1.24 | ) | | | 1.28 | | | | (.49 | ) | | | (1.64 | ) |
Total from investment operations | | | 2.78 | | | | (1.17 | ) | | | 1.38 | | | | (.37 | ) | | | (1.53 | ) |
Less distributions from: |
Net investment income | | | (.13 | ) | | | (.17 | ) | | | (.23 | ) | | | (.13 | ) | | | (.14 | ) |
Total distributions | | | (.13 | ) | | | (.17 | ) | | | (.23 | ) | | | (.13 | ) | | | (.14 | ) |
Net asset value, end of period | | $ | 19.52 | | | $ | 16.87 | | | $ | 18.21 | | | $ | 17.06 | | | $ | 17.56 | |
|
Total Return | | | 16.60 | % | | | (6.54 | %) | | | 8.17 | % | | | (2.11 | %) | | | (7.99 | %) |
Ratios/Supplemental Data |
Net assets, end of period (in thousands) | | $ | 1,880 | | | $ | 1,650 | | | $ | 1,855 | | | $ | 1,161 | | | $ | 1,905 | |
Ratios to average net assets: |
Net investment income (loss) | | | 0.39 | % | | | 0.39 | % | | | 0.54 | % | | | 0.70 | % | | | 0.59 | % |
Total expensesc | | | 1.87 | % | | | 1.82 | % | | | 1.96 | % | | | 1.67 | % | | | 1.67 | % |
Net expensesd,e,f | | | 1.74 | % | | | 1.76 | % | | | 1.76 | % | | | 1.64 | % | | | 1.66 | % |
Portfolio turnover rate | | | 309 | % | | | 283 | % | | | 169 | % | | | 209 | % | | | 126 | % |
28 | THE GUGGENHEIM FUNDS ANNUAL REPORT | SEE NOTES TO FINANCIAL STATEMENTS. |
FINANCIAL HIGHLIGHTS (concluded) |
This table is presented to show selected data for a share outstanding throughout each period and to assist shareholders in evaluating a Fund’s performance for the periods presented.
Institutional Class | | Year Ended
September 30,
2023 | | | Year Ended
September 30,
2022 | | | Year Ended
September 30,
2021 | | | Year Ended
September 30,
2020 | | | Year Ended
September 30,
2019 | |
Per Share Data |
Net asset value, beginning of period | | $ | 24.59 | | | $ | 26.44 | | | $ | 24.65 | | | $ | 25.37 | | | $ | 27.77 | |
Income (loss) from investment operations: |
Net investment income (loss)a | | | .17 | | | | .17 | | | | .22 | | | | .25 | | | | .28 | |
Net gain (loss) on investments (realized and unrealized) | | | 3.97 | | | | (1.81 | ) | | | 1.85 | | | | (.72 | ) | | | (2.37 | ) |
Total from investment operations | | | 4.14 | | | | (1.64 | ) | | | 2.07 | | | | (.47 | ) | | | (2.09 | ) |
Less distributions from: |
Net investment income | | | (.17 | ) | | | (.21 | ) | | | (.28 | ) | | | (.25 | ) | | | (.31 | ) |
Total distributions | | | (.17 | ) | | | (.21 | ) | | | (.28 | ) | | | (.25 | ) | | | (.31 | ) |
Net asset value, end of period | | $ | 28.56 | | | $ | 24.59 | | | $ | 26.44 | | | $ | 24.65 | | | $ | 25.37 | |
|
Total Return | | | 16.89 | % | | | (6.31 | %) | | | 8.46 | % | | | (1.87 | %) | | | (7.57 | %) |
Ratios/Supplemental Data |
Net assets, end of period (in thousands) | | $ | 30,296 | | | $ | 25,632 | | | $ | 29,778 | | | $ | 32,260 | | | $ | 79,318 | |
Ratios to average net assets: |
Net investment income (loss) | | | 0.64 | % | | | 0.64 | % | | | 0.82 | % | | | 1.00 | % | | | 1.05 | % |
Total expensesc | | | 1.56 | % | | | 1.54 | % | | | 1.58 | % | | | 1.36 | % | | | 1.22 | % |
Net expensesd,e,f | | | 1.49 | % | | | 1.51 | % | | | 1.50 | % | | | 1.36 | % | | | 1.21 | % |
Portfolio turnover rate | | | 309 | % | | | 283 | % | | | 169 | % | | | 209 | % | | | 126 | % |
a | Net investment income (loss) per share was computed using average shares outstanding throughout the period. |
b | Total return does not reflect the impact of any applicable sales charges. |
c | Does not include expenses of the underlying funds in which the Fund invests. |
d | Net expense information reflects the expense ratios after expense waivers and reimbursements, as applicable. |
e | The portion of the ratios of net expenses to average net assets attributable to recoupments of prior fee reductions or expense reimbursements for the years presented was as follows: |
| | | 09/30/23 | 09/30/22 | 09/30/21 | 09/30/20 | 09/30/19 |
| | A-Class | 0.02% | 0.02% | 0.01% | 0.02% | 0.09% |
| | C-Class | 0.02% | 0.03% | 0.01% | 0.01% | 0.04% |
| | P-Class | 0.02% | 0.03% | 0.01% | 0.01% | 0.03% |
| | Institutional Class | 0.04% | 0.06% | 0.02% | 0.00%* | 0.00%* |
f | Net expenses may include expenses that are excluded from the expense limitation agreement. Excluding these expenses, the net expense ratios for the years presented would be: |
| | | 09/30/23 | 09/30/22 | 09/30/21 | 09/30/20 | 09/30/19 |
| | A-Class | 1.74% | 1.76% | 1.76% | 1.69% | 1.64% |
| | C-Class | 2.49% | 2.51% | 2.51% | 2.51% | 2.48% |
| | P-Class | 1.74% | 1.76% | 1.76% | 1.64% | 1.66% |
| | Institutional Class | 1.48% | 1.50% | 1.50% | 1.36% | 1.21% |
SEE NOTES TO FINANCIAL STATEMENTS. | THE GUGGENHEIM FUNDS ANNUAL REPORT | 29 |
MANAGERS’ COMMENTARY (Unaudited) | September 30, 2023 |
To Our Shareholders
Security Investors, LLC (“SI”) serves as the investment adviser to Guggenheim Large Cap Value Fund (“Fund”).The Fund is managed by a team of seasoned professionals, led by David Toussaint, CFA, CPA, Managing Director and Portfolio Manager; James Schier, CFA, Senior Managing Director and Portfolio Manager; Farhan Sharaff, Senior Managing Director, Assistant Chief Investment Officer, Equities, and Portfolio Manager; Chris Phalen, Managing Director and Portfolio Manager; Gregg Strohkorb, CFA, Director and Portfolio Manager; and Burak Hurmeydan, Ph.D., Director and Portfolio Manager. In the subsequent paragraphs, the investment team discusses the Fund’s performance and the market environment for the 12-month period ended September 30, 2023 (“Reporting Period”).
For the Reporting Period, the Fund provided a total return of 14.19%1, slightly underperforming the Russell 1000 Value Index, the Fund’s benchmark (“Benchmark”), which returned 14.44% for the same period.
What factors contributed or detracted from the Fund’s performance during the Reporting Period?
The market began the Reporting Period with steady strength, as a buoyant economy helped build expectations that a highly anticipated recession would be pushed further out and that perhaps the U.S. Federal Reserve (“Fed’) could do the unthinkable and engineer a soft landing. Once the banking crisis hit in March, leadership in equities shifted away from the value area and growth stocks once again caught the market’s interest. As the Reporting Period progressed, the continued strong jobs market accompanied by increasing fiscal deficits and treasury issuance caused a significant rise in interest rates. These events have begun to dampen stock performance, as equity returns for the broad market were lower in the third quarter. A flight to safety from growing geopolitical risks has yet to dampen the trend toward rising interest rates in the government debt market.
The Fund’s performance for the Reporting Period was mostly in-line with the Benchmark. During the period, the Fund produced a positive contribution from its security selection and experienced negative contribution from sector allocation.
The Fund’s holding of Comcast Corp., a global media and communications company, was one of the best performers, up over 50% during the period. The company experienced better subscriber additions in its broadband and wireless businesses and controlled costs to expand margins.
Another significant contributor, up over 50% for the year, was semiconductor capital equipment company KLA Corp. The company is expected to benefit from the increase in spending on producing AI chips as well as the construction of semiconductor manufacturing facilities in the U.S. resulting from the government’s CHIPS Act.
Two companies in the steel sector, Reliance Steel & Aluminum Co. and Nucor Corp., performed well for the Fund, as the steel sector remained resilient amid healthy macroeconomic activity. Although revenues and earnings fell, the drop wasn’t as much as investors feared, and these companies continued to produce free cash flow and returned it to shareholders.
Encompass Health Corp., which operates inpatient rehab facilities, gained almost 50%. Favorable Medicare rate reimbursement in the Spring, coupled with solid earnings results that were driven by favorable volumes as well as expense benefits, led to several good earnings reports over the Reporting Period. A looser labor market coming off COVID allowed the company to save from lower usage of contract labor.
While the market was being impacted by stress in the banking sector, the Fund’s significant weight in JP Morgan Chase & Co. aided performance. JP Morgan, with its management team, asset size, and diversified business, provided a relatively sound investment during this tumultuous period.
Finally, the Fund’s 5% underweight to the pharmaceutical sector provided positive contribution to performance as this sector recorded a -0.9% return during the year. Government pricing controls embedded in the Inflation Reduction Act and the interest-rate-sensitive nature of these dividend-paying stocks caused the sector to underperform.
The Fund’s largest detractor from performance was not owning Meta Platforms, Inc. This company, which historically has only been in the Russell Growth Index, was added to the Russell Value Index at the beginning of the Reporting Period after the company’s stock price fell 75%. The Fund did not invest in Meta and the stock performed extremely well and subsequently was removed from the Russell Value Index at mid-year 2023.
30 | THE GUGGENHEIM FUNDS ANNUAL REPORT | |
MANAGERS’ COMMENTARY (Unaudited)(concluded) | September 30, 2023 |
The largest sector allocation detractor was an overweight in the Utilities sector. Utilities, an interest rate sensitive sector, underperformed because interest rates continually moved higher during the Reporting Period and investors moved out of this defensive sector as views on the state of the economy improved. Another detractor from performance was the Fund’s positioning within the Energy sector. The Fund was overweight the sector but was more concentrated in exploration & production companies. Although these companies performed well and outperformed the Fund’s Benchmark, they did not perform as well as the oil service companies and oil refining companies within the Energy sector.
Finally, there were two stocks that hurt the Fund’s performance the most during the Reporting Period, Tyson Foods, Inc. and Charles Schwab Corp. Tyson Foods produces and distributes beef, chicken, and pork products, and they struggled as their operating margins fell significantly as commodity input costs spiked higher. Schwab, a wealth management and brokerage company, experienced declining profitability as their customers moved their cash deposits to higher yielding alternatives.
How was the Fund positioned at the end of the Reporting Period?
In many ways, the environment is similar to last year. The geopolitical environment seems to have become less favorable and the Fed, while still hawkish, is much later in the game of fighting inflation. However, it remains very unclear how long “higher for longer” will really be. Reversing several decades of shifting production from low-cost Asian countries to higher-cost locations closer to end markets could provide many years of stubbornly high inflation that may serve to restrain equity appreciation. The murkiness of the economic outlook has not improved, yet equity prices are higher. The extreme overvaluation in a handful of large cap growth stocks suggests that value stocks could really excel once investors become more comfortable with the economy and market.
At the end of the Reporting Period, the Fund’s largest sector overweight was in Energy. Favorable Saudi and Russian production discipline is controlling supply, and demand is slowly returning in China while demand in India and U.S. has been resilient. Additionally, the Fund continued to hold an overweight in the Utilities sector and a similar-size underweight in the REITs sector. Both sectors are interest-rate sensitive, but we favor Utilities because of their valuations, profitability, and regulatory nature of their businesses. We were also overweight in Materials. This sector should benefit from U.S. onshoring and infrastructure spending, and trades at attractive valuations. Plus, it has ample free cash flow to re-invest in businesses and return capital to shareholders.
The Fund was underweight in Health Care and Consumer Discretionary. Within Health Care, the Fund was primarily underweight in pharmaceuticals, a subsector with dividend-paying companies that is more interest-rate sensitive. Earnings and cash flow in companies in the subsector may disappoint post-pandemic, plus they are continually pressured to make acquisitions to fill their drug pipeline. Finally, given the significant increase in interest costs for the consumer, and inflationary pressures, we are leery of consumers continuing their consumption habits, and believe Consumer Discretionary companies may find it difficult to maintain their margins.
Performance displayed represents past performance which is no guarantee of future results.
1 | Performance figures are based on Class A shares and do not reflect taxes that a shareholder would pay on distributions or the redemption of shares. |
The opinions and forecast expressed may not actually come to pass. This information is subject to change at any time, based on market and other conditions, and should not be construed as a recommendation of any specific security or strategy.
| | THE GUGGENHEIM FUNDS ANNUAL REPORT | 31 |
PERFORMANCE REPORT AND FUND PROFILE (Unaudited) | September 30, 2023 |
LARGE CAP VALUE FUND
OBJECTIVE: Seeks long-term growth of capital.
Holdings Diversification (Market Exposure as % of Net Assets)

“Holdings Diversification (Market Exposure as % of Net Assets)” excludes any temporary cash investments.
Inception Dates: |
A-Class | August 7, 1944 |
C-Class | January 29, 1999 |
P-Class | May 1, 2015 |
Institutional Class | June 7, 2013 |
Ten Largest Holdings | % of Total Net Assets |
iShares Russell 1000 Value ETF | 3.4% |
Chevron Corp. | 3.0% |
ConocoPhillips | 2.7% |
Berkshire Hathaway, Inc. — Class B | 2.5% |
JPMorgan Chase & Co. | 2.4% |
Verizon Communications, Inc. | 2.3% |
Curtiss-Wright Corp. | 2.1% |
Bank of America Corp. | 2.1% |
Walmart, Inc. | 2.0% |
Johnson & Johnson | 1.8% |
Top Ten Total | 24.3% |
| | |
“Ten Largest Holdings” excludes any temporary cash investments. |
32 | THE GUGGENHEIM FUNDS ANNUAL REPORT | |
PERFORMANCE REPORT AND FUND PROFILE (Unaudited)(concluded) | September 30, 2023 |
Cumulative Fund Performance*
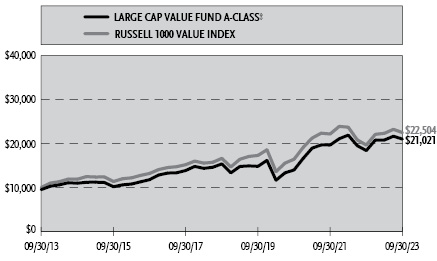
Average Annual Returns*
Periods Ended September 30, 2023
| 1 Year | 5 Year | 10 Year |
A-Class Shares | 14.19% | 6.46% | 8.24% |
A-Class Shares with sales charge† | 8.77% | 5.43% | 7.71% |
C-Class Shares | 13.33% | 5.67% | 7.42% |
C-Class Shares with CDSC‡ | 12.33% | 5.67% | 7.42% |
Institutional Class Shares | 14.48% | 6.73% | 8.50% |
Russell 1000 Value Index | 14.44% | 6.23% | 8.45% |
| 1 Year | 5 Year | Since
Inception
(05/01/15) |
P-Class Shares | 14.19% | 6.46% | 7.59% |
Russell 1000 Value Index | 14.44% | 6.23% | 7.12% |
* | The performance data above represents past performance that is not predictive of future results. The investment return and principal value of an investment in the Fund will fluctuate so that an investor’s shares, when redeemed, may be worth more or less than their original cost. Returns are historical and include changes in principal and reinvested dividends and capital gains and do not reflect the effect of taxes. The Russell 1000 Value Index is an unmanaged index and, unlike the Fund, has no management fees or operating expenses to reduce its reported return. The graph is based on A-Class shares only; performance for C-Class, P-Class and Institutional Class will vary due to differences in fee structures. |
† | Fund returns are calculated using the maximum charge of 4.75%. |
‡ | Fund returns include a CDSC of 1% if redeemed within 12 months of purchase. |
| | THE GUGGENHEIM FUNDS ANNUAL REPORT | 33 |
SCHEDULE OF INVESTMENTS | September 30, 2023 |
LARGE CAP VALUE FUND | |
| | Shares | | | Value | |
COMMON STOCKS† - 93.6% |
| | | | | | | | | |
Financial - 18.3% |
Berkshire Hathaway, Inc. — Class B* | | | 2,471 | | | $ | 865,591 | |
JPMorgan Chase & Co. | | | 5,828 | | | | 845,177 | |
Bank of America Corp. | | | 26,532 | | | | 726,446 | |
Mastercard, Inc. — Class A | | | 1,295 | | | | 512,704 | |
Jefferies Financial Group, Inc. | | | 12,178 | | | | 446,080 | |
Charles Schwab Corp. | | | 6,546 | | | | 359,375 | |
Unum Group | | | 7,213 | | | | 354,807 | |
Ventas, Inc. REIT | | | 8,144 | | | | 343,107 | |
Goldman Sachs Group, Inc. | | | 1,059 | | | | 342,661 | |
First Horizon Corp. | | | 30,507 | | | | 336,187 | |
American Tower Corp. — Class A REIT | | | 1,929 | | | | 317,224 | |
Wells Fargo & Co. | | | 7,241 | | | | 295,867 | |
Synovus Financial Corp. | | | 9,411 | | | | 261,626 | |
STAG Industrial, Inc. REIT | | | 6,837 | | | | 235,945 | |
Markel Group, Inc.* | | | 144 | | | | 212,039 | |
Total Financial | | | | | | | 6,454,836 | |
| | | | | | | | | |
Consumer, Non-cyclical - 17.8% |
Johnson & Johnson | | | 4,170 | | | | 649,477 | |
Humana, Inc. | | | 1,306 | | | | 635,395 | |
Tyson Foods, Inc. — Class A | | | 11,064 | | | | 558,621 | |
Ingredion, Inc. | | | 5,537 | | | | 544,841 | |
Medtronic plc | | | 6,416 | | | | 502,758 | |
Archer-Daniels-Midland Co. | | | 6,265 | | | | 472,506 | |
PayPal Holdings, Inc.* | | | 7,205 | | | | 421,204 | |
Encompass Health Corp. | | | 5,404 | | | | 362,933 | |
Merck & Company, Inc. | | | 3,339 | | | | 343,750 | |
Bunge Ltd. | | | 3,038 | | | | 328,864 | |
HCA Healthcare, Inc. | | | 1,156 | | | | 284,353 | |
Quest Diagnostics, Inc. | | | 2,163 | | | | 263,583 | |
Kenvue, Inc. | | | 10,128 | | | | 203,370 | |
Euronet Worldwide, Inc.* | | | 2,372 | | | | 188,290 | |
Moderna, Inc.* | | | 1,739 | | | | 179,621 | |
Henry Schein, Inc.* | | | 2,357 | | | | 175,007 | |
Pfizer, Inc. | | | 4,745 | | | | 157,392 | |
Total Consumer, Non-cyclical | | | | | | | 6,271,965 | |
| | | | | | | | | |
Energy - 13.2% |
Chevron Corp. | | | 6,300 | | | | 1,062,306 | |
ConocoPhillips | | | 7,974 | | | | 955,285 | |
Diamondback Energy, Inc. | | | 4,180 | | | | 647,399 | |
Coterra Energy, Inc. — Class A | | | 15,804 | | | | 427,498 | |
Pioneer Natural Resources Co. | | | 1,695 | | | | 389,087 | |
Equities Corp. | | | 9,397 | | | | 381,331 | |
Marathon Oil Corp. | | | 12,079 | | | | 323,113 | |
Kinder Morgan, Inc. | | | 16,847 | | | | 279,323 | |
Range Resources Corp. | | | 5,505 | | | | 178,417 | |
Total Energy | | | | | | | 4,643,759 | |
| | | | | | | | | |
Industrial - 9.0% |
Curtiss-Wright Corp. | | | 3,722 | | | | 728,135 | |
Knight-Swift Transportation Holdings, Inc. | | | 9,555 | | | | 479,183 | |
Johnson Controls International plc | | | 8,932 | | | | 475,272 | |
Advanced Energy Industries, Inc. | | | 4,251 | | | | 438,363 | |
Eagle Materials, Inc. | | | 2,503 | | | | 416,799 | |
L3Harris Technologies, Inc. | | | 2,153 | | | | 374,880 | |
Teledyne Technologies, Inc.* | | | 642 | | | | 262,309 | |
Total Industrial | | | | | | | 3,174,941 | |
| | | | | | | | | |
Communications - 8.2% |
Verizon Communications, Inc. | | | 24,434 | | | | 791,906 | |
Alphabet, Inc. — Class A* | | | 4,480 | | | | 586,253 | |
Comcast Corp. — Class A | | | 12,165 | | | | 539,396 | |
Walt Disney Co.* | | | 4,030 | | | | 326,632 | |
Fox Corp. — Class B | | | 8,951 | | | | 258,505 | |
T-Mobile US, Inc. | | | 1,466 | | | | 205,313 | |
Cisco Systems, Inc. | | | 3,338 | | | | 179,451 | |
Total Communications | | | | | | | 2,887,456 | |
| | | | | | | | | |
Consumer, Cyclical - 8.0% |
Walmart, Inc. | | | 4,332 | | | | 692,817 | |
Ferguson plc | | | 3,521 | | | | 579,099 | |
Delta Air Lines, Inc. | | | 11,162 | | | | 412,994 | |
Lear Corp. | | | 2,877 | | | | 386,093 | |
Whirlpool Corp. | | | 2,259 | | | | 302,028 | |
Southwest Airlines Co. | | | 9,056 | | | | 245,146 | |
MSC Industrial Direct Company, Inc. — Class A | | | 1,913 | | | | 187,761 | |
Total Consumer, Cyclical | | | | | | | 2,805,938 | |
| | | | | | | | | |
Utilities - 7.0% |
OGE Energy Corp. | | | 18,873 | | | | 629,037 | |
Edison International | | | 7,613 | | | | 481,827 | |
Pinnacle West Capital Corp. | | | 6,179 | | | | 455,269 | |
Exelon Corp. | | | 11,169 | | | | 422,077 | |
Duke Energy Corp. | | | 3,475 | | | | 306,703 | |
NiSource, Inc. | | | 6,835 | | | | 168,688 | |
Total Utilities | | | | | | | 2,463,601 | |
| | | | | | | | | |
Basic Materials - 6.1% |
Huntsman Corp. | | | 19,666 | | | | 479,851 | |
Nucor Corp. | | | 2,541 | | | | 397,285 | |
Westlake Corp. | | | 2,839 | | | | 353,938 | |
Freeport-McMoRan, Inc. | | | 9,272 | | | | 345,753 | |
DuPont de Nemours, Inc. | | | 4,043 | | | | 301,567 | |
Reliance Steel & Aluminum Co. | | | 1,014 | | | | 265,901 | |
Total Basic Materials | | | | | | | 2,144,295 | |
| | | | | | | | | |
Technology - 6.0% |
Microsoft Corp. | | | 1,371 | | | | 432,893 | |
Teradyne, Inc. | | | 4,240 | | | | 425,950 | |
Leidos Holdings, Inc. | | | 4,014 | | | | 369,930 | |
Fiserv, Inc.* | | | 2,949 | | | | 333,119 | |
KLA Corp. | | | 684 | | | | 313,724 | |
Amdocs Ltd. | | | 2,549 | | | | 215,365 | |
Total Technology | | | | | | | 2,090,981 | |
| | | | | | | | | |
Total Common Stocks | | | | |
(Cost $29,385,201) | | | | | | | 32,937,772 | |
| | | | | | | | | |
34 | THE GUGGENHEIM FUNDS ANNUAL REPORT | SEE NOTES TO FINANCIAL STATEMENTS. |
SCHEDULE OF INVESTMENTS (concluded) | September 30, 2023 |
LARGE CAP VALUE FUND | |
| | Shares | | | Value | |
EXCHANGE-TRADED FUNDS† - 3.4% |
iShares Russell 1000 Value ETF | | | 7,953 | | | $ | 1,207,424 | |
Total Exchange-Traded Funds | | | | |
(Cost $1,121,233) | | | | | | | 1,207,424 | |
| | | | | | | | | |
MONEY MARKET FUND† - 3.8% |
Dreyfus Treasury Securities Cash Management Fund — Institutional Shares, 5.24%1 | | | 1,349,700 | | | | 1,349,700 | |
Total Money Market Fund | | | | |
(Cost $1,349,700) | | | | | | | 1,349,700 | |
| | | | | | | | | |
Total Investments - 100.8% | | | | |
(Cost $31,856,134) | | $ | 35,494,896 | |
Other Assets & Liabilities, net - (0.8)% | | | (295,618 | ) |
Total Net Assets - 100.0% | | $ | 35,199,278 | |
* | Non-income producing security. |
† | Value determined based on Level 1 inputs — See Note 4. |
1 | Rate indicated is the 7-day yield as of September 30, 2023. |
| | plc — Public Limited Company |
| | REIT — Real Estate Investment Trust |
| | |
| | See Sector Classification in Other Information section. |
The following table summarizes the inputs used to value the Fund’s investments at September 30, 2023 (See Note 4 in the Notes to Financial Statements):
Investments in Securities (Assets) | | Level 1
Quoted
Prices | | | Level 2
Significant
Observable
Inputs | | | Level 3
Significant
Unobservable
Inputs | | | Total | |
Common Stocks | | $ | 32,937,772 | | | $ | — | | | $ | — | | | $ | 32,937,772 | |
Exchange-Traded Funds | | | 1,207,424 | | | | — | | | | — | | | | 1,207,424 | |
Money Market Fund | | | 1,349,700 | | | | — | | | | — | | | | 1,349,700 | |
Total Assets | | $ | 35,494,896 | | | $ | — | | | $ | — | | | $ | 35,494,896 | |
SEE NOTES TO FINANCIAL STATEMENTS. | THE GUGGENHEIM FUNDS ANNUAL REPORT | 35 |
STATEMENT OF ASSETS AND LIABILITIES |
September 30, 2023 |
Assets: |
Investments, at value (cost $31,856,134) | | $ | 35,494,896 | |
Prepaid expenses | | | 31,473 | |
Receivables: |
Dividends | | | 51,121 | |
Interest | | | 5,193 | |
Fund shares sold | | | 2 | |
Total assets | | | 35,582,685 | |
| | | | | |
Liabilities: |
Overdraft due to custodian bank | | | 4,418 | |
Payable for: |
Securities purchased | | | 180,326 | |
Fund shares redeemed | | | 152,109 | |
Professional fees | | | 26,338 | |
Distribution and service fees | | | 7,931 | |
Fund accounting/administration fees | | | 4,595 | |
Transfer agent/maintenance fees | | | 3,034 | |
Management fees | | | 1,776 | |
Trustees’ fees* | | | 775 | |
Miscellaneous | | | 2,105 | |
Total liabilities | | | 383,407 | |
Net assets | | $ | 35,199,278 | |
| | | | | |
Net assets consist of: |
Paid in capital | | $ | 27,633,383 | |
Total distributable earnings (loss) | | | 7,565,895 | |
Net assets | | $ | 35,199,278 | |
| | | | | |
A-Class: |
Net assets | | $ | 31,862,255 | |
Capital shares outstanding | | | 697,852 | |
Net asset value per share | | $ | 45.66 | |
Maximum offering price per share (Net asset value divided by 95.25%) | | $ | 47.94 | |
| | | | | |
C-Class: |
Net assets | | $ | 1,225,146 | |
Capital shares outstanding | | | 30,115 | |
Net asset value per share | | $ | 40.68 | |
| | | | | |
P-Class: |
Net assets | | $ | 83,641 | |
Capital shares outstanding | | | 1,837 | |
Net asset value per share | | $ | 45.53 | |
| | | | | |
Institutional Class: |
Net assets | | $ | 2,028,236 | |
Capital shares outstanding | | | 45,170 | |
Net asset value per share | | $ | 44.90 | |
STATEMENT OF OPERATIONS |
Year Ended September 30, 2023 |
Investment Income: |
Dividends | | $ | 916,158 | |
Interest | | | 37,123 | |
Total investment income | | | 953,281 | |
| | | | | |
Expenses: |
Management fees | | | 253,631 | |
Distribution and service fees: |
A-Class | | | 84,150 | |
C-Class | | | 15,606 | |
P-Class | | | 238 | |
Transfer agent/maintenance fees: |
A-Class | | | 48,847 | |
C-Class | | | 3,361 | |
P-Class | | | 362 | |
Institutional Class | | | 6,206 | |
Registration fees | | | 70,994 | |
Professional fees | | | 39,787 | |
Fund accounting/administration fees | | | 25,039 | |
Trustees’ fees* | | | 8,800 | |
Custodian fees | | | 2,831 | |
Line of credit fees | | | 1,371 | |
Miscellaneous | | | 14,639 | |
Total expenses | | | 575,862 | |
Less: |
Expenses reimbursed by Adviser: |
A-Class | | | (48,313 | ) |
C-Class | | | (3,330 | ) |
P-Class | | | (361 | ) |
Institutional Class | | | (6,096 | ) |
Expenses waived by Adviser | | | (77,871 | ) |
Earning credits applied | | | (9 | ) |
Total waived/reimbursed expenses | | | (135,980 | ) |
Net expenses | | | 439,882 | |
Net investment income | | | 513,399 | |
| | | | | |
Net Realized and Unrealized Gain (Loss): |
Net realized gain (loss) on: |
Investments | | | 4,048,731 | |
Net realized gain | | | 4,048,731 | |
Net change in unrealized appreciation (depreciation) on: |
Investments | | | 863,434 | |
Net change in unrealized appreciation (depreciation) | | | 863,434 | |
Net realized and unrealized gain | | | 4,912,165 | |
Net increase in net assets resulting from operations | | $ | 5,425,564 | |
* | Relates to Trustees not deemed “interested persons” within the meaning of Section 2(a)(19) of the 1940 Act. |
36 | THE GUGGENHEIM FUNDS ANNUAL REPORT | SEE NOTES TO FINANCIAL STATEMENTS. |
STATEMENTS OF CHANGES IN NET ASSETS |
| | Year Ended
September 30,
2023 | | | Year Ended
September 30,
2022 | |
Increase (Decrease) in Net Assets from Operations: | | | | | | | | |
Net investment income | | $ | 513,399 | | | $ | 450,747 | |
Net realized gain on investments | | | 4,048,731 | | | | 3,580,356 | |
Net change in unrealized appreciation (depreciation) on investments | | | 863,434 | | | | (6,500,785 | ) |
Net increase (decrease) in net assets resulting from operations | | | 5,425,564 | | | | (2,469,682 | ) |
| | | | | | | | | |
Distributions to shareholders: | | | | | | | | |
A-Class | | | (2,952,899 | ) | | | (2,507,851 | ) |
C-Class | | | (151,235 | ) | | | (71,394 | ) |
P-Class | | | (8,525 | ) | | | (14,229 | ) |
Institutional Class | | | (518,877 | ) | | | (104,499 | ) |
Total distributions to shareholders | | | (3,631,536 | ) | | | (2,697,973 | ) |
| | | | | | | | | |
Capital share transactions: | | | | | | | | |
Proceeds from sale of shares | | | | | | | | |
A-Class | | | 1,050,924 | | | | 1,652,023 | |
C-Class | | | 236,441 | | | | 1,012,743 | |
P-Class | | | 5,872 | | | | 97,002 | |
Institutional Class | | | 1,317,443 | | | | 5,240,686 | |
Distributions reinvested | | | | | | | | |
A-Class | | | 2,884,298 | | | | 2,467,309 | |
C-Class | | | 137,939 | | | | 71,394 | |
P-Class | | | 8,525 | | | | 13,975 | |
Institutional Class | | | 518,877 | | | | 104,499 | |
Cost of shares redeemed | | | | | | | | |
A-Class | | | (4,238,196 | ) | | | (5,675,420 | ) |
C-Class | | | (876,269 | ) | | | (398,244 | ) |
P-Class | | | (33,478 | ) | | | (195,391 | ) |
Institutional Class | | | (5,335,058 | ) | | | (922,034 | ) |
Net increase (decrease) from capital share transactions | | | (4,322,682 | ) | | | 3,468,542 | |
Net decrease in net assets | | | (2,528,654 | ) | | | (1,699,113 | ) |
| | | | | | | | | |
Net assets: | | | | | | | | |
Beginning of year | | | 37,727,932 | | | | 39,427,045 | |
End of year | | $ | 35,199,278 | | | $ | 37,727,932 | |
| | | | | | | | | |
Capital share activity: | | | | | | | | |
Shares sold | | | | | | | | |
A-Class | | | 22,456 | | | | 33,081 | |
C-Class | | | 5,650 | | | | 22,757 | |
P-Class | | | 129 | | | | 1,910 | |
Institutional Class | | | 29,033 | | | | 111,528 | |
Shares issued from reinvestment of distributions | | | | | | | | |
A-Class | | | 63,832 | | | | 50,292 | |
C-Class | | | 3,405 | | | | 1,605 | |
P-Class | | | 189 | | | | 286 | |
Institutional Class | | | 11,697 | | | | 2,166 | |
Shares redeemed | | | | | | | | |
A-Class | | | (90,872 | ) | | | (113,292 | ) |
C-Class | | | (20,843 | ) | | | (8,672 | ) |
P-Class | | | (706 | ) | | | (3,856 | ) |
Institutional Class | | | (117,251 | ) | | | (19,629 | ) |
Net increase (decrease) in shares | | | (93,281 | ) | | | 78,176 | |
SEE NOTES TO FINANCIAL STATEMENTS. | THE GUGGENHEIM FUNDS ANNUAL REPORT | 37 |
This table is presented to show selected data for a share outstanding throughout each period and to assist shareholders in evaluating a Fund’s performance for the periods presented.
A-Class | | Year Ended
September 30,
2023 | | | Year Ended
September 30,
2022 | | | Year Ended
September 30,
2021 | | | Year Ended
September 30,
2020 | | | Year Ended
September 30,
2019 | |
Per Share Data |
Net asset value, beginning of period | | $ | 43.75 | | | $ | 50.08 | | | $ | 38.17 | | | $ | 43.56 | | | $ | 48.08 | |
Income (loss) from investment operations: |
Net investment income (loss)a | | | .61 | | | | .56 | | | | .41 | | | | .97 | | | | .62 | |
Net gain (loss) on investments (realized and unrealized) | | | 5.55 | | | | (3.40 | ) | | | 14.51 | | | | (2.97 | ) | | | (2.66 | ) |
Total from investment operations | | | 6.16 | | | | (2.84 | ) | | | 14.92 | | | | (2.00 | ) | | | (2.04 | ) |
Less distributions from: |
Net investment income | | | (.52 | ) | | | (.43 | ) | | | (1.30 | ) | | | (.70 | ) | | | (.36 | ) |
Net realized gains | | | (3.73 | ) | | | (3.06 | ) | | | (1.71 | ) | | | (2.69 | ) | | | (2.12 | ) |
Total distributions | | | (4.25 | ) | | | (3.49 | ) | | | (3.01 | ) | | | (3.39 | ) | | | (2.48 | ) |
Net asset value, end of period | | $ | 45.66 | | | $ | 43.75 | | | $ | 50.08 | | | $ | 38.17 | | | $ | 43.56 | |
|
Total Returnb | | | 14.19 | % | | | (6.43 | %) | | | 40.59 | % | | | (5.58 | %) | | | (3.59 | %) |
Ratios/Supplemental Data |
Net assets, end of period (in thousands) | | $ | 31,862 | | | $ | 30,733 | | | $ | 36,678 | | | $ | 28,548 | | | $ | 53,248 | |
Ratios to average net assets: |
Net investment income (loss) | | | 1.32 | % | | | 1.11 | % | | | 0.88 | % | | | 2.40 | % | | | 1.42 | % |
Total expensesc | | | 1.47 | % | | | 1.41 | % | | | 1.47 | % | | | 1.46 | % | | | 1.31 | % |
Net expensesd,e,f | | | 1.12 | % | | | 1.13 | % | | | 1.15 | % | | | 1.15 | % | | | 1.15 | % |
Portfolio turnover rate | | | 19 | % | | | 33 | % | | | 19 | % | | | 25 | % | | | 37 | % |
C-Class | | Year Ended
September 30,
2023 | | | Year Ended
September 30,
2022 | | | Year Ended
September 30,
2021 | | | Year Ended
September 30,
2020 | | | Year Ended
September 30,
2019 | |
Per Share Data |
Net asset value, beginning of period | | $ | 39.44 | | | $ | 45.43 | | | $ | 34.79 | | | $ | 39.77 | | | $ | 44.03 | |
Income (loss) from investment operations: |
Net investment income (loss)a | | | .24 | | | | .18 | | | | .05 | | | | .62 | | | | .26 | |
Net gain (loss) on investments (realized and unrealized) | | | 5.00 | | | | (3.07 | ) | | | 13.23 | | | | (2.74 | ) | | | (2.40 | ) |
Total from investment operations | | | 5.24 | | | | (2.89 | ) | | | 13.28 | | | | (2.12 | ) | | | (2.14 | ) |
Less distributions from: |
Net investment income | | | (.27 | ) | | | (.04 | ) | | | (.93 | ) | | | (.17 | ) | | | — | |
Net realized gains | | | (3.73 | ) | | | (3.06 | ) | | | (1.71 | ) | | | (2.69 | ) | | | (2.12 | ) |
Total distributions | | | (4.00 | ) | | | (3.10 | ) | | | (2.64 | ) | | | (2.86 | ) | | | (2.12 | ) |
Net asset value, end of period | | $ | 40.68 | | | $ | 39.44 | | | $ | 45.43 | | | $ | 34.79 | | | $ | 39.77 | |
|
Total Returnb | | | 13.33 | % | | | (7.13 | %) | | | 39.55 | % | | | (6.30 | %) | | | (4.28 | %) |
Ratios/Supplemental Data |
Net assets, end of period (in thousands) | | $ | 1,225 | | | $ | 1,653 | | | $ | 1,191 | | | $ | 911 | | | $ | 1,533 | |
Ratios to average net assets: |
Net investment income (loss) | | | 0.57 | % | | | 0.39 | % | | | 0.12 | % | | | 1.69 | % | | | 0.66 | % |
Total expensesc | | | 2.28 | % | | | 2.29 | % | | | 2.36 | % | | | 2.43 | % | | | 2.18 | % |
Net expensesd,e,f | | | 1.87 | % | | | 1.88 | % | | | 1.89 | % | | | 1.90 | % | | | 1.90 | % |
Portfolio turnover rate | | | 19 | % | | | 33 | % | | | 19 | % | | | 25 | % | | | 37 | % |
38 | THE GUGGENHEIM FUNDS ANNUAL REPORT | SEE NOTES TO FINANCIAL STATEMENTS. |
FINANCIAL HIGHLIGHTS (continued) |
This table is presented to show selected data for a share outstanding throughout each period and to assist shareholders in evaluating a Fund’s performance for the periods presented.
P-Class | | Year Ended
September 30,
2023 | | | Year Ended
September 30,
2022 | | | Year Ended
September 30,
2021 | | | Year Ended
September 30,
2020 | | | Year Ended
September 30,
2019 | |
Per Share Data |
Net asset value, beginning of period | | $ | 43.59 | | | $ | 49.91 | | | $ | 38.06 | | | $ | 43.46 | | | $ | 48.00 | |
Income (loss) from investment operations: |
Net investment income (loss)a | | | .62 | | | | .53 | | | | .41 | | | | .83 | | | | .61 | |
Net gain (loss) on investments (realized and unrealized) | | | 5.52 | | | | (3.34 | ) | | | 14.46 | | | | (2.82 | ) | | | (2.64 | ) |
Total from investment operations | | | 6.14 | | | | (2.81 | ) | | | 14.87 | | | | (1.99 | ) | | | (2.03 | ) |
Less distributions from: |
Net investment income | | | (.47 | ) | | | (.45 | ) | | | (1.31 | ) | | | (.72 | ) | | | (.39 | ) |
Net realized gains | | | (3.73 | ) | | | (3.06 | ) | | | (1.71 | ) | | | (2.69 | ) | | | (2.12 | ) |
Total distributions | | | (4.20 | ) | | | (3.51 | ) | | | (3.02 | ) | | | (3.41 | ) | | | (2.51 | ) |
Net asset value, end of period | | $ | 45.53 | | | $ | 43.59 | | | $ | 49.91 | | | $ | 38.06 | | | $ | 43.46 | |
|
Total Return | | | 14.19 | % | | | (6.44 | %) | | | 40.60 | % | | | (5.58 | %) | | | (3.58 | %) |
Ratios/Supplemental Data |
Net assets, end of period (in thousands) | | $ | 84 | | | $ | 97 | | | $ | 194 | | | $ | 170 | | | $ | 155 | |
Ratios to average net assets: |
Net investment income (loss) | | | 1.33 | % | | | 1.05 | % | | | 0.87 | % | | | 2.12 | % | | | 1.41 | % |
Total expensesc | | | 1.70 | % | | | 1.67 | % | | | 1.71 | % | | | 1.72 | % | | | 1.60 | % |
Net expensesd,e,f | | | 1.12 | % | | | 1.14 | % | | | 1.15 | % | | | 1.15 | % | | | 1.15 | % |
Portfolio turnover rate | | | 19 | % | | | 33 | % | | | 19 | % | | | 25 | % | | | 37 | % |
SEE NOTES TO FINANCIAL STATEMENTS. | THE GUGGENHEIM FUNDS ANNUAL REPORT | 39 |
FINANCIAL HIGHLIGHTS (concluded) |
This table is presented to show selected data for a share outstanding throughout each period and to assist shareholders in evaluating a Fund’s performance for the periods presented.
Institutional Class | | Year Ended
September 30,
2023 | | | Year Ended
September 30,
2022 | | | Year Ended
September 30,
2021 | | | Year Ended
September 30,
2020 | | | Year Ended
September 30,
2019 | |
Per Share Data |
Net asset value, beginning of period | | $ | 43.11 | | | $ | 49.39 | | | $ | 37.71 | | | $ | 43.08 | | | $ | 47.60 | |
Income (loss) from investment operations: |
Net investment income (loss)a | | | .74 | | | | .71 | | | | .52 | | | | .98 | | | | .71 | |
Net gain (loss) on investments (realized and unrealized) | | | 5.43 | | | | (3.38 | ) | | | 14.31 | | | | (2.84 | ) | | | (2.63 | ) |
Total from investment operations | | | 6.17 | | | | (2.67 | ) | | | 14.83 | | | | (1.86 | ) | | | (1.92 | ) |
Less distributions from: |
Net investment income | | | (.65 | ) | | | (.55 | ) | | | (1.44 | ) | | | (.82 | ) | | | (.48 | ) |
Net realized gains | | | (3.73 | ) | | | (3.06 | ) | | | (1.71 | ) | | | (2.69 | ) | | | (2.12 | ) |
Total distributions | | | (4.38 | ) | | | (3.61 | ) | | | (3.15 | ) | | | (3.51 | ) | | | (2.60 | ) |
Net asset value, end of period | | $ | 44.90 | | | $ | 43.11 | | | $ | 49.39 | | | $ | 37.71 | | | $ | 43.08 | |
|
Total Return | | | 14.48 | % | | | (6.20 | %) | | | 40.93 | % | | | (5.35 | %) | | | (3.33 | %) |
Ratios/Supplemental Data |
Net assets, end of period (in thousands) | | $ | 2,028 | | | $ | 5,246 | | | $ | 1,364 | | | $ | 477 | | | $ | 798 | |
Ratios to average net assets: |
Net investment income (loss) | | | 1.61 | % | | | 1.46 | % | | | 1.10 | % | | | 2.50 | % | | | 1.65 | % |
Total expensesc | | | 1.21 | % | | | 1.15 | % | | | 1.24 | % | | | 1.35 | % | | | 1.14 | % |
Net expensesd,e,f | | | 0.87 | % | | | 0.88 | % | | | 0.89 | % | | | 0.90 | % | | | 0.90 | % |
Portfolio turnover rate | | | 19 | % | | | 33 | % | | | 19 | % | | | 25 | % | | | 37 | % |
a | Net investment income (loss) per share was computed using average shares outstanding throughout the period. |
b | Total return does not reflect the impact of any applicable sales charges. |
c | Does not include expenses of the underlying funds in which the Fund invests. |
d | Net expense information reflects the expense ratios after expense waivers and reimbursements, as applicable. |
e | The portion of the ratios of net expenses to average net assets attributable to recoupments of prior fee reductions or expense reimbursements for the years presented was as follows: |
| | | 09/30/23 | 09/30/22 | 09/30/21 | 09/30/20 | 09/30/19 |
| | A-Class | — | — | 0.00%* | 0.00%* | 0.00%* |
| | C-Class | — | — | 0.00%* | — | 0.00%* |
| | P-Class | — | — | — | — | — |
| | Institutional Class | — | — | — | — | — |
f | Net expenses may include expenses that are excluded from the expense limitation agreement. Excluding these expenses, the net expense ratios for the years presented would be: |
| | | 09/30/23 | 09/30/22 | 09/30/21 | 09/30/20 | 09/30/19 |
| | A-Class | 1.12% | 1.13% | 1.14% | 1.15% | 1.15% |
| | C-Class | 1.87% | 1.88% | 1.89% | 1.90% | 1.90% |
| | P-Class | 1.12% | 1.13% | 1.14% | 1.15% | 1.15% |
| | Institutional Class | 0.87% | 0.88% | 0.89% | 0.90% | 0.90% |
40 | THE GUGGENHEIM FUNDS ANNUAL REPORT | SEE NOTES TO FINANCIAL STATEMENTS. |
MANAGERS’ COMMENTARY (Unaudited) | September 30, 2023 |
To Our Shareholders
Guggenheim Partners Investment Management, LLC (“GPIM”) serves as the investment adviser to Guggenheim Market Neutral Real Estate Fund (“Fund”). The Fund is managed by a team of seasoned professionals led by Michael Chong, CFA, Managing Director and Portfolio Manager, and Samir Sanghani, CFA, Managing Director and Portfolio Manager. In the subsequent paragraphs, the investment team discusses the Fund’s performance and the market environment for the 12-month period ended September 30, 2023 (“Reporting Period”).
For the Reporting Period, the Fund provided a total return of 0.96%1, underperforming the ICE BofA 3-Month U.S. Treasury Bill Index, the Fund’s benchmark (“Benchmark”), which returned 4.50% for the same period.
What factors contributed or detracted from the Fund’s performance during the Reporting Period?
The Reporting Period continued to be impacted by challenging macroeconomics, highlighted by inflation not seen in generations and the U.S. Federal Reserve’s (“Fed”) efforts to reign in the economy through a series of ongoing interest rate hikes. Given the rapid ascent in interest rates, market participants worried that the Fed’s actions would tip the economy into a recession. Government shutdown concerns as well as the ongoing war in Ukraine added to the outstanding risks.
The Fund continues to be driven by a fundamental approach to stock-picking, integrating macro and sector outlooks as appropriate. The Fund pursues a generally beta-neutral approach to portfolio construction such that alpha is primarily driven by company and sector views.
During the Reporting Period, the biggest positive contributor to Fund performance was the Office sector, which benefitted from a sector underweight positioning amid dislocation in that property type. Data Centers also contributed, helped by our positioning in Digital Realty Trust, Inc (not held at 9/30/23). Within the Lodging sector, our long position in Ryman Hospitality Properties, Inc. drove gains.
The biggest negative contributor to Fund performance was the Industrial sector, principally hurt by Rexford Industrial Realty, Inc. amid concerns of slowdown in its market. Healthcare was also a negative contributor, led by our positioning on Welltower, Inc (not held at 9/30/23). Lastly, the Tower sector was weak during the period as the rate environment and concerns around carrier spending took the sector lower.
How did the Fund use derivatives during the Reporting Period?
The derivatives in which the Fund invests include, among other derivatives, swap agreements (some of these instruments may be traded in the over-the-counter market). These investments are used to obtain the Fund’s short exposure and may also be used to hedge the Fund’s portfolio, to maintain long exposure to the equity markets, to increase returns, to generate income, or to seek to manage volatility of the portfolio.
During the Reporting Period, swaps were utilized to hedge the long sleeve of the portfolio. The usage of these swaps contributed positively to Fund performance. However, given the hedged nature of the portfolio, the swap contribution is more muted to overall total return.
How was the Fund positioned at the end of the Reporting Period?
Management expects the Fund will continue to add potential high-alpha pairs (a trade involving both a long and short holding with the objective of realizing a strong positive return) to seek to generate returns consistent with the Fund’s strategy. Given the current macroeconomic environment, the Fund is more conservative in its asset allocation than is typical. However, the Fund is capable of adding exposure as conditions warrant.
Performance displayed represents past performance which is no guarantee of future results.
1 | Performance figures are based on Class A shares and do not reflect taxes that a shareholder would pay on distributions or the redemption of shares. |
The opinions and forecast expressed may not actually come to pass. This information is subject to change at any time, based on market and other conditions, and should not be construed as a recommendation of any specific security or strategy.
| | THE GUGGENHEIM FUNDS ANNUAL REPORT | 41 |
PERFORMANCE REPORT AND FUND PROFILE (Unaudited) | September 30, 2023 |
MARKET NEUTRAL REAL ESTATE FUND
OBJECTIVE: Seeks to provide capital appreciation, while limiting exposure to general stock market risk.
Holdings Diversification (Market Exposure as % of Net Assets)
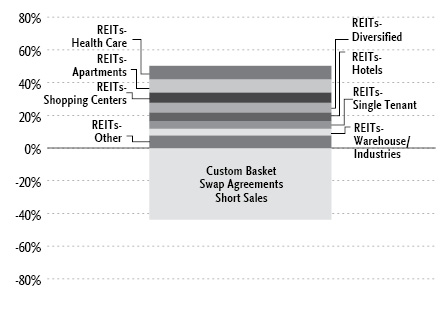
“Holdings Diversification (Market Exposure as % of Net Assets)” excludes any temporary cash investments.
Inception Dates: |
A-Class | February 26, 2016 |
C-Class | February 26, 2016 |
P-Class | February 26, 2016 |
Institutional Class | February 26, 2016 |
Ten Largest Holdings | % of Total Net Assets |
Rexford Industrial Realty, Inc. | 4.1% |
Ryman Hospitality Properties, Inc. | 4.1% |
CareTrust REIT, Inc. | 4.1% |
Gaming and Leisure Properties, Inc. | 3.3% |
AvalonBay Communities, Inc. | 3.0% |
Brixmor Property Group, Inc. | 2.8% |
InvenTrust Properties Corp. | 2.7% |
Equity Residential | 2.7% |
Agree Realty Corp. | 2.5% |
Ventas, Inc. | 2.5% |
Top Ten Total | 31.8% |
| | |
“Ten Largest Holdings” excludes any temporary cash or derivative investments. |
42 | THE GUGGENHEIM FUNDS ANNUAL REPORT | |
PERFORMANCE REPORT AND FUND PROFILE (Unaudited)(concluded) | September 30, 2023 |
Cumulative Fund Performance*
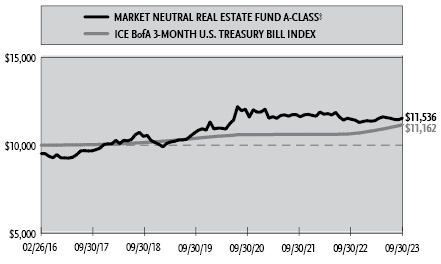
Average Annual Returns*
Periods Ended September 30, 2023
| 1 Year | 5 Year | Since
Inception
(02/26/16) |
A-Class Shares | 0.96% | 2.68% | 2.56% |
A-Class Shares with sales charge† | (3.84%) | 1.69% | 1.90% |
C-Class Shares | 0.19% | 1.88% | 1.77% |
C-Class Shares with CDSC‡ | (0.81%) | 1.88% | 1.77% |
P-Class Shares | 0.96% | 2.60% | 2.50% |
Institutional Class Shares | 1.21% | 2.90% | 2.78% |
ICE BofA 3-Month U.S. Treasury Bill Index | 4.50% | 1.72% | 1.46% |
* | The performance data above represents past performance that is not predictive of future results. The investment return and principal value of an investment in the Fund will fluctuate so that an investor’s shares, when redeemed, may be worth more or less than their original cost. Returns are historical and include changes in principal and reinvested dividends and capital gains and do not reflect the effect of taxes. The ICE BofA 3-Month U.S. Treasury Bill Index is an unmanaged index and, unlike the Fund, has no management fees or operating expenses to reduce its reported return. The graph is based on A-Class shares only; performance for C-Class, P-Class, and Institutional Class will vary due to differences in fee structures. |
† | Fund returns are calculated using the maximum sales charge of 4.75%. |
‡ | Fund returns include a CDSC of 1% if redeemed within 12 months of purchase. |
| | THE GUGGENHEIM FUNDS ANNUAL REPORT | 43 |
SCHEDULE OF INVESTMENTS | September 30, 2023 |
MARKET NEUTRAL REAL ESTATE FUND | |
| | Shares | | | Value | |
COMMON STOCKS† - 50.2% |
| | | | | | | | | |
REITs - 50.2% |
REITs-Health Care - 8.3% |
CareTrust REIT, Inc. | | | 97,230 | | | $ | 1,993,215 | |
Ventas, Inc. | | | 28,525 | | | | 1,201,758 | |
Healthpeak Properties, Inc. | | | 45,313 | | | | 831,947 | |
Total REITs-Health Care | | | | | | | 4,026,920 | |
| | | | | | | | | |
REITs-Apartments - 8.0% |
AvalonBay Communities, Inc. | | | 8,546 | | | | 1,467,690 | |
Equity Residential | | | 22,606 | | | | 1,327,198 | |
Invitation Homes, Inc. | | | 36,188 | | | | 1,146,798 | |
Total REITs-Apartments | | | | | | | 3,941,686 | |
| | | | | | | | | |
REITs-Shopping Centers - 6.3% |
Brixmor Property Group, Inc. | | | 66,795 | | | | 1,388,000 | |
Kite Realty Group Trust | | | 54,444 | | | | 1,166,190 | |
NETSTREIT Corp. | | | 33,994 | | | | 529,627 | |
Total REITs-Shopping Centers | | | | | | | 3,083,817 | |
| | | | | | | | | |
REITs-Diversified - 6.0% |
Gaming and Leisure Properties, Inc. | | | 35,796 | | | | 1,630,508 | |
InvenTrust Properties Corp. | | | 55,880 | | | | 1,330,503 | |
Total REITs-Diversified | | | | | | | 2,961,011 | |
| | | | | | | | | |
REITs-Hotels - 5.1% |
Ryman Hospitality Properties, Inc. | | | 23,972 | | | | 1,996,388 | |
Apple Hospitality REIT, Inc. | | | 31,878 | | | | 489,008 | |
Total REITs-Hotels | | | | | | | 2,485,396 | |
| | | | | | | | | |
REITs-Single Tenant - 4.8% |
Agree Realty Corp. | | | 21,868 | | | | 1,207,988 | |
Four Corners Property Trust, Inc. | | | 50,746 | | | | 1,126,054 | |
Total REITs-Single Tenant | | | | | | | 2,334,042 | |
| | | | | | | | | |
REITs-Warehouse/Industries - 4.1% |
Rexford Industrial Realty, Inc. | | | 40,999 | | | | 2,023,301 | |
| |
REITs-Office Property - 3.8% |
Alexandria Real Estate Equities, Inc. | | | 10,462 | | | | 1,047,246 | |
Boston Properties, Inc. | | | 8,342 | | | | 496,182 | |
Piedmont Office Realty Trust, Inc. — Class A | | | 63,224 | | | | 355,319 | |
Total REITs-Office Property | | | | | | | 1,898,747 | |
| | | | | | | | | |
REITs-Regional Malls - 1.9% |
Simon Property Group, Inc. | | | 8,770 | | | | 947,423 | |
| |
REITs-Storage - 1.9% |
Extra Space Storage, Inc. | | | 7,701 | | | | 936,288 | |
Total REITs | | | | | | | 24,638,631 | |
| | | | | | | | | |
Total Common Stocks | | | | |
(Cost $26,912,325) | | | | | | | 24,638,631 | |
| | | | | | | | | |
MONEY MARKET FUND† - 47.6% |
Goldman Sachs Financial Square Treasury Instruments Fund — Institutional Shares, 5.22%1 | | | 23,297,029 | | | | 23,297,029 | |
Total Money Market Fund | | | | |
(Cost $23,297,029) | | | | | | | 23,297,029 | |
| | | | | | | | | |
Total Investments - 97.8% | | | | |
(Cost $50,209,354) | | $ | 47,935,660 | |
Other Assets & Liabilities, net - 2.2% | | | 1,054,744 | |
Total Net Assets - 100.0% | | $ | 48,990,404 | |
Custom Basket Swap Agreements |
Counterparty | Reference Obligation | Type | | Financing Rate | | Payment
Frequency | | | Maturity
Date | | | Notional
Amount | | | Value and
Unrealized
Appreciation | |
OTC Custom Basket Swap Agreements Sold Short†† |
Morgan Stanley Capital Services LLC | MS Equity Custom Basket | Receive | | 5.03% (Federal Funds Rate - 0.30%) | | | At Maturity | | 11/22/24 | | $ | 12,624,776 | | | $ | 1,950,709 | |
Goldman Sachs International | GS Equity Custom Basket | Receive | | 5.13% (Federal Funds Rate - 0.20%) | | | At Maturity | | 05/06/24 | | | 12,624,783 | | | | 1,949,478 | |
| | | | | | | | | | | | | | | $ | 25,249,559 | | | $ | 3,900,187 | |
44 | THE GUGGENHEIM FUNDS ANNUAL REPORT | SEE NOTES TO FINANCIAL STATEMENTS. |
SCHEDULE OF INVESTMENTS (continued) | September 30, 2023 |
MARKET NEUTRAL REAL ESTATE FUND | |
| | Shares | | | Percentage
Notional
Amount | | | Value and
Unrealized
Appreciation
(Depreciation) | |
MS EQUITY SHORT CUSTOM BASKET | | | | | | | | |
Financial | | | | | | | | | | | | |
Douglas Emmett, Inc. | | | 64,557 | | | | (6.51 | )% | | $ | 568,448 | |
Realty Income Corp. | | | 19,642 | | | | (7.77 | )% | | | 320,843 | |
Broadstone Net Lease, Inc. | | | 20,926 | | | | (2.37 | )% | | | 270,572 | |
Essex Property Trust, Inc. | | | 3,769 | | | | (6.33 | )% | | | 185,413 | |
Camden Property Trust | | | 3,468 | | | | (2.60 | )% | | | 149,549 | |
Apartment Income REIT Corp. | | | 10,926 | | | | (2.66 | )% | | | 139,118 | |
JBG SMITH Properties | | | 46,690 | | | | (5.35 | )% | | | 138,173 | |
Global Net Lease, Inc. | | | 57,302 | | | | (4.36 | )% | | | 100,245 | |
Mid-America Apartment Communities, Inc. | | | 4,467 | | | | (4.55 | )% | | | 84,422 | |
Federal Realty Investment Trust | | | 8,242 | | | | (5.92 | )% | | | 82,960 | |
Service Properties Trust | | | 58,137 | | | | (3.54 | )% | | | 68,254 | |
Sunstone Hotel Investors, Inc. | | | 67,248 | | | | (4.98 | )% | | | 25,522 | |
Pebblebrook Hotel Trust | | | 32,044 | | | | (3.45 | )% | | | 22,332 | |
LTC Properties, Inc. | | | 7,094 | | | | (1.81 | )% | | | 14,361 | |
National Health Investors, Inc. | | | 4,503 | | | | (1.83 | )% | | | 10,014 | |
Macerich Co. | | | 43,175 | | | | (3.73 | )% | | | (19 | ) |
Phillips Edison & Company, Inc. | | | 38,421 | | | | (10.21 | )% | | | (65,495 | ) |
STAG Industrial, Inc. | | | 34,600 | | | | (9.46 | )% | | | (77,902 | ) |
Omega Healthcare Investors, Inc. | | | 15,592 | | | | (4.10 | )% | | | (82,780 | ) |
Welltower, Inc. | | | 9,141 | | | | (5.93 | )% | | | (168,197 | ) |
Total Financial | | | | | | | | | | | 1,785,831 | |
| | | | | | | | | | | | | |
Exchange Traded Funds | | | | | | | | | | | | |
Vanguard Real Estate ETF | | | 4,236 | | | | (2.54 | )% | | | 164,878 | |
Total MS Equity Short Custom Basket | | | | | | $ | 1,950,709 | |
| | Shares | | | Percentage
Notional
Amount | | | Value and
Unrealized
Appreciation
(Depreciation) | |
GS EQUITY SHORT CUSTOM BASKET | | | | | | | | |
Financial | | | | | | �� | | | | | | |
Douglas Emmett, Inc. | | | 64,557 | | | | (6.51 | )% | | $ | 570,160 | |
Realty Income Corp. | | | 19,642 | | | | (7.77 | )% | | | 319,965 | |
Broadstone Net Lease, Inc. | | | 20,926 | | | | (2.37 | )% | | | 263,421 | |
Essex Property Trust, Inc. | | | 3,769 | | | | (6.33 | )% | | | 182,179 | |
Camden Property Trust | | | 3,468 | | | | (2.60 | )% | | | 149,492 | |
Apartment Income REIT Corp. | | | 10,926 | | | | (2.66 | )% | | | 138,752 | |
JBG SMITH Properties | | | 46,690 | | | | (5.35 | )% | | | 136,148 | |
Global Net Lease, Inc. | | | 57,302 | | | | (4.36 | )% | | | 100,596 | |
Mid-America Apartment Communities, Inc. | | | 4,467 | | | | (4.55 | )% | | | 84,642 | |
Federal Realty Investment Trust | | | 8,242 | | | | (5.92 | )% | | | 81,596 | |
Service Properties Trust | | | 58,137 | | | | (3.54 | )% | | | 70,861 | |
Sunstone Hotel Investors, Inc. | | | 67,248 | | | | (4.98 | )% | | | 27,240 | |
Pebblebrook Hotel Trust | | | 32,044 | | | | (3.45 | )% | | | 23,740 | |
Macerich Co. | | | 43,175 | | | | (3.73 | )% | | | 16,468 | |
LTC Properties, Inc. | | | 7,094 | | | | (1.81 | )% | | | 13,413 | |
National Health Investors, Inc. | | | 4,503 | | | | (1.83 | )% | | | 9,002 | |
Phillips Edison & Company, Inc. | | | 38,421 | | | | (10.21 | )% | | | (72,170 | ) |
STAG Industrial, Inc. | | | 34,600 | | | | (9.46 | )% | | | (78,554 | ) |
Omega Healthcare Investors, Inc. | | | 15,592 | | | | (4.10 | )% | | | (83,323 | ) |
Welltower, Inc. | | | 9,141 | | | | (5.93 | )% | | | (169,078 | ) |
Total Financial | | | | | | | | | | | 1,784,549 | |
| | | | | | | | | | | | | |
Exchange Traded Funds | | | | | | | | | | | | |
Vanguard Real Estate ETF | | | 4,236 | | | | (2.54 | )% | | | 164,929 | |
Total GS Equity Short Custom Basket | | | | | | $ | 1,949,478 | |
SEE NOTES TO FINANCIAL STATEMENTS. | THE GUGGENHEIM FUNDS ANNUAL REPORT | 45 |
SCHEDULE OF INVESTMENTS (concluded) | September 30, 2023 |
MARKET NEUTRAL REAL ESTATE FUND | |
† | Value determined based on Level 1 inputs — See Note 4. |
†† | Value determined based on Level 2 inputs — See Note 4. |
1 | Rate indicated is the 7-day yield as of September 30, 2023. |
| | GS — Goldman Sachs International |
| | MS — Morgan Stanley Capital Services LLC |
| | REIT — Real Estate Investment Trust |
| | |
| | See Sector Classification in Other Information section. |
The following table summarizes the inputs used to value the Fund’s investments at September 30, 2023 (See Note 4 in the Notes to Financial Statements):
Investments in Securities (Assets) | | Level 1
Quoted
Prices | | | Level 2
Significant
Observable
Inputs | | | Level 3
Significant
Unobservable
Inputs | | | Total | |
Common Stocks | | $ | 24,638,631 | | | $ | — | | | $ | — | | | $ | 24,638,631 | |
Money Market Fund | | | 23,297,029 | | | | — | | | | — | | | | 23,297,029 | |
Equity Custom Basket Swap Agreements** | | | — | | | | 3,900,187 | | | | — | | | | 3,900,187 | |
Total Assets | | $ | 47,935,660 | | | $ | 3,900,187 | | | $ | — | | | $ | 51,835,847 | |
** | This derivative is reported as unrealized appreciation/depreciation at period end. |
46 | THE GUGGENHEIM FUNDS ANNUAL REPORT | SEE NOTES TO FINANCIAL STATEMENTS. |
MARKET NEUTRAL REAL ESTATE FUND | |
STATEMENT OF ASSETS AND LIABILITIES |
September 30, 2023 |
Assets: |
Investments, at value (cost $50,209,354) | | $ | 47,935,660 | |
Unrealized appreciation on OTC swap agreements | | | 3,900,187 | |
Prepaid expenses | | | 40,798 | |
Receivables: |
Dividends | | | 166,998 | |
Interest | | | 89,859 | |
Fund shares sold | | | 12,075 | |
Total assets | | | 52,145,577 | |
| | | | | |
Liabilities: |
Overdraft due to custodian bank | | | 4,504 | |
Segregated cash due to broker | | | 2,640,000 | |
Payable for: |
Swap settlement | | | 406,942 | |
Management fees | | | 36,055 | |
Transfer agent/maintenance fees | | | 11,376 | |
Fund shares redeemed | | | 8,272 | |
Fund accounting/administration fees | | | 4,714 | |
Trustees’ fees* | | | 703 | |
Distribution and service fees | | | 488 | |
Miscellaneous | | | 42,119 | |
Total liabilities | | | 3,155,173 | |
Net assets | | $ | 48,990,404 | |
| | | | | |
Net assets consist of: |
Paid in capital | | $ | 49,886,130 | |
Total distributable earnings (loss) | | | (895,726 | ) |
Net assets | | $ | 48,990,404 | |
| | | | | |
A-Class: |
Net assets | | $ | 439,308 | |
Capital shares outstanding | | | 16,118 | |
Net asset value per share | | $ | 27.26 | |
Maximum offering price per share (Net asset value divided by 95.25%) | | $ | 28.62 | |
| | | | | |
C-Class: |
Net assets | | $ | 212,139 | |
Capital shares outstanding | | | 8,249 | |
Net asset value per share | | $ | 25.72 | |
| | | | | |
P-Class: |
Net assets | | $ | 1,082,186 | |
Capital shares outstanding | | | 41,119 | |
Net asset value per share | | $ | 26.32 | |
| | | | | |
Institutional Class: |
Net assets | | $ | 47,256,771 | |
Capital shares outstanding | | | 1,748,143 | |
Net asset value per share | | $ | 27.03 | |
STATEMENT OF OPERATIONS |
Year Ended September 30, 2023 |
Investment Income: |
Dividends | | $ | 874,466 | |
Interest | | | 921,486 | |
Total investment income | | | 1,795,952 | |
| | | | | |
Expenses: |
Management fees | | | 528,509 | |
Distribution and service fees: |
A-Class | | | 1,109 | |
C-Class | | | 2,148 | |
P-Class | | | 3,588 | |
Transfer agent fees: |
A-Class | | | 2,108 | |
C-Class | | | 392 | |
P-Class | | | 3,012 | |
Institutional Class | | | 66,995 | |
Registration fees | | | 62,204 | |
Professional fees | | | 51,045 | |
Fund accounting/administration fees | | | 28,713 | |
Trustees’ fees* | | | 14,122 | |
Custodian fees | | | 3,424 | |
Interest expense | | | 2,138 | |
Line of credit fees | | | 1,588 | |
Miscellaneous | | | 14,732 | |
Recoupment of previously waived fees: |
A-Class | | | 9 | |
C-Class | | | 2 | |
P-Class | | | 18 | |
Institutional Class | | | 435 | |
Total expenses | | | 786,291 | |
Less: |
Expenses reimbursed by Adviser: |
A-Class | | | (2,108 | ) |
C-Class | | | (392 | ) |
P-Class | | | (3,012 | ) |
Institutional Class | | | (66,995 | ) |
Expenses waived by Adviser | | | (44,302 | ) |
Earnings credits applied | | | (739 | ) |
Total waived/reimbursed expenses | | | (117,548 | ) |
Net expenses | | | 668,743 | |
Net investment income | | | 1,127,209 | |
| | | | | |
Net Realized and Unrealized Gain (Loss): |
Net realized gain (loss) on: |
Investments | | | (1,519,572 | ) |
Swap agreements | | | 1,791,735 | |
Net realized gain | | | 272,163 | |
Net change in unrealized appreciation (depreciation) on: |
Investments | | | (24,157 | ) |
Swap agreements | | | (812,638 | ) |
Net change in unrealized appreciation (depreciation) | | | (836,795 | ) |
Net realized and unrealized loss | | | (564,632 | ) |
Net increase in net assets resulting from operations | | $ | 562,577 | |
* | Relates to Trustees not deemed “interested persons” within the meaning of Section 2(a)(19) of the 1940 Act. |
SEE NOTES TO FINANCIAL STATEMENTS. | THE GUGGENHEIM FUNDS ANNUAL REPORT | 47 |
MARKET NEUTRAL REAL ESTATE FUND | |
STATEMENTS OF CHANGES IN NET ASSETS |
| | Year Ended
September 30,
2023 | | | Year Ended
September 30,
2022 | |
Increase (Decrease) in Net Assets from Operations: | | | | | | | | |
Net investment income | | $ | 1,127,209 | | | $ | 99,279 | |
Net realized gain (loss) on investments | | | 272,163 | | | | (2,097,736 | ) |
Net change in unrealized appreciation (depreciation) on investments | | | (836,795 | ) | | | 679,359 | |
Net increase (decrease) in net assets resulting from operations | | | 562,577 | | | | (1,319,098 | ) |
| | | | | | | | | |
Distributions to shareholders: | | | | | | | | |
Institutional Class | | | (111,384 | ) | | | (161,651 | ) |
Total distributions to shareholders | | | (111,384 | ) | | | (161,651 | ) |
| | | | | | | | | |
Capital share transactions: | | | | | | | | |
Proceeds from sale of shares | | | | | | | | |
A-Class | | | 9,606 | | | | 120,328 | |
C-Class | | | 360 | | | | 50,203 | |
P-Class | | | 9,676 | | | | 298,054 | |
Institutional Class | | | 14,559,299 | | | | 11,581,110 | |
Distributions reinvested | | | | | | | | |
Institutional Class | | | 111,379 | | | | 161,357 | |
Cost of shares redeemed | | | | | | | | |
A-Class | | | (15,667 | ) | | | (1,539,819 | ) |
C-Class | | | (19,120 | ) | | | (53,438 | ) |
P-Class | | | (636,059 | ) | | | (1,266,443 | ) |
Institutional Class | | | (11,897,103 | ) | | | (19,898,533 | ) |
Net increase (decrease) from capital share transactions | | | 2,122,371 | | | | (10,547,181 | ) |
Net increase (decrease) in net assets | | | 2,573,564 | | | | (12,027,930 | ) |
| | | | | | | | | |
Net assets: | | | | | | | | |
Beginning of year | | | 46,416,840 | | | | 58,444,770 | |
End of year | | $ | 48,990,404 | | | $ | 46,416,840 | |
| | | | | | | | | |
Capital share activity: | | | | | | | | |
Shares sold | | | | | | | | |
A-Class | | | 359 | | | | 4,326 | |
C-Class | | | 14 | | | | 1,906 | |
P-Class | | | 368 | | | | 11,128 | |
Institutional Class | | | 543,333 | | | | 424,223 | |
Shares issued from reinvestment of distributions | | | | | | | | |
Institutional Class | | | 4,185 | | | | 5,876 | |
Shares redeemed | | | | | | | | |
A-Class | | | (579 | ) | | | (55,191 | ) |
C-Class | | | (753 | ) | | | (2,020 | ) |
P-Class | | | (24,402 | ) | | | (47,625 | ) |
Institutional Class | | | (444,521 | ) | | | (729,644 | ) |
Net increase (decrease) in shares | | | 78,004 | | | | (387,021 | ) |
48 | THE GUGGENHEIM FUNDS ANNUAL REPORT | SEE NOTES TO FINANCIAL STATEMENTS. |
MARKET NEUTRAL REAL ESTATE FUND | |
This table is presented to show selected data for a share outstanding throughout each period and to assist shareholders in evaluating a Fund’s performance for the periods presented.
A-Class | | Year Ended
September 30,
2023 | | | Year Ended
September 30,
2022 | | | Year Ended
September 30,
2021 | | | Year Ended
September 30,
2020 | | | Year Ended
September 30,
2019 | |
Per Share Data |
Net asset value, beginning of period | | $ | 27.00 | | | $ | 27.78 | | | $ | 28.18 | | | $ | 26.95 | | | $ | 25.16 | |
Income (loss) from investment operations: |
Net investment income (loss)a | | | .57 | | | | (.07 | ) | | | (.08 | ) | | | (.02 | ) | | | .25 | |
Net gain (loss) on investments (realized and unrealized) | | | (.31 | ) | | | (.71 | ) | | | (.24 | ) | | | 2.30 | | | | 1.78 | |
Total from investment operations | | | .26 | | | | (.78 | ) | | | (.32 | ) | | | 2.28 | | | | 2.03 | |
Less distributions from: |
Net investment income | | | — | | | | — | | | | (.02 | ) | | | (.25 | ) | | | (.01 | ) |
Net realized gains | | | — | | | | — | | | | (.06 | ) | | | (.80 | ) | | | (.23 | ) |
Total distributions | | | — | | | | — | | | | (.08 | ) | | | (1.05 | ) | | | (.24 | ) |
Net asset value, end of period | | $ | 27.26 | | | $ | 27.00 | | | $ | 27.78 | | | $ | 28.18 | | | $ | 26.95 | |
|
Total Returnb | | | 0.96 | % | | | (2.81 | %) | | | (1.14 | %) | | | 8.81 | % | | | 8.12 | % |
Ratios/Supplemental Data |
Net assets, end of period (in thousands) | | $ | 439 | | | $ | 441 | | | $ | 1,867 | | | $ | 11,723 | | | $ | 2,766 | |
Ratios to average net assets: |
Net investment income (loss) | | | 2.11 | % | | | (0.25 | %) | | | (0.29 | %) | | | (0.06 | %) | | | 0.96 | % |
Total expensesc | | | 2.20 | % | | | 2.42 | % | | | 2.08 | % | | | 2.38 | % | | | 3.99 | % |
Net expensesd,e,f | | | 1.63 | % | | | 1.64 | % | | | 1.64 | % | | | 1.65 | % | | | 1.62 | % |
Portfolio turnover rate | | | 55 | % | | | 49 | % | | | 264 | % | | | 355 | % | | | 180 | % |
C-Class | | Year Ended
September 30,
2023 | | | Year Ended
September 30,
2022 | | | Year Ended
September 30,
2021 | | | Year Ended
September 30,
2020 | | | Year Ended
September 30,
2019 | |
Per Share Data |
Net asset value, beginning of period | | $ | 25.67 | | | $ | 26.61 | | | $ | 27.20 | | | $ | 26.07 | | | $ | 24.67 | |
Income (loss) from investment operations: |
Net investment income (loss)a | | | .34 | | | | (.19 | ) | | | (.22 | ) | | | (.15 | ) | | | .05 | |
Net gain (loss) on investments (realized and unrealized) | | | (.29 | ) | | | (.75 | ) | | | (.29 | ) | | | 2.16 | | | | 1.70 | |
Total from investment operations | | | .05 | | | | (.94 | ) | | | (.51 | ) | | | 2.01 | | | | 1.75 | |
Less distributions from: |
Net investment income | | | — | | | | — | | | | (.02 | ) | | | (.08 | ) | | | (.12 | ) |
Net realized gains | | | — | | | | — | | | | (.06 | ) | | | (.80 | ) | | | (.23 | ) |
Total distributions | | | — | | | | — | | | | (.08 | ) | | | (.88 | ) | | | (.35 | ) |
Net asset value, end of period | | $ | 25.72 | | | $ | 25.67 | | | $ | 26.61 | | | $ | 27.20 | | | $ | 26.07 | |
|
Total Returnb | | | 0.19 | % | | | (3.53 | %) | | | (1.88 | %) | | | 7.99 | % | | | 7.15 | % |
Ratios/Supplemental Data |
Net assets, end of period (in thousands) | | $ | 212 | | | $ | 231 | | | $ | 242 | | | $ | 333 | | | $ | 135 | |
Ratios to average net assets: |
Net investment income (loss) | | | 1.33 | % | | | (0.72 | %) | | | (0.83 | %) | | | (0.56 | %) | | | 0.18 | % |
Total expensesc | | | 2.66 | % | | | 2.72 | % | | | 2.71 | % | | | 3.17 | % | | | 4.66 | % |
Net expensesd,e,f | | | 2.38 | % | | | 2.39 | % | | | 2.39 | % | | | 2.40 | % | | | 2.40 | % |
Portfolio turnover rate | | | 55 | % | | | 49 | % | | | 264 | % | | | 355 | % | | | 180 | % |
SEE NOTES TO FINANCIAL STATEMENTS. | THE GUGGENHEIM FUNDS ANNUAL REPORT | 49 |
MARKET NEUTRAL REAL ESTATE FUND | |
FINANCIAL HIGHLIGHTS (continued) |
This table is presented to show selected data for a share outstanding throughout each period and to assist shareholders in evaluating a Fund’s performance for the periods presented.
P-Class | | Year Ended
September 30,
2023 | | | Year Ended
September 30,
2022 | | | Year Ended
September 30,
2021 | | | Year Ended
September 30,
2020 | | | Year Ended
September 30,
2019 | |
Per Share Data |
Net asset value, beginning of period | | $ | 26.07 | | | $ | 26.83 | | | $ | 27.23 | | | $ | 26.10 | | | $ | 25.14 | |
Income (loss) from investment operations: |
Net investment income (loss)a | | | .52 | | | | (.03 | ) | | | (.04 | ) | | | — | | | | .20 | |
Net gain (loss) on investments (realized and unrealized) | | | (.27 | ) | | | (.73 | ) | | | (.28 | ) | | | 2.20 | | | | 1.71 | |
Total from investment operations | | | .25 | | | | (.76 | ) | | | (.32 | ) | | | 2.20 | | | | 1.91 | |
Less distributions from: |
Net investment income | | | — | | | | — | | | | (.02 | ) | | | (.27 | ) | | | (.72 | ) |
Net realized gains | | | — | | | | — | | | | (.06 | ) | | | (.80 | ) | | | (.23 | ) |
Total distributions | | | — | | | | — | | | | (.08 | ) | | | (1.07 | ) | | | (.95 | ) |
Net asset value, end of period | | $ | 26.32 | | | $ | 26.07 | | | $ | 26.83 | | | $ | 27.23 | | | $ | 26.10 | |
|
Total Return | | | 0.96 | % | | | (2.83 | %) | | | (1.17 | %) | | | 8.79 | % | | | 7.80 | % |
Ratios/Supplemental Data |
Net assets, end of period (in thousands) | | $ | 1,082 | | | $ | 1,699 | | | $ | 2,727 | | | $ | 8,360 | | | $ | 332 | |
Ratios to average net assets: |
Net investment income (loss) | | | 1.99 | % | | | (0.11 | %) | | | (0.16 | %) | | | 0.00 | % | | | 0.77 | % |
Total expensesc | | | 1.94 | % | | | 1.95 | % | | | 1.91 | % | | | 2.00 | % | | | 4.05 | % |
Net expensesd,e,f | | | 1.63 | % | | | 1.64 | % | | | 1.64 | % | | | 1.65 | % | | | 1.65 | % |
Portfolio turnover rate | | | 55 | % | | | 49 | % | | | 264 | % | | | 355 | % | | | 180 | % |
50 | THE GUGGENHEIM FUNDS ANNUAL REPORT | SEE NOTES TO FINANCIAL STATEMENTS. |
MARKET NEUTRAL REAL ESTATE FUND | |
FINANCIAL HIGHLIGHTS (concluded) |
This table is presented to show selected data for a share outstanding throughout each period and to assist shareholders in evaluating a Fund’s performance for the periods presented.
Institutional Class | | Year Ended
September 30,
2023 | | | Year Ended
September 30,
2022 | | | Year Ended
September 30,
2021 | | | Year Ended
September 30,
2020 | | | Year Ended
September 30,
2019 | |
Per Share Data |
Net asset value, beginning of period | | $ | 26.77 | | | $ | 27.57 | | | $ | 27.92 | | | $ | 26.74 | | | $ | 25.32 | |
Income (loss) from investment operations: |
Net investment income (loss)a | | | .63 | | | | .06 | | | | .07 | | | | .09 | | | | .31 | |
Net gain (loss) on investments (realized and unrealized) | | | (.31 | ) | | | (.78 | ) | | | (.31 | ) | | | 2.23 | | | | 1.73 | |
Total from investment operations | | | .32 | | | | (.72 | ) | | | (.24 | ) | | | 2.32 | | | | 2.04 | |
Less distributions from: |
Net investment income | | | (.06 | ) | | | (.08 | ) | | | (.05 | ) | | | (.34 | ) | | | (.39 | ) |
Net realized gains | | | — | | | | — | | | | (.06 | ) | | | (.80 | ) | | | (.23 | ) |
Total distributions | | | (.06 | ) | | | (.08 | ) | | | (.11 | ) | | | (1.14 | ) | | | (.62 | ) |
Net asset value, end of period | | $ | 27.03 | | | $ | 26.77 | | | $ | 27.57 | | | $ | 27.92 | | | $ | 26.74 | |
|
Total Return | | | 1.21 | % | | | (2.57 | %) | | | (0.87 | %) | | | 9.06 | % | | | 8.19 | % |
Ratios/Supplemental Data |
Net assets, end of period (in thousands) | | $ | 47,257 | | | $ | 44,047 | | | $ | 53,609 | | | $ | 37,399 | | | $ | 5,479 | |
Ratios to average net assets: |
Net investment income (loss) | | | 2.36 | % | | | 0.21 | % | | | 0.27 | % | | | 0.32 | % | | | 1.18 | % |
Total expensesc | | | 1.62 | % | | | 1.64 | % | | | 1.58 | % | | | 1.85 | % | | | 3.57 | % |
Net expensesd,e,f | | | 1.38 | % | | | 1.39 | % | | | 1.39 | % | | | 1.40 | % | | | 1.40 | % |
Portfolio turnover rate | | | 55 | % | | | 49 | % | | | 264 | % | | | 355 | % | | | 180 | % |
a | Net investment income (loss) per share was computed using average shares outstanding throughout the period. |
b | Total return does not reflect the impact of any applicable sales charges. |
c | Does not include expenses of the underlying funds in which the Fund invests. |
d | Net expense information reflects the expense ratios after expense waivers and reimbursements, as applicable. |
e | The portion of the ratios of net expenses to average net assets attributable to recoupments of prior fee reductions or expense reimbursements for the years presented was as follows: |
| | | 09/30/23 | 09/30/22 | 09/30/21 | 09/30/20 | 09/30/19 |
| | A-Class | 0.00%* | — | — | 0.00%* | 0.00%* |
| | C-Class | 0.00%* | 0.00%* | — | 0.00%* | 0.02% |
| | P-Class | 0.00%* | 0.01% | — | 0.00%* | 0.01% |
| | Institutional Class | 0.00%* | 0.01% | — | 0.00%* | 0.03% |
f | Net expenses may include expenses that are excluded from the expense limitation agreement. Excluding these expenses, the net expense ratios for the years presented would be: |
| | | 09/30/23 | 09/30/22 | 09/30/21 | 09/30/20 | 09/30/19 |
| | A-Class | 1.62% | 1.63% | 1.63% | 1.65% | 1.62% |
| | C-Class | 2.37% | 2.38% | 2.38% | 2.40% | 2.40% |
| | P-Class | 1.62% | 1.63% | 1.63% | 1.64% | 1.65% |
| | Institutional Class | 1.37% | 1.38% | 1.39% | 1.40% | 1.40% |
g | Less than $0.01 per share. |
SEE NOTES TO FINANCIAL STATEMENTS. | THE GUGGENHEIM FUNDS ANNUAL REPORT | 51 |
MANAGERS’ COMMENTARY (Unaudited) | September 30, 2023 |
To Our Shareholders
Guggenheim Partners Investment Management, LLC (“GPIM”) serves as the investment adviser to Guggenheim Risk Managed Real Estate Fund (“Fund”).The Fund is managed by a team of seasoned professionals led by Michael Chong, CFA, Managing Director and Portfolio Manager, and Samir Sanghani, CFA, Managing Director and Portfolio Manager. In the subsequent paragraphs, the investment team discusses the Fund’s performance and the market environment for the 12-month period ended September 30, 2023 (“Reporting Period”).
For the Reporting Period, the Fund provided a total return of 0.58%1, underperforming the FTSE NAREIT Equity REITs Index, the Fund’s benchmark (“Benchmark”), which returned 2.99% for the same period.
What factors contributed or detracted from the Fund’s performance during the Reporting Period?
The Reporting Period continued to be impacted by challenging macroeconomics, highlighted by inflation not seen in generations and the U.S. Federal Reserve’s (“Fed”) efforts to reign in the economy through a series of ongoing interest rate hikes. Given the rapid ascent in interest rates, market participants worried that the Fed’s actions would tip the economy into a recession. Government shutdown concerns as well as the ongoing war in Ukraine added to the outstanding risks.
The Fund continues to be driven by a fundamental approach to stock-picking, integrating macro and sector outlooks as appropriate. In addition, the Fund may dynamically adjust its level of long and short exposure to the real estate markets by adjusting allocations monthly between its long-only REIT strategy sleeve and market-neutral long/short strategy sleeve over time based on macroeconomic, industry-specific, and other factors. However, Guggenheim expects the Fund’s net exposure over time will be long biased.
During the Reporting Period, the biggest positive contributor to Fund performance was the Residential sector, which continued to see strong fundamentals. Strip retail also contributed positively, driven by positioning in lower multiple names. Office REITs were buoyed by our underweight sector position in a struggling sector.
The biggest negative contributor to Fund performance was the Industrial sector, principally hurt by being overweight an underperforming sector amid concerns of slowdown. The Tower sector was weak during the period as the rate environment and concerns around carrier spending took the sector lower. Lastly, Healthcare also hurt during the period, given our positioning on Welltower, Inc.
How did the Fund use derivatives during the Reporting Period?
The Fund may obtain exposure to long and short positions by entering into swap agreements (including, but not limited to, total return swap agreements). Short positions may be used either to hedge long positions or to seek positive returns where Guggenheim believes the security will depreciate.
The Fund may reinvest the proceeds of its short sales by taking additional long positions, or it may use leverage to maintain long positions in excess of 100% of net assets. To enhance the Fund’s exposure to real estate markets and to seek to increase the Fund’s returns, at the discretion of Guggenheim, the Fund’s long and short positions in equities may be combined with investments in derivatives, which may include, among other derivatives: swap agreements (including, among other types of swaps, total return swaps); options on securities, futures contracts, and stock indices; and stock index futures contracts (some of these instruments may be traded in the over-the-counter market). These investments may be used to hedge the Fund’s portfolio, to maintain exposure to the equity markets, to increase returns, to generate income, or to seek to manage volatility of the portfolio.
During the Reporting Period, swaps were utilized to both gain exposure and to hedge the long side of the portfolio within the long-short sleeve. The usage of these swaps contributed negatively to Fund performance. However, when considered in the context of total fund performance, the impact of swap contribution was minimal.
52 | THE GUGGENHEIM FUNDS ANNUAL REPORT | |
MANAGERS’ COMMENTARY (Unaudited)(concluded) | September 30, 2023 |
How was the Fund positioned at the end of the Reporting Period?
Guggenheim expects the Fund will continue to both manage Benchmark exposure as well as add potential high-alpha pairs (a trade involving both a long and short holding with the objective of realizing a strong positive return) to seek to generate returns consistent with the Fund’s strategy. Currently, balancing the underperformance of the REIT market against future prospects for this market, the Fund is running at a beta allocation consistent with historical norms. However, the Fund is capable of adding beta exposure as conditions warrant.
Performance displayed represents past performance which is no guarantee of future results.
1 | Performance figures are based on Class A shares and do not reflect taxes that a shareholder would pay on distributions or the redemption of shares. |
The opinions and forecast expressed may not actually come to pass. This information is subject to change at any time, based on market and other conditions, and should not be construed as a recommendation of any specific security or strategy.
| | THE GUGGENHEIM FUNDS ANNUAL REPORT | 53 |
PERFORMANCE REPORT AND FUND PROFILE (Unaudited) | September 30, 2023 |
RISK MANAGED REAL ESTATE FUND
OBJECTIVE: Seeks to provide total return, comprised of capital appreciation and income.
Holdings Diversification (Market Exposure as % of Net Assets)
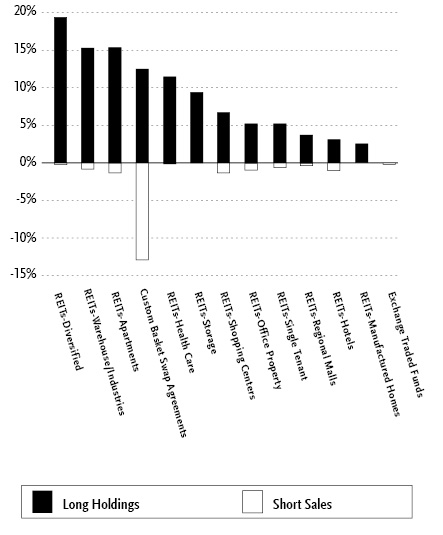
“Holdings Diversification (Market Exposure as % of Net Assets)” excludes any temporary cash investments.
Inception Dates: |
A-Class | March 28, 2014 |
C-Class | March 28, 2014 |
P-Class | May 1, 2015 |
Institutional Class | March 28, 2014 |
Ten Largest Holdings | % of Total Net Assets |
Prologis, Inc. | 10.9% |
Equinix, Inc. | 6.7% |
Public Storage | 4.4% |
Invitation Homes, Inc. | 4.0% |
Digital Realty Trust, Inc. | 4.0% |
VICI Properties, Inc. | 3.7% |
Simon Property Group, Inc. | 3.7% |
AvalonBay Communities, Inc. | 3.5% |
Equity Residential | 3.2% |
Extra Space Storage, Inc. | 3.1% |
Top Ten Total | 47.2% |
| | |
“Ten Largest Holdings” excludes any temporary cash or derivative investments. |
54 | THE GUGGENHEIM FUNDS ANNUAL REPORT | |
PERFORMANCE REPORT AND FUND PROFILE (Unaudited)(concluded) | September 30, 2023 |
Cumulative Fund Performance*
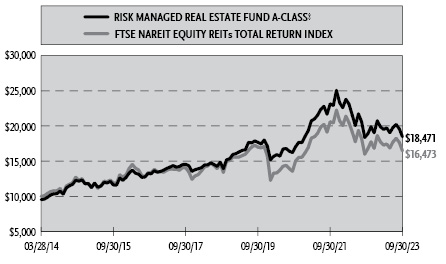
Average Annual Returns*
Periods Ended September 30, 2023
| 1 Year | 5 Year | Since
Inception
(03/28/14) |
A-Class Shares | 0.58% | 4.92% | 7.21% |
A-Class Shares with sales charge† | (4.20%) | 3.91% | 6.67% |
C-Class Shares | (0.10%) | 4.13% | 6.40% |
C-Class Shares with CDSC‡ | (1.04%) | 4.13% | 6.40% |
Institutional Class Shares | 0.91% | 5.23% | 7.53% |
FTSE NAREIT Equity REITs Total Return Index | 2.99% | 2.77% | 5.39% |
| 1 Year | 5 Year | Since
Inception
(05/01/15) |
P-Class Shares | 0.55% | 4.87% | 5.35% |
FTSE NAREIT Equity REITs Total Return Index | 2.99% | 2.77% | 3.94% |
* | The performance data above represents past performance that is not predictive of future results. The investment return and principal value of an investment in the Fund will fluctuate so that an investor’s shares, when redeemed, may be worth more or less than their original cost. Returns are historical and include changes in principal and reinvested dividends and capital gains and do not reflect the effect of taxes. The FTSE NAREIT Equity REITs Total Return Index is an unmanaged index and, unlike the Fund, has no management fees or operating expenses to reduce its reported return. The graph is based on A-Class shares only; performance for C-Class, P-Class and Institutional Class will vary due to differences in fee structures. |
† | Fund returns are calculated using the maximum sales charge of 4.75%. |
‡ | Fund returns include a CDSC of 1% if redeemed within 12 months of purchase. |
| | THE GUGGENHEIM FUNDS ANNUAL REPORT | 55 |
SCHEDULE OF INVESTMENTS | September 30, 2023 |
RISK MANAGED REAL ESTATE FUND | |
| | Shares | | | Value | |
COMMON STOCKS† - 97.4% |
| | | | | | | | | |
REITs - 97.4% |
REITs-Diversified - 19.4% |
Equinix, Inc. | | | 32,686 | | | $ | 23,738,534 | |
Digital Realty Trust, Inc. | | | 115,304 | | | | 13,954,090 | |
VICI Properties, Inc. | | | 454,409 | | | | 13,223,302 | |
Gaming and Leisure Properties, Inc. | | | 182,371 | | | | 8,306,999 | |
InvenTrust Properties Corp. | | | 188,680 | | | | 4,492,471 | |
WP Carey, Inc. | | | 66,346 | | | | 3,587,992 | |
EPR Properties | | | 23,237 | | | | 965,265 | |
Total REITs-Diversified | | | | | | | 68,268,653 | |
| | | | | | | | | |
REITs-Warehouse/Industries - 15.3% |
Prologis, Inc.1 | | | 343,994 | | | | 38,599,567 | |
Rexford Industrial Realty, Inc. | | | 157,747 | | | | 7,784,814 | |
Americold Realty Trust, Inc.1 | | | 144,195 | | | | 4,384,970 | |
First Industrial Realty Trust, Inc. | | | 41,908 | | | | 1,994,402 | |
Terreno Realty Corp. | | | 24,591 | | | | 1,396,769 | |
Total REITs-Warehouse/Industries | | | | | | | 54,160,522 | |
| | | | | | | | | |
REITs-Apartments - 15.4% |
Invitation Homes, Inc. | | | 447,509 | | | | 14,181,560 | |
AvalonBay Communities, Inc. | | | 71,642 | | | | 12,303,797 | |
Equity Residential1 | | | 193,287 | | | | 11,347,880 | |
American Homes 4 Rent — Class A | | | 160,334 | | | | 5,401,652 | |
Essex Property Trust, Inc. | | | 17,322 | | | | 3,673,823 | |
UDR, Inc. | | | 83,509 | | | | 2,978,766 | |
Mid-America Apartment Communities, Inc. | | | 20,648 | | | | 2,656,365 | |
Camden Property Trust | | | 14,347 | | | | 1,356,939 | |
Total REITs-Apartments | | | | | | | 53,900,782 | |
| | | | | | | | | |
REITs-Health Care - 11.5% |
Welltower, Inc. | | | 128,195 | | | | 10,501,734 | |
Ventas, Inc. | | | 229,305 | | | | 9,660,620 | |
Healthpeak Properties, Inc. | | | 405,566 | | | | 7,446,192 | |
CareTrust REIT, Inc. | | | 285,879 | | | | 5,860,519 | |
Sabra Health Care REIT, Inc. | | | 296,339 | | | | 4,130,966 | |
Healthcare Realty Trust, Inc. | | | 129,946 | | | | 1,984,275 | |
Medical Properties Trust, Inc. | | | 201,566 | | | | 1,098,535 | |
Total REITs-Health Care | | | | | | | 40,682,841 | |
| | | | | | | | | |
REITs-Storage - 9.4% |
Public Storage | | | 59,568 | | | | 15,697,359 | |
Extra Space Storage, Inc. | | | 89,639 | | | | 10,898,310 | |
Iron Mountain, Inc. | | | 96,367 | | | | 5,729,018 | |
National Storage Affiliates Trust | | | 29,766 | | | | 944,773 | |
Total REITs-Storage | | | | | | | 33,269,460 | |
| | | | | | | | | |
REITs-Shopping Centers - 6.7% |
Brixmor Property Group, Inc. | | | 290,610 | | | | 6,038,876 | |
Kimco Realty Corp. | | | 295,960 | | | | 5,205,936 | |
Kite Realty Group Trust | | | 230,488 | | | | 4,937,053 | |
Regency Centers Corp. | | | 57,752 | | | | 3,432,779 | |
NETSTREIT Corp. | | | 136,951 | | | | 2,133,697 | |
Federal Realty Investment Trust | | | 10,353 | | | | 938,292 | |
Retail Opportunity Investments Corp. | | | 42,800 | | | | 529,864 | |
Acadia Realty Trust | | | 31,753 | | | | 455,656 | |
Total REITs-Shopping Centers | | | | | | | 23,672,153 | |
| | | | | | | | | |
REITs-Office Property - 5.2% |
Alexandria Real Estate Equities, Inc. | | | 86,464 | | | | 8,655,046 | |
Boston Properties, Inc. | | | 80,288 | | | | 4,775,530 | |
Piedmont Office Realty Trust, Inc. — Class A | | | 234,554 | | | | 1,318,193 | |
Kilroy Realty Corp. | | | 40,073 | | | | 1,266,708 | |
Cousins Properties, Inc. | | | 56,018 | | | | 1,141,087 | |
Highwoods Properties, Inc.1 | | | 35,405 | | | | 729,697 | |
Empire State Realty Trust, Inc. — Class A1 | | | 48,439 | | | | 389,450 | |
Hudson Pacific Properties, Inc. | | | 51,166 | | | | 340,254 | |
Total REITs-Office Property | | | | | | | 18,615,965 | |
| | | | | | | | | |
REITs-Single Tenant - 5.2% |
Realty Income Corp. | | | 150,518 | | | | 7,516,869 | |
Agree Realty Corp. | | | 89,539 | | | | 4,946,134 | |
Four Corners Property Trust, Inc. | | | 184,099 | | | | 4,085,157 | |
NNN REIT, Inc. | | | 45,814 | | | | 1,619,067 | |
Total REITs-Single Tenant | | | | | | | 18,167,227 | |
| | | | | | | | | |
REITs-Regional Malls - 3.7% |
Simon Property Group, Inc. | | | 121,517 | | | | 13,127,482 | |
| | | | | | | | | |
REITs-Hotels - 3.1% |
Ryman Hospitality Properties, Inc. | | | 67,232 | | | | 5,599,081 | |
Host Hotels & Resorts, Inc. | | | 191,128 | | | | 3,071,427 | |
Apple Hospitality REIT, Inc. | | | 101,637 | | | | 1,559,112 | |
Pebblebrook Hotel Trust | | | 43,770 | | | | 594,834 | |
Total REITs-Hotels | | | | | | | 10,824,454 | |
| | | | | | | | | |
REITs-Manufactured Homes - 2.5% |
Sun Communities, Inc. | | | 43,042 | | | | 5,093,590 | |
Equity LifeStyle Properties, Inc. | | | 59,039 | | | | 3,761,375 | |
Total REITs-Manufactured Homes | | | | | | | 8,854,965 | |
| | | | | | | | | |
Total REITS | | | | | | | 343,544,504 | |
| | | | | | | | | |
Total Common Stocks | | | | |
(Cost $386,547,739) | | | | | | | 343,544,504 | |
| | | | | | | | | |
MONEY MARKET FUND† - 0.2% |
Dreyfus Treasury Securities Cash Management Fund — Institutional Shares, 5.24%2 | | | 700,952 | | | | 700,952 | |
Total Money Market Fund | | | | |
(Cost $700,952) | | | | | | | 700,952 | |
| | | | | | | | | |
Total Investments - 97.6% | | | | |
(Cost $387,248,691) | | $ | 344,245,456 | |
| | | | | | | | | |
56 | THE GUGGENHEIM FUNDS ANNUAL REPORT | SEE NOTES TO FINANCIAL STATEMENTS. |
SCHEDULE OF INVESTMENTS (continued) | September 30, 2023 |
RISK MANAGED REAL ESTATE FUND | |
| | Shares | | | Value | |
COMMON STOCKS SOLD SHORT† - (7.8)% |
REITs - (7.8)% |
REITs-Diversified - (0.6)% |
Global Net Lease, Inc. | | | 126,820 | | | $ | (1,218,739 | ) |
Broadstone Net Lease, Inc. | | | 46,314 | | | | (662,290 | ) |
Total REITs-Diversified | | | | | | | (1,881,029 | ) |
REITs-Regional Malls - (0.3)% |
Macerich Co. | | | 95,555 | | | | (1,042,505 | ) |
| | | | | | | | | |
REITs-Single Tenant - (0.6)% |
Realty Income Corp. | | | 43,472 | | | | (2,170,992 | ) |
| | | | | | | | | |
REITs-Warehouse/Industries - (0.8)% |
STAG Industrial, Inc. | | | 76,577 | | | | (2,642,672 | ) |
| | | | | | | | | |
REITs-Office Property - (0.9)% |
JBG SMITH Properties | | | 103,335 | | | | (1,494,224 | ) |
Douglas Emmett, Inc. | | | 142,878 | | | | (1,823,123 | ) |
Total REITs-Office Property | | | | | | | (3,317,347 | ) |
| | | | | | | | | |
REITs-Hotels - (1.0)% |
Pebblebrook Hotel Trust | | | 70,920 | | | | (963,803 | ) |
Service Properties Trust | | | 128,669 | | | | (989,465 | ) |
Sunstone Hotel Investors, Inc. | | | 148,834 | | | | (1,391,598 | ) |
Total REITs-Hotels | | | | | | | (3,344,866 | ) |
| | | | | | | | | |
REITs-Health Care - (1.0)% |
LTC Properties, Inc. | | | 15,701 | | | | (504,473 | ) |
National Health Investors, Inc. | | | 9,966 | | | | (511,854 | ) |
Omega Healthcare Investors, Inc. | | | 34,508 | | | | (1,144,285 | ) |
Welltower, Inc. | | | 20,231 | | | | (1,657,324 | ) |
Total REITs-Health Care | | | | | | | (3,817,936 | ) |
| | | | | | | | | |
REITs-Shopping Centers - (1.3)% |
Federal Realty Investment Trust | | | 18,241 | | | | (1,653,182 | ) |
Phillips Edison & Company, Inc. | | | 85,034 | | | | (2,852,040 | ) |
Total REITs-Shopping Centers | | | | | | | (4,505,222 | ) |
| | | | | | | | | |
REITs-Apartments - (1.3)% |
Camden Property Trust | | | 7,675 | | | | (725,902 | ) |
Apartment Income REIT Corp. | | | 24,182 | | | | (742,387 | ) |
Mid-America Apartment Communities, Inc. | | | 9,886 | | | | (1,271,834 | ) |
Essex Property Trust, Inc. | | | 8,342 | | | | (1,769,255 | ) |
Total REITs-Apartments | | | | | | | (4,509,378 | ) |
| | | | | | | | | |
Total REITs | | | | | | | (27,231,947 | ) |
| | | | | | | | | |
Total Common Stocks Sold Short | | | | |
(Proceeds $31,856,851) | | | | | | | (27,231,947 | ) |
| | | | | | | | | |
EXCHANGE-TRADED FUNDS SOLD SHORT† - (0.2)% |
Vanguard Real Estate ETF | | | 9,375 | | | | (709,312 | ) |
Total Exchange-Traded Funds Sold Short | | | | |
(Proceeds $810,607) | | | | | | | (709,312 | ) |
| | | | | | | | | |
Total Securities Sold Short - (8.0)% | | | | |
(Proceeds $32,667,458) | | $ | (27,941,259 | ) |
Other Assets & Liabilities, net - 10.4% | | | 36,602,163 | |
Total Net Assets - 100.0% | | $ | 352,906,360 | |
Custom Basket Swap Agreements |
Counterparty | Reference Obligation | Type | | Financing
Rate | | Payment
Frequency | | | Maturity
Date | | | Notional
Amount | | | Value and
Unrealized
Appreciation
(Depreciation) | |
OTC Custom Basket Swap Agreements†† |
Morgan Stanley Capital Services LLC | MS Equity Custom Basket | Pay | | 5.73% (Federal Funds Rate + 0.40%) | | | At Maturity | | | | 11/12/24 | | | $ | 22,113,679 | | | $ | (1,659,983 | ) |
Goldman Sachs International | GS Equity Custom Basket | Pay | | 5.78% (Federal Funds Rate + 0.45%) | | | At Maturity | | | | 05/06/24 | | | | 22,113,687 | | | | (1,673,703 | ) |
| | | | | | | | | | | | | | | $ | 44,227,366 | | | $ | (3,333,686 | ) |
OTC Custom Basket Swap Agreements Sold Short†† |
Goldman Sachs International | GS Equity Custom Basket | Receive | | 5.13% (Federal Funds Rate - 0.20%) | | | At Maturity | | | | 05/06/24 | | | $ | 22,704,157 | | | $ | 5,211,587 | |
Morgan Stanley Capital Services LLC | MS Equity Custom Basket | Receive | | 5.03% (Federal Funds Rate - 0.30%) | | | At Maturity | | | | 11/12/24 | | | | 22,704,149 | | | | 5,201,926 | |
| | | | | | | | | | | | | | | $ | 45,408,306 | | | $ | 10,413,513 | |
SEE NOTES TO FINANCIAL STATEMENTS. | THE GUGGENHEIM FUNDS ANNUAL REPORT | 57 |
SCHEDULE OF INVESTMENTS (continued) | September 30, 2023 |
RISK MANAGED REAL ESTATE FUND | |
| | Shares | | | Percentage
Notional
Amount | | | Value and
Unrealized
Appreciation
(Depreciation) | |
MS EQUITY LONG CUSTOM BASKET | | | | | | | | |
Financial | | | | | | | | | | | | |
Gaming and Leisure Properties, Inc. | | | 32,148 | | | | 6.63 | % | | $ | 205,218 | |
CareTrust REIT, Inc. | | | 87,322 | | | | 8.09 | % | | | 197,166 | |
Ryman Hospitality Properties, Inc. | | | 21,529 | | | | 8.11 | % | | | 120,469 | |
InvenTrust Properties Corp. | | | 50,186 | | | | 5.40 | % | | | 31,756 | |
Kite Realty Group Trust | | | 48,857 | | | | 4.73 | % | | | 20,519 | |
AvalonBay Communities, Inc. | | | 7,675 | | | | 5.96 | % | | | 12,781 | |
Apple Hospitality REIT, Inc. | | | 28,416 | | | | 1.97 | % | | | 11,529 | |
Simon Property Group, Inc. | | | 7,876 | | | | 3.85 | % | | | (19,939 | ) |
Brixmor Property Group, Inc. | | | 59,929 | | | | 5.63 | % | | | (20,898 | ) |
Extra Space Storage, Inc. | | | 6,844 | | | | 3.76 | % | | | (34,557 | ) |
Ventas, Inc. | | | 25,618 | | | | 4.88 | % | | | (36,369 | ) |
Equity Residential | | | 20,302 | | | | 5.39 | % | | | (58,137 | ) |
Invitation Homes, Inc. | | | 32,500 | | | | 4.66 | % | | | (78,624 | ) |
NETSTREIT Corp. | | | 30,530 | | | | 2.15 | % | | | (107,721 | ) |
Healthpeak Properties, Inc. | | | 40,695 | | | | 3.38 | % | | | (123,358 | ) |
Boston Properties, Inc. | | | 7,492 | | | | 2.02 | % | | | (157,757 | ) |
Four Corners Property Trust, Inc. | | | 45,575 | | | | 4.57 | % | | | (234,106 | ) |
Agree Realty Corp. | | | 19,640 | | | | 4.91 | % | | | (234,241 | ) |
Rexford Industrial Realty, Inc. | | | 36,821 | | | | 8.22 | % | | | (311,186 | ) |
Piedmont Office Realty Trust, Inc. — Class A | | | 56,781 | | | | 1.44 | % | | | (337,110 | ) |
Alexandria Real Estate Equities, Inc. | | | 9,396 | | | | 4.25 | % | | | (505,418 | ) |
Total Financial | | | | | | | | | | | (1,659,983 | ) |
Total MS Equity Long Custom Basket | | | | | | $ | (1,659,983 | ) |
| | | | | | | | | |
MS EQUITY SHORT CUSTOM BASKET | | | | | | | | |
Financial | | | | | | | | | | | | |
Douglas Emmett, Inc. | | | 115,957 | | | | (6.51 | )% | | $ | 1,468,779 | |
Realty Income Corp. | | | 35,280 | | | | (7.76 | )% | | | 715,359 | |
Broadstone Net Lease, Inc. | | | 37,587 | | | | (2.37 | )% | | | 500,753 | |
Mid-America Apartment Communities, Inc. | | | 8,023 | | | | (4.55 | )% | | | 418,169 | |
Essex Property Trust, Inc. | | | 6,770 | | | | (6.32 | )% | | | 413,518 | |
Apartment Income REIT Corp. | | | 19,625 | | | | (2.65 | )% | | | 388,885 | |
Camden Property Trust | | | 6,230 | | | | (2.60 | )% | | | 340,149 | |
Global Net Lease, Inc. | | | 106,539 | | | | (4.51 | )% | | | 292,704 | |
JBG SMITH Properties | | | 83,865 | | | | (5.34 | )% | | | 266,400 | |
Federal Realty Investment Trust | | | 14,805 | | | | (5.91 | )% | | | 171,302 | |
Service Properties Trust | | | 104,425 | | | | (3.54 | )% | | | 129,007 | |
STAG Industrial, Inc. | | | 62,148 | | | | (9.45 | )% | | | 124,247 | |
Pebblebrook Hotel Trust | | | 57,558 | | | | (3.45 | )% | | | 43,210 | |
Sunstone Hotel Investors, Inc. | | | 119,890 | | | | (4.94 | )% | | | 38,597 | |
LTC Properties, Inc. | | | 12,742 | | | | (1.80 | )% | | | 25,791 | |
National Health Investors, Inc. | | | 8,089 | | | | (1.83 | )% | | | 17,988 | |
Macerich Co. | | | 77,550 | | | | (3.73 | )% | | | (597 | ) |
Phillips Edison & Company, Inc. | | | 69,011 | | | | (10.19 | )% | | | (16,866 | ) |
Omega Healthcare Investors, Inc. | | | 28,006 | | | | (4.09 | )% | | | (150,387 | ) |
Welltower, Inc. | | | 16,419 | | | | (5.92 | )% | | | (293,678 | ) |
Total Financial | | | | | | | | | | | 4,893,330 | |
| | | | | | | | | | | | | |
Exchange Traded Funds | | | | | | | | | | | | |
Vanguard Real Estate ETF | | | 7,625 | | | | (2.54 | )% | | | 308,596 | |
Total MS Equity Short Custom Basket | | | | | | $ | 5,201,926 | |
| | | | | | | | | |
GS EQUITY LONG CUSTOM BASKET | | | | | | | | |
Financial | | | | | | | | | | | | |
Gaming and Leisure Properties, Inc. | | | 32,148 | | | | 6.63 | % | | $ | 205,815 | |
CareTrust REIT, Inc. | | | 87,322 | | | | 8.09 | % | | | 196,634 | |
Ryman Hospitality Properties, Inc. | | | 21,529 | | | | 8.11 | % | | | 121,198 | |
InvenTrust Properties Corp. | | | 50,186 | | | | 5.40 | % | | | 36,492 | |
Kite Realty Group Trust | | | 48,857 | | | | 4.73 | % | | | 25,290 | |
AvalonBay Communities, Inc. | | | 7,675 | | | | 5.96 | % | | | 12,432 | |
Apple Hospitality REIT, Inc. | | | 28,416 | | | | 1.97 | % | | | 11,856 | |
Brixmor Property Group, Inc. | | | 59,929 | | | | 5.63 | % | | | (20,619 | ) |
Simon Property Group, Inc. | | | 7,876 | | | | 3.85 | % | | | (33,400 | ) |
Extra Space Storage, Inc. | | | 6,844 | | | | 3.76 | % | | | (33,603 | ) |
Ventas, Inc. | | | 25,618 | | | | 4.88 | % | | | (36,304 | ) |
Equity Residential | | | 20,302 | | | | 5.39 | % | | | (61,608 | ) |
Invitation Homes, Inc. | | | 32,500 | | | | 4.66 | % | | | (83,595 | ) |
NETSTREIT Corp. | | | 30,530 | | | | 2.15 | % | | | (108,043 | ) |
Healthpeak Properties, Inc. | | | 40,695 | | | | 3.38 | % | | | (119,269 | ) |
Boston Properties, Inc. | | | 7,492 | | | | 2.02 | % | | | (158,779 | ) |
Four Corners Property Trust, Inc. | | | 45,575 | | | | 4.57 | % | | | (236,932 | ) |
Agree Realty Corp. | | | 19,640 | | | | 4.91 | % | | | (240,866 | ) |
Rexford Industrial Realty, Inc. | | | 36,821 | | | | 8.22 | % | | | (309,421 | ) |
Piedmont Office Realty Trust, Inc. — Class A | | | 56,781 | | | | 1.44 | % | | | (336,202 | ) |
Alexandria Real Estate Equities, Inc. | | | 9,396 | | | | 4.25 | % | | | (504,779 | ) |
Total Financial | | | | | | | | | | | (1,673,703 | ) |
Total GS Equity Long Custom Basket | | | | | | $ | (1,673,703 | ) |
| | | | | | | | | |
58 | THE GUGGENHEIM FUNDS ANNUAL REPORT | SEE NOTES TO FINANCIAL STATEMENTS. |
SCHEDULE OF INVESTMENTS (concluded) | September 30, 2023 |
RISK MANAGED REAL ESTATE FUND | |
| | Shares | | | Percentage
Notional
Amount | | | Value and
Unrealized
Appreciation
(Depreciation) | |
GS EQUITY SHORT CUSTOM BASKET | | | | | | | | |
Financial | | | | | | | | | | | | |
Douglas Emmett, Inc. | | | 115,957 | | | | (6.51 | )% | | $ | 1,472,403 | |
Realty Income Corp. | | | 35,280 | | | | (7.76 | )% | | | 715,654 | |
Broadstone Net Lease, Inc. | | | 37,587 | | | | (2.37 | )% | | | 494,176 | |
Mid-America Apartment Communities, Inc. | | | 8,023 | | | | (4.55 | )% | | | 419,298 | |
Essex Property Trust, Inc. | | | 6,770 | | | | (6.32 | )% | | | 404,498 | |
Apartment Income REIT Corp. | | | 19,625 | | | | (2.65 | )% | | | 388,673 | |
Camden Property Trust | | | 6,230 | | | | (2.60 | )% | | | 340,353 | |
Global Net Lease, Inc. | | | 106,539 | | | | (4.51 | )% | | | 294,925 | |
JBG SMITH Properties | | | 83,865 | | | | (5.34 | )% | | | 262,209 | |
Federal Realty Investment Trust | | | 14,805 | | | | (5.91 | )% | | | 168,903 | |
Service Properties Trust | | | 104,425 | | | | (3.54 | )% | | | 135,418 | |
STAG Industrial, Inc. | | | 62,148 | | | | (9.45 | )% | | | 122,372 | |
Pebblebrook Hotel Trust | | | 57,558 | | | | (3.45 | )% | | | 45,038 | |
Sunstone Hotel Investors, Inc. | | | 119,890 | | | | (4.94 | )% | | | 42,214 | |
Macerich Co. | | | 77,550 | | | | (3.73 | )% | | | 29,431 | |
LTC Properties, Inc. | | | 12,742 | | | | (1.80 | )% | | | 24,093 | |
National Health Investors, Inc. | | | 8,089 | | | | (1.83 | )% | | | 16,172 | |
Phillips Edison & Company, Inc. | | | 69,011 | | | | (10.19 | )% | | | (25,526 | ) |
Omega Healthcare Investors, Inc. | | | 28,006 | | | | (4.09 | )% | | | (151,408 | ) |
Welltower, Inc. | | | 16,419 | | | | (5.92 | )% | | | (295,911 | ) |
Total Financial | | | | | | | | | | | 4,902,985 | |
| | | | | | | | | | | | | |
Exchange Traded Funds | | | | | | | | | | | | |
Vanguard Real Estate ETF | | | 7,625 | | | | (2.54 | )% | | | 308,602 | |
Total GS Equity Short Custom Basket | | | | | | $ | 5,211,587 | |
† | Value determined based on Level 1 inputs — See Note 4. |
†† | Value determined based on Level 2 inputs — See Note 4. |
1 | All or a portion of this security is pledged as short security collateral at September 30, 2023. |
2 | Rate indicated is the 7-day yield as of September 30, 2023. |
| | GS — Goldman Sachs International |
| | MS — Morgan Stanley Capital Services LLC |
| | REIT — Real Estate Investment Trust |
| | |
| | See Sector Classification in Other Information section. |
The following table summarizes the inputs used to value the Fund’s investments at September 30, 2023 (See Note 4 in the Notes to Financial Statements):
Investments in Securities (Assets) | | Level 1
Quoted
Prices | | | Level 2
Significant
Observable
Inputs | | | Level 3
Significant
Unobservable
Inputs | | | Total | |
Common Stocks | | $ | 343,544,504 | | | $ | — | | | $ | — | | | $ | 343,544,504 | |
Money Market Fund | | | 700,952 | | | | — | | | | — | | | | 700,952 | |
Equity Custom Basket Swap Agreements** | | | — | | | | 10,413,513 | | | | — | | | | 10,413,513 | |
Total Assets | | $ | 344,245,456 | | | $ | 10,413,513 | | | $ | — | | | $ | 354,658,969 | |
Investments in Securities (Liabilities) | | Level 1
Quoted
Prices | | | Level 2
Significant
Observable
Inputs | | | Level 3
Significant
Unobservable
Inputs | | | Total | |
Common Stocks Sold Short | | $ | 27,231,947 | | | $ | — | | | $ | — | | | $ | 27,231,947 | |
Exchange-Traded Funds Sold Short | | | 709,312 | | | | — | | | | — | | | | 709,312 | |
Equity Custom Basket Swap Agreements** | | | — | | | | 3,333,686 | | | | — | | | | 3,333,686 | |
Total Liabilities | | $ | 27,941,259 | | | $ | 3,333,686 | | | $ | — | | | $ | 31,274,945 | |
** | This derivative is reported as unrealized appreciation/depreciation at period end. |
SEE NOTES TO FINANCIAL STATEMENTS. | THE GUGGENHEIM FUNDS ANNUAL REPORT | 59 |
RISK MANAGED REAL ESTATE FUND | |
STATEMENT OF ASSETS AND LIABILITIES |
September 30, 2023 |
Assets: |
Investments, at value (cost $387,248,691) | | $ | 344,245,456 | |
Cash | | | 33,055,514 | |
Segregated cash with broker | | | 730,000 | |
Unrealized appreciation on OTC swap agreements | | | 10,413,513 | |
Prepaid expenses | | | 43,156 | |
Receivables: |
Dividends | | | 1,442,144 | |
Fund shares sold | | | 177,402 | |
Securities sold | | | 70,816 | |
Interest | | | 24,324 | |
Foreign tax reclaims | | | 19,888 | |
Other assets | | | 100,000 | |
Total assets | | | 390,322,213 | |
| | | | | |
Liabilities: |
Securities sold short, at value (proceeds $32,667,458) | | | 27,941,259 | |
Segregated cash due to broker | | | 3,533,030 | |
Unrealized depreciation on OTC swap agreements | | | 3,333,686 | |
Payable for: |
Fund shares redeemed | | | 938,234 | |
Securities purchased | | | 562,471 | |
Swap settlement | | | 392,317 | |
Distributions to shareholders | | | 329,192 | |
Management fees | | | 231,128 | |
Transfer agent fees | | | 22,730 | |
Fund accounting and administration fees | | | 7,096 | |
Distribution and service fees | | | 6,830 | |
Trustees’ fees* | | | 1,588 | |
Due to Investment Adviser | | | 156 | |
Miscellaneous | | | 116,136 | |
Total liabilities | | | 37,415,853 | |
Net assets | | $ | 352,906,360 | |
| | | | | |
Net assets consist of: |
Paid in capital | | $ | 398,296,411 | |
Total distributable earnings (loss) | | | (45,390,051 | ) |
Net assets | | $ | 352,906,360 | |
| | | | | |
A-Class: |
Net assets | | $ | 4,279,574 | |
Capital shares outstanding | | | 155,026 | |
Net asset value per share | | $ | 27.61 | |
Maximum offering price per share (Net asset value divided by 95.25%) | | $ | 28.99 | |
| | | | | |
C-Class: |
Net assets | | $ | 4,666,752 | |
Capital shares outstanding | | | 170,435 | |
Net asset value per share | | $ | 27.38 | |
| | | | | |
P-Class: |
Net assets | | $ | 8,742,799 | |
Capital shares outstanding | | | 314,801 | |
Net asset value per share | | $ | 27.77 | |
| | | | | |
Institutional Class: |
Net assets | | $ | 335,217,235 | |
Capital shares outstanding | | | 11,966,596 | |
Net asset value per share | | $ | 28.01 | |
* | Relates to Trustees not deemed “interested persons” within the meaning of Section 2(a)(19) of the 1940 Act. |
60 | THE GUGGENHEIM FUNDS ANNUAL REPORT | SEE NOTES TO FINANCIAL STATEMENTS. |
RISK MANAGED REAL ESTATE FUND | |
STATEMENT OF OPERATIONS |
Year Ended September 30, 2023 |
Investment Income: |
Dividends (net of foreign withholding tax of $19,888) | | $ | 13,099,348 | |
Interest | | | 2,404,147 | |
Total investment income | | | 15,503,495 | |
| | | | | |
Expenses: |
Management fees | | | 3,131,145 | |
Distribution and service fees: |
A-Class | | | 14,866 | |
C-Class | | | 52,629 | |
P-Class | | | 27,039 | |
Transfer agent fees: |
A-Class | | | 11,452 | |
C-Class | | | 5,205 | |
P-Class | | | 24,479 | |
Institutional Class | | | 295,538 | |
Short sale dividend expense | | | 1,284,790 | |
Interest expense | | | 338,709 | |
Fund accounting and administration fees | | | 179,764 | |
Professional fees | | | 92,438 | |
Custodian fees | | | 21,942 | |
Trustees’ fees* | | | 18,521 | |
Line of credit fees | | | 14,979 | |
Miscellaneous | | | 131,980 | |
Recoupment of previously waived fees: |
A-Class | | | 1,564 | |
C-Class | | | 724 | |
P-Class | | | 733 | |
Institutional Class | | | 66,878 | |
Total expenses | | | 5,715,375 | |
Less: |
Expenses reimbursed by Adviser: | | | | |
A-Class | | | (1,395 | ) |
C-Class | | | (581 | ) |
P-Class | | | (4,114 | ) |
Expenses waived by Adviser | | | (195,224 | ) |
Earnings credits applied | | | (2,019 | ) |
Total waived/reimbursed expenses | | | (203,333 | ) |
Net expenses | | | 5,512,042 | |
Net investment income | | | 9,991,453 | |
| | | | | |
Net Realized and Unrealized Gain (Loss): |
Net realized gain (loss) on: |
Investments | | $ | (1,306,368 | ) |
Investments sold short | | | 3,232,111 | |
Swap agreements | | | (248,222 | ) |
Net realized gain | | | 1,677,521 | |
Net change in unrealized appreciation (depreciation) on: |
Investments | | | (514,956 | ) |
Investments sold short | | | (2,140,004 | ) |
Swap agreements | | | (1,512,665 | ) |
Net change in unrealized appreciation (depreciation) | | | (4,167,625 | ) |
Net realized and unrealized loss | | | (2,490,104 | ) |
Net increase in net assets resulting from operations | | $ | 7,501,349 | |
* | Relates to Trustees not deemed “interested persons” within the meaning of Section 2(a)(19) of the 1940 Act. |
SEE NOTES TO FINANCIAL STATEMENTS. | THE GUGGENHEIM FUNDS ANNUAL REPORT | 61 |
RISK MANAGED REAL ESTATE FUND | |
STATEMENTS OF CHANGES IN NET ASSETS |
| | Year Ended
September 30,
2023 | | | Year Ended
September 30,
2022 | |
Increase (Decrease) in Net Assets from Operations: | | | | | | | | |
Net investment income | | $ | 9,991,453 | | | $ | 4,716,299 | |
Net realized gain on investments | | | 1,677,521 | | | | 20,235,456 | |
Net change in unrealized appreciation (depreciation) on investments | | | (4,167,625 | ) | | | (108,444,583 | ) |
Net increase (decrease) in net assets resulting from operations | | | 7,501,349 | | | | (83,492,828 | ) |
| | | | | | | | | |
Distributions to shareholders: | | | | | | | | |
A-Class | | | (347,557 | ) | | | (666,926 | ) |
C-Class | | | (302,170 | ) | | | (281,353 | ) |
P-Class | | | (683,918 | ) | | | (925,053 | ) |
Institutional Class | | | (26,554,622 | ) | | | (31,535,699 | ) |
Return of Capital | | | | | | | | |
A-Class | | | (34,317 | ) | | | — | |
C-Class | | | (34,101 | ) | | | — | |
P-Class | | | (67,335 | ) | | | — | |
Institutional Class | | | (2,503,050 | ) | | | — | |
Total distributions to shareholders | | | (30,527,070 | ) | | | (33,409,031 | ) |
| | | | | | | | | |
Capital share transactions: | | | | | | | | |
Proceeds from sale of shares | | | | | | | | |
A-Class | | | 1,251,126 | | | | 4,919,886 | |
C-Class | | | 693,027 | | | | 2,965,796 | |
P-Class | | | 1,230,119 | | | | 15,465,403 | |
Institutional Class | | | 89,132,585 | | | | 187,411,653 | |
Distributions reinvested | | | | | | | | |
A-Class | | | 353,469 | | | | 503,570 | |
C-Class | | | 322,373 | | | | 266,910 | |
P-Class | | | 751,253 | | | | 925,053 | |
Institutional Class | | | 25,711,484 | | | | 28,721,651 | |
Cost of shares redeemed | | | | | | | | |
A-Class | | | (6,232,246 | ) | | | (4,115,443 | ) |
C-Class | | | (1,422,158 | ) | | | (1,492,977 | ) |
P-Class | | | (5,440,837 | ) | | | (14,526,672 | ) |
Institutional Class | | | (167,277,680 | ) | | | (162,507,077 | ) |
Net increase (decrease) from capital share transactions | | | (60,927,485 | ) | | | 58,537,753 | |
Net decrease in net assets | | | (83,953,206 | ) | | | (58,364,106 | ) |
| | | | | | | | | |
Net assets: | | | | | | | | |
Beginning of year | | | 436,859,566 | | | | 495,223,672 | |
End of year | | $ | 352,906,360 | | | $ | 436,859,566 | |
| | | | | | | | | |
Capital share activity: | | | | | | | | |
Shares sold | | | | | | | | |
A-Class | | | 42,057 | | | | 132,091 | |
C-Class | | | 23,748 | | | | 79,841 | |
P-Class | | | 40,388 | | | | 395,522 | |
Institutional Class | | | 2,917,549 | | | | 4,970,480 | |
Shares issued from reinvestment of distributions | | | | | | | | |
A-Class | | | 12,164 | | | | 13,022 | |
C-Class | | | 11,190 | | | | 6,928 | |
P-Class | | | 25,698 | | | | 23,778 | |
Institutional Class | | | 872,328 | | | | 734,856 | |
Shares redeemed | | | | | | | | |
A-Class | | | (205,886 | ) | | | (112,310 | ) |
C-Class | | | (48,660 | ) | | | (40,193 | ) |
P-Class | | | (180,387 | ) | | | (390,592 | ) |
Institutional Class | | | (5,535,082 | ) | | | (4,452,685 | ) |
Net increase (decrease) in shares | | | (2,024,893 | ) | | | 1,360,738 | |
62 | THE GUGGENHEIM FUNDS ANNUAL REPORT | SEE NOTES TO FINANCIAL STATEMENTS. |
RISK MANAGED REAL ESTATE FUND | |
This table is presented to show selected data for a share outstanding throughout each period and to assist shareholders in evaluating a Fund’s performance for the periods presented.
A-Class | | Year Ended
September 30,
2023 | | | Year Ended
September 30,
2022 | | | Year Ended
September 30,
2021 | | | Year Ended
September 30,
2020 | | | Year Ended
September 30,
2019 | |
Per Share Data |
Net asset value, beginning of period | | $ | 29.48 | | | $ | 36.87 | | | $ | 29.97 | | | $ | 34.11 | | | $ | 28.93 | |
Income (loss) from investment operations: |
Net investment income (loss)a | | | .56 | | | | .23 | | | | .32 | | | | .31 | | | | .34 | |
Net gain (loss) on investments (realized and unrealized) | | | (.31 | ) | | | (5.35 | ) | | | 8.86 | | | | (2.53 | ) | | | 5.65 | |
Total from investment operations | | | .25 | | | | (5.12 | ) | | | 9.18 | | | | (2.22 | ) | | | 5.99 | |
Less distributions from: |
Net investment income | | | (.63 | ) | | | (.55 | ) | | | (.54 | ) | | | (.63 | ) | | | (.55 | ) |
Return of capital | | | (.20 | ) | | | — | | | | — | | | | — | | | | — | |
Net realized gains | | | (1.29 | ) | | | (1.72 | ) | | | (1.74 | ) | | | (1.29 | ) | | | (.26 | ) |
Total distributions | | | (2.12 | ) | | | (2.27 | ) | | | (2.28 | ) | | | (1.92 | ) | | | (.81 | ) |
Net asset value, end of period | | $ | 27.61 | | | $ | 29.48 | | | $ | 36.87 | | | $ | 29.97 | | | $ | 34.11 | |
|
Total Returnb | | | 0.58 | % | | | (15.31 | %) | | | 32.13 | % | | | (6.73 | %) | | | 21.12 | % |
Ratios/Supplemental Data |
Net assets, end of period (in thousands) | | $ | 4,280 | | | $ | 9,043 | | | $ | 10,098 | | | $ | 15,857 | | | $ | 16,682 | |
Ratios to average net assets: |
Net investment income (loss) | | | 1.86 | % | | | 0.62 | % | | | 0.95 | % | | | 0.99 | % | | | 1.09 | % |
Total expensesc | | | 1.72 | % | | | 1.62 | % | | | 1.39 | % | | | 1.71 | % | | | 1.89 | % |
Net expensesd,e,f | | | 1.66 | % | | | 1.58 | % | | | 1.38 | % | | | 1.70 | % | | | 1.88 | % |
Portfolio turnover rate | | | 21 | % | | | 47 | % | | | 80 | % | | | 180 | % | | | 122 | % |
C-Class | | Year Ended
September 30,
2023 | | | Year Ended
September 30,
2022 | | | Year Ended
September 30,
2021 | | | Year Ended
September 30,
2020 | | | Year Ended
September 30,
2019 | |
Per Share Data |
Net asset value, beginning of period | | $ | 29.23 | | | $ | 36.55 | | | $ | 29.76 | | | $ | 33.88 | | | $ | 28.75 | |
Income (loss) from investment operations: |
Net investment income (loss)a | | | .42 | | | | (.01 | ) | | | .05 | | | | .08 | | | | .11 | |
Net gain (loss) on investments (realized and unrealized) | | | (.38 | ) | | | (5.30 | ) | | | 8.76 | | | | (2.53 | ) | | | 5.60 | |
Total from investment operations | | | .04 | | | | (5.31 | ) | | | 8.81 | | | | (2.45 | ) | | | 5.71 | |
Less distributions from: |
Net investment income | | | (.40 | ) | | | (.29 | ) | | | (.28 | ) | | | (.38 | ) | | | (.32 | ) |
Return of capital | | | (.20 | ) | | | — | | | | — | | | | — | | | | — | |
Net realized gains | | | (1.29 | ) | | | (1.72 | ) | | | (1.74 | ) | | | (1.29 | ) | | | (.26 | ) |
Total distributions | | | (1.89 | ) | | | (2.01 | ) | | | (2.02 | ) | | | (1.67 | ) | | | (.58 | ) |
Net asset value, end of period | | $ | 27.38 | | | $ | 29.23 | | | $ | 36.55 | | | $ | 29.76 | | | $ | 33.88 | |
|
Total Returnb | | | (0.10 | %) | | | (15.93 | %) | | | 31.05 | % | | | (7.48 | %) | | | 20.23 | % |
Ratios/Supplemental Data |
Net assets, end of period (in thousands) | | $ | 4,667 | | | $ | 5,382 | | | $ | 5,029 | | | $ | 2,446 | | | $ | 1,721 | |
Ratios to average net assets: |
Net investment income (loss) | | | 1.40 | % | | | (0.03 | %) | | | 0.16 | % | | | 0.26 | % | | | 0.35 | % |
Total expensesc | | | 2.36 | % | | | 2.34 | % | | | 2.21 | % | | | 2.54 | % | | | 2.73 | % |
Net expensesd,e,f | | | 2.32 | % | | | 2.31 | % | | | 2.20 | % | | | 2.51 | % | | | 2.65 | % |
Portfolio turnover rate | | | 21 | % | | | 47 | % | | | 80 | % | | | 180 | % | | | 122 | % |
SEE NOTES TO FINANCIAL STATEMENTS. | THE GUGGENHEIM FUNDS ANNUAL REPORT | 63 |
RISK MANAGED REAL ESTATE FUND | |
FINANCIAL HIGHLIGHTS (continued) |
This table is presented to show selected data for a share outstanding throughout each period and to assist shareholders in evaluating a Fund’s performance for the periods presented.
P-Class | | Year Ended
September 30,
2023 | | | Year Ended
September 30,
2022 | | | Year Ended
September 30,
2021 | | | Year Ended
September 30,
2020 | | | Year Ended
September 30,
2019 | |
Per Share Data |
Net asset value, beginning of period | | $ | 29.63 | | | $ | 37.04 | | | $ | 30.12 | | | $ | 34.30 | | | $ | 29.09 | |
Income (loss) from investment operations: |
Net investment income (loss)a | | | .60 | | | | .18 | | | | .29 | | | | .22 | | | | .60 | |
Net gain (loss) on investments (realized and unrealized) | | | (.36 | ) | | | (5.35 | ) | | | 8.91 | | | | (2.48 | ) | | | 5.42 | |
Total from investment operations | | | .24 | | | | (5.17 | ) | | | 9.20 | | | | (2.26 | ) | | | 6.02 | |
Less distributions from: |
Net investment income | | | (.61 | ) | | | (.52 | ) | | | (.54 | ) | | | (.63 | ) | | | (.55 | ) |
Return of capital | | | (.20 | ) | | | — | | | | — | | | | — | | | | — | |
Net realized gains | | | (1.29 | ) | | | (1.72 | ) | | | (1.74 | ) | | | (1.29 | ) | | | (.26 | ) |
Total distributions | | | (2.10 | ) | | | (2.24 | ) | | | (2.28 | ) | | | (1.92 | ) | | | (.81 | ) |
Net asset value, end of period | | $ | 27.77 | | | $ | 29.63 | | | $ | 37.04 | | | $ | 30.12 | | | $ | 34.30 | |
|
Total Return | | | 0.55 | % | | | (15.35 | %) | | | 32.03 | % | | | (6.81 | %) | | | 21.12 | % |
Ratios/Supplemental Data |
Net assets, end of period (in thousands) | | $ | 8,743 | | | $ | 12,716 | | | $ | 14,830 | | | $ | 12,152 | | | $ | 33,894 | |
Ratios to average net assets: |
Net investment income (loss) | | | 1.99 | % | | | 0.48 | % | | | 0.86 | % | | | 0.70 | % | | | 1.87 | % |
Total expensesc | | | 1.73 | % | | | 1.69 | % | | | 1.47 | % | | | 1.84 | % | | | 1.93 | % |
Net expensesd,e,f | | | 1.66 | % | | | 1.64 | % | | | 1.45 | % | | | 1.78 | % | | | 1.89 | % |
Portfolio turnover rate | | | 21 | % | | | 47 | % | | | 80 | % | | | 180 | % | | | 122 | % |
64 | THE GUGGENHEIM FUNDS ANNUAL REPORT | SEE NOTES TO FINANCIAL STATEMENTS. |
RISK MANAGED REAL ESTATE FUND | |
FINANCIAL HIGHLIGHTS (concluded) |
This table is presented to show selected data for a share outstanding throughout each period and to assist shareholders in evaluating a Fund’s performance for the periods presented.
Institutional Class | | Year Ended
September 30,
2023 | | | Year Ended
September 30,
2022 | | | Year Ended
September 30,
2021 | | | Year Ended
September 30,
2020 | | | Year Ended
September 30,
2019 | |
Per Share Data |
Net asset value, beginning of period | | $ | 29.88 | | | $ | 37.34 | | | $ | 30.34 | | | $ | 34.51 | | | $ | 29.27 | |
Income (loss) from investment operations: |
Net investment income (loss)a | | | .74 | | | | .34 | | | | .41 | | | | .41 | | | | .43 | |
Net gain (loss) on investments (realized and unrealized) | | | (.39 | ) | | | (5.42 | ) | | | 8.98 | | | | (2.58 | ) | | | 5.71 | |
Total from investment operations | | | .35 | | | | (5.08 | ) | | | 9.39 | | | | (2.17 | ) | | | 6.14 | |
Less distributions from: |
Net investment income | | | (.73 | ) | | | (.66 | ) | | | (.65 | ) | | | (.71 | ) | | | (.64 | ) |
Return of capital | | | (.20 | ) | | | — | | | | — | | | | — | | | | — | |
Net realized gains | | | (1.29 | ) | | | (1.72 | ) | | | (1.74 | ) | | | (1.29 | ) | | | (.26 | ) |
Total distributions | | | (2.22 | ) | | | (2.38 | ) | | | (2.39 | ) | | | (2.00 | ) | | | (.90 | ) |
Net asset value, end of period | | $ | 28.01 | | | $ | 29.88 | | | $ | 37.34 | | | $ | 30.34 | | | $ | 34.51 | |
|
Total Return | | | 0.91 | % | | | (15.05 | %) | | | 32.52 | % | | | (6.48 | %) | | | 21.46 | % |
Ratios/Supplemental Data |
Net assets, end of period (in thousands) | | $ | 335,217 | | | $ | 409,719 | | | $ | 465,267 | | | $ | 290,551 | | | $ | 200,301 | |
Ratios to average net assets: |
Net investment income (loss) | | | 2.43 | % | | | 0.92 | % | | | 1.18 | % | | | 1.31 | % | | | 1.38 | % |
Total expensesc | | | 1.34 | % | | | 1.30 | % | | | 1.10 | % | | | 1.43 | % | | | 1.61 | % |
Net expensesd,e,f | | | 1.29 | % | | | 1.28 | % | | | 1.10 | % | | | 1.43 | % | | | 1.60 | % |
Portfolio turnover rate | | | 21 | % | | | 47 | % | | | 80 | % | | | 180 | % | | | 122 | % |
a | Net investment income (loss) per share was computed using average shares outstanding throughout the period. |
b | Total return does not reflect the impact of any applicable sales charges. |
c | Does not include expenses of the underlying funds in which the Fund invests. |
d | Net expense information reflects the expense ratios after expense waivers and reimbursements, as applicable. |
e | The portion of the ratios of net expenses to average net assets attributable to recoupments of prior fee reductions or expense reimbursements for the years presented was as follows: |
| | | 09/30/23 | 09/30/22 | 09/30/21 | 09/30/20 | 09/30/19 |
| | A-Class | 0.03% | 0.02% | 0.01% | 0.02% | 0.03% |
| | C-Class | 0.01% | 0.03% | 0.06% | 0.04% | 0.01% |
| | P-Class | 0.01% | 0.05% | 0.06% | 0.02% | 0.02% |
| | Institutional Class | 0.02% | 0.01% | 0.00%* | 0.01% | 0.01% |
f | Net expenses may include expenses that are excluded from the expense limitation agreement. Excluding these expenses, the net expense ratios for the years presented would be: |
| | | 09/30/23 | 09/30/22 | 09/30/21 | 09/30/20 | 09/30/19 |
| | A-Class | 1.27% | 1.22% | 1.21% | 1.23% | 1.27% |
| | C-Class | 1.93% | 1.95% | 2.04% | 2.05% | 2.05% |
| | P-Class | 1.27% | 1.28% | 1.29% | 1.30% | 1.30% |
| | Institutional Class | 0.90% | 0.92% | 0.94% | 0.96% | 1.00% |
SEE NOTES TO FINANCIAL STATEMENTS. | THE GUGGENHEIM FUNDS ANNUAL REPORT | 65 |
MANAGERS’ COMMENTARY (Unaudited) | September 30, 2023 |
To Our Shareholders
Security Investors, LLC (“SI”) serves as the investment adviser to Guggenheim Small Cap Value Fund (“Fund”).The Fund is managed by a team of seasoned professionals, led by David Toussaint, CFA, CPA, Managing Director and Portfolio Manager; James Schier, CFA, Senior Managing Director and Portfolio Manager; Farhan Sharaff, Senior Managing Director, Assistant Chief Investment Officer, Equities, and Portfolio Manager; Chris Phalen, Managing Director and Portfolio Manager; Gregg Strohkorb, CFA, Director and Portfolio Manager; and Burak Hurmeydan, Ph.D., Director and Portfolio Manager. In the subsequent paragraphs, the investment team discusses the Fund’s performance and the market environment for the 12-month period ended September 30, 2023 (“Reporting Period”).
For the Reporting Period, the Fund provided a total return of 12.38%1, outperforming the Russell 2000 Value Index, the Fund’s benchmark (“Benchmark”), which returned 7.84% for the same period.
What factors contributed or detracted from the Fund’s performance during the Reporting Period?
The market began the Reporting Period with steady strength, as a buoyant economy helped build expectations that a highly anticipated recession would be pushed further out and that perhaps the U.S. Federal Reserve (“Fed”) could do the unthinkable and engineer a soft landing. Once the banking crisis hit in March, leadership in equities shifted away from the value area and growth stocks once again caught the market’s interest. As the year progressed, the continued strong jobs market accompanied by increasing fiscal deficits and treasury issuance caused a significant rise in interest rates. These events have begun to dampen stock performance, as equity returns for the broad market were lower in the third quarter. A flight to safety from growing geopolitical risks has yet to dampen the trend toward rising interest rates in the government debt market.
The Fund outperformed the Benchmark by over 4.5%. During the Reporting Period, the Fund had a significant positive contribution from its sector allocation and a positive contribution from security selection. The Fund’s most significant positive contribution for the year was its 6% underweight in the Health Care sector, along with stock selection within the sector. Health Care was the worst-performing sector in the Benchmark, as it returned -19%, while the Fund’s health care holdings returned 15%. Health Care suffered because higher interest rates posed funding issues for many small cap biotech and pharmaceutical companies, and investors lost their appetite for smaller companies with no earnings or revenues. One notable outperformer for the Fund was Encompass Health Corp., which operates inpatient rehab facilities, and gained almost 50%. Favorable Medicare rate reimbursement in the spring, coupled with solid earnings results that were driven by favorable volumes as well as expense benefits, led to several good earnings reports over the Reporting Period. A looser labor market coming off COVID allowed the company to save from lower usage of contract labor.
The second most significant positive contributor to the strategy was its overweight in Industrials, where the Fund had an average weighting of 23% versus 13% for the Benchmark. This sector managed to gain more than 30% during the year. Infrastructure companies geared towards the reindustrialization of America provided some of the best gains, as Terex Corp. (+95%), EnerSys (+64%), Altra Industrial Motion Corp. (not held at 9/30/23) (+83% on a takeover by Regal Rexnord Corp.) and H&E Equipment Services, Inc. (+56%) all provided significant contributions.
Another positive contributor was the Fund’s 3% overweight in Technology, as the Fund’s technology holdings were up 30% while the Benchmark’s were up 17%. Belden, Inc., Infinera Corp. (not held at 9/30/23), Sanmina Corp. (not held at 9/30/23), MACOM Technology Solutions Holdings, Inc., and Amkor Technology, Inc. all benefited from the continued capital spending for internet networking and data center builds, as well as expectations for future capital spending from the implementation of the U.S. Government’s CHIPs Act.
The Fund’s underweight in the Financials sector was also a contributor. Given the stress in the banking sector during the spring, avoiding this sector was beneficial.
Homebuilder Meritage Homes Corp. (not held at 9/30/23) was up over 100% during the year. Even though mortgage rates continued to climb throughout the year, new home sales remained resilient as the supply of existing homes for sale declined.
The largest headwind for performance during the Reporting Period was a significant underweight in the Consumer Discretionary sector. This sector gained 26%, and the Fund had an average weighting of 4% versus 10% for the Benchmark. We have been concerned about the impact higher rates would have on spending, and diminishing stimulus funds would have on aggregate demand. Most companies in the sector continue to have high margins, which should contract in the quarters ahead; we moved our weight lower as the year progressed.
66 | THE GUGGENHEIM FUNDS ANNUAL REPORT | |
MANAGERS’ COMMENTARY (Unaudited)(concluded) | September 30, 2023 |
The second most significant detractor to performance was in Energy stock selection. The Fund’s holdings in this sector gained 28% versus 44% for the Benchmark. Essentially, the Fund lacked exposure to the higher-beta energy services and drilling industries that performed best. Additionally, a large weight in Pioneer Natural Resources Co. detracted from return, as this position only gained 14% while smaller, more operationally levered exploration and production companies performed better.
Finally, there were two stocks that hurt the Fund’s performance the most during the year, Hawaiian Holdings, Inc. and Gray Television. Inc. Hawaiian Holdings is the parent company operating Hawaiian Airlines. The company experienced difficulties with post-pandemic travel and experienced disruptions with the Maui wildfires. Gray Television is the nation’s largest independent operator of TV stations, including all four major network affiliations. Gray’s retransmission fee revenue is slowing as consumers are “cutting the cord” with their cable TV providers.
How was the Fund positioned at the end of the Reporting Period?
In many ways, the environment is similar to last year. The geopolitical environment seems to have become less favorable, and the Fed, while still hawkish, is much later in the game of fighting inflation. However, it remains unclear how long “higher for longer” will really be. Reversing several decades of shifting production from low-cost Asian countries to higher-cost locations closer to end markets could provide many years of stubbornly high inflation that may serve to restrain equity appreciation. The murkiness of the economic outlook has not improved, yet equity prices are higher. The extreme overvaluation in a handful of large cap growth stocks suggests that smaller-cap value stocks could really excel once investors become more comfortable with the economy and market. Amazingly, the top 5 names in the S&P 500 now have an aggregate market capitalization that is 3.3 times larger than the market cap of the entire Russell 2000.
At the beginning of the Reporting Period, our three largest active weights were in Industrials (+1,000 basis points), Technology (+450 basis points), and Materials (+450 basis points). At the end of the Reporting Period, they were in Industrials (+900 basis points), Materials (+200 basis points), and Technology (+175 basis points). One basis point is equal to 0.01%.
At the beginning of the Reporting Period, our largest underweights were in Health Care (-1000 basis points), Consumer Discretionary (-500 basis points), Real Estate (-465 basis points), and Financials (-300 basis points). At the end of the Reporting Period, they were in Consumer Discretionary (-700 basis points), Real Estate (-500 basis points), Financials (-400 basis points), and Health Care (-200 basis points). Our weights have remained consistent except for our Technology and Health Care positioning. In the Technology sector, the Fund has reduced its weight as valuations have become stretched and fundamentals have deteriorated. For Health Care, the Benchmark weight has declined from 12% to 8% and the Fund has increased its holdings by around 4%, as the poor performance for the sector has provided some investment opportunities.
Performance displayed represents past performance which is no guarantee of future results.
1 | Performance figures are based on Class A shares and do not reflect taxes that a shareholder would pay on distributions or the redemption of shares. |
The opinions and forecast expressed may not actually come to pass. This information is subject to change at any time, based on market and other conditions, and should not be construed as a recommendation of any specific security or strategy.
| | THE GUGGENHEIM FUNDS ANNUAL REPORT | 67 |
PERFORMANCE REPORT AND FUND PROFILE (Unaudited) | September 30, 2023 |
SMALL CAP VALUE FUND
OBJECTIVE: Seeks long-term capital appreciation.
Holdings Diversification (Market Exposure as % of Net Assets)
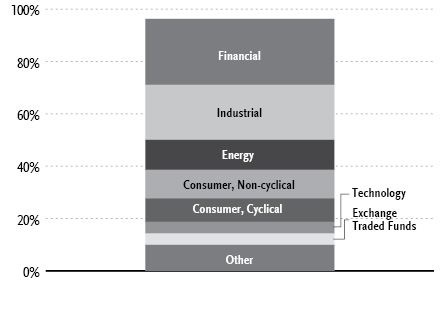
“Holdings Diversification (Market Exposure as % of Net Assets)” excludes any temporary cash investments.
Inception Dates: |
A-Class | July 11, 2008 |
C-Class | July 11, 2008 |
P-Class | May 1, 2015 |
Institutional Class | July 11, 2008 |
Ten Largest Holdings | % of Total Net Assets |
Pioneer Natural Resources Co. | 3.7% |
SPDR S&P Biotech ETF | 2.3% |
Rush Enterprises, Inc. — Class A | 2.1% |
iShares Russell 2000 Value ETF | 2.0% |
MSC Industrial Direct Company, Inc. — Class A | 1.9% |
Liberty Energy, Inc. — Class A | 1.9% |
Murphy Oil Corp. | 1.9% |
Encompass Health Corp. | 1.8% |
OGE Energy Corp. | 1.8% |
Kirby Corp. | 1.7% |
Top Ten Total | 21.1% |
| | |
“Ten Largest Holdings” excludes any temporary cash investments. |
68 | THE GUGGENHEIM FUNDS ANNUAL REPORT | |
PERFORMANCE REPORT AND FUND PROFILE (Unaudited)(concluded) | September 30, 2023 |
Cumulative Fund Performance*
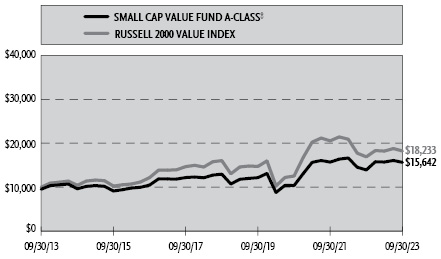
Average Annual Returns*
Periods Ended September 30, 2023
| 1 Year | 5 Year | 10 Year |
A-Class Shares | 12.38% | 3.83% | 5.09% |
A-Class Shares with sales charge† | 7.05% | 2.82% | 4.58% |
C-Class Shares | 11.57% | 3.05% | 4.30% |
C-Class Shares with CDSC‡ | 10.57% | 3.05% | 4.30% |
Institutional Class Shares | 12.63% | 4.08% | 5.34% |
Russell 2000 Value Index | 7.84% | 2.59% | 6.19% |
| 1 Year | 5 Year | Since
Inception
(05/01/15) |
P-Class Shares | 12.32% | 3.84% | 5.19% |
Russell 2000 Value Index | 7.84% | 2.59% | 5.73% |
* | The performance data above represents past performance that is not predictive of future results. The investment return and principal value of an investment in the Fund will fluctuate so that an investor’s shares, when redeemed, may be worth more or less than their original cost. Returns are historical and include changes in principal and reinvested dividends and capital gains and do not reflect the effect of taxes. The Russell 2000 Value Index is an unmanaged index and, unlike the Fund, has no management fees or operating expenses to reduce its reported return. The graph is based on A-Class Shares only; performance for C-Class, P-Class and Institutional Class will vary due to differences in fee structures. |
† | Fund returns are calculated using the maximum sales charge of 4.75%. |
‡ | Fund returns include a CDSC of 1% if redeemed within 12 months of purchase. |
| | THE GUGGENHEIM FUNDS ANNUAL REPORT | 69 |
SCHEDULE OF INVESTMENTS | September 30, 2023 |
SMALL CAP VALUE FUND | |
| | Shares | | | Value | |
COMMON STOCKS† - 92.0% |
| | | | | | | | | |
Financial - 25.2% |
Texas Capital Bancshares, Inc.* | | | 1,314 | | | $ | 77,395 | |
Stifel Financial Corp. | | | 1,227 | | | | 75,387 | |
Old National Bancorp | | | 5,143 | | | | 74,779 | |
STAG Industrial, Inc. REIT | | | 2,120 | | | | 73,161 | |
Cathay General Bancorp | | | 2,063 | | | | 71,710 | |
First Merchants Corp. | | | 2,557 | | | | 71,136 | |
Banc of California, Inc. | | | 5,736 | | | | 71,012 | |
Unum Group | | | 1,349 | | | | 66,357 | |
MGIC Investment Corp. | | | 3,715 | | | | 62,004 | |
Physicians Realty Trust REIT | | | 5,046 | | | | 61,511 | |
LXP Industrial Trust REIT | | | 6,239 | | | | 55,527 | |
Hanmi Financial Corp. | | | 3,405 | | | | 55,263 | |
First Horizon Corp. | | | 4,805 | | | | 52,951 | |
First American Financial Corp. | | | 917 | | | | 51,801 | |
Stewart Information Services Corp. | | | 1,109 | | | | 48,574 | |
Prosperity Bancshares, Inc. | | | 844 | | | | 46,066 | |
Hancock Whitney Corp. | | | 1,166 | | | | 43,130 | |
Apple Hospitality REIT, Inc. | | | 2,759 | | | | 42,323 | |
Simmons First National Corp. — Class A | | | 2,266 | | | | 38,431 | |
Old Republic International Corp. | | | 1,359 | | | | 36,612 | |
UMB Financial Corp. | | | 550 | | | | 34,127 | |
Sunstone Hotel Investors, Inc. REIT | | | 3,160 | | | | 29,546 | |
Synovus Financial Corp. | | | 1,019 | | | | 28,328 | |
Independent Bank Group, Inc. | | | 684 | | | | 27,052 | |
United Community Banks, Inc. | | | 853 | | | | 21,675 | |
First Hawaiian, Inc. | | | 1,177 | | | | 21,245 | |
United Bankshares, Inc. | | | 764 | | | | 21,079 | |
RMR Group, Inc. — Class A | | | 808 | | | | 19,812 | |
Piedmont Office Realty Trust, Inc. — Class A REIT | | | 2,333 | | | | 13,111 | |
Total Financial | | | | | | | 1,391,105 | |
| | | | | | | | | |
Industrial - 21.0% |
Kirby Corp.* | | | 1,124 | | | | 93,067 | |
Arcosa, Inc. | | | 1,106 | | | | 79,521 | |
Advanced Energy Industries, Inc. | | | 648 | | | | 66,822 | |
Knight-Swift Transportation Holdings, Inc. | | | 1,312 | | | | 65,797 | |
Summit Materials, Inc. — Class A* | | | 2,055 | | | | 63,993 | |
Mercury Systems, Inc.* | | | 1,725 | | | | 63,980 | |
Moog, Inc. — Class A | | | 558 | | | | 63,032 | |
PGT Innovations, Inc.* | | | 2,064 | | | | 57,276 | |
Curtiss-Wright Corp. | | | 277 | | | | 54,189 | |
Sonoco Products Co. | | | 988 | | | | 53,698 | |
Belden, Inc. | | | 522 | | | | 50,399 | |
Terex Corp. | | | 871 | | | | 50,187 | |
MDU Resources Group, Inc. | | | 2,521 | | | | 49,361 | |
Esab Corp. | | | 620 | | | | 43,536 | |
Daseke, Inc.* | | | 8,319 | | | | 42,677 | |
Park Aerospace Corp. | | | 2,678 | | | | 41,589 | |
Graphic Packaging Holding Co. | | | 1,832 | | | | 40,817 | |
EnerSys | | | 431 | | | | 40,803 | |
Littelfuse, Inc. | | | 149 | | | | 36,851 | |
AZEK Company, Inc.* | | | 1,151 | | | | 34,231 | |
Plexus Corp.* | | | 322 | | | | 29,939 | |
Stoneridge, Inc.* | | | 1,244 | | | | 24,967 | |
NVE Corp. | | | 176 | | | | 14,457 | |
Total Industrial | | | | | | | 1,161,189 | |
| | | | | | | | | |
Energy - 11.5% |
Pioneer Natural Resources Co. | | | 893 | | | | 204,988 | |
Liberty Energy, Inc. — Class A | | | 5,706 | | | | 105,675 | |
Murphy Oil Corp. | | | 2,262 | | | | 102,582 | |
CNX Resources Corp.* | | | 3,690 | | | | 83,320 | |
Baytex Energy Corp. | | | 11,369 | | | | 50,137 | |
Diamondback Energy, Inc. | | | 217 | | | | 33,609 | |
Patterson-UTI Energy, Inc. | | | 2,075 | | | | 28,718 | |
Range Resources Corp. | | | 851 | | | | 27,581 | |
Total Energy | | | | | | | 636,610 | |
| | | | | | | | | |
Consumer, Non-cyclical - 10.9% |
Encompass Health Corp. | | | 1,489 | | | | 100,001 | |
Euronet Worldwide, Inc.* | | | 1,158 | | | | 91,922 | |
Central Garden & Pet Co. — Class A* | | | 1,442 | | | | 57,810 | |
LivaNova plc* | | | 974 | | | | 51,505 | |
Enovis Corp.* | | | 886 | | | | 46,719 | |
Ingredion, Inc. | | | 472 | | | | 46,445 | |
Certara, Inc.* | | | 2,892 | | | | 42,050 | |
ICF International, Inc. | | | 307 | | | | 37,088 | |
Perdoceo Education Corp. | | | 1,878 | | | | 32,114 | |
Addus HomeCare Corp.* | | | 339 | | | | 28,880 | |
Azenta, Inc.* | | | 510 | | | | 25,597 | |
Integer Holdings Corp.* | | | 291 | | | | 22,823 | |
Ironwood Pharmaceuticals, Inc. — Class A* | | | 1,869 | | | | 17,998 | |
Total Consumer, Non-cyclical | | | | | | | 600,952 | |
| | | | | | | | | |
Consumer, Cyclical - 9.0% |
Rush Enterprises, Inc. — Class A | | | 2,809 | | | | 114,691 | |
MSC Industrial Direct Company, Inc. — Class A | | | 1,090 | | | | 106,984 | |
H&E Equipment Services, Inc. | | | 1,608 | | | | 69,450 | |
Alaska Air Group, Inc.* | | | 1,144 | | | | 42,420 | |
MarineMax, Inc.* | | | 953 | | | | 31,277 | |
Lakeland Industries, Inc. | | | 1,913 | | | | 28,829 | |
Whirlpool Corp. | | | 196 | | | | 26,205 | |
Methode Electronics, Inc. | | | 1,061 | | | | 24,244 | |
Newell Brands, Inc. | | | 2,523 | | | | 22,783 | |
Hawaiian Holdings, Inc.* | | | 3,050 | | | | 19,306 | |
Macy’s, Inc. | | | 1,143 | | | | 13,270 | |
Total Consumer, Cyclical | | | | | | | 499,459 | |
| | | | | | | | | |
Technology - 4.5% |
Science Applications International Corp. | | | 733 | | | | 77,361 | |
Amkor Technology, Inc. | | | 2,348 | | | | 53,065 | |
Conduent, Inc.* | | | 8,619 | | | | 29,994 | |
MACOM Technology Solutions Holdings, Inc.* | | | 348 | | | | 28,390 | |
LivePerson, Inc.* | | | 6,509 | | | | 25,320 | |
Silicon Laboratories, Inc.* | | | 180 | | | | 20,860 | |
Wolfspeed, Inc.* | | | 300 | | | | 11,430 | |
Total Technology | | | | | | | 246,420 | |
| | | | | | | | | |
70 | THE GUGGENHEIM FUNDS ANNUAL REPORT | SEE NOTES TO FINANCIAL STATEMENTS. |
SCHEDULE OF INVESTMENTS (concluded) | September 30, 2023 |
SMALL CAP VALUE FUND | |
| | Shares | | | Value | |
Utilities - 4.2% |
OGE Energy Corp. | | | 2,915 | | | $ | 97,157 | |
Spire, Inc. | | | 671 | | | | 37,965 | |
Black Hills Corp. | | | 708 | | | | 35,818 | |
Avista Corp. | | | 949 | | | | 30,719 | |
ALLETE, Inc. | | | 528 | | | | 27,878 | |
Total Utilities | | | | | | | 229,537 | |
| | | | | | | | | |
Basic Materials - 3.9% |
Huntsman Corp. | | | 2,611 | | | | 63,708 | |
Avient Corp. | | | 1,669 | | | | 58,949 | |
Ashland, Inc. | | | 607 | | | | 49,580 | |
Commercial Metals Co. | | | 865 | | | | 42,740 | |
Total Basic Materials | | | | | | | 214,977 | |
| | | | | | | | | |
Communications - 1.8% |
Ciena Corp.* | | | 799 | | | | 37,761 | |
TEGNA, Inc. | | | 1,821 | | | | 26,532 | |
Gray Television, Inc. | | | 2,934 | | | | 20,303 | |
Luna Innovations, Inc.* | | | 2,251 | | | | 13,191 | |
Total Communications | | | | | | | 97,787 | |
| | | | | | | | | |
Total Common Stocks | | | | |
(Cost $5,190,426) | | | | | | | 5,078,036 | |
| | | | | | | | | |
CONVERTIBLE PREFERRED STOCKS††† - 0.0% |
Industrial - 0.0% |
Thermoenergy Corp.*,1 | | | 6,250 | | | | — | |
| | | | | | | | | |
Total Convertible Preferred Stocks | | | | |
(Cost $5,968) | | | | | | | — | |
| | | | | | | | | |
RIGHTS† - 0.2% |
Basic Materials - 0.2% |
Pan American Silver Corp.* | | | 17,705 | | | | 9,472 | |
Total Rights | | | | |
(Cost $—) | | | | | | | 9,472 | |
| | | | | | | | | |
EXCHANGE-TRADED FUNDS† - 4.3% |
SPDR S&P Biotech ETF | | | 1,778 | | | | 129,830 | |
iShares Russell 2000 Value ETF | | | 795 | | | | 107,762 | |
Total Exchange-Traded Funds | | | | |
(Cost $265,771) | | | | | | | 237,592 | |
| | | | | | | | | |
MONEY MARKET FUND† - 3.3% |
Dreyfus Treasury Securities Cash Management Fund — Institutional Shares, 5.24%2 | | | 183,895 | | | | 183,895 | |
Total Money Market Fund | | | | |
(Cost $183,895) | | | | | | | 183,895 | |
| | | | | | | | | |
Total Investments - 99.8% | | | | |
(Cost $5,646,060) | | $ | 5,508,995 | |
Other Assets & Liabilities, net - 0.2% | | | 8,713 | |
Total Net Assets - 100.0% | | $ | 5,517,708 | |
* | Non-income producing security. |
† | Value determined based on Level 1 inputs — See Note 4. |
††† | Value determined based on Level 3 inputs — See Note 4. |
1 | PIPE (Private Investment in Public Equity) — Stock issued by a company in the secondary market as a means of raising capital more quickly and less expensively than through registration of a secondary public offering. |
2 | Rate indicated is the 7-day yield as of September 30, 2023. |
| | REIT — Real Estate Investment Trust |
| | |
| | See Sector Classification in Other Information section. |
The following table summarizes the inputs used to value the Fund’s investments at September 30, 2023 (See Note 4 in the Notes to Financial Statements):
Investments in Securities (Assets) | | Level 1
Quoted
Prices | | | Level 2
Significant
Observable
Inputs | | | Level 3
Significant
Unobservable
Inputs | | | Total | |
Common Stocks | | $ | 5,078,036 | | | $ | — | | | $ | — | | | $ | 5,078,036 | |
Convertible Preferred Stocks | | | — | | | | — | | | | — | * | | | — | |
Rights | | | 9,472 | | | | — | | | | — | | | | 9,472 | |
Exchange-Traded Funds | | | 237,592 | | | | — | | | | — | | | | 237,592 | |
Money Market Fund | | | 183,895 | | | | — | | | | — | | | | 183,895 | |
Total Assets | | $ | 5,508,995 | | | $ | — | | | $ | — | | | $ | 5,508,995 | |
* | Security has a market value of $0. |
SEE NOTES TO FINANCIAL STATEMENTS. | THE GUGGENHEIM FUNDS ANNUAL REPORT | 71 |
STATEMENT OF ASSETS AND LIABILITIES |
September 30, 2023 |
Assets: |
Investments, at value (cost $5,646,060) | | $ | 5,508,995 | |
Cash | | | 57 | |
Prepaid expenses | | | 48,530 | |
Receivables: |
Investment Adviser | | | 20,056 | |
Dividends | | | 8,548 | |
Interest | | | 722 | |
Total assets | | | 5,586,908 | |
| | | | | |
Liabilities: |
Payable for: |
Securities purchased | | | 27,876 | |
Professional fees | | | 25,871 | |
Insurance | | | 5,055 | |
Fund accounting/administration fees | | | 4,334 | |
Transfer agent fees | | | 2,317 | |
Trustees’ fees* | | | 1,220 | |
Distribution and service fees | | | 1,193 | |
Fund shares redeemed | | | 199 | |
Miscellaneous | | | 1,135 | |
Total liabilities | | | 69,200 | |
Net assets | | $ | 5,517,708 | |
| | | | | |
Net assets consist of: |
Paid in capital | | $ | 5,277,136 | |
Total distributable earnings (loss) | | | 240,572 | |
Net assets | | $ | 5,517,708 | |
| | | | | |
A-Class: |
Net assets | | $ | 3,982,183 | |
Capital shares outstanding | | | 264,474 | |
Net asset value per share | | $ | 15.06 | |
Maximum offering price per share (Net asset value divided by 95.25%) | | $ | 15.81 | |
| | | | | |
C-Class: |
Net assets | | $ | 404,875 | |
Capital shares outstanding | | | 29,734 | |
Net asset value per share | | $ | 13.62 | |
| | | | | |
P-Class: |
Net assets | | $ | 54,481 | |
Capital shares outstanding | | | 3,574 | |
Net asset value per share | | $ | 15.24 | |
| | | | | |
Institutional Class: |
Net assets | | $ | 1,076,169 | |
Capital shares outstanding | | | 79,745 | |
Net asset value per share | | $ | 13.50 | |
STATEMENT OF OPERATIONS |
Year Ended September 30, 2023 |
Investment Income: |
Dividends (net of foreign withholding tax of $28) | | $ | 155,084 | |
Interest | | | 8,674 | |
Total investment income | | | 163,758 | |
| | | | | |
Expenses: |
Management fees | | | 52,214 | |
Distribution and service fees: |
A-Class | | | 10,776 | |
C-Class | | | 4,542 | |
P-Class | | | 300 | |
Transfer agent/maintenance fees: |
A-Class | | | 20,394 | |
C-Class | | | 2,490 | |
P-Class | | | 805 | |
Institutional Class | | | 9,655 | |
Registration fees | | | 59,752 | |
Professional fees | | | 37,608 | |
Trustees’ fees* | | | 14,096 | |
Fund accounting/administration fees | | | 11,830 | |
Custodian fees | | | 6,220 | |
Line of credit fees | | | 237 | |
Miscellaneous | | | 6,491 | |
Total expenses | | | 237,410 | |
Less: |
Expenses reimbursed by Adviser: |
A-Class | | | (52,174 | ) |
C-Class | | | (5,889 | ) |
P-Class | | | (1,751 | ) |
Institutional Class | | | (25,065 | ) |
Expenses waived by Adviser | | | (66,165 | ) |
Total waived/reimbursed expenses | | | (151,044 | ) |
Net expenses | | | 86,366 | |
Net investment income | | | 77,392 | |
| | | | | |
Net Realized and Unrealized Gain (Loss): |
Net realized gain (loss) on: |
Investments | | | 613,023 | |
Net realized gain | | | 613,023 | |
Net change in unrealized appreciation (depreciation) on: |
Investments | | | 16,529 | |
Net change in unrealized appreciation (depreciation) | | | 16,529 | |
Net realized and unrealized gain | | | 629,552 | |
Net increase in net assets resulting from operations | | $ | 706,944 | |
* | Relates to Trustees not deemed “interested persons” within the meaning of Section 2(a)(19) of the 1940 Act. |
72 | THE GUGGENHEIM FUNDS ANNUAL REPORT | SEE NOTES TO FINANCIAL STATEMENTS. |
STATEMENTS OF CHANGES IN NET ASSETS |
| | Year Ended
September 30,
2023 | | | Year Ended
September 30,
2022 | |
Increase (Decrease) in Net Assets from Operations: | | | | | | | | |
Net investment income | | $ | 77,392 | | | $ | 59,972 | |
Net realized gain on investments | | | 613,023 | | | | 418,401 | |
Net change in unrealized appreciation (depreciation) on investments | | | 16,529 | | | | (1,359,821 | ) |
Net increase (decrease) in net assets resulting from operations | | | 706,944 | | | | (881,448 | ) |
| | | | | | | | | |
Distributions to shareholders: | | | | | | | | |
A-Class | | | (204,624 | ) | | | (18,984 | ) |
C-Class | | | (21,650 | ) | | | (3,436 | ) |
P-Class | | | (7,239 | ) | | | (229 | ) |
Institutional Class | | | (95,567 | ) | | | (8,467 | ) |
Total distributions to shareholders | | | (329,080 | ) | | | (31,116 | ) |
| | | | | | | | | |
Capital share transactions: | | | | | | | | |
Proceeds from sale of shares | | | | | | | | |
A-Class | | | 329,795 | | | | 407,538 | |
C-Class | | | 12,037 | | | | 41,313 | |
P-Class | | | 48,131 | | | | 110,889 | |
Institutional Class | | | 3,266,307 | | | | 1,337,253 | |
Distributions reinvested | | | | | | | | |
A-Class | | | 199,088 | | | | 18,496 | |
C-Class | | | 21,650 | | | | 3,410 | |
P-Class | | | 7,117 | | | | 217 | |
Institutional Class | | | 95,567 | | | | 8,466 | |
Cost of shares redeemed | | | | | | | | |
A-Class | | | (706,211 | ) | | | (555,575 | ) |
C-Class | | | (138,572 | ) | | | (273,299 | ) |
P-Class | | | (144,193 | ) | | | (4,885 | ) |
Institutional Class | | | (4,379,888 | ) | | | (505,781 | ) |
Net increase (decrease) from capital share transactions | | | (1,389,172 | ) | | | 588,042 | |
Net decrease in net assets | | | (1,011,308 | ) | | | (324,522 | ) |
| | | | | | | | | |
Net assets: | | | | | | | | |
Beginning of year | | | 6,529,016 | | | | 6,853,538 | |
End of year | | $ | 5,517,708 | | | $ | 6,529,016 | |
| | | | | | | | | |
Capital share activity: | | | | | | | | |
Shares sold | | | | | | | | |
A-Class | | | 20,904 | | | | 25,122 | |
C-Class | | | 855 | | | | 2,809 | |
P-Class | | | 3,028 | | | | 6,839 | |
Institutional Class | | | 231,463 | | | | 90,568 | |
Shares issued from reinvestment of distributions | | | | | | | | |
A-Class | | | 13,229 | | | | 1,152 | |
C-Class | | | 1,581 | | | | 233 | |
P-Class | | | 467 | | | | 13 | |
Institutional Class | | | 7,100 | | | | 586 | |
Shares redeemed | | | | | | | | |
A-Class | | | (45,344 | ) | | | (34,430 | ) |
C-Class | | | (9,606 | ) | | | (18,423 | ) |
P-Class | | | (9,549 | ) | | | (297 | ) |
Institutional Class | | | (320,156 | ) | | | (35,975 | ) |
Net increase (decrease) in shares | | | (106,028 | ) | | | 38,197 | |
SEE NOTES TO FINANCIAL STATEMENTS. | THE GUGGENHEIM FUNDS ANNUAL REPORT | 73 |
This table is presented to show selected data for a share outstanding throughout each period and to assist shareholders in evaluating a Fund’s performance for the periods presented.
A-Class | | Year Ended
September 30,
2023 | | | Year Ended
September 30,
2022 | | | Year Ended
September 30,
2021 | | | Year Ended
September 30,
2020 | | | Year Ended
September 30,
2019 | |
Per Share Data |
Net asset value, beginning of period | | $ | 14.06 | | | $ | 15.93 | | | $ | 10.61 | | | $ | 12.86 | | | $ | 15.56 | |
Income (loss) from investment operations: |
Net investment income (loss)a | | | .16 | | | | .13 | | | | .07 | | | | .06 | | | | .10 | |
Net gain (loss) on investments (realized and unrealized) | | | 1.58 | | | | (1.93 | ) | | | 5.37 | | | | (1.87 | ) | | | (1.28 | ) |
Total from investment operations | | | 1.74 | | | | (1.80 | ) | | | 5.44 | | | | (1.81 | ) | | | (1.18 | ) |
Less distributions from: |
Net investment income | | | (.17 | ) | | | — | | | | (.12 | ) | | | (.18 | ) | | | (.19 | ) |
Net realized gains | | | (.57 | ) | | | (.07 | ) | | | — | | | | (.26 | ) | | | (1.33 | ) |
Total distributions | | | (.74 | ) | | | (.07 | ) | | | (.12 | ) | | | (.44 | ) | | | (1.52 | ) |
Net asset value, end of period | | $ | 15.06 | | | $ | 14.06 | | | $ | 15.93 | | | $ | 10.61 | | | $ | 12.86 | |
|
Total Returnb | | | 12.38 | % | | | (11.36 | %) | | | 51.48 | % | | | (14.79 | %) | | | (6.14 | %) |
Ratios/Supplemental Data |
Net assets, end of period (in thousands) | | $ | 3,982 | | | $ | 3,876 | | | $ | 4,521 | | | $ | 3,390 | | | $ | 9,751 | |
Ratios to average net assets: |
Net investment income (loss) | | | 1.06 | % | | | 0.80 | % | | | 0.47 | % | | | 0.54 | % | | | 0.75 | % |
Total expensesc | | | 3.43 | % | | | 3.50 | % | | | 4.07 | % | | | 3.23 | % | | | 2.27 | % |
Net expensesd,e,f | | | 1.27 | % | | | 1.30 | % | | | 1.30 | % | | | 1.30 | % | | | 1.30 | % |
Portfolio turnover rate | | | 72 | % | | | 37 | % | | | 28 | % | | | 40 | % | | | 78 | % |
C-Class | | Year Ended
September 30,
2023 | | | Year Ended
September 30,
2022 | | | Year Ended
September 30,
2021 | | | Year Ended
September 30,
2020 | | | Year Ended
September 30,
2019 | |
Per Share Data |
Net asset value, beginning of period | | $ | 12.76 | | | $ | 14.57 | | | $ | 9.69 | | | $ | 11.75 | | | $ | 14.30 | |
Income (loss) from investment operations: |
Net investment income (loss)a | | | .04 | | | | — | g | | | (.03 | ) | | | (.02 | ) | | | — | g |
Net gain (loss) on investments (realized and unrealized) | | | 1.44 | | | | (1.74 | ) | | | 4.91 | | | | (1.73 | ) | | | (1.18 | ) |
Total from investment operations | | | 1.48 | | | | (1.74 | ) | | | 4.88 | | | | (1.75 | ) | | | (1.18 | ) |
Less distributions from: |
Net investment income | | | (.05 | ) | | | — | | | | — | | | | (.05 | ) | | | (.04 | ) |
Net realized gains | | | (.57 | ) | | | (.07 | ) | | | — | | | | (.26 | ) | | | (1.33 | ) |
Total distributions | | | (.62 | ) | | | (.07 | ) | | | — | | | | (.31 | ) | | | (1.37 | ) |
Net asset value, end of period | | $ | 13.62 | | | $ | 12.76 | | | $ | 14.57 | | | $ | 9.69 | | | $ | 11.75 | |
|
Total Returnb | | | 11.57 | % | | | (12.02 | %) | | | 50.36 | % | | | (15.43 | %) | | | (6.89 | %) |
Ratios/Supplemental Data |
Net assets, end of period (in thousands) | | $ | 405 | | | $ | 471 | | | $ | 762 | | | $ | 765 | | | $ | 1,593 | |
Ratios to average net assets: |
Net investment income (loss) | | | 0.30 | % | | | (0.02 | %) | | | (0.25 | %) | | | (0.14 | %) | | | 0.01 | % |
Total expensesc | | | 4.26 | % | | | 4.41 | % | | | 5.04 | % | | | 4.33 | % | | | 3.09 | % |
Net expensesd,e,f | | | 2.02 | % | | | 2.05 | % | | | 2.05 | % | | | 2.06 | % | | | 2.05 | % |
Portfolio turnover rate | | | 72 | % | | | 37 | % | | | 28 | % | | | 40 | % | | | 78 | % |
74 | THE GUGGENHEIM FUNDS ANNUAL REPORT | SEE NOTES TO FINANCIAL STATEMENTS. |
FINANCIAL HIGHLIGHTS (continued) |
This table is presented to show selected data for a share outstanding throughout each period and to assist shareholders in evaluating a Fund’s performance for the periods presented.
P-Class | | Year Ended
September 30,
2023 | | | Year Ended
September 30,
2022 | | | Year Ended
September 30,
2021 | | | Year Ended
September 30,
2020 | | | Year Ended
September 30,
2019 | |
Per Share Data |
Net asset value, beginning of period | | $ | 14.17 | | | $ | 16.05 | | | $ | 10.75 | | | $ | 13.01 | | | $ | 15.73 | |
Income (loss) from investment operations: |
Net investment income (loss)a | | | .18 | | | | .16 | | | | .07 | | | | .05 | | | | .09 | |
Net gain (loss) on investments (realized and unrealized) | | | 1.57 | | | | (1.97 | ) | | | 5.42 | | | | (1.86 | ) | | | (1.29 | ) |
Total from investment operations | | | 1.75 | | | | (1.81 | ) | | | 5.49 | | | | (1.81 | ) | | | (1.20 | ) |
Less distributions from: |
Net investment income | | | (.11 | ) | | | — | | | | (.19 | ) | | | (.19 | ) | | | (.19 | ) |
Net realized gains | | | (.57 | ) | | | (.07 | ) | | | — | | | | (.26 | ) | | | (1.33 | ) |
Total distributions | | | (.68 | ) | | | (.07 | ) | | | (.19 | ) | | | (.45 | ) | | | (1.52 | ) |
Net asset value, end of period | | $ | 15.24 | | | $ | 14.17 | | | $ | 16.05 | | | $ | 10.75 | | | $ | 13.01 | |
|
Total Return | | | 12.32 | % | | | (11.34 | %) | | | 51.46 | % | | | (14.66 | %) | | | (6.18 | %) |
Ratios/Supplemental Data |
Net assets, end of period (in thousands) | | $ | 54 | | | $ | 136 | | | $ | 49 | | | $ | 26 | | | $ | 47 | |
Ratios to average net assets: |
Net investment income (loss) | | | 1.15 | % | | | 1.00 | % | | | 0.48 | % | | | 0.46 | % | | | 0.72 | % |
Total expensesc | | | 3.68 | % | | | 3.82 | % | | | 4.39 | % | | | 4.07 | % | | | 2.73 | % |
Net expensesd,e,f | | | 1.27 | % | | | 1.29 | % | | | 1.30 | % | | | 1.30 | % | | | 1.28 | % |
Portfolio turnover rate | | | 72 | % | | | 37 | % | | | 28 | % | | | 40 | % | | | 78 | % |
SEE NOTES TO FINANCIAL STATEMENTS. | THE GUGGENHEIM FUNDS ANNUAL REPORT | 75 |
FINANCIAL HIGHLIGHTS (concluded) |
This table is presented to show selected data for a share outstanding throughout each period and to assist shareholders in evaluating a Fund’s performance for the periods presented.
Institutional Class | | Year Ended
September 30,
2023 | | | Year Ended
September 30,
2022 | | | Year Ended
September 30,
2021 | | | Year Ended
September 30,
2020 | | | Year Ended
September 30,
2019 | |
Per Share Data |
Net asset value, beginning of period | | $ | 12.68 | | | $ | 14.33 | | | $ | 9.54 | | | $ | 11.60 | | | $ | 14.24 | |
Income (loss) from investment operations: |
Net investment income (loss)a | | | .19 | | | | .16 | | | | .10 | | | | .09 | | | | .12 | |
Net gain (loss) on investments (realized and unrealized) | | | 1.42 | | | | (1.74 | ) | | | 4.81 | | | | (1.68 | ) | | | (1.20 | ) |
Total from investment operations | | | 1.61 | | | | (1.58 | ) | | | 4.91 | | | | (1.59 | ) | | | (1.08 | ) |
Less distributions from: |
Net investment income | | | (.22 | ) | | | — | | | | (.12 | ) | | | (.21 | ) | | | (.23 | ) |
Net realized gains | | | (.57 | ) | | | (.07 | ) | | | — | | | | (.26 | ) | | | (1.33 | ) |
Total distributions | | | (.79 | ) | | | (.07 | ) | | | (.12 | ) | | | (.47 | ) | | | (1.56 | ) |
Net asset value, end of period | | $ | 13.50 | | | $ | 12.68 | | | $ | 14.33 | | | $ | 9.54 | | | $ | 11.60 | |
|
Total Return | | | 12.63 | % | | | (11.10 | %) | | | 51.78 | % | | | (14.54 | %) | | | (5.96 | %) |
Ratios/Supplemental Data |
Net assets, end of period (in thousands) | | $ | 1,076 | | | $ | 2,046 | | | $ | 1,522 | | | $ | 892 | | | $ | 3,143 | |
Ratios to average net assets: |
Net investment income (loss) | | | 1.40 | % | | | 1.13 | % | | | 0.75 | % | | | 0.82 | % | | | 0.99 | % |
Total expensesc | | | 3.17 | % | | | 3.24 | % | | | 3.80 | % | | | 2.86 | % | | | 2.09 | % |
Net expensesd,e,f | | | 1.02 | % | | | 1.04 | % | | | 1.05 | % | | | 1.05 | % | | | 1.05 | % |
Portfolio turnover rate | | | 72 | % | | | 37 | % | | | 28 | % | | | 40 | % | | | 78 | % |
a | Net investment income (loss) per share was computed using average shares outstanding throughout the period. |
b | Total return does not reflect the impact of any applicable sales charges. |
c | Does not include expenses of the underlying funds in which the Fund invests. |
d | Net expense information reflects the expense ratios after expense waivers and reimbursements, as applicable. |
e | The portion of the ratios of net expenses to average net assets attributable to recoupments of prior fee reductions or expense reimbursements for the years presented was as follows: |
| | | 09/30/23 | 09/30/22 | 09/30/21 | 09/30/20 | 09/30/19 |
| | A-Class | — | 0.01% | — | — | — |
| | C-Class | — | 0.01% | — | — | — |
| | P-Class | — | 0.02% | — | — | — |
| | Institutional Class | — | 0.02% | — | — | — |
f | Net expenses may include expenses that are excluded from the expense limitation agreement. Excluding these expenses, the net expense ratios for the years presented would be: |
| | | 09/30/23 | 09/30/22 | 09/30/21 | 09/30/20 | 09/30/19 |
| | A-Class | 1.26% | 1.29% | 1.30% | 1.30% | 1.30% |
| | C-Class | 2.01% | 2.04% | 2.05% | 2.05% | 2.05% |
| | P-Class | 1.26% | 1.29% | 1.30% | 1.30% | 1.28% |
| | Institutional Class | 1.01% | 1.04% | 1.05% | 1.05% | 1.05% |
g | Less than $0.01 per share. |
76 | THE GUGGENHEIM FUNDS ANNUAL REPORT | SEE NOTES TO FINANCIAL STATEMENTS. |
MANAGERS’ COMMENTARY (Unaudited) | September 30, 2023 |
To Our Shareholders
Security Investors, LLC (“SI”) serves as the investment adviser to Guggenheim StylePlusTM —Large Core Fund (“Fund”). The Fund is managed by a team of seasoned professionals, including Farhan Sharaff, Senior Managing Director and Assistant Chief Investment Officer, Equities, and Portfolio Manager; Qi Yan, Managing Director and Portfolio Manager; and Adam J. Bloch, Managing Director and Portfolio Manager. In the subsequent paragraphs, the investment team discusses the Fund’s performance and the market environment for the 12-month period ended September 30, 2023 (“Reporting Period”).
For the Reporting Period, the Fund provided a total return of 21.81%1, outperforming the S&P 500 Index, the Fund’s benchmark, which returned 21.62%.
What factors contributed or detracted from the Fund’s performance during the Reporting Period?
Over the Reporting Period, 15%-25% of the total equity position was allocated to actively managed equity and 75%-85% to passive equity. Remaining Fund assets were invested in the Guggenheim Strategy Funds, short-term fixed-income investment companies advised by Guggenheim Investments, and the Guggenheim Ultra Short Duration Fund, whose objective is to seek a high level of income consistent with the preservation of capital.
The Fund outperformed the S&P 500 Index for the Reporting Period by 0.19% net of fees. The Fund performed better than the benchmark due to contributions from the active equity and active fixed income sleeves, offset by cost of derivatives and Fund fees and expenses.
How did the Fund use derivatives during the Reporting Period?
The passive equity component, which accounted for 75%-85% of the Fund’s exposure to the broad equity market, consisted of equity index swaps and equity index futures. On average, the equity index futures accounted for 0%-5% of the overall exposure, with the remainder from equity index swaps. Both the swaps and futures benefited performance.
Performance displayed represents past performance which is no guarantee of future results.
1 | Performance figures are based on Class A shares and do not reflect taxes that a shareholder would pay on distributions or the redemption of shares. |
The opinions and forecast expressed may not actually come to pass. This information is subject to change at any time, based on market and other conditions, and should not be construed as a recommendation of any specific security or strategy.
| | THE GUGGENHEIM FUNDS ANNUAL REPORT | 77 |
PERFORMANCE REPORT AND FUND PROFILE (Unaudited) | September 30, 2023 |
STYLEPLUS—LARGE CORE FUND
OBJECTIVE: Seeks long-term growth of capital.
Holdings Diversification (Market Exposure as % of Net Assets)
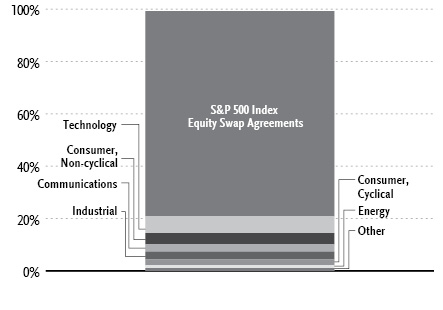
“Holdings Diversification (Market Exposure as % of Net Assets)” excludes any temporary cash investments, investments in Guggenheim Strategy Funds Trust mutual funds, or investments in Guggenheim Ultra Short Duration Fund.
Inception Dates: |
A-Class | September 10, 1962 |
C-Class | January 29, 1999 |
P-Class | May 1, 2015 |
Institutional Class | March 1, 2012 |
Ten Largest Holdings | % of Total Net Assets |
Guggenheim Strategy Fund III | 34.7% |
Guggenheim Strategy Fund II | 28.6% |
Guggenheim Ultra Short Duration Fund — Institutional Class | 15.0% |
Apple, Inc. | 1.5% |
Microsoft Corp. | 1.4% |
Alphabet, Inc. — Class C | 0.7% |
Amazon.com, Inc. | 0.6% |
NVIDIA Corp. | 0.5% |
Exxon Mobil Corp. | 0.5% |
Home Depot, Inc. | 0.4% |
Top Ten Total | 83.9% |
| | |
“Ten Largest Holdings” excludes any temporary cash or derivative investments. |
78 | THE GUGGENHEIM FUNDS ANNUAL REPORT | |
PERFORMANCE REPORT AND FUND PROFILE (Unaudited)(concluded) | September 30, 2023 |
Cumulative Fund Performance*
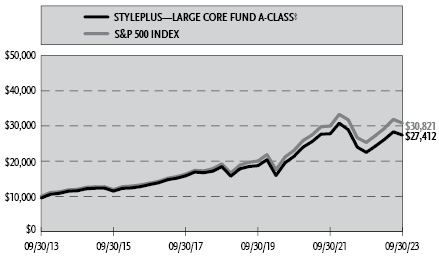
Average Annual Returns*
Periods Ended September 30, 2023
| 1 Year | 5 Year | 10 Year |
A-Class Shares | 21.81% | 8.25% | 11.15% |
A-Class Shares with sales charge† | 16.02% | 7.20% | 10.61% |
C-Class Shares | 20.81% | 7.28% | 10.14% |
C-Class Shares with CDSC‡ | 20.14% | 7.28% | 10.14% |
Institutional Class Shares | 22.06% | 8.48% | 11.42% |
S&P 500 Index | 21.62% | 9.92% | 11.91% |
| 1 Year | 5 Year | Since
Inception
(05/01/15) |
P-Class Shares | 21.62% | 8.11% | 9.55% |
S&P 500 Index | 21.62% | 9.92% | 10.86% |
* | The performance data above represents past performance that is not predictive of future results. The investment return and principal value of an investment in the Fund will fluctuate so that an investor’s shares, when redeemed, may be worth more or less than their original cost. Returns are historical and include changes in principal and reinvested dividends and capital gains and do not reflect the effect of taxes. The S&P 500 Index is an unmanaged index and, unlike the Fund, has no management fees or operating expenses to reduce its reported return. The graph is based on A-Class shares only; performance for C-Class, P-Class and Institutional Class will vary due to differences in fee structures. |
† | Fund returns are calculated using the maximum sales charge of 4.75%. |
‡ | Fund returns include a CDSC of 1% if redeemed within 12 months of purchase. |
| | THE GUGGENHEIM FUNDS ANNUAL REPORT | 79 |
SCHEDULE OF INVESTMENTS | September 30, 2023 |
STYLEPLUS—LARGE CORE FUND | |
| | Shares | | | Value | |
COMMON STOCKS† - 20.8% |
| | | | | | | | | |
Technology - 6.4% |
Apple, Inc. | | | 18,589 | | | $ | 3,182,502 | |
Microsoft Corp. | | | 9,268 | | | | 2,926,371 | |
NVIDIA Corp. | | | 2,439 | | | | 1,060,941 | |
QUALCOMM, Inc. | | | 5,225 | | | | 580,288 | |
International Business Machines Corp. | | | 4,129 | | | | 579,299 | |
Texas Instruments, Inc. | | | 3,217 | | | | 511,535 | |
Applied Materials, Inc. | | | 3,573 | | | | 494,682 | |
NXP Semiconductor N.V. | | | 2,465 | | | | 492,803 | |
Microchip Technology, Inc. | | | 6,153 | | | | 480,242 | |
NetApp, Inc. | | | 5,937 | | | | 450,500 | |
Broadcom, Inc. | | | 529 | | | | 439,377 | |
KLA Corp. | | | 940 | | | | 431,140 | |
Hewlett Packard Enterprise Co. | | | 24,439 | | | | 424,505 | |
Skyworks Solutions, Inc. | | | 3,984 | | | | 392,782 | |
Cognizant Technology Solutions Corp. — Class A | | | 3,406 | | | | 230,722 | |
Lam Research Corp. | | | 230 | | | | 144,157 | |
Akamai Technologies, Inc.* | | | 1,297 | | | | 138,182 | |
Cadence Design Systems, Inc.* | | | 550 | | | | 128,865 | |
Autodesk, Inc.* | | | 617 | | | | 127,664 | |
Intuit, Inc. | | | 246 | | | | 125,691 | |
Adobe, Inc.* | | | 242 | | | | 123,396 | |
Total Technology | | | | | | | 13,465,644 | |
| | | | | | | | | |
Consumer, Non-cyclical - 4.3% |
Merck & Company, Inc. | | | 7,422 | | | | 764,095 | |
UnitedHealth Group, Inc. | | | 1,344 | | | | 677,631 | |
Amgen, Inc. | | | 2,468 | | | | 663,300 | |
Pfizer, Inc. | | | 19,970 | | | | 662,405 | |
Philip Morris International, Inc. | | | 6,712 | | | | 621,397 | |
Bristol-Myers Squibb Co. | | | 10,141 | | | | 588,584 | |
Gilead Sciences, Inc. | | | 7,709 | | | | 577,712 | |
Humana, Inc. | | | 1,117 | | | | 543,443 | |
HCA Healthcare, Inc. | | | 1,892 | | | | 465,394 | |
Altria Group, Inc. | | | 10,437 | | | | 438,876 | |
Incyte Corp.* | | | 7,377 | | | | 426,169 | |
Molina Healthcare, Inc.* | | | 1,231 | | | | 403,633 | |
AbbVie, Inc. | | | 2,076 | | | | 309,448 | |
Vertex Pharmaceuticals, Inc.* | | | 827 | | | | 287,581 | |
Elevance Health, Inc. | | | 634 | | | | 276,056 | |
United Rentals, Inc. | | | 582 | | | | 258,740 | |
Regeneron Pharmaceuticals, Inc.* | | | 173 | | | | 142,372 | |
Johnson & Johnson | | | 859 | | | | 133,789 | |
PepsiCo, Inc. | | | 779 | | | | 131,994 | |
Eli Lilly & Co. | | | 244 | | | | 131,060 | |
Quest Diagnostics, Inc. | | | 1,075 | | | | 131,000 | |
Viatris, Inc. | | | 13,139 | | | | 129,550 | |
PayPal Holdings, Inc.* | | | 2,148 | | | | 125,572 | |
Organon & Co. | | | 6,745 | | | | 117,093 | |
Total Consumer, Non-cyclical | | | | | | | 9,006,894 | |
| | | | | | | | | |
Communications - 2.9% |
Alphabet, Inc. — Class C* | | | 11,677 | | | | 1,539,613 | |
Amazon.com, Inc.* | | | 9,195 | | | | 1,168,868 | |
Cisco Systems, Inc. | | | 12,812 | | | | 688,773 | |
Meta Platforms, Inc. — Class A* | | | 1,911 | | | | 573,701 | |
VeriSign, Inc.* | | | 2,293 | | | | 464,401 | |
Booking Holdings, Inc.* | | | 138 | | | | 425,585 | |
F5, Inc.* | | | 2,558 | | | | 412,196 | |
Juniper Networks, Inc. | | | 14,377 | | | | 399,537 | |
eBay, Inc. | | | 8,899 | | | | 392,357 | |
Total Communications | | | | | | | 6,065,031 | |
| | | | | | | | | |
Industrial - 2.8% |
Caterpillar, Inc. | | | 2,205 | | | | 601,965 | |
Lockheed Martin Corp. | | | 1,323 | | | | 541,054 | |
Deere & Co. | | | 1,412 | | | | 532,861 | |
Northrop Grumman Corp. | | | 1,147 | | | | 504,898 | |
Illinois Tool Works, Inc. | | | 2,184 | | | | 502,997 | |
Keysight Technologies, Inc.* | | | 3,591 | | | | 475,125 | |
Expeditors International of Washington, Inc. | | | 4,094 | | | | 469,295 | |
Snap-on, Inc. | | | 1,768 | | | | 450,946 | |
Masco Corp. | | | 8,089 | | | | 432,357 | |
TE Connectivity Ltd. | | | 3,401 | | | | 420,125 | |
Otis Worldwide Corp. | | | 4,237 | | | | 340,273 | |
Textron, Inc. | | | 4,241 | | | | 331,392 | |
Allegion plc | | | 1,973 | | | | 205,587 | |
Total Industrial | | | | | | | 5,808,875 | |
| | | | | | | | | |
Consumer, Cyclical - 2.2% |
Home Depot, Inc. | | | 2,604 | | | | 786,825 | |
PACCAR, Inc. | | | 6,096 | | | | 518,282 | |
Cummins, Inc. | | | 2,075 | | | | 474,055 | |
BorgWarner, Inc. | | | 11,272 | | | | 455,051 | |
Lennar Corp. — Class A | | | 3,439 | | | | 385,959 | |
Tesla, Inc.* | | | 1,532 | | | | 383,337 | |
Ulta Beauty, Inc.* | | | 936 | | | | 373,885 | |
PulteGroup, Inc. | | | 4,866 | | | | 360,327 | |
DR Horton, Inc. | | | 3,140 | | | | 337,456 | |
NVR, Inc.* | | | 54 | | | | 322,018 | |
Yum! Brands, Inc. | | | 1,059 | | | | 132,311 | |
Total Consumer, Cyclical | | | | | | | 4,529,506 | |
| | | | | | | | | |
Energy - 1.2% |
Exxon Mobil Corp. | | | 8,695 | | | | 1,022,358 | |
Valero Energy Corp. | | | 3,789 | | | | 536,939 | |
Marathon Petroleum Corp. | | | 3,401 | | | | 514,708 | |
EOG Resources, Inc. | | | 2,758 | | | | 349,604 | |
Total Energy | | | | | | | 2,423,609 | |
| | | | | | | | | |
Financial - 0.9% |
Goldman Sachs Group, Inc. | | | 1,805 | | | | 584,044 | |
Berkshire Hathaway, Inc. — Class B* | | | 1,258 | | | | 440,678 | |
Visa, Inc. — Class A | | | 1,104 | | | | 253,931 | |
Capital One Financial Corp. | | | 2,179 | | | | 211,472 | |
JPMorgan Chase & Co. | | | 1,402 | | | | 203,318 | |
Synchrony Financial | | | 4,976 | | | | 152,116 | |
Total Financial | | | | | | | 1,845,559 | |
| | | | | | | | | |
80 | THE GUGGENHEIM FUNDS ANNUAL REPORT | SEE NOTES TO FINANCIAL STATEMENTS. |
SCHEDULE OF INVESTMENTS (continued) | September 30, 2023 |
STYLEPLUS—LARGE CORE FUND | |
| | Shares | | | Value | |
Basic Materials - 0.1% |
CF Industries Holdings, Inc. | | | 3,805 | | | $ | 326,241 | |
| | | | | | | | | |
Total Common Stocks | | | | |
(Cost $41,141,941) | | | | | | | 43,471,359 | |
| | | | | | | | | |
MUTUAL FUNDS† - 78.3% |
Guggenheim Strategy Fund III1 | | | 2,983,504 | | | | 72,469,308 | |
Guggenheim Strategy Fund II1 | | | 2,457,791 | | | | 59,650,586 | |
Guggenheim Ultra Short Duration Fund — Institutional Class1 | | | 3,222,619 | | | | 31,420,533 | |
Total Mutual Funds | | | | |
(Cost $166,247,094) | | | | | | | 163,540,427 | |
| | | | | | | | | |
MONEY MARKET FUND† - 1.1% |
Dreyfus Treasury Securities Cash Management Fund — Institutional Shares, 5.24%2 | | | 2,246,158 | | | | 2,246,158 | |
Total Money Market Fund | | | | |
(Cost $2,246,158) | | | | | | | 2,246,158 | |
| | | | | | | | | |
Total Investments - 100.2% | | | | |
(Cost $209,635,193) | | $ | 209,257,944 | |
Other Assets & Liabilities, net - (0.2)% | | | (509,377 | ) |
Total Net Assets - 100.0% | | $ | 208,748,567 | |
Futures Contracts |
Description | | Number of
Contracts | | | Expiration Date | | | Notional
Amount | | | Value and
Unrealized
Depreciation** | |
Equity Futures Contracts Purchased† |
S&P 500 Index Mini Futures Contracts | | | 6 | | | | Dec 2023 | | | $ | 1,297,875 | | | $ | (56,341 | ) |
Total Return Swap Agreements |
Counterparty | Index | Type | | Financing
Rate | | Payment
Frequency | | | Maturity Date | | | Units | | | Notional
Amount | | | Value and
Unrealized
Appreciation | |
OTC Equity Index Swap Agreements†† |
Wells Fargo Bank, N.A. | S&P 500 Total Return Index | Pay | | 5.64% (Federal Funds Rate + 0.31%) | | | At Maturity | | | | 01/29/24 | | | | 17,723 | | | $ | 163,876,074 | | | $ | 21,088,775 | |
* | Non-income producing security. |
** | Includes cumulative appreciation (depreciation). Variation margin is reported within the Statement of Assets and Liabilities. |
† | Value determined based on Level 1 inputs — See Note 4. |
†† | Value determined based on Level 2 inputs — See Note 4. |
1 | Affiliated issuer. |
2 | Rate indicated is the 7-day yield as of September 30, 2023. |
| | plc — Public Limited Company |
| | |
| | See Sector Classification in Other Information section. |
SEE NOTES TO FINANCIAL STATEMENTS. | THE GUGGENHEIM FUNDS ANNUAL REPORT | 81 |
SCHEDULE OF INVESTMENTS (concluded) | September 30, 2023 |
STYLEPLUS—LARGE CORE FUND | |
The following table summarizes the inputs used to value the Fund’s investments at September 30, 2023 (See Note 4 in the Notes to Financial Statements):
Investments in Securities (Assets) | | Level 1
Quoted
Prices | | | Level 2
Significant
Observable
Inputs | | | Level 3
Significant
Unobservable
Inputs | | | Total | |
Common Stocks | | $ | 43,471,359 | | | $ | — | | | $ | — | | | $ | 43,471,359 | |
Mutual Funds | | | 163,540,427 | | | | — | | | | — | | | | 163,540,427 | |
Money Market Fund | | | 2,246,158 | | | | — | | | | — | | | | 2,246,158 | |
Equity Index Swap Agreements** | | | — | | | | 21,088,775 | | | | — | | | | 21,088,775 | |
Total Assets | | $ | 209,257,944 | | | $ | 21,088,775 | | | $ | — | | | $ | 230,346,719 | |
Investments in Securities (Liabilities) | | Level 1
Quoted
Prices | | | Level 2
Significant
Observable
Inputs | | | Level 3
Significant
Unobservable
Inputs | | | Total | |
Equity Futures Contracts** | | $ | 56,341 | | | $ | — | | | $ | — | | | $ | 56,341 | |
** | This derivative is reported as unrealized appreciation/depreciation at period end. |
Affiliated Transactions
Investments representing 5% or more of the outstanding voting shares of a company, or control of or by, or common control under Guggenheim Investments (“GI”), result in that company being considered an affiliated issuer, as defined in the 1940 Act.
The Fund may invest in certain of the underlying series of Guggenheim Strategy Funds Trust, including Guggenheim Strategy Fund II and Guggenheim Strategy Fund III, (collectively, the “Short Term Investment Vehicles”), each of which are open-end management investment companies managed by GI. The Short Term Investment Vehicles, which launched on March 11, 2014, are offered as short term investment options only to mutual funds, trusts, and other accounts managed by GI and/or its affiliates, and are not available to the public. The Short Term Investment Vehicles pay no investment management fees. The Short Term Investment Vehicles’ annual report on Form N-CSR dated September 30, 2022, is available publicly or upon request. This information is available from the EDGAR database on the SEC’s website at https://www.sec.gov/Archives/edgar/data/1601445/000182126822000340/gug84768.htm. The Fund may invest in certain of the underlying series of Guggenheim Funds Trust, which are open-end management investment companies managed by GI, are available to the public and whose most recent annual report on Form N-CSR is available publicly or upon request.
Transactions during the year ended September 30, 2023, in which the company is an affiliated issuer, were as follows:
Security Name | | Value
09/30/22 | | | Additions | | | Reductions | | | Realized
Gain (Loss) | | | Change in
Unrealized
Appreciation
(Depreciation) | | | Value
09/30/23 | | | Shares
09/30/23 | | | Investment
Income | |
Mutual Funds | | | | | | | | | | | | | | | | | | | | | | | | | | | | | | | | |
Guggenheim Strategy Fund II | | $ | 57,201,913 | | | $ | 22,365,719 | | | $ | (20,648,235 | ) | | $ | (652,333 | ) | | $ | 1,383,522 | | | $ | 59,650,586 | | | | 2,457,791 | | | $ | 2,870,310 | |
Guggenheim Strategy Fund III | | | 67,311,123 | | | | 6,074,186 | | | | (1,659,994 | ) | | | (63,265 | ) | | | 807,258 | | | | 72,469,308 | | | | 2,983,504 | | | | 3,648,680 | |
Guggenheim Ultra Short Duration Fund — Institutional Class | | | 33,794,274 | | | | 1,687,181 | | | | (4,636,000 | ) | | | (99,750 | ) | | | 674,828 | | | | 31,420,533 | | | | 3,222,619 | | | | 1,687,338 | |
| | | $ | 158,307,310 | | | $ | 30,127,086 | | | $ | (26,944,229 | ) | | $ | (815,348 | ) | | $ | 2,865,608 | | | $ | 163,540,427 | | | | | | | $ | 8,206,328 | |
82 | THE GUGGENHEIM FUNDS ANNUAL REPORT | SEE NOTES TO FINANCIAL STATEMENTS. |
STYLEPLUS—LARGE CORE FUND | |
STATEMENT OF ASSETS AND LIABILITIES |
September 30, 2023 |
Assets: |
Investments in unaffiliated issuers, at value (cost $43,388,099) | | $ | 45,717,517 | |
Investments in affiliated issuers, at value (cost $166,247,094) | | | 163,540,427 | |
Segregated cash with broker | | | 200,000 | |
Unrealized appreciation on OTC swap agreements | | | 21,088,775 | |
Prepaid expenses | | | 56,917 | |
Receivables: |
Dividends | | | 806,913 | |
Interest | | | 19,816 | |
Fund shares sold | | | 9,493 | |
Total assets | | | 231,439,858 | |
| | | | | |
Liabilities: |
Overdraft due to custodian bank | | | 13,245 | |
Segregated cash due to broker | | | 15,890,000 | |
Payable for: |
Swap settlement | | | 5,686,748 | |
Securities purchased | | | 794,879 | |
Management fees | | | 125,968 | |
Distribution and service fees | | | 43,595 | |
Fund accounting and administration fees | | | 11,023 | |
Transfer agent fees | | | 6,846 | |
Variation margin on futures contracts | | | 3,375 | |
Trustees’ fees* | | | 1,411 | |
Fund shares redeemed | | | 1,117 | |
Miscellaneous | | | 113,084 | |
Total liabilities | | | 22,691,291 | |
Net assets | | $ | 208,748,567 | |
| | | | | |
Net assets consist of: |
Paid in capital | | $ | 223,467,334 | |
Total distributable earnings (loss) | | | (14,718,767 | ) |
Net assets | | $ | 208,748,567 | |
| | | | | |
A-Class: |
Net assets | | $ | 201,587,406 | |
Capital shares outstanding | | | 10,932,145 | |
Net asset value per share | | $ | 18.44 | |
Maximum offering price per share (Net asset value divided by 95.25%) | | $ | 19.36 | |
| | | | | |
C-Class: |
Net assets | | $ | 797,258 | |
Capital shares outstanding | | | 87,037 | |
Net asset value per share | | $ | 9.16 | |
| | | | | |
P-Class: |
Net assets | | $ | 206,115 | |
Capital shares outstanding | | | 11,432 | |
Net asset value per share | | $ | 18.03 | |
| | | | | |
Institutional Class: |
Net assets | | $ | 6,157,788 | |
Capital shares outstanding | | | 338,644 | |
Net asset value per share | | $ | 18.18 | |
STATEMENT OF OPERATIONS |
Year Ended September 30, 2023 |
Investment Income: |
Dividends from securities of unaffiliated issuers (net of foreign withholding tax of $1,473) | | $ | 758,374 | |
Dividends from securities of affiliated issuers | | | 8,206,328 | |
Interest | | | 315,376 | |
Total investment income | | | 9,280,078 | |
| | | | | |
Expenses: |
Management fees | | | 1,565,264 | |
Distribution and service fees: |
A-Class | | | 504,956 | |
C-Class | | | 8,976 | |
P-Class | | | 567 | |
Transfer agent fees: |
A-Class | | | 195,736 | |
C-Class | | | 1,613 | |
P-Class | | | 538 | |
Institutional Class | | | 5,378 | |
Interest expense | | | 529,210 | |
Fund accounting and administration fees | | | 94,206 | |
Professional fees | | | 56,238 | |
Custodian fees | | | 17,404 | |
Line of credit fees | | | 11,717 | |
Trustees’ fees* | | | 11,560 | |
Miscellaneous | | | 91,141 | |
Total expenses | | | 3,094,504 | |
Less: |
Expenses waived by Adviser | | | (87,068 | ) |
Earnings credits applied | | | (3,877 | ) |
Total waived expenses | | | (90,945 | ) |
Net expenses | | | 3,003,559 | |
Net investment income | | | 6,276,519 | |
| | | | | |
Net Realized and Unrealized Gain (Loss): |
Net realized gain (loss) on: |
Investments in unaffiliated issuers | | | 1,358,525 | |
Investments in affiliated issuers | | | (815,348 | ) |
Swap agreements | | | (37,756,615 | ) |
Futures contracts | | | 231,814 | |
Net realized loss | | | (36,981,624 | ) |
Net change in unrealized appreciation (depreciation) on: |
Investments in unaffiliated issuers | | | 6,142,834 | |
Investments in affiliated issuers | | | 2,865,608 | |
Swap agreements | | | 61,878,961 | |
Futures contracts | | | 183,408 | |
Net change in unrealized appreciation (depreciation) | | | 71,070,811 | |
Net realized and unrealized gain | | | 34,089,187 | |
Net increase in net assets resulting from operations | | $ | 40,365,706 | |
* | Relates to Trustees not deemed “interested persons” within the meaning of Section 2(a)(19) of the 1940 Act. |
SEE NOTES TO FINANCIAL STATEMENTS. | THE GUGGENHEIM FUNDS ANNUAL REPORT | 83 |
STYLEPLUS—LARGE CORE FUND | |
STATEMENTS OF CHANGES IN NET ASSETS |
| | Year Ended
September 30,
2023 | | | Year Ended
September 30,
2022 | |
Increase (Decrease) in Net Assets from Operations: | | | | | | | | |
Net investment income | | $ | 6,276,519 | | | $ | 1,667,535 | |
Net realized gain (loss) on investments | | | (36,981,624 | ) | | | 60,035,690 | |
Net change in unrealized appreciation (depreciation) on investments | | | 71,070,811 | | | | (107,444,090 | ) |
Net increase (decrease) in net assets resulting from operations | | | 40,365,706 | | | | (45,740,865 | ) |
| | | | | | | | | |
Distributions to shareholders: | | | | | | | | |
A-Class | | | (57,362,413 | ) | | | (11,885,985 | ) |
C-Class | | | (480,274 | ) | | | (54,594 | ) |
P-Class | | | (80,505 | ) | | | (14,927 | ) |
Institutional Class | | | (1,403,582 | ) | | | (322,926 | ) |
Total distributions to shareholders | | | (59,326,774 | ) | | | (12,278,432 | ) |
| | | | | | | | | |
Capital share transactions: | | | | | | | | |
Proceeds from sale of shares | | | | | | | | |
A-Class | | | 2,166,582 | | | | 4,911,344 | |
C-Class | | | 125,050 | | | | 523,465 | |
P-Class | | | 7,830 | | | | 123,406 | |
Institutional Class | | | 1,924,452 | | | | 6,528,320 | |
Distributions reinvested | | | | | | | | |
A-Class | | | 54,015,082 | | | | 11,200,028 | |
C-Class | | | 480,152 | | | | 54,594 | |
P-Class | | | 80,505 | | | | 14,927 | |
Institutional Class | | | 1,391,827 | | | | 301,038 | |
Cost of shares redeemed | | | | | | | | |
A-Class | | | (23,234,130 | ) | | | (20,545,489 | ) |
C-Class | | | (520,369 | ) | | | (181,556 | ) |
P-Class | | | (102,107 | ) | | | (154,507 | ) |
Institutional Class | | | (1,714,715 | ) | | | (6,385,546 | ) |
Net increase (decrease) from capital share transactions | | | 34,620,159 | | | | (3,609,976 | ) |
Net increase (decrease) in net assets | | | 15,659,091 | | | | (61,629,273 | ) |
| | | | | | | | | |
Net assets: | | | | | | | | |
Beginning of year | | | 193,089,476 | | | | 254,718,749 | |
End of year | | $ | 208,748,567 | | | $ | 193,089,476 | |
| | | | | | | | | |
Capital share activity: | | | | | | | | |
Shares sold | | | | | | | | |
A-Class | | | 118,847 | | | | 184,289 | |
C-Class | | | 13,926 | | | | 32,562 | |
P-Class | | | 451 | | | | 4,730 | |
Institutional Class | | | 110,833 | | | | 245,318 | |
Shares issued from reinvestment of distributions | | | | | | | | |
A-Class | | | 3,255,882 | | | | 394,367 | |
C-Class | | | 57,850 | | | | 2,980 | |
P-Class | | | 4,957 | | | | 534 | |
Institutional Class | | | 85,231 | | | | 10,717 | |
Shares redeemed | | | | | | | | |
A-Class | | | (1,271,366 | ) | | | (788,816 | ) |
C-Class | | | (58,377 | ) | | | (10,107 | ) |
P-Class | | | (6,243 | ) | | | (5,888 | ) |
Institutional Class | | | (89,973 | ) | | | (254,438 | ) |
Net increase (decrease) in shares | | | 2,222,018 | | | | (183,752 | ) |
84 | THE GUGGENHEIM FUNDS ANNUAL REPORT | SEE NOTES TO FINANCIAL STATEMENTS. |
STYLEPLUS—LARGE CORE FUND | |
This table is presented to show selected data for a share outstanding throughout each period and to assist shareholders in evaluating a Fund’s performance for the periods presented.
A-Class | | Year Ended
September 30,
2023 | | | Year Ended
September 30,
2022 | | | Year Ended
September 30,
2021 | | | Year Ended
September 30,
2020 | | | Year Ended
September 30,
2019 | |
Per Share Data |
Net asset value, beginning of period | | $ | 21.18 | | | $ | 27.35 | | | $ | 23.01 | | | $ | 20.48 | | | $ | 24.78 | |
Income (loss) from investment operations: |
Net investment income (loss)a | | | .56 | | | | .18 | | | | .06 | | | | .17 | | | | .30 | |
Net gain (loss) on investments (realized and unrealized) | | | 3.32 | | | | (5.02 | ) | | | 6.46 | | | | 2.70 | | | | (.72 | ) |
Total from investment operations | | | 3.88 | | | | (4.84 | ) | | | 6.52 | | | | 2.87 | | | | (.42 | ) |
Less distributions from: |
Net investment income | | | (.22 | ) | | | (.08 | ) | | | (.19 | ) | | | (.31 | ) | | | (.30 | ) |
Net realized gains | | | (6.40 | ) | | | (1.25 | ) | | | (1.99 | ) | | | (.03 | ) | | | (3.58 | ) |
Total distributions | | | (6.62 | ) | | | (1.33 | ) | | | (2.18 | ) | | | (.34 | ) | | | (3.88 | ) |
Net asset value, end of period | | $ | 18.44 | | | $ | 21.18 | | | $ | 27.35 | | | $ | 23.01 | | | $ | 20.48 | |
|
Total Returnb | | | 21.81 | % | | | (18.94 | %) | | | 29.91 | % | | | 14.18 | % | | | 1.50 | % |
Ratios/Supplemental Data |
Net assets, end of period (in thousands) | | $ | 201,587 | | | $ | 186,957 | | | $ | 247,243 | | | $ | 204,428 | | | $ | 196,563 | |
Ratios to average net assets: |
Net investment income (loss) | | | 3.01 | % | | | 0.68 | % | | | 0.23 | % | | | 0.79 | % | | | 1.48 | % |
Total expensesc | | | 1.48 | % | | | 1.20 | % | | | 1.23 | % | | | 1.32 | % | | | 1.31 | % |
Net expensesd | | | 1.44 | % | | | 1.15 | % | | | 1.17 | % | | | 1.28 | % | | | 1.28 | % |
Portfolio turnover rate | | | 56 | % | | | 62 | % | | | 25 | % | | | 69 | % | | | 51 | % |
C-Class | | Year Ended
September 30,
2023 | | | Year Ended
September 30,
2022 | | | Year Ended
September 30,
2021 | | | Year Ended
September 30,
2020 | | | Year Ended
September 30,
2019 | |
Per Share Data |
Net asset value, beginning of period | | $ | 13.57 | | | $ | 18.03 | | | $ | 15.87 | | | $ | 14.22 | | | $ | 18.41 | |
Income (loss) from investment operations: |
Net investment income (loss)a | | | .21 | | | | (.02 | ) | | | (.11 | ) | | | (.02 | ) | | | .08 | |
Net gain (loss) on investments (realized and unrealized) | | | 1.93 | | | | (3.20 | ) | | | 4.34 | | | | 1.87 | | | | (.69 | ) |
Total from investment operations | | | 2.14 | | | | (3.22 | ) | | | 4.23 | | | | 1.85 | | | | (.61 | ) |
Less distributions from: |
Net investment income | | | (.15 | ) | | | — | | | | (.08 | ) | | | (.17 | ) | | | — | |
Net realized gains | | | (6.40 | ) | | | (1.24 | ) | | | (1.99 | ) | | | (.03 | ) | | | (3.58 | ) |
Total distributions | | | (6.55 | ) | | | (1.24 | ) | | | (2.07 | ) | | | (.20 | ) | | | (3.58 | ) |
Net asset value, end of period | | $ | 9.16 | | | $ | 13.57 | | | $ | 18.03 | | | $ | 15.87 | | | $ | 14.22 | |
|
Total Returnb | | | 20.81 | % | | | (19.69 | %) | | | 28.69 | % | | | 13.11 | % | | | 0.60 | % |
Ratios/Supplemental Data |
Net assets, end of period (in thousands) | | $ | 797 | | | $ | 999 | | | $ | 869 | | | $ | 1,019 | | | $ | 973 | |
Ratios to average net assets: |
Net investment income (loss) | | | 2.14 | % | | | (0.10 | %) | | | (0.67 | %) | | | (0.15 | %) | | | 0.58 | % |
Total expensesc | | | 2.32 | % | | | 2.10 | % | | | 2.15 | % | | | 2.24 | % | | | 2.23 | % |
Net expensesd | | | 2.28 | % | | | 2.04 | % | | | 2.09 | % | | | 2.20 | % | | | 2.19 | % |
Portfolio turnover rate | | | 56 | % | | | 62 | % | | | 25 | % | | | 69 | % | | | 51 | % |
SEE NOTES TO FINANCIAL STATEMENTS. | THE GUGGENHEIM FUNDS ANNUAL REPORT | 85 |
STYLEPLUS—LARGE CORE FUND | |
FINANCIAL HIGHLIGHTS (concluded) |
This table is presented to show selected data for a share outstanding throughout each period and to assist shareholders in evaluating a Fund’s performance for the periods presented.
P-Class | | Year Ended
September 30,
2023 | | | Year Ended
September 30,
2022 | | | Year Ended
September 30,
2021 | | | Year Ended
September 30,
2020 | | | Year Ended
September 30,
2019 | |
Per Share Data |
Net asset value, beginning of period | | $ | 20.83 | | | $ | 26.93 | | | $ | 22.69 | | | $ | 20.21 | | | $ | 24.49 | |
Income (loss) from investment operations: |
Net investment income (loss)a | | | .53 | | | | .13 | | | | .02 | | | | .14 | | | | .29 | |
Net gain (loss) on investments (realized and unrealized) | | | 3.25 | | | | (4.94 | ) | | | 6.38 | | | | 2.67 | | | | (.73 | ) |
Total from investment operations | | | 3.78 | | | | (4.81 | ) | | | 6.40 | | | | 2.81 | | | | (.44 | ) |
Less distributions from: |
Net investment income | | | (.18 | ) | | | (.05 | ) | | | (.17 | ) | | | (.30 | ) | | | (.26 | ) |
Net realized gains | | | (6.40 | ) | | | (1.24 | ) | | | (1.99 | ) | | | (.03 | ) | | | (3.58 | ) |
Total distributions | | | (6.58 | ) | | | (1.29 | ) | | | (2.16 | ) | | | (.33 | ) | | | (3.84 | ) |
Net asset value, end of period | | $ | 18.03 | | | $ | 20.83 | | | $ | 26.93 | | | $ | 22.69 | | | $ | 20.21 | |
|
Total Return | | | 21.62 | % | | | (19.09 | %) | | | 29.79 | % | | | 13.98 | % | | | 1.47 | % |
Ratios/Supplemental Data |
Net assets, end of period (in thousands) | | $ | 206 | | | $ | 255 | | | $ | 347 | | | $ | 224 | | | $ | 236 | |
Ratios to average net assets: |
Net investment income (loss) | | | 2.83 | % | | | 0.53 | % | | | 0.09 | % | | | 0.67 | % | | | 1.45 | % |
Total expensesc | | | 1.64 | % | | | 1.36 | % | | | 1.36 | % | | | 1.46 | % | | | 1.36 | % |
Net expensesd | | | 1.59 | % | | | 1.31 | % | | | 1.30 | % | | | 1.42 | % | | | 1.33 | % |
Portfolio turnover rate | | | 56 | % | | | 62 | % | | | 25 | % | | | 69 | % | | | 51 | % |
Institutional Class | | Year Ended
September 30,
2023 | | | Year Ended
September 30,
2022 | | | Year Ended
September 30,
2021 | | | Year Ended
September 30,
2020 | | | Year Ended
September 30,
2019 | |
Per Share Data |
Net asset value, beginning of period | | $ | 20.98 | | | $ | 27.10 | | | $ | 22.83 | | | $ | 20.31 | | | $ | 24.65 | |
Income (loss) from investment operations: |
Net investment income (loss)a | | | .60 | | | | .23 | | | | .10 | | | | .21 | | | | .35 | |
Net gain (loss) on investments (realized and unrealized) | | | 3.27 | | | | (4.97 | ) | | | 6.40 | | | | 2.70 | | | | (.75 | ) |
Total from investment operations | | | 3.87 | | | | (4.74 | ) | | | 6.50 | | | | 2.91 | | | | (.40 | ) |
Less distributions from: |
Net investment income | | | (.27 | ) | | | (.14 | ) | | | (.24 | ) | | | (.36 | ) | | | (.36 | ) |
Net realized gains | | | (6.40 | ) | | | (1.24 | ) | | | (1.99 | ) | | | (.03 | ) | | | (3.58 | ) |
Total distributions | | | (6.67 | ) | | | (1.38 | ) | | | (2.23 | ) | | | (.39 | ) | | | (3.94 | ) |
Net asset value, end of period | | $ | 18.18 | | | $ | 20.98 | | | $ | 27.10 | | | $ | 22.83 | | | $ | 20.31 | |
|
Total Return | | | 22.06 | % | | | (18.78 | %) | | | 30.12 | % | | | 14.44 | % | | | 1.74 | % |
Ratios/Supplemental Data |
Net assets, end of period (in thousands) | | $ | 6,158 | | | $ | 4,878 | | | $ | 6,260 | | | $ | 3,344 | | | $ | 3,747 | |
Ratios to average net assets: |
Net investment income (loss) | | | 3.23 | % | | | 0.88 | % | | | 0.38 | % | | | 1.01 | % | | | 1.73 | % |
Total expensesc | | | 1.27 | % | | | 1.00 | % | | | 1.06 | % | | | 1.08 | % | | | 1.09 | % |
Net expensesd | | | 1.23 | % | | | 0.95 | % | | | 0.99 | % | | | 1.04 | % | | | 1.06 | % |
Portfolio turnover rate | | | 56 | % | | | 62 | % | | | 25 | % | | | 69 | % | | | 51 | % |
a | Net investment income (loss) per share was computed using average shares outstanding throughout the period. |
b | Total return does not reflect the impact of any applicable sales charges. |
c | Does not include expenses of the underlying funds in which the Fund invests. |
d | Net expense information reflects the expense ratios after expense waivers and reimbursements, as applicable. |
86 | THE GUGGENHEIM FUNDS ANNUAL REPORT | SEE NOTES TO FINANCIAL STATEMENTS. |
MANAGERS’ COMMENTARY (Unaudited) | September 30, 2023 |
To Our Shareholders
Security Investors, LLC (“SI”) serves as the investment adviser to Guggenheim StylePlusTM—Mid Growth Fund (“Fund”).The Fund is managed by a team of seasoned professionals, including Farhan Sharaff, Senior Managing Director and Assistant Chief Investment Officer, Equities, and Portfolio Manager; Qi Yan, Managing Director and Portfolio Manager; and Adam J. Bloch, Managing Director and Portfolio Manager. In the subsequent paragraphs, the investment team discusses the Fund’s performance and the market environment for the 12-month period ended September 30, 2023 (“Reporting Period”).
For the Reporting Period, the Fund provided a total return of 19.84%1, outperforming the Russell Midcap Growth Index, the Fund’s benchmark, which returned 17.47%.
What factors contributed or detracted from the Fund’s performance during the Reporting Period?
Over the Reporting Period, 15%-25% of the total equity position was allocated to actively managed equity and 75%-85% to passive equity. Remaining Fund assets were invested in the Guggenheim Strategy Funds, short-term fixed-income investment companies advised by Guggenheim Investments, and the Guggenheim Ultra Short Duration Fund, whose objective is to seek a high level of income consistent with the preservation of capital.
For the Reporting Period, the Fund outperformed the Russell Mid Growth Index by 2.37% net of fees. The Fund performed better than the benchmark due to contributions from the active equity and active fixed income sleeves, offset by cost of derivatives and Fund fees and expenses.
How did the Fund use derivatives during the Reporting Period?
The passive equity component, which accounted for 75%-85% of the Fund’s exposure to the broad equity market, consisted of equity index swaps and equity index futures. On average, the equity index futures accounted for 0%-5% of the overall exposure, with the remainder from equity index swaps. Both the swaps and futures benefited performance.
Performance displayed represents past performance which is no guarantee of future results.
1 | Performance figures are based on Class A shares and do not reflect taxes that a shareholder would pay on distributions or the redemption of shares. |
The opinions and forecast expressed may not actually come to pass. This information is subject to change at any time, based on market and other conditions, and should not be construed as a recommendation of any specific security or strategy.
| | THE GUGGENHEIM FUNDS ANNUAL REPORT | 87 |
PERFORMANCE REPORT AND FUND PROFILE (Unaudited) | September 30, 2023 |
STYLEPLUS—MID GROWTH FUND
OBJECTIVE: Seeks long-term growth of capital.
Holdings Diversification (Market Exposure as % of Net Assets)

“Holdings Diversification (Market Exposure as % of Net Assets)” excludes any temporary cash investments, investments in Guggenheim Strategy Funds Trust mutual funds, or investments in Guggenheim Ultra Short Duration Fund.
Inception Dates: |
A-Class | September 17, 1969 |
C-Class | January 29, 1999 |
P-Class | May 1, 2015 |
Institutional Class | March 1, 2012 |
Ten Largest Holdings | % of Total Net Assets |
Guggenheim Strategy Fund III | 36.5% |
Guggenheim Strategy Fund II | 34.2% |
Guggenheim Ultra Short Duration Fund — Institutional Class | 3.3% |
United Therapeutics Corp. | 0.5% |
Builders FirstSource, Inc. | 0.5% |
H&R Block, Inc. | 0.4% |
Dropbox, Inc. — Class A | 0.4% |
Exelixis, Inc. | 0.4% |
UFP Industries, Inc. | 0.4% |
Olin Corp. | 0.4% |
Top Ten Total | 77.0% |
| | |
“Ten Largest Holdings” excludes any temporary cash or derivative investments. |
88 | THE GUGGENHEIM FUNDS ANNUAL REPORT | |
PERFORMANCE REPORT AND FUND PROFILE (Unaudited)(concluded) | September 30, 2023 |
Cumulative Fund Performance*
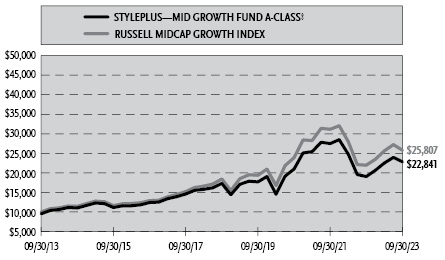
Average Annual Returns*
Periods Ended September 30, 2023
| 1 Year | 5 Year | 10 Year |
A-Class Shares | 19.84% | 5.71% | 9.14% |
A-Class Shares with sales charge† | 14.14% | 4.69% | 8.61% |
C-Class Shares | 18.85% | 4.78% | 8.19% |
C-Class Shares with CDSC‡ | 18.28% | 4.78% | 8.19% |
Institutional Class Shares | 20.02% | 5.85% | 9.25% |
Russell Midcap Growth Index | 17.47% | 6.97% | 9.94% |
| 1 Year | 5 Year | Since
Inception
(05/01/15) |
P-Class Shares | 19.40% | 5.50% | 7.40% |
Russell Midcap Growth Index | 17.47% | 6.97% | 8.68% |
* | The performance data above represents past performance that is not predictive of future results. The investment return and principal value of an investment in the Fund will fluctuate so that an investor’s shares, when redeemed, may be worth more or less than their original cost. Returns are historical and include changes in principal and reinvested dividends and capital gains and do not reflect the effect of taxes. The Russell Midcap Growth Index is an unmanaged index and, unlike the Fund, has no management fees or operating expenses to reduce its reported return. The graph is based on A-Class shares only; performance for C-Class, P-Class, and Institutional Class will vary due to differences in fee structures. |
† | Fund returns are calculated using the maximum sales charge of 4.75%. |
‡ | Fund returns include a CDSC of 1% if redeemed within 12 months of purchase. |
| | THE GUGGENHEIM FUNDS ANNUAL REPORT | 89 |
SCHEDULE OF INVESTMENTS | September 30, 2023 |
STYLEPLUS—MID GROWTH FUND | |
| | Shares | | | Value | |
COMMON STOCKS† - 23.9% |
| | | | | | | | | |
Industrial - 7.3% |
Builders FirstSource, Inc.* | | | 2,411 | | | $ | 300,146 | |
UFP Industries, Inc. | | | 2,386 | | | | 244,327 | |
Carlisle Companies, Inc. | | | 873 | | | | 226,334 | |
Simpson Manufacturing Company, Inc. | | | 1,500 | | | | 224,715 | |
Owens Corning | | | 1,647 | | | | 224,667 | |
Donaldson Company, Inc. | | | 3,544 | | | | 211,364 | |
Landstar System, Inc. | | | 1,181 | | | | 208,966 | |
ITT, Inc. | | | 2,096 | | | | 205,220 | |
Belden, Inc. | | | 2,106 | | | | 203,334 | |
Lincoln Electric Holdings, Inc. | | | 1,053 | | | | 191,425 | |
Watts Water Technologies, Inc. — Class A | | | 1,064 | | | | 183,880 | |
Acuity Brands, Inc. | | | 1,078 | | | | 183,594 | |
Valmont Industries, Inc. | | | 709 | | | | 170,309 | |
Mueller Industries, Inc. | | | 2,125 | | | | 159,715 | |
Boise Cascade Co. | | | 1,508 | | | | 155,384 | |
AGCO Corp. | | | 1,299 | | | | 153,646 | |
Illinois Tool Works, Inc. | | | 652 | | | | 150,162 | |
Masco Corp. | | | 2,756 | | | | 147,308 | |
Hubbell, Inc. | | | 450 | | | | 141,035 | |
Snap-on, Inc. | | | 523 | | | | 133,396 | |
nVent Electric plc | | | 2,367 | | | | 125,427 | |
Keysight Technologies, Inc.* | | | 826 | | | | 109,288 | |
Timken Co. | | | 1,457 | | | | 107,075 | |
Universal Display Corp. | | | 594 | | | | 93,252 | |
Advanced Drainage Systems, Inc. | | | 695 | | | | 79,112 | |
Toro Co. | | | 928 | | | | 77,117 | |
Expeditors International of Washington, Inc. | | | 640 | | | | 73,363 | |
Curtiss-Wright Corp. | | | 360 | | | | 70,427 | |
Graco, Inc. | | | 962 | | | | 70,111 | |
Advanced Energy Industries, Inc. | | | 645 | | | | 66,512 | |
Total Industrial | | | | | | | 4,690,611 | |
| | | | | | | | | |
Consumer, Non-cyclical - 4.3% |
United Therapeutics Corp.* | | | 1,344 | | | | 303,360 | |
H&R Block, Inc. | | | 6,194 | | | | 266,714 | |
Exelixis, Inc.* | | | 11,584 | | | | 253,110 | |
Neurocrine Biosciences, Inc.* | | | 1,809 | | | | 203,513 | |
Humana, Inc. | | | 342 | | | | 166,390 | |
Jazz Pharmaceuticals plc* | | | 1,259 | | | | 162,965 | |
Grand Canyon Education, Inc.* | | | 1,291 | | | | 150,892 | |
Incyte Corp.* | | | 2,522 | | | | 145,696 | |
Molina Healthcare, Inc.* | | | 424 | | | | 139,025 | |
Hologic, Inc.* | | | 1,993 | | | | 138,314 | |
HCA Healthcare, Inc. | | | 521 | | | | 128,156 | |
WEX, Inc.* | | | 600 | | | | 112,854 | |
Lantheus Holdings, Inc.* | | | 1,583 | | | | 109,987 | |
Shockwave Medical, Inc.* | | | 470 | | | | 93,577 | |
Encompass Health Corp. | | | 1,384 | | | | 92,949 | |
Quest Diagnostics, Inc. | | | 665 | | | | 81,037 | |
Darling Ingredients, Inc.* | | | 1,472 | | | | 76,838 | |
Halozyme Therapeutics, Inc.* | | | 1,879 | | | | 71,778 | |
Globus Medical, Inc. — Class A* | | | 1,077 | | | | 53,473 | |
Celsius Holdings, Inc.* | | | 309 | | | | 53,024 | |
Total Consumer, Non-cyclical | | | | | | | 2,803,652 | |
| | | | | | | | | |
Consumer, Cyclical - 4.0% |
Deckers Outdoor Corp.* | | | 435 | | | | 223,629 | |
Murphy USA, Inc. | | | 587 | | | | 200,595 | |
MSC Industrial Direct Company, Inc. — Class A | | | 1,959 | | | | 192,276 | |
Gentex Corp. | | | 5,855 | | | | 190,522 | |
Brunswick Corp. | | | 2,369 | | | | 187,151 | |
Boyd Gaming Corp. | | | 3,054 | | | | 185,775 | |
Polaris, Inc. | | | 1,691 | | | | 176,101 | |
Williams-Sonoma, Inc. | | | 1,037 | | | | 161,150 | |
Yum! Brands, Inc. | | | 939 | | | | 117,319 | |
Ulta Beauty, Inc.* | | | 266 | | | | 106,254 | |
Tempur Sealy International, Inc. | | | 2,364 | | | | 102,456 | |
DR Horton, Inc. | | | 948 | | | | 101,882 | |
Watsco, Inc. | | | 231 | | | | 87,253 | |
Dolby Laboratories, Inc. — Class A | | | 1,099 | | | | 87,106 | |
Crocs, Inc.* | | | 963 | | | | 84,966 | |
Visteon Corp.* | | | 609 | | | | 84,084 | |
Cummins, Inc. | | | 314 | | | | 71,736 | |
AutoNation, Inc.* | | | 424 | | | | 64,194 | |
Harley-Davidson, Inc. | | | 1,887 | | | | 62,384 | |
Choice Hotels International, Inc. | | | 472 | | | | 57,825 | |
Dick’s Sporting Goods, Inc. | | | 525 | | | | 57,004 | |
Total Consumer, Cyclical | | | | | | | 2,601,662 | |
| | | | | | | | | |
Technology - 3.1% |
Dropbox, Inc. — Class A* | | | 9,476 | | | | 258,032 | |
Cirrus Logic, Inc.* | | | 2,181 | | | | 161,307 | |
Lattice Semiconductor Corp.* | | | 1,657 | | | | 142,386 | |
Super Micro Computer, Inc.* | | | 513 | | | | 140,675 | |
NXP Semiconductor N.V. | | | 686 | | | | 137,145 | |
Microchip Technology, Inc. | | | 1,582 | | | | 123,475 | |
Teradata Corp.* | | | 2,301 | | | | 103,591 | |
Qualys, Inc.* | | | 676 | | | | 103,123 | |
KLA Corp. | | | 221 | | | | 101,364 | |
Manhattan Associates, Inc.* | | | 503 | | | | 99,423 | |
CommVault Systems, Inc.* | | | 1,440 | | | | 97,358 | |
Dynatrace, Inc.* | | | 1,848 | | | | 86,357 | |
Cadence Design Systems, Inc.* | | | 318 | | | | 74,507 | |
Silicon Laboratories, Inc.* | | | 619 | | | | 71,736 | |
Amkor Technology, Inc. | | | 3,031 | | | | 68,501 | |
Allegro MicroSystems, Inc.* | | | 2,070 | | | | 66,116 | |
MACOM Technology Solutions Holdings, Inc.* | | | 716 | | | | 58,411 | |
Teradyne, Inc. | | | 466 | | | | 46,814 | |
Autodesk, Inc.* | | | 217 | | | | 44,900 | |
Total Technology | | | | | | | 1,985,221 | |
| | | | | | | | | |
Energy - 2.2% |
Chord Energy Corp. | | | 1,385 | | | | 224,467 | |
Southwestern Energy Co.* | | | 34,484 | | | | 222,422 | |
CNX Resources Corp.* | | | 9,402 | | | | 212,297 | |
90 | THE GUGGENHEIM FUNDS ANNUAL REPORT | SEE NOTES TO FINANCIAL STATEMENTS. |
SCHEDULE OF INVESTMENTS (continued) | September 30, 2023 |
STYLEPLUS—MID GROWTH FUND | |
| | Shares | | | Value | |
Range Resources Corp. | | | 5,447 | | | $ | 176,537 | |
PBF Energy, Inc. — Class A | | | 2,784 | | | | 149,027 | |
Ovintiv, Inc. | | | 2,512 | | | | 119,496 | |
Marathon Petroleum Corp. | | | 747 | | | | 113,051 | |
Occidental Petroleum Corp. | | | 1,237 | | | | 80,257 | |
Coterra Energy, Inc. — Class A | | | 2,181 | | | | 58,996 | |
Matador Resources Co. | | | 823 | | | | 48,952 | |
Total Energy | | | | | | | 1,405,502 | |
| | | | | | | | | |
Financial - 1.5% |
Cathay General Bancorp | | | 4,378 | | | | 152,179 | |
International Bancshares Corp. | | | 3,422 | | | | 148,310 | |
SouthState Corp. | | | 2,159 | | | | 145,430 | |
East West Bancorp, Inc. | | | 2,199 | | | | 115,909 | |
Kinsale Capital Group, Inc. | | | 255 | | | | 105,603 | |
Affiliated Managers Group, Inc. | | | 709 | | | | 92,411 | |
Interactive Brokers Group, Inc. — Class A | | | 1,048 | | | | 90,715 | |
RenaissanceRe Holdings Ltd. | | | 373 | | | | 73,825 | |
Federated Hermes, Inc. — Class B | | | 1,590 | | | | 53,853 | |
Total Financial | | | | | | | 978,235 | |
| | | | | | | | | |
Basic Materials - 1.0% |
Olin Corp. | | | 4,867 | | | | 243,253 | |
NewMarket Corp. | | | 399 | | | | 181,561 | |
Cabot Corp. | | | 1,325 | | | | 91,783 | |
Reliance Steel & Aluminum Co. | | | 238 | | | | 62,411 | |
RPM International, Inc. | | | 487 | | | | 46,172 | |
Total Basic Materials | | | | | | | 625,180 | |
| | | | | | | | | |
Communications - 0.5% |
VeriSign, Inc.* | | | 693 | | | | 140,354 | |
Motorola Solutions, Inc. | | | 392 | | | | 106,718 | |
Calix, Inc.* | | | 1,155 | | | | 52,945 | |
Gen Digital, Inc. | | | 2,359 | | | | 41,707 | |
Total Communications | | | | | | | 341,724 | |
| | | | | | | | | |
Total Common Stocks | | | | |
(Cost $14,736,411) | | | | | | | 15,431,787 | |
| | | | | | | | | |
MUTUAL FUNDS† - 74.0% |
Guggenheim Strategy Fund III1 | | | 972,777 | | | | 23,628,764 | |
Guggenheim Strategy Fund II1 | | | 913,348 | | | | 22,166,962 | |
Guggenheim Ultra Short Duration Fund — Institutional Class1 | | | 218,083 | | | | 2,126,306 | |
Total Mutual Funds | | | | |
(Cost $48,352,340) | | | | | | | 47,922,032 | |
| | | | | | | | | |
MONEY MARKET FUND† - 2.1% |
Dreyfus Treasury Securities Cash Management Fund — Institutional Shares, 5.24%2 | | | 1,380,565 | | | | 1,380,565 | |
Total Money Market Fund | | | | |
(Cost $1,380,565) | | | | | | | 1,380,565 | |
| | | | | | | | | |
Total Investments - 100.0% | | | | |
(Cost $64,469,316) | | $ | 64,734,384 | |
Other Assets & Liabilities, net - 0.0% | | | 13,874 | |
Total Net Assets - 100.0% | | $ | 64,748,258 | |
Futures Contracts |
Description | | Number of
Contracts | | | Expiration Date | | | Notional
Amount | | | Value and
Unrealized
Depreciation** | |
Equity Futures Contracts Purchased† |
S&P MidCap 400 Index Mini Futures Contracts | | | 4 | | | | Dec 2023 | | | $ | 1,008,000 | | | $ | (33,850 | ) |
S&P 500 Index Mini Futures Contracts | | | 4 | | | | Dec 2023 | | | | 865,250 | | | | (37,561 | ) |
NASDAQ-100 Index Mini Futures Contracts | | | 3 | | | | Dec 2023 | | | | 892,035 | | | | (38,000 | ) |
| | | | | | | | | | | $ | 2,765,285 | | | $ | (109,411 | ) |
Total Return Swap Agreements |
Counterparty | Index | Type | | Financing
Rate | | Payment
Frequency | | | Maturity
Date | | | Units | | | Notional
Amount | | | Value and
Unrealized
Appreciation | |
OTC Equity Index Swap Agreements†† |
Wells Fargo Bank, N.A. | Russell MidCap Growth Index Total Return | Pay | | 5.61% (Federal Funds Rate + 0.28%) | | | At Maturity | | | | 01/29/24 | | | | 10,714 | | | $ | 48,204,536 | | | $ | 5,149,352 | |
SEE NOTES TO FINANCIAL STATEMENTS. | THE GUGGENHEIM FUNDS ANNUAL REPORT | 91 |
SCHEDULE OF INVESTMENTS (continued) | September 30, 2023 |
STYLEPLUS—MID GROWTH FUND | |
* | Non-income producing security. |
** | Includes cumulative appreciation (depreciation). Variation margin is reported within the Statement of Assets and Liabilities. |
† | Value determined based on Level 1 inputs — See Note 4. |
†† | Value determined based on Level 2 inputs — See Note 4. |
1 | Affiliated issuer. |
2 | Rate indicated is the 7-day yield as of September 30, 2023. |
| | plc — Public Limited Company |
| | |
| | See Sector Classification in Other Information section. |
The following table summarizes the inputs used to value the Fund’s investments at September 30, 2023 (See Note 4 in the Notes to Financial Statements):
Investments in Securities (Assets) | | Level 1
Quoted
Prices | | | Level 2
Significant
Observable
Inputs | | | Level 3
Significant
Unobservable
Inputs | | | Total | |
Common Stocks | | $ | 15,431,787 | | | $ | — | | | $ | — | | | $ | 15,431,787 | |
Mutual Funds | | | 47,922,032 | | | | — | | | | — | | | | 47,922,032 | |
Money Market Fund | | | 1,380,565 | | | | — | | | | — | | | | 1,380,565 | |
Equity Index Swap Agreements** | | | — | | | | 5,149,352 | | | | — | | | | 5,149,352 | |
Total Assets | | $ | 64,734,384 | | | $ | 5,149,352 | | | $ | — | | | $ | 69,883,736 | |
Investments in Securities (Liabilities) | | Level 1
Quoted
Prices | | | Level 2
Significant
Observable
Inputs | | | Level 3
Significant
Unobservable
Inputs | | | Total | |
Equity Futures Contracts** | | $ | 109,411 | | | $ | — | | | $ | — | | | $ | 109,411 | |
** | This derivative is reported as unrealized appreciation/depreciation at period end. |
92 | THE GUGGENHEIM FUNDS ANNUAL REPORT | SEE NOTES TO FINANCIAL STATEMENTS. |
SCHEDULE OF INVESTMENTS (concluded) | September 30, 2023 |
STYLEPLUS—MID GROWTH FUND | |
Affiliated Transactions
Investments representing 5% or more of the outstanding voting shares of a company, or control of or by, or common control under Guggenheim Investments (“GI”), result in that company being considered an affiliated issuer, as defined in the 1940 Act.
The Fund may invest in certain of the underlying series of Guggenheim Strategy Funds Trust, including Guggenheim Strategy Fund II and Guggenheim Strategy Fund III, (collectively, the “Short Term Investment Vehicles”), each of which are open-end management investment companies managed by GI. The Short Term Investment Vehicles, which launched on March 11, 2014, are offered as short term investment options only to mutual funds, trusts, and other accounts managed by GI and/or its affiliates, and are not available to the public. The Short Term Investment Vehicles pay no investment management fees. The Short Term Investment Vehicles’ annual report on Form N-CSR dated September 30, 2022, is available publicly or upon request. This information is available from the EDGAR database on the SEC’s website at https://www.sec.gov/Archives/edgar/data/1601445/000182126822000340/gug84768.htm. The Fund may invest in certain of the underlying series of Guggenheim Funds Trust, which are open-end management investment companies managed by GI, are available to the public and whose most recent annual report on Form N-CSR is available publicly or upon request.
Transactions during the year ended September 30, 2023, in which the company is an affiliated issuer, were as follows:
Security Name | | Value
09/30/22 | | | Additions | | | Reductions | | | Realized
Gain (Loss) | | | Change in
Unrealized
Appreciation
(Depreciation) | | | Value
09/30/23 | | | Shares
09/30/23 | | | Investment
Income | |
Mutual Funds | | | | | | | | | | | | | | | | | | | | | | | | | | | | | | | | |
Guggenheim Strategy Fund II | | $ | 22,990,350 | | | $ | 12,577,433 | | | $ | (13,675,218 | ) | | $ | (460,982 | ) | | $ | 735,379 | | | $ | 22,166,962 | | | | 913,348 | | | $ | 1,152,979 | |
Guggenheim Strategy Fund III | | | 24,117,173 | | | | 4,899,600 | | | | (5,623,812 | ) | | | (206,384 | ) | | | 442,187 | | | | 23,628,764 | | | | 972,777 | | | | 1,214,997 | |
Guggenheim Ultra Short Duration Fund — Institutional Class | | | 1,992,867 | | | | 99,806 | | | | — | | | | — | | | | 33,633 | | | | 2,126,306 | | | | 218,083 | | | | 99,791 | |
| | | $ | 49,100,390 | | | $ | 17,576,839 | | | $ | (19,299,030 | ) | | $ | (667,366 | ) | | $ | 1,211,199 | | | $ | 47,922,032 | | | | | | | $ | 2,467,767 | |
SEE NOTES TO FINANCIAL STATEMENTS. | THE GUGGENHEIM FUNDS ANNUAL REPORT | 93 |
STYLEPLUS—MID GROWTH FUND | |
STATEMENT OF ASSETS AND LIABILITIES |
September 30, 2023 |
Assets: |
Investments in unaffiliated issuers, at value (cost $16,116,976) | | $ | 16,812,352 | |
Investments in affiliated issuers, at value (cost $48,352,340) | | | 47,922,032 | |
Segregated cash with broker | | | 216,898 | |
Unrealized appreciation on OTC swap agreements | | | 5,149,352 | |
Prepaid expenses | | | 33,455 | |
Receivables: |
Dividends | | | 235,676 | |
Fund shares sold | | | 8,801 | |
Interest | | | 6,796 | |
Total assets | | | 70,385,362 | |
| | | | | |
Liabilities: |
Overdraft due to custodian bank | | | 4,545 | |
Segregated cash due to broker | | | 3,570,000 | |
Payable for: |
Swap settlement | | | 1,704,842 | |
Securities purchased | | | 235,798 | |
Management fees | | | 40,635 | |
Distribution and service fees | | | 13,841 | |
Fund accounting and administration fees | | | 6,541 | |
Variation margin on futures contracts | | | 6,360 | |
Transfer agentfees | | | 3,912 | |
Trustees’ fees* | | | 465 | |
Fund shares redeemed | | | 196 | |
Miscellaneous | | | 49,969 | |
Total liabilities | | | 5,637,104 | |
Net assets | | $ | 64,748,258 | |
| | | | | |
Net assets consist of: |
Paid in capital | | $ | 85,102,686 | |
Total distributable earnings (loss) | | | (20,354,428 | ) |
Net assets | | $ | 64,748,258 | |
| | | | | |
A-Class: |
Net assets | | $ | 63,225,247 | |
Capital shares outstanding | | | 2,170,593 | |
Net asset value per share | | $ | 29.13 | |
Maximum offering price per share (Net asset value divided by 95.25%) | | $ | 30.58 | |
| | | | | |
C-Class: |
Net assets | | $ | 556,155 | |
Capital shares outstanding | | | 51,078 | |
Net asset value per share | | $ | 10.89 | |
| | | | | |
P-Class: |
Net assets | | $ | 49,832 | |
Capital shares outstanding | | | 1,756 | |
Net asset value per share | | $ | 28.38 | |
| | | | | |
Institutional Class: |
Net assets | | $ | 917,024 | |
Capital shares outstanding | | | 31,479 | |
Net asset value per share | | $ | 29.13 | |
STATEMENT OF OPERATIONS |
Year Ended September 30, 2023 |
Investment Income: |
Dividends from securities of unaffiliated issuers (net of foreign withholding tax of $325) | | $ | 192,560 | |
Dividends from securities of affiliated issuers | | | 2,467,767 | |
Interest | | | 93,700 | |
Total investment income | | | 2,754,027 | |
| | | | | |
Expenses: |
Management fees | | | 494,887 | |
Distribution and service fees: |
A-Class | | | 160,785 | |
C-Class | | | 6,094 | |
P-Class | | | 177 | |
Transfer agent fees: |
A-Class | | | 77,327 | |
C-Class | | | 1,297 | |
P-Class | | | 349 | |
Institutional Class | | | 1,881 | |
Interest expense | | | 165,583 | |
Registration fees | | | 65,158 | |
Professional fees | | | 44,834 | |
Fund accounting and administration fees | | | 36,029 | |
Custodian fees | | | 16,225 | |
Trustees’ fees* | | | 13,944 | |
Line of credit fees | | | 2,187 | |
Miscellaneous | | | 12,836 | |
Total expenses | | | 1,099,593 | |
Less: |
Expenses waived by Adviser | | | (5,144 | ) |
Earnings credits applied | | | (1,281 | ) |
Total waived expenses | | | (6,425 | ) |
Net expenses | | | 1,093,168 | |
Net investment income | | | 1,660,859 | |
| | | | | |
Net Realized and Unrealized Gain (Loss): |
Net realized gain (loss) on: |
Investments in unaffiliated issuers | | | (116,923 | ) |
Investments in affiliated issuers | | | (667,366 | ) |
Swap agreements | | | (22,219,474 | ) |
Futures contracts | | | 25,500 | |
Net realized loss | | | (22,978,263 | ) |
Net change in unrealized appreciation (depreciation) on: |
Investments in unaffiliated issuers | | | 3,913,611 | |
Investments in affiliated issuers | | | 1,211,199 | |
Swap agreements | | | 27,974,037 | |
Futures contracts | | | 17,820 | |
Net change in unrealized appreciation (depreciation) | | | 33,116,667 | |
Net realized and unrealized gain | | | 10,138,404 | |
Net increase in net assets resulting from operations | | $ | 11,799,263 | |
* | Relates to Trustees not deemed “interested persons” within the meaning of Section 2(a)(19) of the 1940 Act. |
94 | THE GUGGENHEIM FUNDS ANNUAL REPORT | SEE NOTES TO FINANCIAL STATEMENTS. |
STYLEPLUS—MID GROWTH FUND | |
STATEMENTS OF CHANGES IN NET ASSETS |
| | Year Ended
September 30,
2023 | | | Year Ended
September 30,
2022 | |
Increase (Decrease) in Net Assets from Operations: | | | | | | | | |
Net investment income | | $ | 1,660,859 | | | $ | 324,608 | |
Net realized gain (loss) on investments | | | (22,978,263 | ) | | | 17,885,118 | |
Net change in unrealized appreciation (depreciation) on investments | | | 33,116,667 | | | | (50,489,951 | ) |
Net increase (decrease) in net assets resulting from operations | | | 11,799,263 | | | | (32,280,225 | ) |
| | | | | | | | | |
Distributions to shareholders: | | | | | | | | |
A-Class | | | (18,424,696 | ) | | | (6,756,571 | ) |
C-Class | | | (356,411 | ) | | | (132,465 | ) |
P-Class | | | (34,001 | ) | | | (15,261 | ) |
Institutional Class | | | (258,969 | ) | | | (94,156 | ) |
Total distributions to shareholders | | | (19,074,077 | ) | | | (6,998,453 | ) |
| | | | | | | | | |
Capital share transactions: | | | | | | | | |
Proceeds from sale of shares | | | | | | | | |
A-Class | | | 1,044,582 | | | | 1,567,712 | |
C-Class | | | 26,052 | | | | 27,151 | |
P-Class | | | 5,957 | | | | 30,227 | |
Institutional Class | | | 374,605 | | | | 430,972 | |
Distributions reinvested | | | | | | | | |
A-Class | | | 17,671,252 | | | | 6,449,689 | |
C-Class | | | 298,799 | | | | 107,727 | |
P-Class | | | 34,001 | | | | 15,261 | |
Institutional Class | | | 250,941 | | | | 89,198 | |
Cost of shares redeemed | | | | | | | | |
A-Class | | | (15,576,440 | ) | | | (10,782,195 | ) |
C-Class | | | (213,354 | ) | | | (289,331 | ) |
P-Class | | | (80,078 | ) | | | (102,638 | ) |
Institutional Class | | | (508,296 | ) | | | (507,524 | ) |
Net increase (decrease) from capital share transactions | | | 3,328,021 | | | | (2,963,751 | ) |
Net decrease in net assets | | | (3,946,793 | ) | | | (42,242,429 | ) |
| | | | | | | | | |
Net assets: | | | | | | | | |
Beginning of year | | | 68,695,051 | | | | 110,937,480 | |
End of year | | $ | 64,748,258 | | | $ | 68,695,051 | |
| | | | | | | | | |
Capital share activity: | | | | | | | | |
Shares sold | | | | | | | | |
A-Class | | | 34,720 | | | | 35,090 | |
C-Class | | | 2,227 | | | | 1,116 | |
P-Class | | | 203 | | | | 800 | |
Institutional Class | | | 13,235 | | | | 10,243 | |
Shares issued from reinvestment of distributions | | | | | | | | |
A-Class | | | 659,621 | | | | 131,225 | |
C-Class | | | 29,643 | | | | 3,936 | |
P-Class | | | 1,299 | | | | 315 | |
Institutional Class | | | 9,384 | | | | 1,814 | |
Shares redeemed | | | | | | | | |
A-Class | | | (481,994 | ) | | | (256,009 | ) |
C-Class | | | (17,169 | ) | | | (11,608 | ) |
P-Class | | | (2,987 | ) | | | (2,436 | ) |
Institutional Class | | | (16,939 | ) | | | (12,632 | ) |
Net increase (decrease) in shares | | | 231,243 | | | | (98,146 | ) |
SEE NOTES TO FINANCIAL STATEMENTS. | THE GUGGENHEIM FUNDS ANNUAL REPORT | 95 |
STYLEPLUS—MID GROWTH FUND | |
This table is presented to show selected data for a share outstanding throughout each period and to assist shareholders in evaluating a Fund’s performance for the periods presented.
A-Class | | Year Ended
September 30,
2023 | | | Year Ended
September 30,
2022 | | | Year Ended
September 30,
2021 | | | Year Ended
September 30,
2020 | | | Year Ended
September 30,
2019 | |
Per Share Data |
Net asset value, beginning of period | | $ | 34.22 | | | $ | 52.73 | | | $ | 45.98 | | | $ | 39.64 | | | $ | 49.70 | |
Income (loss) from investment operations: |
Net investment income (loss)a | | | .76 | | | | .16 | | | | (.02 | ) | | | .19 | | | | .45 | |
Net gain (loss) on investments (realized and unrealized) | | | 5.07 | | | | (15.32 | ) | | | 13.67 | | | | 7.06 | | | | (1.58 | ) |
Total from investment operations | | | 5.83 | | | | (15.16 | ) | | | 13.65 | | | | 7.25 | | | | (1.13 | ) |
Less distributions from: |
Net investment income | | | (.19 | ) | | | — | | | | (.20 | ) | | | (.45 | ) | | | (.41 | ) |
Net realized gains | | | (10.73 | ) | | | (3.35 | ) | | | (6.70 | ) | | | (.46 | ) | | | (8.52 | ) |
Total distributions | | | (10.92 | ) | | | (3.35 | ) | | | (6.90 | ) | | | (.91 | ) | | | (8.93 | ) |
Net asset value, end of period | | $ | 29.13 | | | $ | 34.22 | | | $ | 52.73 | | | $ | 45.98 | | | $ | 39.64 | |
|
Total Returnb | | | 19.84 | % | | | (30.68 | %) | | | 31.07 | % | | | 18.57 | % | | | 2.34 | % |
Ratios/Supplemental Data |
Net assets, end of period (in thousands) | | $ | 63,225 | | | $ | 67,014 | | | $ | 107,983 | | | $ | 89,469 | | | $ | 83,027 | |
Ratios to average net assets: |
Net investment income (loss) | | | 2.52 | % | | | 0.36 | % | | | (0.04 | %) | | | 0.46 | % | | | 1.13 | % |
Total expensesc | | | 1.66 | % | | | 1.32 | % | | | 1.34 | % | | | 1.45 | % | | | 1.44 | % |
Net expensesd | | | 1.65 | % | | | 1.30 | % | | | 1.28 | % | | | 1.40 | % | | | 1.41 | % |
Portfolio turnover rate | | | 82 | % | | | 72 | % | | | 44 | % | | | 82 | % | | | 73 | % |
C-Class | | Year Ended
September 30,
2023 | | | Year Ended
September 30,
2022 | | | Year Ended
September 30,
2021 | | | Year Ended
September 30,
2020 | | | Year Ended
September 30,
2019 | |
Per Share Data |
Net asset value, beginning of period | | $ | 18.92 | | | $ | 30.92 | | | $ | 29.40 | | | $ | 25.66 | | | $ | 35.78 | |
Income (loss) from investment operations: |
Net investment income (loss)a | | | .20 | | | | (.15 | ) | | | (.29 | ) | | | (.10 | ) | | | .08 | |
Net gain (loss) on investments (realized and unrealized) | | | 2.50 | | | | (8.50 | ) | | | 8.51 | | | | 4.53 | | | | (1.68 | ) |
Total from investment operations | | | 2.70 | | | | (8.65 | ) | | | 8.22 | | | | 4.43 | | | | (1.60 | ) |
Less distributions from: |
Net investment income | | | — | | | | — | | | | — | | | | (.23 | ) | | | — | |
Net realized gains | | | (10.73 | ) | | | (3.35 | ) | | | (6.70 | ) | | | (.46 | ) | | | (8.52 | ) |
Total distributions | | | (10.73 | ) | | | (3.35 | ) | | | (6.70 | ) | | | (.69 | ) | | | (8.52 | ) |
Net asset value, end of period | | $ | 10.89 | | | $ | 18.92 | | | $ | 30.92 | | | $ | 29.40 | | | $ | 25.66 | |
|
Total Returnb | | | 18.85 | % | | | (31.33 | %) | | | 29.88 | % | | | 17.53 | % | | | 1.46 | % |
Ratios/Supplemental Data |
Net assets, end of period (in thousands) | | $ | 556 | | | $ | 688 | | | $ | 1,327 | | | $ | 1,510 | | | $ | 1,683 | |
Ratios to average net assets: |
Net investment income (loss) | | | 1.66 | % | | | (0.59 | %) | | | (0.94 | %) | | | (0.39 | %) | | | 0.30 | % |
Total expensesc | | | 2.49 | % | | | 2.25 | % | | | 2.26 | % | | | 2.32 | % | | | 2.27 | % |
Net expensesd | | | 2.48 | % | | | 2.23 | % | | | 2.20 | % | | | 2.28 | % | | | 2.24 | % |
Portfolio turnover rate | | | 82 | % | | | 72 | % | | | 44 | % | | | 82 | % | | | 73 | % |
96 | THE GUGGENHEIM FUNDS ANNUAL REPORT | SEE NOTES TO FINANCIAL STATEMENTS. |
STYLEPLUS—MID GROWTH FUND | |
FINANCIAL HIGHLIGHTS (concluded) |
This table is presented to show selected data for a share outstanding throughout each period and to assist shareholders in evaluating a Fund’s performance for the periods presented.
P-Class | | Year Ended
September 30,
2023 | | | Year Ended
September 30,
2022 | | | Year Ended
September 30,
2021 | | | Year Ended
September 30,
2020 | | | Year Ended
September 30,
2019 | |
Per Share Data |
Net asset value, beginning of period | | $ | 33.58 | | | $ | 51.96 | | | $ | 45.45 | | | $ | 39.17 | | | $ | 49.12 | |
Income (loss) from investment operations: |
Net investment income (loss)a | | | .64 | | | | — | | | | (.07 | ) | | | .15 | | | | .41 | |
Net gain (loss) on investments (realized and unrealized) | | | 4.96 | | | | (15.03 | ) | | | 13.51 | | | | 6.99 | | | | (1.58 | ) |
Total from investment operations | | | 5.60 | | | | (15.03 | ) | | | 13.44 | | | | 7.14 | | | | (1.17 | ) |
Less distributions from: |
Net investment income | | | (.07 | ) | | | — | | | | (.23 | ) | | | (.40 | ) | | | (.26 | ) |
Net realized gains | | | (10.73 | ) | | | (3.35 | ) | | | (6.70 | ) | | | (.46 | ) | | | (8.52 | ) |
Total distributions | | | (10.80 | ) | | | (3.35 | ) | | | (6.93 | ) | | | (.86 | ) | | | (8.78 | ) |
Net asset value, end of period | | $ | 28.38 | | | $ | 33.58 | | | $ | 51.96 | | | $ | 45.45 | | | $ | 39.17 | |
|
Total Return | | | 19.40 | % | | | (30.90 | %) | | | 30.92 | % | | | 18.48 | % | | | 2.22 | % |
Ratios/Supplemental Data |
Net assets, end of period (in thousands) | | $ | 50 | | | $ | 109 | | | $ | 237 | | | $ | 116 | | | $ | 93 | |
Ratios to average net assets: |
Net investment income (loss) | | | 2.09 | % | | | 0.01 | % | | | (0.14 | %) | | | 0.36 | % | | | 1.04 | % |
Total expensesc | | | 1.97 | % | | | 1.56 | % | | | 1.43 | % | | | 1.54 | % | | | 1.55 | % |
Net expensesd | | | 1.96 | % | | | 1.54 | % | | | 1.37 | % | | | 1.50 | % | | | 1.51 | % |
Portfolio turnover rate | | | 82 | % | | | 72 | % | | | 44 | % | | | 82 | % | | | 73 | % |
Institutional Class | | Year Ended
September 30,
2023 | | | Year Ended
September 30,
2022 | | | Year Ended
September 30,
2021 | | | Year Ended
September 30,
2020 | | | Year Ended
September 30,
2019 | |
Per Share Data |
Net asset value, beginning of period | | $ | 34.25 | | | $ | 52.71 | | | $ | 45.98 | | | $ | 39.64 | | | $ | 49.80 | |
Income (loss) from investment operations: |
Net investment income (loss)a | | | .82 | | | | .22 | | | | .07 | | | | .24 | | | | .51 | |
Net gain (loss) on investments (realized and unrealized) | | | 5.05 | | | | (15.33 | ) | | | 13.65 | | | | 7.09 | | | | (1.63 | ) |
Total from investment operations | | | 5.87 | | | | (15.11 | ) | | | 13.72 | | | | 7.33 | | | | (1.12 | ) |
Less distributions from: |
Net investment income | | | (.26 | ) | | | — | | | | (.29 | ) | | | (.53 | ) | | | (.52 | ) |
Net realized gains | | | (10.73 | ) | | | (3.35 | ) | | | (6.70 | ) | | | (.46 | ) | | | (8.52 | ) |
Total distributions | | | (10.99 | ) | | | (3.35 | ) | | | (6.99 | ) | | | (.99 | ) | | | (9.04 | ) |
Net asset value, end of period | | $ | 29.13 | | | $ | 34.25 | | | $ | 52.71 | | | $ | 45.98 | | | $ | 39.64 | |
|
Total Return | | | 20.02 | % | | | (30.60 | %) | | | 31.26 | % | | | 18.79 | % | | | 2.42 | % |
Ratios/Supplemental Data |
Net assets, end of period (in thousands) | | $ | 917 | | | $ | 884 | | | $ | 1,390 | | | $ | 1,311 | | | $ | 972 | |
Ratios to average net assets: |
Net investment income (loss) | | | 2.72 | % | | | 0.50 | % | | | 0.14 | % | | | 0.58 | % | | | 1.28 | % |
Total expensesc | | | 1.49 | % | | | 1.20 | % | | | 1.17 | % | | | 1.26 | % | | | 1.31 | % |
Net expensesd | | | 1.49 | % | | | 1.18 | % | | | 1.11 | % | | | 1.22 | % | | | 1.28 | % |
Portfolio turnover rate | | | 82 | % | | | 72 | % | | | 44 | % | | | 82 | % | | | 73 | % |
a | Net investment income (loss) per share was computed using average shares outstanding throughout the period. |
b | Total return does not reflect the impact of any applicable sales charges. |
c | Does not include expenses of the underlying funds in which the Fund invests. |
d | Net expense information reflects the expense ratios after expense waivers and reimbursements, as applicable. |
SEE NOTES TO FINANCIAL STATEMENTS. | THE GUGGENHEIM FUNDS ANNUAL REPORT | 97 |
MANAGERS’ COMMENTARY (Unaudited) | September 30, 2023 |
To Our Shareholders
Security Investors, LLC (“SI”) serves as the investment adviser to Guggenheim World Equity Income Fund (“Fund”).The Fund is managed by a team of seasoned professionals, including Farhan Sharaff, Senior Managing Director and Assistant Chief Investment Officer, Equities, and Portfolio Manager; Evan Einstein, Managing Director and Portfolio Manager; and Douglas Makin, Director and Portfolio Manager. In the subsequent paragraphs, the investment team discusses the Fund’s performance and the market environment for the 12-month period ended September 30, 2023 (“Reporting Period”).
For the Reporting Period, the Fund provided a total return of 15.69%1, underperforming the MSCI World Index (Net), the Fund’s benchmark (“Benchmark”), which returned 21.95% for the same period.
What factors contributed or detracted from the Fund’s performance during the Reporting Period?
Global stocks over the past year initially benefited from more modest inflation readings, dovishness in the European Central Bank, and continued solid economic data from the U.S. But higher U.S. Treasury Bill yields, and the return of a more hawkish U.S. Federal Reserve eventually took their toll. The Fund’s positioning in lower-risk and higher-yielding stocks, compared with the Benchmark, contributed to its relative underperformance for the Reporting Period. The Fund’s strategy tends to create a bias toward value-oriented investments, which can be a drag on performance in up markets.
The leading detractor from return was security selection, with Information Technology, Communication Services, and Utilities sectors responsible for most of the relative underperformance. The Fund was also most underweight relative to the Benchmark in the Information Tech sector, which exacerbated the underperformance. An underweight in the Health Care sector and good selection in Materials were the largest positive contributors to the Fund’s return.
From a country perspective, the U.S. was the single largest relative detractor from return. Its impact is magnified as it is also the largest country represented in the Fund and the Benchmark. Canada, Israel, and the UK were the other leading detractors from return on a relative basis. Japan, the country with the second-largest weighting in the Fund, provided the largest positive relative contribution to return. This was due in part to the weakened currency, which translates to a boost to companies operating there. Although Europe as a whole was a detractor from return, Italy and Spain provided the large positive contributions.
The top individual contributors to the Fund were overweights in Sumitomo Corp. and tech companies Dell Technologies, Inc., Intel Corp., and Broadcom, Inc. The biggest detractors were an underweight in Technology company Nvidia Corp., and communication company Meta Platforms, Inc., and an overweight in SolarEdge Technologies, Inc (not held at 9/30/23).
How did the Fund use derivatives during the Reporting Period?
The Fund uses currency contract futures to hedge non-U.S. dollar equity positions, which helps to reduce volatility. Their contribution to performance in aggregate was positive, as the currency futures were active for much of the Reporting Period and the dollar strengthened against other currencies for much of the Reporting Period as well.
How was the Fund positioned at the end of the Reporting Period?
The continuing rise in interest rates and a historically wide valuation gap between growth and value sectors were among the factors that saw growth stocks solidly outperform value stocks over the Reporting Period. Compared with the Benchmark, the Fund is positioned more cautiously, as we anticipate continuing market volatility that defined much of the Reporting Period. We are also positioned for higher yield than the Benchmark as we aim to generate income.
The Fund was most overweight in the Industrials and Utilities sectors at the end of the Reporting Period, and most underweight in the Health Care, Communication Services, and Information Technology sectors. The currency hedge ended the Reporting Period with several active positions including the Japanese Yen and Euro as the U.S. dollar continued to strengthen.
Performance displayed represents past performance which is no guarantee of future results.
1 | Performance figures are based on Class A shares and do not reflect taxes that a shareholder would pay on distributions or the redemption of shares. |
The opinions and forecast expressed may not actually come to pass. This information is subject to change at any time, based on market and other conditions, and should not be construed as a recommendation of any specific security or strategy.
98 | THE GUGGENHEIM FUNDS ANNUAL REPORT | |
PERFORMANCE REPORT AND FUND PROFILE (Unaudited) | September 30, 2023 |
WORLD EQUITY INCOME FUND
OBJECTIVE: Seeks to provide total return, comprised of capital appreciation and income.
Holdings Diversification (Market Exposure as % of Net Assets)
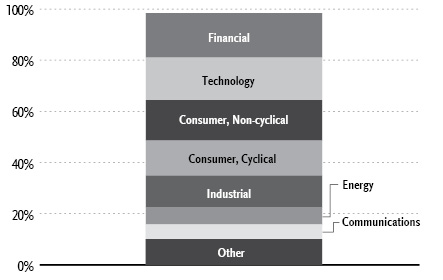
“Holdings Diversification (Market Exposure as % of Net Assets)” excludes any temporary cash investments.
Country Diversification
Country | | % of Long-Term
Investments | |
United States | | | 66.1 | % |
Japan | | | 8.1 | % |
Australia | | | 5.0 | % |
Canada | | | 4.4 | % |
United Kingdom | | | 2.9 | % |
Italy | | | 1.9 | % |
Spain | | | 1.9 | % |
Other | | | 9.7 | % |
Total Long-Term Investments | | | 100.0 | % |
Inception Dates: |
A-Class | October 1, 1993 |
C-Class | January 29, 1999 |
P-Class | May 1, 2015 |
Institutional Class | May 2, 2011 |
Ten Largest Holdings | % of Total Net Assets |
Microsoft Corp. | 3.0% |
Apple, Inc. | 2.7% |
Alphabet, Inc. — Class C | 1.9% |
NVIDIA Corp. | 1.6% |
UnitedHealth Group, Inc. | 1.6% |
Berkshire Hathaway, Inc. — Class B | 1.5% |
Amazon.com, Inc. | 1.4% |
Home Depot, Inc. | 1.1% |
Amgen, Inc. | 1.1% |
Walmart, Inc. | 1.0% |
Top Ten Total | 16.9% |
| | |
“Ten Largest Holdings” excludes any temporary cash or derivative investments. |
| | THE GUGGENHEIM FUNDS ANNUAL REPORT | 99 |
PERFORMANCE REPORT AND FUND PROFILE (Unaudited)(concluded) | September 30, 2023 |
Cumulative Fund Performance*
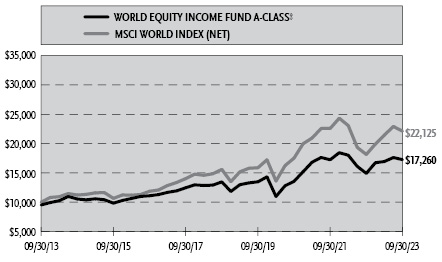
Average Annual Returns*
Periods Ended September 30, 2023
| 1 Year | 5 Year | 10 Year |
A-Class Shares | 15.69% | 5.10% | 6.13% |
A-Class Shares with sales charge† | 10.19% | 4.08% | 5.61% |
C-Class Shares | 14.87% | 4.31% | 5.34% |
C-Class Shares with CDSC‡ | 13.87% | 4.31% | 5.34% |
Institutional Class Shares | 15.97% | 5.38% | 6.40% |
MSCI World Index (Net) | 21.95% | 7.26% | 8.26% |
| 1 Year | 5 Year | Since
Inception
(05/01/15) |
P-Class Shares | 15.65% | 5.09% | 5.86% |
MSCI World Index (Net) | 21.95% | 7.26% | 7.62% |
* | The performance data above represents past performance that is not predictive of future results. The investment return and principal value of an investment in the Fund will fluctuate so that an investor’s shares, when redeemed, may be worth more or less than their original cost. Returns are historical and include changes in principal and reinvested dividends and capital gains and do not reflect the effect of taxes. The MSCI World Index (Net) is an unmanaged index and, unlike the Fund, has no management fees or operating expenses to reduce its reported return. The graph is based on A-Class shares only; performance for C-Class, P-Class and Institutional Class will vary due to differences in fee structures. |
† | Fund returns are calculated using the maximum sales charge of 4.75%. |
‡ | Fund returns include a CDSC of 1% if redeemed within 12 months of purchase. |
100 | THE GUGGENHEIM FUNDS ANNUAL REPORT | |
SCHEDULE OF INVESTMENTS | September 30, 2023 |
WORLD EQUITY INCOME FUND | |
| | Shares | | | Value | |
COMMON STOCKS† - 97.0% |
| | | | | | | | | |
Financial - 17.4% |
Berkshire Hathaway, Inc. — Class B* | | | 1,890 | | | $ | 662,067 | |
National Australia Bank Ltd.†† | | | 21,450 | | | | 398,188 | |
ANZ Group Holdings Ltd.†† | | | 22,520 | | | | 369,349 | |
Goldman Sachs Group, Inc. | | | 1,100 | | | | 355,927 | |
Banco Bilbao Vizcaya Argentaria S.A.†† | | | 43,570 | | | | 352,665 | |
Credit Agricole S.A.†† | | | 28,060 | | | | 345,047 | |
Citigroup, Inc. | | | 8,370 | | | | 344,258 | |
Intesa Sanpaolo SpA†† | | | 131,700 | | | | 337,366 | |
Westpac Banking Corp.†† | | | 24,660 | | | | 333,328 | |
Banco Santander S.A.†† | | | 87,380 | | | | 332,802 | |
Public Storage REIT | | | 1,200 | | | | 316,224 | |
Mediobanca Banca di Credito Finanziario SpA†† | | | 23,070 | | | | 304,206 | |
Capital One Financial Corp. | | | 3,100 | | | | 300,855 | |
Simon Property Group, Inc. REIT | | | 2,690 | | | | 290,601 | |
Swiss Life Holding AG†† | | | 450 | | | | 280,017 | |
T. Rowe Price Group, Inc. | | | 2,600 | | | | 272,662 | |
AvalonBay Communities, Inc. REIT | | | 1,571 | | | | 269,804 | |
AXA S.A.†† | | | 7,000 | | | | 207,715 | |
Amundi S.A.††,1 | | | 3,490 | | | | 196,053 | |
Legal & General Group plc†† | | | 69,760 | | | | 188,143 | |
ASX Ltd.†† | | | 4,000 | | | | 146,306 | |
Mizrahi Tefahot Bank Ltd. | | | 4,000 | | | | 144,968 | |
Gaming and Leisure Properties, Inc. REIT | | | 3,030 | | | | 138,016 | |
Chubb Ltd. | | | 661 | | | | 137,607 | |
Healthcare Realty Trust, Inc. REIT | | | 9,000 | | | | 137,430 | |
Assicurazioni Generali SpA†† | | | 6,000 | | | | 122,494 | |
Allianz AG†† | | | 500 | | | | 119,007 | |
Bank Hapoalim BM | | | 12,000 | | | | 106,726 | |
Loews Corp. | | | 1,600 | | | | 101,296 | |
Zurich Insurance Group AG†† | | | 200 | | | | 91,523 | |
Boston Properties, Inc. REIT | | | 1,300 | | | | 77,324 | |
Total Financial | | | | | | | 7,779,974 | |
| | | | | | | | | |
Technology - 16.6% |
Microsoft Corp. | | | 4,306 | | | | 1,359,619 | |
Apple, Inc. | | | 7,174 | | | | 1,228,261 | |
NVIDIA Corp. | | | 1,630 | | | | 709,034 | |
Texas Instruments, Inc. | | | 2,889 | | | | 459,380 | |
Dell Technologies, Inc. — Class C | | | 6,200 | | | | 427,180 | |
CGI, Inc.* | | | 3,500 | | | | 345,092 | |
Check Point Software Technologies Ltd.* | | | 2,390 | | | | 318,539 | |
Intel Corp. | | | 8,598 | | | | 305,659 | |
Broadcom, Inc. | | | 352 | | | | 292,364 | |
Workday, Inc. — Class A* | | | 1,300 | | | | 279,305 | |
QUALCOMM, Inc. | | | 2,300 | | | | 255,438 | |
Lam Research Corp. | | | 400 | | | | 250,708 | |
Ricoh Company Ltd.†† | | | 27,920 | | | | 240,894 | |
Skyworks Solutions, Inc. | | | 2,400 | | | | 236,616 | |
WiseTech Global Ltd.†† | | | 5,000 | | | | 207,543 | |
Cognizant Technology Solutions Corp. — Class A | | | 2,800 | | | | 189,672 | |
HubSpot, Inc.* | | | 300 | | | | 147,750 | |
Seiko Epson Corp.†† | | | 6,190 | | | | 97,212 | |
KLA Corp. | | | 200 | | | | 91,732 | |
Total Technology | | | | | | | 7,441,998 | |
| | | | | | | | | |
Consumer, Non-cyclical - 15.9% |
UnitedHealth Group, Inc. | | | 1,377 | | | | 694,270 | |
Amgen, Inc. | | | 1,798 | | | | 483,231 | |
PepsiCo, Inc. | | | 2,610 | | | | 442,238 | |
Johnson & Johnson | | | 2,592 | | | | 403,704 | |
Unilever plc†† | | | 8,070 | | | | 399,131 | |
Japan Tobacco, Inc.†† | | | 15,900 | | | | 365,830 | |
McKesson Corp. | | | 830 | | | | 360,925 | |
HCA Healthcare, Inc. | | | 1,400 | | | | 344,372 | |
Colgate-Palmolive Co. | | | 4,803 | | | | 341,541 | |
Sysco Corp. | | | 4,860 | | | | 321,003 | |
Imperial Brands plc†† | | | 15,140 | | | | 307,031 | |
CK Hutchison Holdings Ltd.†† | | | 47,468 | | | | 252,032 | |
Laboratory Corporation of America Holdings | | | 1,200 | | | | 241,260 | |
Archer-Daniels-Midland Co. | | | 3,100 | | | | 233,802 | |
Tyson Foods, Inc. — Class A | | | 4,300 | | | | 217,107 | |
Seagen, Inc.* | | | 1,020 | | | | 216,393 | |
Cencora, Inc. — Class A | | | 1,175 | | | | 211,465 | |
Thermo Fisher Scientific, Inc. | | | 400 | | | | 202,468 | |
Cintas Corp. | | | 390 | | | | 187,594 | |
Pfizer, Inc. | | | 5,000 | | | | 165,850 | |
Bristol-Myers Squibb Co. | | | 2,600 | | | | 150,904 | |
Viatris, Inc. | | | 13,900 | | | | 137,054 | |
Elevance Health, Inc. | | | 300 | | | | 130,626 | |
CSL Ltd.†† | | | 700 | | | | 112,767 | |
Bunge Ltd. | | | 900 | | | | 97,425 | |
Kimberly-Clark Corp. | | | 600 | | | | 72,510 | |
Total Consumer, Non-cyclical | | | | | | | 7,092,533 | |
| | | | | | | | | |
Consumer, Cyclical - 13.7% |
Home Depot, Inc. | | | 1,609 | | | | 486,176 | |
Walmart, Inc. | | | 2,900 | | | | 463,797 | |
Sumitomo Corp.†† | | | 19,900 | | | | 397,166 | |
Lowe’s Companies, Inc. | | | 1,860 | | | | 386,582 | |
Honda Motor Co., Ltd.†† | | | 32,700 | | | | 367,868 | |
WW Grainger, Inc. | | | 480 | | | | 332,083 | |
General Motors Co. | | | 10,000 | | | | 329,700 | |
Ford Motor Co. | | | 24,900 | | | | 309,258 | |
Tesla, Inc.* | | | 1,200 | | | | 300,264 | |
Aisin Corp.†† | | | 7,500 | | | | 283,390 | |
Bayerische Motoren Werke AG†† | | | 2,670 | | | | 271,227 | |
Ferguson plc | | | 1,600 | | | | 263,152 | |
Sekisui House Ltd.†† | | | 12,930 | | | | 257,327 | |
Target Corp. | | | 2,200 | | | | 243,254 | |
Toromont Industries Ltd. | | | 2,900 | | | | 236,256 | |
Isuzu Motors Ltd.†† | | | 16,100 | | | | 202,404 | |
Fastenal Co. | | | 3,700 | | | | 202,168 | |
Canadian Tire Corporation Ltd. — Class A | | | 1,529 | | | | 164,460 | |
InterContinental Hotels Group plc†† | | | 2,200 | | | | 162,639 | |
Lear Corp. | | | 1,140 | | | | 152,988 | |
SEE NOTES TO FINANCIAL STATEMENTS. | THE GUGGENHEIM FUNDS ANNUAL REPORT | 101 |
SCHEDULE OF INVESTMENTS (continued) | September 30, 2023 |
WORLD EQUITY INCOME FUND | |
| | Shares | | | Value | |
Cummins, Inc. | | | 500 | | | $ | 114,230 | |
Costco Wholesale Corp. | | | 200 | | | | 112,992 | |
Aristocrat Leisure Ltd.†† | | | 4,000 | | | | 104,501 | |
Total Consumer, Cyclical | | | | | | | 6,143,882 | |
| | | | | | | | | |
Industrial - 12.5% |
AP Moller - Maersk A/S — Class B†† | | | 220 | | | | 395,766 | |
United Parcel Service, Inc. — Class B | | | 2,390 | | | | 372,529 | |
Illinois Tool Works, Inc. | | | 1,538 | | | | 354,217 | |
Waste Connections, Inc. | | | 2,500 | | | | 335,750 | |
Canadian National Railway Co. | | | 3,010 | | | | 326,063 | |
Lockheed Martin Corp. | | | 789 | | | | 322,670 | |
FedEx Corp. | | | 1,200 | | | | 317,904 | |
Builders FirstSource, Inc.* | | | 2,500 | | | | 311,225 | |
Snap-on, Inc. | | | 1,090 | | | | 278,015 | |
Mitsui OSK Lines Ltd.†† | | | 9,720 | | | | 267,098 | |
Nippon Yusen K.K.†† | | | 9,890 | | | | 256,794 | |
Arrow Electronics, Inc.* | | | 1,680 | | | | 210,403 | |
J.B. Hunt Transport Services, Inc. | | | 1,100 | | | | 207,372 | |
CCL Industries, Inc. — Class B | | | 4,790 | | | | 201,112 | |
Kawasaki Kisen Kaisha Ltd.†† | | | 5,600 | | | | 191,106 | |
Expeditors International of Washington, Inc. | | | 1,500 | | | | 171,945 | |
Amphenol Corp. — Class A | | | 1,980 | | | | 166,300 | |
Garmin Ltd. | | | 1,400 | | | | 147,280 | |
ACS Actividades de Construccion y Servicios S.A.†† | | | 4,000 | | | | 143,822 | |
Obayashi Corp.†† | | | 14,000 | | | | 123,199 | |
Mettler-Toledo International, Inc.* | | | 100 | | | | 110,807 | |
Packaging Corporation of America | | | 624 | | | | 95,815 | |
Owens Corning | | | 700 | | | | 95,487 | |
Poste Italiane SpA††,1 | | | 9,000 | | | | 94,527 | |
CH Robinson Worldwide, Inc. | | | 800 | | | | 68,904 | |
Total Industrial | | | | | | | 5,566,110 | |
| | | | | | | | | |
Energy - 6.6% |
Phillips 66 | | | 3,840 | | | | 461,376 | |
Marathon Petroleum Corp. | | | 2,720 | | | | 411,645 | |
Valero Energy Corp. | | | 2,640 | | | | 374,114 | |
Woodside Energy Group Ltd.†† | | | 14,040 | | | | 326,431 | |
HF Sinclair Corp. | | | 4,560 | | | | 259,601 | |
Ampol Ltd.†† | | | 9,800 | | | | 211,574 | |
Chevron Corp. | | | 1,090 | | | | 183,796 | |
Cheniere Energy, Inc. | | | 1,100 | | | | 182,556 | |
ENEOS Holdings, Inc.†† | | | 40,000 | | | | 157,446 | |
Galp Energia SGPS S.A. — Class B†† | | | 9,000 | | | | 133,330 | |
Exxon Mobil Corp. | | | 1,000 | | | | 117,580 | |
Imperial Oil Ltd. | | | 1,400 | | | | 116,793 | |
Total Energy | | | | | | | 2,936,242 | |
| | | | | | | | | |
Communications - 5.7% |
Alphabet, Inc. — Class C* | | | 6,435 | | | | 848,455 | |
Amazon.com, Inc.* | | | 4,838 | | | | 615,006 | |
Zillow Group, Inc. — Class C* | | | 4,830 | | | | 222,953 | |
HKT Trust & HKT Ltd.†† | | | 201,950 | | | | 210,604 | |
Meta Platforms, Inc. — Class A* | | | 600 | | | | 180,126 | |
Motorola Solutions, Inc. | | | 544 | | | | 148,098 | |
Nice Ltd.* | | | 670 | | | | 113,428 | |
Verizon Communications, Inc. | | | 3,381 | | | | 109,578 | |
WPP plc†† | | | 12,240 | | | | 109,016 | |
Total Communications | | | | | | | 2,557,264 | |
| | | | | | | | | |
Utilities - 4.8% |
Duke Energy Corp. | | | 4,175 | | | | 368,486 | |
DTE Energy Co. | | | 2,980 | | | | 295,854 | |
Consolidated Edison, Inc. | | | 3,400 | | | | 290,802 | |
Centrica plc†† | | | 130,400 | | | | 245,181 | |
Power Assets Holdings Ltd.†† | | | 46,000 | | | | 222,175 | |
Southern Co. | | | 2,975 | | | | 192,542 | |
Sempra | | | 2,400 | | | | 163,272 | |
Emera, Inc. | | | 3,480 | | | | 121,532 | |
Public Service Enterprise Group, Inc. | | | 1,500 | | | | 85,365 | |
Dominion Energy, Inc. | | | 1,800 | | | | 80,406 | |
Exelon Corp. | | | 2,010 | | | | 75,958 | |
Total Utilities | | | | | | | 2,141,573 | |
| | | | | | | | | |
Basic Materials - 3.6% |
Nippon Steel Corp.†† | | | 15,350 | | | | 359,624 | |
LyondellBasell Industries N.V. — Class A | | | 3,788 | | | | 358,724 | |
Nucor Corp. | | | 2,100 | | | | 328,335 | |
International Paper Co. | | | 6,193 | | | | 219,666 | |
Steel Dynamics, Inc. | | | 2,000 | | | | 214,440 | |
Reliance Steel & Aluminum Co. | | | 500 | | | | 131,115 | |
Total Basic Materials | | | | | | | 1,611,904 | |
| | | | | | | | | |
Total Common Stocks | | | | |
(Cost $42,704,413) | | | | | | | 43,271,480 | |
| | | | | | | | | |
EXCHANGE-TRADED FUNDS† - 1.7% |
iShares MSCI EAFE ETF | | | 5,623 | | | | 387,538 | |
SPDR S&P 500 ETF Trust | | | 894 | | | | 382,167 | |
Total Exchange-Traded Funds | | | | |
(Cost $790,541) | | | | | | | 769,705 | |
| | | | | | | | | |
MONEY MARKET FUND† - 0.5% |
Goldman Sachs Financial Square Treasury Instruments Fund Institutional Shares, 5.22%2 | | | 233,728 | | | | 233,728 | |
Total Money Market Fund | | | | |
(Cost $233,728) | | | | | | | 233,728 | |
| | | | | | | | | |
Total Investments - 99.0% | | | | |
(Cost $43,728,682) | | $ | 44,274,913 | |
Other Assets & Liabilities, net - 1.0% | | | 449,450 | |
Total Net Assets - 100.0% | | $ | 44,724,363 | |
102 | THE GUGGENHEIM FUNDS ANNUAL REPORT | SEE NOTES TO FINANCIAL STATEMENTS. |
SCHEDULE OF INVESTMENTS (concluded) | September 30, 2023 |
WORLD EQUITY INCOME FUND | |
Futures Contracts |
Description | | Number of
Contracts | | | Expiration Date | | | Notional
Amount | | | Value and
Unrealized
Appreciation** | |
Currency Futures Contracts Sold Short† |
Japanese Yen Futures Contracts | | | 45 | | | | Dec 2023 | | | $ | 3,811,219 | | | $ | 89,824 | |
Euro FX Futures Contracts | | | 22 | | | | Dec 2023 | | | | 2,917,062 | | | | 53,750 | |
British Pound Futures Contracts | | | 19 | | | | Dec 2023 | | | | 1,449,225 | | | | 39,851 | |
| | | | | | | | | | | $ | 8,177,506 | | | $ | 183,425 | |
* | Non-income producing security. |
** | Includes cumulative appreciation (depreciation). Variation margin is reported within the Statement of Assets and Liabilities. |
† | Value determined based on Level 1 inputs — See Note 4. |
†† | Value determined based on Level 2 inputs — See Note 4. |
1 | Security is a 144A or Section 4(a)(2) security. These securities have been determined to be liquid under guidelines established by the Board of Trustees. The total market value of 144A or Section 4(a)(2) securities is $290,580 (cost $321,146), or 0.6% of total net assets. |
2 | Rate indicated is the 7-day yield as of September 30, 2023. |
| | |
| | See Sector Classification in Other Information section. |
The following table summarizes the inputs used to value the Fund’s investments at September 30, 2023 (See Note 4 in the Notes to Financial Statements):
Investments in Securities (Assets) | | Level 1
Quoted
Prices | | | Level 2
Significant
Observable
Inputs | | | Level 3
Significant
Unobservable
Inputs | | | Total | |
Common Stocks | | $ | 31,670,616 | | | $ | 11,600,864 | | | $ | — | | | $ | 43,271,480 | |
Exchange-Traded Funds | | | 769,705 | | | | — | | | | — | | | | 769,705 | |
Money Market Fund | | | 233,728 | | | | — | | | | — | | | | 233,728 | |
Currency Futures Contracts** | | | 183,425 | | | | — | | | | — | | | | 183,425 | |
Total Assets | | $ | 32,857,474 | | | $ | 11,600,864 | | | $ | — | | | $ | 44,458,338 | |
** | This derivative is reported as unrealized appreciation/depreciation at period end. |
SEE NOTES TO FINANCIAL STATEMENTS. | THE GUGGENHEIM FUNDS ANNUAL REPORT | 103 |
STATEMENT OF ASSETS AND LIABILITIES |
September 30, 2023 |
Assets: |
Investments, at value (cost $43,728,682) | | $ | 44,274,913 | |
Foreign currency, at value (cost $18,055) | | | 18,700 | |
Segregated cash with broker | | | 251,000 | |
Prepaid expenses | | | 41,152 | |
Receivables: |
Securities sold | | | 789,153 | |
Foreign tax reclaims | | | 75,348 | |
Dividends | | | 64,065 | |
Interest | | | 803 | |
Fund shares sold | | | 530 | |
Variation margin on futures contracts | | | 500 | |
Total assets | | | 45,516,164 | |
| | | | | |
Liabilities: |
Overdraft due to custodian bank | | | 2,086 | |
Payable for: |
Securities purchased | | | 626,790 | |
Fund shares redeemed | | | 88,408 | |
Distribution and service fees | | | 10,483 | |
Management fees | | | 8,352 | |
Transfer agent fees | | | 5,417 | |
Fund accounting and administration fees | | | 5,327 | |
Distributions to shareholders | | | 4,765 | |
Trustees’ fees* | | | 1,163 | |
Miscellaneous | | | 39,010 | |
Total liabilities | | | 791,801 | |
Net assets | | $ | 44,724,363 | |
| | | | | |
Net assets consist of: |
Paid in capital | | $ | 44,333,242 | |
Total distributable earnings (loss) | | | 391,121 | |
Net assets | | $ | 44,724,363 | |
| | | | | |
A-Class: |
Net assets | | $ | 39,183,675 | |
Capital shares outstanding | | | 2,761,009 | |
Net asset value per share | | $ | 14.19 | |
Maximum offering price per share (Net asset value divided by 95.25%) | | $ | 14.90 | |
| | | | | |
C-Class: |
Net assets | | $ | 2,644,621 | |
Capital shares outstanding | | | 228,255 | |
Net asset value per share | | $ | 11.59 | |
| | | | | |
P-Class: |
Net assets | | $ | 94,435 | |
Capital shares outstanding | | | 6,590 | |
Net asset value per share | | $ | 14.33 | |
| | | | | |
Institutional Class: |
Net assets | | $ | 2,801,632 | |
Capital shares outstanding | | | 199,037 | |
Net asset value per share | | $ | 14.08 | |
STATEMENT OF OPERATIONS |
Year Ended September 30, 2023 |
Investment Income: |
Dividends (net of foreign withholding tax of $120,286) | | $ | 1,373,153 | |
Interest | | | 9,232 | |
Total investment income | | | 1,382,385 | |
| | | | | |
Expenses: |
Management fees | | | 320,156 | |
Distribution and service fees: |
A-Class | | | 99,384 | |
C-Class | | | 27,204 | |
P-Class | | | 195 | |
Transfer agent fees: |
A-Class | | | 62,339 | |
C-Class | | | 4,396 | |
P-Class | | | 314 | |
Institutional Class | | | 4,945 | |
Registration fees | | | 61,500 | |
Professional fees | | | 45,259 | |
Fund accounting and administration fees | | | 27,875 | |
Custodian fees | | | 16,370 | |
Trustees’ fees* | | | 12,731 | |
Line of credit fees | | | 1,574 | |
Miscellaneous | | | 13,641 | |
Total expenses | | | 697,883 | |
Less: |
Expenses reimbursed by Adviser: | | | | |
A-Class | | | (62,164 | ) |
C-Class | | | (4,381 | ) |
P-Class | | | (313 | ) |
Institutional Class | | | (4,929 | ) |
Expenses waived by Adviser | | | (71,170 | ) |
Total waived/reimbursed expenses | | | (142,957 | ) |
Net expenses | | | 554,926 | |
Net investment income | | | 827,459 | |
| | | | | |
Net Realized and Unrealized Gain (Loss): |
Net realized gain (loss) on: |
Investments | | | (126,502 | ) |
Futures contracts | | | 356,540 | |
Foreign currency transactions | | | (33,285 | ) |
Net realized gain | | | 196,753 | |
Net change in unrealized appreciation (depreciation) on: |
Investments | | | 5,652,331 | |
Futures contracts | | | (101,241 | ) |
Foreign currency translations | | | 6,933 | |
Net change in unrealized appreciation (depreciation) | | | 5,558,023 | |
Net realized and unrealized gain | | | 5,754,776 | |
Net increase in net assets resulting from operations | | $ | 6,582,235 | |
* | Relates to Trustees not deemed “interested persons” within the meaning of Section 2(a)(19) of the 1940 Act. |
104 | THE GUGGENHEIM FUNDS ANNUAL REPORT | SEE NOTES TO FINANCIAL STATEMENTS. |
STATEMENTS OF CHANGES IN NET ASSETS |
| | Year Ended
September 30,
2023 | | | Year Ended
September 30,
2022 | |
Increase (Decrease) in Net Assets from Operations: | | | | | | | | |
Net investment income | | $ | 827,459 | | | $ | 949,839 | |
Net realized gain (loss) on investments | | | 196,753 | | | | (159,738 | ) |
Net change in unrealized appreciation (depreciation) on investments | | | 5,558,023 | | | | (7,578,951 | ) |
Net increase (decrease) in net assets resulting from operations | | | 6,582,235 | | | | (6,788,850 | ) |
| | | | | | | | | |
Distributions to shareholders: | | | | | | | | |
A-Class | | | (722,703 | ) | | | (10,744,755 | ) |
C-Class | | | (29,606 | ) | | | (873,734 | ) |
P-Class | | | (1,387 | ) | | | (28,439 | ) |
Institutional Class | | | (62,449 | ) | | | (968,069 | ) |
Total distributions to shareholders | | | (816,145 | ) | | | (12,614,997 | ) |
| | | | | | | | | |
Capital share transactions: | | | | | | | | |
Proceeds from sale of shares | | | | | | | | |
A-Class | | | 1,839,546 | | | | 1,877,448 | |
C-Class | | | 303,253 | | | | 269,648 | |
P-Class | | | 23,194 | | | | 3,577 | |
Institutional Class | | | 359,897 | | | | 5,857,937 | |
Distributions reinvested | | | | | | | | |
A-Class | | | 695,071 | | | | 10,254,795 | |
C-Class | | | 29,606 | | | | 870,099 | |
P-Class | | | 1,233 | | | | 28,438 | |
Institutional Class | | | 62,113 | | | | 962,451 | |
Cost of shares redeemed | | | | | | | | |
A-Class | | | (4,132,861 | ) | | | (4,367,556 | ) |
C-Class | | | (536,800 | ) | | | (560,409 | ) |
P-Class | | | (275 | ) | | | (48,299 | ) |
Institutional Class | | | (3,906,719 | ) | | | (2,193,005 | ) |
Net increase (decrease) from capital share transactions | | | (5,262,742 | ) | | | 12,955,124 | |
Net increase (decrease) in net assets | | | 503,348 | | | | (6,448,723 | ) |
| | | | | | | | | |
Net assets: | | | | | | | | |
Beginning of year | | | 44,221,015 | | | | 50,669,738 | |
End of year | | $ | 44,724,363 | | | $ | 44,221,015 | |
| | | | | | | | | |
Capital share activity: | | | | | | | | |
Shares sold | | | | | | | | |
A-Class | | | 130,111 | | | | 126,711 | |
C-Class | | | 26,132 | | | | 21,381 | |
P-Class | | | 1,612 | | | | 242 | |
Institutional Class | | | 25,667 | | | | 390,214 | |
Shares issued from reinvestment of distributions | | | | | | | | |
A-Class | | | 48,930 | | | | 659,255 | |
C-Class | | | 2,549 | | | | 68,252 | |
P-Class | | | 86 | | | | 1,802 | |
Institutional Class | | | 4,415 | | | | 62,780 | |
Shares redeemed | | | | | | | | |
A-Class | | | (292,035 | ) | | | (278,966 | ) |
C-Class | | | (47,251 | ) | | | (44,338 | ) |
P-Class | | | (18 | ) | | | (3,361 | ) |
Institutional Class | | | (293,795 | ) | | | (150,633 | ) |
Net increase (decrease) in shares | | | (393,597 | ) | | | 853,339 | |
SEE NOTES TO FINANCIAL STATEMENTS. | THE GUGGENHEIM FUNDS ANNUAL REPORT | 105 |
This table is presented to show selected data for a share outstanding throughout each period and to assist shareholders in evaluating a Fund’s performance for the periods presented.
A-Class | | Year Ended
September 30,
2023 | | | Year Ended
September 30,
2022 | | | Year Ended
September 30,
2021 | | | Year Ended
September 30,
2020 | | | Year Ended
September 30,
2019 | |
Per Share Data |
Net asset value, beginning of period | | $ | 12.49 | | | $ | 18.73 | | | $ | 15.03 | | | $ | 15.26 | | | $ | 15.77 | |
Income (loss) from investment operations: |
Net investment income (loss)a | | | .26 | | | | .29 | | | | .28 | | | | .20 | | | | .35 | |
Net gain (loss) on investments (realized and unrealized) | | | 1.70 | | | | (1.97 | ) | | | 3.79 | | | | (.12 | )g | | | (.36 | ) |
Total from investment operations | | | 1.96 | | | | (1.68 | ) | | | 4.07 | | | | .08 | | | | (.01 | ) |
Less distributions from: |
Net investment income | | | (.25 | ) | | | (.34 | ) | | | (.34 | ) | | | (.27 | ) | | | (.37 | ) |
Net realized gains | | | (.01 | ) | | | (4.22 | ) | | | (.03 | ) | | | (.04 | ) | | | (.13 | ) |
Total distributions | | | (.26 | ) | | | (4.56 | ) | | | (.37 | ) | | | (.31 | ) | | | (.50 | ) |
Net asset value, end of period | | $ | 14.19 | | | $ | 12.49 | | | $ | 18.73 | | | $ | 15.03 | | | $ | 15.26 | |
|
Total Returnb | | | 15.69 | % | | | (13.44 | %) | | | 27.13 | % | | | 0.60 | % | | | 0.14 | % |
Ratios/Supplemental Data |
Net assets, end of period (in thousands) | | $ | 39,183 | | | $ | 35,905 | | | $ | 44,337 | | | $ | 37,911 | | | $ | 60,639 | |
Ratios to average net assets: |
Net investment income (loss) | | | 1.84 | % | | | 1.87 | % | | | 1.55 | % | | | 1.36 | % | | | 2.39 | % |
Total expensesc | | | 1.50 | % | | | 1.39 | % | | | 1.45 | % | | | 1.48 | % | | | 1.37 | % |
Net expensesd,e,f | | | 1.19 | % | | | 1.20 | % | | | 1.21 | % | | | 1.22 | % | | | 1.22 | % |
Portfolio turnover rate | | | 156 | % | | | 162 | % | | | 191 | % | | | 192 | % | | | 127 | % |
C-Class | | Year Ended
September 30,
2023 | | | Year Ended
September 30,
2022 | | | Year Ended
September 30,
2021 | | | Year Ended
September 30,
2020 | | | Year Ended
September 30,
2019 | |
Per Share Data |
Net asset value, beginning of period | | $ | 10.20 | | | $ | 16.03 | | | $ | 12.87 | | | $ | 13.06 | | | $ | 13.53 | |
Income (loss) from investment operations: |
Net investment income (loss)a | | | .13 | | | | .14 | | | | .13 | | | | .08 | | | | .21 | |
Net gain (loss) on investments (realized and unrealized) | | | 1.39 | | | | (1.56 | ) | | | 3.24 | | | | (.10 | )g | | | (.33 | ) |
Total from investment operations | | | 1.52 | | | | (1.42 | ) | | | 3.37 | | | | (.02 | ) | | | (.12 | ) |
Less distributions from: |
Net investment income | | | (.12 | ) | | | (.19 | ) | | | (.18 | ) | | | (.13 | ) | | | (.22 | ) |
Net realized gains | | | (.01 | ) | | | (4.22 | ) | | | (.03 | ) | | | (.04 | ) | | | (.13 | ) |
Total distributions | | | (.13 | ) | | | (4.41 | ) | | | (.21 | ) | | | (.17 | ) | | | (.35 | ) |
Net asset value, end of period | | $ | 11.59 | | | $ | 10.20 | | | $ | 16.03 | | | $ | 12.87 | | | $ | 13.06 | |
|
Total Returnb | | | 14.87 | % | | | (14.11 | %) | | | 26.22 | % | | | (0.13 | %) | | | (0.69 | %) |
Ratios/Supplemental Data |
Net assets, end of period (in thousands) | | $ | 2,645 | | | $ | 2,518 | | | $ | 3,230 | | | $ | 2,893 | | | $ | 3,366 | |
Ratios to average net assets: |
Net investment income (loss) | | | 1.10 | % | | | 1.12 | % | | | 0.81 | % | | | 0.67 | % | | | 1.64 | % |
Total expensesc | | | 2.25 | % | | | 2.20 | % | | | 2.28 | % | | | 2.40 | % | | | 2.28 | % |
Net expensesd,e,f | | | 1.94 | % | | | 1.95 | % | | | 1.96 | % | | | 1.97 | % | | | 1.97 | % |
Portfolio turnover rate | | | 156 | % | | | 162 | % | | | 191 | % | | | 192 | % | | | 127 | % |
106 | THE GUGGENHEIM FUNDS ANNUAL REPORT | SEE NOTES TO FINANCIAL STATEMENTS. |
FINANCIAL HIGHLIGHTS (continued) |
This table is presented to show selected data for a share outstanding throughout each period and to assist shareholders in evaluating a Fund’s performance for the periods presented.
P-Class | | Year Ended
September 30,
2023 | | | Year Ended
September 30,
2022 | | | Year Ended
September 30,
2021 | | | Year Ended
September 30,
2020 | | | Year Ended
September 30,
2019 | |
Per Share Data |
Net asset value, beginning of period | | $ | 12.60 | | | $ | 18.91 | | | $ | 15.17 | | | $ | 15.38 | | | $ | 15.92 | |
Income (loss) from investment operations: |
Net investment income (loss)a | | | .26 | | | | .29 | | | | .30 | | | | .20 | | | | .36 | |
Net gain (loss) on investments (realized and unrealized) | | | 1.71 | | | | (1.99 | ) | | | 3.80 | | | | (.11 | )g | | | (.39 | ) |
Total from investment operations | | | 1.97 | | | | (1.70 | ) | | | 4.10 | | | | .09 | | | | (.03 | ) |
Less distributions from: |
Net investment income | | | (.23 | ) | | | (.39 | ) | | | (.33 | ) | | | (.26 | ) | | | (.38 | ) |
Net realized gains | | | (.01 | ) | | | (4.22 | ) | | | (.03 | ) | | | (.04 | ) | | | (.13 | ) |
Total distributions | | | (.24 | ) | | | (4.61 | ) | | | (.36 | ) | | | (.30 | ) | | | (.51 | ) |
Net asset value, end of period | | $ | 14.33 | | | $ | 12.60 | | | $ | 18.91 | | | $ | 15.17 | | | $ | 15.38 | |
|
Total Return | | | 15.65 | % | | | (13.44 | %) | | | 27.10 | % | | | 0.66 | % | | | 0.06 | % |
Ratios/Supplemental Data |
Net assets, end of period (in thousands) | | $ | 94 | | | $ | 62 | | | $ | 118 | | | $ | 94 | | | $ | 129 | |
Ratios to average net assets: |
Net investment income (loss) | | | 1.80 | % | | | 1.82 | % | | | 1.61 | % | | | 1.36 | % | | | 2.38 | % |
Total expensesc | | | 1.74 | % | | | 1.62 | % | | | 1.53 | % | | | 1.56 | % | | | 1.44 | % |
Net expensesd,e,f | | | 1.19 | % | | | 1.20 | % | | | 1.21 | % | | | 1.22 | % | | | 1.22 | % |
Portfolio turnover rate | | | 156 | % | | | 162 | % | | | 191 | % | | | 192 | % | | | 127 | % |
SEE NOTES TO FINANCIAL STATEMENTS. | THE GUGGENHEIM FUNDS ANNUAL REPORT | 107 |
FINANCIAL HIGHLIGHTS (concluded) |
This table is presented to show selected data for a share outstanding throughout each period and to assist shareholders in evaluating a Fund’s performance for the periods presented.
Institutional Class | | Year Ended
September 30,
2023 | | | Year Ended
September 30,
2022 | | | Year Ended
September 30,
2021 | | | Year Ended
September 30,
2020 | | | Year Ended
September 30,
2019 | |
Per Share Data |
Net asset value, beginning of period | | $ | 12.40 | | | $ | 18.61 | | | $ | 14.94 | | | $ | 15.16 | | | $ | 15.71 | |
Income (loss) from investment operations: |
Net investment income (loss)a | | | .28 | | | | .36 | | | | .33 | | | | .25 | | | | .39 | |
Net gain (loss) on investments (realized and unrealized) | | | 1.70 | | | | (1.98 | ) | | | 3.75 | | | | (.13 | )g | | | (.37 | ) |
Total from investment operations | | | 1.98 | | | | (1.62 | ) | | | 4.08 | | | | .12 | | | | .02 | |
Less distributions from: |
Net investment income | | | (.29 | ) | | | (.37 | ) | | | (.38 | ) | | | (.30 | ) | | | (.44 | ) |
Net realized gains | | | (.01 | ) | | | (4.22 | ) | | | (.03 | ) | | | (.04 | ) | | | (.13 | ) |
Total distributions | | | (.30 | ) | | | (4.59 | ) | | | (.41 | ) | | | (.34 | ) | | | (.57 | ) |
Net asset value, end of period | | $ | 14.08 | | | $ | 12.40 | | | $ | 18.61 | | | $ | 14.94 | | | $ | 15.16 | |
|
Total Return | | | 15.97 | % | | | (13.18 | %) | | | 27.38 | % | | | 0.92 | % | | | 0.40 | % |
Ratios/Supplemental Data |
Net assets, end of period (in thousands) | | $ | 2,802 | | | $ | 5,736 | | | $ | 2,985 | | | $ | 2,513 | | | $ | 3,458 | |
Ratios to average net assets: |
Net investment income (loss) | | | 1.99 | % | | | 2.36 | % | | | 1.82 | % | | | 1.66 | % | | | 2.67 | % |
Total expensesc | | | 1.24 | % | | | 1.13 | % | | | 1.21 | % | | | 1.50 | % | | | 1.17 | % |
Net expensesd,e,f | | | 0.94 | % | | | 0.95 | % | | | 0.96 | % | | | 0.97 | % | | | 0.97 | % |
Portfolio turnover rate | | | 156 | % | | | 162 | % | | | 191 | % | | | 192 | % | | | 127 | % |
a | Net investment income (loss) per share was computed using average shares outstanding throughout the period. |
b | Total return does not reflect the impact of any applicable sales charges. |
c | Does not include expenses of the underlying funds in which the Fund invests. |
d | Net expense information reflects the expense ratios after expense waivers and reimbursements, as applicable. |
e | The portion of the ratios of net expenses to average net assets attributable to recoupments of prior fee reductions or expense reimbursements for the years presented was as follows: |
| | | 09/30/23 | 09/30/22 | 09/30/21 | 09/30/20 | 09/30/19 |
| | A-Class | — | 0.01% | — | — | 0.00%* |
| | C-Class | — | 0.00%* | — | — | — |
| | P-Class | — | 0.00%* | — | — | — |
| | Institutional Class | — | 0.01% | 0.02% | — | — |
f | Net expenses may include expenses that are excluded from the expense limitation agreement. Excluding these expenses, the net expense ratios for the years presented would be: |
| | | 09/30/23 | 09/30/22 | 09/30/21 | 09/30/20 | 09/30/19 |
| | A-Class | 1.18% | 1.20% | 1.21% | 1.22% | 1.22% |
| | C-Class | 1.93% | 1.95% | 1.96% | 1.97% | 1.97% |
| | P-Class | 1.18% | 1.20% | 1.21% | 1.22% | 1.22% |
| | Institutional Class | 0.93% | 0.95% | 0.96% | 0.97% | 0.97% |
g | The amount shown for a share outstanding throughout the year does not agree with the aggregate net gain on investments for the year because of the sales and repurchases of fund shares in relation to the fluctuating market value of the investments of the Fund. |
108 | THE GUGGENHEIM FUNDS ANNUAL REPORT | SEE NOTES TO FINANCIAL STATEMENTS. |
NOTES TO FINANCIAL STATEMENTS |
Note 1 – Organization and Significant Accounting Policies
Organization
Guggenheim Funds Trust (the “Trust”), a Delaware statutory trust, is registered with the U.S. Securities and Exchange Commission (the “SEC”) under the Investment Company Act of 1940 (the “1940 Act”), as an open-ended investment company of the series type. Each series, in effect, is representing a separate fund (each, a “Fund”). The Trust may issue an unlimited number of authorized shares. The Trust accounts for the assets of each Fund separately.
The Trust offers a combination of five separate classes of shares: A-Class shares, C-Class shares, P-Class shares, R6-Class shares and Institutional Class shares. Sales of shares of each Class are made without a front-end sales charge at the net asset value per share (“NAV”), with the exception of A-Class shares. A-Class shares are sold at the NAV, plus the applicable front-end sales charge. The sales charge varies depending on the amount purchased. A-Class share purchases of $1 million or more are exempt from the front-end sales charge but have a 1% contingent deferred sales charge (“CDSC”), if shares are redeemed within 12 months of purchase. C-Class shares have a 1% CDSC if shares are redeemed within 12 months of purchase. C-Class shares of each Fund automatically convert to A-Class shares of the same Fund on or about the 10th day of the month following the 8-year anniversary of the purchase of the C-Class shares. This conversion will be executed without any sales charge, fee or other charge. After the conversion is completed, the shares will be subject to all features and expenses of A-Class shares. Institutional Class shares are offered primarily for direct investment by institutions such as pension and profit sharing plans, endowments, foundations and corporations. Institutional Class shares require a minimum initial investment of $2 million and a minimum account balance of $1 million. R6-Class shares are offered primarily through qualified retirement and benefit plans. R6-Class shares are also offered through certain other plans and platforms sponsored by financial intermediaries. Certain institutional investors and others deemed appropriate by Guggenheim Investments (“GI”or the “Adviser”) may also be eligible to purchase R6-Class shares subject to a $2 million minimum initial investment. At September 30, 2023, the Trust consisted of nineteen funds.
This report covers the following funds (collectively, the “Funds”):
Fund | Investment
Company Type |
Alpha Opportunity Fund | Diversified |
Large Cap Value Fund | Diversified |
Market Neutral Real Estate Fund | Diversified |
Risk Managed Real Estate Fund | Diversified |
Small Cap Value Fund | Diversified |
StylePlus—Large Core Fund | Diversified |
StylePlus—Mid Growth Fund | Diversified |
World Equity Income Fund | Diversified |
At September 30, 2023, A-Class, C-Class, P-Class and Institutional Class shares have been issued by the Funds.
Security Investors, LLC and Guggenheim Partners Investment Management, LLC (“GPIM” or the “Adviser”), which operate under the name Guggenheim Investments (“GI”), provide advisory services. Guggenheim Funds Distributors, LLC (“GFD”) serves as distributor for the Trust. GI and GFD are affiliated entities.
Significant Accounting Policies
The Funds operate as investment companies and, accordingly, follow the investment company accounting and reporting guidance of the Financial Accounting Standards Board (“FASB”) Accounting Standards Codification Topic 946 Financial Services – Investment Companies.
The following significant accounting policies are in conformity with U.S. generally accepted accounting principles (“U.S. GAAP”) and are consistently followed by the Trust. This requires management to make estimates and assumptions that affect the reported amount of assets and liabilities, contingent assets and liabilities at the date of the financial statements, and the reported amounts of revenues and expenses during the reporting period. Actual results could differ from these estimates. All time references are based on Eastern Time.
The NAV of each Class of a fund is calculated by dividing the market value of a fund’s securities and other assets, less all liabilities, attributable to the Class by the number of outstanding shares of the Class.
(a) Valuation of Investments
The Board of Trustees of the Funds (the “Board”) has adopted policies and procedures for the valuation of the Funds’ investments (the “Fund Valuation Procedures”). The SEC adopted Rule 2a-5 under the 1940 Act (“Rule 2a-5”) which establishes requirements for determining fair value in good faith. Rule 2a-5 also defines “readily available market quotations” for purposes of the 1940 Act and establishes requirements for determining whether a fund must fair value a security in good faith.
Pursuant to Rule 2a-5, the Board has designated the Adviser as the valuation designee to perform fair valuation determinations for the Funds with respect to all Fund investments and other assets. As the Funds’ valuation designee pursuant to Rule 2a-5, the Adviser has adopted separate procedures (the “Valuation Designee Procedures” and collectively with the Fund Valuation Procedures, the “Valuation Procedures”) reasonably designed to prevent violations of the requirements of Rule 2a-5 and Rule 31a-4. The Adviser, in its role as valuation designee, utilizes the assistance of a valuation committee, consisting of representatives from Guggenheim’s investment management, fund administration,
| | THE GUGGENHEIM FUNDS ANNUAL REPORT | 109 |
NOTES TO FINANCIAL STATEMENTS (continued) |
legal and compliance departments (the “Valuation Committee”), in determining the fair value of the Funds’ securities and other assets.
Valuations of the Funds’ securities and other assets are supplied primarily by pricing service providers appointed pursuant to the processes set forth in the Valuation Procedures. The Adviser, with the assistance of the Valuation Committee, convenes monthly, or more frequently as needed, to review the valuation of all assets which have been fair valued. The Adviser, consistent with the monitoring and review responsibilities set forth in the Valuation Procedures, regularly reviews the appropriateness of the inputs, methods, models and assumptions employed by the pricing service provider.
If the pricing service provider cannot or does not provide a valuation for a particular investment or such valuation is deemed unreliable, such investment is fair valued by the Adviser.
Equity securities listed or traded on a recognized U.S. securities exchange or the National Association of Securities Dealers Automated Quotations (“NASDAQ”) National Market System will generally be valued on the basis of the last sale price on the primary U.S. exchange or market on which the security is listed or traded; provided, however, that securities listed on NASDAQ will be valued at the NASDAQ official closing price, which may not necessarily represent the last sale price.
Generally, trading in foreign securities markets is substantially completed each day at various times prior to the close of the New York Stock Exchange (“NYSE”). The values of foreign securities are determined as of the close of such foreign markets or the close of the NYSE, if earlier. All investments quoted in foreign currencies are valued in U.S. dollars on the basis of the foreign currency exchange rates prevailing at the close of U.S. business at 4:00 p.m. Investments in foreign securities may involve risks not present in domestic investments. The Adviser will determine the current value of such foreign securities by taking into consideration certain factors which may include the following factors, among others: the value of the securities traded on other foreign markets, American Depositary Receipts. (“ADR”) trading, closed-end fund trading, foreign currency exchange activity, and the trading prices of financial products that are tied to foreign securities. In addition, under the Valuation Procedures, the Adviser is authorized to use prices and other information supplied by a pricing service provider in valuing foreign securities.
Open-end investment companies are valued at their NAV as of the close of business, on the valuation date. Exchange-traded funds and closed-end investment companies are generally valued at the last quoted sale price.
Futures contracts are valued on the basis of the last sale price at the 4:00 p.m. price on the valuation date. In the event that the exchange for a specific futures contract closes earlier than 4:00 p.m., the futures contract is valued at the official settlement price of the exchange. However, the underlying securities from which the futures contract value is derived are monitored until 4:00 p.m. to determine if fair valuation would provide a more accurate valuation.
The value of swap agreements entered into by a Fund are generally valued using an evaluated price provided by a pricing service provider.
Investments for which market quotations are not readily available are fair valued as determined in good faith by the Adviser. Valuations in accordance with these methods are intended to reflect each security’s (or asset’s or liability’s) “fair value”. Each such determination is based on a consideration of all relevant factors, which are likely to vary from one pricing context to another. Examples of such factors may include, but are not limited to market prices; sale prices; broker quotes; and models which derive prices based on inputs such as anticipated cash flows or collateral, spread over U.S. Treasury securities, and other information analysis. In connection with futures contracts and other derivative investments, such factors may include obtaining information as to how (a) these contracts and other derivative investments trade in the futures or other derivative markets, respectively, and (b) the securities underlying these contracts and other derivative investments trade in the cash market.
(b) Short Sales
When a Fund engages in a short sale of a security, an amount equal to the proceeds is reflected as an asset and an equivalent liability. The amount of the liability is subsequently marked-to-market to reflect the market value of the short sale.
Fees, if any, paid to brokers to borrow securities in connection with short sales are recorded as interest expense. In addition, the Fund must pay out the dividend rate of the equity or coupon rate of the obligation to the lender and record this as an expense. Short dividend or interest expense is a cost associated with the investment objective of short sales transactions, rather than an operational cost associated with the day-to-day management of any mutual fund. The Fund may also receive rebate income from the broker resulting from the investment of the proceeds from securities sold short.
(c) Futures Contracts
Upon entering into a futures contract, a Fund deposits and maintains as collateral such initial margin as required by the exchange on which the transaction is affected. Pursuant to the contract, the Fund agrees to receive from or pay to the broker
110 | THE GUGGENHEIM FUNDS ANNUAL REPORT | |
NOTES TO FINANCIAL STATEMENTS (continued) |
an amount of cash equal to the daily fluctuation in value of the contract. Such receipts or payments are known as variation margin and are recorded by the Fund as unrealized appreciation or depreciation. When the contract is closed, the Fund records a realized gain or loss equal to the difference between the value of the contract at the time it was opened and the value at the time it was closed.
(d) Swap Agreements
Swap agreements are marked-to-market daily and the change, if any, is recorded as unrealized appreciation or depreciation. Payments received or made as a result of an agreement or termination of an agreement are recognized as realized gains or losses.
(e) Currency Translations
The accounting records of the Funds are maintained in U.S. dollars. All assets and liabilities initially expressed in foreign currencies are converted into U.S. dollars at prevailing exchange rates. Purchases and sales of investment securities, dividend and interest income, and certain expenses are translated at the rates of exchange prevailing on the respective dates of such transactions. Changes in the relationship of these foreign currencies to the U.S. dollar can significantly affect the value of the investments and earnings of the Funds. Foreign investments may also subject the Funds to foreign government exchange restrictions, expropriation, taxation, or other political, social, geopolitical or economic developments, all of which could affect the market and/or credit risk of the investments.
The Funds do not isolate that portion of the results of operations resulting from changes in the foreign exchange rates on investments from the fluctuations arising from changes in the market prices of securities held. Such fluctuations are included with the net realized gain or loss and unrealized appreciation or depreciation on investments.
Reported net realized foreign exchange gains and losses arise from sales of foreign currencies and currency gains or losses realized between the trade and settlement dates on investment transactions. Net unrealized appreciation and depreciation arise from changes in the fair values of assets and liabilities other than investments in securities at the fiscal period end, resulting from changes in exchange rates.
(f) Foreign Taxes
The Funds may be subject to foreign taxes (a portion of which may be reclaimable) on income, stock dividends, capital gains on investments or certain foreign currency transactions. All foreign taxes are recorded in accordance with the applicable foreign tax regulations and rates that exist in the foreign jurisdictions in which the Funds invest. These foreign taxes, if any, are paid by the Funds and reflected in their Statements of Operations as follows: foreign taxes withheld at source are presented as a reduction of income and foreign taxes on capital gains from sales of investments are included with the net realized gain (loss) on investments. Foreign taxes payable or deferred as of September 30, 2023, if any, are disclosed in the Funds’ Statements of Assets and Liabilities.
(g) Security Transactions
Security transactions are recorded on the trade date for financial reporting purposes. Realized gains and losses from securities transactions are recorded using the identified cost basis. Proceeds from lawsuits related to investment holdings are recorded as a reduction to cost if the securities are still held and as realized gains if no longer held in the respective Fund. Taxable non-cash dividends are recorded as dividend income. Interest income, including amortization of premiums and accretion of discounts, is accrued on a daily basis. Amendment fees are earned as compensation for evaluating and accepting changes to the original loan agreement and are recognized when received. Dividend income from Real Estate Investment Trusts (“REITs”) is recorded based on the income included in the distributions received from the REIT investments using published REIT classifications, including some management estimates when actual amounts are not available. Distributions received in excess of this estimated amount are recorded as a reduction of the cost of investments or reclassified to realized gains. The actual amounts of income, return of capital, and realized gains are only determined by each REIT after its fiscal year-end, and may differ from the estimated amounts.
(h) Distributions
Dividends from net investment income are declared quarterly in the World Equity Income Fund and Risk Managed Real Estate Fund. Dividends are reinvested in additional shares, unless shareholders request payment in cash. Distributions of net investment income in the remaining Funds and distributions of net realized gains, if any, in all Funds are declared at least annually and recorded on the ex-dividend date and are determined in accordance with U.S. federal income tax regulations which may differ from U.S. GAAP.
(i) Class Allocations
Interest and dividend income, most expenses, all realized gains and losses, and all unrealized appreciation and depreciation are allocated to the share classes based upon the value of the outstanding shares in each share class. Certain costs, such as distribution and service fees are charged directly to specific share classes. In addition, certain expenses have been allocated to the individual Funds in the Trust based on the respective net assets of each Fund included in the Trust.
| | THE GUGGENHEIM FUNDS ANNUAL REPORT | 111 |
NOTES TO FINANCIAL STATEMENTS (continued) |
(j) Earnings Credits
Under the fee arrangement with the custodian, the Funds may earn credits based on overnight custody cash balances. These credits are utilized to reduce related custodial expenses. The custodian fees disclosed in the Funds’ Statements of Operations are before the reduction in expense from the related earnings credits, if any. Earnings credits for the year ended September 30, 2023, are disclosed in the Funds’ Statements of Operations.
(k) Cash
The Funds may leave cash overnight in their cash account with the custodian. Periodically, a Fund may have cash due to the custodian bank as an overdraft balance. A fee is incurred on this overdraft, calculated by multiplying the overdraft by a rate based on the federal funds rate, which was 5.33% at September 30, 2023.
(l) Indemnifications
Under the Funds’ organizational documents, the Trustees and Officers are indemnified against certain liabilities arising out of the performance of their duties to the Trust. In addition, throughout the normal course of business, the Funds enter into contracts that contain a variety of representations and warranties which provide general indemnifications. The Funds’ maximum exposure under these arrangements is unknown, as this would involve future claims that may be made against the Funds and/or their affiliates that have not yet occurred. However, based on experience, the Funds expect the risk of loss to be remote.
Note 2 – Financial Instruments and Derivatives
As part of their investment strategies, the Funds may utilize short sales and a variety of derivative instruments. These investments involve, to varying degrees, elements of market risk and risks in excess of amounts recognized on the Funds’ Statements of Assets and Liabilities. Valuation and accounting treatment of these instruments can be found under Significant Accounting Policies in Note 1 of these Notes to Financial Statements.
Short Sales
A short sale is a transaction in which a Fund sells a security it does not own. If the security sold short decreases in price between the time the Fund sells the security and closes its short position, the Fund will realize a gain on the transaction. Conversely, if the security increases in price during the period, the Fund will realize a loss on the transaction. The risk of such price increases is the principal risk of engaging in short sales.
Derivatives
Derivatives are instruments whose values depend on, or are derived from, in whole or in part, the value of one or more other assets, such as securities, currencies, commodities or indices. Derivative instruments may be used to increase investment flexibility (including to maintain cash reserves while maintaining exposure to certain other assets), for risk management (hedging) purposes, to facilitate trading, to reduce transaction costs and to pursue higher investment returns. Derivative instruments may also be used to mitigate certain investment risks, such as foreign currency exchange rate risk, interest rate risk and credit risk. U.S. GAAP requires disclosures to enable investors to better understand how and why a Fund uses derivative instruments, how these derivative instruments are accounted for and their effects on the Fund’s financial position and results of operations.
The Funds may utilize derivatives for the following purposes:
Hedge: an investment made in order to reduce the risk of adverse price movements in a security, by taking an offsetting position to protect against broad market moves.
Income: the use of any instrument that distributes cash flows typically based upon some rate of interest.
Index Exposure: the use of an instrument to obtain exposure to a listed or other type of index.
Leverage: gaining total exposure to equities or other assets on the long and short sides at greater than 100% of invested capital.
For any Fund whose investment strategy consistently involves applying leverage, the value of the Fund’s shares will tend to increase or decrease more than the value of any increase or decrease in the underlying index or other asset. In addition, because an investment in derivative instruments generally requires a small investment relative to the amount of investment exposure assumed, an opportunity for increased net income is created; but, at the same time, leverage risk will increase. The Fund’s use of leverage, through borrowings or instruments such as derivatives, may cause the Fund to be more volatile and riskier than if they had not been leveraged.
Futures Contracts
A futures contract is an agreement to purchase (long) or sell (short) an agreed amount of securities or other instruments at a set price for delivery at a future date. There are significant risks associated with a Fund’s use of futures contracts, including (i) there may be an imperfect or no correlation between the changes in market value of the underlying asset and the prices of futures contracts; (ii) there may not be a liquid secondary market for a futures contract; (iii) trading restrictions or limitations may be imposed by an exchange; and (iv) government regulations may restrict trading in futures contracts. When investing in futures, there is minimal counterparty credit risk to a Fund because futures
112 | THE GUGGENHEIM FUNDS ANNUAL REPORT | |
NOTES TO FINANCIAL STATEMENTS (continued) |
are exchange-traded and the exchange’s clearinghouse, as counterparty to all exchange-traded futures, guarantees against default. Cash deposits are shown as segregated cash with broker on the Funds’ Statements of Assets and Liabilities; securities held as collateral are noted on the Funds’ Schedules of Investments.
The following table represents the Funds’ use and volume of futures on a monthly basis:
| | | | Average Notional Amount | |
Fund | Use | | Long | | | Short | |
StylePlus—Large Core Fund | Index exposure | | $ | 3,477,681 | | | $ | — | |
StylePlus—Mid Growth Fund | Index exposure | | | 2,094,825 | | | | — | |
World Equity Income Fund | Hedge | | | — | | | | 2,620,951 | |
Swap Agreements
A swap is an agreement that obligates two parties to exchange a series of cash flows at specified intervals based upon or calculated by reference to changes in specified prices or rates for a specified amount of an underlying asset. When utilizing over-the-counter (“OTC”) swaps, a Fund bears the risk of loss of the amount expected to be received under a swap agreement in the event of the default or bankruptcy of a swap agreement counterparty or if the underlying asset declines in value. Certain standardized swaps are subject to mandatory central clearing and are executed on a multi-lateral or other trade facility platform, such as a registered exchange. There is limited counterparty credit risk with respect to centrally-cleared swaps as the transaction is facilitated through a central clearinghouse, much like exchange-traded futures contracts. For a Fund utilizing centrally-cleared swaps, the exchange bears the risk of loss resulting from a counterparty not being able to pay. There is no guarantee that a Fund or an underlying fund could eliminate its exposure under an outstanding swap agreement by entering into an offsetting swap agreement with the same or another party.
Total return and custom basket swaps involve commitments where single or multiple cash flows are exchanged based on the price of an underlying reference asset (such as an index or custom basket of securities) for a fixed or variable interest rate. Total return and custom basket swaps will usually be computed based on the current value of the reference asset as of the close of regular trading on the NYSE or other exchange, with the swap value being adjusted to include dividends accrued, financing charges and/or interest associated with the swap agreement. When utilizing total return or custom basket swaps, a Fund bears the risk of loss of the amount expected to be received under a swap agreement in the event of the default or bankruptcy of a swap agreement counterparty or if the underlying reference asset declines in value.
The following table represents the Funds’ use and volume of total return swaps on a monthly basis:
| | | | Average Notional Amount | |
Fund | Use | | Long | | | Short | |
StylePlus—Large Core Fund | Index exposure | | $ | 166,465,138 | | | $ | — | |
StylePlus—Mid Growth Fund | Index exposure | | | 49,729,715 | | | | — | |
The following table represents the Funds’ use and volume of custom basket swaps on a monthly basis:
| | | | Average Notional Amount | |
Fund | Use | | Long | | | Short | |
Alpha Opportunity Fund | Hedge, Leverage | | $ | 16,876,397 | | | $ | 33,610,031 | |
Market Neutral Real Estate Fund | Hedge | | | — | | | | 24,885,511 | |
Risk Managed Real Estate Fund | Hedge, Leverage | | | 52,667,631 | | | | 49,148,092 | |
Derivative Investment Holdings Categorized by Risk Exposure
The following is a summary of the location of derivative investments on the Funds’ Statements of Assets and Liabilities as of September 30, 2023:
Derivative Investment Type | Asset Derivatives | Liability Derivatives |
Currency/Equity futures contracts | Variation margin on futures contracts | Variation margin on futures contracts |
Equity swap contracts | Unrealized appreciation on OTC swap agreements | Unrealized depreciation on OTC swap agreements |
| | THE GUGGENHEIM FUNDS ANNUAL REPORT | 113 |
NOTES TO FINANCIAL STATEMENTS (continued) |
The following tables set forth the fair value of the Funds’ derivative investments categorized by primary risk exposure at September 30, 2023:
Asset Derivative Investments Value |
Fund | | Futures
Equity
Risk* | | | Swaps
Equity
Risk | | | Futures
Foreign
Currency
Exchange
Risk* | | | Total Value at
September 30,
2023 | |
Alpha Opportunity Fund | | $ | — | | | $ | 2,180,789 | | | $ | — | | | $ | 2,180,789 | |
Market Neutral Real Estate Fund | | | — | | | | 3,900,187 | | | | — | | | | 3,900,187 | |
Risk Managed Real Estate Fund | | | — | | | | 10,413,513 | | | | — | | | | 10,413,513 | |
StylePlus—Large Core Fund | | | — | | | | 21,088,775 | | | | — | | | | 21,088,775 | |
StylePlus—Mid Growth Fund | | | — | | | | 5,149,352 | | | | — | | | | 5,149,352 | |
World Equity Income Fund | | | — | | | | — | | | | 183,425 | | | | 183,425 | |
Liability Derivative Investments Value |
Fund | | Futures
Equity
Risk* | | | Swaps
Equity
Risk | | | Futures
Foreign
Currency
Exchange
Risk* | | | Total Value at
September 30,
2023 | |
Risk Managed Real Estate Fund | | $ | — | | | $ | 3,333,686 | | | $ | — | | | $ | 3,333,686 | |
StylePlus—Large Core Fund | | | 56,341 | | | | — | | | | — | | | | 56,341 | |
StylePlus—Mid Growth Fund | | | 109,411 | | | | — | | | | — | | | | 109,411 | |
* | Includes cumulative appreciation (depreciation) of exchange-traded, OTC and centrally-cleared derivatives contracts as reported on the Schedules of Investments. For exchange-traded and centrally-cleared derivatives, variation margin is reported within the Funds’ Statements of Assets and Liabilities. |
The following is a summary of the location of derivative investments on the Funds’ Statements of Operations for the year ended September 30, 2023:
Derivative Investment Type | Location of Gain (Loss) on Derivatives |
Currency/Equity futures contracts | Net realized gain (loss) on futures contracts Net change in unrealized appreciation (depreciation) on futures contracts |
Equity swap contracts | Net realized gain (loss) on swap agreements Net change in unrealized appreciation (depreciation) on swap agreements |
The following is a summary of the Funds’ realized gain (loss) and change in unrealized appreciation (depreciation) on derivative investments recognized on the Funds’ Statements of Operations categorized by primary risk exposure for the year ended September 30, 2023:
Realized Gain (Loss) on Derivative Investments Recognized on the Statements of Operations |
Fund | | Futures
Equity
Risk | | | Swaps
Equity
Risk | | | Futures
Foreign
Currency
Exchange
Risk | | | Total | |
Alpha Opportunity Fund | | $ | — | | | $ | 1,169,204 | | | $ | — | | | $ | 1,169,204 | |
Market Neutral Real Estate Fund | | | — | | | | 1,791,735 | | | | — | | | | 1,791,735 | |
Risk Managed Real Estate Fund | | | — | | | | (248,222 | ) | | | — | | | | (248,222 | ) |
StylePlus—Large Core Fund | | | 231,814 | | | | (37,756,615 | ) | | | — | | | | (37,524,801 | ) |
StylePlus—Mid Growth Fund | | | 25,500 | | | | (22,219,474 | ) | | | — | | | | (22,193,974 | ) |
World Equity Income Fund | | | — | | | | — | | | | 356,540 | | | | 356,540 | |
114 | THE GUGGENHEIM FUNDS ANNUAL REPORT | |
NOTES TO FINANCIAL STATEMENTS (continued) |
Change in Unrealized Appreciation (Depreciation) on Derivative Investments Recognized on the Statements of Operations |
Fund | | Futures
Equity
Risk | | | Swaps
Equity
Risk | | | Futures
Foreign
Currency
Exchange
Risk | | | Total | |
Alpha Opportunity Fund | | $ | — | | | $ | (1,078,261 | ) | | $ | — | | | $ | (1,078,261 | ) |
Market Neutral Real Estate Fund | | | — | | | | (812,638 | ) | | | — | | | | (812,638 | ) |
Risk Managed Real Estate Fund | | | — | | | | (1,512,665 | ) | | | — | | | | (1,512,665 | ) |
StylePlus—Large Core Fund | | | 183,408 | | | | 61,878,961 | | | | — | | | | 62,062,369 | |
StylePlus—Mid Growth Fund | | | 17,820 | | | | 27,974,037 | | | | — | | | | 27,991,857 | |
World Equity Income Fund | | | — | | | | — | | | | (101,241 | ) | | | (101,241 | ) |
In conjunction with short sales and the use of derivative instruments, the Funds are required to maintain collateral in various forms. Depending on the financial instrument utilized and the broker involved, the Funds use margin deposits at the broker, cash and/or securities segregated at the custodian bank, discount notes or repurchase agreements allocated to the Funds as collateral.
Foreign Investments
There are several risks associated with exposure to foreign currencies, foreign issuers and emerging markets. A fund’s indirect and direct exposure to foreign currencies subjects the Fund to the risk that those currencies will decline in value relative to the U.S. dollar, or in the case of short positions, that the U.S. dollar will decline in value relative to the currency being hedged. Currency rates in foreign countries may fluctuate significantly over short periods of time for a number of reasons, including changes in interest rates and the imposition of currency controls or other political developments in the U.S. or abroad. In addition, the Funds may incur transaction costs in connection with conversions between various currencies. The Funds may, but is not obligated to, engage in currency hedging transactions, which generally involve buying currency forward, options or futures contracts. However, not all currency risks may be effectively hedged, and in some cases the costs of hedging techniques may outweigh expected benefits. In such instances, the value of securities denominated in foreign currencies can change significantly when foreign currencies strengthen or weaken relative to the U.S. dollar.
The Funds may invest in securities of foreign companies directly, or in financial instruments, such as ADRs and exchange-traded funds, which are indirectly linked to the performance of foreign issuers. Foreign markets can be more volatile than the U.S. market due to increased risks of adverse issuer, political, regulatory, market, or economic developments and can perform differently from the U.S. market. Investing in securities of foreign companies directly, or in financial instruments that are indirectly linked to the performance of foreign issuers, may involve risks not typically associated with investing in U.S. issuers. The value of securities denominated in foreign currencies, and of dividends from such securities, can change significantly when foreign currencies strengthen or weaken relative to the U.S. dollar. Foreign securities markets generally have less trading volume and less liquidity than U.S. markets, and prices in some foreign markets may fluctuate more than those of securities traded on U.S. markets. Many foreign countries lack accounting and disclosure standards comparable to those that apply to U.S. companies, and it may be more difficult to obtain reliable information regarding a foreign issuer’s financial condition and operations. Transaction costs and costs associated with custody services are generally higher for foreign securities than they are for U.S. securities. Some foreign governments levy withholding taxes against dividend and interest income. Although in some countries portions of these taxes are recoverable, the non-recovered portion will reduce the income received by the Funds.
The Trust has established counterparty credit guidelines and enters into transactions only with financial institutions rated/identified as investment grade or better. The Trust monitors the counterparty credit risk associated with each such financial institution.
Note 3 – Offsetting
In the normal course of business, the Funds enter into transactions subject to enforceable master netting arrangements or other similar arrangements. Generally, the right to offset in those agreements allows the Funds to counteract the exposure to a specific counterparty with collateral received from or delivered to that counterparty based on the terms of the arrangements. These arrangements provide for the right to liquidate upon the occurrence of an event of default, credit event upon merger or additional termination event.
| | THE GUGGENHEIM FUNDS ANNUAL REPORT | 115 |
NOTES TO FINANCIAL STATEMENTS (continued) |
In order to better define their contractual rights and to secure rights that will help the Funds mitigate their counterparty risk, the Funds may enter into an International Swaps and Derivatives Association, Inc. Master Agreement (“ISDA Master Agreement”) or similar agreement with their derivative contract counterparties. An ISDA Master Agreement is a bilateral agreement between a fund and a counterparty that governs OTC derivatives, including foreign exchange contracts, and typically contains, among other things, collateral posting terms and netting provisions in the event of a default and/or termination event. The provisions of the ISDA Master Agreement typically permit a single net payment in the event of a default (close-out netting) or similar event, including the bankruptcy or insolvency of the counterparty.
For derivatives traded under an ISDA Master Agreement, the collateral requirements are typically calculated by netting the mark-to-market amount for each transaction under such agreement and comparing that amount to the value of any collateral currently pledged by the Funds and the counterparty. For financial reporting purposes, cash collateral that has been pledged to cover obligations of the Funds and cash collateral received from the counterparty, if any, are reported separately on the Funds’ Statements of Assets and Liabilities as segregated cash with broker/receivable for variation margin, or payable for swap settlement/variation margin. Cash and/or securities pledged or received as collateral by the Funds in connection with an OTC derivative subject to an ISDA Master Agreement generally may not be invested, sold or rehypothecated by the counterparty or the Funds, as applicable, absent an event of default under such agreement, in which case such collateral generally may be applied towards obligations due to and payable by such counterparty or the Funds, as applicable. Generally, the amount of collateral due from or to a counterparty must exceed a minimum transfer amount threshold (e.g., $300,000) before a transfer is required to be made. To the extent amounts due to the Funds from their counterparties are not fully collateralized, contractually or otherwise, the Funds bear the risk of loss from counterparty nonperformance. The Funds attempt to mitigate counterparty risk by only entering into agreements with counterparties that they believe to be of good standing and by monitoring the financial stability of those counterparties.
For financial reporting purposes, the Funds do not offset derivative assets and derivative liabilities that are subject to netting arrangements in the Funds’ Statements of Assets and Liabilities.
The following tables present derivative financial instruments and secured financing transactions that are subject to enforceable netting arrangements:
| | | | | | | | | | | | | | | | Gross Amounts Not Offset
in the Statements of
Assets and Liabilities | | | | | |
Fund | Instrument | | Gross
Amounts of
Recognized
Assets1 | | | Gross
Amounts
Offset in the
Statements
of Assets and
Liabilities | | | Net Amount
of Assets
Presented on
the Statements
of Assets and
Liabilities | | | Financial
Instruments | | | Cash
Collateral
Received | | | Net
Amount | |
Alpha Opportunity Fund | Custom basket swap agreements | | $ | 2,180,789 | | | $ | — | | | | 2,180,789 | | | | — | | | | — | | | $ | 2,180,789 | |
Market Neutral Real Estate Fund | Custom basket swap agreements | | | 3,900,187 | | | | — | | | | 3,900,187 | | | | — | | | | (2,640,000 | ) | | | 1,260,187 | |
Risk Managed Real Estate Fund | Custom basket swap agreements | | | 10,413,513 | | | | — | | | | 10,413,513 | | | | (3,333,686 | ) | | | (3,533,030 | ) | | | 3,546,797 | |
StylePlus—Large Core Fund | Swap equity contacts | | | 21,088,775 | | | | — | | | | 21,088,775 | | | | — | | | | (15,890,000 | ) | | | 5,198,775 | |
StylePlus—Mid Growth Fund | Swap equity contracts | | | 5,149,352 | | | | — | | | | 5,149,352 | | | | — | | | | (3,570,000 | ) | | | 1,576,352 | |
116 | THE GUGGENHEIM FUNDS ANNUAL REPORT | |
NOTES TO FINANCIAL STATEMENTS (continued) |
| | | | | | | | | | | | | | | | Gross Amounts Not Offset
in the Statements of
Assets and Liabilities | | | | | |
Fund | Instrument | | Gross
Amounts of
Recognized
Liabilities1 | | | Gross
Amounts
Offset in the
Statements
of Assets and
Liabilities | | | Net Amounts
of Liabilities
Presented on
the Statements
of Assets and
Liabilities | | | Financial
Instruments | | | Cash
Collateral
Pledged | | | Net
Amount | |
Risk Managed Real Estate Fund | Custom basket swap agreements | | $ | 3,333,686 | | | $ | – | | | $ | 3,333,686 | | | $ | (3,333,686 | ) | | $ | – | | | $ | – | |
1 | Exchange-traded or centrally-cleared derivatives are excluded from these reported amounts. |
The Funds have the right to offset deposits against any related derivative liabilities outstanding with each counterparty with the exception of exchange-traded or centrally-cleared derivatives. The following table presents deposits held by others in connection with derivative investments as of September 30, 2023.
Fund | Counterparty | Asset Type | | Cash Pledged | | | Cash Received | |
Market Neutral Real Estate Fund | Goldman Sachs International | Custom basket swap agreements | | $ | — | | | $ | 770,000 | |
| Morgan Stanley Capital Services LLC | Custom basket swap agreements | | | — | | | | 1,870,000 | |
Market Neutral Real Estate Fund Total | | | | | | | | | 2,640,000 | |
Risk Managed Real Estate Fund | Goldman Sachs International | Custom basket swap agreements | | | 730,000 | | | | — | |
| Morgan Stanley Capital Services LLC | Custom basket swap agreements | | | — | | | | 3,533,030 | |
Risk Managed Real Estate Fund Total | | | | | 730,000 | | | | 3,533,030 | |
StylePlus—Large Core Fund | Morgan Stanley Capital Services LLC | Futures contracts | | | 200,000 | | | | — | |
| Wells Fargo Bank, N.A. | Total return swap agreements | | | — | | | | 15,890,000 | |
StylePlus—Large Core Fund Total | | | | | 200,000 | | | | 15,890,000 | |
StylePlus—Mid Growth Fund | Morgan Stanley Capital Services LLC | Futures contracts | | | 216,898 | | | | — | |
| Wells Fargo Bank, N.A. | Total return swap agreements | | | — | | | | 3,570,000 | |
StylePlus—Mid Growth Fund Total | | | | | 216,898 | | | | 3,570,000 | |
World Equity Income Fund | BofA Securities, Inc. | Futures contracts | | | 251,000 | | | | — | |
Note 4 – Fair Value Measurement
In accordance with U.S. GAAP, fair value is defined as the price that the Funds would receive to sell an investment or pay to transfer a liability in an orderly transaction between market participants at the measurement date. U.S. GAAP establishes a three-tier fair value hierarchy based on the types of inputs used to value assets and liabilities and requires corresponding disclosure. The hierarchy and the corresponding inputs are summarized below:
Level 1 — unadjusted quoted prices in active markets for identical assets or liabilities.
Level 2 — significant other observable inputs (for example quoted prices for securities that are similar based on characteristics such as interest rates, prepayment speeds, credit risk, etc.).
Level 3 — significant unobservable inputs based on the best information available under the circumstances, to the extent observable inputs are not available, which may include assumptions.
| | THE GUGGENHEIM FUNDS ANNUAL REPORT | 117 |
NOTES TO FINANCIAL STATEMENTS (continued) |
Rule 2a-5 sets forth a definition of “readily available market quotations,” which is consistent with the definition of a Level 1 input under U.S. GAAP. Rule 2a-5 provides that “a market quotation is readily available only when that quotation is a quoted price (unadjusted) in active markets for identical investments that the fund can access at the measurement date, provided that a quotation will not be readily available if it is not reliable.”
Securities for which market quotations are not readily available must be valued at fair value as determined in good faith. Accordingly, any security priced using inputs other than Level 1 inputs will be subject to fair value requirements. The types of inputs available depend on a variety of factors, such as the type of security and the characteristics of the markets in which it trades, if any. Fair valuation determinations that rely on fewer or no observable inputs require greater judgment. Accordingly, fair value determinations for Level 3 securities require the greatest amount of judgment.
The inputs or methodologies selected and applied for valuing securities or other assets are not necessarily an indication of the risk associated with investing in those securities. The suitability, appropriateness and accuracy of the techniques, methodologies and sources employed to determine fair valuation are periodically reviewed and subject to change.
Note 5 – Investment Advisory Agreement and Other Agreements
Under the terms of an investment advisory contract, the Funds pay GI investment advisory fees calculated at the annualized rates below, based on the average daily net assets of the Funds:
Fund | | Management Fees
(as a % of Net Assets) |
Alpha Opportunity Fund | | | 0.90% |
Large Cap Value Fund | | | 0.65% |
Market Neutral Real Estate Fund | | | 1.10% |
Risk Managed Real Estate Fund | | | 0.75% |
Small Cap Value Fund | | | 0.75% |
StylePlus—Large Core Fund | | | 0.75% |
StylePlus—Mid Growth Fund | | | 0.75% |
World Equity Income Fund | | | 0.70% |
GI pays operating expenses on behalf of the Trust, such as audit and accounting related services, legal services, custody, printing and mailing, among others, on a pass-through basis. Such expenses are allocated to various Funds within the complex based on relative net assets.
The Board has adopted Distribution Plans related to the offering of A-Class, C-Class and P-Class shares pursuant to Rule 12b-1 under the 1940 Act. The plans provide for payments at an annual rate of 0.25% of the average daily net assets of the Fund’s A-Class and P-Class shares, and 1.00% of the average daily net assets of the Fund’s C-Class shares.
Contractual expense limitation agreements for the following Funds provide that the total expenses be limited to a percentage of average net assets for each class of shares, exclusive of brokerage costs, dividends or interest on securities sold short, expenses of other investment companies in which a Fund invests, interest, taxes, litigation, indemnification and extraordinary expenses. The limits are listed below:
| | Limit | | | Effective
Date | | | Contract
End Date | |
Alpha Opportunity Fund – A-Class | | | 1.76 | % | | | 05/31/17 | | | | 02/01/25 | |
Alpha Opportunity Fund – C-Class | | | 2.51 | % | | | 05/31/17 | | | | 02/01/25 | |
Alpha Opportunity Fund – P-Class | | | 1.76 | % | | | 05/31/17 | | | | 02/01/25 | |
Alpha Opportunity Fund – Institutional Class | | | 1.51 | % | | | 05/31/17 | | | | 02/01/25 | |
Large Cap Value Fund – A-Class | | | 1.15 | % | | | 11/30/12 | | | | 02/01/25 | |
Large Cap Value Fund – C-Class | | | 1.90 | % | | | 11/30/12 | | | | 02/01/25 | |
Large Cap Value Fund – P-Class | | | 1.15 | % | | | 05/01/15 | | | | 02/01/25 | |
Large Cap Value Fund – Institutional Class | | | 0.90 | % | | | 06/05/13 | | | | 02/01/25 | |
Market Neutral Real Estate Fund – A-Class | | | 1.65 | % | | | 02/26/16 | | | | 02/01/25 | |
Market Neutral Real Estate Fund – C-Class | | | 2.40 | % | | | 02/26/16 | | | | 02/01/25 | |
Market Neutral Real Estate Fund – P-Class | | | 1.65 | % | | | 02/26/16 | | | | 02/01/25 | |
Market Neutral Real Estate Fund – Institutional Class | | | 1.40 | % | | | 02/26/16 | | | | 02/01/25 | |
118 | THE GUGGENHEIM FUNDS ANNUAL REPORT | |
NOTES TO FINANCIAL STATEMENTS (continued) |
| | Limit | | | Effective
Date | | | Contract
End Date | |
Risk Managed Real Estate Fund – A-Class | | | 1.30 | % | | | 03/26/14 | | | | 02/01/25 | |
Risk Managed Real Estate Fund – C-Class | | | 2.05 | % | | | 03/26/14 | | | | 02/01/25 | |
Risk Managed Real Estate Fund – P-Class | | | 1.30 | % | | | 05/01/15 | | | | 02/01/25 | |
Risk Managed Real Estate Fund – Institutional Class | | | 1.10 | % | | | 03/26/14 | | | | 02/01/25 | |
Small Cap Value Fund – A-Class | | | 1.30 | % | | | 11/30/12 | | | | 02/01/25 | |
Small Cap Value Fund – C-Class | | | 2.05 | % | | | 11/30/12 | | | | 02/01/25 | |
Small Cap Value Fund – P-Class | | | 1.30 | % | | | 05/01/15 | | | | 02/01/25 | |
Small Cap Value Fund – Institutional Class | | | 1.05 | % | | | 11/30/12 | | | | 02/01/25 | |
World Equity Income Fund – A-Class | | | 1.22 | % | | | 08/15/13 | | | | 02/01/25 | |
World Equity Income Fund – C-Class | | | 1.97 | % | | | 08/15/13 | | | | 02/01/25 | |
World Equity Income Fund – P-Class | | | 1.22 | % | | | 05/01/15 | | | | 02/01/25 | |
World Equity Income Fund – Institutional Class | | | 0.97 | % | | | 08/15/13 | | | | 02/01/25 | |
GI and GPIM are entitled to reimbursement by the Funds for fees waived or expenses reimbursed during any of the previous 36 months, beginning on the date of the expense limitation agreement, if on any day the estimated operating expenses are less than the indicated percentages. For purposes of this arrangement, GI and GPIM are entitled to recoupment of previously waived fees or reimbursed expenses for 36 months from the date of the waiver or reimbursement by GI or GPIM. At September 30, 2023, the amount of fees waived or expenses reimbursed that are subject to recoupment and will expire during the years ended September 30, are presented in the following table:
Fund | | 2024 | | | 2025 | | | 2026 | | | Total | |
Alpha Opportunity Fund | | | | | | | | | | | | | | | | |
A-Class | | $ | 5,716 | | | $ | 4,189 | | | $ | 4,612 | | | $ | 14,517 | |
C-Class | | | 739 | | | | 584 | | | | 502 | | | | 1,825 | |
P-Class | | | 2,910 | | | | 971 | | | | 1,774 | | | | 5,655 | |
Institutional Class | | | — | | | | — | | | | 8,730 | | | | 8,730 | |
Large Cap Value Fund | | | | | | | | | | | | | | | | |
A-Class | | | 115,360 | | | | 99,071 | | | | 106,239 | | | | 320,670 | |
C-Class | | | 5,446 | | | | 5,729 | | | | 5,870 | | | | 17,045 | |
P-Class | | | 961 | | | | 796 | | | | 522 | | | | 2,279 | |
Institutional Class | | | 3,072 | | | | 6,589 | | | | 11,209 | | | | 20,870 | |
Market Neutral Real Estate Fund | | | | | | | | | | | | | | | | |
A-Class | | | 20,606 | | | | 7,180 | | | | 2,380 | | | | 30,166 | |
C-Class | | | 888 | | | | 689 | | | | 524 | | | | 2,101 | |
P-Class | | | 15,753 | | | | 6,928 | | | | 3,895 | | | | 26,576 | |
Institutional Class | | | 103,050 | | | | 121,875 | | | | 95,116 | | | | 320,041 | |
Risk Managed Real Estate Fund | | | | | | | | | | | | | | | | |
A-Class | | | — | | | | — | | | | 1,314 | | | | 1,314 | |
C-Class | | | — | | | | 334 | | | | 581 | | | | 915 | |
P-Class | | | 834 | | | | 6,841 | | | | 4,114 | | | | 11,789 | |
Institutional Class | | | — | | | | — | | | | — | | | | — | |
Small Cap Value Fund | | | | | | | | | | | | | | | | |
A-Class | | | 126,091 | | | | 98,289 | | | | 91,810 | | | | 316,190 | |
C-Class | | | 24,783 | | | | 14,817 | | | | 10,065 | | | | 49,665 | |
P-Class | | | 1,282 | | | | 2,097 | | | | 2,852 | | | | 6,231 | |
Institutional Class | | | 38,236 | | | | 44,992 | | | | 44,148 | | | | 127,376 | |
World Equity Income Fund | | | | | | | | | | | | | | | | |
A-Class | | | 103,050 | | | | 78,363 | | | | 111,813 | | | | 293,226 | |
C-Class | | | 10,532 | | | | 7,540 | | | | 7,790 | | | | 25,862 | |
P-Class | | | 336 | | | | 408 | | | | 411 | | | | 1,155 | |
Institutional Class | | | 7,366 | | | | 7,859 | | | | 8,688 | | | | 23,913 | |
| | THE GUGGENHEIM FUNDS ANNUAL REPORT | 119 |
NOTES TO FINANCIAL STATEMENTS (continued) |
For the year ended September 30, 2023, GI recouped amounts from the Funds as follows:
Alpha Opportunity Fund | | $ | 13,191 | |
Market Neutral Real Estate Fund | | | 464 | |
Risk Managed Real Estate Fund | | | 69,899 | |
If a Fund invests in a fund that is advised by the same adviser or an affiliated adviser, the investing Fund’s adviser has agreed to waive fees at the investing fund level to the extent necessary to offset the proportionate share of any management fee paid by each Fund with respect to its investment in such affiliated fund. Fee waivers will be calculated at the investing fund level without regard to any expense cap in effect for the investing fund. Fees waived under this arrangement are not subject to reimbursement to GI. For the year ended September 30, 2023, the investing Fund’s adviser waived fees related to investments in affiliated funds for the following Funds:
Fund | | Amount Waived | |
StylePlus—Large Core Fund | | $ | 87,068 | |
StylePlus—Mid Growth Fund | | | 5,144 | |
For the year ended September 30, 2023, GFD retained sales charges of $132,849 relating to sales of A-Class shares of the Trust.
Certain trustees and officers of the Trust are also officers of GI and/or GFD. The Trust does not compensate its officers or trustees who are officers, directors and/or employees of GI or GFD.
MUFG Investor Services (US), LLC (“MUIS”) acts as the Funds’ administrator, transfer agent and accounting agent. As administrator, transfer agent and accounting agent, MUIS maintains the books and records of the Funds’ securities and cash. The Bank of New York Mellon Corp. (“BNY”) acts as the Funds’ custodian. As custodian, BNY is responsible for the custody of the Funds’ assets. For providing the aforementioned administrative and accounting services, MUIS is entitled to receive a monthly fee equal to a percentage of the Funds’ average daily net assets and out of pocket expenses. For providing the aforementioned transfer agent and custodian services, MUIS and BNY are entitled to receive a monthly fee based on the number of transactions during the month and the number of accounts under management, subject to certain minimum monthly fees, and out of pocket expenses.
At September 30, 2023, GI and its affiliates owned over twenty percent of the outstanding shares of the Funds, as follows:
Fund | | Percent of Outstanding
Shares Owned |
Alpha Opportunity Fund | | | 77% |
Note 6 – Federal Income Tax Information
The Funds intend to comply with the provisions of Subchapter M of the Internal Revenue Code of 1986, as amended (the “Internal Revenue Code”), applicable to regulated investment companies and will distribute substantially all taxable net investment income and capital gains sufficient to relieve the Funds from all, or substantially all, federal income, excise and state income taxes. Therefore, no provision for federal or state income tax or federal excise tax is required.
Tax positions taken or expected to be taken in the course of preparing the Funds’ tax returns are evaluated to determine whether the tax positions are “more-likely-than-not” of being sustained by the applicable tax authority. Tax positions not deemed to meet the more-likely-than-not threshold would be recorded as a tax benefit or expense in the current year. Management has analyzed the Funds’ tax positions taken, or to be taken, on U.S. federal income tax returns for all open tax years, and has concluded that no provision for income tax is required in the Funds’ financial statements. The Funds’ U.S. federal income tax returns are subject to examination by the Internal Revenue Service (“IRS”) for a period of three years after they are filed.
120 | THE GUGGENHEIM FUNDS ANNUAL REPORT | |
NOTES TO FINANCIAL STATEMENTS (continued) |
The tax character of distributions paid during the year ended September 30, 2023 was as follows:
Fund | | Ordinary
Income | | | Long-Term
Capital Gain | | | Return
of Capital | | | Total
Distributions | |
Alpha Opportunity Fund | | $ | 205,930 | | | $ | — | | | $ | — | | | $ | 205,930 | |
Large Cap Value Fund | | | 537,701 | | | | 3,093,835 | | | | — | | | | 3,631,536 | |
Market Neutral Real Estate Fund | | | 111,384 | | | | — | | | | — | | | | 111,384 | |
Risk Managed Real Estate Fund | | | 9,734,314 | | | | 18,153,953 | | | | 2,638,803 | | | | 30,527,070 | |
Small Cap Value Fund | | | 78,299 | | | | 250,781 | | | | — | | | | 329,080 | |
StylePlus—Large Core Fund | | | 1,947,148 | | | | 57,379,626 | | | | — | | | | 59,326,774 | |
StylePlus—Mid Growth Fund | | | 326,968 | | | | 18,747,109 | | | | — | | | | 19,074,077 | |
World Equity Income Fund | | | 792,315 | | | | 23,830 | | | | — | | | | 816,145 | |
The tax character of distributions paid during the year ended September 30, 2022 was as follows:
Fund | | Ordinary
Income | | | Long-Term
Capital Gain | | | Total
Distributions | |
Alpha Opportunity Fund | | $ | 282,314 | | | $ | — | | | $ | 282,314 | |
Large Cap Value Fund | | | 570,132 | | | | 2,127,841 | | | | 2,697,973 | |
Market Neutral Real Estate Fund | | | 161,651 | | | | — | | | | 161,651 | |
Risk Managed Real Estate Fund | | | 26,745,499 | | | | 6,663,532 | | | | 33,409,031 | |
Small Cap Value Fund | | | — | | | | 31,116 | | | | 31,116 | |
StylePlus—Large Core Fund | | | 8,865,934 | | | | 3,412,498 | | | | 12,278,432 | |
StylePlus—Mid Growth Fund | | | 5,134,467 | | | | 1,863,986 | | | | 6,998,453 | |
World Equity Income Fund | | | 10,456,355 | | | | 2,158,642 | | | | 12,614,997 | |
Note: For U.S. federal income tax purposes, short-term capital gain distributions are treated as ordinary income distributions.
The tax components of distributable earnings/(loss) as of September 30, 2023 were as follows:
Fund | | Undistributed
Ordinary Income | | | Undistributed
Long-Term
Capital Gain | | | Net Unrealized
Appreciation
(Depreciation) | | | Accumulated
Capital and
Other Losses | | | Other
Temporary
Differences | | | Total | |
Alpha Opportunity Fund | | $ | 199,681 | | | $ | — | | | $ | 1,845,175 | | | $ | (26,871,858 | ) | | $ | — | | | $ | (24,827,002 | ) |
Large Cap Value Fund | | | 674,731 | | | | 3,299,408 | | | | 3,591,756 | | | | — | | | | — | | | | 7,565,895 | |
Market Neutral Real Estate Fund | | | 1,115,104 | | | | — | | | | 1,449,889 | | | | (3,460,719 | ) | | | — | | | | (895,726 | ) |
Risk Managed Real Estate Fund | | | — | | | | — | | | | (40,222,768 | ) | | | (2,038,164 | ) | | | (3,129,119 | ) | | | (45,390,051 | ) |
Small Cap Value Fund | | | 82,744 | | | | 336,090 | | | | (178,262 | ) | | | — | | | | — | | | | 240,572 | |
StylePlus—Large Core Fund | | | 5,630,586 | | | | — | | | | 19,967,423 | | | | (40,316,776 | ) | | | — | | | | (14,718,767 | ) |
StylePlus—Mid Growth Fund | | | 1,661,785 | | | | — | | | | 4,838,558 | | | | (26,854,771 | ) | | | — | | | | (20,354,428 | ) |
World Equity Income Fund | | | 104,682 | | | | — | | | | 419,842 | | | | (133,403 | ) | | | — | | | | 391,121 | |
For U.S. federal income tax purposes, capital loss carryforwards represent realized losses of the Funds that may be carried forward and applied against future capital gains. The Funds are permitted to carry forward capital losses for an unlimited period and such capital loss carryforwards retain their character as either short-term or long-term capital losses. As of September 30, 2023, capital loss carryforwards for the Funds were as follows:
Fund | | Unlimited | | | Total Capital Loss
Carryforward | |
| | Short-Term | | | Long-Term | | |
Alpha Opportunity Fund | | $ | (21,038,059 | ) | | $ | (5,833,799 | ) | | $ | (26,871,858 | ) |
Market Neutral Real Estate Fund | | | (2,482,907 | ) | | | (977,812 | ) | | | (3,460,719 | ) |
Risk Managed Real Estate Fund | | | (681,926 | ) | | | — | | | | (681,926 | ) |
StylePlus—Large Core Fund | | | (3,525,878 | ) | | | (36,790,898 | ) | | | (40,316,776 | ) |
StylePlus—Mid Growth Fund | | | (8,287,378 | ) | | | (18,567,393 | ) | | | (26,854,771 | ) |
World Equity Income Fund | | | (133,403 | ) | | | — | | | | (133,403 | ) |
| | THE GUGGENHEIM FUNDS ANNUAL REPORT | 121 |
NOTES TO FINANCIAL STATEMENTS (continued) |
For the year ended September 30, 2023, the following capital loss carryforward amounts were utilized:
Fund | | Utilized | |
Alpha Opportunity Fund | | $ | 2,170,035 | |
Market Neutral Real Estate Fund | | | 292,217 | |
Net investment income and net realized gains (losses) may differ for financial statement and tax purposes because of temporary or permanent book/tax differences. These differences are primarily due to investments in real estate investment trusts, foreign currency gains and losses, losses deferred due to wash sales, distributions in connection with redemption of fund shares, and the “mark-to-market,” recharacterization, or disposition of certain Passive Foreign Investment Companies (PFICs). Additional differences may result from the tax treatment of securities sold short, dividends payable, distribution reclasses, and the “mark-to-market” of certain derivatives. To the extent these differences are permanent and would require a reclassification between Paid in Capital and Total Distributable Earnings (Loss), such reclassifications are made in the period that the differences arise. These reclassifications have no effect on net assets or NAV per share.
The following adjustments were made on the Statements of Assets and Liabilities as of September 30, 2023 for permanent book/tax differences:
Fund | | Paid In
Capital | | | Total
Distributable
Earnings/(Loss) | |
Large Cap Value Fund | | $ | 586,812 | | | $ | (586,812 | ) |
Risk Managed Real Estate Fund | | | 343,965 | | | | (343,965 | ) |
Small Cap Value Fund | | | 276,854 | | | | (276,854 | ) |
StylePlus—Large Core Fund | | | 1,510 | | | | (1,510 | ) |
At September 30, 2023, the cost of investments for U.S. federal income tax purposes, the aggregate gross unrealized appreciation for all investments for which there was an excess of value over tax cost and the aggregate gross unrealized depreciation for all investments for which there was an excess of tax cost over value, were as follows:
Fund | | Tax
Cost | | | Tax
Unrealized
Appreciation | | | Tax
Unrealized
Depreciation | | | Net Tax
Unrealized
Appreciation/
(Depreciation) | |
Alpha Opportunity Fund | | $ | 33,388,029 | | | $ | 3,477,912 | | | $ | (1,632,737 | ) | | $ | 1,845,175 | |
Large Cap Value Fund | | | 31,903,140 | | | | 5,641,753 | | | | (2,049,997 | ) | | | 3,591,756 | |
Market Neutral Real Estate Fund | | | 50,385,958 | | | | 4,292,020 | | | | (2,842,131 | ) | | | 1,449,889 | |
Risk Managed Real Estate Fund | | | 363,606,792 | | | | 21,043,523 | | | | (61,266,291 | ) | | | (40,222,768 | ) |
Small Cap Value Fund | | | 5,687,257 | | | | 542,648 | | | | (720,910 | ) | | | (178,262 | ) |
StylePlus—Large Core Fund | | | 210,379,296 | | | | 24,459,080 | | | | (4,491,657 | ) | | | 19,967,423 | |
StylePlus—Mid Growth Fund | | | 65,045,178 | | | | 6,267,654 | | | | (1,429,096 | ) | | | 4,838,558 | |
World Equity Income Fund | | | 43,850,215 | | | | 2,775,449 | | | | (2,350,751 | ) | | | 424,698 | |
Note 7 – Securities Transactions
For the year ended September 30, 2023, the cost of purchases and proceeds from sales of investment securities, excluding government securities, short-term investments and derivatives, were as follows:
Fund | | Purchases | | | Sales | |
Alpha Opportunity Fund | | $ | 95,587,706 | | | $ | 94,307,655 | |
Large Cap Value Fund | | | 7,237,153 | | | | 14,560,951 | |
Market Neutral Real Estate Fund | | | 19,393,835 | | | | 13,393,114 | |
Risk Managed Real Estate Fund | | | 87,875,632 | | | | 126,514,132 | |
Small Cap Value Fund | | | 4,811,286 | | | | 6,469,445 | |
StylePlus—Large Core Fund | | | 115,085,324 | | | | 111,237,903 | |
StylePlus—Mid Growth Fund | | | 52,051,581 | | | | 60,527,262 | |
World Equity Income Fund | | | 70,849,087 | | | | 75,533,420 | |
122 | THE GUGGENHEIM FUNDS ANNUAL REPORT | |
NOTES TO FINANCIAL STATEMENTS (concluded) |
Note 8 – Line of Credit
The Trust, along with other affiliated trusts, secured a 364-day committed, $1,150,000,000 line of credit from Citibank, N.A., which was in place through September 29, 2023, at which time a new line of credit was entered into in the amount of $1,165,000,000. A Fund may draw (borrow) from the line of credit as a temporary measure for emergency purposes, to facilitate redemption requests, or for other short-term liquidity purposes consistent with the Fund’s investment objective and program. For example, it may be advantageous for the Fund to borrow money rather than sell existing portfolio positions to meet redemption requests. Fees related to borrowings, if any, vary under this arrangement between the greater of Citibank’s “base rate”, SOFR plus 1%, or the federal funds rate plus 1/2 of 1%.
The commitment fee that may be paid by the Funds is at an annualized rate of 0.15% of the average daily amount of their allocated unused commitment amount. The commitment fee amount is allocated to the individual Funds based on the respective net assets of each participating Fund and is referenced in the Funds’ Statement of Operations under “Line of credit fees”. The Funds did not have any borrowings under this agreement as of and for the year ended September 30, 2023.
Note 9 – Large Shareholder Risk
As of September 30, 2023, 77.3% of the Alpha Opportunity Fund (the “Fund”) was held by Guggenheim Macro Opportunities Fund. The Fund may experience adverse effects if a large number of shares of the Fund are held by a single shareholder (e.g., an institutional investor, financial intermediary or another GI Fund). The Fund is subject to the risk that a redemption by those shareholders of all or a large portion of the Fund could cause the Fund to liquidate its assets at inopportune times, or at a loss or depressed value, which could adversely impact the Fund’s performance and cause the value of a shareholder’s investment to decline. Redemptions of a large number of shares also may increase transaction costs or, by necessitating a sale of portfolio securities, have adverse tax consequences for shareholders. They also potentially limit the use of any capital loss carryforwards and certain other losses to offset future realized capital gains (if any) and may limit or prevent a Fund’s use of tax equalization.
Note 10 – Market Risks
The value of, or income generated by, the investments held by the Funds are subject to the possibility of rapid and unpredictable fluctuation, and loss that may result from various factors. These factors include, among others, developments affecting individual companies, or from broader influences, including real or perceived changes in prevailing interest rates (which have since risen and may continue to rise), changes in inflation rates or expectations about inflation rates (which are currently elevated relative to normal conditions), adverse investor confidence or sentiment, changing economic, political (including geopolitical), social or financial market conditions, increased instability or general uncertainty, environmental disasters, governmental actions, public health emergencies (such as the spread of infectious diseases, pandemics and epidemics), debt crises, actual or threatened wars or other armed conflicts (such as the current Russia-Ukraine conflict and its risk of expansion or collateral economic and other effects) or ratings downgrades, and other similar events, each of which may be temporary or last for extended periods. Moreover, changing economic, political, geopolitical, social, financial market or other conditions in one country, geographic region or industry could adversely affect the value, yield and return of the investments held by the Funds in a different country, geographic region, economy or industry and market because of the increasingly interconnected global economies and financial markets. The duration and extent of the foregoing types of factors or conditions are highly uncertain and difficult to predict and have in the past, and may in the future, cause volatility and distress in economies and financial markets or other adverse circumstances, which may negatively affect the value of the Funds’ investments and performance of the Funds.
Note 11 – Subsequent Events
The Funds evaluated subsequent events through the date the financial statements are issued and determined there were no material events that would require adjustment to or disclosure in the Funds’ financial statements.
| | THE GUGGENHEIM FUNDS ANNUAL REPORT | 123 |
REPORT OF INDEPENDENT REGISTERED PUBLIC ACCOUNTING FIRM |
To the Shareholders of Guggenheim Alpha Opportunity Fund, Guggenheim Large Cap Value Fund, Guggenheim Market Neutral Real Estate Fund, Guggenheim Risk Managed Real Estate Fund, Guggenheim Small Cap Value Fund, Guggenheim StylePlus-Large Core Fund, Guggenheim StylePlus-Mid Growth Fund and Guggenheim World Equity Income Fund and the Board of Trustees of Guggenheim Funds Trust
Opinion on the Financial Statements
We have audited the accompanying statements of assets and liabilities of Guggenheim Alpha Opportunity Fund, Guggenheim Large Cap Value Fund, Guggenheim Market Neutral Real Estate Fund, Guggenheim Risk Managed Real Estate Fund, Guggenheim Small Cap Value Fund, Guggenheim StylePlus-Large Core Fund, Guggenheim StylePlus-Mid Growth Fund and Guggenheim World Equity Income Fund (collectively referred to as the “Funds”) (eight of the funds constituting Guggenheim Funds Trust (the “Trust”)), including the schedules of investments, as of September 30, 2023, and the related statements of operations for the year then ended, the statements of changes in net assets for each of the two years in the period then ended, the financial highlights for each of the five years in the period then ended and the related notes (collectively referred to as the “financial statements”). In our opinion, the financial statements present fairly, in all material respects, the financial position of each of the Funds (eight of the funds constituting Guggenheim Funds Trust) at September 30, 2023, the results of their operations for the year then ended, the changes in their net assets for each of the two years in the period then ended and their financial highlights for each of the five years in the period then ended, in conformity with U.S. generally accepted accounting principles.
Basis for Opinion
These financial statements are the responsibility of the Trust’s management. Our responsibility is to express an opinion on each of the Funds’ financial statements based on our audits. We are a public accounting firm registered with the Public Company Accounting Oversight Board (United States) (“PCAOB”) and are required to be independent with respect to the Trust in accordance with the U.S. federal securities laws and the applicable rules and regulations of the Securities and Exchange Commission and the PCAOB.
We conducted our audits in accordance with the standards of the PCAOB. Those standards require that we plan and perform the audit to obtain reasonable assurance about whether the financial statements are free of material misstatement, whether due to error or fraud. The Trust is not required to have, nor were we engaged to perform, an audit of the Trust’s internal control over financial reporting. As part of our audits, we are required to obtain an understanding of internal control over financial reporting but not for the purpose of expressing an opinion on the effectiveness of the Trust’s internal control over financial reporting. Accordingly, we express no such opinion.
Our audits included performing procedures to assess the risks of material misstatement of the financial statements, whether due to error or fraud, and performing procedures that respond to those risks. Such procedures included examining, on a test basis, evidence regarding the amounts and disclosures in the financial statements. Our procedures included confirmation of securities owned as of September 30, 2023, by correspondence with the custodian, transfer agent, and brokers; when replies were not received from brokers, we performed other auditing procedures. Our audits also included evaluating the accounting principles used and significant estimates made by management, as well as evaluating the overall presentation of the financial statements. We believe that our audits provide a reasonable basis for our opinion.

We have served as the auditor of one or more Guggenheim investment companies since 1979.
Tysons, Virginia
November 28, 2023
124 | THE GUGGENHEIM FUNDS ANNUAL REPORT | |
OTHER INFORMATION (Unaudited) |
Federal Income Tax Information
This information is being provided as required by the Internal Revenue Code. Amounts shown may differ from those elsewhere in the report because of differences in tax and financial reporting practice.
In January 2024, shareholders will be advised on IRS Form 1099 DIV or substitute 1099 DIV as to the federal tax status of the distributions received by shareholders in the calendar year 2023.
The Funds’ investment income (dividend income plus short-term capital gains, if any) qualifies as follows:
Of the taxable ordinary income distributions paid during the fiscal year ended September 30, 2023, the following funds had the corresponding percentages qualify for the reduced tax rate pursuant to the Jobs and Growth Tax Relief and Reconciliation Act of 2003 or for the dividends received deduction for corporations. See the qualified dividend income and dividend received deduction columns, respectively, in the table below.
Additionally, of the taxable ordinary income distributions paid during the fiscal year ended September 30, 2023, the following funds had the corresponding percentages qualify as interest related dividends and qualified short-term capital gains as permitted by IRC Section 871(k)(1) and IRC Section 871(k)(2), respectively. See the qualified interest income and qualified short-term capital gain columns, respectively, in the table below.
Fund | | Qualified
Dividend
Income | | Dividend
Received
Deduction | | Qualified
Interest
Income | | Qualified
Short-Term
Capital Gain |
Alpha Opportunity Fund | | | 100.00 | % | | | 100.00 | % | | | 1.80 | % | | | 0.00 | % |
Large Cap Value Fund | | | 100.00 | % | | | 100.00 | % | | | 2.59 | % | | | 100.00 | % |
Market Neutral Real Estate Fund | | | 9.52 | % | | | 9.52 | % | | | 13.41 | % | | | 0.00 | % |
Risk Managed Real Estate Fund | | | 0.66 | % | | | 0.66 | % | | | 6.18 | % | | | 0.00 | % |
Small Cap Value Fund | | | 100.00 | % | | | 100.00 | % | | | 1.81 | % | | | 0.00 | % |
StylePlus—Large Core Fund | | | 25.78 | % | | | 23.07 | % | | | 24.58 | % | | | 0.00 | % |
StylePlus—Mid Growth Fund | | | 12.02 | % | | | 8.42 | % | | | 0.32 | % | | | 0.00 | % |
World Equity Income Fund | | | 100.00 | % | | | 62.10 | % | | | 1.34 | % | | | 0.00 | % |
With respect to the taxable year ended September 30, 2023, the Funds hereby designate as capital gain dividends the amounts listed below, or, if subsequently determined to be different, the net capital gain of such year:
Fund | | From long-term
capital gain: | | | From long-term capital
gain, using proceeds
from shareholder
redemptions: | |
Large Cap Value Fund | | $ | 3,093,835 | | | $ | 584,434 | |
Risk Managed Real Estate Fund | | | 18,153,953 | | | | — | |
Small Cap Value Fund | | | 250,781 | | | | 276,663 | |
StylePlus—Large Core Fund | | | 57,379,626 | | | | — | |
StylePlus—Mid Growth Fund | | | 18,747,109 | | | | — | |
World Equity Income Fund | | | 23,830 | | | | — | |
Final regulations dated June 24, 2020 enable a regulated investment company to pay Section 199A dividends to its shareholders. Section 199A, enacted as part of the Tax Cuts and Jobs Act of 2017, may allow non-corporate tax payers a deduction of up to 20% of qualified business income from flow-through entities, including dividends from real estate investment trusts. The qualifying percentages of Market Neutral Real Estate Fund’s and Risk Manage Real Estate Fund’s ordinary income and short-term capital gain distributions, if any, for the purpose of the Section 199A deduction was 39.28% and 80.09%, respectively.
| | THE GUGGENHEIM FUNDS ANNUAL REPORT | 125 |
OTHER INFORMATION (Unaudited)(continued) |
Delivery of Shareholder Reports
Paper copies of the Funds’ annual and semi-annual shareholder reports are not sent by mail, unless you specifically request paper copies of the reports from a fund or from your financial intermediary. Instead, the reports are made available on a website, and you are notified by mail each time a report is posted and provided with a website link to access the report.
You may elect to receive all future shareholder reports in paper free of charge. If you hold shares of a fund directly, you can inform the Fund that you wish to receive paper copies of reports by calling 800.820.0888. If you hold shares of a fund through a financial intermediary, please contact the financial intermediary to make this election. Your election to receive reports in paper may apply to all Guggenheim Funds in which you are invested and may apply to all Guggenheim funds held with your financial intermediary.
Tailored Shareholder Reports for Open-End Mutual Funds and Exchange-Traded Funds
Effective January 24, 2023, the SEC adopted rule and form amendments to require open-end mutual funds and exchange-traded funds registered on Form N-1A to transmit concise and visually engaging streamlined annual and semi-annual reports to shareholders that highlight key information. Other information, including financial statements, will no longer appear in a streamlined shareholder report but must be available online, delivered free of charge upon request, and filed on a semi-annual basis on Form N-CSR. The rule and form amendments have a compliance date of July 24, 2024. At this time, management is evaluating the impact of these amendments on the shareholder reports for the Funds.
Proxy Voting Information
A description of the policies and procedures that the Trust uses to determine how to vote proxies relating to securities held in the Funds’ portfolios is available, without charge and upon request, by calling 800.820.0888. This information is also available from the EDGAR database on the SEC’s website at https://www.sec.gov.
Information regarding how the Funds’ voted proxies relating to portfolio securities during the most recent 12-month period ended June 30 is available without charge, upon request, by calling 800.820.0888. This information is also available from the EDGAR database on the SEC’s website at https://www.sec.gov.
Sector Classification
Information in the “Schedule of Investments” is categorized by sectors using sector-level Classifications defined by the Bloomberg Industry Classification System, a widely recognized industry classification system provider. Each Fund’s registration statement has investment policies relating to concentration in specific sectors/industries. For purposes of these investment policies, the Funds usually classify sectors/industries based on industry-level Classifications used by widely recognized industry classification system providers such as Bloomberg Industry Classification System, Global Industry Classification Standards and Barclays Global Classification Scheme.
Quarterly Portfolio Schedules Information
The Trust files its complete schedule of portfolio holdings with the SEC for the first and third quarters of each fiscal year as an exhibit to its reports on Form N-PORT, and for reporting periods ended prior to March 31, 2019, filed such information on Form N-Q. The Funds’ Forms N-PORT and N-Q are available on the SEC’s website at https://www.sec.gov. Copies of the portfolio holdings are also available to shareholders, without charge and upon request, by calling 800.820.0888.
126 | THE GUGGENHEIM FUNDS ANNUAL REPORT | |
OTHER INFORMATION (Unaudited)(continued) |
Report of the Guggenheim Funds Trust Board of Trustees
The Board of Trustees of Guggenheim Funds Trust (the “Trust”), including the Independent Trustees, unanimously approved the renewal of the investment management agreements (as applicable to a specific Fund, the “Advisory Agreement” and collectively, the “Advisory Agreements”) with Security Investors, LLC (“Security Investors”) and Guggenheim Partners Investment Management, LLC (“GPIM”) on behalf of the applicable series of the Trust listed below (each a “Fund” and collectively, the “Funds”) and the investment sub-advisory agreement between Security Investors and GPIM on behalf of Guggenheim Municipal Income Fund (the “Sub-Advisory Agreement” and together with the “Advisory Agreements,” the “Agreements”):
● | Guggenheim Alpha Opportunity Fund (“Alpha Opportunity Fund”)* | ● | Guggenheim Core Bond Fund (“Core Bond Fund”)* |
● | Guggenheim Diversified Income Fund
(“Diversified Income Fund”)** | ● | Guggenheim Floating Rate Strategies Fund
(“Floating Rate Strategies Fund”)** |
● | Guggenheim High Yield Fund (“High Yield Fund”)* | ● | Guggenheim Large Cap Value Fund (“Large Cap Value Fund”)* |
● | Guggenheim Limited Duration Fund
(“Limited Duration Fund”)** | ● | Guggenheim Macro Opportunities Fund
(“Macro Opportunities Fund”)** 1 |
● | Guggenheim Market Neutral Real Estate Fund
(“Market Neutral Real Estate Fund”)** | ● | Guggenheim Municipal Income Fund
(“Municipal Income Fund”)* |
● | Guggenheim Risk Managed Real Estate Fund
(“Risk Managed Real Estate Fund”)** | ● | Guggenheim Small Cap Value Fund
(“Small Cap Value Fund”)* |
● | Guggenheim SMid Cap Value Fund
(“SMid Cap Value Fund”)* | ● | Guggenheim StylePlus—Large Core Fund
(“StylePlus—Large Core Fund”)* |
● | Guggenheim StylePlus—Mid Growth Fund
(“StylePlus—Mid Growth Fund”)* | ● | Guggenheim Total Return Bond Fund
(“Total Return Bond Fund”)** |
● | Guggenheim Ultra Short Duration Fund
(“Ultra Short Duration Fund”)** | ● | Guggenheim World Equity Income Fund
(“World Equity Income Fund”)* |
* | Security Investors serves as investment adviser to the Fund. |
** | GPIM serves as investment adviser to the Fund. Unless the context indicates otherwise, GPIM and Security Investors, with respect to their service as investment adviser to the applicable Funds, are each referred to herein as an “Adviser” and together, the “Advisers.” |
Security Investors and GPIM are each an indirect subsidiary of Guggenheim Partners, LLC, a privately-held, global investment and advisory firm (“Guggenheim Partners”). Guggenheim Partners, Security Investors, GPIM and their affiliates may be referred to herein collectively as “Guggenheim.” Security Investors and GPIM are also known as “Guggenheim Investments,” the global asset management and investment advisory division of Guggenheim Partners that includes other affiliated investment management businesses.
At meetings held in person on April 17-18, 2023 (the “April Meeting”) and meetings held by videoconference on May 15, 2023 and in person on May 24, 2023 (the “May Meeting”), the Contracts Review Committee of the Board (the “Committee”), consisting solely of the Independent Trustees, met separately from Guggenheim to consider the proposed renewal of the Agreements. As part of its review process, the Committee was represented by independent legal counsel to the Independent Trustees (“Independent Legal Counsel”), from whom the Independent Trustees received separate legal advice and with whom they met separately. Independent Legal Counsel reviewed and discussed with the Committee various key aspects of the Trustees’ legal responsibilities relating to the proposed renewal of the Agreements and other principal
1 | GPIM also serves as investment adviser to Guggenheim Macro Opportunities Fund CFC (the “Subsidiary”), a wholly-owned subsidiary of Macro Opportunities Fund that is organized as a limited company under the laws of the Cayman Islands and used by Macro Opportunities Fund to obtain commodities exposure. Pursuant to a separate investment advisory agreement for the Subsidiary (the “Subsidiary Advisory Agreement”), the Subsidiary pays GPIM an advisory fee at the same rate that Macro Opportunities Fund pays GPIM under its Advisory Agreement. The Subsidiary Advisory Agreement does not require annual renewal by the Board and will continue until it is terminated as provided in the Agreement. In addition, GPIM and Macro Opportunities Fund have entered into a separate fee waiver agreement pursuant to which GPIM has contractually agreed to waive the advisory fee it receives from Macro Opportunities Fund in an amount equal to the advisory fee paid to GPIM by the Subsidiary. This undertaking will continue for so long as Macro Opportunities Fund invests in the Subsidiary, and may be terminated only with the approval of the Board. |
| | THE GUGGENHEIM FUNDS ANNUAL REPORT | 127 |
OTHER INFORMATION (Unaudited)(continued) |
contracts. The Committee took into account various materials received from Guggenheim and Independent Legal Counsel. The Committee also considered the variety of written materials, reports and oral presentations the Board received throughout the year regarding performance and operating results of the Funds, and other information relevant to its evaluation of the Agreements.
In connection with the contract review process, FUSE Research Network LLC (“FUSE”), an independent, third-party research provider, was engaged to prepare advisory contract renewal reports designed specifically to help the Board fulfill its advisory contract renewal responsibilities. The objective of the FUSE reports is to present the subject funds’ relative position regarding fees, expenses and total return performance, with peer group and universe comparisons. The Committee assessed the data provided in the FUSE reports as well as commentary presented by Guggenheim, including, among other things, a summary of notable distinctions between certain Funds and the applicable peer group identified in the FUSE reports and explanations for custom peer groups created for certain Funds that do not fit well into any particular category. The Committee noted that although FUSE’s process typically results in the identification for each Fund of a universe of similar funds for performance comparisons and a narrower group of similar funds from the universe based on asset levels for comparative fee and expense data evaluation (i.e., the peer group), the peer group constituent funds identified by FUSE for Market Neutral Real Estate Fund were the same as the performance universe constituent funds due to the Fund’s investment strategy.
In addition, Guggenheim provided materials and data in response to formal requests for information sent by Independent Legal Counsel on behalf of the Committee. Guggenheim also made a presentation at the April Meeting. Throughout the process, the Committee asked questions of management and requested certain additional information, which Guggenheim provided (collectively with the foregoing reports and materials, the “Contract Review Materials”). The Committee considered the Contract Review Materials in the context of its accumulated experience governing the Trust and other Guggenheim funds and weighed the factors and standards discussed with Independent Legal Counsel.
Following an analysis and discussion of relevant factors, including those identified below, and in the exercise of its business judgment, the Committee concluded that it was in the best interest of each Fund to recommend that the Board approve the renewal of the applicable Agreements for an additional annual term. Following its review of the Committee’s recommendation, the Board approved the renewal of the applicable Agreements for each Fund for a one-year period ending August 1, 2024 at a meeting held on May 23-24, 2023 (the “May Board Meeting” and together with the May Meeting, the “May Meetings”) and determined to adopt the Committee’s considerations and conclusions, which follow.
Advisory Agreements
Nature, Extent and Quality of Services Provided by Each Adviser: With respect to the nature, extent and quality of services currently provided by each Adviser, the Committee considered the qualifications, experience and skills of key personnel performing services for the Funds, including those personnel providing compliance and risk oversight, as well as the supervisors and reporting lines for such personnel. The Committee also considered other information, including Guggenheim’s resources and related efforts to retain, attract and motivate capable personnel to serve the Funds. In evaluating Guggenheim’s resources and capabilities, the Committee considered Guggenheim’s commitment to focusing on, and investing resources in support of, funds in the Guggenheim fund complex, including the Funds. The Committee also considered Guggenheim’s discussion of its ongoing review of the Guggenheim fund line-up at the April Meeting and the May Board Meeting. In addition, the Committee considered the acceptability of the terms of each Advisory Agreement, including the scope of services required to be performed by each Adviser.
The Committee’s review of the services provided by Guggenheim to the Funds included consideration of Guggenheim’s investment processes and resulting performance, portfolio oversight and risk management, and the related regular quarterly reports and presentations received by the Board. The Committee took into account the risks borne by Guggenheim in sponsoring and providing services to the Funds, including regulatory, operational, legal and entrepreneurial risks. The Committee considered the resources dedicated by Guggenheim to compliance functions and the reporting made to the Board by Guggenheim compliance personnel regarding Guggenheim’s adherence to regulatory requirements. The Committee also considered the regular reports the Board receives from the Trust’s Chief Compliance Officer regarding compliance policies and procedures established pursuant to Rule 38a-1 under the Investment Company Act of 1940, as amended. In connection with the Committee’s evaluation of the overall package of services provided by Guggenheim, the Committee considered Guggenheim’s administrative services, including its role in supervising, monitoring, coordinating and evaluating the various services provided by the fund administrator, transfer agent, distributor, custodian and other service providers to the Funds. The Committee evaluated the Office of Chief Financial Officer (the “OCFO”), established to oversee the fund administration, accounting and transfer agency services provided to the Funds and other Guggenheim funds, including the OCFO’s resources, personnel and services provided.
128 | THE GUGGENHEIM FUNDS ANNUAL REPORT | |
OTHER INFORMATION (Unaudited)(continued) |
With respect to Municipal Income Fund, the Committee noted that, although Security Investors delegated certain portfolio management responsibilities to the Sub-Adviser, as affiliated companies, both the Adviser and the Sub-Adviser are part of the Guggenheim organization. Further, the Committee took into account Guggenheim’s explanation that investment advisory-related services are provided by many Guggenheim employees under different related legal entities and thus, the services provided by the Adviser on the one hand and the Sub-Adviser on the other, as well as the risks assumed by each party, cannot be ascribed to distinct legal entities.2 As a result, in evaluating the services provided to the Municipal Income Fund under the Sub-Advisory Agreement, the Committee did not separately consider the contributions under the Advisory Agreement and the Sub-Advisory Agreement.
With respect to Guggenheim’s resources and the ability of each Adviser to carry out its responsibilities under the applicable Advisory Agreement, the Chief Financial Officer of Guggenheim Investments reviewed with the Committee financial information concerning the holding company for Guggenheim Investments, Guggenheim Partners Investment Management Holdings, LLC (“GPIMH”), and the various entities comprising Guggenheim Investments, and provided the audited consolidated financial statements of GPIMH. (Thereafter, the Committee received the audited consolidated financial statements of GPIM.)
Based on the foregoing, and based on other information received (both oral and written) at the April Meeting and the May Meetings, as well as other considerations, including the Committee’s knowledge of how each Adviser performs its duties obtained through Board meetings, discussions and reports throughout the year, the Committee concluded that each Adviser and its personnel were qualified to serve the Funds in such capacity and may reasonably be expected to continue to provide a high quality of services under each Advisory Agreement with respect to the Funds.
Investment Performance: The Committee received, for each Fund, investment returns for the since-inception, ten-year, five-year, three-year, one-year and three-month periods ended December 31, 2022, as applicable. In addition, the Committee received a comparison of each Fund’s performance to the performance of a benchmark, a universe of funds and a narrower peer group of similar funds based on asset levels as identified by FUSE (except as noted above with respect to Market Neutral Real Estate Fund), in each case for the same periods, as applicable. The Committee also received from FUSE a description of the methodology for identifying each Fund’s peer group and universe for performance and expense comparisons. The Committee also received certain performance information as of March 31, 2023. In assessing each Fund’s performance, the Committee considered that the Board receives regular reporting from Guggenheim regarding performance and evaluates performance throughout the year.
In seeking to evaluate Fund performance over a full market cycle, the Committee focused its attention on five-year and three-year performance rankings as compared to the relevant universe of funds. Except as to the individual Funds discussed below, the Committee observed that the returns of each Fund’s Institutional Class shares ranked in the third quartile or better of such Fund’s performance universe for each of the relevant periods considered. In addition, the Committee made the following observations:
Alpha Opportunity Fund: The returns of the Fund’s Institutional Class shares ranked in the 96th and 73rd percentiles of its performance universe for the five-year and three-year periods ended December 31, 2022, respectively. The Committee noted management’s explanation that the Fund’s relative underperformance over the five-year time period was primarily due to the Fund’s beta profile and fundamental factor tilts. The Committee noted management’s statement that the Fund’s lower beta profile to broad market U.S. equities relative to its peers and long exposure to value and short exposure to growth have detracted from investment performance. The Committee also noted management’s statement that as a result of an update in 2021 to the quantitative investment methodology that the Fund employs, as well as the more recent comeback of value-oriented, higher quality names, the Fund experienced performance rankings that compare more favorably relative to its performance universe for the three-year and one-year periods ended December 31, 2022.
Diversified Income Fund: The returns of the Fund’s Institutional Class shares ranked in the 78th and 75th percentiles of its performance universe for the five-year and three-year periods ended December 31, 2022, respectively. The Committee noted management’s explanation that the Fund’s relative underperformance over the five-year time period was primarily due to the Fund’s defensively-positioned portfolio, in particular within its fixed-income sleeve which includes allocations to several Guggenheim fixed-income funds that were defensively positioned beginning in 2018, reflecting Guggenheim’s market views. The Committee also noted management’s statement that the Fund maintained a lower beta profile to equities relative to its peers. The Committee further noted management’s statement that the Fund’s allocation process was updated in 2021, resulting in an increase in the Fund’s equity exposure, and that there was some improvement in the Fund’s performance rankings relative to its
2 | Consequently, except where the context indicates otherwise, references to “Adviser,” “Advisers” or “Sub-Adviser” should be understood as referring to Guggenheim Investments generally and the services it provides under the Agreements. |
| | THE GUGGENHEIM FUNDS ANNUAL REPORT | 129 |
OTHER INFORMATION (Unaudited)(continued) |
performance universe for the three-year and one-year periods ended December 31, 2022. The Committee noted management’s statement that although the Fund’s increased equity exposure was detrimental to the Fund’s performance relative to peers in 2022 due to the poor performance of U.S. equities that year, Guggenheim believes the increased equity exposure will ultimately benefit shareholders and support total return performance in the medium to long term. The Committee also noted the Fund’s small size and considered management’s statements that the Fund continues to be a viable offering and that Guggenheim is able to manage the Fund at its current size.
Market Neutral Real Estate Fund: The returns of the Fund’s Institutional Class shares ranked in the 44th and 89th percentiles of its performance universe for the five-year and three-year periods ended December 31, 2022, respectively. The Committee noted management’s explanation that the Fund’s relative underperformance over the three-year time period was due to underperforming pairs of offsetting long and short positions as well as several stock- and sector-specific issues, and considered that, despite recent underperformance, the Fund experienced performance that ranks in the top half of its performance universe for the five-year period ended December 31, 2022.
Municipal Income Fund: The returns of the Fund’s Institutional Class shares ranked in the 89th and 83rd percentiles of its performance universe for the five-year and three-year periods ended December 31, 2022, respectively. The Committee noted management’s explanation that the Fund’s conservative positioning in high quality, long-duration assets, which underperformed over the past two years due to a risk-on sentiment in 2021 and due to fears of duration risk in 2022, contributed to relative underperformance over the five-year and three-year time periods. The Committee noted management’s statement that the Fund’s allocation to closed-end funds also contributed to relative underperformance in 2022 as the increased cost of leverage weighed on the performance of such funds. The Committee considered management’s belief that an economic downturn that is likely to follow the Federal Reserve’s tightening of financial conditions will disproportionately affect weaker municipal credits and could lead to distress in names the Fund has avoided. The Committee also took into account management’s further discussions of performance attribution and outlook for the Fund at the April Meeting and the May Board Meeting, during which management highlighted that the Fund’s relative underperformance in 2022 was due to the exceptional volatility in the fixed-income markets that year which also impacted relative performance for the trailing five-year and three-year time periods, and noted the overall low dispersion in absolute investment returns among municipal bond funds.
StylePlus—Mid Growth Fund: The returns of the Fund’s Institutional Class shares ranked in the 76th and 67th percentiles of its performance universe for the five-year and three-year periods ended December 31, 2022, respectively. The Committee noted management’s explanation that the Fund’s relative underperformance over the five-year time period can be attributed to the more conservative positioning of the underlying funds in which the Fund invests, resulting in yields insufficient to offset fund fees and other costs, as well as the strategy’s tilt to value-oriented, lower-growth names within the mid-cap growth segment as growth outperformed value securities from 2018 through 2020. The Committee also noted management’s statement that as a result of the more recent comeback of value-oriented, lower-growth names, the Fund experienced performance rankings that compare more favorably relative to its performance universe for the three-year and one-year periods ended December 31, 2022.
Ultra Short Duration Fund: The returns of the Fund’s Institutional Class shares ranked in the 76th and 63rd percentiles of its performance universe for the five-year and three-year periods ended December 31, 2022, respectively. The Committee noted management’s explanation that the Fund’s overweight duration positioning over the five-year time period relative to its performance universe as well as higher allocations to structured credit during the second half of 2022, which underperformed corporate credit during that period, contributed to relative underperformance over the five-year time period. The Committee considered management’s expectation that the resetting of higher interest rates should help the Fund to perform well going forward and that the divergence in the relationship between structured and corporate credit should normalize going forward and lead to relative outperformance, noting that there was some improvement in the Fund’s performance ranking relative to its performance universe for the one-year period ended December 31, 2022.
Based on the foregoing, and based on other information received (both oral and written) at the April Meeting and the May Meetings, as well as other considerations, the Committee concluded that, with respect to each Fund other than Municipal Income Fund: (i) the Fund’s performance was acceptable; or (ii) it was satisfied with Guggenheim’s responses and/or efforts to improve investment performance; and, with respect to Municipal Income Fund, it would continue to monitor the Fund’s investment performance.
Comparative Fees, Costs of Services Provided and the Benefits Realized by Each Adviser from Its Relationship with the Funds: The Committee compared each Fund’s contractual advisory fee (which, for Municipal Income Fund, includes the sub-advisory fee paid to the Sub-Adviser), net effective management fee3 and total net expense ratio to the applicable peer group. The Committee also reviewed the
3 | The “net effective management fee” for each Fund represents the combined effective advisory fee and administration fee as a percentage of average net assets for the latest fiscal year, after any waivers and/or reimbursements. |
130 | THE GUGGENHEIM FUNDS ANNUAL REPORT | |
OTHER INFORMATION (Unaudited)(continued) |
median advisory fees and expense ratios, including expense ratio components (e.g., transfer agency fees, administration fees, other operating expenses, distribution fees and fee waivers/reimbursements), of the peer group of funds. In addition, the Committee considered information regarding Guggenheim’s process for evaluating the competitiveness of each Fund’s fees and expenses, noting Guggenheim’s statement that evaluations seek to incorporate a variety of factors with a general focus on ensuring fees and expenses: (i) are competitive; (ii) give consideration to resource support requirements; and (iii) ensure Funds are able to deliver on shareholder return expectations. The Committee also considered Guggenheim’s discussion of information regarding fee and expense trends across the open-end fund industry and its response to those trends with respect to the funds in the Guggenheim fund complex, including the Funds.
As part of its evaluation of each Fund’s advisory fee, the Committee considered how such fees compared to the advisory fee charged by Guggenheim to one or more other clients that it manages pursuant to similar investment strategies, to the extent applicable, noting that, in certain instances, Guggenheim charges a lower advisory fee to such other clients. In this connection, the Committee considered, among other things, Guggenheim’s representations about the significant differences between managing mutual funds as compared to other types of accounts. The Committee also considered Guggenheim’s explanation that lower fees are charged in certain instances due to various other factors, including the scope of contract, type of investors, fee structure, applicable legal, governance and capital structures, tax status and historical pricing reasons. In addition, the Committee took into account Guggenheim’s discussion of the regulatory, operational, legal and entrepreneurial risks involved with the Funds as compared to other types of accounts. The Committee concluded that the information it received demonstrated that the aggregate services provided to, or the specific circumstances of, each Fund were sufficiently different from the services provided to, or the specific circumstances of, other clients with similar investment strategies and/or that the risks borne by Guggenheim were sufficiently greater than those associated with managing other clients with similar investment strategies to support the difference in fees.
In further considering the comparative fee and expense data presented in the Contract Review Materials and addressed by Guggenheim, the Committee took into account those Funds with currently effective expense limitation agreements with the Adviser. Except as to the individual Funds discussed below, the Committee observed that the contractual advisory fee, net effective management fee and total net expense ratio for each Fund’s Institutional Class shares each rank in the third quartile or better of such Fund’s peer group. In addition, the Committee made the following observations:
Floating Rate Strategies Fund: The contractual advisory fee for the Fund’s Institutional Class shares ranks in the third quartile (73rd percentile) of its peer group. Although the net effective management fee for the Fund’s Institutional Class shares ranks in the fourth quartile (80th percentile) of its peer group, the Committee considered that the total net expense ratio for the Fund’s Institutional Class shares ranks in the third quartile (67th percentile) of its peer group. The Committee considered the Adviser’s statement explaining the higher fees that performance is driven by a unique investment approach that requires significant resources. In this regard, the Committee took into consideration the strong investment performance of the Fund’s Institutional Class shares for the three-year period ended December 31, 2022. The Committee also took into account the Fund’s currently effective expense limitation agreement with the Adviser.
Limited Duration Fund: The contractual advisory fee for the Fund’s Institutional Class shares ranks in the fourth quartile (87th percentile) of its peer group. The net effective management fee for the Fund’s Institutional Class shares ranks in the third quartile (73rd percentile) of its peer group. The total net expense ratio for the Fund’s Institutional Class shares ranks in the third quartile (67th percentile) of its peer group. The Committee considered the Adviser’s statement explaining the higher fees that performance is driven by a unique investment approach that requires significant resources. In this regard, the Committee took into consideration the strong investment performance of the Fund’s Institutional Class shares for the five-year and three-year periods ended December 31, 2022. The Committee also took into account the Fund’s currently effective expense limitation agreement with the Adviser.
Macro Opportunities Fund: The contractual advisory fee for the Fund’s Institutional Class shares ranks in the fourth quartile (82nd percentile) of its peer group. The net effective management fee for the Fund’s Institutional Class shares ranks in the third quartile (64th percentile) of its peer group. The total net expense ratio for the Fund’s Institutional Class shares ranks in the third quartile (73rd percentile) of its peer group. The Committee noted that the Fund is categorized as a non-traditional bond fund which seeks to add value by investing in many non-traditional securities within and outside of fixed income, including equities, currencies, commodities and derivatives, and that peer funds have varying degrees of capability, flexibility and associated fees. The Committee considered the Adviser’s statement explaining the higher fees that performance is driven by a unique investment approach that requires significant resources. In this regard, the Committee took into consideration the strong investment performance of the Fund’s Institutional Class shares for the three-year period ended December 31, 2022. The Committee also took into account the Fund’s currently effective expense limitation agreement and contractual advisory fee breakpoint of 5 basis points on average daily net assets above $5 billion.
| | THE GUGGENHEIM FUNDS ANNUAL REPORT | 131 |
OTHER INFORMATION (Unaudited)(continued) |
Risk Managed Real Estate Fund: The contractual advisory fee for the Fund’s Institutional Class shares ranks in the second quartile (43rd percentile) of its peer group. Although the net effective management fee for the Fund’s Institutional Class shares ranks in the fourth quartile (79th percentile) of its peer group, the Committee considered that the total net expense ratio for the Fund’s Institutional Class shares ranks in the third quartile (57th percentile) of its peer group. The Committee considered the Adviser’s statement that the total expense ratio for the Fund’s Institutional Class shares is competitive and in-line with the peer group average and median and that the Fund’s contractual advisory fee is competitive. The Committee also took into account the Fund’s currently effective expense limitation agreement with the Adviser.
SMid Cap Value Fund: The contractual advisory fee for the Fund’s Institutional Class shares ranks in the first quartile (7th percentile) of its peer group. The net effective management fee for the Fund’s Institutional Class shares ranks in the third quartile (71st percentile) of its peer group. The total net expense ratio for the Fund’s Institutional Class shares ranks in the fourth quartile (79th percentile) of its peer group. The Committee considered that the Fund’s contractual advisory fee ranks favorably in the first quartile of its peer group and reviewed the other expenses that impacted the total net expense ratio. The Committee also took into account the Fund’s currently effective expense limitation agreement with the Adviser.
Total Return Bond Fund: The contractual advisory fee for the Fund’s Institutional Class shares ranks in the fourth quartile (87th percentile) of its peer group. The net effective management fee for the Fund’s Institutional Class shares ranks in the third quartile (67th percentile) of its peer group. The total net expense ratio for the Fund’s Institutional Class shares ranks in the third quartile (73rd percentile) of its peer group. The Committee considered the Adviser’s statement explaining the higher fees that performance is driven by a unique investment approach that requires significant resources. In this regard, the Committee took into consideration the strong investment performance of the Fund’s Institutional Class shares for the three-year period ended December 31, 2022. The Committee also took into account the Fund’s currently effective expense limitation agreement with the Adviser.
With respect to the costs of services provided and benefits realized by Guggenheim Investments from its relationship with the Funds, the Committee reviewed a profitability analysis and data from management for each Fund setting forth the average assets under management for the twelve months ended December 31, 2022, gross revenues received, and expenses incurred directly or through allocations, by Guggenheim Investments, expense waivers (as applicable), earnings and the operating margin/profitability rate, including variance information relative to the foregoing amounts as of December 31, 2021. In addition, the Chief Financial Officer of Guggenheim Investments reviewed with, and addressed questions from, the Committee concerning the expense allocation methodology employed in producing the profitability analysis. In the course of its review of Guggenheim Investments’ profitability, the Committee took into account the methods used by Guggenheim Investments to determine expenses and profit and the representation by the Chief Financial Officer of Guggenheim Investments that such methods provided a reasonable basis for determining the profitability of the applicable Adviser with respect to each Fund. The Committee considered all of the foregoing, among other things, in evaluating the costs of services provided, the profitability to Guggenheim Investments and the profitability rates presented.
The Committee also considered other benefits available to each Adviser because of its relationship with the Funds and noted Guggenheim’s statement that it does not believe the Advisers derive any such “fall-out” benefits. In this regard, the Committee noted Guggenheim’s statement that, although it does not consider such benefits to be fall-out benefits, the Advisers may benefit from certain economies of scale and synergies, such as enhanced visibility of the Advisers, enhanced leverage in fee negotiations and other synergies arising from offering a broad spectrum of products, including the Funds.
Based on the foregoing, and based on other information received (both oral and written) at the April Meeting and the May Meetings, as well as other considerations, the Committee concluded that the comparative fees and the benefits realized by each Adviser from its relationship with the Funds were appropriate and that each Adviser’s profitability from its relationship with the Funds was not unreasonable.
Economies of Scale: The Committee received and considered information regarding whether there have been economies of scale with respect to the management of the Funds as Fund assets grow, whether the Funds have appropriately benefited from any economies of scale, and whether there is potential for realization of any further economies of scale. The Committee considered whether economies of scale in the provision of services to the Funds were being passed along to and shared with the shareholders. The Committee considered that Guggenheim believes it is appropriately sharing potential economies of scale and that Guggenheim’s decrease in 2022 in overall expenses was attributable to decreased product costs driven by lower average assets under management and lower non-recurring costs related to closed-end fund matters as well as a decrease in compensation and benefits. The Committee also considered that although expenses related to investment resources decreased in 2022, Guggenheim’s shared services expenses and certain other expenses increased in 2022.
132 | THE GUGGENHEIM FUNDS ANNUAL REPORT | |
OTHER INFORMATION (Unaudited)(concluded) |
The Committee also noted the process employed by the Adviser to evaluate whether it would be appropriate to institute a new breakpoint for a Fund, with consideration given to, among other things: (i) the Fund’s size and trends in asset levels over recent years; (ii) the competitiveness of the expense levels; (iii) whether expense waivers are in place; (iv) changes and trends in revenue and expenses; (v) whether there are any anticipated expenditures that may benefit the Fund in the future; (vi) Fund profit level margins; (vii) relative Fund performance; (viii) the nature, extent and quality of services management provides to the Fund; and (ix) the complexity of the Fund’s investment strategy and the resources required to support the Fund.
As part of its assessment of economies of scale, the Committee took into account Guggenheim’s representation that it seeks to share economies of scale through a number of means, including breakpoints, advisory fees set at competitive rates pre-assuming future asset growth, expense waivers and limitations, and investments in personnel, operations and infrastructure to support the fund business. The Committee also received information regarding amounts that had been shared with shareholders through such breakpoints and expense waivers and limitations. The Committee also noted information from Guggenheim regarding certain challenges and costs associated with managing Funds that have achieved significant scale. Thus, the Committee considered the size of the Funds and the competitiveness of and/or other determinations made regarding the current advisory fee for each Fund, as well as whether a Fund is subject to an expense limitation.
Based on the foregoing, and based on other information received (both oral and written) at the April Meeting and the May Meetings, as well as other considerations, the Committee concluded that the advisory fee for each Fund was reasonable.
Sub-Advisory Agreement for Municipal Income Fund
Nature, Extent and Quality of Services Provided by the Sub-Adviser: As noted above, because both the Adviser and the Sub-Adviser for Municipal Income Fund—Security Investors and GPIM, respectively—are part of and do business as Guggenheim Investments and the services provided by the Adviser on the one hand and the Sub-Adviser on the other cannot be ascribed to distinct legal entities, the Committee did not separately evaluate the services provided under the Advisory Agreement and the Sub-Advisory Agreement. Therefore, the Committee considered the qualifications, experience and skills of the Fund’s portfolio management team in connection with the Committee’s evaluation of Guggenheim’s investment professionals under the Advisory Agreement. With respect to Guggenheim’s resources and the Sub-Adviser’s ability to carry out its responsibilities under the Sub-Advisory Agreement, as noted above, the Committee considered the financial condition of GPIMH and the various entities comprising Guggenheim Investments. The Committee also considered the acceptability of the terms of the Sub-Advisory Agreement, including the scope of services required to be performed by the Sub-Adviser.
Investment Performance: The Committee considered the returns of the Fund under its evaluation of the Advisory Agreement.
Comparative Fees, Costs of Services Provided and the Benefits Realized by the Sub-Adviser from Its Relationship with the Fund: The Committee considered that the Sub-Advisory Agreement is with an affiliate of the Adviser, that the Adviser compensates the Sub-Adviser from its own fees so that the sub-advisory fee rate for the Fund does not impact the fees paid by the Fund and that the Sub-Adviser’s revenues were included in the calculation of Guggenheim Investments’ profitability. Given its conclusion of the reasonableness of the advisory fee, the Committee concluded that the sub-advisory fee rate for the Fund was reasonable.
Economies of Scale: The Committee recognized that, because the Sub-Adviser’s fees are paid by the Adviser and not the Fund, the analysis of economies of scale was more appropriate in the context of the Committee’s consideration of the Advisory Agreement, which was separately considered. (See “Advisory Agreements – Economies of Scale” above.)
Overall Conclusions
The Committee concluded that the investment advisory fees are fair and reasonable in light of the extent and quality of the services provided and other benefits received and that the renewal of each applicable Agreement is in the best interest of each Fund. In reaching this conclusion, no single factor was determinative or conclusive and each Committee member, in the exercise of his or her informed business judgment, may afford different weights to different factors.
Following its review of the Committee’s analysis and determinations, the Board adopted the considerations and conclusions of the Committee and determined to approve the renewal of the Agreements.
| | THE GUGGENHEIM FUNDS ANNUAL REPORT | 133 |
INFORMATION ON BOARD OF TRUSTEES AND OFFICERS (Unaudited) |
A Board of Trustees oversees the Trust, as well as other trusts of GI, in which its members have no stated term of service, and continue to serve after election until resignation. The Funds’ Statement of Additional Information includes further information about Fund Trustees and Officers, and can be obtained without charge by visiting guggenheiminvestments.com or by calling 800.820.0888.
Name, Address*
and Year of Birth | Position(s) Held
with Trust | Term of Office
and Length of
Time Served** | Principal Occupation(s)
During Past Five Years | Number of
Portfolios
in Fund
Complex
Overseen | Other
Directorships Held
by Trustees*** |
INDEPENDENT TRUSTEES | | | |
Randall C. Barnes (1951) | Trustee and Chair of the Valuation Oversight Committee | Since 2014 (Trustee)
Since 2020 (Chair of the Valuation Oversight Committee) | Current: Private Investor (2001-present).
Former: Senior Vice President and Treasurer, PepsiCo, Inc. (1993-1997); President, Pizza Hut International (1991-1993); Senior Vice President, Strategic Planning and New Business Development, PepsiCo, Inc. (1987-1990). | 155 | Current: Advent Convertible and Income Fund (2005-present); Purpose Investments Funds (2013-present).
Former: Fiduciary/Claymore Energy Infrastructure Fund (2004-2022); Guggenheim Enhanced Equity Income Fund (2005-2021); Guggenheim Credit Allocation Fund (2013-2021). |
Angela Brock-Kyle (1959) | Trustee | Since 2019 | Current: Founder and Chief Executive Officer, B.O.A.R.D.S. (2013-present); Director, Mutual Fund Directors Forum (2022-present).
Former: Senior Leader, TIAA (financial services firm)(1987-2012). | 154 | Current: Bowhead Insurance GP, LLC (2020-present); Hunt Companies, Inc. (2019-present).
Former: Fiduciary/Claymore Energy Infrastructure Fund (2019-2022); Guggenheim Enhanced Equity Income Fund (2019-2021); Guggenheim Credit Allocation Fund (2019-2021); Infinity Property & Casualty Corp. (2014-2018). |
134 | THE GUGGENHEIM FUNDS ANNUAL REPORT | |
INFORMATION ON BOARD OF TRUSTEES AND OFFICERS (Unaudited)(continued) |
Name, Address*
and Year of Birth | Position(s) Held
with Trust | Term of Office
and Length of
Time Served** | Principal Occupation(s)
During Past Five Years | Number of
Portfolios
in Fund
Complex
Overseen | Other
Directorships Held
by Trustees*** |
INDEPENDENT TRUSTEES - continued | | |
Thomas F. Lydon, Jr. (1960) | Trustee and Chair of the Contracts Review Committee | Since 2019 (Trustee)
Since 2020 (Chair of the Contracts Review Committee) | Current: President, Global Trends Investments (registered investment adviser) (1996-present); Chief Executive Officer, ETF Flows, LLC (financial advisor education and research provider) (2019-present); Chief Executive Officer, Lydon Media (2016-present); Director, GDX Index Partners, LLC (2021-present); Vice Chairman, VettaFi (financial advisor content, research and digital distribution provider) (2022-present). | 154 | Current: US Global Investors, Inc. (GROW) (1995-present); The 2023 ETF Series Trust (4) (June 2023-present); The 2023 ETF Series Trust II (1) (August 2023-present).
Former: Fiduciary/Claymore Energy Infrastructure Fund (2019-2022); Guggenheim Enhanced Equity Income Fund (2019-2021); Guggenheim Credit Allocation Fund (2019-2021); Harvest Volatility Edge Trust (3) (2017-2019). |
Ronald A. Nyberg (1953) | Trustee and Chair of the Nominating and Governance Committee | Since 2014 | Current: Of Counsel, Momkus LLP (law firm) (2016-present).
Former: Partner, Nyberg & Cassioppi, LLC (law firm) (2000-2016); Executive Vice President, General Counsel, and Corporate Secretary, Van Kampen Investments (1982-1999). | 155 | Current: Advent Convertible and Income Fund (2003-present); PPM Funds (2) (2018-present); NorthShore-Edward-Elmhurst Health (2012-present).
Former: Fiduciary/Claymore Energy Infrastructure Fund (2004-2022); Guggenheim Enhanced Equity Income Fund (2005-2021); Guggenheim Credit Allocation Fund (2013-2021); Western Asset Inflation-Linked Opportunities & Income Fund (2004-2020); Western Asset Inflation-Linked Income Fund (2003-2020). |
| | THE GUGGENHEIM FUNDS ANNUAL REPORT | 135 |
INFORMATION ON BOARD OF TRUSTEES AND OFFICERS (Unaudited)(continued) |
Name, Address*
and Year of Birth | Position(s) Held
with Trust | Term of Office
and Length of
Time Served** | Principal Occupation(s)
During Past Five Years | Number of
Portfolios
in Fund
Complex
Overseen | Other
Directorships Held
by Trustees*** |
INDEPENDENT TRUSTEES - continued | | |
Sandra G. Sponem (1958) | Trustee and Chair of the Audit Committee | Since 2019 (Trustee)
Since 2020 (Chair of the Audit Committee) | Current: Retired.
Former: Senior Vice President and Chief Financial Officer, M.A. Mortenson-Companies, Inc. (construction and real estate development company) (2007-2017). | 154 | Current: SPDR Series Trust (81) (2018-present); SPDR Index Shares Funds (30) (2018-present); SSGA Active Trust (14) (2018-present).
Former: Fiduciary/Claymore Energy Infrastructure Fund (2019-2022); Guggenheim Enhanced Equity Income Fund (2019-2021); Guggenheim Credit Allocation Fund (2019-2021); SSGA Master Trust (1) (2018-2020). |
Ronald E. Toupin, Jr. (1958) | Trustee, Chair of the Board and Chair of the Executive Committee | Since 2014 | Current: Portfolio Consultant (2010-present); Member, Governing Council, Independent Directors Council (2013-present); Governor, Board of Governors, Investment Company Institute (2018-present).
Former: Member, Executive Committee, Independent Directors Council (2016-2018); Vice President, Manager and Portfolio Manager, Nuveen Asset Management (1998-1999); Vice President, Nuveen Investment Advisory Corp. (1992-1999); Vice President and Manager, Nuveen Unit Investment Trusts (1991-1999); and Assistant Vice President and Portfolio Manager, Nuveen Unit Investment Trusts (1988-1999), each of John Nuveen & Co., Inc. . (registered broker dealer) (1982-1999). | 154 | Former: Fiduciary/Claymore Energy Infrastructure Fund (2004-2022); Guggenheim Enhanced Equity Income Fund (2005-2021); Guggenheim Credit Allocation Fund (2013-2021); Western Asset Inflation-Linked Opportunities & Income Fund (2004-2020); Western Asset Inflation-Linked Income Fund (2003-2020). |
136 | THE GUGGENHEIM FUNDS ANNUAL REPORT | |
INFORMATION ON BOARD OF TRUSTEES AND OFFICERS (Unaudited)(continued) |
Name, Address*
and Year of Birth | Position(s) Held
with Trust | Term of Office
and Length of
Time Served** | Principal Occupation(s)
During Past Five Years | Number of
Portfolios
in Fund
Complex
Overseen | Other
Directorships Held
by Trustees*** |
INTERESTED TRUSTEE - concluded | | | | |
Amy J. Lee**** (1961) | Trustee, Vice President and Chief Legal Officer | Since 2018 (Trustee)
Since 2014
(Chief Legal Officer)
Since 2007
(Vice President) | Current: Interested Trustee, certain other funds in the Fund Complex (2018-present); Chief Legal Officer, certain other funds in the Fund Complex (2014-present); Vice President, certain other funds in the Fund Complex (2007-present); Senior Managing Director, Guggenheim Investments (2012-present).
Former: President and Chief Executive Officer, certain other funds in the Fund Complex (2017-2019); Vice President, Associate General Counsel and Assistant Secretary, Security Benefit Life Insurance Company and Security Benefit Corporation (2004-2012). | 154 | Former: Fiduciary/Claymore Energy Infrastructure Fund (2018-2022); Guggenheim Enhanced Equity Income Fund (2018-2021); Guggenheim Credit Allocation Fund (2018-2021). |
* | The business address of each Trustee is c/o Guggenheim Investments, 227 West Monroe Street, Chicago, Illinois 60606. |
** | Each Trustee serves an indefinite term, until his or her successor is elected and qualified. Time served includes time served in the respective position for the Predecessor Corporation. |
*** | Each Trustee also serves on the Boards of Trustees of Guggenheim Funds Trust, Guggenheim Variable Funds Trust, Guggenheim Strategy Funds Trust, Guggenheim Taxable Municipal Bond & Investment Grade Debt Trust, Guggenheim Strategic Opportunities Fund, Guggenheim Active Allocation Fund, Rydex Series Funds, Rydex Dynamic Funds, Rydex Variable Trust and Transparent Value Trust. Messrs. Barnes and Nyberg also serve on the Board of Trustees of Advent Convertible & Income Fund. |
**** | This Trustee is deemed to be an “interested person” of the Funds under the 1940 Act by reason of her position with the Funds’ Adviser and/or the parent of the Adviser. |
| | THE GUGGENHEIM FUNDS ANNUAL REPORT | 137 |
INFORMATION ON BOARD OF TRUSTEES AND OFFICERS (Unaudited)(continued) |
Name, Address*
and Year of Birth | Position(s) Held
with Trust | Term of Office
and Length of
Time Served** | Principal Occupation(s)
During Past Five Years |
OFFICERS | | | |
Brian E. Binder (1972) | President and Chief Executive Officer | Since 2018 | Current: President, Mutual Fund Boards, Guggenheim Investments (2022-present); President and Chief Executive Officer, certain other funds in the Fund Complex (2018-present); President, Mutual Funds Boards, Guggenheim Funds Investment Advisors, LLC and Security Investors, LLC (2018-present); Board Member, Guggenheim Partners Investment Funds plc (2022-present); Board Member, Guggenheim Global Investments plc (2022-present); Board Member, Guggenheim Partners Fund Management (Europe) Limited (2018-present).
Former: Senior Managing Director and Chief Administrative Officer, Guggenheim Investments (2018-2022); Managing Director and President, Deutsche Funds, and Head of US Product, Trading and Fund Administration, Deutsche Asset Management (2013-2018); Managing Director, Chairman of North American Executive Committee and Head of Business Management and Consulting, Invesco Ltd. (2010-2012). |
James Howley (1972) | Chief Financial Officer, Chief Accounting Officer and Treasurer | Since 2022 | Current: Managing Director, Guggenheim Investments (2004-present); Chief Financial Officer, Chief Accounting Officer, and Treasurer, certain other funds in the Fund Complex (2022-present).
Former: Assistant Treasurer, certain other funds in the Fund Complex (2006-2022); Manager, Mutual Fund Administration of Van Kampen Investments, Inc. (1996-2004). |
Mark E. Mathiasen (1978) | Secretary | Since 2014 | Current: Secretary, certain other funds in the Fund Complex (2007-present); Managing Director, Guggenheim Investments (2007-present). |
Glenn McWhinnie (1969) | Assistant Treasurer | Since 2016 | Current: Vice President, Guggenheim Investments (2009-present); Assistant Treasurer, certain other funds in the Fund Complex (2016-present). |
Michael P. Megaris (1984) | Assistant Secretary | Since 2014 | Current: Assistant Secretary, certain other funds in the Fund Complex (2014-present); Managing Director, Guggenheim Investments (2012-present). |
Elisabeth Miller (1968) | Chief Compliance Officer | Since 2012 | Current: Chief Compliance Officer, certain other funds in the Fund Complex (2012-present); Senior Managing Director, Guggenheim Investments (2012-present); Senior Managing Director, Guggenheim Funds Distributors, LLC (2014-present).
Former: Chief Compliance Officer, Security Investors, LLC and Guggenheim Funds Investment Advisors, LLC (2012-2018); Chief Compliance Officer, Guggenheim Distributors, LLC (2009-2014); Senior Manager, Security Investors, LLC (2004-2014); Senior Manager, Guggenheim Distributors, LLC (2004-2014). |
Margaux Misantone (1978) | AML Officer | Since 2017 | Current: Chief Compliance Officer, Security Investors, LLC and Guggenheim Funds Investment Advisors, LLC (2018-present); AML Officer, Security Investors, LLC and certain other funds in the Fund Complex (2017-present); Managing Director, Guggenheim Investments (2015-present).
Former: Assistant Chief Compliance Officer, Security Investors, LLC and Guggenheim Funds Investments Advisors, LLC (2015-2018). |
138 | THE GUGGENHEIM FUNDS ANNUAL REPORT | |
INFORMATION ON BOARD OF TRUSTEES AND OFFICERS (Unaudited)(concluded) |
Name, Address*
and Year of Birth | Position(s) Held
with Trust | Term of Office
and Length of
Time Served** | Principal Occupation(s)
During Past Five Years |
OFFICERS - concluded | |
Kimberly J. Scott (1974) | Assistant Treasurer | Since 2014 | Current: Director, Guggenheim Investments (2012-present); Assistant Treasurer, certain other funds in the Fund Complex (2012-present).
Former: Financial Reporting Manager, Invesco, Ltd. (2010-2011); Vice President/Assistant Treasurer, Mutual Fund Administration for Van Kampen Investments, Inc./Morgan Stanley Investment Management (2009-2010); Manager of Mutual Fund Administration, Van Kampen Investments, Inc./Morgan Stanley Investment Management (2005-2009). |
Bryan Stone (1979) | Vice President | Since 2014 | Current: Vice President, certain other funds in the Fund Complex (2014-present); Managing Director, Guggenheim Investments (2013-present).
Former: Senior Vice President, Neuberger Berman Group LLC (2009-2013); Vice President, Morgan Stanley (2002-2009). |
Jon Szafran (1989) | Assistant Treasurer | Since 2017 | Current: Director, Guggenheim Investments (2017-present); Assistant Treasurer, certain other funds in the Fund Complex (2017-present).
Former: Assistant Treasurer of Henderson Global Funds and Manager of US Fund Administration, Henderson Global Investors (North America) Inc. (“HGINA”), (2017); Senior Analyst of US Fund Administration, HGINA (2014–2017); Senior Associate of Fund Administration, Cortland Capital Market Services, LLC (2013-2014); Experienced Associate, PricewaterhouseCoopers LLP (2012-2013). |
* | The business address of each officer is c/o Guggenheim Investments, 227 West Monroe Street, Chicago, Illinois 60606. |
** | Each officer serves an indefinite term, until his or her successor is duly elected and qualified. |
| | THE GUGGENHEIM FUNDS ANNUAL REPORT | 139 |
GUGGENHEIM INVESTMENTS PRIVACY NOTICE (Unaudited) |
Who We Are
This Privacy Notice describes the data protection practices of Guggenheim Investments. Guggenheim Investments as used herein refers to the affiliated investment management businesses of Guggenheim Partners, LLC: Guggenheim Funds Investment Advisors, LLC, Guggenheim Partners Investment Management, LLC, Guggenheim Funds Distributors, LLC, Security Investors, LLC, Guggenheim Investment Advisors (Europe) Limited, Guggenheim Real Estate, LLC, GS Gamma Advisors, LLC, Guggenheim Partners India Management, LLC, Guggenheim Partners Europe Limited, as well as the funds in the Guggenheim Funds complex (the “Funds”) (“Guggenheim Investments,” “we,” “us,” or “our”).
Guggenheim Partners Investment Management Holdings, LLC, located at 330 Madison Avenue, New York, New York 10017, is the data controller for your information. The affiliates who are also controllers of certain of your information are: Guggenheim Investment Advisors (Europe) Limited, Guggenheim Partners Europe Limited, Guggenheim Partners, LLC, Guggenheim Funds Investment Advisors, LLC, Guggenheim Partners Investment Management, LLC, Guggenheim Funds Distributors, LLC and Security Investors, LLC, as well as the Funds.
Our Commitment to You
Guggenheim Investments considers your privacy our utmost concern. When you become our client or investor, you entrust us with not only your hard-earned money but also with your personal and financial information. Because we have access to your private information, we hold ourselves to the highest standards in its safekeeping and use. We strictly limit how we share your information with others, whether you are a current or former Guggenheim Investments client or investor.
The Information We Collect About You
We collect certain nonpublic personal information about you from information you provide on applications, other forms, our website, and/or from third parties including investment advisors. This information includes Social Security or other tax identification number, assets, income, tax information, retirement and estate plan information, transaction history, account balance, payment history, bank account information, marital status, family relationships, information that we collect on our website through the use of “cookies,” and other personal information that you or others provide to us. We may also collect such information through your inquiries by mail, e-mail or telephone. We may also collect customer due diligence information, as required by applicable law and regulation, through third party service providers.
How We Handle Your Personal Information
The legal basis for using your information as set out in this Privacy Notice is as follows: (a) use of your personal data is necessary to perform our obligations under any contract with you (such as a contract for us to provide financial services to you); or (b) where use of your personal data is not necessary for performance of a contract, use of your personal data is necessary for our legitimate interests or the legitimate interests of others (for example, to enforce the legal terms governing our services, operate and market our website and other services we offer, ensure safe environments for our personnel and others, make and receive payments, prevent fraud and to know the customer to whom we are providing the services). Some processing is done to comply with applicable law.
In addition to the specific uses described above, we also use your information in the following manner:
| | ● | We use your information in connection with servicing your accounts. |
| | ● | We use information to respond to your requests or questions. For example, we might use your information to respond to your customer feedback. |
| | ● | We use information to improve our products and services. We may use your information to make our website and products better. We may use your information to customize your experience with us. |
| | ● | We use information for security purposes. We may use your information to protect our company and our customers. |
| | ● | We use information to communicate with you. For example, we will communicate with you about your account or our relationship. We may contact you about your feedback. We might also contact you about this Privacy Notice. We may also enroll you in our email newsletter. |
140 | THE GUGGENHEIM FUNDS ANNUAL REPORT | |
GUGGENHEIM INVESTMENTS PRIVACY NOTICE (Unaudited)(continued) |
| | ● | We use information as otherwise permitted by law, as we may notify you. |
| | ● | Aggregate/Anonymous Data. We may aggregate and/or anonymize any information collected through the website so that such information can no longer be linked to you or your device (“Aggregate/Anonymous Information”). We may use Aggregate/Anonymous Information for any purpose, including without limitation for research and marketing purposes, and may also share such data with any third parties, including advertisers, promotional partners, and sponsors. |
We do not sell information about current or former clients or their accounts to third parties. Nor do we share this information, except when necessary to complete transactions at your request, to make you aware of investment products and services that we or our affiliates offer, or as permitted or required by law.
We provide information about you to companies and individuals not affiliated with Guggenheim Investments to complete certain transactions or account changes, or to perform services for us related to your account. For example, if you ask to transfer assets from another financial institution to Guggenheim Investments, we must provide certain information about you to that company to complete the transaction. We provide the third party with only the information necessary to carry out its responsibilities and only for that purpose. And we require these third parties to treat your private information with the same high degree of confidentiality that we do. To alert you to other Guggenheim Investments products and services, we share your information within our family of affiliated companies. You may limit our sharing with affiliated companies as set out below. We may also share information with any successor to all or part of our business, or in connection with steps leading up to a merger or acquisition. For example, if part of our business was sold we may give customer information as part of that transaction. We may also share information about you with your consent.
We will release information about you if you direct us to do so, if we are compelled by law to do so, or in other circumstances as permitted by law (for example, to protect your account from fraud).
If you close your account(s) or become an inactive client or investor, we will continue to adhere to the privacy policies and practices described in this notice.
Opt-Out Provisions and Your Data Choices
The law allows you to “opt out” of certain kinds of information sharing with third parties. We do not share personal information about you with any third parties that triggers this opt-out right. This means YOU ARE ALREADY OPTED OUT.
When you are no longer our client or investor, we continue to share your information as described in this notice, and you may contact us at any time to limit our sharing by sending an email to CorporateDataPrivacy@GuggenheimPartners.com.
European Union Data Subjects and certain others: In addition to the choices set forth above, residents of the European Union and certain other jurisdictions have certain rights to (1) request access to or rectification or deletion of information we collect about them, (2) request a restriction on the processing of their information, (3) object to the processing of their information, or (4) request the portability of certain information. To exercise these or other rights, please contact us using the contact information below. We will consider all requests and provide our response within the time period stated by applicable law. Please note, however, that certain information may be exempt from such requests in some circumstances, which may include if we need to keep processing your information for our legitimate interests or to comply with a legal obligation. We may request you provide us with information necessary to confirm your identity before responding to your request.
Residents of France and certain other jurisdictions may also provide us with instructions regarding the manner in which we may continue to store, erase and share your information after your death, and where applicable, the person you have designated to exercise these rights after your death.
How We Protect Privacy Online
We take steps to protect your privacy when you use our web site – www.guggenheiminvestments.com – by using secure forms of online communication, including encryption technology, Secure Socket Layer (SSL) protocol, firewalls and user names and passwords. These safeguards vary based on the sensitivity of the information that we collect and store. However, we cannot and do not guarantee that these measures will prevent every unauthorized attempt to access, use, or disclose your information since despite our efforts, no Internet and/or other
| | THE GUGGENHEIM FUNDS ANNUAL REPORT | 141 |
GUGGENHEIM INVESTMENTS PRIVACY NOTICE (Unaudited)(concluded) |
electronic transmissions can be completely secure. Our web site uses “http cookies”—tiny pieces of information that we ask your browser to store. We use cookies for session management and security features on the Guggenheim Investments web site. We do not use them to pull data from your hard drive, to learn your e-mail address, or to view data in cookies created by other web sites. We will not share the information in our cookies or give others access to it. See the legal information area on our web site for more details about web site security and privacy features.
How We Safeguard Your Personal Information and Data Retention
We restrict access to nonpublic personal information about you to our employees and in some cases to third parties (for example, the service providers described above) as permitted by law. We maintain strict physical, electronic and procedural safeguards that comply with federal standards to guard your nonpublic personal information.
We keep your information for no longer than necessary for the purposes for which it is processed. The length of time for which we retain information depends on the purposes for which we collected and use it and/or as required to comply with applicable laws. Information may persist in copies made for backup and business continuity purposes for additional time.
International Visitors
If you are not a resident of the United States, please be aware that your information may be transferred to, stored and processed in the United States where our servers are located and our databases are operated. The data protection and other laws of the United States and other countries might not be as comprehensive as those in your country.
In such cases, we ensure that a legal basis for such a transfer exists and that adequate protection is provided as required by applicable law, for example, by using standard contractual clauses or by transferring your data to a jurisdiction that has obtained an adequacy finding. Individuals whose data may be transferred on the basis of standard contractual clauses may contact us as described below.
We’ll Keep You Informed
If you have any questions or concerns about how we treat your personal data, we encourage you to consult with us first. You may also contact the relevant supervisory authority.
We reserve the right to modify this policy at any time and will inform you promptly of material changes. You may access our privacy policy from our web site at www.guggenheiminvestments.com. Should you have any questions regarding our privacy policy, contact us by email at CorporateDataPrivacy@GuggenheimPartners.com.
142 | THE GUGGENHEIM FUNDS ANNUAL REPORT | |
LIQUIDITY RISK MANAGEMENT PROGRAM (Unaudited) |
In compliance with SEC Rule 22e-4 under the U.S. Investment Company Act of 1940 (the “Liquidity Rule”), the Guggenheim Funds Trust (the “Trust”) has adopted and implemented a written liquidity risk management program (the “Program”) for each series of the Trust (each, a “Fund” and, collectively, the “Funds”). The Trust’s Board of Trustees (the “Board”) has also designated a Program administrator (the “Administrator”).
The Liquidity Rule requires that the Program be reasonably designed to assess and manage each Fund’s liquidity risk. A Fund’s “liquidity risk” (as defined in the Liquidity Rule) is the risk that the Fund could not meet requests to redeem shares issued by the Fund without significant dilution of the remaining investors’ interests in the Fund. The Program includes a number of elements that support the assessment, management and periodic review of liquidity risk. In accordance with the Program, each Fund’s liquidity risk is assessed, managed, and periodically reviewed no less frequently than annually taking into consideration a variety of factors, including, as applicable, the Fund’s investment strategy and liquidity of portfolio investments, short-term and long-term cash flow projections, and holdings of cash and cash equivalents, as well as borrowing arrangements and other funding sources. Certain factors are considered under both normal and reasonably foreseeable stressed conditions. There is no guarantee that the Program will achieve its objective under all circumstances.
Under the Program, each Fund portfolio investment is classified into one of four liquidity categories. The classification is based on a determination of the number of days a Fund reasonably expects to take to convert the investment into cash, or sell or dispose of the investment, in current market conditions without significantly changing the investment’s market value. The Program is reasonably designed to meet Liquidity Rule requirements relating to “highly liquid investment minimums” (i.e., the minimum amount of a Fund’s net assets to be invested in highly liquid investments that are assets) and to monitor compliance with the Liquidity Rule’s limitations on a Fund’s investments in “illiquid investments” (as defined in the Liquidity Rule). Under the Liquidity Rule, a Fund is prohibited from acquiring any illiquid investment if, immediately after the acquisition, the Fund would have invested more than 15% of its net assets in illiquid investments that are assets.
During the period covered by this shareholder report, the Board received a written report (the “Report”) prepared by the Administrator addressing the Program’s operation and assessing the adequacy and effectiveness of its implementation for the period from March 31, 2022, to March 31, 2023. The Report summarized the Administrator’s assessment of the Program’s implementation and concluded that the Program operated effectively, the Program had been and continued to be reasonably designed to assess and manage each Fund’s liquidity risk, and the Program has been adequately and effectively implemented to monitor and respond to the Funds’ liquidity developments, as applicable.
Please refer to the Fund’s prospectus for more information regarding the Fund’s exposure to liquidity risk and other risks to which an investment in the Fund may be subject.
| | THE GUGGENHEIM FUNDS ANNUAL REPORT | 143 |
This page intentionally left blank.
This page intentionally left blank.
This page intentionally left blank.
This page intentionally left blank.
This page intentionally left blank.
This page intentionally left blank.
9.30.2023
Guggenheim Funds Annual Report
| |
Guggenheim Diversified Income Fund | | |
Guggenheim High Yield Fund | | |
Guggenheim Core Bond Fund | | |
Guggenheim Municipal Income Fund | | |
GuggenheimInvestments.com | SBINC-ANN-0923x0924 |
| | |
DEAR SHAREHOLDER | 2 |
ECONOMIC AND MARKET OVERVIEW | 4 |
ABOUT SHAREHOLDERS’ FUND EXPENSES | 6 |
DIVERSIFIED INCOME FUND | 9 |
HIGH YIELD FUND | 19 |
CORE BOND FUND | 39 |
MUNICIPAL INCOME FUND | 67 |
NOTES TO FINANCIAL STATEMENTS | 80 |
REPORT OF INDEPENDENT REGISTERED PUBLIC ACCOUNTING FIRM | 100 |
OTHER INFORMATION | 101 |
INFORMATION ON BOARD OF TRUSTEES AND OFFICERS | 111 |
GUGGENHEIM INVESTMENTS PRIVACY NOTICE | 117 |
LIQUIDITY RISK MANAGEMENT PROGRAM | 120 |
| | THE GUGGENHEIM FUNDS ANNUAL REPORT | 1 |
Dear Shareholder:
Security Investors, LLC and Guggenheim Partners Investment Management, LLC (the “Investment Advisers”) are pleased to present the shareholder report for a selection of our Funds (the “Fund” or “Funds”) for the annual fiscal period ended September 30, 2023 (the “Reporting Period”).
The Investment Advisers are part of Guggenheim Investments, which represents the investment management businesses of Guggenheim Partners, LLC (“Guggenheim”), a global, diversified financial services firm.
Guggenheim Funds Distributors, LLC is the distributor of the Funds. Guggenheim Funds Distributors, LLC is affiliated with Guggenheim and the Investment Advisers.
We encourage you to read the Economic and Market Overview section of the report, which follows this letter, and then the Managers’ Commentary for each Fund.
We are committed to providing innovative investment solutions and appreciate the trust you place in us.
Sincerely,
Security Investors, LLC,
Guggenheim Partners Investment Management, LLC,
October 31, 2023
Read a prospectus and summary prospectus (if available) carefully before investing. It contains the investment objectives, risks, charges, expenses and other information, which should be considered carefully before investing. Obtain a prospectus and summary prospectus (if available) at guggenheiminvestments.com or call 800.820.0888.
This material is not intended as a recommendation or as investment advice of any kind, including in connection with rollovers, transfers, and distributions. Such material is not provided in a fiduciary capacity, may not be relied upon for or in connection with the making of investment decisions, and does not constitute a solicitation of an offer to buy or sell securities. All content has been provided for informational or educational purposes only and is not intended to be and should not be construed as legal or tax advice and/or a legal opinion. Always consult a financial, tax and/ or legal professional regarding your specific situation.
Diversified Income Fund may not be suitable for all investors. ● The Fund’s market value will change in response to interest rate changes and market conditions among other factors. In general, bond prices rise when interest rates fall and vice versa. ● The Fund’s exposure to high yield securities may subject the fund to greater volatility. ● Derivatives may pose risks in addition to and greater than those associated with investing directly in securities or other investments, including risks relating to leverage, imperfect correlations with underlying investments or the fund’s other portfolio holdings, high price volatility, lack of availability, counterparty credit, liquidity, valuation and legal restrictions. ● Stock prices, especially stock prices of smaller companies, can be volatile as they reflect changes in the issuing company’s financial conditions and changes in the overall market ● Some asset-backed securities, including mortgage-backed securities, may have structures that make their reaction to interest rates and other factors difficult to predict, making their prices very volatile and they are subject to liquidity risk. ● The Fund’s investments in other investment vehicles subject the fund to those risks and expenses affecting the investment vehicle. ●The Fund’s investments in foreign securities carry additional risks when compared to U.S. securities, due to the impact of diplomatic, political or economic developments in the country in question (investments in emerging markets securities are generally subject to an even greater level of risks). ● Investments in syndicated bank loans generally offer a floating interest rate and involve special types of risks. ● Master limited partnerships(“MLPs”) are subject to certain risks inherent in the structure of MLPs, including tax risks, limited control and voting rights and potential conflicts of interest. MLPs that concentrate in a particular industry or a particular geographic region are subject to risks associated with such industry or region. ● The Fund’s investments in real estate securities subject the fund to the same risks as direct investments in real estate, which is particularly sensitive to economic downturns. ● The
2 | THE GUGGENHEIM FUNDS ANNUAL REPORT | |
Fund’s investments and investment strategies, including investments in MLPs and certain investment vehicles, may be subject to special and complex federal income tax provisions that may adversely affect the fund and its distributions to shareholders. ● Leveraging will exaggerate the effect on NAV of any increase or decrease in the market value of the Fund’s portfolio. ● It is important to note that the Fund is not guaranteed by the U.S. government. ● Please read the prospectus for more detailed information regarding these and other risks.
High Yield Fund may not be suitable for all investors. ● The Fund’s market value will change in response to interest rate changes and market conditions among other factors. In general, bond prices rise when interest rates fall and vice versa. ● The Fund’s exposure to high yield securities may subject the Fund to greater volatility. ● The Fund may invest in derivative instruments, which may be more volatile and less liquid, increasing the risk of loss when compared to traditional securities. Certain of the derivative instruments are also subject to the risks of counterparty default and adverse tax treatment. ● The Fund’s use of leverage, through borrowings or instruments such as derivatives, may cause the Fund to be more volatile than if it had not been leveraged. ● Instruments and strategies (such as borrowing transactions and reverse repurchase agreements) may provide leveraged exposure to a particular investment, which will magnify any gains or losses on those investments. ● The Fund may invest in foreign securities which carry additional risks when compared to U.S. securities, due to the impact of diplomatic, political, or economic developments in the country in question (investments in emerging markets securities are generally subject to an even greater level of risks). ● Investments in syndicated bank loans generally offer a floating interest rate and involve special types of risks. ●The Fund’s investments in other investment vehicles subject the Fund to those risks and expenses affecting the investment vehicle. ● The Fund’s investments in restricted securities may involve financial and liquidity risk. ● You may have a gain or loss when you sell your shares. ● It is important to note that the Fund is not guaranteed by the U.S. government. ● Please read the prospectus for more detailed information regarding these and other risks.
Core Bond Fund may not be suitable for all investors. ● The Fund’s market value will change in response to interest rate changes and market conditions among other factors. In general, bond prices rise when interest rates fall and vice versa. ● The Fund’s exposure to high yield securities may subject the Fund to greater volatility. ● When market conditions are deemed appropriate, the Fund may use leverage to the full extent permitted by its investment policies and restrictions and applicable law. Leveraging will exaggerate the effect on net asset value of any increase or decrease in the market value of the Fund’s portfolio. ● The Fund may invest in derivative instruments, which may be more volatile and less liquid, increasing the risk of loss when compared to traditional securities. Certain of the derivative instruments are also subject to the risks of counterparty default and adverse tax treatment. ● Instruments and strategies (such as borrowing transactions and reverse repurchase agreements) may provide leveraged exposure to a particular investment, which will magnify any gains or losses on those investments. ● Investments in reverse repurchase agreements expose the Fund to the many of the same risks as investments in derivatives. ● The Fund’s investments in other investment vehicles subject the Fund to those risks and expenses affecting the investment vehicle. ● The Fund’s investments in foreign securities carry additional risks when compared to U.S. securities, due to the impact of diplomatic, political or economic developments in the country in question (investments in emerging markets securities are generally subject to an even greater level of risk). ●Investments in syndicated bank loans generally offer a floating interest rate and involve special types of risks. ● The Fund’s investments in municipal securities can be affected by events that affect the municipal bond market. ● The Fund’s investments in real estate securities subject the Fund to the same risks as direct investments in real estate, which is particularly sensitive to economic downturns. ● The Fund’s investments in restricted securities may involve financial and liquidity risk. ● You may have a gain or loss when you sell your shares. ● It is important to note that the Fund is not guaranteed by the U.S. government. ● Please read the prospectus for more detailed information regarding these and other risks.
Municipal Income Fund may not be suitable for all investors. ●The Fund will be significantly affected by events that affect the municipal bond market, which could include unfavorable legislative or political developments and adverse changes in the financial conditions of state and municipal issuers or the federal government in case it provides financial support to the municipality. Income from municipal bonds held by the Fund could be declared taxable because of changes in tax laws. The Fund may invest in securities that generate taxable income. A portion of the Fund’s otherwise tax-exempt dividends may be taxable to those shareholders subject to the alternative minimum tax. ● Certain sectors of the municipal bond market have special risks that can affect them more significantly than the market as a whole. Because many municipal instruments are issued to finance similar projects, conditions in these industries can significantly affect the Fund and the overall municipal market. ● Municipalities currently experience budget shortfalls, which could cause them to default on their debt and thus subject the Fund to unforeseen losses. ● Like other funds that hold bonds and other fixed-income investments, the Fund’s market value will change in response to interest rate changes and market conditions, among other factors. In general, bond prices rise when interest rates fall and vice versa. ● The Fund’s exposure to high-yield securities may subject the Fund to greater volatility. ● When market conditions are deemed appropriate, the Fund will leverage to the full extent permitted by its investment policies and restrictions and applicable law. Leveraging will exaggerate the effect on net asset value of any increase or decrease in the market value of the Fund’s portfolio. ● The Fund may invest in derivative instruments, which may be more volatile and less liquid, increasing the risk of loss when compared to traditional securities. Certain of the derivative instruments are also subject to the risks of counterparty default and adverse tax treatment. ● Instruments and strategies (such as reverse repurchase agreements, unfunded commitments, tender option bonds, and borrowings) may expose the Fund to many of the same risks as investments in derivatives and may provide leveraged exposure to a particular investment, which will magnify any gains or losses on those investments. ● The Fund’s investments in other investment vehicles subject the Fund to those risks and expenses affecting the investment vehicle. ● The Fund’s investments in foreign securities carry additional risks when compared to U.S. securities, due to the impact of diplomatic, political, or economic developments in the country in question (investments in emerging markets securities are generally subject to an even greater level of risks). ● Investments in syndicated bank loans generally offer a floating interest rate and involve special types of risks. ● The Fund is subject to active trading risks that may increase volatility and impact its ability to achieve its investment objective. ● You may have a gain or loss when you sell your shares. ● It is important to note that the Fund is not guaranteed by the U.S. government. ● To the extent the Fund invests a substantial portion of its assets in municipal securities issued by issuers in a particular state, municipality or project, the Fund will be particularly sensitive to developments and events adversely affecting such state or municipality or with respect to a particular project. Please read the prospectus for more detailed information regarding these and other risks.
| | THE GUGGENHEIM FUNDS ANNUAL REPORT | 3 |
ECONOMIC AND MARKET OVERVIEW (Unaudited) | September 30, 2023 |
Faced with a series of strong economic data releases, the market increasingly appears to be coming to the conclusion that the economy is structurally better able to withstand higher interest rates than it really is. This dynamic can be seen by examining the move in Treasury yields, with the selloff almost entirely being due to real yields rather than inflation expectations, and with the move most pronounced at the long end of the yield curve. Digging further, however, a large portion of this shift is due to a rising term premium (the premium for unknown and unquantified risks in the future, beyond current assumptions on the path of inflation or policy rates), which is indicating greater uncertainty about the outlook.
Many forecasters are extrapolating the current year’s economic strength without recognizing the fact that growth has benefited from a number of factors this year that are unlikely to be repeated, namely an expansion of the fiscal deficit, a slowdown in inflation, and a rebound in labor supply. As these factors fade, the headwinds from tight monetary policy may be more apparent and pronounced. And the longer monetary conditions stay tight, the greater the risk of something breaking (banks and commercial real estate remain key risks). All of this suggests that the recent economic trajectory cannot be assumed to continue, especially given the substantial restraint that could be imposed by the recent rise in long-term borrowing costs.
Uncertainty is elevated given the diverging signals in the data and the fact that many traditional economic models are not “working” as they traditionally would. This uncertainty extends to the U.S. Federal Reserve, which looks set to hold off on further rate hikes while it waits to see if the data start to align with the softening conditions policymakers say they are hearing on the ground. We continue to think the gravitational pull of tight money and credit conditions could result in a slowing economy and cooler inflation over the next year, paving the way for more rate cuts than the market presently expects.
For the Reporting Period, the S&P 500® Index* returned 21.62%. The MSCI Europe-Australasia-Far East (“EAFE”) Index* returned 25.65%. The return of the MSCI Emerging Markets Index* was 11.70%.
In the bond market, the Bloomberg U.S. Aggregate Bond Index* posted a 0.64% return for the Reporting Period, while the Bloomberg U.S. Corporate High Yield Index* returned 10.28%. The return of the ICE Bank of America (“BofA”) 3-Month U.S. Treasury Bill Index* was 4.50% for the Reporting Period.
The opinions and forecasts expressed may not actually come to pass. This information is subject to change at any time, based on market and other conditions, and should not be construed as a recommendation of any specific security or strategy.
4 | THE GUGGENHEIM FUNDS ANNUAL REPORT | |
ECONOMIC AND MARKET OVERVIEW (Unaudited)(concluded) | September 30, 2023 |
*Index Definitions
Indices are unmanaged and not available for direct investment. Index performance does not reflect transaction costs, fees, or expenses.
Bloomberg U.S. Aggregate Bond Index is a broad-based flagship benchmark that measures the investment grade, U.S. dollar-denominated, fixed-rate taxable bond market, including U.S. Treasuries, government-related and corporate securities, mortgage-backed securities or “MBS” (agency fixed-rate and hybrid adjustable-rate mortgage, or “ARM”, pass-throughs), asset-backed securities (“ABS”), and commercial mortgage-backed securities (“CMBS”) (agency and non-agency).
Bloomberg U.S. Corporate High Yield Index measures the U.S. dollar-denominated, high yield, fixed-rate corporate bond market. Securities are classified as high yield if the middle rating of Moody’s, Fitch, and S&P is Ba1/BB +/BB + or below.
Bloomberg Municipal Bond Index is a broad market performance benchmark for the tax-exempt bond market. The bonds included in this index must have a minimum credit rating of at least Baa.
ICE BofA 3-Month U.S. Treasury Bill Index is an unmanaged market index (LC) of U.S. Treasury securities maturing in 90 days that assumes reinvestment of all income.
MSCI EAFE Index is a free float-adjusted market capitalization index that is designed to measure the equity market performance of developed markets, excluding the U.S. & Canada.
MSCI Emerging Markets Index is a free float-adjusted market capitalization weighted index that is designed to measure equity market performance in the global emerging markets.
S&P 500® Index is a broad-based index, the performance of which is based on the performance of 500 widely held common stocks chosen for market size, liquidity, and industry group representation.
| | THE GUGGENHEIM FUNDS ANNUAL REPORT | 5 |
ABOUT SHAREHOLDERS’ FUND EXPENSES (Unaudited) | |
All mutual funds have operating expenses, and it is important for our shareholders to understand the impact of costs on their investments. Shareholders of a fund incur two types of costs: (i) transaction costs, including sales charges (loads) on purchase payments, reinvested dividends, other distributions, and exchange fees, and (ii) ongoing costs, including management fees, administrative services, and shareholder reports, among others. These ongoing costs, or operating expenses, are deducted from a fund’s gross income and reduce the investment return of the fund.
A fund’s expenses are expressed as a percentage of its average net assets, which is known as the expense ratio. The following examples are intended to help investors understand the ongoing costs (in dollars) of investing in a fund and to compare these costs with the ongoing costs of investing in other mutual funds.
The examples are based on an investment of $1,000 made at the beginning of the period and held for the entire six-month period beginning March 31, 2023 and ending September 30, 2023.
The following tables illustrate the Funds’ costs in two ways:
Table 1. Based on actual Fund return: This section helps investors estimate the actual expenses paid over the period. The “Ending Account Value” shown is derived from the Fund’s actual return, and the fifth column shows the dollar amount that would have been paid by an investor who started with $1,000 in the Fund. Investors may use the information here, together with the amount invested, to estimate the expenses paid over the period. Simply divide the Fund’s account value by $1,000 (for example, an $8,600 account value divided by $1,000 = 8.6), then multiply the result by the number provided under the heading “Expenses Paid During Period.”
Table 2. Based on hypothetical 5% return: This section is intended to help investors compare a fund’s cost with those of other mutual funds. The table provides information about hypothetical account values and hypothetical expenses based on the Fund’s actual expense ratio and an assumed rate of return of 5% per year before expenses, which is not the Fund’s actual return. The hypothetical account values and expenses may not be used to estimate the actual ending account balance or expenses paid during the period. The example is useful in making comparisons because the U.S. Securities and Exchange Commission (the “SEC”) requires all mutual funds to calculate expenses based on the 5% return. Investors can assess a fund’s costs by comparing this hypothetical example with the hypothetical examples that appear in shareholder reports of other funds.
The calculations illustrated above assume no shares were bought or sold during the period. Actual costs may have been higher or lower, depending on the amount of investment and the timing of any purchases or redemptions.
Please note that the expenses shown in the table are meant to highlight your ongoing costs only and do not reflect any transactional costs, such as sales charges (loads) on purchase payments, and contingent deferred sales charges (“CDSC”) on redemptions, if any. Therefore, the second table is useful in comparing ongoing costs only, and will not help you determine the relative total costs of owning different funds. In addition, if these transactional costs were included, your costs would have been higher.
More information about the Funds’ expenses, including annual expense ratios for periods up to five years (subject to the Fund’s inception date), can be found in the Financial Highlights section of this report. For additional information on operating expenses and other shareholder costs, please refer to the appropriate Fund prospectus.
6 | THE GUGGENHEIM FUNDS ANNUAL REPORT | |
ABOUT SHAREHOLDERS’ FUND EXPENSES (Unaudited)(continued) | |
| | Expense
Ratio1 | | | Fund
Return | | | Beginning
Account Value
March 31, 2023 | | | Ending
Account Value
September 30, 2023 | | | Expenses
Paid During
Period2 | |
Table 1. Based on actual Fund return3 | | | | | | | | | | | | | | | | | | | | |
Diversified Income Fund | | | | | | | | | | | | | | | | | | | | |
A-Class | | | 0.72 | % | | | 1.84 | % | | $ | 1,000.00 | | | $ | 1,018.40 | | | $ | 3.64 | |
C-Class | | | 1.46 | % | | | 1.44 | % | | | 1,000.00 | | | | 1,014.40 | | | | 7.37 | |
P-Class | | | 0.70 | % | | | 1.85 | % | | | 1,000.00 | | | | 1,018.50 | | | | 3.54 | |
Institutional Class | | | 0.47 | % | | | 1.93 | % | | | 1,000.00 | | | | 1,019.30 | | | | 2.38 | |
High Yield Fund | | | | | | | | | | | | | | | | | | | | |
A-Class | | | 1.15 | % | | | 2.46 | % | | | 1,000.00 | | | | 1,024.60 | | | | 5.84 | |
C-Class | | | 1.92 | % | | | 2.07 | % | | | 1,000.00 | | | | 1,020.70 | | | | 9.73 | |
P-Class | | | 1.16 | % | | | 2.56 | % | | | 1,000.00 | | | | 1,025.60 | | | | 5.89 | |
Institutional Class | | | 0.91 | % | | | 2.57 | % | | | 1,000.00 | | | | 1,025.70 | | | | 4.62 | |
R6-Class | | | 0.80 | % | | | 2.64 | % | | | 1,000.00 | | | | 1,026.40 | | | | 4.06 | |
Core Bond Fund | | | | | | | | | | | | | | | | | | | | |
A-Class | | | 0.92 | % | | | (3.56 | %) | | | 1,000.00 | | | | 964.40 | | | | 4.53 | |
C-Class | | | 1.63 | % | | | (3.94 | %) | | | 1,000.00 | | | | 960.60 | | | | 8.01 | |
P-Class | | | 0.87 | % | | | (3.56 | %) | | | 1,000.00 | | | | 964.40 | | | | 4.28 | |
Institutional Class | | | 0.58 | % | | | (3.43 | %) | | | 1,000.00 | | | | 965.70 | | | | 2.86 | |
Municipal Income Fund | | | | | | | | | | | | | | | | | | | | |
A-Class | | | 0.78 | % | | | (5.28 | %) | | | 1,000.00 | | | | 947.20 | | | | 3.81 | |
C-Class | | | 1.54 | % | | | (5.65 | %) | | | 1,000.00 | | | | 943.50 | | | | 7.50 | |
P-Class | | | 0.78 | % | | | (5.28 | %) | | | 1,000.00 | | | | 947.20 | | | | 3.81 | |
Institutional Class | | | 0.53 | % | | | (5.16 | %) | | | 1,000.00 | | | | 948.40 | | | | 2.59 | |
| | THE GUGGENHEIM FUNDS ANNUAL REPORT | 7 |
ABOUT SHAREHOLDERS’ FUND EXPENSES (Unaudited)(concluded) | |
| | Expense
Ratio1 | | | Fund
Return | | | Beginning
Account Value
March 31, 2023 | | | Ending
Account Value
September 30, 2023 | | | Expenses
Paid During
Period2 | |
Table 2. Based on hypothetical 5% return (before expenses) | | | | | | | | | | | | | |
Diversified Income Fund | | | | | | | | | | | | | | | | | | | | |
A-Class | | | 0.72 | % | | | 5.00 | % | | $ | 1,000.00 | | | $ | 1,021.46 | | | $ | 3.65 | |
C-Class | | | 1.46 | % | | | 5.00 | % | | | 1,000.00 | | | | 1,017.75 | | | | 7.38 | |
P-Class | | | 0.70 | % | | | 5.00 | % | | | 1,000.00 | | | | 1,021.56 | | | | 3.55 | |
Institutional Class | | | 0.47 | % | | | 5.00 | % | | | 1,000.00 | | | | 1,022.71 | | | | 2.38 | |
High Yield Fund | | | | | | | | | | | | | | | | | | | | |
A-Class | | | 1.15 | % | | | 5.00 | % | | | 1,000.00 | | | | 1,019.30 | | | | 5.82 | |
C-Class | | | 1.92 | % | | | 5.00 | % | | | 1,000.00 | | | | 1,015.44 | | | | 9.70 | |
P-Class | | | 1.16 | % | | | 5.00 | % | | | 1,000.00 | | | | 1,019.25 | | | | 5.87 | |
Institutional Class | | | 0.91 | % | | | 5.00 | % | | | 1,000.00 | | | | 1,020.51 | | | | 4.61 | |
R6-Class | | | 0.80 | % | | | 5.00 | % | | | 1,000.00 | | | | 1,021.06 | | | | 4.05 | |
Core Bond Fund | | | | | | | | | | | | | | | | | | | | |
A-Class | | | 0.92 | % | | | 5.00 | % | | | 1,000.00 | | | | 1,020.46 | | | | 4.66 | |
C-Class | | | 1.63 | % | | | 5.00 | % | | | 1,000.00 | | | | 1,016.90 | | | | 8.24 | |
P-Class | | | 0.87 | % | | | 5.00 | % | | | 1,000.00 | | | | 1,020.71 | | | | 4.41 | |
Institutional Class | | | 0.58 | % | | | 5.00 | % | | | 1,000.00 | | | | 1,022.16 | | | | 2.94 | |
Municipal Income Fund | | | | | | | | | | | | | | | | | | | | |
A-Class | | | 0.78 | % | | | 5.00 | % | | | 1,000.00 | | | | 1,021.16 | | | | 3.95 | |
C-Class | | | 1.54 | % | | | 5.00 | % | | | 1,000.00 | | | | 1,017.35 | | | | 7.79 | |
P-Class | | | 0.78 | % | | | 5.00 | % | | | 1,000.00 | | | | 1,021.16 | | | | 3.95 | |
Institutional Class | | | 0.53 | % | | | 5.00 | % | | | 1,000.00 | | | | 1,022.41 | | | | 2.69 | |
1 | Annualized and excludes expenses of the underlying funds in which the Funds invest, if any. This ratio represents net expenses, which may include expenses that are excluded from the expense limitation agreement. Excluding these expenses, the net expense ratios for the period would be: |
| | | A-Class | C-Class | P-Class | Institutional
Class | R6-Class |
| | Diversified Income Fund | 0.71% | 1.45% | 0.70% | 0.46% | N/A |
| | High Yield Fund | 1.12% | 1.89% | 1.14% | 0.88% | 0.77% |
| | Core Bond Fund | 0.76% | 1.52% | 0.77% | 0.47% | N/A |
| | Municipal Income Fund | 0.77% | 1.53% | 0.77% | 0.52% | N/A |
2 | Expenses are equal to the Fund’s annualized expense ratio, net of any applicable fee waivers, multiplied by the average account value over the period, multiplied by 183/365 (to reflect the one-half year period). |
3 | Actual cumulative return at net asset value for the period March 31, 2023 to September 30, 2023. |
8 | THE GUGGENHEIM FUNDS ANNUAL REPORT | |
MANAGERS’ COMMENTARY (Unaudited) | September 30, 2023 |
To Our Shareholders
Guggenheim Partners Investment Management, LLC (“GPIM”) serves as the investment adviser to Guggenheim Diversified Income Fund (“Fund”). The Fund is managed by a team of seasoned professionals led by Farhan Sharaff, Senior Managing Director, Portfolio Manager and Assistant Chief Investment Officer, Equities; and Qi Yan, Managing Director and Portfolio Manager. In the subsequent paragraphs, the investment team discusses the Fund’s performance and the market environment for the 12-month period ended September 30, 2023 (“Reporting Period”).
For the Reporting Period, the Fund returned 10.35%1 , outperforming the Bloomberg U.S.Aggregate Bond Index, the Fund’s primary benchmark (“Benchmark”), which returned 0.64% for the same period. The 70% Bloomberg U.S.Aggregate Bond Index / 30% MSCI World Index, the Fund’s secondary benchmark, returned 6.85%.
What factors contributed or detracted from the Fund’s performance during the Reporting Period?
The Fund outperformed its primary benchmark by almost 10 percentage points during the Reporting Period. On average, the Fund allocated 50% to fixed income, 40% to equity, 9% to closed-end funds, with the remainder in cash. The fixed-income component outperformed its benchmark by 8.17% and the equity component underperformed its benchmark by 7.25%. However, the Fund’s decision to overweight equity relative to the secondary benchmark was the main detractor in asset allocation. Overall, allocation effect and selection effect contributed 2.96% and 1.56%, respectively, before fees.
How was the Fund positioned at the end of the Reporting Period?
At the end of the Reporting Period, the Fund maintained the same equity/fixed income allocation that it had during the Reporting Period, and some of the funds within each asset class. This is due to the Fund’s long-term approach to allocation decisions, in which few changes are made within a single Reporting Period.
Performance displayed represents past performance which is no guarantee of future results.
1 | Performance figures are based on Class A shares and do not reflect taxes that a shareholder would pay on distributions or the redemption of shares. |
The opinions and forecast expressed may not actually come to pass. This information is subject to change at any time, based on market and other conditions, and should not be construed as a recommendation of any specific security or strategy.
| | THE GUGGENHEIM FUNDS ANNUAL REPORT | 9 |
PERFORMANCE REPORT AND FUND PROFILE (Unaudited) | September 30, 2023 |
DIVERSIFIED INCOME FUND
OBJECTIVE: Seeks to achieve high current income with consideration for capital appreciation.
Holdings Diversification (Market Exposure as % of Net Assets)
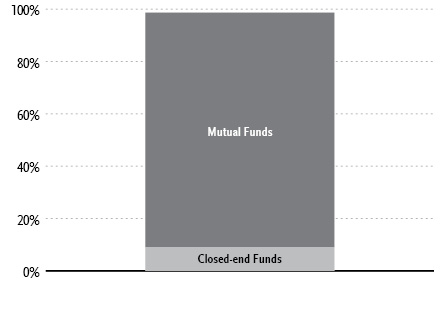
“Holdings Diversification (Market Exposure as % of Net Assets)” excludes any temporary cash investments or investments in Guggenheim Ultra Short Duration Fund.
Inception Dates: |
A-Class | January 29, 2016 |
C-Class | January 29, 2016 |
P-Class | January 29, 2016 |
Institutional Class | January 29, 2016 |
Ten Largest Holdings | % of Total Net Assets |
Guggenheim High Yield Fund — R6-Class | 25.4% |
Guggenheim RBP Large-Cap Market Fund — Institutional Class | 19.3% |
Guggenheim Floating Rate Strategies Fund — R6-Class | 10.6% |
Guggenheim Core Bond Fund — Institutional Class | 9.6% |
Guggenheim RBP Dividend Fund — Institutional Class | 9.6% |
Guggenheim Ultra Short Duration Fund — Institutional Class | 5.2% |
Guggenheim World Equity Income Fund — Institutional Class | 5.1% |
Guggenheim Risk Managed Real Estate Fund — Institutional Class | 4.8% |
ClearBridge MLP & Midstream Total Return Fund, Inc. | 0.3% |
KKR Income Opportunities Fund | 0.3% |
Top Ten Total | 90.2% |
| | |
“Ten Largest Holdings” excludes any temporary cash investments. |
10 | THE GUGGENHEIM FUNDS ANNUAL REPORT | |
PERFORMANCE REPORT AND FUND PROFILE (Unaudited)(concluded) | September 30, 2023 |
Cumulative Fund Performance*
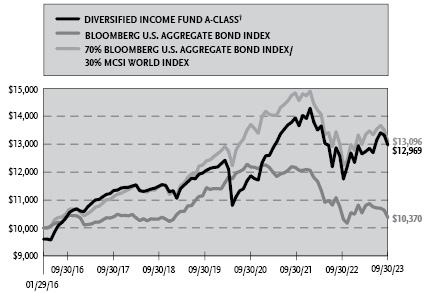
Average Annual Returns*
Periods Ended September 30, 2023
| 1 Year | 5 Year | Since
Inception
(01/29/16) |
A-Class Shares | 10.35% | 2.39% | 4.00% |
A-Class Shares with sales charge† | 5.95% | 1.56% | 3.45% |
C-Class Shares | 9.51% | 1.63% | 3.23% |
C-Class Shares with CDSC‡ | 8.51% | 1.63% | 3.23% |
P-Class Shares | 10.34% | 2.38% | 3.99% |
Institutional Class Shares | 10.63% | 2.64% | 4.25% |
Bloomberg U.S. Aggregate Bond Index | 0.64% | 0.10% | 0.47% |
70% Bloomberg U.S. Aggregate Bond Index/30% MSCI World Index | 6.85% | 2.59% | 3.58% |
* | The performance data above represents past performance that is not predictive of future results. The investment return and principal value of an investment in the Fund will fluctuate so that an investor’s shares, when redeemed, may be worth more or less than their original cost. Returns are historical and include changes in principal and reinvested dividends and capital gains and do not reflect the effect of taxes. The Bloomberg U.S. Aggregate Bond Index and MSCI World Index are unmanaged indices and, unlike the Fund, have no management fees or operating expenses to reduce their reported returns. The graph is based on A-Class shares only; performance for C-Class shares, P-Class shares and Institutional Class shares will vary due to differences in fee structures. |
† | Fund returns are calculated using the maximum sales charge of 4.00%. |
‡ | Fund returns include a CDSC of 1% if redeemed within 12 months of purchase. |
| | THE GUGGENHEIM FUNDS ANNUAL REPORT | 11 |
SCHEDULE OF INVESTMENTS | September 30, 2023 |
DIVERSIFIED INCOME FUND | |
| | Shares | | | Value | |
MUTUAL FUNDS† - 89.6% |
Guggenheim High Yield Fund — R6-Class1 | | | 202,859 | | | $ | 1,908,905 | |
Guggenheim RBP Large-Cap Market Fund — Institutional Class1 | | | 135,585 | | | | 1,449,403 | |
Guggenheim Floating Rate Strategies Fund — R6-Class1 | | | 32,515 | | | | 798,232 | |
Guggenheim Core Bond Fund — Institutional Class1 | | | 46,447 | | | | 721,321 | |
Guggenheim RBP Dividend Fund — Institutional Class1 | | | 60,265 | | | | 719,569 | |
Guggenheim Ultra Short Duration Fund — Institutional Class1 | | | 39,734 | | | | 387,411 | |
Guggenheim World Equity Income Fund — Institutional Class1 | | | 27,300 | | | | 384,380 | |
Guggenheim Risk Managed Real Estate Fund — Institutional Class1 | | | 12,950 | | | | 362,587 | |
Total Mutual Funds | | | | |
(Cost $7,262,607) | | | | | | | 6,731,808 | |
| | | | | | | | | |
CLOSED-END FUNDS† - 9.1% |
ClearBridge MLP & Midstream Total Return Fund, Inc. | | | 750 | | | | 24,052 | |
KKR Income Opportunities Fund | | | 1,850 | | | | 22,126 | |
Apollo Senior Floating Rate Fund, Inc. | | | 1,550 | | | | 20,832 | |
PIMCO Corporate & Income Strategy Fund | | | 1,700 | | | | 20,689 | |
BlackRock Floating Rate Income Strategies Fund, Inc. | | | 1,600 | | | | 20,192 | |
PIMCO Dynamic Income Fund | | | 1,145 | | | | 19,786 | |
First Trust Energy Income and Growth Fund | | | 1,500 | | | | 19,725 | |
Western Asset Global Corporate Defined Opportunity Fund, Inc. | | | 1,650 | | | | 19,553 | |
BlackRock Floating Rate Income Trust | | | 1,600 | | | | 19,296 | |
BlackRock Limited Duration Income Trust | | | 1,400 | | | | 18,032 | |
abrdn Income Credit Strategies Fund | | | 2,584 | | | | 17,573 | |
Neuberger Berman High Yield Strategies Fund, Inc. | | | 2,317 | | | | 17,447 | |
Voya Infrastructure Industrials and Materials Fund | | | 1,850 | | | | 17,445 | |
Blackstone Strategic Credit Fund | | | 1,550 | | | | 17,034 | |
Western Asset High Income Fund II, Inc. | | | 3,798 | | | | 16,939 | |
Eaton Vance Tax-Advantaged Dividend Income Fund | | | 797 | | | | 16,880 | |
Calamos Convertible Opportunities and Income Fund | | | 1,594 | | | | 16,753 | |
Voya Global Equity Dividend and Premium Opportunity Fund | | | 3,400 | | | | 16,660 | |
DoubleLine Income Solutions Fund | | | 1,400 | | | | 16,408 | |
Eaton Vance Tax-Managed Buy-Write Opportunities Fund | | | 1,370 | | | | 16,399 | |
BlackRock Enhanced Equity Dividend Trust | | | 2,100 | | | | 15,981 | |
Pioneer High Income Fund, Inc. | | | 2,350 | | | | 15,769 | |
Eaton Vance Tax-Managed Buy-Write Income Fund | | | 1,250 | | | | 15,763 | |
Western Asset Premier Bond Fund | | | 1,550 | | | | 15,639 | |
Eaton Vance Enhanced Equity Income Fund II | | | 908 | | | | 15,599 | |
PIMCO High Income Fund | | | 3,500 | | | | 15,470 | |
Royce Value Trust, Inc. | | | 1,195 | | | | 15,380 | |
PGIM High Yield Bond Fund, Inc. | | | 1,300 | | | | 15,314 | |
John Hancock Preferred Income Fund | | | 1,050 | | | | 15,298 | |
Invesco High Income Trust II | | | 1,525 | | | | 15,158 | |
Eaton Vance Limited Duration Income Fund | | | 1,650 | | | | 14,916 | |
John Hancock Income Securities Trust | | | 1,450 | | | | 14,877 | |
Virtus Diversified Income & Convertible Fund | | | 779 | | | | 14,536 | |
BlackRock Credit Allocation Income Trust | | | 1,500 | | | | 14,520 | |
John Hancock Investors Trust | | | 1,178 | | | | 14,313 | |
Cohen & Steers REIT and Preferred and Income Fund, Inc. | | | 815 | | | | 13,985 | |
John Hancock Premium Dividend Fund | | | 1,450 | | | | 13,949 | |
Western Asset Emerging Markets Debt Fund, Inc. | | | 1,650 | | | | 13,695 | |
PIMCO Dynamic Income Opportunities Fund | | | 1,150 | | | | 13,662 | |
Reaves Utility Income Fund | | | 550 | | | | 13,558 | |
Western Asset Mortgage Opportunity Fund, Inc. | | | 1,250 | | | | 13,388 | |
Total Closed-End Funds | | | | |
(Cost $776,541) | | | | | | | 684,591 | |
| | | | | | | | | |
MONEY MARKET FUND† - 1.3% |
Goldman Sachs Financial Square Treasury Instruments Fund — Institutional Shares, 5.22%2 | | | 99,375 | | | | 99,375 | |
Total Money Market Fund | | | | |
(Cost $99,375) | | | | | | | 99,375 | |
| | | | | | | | | |
Total Investments - 100.0% | | | | |
(Cost $8,138,523) | | $ | 7,515,774 | |
Other Assets & Liabilities, net - 0.0% | | | 3,473 | |
Total Net Assets - 100.0% | | $ | 7,519,247 | |
† | Value determined based on Level 1 inputs — See Note 4. |
1 | Affiliated issuer. |
2 | Rate indicated is the 7-day yield as of September 30, 2023. |
| | REIT — Real Estate Investment Trust |
| | |
| | See Sector Classification in Other Information section. |
12 | THE GUGGENHEIM FUNDS ANNUAL REPORT | SEE NOTES TO FINANCIAL STATEMENTS. |
SCHEDULE OF INVESTMENTS (concluded) | September 30, 2023 |
DIVERSIFIED INCOME FUND | |
The following table summarizes the inputs used to value the Fund’s investments at September 30, 2023 (See Note 4 in the Notes to Financial Statements):
Investments in Securities (Assets) | | Level 1
Quoted
Prices | | | Level 2
Significant
Observable
Inputs | | | Level 3
Significant
Unobservable
Inputs | | | Total | |
Mutual Funds | | $ | 6,731,808 | | | $ | — | | | $ | — | | | $ | 6,731,808 | |
Closed-End Funds | | | 684,591 | | | | — | | | | — | | | | 684,591 | |
Money Market Fund | | | 99,375 | | | | — | | | | — | | | | 99,375 | |
Total Assets | | $ | 7,515,774 | | | $ | — | | | $ | — | | | $ | 7,515,774 | |
Affiliated Transactions
Investments representing 5% or more of the outstanding voting shares of a company, or control of or by, or common control under Guggenheim Investments, result in that company being considered an affiliated issuer, as defined in the 1940 Act.
Transactions during the year ended September 30, 2023, in which the company is an affiliated issuer, were as follows:
Security Name | | Value
09/30/22 | | | Additions | | | Reductions | | | Realized
Gain (Loss) | | | Change in
Unrealized
Appreciation
(Depreciation) | | | Value
09/30/23 | | | Shares
09/30/23 | | | Investment
Income | | | Capital
Gain
Distributions | |
Mutual Funds | | | | | | | | | | | | | | | | | | | | | | | | | | | | | | | | | | | | |
Guggenheim Core Bond Fund — Institutional Class | | $ | 704,685 | | | $ | 66,893 | | | $ | (32,991 | ) | | $ | (6,706 | ) | | $ | (10,560 | ) | | $ | 721,321 | | | | 46,447 | | | $ | 31,945 | | | $ | — | |
Guggenheim Floating Rate Strategies Fund — R6-Class | | | 747,554 | | | | 63,082 | | | | (49,997 | ) | | | (2,284 | ) | | | 39,877 | | | | 798,232 | | | | 32,515 | | | | 63,149 | | | | — | |
Guggenheim High Yield Fund — R6-Class | | | 1,837,726 | | | | 122,675 | | | | (109,991 | ) | | | (15,973 | ) | | | 74,468 | | | | 1,908,905 | | | | 202,859 | | | | 122,934 | | | | — | |
Guggenheim RBP Dividend Fund — Institutional Class | | | 685,303 | | | | 22,783 | | | | (100,145 | ) | | | (16,045 | ) | | | 127,673 | | | | 719,569 | | | | 60,265 | | | | 10,793 | | | | — | |
Guggenheim RBP Large-Cap Market Fund — Institutional Class | | | 1,383,590 | | | | 82,845 | | | | (192,978 | ) | | | (63,804 | ) | | | 239,750 | | | | 1,449,403 | | | | 135,585 | | | | 5,578 | | | | 40,807 | |
Guggenheim Risk Managed Real Estate Fund — Institutional Class | | | 337,666 | | | | 49,212 | | | | — | | | | — | | | | (24,291 | ) | | | 362,587 | | | | 12,950 | | | | 11,759 | | | | 15,483 | |
Guggenheim Ultra Short Duration Fund — Institutional Class | | | 367,906 | | | | 18,298 | | | | (4,992 | ) | | | (128 | ) | | | 6,327 | | | | 387,411 | | | | 39,734 | | | | 18,296 | | | | — | |
Guggenheim World Equity Income Fund — Institutional Class | | | 344,667 | | | | 8,186 | | | | (14,998 | ) | | | (5,053 | ) | | | 51,578 | | | | 384,380 | | | | 27,300 | | | | 7,974 | | | | 212 | |
| | | $ | 6,409,097 | | | $ | 433,974 | | | $ | (506,092 | ) | | $ | (109,993 | ) | | $ | 504,822 | | | $ | 6,731,808 | | | | | | | $ | 272,428 | | | $ | 56,502 | |
SEE NOTES TO FINANCIAL STATEMENTS. | THE GUGGENHEIM FUNDS ANNUAL REPORT | 13 |
STATEMENT OF ASSETS AND LIABILITIES |
September 30, 2023 |
Assets: |
Investments in unaffiliated issuers, at value (cost $875,916) | | $ | 783,966 | |
Investments in affiliated issuers, at value (cost $7,262,607) | | | 6,731,808 | |
Prepaid expenses | | | 35,550 | |
Receivables: |
Dividends | | | 29,728 | |
Investment Adviser | | | 7,193 | |
Interest | | | 272 | |
Total assets | | | 7,588,517 | |
| | | | | |
Liabilities: |
Overdraft due to custodian bank | | | 2 | |
Payable for: |
Securities purchased | | | 28,758 | |
Professional fees | | | 23,559 | |
Insurance | | | 5,071 | |
Fund accounting fees | | | 4,414 | |
Transfer agent and maintenance fees | | | 2,137 | |
Trustees’ fees* | | | 1,733 | |
Distribution and service fees | | | 296 | |
Fund shares redeemed | | | 120 | |
Miscellaneous | | | 3,180 | |
Total liabilities | | | 69,270 | |
Net assets | | $ | 7,519,247 | |
| | | | | |
Net assets consist of: |
Paid in capital | | $ | 8,288,286 | |
Total distributable earnings (loss) | | | (769,039 | ) |
Net assets | | $ | 7,519,247 | |
| | | | | |
A-Class: |
Net assets | | $ | 316,555 | |
Capital shares outstanding | | | 13,290 | |
Net asset value per share | | $ | 23.82 | |
Maximum offering price per share (Net asset value divided by 96.00%) | | $ | 24.81 | |
| | | | | |
C-Class: |
Net assets | | $ | 231,812 | |
Capital shares outstanding | | | 9,782 | |
Net asset value per share | | $ | 23.70 | |
| | | | | |
P-Class: |
Net assets | | $ | 166,403 | |
Capital shares outstanding | | | 7,008 | |
Net asset value per share | | $ | 23.74 | |
| | | | | |
Institutional Class: |
Net assets | | $ | 6,804,477 | |
Capital shares outstanding | | | 285,625 | |
Net asset value per share | | $ | 23.82 | |
STATEMENT OF OPERATIONS |
Year Ended September 30, 2023 |
Investment Income: |
Dividends from securities of unaffiliated issuers | | $ | 53,336 | |
Dividends from securities of affiliated issuers | | | 272,428 | |
Interest | | | 4,124 | |
Total investment income | | | 329,888 | |
| | | | | |
Expenses: |
Management fees | | | 57,736 | |
Distribution and service fees: |
A-Class | | | 773 | |
C-Class | | | 2,392 | |
P-Class | | | 895 | |
Transfer agent fees: |
A-Class | | | 1,471 | |
C-Class | | | 1,191 | |
P-Class | | | 1,845 | |
Institutional Class | | | 21,982 | |
Registration fees | | | 61,533 | |
Professional fees | | | 38,404 | |
Trustees’ fees* | | | 13,495 | |
Fund accounting and administration fees | | | 12,233 | |
Custodian fees | | | 7,321 | |
Line of credit fees | | | 266 | |
Miscellaneous | | | 8,650 | |
Recoupment of previously waived fees: |
A-Class | | | 25 | |
C-Class | | | 24 | |
P-Class | | | 88 | |
Institutional Class | | | 527 | |
Total expenses | | | 230,851 | |
Less: |
Expenses reimbursed by Adviser: |
A-Class | | | (4,132 | ) |
C-Class | | | (3,266 | ) |
P-Class | | | (4,916 | ) |
Institutional Class | | | (80,303 | ) |
Expenses waived by Adviser | | | (97,718 | ) |
Total waived/reimbursed expenses | | | (190,335 | ) |
Net expenses | | | 40,516 | |
Net investment income | | | 289,372 | |
| | | | | |
Net Realized and Unrealized Gain (Loss): |
Net realized gain (loss) on: |
Investments in unaffiliated issuers | | | 12,914 | |
Investments in affiliated issuers | | | (109,993 | ) |
Distributions received from affiliated investment companies | | | 56,502 | |
Net realized loss | | | (40,577 | ) |
Net change in unrealized appreciation (depreciation) on: |
Investments in unaffiliated issuers | | | 7,622 | |
Investments in affiliated issuers | | | 504,822 | |
Net change in unrealized appreciation (depreciation) | | | 512,444 | |
Net realized and unrealized gain | | | 471,867 | |
Net increase in net assets resulting from operations | | $ | 761,239 | |
* | Relates to Trustees not deemed “interested persons” within the meaning of Section 2(a)(19) of the 1940 Act. |
14 | THE GUGGENHEIM FUNDS ANNUAL REPORT | SEE NOTES TO FINANCIAL STATEMENTS. |
STATEMENTS OF CHANGES IN NET ASSETS |
| | Year Ended
September 30,
2023 | | | Year Ended
September 30,
2022 | |
Increase (Decrease) in Net Assets from Operations: | | | | | | | | |
Net investment income | | $ | 289,372 | | | $ | 206,098 | |
Net realized gain (loss) on investments | | | (40,577 | ) | | | 506,371 | |
Net change in unrealized appreciation (depreciation) on investments | | | 512,444 | | | | (1,949,416 | ) |
Net increase (decrease) in net assets resulting from operations | | | 761,239 | | | | (1,236,947 | ) |
| | | | | | | | | |
Distributions to shareholders: | | | | | | | | |
A-Class | | | (26,440 | ) | | | (13,926 | ) |
C-Class | | | (19,007 | ) | | | (22,111 | ) |
P-Class | | | (38,784 | ) | | | (9,123 | ) |
Institutional Class | | | (601,669 | ) | | | (277,436 | ) |
Total distributions to shareholders | | | (685,900 | ) | | | (322,596 | ) |
| | | | | | | | | |
Capital share transactions: | | | | | | | | |
Proceeds from sale of shares | | | | | | | | |
A-Class | | | 11,427 | | | | 120,099 | |
C-Class | | | 1,000 | | | | 628,708 | |
P-Class | | | 196,785 | | | | 389,539 | |
Institutional Class | | | 38,754 | | | | 583,577 | |
Distributions reinvested | | | | | | | | |
A-Class | | | 26,440 | | | | 13,926 | |
C-Class | | | 19,007 | | | | 22,111 | |
P-Class | | | 38,784 | | | | 9,123 | |
Institutional Class | | | 601,669 | | | | 277,436 | |
Cost of shares redeemed | | | | | | | | |
A-Class | | | (8,379 | ) | | | (126,698 | ) |
C-Class | | | (15,175 | ) | | | (551,222 | ) |
P-Class | | | (484,767 | ) | | | (72,266 | ) |
Institutional Class | | | (205,042 | ) | | | (206,918 | ) |
Net increase from capital share transactions | | | 220,503 | | | | 1,087,415 | |
Net increase (decrease) in net assets | | | 295,842 | | | | (472,128 | ) |
| | | | | | | | | |
Net assets: | | | | | | | | |
Beginning of year | | | 7,223,405 | | | | 7,695,533 | |
End of year | | $ | 7,519,247 | | | $ | 7,223,405 | |
| | | | | | | | | |
Capital share activity: | | | | | | | | |
Shares sold | | | | | | | | |
A-Class | | | 470 | | | | 4,278 | |
C-Class | | | 42 | | | | 22,058 | |
P-Class | | | 8,066 | | | | 14,554 | |
Institutional Class | | | 1,591 | | | | 20,354 | |
Shares issued from reinvestment of distributions | | | | | | | | |
A-Class | | | 1,118 | | | | 503 | |
C-Class | | | 810 | | | | 791 | |
P-Class | | | 1,647 | | | | 339 | |
Institutional Class | | | 25,437 | | | | 10,120 | |
Shares redeemed | | | | | | | | |
A-Class | | | (343 | ) | | | (4,685 | ) |
C-Class | | | (622 | ) | | | (22,244 | ) |
P-Class | | | (20,305 | ) | | | (2,623 | ) |
Institutional Class | | | (8,451 | ) | | | (7,812 | ) |
Net increase in shares | | | 9,460 | | | | 35,633 | |
SEE NOTES TO FINANCIAL STATEMENTS. | THE GUGGENHEIM FUNDS ANNUAL REPORT | 15 |
This table is presented to show selected data for a share outstanding throughout each period and to assist shareholders in evaluating a Fund’s performance for the periods presented.
A-Class | | Year Ended
September 30,
2023 | | | Year Ended
September 30,
2022 | | | Year Ended
September 30,
2021 | | | Year Ended
September 30,
2020 | | | Year Ended
September 30,
2019 | |
Per Share Data |
Net asset value, beginning of period | | $ | 23.59 | | | $ | 28.45 | | | $ | 25.27 | | | $ | 26.99 | | | $ | 26.70 | |
Income (loss) from investment operations: |
Net investment income (loss)a | | | .86 | | | | .71 | | | | .73 | | | | .81 | | | | .86 | |
Net gain (loss) on investments (realized and unrealized) | | | 1.50 | | | | (4.55 | ) | | | 3.30 | | | | (1.63 | ) | | | .50 | |
Total from investment operations | | | 2.36 | | | | (3.84 | ) | | | 4.03 | | | | (.82 | ) | | | 1.36 | |
Less distributions from: |
Net investment income | | | (.89 | ) | | | (.93 | ) | | | (.85 | ) | | | (.81 | ) | | | (.77 | ) |
Net realized gains | | | (1.24 | ) | | | (.09 | ) | | | — | | | | (.09 | ) | | | (.30 | ) |
Total distributions | | | (2.13 | ) | | | (1.02 | ) | | | (.85 | ) | | | (.90 | ) | | | (1.07 | ) |
Net asset value, end of period | | $ | 23.82 | | | $ | 23.59 | | | $ | 28.45 | | | $ | 25.27 | | | $ | 26.99 | |
|
Total Returnb | | | 10.35 | % | | | (13.94 | %) | | | 16.10 | % | | | (3.06 | %) | | | 5.31 | % |
Ratios/Supplemental Data |
Net assets, end of period (in thousands) | | $ | 317 | | | $ | 284 | | | $ | 340 | | | $ | 267 | | | $ | 278 | |
Ratios to average net assets: |
Net investment income (loss) | | | 3.56 | % | | | 2.59 | % | | | 2.64 | % | | | 3.14 | % | | | 3.26 | % |
Total expensesc | | | 3.33 | % | | | 3.42 | % | | | 3.92 | % | | | 4.24 | % | | | 4.03 | % |
Net expensesd,e,f | | | 0.72 | % | | | 0.74 | % | | | 0.78 | % | | | 0.83 | % | | | 0.85 | % |
Portfolio turnover rate | | | 6 | % | | | 12 | % | | | 50 | % | | | 66 | % | | | 58 | % |
C-Class | | Year Ended
September 30,
2023 | | | Year Ended
September 30,
2022 | | | Year Ended
September 30,
2021 | | | Year Ended
September 30,
2020 | | | Year Ended
September 30,
2019 | |
Per Share Data |
Net asset value, beginning of period | | $ | 23.48 | | | $ | 28.36 | | | $ | 25.19 | | | $ | 27.00 | | | $ | 26.69 | |
Income (loss) from investment operations: |
Net investment income (loss)a | | | .68 | | | | .47 | | | | .52 | | | | .60 | | | | .69 | |
Net gain (loss) on investments (realized and unrealized) | | | 1.50 | | | | (4.49 | ) | | | 3.29 | | | | (1.62 | ) | | | .46 | |
Total from investment operations | | | 2.18 | | | | (4.02 | ) | | | 3.81 | | | | (1.02 | ) | | | 1.15 | |
Less distributions from: |
Net investment income | | | (.72 | ) | | | (.77 | ) | | | (.64 | ) | | | (.70 | ) | | | (.54 | ) |
Net realized gains | | | (1.24 | ) | | | (.09 | ) | | | — | | | | (.09 | ) | | | (.30 | ) |
Total distributions | | | (1.96 | ) | | | (.86 | ) | | | (.64 | ) | | | (.79 | ) | | | (.84 | ) |
Net asset value, end of period | | $ | 23.70 | | | $ | 23.48 | | | $ | 28.36 | | | $ | 25.19 | | | $ | 27.00 | |
|
Total Returnb | | | 9.51 | % | | | (14.57 | %) | | | 15.24 | % | | | (3.77 | %) | | | 4.50 | % |
Ratios/Supplemental Data |
Net assets, end of period (in thousands) | | $ | 232 | | | $ | 224 | | | $ | 254 | | | $ | 197 | | | $ | 816 | |
Ratios to average net assets: |
Net investment income (loss) | | | 2.82 | % | | | 1.70 | % | | | 1.89 | % | | | 2.26 | % | | | 2.59 | % |
Total expensesc | | | 4.10 | % | | | 4.04 | % | | | 4.68 | % | | | 4.86 | % | | | 4.74 | % |
Net expensesd,e,f | | | 1.46 | % | | | 1.49 | % | | | 1.52 | % | | | 1.58 | % | | | 1.59 | % |
Portfolio turnover rate | | | 6 | % | | | 12 | % | | | 50 | % | | | 66 | % | | | 58 | % |
16 | THE GUGGENHEIM FUNDS ANNUAL REPORT | SEE NOTES TO FINANCIAL STATEMENTS. |
FINANCIAL HIGHLIGHTS (continued) |
This table is presented to show selected data for a share outstanding throughout each period and to assist shareholders in evaluating a Fund’s performance for the periods presented.
P-Class | | Year Ended
September 30,
2023 | | | Year Ended
September 30,
2022 | | | Year Ended
September 30,
2021 | | | Year Ended
September 30,
2020 | | | Year Ended
September 30,
2019 | |
Per Share Data |
Net asset value, beginning of period | | $ | 23.59 | | | $ | 28.43 | | | $ | 25.25 | | | $ | 26.97 | | | $ | 26.70 | |
Income (loss) from investment operations: |
Net investment income (loss)a | | | .86 | | | | .58 | | | | .73 | | | | .81 | | | | .85 | |
Net gain (loss) on investments (realized and unrealized) | | | 1.51 | | | | (4.43 | ) | | | 3.30 | | | | (1.63 | ) | | | .51 | |
Total from investment operations | | | 2.37 | | | | (3.85 | ) | | | 4.03 | | | | (.82 | ) | | | 1.36 | |
Less distributions from: |
Net investment income | | | (.98 | ) | | | (.90 | ) | | | (.85 | ) | | | (.81 | ) | | | (.79 | ) |
Net realized gains | | | (1.24 | ) | | | (.09 | ) | | | — | | | | (.09 | ) | | | (.30 | ) |
Total distributions | | | (2.22 | ) | | | (.99 | ) | | | (.85 | ) | | | (.90 | ) | | | (1.09 | ) |
Net asset value, end of period | | $ | 23.74 | | | $ | 23.59 | | | $ | 28.43 | | | $ | 25.25 | | | $ | 26.97 | |
|
Total Return | | | 10.34 | % | | | (13.95 | %) | | | 16.12 | % | | | (3.03 | %) | | | 5.23 | % |
Ratios/Supplemental Data |
Net assets, end of period (in thousands) | | $ | 166 | | | $ | 415 | | | $ | 152 | | | $ | 128 | | | $ | 131 | |
Ratios to average net assets: |
Net investment income (loss) | | | 3.56 | % | | | 2.16 | % | | | 2.64 | % | | | 3.14 | % | | | 3.22 | % |
Total expensesc | | | 3.41 | % | | | 3.49 | % | | | 3.92 | % | | | 4.19 | % | | | 3.97 | % |
Net expensesd,e,f | | | 0.73 | % | | | 0.74 | % | | | 0.78 | % | | | 0.83 | % | | | 0.85 | % |
Portfolio turnover rate | | | 6 | % | | | 12 | % | | | 50 | % | | | 66 | % | | | 58 | % |
SEE NOTES TO FINANCIAL STATEMENTS. | THE GUGGENHEIM FUNDS ANNUAL REPORT | 17 |
FINANCIAL HIGHLIGHTS (concluded) |
This table is presented to show selected data for a share outstanding throughout each period and to assist shareholders in evaluating a Fund’s performance for the periods presented.
Institutional Class | | Year Ended
September 30,
2023 | | | Year Ended
September 30,
2022 | | | Year Ended
September 30,
2021 | | | Year Ended
September 30,
2020 | | | Year Ended
September 30,
2019 | |
Per Share Data |
Net asset value, beginning of period | | $ | 23.59 | | | $ | 28.44 | | | $ | 25.26 | | | $ | 26.98 | | | $ | 26.72 | |
Income (loss) from investment operations: |
Net investment income (loss)a | | | .92 | | | | .69 | | | | .80 | | | | .87 | | | | .92 | |
Net gain (loss) on investments (realized and unrealized) | | | 1.51 | | | | (4.46 | ) | | | 3.30 | | | | (1.63 | ) | | | .49 | |
Total from investment operations | | | 2.43 | | | | (3.77 | ) | | | 4.10 | | | | (.76 | ) | | | 1.41 | |
Less distributions from: |
Net investment income | | | (.96 | ) | | | (.99 | ) | | | (.92 | ) | | | (.87 | ) | | | (.85 | ) |
Net realized gains | | | (1.24 | ) | | | (.09 | ) | | | — | | | | (.09 | ) | | | (.30 | ) |
Total distributions | | | (2.20 | ) | | | (1.08 | ) | | | (.92 | ) | | | (.96 | ) | | | (1.15 | ) |
Net asset value, end of period | | $ | 23.82 | | | $ | 23.59 | | | $ | 28.44 | | | $ | 25.26 | | | $ | 26.98 | |
|
Total Return | | | 10.63 | % | | | (13.74 | %) | | | 16.40 | % | | | (2.82 | %) | | | 5.52 | % |
Ratios/Supplemental Data |
Net assets, end of period (in thousands) | | $ | 6,804 | | | $ | 6,300 | | | $ | 6,950 | | �� | $ | 5,965 | | | $ | 6,165 | |
Ratios to average net assets: |
Net investment income (loss) | | | 3.81 | % | | | 2.54 | % | | | 2.89 | % | | | 3.39 | % | | | 3.47 | % |
Total expensesc | | | 2.92 | % | | | 3.05 | % | | | 3.55 | % | | | 3.78 | % | | | 3.58 | % |
Net expensesd,e,f | | | 0.47 | % | | | 0.49 | % | | | 0.53 | % | | | 0.58 | % | | | 0.60 | % |
Portfolio turnover rate | | | 6 | % | | | 12 | % | | | 50 | % | | | 66 | % | | | 58 | % |
a | Net investment income (loss) per share was computed using average shares outstanding throughout the period. |
b | Total return does not reflect the impact of any applicable sales charges. |
c | Does not include expenses of the underlying funds in which the Fund invests. |
d | Net expense information reflects the expense ratios after expense waivers and reimbursements, as applicable. |
e | The portion of the ratios of net expenses to average net assets attributable to recoupments of prior fee reductions or expense reimbursements for the years presented was as follows: |
| | | 09/30/23 | 09/30/22 | 09/30/21 | 09/30/20 | 09/30/19 |
| | A-Class | 0.01% | — | — | — | — |
| | C-Class | 0.01% | — | — | 0.00%* | — |
| | P-Class | 0.02% | — | — | 0.00%* | — |
| | Institutional Class | 0.01% | — | — | 0.00%* | — |
f | Net expenses may include expenses that are excluded from the expense limitation agreement. Excluding these expenses, the net expense ratios for the years presented would be: |
| | | 09/30/23 | 09/30/22 | 09/30/21 | 09/30/20 | 09/30/19 |
| | A-Class | 0.72% | 0.73% | 0.77% | 0.82% | 0.85% |
| | C-Class | 1.46% | 1.48% | 1.51% | 1.57% | 1.59% |
| | P-Class | 0.72% | 0.73% | 0.77% | 0.82% | 0.85% |
| | Institutional Class | 0.47% | 0.48% | 0.52% | 0.57% | 0.60% |
18 | THE GUGGENHEIM FUNDS ANNUAL REPORT | SEE NOTES TO FINANCIAL STATEMENTS. |
MANAGERS’ COMMENTARY (Unaudited) | September 30, 2023 |
To Our Shareholders
Security Investors, LLC (“SI”) serves as the investment adviser to Guggenheim High Yield Fund (“Fund”). The Fund is managed by a team of seasoned professionals at SI, including Anne B. Walsh, CFA, JD, Chief Investment Officer and Managing Partner; Steven H. Brown, CFA, Chief Investment Officer, Total Return and Macro Strategies, Senior Managing Director, and Portfolio Manager; Thomas J. Hauser, Senior Managing Director and Portfolio Manager; and John Walsh, Managing Director and Portfolio Manager. In the subsequent paragraphs, the investment team discusses the Fund’s performance and the market environment for the 12-month period ended September 30, 2023 (the “Reporting Period”).
For the Reporting Period, the Fund returned 9.60%1, underperforming the Bloomberg U.S. Corporate High Yield Index, the Fund’s benchmark (“Benchmark”), which returned 10.28% for the same period.
What factors contributed or detracted from the Fund’s performance during the Reporting Period?
The Reporting Period benefitted from a strong snap-back following a difficult operating environment in the prior Reporting Period. Almost all sectors and rating categories generated positive returns over the Reporting Period, even as interest rates continued to climb.
Bottom-up fundamental credit analysis continues to be the main driver of the Fund’s performance. The largest contributing sectors to performance were Technology and Consumer Non-Cyclicals, in which the Fund benefited from strong security selection relative to the benchmark. The Fund’s allocation to bank loans was a meaningful contributor to performance as well, driven by higher base rates and price appreciation. This was offset by the Fund’s large underweight to the leisure subsector, predominantly cruise lines, which was one of the top-performing subsectors.
How did the Fund use derivatives during the Reporting Period?
The Fund invests in non-U.S. dollar denominated assets when the risk-return profile is favorable. The Fund entered forward foreign currency exchange contracts to hedge exchange rate risk for non-U.S. dollar denominated positions which had a negative impact to performance. Non-U.S. dollar denominated assets comprise less than 2% of the Fund.
How was the Fund positioned at the end of the Reporting Period?
The Fund’s largest exposure is to high yield bonds, followed by a meaningful exposure to bank loans at about 15%. We continue to evaluate the relative value between high yield bonds and bank loans, potentially looking to shift the allocation as the relationship changes. The Fund remains positioned up-in-quality versus the benchmark, driven by an underweight to CCCs and distressed issuers. Overall, we remain nimble to take advantage of discounted levels in the secondary market and add selectively using our bottom-up credit approach.
The Benchmark’s yield ended the Reporting Period at 8.88%, amid higher U.S. Treasury yields. Yields in high yield are currently in the mid-60th percentile dating back to 1994. Notably, since 2000, yields are in the mid-80th percentile and since 2010 yields are in the mid-90th percentile. Even with heightened credit risk and rising risk of recession, we think current yields offer opportunities to find credits that are trading at favorable prices relative to their fundamentals and the risk of default/loss.
Performance displayed represents past performance which is no guarantee of future results.
1 | Performance figures are based on Class A shares and do not reflect taxes that a shareholder would pay on distributions or the redemption of shares. |
The opinions and forecast expressed may not actually come to pass. This information is subject to change at any time, based on market and other conditions, and should not be construed as a recommendation of any specific security or strategy.
| | THE GUGGENHEIM FUNDS ANNUAL REPORT | 19 |
PERFORMANCE REPORT AND FUND PROFILE (Unaudited) | September 30, 2023 |
HIGH YIELD FUND
OBJECTIVE: Seeks high current income. Capital appreciation is a secondary objective.
Holdings Diversification (Market Exposure as % of Net Assets)
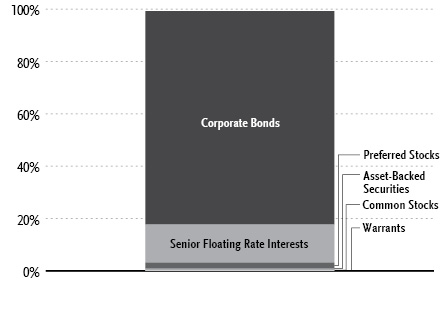
“Holdings Diversification (Market Exposure as % of Net Assets)” excludes any temporary cash investments.
Portfolio Composition by Quality Rating1 |
Rating | % of Total
Investments |
Fixed Income Instruments | |
BBB | 4.1% |
BB | 46.1% |
B | 37.9% |
CCC | 6.0% |
NR2 | 2.0% |
Other Instruments | 3.9% |
Total Investments | 100.0% |
Inception Dates: |
A-Class | August 5, 1996 |
C-Class | May 1, 2000 |
P-Class | May 1, 2015 |
Institutional Class | July 11, 2008 |
R6-Class | May 15, 2017 |
Ten Largest Holdings | % of Total Net Assets |
CPI CG, Inc., 8.63% | 1.3% |
Terraform Global Operating, LP, 6.13% | 1.2% |
Jefferies Finance LLC / JFIN Company-Issuer Corp., 5.00% | 1.1% |
Upbound Group, Inc., 6.38% | 1.1% |
Brundage-Bone Concrete Pumping Holdings, Inc., 6.00% | 1.0% |
GrafTech Finance, Inc., 4.63% | 1.0% |
Cheplapharm Arzneimittel GmbH, 5.50% | 0.9% |
VZ Secured Financing BV, 5.00% | 0.9% |
Artera Services LLC, 9.03% | 0.9% |
JB Poindexter & Company, Inc., 7.13% | 0.9% |
Top Ten Total | 10.3% |
| | |
“Ten Largest Holdings” excludes any temporary cash or derivative investments. |
1 | Source: BlackRock Solutions. Credit quality ratings are measured on a scale that generally ranges from AAA (highest) to D (lowest). All securities except for those labeled “NR” have been rated by Moody’s, Standard & Poor’s (“S&P”), or Fitch, each of which is a Nationally Recognized Statistical Rating Organization (“NRSRO”). For purposes of this presentation, when ratings are available from more than one agency, the highest rating is used. Guggenheim Investments has converted ratings to the equivalent S&P rating. Security ratings are determined at the time of purchase and may change thereafter. |
2 | NR (not rated) securities do not necessarily indicate low credit quality. |
20 | THE GUGGENHEIM FUNDS ANNUAL REPORT | |
PERFORMANCE REPORT AND FUND PROFILE (Unaudited)(concluded) | September 30, 2023 |
Cumulative Fund Performance*
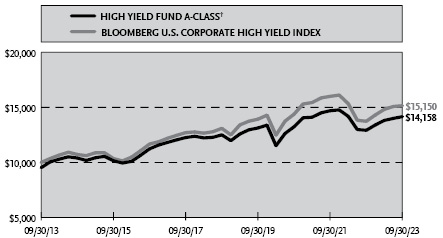
Average Annual Returns*
Periods Ended September 30, 2023
| 1 Year | 5 Year | 10 Year |
A-Class Shares | 9.60% | 2.52% | 4.05% |
A-Class Shares with sales charge† | 5.23% | 1.68% | 3.54% |
C-Class Shares | 8.75% | 1.70% | 3.25% |
C-Class Shares with CDSC‡ | 7.75% | 1.70% | 3.25% |
Institutional Class Shares | 9.78% | 2.73% | 4.30% |
Bloomberg U.S. Corporate High Yield Index | 10.28% | 2.96% | 4.24% |
| 1 Year | 5 Year | Since
Inception
(05/01/15) |
P-Class Shares | 9.71% | 2.48% | 3.51% |
Bloomberg U.S. Corporate High Yield Index | 10.28% | 2.96% | 3.86% |
| 1 Year | 5 Year | Since
Inception
(05/15/17) |
R6-Class Shares | 10.00% | 2.85% | 2.99% |
Bloomberg U.S. Corporate High Yield Index | 10.28% | 2.96% | 3.22% |
* | The performance data above represents past performance that is not predictive of future results. The investment return and principal value of an investment in the Fund will fluctuate so that an investor’s shares, when redeemed, may be worth more or less than their original cost. Returns are historical and include changes in principal and reinvested dividends and capital gains and do not reflect the effect of taxes. The Bloomberg U.S. Corporate High Yield Index is an unmanaged index and, unlike the Fund, has no management fees or operating expenses to reduce its reported return. The graph is based on A-Class shares only; performance for C-Class shares, P-Class shares, Institutional Class and R6-Class shares will vary due to differences in fee structures |
† | Effective October 1, 2015, the maximum sales charge decreased from 4.75% to 4.00%. A 4.75% maximum sales charge is used in the calculation of the Average Annual Returns based on subscriptions made prior to October 1, 2015, and a 4.00% maximum sales charge is used to calculate performance for periods based on subscriptions made on or after October 2, 2015. |
‡ | Fund returns include a CDSC of 1% if redeemed within 12 months of purchase. |
| | THE GUGGENHEIM FUNDS ANNUAL REPORT | 21 |
SCHEDULE OF INVESTMENTS | September 30, 2023 |
HIGH YIELD FUND | |
| | Shares | | | Value | |
COMMON STOCKS† - 0.4% |
| | | | | | | | | |
Utilities - 0.4% |
TexGen Power LLC*,†† | | | 26,665 | | | $ | 706,623 | |
| | | | | | | | | |
Industrial - 0.0% |
BP Holdco LLC*,†††,1 | | | 23,711 | | | | 30,456 | |
Vector Phoenix Holdings, LP*,††† | | | 23,711 | | | | 1,458 | |
Targus, Inc.*,††† | | | 12,825 | | | | 378 | |
Targus, Inc.*,††† | | | 12,825 | | | | 378 | |
Targus, Inc.*,††† | | | 12,825 | | | | 308 | |
Targus , Inc.*,††† | | | 12,825 | | | | 140 | |
YAK BLOCKER 2 LLC*,††† | | | 6,243 | | | | 63 | |
YAK BLOCKER 2 LLC*,††† | | | 5,770 | | | | 58 | |
Targus, Inc.*,††† | | | 12,825 | | | | — | |
Total Industrial | | | | | | | 33,239 | |
| | | | | | | | | |
Energy - 0.0% |
Legacy Reserves, Inc.*,††† | | | 3,452 | | | | 27,616 | |
Permian Production Partners LLC*,††† | | | 57,028 | | | | 2,268 | |
Bruin E&P Partnership Units*,††† | | | 44,023 | | | | 986 | |
Total Energy | | | | | | | 30,870 | |
| | | | | | | | | |
Consumer, Non-cyclical - 0.0% |
Cengage Learning Holdings II, Inc.*,†† | | | 2,107 | | | | 20,280 | |
Save-A-Lot*,†† | | | 17,185 | | | | 3,299 | |
Total Consumer, Non-cyclical | | | | | | | 23,579 | |
| | | | | | | | | |
Financial - 0.0% |
Tensor Ltd.*,††† | | | 158,811 | | | | 16 | |
| | | | | | | | | |
Total Common Stocks | | | | |
(Cost $423,255) | | | | | | | 794,327 | |
| | | | | | | | | |
PREFERRED STOCKS†† - 2.1% |
Financial - 2.1% |
American Equity Investment Life Holding Co. |
5.95%2 | | | 54,000 | | | | 1,216,620 | |
Charles Schwab Corp. |
4.00%* | | | 1,325,000 | | | | 934,881 | |
Citigroup, Inc. |
7.63%2 | | | 775,000 | | | | 756,092 | |
Assurant, Inc. |
5.25% due 01/15/61 | | | 30,000 | | | | 585,000 | |
Goldman Sachs Group, Inc. |
7.50%2 | | | 475,000 | | | | 469,470 | |
Total Financial | | | | | | | 3,962,063 | |
| | | | | | | | | |
Industrial - 0.0% |
YAK BLOCKER 2 LLC *,††† | | | 342,958 | | | | 85,796 | |
U.S. Shipping Corp.*,††† | | | 14,718 | | | | 2 | |
Total Industrial | | | | | | | 85,798 | |
| | | | | | | | | |
Total Preferred Stocks | | | | |
(Cost $5,973,255) | | | | | | | 4,047,861 | |
| | | | | | | | | |
WARRANTS† - 0.0% |
Acropolis Infrastructure Acquisition Corp. | | | | | | | | |
Expiring 03/31/263 | | | 12,947 | | | | 778 | |
Ginkgo Bioworks Holdings, Inc. | | | | | | | | |
Expiring 08/01/26 | | | 4 | | | | — | |
Total Warrants | | | | |
(Cost $10,696) | | | | | | | 778 | |
| | | | | | | | | |
MONEY MARKET FUND† - 1.3% |
Dreyfus Treasury Securities Cash Management Fund — Institutional Shares, 5.24%4 | | | 2,517,574 | | | | 2,517,574 | |
Total Money Market Fund | | | | |
(Cost $2,517,574) | | | | | | | 2,517,574 | |
| | | | | | | | | |
| | | Face
Amount~ | | | | | |
CORPORATE BONDS†† - 81.6% |
Consumer, Non-cyclical - 15.1% | | | | | | | | |
CPI CG, Inc. | | | | | | | | |
8.63% due 03/15/265 | | | 2,572,000 | | | | 2,533,909 | |
Upbound Group, Inc. | | | | | | | | |
6.38% due 02/15/295,6 | | | 2,281,000 | | | | 2,024,387 | |
Cheplapharm Arzneimittel GmbH | | | | | | | | |
5.50% due 01/15/285 | | | 1,953,000 | | | | 1,772,015 | |
Tenet Healthcare Corp. | | | | | | | | |
6.75% due 05/15/315 | | | 675,000 | | | | 651,017 | |
4.38% due 01/15/30 | | | 625,000 | | | | 537,578 | |
6.13% due 06/15/30 | | | 275,000 | | | | 257,826 | |
Prime Security Services Borrower LLC / Prime Finance, Inc. | | | | | | | | |
3.38% due 08/31/275 | | | 1,525,000 | | | | 1,336,049 | |
Legends Hospitality Holding Company LLC / Legends Hospitality Co-Issuer, Inc. | | | | | | | | |
5.00% due 02/01/265 | | | 1,250,000 | | | | 1,225,000 | |
Kronos Acquisition Holdings, Inc. / KIK Custom Products, Inc. | | | | | | | | |
7.00% due 12/31/275 | | | 961,000 | | | | 828,862 | |
5.00% due 12/31/265 | | | 350,000 | | | | 318,891 | |
Post Holdings, Inc. | | | | | | | | |
4.63% due 04/15/305 | | | 600,000 | | | | 513,768 | |
5.50% due 12/15/295 | | | 500,000 | | | | 453,240 | |
Sotheby’s/Bidfair Holdings, Inc. | | | | | | | | |
5.88% due 06/01/295 | | | 1,200,000 | | | | 963,000 | |
KeHE Distributors LLC / KeHE Finance Corp. | | | | | | | | |
8.63% due 10/15/265 | | | 956,000 | | | | 954,955 | |
DaVita, Inc. | | | | | | | | |
3.75% due 02/15/315 | | | 1,225,000 | | | | 930,705 | |
Carriage Services, Inc. | | | | | | | | |
4.25% due 05/15/295 | | | 1,075,000 | | | | 919,537 | |
ADT Security Corp. | | | | | | | | |
4.13% due 08/01/295 | | | 1,050,000 | | | | 887,785 | |
Par Pharmaceutical, Inc. | | | | | | | | |
due 04/01/275,7 | | | 1,210,000 | | | | 859,100 | |
GTCR W-2 Merger Sub LLC | | | | | | | | |
7.50% due 01/15/315 | | | 850,000 | | | | 851,190 | |
22 | THE GUGGENHEIM FUNDS ANNUAL REPORT | SEE NOTES TO FINANCIAL STATEMENTS. |
SCHEDULE OF INVESTMENTS (continued) | September 30, 2023 |
HIGH YIELD FUND | |
| | Face
Amount~ | | | Value | |
Medline Borrower, LP | | | | | | | | |
5.25% due 10/01/295 | | | 850,000 | | | $ | 734,652 | |
Williams Scotsman, Inc. | | | | | | | | |
7.38% due 10/01/315 | | | 725,000 | | | | 721,045 | |
US Foods, Inc. | | | | | | | | |
7.25% due 01/15/325 | | | 700,000 | | | | 699,293 | |
Bausch Health Companies, Inc. | | | | | | | | |
4.88% due 06/01/285 | | | 1,200,000 | | | | 682,424 | |
Endo Luxembourg Finance Company I SARL / Endo US, Inc. | | | | | | | | |
7.13% due 04/01/295,7 | | | 950,000 | | | | 672,125 | |
IQVIA, Inc. | | | | | | | | |
6.50% due 05/15/305 | | | 675,000 | | | | 660,669 | |
BCP V Modular Services Finance II plc | | | | | | | | |
4.75% due 10/30/285 | EUR | | 736,000 | | | | 650,804 | |
TriNet Group, Inc. | | | | | | | | |
7.00% due 08/15/315 | | | 650,000 | | | | 643,500 | |
Albertsons Companies Incorporated / Safeway Inc / New Albertsons Limited Partnership / Albertsons LLC | | | | | | | | |
5.88% due 02/15/285 | | | 475,000 | | | | 457,177 | |
6.50% due 02/15/285 | | | 175,000 | | | | 172,966 | |
Central Garden & Pet Co. | | | | | | | | |
4.13% due 10/15/30 | | | 711,000 | | | | 592,771 | |
Grifols S.A. | | | | | | | | |
4.75% due 10/15/285 | | | 600,000 | | | | 511,566 | |
WW International, Inc. | | | | | | | | |
4.50% due 04/15/295 | | | 690,000 | | | | 484,725 | |
Fortrea Holdings, Inc. | | | | | | | | |
7.50% due 07/01/305 | | | 450,000 | | | | 437,857 | |
Lamb Weston Holdings, Inc. | | | | | | | | |
4.13% due 01/31/305 | | | 425,000 | | | | 363,438 | |
Sabre GLBL, Inc. | | | | | | | | |
7.38% due 09/01/255 | | | 320,000 | | | | 310,982 | |
9.25% due 04/15/255 | | | 31,000 | | | | 30,380 | |
Garden Spinco Corp. | | | | | | | | |
8.63% due 07/20/305 | | | 300,000 | | | | 313,157 | |
Service Corporation International | | | | | | | | |
3.38% due 08/15/30 | | | 325,000 | | | | 261,950 | |
Nathan’s Famous, Inc. | | | | | | | | |
6.63% due 11/01/255 | | | 189,000 | | | | 188,055 | |
Ingles Markets, Inc. | | | | | | | | |
4.00% due 06/15/315 | | | 75,000 | | | | 61,594 | |
Endo Dac / Endo Finance LLC / Endo Finco, Inc. | | | | | | | | |
due 07/31/275,7 | | | 171,000 | | | | 11,970 | |
Total Consumer, Non-cyclical | | | | | | | 28,481,914 | |
| | | | | | | | | |
Industrial - 13.8% | | | | | | | | |
Brundage-Bone Concrete Pumping Holdings, Inc. | | | | | | | | |
6.00% due 02/01/265 | | | 2,076,000 | | | | 1,974,712 | |
GrafTech Finance, Inc. | | | | | | | | |
4.63% due 12/15/285 | | | 2,500,000 | | | | 1,933,238 | |
New Enterprise Stone & Lime Company, Inc. | | | | | | | | |
9.75% due 07/15/285 | | | 1,225,000 | | | | 1,209,688 | |
5.25% due 07/15/285 | | | 675,000 | | | | 605,657 | |
Artera Services LLC | | | | | | | | |
9.03% due 12/04/255 | | | 1,807,842 | | | | 1,667,734 | |
Trinity Industries, Inc. | | | | | | | | |
7.75% due 07/15/285 | | | 1,075,000 | | | | 1,081,719 | |
4.55% due 10/01/24 | | | 550,000 | | | | 535,592 | |
TransDigm, Inc. | | | | | | | | |
6.88% due 12/15/305 | | | 575,000 | | | | 563,813 | |
6.25% due 03/15/265 | | | 500,000 | | | | 491,290 | |
6.75% due 08/15/285 | | | 425,000 | | | | 418,408 | |
Mauser Packaging Solutions Holding Co. | | | | | | | | |
7.88% due 08/15/265 | | | 1,025,000 | | | | 988,854 | |
9.25% due 04/15/275 | | | 500,000 | | | | 437,042 | |
Standard Industries, Inc. | | | | | | | | |
5.00% due 02/15/275 | | | 900,000 | | | | 834,256 | |
4.38% due 07/15/305 | | | 550,000 | | | | 455,509 | |
Great Lakes Dredge & Dock Corp. | | | | | | | | |
5.25% due 06/01/295 | | | 1,525,000 | | | | 1,250,801 | |
Enviri Corp. | | | | | | | | |
5.75% due 07/31/275 | | | 1,375,000 | | | | 1,209,354 | |
Clearwater Paper Corp. | | | | | | | | |
4.75% due 08/15/285 | | | 1,375,000 | | | | 1,175,268 | |
Ball Corp. | | | | | | | | |
6.88% due 03/15/28 | | | 600,000 | | | | 603,628 | |
6.00% due 06/15/29 | | | 425,000 | | | | 412,598 | |
Masonite International Corp. | | | | | | | | |
5.38% due 02/01/285 | | | 850,000 | | | | 790,602 | |
Builders FirstSource, Inc. | | | | | | | | |
6.38% due 06/15/325 | | | 750,000 | | | | 705,981 | |
4.25% due 02/01/325 | | | 100,000 | | | | 82,007 | |
Amsted Industries, Inc. | | | | | | | | |
4.63% due 05/15/305 | | | 900,000 | | | | 762,066 | |
Emerald Debt Merger Sub LLC | | | | | | | | |
6.63% due 12/15/305 | | | 700,000 | | | | 673,872 | |
Pactiv Evergreen Group Issuer Incorporated/Pactiv Evergreen Group Issuer LLC | | | | | | | | |
4.00% due 10/15/275 | | | 700,000 | | | | 621,250 | |
Arcosa, Inc. | | | | | | | | |
4.38% due 04/15/295 | | | 700,000 | | | | 610,892 | |
Advanced Drainage Systems, Inc. | | | | | | | | |
6.38% due 06/15/305 | | | 575,000 | | | | 552,259 | |
Ardagh Metal Packaging Finance USA LLC / Ardagh Metal Packaging Finance plc | | | | | | | | |
6.00% due 06/15/275 | | | 500,000 | | | | 480,484 | |
Sealed Air Corporation/Sealed Air Corp US | | | | | | | | |
6.13% due 02/01/285 | | | 475,000 | | | | 460,047 | |
Howmet Aerospace, Inc. | | | | | | | | |
5.95% due 02/01/37 | | | 475,000 | | | | 445,994 | |
Calderys Financing LLC | | | | | | | | |
11.25% due 06/01/285 | | | 425,000 | | | | 435,330 | |
Summit Materials LLC / Summit Materials Finance Corp. | | | | | | | | |
6.50% due 03/15/275 | | | 425,000 | | | | 414,943 | |
Stericycle, Inc. | | | | | | | | |
5.38% due 07/15/245 | | | 375,000 | | | | 370,160 | |
SEE NOTES TO FINANCIAL STATEMENTS. | THE GUGGENHEIM FUNDS ANNUAL REPORT | 23 |
SCHEDULE OF INVESTMENTS (continued) | September 30, 2023 |
HIGH YIELD FUND | |
| | Face
Amount~ | | | Value | |
GXO Logistics, Inc. | | | | | | | | |
2.65% due 07/15/31 | | | 250,000 | | | $ | 189,680 | |
1.65% due 07/15/26 | | | 175,000 | | | | 153,769 | |
AmeriTex HoldCo Intermediate LLC | | | | | | | | |
10.25% due 10/15/285 | | | 300,000 | | | | 296,625 | |
Clean Harbors, Inc. | | | | | | | | |
6.38% due 02/01/315 | | | 225,000 | | | | 218,783 | |
Total Industrial | | | | | | | 26,113,905 | |
| | | | | | | | | |
Consumer, Cyclical - 12.7% | | | | | | | | |
JB Poindexter & Company, Inc. | | | | | | | | |
7.13% due 04/15/265 | | | 1,650,000 | | | | 1,605,160 | |
Hawaiian Brand Intellectual Property Ltd. / HawaiianMiles Loyalty Ltd. | | | | | | | | |
5.75% due 01/20/265 | | | 1,500,000 | | | | 1,349,786 | |
Ferrellgas Limited Partnership / Ferrellgas Finance Corp. | | | | | | | | |
5.38% due 04/01/265 | | | 1,225,000 | | | | 1,148,186 | |
CD&R Smokey Buyer, Inc. | | | | | | | | |
6.75% due 07/15/255 | | | 1,075,000 | | | | 1,035,870 | |
PetSmart, Inc. / PetSmart Finance Corp. | | | | | | | | |
4.75% due 02/15/285 | | | 1,150,000 | | | | 1,006,754 | |
Ritchie Bros Holdings, Inc. | | | | | | | | |
6.75% due 03/15/285 | | | 550,000 | | | | 548,735 | |
7.75% due 03/15/315 | | | 450,000 | | | | 456,750 | |
Penn Entertainment, Inc. | | | | | | | | |
4.13% due 07/01/295 | | | 1,204,000 | | | | 983,891 | |
Hanesbrands, Inc. | | | | | | | | |
4.88% due 05/15/265 | | | 1,050,000 | | | | 962,599 | |
Scientific Games Holdings Limited Partnership/Scientific Games US FinCo, Inc. | | | | | | | | |
6.63% due 03/01/305 | | | 1,100,000 | | | | 948,750 | |
Fertitta Entertainment LLC / Fertitta Entertainment Finance Company, Inc. | | | | | | | | |
4.63% due 01/15/295 | | | 1,100,000 | | | | 932,250 | |
Crocs, Inc. | | | | | | | | |
4.25% due 03/15/295 | | | 1,094,000 | | | | 905,145 | |
Wolverine World Wide, Inc. | | | | | | | | |
4.00% due 08/15/295 | | | 1,200,000 | | | | 889,500 | |
United Airlines, Inc. | | | | | | | | |
4.63% due 04/15/295 | | | 1,025,000 | | | | 881,019 | |
Wabash National Corp. | | | | | | | | |
4.50% due 10/15/285 | | | 1,025,000 | | | | 863,420 | |
Allwyn Entertainment Financing UK plc | | | | | | | | |
7.88% due 04/30/295 | | | 825,000 | | | | 833,250 | |
Air Canada | | | | | | | | |
3.88% due 08/15/265 | | | 900,000 | | | | 816,802 | |
Scotts Miracle-Gro Co. | | | | | | | | |
4.38% due 02/01/32 | | | 1,050,000 | | | | 788,229 | |
Tempur Sealy International, Inc. | | | | | | | | |
3.88% due 10/15/315 | | | 875,000 | | | | 675,025 | |
Suburban Propane Partners Limited Partnership/Suburban Energy Finance Corp. | | | | | | | | |
5.00% due 06/01/315 | | | 800,000 | | | | 667,784 | |
Newell Brands, Inc. | | | | | | | | |
6.38% due 09/15/27 | | | 500,000 | | | | 476,991 | |
4.70% due 04/01/26 | | | 200,000 | | | | 188,479 | |
Ontario Gaming GTA, LP | | | | | | | | |
8.00% due 08/01/305 | | | 625,000 | | | | 625,000 | |
Park River Holdings, Inc. | | | | | | | | |
5.63% due 02/01/295 | | | 675,000 | | | | 514,669 | |
Michaels Companies, Inc. | | | | | | | | |
5.25% due 05/01/285 | | | 600,000 | | | | 478,860 | |
Clarios Global, LP / Clarios US Finance Co. | | | | | | | | |
8.50% due 05/15/275 | | | 475,000 | | | | 473,637 | |
Asbury Automotive Group, Inc. | | | | | | | | |
5.00% due 02/15/325 | | | 550,000 | | | | 455,696 | |
Evergreen Acqco 1 Limited Partnership / TVI, Inc. | | | | | | | | |
9.75% due 04/26/285 | | | 427,000 | | | | 439,639 | |
Clarios Global, LP | | | | | | | | |
6.75% due 05/15/255 | | | 430,000 | | | | 426,763 | |
Superior Plus, LP | | | | | | | | |
4.25% due 05/18/285 | CAD | | 550,000 | | | | 357,587 | |
Clarios Global Limited Partnership / Clarios US Finance Co. | | | | | | | | |
6.75% due 05/15/285 | | | 350,000 | | | | 341,688 | |
Caesars Entertainment, Inc. | | | | | | | | |
6.25% due 07/01/255 | | | 275,000 | | | | 271,236 | |
Papa John’s International, Inc. | | | | | | | | |
3.88% due 09/15/295 | | | 275,000 | | | | 226,996 | |
Six Flags Theme Parks, Inc. | | | | | | | | |
7.00% due 07/01/255 | | | 215,000 | | | | 214,455 | |
Allison Transmission, Inc. | | | | | | | | |
4.75% due 10/01/275 | | | 200,000 | | | | 184,570 | |
Total Consumer, Cyclical | | | | | | | 23,975,171 | |
| | | | | | | | | |
Communications - 11.9% | | | | | | | | |
CCO Holdings LLC / CCO Holdings Capital Corp. | | | | | | | | |
4.50% due 05/01/32 | | | 1,850,000 | | | | 1,451,969 | |
4.25% due 01/15/345 | | | 975,000 | | | | 717,871 | |
4.25% due 02/01/315 | | | 400,000 | | | | 318,415 | |
6.38% due 09/01/295 | | | 275,000 | | | | 256,428 | |
Altice France S.A. | | | | | | | | |
5.13% due 07/15/295 | | | 1,450,000 | | | | 1,030,813 | |
5.50% due 10/15/295 | | | 1,250,000 | | | | 898,894 | |
8.13% due 02/01/275 | | | 900,000 | | | | 798,117 | |
McGraw-Hill Education, Inc. | | | | | | | | |
5.75% due 08/01/285 | | | 1,675,000 | | | | 1,445,106 | |
8.00% due 08/01/295 | | | 775,000 | | | | 672,313 | |
CSC Holdings LLC | | | | | | | | |
3.38% due 02/15/315 | | | 1,025,000 | | | | 698,473 | |
4.13% due 12/01/305 | | | 975,000 | | | | 690,021 | |
4.63% due 12/01/305 | | | 950,000 | | | | 505,071 | |
Level 3 Financing, Inc. | | | | | | | | |
3.63% due 01/15/295 | | | 1,825,000 | | | | 1,022,000 | |
4.25% due 07/01/285 | | | 1,325,000 | | | | 825,519 | |
VZ Secured Financing BV | | | | | | | | |
5.00% due 01/15/325 | | | 2,175,000 | | | | 1,708,581 | |
24 | THE GUGGENHEIM FUNDS ANNUAL REPORT | SEE NOTES TO FINANCIAL STATEMENTS. |
SCHEDULE OF INVESTMENTS (continued) | September 30, 2023 |
HIGH YIELD FUND | |
| | Face
Amount~ | | | Value | |
Vmed O2 UK Financing I plc | | | | | | | | |
4.25% due 01/31/315 | | | 1,125,000 | | | $ | 895,843 | |
4.75% due 07/15/315 | | | 850,000 | | | | 686,692 | |
LCPR Senior Secured Financing DAC | | | | | | | | |
6.75% due 10/15/275 | | | 1,417,000 | | | | 1,301,514 | |
Telenet Finance Luxembourg Notes SARL | | | | | | | | |
5.50% due 03/01/28 | | | 1,400,000 | | | | 1,260,000 | |
UPC Broadband Finco BV | | | | | | | | |
4.88% due 07/15/315 | | | 1,200,000 | | | | 973,776 | |
Sirius XM Radio, Inc. | | | | | | | | |
4.13% due 07/01/305 | | | 800,000 | | | | 640,488 | |
5.50% due 07/01/295 | | | 325,000 | | | | 287,456 | |
3.88% due 09/01/315 | | | 50,000 | | | | 37,873 | |
AMC Networks, Inc. | | | | | | | | |
4.25% due 02/15/29 | | | 1,550,000 | | | | 951,073 | |
Cogent Communications Group, Inc. | | | | | | | | |
7.00% due 06/15/275 | | | 975,000 | | | | 931,125 | |
Match Group Holdings II LLC | | | | | | | | |
4.63% due 06/01/285 | | | 600,000 | | | | 537,909 | |
Outfront Media Capital LLC / Outfront Media Capital Corp. | | | | | | | | |
4.25% due 01/15/295 | | | 550,000 | | | | 436,436 | |
Zayo Group Holdings, Inc. | | | | | | | | |
4.00% due 03/01/275 | | | 300,000 | | | | 222,566 | |
Go Daddy Operating Company LLC / GD Finance Co., Inc. | | | | | | | | |
3.50% due 03/01/295 | | | 200,000 | | | | 168,271 | |
Cengage Learning, Inc. | | | | | | | | |
9.50% due 06/15/245 | | | 101,000 | | | | 101,084 | |
Total Communications | | | | | | | 22,471,697 | |
| | | | | | | | | |
Financial - 8.4% | | | | | | | | |
Jefferies Finance LLC / JFIN Company-Issuer Corp. | | | | | | | | |
5.00% due 08/15/285 | | | 2,500,000 | | | | 2,105,015 | |
United Wholesale Mortgage LLC | | | | | | | | |
5.50% due 04/15/295 | | | 1,475,000 | | | | 1,246,375 | |
5.75% due 06/15/275 | | | 675,000 | | | | 610,943 | |
NFP Corp. | | | | | | | | |
6.88% due 08/15/285 | | | 1,425,000 | | | | 1,220,766 | |
8.50% due 10/01/315 | | | 600,000 | | | | 600,911 | |
OneMain Finance Corp. | | | | | | | | |
3.88% due 09/15/28 | | | 1,225,000 | | | | 983,237 | |
4.00% due 09/15/30 | | | 750,000 | | | | 562,766 | |
Hunt Companies, Inc. | | | | | | | | |
5.25% due 04/15/295 | | | 1,225,000 | | | | 962,120 | |
Rocket Mortgage LLC / Rocket Mortgage Company-Issuer, Inc. | | | | | | | | |
3.88% due 03/01/315 | | | 875,000 | | | | 697,699 | |
4.00% due 10/15/335 | | | 350,000 | | | | 264,314 | |
Jones Deslauriers Insurance Management, Inc. | | | | | | | | |
10.50% due 12/15/305 | | | 725,000 | | | | 737,640 | |
8.50% due 03/15/305 | | | 200,000 | | | | 201,468 | |
HUB International Ltd. | | | | | | | | |
7.00% due 05/01/265 | | | 575,000 | | | | 573,736 | |
5.63% due 12/01/295 | | | 375,000 | | | | 326,534 | |
Iron Mountain Information Management Services, Inc. | | | | | | | | |
5.00% due 07/15/325 | | | 1,000,000 | | | | 821,933 | |
SLM Corp. | | | | | | | | |
3.13% due 11/02/26 | | | 900,000 | | | | 780,654 | |
USI, Inc. | | | | | | | | |
6.88% due 05/01/255 | | | 775,000 | | | | 769,031 | |
Jane Street Group / JSG Finance, Inc. | | | | | | | | |
4.50% due 11/15/295 | | | 700,000 | | | | 601,482 | |
Starwood Property Trust, Inc. | | | | | | | | |
4.38% due 01/15/275 | | | 550,000 | | | | 479,738 | |
Alliant Holdings Intermediate LLC / Alliant Holdings Company-Issuer | | | | | | | | |
4.25% due 10/15/275 | | | 475,000 | | | | 425,286 | |
6.75% due 04/15/285 | | | 50,000 | | | | 48,253 | |
Kennedy-Wilson, Inc. | | | | | | | | |
4.75% due 02/01/30 | | | 450,000 | | | | 335,752 | |
4.75% due 03/01/29 | | | 150,000 | | | | 115,126 | |
Liberty Mutual Group, Inc. | | | | | | | | |
4.30% due 02/01/615 | | | 750,000 | | | | 442,795 | |
Total Financial | | | | | | | 15,913,574 | |
| | | | | | | | | |
Energy - 7.4% | | | | | | | | |
Parkland Corp. | | | | | | | | |
4.50% due 10/01/295 | | | 1,275,000 | | | | 1,091,814 | |
4.63% due 05/01/305 | | | 1,100,000 | | | | 937,727 | |
Global Partners Limited Partnership / GLP Finance Corp. | | | | | | | | |
7.00% due 08/01/27 | | | 1,200,000 | | | | 1,169,390 | |
6.88% due 01/15/29 | | | 900,000 | | | | 837,603 | |
CVR Energy, Inc. | | | | | | | | |
5.75% due 02/15/285 | | | 1,725,000 | | | | 1,561,122 | |
5.25% due 02/15/255 | | | 250,000 | | | | 243,882 | |
ITT Holdings LLC | | | | | | | | |
6.50% due 08/01/295 | | | 1,875,000 | | | | 1,589,295 | |
NuStar Logistics, LP | | | | | | | | |
5.63% due 04/28/27 | | | 1,585,000 | | | | 1,510,077 | |
Crestwood Midstream Partners Limited Partnership / Crestwood Midstream Finance Corp. | | | | | | | | |
5.63% due 05/01/275 | | | 1,250,000 | | | | 1,198,046 | |
Holly Energy Partners Limited Partnership / Holly Energy Finance Corp. | | | | | | | | |
6.38% due 04/15/275 | | | 1,050,000 | | | | 1,030,869 | |
EnLink Midstream LLC | | | | | | | | |
5.38% due 06/01/29 | | | 925,000 | | | | 855,626 | |
TransMontaigne Partners Limited Partnership / TLP Finance Corp. | | | | | | | | |
6.13% due 02/15/26 | | | 1,000,000 | | | | 853,750 | |
Venture Global Calcasieu Pass LLC | | | | | | | | |
6.25% due 01/15/305 | | | 500,000 | | | | 476,935 | |
Southwestern Energy Co. | | | | | | | | |
5.38% due 02/01/29 | | | 425,000 | | | | 391,420 | |
Kinetik Holdings, LP | | | | | | | | |
5.88% due 06/15/305 | | | 350,000 | | | | 328,125 | |
SEE NOTES TO FINANCIAL STATEMENTS. | THE GUGGENHEIM FUNDS-ANNUAL REPORT | 25 |
SCHEDULE OF INVESTMENTS (continued) | September 30, 2023 |
HIGH YIELD FUND | |
| | Face
Amount~ | | | Value | |
Basic Energy Services, Inc. | | | | | | | | |
due 10/15/237 | | | 1,175,000 | | | $ | 5,875 | |
Total Energy | | | | | | | 14,081,556 | |
| | | | | | | | | |
Basic Materials - 7.2% | | | | | | | | |
Carpenter Technology Corp. | | | | | | | | |
6.38% due 07/15/28 | | | 1,425,000 | | | | 1,374,362 | |
7.63% due 03/15/30 | | | 650,000 | | | | 650,813 | |
SCIL IV LLC / SCIL USA Holdings LLC | | | | | | | | |
5.38% due 11/01/265 | | | 1,650,000 | | | | 1,507,636 | |
Minerals Technologies, Inc. | | | | | | | | |
5.00% due 07/01/285 | | | 1,547,000 | | | | 1,418,908 | |
Kaiser Aluminum Corp. | | | | | | | | |
4.63% due 03/01/285 | | | 790,000 | | | | 689,820 | |
4.50% due 06/01/315 | | | 725,000 | | | | 574,293 | |
SK Invictus Intermediate II SARL | | | | | | | | |
5.00% due 10/30/295 | | | 1,350,000 | | | | 1,081,930 | |
INEOS Finance plc | | | | | | | | |
6.75% due 05/15/285 | | | 1,100,000 | | | | 1,029,002 | |
Ingevity Corp. | | | | | | | | |
3.88% due 11/01/285 | | | 1,150,000 | | | | 948,198 | |
Novelis Corp. | | | | | | | | |
4.75% due 01/30/305 | | | 1,025,000 | | | | 887,086 | |
Illuminate Buyer LLC / Illuminate Holdings IV, Inc. | | | | | | | | |
9.00% due 07/01/285 | | | 900,000 | | | | 850,004 | |
Compass Minerals International, Inc. | | | | | | | | |
6.75% due 12/01/275 | | | 875,000 | | | | 828,993 | |
Valvoline, Inc. | | | | | | | | |
3.63% due 06/15/315 | | | 600,000 | | | | 464,852 | |
4.25% due 02/15/305 | | | 250,000 | | | | 245,504 | |
Arsenal AIC Parent LLC | | | | | | | | |
8.00% due 10/01/305 | | | 675,000 | | | | 671,638 | |
WR Grace Holdings LLC | | | | | | | | |
4.88% due 06/15/275 | | | 450,000 | | | | 412,847 | |
Mirabela Nickel Ltd. | | | | | | | | |
due 06/24/19†††,7,8 | | | 278,115 | | | | 13,211 | |
Total Basic Materials | | | | | | | 13,649,097 | |
| | | | | | | | | |
Technology - 3.3% | | | | | | | | |
NCR Corp. | | | | | | | | |
5.13% due 04/15/295 | | | 1,250,000 | | | | 1,101,323 | |
Boxer Parent Company, Inc. | | | | | | | | |
7.13% due 10/02/255 | | | 1,025,000 | | | | 1,019,876 | |
Capstone Borrower, Inc. | | | | | | | | |
8.00% due 06/15/305 | | | 950,000 | | | | 927,438 | |
Central Parent Incorporated / CDK Global, Inc. | | | | | | | | |
7.25% due 06/15/295 | | | 875,000 | | | | 848,323 | |
Dun & Bradstreet Corp. | | | | | | | | |
5.00% due 12/15/295 | | | 925,000 | | | | 797,477 | |
Qorvo, Inc. | | | | | | | | |
3.38% due 04/01/315 | | | 600,000 | | | | 475,240 | |
Playtika Holding Corp. | | | | | | | | |
4.25% due 03/15/295 | | | 500,000 | | | | 417,500 | |
CDW LLC / CDW Finance Corp. | | | | | | | | |
3.57% due 12/01/31 | | | 300,000 | | | | 247,092 | |
Cloud Software Group, Inc. | | | | | | | | |
6.50% due 03/31/295 | | | 250,000 | | | | 221,083 | |
Central Parent LLC / CDK Global II LLC / CDK Financing Company, Inc. | | | | | | | | |
8.00% due 06/15/295 | | | 200,000 | | | | 199,260 | |
Total Technology | | | | | | | 6,254,612 | |
| | | | | | | | | |
Utilities - 1.8% | | | | | | | | |
Terraform Global Operating, LP | | | | | | | | |
6.13% due 03/01/265 | | | 2,280,000 | | | | 2,237,250 | |
AmeriGas Partners Limited Partnership / AmeriGas Finance Corp. | | | | | | | | |
5.50% due 05/20/25 | | | 625,000 | | | | 605,952 | |
Atlantica Sustainable Infrastructure plc | | | | | | | | |
4.13% due 06/15/285 | | | 400,000 | | | | 345,127 | |
Clearway Energy Operating LLC | | | | | | | | |
4.75% due 03/15/285 | | | 175,000 | | | | 156,513 | |
Total Utilities | | | | | | | 3,344,842 | |
| | | | | | | | | |
Total Corporate Bonds | | | | |
(Cost $174,097,670) | | | 154,286,368 | |
| |
SENIOR FLOATING RATE INTERESTS††,◊ - 14.6% |
Consumer, Non-cyclical - 3.1% | | | | | | | | |
Quirch Foods Holdings LLC | | | | | | | | |
10.45% (3 Month Term SOFR + 4.75%, Rate Floor: 5.75%) due 10/27/27 | | | 948,188 | | | | 942,859 | |
Blue Ribbon LLC | | | | | | | | |
11.44% (1 Month Term SOFR + 6.00%, Rate Floor: 6.00%) due 05/08/28 | | | 1,039,557 | | | | 873,228 | |
Gibson Brands, Inc. | | | | | | | | |
10.57% (3 Month Term SOFR + 5.00%, Rate Floor: 5.00%) due 08/11/28 | | | 854,775 | | | | 709,463 | |
Moran Foods LLC | | | | | | | | |
12.74% (3 Month Term SOFR + 7.25%, Rate Floor: 7.25%) due 06/30/26††† | | | 472,753 | | | | 430,371 | |
16.99% (6 Month Term SOFR + 11.50%, Rate Floor: 9.50%) due 12/31/26††† | | | 276,200 | | | | 181,481 | |
Women’s Care Holdings, Inc. | | | | | | | | |
10.05% (6 Month Term SOFR + 4.50%, Rate Floor: 4.50%) due 01/17/28 | | | 654,976 | | | | 579,654 | |
Confluent Health LLC | | | | | | | | |
9.43% (1 Month Term SOFR + 4.00%, Rate Floor: 4.00%) due 11/30/28 | | | 493,013 | | | | 467,539 | |
Balrog Acquisition, Inc. | | | | | | | | |
9.93% (1 Month Term SOFR + 4.50%, Rate Floor: 4.50%) due 09/05/28††† | | | 349,125 | | | | 346,507 | |
PlayCore | | | | | | | | |
9.38% (3 Month Term SOFR + 4.00%, Rate Floor: 4.00%) due 03/29/27 | | | 300,000 | | | | 299,064 | |
Kronos Acquisition Holdings, Inc. | | | | | | | | |
11.57% (3 Month Term SOFR + 6.00%, Rate Floor: 6.00%) due 12/22/26 | | | 294,750 | | | | 294,567 | |
TGP Holdings LLC | | | | | | | | |
8.67% (1 Month Term SOFR + 3.25%, Rate Floor: 3.25%) due 06/29/28 | | | 235,454 | | | | 214,499 | |
26 | THE GUGGENHEIM FUNDS ANNUAL REPORT | SEE NOTES TO FINANCIAL STATEMENTS. |
SCHEDULE OF INVESTMENTS (continued) | September 30, 2023 |
HIGH YIELD FUND | |
| | Face
Amount~ | | | Value | |
Medline Borrower LP | | | | | | | | |
8.68% (1 Month Term SOFR + 3.25%, Rate Floor: 3.25%) due 10/23/28 | | | 199,494 | | | $ | 198,835 | |
CHG PPC Parent LLC | | | | | | | | |
8.43% (1 Month Term SOFR + 3.00%, Rate Floor: 3.50%) due 12/08/28 | | | 200,000 | | | | 198,250 | |
Florida Food Products LLC | | | | | | | | |
10.43% (1 Month Term SOFR + 5.00%, Rate Floor: 5.00%) due 10/18/28 | | | 221,625 | | | | 188,935 | |
Total Consumer, Non-cyclical | | | | | | | 5,925,252 | |
| | | | | | | | | |
Consumer, Cyclical - 2.9% | | | | | | | | |
First Brands Group LLC | | | | | | | | |
10.88% (6 Month Term SOFR + 5.00%, Rate Floor: 6.00%) due 03/30/27 | | | 1,268,467 | | | | 1,249,597 | |
Alexander Mann | | | | | | | | |
11.37% (3 Month Term SOFR + 6.00%, Rate Floor: 6.00%) due 06/29/27 | | | 958,848 | | | | 934,877 | |
American Tire Distributors, Inc. | | | | | | | | |
11.81% (3 Month Term SOFR + 6.25%, Rate Floor: 6.25%) due 10/20/28 | | | 913,936 | | | | 796,075 | |
Holding SOCOTEC | | | | | | | | |
9.56% (3 Month SOFR + 4.00%, Rate Floor: 4.00%) due 06/02/28 | | | 597,800 | | | | 591,822 | |
ScribeAmerica Intermediate Holdco LLC (Healthchannels) | | | | | | | | |
9.82% (1 Month Term SOFR + 4.50%, Rate Floor: 4.50%) due 04/03/25 | | | 742,618 | | | | 545,082 | |
Accuride Corp. | | | | | | | | |
12.19% (1 Month Term SOFR + 5.25%, Rate Floor: 10.57%) (in-kind rate was 1.62%) due 07/07/269 | | | 490,444 | | | | 427,912 | |
WW International, Inc. | | | | | | | | |
8.93% (1 Month Term SOFR + 3.50%, Rate Floor: 3.50%) due 04/13/28 | | | 491,625 | | | | 369,540 | |
Sweetwater Sound | | | | | | | | |
9.68% (1 Month Term SOFR + 4.25%, Rate Floor: 4.25%) due 08/07/28††† | | | 348,034 | | | | 336,723 | |
Flutter Financing B.V. | | | | | | | | |
8.90% (3 Month Term SOFR + 3.25%, Rate Floor: 3.25%) due 07/24/28 | | | 297,000 | | | | 297,149 | |
Total Consumer, Cyclical | | | | | | | 5,548,777 | |
| | | | | | | | | |
Industrial - 2.6% | | | | | | | | |
Dispatch Terra Acquisition LLC | | | | | | | | |
9.79% (3 Month Term SOFR + 4.25%, Rate Floor: 4.25%) due 03/27/28 | | | 1,173,612 | | | | 1,079,723 | |
Aegion Corp. | | | | | | | | |
10.18% (1 Month Term SOFR + 4.75%, Rate Floor: 4.75%) due 05/17/28 | | | 686,203 | | | | 680,782 | |
Pelican Products, Inc. | | | | | | | | |
9.79% (3 Month Term SOFR + 4.25%, Rate Floor: 4.25%) due 12/29/28 | | | 647,603 | | | | 611,985 | |
Barnes Group, Inc. | | | | | | | | |
8.42% (1 Month Term SOFR + 3.00%, Rate Floor: 3.00%) due 09/03/30 | | | 600,000 | | | | 600,300 | |
PECF USS Intermediate Holding III Corp. | | | | | | | | |
9.88% (3 Month Term SOFR + 4.25%, Rate Floor: 4.25%) due 12/15/28 | | | 540,869 | | | | 431,970 | |
ProAmpac PG Borrower LLC | | | | | | | | |
due 09/26/28 | | | 325,000 | | | | 322,888 | |
Osmose Utility Services, Inc. | | | | | | | | |
8.68% (1 Month Term SOFR + 3.25%, Rate Floor: 3.25%) due 06/23/28 | | | 316,957 | | | | 314,184 | |
Charter Next Generation, Inc. | | | | | | | | |
9.18% (1 Month Term SOFR + 3.75%, Rate Floor: 3.75%) due 12/01/27 | | | 200,000 | | | | 198,000 | |
Sundyne (Star US Bidco) | | | | | | | | |
9.67% (1 Month Term SOFR + 4.25%, Rate Floor: 4.25%) due 03/17/27 | | | 196,938 | | | | 196,260 | |
Anchor Packaging LLC | | | | | | | | |
8.92% (1 Month Term SOFR + 3.50%, Rate Floor: 3.50%) due 07/18/26 | | | 148,962 | | | | 147,332 | |
EMRLD Borrower LP | | | | | | | | |
8.32% (1 Month Term SOFR + 3.00%, Rate Floor: 3.00%) due 05/31/30 | | | 139,172 | | | | 138,911 | |
Brown Group Holding LLC | | | | | | | | |
8.17% (1 Month Term SOFR + 2.75%, Rate Floor: 2.75%) due 06/07/28 | | | 134,632 | | | | 133,257 | |
Total Industrial | | | | | | | 4,855,592 | |
| | | | | | | | | |
Technology - 2.2% | | | | | | | | |
Datix Bidco Ltd. | | | | | | | | |
8.68% (6 Month GBP SONIA + 4.50%, Rate Floor: 4.50%) due 04/28/25††† | GBP | | 1,300,000 | | | | 1,556,403 | |
11.93% (6 Month GBP SONIA + 7.75%, Rate Floor: 7.75%) due 04/27/26††† | GBP | | 650,000 | | | | 776,774 | |
Park Place Technologies, LLC | | | | | | | | |
10.42% (1 Month Term SOFR + 5.00%, Rate Floor: 5.00%) due 11/10/27 | | | 564,958 | | | | 555,308 | |
Atlas CC Acquisition Corp. | | | | | | | | |
9.93% (3 Month Term SOFR + 4.25%, Rate Floor: 4.25%) due 05/25/28 | | | 562,063 | | | | 522,718 | |
Cloud Software Group, Inc. | | | | | | | | |
9.99% (3 Month Term SOFR + 4.50%, Rate Floor: 4.50%) due 09/29/28 | | | 497,196 | | | | 476,617 | |
24-7 Intouch, Inc. | | | | | | | | |
10.17% (1 Month Term SOFR + 4.75%, Rate Floor: 4.75%) due 08/25/25 | | | 265,803 | | | | 263,034 | |
Total Technology | | | | | | | 4,150,854 | |
| | | | | | | | | |
Financial - 1.7% | | | | | | | | |
Franchise Group, Inc. | | | | | | | | |
10.31% (3 Month Term SOFR + 4.75%, Rate Floor: 4.75%) due 03/10/26 | | | 938,947 | | | | 857,963 | |
Teneo Holdings LLC | | | | | | | | |
10.67% (1 Month Term SOFR + 5.25%, Rate Floor: 5.25%) due 07/11/25 | | | 470,426 | | | | 469,721 | |
Osaic Holdings, Inc. | | | | | | | | |
9.82% (3 Month Term SOFR + 4.50%, Rate Floor: 4.50%) due 08/10/28 | | | 450,000 | | | | 449,298 | |
SEE NOTES TO FINANCIAL STATEMENTS. | THE GUGGENHEIM FUNDS-ANNUAL REPORT | 27 |
SCHEDULE OF INVESTMENTS (continued) | September 30, 2023 |
HIGH YIELD FUND | |
| | Face
Amount~ | | | Value | |
Eisner Advisory Group | | | | | | | | |
10.68% (1 Month Term SOFR + 5.25%, Rate Floor: 5.25%) due 07/28/28 | | | 441,005 | | | $ | 439,902 | |
Cobham Ultra SeniorCo SARL | | | | | | | | |
9.36% (6 Month Term SOFR + 3.50%, Rate Floor: 4.00%) due 08/06/29 | | | 398,003 | | | | 395,348 | |
HarbourVest Partners, LP | | | | | | | | |
8.39% (3 Month Term SOFR + 3.00%, Rate Floor: 3.00%) due 04/20/30 | | | 310,000 | | | | 309,482 | |
Avison Young (Canada), Inc. | | | | | | | | |
12.15% (3 Month Term SOFR + 6.50%, Rate Floor: 6.50%) due 01/31/26 | | | 523,875 | | | | 195,143 | |
Total Financial | | | | | | | 3,116,857 | |
| | | | | | | | | |
Basic Materials - 1.0% | | | | | | | | |
LTI Holdings, Inc. | | | | | | | | |
10.18% (1 Month Term SOFR + 4.75%, Rate Floor: 4.75%) due 07/24/26 | | | 739,485 | | | | 721,611 | |
NIC Acquisition Corp. | | | | | | | | |
9.40% (3 Month Term SOFR + 3.75%, Rate Floor: 3.75%) due 12/29/27 | | | 653,766 | | | | 538,186 | |
Nouryon USA LLC | | | | | | | | |
9.43% (1 Month Term SOFR + 4.00%, Rate Floor: 4.00%) due 04/03/28 | | | 268,598 | | | | 264,792 | |
9.35% (3 Month Term SOFR + 4.00%, Rate Floor: 4.00%) due 04/03/28 | | | 74,813 | | | | 73,815 | |
DCG Acquisition Corp. | | | | | | | | |
9.92% (1 Month Term SOFR + 4.50%, Rate Floor: 4.50%) due 09/30/26 | | | 246,212 | | | | 243,519 | |
Total Basic Materials | | | | | | | 1,841,923 | |
| | | | | | | | | |
Communications - 0.5% | | | | | | | | |
Cengage Learning Acquisitions, Inc. | | | | | | | | |
10.32% (3 Month Term SOFR + 4.75%, Rate Floor: 4.75%) due 07/14/26 | | | 1,010,470 | | | | 1,004,407 | |
| | | | | | | | | |
Energy - 0.3% | | | | | | | | |
BANGL LLC | | | | | | | | |
9.83% (1 Month Term SOFR + 4.50%, Rate Floor: 4.50%) due 02/01/29 | | | 543,000 | | | | 537,912 | |
Permian Production Partners LLC | | | | | | | | |
13.43% (3 Month Term SOFR + 6.00%, Rate Floor: 11.43%) (in-kind rate was 2.00%) due 11/24/25†††,9 | | | 116,927 | | | | 116,342 | |
Total Energy | | | | | | | 654,254 | |
| | | | | | | | | |
Utilities - 0.3% | | | | | | | | |
Calpine Construction Finance Company, LP | | | | | | | | |
7.57% (1 Month Term SOFR + 2.25%, Rate Floor: 2.25%) due 07/31/30 | | | 250,000 | | | | 248,482 | |
TerraForm Power Operating LLC | | | | | | | | |
7.99% (3 Month Term SOFR + 2.50%, Rate Floor: 2.50%) due 05/21/29 | | | 226,875 | | | | 224,820 | |
Total Utilities | | | | | | | 473,302 | |
| | | | | | | | | |
Total Senior Floating Rate Interests | | | | |
(Cost $29,327,981) | | | 27,571,218 | |
| |
ASSET-BACKED SECURITIES†† - 0.6% |
Collateralized Loan Obligations - 0.4% |
WhiteHorse X Ltd. | | | | | | | | |
2015-10A E, 10.87% (3 Month Term SOFR + 5.56%, Rate Floor: 5.30%) due 04/17/27◊,5 | | | 756,443 | | | | 738,453 | |
| | | | | | | | | |
Infrastructure - 0.2% | | | | | | | | |
Hotwire Funding LLC | | | | | | | | |
2021-1, 4.46% due 11/20/515 | | | 400,000 | | | | 332,753 | |
Total Asset-Backed Securities | | | | |
(Cost $1,087,767) | | | 1,071,206 | |
| | | | | | | | | |
Total Investments - 100.6% | | | | |
(Cost $213,438,198) | | $ | 190,289,332 | |
Other Assets & Liabilities, net - (0.6)% | | | (1,190,208 | ) |
Total Net Assets - 100.0% | | $ | 189,099,124 | |
Forward Foreign Currency Exchange Contracts†† |
Counterparty | | Currency | | | Type | | | Quantity | | | Contract
Amount | | | Settlement
Date | | | Unrealized
Appreciation | |
Morgan Stanley Capital Services LLC | | | GBP | | | | Sell | | | | 1,998,000 | | | | 2,495,564 USD | | | | 10/16/23 | | | $ | 57,700 | |
Barclays Bank plc | | | EUR | | | | Sell | | | | 642,000 | | | | 690,399 USD | | | | 10/16/23 | | | | 11,160 | |
Bank of America, N.A. | | | CAD | | | | Sell | | | | 497,000 | | | | 366,772 USD | | | | 10/16/23 | | | | 679 | |
| | | | | | | | | | | | | | | | | | | | | | | $ | 69,539 | |
28 | THE GUGGENHEIM FUNDS ANNUAL REPORT | SEE NOTES TO FINANCIAL STATEMENTS. |
SCHEDULE OF INVESTMENTS (continued) | September 30, 2023 |
HIGH YIELD FUND | |
~ | The face amount is denominated in U.S. dollars unless otherwise indicated. |
* | Non-income producing security. |
† | Value determined based on Level 1 inputs, unless otherwise noted — See Note 4. |
†† | Value determined based on Level 2 inputs, unless otherwise noted — See Note 4. |
††† | Value determined based on Level 3 inputs — See Note 4. |
◊ | Variable rate security. Rate indicated is the rate effective at September 30, 2023. In some instances, the effective rate is limited by a minimum rate floor or a maximum rate cap established by the issuer. The settlement status of a position may also impact the effective rate indicated. In some cases, a position may be unsettled at period end and may not have a stated effective rate. In instances where multiple underlying reference rates and spread amounts are shown, the effective rate is based on a weighted average. |
1 | Affiliated issuer. |
2 | Security has a fixed rate coupon which will convert to a floating or variable rate coupon on a future date. |
3 | Special Purpose Acquisition Company (SPAC). |
4 | Rate indicated is the 7-day yield as of September 30, 2023. |
5 | Security is a 144A or Section 4(a)(2) security. These securities have been determined to be liquid under guidelines established by the Board of Trustees. The total market value of 144A or Section 4(a)(2) securities is $134,956,741 (cost $150,971,353), or 71.4% of total net assets. |
6 | All or a portion of this security has been physically segregated or earmarked in connection with reverse repurchase agreements. At September 30, 2023, the total market value of segregated or earmarked securities was $2,024,387— See Note 6. |
7 | Security is in default of interest and/or principal obligations. |
8 | Security is a 144A or Section 4(a)(2) security. These securities have been determined to be illiquid and restricted under guidelines established by the Board of Trustees. The total market value of 144A or Section 4(a)(2) illiquid and restricted securities is $13,211 (cost $252,369), or 0.0% of total net assets — See Note 10. |
9 | Payment-in-kind security. |
| | CAD — Canadian Dollar |
| | EUR — Euro |
| | GBP — British Pound |
| | plc — Public Limited Company |
| | SARL — Société à Responsabilité Limitée |
| | SOFR — Secured Overnight Financing Rate |
| | SONIA — Sterling Overnight Index Average |
| | |
| | See Sector Classification in Other Information section. |
The following table summarizes the inputs used to value the Fund’s investments at September 30, 2023 (See Note 4 in the Notes to Financial Statements):
Investments in Securities (Assets) | | Level 1
Quoted
Prices | | | Level 2
Significant
Observable
Inputs | | | Level 3
Significant
Unobservable
Inputs | | | Total | |
Common Stocks | | $ | — | | | $ | 730,202 | | | $ | 64,125 | | | $ | 794,327 | |
Preferred Stocks | | | — | | | | 3,962,063 | | | | 85,798 | | | | 4,047,861 | |
Warrants | | | 778 | | | | — | | | | — | | | | 778 | |
Money Market Fund | | | 2,517,574 | | | | — | | | | — | | | | 2,517,574 | |
Corporate Bonds | | | — | | | | 154,273,157 | | | | 13,211 | | | | 154,286,368 | |
Senior Floating Rate Interests | | | — | | | | 23,826,617 | | | | 3,744,601 | | | | 27,571,218 | |
Asset-Backed Securities | | | — | | | | 1,071,206 | | | | — | | | | 1,071,206 | |
Forward Foreign Currency Exchange Contracts** | | | — | | | | 69,539 | | | | — | | | | 69,539 | |
Total Assets | | $ | 2,518,352 | | | $ | 183,932,784 | | | $ | 3,907,735 | | | $ | 190,358,871 | |
** | This derivative is reported as unrealized appreciation/depreciation at period end. |
SEE NOTES TO FINANCIAL STATEMENTS. | THE GUGGENHEIM FUNDS ANNUAL REPORT | 29 |
SCHEDULE OF INVESTMENTS (continued) | September 30, 2023 |
HIGH YIELD FUND | |
The Fund may hold assets and/or liabilities in which the fair value approximates the carrying amount for financial statement purposes. As of the period end, reverse repurchase agreements of $1,479,698 are categorized as Level 2 within the disclosure hierarchy — See Note 6.
The following is a summary of significant unobservable inputs used in the fair valuation of assets and liabilities categorized within Level 3 of the fair value hierarchy:
Category | | Ending Balance at
September 30, 2023 | | Valuation Technique | Unobservable Inputs | | Input Range | | | Weighted Average* | |
Assets: | | | | | | | | |
Common Stocks | | $ | 61,918 | | Enterprise Valuation | Valuation Multiple | | | 2.7x-8.1x | | | | 3.7x | |
Common Stocks | | | 2,191 | | Model Price | Liquidation Value | | | — | | | | — | |
Common Stocks | | | 16 | | Third Party Pricing | Trade Price | | | — | | | | — | |
Corporate Bonds | | | 13,211 | | Third Party Pricing | Broker Quote | | | — | | | | — | |
Preferred Stocks | | | 85,796 | | Enterprise Valuation | Valuation Multiple | | | 4.9x | | | | — | |
Preferred Stocks | | | 2 | | Model Price | Purchase Price | | | — | | | | — | |
Senior Floating Rate Interests | | | 2,945,029 | | Yield Analysis | Yield | | | 11.2%-39.1% | | | | 14.8 | % |
Senior Floating Rate Interests | | | 799,572 | | Third Party Pricing | Broker Quote | | | — | | | | — | |
Total Assets | | $ | 3,907,735 | | | | | | | | | | | |
* | Inputs are weighted by the fair value of the instruments. |
Significant changes in a quote, yield, liquidation value or valuation multiple would generally result in significant changes in the fair value of the security. Any remaining Level 3 securities held by the Fund and excluded from the table above, were not considered material to the Fund.
The Fund’s fair valuation leveling guidelines classify a single daily broker quote, or a vendor price based on a single daily or monthly broker quote, as Level 3, if such a quote or price cannot be supported with other available market information.
Transfers between Level 2 and Level 3 may occur as markets fluctuate and/or the availability of data used in an investment’s valuation changes. For the year ended September 30, 2023, the Fund had securities with a total value of $338,177 transfer into Level 3 from Level 2 due to a lack of observable inputs and had securities with a total value of $4,872,665 transfer out of Level 3 into Level 2 due to the availability of current and reliable market-based data provided by a third-party pricing service which utilizes significant observable inputs.
Summary of Fair Value Level 3 Activity
Following is a reconciliation of Level 3 assets for which significant unobservable inputs were used to determine fair value for the year ended September 30, 2023:
30 | THE GUGGENHEIM FUNDS ANNUAL REPORT | SEE NOTES TO FINANCIAL STATEMENTS. |
SCHEDULE OF INVESTMENTS (concluded) | September 30, 2023 |
HIGH YIELD FUND | |
| | | Assets | | | | | | | Liabilities | |
| | Corporate
Bonds | | | Senior Floating
Rate Interests | | | Common
Stocks | | | Preferred
Stocks | | | Total Assets | | | Unfunded Loan
Commitments | |
Beginning Balance | | $ | 378,860 | | | $ | 12,689,191 | | | $ | 130,253 | | | $ | — | | | $ | 13,198,304 | | | $ | (12,748 | ) |
Purchases/(Receipts) | | | — | | | | 719,019 | | | | 1,673 | | | | — | | | | 720,692 | | | | — | |
(Sales, maturities and paydowns)/Fundings | | | — | | | | (5,761,285 | ) | | | (35,013 | ) | | | — | | | | (5,796,298 | ) | | | 1,803 | |
Amortization of premiums/discounts | | | — | | | | 50,517 | | | | — | | | | — | | | | 50,517 | | | | (321 | ) |
Mergers | | | — | | | | (924,625 | ) | | | 1,370 | | | | 923,255 | | | | — | | | | — | |
Total realized gains (losses) including in earnings | | | — | | | | (163,598 | ) | | | 30,657 | | | | — | | | | (132,941 | ) | | | 3,268 | |
Total change in unrealized appreciation (depreciation) included in earnings | | | (15,398 | ) | | | 1,319,619 | | | | (64,815 | ) | | | (837,457 | ) | | | 401,949 | | | | 7,998 | |
Transfers into Level 3 | | | 13,211 | | | | 324,966 | | | | — | | | | — | | | | 338,177 | | | | — | |
Transfers out of Level 3 | | | (363,462 | ) | | | (4,509,203 | ) | | | — | | | | — | | | | (4,872,665 | ) | | | — | |
Ending Balance | | $ | 13,211 | | | $ | 3,744,601 | | | $ | 64,125 | | | $ | 85,798 | | | $ | 3,907,735 | | | $ | — | |
Net change in unrealized appreciation (depreciation) for investments in Level 3 securities still held at September 30, 2023 | | $ | — | | | $ | 225,294 | | | $ | (36,916 | ) | | $ | (837,457 | ) | | $ | (649,079 | ) | | $ | — | |
Affiliated Transactions
Investments representing 5% or more of the outstanding voting shares of a company, or control of or by, or common control under Guggenheim Investments (“GI”), result in that company being considered an affiliated issuer, as defined in the 1940 Act.
Security Name | | Value
09/30/22 | | | Additions | | | Reductions | | | Realized
Gain (Loss) | | | Change in
Unrealized
Appreciation
(Depreciation) | | | Value
09/30/23 | | | Shares
09/30/23 | |
Common Stocks | | | | | | | | | | | | | | | | | | | | | | | | | | | | |
BP Holdco LLC * | | $ | 14,378 | | | $ | — | | | $ | — | | | $ | — | | | $ | 16,078 | | | $ | 30,456 | | | | 23,711 | |
Targus Group International Equity, Inc. * | | | 32,255 | | | | — | | | | (34,485 | ) | | | 30,129 | | | | (27,899 | ) | | | — | | | | — | |
| | | $ | 46,633 | | | $ | — | | | $ | (34,485 | ) | | $ | 30,129 | | | $ | (11,821 | ) | | $ | 30,456 | | | | | |
* | Non-income producing security. |
SEE NOTES TO FINANCIAL STATEMENTS. | THE GUGGENHEIM FUNDS ANNUAL REPORT | 31 |
STATEMENT OF ASSETS AND LIABILITIES |
September 30, 2023 |
Assets: |
Investments in unaffiliated issuers, at value (cost $213,429,825) | | $ | 190,258,876 | |
Investments in affiliated issuers, at value (cost $8,373) | | | 30,456 | |
Foreign currency, at value (cost 875) | | | 865 | |
Cash | | | 65,746 | |
Unrealized appreciation on forward foreign currency exchange contracts | | | 69,539 | |
Prepaid expenses | | | 36,616 | |
Receivables: |
Interest | | | 2,925,390 | |
Securities sold | | | 348,564 | |
Fund shares sold | | | 197,162 | |
Dividends | | | 9,844 | |
Foreign tax reclaims | | | 4,934 | |
Total assets | | | 193,947,992 | |
| | | | | |
Liabilities: |
Unfunded loan commitments, at value (Note 9)(commitment fees received $—) | | | — | |
Reverse repurchase agreements (Note 6) | | | 1,479,698 | |
Payable for: |
Securities purchased | | | 2,438,223 | |
Fund shares redeemed | | | 545,096 | |
Distributions to shareholders | | | 116,292 | |
Management fees | | | 91,058 | |
Transfer agent/maintenance fees | | | 48,770 | |
Distribution and service fees | | | 18,250 | |
Fund accounting/administration fees | | | 5,802 | |
Trustees’ fees* | | | 3,359 | |
Due to Investment Adviser | | | 1,178 | |
Miscellaneous | | | 101,142 | |
Total liabilities | | | 4,848,868 | |
Net assets | | $ | 189,099,124 | |
| | | | | |
Net assets consist of: |
Paid in capital | | $ | 244,197,765 | |
Total distributable earnings (loss) | | | (55,098,641 | ) |
Net assets | | $ | 189,099,124 | |
| | | | | |
A-Class: |
Net assets | | $ | 44,845,663 | |
Capital shares outstanding | | | 4,754,576 | |
Net asset value per share | | $ | 9.43 | |
Maximum offering price per share (Net asset value divided by 96.00%) | | $ | 9.82 | |
| | | | | |
C-Class: |
Net assets | | $ | 9,417,005 | |
Capital shares outstanding | | | 990,002 | |
Net asset value per share | | $ | 9.51 | |
| | | | | |
P-Class: |
Net assets | | $ | 5,205,235 | |
Capital shares outstanding | | | 551,651 | |
Net asset value per share | | $ | 9.44 | |
| | | | | |
Institutional Class: |
Net assets | | $ | 127,649,434 | |
Capital shares outstanding | | | 16,612,921 | |
Net asset value per share | | $ | 7.68 | |
| | | | | |
R6-Class: |
Net assets | | $ | 1,981,787 | |
Capital shares outstanding | | | 210,514 | |
Net asset value per share | | $ | 9.41 | |
* | Relates to Trustees not deemed “interested persons” within the meaning of Section 2(a)(19) of the 1940 Act. |
32 | THE GUGGENHEIM FUNDS ANNUAL REPORT | SEE NOTES TO FINANCIAL STATEMENTS. |
STATEMENT OF OPERATIONS |
Year Ended September 30, 2023 |
Investment Income: |
Dividends from securities of unaffiliated issuers | | $ | 153,147 | |
Interest from securities of unaffiliated issuers | | | 13,176,479 | |
Total investment income | | | 13,329,626 | |
| | | | | |
Expenses: |
Management fees | | | 1,106,317 | |
Distribution and service fees: |
A-Class | | | 111,343 | |
C-Class | | | 101,122 | |
P-Class | | | 12,564 | |
Transfer agent/maintenance fees: |
A-Class | | | 53,245 | |
C-Class | | | 13,039 | |
P-Class | | | 7,611 | |
Institutional Class | | | 138,989 | |
R6-Class | | | 589 | |
Registration fees | | | 99,511 | |
Fund accounting/administration fees | | | 84,432 | |
Professional fees | | | 78,105 | |
Interest expense | | | 40,352 | |
Trustees’ fees* | | | 19,307 | |
Custodian fees | | | 15,547 | |
Line of credit fees | | | 10,970 | |
Miscellaneous | | | 39,011 | |
Recoupment of previously waived fees: |
A-Class | | | 18,544 | |
C-Class | | | 3,546 | |
P-Class | | | 577 | |
Institutional Class | | | 36,305 | |
Total expenses | | | 1,991,026 | |
Less: |
Expenses reimbursed by Adviser: |
A-Class | | | (14,511 | ) |
C-Class | | | (2,464 | ) |
P-Class | | | (1,432 | ) |
Institutional Class | | | (11,083 | ) |
R6-Class | | | (143 | ) |
Expenses waived by Adviser | | | (57,160 | ) |
Earning credits | | | (4,050 | ) |
Total waived/reimbursed expenses | | | (90,843 | ) |
Net expenses | | | 1,900,183 | |
Net investment income | | | 11,429,443 | |
| | | | | |
Net Realized and Unrealized Gain (Loss): |
Net realized gain (loss) on: |
Investments in unaffiliated issuers | | | (4,220,224 | ) |
Investments in affiliated issuers | | | 30,129 | |
Forward foreign currency exchange contracts | | | (252,159 | ) |
Foreign currency transactions | | | (3,166 | ) |
Net realized loss | | | (4,445,420 | ) |
Net change in unrealized appreciation (depreciation) on: |
Investments in unaffiliated issuers | | | 9,988,852 | |
Investments in affiliated issuers | | | (11,821 | ) |
Forward foreign currency exchange contracts | | | (70,079 | ) |
Foreign currency translations | | | 1,197 | |
Net change in unrealized appreciation (depreciation) | | | 9,908,149 | |
Net realized and unrealized gain | | | 5,462,729 | |
Net increase in net assets resulting from operations | | $ | 16,892,172 | |
* | Relates to Trustees not deemed “interested persons” within the meaning of Section 2(a)(19) of the 1940 Act. |
SEE NOTES TO FINANCIAL STATEMENTS. | THE GUGGENHEIM FUNDS ANNUAL REPORT | 33 |
STATEMENTS OF CHANGES IN NET ASSETS |
| | Year Ended
September 30,
2023 | | | Year Ended
September 30,
2022 | |
Increase (Decrease) in Net Assets from Operations: | | | | | | | | |
Net investment income | | $ | 11,429,443 | | | $ | 14,291,090 | |
Net realized loss on investments | | | (4,445,420 | ) | | | (3,627,492 | ) |
Net change in unrealized appreciation (depreciation) on investments | | | 9,908,149 | | | | (41,448,065 | ) |
Net increase (decrease) in net assets resulting from operations | | | 16,892,172 | | | | (30,784,467 | ) |
| | | | | | | | | |
Distributions to shareholders: | | | | | | | | |
A-Class | | | (2,681,360 | ) | | | (2,597,694 | ) |
C-Class | | | (531,795 | ) | | | (553,044 | ) |
P-Class | | | (302,555 | ) | | | (247,398 | ) |
Institutional Class | | | (7,690,867 | ) | | | (7,588,631 | ) |
R6-Class | | | (126,227 | ) | | | (2,498,200 | ) |
Return of capital | | | | | | | | |
A-Class | | | (27,032 | ) | | | (89,963 | ) |
C-Class | | | (5,361 | ) | | | (19,153 | ) |
P-Class | | | (3,050 | ) | | | (8,568 | ) |
Institutional Class | | | (77,534 | ) | | | (262,809 | ) |
R6 Class | | | (1,273 | ) | | | (86,517 | ) |
Total distributions to shareholders | | | (11,447,054 | ) | | | (13,951,977 | ) |
| | | | | | | | | |
Capital share transactions: | | | | | | | | |
Proceeds from sale of shares | | | | | | | | |
A-Class | | | 4,413,398 | | | | 5,952,402 | |
C-Class | | | 1,181,267 | | | | 657,102 | |
P-Class | | | 1,437,731 | | | | 1,402,958 | |
Institutional Class | | | 39,343,841 | | | | 43,343,283 | |
R6-Class | | | 2,663 | | | | 2,433,069 | |
Redemption fees collected | | | | | | | | |
A-Class | | | 133 | | | | 751 | |
C-Class | | | 29 | | | | 195 | |
P-Class | | | 15 | | | | 73 | |
Institutional Class | | | 387 | | | | 2,141 | |
R6-Class | | | 6 | | | | 796 | |
Distributions reinvested | | | | | | | | |
A-Class | | | 2,472,792 | | | | 2,442,802 | |
C-Class | | | 524,910 | | | | 555,783 | |
P-Class | | | 305,110 | | | | 255,966 | |
Institutional Class | | | 6,336,875 | | | | 6,418,053 | |
R6-Class | | | 127,232 | | | | 2,584,717 | |
Cost of shares redeemed | | | | | | | | |
A-Class | | | (7,261,678 | ) | | | (11,072,154 | ) |
C-Class | | | (2,518,867 | ) | | | (5,286,119 | ) |
P-Class | | | (1,100,898 | ) | | | (2,043,886 | ) |
Institutional Class | | | (35,208,501 | ) | | | (78,495,447 | ) |
R6-Class | | | (113,880 | ) | | | (122,325,066 | ) |
Net increase (decrease) from capital share transactions | | | 9,942,565 | | | | (153,172,581 | ) |
Net increase (decrease) in net assets | | | 15,387,683 | | | | (197,909,025 | ) |
| | | | | | | | | |
Net assets: | | | | | | | | |
Beginning of year | | | 173,711,441 | | | | 371,620,466 | |
End of year | | $ | 189,099,124 | | | $ | 173,711,441 | |
| | | | | | | | | |
34 | THE GUGGENHEIM FUNDS ANNUAL REPORT | SEE NOTES TO FINANCIAL STATEMENTS. |
STATEMENTS OF CHANGES IN NET ASSETS (concluded)
| | Year Ended
September 30,
2023 | | | Year Ended
September 30,
2022 | |
Capital share activity: | | | | | | | | |
Shares sold | | | | | | | | |
A-Class | | | 466,658 | | | | 579,055 | |
C-Class | | | 123,430 | | | | 62,888 | |
P-Class | | | 152,312 | | | | 143,033 | |
Institutional Class | | | 5,099,917 | | | | 5,262,893 | |
R6-Class | | | 283 | | | | 225,179 | |
Shares issued from reinvestment of distributions | | | | | | | | |
A-Class | | | 261,165 | | | | 242,943 | |
C-Class | | | 54,963 | | | | 54,648 | |
P-Class | | | 32,203 | | | | 25,590 | |
Institutional Class | | | 821,359 | | | | 780,797 | |
R6-Class | | | 13,463 | | | | 242,535 | |
Shares redeemed | | | | | | | | |
A-Class | | | (767,705 | ) | | | (1,087,791 | ) |
C-Class | | | (264,048 | ) | | | (509,028 | ) |
P-Class | | | (116,881 | ) | | | (199,930 | ) |
Institutional Class | | | (4,570,555 | ) | | | (9,508,654 | ) |
R6-Class | | | (12,038 | ) | | | (11,811,894 | ) |
Net increase (decrease) in shares | | | 1,294,526 | | | | (15,497,736 | ) |
SEE NOTES TO FINANCIAL STATEMENTS. | THE GUGGENHEIM FUNDS ANNUAL REPORT | 35 |
This table is presented to show selected data for a share outstanding throughout each period and to assist shareholders in evaluating a Fund’s performance for the periods presented.
A-Class | | Year Ended
September 30,
2023 | | | Year Ended
September 30,
2022 | | | Year Ended
September 30,
2021 | | | Year Ended
September 30,
2020 | | | Year Ended
September 30,
2019 | |
Per Share Data |
Net asset value, beginning of period | | $ | 9.14 | | | $ | 10.98 | | | $ | 10.37 | | | $ | 10.90 | | | $ | 11.04 | |
Income (loss) from investment operations: |
Net investment income (loss)a | | | .57 | | | | .56 | | | | .49 | | | | .57 | | | | .64 | |
Net gain (loss) on investments (realized and unrealized) | | | .30 | | | | (1.86 | ) | | | .63 | | | | (.50 | ) | | | (.12 | ) |
Total from investment operations | | | .87 | | | | (1.30 | ) | | | 1.12 | | | | .07 | | | | .52 | |
Less distributions from: |
Net investment income | | | (.57 | ) | | | (.52 | ) | | | (.48 | ) | | | (.60 | ) | | | (.66 | ) |
Return of capital | | | (.01 | ) | | | (.02 | ) | | | (.03 | ) | | | — | | | | — | |
Total distributions | | | (.58 | ) | | | (.54 | ) | | | (.51 | ) | | | (.60 | ) | | | (.66 | ) |
Redemption fees collected | | | — | b | | | — | b | | | — | b | | | — | b | | | — | b |
Net asset value, end of period | | $ | 9.43 | | | $ | 9.14 | | | $ | 10.98 | | | $ | 10.37 | | | $ | 10.90 | |
|
Total Returnc | | | 9.60 | % | | | (12.10 | %) | | | 11.02 | % | | | 0.84 | % | | | 4.99 | % |
Ratios/Supplemental Data |
Net assets, end of period (in thousands) | | $ | 44,846 | | | $ | 43,822 | | | $ | 55,550 | | | $ | 53,997 | | | $ | 67,916 | |
Ratios to average net assets: |
Net investment income (loss) | | | 6.07 | % | | | 5.46 | % | | | 4.51 | % | | | 5.44 | % | | | 5.94 | % |
Total expensesd | | | 1.22 | % | | | 1.14 | % | | | 1.07 | % | | | 1.21 | % | | | 1.27 | % |
Net expensese,f,g | | | 1.16 | % | | | 1.10 | % | | | 1.05 | % | | | 1.20 | % | | | 1.26 | % |
Portfolio turnover rate | | | 31 | % | | | 42 | % | | | 86 | % | | | 81 | % | | | 61 | % |
C-Class | | Year Ended
September 30,
2023 | | | Year Ended
September 30,
2022 | | | Year Ended
September 30,
2021 | | | Year Ended
September 30,
2020 | | | Year Ended
September 30,
2019 | |
Per Share Data |
Net asset value, beginning of period | | $ | 9.22 | | | $ | 11.07 | | | $ | 10.46 | | | $ | 10.99 | | | $ | 11.14 | |
Income (loss) from investment operations: |
Net investment income (loss)a | | | .51 | | | | .47 | | | | .40 | | | | .49 | | | | .56 | |
Net gain (loss) on investments (realized and unrealized) | | | .29 | | | | (1.85 | ) | | | .64 | | | | (.49 | ) | | | (.12 | ) |
Total from investment operations | | | .80 | | | | (1.38 | ) | | | 1.04 | | | | — | | | | .44 | |
Less distributions from: |
Net investment income | | | (.50 | ) | | | (.45 | ) | | | (.40 | ) | | | (.53 | ) | | | (.59 | ) |
Return of capital | | | (.01 | ) | | | (.02 | ) | | | (.03 | ) | | | — | | | | — | |
Total distributions | | | (.51 | ) | | | (.47 | ) | | | (.43 | ) | | | (.53 | ) | | | (.59 | ) |
Redemption fees collected | | | — | b | | | — | b | | | — | b | | | — | b | | | — | b |
Net asset value, end of period | | $ | 9.51 | | | $ | 9.22 | | | $ | 11.07 | | | $ | 10.46 | | | $ | 10.99 | |
|
Total Returnc | | | 8.75 | % | | | (12.76 | %) | | | 10.04 | % | | | 0.09 | % | | | 4.12 | % |
Ratios/Supplemental Data |
Net assets, end of period (in thousands) | | $ | 9,417 | | | $ | 9,915 | | | $ | 16,242 | | | $ | 16,437 | | | $ | 21,935 | |
Ratios to average net assets: |
Net investment income (loss) | | | 5.30 | % | | | 4.55 | % | | | 3.67 | % | | | 4.68 | % | | | 5.17 | % |
Total expensesd | | | 1.97 | % | | | 1.94 | % | | | 1.91 | % | | | 2.00 | % | | | 2.03 | % |
Net expensese,f,g | | | 1.92 | % | | | 1.90 | % | | | 1.89 | % | | | 1.99 | % | | | 2.02 | % |
Portfolio turnover rate | | | 31 | % | | | 42 | % | | | 86 | % | | | 81 | % | | | 61 | % |
36 | THE GUGGENHEIM FUNDS ANNUAL REPORT | SEE NOTES TO FINANCIAL STATEMENTS. |
FINANCIAL HIGHLIGHTS (continued) |
This table is presented to show selected data for a share outstanding throughout each period and to assist shareholders in evaluating a Fund’s performance for the periods presented.
P-Class | | Year Ended
September 30,
2023 | | | Year Ended
September 30,
2022 | | | Year Ended
September 30,
2021 | | | Year Ended
September 30,
2020 | | | Year Ended
September 30,
2019 | |
Per Share Data |
Net asset value, beginning of period | | $ | 9.14 | | | $ | 10.98 | | | $ | 10.38 | | | $ | 10.91 | | | $ | 11.05 | |
Income (loss) from investment operations: |
Net investment income (loss)a | | | .57 | | | | .55 | | | | .48 | | | | .57 | | | | .64 | |
Net gain (loss) on investments (realized and unrealized) | | | .30 | | | | (1.85 | ) | | | .62 | | | | (.50 | ) | | | (.12 | ) |
Total from investment operations | | | .87 | | | | (1.30 | ) | | | 1.10 | | | | .07 | | | | .52 | |
Less distributions from: |
Net investment income | | | (.56 | ) | | | (.52 | ) | | | (.47 | ) | | | (.60 | ) | | | (.66 | ) |
Return of capital | | | (.01 | ) | | | (.02 | ) | | | (.03 | ) | | | — | | | | — | |
Total distributions | | | (.57 | ) | | | (.54 | ) | | | (.50 | ) | | | (.60 | ) | | | (.66 | ) |
Redemption fees collected | | | — | b | | | — | b | | | — | b | | | — | b | | | — | b |
Net asset value, end of period | | $ | 9.44 | | | $ | 9.14 | | | $ | 10.98 | | | $ | 10.38 | | | $ | 10.91 | |
|
Total Return | | | 9.71 | % | | | (12.13 | %) | | | 10.80 | % | | | 0.80 | % | | | 4.98 | % |
Ratios/Supplemental Data |
Net assets, end of period (in thousands) | | $ | 5,205 | | | $ | 4,426 | | | $ | 5,660 | | | $ | 5,837 | | | $ | 8,170 | |
Ratios to average net assets: |
Net investment income (loss) | | | 6.07 | % | | | 5.37 | % | | | 4.40 | % | | | 5.42 | % | | | 5.93 | % |
Total expensesd | | | 1.22 | % | | | 1.28 | % | | | 1.20 | % | | | 1.26 | % | | | 1.30 | % |
Net expensese,f,g | | | 1.16 | % | | | 1.15 | % | | | 1.16 | % | | | 1.25 | % | | | 1.28 | % |
Portfolio turnover rate | | | 31 | % | | | 42 | % | | | 86 | % | | | 81 | % | | | 61 | % |
Institutional Class | | Year Ended
September 30,
2023 | | | Year Ended
September 30,
2022 | | | Year Ended
September 30,
2021 | | | Year Ended
September 30,
2020 | | | Year Ended
September 30,
2019 | |
Per Share Data |
Net asset value, beginning of period | | $ | 7.45 | | | $ | 8.94 | | | $ | 8.45 | | | $ | 8.88 | | | $ | 9.01 | |
Income (loss) from investment operations: |
Net investment income (loss)a | | | .49 | | | | .47 | | | | .41 | | | | .48 | | | | .54 | |
Net gain (loss) on investments (realized and unrealized) | | | .23 | | | | (1.50 | ) | | | .51 | | | | (.39 | ) | | | (.10 | ) |
Total from investment operations | | | .72 | | | | (1.03 | ) | | | .92 | | | | .09 | | | | .44 | |
Less distributions from: |
Net investment income | | | (.48 | ) | | | (.44 | ) | | | (.40 | ) | | | (.52 | ) | | | (.57 | ) |
Return of capital | | | (.01 | ) | | | (.02 | ) | | | (.03 | ) | | | — | | | | — | |
Total distributions | | | (.49 | ) | | | (.46 | ) | | | (.43 | ) | | | (.52 | ) | | | (.57 | ) |
Redemption fees collected | | | — | b | | | — | b | | | — | b | | | — | b | | | — | b |
Net asset value, end of period | | $ | 7.68 | | | $ | 7.45 | | | $ | 8.94 | | | $ | 8.45 | | | $ | 8.88 | |
|
Total Return | | | 9.78 | % | | | (11.80 | %) | | | 11.14 | % | | | 1.14 | % | | | 5.15 | % |
Ratios/Supplemental Data |
Net assets, end of period (in thousands) | | $ | 127,649 | | | $ | 113,644 | | | $ | 167,486 | | | $ | 171,641 | | | $ | 180,442 | |
Ratios to average net assets: |
Net investment income (loss) | | | 6.32 | % | | | 5.63 | % | | | 4.71 | % | | | 5.67 | % | | | 6.17 | % |
Total expensesd | | | 0.95 | % | | | 0.95 | % | | | 0.88 | % | | | 0.98 | % | | | 0.99 | % |
Net expensese,f,g | | | 0.91 | % | | | 0.88 | % | | | 0.85 | % | | | 0.96 | % | | | 0.97 | % |
Portfolio turnover rate | | | 31 | % | | | 42 | % | | | 86 | % | | | 81 | % | | | 61 | % |
SEE NOTES TO FINANCIAL STATEMENTS. | THE GUGGENHEIM FUNDS ANNUAL REPORT | 37 |
FINANCIAL HIGHLIGHTS (concluded) |
This table is presented to show selected data for a share outstanding throughout each period and to assist shareholders in evaluating a Fund’s performance for the periods presented.
R6-Class | | Year Ended
September 30,
2023 | | | Year Ended
September 30,
2022 | | | Year Ended
September 30,
2021 | | | Year Ended
September 30,
2020 | | | Year Ended
September 30,
2019 | |
Per Share Data |
Net asset value, beginning of period | | $ | 9.12 | | | $ | 10.97 | | | $ | 10.36 | | | $ | 10.89 | | | $ | 11.03 | |
Income (loss) from investment operations: |
Net investment income (loss)a | | | .61 | | | | .50 | | | | .52 | | | | .60 | | | | .68 | |
Net gain (loss) on investments (realized and unrealized) | | | .29 | | | | (1.77 | ) | | | .63 | | | | (.49 | ) | | | (.12 | ) |
Total from investment operations | | | .90 | | | | (1.27 | ) | | | 1.15 | | | | .11 | | | | .56 | |
Less distributions from: |
Net investment income | | | (.60 | ) | | | (.56 | ) | | | (.51 | ) | | | (.64 | ) | | | (.70 | ) |
Return of capital | | | (.01 | ) | | | (.02 | ) | | | (.03 | ) | | | — | | | | — | |
Total distributions | | | (.61 | ) | | | (.58 | ) | | | (.54 | ) | | | (.64 | ) | | | (.70 | ) |
Redemption fees collected | | | — | b | | | — | b | | | — | b | | | — | b | | | — | b |
Net asset value, end of period | | $ | 9.41 | | | $ | 9.12 | | | $ | 10.97 | | | $ | 10.36 | | | $ | 10.89 | |
|
Total Return | | | 10.00 | % | | | (11.91 | %) | | | 11.35 | % | | | 1.19 | % | | | 5.39 | % |
Ratios/Supplemental Data |
Net assets, end of period (in thousands) | | $ | 1,982 | | | $ | 1,905 | | | $ | 126,683 | | | $ | 127,037 | | | $ | 151,558 | |
Ratios to average net assets: |
Net investment income (loss) | | | 6.43 | % | | | 4.70 | % | | | 4.80 | % | | | 5.79 | % | | | 6.31 | % |
Total expensesd | | | 0.84 | % | | | 0.75 | % | | | 0.77 | % | | | 0.85 | % | | | 0.89 | % |
Net expensese,f,g | | | 0.80 | % | | | 0.75 | % | | | 0.76 | % | | | 0.85 | % | | | 0.88 | % |
Portfolio turnover rate | | | 31 | % | | | 42 | % | | | 86 | % | | | 81 | % | | | 61 | % |
a | Net investment income (loss) per share was computed using average shares outstanding throughout the period. |
b | Redemption fees collected are less than $0.01 per share. |
c | Total return does not reflect the impact of any applicable sales charges. |
d | Does not include expenses of the underlying funds in which the Fund invests. |
e | Net expense information reflects the expense ratios after expense waivers and reimbursements, as applicable. |
f | The portion of the ratios of net expenses to average net assets attributable to recoupments of prior fee reductions or expense reimbursements for the years presented was as follows: |
| | | 09/30/23 | 09/30/22 | 09/30/21 | 09/30/20 | 09/30/19 |
| | A-Class | 0.04% | 0.01% | 0.00%* | 0.05% | 0.05% |
| | C-Class | 0.04% | 0.00%* | 0.01% | 0.04% | 0.05% |
| | P-Class | 0.01% | 0.04% | 0.04% | 0.02% | 0.01% |
| | Institutional Class | 0.03% | 0.02% | 0.01% | 0.02% | 0.02% |
| | R6-Class | — | — | — | 0.00%* | 0.00%* |
g | Net expenses may include expenses that are excluded from the expense limitation agreement. Excluding these expenses, the net expense ratios for the years presented would be: |
| | | 09/30/23 | 09/30/22 | 09/30/21 | 09/30/20 | 09/30/19 |
| | A-Class | 1.13% | 1.09% | 1.03% | 1.12% | 1.15% |
| | C-Class | 1.89% | 1.89% | 1.87% | 1.90% | 1.91% |
| | P-Class | 1.13% | 1.14% | 1.14% | 1.16% | 1.16% |
| | Institutional Class | 0.88% | 0.87% | 0.83% | 0.87% | 0.88% |
| | R6-Class | 0.77% | 0.75% | 0.74% | 0.77% | 0.77% |
38 | THE GUGGENHEIM FUNDS ANNUAL REPORT | SEE NOTES TO FINANCIAL STATEMENTS. |
MANAGERS’ COMMENTARY (Unaudited) | September 30, 2023 |
To Our Shareholders
Security Investors, LLC (“SI”) serves as the investment adviser to Guggenheim Core Bond Fund (“Fund”). The Fund is managed by a team of seasoned professionals at SI, including Anne B. Walsh, CFA, JD, Chief Investment Officer and Managing Partner; Steven H. Brown, CFA, Chief Investment Officer, Total Return and Macro Strategies, Senior Managing Director, and Portfolio Manager; Adam J. Bloch, Managing Director and Portfolio Manager; and Evan L. Serdensky, Director and Portfolio Manager. In the subsequent paragraphs, the investment team discusses the Fund’s performance and the market environment for the 12-month period ended September 30, 2023 (the “Reporting Period”).
For the Reporting Period, the Fund returned 1.46% 1, outperforming the Bloomberg U.S.Aggregate Bond Index, the Fund’s benchmark (“Benchmark”), which returned 0.64% for the same period.
What factors contributed or detracted from the Fund’s performance during the Reporting Period?
For the Reporting Period, the Fund outperformed the Benchmark by 82 basis points. Carry, or earned income, remained a consistent source of relative performance for the Fund. Spreads also added to performance relative to the Benchmark. Credit selection within corporates, the Fund’s allocation to securitized credit, and an underweight to Agency residential mortgage-backed securities (“RMBS”) drove most of the active performance versus the Benchmark. Duration detracted from performance as the Fund was positioned modestly overweight duration while the curve bear steepened. Bear steepening refers to yield-curve widening due to long-term rates increasing more than short-term rates, amid a period of falling bond prices and rising yields.
How did the Fund use derivatives during the Reporting Period?
During the Reporting Period, the Fund used interest rate futures, forwards, options, and swaps to help manage duration positioning, foreign exchange risk, and credit exposure. Over the reporting period, performance from interest rate swaps, caps, and swaptions detracted from performance, and performance from SOFR futures was positive (SOFR is Secured Overnight Financing Rate, which measures the cost of borrowing cash overnight collateralized by Treasury Securities). Options on equities, which functioned as hedges to the Fund’s credit positioning, detracted from performance and performance from credit default swaps and credit default swap index (CDX) positions was negative. In addition, the Fund hedged non-USD exposure with foreign-exchange derivatives, which had a negative impact on performance over the Reporting Period.
How was the Fund positioned at the end of the Reporting Period?
Over the past several quarters the Fund has increasingly prioritized diversification, quality, and liquidity as recession concerns continued to persist. To that end, the Fund has steadily moved up-in-quality and positioned more defensively, uniquely, without having to sacrifice yield due to the flatness of the yield curve and the lack of any material decompression witnessed in credit spreads with respect to quality. While spreads for many credit sectors have reverted to long-term-average levels, certain segments remain dislocated and offer attractive relative value. Structured credit spreads are especially cheap, particularly when analyzed in the context of broader fixed income spread levels. Specifically, the basis between structured credit spreads and investment-grade corporate spreads currently sits north of the 90th percentile of historically observed data.
Structured credit is the Fund’s largest allocation. Spreads continued their rebound, but broadly remain wide, both compared to similarly rated investment-grade corporate credit and in an absolute sense. Furthermore, the lower dollar prices of these assets following the rise in interest rates sets up the potential for higher total return opportunities than typically exists in the asset class. With much of its active buying base largely coming from income-focused accounts, structured credit spreads should continue to compress from the resetting higher of yields and the resulting increased interest that comes with it. Within securitized credit, we continue to focus on opportunities senior in the capital structure with sufficient credit enhancement and often unique structural features that limit cash flow variability or extension concerns. We believe the focus on superior structures will be paramount in helping mitigate mark-to-market risks that could emerge should volatility rise.
The corporate credit allocation, represents roughly 22% of the Fund’s holdings. Investment-grade-rated credit makes up 19% of that allocation while 3% is below-investment-grade rated. While in our view, overall corporate credit spreads are trading around fair value levels, there remain both idiosyncratic opportunities and risks across certain issuers and industries given tighter credit conditions across capital markets. Primary market offerings have priced at especially attractive levels, as many investors have pulled back from lending activities. The Fund has employed modestly sized credit hedges to protect the portfolio from potential spread widening.
| | THE GUGGENHEIM FUNDS ANNUAL REPORT | 39 |
MANAGERS’ COMMENTARY (Unaudited)(concluded) | September 30, 2023 |
At the end of the Reporting Period, the Fund had a duration of 6.5 years, unchanged versus the end of the previous Reporting Period. During the period, however, we shifted more total duration during the selloff, we did continue to shift more of the Fund’s duration concentration toward the front end and belly of the curve. While we feel that much of the move in the long end of the Treasury curve has been driven by technical factors and current yields are above levels justified by fundamentals (e.g. inflation expectations, growth expectations, term premium, etc.), the path to those technical factors dissipating in the near term is unclear. Our conviction on the future path of rates is higher at the front end of the curve at this point in the cycle. On a related note, interest rate volatility has remained elevated, which has presented the Fund with opportunities to tactically add to positions in Agency RMBS, locking in spreads, both static and option adjusted, that are near 15-year wides.
Despite another volatile quarter for fixed income returns, our broader macroeconomic views from a fundamental perspective remain consistent. We continue to expect inflation to moderate with time and view the market’s increasingly optimistic expectations of a soft landing as misguided. To that end, we continue to emphasize a defensive tilt to our positioning. From a valuation perspective, the recent move higher in interest rates does potentially present an interesting opportunity to extend duration further, but as we noted, the technical backdrop (particularly at the long end of the curve) is fairly precarious at the moment. Our conviction on the future path of rates is higher on the front end of the curve at this point in the cycle, which informed our shift in curve positioning. However, with the yield curve having steepened out, investors can now “lock-in” roughly similar yields to what they are able to earn in overnight rates, which may be a catalyst for some of the nearly $2 trillion growth in money market funds to move back into fixed income. Looking further out into the economic future, we believe the Fed’s restrictive monetary policy could ultimately shepherd in a recession in the next 6-18 months, which we believe will likely be met with lower rates. Ultimately, the current path of weakening growth, high prices, and high interest rates appears unsustainable, and we are already starting to see signs of pressure on consumers and levered corporate borrowers, which could call into question any soft-landing narrative.
Performance displayed represents past performance which is no guarantee of future results..
1 | Performance figures are based on Class A shares and do not reflect taxes that a shareholder would pay on distributions or the redemption of shares. |
The opinions and forecast expressed may not actually come to pass. This information is subject to change at any time, based on market and other conditions, and should not be construed as a recommendation of any specific security or strategy.
40 | THE GUGGENHEIM FUNDS ANNUAL REPORT | |
PERFORMANCE REPORT AND FUND PROFILE (Unaudited) | September 30, 2023 |
CORE BOND FUND
OBJECTIVE: Seeks to provide current income.
Holdings Diversification (Market Exposure as % of Net Assets)
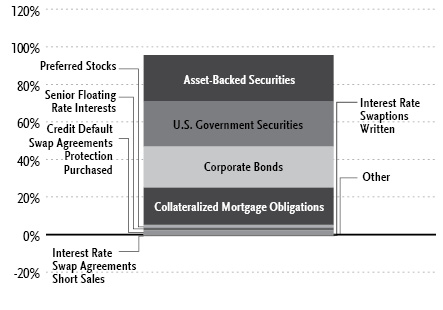
“Holdings Diversification (Market Exposure as % of Net Assets)” excludes any temporary cash investments.
Portfolio Composition by Quality Rating1 |
Rating | % of Total
Investments |
Fixed Income Instruments | |
AAA | 51.6% |
AA | 7.1% |
A | 17.3% |
BBB | 19.1% |
BB | 1.6% |
B | 0.4% |
CC | 0.1% |
C | 0.1% |
NR2 | 0.8% |
Other Instruments | 1.9% |
Total Investments | 100.0% |
Inception Dates: |
A-Class | August 15, 1985 |
C-Class | May 1, 2000 |
P-Class | May 1, 2015 |
Institutional Class | January 29, 2013 |
Ten Largest Holdings | % of Total Net Assets |
U.S. Treasury Notes, 4.63% | 7.8% |
U.S. Treasury Notes, 3.88% | 5.8% |
U.S. Treasury Notes, 4.13% | 4.7% |
U.S. Treasury Notes, 3.50% | 3.8% |
U.S. Treasury Bonds, due 05/15/53 | 2.8% |
Fannie Mae, 5.50% due 05/01/53 | 2.8% |
U.S. Treasury Notes, 3.63% | 1.4% |
Fannie Mae, 5.00% due 06/01/53 | 1.2% |
Fannie Mae, 5.00% due 05/01/53 | 1.0% |
U.S. Treasury Notes, 4.38% | 0.9% |
Top Ten Total | 32.2% |
| | |
“Ten Largest Holdings” excludes any temporary cash or derivative investments. |
1 | Source: BlackRock Solutions. Credit quality ratings are measured on a scale that generally ranges from AAA (highest) to D (lowest). All securities except for those labeled “NR” have been rated by Moody’s, Standard & Poor’s (“S&P”), or Fitch, each of which is a Nationally Recognized Statistical Rating Organization (“NRSRO”). For purposes of this presentation, when ratings are available from more than one agency, the highest rating is used. Guggenheim Investments has converted ratings to the equivalent S&P rating. Security ratings are determined at the time of purchase and may change thereafter. |
2 | NR (not rated) securities do not necessarily indicate low credit quality. |
| | THE GUGGENHEIM FUNDS ANNUAL REPORT | 41 |
PERFORMANCE REPORT AND FUND PROFILE (Unaudited)(concluded) | September 30, 2023 |
Cumulative Fund Performance*
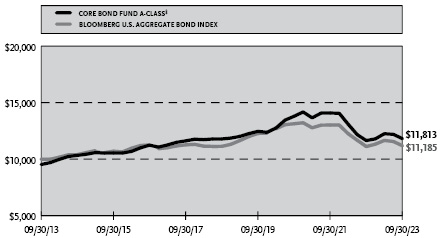
Average Annual Returns*
Periods Ended September 30, 2023
| 1 Year | 5 Year | 10 Year |
A-Class Shares | 1.46% | 0.05% | 2.18% |
A-Class Shares with sales charge† | (2.60%) | (0.76%) | 1.68% |
C-Class Shares | 0.68% | (0.69%) | 1.43% |
C-Class Shares with CDSC‡ | (0.29%) | (0.69%) | 1.43% |
Institutional Class Shares | 1.80% | 0.34% | 2.46% |
Bloomberg U.S. Aggregate Bond Index | 0.64% | 0.10% | 1.13% |
| 1 Year | 5 Year | Since
Inception
(05/01/15) |
P-Class Shares | 1.50% | 0.05% | 1.34% |
Bloomberg U.S. Aggregate Bond Index | 0.64% | 0.10% | 0.55% |
* | The performance data above represents past performance that is not predictive of future results. The investment return and principal value of an investment in the Fund will fluctuate so that an investor’s shares, when redeemed, may be worth more or less than their original cost. Returns are historical and include changes in principal and reinvested dividends and capital gains and do not reflect the effect of taxes. The Bloomberg U.S. Aggregate Bond Index is an unmanaged index and, unlike the Fund, has no management fees or operating expenses to reduce its reported return. The graph is based on A-Class shares only: performance for C-Class shares, P-Class shares and Institutional Class shares will vary due to differences in fee structures. |
† | Effective October 1, 2015, the maximum sales charge decreased from 4.75% to 4.00%. A 4.75% maximum sales charge is used in the calculation of the Average Annual Returns based on subscriptions made prior to October 1, 2015, and a 4.00% maximum sales charge is used to calculated performance for the periods based on subscriptions made on or after October 1, 2015. |
‡ | Fund returns include a CDSC of 1% if redeemed within 12 months of purchase. |
42 | THE GUGGENHEIM FUNDS ANNUAL REPORT | |
SCHEDULE OF INVESTMENTS | September 30, 2023 |
CORE BOND FUND | |
| | Shares | | | Value | |
COMMON STOCKS† - 0.0% |
| | | | | | | | | |
Communications - 0.0% |
Vacasa, Inc. — Class A* | | | 31,926 | | | $ | 14,721 | |
| | | | | | | | | |
Financial - 0.0% |
Pershing Square Tontine Holdings, Ltd. — Class A*,††† | | | 622,890 | | | | 62 | |
| | | | | | | | | |
Industrial - 0.0% |
Constar International Holdings LLC*,††† | | | 68 | | | | — | |
| | | | | | | | | |
Total Common Stocks | | | | |
(Cost $318,263) | | | | | | | 14,783 | |
| | | | | | | | | |
PREFERRED STOCKS†† - 1.6% |
Financial - 1.6% |
Charles Schwab Corp. |
4.00% | | | 8,500,000 | | | | 5,997,354 | |
MetLife, Inc. |
3.85% | | | 3,520,000 | | | | 3,256,307 | |
Bank of New York Mellon Corp. |
3.75% | | | 3,900,000 | | | | 3,163,264 | |
Wells Fargo & Co. |
3.90% | | | 3,250,000 | | | | 2,838,382 | |
JPMorgan Chase & Co. |
3.65%2 | | | 2,350,000 | | | | 2,051,169 | |
Bank of America Corp. |
6.13% | | | 1,650,000 | | | | 1,580,903 | |
Markel Group, Inc. |
6.00% | | | 1,360,000 | | | | 1,312,837 | |
Kuvare US Holdings, Inc. |
7.00%3 | | | 1,000,000 | | | | 1,052,805 | |
CNO Financial Group, Inc. |
5.13% due 11/25/60 | | | 48,000 | | | | 745,440 | |
Assurant, Inc. |
5.25% due 01/15/61 | | | 38,000 | | | | 741,000 | |
Depository Trust & Clearing Corp. |
3.38%2,3 | | | 1,000,000 | | | | 740,437 | |
Lincoln National Corp. |
9.25%2 | | | 644,000 | | | | 663,315 | |
First Republic Bank |
4.25% | | | 77,975 | | | | 8 | |
Total Financial | | | | | | | 24,143,221 | |
| | | | | | | | | |
Industrial - 0.0% |
Constar International Holdings LLC*,††† | | | 7 | | | | — | |
| | | | | | | | | |
Total Preferred Stocks | | | | |
(Cost $31,237,477) | | | | | | | 24,143,221 | |
| | | | | | | | | |
WARRANTS† - 0.0% |
Ginkgo Bioworks Holdings, Inc. | | | | | | | | |
Expiring 09/16/26 | | | 6,510 | | | | 1,465 | |
Acropolis Infrastructure Acquisition Corp. | | | | | | | | |
Expiring 03/31/261 | | | 8,300 | | | | 498 | |
Pershing Square Tontine Holdings, Ltd. | | | | | | | | |
Expiring 07/24/25*,††† | | | 69,210 | | | | 7 | |
Total Warrants | | | | |
(Cost $21,927) | | | | | | | 1,970 | |
MONEY MARKET FUNDS† - 0.2% |
Dreyfus Treasury Securities Cash Management Fund — Institutional Shares, 5.24%4 | | | 2,271,130 | | | | 2,271,130 | |
Dreyfus Treasury Obligations Cash Management Fund — Institutional Shares, 5.23%4 | | | 1,586,284 | | | | 1,586,284 | |
Total Money Market Fund | | | | |
(Cost $3,857,414) | | | | | | | 3,857,414 | |
| | | | | | | | | |
| | | Face
Amount~ | | | | | |
U.S. GOVERNMENT SECURITIES†† - 32.1% |
U.S. Treasury Notes |
3.88% due 08/15/33 | | | 95,300,000 | | | | 90,043,609 | |
4.13% due 07/31/2816 | | | 73,650,000 | | | | 72,061,922 | |
3.50% due 01/31/2812 | | | 61,817,000 | | | | 58,994,185 | |
3.63% due 05/15/26 | | | 22,000,000 | | | | 21,325,391 | |
4.38% due 08/31/28 | | | 14,500,000 | | | | 14,356,133 | |
2.75% due 02/15/28 | | | 8,370,000 | | | | 7,740,942 | |
3.75% due 06/30/30 | | | 5,340,000 | | | | 5,068,411 | |
3.38% due 05/15/3316 | | | 4,130,000 | | | | 3,745,394 | |
4.13% due 06/15/26 | | | 260,000 | | | | 255,186 | |
U.S. Treasury Notes | | | | | | | | |
4.63% due 09/30/28 | | | 121,000,000 | | | | 121,217,422 | |
U.S. Treasury Bonds |
due 05/15/538,9 | | | 164,480,000 | | | | 43,551,995 | |
3.00% due 08/15/52 | | | 16,000,000 | | | | 11,658,750 | |
due 02/15/528,9 | | | 29,980,000 | | | | 8,166,154 | |
due 02/15/468,9 | | | 22,605,000 | | | | 7,574,924 | |
2.88% due 05/15/52 | | | 10,000,000 | | | | 7,090,234 | |
due 05/15/448,9 | | | 19,265,000 | | | | 7,016,364 | |
4.00% due 11/15/52 | | | 5,300,000 | | | | 4,697,539 | |
1.88% due 11/15/51 | | | 8,000,000 | | | | 4,459,062 | |
due 11/15/448,9,12 | | | 4,520,000 | | | | 1,604,392 | |
United States Treasury Inflation Indexed Bonds |
1.25% due 04/15/2814 | | | 3,974,412 | | | | 3,779,844 | |
1.38% due 07/15/3314 | | | 1,942,487 | | | | 1,796,004 | |
Total U.S. Government Securities |
(Cost $533,351,500) | | | | | | | 496,203,857 | |
| | | | | | | | | |
ASSET-BACKED SECURITIES†† - 24.5% |
Collateralized Loan Obligations - 14.8% |
LoanCore Issuer Ltd. | | | | | | | | |
2021-CRE5 C, 7.80% (1 Month Term SOFR + 2.35%, Rate Floor: 2.35%) due 07/15/36◊,3 | | | 7,500,000 | | | | 7,010,106 | |
2021-CRE4 D, 7.93% (30 Day Average SOFR + 2.61%, Rate Floor: 2.61%) due 07/15/35◊,3 | | | 4,426,000 | | | | 4,125,496 | |
SEE NOTES TO FINANCIAL STATEMENTS. | THE GUGGENHEIM FUNDS ANNUAL REPORT | 43 |
SCHEDULE OF INVESTMENTS (continued) | September 30, 2023 |
CORE BOND FUND | |
| | Face
Amount~ | | | Value | |
2021-CRE6 C, 7.75% (1 Month Term SOFR + 2.41%, Rate Floor: 2.30%) due 11/15/38◊,3 | | | 4,000,000 | | | $ | 3,811,546 | |
2021-CRE4 C, 7.13% (30 Day Average SOFR + 1.81%, Rate Floor: 1.81%) due 07/15/35◊,3 | | | 1,000,000 | | | | 971,776 | |
Octagon Investment Partners 49 Ltd. | | | | | | | | |
2021-5A B, 7.12% (3 Month Term SOFR + 1.81%, Rate Floor: 1.55%) due 01/15/33◊,3 | | | 8,500,000 | | | | 8,395,450 | |
2021-5A C, 7.62% (3 Month Term SOFR + 2.31%, Rate Floor: 2.05%) due 01/15/33◊,3 | | | 7,450,000 | | | | 7,244,404 | |
Woodmont Trust | | | | | | | | |
2020-7A A1A, 7.47% (3 Month Term SOFR + 2.16%, Rate Floor: 1.90%) due 01/15/32◊,3 | | | 12,000,000 | | | | 11,966,848 | |
2020-7A B, 8.17% (3 Month Term SOFR + 2.86%, Rate Floor: 2.60%) due 01/15/32◊,3 | | | 3,750,000 | | | | 3,668,723 | |
Cerberus Loan Funding XXX, LP | | | | | | | | |
2020-3A A, 7.42% (3 Month Term SOFR + 1.85%, Rate Floor: 1.85%) due 01/15/33◊,3 | | | 13,500,000 | | | | 13,453,212 | |
2020-3A B, 8.07% (3 Month Term SOFR + 2.50%, Rate Floor: 2.50%) due 01/15/33◊,3 | | | 2,000,000 | | | | 1,967,421 | |
LCCM Trust | | | | | | | | |
2021-FL3 A, 6.90% (1 Month Term SOFR + 1.56%, Rate Floor: 1.56%) due 11/15/38◊,3 | | | 6,000,000 | | | | 5,863,291 | |
2021-FL3 AS, 7.25% (1 Month Term SOFR + 1.91%, Rate Floor: 1.91%) due 11/15/38◊,3 | | | 3,950,000 | | | | 3,745,892 | |
2021-FL2 C, 7.60% (1 Month Term SOFR + 2.26%, Rate Floor: 2.26%) due 12/13/38◊,3 | | | 3,100,000 | | | | 2,829,631 | |
Dryden 36 Senior Loan Fund | | | | | | | | |
2020-36A CR3, 7.62% (3 Month Term SOFR + 2.31%, Rate Floor: 2.05%) due 04/15/29◊,3 | | | 8,000,000 | | | | 7,931,896 | |
Madison Park Funding XLVIII Ltd. | | | | | | | | |
2021-48A B, 7.03% (3 Month Term SOFR + 1.71%, Rate Floor: 1.71%) due 04/19/33◊,3 | | | 4,000,000 | | | | 3,964,800 | |
2021-48A C, 7.58% (3 Month Term SOFR + 2.26%, Rate Floor: 2.26%) due 04/19/33◊,3 | | | 4,000,000 | | | | 3,955,188 | |
MF1 Multifamily Housing Mortgage Loan Trust | | | | | | | | |
2021-FL6 D, 8.00% (1 Month Term SOFR + 2.66%, Rate Floor: 2.55%) due 07/16/36◊,3 | | | 4,000,000 | | | | 3,807,214 | |
2021-FL6 C, 7.30% (1 Month Term SOFR + 1.96%, Rate Floor: 1.85%) due 07/16/36◊,3 | | | 3,400,000 | | | | 3,211,757 | |
Palmer Square Loan Funding Ltd. | | | | | | | | |
2021-1A A2, 6.84% (3 Month Term SOFR + 1.51%, Rate Floor: 1.51%) due 04/20/29◊,3 | | | 2,000,000 | | | | 1,984,311 | |
2021-1A B, 7.39% (3 Month Term SOFR + 2.06%, Rate Floor: 2.06%) due 04/20/29◊,3 | | | 2,000,000 | | | | 1,979,243 | |
2021-3A C, 8.09% (3 Month Term SOFR + 2.76%, Rate Floor: 2.76%) due 07/20/29◊,3 | | | 2,000,000 | | | | 1,965,066 | |
2021-2A C, 8.04% (3 Month Term SOFR + 2.66%, Rate Floor: 2.66%) due 05/20/29◊,3 | | | 1,000,000 | | | | 986,154 | |
Golub Capital Partners CLO 33M Ltd. | | | | | | | | |
2021-33A AR2, 7.51% (3 Month Term SOFR + 2.12%, Rate Floor: 1.86%) due 08/25/33◊,3 | | | 6,500,000 | | | | 6,242,286 | |
Golub Capital Partners CLO 16 Ltd. | | | | | | | | |
2021-16A A1R2, 7.22% (3 Month Term SOFR + 1.87%, Rate Floor: 1.61%) due 07/25/33◊,3 | | | 4,000,000 | | | | 3,975,144 | |
2021-16A A2R2, 7.41% (3 Month Term SOFR + 2.06%, Rate Floor: 1.80%) due 07/25/33◊,3 | | | 2,000,000 | | | | 1,940,101 | |
ABPCI Direct Lending Fund CLO II LLC | | | | | | | | |
2021-1A A1R, 7.19% (3 Month Term SOFR + 1.86%, Rate Floor: 1.60%) due 04/20/32◊,3 | | | 5,500,000 | | | | 5,439,950 | |
Cerberus Loan Funding XXXII, LP | | | | | | | | |
2021-2A A, 7.19% (3 Month Term SOFR + 1.88%, Rate Floor: 1.88%) due 04/22/33◊,3 | | | 4,250,000 | | | | 4,197,749 | |
2021-2A C, 8.42% (3 Month Term SOFR + 3.11%, Rate Floor: 3.11%) due 04/22/33◊,3 | | | 1,250,000 | | | | 1,204,505 | |
AMMC CLO XIV Ltd. | | | | | | | | |
2021-14A A2R2, 7.01% (3 Month Term SOFR + 1.66%, Rate Floor: 1.40%) due 07/25/29◊,3 | | | 5,332,385 | | | | 5,330,252 | |
Cerberus Loan Funding XLII LLC | | | | | | | | |
2023-3A A1, 7.91% (3 Month Term SOFR + 2.48%, Rate Floor: 2.48%) due 09/13/35◊,3 | | | 3,750,000 | | | | 3,749,737 | |
2023-3A B, 8.78% (3 Month Term SOFR + 3.35%, Rate Floor: 3.35%) due 09/13/35◊,3 | | | 1,250,000 | | | | 1,249,893 | |
THL Credit Lake Shore MM CLO I Ltd. | | | | | | | | |
2021-1A A1R, 7.27% (3 Month Term SOFR + 1.96%, Rate Floor: 1.70%) due 04/15/33◊,3 | | | 4,250,000 | | | | 4,191,981 | |
Fortress Credit Opportunities IX CLO Ltd. | | | | | | | | |
2021-9A A2TR, 7.37% (3 Month Term SOFR + 2.06%, Rate Floor: 1.80%) due 10/15/33◊,3 | | | 3,250,000 | | | | 3,164,925 | |
2021-9A A1TR, 7.12% (3 Month Term SOFR + 1.81%, Rate Floor: 1.55%) due 10/15/33◊,3 | | | 1,000,000 | | | | 981,243 | |
44 | THE GUGGENHEIM FUNDS ANNUAL REPORT | SEE NOTES TO FINANCIAL STATEMENTS. |
SCHEDULE OF INVESTMENTS (continued) | September 30, 2023 |
CORE BOND FUND | |
| | Face
Amount~ | | | Value | |
ABPCI Direct Lending Fund CLO I LLC | | | | | | | | |
2021-1A A1A2, 7.29% (3 Month Term SOFR + 1.96%, Rate Floor: 1.96%) due 07/20/33◊,3 | | | 3,750,000 | | | $ | 3,717,811 | |
BSPDF Issuer Ltd. | | | | | | | | |
2021-FL1 C, 7.70% (1 Month Term SOFR + 2.36%, Rate Floor: 2.25%) due 10/15/36◊,3 | | | 4,000,000 | | | | 3,709,869 | |
Golub Capital Partners CLO 36M Ltd. | | | | | | | | |
2018-36A A, 6.93% (3 Month Term SOFR + 1.56%, Rate Floor: 0.00%) due 02/05/31◊,3 | | | 3,722,023 | | | | 3,699,691 | |
Owl Rock CLO IV Ltd. | | | | | | | | |
2021-4A A1R, 7.24% (3 Month Term SOFR + 1.86%, Rate Floor: 1.60%) due 08/20/33◊,3 | | | 3,750,000 | | | | 3,693,708 | |
PFP Ltd. | | | | | | | | |
2021-7 D, 7.85% (1 Month Term SOFR + 2.51%, Rate Floor: 2.40%) due 04/14/38◊,3 | | | 3,749,813 | | | | 3,501,277 | |
Cerberus Loan Funding XL LLC | | | | | | | | |
2023-1A A, 7.71% (3 Month Term SOFR + 2.40%, Rate Floor: 2.40%) due 03/22/35◊,3 | | | 3,500,000 | | | | 3,499,799 | |
ABPCI Direct Lending Fund CLO V Ltd. | | | | | | | | |
2021-5A A1R, 7.09% (3 Month Term SOFR + 1.76%, Rate Floor: 1.50%) due 04/20/31◊,3 | | | 3,207,310 | | | | 3,167,868 | |
Cerberus Loan Funding XXXIII, LP | | | | | | | | |
2021-3A B, 7.42% (3 Month Term SOFR + 2.11%, Rate Floor: 1.85%) due 07/23/33◊,3 | | | 2,000,000 | | | | 1,930,635 | |
2021-3A A, 7.13% (3 Month Term SOFR + 1.82%, Rate Floor: 1.56%) due 07/23/33◊,3 | | | 1,250,000 | | | | 1,231,138 | |
Cerberus Loan Funding XXXI, LP | | | | | | | | |
2021-1A A, 7.07% (3 Month Term SOFR + 1.76%, Rate Floor: 1.50%) due 04/15/32◊,3 | | | 3,025,262 | | | | 3,012,407 | |
GoldenTree Loan Management US CLO 1 Ltd. | | | | | | | | |
2021-9A C, 7.39% (3 Month Term SOFR + 2.06%, Rate Floor: 1.80%) due 01/20/33◊,3 | | | 3,000,000 | | | | 2,933,833 | |
KREF Funding V LLC | | | | | | | | |
7.19% (1 Month Term SOFR + 1.86%, Rate Floor: 1.86%) due 06/25/26◊,††† | | | 2,840,938 | | | | 2,817,778 | |
0.15% due 06/25/26†††,5 | | | 21,818,182 | | | | 15,055 | |
BXMT Ltd. | | | | | | | | |
2020-FL2 A, 6.35% (1 Month Term SOFR + 1.01%, Rate Floor: 1.01%) due 02/15/38◊,3 | | | 2,896,986 | | | | 2,753,049 | |
VOYA CLO | | | | | | | | |
2021-2A A2AR, 7.22% (3 Month Term SOFR + 1.91%, Rate Floor: 1.65%) due 06/07/30◊,3 | | | 2,550,000 | | | | 2,532,915 | |
Palmer Square CLO 2023-4 Ltd. | | | | | | | | |
2023-4A C, due 10/20/33◊,3 | | | 2,250,000 | | | | 2,250,000 | |
Apres Static CLO Ltd. | | | | | | | | |
2020-1A A2R, 7.27% (3 Month Term SOFR + 1.96%, Rate Floor: 0.00%) due 10/15/28◊,3 | | | 2,000,000 | | | | 1,991,621 | |
MidOcean Credit CLO VII | | | | | | | | |
2020-7A BR, 7.17% (3 Month Term SOFR + 1.86%, Rate Floor: 0.00%) due 07/15/29◊,3 | | | 2,000,000 | | | | 1,964,200 | |
Neuberger Berman Loan Advisers CLO 40 Ltd. | | | | | | | | |
2021-40A C, 7.32% (3 Month Term SOFR + 2.01%, Rate Floor: 1.75%) due 04/16/33◊,3 | | | 2,000,000 | | | | 1,956,779 | |
ACRES Commercial Realty Ltd. | | | | | | | | |
2021-FL2 AS, 7.20% (1 Month Term SOFR + 1.86%, Rate Floor: 1.86%) due 01/15/37◊,3 | | | 2,000,000 | | | | 1,951,724 | |
Magnetite XXIX Ltd. | | | | | | | | |
2021-29A C, 7.22% (3 Month Term SOFR + 1.91%, Rate Floor: 1.65%) due 01/15/34◊,3 | | | 2,000,000 | | | | 1,946,532 | |
ABPCI Direct Lending Fund IX LLC | | | | | | | | |
2021-9A A2R, 7.42% (3 Month Term SOFR + 2.06%, Rate Floor: 1.80%) due 11/18/31◊,3 | | | 2,000,000 | | | | 1,943,225 | |
ACRES Commercial Realty Ltd. | | | | | | | | |
2021-FL1 AS, 7.05% (1 Month Term SOFR + 1.71%, Rate Floor: 1.71%) due 06/15/36◊,3 | | | 2,000,000 | | | | 1,926,802 | |
FS Rialto | | | | | | | | |
2021-FL3 C, 7.50% (1 Month Term SOFR + 2.16%, Rate Floor: 2.05%) due 11/16/36◊,3 | | | 2,000,000 | | | | 1,882,224 | |
Canyon Capital CLO Ltd. | | | | | | | | |
2018-1A A2R, 7.13% (3 Month Term SOFR + 1.76%, Rate Floor: 1.50%) due 01/30/31◊,3 | | | 1,900,000 | | | | 1,868,150 | |
BRSP Ltd. | | | | | | | | |
2021-FL1 C, 7.59% (1 Month Term SOFR + 2.26%, Rate Floor: 2.15%) due 08/19/38◊,3 | | | 2,000,000 | | | | 1,835,700 | |
Fortress Credit Opportunities XI CLO Ltd. | | | | | | | | |
2018-11A A1T, 6.87% (3 Month Term SOFR + 1.56%, Rate Floor: 0.00%) due 04/15/31◊,3 | | | 1,819,878 | | | | 1,809,448 | |
OCP CLO Ltd. | | | | | | | | |
2020-4A A2RR, 7.06% (3 Month Term SOFR + 1.71%, Rate Floor: 1.45%) due 04/24/29◊,3 | | | 1,500,000 | | | | 1,490,550 | |
SEE NOTES TO FINANCIAL STATEMENTS. | THE GUGGENHEIM FUNDS ANNUAL REPORT | 45 |
SCHEDULE OF INVESTMENTS (continued) | September 30, 2023 |
CORE BOND FUND | |
| | Face
Amount~ | | | Value | |
Golub Capital Partners CLO 54M L.P | | | | | | | | |
2021-54A B, 7.48% (3 Month Term SOFR + 2.11%, Rate Floor: 1.85%) due 08/05/33◊,3 | | | 1,500,000 | | | $ | 1,423,599 | |
STWD Ltd. | | | | | | | | |
2019-FL1 D, 7.80% (1 Month Term SOFR + 2.46%, Rate Floor: 2.46%) due 07/15/38◊,3 | | | 1,459,000 | | | | 1,329,331 | |
Palmer Square Loan Funding Ltd. | | | | | | | | |
2023-1A B, due 07/20/31◊,3 | | | 1,250,000 | | | | 1,256,621 | |
Palmer Square Loan Funding Ltd. | | | | | | | | |
2023-4A B, 8.10% (3 Month Term SOFR + 2.75%, Rate Floor: 2.75%) due 07/24/31◊,3 | | | 1,000,000 | | | | 1,006,817 | |
Owl Rock CLO XIII LLC | | | | | | | | |
2023-13A B, 8.77% (3 Month Term SOFR + 3.35%, Rate Floor: 3.35%) due 09/20/35◊,3 | | | 1,000,000 | | | | 999,821 | |
Cerberus Loan Funding XXXVIII, LP | | | | | | | | |
2022-2A A1, 8.06% (3 Month Term SOFR + 2.75%, Rate Floor: 2.75%) due 10/15/34◊,3 | | | 1,000,000 | | | | 999,102 | |
Cerberus Loan Funding XXXV, LP | | | | | | | | |
2021-5A A, 7.07% (3 Month Term SOFR + 1.76%, Rate Floor: 1.50%) due 09/22/33◊,3 | | | 1,000,000 | | | | 991,011 | |
Owl Rock CLO II Ltd. | | | | | | | | |
2021-2A ALR, 7.14% (3 Month Term SOFR + 1.81%, Rate Floor: 1.55%) due 04/20/33◊,3 | | | 1,000,000 | | | | 983,346 | |
Owl Rock CLO I Ltd. | | | | | | | | |
2019-1A A, 7.44% (3 Month Term SOFR + 2.06%, Rate Floor: 1.80%) due 05/20/31◊,3 | | | 986,802 | | | | 983,164 | |
Northwoods Capital XII-B Ltd. | | | | | | | | |
2018-12BA B, 7.52% (3 Month Term SOFR + 2.11%, Rate Floor: 1.85%) due 06/15/31◊,3 | | | 1,000,000 | | | | 971,600 | |
BSPRT Issuer Ltd. | | | | | | | | |
2021-FL7 C, 7.75% (1 Month Term SOFR + 2.41%, Rate Floor: 2.41%) due 12/15/38◊,3 | | | 1,000,000 | | | | 955,308 | |
KREF | | | | | | | | |
2021-FL2 C, 7.45% (1 Month Term SOFR + 2.11%, Rate Floor: 2.00%) due 02/15/39◊,3 | | | 1,000,000 | | | | 937,028 | |
NewStar Fairfield Fund CLO Ltd. | | | | | | | | |
2018-2A A1N, 6.86% (3 Month Term SOFR + 1.53%, Rate Floor: 1.27%) due 04/20/30◊,3 | | | 922,122 | | | | 913,811 | |
Dryden 37 Senior Loan Fund | | | | | | | | |
2015-37A Q, due 01/15/313,6 | | | 1,000,000 | | | | 732,245 | |
ACRE Commercial Mortgage Ltd. | | | | | | | | |
2021-FL4 D, 8.05% (1 Month Term SOFR + 2.71%, Rate Floor: 2.60%) due 12/18/37◊,3 | | | 773,000 | | | | 711,125 | |
Golub Capital Partners CLO 17 Ltd. | | | | | | | | |
2017-17A A1R, 7.26% (3 Month Term SOFR + 1.91%, Rate Floor: 0.00%) due 10/25/30◊,3 | | | 604,218 | | | | 601,643 | |
Cerberus Loan Funding XXXVI, LP | | | | | | | | |
2021-6A A, 6.97% (3 Month Term SOFR + 1.66%, Rate Floor: 1.40%) due 11/22/33◊,3 | | | 161,421 | | | | 160,942 | |
Marathon CLO V Ltd. | | | | | | | | |
2017-5A A2R, 7.09% (3 Month Term SOFR + 1.71%, Rate Floor: 0.00%) due 11/21/27◊,3 | | | 117,522 | | | | 117,383 | |
Babson CLO Ltd. | | | | | | | | |
2014-IA SUB, due 07/20/253,6 | | | 633,344 | | | | 14,757 | |
Treman Park CLO Ltd. | | | | | | | | |
2015-1A COM, due 10/20/283,6 | | | 162,950 | | | | 1,636 | |
Copper River CLO Ltd. | | | | | | | | |
2007-1A INC, due 01/20/216,7 | | | 700,000 | | | | 70 | |
Total Collateralized Loan Obligations | | | 229,631,339 | |
| | | | | | | | | |
Financial - 2.3% |
Project Onyx I | | | | | | | | |
due 01/26/27†††15 | | | 5,700,000 | | | | 5,700,248 | |
HV Eight LLC | | | | | | | | |
7.10% (3 Month EURIBOR + 3.50%, Rate Floor: 3.50%) due 12/31/27◊,††† | EUR | | 4,400,000 | | | | 4,653,622 | |
Strategic Partners Fund VIII LP | | | | | | | | |
7.93% (1 Month Term SOFR + 2.60%, Rate Floor: 2.60%) due 03/10/26◊,††† | | | 4,583,099 | | | | 4,560,941 | |
KKR Core Holding Company LLC | | | | | | | | |
4.00% due 08/12/31††† | | | 5,122,847 | | | | 4,429,135 | |
Madison Avenue Secured Funding Trust | | | | | | | | |
2023-1, 7.32% (1 Month Term SOFR + 2.00%, Rate Floor: 2.00%) due 03/04/24◊,†††,3 | | | 3,050,000 | | | | 3,050,000 | |
HarbourVest Structured Solutions IV Holdings, LP | | | | | | | | |
7.61% (3 Month USD LIBOR + 2.45%, Rate Floor: 2.45%) due 09/15/26◊,††† | | | 1,736,198 | | | | 1,736,495 | |
6.05% (3 Month EURIBOR + 2.45%, Rate Floor: 2.45%) due 09/15/26◊,††† | EUR | | 1,000,000 | | | | 1,057,740 | |
Project Onyx II | | | | | | | | |
due 01/26/27†††15 | | | 1,900,000 | | | | 1,899,931 | |
Ceamer Finance LLC | | | | | | | | |
6.92% due 11/15/37††† | | | 1,987,290 | | | | 1,894,690 | |
Lightning A | | | | | | | | |
5.50% due 03/01/37††† | | | 1,736,222 | | | | 1,576,302 | |
Thunderbird A | | | | | | | | |
5.50% due 03/01/37††† | | | 1,711,333 | | | | 1,553,553 | |
Madison Avenue Secured Funding Trust | | | | | | | | |
2024-1, due 10/15/2415 | | | 1,175,000 | | | | 1,175,000 | |
Bib Merchant Voucher Receivables Ltd. | | | | | | | | |
4.18% due 04/07/28††† | | | 756,775 | | | | 716,740 | |
Nassau LLC | | | | | | | | |
2019-1, 3.98% due 08/15/343 | | | 654,696 | | | | 618,915 | |
Station Place Securitization Trust | | | | | | | | |
2024-1, due 10/15/2415 | | | 575,000 | | | | 575,000 | |
46 | THE GUGGENHEIM FUNDS ANNUAL REPORT | SEE NOTES TO FINANCIAL STATEMENTS. |
SCHEDULE OF INVESTMENTS (continued) | September 30, 2023 |
CORE BOND FUND | |
| | Face
Amount~ | | | Value | |
Aesf Vi Verdi, LP | | | | | | | | |
6.00% (3 Month EURIBOR + 2.40%, Rate Floor: 2.40%) due 11/25/24◊,††† | EUR | | 103,023 | | | $ | 110,598 | |
Total Financial | | | 35,308,910 | |
| | | | | | | | | |
Whole Business - 2.2% |
Arbys Funding LLC | | | | | | | | |
2020-1A, 3.24% due 07/30/503 | | | 6,547,500 | | | | 5,798,950 | |
Domino’s Pizza Master Issuer LLC | | | | | | | | |
2017-1A, 4.12% due 07/25/473 | | | 5,103,000 | | | | 4,721,020 | |
2021-1A, 3.15% due 04/25/513 | | | 1,124,125 | | | | 905,642 | |
Taco Bell Funding LLC | | | | | | | | |
2016-1A, 4.97% due 05/25/463 | | | 3,515,625 | | | | 3,388,261 | |
2021-1A, 2.29% due 08/25/513 | | | 1,404,975 | | | | 1,147,637 | |
SERVPRO Master Issuer LLC | | | | | | | | |
2021-1A, 2.39% due 04/25/513 | | | 4,154,375 | | | | 3,429,275 | |
2019-1A, 3.88% due 10/25/493 | | | 962,500 | | | | 878,813 | |
ServiceMaster Funding LLC | | | | | | | | |
2020-1, 2.84% due 01/30/513 | | | 3,801,840 | | | | 3,210,346 | |
Five Guys Funding LLC | | | | | | | | |
2017-1A, 4.60% due 07/25/473 | | | 3,102,750 | | | | 3,046,475 | |
Sonic Capital LLC | | | | | | | | |
2021-1A, 2.19% due 08/20/513 | | | 1,734,600 | | | | 1,393,177 | |
2020-1A, 4.34% due 01/20/503 | | | 969,167 | | | | 837,088 | |
2020-1A, 3.85% due 01/20/503 | | | 751,104 | | | | 679,649 | |
Applebee’s Funding LLC / IHOP Funding LLC | | | | | | | | |
2019-1A, 4.72% due 06/05/493 | | | 1,732,500 | | | | 1,610,528 | |
DB Master Finance LLC | | | | | | | | |
2021-1A, 2.79% due 11/20/513 | | | 1,965,000 | | | | 1,514,915 | |
Wendy’s Funding LLC | | | | | | | | |
2019-1A, 3.78% due 06/15/493 | | | 1,321,260 | | | | 1,223,952 | |
Wingstop Funding LLC | | | | | | | | |
2022-1A, 3.73% due 03/05/523 | | | 347,375 | | | | 303,783 | |
Total Whole Business | | | 34,089,511 | |
| | | | | | | | | |
Transport-Aircraft - 1.6% |
AASET Trust | | | | | | | | |
2021-1A, 2.95% due 11/16/413 | | | 3,555,584 | | | | 3,128,985 | |
2021-2A, 2.80% due 01/15/473 | | | 2,476,849 | | | | 2,117,177 | |
2020-1A, 3.35% due 01/16/403 | | | 901,859 | | | | 784,617 | |
2017-1A, 3.97% due 05/16/423 | | | 42,488 | | | | 37,389 | |
Navigator Aircraft ABS Ltd. | | | | | | | | |
2021-1, 2.77% due 11/15/463 | | | 3,052,083 | | | | 2,648,445 | |
Castlelake Aircraft Structured Trust | | | | | | | | |
2021-1A, 3.47% due 01/15/463 | | | 2,771,088 | | | | 2,556,273 | |
Lunar Structured Aircraft Portfolio Notes | | | | | | | | |
2021-1, 2.64% due 10/15/463 | | | 2,066,031 | | | | 1,771,105 | |
AASET US Ltd. | | | | | | | | |
2018-2A, 4.45% due 11/18/383 | | | 2,035,210 | | | | 1,769,572 | |
MACH 1 Cayman Ltd. | | | | | | | | |
2019-1, 3.47% due 10/15/393 | | | 1,920,801 | | | | 1,617,737 | |
Sprite Ltd. | | | | | | | | |
2021-1, 3.75% due 11/15/463 | | | 1,749,440 | | | | 1,568,167 | |
Sapphire Aviation Finance II Ltd. | | | | | | | | |
2020-1A, 3.23% due 03/15/403 | | | 1,605,912 | | | | 1,358,907 | |
Falcon Aerospace Ltd. | | | | | | | | |
2019-1, 3.60% due 09/15/393 | | | 1,025,140 | | | | 927,783 | |
2017-1, 4.58% due 02/15/423 | | | 157,722 | | | | 147,433 | |
Raspro Trust | | | | | | | | |
2005-1A, 6.18% (3 Month Term SOFR + 0.93%, Rate Floor: 0.93%) due 03/23/24◊,3 | | | 984,943 | | | | 978,598 | |
MAPS Ltd. | | | | | | | | |
2018-1A, 4.21% due 05/15/433 | | | 985,632 | | | | 883,491 | |
Slam 2021-1 Ltd. | | | | | | | | |
2021-1A, 2.43% due 06/15/463 | | | 859,400 | | | | 731,023 | |
Sapphire Aviation Finance I Ltd. | | | | | | | | |
2018-1A, 4.25% due 03/15/403 | | | 769,353 | | | | 641,325 | |
WAVE LLC | | | | | | | | |
2019-1, 3.60% due 09/15/443 | | | 719,910 | | | | 593,112 | |
Castlelake Aircraft Securitization Trust | | | | | | | | |
2018-1, 4.13% due 06/15/433 | | | 526,869 | | | | 479,021 | |
Total Transport-Aircraft | | | 24,740,160 | |
| | | | | | | | | |
Net Lease - 1.4% |
CF Hippolyta Issuer LLC | | | | | | | | |
2022-1A, 6.11% due 08/15/623 | | | 2,687,109 | | | | 2,592,812 | |
2020-1, 2.28% due 07/15/603 | | | 674,589 | | | | 592,306 | |
SVC ABS LLC | | | | | | | | |
2023-1A, 5.15% due 02/20/533 | | | 3,240,521 | | | | 3,018,883 | |
CARS-DB4, LP | | | | | | | | |
2020-1A, 3.81% due 02/15/503 | | | 2,224,219 | | | | 1,777,621 | |
2020-1A, 4.95% due 02/15/503 | | | 1,500,000 | | | | 1,203,424 | |
CMFT Net Lease Master Issuer LLC | | | | | | | | |
2021-1, 3.44% due 07/20/513 | | | 3,570,000 | | | | 2,626,388 | |
STORE Master Funding I-VII | | | | | | | | |
2016-1A, 3.96% due 10/20/463 | | | 2,501,232 | | | | 2,303,465 | |
Oak Street Investment Grade Net Lease Fund Series | | | | | | | | |
2020-1A, 2.26% due 11/20/503 | | | 2,500,000 | | | | 2,213,759 | |
CF Hippolyta LLC | | | | | | | | |
2020-1, 2.60% due 07/15/603 | | | 2,479,789 | | | | 1,943,240 | |
Capital Automotive REIT | | | | | | | | |
2020-1A, 3.48% due 02/15/503 | | | 1,235,677 | | | | 1,084,082 | |
2021-1A, 2.76% due 08/15/513 | | | 996,458 | | | | 716,880 | |
AFN ABSPROP001 LLC | | | | | | | | |
2021-1A, 2.21% due 05/20/513 | | | 1,629,658 | | | | 1,318,953 | |
Total Net Lease | | | 21,391,813 | |
| | | | | | | | | |
Single Family Residence - 0.6% |
FirstKey Homes Trust | | | | | | | | |
2020-SFR2, 2.67% due 10/19/373 | | | 2,250,000 | | | | 2,047,943 | |
2020-SFR2, 4.00% due 10/19/373 | | | 1,400,000 | | | | 1,290,230 | |
2020-SFR2, 4.50% due 10/19/373 | | | 1,350,000 | | | | 1,250,921 | |
2020-SFR2, 3.37% due 10/19/373 | | | 900,000 | | | | 822,587 | |
Tricon Residential 2023-SFR1 Trust | | | | | | | | |
2023-SFR1, 5.10% due 07/17/403 | | | 2,722,000 | | | | 2,538,943 | |
Home Partners of America Trust | | | | | | | | |
2021-3, 2.80% due 01/17/413 | | | 920,614 | | | | 773,150 | |
Home Partners of America Trust | | | | | | | | |
2021-2, 2.40% due 12/17/263 | | | 481,325 | | | | 420,918 | |
Total Single Family Residence | | | 9,144,692 | |
| | | | | | | | | |
SEE NOTES TO FINANCIAL STATEMENTS. | THE GUGGENHEIM FUNDS ANNUAL REPORT | 47 |
SCHEDULE OF INVESTMENTS (continued) | September 30, 2023 |
CORE BOND FUND | |
| | Face
Amount~ | | | Value | |
Infrastructure - 0.5% |
VB-S1 Issuer LLC - VBTEL | | | | | | | | |
2022-1A, 4.29% due 02/15/523 | | | 2,500,000 | | | $ | 2,177,496 | |
Stack Infrastructure Issuer LLC | | | | | | | | |
2023-1A, 5.90% due 03/25/483 | | | 1,000,000 | | | | 951,979 | |
2020-1A, 1.89% due 08/25/453 | | | 1,000,000 | | | | 907,740 | |
Hotwire Funding LLC | | | | | | | | |
2021-1, 2.31% due 11/20/513 | | | 2,000,000 | | | | 1,756,420 | |
Vantage Data Centers Issuer LLC | | | | | | | | |
2019-1A, 3.19% due 07/15/443 | | | 1,127,021 | | | | 1,094,560 | |
Aligned Data Centers Issuer LLC | | | | | | | | |
2021-1A, 1.94% due 08/15/463 | | | 1,150,000 | | | | 1,005,949 | |
Total Infrastructure | | | 7,894,144 | |
| | | | | | | | | |
Transport-Container - 0.5% |
MC Ltd. | | | | | | | | |
2021-1, 2.63% due 11/05/353 | | | 3,300,822 | | | | 2,867,079 | |
Textainer Marine Containers VII Ltd. | | | | | | | | |
2020-1A, 2.73% due 08/21/453 | | | 3,061,294 | | | | 2,780,626 | |
CLI Funding VI LLC | | | | | | | | |
2020-1A, 2.08% due 09/18/453 | | | 1,176,400 | | | | 1,016,041 | |
TIF Funding II LLC | | | | | | | | |
2021-1A, 1.65% due 02/20/463 | | | 750,503 | | | | 621,214 | |
Total Transport-Container | | | 7,284,960 | |
| | | | | | | | | |
Collateralized Debt Obligations - 0.4% |
Anchorage Credit Funding 4 Ltd. | | | | | | | | |
2021-4A AR, 2.72% due 04/27/393 | | | 7,250,000 | | | | 6,261,988 | |
Automotive - 0.1% |
Avis Budget Rental Car Funding AESOP LLC | | | | | | | | |
2023-8A, 6.66% due 02/20/30†††,3 | | | 1,600,000 | | | | 1,587,096 | |
Insurance - 0.1% |
CHEST | | | | | | | | |
7.13% due 03/15/43††† | | | 1,000,000 | | | | 972,691 | |
Total Asset-Backed Securities |
(Cost $397,040,825) | | | 378,307,304 | |
| |
CORPORATE BONDS†† - 21.8% |
Financial - 11.4% |
Pershing Square Holdings Ltd. | | | | | | | | |
3.25% due 10/01/31 | | | 6,200,000 | | | | 4,494,053 | |
3.25% due 11/15/30 | | | 4,000,000 | | | | 3,024,656 | |
Nippon Life Insurance Co. | | | | | | | | |
2.75% due 01/21/512,3 | | | 8,150,000 | | | | 6,411,014 | |
BPCE S.A. | | | | | | | | |
2.28% due 01/20/322,3 | | | 8,200,000 | | | | 6,134,366 | |
Reliance Standard Life Global Funding II | | | | | | | | |
2.75% due 05/07/253 | | | 5,989,000 | | | | 5,630,924 | |
Wilton RE Ltd. | | | | | | | | |
6.00% 2,3,10 | | | 6,237,000 | | | | 5,479,017 | |
Blue Owl Capital GP LLC | | | | | | | | |
7.21% due 08/22/43††† | | | 5,000,000 | | | | 4,920,044 | |
GA Global Funding Trust | | | | | | | | |
1.63% due 01/15/263 | | | 5,450,000 | | | | 4,864,654 | |
Liberty Mutual Group, Inc. | | | | | | | | |
4.13% due 12/15/512,3 | | | 5,800,000 | | | | 4,768,383 | |
American Equity Investment Life Holding Co. | | | | | | | | |
5.00% due 06/15/27 | | | 5,036,000 | | | | 4,730,307 | |
GLP Capital Limited Partnership / GLP Financing II, Inc. | | | | | | | | |
4.00% due 01/15/31 | | | 4,650,000 | | | | 3,871,203 | |
5.30% due 01/15/29 | | | 900,000 | | | | 834,318 | |
JPMorgan Chase & Co. | | | | | | | | |
2.52% due 04/22/312 | | | 2,210,000 | | | | 1,791,380 | |
4.49% due 03/24/312 | | | 1,600,000 | | | | 1,464,994 | |
2.96% due 05/13/312 | | | 1,093,000 | | | | 898,036 | |
Iron Mountain, Inc. | | | | | | | | |
4.50% due 02/15/313 | | | 1,917,000 | | | | 1,576,662 | |
5.25% due 07/15/303 | | | 1,283,000 | | | | 1,120,887 | |
5.63% due 07/15/323 | | | 1,000,000 | | | | 863,302 | |
Allianz SE | | | | | | | | |
3.20% 2,3,10 | | | 5,000,000 | | | | 3,550,527 | |
PartnerRe Finance B LLC | | | | | | | | |
4.50% due 10/01/502 | | | 4,040,000 | | | | 3,426,473 | |
FS KKR Capital Corp. | | | | | | | | |
2.63% due 01/15/27 | | | 2,150,000 | | | | 1,841,139 | |
3.25% due 07/15/27 | | | 1,800,000 | | | | 1,549,892 | |
Safehold GL Holdings LLC | | | | | | | | |
2.85% due 01/15/32 | | | 2,428,000 | | | | 1,783,521 | |
2.80% due 06/15/31 | | | 1,931,000 | | | | 1,443,137 | |
Macquarie Group Ltd. | | | | | | | | |
2.87% due 01/14/332,3 | | | 2,150,000 | | | | 1,624,965 | |
2.69% due 06/23/322,3 | | | 2,000,000 | | | | 1,532,337 | |
Jefferies Financial Group, Inc. | | | | | | | | |
2.75% due 10/15/32 | | | 2,720,000 | | | | 2,030,217 | |
2.63% due 10/15/31 | | | 1,400,000 | | | | 1,063,880 | |
Fairfax Financial Holdings Ltd. | | | | | | | | |
3.38% due 03/03/31 | | | 2,500,000 | | | | 2,032,097 | |
5.63% due 08/16/32 | | | 1,000,000 | | | | 934,010 | |
Ares Finance Company II LLC | | | | | | | | |
3.25% due 06/15/303 | | | 3,660,000 | | | | 2,962,990 | |
Maple Grove Funding Trust I | | | | | | | | |
4.16% due 08/15/513 | | | 4,750,000 | | | | 2,954,130 | |
Macquarie Bank Ltd. | | | | | | | | |
3.62% due 06/03/303 | | | 3,570,000 | | | | 2,903,873 | |
Host Hotels & Resorts, LP | | | | | | | | |
3.50% due 09/15/30 | | | 3,385,000 | | | | 2,806,568 | |
Assurant, Inc. | | | | | | | | |
2.65% due 01/15/32 | | | 2,300,000 | | | | 1,681,642 | |
4.90% due 03/27/28 | | | 1,100,000 | | | | 1,051,143 | |
First American Financial Corp. | | | | | | | | |
4.00% due 05/15/30 | | | 3,180,000 | | | | 2,693,111 | |
Fidelity National Financial, Inc. | | | | | | | | |
3.40% due 06/15/30 | | | 3,085,000 | | | | 2,621,544 | |
2.45% due 03/15/31 | | | 70,000 | | | | 53,973 | |
Nationwide Mutual Insurance Co. | | | | | | | | |
4.35% due 04/30/503 | | | 3,687,000 | | | | 2,634,223 | |
Reinsurance Group of America, Inc. | | | | | | | | |
3.15% due 06/15/30 | | | 3,070,000 | | | | 2,541,590 | |
48 | THE GUGGENHEIM FUNDS ANNUAL REPORT | SEE NOTES TO FINANCIAL STATEMENTS. |
SCHEDULE OF INVESTMENTS (continued) | September 30, 2023 |
CORE BOND FUND | |
| | Face
Amount~ | | | Value | |
Rocket Mortgage LLC / Rocket Mortgage Company-Issuer, Inc. | | | | | | | | |
3.88% due 03/01/313 | | | 3,150,000 | | | $ | 2,511,715 | |
Accident Fund Insurance Company of America | | | | | | | | |
8.50% due 08/01/323 | | | 2,450,000 | | | | 2,387,715 | |
Corebridge Financial, Inc. | | | | | | | | |
3.90% due 04/05/32 | | | 1,600,000 | | | | 1,346,394 | |
6.88% due 12/15/522 | | | 1,000,000 | | | | 957,990 | |
OneAmerica Financial Partners, Inc. | | | | | | | | |
4.25% due 10/15/503 | | | 3,620,000 | | | | 2,295,383 | |
UBS Group AG | | | | | | | | |
2.10% due 02/11/322,3 | | | 2,950,000 | | | | 2,182,853 | |
Equitable Holdings, Inc. | | | | | | | | |
7.00% due 04/01/28 | | | 2,050,000 | | | | 2,131,133 | |
Sumitomo Life Insurance Co. | | | | | | | | |
3.38% due 04/15/812,3 | | | 2,500,000 | | | | 2,077,712 | |
Belrose Funding Trust | | | | | | | | |
2.33% due 08/15/303 | | | 2,780,000 | | | | 2,071,662 | |
Mizuho Financial Group, Inc. | | | | | | | | |
5.67% due 05/27/292 | | | 2,100,000 | | | | 2,064,835 | |
Jefferies Finance LLC / JFIN Company-Issuer Corp. | | | | | | | | |
5.00% due 08/15/283 | | | 2,450,000 | | | | 2,062,915 | |
Standard Chartered plc | | | | | | | | |
4.64% due 04/01/312,3 | | | 2,250,000 | | | | 2,024,178 | |
Mid-Atlantic Military Family Communities LLC | | | | | | | | |
5.30% due 08/01/503 | | | 2,164,746 | | | | 1,773,099 | |
QBE Insurance Group Ltd. | | | | | | | | |
5.88% 2,3,10 | | | 1,750,000 | | | | 1,663,455 | |
Stewart Information Services Corp. | | | | | | | | |
3.60% due 11/15/31 | | | 2,250,000 | | | | 1,653,417 | |
Manulife Financial Corp. | | | | | | | | |
2.48% due 05/19/27 | | | 1,800,000 | | | | 1,625,408 | |
Westpac Banking Corp. | | | | | | | | |
3.02% due 11/18/362 | | | 1,200,000 | | | | 887,842 | |
2.96% due 11/16/40 | | | 805,000 | | | | 489,586 | |
2.67% due 11/15/352 | | | 295,000 | | | | 221,008 | |
Americo Life, Inc. | | | | | | | | |
3.45% due 04/15/313 | | | 2,060,000 | | | | 1,486,380 | |
KKR Group Finance Company VIII LLC | | | | | | | | |
3.50% due 08/25/503 | | | 2,360,000 | | | | 1,472,167 | |
Bank of America Corp. | | | | | | | | |
2.59% due 04/29/312 | | | 1,800,000 | | | | 1,446,464 | |
Trustage Financial Group, Inc. | | | | | | | | |
4.63% due 04/15/323 | | | 1,750,000 | | | | 1,444,138 | |
HS Wildcat LLC | | | | | | | | |
3.83% due 12/31/50††† | | | 1,992,848 | | | | 1,413,757 | |
Dyal Capital Partners III | | | | | | | | |
4.40% due 06/15/40††† | | | 1,750,000 | | | | 1,406,583 | |
Australia & New Zealand Banking Group Ltd. | | | | | | | | |
2.57% due 11/25/352,3 | | | 1,800,000 | | | | 1,332,569 | |
Muenchener Rueckversicherungs-Gesellschaft AG in Muenchen | | | | | | | | |
5.88% due 05/23/422,3 | | | 1,350,000 | | | | 1,300,072 | |
Brookfield Finance, Inc. | | | | | | | | |
3.50% due 03/30/51 | | | 1,250,000 | | | | 777,475 | |
4.70% due 09/20/47 | | | 650,000 | | | | 506,262 | |
AmFam Holdings, Inc. | | | | | | | | |
2.81% due 03/11/313 | | | 1,750,000 | | | | 1,266,932 | |
ABN AMRO Bank N.V. | | | | | | | | |
2.47% due 12/13/292,3 | | | 1,400,000 | | | | 1,156,105 | |
National Australia Bank Ltd. | | | | | | | | |
2.33% due 08/21/303 | | | 1,500,000 | | | | 1,134,153 | |
Global Atlantic Finance Co. | | | | | | | | |
3.13% due 06/15/313 | | | 1,582,000 | | | | 1,127,580 | |
Lincoln National Corp. | | | | | | | | |
4.38% due 06/15/50 | | | 1,580,000 | | | | 1,082,453 | |
Brookfield Capital Finance LLC | | | | | | | | |
6.09% due 06/14/33 | | | 1,100,000 | | | | 1,068,901 | |
Mitsubishi UFJ Financial Group, Inc. | | | | | | | | |
5.44% due 02/22/342 | | | 1,100,000 | | | | 1,049,108 | |
Societe Generale S.A. | | | | | | | | |
2.89% due 06/09/322,3 | | | 1,300,000 | | | | 983,609 | |
Horace Mann Educators Corp. | | | | | | | | |
7.25% due 09/15/28 | | | 950,000 | | | | 949,199 | |
Prudential Financial, Inc. | | | | | | | | |
3.70% due 10/01/502 | | | 1,160,000 | | | | 943,411 | |
Sumitomo Mitsui Financial Group, Inc. | | | | | | | | |
2.22% due 09/17/31 | | | 1,050,000 | | | | 796,596 | |
Fort Moore Family Communities LLC | | | | | | | | |
6.09% due 01/15/513 | | | 874,640 | | | | 764,545 | |
Apollo Management Holdings, LP | | | | | | | | |
2.65% due 06/05/303 | | | 930,000 | | | | 748,179 | |
Central Storage Safety Project Trust | | | | | | | | |
4.82% due 02/01/387 | | | 852,800 | | | | 711,207 | |
CNO Financial Group, Inc. | | | | | | | | |
5.25% due 05/30/29 | | | 700,000 | | | | 659,290 | |
Protective Life Corp. | | | | | | | | |
3.40% due 01/15/303 | | | 740,000 | | | | 623,962 | |
Brown & Brown, Inc. | | | | | | | | |
2.38% due 03/15/31 | | | 800,000 | | | | 618,138 | |
Penn Mutual Life Insurance Co. | | | | | | | | |
3.80% due 04/29/613 | | | 950,000 | | | | 567,448 | |
Western & Southern Life Insurance Co. | | | | | | | | |
3.75% due 04/28/613 | | | 850,000 | | | | 513,867 | |
Kemper Corp. | | | | | | | | |
2.40% due 09/30/30 | | | 675,000 | | | | 498,810 | |
Assured Guaranty US Holdings, Inc. | | | | | | | | |
3.60% due 09/15/51 | | | 800,000 | | | | 490,210 | |
Fidelity & Guaranty Life Holdings, Inc. | | | | | | | | |
5.50% due 05/01/253 | | | 400,000 | | | | 390,503 | |
Cooperatieve Rabobank UA | | | | | | | | |
4.66% due 08/22/282,3 | | | 400,000 | | | | 379,804 | |
Hanover Insurance Group, Inc. | | | | | | | | |
2.50% due 09/01/30 | | | 480,000 | | | | 367,909 | |
SEE NOTES TO FINANCIAL STATEMENTS. | THE GUGGENHEIM FUNDS ANNUAL REPORT | 49 |
SCHEDULE OF INVESTMENTS (continued) | September 30, 2023 |
CORE BOND FUND | |
| | Face
Amount~ | | | Value | |
Brookfield Finance LLC / Brookfield Finance, Inc. | | | | | | | | |
3.45% due 04/15/50 | | | 470,000 | | | $ | 285,498 | |
Cushman & Wakefield US Borrower LLC | | | | | | | | |
6.75% due 05/15/283 | | | 296,000 | | | | 273,090 | |
Nasdaq, Inc. | | | | | | | | |
5.95% due 08/15/53 | | | 200,000 | | | | 186,816 | |
KKR Group Finance Company III LLC | | | | | | | | |
5.13% due 06/01/443 | | | 100,000 | | | | 82,781 | |
Total Financial | | | 175,329,453 | |
| | | | | | | | | |
Consumer, Cyclical - 2.6% |
Hyatt Hotels Corp. | | | | | | | | |
5.38% due 04/23/25 | | | 3,950,000 | | | | 3,906,038 | |
5.75% due 04/23/30 | | | 3,010,000 | | | | 2,918,042 | |
Choice Hotels International, Inc. | | | | | | | | |
3.70% due 01/15/31 | | | 7,340,000 | | | | 6,112,634 | |
Whirlpool Corp. | | | | | | | | |
4.60% due 05/15/5016 | | | 6,145,000 | | | | 4,789,526 | |
Delta Air Lines, Inc. | | | | | | | | |
7.00% due 05/01/253 | | | 3,014,000 | | | | 3,046,720 | |
Alt-2 Structured Trust | | | | | | | | |
2.95% due 05/14/31††† | | | 3,199,620 | | | | 2,794,194 | |
Smithsonian Institution | | | | | | | | |
2.70% due 09/01/44 | | | 4,000,000 | | | | 2,479,599 | |
British Airways Class A Pass Through Trust | | | | | | | | |
4.25% due 11/15/323 | | | 1,980,278 | | | | 1,774,831 | |
2.90% due 03/15/353 | | | 798,906 | | | | 661,433 | |
Delta Air Lines Inc. / SkyMiles IP Ltd. | | | | | | | | |
4.50% due 10/20/253 | | | 2,360,000 | | | | 2,292,264 | |
Mileage Plus Holdings LLC / Mileage Plus Intellectual Property Assets Ltd. | | | | | | | | |
6.50% due 06/20/273 | | | 1,912,500 | | | | 1,894,908 | |
Warnermedia Holdings, Inc. | | | | | | | | |
5.14% due 03/15/52 | | | 1,650,000 | | | | 1,226,017 | |
6.41% due 03/15/26 | | | 600,000 | | | | 599,899 | |
Ferguson Finance plc | | | | | | | | |
3.25% due 06/02/303 | | | 1,204,000 | | | | 1,020,507 | |
4.65% due 04/20/323 | | | 600,000 | | | | 538,735 | |
United Airlines Class A Pass Through Trust | | | | | | | | |
5.80% due 01/15/36 | | | 1,450,000 | | | | 1,409,531 | |
Walgreens Boots Alliance, Inc. | | | | | | | | |
4.10% due 04/15/50 | | | 1,541,000 | | | | 958,390 | |
American Airlines Class AA Pass Through Trust | | | | | | | | |
3.20% due 06/15/28 | | | 697,000 | | | | 626,917 | |
Steelcase, Inc. | | | | | | | | |
5.13% due 01/18/29 | | | 637,000 | | | | 565,309 | |
JB Poindexter & Company, Inc. | | | | | | | | |
7.13% due 04/15/263 | | | 200,000 | | | | 194,565 | |
Total Consumer, Cyclical | | | 39,810,059 | |
| | | | | | | | | |
Consumer, Non-cyclical - 2.1% |
Altria Group, Inc. | | | | | | | | |
3.40% due 05/06/30 | | | 2,510,000 | | | | 2,145,714 | |
3.70% due 02/04/51 | | | 2,350,000 | | | | 1,461,172 | |
4.45% due 05/06/50 | | | 390,000 | | | | 276,260 | |
Smithfield Foods, Inc. | | | | | | | | |
2.63% due 09/13/313 | | | 2,400,000 | | | | 1,720,820 | |
5.20% due 04/01/293 | | | 1,200,000 | | | | 1,096,046 | |
3.00% due 10/15/303 | | | 970,000 | | | | 741,477 | |
CoStar Group, Inc. | | | | | | | | |
2.80% due 07/15/303 | | | 4,130,000 | | | | 3,327,720 | |
Global Payments, Inc. | | | | | | | | |
2.90% due 05/15/30 | | | 1,620,000 | | | | 1,328,119 | |
2.90% due 11/15/31 | | | 1,650,000 | | | | 1,294,378 | |
JBS USA LUX S.A. / JBS USA Food Company / JBS Luxembourg SARL | | | | | | | | |
6.75% due 03/15/343 | | | 2,200,000 | | | | 2,140,578 | |
BAT Capital Corp. | | | | | | | | |
3.98% due 09/25/50 | | | 2,800,000 | | | | 1,757,286 | |
JBS USA LUX S.A. / JBS USA Food Company / JBS USA Finance, Inc. | | | | | | | | |
3.00% due 05/15/32 | | | 1,750,000 | | | | 1,320,168 | |
4.38% due 02/02/52 | | | 600,000 | | | | 398,747 | |
Royalty Pharma plc | | | | | | | | |
3.55% due 09/02/50 | | | 2,690,000 | | | | 1,644,126 | |
Triton Container International Ltd. | | | | | | | | |
3.15% due 06/15/313 | | | 2,100,000 | | | | 1,583,098 | |
California Institute of Technology | | | | | | | | |
3.65% due 09/01/19 | | | 2,000,000 | | | | 1,224,424 | |
Kimberly-Clark de Mexico SAB de CV | | | | | | | | |
2.43% due 07/01/313 | | | 1,500,000 | | | | 1,223,464 | |
Yale-New Haven Health Services Corp. | | | | | | | | |
2.50% due 07/01/50 | | | 2,250,000 | | | | 1,206,893 | |
Quanta Services, Inc. | | | | | | | | |
2.90% due 10/01/30 | | | 1,464,000 | | | | 1,194,097 | |
Universal Health Services, Inc. | | | | | | | | |
2.65% due 10/15/30 | | | 1,320,000 | | | | 1,028,832 | |
Transurban Finance Company Pty Ltd. | | | | | | | | |
2.45% due 03/16/313 | | | 1,300,000 | | | | 1,027,198 | |
Kraft Heinz Foods Co. | | | | | | | | |
7.13% due 08/01/393 | | | 650,000 | | | | 689,650 | |
Wisconsin Alumni Research Foundation | | | | | | | | |
3.56% due 10/01/49 | | | 1,000,000 | | | | 685,726 | |
OhioHealth Corp. | | | | | | | | |
3.04% due 11/15/50 | | | 1,000,000 | | | | 650,069 | |
Children’s Hospital Corp. | | | | | | | | |
2.59% due 02/01/50 | | | 1,000,000 | | | | 573,532 | |
Children’s Health System of Texas | | | | | | | | |
2.51% due 08/15/50 | | | 1,000,000 | | | | 556,559 | |
Catalent Pharma Solutions, Inc. | | | | | | | | |
3.13% due 02/15/293 | | | 250,000 | | | | 205,049 | |
Triton Container International Limited / TAL International Container Corp. | | | | | | | | |
3.25% due 03/15/32 | | | 200,000 | | | | 149,563 | |
Total Consumer, Non-cyclical | | | 32,650,765 | |
| | | | | | | | | |
Industrial - 1.7% |
Howmet Aerospace, Inc. | | | | | | | | |
3.00% due 01/15/29 | | | 3,800,000 | | | | 3,216,546 | |
FLNG Liquefaction 3 LLC | | | | | | | | |
3.08% due 06/30/39††† | | | 4,109,105 | | | | 3,086,442 | |
50 | THE GUGGENHEIM FUNDS ANNUAL REPORT | SEE NOTES TO FINANCIAL STATEMENTS. |
SCHEDULE OF INVESTMENTS (continued) | September 30, 2023 |
CORE BOND FUND | |
| | Face
Amount~ | | | Value | |
TD SYNNEX Corp. | | | | | | | | |
2.65% due 08/09/31 | | | 2,142,000 | | | $ | 1,592,653 | |
2.38% due 08/09/28 | | | 1,600,000 | | | | 1,314,812 | |
Vontier Corp. | | | | | | | | |
2.95% due 04/01/31 | | | 3,450,000 | | | | 2,660,906 | |
Flowserve Corp. | | | | | | | | |
3.50% due 10/01/30 | | | 1,810,000 | | | | 1,509,049 | |
2.80% due 01/15/32 | | | 1,150,000 | | | | 879,917 | |
Owens Corning | | | | | | | | |
3.88% due 06/01/30 | | | 2,380,000 | | | | 2,102,382 | |
Fortune Brands Innovations, Inc. | | | | | | | | |
4.00% due 03/25/32 | | | 2,050,000 | | | | 1,747,576 | |
Cliffwater Corporate Lending Fund | | | | | | | | |
6.77% due 08/04/28††† | | | 1,550,000 | | | | 1,507,777 | |
Stadco LA, LLC | | | | | | | | |
3.75% due 05/15/56††† | | | 2,000,000 | | | | 1,267,001 | |
Amcor Flexibles North America, Inc. | | | | | | | | |
2.63% due 06/19/30 | | | 1,230,000 | | | | 992,971 | |
IP Lending V Ltd. | | | | | | | | |
5.13% due 04/02/26†††, 3 | | | 1,050,000 | | | | 976,500 | |
Ingersoll Rand, Inc. | | | | | | | | |
5.70% due 08/14/33 | | | 1,000,000 | | | | 965,115 | |
Cellnex Finance Company S.A. | | | | | | | | |
3.88% due 07/07/413 | | | 1,372,000 | | | | 950,577 | |
HEICO Corp. | | | | | | | | |
5.35% due 08/01/33 | | | 1,000,000 | | | | 947,106 | |
Boeing Co. | | | | | | | | |
5.81% due 05/01/50 | | | 700,000 | | | | 633,862 | |
Norfolk Southern Corp. | | | | | | | | |
4.10% due 05/15/21 | | | 600,000 | | | | 389,803 | |
Total Industrial | | | 26,740,995 | |
| | | | | | | | | |
Energy - 1.2% |
BP Capital Markets plc | | | | | | | | |
4.88% 2,10 | | | 7,310,000 | | | | 6,530,925 | |
ONEOK, Inc. | | | | | | | | |
6.05% due 09/01/33 | | | 3,800,000 | | | | 3,733,237 | |
Galaxy Pipeline Assets Bidco Ltd. | | | | | | | | |
3.25% due 09/30/403 | | | 2,986,000 | | | | 2,172,632 | |
Targa Resources Partners Limited Partnership / Targa Resources Partners Finance Corp. | | | | | | | | |
6.88% due 01/15/29 | | | 2,158,000 | | | | 2,160,068 | |
Magellan Midstream Partners, LP | | | | | | | | |
3.95% due 03/01/50 | | | 2,000,000 | | | | 1,338,647 | |
Midwest Connector Capital Company LLC | | | | | | | | |
4.63% due 04/01/293 | | | 1,050,000 | | | | 959,678 | |
NuStar Logistics, LP | | | | | | | | |
6.38% due 10/01/30 | | | 534,000 | | | | 505,837 | |
6.00% due 06/01/26 | | | 200,000 | | | | 194,043 | |
TransCanada PipeLines Ltd. | | | | | | | | |
6.20% due 03/09/26 | | | 700,000 | | | | 698,850 | |
Greensaif Pipelines Bidco SARL | | | | | | | | |
6.51% due 02/23/423 | | | 400,000 | | | | 392,173 | |
Greensaif Pipelines Bidco SARL | | | | | | | | |
6.13% due 02/23/383 | | | 350,000 | | | | 341,530 | |
Total Energy | | | 19,027,620 | |
| | | | | | | | | |
Technology - 1.2% |
Broadcom, Inc. | | | | | | | | |
4.93% due 05/15/373 | | | 2,306,000 | | | | 1,987,603 | |
4.15% due 11/15/30 | | | 1,702,000 | | | | 1,507,517 | |
3.19% due 11/15/363 | | | 217,000 | | | | 155,803 | |
Entegris Escrow Corp. | | | | | | | | |
4.75% due 04/15/293 | | | 3,700,000 | | | | 3,326,331 | |
Oracle Corp. | | | | | | | | |
3.95% due 03/25/51 | | | 2,128,000 | | | | 1,458,840 | |
5.55% due 02/06/53 | | | 1,510,000 | | | | 1,323,007 | |
CDW LLC / CDW Finance Corp. | | | | | | | | |
3.57% due 12/01/31 | | | 2,600,000 | | | | 2,141,464 | |
Leidos, Inc. | | | | | | | | |
2.30% due 02/15/31 | | | 1,750,000 | | | | 1,345,799 | |
5.75% due 03/15/33 | | | 500,000 | | | | 479,180 | |
4.38% due 05/15/30 | | | 200,000 | | | | 179,043 | |
MSCI, Inc. | | | | | | | | |
3.63% due 11/01/313 | | | 1,300,000 | | | | 1,063,500 | |
CGI, Inc. | | | | | | | | |
2.30% due 09/14/31 | | | 1,300,000 | | | | 975,753 | |
Fiserv, Inc. | | | | | | | | |
5.63% due 08/21/33 | | | 1,000,000 | | | | 968,944 | |
Booz Allen Hamilton, Inc. | | | | | | | | |
5.95% due 08/04/33 | | | 700,000 | | | | 682,920 | |
Fidelity National Information Services, Inc. | | | | | | | | |
5.63% due 07/15/52 | | | 750,000 | | | | 680,930 | |
Foundry JV Holdco LLC | | | | | | | | |
5.88% due 01/25/343 | | | 400,000 | | | | 382,101 | |
Total Technology | | | 18,658,735 | |
| | | | | | | | | |
Communications - 0.9% |
British Telecommunications plc | | | | | | | | |
4.88% due 11/23/812,3 | | | 2,900,000 | | | | 2,326,448 | |
4.25% due 11/23/812,3 | | | 500,000 | | | | 438,260 | |
9.63% due 12/15/30 | | | 150,000 | | | | 176,675 | |
Paramount Global | | | | | | | | |
4.95% due 05/19/50 | | | 2,490,000 | | | | 1,686,599 | |
2.90% due 01/15/27 | | | 450,000 | | | | 398,900 | |
Charter Communications Operating LLC / Charter Communications Operating Capital | | | | | | | | |
3.90% due 06/01/52 | | | 3,350,000 | | | | 2,002,894 | |
Vodafone Group plc | | | | | | | | |
4.13% due 06/04/812 | | | 2,550,000 | | | | 1,968,931 | |
Virgin Media Secured Finance plc | | | | | | | | |
4.50% due 08/15/303 | | | 2,350,000 | | | | 1,941,334 | |
Rogers Communications, Inc. | | | | | | | | |
4.55% due 03/15/52 | | | 2,000,000 | | | | 1,458,841 | |
Level 3 Financing, Inc. | | | | | | | | |
4.25% due 07/01/283 | | | 2,175,000 | | | | 1,355,097 | |
CSC Holdings LLC | | | | | | | | |
4.13% due 12/01/303 | | | 600,000 | | | | 424,629 | |
SEE NOTES TO FINANCIAL STATEMENTS. | THE GUGGENHEIM FUNDS ANNUAL REPORT | 51 |
SCHEDULE OF INVESTMENTS (continued) | September 30, 2023 |
CORE BOND FUND | |
| | Face
Amount~ | | | Value | |
Telenet Finance Luxembourg Notes SARL | | | | | | | | |
5.50% due 03/01/28 | | | 200,000 | | | $ | 180,000 | |
Altice France S.A. | | | | | | | | |
5.13% due 01/15/293 | | | 250,000 | | | | 177,757 | |
Total Communications | | | 14,536,365 | |
| | | | | | | | | |
Utilities - 0.4% |
AES Corp. | | | | | | | | |
3.95% due 07/15/303 | | | 1,760,000 | | | | 1,516,979 | |
NRG Energy, Inc. | | | | | | | | |
2.45% due 12/02/273 | | | 1,750,000 | | | | 1,483,417 | |
Alexander Funding Trust | | | | | | | | |
1.84% due 11/15/233 | | | 950,000 | | | | 943,720 | |
Brooklyn Union Gas Co. | | | | | | | | |
6.39% due 09/15/333 | | | 800,000 | | | | 784,726 | |
Enel Finance International N.V. | | | | | | | | |
5.00% due 06/15/323 | | | 850,000 | | | | 768,976 | |
Alexander Funding Trust II | | | | | | | | |
7.47% due 07/31/283 | | | 450,000 | | | | 450,590 | |
Total Utilities | | | 5,948,408 | |
| | | | | | | | | |
Basic Materials - 0.3% |
Anglo American Capital plc | | | | | | | | |
5.63% due 04/01/303 | | | 1,800,000 | | | | 1,738,394 | |
3.95% due 09/10/503 | | | 970,000 | | | | 659,290 | |
2.63% due 09/10/303 | | | 250,000 | | | | 199,710 | |
Newcrest Finance Pty Ltd. | | | | | | | | |
3.25% due 05/13/303 | | | 1,653,000 | | | | 1,405,434 | |
Yamana Gold, Inc. | | | | | | | | |
2.63% due 08/15/31 | | | 1,200,000 | | | | 920,783 | |
Total Basic Materials | | | 4,923,611 | |
Total Corporate Bonds |
(Cost $418,991,509) | | | 337,626,011 | |
| |
COLLATERALIZED MORTGAGE OBLIGATIONS†† - 19.9% |
Government Agency - 14.3% |
Fannie Mae | | | | | | | | |
5.50% due 05/01/53 | | | 45,330,852 | | | | 43,824,311 | |
5.00% due 06/01/53 | | | 21,742,548 | | | | 20,521,845 | |
5.00% due 05/01/53 | | | 17,702,978 | | | | 16,708,766 | |
5.00% due 04/01/53 | | | 13,169,246 | | | | 12,429,371 | |
4.00% due 06/01/52 | | | 7,113,176 | | | | 6,370,092 | |
5.00% due 08/01/53 | | | 5,875,944 | | | | 5,545,814 | |
2.81% due 05/01/51 | | | 8,250,000 | | | | 5,434,978 | |
4.00% due 07/01/52 | | | 5,900,403 | | | | 5,270,353 | |
2.00% due 03/01/52 | | | 4,680,274 | | | | 3,576,951 | |
2.50% due 10/01/51 | | | 3,906,391 | | | | 3,118,302 | |
2.36% due 08/01/50 | | | 4,451,644 | | | | 2,822,257 | |
3.00% due 03/01/52 | | | 3,181,680 | | | | 2,638,947 | |
5.00% due 09/01/52 | | | 2,162,178 | | | | 2,042,284 | |
2.78% due 05/01/51 | | | 2,653,229 | | | | 1,859,971 | |
2.59% due 06/01/51 | | | 2,400,024 | | | | 1,672,863 | |
2.32% due 02/01/51 | | | 2,008,909 | | | | 1,344,613 | |
2.00% due 09/01/50 | | | 2,031,298 | | | | 1,314,198 | |
2.40% due 03/01/40 | | | 2,000,000 | | | | 1,280,619 | |
2.11% due 10/01/50 | | | 1,795,566 | | | | 1,182,425 | |
2.27% due 02/01/51 | | | 1,672,983 | | | | 1,112,792 | |
2.39% due 02/01/51 | | | 1,392,878 | | | | 943,172 | |
4.24% due 08/01/48 | | | 998,910 | | | | 828,433 | |
3.83% due 05/01/49 | | | 1,000,000 | | | | 800,189 | |
2.58% due 10/01/51 | | | 1,164,405 | | | | 798,778 | |
3.46% due 08/01/49 | | | 932,237 | | | | 739,024 | |
2.99% due 01/01/40 | | | 1,000,000 | | | | 700,388 | |
2.68% due 04/01/50 | | | 933,248 | | | | 671,971 | |
4.07% due 05/01/49 | | | 749,994 | | | | 637,026 | |
4.37% due 10/01/48 | | | 699,952 | | | | 616,080 | |
2.27% due 10/01/41 | | | 1,000,000 | | | | 611,942 | |
1.76% due 08/01/40 | | | 1,000,000 | | | | 605,410 | |
4.25% due 05/01/48 | | | 615,372 | | | | 530,620 | |
due 12/25/439 | | | 713,373 | | | | 515,019 | |
Freddie Mac | | | | | | | | |
5.50% due 06/01/53 | | | 12,946,444 | | | | 12,523,613 | |
5.00% due 04/01/53 | | | 12,963,466 | | | | 12,235,917 | |
5.00% due 06/01/53 | | | 11,232,614 | | | | 10,602,977 | |
due 08/01/53◊ | | | 8,337,495 | | | | 7,970,850 | |
4.00% due 02/01/53 | | | 7,920,146 | | | | 7,114,360 | |
5.00% due 09/01/52 | | | 5,660,084 | | | | 5,345,790 | |
5.00% due 03/01/53 | | | 4,418,072 | | | | 4,171,903 | |
4.00% due 10/01/52 | | | 3,121,027 | | | | 2,787,603 | |
4.00% due 04/01/52 | | | 2,004,273 | | | | 1,798,925 | |
1.98% due 05/01/50 | | | 1,337,086 | | | | 850,359 | |
4.00% due 01/15/46 | | | 637 | | | | 635 | |
Freddie Mac Seasoned Credit Risk Transfer Trust | | | | | | | | |
2.00% due 05/25/60 | | | 3,227,905 | | | | 2,452,423 | |
2.00% due 11/25/59 | | | 1,237,216 | | | | 938,335 | |
Fannie Mae-Aces | | | | | | | | |
1.59% (WAC) due 03/25/35◊,5 | | | 17,538,255 | | | | 1,730,550 | |
Ginnie Mae | | | | | | | | |
6.00% due 06/20/47††† | | | 1,150,000 | | | | 1,150,806 | |
FARM Mortgage Trust | | | | | | | | |
2.18% (WAC) due 01/25/51◊,3 | | | 853,698 | | | | 675,094 | |
Total Government Agency | | | 221,419,944 | |
| | | | | | | | | |
Residential Mortgage-Backed Securities - 2.4% |
RCKT Mortgage Trust 2023-CES2 | | | | | | | | |
2023-CES2, 6.81% (WAC) due 09/25/43◊,3 | | | 4,000,000 | | | | 3,994,391 | |
Mill City Mortgage Loan Trust | | | | | | | | |
2021-NMR1, 2.50% (WAC) due 11/25/60◊,3 | | | 4,800,000 | | | | 3,646,384 | |
GCAT Trust | | | | | | | | |
2022-NQM3, 4.35% (WAC) due 04/25/67◊,3 | | | 3,183,444 | | | | 2,847,419 | |
CFMT LLC | | | | | | | | |
2022-HB9, 3.25% (WAC) due 09/25/37◊ | | | 2,778,865 | | | | 2,486,858 | |
COLT Mortgage Loan Trust | | | | | | | | |
2021-2, 2.38% (WAC) due 08/25/66◊,3 | | | 4,000,000 | | | | 2,188,944 | |
GCAT Trust | | | | | | | | |
2023-NQM3, 6.89% (WAC) due 08/25/68◊,†††,3 | | | 2,000,000 | | | | 1,992,235 | |
52 | THE GUGGENHEIM FUNDS ANNUAL REPORT | SEE NOTES TO FINANCIAL STATEMENTS. |
SCHEDULE OF INVESTMENTS (continued) | September 30, 2023 |
CORE BOND FUND | |
| | Face
Amount~ | | | Value | |
GCAT 2023-NQM3 Trust | | | | | | | | |
2023-NQM3, 7.34% (WAC) due 08/25/68◊,†††,3 | | | 2,000,000 | | | $ | 1,992,174 | |
PRPM LLC | | | | | | | | |
2021-RPL2, 2.93% (WAC) due 10/25/51◊,3 | | | 2,472,000 | | | | 1,866,656 | |
BRAVO Residential Funding Trust 2023-NQM2 | | | | | | | | |
2023-NQM2, 4.50% due 05/25/623,11 | | | 1,873,702 | | | | 1,694,714 | |
Imperial Fund Mortgage Trust | | | | | | | | |
2022-NQM2, 4.02% (WAC) due 03/25/67◊,3 | | | 888,474 | | | | 779,728 | |
2022-NQM2, 4.20% (WAC) due 03/25/67◊,3 | | | 888,474 | | | | 769,457 | |
OBX Trust | | | | | | | | |
2022-NQM8, 6.10% due 09/25/623,11 | | | 879,845 | | | | 865,220 | |
2022-NQM9, 6.45% due 09/25/623,11 | | | 595,038 | | | | 591,482 | |
Angel Oak Mortgage Trust 2023-1 | | | | | | | | |
2023-1, 4.75% due 09/26/673,11 | | | 1,526,091 | | | | 1,420,744 | |
Starwood Mortgage Residential Trust | | | | | | | | |
2020-1, 2.41% (WAC) due 02/25/50◊,3 | | | 714,234 | | | | 658,962 | |
2020-1, 2.56% (WAC) due 02/25/50◊,3 | | | 714,234 | | | | 658,650 | |
SPS Servicer Advance Receivables Trust | | | | | | | | |
2020-T2, 1.83% due 11/15/553 | | | 1,250,000 | | | | 1,126,073 | |
BRAVO Residential Funding Trust | | | | | | | | |
2021-HE1, 6.82% (30 Day Average SOFR + 1.50%, Rate Floor: 0.00%) due 01/25/70◊,3 | | | 1,000,000 | | | | 978,605 | |
Towd Point Mortgage Trust 2023-CES1 | | | | | | | | |
2023-CES1, 6.75% (WAC) due 07/25/63◊,3 | | | 958,421 | | | | 954,169 | |
CSMC Trust | | | | | | | | |
2018-RPL9, 3.85% (WAC) due 09/25/57◊,3 | | | 773,362 | | | | 735,324 | |
2020-NQM1, 1.72% due 05/25/653,11 | | | 222,909 | | | | 197,242 | |
PRPM 2023-RCF1 LLC | | | | | | | | |
2023-RCF1, 4.00% due 06/25/533,11 | | | 947,890 | | | | 892,549 | |
American Home Mortgage Investment Trust | | | | | | | | |
2007-1, 2.08% due 05/25/475 | | | 6,017,564 | | | | 841,773 | |
Securitized Asset-Backed Receivables LLC Trust | | | | | | | | |
2006-HE2, 5.73% (1 Month Term SOFR + 0.41%, Rate Floor: 0.30%) due 07/25/36◊ | | | 1,406,043 | | | | 550,324 | |
Verus Securitization Trust | | | | | | | | |
2019-4, 2.85% due 11/25/593,11 | | | 520,817 | | | | 496,461 | |
MFRA Trust | | | | | | | | |
2021-INV1, 2.29% (WAC) due 01/25/56◊,3 | | | 700,000 | | | | 495,477 | |
New Residential Mortgage Loan Trust | | | | | | | | |
2019-6A, 3.50% (WAC) due 09/25/59◊,3 | | | 445,516 | | | | 398,540 | |
Angel Oak Mortgage Trust | | | | | | | | |
2020-1, 2.77% (WAC) due 12/25/59◊,3 | | | 315,186 | | | | 289,446 | |
RALI Series Trust | | | | | | | | |
2006-QO2, 5.87% (1 Month Term SOFR + 0.55%, Rate Floor: 0.44%) due 02/25/46◊ | | | 1,487,218 | | | | 286,955 | |
MASTR Adjustable Rate Mortgages Trust | | | | | | | | |
2003-5, 2.49% (WAC) due 11/25/33◊ | | | 221,291 | | | | 189,893 | |
Washington Mutual Mortgage Pass-Through Certificates WMALT Series Trust | | | | | | | | |
2006-AR9, 5.47% (1 Year CMT Rate + 0.84%, Rate Floor: 0.84%) due 11/25/46◊ | | | 234,802 | | | | 186,855 | |
GS Mortgage-Backed Securities Trust | | | | | | | | |
2020-NQM1, 1.79% (WAC) due 09/27/60◊,3 | | | 191,372 | | | | 168,671 | |
Residential Mortgage Loan Trust | | | | | | | | |
2020-1, 2.68% (WAC) due 01/26/60◊,3 | | | 129,469 | | | | 121,330 | |
UCFC Manufactured Housing Contract | | | | | | | | |
1997-2, 7.38% due 10/15/28 | | | 21,628 | | | | 21,370 | |
Total Residential Mortgage-Backed Securities | | | 37,385,075 | |
| | | | | | | | | |
Commercial Mortgage-Backed Securities - 2.4% |
GS Mortgage Securities Trust | | | | | | | | |
2020-GSA2, 2.34% due 12/12/53 | | | 8,000,000 | | | | 5,652,049 | |
2020-GC45, 0.78% (WAC) due 02/13/53◊,5 | | | 18,757,813 | | | | 542,478 | |
2019-GC42, 0.93% (WAC) due 09/10/52◊,5 | | | 14,831,119 | | | | 502,627 | |
JP Morgan Chase Commercial Mortgage Securities Trust | | | | | | | | |
2021-NYAH, 7.29% (1 Month Term SOFR + 1.95%, Rate Floor: 1.84%) due 06/15/38◊,3 | | | 4,000,000 | | | | 3,448,058 | |
2016-JP3, 3.55% (WAC) due 08/15/49◊ | | | 4,000,000 | | | | 2,908,677 | |
DBGS Mortgage Trust | | | | | | | | |
2018-C1, 4.80% (WAC) due 10/15/51◊ | | | 7,000,000 | | | | 5,930,435 | |
CD Mortgage Trust | | | | | | | | |
2017-CD4, 3.95% (WAC) due 05/10/50◊ | | | 4,750,000 | | | | 3,864,623 | |
2016-CD1, 1.50% (WAC) due 08/10/49◊,5 | | | 2,088,214 | | | | 56,870 | |
BX Commercial Mortgage Trust | | | | | | | | |
2021-VOLT, 7.45% (1 Month Term SOFR + 2.11%, Rate Floor: 2.00%) due 09/15/36◊,3 | | | 3,450,000 | | | | 3,289,551 | |
SMRT | | | | | | | | |
2022-MINI, 7.28% (1 Month Term SOFR + 1.95%, Rate Floor: 1.95%) due 01/15/39◊,3 | | | 2,000,000 | | | | 1,915,951 | |
Life Mortgage Trust | | | | | | | | |
2021-BMR, 6.85% (1 Month Term SOFR + 1.51%, Rate Floor: 1.40%) due 03/15/38◊,3 | | | 1,965,940 | | | | 1,901,725 | |
GS Mortgage Securities Corporation Trust | | | | | | | | |
2020-DUNE, 6.81% (1 Month Term SOFR + 1.46%, Rate Floor: 1.35%) due 12/15/36◊,3 | | | 1,000,000 | | | | 977,243 | |
2020-UPTN, 3.35% (WAC) due 02/10/37◊,3 | | | 1,000,000 | | | | 879,122 | |
Extended Stay America Trust | | | | | | | | |
2021-ESH, 7.70% (1 Month Term SOFR + 2.36%, Rate Floor: 2.25%) due 07/15/38◊,3 | | | 1,045,536 | | | | 1,028,472 | |
BENCHMARK Mortgage Trust | | | | | | | | |
2019-B14, 0.90% (WAC) due 12/15/62◊,5 | | | 19,662,951 | | | | 545,788 | |
2018-B6, 0.56% (WAC) due 10/10/51◊,5 | | | 28,930,608 | | | | 365,547 | |
SEE NOTES TO FINANCIAL STATEMENTS. | THE GUGGENHEIM FUNDS ANNUAL REPORT | 53 |
SCHEDULE OF INVESTMENTS (continued) | September 30, 2023 |
CORE BOND FUND | |
| | Face
Amount~ | | | Value | |
Citigroup Commercial Mortgage Trust | | | | | | | | |
2019-GC43, 0.74% (WAC) due 11/10/52◊,5 | | | 19,821,486 | | | $ | 558,022 | |
2016-GC37, 1.82% (WAC) due 04/10/49◊,5 | | | 2,812,757 | | | | 85,250 | |
2016-C2, 1.81% (WAC) due 08/10/49◊,5 | | | 2,192,743 | | | | 75,492 | |
2016-P5, 1.52% (WAC) due 10/10/49◊,5 | | | 1,559,959 | | | | 47,966 | |
COMM Mortgage Trust | | | | | | | | |
2015-CR24, 0.83% (WAC) due 08/10/48◊,5 | | | 36,945,247 | | | | 357,253 | |
2015-CR26, 1.04% (WAC) due 10/10/48◊,5 | | | 8,188,771 | | | | 106,622 | |
CSAIL Commercial Mortgage Trust | | | | | | | | |
2019-C15, 1.19% (WAC) due 03/15/52◊,5 | | | 12,053,454 | | | | 453,128 | |
SG Commercial Mortgage Securities Trust | | | | | | | | |
2016-C5, 2.02% (WAC) due 10/10/48◊,5 | | | 7,794,546 | | | | 269,111 | |
UBS Commercial Mortgage Trust | | | | | | | | |
2017-C2, 1.22% (WAC) due 08/15/50◊,5 | | | 7,949,822 | | | | 253,004 | |
Morgan Stanley Capital I Trust | | | | | | | | |
2016-UB11, 1.58% (WAC) due 08/15/49◊,5 | | | 5,766,880 | | | | 184,772 | |
JPMDB Commercial Mortgage Securities Trust | | | | | | | | |
2016-C2, 1.63% (WAC) due 06/15/49◊,5 | | | 6,238,287 | | | | 175,595 | |
Wells Fargo Commercial Mortgage Trust | | | | | | | | |
2016-NXS5, 1.57% (WAC) due 01/15/59◊,5 | | | 3,251,045 | | | | 84,220 | |
2016-C37, 0.95% (WAC) due 12/15/49◊,5 | | | 2,642,311 | | | | 47,077 | |
CFCRE Commercial Mortgage Trust | | | | | | | | |
2016-C3, 1.14% (WAC) due 01/10/48◊,5 | | | 5,288,890 | | | | 93,661 | |
Total Commercial Mortgage-Backed Securities | | | 36,600,389 | |
| | | | | | | | | |
Military Housing - 0.8% |
Freddie Mac Military Housing Bonds Resecuritization Trust Certificates | | | | | | | | |
2015-R1, 4.66% (WAC) due 11/25/55◊,3 | | | 6,846,420 | | | | 5,252,520 | |
2015-R1, 4.44% (WAC) due 11/25/52◊,3 | | | 2,766,395 | | | | 2,249,206 | |
2015-R1, 0.70% (WAC) due 11/25/55◊,3,5 | | | 10,020,257 | | | | 640,764 | |
Capmark Military Housing Trust | | | | | | | | |
2006-RILY, 6.15% due 07/10/51†††,3 | | | 2,238,364 | | | | 1,925,077 | |
2007-ROBS, 6.06% due 10/10/52†††,3 | | | 451,218 | | | | 387,390 | |
2007-AETC, 5.75% due 02/10/52†††,3 | | | 265,462 | | | | 222,232 | |
GMAC Commercial Mortgage Asset Corp. | | | | | | | | |
2007-HCKM, 6.11% due 08/10/52†††,3 | | | 1,418,618 | | | | 1,311,445 | |
Total Military Housing | | | 11,988,634 | |
| | | | | | | | | |
Total Collateralized Mortgage Obligations |
(Cost $350,883,671) | | | 307,394,042 | |
| |
SENIOR FLOATING RATE INTERESTS††,◊ - 1.3% |
Industrial - 0.5% |
Mileage Plus Holdings LLC | | | | | | | | |
10.80% (3 Month Term SOFR + 5.25%, Rate Floor: 5.25%) due 06/21/27 | | | 6,337,500 | | | | 6,575,854 | |
SkyMiles IP Ltd. | | | | | | | | |
9.08% (3 Month Term SOFR + 3.75%, Rate Floor: 3.75%) due 10/20/27 | | | 1,445,000 | | | | 1,495,040 | |
Air Canada | | | | | | | | |
9.13% (3 Month Term SOFR + 3.50%, Rate Floor: 3.50%) due 08/11/28 | | | 444,761 | | | | 444,668 | |
Total Industrial | | | 8,515,562 | |
| | | | | | | | | |
Technology - 0.3% |
Datix Bidco Ltd. | | | | | | | | |
8.68% (6 Month GBP SONIA + 4.50%, Rate Floor: 4.50%) due 04/28/25††† | GBP | | 2,900,000 | | | | 3,471,975 | |
RLDatix | | | | | | | | |
9.53% (6 Month Term SOFR + 4.50%, Rate Floor: 4.50%) due 04/28/25††† | | | 1,252,544 | | | | 1,229,122 | |
Total Technology | | | 4,701,097 | |
| | | | | | | | | |
Consumer, Cyclical - 0.3% |
Amaya Holdings BV | | | | | | | | |
6.36% (3 Month EURIBOR + 2.50%, Rate Floor: 2.50%) due 07/21/26 | EUR | | 4,000,000 | | | | 4,227,937 | |
| | | | | | | | | |
Consumer, Non-cyclical - 0.1% |
Southern Veterinary Partners LLC | | | | | | | | |
9.43% (1 Month Term SOFR + 4.00%, Rate Floor: 4.00%) due 10/05/27 | | | 1,057,214 | | | | 1,049,612 | |
HAH Group Holding Co. LLC | | | | | | | | |
10.42% (1 Month Term SOFR + 5.00%, Rate Floor: 5.00%) due 10/29/27 | | | 261,388 | | | | 257,684 | |
Total Consumer, Non-cyclical | | | 1,307,296 | |
| | | | | | | | | |
Financial - 0.1% |
Citadel Securities, LP | | | | | | | | |
7.93% (1 Month Term SOFR + 2.50%, Rate Floor: 2.50%) due 07/29/30 | | | 947,625 | | | | 944,668 | |
| | | | | | | | | |
Energy - 0.0% |
Venture Global Calcasieu Pass LLC | | | | | | | | |
8.04% (1 Month Term SOFR + 2.63%, Rate Floor: 2.63%) due 08/19/26 | | | 444,419 | | | | 440,344 | |
| | | | | | | | | |
Communications - 0.0% |
Radiate Holdco LLC | | | | | | | | |
8.68% (1 Month Term SOFR + 3.25%, Rate Floor: 3.25%) due 09/25/26 | | | 161,506 | | | | 131,721 | |
Total Senior Floating Rate Interests |
(Cost $21,193,661) | | | 20,268,625 | |
| |
FEDERAL AGENCY BONDS†† - 1.0% |
Tennessee Valley Authority Principal Strips |
due 06/15/388,9 | | | 9,400,000 | | | | 4,215,646 | |
due 01/15/488,9 | | | 9,700,000 | | | | 2,489,534 | |
due 01/15/388 | | | 4,000,000 | | | | 1,840,236 | |
due 06/15/358,9 | | | 1,583,000 | | | | 855,995 | |
due 12/15/428,9 | | | 1,600,000 | | | | 546,899 | |
Federal Farm Credit Bank |
3.51% due 06/11/40 | | | 3,300,000 | | | | 2,603,099 | |
Tennessee Valley Authority |
4.25% due 09/15/65 | | | 2,450,000 | | | | 1,953,892 | |
5.38% due 04/01/56 | | | 600,000 | | | | 594,158 | |
U.S. International Development Finance Corp. |
due 01/17/268 | | | 800,000 | | | | 806,136 | |
Total Federal Agency Bonds |
(Cost $24,641,407) | | | | | | | 15,905,595 | |
| | | | | | | | | |
54 | THE GUGGENHEIM FUNDS ANNUAL REPORT | SEE NOTES TO FINANCIAL STATEMENTS. |
SCHEDULE OF INVESTMENTS (continued) | September 30, 2023 |
CORE BOND FUND | |
| | Face
Amount~ | | | Value | |
MUNICIPAL BONDS†† - 0.8% |
Texas - 0.3% |
Tarrant County Cultural Education Facilities Finance Corp. Revenue Bonds | | | | | | | | |
3.29% due 09/01/40 | | | 2,100,000 | | | $ | 1,477,389 | |
2.78% due 09/01/34 | | | 700,000 | | | | 521,611 | |
2.69% due 09/01/33 | | | 500,000 | | | | 379,082 | |
2.57% due 09/01/32 | | | 475,000 | | | | 366,201 | |
2.41% due 09/01/31 | | | 450,000 | | | | 352,712 | |
Grand Parkway Transportation Corp. Revenue Bonds | | | | | | | | |
3.31% due 10/01/49 | | | 1,500,000 | | | | 1,011,588 | |
Dallas/Fort Worth International Airport Revenue Bonds | | | | | | | | |
2.92% due 11/01/50 | | | 1,000,000 | | | | 673,356 | |
Total Texas | | | 4,781,939 | |
| | | | | | | | | |
California - 0.2% |
California Statewide Communities Development Authority Revenue Bonds | | | | | | | | |
7.14% due 08/15/47 | | | 1,200,000 | | | | 1,257,684 | |
2.68% due 02/01/39 | | | 1,200,000 | | | | 816,454 | |
Total California | | | 2,074,138 | |
| | | | | | | | | |
New York - 0.1% |
Westchester County Local Development Corp. Revenue Bonds | | | | | | | | |
3.85% due 11/01/50 | | | 2,700,000 | | | | 1,787,557 | |
| | | | | | | | | |
Virginia - 0.1% |
City of Manassas Virginia General Obligation Unlimited | | | | | | | | |
2.00% due 01/01/40 | | | 1,700,000 | | | | 1,100,595 | |
| | | | | | | | | |
Idaho - 0.1% |
Boise State University Revenue Bonds | | | | | | | | |
3.06% due 04/01/40 | | | 1,150,000 | | | | 835,037 | |
| | | | | | | | | |
Mississippi - 0.0% |
Medical Center Educational Building Corp. Revenue Bonds | | | | | | | | |
2.92% due 06/01/41 | | | 1,000,000 | | | | 682,956 | |
| | | | | | | | | |
Ohio - 0.0% |
County of Franklin Ohio Revenue Bonds | | | | | | | | |
2.88% due 11/01/50 | | | 1,000,000 | | | | 604,169 | |
| | | | | | | | | |
Alabama - 0.0% |
Auburn University Revenue Bonds | | | | | | | | |
2.68% due 06/01/50 | | | 1,000,000 | | | | 593,426 | |
| | | | | | | | | |
Illinois - 0.0% |
State of Illinois General Obligation Unlimited | | | | | | | | |
5.65% due 12/01/38 | | | 444,444 | | | | 426,966 | |
Total Municipal Bonds |
(Cost $17,738,366) | | | 12,886,783 | |
| |
FOREIGN GOVERNMENT DEBT†† - 0.2% |
Panama Government International Bond |
4.50% due 01/19/63 | | | 2,600,000 | | | $ | 1,677,627 | |
4.50% due 04/16/50 | | | 1,450,000 | | | | 984,992 | |
Total Foreign Government Debt |
(Cost $4,205,162) | | | | | | | 2,662,619 | |
| | | | | | | | | |
SENIOR FIXED RATE INTERESTS††† - 0.2% |
Industrial - 0.2% |
CTL Logistics | | | | | | | | |
2.65% due 10/10/42 | | | 3,526,004 | | | | 2,572,239 | |
Total Senior Fixed Rate Interests |
(Cost $3,526,004) | | | 2,572,239 | |
| | | | | | | | | |
| | | Contracts/
Notional
Value | | | | | |
OTC OPTIONS PURCHASED†† - 0.0% |
Call Options on: |
Interest Rate Options |
Morgan Stanley Capital Services LLC 10Y-2Y SOFR CMS CAP Expiring June 2024 with strike price of $0.10 | USD | | 34,200,000 | | | | 68,477 | |
Barclays Bank plc 10Y-2Y SOFR CMS CAP Expiring June 2024 with strike price of $0.10 | USD | | 33,900,000 | | | | 67,877 | |
Bank of America, N.A. 10Y-2Y SOFR CMS CAP Expiring June 2024 with strike price of $0.10 | USD | | 17,150,000 | | | | 34,339 | |
Goldman Sachs International 10Y-2Y SOFR CMS CAP Expiring June 2024 with strike price of $0.10 | USD | | 13,950,000 | | | | 27,932 | |
Barclays Bank plc 10Y-2Y SOFR CMS CAP Expiring December 2023 with strike price of $0.20 | USD | | 34,250,000 | | | | 21,461 | |
Morgan Stanley Capital Services LLC 10Y-2Y SOFR CMS CAP Expiring December 2023 with strike price of $0.10 | USD | | 34,200,000 | | | | 21,430 | |
Bank of America, N.A. 10Y-2Y SOFR CMS CAP Expiring December 2023 with strike price of $0.20 | USD | | 16,800,000 | | | | 10,527 | |
Goldman Sachs International 10Y-2Y SOFR CMS CAP Expiring December 2023 with strike price of $0.20 | USD | | 13,950,000 | | | | 8,741 | |
Total OTC Options Purchased |
(Cost $846,473) | | | | | | | 260,784 | |
| | | | | | | | | |
Total Investments - 103.6% |
(Cost $1,807,853,659) | | | 1,602,105,247 | |
| | | | | | | | | |
SEE NOTES TO FINANCIAL STATEMENTS. | THE GUGGENHEIM FUNDS ANNUAL REPORT | 55 |
SCHEDULE OF INVESTMENTS (continued) | September 30, 2023 |
CORE BOND FUND | |
| | Contracts/
Notional
Value | | | Value | |
OTC INTEREST RATE SWAPTIONS WRITTEN††13 - (0.0)% |
Put Swaptions on: |
Interest Rate Swaptions |
Barclays Bank plc 5-Year Interest Rate Swap Expiring October 2023 with exercise rate of 3.93% | | | 24,400,000 | | | $ | (487,166 | ) |
Total OTC Interest Rate Swaptions Written |
| | | | | | | | | |
(Premiums received $168,360) | | | | | | | (487,166 | ) |
Other Assets & Liabilities, net - (3.6)% | | | (54,859,783 | ) |
Total Net Assets - 100.0% | | $ | 1,546,758,298 | |
Centrally Cleared Credit Default Swap Agreements Protection Purchased†† |
Counterparty | Exchange | Index | Protection
Premium
Rate | | Payment
Frequency | | | Maturity
Date | | | Notional
Amount~ | | | Value | | | Upfront
Premiums
Paid
(Received) | | | Unrealized
Depreciation** | |
BofA Securities, Inc. | ICE | CDX.NA.HY.40.V1 | 5.00% | | | Quarterly | | | | 06/20/28 | | | | 12,700,000 | | | $ | (199,058 | ) | | $ | 53,104 | | | $ | (252,162 | ) |
BofA Securities, Inc. | ICE | ITRAXX.EUR.38.V1 | 1.00% | | | Quarterly | | | | 12/20/27 | | | EUR | 14,500,000 | | | | (202,134 | ) | | | (112,978 | ) | | | (89,156 | ) |
| | | | | | | | | | | | | | | | | | $ | (401,192 | ) | | $ | (59,874 | ) | | $ | (341,318 | ) |
Centrally Cleared Interest Rate Swap Agreements†† |
| |
Counterparty | Exchange | Floating
Rate
Type | Floating
Rate Index | | Fixed
Rate | | Payment
Frequency | | Maturity
Date | | | Notional
Amount | | | Value | | | Upfront
Premiums
Paid | | | Unrealized
Depreciation** | |
BofA Securities, Inc. | CME | Pay | U.S. Secured Overnight Financing Rate | 4.35% | Annually | 10/3/2028 | | $ | 80,000,000 | | | $ | 660 | | | $ | 660 | | | $ | — | |
BofA Securities, Inc. | CME | Pay | U.S. Secured Overnight Financing Rate | 3.40% | Annually | 04/04/28 | | | 32,100,000 | | | | (1,318,963 | ) | | | 323 | | | | (1,319,286 | ) |
BofA Securities, Inc. | CME | Pay | U.S. Secured Overnight Financing Rate | 2.78% | Annually | 07/18/27 | | | 77,800,000 | | | | (4,613,040 | ) | | | 409 | | | | (4,613,449 | ) |
| | | | | | | | | | | | | | | | | | | $ | (5,931,343 | ) | | $ | 1,392 | | | $ | (5,932,735 | ) |
Forward Foreign Currency Exchange Contracts†† |
Counterparty | | Currency | | | Type | | | Quantity | | | Contract
Amount | | | Settlement Date | | | Unrealized
Appreciation | |
Barclays Bank plc | | | EUR | | | | Sell | | | | 9,504,000 | | | | 10,220,487 USD | | | | 10/16/23 | | | $ | 165,205 | |
Morgan Stanley Capital Services LLC | | | GBP | | | | Sell | | | | 2,962,000 | | | | 3,699,630 USD | | | | 10/16/23 | | | | 85,539 | |
| | | | | | | | | | | | | | | | | | | | | | | $ | 250,744 | |
56 | THE GUGGENHEIM FUNDS ANNUAL REPORT | SEE NOTES TO FINANCIAL STATEMENTS. |
SCHEDULE OF INVESTMENTS (continued) | September 30, 2023 |
CORE BOND FUND | |
OTC Interest Rate Swaptions Written |
Counterparty/
Description | | Floating
Rate Type | | | Floating
Rate Index | | | Payment
Frequency | | | Fixed
Rate | | | Expiration
Date | | | Exercise
Rate | | | Swaption
Notional
Amount | | | Swaption
Value | |
Put | | | | | | | | | | | | | | | | | | | | | | | | | | | | | | | | |
Barclays Bank plc 5-Year Interest Rate Swap | Pay | SOFR | | | Annual | | | | 3.93 | % | | | 10/16/23 | | | | 3.93 | % | | $ | 24,400,000 | | | $ | (487,166 | ) |
~ | The face amount is denominated in U.S. dollars unless otherwise indicated. |
* | Non-income producing security. |
** | Includes cumulative appreciation (depreciation). Variation margin is reported within the Statement of Assets and Liabilities. |
† | Value determined based on Level 1 inputs, unless otherwise noted — See Note 4. |
†† | Value determined based on Level 2 inputs, unless otherwise noted — See Note 4. |
††† | Value determined based on Level 3 inputs — See Note 4. |
◊ | Variable rate security. Rate indicated is the rate effective at September 30, 2023. In some instances, the effective rate is limited by a minimum rate floor or a maximum rate cap established by the issuer. The settlement status of a position may also impact the effective rate indicated. In some cases, a position may be unsettled at period end and may not have a stated effective rate. In instances where multiple underlying reference rates and spread amounts are shown, the effective rate is based on a weighted average. |
1 | Special Purpose Acquisition Company (SPAC). |
2 | Security has a fixed rate coupon which will convert to a floating or variable rate coupon on a future date. |
3 | Security is a 144A or Section 4(a)(2) security. These securities have been determined to be liquid under guidelines established by the Board of Trustees. The total market value of 144A or Section 4(a)(2) securities is $555,686,984 (cost $619,722,761), or 35.9% of total net assets. |
4 | Rate indicated is the 7-day yield as of September 30, 2023. |
5 | Security is an interest-only strip. |
6 | Security has no stated coupon. However, it is expected to receive residual cash flow payments on defined deal dates. |
7 | Security is a 144A or Section 4(a)(2) security. These securities have been determined to be illiquid and restricted under guidelines established by the Board of Trustees. The total market value of 144A or Section 4(a)(2) illiquid and restricted securities is $711,277 (cost $871,193), or 0.0% of total net assets — See Note 10. |
8 | Zero coupon rate security. |
9 | Security is a principal-only strip. |
10 | Perpetual maturity. |
11 | Security is a step up/down bond. The coupon increases or decreases at regular intervals until the bond reaches full maturity. Rate indicated is the rate at September 30, 2023. See table below for additional step information for each security. |
12 | All or a portion of this security is pledged as interest rate swap collateral at September 30, 2023. |
13 | Swaptions — See additional disclosure in the swaptions table above for more information on swaptions. |
14 | Face amount of security is adjusted for inflation. |
15 | Security is unsettled at period end and does not have a stated effective rate. |
16 | All or a portion of this security has been physically segregated or earmarked in connection with reverse repurchase agreements. At September 30, 2023, the total market value of segregated or earmarked securities was $80,596,842— See Note 6. |
| | BofA — Bank of America |
| | CDX.NA.HY.40.V1 — Credit Default Swap North American High Yield Series 40 Index Version 1 |
| | CME — Chicago Mercantile Exchange |
| | CMS — Constant Maturity Swap |
| | CMT — Constant Maturity Treasury |
| | EUR — Euro |
| | EURIBOR — European Interbank Offered Rate |
| | GBP — British Pound |
| | ICE — Intercontinental Exchange |
| | ITRAXX.EUR.38.V1 — iTraxx Europe Series 38 Index Version 1 |
| | LIBOR — London Interbank Offered Rate |
| | plc — Public Limited Company |
| | REIT — Real Estate Investment Trust |
| | SARL — Société à Responsabilité Limitée |
| | SOFR — Secured Overnight Financing Rate |
| | SONIA — Sterling Overnight Index Average |
| | WAC — Weighted Average Coupon |
| | |
| | See Sector Classification in Other Information section. |
SEE NOTES TO FINANCIAL STATEMENTS. | THE GUGGENHEIM FUNDS ANNUAL REPORT | 57 |
SCHEDULE OF INVESTMENTS (continued) | September 30, 2023 |
CORE BOND FUND | |
The following table summarizes the inputs used to value the Fund’s investments at September 30, 2023 (See Note 4 in the Notes to Financial Statements):
Investments in Securities (Assets) | | Level 1
Quoted
Prices | | | Level 2
Significant
Observable
Inputs | | | Level 3
Significant
Unobservable
Inputs | | | Total | |
Common Stocks | | $ | 14,721 | | | $ | — | | | $ | 62 | | | $ | 14,783 | |
Preferred Stocks | | | — | | | | 24,143,221 | | | | — | * | | | 24,143,221 | |
Warrants | | | 1,963 | | | | — | | | | 7 | | | | 1,970 | |
Money Market Funds | | | 3,857,414 | | | | — | | | | — | | | | 3,857,414 | |
U.S. Government Securities | | | — | | | | 496,203,857 | | | | — | | | | 496,203,857 | |
Asset-Backed Securities | | | — | | | | 339,974,689 | | | | 38,332,615 | | | | 378,307,304 | |
Corporate Bonds | | | — | | | | 320,253,713 | | | | 17,372,298 | | | | 337,626,011 | |
Collateralized Mortgage Obligations | | | — | | | | 298,412,683 | | | | 8,981,359 | | | | 307,394,042 | |
Senior Floating Rate Interests | | | — | | | | 15,567,528 | | | | 4,701,097 | | | | 20,268,625 | |
Federal Agency Bonds | | | — | | | | 15,905,595 | | | | — | | | | 15,905,595 | |
Municipal Bonds | | | — | | | | 12,886,783 | | | | — | | | | 12,886,783 | |
Foreign Government Debt | | | — | | | | 2,662,619 | | | | — | | | | 2,662,619 | |
Senior Fixed Rate Interests | | | — | | | | — | | | | 2,572,239 | | | | 2,572,239 | |
Options Purchased | | | — | | | | 260,784 | | | | — | | | | 260,784 | |
Forward Foreign Currency Exchange Contracts** | | | — | | | | 250,744 | | | | — | | | | 250,744 | |
Total Assets | | $ | 3,874,098 | | | $ | 1,526,522,216 | | | $ | 71,959,677 | | | $ | 1,602,355,991 | |
Investments in Securities (Liabilities) | | Level 1
Quoted
Prices | | | Level 2
Significant
Observable
Inputs | | | Level 3
Significant
Unobservable
Inputs | | | Total | |
Interest Rate Swaptions Written | | $ | — | | | $ | 487,166 | | | $ | — | | | $ | 487,166 | |
Credit Default Swap Agreements** | | | — | | | | 341,318 | | | | — | | | | 341,318 | |
Interest Rate Swap Agreements** | | | — | | | | 5,932,735 | | | | — | | | | 5,932,735 | |
Total Liabilities | | $ | — | | | $ | 6,761,219 | | | $ | — | | | $ | 6,761,219 | |
* | Security has a market value of $0. |
** | This derivative is reported as unrealized appreciation/depreciation at period end. |
The Fund may hold assets and/or liabilities in which the fair value approximates the carrying amount for financial statement purposes. As of the period end, reverse repurchase agreements of $59,394,748 are categorized as Level 2 within the disclosure hierarchy — See Note 6.
58 | THE GUGGENHEIM FUNDS ANNUAL REPORT | SEE NOTES TO FINANCIAL STATEMENTS. |
SCHEDULE OF INVESTMENTS (continued) | September 30, 2023 |
CORE BOND FUND | |
The following is a summary of significant unobservable inputs used in the fair valuation of assets and liabilities categorized within Level 3 of the fair value hierarchy:
Category | | Ending Balance at
September 30, 2023 | | | Valuation Technique | | | Unobservable Inputs | | | Input Range | | | Weighted Average* | |
Assets: | | | | | | | | | | | | | | | | | | | | |
Asset-Backed Securities | | $ | 24,432,043 | | Option adjusted spread off prior month end broker quote | Broker Quote | | | — | | | | — | |
Asset-Backed Securities | | | 9,248,421 | | Yield Analysis | Yield | | | 6.6%-7.8% | | | | 7.0 | % |
Asset-Backed Securities | | | 3,065,055 | | Third Party Pricing | Broker Quote | | | — | | | | — | |
Asset-Backed Securities | | | 1,587,096 | | Model Price | Purchase Price | | | — | | | | — | |
Collateralized Mortgage Obligations | | | 5,135,215 | | Model Price | Purchase Price | | | — | | | | — | |
Collateralized Mortgage Obligations | | | 3,846,144 | | Option adjusted spread off prior month end broker quote | Broker Quote | | | — | | | | — | |
Common Stocks | | | 62 | | Model Price | Liquidation Value | | | — | | | | — | |
Corporate Bonds | | | 8,681,560 | | Option adjusted spread off prior month end broker quote | Broker Quote | | | — | | | | — | |
Corporate Bonds | | | 4,920,043 | | Model Price | Purchase Price | | | — | | | | — | |
Corporate Bonds | | | 2,794,195 | | Yield Analysis | Yield | | | 6.7 | % | | | — | |
Corporate Bonds | | | 976,500 | | Third Party Pricing | Broker Quote | | | — | | | | — | |
Senior Fixed Rate Interests | | | 2,572,239 | | Option adjusted spread off prior month end broker quote | Broker Quote | | | — | | | | — | |
Senior Floating Rate Interests | | | 4,701,097 | | Yield Analysis | Yield | | | 11.2 | % | | | — | |
Warrants | | | 7 | | Model Price | Liquidation Value | | | — | | | | — | |
Total Assets | | $ | 71,959,677 | | | | | | | | | | | |
* | Inputs are weighted by the fair value of the instruments. |
Significant changes in a quote, yield or liquidation value would generally result in significant changes in the fair value of the security. Any remaining Level 3 securities held by the Fund and excluded from the table above, were not considered material to the Fund.
The Fund’s fair valuation leveling guidelines classify a single daily broker quote, or a vendor price based on a single daily or monthly broker quote, as Level 3, if such a quote or price cannot be supported with other available market information.
Transfers between Level 2 and Level 3 may occur as markets fluctuate and/or the availability of data used in an investment’s valuation changes.For the year ended September 30, 2023, the Fund did not have any securities transfer into Level 3 from Level 2 and had securities with a total value of $440,414 transfer out of Level 3 into Level 2 due to the availability of current and reliable market-based data provided by a third-party pricing service which utilizes significant observable inputs.
SEE NOTES TO FINANCIAL STATEMENTS. | THE GUGGENHEIM FUNDS ANNUAL REPORT | 59 |
SCHEDULE OF INVESTMENTS (concluded) | September 30, 2023 |
CORE BOND FUND | |
Summary of Fair Value Level 3 Activity
Following is a reconciliation of Level 3 assets for which significant unobservable inputs were used to determine fair value for the year ended September 30, 2023:
| | | Assets | | | | | | | Liabilities | |
| | Asset-
Backed
Securities | | | Collateralized
Mortgage
Obligations | | | Corporate
Bonds | | | Senior
Floating
Rate
Interests | | | Warrants | | | Common
Stocks | | | Senior
Fixed
Rate
Interests | | | Total
Assets | | | Unfunded
Loan
Commitments | |
Beginning Balance | | $ | 26,064,883 | | | $ | 4,110,384 | | | $ | 22,901,392 | | | $ | 5,218,034 | | | $ | 7 | | | $ | 62 | | | $ | 2,788,277 | | | $ | 61,083,039 | | | $ | (84,249 | ) |
Purchases/(Receipts) | | | 20,157,536 | | | | 5,147,084 | | | | 6,550,000 | | | | 12,525 | | | | — | | | | — | | | | — | | | | 31,867,145 | | | | — | |
(Sales, maturities and paydowns)/Fundings | | | (7,585,650 | ) | | | (54,335 | ) | | | (12,187,048 | ) | | | (397,377 | ) | | | — | | | | — | | | | (113,465 | ) | | | (20,337,875 | ) | | | 110 | |
Amortization of premiums/discounts | | | 72,880 | | | | (14,785 | ) | | | 3,785 | | | | 63,624 | | | | — | | | | — | | | | — | | | | 125,504 | | | | — | |
Total realized gains (losses) included in earnings | | | (36,737 | ) | | | — | | | | (1,525,822 | ) | | | — | | | | — | | | | — | | | | — | | | | (1,562,559 | ) | | | — | |
Total change in unrealized appreciation (depreciation) included in earnings | | | (340,227 | ) | | | (206,989 | ) | | | 1,629,991 | | | | 244,635 | | | | — | | | | — | | | | (102,573 | ) | | | 1,224,837 | | | | 84,139 | |
Transfers into Level 3 | | | — | | | | — | | | | — | | | | — | | | | — | | | | — | | | | — | | | | — | | | | — | |
Transfers out of Level 3 | | | (70 | ) | | | — | | | | — | | | | (440,344 | ) | | | — | | | | — | | | | — | | | | (440,414 | ) | | | — | |
Ending Balance | | $ | 38,332,615 | | | $ | 8,981,359 | | | $ | 17,372,298 | | | $ | 4,701,097 | | | $ | 7 | | | $ | 62 | | | $ | 2,572,239 | | | $ | 71,959,677 | | | $ | — | |
Net change in unrealized appreciation (depreciation) for investments in Level 3 securities still held at September 30, 2023 | | $ | (340,003 | ) | | $ | (206,989 | ) | | $ | (327,610 | ) | | $ | 272,542 | | | $ | — | | | $ | — | | | $ | (102,573 | ) | | $ | (704,633 | ) | | $ | — | |
Step Coupon Bonds
The following table discloses additional information related to step coupon bonds held by the Fund. Certain securities are subject to multiple rate changes prior to maturity. For those securities, a range of rates and corresponding dates have been provided. Rates for all step coupon bonds held by the Fund are scheduled to increase, none are scheduled to decrease.
Name | | Coupon Rate at
Next Reset Date | | | Next Rate Reset Date | |
Angel Oak Mortgage Trust 2023-1 4.75% due 09/26/67 | | | 5.75 | % | | | 01/01/27 | |
BRAVO Residential Funding Trust 2023-NQM2, 4.50% due 05/25/62 | | | 5.50 | % | | | 02/01/27 | |
CSMC Trust 2020-NQM1, 1.72% due 05/25/65 | | | 2.72 | % | | | 09/26/24 | |
OBX Trust 2022-NQM8, 6.10% due 09/25/62 | | | 7.10 | % | | | 10/01/26 | |
OBX Trust 2022-NQM9, 6.45% due 09/25/62 | | | 7.45 | % | | | 11/01/26 | |
PRPM 2023-RCF1 LLC, 4.00% due 06/25/53 | | | 5.00 | % | | | 06/25/27 | |
Verus Securitization Trust 2019-4, 2.85% due 11/25/59 | | | 3.85 | % | | | 10/26/23 | |
60 | THE GUGGENHEIM FUNDS ANNUAL REPORT | SEE NOTES TO FINANCIAL STATEMENTS. |
STATEMENT OF ASSETS AND LIABILITIES |
September 30, 2023 |
Assets: |
Investments, at value (cost $1,807,853,659) | | $ | 1,602,105,247 | |
Cash | | | 2,415,823 | |
Foreign currency, at value (cost 126,660) | | | 126,476 | |
Segregated cash with broker | | | 913,043 | |
Unamortized upfront premiums paid on credit default swap agreements | | | 53,104 | |
Unamortized upfront premiums paid on interest rate swap agreements | | | 1,392 | |
Unrealized appreciation on forward foreign currency exchange contracts | | | 250,744 | |
Prepaid expenses | | | 86,167 | |
Receivables: |
Securities sold | | | 123,627,532 | |
Interest | | | 13,431,911 | |
Fund shares sold | | | 4,735,236 | |
Dividends | | | 12,469 | |
Foreign tax reclaims | | | 2,236 | |
Total assets | | | 1,747,761,380 | |
| | | | | |
Liabilities: |
Unfunded loan commitments at value ( Note 9) (commitments fees received $—) | | | — | |
Reverse repurchase agreements (Note 6) | | | 59,394,748 | |
Options written, at value (premiums received $168,360) | | | 487,166 | |
Segregated cash due to broker | | | 200,652 | |
Unamortized upfront premiums received on credit default swap agreements | | | 112,978 | |
Payable for: |
Securities purchased | | | 134,340,809 | |
Fund shares redeemed | | | 4,598,729 | |
Variation margin on interest rate swap agreements | | | 660,695 | |
Management fees | | | 451,147 | |
Transfer agent/maintenance fees | | | 366,706 | |
Distribution and service fees | | | 48,883 | |
Distributions to shareholders | | | 44,332 | |
Protection fees on credit default swap agreements | | | 24,088 | |
Fund accounting/administration fees | | | 15,809 | |
Trustees’ fees* | | | 2,077 | |
Variation margin on credit default swap agreements | | | 42 | |
Miscellaneous | | | 254,221 | |
Total liabilities | | | 201,003,082 | |
Net assets | | $ | 1,546,758,298 | |
| | | | | |
Net assets consist of: |
Paid in capital | | $ | 1,875,792,584 | |
Total distributable earnings (loss) | | | (329,034,286 | ) |
Net assets | | $ | 1,546,758,298 | |
| | | | | |
A-Class: |
Net assets | | $ | 117,099,801 | |
Capital shares outstanding | | | 7,527,213 | |
Net asset value per share | | $ | 15.56 | |
Maximum offering price per share (Net asset value divided by 96.00%) | | $ | 16.21 | |
| | | | | |
C-Class: |
Net assets | | $ | 22,026,807 | |
Capital shares outstanding | | | 1,422,112 | |
Net asset value per share | | $ | 15.49 | |
| | | | | |
P-Class: |
Net assets | | $ | 28,884,719 | |
Capital shares outstanding | | | 1,855,147 | |
Net asset value per share | | $ | 15.57 | |
| | | | | |
Institutional Class: |
Net assets | | $ | 1,378,746,971 | |
Capital shares outstanding | | | 88,747,852 | |
Net asset value per share | | $ | 15.54 | |
* | Relates to Trustees not deemed “interested persons” within the meaning of Section 2(a)(19) of the 1940 Act. |
SEE NOTES TO FINANCIAL STATEMENTS. | THE GUGGENHEIM FUNDS ANNUAL REPORT | 61 |
STATEMENT OF OPERATIONS |
Year Ended September 30, 2023 |
Investment Income: |
Dividends | | $ | 827,998 | |
Interest (net of foreign withholding tax of $18,108) | | | 65,161,242 | |
Total investment income | | | 65,989,240 | |
| | | | | |
Expenses: |
Management fees | | | 5,175,537 | |
Distribution and service fees: |
A-Class | | | 289,602 | |
C-Class | | | 213,296 | |
P-Class | | | 94,265 | |
Transfer agent/maintenance fees: |
A-Class | | | 143,945 | |
C-Class | | | 23,030 | |
P-Class | | | 84,494 | |
Institutional Class | | | 1,141,735 | |
Interest expense | | | 885,433 | |
Fund accounting/administration fees | | | 550,331 | |
Professional fees | | | 151,955 | |
Line of credit fees | | | 86,444 | |
Custodian fees | | | 58,517 | |
Trustees’ fees* | | | 30,122 | |
Miscellaneous | | | 270,998 | |
Recoupment of previously waived fees: |
A-Class | | | 10,796 | |
C-Class | | | 1,752 | |
P-Class | | | 1,061 | |
Institutional Class | | | 24,518 | |
Total expenses | | | 9,237,831 | |
Less: |
Expense reimbursed by adviser: |
A-Class | | | (65,894 | ) |
C-Class | | | (7,886 | ) |
P-Class | | | (56,381 | ) |
Institutional Class | | | (768,096 | ) |
Expenses waived by Adviser | | | (418,250 | ) |
Earnings credits applied | | | (23,053 | ) |
Total waived/reimbursed expenses | | | (1,339,560 | ) |
Net expenses | | | 7,898,271 | |
Net investment income | | | 58,090,969 | |
| | | | | |
Net Realized and Unrealized Gain (Loss): |
Net realized gain (loss) on: |
Investments | | | (77,549,432 | ) |
Swap agreements | | | (3,378,716 | ) |
Futures contracts | | | 441,718 | |
Options purchased | | | (2,469,939 | ) |
Options written | | | 260,104 | |
Forward foreign currency exchange contracts | | | (633,512 | ) |
Foreign currency transactions | | | (66,875 | ) |
Net realized loss | | | (83,396,652 | ) |
Net change in unrealized appreciation (depreciation) on: |
Investments | | | 37,871,237 | |
Swap agreements | | | (562,113 | ) |
Options purchased | | | (3,923,380 | ) |
Options written | | | 765,696 | |
Forward foreign currency exchange contracts | | | 41,478 | |
Foreign currency translations | | | (678 | ) |
Net change in unrealized appreciation (depreciation) | | | 34,192,240 | |
Net realized and unrealized loss | | | (49,204,412 | ) |
Net increase in net assets resulting from operations | | $ | 8,886,557 | |
* | Relates to Trustees not deemed “interested persons” within the meaning of Section 2(a)(19) of the 1940 Act. |
62 | THE GUGGENHEIM FUNDS ANNUAL REPORT | SEE NOTES TO FINANCIAL STATEMENTS. |
STATEMENTS OF CHANGES IN NET ASSETS |
| | Year Ended
September 30,
2023 | | | Year Ended
September 30,
2022 | |
Increase (Decrease) in Net Assets from Operations: | | | | | | | | |
Net investment income | | $ | 58,090,969 | | | $ | 41,195,372 | |
Net realized loss on investments | | | (83,396,652 | ) | | | (32,706,882 | ) |
Net change in unrealized appreciation (depreciation) on investments | | | 34,192,240 | | | | (281,501,636 | ) |
Net increase (decrease) in net assets resulting from operations | | | 8,886,557 | | | | (273,013,146 | ) |
| | | | | | | | | |
Distributions to shareholders: | | | | | | | | |
A-Class | | | (4,628,669 | ) | | | (5,310,242 | ) |
C-Class | | | (690,054 | ) | | | (886,223 | ) |
P-Class | | | (1,494,786 | ) | | | (3,202,815 | ) |
Institutional Class | | | (49,253,737 | ) | | | (53,683,559 | ) |
Total distributions to shareholders | | | (56,067,246 | ) | | | (63,082,839 | ) |
| | | | | | | | | |
Capital share transactions: | | | | | | | | |
Proceeds from sale of shares | | | | | | | | |
A-Class | | | 27,585,227 | | | | 25,104,560 | |
C-Class | | | 9,484,399 | | | | 3,987,535 | |
P-Class | | | 6,643,720 | | | | 23,865,120 | |
Institutional Class | | | 875,193,068 | | | | 846,789,895 | |
Distributions reinvested | | | | | | | | |
A-Class | | | 4,189,176 | | | | 4,975,780 | |
C-Class | | | 610,361 | | | | 789,061 | |
P-Class | | | 1,488,895 | | | | 3,202,815 | |
Institutional Class | | | 46,738,789 | | | | 50,481,098 | |
Cost of shares redeemed | | | | | | | | |
A-Class | | | (23,834,759 | ) | | | (39,064,313 | ) |
C-Class | | | (8,402,408 | ) | | | (11,198,757 | ) |
P-Class | | | (32,056,257 | ) | | | (45,775,520 | ) |
Institutional Class | | | (582,763,645 | ) | | | (914,366,168 | ) |
Net increase (decrease) from capital share transactions | | | 324,876,566 | | | | (51,208,894 | ) |
Net increase (decrease) in net assets | | | 277,695,877 | | | | (387,304,879 | ) |
| | | | | | | | | |
Net assets: | | | | | | | | |
Beginning of year | | | 1,269,062,421 | | | | 1,656,367,300 | |
End of year | | $ | 1,546,758,298 | | | $ | 1,269,062,421 | |
| | | | | | | | | |
Capital share activity: | | | | | | | | |
Shares sold | | | | | | | | |
A-Class | | | 1,708,895 | | | | 1,393,708 | |
C-Class | | | 586,868 | | | | 219,121 | |
P-Class | | | 410,906 | | | | 1,227,313 | |
Institutional Class | | | 54,190,672 | | | | 47,258,448 | |
Shares issued from reinvestment of distributions | | | | | | | | |
A-Class | | | 259,787 | | | | 268,662 | |
C-Class | | | 38,033 | | | | 42,495 | |
P-Class | | | 92,259 | | | | 172,067 | |
Institutional Class | | | 2,904,961 | | | | 2,738,168 | |
Shares redeemed | | | | | | | | |
A-Class | | | (1,470,307 | ) | | | (2,163,532 | ) |
C-Class | | | (523,605 | ) | | | (613,680 | ) |
P-Class | | | (1,981,473 | ) | | | (2,510,695 | ) |
Institutional Class | | | (36,342,037 | ) | | | (51,037,587 | ) |
Net increase (decrease) in shares | | | 19,874,959 | | | | (3,005,512 | ) |
SEE NOTES TO FINANCIAL STATEMENTS. | THE GUGGENHEIM FUNDS ANNUAL REPORT | 63 |
This table is presented to show selected data for a share outstanding throughout each period and to assist shareholders in evaluating a Fund’s performance for the periods presented.
A-Class | | Year Ended
September 30,
2023 | | | Year Ended
September 30,
2022 | | | Year Ended
September 30,
2021 | | | Year Ended
September 30,
2020 | | | Year Ended
September 30,
2019 | |
Per Share Data |
Net asset value, beginning of period | | $ | 15.95 | | | $ | 20.06 | | | $ | 20.53 | | | $ | 18.94 | | | $ | 18.33 | |
Income (loss) from investment operations: |
Net investment income (loss)a | | | .67 | | | | .46 | | | | .44 | | | | .37 | | | | .41 | |
Net gain (loss) on investments (realized and unrealized) | | | (.41 | ) | | | (3.84 | ) | | | (.01 | ) | | | 1.63 | | | | .63 | |
Total from investment operations | | | .26 | | | | (3.38 | ) | | | .43 | | | | 2.00 | | | | 1.04 | |
Less distributions from: |
Net investment income | | | (.65 | ) | | | (.47 | ) | | | (.47 | ) | | | (.41 | ) | | | (.43 | ) |
Net realized gains | | | — | | | | (.26 | ) | | | (.43 | ) | | | — | | | | — | |
Total distributions | | | (.65 | ) | | | (.73 | ) | | | (.90 | ) | | | (.41 | ) | | | (.43 | ) |
Net asset value, end of period | | $ | 15.56 | | | $ | 15.95 | | | $ | 20.06 | | | $ | 20.53 | | | $ | 18.94 | |
|
Total Returnb | | | 1.46 | % | | | (17.30 | %) | | | 2.09 | % | | | 10.68 | % | | | 5.72 | % |
Ratios/Supplemental Data |
Net assets, end of period (in thousands) | | $ | 117,100 | | | $ | 112,084 | | | $ | 151,026 | | | $ | 218,856 | | | $ | 149,442 | |
Ratios to average net assets: |
Net investment income (loss) | | | 4.12 | % | | | 2.53 | % | | | 2.20 | % | | | 1.87 | % | | | 2.23 | % |
Total expensesc | | | 0.92 | % | | | 0.82 | % | | | 0.85 | % | | | 0.85 | % | | | 0.89 | % |
Net expensesd,e,f | | | 0.83 | % | | | 0.78 | % | | | 0.79 | % | | | 0.79 | % | | | 0.80 | % |
Portfolio turnover rate | | | 88 | % | | | 49 | % | | | 103 | % | | | 126 | % | | | 77 | % |
C-Class | | Year Ended
September 30,
2023 | | | Year Ended
September 30,
2022 | | | Year Ended
September 30,
2021 | | | Year Ended
September 30,
2020 | | | Year Ended
September 30,
2019 | |
Per Share Data |
Net asset value, beginning of period | | $ | 15.88 | | | $ | 19.97 | | | $ | 20.45 | | | $ | 18.86 | | | $ | 18.25 | |
Income (loss) from investment operations: |
Net investment income (loss)a | | | .55 | | | | .33 | | | | .29 | | | | .22 | | | | .28 | |
Net gain (loss) on investments (realized and unrealized) | | | (.42 | ) | | | (3.83 | ) | | | (.03 | ) | | | 1.64 | | | | .62 | |
Total from investment operations | | | .13 | | | | (3.50 | ) | | | .26 | | | | 1.86 | | | | .90 | |
Less distributions from: |
Net investment income | | | (.52 | ) | | | (.33 | ) | | | (.31 | ) | | | (.27 | ) | | | (.29 | ) |
Net realized gains | | | — | | | | (.26 | ) | | | (.43 | ) | | | — | | | | — | |
Total distributions | | | (.52 | ) | | | (.59 | ) | | | (.74 | ) | | | (.27 | ) | | | (.29 | ) |
Net asset value, end of period | | $ | 15.49 | | | $ | 15.88 | | | $ | 19.97 | | | $ | 20.45 | | | $ | 18.86 | |
|
Total Returnb | | | 0.68 | % | | | (17.90 | %) | | | 1.34 | % | | | 9.86 | % | | | 4.96 | % |
Ratios/Supplemental Data |
Net assets, end of period (in thousands) | | $ | 22,027 | | | $ | 20,970 | | | $ | 33,407 | | | $ | 33,163 | | | $ | 22,531 | |
Ratios to average net assets: |
Net investment income (loss) | | | 3.39 | % | | | 1.78 | % | | | 1.46 | % | | | 1.13 | % | | | 1.50 | % |
Total expensesc | | | 1.66 | % | | | 1.61 | % | | | 1.61 | % | | | 1.62 | % | | | 1.67 | % |
Net expensesd,e,f | | | 1.59 | % | | | 1.53 | % | | | 1.54 | % | | | 1.54 | % | | | 1.55 | % |
Portfolio turnover rate | | | 88 | % | | | 49 | % | | | 103 | % | | | 126 | % | | | 77 | % |
64 | THE GUGGENHEIM FUNDS ANNUAL REPORT | SEE NOTES TO FINANCIAL STATEMENTS. |
FINANCIAL HIGHLIGHTS (continued) |
This table is presented to show selected data for a share outstanding throughout each period and to assist shareholders in evaluating a Fund’s performance for the periods presented.
P-Class | | Year Ended
September 30,
2023 | | | Year Ended
September 30,
2022 | | | Year Ended
September 30,
2021 | | | Year Ended
September 30,
2020 | | | Year Ended
September 30,
2019 | |
Per Share Data |
Net asset value, beginning of period | | $ | 15.96 | | | $ | 20.07 | | | $ | 20.55 | | | $ | 18.96 | | | $ | 18.34 | |
Income (loss) from investment operations: |
Net investment income (loss)a | | | .66 | | | | .46 | | | | .44 | | | | .36 | | | | .41 | |
Net gain (loss) on investments (realized and unrealized) | | | (.41 | ) | | | (3.84 | ) | | | (.02 | ) | | | 1.64 | | | | .63 | |
Total from investment operations | | | .25 | | | | (3.38 | ) | | | .42 | | | | 2.00 | | | | 1.04 | |
Less distributions from: |
Net investment income | | | (.64 | ) | | | (.47 | ) | | | (.47 | ) | | | (.41 | ) | | | (.42 | ) |
Net realized gains | | | — | | | | (.26 | ) | | | (.43 | ) | | | — | | | | — | |
Total distributions | | | (.64 | ) | | | (.73 | ) | | | (.90 | ) | | | (.41 | ) | | | (.42 | ) |
Net asset value, end of period | | $ | 15.57 | | | $ | 15.96 | | | $ | 20.07 | | | $ | 20.55 | | | $ | 18.96 | |
|
Total Return | | | 1.50 | % | | | (17.30 | %) | | | 2.04 | % | | | 10.67 | % | | | 5.77 | % |
Ratios/Supplemental Data |
Net assets, end of period (in thousands) | | $ | 28,885 | | | $ | 53,203 | | | $ | 89,223 | | | $ | 60,534 | | | $ | 50,258 | |
Ratios to average net assets: |
Net investment income (loss) | | | 4.10 | % | | | 2.49 | % | | | 2.17 | % | | | 1.86 | % | | | 2.24 | % |
Total expensesc | | | 1.01 | % | | | 0.94 | % | | | 0.90 | % | | | 0.91 | % | | | 0.93 | % |
Net expensesd,e,f | | | 0.82 | % | | | 0.78 | % | | | 0.79 | % | | | 0.79 | % | | | 0.80 | % |
Portfolio turnover rate | | | 88 | % | | | 49 | % | | | 103 | % | | | 126 | % | | | 77 | % |
SEE NOTES TO FINANCIAL STATEMENTS. | THE GUGGENHEIM FUNDS ANNUAL REPORT | 65 |
FINANCIAL HIGHLIGHTS (concluded) |
This table is presented to show selected data for a share outstanding throughout each period and to assist shareholders in evaluating a Fund’s performance for the periods presented.
Institutional Class | | Year Ended
September 30,
2023 | | | Year Ended
September 30,
2022 | | | Year Ended
September 30,
2021 | | | Year Ended
September 30,
2020 | | | Year Ended
September 30,
2019 | |
Per Share Data |
Net asset value, beginning of period | | $ | 15.92 | | | $ | 20.03 | | | $ | 20.51 | | | $ | 18.91 | | | $ | 18.30 | |
Income (loss) from investment operations: |
Net investment income (loss)a | | | .71 | | | | .52 | | | | .50 | | | | .42 | | | | .47 | |
Net gain (loss) on investments (realized and unrealized) | | | (.40 | ) | | | (3.85 | ) | | | (.03 | ) | | | 1.65 | | | | .62 | |
Total from investment operations | | | .31 | | | | (3.33 | ) | | | .47 | | | | 2.07 | | | | 1.09 | |
Less distributions from: |
Net investment income | | | (.69 | ) | | | (.52 | ) | | | (.52 | ) | | | (.47 | ) | | | (.48 | ) |
Net realized gains | | | — | | | | (.26 | ) | | | (.43 | ) | | | — | | | | — | |
Total distributions | | | (.69 | ) | | | (.78 | ) | | | (.95 | ) | | | (.47 | ) | | | (.48 | ) |
Net asset value, end of period | | $ | 15.54 | | | $ | 15.92 | | | $ | 20.03 | | | $ | 20.51 | | | $ | 18.91 | |
|
Total Return | | | 1.80 | % | | | (17.09 | %) | | | 2.34 | % | | | 11.07 | % | | | 6.03 | % |
Ratios/Supplemental Data |
Net assets, end of period (in thousands) | | $ | 1,378,747 | | | $ | 1,082,805 | | | $ | 1,382,711 | | | $ | 1,139,109 | | | $ | 613,571 | |
Ratios to average net assets: |
Net investment income (loss) | | | 4.43 | % | | | 2.84 | % | | | 2.49 | % | | | 2.17 | % | | | 2.52 | % |
Total expensesc | | | 0.65 | % | | | 0.60 | % | | | 0.60 | % | | | 0.58 | % | | | 0.62 | % |
Net expensesd,e,f | | | 0.55 | % | | | 0.49 | % | | | 0.50 | % | | | 0.50 | % | | | 0.51 | % |
Portfolio turnover rate | | | 88 | % | | | 49 | % | | | 103 | % | | | 126 | % | | | 77 | % |
a | Net investment income (loss) per share was computed using average shares outstanding throughout the period. |
b | Total return does not reflect the impact of any applicable sales charges. |
c | Does not include expenses of the underlying funds in which the Fund invests. |
d | Net expense information reflects the expense ratios after expense waivers and reimbursements, as applicable. |
e | The portion of the ratios of net expenses to average net assets attributable to recoupments of prior fee reductions or expense reimbursements for the years presented was as follows: |
| | | 09/30/23 | 09/30/22 | 09/30/21 | 09/30/20 | 09/30/19 |
| | A-Class | 0.01% | 0.01% | 0.01% | 0.00%* | — |
| | C-Class | 0.01% | 0.00%* | — | 0.00%* | — |
| | P-Class | 0.00%* | — | — | 0.00%* | 0.00%* |
| | Institutional Class | 0.00%* | — | — | 0.00%* | — |
f | Net expenses may include expenses that are excluded from the expense limitation agreement. Excluding these expenses, the net expense ratios for the years presented would be: |
| | | 09/30/23 | 09/30/22 | 09/30/21 | 09/30/20 | 09/30/19 |
| | A-Class | 0.76% | 0.77% | 0.78% | 0.78% | 0.79% |
| | C-Class | 1.52% | 1.52% | 1.53% | 1.53% | 1.54% |
| | P-Class | 0.76% | 0.77% | 0.78% | 0.78% | 0.79% |
| | Institutional Class | 0.47% | 0.48% | 0.49% | 0.49% | 0.50% |
66 | THE GUGGENHEIM FUNDS ANNUAL REPORT | SEE NOTES TO FINANCIAL STATEMENTS. |
MANAGERS’ COMMENTARY (Unaudited) | September 30, 2023 |
To Our Shareholders
Security Investors, LLC (“SI”) serves as the investment adviser to Guggenheim Municipal Income Fund (“Fund”). Guggenheim Partners Investment Management, LLC (“GPIM”) serves as the Fund’s sub-adviser (“Sub-Adviser”). The Fund is managed by a team of seasoned professionals, including Anne B. Walsh, CFA, JD, Chief Investment Officer and Managing Partner of GPIM; Allen Li, CFA, Managing Director and Portfolio Manager of GPIM; Steven H. Brown, CFA, Chief Investment Officer, Total Return and Macro Strategies, Senior Managing Director, and Portfolio Manager of GPIM; Adam J. Bloch, Managing Director and Portfolio Manager of GPIM; and Evan L. Serdensky, Director and Portfolio Manager of GPIM. In the subsequent paragraphs, the investment team discusses the Fund’s performance and the market environment for the 12-month period ended September 30, 2023 (the “Reporting Period”).
For the Reporting Period, the Fund returned 1.67%1, underperforming the Bloomberg Municipal Bond Index, the Fund’s benchmark (“Benchmark”), which returned 2.66% for the same period.
What factors contributed or detracted from the Fund’s performance during the Reporting Period?
Negative absolute returns during most of calendar 2022 drove a bout of tax-related selling near the end of that year. After the tax-related selling subsided, buyers heavily reinvested into tax exempts at the start of 2023, tempted by the higher all-in yields on offer. Lower-quality bonds that had underperformed subsequently snapped back, outperforming higher quality credits. For the Reporting Period, bonds rated Baa returned 3.63% whereas bonds rated Aaa and Aa—where the Fund has greater weighting—returned 1.83% and 2.49%, respectively.
At the sector level, high quality assets such as tax-exempt agency commercial mortgage-backed securities contributed to the underperformance. Tax-exempt closed-end funds, with their levered duration profile and exposure to short-term funding costs, also came under pressure and lagged cash bonds.
How did the Fund use derivatives during the Reporting Period?
During the reporting period, the Fund used interest rate swaps to help manage duration positioning. Over the period, interest rate swaps contributed to performance.
How was the Fund positioned at the end of the Reporting Period?
We continue to emphasize security selection of high-quality municipal issuers in the current environment. While most municipalities entered 2023 with high fund reserves and prudent budget planning, a slowing economic environment should favor the high quality, long duration securities that are overweight in the Fund. We remain focused on structural creditworthiness that can endure macroeconomic volatility while generating tax-exempt income that is competitive with high quality taxable bond markets.
Performance displayed represents past performance which is no guarantee of future results.
1 | Performance figures are based on Class A shares and do not reflect taxes that a shareholder would pay on distributions or the redemption of shares. |
The opinions and forecast expressed may not actually come to pass. This information is subject to change at any time, based on market and other conditions, and should not be construed as a recommendation of any specific security or strategy.
| | THE GUGGENHEIM FUNDS ANNUAL REPORT | 67 |
PERFORMANCE REPORT AND FUND PROFILE (Unaudited) | September 30, 2023 |
MUNICIPAL INCOME FUND
OBJECTIVE: Seeks to provide current income with an emphasis on income exempt from federal income tax, while also considering capital appreciation.
Holdings Diversification (Market Exposure as % of Net Assets)
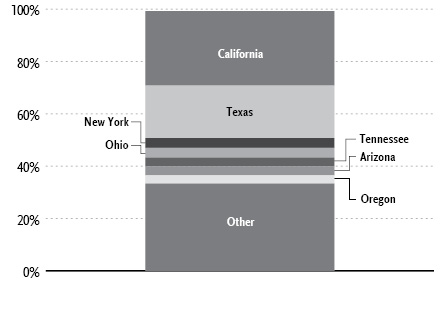
“Holdings Diversification (Market Exposure as % of Net Assets)” excludes any temporary cash investments.
Portfolio Composition by Quality Rating1 |
Rating | % of Total
Investments |
Fixed Income Instruments | |
AAA | 38.2% |
AA | 43.5% |
A | 12.3% |
BBB | 2.4% |
BB | 0.8% |
NR2 | 0.1% |
Other Instruments | 2.7% |
Total Investments | 100.0% |
Inception Dates: |
A-Class | April 28, 2004 |
C-Class | January 13, 2012 |
P-Class | May 1, 2015 |
Institutional Class | January 13, 2012 |
Ten Largest Holdings | % of Total Net Assets |
El Camino Healthcare District General Obligation Unlimited | 4.8% |
Freddie Mac Multifamily ML Certificates Revenue Bonds, 2.49% | 4.1% |
Denton County Housing Finance Corp. Revenue Bonds, 2.15% | 3.5% |
Freddie Mac Multifamily, 1.90% | 3.4% |
Stockton Unified School District General Obligation Unlimited | 3.2% |
Ysleta Independent School District General Obligation Unlimited, 4.00% | 3.0% |
Dayton-Montgomery County Port Authority Revenue Bonds, 1.83% | 2.7% |
Freddie Mac Multifamily Variable Rate Certificate Revenue Bonds, 3.15% | 2.5% |
New York City Municipal Water Finance Authority Revenue Bonds, 5.00% | 2.5% |
Bexar County Hospital District General Obligation Limited, 5.00% | 2.5% |
Top Ten Total | 32.2% |
| | |
“Ten Largest Holdings” excludes any temporary cash or derivative investments. |
1 | Source: BlackRock Solutions. Credit quality ratings are measured on a scale that generally ranges from AAA (highest) to D (lowest). All securities except for those labeled “NR” have been rated by Moody’s, Standard & Poor’s (“S&P”), or Fitch, each of which is a Nationally Recognized Statistical Rating Organization (“NRSRO”). For purposes of this presentation, when ratings are available from more than one agency, the highest rating is used. Guggenheim Investments has converted ratings to the equivalent S&P rating. Security ratings are determined at the time of purchase and may change thereafter. |
2 | NR (not rated) securities do not necessarily indicate low credit quality. |
68 | THE GUGGENHEIM FUNDS ANNUAL REPORT | |
PERFORMANCE REPORT AND FUND PROFILE (Unaudited)(concluded) | September 30, 2023 |
Cumulative Fund Performance*
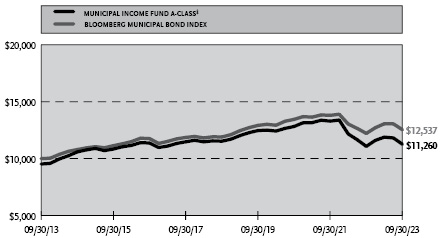
Average Annual Returns*
Periods Ended September 30, 2023
| 1 Year | 5 Year | 10 Year |
A-Class Shares~ | 1.67% | (0.47%) | 1.69% |
A-Class Shares with sales charge† | (2.40%) | (1.28%) | 1.19% |
C-Class Shares | 0.91% | (1.21%) | 0.92% |
C-Class Shares with CDSC‡ | (0.07%) | (1.21%) | 0.92% |
Institutional Class Shares | 1.93% | (0.22%) | 1.93% |
Bloomberg Municipal Bond Index | 2.66% | 1.05% | 2.29% |
| 1 Year | 5 Year | Since
Inception
(05/01/15) |
P-Class Shares | 1.58% | (0.49%) | 0.44% |
Bloomberg Municipal Bond Index | 2.66% | 1.05% | 1.59% |
* | The performance data above represents past performance that is not predictive of future results. The investment return and principal value of an investment in the Fund will fluctuate so that an investor’s shares, when redeemed, may be worth more or less than their original cost. Returns are historical and include changes in principal and reinvested dividends and capital gains and do not reflect the effect of taxes. The Bloomberg Municipal Bond Index is an unmanaged index and, unlike the Fund, has no management fees or operating expenses to reduce its reported return. The graph is based on A-Class shares only; performance for C-Class shares, P-Class shares and Institutional shares will vary due to differences in fee structures. |
† | Effective October 1, 2015, the maximum sales charge decreased from 4.75% to 4.00%. A 4.75% maximum sales charge is used in the calculation of the Average Annual Returns based on subscriptions made prior to October 1, 2015, and a 4.00% maximum sales charge is used to calculate performance for periods based on subscriptions made on or after October 1, 2015. |
‡ | Fund returns include a CDSC of 1% if redeemed within 12 months of purchase. |
~ | Effective January 13, 2012, the Fund acquired all of the assets and liabilities of the TS&W/Claymore Tax-Advantage Balanced Fund (“TYW”), a registered closed-end management investment company. The A-Class performance prior to that date reflects performance of TYW. |
| | THE GUGGENHEIM FUNDS ANNUAL REPORT | 69 |
SCHEDULE OF INVESTMENTS | September 30, 2023 |
MUNICIPAL INCOME FUND | |
| | Shares | | | Value | |
MONEY MARKET FUND† - 2.6% |
Dreyfus AMT-Free Tax Exempt Cash Management Fund — Institutional Shares, 3.96%1 | | | 1,075,834 | | | $ | 1,075,619 | |
Total Money Market Fund | | | | |
(Cost $1,075,619) | | | | | | | 1,075,619 | |
| | | | | | | | | |
| | | Face
Amount | | | | | |
MUNICIPAL BONDS†† - 92.6% |
California - 28.5% | | | | | | | | |
El Camino Healthcare District General Obligation Unlimited | | | | | | | | |
due 08/01/292 | | $ | 2,500,000 | | | | 1,959,602 | |
Stockton Unified School District General Obligation Unlimited | | | | | | | | |
due 08/01/332 | | | 2,000,000 | | | | 1,299,744 | |
due 08/01/372 | | | 810,000 | | | | 417,946 | |
due 08/01/422 | | | 250,000 | | | | 94,478 | |
Freddie Mac Multifamily ML Certificates Revenue Bonds | | | | | | | | |
2.49% due 07/25/35 | | | 2,128,341 | | | | 1,663,721 | |
San Diego Unified School District General Obligation Unlimited | | | | | | | | |
due 07/01/392 | | | 1,000,000 | | | | 453,818 | |
due 07/01/462 | | | 1,360,000 | | | | 426,698 | |
College of the Sequoias Tulare Area Improvement District No. 3 General Obligation Unlimited | | | | | | | | |
due 08/01/423,5 | | | 1,000,000 | | | | 699,575 | |
Newport Mesa Unified School District General Obligation Unlimited | | | | | | | | |
due 08/01/392 | | | 1,300,000 | | | | 617,542 | |
Sonoma Valley Unified School District General Obligation Unlimited | | | | | | | | |
4.00% due 08/01/44 | | | 600,000 | | | | 555,380 | |
California Statewide Communities Development Authority Revenue Bonds | | | | | | | | |
5.25% due 08/15/52 | | | 500,000 | | | | 520,575 | |
Sierra Joint Community College District School Facilities District No. 1 General Obligation Unlimited | | | | | | | | |
due 08/01/312 | | | 705,000 | | | | 513,560 | |
Compton Unified School District General Obligation Unlimited | | | | | | | | |
due 06/01/402 | | | 1,000,000 | | | | 407,260 | |
Delhi Unified School District General Obligation Unlimited | | | | | | | | |
5.00% due 08/01/44 | | | 250,000 | | | | 254,892 | |
Alameda Corridor Transportation Authority Revenue Bonds | | | | | | | | |
due 10/01/512 | | | 500,000 | | | | 240,917 | |
Upland Unified School District General Obligation Unlimited | | | | | | | | |
due 08/01/382 | | | 400,000 | | | | 195,218 | |
M-S-R Energy Authority Revenue Bonds | | | | | | | | |
6.13% due 11/01/29 | | | 175,000 | | | | 182,505 | |
El Monte Union High School District General Obligation Unlimited | | | | | | | | |
due 06/01/432 | | | 500,000 | | | | 177,692 | |
Westside Elementary School District General Obligation Unlimited | | | | | | | | |
5.00% due 08/01/48 | | | 155,000 | | | | 158,324 | |
Rio Hondo Community College District General Obligation Unlimited | | | | | | | | |
due 08/01/292 | | | 200,000 | | | | 158,117 | |
Freddie Mac Multifamily VRD Certificates Revenue Bonds | | | | | | | | |
2.40% due 10/15/29 | | | 150,000 | | | | 131,205 | |
Coast Community College District General Obligation Unlimited | | | | | | | | |
due 08/01/402 | | | 250,000 | | | | 106,287 | |
City of Los Angeles Department of Airports Revenue Bonds | | | | | | | | |
5.00% due 05/15/44 | | | 100,000 | | | | 103,394 | |
Buena Park School District General Obligation Unlimited | | | | | | | | |
5.00% due 08/01/47 | | | 100,000 | | | | 102,306 | |
Department of Veterans Affairs Veteran’s Farm & Home Purchase Program Revenue Bonds | | | | | | | | |
3.45% due 12/01/39 | | | 110,000 | | | | 91,551 | |
Roseville Joint Union High School District General Obligation Unlimited | | | | | | | | |
due 08/01/302 | | | 100,000 | | | | 75,938 | |
Total California | | | | | | | 11,608,245 | |
| | | | | | | | | |
Texas - 20.1% | | | | | | | | |
Denton County Housing Finance Corp. Revenue Bonds | | | | | | | | |
2.15% due 11/01/38 | | | 2,000,000 | | | | 1,407,762 | |
Central Texas Regional Mobility Authority Revenue Bonds | | | | | | | | |
5.00% due 01/01/45 | | | 1,250,000 | | | | 1,256,797 | |
Ysleta Independent School District General Obligation Unlimited | | | | | | | | |
4.00% due 08/15/52 | | | 1,400,000 | | | | 1,212,194 | |
Bexar County Hospital District General Obligation Limited | | | | | | | | |
5.00% due 02/15/47 | | | 1,000,000 | | | | 1,005,879 | |
Cleveland Independent School District General Obligation Unlimited | | | | | | | | |
4.00% due 02/15/52 | | | 1,000,000 | | | | 859,983 | |
North Texas Tollway Authority Revenue Bonds | | | | | | | | |
due 01/01/362 | | | 1,000,000 | | | | 569,268 | |
Southwest Independent School District General Obligation Unlimited | | | | | | | | |
due 02/01/422 | | | 500,000 | | | | 203,934 | |
United Independent School District General Obligation Unlimited | | | | | | | | |
5.00% due 08/15/49 | | | 200,000 | | | | 203,038 | |
70 | THE GUGGENHEIM FUNDS ANNUAL REPORT | SEE NOTES TO FINANCIAL STATEMENTS. |
SCHEDULE OF INVESTMENTS (continued) | September 30, 2023 |
MUNICIPAL INCOME FUND | |
| | Face
Amount | | | Value | |
Lindale Independent School District General Obligation Unlimited | | | | | | | | |
5.00% due 02/15/49 | | $ | 200,000 | | | $ | 203,017 | |
Clifton Higher Education Finance Corp. Revenue Bonds | | | | | | | | |
4.00% due 08/15/33 | | | 200,000 | | | | 196,774 | |
Arlington Higher Education Finance Corp. Revenue Bonds | | | | | | | | |
5.00% due 12/01/46 | | | 200,000 | | | | 179,064 | |
Grand Parkway Transportation Corp. Revenue Bonds | | | | | | | | |
5.00% due 10/01/43 | | | 175,000 | | | | 178,094 | |
Harris County-Houston Sports Authority Revenue Bonds | | | | | | | | |
due 11/15/532 | | | 1,000,000 | | | | 174,256 | |
Texas Municipal Gas Acquisition and Supply Corporation I Revenue Bonds | | | | | | | | |
6.25% due 12/15/26 | | | 115,000 | | | | 117,406 | |
Mansfield Independent School District General Obligation Unlimited | | | | | | | | |
5.00% due 02/15/44 | | | 100,000 | | | | 101,826 | |
Hutto Independent School District General Obligation Unlimited | | | | | | | | |
5.00% due 08/01/49 | | | 100,000 | | | | 101,380 | |
University of North Texas System Revenue Bonds | | | | | | | | |
5.00% due 04/15/44 | | | 100,000 | | | | 101,316 | |
City of Arlington Texas Special Tax Revenue Special Tax | | | | | | | | |
5.00% due 02/15/48 | | | 100,000 | | | | 100,150 | |
Tarrant County Health Facilities Development Corp. Revenue Bonds | | | | | | | | |
6.00% due 09/01/24 | | | 5,000 | | | | 5,040 | |
Leander Independent School District General Obligation Unlimited | | | | | | | | |
due 08/15/242 | | | 5,000 | | | | 2,848 | |
Total Texas | | | | | | | 8,180,026 | |
| | | | | | | | | |
New York - 3.7% | | | | | | | | |
New York City Municipal Water Finance Authority Revenue Bonds | | | | | | | | |
5.00% due 06/15/49 | | | 1,000,000 | | | | 1,015,462 | |
New York State Dormitory Authority Revenue Bonds | | | | | | | | |
4.00% due 08/01/43 | | | 250,000 | | | | 221,028 | |
New York Transportation Development Corp. Revenue Bonds | | | | | | | | |
5.00% due 07/01/34 | | | 200,000 | | | | 198,063 | |
New York Power Authority Revenue Bonds | | | | | | | | |
4.00% due 11/15/45 | | | 100,000 | | | | 91,195 | |
Total New York | | | | | | | 1,525,748 | |
| | | | | | | | | |
Ohio - 3.7% | | | | | | | | |
Dayton-Montgomery County Port Authority Revenue Bonds | | | | | | | | |
1.83% due 09/01/38 | | | 1,600,000 | | | | 1,116,010 | |
County of Miami Ohio Revenue Bonds | | | | | | | | |
5.00% due 08/01/33 | | | 200,000 | | | | 206,901 | |
American Municipal Power, Inc. Revenue Bonds | | | | | | | | |
5.00% due 02/15/41 | | | 200,000 | | | | 200,240 | |
Total Ohio | | | | | | | 1,523,151 | |
| | | | | | | | | |
Tennessee - 3.4% | | | | | | | | |
Metropolitan Government Nashville & Davidson County Health & Educational Facilities Board Revenue Bonds | | | | | | | | |
2.25% due 07/01/45 | | | 1,500,000 | | | | 898,543 | |
City of Shelbyville & Bedford County Health Educational & Housing Facility Board Revenue Bonds | | | | | | | | |
2.21% due 06/01/38 | | | 498,820 | | | | 346,758 | |
Metropolitan Government Nashville & Davidson County Health & Educational Facilities Board Revenue Bonds | | | | | | | | |
2.48% due 12/01/37 | | | 200,000 | | | | 146,045 | |
Total Tennessee | | | | | | | 1,391,346 | |
| | | | | | | | | |
Arizona - 3.4% | | | | | | | | |
Arizona Industrial Development Authority Revenue Bonds | | | | | | | | |
2.12% due 07/01/37 | | | 1,143,357 | | | | 801,061 | |
Maricopa County Industrial Development Authority Revenue Bonds | | | | | | | | |
5.00% due 01/01/41 | | | 250,000 | | | | 251,069 | |
Salt Verde Financial Corp. Revenue Bonds | | | | | | | | |
5.00% due 12/01/32 | | | 200,000 | | | | 201,579 | |
Pinal County Elementary School District No. 4 Casa Grande General Obligation Unlimited | | | | | | | | |
5.00% due 07/01/37 | | | 100,000 | | | | 103,948 | |
Total Arizona | | | | | | | 1,357,657 | |
| | | | | | | | | |
Oregon - 3.2% | | | | | | | | |
Clackamas & Washington Counties School District No. 3 General Obligation Unlimited | | | | | | | | |
due 06/15/482 | | | 2,000,000 | | | | 508,382 | |
due 06/15/502 | | | 400,000 | | | | 90,556 | |
due 06/15/492 | | | 350,000 | | | | 83,844 | |
Salem-Keizer School District No. 24J General Obligation Unlimited | | | | | | | | |
due 06/15/402 | | | 1,250,000 | | | | 512,368 | |
University of Oregon Revenue Bonds | | | | | | | | |
5.00% due 04/01/48 | | | 100,000 | | | | 101,032 | |
Total Oregon | | | | | | | 1,296,182 | |
| | | | | | | | | |
Colorado - 3.1% | | | | | | | | |
E-470 Public Highway Authority Revenue Bonds | | | | | | | | |
5.00% due 09/01/36 | | | 650,000 | | | | 689,435 | |
SEE NOTES TO FINANCIAL STATEMENTS. | THE GUGGENHEIM FUNDS ANNUAL REPORT | 71 |
SCHEDULE OF INVESTMENTS (continued) | September 30, 2023 |
MUNICIPAL INCOME FUND | |
| | Face
Amount | | | Value | |
City & County of Denver Colorado Airport System Revenue Bonds | | | | | | | | |
5.00% due 12/01/28 | | $ | 200,000 | | | $ | 206,352 | |
City & County of Denver Colorado Pledged Excise Tax Revenue Bonds | | | | | | | | |
due 08/01/302 | | | 200,000 | | | | 145,090 | |
Colorado Educational & Cultural Facilities Authority Revenue Bonds | | | | | | | | |
5.00% due 03/01/47 | | | 110,000 | | | | 111,361 | |
Colorado School of Mines Revenue Bonds | | | | | | | | |
5.00% due 12/01/47 | | | 100,000 | | | | 101,435 | |
Total Colorado | | | | | | | 1,253,673 | |
| | | | | | | | | |
Virginia - 2.9% | | | | | | | | |
Freddie Mac Multifamily Variable Rate Certificate Revenue Bonds | | | | | | | | |
3.15% due 10/15/36 | | | 1,285,000 | | | | 1,028,747 | |
Loudoun County Economic Development Authority Revenue Bonds | | | | | | | | |
due 07/01/492 | | | 500,000 | | | | 134,084 | |
Total Virginia | | | | | | | 1,162,831 | |
| | | | | | | | | |
North Carolina - 2.3% | | | | | | | | |
Inlivian Revenue Bonds | | | | | | | | |
2.02% due 04/01/42 | | | 1,000,000 | | | | 625,113 | |
North Carolina Central University Revenue Bonds | | | | | | | | |
5.00% due 04/01/44 | | | 300,000 | | | | 305,443 | |
Total North Carolina | | | | | | | 930,556 | |
| | | | | | | | | |
West Virginia - 2.3% | | | | | | | | |
West Virginia University Revenue Bonds | | | | | | | | |
5.00% due 10/01/41 | | | 600,000 | | | | 621,060 | |
West Virginia Hospital Finance Authority Revenue Bonds | | | | | | | | |
5.00% due 06/01/42 | | | 300,000 | | | | 298,890 | |
Total West Virginia | | | | | | | 919,950 | |
| | | | | | | | | |
Illinois - 2.2% | | | | | | | | |
City of Chicago Illinois Wastewater Transmission Revenue Bonds | | | | | | | | |
5.25% due 01/01/42 | | | 400,000 | | | | 407,323 | |
Illinois Finance Authority Revenue Bonds | | | | | | | | |
5.00% due 10/01/38 | | | 250,000 | | | | 272,014 | |
University of Illinois Revenue Bonds | | | | | | | | |
6.00% due 10/01/29 | | | 200,000 | | | | 200,323 | |
Total Illinois | | | | | | | 879,660 | |
| | | | | | | | | |
Washington - 1.9% | | | | | | | | |
Yakima & Kittitas Counties School District No. 119 Selah General Obligation Unlimited | | | | | | | | |
5.00% due 12/01/42 | | | 200,000 | | | | 205,281 | |
County of King Washington Sewer Revenue Bonds | | | | | | | | |
5.00% due 07/01/42 | | | 200,000 | | | | 203,838 | |
Central Puget Sound Regional Transit Authority Revenue Bonds | | | | | | | | |
5.00% due 11/01/41 | | | 200,000 | | | | 202,688 | |
Washington State Convention Center Public Facilities District Revenue Bonds | | | | | | | | |
4.00% due 07/01/48 | | | 210,000 | | | | 172,775 | |
Total Washington | | | | | | | 784,582 | |
| | | | | | | | | |
New Jersey - 1.4% | | | | | | | | |
New Jersey Turnpike Authority Revenue Bonds | | | | | | | | |
5.00% due 01/01/31 | | | 300,000 | | | | 314,570 | |
New Jersey Economic Development Authority Revenue Bonds | | | | | | | | |
5.00% due 06/01/28 | | | 250,000 | | | | 257,197 | |
Total New Jersey | | | | | | | 571,767 | |
| | | | | | | | | |
Oklahoma - 1.3% | | | | | | | | |
Oklahoma Development Finance Authority Revenue Bonds | | | | | | | | |
5.00% due 08/15/28 | | | 350,000 | | | | 335,518 | |
Oklahoma City Airport Trust Revenue Bonds | | | | | | | | |
5.00% due 07/01/30 | | | 200,000 | | | | 204,334 | |
Total Oklahoma | | | | | | | 539,852 | |
| | | | | | | | | |
North Dakota - 1.3% | | | | | | | | |
City of Grand Forks North Dakota Revenue Bonds | | | | | | | | |
5.00% due 12/01/33 | | | 500,000 | | | | 529,001 | |
| | | | | | | | | |
Michigan - 1.1% | | | | | | | | |
Michigan State Hospital Finance Authority Revenue Bonds | | | | | | | | |
5.00% due 11/15/47 | | | 200,000 | | | | 197,385 | |
Michigan State Housing Development Authority Revenue Bonds | | | | | | | | |
3.35% due 12/01/34 | | | 200,000 | | | | 178,714 | |
Flint Hospital Building Authority Revenue Bonds | | | | | | | | |
5.00% due 07/01/25 | | | 100,000 | | | | 99,027 | |
Total Michigan | | | | | | | 475,126 | |
| | | | | | | | | |
Missouri - 0.8% | | | | | | | | |
Industrial Development Authority of the City of State Louis Missouri Revenue Bonds | | | | | | | | |
2.22% due 12/01/38 | | | 487,166 | | | | 337,547 | |
| | | | | | | | | |
Arkansas - 0.8% | | | | | | | | |
County of Baxter Arkansas Revenue Bonds | | | | | | | | |
5.00% due 09/01/26 | | | 330,000 | | | | 332,001 | |
| | | | | | | | | |
Louisiana - 0.6% | | | | | | | | |
City of Shreveport Louisiana Water & Sewer Revenue Bonds | | | | | | | | |
5.00% due 12/01/35 | | | 250,000 | | | | 257,408 | |
72 | THE GUGGENHEIM FUNDS ANNUAL REPORT | SEE NOTES TO FINANCIAL STATEMENTS. |
SCHEDULE OF INVESTMENTS (continued) | September 30, 2023 |
MUNICIPAL INCOME FUND | |
| | Face
Amount | | | Value | |
Louisiana Public Facilities Authority Revenue Bonds | | | | | | | | |
5.00% due 05/15/26 | | $ | 5,000 | | | $ | 5,087 | |
Total Louisiana | | | | | | | 262,495 | |
| | | | | | | | | |
Alaska - 0.6% | | | | | | | | |
University of Alaska Revenue Bonds | | | | | | | | |
5.00% due 10/01/40 | | | 260,000 | | | | 256,407 | |
| | | | | | | | | |
South Carolina - 0.5% | | | | | | | | |
Charleston County Airport District Revenue Bonds | | | | | | | | |
5.00% due 07/01/43 | | | 200,000 | | | | 201,771 | |
| | | | | | | | | |
Nebraska - 0.5% | | | | | | | | |
Central Plains Energy Project Revenue Bonds | | | | | | | | |
5.00% due 09/01/29 | | | 200,000 | | | | 201,587 | |
| | | | | | | | | |
Vermont - 0.5% | | | | | | | | |
Vermont Educational & Health Buildings Financing Agency Revenue Bonds | | | | | | | | |
5.00% due 12/01/46 | | | 200,000 | | | | 190,006 | |
| | | | | | | | | |
Connecticut - 0.4% | | | | | | | | |
New Haven Housing Authority Revenue Bonds | | | | | | | | |
2.26% due 05/01/38 | | | 243,833 | | | | 171,133 | |
| | | | | | | | | |
Massachusetts - 0.4% | | | | | | | | |
Massachusetts Development Finance Agency Revenue Bonds | | | | | | | | |
5.00% due 10/01/34 | | | 150,000 | | | | 153,594 | |
| | | | | | | | | |
Pennsylvania - 0.3% | | | | | | | | |
Allegheny County Hospital Development Authority Revenue Bonds | | | | | | | | |
5.00% due 07/15/32 | | | 100,000 | | | | 104,931 | |
| | | | | | | | | |
Rhode Island - 0.3% | | | | | | | | |
Rhode Island Health and Educational Building Corp. Revenue Bonds | | | | | | | | |
5.00% due 05/15/42 | | | 100,000 | | | | 104,058 | |
| | | | | | | | | |
Florida - 0.3% | | | | | | | | |
Greater Orlando Aviation Authority Revenue Bonds | | | | | | | | |
5.00% due 10/01/32 | | | 100,000 | | | | 102,915 | |
| | | | | | | | | |
Montana - 0.3% | | | | | | | | |
Montana State Board of Regents Revenue Bonds | | | | | | | | |
5.00% due 11/15/43 | | | 100,000 | | | | 101,532 | |
| | | | | | | | | |
Kansas - 0.2% | | | | | | | | |
University of Kansas Hospital Authority Revenue Bonds | | | | | | | | |
5.00% due 09/01/48 | | | 100,000 | | | | 100,460 | |
| | | | | | | | | |
Iowa - 0.2% | | | | | | | | |
PEFA, Inc. Revenue Bonds | | | | | | | | |
5.00% due 09/01/264 | | | 100,000 | | | | 99,759 | |
| | | | | | | | | |
New Mexico - 0.0% | | | | | | | | |
City of Albuquerque New Mexico Gross Receipts Tax Revenue Bonds | | | | | | | | |
5.00% due 07/01/25 | | | 20,000 | | | | 19,984 | |
Total New Mexico | | | | | | | 19,984 | |
| | | | | | | | | |
Maryland - 0.0% | | | | | | | | |
Maryland Health & Higher Educational Facilities Authority Revenue Bonds | | | | | | | | |
5.00% due 07/01/27 | | | 5,000 | | | | 5,067 | |
Total Municipal Bonds | | | | |
(Cost $46,738,772) | | | 37,674,600 | |
| |
COLLATERALIZED MORTGAGE OBLIGATIONS†† - 3.4% |
Government Agency - 3.4% | | | | | | | | |
Freddie Mac Multifamily | | | | | | | | |
1.90% due 11/25/37 | | | 1,932,178 | | | | 1,376,893 | |
Total Collateralized Mortgage Obligations | | | | |
(Cost $1,979,574) | | | 1,376,893 | |
| | | | | | | | | |
Total Investments - 98.6% | | | | |
(Cost $49,793,965) | | $ | 40,127,112 | |
Other Assets & Liabilities, net - 1.4% | | | 568,699 | |
Total Net Assets - 100.0% | | $ | 40,695,811 | |
SEE NOTES TO FINANCIAL STATEMENTS. | THE GUGGENHEIM FUNDS ANNUAL REPORT | 73 |
SCHEDULE OF INVESTMENTS (concluded) | September 30, 2023 |
MUNICIPAL INCOME FUND | |
Centrally Cleared Interest Rate Swap Agreements†† |
| |
Counterparty | Exchange | Floating
Rate
Type | Floating
Rate Index | | Fixed
Rate | | Payment
Frequency | | Maturity
Date | | | Notional
Amount | | | Value | | | Upfront
Premiums
Paid
(Received) | | | Unrealized
Appreciation** | |
BofA Securities, Inc. | CME | Receive | U.S. Secured Overnight Financing Rate + 0.26% | 1.67% | Quarterly | 09/27/51 | | $ | 2,550,000 | | | $ | 1,115,738 | | | $ | (752 | ) | | $ | 1,116,490 | |
BofA Securities, Inc. | CME | Receive | U.S. Secured Overnight Financing Rate | 3.26% | Annually | 05/24/53 | | | 1,150,000 | | | | 149,000 | | | | 317 | | | | 148,683 | |
BofA Securities, Inc. | CME | Receive | U.S. Secured Overnight Financing Rate | 3.14% | Annually | 04/12/33 | | | 1,000,000 | | | | 87,577 | | | | 293 | | | | 87,284 | |
BofA Securities, Inc. | CME | Receive | U.S. Secured Overnight Financing Rate | 3.45% | Annually | 06/06/33 | | | 800,000 | | | | 51,689 | | | | 296 | | | | 51,393 | |
| | | | | | | | | | | | | | | | | | | $ | 1,404,004 | | | $ | 154 | | | $ | 1,403,850 | |
** | Includes cumulative appreciation (depreciation). Variation margin is reported within the Statement of Assets and Liabilities. |
† | Value determined based on Level 1 inputs — See Note 4. |
†† | Value determined based on Level 2 inputs — See Note 4. |
1 | Rate indicated is the 7-day yield as of September 30, 2023. |
2 | Zero coupon rate security. |
3 | Security is a step up/down bond with a 6.85% coupon rate until 08/01/2032. |
4 | The rate is adjusted periodically by the counterparty, allows the holder to tender the security upon a rate reset, and is not based upon a set reference rate and spread. |
5 | Security has no current coupon. However, a coupon rate will come into effect at a future rate reset date. |
| | BofA — Bank of America |
| | CME — Chicago Mercantile Exchange |
| | |
| | See Sector Classification in Other Information section. |
The following table summarizes the inputs used to value the Fund’s investments at September 30, 2023 (See Note 4 in the Notes to Financial Statements):
Investments in Securities (Assets) | | Level 1
Quoted
Prices | | | Level 2
Significant
Observable
Inputs | | | Level 3
Significant
Unobservable
Inputs | | | Total | |
Money Market Fund | | $ | 1,075,619 | | | $ | — | | | $ | — | | | $ | 1,075,619 | |
Municipal Bonds | | | — | | | | 37,674,600 | | | | — | | | | 37,674,600 | |
Collateralized Mortgage Obligations | | | — | | | | 1,376,893 | | | | — | | | | 1,376,893 | |
Interest Rate Swap Agreements** | | | — | | | | 1,403,850 | | | | — | | | | 1,403,850 | |
Total Assets | | $ | 1,075,619 | | | $ | 40,455,343 | | | $ | — | | | $ | 41,530,962 | |
** | This derivative is reported as unrealized appreciation/depreciation at period end. |
74 | THE GUGGENHEIM FUNDS ANNUAL REPORT | SEE NOTES TO FINANCIAL STATEMENTS. |
STATEMENT OF ASSETS AND LIABILITIES |
September 30, 2023 |
Assets: |
Investments, at value (cost $49,793,965) | | $ | 40,127,112 | |
Segregated cash with broker | | | 387,498 | |
Unamortized upfront premiums paid on interest rate swap agreements | | | 906 | |
Prepaid expenses | | | 41,774 | |
Receivables: |
Interest | | | 250,008 | |
Variation margin on interest rate swap agreements | | | 22,169 | |
Fund shares sold | | | 5,006 | |
Total assets | | | 40,834,473 | |
| | | | | |
Liabilities: |
Overdraft due to custodian bank | | | 6,840 | |
Unamortized upfront premiums received on interest rate swap agreements | | | 752 | |
Payable for: |
Fund shares redeemed | | | 54,947 | |
Professional fees | | | 30,048 | |
Transfer agent/maintenance fees | | | 12,358 | |
Distribution and service fees | | | 6,842 | |
Fund accounting/administration fees | | | 4,713 | |
Distributions to shareholders | | | 3,201 | |
Trustees’ fees* | | | 1,586 | |
Management fees | | | 1,251 | |
Miscellaneous | | | 16,124 | |
Total liabilities | | | 138,662 | |
Net assets | | $ | 40,695,811 | |
| | | | | |
Net assets consist of: |
Paid in capital | | $ | 49,865,292 | |
Total distributable earnings (loss) | | | (9,169,481 | ) |
Net assets | | $ | 40,695,811 | |
| | | | | |
A-Class: |
Net assets | | $ | 28,908,722 | |
Capital shares outstanding | | | 2,683,907 | |
Net asset value per share | | $ | 10.77 | |
Maximum offering price per share (Net asset value divided by 96.00%) | | $ | 11.22 | |
| | | | | |
C-Class: |
Net assets | | $ | 847,110 | |
Capital shares outstanding | | | 78,713 | |
Net asset value per share | | $ | 10.76 | |
| | | | | |
P-Class: |
Net assets | | $ | 114,418 | |
Capital shares outstanding | | | 10,630 | |
Net asset value per share | | $ | 10.76 | |
| | | | | |
Institutional Class: |
Net assets | | $ | 10,825,561 | |
Capital shares outstanding | | | 1,004,926 | |
Net asset value per share | | $ | 10.77 | |
STATEMENT OF OPERATIONS |
Year Ended September 30, 2023 |
Investment Income: |
Dividends | | $ | 116,351 | |
Interest | | | 1,352,764 | |
Total investment income | | | 1,469,115 | |
| | | | | |
Expenses: |
Management fees | | | 258,691 | |
Distribution and service fees: |
A-Class | | | 102,858 | |
C-Class | | | 10,649 | |
P-Class | | | 366 | |
Transfer agent/maintenance fees: |
A-Class | | | 36,994 | |
C-Class | | | 1,503 | |
P-Class | | | 596 | |
Institutional Class | | | 9,988 | |
Registration fees | | | 58,107 | |
Professional fees | | | 49,075 | |
Fund accounting/administration fees | | | 30,229 | |
Trustees’ fees* | | | 14,700 | |
Custodian fees | | | 3,785 | |
Line of credit fees | | | 3,410 | |
Interest expense | | | 215 | |
Miscellaneous | | | 23,462 | |
Recoupment of previously waived fees: |
A-Class | | | 1,462 | |
C-Class | | | 80 | |
P-Class | | | 4 | |
Institutional Class | | | 219 | |
Total expenses | | | 606,393 | |
Less: |
Expenses reimbursed by Adviser: |
A-Class | | | (37,157 | ) |
C-Class | | | (1,502 | ) |
P-Class | | | (593 | ) |
Institutional Class | | | (9,965 | ) |
Expenses waived by Adviser | | | (168,527 | ) |
Total waived/reimbursed expenses | | | (217,744 | ) |
Net expenses | | | 388,649 | |
Net investment income | | | 1,080,466 | |
| | | | | |
Net Realized and Unrealized Gain (Loss): |
Net realized gain (loss) on: |
Investments | | | (1,990,408 | ) |
Swap agreements | | | 1,202,369 | |
Net realized loss | | | (788,039 | ) |
Net change in unrealized appreciation (depreciation) on: |
Investments | | | 1,319,419 | |
Swap agreements | | | (514,901 | ) |
Net change in unrealized appreciation (depreciation) | | | 804,518 | |
Net realized and unrealized gain | | | 16,479 | |
Net increase in net assets resulting from operations | | $ | 1,096,945 | |
* | Relates to Trustees not deemed “interested persons” within the meaning of Section 2(a)(19) of the 1940 Act. |
75 | THE GUGGENHEIM FUNDS ANNUAL REPORT | SEE NOTES TO FINANCIAL STATEMENTS. |
STATEMENTS OF CHANGES IN NET ASSETS |
| | Year Ended
September 30,
2023 | | | Year Ended
September 30,
2022 | |
Increase (Decrease) in Net Assets from Operations: | | | | | | | | |
Net investment income | | $ | 1,080,466 | | | $ | 1,185,769 | |
Net realized gain (loss) on investments | | | (788,039 | ) | | | 798,322 | |
Net change in unrealized appreciation (depreciation) on investments | | | 804,518 | | | | (13,026,308 | ) |
Net increase (decrease) in net assets resulting from operations | | | 1,096,945 | | | | (11,042,217 | ) |
| | | | | | | | | |
Distributions to shareholders: | | | | | | | | |
A-Class | | | (1,453,969 | ) | | | (1,171,658 | ) |
C-Class | | | (31,189 | ) | | | (24,004 | ) |
P-Class | | | (4,574 | ) | | | (3,881 | ) |
Institutional Class | | | (364,176 | ) | | | (235,117 | ) |
Total distributions to shareholders | | | (1,853,908 | ) | | | (1,434,660 | ) |
| | | | | | | | | |
Capital share transactions: | | | | | | | | |
Proceeds from sale of shares | | | | | | | | |
A-Class | | | 3,606,381 | | | | 4,529,943 | |
C-Class | | | 346,333 | | | | 540,692 | |
P-Class | | | 846,126 | | | | 8,594 | |
Institutional Class | | | 12,725,440 | | | | 4,638,825 | |
Distributions reinvested | | | | | | | | |
A-Class | | | 1,328,775 | | | | 1,073,119 | |
C-Class | | | 30,159 | | | | 22,692 | |
P-Class | | | 4,569 | | | | 3,881 | |
Institutional Class | | | 359,627 | | | | 231,198 | |
Cost of shares redeemed | | | | | | | | |
A-Class | | | (19,006,404 | ) | | | (15,257,098 | ) |
C-Class | | | (581,224 | ) | | | (929,727 | ) |
P-Class | | | (867,839 | ) | | | (70,519 | ) |
Institutional Class | | | (6,514,995 | ) | | | (11,258,625 | ) |
Net decrease from capital share transactions | | | (7,723,052 | ) | | | (16,467,025 | ) |
Net decrease in net assets | | | (8,480,015 | ) | | | (28,943,902 | ) |
| | | | | | | | | |
Net assets: | | | | | | | | |
Beginning of year | | | 49,175,826 | | | | 78,119,728 | |
End of year | | $ | 40,695,811 | | | $ | 49,175,826 | |
| | | | | | | | | |
Capital share activity: | | | | | | | | |
Shares sold | | | | | | | | |
A-Class | | | 316,903 | | | | 341,411 | |
C-Class | | | 30,364 | | | | 41,372 | |
P-Class | | | 75,140 | | | | 690 | |
Institutional Class | | | 1,120,796 | | | | 366,434 | |
Shares issued from reinvestment of distributions | | | | | | | | |
A-Class | | | 117,206 | | | | 86,038 | |
C-Class | | | 2,659 | | | | 1,798 | |
P-Class | | | 404 | | | | 310 | |
Institutional Class | | | 31,729 | | | | 18,207 | |
Shares redeemed | | | | | | | | |
A-Class | | | (1,700,924 | ) | | | (1,183,904 | ) |
C-Class | | | (51,290 | ) | | | (77,700 | ) |
P-Class | | | (76,692 | ) | | | (5,573 | ) |
Institutional Class | | | (569,408 | ) | | | (911,726 | ) |
Net decrease in shares | | | (703,113 | ) | | | (1,322,643 | ) |
SEE NOTES TO FINANCIAL STATEMENTS. | THE GUGGENHEIM FUNDS ANNUAL REPORT | 76 |
This table is presented to show selected data for a share outstanding throughout each period and to assist shareholders in evaluating a Fund’s performance for the periods presented.
A-Class | | Year Ended
September 30,
2023 | | | Year Ended
September 30,
2022 | | | Year Ended
September 30,
2021 | | | Year Ended
September 30,
2020 | | | Year Ended
September 30,
2019 | |
Per Share Data |
Net asset value, beginning of period | | $ | 10.97 | | | $ | 13.46 | | | $ | 13.23 | | | $ | 13.12 | | | $ | 12.46 | |
Income (loss) from investment operations: |
Net investment income (loss)a | | | .23 | | | | .23 | | | | .25 | | | | .26 | | | | .30 | |
Net gain (loss) on investments (realized and unrealized) | | | (.04 | ) | | | (2.44 | ) | | | .23 | | | | .11 | | | | .70 | |
Total from investment operations | | | .19 | | | | (2.21 | ) | | | .48 | | | | .37 | | | | 1.00 | |
Less distributions from: |
Net investment income | | | (.25 | ) | | | (.22 | ) | | | (.23 | ) | | | (.26 | ) | | | (.30 | ) |
Net realized gains | | | (.14 | ) | | | (.06 | ) | | | (.02 | ) | | | — | | | | (.04 | ) |
Total distributions | | | (.39 | ) | | | (.28 | ) | | | (.25 | ) | | | (.26 | ) | | | (.34 | ) |
Net asset value, end of period | | $ | 10.77 | | | $ | 10.97 | | | $ | 13.46 | | | $ | 13.23 | | | $ | 13.12 | |
|
Total Returnb | | | 1.67 | % | | | (16.67 | %) | | | 3.67 | % | | | 2.85 | % | | | 8.13 | % |
Ratios/Supplemental Data |
Net assets, end of period (in thousands) | | $ | 28,909 | | | $ | 43,354 | | | $ | 63,359 | | | $ | 62,583 | | | $ | 42,512 | |
Ratios to average net assets: |
Net investment income (loss) | | | 2.06 | % | | | 1.84 | % | | | 1.82 | % | | | 1.95 | % | | | 2.31 | % |
Total expensesc | | | 1.20 | % | | | 1.18 | % | | | 1.17 | % | | | 1.21 | % | | | 1.34 | % |
Net expensesd,e,f | | | 0.78 | % | | | 0.79 | % | | | 0.80 | % | | | 0.81 | % | | | 0.81 | % |
Portfolio turnover rate | | | 11 | % | | | 14 | % | | | 22 | % | | | 58 | % | | | 30 | % |
C-Class | | Year Ended
September 30,
2023 | | | Year Ended
September 30,
2022 | | | Year Ended
September 30,
2021 | | | Year Ended
September 30,
2020 | | | Year Ended
September 30,
2019 | |
Per Share Data |
Net asset value, beginning of period | | $ | 10.96 | | | $ | 13.45 | | | $ | 13.22 | | | $ | 13.11 | | | $ | 12.45 | |
Income (loss) from investment operations: |
Net investment income (loss)a | | | .15 | | | | .14 | | | | .15 | | | | .16 | | | | .21 | |
Net gain (loss) on investments (realized and unrealized) | | | (.04 | ) | | | (2.45 | ) | | | .23 | | | | .11 | | | | .69 | |
Total from investment operations | | | .11 | | | | (2.31 | ) | | | .38 | | | | .27 | | | | .90 | |
Less distributions from: |
Net investment income | | | (.17 | ) | | | (.12 | ) | | | (.13 | ) | | | (.16 | ) | | | (.20 | ) |
Net realized gains | | | (.14 | ) | | | (.06 | ) | | | (.02 | ) | | | — | | | | (.04 | ) |
Total distributions | | | (.31 | ) | | | (.18 | ) | | | (.15 | ) | | | (.16 | ) | | | (.24 | ) |
Net asset value, end of period | | $ | 10.76 | | | $ | 10.96 | | | $ | 13.45 | | | $ | 13.22 | | | $ | 13.11 | |
|
Total Returnb | | | 0.91 | % | | | (17.23 | %) | | | 2.91 | % | | | 2.09 | % | | | 7.33 | % |
Ratios/Supplemental Data |
Net assets, end of period (in thousands) | | $ | 847 | | | $ | 1,063 | | | $ | 1,769 | | | $ | 2,177 | | | $ | 1,981 | |
Ratios to average net assets: |
Net investment income (loss) | | | 1.30 | % | | | 1.08 | % | | | 1.08 | % | | | 1.23 | % | | | 1.63 | % |
Total expensesc | | | 2.00 | % | | | 1.97 | % | | | 1.97 | % | | | 1.97 | % | | | 2.12 | % |
Net expensesd,e,f | | | 1.54 | % | | | 1.54 | % | | | 1.55 | % | | | 1.56 | % | | | 1.56 | % |
Portfolio turnover rate | | | 11 | % | | | 14 | % | | | 22 | % | | | 58 | % | | | 30 | % |
SEE NOTES TO FINANCIAL STATEMENTS. | THE GUGGENHEIM FUNDS ANNUAL REPORT | 77 |
FINANCIAL HIGHLIGHTS (continued) |
This table is presented to show selected data for a share outstanding throughout each period and to assist shareholders in evaluating a Fund’s performance for the periods presented.
P-Class | | Year Ended
September 30,
2023 | | | Year Ended
September 30,
2022 | | | Year Ended
September 30,
2021 | | | Year Ended
September 30,
2020 | | | Year Ended
September 30,
2019 | |
Per Share Data |
Net asset value, beginning of period | | $ | 10.97 | | | $ | 13.45 | | | $ | 13.22 | | | $ | 13.13 | | | $ | 12.46 | |
Income (loss) from investment operations: |
Net investment income (loss)a | | | .23 | | | | .23 | | | | .25 | | | | .26 | | | | .29 | |
Net gain (loss) on investments (realized and unrealized) | | | (.05 | ) | | | (2.43 | ) | | | .23 | | | | .09 | | | | .72 | |
Total from investment operations | | | .18 | | | | (2.20 | ) | | | .48 | | | | .35 | | | | 1.01 | |
Less distributions from: |
Net investment income | | | (.25 | ) | | | (.22 | ) | | | (.23 | ) | | | (.26 | ) | | | (.30 | ) |
Net realized gains | | | (.14 | ) | | | (.06 | ) | | | (.02 | ) | | | — | | | | (.04 | ) |
Total distributions | | | (.39 | ) | | | (.28 | ) | | | (.25 | ) | | | (.26 | ) | | | (.34 | ) |
Net asset value, end of period | | $ | 10.76 | | | $ | 10.97 | | | $ | 13.45 | | | $ | 13.22 | | | $ | 13.13 | |
|
Total Return | | | 1.58 | % | | | (16.61 | %) | | | 3.67 | % | | | 2.69 | % | | | 8.20 | % |
Ratios/Supplemental Data |
Net assets, end of period (in thousands) | | $ | 114 | | | $ | 129 | | | $ | 220 | | | $ | 202 | | | $ | 207 | |
Ratios to average net assets: |
Net investment income (loss) | | | 2.04 | % | | | 1.81 | % | | | 1.83 | % | | | 1.96 | % | | | 2.25 | % |
Total expensesc | | | 1.51 | % | | | 1.47 | % | | | 1.38 | % | | | 1.40 | % | | | 1.55 | % |
Net expensesd,e,f | | | 0.78 | % | | | 0.79 | % | | | 0.80 | % | | | 0.81 | % | | | 0.81 | % |
Portfolio turnover rate | | | 11 | % | | | 14 | % | | | 22 | % | | | 58 | % | | | 30 | % |
78 | THE GUGGENHEIM FUNDS ANNUAL REPORT | SEE NOTES TO FINANCIAL STATEMENTS. |
FINANCIAL HIGHLIGHTS (concluded) |
This table is presented to show selected data for a share outstanding throughout each period and to assist shareholders in evaluating a Fund’s performance for the periods presented.
Institutional Class | | Year Ended
September 30,
2023 | | | Year Ended
September 30,
2022 | | | Year Ended
September 30,
2021 | | | Year Ended
September 30,
2020 | | | Year Ended
September 30,
2019 | |
Per Share Data |
Net asset value, beginning of period | | $ | 10.97 | | | $ | 13.46 | | | $ | 13.23 | | | $ | 13.13 | | | $ | 12.46 | |
Income (loss) from investment operations: |
Net investment income (loss)a | | | .26 | | | | .26 | | | | .28 | | | | .29 | | | | .33 | |
Net gain (loss) on investments (realized and unrealized) | | | (.03 | ) | | | (2.44 | ) | | | .24 | | | | .10 | | | | .71 | |
Total from investment operations | | | .23 | | | | (2.18 | ) | | | .52 | | | | .39 | | | | 1.04 | |
Less distributions from: |
Net investment income | | | (.29 | ) | | | (.25 | ) | | | (.27 | ) | | | (.29 | ) | | | (.33 | ) |
Net realized gains | | | (.14 | ) | | | (.06 | ) | | | (.02 | ) | | | — | | | | (.04 | ) |
Total distributions | | | (.43 | ) | | | (.31 | ) | | | (.29 | ) | | | (.29 | ) | | | (.37 | ) |
Net asset value, end of period | | $ | 10.77 | | | $ | 10.97 | | | $ | 13.46 | | | $ | 13.23 | | | $ | 13.13 | |
|
Total Return | | | 1.93 | % | | | (16.46 | %) | | | 3.93 | % | | | 3.03 | % | | | 8.48 | % |
Ratios/Supplemental Data |
Net assets, end of period (in thousands) | | $ | 10,826 | | | $ | 4,629 | | | $ | 12,772 | | | $ | 13,406 | | | $ | 13,970 | |
Ratios to average net assets: |
Net investment income (loss) | | | 2.30 | % | | | 2.04 | % | | | 2.08 | % | | | 2.23 | % | | | 2.59 | % |
Total expensesc | | | 0.96 | % | | | 0.98 | % | | | 0.96 | % | | | 1.00 | % | | | 1.08 | % |
Net expensesd,e,f | | | 0.53 | % | | | 0.54 | % | | | 0.55 | % | | | 0.56 | % | | | 0.56 | % |
Portfolio turnover rate | | | 11 | % | | | 14 | % | | | 22 | % | | | 58 | % | | | 30 | % |
a | Net investment income (loss) per share was computed using average shares outstanding throughout the period. |
b | Total return does not reflect the impact of any applicable sales charges. |
c | Does not include expenses of the underlying funds in which the Fund invests. |
d | Net expense information reflects the expense ratios after expense waivers and reimbursements, as applicable. |
e | The portion of the ratios of net expenses to average net assets attributable to recoupments of prior fee reductions or expense reimbursements for the years presented was as follows: |
| | | 09/30/23 | 09/30/22 | 09/30/21 | 09/30/20 | 09/30/19 |
| | A-Class | 0.00%* | 0.02% | — | 0.00%* | 0.00%* |
| | C-Class | 0.01% | 0.01% | — | 0.00%* | — |
| | P-Class | 0.00%* | 0.01% | — | 0.00%* | — |
| | Institutional Class | 0.00%* | 0.01% | — | 0.00%* | — |
f | Net expenses may include expenses that are excluded from the expense limitation agreement. Excluding these expenses, the net expense ratios for the years presented would be: |
| | | 09/30/23 | 09/30/22 | 09/30/21 | 09/30/20 | 09/30/19 |
| | A-Class | 0.77% | 0.78% | 0.79% | 0.80% | 0.80% |
| | C-Class | 1.53% | 1.53% | 1.54% | 1.55% | 1.55% |
| | P-Class | 0.77% | 0.78% | 0.79% | 0.80% | 0.80% |
| | Institutional Class | 0.52% | 0.53% | 0.54% | 0.55% | 0.55% |
SEE NOTES TO FINANCIAL STATEMENTS. | THE GUGGENHEIM FUNDS ANNUAL REPORT | 79 |
NOTES TO FINANCIAL STATEMENTS |
Note 1 – Organization and Significant Accounting Policies
Organization
Guggenheim Funds Trust (the “Trust”), a Delaware statutory trust, is registered with the U.S. Securities and Exchange Commission (the “SEC”) under the Investment Company Act of 1940 (the “1940 Act”), as an open-ended investment company of the series type. Each series, in effect, is representing a separate fund (each, a “Fund”). The Trust may issue an unlimited number of authorized shares. The Trust accounts for the assets of each Fund separately.
The Trust offers a combination of five separate classes of shares: A-Class shares, C-Class shares, P-Class shares, R6-Class shares and Institutional Class shares. Sales of shares of each Class are made without a front-end sales charge at the net asset value per share (“NAV”), with the exception of A-Class shares. A-Class shares are sold at the NAV, plus the applicable front-end sales charge. The sales charge varies depending on the amount purchased. A-Class share purchases of $1 million or more are exempt from the front-end sales charge but have a 1% contingent deferred sales charge (“CDSC”), if shares are redeemed within 12 months of purchase. C-Class shares have a 1% CDSC if shares are redeemed within 12 months of purchase. C-Class shares of each Fund automatically convert to A-Class shares of the same Fund on or about the 10th day of the month following the 8-year anniversary of the purchase of the C-Class shares. This conversion will be executed without any sales charge, fee or other charge. After the conversion is completed, the shares will be subject to all features and expenses of A-Class shares. Institutional Class shares are offered primarily for direct investment by institutions such as pension and profit sharing plans, endowments, foundations and corporations. Institutional Class shares require a minimum initial investment of $2 million and a minimum account balance of $1 million. R6-Class shares are offered primarily through qualified retirement and benefit plans. R6-Class shares are also offered through certain other plans and platforms sponsored by financial intermediaries. Certain institutional investors and others deemed appropriate by Guggenheim Investments (“GI” or the “Adviser”) may also be eligible to purchase R6-Class shares subject to a $2 million minimum initial investment. At September 30, 2023, the Trust consisted of nineteen funds.
As of January 1, 2012, A-Class, C-Class and Institutional Class shares of High Yield Fund are subject to a 2% redemption fee when shares are redeemed or exchanged within 90 days of purchase.
This report covers the following funds (collectively, the “Funds”):
Fund Name | Investment
Company Type |
Diversified Income Fund | Diversified |
High Yield Fund | Diversified |
Core Bond Fund | Diversified |
Municipal Income Fund | Diversified |
Security Investors, LLC and Guggenheim Partners Investment Management, LLC (“GPIM”), which operate under the name Guggenheim Investments, provide advisory services. Security Investors, LLC (or the “Adviser”) provides advisory services to High Yield Fund, Core Bond Fund and Municipal Income Fund and GPIM (or the “Adviser”) provides advisory services to Diversified Income Fund. Guggenheim Funds Distributors, LLC (“GFD”) serves as distributor of the Funds’ shares. GI and GFD are affiliated entities. GPIM, an affiliate of GI, serves as investment sub-advisor (the “Sub-Advisor”) to the Municipal Income Fund and is responsible for the day-to-day management of the Fund’s portfolio.
Pursuant to an investment Sub-Advisory Agreement between Security Investors, LLC (“SI”) and Guggenheim Partners Advisors, LLC (“GPA”), that was in effect during a portion of the Reporting Period, GPA was engaged to provide investment subadvisory services to High Yield Fund, Core Bond Fund, and Municipal Income Fund. GPA operated as an investment sub-advisor to these Funds from April 29, 2022 to December 22, 2022.
GPA, under the oversight of the Board and SI, assisted SI in the supervision and direction of the investment strategies of High Yield Fund, Core Bond Fund, and Municipal Income Fund in accordance with their investment policies. As compensation for its services, SI paid GPA a fee, payable monthly, in an amount equal to 0.005% of the average daily net assets of High Yield Fund, Core Bond Fund, and Municipal Income Fund.
Significant Accounting Policies
The Funds operate as investment companies and, accordingly, follow the investment company accounting and reporting guidance of the Financial Accounting Standards Board (“FASB”) Accounting Standards Codification Topic 946 Financial Services – Investment Companies.
The following significant accounting policies are in conformity with U.S. generally accepted accounting principles (“U.S. GAAP”) and are consistently followed by the Trust. This requires management to make estimates and assumptions that affect the reported amount of assets and liabilities, contingent assets and liabilities at the date of the financial statements, and the reported amounts of
80 | THE GUGGENHEIM FUNDS ANNUAL REPORT | |
NOTES TO FINANCIAL STATEMENTS (continued) |
revenues and expenses during the reporting period. Actual results could differ from these estimates. All time references are based on Eastern Time.
The NAV of each share class of a fund is calculated by dividing the market value of a fund’s securities and other assets, less all liabilities, attributable to the share class by the number of outstanding shares of the share class.
(a) Valuation of Investments
The Board of Trustees of the Funds (the “Board”) has adopted policies and procedures for the valuation of the Funds’ investments (the “Fund Valuation Procedures”). The SEC adopted Rule 2a-5 under the 1940 Act (“Rule 2a-5”) which establishes requirements for determining fair value in good faith. Rule 2a-5 also defines “readily available market quotations” for purposes of the 1940 Act and establishes requirements for determining whether a fund must fair value a security in good faith.
Pursuant to Rule 2a-5, the Board has designated the Adviser as the valuation designee to perform fair valuation determinations for the Funds with respect to all Fund investments and other assets. As the Funds’ valuation designee pursuant to Rule 2a-5, the Adviser has adopted separate procedures (the “Valuation Designee Procedures” and collectively with the Fund Valuation Procedures, the “Valuation Procedures”) reasonably designed to prevent violations of the requirements of Rule 2a-5 and Rule 31a-4. The Adviser, in its role as valuation designee, utilizes the assistance of a valuation committee, consisting of representatives from Guggenheim’s investment management, fund administration, legal and compliance departments (the “Valuation Committee”), in determining the fair value of the Funds’ securities and other assets.
Valuations of the Funds’ securities and other assets are supplied primarily by pricing service providers appointed pursuant to the processes set forth in the Valuation Procedures. The Adviser, with the assistance of the Valuation Committee, convenes monthly, or more frequently as needed, to review the valuation of all assets which have been fair valued. The Adviser, consistent with the monitoring and review responsibilities set forth in the Valuation Procedures, regularly reviews the appropriateness of the inputs, methods, models and assumptions employed by the pricing service provider.
If the pricing service provider cannot or does not provide a valuation for a particular investment or such valuation is deemed unreliable, such investment is fair valued by the Adviser.
Equity securities listed or traded on a recognized U.S. securities exchange or the National Association of Securities Dealers Automated Quotations (“NASDAQ”) National Market System will generally be valued on the basis of the last sale price on the primary U.S. exchange or market on which the security is listed or traded; provided, however, that securities listed on NASDAQ will be valued at the NASDAQ official closing price, which may not necessarily represent the last sale price.
Generally, trading in foreign securities markets is substantially completed each day at various times prior to the close of the New York Stock Exchange (“NYSE”). The values of foreign securities are determined as of the close of such foreign markets or the close of the NYSE, if earlier. All investments quoted in foreign currencies are valued in U.S. dollars on the basis of the foreign currency exchange rates prevailing at the close of U.S. business at 4:00 p.m. Investments in foreign securities may involve risks not present in domestic investments. The Adviser will determine the current value of such foreign securities by taking into consideration certain factors which may include the following factors, among others: the value of the securities traded on other foreign markets, American Depositary Receipts (“ADR”) trading, closed-end fund trading, foreign currency exchange activity, and the trading prices of financial products that are tied to foreign securities. In addition, under the Valuation Procedures, the Adviser is authorized to use prices and other information supplied by a pricing service provider in valuing foreign securities.
Open-end investment companies are valued at their NAV as of the close of business, on the valuation date. Exchange-traded funds and closed-end investment companies are generally valued at the last quoted sale price.
U.S. Government securities are valued by pricing service providers, the last traded fill price, or at the reported bid price at the close of business.
CLOs, CDOs, MBS, ABS, and other structured finance securities are generally valued using a pricing service provider.
Commercial paper and discount notes with a maturity of greater than 60 days at acquisition are valued at prices that reflect broker-dealer supplied valuations or are obtained from pricing service providers, which may consider the trade activity, treasury spreads, yields or price of bonds of comparable quality, coupon, maturity, and type, as well as prices quoted by dealers who make markets in such securities. Commercial paper and discount notes with a maturity of 60 days or less at acquisition are valued at amortized cost, unless the Adviser concludes that amortized cost does not represent the fair value of the applicable asset in which case it will be valued using an independent pricing service.
Typically, loans are valued using information provided by a pricing service provider which uses broker quotes, among other inputs. If the pricing service cannot or does not provide a valuation for
| | THE GUGGENHEIM FUNDS ANNUAL REPORT | 81 |
NOTES TO FINANCIAL STATEMENTS (continued) |
a particular loan, or such valuation is deemed unreliable, such investment is valued based on a quote from a broker-dealer or is fair valued by the Adviser.
Exchange-traded options are valued at the mean of the bid and ask prices on the principal exchange on which they are traded. Over-the-counter (“OTC”) options and options on swaps (“swaptions”) are valued using a price provided by a pricing service.
Futures contracts are valued on the basis of the last sale price at the 4:00 p.m. price on the valuation date. In the event that the exchange for a specific futures contract closes earlier than 4:00 p.m., the futures contract is valued at the official settlement price of the exchange. However, the underlying securities from which the futures contract value is derived are monitored until 4:00 p.m. to determine if fair valuation would provide a more accurate valuation.
Interest rate swap agreements entered into by a fund are valued on the basis of the last sale price on the primary exchange on which the swap is traded.
Other swap agreements entered into by a fund are generally valued using an evaluated price provided by a pricing service provider.
Forward foreign currency exchange contracts are valued daily based on the applicable exchange rate of the underlying currency.
Investments for which market quotations are not readily available are fair valued as determined in good faith by the Adviser. Valuations in accordance with these methods are intended to reflect each security’s (or asset’s or liability’s) “fair value”. Each such determination is based on a consideration of all relevant factors, which are likely to vary from one pricing context to another. Examples of such factors may include, but are not limited to market prices; sale prices; broker quotes; and models which derive prices based on inputs such as anticipated cash flows or collateral, spread over U.S. Treasury securities, and other information analysis.
In connection with futures contracts and other derivative investments, such factors may include obtaining information as to how (a) these contracts and other derivative investments trade in the futures or other derivative markets, respectively, and (b) the securities underlying these contracts and other derivative investments trade in the cash market.
(b) U.S. Government and Agency Obligations
Certain U.S. Government and Agency Obligations are traded on a discount basis; the interest rates shown on the Schedules of Investments reflect the effective rates paid at the time of purchase by the Funds. Other securities bear interest at the rates shown, payable at fixed dates through maturity.
Inflation-Indexed bonds are fixed-income securities whose principal value is periodically adjusted to the rate of inflation. The interest rate on these securities is generally fixed at issuance at a rate lower than typical bonds. Over the life of an inflation-indexed bond however, interest will be paid based on a principal value which is adjusted for inflation. Any increase in the principal amount of an inflation-indexed bond is recognized as a component of Interest on the Fund’s Statements of Operations, even though principal is not received until maturity.
(c) Senior Floating Rate Interests and Loan Investments
Senior floating rate interests in which the Trust invests generally pay interest rates which are periodically adjusted by reference to a base short-term floating rate, plus a premium. These base lending rates are generally (i) the lending rate offered by one or more major European banks, (ii) the prime rate offered by one or more major United States banks, or (iii) the bank’s certificate of deposit rate. Senior floating rate interests often require prepayments from excess cash flows or permit the borrower to repay at its election. The rate at which the borrower repays cannot be predicted with accuracy. As a result, the actual remaining maturity may be substantially less than the stated maturities disclosed in the Funds’ Schedules of Investments.
The Funds invest in loans and other similar debt obligations (“obligations”). A portion of the Funds’ investments in these obligations is sometimes referred to as “covenant lite” loans or obligations (“covenant lite obligations”), which are obligations that lack covenants or possess fewer or less restrictive covenants or constraints on borrowers than certain other types of obligations. The Funds may also obtain exposure to covenant lite obligations through investment in securitization vehicles and other structured products. Recently, many new or reissued obligations have not featured traditional covenants, which are intended to protect lenders and investors by (i) imposing certain restrictions or other limitations on a borrower’s operations or assets or (ii) providing certain rights to lenders. The Funds may have fewer rights with respect to covenant lite obligations, including fewer protections against the possibility of default and fewer remedies in the event of default. As a result, investments in (or exposure to) covenant lite obligations are subject to more risk than investments in (or exposure to) certain other types of obligations. The Funds are subject to other risks associated with investments in (or exposure to) obligations, including that obligations may not be considered
82 | THE GUGGENHEIM FUNDS ANNUAL REPORT | |
NOTES TO FINANCIAL STATEMENTS (continued) |
“securities” and, as a result, the Funds may not be entitled to rely on the anti-fraud protections under the federal securities laws and instead may have to resort to state law and direct claims.
(d) Interest on When-Issued Securities
The Funds may purchase and sell interests in securities on a when-issued and delayed delivery basis, with payment and delivery scheduled for a future date. No income accrues to the Funds on such interests or securities in connection with such transactions prior to the date the Funds actually take delivery of such interests or securities. These transactions are subject to market fluctuations and are subject to the risk that the value at delivery may be more or less than the trade date purchase price. Although the Funds will generally purchase these securities with the intention of acquiring such securities, they may sell such securities before the settlement date.
(e) Short Sales
When a Fund engages in a short sale of a security, an amount equal to the proceeds is reflected as an asset and an equivalent liability. The amount of the liability is subsequently marked-to-market to reflect the market value of the short sale. The Fund maintains a segregated account of cash and/or securities as collateral for short sales.
(f) Options
Upon the purchase of an option, the premium paid is recorded as an investment, the value of which is marked-to-market daily. If a purchased option expires, the Fund realizes a loss in the amount of the cost of the option. When the Fund enters into a closing sale transaction, it realizes a gain or loss depending on whether the proceeds from the closing sale transaction are greater or less than the cost of the option. If the Fund exercises a put option, it realizes a gain or loss from the sale of the underlying security and the proceeds from such sale will be decreased by the premium originally paid. When the Fund exercises a call option, the cost of the security purchased by the Fund upon exercise increases by the premium originally paid.
When the Fund writes (sells) an option, an amount equal to the premium received is entered in that Fund’s accounting records as an asset and equivalent liability. The amount of the liability is subsequently marked-to-market to reflect the current value of the option written. When a written option expires, or if the Fund enters into a closing purchase transaction, it realizes a gain (or loss if the cost of a closing purchase transaction exceeds the premium received when the option was sold).
The Fund may purchase and write swaptions primarily to preserve a return or spread on a particular investment or portion of the Funds’ holdings, as a duration management technique or to protect against an increase in the price of securities it anticipates purchasing at a later date. The purchaser and writer of a swaption is buying or granting the right to enter into a previously agreed upon interest rate swap agreement at any time before the expiration of the options. The swaptions are forward premium swaptions which have extended settlement dates.
(g) Swap Agreements
Swap agreements are marked-to-market daily and the change, if any, is recorded as unrealized appreciation or depreciation. Payments received or made as a result of an agreement or termination of an agreement are recognized as realized gains or losses.
Upon entering into certain centrally-cleared swap transactions, a Fund is required to deposit with its clearing broker an amount of cash or securities as an initial margin. Subsequent variation margin receipts or payments are received or made by the Fund depending on fluctuations in the fair value of the reference entity and are recorded by the Fund as unrealized appreciation or depreciation. When the contract is closed, the Fund records a realized gain or loss equal to the difference between the value of the contract at the time it was opened and the value at the time it was closed.
Upfront payments received or made by a Fund on credit default swap agreements and interest rate swap agreements are amortized over the expected life of the agreement. Periodic payments received or paid by a Fund are recorded as realized gains or losses. Payments received or made as a result of a credit event or termination of the contract are recognized, net of a proportional amount of the upfront payment, as realized gains or losses.
(h) Currency Translations
The accounting records of the Funds are maintained in U.S. dollars. All assets and liabilities initially expressed in foreign currencies are converted into U.S. dollars at prevailing exchange rates. Purchases and sales of investment securities, dividend and interest income, and certain expenses are translated at the rates of exchange prevailing on the respective dates of such transactions. Changes in the relationship of these foreign currencies to the U.S. dollar can significantly affect the value of the investments and earnings of the Funds. Foreign investments may also subject the Funds to foreign government exchange restrictions, expropriation, taxation, or other political, social, geopolitical or economic developments, all of which could affect the market and/or credit risk of the investments.
The Funds do not isolate that portion of the results of operations resulting from changes in the foreign exchange rates on investments from the fluctuations arising from changes in the
| | THE GUGGENHEIM FUNDS ANNUAL REPORT | 83 |
NOTES TO FINANCIAL STATEMENTS (continued) |
market prices of securities held. Such fluctuations are included with the net realized gain or loss and unrealized appreciation or depreciation on investments.
Reported net realized foreign exchange gains and losses arise from sales of foreign currencies and currency gains or losses realized between the trade and settlement dates on investment transactions. Net unrealized appreciation and depreciation arise from changes in the fair values of assets and liabilities other than investments in securities at the fiscal period end, resulting from changes in exchange rates.
(i) Forward Foreign Currency Exchange Contracts
The change in value of a forward foreign currency exchange contract is recorded as unrealized appreciation or depreciation until the contract is closed. When the contract is closed, the Funds record a realized gain or loss equal to the difference between the value at the time the contract was opened and the value at the time it was closed.
(j) Foreign Taxes
The Funds may be subject to foreign taxes (a portion of which may be reclaimable) on income, stock dividends, capital gains on investments or certain foreign currency transactions. All foreign taxes are recorded in accordance with the applicable foreign tax regulations and rates that exist in the foreign jurisdictions in which the Funds invest. These foreign taxes, if any, are paid by the Funds and reflected in their Statements of Operations as follows: foreign taxes withheld at source are presented as a reduction of income and foreign taxes on capital gains from sales of investments are included with the net realized gain (loss) on investments. Foreign taxes payable or deferred as of September 30, 2023, if any, are disclosed in the Funds’ Statements of Assets and Liabilities.
(k) Security Transactions
Security transactions are recorded on the trade date for financial reporting purposes. Realized gains and losses from securities transactions are recorded using the identified cost basis. Proceeds from lawsuits related to investment holdings are recorded as a reduction to cost if the securities are still held and as realized gains if no longer held in the respective Fund. Dividend income is recorded on the ex-dividend date, net of applicable taxes withheld by foreign countries, if any. Taxable non-cash dividends are recorded as dividend income. Interest income, including amortization of premiums and accretion of discounts, is accrued on a daily basis. Interest income also includes paydown gains and losses on mortgage-backed and asset-backed securities and senior and subordinated loans. Amendment fees are earned as compensation for evaluating and accepting changes to the original loan agreement and are recognized when received. Dividend income from Real Estate Investment Trusts (“REITs”) is recorded based on the income included in the distributions received from the REIT investments using published REIT classifications, including some management estimates when actual amounts are not available. Distributions received in excess of this estimated amount are recorded as a reduction of the cost of investments or reclassified to realized gains. The actual amounts of income, return of capital, and realized gains are only determined by each REIT after its fiscal year-end, and may differ from the estimated amounts.
Income from residual collateralized loan obligations is recognized using the effective interest method. At the time of purchase, management estimates the future expected cash flows and determines the effective yield and estimated maturity date based on the estimated cash flows. Subsequent to the purchase, the estimated cash flows are updated periodically and a revised yield is calculated prospectively.
Certain Funds may receive other income from investments in senior loan interests including amendment fees, consent fees and commitment fees. For funded loans, these fees are recorded as income when received by the Funds and included in interest income on the Funds’ Statements of Operations. For unfunded loans, commitment fees are included in realized gain on investments on the Funds’ Statements of Operations at the end of the commitment period.
(l) Distributions
The Funds declare dividends from investment income daily, except for the Diversified Income Fund, which declares monthly. Each Fund pays its shareholders from its net investment income monthly and distributes any net capital gains that it has realized, at least annually. Distributions to shareholders are recorded on the ex-dividend date. Dividends are reinvested in additional shares, unless shareholders request payment in cash. The character of distributions made during the year from net investment income or net realized gains may differ from their ultimate characterization for U.S. federal income tax purposes.
(m) Class Allocations
Interest and dividend income, most expenses, all realized gains and losses, and all unrealized appreciation and depreciation are allocated to the share classes based upon the value of the outstanding shares in each share class. Certain costs, such as distribution and service fees are charged directly to specific share classes. In addition, certain expenses have been allocated to the individual Funds in the Trust based on the respective net assets of each Fund included in the Trust.
84 | THE GUGGENHEIM FUNDS ANNUAL REPORT | |
NOTES TO FINANCIAL STATEMENTS (continued) |
(n) Earnings Credits
Under the fee arrangement with the custodian, the Funds may earn credits based on overnight custody cash balances. These credits are utilized to reduce related custodial expenses. The custodian fees disclosed in the Funds’ Statements of Operations are before the reduction in expense from the related earnings credits, if any. Earnings credits for the year ended September 30, 2023, are disclosed in the Funds’ Statements of Operations.
(o) Cash
The Funds may leave cash overnight in their cash account with the custodian. Periodically, a Fund may have cash due to the custodian bank as an overdraft balance. A fee is incurred on this overdraft, calculated by multiplying the overdraft by a rate based on the federal funds rate, which was 5.33% at September 30, 2023.
(p) Indemnifications
Under the Funds’ organizational documents, the Trustees and Officers are indemnified against certain liabilities arising out of the performance of their duties to the Trust. In addition, throughout the normal course of business, the Funds enter into contracts that contain a variety of representations and warranties which provide general indemnifications. The Funds’ maximum exposure under these arrangements is unknown, as this would involve future claims that may be made against the Funds and/or their affiliates that have not yet occurred. However, based on experience, the Funds expect the risk of loss to be remote.
(q) Special Purpose Acquisition Companies
The Funds may acquire an interest in a special purpose acquisition company (“SPAC”) in an initial public offering or a secondary market transaction. SPAC investments carry many of the same risks as investments in initial public offering securities, such as erratic price movements, greater risk of loss, lack of information about the issuer, limited operating and little public or no trading history, and higher transaction costs. An investment in a SPAC is typically subject to a higher risk of dilution by additional later offerings of interests in the SPAC or by other investors exercising existing rights to purchase shares of the SPAC and interests in SPACs may be illiquid and/or be subject to restrictions on resale. A SPAC is a publicly traded company that raises investment capital for the purpose of acquiring the equity securities of one or more existing companies (or interests therein) via merger, combination, acquisition or other similar transactions. Unless and until an acquisition is completed, a SPAC generally invests its assets (less a portion retained to cover expenses) in U.S. government securities, money market securities and cash and does not typically pay dividends in respect of its common stock. SPAC investments are also subject to the risk that a significant portion of the funds raised by the SPAC may be expended during the search for a target acquisition or merger and that the SPAC may have limited time in which to conduct due diligence on potential business combination targets. Because SPACs are in essence blank check companies without operating history or ongoing business other than seeking acquisitions, the value of their securities is particularly dependent on the ability of the entity’s management to identify and complete a profitable acquisition. Among other conflicts of interest, the economic interests of the management, directors, officers and related parties of a SPAC can differ from the economic interests of public shareholders, which may lead to conflicts as they evaluate, negotiate and recommend business combination transactions to shareholders. This risk may become more acute as the deadline for the completion of a business combination nears. There is no guarantee that the SPACs in which the Funds invest will complete an acquisition or that any acquisitions that are completed will be profitable.
Note 2 – Financial Instruments and Derivatives
As part of their investment strategies, the Funds may utilize short sales and a variety of derivative instruments. These investments involve, to varying degrees, elements of market risk and risks in excess of amounts recognized on the Funds’ Statements of Assets and Liabilities. Valuation and accounting treatment of these instruments can be found under Significant Accounting Policies in Note 1 of these Notes to Financial Statements.
Short Sales
A short sale is a transaction in which a Fund sells a security it does not own. If the security sold short decreases in price between the time the Fund sells the security and closes its short position, the Fund will realize a gain on the transaction. Conversely, if the security increases in price during the period, the Fund will realize a loss on the transaction. The risk of such price increases is the principal risk of engaging in short sales.
Derivatives
Derivatives are instruments whose values depend on, or are derived from, in whole or in part, the value of one or more other assets, such as securities, currencies, commodities or indices. Derivative instruments may be used to increase investment flexibility (including to maintain cash reserves while maintaining exposure to certain other assets), for risk management (hedging) purposes, to facilitate trading, to reduce transaction costs and to pursue higher investment returns. Derivative instruments may also be used to mitigate certain investment risks, such as foreign currency exchange rate risk, interest rate risk and credit risk. U.S. GAAP requires disclosures to enable investors to better understand how and why a Fund uses derivative instruments, how these derivative instruments are accounted for and their effects on the Fund’s financial position and results of operations.
| | THE GUGGENHEIM FUNDS ANNUAL REPORT | 85 |
NOTES TO FINANCIAL STATEMENTS (continued) |
The Funds may utilize derivatives for the following purposes:
Duration: the use of an instrument to manage the interest rate risk of a portfolio.
Hedge: an investment made in order to reduce the risk of adverse price movements in a security, by taking an offsetting position to protect against broad market moves.
Income: the use of any instrument that distributes cash flows typically based upon some rate of interest.
Index Exposure: the use of an instrument to obtain exposure to a listed or other type of index.
Options Purchased and Written
A call option on a security gives the purchaser of the option the right to buy, and the writer of a call option the obligation to sell, the underlying security. The purchaser of a put option has the right to sell, and the writer of the put option the obligation to buy, the underlying security at any time during the option period. The risk associated with purchasing options is limited to the premium originally paid.
The following table represents the Funds’ use and volume of call/put options purchased on a monthly basis:
| | | | Average Notional Amount | |
Fund | Use | | Call | | | Put | |
Core Bond Fund | Duration, Hedge, Income | | $ | 165,333,333 | | | $ | 13,392,165 | |
The risk in writing a call option is that a Fund may incur a loss if the market price of the underlying security increases and the option is exercised. The risk in writing a put option is that a Fund may incur a loss if the market price of the underlying security decreases and the option is exercised. In addition, there may be an imperfect correlation between the movement in prices of options and the underlying securities where a Fund may not be able to enter into a closing transaction because of an illiquid secondary market; or, for OTC options, a Fund may be at risk because of the counterparty’s inability to perform.
The following table represents the Funds’ use and volume of call/put options written on a monthly basis:
| | | | Average Notional Amount | |
Fund | Use | | Call | | | Put | |
Core Bond Fund | Income, Hedge | | $ | 2,282 | | | $ | 28,657,500 | |
Futures Contracts
A futures contract is an agreement to purchase (long) or sell (short) an agreed amount of securities or other instruments at a set price for delivery at a future date. There are significant risks associated with a Fund’s use of futures contracts, including (i) there may be an imperfect or no correlation between the changes in market value of the underlying asset and the prices of futures contracts; (ii) there may not be a liquid secondary market for a futures contract; (iii) trading restrictions or limitations may be imposed by an exchange; and (iv) government regulations may restrict trading in futures contracts. When investing in futures, there is minimal counterparty credit risk to a Fund because futures are exchange-traded and the exchange’s clearinghouse, as counterparty to all exchange-traded futures, guarantees against default. Cash deposits are shown as segregated cash with broker on the Funds’ Consolidated Statements of Assets and Liabilities; securities held as collateral are noted on the Funds’ Consolidated Schedule of Investments.
The following table represents the Funds’ use and volume of futures on a monthly basis:
| | | | Average Notional Amount | |
Fund | Use | | Long | | | Short | |
Core Bond Fund | Duration, Hedge | | $ | 18,219,750 | | | $ | — | |
86 | THE GUGGENHEIM FUNDS ANNUAL REPORT | |
NOTES TO FINANCIAL STATEMENTS (continued) |
Swap Agreements
A swap is an agreement that obligates two parties to exchange a series of cash flows at specified intervals based upon or calculated by reference to changes in specified prices or rates for a specified amount of an underlying asset. When utilizing OTC swaps, a Fund bears the risk of loss of the amount expected to be received under a swap agreement in the event of the default or bankruptcy of a swap agreement counterparty or if the underlying asset declines in value. Certain standardized swaps are subject to mandatory central clearing and are executed on a multi-lateral or other trade facility platform, such as a registered exchange. There is limited counterparty credit risk with respect to centrally-cleared swaps as the transaction is facilitated through a central clearinghouse, much like exchange-traded futures contracts. For a Fund utilizing centrally-cleared swaps, the exchange bears the risk of loss resulting from a counterparty not being able to pay. There is no guarantee that a Fund or an underlying fund could eliminate its exposure under an outstanding swap agreement by entering into an offsetting swap agreement with the same or another party.
Interest rate swaps involve the exchange by the Funds with another party for their respective commitment to pay or receive a fixed or variable interest rate on a notional amount of principal. Interest rate swaps are generally centrally-cleared, but central clearing does not make interest rate swap transactions risk free.
The following table represents the Funds’ use and volume of interest rate swaps on a monthly basis:
| | | | Average Notional Amount | |
Fund | Use | | Pay Floating Rate | | | Receive Floating Rate | |
Core Bond Fund | Duration, Hedge, Income | | $ | 116,800,000 | | | $ | — | |
Municipal Income Fund | Duration, Hedge | | | 1,600,000 | | | | 6,315,833 | |
Credit default swaps are instruments which allow for the full or partial transfer of third party credit risk, with respect to a particular entity or entities, from one counterparty to the other. A fund enters into credit default swaps as a “seller” or “buyer” of protection primarily to gain or reduce exposure to the investment grade and/or high yield bond market. A seller of credit default swaps is selling credit protection or assuming credit risk with respect to the underlying entity or entities. The buyer in a credit default swap is obligated to pay the seller a periodic stream of payments over the term of the contract provided that no event of default on an underlying reference obligation has occurred. If a credit event occurs, as defined under the terms of the swap agreement, the seller will either (i) pay to the buyer of protection an amount equal to the notional amount of the swap and take delivery of the referenced obligation or underlying securities comprising the referenced index or (ii) pay a net settlement amount in the form of cash or securities equal to the notional amount of the swap less the recovery value of the referenced obligation or underlying securities comprising the referenced index. The notional amount reflects the maximum potential amount the seller of credit protection could be required to pay to the buyer if a credit event occurs. The seller of protection receives periodic premium payments from the buyer and may also receive or pay an upfront premium adjustment to the stated periodic payments. In the event a credit default occurs on a credit default swap referencing an index, a factor adjustment will take place and the buyer of protection will receive a payment reflecting the par less the default recovery rate of the defaulted index component based on its weighting in the index. If no default occurs, the counterparty will pay the stream of payments and have no further obligations to the fund selling the credit protection. For a fund utilizing centrally cleared credit default swaps, the exchange bears the risk of loss resulting from a counterparty not being able to pay. For OTC credit default swaps, a fund bears the risk of loss of the amount expected to be received under a swap agreement in the event of the default or bankruptcy of a swap agreement counterparty, or in the case of a credit default swap in which a fund is selling credit protection, the default of a third party issuer.
The quoted market prices and resulting market values for credit default swap agreements on securities and credit indices serve as an indicator of the current status of the payment/performance risk and represent the likelihood of an expected liability (or profit) for the credit derivative had the notional amount of the swap agreement been closed/sold as of the period end. Increasing market values, in absolute terms when compared to the notional amount of the swap, represent a deterioration of the referenced entity’s credit soundness and a greater likelihood or risk of default or other credit event occurring as defined under the terms of the agreement.
The following table represents the Funds’ use and volume of credit default swaps on a monthly basis:
| | | | Average Notional Amount | |
Fund | Use | | Protection Sold | | | Protection Purchased | |
Core Bond Fund | Index exposure, Hedge | | $ | — | | | $ | 18,283,333 | |
| | THE GUGGENHEIM FUNDS ANNUAL REPORT | 87 |
NOTES TO FINANCIAL STATEMENTS (continued) |
Forward Foreign Currency Exchange Contracts
A forward foreign currency exchange contract is an agreement between two parties to exchange two designated currencies at a specific time in the future. Certain types of contracts may be cash settled, in an amount equal to the change in exchange rates during the term of the contract. The contracts can be used to hedge or manage exposure to foreign currency risks with portfolio investments or to gain exposure to foreign currencies.
The market value of a forward foreign currency exchange contract changes with fluctuations in foreign currency exchange rates. Furthermore, the Funds may be exposed to risk if the counterparties cannot meet the contract terms or if the currency value changes unfavorably as compared to the U.S. dollar.
The following table represents the Funds’ use and volume of forward foreign currency exchange contracts on a monthly basis:
| | | | Average Value | |
Fund | Use | | Purchased | | | Sold | |
High Yield Fund | Hedge | | $ | 49,868 | | | $ | 4,243,632 | |
Core Bond Fund | Hedge | | | 139,218 | | | | 13,304,545 | |
Derivative Investment Holdings Categorized by Risk Exposure
The following is a summary of the location of derivative investments on the Funds’ Statements of Assets and Liabilities as of September 30, 2023:
Derivative Investment Type | Asset Derivatives | Liability Derivatives |
Currency forward contracts | Unrealized appreciation on forward foreign currency exchange contracts | — |
Interest rate swap contracts | Unamortized upfront premiums paid on interest rate swap agreements Variation margin on interest rate swap agreements | Variation margin on interest rate swap agreements |
Credit default swap contracts | Unamortized upfront premiums paid on credit default swap agreements | Unamortized upfront premiums received on credit default swap agreements Variation margin on credit default swap agreements |
Interest rate option contracts | Investments in unaffiliated issuers, at value | Options written, at value |
The following tables set forth the fair value of the Funds’ derivative investments categorized by primary risk exposure at September 30, 2023:
Asset Derivative Investments Value |
Fund | | Swaps
Interest
Rate
Risk* | | | Swaps
Credit
Risk* | | | Forward
Foreign
Currency
Exchange
Risk | | | Options
Purchased
Interest
Rate Risk | | | Options
Written
Interest
Rate Risk | | | Total
Value at
September 30,
2023 | |
High Yield Fund | | $ | — | | | $ | — | | | | 69,539 | | | $ | — | | | $ | — | | | $ | 69,539 | |
Core Bond Fund | | | — | | | | — | | | | 250,744 | | | | 260,784 | | | | — | | | | 511,528 | |
Municipal Income Fund | | | 1,403,850 | | | | — | | | | — | | | | — | | | | — | | | | 1,403,850 | |
Liability Derivative Investments Value |
Fund | | Swaps
Interest
Rate
Risk* | | | Swaps
Credit
Risk* | | | Forward
Foreign
Currency
Exchange
Risk | | | Options
Purchased
Interest
Rate Risk | | | Options
Written
Interest
Rate Risk | | | Total
Value at
September 30,
2023 | |
Core Bond Fund | | $ | 5,932,735 | | | $ | 341,318 | | | | — | | | $ | — | | | $ | 487,166 | | | $ | 6,761,219 | |
* | Includes cumulative appreciation (depreciation) of OTC and centrally-cleared derivatives contracts as reported on the Schedules of Investments. For centrally-cleared derivatives, variation margin is reported within the Funds’ Statements of Assets and Liabilities. |
88 | THE GUGGENHEIM FUNDS ANNUAL REPORT | |
NOTES TO FINANCIAL STATEMENTS (continued) |
The following is a summary of the location of derivative investments on the Funds’ Statements of Operations for the year ended September 30, 2023:
Derivative Investment Type | Location of Gain (Loss) on Derivatives |
Interest rate futures contracts | Net realized gain (loss) on futures contracts |
Currency forward contracts | Net realized gain (loss) on forward foreign currency exchange contracts |
| | Net change in unrealized appreciation (depreciation) on forward foreign currency exchange contracts |
Interest rate option contracts | Net realized gain (loss) on options purchased |
| | Net change in unrealized appreciation (depreciation) on options purchased |
| | Net realized gain (loss) on options written |
| | Net change in unrealized appreciation (depreciation) on options written |
Credit /Interest rate swap contracts | Net realized gain (loss) on swap agreements |
| | Net change in unrealized appreciation (depreciation) on swap agreements |
The following is a summary of the Funds’ realized gain (loss) and change in unrealized appreciation (depreciation) on derivative investments recognized on the Funds’ Statements of Operations categorized by primary risk exposure for the year ended September 30, 2023:
Realized Gain (Loss) on Derivative Investments Recognized on the Statements of Operations |
Fund | | Futures
Interest
Rate
Risk | | | Swaps
Interest
Rate
Risk | | | Swaps
Credit
Risk | | | Options
Written
Equity Risk | | | Options
Purchased
Equity Risk | | | Forward
Foreign
Currency
Exchange
Risk | | | Options
Purchased
Interest
Rate Risk | | | Options
Written
Interest
Rate Risk | | | Total | |
High Yield Fund | | $ | — | | | $ | — | | | $ | — | | | $ | — | | | $ | — | | | $ | (252,159 | ) | | $ | — | | | $ | — | | | $ | (252,159 | ) |
Core Bond Fund | | | 441,718 | | | | (2,949,536 | ) | | | (429,180 | ) | | | 1,330,928 | | | | (2,469,939 | ) | | | (633,512 | ) | | | — | | | | (1,070,824 | ) | | | (5,780,345 | ) |
Municipal Income Fund | | | — | | | | 1,202,369 | | | | — | | | | — | | | | — | | | | — | | | | — | | | | — | | | | 1,202,369 | |
| | | | | | | | | | | | | | | | | | | | | | | | | | | | | | | | | | | | | |
Change in Unrealized Appreciation (Depreciation) on Derivative Investments Recognized on the Statements of Operations |
Fund | | Futures
Interest
Rate
Risk | | | Swaps
Interest
Rate
Risk | | | Swaps
Credit
Risk | | | Options
Written
Equity Risk | | | Options
Purchased
Equity Risk | | | Forward
Foreign
Currency
Exchange
Risk | | | Options
Purchased
Interest
Rate Risk | | | Options
Written
Interest
Rate Risk | | | Total | |
High Yield Fund | | $ | — | | | $ | — | | | $ | — | | | $ | — | | | $ | — | | | $ | (70,079 | ) | | $ | — | | | $ | — | | | $ | (70,079 | ) |
Core Bond Fund | | | — | | | | (220,795 | ) | | | (341,318 | ) | | | 625,047 | | | | (3,337,691 | ) | | | 41,478 | | | | (585,689 | ) | | | 140,649 | | | | (3,678,319 | ) |
Municipal Income Fund | | | — | | | | (514,901 | ) | | | — | | | | — | | | | — | | | | — | | | | — | | | | — | | | | (514,901 | ) |
In conjunction with short sales and the use of derivative instruments, the Funds are required to maintain collateral in various forms. Depending on the financial instrument utilized and the broker involved, the Funds use margin deposits at the broker, cash and/or securities segregated at the custodian bank, discount notes or repurchase agreements allocated to the Funds as collateral.
Foreign Investments
There are several risks associated with exposure to foreign currencies, foreign issuers and emerging markets. A fund’s indirect and direct exposure to foreign currencies subjects the Fund to the risk that those currencies will decline in value relative to the U.S. dollar, or in the case of short positions, that the U.S. dollar will decline in value relative to the currency being hedged. Currency rates in foreign countries may fluctuate significantly over short periods of time for a number of reasons, including changes in interest rates and the imposition of currency controls or other political developments in the U.S. or abroad. In addition, the Fund may incur transaction costs in connection with conversions between various currencies. The Fund may, but is not obligated to, engage in currency hedging transactions, which generally involve buying currency
| | THE GUGGENHEIM FUNDS ANNUAL REPORT | 89 |
NOTES TO FINANCIAL STATEMENTS (continued) |
forward, options or futures contracts. However, not all currency risks may be effectively hedged, and in some cases the costs of hedging techniques may outweigh expected benefits. In such instances, the value of securities denominated in foreign currencies can change significantly when foreign currencies strengthen or weaken relative to the U.S. dollar.
The Fund may invest in securities of foreign companies directly, or in financial instruments, such as ADRs and exchange-traded funds, which are indirectly linked to the performance of foreign issuers. Foreign markets can be more volatile than the U.S. market due to increased risks of adverse issuer, political, regulatory, market, or economic developments and can perform differently from the U.S. market. Investing in securities of foreign companies directly, or in financial instruments that are indirectly linked to the performance of foreign issuers, may involve risks not typically associated with investing in U.S. issuers. The value of securities denominated in foreign currencies, and of dividends from such securities, can change significantly when foreign currencies strengthen or weaken relative to the U.S. dollar. Foreign securities markets generally have less trading volume and less liquidity than U.S. markets, and prices in some foreign markets may fluctuate more than those of securities traded on U.S. markets. Many foreign countries lack accounting and disclosure standards comparable to those that apply to U.S. companies, and it may be more difficult to obtain reliable information regarding a foreign issuer’s financial condition and operations. Transaction costs and costs associated with custody services are generally higher for foreign securities than they are for U.S. securities. Some foreign governments levy withholding taxes against dividend and interest income. Although in some countries portions of these taxes are recoverable, the non-recovered portion will reduce the income received by the Funds.
The Trust has established counterparty credit guidelines and enters into transactions only with financial institutions rated/identified as investment grade or better. The Trust monitors the counterparty credit risk associated with each such financial institution.
Note 3 – Offsetting
In the normal course of business, the Funds enter into transactions subject to enforceable master netting arrangements or other similar arrangements. Generally, the right to offset in those agreements allows the Funds to counteract the exposure to a specific counterparty with collateral received from or delivered to that counterparty based on the terms of the arrangements. These arrangements provide for the right to liquidate upon the occurrence of an event of default, credit event upon merger or additional termination event.
In order to better define their contractual rights and to secure rights that will help the Funds mitigate their counterparty risk, the Funds may enter into an International Swaps and Derivatives Association, Inc. Master Agreement (“ISDA Master Agreement”) or similar agreement with their derivative contract counterparties. An ISDA Master Agreement is a bilateral agreement between a fund and a counterparty that governs OTC derivatives, including foreign exchange contracts, and typically contains, among other things, collateral posting terms and netting provisions in the event of a default and/or termination event. The provisions of the ISDA Master Agreement typically permit a single net payment in the event of a default (close-out netting) or similar event, including the bankruptcy or insolvency of the counterparty.
For derivatives traded under an ISDA Master Agreement, the collateral requirements are typically calculated by netting the mark-to-market amount for each transaction under such agreement and comparing that amount to the value of any collateral currently pledged by the Funds and the counterparty. For financial reporting purposes, cash collateral that has been pledged to cover obligations of the Funds and cash collateral received from the counterparty, if any, are reported separately on the Funds’ Statements of Assets and Liabilities as segregated cash with broker/receivable for variation margin, or payable for swap settlement/variation margin. Cash and/or securities pledged or received as collateral by the Funds in connection with an OTC derivative subject to an ISDA Master Agreement generally may not be invested, sold or rehypothecated by the counterparty or the Funds, as applicable, absent an event of default under such agreement, in which case such collateral generally may be applied towards obligations due to and payable by such counterparty or the Funds, as applicable. Generally, the amount of collateral due from or to a counterparty must exceed a minimum transfer amount threshold (e.g., $300,000) before a transfer is required to be made. To the extent amounts due to the Funds from their counterparties are not fully collateralized, contractually or otherwise, the Funds bear the risk of loss from counterparty nonperformance. The Funds attempt to mitigate counterparty risk by only entering into agreements with counterparties that they believe to be of good standing and by monitoring the financial stability of those counterparties.
For financial reporting purposes, the Funds do not offset derivative assets and derivative liabilities that are subject to netting arrangements in the Funds’ Statements of Assets and Liabilities.
90 | THE GUGGENHEIM FUNDS ANNUAL REPORT | |
NOTES TO FINANCIAL STATEMENTS (continued) |
The following tables present derivative financial instruments and secured financing transactions that are subject to enforceable netting arrangements:
| | | | | | | | | | | | | | | | Gross Amounts Not Offset
in the Statements of
Assets and Liabilities | | | | | |
Fund | Instrument | | Gross
Amounts of
Recognized
Assets1 | | | Gross
Amounts
Offset in the
Statements
of Assets and
Liabilities | | | Net Amount
of Assets
Presented on
the Statements
of Assets and
Liabilities | | | Financial
Instruments | | | Cash
Collateral
Received | | | Net
Amount | |
High Yield Fund | Forward foreign currency exchange contracts | | $ | 69,539 | | | $ | — | | | $ | 69,539 | | | $ | — | | | $ | — | | | $ | 69,539 | |
Core Bond Fund | Options purchased | | | 260,784 | | | | — | | | | 260,784 | | | | (89,338 | ) | | | (51,786 | ) | | | 119,660 | |
Core Bond Fund | Forward foreign currency exchange contracts | | | 250,744 | | | | — | | | | 250,744 | | | | (165,205 | ) | | | (85,539 | ) | | | — | |
| | | | | | | | | | | | | | | | | | | Gross Amounts Not Offset
in the Statements of
Assets and Liabilities | | | | | |
Fund | | Instrument | | | Gross
Amounts of
Recognized
Liabilities1 | | | Gross
Amounts
Offset in the
Statements
of Assets and
Liabilities | | | Net Amounts
of Assets
Presented on
the Statements
of Assets and
Liabilities | | | Financial
Instruments | | | Cash
Collateral
Pledged | | | Net
Amount | |
Core Bond Fund | Options written | | $ | 487,166 | | | $ | — | | | $ | 487,166 | | | $ | (254,543 | ) | | $ | — | | | $ | 232,623 | |
1 | Exchange traded or centrally-cleared derivatives are excluded from these reported amounts. |
The Funds have the right to offset deposits against any related derivative liabilities outstanding with each counterparty with the exception of exchange-traded or centrally-cleared derivatives. The following table presents deposits held by others in connection with derivative investments as of September 30, 2023.
Fund | Counterparty | Asset Type | | Cash Pledged | | | Cash Received | |
Core Bond Fund | BofA Securities, Inc. | Credit default swap agreements | | $ | 442,673 | | | $ | — | |
| | BofA Securities, Inc. | Interest rate swap agreements | | | 470,370 | | | | — | |
| | Goldman Sachs International | Options | | | — | | | | 100,000 | |
| Morgan Stanley Capital Services LLC | Forward foreign currency exchange contracts, Options | | | — | | | | 100,652 | |
| | | | | 913,043 | | | | 200,652 | |
Municipal Income Fund | BofA Securities, Inc. | Interest rate swap agreements | | | 387,498 | | | | — | |
Note 4 – Fair Value Measurement
In accordance with U.S. GAAP, fair value is defined as the price that the Funds would receive to sell an investment or pay to transfer a liability in an orderly transaction between market participants at the measurement date. U.S. GAAP establishes a three-tier fair value hierarchy based on the types of inputs used to value assets and liabilities and requires corresponding disclosure. The hierarchy and the corresponding inputs are summarized below:
Level 1 — | unadjusted quoted prices in active markets for identical assets or liabilities. |
| | THE GUGGENHEIM FUNDS ANNUAL REPORT | 91 |
NOTES TO FINANCIAL STATEMENTS (continued) |
Level 2 — | significant other observable inputs (for example quoted prices for securities that are similar based on characteristics such as interest rates, prepayment speeds, credit risk, etc.). |
Level 3 — | significant unobservable inputs based on the best information available under the circumstances, to the extent observable inputs are not available, which may include assumptions. |
Rule 2a-5 sets forth a definition of “readily available market quotations,” which is consistent with the definition of a Level 1 input under U.S. GAAP. Rule 2a-5 provides that “a market quotation is readily available only when that quotation is a quoted price (unadjusted) in active markets for identical investments that the fund can access at the measurement date, provided that a quotation will not be readily available if it is not reliable.”
Securities for which market quotations are not readily available must be valued at fair value as determined in good faith. Accordingly, any security priced using inputs other than Level 1 inputs will be subject to fair value requirements. The types of inputs available depend on a variety of factors, such as the type of security and the characteristics of the markets in which it trades, if any. Fair valuation determinations that rely on fewer or no observable inputs require greater judgment. Accordingly, fair value determinations for Level 3 securities require the greatest amount of judgment.
Pricing service providers are used to value a majority of the Funds’ investments. When values are not available from a pricing service provider, they will be determined using a variety of sources and techniques, including: market prices; broker quotes; and models which derive prices based on inputs such as prices of securities with comparable maturities and characteristics or based on inputs such as anticipated cash flows or collateral, spread over U.S. Treasury securities, and other information and analysis. A significant portion of the Funds’ assets and liabilities are categorized as Level 2, as indicated in this report.
Quotes from broker-dealers, adjusted for fluctuations in criteria such as credit spreads and interest rates, may also be used to value the Funds’ assets and liabilities, i.e. prices provided by a broker-dealer or other market participant who has not committed to trade at that price. Although quotes are typically received from established market participants, the Funds may not have the transparency to view the underlying inputs which support the market quotations. Significant changes in a quote would generally result in significant changes in the fair value of the security.
Certain fixed income securities are valued by obtaining a monthly quote from a broker-dealer, adjusted for fluctuations in criteria such as credit spreads and interest rates. Certain loans and other securities are valued using a single daily broker quote or a price from a pricing service provider based on a single daily or monthly broker quote.
The inputs or methodologies selected and applied for valuing securities or other assets are not necessarily an indication of the risk associated with investing in those securities. The suitability, appropriateness and accuracy of the techniques, methodologies and sources employed to determine fair valuation are periodically reviewed and subject to change.
Note 5 – Investment Advisory Agreement and Other Agreements
Under the terms of an investment advisory contract, the Funds pay GI investment advisory fees calculated at the annualized rates below, based on the average daily net assets of the Funds:
Fund | | Management Fees
(as a % of Net Assets) | |
Diversified Income Fund | | | 0.75 | % |
High Yield Fund | | | 0.60 | % |
Core Bond Fund | | | 0.39 | % |
Municipal Income Fund | | | 0.50 | % |
GI pays operating expenses on behalf of the Trust, such as audit and accounting related services, legal services, custody, printing and mailing, among others, on a pass-through basis. Such expenses are allocated to various Funds within the complex based on relative net assets.
GI pays operating expenses on behalf of the Trust, such as audit and accounting related services, legal services, custody, printing and mailing, among others, on a pass-through basis. Such expenses are allocated to various Funds within the complex based on relative net assets.
92 | THE GUGGENHEIM FUNDS ANNUAL REPORT | |
NOTES TO FINANCIAL STATEMENTS (continued) |
The Board has adopted Distribution Plans related to the offering of A-Class, C-Class and P-Class shares pursuant to Rule 12b-1 under the 1940 Act. The plans provide for payments at an annual rate of 0.25% of the average daily net assets of the Fund’s A-Class and P-Class shares, and 1.00% of the average daily net assets of the Fund’s C-Class shares.
The investment advisory contract for the Funds provide that the total expenses be limited to a percentage of average net assets for each class of shares, exclusive of brokerage costs, dividends or interest on securities sold short, expenses of other investment companies in which a Fund invests, interest, taxes, litigation, indemnification and extraordinary expenses. The limits are listed below:
| | Limit | | | Effective
Date | | | Contract
End Date | |
Diversified Income Fund - A-Class | | | 1.30 | % | | | 01/29/16 | | | | 02/01/25 | |
Diversified Income Fund - C-Class | | | 2.05 | % | | | 01/29/16 | | | | 02/01/25 | |
Diversified Income Fund - P-Class | | | 1.30 | % | | | 01/29/16 | | | | 02/01/25 | |
Diversified Income Fund - Institutional Class | | | 1.05 | % | | | 01/29/16 | | | | 02/01/25 | |
High Yield Fund - A-Class | | | 1.16 | % | | | 11/30/12 | | | | 02/01/25 | |
High Yield Fund - C-Class | | | 1.91 | % | | | 11/30/12 | | | | 02/01/25 | |
High Yield Fund - P-Class | | | 1.16 | % | | | 05/01/15 | | | | 02/01/25 | |
High Yield Fund - Institutional Class | | | 0.91 | % | | | 11/30/12 | | | | 02/01/25 | |
High Yield Fund - R6-Class | | | 0.91 | % | | | 05/15/17 | | | | 02/01/25 | |
Core Bond Fund - A-Class | | | 0.79 | % | | | 11/30/12 | | | | 02/01/25 | |
Core Bond Fund - C-Class | | | 1.54 | % | | | 11/30/12 | | | | 02/01/25 | |
Core Bond Fund - P-Class | | | 0.79 | % | | | 05/01/15 | | | | 02/01/25 | |
Core Bond Fund - Institutional Class | | | 0.50 | % | | | 11/30/12 | | | | 02/01/25 | |
Municipal Income Fund - A-Class | | | 0.80 | % | | | 11/30/12 | | | | 02/01/25 | |
Municipal Income Fund - C-Class | | | 1.55 | % | | | 11/30/12 | | | | 02/01/25 | |
Municipal Income Fund - P-Class | | | 0.80 | % | | | 05/01/15 | | | | 02/01/25 | |
Municipal Income Fund - Institutional Class | | | 0.55 | % | | | 11/30/12 | | | | 02/01/25 | |
GI is entitled to reimbursement by the Funds for fees waived or expenses reimbursed during any of the previous 36 months, beginning on the date of the expense limitation agreement, if on any day the estimated operating expenses are less than the indicated percentages. For purposes of this arrangement, GI is entitled to recoupment of previously waived fees or reimbursed expenses for 36 months from the date of the waiver or reimbursement by GI. At September 30, 2023, the amount of fees waived or expenses reimbursed that are subject to recoupment and will expire during the years ended September 30, are presented in the following table:
Fund | | 2024 | | | 2025 | | | 2026 | | | Fund
Total | |
Diversified Income Fund | | | | | | | | | | | | | | | | |
A-Class | | $ | 8,022 | | | $ | 7,429 | | | $ | 6,440 | | | $ | 21,891 | |
C-Class | | | 5,885 | | | | 13,460 | | | | 5,060 | | | | 24,405 | |
P-Class | | | 3,708 | | | | 5,940 | | | | 7,594 | | | | 17,242 | |
Institutional Class | | | 164,958 | | | | 140,525 | | | | 130,966 | | | | 436,449 | |
High Yield Fund | | | | | | | | | | | | | | | | |
A-Class | | | — | | | | — | | | | 7,986 | | | | 7,986 | |
C-Class | | | — | | | | 1,069 | | | | 2,464 | | | | 3,533 | |
P-Class | | | 1,534 | | | | 5,764 | | | | 1,432 | | | | 8,730 | |
Institutional Class | | | — | | | | 38,336 | | | | 11,083 | | | | 49,419 | |
R6-Class | | | — | | | | 151 | | | | 143 | | | | 294 | |
Core Bond Fund | | | | | | | | | | | | | | | | |
A-Class | | | 98,028 | | | | 35,811 | | | | 66,528 | | | | 200,367 | |
C-Class | | | 23,013 | | | | 19,268 | | | | 7,997 | | | | 50,278 | |
P-Class | | | 82,001 | | | | 114,700 | | | | 56,610 | | | | 253,311 | |
Institutional Class | | | 1,336,675 | | | | 1,278,995 | | | | 773,981 | | | | 3,389,651 | |
Municipal Income Fund | | | | | | | | | | | | | | | | |
A-Class | | | 233,041 | | | | 204,036 | | | | 158,775 | | | | 595,852 | |
C-Class | | | 7,997 | | | | 6,810 | | | | 4,657 | | | | 19,464 | |
P-Class | | | 1,251 | | | | 1,160 | | | | 1,024 | | | | 3,435 | |
Institutional Class | | | 57,993 | | | | 39,988 | | | | 37,249 | | | | 135,230 | |
| | THE GUGGENHEIM FUNDS ANNUAL REPORT | 93 |
NOTES TO FINANCIAL STATEMENTS (continued) |
For the year ended September 30, 2023, GI recouped amounts from the Funds as follows:
Diversified Income Fund | | $ | 664 | |
High Yield Fund | | | 58,972 | |
Core Bond Fund | | | 38,127 | |
Municipal Income Fund | | | 1,765 | |
If a Fund invests in a fund that is advised by the same adviser or an affiliated adviser, the investing Fund’s adviser has agreed to waive fees at the investing fund level to the extent necessary to offset the proportionate share of any management fee paid by each Fund with respect to its investment in such affiliated fund. Fee waivers will be calculated at the investing fund level without regard to any expense cap in effect for the investing fund. Fees waived under this arrangement are not subject to reimbursement to GI. For the year ended September 30, 2023, the following Funds waived fees related to investments in affiliated funds:
Fund | | Amount Waived | |
Diversified Income Fund | | $ | 43,079 | |
For the year ended September 30, 2023, GFD retained sales charges of $132,849 relating to sales of A-Class shares of the Trust.
Certain trustees and officers of the Trust are also officers of GI and/or GFD. The Trust does not compensate its officers or trustees who are officers, directors and/or employees of GI or GFD.
MUFG Investor Services (US), LLC (“MUIS”) acts as the Funds’ administrator, transfer agent and accounting agent. As administrator, transfer agent and accounting agent, MUIS maintains the books and records of the Funds’ securities and cash. The Bank of New York Mellon Corp. (“BNY”) acts as the Funds’ custodian. As custodian, BNY is responsible for the custody of the Funds’ assets. For providing the aforementioned administrative and accounting services, MUIS is entitled to receive a monthly fee equal to a percentage of the Funds’ average daily net assets and out of pocket expenses. For providing the aforementioned transfer agent and custodian services, MUIS and BNY are entitled to receive a monthly fee based on the number of transactions during the month and the number of accounts under management, subject to certain minimum monthly fees, and out of pocket expenses.
At September 30, 2023, GI and its affiliates owned over twenty percent of the outstanding shares of the Funds, as follows:
Fund | Percent of Outstanding
Shares Owned |
Diversified Income Fund | 91% |
Note 6 – Reverse Repurchase Agreements
Each of the Funds may enter into reverse repurchase agreements. Under a reverse repurchase agreement, a Fund sells securities and agrees to repurchase them at a particular price at a future date. In the event the buyer of securities under a reverse repurchase agreement files for bankruptcy or becomes insolvent, such buyer or its trustee or receiver may receive an extension of time to determine whether to enforce the Fund’s obligation to repurchase the securities, and the Fund’s use of the proceeds of the reverse repurchase agreement may effectively be restricted pending such decision.
94 | THE GUGGENHEIM FUNDS ANNUAL REPORT | |
NOTES TO FINANCIAL STATEMENTS (continued) |
For the year ended September 30, 2023, the Funds entered into reverse repurchase agreements:
Fund | | Number of Days
Outstanding | | | Balance at
September 30, 2023 | | | Average Balance
Outstanding | | | Average
Interest Rate | |
High Yield Fund | | | 365 | | | $ | 1,479,698 | | | $ | 1,445,178 | | | | 2.79 | % |
Core Bond Fund | | | 199 | | | | 59,394,748 | | | | 40,269,175 | | | | 4.03 | % |
Municipal Income Fund | | | 2 | | | | — | * | | | 1,087,500 | | | | 3.60 | % |
* | As of September 30, 2023, the Municipal Income Fund had no open reverse repurchase agreements. |
The following table presents reverse repurchase agreements that are subject to netting arrangements and offset in the Funds’ Statements of Assets and Liabilities in conformity with U.S. GAAP:
| | | | | | | | | | | | | | | | Gross Amounts Not Offset
in the Statements of
Assets and Liabilities | | | | | |
Fund | Instrument | | Gross
Amounts of
Recognized
Liabilities | | | Gross
Amounts
Offset in the
Statements of
Assets and
Liabilities | | | Net Amounts
of Assets
Presented on
the Statements
of Assets and
Liabilities | | | Financial
Instruments | | | Cash
Collateral
Pledged | | | Net Amount | |
High Yield Fund | Reverse Repurchase Agreements | | $ | 1,479,698 | | | $ | — | | | $ | 1,479,698 | | | ($ | 1,479,698 | ) | | $ | — | | | $ | — | |
Core Bond Fund | Reverse Repurchase Agreements | | | 59,394,748 | | | | — | | | | 59,394,748 | | | | (59,394,748 | ) | | | — | | | | — | |
As of September 30, 2023, the High Yield Fund and Core Bond Fund had $1,479,698 and $59,394,748, respectively, in reverse repurchase agreements outstanding with various counterparties. Details of the reverse repurchase agreement by counterparty is as follows:
Fund | Counterparty | Interest Rate(s) | | Maturity Date | | | Face Value | |
High Yield Fund | Goldman Sachs & Co. LLC | 3.25%* | Open Maturity | | $ | 1,479,698 | |
Core Bond Fund | Bank of Montreal | 5.37%* | Open Maturity | | $ | 39,182,846 | |
Core Bond Fund | J.P. Morgan Securities LLC | 5.37%* | Open Maturity | | | 16,997,605 | |
Core Bond Fund | RBC Capital Markets LLC | (0.50%)* | Open Maturity | | | 3,214,297 | |
| | | | | $ | 59,394,748 | |
* | The rate is adjusted periodically by the counterparty, subject to approval by the Adviser, and is not based upon a set reference rate and spread. Rate indicated is the rate effective as of September 30, 2023. |
The following is a summary of the remaining contractual maturities of the reverse repurchase agreement outstanding as of year-end, as aggregated by asset class of the related collateral pledged by the Funds:
Fund | Asset Type | | Overnight and
Continuous | | | Total | |
High Yield Fund | Corporate Bonds | | $ | 1,479,698 | | | $ | 1,479,698 | |
Gross amount of recognized liabilities for reverse repurchase agreements | | | $ | 1,479,698 | | | $ | 1,479,698 | |
Core Bond Fund | U.S. Treasury Notes | | $ | 56,180,451 | | | $ | 56,180,451 | |
| Corporate Bonds | | $ | 3,214,297 | | | $ | 3,214,297 | |
Gross amount of recognized liabilities for reverse repurchase agreements | | | $ | 59,394,748 | | | $ | 59,394,748 | |
| | THE GUGGENHEIM FUNDS ANNUAL REPORT | 95 |
NOTES TO FINANCIAL STATEMENTS (continued) |
Note 7 - Federal Income Tax Information
The Funds intend to comply with the provisions of Subchapter M of the Internal Revenue Code of 1986, as amended (the “Internal Revenue Code”), applicable to regulated investment companies and will distribute substantially all taxable net investment income and capital gains sufficient to relieve the Funds from all, or substantially all, federal income, excise and state income taxes. Therefore, no provision for federal or state income tax or federal excise tax is required.
Tax positions taken or expected to be taken in the course of preparing the Funds’ tax returns are evaluated to determine whether the tax positions are “more-likely-than-not” of being sustained by the applicable tax authority. Tax positions not deemed to meet the more-likely-than-not threshold would be recorded as a tax benefit or expense in the current year. Management has analyzed the Funds’ tax positions taken, or to be taken, on U.S. federal income tax returns for all open tax years, and has concluded that no provision for income tax is required in the Funds’ financial statements. The Funds’ U.S. federal income tax returns are subject to examination by the Internal Revenue Service (“IRS”) for a period of three years after they are filed.
The tax character of distributions paid during the year ended September 30, 2023 was as follows:
Fund | | Ordinary
Income | | | Long-Term
Capital Gain | | | Tax-Exempt
Income | | | Return of
Capital | | | Total
Distributions | |
Diversified Income Fund | | $ | 667,521 | | | $ | 18,379 | | | $ | — | | | $ | — | | | $ | 685,900 | |
High Yield Fund | | | 11,332,804 | | | | — | | | | — | | | | 114,250 | | | | 11,447,054 | |
Core Bond Fund | | | 56,067,246 | | | | — | | | | — | | | | — | | | | 56,067,246 | |
Municipal Income Fund | | | 832,530 | | | | — | | | | 1,021,378 | | | | — | | | | 1,853,908 | |
The tax character of distributions paid during the year ended September 30, 2022 was as follows:
Fund | | Ordinary
Income | | | Long-Term
Capital Gain | | | Tax-Exempt
Income | | | Return of
Capital | | | Total
Distributions | |
Diversified Income Fund | | $ | 291,747 | | | $ | 30,849 | | | $ | — | | | $ | — | | | $ | 322,596 | |
High Yield Fund | | | 13,484,967 | | | | — | | | | — | | | | 467,010 | | | | 13,951,977 | |
Core Bond Fund | | | 49,456,388 | | | | 13,626,451 | | | | — | | | | — | | | | 63,082,839 | |
Municipal Income Fund | | | — | | | | 316,286 | | | | 1,118,374 | | | | — | | | | 1,434,660 | |
Note: For U.S. federal income tax purposes, short-term capital gain distributions are treated as ordinary income distributions.
The tax components of distributable earnings/(loss) as of September 30, 2023 were as follows:
Fund | | Undistributed
Ordinary
Income | | | Undistributed
Long-Term
Capital Gain | | | Net Unrealized
Appreciation
(Depreciation) | | | Accumulated
Capital and
Other Losses | | | Other
Temporary
Differences | | | Total | |
Diversified Income Fund | | $ | 5,466 | | | $ | — | | | $ | (712,499 | ) | | $ | (38,729 | ) | | $ | (23,277 | ) | | $ | (769,039 | ) |
High Yield Fund | | | — | | | | — | | | | (23,387,520 | ) | | | (30,675,979 | ) | | | (1,035,142 | ) | | | (55,098,641 | ) |
Core Bond Fund | | | 3,887,176 | | | | — | | | | (213,539,742 | ) | | | (113,575,802 | ) | | | (5,805,918 | ) | | | (329,034,286 | ) |
Municipal Income Fund | | | 75,057 | * | | | — | | | | (8,263,004 | ) | | | (892,965 | ) | | | (88,569 | ) | | | (9,169,481 | ) |
* | For Municipal Income Fund, the amount shown includes Undistributed Tax-Exempt Income of $75,057. |
96 | THE GUGGENHEIM FUNDS ANNUAL REPORT | |
NOTES TO FINANCIAL STATEMENTS (continued) |
For U.S. federal income tax purposes, capital loss carryforwards represent realized losses of the Funds that may be carried forward and applied against future capital gains. The Funds are permitted to carry forward capital losses for an unlimited period and such capital loss carryforwards retain their character as either short-term or long-term capital losses. As of September 30, 2023, capital loss carryforwards for the Funds were as follows:
| | | Unlimited | | | Total
Capital Loss | |
Fund | | Short-Term | | | Long-Term | | | Carryforward | |
Diversified Income Fund | | $ | — | | | $ | (38,729 | ) | | $ | (38,729 | ) |
High Yield Fund | | | (2,024,650 | ) | | | (28,633,270 | ) | | | (30,657,920 | ) |
Core Bond Fund | | | (51,378,194 | ) | | | (62,197,608 | ) | | | (113,575,802 | ) |
Municipal Income Fund | | | — | | | | (892,965 | ) | | | (892,965 | ) |
Net investment income and net realized gains (losses) may differ for financial statement and tax purposes because of temporary or permanent book/tax differences. These differences are primarily due to investments in swap agreements, partnerships, real estate investment trusts, and CLO securities, foreign currency gains and losses, the “mark-to-market” of certain derivatives, losses deferred due to wash sales, the deferral of qualified late-year losses, reclassification of distributions paid or dividends received, dividends payable, and the disposition of certain Passive Foreign Investment Companies (PFICs). Additional differences may result from the tax treatment of bond premium/discount amortization, paydown reclasses, income accruals on certain investments, and the “mark-to-market” of certain investments denominated in foreign currencies. To the extent these differences are permanent and would require a reclassification between Paid in Capital and Total Distributable Earnings (Loss), such reclassifications are made in the period that the differences arise. These reclassifications have no effect on net assets or NAV per share.
The following adjustments were made on the Statements of Assets and Liabilities as of September 30, 2023 for permanent book/tax differences:
Fund | | Paid In
Capital | | | Total
Distributable
Earnings/(Loss) | |
Core Bond Fund | | $ | 230,503 | | | $ | (230,503 | ) |
At September 30, 2023, the cost of investments for U.S. federal income tax purposes, the aggregate gross unrealized appreciation for all investments for which there was an excess of value over tax cost and the aggregate gross unrealized depreciation for all investments for which there was an excess of tax cost over value, were as follows:
Fund | | Tax
Cost | | | Tax
Unrealized
Appreciation | | | Tax
Unrealized
Depreciation | | | Net Tax
Unrealized
Appreciation/
(Depreciation) | |
Diversified Income Fund | | $ | 8,228,273 | | | $ | 163,628 | | | $ | (876,127 | ) | | $ | (712,499 | ) |
High Yield Fund | | | 213,672,827 | | | | 507,762 | | | | (23,891,257 | ) | | | (23,383,495 | ) |
Core Bond Fund | | | 1,808,877,919 | | | | — | | | | (213,533,891 | ) | | | (213,533,891 | ) |
Municipal Income Fund | | | 49,793,966 | | | | 1,541,737 | | | | (9,804,741 | ) | | | (8,263,004 | ) |
Pursuant to U.S. federal income tax regulations applicable to regulated investment companies, the Funds have elected to treat net capital losses and certain ordinary losses realized between November 1 and September 30 of each year as occurring on the first day of the following tax year. The Funds have also elected to treat certain ordinary losses realized between January 1 and September 30 of each year as occurring on the first day of the following tax year. For the year ended September 30, 2023, the following losses reflected in the accompanying financial statements were deferred for U.S. federal income tax purposes until October 1, 2023:
Fund | | Ordinary | | | Capital | |
High Yield Fund | | $ | (18,059 | ) | | $ | — | |
| | THE GUGGENHEIM FUNDS ANNUAL REPORT | 97 |
NOTES TO FINANCIAL STATEMENTS (continued) |
Note 8 – Securities Transactions
For the year ended September 30, 2023, the cost of purchases and proceeds from sales of investment securities, excluding government securities, short-term investments and derivatives, were as follows:
Fund | | Purchases | | | Sales | |
Diversified Income Fund | | $ | 478,419 | | | $ | 507,991 | |
High Yield Fund | | | 56,095,691 | | | | 54,050,834 | |
Core Bond Fund | | | 1,355,065,244 | | | | 1,102,025,109 | |
Municipal Income Fund | | | 5,263,930 | | | | 13,096,118 | |
For the year ended September 30, 2023, the cost of purchases and proceeds from sales of government securities were as follows:
Fund | | Purchases | | | Sales | |
Core Bond Fund | | $ | 717,570,361 | | | $ | 444,878,832 | |
The Funds are permitted to purchase or sell securities from or to certain affiliated funds under specified conditions outlined in procedures adopted by the Board. The procedures have been designed to ensure that any purchase or sale of securities by a Fund from or to another fund or portfolio that is or could be considered an affiliate by virtue of having a common investment adviser (or affiliated investment advisers), common trustees and/or common officers complies with Rule 17a-7 of the 1940 Act. Further, as defined under these procedures, each transaction is effected at the current market price to save costs, where permissible. For the year ended September 30, 2023, the Funds did not engaged in purchases and sales of securities, pursuant to Rule 17a-7 of the 1940 Act.
Note 9 – Unfunded Loan Commitments
Pursuant to the terms of certain loan agreements, certain Funds held unfunded loan commitments as of September 30, 2023. The Funds are obligated to fund these loan commitments at the borrower’s discretion.
Fund | | Borrower | | | Maturity Date | | | Face Amount | | | Value | |
High Yield Fund | | | Wellsky | | | | 11/ 24/23 | | | $ | 421,000 | | | $ | — | |
| | | | | | | | | | | | | | | | | |
Core Bond Fund | | | Lightning A | | | | 03/01/37 | | | | 1,663,778 | | | | — | |
| | | | Thunderbird A | | | | 03/01/37 | | | | 1,688,667 | | | | — | |
| | | | | | | | | | | | | | | $ | — | |
Note 10– Restricted Securities
The securities below are considered illiquid and restricted under guidelines established by the Board:
Fund | Restricted Securities | | Acquisition Date | | | Cost | | | Value | |
High Yield Fund | | | | | | | | | | | | |
| | Mirabela Nickel Ltd. | | | | | | | | | | | | |
| | 9.50% due 06/24/192 | | | 12/31/13 | | | $ | 252,369 | | | $ | 13,211 | |
Core Bond Fund | | | | | | | | | | | | | |
| | Central Storage Safety Project Trust | | | | | | | | | | | | |
| | 4.82% due 02/01/38 | | | 03/20/18 | | | $ | 871,193 | | | $ | 711,207 | |
| | Copper River CLO Ltd. | | | | | | | | | | | | |
| | 2007-1A INC, due 01/20/211 | | | 05/09/14 | | | | — | | | | 70 | |
| | | | | | | | $ | 871,193 | | | $ | 711,277 | |
1 | Security has no stated coupon. However, it is expected to receive residual cash flow payments on defined deal dates. |
2 | Security is in default of interest and/or principal obligations. |
98 | THE GUGGENHEIM FUNDS ANNUAL REPORT | |
NOTES TO FINANCIAL STATEMENTS (concluded) |
Note 11 – Line of Credit
The Trust, along with other affiliated trusts, secured a 364-day committed, $1,150,000,000 line of credit from Citibank, N.A., which was in place through September 29, 2023, at which time a new line of credit was entered into in the amount of $1,165,000,000. A Fund may draw (borrow) from the line of credit as a temporary measure for emergency purposes, to facilitate redemption requests, or for other short-term liquidity purposes consistent with the Fund’s investment objective and program. For example, it may be advantageous for the Fund to borrow money rather than sell existing portfolio positions to meet redemption requests. Fees related to borrowings, if any, vary under this arrangement between the greater of Citibank’s “base rate”, SOFR plus 1%, or the federal funds rate plus 1/2 of 1%.
The commitment fee that may be paid by the Funds is at an annualized rate of 0.15% of the average daily amount of their allocated unused commitment amount. The commitment fee amount is allocated to the individual Funds based on the respective net assets of each participating Fund and is referenced in the Funds’ Statements of Operations under “Line of credit fees”. The Funds did not have any borrowings under this agreement as of and for the year ended September 30, 2023.
Note 12 – Market Risks
The value of, or income generated by, the investments held by the Funds are subject to the possibility of rapid and unpredictable fluctuation, and loss that may result from various factors. These factors include, among others, developments affecting individual companies, or from broader influences, including real or perceived changes in prevailing interest rates (which have since risen and may continue to rise), changes in inflation rates or expectations about inflation rates (which are currently elevated relative to normal conditions), adverse investor confidence or sentiment, changing economic, political (including geopolitical), social or financial market conditions, increased instability or general uncertainty, environmental disasters, governmental actions, public health emergencies (such as the spread of infectious diseases, pandemics and epidemics), debt crises, actual or threatened wars or other armed conflicts (such as the current Russia-Ukraine conflict and its risk of expansion or collateral economic and other effects) or ratings downgrades, and other similar events, each of which may be temporary or last for extended periods. Moreover, changing economic, political, geopolitical, social, financial market or other conditions in one country or geographic region could adversely affect the value, yield and return of the investments held by the Funds in a different country or geographic region, economy, and market because of the increasingly interconnected global economies and financial markets. The duration and extent of the foregoing types of factors or conditions are highly uncertain and difficult to predict and have in the past, and may in the future, cause volatility and distress in economies and financial markets or other adverse circumstances, which may negatively affect the value of the Funds’ investments and performance of the Funds.
Note 13 – Subsequent Events
Following the period covered by this report, the Board of Trustees of Guggenheim Diversified Income Fund approved the liquidation of the Fund, effective on or about January 23, 2024. In connection with the liquidation, the Fund will close to new shareholders effective on or about December 22, 2023, and it will be closed to additional investments by existing shareholders on or about January 16, 2024. The Fund will deviate from its investment objective prior to the liquidation.
The Funds evaluated subsequent events through the date the financial statements are issued and determined there were no additional material events that would require adjustment to or disclosure in the Funds’ financial statements.
| | THE GUGGENHEIM FUNDS ANNUAL REPORT | 99 |
REPORT OF INDEPENDENT REGISTERED PUBLIC ACCOUNTING FIRM |
To the Shareholders of Guggenheim Diversified Income Fund, Guggenheim High Yield Fund, Guggenheim Core Bond Fund and Guggenheim Municipal Income Fund and the Board of Trustees of Guggenheim Funds Trust
Opinion on the Financial Statements
We have audited the accompanying statements of assets and liabilities of Guggenheim Diversified Income Fund, Guggenheim High Yield Fund, Guggenheim Core Bond Fund and Guggenheim Municipal Income Fund (collectively referred to as the “Funds”), (four of the funds constituting Guggenheim Funds Trust (the “Trust”)), including the schedules of investments, as of September 30, 2023, and the related statements of operations for the year then ended, the statements of changes in net assets for each of the two years in the period then ended, the financial highlights for each of the five years in the period then ended and the related notes (collectively referred to as the “financial statements”). In our opinion, the financial statements present fairly, in all material respects, the financial position of each of the Funds (four of the funds constituting Guggenheim Funds Trust) at September 30, 2023, the results of their operations for the year then ended, the changes in their net assets for each of the two years in the period then ended and their financial highlights for each of the five years in the period then ended, in conformity with U.S. generally accepted accounting principles.
Basis for Opinion
These financial statements are the responsibility of the Trust’s management. Our responsibility is to express an opinion on each of the Funds’ financial statements based on our audits. We are a public accounting firm registered with the Public Company Accounting Oversight Board (United States) (“PCAOB”) and are required to be independent with respect to the Trust in accordance with the U.S. federal securities laws and the applicable rules and regulations of the Securities and Exchange Commission and the PCAOB.
We conducted our audits in accordance with the standards of the PCAOB. Those standards require that we plan and perform the audit to obtain reasonable assurance about whether the financial statements are free of material misstatement, whether due to error or fraud. The Trust is not required to have, nor were we engaged to perform, an audit of the Trust’s internal control over financial reporting. As part of our audits, we are required to obtain an understanding of internal control over financial reporting but not for the purpose of expressing an opinion on the effectiveness of the Trust’s internal control over financial reporting. Accordingly, we express no such opinion.
Our audits included performing procedures to assess the risks of material misstatement of the financial statements, whether due to error or fraud, and performing procedures that respond to those risks. Such procedures included examining, on a test basis, evidence regarding the amounts and disclosures in the financial statements. Our procedures included confirmation of securities owned as of September 30, 2023, by correspondence with the custodian, transfer agent, brokers, and paying agents; when replies were not received from brokers or paying agents, we performed other auditing procedures. Our audits also included evaluating the accounting principles used and significant estimates made by management, as well as evaluating the overall presentation of the financial statements. We believe that our audits provide a reasonable basis for our opinion.

We have served as the auditor of one or more Guggenheim investment companies since 1979.
Tysons, Virginia
November 28, 2023
100 | THE GUGGENHEIM FUNDS ANNUAL REPORT | |
OTHER INFORMATION (Unaudited) |
Federal Income Tax Information
This information is being provided as required by the Internal Revenue Code. Amounts shown may differ from those elsewhere in the report because of differences in tax and financial reporting practice.
In January 2024, shareholders will be advised on IRS Form 1099 DIV or substitute 1099 DIV as to the federal tax status of the distributions received by shareholders in the calendar year 2023.
The Funds’ investment income (dividend income plus short-term capital gains, if any) qualifies as follows:
Municipal Income Fund designates $1,021,378 as tax-exempt interest income according to IRC Section 852(b)(5)(A).
Of the taxable ordinary income distributions paid during the fiscal year ended September 30, 2023, the following funds had the corresponding percentages qualify for the reduced tax rate pursuant to the Jobs and Growth Tax Relief and Reconciliation Act of 2003 or for the dividends received deduction for corporations. See the qualified dividend income and dividend received deduction columns, respectively, in the table below.
Additionally, of the taxable ordinary income distributions paid during the fiscal year ended September 30, 2023, the following funds had the corresponding percentages qualify as interest related dividends and qualified short-term capital gains as permitted by IRC Section 871(k)(1) and IRC Section 871(k)(2), respectively. See the qualified interest income and qualified short-term capital gain columns, respectively, in the table below.
Fund | | Qualified
Dividend
Income | | | Dividend
Received
Deduction | | | Qualified
Interest
Income | | | Qualified
Short-Term
Capital Gain | |
Diversified Income Fund | | | 7.56 | % | | | 1.98 | % | | | 46.50 | % | | | 100.00 | % |
High Yield Fund | | | 0.98 | % | | | 0.72 | % | | | 92.90 | % | | | 0.00 | % |
Core Bond Fund | | | 1.50 | % | | | 1.29 | % | | | 83.61 | % | | | 0.00 | % |
Municipal Income Fund | | | 0.00 | % | | | 0.00 | % | | | 14.85 | % | | | 100.00 | % |
With respect to the taxable year ended September 30, 2023, the Funds hereby designate as capital gain dividends the amounts listed below, or, if subsequently determined to be different, the net capital gain of such year:
Fund | | From long-term
capital gain: | | | From long-term capital
gain, using proceeds
from shareholder
redemptions: | |
Diversified Income Fund | | $ | 18,379 | | | $ | — | |
Delivery of Shareholder Reports
Paper copies of the Funds’ annual and semi-annual shareholder reports are not sent by mail, unless you specifically request paper copies of the reports from a fund or from your financial intermediary. Instead, the reports are made available on a website, and you are notified by mail each time a report is posted and provided with a website link to access the report.
You may elect to receive all future shareholder reports in paper free of charge. If you hold shares of a fund directly, you can inform the Fund that you wish to receive paper copies of reports by calling 800.820.0888. If you hold shares of a fund through a financial intermediary, please contact the financial intermediary to make this election. Your election to receive reports in paper may apply to all Guggenheim Funds in which you are invested and may apply to all Guggenheim funds held with your financial intermediary.
Tailored Shareholder Reports for Open-End Mutual Funds and Exchange-Traded Funds
Effective January 24, 2023, the SEC adopted rule and form amendments to require open-end mutual funds and exchange-traded funds registered on Form N-1A to transmit concise and visually engaging streamlined annual and semi-annual reports to shareholders that highlight key information. Other information, including financial statements, will no longer appear in a streamlined shareholder report but must be
| | THE GUGGENHEIM FUNDS ANNUAL REPORT | 101 |
OTHER INFORMATION (Unaudited)(continued) |
available online, delivered free of charge upon request, and filed on a semi-annual basis on Form N-CSR. The rule and form amendments have a compliance date of July 24, 2024. At this time, management is evaluating the impact of these amendments on the shareholder reports for the Funds.
Proxy Voting Information
A description of the policies and procedures that the Trust uses to determine how to vote proxies relating to securities held in the Funds’ portfolios is available, without charge and upon request, by calling 800.820.0888. This information is also available from the EDGAR database on the SEC’s website at https://www.sec.gov.
Information regarding how the Funds’ voted proxies relating to portfolio securities during the most recent 12-month period ended June 30 is available without charge, upon request, by calling 800.820.0888. This information is also available from the EDGAR database on the SEC’s website at https://www.sec.gov.
Sector Classification
Information in the “Schedule of Investments” is categorized by sectors using sector-level Classifications defined by the Bloomberg Industry Classification System, a widely recognized industry classification system provider. Each Fund’s registration statement has investment policies relating to concentration in specific sectors/industries. For purposes of these investment policies, the Funds usually classify sectors/industries based on industry-level Classifications used by widely recognized industry classification system providers such as Bloomberg Industry Classification System, Global Industry Classification Standards and Barclays Global Classification Scheme.
Quarterly Portfolio Schedules Information
The Trust files its complete schedule of portfolio holdings with the SEC for the first and third quarters of each fiscal year as an exhibit to its reports on Form N-PORT, and for reporting periods ended prior to March 31, 2019, filed such information on Form N-Q. The Funds’ Forms N-PORT and N-Q are available on the SEC’s website at https://www.sec.gov. Copies of the portfolio holdings are also available to shareholders, without charge and upon request, by calling 800.820.0888.
102 | THE GUGGENHEIM FUNDS ANNUAL REPORT | |
OTHER INFORMATION (Unaudited)(continued) |
Report of the Guggenheim Funds Trust Board of Trustees
The Board of Trustees of Guggenheim Funds Trust (the “Trust”), including the Independent Trustees, unanimously approved the renewal of the investment management agreements (as applicable to a specific Fund, the “Advisory Agreement” and collectively, the “Advisory Agreements”) with Security Investors, LLC (“Security Investors”) and Guggenheim Partners Investment Management, LLC (“GPIM”) on behalf of the applicable series of the Trust listed below (each a “Fund” and collectively, the “Funds”) and the investment sub-advisory agreement between Security Investors and GPIM on behalf of Guggenheim Municipal Income Fund (the “Sub-Advisory Agreement” and together with the “Advisory Agreements,” the “Agreements”):
● Guggenheim Alpha Opportunity Fund
(“Alpha Opportunity Fund”)* | ● Guggenheim Core Bond Fund
(“Core Bond Fund”)* |
● Guggenheim Diversified Income Fund
(“Diversified Income Fund”)** | ● Guggenheim Floating Rate Strategies Fund
(“Floating Rate Strategies Fund”)** |
● Guggenheim High Yield Fund
(“High Yield Fund”)* | ● Guggenheim Large Cap Value Fund
(“Large Cap Value Fund”)* |
● Guggenheim Limited Duration Fund
(“Limited Duration Fund”)** | ● Guggenheim Macro Opportunities Fund
(“Macro Opportunities Fund”)**1 |
● Guggenheim Market Neutral Real Estate Fund
(“Market Neutral Real Estate Fund”)** | ● Guggenheim Municipal Income Fund
(“Municipal Income Fund”)* |
● Guggenheim Risk Managed Real Estate Fund
(“Risk Managed Real Estate Fund”)** | ● Guggenheim Small Cap Value Fund
(“Small Cap Value Fund”)* |
● Guggenheim SMid Cap Value Fund
(“SMid Cap Value Fund”)* | ● Guggenheim StylePlus—Large Core Fund
(“StylePlus—Large Core Fund”)* |
● Guggenheim StylePlus—Mid Growth Fund
(“StylePlus—Mid Growth Fund”)* | ● Guggenheim Total Return Bond Fund
(“Total Return Bond Fund”)** |
● Guggenheim Ultra Short Duration Fund
(“Ultra Short Duration Fund”)** | ● Guggenheim World Equity Income Fund
(“World Equity Income Fund”)* |
* | Security Investors serves as investment adviser to the Fund. |
** | GPIM serves as investment adviser to the Fund. Unless the context indicates otherwise, GPIM and Security Investors, with respect to their service as investment adviser to the applicable Funds, are each referred to herein as an “Adviser” and together, the “Advisers.” |
Security Investors and GPIM are each an indirect subsidiary of Guggenheim Partners, LLC, a privately-held, global investment and advisory firm (“Guggenheim Partners”). Guggenheim Partners, Security Investors, GPIM and their affiliates may be referred to herein collectively as “Guggenheim.” Security Investors and GPIM are also known as “Guggenheim Investments,” the global asset management and investment advisory division of Guggenheim Partners that includes other affiliated investment management businesses.
At meetings held in person on April 17-18, 2023 (the “April Meeting”) and meetings held by videoconference on May 15, 2023 and in person on May 24, 2023 (the “May Meeting”), the Contracts Review Committee of the Board (the “Committee”), consisting solely of the Independent Trustees, met separately from Guggenheim to consider the proposed renewal of the Agreements. As part of its review process, the Committee was represented by independent legal counsel to the Independent Trustees (“Independent Legal Counsel”), from whom the Independent Trustees received separate legal advice and with whom they met separately. Independent Legal Counsel reviewed and discussed with the Committee various key aspects of the Trustees’ legal responsibilities relating to the proposed renewal of the Agreements and other principal
1 | GPIM also serves as investment adviser to Guggenheim Macro Opportunities Fund CFC (the “Subsidiary”), a wholly-owned subsidiary of Macro Opportunities Fund that is organized as a limited company under the laws of the Cayman Islands and used by Macro Opportunities Fund to obtain commodities exposure. Pursuant to a separate investment advisory agreement for the Subsidiary (the “Subsidiary Advisory Agreement”), the Subsidiary pays GPIM an advisory fee at the same rate that Macro Opportunities Fund pays GPIM under its Advisory Agreement. The Subsidiary Advisory Agreement does not require annual renewal by the Board and will continue until it is terminated as provided in the Agreement. In addition, GPIM and Macro Opportunities Fund have entered into a separate fee waiver agreement pursuant to which GPIM has contractually agreed to waive the advisory fee it receives from Macro Opportunities Fund in an amount equal to the advisory fee paid to GPIM by the Subsidiary. This undertaking will continue for so long as Macro Opportunities Fund invests in the Subsidiary, and may be terminated only with the approval of the Board. |
| | THE GUGGENHEIM FUNDS ANNUAL REPORT | 103 |
OTHER INFORMATION (Unaudited)(continued) |
contracts. The Committee took into account various materials received from Guggenheim and Independent Legal Counsel. The Committee also considered the variety of written materials, reports and oral presentations the Board received throughout the year regarding performance and operating results of the Funds, and other information relevant to its evaluation of the Agreements.
In connection with the contract review process, FUSE Research Network LLC (“FUSE”), an independent, third-party research provider, was engaged to prepare advisory contract renewal reports designed specifically to help the Board fulfill its advisory contract renewal responsibilities. The objective of the FUSE reports is to present the subject funds’ relative position regarding fees, expenses and total return performance, with peer group and universe comparisons. The Committee assessed the data provided in the FUSE reports as well as commentary presented by Guggenheim, including, among other things, a summary of notable distinctions between certain Funds and the applicable peer group identified in the FUSE reports and explanations for custom peer groups created for certain Funds that do not fit well into any particular category. The Committee noted that although FUSE’s process typically results in the identification for each Fund of a universe of similar funds for performance comparisons and a narrower group of similar funds from the universe based on asset levels for comparative fee and expense data evaluation (i.e., the peer group), the peer group constituent funds identified by FUSE for Market Neutral Real Estate Fund were the same as the performance universe constituent funds due to the Fund’s investment strategy.
In addition, Guggenheim provided materials and data in response to formal requests for information sent by Independent Legal Counsel on behalf of the Committee. Guggenheim also made a presentation at the April Meeting. Throughout the process, the Committee asked questions of management and requested certain additional information, which Guggenheim provided (collectively with the foregoing reports and materials, the “Contract Review Materials”). The Committee considered the Contract Review Materials in the context of its accumulated experience governing the Trust and other Guggenheim funds and weighed the factors and standards discussed with Independent Legal Counsel.
Following an analysis and discussion of relevant factors, including those identified below, and in the exercise of its business judgment, the Committee concluded that it was in the best interest of each Fund to recommend that the Board approve the renewal of the applicable Agreements for an additional annual term. Following its review of the Committee’s recommendation, the Board approved the renewal of the applicable Agreements for each Fund for a one-year period ending August 1, 2024 at a meeting held on May 23-24, 2023 (the “May Board Meeting” and together with the May Meeting, the “May Meetings”) and determined to adopt the Committee’s considerations and conclusions, which follow.
Advisory Agreements
Nature, Extent and Quality of Services Provided by Each Adviser: With respect to the nature, extent and quality of services currently provided by each Adviser, the Committee considered the qualifications, experience and skills of key personnel performing services for the Funds, including those personnel providing compliance and risk oversight, as well as the supervisors and reporting lines for such personnel. The Committee also considered other information, including Guggenheim’s resources and related efforts to retain, attract and motivate capable personnel to serve the Funds. In evaluating Guggenheim’s resources and capabilities, the Committee considered Guggenheim’s commitment to focusing on, and investing resources in support of, funds in the Guggenheim fund complex, including the Funds. The Committee also considered Guggenheim’s discussion of its ongoing review of the Guggenheim fund line-up at the April Meeting and the May Board Meeting. In addition, the Committee considered the acceptability of the terms of each Advisory Agreement, including the scope of services required to be performed by each Adviser.
The Committee’s review of the services provided by Guggenheim to the Funds included consideration of Guggenheim’s investment processes and resulting performance, portfolio oversight and risk management, and the related regular quarterly reports and presentations received by the Board. The Committee took into account the risks borne by Guggenheim in sponsoring and providing services to the Funds, including regulatory, operational, legal and entrepreneurial risks. The Committee considered the resources dedicated by Guggenheim to compliance functions and the reporting made to the Board by Guggenheim compliance personnel regarding Guggenheim’s adherence to regulatory requirements. The Committee also considered the regular reports the Board receives from the Trust’s Chief Compliance Officer regarding compliance policies and procedures established pursuant to Rule 38a-1 under the Investment Company Act of 1940, as amended. In connection with the Committee’s evaluation of the overall package of services provided by Guggenheim, the Committee considered Guggenheim’s administrative services, including its role in supervising, monitoring, coordinating and evaluating the various services provided by the fund administrator, transfer agent, distributor, custodian and other service providers to the Funds. The Committee evaluated the Office of Chief Financial Officer (the “OCFO”), established to oversee the fund administration, accounting and transfer agency services provided to the Funds and other Guggenheim funds, including the OCFO’s resources, personnel and services provided.
104 | THE GUGGENHEIM FUNDS ANNUAL REPORT | |
OTHER INFORMATION (Unaudited)(continued) |
With respect to Municipal Income Fund, the Committee noted that, although Security Investors delegated certain portfolio management responsibilities to the Sub-Adviser, as affiliated companies, both the Adviser and the Sub-Adviser are part of the Guggenheim organization. Further, the Committee took into account Guggenheim’s explanation that investment advisory-related services are provided by many Guggenheim employees under different related legal entities and thus, the services provided by the Adviser on the one hand and the Sub-Adviser on the other, as well as the risks assumed by each party, cannot be ascribed to distinct legal entities.2 As a result, in evaluating the services provided to the Municipal Income Fund under the Sub-Advisory Agreement, the Committee did not separately consider the contributions under the Advisory Agreement and the Sub-Advisory Agreement.
With respect to Guggenheim’s resources and the ability of each Adviser to carry out its responsibilities under the applicable Advisory Agreement, the Chief Financial Officer of Guggenheim Investments reviewed with the Committee financial information concerning the holding company for Guggenheim Investments, Guggenheim Partners Investment Management Holdings, LLC (“GPIMH”), and the various entities comprising Guggenheim Investments, and provided the audited consolidated financial statements of GPIMH. (Thereafter, the Committee received the audited consolidated financial statements of GPIM.)
Based on the foregoing, and based on other information received (both oral and written) at the April Meeting and the May Meetings, as well as other considerations, including the Committee’s knowledge of how each Adviser performs its duties obtained through Board meetings, discussions and reports throughout the year, the Committee concluded that each Adviser and its personnel were qualified to serve the Funds in such capacity and may reasonably be expected to continue to provide a high quality of services under each Advisory Agreement with respect to the Funds.
Investment Performance: The Committee received, for each Fund, investment returns for the since-inception, ten-year, five-year, three-year, one-year and three-month periods ended December 31, 2022, as applicable. In addition, the Committee received a comparison of each Fund’s performance to the performance of a benchmark, a universe of funds and a narrower peer group of similar funds based on asset levels as identified by FUSE (except as noted above with respect to Market Neutral Real Estate Fund), in each case for the same periods, as applicable. The Committee also received from FUSE a description of the methodology for identifying each Fund’s peer group and universe for performance and expense comparisons. The Committee also received certain performance information as of March 31, 2023. In assessing each Fund’s performance, the Committee considered that the Board receives regular reporting from Guggenheim regarding performance and evaluates performance throughout the year.
In seeking to evaluate Fund performance over a full market cycle, the Committee focused its attention on five-year and three-year performance rankings as compared to the relevant universe of funds. Except as to the individual Funds discussed below, the Committee observed that the returns of each Fund’s Institutional Class shares ranked in the third quartile or better of such Fund’s performance universe for each of the relevant periods considered. In addition, the Committee made the following observations:
Alpha Opportunity Fund: The returns of the Fund’s Institutional Class shares ranked in the 96th and 73rd percentiles of its performance universe for the five-year and three-year periods ended December 31, 2022, respectively. The Committee noted management’s explanation that the Fund’s relative underperformance over the five-year time period was primarily due to the Fund’s beta profile and fundamental factor tilts. The Committee noted management’s statement that the Fund’s lower beta profile to broad market U.S. equities relative to its peers and long exposure to value and short exposure to growth have detracted from investment performance. The Committee also noted management’s statement that as a result of an update in 2021 to the quantitative investment methodology that the Fund employs, as well as the more recent comeback of value-oriented, higher quality names, the Fund experienced performance rankings that compare more favorably relative to its performance universe for the three-year and one-year periods ended December 31, 2022.
Diversified Income Fund: The returns of the Fund’s Institutional Class shares ranked in the 78th and 75th percentiles of its performance universe for the five-year and three-year periods ended December 31, 2022, respectively. The Committee noted management’s explanation that the Fund’s relative underperformance over the five-year time period was primarily due to the Fund’s defensively-positioned portfolio, in particular within its fixed-income sleeve which includes allocations to several Guggenheim fixed-income funds that were defensively positioned beginning in 2018, reflecting Guggenheim’s market views. The Committee also noted management’s statement that the Fund maintained a lower beta profile to
2 | Consequently, except where the context indicates otherwise, references to “Adviser,” “Advisers” or “Sub-Adviser” should be understood as referring to Guggenheim Investments generally and the services it provides under the Agreements. |
| | THE GUGGENHEIM FUNDS ANNUAL REPORT | 105 |
OTHER INFORMATION (Unaudited)(continued) |
equities relative to its peers. The Committee further noted management’s statement that the Fund’s allocation process was updated in 2021, resulting in an increase in the Fund’s equity exposure, and that there was some improvement in the Fund’s performance rankings relative to its performance universe for the three-year and one-year periods ended December 31, 2022. The Committee noted management’s statement that although the Fund’s increased equity exposure was detrimental to the Fund’s performance relative to peers in 2022 due to the poor performance of U.S. equities that year, Guggenheim believes the increased equity exposure will ultimately benefit shareholders and support total return performance in the medium to long term. The Committee also noted the Fund’s small size and considered management’s statements that the Fund continues to be a viable offering and that Guggenheim is able to manage the Fund at its current size.
Market Neutral Real Estate Fund: The returns of the Fund’s Institutional Class shares ranked in the 44th and 89th percentiles of its performance universe for the five-year and three-year periods ended December 31, 2022, respectively. The Committee noted management’s explanation that the Fund’s relative underperformance over the three-year time period was due to underperforming pairs of offsetting long and short positions as well as several stock- and sector-specific issues, and considered that, despite recent underperformance, the Fund experienced performance that ranks in the top half of its performance universe for the five-year period ended December 31, 2022.
Municipal Income Fund: The returns of the Fund’s Institutional Class shares ranked in the 89th and 83rd percentiles of its performance universe for the five-year and three-year periods ended December 31, 2022, respectively. The Committee noted management’s explanation that the Fund’s conservative positioning in high quality, long-duration assets, which underperformed over the past two years due to a risk-on sentiment in 2021 and due to fears of duration risk in 2022, contributed to relative underperformance over the five-year and three-year time periods. The Committee noted management’s statement that the Fund’s allocation to closed-end funds also contributed to relative underperformance in 2022 as the increased cost of leverage weighed on the performance of such funds. The Committee considered management’s belief that an economic downturn that is likely to follow the Federal Reserve’s tightening of financial conditions will disproportionately affect weaker municipal credits and could lead to distress in names the Fund has avoided. The Committee also took into account management’s further discussions of performance attribution and outlook for the Fund at the April Meeting and the May Board Meeting, during which management highlighted that the Fund’s relative underperformance in 2022 was due to the exceptional volatility in the fixed-income markets that year which also impacted relative performance for the trailing five-year and three-year time periods, and noted the overall low dispersion in absolute investment returns among municipal bond funds.
StylePlus—Mid Growth Fund: The returns of the Fund’s Institutional Class shares ranked in the 76th and 67th percentiles of its performance universe for the five-year and three-year periods ended December 31, 2022, respectively. The Committee noted management’s explanation that the Fund’s relative underperformance over the five-year time period can be attributed to the more conservative positioning of the underlying funds in which the Fund invests, resulting in yields insufficient to offset fund fees and other costs, as well as the strategy’s tilt to value-oriented, lower-growth names within the mid-cap growth segment as growth outperformed value securities from 2018 through 2020. The Committee also noted management’s statement that as a result of the more recent comeback of value-oriented, lower-growth names, the Fund experienced performance rankings that compare more favorably relative to its performance universe for the three-year and one-year periods ended December 31, 2022.
Ultra Short Duration Fund: The returns of the Fund’s Institutional Class shares ranked in the 76th and 63rd percentiles of its performance universe for the five-year and three-year periods ended December 31, 2022, respectively. The Committee noted management’s explanation that the Fund’s overweight duration positioning over the five-year time period relative to its performance universe as well as higher allocations to structured credit during the second half of 2022, which underperformed corporate credit during that period, contributed to relative underperformance over the five-year time period. The Committee considered management’s expectation that the resetting of higher interest rates should help the Fund to perform well going forward and that the divergence in the relationship between structured and corporate credit should normalize going forward and lead to relative outperformance, noting that there was some improvement in the Fund’s performance ranking relative to its performance universe for the one-year period ended December 31, 2022.
Based on the foregoing, and based on other information received (both oral and written) at the April Meeting and the May Meetings, as well as other considerations, the Committee concluded that, with respect to each Fund other than Municipal Income Fund: (i) the Fund’s performance was acceptable; or (ii) it was satisfied with Guggenheim’s responses and/or efforts to improve investment performance; and, with respect to Municipal Income Fund, it would continue to monitor the Fund’s investment performance.
106 | THE GUGGENHEIM FUNDS ANNUAL REPORT | |
OTHER INFORMATION (Unaudited)(continued) |
Comparative Fees, Costs of Services Provided and the Benefits Realized by Each Adviser from Its Relationship with the Funds: The Committee compared each Fund’s contractual advisory fee (which, for Municipal Income Fund, includes the sub-advisory fee paid to the Sub-Adviser), net effective management fee3 and total net expense ratio to the applicable peer group. The Committee also reviewed the median advisory fees and expense ratios, including expense ratio components (e.g., transfer agency fees, administration fees, other operating expenses, distribution fees and fee waivers/reimbursements), of the peer group of funds. In addition, the Committee considered information regarding Guggenheim’s process for evaluating the competitiveness of each Fund’s fees and expenses, noting Guggenheim’s statement that evaluations seek to incorporate a variety of factors with a general focus on ensuring fees and expenses: (i) are competitive; (ii) give consideration to resource support requirements; and (iii) ensure Funds are able to deliver on shareholder return expectations. The Committee also considered Guggenheim’s discussion of information regarding fee and expense trends across the open-end fund industry and its response to those trends with respect to the funds in the Guggenheim fund complex, including the Funds.
As part of its evaluation of each Fund’s advisory fee, the Committee considered how such fees compared to the advisory fee charged by Guggenheim to one or more other clients that it manages pursuant to similar investment strategies, to the extent applicable, noting that, in certain instances, Guggenheim charges a lower advisory fee to such other clients. In this connection, the Committee considered, among other things, Guggenheim’s representations about the significant differences between managing mutual funds as compared to other types of accounts. The Committee also considered Guggenheim’s explanation that lower fees are charged in certain instances due to various other factors, including the scope of contract, type of investors, fee structure, applicable legal, governance and capital structures, tax status and historical pricing reasons. In addition, the Committee took into account Guggenheim’s discussion of the regulatory, operational, legal and entrepreneurial risks involved with the Funds as compared to other types of accounts. The Committee concluded that the information it received demonstrated that the aggregate services provided to, or the specific circumstances of, each Fund were sufficiently different from the services provided to, or the specific circumstances of, other clients with similar investment strategies and/or that the risks borne by Guggenheim were sufficiently greater than those associated with managing other clients with similar investment strategies to support the difference in fees.
In further considering the comparative fee and expense data presented in the Contract Review Materials and addressed by Guggenheim, the Committee took into account those Funds with currently effective expense limitation agreements with the Adviser. Except as to the individual Funds discussed below, the Committee observed that the contractual advisory fee, net effective management fee and total net expense ratio for each Fund’s Institutional Class shares each rank in the third quartile or better of such Fund’s peer group. In addition, the Committee made the following observations:
Floating Rate Strategies Fund: The contractual advisory fee for the Fund’s Institutional Class shares ranks in the third quartile (73rd percentile) of its peer group. Although the net effective management fee for the Fund’s Institutional Class shares ranks in the fourth quartile (80th percentile) of its peer group, the Committee considered that the total net expense ratio for the Fund’s Institutional Class shares ranks in the third quartile (67th percentile) of its peer group. The Committee considered the Adviser’s statement explaining the higher fees that performance is driven by a unique investment approach that requires significant resources. In this regard, the Committee took into consideration the strong investment performance of the Fund’s Institutional Class shares for the three-year period ended December 31, 2022. The Committee also took into account the Fund’s currently effective expense limitation agreement with the Adviser.
Limited Duration Fund: The contractual advisory fee for the Fund’s Institutional Class shares ranks in the fourth quartile (87th percentile) of its peer group. The net effective management fee for the Fund’s Institutional Class shares ranks in the third quartile (73rd percentile) of its peer group. The total net expense ratio for the Fund’s Institutional Class shares ranks in the third quartile (67th percentile) of its peer group. The Committee considered the Adviser’s statement explaining the higher fees that performance is driven by a unique investment approach that requires significant resources. In this regard, the Committee took into consideration the strong investment performance of the Fund’s Institutional Class shares for the five-year and three-year periods ended December 31, 2022. The Committee also took into account the Fund’s currently effective expense limitation agreement with the Adviser.
Macro Opportunities Fund: The contractual advisory fee for the Fund’s Institutional Class shares ranks in the fourth quartile (82nd percentile) of its peer group. The net effective management fee for the Fund’s Institutional Class shares ranks in the third quartile (64th percentile) of its peer group. The total net expense ratio for the Fund’s Institutional Class shares ranks in the third quartile (73rd percentile) of its peer group. The Committee noted that the Fund is categorized as a non-traditional bond fund which seeks to add value by investing in many non-
3 | The “net effective management fee” for each Fund represents the combined effective advisory fee and administration fee as a percentage of average net assets for the latest fiscal year, after any waivers and/or reimbursements. |
| | THE GUGGENHEIM FUNDS ANNUAL REPORT | 107 |
OTHER INFORMATION (Unaudited)(continued) |
traditional securities within and outside of fixed income, including equities, currencies, commodities and derivatives, and that peer funds have varying degrees of capability, flexibility and associated fees. The Committee considered the Adviser’s statement explaining the higher fees that performance is driven by a unique investment approach that requires significant resources. In this regard, the Committee took into consideration the strong investment performance of the Fund’s Institutional Class shares for the three-year period ended December 31, 2022. The Committee also took into account the Fund’s currently effective expense limitation agreement and contractual advisory fee breakpoint of 5 basis points on average daily net assets above $5 billion.
Risk Managed Real Estate Fund: The contractual advisory fee for the Fund’s Institutional Class shares ranks in the second quartile (43rd percentile) of its peer group. Although the net effective management fee for the Fund’s Institutional Class shares ranks in the fourth quartile (79th percentile) of its peer group, the Committee considered that the total net expense ratio for the Fund’s Institutional Class shares ranks in the third quartile (57th percentile) of its peer group. The Committee considered the Adviser’s statement that the total expense ratio for the Fund’s Institutional Class shares is competitive and in-line with the peer group average and median and that the Fund’s contractual advisory fee is competitive. The Committee also took into account the Fund’s currently effective expense limitation agreement with the Adviser.
SMid Cap Value Fund: The contractual advisory fee for the Fund’s Institutional Class shares ranks in the first quartile (7th percentile) of its peer group. The net effective management fee for the Fund’s Institutional Class shares ranks in the third quartile (71st percentile) of its peer group. The total net expense ratio for the Fund’s Institutional Class shares ranks in the fourth quartile (79th percentile) of its peer group. The Committee considered that the Fund’s contractual advisory fee ranks favorably in the first quartile of its peer group and reviewed the other expenses that impacted the total net expense ratio. The Committee also took into account the Fund’s currently effective expense limitation agreement with the Adviser.
Total Return Bond Fund: The contractual advisory fee for the Fund’s Institutional Class shares ranks in the fourth quartile (87th percentile) of its peer group. The net effective management fee for the Fund’s Institutional Class shares ranks in the third quartile (67th percentile) of its peer group. The total net expense ratio for the Fund’s Institutional Class shares ranks in the third quartile (73rd percentile) of its peer group. The Committee considered the Adviser’s statement explaining the higher fees that performance is driven by a unique investment approach that requires significant resources. In this regard, the Committee took into consideration the strong investment performance of the Fund’s Institutional Class shares for the three-year period ended December 31, 2022. The Committee also took into account the Fund’s currently effective expense limitation agreement with the Adviser.
With respect to the costs of services provided and benefits realized by Guggenheim Investments from its relationship with the Funds, the Committee reviewed a profitability analysis and data from management for each Fund setting forth the average assets under management for the twelve months ended December 31, 2022, gross revenues received, and expenses incurred directly or through allocations, by Guggenheim Investments, expense waivers (as applicable), earnings and the operating margin/profitability rate, including variance information relative to the foregoing amounts as of December 31, 2021. In addition, the Chief Financial Officer of Guggenheim Investments reviewed with, and addressed questions from, the Committee concerning the expense allocation methodology employed in producing the profitability analysis. In the course of its review of Guggenheim Investments’ profitability, the Committee took into account the methods used by Guggenheim Investments to determine expenses and profit and the representation by the Chief Financial Officer of Guggenheim Investments that such methods provided a reasonable basis for determining the profitability of the applicable Adviser with respect to each Fund. The Committee considered all of the foregoing, among other things, in evaluating the costs of services provided, the profitability to Guggenheim Investments and the profitability rates presented.
The Committee also considered other benefits available to each Adviser because of its relationship with the Funds and noted Guggenheim’s statement that it does not believe the Advisers derive any such “fall-out” benefits. In this regard, the Committee noted Guggenheim’s statement that, although it does not consider such benefits to be fall-out benefits, the Advisers may benefit from certain economies of scale and synergies, such as enhanced visibility of the Advisers, enhanced leverage in fee negotiations and other synergies arising from offering a broad spectrum of products, including the Funds.
Based on the foregoing, and based on other information received (both oral and written) at the April Meeting and the May Meetings, as well as other considerations, the Committee concluded that the comparative fees and the benefits realized by each Adviser from its relationship with the Funds were appropriate and that each Adviser’s profitability from its relationship with the Funds was not unreasonable.
108 | THE GUGGENHEIM FUNDS ANNUAL REPORT | |
OTHER INFORMATION (Unaudited)(continued) |
Economies of Scale: The Committee received and considered information regarding whether there have been economies of scale with respect to the management of the Funds as Fund assets grow, whether the Funds have appropriately benefited from any economies of scale, and whether there is potential for realization of any further economies of scale. The Committee considered whether economies of scale in the provision of services to the Funds were being passed along to and shared with the shareholders. The Committee considered that Guggenheim believes it is appropriately sharing potential economies of scale and that Guggenheim’s decrease in 2022 in overall expenses was attributable to decreased product costs driven by lower average assets under management and lower non-recurring costs related to closed-end fund matters as well as a decrease in compensation and benefits. The Committee also considered that although expenses related to investment resources decreased in 2022, Guggenheim’s shared services expenses and certain other expenses increased in 2022.
The Committee also noted the process employed by the Adviser to evaluate whether it would be appropriate to institute a new breakpoint for a Fund, with consideration given to, among other things: (i) the Fund’s size and trends in asset levels over recent years; (ii) the competitiveness of the expense levels; (iii) whether expense waivers are in place; (iv) changes and trends in revenue and expenses; (v) whether there are any anticipated expenditures that may benefit the Fund in the future; (vi) Fund profit level margins; (vii) relative Fund performance; (viii) the nature, extent and quality of services management provides to the Fund; and (ix) the complexity of the Fund’s investment strategy and the resources required to support the Fund.
As part of its assessment of economies of scale, the Committee took into account Guggenheim’s representation that it seeks to share economies of scale through a number of means, including breakpoints, advisory fees set at competitive rates pre-assuming future asset growth, expense waivers and limitations, and investments in personnel, operations and infrastructure to support the fund business. The Committee also received information regarding amounts that had been shared with shareholders through such breakpoints and expense waivers and limitations. The Committee also noted information from Guggenheim regarding certain challenges and costs associated with managing Funds that have achieved significant scale. Thus, the Committee considered the size of the Funds and the competitiveness of and/or other determinations made regarding the current advisory fee for each Fund, as well as whether a Fund is subject to an expense limitation.
Based on the foregoing, and based on other information received (both oral and written) at the April Meeting and the May Meetings, as well as other considerations, the Committee concluded that the advisory fee for each Fund was reasonable.
Sub-Advisory Agreement for Municipal Income Fund
Nature, Extent and Quality of Services Provided by the Sub-Adviser: As noted above, because both the Adviser and the Sub-Adviser for Municipal Income Fund—Security Investors and GPIM, respectively—are part of and do business as Guggenheim Investments and the services provided by the Adviser on the one hand and the Sub-Adviser on the other cannot be ascribed to distinct legal entities, the Committee did not separately evaluate the services provided under the Advisory Agreement and the Sub-Advisory Agreement. Therefore, the Committee considered the qualifications, experience and skills of the Fund’s portfolio management team in connection with the Committee’s evaluation of Guggenheim’s investment professionals under the Advisory Agreement. With respect to Guggenheim’s resources and the Sub-Adviser’s ability to carry out its responsibilities under the Sub-Advisory Agreement, as noted above, the Committee considered the financial condition of GPIMH and the various entities comprising Guggenheim Investments. The Committee also considered the acceptability of the terms of the Sub-Advisory Agreement, including the scope of services required to be performed by the Sub-Adviser.
Investment Performance: The Committee considered the returns of the Fund under its evaluation of the Advisory Agreement.
Comparative Fees, Costs of Services Provided and the Benefits Realized by the Sub-Adviser from Its Relationship with the Fund: The Committee considered that the Sub-Advisory Agreement is with an affiliate of the Adviser, that the Adviser compensates the Sub-Adviser from its own fees so that the sub-advisory fee rate for the Fund does not impact the fees paid by the Fund and that the Sub-Adviser’s revenues were included in the calculation of Guggenheim Investments’ profitability. Given its conclusion of the reasonableness of the advisory fee, the Committee concluded that the sub-advisory fee rate for the Fund was reasonable.
Economies of Scale: The Committee recognized that, because the Sub-Adviser’s fees are paid by the Adviser and not the Fund, the analysis of economies of scale was more appropriate in the context of the Committee’s consideration of the Advisory Agreement, which was separately considered. (See “Advisory Agreements – Economies of Scale” above.)
| | THE GUGGENHEIM FUNDS ANNUAL REPORT | 109 |
OTHER INFORMATION (Unaudited)(concluded) |
Overall Conclusions
The Committee concluded that the investment advisory fees are fair and reasonable in light of the extent and quality of the services provided and other benefits received and that the renewal of each applicable Agreement is in the best interest of each Fund. In reaching this conclusion, no single factor was determinative or conclusive and each Committee member, in the exercise of his or her informed business judgment, may afford different weights to different factors.
Following its review of the Committee’s analysis and determinations, the Board adopted the considerations and conclusions of the Committee and determined to approve the renewal of the Agreements.
110 | THE GUGGENHEIM FUNDS ANNUAL REPORT | |
INFORMATION ON BOARD OF TRUSTEES AND OFFICERS (Unaudited) |
A Board of Trustees oversees the Trust, as well as other trusts of GI, in which its members have no stated term of service, and continue to serve after election until resignation. The Funds’ Statement of Additional Information includes further information about Fund Trustees and Officers, and can be obtained without charge by visiting guggenheiminvestments.com or by calling 800.820.0888.
Name, Address*
and Year of Birth | Position(s)
Held with
Trust | Term of Office
and Length of
Time Served** | Principal Occupation(s)
During Past Five Years | Number of
Portfolios
in Fund
Complex
Overseen | Other
Directorships Held
by Trustees*** |
INDEPENDENT TRUSTEES | | | |
Randall C. Barnes (1951) | Trustee and Chair of the Valuation Oversight Committee | Since 2014 (Trustee) Since 2020 (Chair of the Valuation Oversight Committee) | Current: Private Investor (2001-present). Former: Senior Vice President and Treasurer, PepsiCo, Inc. (1993-1997); President, Pizza Hut International (1991-1993); Senior Vice President, Strategic Planning and New Business Development, PepsiCo, Inc. (1987-1990). | 155 | Current: Advent Convertible and Income Fund (2005-present); Purpose Investments Funds (2013-present). Former: Fiduciary/Claymore Energy Infrastructure Fund (2004-2022); Guggenheim Enhanced Equity Income Fund (2005-2021); Guggenheim Credit Allocation Fund (2013-2021). |
Angela Brock-Kyle (1959) | Trustee | Since 2019 | Current: Founder and Chief Executive Officer, B.O.A.R.D.S. (2013-present); Director, Mutual Fund Directors Forum (2022-present). Former: Senior Leader, TIAA (financial services firm) (1987-2012). | 154 | Current: Bowhead Insurance GP, LLC (2020-present); Hunt Companies, Inc. (2019-present). Former: Fiduciary/Claymore Energy Infrastructure Fund (2019-2022); Guggenheim Enhanced Equity Income Fund (2019-2021); Guggenheim Credit Allocation Fund (2019-2021); Infinity Property & Casualty Corp. (2014-2018). |
| | THE GUGGENHEIM FUNDS ANNUAL REPORT | 111 |
INFORMATION ON BOARD OF TRUSTEES AND OFFICERS (Unaudited)(continued) |
Name, Address*
and Year of Birth | Position(s)
Held with
Trust | Term of Office
and Length of
Time Served** | Principal Occupation(s)
During Past Five Years | Number of
Portfolios
in Fund
Complex
Overseen | Other
Directorships Held
by Trustees*** |
INDEPENDENT TRUSTEES - continued | | |
Thomas F. Lydon, Jr. (1960) | Trustee and Chair of the Contracts Review Committee | Since 2019 (Trustee) Since 2020 (Chair of the Contracts Review Committee) | Current: President, Global Trends Investments (registered investment adviser) (1996-present); Chief Executive Officer, ETF Flows, LLC (financial advisor education and research provider) (2019-present); Chief Executive Officer, Lydon Media (2016-present); Director, GDX Index Partners, LLC (index provider) (2021-present); Vice Chairman, VettaFi (financial advisor content, research and digital distribution provider) (2022-present). | 154 | Current: US Global Investors, Inc. (GROW) (1995-present); The 2023 ETF Series Trust (4) (June 2023-present); The 2023 ETF Series Trust II (1) (August 2023-present). Former: Fiduciary/Claymore Energy Infrastructure Fund (2019-2022); Guggenheim Enhanced Equity Income Fund (2019-2021); Guggenheim Credit Allocation Fund (2019-2021); Harvest Volatility Edge Trust (3) (2017-2019). |
Ronald A. Nyberg (1953) | Trustee and Chair of the Nominating and Governance Committee | Since 2014 | Current: Of Counsel, Momkus LLP (law firm) (2016-present). Former: Partner, Nyberg & Cassioppi, LLC (law firm) (2000-2016); Executive Vice President, General Counsel, and Corporate Secretary, Van Kampen Investments (1982-1999). | 155 | Current: Advent Convertible and Income Fund (2003-present); PPM Funds (2) (2018-present); NorthShore-Edward-Elmhurst Health (2012-present). Former: Fiduciary/Claymore Energy Infrastructure Fund (2004-2022); Guggenheim Enhanced Equity Income Fund (2005-2021); Guggenheim Credit Allocation Fund (2013-2021); Western Asset Inflation-Linked Opportunities & Income Fund (2004-2020); Western Asset Inflation-Linked Income Fund (2003-2020). |
112 | THE GUGGENHEIM FUNDS ANNUAL REPORT | |
INFORMATION ON BOARD OF TRUSTEES AND OFFICERS (Unaudited)(continued) |
Name, Address*
and Year of Birth | Position(s)
Held with
Trust | Term of Office
and Length of
Time Served** | Principal Occupation(s)
During Past Five Years | Number of
Portfolios
in Fund
Complex
Overseen | Other
Directorships Held
by Trustees*** |
INDEPENDENT TRUSTEES - concluded | | |
Sandra G. Sponem (1958) | Trustee and Chair of the Audit Committee | Since 2019 (Trustee) Since 2020 (Chair of the Audit Committee) | Current: Retired. Former: Senior Vice President and Chief Financial Officer, M.A. Mortenson-Companies, Inc. (construction and real estate development company) (2007-2017). | 154 | Current: SPDR Series Trust (81) (2018-present); SPDR Index Shares Funds (30) (2018-present); SSGA Active Trust (14) (2018-present). Former: Fiduciary/Claymore Energy Infrastructure Fund (2019-2022); Guggenheim Enhanced Equity Income Fund (2019-2021); Guggenheim Credit Allocation Fund (2019-2021); SSGA Master Trust (1) (2018-2020). |
Ronald E. Toupin, Jr. (1958) | Trustee, Chair of the Board and Chair of the Executive Committee | Since 2014 | Current: Portfolio Consultant (2010-present); Member, Governing Council, Independent Directors Council (2013-present); Governor, Board of Governors, Investment Company Institute (2018-present). Former: Member, Executive Committee, Independent Directors Council (2016-2018); Vice President, Manager and Portfolio Manager, Nuveen Asset Management (1998-1999); Vice President, Nuveen Investment Advisory Corp. (1992-1999); Vice President and Manager, Nuveen Unit Investment Trusts (1991-1999); and Assistant Vice President and Portfolio Manager, Nuveen Unit Investment Trusts (1988-1999), each of John Nuveen & Co., Inc. (registered broker dealer) (1982-1999). | 154 | Former: Fiduciary/Claymore Energy Infrastructure Fund (2004-2022); Guggenheim Enhanced Equity Income Fund (2005-2021); Guggenheim Credit Allocation Fund (2013-2021); Western Asset Inflation-Linked Opportunities & Income Fund (2004-2020); Western Asset Inflation-Linked Income Fund (2003-2020). |
| | THE GUGGENHEIM FUNDS ANNUAL REPORT | 113 |
INFORMATION ON BOARD OF TRUSTEES AND OFFICERS (Unaudited)(continued) |
Name, Address*
and Year of Birth | Position(s)
Held with
Trust | Term of Office
and Length of
Time Served** | Principal Occupation(s)
During Past Five Years | Number of
Portfolios
in Fund
Complex
Overseen | Other
Directorships Held
by Trustees*** |
INTERESTED TRUSTEE | | | | |
Amy J. Lee**** (1961) | Trustee, Vice President and Chief Legal Officer | Since 2018 (Trustee) Since 2014 (Chief Legal Officer) Since 2007 (Vice President) | Current: Interested Trustee, certain other funds in the Fund Complex (2018-present); Chief Legal Officer, certain other funds in the Fund Complex (2014-present); Vice President, certain other funds in the Fund Complex (2007-present); Senior Managing Director, Guggenheim Investments (2012-present). Former: President and Chief Executive Officer, certain other funds in the Fund Complex (2017-2019); Vice President, Associate General Counsel and Assistant Secretary, Security Benefit Life Insurance Company and Security Benefit Corporation (2004-2012). | 154 | Former: Fiduciary/Claymore Energy Infrastructure Fund (2018-2022); Guggenheim Enhanced Equity Income Fund (2018-2021); Guggenheim Credit Allocation Fund (2018-2021). |
* | The business address of each Trustee is c/o Guggenheim Investments, 227 West Monroe Street, Chicago, Illinois 60606. |
** | Each Trustee serves an indefinite term, until his or her successor is elected and qualified. Time served includes time served in the respective position for the Predecessor Corporation. |
*** | Each Trustee also serves on the Boards of Trustees of Guggenheim Funds Trust, Guggenheim Variable Funds Trust, Guggenheim Strategy Funds Trust, Guggenheim Taxable Municipal Bond & Investment Grade Debt Trust, Guggenheim Strategic Opportunities Fund, Guggenheim Active Allocation Fund, Rydex Series Funds, Rydex Dynamic Funds, Rydex Variable Trust and Transparent Value Trust. Messrs. Barnes and Nyberg also serve on the Board of Trustees of Advent Convertible & Income Fund. |
**** | This Trustee is deemed to be an “interested person” of the Funds under the 1940 Act by reason of her position with the Funds’ Adviser and/or the parent of the Adviser. |
114 | THE GUGGENHEIM FUNDS ANNUAL REPORT | |
INFORMATION ON BOARD OF TRUSTEES AND OFFICERS (Unaudited)(continued) |
Name, Address*
and Year of Birth | Position(s)
Held with
Trust | Term of Office
and Length of
Time Served** | Principal Occupation(s)
During Past Five Years |
OFFICERS | | | |
Brian E. Binder (1972) | President and Chief Executive Officer | Since 2018 | Current: President, Mutual Fund Boards, Guggenheim Investments (2022-present); President and Chief Executive Officer, certain other funds in the Fund Complex (2018-present); President, Mutual Funds Boards, Guggenheim Funds Investment Advisors, LLC and Security Investors, LLC (2018-present); Board Member, Guggenheim Partners Investment Funds plc (2022-present); Board Member, Guggenheim Global Investments plc (2022-present); Board Member, Guggenheim Partners Fund Management (Europe) Limited (2018-present). Former: Senior Managing Director and Chief Administrative Officer, Guggenheim Investments (2018-2022); Managing Director and President, Deutsche Funds, and Head of US Product, Trading and Fund Administration, Deutsche Asset Management (2013-2018); Managing Director, Chairman of North American Executive Committee and Head of Business Management and Consulting, Invesco Ltd. (2010-2012). |
James Howley (1972) | Chief Financial Officer, Chief Accounting Officer and Treasurer | Since 2022 | Current: Managing Director, Guggenheim Investments (2004-present); Chief Financial Officer, Chief Accounting Officer, and Treasurer, certain other funds in the Fund Complex (2022-present). Former: Assistant Treasurer, certain other funds in the Fund Complex (2006-2022); Manager, Mutual Fund Administration of Van Kampen Investments, Inc. (1996-2004). |
Mark E. Mathiasen (1978) | Secretary | Since 2014 | Current: Secretary, certain other funds in the Fund Complex (2007-present); Managing Director, Guggenheim Investments (2007-present). |
Glenn McWhinnie (1969) | Assistant Treasurer | Since 2016 | Current: Vice President, Guggenheim Investments (2009-present); Assistant Treasurer, certain other funds in the Fund Complex (2016-present). |
Michael P. Megaris (1984) | Assistant Secretary | Since 2014 | Current: Assistant Secretary, certain other funds in the Fund Complex (2014-present); Managing Director, Guggenheim Investments (2012-present). |
Elisabeth Miller (1968) | Chief Compliance Officer | Since 2012 | Current: Chief Compliance Officer, certain other funds in the Fund Complex (2012-present); Senior Managing Director, Guggenheim Investments (2012-present); Senior Managing Director, Guggenheim Funds Distributors, LLC (2014-present). Former: Chief Compliance Officer, Security Investors, LLC and Guggenheim Funds Investment Advisors, LLC (2012-2018); Chief Compliance Officer, Guggenheim Distributors, LLC (2009-2014); Senior Manager, Security Investors, LLC (2004-2014); Senior Manager, Guggenheim Distributors, LLC (2004-2014). |
Margaux Misantone (1978) | AML Officer | Since 2017 | Current: Chief Compliance Officer, Security Investors, LLC and Guggenheim Funds Investment Advisors, LLC (2018-present); AML Officer, Security Investors, LLC and certain other funds in the Fund Complex (2017-present); Managing Director, Guggenheim Investments (2015-present). Former: Assistant Chief Compliance Officer, Security Investors, LLC and Guggenheim Funds Investments Advisors, LLC (2015-2018). |
| | THE GUGGENHEIM FUNDS ANNUAL REPORT | 115 |
INFORMATION ON BOARD OF TRUSTEES AND OFFICERS (Unaudited)(concluded) |
Name, Address*
and Year of Birth | Position(s)
Held with
Trust | Term of Office
and Length of
Time Served** | Principal Occupation(s)
During Past Five Years |
OFFICERS - concluded | |
Kimberly J. Scott (1974) | Assistant Treasurer | Since 2014 | Current: Director, Guggenheim Investments (2012-present); Assistant Treasurer, certain other funds in the Fund Complex (2012-present). Former: Financial Reporting Manager, Invesco, Ltd. (2010-2011); Vice President/Assistant Treasurer, Mutual Fund Administration for Van Kampen Investments, Inc./Morgan Stanley Investment Management (2009-2010); Manager of Mutual Fund Administration, Van Kampen Investments, Inc./Morgan Stanley Investment Management (2005-2009). |
Bryan Stone (1979) | Vice President | Since 2014 | Current: Vice President, certain other funds in the Fund Complex (2014-present); Managing Director, Guggenheim Investments (2013-present). Former: Senior Vice President, Neuberger Berman Group LLC (2009-2013); Vice President, Morgan Stanley (2002-2009). |
Jon Szafran (1989) | Assistant Treasurer | Since 2017 | Current: Director, Guggenheim Investments (2017-present); Assistant Treasurer, certain other funds in the Fund Complex (2017-present). Former: Assistant Treasurer of Henderson Global Funds and Manager of US Fund Administration, Henderson Global Investors (North America) Inc. (“HGINA”), (2017); Senior Analyst of US Fund Administration, HGINA (2014–2017); Senior Associate of Fund Administration, Cortland Capital Market Services, LLC (2013-2014); Experienced Associate, PricewaterhouseCoopers LLP (2012-2013). |
* | The business address of each officer is c/o Guggenheim Investments, 227 West Monroe Street, Chicago, Illinois 60606. |
** | Each officer serves an indefinite term, until his or her successor is duly elected and qualified. |
116 | THE GUGGENHEIM FUNDS ANNUAL REPORT | |
GUGGENHEIM INVESTMENTS PRIVACY NOTICE (Unaudited) |
Who We Are
This Privacy Notice describes the data protection practices of Guggenheim Investments. Guggenheim Investments as used herein refers to the affiliated investment management businesses of Guggenheim Partners, LLC: Guggenheim Funds Investment Advisors, LLC, Guggenheim Partners Investment Management, LLC, Guggenheim Funds Distributors, LLC, Security Investors, LLC, Guggenheim Investment Advisors (Europe) Limited, Guggenheim Real Estate, LLC, GS Gamma Advisors, LLC, Guggenheim Partners India Management, LLC, Guggenheim Partners Europe Limited, as well as the funds in the Guggenheim Funds complex (the “Funds”) (“Guggenheim Investments,” “we,” “us,” or “our”).
Guggenheim Partners Investment Management Holdings, LLC, located at 330 Madison Avenue, New York, New York, 10017, is the data controller for your information. The affiliates who are also controllers of certain of your information are: Guggenheim Investment Advisors (Europe) Limited, Guggenheim Partners Europe Limited, Guggenheim Partners, LLC, Guggenheim Funds Investment Advisors, LLC, Guggenheim Partners Investment Management, LLC, Guggenheim Funds Distributors, LLC and Security Investors, LLC, as well as the Funds.
Our Commitment to You
Guggenheim Investments considers your privacy our utmost concern. When you become our client or investor, you entrust us with not only your hard-earned money but also with your personal and financial information. Because we have access to your private information, we hold ourselves to the highest standards in its safekeeping and use. We strictly limit how we share your information with others, whether you are a current or former Guggenheim Investments client or investor.
The Information We Collect About You
We collect certain nonpublic personal information about you from information you provide on applications, other forms, our website, and/or from third parties including investment advisors. This information includes Social Security or other tax identification number, assets, income, tax information, retirement and estate plan information, transaction history, account balance, payment history, bank account information, marital status, family relationships, information that we collect on our website through the use of “cookies,” and other personal information that you or others provide to us. We may also collect such information through your inquiries by mail, e-mail or telephone. We may also collect customer due diligence information, as required by applicable law and regulation, through third party service providers.
How We Handle Your Personal Information
The legal basis for using your information as set out in this Privacy Notice is as follows: (a) use of your personal data is necessary to perform our obligations under any contract with you (such as a contract for us to provide financial services to you); or (b) where use of your personal data is not necessary for performance of a contract, use of your personal data is necessary for our legitimate interests or the legitimate interests of others (for example, to enforce the legal terms governing our services, operate and market our website and other services we offer, ensure safe environments for our personnel and others, make and receive payments, prevent fraud and to know the customer to whom we are providing the services). Some processing is done to comply with applicable law.
In addition to the specific uses described above, we also use your information in the following manner:
| | ● | We use your information in connection with servicing your accounts. |
| | ● | We use information to respond to your requests or questions. For example, we might use your information to respond to your customer feedback. |
| | ● | We use information to improve our products and services. We may use your information to make our website and products better. We may use your information to customize your experience with us. |
| | ● | We use information for security purposes. We may use your information to protect our company and our customers. |
| | ● | We use information to communicate with you. For example, we will communicate with you about your account or our relationship. We may contact you about your feedback. We might also contact you about this Privacy Notice. We may also enroll you in our email newsletter. |
| | THE GUGGENHEIM FUNDS ANNUAL REPORT | 117 |
GUGGENHEIM INVESTMENTS PRIVACY NOTICE (Unaudited)(continued) |
| | ● | We use information as otherwise permitted by law, as we may notify you. |
| | ● | Aggregate/Anonymous Data. We may aggregate and/or anonymize any information collected through the website so that such information can no longer be linked to you or your device (“Aggregate/Anonymous Information”). We may use Aggregate/Anonymous Information for any purpose, including without limitation for research and marketing purposes, and may also share such data with any third parties, including advertisers, promotional partners, and sponsors. |
We do not sell information about current or former clients or their accounts to third parties. Nor do we share this information, except when necessary to complete transactions at your request, to make you aware of investment products and services that we or our affiliates offer, or as permitted or required by law.
We provide information about you to companies and individuals not affiliated with Guggenheim Investments to complete certain transactions or account changes, or to perform services for us related to your account. For example, if you ask to transfer assets from another financial institution to Guggenheim Investments, we must provide certain information about you to that company to complete the transaction. We provide the third party with only the information necessary to carry out its responsibilities and only for that purpose. And we require these third parties to treat your private information with the same high degree of confidentiality that we do. To alert you to other Guggenheim Investments products and services, we share your information within our family of affiliated companies. You may limit our sharing with affiliated companies as set out below. We may also share information with any successor to all or part of our business, or in connection with steps leading up to a merger or acquisition. For example, if part of our business was sold we may give customer information as part of that transaction. We may also share information about you with your consent.
We will release information about you if you direct us to do so, if we are compelled by law to do so, or in other circumstances as permitted by law (for example, to protect your account from fraud).
If you close your account(s) or become an inactive client or investor, we will continue to adhere to the privacy policies and practices described in this notice.
Opt-Out Provisions and Your Data Choices
The law allows you to “opt out” of certain kinds of information sharing with third parties. We do not share personal information about you with any third parties that triggers this opt-out right. This means YOU ARE ALREADY OPTED OUT.
When you are no longer our client or investor, we continue to share your information as described in this notice, and you may contact us at any time to limit our sharing by sending an email to CorporateDataPrivacy@GuggenheimPartners.com.
European Union Data Subjects and certain others: In addition to the choices set forth above, residents of the European Union and certain other jurisdictions have certain rights to (1) request access to or rectification or deletion of information we collect about them, (2) request a restriction on the processing of their information, (3) object to the processing of their information, or (4) request the portability of certain information. To exercise these or other rights, please contact us using the contact information below. We will consider all requests and provide our response within the time period stated by applicable law. Please note, however, that certain information may be exempt from such requests in some circumstances, which may include if we need to keep processing your information for our legitimate interests or to comply with a legal obligation. We may request you provide us with information necessary to confirm your identity before responding to your request.
Residents of France and certain other jurisdictions may also provide us with instructions regarding the manner in which we may continue to store, erase and share your information after your death, and where applicable, the person you have designated to exercise these rights after your death.
118 | THE GUGGENHEIM FUNDS ANNUAL REPORT | |
GUGGENHEIM INVESTMENTS PRIVACY NOTICE (Unaudited)(concluded) |
How We Protect Privacy Online
We take steps to protect your privacy when you use our web site – www.guggenheiminvestments.com – by using secure forms of online communication, including encryption technology, Secure Socket Layer (SSL) protocol, firewalls and user names and passwords. These safeguards vary based on the sensitivity of the information that we collect and store. However, we cannot and do not guarantee that these measures will prevent every unauthorized attempt to access, use, or disclose your information since despite our efforts, no Internet and/or other electronic transmissions can be completely secure. Our web site uses “http cookies”—tiny pieces of information that we ask your browser to store. We use cookies for session management and security features on the Guggenheim Investments web site. We do not use them to pull data from your hard drive, to learn your e-mail address, or to view data in cookies created by other web sites. We will not share the information in our cookies or give others access to it. See the legal information area on our web site for more details about web site security and privacy features.
How We Safeguard Your Personal Information and Data Retention
We restrict access to nonpublic personal information about you to our employees and in some cases to third parties (for example, the service providers described above) as permitted by law. We maintain strict physical, electronic and procedural safeguards that comply with federal standards to guard your nonpublic personal information.
We keep your information for no longer than necessary for the purposes for which it is processed. The length of time for which we retain information depends on the purposes for which we collected and use it and/or as required to comply with applicable laws. Information may persist in copies made for backup and business continuity purposes for additional time.
International Visitors
If you are not a resident of the United States, please be aware that your information may be transferred to, stored and processed in the United States where our servers are located and our databases are operated. The data protection and other laws of the United States and other countries might not be as comprehensive as those in your country.
In such cases, we ensure that a legal basis for such a transfer exists and that adequate protection is provided as required by applicable law, for example, by using standard contractual clauses or by transferring your data to a jurisdiction that has obtained an adequacy finding. Individuals whose data may be transferred on the basis of standard contractual clauses may contact us as described below.
We’ll Keep You Informed
If you have any questions or concerns about how we treat your personal data, we encourage you to consult with us first. You may also contact the relevant supervisory authority.
We reserve the right to modify this policy at any time and will inform you promptly of material changes. You may access our privacy policy from our web site at www.guggenheiminvestments.com. Should you have any questions regarding our privacy policy, contact us by email at CorporateDataPrivacy@GuggenheimPartners.com.
| | THE GUGGENHEIM FUNDS ANNUAL REPORT | 119 |
LIQUIDITY RISK MANAGEMENT PROGRAM (Unaudited) |
In compliance with SEC Rule 22e-4 under the U.S. Investment Company Act of 1940 (the “Liquidity Rule”), the Guggenheim Funds Trust (the “Trust”) has adopted and implemented a written liquidity risk management program (the “Program”) for each series of the Trust (each, a “Fund” and, collectively, the “Funds”). The Trust’s Board of Trustees (the “Board”) has also designated a Program administrator (the “Administrator”).
The Liquidity Rule requires that the Program be reasonably designed to assess and manage each Fund’s liquidity risk. A Fund’s “liquidity risk” (as defined in the Liquidity Rule) is the risk that the Fund could not meet requests to redeem shares issued by the Fund without significant dilution of the remaining investors’ interests in the Fund. The Program includes a number of elements that support the assessment, management and periodic review of liquidity risk. In accordance with the Program, each Fund’s liquidity risk is assessed, managed, and periodically reviewed no less frequently than annually taking into consideration a variety of factors, including, as applicable, the Fund’s investment strategy and liquidity of portfolio investments, short-term and long-term cash flow projections, and holdings of cash and cash equivalents, as well as borrowing arrangements and other funding sources. Certain factors are considered under both normal and reasonably foreseeable stressed conditions. There is no guarantee that the Program will achieve its objective under all circumstances.
Under the Program, each Fund portfolio investment is classified into one of four liquidity categories. The classification is based on a determination of the number of days a Fund reasonably expects to take to convert the investment into cash, or sell or dispose of the investment, in current market conditions without significantly changing the investment’s market value. The Program is reasonably designed to meet Liquidity Rule requirements relating to “highly liquid investment minimums” (i.e., the minimum amount of a Fund’s net assets to be invested in highly liquid investments that are assets) and to monitor compliance with the Liquidity Rule’s limitations on a Fund’s investments in “illiquid investments” (as defined in the Liquidity Rule). Under the Liquidity Rule, a Fund is prohibited from acquiring any illiquid investment if, immediately after the acquisition, the Fund would have invested more than 15% of its net assets in illiquid investments that are assets.
During the period covered by this shareholder report, the Board received a written report (the “Report”) prepared by the Administrator addressing the Program’s operation and assessing the adequacy and effectiveness of its implementation for the period from March 31, 2022, to March 31, 2023. The Report summarized the Administrator’s assessment of the Program’s implementation and concluded that the Program operated effectively, the Program had been and continued to be reasonably designed to assess and manage each Fund’s liquidity risk, and the Program has been adequately and effectively implemented to monitor and respond to the Funds’ liquidity developments, as applicable.
Please refer to the Fund’s prospectus for more information regarding the Fund’s exposure to liquidity risk and other risks to which an investment in the Fund may be subject.
120 | THE GUGGENHEIM FUNDS ANNUAL REPORT | |
This page intentionally left blank.
This page intentionally left blank.
This page intentionally left blank.
This page intentionally left blank.
This page intentionally left blank.
9.30.2023
Guggenheim Funds Annual Report
Guggenheim SMid Cap Value Fund | | |
GuggenheimInvestments.com | SBMCV-ANN-0923x0924 |

| | |
DEAR SHAREHOLDER | 2 |
ECONOMIC AND MARKET OVERVIEW | 3 |
ABOUT SHAREHOLDERS’ FUND EXPENSES | 5 |
SMID CAP VALUE FUND | 8 |
NOTES TO FINANCIAL STATEMENTS | 26 |
REPORT OF INDEPENDENT REGISTERED PUBLIC ACCOUNTING FIRM | 36 |
OTHER INFORMATION | 38 |
INFORMATION ON BOARD OF TRUSTEES AND OFFICERS | 52 |
GUGGENHEIM INVESTMENTS PRIVACY NOTICE | 62 |
LIQUIDITY RISK MANAGEMENT PROGRAM | 66 |
| | THE GUGGENHEIM FUNDS ANNUAL REPORT | 1 |
Dear Shareholder:
Security Investors, LLC (“Investment Adviser”) is pleased to present the shareholder report for Guggenheim SMid Cap Value Fund (“Fund”) for the annual fiscal period ended September 30, 2023 (“Reporting Period”).
The Investment Adviser is part of Guggenheim Investments, which represents the investment management businesses of Guggenheim Partners, LLC (“Guggenheim”), a global, diversified financial services firm.
Guggenheim Funds Distributors, LLC is the distributor of the Fund. Guggenheim Funds Distributors, LLC is affiliated with Guggenheim and the Investment Adviser.
We encourage you to read the Economic and Market Overview section of the report, which follows this letter, and then the Managers’ Commentary for the Fund.
We are committed to providing innovative investment solutions and appreciate the trust you place in us.
Sincerely,
Security Investors, LLC
October 31, 2023
Read a prospectus and summary prospectus (if available) carefully before investing. It contains the investment objectives, risks, charges, expenses and other information, which should be considered carefully before investing. Obtain a prospectus and summary prospectus (if available) at guggenheiminvestments.com or call 800.820.0888.
This material is not intended as a recommendation or as investment advice of any kind, including in connection with rollovers, transfers, and distributions. Such material is not provided in a fiduciary capacity, may not be relied upon for or in connection with the making of investment decisions, and does not constitute a solicitation of an offer to buy or sell securities. All content has been provided for informational or educational purposes only and is not intended to be and should not be construed as legal or tax advice and/or a legal opinion. Always consult a financial, tax and/ or legal professional regarding your specific situation.
SMid Cap Value Fund may not be suitable for all investors. ● An investment in the Fund will fluctuate and is subject to investment risks, which means investors could lose money. ● The intrinsic value of the underlying stocks may never be realized, or the stock may decline in value. ● Investments in small- and/or mid-sized company securities may present additional risks such as less predictable earnings, higher volatility and less liquidity than larger, more established companies. ● It is important to note that the Fund is not guaranteed by the U.S. government. ● Please read the prospectus for more detailed information regarding these and other risks.
2 | THE GUGGENHEIM FUNDS ANNUAL REPORT | |
ECONOMIC AND MARKET OVERVIEW (Unaudited) | September 30, 2023 |
Faced with a series of strong economic data releases, the market increasingly appears to be coming to the conclusion that the economy is structurally better able to withstand higher interest rates than it really is. This dynamic can be seen by examining the move in Treasury yields, with the selloff almost entirely being due to real yields rather than inflation expectations, and with the move most pronounced at the long end of the yield curve. Digging further, however, a large portion of this shift is due to a rising term premium (the premium for unknown and unquantified risks in the future, beyond current assumptions on the path of inflation or policy rates), which is indicating greater uncertainty about the outlook.
Many forecasters are extrapolating the current year’s economic strength without recognizing the fact that growth has benefited from a number of factors this year that are unlikely to be repeated, namely an expansion of the fiscal deficit, a slowdown in inflation, and a rebound in labor supply. As these factors fade, the headwinds from tight monetary policy may be more apparent and pronounced. And the longer monetary conditions stay tight, the greater the risk of something breaking (banks and commercial real estate remain key risks). All of this suggests that the recent economic trajectory cannot be assumed to continue, especially given the substantial restraint that could be imposed by the recent rise in long-term borrowing costs.
Uncertainty is elevated given the diverging signals in the data and the fact that many traditional economic models are not “working” as they traditionally would. This uncertainty extends to the U.S. Federal Reserve, which looks set to hold off on further rate hikes while it waits to see if the data start to align with the softening conditions policymakers say they are hearing on the ground. We continue to think the gravitational pull of tight money and credit conditions could result in a slowing economy and cooler inflation over the next year, paving the way for more rate cuts than the market presently expects.
For the Reporting Period, the S&P 500® Index* returned 21.62%. The MSCI Europe-Australasia-Far East (“EAFE”) Index* returned 25.65%. The return of the MSCI Emerging Markets Index* was 11.70%.
In the bond market, the Bloomberg U.S. Aggregate Bond Index* posted a 0.64% return for the Reporting Period, while the Bloomberg U.S. Corporate High Yield Index* returned 10.28%. The return of the ICE Bank of America (“BofA”) 3-Month U.S. Treasury Bill Index* was 4.50% for the Reporting Period.
The opinions and forecasts expressed may not actually come to pass. This information is subject to change at any time, based on market and other conditions, and should not be construed as a recommendation of any specific security or strategy.
| | THE GUGGENHEIM FUNDS ANNUAL REPORT | 3 |
ECONOMIC AND MARKET OVERVIEW (Unaudited)(concluded) | September 30, 2023 |
*Index Definitions:
The following indices are referenced throughout this report. Indices are unmanaged and not available for direct investment. Index performance does not reflect transaction costs, fees, or expenses.
Bloomberg U.S. Aggregate Bond Index is a broad-based flagship benchmark that measures the investment grade, U.S. dollar-denominated, fixed-rate taxable bond market, including U.S. Treasuries, government-related and corporate securities, mortgage-backed securities or “MBS” (agency fixed-rate and hybrid adjustable-rate mortgage, or “ARM”, pass-throughs), asset-backed securities (“ABS”), and commercial mortgage-backed securities (“CMBS”) (agency and non-agency).
Bloomberg U.S. Corporate High Yield Index measures the U.S. dollar-denominated, high yield, fixed-rate corporate bond market. Securities are classified as high yield if the middle rating of Moody’s, Fitch, and S&P is Ba1/BB +/BB + or below.
ICE BofA 3-Month U.S. Treasury Bill Index is an unmanaged market index of U.S. Treasury securities maturing in 90 days that assumes reinvestment of all income.
MSCI EAFE Index is a free float-adjusted market capitalization index that is designed to measure the equity market performance of developed markets, excluding the U.S. & Canada.
MSCI Emerging Markets Index is a free float-adjusted market capitalization weighted index that is designed to measure equity market performance in the global emerging markets.
Russell 2500® Value Index measures the performance of the small-to mid-cap value segment of the U.S. equity universe. It includes those Russell 2500 companies with lower price-to-book ratios and lower forecasted growth values.
S&P 500® Index is a broad-based index, the performance of which is based on the performance of 500 widely held common stocks chosen for market size, liquidity, and industry group representation.
4 | THE GUGGENHEIM FUNDS ANNUAL REPORT | |
ABOUT SHAREHOLDERS’ FUND EXPENSES (Unaudited) |
All mutual funds have operating expenses, and it is important for our shareholders to understand the impact of costs on their investments. Shareholders of a fund incur two types of costs: (i) transaction costs, including sales charges (loads) on purchase payments, reinvested dividends, other distributions, and exchange fees, and (ii) ongoing costs, including management fees, administrative services, and shareholder reports, among others. These ongoing costs, or operating expenses, are deducted from a fund’s gross income and reduce the investment return of the fund.
A fund’s expenses are expressed as a percentage of its average net assets, which is known as the expense ratio. The following examples are intended to help investors understand the ongoing costs (in dollars) of investing in a fund and to compare these costs with the ongoing costs of investing in other mutual funds.
The examples are based on an investment of $1,000 made at the beginning of the period and held for the entire six-month period beginning March 31, 2023 and ending September 30, 2023.
The following tables illustrate the Fund’s costs in two ways:
Table 1. Based on actual Fund return: This section helps investors estimate the actual expenses paid over the period. The “Ending Account Value” shown is derived from the Fund’s actual return, and the fifth column shows the dollar amount that would have been paid by an investor who started with $1,000 in the Fund. Investors may use the information here, together with the amount invested, to estimate the expenses paid over the period. Simply divide the Fund’s account value by $1,000 (for example, an $8,600 account value divided by $1,000 = 8.6), then multiply the result by the number provided under the heading “Expenses Paid During Period.”
Table 2. Based on hypothetical 5% return: This section is intended to help investors compare a fund’s cost with those of other mutual funds. The table provides information about hypothetical account values and hypothetical expenses based on the Fund’s actual expense ratio and an assumed rate of return of 5% per year before expenses, which is not the Fund’s actual return. The hypothetical account values and expenses may not be used to estimate the actual ending account balance or expenses paid during the period. The example is useful in making comparisons because the U.S. Securities and Exchange Commission (the “SEC”) requires all mutual funds to calculate expenses based on the 5% return. Investors can assess a Fund’s costs by comparing this hypothetical example with the hypothetical examples that appear in shareholder reports of other funds.
The calculations illustrated above assume no shares were bought or sold during the period. Actual costs may have been higher or lower, depending on the amount of investment and the timing of any purchases or redemptions.
| | THE GUGGENHEIM FUNDS ANNUAL REPORT | 5 |
ABOUT SHAREHOLDERS’ FUND EXPENSES (Unaudited)(continued) |
Please note that the expenses shown in the table are meant to highlight your ongoing costs only and do not reflect any transactional costs, such as sales charges (loads) on purchase payments, and contingent deferred sales charges (“CDSC”) on redemptions, if any. Therefore, the second table is useful in comparing ongoing costs only, and will not help you determine the relative total costs of owning different funds. In addition, if these transactional costs were included, your costs would have been higher.
More information about the Fund’s expenses, including annual expense ratios for periods up to five years (subject to the Fund’s inception date), can be found in the Financial Highlights section of this report. For additional information on operating expenses and other shareholder costs, please refer to the Fund’s prospectus.
6 | THE GUGGENHEIM FUNDS ANNUAL REPORT | |
ABOUT SHAREHOLDERS’ FUND EXPENSES (Unaudited)(concluded) |
| Expense
Ratio1 | Fund
Return | Beginning
Account Value
March 31,
2023 | Ending
Account Value
September 30,
2023 | Expenses
Paid During
Period2 |
Table 1. Based on actual Fund return3 |
A-Class | 1.16% | (1.08%) | $1,000.00 | $989.20 | $5.78 |
C-Class | 2.02% | (1.49%) | 1,000.00 | 985.10 | 10.05 |
P-Class | 1.25% | (1.12%) | 1,000.00 | 988.80 | 6.23 |
Institutional Class | 0.90% | (0.98%) | 1,000.00 | 990.20 | 4.49 |
|
Table 2. Based on hypothetical 5% return (before expenses) |
A-Class | 1.16% | 5.00% | $1,000.00 | $1,019.25 | $5.87 |
C-Class | 2.02% | 5.00% | 1,000.00 | 1,014.94 | 10.20 |
P-Class | 1.25% | 5.00% | 1,000.00 | 1,018.80 | 6.33 |
Institutional Class | 0.90% | 5.00% | 1,000.00 | 1,020.56 | 4.56 |
1 | Annualized and excludes expenses of the underlying funds in which the Fund invests, if any. |
2 | Expenses are equal to the Fund’s annualized expense ratio, net of any applicable fee waivers, multiplied by the average account value over the period, multiplied by 183/365 (to reflect the one-half year period). |
3 | Actual cumulative return at net asset value for the period March 31, 2023 to September 30, 2023. |
| | THE GUGGENHEIM FUNDS ANNUAL REPORT | 7 |
MANAGERS’ COMMENTARY (Unaudited) | September 30, 2023 |
To Our Shareholders
Guggenheim SMid Cap Value Fund (“Fund”) is managed by a team of seasoned professionals led by James Schier, CFA, Senior Managing Director and Portfolio Manager; David Toussaint, CFA, CPA, Managing Director and Portfolio Manager; Farhan Sharaff, Senior Managing Director, Assistant Chief Investment Officer, Equities, and Portfolio Manager; Chris Phalen, Managing Director and Portfolio Manager; Gregg Strohkorb, CFA, Director and Portfolio Manager; and Burak Hurmeydan, Ph.D., Director and Portfolio Manager. In the subsequent paragraphs, the investment team discusses the Fund’s performance and the market environment for the 12-month period ended September 30, 2023 (“Reporting Period”).
For the Reporting Period, the Fund provided a total return of 12.65%1, outperforming the Russell 2500 Value Index, the Fund’s benchmark (“Benchmark”), which returned 11.34% for the same period.
What factors contributed or detracted from the Fund’s performance during the Reporting Period?
The market began the Reporting Period with steady strength, as a buoyant economy helped build expectations that a highly anticipated recession would be pushed further out and that perhaps the Fed could do the unthinkable and engineer a soft landing. Once the banking crisis hit in March, leadership in equities shifted away from the value area and growth stocks once again caught the market’s interest. As the year progressed, the continued strong jobs market accompanied by increasing fiscal deficits and treasury issuance caused a significant rise in interest rates. These events have begun to dampen stock performance, as equity returns for the broad market were lower in Q3. A flight to safety from growing geopolitical risks has yet to dampen the trend toward rising interest rates in the government debt market.
The Fund had a solid year as it outperformed its Benchmark by 131 basis points. The most significant positive contributor to the strategy was its overweighting in Industrials, where the Fund had an average weighing of 23% versus 18.6% for the Benchmark. This sector managed to gain more than 30% during the year. Infrastructure companies geared towards the reindustrialization of America provided some of the best gains, as Terex Corp. (+95%), EnerSys (+64%), Altra Industrial Motion Corp. (+83% on a takeover by Regal Rexnord Corp.) and H&E Equipment Services, Inc (+56%) all provided significant contributions.
Stock selection in Health Care was much better than the Benchmark (+2.8% versus a negative 5%). This provided the second-most meaningful boost for relative performance. Encompass Health Corp., which operates inpatient rehab facilities at hospitals, gained almost 50%. Favorable Medicare rate reimbursement in the Spring, coupled with solid earnings results that were driven by favorable volumes as well as expense benefits, led to several good earnings reports over the Reporting Period. A looser labor market coming off COVID allowed the company to save from
8 | THE GUGGENHEIM FUNDS ANNUAL REPORT | |
MANAGERS’ COMMENTARY (Unaudited)(continued) | September 30, 2023 |
lower usage of contract labor. Integer Holdings Corp., a large contract manufacturer for medical device componentry, gained 26%. Earnings during the year were largely favorable, as supply chain issues began to subside, aiding margins and boosting sales. Relative to other subindustries in Health Care, these two names represent situations that avoid the funding issues that higher interest rates pose for many small cap biotech and pharmaceutical companies, and they also sidestep the fear among companies in the space that diet drugs could potentially reduce demand.
Stock selection in Consumer Staples was the third-most significant relative performance contributor, as the +25% return in the sector easily outpaced the 12% gain in the Benchmark. Bunge Ltd. gained 34%. The company’s business benefitted from high demand for biodiesel/ethanol that helped margins and volume of processed soybeans throughout the year. The market also reacted favorably to the company’s merger with Viterra.
On the negative side, stock selection in Financials was the largest drawback, as the Fund lost 134 basis points from its position in SVB Financial. For the Financials sector as a whole, performance was a negative 6.3% versus a positive 0.5% in the Benchmark. The unprecedented collapse of SVB Financial Group was unique in the speed with which it occurred and the fact that its failure did not produce many credit-related issues. The other bank holdings in the strategy outperformed the Benchmark, alleviating the damage that selection posed to the strategy from the banking industry.
The second-largest headwind for performance during the Reporting Period was a significant underweight in the Consumer Discretionary sector. This sector gained 21.8%, and the Fund had an average weighting of 3.8% versus 11.5% for the Benchmark. We have been concerned about the impact higher rates would have on spending, and the headwinds diminishing stimulus funds would create for aggregate demand. Most companies in the sector continue to have high margins, which should contract in the quarters ahead; we moved our weighting lower as the year progressed.
The third most significant detractor to performance was in Energy stock selection. The Fund’s holdings in this sector gained 18% versus 26.3% for the Benchmark. Essentially, the Fund lacked exposure to the higher-beta energy service and drilling industries that performed the best. Additionally, a large weighting in Pioneer Natural Resources Co. detracted from return, as this position only gained 14%, while smaller, more operationally levered exploration and production companies performed better. An above-average weighting to this sector, however, served to completely offset the selection headwind; overall, Energy was neutral to relative performance.
How was the Fund positioned at the end of the Reporting Period?
In many ways, the environment is similar to last year. The geopolitical outlook seems to have become less favorable, and the Fed, while still hawkish, is much later in the game of fighting inflation. However, it remains unclear how long “higher for longer” will really be. Reversing several decades of shifting production from low-cost Asian countries to higher-cost locations closer to
| | THE GUGGENHEIM FUNDS ANNUAL REPORT | 9 |
MANAGERS’ COMMENTARY (Unaudited)(concluded) | September 30, 2023 |
end markets could provide many years of stubbornly high inflation that may serve to restrain equity appreciation. The murkiness of the economic outlook has not improved, yet equity prices are higher.
At the beginning of the Reporting Period, our three largest active weights were in Industrials (+561 basis points), Materials (+422 basis points) and Consumer Staples (+303 basis points). At the end of the Reporting Period, they were in Materials (+419 basis points), Energy (+349 basis points) and Industrials (+280 basis points).
At the beginning of the Reporting Period, our largest underweights were in Consumer Discretionary (-533 basis points), Financials (-381 basis points) and Real Estate (-374 basis points). At the end of the Reporting Period, they were in Consumer Discretionary (-957 basis points), Real Estate (-528 basis points) and Financials (-246 basis points). So, while there is not much change in leadership, we have boosted exposure to the sectors that we like and lessened exposure to those we don’t. Cash at the end of the Reporting Period was less than 1%.
Performance displayed represents past performance which is no guarantee of future results.
1 | Performance figures are based on Class A shares and do not reflect taxes that a shareholder would pay on distributions or the redemption of shares. |
The opinions and forecast expressed may not actually come to pass. This information is subject to change at any time, based on market and other conditions, and should not be construed as a recommendation of any specific security or strategy.
10 | THE GUGGENHEIM FUNDS ANNUAL REPORT | |
PERFORMANCE REPORT AND FUND PROFILE (Unaudited) | September 30, 2023 |
SMID CAP VALUE FUND
OBJECTIVE: Seeks long-term growth of capital.
Holdings Diversification (Market Exposure as % of Net Assets)
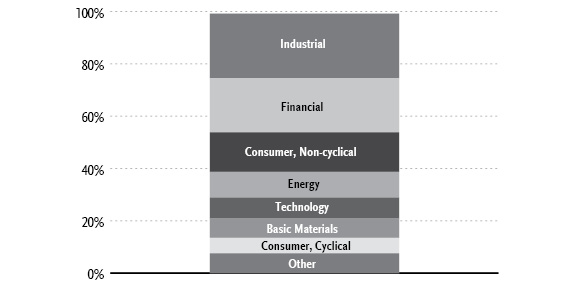
“Holdings Diversification (Market Exposure as % of Net Assets)” excludes any temporary cash investments.
Inception Dates: |
A-Class | May 1, 1997 |
C-Class | January 29, 1999 |
P-Class | May 1, 2015 |
Institutional Class | January 3, 2020 |
Ten Largest Holdings | % of Total Net Assets |
Pioneer Natural Resources Co. | 3.7% |
Unum Group | 2.8% |
Ingredion, Inc. | 2.4% |
Bunge Ltd. | 2.3% |
Kirby Corp. | 2.1% |
MSC Industrial Direct Company, Inc. — Class A | 2.0% |
Curtiss-Wright Corp. | 2.0% |
Markel Group, Inc. | 2.0% |
Encompass Health Corp. | 1.8% |
Diamondback Energy, Inc. | 1.7% |
Top Ten Total | 22.8% |
| | |
“Ten Largest Holdings” excludes any temporary cash investments. |
| | THE GUGGENHEIM FUNDS ANNUAL REPORT | 11 |
PERFORMANCE REPORT AND FUND PROFILE (Unaudited)(concluded) | September 30, 2023 |
Cumulative Fund Performance*
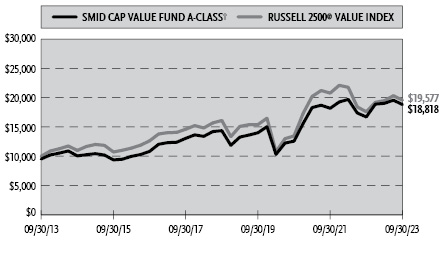
Average Annual Returns*
Periods Ended September 30, 2023
| 1 Year | 5 Year | 10 Year |
A-Class Shares | 12.65% | 5.56% | 7.05% |
A-Class Shares with sales charge† | 7.32% | 4.53% | 6.53% |
C-Class Shares | 11.67% | 4.68% | 6.20% |
C-Class Shares with CDSC‡ | 10.67% | 4.68% | 6.20% |
Institutional Class Shares1 | 12.91% | 5.87% | 7.38% |
Russell 2500 Value Index | 11.34% | 3.99% | 6.95% |
| 1 Year | 5 Year | Since
Inception
(05/01/15) |
P-Class Shares | 12.57% | 5.48% | 7.35% |
Russell 2500 Value Index | 11.34% | 3.99% | 6.09% |
* | The performance data above represents past performance that is not predictive of future results. The investment return and principal value of an investment in the Fund will fluctuate so that an investor’s shares, when redeemed, may be worth more or less than their original cost. Returns are historical and include changes in principal and reinvested dividends and capital gains and do not reflect the effect of taxes. The Russell 2500 Value Index is an unmanaged index and, unlike the Fund, has no management fees or operating expenses to reduce its reported return. The graph is based on A-Class shares only; performance for C-Class shares, P-Class shares and Institutional Class shares will vary due to difference in fee structures. |
1 | The Institutional Class shares commenced operations on January 3, 2020 in connection with the reorganization of the SMid Cap Value Institutional Fund. The performance of the Institutional Class shares of the Fund for periods prior to January 3, 2020 reflects the performance of the Guggenheim SMid Cap Value Institutional Fund. The returns for the SMid Cap Value Institutional Fund have not been restated to reflect the fees and expenses applicable to the Institutional Class shares of the Fund. The SMid Cap Value Institutional Fund commenced operations on July 11, 2008. |
† | Fund returns are calculated using the maximum sales charge of 4.75%. |
‡ | Fund returns include a CDSC of 1% if redeemed within 12 months of purchase. |
12 | THE GUGGENHEIM FUNDS ANNUAL REPORT | |
SCHEDULE OF INVESTMENTS | September 30, 2023 |
SMID CAP VALUE FUND | |
| | Shares | | | Value | |
COMMON STOCKS† - 99.1% |
| | | | | | | | | |
Industrial - 24.7% |
Kirby Corp.* | | | 90,242 | | | $ | 7,472,038 | |
Curtiss-Wright Corp. | | | 37,616 | | | | 7,358,818 | |
Graphic Packaging Holding Co. | | | 279,720 | | | | 6,232,162 | |
Knight-Swift Transportation Holdings, Inc. | | | 99,408 | | | | 4,985,311 | |
Teledyne Technologies, Inc.* | | | 11,570 | | | | 4,727,271 | |
PGT Innovations, Inc.* | | | 161,297 | | | | 4,475,992 | |
Advanced Energy Industries, Inc. | | | 42,919 | | | | 4,425,807 | |
Summit Materials, Inc. — Class A* | | | 141,380 | | | | 4,402,573 | |
Johnson Controls International plc | | | 76,754 | | | | 4,084,080 | |
Arcosa, Inc. | | | 55,422 | | | | 3,984,842 | |
Mercury Systems, Inc.* | | | 96,209 | | | | 3,568,392 | |
Coherent Corp.* | | | 106,220 | | | | 3,467,021 | |
Terex Corp. | | | 56,576 | | | | 3,259,909 | |
MDU Resources Group, Inc. | | | 160,895 | | | | 3,150,324 | |
Daseke, Inc.* | | | 576,933 | | | | 2,959,666 | |
Esab Corp. | | | 41,571 | | | | 2,919,116 | |
Park Aerospace Corp. | | | 174,887 | | | | 2,715,995 | |
EnerSys | | | 26,876 | | | | 2,544,351 | |
Littelfuse, Inc. | | | 9,911 | | | | 2,451,188 | |
AZEK Company, Inc.* | | | 73,980 | | | | 2,200,165 | |
Plexus Corp.* | | | 22,485 | | | | 2,090,655 | |
Sonoco Products Co. | | | 34,129 | | | | 1,854,911 | |
GATX Corp. | | | 16,707 | | | | 1,818,223 | |
Stoneridge, Inc.* | | | 82,637 | | | | 1,658,525 | |
NVE Corp. | | | 11,642 | | | | 956,274 | |
Total Industrial | | | | | | | 89,763,609 | |
| | | | | | | | | |
Financial - 20.7% |
Unum Group | | | 205,355 | | | | 10,101,412 | |
Markel Group, Inc.* | | | 4,955 | | | | 7,296,188 | |
Prosperity Bancshares, Inc. | | | 108,788 | | | | 5,937,649 | |
Stifel Financial Corp. | | | 82,644 | | | | 5,077,647 | |
Texas Capital Bancshares, Inc.* | | | 83,797 | | | | 4,935,643 | |
Old Republic International Corp. | | | 178,191 | | | | 4,800,466 | |
First Merchants Corp. | | | 169,562 | | | | 4,717,215 | |
Jefferies Financial Group, Inc. | | | 122,785 | | | | 4,497,615 | |
Physicians Realty Trust REIT | | | 269,332 | | | | 3,283,157 | |
First American Financial Corp. | | | 57,283 | | | | 3,235,917 | |
Apple Hospitality REIT, Inc. | | | 191,498 | | | | 2,937,579 | |
Sun Communities, Inc. REIT | | | 24,554 | | | | 2,905,720 | |
Alexandria Real Estate Equities, Inc. REIT | | | 27,079 | | | | 2,710,608 | |
Ventas, Inc. REIT | | | 61,227 | | | | 2,579,494 | |
Stewart Information Services Corp. | | | 49,893 | | | | 2,185,313 | |
UMB Financial Corp. | | | 34,410 | | | | 2,135,140 | |
Gaming and Leisure Properties, Inc. REIT | | | 46,248 | | | | 2,106,597 | |
Synovus Financial Corp. | | | 61,975 | | | | 1,722,905 | |
United Bankshares, Inc. | | | 49,223 | | | | 1,358,063 | |
Jones Lang LaSalle, Inc.* | | | 6,026 | | | | 850,751 | |
Total Financial | | | | | | | 75,375,079 | |
| | | | | | | | | |
Consumer, Non-cyclical - 15.1% |
Ingredion, Inc. | | | 87,551 | | | | 8,615,018 | |
Bunge Ltd. | | | 77,683 | | | | 8,409,185 | |
Encompass Health Corp. | | | 96,089 | | | | 6,453,337 | |
Euronet Worldwide, Inc.* | | | 66,598 | | | | 5,286,549 | |
SEE NOTES TO FINANCIAL STATEMENTS. | THE GUGGENHEIM FUNDS ANNUAL REPORT | 13 |
SCHEDULE OF INVESTMENTS (continued) | September 30, 2023 |
SMID CAP VALUE FUND | |
| | Shares | | | Value | |
Integer Holdings Corp.* | | | 53,596 | | | $ | 4,203,534 | |
Central Garden & Pet Co. — Class A* | | | 100,456 | | | | 4,027,281 | |
Enovis Corp.* | | | 63,654 | | | | 3,356,476 | |
Henry Schein, Inc.* | | | 37,516 | | | | 2,785,563 | |
ICF International, Inc. | | | 19,374 | | | | 2,340,573 | |
LivaNova plc* | | | 39,390 | | | | 2,082,943 | |
Quest Diagnostics, Inc. | | | 15,093 | | | | 1,839,233 | |
Azenta, Inc.* | | | 33,889 | | | | 1,700,889 | |
Certara, Inc.* | | | 109,254 | | | | 1,588,553 | |
Jazz Pharmaceuticals plc* | | | 7,906 | | | | 1,023,353 | |
Ironwood Pharmaceuticals, Inc. — Class A* | | | 101,303 | | | | 975,548 | |
Total Consumer, Non-cyclical | | | 54,688,035 | |
| | | | | | | | | |
Energy - 9.7% |
Pioneer Natural Resources Co. | | | 58,145 | | | | 13,347,185 | |
Diamondback Energy, Inc. | | | 40,485 | | | | 6,270,317 | |
Murphy Oil Corp. | | | 98,302 | | | | 4,457,996 | |
Liberty Energy, Inc. — Class A | | | 165,250 | | | | 3,060,430 | |
Equities Corp. | | | 73,308 | | | | 2,974,838 | |
Kinder Morgan, Inc. | | | 112,598 | | | | 1,866,875 | |
Range Resources Corp. | | | 56,484 | | | | 1,830,646 | |
Patterson-UTI Energy, Inc. | | | 116,563 | | | | 1,613,231 | |
HydroGen Corp.*,†††,1 | | | 1,265,700 | | | | 2 | |
Total Energy | | | | | | | 35,421,520 | |
| | | | | | | | | |
Technology - 8.1% |
Teradyne, Inc. | | | 59,776 | | | | 6,005,097 | |
Evolent Health, Inc. — Class A* | | | 213,537 | | | | 5,814,613 | |
Science Applications International Corp. | | | 54,403 | | | | 5,741,693 | |
Leidos Holdings, Inc. | | | 45,214 | | | | 4,166,922 | |
MACOM Technology Solutions Holdings, Inc.* | | | 50,130 | | | | 4,089,605 | |
LivePerson, Inc.* | | | 433,833 | | | | 1,687,610 | |
Silicon Laboratories, Inc.* | | | 11,320 | | | | 1,311,875 | |
Wolfspeed, Inc.* | | | 19,914 | | | | 758,723 | |
Total Technology | | | | | | | 29,576,138 | |
| | | | | | | | | |
Basic Materials - 7.3% |
Reliance Steel & Aluminum Co. | | | 22,854 | | | | 5,993,004 | |
Huntsman Corp. | | | 189,411 | | | | 4,621,628 | |
Westlake Corp. | | | 36,815 | | | | 4,589,726 | |
Nucor Corp. | | | 24,912 | | | | 3,894,991 | |
Avient Corp. | | | 109,330 | | | | 3,861,536 | |
Ashland, Inc. | | | 41,548 | | | | 3,393,641 | |
Total Basic Materials | | | | | | | 26,354,526 | |
| | | | | | | | | |
Consumer, Cyclical - 6.0% |
MSC Industrial Direct Company, Inc. — Class A | | | 75,691 | | | | 7,429,072 | |
H&E Equipment Services, Inc. | | | 105,031 | | | | 4,536,289 | |
Whirlpool Corp. | | | 28,650 | | | | 3,830,505 | |
Lear Corp. | | | 14,734 | | | | 1,977,303 | |
Methode Electronics, Inc. | | | 68,189 | | | | 1,558,118 | |
Newell Brands, Inc. | | | 141,095 | | | | 1,274,088 | |
Lakeland Industries, Inc. | | | 82,219 | | | | 1,239,040 | |
Total Consumer, Cyclical | | | 21,844,415 | |
| | | | | | | | | |
Utilities - 5.6% |
Pinnacle West Capital Corp. | | | 84,650 | | | | 6,237,012 | |
OGE Energy Corp. | | | 186,889 | | | | 6,229,011 | |
Evergy, Inc. | | | 100,936 | | | | 5,117,455 | |
Black Hills Corp. | | | 52,292 | | | | 2,645,452 | |
Total Utilities | | | | | | | 20,228,930 | |
| | | | | | | | | |
14 | THE GUGGENHEIM FUNDS ANNUAL REPORT | SEE NOTES TO FINANCIAL STATEMENTS. |
SCHEDULE OF INVESTMENTS (continued) | September 30, 2023 |
SMID CAP VALUE FUND | |
| | Shares | | | Value | |
Communications - 1.9% |
Fox Corp. — Class B | | | 126,041 | | | $ | 3,640,064 | |
Ciena Corp.* | | | 47,396 | | | | 2,239,935 | |
Luna Innovations, Inc.* | | | 148,908 | | | | 872,601 | |
Total Communications | | | | | | | 6,752,600 | |
| | | | | | | | | |
Total Common Stocks | | | | |
(Cost $317,740,239) | | | | | | | 360,004,852 | |
| | | | | | | | | |
CONVERTIBLE PREFERRED STOCKS††† - 0.0% |
Industrial - 0.0% |
Thermoenergy Corp.*,2 | | | 1,652,084 | | | | 5 | |
| | | | | | | | | |
Total Convertible Preferred Stocks | | | | |
(Cost $1,577,635) | | | | | | | 5 | |
| | | | | | | | | |
RIGHTS† - 0.1% |
Basic Materials - 0.1% |
Pan American Silver Corp. | | | 516,551 | | | | 276,355 | |
Total Rights | | | | |
(Cost $—) | | | | | | | 276,355 | |
| | | | | | | | | |
MONEY MARKET FUND† - 0.9% |
Dreyfus Treasury Securities Cash Management Fund — Institutional Shares, 5.24%3 | | | 3,277,134 | | | | 3,277,134 | |
Total Money Market Fund | | | | |
(Cost $3,277,134) | | | | | | | 3,277,134 | |
| | | | | | | | | |
Total Investments - 100.1% | | | | |
(Cost $322,595,008) | | $ | 363,558,346 | |
Other Assets & Liabilities, net - (0.1)% | | | (194,708 | ) |
Total Net Assets - 100.0% | | $ | 363,363,638 | |
* | Non-income producing security. |
† | Value determined based on Level 1 inputs — See Note 4. |
††† | Value determined based on Level 3 inputs — See Note 4. |
1 | Affiliated issuer. |
2 | PIPE (Private Investment in Public Equity) — Stock issued by a company in the secondary market as a means of raising capital more quickly and less expensively than through registration of a secondary public offering. |
3 | Rate indicated is the 7-day yield as of September 30, 2023. |
| | plc — Public Limited Company |
| | REIT — Real Estate Investment Trust |
| | |
| | See Sector Classification in Other Information section. |
SEE NOTES TO FINANCIAL STATEMENTS. | THE GUGGENHEIM FUNDS ANNUAL REPORT | 15 |
SCHEDULE OF INVESTMENTS (concluded) | September 30, 2023 |
SMID CAP VALUE FUND | |
The following table summarizes the inputs used to value the Fund’s investments at September 30, 2023 (See Note 4 in the Notes to Financial Statements):
Investments in Securities (Assets) | | Level 1
Quoted
Prices | | | Level 2
Significant
Observable
Inputs | | | Level 3
Significant
Unobservable
Inputs | | | Total | |
Common Stocks | | $ | 360,004,850 | | | $ | — | | | $ | 2 | | | $ | 360,004,852 | |
Rights | | | 276,355 | | | | — | | | | — | | | | 276,355 | |
Money Market Fund | | | 3,277,134 | | | | — | | | | — | | | | 3,277,134 | |
Convertible Preferred Stocks | | | — | | | | — | | | | 5 | | | | 5 | |
Total Assets | | $ | 363,558,339 | | | $ | — | | | $ | 7 | | | $ | 363,558,346 | |
Affiliated Transactions
Investments representing 5% or more of the outstanding voting shares of a company, or control of or by, or common control under Guggenheim Investments, result in that company being considered an affiliated issuer, as defined in the 1940 Act.
Transactions during the year ended September 30, 2023, in which the company is an affiliated issuer, were as follows:
Security Name | | Value
09/30/22 | | | Additions | | | Reductions | | | Realized
Gain (Loss) | | | Change in
Unrealized
Appreciation
(Depreciation) | | | Value
09/30/23 | | | Shares
09/30/23 | |
Common Stocks | | | | | | | | | | | | | | | | | | | | | | | | | | | | |
HydroGen Corp.* | | $ | 2 | | | $ | — | | | $ | — | | | $ | — | | | $ | — | | | $ | 2 | | | | 1,265,700 | |
* | Non-income producing security. |
16 | THE GUGGENHEIM FUNDS ANNUAL REPORT | SEE NOTES TO FINANCIAL STATEMENTS. |
STATEMENT OF ASSETS AND LIABILITIES |
SMID CAP VALUE FUND |
September 30, 2023
Assets: |
Investments in unaffiliated issuers, at value (cost $322,592,477) | | $ | 363,558,344 | |
Investments in affiliated issuers, at value (cost $2,531) | | | 2 | |
Cash | | | 8,943 | |
Prepaid expenses | | | 26,482 | |
Receivables: |
Securities sold | | | 3,576,772 | |
Dividends | | | 471,071 | |
Fund shares sold | | | 28,689 | |
Interest | | | 16,550 | |
Foreign tax reclaims | | | 302 | |
Total assets | | | 367,687,155 | |
| | | | | |
Liabilities: |
Payable for: |
Securities purchased | | | 3,439,960 | |
Fund shares redeemed | | | 532,857 | |
Management fees | | | 210,673 | |
Distribution and service fees | | | 62,502 | |
Transfer agent fees | | | 24,383 | |
Fund accounting and administration fees | | | 6,750 | |
Trustees’ fees* | | | 1,202 | |
Due to Investment Adviser | | | 103 | |
Miscellaneous | | | 45,087 | |
Total liabilities | | | 4,323,517 | |
Net assets | | $ | 363,363,638 | |
| | | | | |
Net assets consist of: |
Paid in capital | | | 310,948,816 | |
Total distributable earnings (loss) | | | 52,414,822 | |
Net assets | | $ | 363,363,638 | |
| | | | | |
A-Class: |
Net assets | | $ | 273,173,335 | |
Capital shares outstanding | | | 7,853,728 | |
Net asset value per share | | $ | 34.78 | |
Maximum offering price per share (Net asset value divided by 95.25%) | | $ | 36.51 | |
| | | | | |
C-Class: |
Net assets | | $ | 4,205,261 | |
Capital shares outstanding | | | 199,312 | |
Net asset value per share | | $ | 21.10 | |
| | | | | |
P-Class: |
Net assets | | $ | 5,306,066 | |
Capital shares outstanding | | | 153,977 | |
Net asset value per share | | $ | 34.46 | |
| | | | | |
Institutional Class: |
Net assets | | $ | 80,678,976 | |
Capital shares outstanding | | | 9,961,332 | |
Net asset value per share | | $ | 8.10 | |
* | Relates to Trustees not deemed “interested persons” within the meaning of Section 2(a)(19) of the 1940 Act. |
SEE NOTES TO FINANCIAL STATEMENTS. | THE GUGGENHEIM FUNDS ANNUAL REPORT | 17 |
STATEMENT OF OPERATIONS |
SMID CAP VALUE FUND |
Year Ended September 30, 2023
Investment Income: |
Dividends from securities of unaffiliated issuers | | $ | 8,249,663 | |
Interest from securities of unaffiliated issuers | | | 302,690 | |
Total investment income | | | 8,552,353 | |
| | | | | |
Expenses: |
Management fees | | | 2,917,656 | |
Distribution and service fees: |
A-Class | | | 726,214 | |
C-Class | | | 49,840 | |
P-Class | | | 14,795 | |
Transfer agent fees: |
A-Class | | | 292,070 | |
C-Class | | | 10,280 | |
P-Class | | | 9,684 | |
Institutional Class | | | 75,490 | |
Fund accounting and administration fees | | | 167,998 | |
Professional fees | | | 66,853 | |
Trustees’ fees* | | | 17,861 | |
Line of credit fees | | | 12,977 | |
Custodian fees | | | 8,328 | |
Miscellaneous | | | 114,551 | |
Recoupment of previously waived fees: |
A-Class | | | 11,105 | |
C-Class | | | 2,027 | |
P-Class | | | 302 | |
Institutional Class | | | 35,535 | |
Total expenses | | | 4,533,566 | |
Less: |
Expenses reimbursed by Adviser: |
A-Class | | | (59,194 | ) |
C-Class | | | (2,172 | ) |
P-Class | | | (104 | ) |
Institutional Class | | | (1,842 | ) |
Expenses waived by Adviser | | | (121,236 | ) |
Earnings credits applied | | | (572 | ) |
Total waived/reimbursed expenses | | | (185,120 | ) |
Net expenses | | | 4,348,446 | |
Net investment income | | | 4,203,907 | |
| | | | | |
Net Realized and Unrealized Gain (Loss): |
Net realized gain (loss) on: |
Investments in unaffiliated issuers | | | 12,000,716 | |
Net realized gain | | | 12,000,716 | |
Net change in unrealized appreciation (depreciation) on: |
Investments in unaffiliated issuers | | | 29,280,726 | |
Net change in unrealized appreciation (depreciation) | | | 29,280,726 | |
Net realized and unrealized gain | | | 41,281,442 | |
Net increase in net assets resulting from operations | | $ | 45,485,349 | |
* | Relates to Trustees not deemed “interested persons” within the meaning of Section 2(a)(19) of the 1940 Act. |
18 | THE GUGGENHEIM FUNDS ANNUAL REPORT | SEE NOTES TO FINANCIAL STATEMENTS. |
STATEMENTS OF CHANGES IN NET ASSETS |
SMID CAP VALUE FUND | |
| | Year Ended
September 30,
2023 | | | Year Ended
September 30,
2022 | |
Increase (Decrease) in Net Assets from Operations: | | | | | | | | |
Net investment income | | $ | 4,203,907 | | | $ | 4,089,634 | |
Net realized gain on investments | | | 12,000,716 | | | | 35,337,758 | |
Net change in unrealized appreciation (depreciation) on investments | | | 29,280,726 | | | | (69,238,366 | ) |
Net increase (decrease) in net assets resulting from operations | | | 45,485,349 | | | | (29,810,974 | ) |
| | | | | | | | | |
Distributions to shareholders: | | | | | | | | |
A-Class | | | (15,287,730 | ) | | | (21,330,395 | ) |
C-Class | | | (400,511 | ) | | | (847,652 | ) |
P-Class | | | (319,757 | ) | | | (452,599 | ) |
Institutional Class | | | (17,898,014 | ) | | | (20,988,300 | ) |
Total distributions to shareholders | | | (33,906,012 | ) | | | (43,618,946 | ) |
| | | | | | | | | |
Capital share transactions: | | | | | | | | |
Proceeds from sale of shares | | | | | | | | |
A-Class | | | 9,197,883 | | | | 11,484,211 | |
C-Class | | | 485,848 | | | | 480,284 | |
P-Class | | | 151,281 | | | | 1,019,491 | |
Institutional Class | | | 21,824,839 | | | | 19,826,586 | |
Distributions reinvested | | | | | | | | |
A-Class | | | 14,853,499 | | | | 20,707,053 | |
C-Class | | | 379,175 | | | | 813,998 | |
P-Class | | | 319,757 | | | | 452,599 | |
Institutional Class | | | 13,919,483 | | | | 16,362,390 | |
Cost of shares redeemed | | | | | | | | |
A-Class | | | (32,127,530 | ) | | | (41,110,959 | ) |
C-Class | | | (2,161,822 | ) | | | (4,830,625 | ) |
P-Class | | | (1,145,194 | ) | | | (1,852,112 | ) |
Institutional Class | | | (29,487,889 | ) | | | (23,566,323 | ) |
Net decrease from capital share transactions | | | (3,790,670 | ) | | | (213,407 | ) |
Net increase (decrease) in net assets | | | 7,788,667 | | | | (73,643,327 | ) |
| | | | | | | | | |
Net assets: | | | | | | | | |
Beginning of year | | | 355,574,971 | | | | 429,218,298 | |
End of year | | $ | 363,363,638 | | | $ | 355,574,971 | |
| | | | | | | | | |
SEE NOTES TO FINANCIAL STATEMENTS. | THE GUGGENHEIM FUNDS ANNUAL REPORT | 19 |
STATEMENTS OF CHANGES IN NET ASSETS (concluded) |
SMID CAP VALUE FUND | |
| | Year Ended
September 30,
2023 | | | Year Ended
September 30,
2022 | |
Capital share activity: | | | | | | | | |
Shares sold | | | | | | | | |
A-Class | | | 253,740 | | | | 307,454 | |
C-Class | | | 22,243 | | | | 19,865 | |
P-Class | | | 4,170 | | | | 27,573 | |
Institutional Class | | | 2,544,475 | | | | 1,899,357 | |
Shares issued from reinvestment of distributions | | | | | | | | |
A-Class | | | 428,425 | | | | 569,188 | |
C-Class | | | 17,903 | | | | 35,484 | |
P-Class | | | 9,303 | | | | 12,544 | |
Institutional Class | | | 1,726,983 | | | | 1,634,604 | |
Shares redeemed | | | | | | | | |
A-Class | | | (898,347 | ) | | | (1,104,633 | ) |
C-Class | | | (98,361 | ) | | | (200,888 | ) |
P-Class | | | (32,403 | ) | | | (50,585 | ) |
Institutional Class | | | (3,417,401 | ) | | | (2,235,401 | ) |
Net increase in shares | | | 560,730 | | | | 914,562 | |
20 | THE GUGGENHEIM FUNDS ANNUAL REPORT | SEE NOTES TO FINANCIAL STATEMENTS. |
FINANCIAL HIGHLIGHTS |
SMID CAP VALUE FUND | |
This table is presented to show selected data for a share outstanding throughout each period and to assist shareholders in evaluating a Fund’s performance for the periods presented.
A-Class | | Year
Ended
Sept. 30,
2023 | | | Year
Ended
Sept. 30,
2022 | | | Year
Ended
Sept. 30,
2021 | | | Year
Ended
Sept. 30,
2020 | | | Year
Ended
Sept. 30,
2019 | |
Per Share Data |
Net asset value, beginning of period | | $ | 32.58 | | | $ | 38.00 | | | $ | 26.27 | | | $ | 30.52 | | | $ | 36.20 | |
Income (loss) from investment operations: |
Net investment income (loss)a | | | .37 | | | | .36 | | | | .19 | | | | .46 | | | | .22 | |
Net gain (loss) on investments (realized and unrealized) | | | 3.75 | | | | (3.16 | ) | | | 11.54 | | | | (3.37 | ) | | | (1.89 | ) |
Total from investment operations | | | 4.12 | | | | (2.80 | ) | | | 11.73 | | | | (2.91 | ) | | | (1.67 | ) |
Less distributions from: |
Net investment income | | | (.22 | ) | | | (.10 | ) | | | — | | | | (.26 | ) | | | (.03 | ) |
Net realized gains | | | (1.70 | ) | | | (2.52 | ) | | | — | | | | (1.04 | ) | | | (3.98 | ) |
Return of capital | | | — | | | | — | | | | — | | | | (.04 | ) | | | — | |
Total distributions | | | (1.92 | ) | | | (2.62 | ) | | | — | | | | (1.34 | ) | | | (4.01 | ) |
Net asset value, end of period | | $ | 34.78 | | | $ | 32.58 | | | $ | 38.00 | | | $ | 26.27 | | | $ | 30.52 | |
|
Total Returnb | | | 12.65 | % | | | (8.08 | %) | | | 44.65 | % | | | (10.25 | %) | | | (2.51 | %) |
Ratios/Supplemental Data |
Net assets, end of period (in thousands) | | $ | 273,173 | | | $ | 262,943 | | | $ | 315,323 | | | $ | 243,072 | | | $ | 335,806 | |
Ratios to average net assets: |
Net investment income (loss) | | | 1.05 | % | | | 0.96 | % | | | 0.53 | % | | | 1.64 | % | | | 0.72 | % |
Total expensesc | | | 1.20 | % | | | 1.19 | % | | | 1.20 | % | | | 1.25 | % | | | 1.23 | % |
Net expensesd,e,f | | | 1.15 | % | | | 1.18 | % | | | 1.19 | % | | | 1.24 | % | | | 1.23 | % |
Portfolio turnover rate | | | 28 | % | | | 39 | % | | | 34 | % | | | 41 | % | | | 45 | % |
SEE NOTES TO FINANCIAL STATEMENTS. | THE GUGGENHEIM FUNDS ANNUAL REPORT | 21 |
FINANCIAL HIGHLIGHTS (continued) |
SMID CAP VALUE FUND | |
This table is presented to show selected data for a share outstanding throughout each period and to assist shareholders in evaluating a Fund’s performance for the periods presented.
C-Class | | Year
Ended
Sept. 30,
2023 | | | Year
Ended
Sept. 30,
2022 | | | Year
Ended
Sept. 30,
2021 | | | Year
Ended
Sept. 30,
2020 | | | Year
Ended
Sept. 30,
2019 | |
Per Share Data |
Net asset value, beginning of period | | $ | 20.41 | | | $ | 24.85 | | | $ | 17.32 | | | $ | 20.48 | | | $ | 26.05 | |
Income (loss) from investment operations: |
Net investment income (loss)a | | | .04 | | | | .01 | | | | (.06 | ) | | | .16 | | | | (.02 | ) |
Net gain (loss) on investments (realized and unrealized) | | | 2.35 | | | | (1.93 | ) | | | 7.59 | | | | (2.22 | ) | | | (1.57 | ) |
Total from investment operations | | | 2.39 | | | | (1.92 | ) | | | 7.53 | | | | (2.06 | ) | | | (1.59 | ) |
Less distributions from: |
Net investment income | | | — | | | | — | | | | — | | | | (.03 | ) | | | — | |
Net realized gains | | | (1.70 | ) | | | (2.52 | ) | | | — | | | | (1.04 | ) | | | (3.98 | ) |
Return of capital | | | — | | | | — | | | | — | | | | (.03 | ) | | | — | |
Total distributions | | | (1.70 | ) | | | (2.52 | ) | | | — | | | | (1.10 | ) | | | (3.98 | ) |
Net asset value, end of period | | $ | 21.10 | | | $ | 20.41 | | | $ | 24.85 | | | $ | 17.32 | | | $ | 20.48 | |
|
Total Returnb | | | 11.67 | % | | | (8.85 | %) | | | 43.48 | % | | | (10.95 | %) | | | (3.35 | %) |
Ratios/Supplemental Data |
Net assets, end of period (in thousands) | | $ | 4,205 | | | $ | 5,256 | | | $ | 10,015 | | | $ | 14,276 | | | $ | 31,221 | |
Ratios to average net assets: |
Net investment income (loss) | | | 0.18 | % | | | 0.04 | % | | | (0.27 | %) | | | 0.86 | % | | | (0.11 | %) |
Total expensesc | | | 2.10 | % | | | 2.09 | % | | | 2.05 | % | | | 2.14 | % | | | 2.07 | % |
Net expensesd,e,f | | | 2.02 | % | | | 2.02 | % | | | 2.02 | % | | | 2.07 | % | | | 2.06 | % |
Portfolio turnover rate | | | 28 | % | | | 39 | % | | | 34 | % | | | 41 | % | | | 45 | % |
22 | THE GUGGENHEIM FUNDS ANNUAL REPORT | SEE NOTES TO FINANCIAL STATEMENTS. |
FINANCIAL HIGHLIGHTS (continued) |
SMID CAP VALUE FUND |
This table is presented to show selected data for a share outstanding throughout each period and to assist shareholders in evaluating a Fund’s performance for the periods presented.
P-Class | | Year
Ended
Sept. 30,
2023 | | | Year
Ended
Sept. 30,
2022 | | | Year
Ended
Sept. 30,
2021 | | | Year
Ended
Sept. 30,
2020 | | | Year
Ended
Sept. 30,
2019 | |
Per Share Data |
Net asset value, beginning of period | | $ | 32.30 | | | $ | 37.67 | | | $ | 26.06 | | | $ | 30.25 | | | $ | 35.94 | |
Income (loss) from investment operations: |
Net investment income (loss)a | | | .34 | | | | .33 | | | | .15 | | | | .46 | | | | .19 | |
Net gain (loss) on investments (realized and unrealized) | | | 3.71 | | | | (3.12 | ) | | | 11.46 | | | | (3.37 | ) | | | (1.88 | ) |
Total from investment operations | | | 4.05 | | | | (2.79 | ) | | | 11.61 | | | | (2.91 | ) | | | (1.69 | ) |
Less distributions from: |
Net investment income | | | (.19 | ) | | | (.06 | ) | | | — | | | | (.20 | ) | | | (.02 | ) |
Net realized gains | | | (1.70 | ) | | | (2.52 | ) | | | — | | | | (1.04 | ) | | | (3.98 | ) |
Return of capital | | | — | | | | — | | | | — | | | | (.04 | ) | | | — | |
Total distributions | | | (1.89 | ) | | | (2.58 | ) | | | — | | | | (1.28 | ) | | | (4.00 | ) |
Net asset value, end of period | | $ | 34.46 | | | $ | 32.30 | | | $ | 37.67 | | | $ | 26.06 | | | $ | 30.25 | |
|
Total Return | | | 12.57 | % | | | (8.16 | %) | | | 44.55 | % | | | (10.30 | %) | | | (2.61 | %) |
Ratios/Supplemental Data |
Net assets, end of period (in thousands) | | $ | 5,306 | | | $ | 5,584 | | | $ | 6,907 | | | $ | 7,662 | | | $ | 14,165 | |
Ratios to average net assets: |
Net investment income (loss) | | | 0.96 | % | | | 0.90 | % | | | 0.43 | % | | | 1.64 | % | | | 0.63 | % |
Total expensesc | | | 1.27 | % | | | 1.30 | % | | | 1.32 | % | | | 1.33 | % | | | 1.35 | % |
Net expensesd,e,f | | | 1.24 | % | | | 1.26 | % | | | 1.28 | % | | | 1.31 | % | | | 1.32 | % |
Portfolio turnover rate | | | 28 | % | | | 39 | % | | | 34 | % | | | 41 | % | | | 45 | % |
SEE NOTES TO FINANCIAL STATEMENTS. | THE GUGGENHEIM FUNDS ANNUAL REPORT | 23 |
FINANCIAL HIGHLIGHTS (continued) |
SMID CAP VALUE FUND |
This table is presented to show selected data for a share outstanding throughout each period and to assist shareholders in evaluating a Fund’s performance for the periods presented.
Institutional Class | | Year
Ended
Sept. 30,
2023 | | | Year
Ended
Sept. 30,
2022 | | | Year
Ended
Sept. 30,
2021 | | | Period
Ended
Sept. 30,
2020g | |
Per Share Data |
Net asset value, beginning of period | | $ | 8.98 | | | $ | 12.42 | | | $ | 8.57 | | | $ | 10.20 | |
Income (loss) from investment operations: |
Net investment income (loss)a | | | .11 | | | | .12 | | | | .08 | | | | .11 | |
Net gain (loss) on investments (realized and unrealized) | | | 1.04 | | | | (.82 | ) | | | 3.77 | | | | (1.74 | ) |
Total from investment operations | | | 1.15 | | | | (.70 | ) | | | 3.85 | | | | (1.63 | ) |
Less distributions from: |
Net investment income | | | (.33 | ) | | | (.22 | ) | | | — | | | | — | |
Net realized gains | | | (1.70 | ) | | | (2.52 | ) | | | — | | | | — | |
Total distributions | | | (2.03 | ) | | | (2.74 | ) | | | — | | | | — | |
Net asset value, end of period | | $ | 8.10 | | | $ | 8.98 | | | $ | 12.42 | | | $ | 8.57 | |
|
Total Return | | | 12.91 | % | | | (7.93 | %) | | | 44.92 | % | | | (15.98 | %) |
Ratios/Supplemental Data |
Net assets, end of period (in thousands) | | $ | 80,679 | | | $ | 81,792 | | | $ | 96,973 | | | $ | 60,783 | |
Ratios to average net assets: |
Net investment income (loss) | | | 1.26 | % | | | 1.14 | % | | | 0.70 | % | | | 1.87 | % |
Total expensesc | | | 0.98 | % | | | 1.03 | % | | | 1.06 | % | | | 1.09 | % |
Net expensesd,e,f | | | 0.94 | % | | | 1.01 | % | | | 1.02 | % | | | 1.03 | % |
Portfolio turnover rate | | | 28 | % | | | 39 | % | | | 34 | % | | | 41 | % |
24 | THE GUGGENHEIM FUNDS ANNUAL REPORT | SEE NOTES TO FINANCIAL STATEMENTS. |
FINANCIAL HIGHLIGHTS (concluded) |
SMID CAP VALUE FUND |
a | Net investment income (loss) per share was computed using average shares outstanding throughout the period. |
b | Total return does not reflect the impact of any applicable sales charges. |
c | Does not include expenses of the underlying funds in which the Fund invests, if any. |
d | Net expense information reflects the expense ratios after expense waivers and reimbursements, as applicable. |
e | The portion of the ratios of net expenses to average net assets attributable to recoupments of prior fee reductions or expense reimbursements for the years presented was as follows: |
| | | 09/30/23 | 09/30/22 | 09/30/21 | 09/30/20 | 09/30/19 |
| | A-Class | 0.00%* | 0.01% | 0.00% | 0.00%* | 0.00%* |
| | C-Class | 0.04% | 0.00%* | 0.00%* | 0.00%* | 0.01% |
| | P-Class | 0.01% | 0.02% | 0.07% | 0.01% | 0.04% |
| | Institutional Class | 0.04% | 0.00%* | 0.00% | 0.00%*,g | N/A |
| | * | Less than 0.01% |
f | Net expenses may include expenses that are excluded from the expense limitation agreement. Excluding these expenses, the net expense ratios for the years presented would be: |
| | | 09/30/23 | 09/30/22 | 09/30/21 | 09/30/20 | 09/30/19 |
| | A-Class | 1.15% | 1.18% | 1.19% | 1.24% | 1.23% |
| | C-Class | 2.02% | 2.02% | 2.01% | 2.07% | 2.06% |
| | P-Class | 1.23% | 1.25% | 1.28% | 1.30% | 1.32% |
| | Institutional Class | 0.94% | 1.01% | 1.02% | 1.03%g | N/A |
g | Since commencement of operations: January 3, 2020. Percentage amounts for the period, except total return and portfolio turnover rate, have been annualized. |
SEE NOTES TO FINANCIAL STATEMENTS. | THE GUGGENHEIM FUNDS ANNUAL REPORT | 25 |
NOTES TO FINANCIAL STATEMENTS |
Note 1 – Organization and Significant Accounting Policies
Organization
Guggenheim Funds Trust (the “Trust”), a Delaware statutory trust, is registered with the U.S. Securities and Exchange Commission (the “SEC”) under the Investment Company Act of 1940 (the “1940 Act”), as an open-ended investment company of the series type. Each series, in effect, is representing a separate fund. The Trust may issue an unlimited number of authorized shares. The Trust accounts for the assets of each fund separately.
The Trust offers a combination of five separate classes of shares: A-Class shares, C-Class shares, P-Class shares, R6-Class shares and Institutional Class shares. Sales of shares of each Class are made without a front-end sales charge at the net asset value per share (“NAV”), with the exception of A-Class shares. A-Class shares are sold at the NAV, plus the applicable front-end sales charge. The sales charge varies depending on the amount purchased. A-Class share purchases of $1 million or more are exempt from the front-end sales charge but have a 1% contingent deferred sales charge (“CDSC”), if shares are redeemed within 12 months of purchase. C-Class shares have a 1% CDSC if shares are redeemed within 12 months of purchase. C-Class shares automatically convert to A-Class shares on or about the 10th day of the month following the 8-year anniversary of the purchase of the C-Class shares. This conversion will be executed without any sales charge, fee or other charge. After the conversion is completed, the shares will be subject to all features and expenses of A-Class shares. Institutional Class shares are offered primarily for direct investment by institutions such as pension and profit sharing plans, endowments, foundations and corporations. Institutional Class shares require a minimum initial investment of $2 million and a minimum account balance of $1 million. R6-Class shares are offered primarily through qualified retirement and benefit plans. R6-Class shares are also offered through certain other plans and platforms sponsored by financial intermediaries. Certain institutional investors and others deemed appropriate by Guggenheim Investments (“GI” or the “Adviser”) may also be eligible to purchase R6-Class shares subject to a $2 million minimum initial investment. At September 30, 2023, the Trust consisted of nineteen funds (the “Funds”).
This report covers the SMid Cap Value Fund (the “Fund”), a diversified investment company. At September 30, 2023, A-Class, C-Class, P-Class and Institutional Class shares have been issued by the Fund.
Security Investors, LLC which operates under the name Guggenheim Investments (“GI” or the “Adviser”), provides advisory services. Guggenheim Funds Distributors, LLC (“GFD”) serves as distributor of the Fund’s shares. GI and GFD are affiliated entities.
Significant Accounting Policies
The Fund operates as an investment company and, accordingly, follows the investment company accounting and reporting guidance of the Financial Accounting Standards Board (“FASB”) Accounting Standards Codification Topic 946 Financial Services – Investment Companies.
26 | THE GUGGENHEIM FUNDS ANNUAL REPORT | |
NOTES TO FINANCIAL STATEMENTS (continued) |
The following significant accounting policies are in conformity with U.S. generally accepted accounting principles (“U.S. GAAP”) and are consistently followed by the Trust. This requires management to make estimates and assumptions that affect the reported amount of assets and liabilities, contingent assets and liabilities at the date of the financial statements, and the reported amounts of revenues and expenses during the reporting period. Actual results could differ from these estimates. All time references are based on Eastern Time.
The NAV of each share class of the Fund is calculated by dividing the market value of the Fund’s securities and other assets, less all liabilities, attributable to the share class by the number of outstanding shares of the share class.
(a) Valuation of Investments
The Board of Trustees of the Fund (the “Board”) has adopted policies and procedures for the valuation of the Fund’s investments (the “Fund Valuation Procedures”). The SEC adopted Rule 2a-5 under the 1940 Act (“Rule 2a-5”) which establishes requirements for determining fair value in good faith. Rule 2a-5 also defines “readily available market quotations” for purposes of the 1940 Act and establishes requirements for determining whether a fund must fair value a security in good faith.
Pursuant to Rule 2a-5, the Board has designated the Adviser as the valuation designee to perform fair valuation determinations for the Fund with respect to all Fund investments and other assets. As the Fund’s valuation designee pursuant to Rule 2a-5, the Adviser has adopted separate procedures (the “Valuation Designee Procedures” and collectively with the Fund Valuation Procedures, the “Valuation Procedures”) reasonably designed to prevent violations of the requirements of Rule 2a-5 and Rule 31a-4. The Adviser, in its role as valuation designee, utilizes the assistance of a valuation committee, consisting of representatives from Guggenheim’s investment management, fund administration, legal and compliance departments (the “Valuation Committee”), in determining the fair value of the Fund’s securities and other assets.
Valuations of the Fund’s securities and other assets are supplied primarily by pricing service providers appointed pursuant to the processes set forth in the Valuation Procedures. The Adviser, with the assistance of the Valuation Committee, convenes monthly, or more frequently as needed, to review the valuation of all assets which have been fair valued. The Adviser, consistent with the monitoring and review responsibilities set forth in the Valuation Procedures, regularly reviews the appropriateness of the inputs, methods, models and assumptions employed by the pricing service provider.
If the pricing service provider cannot or does not provide a valuation for a particular investment or such valuation is deemed unreliable, such investment is fair valued by the Adviser.
Equity securities listed or traded on a recognized U.S. securities exchange or the National Association of Securities Dealers Automated Quotations (“NASDAQ”) National Market System will generally be valued on the basis of the last sale price on the primary U.S. exchange or market
| | THE GUGGENHEIM FUNDS ANNUAL REPORT | 27 |
NOTES TO FINANCIAL STATEMENTS (continued) |
on which the security is listed or traded; provided, however, that securities listed on NASDAQ will be valued at the NASDAQ official closing price, which may not necessarily represent the last sale price.
Open-end investment companies are valued at their NAV as of the close of business, on the valuation date. Exchange-traded funds and closed-end investment companies are generally valued at the last quoted sale price.
Investments for which market quotations are not readily available are fair valued as determined in good faith by the Adviser. Valuations in accordance with these methods are intended to reflect each security’s (or asset’s or liability’s) “fair value”. Each such determination is based on a consideration of all relevant factors, which are likely to vary from one pricing context to another. Examples of such factors may include, but are not limited to market prices; sale prices; broker quotes; and models which derive prices based on inputs such as anticipated cash flows or collateral, spread over U.S. Treasury securities, and other information analysis.
(b) Foreign Taxes
The Fund may be subject to foreign taxes (a portion of which may be reclaimable) on income, stock dividends, capital gains on investments or certain foreign currency transactions. All foreign taxes are recorded in accordance with the applicable foreign tax regulations and rates that exist in the foreign jurisdictions in which the Fund invests. These foreign taxes, if any, are paid by the Fund and reflected in its Statement of Operations as follows: foreign taxes withheld at source are presented as a reduction of income and foreign taxes on capital gains from sales of investments are included with the net realized gain (loss) on investments. Foreign taxes payable or deferred as of September 30, 2023, if any, are disclosed in the Fund’s Statement of Assets and Liabilities.
(c) Security Transactions
Security transactions are recorded on the trade date for financial reporting purposes. Realized gains and losses from securities transactions are recorded using the identified cost basis. Proceeds from lawsuits related to investment holdings are recorded as a reduction to cost if the securities are still held and as realized gains if no longer held in the Fund. Dividend income is recorded on the ex-dividend date, net of applicable taxes withheld by foreign countries, if any. Taxable non-cash dividends are recorded as dividend income. Interest income, including amortization of premiums and accretion of discounts, is accrued on a daily basis. Dividend income from Real Estate Investment Trusts (“REITs”) is recorded based on the income included in the distributions received from the REIT investments using published REIT classifications, including some management estimates when actual amounts are not available. Distributions received in excess of this estimated amount are recorded as a reduction of the cost of investments or reclassified to realized gains. The actual amounts of income, return of capital, and realized gains are only determined by each REIT after its fiscal year-end, and may differ from the estimated amounts.
28 | THE GUGGENHEIM FUNDS ANNUAL REPORT | |
NOTES TO FINANCIAL STATEMENTS (continued) |
(d) Distributions
Distributions of net investment income and net realized gains, if any, are declared and paid at least annually. Dividends are reinvested in additional shares, unless shareholders request payment in cash. Distributions are recorded on the ex-dividend date and are determined in accordance with U.S. federal income tax regulations which may differ from U.S. GAAP.
(e) Class Allocations
Interest and dividend income, most expenses, all realized gains and losses, and all unrealized appreciation and depreciation are allocated to the share classes based upon the value of the outstanding shares in each share class. Certain costs, such as distribution and service fees are charged directly to specific share classes. In addition, certain expenses have been allocated to the individual Funds in the Trust based on the respective net assets of each Fund included in the Trust.
(f) Earnings Credits
Under the fee arrangement with the custodian, the Fund may earn credits based on overnight custody cash balances. These credits are utilized to reduce related custodial expenses. The custodian fees disclosed in the Statement of Operations are before the reduction in expense from the related earnings credits, if any. Earnings credits for the year ended September 30, 2023, are disclosed in the Fund’s Statement of Operations.
(g) Cash
The Fund may leave cash overnight in its cash account with the custodian. Periodically, the Fund may have cash due to the custodian bank as an overdraft balance. A fee is incurred on this overdraft, calculated by multiplying the overdraft by a rate based on the federal funds rate, which was 5.33% at September 30, 2023.
(h) Indemnifications
Under the Fund’s organizational documents, its Trustees and Officers are indemnified against certain liabilities arising out of the performance of their duties to the Trust. In addition, throughout the normal course of business, the Fund enters into contracts that contain a variety of representations and warranties which provide general indemnifications. The Fund’s maximum exposure under these arrangements is unknown, as this would involve future claims that may be made against the Fund and/or its affiliates that have not yet occurred. However, based on experience, the Fund expects the risk of loss to be remote.
Note 2 – Investment Advisory Agreement and Other Agreements
Under the terms of an investment advisory contract, the Fund pays GI investment advisory fees calculated at an annualized rate of 0.75% of the average daily net assets of the Fund.
| | THE GUGGENHEIM FUNDS ANNUAL REPORT | 29 |
NOTES TO FINANCIAL STATEMENTS (continued) |
GI pays operating expenses on behalf of the Trust, such as audit and accounting related services, legal services, custody, printing and mailing, among others, on a pass-through basis. Such expenses are allocated to various Funds within the complex based on relative net assets.
The Board has adopted Distribution Plans related to the offering of A-Class, C-Class and P-Class shares pursuant to Rule 12b-1 under the 1940 Act. The plans provide for payments at an annual rate of 0.25% of the average daily net assets of the Fund’s A-Class and P-Class shares, and 1.00% of the average daily net assets of the Fund’s C-Class shares.
The investment advisory contract for the Fund provides that the total expenses be limited to a percentage of average net assets for each class of shares, exclusive of brokerage costs, dividends or interest on securities sold short, expenses of other investment companies in which the Fund invests, interest, taxes, litigation, indemnification and extraordinary expenses. The limits are listed below:
| Limit | Effective Date | Contract End Date |
A-Class | 1.30%1 | 01/03/20 | 02/01/25 |
C-Class | 2.05%1 | 01/03/20 | 02/01/25 |
P-Class | 1.30%1 | 01/03/20 | 02/01/25 |
Institutional Class | 1.05% | 01/03/20 | 02/01/25 |
1 | Prior to January 3, 2020, the expense limit for A-Class, C-Class and P-Class shares of the Fund was 1.42%, 2.12% and 1.32%, respectively. |
GI is entitled to reimbursement by the Fund for fees waived or expenses reimbursed during any of the previous 36 months, beginning on the date of the expense limitation agreement, if on any day the estimated operating expenses are less than the indicated percentages. For purposes of this arrangement, GI is entitled to recoupment of previously waived fees or reimbursed expenses for 36 months from the date of the waiver or reimbursement by GI. At September 30, 2023, the amount of fees waived or expenses reimbursed that are subject to recoupment are presented in the following table:
Fund | | 2024 | | | 2025 | | | 2026 | | | Fund
Total | |
A-Class | | $ | — | | | $ | 380 | | | $ | 59,194 | | | $ | 59,574 | |
C-Class | | | 4,260 | | | | 4,648 | | | | 2,172 | | | | 11,080 | |
P-Class | | | 2,971 | | | | 2,276 | | | | 104 | | | | 5,351 | |
Institutional Class | | | 17,378 | | | | 17,866 | | | | 1,842 | | | | 37,086 | |
During the year ended September 30, 2023, GI recouped $48,969 from the Fund.
For the year ended September 30, 2023, GFD retained sales charges of $132,849 relating to sales of A-Class shares of the Trust.
Certain trustees and officers of the Trust are also officers of GI and/or GFD. The Trust does not compensate its officers or trustees who are officers, directors and/or employees of GI or GFD.
30 | THE GUGGENHEIM FUNDS ANNUAL REPORT | |
NOTES TO FINANCIAL STATEMENTS (continued) |
MUFG Investor Services (US), LLC (“MUIS”) acts as the Fund’s administrator, transfer agent and accounting agent. As administrator, transfer agent and accounting agent, MUIS maintains the books and records of the Fund’s securities and cash. The Bank of New York Mellon Corp. (“BNY”) acts as the Fund’s custodian. As custodian, BNY is responsible for the custody of the Fund’s assets. For providing the aforementioned administrative and accounting services, MUIS is entitled to receive a monthly fee equal to a percentage of the Fund’s average daily net assets and out of pocket expenses. For providing the aforementioned transfer agent and custodian services, MUIS and BNY are entitled to receive a monthly fee based on the number of transactions during the month and the number of accounts under management, subject to certain minimum monthly fees, and out of pocket expenses.
Note 3 – Federal Income Tax Information
The Fund intends to comply with the provisions of Subchapter M of the Internal Revenue Code of 1986, as amended (the “Internal Revenue Code”), applicable to regulated investment companies and will distribute substantially all taxable net investment income and capital gains sufficient to relieve the Fund from all, or substantially all, federal income, excise and state income taxes. Therefore, no provision for federal or state income tax or federal excise tax is required.
Tax positions taken or expected to be taken in the course of preparing the Fund’s tax returns are evaluated to determine whether the tax positions are “more-likely-than-not” of being sustained by the applicable tax authority. Tax positions not deemed to meet the more-likely-than-not threshold would be recorded as a tax benefit or expense in the current year. Management has analyzed the Fund’s tax positions taken, or to be taken, on U.S. federal income tax returns for all open tax years, and has concluded that no provision for income tax is required in the Fund’s financial statements. The Fund’s U.S. federal income tax returns are subject to examination by the Internal Revenue Service (“IRS”) for a period of three years after they are filed.
The tax character of distributions paid during the year ended September 30, 2023 was as follows:
| | Ordinary
Income | | | Long-Term
Capital Gain | | | Total
Distributions | |
| | | $ | 5,582,517 | | | $ | 28,323,495 | | | $ | 33,906,012 | |
The tax character of distributions paid during the year ended September 30, 2022 was as follows:
| | Ordinary
Income | | | Long-Term
Capital Gain | | | Total
Distributions | |
| | | $ | 14,921,805 | | | $ | 28,697,141 | | | $ | 43,618,946 | |
Note: For U.S. federal income tax purposes, short-term capital gain distributions are treated as ordinary income distributions.
| | THE GUGGENHEIM FUNDS ANNUAL REPORT | 31 |
NOTES TO FINANCIAL STATEMENTS (continued) |
The tax components of distributable earnings/(loss) as of September 30, 2023 were as follows:
| | Undistributed
Ordinary
Income | | | Undistributed
Long-Term
Capital Gain | | | Net Unrealized
Appreciation
(Depreciation) | | | Accumulated
Capital and
Other Losses | | | Total | |
| | | $ | 2,717,162 | | | $ | 8,857,857 | | | $ | 40,839,803 | | | $ | — | | | $ | 52,414,822 | |
For U.S. federal income tax purposes, capital loss carryforwards represent realized losses of the Fund that may be carried forward and applied against future capital gains. The Fund is permitted to carry forward capital losses for an unlimited period and such capital loss carryforwards retain their character as either short-term or long-term capital losses. As of September 30, 2023, the Fund had no capital loss carryforwards.
Net investment income and net realized gains (losses) may differ for financial statement and tax purposes because of temporary or permanent book/tax differences. These differences are primarily due to losses deferred due to wash sales, reclassification of distributions, and distributions in connection with redemption of fund shares. To the extent these differences are permanent and would require a reclassification between Paid in Capital and Total Distributable Earnings (Loss), such reclassifications are made in the period that the differences arise. These reclassifications have no effect on net assets or NAV per share.
The following adjustments were made on the Statement of Assets and Liabilities as of September 30, 2023 for permanent book/tax differences:
| | Paid In
Capital | | | Total
Distributable
Earnings/(Loss) | |
| | | $ | 2,911,897 | | | $ | (2,911,897 | ) |
At September 30, 2023, the cost of investments for U.S. federal income tax purposes, the aggregate gross unrealized appreciation for all investments for which there was an excess of value over tax cost and the aggregate gross unrealized depreciation for all investments for which there was an excess of tax cost over value, were as follows:
| | Tax
Cost | | | Tax
Unrealized
Appreciation | | | Tax
Unrealized
Depreciation | | | Net Tax
Unrealized
Appreciation/
(Depreciation) | |
| | | $ | 322,718,543 | | | $ | 67,489,581 | | | $ | (26,649,778 | ) | | $ | 40,839,803 | |
32 | THE GUGGENHEIM FUNDS ANNUAL REPORT | |
NOTES TO FINANCIAL STATEMENTS (continued) |
Note 4 – Fair Value Measurement
In accordance with U.S. GAAP, fair value is defined as the price that the Fund would receive to sell an investment or pay to transfer a liability in an orderly transaction between market participants at the measurement date. U.S. GAAP establishes a three-tier fair value hierarchy based on the types of inputs used to value assets and liabilities and requires corresponding disclosure. The hierarchy and the corresponding inputs are summarized below:
Level 1 — | unadjusted quoted prices in active markets for identical assets or liabilities. |
Level 2 — | significant other observable inputs (for example quoted prices for securities that are similar based on characteristics such as interest rates, prepayment speeds, credit risk, etc.). |
Level 3 — | significant unobservable inputs based on the best information available under the circumstances, to the extent observable inputs are not available, which may include assumptions. |
Rule 2a-5 sets forth a definition of “readily available market quotations,” which is consistent with the definition of a Level 1 input under U.S. GAAP. Rule 2a-5 provides that “a market quotation is readily available only when that quotation is a quoted price (unadjusted) in active markets for identical investments that the fund can access at the measurement date, provided that a quotation will not be readily available if it is not reliable.”
Securities for which market quotations are not readily available must be valued at fair value as determined in good faith. Accordingly, any security priced using inputs other than Level 1 inputs will be subject to fair value requirements.
The types of inputs available depend on a variety of factors, such as the type of security and the characteristics of the markets in which it trades, if any. Fair valuation determinations that rely on fewer or no observable inputs require greater judgment. Accordingly, fair value determinations for Level 3 securities require the greatest amount of judgment.
The inputs or methodologies selected and applied for valuing securities or other assets are not necessarily an indication of the risk associated with investing in those securities. The suitability, appropriateness and accuracy of the techniques, methodologies and sources employed to determine fair valuation are periodically reviewed and subject to change.
Note 5 – Securities Transactions
For the year ended September 30, 2023, the cost of purchases and proceeds from sales of investment securities, excluding short-term investments, were as follows:
| | Purchases | | | Sales | |
| | | $ | 107,867,915 | | | $ | 132,206,442 | |
| | THE GUGGENHEIM FUNDS ANNUAL REPORT | 33 |
NOTES TO FINANCIAL STATEMENTS (continued) |
Note 6 – Line of Credit
The Trust, along with other affiliated trusts, secured a 364-day committed, $1,150,000,000 line of credit from Citibank, N.A., which was in place through September 29, 2023, at which time a new line of credit was entered into in the amount of $1,165,000,000. The Fund may draw (borrow) from the line of credit as a temporary measure for emergency purposes, to facilitate redemption requests, or for other short-term liquidity purposes consistent with the Fund’s investment objective and program. For example, it may be advantageous for the Fund to borrow money rather than sell existing portfolio positions to meet redemption requests. Fees related to borrowings, if any, vary under this arrangement between the greater of Citibank’s “base rate”, SOFR plus 1%, or the federal funds rate plus 1/2 of 1%.
The commitment fee that may be paid by the Fund is at an annualized rate of 0.15% of the average daily amount of its allocated unused commitment amount. The commitment fee amount is allocated to the individual Funds based on the respective net assets of each participating Fund and is referenced in the Fund’s Statement of Operations under “Line of credit fees”. The Fund did not have any borrowings under this agreement as of and for the year ended September 30, 2023.
Note 7 – Market Risks
The value of, or income generated by, the investments held by the Fund are subject to the possibility of rapid and unpredictable fluctuation, and loss that may result from various factors. These factors include, among others, developments affecting individual companies, or from broader influences, including real or perceived changes in prevailing interest rates (which have since risen and may continue to rise), changes in inflation rates or expectations about inflation rates (which are currently elevated relative to normal conditions), adverse investor confidence or sentiment, changing economic, political (including geopolitical), social or financial market conditions, increased instability or general uncertainty, environmental disasters, governmental actions, public health emergencies (such as the spread of infectious diseases, pandemics and epidemics), debt crises, actual or threatened wars or other armed conflicts (such as the current Russia-Ukraine conflict and its risk of expansion or collateral economic and other effects) or ratings downgrades, and other similar events, each of which may be temporary or last for extended periods. Moreover, changing economic, political, geopolitical, social, financial market or other conditions in one country or geographic region could adversely affect the value, yield and return of the investments held by the Fund in a different country or geographic region, economy, and market because of the increasingly interconnected global economies and financial markets. The duration and extent of the foregoing types of factors or conditions are highly uncertain and difficult to predict and have in the past, and may in the future, cause volatility and distress in economies and financial markets or other adverse circumstances, which may negatively affect the value of the Fund’s investments and performance of the Fund.
34 | THE GUGGENHEIM FUNDS ANNUAL REPORT | |
NOTES TO FINANCIAL STATEMENTS (concluded) |
Note 8 – Subsequent Events
The Fund evaluated subsequent events through the date the financial statements are issued and determined there were no material events that would require adjustment to or disclosure in the Fund’s financial statements.
| | THE GUGGENHEIM FUNDS ANNUAL REPORT | 35 |
REPORT OF INDEPENDENT REGISTERED PUBLIC ACCOUNTING FIRM |
To the Shareholders and the Board of Trustees of Guggenheim SMid Cap Value Fund
Opinion on the Financial Statements
We have audited the accompanying statement of assets and liabilities of Guggenheim SMid Cap Value Fund (the “Fund”), (one of the funds constituting Guggenheim Funds Trust (the “Trust”)), including the schedule of investments, as of September 30, 2023, and the related statement of operations for the year then ended, the statements of changes in net assets for each of the two years in the period then ended, the financial highlights for each of the five years in the period then ended and the related notes (collectively referred to as the “financial statements”). In our opinion, the financial statements present fairly, in all material respects, the financial position of the Fund (one of the funds constituting Guggenheim Funds Trust) at September 30, 2023, the results of its operations for the year then ended, the changes in its net assets for each of the two years in the period then ended and its financial highlights for each of the five years in the period then ended, in conformity with U.S. generally accepted accounting principles.
Basis for Opinion
These financial statements are the responsibility of the Trust’s management. Our responsibility is to express an opinion on the Fund’s financial statements based on our audits. We are a public accounting firm registered with the Public Company Accounting Oversight Board (United States) (“PCAOB”) and are required to be independent with respect to the Trust in accordance with the U.S. federal securities laws and the applicable rules and regulations of the Securities and Exchange Commission and the PCAOB.
We conducted our audits in accordance with the standards of the PCAOB. Those standards require that we plan and perform the audit to obtain reasonable assurance about whether the financial statements are free of material misstatement, whether due to error or fraud. The Trust is not required to have, nor were we engaged to perform, an audit of the Trust’s internal control over financial reporting. As part of our audits, we are required to obtain an understanding of internal control over financial reporting but not for the purpose of expressing an opinion on the effectiveness of the Trust’s internal control over financial reporting. Accordingly, we express no such opinion.
Our audits included performing procedures to assess the risks of material misstatement of the financial statements, whether due to error or fraud, and performing procedures that respond to those risks. Such procedures included examining, on a test basis, evidence regarding the amounts and disclosures in the financial statements. Our procedures included confirmation of securities owned as of September 30, 2023, by correspondence with the custodian and brokers;
36 | THE GUGGENHEIM FUNDS ANNUAL REPORT | |
REPORT OF INDEPENDENT REGISTERED PUBLIC ACCOUNTING FIRM (concluded) |
when replies were not received from brokers, we performed other auditing procedures. Our audits also included evaluating the accounting principles used and significant estimates made by management, as well as evaluating the overall presentation of the financial statements. We believe that our audits provide a reasonable basis for our opinion.

We have served as the auditor of one or more Guggenheim investment companies since 1979.
Tysons, Virginia
November 28, 2023
| | THE GUGGENHEIM FUNDS ANNUAL REPORT | 37 |
OTHER INFORMATION (Unaudited) |
Federal Income Tax Information
This information is being provided as required by the Internal Revenue Code. Amounts shown may differ from those elsewhere in the report because of differences in tax and financial reporting practice.
In January 2024, shareholders will be advised on IRS Form 1099 DIV or substitute 1099 DIV as to the federal tax status of the distributions received by shareholders in the calendar year 2023.
The Fund’s investment income (dividend income plus short-term capital gains, if any) qualifies as follows:
Of the taxable ordinary income distributions paid during the fiscal year ended September 30, 2023, the Fund had the corresponding percentages qualify for the reduced tax rate pursuant to the Jobs and Growth Tax Relief and Reconciliation Act of 2003 or for the dividends received deduction for corporations. See the qualified dividend income and dividend received deduction columns, respectively, in the table below.
Additionally, of the taxable ordinary income distributions paid during the fiscal year ended September 30, 2023, the Fund had the corresponding percentages qualify as interest related dividends and qualified short-term capital gains as permitted by IRC Section 871(k)(1) and IRC Section 871(k)(2), respectively. See the qualified interest income and qualified short-term capital gain columns, respectively, in the table below.
| | Qualified
Dividend
Income | | | Dividend
Received
Deduction | | | Qualified
Interest
Income | | | Qualified
Short-Term
Capital Gain | |
| | | | 100.00 | % | | | 100.00 | % | | | 1.58 | % | | | 100.00 | % |
With respect to the taxable year ended September 30, 2023, the Fund hereby designates as capital gain dividends the amount listed below, or, if subsequently determined to be different, the net capital gain of such year:
| | From long-term
capital gain: | | | From long-term capital
gain, using proceeds from
shareholder redemptions: | |
| | | $ | 28,323,495 | | | $ | 2,911,871 | |
Delivery of Shareholder Reports
Paper copies of the Fund’s annual and semi-annual shareholder reports are not sent by mail, unless you specifically request paper copies of the reports from a fund or from your financial intermediary. Instead, the reports are made available on a website, and you are notified by mail each time a report is posted and provided with a website link to access the report.
38 | THE GUGGENHEIM FUNDS ANNUAL REPORT | |
OTHER INFORMATION (Unaudited)(continued) |
You may elect to receive all future shareholder reports in paper free of charge. If you hold shares of a fund directly, you can inform the Fund that you wish to receive paper copies of reports by calling 800.820.0888. If you hold shares of a fund through a financial intermediary, please contact the financial intermediary to make this election. Your election to receive reports in paper may apply to all Guggenheim Funds in which you are invested and may apply to all Guggenheim funds held with your financial intermediary.
Tailored Shareholder Reports for Open-End Mutual Funds and Exchange-Traded Funds
Effective January 24, 2023, the SEC adopted rule and form amendments to require open-end mutual funds and exchange-traded funds registered on Form N-1A to transmit concise and visually engaging streamlined annual and semi-annual reports to shareholders that highlight key information. Other information, including financial statements, will no longer appear in a streamlined shareholder report but must be available online, delivered free of charge upon request, and filed on a semi-annual basis on Form N-CSR. The rule and form amendments have a compliance date of July 24, 2024. At this time, management is evaluating the impact of these amendments on the shareholder reports for the Fund.
Proxy Voting Information
A description of the policies and procedures that the Trust uses to determine how to vote proxies relating to securities held in the Fund’s portfolio is available, without charge and upon request, by calling 800.820.0888. This information is also available from the EDGAR database on the SEC’s website at https://www.sec.gov.
Information regarding how the Fund voted proxies relating to portfolio securities during the most recent 12-month period ended June 30 is available without charge, upon request, by calling 800.820.0888. This information is also available from the EDGAR database on the SEC’s website at https://www.sec.gov.
Sector Classification
Information in the Schedule of Investments is categorized by sectors using sector-level Classifications defined by the Bloomberg Industry Classification System, a widely recognized industry classification system provider. The Fund’s registration statement has investment policies relating to concentration in specific sectors/industries. For purposes of these investment policies, the Fund usually classifies sectors/industries based on industry-level Classifications used by widely recognized industry classification system providers such as Bloomberg Industry Classification System, Global Industry Classification Standards and Barclays Global Classification Scheme.
| | THE GUGGENHEIM FUNDS ANNUAL REPORT | 39 |
OTHER INFORMATION (Unaudited)(continued) |
Quarterly Portfolio Schedules Information
The Trust files its complete schedule of portfolio holdings with the SEC for the first and third quarters of each fiscal year as an exhibit to its reports on Form N-PORT, and for reporting periods ended prior to March 31, 2019, filed such information on Form N-Q. The Fund’s Forms N-PORT and N-Q are available on the SEC’s website at https://www.sec.gov. Copies of the portfolio holdings are also available to shareholders, without charge and upon request, by calling 800.820.0888.
Report of the Guggenheim Funds Trust Board of Trustees
The Board of Trustees of Guggenheim Funds Trust (the “Trust”), including the Independent Trustees, unanimously approved the renewal of the investment management agreements (as applicable to a specific Fund, the “Advisory Agreement” and collectively, the “Advisory Agreements”) with Security Investors, LLC (“Security Investors”) and Guggenheim Partners Investment Management, LLC (“GPIM”) on behalf of the applicable series of the Trust listed below (each a “Fund” and collectively, the “Funds”) and the investment sub-advisory agreement between Security Investors and GPIM on behalf of Guggenheim Municipal Income Fund (the “Sub-Advisory Agreement” and together with the “Advisory Agreements,” the “Agreements”):
● Guggenheim Alpha Opportunity Fund (“Alpha Opportunity Fund”)* ● Guggenheim Diversified Income Fund (“Diversified Income Fund”)** ● Guggenheim High Yield Fund
(“High Yield Fund”)* ● Guggenheim Limited Duration Fund (“Limited Duration Fund”)** ● Guggenheim Market Neutral Real Estate Fund (“Market Neutral Real Estate Fund”)** | ● Guggenheim Core Bond Fund
(“Core Bond Fund”)* ● Guggenheim Floating Rate Strategies Fund (“Floating Rate Strategies Fund”)** ● Guggenheim Large Cap Value Fund (“Large Cap Value Fund”)* ● Guggenheim Macro Opportunities Fund (“Macro Opportunities Fund”)**1 ● Guggenheim Municipal Income Fund (“Municipal Income Fund”)* |
1 | GPIM also serves as investment adviser to Guggenheim Macro Opportunities Fund CFC (the “Subsidiary”), a wholly-owned subsidiary of Macro Opportunities Fund that is organized as a limited company under the laws of the Cayman Islands and used by Macro Opportunities Fund to obtain commodities exposure. Pursuant to a separate investment advisory agreement for the Subsidiary (the “Subsidiary Advisory Agreement”), the Subsidiary pays GPIM an advisory fee at the same rate that Macro Opportunities Fund pays GPIM under its Advisory Agreement. The Subsidiary Advisory Agreement does not require annual renewal by the Board and will continue until it is terminated as provided in the Agreement. In addition, GPIM and Macro Opportunities Fund have entered into a separate fee waiver agreement pursuant to which GPIM has contractually agreed to waive the advisory fee it receives from Macro Opportunities Fund in an amount equal to the advisory fee paid to GPIM by the Subsidiary. This undertaking will continue for so long as Macro Opportunities Fund invests in the Subsidiary, and may be terminated only with the approval of the Board. |
40 | THE GUGGENHEIM FUNDS ANNUAL REPORT | |
OTHER INFORMATION (Unaudited)(continued) |
● Guggenheim Risk Managed Real Estate Fund (“Risk Managed Real Estate Fund”)** ● Guggenheim SMid Cap Value Fund (“SMid Cap Value Fund”)* ● Guggenheim StylePlus—Mid Growth Fund (“StylePlus—Mid Growth Fund”)* ● Guggenheim Ultra Short Duration Fund (“Ultra Short Duration Fund”)** | ● Guggenheim Small Cap Value Fund (“Small Cap Value Fund”)* ● Guggenheim StylePlus—Large Core Fund (“StylePlus—Large Core Fund”)* ● Guggenheim Total Return Bond Fund (“Total Return Bond Fund”)** ● Guggenheim World Equity Income Fund (“World Equity Income Fund”)* |
* | Security Investors serves as investment adviser to the Fund. |
** | GPIM serves as investment adviser to the Fund. Unless the context indicates otherwise, GPIM and Security Investors, with respect to their service as investment adviser to the applicable Funds, are each referred to herein as an “Adviser” and together, the “Advisers.” |
Security Investors and GPIM are each an indirect subsidiary of Guggenheim Partners, LLC, a privately-held, global investment and advisory firm (“Guggenheim Partners”). Guggenheim Partners, Security Investors, GPIM and their affiliates may be referred to herein collectively as “Guggenheim.” Security Investors and GPIM are also known as “Guggenheim Investments,” the global asset management and investment advisory division of Guggenheim Partners that includes other affiliated investment management businesses.
At meetings held in person on April 17-18, 2023 (the “April Meeting”) and meetings held by videoconference on May 15, 2023 and in person on May 24, 2023 (the “May Meeting”), the Contracts Review Committee of the Board (the “Committee”), consisting solely of the Independent Trustees, met separately from Guggenheim to consider the proposed renewal of the Agreements. As part of its review process, the Committee was represented by independent legal counsel to the Independent Trustees (“Independent Legal Counsel”), from whom the Independent Trustees received separate legal advice and with whom they met separately. Independent Legal Counsel reviewed and discussed with the Committee various key aspects of the Trustees’ legal responsibilities relating to the proposed renewal of the Agreements and other principal contracts. The Committee took into account various materials received from Guggenheim and Independent Legal Counsel. The Committee also considered the variety of written materials, reports and oral presentations the Board received throughout the year regarding performance and operating results of the Funds, and other information relevant to its evaluation of the Agreements.
In connection with the contract review process, FUSE Research Network LLC (“FUSE”), an independent, third-party research provider, was engaged to prepare advisory contract renewal reports designed specifically to help the Board fulfill its advisory contract renewal responsibilities. The objective of the FUSE reports is to present the subject funds’ relative position regarding fees, expenses and total return performance, with peer group and universe comparisons. The Committee assessed the data provided in the FUSE reports as well as commentary presented
| | THE GUGGENHEIM FUNDS ANNUAL REPORT | 41 |
OTHER INFORMATION (Unaudited)(continued) |
by Guggenheim, including, among other things, a summary of notable distinctions between certain Funds and the applicable peer group identified in the FUSE reports and explanations for custom peer groups created for certain Funds that do not fit well into any particular category. The Committee noted that although FUSE’s process typically results in the identification for each Fund of a universe of similar funds for performance comparisons and a narrower group of similar funds from the universe based on asset levels for comparative fee and expense data evaluation (i.e., the peer group), the peer group constituent funds identified by FUSE for Market Neutral Real Estate Fund were the same as the performance universe constituent funds due to the Fund’s investment strategy.
In addition, Guggenheim provided materials and data in response to formal requests for information sent by Independent Legal Counsel on behalf of the Committee. Guggenheim also made a presentation at the April Meeting. Throughout the process, the Committee asked questions of management and requested certain additional information, which Guggenheim provided (collectively with the foregoing reports and materials, the “Contract Review Materials”). The Committee considered the Contract Review Materials in the context of its accumulated experience governing the Trust and other Guggenheim funds and weighed the factors and standards discussed with Independent Legal Counsel.
Following an analysis and discussion of relevant factors, including those identified below, and in the exercise of its business judgment, the Committee concluded that it was in the best interest of each Fund to recommend that the Board approve the renewal of the applicable Agreements for an additional annual term. Following its review of the Committee’s recommendation, the Board approved the renewal of the applicable Agreements for each Fund for a one-year period ending August 1, 2024 at a meeting held on May 23-24, 2023 (the “May Board Meeting” and together with the May Meeting, the “May Meetings”) and determined to adopt the Committee’s considerations and conclusions, which follow.
Advisory Agreements
Nature, Extent and Quality of Services Provided by Each Adviser: With respect to the nature, extent and quality of services currently provided by each Adviser, the Committee considered the qualifications, experience and skills of key personnel performing services for the Funds, including those personnel providing compliance and risk oversight, as well as the supervisors and reporting lines for such personnel. The Committee also considered other information, including Guggenheim’s resources and related efforts to retain, attract and motivate capable personnel to serve the Funds. In evaluating Guggenheim’s resources and capabilities, the Committee considered Guggenheim’s commitment to focusing on, and investing resources in support of, funds in the Guggenheim fund complex, including the Funds. The Committee also considered Guggenheim’s discussion of its ongoing review of the Guggenheim fund line-up at the April Meeting and the May Board Meeting. In addition, the Committee considered the acceptability of the terms of each Advisory Agreement, including the scope of services required to be performed by each Adviser.
42 | THE GUGGENHEIM FUNDS ANNUAL REPORT | |
OTHER INFORMATION (Unaudited)(continued) |
The Committee’s review of the services provided by Guggenheim to the Funds included consideration of Guggenheim’s investment processes and resulting performance, portfolio oversight and risk management, and the related regular quarterly reports and presentations received by the Board. The Committee took into account the risks borne by Guggenheim in sponsoring and providing services to the Funds, including regulatory, operational, legal and entrepreneurial risks. The Committee considered the resources dedicated by Guggenheim to compliance functions and the reporting made to the Board by Guggenheim compliance personnel regarding Guggenheim’s adherence to regulatory requirements. The Committee also considered the regular reports the Board receives from the Trust’s Chief Compliance Officer regarding compliance policies and procedures established pursuant to Rule 38a-1 under the Investment Company Act of 1940, as amended. In connection with the Committee’s evaluation of the overall package of services provided by Guggenheim, the Committee considered Guggenheim’s administrative services, including its role in supervising, monitoring, coordinating and evaluating the various services provided by the fund administrator, transfer agent, distributor, custodian and other service providers to the Funds. The Committee evaluated the Office of Chief Financial Officer (the “OCFO”), established to oversee the fund administration, accounting and transfer agency services provided to the Funds and other Guggenheim funds, including the OCFO’s resources, personnel and services provided.
With respect to Municipal Income Fund, the Committee noted that, although Security Investors delegated certain portfolio management responsibilities to the Sub-Adviser, as affiliated companies, both the Adviser and the Sub-Adviser are part of the Guggenheim organization. Further, the Committee took into account Guggenheim’s explanation that investment advisory-related services are provided by many Guggenheim employees under different related legal entities and thus, the services provided by the Adviser on the one hand and the Sub-Adviser on the other, as well as the risks assumed by each party, cannot be ascribed to distinct legal entities.2 As a result, in evaluating the services provided to the Municipal Income Fund under the Sub-Advisory Agreement, the Committee did not separately consider the contributions under the Advisory Agreement and the Sub-Advisory Agreement.
With respect to Guggenheim’s resources and the ability of each Adviser to carry out its responsibilities under the applicable Advisory Agreement, the Chief Financial Officer of Guggenheim Investments reviewed with the Committee financial information concerning the holding company for Guggenheim Investments, Guggenheim Partners Investment Management Holdings, LLC (“GPIMH”), and the various entities comprising Guggenheim Investments, and provided the audited consolidated financial statements of GPIMH. (Thereafter, the Committee received the audited consolidated financial statements of GPIM.)
2 | Consequently, except where the context indicates otherwise, references to “Adviser,” “Advisers” or “Sub-Adviser” should be understood as referring to Guggenheim Investments generally and the services it provides under the Agreements. |
| | THE GUGGENHEIM FUNDS ANNUAL REPORT | 43 |
OTHER INFORMATION (Unaudited)(continued) |
Based on the foregoing, and based on other information received (both oral and written) at the April Meeting and the May Meetings, as well as other considerations, including the Committee’s knowledge of how each Adviser performs its duties obtained through Board meetings, discussions and reports throughout the year, the Committee concluded that each Adviser and its personnel were qualified to serve the Funds in such capacity and may reasonably be expected to continue to provide a high quality of services under each Advisory Agreement with respect to the Funds.
Investment Performance: The Committee received, for each Fund, investment returns for the since-inception, ten-year, five-year, three-year, one-year and three-month periods ended December 31, 2022, as applicable. In addition, the Committee received a comparison of each Fund’s performance to the performance of a benchmark, a universe of funds and a narrower peer group of similar funds based on asset levels as identified by FUSE (except as noted above with respect to Market Neutral Real Estate Fund), in each case for the same periods, as applicable. The Committee also received from FUSE a description of the methodology for identifying each Fund’s peer group and universe for performance and expense comparisons. The Committee also received certain performance information as of March 31, 2023. In assessing each Fund’s performance, the Committee considered that the Board receives regular reporting from Guggenheim regarding performance and evaluates performance throughout the year.
In seeking to evaluate Fund performance over a full market cycle, the Committee focused its attention on five-year and three-year performance rankings as compared to the relevant universe of funds. Except as to the individual Funds discussed below, the Committee observed that the returns of each Fund’s Institutional Class shares ranked in the third quartile or better of such Fund’s performance universe for each of the relevant periods considered. In addition, the Committee made the following observations:
Alpha Opportunity Fund: The returns of the Fund’s Institutional Class shares ranked in the 96th and 73rd percentiles of its performance universe for the five-year and three-year periods ended December 31, 2022, respectively. The Committee noted management’s explanation that the Fund’s relative underperformance over the five-year time period was primarily due to the Fund’s beta profile and fundamental factor tilts. The Committee noted management’s statement that the Fund’s lower beta profile to broad market U.S. equities relative to its peers and long exposure to value and short exposure to growth have detracted from investment performance. The Committee also noted management’s statement that as a result of an update in 2021 to the quantitative investment methodology that the Fund employs, as well as the more recent comeback of value-oriented, higher quality names, the Fund experienced performance rankings that compare more favorably relative to its performance universe for the three-year and one-year periods ended December 31, 2022.
Diversified Income Fund: The returns of the Fund’s Institutional Class shares ranked in the 78th and 75th percentiles of its performance universe for the five-year and three-year periods ended December 31, 2022, respectively. The Committee noted management’s explanation that the Fund’s relative underperformance over the five-year time period was primarily due to the Fund’s
44 | THE GUGGENHEIM FUNDS ANNUAL REPORT | |
OTHER INFORMATION (Unaudited)(continued) |
defensively-positioned portfolio, in particular within its fixed-income sleeve which includes allocations to several Guggenheim fixed-income funds that were defensively positioned beginning in 2018, reflecting Guggenheim’s market views. The Committee also noted management’s statement that the Fund maintained a lower beta profile to equities relative to its peers. The Committee further noted management’s statement that the Fund’s allocation process was updated in 2021, resulting in an increase in the Fund’s equity exposure, and that there was some improvement in the Fund’s performance rankings relative to its performance universe for the three-year and one-year periods ended December 31, 2022. The Committee noted management’s statement that although the Fund’s increased equity exposure was detrimental to the Fund’s performance relative to peers in 2022 due to the poor performance of U.S. equities that year, Guggenheim believes the increased equity exposure will ultimately benefit shareholders and support total return performance in the medium to long term. The Committee also noted the Fund’s small size and considered management’s statements that the Fund continues to be a viable offering and that Guggenheim is able to manage the Fund at its current size.
Market Neutral Real Estate Fund: The returns of the Fund’s Institutional Class shares ranked in the 44th and 89th percentiles of its performance universe for the five-year and three-year periods ended December 31, 2022, respectively. The Committee noted management’s explanation that the Fund’s relative underperformance over the three-year time period was due to underperforming pairs of offsetting long and short positions as well as several stock- and sector-specific issues, and considered that, despite recent underperformance, the Fund experienced performance that ranks in the top half of its performance universe for the five-year period ended December 31, 2022.
Municipal Income Fund: The returns of the Fund’s Institutional Class shares ranked in the 89th and 83rd percentiles of its performance universe for the five-year and three-year periods ended December 31, 2022, respectively. The Committee noted management’s explanation that the Fund’s conservative positioning in high quality, long-duration assets, which underperformed over the past two years due to a risk-on sentiment in 2021 and due to fears of duration risk in 2022, contributed to relative underperformance over the five-year and three-year time periods. The Committee noted management’s statement that the Fund’s allocation to closed-end funds also contributed to relative underperformance in 2022 as the increased cost of leverage weighed on the performance of such funds. The Committee considered management’s belief that an economic downturn that is likely to follow the Federal Reserve’s tightening of financial conditions will disproportionately affect weaker municipal credits and could lead to distress in names the Fund has avoided. The Committee also took into account management’s further discussions of performance attribution and outlook for the Fund at the April Meeting and the May Board Meeting, during which management highlighted that the Fund’s relative underperformance in 2022 was due to the exceptional volatility in the fixed-income markets that year which also impacted relative performance for the trailing five-year and three-year time periods, and noted the overall low dispersion in absolute investment returns among municipal bond funds.
| | THE GUGGENHEIM FUNDS ANNUAL REPORT | 45 |
OTHER INFORMATION (Unaudited)(continued) |
StylePlus—Mid Growth Fund: The returns of the Fund’s Institutional Class shares ranked in the 76th and 67th percentiles of its performance universe for the five-year and three-year periods ended December 31, 2022, respectively. The Committee noted management’s explanation that the Fund’s relative underperformance over the five-year time period can be attributed to the more conservative positioning of the underlying funds in which the Fund invests, resulting in yields insufficient to offset fund fees and other costs, as well as the strategy’s tilt to value-oriented, lower-growth names within the mid-cap growth segment as growth outperformed value securities from 2018 through 2020. The Committee also noted management’s statement that as a result of the more recent comeback of value-oriented, lower-growth names, the Fund experienced performance rankings that compare more favorably relative to its performance universe for the three-year and one-year periods ended December 31, 2022.
Ultra Short Duration Fund: The returns of the Fund’s Institutional Class shares ranked in the 76th and 63rd percentiles of its performance universe for the five-year and three-year periods ended December 31, 2022, respectively. The Committee noted management’s explanation that the Fund’s overweight duration positioning over the five-year time period relative to its performance universe as well as higher allocations to structured credit during the second half of 2022, which underperformed corporate credit during that period, contributed to relative underperformance over the five-year time period. The Committee considered management’s expectation that the resetting of higher interest rates should help the Fund to perform well going forward and that the divergence in the relationship between structured and corporate credit should normalize going forward and lead to relative outperformance, noting that there was some improvement in the Fund’s performance ranking relative to its performance universe for the one-year period ended December 31, 2022.
Based on the foregoing, and based on other information received (both oral and written) at the April Meeting and the May Meetings, as well as other considerations, the Committee concluded that, with respect to each Fund other than Municipal Income Fund: (i) the Fund’s performance was acceptable; or (ii) it was satisfied with Guggenheim’s responses and/or efforts to improve investment performance; and, with respect to Municipal Income Fund, it would continue to monitor the Fund’s investment performance.
Comparative Fees, Costs of Services Provided and the Benefits Realized by Each Adviser from Its Relationship with the Funds: The Committee compared each Fund’s contractual advisory fee (which, for Municipal Income Fund, includes the sub-advisory fee paid to the Sub-Adviser), net effective management fee3 and total net expense ratio to the applicable peer group. The Committee also reviewed the median advisory fees and expense ratios, including expense ratio components (e.g., transfer agency fees, administration fees, other operating expenses, distribution fees and fee waivers/reimbursements), of the peer group of funds. In
3 | The “net effective management fee” for each Fund represents the combined effective advisory fee and administration fee as a percentage of average net assets for the latest fiscal year, after any waivers and/or reimbursements. |
46 | THE GUGGENHEIM FUNDS ANNUAL REPORT | |
OTHER INFORMATION (Unaudited)(continued) |
addition, the Committee considered information regarding Guggenheim’s process for evaluating the competitiveness of each Fund’s fees and expenses, noting Guggenheim’s statement that evaluations seek to incorporate a variety of factors with a general focus on ensuring fees and expenses: (i) are competitive; (ii) give consideration to resource support requirements; and (iii) ensure Funds are able to deliver on shareholder return expectations. The Committee also considered Guggenheim’s discussion of information regarding fee and expense trends across the open-end fund industry and its response to those trends with respect to the funds in the Guggenheim fund complex, including the Funds.
As part of its evaluation of each Fund’s advisory fee, the Committee considered how such fees compared to the advisory fee charged by Guggenheim to one or more other clients that it manages pursuant to similar investment strategies, to the extent applicable, noting that, in certain instances, Guggenheim charges a lower advisory fee to such other clients. In this connection, the Committee considered, among other things, Guggenheim’s representations about the significant differences between managing mutual funds as compared to other types of accounts. The Committee also considered Guggenheim’s explanation that lower fees are charged in certain instances due to various other factors, including the scope of contract, type of investors, fee structure, applicable legal, governance and capital structures, tax status and historical pricing reasons. In addition, the Committee took into account Guggenheim’s discussion of the regulatory, operational, legal and entrepreneurial risks involved with the Funds as compared to other types of accounts. The Committee concluded that the information it received demonstrated that the aggregate services provided to, or the specific circumstances of, each Fund were sufficiently different from the services provided to, or the specific circumstances of, other clients with similar investment strategies and/or that the risks borne by Guggenheim were sufficiently greater than those associated with managing other clients with similar investment strategies to support the difference in fees.
In further considering the comparative fee and expense data presented in the Contract Review Materials and addressed by Guggenheim, the Committee took into account those Funds with currently effective expense limitation agreements with the Adviser. Except as to the individual Funds discussed below, the Committee observed that the contractual advisory fee, net effective management fee and total net expense ratio for each Fund’s Institutional Class shares each rank in the third quartile or better of such Fund’s peer group. In addition, the Committee made the following observations:
Floating Rate Strategies Fund: The contractual advisory fee for the Fund’s Institutional Class shares ranks in the third quartile (73rd percentile) of its peer group. Although the net effective management fee for the Fund’s Institutional Class shares ranks in the fourth quartile (80th percentile) of its peer group, the Committee considered that the total net expense ratio for the Fund’s Institutional Class shares ranks in the third quartile (67th percentile) of its peer group. The Committee considered the Adviser’s statement explaining the higher fees that performance is driven by a unique investment approach that requires significant resources. In this regard, the
| | THE GUGGENHEIM FUNDS ANNUAL REPORT | 47 |
OTHER INFORMATION (Unaudited)(continued) |
Committee took into consideration the strong investment performance of the Fund’s Institutional Class shares for the three-year period ended December 31, 2022. The Committee also took into account the Fund’s currently effective expense limitation agreement with the Adviser.
Limited Duration Fund: The contractual advisory fee for the Fund’s Institutional Class shares ranks in the fourth quartile (87th percentile) of its peer group. The net effective management fee for the Fund’s Institutional Class shares ranks in the third quartile (73rd percentile) of its peer group. The total net expense ratio for the Fund’s Institutional Class shares ranks in the third quartile (67th percentile) of its peer group. The Committee considered the Adviser’s statement explaining the higher fees that performance is driven by a unique investment approach that requires significant resources. In this regard, the Committee took into consideration the strong investment performance of the Fund’s Institutional Class shares for the five-year and three-year periods ended December 31, 2022. The Committee also took into account the Fund’s currently effective expense limitation agreement with the Adviser.
Macro Opportunities Fund: The contractual advisory fee for the Fund’s Institutional Class shares ranks in the fourth quartile (82nd percentile) of its peer group. The net effective management fee for the Fund’s Institutional Class shares ranks in the third quartile (64th percentile) of its peer group. The total net expense ratio for the Fund’s Institutional Class shares ranks in the third quartile (73rd percentile) of its peer group. The Committee noted that the Fund is categorized as a non-traditional bond fund which seeks to add value by investing in many non-traditional securities within and outside of fixed income, including equities, currencies, commodities and derivatives, and that peer funds have varying degrees of capability, flexibility and associated fees. The Committee considered the Adviser’s statement explaining the higher fees that performance is driven by a unique investment approach that requires significant resources. In this regard, the Committee took into consideration the strong investment performance of the Fund’s Institutional Class shares for the three-year period ended December 31, 2022. The Committee also took into account the Fund’s currently effective expense limitation agreement and contractual advisory fee breakpoint of 5 basis points on average daily net assets above $5 billion.
Risk Managed Real Estate Fund: The contractual advisory fee for the Fund’s Institutional Class shares ranks in the second quartile (43rd percentile) of its peer group. Although the net effective management fee for the Fund’s Institutional Class shares ranks in the fourth quartile (79th percentile) of its peer group, the Committee considered that the total net expense ratio for the Fund’s Institutional Class shares ranks in the third quartile (57th percentile) of its peer group. The Committee considered the Adviser’s statement that the total expense ratio for the Fund’s Institutional Class shares is competitive and in-line with the peer group average and median and that the Fund’s contractual advisory fee is competitive. The Committee also took into account the Fund’s currently effective expense limitation agreement with the Adviser.
SMid Cap Value Fund: The contractual advisory fee for the Fund’s Institutional Class shares ranks in the first quartile (7th percentile) of its peer group. The net effective management fee for the Fund’s Institutional Class shares ranks in the third quartile (71st percentile) of its peer group. The
48 | THE GUGGENHEIM FUNDS ANNUAL REPORT | |
OTHER INFORMATION (Unaudited)(continued) |
total net expense ratio for the Fund’s Institutional Class shares ranks in the fourth quartile (79th percentile) of its peer group. The Committee considered that the Fund’s contractual advisory fee ranks favorably in the first quartile of its peer group and reviewed the other expenses that impacted the total net expense ratio. The Committee also took into account the Fund’s currently effective expense limitation agreement with the Adviser.
Total Return Bond Fund: The contractual advisory fee for the Fund’s Institutional Class shares ranks in the fourth quartile (87th percentile) of its peer group. The net effective management fee for the Fund’s Institutional Class shares ranks in the third quartile (67th percentile) of its peer group. The total net expense ratio for the Fund’s Institutional Class shares ranks in the third quartile (73rd percentile) of its peer group. The Committee considered the Adviser’s statement explaining the higher fees that performance is driven by a unique investment approach that requires significant resources. In this regard, the Committee took into consideration the strong investment performance of the Fund’s Institutional Class shares for the three-year period ended December 31, 2022. The Committee also took into account the Fund’s currently effective expense limitation agreement with the Adviser.
With respect to the costs of services provided and benefits realized by Guggenheim Investments from its relationship with the Funds, the Committee reviewed a profitability analysis and data from management for each Fund setting forth the average assets under management for the twelve months ended December 31, 2022, gross revenues received, and expenses incurred directly or through allocations, by Guggenheim Investments, expense waivers (as applicable), earnings and the operating margin/profitability rate, including variance information relative to the foregoing amounts as of December 31, 2021. In addition, the Chief Financial Officer of Guggenheim Investments reviewed with, and addressed questions from, the Committee concerning the expense allocation methodology employed in producing the profitability analysis. In the course of its review of Guggenheim Investments’ profitability, the Committee took into account the methods used by Guggenheim Investments to determine expenses and profit and the representation by the Chief Financial Officer of Guggenheim Investments that such methods provided a reasonable basis for determining the profitability of the applicable Adviser with respect to each Fund. The Committee considered all of the foregoing, among other things, in evaluating the costs of services provided, the profitability to Guggenheim Investments and the profitability rates presented.
The Committee also considered other benefits available to each Adviser because of its relationship with the Funds and noted Guggenheim’s statement that it does not believe the Advisers derive any such “fall-out” benefits. In this regard, the Committee noted Guggenheim’s statement that, although it does not consider such benefits to be fall-out benefits, the Advisers may benefit from certain economies of scale and synergies, such as enhanced visibility of the Advisers, enhanced leverage in fee negotiations and other synergies arising from offering a broad spectrum of products, including the Funds.
| | THE GUGGENHEIM FUNDS ANNUAL REPORT | 49 |
OTHER INFORMATION (Unaudited)(continued) |
Based on the foregoing, and based on other information received (both oral and written) at the April Meeting and the May Meetings, as well as other considerations, the Committee concluded that the comparative fees and the benefits realized by each Adviser from its relationship with the Funds were appropriate and that each Adviser’s profitability from its relationship with the Funds was not unreasonable.
Economies of Scale: The Committee received and considered information regarding whether there have been economies of scale with respect to the management of the Funds as Fund assets grow, whether the Funds have appropriately benefited from any economies of scale, and whether there is potential for realization of any further economies of scale. The Committee considered whether economies of scale in the provision of services to the Funds were being passed along to and shared with the shareholders. The Committee considered that Guggenheim believes it is appropriately sharing potential economies of scale and that Guggenheim’s decrease in 2022 in overall expenses was attributable to decreased product costs driven by lower average assets under management and lower non-recurring costs related to closed-end fund matters as well as a decrease in compensation and benefits. The Committee also considered that although expenses related to investment resources decreased in 2022, Guggenheim’s shared services expenses and certain other expenses increased in 2022.
The Committee also noted the process employed by the Adviser to evaluate whether it would be appropriate to institute a new breakpoint for a Fund, with consideration given to, among other things: (i) the Fund’s size and trends in asset levels over recent years; (ii) the competitiveness of the expense levels; (iii) whether expense waivers are in place; (iv) changes and trends in revenue and expenses; (v) whether there are any anticipated expenditures that may benefit the Fund in the future; (vi) Fund profit level margins; (vii) relative Fund performance; (viii) the nature, extent and quality of services management provides to the Fund; and (ix) the complexity of the Fund’s investment strategy and the resources required to support the Fund.
As part of its assessment of economies of scale, the Committee took into account Guggenheim’s representation that it seeks to share economies of scale through a number of means, including breakpoints, advisory fees set at competitive rates pre-assuming future asset growth, expense waivers and limitations, and investments in personnel, operations and infrastructure to support the fund business. The Committee also received information regarding amounts that had been shared with shareholders through such breakpoints and expense waivers and limitations. The Committee also noted information from Guggenheim regarding certain challenges and costs associated with managing Funds that have achieved significant scale. Thus, the Committee considered the size of the Funds and the competitiveness of and/or other determinations made regarding the current advisory fee for each Fund, as well as whether a Fund is subject to an expense limitation.
Based on the foregoing, and based on other information received (both oral and written) at the April Meeting and the May Meetings, as well as other considerations, the Committee concluded that the advisory fee for each Fund was reasonable.
50 | THE GUGGENHEIM FUNDS ANNUAL REPORT | |
OTHER INFORMATION (Unaudited)(concluded) |
Sub-Advisory Agreement for Municipal Income Fund
Nature, Extent and Quality of Services Provided by the Sub-Adviser: As noted above, because both the Adviser and the Sub-Adviser for Municipal Income Fund—Security Investors and GPIM, respectively—are part of and do business as Guggenheim Investments and the services provided by the Adviser on the one hand and the Sub-Adviser on the other cannot be ascribed to distinct legal entities, the Committee did not separately evaluate the services provided under the Advisory Agreement and the Sub-Advisory Agreement. Therefore, the Committee considered the qualifications, experience and skills of the Fund’s portfolio management team in connection with the Committee’s evaluation of Guggenheim’s investment professionals under the Advisory Agreement. With respect to Guggenheim’s resources and the Sub-Adviser’s ability to carry out its responsibilities under the Sub-Advisory Agreement, as noted above, the Committee considered the financial condition of GPIMH and the various entities comprising Guggenheim Investments. The Committee also considered the acceptability of the terms of the Sub-Advisory Agreement, including the scope of services required to be performed by the Sub-Adviser.
Investment Performance: The Committee considered the returns of the Fund under its evaluation of the Advisory Agreement.
Comparative Fees, Costs of Services Provided and the Benefits Realized by the Sub-Adviser from Its Relationship with the Fund: The Committee considered that the Sub-Advisory Agreement is with an affiliate of the Adviser, that the Adviser compensates the Sub-Adviser from its own fees so that the sub-advisory fee rate for the Fund does not impact the fees paid by the Fund and that the Sub-Adviser’s revenues were included in the calculation of Guggenheim Investments’ profitability. Given its conclusion of the reasonableness of the advisory fee, the Committee concluded that the sub-advisory fee rate for the Fund was reasonable.
Economies of Scale: The Committee recognized that, because the Sub-Adviser’s fees are paid by the Adviser and not the Fund, the analysis of economies of scale was more appropriate in the context of the Committee’s consideration of the Advisory Agreement, which was separately considered. (See “Advisory Agreements – Economies of Scale” above.)
Overall Conclusions
The Committee concluded that the investment advisory fees are fair and reasonable in light of the extent and quality of the services provided and other benefits received and that the renewal of each applicable Agreement is in the best interest of each Fund. In reaching this conclusion, no single factor was determinative or conclusive and each Committee member, in the exercise of his or her informed business judgment, may afford different weights to different factors.
Following its review of the Committee’s analysis and determinations, the Board adopted the considerations and conclusions of the Committee and determined to approve the renewal of the Agreements.
| | THE GUGGENHEIM FUNDS ANNUAL REPORT | 51 |
INFORMATION ON BOARD OF TRUSTEES AND OFFICERS (Unaudited) |
A Board of Trustees oversees the Trust, as well as other trusts of GI, in which its members have no stated term of service, and continue to serve after election until resignation. The Statement of Additional Information includes further information about Fund Trustees and Officers, and can be obtained without charge by visiting guggenheiminvestments.com or by calling 800.820.0888.
Name, Address*
and Year of Birth | Position(s)
Held with
Trust | Term of Office
and Length of
Time Served** | Principal Occupation(s)
During Past Five Years | Number of
Portfolios
in Fund
Complex
Overseen | Other
Directorships Held
by Trustees*** |
Independent Trustees: | | | |
Randall C. Barnes (1951) | Trustee and Chair of the Valuation Oversight Committee | Since 2014 (Trustee) Since 2020 (Chair of the Valuation Oversight Committee) | Current: Private Investor (2001-present). Former: Senior Vice President and Treasurer, PepsiCo, Inc. (1993-1997); President, Pizza Hut International (1991-1993); Senior Vice President, Strategic Planning and New Business Development, PepsiCo, Inc. (1987-1990). | 155 | Current: Advent Convertible and Income Fund (2005-present); Purpose Investments Funds (2013-present). Former: Fiduciary/Claymore Energy Infrastructure Fund (2004-2022); Guggenheim Enhanced Equity Income Fund (2005-2021); Guggenheim Credit Allocation Fund (2013-2021). |
52 | THE GUGGENHEIM FUNDS ANNUAL REPORT | |
INFORMATION ON BOARD OF TRUSTEES AND OFFICERS (Unaudited)(continued) |
Name, Address*
and Year of Birth | Position(s)
Held with
Trust | Term of Office
and Length of
Time Served** | Principal Occupation(s)
During Past Five Years | Number of
Portfolios
in Fund
Complex
Overseen | Other
Directorships Held
by Trustees*** |
Independent Trustees - continued | | | |
Angela Brock-Kyle (1959) | Trustee | Since 2019 | Current: Founder and Chief Executive Officer, B.O.A.R.D.S. (2013-present); Director, Mutual Fund Directors Forum (2022-present). Former: Senior Leader, TIAA (financial services firm) (1987-2012). | 154 | Current: Bowhead Insurance GP, LLC (2020-present); Hunt Companies, Inc. (2019-present). Former: Fiduciary/Claymore Energy Infrastructure Fund (2019-2022); Guggenheim Enhanced Equity Income Fund (2019-2021); Guggenheim Credit Allocation Fund (2019-2021); Infinity Property & Casualty Corp. (2014-2018). |
| | THE GUGGENHEIM FUNDS ANNUAL REPORT | 53 |
INFORMATION ON BOARD OF TRUSTEES AND OFFICERS (Unaudited)(continued) |
Name, Address*
and Year of Birth | Position(s)
Held with
Trust | Term of Office
and Length of
Time Served** | Principal Occupation(s)
During Past Five Years | Number of
Portfolios
in Fund
Complex
Overseen | Other
Directorships Held
by Trustees*** |
Independent Trustees - continued | | | |
Thomas F. Lydon, Jr. (1960) | Trustee and Chair of the Contracts Review Committee | Since 2019 (Trustee) Since 2020 (Chair of the Contracts Review Committee) | Current: President, Global Trends Investments (registered investment adviser) (1996-present); Chief Executive Officer, ETF Flows, LLC (financial advisor education and research provider) (2019-present); Chief Executive Officer, Lydon Media (2016-present); Director, GDX Index Partners, LLC (index provider) (2021-present); Vice Chairman, VettaFi (financial advisor content, research and digital distribution provider) (2022-present). | 154 | Current: US Global Investors, Inc. (GROW) (1995-present); The 2023 ETF Series Trust (4) (June 2023-present); The 2023 ETF Series Trust II (1) (August 2023-present). Former: Fiduciary/Claymore Energy Infrastructure Fund (2019-2022); Guggenheim Enhanced Equity Income Fund (2019-2021); Guggenheim Credit Allocation Fund (2019-2021); Harvest Volatility Edge Trust (3) (2017-2019). |
54 | THE GUGGENHEIM FUNDS ANNUAL REPORT | |
INFORMATION ON BOARD OF TRUSTEES AND OFFICERS (Unaudited)(continued) |
Name, Address*
and Year of Birth | Position(s)
Held with
Trust | Term of Office
and Length of
Time Served** | Principal Occupation(s)
During Past Five Years | Number of
Portfolios
in Fund
Complex
Overseen | Other
Directorships Held
by Trustees*** |
Independent Trustees - continued | | | |
Ronald A. Nyberg (1953) | Trustee and Chair of the Nominating and Governance Committee | Since 2014 | Current: Of Counsel, Momkus LLP (law firm) (2016-present). Former: Partner, Nyberg & Cassioppi, LLC (law firm) (2000-2016); Executive Vice President, General Counsel, and Corporate Secretary, Van Kampen Investments (1982-1999). | 155 | Current: Advent Convertible and Income Fund (2003-present); PPM Funds (2) (2018-present); NorthShore-Edward-Elmhurst Health (2012-present). Former: Fiduciary/Claymore Energy Infrastructure Fund (2004-2022); Guggenheim Enhanced Equity Income Fund (2005-2021); Guggenheim Credit Allocation Fund (2013-2021); Western Asset Inflation-Linked Opportunities & Income Fund (2004-2020); Western Asset Inflation-Linked Income Fund (2003-2020). |
| | THE GUGGENHEIM FUNDS ANNUAL REPORT | 55 |
INFORMATION ON BOARD OF TRUSTEES AND OFFICERS (Unaudited)(continued) |
Name, Address*
and Year of Birth | Position(s)
Held with
Trust | Term of Office
and Length of
Time Served** | Principal Occupation(s)
During Past Five Years | Number of
Portfolios
in Fund
Complex
Overseen | Other
Directorships Held
by Trustees*** |
Independent Trustees - continued | | | |
Sandra G. Sponem (1958) | Trustee and Chair of the Audit Committee | Since 2019 (Trustee) Since 2020 (Chair of the Audit Committee) | Current: Retired. Former: Senior Vice President and Chief Financial Officer, M.A. Mortenson-Companies, Inc. (construction and real estate development company) (2007-2017). | 154 | Current: SPDR Series Trust (81) (2018-present); SPDR Index Shares Funds (30) (2018-present); SSGA Active Trust (14) (2018-present). Former: Fiduciary/Claymore Energy Infrastructure Fund (2019-2022); Guggenheim Enhanced Equity Income Fund (2019-2021); Guggenheim Credit Allocation Fund (2019-2021); SSGA Master Trust (1) (2018-2020). |
56 | THE GUGGENHEIM FUNDS ANNUAL REPORT | |
INFORMATION ON BOARD OF TRUSTEES AND OFFICERS (Unaudited)(continued) |
Name, Address*
and Year of Birth | Position(s)
Held with
Trust | Term of Office
and Length of
Time Served** | Principal Occupation(s)
During Past Five Years | Number of
Portfolios
in Fund
Complex
Overseen | Other
Directorships Held
by Trustees*** |
Independent Trustees - concluded | | | |
Ronald E. Toupin, Jr. (1958) | Trustee, Chair of the Board and Chair of the Executive Committee | Since 2014 | Current: Portfolio Consultant (2010-present); Member, Governing Council, Independent Directors Council (2013-present); Governor, Board of Governors, Investment Company Institute (2018-present). Former: Member, Executive Committee, Independent Directors Council (2016-2018); Vice President, Manager and Portfolio Manager, Nuveen Asset Management (1998-1999); Vice President, Nuveen Investment Advisory Corp. (1992-1999); Vice President and Manager, Nuveen Unit Investment Trusts (1991-1999); and Assistant Vice President and Portfolio Manager, Nuveen Unit Investment Trusts (1988-1999), each of John Nuveen & Co., Inc. (registered broker dealer) (1982-1999). | 154 | Former: Fiduciary/Claymore Energy Infrastructure Fund (2004-2022); Guggenheim Enhanced Equity Income Fund (2005-2021); Guggenheim Credit Allocation Fund (2013-2021); Western Asset Inflation-Linked Opportunities & Income Fund (2004-2020); Western Asset Inflation-Linked Income Fund (2003-2020). |
| | THE GUGGENHEIM FUNDS ANNUAL REPORT | 57 |
INFORMATION ON BOARD OF TRUSTEES AND OFFICERS (Unaudited)(continued) |
Name, Address*
and Year of Birth | Position(s)
Held with
Trust | Term of Office
and Length of
Time Served** | Principal Occupation(s)
During Past Five Years | Number of
Portfolios
in Fund
Complex
Overseen | Other
Directorships Held
by Trustees*** |
Interested Trustee: | | |
Amy J. Lee**** (1961) | Trustee, Vice President and Chief Legal Officer | Since 2018 (Trustee) Since 2014 (Chief Legal Officer) Since 2007
(Vice President) | Current: Interested Trustee, certain other funds in the Fund Complex (2018-present); Chief Legal Officer, certain other funds in the Fund Complex (2014-present); Vice President, certain other funds in the Fund Complex (2007-present); Senior Managing Director, Guggenheim Investments (2012-present). Former: President and Chief Executive Officer, certain other funds in the Fund Complex (2017-2019); Vice President, Associate General Counsel and Assistant Secretary, Security Benefit Life Insurance Company and Security Benefit Corporation (2004-2012). | 154 | Former: Fiduciary/Claymore Energy Infrastructure Fund (2018-2022); Guggenheim Enhanced Equity Income Fund (2018-2021); Guggenheim Credit Allocation Fund (2018-2021). |
* | The business address of each Trustee is c/o Guggenheim Investments, 227 West Monroe Street, Chicago, Illinois 60606. |
** | Each Trustee serves an indefinite term, until his or her successor is elected and qualified. Time served includes time served in the respective position for the Predecessor Corporation. |
*** | Each Trustee also serves on the Boards of Trustees of Guggenheim Funds Trust, Guggenheim Variable Funds Trust, Guggenheim Strategy Funds Trust, Guggenheim Taxable Municipal Bond & Investment Grade Debt Trust, Guggenheim Strategic Opportunities Fund, Guggenheim Active Allocation Fund, Rydex Series Funds, Rydex Dynamic Funds, Rydex Variable Trust and Transparent Value Trust. Messrs. Barnes and Nyberg also serve on the Board of Trustees of Advent Convertible & Income Fund. |
**** | This Trustee is deemed to be an “interested person” of the Fund under the 1940 Act by reason of her position with the Fund’s Adviser and/or the parent of the Adviser. |
58 | THE GUGGENHEIM FUNDS ANNUAL REPORT | |
INFORMATION ON BOARD OF TRUSTEES AND OFFICERS (Unaudited)(continued) |
Name, Address*
and Year of Birth | Position(s)
Held with
Trust | Term of Office
and Length of
Time Served** | Principal Occupation(s)
During Past Five Years |
Officers | | | |
Brian E. Binder (1972) | President and Chief Executive Officer | Since 2018 | Current: President, Mutual Fund Boards, Guggenheim Investments (2022-present); President and Chief Executive Officer, certain other funds in the Fund Complex (2018-present); President, Mutual Funds Boards, Guggenheim Funds Investment Advisors, LLC and Security Investors, LLC (2018-present);Board Member, Guggenheim Partners Investment Funds plc (2022-present); Board Member, Guggenheim Global Investments plc (2022-present); Board Member, Guggenheim Partners Fund Management (Europe) Limited (2018-present). Former: Senior Managing Director and Chief Administrative Officer, Guggenheim Investments (2018-2022); Managing Director and President, Deutsche Funds, and Head of US Product, Trading and Fund Administration, Deutsche Asset Management (2013-2018); Managing Director, Chairman of North American Executive Committee and Head of Business Management and Consulting, Invesco Ltd. (2010-2012). |
James Howley (1972) | Chief Financial Officer, Chief Accounting Officer and Treasurer | Since 2022 | Current: Managing Director, Guggenheim Investments (2004-present); Chief Financial Officer, Chief Accounting Officer, and Treasurer, certain other funds in the Fund Complex (2022-present). Former: Assistant Treasurer, certain other funds in the Fund Complex (2006-2022); Manager, Mutual Fund Administration of Van Kampen Investments, Inc. (1996-2004). |
Mark E. Mathiasen (1978) | Secretary | Since 2014 | Current: Secretary, certain other funds in the Fund Complex (2007-present); Managing Director, Guggenheim Investments (2007-present). |
Glenn McWhinnie (1969) | Assistant Treasurer | Since 2016 | Current: Vice President, Guggenheim Investments (2009-present); Assistant Treasurer, certain other funds in the Fund Complex (2016-present). |
Michael P. Megaris (1984) | Assistant Secretary | Since 2014 | Current: Assistant Secretary, certain other funds in the Fund Complex (2014-present); Managing Director, Guggenheim Investments (2012-present). |
| | THE GUGGENHEIM FUNDS ANNUAL REPORT | 59 |
INFORMATION ON BOARD OF TRUSTEES AND OFFICERS (Unaudited)(continued) |
Name, Address*
and Year of Birth | Position(s)
Held with
Trust | Term of Office
and Length of
Time Served** | Principal Occupation(s)
During Past Five Years |
OFFICERS - continued | |
Elisabeth Miller (1968) | Chief Compliance Officer | Since 2012 | Current: Chief Compliance Officer, certain other funds in the Fund Complex (2012-present); Senior Managing Director, Guggenheim Investments (2012-present); Senior Managing Director, Guggenheim Funds Distributors, LLC (2014-present). Former: Chief Compliance Officer, Security Investors, LLC and Guggenheim Funds Investment Advisors, LLC (2012-2018); Chief Compliance Officer, Guggenheim Distributors, LLC (2009-2014); Senior Manager, Security Investors, LLC (2004-2014); Senior Manager, Guggenheim Distributors, LLC (2004-2014). |
Margaux Misantone (1978) | AML Officer | Since 2017 | Current: Chief Compliance Officer, Security Investors, LLC and Guggenheim Funds Investment Advisors, LLC (2018-present); AML Officer, Security Investors, LLC and certain other funds in the Fund Complex (2017-present); Managing Director, Guggenheim Investments (2015-present). Former: Assistant Chief Compliance Officer, Security Investors, LLC and Guggenheim Funds Investments Advisors, LLC (2015-2018). |
Kimberly J. Scott (1974) | Assistant Treasurer | Since 2014 | Current: Director, Guggenheim Investments (2012-present); Assistant Treasurer, certain other funds in the Fund Complex (2012-present). Former: Financial Reporting Manager, Invesco, Ltd. (2010-2011); Vice President/Assistant Treasurer, Mutual Fund Administration for Van Kampen Investments, Inc./Morgan Stanley Investment Management (2009-2010); Manager of Mutual Fund Administration, Van Kampen Investments, Inc./Morgan Stanley Investment Management (2005-2009). |
Bryan Stone (1979) | Vice President | Since 2014 | Current: Vice President, certain other funds in the Fund Complex (2014-present); Managing Director, Guggenheim Investments (2013-present). Former: Senior Vice President, Neuberger Berman Group LLC (2009-2013); Vice President, Morgan Stanley (2002-2009). |
60 | THE GUGGENHEIM FUNDS ANNUAL REPORT | |
INFORMATION ON BOARD OF TRUSTEES AND OFFICERS (Unaudited)(concluded) |
Name, Address*
and Year of Birth | Position(s)
Held with
Trust | Term of Office
and Length of
Time Served** | Principal Occupation(s)
During Past Five Years |
OFFICERS - concluded | |
Jon Szafran (1989) | Assistant Treasurer | Since 2017 | Current: Director, Guggenheim Investments (2017-present); Assistant Treasurer, certain other funds in the Fund Complex (2017-present). Former: Assistant Treasurer of Henderson Global Funds and Manager of US Fund Administration, Henderson Global Investors (North America) Inc. (“HGINA”), (2017); Senior Analyst of US Fund Administration, HGINA (2014–2017); Senior Associate of Fund Administration, Cortland Capital Market Services, LLC (2013-2014); Experienced Associate, PricewaterhouseCoopers LLP (2012-2013). |
* | The business address of each officer is c/o Guggenheim Investments, 227 West Monroe Street, Chicago, Illinois 60606. |
** | Each officer serves an indefinite term, until his or her successor is duly elected and qualified. |
| | THE GUGGENHEIM FUNDS ANNUAL REPORT | 61 |
GUGGENHEIM INVESTMENTS PRIVACY NOTICE (Unaudited) |
Who We Are
This Privacy Notice describes the data protection practices of Guggenheim Investments. Guggenheim Investments as used herein refers to the affiliated investment management businesses of Guggenheim Partners, LLC: Guggenheim Funds Investment Advisors, LLC, Guggenheim Partners Investment Management, LLC, Guggenheim Funds Distributors, LLC, Security Investors, LLC, Guggenheim Investment Advisors (Europe) Limited, Guggenheim Real Estate, LLC, GS Gamma Advisors, LLC, Guggenheim Partners India Management, LLC, Guggenheim Partners Europe Limited, as well as the funds in the Guggenheim Funds complex (the “Funds”) (“Guggenheim Investments,” “we,” “us,” or “our”).
Guggenheim Partners Investment Management Holdings, LLC, located at 330 Madison Avenue, New York, New York 10017, is the data controller for your information. The affiliates who are also controllers of certain of your information are: Guggenheim Investment Advisors (Europe) Limited, Guggenheim Partners Europe Limited, Guggenheim Partners, LLC, Guggenheim Funds Investment Advisors, LLC, Guggenheim Partners Investment Management, LLC, Guggenheim Funds Distributors, LLC and Security Investors, LLC, as well as the Funds.
Our Commitment to You
Guggenheim Investments considers your privacy our utmost concern. When you become our client or investor, you entrust us with not only your hard-earned money but also with your personal and financial information. Because we have access to your private information, we hold ourselves to the highest standards in its safekeeping and use. We strictly limit how we share your information with others, whether you are a current or former Guggenheim Investments client or investor.
The Information We Collect About You
We collect certain nonpublic personal information about you from information you provide on applications, other forms, our website, and/or from third parties including investment advisors. This information includes Social Security or other tax identification number, assets, income, tax information, retirement and estate plan information, transaction history, account balance, payment history, bank account information, marital status, family relationships, information that we collect on our website through the use of “cookies,” and other personal information that you or others provide to us. We may also collect such information through your inquiries by mail, e-mail or telephone. We may also collect customer due diligence information, as required by applicable law and regulation, through third party service providers.
How We Handle Your Personal Information
The legal basis for using your information as set out in this Privacy Notice is as follows: (a) use of your personal data is necessary to perform our obligations under any contract with you (such as a contract for us to provide financial services to you); or (b) where use of your personal data is not necessary for performance of a contract, use of your personal data is necessary for our
62 | THE GUGGENHEIM FUNDS ANNUAL REPORT | |
GUGGENHEIM INVESTMENTS PRIVACY NOTICE (Unaudited)(continued) |
legitimate interests or the legitimate interests of others (for example, to enforce the legal terms governing our services, operate and market our website and other services we offer, ensure safe environments for our personnel and others, make and receive payments, prevent fraud and to know the customer to whom we are providing the services). Some processing is done to comply with applicable law.
In addition to the specific uses described above, we also use your information in the following manner:
| | ● | We use your information in connection with servicing your accounts. |
| | ● | We use information to respond to your requests or questions. For example, we might use your information to respond to your customer feedback. |
| | ● | We use information to improve our products and services. We may use your information to make our website and products better. We may use your information to customize your experience with us. |
| | ● | We use information for security purposes. We may use your information to protect our company and our customers. |
| | ● | We use information to communicate with you. For example, we will communicate with you about your account or our relationship. We may contact you about your feedback. We might also contact you about this Privacy Notice. We may also enroll you in our email newsletter. |
| | ● | We use information as otherwise permitted by law, as we may notify you. |
| | ● | Aggregate/Anonymous Data. We may aggregate and/or anonymize any information collected through the website so that such information can no longer be linked to you or your device (“Aggregate/Anonymous Information”). We may use Aggregate/Anonymous Information for any purpose, including without limitation for research and marketing purposes, and may also share such data with any third parties, including advertisers, promotional partners, and sponsors. |
We do not sell information about current or former clients or their accounts to third parties. Nor do we share this information, except when necessary to complete transactions at your request, to make you aware of investment products and services that we or our affiliates offer, or as permitted or required by law.
We provide information about you to companies and individuals not affiliated with Guggenheim Investments to complete certain transactions or account changes, or to perform services for us related to your account. For example, if you ask to transfer assets from another financial institution to Guggenheim Investments, we must provide certain information about you to that company to complete the transaction. We provide the third party with only the information necessary to carry out its responsibilities and only for that purpose. And we require these third
| | THE GUGGENHEIM FUNDS ANNUAL REPORT | 63 |
GUGGENHEIM INVESTMENTS PRIVACY NOTICE (Unaudited)(continued) |
parties to treat your private information with the same high degree of confidentiality that we do. To alert you to other Guggenheim Investments products and services, we share your information within our family of affiliated companies. You may limit our sharing with affiliated companies as set out below. We may also share information with any successor to all or part of our business, or in connection with steps leading up to a merger or acquisition. For example, if part of our business was sold we may give customer information as part of that transaction. We may also share information about you with your consent.
We will release information about you if you direct us to do so, if we are compelled by law to do so, or in other circumstances as permitted by law (for example, to protect your account from fraud).
If you close your account(s) or become an inactive client or investor, we will continue to adhere to the privacy policies and practices described in this notice.
Opt-Out Provisions and Your Data Choices
The law allows you to “opt out” of certain kinds of information sharing with third parties. We do not share personal information about you with any third parties that triggers this opt-out right. This means YOU ARE ALREADY OPTED OUT.
When you are no longer our client or investor, we continue to share your information as described in this notice, and you may contact us at any time to limit our sharing by sending an email to CorporateDataPrivacy@GuggenheimPartners.com.
European Union Data Subjects and certain others: In addition to the choices set forth above, residents of the European Union and certain other jurisdictions have certain rights to (1) request access to or rectification or deletion of information we collect about them, (2) request a restriction on the processing of their information, (3) object to the processing of their information, or (4) request the portability of certain information. To exercise these or other rights, please contact us using the contact information below. We will consider all requests and provide our response within the time period stated by applicable law. Please note, however, that certain information may be exempt from such requests in some circumstances, which may include if we need to keep processing your information for our legitimate interests or to comply with a legal obligation. We may request you provide us with information necessary to confirm your identity before responding to your request.
Residents of France and certain other jurisdictions may also provide us with instructions regarding the manner in which we may continue to store, erase and share your information after your death, and where applicable, the person you have designated to exercise these rights after your death.
How We Protect Privacy Online
We take steps to protect your privacy when you use our web site – www.guggenheiminvestments.com – by using secure forms of online communication, including encryption technology, Secure Socket Layer (SSL) protocol, firewalls and user names and
64 | THE GUGGENHEIM FUNDS ANNUAL REPORT | |
GUGGENHEIM INVESTMENTS PRIVACY NOTICE (Unaudited)(concluded) |
passwords. These safeguards vary based on the sensitivity of the information that we collect and store. However, we cannot and do not guarantee that these measures will prevent every unauthorized attempt to access, use, or disclose your information since despite our efforts, no Internet and/or other electronic transmissions can be completely secure. Our web site uses “http cookies”—tiny pieces of information that we ask your browser to store. We use cookies for session management and security features on the Guggenheim Investments web site. We do not use them to pull data from your hard drive, to learn your e-mail address, or to view data in cookies created by other web sites. We will not share the information in our cookies or give others access to it. See the legal information area on our web site for more details about web site security and privacy features.
How We Safeguard Your Personal Information and Data Retention
We restrict access to nonpublic personal information about you to our employees and in some cases to third parties (for example, the service providers described above) as permitted by law. We maintain strict physical, electronic and procedural safeguards that comply with federal standards to guard your nonpublic personal information.
We keep your information for no longer than necessary for the purposes for which it is processed. The length of time for which we retain information depends on the purposes for which we collected and use it and/or as required to comply with applicable laws. Information may persist in copies made for backup and business continuity purposes for additional time.
International Visitors
If you are not a resident of the United States, please be aware that your information may be transferred to, stored and processed in the United States where our servers are located and our databases are operated. The data protection and other laws of the United States and other countries might not be as comprehensive as those in your country.
In such cases, we ensure that a legal basis for such a transfer exists and that adequate protection is provided as required by applicable law, for example, by using standard contractual clauses or by transferring your data to a jurisdiction that has obtained an adequacy finding. Individuals whose data may be transferred on the basis of standard contractual clauses may contact us as described below.
We’ll Keep You Informed
If you have any questions or concerns about how we treat your personal data, we encourage you to consult with us first. You may also contact the relevant supervisory authority.
We reserve the right to modify this policy at any time and will inform you promptly of material changes. You may access our privacy policy from our web site at www.guggenheiminvestments.com. Should you have any questions regarding our privacy policy, contact us by email at CorporateDataPrivacy@GuggenheimPartners.com.
| | THE GUGGENHEIM FUNDS ANNUAL REPORT | 65 |
LIQUIDITY RISK MANAGEMENT PROGRAM (Unaudited) |
In compliance with SEC Rule 22e-4 under the U.S. Investment Company Act of 1940 (the “Liquidity Rule”), the Guggenheim Funds Trust (the ���Trust”) has adopted and implemented a written liquidity risk management program (the “Program”) for each series of the Trust (each, a “Fund” and, collectively, the “Funds”). The Trust’s Board of Trustees (the “Board”) has also designated a Program administrator (the “Administrator”).
The Liquidity Rule requires that the Program be reasonably designed to assess and manage each Fund’s liquidity risk. A Fund’s “liquidity risk” (as defined in the Liquidity Rule) is the risk that the Fund could not meet requests to redeem shares issued by the Fund without significant dilution of the remaining investors’ interests in the Fund. The Program includes a number of elements that support the assessment, management and periodic review of liquidity risk. In accordance with the Program, each Fund’s liquidity risk is assessed, managed, and periodically reviewed no less frequently than annually taking into consideration a variety of factors, including, as applicable, the Fund’s investment strategy and liquidity of portfolio investments, short-term and long-term cash flow projections, and holdings of cash and cash equivalents, as well as borrowing arrangements and other funding sources. Certain factors are considered under both normal and reasonably foreseeable stressed conditions. There is no guarantee that the Program will achieve its objective under all circumstances.
Under the Program, each Fund portfolio investment is classified into one of four liquidity categories. The classification is based on a determination of the number of days a Fund reasonably expects to take to convert the investment into cash, or sell or dispose of the investment, in current market conditions without significantly changing the investment’s market value. The Program is reasonably designed to meet Liquidity Rule requirements relating to “highly liquid investment minimums” (i.e., the minimum amount of a Fund’s net assets to be invested in highly liquid investments that are assets) and to monitor compliance with the Liquidity Rule’s limitations on a Fund’s investments in “illiquid investments” (as defined in the Liquidity Rule). Under the Liquidity Rule, a Fund is prohibited from acquiring any illiquid investment if, immediately after the acquisition, the Fund would have invested more than 15% of its net assets in illiquid investments that are assets.
During the period covered by this shareholder report, the Board received a written report (the “Report”) prepared by the Administrator addressing the Program’s operation and assessing the adequacy and effectiveness of its implementation for the period from March 31, 2022, to March 31, 2023. The Report summarized the Administrator’s assessment of the Program’s implementation and concluded that the Program operated effectively, the Program had been and continued to be reasonably designed to assess and manage each Fund’s liquidity risk, and the Program has been adequately and effectively implemented to monitor and respond to the Funds’ liquidity developments, as applicable.
Please refer to the Fund’s prospectus for more information regarding the Fund’s exposure to liquidity risk and other risks to which an investment in the Fund may be subject.
66 | THE GUGGENHEIM FUNDS ANNUAL REPORT | |
This page intentionally left blank.
This page intentionally left blank.
This page intentionally left blank.
This page intentionally left blank.
This page intentionally left blank.
This page intentionally left blank.
This page intentionally left blank.
9.30.2023
Guggenheim Funds Annual Report
| |
Guggenheim Capital Stewardship Fund | | |
GuggenheimInvestments.com | CSF-ANN-0923x0924 |

| | |
DEAR SHAREHOLDER | 2 |
ECONOMIC AND MARKET OVERVIEW | 3 |
ABOUT SHAREHOLDERS’ FUND EXPENSES | 4 |
CAPITAL STEWARDSHIP FUND | 6 |
NOTES TO FINANCIAL STATEMENTS | 14 |
REPORT OF INDEPENDENT REGISTERED PUBLIC ACCOUNTING FIRM | 19 |
OTHER INFORMATION | 20 |
INFORMATION ON BOARD OF TRUSTEES AND OFFICERS | 26 |
GUGGENHEIM INVESTMENTS PRIVACY NOTICE | 32 |
LIQUIDITY RISK MANAGEMENT PROGRAM | 35 |
| | THE GUGGENHEIM FUNDS ANNUAL REPORT | 1 |
Dear Shareholder:
Guggenheim Partners Investment Management, LLC (“Investment Adviser”), is pleased to present the shareholder report for Guggenheim Capital Stewardship Fund (“Fund”). The report covers the annual fiscal period ended September 30, 2023 (“Reporting Period”).
Concinnity Advisors, LP, serves as the Fund’s sub-adviser (“Sub-Adviser”).
The Investment Adviser is part of Guggenheim Investments, which represents the investment management businesses of Guggenheim Partners, LLC (“Guggenheim”), a global, diversified financial services firm.
Guggenheim Funds Distributors, LLC is the distributor of the Fund. Guggenheim Funds Distributors, LLC is affiliated with Guggenheim and the Investment Adviser.
We encourage you to read the Economic and Market Overview section of the report, which follows this letter, and then the Managers’ Commentary for the Fund.
We are committed to providing innovative investment solutions and appreciate the trust you place in us.
Sincerely,
Guggenheim Partners Investment Management, LLC
October 31, 2023
Read a prospectus and summary prospectus (if available) carefully before investing. It contains the investment objectives, risks, charges, expenses and other information, which should be considered carefully before investing. Obtain a prospectus and summary prospectus (if available) at guggenheiminvestments.com or call 800.820.0888.
This material is not intended as a recommendation or as investment advice of any kind, including in connection with rollovers, transfers, and distributions. Such material is not provided in a fiduciary capacity, may not be relied upon for or in connection with the making of investment decisions, and does not constitute a solicitation of an offer to buy or sell securities. All content has been provided for informational or educational purposes only and is not intended to be and should not be construed as legal or tax advice and/or a legal opinion. Always consult a financial, tax and/or legal professional regarding your specific situation.
Capital Stewardship Fund may not be suitable for all investors. ●An investment in the Fund will fluctuate and is subject to investment risks, which means an investor could lose money ● The intrinsic value of the underlying stocks may never be realized, or the stock may decline in value ● The Fund is subject to risk that stocks in which the Fund invests may underperform the equity markets as a whole ● Please read the prospectus for more detailed information regarding these and other risks.
2 | THE GUGGENHEIM FUNDS ANNUAL REPORT | |
ECONOMIC AND MARKET OVERVIEW (Unaudited) | September 30, 2023 |
Faced with a series of strong economic data releases, the market increasingly appears to be coming to the conclusion that the economy is structurally better able to withstand higher interest rates than it really is. This dynamic can be seen by examining the move in Treasury yields, with the selloff almost entirely being due to real yields rather than inflation expectations, and with the move most pronounced at the long end of the yield curve. Digging further, however, a large portion of this shift is due to a rising term premium (the premium for unknown and unquantified risks in the future, beyond current assumptions on the path of inflation or policy rates), which is indicating greater uncertainty about the outlook.
Many forecasters are extrapolating the current year’s economic strength without recognizing the fact that growth has benefited from a number of factors this year that are unlikely to be repeated, namely an expansion of the fiscal deficit, a slowdown in inflation, and a rebound in labor supply. As these factors fade, the headwinds from tight monetary policy may be more apparent and pronounced. And the longer monetary conditions stay tight, the greater the risk of something breaking (banks and commercial real estate remain key risks). All of this suggests that the recent economic trajectory cannot be assumed to continue, especially given the substantial restraint that could be imposed by the recent rise in long-term borrowing costs.
Uncertainty is elevated given the diverging signals in the data and the fact that many traditional economic models are not “working” as they traditionally would. This uncertainty extends to the U.S. Federal Reserve, which looks set to hold off on further rate hikes while it waits to see if the data start to align with the softening conditions policymakers say they are hearing on the ground. We continue to think the gravitational pull of tight money and credit conditions could result in a slowing economy and cooler inflation over the next year, paving the way for more rate cuts than the market presently expects.
For the Reporting Period, the S&P 500® Index* returned 21.62%. The MSCI Europe-Australasia-Far East (“EAFE”) Index* returned 25.65%. The return of the MSCI Emerging Markets Index* was 11.70%.
In the bond market, the Bloomberg U.S. Aggregate Bond Index* posted a 0.64% return for the Reporting Period, while the Bloomberg U.S. Corporate High Yield Index* returned 10.28%. The return of the ICE Bank of America (“BofA”) 3-Month U.S. Treasury Bill Index* was 4.50% for the Reporting Period.
The opinions and forecasts expressed may not actually come to pass. This information is subject to change at any time, based on market and other conditions, and should not be construed as a recommendation of any specific security or strategy.
*Index Definitions:
The following indices are referenced throughout this report. Indices are unmanaged and not available for direct investment. Index performance does not reflect transaction costs, fees, or expenses.
Bloomberg U.S. Aggregate Bond Index is a broad-based flagship benchmark that measures the investment grade, U.S. dollar-denominated, fixed-rate taxable bond market, including U.S. Treasuries, government-related and corporate securities, mortgage-backed securities or “MBS” (agency fixed-rate and hybrid adjustable-rate mortgage, or “ARM”, pass-throughs), asset-backed securities (“ABS”), and commercial mortgage-backed securities (“CMBS”) (agency and non-agency).
Bloomberg U.S. Corporate High Yield Index measures the U.S. dollar-denominated, high yield, fixed-rate corporate bond market. Securities are classified as high yield if the middle rating of Moody’s, Fitch, and S&P is Ba1/BB +/BB + or below.
ICE BofA 3-Month U.S. Treasury Bill Index is an unmanaged market Index of U.S. Treasury securities maturing in 90 days that assumes reinvestment of all income.
MSCI EAFE Index is a free float-adjusted market capitalization index that is designed to measure the equity market performance of developed markets, excluding the U.S. & Canada.
MSCI Emerging Markets Index is a free float-adjusted market capitalization weighted index that is designed to measure equity market performance in the global emerging markets.
S&P 500® Index is a broad-based index, the performance of which is based on the performance of 500 widely held common stocks chosen for market size, liquidity, and industry group representation.
| | THE GUGGENHEIM FUNDS ANNUAL REPORT | 3 |
ABOUT SHAREHOLDERS’ FUND EXPENSES (Unaudited) | |
All mutual funds have operating expenses, and it is important for our shareholders to understand the impact of costs on their investments. Shareholders of a fund incur two types of costs: (i) transaction costs, including sales charges (loads) on purchase payments, reinvested dividends, other distributions, and exchange fees, and (ii) ongoing costs, including management fees, administrative services, and shareholder reports, among others. These ongoing costs, or operating expenses, are deducted from a fund’s gross income and reduce the investment return of the fund.
A fund’s expenses are expressed as a percentage of its average net assets, which is known as the expense ratio. The following examples are intended to help investors understand the ongoing costs (in dollars) of investing in a fund and to compare these costs with the ongoing costs of investing in other mutual funds.
The examples are based on an investment of $1,000 made at the beginning of the period and held for the entire six-month period beginning March 31, 2023 and ending September 30, 2023.
The following tables illustrate the Fund’s costs in two ways:
Table 1. Based on actual Fund return: This section helps investors estimate the actual expenses paid over the period. The “Ending Account Value” shown is derived from the Fund’s actual return, and the fifth column shows the dollar amount that would have been paid by an investor who started with $1,000 in the Fund. Investors may use the information here, together with the amount invested, to estimate the expenses paid over the period. Simply divide the Fund’s account value by $1,000 (for example, an $8,600 account value divided by $1,000 = 8.6), then multiply the result by the number provided under the heading “Expenses Paid During Period.”
Table 2. Based on hypothetical 5% return: This section is intended to help investors compare a fund’s cost with those of other mutual funds. The table provides information about hypothetical account values and hypothetical expenses based on the Fund’s actual expense ratio and an assumed rate of return of 5% per year before expenses, which is not the Fund’s actual return. The hypothetical account values and expenses may not be used to estimate the actual ending account balance or expenses paid during the period. The example is useful in making comparisons because the U.S. Securities and Exchange Commission (the “SEC”) requires all mutual funds to calculate expenses based on the 5% return. Investors can assess a Fund’s costs by comparing this hypothetical example with the hypothetical examples that appear in shareholder reports of other funds.
The calculations illustrated above assume no shares were bought or sold during the period. Actual costs may have been higher or lower, depending on the amount of investment and the timing of any purchases or redemptions.
Please note that the expenses shown in the table are meant to highlight your ongoing costs only and do not reflect any transactional costs, such as sales charges (loads) on purchase payments, and contingent deferred sales charges (“CDSC”) on redemptions, if any. Therefore, the second table is useful in comparing ongoing costs only, and will not help you determine the relative total costs of owning different funds. In addition, if these transactional costs were included, your costs would have been higher.
More information about the Fund’s expenses, including annual expense ratios for periods up to five years (subject to the Fund’s inception date), can be found in the Financial Highlights section of this report. For additional information on operating expenses and other shareholder costs, please refer to the Fund’s prospectus.
4 | THE GUGGENHEIM FUNDS ANNUAL REPORT | |
ABOUT SHAREHOLDERS’ FUND EXPENSES (Unaudited)(concluded) | |
| | Expense
Ratio1 | | | Fund
Return | | | Beginning
Account Value
March 31, 2023 | | | Ending
Account Value
September 30, 2023 | | | Expenses
Paid During
Period2 | |
Table 1. Based on actual Fund return3 | | | | | | | | | | | | | | | | |
| | | | 1.00 | % | | | 1.64 | % | | $ | 1,000.00 | | | $ | 1,016.40 | | | $ | 5.05 | |
|
Table 2. Based on hypothetical 5% return (before expenses) | | | | | | | | | | | | | | | | |
| | | | 1.00 | % | | | 5.00 | % | | $ | 1,000.00 | | | $ | 1,020.05 | | | $ | 5.06 | |
1 | Annualized and excludes expenses of the underlying funds in which the Fund invest. |
2 | Expenses are equal to the Fund’s annualized expense ratio, net of any applicable fee waivers, multiplied by the average account value over the period, multiplied by 183/365 (to reflect the one-half year period). |
3 | Actual cumulative return at net asset value for the period March 31, 2023 to September 30, 2023. |
| | THE GUGGENHEIM FUNDS ANNUAL REPORT | 5 |
MANAGERS’ COMMENTARY (Unaudited) | September 30, 2022 |
To Our Shareholders
Guggenheim Partners Investment Management, LLC (“GPIM”) serves as the investment adviser to Guggenheim Capital Stewardship Fund (“Fund”). Concinnity Advisors, LP serves as the Fund’s unaffiliated sub-adviser. The Fund is managed by a team of seasoned professionals led by Farhan Sharaff, Senior Managing Director and Assistant Chief Investment Officer, Equities, and Portfolio Manager; Qi Yan, Managing Director and Portfolio Manager; and Peter Derby, Portfolio Manager at Concinnity. In the subsequent paragraphs, the investment team discusses the Fund’s performance and the market environment for the 12-month period ended September 30, 2023 (“Reporting Period”).
For the Reporting Period, the Guggenheim Capital Stewardship Fund Institutional Class returned 14.62%, underperforming the S&P 500 Index, the Fund’s benchmark (“Benchmark”), which returned 21.62% for the same period.
What factors contributed or detracted from the Fund’s performance during the Reporting Period?
During the Reporting Period, the Fund underperformed its Benchmark by 7 percentage points. The contribution from sector allocation effect and security selection effect were 0.06% and -5.92%, respectively.
Across the 11 S&P sectors, relatively speaking, the Industrials sector detracted 2.09%. The Real Estate sector contributed 0.65%.
The top individual contributors to return were Microsoft Corp., Apple, Inc., and Alphabet, Inc. - Class A. The top individual detractors were Dollar General Corp., Lockheed Martin Corp., and Pfizer, Inc.
How was the Fund positioned at the end of the Reporting Period?
As of end of the Reporting Period, the Fund was fully invested, with less than 1% in cash or cash equivalents. Relative to its Benchmark, the Fund was overweight in the Information Technology sector and Industrials sector by 7.0% and 4.4%, respectively. The Fund was underweight in the Consumer Staples and the Communication Services sectors by 4.6% and 4.4%, respectively.
Performance displayed represents past performance which is no guarantee of future results.
The opinions and forecast expressed may not actually come to pass. This information is subject to change at any time, based on market and other conditions, and should not be construed as a recommendation of any specific security or strategy.
6 | THE GUGGENHEIM FUNDS ANNUAL REPORT | |
PERFORMANCE REPORT AND FUND PROFILE (Unaudited) | September 30, 2023 |
CAPITAL STEWARDSHIP FUND
OBJECTIVE: Seeks long-term capital appreciation.
Holdings Diversification (Market Exposure as % of Net Assets)
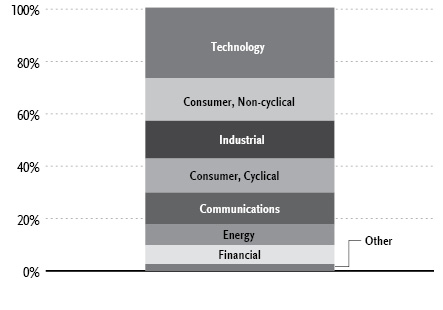
“Holdings Diversification (Market Exposure as % of Net Assets)” excludes any temporary cash investments.
Cumulative Fund Performance*
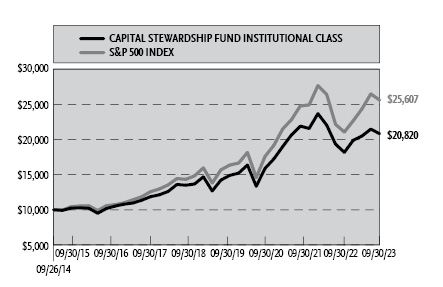
Inception Date: September 26, 2014 |
Ten Largest Holdings | % of Total Net Assets |
Apple, Inc. | 5.8% |
Microsoft Corp. | 5.6% |
Amazon.com, Inc. | 2.8% |
Alphabet, Inc. — Class A | 2.8% |
Home Depot, Inc. | 2.6% |
UnitedHealth Group, Inc. | 2.1% |
Valero Energy Corp. | 2.0% |
Illinois Tool Works, Inc. | 1.9% |
Lockheed Martin Corp. | 1.9% |
Texas Instruments, Inc. | 1.8% |
Top Ten Total | 29.3% |
| | |
“Ten Largest Holdings” excludes any temporary cash investments. |
Average Annual Returns*
Periods Ended September 30, 2023
| 1 Year | 5 Year | Since
Inception
(09/26/14) |
Capital Stewardship Fund | 14.62% | 7.23% | 8.48% |
S&P 500 Index | 21.62% | 9.92% | 11.00% |
* | The performance data above represents past performance that is not predictive of future results. The investment return and principal value of an investment in the Fund will fluctuate so that an investor’s shares, when redeemed, may be worth more or less than their original cost. Returns are historical and include changes in principal and reinvested dividends and capital gains and do not reflect the effect of taxes. The S&P 500 Index is an unmanaged index and, unlike the Fund, has no management fees or operating expenses to reduce its reported return. |
| | THE GUGGENHEIM FUNDS ANNUAL REPORT | 7 |
SCHEDULE OF INVESTMENTS | September 30, 2023 |
CAPITAL STEWARDSHIP FUND | |
| | Shares | | | Value | |
COMMON STOCKS† - 99.6% |
| | | | | | | | | |
Technology - 26.9% |
Apple, Inc. | | | 62,141 | | | $ | 10,639,161 | |
Microsoft Corp. | | | 32,170 | | | | 10,157,678 | |
Texas Instruments, Inc. | | | 21,182 | | | | 3,368,150 | |
NVIDIA Corp. | | | 7,462 | | | | 3,245,895 | |
QUALCOMM, Inc. | | | 20,803 | | | | 2,310,381 | |
Applied Materials, Inc. | | | 11,356 | | | | 1,572,238 | |
KLA Corp. | | | 3,098 | | | | 1,420,929 | |
Dropbox, Inc. — Class A* | | | 51,152 | | | | 1,392,869 | |
NetApp, Inc. | | | 18,290 | | | | 1,387,845 | |
Micron Technology, Inc. | | | 17,194 | | | | 1,169,708 | |
Cadence Design Systems, Inc.* | | | 4,888 | | | | 1,145,258 | |
Cognizant Technology Solutions Corp. — Class A | | | 16,855 | | | | 1,141,758 | |
ServiceNow, Inc.* | | | 1,945 | | | | 1,087,177 | |
Dell Technologies, Inc. — Class C | | | 14,677 | | | | 1,011,245 | |
Workday, Inc. — Class A* | | | 4,404 | | | | 946,199 | |
Lam Research Corp. | | | 1,488 | | | | 932,634 | |
VMware, Inc. — Class A* | | | 5,596 | | | | 931,622 | |
Broadcom, Inc. | | | 1,103 | | | | 916,130 | |
HubSpot, Inc.* | | | 1,769 | | | | 871,233 | |
Snowflake, Inc. — Class A* | | | 5,508 | | | | 841,457 | |
Intuit, Inc. | | | 977 | | | | 499,188 | |
Zoom Video Communications, Inc. — Class A* | | | 6,427 | | | | 449,504 | |
Akamai Technologies, Inc.* | | | 2,703 | | | | 287,978 | |
HP, Inc. | | | 10,813 | | | | 277,894 | |
Autodesk, Inc.* | | | 1,288 | | | | 266,500 | |
Salesforce, Inc.* | | | 1,292 | | | | 261,992 | |
Adobe, Inc.* | | | 500 | | | | 254,950 | |
Playtika Holding Corp.* | | | 24,998 | | | | 240,731 | |
Total Technology | | | | | | | 49,028,304 | |
| | | | | | | | | |
Consumer, Non-cyclical - 16.4% |
UnitedHealth Group, Inc. | | | 7,742 | | | | 3,903,439 | |
Humana, Inc. | | | 5,040 | | | | 2,452,061 | |
McKesson Corp. | | | 5,385 | | | | 2,341,667 | |
Merck & Company, Inc. | | | 19,574 | | | | 2,015,143 | |
Amgen, Inc. | | | 6,768 | | | | 1,818,968 | |
Pfizer, Inc. | | | 54,049 | | | | 1,792,805 | |
Bristol-Myers Squibb Co. | | | 28,640 | | | | 1,662,266 | |
Gilead Sciences, Inc. | | | 21,971 | | | | 1,646,507 | |
HCA Healthcare, Inc. | | | 6,273 | | | | 1,543,032 | |
United Therapeutics Corp.* | | | 5,772 | | | | 1,303,722 | |
Biogen, Inc.* | | | 5,027 | | | | 1,291,989 | |
Archer-Daniels-Midland Co. | | | 13,197 | | | | 995,318 | |
AbbVie, Inc. | | | 6,257 | | | | 932,669 | |
Vertex Pharmaceuticals, Inc.* | | | 2,390 | | | | 831,098 | |
PayPal Holdings, Inc.* | | | 12,987 | | | | 759,220 | |
Block, Inc. — Class A* | | | 15,644 | | | | 692,403 | |
Procter & Gamble Co. | | | 4,709 | | | | 686,855 | |
Elevance Health, Inc. | | | 1,542 | | | | 671,418 | |
Colgate-Palmolive Co. | | | 9,334 | | | | 663,741 | |
General Mills, Inc. | | | 7,720 | | | | 494,003 | |
Eli Lilly & Co. | | | 832 | | | | 446,892 | |
Thermo Fisher Scientific, Inc. | | | 725 | | | | 366,973 | |
Regeneron Pharmaceuticals, Inc.* | | | 368 | | | | 302,849 | |
Quest Diagnostics, Inc. | | | 2,221 | | | | 270,651 | |
Total Consumer, Non-cyclical | | | | | | | 29,885,689 | |
| | | | | | | | | |
Industrial - 14.4% |
Illinois Tool Works, Inc. | | | 15,344 | | | | 3,533,877 | |
Lockheed Martin Corp. | | | 8,299 | | | | 3,393,959 | |
Expeditors International of Washington, Inc. | | | 24,087 | | | | 2,761,093 | |
United Parcel Service, Inc. — Class B | | | 12,534 | | | | 1,953,675 | |
Deere & Co. | | | 5,176 | | | | 1,953,319 | |
Amphenol Corp. — Class A | | | 22,910 | | | | 1,924,211 | |
Keysight Technologies, Inc.* | | | 13,805 | | | | 1,826,540 | |
Caterpillar, Inc. | | | 6,303 | | | | 1,720,719 | |
Jabil, Inc. | | | 11,835 | | | | 1,501,743 | |
Avnet, Inc. | | | 20,191 | | | | 973,004 | |
TD SYNNEX Corp. | | | 8,814 | | | | 880,166 | |
CH Robinson Worldwide, Inc. | | | 10,046 | | | | 865,262 | |
Waste Management, Inc. | | | 5,627 | | | | 857,780 | |
Honeywell International, Inc. | | | 4,541 | | | | 838,904 | |
General Dynamics Corp. | | | 2,497 | | | | 551,762 | |
Mettler-Toledo International, Inc.* | | | 403 | | | | 446,552 | |
Union Pacific Corp. | | | 1,364 | | | | 277,751 | |
Total Industrial | | | | | | | 26,260,317 | |
| | | | | | | | | |
Consumer, Cyclical - 13.0% |
Home Depot, Inc. | | | 15,748 | | | | 4,758,416 | |
PulteGroup, Inc. | | | 35,520 | | | | 2,630,256 | |
WW Grainger, Inc. | | | 3,527 | | | | 2,440,120 | |
Lowe’s Companies, Inc. | | | 10,464 | | | | 2,174,838 | |
Cummins, Inc. | | | 8,873 | | | | 2,027,125 | |
Ulta Beauty, Inc.* | | | 4,854 | | | | 1,938,930 | |
BorgWarner, Inc. | | | 42,171 | | | | 1,702,443 | |
Yum! Brands, Inc. | | | 11,195 | | | | 1,398,703 | |
Lear Corp. | | | 6,025 | | | | 808,555 | |
Walmart, Inc. | | | 4,960 | | | | 793,253 | |
Tesla, Inc.* | | | 3,145 | | | | 786,942 | |
AutoNation, Inc.* | | | 5,186 | | | | 785,160 | |
Williams-Sonoma, Inc. | | | 4,609 | | | | 716,238 | |
Gentex Corp. | | | 17,703 | | | | 576,056 | |
Lithia Motors, Inc. — Class A | | | 599 | | | | 176,903 | |
Total Consumer, Cyclical | | | | | | | 23,713,938 | |
| | | | | | | | | |
Communications - 12.2% |
Amazon.com, Inc.* | | | 40,703 | | | | 5,174,165 | |
Alphabet, Inc. — Class A* | | | 38,811 | | | | 5,078,808 | |
Cisco Systems, Inc. | | | 34,933 | | | | 1,877,998 | |
VeriSign, Inc.* | | | 7,078 | | | | 1,433,507 | |
F5, Inc.* | | | 8,734 | | | | 1,407,397 | |
Motorola Solutions, Inc. | | | 5,147 | | | | 1,401,219 | |
Meta Platforms, Inc. — Class A* | | | 4,368 | | | | 1,311,317 | |
eBay, Inc. | | | 25,487 | | | | 1,123,722 | |
FactSet Research Systems, Inc. | | | 2,539 | | | | 1,110,203 | |
Pinterest, Inc. — Class A* | | | 33,027 | | | | 892,720 | |
8 | THE GUGGENHEIM FUNDS ANNUAL REPORT | SEE NOTES TO FINANCIAL STATEMENTS. |
SCHEDULE OF INVESTMENTS (continued) | September 30, 2023 |
CAPITAL STEWARDSHIP FUND | |
| | Shares | | | Value | |
GoDaddy, Inc. — Class A* | | | 11,398 | | | $ | 848,923 | |
TELUS Corp. | | | 42,095 | | | | 687,833 | |
Total Communications | | | | | | | 22,347,812 | |
| | | | | | | | | |
Energy - 7.9% |
Valero Energy Corp. | | | 25,133 | | | | 3,561,598 | |
Exxon Mobil Corp. | | | 24,776 | | | | 2,913,162 | |
Phillips 66 | | | 20,908 | | | | 2,512,096 | |
Cheniere Energy, Inc. | | | 11,555 | | | | 1,917,668 | |
EOG Resources, Inc. | | | 14,104 | | | | 1,787,823 | |
Chevron Corp. | | | 9,913 | | | | 1,671,530 | |
Total Energy | | | | | | | 14,363,877 | |
| | | | | | | | | |
Financial - 7.2% |
Capital One Financial Corp. | | | 22,289 | | | | 2,163,148 | |
Citigroup, Inc. | | | 37,970 | | | | 1,561,706 | |
Hartford Financial Services Group, Inc. | | | 20,446 | | | | 1,449,826 | |
Travelers Companies, Inc. | | | 7,216 | | | | 1,178,445 | |
Discover Financial Services | | | 13,030 | | | | 1,128,789 | |
Progressive Corp. | | | 6,819 | | | | 949,887 | |
Toronto-Dominion Bank | | | 14,731 | | | | 887,690 | |
Bank of Montreal | | | 9,826 | | | | 829,019 | |
Synchrony Financial | | | 24,272 | | | | 741,995 | |
Mastercard, Inc. — Class A | | | 1,830 | | | | 724,515 | |
Visa, Inc. — Class A | | | 2,458 | | | | 565,365 | |
JPMorgan Chase & Co. | | | 2,595 | | | | 376,327 | |
Marsh & McLennan Companies, Inc. | | | 998 | | | | 189,919 | |
T. Rowe Price Group, Inc. | | | 1,605 | | | | 168,316 | |
American Express Co. | | | 1,090 | | | | 162,617 | |
Total Financial | | | | | | | 13,077,564 | |
| | | | | | | | | |
Basic Materials - 1.6% |
Steel Dynamics, Inc. | | | 7,265 | | | | 778,953 | |
Ecolab, Inc. | | | 4,563 | | | | 772,972 | |
Reliance Steel & Aluminum Co. | | | 2,632 | | | | 690,189 | |
Nucor Corp. | | | 4,044 | | | | 632,280 | |
Total Basic Materials | | | | | | | 2,874,394 | |
| | | | | | | | | |
Total Common Stocks | | | | |
(Cost $173,142,647) | | | | | | | 181,551,895 | |
| | | | | | | | | |
EXCHANGE-TRADED FUNDS† - 0.8% |
SPDR S&P 500 ETF Trust | | | 3,375 | | | | 1,442,745 | |
Total Exchange-Traded Funds | | | | |
(Cost $1,462,073) | | | | | | | 1,442,745 | |
| | | | | | | | | |
MONEY MARKET FUND† - 0.2% |
Dreyfus Treasury Securities Cash Management Fund — Institutional Shares, 5.24%1 | | | 317,001 | | | | 317,001 | |
Total Money Market Fund | | | | |
(Cost $317,001) | | | | | | | 317,001 | |
| | | | | | | | | |
Total Investments - 100.6% | | | | |
(Cost $174,921,721) | | $ | 183,311,641 | |
Other Assets & Liabilities, net - (0.6)% | | | (1,013,091 | ) |
Total Net Assets - 100.0% | | $ | 182,298,550 | |
* | Non-income producing security. |
† | Value determined based on Level 1 inputs — See Note 4. |
1 | Rate indicated is the 7-day yield as of September 30, 2023. |
| | |
| | See Sector Classification in Other Information section. |
SEE NOTES TO FINANCIAL STATEMENTS. | THE GUGGENHEIM FUNDS ANNUAL REPORT | 9 |
SCHEDULE OF INVESTMENTS (concluded) | September 30, 2023 |
CAPITAL STEWARDSHIP FUND | |
The following table summarizes the inputs used to value the Fund’s investments at September 30, 2023 (See Note 4 in the Notes to Financial Statements):
Investments in Securities (Assets) | | Level 1
Quoted
Prices | | | Level 2
Significant
Observable
Inputs | | | Level 3
Significant
Unobservable
Inputs | | | Total | |
Common Stocks | | $ | 181,551,895 | | | $ | — | | | $ | — | | | $ | 181,551,895 | |
Exchange-Traded Funds | | | 1,442,745 | | | | — | | | | — | | | | 1,442,745 | |
Money Market Fund | | | 317,001 | | | | — | | | | — | | | | 317,001 | |
Total Assets | | $ | 183,311,641 | | | $ | — | | | $ | — | | | $ | 183,311,641 | |
10 | THE GUGGENHEIM FUNDS ANNUAL REPORT | SEE NOTES TO FINANCIAL STATEMENTS. |
STATEMENT OF ASSETS AND LIABILITIES |
September 30, 2023 |
Assets: |
Investments, at value (cost $174,921,721) | | $ | 183,311,641 | |
Prepaid expenses | | | 9,877 | |
Receivables: |
Dividends | | | 102,326 | |
Foreign tax reclaims | | | 22,165 | |
Interest | | | 1,668 | |
Total assets | | | 183,447,677 | |
| | | | | |
Liabilities: |
Overdraft due to custodian bank | | | 8,456 | |
Payable for: |
Fund shares redeemed | | | 960,364 | |
Management fees | | | 138,677 | |
Fund accounting and administration fees | | | 10,503 | |
Transfer agent fees/maintenance fees | | | 2,067 | |
Trustees’ fees* | | | 582 | |
Miscellaneous | | | 28,478 | |
Total liabilities | | | 1,149,127 | |
Net assets | | $ | 182,298,550 | |
| | | | | |
Net assets consist of: |
Paid in capital | | $ | 174,592,849 | |
Total distributable earnings (loss) | | | 7,705,701 | |
Net assets | | $ | 182,298,550 | |
| | | | | |
Institutional Class: |
Net assets | | $ | 182,298,550 | |
Capital shares outstanding | | | 6,666,529 | |
Net asset value per share | | $ | 27.35 | |
STATEMENT OF OPERATIONS |
Year Ended September 30, 2023 |
Investment Income: |
Dividends (net of foreign withholding tax of $29,015) | | $ | 3,256,087 | |
Interest | | | 21,490 | |
Total investment income | | | 3,277,577 | |
| | | | | |
Expenses: |
Management fees | | | 1,653,704 | |
Transfer agent/maintenance fees | | | 25,004 | |
Fund accounting and administration fees | | | 84,121 | |
Professional fees | | | 45,102 | |
Trustees’ fees* | | | 13,538 | |
Custodian fees | | | 12,501 | |
Miscellaneous | | | 14,631 | |
Total expenses | | | 1,848,601 | |
Less: | | | | |
Earnings credits applied | | | (3,111 | ) |
Net expenses | | | 1,845,490 | |
Net investment income | | | 1,432,087 | |
| | | | | |
Net Realized and Unrealized Gain (Loss): |
Net realized gain (loss) on: |
Investments | | | 512,684 | |
Net realized gain | | | 512,684 | |
Net change in unrealized appreciation (depreciation) on: |
Investments | | | 22,342,898 | |
Net change in unrealized appreciation (depreciation) | | | 22,342,898 | |
Net realized and unrealized gain | | | 22,855,582 | |
Net increase in net assets resulting from operations | | $ | 24,287,669 | |
* | Relates to Trustees not deemed “interested persons” within the meaning of Section 2(a)(19) of the 1940 Act. |
SEE NOTES TO FINANCIAL STATEMENTS. | THE GUGGENHEIM FUNDS ANNUAL REPORT | 11 |
STATEMENTS OF CHANGES IN NET ASSETS |
| | Year Ended
September 30,
2023 | | | Year Ended
September 30,
2022 | |
Increase (Decrease) in Net Assets from Operations: | | | | | | | | |
Net investment income | | $ | 1,432,087 | | | $ | 1,870,301 | |
Net realized gain on investments | | | 512,684 | | | | 3,056,329 | |
Net change in unrealized appreciation (depreciation) on investments | | | 22,342,898 | | | | (35,592,196 | ) |
Net increase (decrease) in net assets resulting from operations | | | 24,287,669 | | | | (30,665,566 | ) |
| | | | | | | | | |
Distributions to shareholders | | | (291,687 | ) | | | (54,426,863 | ) |
| | | | | | | | | |
Capital share transactions: | | | | | | | | |
Proceeds from sale of shares | | | — | | | | 106,639,651 | |
Distributions reinvested | | | 289,248 | | | | 54,379,479 | |
Cost of shares redeemed | | | (8,455,439 | ) | | | (135,570,764 | ) |
Net increase (decrease) from capital share transactions | | | (8,166,191 | ) | | | 25,448,366 | |
Net increase (decrease) in net assets | | | 15,829,791 | | | | (59,644,063 | ) |
| | | | | | | | | |
Net assets: | | | | | | | | |
Beginning of year | | | 166,468,759 | | | | 226,112,822 | |
End of year | | $ | 182,298,550 | | | $ | 166,468,759 | |
| | | | | | | | | |
Capital share activity: | | | | | | | | |
Shares sold | | | — | | | | 3,780,096 | |
Shares issued from reinvestment of distributions | | | 10,990 | | | | 1,772,473 | |
Shares redeemed | | | (311,973 | ) | | | (4,747,908 | ) |
Net increase (decrease) in shares | | | (300,983 | ) | | | 804,661 | |
12 | THE GUGGENHEIM FUNDS ANNUAL REPORT | SEE NOTES TO FINANCIAL STATEMENTS. |
This table is presented to show selected data for a share outstanding throughout each period and to assist shareholders in evaluating a Fund’s performance for the periods presented.
Institutional Class | | Year Ended
September 30,
2023 | | | Year Ended
September 30,
2022 | | | Year Ended
September 30,
2021 | | | Year Ended
September 30,
2020 | | | Year Ended
September 30,
2019 | |
Per Share Data |
Net asset value, beginning of period | | $ | 23.89 | | | $ | 36.69 | | | $ | 31.08 | | | $ | 28.23 | | | $ | 31.23 | |
Income (loss) from investment operations: |
Net investment income (loss)a | | | .21 | | | | .27 | | | | .25 | | | | .28 | | | | .33 | |
Net gain (loss) on investments (realized and unrealized) | | | 3.29 | | | | (4.05 | ) | | | 7.28 | | | | 3.43 | | | | .05 | |
Total from investment operations | | | 3.50 | | | | (3.78 | ) | | | 7.53 | | | | 3.71 | | | | .38 | |
Less distributions from: |
Net investment income | | | (.04 | ) | | | (.18 | ) | | | (.28 | ) | | | (.39 | ) | | | (.32 | ) |
Net realized gains | | | — | | | | (8.84 | ) | | | (1.64 | ) | | | (.47 | ) | | | (3.06 | ) |
Total distributions | | | (.04 | ) | | | (9.02 | ) | | | (1.92 | ) | | | (.86 | ) | | | (3.38 | ) |
Net asset value, end of period | | $ | 27.35 | | | $ | 23.89 | | | $ | 36.69 | | | $ | 31.08 | | | $ | 28.23 | |
|
Total Return | | | 14.62 | % | | | (15.74 | %) | | | 25.11 | % | | | 13.31 | % | | | 3.56 | % |
Ratios/Supplemental Data |
Net assets, end of period (in thousands) | | $ | 182,299 | | | $ | 166,469 | | | $ | 226,113 | | | $ | 206,751 | | | $ | 210,053 | |
Ratios to average net assets: |
Net investment income (loss) | | | 0.78 | % | | | 0.90 | % | | | 0.70 | % | | | 0.96 | % | | | 1.23 | % |
Total expensesb | | | 1.01 | % | | | 1.02 | % | | | 1.02 | % | | | 1.04 | % | | | 1.05 | % |
Portfolio turnover rate | | | 164 | % | | | 162 | % | | | 154 | % | | | 147 | % | | | 131 | % |
a | Net investment income (loss) per share was computed using average shares outstanding throughout the period. |
b | Does not include expenses of the underlying funds in which the Fund invests. |
SEE NOTES TO FINANCIAL STATEMENTS. | THE GUGGENHEIM FUNDS-ANNUAL REPORT | 13 |
NOTES TO FINANCIAL STATEMENTS |
Note 1 – Organization, and Significant Accounting Policies
Organization
Guggenheim Funds Trust (the “Trust”), a Delaware statutory trust, is registered with the U.S. Securities and Exchange Commission (the “SEC”) under the Investment Company Act of 1940 (the “1940 Act”), as an open-ended investment company of the series type. Each series, in effect, is representing a separate fund. The Trust may issue an unlimited number of authorized shares. The Trust accounts for the assets of each fund separately.
The Trust offers a combination of five separate classes of shares: A-Class shares, C-Class shares, P-Class shares, R6-Class shares and Institutional Class shares. Sales of shares of each Class are made without a front-end sales charge at the net asset value per share (“NAV”), with the exception of A-Class shares. A-Class shares are sold at the NAV, plus the applicable front-end sales charge. The sales charge varies depending on the amount purchased. A-Class share purchases of $1 million or more are exempt from the front-end sales charge but have a 1% contingent deferred sales charge (“CDSC”), if shares are redeemed within 12 months of purchase. C-Class shares have a 1% CDSC if shares are redeemed within 12 months of purchase. C-Class shares automatically convert to A-Class shares on or about the 10th day of the month following the 8-year anniversary of the purchase of the C-Class shares. This conversion will be executed without any sales charge, fee or other charge. After the conversion is completed, the shares will be subject to all features and expenses of A-Class shares. Institutional Class shares are offered primarily for direct investment by institutions such as pension and profit sharing plans, endowments, foundations and corporations. Institutional Class shares require a minimum initial investment of $2 million and a minimum account balance of $1 million. R6-Class shares are offered primarily through qualified retirement and benefit plans. R6-Class shares are also offered through certain other plans and platforms sponsored by financial intermediaries. Certain institutional investors and others deemed appropriate by Guggenheim Investments (“GI”) may also be eligible to purchase R6-Class shares subject to a $2 million minimum initial investment. At September 30, 2023, the Trust consisted of nineteen funds (the “Funds”).
This report covers the Capital Stewardship Fund (the “Fund”), a diversified investment company. At September 30, 2023, Institutional Class shares have been issued by the Fund.
Guggenheim Partners Investment Management, LLC (“GPIM” or “the Adviser”), which operates under the name Guggenheim Investments, provides advisory services. Guggenheim Funds Distributors, LLC (“GFD”) acts as principal underwriter for the Trust. GI and GFD are affiliated entities.
Concinnity Advisors, LP (the “Sub-Adviser”) serves as the subadviser to the Fund.
Significant Accounting Policies
The Fund operates as an investment company and, accordingly, follows the investment company accounting and reporting guidance of the Financial Accounting Standards Board (“FASB”) Accounting Standards Codification Topic 946 Financial Services – Investment Companies.
The following significant accounting policies are in conformity with U.S. generally accepted accounting principles (“U.S. GAAP”) and are consistently followed by the Trust. This requires management to make estimates and assumptions that affect the reported amount of assets and liabilities, contingent assets and liabilities at the date of the financial statements, and the reported amounts of revenues and expenses during the reporting period. Actual results could differ from these estimates. All time references are based on Eastern Time.
The NAV of the Fund is calculated by dividing the market value of the Fund’s securities and other assets, less all liabilities, by the number of outstanding shares of the Fund.
(a) Valuation of Investments
The Board of Trustees of the Fund (the “Board”) adopted policies and procedures for the valuation of the Fund’s investments (the “Fund Valuation Procedures”). The SEC adopted Rule 2a-5 under the 1940 Act (“Rule 2a-5”) which establishes requirements for determining fair value in good faith. Rule 2a-5 also defines “readily available market quotations” for purposes of the 1940 Act and establishes requirements for determining whether a fund must fair value a security in good faith.
Pursuant to Rule 2a-5, the Board has designated the Adviser as the valuation designee to perform fair valuation determinations for the Fund with respect to all Fund investments and other assets. As the Fund’s valuation designee pursuant to Rule 2a-5, the Adviser has adopted separate procedures (the “Valuation Designee Procedures” and collectively with the Fund Valuation Procedures, the “Valuation Procedures”) reasonably designed to prevent violations of the requirements of Rule 2a-5 and Rule 31a-4. The Adviser, in its role as valuation designee, utilizes the assistance of a valuation committee, consisting of representatives from Guggenheim’s investment management, fund administration, legal and compliance departments (the “Valuation Committee”), in determining the fair value of the Fund’s securities and other assets.
Valuations of the Fund’s securities and other assets are supplied primarily by pricing service providers appointed pursuant to the processes set forth in the Valuation Procedures. The Adviser, with the assistance of the Valuation Committee, convenes monthly, or
14 | THE GUGGENHEIM FUNDS ANNUAL REPORT | |
NOTES TO FINANCIAL STATEMENTS (continued) |
more frequently as needed, to review the valuation of all assets which have been fair valued. The Adviser, consistent with the monitoring and review responsibilities set forth in the Valuation Procedures, regularly reviews the appropriateness of the inputs, methods, models and assumptions employed by the pricing service provider.
If the pricing service provider cannot or does not provide a valuation for a particular investment or such valuation is deemed unreliable, such investment is fair valued by the Adviser.
Equity securities listed or traded on a recognized U.S. securities exchange or the National Association of Securities Dealers Automated Quotations (“NASDAQ”) National Market System will generally be valued on the basis of the last sale price on the primary U.S. exchange or market on which the security is listed or traded; provided, however, that securities listed on NASDAQ will be valued at the NASDAQ official closing price, which may not necessarily represent the last sale price.
Open-end investment companies are valued at their NAV as of the close of business, on the valuation date. Exchange-traded funds and closed-end investment companies are generally valued at the last quoted sale price.
Investments for which market quotations are not readily available are fair valued as determined in good faith by the Adviser. Valuations in accordance with these methods are intended to reflect each security’s (or asset’s or liability’s) “fair value”. Each such determination is based on a consideration of all relevant factors, which are likely to vary from one pricing context to another. Examples of such factors may include, but are not limited to market prices; sale prices; broker quotes; and models which derive prices based on inputs such as anticipated cash flows or collateral, spread over U.S. Treasury securities, and other information analysis.
(b) Security Transactions
Security transactions are recorded on the trade date for financial reporting purposes. Realized gains and losses from securities transactions are recorded using the identified cost basis. Proceeds from lawsuits related to investment holdings are recorded as a reduction to cost if the securities are still held and as realized gains if no longer held in the Fund. Taxable non-cash dividends are recorded as dividend income. Interest income, including amortization of premiums and accretion of discounts, is accrued on a daily basis. Dividend income from Real Estate Investment Trusts (“REITs”) is recorded based on the income included in the distributions received from the REIT investments using published REIT classifications, including some management estimates when actual amounts are not available. Distributions received in excess of this estimated amount are recorded as a reduction of the cost of investments or reclassified to realized gains. The actual amounts of income, return of capital, and realized gains are only determined by each REIT after its fiscal year-end, and may differ from the estimated amounts.
(c) Distributions
Distributions of net investment income and net realized gains, if any, are declared and paid at least annually. Dividends are reinvested in additional shares, unless shareholders request payment in cash. Distributions are recorded on the ex-dividend date and are determined in accordance with U.S. federal income tax regulations which may differ from U.S. GAAP.
(d) Expenses
Certain expenses have been allocated to the individual Funds in the Trust based on the respective net assets of each Fund included in the Trust.
(e) Earnings Credits
Under the fee arrangement with the custodian, the Fund may earn credits based on overnight custody cash balances. These credits are utilized to reduce related custodial expenses. The custodian fees disclosed in the Fund’s Statement of Operations are before the reduction in expense from the related earnings credits, if any. Earnings credits for the year ended September 30, 2023, are disclosed in the Fund’s Statement of Operations.
(f) Cash
The Fund may leave cash overnight in its cash account with the custodian. Periodically, the Fund may have cash due to the custodian bank as an overdraft balance. A fee is incurred on this overdraft, calculated by multiplying the overdraft by a rate based on the federal funds rate, which was 5.33% at September 30, 2023.
(g) Indemnifications
Under the Fund’s organizational documents, its Trustees and Officers are indemnified against certain liabilities arising out of the performance of their duties to the Trust. In addition, throughout the normal course of business, the Fund enters into contracts that contain a variety of representations and warranties which provide general indemnifications. The Fund’s maximum exposure under these arrangements is unknown, as this would involve future claims that may be made against the Fund and/or its affiliates that have not yet occurred. However, based on experience, the Fund expects the risk of loss to be remote.
| | THE GUGGENHEIM FUNDS ANNUAL REPORT | 15 |
NOTES TO FINANCIAL STATEMENTS (continued) |
Note 2 – Investment Advisory Agreement and Other Agreements
Under the terms of an investment advisory contract, the Fund pays GI investment advisory fees calculated at an annualized rate of 0.90% of the average daily net assets of the Fund.
GI pays operating expenses on behalf of the Trust, such as audit and accounting related services, legal services, custody, printing and mailing, among others, on a pass-through basis. Such expenses are allocated to various Funds within the complex based on relative net assets.
Certain trustees and officers of the Trust are also officers of GI and/or GFD. The Trust does not compensate its officers or trustees who are officers, directors and/or employees of GI or GFD.
MUFG Investor Services (US), LLC (“MUIS”) acts as the Fund’s administrator, transfer agent and accounting agent. As administrator, transfer agent and accounting agent, MUIS maintains the books and records of the Fund’s securities and cash. The Bank of New York Mellon Corp. (“BNY”) acts as the Fund’s custodian. As custodian, BNY is responsible for the custody of the Fund’s assets. For providing the aforementioned administrative and accounting services, MUIS is entitled to receive a monthly fee equal to a percentage of the Fund’s average daily net assets and out of pocket expenses. For providing the aforementioned transfer agent and custodian services, MUIS and BNY are entitled to receive a monthly fee based on the number of transactions during the month and the number of accounts under management, subject to certain minimum monthly fees, and out of pocket expenses.
Note 3 – Federal Income Tax Information
The Fund intends to comply with the provisions of Subchapter M of the Internal Revenue Code of 1986, as amended (the “Internal Revenue Code”), applicable to regulated investment companies and will distribute substantially all taxable net investment income and capital gains sufficient to relieve the Fund from all, or substantially all, federal income, excise and state income taxes. Therefore, no provision for federal or state income tax or federal excise tax is required.
Tax positions taken or expected to be taken in the course of preparing the Fund’s tax returns are evaluated to determine whether the tax positions are “more-likely-than-not” of being sustained by the applicable tax authority. Tax positions not deemed to meet the more-likely-than-not threshold would be recorded as a tax benefit or expense in the current year. Management has analyzed the Fund’s tax positions taken, or to be taken, on U.S. federal income tax returns for all open tax years, and has concluded that no provision for income tax is required in the Fund’s financial statements. The Fund’s U.S. federal income tax returns are subject to examination by the Internal Revenue Service (“IRS”) for a period of three years after they are filed.
The tax character of distributions paid during the year ended September 30, 2023 was as follows:
| | Ordinary
Income | | | Long-Term
Capital Gain | | | Total
Distributions | |
| | | $ | 291,687 | | | $ | — | | | $ | 291,687 | |
The tax character of distributions paid during the year ended September 30, 2022 was as follows:
| | Ordinary
Income | | | Long-Term
Capital Gain | | | Total
Distributions | |
| | | $ | 38,843,524 | | | $ | 15,583,339 | | | $ | 54,426,863 | |
Note: For U.S. federal income tax purposes, short-term capital gain distributions are treated as ordinary income distributions.
16 | THE GUGGENHEIM FUNDS ANNUAL REPORT | |
NOTES TO FINANCIAL STATEMENTS (continued) |
The tax components of distributable earnings/(loss) as of September 30, 2023 were as follows:
| | Undistributed
Ordinary
Income | | | Undistributed
Long-Term
Capital Gain | | | Net Unrealized
Appreciation
(Depreciation) | | | Accumulated
Capital and
Other Losses | | | Total | |
| | | $ | 1,432,087 | | | $ | — | | | $ | 6,924,764 | | | $ | (651,150 | ) | | $ | 7,705,701 | |
For U.S. federal income tax purposes, capital loss carryforwards represent realized losses of the Fund that may be carried forward and applied against future capital gains. The Fund is permitted to carry forward capital losses for an unlimited period and such capital loss carryforwards retain their character as either short-term or long-term capital losses. As of September 30, 2023, capital loss carryforwards for the Fund were as follows:
| | | | | | | Unlimited | | | | |
| | | | | | | | Short Term | | | Long Term | | | Total
Capital Loss
Carryforward | |
| | | | | | | | | | $ | (651,150 | ) | | $ | — | | | $ | (651,150) |
Net investment income and net realized gains (losses) may differ for financial statement and tax purposes because of temporary or permanent book/tax differences. These differences are primarily due to losses deferred due to wash sales and distributions in connection with redemption of fund shares. To the extent these differences are permanent and would require a reclassification between Paid in Capital and Total Distributable Earnings (Loss), such reclassifications are made in the period that the differences arise. These reclassifications have no effect on net assets or NAV per share.
The following adjustments were made on the Statement of Assets and Liabilities as of September 30, 2023 for permanent book/tax differences:
| | Paid In
Capital | | | Total
Distributable
Earnings/(Loss) | |
| | | $ | 58,096 | | | $ | (58,096 | ) |
At September 30, 2023, the cost of investments for U.S. federal income tax purposes, the aggregate gross unrealized appreciation for all investments for which there was an excess of value over tax cost and the aggregate gross unrealized depreciation for all investments for which there was an excess of tax cost over value, were as follows:
| | Tax
Cost | | | Tax
Unrealized
Appreciation | | | Tax
Unrealized
Depreciation | | | Net Tax
Unrealized
Appreciation/
(Depreciation) | |
| | | $ | 176,386,877 | | | $ | 13,969,457 | | | $ | (7,044,693 | ) | | $ | 6,924,764 | |
Note 4 – Fair Value Measurement
In accordance with U.S. GAAP, fair value is defined as the price that the Fund would receive to sell an investment or pay to transfer a liability in an orderly transaction between market participants at the measurement date. U.S. GAAP establishes a three-tier fair value hierarchy based on the types of inputs used to value assets and liabilities and requires corresponding disclosure. The hierarchy and the corresponding inputs are summarized below:
Level 1 — | unadjusted quoted prices in active markets for identical assets or liabilities. |
Level 2 — | significant other observable inputs (for example quoted prices for securities that are similar based on characteristics such as interest rates, prepayment speeds, credit risk, etc.). |
| | THE GUGGENHEIM FUNDS ANNUAL REPORT | 17 |
NOTES TO FINANCIAL STATEMENTS (concluded) |
Level 3 — | significant unobservable inputs based on the best information available under the circumstances, to the extent observable inputs are not available, which may include assumptions. |
Rule 2a-5 sets forth a definition of “readily available market quotations,” which is consistent with the definition of a Level 1 input under U.S. GAAP. Rule 2a-5 provides that “a market quotation is readily available only when that quotation is a quoted price (unadjusted) in active markets for identical investments that the fund can access at the measurement date, provided that a quotation will not be readily available if it is not reliable.”
Securities for which market quotations are not readily available must be valued at fair value as determined in good faith. Accordingly, any security priced using inputs other than Level 1 inputs will be subject to fair value requirements. The types of inputs available depend on a variety of factors, such as the type of security and the characteristics of the markets in which it trades, if any. Fair valuation determinations that rely on fewer or no observable inputs require greater judgment. Accordingly, fair value determinations for Level 3 securities require the greatest amount of judgment.
The inputs or methodologies selected and applied for valuing securities or other assets are not necessarily an indication of the risk associated with investing in those securities. The suitability, appropriateness and accuracy of the techniques, methodologies and sources employed to determine fair valuation are periodically reviewed and subject to change.
Note 5 – Securities Transactions
For the year ended September 30, 2023, the cost of purchases and proceeds from sales of investment securities, excluding short-term investments, were as follows:
| | Purchases | | | Sales | |
| | | $ | 300,984,785 | | | $ | 307,776,017 | |
Note 6 – Market Risks
The value of, or income generated by, the investments held by the Fund are subject to the possibility of rapid and unpredictable fluctuation, and loss that may result from various factors. These factors include, among others, developments affecting individual companies, or from broader influences, including real or perceived changes in prevailing interest rates (which have since risen and may continue to rise), changes in inflation rates or expectations about inflation rates (which are currently elevated relative to normal conditions), adverse investor confidence or sentiment, changing economic, political (including geopolitical), social or financial market conditions, increased instability or general uncertainty, environmental disasters, governmental actions, public health emergencies (such as the spread of infectious diseases, pandemics and epidemics), debt crises, actual or threatened wars or other armed conflicts (such as the current Russia-Ukraine conflict and its risk of expansion or collateral economic and other effects) or ratings downgrades, and other similar events, each of which may be temporary or last for extended periods. Moreover, changing economic, political, geopolitical, social, financial market or other conditions in one country or geographic region could adversely affect the value, yield and return of the investments held by the Fund in a different country or geographic region, economy, and market because of the increasingly interconnected global economies and financial markets. The duration and extent of the foregoing types of factors or conditions are highly uncertain and difficult to predict and have in the past, and may in the future, cause volatility and distress in economies and financial markets or other adverse circumstances, which may negatively affect the value of the Fund’s investments and performance of the Fund.
Note 7 – Subsequent Events
The Fund evaluated subsequent events through the date the financial statements are issued and determined there were no material events that would require adjustment to or disclosure in the Fund’s financial statements.
18 | THE GUGGENHEIM FUNDS ANNUAL REPORT | |
REPORT OF INDEPENDENT REGISTERED PUBLIC ACCOUNTING FIRM |
To the Shareholders and the Board of Trustees of Guggenheim Capital Stewardship Fund
Opinion on the Financial Statements
We have audited the accompanying statement of assets and liabilities of Guggenheim Capital Stewardship Fund (the “Fund”) (one of the funds constituting Guggenheim Funds Trust (the “Trust”)), including the schedule of investments, as of September 30, 2023, and the related statement of operations for the year then ended, the statements of changes in net assets for each of the two years in the period then ended, the financial highlights for each of the five years in the period then ended and the related notes (collectively referred to as the “financial statements”). In our opinion, the financial statements present fairly, in all material respects, the financial position of the Fund (one of the funds constituting Guggenheim Funds Trust) at September 30, 2023, the results of its operations for the year then ended, the changes in its net assets for each of the two years in the period then ended and its financial highlights for each of the five years in the period then ended, in conformity with U.S. generally accepted accounting principles.
Basis for Opinion
These financial statements are the responsibility of the Trust’s management. Our responsibility is to express an opinion on the Fund’s financial statements based on our audits. We are a public accounting firm registered with the Public Company Accounting Oversight Board (United States) (“PCAOB”) and are required to be independent with respect to the Trust in accordance with the U.S. federal securities laws and the applicable rules and regulations of the Securities and Exchange Commission and the PCAOB.
We conducted our audits in accordance with the standards of the PCAOB. Those standards require that we plan and perform the audit to obtain reasonable assurance about whether the financial statements are free of material misstatement, whether due to error or fraud. The Trust is not required to have, nor were we engaged to perform, an audit of the Trust’s internal control over financial reporting. As part of our audits, we are required to obtain an understanding of internal control over financial reporting but not for the purpose of expressing an opinion on the effectiveness of the Trust’s internal control over financial reporting. Accordingly, we express no such opinion.
Our audits included performing procedures to assess the risks of material misstatement of the financial statements, whether due to error or fraud, and performing procedures that respond to those risks. Such procedures included examining, on a test basis, evidence regarding the amounts and disclosures in the financial statements. Our procedures included confirmation of securities owned as of September 30, 2023, by correspondence with the custodian. Our audits also included evaluating the accounting principles used and significant estimates made by management, as well as evaluating the overall presentation of the financial statements. We believe that our audits provide a reasonable basis for our opinion.

We have served as the auditor of one or more Guggenheim investment companies since 1979.
Tysons, Virginia
November 28, 2023
| | THE GUGGENHEIM FUNDS ANNUAL REPORT | 19 |
OTHER INFORMATION (Unaudited) |
Federal Income Tax Information
This information is being provided as required by the Internal Revenue Code. Amounts shown may differ from those elsewhere in the report because of differences in tax and financial reporting practice.
In January 2024, shareholders will be advised on IRS Form 1099 DIV or substitute 1099 DIV as to the federal tax status of the distributions received by shareholders in the calendar year 2023.
The Fund’s investment income (dividend income plus short-term capital gains, if any) qualifies as follows:
Of the taxable ordinary income distributions paid during the fiscal year ended September 30, 2023, the Fund had the corresponding percentages qualify for the reduced tax rate pursuant to the Jobs and Growth Tax Relief and Reconciliation Act of 2003 or for the dividends received deduction for corporations. See the qualified dividend income and dividend received deduction columns, respectively, in the table below.
Additionally, of the taxable ordinary income distributions paid during the fiscal year ended September 30, 2023, the Fund had the corresponding percentage qualify as interest related dividends as permitted by IRC Section 871(k)(1). See the qualified interest income column in the table below.
| | Qualified
Dividend
Income | | | Dividend
Received
Deduction | | | Qualified
Interest
Income | |
| | | | 100.00 | % | | | 100.00 | % | | | 1.40 | % |
Delivery of Shareholder Reports
Paper copies of the Fund’s annual and semi-annual shareholder reports are not sent by mail, unless you specifically request paper copies of the reports from a fund or from your financial intermediary. Instead, the reports are made available on a website, and you are notified by mail each time a report is posted and provided with a website link to access the report.
You may elect to receive all future shareholder reports in paper free of charge. If you hold shares of a fund directly, you can inform the Fund that you wish to receive paper copies of reports by calling 800.820.0888. If you hold shares of a fund through a financial intermediary, please contact the financial intermediary to make this election. Your election to receive reports in paper may apply to all Guggenheim Funds in which you are invested and may apply to all Guggenheim funds held with your financial intermediary.
Tailored Shareholder Reports for Open-End Mutual Funds and Exchange-Traded Funds
Effective January 24, 2023, the SEC adopted rule and form amendments to require open-end mutual funds and exchange-traded funds registered on Form N-1A to transmit concise and visually engaging streamlined annual and semi-annual reports to shareholders that highlight key information. Other information, including financial statements, will no longer appear in a streamlined shareholder report but must be available online, delivered free of charge upon request, and filed on a semi-annual basis on Form N-CSR. The rule and form amendments have a compliance date of July 24, 2024. At this time, management is evaluating the impact of these amendments on the shareholder reports for the Fund.
Proxy Voting Information
A description of the policies and procedures that the Trust uses to determine how to vote proxies relating to securities held in the Fund’s portfolio is available, without charge and upon request, by calling 800.820.0888. This information is also available from the EDGAR database on the SEC’s website at https://www.sec.gov.
Information regarding how the Fund voted proxies relating to portfolio securities during the most recent 12-month period ended June 30 is available without charge, upon request, by calling 800.820.0888. This information is also available from the EDGAR database on the SEC’s website at https://www.sec.gov.
20 | THE GUGGENHEIM FUNDS ANNUAL REPORT | |
OTHER INFORMATION (Unaudited)(continued) |
Sector Classification
Information in the Schedule of Investments is categorized by sectors using sector-level Classifications defined by the Bloomberg Industry Classification System, a widely recognized industry classification system provider. The Fund’s registration statement has investment policies relating to concentration in specific sectors/industries. For purposes of these investment policies, the Fund usually classifies sectors/industries based on industry-level Classifications used by widely recognized industry classification system providers such as Bloomberg Industry Classification System, Global Industry Classification Standards and Barclays Global Classification Scheme.
Quarterly Portfolio Schedules Information
The Trust files its complete schedule of portfolio holdings with the SEC for the first and third quarters of each fiscal year as an exhibit to its reports on Form N-PORT, and for reporting periods ended prior to March 31, 2019, filed such information on Form N-Q. The Fund’s Forms N-PORT and N-Q are available on the SEC’s website at https://www.sec.gov. Copies of the portfolio holdings are also available to shareholders, without charge and upon request, by calling 800.820.0888.
Report of the Guggenheim Funds Trust Contracts Review Committee
The Board of Trustees of Guggenheim Funds Trust (the “Trust”), including the Independent Trustees, unanimously approved the renewal of the investment management agreement (the “Investment Advisory Agreement”) with Guggenheim Partners Investment Management, LLC (“GPIM” or the “Adviser”) on behalf of Guggenheim Capital Stewardship Fund (“Capital Stewardship Fund” or the “Fund”), a series of the Trust, and the investment sub-advisory agreement between Concinnity Advisors, LP (“Concinnity” or the “Sub-Adviser”) and GPIM on behalf of the Fund (the “Sub-Advisory Agreement” and together with the “Investment Advisory Agreement,” the “Agreements”).
GPIM, is an indirect subsidiary of Guggenheim Partners, LLC, a privately-held, global investment and advisory firm(“Guggenheim Partners”). Guggenheim Partners, GPIM and their affiliates may be referred to collectively as “Guggenheim.” “Guggenheim Investments” refers to the global asset management and investment advisory division of Guggenheim Partners and includes GPIM, Guggenheim Funds Investment Advisors, LLC, Security Investors, LLC and other affiliated investment management businesses of Guggenheim Partners.
At meetings held in person on April 17-18, 2023 (the “April Meeting”) and meetings held by videoconference on May 15, 2023 and in person on May 24, 2023 (the “May Meeting”), the Contracts Review Committee of the Board (the “Committee”), consisting solely of the Independent Trustees, met separately from Guggenheim to consider the proposed renewal of the Agreements. As part of its review process, the Committee was represented by independent legal counsel to the Independent Trustees (“Independent Legal Counsel”), from whom the Independent Trustees received separate legal advice and with whom they met separately. Independent Legal Counsel reviewed and discussed with the Committee various key aspects of the Trustees’ legal responsibilities relating to the proposed renewal of the Agreements and other principal contracts. The Committee took into account various materials received from Guggenheim and Independent Legal Counsel. The Committee also considered the variety of written materials, reports and oral presentations the Board received throughout the year regarding performance and operating results of the Fund, and other information relevant to its evaluation of the Agreements.
In connection with the contract review process, FUSE Research Network LLC (“FUSE”), an independent, third-party research provider, was engaged to prepare advisory contract renewal reports designed specifically to help the Board fulfill its advisory contract renewal responsibilities. The objective of the FUSE reports is to present the subject funds’ relative position regarding fees, expenses and total return performance, with peer group and universe comparisons. The Committee assessed the data provided in the FUSE report, noting that the peer group identified by FUSE included 11 other large blend funds with similar pricing characteristics.
In addition, Guggenheim and Concinnity provided materials and data in response to formal requests for information sent by Independent Legal Counsel on behalf of the Committee. Guggenheim also made a presentation at the April Meeting. Throughout the process, the Committee asked questions of management and requested certain additional information, which Guggenheim provided (collectively with the foregoing reports and materials, the “Contract Review Materials”).
The Committee considered the circumstances unique to Capital Stewardship Fund, including its organizational history. In this connection, the assets of Guggenheim Concinnity Master Strategy Fund SPC, a Cayman Islands exempted segregated portfolio company which relied on the exclusion from the definition of an “investment company” provided by Section 3(c)(7) of the Investment Company Act of 1940, as amended (the “Predecessor Fund”), and for which GPIM served as investment adviser and Concinnity served as investment sub-adviser, were reorganized with and into Capital Stewardship Fund (the “Reorganization”). The Predecessor Fund was a master fund in a set of unregistered
| | THE GUGGENHEIM FUNDS ANNUAL REPORT | 21 |
OTHER INFORMATION (Unaudited)(continued) |
offshore and domestic master-feeder funds (collectively, the “Private Funds”), which had certain bank investors. The investors issued notes that provided coupon payments based on the after-tax return of the Private Funds and the notes, in turn, were held by a single holder affiliated with Guggenheim. The Reorganization enabled the bank investors and the noteholder to continue to benefit from the strategies previously offered by the Private Funds by converting the Predecessor Fund into a registered investment company structure that pursues the same investment strategies, because Capital Stewardship Fund’s investment objective and strategies are, in all material respects, the same as those of the Predecessor Fund. The Board had authorized the launch of Capital Stewardship Fund on the condition that it not be offered to other investors unless and until such time as the Board determines to permit additional sales. The Committee considered the foregoing and the Contract Review Materials in the context of its accumulated experience governing the Trust and other Guggenheim funds and weighed the factors and standards discussed with Independent Legal Counsel.
Following an analysis and discussion of relevant factors, including those identified below, and in the exercise of its business judgment, the Committee concluded that it was in the best interest of the Fund to recommend that the Board approve the renewal of the Agreements for an additional annual term. Following its review of the Committee’s recommendation, the Board approved the renewal of the Agreements for the Fund for a one-year period ending August 1, 2024 at a meeting held on May 23-24, 2023 (the “May Board Meeting” and together with the May Meeting, the “May Meetings”) and determined to adopt the Committee’s considerations and conclusions, which follow.
Investment Advisory Agreement
Nature, Extent and Quality of Services Provided by the Adviser: With respect to the nature, extent and quality of services currently provided by the Adviser, the Committee noted that the Adviser delegated certain, but not all, portfolio management responsibilities to the Sub-Adviser. Unlike many traditional sub-advisory arrangements, the Sub-Adviser does not execute trades for the Fund’s portfolio. Rather, the Sub-Adviser provides a list of eligible investments to the Adviser based on the Sub-Adviser’s proprietary screening methodology, and the Adviser selects investments and engages in securities transactions for the Fund. In this connection, the Committee considered the scope of services provided by each of the Adviser and the Sub-Adviser, and took into account the Adviser’s responsibility to oversee the Sub-Adviser and information provided by Guggenheim describing the Adviser’s processes and activities for providing oversight of sub-advisers (including Concinnity), including information regarding Guggenheim’s Sub-Advisory Oversight Working Group.
The Committee also considered the qualifications, experience and skills of key personnel performing services for the Fund, including those personnel providing compliance and risk oversight, as well as the supervisors and reporting lines for such personnel. The Committee also considered other information, including Guggenheim’s resources and related efforts to retain, attract and motivate capable personnel to serve the Fund. In evaluating Guggenheim’s resources and capabilities, the Committee considered Guggenheim’s commitment to focusing on, and investing resources in support of, funds in the Guggenheim fund complex, including Capital Stewardship Fund. The Committee also considered Guggenheim’s discussion of its ongoing review of the Guggenheim fund line-up at the April Meeting and the May Board Meeting. In addition, the Committee considered the acceptability of the terms of the Investment Advisory Agreement, including the scope of services required to be performed by the Adviser.
The Committee’s review of the services provided by Guggenheim to the Fund included consideration of Guggenheim’s investment processes and resulting performance, portfolio oversight and risk management, and the related regular quarterly reports and presentations received by the Board. The Committee took into account the risks borne by Guggenheim in sponsoring and providing services to the Fund, including regulatory, operational, legal and entrepreneurial risks. The Committee considered the resources dedicated by Guggenheim to compliance functions and the reporting made to the Board by Guggenheim compliance personnel regarding Guggenheim’s and Concinnity’s adherence to regulatory requirements. The Committee also considered the regular reports the Board receives from the Trust’s Chief Compliance Officer regarding compliance policies and procedures established pursuant to Rule 38a-1 under the Investment Company Act of 1940, as amended. In connection with the Committee’s evaluation of the overall package of services provided by Guggenheim, the Committee considered Guggenheim’s administrative services, including its role in supervising, monitoring, coordinating and evaluating the various services provided by the fund administrator, transfer agent, custodian and other service providers to the Fund. The Committee evaluated the Office of Chief Financial Officer (the “OCFO”), established to oversee the fund administration, accounting and transfer agency services provided to the Fund and other Guggenheim funds, including the OCFO’s resources, personnel and services provided.
22 | THE GUGGENHEIM FUNDS ANNUAL REPORT | |
OTHER INFORMATION (Unaudited)(continued) |
With respect to Guggenheim’s resources and the ability of the Adviser to carry out its responsibilities under the Investment Advisory Agreement, the Chief Financial Officer of Guggenheim Investments reviewed with the Committee financial information concerning the holding company for Guggenheim Investments, Guggenheim Partners Investment Management Holdings, LLC (“GPIMH”), and the various entities comprising Guggenheim Investments, and provided the audited consolidated financial statements of GPIMH. (Thereafter, the Committee received the audited consolidated financial statements of GPIM.)
Based on the foregoing, and based on other information received (both oral and written) at the April Meeting and the May Meetings, as well as other considerations, including the Committee’s knowledge of how the Adviser performs its duties obtained through Board meetings, discussions and reports throughout the year, the Committee concluded that the Adviser and its personnel were qualified to serve the Fund in such capacity and may reasonably be expected to continue to provide a high quality of services under the Investment Advisory Agreement with respect to the Fund.
Investment Performance: The Committee received investment returns for the Fund for the five-year, three-year, one-year and three-month periods ended December 31, 2022, noting the Fund’s inception date of September 26, 2014. In addition, the Committee received a comparison of the Fund’s performance to the performance of a benchmark, a universe of funds and a narrower peer group of similar funds based on asset levels as identified by FUSE, in each case for the same periods. The Committee also received from FUSE a description of the methodology for identifying the Fund’s peer group and universe for performance and expense comparisons. The Committee also received certain performance information as of March 31, 2023. In assessing the Fund’s performance, the Committee considered that the Board receives regular reporting from Guggenheim regarding performance and evaluates performance throughout the year.
The Committee took into account the roles and responsibilities of each of the Adviser and the Sub-Adviser in implementing the Fund’s investment strategy, including the manner in which the relationship between the advisory firms differs in certain respects from traditional fund management structures with an adviser and an unaffiliated sub-adviser. The Committee noted that the Sub-Adviser uses its proprietary research methodology system to identify a list of companies eligible for investment by the Fund. From that list, the Adviser selects, based on desired factor tilts and subject to a risk management process, a portfolio composed of a sub-set of the eligible companies compiled by the Sub-Adviser. The Adviser retains the responsibility for executing the trades based on the Fund’s investment policies and limitations.
In seeking to evaluate Fund performance over a full market cycle, the Committee focused its attention on five-year and three-year performance rankings as compared to the universe of funds identified by FUSE. The Committee observed that the returns of the Fund’s Institutional Class shares ranked in the 63rd and 61st percentiles of its performance universe for the five-year and three-year periods ended December 31, 2022, respectively. The Committee noted that the Fund’s investment results were consistent with its investment objective of seeking long-term capital appreciation.
Based on the foregoing, and based on other information received (both oral and written) at the April Meeting and the May Meetings, as well as other considerations, the Committee concluded that the Fund’s investment performance was acceptable and that the Adviser had appropriately reviewed and monitored the Sub-Adviser’s investment performance.
Comparative Fees, Costs of Services Provided and the Benefits Realized by the Adviser from Its Relationship with the Fund: The Committee compared the Fund’s contractual advisory fee, net effective management fee1 and total net expense ratio to the peer group identified by FUSE. The Committee also reviewed the median advisory fees and expense ratios, including expense ratio components (e.g., transfer agency fees, administration fees, other operating expenses and fee waivers/reimbursements), of the peer group of funds. In addition, the Committee considered information regarding Guggenheim’s process for evaluating the competitiveness of the Fund’s fees and expenses, noting Guggenheim’s statement that evaluations seek to incorporate a variety of factors with a general focus on ensuring fees and expenses: (i) are competitive; (ii) give consideration to resource support requirements; and (iii) ensure the Fund is able to deliver on shareholder return expectations. The Committee also considered Guggenheim’s discussion of information regarding fee and expense trends across the open-end fund industry and its response to those trends with respect to the funds in the Guggenheim fund complex, including the Fund.
1 | The “net effective management fee” for the Fund represents the combined effective advisory fee and administration fee as a percentage of average net assets for the latest fiscal year, after any waivers and/or reimbursements. |
| | THE GUGGENHEIM FUNDS ANNUAL REPORT | 23 |
OTHER INFORMATION (Unaudited)(continued) |
The Committee also noted Guggenheim’s statement that it does not provide advisory services to other clients that have investment strategies similar to those of the Fund and, as a result, the Committee did not consider it relevant to compare the Fund’s advisory fees to the advisory fees charged to other clients of Guggenheim.
The Committee observed that the contractual advisory fee and the net effective management fee for the Fund’s Institutional Class shares each rank in the fourth quartile (both in the 100th percentile) of its peer group and the total net expense ratio for the Fund’s Institutional Class shares ranks in the fourth quartile (91st percentile) of its peer group. In evaluating the foregoing, the Committee considered that the Fund was launched to accommodate certain bank clients that were invested in an unregistered private fund (previously defined as the Predecessor Fund) with a unique investment strategy. Accordingly, in evaluating the reasonableness of the advisory fee, the Committee considered the sophistication of the Fund’s bank client investors and the Fund’s purpose.
With respect to the costs of services provided and benefits realized by Guggenheim Investments from its relationship with the Fund, the Committee reviewed a profitability analysis and data from management for the Fund setting forth the average assets under management for the twelve months ended December 31, 2022, gross revenues received, and expenses incurred directly or through allocations, by Guggenheim Investments, earnings and the operating margin/profitability rate (noting the negative rate reported with respect to the Fund), including variance information relative to the foregoing amounts as of December 31, 2021. In addition, the Chief Financial Officer of Guggenheim Investments reviewed with, and addressed questions from, the Committee concerning the expense allocation methodology employed in producing the profitability analysis. In the course of its review of Guggenheim Investments’ profitability with respect to the Guggenheim funds generally, the Committee took into account the methods used by Guggenheim Investments to determine expenses and profit and the representation by the Chief Financial Officer of Guggenheim Investments that such methods provided a reasonable basis for determining the profitability of the Adviser with respect to the Fund. The Committee considered all of the foregoing, among other things, in evaluating the costs of services provided and noted the negative profitability rate to Guggenheim Investments with respect to the Fund.
The Committee also considered other benefits available to the Adviser because of its relationship with the Fund and noted Guggenheim’s statement that it does not believe the Adviser derives any such “fall-out” benefits.
Based on the foregoing, and based on other information received (both oral and written) at the April Meeting and the May Meetings, as well as other considerations, the Committee concluded that the comparative fees and the benefits realized by the Adviser from its relationship with the Fund were appropriate and that the Adviser’s profitability from its relationship with the Fund was not unreasonable.
Economies of Scale: With respect to economies of scale, the Committee considered that the Fund is not made available to retail investors and has limited inflows of assets. The Committee concluded that the advisory fee schedule reflected an appropriate level of sharing of any economies of scale.
Based on the foregoing, and based on other information received (both oral and written) at the April Meeting and the May Meetings, as well as other considerations, the Committee concluded that the Fund’s advisory fee was reasonable.
Sub-Advisory Agreement
Nature, Extent and Quality of Services Provided by the Sub-Adviser: With respect to the nature, extent and quality of services provided by the Sub-Adviser, the Committee considered the Fund’s investment objective and Concinnity’s investment strategy and method for implementing such investment strategy, including, but not limited to, the investment decision processes employed for the Fund. The Committee also noted the Sub-Adviser’s experience in implementing the investment strategy. In addition, the Committee took into account the information provided by the Sub-Adviser regarding, among other things: its current advisory services and clients and the principal activities in which it is engaged; the qualifications, experience and skills of key personnel responsible for providing services to the Fund; the Sub-Adviser’s evaluation of its success in meeting the Fund’s investment objective; the Fund’s portfolio construction process and the sources of information generally relied upon by the Sub-Adviser in providing investment advisory, statistical and research services to the Fund; and the Sub-Adviser’s process, in collaboration with Guggenheim, for portfolio risk management.
With respect to the Sub-Adviser’s resources and its ability to carry out its responsibilities under the Sub-Advisory Agreement, the Committee noted that the Sub-Adviser provided its tax return filing. The Committee also considered the Sub-Adviser’s statement that it is an ongoing viable business enterprise that currently has the resources necessary to provide the contracted-for services to the Fund. In further assessing the Sub-Adviser’s resources, as well as the nature and quality of the services it provides, the Committee took into account Guggenheim’s statement that,
24 | THE GUGGENHEIM FUNDS ANNUAL REPORT | |
OTHER INFORMATION (Unaudited)(concluded) |
given the limited scope of services provided by Concinnity and its role in the Fund’s management, and Guggenheim’s oversight of such services, the Sub-Adviser’s resources are sufficient to provide the contracted-for services to the Fund. The Committee also considered the acceptability of the terms of the Sub-Advisory Agreement, including the scope of services required to be performed by the Sub-Adviser.
Based on the foregoing, and based on other information received (both oral and written) at the April Meeting and the May Meetings, the Committee concluded that the Sub-Adviser and its personnel were qualified to serve the Fund in such capacity and may reasonably be expected to continue to provide a high quality of services under the Sub-Advisory Agreement with respect to the Fund.
Investment Performance: The Committee considered the Fund’s performance, as described above, and based on the foregoing, and based on other information received (both oral and written) at the April Meeting and the May Meetings, as well as other considerations, concluded that the investment performance of the Sub-Adviser was acceptable.
Comparative Fees, Costs of Services Provided and the Benefits Realized by the Sub-Adviser from Its Relationship with the Fund: The Committee noted that the sub-advisory fees payable to Concinnity are paid by GPIM and do not impact the advisory fee paid by the Fund (which the Committee concluded to be reasonable). The Committee reviewed the total amount of sub-advisory fees paid to the Sub-Adviser for the twelve months ended December 31, 2022, as compared to the prior year, noting that the sub-advisory fees paid by GPIM to Concinnity are the product of arm’s-length negotiations between GPIM and Concinnity. The Committee considered the allocation of the advisory fee charged to the Fund between GPIM and Concinnity in light of the nature, extent and quality of the investment advisory services provided by GPIM and Concinnity.
With respect to the costs of services provided and benefits realized by the Sub-Adviser from its relationship with the Fund, the Committee considered Concinnity’s size and partnership structure, the aggregate management fees paid to Concinnity and the methodology used to calculate its profitability. The Committee also considered that no other benefits to the Sub-Adviser as a result of its relationship with the Fund were reported.
Based on the foregoing, and based on other information received (both oral and written) at the April Meeting and the May Meetings, as well as other considerations, the Committee concluded that the benefits realized by the Sub-Adviser from its relationship with the Fund were appropriate and that the Sub-Adviser’s profitability from its relationship with the Fund was not unreasonable.
Economies of Scale: The Committee recognized that, because the Sub-Adviser’s fees are paid by the Adviser and not the Fund, the analysis of economies of scale was more appropriate in the context of the Committee’s consideration of the Investment Advisory Agreement, which was separately considered. (See “Investment Advisory Agreement – Economies of Scale” above.)
Based on the foregoing, and based on other information received (both oral and written) at the April Meeting and the May Meetings, as well as other considerations, the Committee concluded that the Fund’s sub-advisory fee was reasonable.
Overall Conclusions
The Committee concluded that the investment advisory fees are fair and reasonable in light of the extent and quality of the services provided and other benefits received and that the renewal of the Agreements is in the best interest of the Fund. In reaching this conclusion, no single factor was determinative or conclusive and each Committee member, in the exercise of his or her informed business judgment, may afford different weights to different factors.
Following its review of the Committee’s analysis and determinations, the Board adopted the considerations and conclusions of the Committee and determined to approve the renewal of the Agreements.
| | THE GUGGENHEIM FUNDS ANNUAL REPORT | 25 |
INFORMATION ON BOARD OF TRUSTEES AND OFFICERS (Unaudited) |
A Board of Trustees oversees the Trust, as well as other trusts of GI, in which its members have no stated term of service, and continue to serve after election until resignation. The Statement of Additional Information includes further information about Fund Trustees and Officers, and can be obtained without charge by visiting guggenheiminvestments.com or by calling 800.820.0888.
Name, Address*
and Year of Birth | Position(s) Held
with Trust | Term of Office
and Length of
Time Served** | Principal Occupation(s)
During Past Five Years | Number of
Portfolios
in Fund
Complex
Overseen | Other Directorships
Held by Trustees*** |
INDEPENDENT TRUSTEES | | | |
Randall C. Barnes (1951) | Trustee and Chair of the Valuation Oversight Committee | Since 2014 (Trustee)
Since 2020 (Chair of the Valuation
Oversight
Committee) | Current: Private Investor (2001-present). Former: Senior Vice President and Treasurer, PepsiCo, Inc. (1993-1997); President, Pizza Hut International (1991-1993); Senior Vice President, Strategic Planning and New Business Development, PepsiCo, Inc. (1987-1990). | 155 | Current: Advent Convertible and Income Fund (2005-present); Purpose Investments Funds (2013-present). Former: Fiduciary/Claymore Energy Infrastructure Fund (2004-2022); Guggenheim Enhanced Equity Income Fund (2005-2021); Guggenheim Credit Allocation Fund (2013-2021). |
Angela Brock-Kyle (1959) | Trustee | Since 2019 | Current: Founder and Chief Executive Officer, B.O.A.R.D.S. (2013-present); Director, Mutual Fund Directors Forum (2022-present). Former: Senior Leader, TIAA (financial services firm) (1987-2012). | 154 | Current: Bowhead Insurance GP, LLC (2020-present); Hunt Companies, Inc. (2019-present). Former: Fiduciary/Claymore Energy Infrastructure Fund (2019-2022); Guggenheim Enhanced Equity Income Fund (2019-2021); Guggenheim Credit Allocation Fund (2019-2021); Infinity Property & Casualty Corp. (2014-2018). |
26 | THE GUGGENHEIM FUNDS ANNUAL REPORT | |
INFORMATION ON BOARD OF TRUSTEES AND OFFICERS (Unaudited)(continued) |
Name, Address*
and Year of Birth | Position(s) Held
with Trust | Term of Office
and Length of
Time Served** | Principal Occupation(s)
During Past Five Years | Number of
Portfolios
in Fund
Complex
Overseen | Other Directorships
Held by Trustees*** |
INDEPENDENT TRUSTEES - continued | | | |
Thomas F. Lydon, Jr. (1960) | Trustee and Chair of the Contracts Review Committee | Since 2019 (Trustee) Since 2020 (Chair of the Contracts Review Committee) | Current: President, Global Trends Investments (registered investment adviser) (1996-present); Chief Executive Officer, ETF Flows, LLC (financial advisor education and research provider) (2019-present); Chief Executive Officer, Lydon Media (2016-present); Director, GDX Index Partners, LLC (index provider) (2021-present); Vice Chairman, VettaFi (financial advisor content, research and digital distribution provider) (2022-present). | 154 | Current: US Global Investors, Inc. (GROW) (1995-present); The 2023 ETF Series Trust (4) (June 2023-present); The 2023 ETF Series Trust II (1) (August 2023-present). Former: Fiduciary/Claymore Energy Infrastructure Fund (2019-2022); Guggenheim Enhanced Equity Income Fund (2019-2021); Guggenheim Credit Allocation Fund (2019-2021); Harvest Volatility Edge Trust (3) (2017-2019). |
Ronald A. Nyberg (1953) | Trustee and Chair of the Nominating and Governance Committee | Since 2014 | Current: Of Counsel, Momkus LLP (law firm) (2016-present). Former: Partner, Nyberg & Cassioppi, LLC (law firm) (2000-2016); Executive Vice President, General Counsel, and Corporate Secretary, Van Kampen Investments (1982-1999). | 155 | Current: Advent Convertible and Income Fund (2003-present); PPM Funds (2) (2018-present); NorthShore-Edward-Elmhurst Health (2012-present). Former: Fiduciary/Claymore Energy Infrastructure Fund (2004-2022); Guggenheim Enhanced Equity Income Fund (2005-2021); Guggenheim Credit Allocation Fund (2013-2021); Western Asset Inflation-Linked Opportunities & Income Fund (2004-2020); Western Asset Inflation-Linked Income Fund (2003-2020). |
| | THE GUGGENHEIM FUNDS ANNUAL REPORT | 27 |
INFORMATION ON BOARD OF TRUSTEES AND OFFICERS (Unaudited)(continued) |
Name, Address*
and Year of Birth | Position(s) Held
with Trust | Term of Office
and Length of
Time Served** | Principal Occupation(s)
During Past Five Years | Number of
Portfolios
in Fund
Complex
Overseen | Other Directorships
Held by Trustees*** |
INDEPENDENT TRUSTEES - concluded | | |
Sandra G. Sponem (1958) | Trustee and Chair of the Audit Committee | Since 2019 (Trustee) Since 2020 (Chair of
the Audit
Committee) | Current: Retired. Former: Senior Vice President and Chief Financial Officer, M.A. Mortenson-Companies, Inc. (construction and real estate development company) (2007-2017). | 154 | Current: SPDR Series Trust (81) (2018-present); SPDR Index Shares Funds (30) (2018-present); SSGA Active Trust (14) (2018-present). Former: Fiduciary/Claymore Energy Infrastructure Fund (2019-2022); Guggenheim Enhanced Equity Income Fund (2019-2021); Guggenheim Credit Allocation Fund (2019-2021); SSGA Master Trust (1) (2018-2020). |
Ronald E. Toupin, Jr. (1958) | Trustee, Chair of the Board and Chair of the Executive Committee | Since 2014 | Current: Portfolio Consultant (2010-present); Member, Governing Council, Independent Directors Council (2013-present); Governor, Board of Governors, Investment Company Institute (2018-present). Former: Member, Executive Committee, Independent Directors Council (2016-2018); Vice President, Manager and Portfolio Manager, Nuveen Asset Management (1998-1999); Vice President, Nuveen Investment Advisory Corp. (1992-1999); Vice President and Manager, Nuveen Unit Investment Trusts (1991-1999); and Assistant Vice President and Portfolio Manager, Nuveen Unit Investment Trusts (1988-1999), each of John Nuveen & Co., Inc. (registered broker dealer) (1982-1999). | 154 | Former: Fiduciary/Claymore Energy Infrastructure Fund (2004-2022); Guggenheim Enhanced Equity Income Fund (2005-2021); Guggenheim Credit Allocation Fund (2013-2021); Western Asset Inflation-Linked Opportunities & Income Fund (2004-2020); Western Asset Inflation-Linked Income Fund (2003-2020). |
28 | THE GUGGENHEIM FUNDS ANNUAL REPORT | |
INFORMATION ON BOARD OF TRUSTEES AND OFFICERS (Unaudited)(continued) |
Name, Address*
and Year of Birth | Position(s) Held
with Trust | Term of Office
and Length of
Time Served** | Principal Occupation(s)
During Past Five Years | Number of
Portfolios
in Fund
Complex
Overseen | Other Directorships
Held by Trustees*** |
INTERESTED TRUSTEE | | | | |
Amy J. Lee**** (1961) | Trustee, Vice President and Chief Legal Officer | Since 2018 (Trustee) Since 2014
(Chief Legal Officer) Since 2007
(Vice President) | Current: Interested Trustee, certain other funds in the Fund Complex (2018-present); Chief Legal Officer, certain other funds in the Fund Complex (2014-present); Vice President, certain other funds in the Fund Complex (2007-present); Senior Managing Director, Guggenheim Investments (2012-present). Former: President and Chief Executive Officer, certain other funds in the Fund Complex (2017-2019); Vice President, Associate General Counsel and Assistant Secretary, Security Benefit Life Insurance Company and Security Benefit Corporation (2004-2012). | 154 | Former: Fiduciary/Claymore Energy Infrastructure Fund (2018-2022); Guggenheim Enhanced Equity Income Fund (2018-2021); Guggenheim Credit Allocation Fund (2018-2021). |
* | The business address of each Trustee is c/o Guggenheim Investments, 227 West Monroe Street, Chicago, Illinois 60606. |
** | Each Trustee serves an indefinite term, until his or her successor is elected and qualified. Time served includes time served in the respective position for the Predecessor Corporation. |
*** | Each Trustee also serves on the Boards of Trustees of Guggenheim Funds Trust, Guggenheim Variable Funds Trust, Guggenheim Strategy Funds Trust, Guggenheim Taxable Municipal Bond & Investment Grade Debt Trust, Guggenheim Strategic Opportunities Fund, Guggenheim Active Allocation Fund, Rydex Series Funds, Rydex Dynamic Funds, Rydex Variable Trust and Transparent Value Trust. Messrs. Barnes and Nyberg also serve on the Board of Trustees of Advent Convertible & Income Fund. |
**** | This Trustee is deemed to be an “interested person” of the Fund under the 1940 Act by reason of her position with the Fund’s Adviser and/or the parent of the Adviser. |
| | THE GUGGENHEIM FUNDS ANNUAL REPORT | 29 |
INFORMATION ON BOARD OF TRUSTEES AND OFFICERS (Unaudited)(continued) |
Name, Address*
and Year of Birth | Position(s) Held
with Trust | Term of Office
and Length of
Time Served** | Principal Occupation(s) During Past Five Years |
OFFICERS | | | |
Brian E. Binder (1972) | President and Chief Executive Officer | Since 2018 | Current: President, Mutual Fund Boards, Guggenheim Investments (2022-present); President and Chief Executive Officer, certain other funds in the Fund Complex (2018-present); President, Mutual Funds Boards, Guggenheim Funds Investment Advisors, LLC and Security Investors, LLC (2018-present);Board Member, Guggenheim Partners Investment Funds plc (2022-present); Board Member, Guggenheim Global Investments plc (2022-present); Board Member, Guggenheim Partners Fund Management (Europe) Limited (2018-present). Former: Senior Managing Director and Chief Administrative Officer, Guggenheim Investments (2018-2022); Managing Director and President, Deutsche Funds, and Head of US Product, Trading and Fund Administration, Deutsche Asset Management (2013-2018); Managing Director, Chairman of North American Executive Committee and Head of Business Management and Consulting, Invesco Ltd. (2010-2012). |
James Howley (1972) | Chief Financial Officer, Chief Accounting Officer and Treasurer | Since 2022 | Current: Managing Director, Guggenheim Investments (2004-present); Chief Financial Officer, Chief Accounting Officer, and Treasurer, certain other funds in the Fund Complex (2022-present). Former: Assistant Treasurer, certain other funds in the Fund Complex (2006-2022); Manager, Mutual Fund Administration of Van Kampen Investments, Inc. (1996-2004). |
Mark E. Mathiasen (1978) | Secretary | Since 2014 | Current: Secretary, certain other funds in the Fund Complex (2007-present); Managing Director, Guggenheim Investments (2007-present). |
Glenn McWhinnie (1969) | Assistant Treasurer | Since 2016 | Current: Vice President, Guggenheim Investments (2009-present); Assistant Treasurer, certain other funds in the Fund Complex (2016-present). |
Michael P. Megaris (1984) | Assistant Secretary | Since 2014 | Current: Assistant Secretary, certain other funds in the Fund Complex (2014-present); Managing Director, Guggenheim Investments (2012-present). |
Elisabeth Miller (1968) | Chief Compliance Officer | Since 2012 | Current: Chief Compliance Officer, certain other funds in the Fund Complex (2012-present); Senior Managing Director, Guggenheim Investments (2012-present); Senior Managing Director, Guggenheim Funds Distributors, LLC (2014-present). Former: Chief Compliance Officer, Security Investors, LLC and Guggenheim Funds Investment Advisors, LLC (2012-2018); Chief Compliance Officer, Guggenheim Distributors, LLC (2009-2014); Senior Manager, Security Investors, LLC (2004-2014); Senior Manager, Guggenheim Distributors, LLC (2004-2014). |
Margaux Misantone (1978) | AML Officer | Since 2017 | Current: Chief Compliance Officer, Security Investors, LLC and Guggenheim Funds Investment Advisors, LLC (2018-present); AML Officer, Security Investors, LLC and certain other funds in the Fund Complex (2017-present); Managing Director, Guggenheim Investments (2015-present). Former: Assistant Chief Compliance Officer, Security Investors, LLC and Guggenheim Funds Investments Advisors, LLC (2015-2018). |
30 | THE GUGGENHEIM FUNDS ANNUAL REPORT | |
INFORMATION ON BOARD OF TRUSTEES AND OFFICERS (Unaudited)(concluded) |
Name, Address*
and Year of Birth | Position(s) Held
with Trust | Term of Office
and Length of
Time Served** | Principal Occupation(s) During Past Five Years |
OFFICERS - concluded | |
Kimberly J. Scott (1974) | Assistant Treasurer | Since 2014 | Current: Director, Guggenheim Investments (2012-present); Assistant Treasurer, certain other funds in the Fund Complex (2012-present). Former: Financial Reporting Manager, Invesco, Ltd. (2010-2011); Vice President/Assistant Treasurer, Mutual Fund Administration for Van Kampen Investments, Inc./Morgan Stanley Investment Management (2009-2010); Manager of Mutual Fund Administration, Van Kampen Investments, Inc./Morgan Stanley Investment Management (2005-2009). |
Bryan Stone (1979) | Vice President | Since 2014 | Current: Vice President, certain other funds in the Fund Complex (2014-present); Managing Director, Guggenheim Investments (2013-present). Former: Senior Vice President, Neuberger Berman Group LLC (2009-2013); Vice President, Morgan Stanley (2002-2009). |
Jon Szafran (1989) | Assistant Treasurer | Since 2017 | Current: Director, Guggenheim Investments (2017-present); Assistant Treasurer, certain other funds in the Fund Complex (2017-present). Former: Assistant Treasurer of Henderson Global Funds and Manager of US Fund Administration, Henderson Global Investors (North America) Inc. (“HGINA”), (2017); Senior Analyst of US Fund Administration, HGINA (2014–2017); Senior Associate of Fund Administration, Cortland Capital Market Services, LLC (2013-2014); Experienced Associate, PricewaterhouseCoopers LLP (2012-2013). |
* | The business address of each officer is c/o Guggenheim Investments, 227 West Monroe Street, Chicago, Illinois 60606. |
** | Each officer serves an indefinite term, until his or her successor is duly elected and qualified. |
| | THE GUGGENHEIM FUNDS ANNUAL REPORT | 31 |
GUGGENHEIM INVESTMENTS PRIVACY NOTICE (Unaudited) |
Who We Are
This Privacy Notice describes the data protection practices of Guggenheim Investments. Guggenheim Investments as used herein refers to the affiliated investment management businesses of Guggenheim Partners, LLC: Guggenheim Funds Investment Advisors, LLC, Guggenheim Partners Investment Management, LLC, Guggenheim Funds Distributors, LLC, Security Investors, LLC, Guggenheim Investment Advisors (Europe) Limited, Guggenheim Real Estate, LLC, GS Gamma Advisors, LLC, Guggenheim Partners India Management, LLC, Guggenheim Partners Europe Limited, as well as the funds in the Guggenheim Funds complex (the “Funds”) (“Guggenheim Investments,” “we,” “us,” or “our”).
Guggenheim Partners Investment Management Holdings, LLC, located at 330 Madison Avenue, New York, New York 10017 is the data controller for your information. The affiliates who are also controllers of certain of your information are: Guggenheim Investment Advisors (Europe) Limited, Guggenheim Partners Europe Limited, Guggenheim Partners, LLC, Guggenheim Funds Investment Advisors, LLC, Guggenheim Partners Investment Management, LLC, Guggenheim Funds Distributors, LLC and Security Investors, LLC, as well as the Funds.
Our Commitment to You
Guggenheim Investments considers your privacy our utmost concern. When you become our client or investor, you entrust us with not only your hard-earned money but also with your personal and financial information. Because we have access to your private information, we hold ourselves to the highest standards in its safekeeping and use. We strictly limit how we share your information with others, whether you are a current or former Guggenheim Investments client or investor.
The Information We Collect About You
We collect certain nonpublic personal information about you from information you provide on applications, other forms, our website, and/or from third parties including investment advisors. This information includes Social Security or other tax identification number, assets, income, tax information, retirement and estate plan information, transaction history, account balance, payment history, bank account information, marital status, family relationships, information that we collect on our website through the use of “cookies,” and other personal information that you or others provide to us. We may also collect such information through your inquiries by mail, e-mail or telephone. We may also collect customer due diligence information, as required by applicable law and regulation, through third party service providers.
How We Handle Your Personal Information
The legal basis for using your information as set out in this Privacy Notice is as follows: (a) use of your personal data is necessary to perform our obligations under any contract with you (such as a contract for us to provide financial services to you); or (b) where use of your personal data is not necessary for performance of a contract, use of your personal data is necessary for our legitimate interests or the legitimate interests of others (for example, to enforce the legal terms governing our services, operate and market our website and other services we offer, ensure safe environments for our personnel and others, make and receive payments, prevent fraud and to know the customer to whom we are providing the services). Some processing is done to comply with applicable law.
In addition to the specific uses described above, we also use your information in the following manner:
| | ● | We use your information in connection with servicing your accounts. |
| | ● | We use information to respond to your requests or questions. For example, we might use your information to respond to your customer feedback. |
| | ● | We use information to improve our products and services. We may use your information to make our website and products better. We may use your information to customize your experience with us. |
| | ● | We use information for security purposes. We may use your information to protect our company and our customers. |
| | ● | We use information to communicate with you. For example, we will communicate with you about your account or our relationship. We may contact you about your feedback. We might also contact you about this Privacy Notice. We may also enroll you in our email newsletter. |
32 | THE GUGGENHEIM FUNDS ANNUAL REPORT | |
GUGGENHEIM INVESTMENTS PRIVACY NOTICE (Unaudited)(continued) |
| | ● | We use information as otherwise permitted by law, as we may notify you. |
| | ● | Aggregate/Anonymous Data. We may aggregate and/or anonymize any information collected through the website so that such information can no longer be linked to you or your device (“Aggregate/Anonymous Information”). We may use Aggregate/Anonymous Information for any purpose, including without limitation for research and marketing purposes, and may also share such data with any third parties, including advertisers, promotional partners, and sponsors. |
We do not sell information about current or former clients or their accounts to third parties. Nor do we share this information, except when necessary to complete transactions at your request, to make you aware of investment products and services that we or our affiliates offer, or as permitted or required by law.
We provide information about you to companies and individuals not affiliated with Guggenheim Investments to complete certain transactions or account changes, or to perform services for us related to your account. For example, if you ask to transfer assets from another financial institution to Guggenheim Investments, we must provide certain information about you to that company to complete the transaction. We provide the third party with only the information necessary to carry out its responsibilities and only for that purpose. And we require these third parties to treat your private information with the same high degree of confidentiality that we do. To alert you to other Guggenheim Investments products and services, we share your information within our family of affiliated companies. You may limit our sharing with affiliated companies as set out below. We may also share information with any successor to all or part of our business, or in connection with steps leading up to a merger or acquisition. For example, if part of our business was sold we may give customer information as part of that transaction. We may also share information about you with your consent.
We will release information about you if you direct us to do so, if we are compelled by law to do so, or in other circumstances as permitted by law (for example, to protect your account from fraud).
If you close your account(s) or become an inactive client or investor, we will continue to adhere to the privacy policies and practices described in this notice.
Opt-Out Provisions and Your Data Choices
The law allows you to “opt out” of certain kinds of information sharing with third parties. We do not share personal information about you with any third parties that triggers this opt-out right. This means YOU ARE ALREADY OPTED OUT.
When you are no longer our client or investor, we continue to share your information as described in this notice, and you may contact us at any time to limit our sharing by sending an email to CorporateDataPrivacy@GuggenheimPartners.com.
European Union Data Subjects and certain others: In addition to the choices set forth above, residents of the European Union and certain other jurisdictions have certain rights to (1) request access to or rectification or deletion of information we collect about them, (2) request a restriction on the processing of their information, (3) object to the processing of their information, or (4) request the portability of certain information. To exercise these or other rights, please contact us using the contact information below. We will consider all requests and provide our response within the time period stated by applicable law. Please note, however, that certain information may be exempt from such requests in some circumstances, which may include if we need to keep processing your information for our legitimate interests or to comply with a legal obligation. We may request you provide us with information necessary to confirm your identity before responding to your request.
Residents of France and certain other jurisdictions may also provide us with instructions regarding the manner in which we may continue to store, erase and share your information after your death, and where applicable, the person you have designated to exercise these rights after your death.
How We Protect Privacy Online
We take steps to protect your privacy when you use our web site – www.guggenheiminvestments.com – by using secure forms of online communication, including encryption technology, Secure Socket Layer (SSL) protocol, firewalls and user names and passwords. These safeguards vary based on the sensitivity of the information that we collect and store. However, we cannot and do not guarantee that these measures will prevent every unauthorized attempt to access, use, or disclose your information since despite our efforts, no Internet and/or other
| | THE GUGGENHEIM FUNDS ANNUAL REPORT | 33 |
GUGGENHEIM INVESTMENTS PRIVACY NOTICE (Unaudited)(concluded) |
electronic transmissions can be completely secure. Our web site uses “http cookies”—tiny pieces of information that we ask your browser to store. We use cookies for session management and security features on the Guggenheim Investments web site. We do not use them to pull data from your hard drive, to learn your e-mail address, or to view data in cookies created by other web sites. We will not share the information in our cookies or give others access to it. See the legal information area on our web site for more details about web site security and privacy features.
How We Safeguard Your Personal Information and Data Retention
We restrict access to nonpublic personal information about you to our employees and in some cases to third parties (for example, the service providers described above) as permitted by law. We maintain strict physical, electronic and procedural safeguards that comply with federal standards to guard your nonpublic personal information.
We keep your information for no longer than necessary for the purposes for which it is processed. The length of time for which we retain information depends on the purposes for which we collected and use it and/or as required to comply with applicable laws. Information may persist in copies made for backup and business continuity purposes for additional time.
International Visitors
If you are not a resident of the United States, please be aware that your information may be transferred to, stored and processed in the United States where our servers are located and our databases are operated. The data protection and other laws of the United States and other countries might not be as comprehensive as those in your country.
In such cases, we ensure that a legal basis for such a transfer exists and that adequate protection is provided as required by applicable law, for example, by using standard contractual clauses or by transferring your data to a jurisdiction that has obtained an adequacy finding. Individuals whose data may be transferred on the basis of standard contractual clauses may contact us as described below.
We’ll Keep You Informed
If you have any questions or concerns about how we treat your personal data, we encourage you to consult with us first. You may also contact the relevant supervisory authority.
We reserve the right to modify this policy at any time and will inform you promptly of material changes. You may access our privacy policy from our web site at www.guggenheiminvestments.com. Should you have any questions regarding our privacy policy, contact us by email at CorporateDataPrivacy@GuggenheimPartners.com.
34 | THE GUGGENHEIM FUNDS ANNUAL REPORT | |
LIQUIDITY RISK MANAGEMENT PROGRAM (Unaudited) |
In compliance with SEC Rule 22e-4 under the U.S. Investment Company Act of 1940 (the “Liquidity Rule”), the Guggenheim Funds Trust (the “Trust”) has adopted and implemented a written liquidity risk management program (the “Program”) for each series of the Trust (each, a “Fund” and, collectively, the “Funds”). The Trust’s Board of Trustees (the “Board”) has also designated a Program administrator (the “Administrator”).
The Liquidity Rule requires that the Program be reasonably designed to assess and manage each Fund’s liquidity risk. A Fund’s “liquidity risk” (as defined in the Liquidity Rule) is the risk that the Fund could not meet requests to redeem shares issued by the Fund without significant dilution of the remaining investors’ interests in the Fund. The Program includes a number of elements that support the assessment, management and periodic review of liquidity risk. In accordance with the Program, each Fund’s liquidity risk is assessed, managed, and periodically reviewed no less frequently than annually taking into consideration a variety of factors, including, as applicable, the Fund’s investment strategy and liquidity of portfolio investments, short-term and long-term cash flow projections, and holdings of cash and cash equivalents, as well as borrowing arrangements and other funding sources. Certain factors are considered under both normal and reasonably foreseeable stressed conditions. There is no guarantee that the Program will achieve its objective under all circumstances.
Under the Program, each Fund portfolio investment is classified into one of four liquidity categories. The classification is based on a determination of the number of days a Fund reasonably expects to take to convert the investment into cash, or sell or dispose of the investment, in current market conditions without significantly changing the investment’s market value. The Program is reasonably designed to meet Liquidity Rule requirements relating to “highly liquid investment minimums” (i.e., the minimum amount of a Fund’s net assets to be invested in highly liquid investments that are assets) and to monitor compliance with the Liquidity Rule’s limitations on a Fund’s investments in “illiquid investments” (as defined in the Liquidity Rule). Under the Liquidity Rule, a Fund is prohibited from acquiring any illiquid investment if, immediately after the acquisition, the Fund would have invested more than 15% of its net assets in illiquid investments that are assets.
During the period covered by this shareholder report, the Board received a written report (the “Report”) prepared by the Administrator addressing the Program’s operation and assessing the adequacy and effectiveness of its implementation for the period from March 31, 2022, to March 31, 2023. The Report summarized the Administrator’s assessment of the Program’s implementation and concluded that the Program operated effectively, the Program had been and continued to be reasonably designed to assess and manage each Fund’s liquidity risk, and the Program has been adequately and effectively implemented to monitor and respond to the Funds’ liquidity developments, as applicable.
Please refer to the Fund’s prospectus for more information regarding the Fund’s exposure to liquidity risk and other risks to which an investment in the Fund may be subject.
| | THE GUGGENHEIM FUNDS ANNUAL REPORT | 35 |
This page intentionally left blank.
This page intentionally left blank.
9.30.2023
Guggenheim Funds Annual Report
| |
Guggenheim Macro Opportunities Fund | | |
GuggenheimInvestments.com | MO-ANN-0923x0924 |

| | |
DEAR SHAREHOLDER | 2 |
ECONOMIC AND MARKET OVERVIEW | 4 |
ABOUT SHAREHOLDERS’ FUND EXPENSES | 6 |
MACRO OPPORTUNITIES FUND | 9 |
NOTES TO CONSOLIDATED FINANCIAL STATEMENTS | 74 |
REPORT OF INDEPENDENT REGISTERED PUBLIC ACCOUNTING FIRM | 103 |
OTHER INFORMATION | 105 |
INFORMATION ON BOARD OF TRUSTEES AND OFFICERS | 119 |
GUGGENHEIM INVESTMENTS PRIVACY NOTICE | 128 |
LIQUIDITY RISK MANAGEMENT PROGRAM | 132 |
| | THE GUGGENHEIM FUNDS ANNUAL REPORT | 1 |
Dear Shareholder:
Guggenheim Partners Investment Management, LLC (“GPIM” or “Investment Adviser”), is pleased to present the shareholder report for Guggenheim Macro Opportunities Fund (“Fund”) for the annual fiscal period ended September 30, 2023 (“Reporting Period”).
The Investment Adviser is part of Guggenheim Investments, which represents the investment management businesses of Guggenheim Partners, LLC (“Guggenheim”), a global, diversified financial services firm.
Guggenheim Funds Distributors, LLC is the distributor of the Fund. Guggenheim Funds Distributors, LLC is affiliated with Guggenheim and the Investment Adviser.
We encourage you to read the Economic and Market Overview section of the report, which follows this letter, and then the Managers’ Commentary for the Fund.
We are committed to providing innovative investment solutions and appreciate the trust you place in us.
Sincerely,
Guggenheim Partners Investment Management, LLC
October 31, 2023
Read a prospectus and summary prospectus (if available) carefully before investing. It contains the investment objectives, risks, charges, expenses and other information, which should be considered carefully before investing. Obtain a prospectus and summary prospectus (if available) at guggenheiminvestments.com or call 800.820.0888.
This material is not intended as a recommendation or as investment advice of any kind, including in connection with rollovers, transfers, and distributions. Such material is not provided in a fiduciary capacity, may not be relied upon for or in connection with the making of investment decisions, and does not constitute a solicitation of an offer to buy or sell securities. All content has been provided for informational or educational purposes only and is not intended to be and should not be construed as legal or tax advice and/or a legal opinion. Always consult a financial, tax and/or legal professional regarding your specific situation.
Macro Opportunities Fund may not be suitable for all investors. ● The Fund’s market value will change in response to interest rate changes and market conditions among other factors. In general, bond prices rise when interest rates fall and vice versa. ● The Fund’s exposure to high yield securities may subject the Fund to greater volatility. ● The intrinsic value of the underlying stocks in which the Fund invests may never be realized or the stock may decline in value. ● When market conditions are deemed appropriate, the Fund may use leverage to the full extent permitted by its investment policies and restrictions and applicable law. Leveraging will exaggerate the effect on net asset value of any increase or
2 | THE GUGGENHEIM FUNDS ANNUAL REPORT | |
decrease in the market value of the Fund’s portfolio. ● The use of short selling involves increased risks and costs. You risk paying more for a security than you received from its sale. Theoretically, stocks sold short have the risk of unlimited losses. ● The Fund may invest in derivative instruments, which may be more volatile and less liquid, increasing the risk of loss when compared to traditional securities. Certain of the derivative instruments are also subject to the risks of counterparty default and adverse tax treatment. ● Instruments and strategies (such as borrowing transactions and reverse repurchase agreements) may provide leveraged exposure to a particular investment, which will magnify any gains or losses on those investments. ● Investments in reverse repurchase agreements expose the Fund to the many of the same risks as investments in derivatives. ● The Fund’s investments in other investment vehicles subject the Fund to those risks and expenses affecting the investment vehicle. ●The Fund’s investments in foreign securities carry additional risks when compared to U.S. securities, due to the impact of diplomatic, political or economic developments in the country in question (investments in emerging markets securities are generally subject to an even greater level of risks). ● Investments in syndicated bank loans generally offer a floating interest rate and involve special types of risks. ●A highly liquid secondary market may not exist for the commodity-linked structured notes the Fund invests in, and there can be no assurance that a highly liquid secondary market will develop. ● The Fund’s exposure to the commodity markets may subject the Fund to greater volatility as commodity-linked investments may be affected by changes in overall market movements, commodity index volatility, changes in interest rates or factors affecting a particular industry or commodity such as droughts, floods, weather, embargos, tariffs and international economic, political and regulatory developments. ●The Fund’s investments in municipal securities can be affected by events that affect the municipal bond market. ●The Fund’s investments in real estate securities subject the Fund to the same risks as direct investments in real estate, which is particularly sensitive to economic downturns. ●The Fund’s investments in restricted securities may involve financial and liquidity risk. ●You may have a gain or loss when you sell your shares. ● It is important to note that the Fund is not guaranteed by the U.S. government. ● Please read the prospectus for more detailed information regarding these and other risks.
| | THE GUGGENHEIM FUNDS ANNUAL REPORT | 3 |
ECONOMIC AND MARKET OVERVIEW (Unaudited) | September 30, 2023 |
Faced with a series of strong economic data releases, the market increasingly appears to be coming to the conclusion that the economy is structurally better able to withstand higher interest rates than it really is. This dynamic can be seen by examining the move in Treasury yields, with the selloff almost entirely being due to real yields rather than inflation expectations, and with the move most pronounced at the long end of the yield curve. Digging further, however, a large portion of this shift is due to a rising term premium (the premium for unknown and unquantified risks in the future, beyond current assumptions on the path of inflation or policy rates), which is indicating greater uncertainty about the outlook.
Many forecasters are extrapolating the current year’s economic strength without recognizing the fact that growth has benefited from a number of factors this year that are unlikely to be repeated, namely an expansion of the fiscal deficit, a slowdown in inflation, and a rebound in labor supply. As these factors fade, the headwinds from tight monetary policy may be more apparent and pronounced. And the longer monetary conditions stay tight, the greater the risk of something breaking (banks and commercial real estate remain key risks). All of this suggests that the recent economic trajectory cannot be assumed to continue, especially given the substantial restraint that could be imposed by the recent rise in long-term borrowing costs.
Uncertainty is elevated given the diverging signals in the data and the fact that many traditional economic models are not “working” as they traditionally would. This uncertainty extends to the U.S. Federal Reserve, which looks set to hold off on further rate hikes while it waits to see if the data start to align with the softening conditions policymakers say they are hearing on the ground. We continue to think the gravitational pull of tight money and credit conditions could result in a slowing economy and cooler inflation over the next year, paving the way for more rate cuts than the market presently expects.
For the Reporting Period, the S&P 500® Index* returned 21.62%. The MSCI Europe-Australasia-Far East (“EAFE”) Index* returned 25.65%. The return of the MSCI Emerging Markets Index* was 11.70%.
In the bond market, the Bloomberg U.S. Aggregate Bond Index* posted a 0.64% return for the Reporting Period, while the Bloomberg U.S. Corporate High Yield Index* returned 10.28%. The return of the ICE Bank of America (“BofA”) 3-Month U.S. Treasury Bill Index* was 4.50% for the Reporting Period.
4 | THE GUGGENHEIM FUNDS ANNUAL REPORT | |
ECONOMIC AND MARKET OVERVIEW (Unaudited)(concluded) | September 30, 2023 |
The opinions and forecasts expressed may not actually come to pass. This information is subject to change at any time, based on market and other conditions, and should not be construed as a recommendation of any specific security or strategy.
*Index Definitions:
The following indices are referenced throughout this report. Indices are unmanaged and not available for direct investment. Index performance does not reflect transaction costs, fees, or expenses.
Bloomberg U.S. Aggregate Bond Index is a broad-based flagship benchmark that measures the investment grade, U.S. dollar-denominated, fixed-rate taxable bond market, including U.S. Treasuries, government-related and corporate securities, mortgage-backed securities or “MBS” (agency fixed-rate and hybrid adjustable-rate mortgage, or “ARM”, pass-throughs), asset-backed securities (“ABS”), and commercial mortgage-backed securities (“CMBS”) (agency and non-agency).
Bloomberg U.S. Corporate High Yield Index measures the U.S. dollar-denominated, high yield, fixed-rate corporate bond market. Securities are classified as high yield if the middle rating of Moody’s, Fitch, and S&P is Ba1/BB +/BB + or below.
ICE BofA 3-Month U.S. Treasury Bill Index is an unmanaged market index of U.S. Treasury securities maturing in 90 days that assumes reinvestment of all income.
MSCI EAFE Index is a free float-adjusted market capitalization index that is designed to measure the equity market performance of developed markets, excluding the U.S. & Canada.
MSCI Emerging Markets Index is a free float-adjusted market capitalization weighted index that is designed to measure equity market performance in the global emerging markets.
S&P 500® Index is a broad-based index, the performance of which is based on the performance of 500 widely held common stocks chosen for market size, liquidity, and industry group representation.
| | THE GUGGENHEIM FUNDS ANNUAL REPORT | 5 |
ABOUT SHAREHOLDERS’ FUND EXPENSES (Unaudited) |
All mutual funds have operating expenses, and it is important for our shareholders to understand the impact of costs on their investments. Shareholders of a fund incur two types of costs: (i) transaction costs, including sales charges (loads) on purchase payments, reinvested dividends, other distributions, and exchange fees, and (ii) ongoing costs, including management fees, administrative services, and shareholder reports, among others. These ongoing costs, or operating expenses, are deducted from a fund’s gross income and reduce the investment return of the fund.
A fund’s expenses are expressed as a percentage of its average net assets, which is known as the expense ratio. The following examples are intended to help investors understand the ongoing costs (in dollars) of investing in a fund and to compare these costs with the ongoing costs of investing in other mutual funds.
The examples are based on an investment of $1,000 made at the beginning of the period and held for the entire six-month period beginning March 31, 2023 and ending September 30, 2023.
The following tables illustrate the Fund’s costs in two ways:
Table 1. Based on actual Fund return: This section helps investors estimate the actual expenses paid over the period. The “Ending Account Value” shown is derived from the Fund’s actual return, and the fifth column shows the dollar amount that would have been paid by an investor who started with $1,000 in the Fund. Investors may use the information here, together with the amount invested, to estimate the expenses paid over the period. Simply divide the Fund’s account value by $1,000 (for example, an $8,600 account value divided by $1,000 = 8.6), then multiply the result by the number provided under the heading “Expenses Paid During Period.”
Table 2. Based on hypothetical 5% return: This section is intended to help investors compare a fund’s cost with those of other mutual funds. The table provides information about hypothetical account values and hypothetical expenses based on the Fund’s actual expense ratio and an assumed rate of return of 5% per year before expenses, which is not the Fund’s actual return. The hypothetical account values and expenses may not be used to estimate the actual ending account balance or expenses paid during the period. The example is useful in making comparisons because the U.S. Securities and Exchange Commission (the “SEC”) requires all mutual funds to calculate expenses based on the 5% return. Investors can assess a Fund’s costs by comparing this hypothetical example with the hypothetical examples that appear in shareholder reports of other funds.
The calculations illustrated above assume no shares were bought or sold during the period. Actual costs may have been higher or lower, depending on the amount of investment and the timing of any purchases or redemptions.
6 | THE GUGGENHEIM FUNDS ANNUAL REPORT | |
ABOUT SHAREHOLDERS’ FUND EXPENSES (Unaudited)(continued) |
Please note that the expenses shown in the table are meant to highlight your ongoing costs only and do not reflect any transactional costs, such as sales charges (loads) on purchase payments, and contingent deferred sales charges (“CDSC”) on redemptions, if any. Therefore, the second table is useful in comparing ongoing costs only, and will not help you determine the relative total costs of owning different funds. In addition, if these transactional costs were included, your costs would have been higher.
More information about the Fund’s expenses, including annual expense ratios for periods up to five years (subject to the Fund’s inception date), can be found in the Financial Highlights section of this report. For additional information on operating expenses and other shareholder costs, please refer to the Fund’s prospectus.
| | THE GUGGENHEIM FUNDS ANNUAL REPORT | 7 |
ABOUT SHAREHOLDERS’ FUND EXPENSES (Unaudited)(concluded) |
| | Expense
Ratio1 | | | Fund
Return | | | Beginning
Account Value
March 31,
2023 | | | Ending
Account Value
September 30,
2023 | | | Expenses
Paid During
Period2 | |
Table 1. Based on actual Fund return3 |
A-Class | | | 1.33 | % | | | 1.43 | % | | $ | 1,000.00 | | | $ | 1,014.30 | | | $ | 6.72 | |
C-Class | | | 2.08 | % | | | 1.05 | % | | | 1,000.00 | | | | 1,010.50 | | | | 10.48 | |
P-Class | | | 1.32 | % | | | 1.42 | % | | | 1,000.00 | | | | 1,014.20 | | | | 6.67 | |
Institutional Class | | | 0.91 | % | | | 1.63 | % | | | 1,000.00 | | | | 1,016.30 | | | | 4.60 | |
R6-Class | | | 0.92 | % | | | 1.63 | % | | | 1,000.00 | | | | 1,016.30 | | | | 4.65 | |
|
Table 2. Based on hypothetical 5% return (before expenses) |
A-Class | | | 1.33 | % | | | 5.00 | % | | $ | 1,000.00 | | | $ | 1,018.40 | | | $ | 6.73 | |
C-Class | | | 2.08 | % | | | 5.00 | % | | | 1,000.00 | | | | 1,014.64 | | | | 10.50 | |
P-Class | | | 1.32 | % | | | 5.00 | % | | | 1,000.00 | | | | 1,018.45 | | | | 6.68 | |
Institutional Class | | | 0.91 | % | | | 5.00 | % | | | 1,000.00 | | | | 1,020.51 | | | | 4.61 | |
R6-Class | | | 0.92 | % | | | 5.00 | % | | | 1,000.00 | | | | 1,020.46 | | | | 4.66 | |
1 | This ratio represents annualized net expenses, which may include short interest expense. Excluding these expenses, the operating expense ratios for the Fund would be 1.32%, 2.08%, 1.32%, 0.91% and 0.91% for the A-Class, C-Class, P-Class, Institutional Class and R6-Class, respectively. Excludes expenses of the underlying funds in which the Fund invests. |
2 | Expenses are equal to the Fund’s annualized expense ratio, net of any applicable fee waivers, multiplied by the average account value over the period, multiplied by 183/365 (to reflect the one-half year period). |
3 | Actual cumulative return at net asset value for the period March 31, 2023 to September 30, 2023. |
8 | THE GUGGENHEIM FUNDS ANNUAL REPORT | |
MANAGERS’ COMMENTARY (Unaudited) | September 30, 2023 |
To Our Shareholders
Guggenheim Partners Investment Management, LLC (“GPIM”) serves as the investment adviser to Guggenheim Macro Opportunities Fund (“Fund”). The Fund is managed by a team of seasoned professionals at GPIM, including Anne B. Walsh, CFA, JD, Chief Investment Officer and Managing Partner; Steven H. Brown, CFA, Chief Investment Officer, Total Return and Macro Strategies, Senior Managing Director, and Portfolio Manager; Adam J. Bloch, Managing Director and Portfolio Manager; and Evan L. Serdensky, Director and Portfolio Manager. In the subsequent paragraphs, the investment team discusses the Fund’s performance and the market environment for the 12-month period ended September 30, 2023 (“Reporting Period”).
For the Reporting Period, the Fund returned 7.09%1. The comparison index is the ICE BofA 3-Month Treasury Bill Index (“Index”), which returned 4.50% for the same period.
What factors contributed or detracted from the Fund’s performance during the Reporting Period?
During the Reporting Period, the Fund generated positive performance with an absolute return of 7.09%. Carry, or earned income, remained a consistent source of positive performance for the Fund. Spreads also contributed, as the credit selection and allocation within corporates and structured credit led to positive performance. Duration detracted from performance, as the yield curve bear steepened. Bear steepening refers to yield-curve widening due to long-term rates increasing more than short-term rates, amid a period of falling bond prices and rising yields. The macro sleeve, which consists of various credit and equity hedges and commodity exposure, contributed to performance.
How did the Fund use derivatives during the Reporting Period?
During the Reporting Period, the Fund used interest rate futures, options, swaptions, and swaps to help manage duration, generate additional yield, and for hedging purposes. Credit default swaps and total return swaps were used to both obtain and hedge existing Index exposure. Forward foreign currency contracts and currency options were used for hedging and income producing purposes. The Fund also employed futures, options, total return swaps and interest rate swaps opportunistically for speculative purposes. Over the Reporting Period, interest rate swaps, interest rate swaptions, and interest rate curve caps detracted from performance while performance from futures was incrementally positive. Options on equities, which functioned as hedges to the Fund’s credit positioning, detracted from performance. Performance from credit default swaps was a minor detractor. In addition, the Fund hedged non-USD exposure with foreign-exchange derivatives, which had a negative impact on performance over the Reporting Period. Futures and options on various commodities contributed to performance over the Reporting Period.
| | THE GUGGENHEIM FUNDS ANNUAL REPORT | 9 |
MANAGERS’ COMMENTARY (Unaudited)(continued) | September 30, 2023 |
How was the Fund positioned at the end of the Reporting Period?
Over the past several quarters the Fund has increasingly prioritized diversification, quality, and liquidity as recession concerns continued to persist. The Fund has steadily moved up-in-quality and more defensively, uniquely, without having to sacrifice yield due to the move higher in interest rates. While spreads for many credit sectors have recovered to long-term-average levels, certain segments remain dislocated and offer attractive relative value. Structured credit spreads are especially cheap, with valuations currently north of the 90th percentile versus current corporate spreads.
The corporate credit allocation, which represents roughly 42% of the Fund’s holdings, has increasingly shifted to higher quality. About 32% is below-investment-grade-rated, weighted towards BB-rated high yield bonds, and 10% is investment-grade-rated. While in our view, overall corporate credit spreads are trading around fair value levels, there remain both idiosyncratic opportunities and risks across certain issuers and industries given tighter credit conditions across capital markets. Primary market offerings have priced at especially attractive levels as many investors have pulled back from lending activities. The Fund has employed modestly sized credit hedges to protect the portfolio from potential spread widening.
Structured credit, the second largest allocation in the Fund, represents roughly 29% of the Fund’s holdings. Spreads continued their rebound, but broadly remain wide, both compared to similarly rated investment-grade corporate credit and in an absolute sense. Furthermore, the lower dollar prices of these assets following the rise in interest rates sets up the potential for higher total return opportunities than typically exists in the asset class. With much of its active buying base largely coming from income-focused accounts, structured credit spreads should continue to compress from the resetting higher of yields and the resulting increased interest that comes with it. Within securitized credit, we continue to focus on opportunities senior in the capital structure with sufficient credit enhancement and often unique structural features that limit cash flow variability or extension concerns. We believe the focus on superior structures will be paramount in helping mitigate mark-to-market risks that could emerge should volatility rise.
At the end of the Reporting Period, the Fund had a duration of 2.5 years. Interest rate volatility remains elevated, which has presented the Fund with opportunities to tactically add to positions in Agency residential mortgage-backed securities (“RMBS”), locking in spreads, both static and option adjusted, that are near 15-year wides. Lastly, the Fund ended the period with 11% in cash and cash equivalents. Elevated yields on short duration products have made it more attractive to hold higher balances of liquidity with the added benefit of giving the Fund dry powder to take advantage of future market opportunities.
Despite the quarter ended September 30, 2023 continuing a trend of volatility for fixed income returns, our broader macroeconomic views from a fundamental perspective remain consistent. We continue to expect inflation to moderate with time and view the market’s increasingly optimistic expectations of a soft landing as misguided. Looking further out into the economic future, we believe the Fed’s restrictive monetary policy could ultimately shepherd in a recession in the next
10 | THE GUGGENHEIM FUNDS ANNUAL REPORT | |
MANAGERS’ COMMENTARY (Unaudited)(concluded) | September 30, 2023 |
6-18 months, which we believe will likely be met with lower rates. Ultimately, the current path of weakening growth, high prices, and high interest rates appears unsustainable, and we are already starting to see signs of pressure on consumers and levered corporate borrowers, which could call into question any soft-landing narrative.
The Fund may invest in certain of the underlying series of Guggenheim Funds Trust and Guggenheim Strategy Funds Trust, including Guggenheim Ultra Short Duration Fund, Guggenheim Strategy Fund II, and Guggenheim Strategy Fund III, (collectively, the “Short Term Investment Vehicles”), each of which are open-end management investment companies managed by Guggenheim Investments. The Short Term Investment Vehicles, which launched on March 11, 2014, are offered as short term investment options only to mutual funds, trusts, and other accounts managed by Guggenheim Investments and/or its affiliates, and are not available to the public, with the exception of Guggenheim Ultra Short Duration Fund, which is available to the public. Guggenheim Strategy Fund II and Guggenheim Strategy Fund III do not charge an investment management fee. Guggenheim Ultra Short Duration Fund charges an investment management fee but that fee is waived by the respective investee fund. For the Reporting Period, investment in the Short Term Investment Vehicles contributed to Fund performance.
Performance displayed represents past performance which is no guarantee of future results.
1 | Performance figures are based on Class A shares and do not reflect taxes that a shareholder would pay on distributions or the redemption of shares. |
The opinions and forecast expressed may not actually come to pass. This information is subject to change at any time, based on market and other conditions, and should not be construed as a recommendation of any specific security or strategy.
| | THE GUGGENHEIM FUNDS ANNUAL REPORT | 11 |
PERFORMANCE REPORT AND FUND PROFILE (Unaudited) | September 30, 2023 |
MACRO OPPORTUNITIES FUND
OBJECTIVE: Seeks to provide total return, comprised of current income and capital appreciation.
Consolidated Holdings Diversification (Market Exposure as % of Net Assets)
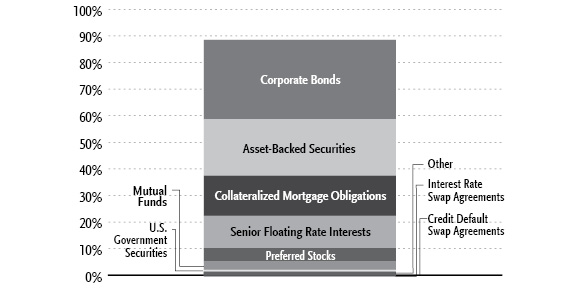
“Consolidated Holdings Diversification (Market Exposure as % of Net Assets)” excludes any temporary cash investments, investments in Guggenheim Strategy Funds Trust mutual funds, or investments in Guggenheim Ultra Short Duration Fund.
Inception Dates: |
A-Class | November 30, 2011 |
C-Class | November 30, 2011 |
P-Class | May 1, 2015 |
Institutional Class | November 30, 2011 |
R6-Class | March 13, 2019 |
Ten Largest Holdings | % of Total Net Assets |
Guggenheim Limited Duration Fund — R6-Class | 2.1% |
Fannie Mae, 5.50% due 05/01/53 | 1.8% |
Fannie Mae, 5.00% due 05/01/53 | 1.3% |
Freddie Mac, 5.50% due 02/01/53 | 0.9% |
Guggenheim Ultra Short Duration Fund — Institutional Class | 0.8% |
VanEck Gold Miners ETF | 0.7% |
BP Capital Markets plc, 4.88% | 0.6% |
FS Rialto, 7.95% | 0.6% |
Guggenheim Strategy Fund III | 0.6% |
Fortress Credit Opportunities IX CLO Ltd., 8.37% | 0.6% |
Top Ten Total | 10.0% |
| | |
“Ten Largest Holdings” excludes any temporary cash or derivative investments. |
12 | THE GUGGENHEIM FUNDS ANNUAL REPORT | |
PERFORMANCE REPORT AND FUND PROFILE (Unaudited)(continued) | September 30, 2023 |
Portfolio Composition by Quality Rating1 |
Rating | % of Total
Investments |
Fixed Income Instruments | |
AAA | 11.7% |
AA | 1.4% |
A | 11.5% |
BBB | 18.1% |
BB | 14.4% |
B | 14.5% |
CCC | 2.6% |
CC | 3.1% |
C | 0.0%* |
NR2 | 5.8% |
Other Instruments | 16.9% |
Total Investments | 100.0% |
1 | Source: BlackRock Solutions. Credit quality ratings are measured on a scale that generally ranges from AAA (highest) to D (lowest). All securities except for those labeled “NR” have been rated by Moody’s, Standard & Poor’s (“S&P”), or Fitch, each of which is a Nationally Recognized Statistical Rating Organization (“NRSRO”). For purposes of this presentation, when ratings are available from more than one agency, the highest rating is used. Guggenheim Investments has converted ratings to the equivalent S&P rating. Security ratings are determined at the time of purchase and may change thereafter. |
2 | NR (not rated) securities do not necessarily indicate low credit quality. |
* | Less than 0.1%. |
| | THE GUGGENHEIM FUNDS ANNUAL REPORT | 13 |
PERFORMANCE REPORT AND FUND PROFILE (Unaudited)(continued) | September 30, 2023 |
Cumulative Fund Performance*

14 | THE GUGGENHEIM FUNDS ANNUAL REPORT | |
PERFORMANCE REPORT AND FUND PROFILE (Unaudited)(concluded) | September 30, 2023 |
Average Annual Returns*
Periods Ended September 30, 2023
| 1 Year | 5 Year | 10 Year |
A-Class Shares | 7.09% | 1.68% | 3.10% |
A-Class Shares with sales charge† | 2.82% | 0.85% | 2.60% |
C-Class Shares | 6.25% | 0.92% | 2.33% |
C-Class Shares with CDSC‡ | 5.25% | 0.92% | 2.33% |
Institutional Class Shares | 7.47% | 2.08% | 3.49% |
ICE BofA 3-Month U.S. Treasury Bill Index | 4.50% | 1.72% | 1.12% |
| 1 Year | 5 Year | Since
Inception
(05/01/15) |
P-Class Shares | 7.09% | 1.68% | 2.58% |
ICE BofA 3-Month U.S. Treasury Bill Index | 4.50% | 1.72% | 1.32% |
| | 1 Year | Since
Inception
(03/13/19) |
R6-Class Shares | | 7.51% | 2.41% |
ICE BofA 3-Month U.S. Treasury Bill Index | | 4.50% | 1.67% |
* | The performance data above represents past performance that is not predictive of future results. The investment return and principal value of an investment in the Fund will fluctuate so that an investor’s shares, when redeemed, may be worth more or less than their original cost. Returns are historical and include changes in principal and reinvested dividends and capital gains and do not reflect the effect of taxes. The ICE BofA 3-Month U.S. Treasury Bill Index is an unmanaged index and, unlike the Fund, has no management fees or operating expenses to reduce its reported return. The graph is based on A-Class shares only; performance for C-Class shares, P-Class shares, Institutional Class shares and R6-Class shares will vary due to differences in fee structures. |
† | Effective October 1, 2015, the maximum sales charge decreased from 4.75% to 4.00%. A 4.75% maximum sales charge is used in the calculation of the Average Annual Returns based on subscriptions made prior to October 1, 2015, and a 4.00% maximum sales charge is used to calculate performance for periods based on subscriptions made on or after October 1, 2015. |
‡ | Fund returns include a CDSC of 1% if redeemed within 12 months of purchase. |
| | THE GUGGENHEIM FUNDS ANNUAL REPORT | 15 |
CONSOLIDATED SCHEDULE OF INVESTMENTS | September 30, 2023 |
MACRO OPPORTUNITIES FUND | |
| | Shares | | | Value | |
COMMON STOCKS† - 0.2% |
| | | | | | | | | |
Utilities - 0.1% |
Texgen Power LLC*,†† | | | 180,169 | | | $ | 4,774,478 | |
| | | | | | | | | |
Consumer, Cyclical - 0.1% |
ATD New Holdings, Inc.*,†† | | | 42,478 | | | | 1,529,208 | |
| | | | | | | | | |
Industrial - 0.0% |
Schur Flexibles GesmbH*,†† | | | 1,661 | | | | 592,190 | |
BP Holdco LLC*,†††,1 | | | 37,539 | | | | 48,218 | |
Vector Phoenix Holdings, LP*,††† | | | 37,539 | | | | 2,306 | |
YAK BLOCKER 2 LLC*,††† | | | 74,424 | | | | 744 | |
YAK BLOCKER 2 LLC*,††† | | | 68,788 | | | | 688 | |
Targus, Inc.*,††† | | | 12,773 | | | | 377 | |
Targus, Inc.*,††† | | | 12,773 | | | | 377 | |
Targus, Inc.*,††† | | | 12,773 | | | | 307 | |
API Heat Transfer Parent LLC*,††† | | | 1,763,707 | | | | 176 | |
Targus, Inc.*,††† | | | 12,773 | | | | 140 | |
Targus, Inc.*,††† | | | 12,773 | | | | 1 | |
Total Industrial | | | | | | | 645,524 | |
| | | | | | | | | |
Financial - 0.0% |
Checkers Holdings, Inc.*,††† | | | 158,620 | | | | 631,308 | |
Pershing Square Tontine Holdings, Ltd. — Class A*,†††,2 | | | 6,864,930 | | | | 686 | |
Tensor Ltd.*,††† | | | 1,173,803 | | | | 117 | |
Total Financial | | | | | | | 632,111 | |
| | | | | | | | | |
Technology - 0.0% |
Qlik Technologies, Inc. - Class A*,††† | | | 177 | | | | 286,885 | |
Qlik Technologies, Inc. - Class B*,††† | | | 43,738 | | | | 4 | |
Total Technology | | | | | | | 286,889 | |
| | | | | | | | | |
Communications - 0.0% |
Vacasa, Inc. — Class A* | | | 503,817 | | | | 232,310 | |
| | | | | | | | | |
Consumer, Non-cyclical - 0.0% |
Cengage Learning Holdings II, Inc.*,†† | | | 21,660 | | | | 208,478 | |
Save-A-Lot*,†† | | | 22,703 | | | | 4,359 | |
Total Consumer, Non-cyclical | | | 212,837 | |
| | | | | | | | | |
Energy - 0.0% |
Permian Production Partners LLC*,††† | | | 573,522 | | | | 22,811 | |
| | | | | | | | | |
Total Common Stocks | | | | |
(Cost $11,441,249) | | | | | | | 8,336,168 | |
| | | | | | | | | |
PREFERRED STOCKS†† - 5.1% |
Financial - 4.2% |
Citigroup, Inc. |
3.88% | | | 30,600,000 | | | | 26,112,284 | |
4.00% | | | 13,100,000 | | | | 11,459,241 | |
7.38% | | | 1,400,000 | | | | 1,358,455 | |
Markel Group, Inc. |
6.00% | | | 29,050,000 | | | | 28,042,598 | |
Equitable Holdings, Inc. |
4.95% | | | 24,550,000 | | | | 23,105,508 | |
4.30% | | | 296,404 | | | | 4,478,664 | |
Wells Fargo & Co. |
3.90% | | | 25,750,000 | | | | 22,488,719 | |
Kuvare US Holdings, Inc. |
7.00% due 02/17/513 | | | 19,150,000 | | | | 20,161,216 | |
Bank of America Corp. |
4.38% | | | 13,850,000 | | | | 11,606,977 | |
6.13% | | | 5,800,000 | | | | 5,557,112 | |
Goldman Sachs Group, Inc. |
4.13% | | | 20,500,000 | | | | 16,767,520 | |
Bank of New York Mellon Corp. |
3.75% | | | 20,550,000 | | | | 16,667,969 | |
Charles Schwab Corp. |
4.00% | | | 18,700,000 | | | | 13,194,178 | |
MetLife, Inc. |
3.85% | | | 12,200,000 | | | | 11,286,064 | |
Reinsurance Group of America, Inc. |
7.13% due 10/15/52 | | | 300,400 | | | | 7,852,456 | |
16 | THE GUGGENHEIM FUNDS ANNUAL REPORT | SEE NOTES TO CONSOLIDATED FINANCIAL STATEMENTS. |
CONSOLIDATED SCHEDULE OF INVESTMENTS (continued) | September 30, 2023 |
MACRO OPPORTUNITIES FUND | |
| | Shares | | | Value | |
Jackson Financial, Inc. |
8.00% | | | 284,000 | | | $ | 7,114,200 | |
CNO Financial Group, Inc. |
5.13% due 11/25/60 | | | 324,000 | | | | 5,031,720 | |
Assurant, Inc. |
5.25% due 01/15/61 | | | 258,000 | | | | 5,031,000 | |
Selective Insurance Group, Inc. |
4.60% | | | 246,000 | | | | 4,014,720 | |
PartnerRe Ltd. |
4.88% | | | 122,848 | | | | 2,246,890 | |
First Republic Bank |
4.25% | | | 803,675 | | | | 80 | |
4.50% | | | 238,300 | | | | 71 | |
Total Financial | | | | | | | 243,577,642 | |
| | | | | | | | | |
Communications - 0.5% |
AT&T Mobility II LLC *,††† | | | 27,000 | | | | 27,000,000 | |
| | | | | | | | | |
Government - 0.4% |
CoBank ACB |
4.25% | | | 20,000,000 | | | | 15,900,000 | |
Farmer Mac |
5.75% | | | 378,000 | | | | 8,421,840 | |
Total Government | | | | | | | 24,321,840 | |
| | | | | | | | | |
Industrial - 0.0% |
YAK BLOCKER 2 LLC *,††† | | | 4,088,802 | | | | 1,022,876 | |
API Heat Transfer Intermediate*,††† | | | 218 | | | | 99,036 | |
Total Industrial | | | | | | | 1,121,912 | |
| | | | | | | | | |
Total Preferred Stocks | | | | |
(Cost $373,135,490) | | | | | | | 296,021,394 | |
| | | | | | | | | |
WARRANTS† - 0.0% |
Ginkgo Bioworks Holdings, Inc. | | | | | | | | |
Expiring 08/01/26* | | | 128,004 | | | | 28,801 | |
Acropolis Infrastructure Acquisition Corp. — Class A | | | | | | | | |
Expiring 03/31/26*,2 | | | 192,759 | | | | 11,566 | |
Pershing Square Tontine Holdings, Ltd. — Class A | | | | | | | | |
Expiring 07/24/25*,†††,2 | | | 762,770 | | | | 76 | |
Total Warrants | | | | |
(Cost $455,536) | | | | | | | 40,443 | |
| | | | | | | | | |
EXCHANGE-TRADED FUNDS† - 0.7% |
VanEck Gold Miners ETF | | | 1,430,590 | | | | 38,497,177 | |
Total Exchange-Traded Funds | | | | |
(Cost $54,624,676) | | | | | | | 38,497,177 | |
| | | | | | | | | |
MUTUAL FUNDS† - 4.8% |
Guggenheim Limited Duration Fund — R6-Class1 | | | 5,207,287 | | | | 122,839,898 | |
Guggenheim Ultra Short Duration Fund — Institutional Class1 | | | 5,010,206 | | | | 48,849,509 | |
Guggenheim Strategy Fund III1 | | | 1,372,225 | | | | 33,331,353 | |
Guggenheim Risk Managed Real Estate Fund — Institutional Class1 | | | 1,061,130 | | | | 29,711,644 | |
Guggenheim Alpha Opportunity Fund — Institutional Class1 | | | 1,017,008 | | | | 29,045,744 | |
Guggenheim Strategy Fund II1 | | | 791,418 | | | | 19,207,708 | |
Total Mutual Funds | | | | |
(Cost $292,086,492) | | | | | | | 282,985,856 | |
| | | | | | | | | |
SEE NOTES TO CONSOLIDATED FINANCIAL STATEMENTS. | THE GUGGENHEIM FUNDS ANNUAL REPORT | 17 |
CONSOLIDATED SCHEDULE OF INVESTMENTS (continued) | September 30, 2023 |
MACRO OPPORTUNITIES FUND | |
| | Shares | | | Value | |
MONEY MARKET FUNDS† - 2.1% |
Dreyfus Treasury Obligations Cash Management Fund — Institutional Shares, 5.23%4 | | | 119,127,495 | | | $ | 119,127,495 | |
Federated Hermes U.S. Treasury Cash Reserves Fund — Institutional Shares, 5.20%4 | | | 2,422,158 | | | | 2,422,158 | |
Western Asset Institutional U.S. Treasury Reserves — Institutional Shares, 5.23%4 | | | 668,623 | | | | 668,623 | |
Total Money Market Funds | | | | |
(Cost $122,218,276) | | | | | | | 122,218,276 | |
| | | Face
Amount~ | | | | | |
CORPORATE BONDS†† - 29.9% |
Financial - 9.7% | | | | | | | | |
Pershing Square Holdings Ltd. | | | | | | | | |
3.25% due 10/01/313 | | | 33,500,000 | | | | 24,282,381 | |
3.25% due 11/15/30 | | | 15,100,000 | | | | 11,418,076 | |
NFP Corp. | | | | | | | | |
6.88% due 08/15/283 | | | 28,700,000 | | | | 24,586,665 | |
7.50% due 10/01/303 | | | 4,150,000 | | | | 3,985,358 | |
4.88% due 08/15/283 | | | 3,950,000 | | | | 3,477,402 | |
Wilton RE Ltd. | | | | | | | | |
6.00% 3,5,6 | | | 31,350,000 | | | | 27,540,034 | |
GLP Capital Limited Partnership / GLP Financing II, Inc. | | | | | | | | |
4.00% due 01/15/31 | | | 22,640,000 | | | | 18,848,178 | |
5.30% due 01/15/29 | | | 6,950,000 | | | | 6,442,790 | |
Rocket Mortgage LLC / Rocket Mortgage Company-Issuer, Inc. | | | | | | | | |
3.88% due 03/01/313 | | | 21,650,000 | | | | 17,263,060 | |
2.88% due 10/15/263 | | | 8,750,000 | | | | 7,706,037 | |
Iron Mountain, Inc. | | | | | | | | |
5.63% due 07/15/323 | | | 25,025,000 | | | | 21,604,133 | |
4.50% due 02/15/313 | | | 925,000 | | | | 760,779 | |
CBS Studio Center | | | | | | | | |
8.31% (30 Day Average SOFR + 3.00%, Rate Floor: 3.00%) due 01/09/24◊,††† | | | 22,000,000 | | | | 22,000,000 | |
Liberty Mutual Group, Inc. | | | | | | | | |
4.30% due 02/01/613 | | | 36,940,000 | | | | 21,809,121 | |
Host Hotels & Resorts, LP | | | | | | | | |
3.50% due 09/15/30 | | | 24,000,000 | | | | 19,898,861 | |
Jefferies Finance LLC / JFIN Company-Issuer Corp. | | | | | | | | |
5.00% due 08/15/283 | | | 23,000,000 | | | | 19,366,143 | |
FS KKR Capital Corp. | | | | | | | | |
3.25% due 07/15/27 | | | 21,000,000 | | | | 18,082,075 | |
Mitsubishi UFJ Financial Group, Inc. | | | | | | | | |
5.42% due 02/22/296 | | | 18,050,000 | | | | 17,666,133 | |
LPL Holdings, Inc. | | | | | | | | |
4.00% due 03/15/293 | | | 14,788,000 | | | | 12,893,100 | |
4.38% due 05/15/313 | | | 5,500,000 | | | | 4,704,988 | |
Starwood Property Trust, Inc. | | | | | | | | |
4.38% due 01/15/273 | | | 19,000,000 | | | | 16,572,777 | |
Global Atlantic Finance Co. | | | | | | | | |
4.70% due 10/15/513,6 | | | 22,350,000 | | | | 16,166,207 | |
United Wholesale Mortgage LLC | | | | | | | | |
5.50% due 04/15/293 | | | 7,150,000 | | | | 6,041,750 | |
5.50% due 11/15/253 | | | 6,300,000 | | | | 5,992,419 | |
5.75% due 06/15/273 | | | 4,550,000 | | | | 4,118,205 | |
JPMorgan Chase & Co. | | | | | | | | |
5.72% due 09/14/336 | | | 16,800,000 | | | | 16,149,519 | |
Nationwide Mutual Insurance Co. | | | | | | | | |
4.35% due 04/30/503 | | | 21,150,000 | | | | 15,110,883 | |
18 | THE GUGGENHEIM FUNDS ANNUAL REPORT | SEE NOTES TO CONSOLIDATED FINANCIAL STATEMENTS. |
CONSOLIDATED SCHEDULE OF INVESTMENTS (continued) | September 30, 2023 |
MACRO OPPORTUNITIES FUND | |
| | Face
Amount~ | | | Value | |
Hampton Roads PPV LLC | | | | | | | | |
6.62% due 06/15/533 | | | 16,560,000 | | | $ | 13,410,399 | |
Sherwood Financing plc | | | | | | | | |
4.50% due 11/15/263 | | EUR | 13,600,000 | | | | 12,510,965 | |
Lloyds Banking Group plc | | | | | | | | |
5.87% due 03/06/296 | | | 12,100,000 | | | | 11,831,311 | |
Kennedy-Wilson, Inc. | | | | | | | | |
5.00% due 03/01/31 | | | 14,669,000 | | | | 10,700,805 | |
4.75% due 02/01/30 | | | 250,000 | | | | 186,529 | |
4.75% due 03/01/29 | | | 25,000 | | | | 19,188 | |
Hunt Companies, Inc. | | | | | | | | |
5.25% due 04/15/293 | | | 13,700,000 | | | | 10,760,037 | |
Corebridge Financial, Inc. | | | | | | | | |
6.88% due 12/15/526 | | | 10,750,000 | | | | 10,298,392 | |
First American Financial Corp. | | | | | | | | |
4.00% due 05/15/30 | | | 11,760,000 | | | | 9,959,428 | |
Mizuho Financial Group, Inc. | | | | | | | | |
5.67% due 05/27/296 | | | 9,850,000 | | | | 9,685,057 | |
Nationstar Mortgage Holdings, Inc. | | | | | | | | |
5.00% due 02/01/263 | | | 9,810,000 | | | | 9,163,484 | |
Jane Street Group / JSG Finance, Inc. | | | | | | | | |
4.50% due 11/15/293 | | | 9,650,000 | | | | 8,291,855 | |
OneMain Finance Corp. | | | | | | | | |
4.00% due 09/15/30 | | | 7,250,000 | | | | 5,440,074 | |
9.00% due 01/15/29 | | | 2,200,000 | | | | 2,192,894 | |
OneAmerica Financial Partners, Inc. | | | | | | | | |
4.25% due 10/15/503 | | | 11,550,000 | | | | 7,323,668 | |
QBE Insurance Group Ltd. | | | | | | | | |
5.88% 3,5,6 | | | 7,550,000 | | | | 7,176,622 | |
SLM Corp. | | | | | | | | |
3.13% due 11/02/26 | | | 7,714,000 | | | | 6,691,075 | |
Toronto-Dominion Bank | | | | | | | | |
8.13% due 10/31/826 | | | 6,300,000 | | | | 6,267,580 | |
PartnerRe Finance B LLC | | | | | | | | |
4.50% due 10/01/506 | | | 6,460,000 | | | | 5,478,964 | |
Blue Owl Capital GP LLC | | | | | | | | |
7.11% due 08/22/43††† | | | 5,000,000 | | | | 4,975,137 | |
Cushman & Wakefield US Borrower LLC | | | | | | | | |
6.75% due 05/15/283 | | | 5,303,000 | | | | 4,892,548 | |
Bank of Nova Scotia | | | | | | | | |
8.63% due 10/27/826 | | | 4,650,000 | | | | 4,637,542 | |
American Equity Investment Life Holding Co. | | | | | | | | |
5.00% due 06/15/27 | | | 4,813,000 | | | | 4,520,844 | |
Horace Mann Educators Corp. | | | | | | | | |
7.25% due 09/15/28 | | | 3,600,000 | | | | 3,596,964 | |
Accident Fund Insurance Company of America | | | | | | | | |
8.50% due 08/01/323 | | | 3,000,000 | | | | 2,923,732 | |
SBA Communications Corp. | | | | | | | | |
3.13% due 02/01/29 | | | 3,100,000 | | | | 2,585,624 | |
Prudential Financial, Inc. | | | | | | | | |
5.13% due 03/01/526 | | | 2,750,000 | | | | 2,368,147 | |
Atlas Mara Ltd. | | | | | | | | |
due 12/31/21†††,7,8 | | | 4,642,499 | | | | 2,154,120 | |
Jones Deslauriers Insurance Management, Inc. | | | | | | | | |
10.50% due 12/15/303 | | | 1,700,000 | | | | 1,729,638 | |
Iron Mountain Information Management Services, Inc. | | | | | | | | |
5.00% due 07/15/323 | | | 1,726,000 | | | | 1,418,655 | |
Total Financial | | | 567,678,352 | |
| | | | | | | | | |
SEE NOTES TO CONSOLIDATED FINANCIAL STATEMENTS. | THE GUGGENHEIM FUNDS ANNUAL REPORT | 19 |
CONSOLIDATED SCHEDULE OF INVESTMENTS (continued) | September 30, 2023 |
MACRO OPPORTUNITIES FUND | |
| | Face
Amount~ | | | Value | |
Communications - 4.3% |
British Telecommunications plc | | | | | | | | |
4.88% due 11/23/813,6 | | | 28,200,000 | | | $ | 22,622,705 | |
4.25% due 11/23/813,6 | | | 5,250,000 | | | | 4,601,725 | |
McGraw-Hill Education, Inc. | | | | | | | | |
8.00% due 08/01/293 | | | 22,634,000 | | | | 19,634,995 | |
5.75% due 08/01/283 | | | 4,600,000 | | | | 3,968,650 | |
Level 3 Financing, Inc. | | | | | | | | |
4.25% due 07/01/283 | | | 19,794,000 | | | | 12,332,321 | |
3.75% due 07/15/293 | | | 7,600,000 | | | | 4,248,036 | |
3.88% due 11/15/293 | | | 2,600,000 | | | | 2,395,384 | |
Altice France S.A. | | | | | | | | |
5.13% due 07/15/293 | | | 13,250,000 | | | | 9,419,502 | |
5.50% due 10/15/293 | | | 11,760,000 | | | | 8,456,794 | |
Virgin Media Finance plc | | | | | | | | |
5.00% due 07/15/303 | | | 21,400,000 | | | | 16,821,019 | |
UPC Broadband Finco BV | | | | | | | | |
4.88% due 07/15/313 | | | 20,200,000 | | | | 16,391,896 | |
CSC Holdings LLC | | | | | | | | |
4.13% due 12/01/303 | | | 20,672,000 | | | | 14,629,866 | |
4.63% due 12/01/303 | | | 2,715,000 | | | | 1,443,438 | |
LCPR Senior Secured Financing DAC | | | | | | | | |
5.13% due 07/15/293 | | | 16,250,000 | | | | 13,071,409 | |
Vodafone Group plc | | | | | | | | |
5.13% due 06/04/816 | | | 16,875,000 | | | | 11,449,482 | |
CCO Holdings LLC / CCO Holdings Capital Corp. | | | | | | | | |
4.50% due 06/01/333 | | | 14,265,000 | | | | 10,914,712 | |
Cable One, Inc. | | | | | | | | |
4.00% due 11/15/303 | | | 12,575,000 | | | | 9,579,635 | |
Rogers Communications, Inc. | | | | | | | | |
4.55% due 03/15/52 | | | 9,800,000 | | | | 7,148,322 | |
Sirius XM Radio, Inc. | | | | | | | | |
4.13% due 07/01/303 | | | 8,900,000 | | | | 7,125,429 | |
Paramount Global | | | | | | | | |
4.95% due 05/19/50 | | | 10,340,000 | | | | 7,003,788 | |
Match Group Holdings II LLC | | | | | | | | |
4.63% due 06/01/283 | | | 7,700,000 | | | | 6,903,165 | |
Virgin Media Secured Finance plc | | | | | | | | |
4.50% due 08/15/303 | | | 7,950,000 | | | | 6,567,491 | |
Telenet Finance Luxembourg Notes SARL | | | | | | | | |
5.50% due 03/01/28 | | | 7,000,000 | | | | 6,300,000 | |
AMC Networks, Inc. | | | | | | | | |
4.25% due 02/15/29 | | | 10,200,000 | | | | 6,258,672 | |
VZ Secured Financing BV | | | | | | | | |
5.00% due 01/15/323 | | | 6,830,000 | | | | 5,365,337 | |
Cogent Communications Group, Inc. | | | | | | | | |
7.00% due 06/15/273 | | | 3,750,000 | | | | 3,581,250 | |
Virgin Media Vendor Financing Notes IV DAC | | | | | | | | |
5.00% due 07/15/283 | | | 3,650,000 | | | | 3,149,659 | |
Radiate Holdco LLC / Radiate Finance, Inc. | | | | | | | | |
4.50% due 09/15/263 | | | 3,518,000 | | | | 2,672,502 | |
Charter Communications Operating LLC / Charter Communications Operating Capital | | | | | | | | |
3.90% due 06/01/52 | | | 3,500,000 | | | | 2,092,576 | |
TripAdvisor, Inc. | | | | | | | | |
7.00% due 07/15/253 | | | 1,800,000 | | | | 1,796,580 | |
Ziggo BV | | | | | | | | |
4.88% due 01/15/303 | | | 1,685,000 | | | | 1,372,692 | |
Zayo Group Holdings, Inc. | | | | | | | | |
4.00% due 03/01/273 | | | 700,000 | | | | 519,320 | |
Cengage Learning, Inc. | | | | | | | | |
9.50% due 06/15/243 | | | 241,000 | | | | 241,200 | |
Total Communications | | | 250,079,552 | |
| | | | | | | | | |
20 | THE GUGGENHEIM FUNDS ANNUAL REPORT | SEE NOTES TO CONSOLIDATED FINANCIAL STATEMENTS. |
CONSOLIDATED SCHEDULE OF INVESTMENTS (continued) | September 30, 2023 |
MACRO OPPORTUNITIES FUND | |
| | Face
Amount~ | | | Value | |
Industrial - 3.2% |
IP Lending I LLC | | | | | | | | |
4.00% due 09/08/25†††,3 | | | 15,347,531 | | | $ | 14,151,958 | |
XPO, Inc. | | | | | | | | |
6.25% due 06/01/283 | | | 14,085,000 | | | | 13,627,940 | |
New Enterprise Stone & Lime Company, Inc. | | | | | | | | |
5.25% due 07/15/283 | | | 9,081,000 | | | | 8,148,111 | |
9.75% due 07/15/283 | | | 5,350,000 | | | | 5,283,125 | |
Artera Services LLC | | | | | | | | |
9.03% due 12/04/253 | | | 14,385,000 | | | | 13,270,163 | |
Great Lakes Dredge & Dock Corp. | | | | | | | | |
5.25% due 06/01/293 | | | 15,785,000 | | | | 12,946,819 | |
Boeing Co. | | | | | | | | |
5.81% due 05/01/50 | | | 12,010,000 | | | | 10,875,262 | |
TransDigm, Inc. | | | | | | | | |
6.75% due 08/15/283 | | | 7,000,000 | | | | 6,891,420 | |
6.88% due 12/15/303 | | | 4,050,000 | | | | 3,971,204 | |
Standard Industries, Inc. | | | | | | | | |
4.38% due 07/15/303 | | | 6,200,000 | | | | 5,134,834 | |
3.38% due 01/15/313 | | | 6,552,000 | | | | 5,064,571 | |
Flowserve Corp. | | | | | | | | |
3.50% due 10/01/30 | | | 10,270,000 | | | | 8,562,393 | |
IP Lending X Ltd. | | | | | | | | |
7.75% due 07/02/29†††,3 | | | 8,400,000 | | | | 8,271,244 | |
Dyal Capital Partners IV | | | | | | | | |
3.65% due 02/22/41††† | | | 10,950,000 | | | | 8,208,218 | |
Arcosa, Inc. | | | | | | | | |
4.38% due 04/15/293 | | | 9,400,000 | | | | 8,203,403 | |
GrafTech Finance, Inc. | | | | | | | | |
4.63% due 12/15/283 | | | 10,000,000 | | | | 7,732,950 | |
Pactiv Evergreen Group Issuer Incorporated/Pactiv Evergreen Group Issuer LLC | | | | | | | | |
4.00% due 10/15/273 | | | 7,943,000 | | | | 7,049,412 | |
GrafTech Global Enterprises, Inc. | | | | | | | | |
9.88% due 12/15/283 | | | 6,520,000 | | | | 6,177,700 | |
Atkore, Inc. | | | | | | | | |
4.25% due 06/01/313 | | | 6,875,000 | | | | 5,779,847 | |
Deuce FinCo plc | | | | | | | | |
5.50% due 06/15/273 | | GBP | 5,350,000 | | | | 5,723,425 | |
TopBuild Corp. | | | | | | | | |
3.63% due 03/15/293 | | | 5,550,000 | | | | 4,726,964 | |
SCIL IV LLC / SCIL USA Holdings LLC | | | | | | | | |
9.50% due 07/15/28 | | EUR | 3,500,000 | | | | 3,769,008 | |
Enviri Corp. | | | | | | | | |
5.75% due 07/31/273 | | | 4,075,000 | | | | 3,584,085 | |
Adevinta ASA | | | | | | | | |
3.00% due 11/15/27 | | EUR | 3,433,000 | | | | 3,540,386 | |
TK Elevator US Newco, Inc. | | | | | | | | |
5.25% due 07/15/273 | | | 3,000,000 | | | | 2,749,585 | |
Clearwater Paper Corp. | | | | | | | | |
4.75% due 08/15/283 | | | 1,890,000 | | | | 1,615,459 | |
AmeriTex HoldCo Intermediate LLC | | | | | | | | |
10.25% due 10/15/283 | | | 1,450,000 | | | | 1,433,687 | |
Builders FirstSource, Inc. | | | | | | | | |
6.38% due 06/15/323 | | | 800,000 | | | | 753,047 | |
Brundage-Bone Concrete Pumping Holdings, Inc. | | | | | | | | |
6.00% due 02/01/263 | | | 525,000 | | | | 499,385 | |
Total Industrial | | | 187,745,605 | |
| | | | | | | | | |
Consumer, Cyclical - 3.0% |
Hilton Domestic Operating Company, Inc. | | | | | | | | |
4.00% due 05/01/313 | | | 15,900,000 | | | | 13,366,755 | |
3.63% due 02/15/323 | | | 4,150,000 | | | | 3,345,713 | |
5.75% due 05/01/283 | | | 525,000 | | | | 507,530 | |
Mileage Plus Holdings LLC / Mileage Plus Intellectual Property Assets Ltd. | | | | | | | | |
6.50% due 06/20/273 | | | 14,775,000 | | | | 14,639,092 | |
SEE NOTES TO CONSOLIDATED FINANCIAL STATEMENTS. | THE GUGGENHEIM FUNDS ANNUAL REPORT | 21 |
CONSOLIDATED SCHEDULE OF INVESTMENTS (continued) | September 30, 2023 |
MACRO OPPORTUNITIES FUND | |
| | Face
Amount~ | | | Value | |
JB Poindexter & Company, Inc. | | | | | | | | |
7.13% due 04/15/263 | | | 11,875,000 | | | $ | 11,552,287 | |
Delta Air Lines, Inc. | | | | | | | | |
7.00% due 05/01/253 | | | 10,536,000 | | | | 10,650,380 | |
Suburban Propane Partners Limited Partnership/Suburban Energy Finance Corp. | | | | | | | | |
5.00% due 06/01/313 | | | 11,350,000 | | | | 9,474,186 | |
5.88% due 03/01/27 | | | 660,000 | | | | 630,300 | |
Evergreen Acqco 1 Limited Partnership / TVI, Inc. | | | | | | | | |
9.75% due 04/26/283 | | | 7,874,000 | | | | 8,107,070 | |
1011778 BC ULC / New Red Finance, Inc. | | | | | | | | |
4.00% due 10/15/303 | | | 9,333,000 | | | | 7,755,478 | |
Warnermedia Holdings, Inc. | | | | | | | | |
6.41% due 03/15/26 | | | 7,200,000 | | | | 7,198,796 | |
British Airways Class A Pass Through Trust | | | | | | | | |
4.25% due 11/15/323 | | | 7,434,575 | | | | 6,663,264 | |
Hyatt Hotels Corp. | | | | | | | | |
5.75% due 04/23/30 | | | 6,530,000 | | | | 6,330,502 | |
Hawaiian Brand Intellectual Property Ltd. / HawaiianMiles Loyalty Ltd. | | | | | | | | |
5.75% due 01/20/263 | | | 6,645,000 | | | | 5,979,549 | |
Hanesbrands, Inc. | | | | | | | | |
9.00% due 02/15/313 | | | 6,100,000 | | | | 5,814,188 | |
Papa John’s International, Inc. | | | | | | | | |
3.88% due 09/15/293 | | | 7,025,000 | | | | 5,798,716 | |
Penn Entertainment, Inc. | | | | | | | | |
4.13% due 07/01/293 | | | 6,975,000 | | | | 5,699,865 | |
Boyne USA, Inc. | | | | | | | | |
4.75% due 05/15/293 | | | 5,484,000 | | | | 4,796,609 | |
American Airlines Class AA Pass Through Trust | | | | | | | | |
3.58% due 01/15/28 | | | 2,172,067 | | | | 1,992,090 | |
3.35% due 10/15/29 | | | 1,167,022 | | | | 1,039,085 | |
3.65% due 02/15/29 | | | 1,017,023 | | | | 920,922 | |
3.15% due 02/15/32 | | | 972,170 | | | | 832,478 | |
Ontario Gaming GTA, LP | | | | | | | | |
8.00% due 08/01/303 | | | 4,175,000 | | | | 4,175,000 | |
Superior Plus Limited Partnership / Superior General Partner, Inc. | | | | | | | | |
4.50% due 03/15/293 | | | 4,800,000 | | | | 4,171,248 | |
Asbury Automotive Group, Inc. | | | | | | | | |
4.63% due 11/15/293 | | | 4,472,000 | | | | 3,840,912 | |
Beacon Roofing Supply, Inc. | | | | | | | | |
4.13% due 05/15/293 | | | 4,117,000 | | | | 3,520,035 | |
Allwyn Entertainment Financing UK plc | | | | | | | | |
7.88% due 04/30/293 | | | 3,450,000 | | | | 3,484,500 | |
Station Casinos LLC | | | | | | | | |
4.63% due 12/01/313 | | | 3,800,000 | | | | 3,039,556 | |
Scientific Games Holdings Limited Partnership/Scientific Games US FinCo, Inc. | | | | | | | | |
6.63% due 03/01/303 | | | 3,500,000 | | | | 3,018,750 | |
Ritchie Bros Holdings, Inc. | | | | | | | | |
6.75% due 03/15/283 | | | 2,950,000 | | | | 2,943,215 | |
Six Flags Theme Parks, Inc. | | | | | | | | |
7.00% due 07/01/253 | | | 2,757,000 | | | | 2,750,014 | |
Air Canada Class A Pass Through Trust | | | | | | | | |
5.25% due 04/01/293 | | | 2,561,246 | | | | 2,471,384 | |
PetSmart, Inc. / PetSmart Finance Corp. | | | | | | | | |
4.75% due 02/15/283 | | | 2,800,000 | | | | 2,451,227 | |
22 | THE GUGGENHEIM FUNDS ANNUAL REPORT | SEE NOTES TO CONSOLIDATED FINANCIAL STATEMENTS. |
CONSOLIDATED SCHEDULE OF INVESTMENTS (continued) | September 30, 2023 |
MACRO OPPORTUNITIES FUND | |
| | Face
Amount~ | | | Value | |
Air Canada | | | | | | | | |
4.63% due 08/15/293 | | CAD | 3,550,000 | | | $ | 2,299,092 | |
Acushnet Co. | | | | | | | | |
7.38% due 10/15/283 | | | 1,500,000 | | | | 1,511,250 | |
United Airlines, Inc. | | | | | | | | |
4.63% due 04/15/293 | | | 1,700,000 | | | | 1,461,202 | |
Aramark Services, Inc. | | | | | | | | |
6.38% due 05/01/253 | | | 1,200,000 | | | | 1,219,128 | |
CD&R Smokey Buyer, Inc. | | | | | | | | |
6.75% due 07/15/253 | | | 950,000 | | | | 915,420 | |
United Airlines Class AA Pass Through Trust | | | | | | | | |
4.15% due 08/25/31 | | | 945,045 | | | | 856,378 | |
Wyndham Hotels & Resorts, Inc. | | | | | | | | |
4.38% due 08/15/283 | | | 700,000 | | | | 628,728 | |
Total Consumer, Cyclical | | | 177,851,894 | |
| | | | | | | | | |
Energy - 3.0% |
BP Capital Markets plc | | | | | | | | |
4.88%5,6 | | | 39,360,000 | | | | 35,165,145 | |
ITT Holdings LLC | | | | | | | | |
6.50% due 08/01/293 | | | 38,952,000 | | | | 33,016,639 | |
Midwest Connector Capital Company LLC | | | | | | | | |
4.63% due 04/01/293 | | | 18,763,000 | | | | 17,148,999 | |
Targa Resources Partners Limited Partnership / Targa Resources Partners Finance Corp. | | | | | | | | |
6.88% due 01/15/29 | | | 12,632,000 | | | | 12,644,103 | |
4.88% due 02/01/31 | | | 5,000,000 | | | | 4,478,248 | |
Parkland Corp. | | | | | | | | |
4.63% due 05/01/303 | | | 20,000,000 | | | | 17,049,588 | |
Occidental Petroleum Corp. | | | | | | | | |
7.95% due 06/15/39 | | | 12,735,000 | | | | 13,805,203 | |
4.50% due 07/15/44 | | | 2,850,000 | | | | 2,007,341 | |
NuStar Logistics, LP | | | | | | | | |
6.38% due 10/01/30 | | | 14,506,000 | | | | 13,740,954 | |
5.63% due 04/28/27 | | | 450,000 | | | | 428,729 | |
Global Partners Limited Partnership / GLP Finance Corp. | | | | | | | | |
6.88% due 01/15/29 | | | 7,750,000 | | | | 7,212,693 | |
7.00% due 08/01/27 | | | 2,200,000 | | | | 2,143,882 | |
Kinetik Holdings, LP | | | | | | | | |
5.88% due 06/15/303 | | | 6,100,000 | | | | 5,718,750 | |
DT Midstream, Inc. | | | | | | | | |
4.13% due 06/15/293 | | | 5,250,000 | | | | 4,541,468 | |
TransCanada PipeLines Ltd. | | | | | | | | |
6.20% due 03/09/26 | | | 3,300,000 | | | | 3,294,578 | |
Holly Energy Partners Limited Partnership / Holly Energy Finance Corp. | | | | | | | | |
6.38% due 04/15/273 | | | 2,689,000 | | | | 2,640,006 | |
TransMontaigne Partners Limited Partnership / TLP Finance Corp. | | | | | | | | |
6.13% due 02/15/26 | | | 700,000 | | | | 597,625 | |
Basic Energy Services, Inc. | | | | | | | | |
due 10/15/238 | | | 1,438,000 | | | | 7,190 | |
Total Energy | | | 175,641,141 | |
| | | | | | | | | |
Consumer, Non-cyclical - 2.6% |
Medline Borrower, LP | | | | | | | | |
5.25% due 10/01/293 | | | 7,200,000 | | | | 6,222,933 | |
3.88% due 04/01/293 | | | 6,596,000 | | | | 5,576,407 | |
DaVita, Inc. | | | | | | | | |
4.63% due 06/01/303 | | | 8,678,000 | | | | 7,125,691 | |
3.75% due 02/15/313 | | | 4,892,000 | | | | 3,716,742 | |
US Foods, Inc. | | | | | | | | |
4.75% due 02/15/293 | | | 6,550,000 | | | | 5,854,180 | |
6.88% due 09/15/283 | | | 3,875,000 | | | | 3,866,862 | |
Bausch Health Companies, Inc. | | | | | | | | |
4.88% due 06/01/283 | | | 15,600,000 | | | | 8,871,505 | |
Sotheby’s/Bidfair Holdings, Inc. | | | | | | | | |
5.88% due 06/01/293 | | | 9,400,000 | | | | 7,543,500 | |
Cheplapharm Arzneimittel GmbH | | | | | | | | |
5.50% due 01/15/283 | | | 8,085,000 | | | | 7,335,762 | |
SEE NOTES TO CONSOLIDATED FINANCIAL STATEMENTS. | THE GUGGENHEIM FUNDS ANNUAL REPORT | 23 |
CONSOLIDATED SCHEDULE OF INVESTMENTS (continued) | September 30, 2023 |
MACRO OPPORTUNITIES FUND | |
| | Face
Amount~ | | | Value | |
JBS USA LUX S.A. / JBS USA Food Company / JBS USA Finance, Inc. | | | | | | | | |
4.38% due 02/02/52 | | | 6,500,000 | | | $ | 4,319,755 | |
3.75% due 12/01/31 | | | 3,400,000 | | | | 2,723,536 | |
Option Care Health, Inc. | | | | | | | | |
4.38% due 10/31/293 | | | 7,736,000 | | | | 6,681,970 | |
BCP V Modular Services Finance II plc | | | | | | | | |
4.75% due 10/30/283 | | EUR | 7,000,000 | | | | 6,189,711 | |
Prime Security Services Borrower LLC / Prime Finance, Inc. | | | | | | | | |
3.38% due 08/31/273 | | | 6,861,000 | | | | 6,010,904 | |
HealthEquity, Inc. | | | | | | | | |
4.50% due 10/01/293 | | | 6,555,000 | | | | 5,646,314 | |
Smithfield Foods, Inc. | | | | | | | | |
3.00% due 10/15/303 | | | 7,000,000 | | | | 5,350,863 | |
WW International, Inc. | | | | | | | | |
4.50% due 04/15/293 | | | 6,985,000 | | | | 4,906,963 | |
JBS USA LUX S.A. / JBS USA Food Company / JBS Luxembourg SARL | | | | | | | | |
6.75% due 03/15/343 | | | 4,500,000 | | | | 4,378,455 | |
Central Garden & Pet Co. | | | | | | | | |
4.13% due 04/30/313 | | | 5,300,000 | | | | 4,321,052 | |
ADT Security Corp. | | | | | | | | |
4.88% due 07/15/323 | | | 5,150,000 | | | | 4,300,250 | |
Chrome Bidco | | | | | | | | |
3.50% due 05/31/283 | | EUR | 4,800,000 | | | | 4,199,922 | |
Carriage Services, Inc. | | | | | | | | |
4.25% due 05/15/293 | | | 4,575,000 | | | | 3,913,379 | |
GTCR W-2 Merger Sub LLC | | | | | | | | |
7.50% due 01/15/313 | | | 3,875,000 | | | | 3,880,425 | |
TreeHouse Foods, Inc. | | | | | | | | |
4.00% due 09/01/28 | | | 4,575,000 | | | | 3,711,469 | |
CAB SELAS | | | | | | | | |
3.38% due 02/01/283 | | EUR | 4,100,000 | | | | 3,616,142 | |
Endo Luxembourg Finance Company I SARL / Endo US, Inc. | | | | | | | | |
due 04/01/293,8 | | | 4,400,000 | | | | 3,113,000 | |
Legends Hospitality Holding Company LLC / Legends Hospitality Co-Issuer, Inc. | | | | | | | | |
5.00% due 02/01/263 | | | 2,775,000 | | | | 2,719,500 | |
CPI CG, Inc. | | | | | | | | |
8.63% due 03/15/263 | | | 2,750,000 | | | | 2,709,272 | |
Kronos Acquisition Holdings, Inc. / KIK Custom Products, Inc. | | | | | | | | |
7.00% due 12/31/273 | | | 3,061,000 | | | | 2,640,113 | |
Catalent Pharma Solutions, Inc. | | | | | | | | |
3.13% due 02/15/293 | | | 2,825,000 | | | | 2,317,051 | |
Williams Scotsman, Inc. | | | | | | | | |
7.38% due 10/01/313 | | | 1,950,000 | | | | 1,939,361 | |
Molina Healthcare, Inc. | | | | | | | | |
4.38% due 06/15/283 | | | 1,770,000 | | | | 1,586,005 | |
Fortrea Holdings, Inc. | | | | | | | | |
7.50% due 07/01/303 | | | 1,570,000 | | | | 1,527,634 | |
Tenet Healthcare Corp. | | | | | | | | |
4.63% due 06/15/28 | | | 975,000 | | | | 877,648 | |
5.13% due 11/01/27 | | | 550,000 | | | | 511,849 | |
Par Pharmaceutical, Inc. | | | | | | | | |
due 04/01/273,8 | | | 1,825,000 | | | | 1,295,750 | |
Upbound Group, Inc. | | | | | | | | |
6.38% due 02/15/293 | | | 1,450,000 | | | | 1,286,875 | |
Altria Group, Inc. | | | | | | | | |
4.45% due 05/06/50 | | | 1,670,000 | | | | 1,182,960 | |
Performance Food Group, Inc. | | | | | | | | |
6.88% due 05/01/253 | | | 304,000 | | | | 303,620 | |
Total Consumer, Non-cyclical | | | 154,275,330 | |
| | | | | | | | | |
24 | THE GUGGENHEIM FUNDS ANNUAL REPORT | SEE NOTES TO CONSOLIDATED FINANCIAL STATEMENTS. |
CONSOLIDATED SCHEDULE OF INVESTMENTS (continued) | September 30, 2023 |
MACRO OPPORTUNITIES FUND | |
| | Face
Amount~ | | | Value | |
Technology - 1.7% |
AthenaHealth Group, Inc. | | | | | | | | |
6.50% due 02/15/303 | | | 26,650,000 | | | $ | 22,292,917 | |
Qorvo, Inc. | | | | | | | | |
3.38% due 04/01/313 | | | 9,225,000 | | | | 7,306,810 | |
4.38% due 10/15/29 | | | 7,833,000 | | | | 6,888,629 | |
NCR Corp. | | | | | | | | |
5.25% due 10/01/303 | | | 10,325,000 | | | | 8,897,912 | |
5.13% due 04/15/293 | | | 3,850,000 | | | | 3,392,076 | |
6.13% due 09/01/293 | | | 25,000 | | | | 25,638 | |
TeamSystem SpA | | | | | | | | |
7.41% (3 Month EURIBOR + 3.75%, Rate Floor: 3.75%) due 02/15/28◊ | | EUR | 11,750,000 | | | | 12,300,412 | |
CDW LLC / CDW Finance Corp. | | | | | | | | |
3.57% due 12/01/31 | | | 14,000,000 | | | | 11,530,960 | |
Booz Allen Hamilton, Inc. | | | | | | | | |
3.88% due 09/01/283 | | | 11,800,000 | | | | 10,571,620 | |
Boxer Parent Company, Inc. | | | | | | | | |
6.50% due 10/02/25 | | EUR | 5,500,000 | | | | 5,762,002 | |
Playtika Holding Corp. | | | | | | | | |
4.25% due 03/15/293 | | | 5,850,000 | | | | 4,884,750 | |
Twilio, Inc. | | | | | | | | |
3.88% due 03/15/31 | | | 4,000,000 | | | | 3,252,331 | |
Central Parent LLC / CDK Global II LLC / CDK Financing Company, Inc. | | | | | | | | |
8.00% due 06/15/293 | | | 3,050,000 | | | | 3,038,715 | |
MSCI, Inc. | | | | | | | | |
3.88% due 02/15/313 | | | 883,000 | | | | 748,082 | |
ACI Worldwide, Inc. | | | | | | | | |
5.75% due 08/15/263 | | | 400,000 | | | | 387,788 | |
Cloud Software Group, Inc. | | | | | | | | |
6.50% due 03/31/293 | | | 200,000 | | | | 176,866 | |
Total Technology | | | 101,457,508 | |
| | | | | | | | | |
Basic Materials - 1.7% |
Alcoa Nederland Holding BV | | | | | | | | |
5.50% due 12/15/273 | | | 15,125,000 | | | | 14,367,145 | |
6.13% due 05/15/283 | | | 7,450,000 | | | | 7,173,470 | |
4.13% due 03/31/293 | | | 4,900,000 | | | | 4,335,589 | |
Kaiser Aluminum Corp. | | | | | | | | |
4.50% due 06/01/313 | | | 13,250,000 | | | | 10,495,705 | |
4.63% due 03/01/283 | | | 650,000 | | | | 567,574 | |
International Flavors & Fragrances, Inc. | | | | | | | | |
1.23% due 10/01/253 | | | 11,950,000 | | | | 10,711,958 | |
Minerals Technologies, Inc. | | | | | | | | |
5.00% due 07/01/283 | | | 11,280,000 | | | | 10,346,016 | |
SCIL IV LLC / SCIL USA Holdings LLC | | | | | | | | |
5.38% due 11/01/263 | | | 10,375,000 | | | | 9,479,832 | |
SK Invictus Intermediate II SARL | | | | | | | | |
5.00% due 10/30/293 | | | 11,525,000 | | | | 9,236,481 | |
Carpenter Technology Corp. | | | | | | | | |
6.38% due 07/15/28 | | | 8,315,000 | | | | 8,019,526 | |
HB Fuller Co. | | | | | | | | |
4.25% due 10/15/28 | | | 5,250,000 | | | | 4,632,600 | |
Novelis Sheet Ingot GmbH | | | | | | | | |
3.38% due 04/15/29 | | EUR | 4,500,000 | | | | 4,103,018 | |
Arsenal AIC Parent LLC | | | | | | | | |
8.00% due 10/01/303 | | | 3,800,000 | | | | 3,781,076 | |
Ingevity Corp. | | | | | | | | |
3.88% due 11/01/283 | | | 1,000,000 | | | | 824,520 | |
Mirabela Nickel Ltd. | | | | | | | | |
due 06/24/19†††,7.8 | | | 1,885,418 | | | | 89,557 | |
Total Basic Materials | | | 98,164,067 | |
| | | | | | | | | |
Utilities - 0.7% |
AES Corp. | | | | | | | | |
3.95% due 07/15/303 | | | 9,760,000 | | | | 8,412,339 | |
Terraform Global Operating, LP | | | | | | | | |
6.13% due 03/01/263 | | | 8,285,000 | | | | 8,129,656 | |
Alexander Funding Trust II | | | | | | | | |
7.47% due 07/31/283 | | | 7,750,000 | | | | 7,760,151 | |
SEE NOTES TO CONSOLIDATED FINANCIAL STATEMENTS. | THE GUGGENHEIM FUNDS ANNUAL REPORT | 25 |
CONSOLIDATED SCHEDULE OF INVESTMENTS (continued) | September 30, 2023 |
MACRO OPPORTUNITIES FUND | |
| | Face
Amount~ | | | Value | |
Clearway Energy Operating LLC | | | | | | | | |
3.75% due 02/15/313 | | | 9,409,000 | | | $ | 7,421,806 | |
NRG Energy, Inc. | | | | | | | | |
7.00% due 03/15/333 | | | 6,950,000 | | | | 6,714,914 | |
Atlantica Sustainable Infrastructure plc | | | | | | | | |
4.13% due 06/15/283 | | | 1,550,000 | | | | 1,337,367 | |
Total Utilities | | | 39,776,233 | |
| | | | | | | | | |
Total Corporate Bonds |
(Cost $2,076,639,641) | | | 1,752,669,682 | |
| | | | | | | | | |
ASSET-BACKED SECURITIES†† - 21.1% |
Collateralized Loan Obligations - 11.9% |
LoanCore Issuer Ltd. | | | | | | | | |
2021-CRE4 D, 7.93% (30 Day Average SOFR + 2.61%, Rate Floor: 2.61%) due 07/15/35◊,3 | | | 20,500,000 | | | | 19,108,151 | |
2021-CRE6 D, 8.30% (1 Month Term SOFR + 2.96%, Rate Floor: 2.85%) due 11/15/38◊,3 | | | 11,300,000 | | | | 9,886,463 | |
2021-CRE5 D, 8.45% (1 Month Term SOFR + 3.00%, Rate Floor: 3.00%) due 07/15/36◊,3 | | | 8,250,000 | | | | 7,535,833 | |
2019-CRE2 AS, 6.95% (1 Month Term SOFR + 1.61%, Rate Floor: 1.50%) due 05/15/36◊,3 | | | 6,999,941 | | | | 6,849,005 | |
2022-CRE7 D, 8.41% (30 Day Average SOFR + 3.10%, Rate Floor: 3.10%) due 01/17/37◊,3 | | | 6,400,000 | | | | 6,014,888 | |
Fortress Credit Opportunities IX CLO Ltd. | | | | | | | | |
2021-9A CR, 8.37% (3 Month Term SOFR + 3.06%, Rate Floor: 2.80%) due 10/15/33◊,3 | | | 35,000,000 | | | | 33,262,835 | |
2021-9A DR, 9.52% (3 Month Term SOFR + 4.21%, Rate Floor: 3.95%) due 10/15/33◊,3 | | | 7,750,000 | | | | 6,897,182 | |
2021-9A A2TR, 7.37% (3 Month Term SOFR + 2.06%, Rate Floor: 1.80%) due 10/15/33◊,3 | | | 2,950,000 | | | | 2,872,778 | |
FS Rialto | | | | | | | | |
2021-FL3 D, 7.95% (1 Month Term SOFR + 2.61%, Rate Floor: 2.50%) due 11/16/36◊,3 | | | 36,500,000 | | | | 34,037,429 | |
2021-FL2 D, 8.25% (1 Month Term SOFR + 2.91%, Rate Floor: 2.91%) due 05/16/38◊,3 | | | 8,850,000 | | | | 8,277,683 | |
Palmer Square Loan Funding Ltd. | | | | | | | | |
2022-1A B, 7.31% (3 Month Term SOFR + 2.00%, Rate Floor: 2.00%) due 04/15/30◊,3 | | | 26,200,000 | | | | 25,492,770 | |
2021-3A C, 8.09% (3 Month Term SOFR + 2.76%, Rate Floor: 2.76%) due 07/20/29◊,3 | | | 8,300,000 | | | | 8,155,026 | |
26 | THE GUGGENHEIM FUNDS ANNUAL REPORT | SEE NOTES TO CONSOLIDATED FINANCIAL STATEMENTS. |
CONSOLIDATED SCHEDULE OF INVESTMENTS (continued) | September 30, 2023 |
MACRO OPPORTUNITIES FUND | |
| | Face
Amount~ | | | Value | |
2022-1A C, 7.91% (3 Month Term SOFR + 2.60%, Rate Floor: 2.60%) due 04/15/30◊,3 | | | 3,400,000 | | | $ | 3,221,157 | |
LCCM Trust | | | | | | | | |
2021-FL3 C, 8.05% (1 Month Term SOFR + 2.71%, Rate Floor: 2.71%) due 11/15/38◊,3 | | | 28,865,000 | | | | 27,243,029 | |
2021-FL2 D, 8.35% (1 Month Term SOFR + 3.01%, Rate Floor: 3.01%) due 12/13/38◊,3 | | | 5,750,000 | | | | 5,309,850 | |
BXMT Ltd. | | | | | | | | |
2020-FL2 C, 7.10% (1 Month Term SOFR + 1.76%, Rate Floor: 1.76%) due 02/15/38◊,3 | | | 15,640,000 | | | | 13,300,509 | |
2020-FL3 D, 8.25% (1 Month Term SOFR + 2.91%, Rate Floor: 2.91%) due 11/15/37◊,3 | | | 7,350,000 | | | | 6,408,611 | |
2020-FL2 D, 7.40% (1 Month Term SOFR + 2.06%, Rate Floor: 2.06%) due 02/15/38◊,3 | | | 8,000,000 | | | | 6,404,439 | |
ACRES Commercial Realty Ltd. | | | | | | | | |
2021-FL2 D, 8.55% (1 Month Term SOFR + 3.21%, Rate Floor: 3.21%) due 01/15/37◊,3 | | | 8,350,000 | | | | 7,601,741 | |
2021-FL1 D, 8.10% (1 Month Term SOFR + 2.76%, Rate Floor: 2.76%) due 06/15/36◊,3 | | | 7,250,000 | | | | 6,641,300 | |
2021-FL2 C, 8.10% (1 Month Term SOFR + 2.76%, Rate Floor: 2.76%) due 01/15/37◊,3 | | | 6,500,000 | | | | 6,023,475 | |
2021-FL2 B, 7.70% (1 Month Term SOFR + 2.36%, Rate Floor: 2.36%) due 01/15/37◊,3 | | | 3,500,000 | | | | 3,391,568 | |
Cerberus Loan Funding XLII LLC | | | | | | | | |
2023-3A C, 9.58% (3 Month Term SOFR + 4.15%, Rate Floor: 4.15%) due 09/13/35◊,3 | | | 21,550,000 | | | | 21,547,869 | |
Fontainbleau Vegas | | | | | | | | |
10.98% (1 Month Term SOFR + 5.65%, Rate Floor: 5.65%) due 01/31/26◊,††† | | | 21,100,820 | | | | 21,100,820 | |
MidOcean Credit CLO VII | | | | | | | | |
2020-7A CR, 7.77% (3 Month Term SOFR + 2.46%, Rate Floor: 0.00%) due 07/15/29◊,3 | | | 21,000,000 | | | | 20,723,023 | |
Golub Capital Partners CLO Ltd. | | | | | | | | |
2018-36A C, 7.73% (3 Month Term SOFR + 2.36%, Rate Floor: 0.00%) due 02/05/31◊,3 | | | 20,000,000 | | | | 18,782,642 | |
BSPDF Issuer Ltd. | | | | | | | | |
2021-FL1 D, 8.20% (1 Month Term SOFR + 2.86%, Rate Floor: 2.75%) due 10/15/36◊,3 | | | 19,975,000 | | | | 18,073,252 | |
SEE NOTES TO CONSOLIDATED FINANCIAL STATEMENTS. | THE GUGGENHEIM FUNDS ANNUAL REPORT | 27 |
CONSOLIDATED SCHEDULE OF INVESTMENTS (continued) | September 30, 2023 |
MACRO OPPORTUNITIES FUND | |
| | Face
Amount~ | | | Value | |
BSPRT Issuer Ltd. | | | | | | | | |
2021-FL6 D, 8.45% (1 Month Term SOFR + 3.11%, Rate Floor: 3.00%) due 03/15/36◊,3 | | | 18,425,000 | | | $ | 16,417,541 | |
2021-FL7 D, 8.20% (1 Month Term SOFR + 2.86%, Rate Floor: 2.86%) due 12/15/38◊,3 | | | 1,600,000 | | | | 1,500,972 | |
Voya CLO Ltd. | | | | | | | | |
2021-2A CR, 9.17% (3 Month Term SOFR + 3.86%, Rate Floor: 3.60%) due 06/07/30◊,3 | | | 16,500,000 | | | | 15,844,531 | |
2013-1A INC, due 10/15/303,9 | | | 28,970,307 | | | | 1,681,726 | |
Anchorage Capital CLO 6 Ltd. | | | | | | | | |
2021-6A DRR, 9.02% (3 Month Term SOFR + 3.71%, Rate Floor: 3.45%) due 07/15/30◊,3 | | | 17,350,000 | | | | 17,332,038 | |
Golub Capital Partners CLO 49M Ltd. | | | | | | | | |
2021-49A D, 9.44% (3 Month Term SOFR + 3.85%, Rate Floor: 3.85%) due 08/26/33◊,3 | | | 18,100,000 | | | | 16,271,364 | |
Cerberus Loan Funding XXX, LP | | | | | | | | |
2020-3A C, 9.22% (3 Month Term SOFR + 3.65%, Rate Cap/Floor: 14.50%/3.65%) due 01/15/33◊,3 | | | 14,500,000 | | | | 14,112,138 | |
STWD Ltd. | | | | | | | | |
2022-FL3 D, 8.06% (30 Day Average SOFR + 2.75%, Rate Floor: 2.75%) due 11/15/38◊,3 | | | 11,900,000 | | | | 10,739,082 | |
2021-FL2 D, 8.25% (1 Month Term SOFR + 2.91%, Rate Floor: 2.80%) due 04/18/38◊,3 | | | 3,750,000 | | | | 3,317,325 | |
Cerberus Loan Funding XL LLC | | | | | | | | |
2023-1A C, 9.71% (3 Month Term SOFR + 4.40%, Rate Floor: 4.40%) due 03/22/35◊,3 | | | 12,750,000 | | | | 12,529,420 | |
Neuberger Berman Loan Advisers CLO 32 Ltd. | | | | | | | | |
2021-32A DR, 8.28% (3 Month Term SOFR + 2.96%, Rate Floor: 2.70%) due 01/20/32◊,3 | | | 11,500,000 | | | | 11,119,719 | |
ABPCI Direct Lending Fund IX LLC | | | | | | | | |
2021-9A BR, 8.12% (3 Month Term SOFR + 2.76%, Rate Floor: 2.50%) due 11/18/31◊,3 | | | 11,550,000 | | | | 11,099,731 | |
Atlas Senior Loan Fund IX Ltd. | | | | | | | | |
2018-9A C, 7.39% (3 Month Term SOFR + 2.06%, Rate Floor: 1.80%) due 04/20/28◊,3 | | | 10,250,000 | | | | 10,184,583 | |
2018-9A SUB, due 04/20/283,9 | | | 9,600,000 | | | | 237,034 | |
28 | THE GUGGENHEIM FUNDS ANNUAL REPORT | SEE NOTES TO CONSOLIDATED FINANCIAL STATEMENTS. |
CONSOLIDATED SCHEDULE OF INVESTMENTS (continued) | September 30, 2023 |
MACRO OPPORTUNITIES FUND | |
| | Face
Amount~ | | | Value | |
Diamond CLO Ltd. | | | | | | | | |
2021-1A DR, 9.01% (3 Month Term SOFR + 3.66%, Rate Floor: 3.66%) due 04/25/29◊,3 | | | 5,500,000 | | | $ | 5,387,819 | |
2018-1A D, 9.31% (3 Month Term SOFR + 3.96%, Rate Floor: 3.70%) due 07/22/30◊,3 | | | 4,181,292 | | | | 4,154,521 | |
2021-1A CR, 8.01% (3 Month Term SOFR + 2.66%, Rate Floor: 2.66%) due 04/25/29◊,3 | | | 448,217 | | | | 446,752 | |
GoldenTree Loan Management US CLO 1 Ltd. | | | | | | | | |
2021-9A D, 8.49% (3 Month Term SOFR + 3.16%, Rate Floor: 2.90%) due 01/20/33◊,3 | | | 9,950,000 | | | | 9,587,319 | |
KREF Funding V LLC | | | | | | | | |
7.19% (1 Month Term SOFR + 1.86%, Rate Floor: 1.86%) due 06/25/26◊,††† | | | 9,588,167 | | | | 9,510,001 | |
0.15% due 06/25/26†††,10 | | | 73,636,363 | | | | 50,809 | |
THL Credit Lake Shore MM CLO I Ltd. | | | | | | | | |
2021-1A CR, 8.57% (3 Month Term SOFR + 3.26%, Rate Floor: 3.00%) due 04/15/33◊,3 | | | 9,900,000 | | | | 9,408,316 | |
Golub Capital Partners CLO 16 Ltd. | | | | | | | | |
2021-16A CR2, 8.51% (3 Month Term SOFR + 3.16%, Rate Floor: 2.90%) due 07/25/33◊,3 | | | 9,300,000 | | | | 8,965,318 | |
Cerberus Loan Funding XXXVI, LP | | | | | | | | |
2021-6A B, 7.32% (3 Month Term SOFR + 2.01%, Rate Floor: 1.75%) due 11/22/33◊,3 | | | 9,000,000 | | | | 8,918,728 | |
BCC Middle Market CLO LLC | | | | | | | | |
2021-1A A1R, 7.07% (3 Month Term SOFR + 1.76%, Rate Floor: 1.50%) due 10/15/33◊,3 | | | 9,000,000 | | | | 8,884,703 | |
ABPCI Direct Lending Fund CLO V Ltd. | | | | | | | | |
2021-5A BR, 8.49% (3 Month Term SOFR + 3.16%, Rate Floor: 2.90%) due 04/20/31◊,3 | | | 9,200,000 | | | | 8,843,923 | |
Magnetite XXIX Ltd. | | | | | | | | |
2021-29A D, 8.17% (3 Month Term SOFR + 2.86%, Rate Floor: 2.60%) due 01/15/34◊,3 | | | 8,800,000 | | | | 8,621,073 | |
Venture XIV CLO Ltd. | | | | | | | | |
2020-14A CRR, 7.90% (3 Month Term SOFR + 2.51%, Rate Floor: 2.25%) due 08/28/29◊,3 | | | 8,000,000 | | | | 7,993,600 | |
CIFC Funding Ltd. | | | | | | | | |
2021-2A DR, 8.69% (3 Month Term SOFR + 3.36%, Rate Floor: 3.10%) due 04/20/30◊,3 | | | 8,100,000 | | | | 7,974,205 | |
ABPCI Direct Lending Fund CLO VII, LP | | | | | | | | |
SEE NOTES TO CONSOLIDATED FINANCIAL STATEMENTS. | THE GUGGENHEIM FUNDS ANNUAL REPORT | 29 |
CONSOLIDATED SCHEDULE OF INVESTMENTS (continued) | September 30, 2023 |
MACRO OPPORTUNITIES FUND | |
| | Face
Amount~ | | | Value | |
2021-7A BR, 8.17% (3 Month Term SOFR + 2.81%, Rate Floor: 2.55%) due 10/20/31◊,3 | | | 7,950,000 | | | $ | 7,651,961 | |
Madison Park Funding XLVIII Ltd. | | | | | | | | |
2021-48A D, 8.58% (3 Month Term SOFR + 3.26%, Rate Floor: 3.26%) due 04/19/33◊,3 | | | 7,500,000 | | | | 7,372,703 | |
Dryden 37 Senior Loan Fund | | | | | | | | |
2015-37A Q, due 01/15/313,9 | | | 9,500,000 | | | | 6,956,331 | |
FS Rialto Issuer LLC | | | | | | | | |
2022-FL5 C, 9.25% (1 Month Term SOFR + 3.92%, Rate Floor: 3.92%) due 06/19/37◊,3 | | | 6,950,000 | | | | 6,796,639 | |
ACRE Commercial Mortgage Ltd. | | | | | | | | |
2021-FL4 D, 8.05% (1 Month Term SOFR + 2.71%, Rate Floor: 2.60%) due 12/18/37◊,3 | | | 7,350,000 | | | | 6,761,667 | |
Cerberus Loan Funding XXXIII, LP | | | | | | | | |
2021-3A C, 8.37% (3 Month Term SOFR + 3.06%, Rate Floor: 2.80%) due 07/23/33◊,3 | | | 5,900,000 | | | | 5,661,135 | |
ABPCI Direct Lending Fund CLO I LLC | | | | | | | | |
2021-1A C2, 8.59% (3 Month Term SOFR + 3.26%, Rate Floor: 3.26%) due 07/20/33◊,3 | | | 5,550,000 | | | | 5,273,482 | |
CHCP Ltd. | | | | | | | | |
2021-FL1 D, 8.45% (1 Month Term SOFR + 3.11%, Rate Floor: 3.00%) due 02/15/38◊,3 | | | 5,500,000 | | | | 5,234,404 | |
WhiteHorse X Ltd. | | | | | | | | |
2015-10A E, 10.87% (3 Month Term SOFR + 5.56%, Rate Floor: 5.30%) due 04/17/27◊,3 | | | 5,022,785 | | | | 4,903,329 | |
Cerberus Loan Funding XXXV, LP | | | | | | | | |
2021-5A C, 8.17% (3 Month Term SOFR + 2.86%, Rate Floor: 2.60%) due 09/22/33◊,3 | | | 5,150,000 | | | | 4,893,697 | |
Octagon Loan Funding Ltd. | | | | | | | | |
2014-1A SUB, due 11/18/313,9 | | | 19,435,737 | | | | 4,773,475 | |
Wind River CLO Ltd. | | | | | | | | |
2018-1A ARR, 6.62% (3 Month Term SOFR + 1.31%, Rate Floor: 1.05%) due 07/18/31◊,3 | | | 3,983,606 | | | | 3,959,013 | |
Neuberger Berman Loan Advisers CLO 40 Ltd. | | | | | | | | |
2021-40A D, 8.32% (3 Month Term SOFR + 3.01%, Rate Floor: 2.75%) due 04/16/33◊,3 | | | 4,050,000 | | | | 3,924,318 | |
Dryden 50 Senior Loan Fund | | | | | | | | |
2017-50A SUB, due 07/15/303,9 | | | 7,895,000 | | | | 2,766,092 | |
30 | THE GUGGENHEIM FUNDS ANNUAL REPORT | SEE NOTES TO CONSOLIDATED FINANCIAL STATEMENTS. |
CONSOLIDATED SCHEDULE OF INVESTMENTS (continued) | September 30, 2023 |
MACRO OPPORTUNITIES FUND | |
| | Face
Amount~ | | | Value | |
HGI CRE CLO Ltd. | | | | | | | | |
2021-FL2 D, 7.60% (1 Month Term SOFR + 2.26%, Rate Floor: 2.26%) due 09/17/36◊,3 | | | 1,600,000 | | | $ | 1,490,227 | |
2021-FL2 E, 7.90% (1 Month Term SOFR + 2.56%, Rate Floor: 2.56%) due 09/17/36◊,3 | | | 1,200,000 | | | | 1,119,860 | |
Denali Capital CLO XI Ltd. | | | | | | | | |
2018-1A BRR, 7.74% (3 Month Term SOFR + 2.41%, Rate Floor: 0.26%) due 10/20/28◊,3 | | | 2,500,000 | | | | 2,493,118 | |
BDS Ltd. | | | | | | | | |
2021-FL9 E, 8.05% (1 Month Term SOFR + 2.71%, Rate Floor: 2.60%) due 11/16/38◊,3 | | | 2,700,000 | | | | 2,485,484 | |
KVK CLO Ltd. | | | | | | | | |
2013-1A SUB, due 01/14/283,9 | | | 11,900,000 | | | | 2,111,369 | |
Carlyle Global Market Strategies CLO Ltd. | | | | | | | | |
2012-3A SUB, due 01/14/323,9 | | | 6,400,000 | | | | 1,696,000 | |
2013-3X SUB, due 10/15/309 | | | 4,938,326 | | | | 346,374 | |
Goldentree Loan Management US CLO 4 Ltd. | | | | | | | | |
2021-4A DR, 8.76% (3 Month Term SOFR + 3.41%, Rate Floor: 3.15%) due 04/24/31◊,3 | | | 2,000,000 | | | | 1,966,762 | |
BNPP IP CLO Ltd. | | | | | | | | |
2014-2A E, 10.88% (3 Month Term SOFR + 5.51%, Rate Floor: 0.00%) due 10/30/25◊,3 | | | 6,226,382 | | | | 1,874,639 | |
Dryden 41 Senior Loan Fund | | | | | | | | |
2015-41A SUB, due 04/15/313,9 | | | 11,700,000 | | | | 1,826,698 | |
PFP Ltd. | | | | | | | | |
2021-7 E, 8.45% (1 Month Term SOFR + 3.11%, Rate Floor: 3.00%) due 04/14/38◊,3 | | | 1,789,911 | | | | 1,684,760 | |
AMMC CLO XI Ltd. | | | | | | | | |
2012-11A SUB, due 04/30/313,9 | | | 5,650,000 | | | | 1,521,364 | |
Hull Street CLO Ltd. | | | | | | | | |
2014-1A D, 9.17% (3 Month Term SOFR + 3.86%, Rate Floor: 0.00%) due 10/18/26◊,3 | | | 1,417,814 | | | | 1,416,571 | |
Marathon CLO V Ltd. | | | | | | | | |
2017-5A A2R, 7.09% (3 Month Term SOFR + 1.71%, Rate Floor: 0.00%) due 11/21/27◊,3 | | | 930,801 | | | | 929,703 | |
2013-5A SUB, due 11/21/273,9 | | | 5,500,000 | | | | 196,240 | |
Great Lakes CLO Ltd. | | | | | | | | |
2014-1A SUB, due 10/15/293,9 | | | 1,500,000 | | | | 577,082 | |
Venture XIII CLO Ltd. | | | | | | | | |
2013-13A SUB, due 09/10/293,9 | | | 13,790,000 | | | | 415,658 | |
Dryden Senior Loan Fund | | | | | | | | |
due 01/15/319 | | | 1,897,598 | | | | 274,404 | |
Babson CLO Ltd. | | | | | | | | |
2014-IA SUB, due 07/20/253,9 | | | 11,595,061 | | | | 270,165 | |
SEE NOTES TO CONSOLIDATED FINANCIAL STATEMENTS. | THE GUGGENHEIM FUNDS ANNUAL REPORT | 31 |
CONSOLIDATED SCHEDULE OF INVESTMENTS (continued) | September 30, 2023 |
MACRO OPPORTUNITIES FUND | |
| | Face
Amount~ | | | Value | |
Treman Park CLO Ltd. | | | | | | | | |
2015-1A SUB, due 10/20/283,9 | | | 18,918,010 | | | $ | 189,937 | |
Copper River CLO Ltd. | | | | | | | | |
2007-1A INC, due 01/20/217,9 | | | 8,150,000 | | | | 815 | |
West CLO Ltd. | | | | | | | | |
2013-1A SUB, due 11/07/253,9 | | | 5,300,000 | | | | 530 | |
Total Collateralized Loan Obligations | | | 697,113,625 | |
| | | | | | | | | |
Transport-Aircraft - 3.2% |
KDAC Aviation Finance Ltd. | | | | | | | | |
2017-1A, 4.21% due 12/15/423 | | | 27,962,846 | | | | 23,183,995 | |
AASET Trust | | | | | | | | |
2021-1A, 2.95% due 11/16/413 | | | 17,403,650 | | | | 15,315,560 | |
2017-1A, 3.97% due 05/16/423 | | | 3,122,867 | | | | 2,748,088 | |
2021-2A, 3.54% due 01/15/473 | | | 3,314,648 | | | | 2,651,950 | |
2020-1A, 4.34% due 01/16/403 | | | 3,751,347 | | | | 1,932,392 | |
Raspro Trust | | | | | | | | |
2005-1A, 6.18% (3 Month Term SOFR + 0.93%, Rate Floor: 0.93%) due 03/23/24◊,3 | | | 15,020,380 | | | | 14,923,618 | |
GAIA Aviation Ltd. | | | | | | | | |
2019-1, 3.97% due 12/15/443,11 | | | 11,201,010 | | | | 10,070,212 | |
2019-1, 5.19% due 12/15/443,11 | | | 5,043,991 | | | | 4,136,300 | |
Falcon Aerospace Ltd. | | | | | | | | |
2017-1, 4.58% due 02/15/423 | | | 7,770,694 | | | | 7,263,735 | |
2019-1, 3.60% due 09/15/393 | | | 4,196,239 | | | | 3,797,726 | |
2017-1, 6.30% due 02/15/423 | | | 3,313,090 | | | | 2,880,722 | |
Sprite Ltd. | | | | | | | | |
2021-1, 3.75% due 11/15/463 | | | 15,550,581 | | | | 13,939,264 | |
Castlelake Aircraft Securitization Trust | | | | | | | | |
2018-1, 4.13% due 06/15/433 | | | 9,103,123 | | | | 8,276,410 | |
2019-1A, 3.97% due 04/15/393 | | | 5,494,769 | | | | 4,886,578 | |
AASET US Ltd. | | | | | | | | |
2018-2A, 4.45% due 11/18/383 | | | 10,649,355 | | | | 9,259,388 | |
JOL Air Ltd. | | | | | | | | |
2019-1, 3.97% due 04/15/443 | | | 9,602,364 | | | | 8,654,707 | |
Sapphire Aviation Finance I Ltd. | | | | | | | | |
2018-1A, 4.25% due 03/15/403 | | | 9,567,958 | | | | 7,975,754 | |
Labrador Aviation Finance Ltd. | | | | | | | | |
2016-1A, 4.30% due 01/15/423 | | | 8,623,240 | | | | 7,265,545 | |
Sapphire Aviation Finance II Ltd. | | | | | | | | |
2020-1A, 4.34% due 03/15/403 | | | 8,811,255 | | | | 6,300,224 | |
2020-1A, 3.23% due 03/15/403 | | | 512,525 | | | | 433,694 | |
WAVE LLC | | | | | | | | |
2019-1, 3.60% due 09/15/443 | | | 6,435,994 | | | | 5,302,422 | |
Project Silver | | | | | | | | |
2019-1, 3.97% due 07/15/443 | | | 5,796,713 | | | | 4,914,338 | |
Navigator Aircraft ABS Ltd. | | | | | | | | |
2021-1, 3.57% due 11/15/463 | | | 5,570,424 | | | | 4,556,997 | |
Lunar Structured Aircraft Portfolio Notes | | | | | | | | |
2021-1, 3.43% due 10/15/463 | | | 5,084,559 | | | | 4,169,694 | |
32 | THE GUGGENHEIM FUNDS ANNUAL REPORT | SEE NOTES TO CONSOLIDATED FINANCIAL STATEMENTS. |
CONSOLIDATED SCHEDULE OF INVESTMENTS (continued) | September 30, 2023 |
MACRO OPPORTUNITIES FUND | |
| | Face
Amount~ | | | Value | |
MACH 1 Cayman Ltd. | | | | | | | | |
2019-1, 3.47% due 10/15/393 | | | 3,782,345 | | | $ | 3,185,567 | |
MAPS Ltd. | | | | | | | | |
2018-1A, 4.21% due 05/15/433 | | | 3,134,703 | | | | 2,809,854 | |
Slam Ltd. | | | | | | | | |
2021-1A, 3.42% due 06/15/463 | | | 3,093,840 | | | | 2,583,418 | |
Castlelake Aircraft Structured Trust | | | | | | | | |
2021-1A, 6.66% due 01/15/463 | | | 2,538,516 | | | | 2,088,981 | |
Total Transport-Aircraft | | | 185,507,133 | |
| | | | | | | | | |
Financial - 2.6% |
HarbourVest Structured Solutions IV Holdings, LP | | | | | | | | |
7.61% (3 Month USD LIBOR + 2.45%, Rate Floor: 2.45%) due 09/15/26◊,††† | | | 21,755,302 | | | | 21,759,027 | |
6.05% (3 Month EURIBOR + 2.45%, Rate Floor: 2.45%) due 09/15/26◊,††† | | EUR | 12,900,000 | | | | 13,644,847 | |
KKR Core Holding Company LLC | | | | | | | | |
4.00% due 08/12/31◊,††† | | | 23,809,039 | | | | 20,584,932 | |
Project Onyx I | | | | | | | | |
due 01/26/27◊,††† | | | 17,250,000 | | | | 17,250,752 | |
Lightning A | | | | | | | | |
5.50% due 03/01/37††† | | | 17,770,745 | | | | 16,133,915 | |
Thunderbird A | | | | | | | | |
5.50% due 03/01/37††† | | | 17,516,000 | | | | 15,901,075 | |
Ceamer Finance LLC | | | | | | | | |
6.92% due 11/15/37††† | | | 10,979,778 | | | | 10,468,159 | |
3.69% due 03/24/31††† | | | 5,502,233 | | | | 5,104,836 | |
Bib Merchant Voucher Receivables Ltd. | | | | | | | | |
4.18% due 04/07/28††† | | | 11,578,656 | | | | 10,966,117 | |
Nassau LLC | | | | | | | | |
2019-1, 3.98% due 08/15/343 | | | 10,867,958 | | | | 10,273,987 | |
Project Onyx II | | | | | | | | |
due 01/26/27◊,††† | | | 5,750,000 | | | | 5,749,792 | |
Lightning B | | | | | | | | |
7.50% due 03/01/37††† | | | 3,574,575 | | | | 3,203,068 | |
Thunderbird B | | | | | | | | |
7.50% due 03/01/37††† | | | 3,523,333 | | | | 3,157,151 | |
Aesf Vi Verdi, LP | | | | | | | | |
6.00% (3 Month EURIBOR + 2.40%, Rate Floor: 2.40%) due 11/25/24◊,††† | | EUR | 432,695 | | | | 464,512 | |
Total Financial | | | 154,662,170 | |
| | | | | | | | | |
Infrastructure - 1.2% |
VB-S1 Issuer LLC - VBTEL | | | | | | | | |
2022-1A, 5.27% due 02/15/523 | | | 39,650,000 | | | | 32,920,023 | |
Hotwire Funding LLC | | | | | | | | |
2023-1A, 8.84% due 05/20/533 | | | 20,000,000 | | | | 18,765,912 | |
2021-1, 4.46% due 11/20/513 | | | 11,750,000 | | | | 9,774,628 | |
Vault DI Issuer LLC | | | | | | | | |
2021-1A, 2.80% due 07/15/463 | | | 7,150,000 | | | | 6,212,701 | |
Blue Stream Issuer LLC | | | | | | | | |
2023-1A, 6.90% due 05/20/533 | | | 3,400,000 | | | | 3,162,389 | |
Total Infrastructure | | | 70,835,653 | |
| | | | | | | | | |
Whole Business - 0.7% |
TSGE | | | | | | | | |
2017-1, 6.25% due 09/25/31††† | | | 38,374,659 | | | | 31,596,349 | |
SEE NOTES TO CONSOLIDATED FINANCIAL STATEMENTS. | THE GUGGENHEIM FUNDS ANNUAL REPORT | 33 |
CONSOLIDATED SCHEDULE OF INVESTMENTS (continued) | September 30, 2023 |
MACRO OPPORTUNITIES FUND | |
| | Face
Amount~ | | | Value | |
Applebee’s Funding LLC / IHOP Funding LLC | | | | | | | | |
2019-1A, 4.72% due 06/05/493 | | | 9,742,590 | | | $ | 9,056,692 | |
Taco Bell Funding LLC | | | | | | | | |
2016-1A, 4.97% due 05/25/463 | | | 2,648,438 | | | | 2,552,490 | |
Wendy’s Funding LLC | | | | | | | | |
2018-1A, 3.88% due 03/15/483 | | | 377,000 | | | | 337,541 | |
Total Whole Business | | | 43,543,072 | |
| | | | | | | | | |
Net Lease - 0.7% |
CARS-DB4, LP | | | | | | | | |
2020-1A, 4.95% due 02/15/503 | | | 27,799,000 | | | | 22,302,651 | |
CARS-DB7, LP | | | | | | | | |
2023-1A, 6.50% due 09/15/53†††,3 | | | 11,300,000 | | | | 10,866,626 | |
SVC ABS LLC | | | | | | | | |
2023-1A, 5.55% due 02/20/533 | | | 5,941,323 | | | | 5,404,092 | |
Total Net Lease | | | 38,573,369 | |
| | | | | | | | | |
Single Family Residence - 0.6% |
FirstKey Homes Trust | | | | | | | | |
2020-SFR2, 4.00% due 10/19/373 | | | 13,550,000 | | | | 12,487,584 | |
2020-SFR2, 4.50% due 10/19/373 | | | 13,250,000 | | | | 12,277,563 | |
2020-SFR2, 3.37% due 10/19/373 | | | 8,550,000 | | | | 7,814,575 | |
Total Single Family Residence | | | 32,579,722 | |
| | | | | | | | | |
Insurance - 0.1% |
CHEST | | | | | | | | |
7.13% due 03/15/43††† | | | 6,000,000 | | | | 5,836,144 | |
| | | | | | | | | |
Collateralized Debt Obligations - 0.1% |
Anchorage Credit Funding 4 Ltd. | | | | | | | | |
2021-4A CR, 3.52% due 04/27/393 | | | 4,250,000 | | | | 3,491,349 | |
Total Asset-Backed Securities |
(Cost $1,315,553,143) | | | 1,232,142,237 | |
COLLATERALIZED MORTGAGE OBLIGATIONS†† - 15.2% |
Government Agency - 7.1% |
Fannie Mae | | | | | | | | |
5.50% due 05/01/53 | | | 110,754,191 | | | | 107,134,417 | |
5.00% due 05/01/53 | | | 83,417,363 | | | | 78,736,786 | |
5.00% due 08/01/53 | | | 23,018,780 | | | | 21,725,510 | |
2.00% due 03/01/52 | | | 18,463,224 | | | | 14,110,721 | |
2.50% due 10/01/51 | | | 15,537,780 | | | | 12,403,134 | |
3.00% due 03/01/52 | | | 12,612,159 | | | | 10,460,771 | |
5.00% due 09/01/52 | | | 8,470,253 | | | | 8,000,572 | |
5.00% due 06/01/53 | | | 7,694,210 | | | | 7,265,301 | |
Freddie Mac | | | | | | | | |
5.50% due 02/01/53 | | | 57,318,990 | | | | 55,535,182 | |
5.00% due 06/01/53 | | | 29,626,035 | | | | 28,004,182 | |
5.00% due 02/01/53 | | | 26,455,107 | | | | 25,003,208 | |
5.00% due 09/01/52 | | | 22,173,153 | | | | 20,941,917 | |
5.00% due 03/01/53 | | | 19,958,985 | | | | 18,846,899 | |
due 08/01/5315 | | | 9,925,590 | | | | 9,489,107 | |
Total Government Agency | | | 417,657,707 | |
| | | | | | | | | |
Residential Mortgage-Backed Securities - 6.4% |
LSTAR Securities Investment Ltd. | | | | | | | | |
2023-1, 8.81% (SOFR + 3.50%, Rate Floor: 0.00%) due 01/01/28◊,3 | | | 26,422,498 | | | | 26,404,441 | |
JP Morgan Mortgage Acquisition Trust | | | | | | | | |
2006-WMC4, 5.58% (1 Month Term SOFR + 0.26%, Rate Floor: 0.15%) due 12/25/36◊ | | | 20,892,135 | | | | 10,747,911 | |
2006-WMC3, 5.73% (1 Month Term SOFR + 0.41%, Rate Floor: 0.30%) due 08/25/36◊ | | | 8,265,365 | | | | 5,688,900 | |
2006-HE3, 5.75% (1 Month Term SOFR + 0.43%, Rate Floor: 0.32%) due 11/25/36◊ | | | 5,025,238 | | | | 4,315,946 | |
34 | THE GUGGENHEIM FUNDS ANNUAL REPORT | SEE NOTES TO CONSOLIDATED FINANCIAL STATEMENTS. |
CONSOLIDATED SCHEDULE OF INVESTMENTS (continued) | September 30, 2023 |
MACRO OPPORTUNITIES FUND | |
| | Face
Amount~ | | | Value | |
2006-WMC4, 5.55% (1 Month Term SOFR + 0.23%, Rate Floor: 0.12%) due 12/25/36◊ | | | 7,191,257 | | | $ | 3,699,223 | |
2006-WMC4, 5.51% (1 Month Term SOFR + 0.19%, Rate Floor: 0.08%) due 12/25/36◊ | | | 3,040,715 | | | | 1,563,901 | |
Ameriquest Mortgage Securities Trust | | | | | | | | |
2006-M3, 5.61% (1 Month Term SOFR + 0.29%, Rate Floor: 0.18%) due 10/25/36◊ | | | 19,153,214 | | | | 10,409,979 | |
2006-M3, 5.67% (1 Month Term SOFR + 0.35%, Rate Floor: 0.24%) due 10/25/36◊ | | | 31,546,676 | | | | 9,294,505 | |
2006-M3, 5.53% (1 Month Term SOFR + 0.21%, Rate Floor: 0.10%) due 10/25/36◊ | | | 13,114,535 | | | | 3,864,101 | |
BRAVO Residential Funding Trust | | | | | | | | |
2022-R1, 3.13% due 01/29/703,11 | | | 24,929,582 | | | | 22,337,508 | |
WaMu Asset-Backed Certificates WaMu Series | | | | | | | | |
2007-HE2, 5.79% (1 Month Term SOFR + 0.47%, Rate Floor: 0.47%) due 04/25/37◊ | | | 23,588,544 | | | | 8,760,446 | |
2007-HE2, 5.62% (1 Month Term SOFR + 0.30%, Rate Floor: 0.30%) due 04/25/37◊ | | | 17,974,262 | | | | 6,675,382 | |
2007-HE4, 5.60% (1 Month Term SOFR + 0.28%, Rate Floor: 0.28%) due 07/25/47◊ | | | 6,566,368 | | | | 4,536,429 | |
2007-HE4, 5.68% (1 Month Term SOFR + 0.36%, Rate Floor: 0.36%) due 07/25/47◊ | | | 1,968,187 | | | | 1,138,296 | |
RALI Series Trust | | | | | | | | |
2006-QO6, 5.79% (1 Month Term SOFR + 0.47%, Rate Floor: 0.36%) due 06/25/46◊ | | | 30,674,404 | | | | 7,046,619 | |
2007-QO2, 5.58% (1 Month Term SOFR + 0.26%, Rate Floor: 0.15%) due 02/25/47◊ | | | 12,871,924 | | | | 4,528,844 | |
2006-QO8, 5.83% (1 Month Term SOFR + 0.51%, Rate Floor: 0.40%) due 10/25/46◊ | | | 3,386,740 | | | | 3,114,122 | |
2006-QO6, 5.89% (1 Month Term SOFR + 0.57%, Rate Floor: 0.46%) due 06/25/46◊ | | | 7,981,062 | | | | 1,876,927 | |
2006-QO6, 5.95% (1 Month Term SOFR + 0.63%, Rate Floor: 0.52%) due 06/25/46◊ | | | 5,035,370 | | | | 1,200,519 | |
2006-QO2, 5.97% (1 Month Term SOFR + 0.65%, Rate Floor: 0.54%) due 02/25/46◊ | | | 5,947,913 | | | | 1,178,926 | |
2006-QO2, 6.11% (1 Month Term SOFR + 0.79%, Rate Floor: 0.68%) due 02/25/46◊ | | | 3,182,638 | | | | 652,407 | |
SEE NOTES TO CONSOLIDATED FINANCIAL STATEMENTS. | THE GUGGENHEIM FUNDS ANNUAL REPORT | 35 |
CONSOLIDATED SCHEDULE OF INVESTMENTS (continued) | September 30, 2023 |
MACRO OPPORTUNITIES FUND | |
| | Face
Amount~ | | | Value | |
2006-QO2, 5.87% (1 Month Term SOFR + 0.55%, Rate Floor: 0.44%) due 02/25/46◊ | | | 213,333 | | | $ | 41,162 | |
Long Beach Mortgage Loan Trust | | | | | | | | |
2006-6, 5.93% (1 Month Term SOFR + 0.61%, Rate Floor: 0.50%) due 07/25/36◊ | | | 13,711,155 | | | | 5,230,007 | |
2006-8, 5.75% (1 Month Term SOFR + 0.43%, Rate Floor: 0.32%) due 09/25/36◊ | | | 16,366,940 | | | | 4,441,335 | |
2006-1, 5.81% (1 Month Term SOFR + 0.49%, Rate Floor: 0.38%) due 02/25/36◊ | | | 3,686,909 | | | | 2,922,026 | |
2006-4, 5.75% (1 Month Term SOFR + 0.43%, Rate Floor: 0.32%) due 05/25/36◊ | | | 9,796,801 | | | | 2,746,645 | |
2006-6, 5.73% (1 Month Term SOFR + 0.41%, Rate Floor: 0.30%) due 07/25/36◊ | | | 4,269,488 | | | | 1,628,555 | |
2006-8, 5.61% (1 Month Term SOFR + 0.29%, Rate Floor: 0.18%) due 09/25/36◊ | | | 4,435,133 | | | | 1,202,978 | |
2006-6, 5.63% (1 Month Term SOFR + 0.31%, Rate Floor: 0.20%) due 07/25/36◊ | | | 2,471,516 | | | | 942,605 | |
OBX Trust | | | | | | | | |
2022-NQM9, 6.45% due 09/25/623,11 | | | 7,689,727 | | | | 7,559,891 | |
2023-NQM2, 6.80% due 01/25/623,11 | | | 6,456,463 | | | | 6,399,685 | |
2022-NQM8, 6.10% due 09/25/623,11 | | | 4,311,241 | | | | 4,215,401 | |
American Home Mortgage Assets Trust | | | | | | | | |
2006-6, 5.64% (1 Month Term SOFR + 0.32%, Rate Floor: 0.21%) due 12/25/46◊ | | | 7,340,183 | | | | 5,958,329 | |
2006-1, 5.62% (1 Month Term SOFR + 0.30%, Rate Floor: 0.19%) due 05/25/46◊ | | | 6,209,397 | | | | 5,125,745 | |
2006-3, 5.57% (1 Year CMT Rate + 0.94%, Rate Floor: 0.94%) due 10/25/46◊ | | | 4,943,739 | | | | 3,328,491 | |
Morgan Stanley IXIS Real Estate Capital Trust | | | | | | | | |
2006-2, 5.65% (1 Month Term SOFR + 0.33%, Rate Floor: 0.22%) due 11/25/36◊ | | | 21,596,796 | | | | 7,411,010 | |
2006-2, 5.58% (1 Month Term SOFR + 0.26%, Rate Floor: 0.15%) due 11/25/36◊ | | | 18,991,265 | | | | 6,517,059 | |
NYMT Loan Trust | | | | | | | | |
2022-SP1, 5.25% due 07/25/623,11 | | | 13,168,804 | | | | 12,704,096 | |
GCAT Trust | | | | | | | | |
2022-NQM5, 5.71% due 08/25/673,11 | | | 8,863,141 | | | | 8,580,861 | |
2023-NQM2, 6.60% due 11/25/673,11 | | | 3,066,395 | | | | 3,027,246 | |
36 | THE GUGGENHEIM FUNDS ANNUAL REPORT | SEE NOTES TO CONSOLIDATED FINANCIAL STATEMENTS. |
CONSOLIDATED SCHEDULE OF INVESTMENTS (continued) | September 30, 2023 |
MACRO OPPORTUNITIES FUND | |
| | Face
Amount~ | | | Value | |
Morgan Stanley ABS Capital I Incorporated Trust | | | | | | | | |
2006-HE8, 5.65% (1 Month Term SOFR + 0.33%, Rate Floor: 0.22%) due 10/25/36◊ | | | 18,823,538 | | | $ | 8,014,923 | |
2006-HE6, 5.63% (1 Month Term SOFR + 0.31%, Rate Floor: 0.20%) due 09/25/36◊ | | | 4,299,857 | | | | 1,503,816 | |
2007-HE4, 5.66% (1 Month Term SOFR + 0.34%, Rate Floor: 0.23%) due 02/25/37◊ | | | 3,740,313 | | | | 1,142,861 | |
IXIS Real Estate Capital Trust | | | | | | | | |
2007-HE1, 5.59% (1 Month Term SOFR + 0.27%, Rate Floor: 0.16%) due 05/25/37◊ | | | 23,723,441 | | | | 5,608,497 | |
2007-HE1, 5.66% (1 Month Term SOFR + 0.34%, Rate Floor: 0.23%) due 05/25/37◊ | | | 16,807,725 | | | | 3,973,410 | |
GSAMP Trust | | | | | | | | |
2007-NC1, 5.56% (1 Month Term SOFR + 0.24%, Rate Floor: 0.13%) due 12/25/46◊ | | | 17,972,959 | | | | 9,371,972 | |
Master Asset-Backed Securities Trust | | | | | | | | |
2006-WMC3, 5.75% (1 Month Term SOFR + 0.43%, Rate Floor: 0.32%) due 08/25/36◊ | | | 9,973,076 | | | | 3,566,182 | |
2006-HE3, 5.63% (1 Month Term SOFR + 0.31%, Rate Floor: 0.20%) due 08/25/36◊ | | | 9,392,819 | | | | 2,808,595 | |
2006-HE3, 5.73% (1 Month Term SOFR + 0.41%, Rate Floor: 0.30%) due 08/25/36◊ | | | 7,897,118 | | | | 2,361,357 | |
Citigroup Mortgage Loan Trust, Inc. | | | | | | | | |
2007-AMC3, 5.68% (1 Month Term SOFR + 0.36%, Rate Floor: 0.25%) due 03/25/37◊ | | | 9,673,269 | | | | 7,863,044 | |
GSAA Home Equity Trust | | | | | | | | |
2006-3, 6.03% (1 Month Term SOFR + 0.71%, Rate Floor: 0.60%) due 03/25/36◊ | | | 10,077,377 | | | | 5,295,940 | |
2006-9, 5.91% (1 Month Term SOFR + 0.59%, Rate Floor: 0.48%) due 06/25/36◊ | | | 7,295,418 | | | | 2,162,395 | |
2007-7, 5.97% (1 Month Term SOFR + 0.65%, Rate Floor: 0.54%) due 07/25/37◊ | | | 396,829 | | | | 361,901 | |
CFMT LLC | | | | | | | | |
2022-HB9, 3.25% (WAC) due 09/25/37◊,7 | | | 8,650,000 | | | | 7,140,481 | |
OSAT Trust | | | | | | | | |
2021-RPL1, 2.12% due 05/25/653,11 | | | 7,318,995 | | | | 6,708,660 | |
PRPM LLC | | | | | | | | |
2023-1, 6.88% (WAC) due 02/25/28◊,3 | | | 6,052,590 | | | | 6,034,621 | |
SEE NOTES TO CONSOLIDATED FINANCIAL STATEMENTS. | THE GUGGENHEIM FUNDS ANNUAL REPORT | 37 |
CONSOLIDATED SCHEDULE OF INVESTMENTS (continued) | September 30, 2023 |
MACRO OPPORTUNITIES FUND | |
| | Face
Amount~ | | | Value | |
Home Equity Loan Trust | | | | | | | | |
2007-FRE1, 5.62% (1 Month Term SOFR + 0.30%, Rate Floor: 0.19%) due 04/25/37◊ | | | 6,383,948 | | | $ | 5,906,147 | |
First NLC Trust | | | | | | | | |
2007-1, 5.71% (1 Month Term SOFR + 0.39%, Rate Floor: 0.28%) due 08/25/37◊,3 | | | 6,440,216 | | | | 3,176,941 | |
2007-1, 5.50% (1 Month Term SOFR + 0.18%, Rate Floor: 0.07%) due 08/25/37◊,3 | | | 4,883,822 | | | | 2,409,290 | |
Lehman XS Trust Series | | | | | | | | |
2006-18N, 5.79% (1 Month Term SOFR + 0.47%, Rate Floor: 0.36%) due 12/25/36◊ | | | 3,687,508 | | | | 3,488,686 | |
2006-10N, 5.85% (1 Month Term SOFR + 0.53%, Rate Floor: 0.42%) due 07/25/46◊ | | | 2,331,108 | | | | 2,077,792 | |
Argent Securities Trust | | | | | | | | |
2006-W5, 5.73% (1 Month Term SOFR + 0.41%, Rate Floor: 0.30%) due 06/25/36◊ | | | 8,759,684 | | | | 5,556,293 | |
Merrill Lynch Mortgage Investors Trust Series | | | | | | | | |
2007-HE2, 5.85% (1 Month Term SOFR + 0.53%, Rate Floor: 0.42%) due 02/25/37◊ | | | 6,888,161 | | | | 2,025,819 | |
2007-HE2, 5.95% (1 Month Term SOFR + 0.63%, Rate Floor: 0.52%) due 02/25/37◊ | | | 4,986,041 | | | | 1,466,393 | |
2007-HE2, 5.67% (1 Month Term SOFR + 0.35%, Rate Floor: 0.24%) due 02/25/37◊ | | | 3,964,415 | | | | 1,165,890 | |
2007-HE2, 6.27% (1 Month Term SOFR + 0.95%, Rate Floor: 0.84%) due 02/25/37◊ | | | 1,613,261 | | | | 474,427 | |
Alternative Loan Trust | | | | | | | | |
2007-OA7, 5.79% (1 Month Term SOFR + 0.47%, Rate Floor: 0.36%) due 05/25/47◊ | | | 6,020,995 | | | | 5,044,754 | |
WaMu Asset-Backed Certificates WaMu Series Trust | | | | | | | | |
2007-HE1, 5.66% (1 Month Term SOFR + 0.34%, Rate Floor: 0.34%) due 01/25/37◊ | | | 7,169,000 | | | | 3,259,381 | |
2007-HE4, 5.60% (1 Month Term SOFR + 0.28%, Rate Floor: 0.28%) due 07/25/47◊ | | | 2,756,565 | | | | 1,594,276 | |
Citigroup Mortgage Loan Trust | | | | | | | | |
2022-A, 6.17% due 09/25/623,11 | | | 4,686,300 | | | | 4,644,824 | |
Verus Securitization Trust | | | | | | | | |
2022-8, 6.13% due 09/25/673,11 | | | 4,593,102 | | | | 4,502,876 | |
38 | THE GUGGENHEIM FUNDS ANNUAL REPORT | SEE NOTES TO CONSOLIDATED FINANCIAL STATEMENTS. |
CONSOLIDATED SCHEDULE OF INVESTMENTS (continued) | September 30, 2023 |
MACRO OPPORTUNITIES FUND | |
| | Face
Amount~ | | | Value | |
ACE Securities Corporation Home Equity Loan Trust Series | | | | | | | | |
2007-ASP1, 6.19% (1 Month Term SOFR + 0.87%, Rate Floor: 0.76%) due 03/25/37◊ | | | 10,488,114 | | | $ | 4,361,044 | |
HSI Asset Securitization Corporation Trust | | | | | | | | |
2007-HE1, 5.62% (1 Month Term SOFR + 0.30%, Rate Floor: 0.19%) due 01/25/37◊ | | | 5,661,445 | | | | 3,900,601 | |
Finance of America HECM Buyout | | | | | | | | |
2022-HB2, 6.00% (WAC) due 08/01/32◊,3 | | | 3,850,000 | | | | 3,460,690 | |
CSMC Trust | | | | | | | | |
2020-RPL5, 3.02% (WAC) due 08/25/60◊,3 | | | 3,385,382 | | | | 3,323,603 | |
First Franklin Mortgage Loan Trust | | | | | | | | |
2006-FF16, 5.85% (1 Month Term SOFR + 0.53%, Rate Floor: 0.42%) due 12/25/36◊ | | | 7,396,342 | | | | 3,036,859 | |
Washington Mutual Mortgage Pass-Through Certificates WMALT Series Trust | | | | | | | | |
2006-AR9, 5.47% (1 Year CMT Rate + 0.84%, Rate Floor: 0.84%) due 11/25/46◊ | | | 3,686,392 | | | | 2,933,619 | |
Morgan Stanley Mortgage Loan Trust | | | | | | | | |
2006-9AR, 5.73% (1 Month Term SOFR + 0.41%, Rate Floor: 0.30%) due 08/25/36◊ | | | 8,124,451 | | | | 2,103,637 | |
Alliance Bancorp Trust | | | | | | | | |
2007-OA1, 5.91% (1 Month Term SOFR + 0.59%, Rate Floor: 0.48%) due 07/25/37◊ | | | 1,932,111 | | | | 1,599,126 | |
Nomura Resecuritization Trust | | | | | | | | |
2015-4R, 2.73% (1 Month Term SOFR + 0.54%, Rate Floor: 0.43%) due 03/26/36◊,3 | | | 1,424,043 | | | | 1,313,537 | |
Morgan Stanley Re-REMIC Trust | | | | | | | | |
2010-R5, 3.47% due 06/26/36 | | | 491,004 | | | | 445,083 | |
Asset-Backed Securities Corporation Home Equity Loan Trust | | | | | | | | |
2006-HE5, 5.71% (1 Month Term SOFR + 0.39%, Rate Floor: 0.28%) due 07/25/36◊ | | | 58,558 | | | | 57,893 | |
Total Residential Mortgage-Backed Securities | | | 376,266,595 | |
| | | | | | | | | |
Commercial Mortgage-Backed Securities - 1.4% |
BX Commercial Mortgage Trust | | | | | | | | |
2021-VOLT, 7.45% (1 Month Term SOFR + 2.11%, Rate Floor: 2.00%) due 09/15/36◊,3 | | | 19,750,000 | | | | 18,831,491 | |
SEE NOTES TO CONSOLIDATED FINANCIAL STATEMENTS. | THE GUGGENHEIM FUNDS ANNUAL REPORT | 39 |
CONSOLIDATED SCHEDULE OF INVESTMENTS (continued) | September 30, 2023 |
MACRO OPPORTUNITIES FUND | |
| | Face
Amount~ | | | Value | |
2019-XL, 7.75% (1 Month Term SOFR + 2.41%, Rate Floor: 2.30%) due 10/15/36◊,3 | | | 1,989,000 | | | $ | 1,956,269 | |
GS Mortgage Securities Corporation Trust | | | | | | | | |
2020-UPTN, 3.35% (WAC) due 02/10/37◊,3 | | | 8,256,000 | | | | 7,196,605 | |
2020-DUNE, 7.96% (1 Month Term SOFR + 2.61%, Rate Floor: 2.50%) due 12/15/36◊,3 | | | 7,340,000 | | | | 6,952,764 | |
2020-DUNE, 7.36% (1 Month Term SOFR + 2.01%, Rate Floor: 1.90%) due 12/15/36◊,3 | | | 2,750,000 | | | | 2,633,559 | |
JP Morgan Chase Commercial Mortgage Securities Trust | | | | | | | | |
2021-NYAH, 8.09% (1 Month Term SOFR + 2.75%, Rate Floor: 2.64%) due 06/15/38◊,3 | | | 15,000,000 | | | | 12,661,117 | |
BX Trust | | | | | | | | |
2023-DELC, 8.67% (1 Month Term SOFR + 3.34%, Rate Floor: 3.34%) due 05/15/38◊,3 | | | 10,650,000 | | | | 10,643,320 | |
SMRT | | | | | | | | |
2022-MINI, 7.28% (1 Month Term SOFR + 1.95%, Rate Floor: 1.95%) due 01/15/39◊,3 | | | 10,000,000 | | | | 9,579,754 | |
MHP | | | | | | | | |
2022-MHIL, 7.94% (1 Month Term SOFR + 2.61%, Rate Floor: 2.61%) due 01/15/27◊,3 | | | 8,744,927 | | | | 8,218,402 | |
Total Commercial Mortgage-Backed Securities | | | 78,673,281 | |
| | | | | | | | | |
Military Housing - 0.3% |
Freddie Mac Military Housing Bonds Resecuritization Trust Certificates | | | | | | | | |
2015-R1, 0.70% (WAC) due 11/25/52◊,3,10 | | | 153,215,699 | | | | 8,805,168 | |
2015-R1, 0.70% (WAC) due 11/25/55◊,3,10 | | | 63,794,122 | | | | 4,079,437 | |
Capmark Military Housing Trust | | | | | | | | |
2007-AET2, 6.06% due 10/10/52†††,3 | | | 5,472,411 | | | | 4,986,289 | |
Total Military Housing | | | 17,870,894 | |
| | | | | | | | | |
Total Collateralized Mortgage Obligations |
(Cost $1,045,793,313) | | | 890,468,477 | |
| | | | | | | | | |
SENIOR FLOATING RATE INTERESTS††,◊ - 12.6% |
Consumer, Non-cyclical - 3.5% |
Women’s Care Holdings, Inc. | | | | | | | | |
10.05% (6 Month Term SOFR + 4.50%, Rate Floor: 4.50%) due 01/17/28 | | | 30,676,344 | | | | 27,148,564 | |
Mission Veterinary Partners | | | | | | | | |
9.43% (1 Month Term SOFR + 4.00%, Rate Floor: 4.00%) due 04/27/28 | | | 21,021,000 | | | | 20,784,514 | |
40 | THE GUGGENHEIM FUNDS ANNUAL REPORT | SEE NOTES TO CONSOLIDATED FINANCIAL STATEMENTS. |
CONSOLIDATED SCHEDULE OF INVESTMENTS (continued) | September 30, 2023 |
MACRO OPPORTUNITIES FUND | |
| | Face
Amount~ | | | Value | |
Quirch Foods Holdings LLC | | | | | | | | |
10.45% (3 Month Term SOFR + 4.75%, Rate Floor: 5.75%) due 10/27/27 | | | 15,177,709 | | | $ | 15,092,411 | |
Dhanani Group, Inc. | | | | | | | | |
11.42% (1 Month Term SOFR + 6.00%, Rate Floor: 6.00%) due 06/10/27††† | | | 14,365,909 | | | | 14,222,250 | |
PetIQ LLC | | | | | | | | |
9.84% (3 Month Term SOFR + 4.25%, Rate Floor: 4.25%) due 04/13/28††† | | | 14,174,004 | | | | 13,890,524 | |
Blue Ribbon LLC | | | | | | | | |
11.44% (1 Month Term SOFR + 6.00%, Rate Floor: 6.00%) due 05/08/28 | | | 16,024,615 | | | | 13,460,677 | |
LaserAway Intermediate Holdings II LLC | | | | | | | | |
11.32% (3 Month Term SOFR + 5.75%, Rate Floor: 5.75%) due 10/14/27 | | | 12,315,180 | | | | 12,084,270 | |
Southern Veterinary Partners LLC | | | | | | | | |
9.43% (1 Month Term SOFR + 4.00%, Rate Floor: 4.00%) due 10/05/27 | | | 11,253,371 | | | | 11,172,460 | |
HAH Group Holding Co. LLC | | | | | | | | |
10.42% (1 Month Term SOFR + 5.00%, Rate Floor: 5.00%) due 10/29/27 | | | 10,714,873 | | | | 10,556,479 | |
Sigma Holding BV (Flora Food) | | | | | | | | |
7.41% (6 Month EURIBOR + 3.50%, Rate Floor: 3.50%) due 07/02/25 | | EUR | 9,050,637 | | | | 9,532,406 | |
Nidda Healthcare Holding GmbH | | | | | | | | |
7.31% (3 Month EURIBOR + 3.50%, Rate Floor: 3.50%) due 08/21/26 | | EUR | 7,897,239 | | | | 8,276,861 | |
Florida Food Products LLC | | | | | | | | |
10.43% (1 Month Term SOFR + 5.00%, Rate Floor: 5.00%) due 10/18/28 | | | 8,756,447 | | | | 7,464,871 | |
Hearthside Group Holdings LLC | | | | | | | | |
9.58% (3 Month USD LIBOR + 4.00%, Rate Floor: 4.00%) due 05/23/25 | | | 4,936,394 | | | | 4,303,943 | |
9.27% (3 Month USD LIBOR + 3.69%, Rate Floor: 3.69%) due 05/23/25 | | | 3,525,934 | | | | 3,063,649 | |
EyeCare Partners LLC | | | | | | | | |
9.18% (1 Month Term SOFR + 3.75%, Rate Floor: 3.75%) due 11/15/28 | | | 8,003,125 | | | | 5,495,506 | |
SEE NOTES TO CONSOLIDATED FINANCIAL STATEMENTS. | THE GUGGENHEIM FUNDS ANNUAL REPORT | 41 |
CONSOLIDATED SCHEDULE OF INVESTMENTS (continued) | September 30, 2023 |
MACRO OPPORTUNITIES FUND | |
| | Face
Amount~ | | | Value | |
9.18% (1 Month Term SOFR + 3.75%, Rate Floor: 3.75%) due 02/18/27 | | | 2,128,650 | | | $ | 1,485,797 | |
Gibson Brands, Inc. | | | | | | | | |
10.57% (3 Month Term SOFR + 5.00%, Rate Floor: 5.00%) due 08/11/28 | | | 8,154,750 | | | | 6,768,442 | |
Endo Luxembourg Finance Company I SARL | | | | | | | | |
14.50% (Commercial Prime Lending Rate + 6.00%, Rate Floor: 7.75%) due 03/27/28 | | | 7,653,125 | | | | 5,457,673 | |
Confluent Health LLC | | | | | | | | |
9.43% (1 Month Term SOFR + 4.00%, Rate Floor: 4.00%) due 11/30/28 | | | 5,472,444 | | | | 5,189,683 | |
Medical Solutions Parent Holdings, Inc. | | | | | | | | |
8.77% (3 Month Term SOFR + 3.25%, Rate Floor: 3.25%) due 11/01/28 | | | 2,240,362 | | | | 2,163,944 | |
Resonetics LLC | | | | | | | | |
9.63% (3 Month Term SOFR + 4.00%, Rate Floor: 4.00%) due 04/28/28 | | | 1,770,949 | | | | 1,735,530 | |
Heritage Grocers Group LLC | | | | | | | | |
12.24% (3 Month Term SOFR + 6.75%, Rate Floor: 6.75%) due 08/01/29 | | | 1,695,729 | | | | 1,694,321 | |
Moran Foods LLC | | | | | | | | |
12.74% (3 Month Term SOFR + 7.25%, Rate Floor: 7.25%) due 06/30/26††† | | | 624,540 | | | | 568,551 | |
16.99% (6 Month Term SOFR + 11.50%, Rate Floor: 9.50%) 12/31/26††† | | | 364,879 | | | | 239,749 | |
Weber-Stephen Products LLC | | | | | | | | |
9.67% (1 Month Term SOFR + 4.25%, Rate Floor: 4.25%) due 10/29/27 | | | 418,625 | | | | 377,549 | |
TGP Holdings LLC | | | | | | | | |
8.67% (1 Month Term SOFR + 3.25%, Rate Floor: 3.25%) due 06/29/28 | | | 211,730 | | | | 192,886 | |
Total Consumer, Non-cyclical | | | 202,423,510 | |
| | | | | | | | | |
Consumer, Cyclical - 3.4% |
MB2 Dental Solutions LLC | | | | | | | | |
11.42% (1 Month Term SOFR + 6.00%, Rate Floor: 7.00%) due 01/29/27††† | | | 31,459,499 | | | | 31,098,350 | |
42 | THE GUGGENHEIM FUNDS ANNUAL REPORT | SEE NOTES TO CONSOLIDATED FINANCIAL STATEMENTS. |
CONSOLIDATED SCHEDULE OF INVESTMENTS (continued) | September 30, 2023 |
MACRO OPPORTUNITIES FUND | |
| | Face
Amount~ | | | Value | |
Zephyr Bidco Ltd. | | | | | | | | |
9.97% (1 Month GBP SONIA + 4.75%, Rate Floor: 4.75%) due 07/23/25 | | GBP | 20,850,000 | | | $ | 25,067,111 | |
12.72% (1 Month GBP SONIA + 7.50%, Rate Floor: 7.50%) due 07/23/26 | | GBP | 1,540,417 | | | | 1,750,174 | |
FR Refuel LLC | | | | | | | | |
10.18% (1 Month Term SOFR + 4.75%, Rate Floor: 4.75%) due 11/08/28††† | | | 20,936,496 | | | | 20,360,743 | |
Alexander Mann | | | | | | | | |
11.37% (3 Month Term SOFR + 6.00%, Rate Floor: 6.00%) due 06/29/27 | | | 16,065,952 | | | | 15,664,303 | |
First Brands Group LLC | | | | | | | | |
10.88% (6 Month Term SOFR + 5.00%, Rate Floor: 6.00%) due 03/30/27 | | | 14,234,504 | | | | 14,025,332 | |
Pacific Bells LLC | | | | | | | | |
10.15% (3 Month Term SOFR + 4.50%, Rate Floor: 5.00%) due 11/10/28 | | | 12,035,361 | | | | 11,866,144 | |
Rent-A-Center, Inc. | | | | | | | | |
8.88% (3 Month Term SOFR + 3.25%, Rate Floor: 3.25%) due 02/17/28 | | | 9,836,567 | | | | 9,796,630 | |
NFM & J LLC | | | | | | | | |
11.22% (3 Month Term SOFR + 5.75%, Rate Floor: 5.75%) due 11/30/27††† | | | 8,278,833 | | | | 8,082,212 | |
The Facilities Group | | | | | | | | |
11.27% (3 Month Term SOFR + 5.75%, Rate Floor: 5.75%) due 11/30/27††† | | | 7,638,581 | | | | 7,457,166 | |
Holding SOCOTEC | | | | | | | | |
9.56% (3 Month SOFR + 4.00%, Rate Floor: 4.00%) due 06/02/28 | | | 7,007,000 | | | | 6,936,930 | |
BCP V Modular Services Holdings IV Ltd. | | | | | | | | |
8.40% (3 Month EURIBOR + 4.43%, Rate Floor: 4.43%) due 12/15/28 | | EUR | 6,400,000 | | | | 6,342,206 | |
Camin Cargo Control, Inc. | | | | | | | | |
11.93% (1 Month Term SOFR + 6.50%, Rate Floor: 6.50%) due 06/04/26††† | | | 6,510,852 | | | | 6,250,418 | |
Packers Holdings LLC | | | | | | | | |
8.67% (1 Month Term SOFR + 3.25%, Rate Floor: 3.25%) due 03/09/28 | | | 9,196,441 | | | | 5,425,900 | |
Accuride Corp. | | | | | | | | |
12.19% (1 Month Term SOFR + 5.25%, Rate Floor: 10.57%) (in-kind rate was 1.62%) due 07/07/2612 | | | 5,891,708 | | | | 5,140,516 | |
Galls LLC | | | | | | | | |
12.27% (3 Month Term SOFR + 6.75%, Rate Floor: 6.75%) due 01/31/25††† | | | 3,911,995 | | | | 3,814,195 | |
SEE NOTES TO CONSOLIDATED FINANCIAL STATEMENTS. | THE GUGGENHEIM FUNDS ANNUAL REPORT | 43 |
CONSOLIDATED SCHEDULE OF INVESTMENTS (continued) | September 30, 2023 |
MACRO OPPORTUNITIES FUND | |
| | Face
Amount~ | | | Value | |
12.14% ((1 Month Term SOFR + 6.75%) and (3 Month Term SOFR + 6.75%), Rate Floor: 6.75%) due 01/31/24††† | | | 208,932 | | | $ | 203,709 | |
Flamingo | | | | | | | | |
7.46% (3 Month EURIBOR + 3.50%, Rate Floor: 3.50%) due 03/27/28 | | EUR | 4,045,312 | | | | 3,991,543 | |
ScribeAmerica Intermediate Holdco LLC (Healthchannels) | | | | | | | | |
9.82% (1 Month Term SOFR + 4.50%, Rate Floor: 4.50%) due 04/03/25 | | | 4,663,808 | | | | 3,423,235 | |
Congruex Group LLC | | | | | | | | |
11.27% (3 Month Term SOFR + 5.75%, Rate Floor: 5.75%) due 05/03/29 | | | 2,766,659 | | | | 2,718,242 | |
SHO Holding I Corp. | | | | | | | | |
10.88% (3 Month Term SOFR + 5.25%, Rate Floor: 5.25%) due 04/26/24 | | | 3,566,084 | | | | 2,365,490 | |
10.86% (3 Month Term SOFR + 5.23%, Rate Floor: 5.23%) due 04/29/24 | | | 50,787 | | | | 33,689 | |
ImageFIRST Holdings LLC | | | | | | | | |
10.47% ((3 Month Term SOFR + 5.00%) and (6 Month Term SOFR + 5.00%), Rate Floor: 5.75%) due 04/27/28 | | | 2,084,951 | | | | 2,066,708 | |
Adevinta ASA | | | | | | | | |
6.47% (3 Month EURIBOR + 2.50%, Rate Floor: 2.50%) due 06/26/28 | | EUR | 1,834,444 | | | | 1,937,582 | |
Orion Group | | | | | | | | |
11.88% (3 Month Term SOFR + 6.25%, Rate Floor: 6.25%) due 03/19/27††† | | | 1,422,183 | | | | 1,394,836 | |
11.24% (3 Month Term SOFR + 6.00%, Rate Floor: 6.00%) due 03/19/27 | | | 95,997 | | | | 86,818 | |
Checkers Holdings, Inc. | | | | | | | | |
14.70% (6 Month Term SOFR + 3.00%, Rate Floor: 8.70%) (in-kind rate was 6.00%) due 05/31/28†††,12 | | | 1,226,012 | | | | 1,226,012 | |
12.70% (6 Month Term SOFR + 3.00%, Rate Floor: 8.70%) (in-kind rate was 4.00%) due 06/16/27†††,12 | | | 176,527 | | | | 176,527 | |
44 | THE GUGGENHEIM FUNDS ANNUAL REPORT | SEE NOTES TO CONSOLIDATED FINANCIAL STATEMENTS. |
CONSOLIDATED SCHEDULE OF INVESTMENTS (continued) | September 30, 2023 |
MACRO OPPORTUNITIES FUND | |
| | Face
Amount~ | | | Value | |
EG Finco Ltd. | | | | | | | | |
10.00% (1 Month GBP SONIA + 4.75%, Rate Floor: 4.75%) due 02/07/28 | | GBP | 568,500 | | | $ | 641,577 | |
10.00% (1 Month GBP SONIA + 4.75%, Rate Floor: 4.75%) due 02/07/25††† | | GBP | 147,675 | | | | 172,963 | |
CD&R Firefly Bidco Ltd. | | | | | | | | |
9.29% (3 Month GBP SONIA + 4.36%, Rate Floor: 4.36%) due 06/23/25 | | GBP | 441,031 | | | | 524,357 | |
Verisure Holding AB | | | | | | | | |
6.97% (3 Month EURIBOR + 3.00%, Rate Floor: 3.00%) due 03/27/28 | | EUR | 370,000 | | | | 386,460 | |
WW International, Inc. | | | | | | | | |
8.93% (1 Month Term SOFR + 3.50%, Rate Floor: 3.50%) due 04/13/28 | | | 100,000 | | | | 75,167 | |
Total Consumer, Cyclical | | | 200,503,245 | |
| | | | | | | | | |
Technology - 1.8% |
Sitecore Holding III A/S | | | | | | | | |
10.94% (3 Month EURIBOR + 7.00%, Rate Floor: 7.00%) due 03/12/26††† | | EUR | 9,030,493 | | | | 9,478,952 | |
11.81% (3 Month Term SOFR + 6.25%, Rate Floor: 6.25%) due 03/12/26††† | | | 7,442,790 | | | | 7,388,189 | |
11.81% (3 Month Term SOFR + 6.25%, Rate Floor: 6.25%) due 03/09/26††† | | | 1,459,661 | | | | 1,448,953 | |
Avalara, Inc. | | | | | | | | |
12.64% (3 Month Term SOFR + 7.25%, Rate Floor: 7.25%) due 10/19/28††† | | | 16,000,000 | | | | 15,805,219 | |
Datix Bidco Ltd. | | | | | | | | |
9.53% (6 Month Term SOFR + 4.50%, Rate Floor: 4.50%) due 04/28/25††† | | | 9,112,505 | | | | 8,942,101 | |
11.93% (6 Month GBP SONIA + 7.75%, Rate Floor: 7.75%) due 04/27/26††† | | GBP | 4,225,000 | | | | 5,049,031 | |
8.68% (6 Month GBP SONIA + 4.50%, Rate Floor: 4.50%) due 04/28/25††† | | GBP | 1,000,000 | | | | 1,197,233 | |
12.78% (6 Month Term SOFR + 7.75%, Rate Floor: 7.75%) due 04/27/26††† | | | 461,709 | | | | 452,244 | |
Aston FinCo SARL | | | | | | | | |
9.96% (1 Month GBP SONIA + 4.75%, Rate Floor: 4.75%) due 10/09/26 | | GBP | 12,708,638 | | | | 13,140,611 | |
Polaris Newco LLC | | | | | | | | |
8.70% (1 Month Term SOFR + 3.50%, Rate Floor: 3.50%) due 06/04/26††† | | | 13,153,185 | | | | 12,271,684 | |
SEE NOTES TO CONSOLIDATED FINANCIAL STATEMENTS. | THE GUGGENHEIM FUNDS ANNUAL REPORT | 45 |
CONSOLIDATED SCHEDULE OF INVESTMENTS (continued) | September 30, 2023 |
MACRO OPPORTUNITIES FUND | |
| | Face
Amount~ | | | Value | |
Finastra | | | | | | | | |
12.71% (6 Month Term SOFR + 7.25%, Rate Floor: 7.25%) due 09/13/29††† | | | 7,669,000 | | | $ | 7,600,532 | |
12.58% (1 Month Term SOFR + 7.25%, Rate Floor: 7.25%) due 09/13/29††† | | | 204,542 | | | | 179,480 | |
RLDatix | | | | | | | | |
9.53% (6 Month Term SOFR + 4.50%, Rate Floor: 4.50%) due 04/28/25††† | | | 3,400,533 | | | | 3,336,943 | |
8.68% (6 Month GBP SONIA + 4.50%, Rate Floor: 4.50%) due 10/28/24††† | | GBP | 2,313,216 | | | | 2,769,459 | |
12.78% (6 Month Term SOFR + 7.75%, Rate Floor: 7.75%) due 04/27/26††† | | | 912,001 | | | | 893,305 | |
Sitecore USA, Inc. | | | | | | | | |
11.81% (3 Month Term SOFR + 6.25%, Rate Floor: 6.25%) due 03/12/26††† | | | 4,219,206 | | | | 4,188,253 | |
Team.Blue Finco SARL | | | | | | | | |
7.06% (1 Month EURIBOR + 3.20%, Rate Floor: 3.20%) due 03/30/28 | | EUR | 4,026,144 | | | | 4,146,626 | |
Greenway Health LLC | | | | | | | | |
9.18% (1 Month Term SOFR + 3.75%, Rate Floor: 4.75%) due 02/16/24††† | | | 3,400,504 | | | | 3,145,466 | |
Atlas CC Acquisition Corp. | | | | | | | | |
9.93% (3 Month Term SOFR + 4.25%, Rate Floor: 4.25%) due 05/25/28 | | | 3,053,602 | | | | 2,839,850 | |
24-7 Intouch, Inc. | | | | | | | | |
10.17% (1 Month Term SOFR + 4.75%, Rate Floor: 4.75%) due 08/25/25 | | | 2,198,128 | | | | 2,175,223 | |
Total Technology | | | 106,449,354 | |
| | | | | | | | | |
Industrial - 1.6% |
United Airlines, Inc. | | | | | | | | |
9.18% (1 Month Term SOFR + 3.75%, Rate Floor: 3.75%) due 04/21/28 | | | 19,788,520 | | | | 19,793,072 | |
Minerva Bidco Ltd. | | | | | | | | |
9.55% (3 Month GBP SONIA + 4.50%, Rate Floor: 4.50%) due 07/30/25 | | GBP | 11,000,000 | | | | 13,331,011 | |
CapStone Acquisition Holdings, Inc. | | | | | | | | |
10.17% (1 Month Term SOFR + 4.75%, Rate Floor: 4.75%) due 11/12/27††† | | | 12,395,788 | | | | 12,109,431 | |
Mileage Plus Holdings LLC | | | | | | | | |
10.80% (3 Month Term SOFR + 5.25%, Rate Floor: 5.25%) due 06/21/27 | | | 11,437,500 | | | | 11,867,664 | |
46 | THE GUGGENHEIM FUNDS ANNUAL REPORT | SEE NOTES TO CONSOLIDATED FINANCIAL STATEMENTS. |
CONSOLIDATED SCHEDULE OF INVESTMENTS (continued) | September 30, 2023 |
MACRO OPPORTUNITIES FUND | |
| | Face
Amount~ | | | Value | |
Dispatch Terra Acquisition LLC | | | | | | | | |
9.79% (3 Month Term SOFR + 4.25%, Rate Floor: 4.25%) due 03/27/28 | | | 10,163,242 | | | $ | 9,350,183 | |
Valcour Packaging LLC | | | | | | | | |
9.40% (3 Month USD LIBOR + 3.75%, Rate Floor: 4.25%) due 10/04/28 | | | 6,205,500 | | | | 4,977,680 | |
Saverglass | | | | | | | | |
7.72% (3 Month EURIBOR + 3.90%, Rate Floor: 3.90%) due 02/19/29 | | EUR | 3,700,000 | | | | 3,902,743 | |
Integrated Power Services Holdings, Inc. | | | | | | | | |
9.93% ((1 Month Term SOFR + 4.50%) and (Commercial Prime Lending Rate + 3.50%), Rate Floor: 4.50%) due 11/22/28††† | | | 3,450,468 | | | | 3,352,311 | |
ILPEA Parent, Inc. | | | | | | | | |
9.93% (1 Month Term SOFR + 4.50%, Rate Floor: 4.50%) due 06/22/28††† | | | 3,320,576 | | | | 3,295,671 | |
Air Canada | | | | | | | | |
9.13% (3 Month Term SOFR + 3.50%, Rate Floor: 3.50%) due 08/11/28 | | | 3,228,633 | | | | 3,227,955 | |
TK Elevator Midco GmbH | | | | | | | | |
6.86% (1 Month EURIBOR + 3.00%, Rate Floor: 3.00%) due 01/29/27 | | EUR | 1,941,980 | | | | 1,936,718 | |
EMRLD Borrower LP | | | | | | | | |
8.32% (1 Month Term SOFR + 3.00%, Rate Floor: 3.00%) due 05/31/30 | | | 1,903,486 | | | | 1,899,927 | |
API Heat Transfer | | | | | | | | |
16.65% (1 Month Term SOFR, Rate Floor: 0.00%) (in-kind rate was 16.65%) due 01/01/24†††,12 | | | 1,556,370 | | | | 1,427,562 | |
16.43% (1 Month Term SOFR, Rate Floor: 0.00%) (in-kind rate was 16.43%) due 10/31/23†††,12 | | | 277,673 | | | | 277,673 | |
Merlin Buyer, Inc. | | | | | | | | |
9.32% (1 Month Term SOFR + 4.00%, Rate Floor: 4.00%) due 12/14/28 | | | 367,731 | | | | 360,148 | |
Total Industrial | | | 91,109,749 | |
| | | | | | | | | |
Communications - 1.2% |
Syndigo LLC | | | | | | | | |
9.93% (1 Month Term SOFR + 4.50%, Rate Floor: 4.50%) due 12/15/27 | | | 22,269,750 | | | | 20,766,542 | |
Simon & Schuster | | | | | | | | |
due 09/26/30 | | | 13,400,000 | | | | 13,299,500 | |
SEE NOTES TO CONSOLIDATED FINANCIAL STATEMENTS. | THE GUGGENHEIM FUNDS ANNUAL REPORT | 47 |
CONSOLIDATED SCHEDULE OF INVESTMENTS (continued) | September 30, 2023 |
MACRO OPPORTUNITIES FUND | |
| | Face
Amount~ | | | Value | |
Xplornet Communications, Inc. | | | | | | | | |
9.65% (3 Month Term SOFR + 4.00%, Rate Floor: 4.00%) due 10/02/28 | | | 15,173,185 | | | $ | 11,850,258 | |
FirstDigital Communications LLC | | | | | | | | |
9.68% (1 Month Term SOFR + 4.25%, Rate Floor: 4.25%) due 12/17/26††† | | | 10,550,000 | | | | 10,239,603 | |
Radiate Holdco LLC | | | | | | | | |
8.68% (1 Month Term SOFR + 3.25%, Rate Floor: 3.25%) due 09/25/26 | | | 7,587,936 | | | | 6,188,569 | |
Zayo Group Holdings, Inc. | | | | | | | | |
8.43% (1 Month Term SOFR + 3.00%, Rate Floor: 3.00%) due 03/09/27 | | | 6,146,447 | | | | 5,005,114 | |
Flight Bidco, Inc. | | | | | | | | |
12.93% (1 Month Term SOFR + 7.61%, Rate Floor: 7.61%) due 07/23/26 | | | 1,000,000 | | | | 965,000 | |
Cincinnati Bell, Inc. | | | | | | | | |
8.67% (1 Month Term SOFR + 3.25%, Rate Floor: 3.25%) due 11/22/28 | | | 982,500 | | | | 963,007 | |
Total Communications | | | 69,277,593 | |
| | | | | | | | | |
Financial - 0.8% |
Higginbotham Insurance Agency, Inc. | | | | | | | | |
10.92% (1 Month Term SOFR + 5.35%, Rate Floor: 5.35%) due 11/24/28††† | | | 12,668,032 | | | | 12,544,114 | |
10.92% (1 Month Term SOFR + 5.35%, Rate Floor: 5.35%) due 11/25/26††† | | | 6,044,863 | | | | 5,985,733 | |
Eisner Advisory Group | | | | | | | | |
10.68% (1 Month Term SOFR + 5.25%, Rate Floor: 5.25%) due 07/28/28 | | | 12,040,204 | | | | 12,010,103 | |
HighTower Holding LLC | | | | | | | | |
9.61% (3 Month Term SOFR + 4.00%, Rate Floor: 4.00%) due 04/21/28 | | | 6,952,053 | | | | 6,934,672 | |
Duff & Phelps | | | | | | | | |
9.14% (3 Month Term SOFR + 3.75%, Rate Floor: 3.75%) due 04/09/27 | | | 4,290,779 | | | | 4,179,048 | |
Worldpay | | | | | | | | |
due 09/21/30 | | | 3,000,000 | | | | 2,998,140 | |
Asurion LLC | | | | | | | | |
9.67% (1 Month Term SOFR + 4.25%, Rate Floor: 4.25%) due 08/20/28 | | | 2,094,737 | | | | 2,031,895 | |
48 | THE GUGGENHEIM FUNDS ANNUAL REPORT | SEE NOTES TO CONSOLIDATED FINANCIAL STATEMENTS. |
CONSOLIDATED SCHEDULE OF INVESTMENTS (continued) | September 30, 2023 |
MACRO OPPORTUNITIES FUND | |
| | Face
Amount~ | | | Value | |
Teneo Holdings LLC | | | | | | | | |
10.67% (1 Month Term SOFR + 5.25%, Rate Floor: 5.25%) due 07/11/25 | | | 979,276 | | | $ | 977,807 | |
Total Financial | | | 47,661,512 | |
| | | | | | | | | |
Energy - 0.2% |
BANGL LLC | | | | | | | | |
9.83% (1 Month Term SOFR + 4.50%, Rate Floor: 4.50%) due 02/01/29 | | | 10,050,000 | | | | 9,955,832 | |
Venture Global Calcasieu Pass LLC | | | | | | | | |
8.04% (1 Month Term SOFR + 2.63%, Rate Floor: 2.63%) due 08/19/26 | | | 2,888,724 | | | | 2,862,234 | |
Permian Production Partners LLC | | | | | | | | |
13.43% (3 Month Term SOFR + 6.00%, Rate Floor: 11.43%) (in-kind rate was 2.00%) due 11/24/25†††,12 | | | 1,155,234 | | | | 1,149,458 | |
Total Energy | | | 13,967,524 | |
| | | | | | | | | |
Basic Materials - 0.1% |
LTI Holdings, Inc. | | | | | | | | |
10.18% (1 Month Term SOFR + 4.75%, Rate Floor: 4.75%) due 07/24/26 | | | 3,845,320 | | | | 3,752,378 | |
Arsenal AIC Parent LLC | | | | | | | | |
9.88% (3 Month Term SOFR + 4.50%, Rate Floor: 4.50%) due 08/19/30 | | | 3,400,000 | | | | 3,390,072 | |
Schur Flexibles GmbH | | | | | | | | |
9.59% (6 Month EURIBOR + 5.50%, Rate Floor: 5.50%) due 09/28/27 | | EUR | 787,500 | | | | 599,556 | |
Total Basic Materials | | | 7,742,006 | |
| | | | | | | | | |
Total Senior Floating Rate Interests |
(Cost $787,179,578) | | | 739,134,493 | |
| | | | | | | | | |
U.S. TREASURY BILLS†† - 4.1% |
U.S. Treasury Bills |
5.28% due 10/10/2313 | | | 109,903,000 | | | | 109,774,535 | |
5.28% due 10/17/2313 | | | 88,115,000 | | | | 87,921,422 | |
5.28% due 10/26/2313 | | | 19,000,000 | | | | 18,933,078 | |
5.27% due 10/03/2313 | | | 13,720,000 | | | | 13,717,995 | |
5.27% due 10/19/2313 | | | 5,675,000 | | | | 5,660,823 | |
5.27% due 10/10/2313 | | | 3,780,000 | | | | 3,775,582 | |
Total U.S. Treasury Bills |
(Cost $239,747,805) | | | | | | | 239,783,435 | |
| | | | | | | | | |
FEDERAL AGENCY DISCOUNT NOTES†† - 2.9% |
Federal Home Loan Bank |
5.20% due 10/02/2313 | | | 170,612,000 | | | | 170,587,356 | |
Total Federal Agency Discount Notes |
(Cost $170,587,356) | | | | | | | 170,587,356 | |
| | | | | | | | | |
U.S. GOVERNMENT SECURITIES†† - 0.7% |
United States Treasury Inflation Indexed Bonds |
1.25% due 04/15/2816 | | | 15,795,740 | | | | 15,022,458 | |
1.38% due 07/15/3316 | | | 7,457,943 | | | | 6,895,538 | |
U.S. Treasury Notes |
4.63% due 02/28/25 | | | 21,000,000 | | | | 20,809,688 | |
Total U.S. Government Securities |
(Cost $43,818,598) | | | | | | | 42,727,684 | |
| | | | | | | | | |
SEE NOTES TO CONSOLIDATED FINANCIAL STATEMENTS. | THE GUGGENHEIM FUNDS ANNUAL REPORT | 49 |
CONSOLIDATED SCHEDULE OF INVESTMENTS (continued) | September 30, 2023 |
MACRO OPPORTUNITIES FUND | |
| | Face
Amount~ | | | Value | |
CONVERTIBLE BONDS†† - 0.4% |
Consumer, Non-cyclical - 0.3% |
Block, Inc. | | | | | | | | |
due 05/01/2614 | | | 21,951,000 | | | $ | 18,329,085 | |
| | | | | | | | | |
Communications - 0.1% |
Cable One, Inc. | | | | | | | | |
due 03/15/2614 | | | 5,750,000 | | | | 4,703,500 | |
Total Convertible Bonds |
(Cost $24,071,427) | | | 23,032,585 | |
| | | | | | | | | |
SENIOR FIXED RATE INTERESTS†† - 0.0% |
Industrial - 0.0% |
Schur Flexibles GmbH | | | | | | | | |
13.41% due 09/30/26 | | EUR | 413,156 | | | | 416,489 | |
9.59% due 09/30/26 | | EUR | 286,149 | | | | 288,458 | |
13.27% due 09/30/26 | | EUR | 73,033 | | | | 73,622 | |
Total Industrial | | | 778,569 | |
| | | | | | | | | |
Total Senior Fixed Rate Interests |
(Cost $786,010) | | | 778,569 | |
| | | | | | | | | |
| | | Notional
Value~ | | | | | |
OTC OPTIONS PURCHASED†† - 0.0% |
Call Options on: |
Interest Rate Options |
Morgan Stanley Capital Services LLC 10Y-2Y SOFR CMS CAP Expiring June 2024 with strike price of $0.10 | | | 164,200,000 | | | | 328,771 | |
Barclays Bank plc 10Y-2Y SOFR CMS CAP Expiring June 2024 with strike price of $0.10 | | | 162,650,000 | | | | 325,668 | |
Morgan Stanley Capital Services LLC 10Y-2Y SOFR CMS CAP Expiring December 2023 with strike price of $0.10 | | | 164,200,000 | | | | 102,889 | |
Barclays Bank plc 10Y-2Y SOFR CMS CAP Expiring December 2023 with strike price of $0.20 | | | 164,200,000 | | | $ | 102,889 | |
Bank of America, N.A. 10Y-2Y SOFR CMS CAP Expiring June 2024 with strike price of $0.10 | | | 82,100,000 | | | | 164,386 | |
Goldman Sachs International 10Y-2Y SOFR CMS CAP Expiring June 2024 with strike price of $0.10 | | | 66,950,000 | | | | 134,051 | |
Bank of America, N.A. 10Y-2Y SOFR CMS CAP Expiring December 2023 with strike price of $0.20 | | | 80,550,000 | | | | 50,473 | |
Goldman Sachs International 10Y-2Y SOFR CMS CAP Expiring December 2023 with strike price of $0.20 | | | 66,950,000 | | | | 41,952 | |
Total OTC Options Purchased |
(Cost $4,060,737) | | | | | | | 1,251,079 | |
| | | | | | | | | |
Total Investments - 99.8% |
(Cost $6,562,199,327) | | | 5,840,674,911 | |
Other Assets & Liabilities, net - 0.2% | | | 14,316,852 | |
Total Net Assets - 100.0% | | $ | 5,854,991,763 | |
50 | THE GUGGENHEIM FUNDS ANNUAL REPORT | SEE NOTES TO CONSOLIDATED FINANCIAL STATEMENTS. |
CONSOLIDATED SCHEDULE OF INVESTMENTS (continued) | September 30, 2023 |
MACRO OPPORTUNITIES FUND | |
Centrally Cleared Credit Default Swap Agreements Protection Purchased†† |
Counterparty | Exchange | Index | | Protection
Premium Rate | | | Payment
Frequency | | | Maturity
Date | |
J.P. Morgan Securities LLC | ICE | CDX.NA.HY.40.V1 | | | 5.00% | | | | Quarterly | | | | 06/20/28 | |
J.P. Morgan Securities LLC | ICE | ITRAXX.EUR.38.V1 | | | 1.00% | | | | Quarterly | | | | 12/20/27 | |
Notional
Amount~ | | Value | | | Upfront
Premiums
Paid (Received) | | | Unrealized
Depreciation** | |
57,400,000 | | $ | (899,679 | ) | | $ | 237,705 | | | $ | (1,137,384 | ) |
EUR 253,900,000 | | | (3,539,444 | ) | | | (1,356,909 | ) | | | (2,182,535 | ) |
| | | $ | (4,439,123 | ) | | $ | (1,119,204 | ) | | $ | (3,319,919 | ) |
Centrally Cleared Interest Rate Swap Agreements†† |
Counterparty | Exchange | Floating
Rate Type | Floating
Rate Index | | Fixed
Rate | | | Payment
Frequency | | | Maturity
Date | |
J.P. Morgan Securities LLC | CME | Pay | U.S. Secured Overnight Financing Rate | | | 2.78% | | Annually | 07/18/27 |
Notional
Amount | | Value | | | Upfront
Premiums
Paid | | | Unrealized
Depreciation** | |
$ 332,150,000 | | $ | (19,694,359 | ) | | $ | 1,228 | | | $ | (19,695,587 | ) |
Forward Foreign Currency Exchange Contracts†† |
Counterparty | | Currency | | | Type | | | Quantity | | | Contract
Amount | | | Settlement
Date | | | Unrealized
Appreciation
(Depreciation) | |
Barclays Bank plc | | | EUR | | | | Sell | | | | 116,360,000 | | | | 125,132,148 USD | | | | 10/16/23 | | | $ | 2,022,651 | |
Morgan Stanley Capital Services LLC | | | GBP | | | | Sell | | | | 58,230,000 | | | | 72,731,075 USD | | | | 10/16/23 | | | | 1,681,604 | |
Bank of America, N.A. | | | CAD | | | | Sell | | | | 3,173,000 | | | | 2,341,585 USD | | | | 10/16/23 | | | | 4,339 | |
BNP Paribas | | | EUR | | | | Buy | | | | 470,000 | | | | 502,802 USD | | | | 10/16/23 | | | | (5,539 | ) |
| | | | | | | | | | | | | | | | | | | | | | | $ | 3,703,055 | |
SEE NOTES TO CONSOLIDATED FINANCIAL STATEMENTS. | THE GUGGENHEIM FUNDS ANNUAL REPORT | 51 |
CONSOLIDATED SCHEDULE OF INVESTMENTS (continued) | September 30, 2023 |
MACRO OPPORTUNITIES FUND | |
~ | The face amount is denominated in U.S. dollars unless otherwise indicated. |
* | Non-income producing security. |
** | Includes cumulative appreciation (depreciation). Variation margin is reported within the Consolidated Statement of Assets and Liabilities. |
† | Value determined based on Level 1 inputs, unless otherwise noted — See Note 4. |
†† | Value determined based on Level 2 inputs, unless otherwise noted — See Note 4. |
††† | Value determined based on Level 3 inputs — See Note 4. |
◊ | Variable rate security. Rate indicated is the rate effective at September 30, 2023. In some instances, the effective rate is limited by a minimum rate floor or a maximum rate cap established by the issuer. The settlement status of a position may also impact the effective rate indicated. In some cases, a position may be unsettled at period end and may not have a stated effective rate. In instances where multiple underlying reference rates and spread amounts are shown, the effective rate is based on a weighted average. |
1 | Affiliated issuer. |
2 | Special Purpose Acquisition Company (SPAC). |
3 | Security is a 144A or Section 4(a)(2) security. These securities have been determined to be liquid under guidelines established by the Board of Trustees. The total market value of 144A or Section 4(a)(2) securities is $2,520,681,674 (cost $2,845,986,920), or 43.1% of total net assets. |
4 | Rate indicated is the 7-day yield as of September 30, 2023. |
5 | Perpetual maturity. |
6 | Security has a fixed rate coupon which will convert to a floating or variable rate coupon on a future date. |
7 | Security is a 144A or Section 4(a)(2) security. These securities have been determined to be illiquid and restricted under guidelines established by the Board of Trustees. The total market value of 144A or Section 4(a)(2) illiquid and restricted securities is $9,384,973 (cost $15,537,123), or 0.2% of total net assets — See Note 10. |
8 | Security is in default of interest and/or principal obligations. |
9 | Security has no stated coupon. However, it is expected to receive residual cash flow payments on defined deal dates. |
10 | Security is an interest-only strip. |
11 | Security is a step up/down bond. The coupon increases or decreases at regular intervals until the bond reaches full maturity. Rate indicated is the rate at September 30, 2023. See table below for additional step information for each security. |
12 | Payment-in-kind security. |
13 | Rate indicated is the effective yield at the time of purchase. |
14 | Zero coupon rate security. |
15 | Security is unsettled at period end and does not have a stated effective rate. |
16 | Face amount of security is adjusted for inflation. |
| | CAD — Canadian Dollar |
| | CDX.NA.HY.40.V1 — Credit Default Swap North American High Yield Series 40 Index Version 1 |
| | CME — Chicago Mercantile Exchange |
| | CMS — Constant Maturity Swap |
| | CMT — Constant Maturity Treasury |
| | EUR — Euro |
| | EURIBOR — European Interbank Offered Rate |
| | GBP — British Pound |
| | ICE — Intercontinental Exchange |
| | ITRAXX.EUR.38.V1 — iTraxx Europe Series 38 Index Version 1 |
| | LIBOR — London Interbank Offered Rate |
| | plc — Public Limited Company |
52 | THE GUGGENHEIM FUNDS ANNUAL REPORT | SEE NOTES TO CONSOLIDATED FINANCIAL STATEMENTS. |
CONSOLIDATED SCHEDULE OF INVESTMENTS (continued) | September 30, 2023 |
MACRO OPPORTUNITIES FUND | |
| | PPV — Public-Private Venture |
| | REMIC — Real Estate Mortgage Investment Conduit |
| | SARL — Société à Responsabilité Limitée |
| | SOFR — Secured Overnight Financing Rate |
| | SONIA — Sterling Overnight Index Average |
| | WAC — Weighted Average Coupon |
| | |
| | See Sector Classification in Other Information section. |
The following table summarizes the inputs used to value the Fund’s investments at September 30, 2023 (See Note 4 in the Notes to Consolidated Financial Statements):
Investments in Securities (Assets) | | Level 1
Quoted
Prices | | | Level 2
Significant
Observable
Inputs | | | Level 3
Significant
Unobservable
Inputs | | | Total | |
Common Stocks | | $ | 232,310 | | | $ | 7,108,713 | | | $ | 995,145 | | | $ | 8,336,168 | |
Preferred Stocks | | | — | | | | 267,899,482 | | | | 28,121,912 | | | | 296,021,394 | |
Warrants | | | 40,367 | | | | — | | | | 76 | | | | 40,443 | |
Exchange-Traded Funds | | | 38,497,177 | | | | — | | | | — | | | | 38,497,177 | |
Mutual Funds | | | 282,985,856 | | | | — | | | | — | | | | 282,985,856 | |
Money Market Funds | | | 122,218,276 | | | | — | | | | — | | | | 122,218,276 | |
Corporate Bonds | | | — | | | | 1,692,819,448 | | | | 59,850,234 | | | | 1,752,669,682 | |
Asset-Backed Securities | | | — | | | | 1,008,793,305 | | | | 223,348,932 | | | | 1,232,142,237 | |
Collateralized Mortgage Obligations | | | — | | | | 885,482,188 | | | | 4,986,289 | | | | 890,468,477 | |
Senior Floating Rate Interests | | | — | | | | 495,447,688 | | | | 243,686,805 | | | | 739,134,493 | |
U.S. Treasury Bills | | | — | | | | 239,783,435 | | | | — | | | | 239,783,435 | |
Federal Agency Discount Notes | | | — | | | | 170,587,356 | | | | — | | | | 170,587,356 | |
U.S. Government Securities | | | — | | | | 42,727,684 | | | | — | | | | 42,727,684 | |
Convertible Bonds | | | — | | | | 23,032,585 | | | | — | | | | 23,032,585 | |
Senior Fixed Rate Interests | | | — | | | | 778,569 | | | | — | | | | 778,569 | |
Options Purchased | | | — | | | | 1,251,079 | | | | — | | | | 1,251,079 | |
Forward Foreign Currency Exchange Contracts** | | | — | | | | 3,708,594 | | | | — | | | | 3,708,594 | |
Total Assets | | $ | 443,973,986 | | | $ | 4,839,420,126 | | | $ | 560,989,393 | | | $ | 5,844,383,505 | |
SEE NOTES TO CONSOLIDATED FINANCIAL STATEMENTS. | THE GUGGENHEIM FUNDS ANNUAL REPORT | 53 |
CONSOLIDATED SCHEDULE OF INVESTMENTS (continued) | September 30, 2023 |
MACRO OPPORTUNITIES FUND | |
Investments in Securities (Liabilities) | | Level 1
Quoted
Prices | | | Level 2
Significant
Observable
Inputs | | | Level 3
Significant
Unobservable
Inputs | | | Total | |
Credit Default Swap Agreements** | | $ | — | | | $ | 3,319,919 | | | $ | — | | | $ | 3,319,919 | |
Interest Rate Swap Agreements** | | | — | | | | 19,695,587 | | | | — | | | | 19,695,587 | |
Forward Foreign Currency Exchange Contracts** | | | — | | | | 5,539 | | | | — | | | | 5,539 | |
Unfunded Loan Commitments (Note 9) | | | — | | | | — | | | | 1,990,229 | | | | 1,990,229 | |
Total Liabilities | | $ | — | | | $ | 23,021,045 | | | $ | 1,990,229 | | | $ | 25,011,274 | |
** | This derivative is reported as unrealized appreciation/depreciation at period end. |
The following is a summary of significant unobservable inputs used in the fair valuation of assets and liabilities categorized within Level 3 of the fair value hierarchy:
Category | | Ending
Balance at
September 30,
2023 | | Valuation
Technique | Unobservable
Inputs | | Input
Range | | | Weighted
Average* | |
Assets: | | | | | | | | | | | | | | |
Asset-Backed Securities | | $ | 128,479,571 | | Yield Analysis | Yield | 6.2%-12.0% | 8.3% |
Asset-Backed Securities | | | 83,951,926 | | Option adjusted spread off prior month end broker quote | Broker Quote | — | — |
Asset-Backed Securities | | | 10,866,626 | | Model Price | Purchase Price | — | — |
Asset-Backed Securities | | | 50,809 | | Third Party Pricing | Broker Quote | — | — |
Collateralized Mortgage Obligations | | | 4,986,289 | | Option adjusted spread off prior month end broker quote | Broker Quote | — | — |
Common Stocks | | | 631,308 | | Yield Analysis | Yield | 14.2% | — |
Common Stocks | | | 361,652 | | Enterprise Valuation | Valuation Multiple | 2.7x-17.6x | 14.7x |
Common Stocks | | | 2,068 | | Model Price | Liquidation Value | — | — |
Common Stocks | | | 117 | | Third Party Pricing | Trade Price | — | — |
Corporate Bonds | | | 22,000,000 | | Yield Analysis | Yield | 6.7% | — |
Corporate Bonds | | | 16,479,462 | | Option adjusted spread off prior month end broker quote | Broker Quote | — | — |
54 | THE GUGGENHEIM FUNDS ANNUAL REPORT | SEE NOTES TO CONSOLIDATED FINANCIAL STATEMENTS. |
CONSOLIDATED SCHEDULE OF INVESTMENTS (continued) | September 30, 2023 |
MACRO OPPORTUNITIES FUND | |
Category | | Ending
Balance at
September 30,
2023 | | Valuation
Technique | Unobservable
Inputs | | Input
Range | | | Weighted
Average* | |
Corporate Bonds | | $ | 14,241,515 | | Third Party Pricing | Broker Quote | — | — |
Corporate Bonds | | | 7,129,257 | | Model Price | Purchase Price | — | — |
Preferred Stocks | | | 27,000,000 | | Third Party Pricing | Trade Price | — | — |
Preferred Stocks | | | 1,121,912 | | Enterprise Valuation | Valuation Multiple | 4.8x-4.9x | 4.9x |
Senior Floating Rate Interests | | | 152,446,672 | | Yield Analysis | Yield | 10.3%-39.1% | 11.7% |
Senior Floating Rate Interests | | | 48,265,243 | | Third Party Pricing | Broker Quote | — | — |
Senior Floating Rate Interests | | | 38,981,215 | | Model Price | Purchase Price | — | — |
Senior Floating Rate Interests | | | 3,814,195 | | Model Price | Market Comparable Yields | 14.5% | — |
Senior Floating Rate Interests | | | 179,480 | | Third Party Pricing | Trade Price | — | — |
Warrants | | | 76 | | Model Price | Liquidation Value | — | — |
Total Assets | | $ | 560,989,393 | | | | | |
| | | | | | | | | | | | | | | |
Liabilities: | | | | | | | | | | | | | | |
Unfunded Loan Commitments | | $ | 1,990,229 | | Model Price | Purchase Price | — | — |
* | Inputs are weighted by the fair value of the instruments. |
Significant changes in a quote, yield, market comparable yields, liquidation value or valuation multiple would generally result in significant changes in the fair value of the security.
The Fund’s fair valuation leveling guidelines classify a single daily broker quote, or a vendor price based on a single daily or monthly broker quote, as Level 3, if such a quote or price cannot be supported with other available market information.
Transfers between Level 2 and Level 3 may occur as markets fluctuate and/or the availability of data used in an investment’s valuation changes. For the year ended September 30, 2023, the Fund had securities with a total value of $3,664,326 transfer into Level 3 from Level 2 due to a lack of observable inputs and had securities with a total value of $96,849,928 transfer out of Level 3 into Level 2 due to the availability of current and reliable market-based data provided by a third-party pricing service which utilizes significant observable inputs.
SEE NOTES TO CONSOLIDATED FINANCIAL STATEMENTS. | THE GUGGENHEIM FUNDS ANNUAL REPORT | 55 |
CONSOLIDATED SCHEDULE OF INVESTMENTS (continued) | September 30, 2023 |
MACRO OPPORTUNITIES FUND | |
Summary of Fair Value Level 3 Activity
Following is a reconciliation of Level 3 assets for which significant unobservable inputs were used to determine fair value for the year ended September 30, 2023:
| | | Assets | |
| | Asset-Backed
Securities | | | Collateralized
Mortgage
Obligations | | | Corporate
Bonds | | | Senior
Floating Rate
Interests | | | Warrants | |
Beginning Balance | | $ | 249,933,932 | | | $ | 14,043,263 | | | $ | 116,766,054 | | | $ | 475,030,632 | | | $ | 76 | |
Purchases/(Receipts) | | | 81,206,332 | | | | — | | | | 13,400,000 | | | | 60,572,023 | | | | — | |
(Sales, maturities and paydowns)/Fundings | | | (103,527,866 | ) | | | (8,894,741 | ) | | | (71,555,460 | ) | | | (211,072,421 | ) | | | — | |
Amortization of premiums/discounts | | | 270,604 | | | | (6,610 | ) | | | 47,305 | | | | 1,400,666 | | | | — | |
Corporate actions | | | — | | | | — | | | | — | | | | (9,679,742 | ) | | | — | |
Total realized gains (losses) included in earnings | | | (3,598,868 | ) | | | (1,133,205 | ) | | | (2,996,492 | ) | | | (7,121,870 | ) | | | — | |
Total change in unrealized appreciation (depreciation) included in earnings | | | (934,387 | ) | | | 977,582 | | | | 6,405,552 | | | | 25,525,579 | | | | — | |
Transfers into Level 3 | | | — | | | | — | | | | 89,557 | | | | 3,574,769 | | | | — | |
Transfers out of Level 3 | | | (815 | ) | | | — | | | | (2,306,282 | ) | | | (94,542,831 | ) | | | — | |
Ending Balance | | $ | 223,348,932 | | | $ | 4,986,289 | | | $ | 59,850,234 | | | $ | 243,686,805 | | | $ | 76 | |
Net change in unrealized appreciation (depreciation) for investments in Level 3 securities still held at September 30, 2023 | | $ | (8,143,384 | ) | | $ | (148,194 | ) | | $ | 318,903 | | | $ | 3,541,571 | | | $ | — | |
56 | THE GUGGENHEIM FUNDS ANNUAL REPORT | SEE NOTES TO CONSOLIDATED FINANCIAL STATEMENTS. |
CONSOLIDATED SCHEDULE OF INVESTMENTS (continued) | September 30, 2023 |
MACRO OPPORTUNITIES FUND | |
| | | Assets | | | | | | | Liabilities | |
| | Common
Stocks | | | Preferred
Stocks | | | Senior
Fixed Rate
Interests | | | Total
Assets | | | Unfunded
Loan
Commitments | |
Beginning Balance | | $ | 801,687 | | | $ | — | | | $ | 2,750,527 | | | $ | 859,326,171 | | | $ | (2,356,646 | ) |
Purchases/(Receipts) | | | 632,974 | | | | 27,000,000 | | | | — | | | | 182,811,329 | | | | (2,788,541 | ) |
(Sales, maturities and paydowns)/Fundings | | | (34,345 | ) | | | — | | | | (2,801,412 | ) | | | (397,886,245 | ) | | | 2,441,815 | |
Amortization of premiums/discounts | | | — | | | | — | | | | 4,225 | | | | 1,716,190 | | | | 205,188 | |
Corporate actions | | | 14,343 | | | | 9,665,399 | | | | — | | | | — | | | | — | |
Total realized gains (losses) included in earnings | | | 29,321 | | | | — | | | | (132,088 | ) | | | (14,953,202 | ) | | | 491,175 | |
Total change in unrealized appreciation (depreciation) included in earnings | | | (448,835 | ) | | | (8,543,487 | ) | | | 178,748 | | | | 23,160,752 | | | | 16,780 | |
Transfers into Level 3 | | | — | | | | — | | | | — | | | | 3,664,326 | | | | — | |
Transfers out of Level 3 | | | — | | | | — | | | | — | | | | (96,849,928 | ) | | | — | |
Ending Balance | | $ | 995,145 | | | $ | 28,121,912 | | | $ | — | | | $ | 560,989,393 | | | $ | (1,990,229 | ) |
Net change in unrealized appreciation (depreciation) for investments in Level 3 securities still held at September 30, 2023 | | $ | (421,735 | ) | | $ | (8,543,487 | ) | | $ | — | | | $ | (13,396,326 | ) | | $ | (260,399 | ) |
Step Coupon Bonds
The following table discloses additional information related to step coupon bonds held by the Fund. Certain securities are subject to multiple rate changes prior to maturity. For those securities, a range of rates and corresponding dates have been provided. Rates for all step coupon bonds held by the Fund are scheduled to increase, except GAIA Aviation Ltd. which is scheduled to decrease.
Name | | Coupon Rate at
Next Reset Date | | | Next Rate
Reset Date | | | Future Reset Rate | | | Future Reset Date | |
BRAVO Residential Funding Trust 2022-R1, 3.13% due 01/29/70 | | | 6.13 | % | | | 01/30/25 | | | | — | | | | — | |
Citigroup Mortgage Loan Trust 2022-A, 6.17% due 09/25/62 | | | 9.17 | % | | | 09/25/25 | | | | 10.17 | % | | | 09/25/26 | |
GAIA Aviation Ltd. 2019-1, 3.97% due 12/15/44 | | | 2.00 | % | | | 11/15/26 | | | | — | | | | — | |
GAIA Aviation Ltd. 2019-1, 5.19% due 12/15/44 | | | 2.00 | % | | | 10/15/26 | | | | — | | | | — | |
GCAT Trust 2022-NQM5, 5.71% due 08/25/67 | | | 6.71 | % | | | 10/01/26 | | | | — | | | | — | |
GCAT Trust 2023-NQM2, 6.60% due 11/25/67 | | | 7.60 | % | | | 01/01/27 | | | | — | | | | — | |
NYMT Loan Trust 2022-SP1, 5.25% due 07/25/62 | | | 8.25 | % | | | 07/01/25 | | | | 9.25 | % | | | 07/01/26 | |
SEE NOTES TO CONSOLIDATED FINANCIAL STATEMENTS. | THE GUGGENHEIM FUNDS ANNUAL REPORT | 57 |
CONSOLIDATED SCHEDULE OF INVESTMENTS (continued) | September 30, 2023 |
MACRO OPPORTUNITIES FUND | |
Name | | Coupon Rate at
Next Reset Date | | | Next Rate
Reset Date | | | Future Reset Rate | | | Future Reset Date | |
OBX Trust 2023-NQM2, 6.80% due 01/25/62 | | | 7.80 | % | | | 02/01/27 | | | | — | | | | — | |
OBX Trust 2022-NQM8, 6.10% due 09/25/62 | | | 7.10 | % | | | 10/01/26 | | | | — | | | | — | |
OBX Trust 2022-NQM9, 6.45% due 09/25/62 | | | 7.45 | % | | | 11/01/26 | | | | — | | | | — | |
OSAT Trust 2021-RPL1, 2.12% due 05/25/65 | | | 5.12 | % | | | 06/25/24 | | | | 6.12 | % | | | 06/25/25 | |
Verus Securitization Trust 2022-8, 6.13% due 09/25/67 | | | 7.13 | % | | | 10/01/26 | | | | — | | | | — | |
Affiliated Transactions
Investments representing 5% or more of the outstanding voting shares of a company, or control of or by, or common control under Guggenheim Investments (“GI”), result in that company being considered an affiliated issuer, as defined in the 1940 Act.
The Fund may invest in certain of the underlying series of Guggenheim Strategy Funds Trust, including Guggenheim Strategy Fund II and Guggenheim Strategy Fund III, (collectively, the “Short Term Investment Vehicles”), each of which are open-end management investment companies managed by GI. The Short Term Investment Vehicles, which launched on March 11, 2014, are offered as short term investment options only to mutual funds, trusts, and other accounts managed by GI and/or its affiliates, and are not available to the public. The Short Term Investment Vehicles pay no investment management fees. The Short Term Investment Vehicles’ annual report on Form N-CSR dated September 30, 2022, is available publicly or upon request. This information is available from the EDGAR database on the SEC’s website at https://www.sec.gov/Archives/edgar/data/1601445/000182126822000340/gug84768.htm. The Fund may invest in certain of the underlying series of Guggenheim Funds Trust, which are open-end management investment companies managed by GI, are available to the public and whose most recent annual report on Form N-CSR is available publicly or upon request.
Transactions during the year ended September 30, 2023, in which the company is an affiliated issuer, were as follows:
Security Name | | Value
09/30/22 | | | Additions | | | Reductions | | | Realized
Gain (Loss) | |
Common Stocks | | | | | | | | | | | | | | | | |
BP Holdco LLC* | | $ | 22,763 | | | $ | — | | | $ | — | | | $ | — | |
Targus Group International Equity, Inc.* | | | 32,125 | | | | — | | | | (34,346 | ) | | | 29,321 | |
Mutual Funds | | | | | | | | | | | | | | | | |
Guggenheim Alpha Opportunity Fund — Institutional Class | | | 24,848,949 | | | | 168,796 | | | | — | | | | — | |
Guggenheim Limited Duration Fund — R6-Class | | | — | | | | 123,105,870 | | | | — | | | | — | |
Guggenheim Risk Managed Real Estate Fund — Institutional Class | | | 67,397,011 | | | | 3,642,869 | | | | (40,000,000 | ) | | | 2,012,260 | |
Guggenheim Strategy Fund II | | | 18,015,885 | | | | 963,101 | | | | — | | | | — | |
Guggenheim Strategy Fund III | | | 17,512,927 | | | | 15,586,600 | | | | — | | | | — | |
Guggenheim Ultra Short Duration Fund — Institutional Class | | | 45,783,897 | | | | 2,292,942 | | | | — | | | | — | |
| | | $ | 173,613,557 | | | $ | 145,760,178 | | | $ | (40,034,346 | ) | | $ | 2,041,581 | |
58 | THE GUGGENHEIM FUNDS ANNUAL REPORT | SEE NOTES TO CONSOLIDATED FINANCIAL STATEMENTS. |
CONSOLIDATED SCHEDULE OF INVESTMENTS (concluded) | September 30, 2023 |
MACRO OPPORTUNITIES FUND | |
Security Name | | Change in
Unrealized
Appreciation
(Depreciation) | | | Value
09/30/23 | | | Shares
09/30/23 | | | Investment
Income | | | Capital Gain
Distributions | |
Common Stocks | | | | | | | | | | | | | | | | | | | | |
BP Holdco LLC* | | $ | 25,455 | | | $ | 48,218 | | | | 37,539 | | | $ | — | | | $ | — | |
Targus Group International Equity, Inc.* | | | (27,100 | ) | | | — | | | | — | | | | — | | | | — | |
Mutual Funds | | | | | | | | | | | | | | | | | | | | |
Guggenheim Alpha Opportunity Fund — Institutional Class | | | 4,027,999 | | | | 29,045,744 | | | | 1,017,008 | | | | 168,796 | | | | — | |
Guggenheim Limited Duration Fund — R6-Class | | | (265,972 | ) | | �� | 122,839,898 | | | | 5,207,287 | | | | 3,086,883 | | | | — | |
Guggenheim Risk Managed Real Estate Fund — Institutional Class | | | (3,340,496 | ) | | | 29,711,644 | | | | 1,061,130 | | | | 1,155,898 | | | | 2,486,971 | |
Guggenheim Strategy Fund II | | | 228,722 | | | | 19,207,708 | | | | 791,418 | | | | 963,349 | | | | — | |
Guggenheim Strategy Fund III | | | 231,826 | | | | 33,331,353 | | | | 1,372,225 | | | | 1,476,117 | | | | — | |
Guggenheim Ultra Short Duration Fund — Institutional Class | | | 772,670 | | | | 48,849,509 | | | | 5,010,206 | | | | 2,292,585 | | | | — | |
| | | $ | 1,653,104 | | | $ | 283,034,074 | | | | | | | $ | 9,143,628 | | | $ | 2,486,971 | |
* | Non-income producing security. |
SEE NOTES TO CONSOLIDATED FINANCIAL STATEMENTS. | THE GUGGENHEIM FUNDS ANNUAL REPORT | 59 |
CONSOLIDATED STATEMENT OF ASSETS AND LIABILITIES |
MACRO OPPORTUNITIES FUND |
September 30, 2023
Assets: |
Investments in unaffiliated issuers, at value (cost $6,270,099,580) | | $ | 5,557,640,837 | |
Investments in affiliated issuers, at value (cost $292,099,747) | | | 283,034,074 | |
Foreign currency, at value (cost $187,977) | | | 188,332 | |
Cash | | | 1,069,903 | |
Segregated cash with broker | | | 3,327,828 | |
Unamortized upfront premiums paid on credit default swap agreements | | | 237,705 | |
Unamortized upfront premiums paid on interest rate swap agreements | | | 1,228 | |
Unrealized appreciation on forward foreign currency exchange contracts | | | 3,708,594 | |
Prepaid expenses | | | 313,026 | |
Receivables: |
Interest | | | 49,656,606 | |
Securities sold | | | 20,274,260 | |
Fund shares sold | | | 9,520,585 | |
Dividends | | | 1,890,315 | |
Investment Adviser | | | 8,781 | |
Total assets | | | 5,930,872,074 | |
| | | | | |
Liabilities: |
Unfunded loan commitments, at value (Note 9) (commitment fees received $2,585,615) | | $ | 1,990,229 | |
Segregated cash due to broker | | | 4,892,000 | |
Unamortized upfront premiums received on credit default swap agreements | | | 1,356,909 | |
Unrealized depreciation on forward foreign currency exchange contracts | | | 5,539 | |
Payable for: |
Securities purchased | | | 34,990,602 | |
Fund shares redeemed | | | 21,126,798 | |
Management fees | | | 3,791,134 | |
Distributions to shareholders | | | 3,083,939 | |
Variation margin on interest rate swap agreements | | | 1,609,059 | |
Transfer agent/maintenance fees | | | 804,429 | |
Protection fees on credit default swap agreements | | | 169,730 | |
Distribution and service fees | | | 157,390 | |
Fund accounting/administration fees | | | 47,467 | |
Due to Investment Adviser | | | 15,658 | |
Trustees’ fees* | | | 4,352 | |
Variation margin on credit default swap agreements | | | 741 | |
Miscellaneous | | | 1,834,335 | |
Total liabilities | | | 75,880,311 | |
Net assets | | $ | 5,854,991,763 | |
| | | | | |
* | Relates to Trustees not deemed “interested persons” within the meaning of Section 2(a)(19) of the 1940 Act. |
60 | THE GUGGENHEIM FUNDS ANNUAL REPORT | SEE NOTES TO CONSOLIDATED FINANCIAL STATEMENTS. |
CONSOLIDATED STATEMENT OF ASSETS AND LIABILITIES (concluded) |
MACRO OPPORTUNITIES FUND |
September 30, 2023
Net assets consist of: |
Paid in capital | | $ | 6,933,442,850 | |
Total distributable earnings (loss) | | | (1,078,451,087 | ) |
Net assets | | $ | 5,854,991,763 | |
| | | | | |
A-Class: |
Net assets | | $ | 280,275,264 | |
Capital shares outstanding | | | 11,845,565 | |
Net asset value per share | | $ | 23.66 | |
Maximum offering price per share (Net asset value divided by 96.00%) | | $ | 24.65 | |
| | | | | |
C-Class: |
Net assets | | $ | 103,332,244 | |
Capital shares outstanding | | | 4,370,346 | |
Net asset value per share | | $ | 23.64 | |
| | | | | |
P-Class: |
Net assets | | $ | 54,987,356 | |
Capital shares outstanding | | | 2,323,042 | |
Net asset value per share | | $ | 23.67 | |
| | | | | |
Institutional Class: |
Net assets | | $ | 5,228,679,911 | |
Capital shares outstanding | | | 220,670,197 | |
Net asset value per share | | $ | 23.69 | |
| | | | | |
R6-Class: |
Net assets | | $ | 187,716,988 | |
Capital shares outstanding | | | 7,924,469 | |
Net asset value per share | | $ | 23.69 | |
SEE NOTES TO CONSOLIDATED FINANCIAL STATEMENTS. | THE GUGGENHEIM FUNDS ANNUAL REPORT | 61 |
CONSOLIDATED STATEMENT OF OPERATIONS |
MACRO OPPORTUNITIES FUND |
Year Ended September 30, 2023
Investment Income: |
Dividends from securities of unaffiliated issuers | | $ | 7,196,247 | |
Dividends from securities of affiliated issuers | | | 9,143,628 | |
Interest from securities of unaffiliated issuers (net of foreign withholding tax of $28,250) | | | 386,175,069 | |
Total investment income | | | 402,514,944 | |
| | | | | |
Expenses: |
Management fees | | | 51,846,776 | |
Distribution and service fees: |
A-Class | | | 758,150 | |
C-Class | | | 1,224,521 | |
P-Class | | | 221,459 | |
Transfer agent/maintenance fees: |
A-Class | | | 355,648 | |
C-Class | | | 155,734 | |
P-Class | | | 238,753 | |
Institutional Class | | | 4,876,017 | |
R6-Class | | | 7,131 | |
Interest expense | | | 6,740,407 | |
Fund accounting/administration fees | | | 2,396,713 | |
Professional fees | | $ | 637,193 | |
Line of credit fees | | | 400,407 | |
Custodian fees | | | 330,326 | |
Trustees’ fees* | | | 105,414 | |
Miscellaneous | | | 641,943 | |
Recoupment of previously waived fees: |
A-Class | | | 155,426 | |
C-Class | | | 53,643 | |
P-Class | | | 4,865 | |
Institutional Class | | | 214,539 | |
R6-Class | | | 9,128 | |
Total expenses | | | 71,374,193 | |
Less: |
Expenses reimbursed by Adviser: | | | | |
A-Class | | | (5,449 | ) |
C-Class | | | (2,265 | ) |
P-Class | | | (96,205 | ) |
Institutional Class | | | (4,699,183 | ) |
R6-Class | | | (5,082 | ) |
Expenses waived by Adviser | | | (3,327,899 | ) |
Earnings credits applied | | | (152,273 | ) |
Total waived/reimbursed expenses | | | (8,288,356 | ) |
Net expenses | | | 63,085,837 | |
Net investment income | | | 339,429,107 | |
* | Relates to Trustees not deemed “interested persons” within the meaning of Section 2(a)(19) of the 1940 Act. |
62 | THE GUGGENHEIM FUNDS ANNUAL REPORT | SEE NOTES TO CONSOLIDATED FINANCIAL STATEMENTS. |
CONSOLIDATED STATEMENT OF OPERATIONS (concluded) |
MACRO OPPORTUNITIES FUND |
Year Ended September 30, 2023
Net Realized and Unrealized Gain (Loss): |
Net realized gain (loss) on: |
Investments in unaffiliated issuers | | $ | (217,639,400 | ) |
Investments in affiliated issuers | | | 2,041,581 | |
Distributions received from affiliated investment companies | | | 2,486,971 | |
Swap agreements | | | 4,724,292 | |
Futures contracts | | | 15,935,361 | |
Options purchased | | | (30,312,894 | ) |
Options written | | | 54,585,910 | |
Forward foreign currency exchange contracts | | | (26,211,908 | ) |
Foreign currency transactions | | | (16,466,026 | ) |
Net realized loss | | | (210,856,113 | ) |
Net change in unrealized appreciation (depreciation) on: |
Investments in unaffiliated issuers | | | 341,220,997 | |
Investments in affiliated issuers | | | 1,653,104 | |
Swap agreements | | | (22,035,486 | ) |
Futures contracts | | | 2,600,964 | |
Options purchased | | | (26,705,217 | ) |
Options written | | | 3,029,686 | |
Forward foreign currency exchange contracts | | | (5,969,967 | ) |
Foreign currency translations | | | (1,275,787 | ) |
Net change in unrealized appreciation (depreciation) | | | 292,518,294 | |
Net realized and unrealized gain | | | 81,662,181 | |
Net increase in net assets resulting from operations | | $ | 421,091,288 | |
SEE NOTES TO CONSOLIDATED FINANCIAL STATEMENTS. | THE GUGGENHEIM FUNDS ANNUAL REPORT | 63 |
CONSOLIDATED STATEMENTS OF CHANGES IN NET ASSETS |
MACRO OPPORTUNITIES FUND | |
| | Year Ended
September 30,
2023 | | | Year Ended
September 30,
2022 | |
Increase (Decrease) in Net Assets from Operations: | | | | | | | | |
Net investment income | | $ | 339,429,107 | | | $ | 288,548,755 | |
Net realized gain (loss) on investments | | | (210,856,113 | ) | | | 28,394,110 | |
Net change in unrealized appreciation (depreciation) on investments | | | 292,518,294 | | | | (1,144,746,402 | ) |
Net increase (decrease) in net assets resulting from operations | | | 421,091,288 | | | | (827,803,537 | ) |
| | | | | | | | | |
Distributions to shareholders: | | | | | | | | |
A-Class | | | (16,952,857 | ) | | | (14,450,678 | ) |
C-Class | | | (5,928,309 | ) | | | (5,329,080 | ) |
P-Class | | | (4,987,662 | ) | | | (6,862,970 | ) |
Institutional Class | | | (310,664,175 | ) | | | (271,453,423 | ) |
R6-Class | | | (8,818,791 | ) | | | (6,954,612 | ) |
Total distributions to shareholders | | | (347,351,794 | ) | | | (305,050,763 | ) |
| | | | | | | | | |
Capital share transactions: | | | | | | | | |
Proceeds from sale of shares | | | | | | | | |
A-Class | | | 88,917,715 | | | | 126,958,094 | |
C-Class | | | 12,403,253 | | | | 17,647,591 | |
P-Class | | | 16,822,252 | | | | 141,236,656 | |
Institutional Class | | | 2,128,695,437 | | | | 2,865,859,194 | |
R6-Class | | | 83,550,238 | | | | 39,129,088 | |
Distributions reinvested | | | | | | | | |
A-Class | | | 14,302,558 | | | | 12,395,501 | |
C-Class | | | 5,285,062 | | | | 4,714,100 | |
P-Class | | | 4,948,543 | | | | 6,862,970 | |
Institutional Class | | | 268,719,399 | | | | 236,975,014 | |
R6-Class | | | 8,818,791 | | | | 6,954,612 | |
Cost of shares redeemed | | | | | | | | |
A-Class | | | (154,649,331 | ) | | | (190,135,392 | ) |
C-Class | | | (61,940,389 | ) | | | (58,112,906 | ) |
P-Class | | | (130,394,089 | ) | | | (120,265,759 | ) |
Institutional Class | | | (2,629,895,397 | ) | | | (3,617,935,972 | ) |
R6-Class | | | (30,444,262 | ) | | | (92,877,977 | ) |
Net decrease from capital share transactions | | | (374,860,220 | ) | | | (620,595,186 | ) |
Net decrease in net assets | | | (301,120,726 | ) | | | (1,753,449,486 | ) |
| | | | | | | | | |
Net assets: | | | | | | | | |
Beginning of year | | | 6,156,112,489 | | | | 7,909,561,975 | |
End of year | | $ | 5,854,991,763 | | | $ | 6,156,112,489 | |
| | | | | | | | | |
64 | THE GUGGENHEIM FUNDS ANNUAL REPORT | SEE NOTES TO CONSOLIDATED FINANCIAL STATEMENTS. |
CONSOLIDATED STATEMENTS OF CHANGES IN NET ASSETS (concluded) |
MACRO OPPORTUNITIES FUND | |
| | Year Ended
September 30,
2023 | | | Year Ended
September 30,
2022 | |
Capital share activity: | | | | | | | | |
Shares sold | | | | | | | | |
A-Class | | | 3,734,087 | | | | 4,889,782 | |
C-Class | | | 521,851 | | | | 674,828 | |
P-Class | | | 707,632 | | | | 5,424,419 | |
Institutional Class | | | 89,245,962 | | | | 110,104,278 | |
R6-Class | | | 3,495,646 | | | | 1,482,039 | |
Shares issued from reinvestment of distributions | | | | | | | | |
A-Class | | | 600,755 | | | | 488,657 | |
C-Class | | | 222,238 | | | | 186,340 | |
P-Class | | | 208,213 | | | | 273,119 | |
Institutional Class | | | 11,271,078 | | | | 9,317,790 | |
R6-Class | | | 370,155 | | | | 273,699 | |
Shares redeemed | | | | | | | | |
A-Class | | | (6,501,599 | ) | | | (7,374,841 | ) |
C-Class | | | (2,604,191 | ) | | | (2,275,909 | ) |
P-Class | | | (5,490,413 | ) | | | (4,789,373 | ) |
Institutional Class | | | (110,513,346 | ) | | | (142,390,344 | ) |
R6-Class | | | (1,280,546 | ) | | | (3,655,968 | ) |
Net decrease in shares | | | (16,012,478 | ) | | | (27,371,484 | ) |
SEE NOTES TO CONSOLIDATED FINANCIAL STATEMENTS. | THE GUGGENHEIM FUNDS ANNUAL REPORT | 65 |
CONSOLIDATED STATEMENT OF CASH FLOWS |
MACRO OPPORTUNITIES FUND | |
Year Ended September 30, 2023
Cash Flows from Operating Activities: | | | | |
Net increase in net assets resulting from operations | | $ | 421,091,288 | |
Adjustments to Reconcile Net Increase in Net Assets Resulting from Operations to | | | | |
Net Cash Provided by Operating and Investing Activities: | | | | |
Net change in unrealized (appreciation) depreciation on investments | | | (342,874,101 | ) |
Net change in unrealized (appreciation) depreciation on options purchased | | | 26,705,217 | |
Net change in unrealized (appreciation) depreciation on options written | | | (3,029,686 | ) |
Net change in unrealized (appreciation) depreciation on forward foreign currency exchange contracts | | | 5,969,967 | |
Net realized loss on investments | | | 213,110,848 | |
Net realized loss on options purchased | | | 30,312,894 | |
Net realized gain on options written | | | (54,585,910 | ) |
Purchase of long-term investments | | | (1,578,745,799 | ) |
Proceeds from sale of long-term investments | | | 3,126,366,102 | |
Net purchases of short-term investments | | | (29,722,552 | ) |
Net accretion of bond discount and amortization of bond premium | | | (40,595,574 | ) |
Corporate actions and other payments | | | 17,325,665 | |
Premiums received on options written | | | 43,588,352 | |
Cost of closing options written | | | (5,579,763 | ) |
Commitment fees received and repayments of unfunded commitments | | | 189,767 | |
Decrease in interest receivable | | | 7,742,891 | |
Increase in dividends receivable | | | (846,731 | ) |
Decrease in securities sold receivable | | | 404,064,465 | |
Decrease in variation margin on futures contracts receivable | | | 887,390 | |
Decrease in swap settlement receivable | | | 303,021 | |
Decrease in unamortized upfront premiums paid on interest rate swap agreements | | | 224,011 | |
Increase in prepaid expenses | | | (120,120 | ) |
Decrease in foreign tax reclaims receivable | | | 26,649 | |
Increase in investment adviser receivable | | | (8,781 | ) |
Decrease in unamortized upfront premiums paid on credit default swap agreements | | | 863,019 | |
Decrease in variation margin on credit default swap agreements receivable | | | 2,539 | |
Decrease in protection fees on credit default swap agreements receivable | | | 21,389 | |
Decrease in securities purchased payable | | | (824,345,983 | ) |
Increase in unamortized upfront premiums received on credit default swap agreements | | | 1,356,909 | |
Decrease in fund accounting/administration fees payable | | | (4,513 | ) |
Decrease in distribution and service fees payable | | | (71,887 | ) |
Decrease in transfer agent/maintenance fees payable | | | (108,047 | ) |
Decrease in segregated cash due to broker | | | (36,169,894 | ) |
Decrease in unamortized upfront premiums received on interest rate swap agreements | | | (2,424,352 | ) |
Decrease in management fees payable | | | (197,849 | ) |
Increase in variation margin on interest rate swap agreements payable | | | 1,211,611 | |
Increase in variation margin on credit default swap agreements payable | | | 741 | |
Increase in due to investment adviser payable | | | 2,492 | |
Increase in trustees’ fees payable* | | | 1,968 | |
Increase in protection fees on credit default swap agreements payable | | | 169,730 | |
Decrease in miscellaneous payable | | | (414,551 | ) |
Net Cash Provided by Operating and Investing Activities | | | 1,381,692,832 | |
66 | THE GUGGENHEIM FUNDS ANNUAL REPORT | SEE NOTES TO CONSOLIDATED FINANCIAL STATEMENTS. |
CONSOLIDATED STATEMENT OF CASH FLOWS (concluded) |
MACRO OPPORTUNITIES FUND | |
Year Ended September 30, 2023
Cash Flows From Financing Activities: | | | | |
Distributions to shareholders | | $ | (44,456,463 | ) |
Proceeds from sale of shares | | | 2,329,085,260 | |
Cost of shares redeemed | | | (3,020,392,040 | ) |
Proceeds from reverse repurchase agreements | | | 3,170,920,036 | |
Payments made on reverse repurchase agreements | | | (3,842,973,638 | ) |
Net Cash Used in Financing Activities | | | (1,407,816,845 | ) |
Net decrease in cash | | | (26,124,013 | ) |
Cash at Beginning of Year (including foreign cash)** | | | 30,710,076 | |
Cash at End of Year (including foreign cash)*** | | $ | 4,586,063 | |
Supplemental Disclosure of Cash Flow Information: | | | | |
Cash paid during the year for interest | | $ | 8,300,821 | |
Supplemental Disclosure of Cash Financing Activity: | | | | |
Dividend reinvestment | | $ | 302,074,353 | |
* | Relates to Trustees not deemed “interested persons” within the meaning of Section 2(a)(19) of the 1940 Act. |
** | Includes $7,211,350 of segregated cash with broker for futures contracts, swap agreements and options and $7,184,327 of foreign currency. |
*** | Includes $3,327,828 of segregated cash with broker for swap agreements and $188,332 of foreign currency. |
SEE NOTES TO CONSOLIDATED FINANCIAL STATEMENTS. | THE GUGGENHEIM FUNDS ANNUAL REPORT | 67 |
CONSOLIDATED FINANCIAL HIGHLIGHTS |
MACRO OPPORTUNITIES FUND | |
This table is presented to show selected data for a share outstanding throughout each period and to assist shareholders in evaluating a Fund’s performance for the periods presented.
A-Class | | Year
Ended
Sept. 30,
2023 | | | Year
Ended
Sept. 30,
2022 | | | Year
Ended
Sept. 30,
2021 | | | Year
Ended
Sept. 30,
2020 | | | Year
Ended
Sept. 30,
2019 | |
Per Share Data |
Net asset value, beginning of period | | $ | 23.36 | | | $ | 27.19 | | | $ | 26.31 | | | $ | 25.82 | | | $ | 26.53 | |
Income (loss) from investment operations: |
Net investment income (loss)a | | | 1.30 | | | | .89 | | | | .91 | | | | .74 | | | | .72 | |
Net gain (loss) on investments (realized and unrealized) | | | .33 | | | | (3.77 | ) | | | 1.04 | | | | .61 | | | | (.62 | ) |
Total from investment operations | | | 1.63 | | | | (2.88 | ) | | | 1.95 | | | | 1.35 | | | | .10 | |
Less distributions from: | | | | | | | | | | | | | | | | | | | | |
Net investment income | | | (1.33 | ) | | | (.95 | ) | | | (1.07 | ) | | | (.86 | ) | | | (.79 | ) |
Net realized gains | | | — | | | | — | | | | — | | | | — | | | | (.02 | ) |
Total distributions | | | (1.33 | ) | | | (.95 | ) | | | (1.07 | ) | | | (.86 | ) | | | (.81 | ) |
Net asset value, end of period | | $ | 23.66 | | | $ | 23.36 | | | $ | 27.19 | | | $ | 26.31 | | | $ | 25.82 | |
|
Total Returnb | | | 7.09 | % | | | (10.77 | %) | | | 7.49 | % | | | 5.39 | % | | | 0.41 | % |
Ratios/Supplemental Data |
Net assets, end of period (in thousands) | | $ | 280,275 | | | $ | 327,393 | | | $ | 435,293 | | | $ | 312,986 | | | $ | 461,781 | |
Ratios to average net assets: |
Net investment income (loss) | | | 5.46 | % | | | 3.46 | % | | | 3.35 | % | | | 2.90 | % | | | 2.76 | % |
Total expensesc | | | 1.50 | % | | | 1.42 | % | | | 1.43 | % | | | 1.51 | % | | | 1.47 | % |
Net expensesd,e,f | | | 1.44 | % | | | 1.37 | % | | | 1.37 | % | | | 1.39 | % | | | 1.39 | % |
Portfolio turnover rate | | | 32 | % | | | 25 | % | | | 84 | % | | | 130 | % | | | 46 | % |
68 | THE GUGGENHEIM FUNDS ANNUAL REPORT | SEE NOTES TO CONSOLIDATED FINANCIAL STATEMENTS. |
CONSOLIDATED FINANCIAL HIGHLIGHTS (continued) |
MACRO OPPORTUNITIES FUND | |
This table is presented to show selected data for a share outstanding throughout each period and to assist shareholders in evaluating a Fund’s performance for the periods presented.
C-Class | | Year
Ended
Sept. 30,
2023 | | | Year
Ended
Sept. 30,
2022 | | | Year
Ended
Sept. 30,
2021 | | | Year
Ended
Sept. 30,
2020 | | | Year
Ended
Sept. 30,
2019 | |
Per Share Data |
Net asset value, beginning of period | | $ | 23.35 | | | $ | 27.17 | | | $ | 26.29 | | | $ | 25.80 | | | $ | 26.52 | |
Income (loss) from investment operations: |
Net investment income (loss)a | | | 1.12 | | | | .70 | | | | .72 | | | | .55 | | | | .52 | |
Net gain (loss) on investments (realized and unrealized) | | | .32 | | | | (3.76 | ) | | | 1.03 | | | | .61 | | | | (.62 | ) |
Total from investment operations | | | 1.44 | | | | (3.06 | ) | | | 1.75 | | | | 1.16 | | | | (.10 | ) |
Less distributions from: |
Net investment income | | | (1.15 | ) | | | (.76 | ) | | | (.87 | ) | | | (.67 | ) | | | (.60 | ) |
Net realized gains | | | — | | | | — | | | | — | | | | — | | | | (.02 | ) |
Total distributions | | | (1.15 | ) | | | (.76 | ) | | | (.87 | ) | | | (.67 | ) | | | (.62 | ) |
Net asset value, end of period | | $ | 23.64 | | | $ | 23.35 | | | $ | 27.17 | | | $ | 26.29 | | | $ | 25.80 | |
|
Total Returnb | | | 6.25 | % | | | (11.41 | %) | | | 6.70 | % | | | 4.60 | % | | | (0.37 | %) |
Ratios/Supplemental Data |
Net assets, end of period (in thousands) | | $ | 103,332 | | | $ | 145,469 | | | $ | 207,739 | | | $ | 219,866 | | | $ | 321,576 | |
Ratios to average net assets: |
Net investment income (loss) | | | 4.72 | % | | | 2.70 | % | | | 2.64 | % | | | 2.15 | % | | | 2.00 | % |
Total expensesc | | | 2.27 | % | | | 2.17 | % | | | 2.18 | % | | | 2.25 | % | | | 2.20 | % |
Net expensesd,e,f | | | 2.21 | % | | | 2.12 | % | | | 2.12 | % | | | 2.15 | % | | | 2.13 | % |
Portfolio turnover rate | | | 32 | % | | | 25 | % | | | 84 | % | | | 130 | % | | | 46 | % |
SEE NOTES TO CONSOLIDATED FINANCIAL STATEMENTS. | THE GUGGENHEIM FUNDS ANNUAL REPORT | 69 |
CONSOLIDATED FINANCIAL HIGHLIGHTS (continued) |
MACRO OPPORTUNITIES FUND |
This table is presented to show selected data for a share outstanding throughout each period and to assist shareholders in evaluating a Fund’s performance for the periods presented.
P-Class | | Year
Ended
Sept. 30,
2023 | | | Year
Ended
Sept. 30,
2022 | | | Year
Ended
Sept. 30,
2021 | | | Year
Ended
Sept. 30,
2020 | | | Year
Ended
Sept. 30,
2019 | |
Per Share Data |
Net asset value, beginning of period | | $ | 23.38 | | | $ | 27.20 | | | $ | 26.32 | | | $ | 25.82 | | | $ | 26.54 | |
Income (loss) from investment operations: |
Net investment income (loss)a | | | 1.30 | | | | .90 | | | | .91 | | | | .74 | | | | .71 | |
Net gain (loss) on investments (realized and unrealized) | | | .32 | | | | (3.77 | ) | | | 1.04 | | | | .62 | | | | (.62 | ) |
Total from investment operations | | | 1.62 | | | | (2.87 | ) | | | 1.95 | | | | 1.36 | | | | .09 | |
Less distributions from: |
Net investment income | | | (1.33 | ) | | | (.95 | ) | | | (1.07 | ) | | | (.86 | ) | | | (.79 | ) |
Net realized gains | | | — | | | | — | | | | — | | | | — | | | | (.02 | ) |
Total distributions | | | (1.33 | ) | | | (.95 | ) | | | (1.07 | ) | | | (.86 | ) | | | (.81 | ) |
Net asset value, end of period | | $ | 23.67 | | | $ | 23.38 | | | $ | 27.20 | | | $ | 26.32 | | | $ | 25.82 | |
|
Total Return | | | 7.09 | % | | | (10.77 | %) | | | 7.48 | % | | | 5.42 | % | | | 0.37 | % |
Ratios/Supplemental Data |
Net assets, end of period (in thousands) | | $ | 54,987 | | | $ | 161,232 | | | $ | 162,928 | | | $ | 99,575 | | | $ | 126,334 | |
Ratios to average net assets: |
Net investment income (loss) | | | 5.49 | % | | | 3.51 | % | | | 3.33 | % | | | 2.91 | % | | | 2.73 | % |
Total expensesc | | | 1.66 | % | | | 1.45 | % | | | 1.45 | % | | | 1.50 | % | | | 1.46 | % |
Net expensesd,e,f | | | 1.49 | % | | | 1.37 | % | | | 1.37 | % | | | 1.40 | % | | | 1.39 | % |
Portfolio turnover rate | | | 32 | % | | | 25 | % | | | 84 | % | | | 130 | % | | | 46 | % |
70 | THE GUGGENHEIM FUNDS ANNUAL REPORT | SEE NOTES TO CONSOLIDATED FINANCIAL STATEMENTS. |
CONSOLIDATED FINANCIAL HIGHLIGHTS (continued) |
MACRO OPPORTUNITIES FUND | |
This table is presented to show selected data for a share outstanding throughout each period and to assist shareholders in evaluating a Fund’s performance for the periods presented.
Institutional Class | | Year
Ended
Sept. 30,
2023 | | | Year
Ended
Sept. 30,
2022 | | | Year
Ended
Sept. 30,
2021 | | | Year
Ended
Sept. 30,
2020 | | | Year
Ended
Sept. 30,
2019 | |
Per Share Data |
Net asset value, beginning of period | | $ | 23.40 | | | $ | 27.23 | | | $ | 26.34 | | | $ | 25.85 | | | $ | 26.57 | |
Income (loss) from investment operations: |
Net investment income (loss)a | | | 1.40 | | | | .99 | | | | 1.02 | | | | .85 | | | | .81 | |
Net gain (loss) on investments (realized and unrealized) | | | .32 | | | | (3.76 | ) | | | 1.05 | | | | .60 | | | | (.61 | ) |
Total from investment operations | | | 1.72 | | | | (2.77 | ) | | | 2.07 | | | | 1.45 | | | | .20 | |
Less distributions from: |
Net investment income | | | (1.43 | ) | | | (1.06 | ) | | | (1.18 | ) | | | (.96 | ) | | | (.90 | ) |
Net realized gains | | | — | | | | — | | | | — | | | | — | | | | (.02 | ) |
Total distributions | | | (1.43 | ) | | | (1.06 | ) | | | (1.18 | ) | | | (.96 | ) | | | (.92 | ) |
Net asset value, end of period | | $ | 23.69 | | | $ | 23.40 | | | $ | 27.23 | | | $ | 26.34 | | | $ | 25.85 | |
|
Total Return | | | 7.47 | % | | | (10.39 | %) | | | 7.91 | % | | | 5.84 | % | | | 0.77 | % |
Ratios/Supplemental Data |
Net assets, end of period (in thousands) | | $ | 5,228,680 | | | $ | 5,397,131 | | | $ | 6,906,534 | | | $ | 4,097,303 | | | $ | 5,396,868 | |
Ratios to average net assets: |
Net investment income (loss) | | | 5.86 | % | | | 3.85 | % | | | 3.74 | % | | | 3.32 | % | | | 3.12 | % |
Total expensesc | | | 1.18 | % | | | 1.09 | % | | | 1.08 | % | | | 1.17 | % | | | 1.13 | % |
Net expensesd,e,f | | | 1.03 | % | | | 0.96 | % | | | 0.96 | % | | | 0.99 | % | | | 0.98 | % |
Portfolio turnover rate | | | 32 | % | | | 25 | % | | | 84 | % | | | 130 | % | | | 46 | % |
SEE NOTES TO CONSOLIDATED FINANCIAL STATEMENTS. | THE GUGGENHEIM FUNDS ANNUAL REPORT | 71 |
CONSOLIDATED FINANCIAL HIGHLIGHTS (continued) |
MACRO OPPORTUNITIES FUND | |
This table is presented to show selected data for a share outstanding throughout each period and to assist shareholders in evaluating a Fund’s performance for the periods presented.
R6-Class | | Year
Ended
Sept. 30,
2023 | | | Year
Ended
Sept. 30,
2022 | | | Year
Ended
Sept. 30,
2021 | | | Year
Ended
Sept. 30,
2020 | | | Period
Ended
Sept. 30,
2019g | |
Per Share Data |
Net asset value, beginning of period | | $ | 23.39 | | | $ | 27.22 | | | $ | 26.34 | | | $ | 25.84 | | | $ | 25.98 | |
Income (loss) from investment operations: |
Net investment income (loss)a | | | 1.40 | | | | .98 | | | | 1.02 | | | | .87 | | | | .36 | |
Net gain (loss) on investments (realized and unrealized) | | | .33 | | | | (3.75 | ) | | | 1.04 | | | | .58 | | | | (.03 | ) |
Total from investment operations | | | 1.73 | | | | (2.77 | ) | | | 2.06 | | | | 1.45 | | | | .33 | |
Less distributions from: |
Net investment income | | | (1.43 | ) | | | (1.06 | ) | | | (1.18 | ) | | | (.95 | ) | | | (.47 | ) |
Total distributions | | | (1.43 | ) | | | (1.06 | ) | | | (1.18 | ) | | | (.95 | ) | | | (.47 | ) |
Net asset value, end of period | | $ | 23.69 | | | $ | 23.39 | | | $ | 27.22 | | | $ | 26.34 | | | $ | 25.84 | |
|
Total Return | | | 7.51 | % | | | (10.39 | %) | | | 7.91 | % | | | 5.81 | % | | | 1.30 | % |
Ratios/Supplemental Data |
Net assets, end of period (in thousands) | | $ | 187,717 | | | $ | 124,888 | | | $ | 197,067 | | | $ | 136,669 | | | $ | 676 | |
Ratios to average net assets: |
Net investment income (loss) | | | 5.85 | % | | | 3.79 | % | | | 3.74 | % | | | 3.41 | % | | | 2.79 | % |
Total expensesc | | | 1.07 | % | | | 1.00 | % | | | 1.01 | % | | | 1.09 | % | | | 1.11 | % |
Net expensesd,e,f | | | 1.01 | % | | | 0.96 | % | | | 0.96 | % | | | 0.99 | % | | | 1.03 | % |
Portfolio turnover rate | | | 32 | % | | | 25 | % | | | 84 | % | | | 130 | % | | | 46 | % |
72 | THE GUGGENHEIM FUNDS ANNUAL REPORT | SEE NOTES TO CONSOLIDATED FINANCIAL STATEMENTS. |
CONSOLIDATED FINANCIAL HIGHLIGHTS (concluded) |
MACRO OPPORTUNITIES FUND |
a | Net investment income (loss) per share was computed using average shares outstanding throughout the period. |
b | Total return does not reflect the impact of any applicable sales charges. |
c | Does not include expenses of the underlying funds in which the Fund invests. |
d | Net expense information reflects the expense ratios after expense waivers and reimbursements, as applicable. |
e | The portion of the ratios of net expenses to average net assets attributable to recoupments of prior fee reductions or expense reimbursements for the years presented was as follows: |
| 09/30/23 | 09/30/22 | 09/30/21 | 09/30/20 | 09/30/19 |
A-Class | 0.05% | 0.06% | 0.10% | 0.03% | 0.02% |
C-Class | 0.04% | 0.06% | 0.08% | 0.05% | 0.05% |
P-Class | 0.01% | 0.05% | 0.09% | 0.03% | 0.04% |
Institutional Class | 0.00%* | — | — | 0.00%* | 0.00%* |
R6-Class | 0.01% | 0.00%* | 0.00%* | 0.00%* | 0.00%*,g |
f | Net expenses may include expenses that are excluded from the expense limitation agreement. Excluding these expenses, the net expense ratios for the years presented would be: |
| 09/30/23 | 09/30/22 | 09/30/21 | 09/30/20 | 09/30/19 |
A-Class | 1.32% | 1.33% | 1.33% | 1.33% | 1.33% |
C-Class | 2.07% | 2.08% | 2.08% | 2.08% | 2.07% |
P-Class | 1.32% | 1.33% | 1.33% | 1.33% | 1.33% |
Institutional Class | 0.91% | 0.92% | 0.92% | 0.92% | 0.92% |
R6-Class | 0.91% | 0.92% | 0.92% | 0.92% | 0.92%g |
g | Since commencement of operations: March 13, 2019. Percentage amounts for the period, except total return and portfolio turnover rate, have been annualized. |
SEE NOTES TO CONSOLIDATED FINANCIAL STATEMENTS. | THE GUGGENHEIM FUNDS ANNUAL REPORT | 73 |
NOTES TO CONSOLIDATED FINANCIAL STATEMENTS |
Note 1 – Organization, Consolidation of Subsidiary and Significant Accounting Policies
Organization
Guggenheim Funds Trust (the “Trust”), a Delaware statutory trust, is registered with the U.S. Securities and Exchange Commission (the “SEC”) under the Investment Company Act of 1940 (the “1940 Act”), as an open-ended investment company of the series type. Each series, in effect, is representing a separate fund. The Trust may issue an unlimited number of authorized shares. The Trust accounts for the assets of each fund separately.
The Trust offers a combination of five separate classes of shares: A-Class shares, C-Class shares, P-Class shares, R6-Class shares and Institutional Class shares. Sales of shares of each Class are made without a front-end sales charge at the net asset value per share (“NAV”), with the exception of A-Class shares. A-Class shares are sold at the NAV, plus the applicable front-end sales charge. The sales charge varies depending on the amount purchased. A-Class share purchases of $1 million or more are exempt from the front-end sales charge but have a 1% contingent deferred sales charge (“CDSC”), if shares are redeemed within 12 months of purchase. C-Class shares have a 1% CDSC if shares are redeemed within 12 months of purchase. C-Class shares automatically convert to A-Class shares on or about the 10th day of the month following the 8-year anniversary of the purchase of the C-Class shares. This conversion will be executed without any sales charge, fee or other charge. After the conversion is completed, the shares will be subject to all features and expenses of A-Class shares. Institutional Class shares are offered primarily for direct investment by institutions such as pension and profit sharing plans, endowments, foundations and corporations. Institutional Class shares require a minimum initial investment of $2 million and a minimum account balance of $1 million. R6-Class shares are offered primarily through qualified retirement and benefit plans. R6-Class shares are also offered through certain other plans and platforms sponsored by financial intermediaries. Certain institutional investors and others deemed appropriate by Guggenheim Investments (“GI”) may also be eligible to purchase R6-Class shares subject to a $2 million minimum initial investment. At September 30, 2023, the Trust consisted of nineteen funds (the “Funds”).
This report covers the Macro Opportunities Fund (the “Fund”), a diversified investment company. At September 30, 2023, A-Class, C-Class, P-Class, Institutional Class and R6-Class shares have been issued by the Fund.
Guggenheim Partners Investment Management, LLC (“GPIM” or the “Adviser”), which operates under the name Guggenheim Investments, provides advisory services. Guggenheim Funds Distributors, LLC (“GFD”) serves as distributor of the Fund’s shares. GI and GFD are affiliated entities.
Pursuant to an investment Sub-Advisory Agreement between GPIM and Guggenheim Partners Advisors, LLC (“GPA”) that was in effect during a portion of the Reporting Period, GPA was engaged to provide investment subadvisory services to the Fund. GPA operated as an investment sub-advisor to the Fund from April 29, 2022 to December 22, 2022.
74 | THE GUGGENHEIM FUNDS ANNUAL REPORT | |
NOTES TO CONSOLIDATED FINANCIAL STATEMENTS (continued) |
GPA, under the oversight of the Board and GPIM, assisted GPIM in the supervision and direction of the investment strategies of the Fund in accordance with its investment policies. As compensation for its services, GPIM paid GPA a fee, payable monthly, in an amount equal to 0.005% of the average daily net assets of the Fund.
Consolidation of Subsidiary
The consolidated financial statements of the Fund include the accounts of a wholly-owned and controlled Cayman Islands subsidiary (the “Subsidiary”). Significant inter-company accounts and transactions have been eliminated in consolidation for the Fund.
The Fund may invest up to 25% of its total assets in its Subsidiary which acts as an investment vehicle in order to effect certain investments consistent with the Fund’s investment objectives and policies.
A summary of the Fund’s investment in its Subsidiary is as follows:
| | Inception Date
of Subsidiary | | | Subsidiary
Net Assets at
September 30, 2023 | | | % of Net Assets
of the Fund at
September 30, 2023 | |
| | | | 01/08/15 | | | $ | 546,202 | | | | 0.01 | % |
Significant Accounting Policies
The Fund operates as an investment company and, accordingly, follows the investment company accounting and reporting guidance of the Financial Accounting Standards Board (“FASB”) Accounting Standards Codification Topic 946 Financial Services – Investment Companies.
The following significant accounting policies are in conformity with U.S. generally accepted accounting principles (“U.S. GAAP”) and are consistently followed by the Trust. This requires management to make estimates and assumptions that affect the reported amount of assets and liabilities, contingent assets and liabilities at the date of the consolidated financial statements, and the reported amounts of revenues and expenses during the reporting period. Actual results could differ from these estimates. All time references are based on Eastern Time.
The NAV of each share class of the Fund is calculated by dividing the market value of the Fund’s securities and other assets, less all liabilities attributable to the share class by the number of outstanding shares of the share class.
(a) Valuation of Investments
The Board of Trustees of the Fund (the “Board”) has adopted policies and procedures for the valuation of the Fund’s investments (the “Fund Valuation Procedures”). The SEC adopted Rule 2a-5 under the 1940 Act (“Rule 2a-5”) which establishes requirements for determining fair value in good faith. Rule 2a-5 also defines “readily available market quotations” for purposes of the 1940 Act and establishes requirements for determining whether a fund must fair value a security in good faith.
| | THE GUGGENHEIM FUNDS ANNUAL REPORT | 75 |
NOTES TO CONSOLIDATED FINANCIAL STATEMENTS (continued) |
Pursuant to Rule 2a-5, the Board has designated the Adviser as the valuation designee to perform fair valuation determinations for the Fund with respect to all Fund investments and other assets. As the Fund’s valuation designee pursuant to Rule 2a-5, the Adviser has adopted separate procedures (the “Valuation Designee Procedures” and collectively with the Fund Valuation Procedures, the “Valuation Procedures”) reasonably designed to prevent violations of the requirements of Rule 2a-5 and Rule 31a-4. The Adviser, in its role as valuation designee, utilizes the assistance of a valuation committee, consisting of representatives from Guggenheim’s investment management, fund administration, legal and compliance departments (the “Valuation Committee”), in determining the fair value of the Fund’s securities and other assets.
Valuations of the Fund’s securities and other assets are supplied primarily by pricing service providers appointed pursuant to the processes set forth in the Valuation Procedures. The Adviser, with the assistance of the Valuation Committee, convenes monthly, or more frequently as needed, to review the valuation of all assets which have been fair valued. The Adviser, consistent with the monitoring and review responsibilities set forth in the Valuation Procedures, regularly reviews the appropriateness of the inputs, methods, models and assumptions employed by the pricing service provider.
If the pricing service provider cannot or does not provide a valuation for a particular investment or such valuation is deemed unreliable, such investment is fair valued by the Adviser.
Equity securities listed or traded on a recognized U.S. securities exchange or the National Association of Securities Dealers Automated Quotations (“NASDAQ”) National Market System will generally be valued on the basis of the last sale price on the primary U.S. exchange or market on which the security is listed or traded; provided, however, that securities listed on NASDAQ will be valued at the NASDAQ official closing price, which may not necessarily represent the last sale price.
Generally, trading in foreign securities markets is substantially completed each day at various times prior to the close of the New York Stock Exchange (“NYSE”). The values of foreign securities are determined as of the close of such foreign markets or the close of the NYSE, if earlier. All investments quoted in foreign currencies are valued in U.S. dollars on the basis of the foreign currency exchange rates prevailing at the close of U.S. business at 4:00 p.m. Investments in foreign securities may involve risks not present in domestic investments. The Adviser will determine the current value of such foreign securities by taking into consideration certain factors which may include the following factors, among others: the value of the securities traded on other foreign markets, American Depositary Receipts (“ADR”) trading, closed-end fund trading, foreign currency exchange activity, and the trading prices of financial products that are tied to foreign securities. In addition, under the Valuation Procedures, the Adviser is authorized to use prices and other information supplied by a pricing service provider in valuing foreign securities.
Open-end investment companies are valued at their NAV as of the close of business, on the valuation date. Exchange-traded funds and closed-end investment companies are generally valued at the last quoted sale price.
76 | THE GUGGENHEIM FUNDS ANNUAL REPORT | |
NOTES TO CONSOLIDATED FINANCIAL STATEMENTS (continued) |
U.S. Government securities are valued by pricing service providers, the last traded fill price, or at the reported bid price at the close of business.
Repurchase agreements are generally valued at amortized cost, provided such amounts approximate market value.
Commercial paper and discount notes with a maturity of greater than 60 days at acquisition are valued at prices that reflect broker-dealer supplied valuations or are obtained from pricing service providers, which may consider the trade activity, treasury spreads, yields or price of bonds of comparable quality, coupon, maturity, and type, as well as prices quoted by dealers who make markets in such securities. Commercial paper and discount notes with a maturity of 60 days or less at acquisition are valued at amortized cost, unless the Adviser concludes that amortized cost does not represent the fair value of the applicable asset in which case it will be valued using an independent pricing service.
Typically, loans are valued using information provided by a pricing service provider which uses broker quotes, among other inputs. If the pricing service cannot or does not provide a valuation for a particular loan, or such valuation is deemed unreliable, such investment is valued based on a quote from a broker-dealer or is fair valued by the Adviser.
Exchange-traded options are valued at the mean of the bid and ask prices on the principal exchange on which they are traded. Over-the-counter (“OTC”) options and options on swaps (“swaptions”) are valued using a price provided by a pricing service.
Futures contracts are valued on the basis of the last sale price at the 4:00 p.m. price on the valuation date. In the event that the exchange for a specific futures contract closes earlier than 4:00 p.m., the futures contract is valued at the official settlement price of the exchange. However, the underlying securities from which the futures contract value is derived are monitored until 4:00 p.m. to determine if fair valuation would provide a more accurate valuation.
Interest rate swap agreements entered into by the Fund is valued on the basis of the last sale price on the primary exchange on which the swap is traded.
Other swap agreements entered into by the Fund are generally valued using an evaluated price provided by a pricing service provider.
Forward foreign currency exchange contracts are valued daily based on the applicable exchange rate of the underlying currency.
Investments for which market quotations are not readily available are fair valued as determined in good faith by the Adviser. Valuations in accordance with these methods are intended to reflect each security’s (or asset’s or liability’s) “fair value”. Each such determination is based on a consideration of all relevant factors, which are likely to vary from one pricing context to another. Examples of such factors may include, but are not limited to market prices; sale prices; broker quotes; and models which derive prices based on inputs such as prices of securities with
| | THE GUGGENHEIM FUNDS ANNUAL REPORT | 77 |
NOTES TO CONSOLIDATED FINANCIAL STATEMENTS (continued) |
comparable maturities and characteristics, or based on inputs such as anticipated cash flows or collateral, spread over U.S. Treasury securities, and other information analysis. In connection with futures contracts and other derivative investments, such factors may include obtaining information as to how (a) these contracts and other derivative investments trade in the futures or other derivative markets, respectively, and (b) the securities underlying these contracts and other derivative investments trade in the cash market.
(b) Special Purpose Acquisition Companies
The Fund may acquire an interest in a special purpose acquisition company (“SPAC”) in an initial public offering or a secondary market transaction. SPAC investments carry many of the same risks as investments in initial public offering securities, such as erratic price movements, greater risk of loss, lack of information about the issuer, limited operating and little public or no trading history, and higher transaction costs. An investment in a SPAC is typically subject to a higher risk of dilution by additional later offerings of interests in the SPAC or by other investors exercising existing rights to purchase shares of the SPAC and interests in SPACs may be illiquid and/or be subject to restrictions on resale. A SPAC is a publicly traded company that raises investment capital for the purpose of acquiring the equity securities of one or more existing companies (or interests therein) via merger, combination, acquisition or other similar transactions. Unless and until an acquisition is completed, a SPAC generally invests its assets (less a portion retained to cover expenses) in U.S. government securities, money market securities and cash and does not typically pay dividends in respect of its common stock. SPAC investments are also subject to the risk that a significant portion of the funds raised by the SPAC may be expended during the search for a target acquisition or merger and that the SPAC may have limited time in which to conduct due diligence on potential business combination targets. Because SPACs are in essence blank check companies without operating history or ongoing business other than seeking acquisitions, the value of their securities is particularly dependent on the ability of the entity’s management to identify and complete a profitable acquisition. Among other conflicts of interest, the economic interests of the management, directors, officers and related parties of a SPAC can differ from the economic interests of public shareholders, which may lead to conflicts as they evaluate, negotiate and recommend business combination transactions to shareholders. This risk may become more acute as the deadline for the completion of a business combination nears. There is no guarantee that the SPACs in which the Fund invests will complete an acquisition or that any acquisitions that are completed will be profitable.
(c) U.S. Government and Agency Obligations
Certain U.S. Government and Agency Obligations are traded on a discount basis; the interest rates shown on the Consolidated Schedule of Investments reflect the effective rates paid at the time of purchase by the Fund. Other securities bear interest at the rates shown, payable at fixed dates through maturity.
78 | THE GUGGENHEIM FUNDS ANNUAL REPORT | |
NOTES TO CONSOLIDATED FINANCIAL STATEMENTS (continued) |
Inflation-Indexed bonds are fixed-income securities whose principal value is periodically adjusted to the rate of inflation. The interest rate on these securities is generally fixed at issuance at a rate lower than typical bonds. Over the life of an inflation-indexed bond however, interest will be paid based on a principal value which is adjusted for inflation. Any increase in the principal amount of an inflation-indexed bond is recognized as a component of Interest on the Fund’s Consolidated Statement of Operations, even though principal is not received until maturity.
(d) Senior Floating Rate Interests and Loan Investments
Senior floating rate interests in which the Fund invests generally pay interest rates which are periodically adjusted by reference to a base short-term floating rate, plus a premium. These base lending rates are generally (i) a broad measure of the cost of borrowing cash, such as the one-month or three-month Secured Overnight Financing Rate (“SOFR”), (ii) the prime rate offered by one or more major United States banks, or (iii) the bank’s certificate of deposit rate. Senior floating rate interests often require prepayments from excess cash flows or permit the borrower to repay at its election. The rate at which the borrower repays cannot be predicted with accuracy. As a result, the actual remaining maturity may be substantially less than the stated maturities disclosed in the Fund’s Consolidated Schedule of Investments.
The Fund invests in loans and other similar debt obligations (“obligations”). A portion of the Fund’s investments in these obligations is sometimes referred to as “covenant lite” loans or obligations (“covenant lite obligations”), which are obligations that lack covenants or possess fewer or less restrictive covenants or constraints on borrowers than certain other types of obligations. The Fund may also obtain exposure to covenant lite obligations through investment in securitization vehicles and other structured products. Recently, many new or reissued obligations have not featured traditional covenants, which are intended to protect lenders and investors by (i) imposing certain restrictions or other limitations on a borrower’s operations or assets or (ii) providing certain rights to lenders. The Fund may have fewer rights with respect to covenant lite obligations, including fewer protections against the possibility of default and fewer remedies in the event of default. As a result, investments in (or exposure to) covenant lite obligations are subject to more risk than investments in (or exposure to) certain other types of obligations. The Fund is subject to other risks associated with investments in (or exposure to) obligations, including that obligations may not be considered “securities” and, as a result, the Fund may not be entitled to rely on the anti-fraud protections under the federal securities laws and instead may have to resort to state law and direct claims.
(e) Interest on When-Issued Securities
The Fund may purchase and sell interests in securities on a when-issued and delayed delivery basis, with payment and delivery scheduled for a future date. No income accrues to the Fund on such interests or securities in connection with such transactions prior to the date the Fund actually takes delivery of such interests or securities. These transactions are subject to market
| | THE GUGGENHEIM FUNDS ANNUAL REPORT | 79 |
NOTES TO CONSOLIDATED FINANCIAL STATEMENTS (continued) |
fluctuations and are subject to the risk that the value at delivery may be more or less than the trade date purchase price. Although the Fund will generally purchase these securities with the intention of acquiring such securities, it may sell such securities before the settlement date.
(f) Short Sales
When the Fund engages in a short sale of a security, an amount equal to the proceeds is reflected as an asset and an equivalent liability. The amount of the liability is subsequently marked-to-market to reflect the market value of the short sale.
Fees, if any, paid to brokers to borrow securities in connection with short sales are recorded as interest expense. In addition, the Fund must pay out the dividend rate of the equity or coupon rate of the obligation to the lender and record this as an expense. Short dividend or interest expense is a cost associated with the investment objective of short sales transactions, rather than an operational cost associated with the day-to-day management of any mutual fund. The Fund may also receive rebate income from the broker resulting from the investment of the proceeds from securities sold short.
(g) Options
Upon the purchase of an option, the premium paid is recorded as an investment, the value of which is marked-to-market daily. If a purchased option expires, the Fund realizes a loss in the amount of the cost of the option. When the Fund enters into a closing sale transaction, it realizes a gain or loss depending on whether the proceeds from the closing sale transaction are greater or less than the cost of the option. If the Fund exercises a put option, it realizes a gain or loss from the sale of the underlying security and the proceeds from such sale will be decreased by the premium originally paid. When the Fund exercises a call option, the cost of the security purchased by the Fund upon exercise increases by the premium originally paid.
When the Fund writes (sells) an option, an amount equal to the premium received is entered in that Fund’s accounting records as an asset and equivalent liability. The amount of the liability is subsequently marked-to-market to reflect the current value of the option written. When a written option expires, or if the Fund enters into a closing purchase transaction, it realizes a gain (or loss if the cost of a closing purchase transaction exceeds the premium received when the option was sold).
The Fund may purchase and write swaptions primarily to preserve a return or spread on a particular investment or portion of the Funds’ holdings, as a duration management technique or to protect against an increase in the price of securities it anticipates purchasing at a later date. The purchaser and writer of a swaption is buying or granting the right to enter into a previously agreed upon interest rate swap agreement at any time before the expiration of the options. The swaptions are forward premium swaptions which have extended settlement dates.
80 | THE GUGGENHEIM FUNDS ANNUAL REPORT | |
NOTES TO CONSOLIDATED FINANCIAL STATEMENTS (continued) |
(h) Futures Contracts
Upon entering into a futures contract, the Fund deposits and maintains as collateral such initial margin as required by the exchange on which the transaction is affected. Pursuant to the contract, the Fund agrees to receive from or pay to the broker an amount of cash equal to the daily fluctuation in value of the contract. Such receipts or payments are known as variation margin and are recorded by the Fund as unrealized appreciation or depreciation. When the contract is closed, the Fund records a realized gain or loss equal to the difference between the value of the contract at the time it was opened and the value at the time it was closed.
(i) Swap Agreements
Swap agreements are marked-to-market daily and the change, if any, is recorded as unrealized appreciation or depreciation. Payments received or made as a result of an agreement or termination of an agreement are recognized as realized gains or losses.
Upon entering into certain centrally-cleared swap transactions, a Fund is required to deposit with its clearing broker an amount of cash or securities as an initial margin. Subsequent variation margin receipts or payments are received or made by the Fund depending on fluctuations in the fair value of the reference entity and are recorded by the Fund as unrealized appreciation or depreciation. When the contract is closed, the Fund records a realized gain or loss equal to the difference between the value of the contract at the time it was opened and the value at the time it was closed.
Upfront payments received or made by a Fund on credit default swap agreements and interest rate swap agreements are amortized over the expected life of the agreement. Periodic payments received or paid by a Fund are recorded as realized gains or losses. Payments received or made as a result of a credit event or termination of the contract are recognized, net of a proportional amount of the upfront payment, as realized gains or losses.
(j) Currency Translations
The accounting records of the Fund are maintained in U.S. dollars. All assets and liabilities initially expressed in foreign currencies are converted into U.S. dollars at prevailing exchange rates. Purchases and sales of investment securities, dividend and interest income, and certain expenses are translated at the rates of exchange prevailing on the respective dates of such transactions. Changes in the relationship of these foreign currencies to the U.S. dollar can significantly affect the value of the investments and earnings of the Fund. Foreign investments may also subject the Fund to foreign government exchange restrictions, expropriation, taxation, or other political, social, geopolitical or economic developments, all of which could affect the market and/or credit risk of the investments.
| | THE GUGGENHEIM FUNDS ANNUAL REPORT | 81 |
NOTES TO CONSOLIDATED FINANCIAL STATEMENTS (continued) |
The Fund does not isolate that portion of the results of operations resulting from changes in the foreign exchange rates on investments from the fluctuations arising from changes in the market prices of securities held. Such fluctuations are included with the net realized gain or loss and unrealized appreciation or depreciation on investments.
Reported net realized foreign exchange gains and losses arise from sales of foreign currencies and currency gains or losses realized between the trade and settlement dates on investment transactions. Net unrealized appreciation and depreciation arise from changes in the fair values of assets and liabilities other than investments in securities at the fiscal period end, resulting from changes in exchange rates.
(k) Forward Foreign Currency Exchange Contracts
The change in value of a forward foreign currency exchange contract is recorded as unrealized appreciation or depreciation until the contract is closed. When the contract is closed, the Fund records a realized gain or loss equal to the difference between the value at the time the contract was opened and the value at the time it was closed.
(l) Foreign Taxes
The Fund may be subject to foreign taxes (a portion of which may be reclaimable) on income, stock dividends, capital gains on investments or certain foreign currency transactions. All foreign taxes are recorded in accordance with the applicable foreign tax regulations and rates that exist in the foreign jurisdictions in which the Fund invests. These foreign taxes, if any, are paid by the Fund and reflected in its Consolidated Statement of Operations as follows: foreign taxes withheld at source are presented as a reduction of income and foreign taxes on capital gains from sales of investments are included with the net realized gain (loss) on investments. Foreign taxes payable or deferred as of September 30, 2023, if any, are disclosed in the Fund’s Consolidated Statement of Assets and Liabilities.
(m) Security Transactions
Security transactions are recorded on the trade date for financial reporting purposes. Realized gains and losses from securities transactions are recorded using the identified cost basis. Proceeds from lawsuits related to investment holdings are recorded as a reduction to cost if the securities are still held and as realized gains if no longer held in the Fund. Dividend income is recorded on the ex-dividend date, net of applicable taxes withheld by foreign countries, if any. Taxable non-cash dividends are recorded as dividend income. Interest income, including amortization of premiums and accretion of discounts, is accrued on a daily basis. Interest income also includes paydown gains and losses on mortgage-backed and asset-backed securities and senior and subordinated loans. Amendment fees are earned as compensation for evaluating and accepting changes to the original loan agreement and are recognized when received. Dividend income from Real Estate Investment Trusts (“REITs”) is recorded based on the income included in the distributions received from the REIT investments using published REIT classifications,
82 | THE GUGGENHEIM FUNDS ANNUAL REPORT | |
NOTES TO CONSOLIDATED FINANCIAL STATEMENTS (continued) |
including some management estimates when actual amounts are not available. Distributions received in excess of this estimated amount are recorded as a reduction of the cost of investments or reclassified to realized gains. The actual amounts of income, return of capital, and realized gains are only determined by each REIT after its fiscal year-end, and may differ from the estimated amounts.
��
Income from residual collateralized loan obligations is recognized using the effective interest method. At the time of purchase, management estimates the future expected cash flows and determines the effective yield and estimated maturity date based on the estimated cash flows. Subsequent to the purchase, the estimated cash flows are updated periodically and a revised yield is calculated prospectively.
The Fund may receive other income from investments in senior loan interests including amendment fees, consent fees and commitment fees. For funded loans, these fees are recorded as income when received by the Fund and included in interest income on the Fund’s Consolidated Statement of Operations. For unfunded loans, commitment fees are included in realized gain on investments on the Fund’s Consoldated Statement of Operations at the end of the commitment period.
(n) Distributions
The Fund declares dividends from investment income daily. The Fund pays its shareholders from its net investment income monthly and distributes any net capital gains that it has realized, at least annually. Distributions to shareholders are recorded on the ex-dividend date. Dividends are reinvested in additional shares, unless shareholders request payment in cash. The character of distributions made during the year from net investment income or net realized gains may differ from their ultimate characterization for U.S. federal income tax purposes.
(o) Class Allocations
Interest and dividend income, most expenses, all realized gains and losses, and all unrealized appreciation and depreciation are allocated to the share classes based upon the value of the outstanding shares in each share class. Certain costs, such as distribution and service fees are charged directly to specific share classes. In addition, certain expenses have been allocated to the individual Funds in the Trust based on the respective net assets of each Fund included in the Trust.
(p) Earnings Credits
Under the fee arrangement with the custodian, the Fund may earn credits based on overnight custody cash balances. These credits are utilized to reduce related custodial expenses. The custodian fees disclosed in the Fund’s Consolidated Statement of Operations are before the reduction in expense from the related earnings credits, if any. Earnings credits for the year ended September 30, 2023, are disclosed in the Fund’s Consolidated Statement of Operations.
| | THE GUGGENHEIM FUNDS ANNUAL REPORT | 83 |
NOTES TO CONSOLIDATED FINANCIAL STATEMENTS (continued) |
(q) Cash
The Fund may leave cash overnight in its cash account with the custodian. Periodically, the Fund may have cash due to the custodian bank as an overdraft balance. A fee is incurred on this overdraft, calculated by multiplying the overdraft by a rate based on the federal funds rate, which was 5.33% at September 30, 2023.
(r) Indemnifications
Under the Fund’s organizational documents, its Trustees and Officers are indemnified against certain liabilities arising out of the performance of their duties to the Trust. In addition, throughout the normal course of business, the Fund enters into contracts that contain a variety of representations and warranties which provide general indemnifications. The Fund’s maximum exposure under these arrangements is unknown, as this would involve future claims that may be made against the Fund and/or its affiliates that have not yet occurred. However, based on experience, the Fund expects the risk of loss to be remote.
Note 2 – Financial Instruments and Derivatives
As part of its investment strategy, the Fund utilizes a variety of derivative instruments. These investments involve, to varying degrees, elements of market risk and risks in excess of amounts recognized on the Fund’s Consolidated Statement of Assets and Liabilities. Valuation and accounting treatment of these instruments can be found under Significant Accounting Policies in Note 1 of these Notes to Consolidated Financial Statements.
Derivatives
Derivatives are instruments whose values depend on, or are derived from, in whole or in part, the value of one or more other assets, such as securities, currencies, commodities or indices. Derivative instruments may be used to increase investment flexibility (including to maintain cash reserves while maintaining exposure to certain other assets), for risk management (hedging) purposes, to facilitate trading, to reduce transaction costs and to pursue higher investment returns. Derivative instruments may also be used to mitigate certain investment risks, such as foreign currency exchange rate risk, interest rate risk and credit risk. U.S. GAAP requires disclosures to enable investors to better understand how and why a Fund uses derivative instruments, how these derivative instruments are accounted for and their effects on the Fund’s financial position and results of operations.
The Fund may utilize derivatives for the following purposes:
Duration: the use of an instrument to manage the interest rate risk of a portfolio.
Hedge: an investment made in order to reduce the risk of adverse price movements in a security, by taking an offsetting position to protect against broad market moves.
84 | THE GUGGENHEIM FUNDS ANNUAL REPORT | |
NOTES TO CONSOLIDATED FINANCIAL STATEMENTS (continued) |
Income: the use of any instrument that distributes cash flows typically based upon some rate of interest.
Index Exposure: the use of an instrument to obtain exposure to a listed or other type of index.
Speculation: the use of an instrument to express macro-economic and other investment views.
Options Purchased and Written
A call option on a security gives the purchaser of the option the right to buy, and the writer of a call option the obligation to sell, the underlying security. The purchaser of a put option has the right to sell, and the writer of the put option the obligation to buy, the underlying security at any time during the option period. The risk associated with purchasing options is limited to the premium originally paid.
The following table represents the Fund’s use and volume of call/put options purchased on a monthly basis:
| | | Average Notional Amount | |
Use | | Call | | | Put | |
Duration, Hedge, Speculation, Income | | $ | 1,061,153,899 | | | $ | 349,634,210 | |
The risk in writing a call option is that a Fund may incur a loss if the market price of the underlying security increases and the option is exercised. The risk in writing a put option is that a Fund may incur a loss if the market price of the underlying security decreases and the option is exercised. In addition, there may be an imperfect correlation between the movement in prices of options and the underlying securities where a Fund may not be able to enter into a closing transaction because of an illiquid secondary market; or, for OTC options, a Fund may be at risk because of the counterparty’s inability to perform.
The following table represents the Fund’s use and volume of call/put options written on a monthly basis:
| | | Average Notional Amount | |
Use | | Call | | | Put | |
Hedge, Income | | $ | 135,765,375 | | | $ | 137,723,377 | |
Futures Contracts
A futures contract is an agreement to purchase (long) or sell (short) an agreed amount of securities or other instruments at a set price for delivery at a future date. There are significant risks associated with a Fund’s use of futures contracts, including (i) there may be an imperfect or no correlation between the changes in market value of the underlying asset and the prices of futures contracts; (ii) there may not be a liquid secondary market for a futures contract; (iii) trading restrictions or limitations may be imposed by an exchange; and (iv) government
| | THE GUGGENHEIM FUNDS ANNUAL REPORT | 85 |
NOTES TO CONSOLIDATED FINANCIAL STATEMENTS (continued) |
regulations may restrict trading in futures contracts. When investing in futures, there is minimal counterparty credit risk to a Fund because futures are exchange-traded and the exchange’s clearinghouse, as counterparty to all exchange-traded futures, guarantees against default. Cash deposits are shown as segregated cash with broker on the Fund’s Consolidated Statement of Assets and Liabilities; securities held as collateral are noted on the Fund’s Consolidated Schedule of Investments.
The following table represents the Fund’s use and volume of futures on a monthly basis:
| | | Average Notional Amount | |
Use | | Long | | | Short | |
Duration, Hedge, Speculation | | $ | 189,848,176 | | | $ | 5,904,548 | |
Swap Agreements
A swap is an agreement that obligates two parties to exchange a series of cash flows at specified intervals based upon or calculated by reference to changes in specified prices or rates for a specified amount of an underlying asset. When utilizing OTC swaps, the Fund bears the risk of loss of the amount expected to be received under a swap agreement in the event of the default or bankruptcy of a swap agreement counterparty or if the underlying asset declines in value. Certain standardized swaps are subject to mandatory central clearing and are executed on a multi-lateral or other trade facility platform, such as a registered exchange. There is limited counterparty credit risk with respect to centrally-cleared swaps as the transaction is facilitated through a central clearinghouse, much like exchange-traded futures contracts. For a Fund utilizing centrally-cleared swaps, the exchange bears the risk of loss resulting from a counterparty not being able to pay. There is no guarantee that a Fund or an underlying fund could eliminate its exposure under an outstanding swap agreement by entering into an offsetting swap agreement with the same or another party.
Interest rate swaps involve the exchange by the Fund with another party for its respective commitment to pay or receive a fixed or variable interest rate on a notional amount of principal. Interest rate swaps are generally centrally-cleared, but central clearing does not make interest rate swap transactions risk free.
The following table represents the Fund’s use and volume of interest rate swaps on a monthly basis:
| | | Average Notional Amount | |
Use | | Pay Floating Rate | | | Receive Floating Rate | |
Duration, Hedge, Speculation | | $ | 1,955,587,583 | | | $ | 5,136,314,500 | |
86 | THE GUGGENHEIM FUNDS ANNUAL REPORT | |
NOTES TO CONSOLIDATED FINANCIAL STATEMENTS (continued) |
Credit default swaps are instruments which allow for the full or partial transfer of third party credit risk, with respect to a particular entity or entities, from one counterparty to the other. The Fund enters into credit default swaps as a “seller” or “buyer” of protection primarily to gain or reduce exposure to the investment grade and/or high yield bond market. A seller of credit default swaps is selling credit protection or assuming credit risk with respect to the underlying entity or entities. The buyer in a credit default swap is obligated to pay the seller a periodic stream of payments over the term of the contract provided that no event of default on an underlying reference obligation has occurred. If a credit event occurs, as defined under the terms of the swap agreement, the seller will either (i) pay to the buyer of protection an amount equal to the notional amount of the swap and take delivery of the referenced obligation or underlying securities comprising the referenced index or (ii) pay a net settlement amount in the form of cash or securities equal to the notional amount of the swap less the recovery value of the referenced obligation or underlying securities comprising the referenced index. The notional amount reflects the maximum potential amount the seller of credit protection could be required to pay to the buyer if a credit event occurs. The seller of protection receives periodic premium payments from the buyer and may also receive or pay an upfront premium adjustment to the stated periodic payments. In the event a credit default occurs on a credit default swap referencing an index, a factor adjustment will take place and the buyer of protection will receive a payment reflecting the par less the default recovery rate of the defaulted index component based on its weighting in the index. If no default occurs, the counterparty will pay the stream of payments and have no further obligations to the fund selling the credit protection. For a fund utilizing centrally cleared credit default swaps, the exchange bears the risk of loss resulting from a counterparty not being able to pay. For OTC credit default swaps, a fund bears the risk of loss of the amount expected to be received under a swap agreement in the event of the default or bankruptcy of a swap agreement counterparty, or in the case of a credit default swap in which a fund is selling credit protection, the default of a third party issuer.
The quoted market prices and resulting market values for credit default swap agreements on securities and credit indices serve as an indicator of the current status of the payment/performance risk and represent the likelihood of an expected liability (or profit) for the credit derivative had the notional amount of the swap agreement been closed/sold as of the period end. Increasing market values, in absolute terms when compared to the notional amount of the swap, represent a deterioration of the referenced entity’s credit soundness and a greater likelihood or risk of default or other credit event occurring as defined under the terms of the agreement.
The following table represents the Fund’s use and volume of credit default swaps on a monthly basis:
| | | Average Notional Amount | |
Use | | Protection Sold | | | Protection Purchased | |
Hedge, Index exposure | | $ | 29,166,667 | | | $ | 243,241,667 | |
| | THE GUGGENHEIM FUNDS ANNUAL REPORT | 87 |
NOTES TO CONSOLIDATED FINANCIAL STATEMENTS (continued) |
Forward Foreign Currency Exchange Contracts
A forward foreign currency exchange contract is an agreement between two parties to exchange two designated currencies at a specific time in the future. Certain types of contracts may be cash settled, in an amount equal to the change in exchange rates during the term of the contract. The contracts can be used to hedge or manage exposure to foreign currency risks with portfolio investments or to gain exposure to foreign currencies.
The market value of a forward foreign currency exchange contract changes with fluctuations in foreign currency exchange rates. Furthermore, the Fund may be exposed to risk if the counterparties cannot meet the contract terms or if the currency value changes unfavorably as compared to the U.S. dollar.
The following table represents the Fund’s use and volume of forward foreign currency exchange contracts on a monthly basis:
| | | Average Value | |
Use | | Purchased | | | Sold | |
Hedge, Income | | $ | 1,286,885,526 | | | $ | 1,571,115,647 | |
Derivative Investment Holdings Categorized by Risk Exposure
The following is a summary of the location of derivative investments on the Fund’s Consolidated Statement of Assets and Liabilities as of September 30, 2023:
Derivative Investment Type | Asset Derivatives | Liability Derivatives |
Credit/Interest rate swap contracts | Unamortized upfront premiums paid on credit default swap agreements | Unamortized upfront premiums received on credit default swap agreements |
| | Unamortized upfront premiums paid on interest rate swap agreements | Variation margin on interest rate swap agreements |
| | | Variation margin on credit default swap agreements |
Interest rate option contracts | Investments in unaffiliated issuers, at value | — |
Currency forward contracts | Unrealized appreciation on forward foreign currency exchange contracts | Unrealized depreciation on forward foreign currency exchange contracts |
88 | THE GUGGENHEIM FUNDS ANNUAL REPORT | |
NOTES TO CONSOLIDATED FINANCIAL STATEMENTS (continued) |
The following tables set forth the fair value of the Fund’s derivative investments categorized by primary risk exposure at September 30, 2023:
Asset Derivative Investments Value |
| | | Swaps
Interest
Rate
Risk* | | | Swaps
Credit
Risk* | | | Forward
Foreign
Currency
Exchange Risk | | | Options
Purchased
Interest
Rate Risk | | | Total
Value at
September 30,
2023 | |
| | | $ | — | | | $ | — | | | | 3,708,594 | | | $ | 1,251,079 | | | $ | 4,959,673 | |
Liability Derivative Investments Value |
| | | Swaps
Interest
Rate
Risk* | | | Swaps
Credit
Risk* | | | Forward
Foreign
Currency
Exchange Risk | | | Options
Written
Interest
Rate Risk | | | Total
Value at
September 30,
2023 | |
| | | $ | 19,695,587 | | | $ | 3,319,919 | | | | 5,539 | | | $ | — | | | $ | 23,021,045 | |
* | Includes cumulative appreciation (depreciation) of exchange-traded, OTC and centrally-cleared derivatives contracts as reported on the Fund’s Consolidated Schedule of Investments. For exchange-traded and centrally-cleared derivatives, variation margin is reported within the Fund’s Consolidated Statement of Assets and Liabilities |
The following is a summary of the location of derivative investments on the Fund’s Consolidated Statement of Operations for the year ended September 30, 2023:
Derivative Investment Type | Location of Gain (Loss) on Derivatives |
Commodity/Interest rate futures contracts | Net realized gain (loss) on futures contracts |
| Net change in unrealized appreciation (depreciation) on futures contracts |
Credit/Interest rate swap contracts | Net realized gain (loss) on swap agreements |
| Net change in unrealized appreciation (depreciation) on swap agreements |
Credit/Commodity/Currency/Equity/Interest rate option contracts | Net realized gain (loss) on options purchased Net change in unrealized appreciation |
| | (depreciation) on options purchased |
| | Net realized gain (loss) on options written |
| Net change in unrealized appreciation (depreciation) on options written |
Currency forward contracts | Net realized gain (loss) on forward foreign currency exchange contracts |
| Net change in unrealized appreciation (depreciation) on forward foreign currency exchange contracts |
| | THE GUGGENHEIM FUNDS ANNUAL REPORT | 89 |
NOTES TO CONSOLIDATED FINANCIAL STATEMENTS (continued) |
The following is a summary of the Fund’s realized gain (loss) and change in unrealized appreciation (depreciation) on derivative investments recognized on the Fund’s Consolidated Statement of Operations categorized by primary risk exposure for the year ended September 30, 2023:
| | Realized Gain (Loss) on Derivative Investments Recognized on the Consolidated Statement of Operations | |
| | | | | Futures
Interest
Rate Risk | | | Futures
Commodity
Risk | | | Swaps
Interest
Rate Risk | | | Swaps
Credit Risk | | | Options
Written
Equity Risk | | | Options
Purchased
Equity Risk | | | Forward
Foreign
Currency
Exchange Risk | |
| | | | | | $ | 2,148,466 | | | $ | 13,786,895 | | | $ | 8,382,101 | | | $ | (3,657,809 | ) | | $ | 7,459,222 | | | $ | (13,620,954 | ) | | $ | (26,211,908 | ) |
| | Options
Purchased
Foreign
Currency
Exchange Risk | | | Options
Purchased
Commodity
Risk | | | Options
Purchased
Interest
Rate Risk | | | Options
Written
Foreign
Currency
Exchange Risk | | | Options
Written
Commodity
Risk | | | Options
Written
Interest
Rate Risk | | | Options
Purchased
Credit Risk | | | Total | |
| | $ | (13,717,865 | ) | | $ | (3,453,674 | ) | | $ | 710,478 | | | $ | 38,044,751 | | | $ | 8,913,602 | | | $ | 168,335 | | | $ | (230,879 | ) | | $ | 18,720,761 | |
| | Change in Unrealized Appreciation (Depreciation) on Derivative Investments
Recognized on the Consolidated Statement of Operations | |
| | | | | Futures
Interest
Rate Risk | | | Futures
Commodity
Risk | | | Swaps
Interest
Rate Risk | | | Swaps
Credit Risk | | | Options
Written
Equity Risk | | | Options
Purchased
Equity Risk | | | Forward
Foreign
Currency
Exchange Risk | |
| | | | | | $ | — | | | $ | 2,600,964 | | | $ | (19,639,825 | ) | | $ | (2,395,661 | ) | | $ | 3,173,706 | | | $ | (17,460,200 | ) | | $ | (5,969,967 | ) |
| | Options
Purchased
Foreign
Currency
Exchange Risk | | | Options
Purchased
Commodity
Risk | | | Options
Purchased
Interest
Rate Risk | | | Options
Written
Foreign
Currency
Exchange Risk | | | Options
Written
Commodity
Risk | | | Options
Written
Interest
Rate Risk | | | Options
Purchased
Credit Risk | | | Total | |
| | $ | (1,446,705 | ) | | $ | — | | | $ | (7,798,312 | ) | | $ | (303,894 | ) | | $ | (6,195 | ) | | $ | 166,069 | | | $ | — | | | $ | (49,080,020 | ) |
In conjunction with the use of derivative instruments, the Fund is required to maintain collateral in various forms. Depending on the financial instrument utilized and the broker involved, the Fund uses margin deposits at the broker, cash and/or securities segregated at the custodian bank, discount notes or repurchase agreements allocated to the Fund as collateral.
The Trust has established counterparty credit guidelines and enters into transactions only with financial institutions rated/identified as investment grade or better. The Trust monitors the counterparty credit risk associated with each such financial institution.
90 | THE GUGGENHEIM FUNDS ANNUAL REPORT | |
NOTES TO CONSOLIDATED FINANCIAL STATEMENTS (continued) |
Foreign Investments
There are several risks associated with exposure to foreign currencies, foreign issuers and emerging markets. The Fund’s indirect and direct exposure to foreign currencies subjects the Fund to the risk that those currencies will decline in value relative to the U.S. dollar, or in the case of short positions, that the U.S. dollar will decline in value relative to the currency being hedged. Currency rates in foreign countries may fluctuate significantly over short periods of time for a number of reasons, including changes in interest rates and the imposition of currency controls or other political developments in the U.S. or abroad. In addition, the Fund may incur transaction costs in connection with conversions between various currencies. The Fund may, but is not obligated to, engage in currency hedging transactions, which generally involve buying currency forward, options or futures contracts. However, not all currency risks may be effectively hedged, and in some cases the costs of hedging techniques may outweigh expected benefits. In such instances, the value of securities denominated in foreign currencies can change significantly when foreign currencies strengthen or weaken relative to the U.S. dollar.
The Fund may invest in securities of foreign companies directly, or in financial instruments, such as ADRs and exchange-traded funds, which are indirectly linked to the performance of foreign issuers. Foreign markets can be more volatile than the U.S. market due to increased risks of adverse issuer, political, regulatory, market, or economic developments and can perform differently from the U.S. market. Investing in securities of foreign companies directly, or in financial instruments that are indirectly linked to the performance of foreign issuers, may involve risks not typically associated with investing in U.S. issuers. The value of securities denominated in foreign currencies, and of dividends from such securities, can change significantly when foreign currencies strengthen or weaken relative to the U.S. dollar. Foreign securities markets generally have less trading volume and less liquidity than U.S. markets, and prices in some foreign markets may fluctuate more than those of securities traded on U.S. markets. Many foreign countries lack accounting and disclosure standards comparable to those that apply to U.S. companies, and it may be more difficult to obtain reliable information regarding a foreign issuer’s financial condition and operations. Transaction costs and costs associated with custody services are generally higher for foreign securities than they are for U.S. securities. Some foreign governments levy withholding taxes against dividend and interest income. Although in some countries portions of these taxes are recoverable, the non-recovered portion will reduce the income received by the Fund.
Note 3 – Offsetting
In the normal course of business, the Fund enters into transactions subject to enforceable master netting arrangements or other similar arrangements. Generally, the right to offset in those agreements allows the Fund to counteract the exposure to a specific counterparty with collateral received from or delivered to that counterparty based on the terms of the arrangements. These arrangements provide for the right to liquidate upon the occurrence of an event of default, credit event upon merger or additional termination event.
| | THE GUGGENHEIM FUNDS ANNUAL REPORT | 91 |
NOTES TO CONSOLIDATED FINANCIAL STATEMENTS (continued) |
In order to better define its contractual rights and to secure rights that will help the Fund mitigate its counterparty risk, the Fund may enter into an International Swaps and Derivatives Association, Inc. Master Agreement (“ISDA Master Agreement”) or similar agreement with its derivative contract counterparties. An ISDA Master Agreement is a bilateral agreement between a fund and a counterparty that governs OTC derivatives, including foreign exchange contracts, and typically contains, among other things, collateral posting terms and netting provisions in the event of a default and/or termination event. The provisions of the ISDA Master Agreement typically permit a single net payment in the event of a default (close-out netting) or similar event, including the bankruptcy or insolvency of the counterparty.
For derivatives traded under an ISDA Master Agreement, the collateral requirements are typically calculated by netting the mark-to-market amount for each transaction under such agreement and comparing that amount to the value of any collateral currently pledged by the Fund and the counterparty. For financial reporting purposes, cash collateral that has been pledged to cover obligations of the Fund and cash collateral received from the counterparty, if any, are reported separately on the Fund’s Consolidated Statement of Assets and Liabilities as segregated cash with broker/receivable for variation margin, or payable for swap settlement/variation margin. Cash and/or securities pledged or received as collateral by the Fund in connection with an OTC derivative subject to an ISDA Master Agreement generally may not be invested, sold or rehypothecated by the counterparty or the Fund, as applicable, absent an event of default under such agreement, in which case such collateral generally may be applied towards obligations due to and payable by such counterparty or the Fund, as applicable. Generally, the amount of collateral due from or to a counterparty must exceed a minimum transfer amount threshold (e.g., $300,000) before a transfer is required to be made. To the extent amounts due to the Fund from its counterparties are not fully collateralized, contractually or otherwise, the Fund bears the risk of loss from counterparty nonperformance. The Fund attempts to mitigate counterparty risk by only entering into agreements with counterparties that it believes to be of good standing and by monitoring the financial stability of those counterparties.
For financial reporting purposes, the Fund does not offset derivative assets and derivative liabilities that are subject to netting arrangements in the Fund’s Consolidated Statement of Assets and Liabilities.
92 | THE GUGGENHEIM FUNDS ANNUAL REPORT | |
NOTES TO CONSOLIDATED FINANCIAL STATEMENTS (continued) |
The following tables present derivative financial instruments and secured financing transactions that are subject to enforceable netting arrangements:
| | | | | | | | | | | | | | | Gross Amounts Not Offset
in the Consolidated Statement
of Assets and Liabilities | |
Instrument | | Gross
Amounts of
Recognized
Assets1 | | | Gross
Amounts
Offset in the
Consolidated
Statement of
Assets and
Liabilities | | | Net Amount
of Assets
Presented
on the
Consolidated
Statement of
Assets and
Liabilities | | | Financial
Instruments | | | Cash
Collateral
Received | | | Net Amount | |
Options purchased | | $ | 1,251,079 | | | $ | — | | | | 1,251,079 | | | $ | — | | | $ | (990,217 | ) | | $ | 260,862 | |
Forward foreign currency exchange contracts | | | 3,708,594 | | | | — | | | | 3,708,594 | | | | — | | | | (3,704,255 | ) | | | 4,339 | |
| | | | | | | | | | | | | | | Gross Amounts Not Offset
in the Consolidated Statement
of Assets and Liabilities | |
Instrument | | Gross
Amounts of
Recognized
Liabilities1 | | | Gross
Amounts
Offset in the
Consolidated
Statement of
Assets and
Liabilities | | | Net Amount
of Liabilities
Presented
on the
Consolidated
Statement of
Assets and
Liabilities | | | Financial
Instruments | | | Cash
Collateral
Pledged | | | Net Amount | |
Forward foreign currency exchange contracts | | $ | 5,539 | | | $ | — | | | $ | 5,539 | | | $ | — | | | $ | — | | | $ | 5,539 | |
1 | Exchange-traded or centrally-cleared derivatives are excluded from these reported amounts. |
| | THE GUGGENHEIM FUNDS ANNUAL REPORT | 93 |
NOTES TO CONSOLIDATED FINANCIAL STATEMENTS (continued) |
The Fund has the right to offset deposits against any related derivative liabilities outstanding with each counterparty with the exception of exchange-traded or centrally-cleared derivatives. The following table presents deposits held by others in connection with derivative investments as of September 30, 2023.
Counterparty | Asset Type | | Cash Pledged | | | Cash Received | |
Barclays Bank plc | Forward foreign currency exchange contracts, Options | | $ | — | | | $ | 2,640,000 | |
Goldman Sachs International | Options | | | — | | | | 130,000 | |
J.P. Morgan Securities LLC | Credit default swap agreements | | | 3,327,828 | | | | — | |
Morgan Stanley Capital Services LLC | Forward foreign currency exchange contracts, Options | | | — | | | | 2,122,000 | |
| | | | $ | 3,327,828 | | | $ | 4,892,000 | |
Note 4 – Fair Value Measurement
In accordance with U.S. GAAP, fair value is defined as the price that the Fund would receive to sell an investment or pay to transfer a liability in an orderly transaction between market participants at the measurement date. U.S. GAAP establishes a three-tier fair value hierarchy based on the types of inputs used to value assets and liabilities and requires corresponding disclosure. The hierarchy and the corresponding inputs are summarized below:
Level 1 | — | unadjusted quoted prices in active markets for identical assets or liabilities. |
Level 2 | — | significant other observable inputs (for example quoted prices for securities that are similar based on characteristics such as interest rates, prepayment speeds, credit risk, etc.). |
Level 3 | — | significant unobservable inputs based on the best information available under the circumstances, to the extent observable inputs are not available, which may include assumptions. |
Rule 2a-5 sets forth a definition of “readily available market quotations,” which is consistent with the definition of a Level 1 input under U.S. GAAP. Rule 2a-5 provides that “a market quotation is readily available only when that quotation is a quoted price (unadjusted) in active markets for identical investments that the fund can access at the measurement date, provided that a quotation will not be readily available if it is not reliable.”
Securities for which market quotations are not readily available must be valued at fair value as determined in good faith. Accordingly, any security priced using inputs other than Level 1 inputs will be subject to fair value requirements. The types of inputs available depend on a variety of factors, such as the type of security and the characteristics of the markets in which it trades, if any. Fair valuation determinations that rely on fewer or no observable inputs require greater judgment. Accordingly, fair value determinations for Level 3 securities require the greatest amount of judgment.
94 | THE GUGGENHEIM FUNDS ANNUAL REPORT | |
NOTES TO CONSOLIDATED FINANCIAL STATEMENTS (continued) |
Pricing service providers are used to value a majority of the Fund’s investments. When values are not available from a pricing service provider, they will be determined using a variety of sources and techniques, including: market prices; broker quotes; and models which derive prices based on inputs such as prices of securities with comparable maturities and characteristics or based on inputs such as anticipated cash flows or collateral, spread over U.S. Treasury securities, and other information and analysis. A significant portion of the Fund’s assets and liabilities are categorized as Level 2, as indicated in this report.
Quotes from broker-dealers, adjusted for fluctuations in criteria such as credit spreads and interest rates, may also be used to value the Fund’s assets and liabilities, i.e. prices provided by a broker-dealer or other market participant who has not committed to trade at that price. Although quotes are typically received from established market participants, the Fund may not have the transparency to view the underlying inputs which support the market quotations. Significant changes in a quote would generally result in significant changes in the fair value of the security.
Certain fixed income securities are valued by obtaining a monthly quote from a broker-dealer, adjusted for fluctuations in criteria such as credit spreads and interest rates.
Certain loans and other securities are valued using a single daily broker quote or a price from a pricing service provider based on a single daily or monthly broker quote.
The inputs or methodologies selected and applied for valuing securities or other assets are not necessarily an indication of the risk associated with investing in those securities. The suitability, appropriateness and accuracy of the techniques, methodologies and sources employed to determine fair valuation are periodically reviewed and subject to change.
Note 5 – Investment Advisory Agreement and Other Agreements
Under the terms of an investment advisory contract, the Fund pays GI investment advisory fees at an annualized rate based on the average daily net assets as follows:
Average Daily Net Assets
| | Annualized
Rate | |
$5 billion or less | | | 0.89 | % |
> $5 billion | | | 0.84 | % |
GI has contractually agreed to waive the management fee it receives from the Subsidiary in an amount equal to the management fee paid to GI by the Subsidiary. This undertaking will continue in effect for so long as the Fund invests in the Subsidiary, and may not be terminated by GI unless GI obtains the prior approval of the Fund’s Board for such termination. Fees waived under this arrangement are not subject to reimbursement to GI. For the year ended September 30, 2023, the Fund waived $244,683 related to advisory fees in the Subsidiary.
| | THE GUGGENHEIM FUNDS ANNUAL REPORT | 95 |
NOTES TO CONSOLIDATED FINANCIAL STATEMENTS (continued) |
GI pays operating expenses on behalf of the Trust, such as audit and accounting related services, legal services, custody, printing and mailing, among others, on a pass-through basis. Such expenses are allocated to various Funds within the complex based on relative net assets.
The Board has adopted Distribution Plans related to the offering of A-Class, C-Class and P-Class shares pursuant to Rule 12b-1 under the 1940 Act. The plans provide for payments at an annual rate of 0.25% of the average daily net assets of the Fund’s A-Class and P-Class shares, and 1.00% of the average daily net assets of the Fund’s C-Class shares.
The investment advisory contract for the Fund provides that the total expenses be limited to a percentage of average net assets for each class of shares, exclusive of brokerage costs, dividends or interest on securities sold short, expenses of other investment companies in which the Fund invests, interest, taxes, litigation, indemnification and extraordinary expenses. The limits are listed below:
| | Limit | | | Effective
Date | | | Contract
End Date | |
A-Class | | | 1.36 | % | | | 11/30/12 | | | | 02/01/25 | |
C-Class | | | 2.11 | % | | | 11/30/12 | | | | 02/01/25 | |
P-Class | | | 1.36 | % | | | 05/01/15 | | | | 02/01/25 | |
Institutional Class | | | 0.95 | % | | | 11/30/12 | | | | 02/01/25 | |
R6-Class | | | 0.95 | % | | | 03/13/19 | | | | 02/01/25 | |
GI is entitled to reimbursement by the Fund for fees waived or expenses reimbursed during any of the previous 36 months, beginning on the date of the expense limitation agreement, if on any day the estimated operating expenses are less than the indicated percentages. For purposes of this arrangement, GI is entitled to recoupment of previously waived fees or reimbursed expenses for 36 months from the date of the waiver or reimbursement by GI. At September 30, 2023, the amount of fees waived or expenses reimbursed that are subject to recoupment and will expire during the years ended September 30, are presented in the following table:
| | 2024 | | | 2025 | | | 2026 | | | Fund
Total | |
A-Class | | $ | 196,169 | | | $ | 80,282 | | | $ | 15,216 | | | $ | 291,667 | |
C-Class | | | 102,752 | | | | 37,685 | | | | 6,309 | | | | 146,746 | |
P-Class | | | 81,801 | | | | 101,516 | | | | 99,081 | | | | 282,398 | |
Institutional Class | | | 6,245,889 | | | | 7,075,307 | | | | 4,861,940 | | | | 18,183,136 | |
R6-Class | | | 59,463 | | | | 38,182 | | | | 9,192 | | | | 106,837 | |
For the year ended September 30, 2023, GI recouped $437,601 from the Fund.
If the Fund invests in a fund that is advised by the same adviser or an affiliated adviser, the investing Fund’s adviser has agreed to waive fees at the investing fund level to the extent necessary to offset the proportionate share of any management fee paid by the Fund with respect to its investment in such affiliated fund. Fee waivers will be calculated at the investing Fund level
96 | THE GUGGENHEIM FUNDS ANNUAL REPORT | |
NOTES TO CONSOLIDATED FINANCIAL STATEMENTS (continued) |
without regard to any expense cap, if any, in effect for the investing Fund. Fees waived under this arrangement are not subject to reimbursement to GI. For the year ended September 30, 2023, the Fund waived $1,087,529 related to investments in affiliated funds.
For the year ended September 30, 2023, GFD retained sales charges of $132,849 relating to sales of A-Class shares of the Trust.
Certain trustees and officers of the Trust are also officers of GI and/or GFD. The Trust does not compensate its officers or trustees who are officers, directors and/or employees of GI or GFD.
MUFG Investor Services (US), LLC (“MUIS”) acts as the Fund’s administrator, transfer agent and accounting agent. As administrator, transfer agent and accounting agent, MUIS maintains the books and records of the Fund’s securities and cash. The Bank of New York Mellon Corp. (“BNY”) acts as the Fund’s custodian. As custodian, BNY is responsible for the custody of the Fund’s assets. For providing the aforementioned administrative and accounting services, MUIS is entitled to receive a monthly fee equal to a percentage of the Fund’s average daily net assets and out of pocket expenses. For providing the aforementioned transfer agent and custodian services, MUIS and BNY are entitled to receive a monthly fee based on the number of transactions during the month and the number of accounts under management, subject to certain minimum monthly fees, and out of pocket expenses.
Note 6 – Reverse Repurchase Agreements
The Fund may enter into reverse repurchase agreements. Under a reverse repurchase agreement, the Fund sells securities and agrees to repurchase them at a particular price at a future date. In the event the buyer of securities under a reverse repurchase agreement files for bankruptcy or becomes insolvent, such buyer or its trustee or receiver may receive an extension of time to determine whether to enforce the Fund’s obligation to repurchase the securities, and the Fund’s use of the proceeds of the reverse repurchase agreement may effectively be restricted pending such decision.
For the year ended September 30, 2023, the Fund entered into reverse repurchase agreements:
| | Number of Days
Outstanding | | | Balance at
September 30, 2023 | | | Average Balance
Outstanding | | | Average
Interest Rate | |
| | | | 211 | | | $ | — | * | | $ | 304,478,898 | | | | 3.83 | % |
* | As of September 30, 2023, there were no open reverse repurchase agreements |
Note 7 – Federal Income Tax Information
The Fund intends to comply with the provisions of Subchapter M of the Internal Revenue Code of 1986, as amended (the “Internal Revenue Code”), applicable to regulated investment companies and will distribute substantially all taxable net investment income and capital gains sufficient to relieve the Fund from all, or substantially all, federal income, excise and state income taxes. Therefore, no provision for federal or state income tax or federal excise tax is required.
| | THE GUGGENHEIM FUNDS ANNUAL REPORT | 97 |
NOTES TO CONSOLIDATED FINANCIAL STATEMENTS (continued) |
Tax positions taken or expected to be taken in the course of preparing the Fund’s tax returns are evaluated to determine whether the tax positions are “more-likely-than-not” of being sustained by the applicable tax authority. Tax positions not deemed to meet the more-likely-than-not threshold would be recorded as a tax benefit or expense in the current year. Management has analyzed the Fund’s tax positions taken, or to be taken, on U.S. federal income tax returns for all open tax years, and has concluded that no provision for income tax is required in the Fund’s financial statements. The Fund’s U.S. federal income tax returns are subject to examination by the Internal Revenue Service (“IRS”) for a period of three years after they are filed.
The Fund intends to invest up to 25% of its assets in the Subsidiary which is expected to provide the Fund with exposure to the commodities markets within the limitations of the U.S. federal income tax requirements under Subchapter M of the Internal Revenue Code. The Fund has received a private letter ruling from the IRS that concludes that the income the Fund receives from the Subsidiary will constitute qualifying income for purposes of Subchapter M of the Internal Revenue Code. The Subsidiary will be classified as a corporation for U.S. federal income tax purposes. A foreign corporation, such as the Subsidiary, will generally not be subject to U.S. federal income taxation unless it is deemed to be engaged in a U.S. trade or business. If, during a taxable year, the Subsidiary’s taxable losses (and other deductible items) exceed its income and gains, the net loss will not pass through to the Fund as a deductible amount for U.S. federal income tax purposes and cannot be carried forward to reduce future income from the Subsidiary in subsequent years.
The tax character of distributions paid during the year ended September 30, 2023 was as follows:
| | Ordinary
Income | | | Long-Term
Capital Gain | | | Total
Distributions | |
| | | $ | 346,075,668 | | | $ | 1,276,126 | | | $ | 347,351,794 | |
The tax character of distributions paid during the year ended September 30, 2022 was as follows:
| | Ordinary
Income | | | Long-Term
Capital Gain | | | Total
Distributions | |
| | | $ | 305,050,763 | | | $ | — | | | $ | 305,050,763 | |
Note: For U.S. federal income tax purposes, short-term capital gain distributions are treated as ordinary income distributions.
The tax components of distributable earnings/(loss) as of September 30, 2023 were as follows:
| | Undistributed
Ordinary
Income | | | Undistributed
Long-Term
Capital Gain | | | Net
Unrealized
Appreciation
(Depreciation) | | | Accumulated
Capital and
Other Losses | | | Other
Temporary
Differences | | | Total | |
| | | $ | 47,136,918 | | | $ | — | | | $ | (883,723,338 | ) | | $ | (207,484,654 | ) | | $ | (34,380,013 | ) | | $ | (1,078,451,087 | ) |
98 | THE GUGGENHEIM FUNDS ANNUAL REPORT | |
NOTES TO CONSOLIDATED FINANCIAL STATEMENTS (continued) |
For U.S. federal income tax purposes, capital loss carryforwards represent realized losses of the Fund that may be carried forward and applied against future capital gains. The Fund is permitted to carry forward capital losses for an unlimited period and such capital loss carryforwards retain their character as either short-term or long-term capital losses. As of September 30, 2023, capital loss carryforwards for the Fund were as follows:
| | | Unlimited | | | | | |
| |
Short-Term
| | | Long-Term | | | Total
Capital Loss
Carryforward | |
| | | $ | — | | | $ | (207,484,654 | ) | | $ | (207,484,654 | ) |
Net investment income and net realized gains (losses) may differ for financial statement and tax purposes because of temporary or permanent book/tax differences. These differences are primarily due to investments in CLO securities and swap agreements, the “mark-to-market” of certain derivatives, investments in bonds, foreign currency gains and losses, losses deferred due to wash sales, dividends payable, amortization, recharacterization of income from investments, and transactions with the Fund’s wholly owned subsidiary. Additional differences may result from investments in partnerships, distribution reclass, the “mark-to-market” of certain foreign denominated securities, and the “mark-to-market” or disposition of certain Passive Foreign Investment Companies (PFICs). To the extent these differences are permanent and would require a reclassification between Paid in Capital and Total Distributable Earnings (Loss), such reclassifications are made in the period that the differences arise. These reclassifications have no effect on net assets or NAV per share.
The following adjustments were made on the Fund’s Consolidated Statement of Assets and Liabilities as of September 30, 2023 for permanent book/tax differences:
| | Paid In
Capital | | | Total
Distributable
Earnings/(Loss) | |
| | | $ | 19,711,568 | | | $ | (19,711,568 | ) |
At September 30, 2023, the cost of investments for U.S. federal income tax purposes, the aggregate gross unrealized appreciation for all investments for which there was an excess of value over tax cost and the aggregate gross unrealized depreciation for all investments for which there was an excess of tax cost over value, were as follows:
| | Tax
Cost | | | Tax
Unrealized
Appreciation | | | Tax
Unrealized
Depreciation | | | Net Tax
Unrealized
Appreciation/
(Depreciation) | |
| | | $ | 6,701,892,398 | | | $ | 3,685,439 | | | $ | (887,918,432 | ) | | $ | (884,232,993 | ) |
| | THE GUGGENHEIM FUNDS ANNUAL REPORT | 99 |
NOTES TO CONSOLIDATED FINANCIAL STATEMENTS (continued) |
Note 8 – Securities Transactions
For the year ended September 30, 2023, the cost of purchases and proceeds from sales of investment securities, excluding government securities, short-term investments and derivatives, were as follows:
| | Purchases | | | Sales | |
| | | $ | 1,379,632,781 | | | $ | 2,841,292,119 | |
For the year ended September 30, 2023, the cost of purchases and proceeds from sales of government securities were as follows:
| | Purchases | | | Sales | |
| | | $ | 199,113,018 | | | $ | 285,073,983 | |
The Fund is permitted to purchase or sell securities from or to certain affiliated funds under specified conditions outlined in procedures adopted by the Board. The procedures have been designed to ensure that any purchase or sale of securities by the Fund from or to another fund or portfolio that is or could be considered an affiliate by virtue of having a common investment adviser (or affiliated investment advisers), common trustees and/or common officers complies with Rule 17a-7 of the 1940 Act. Further, as defined under these procedures, each transaction is effected at the current market price to save costs, where permissible. For the year ended September 30, 2023, the Fund did not engage in purchases and sales of securities, pursuant to Rule 17a-7 of the 1940 Act.
Note 9 – Unfunded Loan Commitments
Pursuant to the terms of certain loan agreements, the Fund held unfunded loan commitments as of September 30, 2023. The Fund is obligated to fund these loan commitments at the borrower’s discretion.
The unfunded loan commitments as of September 30, 2023, were as follows:
Borrower | | Maturity Date | | | Face Amount* | | | Value | |
Avalara, Inc. | | | 10/19/28 | | | $ | 1,600,000 | | | $ | 19,478 | |
Care BidCo | | | 05/04/28 | | | | EUR 9,200,000 | | | | 595,119 | |
Checkers Holdings, Inc. | | | 06/16/27 | | | | 262,053 | | | | — | |
Finastra | | | 09/13/29 | | | | 761,458 | | | | 93,301 | |
Fontainbleau Vegas | | | 01/31/26 | | | | 3,523,283 | | | | — | |
Galls LLC | | | 01/31/24 | | | | 305,108 | | | | 7,628 | |
Higginbotham Insurance Agency, Inc. | | | 11/25/28 | | | | 2,250,000 | | | | 22,044 | |
Lightning A | | | 03/01/37 | | | | 17,029,255 | | | | — | |
Lightning B | | | 03/01/37 | | | | 3,425,425 | | | | — | |
Orion Group | | | 03/19/27 | | | | 2,837,255 | | | | 35,508 | |
Polaris Newco LLC | | | 06/04/26 | | | | 5,477,389 | | | | 367,084 | |
RLDatix | | | 10/28/24 | | | | GBP 6,186,784 | | | | 141,151 | |
100 | THE GUGGENHEIM FUNDS ANNUAL REPORT | |
NOTES TO CONSOLIDATED FINANCIAL STATEMENTS (continued) |
Borrower | | Maturity Date | | | Face Amount* | | | Value | |
Schur Flexibles GmbH | | | 09/30/26 | | | | EUR 214,755 | | | $ | 10,598 | |
Shaw Development LLC | | | 11/22/23 | | | | 6,900,000 | | | | — | |
The Facilities Group | | | 11/30/27 | | | | 774,440 | | | | 18,393 | |
Thunderbird A | | | 03/01/37 | | | | 17,284,000 | | | | — | |
Thunderbird B | | | 03/01/37 | | | | 3,476,667 | | | | — | |
TK Elevator Midco GmbH | | | 01/29/27 | | | | EUR 11,308,020 | | | | 679,925 | |
WellSky Corp. | | | 11/24/23 | | | | 12,400,000 | | | | — | |
| | | | | | | | | | | $ | 1,990,229 | |
* | The face amount is denominated in U.S. dollars unless otherwise indicated. |
| | EUR — Euro |
| | GBP — British Pound |
Note 10 – Restricted Securities
The securities below are considered illiquid and restricted under guidelines established by the Board:
Restricted
Securities | | Acquisition
Date | | | Cost | | | Value | |
Atlas Mara Ltd. | | | | | | | | | | | | |
due 12/31/211 | | | 10/01/15 | | | $ | 6,243,950 | | | $ | 2,154,120 | |
CFMT LLC | | | | | | | | | | | | |
2022-HB9 3.25% (WAC) due 09/25/372 | | | 09/23/22 | | | | 7,582,690 | | | | 7,140,481 | |
Copper River CLO Ltd. | | | | | | | | | | | | |
2007-1A INC, due 01/20/213 | | | 05/09/14 | | | | — | | | | 815 | |
Mirabela Nickel Ltd. | | | | | | | | | | | | |
due 06/24/191 | | | 12/31/13 | | | | 1,710,483 | | | | 89,557 | |
| | | | | | | $ | 15,537,123 | | | $ | 9,384,973 | |
1 | Security is in default of interest and/or principal obligations. |
2 | Variable rate security. Rate indicated is the rate effective at September 30, 2023. In some instances, the effective rate is limited by a minimum rate floor or a maximum rate cap established by the issuer. The settlement status of a position may also impact the effective rate indicated. In some cases, a position may be unsettled at period end and may not have a stated effective rate. In instances where multiple underlying reference rates and spread amounts are shown, the effective rate is based on a weighted average. |
3 | Security has no stated coupon. However, it is expected to receive residual cash flow payments on defined deal dates. |
Note 11 – Line of Credit
The Trust, along with other affiliated trusts, secured a 364-day committed, $1,150,000,000 line of credit from Citibank, N.A., which was in place through September 29, 2023, at which time a new line of credit was entered into in the amount of $1,165,000,000. The Fund may draw (borrow) from the line of credit as a temporary measure for emergency purposes, to facilitate redemption requests, or for other short-term liquidity purposes consistent with the Fund’s investment
| | THE GUGGENHEIM FUNDS ANNUAL REPORT | 101 |
NOTES TO CONSOLIDATED FINANCIAL STATEMENTS (concluded) |
objective and program. For example, it may be advantageous for the Fund to borrow money rather than sell existing portfolio positions to meet redemption requests. Fees related to borrowings, if any, vary under this arrangement between the greater of Citibank’s “base rate”, SOFR plus 1%, or the federal funds rate plus 1/2 of 1%.
The commitment fee that may be paid by the Fund is at an annualized rate of 0.15% of the average daily amount of their allocated unused commitment amount. The commitment fee amount is allocated to the individual Funds based on the respective net assets of each participating Fund and is referenced in the Fund’s Consolidated Statement of Operations under “Line of credit fees”. The Fund did not have any borrowings under this agreement as of and for the year ended September 30, 2023.
Note 12 – Market Risks
The value of, or income generated by, the investments held by the Fund are subject to the possibility of rapid and unpredictable fluctuation, and loss that may result from various factors. These factors include, among others, developments affecting individual companies, or from broader influences, including real or perceived changes in prevailing interest rates, changes in inflation rates or expectations about inflation rates (which are currently elevated relative to normal conditions), adverse investor confidence or sentiment, changing economic, political (including geopolitical), social or financial market conditions, increased instability or general uncertainty, environmental disasters, governmental actions, public health emergencies (such as the spread of infectious diseases, pandemics and epidemics), debt crises, actual or threatened wars or other armed conflicts (such as the current Russia-Ukraine conflict and its risk of expansion or collateral economic and other effects) or ratings downgrades, and other similar events, each of which may be temporary or last for extended periods. Moreover, changing economic, political, geopolitical, social, financial market or other conditions in one country or geographic region could adversely affect the value, yield and return of the investments held by the Fund in a different country or geographic region, economy, and market because of the increasingly interconnected global economies and financial markets. The duration and extent of the foregoing types of factors or conditions are highly uncertain and difficult to predict and have in the past, and may in the future, cause volatility and distress in economies and financial markets or other adverse circumstances, which may negatively affect the value of the Fund’s investments and performance of the Fund.
Note 13 – Subsequent Events
The Fund evaluated subsequent events through the date the consolidated financial statements are issued and determined there were no material events that would require adjustment to or disclosure in the Fund’s consolidated financial statements.
102 | THE GUGGENHEIM FUNDS ANNUAL REPORT | |
REPORT OF INDEPENDENT REGISTERED PUBLIC ACCOUNTING FIRM |
To the Shareholders and the Board of Trustees of Guggenheim Macro Opportunities Fund
Opinion on the Financial Statements
We have audited the accompanying consolidated statement of assets and liabilities of Guggenheim Macro Opportunities Fund (the “Fund”), (one of the funds constituting Guggenheim Funds Trust (the “Trust”)), including the consolidated schedule of investments, as of September 30, 2023, and the related consolidated statements of operations and cash flows for the year then ended, the consolidated statements of changes in net assets for each of the two years in the period then ended, the consolidated financial highlights for each of the five years in the period then ended and the related notes (collectively referred to as the “financial statements”). In our opinion, the financial statements present fairly, in all material respects, the consolidated financial position of the Fund (one of the funds constituting Guggenheim Funds Trust) at September 30, 2023, the consolidated results of its operations and its cash flows for the year then ended, the consolidated changes in its net assets for each of the two years in the period then ended and the consolidated financial highlights for each of the five years in the period then ended, in conformity with U.S. generally accepted accounting principles.
Basis for Opinion
These financial statements are the responsibility of the Trust’s management. Our responsibility is to express an opinion on the Fund’s financial statements based on our audits. We are a public accounting firm registered with the Public Company Accounting Oversight Board (United States) (“PCAOB”) and are required to be independent with respect to the Trust in accordance with the U.S. federal securities laws and the applicable rules and regulations of the Securities and Exchange Commission and the PCAOB.
We conducted our audits in accordance with the standards of the PCAOB. Those standards require that we plan and perform the audit to obtain reasonable assurance about whether the financial statements are free of material misstatement, whether due to error or fraud. The Trust is not required to have, nor were we engaged to perform, an audit of the Trust’s internal control over financial reporting. As part of our audits, we are required to obtain an understanding of internal control over financial reporting but not for the purpose of expressing an opinion on the effectiveness of the Trust’s internal control over financial reporting. Accordingly, we express no such opinion.
Our audits included performing procedures to assess the risks of material misstatement of the financial statements, whether due to error or fraud, and performing procedures that respond to those risks. Such procedures included examining, on a test basis, evidence regarding the amounts and disclosures in the financial statements. Our procedures included confirmation of securities owned as of September 30, 2023, by correspondence with the custodian, transfer agent, brokers, and paying agents; when replies were not received from brokers or paying agents, we performed
| | THE GUGGENHEIM FUNDS ANNUAL REPORT | 103 |
REPORT OF INDEPENDENT REGISTERED PUBLIC ACCOUNTING FIRM (concluded) |
other auditing procedures. Our audits also included evaluating the accounting principles used and significant estimates made by management, as well as evaluating the overall presentation of the financial statements. We believe that our audits provide a reasonable basis for our opinion.

We have served as the auditor of one or more Guggenheim investment companies since 1979.
Tysons, Virginia
November 28, 2023
104 | THE GUGGENHEIM FUNDS ANNUAL REPORT | |
OTHER INFORMATION (Unaudited) |
Federal Income Tax Information
This information is being provided as required by the Internal Revenue Code. Amounts shown may differ from those elsewhere in the report because of differences in tax and financial reporting practice.
In January 2024, shareholders will be advised on IRS Form 1099 DIV or substitute 1099 DIV as to the federal tax status of the distributions received by shareholders in the calendar year 2023.
The Fund’s investment income (dividend income plus short-term capital gains, if any) qualifies as follows:
Of the taxable ordinary income distributions paid during the fiscal year ended September 30, 2023, the Fund had the corresponding percentages qualify for the reduced tax rate pursuant to the Jobs and Growth Tax Relief and Reconciliation Act of 2003 or for the dividends received deduction for corporations. See the qualified dividend income and dividend received deduction columns, respectively, in the table below.
Additionally, of the taxable ordinary income distributions paid during the fiscal year ended September 30, 2023, the Fund had the corresponding percentages qualify as interest related dividends as permitted by IRC Section 871(k)(1) . See the qualified interest income in the table below.
| | Qualified
Dividend
Income | | | Dividend
Received
Deduction | | | Qualified
Interest
Income | |
| | | | 1.52 | % | | | 1.46 | % | | | 73.24 | % |
With respect to the taxable year ended September 30, 2023, the Fund hereby designates as capital gain dividends the amount listed below, or, if subsequently determined to be different, the net capital gain of such year:
| | From long-term
capital gain: | | | From long-term
capital gain,
using proceeds
from shareholder
redemptions: | |
| | | $ | 1,276,126 | | | $ | — | |
Delivery of Shareholder Reports
Paper copies of the Fund’s annual and semi-annual shareholder reports are not sent by mail, unless you specifically request paper copies of the reports from the Fund or from your financial intermediary. Instead, the reports are made available on a website, and you are notified by mail each time a report is posted and provided with a website link to access the report.
| | THE GUGGENHEIM FUNDS ANNUAL REPORT | 105 |
OTHER INFORMATION (Unaudited)(continued) |
You may elect to receive all future shareholder reports in paper free of charge. If you hold shares of the Fund directly, you can inform the Fund that you wish to receive paper copies of reports by calling 800.820.0888. If you hold shares of the Fund through a financial intermediary, please contact the financial intermediary to make this election. Your election to receive reports in paper may apply to all Guggenheim Funds in which you are invested and may apply to all Guggenheim Funds held with your financial intermediary.
Tailored Shareholder Reports for Open-End Mutual Funds and Exchange-Traded Funds
Effective January 24, 2023, the SEC adopted rule and form amendments to require open-end mutual funds and exchange-traded funds registered on Form N-1A to transmit concise and visually engaging streamlined annual and semi-annual reports to shareholders that highlight key information. Other information, including financial statements, will no longer appear in a streamlined shareholder report but must be available online, delivered free of charge upon request, and filed on a semi-annual basis on Form N-CSR. The rule and form amendments have a compliance date of July 24, 2024. At this time, management is evaluating the impact of these amendments on the shareholder reports for the Fund.
Proxy Voting Information
A description of the policies and procedures that the Trust uses to determine how to vote proxies relating to securities held in the Fund’s portfolio is available, without charge and upon request, by calling 800.820.0888. This information is also available from the EDGAR database on the SEC’s website at https://www.sec.gov.
Information regarding how the Fund voted proxies relating to portfolio securities during the most recent 12-month period ended June 30 is available without charge, upon request, by calling 800.820.0888. This information is also available from the EDGAR database on the SEC’s website at https://www.sec.gov.
Sector Classification
Information in the Consolidated Schedule of Investments is categorized by sectors using sector-level Classifications defined by the Bloomberg Industry Classification System, a widely recognized industry classification system provider. The Fund’s registration statement has investment policies relating to concentration in specific sectors/industries. For purposes of these investment policies, the Fund usually classifies sectors/industries based on industry-level Classifications used by widely recognized industry classification system providers such as Bloomberg Industry Classification System, Global Industry Classification Standards and Barclays Global Classification Scheme.
106 | THE GUGGENHEIM FUNDS ANNUAL REPORT | |
OTHER INFORMATION (Unaudited)(continued) |
Quarterly Portfolio Schedules Information
The Trust files its complete schedule of portfolio holdings with the SEC for the first and third quarters of each fiscal year as an exhibit to its reports on Form N-PORT, and for reporting periods ended prior to March 31, 2019, filed such information on Form N-Q. The Fund’s Forms N-PORT and N-Q are available on the SEC’s website at https://www.sec.gov. Copies of the portfolio holdings are also available to shareholders, without charge and upon request, by calling 800.820.0888.
Report of the Guggenheim Funds Trust Board of Trustees
The Board of Trustees of Guggenheim Funds Trust (the “Trust”), including the Independent Trustees, unanimously approved the renewal of the investment management agreements (as applicable to a specific Fund, the “Advisory Agreement” and collectively, the “Advisory Agreements”) with Security Investors, LLC (“Security Investors”) and Guggenheim Partners Investment Management, LLC (“GPIM”) on behalf of the applicable series of the Trust listed below (each a “Fund” and collectively, the “Funds”) and the investment sub-advisory agreement between Security Investors and GPIM on behalf of Guggenheim Municipal Income Fund (the “Sub-Advisory Agreement” and together with the “Advisory Agreements,” the “Agreements”):
● | Guggenheim Alpha Opportunity Fund
(“Alpha Opportunity Fund”)* | ● | Guggenheim Core Bond Fund
(“Core Bond Fund”)* |
● | Guggenheim Diversified Income Fund (“Diversified Income Fund”)** | ● | Guggenheim Floating Rate Strategies Fund (“Floating Rate Strategies Fund”)** |
● | Guggenheim High Yield Fund
(“High Yield Fund”)* | ● | Guggenheim Large Cap Value Fund
(“Large Cap Value Fund”)* |
● | Guggenheim Limited Duration Fund
(“Limited Duration Fund”)** | ● | Guggenheim Macro Opportunities Fund (“Macro Opportunities Fund”)**1 |
* | Security Investors serves as investment adviser to the Fund. |
** | GPIM serves as investment adviser to the Fund. Unless the context indicates otherwise, GPIM and Security Investors, with respect to their service as investment adviser to the applicable Funds, are each referred to herein as an “Adviser” and together, the “Advisers.” |
1 | GPIM also serves as investment adviser to Guggenheim Macro Opportunities Fund CFC (the “Subsidiary”), a wholly-owned subsidiary of Macro Opportunities Fund that is organized as a limited company under the laws of the Cayman Islands and used by Macro Opportunities Fund to obtain commodities exposure. Pursuant to a separate investment advisory agreement for the Subsidiary (the “Subsidiary Advisory Agreement”), the Subsidiary pays GPIM an advisory fee at the same rate that Macro Opportunities Fund pays GPIM under its Advisory Agreement. The Subsidiary Advisory Agreement does not require annual renewal by the Board and will continue until it is terminated as provided in the Agreement. In addition, GPIM and Macro Opportunities Fund have entered into a separate fee waiver agreement pursuant to which GPIM has contractually agreed to waive the advisory fee it receives from Macro Opportunities Fund in an amount equal to the advisory fee paid to GPIM by the Subsidiary. This undertaking will continue for so long as Macro Opportunities Fund invests in the Subsidiary, and may be terminated only with the approval of the Board. |
| | THE GUGGENHEIM FUNDS ANNUAL REPORT | 107 |
OTHER INFORMATION (Unaudited)(continued) |
● | Guggenheim Market Neutral Real Estate Fund (“Market Neutral Real Estate Fund”)** | ● | Guggenheim Municipal Income Fund (“Municipal Income Fund”)* |
● | Guggenheim Risk Managed Real Estate Fund (“Risk Managed Real Estate Fund”)** | ● | Guggenheim Small Cap Value Fund
(“Small Cap Value Fund”)* |
● | Guggenheim SMid Cap Value Fund
(“SMid Cap Value Fund”)* | ● | Guggenheim StylePlus—Large Core Fund (“StylePlus—Large Core Fund”)* |
● | Guggenheim StylePlus—Mid Growth Fund (“StylePlus—Mid Growth Fund”)* | ● | Guggenheim Total Return Bond Fund
(“Total Return Bond Fund”)** |
● | Guggenheim Ultra Short Duration Fund
(“Ultra Short Duration Fund”)** | ● | Guggenheim World Equity Income Fund (“World Equity Income Fund”)* |
Security Investors and GPIM are each an indirect subsidiary of Guggenheim Partners, LLC, a privately-held, global investment and advisory firm (“Guggenheim Partners”). Guggenheim Partners, Security Investors, GPIM and their affiliates may be referred to herein collectively as “Guggenheim.” Security Investors and GPIM are also known as “Guggenheim Investments,” the global asset management and investment advisory division of Guggenheim Partners that includes other affiliated investment management businesses.
At meetings held in person on April 17-18, 2023 (the “April Meeting”) and meetings held by videoconference on May 15, 2023 and in person on May 24, 2023 (the “May Meeting”), the Contracts Review Committee of the Board (the “Committee”), consisting solely of the Independent Trustees, met separately from Guggenheim to consider the proposed renewal of the Agreements. As part of its review process, the Committee was represented by independent legal counsel to the Independent Trustees (“Independent Legal Counsel”), from whom the Independent Trustees received separate legal advice and with whom they met separately. Independent Legal Counsel reviewed and discussed with the Committee various key aspects of the Trustees’ legal responsibilities relating to the proposed renewal of the Agreements and other principal contracts. The Committee took into account various materials received from Guggenheim and Independent Legal Counsel. The Committee also considered the variety of written materials, reports and oral presentations the Board received throughout the year regarding performance and operating results of the Funds, and other information relevant to its evaluation of the Agreements.
In connection with the contract review process, FUSE Research Network LLC (“FUSE”), an independent, third-party research provider, was engaged to prepare advisory contract renewal reports designed specifically to help the Board fulfill its advisory contract renewal responsibilities. The objective of the FUSE reports is to present the subject funds’ relative position regarding fees, expenses and total return performance, with peer group and universe comparisons. The Committee assessed the data provided in the FUSE reports as well as commentary presented by Guggenheim, including, among other things, a summary of notable distinctions between certain Funds and the applicable peer group identified in the FUSE reports and explanations for custom peer groups created for certain Funds that do not fit well into any particular category. The Committee noted that although FUSE’s process typically results in the identification for each Fund
108 | THE GUGGENHEIM FUNDS ANNUAL REPORT | |
OTHER INFORMATION (Unaudited)(continued) |
of a universe of similar funds for performance comparisons and a narrower group of similar funds from the universe based on asset levels for comparative fee and expense data evaluation (i.e., the peer group), the peer group constituent funds identified by FUSE for Market Neutral Real Estate Fund were the same as the performance universe constituent funds due to the Fund’s investment strategy.
In addition, Guggenheim provided materials and data in response to formal requests for information sent by Independent Legal Counsel on behalf of the Committee. Guggenheim also made a presentation at the April Meeting. Throughout the process, the Committee asked questions of management and requested certain additional information, which Guggenheim provided (collectively with the foregoing reports and materials, the “Contract Review Materials”). The Committee considered the Contract Review Materials in the context of its accumulated experience governing the Trust and other Guggenheim funds and weighed the factors and standards discussed with Independent Legal Counsel.
Following an analysis and discussion of relevant factors, including those identified below, and in the exercise of its business judgment, the Committee concluded that it was in the best interest of each Fund to recommend that the Board approve the renewal of the applicable Agreements for an additional annual term. Following its review of the Committee’s recommendation, the Board approved the renewal of the applicable Agreements for each Fund for a one-year period ending August 1, 2024 at a meeting held on May 23-24, 2023 (the “May Board Meeting” and together with the May Meeting, the “May Meetings”) and determined to adopt the Committee’s considerations and conclusions, which follow.
Advisory Agreements
Nature, Extent and Quality of Services Provided by Each Adviser: With respect to the nature, extent and quality of services currently provided by each Adviser, the Committee considered the qualifications, experience and skills of key personnel performing services for the Funds, including those personnel providing compliance and risk oversight, as well as the supervisors and reporting lines for such personnel. The Committee also considered other information, including Guggenheim’s resources and related efforts to retain, attract and motivate capable personnel to serve the Funds. In evaluating Guggenheim’s resources and capabilities, the Committee considered Guggenheim’s commitment to focusing on, and investing resources in support of, funds in the Guggenheim fund complex, including the Funds. The Committee also considered Guggenheim’s discussion of its ongoing review of the Guggenheim fund line-up at the April Meeting and the May Board Meeting. In addition, the Committee considered the acceptability of the terms of each Advisory Agreement, including the scope of services required to be performed by each Adviser.
| | THE GUGGENHEIM FUNDS ANNUAL REPORT | 109 |
OTHER INFORMATION (Unaudited)(continued) |
The Committee’s review of the services provided by Guggenheim to the Funds included consideration of Guggenheim’s investment processes and resulting performance, portfolio oversight and risk management, and the related regular quarterly reports and presentations received by the Board. The Committee took into account the risks borne by Guggenheim in sponsoring and providing services to the Funds, including regulatory, operational, legal and entrepreneurial risks. The Committee considered the resources dedicated by Guggenheim to compliance functions and the reporting made to the Board by Guggenheim compliance personnel regarding Guggenheim’s adherence to regulatory requirements. The Committee also considered the regular reports the Board receives from the Trust’s Chief Compliance Officer regarding compliance policies and procedures established pursuant to Rule 38a-1 under the Investment Company Act of 1940, as amended. In connection with the Committee’s evaluation of the overall package of services provided by Guggenheim, the Committee considered Guggenheim’s administrative services, including its role in supervising, monitoring, coordinating and evaluating the various services provided by the fund administrator, transfer agent, distributor, custodian and other service providers to the Funds. The Committee evaluated the Office of Chief Financial Officer (the “OCFO”), established to oversee the fund administration, accounting and transfer agency services provided to the Funds and other Guggenheim funds, including the OCFO’s resources, personnel and services provided.
With respect to Municipal Income Fund, the Committee noted that, although Security Investors delegated certain portfolio management responsibilities to the Sub-Adviser, as affiliated companies, both the Adviser and the Sub-Adviser are part of the Guggenheim organization. Further, the Committee took into account Guggenheim’s explanation that investment advisory-related services are provided by many Guggenheim employees under different related legal entities and thus, the services provided by the Adviser on the one hand and the Sub-Adviser on the other, as well as the risks assumed by each party, cannot be ascribed to distinct legal entities.2 As a result, in evaluating the services provided to the Municipal Income Fund under the Sub-Advisory Agreement, the Committee did not separately consider the contributions under the Advisory Agreement and the Sub-Advisory Agreement.
With respect to Guggenheim’s resources and the ability of each Adviser to carry out its responsibilities under the applicable Advisory Agreement, the Chief Financial Officer of Guggenheim Investments reviewed with the Committee financial information concerning the holding company for Guggenheim Investments, Guggenheim Partners Investment Management Holdings, LLC (“GPIMH”), and the various entities comprising Guggenheim Investments, and provided the audited consolidated financial statements of GPIMH. (Thereafter, the Committee received the audited consolidated financial statements of GPIM.)
2 | Consequently, except where the context indicates otherwise, references to “Adviser,” “Advisers” or “Sub-Adviser” should be understood as referring to Guggenheim Investments generally and the services it provides under the Agreements. |
110 | THE GUGGENHEIM FUNDS ANNUAL REPORT | |
OTHER INFORMATION (Unaudited)(continued) |
Based on the foregoing, and based on other information received (both oral and written) at the April Meeting and the May Meetings, as well as other considerations, including the Committee’s knowledge of how each Adviser performs its duties obtained through Board meetings, discussions and reports throughout the year, the Committee concluded that each Adviser and its personnel were qualified to serve the Funds in such capacity and may reasonably be expected to continue to provide a high quality of services under each Advisory Agreement with respect to the Funds.
Investment Performance: The Committee received, for each Fund, investment returns for the since-inception, ten-year, five-year, three-year, one-year and three-month periods ended December 31, 2022, as applicable. In addition, the Committee received a comparison of each Fund’s performance to the performance of a benchmark, a universe of funds and a narrower peer group of similar funds based on asset levels as identified by FUSE (except as noted above with respect to Market Neutral Real Estate Fund), in each case for the same periods, as applicable. The Committee also received from FUSE a description of the methodology for identifying each Fund’s peer group and universe for performance and expense comparisons. The Committee also received certain performance information as of March 31, 2023. In assessing each Fund’s performance, the Committee considered that the Board receives regular reporting from Guggenheim regarding performance and evaluates performance throughout the year.
In seeking to evaluate Fund performance over a full market cycle, the Committee focused its attention on five-year and three-year performance rankings as compared to the relevant universe of funds. Except as to the individual Funds discussed below, the Committee observed that the returns of each Fund’s Institutional Class shares ranked in the third quartile or better of such Fund’s performance universe for each of the relevant periods considered. In addition, the Committee made the following observations:
Alpha Opportunity Fund: The returns of the Fund’s Institutional Class shares ranked in the 96th and 73rd percentiles of its performance universe for the five-year and three-year periods ended December 31, 2022, respectively. The Committee noted management’s explanation that the Fund’s relative underperformance over the five-year time period was primarily due to the Fund’s beta profile and fundamental factor tilts. The Committee noted management’s statement that the Fund’s lower beta profile to broad market U.S. equities relative to its peers and long exposure to value and short exposure to growth have detracted from investment performance. The Committee also noted management’s statement that as a result of an update in 2021 to the quantitative investment methodology that the Fund employs, as well as the more recent comeback of value-oriented, higher quality names, the Fund experienced performance rankings that compare more favorably relative to its performance universe for the three-year and one-year periods ended December 31, 2022.
Diversified Income Fund: The returns of the Fund’s Institutional Class shares ranked in the 78th and 75th percentiles of its performance universe for the five-year and three-year periods ended December 31, 2022, respectively. The Committee noted management’s explanation that the Fund’s relative underperformance over the five-year time period was primarily due to the Fund’s
| | THE GUGGENHEIM FUNDS ANNUAL REPORT | 111 |
OTHER INFORMATION (Unaudited)(continued) |
defensively-positioned portfolio, in particular within its fixed-income sleeve which includes allocations to several Guggenheim fixed-income funds that were defensively positioned beginning in 2018, reflecting Guggenheim’s market views. The Committee also noted management’s statement that the Fund maintained a lower beta profile to equities relative to its peers. The Committee further noted management’s statement that the Fund’s allocation process was updated in 2021, resulting in an increase in the Fund’s equity exposure, and that there was some improvement in the Fund’s performance rankings relative to its performance universe for the three-year and one-year periods ended December 31, 2022. The Committee noted management’s statement that although the Fund’s increased equity exposure was detrimental to the Fund’s performance relative to peers in 2022 due to the poor performance of U.S. equities that year, Guggenheim believes the increased equity exposure will ultimately benefit shareholders and support total return performance in the medium to long term. The Committee also noted the Fund’s small size and considered management’s statements that the Fund continues to be a viable offering and that Guggenheim is able to manage the Fund at its current size.
Market Neutral Real Estate Fund: The returns of the Fund’s Institutional Class shares ranked in the 44th and 89th percentiles of its performance universe for the five-year and three-year periods ended December 31, 2022, respectively. The Committee noted management’s explanation that the Fund’s relative underperformance over the three-year time period was due to underperforming pairs of offsetting long and short positions as well as several stock- and sector-specific issues, and considered that, despite recent underperformance, the Fund experienced performance that ranks in the top half of its performance universe for the five-year period ended December 31, 2022.
Municipal Income Fund: The returns of the Fund’s Institutional Class shares ranked in the 89th and 83rd percentiles of its performance universe for the five-year and three-year periods ended December 31, 2022, respectively. The Committee noted management’s explanation that the Fund’s conservative positioning in high quality, long-duration assets, which underperformed over the past two years due to a risk-on sentiment in 2021 and due to fears of duration risk in 2022, contributed to relative underperformance over the five-year and three-year time periods. The Committee noted management’s statement that the Fund’s allocation to closed-end funds also contributed to relative underperformance in 2022 as the increased cost of leverage weighed on the performance of such funds. The Committee considered management’s belief that an economic downturn that is likely to follow the Federal Reserve’s tightening of financial conditions will disproportionately affect weaker municipal credits and could lead to distress in names the Fund has avoided. The Committee also took into account management’s further discussions of performance attribution and outlook for the Fund at the April Meeting and the May Board Meeting, during which management highlighted that the Fund’s relative underperformance in 2022 was due to the exceptional volatility in the fixed-income markets that year which also impacted relative performance for the trailing five-year and three-year time periods, and noted the overall low dispersion in absolute investment returns among municipal bond funds.
112 | THE GUGGENHEIM FUNDS ANNUAL REPORT | |
OTHER INFORMATION (Unaudited)(continued) |
StylePlus—Mid Growth Fund: The returns of the Fund’s Institutional Class shares ranked in the 76th and 67th percentiles of its performance universe for the five-year and three-year periods ended December 31, 2022, respectively. The Committee noted management’s explanation that the Fund’s relative underperformance over the five-year time period can be attributed to the more conservative positioning of the underlying funds in which the Fund invests, resulting in yields insufficient to offset fund fees and other costs, as well as the strategy’s tilt to value-oriented, lower-growth names within the mid-cap growth segment as growth outperformed value securities from 2018 through 2020. The Committee also noted management’s statement that as a result of the more recent comeback of value-oriented, lower-growth names, the Fund experienced performance rankings that compare more favorably relative to its performance universe for the three-year and one-year periods ended December 31, 2022.
Ultra Short Duration Fund: The returns of the Fund’s Institutional Class shares ranked in the 76th and 63rd percentiles of its performance universe for the five-year and three-year periods ended December 31, 2022, respectively. The Committee noted management’s explanation that the Fund’s overweight duration positioning over the five-year time period relative to its performance universe as well as higher allocations to structured credit during the second half of 2022, which underperformed corporate credit during that period, contributed to relative underperformance over the five-year time period. The Committee considered management’s expectation that the resetting of higher interest rates should help the Fund to perform well going forward and that the divergence in the relationship between structured and corporate credit should normalize going forward and lead to relative outperformance, noting that there was some improvement in the Fund’s performance ranking relative to its performance universe for the one-year period ended December 31, 2022.
Based on the foregoing, and based on other information received (both oral and written) at the April Meeting and the May Meetings, as well as other considerations, the Committee concluded that, with respect to each Fund other than Municipal Income Fund: (i) the Fund’s performance was acceptable; or (ii) it was satisfied with Guggenheim’s responses and/or efforts to improve investment performance; and, with respect to Municipal Income Fund, it would continue to monitor the Fund’s investment performance.
Comparative Fees, Costs of Services Provided and the Benefits Realized by Each Adviser from Its Relationship with the Funds: The Committee compared each Fund’s contractual advisory fee (which, for Municipal Income Fund, includes the sub-advisory fee paid to the Sub-Adviser), net effective management fee3 and total net expense ratio to the applicable peer group. The Committee also reviewed the median advisory fees and expense ratios, including expense ratio components (e.g., transfer agency fees, administration fees, other operating expenses, distribution fees and fee waivers/reimbursements), of the peer group of funds. In addition, the Committee considered information regarding Guggenheim’s process for evaluating
3 | The “net effective management fee” for each Fund represents the combined effective advisory fee and administration fee as a percentage of average net assets for the latest fiscal year, after any waivers and/or reimbursements. |
| | THE GUGGENHEIM FUNDS ANNUAL REPORT | 113 |
OTHER INFORMATION (Unaudited)(continued) |
the competitiveness of each Fund’s fees and expenses, noting Guggenheim’s statement that evaluations seek to incorporate a variety of factors with a general focus on ensuring fees and expenses: (i) are competitive; (ii) give consideration to resource support requirements; and (iii) ensure Funds are able to deliver on shareholder return expectations. The Committee also considered Guggenheim’s discussion of information regarding fee and expense trends across the open-end fund industry and its response to those trends with respect to the funds in the Guggenheim fund complex, including the Funds.
As part of its evaluation of each Fund’s advisory fee, the Committee considered how such fees compared to the advisory fee charged by Guggenheim to one or more other clients that it manages pursuant to similar investment strategies, to the extent applicable, noting that, in certain instances, Guggenheim charges a lower advisory fee to such other clients. In this connection, the Committee considered, among other things, Guggenheim’s representations about the significant differences between managing mutual funds as compared to other types of accounts. The Committee also considered Guggenheim’s explanation that lower fees are charged in certain instances due to various other factors, including the scope of contract, type of investors, fee structure, applicable legal, governance and capital structures, tax status and historical pricing reasons. In addition, the Committee took into account Guggenheim’s discussion of the regulatory, operational, legal and entrepreneurial risks involved with the Funds as compared to other types of accounts. The Committee concluded that the information it received demonstrated that the aggregate services provided to, or the specific circumstances of, each Fund were sufficiently different from the services provided to, or the specific circumstances of, other clients with similar investment strategies and/or that the risks borne by Guggenheim were sufficiently greater than those associated with managing other clients with similar investment strategies to support the difference in fees.
In further considering the comparative fee and expense data presented in the Contract Review Materials and addressed by Guggenheim, the Committee took into account those Funds with currently effective expense limitation agreements with the Adviser. Except as to the individual Funds discussed below, the Committee observed that the contractual advisory fee, net effective management fee and total net expense ratio for each Fund’s Institutional Class shares each rank in the third quartile or better of such Fund’s peer group. In addition, the Committee made the following observations:
Floating Rate Strategies Fund: The contractual advisory fee for the Fund’s Institutional Class shares ranks in the third quartile (73rd percentile) of its peer group. Although the net effective management fee for the Fund’s Institutional Class shares ranks in the fourth quartile (80th percentile) of its peer group, the Committee considered that the total net expense ratio for the Fund’s Institutional Class shares ranks in the third quartile (67th percentile) of its peer group. The Committee considered the Adviser’s statement explaining the higher fees that performance is driven by a unique investment approach that requires significant resources. In this regard, the
114 | THE GUGGENHEIM FUNDS ANNUAL REPORT | |
OTHER INFORMATION (Unaudited)(continued) |
Committee took into consideration the strong investment performance of the Fund’s Institutional Class shares for the three-year period ended December 31, 2022. The Committee also took into account the Fund’s currently effective expense limitation agreement with the Adviser.
Limited Duration Fund: The contractual advisory fee for the Fund’s Institutional Class shares ranks in the fourth quartile (87th percentile) of its peer group. The net effective management fee for the Fund’s Institutional Class shares ranks in the third quartile (73rd percentile) of its peer group. The total net expense ratio for the Fund’s Institutional Class shares ranks in the third quartile (67th percentile) of its peer group. The Committee considered the Adviser’s statement explaining the higher fees that performance is driven by a unique investment approach that requires significant resources. In this regard, the Committee took into consideration the strong investment performance of the Fund’s Institutional Class shares for the five-year and three-year periods ended December 31, 2022. The Committee also took into account the Fund’s currently effective expense limitation agreement with the Adviser.
Macro Opportunities Fund: The contractual advisory fee for the Fund’s Institutional Class shares ranks in the fourth quartile (82nd percentile) of its peer group. The net effective management fee for the Fund’s Institutional Class shares ranks in the third quartile (64th percentile) of its peer group. The total net expense ratio for the Fund’s Institutional Class shares ranks in the third quartile (73rd percentile) of its peer group. The Committee noted that the Fund is categorized as a non-traditional bond fund which seeks to add value by investing in many non-traditional securities within and outside of fixed income, including equities, currencies, commodities and derivatives, and that peer funds have varying degrees of capability, flexibility and associated fees. The Committee considered the Adviser’s statement explaining the higher fees that performance is driven by a unique investment approach that requires significant resources. In this regard, the Committee took into consideration the strong investment performance of the Fund’s Institutional Class shares for the three-year period ended December 31, 2022. The Committee also took into account the Fund’s currently effective expense limitation agreement and contractual advisory fee breakpoint of 5 basis points on average daily net assets above $5 billion.
Risk Managed Real Estate Fund: The contractual advisory fee for the Fund’s Institutional Class shares ranks in the second quartile (43rd percentile) of its peer group. Although the net effective management fee for the Fund’s Institutional Class shares ranks in the fourth quartile (79th percentile) of its peer group, the Committee considered that the total net expense ratio for the Fund’s Institutional Class shares ranks in the third quartile (57th percentile) of its peer group. The Committee considered the Adviser’s statement that the total expense ratio for the Fund’s Institutional Class shares is competitive and in-line with the peer group average and median and that the Fund’s contractual advisory fee is competitive. The Committee also took into account the Fund’s currently effective expense limitation agreement with the Adviser.
SMid Cap Value Fund: The contractual advisory fee for the Fund’s Institutional Class shares ranks in the first quartile (7th percentile) of its peer group. The net effective management fee for the Fund’s Institutional Class shares ranks in the third quartile (71st percentile) of its peer group. The
| | THE GUGGENHEIM FUNDS ANNUAL REPORT | 115 |
OTHER INFORMATION (Unaudited)(continued) |
total net expense ratio for the Fund’s Institutional Class shares ranks in the fourth quartile (79th percentile) of its peer group. The Committee considered that the Fund’s contractual advisory fee ranks favorably in the first quartile of its peer group and reviewed the other expenses that impacted the total net expense ratio. The Committee also took into account the Fund’s currently effective expense limitation agreement with the Adviser.
Total Return Bond Fund: The contractual advisory fee for the Fund’s Institutional Class shares ranks in the fourth quartile (87th percentile) of its peer group. The net effective management fee for the Fund’s Institutional Class shares ranks in the third quartile (67th percentile) of its peer group. The total net expense ratio for the Fund’s Institutional Class shares ranks in the third quartile (73rd percentile) of its peer group. The Committee considered the Adviser’s statement explaining the higher fees that performance is driven by a unique investment approach that requires significant resources. In this regard, the Committee took into consideration the strong investment performance of the Fund’s Institutional Class shares for the three-year period ended December 31, 2022. The Committee also took into account the Fund’s currently effective expense limitation agreement with the Adviser.
With respect to the costs of services provided and benefits realized by Guggenheim Investments from its relationship with the Funds, the Committee reviewed a profitability analysis and data from management for each Fund setting forth the average assets under management for the twelve months ended December 31, 2022, gross revenues received, and expenses incurred directly or through allocations, by Guggenheim Investments, expense waivers (as applicable), earnings and the operating margin/profitability rate, including variance information relative to the foregoing amounts as of December 31, 2021. In addition, the Chief Financial Officer of Guggenheim Investments reviewed with, and addressed questions from, the Committee concerning the expense allocation methodology employed in producing the profitability analysis. In the course of its review of Guggenheim Investments’ profitability, the Committee took into account the methods used by Guggenheim Investments to determine expenses and profit and the representation by the Chief Financial Officer of Guggenheim Investments that such methods provided a reasonable basis for determining the profitability of the applicable Adviser with respect to each Fund. The Committee considered all of the foregoing, among other things, in evaluating the costs of services provided, the profitability to Guggenheim Investments and the profitability rates presented.
The Committee also considered other benefits available to each Adviser because of its relationship with the Funds and noted Guggenheim’s statement that it does not believe the Advisers derive any such “fall-out” benefits. In this regard, the Committee noted Guggenheim’s statement that, although it does not consider such benefits to be fall-out benefits, the Advisers may benefit from certain economies of scale and synergies, such as enhanced visibility of the Advisers, enhanced leverage in fee negotiations and other synergies arising from offering a broad spectrum of products, including the Funds.
116 | THE GUGGENHEIM FUNDS ANNUAL REPORT | |
OTHER INFORMATION (Unaudited)(continued) |
Based on the foregoing, and based on other information received (both oral and written) at the April Meeting and the May Meetings, as well as other considerations, the Committee concluded that the comparative fees and the benefits realized by each Adviser from its relationship with the Funds were appropriate and that each Adviser’s profitability from its relationship with the Funds was not unreasonable.
Economies of Scale: The Committee received and considered information regarding whether there have been economies of scale with respect to the management of the Funds as Fund assets grow, whether the Funds have appropriately benefited from any economies of scale, and whether there is potential for realization of any further economies of scale. The Committee considered whether economies of scale in the provision of services to the Funds were being passed along to and shared with the shareholders. The Committee considered that Guggenheim believes it is appropriately sharing potential economies of scale and that Guggenheim’s decrease in 2022 in overall expenses was attributable to decreased product costs driven by lower average assets under management and lower non-recurring costs related to closed-end fund matters as well as a decrease in compensation and benefits. The Committee also considered that although expenses related to investment resources decreased in 2022, Guggenheim’s shared services expenses and certain other expenses increased in 2022.
The Committee also noted the process employed by the Adviser to evaluate whether it would be appropriate to institute a new breakpoint for a Fund, with consideration given to, among other things: (i) the Fund’s size and trends in asset levels over recent years; (ii) the competitiveness of the expense levels; (iii) whether expense waivers are in place; (iv) changes and trends in revenue and expenses; (v) whether there are any anticipated expenditures that may benefit the Fund in the future; (vi) Fund profit level margins; (vii) relative Fund performance; (viii) the nature, extent and quality of services management provides to the Fund; and (ix) the complexity of the Fund’s investment strategy and the resources required to support the Fund.
As part of its assessment of economies of scale, the Committee took into account Guggenheim’s representation that it seeks to share economies of scale through a number of means, including breakpoints, advisory fees set at competitive rates pre-assuming future asset growth, expense waivers and limitations, and investments in personnel, operations and infrastructure to support the fund business. The Committee also received information regarding amounts that had been shared with shareholders through such breakpoints and expense waivers and limitations. The Committee also noted information from Guggenheim regarding certain challenges and costs associated with managing Funds that have achieved significant scale. Thus, the Committee considered the size of the Funds and the competitiveness of and/or other determinations made regarding the current advisory fee for each Fund, as well as whether a Fund is subject to an expense limitation.
Based on the foregoing, and based on other information received (both oral and written) at the April Meeting and the May Meetings, as well as other considerations, the Committee concluded that the advisory fee for each Fund was reasonable.
| | THE GUGGENHEIM FUNDS ANNUAL REPORT | 117 |
OTHER INFORMATION (Unaudited)(concluded) |
Sub-Advisory Agreement for Municipal Income Fund
Nature, Extent and Quality of Services Provided by the Sub-Adviser: As noted above, because both the Adviser and the Sub-Adviser for Municipal Income Fund—Security Investors and GPIM, respectively—are part of and do business as Guggenheim Investments and the services provided by the Adviser on the one hand and the Sub-Adviser on the other cannot be ascribed to distinct legal entities, the Committee did not separately evaluate the services provided under the Advisory Agreement and the Sub-Advisory Agreement. Therefore, the Committee considered the qualifications, experience and skills of the Fund’s portfolio management team in connection with the Committee’s evaluation of Guggenheim’s investment professionals under the Advisory Agreement. With respect to Guggenheim’s resources and the Sub-Adviser’s ability to carry out its responsibilities under the Sub-Advisory Agreement, as noted above, the Committee considered the financial condition of GPIMH and the various entities comprising Guggenheim Investments. The Committee also considered the acceptability of the terms of the Sub-Advisory Agreement, including the scope of services required to be performed by the Sub-Adviser.
Investment Performance: The Committee considered the returns of the Fund under its evaluation of the Advisory Agreement.
Comparative Fees, Costs of Services Provided and the Benefits Realized by the Sub-Adviser from Its Relationship with the Fund: The Committee considered that the Sub-Advisory Agreement is with an affiliate of the Adviser, that the Adviser compensates the Sub-Adviser from its own fees so that the sub-advisory fee rate for the Fund does not impact the fees paid by the Fund and that the Sub-Adviser’s revenues were included in the calculation of Guggenheim Investments’ profitability. Given its conclusion of the reasonableness of the advisory fee, the Committee concluded that the sub-advisory fee rate for the Fund was reasonable.
Economies of Scale: The Committee recognized that, because the Sub-Adviser’s fees are paid by the Adviser and not the Fund, the analysis of economies of scale was more appropriate in the context of the Committee’s consideration of the Advisory Agreement, which was separately considered. (See “Advisory Agreements – Economies of Scale” above.)
Overall Conclusions
The Committee concluded that the investment advisory fees are fair and reasonable in light of the extent and quality of the services provided and other benefits received and that the renewal of each applicable Agreement is in the best interest of each Fund. In reaching this conclusion, no single factor was determinative or conclusive and each Committee member, in the exercise of his or her informed business judgment, may afford different weights to different factors.
Following its review of the Committee’s analysis and determinations, the Board adopted the considerations and conclusions of the Committee and determined to approve the renewal of the Agreements.
118 | THE GUGGENHEIM FUNDS ANNUAL REPORT | |
INFORMATION ON BOARD OF TRUSTEES AND OFFICERS (Unaudited) |
A Board of Trustees oversees the Trust, as well as other trusts of GI, in which its members have no stated term of service, and continue to serve after election until resignation. The Statement of Additional Information includes further information about Fund Trustees and Officers, and can be obtained without charge by visiting guggenheiminvestments.com or by calling 800.820.0888.
Name, Address*
and Year of Birth | Position(s)
Held with
Trust | Term of Office
and Length of
Time Served** | Principal Occupation(s)
During Past Five Years | Number of
Portfolios
in Fund
Complex
Overseen | Other Directorships
Held by Trustees*** |
INDEPENDENT TRUSTEES | | | |
Randall C. Barnes (1951) | Trustee and Chair of the Valuation Oversight Committee | Since 2014 (Trustee)
Since 2020 (Chair of the Valuation Oversight Committee) | Current: Private Investor (2001-present).
Former: Senior Vice President and Treasurer, PepsiCo, Inc. (1993-1997); President, Pizza Hut International (1991-1993); Senior Vice President, Strategic Planning and New Business Development, PepsiCo, Inc. (1987-1990). | 155 | Current: Advent Convertible and Income Fund (2005-present); Purpose Investments Funds (2013-present).
Former: Fiduciary/Claymore Energy Infrastructure Fund (2004-2022); Guggenheim Enhanced Equity Income Fund (2005-2021); Guggenheim Credit Allocation Fund (2013-2021). |
Angela Brock-Kyle (1959) | Trustee | Since 2019 | Current: Founder and Chief Executive Officer, B.O.A.R.D.S. (2013-present); Director, Mutual Fund Directors Forum (2022-present). Former: Senior Leader, TIAA (financial services firm) (1987-2012). | 154 | Current: Bowhead Insurance GP, LLC (2020-present); Hunt Companies, Inc. (2019-present). Former: Fiduciary/Claymore Energy Infrastructure Fund (2019-2022); Guggenheim Enhanced Equity Income Fund (2019-2021); Guggenheim Credit Allocation Fund (2019-2021); Infinity Property & Casualty Corp. (2014-2018). |
| | THE GUGGENHEIM FUNDS ANNUAL REPORT | 119 |
INFORMATION ON BOARD OF TRUSTEES AND OFFICERS (Unaudited)(continued) |
Name, Address*
and Year of Birth | Position(s)
Held with
Trust | Term of Office
and Length of
Time Served** | Principal Occupation(s)
During Past Five Years | Number of
Portfolios
in Fund
Complex
Overseen | Other Directorships
Held by Trustees*** |
INDEPENDENT TRUSTEES - continued | | |
Thomas F. Lydon, Jr. (1960) | Trustee and Chair of the Contracts Review Committee | Since 2019 (Trustee)
Since 2020 (Chair of the Contracts Review Committee) | Current: President, Global Trends Investments (registered investment adviser) (1996-present); Chief Executive Officer, ETF Flows, LLC (financial advisor education and research provider) (2019-present); Chief Executive Officer, Lydon Media (2016-present); Director, GDX Index Partners, LLC (index provider) (2021-present); Vice Chairman, VettaFi (financial advisor content, research and digital distribution provider) (2022-present). | 154 | Current: US Global Investors, Inc. (GROW) (1995-present); The 2023 ETF Series Trust (4) (June 2023-present); The 2023 ETF Series Trust II (1) (August 2023-present). Former: Fiduciary/Claymore Energy Infrastructure Fund (2019-2022); Guggenheim Enhanced Equity Income Fund (2019-2021); Guggenheim Credit Allocation Fund (2019-2021); Harvest Volatility Edge Trust (3) (2017-2019). |
120 | THE GUGGENHEIM FUNDS ANNUAL REPORT | |
INFORMATION ON BOARD OF TRUSTEES AND OFFICERS (Unaudited)(continued) |
Name, Address*
and Year of Birth | Position(s)
Held with
Trust | Term of Office
and Length of
Time Served** | Principal Occupation(s)
During Past Five Years | Number of
Portfolios
in Fund
Complex
Overseen | Other Directorships
Held by Trustees*** |
INDEPENDENT TRUSTEES - continued | | |
Ronald A. Nyberg (1953) | Trustee and Chair of the Nominating and Governance Committee | Since 2014 | Current: Of Counsel, Momkus LLP (law firm) (2016-present). Former: Partner, Nyberg & Cassioppi, LLC (law firm) (2000-2016); Executive Vice President, General Counsel, and Corporate Secretary, Van Kampen Investments (1982-1999). | 155 | Current: Advent Convertible and Income Fund (2003-present); PPM Funds (2) (2018-present); NorthShore-Edward-Elmhurst Health (2012-present). Former: Fiduciary/Claymore Energy Infrastructure Fund (2004-2022); Guggenheim Enhanced Equity Income Fund (2005-2021); Guggenheim Credit Allocation Fund (2013-2021); Western Asset Inflation-Linked Opportunities & Income Fund (2004-2020); Western Asset Inflation-Linked Income Fund (2003-2020). |
| | THE GUGGENHEIM FUNDS ANNUAL REPORT | 121 |
INFORMATION ON BOARD OF TRUSTEES AND OFFICERS (Unaudited)(continued) |
Name, Address*
and Year of Birth | Position(s)
Held with
Trust | Term of Office
and Length of
Time Served** | Principal Occupation(s)
During Past Five Years | Number of
Portfolios
in Fund
Complex
Overseen | Other Directorships
Held by Trustees*** |
INDEPENDENT TRUSTEES - continued | | |
Sandra G. Sponem (1958) | Trustee and Chair of the Audit Committee | Since 2019 (Trustee)
Since 2020 (Chair of the Audit Committee) | Current: Retired. Former: Senior Vice President and Chief Financial Officer, M.A. Mortenson-Companies, Inc. (construction and real estate development company) (2007-2017). | 154 | Current: SPDR Series Trust (81) (2018-present); SPDR Index Shares Funds (30) (2018-present); SSGA Active Trust (14) (2018-present).
Former: Fiduciary/Claymore Energy Infrastructure Fund (2019-2022); Guggenheim Enhanced Equity Income Fund (2019-2021); Guggenheim Credit Allocation Fund (2019-2021); SSGA Master Trust (1) (2018-2020). |
122 | THE GUGGENHEIM FUNDS ANNUAL REPORT | |
INFORMATION ON BOARD OF TRUSTEES AND OFFICERS (Unaudited)(continued) |
Name, Address*
and Year of Birth | Position(s)
Held with
Trust | Term of Office
and Length of
Time Served** | Principal Occupation(s)
During Past Five Years | Number of
Portfolios
in Fund
Complex
Overseen | Other Directorships
Held by Trustees*** |
INDEPENDENT TRUSTEES - concluded | | |
Ronald E. Toupin, Jr. (1958) | Trustee, Chair of the Board and Chair of the Executive Committee | Since 2014 | Current: Portfolio Consultant (2010-present); Member, Governing Council, Independent Directors Council (2013-present); Governor, Board of Governors, Investment Company Institute (2018-present). Former: Member, Executive Committee, Independent Directors Council (2016-2018); Vice President, Manager and Portfolio Manager, Nuveen Asset Management (1998-1999); Vice President, Nuveen Investment Advisory Corp. (1992-1999); Vice President and Manager, Nuveen Unit Investment Trusts (1991-1999); and Assistant Vice President and Portfolio Manager, Nuveen Unit Investment Trusts (1988-1999), each of John Nuveen & Co., Inc. (registered broker dealer) (1982-1999). | 154 | Former: Fiduciary/Claymore Energy Infrastructure Fund (2004-2022); Guggenheim Enhanced Equity Income Fund (2005-2021); Guggenheim Credit Allocation Fund (2013-2021); Western Asset Inflation-Linked Opportunities & Income Fund (2004-2020); Western Asset Inflation-Linked Income Fund (2003-2020). |
| | THE GUGGENHEIM FUNDS ANNUAL REPORT | 123 |
INFORMATION ON BOARD OF TRUSTEES AND OFFICERS (Unaudited)(continued) |
Name, Address*
and Year of Birth | Position(s)
Held with
Trust | Term of Office
and Length of
Time Served** | Principal Occupation(s)
During Past Five Years | Number of
Portfolios
in Fund
Complex
Overseen | Other Directorships
Held by Trustees*** |
INTERESTED TRUSTEE | |
Amy J. Lee**** (1961) | Trustee, Vice President and Chief Legal Officer | Since 2018 (Trustee) Since 2014
(Chief Legal Officer) Since 2007 (Vice President) | Current: Interested Trustee, certain other funds in the Fund Complex (2018-present); Chief Legal Officer, certain other funds in the Fund Complex (2014-present); Vice President, certain other funds in the Fund Complex (2007-present); Senior Managing Director, Guggenheim Investments (2012-present). Former: President and Chief Executive Officer, certain other funds in the Fund Complex (2017-2019); Vice President, Associate General Counsel and Assistant Secretary, Security Benefit Life Insurance Company and Security Benefit Corporation (2004-2012). | 154 | Former: Fiduciary/Claymore Energy Infrastructure Fund (2018-2022); Guggenheim Enhanced Equity Income Fund (2018-2021); Guggenheim Credit Allocation Fund (2018-2021). |
* | The business address of each Trustee is c/o Guggenheim Investments, 227 West Monroe Street, Chicago, Illinois 60606. |
** | Each Trustee serves an indefinite term, until his or her successor is elected and qualified. Time served includes time served in the respective position for the Predecessor Corporation. |
*** | Each Trustee also serves on the Boards of Trustees of Guggenheim Funds Trust, Guggenheim Variable Funds Trust, Guggenheim Strategy Funds Trust, Guggenheim Taxable Municipal Bond & Investment Grade Debt Trust, Guggenheim Strategic Opportunities Fund, Guggenheim Active Allocation Fund, Rydex Series Funds, Rydex Dynamic Funds, Rydex Variable Trust and Transparent Value Trust. Messrs. Barnes and Nyberg also serve on the Board of Trustees of Advent Convertible & Income Fund. |
**** | This Trustee is deemed to be an “interested person” of the Fund under the 1940 Act by reason of her position with the Fund’s Adviser and/or the parent of the Adviser. |
124 | THE GUGGENHEIM FUNDS ANNUAL REPORT | |
INFORMATION ON BOARD OF TRUSTEES AND OFFICERS (Unaudited)(continued) |
Name, Address*
and Year of Birth | Position(s)
Held with
Trust | Term of Office
and Length of
Time Served** | Principal Occupation(s)
During Past Five Years |
OFFICERS | | | |
Brian E. Binder (1972) | President and Chief Executive Officer | Since 2018 | Current: President, Mutual Fund Boards, Guggenheim Investments (2022-present); President and Chief Executive Officer, certain other funds in the Fund Complex (2018-present); President, Mutual Funds Boards, Guggenheim Funds Investment Advisors, LLC and Security Investors, LLC (2018-present);Board Member, Guggenheim Partners Investment Funds plc (2022-present); Board Member, Guggenheim Global Investments plc (2022-present); Board Member, Guggenheim Partners Fund Management (Europe) Limited (2018-present). Former: Senior Managing Director and Chief Administrative Officer, Guggenheim Investments (2018-2022); Managing Director and President, Deutsche Funds, and Head of US Product, Trading and Fund Administration, Deutsche Asset Management (2013-2018); Managing Director, Chairman of North American Executive Committee and Head of Business Management and Consulting, Invesco Ltd. (2010-2012). |
James Howley (1972) | Chief Financial Officer, Chief Accounting Officer and Treasurer | Since 2022 | Current: Managing Director, Guggenheim Investments (2004-present); Chief Financial Officer, Chief Accounting Officer, and Treasurer, certain other funds in the Fund Complex (2022-present). Former: Assistant Treasurer, certain other funds in the Fund Complex (2006-2022); Manager, Mutual Fund Administration of Van Kampen Investments, Inc. (1996-2004). |
Mark E. Mathiasen (1978) | Secretary | Since 2014 | Current: Secretary, certain other funds in the Fund Complex (2007-present); Managing Director, Guggenheim Investments (2007-present). |
Glenn McWhinnie (1969) | Assistant Treasurer | Since 2016 | Current: Vice President, Guggenheim Investments (2009-present); Assistant Treasurer, certain other funds in the Fund Complex (2016-present). |
Michael P. Megaris (1984) | Assistant Secretary | Since 2014 | Current: Assistant Secretary, certain other funds in the Fund Complex (2014-present); Managing Director, Guggenheim Investments (2012-present). |
| | THE GUGGENHEIM FUNDS ANNUAL REPORT | 125 |
INFORMATION ON BOARD OF TRUSTEES AND OFFICERS (Unaudited)(continued) |
Name, Address*
and Year of Birth | Position(s)
Held with
Trust | Term of Office
and Length of
Time Served** | Principal Occupation(s)
During Past Five Years |
OFFICERS - continued | |
Elisabeth Miller (1968) | Chief Compliance
Officer | Since 2012 | Current: Chief Compliance Officer, certain other funds in the Fund Complex (2012-present); Senior Managing Director, Guggenheim Investments (2012-present); Senior Managing Director, Guggenheim Funds Distributors, LLC (2014-present).
Former: Chief Compliance Officer, Security Investors, LLC and Guggenheim Funds Investment Advisors, LLC (2012-2018); Chief Compliance Officer, Guggenheim Distributors, LLC (2009-2014); Senior Manager, Security Investors, LLC (2004-2014); Senior Manager, Guggenheim Distributors, LLC (2004-2014). |
Margaux Misantone (1978) | AML Officer | Since 2017 | Current: Chief Compliance Officer, Security Investors, LLC and Guggenheim Funds Investment Advisors, LLC (2018-present); AML Officer, Security Investors, LLC and certain other funds in the Fund Complex (2017-present); Managing Director, Guggenheim Investments (2015-present).
Former: Assistant Chief Compliance Officer, Security Investors, LLC and Guggenheim Funds Investments Advisors, LLC (2015-2018). |
Kimberly J. Scott (1974) | Assistant Treasurer | Since 2014 | Current: Director, Guggenheim Investments (2012-present); Assistant Treasurer, certain other funds in the Fund Complex (2012-present).
Former: Financial Reporting Manager, Invesco, Ltd. (2010-2011); Vice President/Assistant Treasurer, Mutual Fund Administration for Van Kampen Investments, Inc./Morgan Stanley Investment Management (2009-2010); Manager of Mutual Fund Administration, Van Kampen Investments, Inc./Morgan Stanley Investment Management (2005-2009). |
Bryan Stone (1979) | Vice President | Since 2014 | Current: Vice President, certain other funds in the Fund Complex (2014-present); Managing Director, Guggenheim Investments (2013-present).
Former: Senior Vice President, Neuberger Berman Group LLC (2009-2013); Vice President, Morgan Stanley (2002-2009). |
126 | THE GUGGENHEIM FUNDS ANNUAL REPORT | |
INFORMATION ON BOARD OF TRUSTEES AND OFFICERS (Unaudited)(concluded) |
Name, Address*
and Year of Birth | Position(s)
Held with
Trust | Term of Office
and Length of
Time Served** | Principal Occupation(s)
During Past Five Years |
OFFICERS - concluded | |
Jon Szafran (1989) | Assistant Treasurer | Since 2017 | Current: Director, Guggenheim Investments (2017-present); Assistant Treasurer, certain other funds in the Fund Complex (2017-present).
Former: Assistant Treasurer of Henderson Global Funds and Manager of US Fund Administration, Henderson Global Investors (North America) Inc. (“HGINA”), (2017); Senior Analyst of US Fund Administration, HGINA (2014–2017); Senior Associate of Fund Administration, Cortland Capital Market Services, LLC (2013-2014); Experienced Associate, PricewaterhouseCoopers LLP (2012-2013). |
* | The business address of each officer is c/o Guggenheim Investments, 227 West Monroe Street, Chicago, Illinois 60606. |
** | Each officer serves an indefinite term, until his or her successor is duly elected and qualified. |
| | THE GUGGENHEIM FUNDS ANNUAL REPORT | 127 |
GUGGENHEIM INVESTMENTS PRIVACY NOTICE (Unaudited) |
Who We Are
This Privacy Notice describes the data protection practices of Guggenheim Investments. Guggenheim Investments as used herein refers to the affiliated investment management businesses of Guggenheim Partners, LLC: Guggenheim Funds Investment Advisors, LLC, Guggenheim Partners Investment Management, LLC, Guggenheim Funds Distributors, LLC, Security Investors, LLC, Guggenheim Investment Advisors (Europe) Limited, Guggenheim Real Estate, LLC, GS Gamma Advisors, LLC, Guggenheim Partners India Management, LLC, Guggenheim Partners Europe Limited, as well as the funds in the Guggenheim Funds complex (the “Funds”) (“Guggenheim Investments,” “we,” “us,” or “our”).
Guggenheim Partners Investment Management Holdings, LLC, located at 330 Madison Avenue, New York, New York, 10017 is the data controller for your information. The affiliates who are also controllers of certain of your information are: Guggenheim Investment Advisors (Europe) Limited, Guggenheim Partners Europe Limited, Guggenheim Partners, LLC, Guggenheim Funds Investment Advisors, LLC, Guggenheim Partners Investment Management, LLC, Guggenheim Funds Distributors, LLC and Security Investors, LLC, as well as the Funds.
Our Commitment to You
Guggenheim Investments considers your privacy our utmost concern. When you become our client or investor, you entrust us with not only your hard-earned money but also with your personal and financial information. Because we have access to your private information, we hold ourselves to the highest standards in its safekeeping and use. We strictly limit how we share your information with others, whether you are a current or former Guggenheim Investments client or investor.
The Information We Collect About You
We collect certain nonpublic personal information about you from information you provide on applications, other forms, our website, and/or from third parties including investment advisors. This information includes Social Security or other tax identification number, assets, income, tax information, retirement and estate plan information, transaction history, account balance, payment history, bank account information, marital status, family relationships, information that we collect on our website through the use of “cookies,” and other personal information that you or others provide to us. We may also collect such information through your inquiries by mail, e-mail or telephone. We may also collect customer due diligence information, as required by applicable law and regulation, through third party service providers.
How We Handle Your Personal Information
The legal basis for using your information as set out in this Privacy Notice is as follows: (a) use of your personal data is necessary to perform our obligations under any contract with you (such as a contract for us to provide financial services to you); or (b) where use of your personal data is not necessary for performance of a contract, use of your personal data is necessary for our
128 | THE GUGGENHEIM FUNDS ANNUAL REPORT | |
GUGGENHEIM INVESTMENTS PRIVACY NOTICE (Unaudited)(continued) |
legitimate interests or the legitimate interests of others (for example, to enforce the legal terms governing our services, operate and market our website and other services we offer, ensure safe environments for our personnel and others, make and receive payments, prevent fraud and to know the customer to whom we are providing the services). Some processing is done to comply with applicable law.
In addition to the specific uses described above, we also use your information in the following manner:
| | ● | We use your information in connection with servicing your accounts. |
| | ● | We use information to respond to your requests or questions. For example, we might use your information to respond to your customer feedback. |
| | ● | We use information to improve our products and services. We may use your information to make our website and products better. We may use your information to customize your experience with us. |
| | ● | We use information for security purposes. We may use your information to protect our company and our customers. |
| | ● | We use information to communicate with you. For example, we will communicate with you about your account or our relationship. We may contact you about your feedback. We might also contact you about this Privacy Notice. We may also enroll you in our email newsletter. |
| | ● | We use information as otherwise permitted by law, as we may notify you. |
| | ● | Aggregate/Anonymous Data. We may aggregate and/or anonymize any information collected through the website so that such information can no longer be linked to you or your device (“Aggregate/Anonymous Information”). We may use Aggregate/Anonymous Information for any purpose, including without limitation for research and marketing purposes, and may also share such data with any third parties, including advertisers, promotional partners, and sponsors. |
We do not sell information about current or former clients or their accounts to third parties. Nor do we share this information, except when necessary to complete transactions at your request, to make you aware of investment products and services that we or our affiliates offer, or as permitted or required by law.
We provide information about you to companies and individuals not affiliated with Guggenheim Investments to complete certain transactions or account changes, or to perform services for us related to your account. For example, if you ask to transfer assets from another financial institution to Guggenheim Investments, we must provide certain information about you to that company to complete the transaction. We provide the third party with only the information necessary to carry out its responsibilities and only for that purpose. And we require these third
| | THE GUGGENHEIM FUNDS ANNUAL REPORT | 129 |
GUGGENHEIM INVESTMENTS PRIVACY NOTICE (Unaudited)(continued) |
parties to treat your private information with the same high degree of confidentiality that we do. To alert you to other Guggenheim Investments products and services, we share your information within our family of affiliated companies. You may limit our sharing with affiliated companies as set out below. We may also share information with any successor to all or part of our business, or in connection with steps leading up to a merger or acquisition. For example, if part of our business was sold we may give customer information as part of that transaction. We may also share information about you with your consent.
We will release information about you if you direct us to do so, if we are compelled by law to do so, or in other circumstances as permitted by law (for example, to protect your account from fraud).
If you close your account(s) or become an inactive client or investor, we will continue to adhere to the privacy policies and practices described in this notice.
Opt-Out Provisions and Your Data Choices
The law allows you to “opt out” of certain kinds of information sharing with third parties. We do not share personal information about you with any third parties that triggers this opt-out right. This means YOU ARE ALREADY OPTED OUT.
When you are no longer our client or investor, we continue to share your information as described in this notice, and you may contact us at any time to limit our sharing by sending an email to CorporateDataPrivacy@GuggenheimPartners.com.
European Union Data Subjects and certain others: In addition to the choices set forth above, residents of the European Union and certain other jurisdictions have certain rights to (1) request access to or rectification or deletion of information we collect about them, (2) request a restriction on the processing of their information, (3) object to the processing of their information, or (4) request the portability of certain information. To exercise these or other rights, please contact us using the contact information below. We will consider all requests and provide our response within the time period stated by applicable law. Please note, however, that certain information may be exempt from such requests in some circumstances, which may include if we need to keep processing your information for our legitimate interests or to comply with a legal obligation. We may request you provide us with information necessary to confirm your identity before responding to your request.
Residents of France and certain other jurisdictions may also provide us with instructions regarding the manner in which we may continue to store, erase and share your information after your death, and where applicable, the person you have designated to exercise these rights after your death.
How We Protect Privacy Online
We take steps to protect your privacy when you use our web site – www.guggenheiminvestments.com – by using secure forms of online communication, including encryption technology, Secure Socket Layer (SSL) protocol, firewalls and user names and passwords. These safeguards vary based
130 | THE GUGGENHEIM FUNDS ANNUAL REPORT | |
GUGGENHEIM INVESTMENTS PRIVACY NOTICE (Unaudited)(concluded) |
on the sensitivity of the information that we collect and store. However, we cannot and do not guarantee that these measures will prevent every unauthorized attempt to access, use, or disclose your information since despite our efforts, no Internet and/or other electronic transmissions can be completely secure. Our web site uses “http cookies”—tiny pieces of information that we ask your browser to store. We use cookies for session management and security features on the Guggenheim Investments web site. We do not use them to pull data from your hard drive, to learn your e-mail address, or to view data in cookies created by other web sites. We will not share the information in our cookies or give others access to it. See the legal information area on our web site for more details about web site security and privacy features.
How We Safeguard Your Personal Information and Data Retention
We restrict access to nonpublic personal information about you to our employees and in some cases to third parties (for example, the service providers described above) as permitted by law. We maintain strict physical, electronic and procedural safeguards that comply with federal standards to guard your nonpublic personal information.
We keep your information for no longer than necessary for the purposes for which it is processed. The length of time for which we retain information depends on the purposes for which we collected and use it and/or as required to comply with applicable laws. Information may persist in copies made for backup and business continuity purposes for additional time.
International Visitors
If you are not a resident of the United States, please be aware that your information may be transferred to, stored and processed in the United States where our servers are located and our databases are operated. The data protection and other laws of the United States and other countries might not be as comprehensive as those in your country.
In such cases, we ensure that a legal basis for such a transfer exists and that adequate protection is provided as required by applicable law, for example, by using standard contractual clauses or by transferring your data to a jurisdiction that has obtained an adequacy finding. Individuals whose data may be transferred on the basis of standard contractual clauses may contact us as described below.
We’ll Keep You Informed
If you have any questions or concerns about how we treat your personal data, we encourage you to consult with us first. You may also contact the relevant supervisory authority.
We reserve the right to modify this policy at any time and will inform you promptly of material changes. You may access our privacy policy from our web site at www.guggenheiminvestments.com. Should you have any questions regarding our privacy policy, contact us by email at CorporateDataPrivacy@GuggenheimPartners.com.
| | THE GUGGENHEIM FUNDS ANNUAL REPORT | 131 |
LIQUIDITY RISK MANAGEMENT PROGRAM (Unaudited) |
In compliance with SEC Rule 22e-4 under the U.S. Investment Company Act of 1940 (the “Liquidity Rule”), the Guggenheim Funds Trust (the “Trust”) has adopted and implemented a written liquidity risk management program (the “Program”) for each series of the Trust (each, a “Fund” and, collectively, the “Funds”). The Trust’s Board of Trustees (the “Board”) has also designated a Program administrator (the “Administrator”).
The Liquidity Rule requires that the Program be reasonably designed to assess and manage each Fund’s liquidity risk. A Fund’s “liquidity risk” (as defined in the Liquidity Rule) is the risk that the Fund could not meet requests to redeem shares issued by the Fund without significant dilution of the remaining investors’ interests in the Fund. The Program includes a number of elements that support the assessment, management and periodic review of liquidity risk. In accordance with the Program, each Fund’s liquidity risk is assessed, managed, and periodically reviewed no less frequently than annually taking into consideration a variety of factors, including, as applicable, the Fund’s investment strategy and liquidity of portfolio investments, short-term and long-term cash flow projections, and holdings of cash and cash equivalents, as well as borrowing arrangements and other funding sources. Certain factors are considered under both normal and reasonably foreseeable stressed conditions. There is no guarantee that the Program will achieve its objective under all circumstances.
Under the Program, each Fund portfolio investment is classified into one of four liquidity categories. The classification is based on a determination of the number of days a Fund reasonably expects to take to convert the investment into cash, or sell or dispose of the investment, in current market conditions without significantly changing the investment’s market value. The Program is reasonably designed to meet Liquidity Rule requirements relating to “highly liquid investment minimums” (i.e., the minimum amount of a Fund’s net assets to be invested in highly liquid investments that are assets) and to monitor compliance with the Liquidity Rule’s limitations on a Fund’s investments in “illiquid investments” (as defined in the Liquidity Rule). Under the Liquidity Rule, a Fund is prohibited from acquiring any illiquid investment if, immediately after the acquisition, the Fund would have invested more than 15% of its net assets in illiquid investments that are assets.
During the period covered by this shareholder report, the Board received a written report (the “Report”) prepared by the Administrator addressing the Program’s operation and assessing the adequacy and effectiveness of its implementation for the period from March 31, 2022, to March 31, 2023. The Report summarized the Administrator’s assessment of the Program’s implementation and concluded that the Program operated effectively, the Program had been and continued to be reasonably designed to assess and manage each Fund’s liquidity risk, and the Program has been adequately and effectively implemented to monitor and respond to the Funds’ liquidity developments, as applicable.
Please refer to the Fund’s prospectus for more information regarding the Fund’s exposure to liquidity risk and other risks to which an investment in the Fund may be subject.
132 | THE GUGGENHEIM FUNDS ANNUAL REPORT | |
This page intentionally left blank.
This page intentionally left blank.
This page intentionally left blank.
This page intentionally left blank.
This page intentionally left blank.
9.30.2023
Guggenheim Funds Annual Report
| |
Guggenheim Floating Rate Strategies Fund | | |
GuggenheimInvestments.com | FR-ANN-0923x0924 |
| | |
DEAR SHAREHOLDER | 2 |
ECONOMIC AND MARKET OVERVIEW | 4 |
ABOUT SHAREHOLDERS’ FUND EXPENSES | 6 |
FLOATING RATE STRATEGIES FUND | 9 |
NOTES TO FINANCIAL STATEMENTS | 51 |
REPORT OF INDEPENDENT REGISTERED PUBLIC ACCOUNTING FIRM | 70 |
OTHER INFORMATION | 72 |
INFORMATION ON BOARD OF TRUSTEES AND OFFICERS | 86 |
GUGGENHEIM INVESTMENTS PRIVACY NOTICE | 95 |
LIQUIDITY RISK MANAGEMENT PROGRAM | 99 |
| | THE GUGGENHEIM FUNDS ANNUAL REPORT | 1 |
Dear Shareholder:
Guggenheim Partners Investment Management, LLC (“Investment Adviser”) is pleased to present the shareholder report for Guggenheim Floating Rate Strategies Fund (“Fund”) for the annual fiscal period ended September 30, 2023 (“Reporting Period”).
The Investment Adviser is part of Guggenheim Investments, which represents the investment management businesses of Guggenheim Partners, LLC (“Guggenheim”), a global, diversified financial services firm.
Guggenheim Funds Distributors, LLC is the distributor of the Fund. Guggenheim Funds Distributors, LLC is affiliated with Guggenheim and the Investment Adviser.
We encourage you to read the Economic and Market Overview section of the report, which follows this letter, and then the Managers’ Commentary for the Fund.
We are committed to providing innovative investment solutions and appreciate the trust you place in us.
Sincerely,
Guggenheim Partners Investment Management, LLC
October 31, 2023
Read a prospectus and summary prospectus (if available) carefully before investing. It contains the investment objectives, risks, charges, expenses and other information, which should be considered carefully before investing. Obtain a prospectus and summary prospectus (if available) at guggenheiminvestments.com or call 800.820.0888.
This material is not intended as a recommendation or as investment advice of any kind, including in connection with rollovers, transfers, and distributions. Such material is not provided in a fiduciary capacity, may not be relied upon for or in connection with the making of investment decisions, and does not constitute a solicitation of an offer to buy or sell securities. All content has been provided for informational or educational purposes only and is not intended to be and should not be construed as legal or tax advice and/or a legal opinion. Always consult a financial, tax and/ or legal professional regarding your specific situation.
2 | THE GUGGENHEIM FUNDS ANNUAL REPORT | |
Floating Rate Strategies Fund may not be suitable for all investors. ● Investments in floating rate senior secured syndicated bank loans and other floating rate securities involve special types of risks, including credit rate risk, interest rate risk, liquidity risk and prepayment risk. ● The Fund’s market value will change in response to interest rate changes and market conditions among other factors. In general, bond prices rise when interest rates fall and vice versa. ● The Fund’s exposure to high yield securities may subject the Fund to greater volatility. ● When market conditions are deemed appropriate, the Fund may use leverage to the full extent permitted by its investment policies and restrictions and applicable law. Leveraging will exaggerate the effect on net asset value of any increase or decrease in the market value of the Fund’s portfolio. ● The Fund may invest in derivative instruments, which may be more volatile and less liquid, increasing the risk of loss when compared to traditional securities. Certain of the derivative instruments are also subject to the risks of counterparty default and adverse tax treatment. ● Instruments and strategies (such as borrowing transactions and reverse repurchase agreements) may provide leveraged exposure to a particular investment, which will magnify any gains or losses on those investments. ● Investments in reverse repurchase agreements and synthetic instruments (such as synthetic collateralized debt obligations) expose the Fund to the many of the same risks as investments in derivatives. ● The Fund’s investments in other investment vehicles subject the Fund to those risks and expenses affecting the investment vehicle. ● The Fund’s investments in foreign securities carry additional risks when compared to U.S. securities, due to the impact of diplomatic, political or economic developments in the country in question (investments in emerging markets securities are generally subject to an even greater level of risk). ● The Fund’s investments in real estate securities subject the Fund to the same risks as direct investments in real estate, which is particularly sensitive to economic downturns. ● The Fund’s investments in restricted securities may involve financial and liquidity risk. ● The Fund is subject to active trading risks that may increase volatility and impact its ability to achieve its investment objective. ● You may have a gain or loss when you sell your shares. ● It is important to note that the Fund is not guaranteed by the U.S. government. ● Please read the prospectus for more detailed information regarding these and other risks.
| | THE GUGGENHEIM FUNDS ANNUAL REPORT | 3 |
ECONOMIC AND MARKET OVERVIEW (Unaudited) | September 30, 2023 |
Faced with a series of strong economic data releases, the market increasingly appears to be coming to the conclusion that the economy is structurally better able to withstand higher interest rates than it really is. This dynamic can be seen by examining the move in Treasury yields, with the selloff almost entirely being due to real yields rather than inflation expectations, and with the move most pronounced at the long end of the yield curve. Digging further, however, a large portion of this shift is due to a rising term premium (the premium for unknown and unquantified risks in the future, beyond current assumptions on the path of inflation or policy rates), which is indicating greater uncertainty about the outlook.
Many forecasters are extrapolating the current year’s economic strength without recognizing the fact that growth has benefited from a number of factors this year that are unlikely to be repeated, namely an expansion of the fiscal deficit, a slowdown in inflation, and a rebound in labor supply. As these factors fade, the headwinds from tight monetary policy may be more apparent and pronounced. And the longer monetary conditions stay tight, the greater the risk of something breaking (banks and commercial real estate remain key risks). All of this suggests that the recent economic trajectory cannot be assumed to continue, especially given the substantial restraint that could be imposed by the recent rise in long-term borrowing costs.
Uncertainty is elevated given the diverging signals in the data and the fact that many traditional economic models are not “working” as they traditionally would. This uncertainty extends to the U.S. Federal Reserve, which looks set to hold off on further rate hikes while it waits to see if the data start to align with the softening conditions policymakers say they are hearing on the ground. We continue to think the gravitational pull of tight money and credit conditions could result in a slowing economy and cooler inflation over the next year, paving the way for more rate cuts than the market presently expects.
For the Reporting Period, the S&P 500® Index* returned 21.62%. The MSCI Europe-Australasia-Far East (“EAFE”) Index* returned 25.65%. The return of the MSCI Emerging Markets Index* was 11.70%.
In the bond market, the Bloomberg U.S. Aggregate Bond Index* posted a 0.64% return for the Reporting Period, while the Bloomberg U.S. Corporate High Yield Index* returned 10.28%. The return of the ICE Bank of America (“BofA”) 3-Month U.S. Treasury Bill Index* was 4.50% for the Reporting Period.
The opinions and forecasts expressed may not actually come to pass. This information is subject to change at any time, based on market and other conditions, and should not be construed as a recommendation of any specific security or strategy.
4 | THE GUGGENHEIM FUNDS ANNUAL REPORT | |
ECONOMIC AND MARKET OVERVIEW (Unaudited)(concluded) | September 30, 2023 |
*Index Definitions:
The following indices are referenced throughout this report. Indices are unmanaged and not available for direct investment. Index performance does not reflect transaction costs, fees, or expenses.
Bloomberg U.S. Aggregate Bond Index is a broad-based flagship benchmark that measures the investment grade, U.S. dollar-denominated, fixed-rate taxable bond market, including U.S. Treasuries, government-related and corporate securities, mortgage-backed securities or “MBS” (agency fixed-rate and hybrid adjustable-rate mortgage, or “ARM”, pass-throughs), asset-backed securities (“ABS”), and commercial mortgage-backed securities (“CMBS”) (agency and non-agency).
Bloomberg U.S. Corporate High Yield Index measures the U.S. dollar-denominated, high yield, fixed-rate corporate bond market. Securities are classified as high yield if the middle rating of Moody’s, Fitch, and S&P is Ba1/BB +/BB + or below.
Credit Suisse Leveraged Loan Index tracks the investable market of the U.S. dollar denominated leveraged loan market. It consists of issues rated “5B” or lower, meaning that the highest rated issues included in this index are Moody’s/S&P ratings of Baa1/BB+ or Ba1/BBB+. All loans are funded term loans with a tenor of at least one year and are made by issuers domiciled in developed countries.
ICE BofA 3-Month U.S. Treasury Bill Index is an unmanaged market index of U.S. Treasury securities maturing in 90 days that assumes reinvestment of all income.
MSCI EAFE Index is a free float-adjusted market capitalization index that is designed to measure the equity market performance of developed markets, excluding the U.S. & Canada.
MSCI Emerging Markets Index is a free float-adjusted market capitalization weighted index that is designed to measure equity market performance in the global emerging markets.
S&P 500® Index is a broad-based index, the performance of which is based on the performance of 500 widely held common stocks chosen for market size, liquidity, and industry group representation.
| | THE GUGGENHEIM FUNDS ANNUAL REPORT | 5 |
ABOUT SHAREHOLDERS’ FUND EXPENSES (Unaudited) |
All mutual funds have operating expenses, and it is important for our shareholders to understand the impact of costs on their investments. Shareholders of a fund incur two types of costs: (i) transaction costs, including sales charges (loads) on purchase payments, reinvested dividends, other distributions, and exchange fees, and (ii) ongoing costs, including management fees, administrative services, and shareholder reports, among others. These ongoing costs, or operating expenses, are deducted from a fund’s gross income and reduce the investment return of the fund.
A fund’s expenses are expressed as a percentage of its average net assets, which is known as the expense ratio. The following examples are intended to help investors understand the ongoing costs (in dollars) of investing in a fund and to compare these costs with the ongoing costs of investing in other mutual funds.
The examples are based on an investment of $1,000 made at the beginning of the period and held for the entire six-month period beginning March 31, 2023 and ending September 30, 2023.
The following tables illustrate the Fund’s costs in two ways:
Table 1. Based on actual Fund return: This section helps investors estimate the actual expenses paid over the period. The “Ending Account Value” shown is derived from the Fund’s actual return, and the fifth column shows the dollar amount that would have been paid by an investor who started with $1,000 in the Fund. Investors may use the information here, together with the amount invested, to estimate the expenses paid over the period. Simply divide the Fund’s account value by $1,000 (for example, an $8,600 account value divided by $1,000 = 8.6), then multiply the result by the number provided under the heading “Expenses Paid During Period.”
Table 2. Based on hypothetical 5% return: This section is intended to help investors compare a fund’s cost with those of other mutual funds. The table provides information about hypothetical account values and hypothetical expenses based on the Fund’s actual expense ratio and an assumed rate of return of 5% per year before expenses, which is not the Fund’s actual return. The hypothetical account values and expenses may not be used to estimate the actual ending account balance or expenses paid during the period. The example is useful in making comparisons because the U.S. Securities and Exchange Commission (the “SEC”) requires all mutual funds to calculate expenses based on the 5% return. Investors can assess a Fund’s costs by comparing this hypothetical example with the hypothetical examples that appear in shareholder reports of other funds.
The calculations illustrated above assume no shares were bought or sold during the period. Actual costs may have been higher or lower, depending on the amount of investment and the timing of any purchases or redemptions.
6 | THE GUGGENHEIM FUNDS ANNUAL REPORT | |
ABOUT SHAREHOLDERS’ FUND EXPENSES (Unaudited)(continued) |
Please note that the expenses shown in the table are meant to highlight your ongoing costs only and do not reflect any transactional costs, such as sales charges (loads) on purchase payments, and contingent deferred sales charges (“CDSC”) on redemptions, if any. Therefore, the second table is useful in comparing ongoing costs only, and will not help you determine the relative total costs of owning different funds. In addition, if these transactional costs were included, your costs would have been higher.
More information about the Fund’s expenses, including annual expense ratios for periods up to five years (subject to the Fund’s inception date), can be found in the Financial Highlights section of this report. For additional information on operating expenses and other shareholder costs, please refer to the Fund’s prospectus.
| | THE GUGGENHEIM FUNDS ANNUAL REPORT | 7 |
ABOUT SHAREHOLDERS’ FUND EXPENSES (Unaudited)(concluded) |
| | Expense
Ratio1 | | | Fund
Return | | | Beginning
Account Value
March 31,
2023 | | | Ending
Account Value
September 30,
2023 | | | Expenses
Paid During
Period2 | |
Table 1. Based on actual Fund return3 |
A-Class | | | 1.02 | % | | | 6.41 | % | | $ | 1,000.00 | | | $ | 1,064.10 | | | $ | 5.28 | |
C-Class | | | 1.78 | % | | | 6.01 | % | | | 1,000.00 | | | | 1,060.10 | | | | 9.19 | |
P-Class | | | 1.02 | % | | | 6.40 | % | | | 1,000.00 | | | | 1,064.00 | | | | 5.28 | |
Institutional Class | | | 0.78 | % | | | 6.53 | % | | | 1,000.00 | | | | 1,065.30 | | | | 4.04 | |
R6-Class | | | 0.74 | % | | | 6.54 | % | | | 1,000.00 | | | | 1,065.40 | | | | 3.83 | |
|
Table 2. Based on hypothetical 5% return (before expenses) |
A-Class | | | 1.02 | % | | | 5.00 | % | | $ | 1,000.00 | | | $ | 1,019.95 | | | $ | 5.16 | |
C-Class | | | 1.78 | % | | | 5.00 | % | | | 1,000.00 | | | | 1,016.14 | | | | 9.00 | |
P-Class | | | 1.02 | % | | | 5.00 | % | | | 1,000.00 | | | | 1,019.95 | | | | 5.16 | |
Institutional Class | | | 0.78 | % | | | 5.00 | % | | | 1,000.00 | | | | 1,021.16 | | | | 3.95 | |
R6-Class | | | 0.74 | % | | | 5.00 | % | | | 1,000.00 | | | | 1,021.36 | | | | 3.75 | |
1 | Annualized and excludes expenses of the underlying funds in which the Fund invests, if any. |
2 | Expenses are equal to the Fund’s annualized expense ratio, net of any applicable fee waivers, multiplied by the average account value over the period, multiplied by 183/365 (to reflect the one-half year period). |
3 | Actual cumulative return at net asset value for the period March 31, 2023 to September 30, 2023. |
8 | THE GUGGENHEIM FUNDS ANNUAL REPORT | |
MANAGERS’ COMMENTARY (Unaudited) | September 30, 2023 |
To Our Shareholders
Guggenheim Partners Investment Management, LLC (“GPIM”) serves as the investment adviser to Guggenheim Floating Rate Strategies Fund (“Fund”). The Fund is managed by a team of seasoned professionals, including Anne B. Walsh, CFA, JD, Chief Investment Officer and Managing Partner; Steven H. Brown, CFA, Chief Investment Officer, Total Return and Macro Strategies, Senior Managing Director, and Portfolio Manager; Thomas J. Hauser, Senior Managing Director and Portfolio Manager; and Christopher Keywork, Managing Director and Portfolio Manager. In the subsequent paragraphs, the investment team discusses the Fund’s performance and the market environment for the 12-month period ended September 30, 2023 (“Reporting Period”).
For the Reporting Period, the Fund provided a total return of 13.47%1 , outperforming the Credit Suisse Leveraged Loan Index, the Fund’s benchmark (“Benchmark”), which returned 12.47% for the same period.
What factors contributed or detracted from the Fund’s performance during the Reporting Period?
Leveraged loans had strong performance for the Reporting Period, putting the asset class on pace for its best calendar year since the global financial crisis. Loans also outperformed many other credit asset classes in the Reporting Period, as the high base rate has translated into higher coupons and driven historically high interest returns. Meanwhile, fixed-rate asset classes have felt the negative impact of duration. The technical backdrop has also remained supportive for loan prices, as demand, driven by solid collateralized loan obligation (“CLO”) origination, has outpaced meager new money supply.
The primary driver of relative return for the Reporting Period continues to be strong credit selection driven by our bottom-up process. Credit selection in the Consumer Non-Cyclicals and Capital Goods sectors, as well as in the CCC ratings segment, were the largest drivers of performance. The Fund’s underweight to the CCC ratings segment and avoidance of defaulted issuers also contributed to performance. An underweight to the BB ratings segment, a result of relative-value driven portfolio construction, also was a contributor. Given liquidity requirements, the Fund has an allocation to a bank loan ETF which hurt performance, as the holding underperformed the broader market. An underweight to the technology sector also slightly detracted from performance.
How did the Fund use derivatives during the Reporting Period?
The Fund used forward foreign currency exchange contracts to hedge currency exposure on foreign-denominated bonds. The hedges had a negative impact on performance for the Reporting Period.
| | THE GUGGENHEIM FUNDS ANNUAL REPORT | 9 |
MANAGERS’ COMMENTARY (Unaudited)(concluded) | September 30, 2023 |
How was the Fund positioned at the end of the Reporting Period?
Discount margins (spreads) broadly tightened during the Reporting Period, ending at about 550 basis points, 65 basis points tighter of where they started the Reporting Period. One basis point (“bps”) is equal to 0.01%. While issuer fundamentals remain in a satisfactory position, we remain cautious of where we are in the cycle. Despite markets tightening on the prospect of a soft landing, we think credit selection will be particularly important over the next 12-18 months.
The Fund remains up-in-quality and is well-positioned amid the market volatility to take advantage of any spread widening. At the end of the Reporting Period, the Fund was underweight the CCC-and-below segment by approximately 375 basis points, and the distress ratio (loans trading below 80) was 1.2% for the portfolio versus 4.1% for the Benchmark. Our bottom-up process has limited volatility to the downside and to credit losses, and we also believe Fund constituents remain up-in-quality from a fundamentals standpoint versus the Benchmark.
In terms of portfolio positioning, although focus has shifted slightly to the primary market, we continue to review both primary and secondary market opportunities, evaluate the risk of our existing positions, and look to use the market strength to opportunistically exit or trim some names we believe have traded up tight to fair value.
Performance displayed represents past performance which is no guarantee of future results.
1 | Performance figures are based on Class A shares and do not reflect deduction of the sales charge or taxes that a shareholder would pay on distributions or the redemption of shares. |
The opinions and forecast expressed may not actually come to pass. This information is subject to change at any time, based on market and other conditions, and should not be construed as a recommendation of any specific security or strategy.
10 | THE GUGGENHEIM FUNDS ANNUAL REPORT | |
PERFORMANCE REPORT AND FUND PROFILE (Unaudited) | September 30, 2023 |
FLOATING RATE STRATEGIES FUND
OBJECTIVE: Seeks to provide a high level of current income while maximizing total return.
Holdings Diversification (Market Exposure as % of Net Assets)
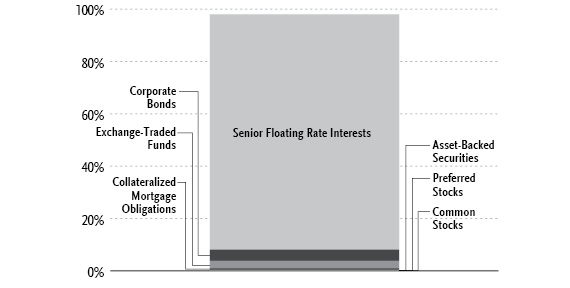
“Holdings Diversification (Market Exposure as % of Net Assets)” excludes any temporary cash investments.
Inception Dates: |
A-Class | November 30, 2011 |
C-Class | November 30, 2011 |
P-Class | May 1, 2015 |
Institutional-Class | November 30, 2011 |
R6-Class | March 13, 2019 |
Ten Largest Holdings | % of Total Net Assets |
SPDR Blackstone Senior Loan ETF | 2.8% |
Bombardier Recreational Products, Inc., 7.42% | 1.0% |
First Brands Group LLC, 10.88% | 0.9% |
Hunter Douglas, Inc., 8.89% | 0.9% |
Arcline FM Holdings LLC, 10.40% | 0.9% |
Fertitta Entertainment LLC, 9.32% | 0.9% |
Del Monte Foods, Inc., 9.67% | 0.9% |
Osmosis Holdings Australia II Pty Ltd., 9.08% | 0.9% |
Medical Solutions Parent Holdings, Inc., 8.77% | 0.9% |
Ascend Learning LLC, 8.92% | 0.8% |
Top Ten Total | 10.9% |
| | |
“Ten Largest Holdings” excludes any temporary cash or derivative investments. |
| | THE GUGGENHEIM FUNDS ANNUAL REPORT | 11 |
PERFORMANCE REPORT AND FUND PROFILE (Unaudited)(continued) | September 30, 2023 |
Cumulative Fund Performance*
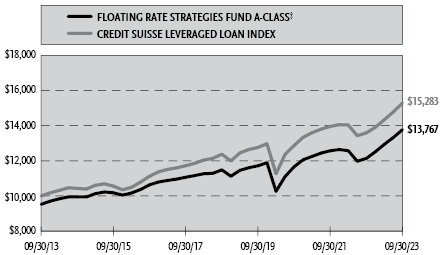
12 | THE GUGGENHEIM FUNDS ANNUAL REPORT | |
PERFORMANCE REPORT AND FUND PROFILE (Unaudited)(continued) | September 30, 2023 |
Average Annual Returns*
Periods Ended September 30, 2023
| 1 Year | 5 Year | 10 Year |
A-Class Shares | 13.47% | 3.69% | 3.75% |
A-Class Shares with sales charge† | 10.08% | 3.06% | 3.25% |
C-Class Shares | 12.58% | 2.92% | 2.98% |
C-Class Shares with CDSC‡ | 11.58% | 2.92% | 2.98% |
Institutional Class Shares | 13.68% | 3.93% | 4.00% |
Credit Suisse Leveraged Loan Index | 12.47% | 4.31% | 4.33% |
| 1 Year | 5 Year | Since
Inception
(05/01/15) |
P-Class Shares | 13.46% | 3.69% | 3.62% |
Credit Suisse Leveraged Loan Index | 12.47% | 4.31% | 4.32% |
| | 1 Year | Since
Inception
(03/13/19) |
R6-Class Shares | | 13.87% | 4.36% |
Credit Suisse Leveraged Loan Index | | 12.47% | 4.59% |
* | The performance data above represents past performance that is not predictive of future results. The investment return and principal value of an investment in the Fund will fluctuate so that an investor’s shares, when redeemed, may be worth more or less than their original cost. Returns are historical and include changes in principal and reinvested dividends and capital gains and do not reflect the effect of taxes. The Credit Suisse Leveraged Loan Index is an unmanaged index and, unlike the Fund, has no management fees or operating expenses to reduce its reported return. The graph is based on A-Class shares only; performance for C-Class shares, P-Class shares, Institutional Class shares and R6-Class shares will vary due to differences in fee structures. |
† | Effective October 1, 2015, the maximum sales charge decreased from 4.75% to 3.00%. A 4.75% maximum sales charge is used in the calculation of the Average Annual Returns based on subscriptions made prior to October 1, 2015, and a 3.00% maximum sales charge is used to calculate performance for periods based on subscriptions made on or after October 1, 2015. |
‡ | Fund returns include a CDSC of 1% if redeemed within 12 months of purchase. |
| | THE GUGGENHEIM FUNDS ANNUAL REPORT | 13 |
PERFORMANCE REPORT AND FUND PROFILE (Unaudited)(concluded) | September 30, 2023 |
Portfolio Composition by Quality Rating1 |
Rating | % of Total
Investments |
Fixed Income Instruments | |
BBB | 4.3% |
BB | 27.8% |
B | 59.8% |
CCC | 2.0% |
CC | 0.5% |
NR2 | 1.9% |
Other Instruments | 3.7% |
Total Investments | 100.0% |
1 | Source: BlackRock Solutions. Credit quality ratings are measured on a scale that generally ranges from AAA (highest) to D (lowest). All securities except for those labeled “NR” have been rated by Moody’s, Standard & Poor’s (“S&P”), or Fitch, each of which is a Nationally Recognized Statistical Rating Organization (“NRSRO”). For purposes of this presentation, when ratings are available from more than one agency, the highest rating is used. Guggenheim Investments has converted ratings to the equivalent S&P rating. Security ratings are determined at the time of purchase and may change thereafter. |
2 | NR (not rated) securities do not necessarily indicate low credit quality. |
14 | THE GUGGENHEIM FUNDS ANNUAL REPORT | |
SCHEDULE OF INVESTMENTS | September 30, 2023 |
FLOATING RATE STRATEGIES FUND | |
| | Shares | | | Value | |
COMMON STOCKS††† - 0.0% |
| | | | | | | | | |
Industrial - 0.0% |
BP Holdco LLC*,1 | | | 244,278 | | | $ | 313,770 | |
Vector Phoenix Holdings, LP* | | | 244,278 | | | | 15,006 | |
API Heat Transfer Parent LLC* | | | 4,994,727 | | | | 499 | |
Targus, Inc.* | | | 12,773 | | | | 377 | |
Targus, Inc.* | | | 12,773 | | | | 377 | |
Targus, Inc.* | | | 12,773 | | | | 307 | |
YAK BLOCKER 2 LLC* | | | 15,530 | | | | 155 | |
YAK BLOCKER 2 LLC* | | | 14,354 | | | | 144 | |
Targus , Inc.* | | | 12,773 | | | | 140 | |
Targus, Inc.* | | | 12,773 | | | | 1 | |
Total Industrial | | | | | | | 330,776 | |
| | | | | | | | | |
Energy - 0.0% |
Permian Production Partners LLC* | | | 401,481 | | | | 15,968 | |
| | | | | | | | | |
Financial - 0.0% |
Tensor Ltd.* | | | 177,413 | | | | 18 | |
| | | | | | | | | |
Total Common Stocks | | | | |
(Cost $1,536,493) | | | | | | | 346,762 | |
| | | | | | | | | |
PREFERRED STOCKS††† - 0.0% |
Industrial - 0.0% |
API Heat Transfer Intermediate * | | | 618 | | | | 280,462 | |
YAK BLOCKER 2 LLC * | | | 853,214 | | | | 213,445 | |
Total Industrial | | | | | | | 493,907 | |
| | | | | | | | | |
Total Preferred Stocks | | | | |
(Cost $2,861,906) | | | | | | | 493,907 | |
| | | | | | | | | |
EXCHANGE-TRADED FUNDS† - 2.8% |
SPDR Blackstone Senior Loan ETF | | | 676,240 | | | | 28,354,743 | |
Total Exchange-Traded Funds | | | | |
(Cost $28,000,558) | | | | | | | 28,354,743 | |
| | | | | | | | | |
MONEY MARKET FUND† - 0.8% |
Federated Hermes U.S. Treasury Cash Reserves Fund — Institutional Shares, 5.20%2 | | | 7,998,678 | | | | 7,998,678 | |
Total Money Market Fund | | | | |
(Cost $7,998,678) | | | | | | | 7,998,678 | |
| | | | | | | | | |
| | | Face
Amount~ | | | | | |
SENIOR FLOATING RATE INTERESTS††,◊ - 89.9% |
Consumer, Non-cyclical - 18.3% |
Bombardier Recreational Products, Inc. | | | | | | | | |
7.42% (1 Month Term SOFR + 2.00%, Rate Floor: 2.00%) due 05/24/27 | | | 9,851,169 | | | | 9,781,423 | |
Del Monte Foods, Inc. | | | | | | | | |
9.67% (1 Month Term SOFR + 4.25%, Rate Floor: 4.25%) due 05/16/29 | | | 9,527,005 | | | | 9,250,150 | |
Osmosis Holdings Australia II Pty Ltd. | | | | | | | | |
9.08% (1 Month Term SOFR + 3.75%, Rate Floor: 3.75%) due 07/30/28 | | | 9,138,644 | | | | 9,037,296 | |
Medical Solutions Parent Holdings, Inc. | | | | | | | | |
8.77% (3 Month Term SOFR + 3.25%, Rate Floor: 3.25%) due 11/01/28 | | | 9,167,873 | | | | 8,855,156 | |
SEE NOTES TO FINANCIAL STATEMENTS. | THE GUGGENHEIM FUNDS ANNUAL REPORT | 15 |
SCHEDULE OF INVESTMENTS (continued) | September 30, 2023 |
FLOATING RATE STRATEGIES FUND | |
| | Face
Amount~ | | | Value | |
National Mentor Holdings, Inc. | | | | | | | | |
9.18% (1 Month Term SOFR + 3.75%, Rate Floor: 3.75%) due 03/02/28 | | | 8,732,139 | | | $ | 7,753,441 | |
9.24% (3 Month Term SOFR + 3.75%, Rate Floor: 3.75%) due 03/02/28 | | | 276,228 | | | | 245,269 | |
Hayward Industries, Inc. | | | | | | | | |
8.18% (1 Month Term SOFR + 2.75%, Rate Floor: 2.75%) due 05/30/28 | | | 7,624,500 | | | | 7,564,114 | |
Kronos Acquisition Holdings, Inc. | | | | | | | | |
9.40% (3 Month Term SOFR + 3.75%, Rate Floor: 3.75%) due 12/22/26 | | | 7,245,125 | | | | 7,199,843 | |
VC GB Holdings I Corp. | | | | | | | | |
8.65% (3 Month Term SOFR + 3.00%, Rate Floor: 3.00%) due 07/21/28 | | | 7,288,533 | | | | 7,138,827 | |
Medline Borrower LP | | | | | | | | |
8.68% (1 Month Term SOFR + 3.25%, Rate Floor: 3.25%) due 10/23/28 | | | 7,092,000 | | | | 7,068,596 | |
Quirch Foods Holdings LLC | | | | | | | | |
10.45% (3 Month Term SOFR + 4.75%, Rate Floor: 5.75%) due 10/27/27 | | | 6,617,924 | | | | 6,580,731 | |
Mission Veterinary Partners | | | | | | | | |
9.43% (1 Month Term SOFR + 4.00%, Rate Floor: 4.00%) due 04/27/28 | | | 6,377,387 | | | | 6,305,641 | |
HAH Group Holding Co. LLC | | | | | | | | |
10.42% (1 Month Term SOFR + 5.00%, Rate Floor: 5.00%) due 10/29/27 | | | 6,227,400 | | | | 6,133,989 | |
Electron BidCo, Inc. | | | | | | | | |
8.43% (1 Month Term SOFR + 3.00%, Rate Floor: 3.00%) due 11/01/28 | | | 6,030,760 | | | | 6,000,606 | |
Grifols Worldwide Operations USA, Inc. | | | | | | | | |
7.42% (1 Month Term SOFR + 2.00%, Rate Floor: 2.00%) due 11/15/27 | | | 6,030,304 | | | | 5,923,267 | |
Weber-Stephen Products LLC | | | | | | | | |
8.68% (1 Month Term SOFR + 3.25%, Rate Floor: 3.25%) due 10/29/27 | | | 6,379,866 | | | | 5,731,225 | |
Froneri US, Inc. | | | | | | | | |
7.67% (1 Month Term SOFR + 2.25%, Rate Floor: 2.25%) due 01/29/27 | | | 5,436,780 | | | | 5,391,655 | |
16 | THE GUGGENHEIM FUNDS ANNUAL REPORT | SEE NOTES TO FINANCIAL STATEMENTS. |
SCHEDULE OF INVESTMENTS (continued) | September 30, 2023 |
FLOATING RATE STRATEGIES FUND | |
| | Face
Amount~ | | | Value | |
Triton Water Holdings, Inc. | | | | | | | | |
8.90% (3 Month Term SOFR + 3.25%, Rate Floor: 3.25%) due 03/31/28 | | | 5,332,738 | | | $ | 5,190,514 | |
Dermatology Intermediate Holdings III, Inc. | | | | | | | | |
9.62% (3 Month Term SOFR + 4.25%, Rate Floor: 4.25%) due 04/02/29 | | | 4,359,618 | | | | 4,328,011 | |
9.62% (3 Month Term SOFR + 4.25%, Rate Floor: 4.25%) due 03/30/29 | | | 816,456 | | | | 810,536 | |
Phoenix Newco, Inc. | | | | | | | | |
8.68% (1 Month Term SOFR + 3.25%, Rate Floor: 3.25%) due 11/15/28 | | | 4,925,000 | | | | 4,885,846 | |
Southern Veterinary Partners LLC | | | | | | | | |
9.43% (1 Month Term SOFR + 4.00%, Rate Floor: 4.00%) due 10/05/27 | | | 4,687,163 | | | | 4,653,462 | |
Chefs’ Warehouse, Inc. | | | | | | | | |
10.17% (1 Month Term SOFR + 4.75%, Rate Floor: 4.75%) due 08/23/29 | | | 4,478,167 | | | | 4,489,362 | |
Perrigo Investments LLC | | | | | | | | |
7.67% (1 Month Term SOFR + 2.25%, Rate Floor: 2.25%) due 04/20/29 | | | 4,433,825 | | | | 4,413,031 | |
Resonetics LLC | | | | | | | | |
9.63% (3 Month Term SOFR + 4.00%, Rate Floor: 4.00%) due 04/28/28 | | | 3,545,729 | | | | 3,474,814 | |
CHG PPC Parent LLC | | | | | | | | |
8.43% (1 Month Term SOFR + 3.00%, Rate Floor: 3.50%) due 12/08/28 | | | 3,438,890 | | | | 3,408,800 | |
Elanco Animal Health, Inc. | | | | | | | | |
7.18% (1 Month Term SOFR + 1.75%, Rate Floor: 1.75%) due 08/02/27 | | | 2,929,404 | | | | 2,870,406 | |
Topgolf Callaway Brands Corp. | | | | | | | | |
8.92% (1 Month Term SOFR + 3.50%, Rate Floor: 3.50%) due 03/15/30 | | | 2,865,600 | | | | 2,847,088 | |
TGP Holdings LLC | | | | | | | | |
8.67% (1 Month Term SOFR + 3.25%, Rate Floor: 3.25%) due 06/29/28 | | | 3,049,759 | | | | 2,778,331 | |
Cambrex Corp. | | | | | | | | |
8.92% (1 Month Term SOFR + 3.50%, Rate Floor: 3.50%) due 12/04/26 | | | 2,595,327 | | | | 2,579,106 | |
SEE NOTES TO FINANCIAL STATEMENTS. | THE GUGGENHEIM FUNDS ANNUAL REPORT | 17 |
SCHEDULE OF INVESTMENTS (continued) | September 30, 2023 |
FLOATING RATE STRATEGIES FUND | |
| | Face
Amount~ | | | Value | |
Balrog Acquisition, Inc. | | | | | | | | |
9.93% (1 Month Term SOFR + 4.50%, Rate Floor: 4.50%) due 09/05/28††† | | | 2,588,770 | | | $ | 2,569,354 | |
Hostess Brands LLC | | | | | | | | |
7.89% (3 Month Term SOFR + 2.50%, Rate Floor: 2.50%) due 06/28/30 | | | 2,514,551 | | | | 2,517,166 | |
Fortrea Holdings, Inc. | | | | | | | | |
9.07% (1 Month Term SOFR + 3.75%, Rate Floor: 3.75%) due 07/01/30 | | | 2,513,700 | | | | 2,503,218 | |
Heritage Grocers Group LLC | | | | | | | | |
12.24% (3 Month Term SOFR + 6.75%, Rate Floor: 6.75%) due 08/01/29 | | | 2,490,522 | | | | 2,488,455 | |
Sigma Holding BV (Flora Food) | | | | | | | | |
7.41% (6 Month EURIBOR + 3.50%, Rate Floor: 3.50%) due 07/02/25 | | EUR | 2,258,979 | | | | 2,379,226 | |
Energizer Holdings, Inc. | | | | | | | | |
7.69% (1 Month Term SOFR + 2.25%, Rate Floor: 2.25%) due 12/22/27 | | | 2,329,875 | | | | 2,319,973 | |
Blue Ribbon LLC | | | | | | | | |
11.44% (1 Month Term SOFR + 6.00%, Rate Floor: 6.00%) due 05/08/28 | | | 2,584,615 | | | | 2,171,077 | |
Aramark Services, Inc. | | | | | | | | |
7.93% (1 Month Term SOFR + 2.50%, Rate Floor: 2.50%) due 06/22/30 | | | 1,496,250 | | | | 1,492,509 | |
DaVita, Inc. | | | | | | | | |
7.18% (1 Month Term SOFR + 1.75%, Rate Floor: 1.75%) due 08/12/26 | | | 1,492,161 | | | | 1,472,583 | |
Endo Luxembourg Finance Company I SARL | | | | | | | | |
14.50% (Commercial Prime Lending Rate + 6.00%, Rate Floor: 7.75%) due 03/27/28 | | | 1,896,000 | | | | 1,352,095 | |
Upstream Newco, Inc. | | | | | | | | |
9.68% (1 Month Term SOFR + 4.25%, Rate Floor: 4.25%) due 11/20/26 | | | 733,125 | | | | 701,601 | |
PlayCore | | | | | | | | |
9.38% (3 Month Term SOFR + 4.00%, Rate Floor: 4.00%) due 03/29/27 | | | 632,392 | | | | 630,419 | |
Mamba Purchaser, Inc. | | | | | | | | |
8.93% (1 Month Term SOFR + 3.50%, Rate Floor: 3.50%) due 10/16/28 | | | 312,983 | | | | 311,678 | |
Total Consumer, Non-cyclical | | | 185,599,890 | |
| | | | | | | | | |
18 | THE GUGGENHEIM FUNDS ANNUAL REPORT | SEE NOTES TO FINANCIAL STATEMENTS. |
SCHEDULE OF INVESTMENTS (continued) | September 30, 2023 |
FLOATING RATE STRATEGIES FUND | |
| | Face
Amount~ | | | Value | |
Industrial - 17.5% |
Hunter Douglas, Inc. | | | | | | | | |
8.89% (3 Month Term SOFR + 3.50%, Rate Floor: 3.50%) due 02/26/29 | | | 9,662,576 | | | $ | 9,394,439 | |
Arcline FM Holdings LLC | | | | | | | | |
10.40% (3 Month Term SOFR + 4.75%, Rate Floor: 4.75%) due 06/23/28 | | | 9,422,700 | | | | 9,348,072 | |
Pelican Products, Inc. | | | | | | | | |
9.79% (3 Month Term SOFR + 4.25%, Rate Floor: 4.25%) due 12/29/28 | | | 9,005,128 | | | | 8,509,846 | |
American Bath Group LLC | | | | | | | | |
9.17% (1 Month Term SOFR + 3.75%, Rate Floor: 3.75%) due 11/23/27 | | | 8,781,501 | | | | 8,263,744 | |
CPG International LLC | | | | | | | | |
7.92% (1 Month Term SOFR + 2.50%, Rate Floor: 2.50%) due 04/28/29 | | | 6,930,000 | | | | 6,921,338 | |
Aegion Corp. | | | | | | | | |
10.18% (1 Month Term SOFR + 4.75%, Rate Floor: 4.75%) due 05/17/28 | | | 6,896,511 | | | | 6,842,028 | |
LTI Holdings, Inc. | | | | | | | | |
8.93% (1 Month Term SOFR + 3.50%, Rate Floor: 3.50%) due 09/08/25 | | | 6,847,946 | | | | 6,659,627 | |
PECF USS Intermediate Holding III Corp. | | | | | | | | |
9.88% (3 Month Term SOFR + 4.25%, Rate Floor: 4.25%) due 12/15/28 | | | 7,806,694 | | | | 6,234,894 | |
TricorBraun Holdings, Inc. | | | | | | | | |
8.68% (1 Month Term SOFR + 3.25%, Rate Floor: 3.25%) due 03/03/28 | | | 6,173,733 | | | | 6,049,579 | |
Park River Holdings, Inc. | | | | | | | | |
8.52% (3 Month Term SOFR + 3.25%, Rate Floor: 3.25%) due 12/28/27 | | | 5,984,684 | | | | 5,767,081 | |
USIC Holding, Inc. | | | | | | | | |
8.93% (1 Month Term SOFR + 3.50%, Rate Floor: 3.50%) due 05/12/28 | | | 5,250,368 | | | | 5,158,487 | |
White Cap Supply Holdings LLC | | | | | | | | |
9.07% (1 Month Term SOFR + 3.75%, Rate Floor: 3.75%) due 10/19/27 | | | 4,962,217 | | | | 4,948,670 | |
Titan Acquisition Ltd. (Husky) | | | | | | | | |
8.73% (3 Month Term SOFR + 3.00%, Rate Floor: 3.00%) due 03/28/25 | | | 4,937,422 | | | | 4,891,751 | |
SEE NOTES TO FINANCIAL STATEMENTS. | THE GUGGENHEIM FUNDS ANNUAL REPORT | 19 |
SCHEDULE OF INVESTMENTS (continued) | September 30, 2023 |
FLOATING RATE STRATEGIES FUND | |
| | Face
Amount~ | | | Value | |
API Heat Transfer | | | | | | | | |
16.65% (1 Month Term SOFR) (in-kind rate was 16.65%) due 01/01/24†††,3 | | | 4,407,563 | | | $ | 4,042,783 | |
16.43% (1 Month Term SOFR) (in-kind rate was 16.43%) due 10/31/23†††,3 | | | 786,356 | | | | 786,356 | |
Duran Group Holding GmbH | | | | | | | | |
8.59% (6 Month EURIBOR + 5.25%, Rate Floor: 5.25%) due 05/31/26††† | | EUR | 4,527,760 | | | | 4,727,887 | |
Brown Group Holding LLC | | | | | | | | |
8.17% (1 Month Term SOFR + 2.75%, Rate Floor: 2.75%) due 06/07/28 | | | 4,464,298 | | | | 4,418,718 | |
STS Operating, Inc. (SunSource) | | | | | | | | |
9.67% (1 Month Term SOFR + 4.25%, Rate Floor: 4.25%) due 12/11/24 | | | 3,999,789 | | | | 3,997,789 | |
Engineered Machinery Holdings, Inc. | | | | | | | | |
9.15% (3 Month Term SOFR + 3.50%, Rate Floor: 4.25%) due 05/19/28 | | | 3,900,227 | | | | 3,875,851 | |
DG Investment Intermediate Holdings 2, Inc. | | | | | | | | |
9.18% (1 Month Term SOFR + 3.75%, Rate Floor: 3.75%) due 03/31/28 | | | 3,812,376 | | | | 3,741,695 | |
Ravago Holdings America, Inc. | | | | | | | | |
8.15% (3 Month Term SOFR + 2.50%, Rate Floor: 2.50%) due 03/04/28 | | | 3,671,084 | | | | 3,597,662 | |
Pro Mach Group, Inc. | | | | | | | | |
9.43% (1 Month Term SOFR + 4.00%, Rate Floor: 4.00%) due 08/31/28 | | | 3,420,031 | | | | 3,420,476 | |
Berlin Packaging LLC | | | | | | | | |
9.20% ((1 Month Term SOFR + 3.75%) and (3 Month Term SOFR + 3.75%), Rate Floor: 3.75%) due 03/13/28 | | | 3,381,000 | | | | 3,340,563 | |
Hillman Group, Inc. | | | | | | | | |
8.18% (1 Month Term SOFR + 2.75%, Rate Floor: 2.75%) due 07/14/28 | | | 3,278,174 | | | | 3,273,060 | |
Mirion Technologies, Inc. | | | | | | | | |
8.40% (3 Month Term SOFR + 2.75%, Rate Floor: 2.75%) due 10/20/28 | | | 3,065,287 | | | | 3,060,475 | |
20 | THE GUGGENHEIM FUNDS ANNUAL REPORT | SEE NOTES TO FINANCIAL STATEMENTS. |
SCHEDULE OF INVESTMENTS (continued) | September 30, 2023 |
FLOATING RATE STRATEGIES FUND | |
| | Face
Amount~ | | | Value | |
Anchor Packaging LLC | | | | | | | | |
8.92% (1 Month Term SOFR + 3.50%, Rate Floor: 3.50%) due 07/18/26 | | | 3,049,155 | | | $ | 3,015,797 | |
Alliance Laundry Systems LLC | | | | | | | | |
8.90% (3 Month Term SOFR + 3.50%, Rate Floor: 3.50%) due 10/08/27 | | | 3,009,107 | | | | 3,005,346 | |
Quikrete Holdings, Inc. | | | | | | | | |
8.20% (1 Month Term SOFR + 3.00%, Rate Floor: 3.00%) due 03/19/29 | | | 2,937,688 | | | | 2,943,946 | |
Transdigm, Inc. | | | | | | | | |
8.64% (3 Month Term SOFR + 3.25%, Rate Floor: 3.25%) due 08/24/28 | | | 2,897,169 | | | | 2,896,705 | |
DXP Enterprises, Inc. | | | | | | | | |
10.44% (6 Month Term SOFR + 5.25%, Rate Floor: 5.25%) due 12/23/27 | | | 2,870,483 | | | | 2,859,719 | |
Service Logic Acquisition, Inc. | | | | | | | | |
9.63% (3 Month Term SOFR + 4.00%, Rate Floor: 4.00%) due 10/29/27 | | | 2,735,969 | | | | 2,724,013 | |
Standard Industries, Inc. | | | | | | | | |
7.94% (1 Month Term SOFR + 2.50%, Rate Floor: 2.50%) due 09/22/28 | | | 2,501,912 | | | | 2,499,986 | |
Michael Baker International LLC | | | | | | | | |
10.43% (1 Month Term SOFR + 5.00%, Rate Floor: 5.00%) due 12/01/28 | | | 2,244,289 | | | | 2,227,457 | |
Mileage Plus Holdings LLC | | | | | | | | |
10.80% (3 Month Term SOFR + 5.25%, Rate Floor: 5.25%) due 06/21/27 | | | 2,100,000 | | | | 2,178,981 | |
Air Canada | | | | | | | | |
9.13% (3 Month Term SOFR + 3.50%, Rate Floor: 3.50%) due 08/11/28 | | | 2,172,500 | | | | 2,172,044 | |
Charter Next Generation, Inc. | | | | | | | | |
9.18% (1 Month Term SOFR + 3.75%, Rate Floor: 3.75%) due 12/01/27 | | | 2,148,018 | | | | 2,126,538 | |
Fugue Finance LLC | | | | | | | | |
9.92% (3 Month Term SOFR + 4.50%, Rate Floor: 4.50%) due 01/31/28 | | | 2,120,141 | | | | 2,121,328 | |
Beacon Roofing Supply, Inc. | | | | | | | | |
7.68% (1 Month Term SOFR + 2.25%, Rate Floor: 2.25%) due 05/19/28 | | | 2,113,782 | | | | 2,111,351 | |
SEE NOTES TO FINANCIAL STATEMENTS. | THE GUGGENHEIM FUNDS ANNUAL REPORT | 21 |
SCHEDULE OF INVESTMENTS (continued) | September 30, 2023 |
FLOATING RATE STRATEGIES FUND | |
| | Face
Amount~ | | | Value | |
TK Elevator Midco GmbH | | | | | | | | |
9.38% (6 Month Term SOFR + 3.50%, Rate Floor: 4.00%) due 07/30/27 | | | 1,848,398 | | | $ | 1,842,853 | |
United Airlines, Inc. | | | | | | | | |
9.18% (1 Month Term SOFR + 3.75%, Rate Floor: 3.75%) due 04/21/28 | | | 1,837,353 | | | | 1,837,775 | |
Protective Industrial Products, Inc. | | | | | | | | |
9.43% (1 Month Term SOFR + 4.00%, Rate Floor: 4.00%) due 12/29/27 | | | 1,818,283 | | | | 1,754,643 | |
EMRLD Borrower LP | | | | | | | | |
8.32% (1 Month Term SOFR + 3.00%, Rate Floor: 3.00%) due 05/31/30 | | | 1,757,488 | | | | 1,754,201 | |
CPM Holdings, Inc. | | | | | | | | |
due 09/22/28 | | | 1,576,025 | | | | 1,571,108 | |
Barnes Group, Inc. | | | | | | | | |
8.42% (1 Month Term SOFR + 3.00%, Rate Floor: 3.00%) due 09/03/30 | | | 1,525,000 | | | | 1,525,763 | |
Sundyne (Star US Bidco) | | | | | | | | |
9.67% (1 Month Term SOFR + 4.25%, Rate Floor: 4.25%) due 03/17/27 | | | 1,461,366 | | | | 1,456,339 | |
Bleriot US Bidco LLC | | | | | | | | |
9.65% (3 Month Term SOFR + 4.00%, Rate Floor: 4.00%) due 10/31/28 | | | 998,747 | | | | 998,747 | |
ProAmpac PG Borrower LLC | | | | | | | | |
due 09/26/28 | | | 661,500 | | | | 657,200 | |
Osmose Utility Services, Inc. | | | | | | | | |
8.68% (1 Month Term SOFR + 3.25%, Rate Floor: 3.25%) due 06/23/28 | | | 485,088 | | | | 480,843 | |
Total Industrial | | | 178,035,554 | |
| | | | | | | | | |
Consumer, Cyclical - 16.5% |
First Brands Group LLC | | | | | | | | |
10.88% (6 Month Term SOFR + 5.00%, Rate Floor: 6.00%) due 03/30/27 | | | 11,857,237 | | | | 11,680,638 | |
Fertitta Entertainment LLC | | | | | | | | |
9.32% (1 Month Term SOFR + 4.00%, Rate Floor: 4.00%) due 01/29/29 | | | 9,357,500 | | | | 9,252,228 | |
Restaurant Brands | | | | | | | | |
7.57% (1 Month Term SOFR + 2.25%, Rate Floor: 2.25%) due 09/13/30 | | | 8,111,524 | | | | 8,076,077 | |
WIRB - Copernicus Group, Inc. | | | | | | | | |
9.43% (1 Month Term SOFR + 4.00%, Rate Floor: 4.00%) due 01/08/27 | | | 7,276,052 | | | | 7,185,101 | |
22 | THE GUGGENHEIM FUNDS ANNUAL REPORT | SEE NOTES TO FINANCIAL STATEMENTS. |
SCHEDULE OF INVESTMENTS (continued) | September 30, 2023 |
FLOATING RATE STRATEGIES FUND | |
| | Face
Amount~ | | | Value | |
Congruex Group LLC | | | | | | | | |
11.27% (3 Month Term SOFR + 5.75%, Rate Floor: 5.75%) due 05/03/29 | | | 6,912,500 | | | $ | 6,791,531 | |
Zephyr Bidco Ltd. | | | | | | | | |
9.97% (1 Month GBP SONIA + 4.75%, Rate Floor: 4.75%) due 07/23/25 | | GBP | 5,265,000 | | | | 6,329,897 | |
PetSmart LLC | | | | | | | | |
9.17% (1 Month Term SOFR + 3.75%, Rate Floor: 3.75%) due 02/11/28 | | | 6,223,000 | | | | 6,197,424 | |
Thevelia US LLC | | | | | | | | |
9.54% (3 Month Term SOFR + 4.00%, Rate Floor: 4.00%) due 06/18/29 | | | 6,207,638 | | | | 6,189,512 | |
Eagle Parent Corp. | | | | | | | | |
9.64% (3 Month Term SOFR + 4.25%, Rate Floor: 4.25%) due 04/02/29 | | | 6,279,375 | | | | 6,089,675 | |
American Tire Distributors, Inc. | | | | | | | | |
11.81% (3 Month Term SOFR + 6.25%, Rate Floor: 6.25%) due 10/20/28 | | | 6,912,500 | | | | 6,021,064 | |
Scientific Games Holdings, LP | | | | | | | | |
8.77% (3 Month Term SOFR + 3.50%, Rate Floor: 3.50%) due 04/04/29 | | | 5,890,500 | | | | 5,851,210 | |
Truck Hero, Inc. | | | | | | | | |
9.18% (1 Month Term SOFR + 3.75%, Rate Floor: 3.75%) due 01/31/28 | | | 5,860,177 | | | | 5,585,979 | |
Petco Health And Wellness Company, Inc. | | | | | | | | |
8.90% (3 Month Term SOFR + 3.25%, Rate Floor: 3.25%) due 03/03/28 | | | 5,179,248 | | | | 5,114,508 | |
Belron Finance US LLC | | | | | | | | |
8.16% (3 Month Term SOFR + 2.75%, Rate Floor: 2.75%) due 04/18/29 | | | 3,990,000 | | | | 3,988,763 | |
Ontario Gaming GTA LP | | | | | | | | |
9.64% (3 Month Term SOFR + 4.25%, Rate Floor: 4.25%) due 08/01/30 | | | 3,977,906 | | | | 3,977,906 | |
Galaxy US Opco, Inc. | | | | | | | | |
10.07% (1 Month Term SOFR + 4.75%, Rate Floor: 4.75%) due 04/30/29 | | | 4,109,390 | | | | 3,909,057 | |
Alterra Mountain Co. | | | | | | | | |
8.93% (1 Month Term SOFR + 3.50%, Rate Floor: 3.50%) due 08/17/28 | | | 3,579,588 | | | | 3,567,668 | |
EG Finco Limited | | | | | | | | |
7.86% (3 Month EURIBOR + 4.00%, Rate Floor: 4.00%) due 02/07/28 | | EUR | 1,958,645 | | | | 2,010,920 | |
SEE NOTES TO FINANCIAL STATEMENTS. | THE GUGGENHEIM FUNDS ANNUAL REPORT | 23 |
SCHEDULE OF INVESTMENTS (continued) | September 30, 2023 |
FLOATING RATE STRATEGIES FUND | |
| | Face
Amount~ | | | Value | |
7.86% (6 Month EURIBOR + 4.00%, Rate Floor: 4.00%) due 02/07/25 | | EUR | 1,013,663 | | | $ | 1,070,525 | |
Rent-A-Center, Inc. | | | | | | | | |
8.88% (3 Month Term SOFR + 3.25%, Rate Floor: 3.25%) due 02/17/28 | | | 3,061,373 | | | | 3,048,944 | |
Mavis Tire Express Services TopCo Corp. | | | | | | | | |
9.43% (1 Month Term SOFR + 4.00%, Rate Floor: 4.00%) due 05/04/28 | | | 3,050,000 | | | | 3,039,325 | |
Wyndham Hotels & Resorts, Inc. | | | | | | | | |
7.67% (1 Month Term SOFR + 2.25%, Rate Floor: 2.25%) due 05/24/30 | | | 3,035,043 | | | | 3,035,043 | |
Stars Group (Amaya) | | | | | | | | |
7.90% (3 Month Term SOFR + 2.25%, Rate Floor: 2.25%) due 07/21/26 | | | 2,935,946 | | | | 2,931,983 | |
Michaels Stores, Inc. | | | | | | | | |
9.90% (3 Month Term SOFR + 4.25%, Rate Floor: 4.25%) due 04/15/28 | | | 3,203,501 | | | | 2,916,627 | |
Clarios Global LP | | | | | | | | |
9.07% (1 Month Term SOFR + 3.75%, Rate Floor: 3.75%) due 05/06/30 | | | 2,900,058 | | | | 2,891,010 | |
Guardian US HoldCo LLC | | | | | | | | |
9.39% (3 Month Term SOFR + 4.00%, Rate Floor: 4.00%) due 01/31/30 | | | 2,743,125 | | | | 2,743,811 | |
Entain Holdings (Gibraltar) Ltd. | | | | | | | | |
7.99% (3 Month Term SOFR + 2.50%, Rate Floor: 2.50%) due 03/29/27 | | | 2,667,366 | | | | 2,660,217 | |
TTF Holdings Intermediate LLC | | | | | | | | |
9.43% (1 Month Term SOFR + 4.00%, Rate Floor: 4.00%) due 03/31/28 | | | 2,661,120 | | | | 2,656,676 | |
CCRR Parent, Inc. | | | | | | | | |
9.18% (1 Month Term SOFR + 3.75%, Rate Floor: 3.75%) due 03/06/28 | | | 2,785,714 | | | | 2,653,393 | |
Packers Holdings LLC | | | | | | | | |
8.67% (1 Month Term SOFR + 3.25%, Rate Floor: 3.25%) due 03/09/28 | | | 4,451,092 | | | | 2,626,144 | |
Match Group, Inc. | | | | | | | | |
7.30% (3 Month Term SOFR + 1.75%, Rate Floor: 1.75%) due 02/13/27 | | | 2,500,000 | | | | 2,488,275 | |
AlixPartners, LLP | | | | | | | | |
8.18% (1 Month Term SOFR + 2.75%, Rate Floor: 2.75%) due 02/04/28 | | | 2,487,180 | | | | 2,483,449 | |
24 | THE GUGGENHEIM FUNDS ANNUAL REPORT | SEE NOTES TO FINANCIAL STATEMENTS. |
SCHEDULE OF INVESTMENTS (continued) | September 30, 2023 |
FLOATING RATE STRATEGIES FUND | |
| | Face
Amount~ | | | Value | |
Peloton Interactive, Inc. | | | | | | | | |
12.26% (6 Month Term SOFR + 7.00%, Rate Floor: 7.00%) due 05/25/27 | | | 2,468,750 | | | $ | 2,466,281 | |
Hanesbrands, Inc. | | | | | | | | |
9.07% (1 Month Term SOFR + 3.75%, Rate Floor: 3.75%) due 03/08/30 | | | 2,437,750 | | | | 2,382,901 | |
Seren BidCo AB | | | | | | | | |
8.45% (3 Month SOFR + 3.15%, Rate Floor: 3.15%) due 11/16/28 | | | 2,161,500 | | | | 2,141,247 | |
BCPE Empire Holdings, Inc. | | | | | | | | |
10.07% (1 Month Term SOFR + 4.75%, Rate Floor: 4.75%) due 12/11/28 | | | 2,024,426 | | | | 2,022,402 | |
Alexander Mann | | | | | | | | |
11.37% (3 Month Term SOFR + 6.00%, Rate Floor: 6.00%) due 06/29/27 | | | 1,971,200 | | | | 1,921,920 | |
TMF Sapphire Bidco BV | | | | | | | | |
10.37% (3 Month Term SOFR + 5.00%, Rate Floor: 5.00%) due 05/03/28 | | | 1,858,571 | | | | 1,851,601 | |
Burlington Stores, Inc. | | | | | | | | |
7.43% (1 Month Term SOFR + 2.00%, Rate Floor: 2.00%) due 06/26/28 | | | 1,813,200 | | | | 1,809,428 | |
GoDaddy Operating Co. | | | | | | | | |
7.82% (1 Month Term SOFR + 2.50%, Rate Floor: 2.50%) due 11/10/29 | | | 1,725,000 | | | | 1,725,535 | |
Caesars Entertainment, Inc. | | | | | | | | |
8.67% (1 Month Term SOFR + 3.25%, Rate Floor: 3.25%) due 02/06/30 | | | 1,691,500 | | | | 1,690,451 | |
WW International, Inc. | | | | | | | | |
8.93% (1 Month Term SOFR + 3.50%, Rate Floor: 3.50%) due 04/13/28 | | | 1,653,750 | | | | 1,243,074 | |
Sweetwater Sound | | | | | | | | |
9.68% (1 Month Term SOFR + 4.25%, Rate Floor: 4.25%) due 08/07/28††† | | | 1,141,336 | | | | 1,104,243 | |
American Trailer World Corp. | | | | | | | | |
9.17% (1 Month Term SOFR + 3.75%, Rate Floor: 3.75%) due 03/03/28 | | | 1,085,951 | | | | 1,040,102 | |
SHO Holding I Corp. | | | | | | | | |
10.88% (3 Month Term SOFR + 5.25%, Rate Floor: 5.25%) due 04/26/24 | | | 552,713 | | | | 366,631 | |
10.86% (3 Month Term SOFR + 5.23%, Rate Floor: 5.23%) due 04/29/24 | | | 7,872 | | | | 5,222 | |
SEE NOTES TO FINANCIAL STATEMENTS. | THE GUGGENHEIM FUNDS ANNUAL REPORT | 25 |
SCHEDULE OF INVESTMENTS (continued) | September 30, 2023 |
FLOATING RATE STRATEGIES FUND | |
| | Face
Amount~ | | | Value | |
EG Finco Ltd. | | | | | | | | |
9.41% (1 Month SOFR + 4.00%, Rate Floor: 4.00%) due 02/07/28††† | | | 159,262 | | | $ | 151,299 | |
9.41% (6 Month Term SOFR + 5.38%, Rate Floor: 5.38%) due 02/07/25††† | | | 75,363 | | | | 75,175 | |
New Trojan Parent, Inc. | | | | | | | | |
8.69% (1 Month Term SOFR + 3.25%, Rate Floor: 3.25%) due 01/06/28 | | | 205,601 | | | | 107,256 | |
Total Consumer, Cyclical | | | 167,169,348 | |
| | | | | | | | | |
Financial - 11.3% |
NFP Corp. | | | | | | | | |
8.68% (1 Month Term SOFR + 3.25%, Rate Floor: 3.25%) due 02/15/27 | | | 7,608,522 | | | | 7,505,275 | |
USI, Inc. | | | | | | | | |
9.14% (3 Month Term SOFR + 3.75%, Rate Floor: 3.75%) due 11/22/29 | | | 5,507,937 | | | | 5,499,510 | |
due 09/13/30 | | | 1,497,529 | | | | 1,492,849 | |
AqGen Island Holdings, Inc. | | | | | | | | |
8.93% (1 Month Term SOFR + 3.50%, Rate Floor: 3.50%) due 08/02/28 | | | 6,904,369 | | | | 6,822,415 | |
AmWINS Group, Inc. | | | | | | | | |
7.68% (1 Month Term SOFR + 2.25%, Rate Floor: 3.00%) due 02/22/28 | | | 6,837,163 | | | | 6,789,782 | |
Teneo Holdings LLC | | | | | | | | |
10.67% (1 Month Term SOFR + 5.25%, Rate Floor: 5.25%) due 07/11/25 | | | 6,641,745 | | | | 6,631,782 | |
Citadel Securities, LP | | | | | | | | |
7.93% (1 Month Term SOFR + 2.50%, Rate Floor: 2.50%) due 07/29/30 | | | 6,444,827 | | | | 6,424,719 | |
Aretec Group, Inc. | | | | | | | | |
9.67% (1 Month Term SOFR + 4.25%, Rate Floor: 4.25%) due 10/01/25 | | | 3,383,665 | | | | 3,380,146 | |
9.92% (1 Month Term SOFR + 4.50%, Rate Floor: 4.50%) due 08/09/30 | | | 2,623,014 | | | | 2,600,063 | |
Jane Street Group LLC | | | | | | | | |
8.18% (1 Month Term SOFR + 2.75%, Rate Floor: 2.75%) due 01/26/28 | | | 4,840,208 | | | | 4,822,057 | |
Duff & Phelps | | | | | | | | |
9.14% (3 Month Term SOFR + 3.75%, Rate Floor: 3.75%) due 04/09/27 | | | 4,885,163 | | | | 4,757,954 | |
Nexus Buyer LLC | | | | | | | | |
9.17% (1 Month Term SOFR + 3.75%, Rate Floor: 3.75%) due 11/09/26 | | | 4,589,233 | | | | 4,517,917 | |
26 | THE GUGGENHEIM FUNDS ANNUAL REPORT | SEE NOTES TO FINANCIAL STATEMENTS. |
SCHEDULE OF INVESTMENTS (continued) | September 30, 2023 |
FLOATING RATE STRATEGIES FUND | |
| | Face
Amount~ | | | Value | |
Focus Financial Partners, LLC | | | | | | | | |
8.57% (1 Month Term SOFR + 3.25%, Rate Floor: 3.25%) due 06/30/28 | | | 4,207,500 | | | $ | 4,192,900 | |
Franchise Group, Inc. | | | | | | | | |
10.31% (3 Month Term SOFR + 4.75%, Rate Floor: 4.75%) due 03/10/26 | | | 3,955,564 | | | | 3,614,397 | |
Alliant Holdings Intermediate LLC | | | | | | | | |
8.83% (1 Month Term SOFR + 3.50%, Rate Floor: 3.50%) due 11/05/27 | | | 3,552,447 | | | | 3,544,667 | |
Virtu Financial | | | | | | | | |
8.42% (1 Month Term SOFR + 3.00%, Rate Floor: 3.00%) due 01/12/29 | | | 3,564,000 | | | | 3,532,067 | |
Worldpay | | | | | | | | |
due 09/21/30 | | | 3,530,000 | | | | 3,527,811 | |
Ryan Specialty Group LLC | | | | | | | | |
8.42% (1 Month Term SOFR + 3.00%, Rate Floor: 3.00%) due 09/01/27 | | | 3,492,000 | | | | 3,488,264 | |
Apex Group Treasury LLC | | | | | | | | |
9.38% (3 Month Term SOFR + 3.75%, Rate Floor: 3.75%) due 07/27/28 | | | 3,430,000 | | | | 3,394,259 | |
Cobham Ultra SeniorCo SARL | | | | | | | | |
9.36% (6 Month Term SOFR + 3.50%, Rate Floor: 4.00%) due 08/06/29 | | | 3,267,124 | | | | 3,245,332 | |
Asurion LLC | | | | | | | | |
9.67% (1 Month Term SOFR + 4.25%, Rate Floor: 4.25%) due 08/20/28 | | | 3,174,050 | | | | 3,078,828 | |
Zodiac Pool Solutions LLC | | | | | | | | |
7.34% (1 Month Term SOFR + 1.93%, Rate Floor: 1.93%) due 01/29/29 | | | 3,014,770 | | | | 2,992,912 | |
FleetCor Technologies Operating Company LLC | | | | | | | | |
7.17% (1 Month Term SOFR + 1.75%, Rate Floor: 1.75%) due 04/28/28 | | | 2,968,282 | | | | 2,955,459 | |
Delos Aircraft Leasing | | | | | | | | |
7.40% (3 Month Term SOFR + 2.00%, Rate Floor: 2.00%) due 10/31/27 | | | 2,808,571 | | | | 2,810,341 | |
HighTower Holding LLC | | | | | | | | |
9.61% (3 Month Term SOFR + 4.00%, Rate Floor: 4.00%) due 04/21/28 | | | 2,646,000 | | | | 2,639,385 | |
SEE NOTES TO FINANCIAL STATEMENTS. | THE GUGGENHEIM FUNDS ANNUAL REPORT | 27 |
SCHEDULE OF INVESTMENTS (continued) | September 30, 2023 |
FLOATING RATE STRATEGIES FUND | |
| | Face
Amount~ | | | Value | |
HarbourVest Partners, LP | | | | | | | | |
8.39% (3 Month Term SOFR + 3.00%, Rate Floor: 3.00%) due 04/20/30 | | | 2,584,351 | | | $ | 2,580,035 | |
Capstone Borrower, Inc. | | | | | | | | |
9.14% (3 Month Term SOFR + 3.75%, Rate Floor: 3.75%) due 06/17/30 | | | 2,143,256 | | | | 2,132,540 | |
Apex Group Treasury LLC | | | | | | | | |
10.31% (3 Month Term SOFR + 5.00%, Rate Floor: 5.00%) due 07/27/28††† | | | 2,084,250 | | | | 2,084,250 | |
GIP Pilot Acquisition Partners LP | | | | | | | | |
due 09/15/30 | | | 1,609,650 | | | | 1,603,614 | |
Jones Deslauriers Insurance Management, Inc. | | | | | | | | |
9.62% (3 Month Term SOFR + 4.25%, Rate Floor: 4.25%) due 03/15/30 | | | 1,585,000 | | | | 1,587,980 | |
HUB International Ltd. | | | | | | | | |
9.58% (3 Month Term SOFR + 4.25%, Rate Floor: 4.25%) due 06/20/30 | | | 644,234 | | | | 645,309 | |
Total Financial | | | 114,894,819 | |
| | | | | | | | | |
Technology - 11.3% |
Ascend Learning LLC | | | | | | | | |
8.92% (1 Month Term SOFR + 3.50%, Rate Floor: 3.50%) due 12/11/28 | | | 8,940,750 | | | | 8,511,862 | |
Athenahealth Group, Inc. | | | | | | | | |
8.57% (1 Month Term SOFR + 3.25%, Rate Floor: 3.25%) due 02/15/29 | | | 8,600,950 | | | | 8,426,264 | |
Emerald TopCo, Inc. (Press Ganey) | | | | | | | | |
9.18% (3 Month Term SOFR + 3.50%, Rate Floor: 3.50%) due 07/24/26 | | | 8,419,146 | | | | 8,084,485 | |
CoreLogic, Inc. | | | | | | | | |
8.93% (1 Month Term SOFR + 3.50%, Rate Floor: 3.50%) due 06/02/28 | | | 8,543,930 | | | | 7,878,187 | |
Peraton Corp. | | | | | | | | |
9.17% (1 Month Term SOFR + 3.75%, Rate Floor: 3.75%) due 02/01/28 | | | 7,395,576 | | | | 7,372,501 | |
Atlas CC Acquisition Corp. | | | | | | | | |
9.93% (3 Month Term SOFR + 4.25%, Rate Floor: 4.25%) due 05/25/28 | | | 6,752,722 | | | | 6,280,031 | |
28 | THE GUGGENHEIM FUNDS ANNUAL REPORT | SEE NOTES TO FINANCIAL STATEMENTS. |
SCHEDULE OF INVESTMENTS (continued) | September 30, 2023 |
FLOATING RATE STRATEGIES FUND | |
| | Face
Amount~ | | | Value | |
Boxer Parent Company, Inc. | | | | | | | | |
9.18% (1 Month Term SOFR + 3.75%, Rate Floor: 3.75%) due 10/02/25 | | | 5,977,525 | | | $ | 5,968,439 | |
Polaris Newco LLC | | | | | | | | |
9.43% (3 Month Term SOFR + 4.00%, Rate Floor: 4.50%) due 06/02/28 | | | 5,969,543 | | | | 5,707,301 | |
Wrench Group LLC | | | | | | | | |
9.65% (3 Month Term SOFR + 4.00%, Rate Floor: 4.00%) due 04/30/26 | | | 5,397,819 | | | | 5,377,577 | |
Cloud Software Group, Inc. | | | | | | | | |
9.99% (3 Month Term SOFR + 4.50%, Rate Floor: 4.50%) due 09/29/28 | | | 4,938,577 | | | | 4,734,170 | |
Conair Holdings LLC | | | | | | | | |
9.40% (3 Month Term SOFR + 3.75%, Rate Floor: 4.25%) due 05/17/28 | | | 4,523,860 | | | | 4,324,041 | |
Sabre GLBL, Inc. | | | | | | | | |
10.42% (1 Month Term SOFR + 5.00%, Rate Floor: 5.00%) due 06/30/28 | | | 3,296,299 | | | | 2,896,623 | |
8.93% (1 Month Term SOFR + 3.50%, Rate Floor: 3.50%) due 12/17/27 | | | 1,351,884 | | | | 1,179,519 | |
CCC Intelligent Solutions, Inc. | | | | | | | | |
7.68% (1 Month Term SOFR + 2.25%, Rate Floor: 2.25%) due 09/21/28 | | | 3,920,126 | | | | 3,906,248 | |
Indicor LLC | | | | | | | | |
9.89% (3 Month Term SOFR + 4.50%, Rate Floor: 4.50%) due 11/22/29 | | | 3,804,679 | | | | 3,810,120 | |
Taxware Holdings (Sovos Compliance LLC) | | | | | | | | |
9.93% (1 Month Term SOFR + 4.50%, Rate Floor: 4.50%) due 08/11/28 | | | 3,736,298 | | | | 3,671,772 | |
Epicor Software | | | | | | | | |
8.68% (1 Month Term SOFR + 3.25%, Rate Floor: 3.25%) due 07/30/27 | | | 3,664,987 | | | | 3,656,961 | |
Park Place Technologies, LLC | | | | | | | | |
10.42% (1 Month Term SOFR + 5.00%, Rate Floor: 5.00%) due 11/10/27 | | | 3,601,113 | | | | 3,539,606 | |
Project Ruby Ultimate Parent Corp. | | | | | | | | |
8.68% (1 Month Term SOFR + 3.25%, Rate Floor: 3.25%) due 03/10/28 | | | 3,412,500 | | | | 3,364,862 | |
SEE NOTES TO FINANCIAL STATEMENTS. | THE GUGGENHEIM FUNDS ANNUAL REPORT | 29 |
SCHEDULE OF INVESTMENTS (continued) | September 30, 2023 |
FLOATING RATE STRATEGIES FUND | |
| | Face
Amount~ | | | Value | |
Gen Digital, Inc. | | | | | | | | |
7.42% (1 Month Term SOFR + 2.10%, Rate Floor: 2.10%) due 09/12/29 | | | 3,212,940 | | | $ | 3,200,089 | |
CDK Global, Inc. | | | | | | | | |
9.64% (3 Month Term SOFR + 4.25%, Rate Floor: 4.25%) due 07/06/29 | | | 2,977,500 | | | | 2,975,892 | |
RealPage, Inc. | | | | | | | | |
8.43% (1 Month Term SOFR + 3.00%, Rate Floor: 3.00%) due 04/24/28 | | | 2,978,305 | | | | 2,941,076 | |
Entegris, Inc. | | | | | | | | |
7.87% ((1 Month Term SOFR + 2.50%) and (3 Month Term SOFR + 2.50%), Rate Floor: 2.50%) due 07/06/29 | | | 2,793,791 | | | | 2,792,925 | |
Dun & Bradstreet | | | | | | | | |
8.17% (1 Month Term SOFR + 2.75%, Rate Floor: 2.75%) due 02/06/26 | | | 1,655,624 | | | | 1,651,998 | |
World Wide Technology Holding Co. LLC | | | | | | | | |
8.68% (1 Month Term SOFR + 3.25%, Rate Floor: 3.25%) due 03/01/30 | | | 1,566,075 | | | | 1,564,117 | |
Imprivata, Inc. | | | | | | | | |
9.57% (1 Month Term SOFR + 4.25%, Rate Floor: 4.25%) due 12/01/27 | | | 641,875 | | | | 641,073 | |
Total Technology | | | 114,457,739 | |
| | | | | | | | | |
Communications - 8.4% |
Zayo Group Holdings, Inc. | | | | | | | | |
8.43% (1 Month Term SOFR + 3.00%, Rate Floor: 3.00%) due 03/09/27 | | | 6,648,468 | | | | 5,413,914 | |
9.64% (1 Month Term SOFR + 4.33%, Rate Floor: 4.33%) due 03/09/27 | | | 3,940,000 | | | | 3,192,385 | |
McGraw Hill LLC | | | | | | | | |
10.18% (1 Month Term SOFR + 4.75%, Rate Floor: 4.75%) due 07/28/28 | | | 8,529,930 | | | | 8,346,878 | |
Virgin Media Bristol LLC | | | | | | | | |
7.95% (1 Month Term SOFR + 2.50%, Rate Floor: 2.50%) due 01/31/28 | | | 7,916,233 | | | | 7,679,775 | |
30 | THE GUGGENHEIM FUNDS ANNUAL REPORT | SEE NOTES TO FINANCIAL STATEMENTS. |
SCHEDULE OF INVESTMENTS (continued) | September 30, 2023 |
FLOATING RATE STRATEGIES FUND | |
| | Face
Amount~ | | | Value | |
Xplornet Communications, Inc. | | | | | | | | |
9.65% (3 Month Term SOFR + 4.00%, Rate Floor: 4.00%) due 10/02/28 | | | 8,484,439 | | | $ | 6,626,347 | |
Ziggo Financing Partnership | | | | | | | | |
7.95% (1 Month Term SOFR + 2.50%, Rate Floor: 2.50%) due 04/28/28 | | | 6,685,000 | | | | 6,523,424 | |
CSC Holdings LLC | | | | | | | | |
9.83% (1 Month Term SOFR + 4.50%, Rate Floor: 4.50%) due 01/17/28 | | | 6,728,265 | | | | 6,363,795 | |
Titan AcquisitionCo New Zealand Ltd. (Trade Me) | | | | | | | | |
9.65% (3 Month Term SOFR + 4.00%, Rate Floor: 4.00%) due 10/18/28 | | | 6,380,170 | | | | 6,244,591 | |
Cengage Learning Acquisitions, Inc. | | | | | | | | |
10.32% (3 Month Term SOFR + 4.75%, Rate Floor: 4.75%) due 07/14/26 | | | 5,080,358 | | | | 5,049,875 | |
Altice France SA | | | | | | | | |
10.81% (3 Month Term SOFR + 5.50%, Rate Floor: 5.50%) due 08/15/28 | | | 4,929,984 | | | | 4,450,543 | |
Telenet Financing USD LLC | | | | | | | | |
7.45% (1 Month Term SOFR + 2.00%, Rate Floor: 2.00%) due 04/28/28 | | | 4,000,000 | | | | 3,888,760 | |
Radiate Holdco LLC | | | | | | | | |
8.68% (1 Month Term SOFR + 3.25%, Rate Floor: 3.25%) due 09/25/26 | | | 4,604,486 | | | | 3,755,327 | |
Playtika Holding Corp. | | | | | | | | |
8.18% (1 Month Term SOFR + 2.75%, Rate Floor: 2.75%) due 03/13/28 | | | 3,542,411 | | | | 3,535,786 | |
WMG Acquisition Corp. | | | | | | | | |
7.56% (1 Month Term SOFR + 2.13%, Rate Floor: 2.13%) due 01/20/28 | | | 3,500,000 | | | | 3,496,605 | |
Cincinnati Bell, Inc. | | | | | | | | |
8.67% (1 Month Term SOFR + 3.25%, Rate Floor: 3.25%) due 11/22/28 | | | 2,848,006 | | | | 2,791,502 | |
Level 3 Financing, Inc. | | | | | | | | |
7.18% (1 Month Term SOFR + 1.75%, Rate Floor: 1.75%) due 03/01/27 | | | 2,588,000 | | | | 2,439,837 | |
Authentic Brands | | | | | | | | |
9.42% (1 Month Term SOFR + 4.00%, Rate Floor: 4.00%) due 12/21/28 | | | 2,104,790 | | | | 2,103,485 | |
Simon & Schuster | | | | | | | | |
due 09/26/30 | | | 2,066,400 | | | | 2,050,902 | |
SEE NOTES TO FINANCIAL STATEMENTS. | THE GUGGENHEIM FUNDS ANNUAL REPORT | 31 |
SCHEDULE OF INVESTMENTS (continued) | September 30, 2023 |
FLOATING RATE STRATEGIES FUND | |
| | Face
Amount~ | | | Value | |
UPC Broadband Holding BV | | | | | | | | |
8.37% (1 Month Term SOFR + 2.93%, Rate Floor: 2.93%) due 01/31/29 | | | 1,464,906 | | | $ | 1,441,101 | |
Total Communications | | | 85,394,832 | |
| | | | | | | | | |
Basic Materials - 3.8% |
CTEC III GmbH | | | | | | | | |
7.28% (3 Month EURIBOR + 3.50%, Rate Floor: 3.50%) due 03/16/29 | | EUR | 7,500,000 | | | | 7,824,918 | |
Illuminate Buyer LLC | | | | | | | | |
8.93% (1 Month Term SOFR + 3.50%, Rate Floor: 3.50%) due 06/30/27 | | | 7,559,411 | | | | 7,533,558 | |
Arsenal AIC Parent LLC | | | | | | | | |
9.88% (3 Month Term SOFR + 4.50%, Rate Floor: 4.50%) due 08/19/30 | | | 4,130,800 | | | | 4,118,738 | |
Nouryon USA LLC | | | | | | | | |
9.43% (1 Month Term SOFR + 4.00%, Rate Floor: 4.00%) due 04/03/28 | | | 1,813,253 | | | | 1,787,559 | |
9.35% (3 Month Term SOFR + 4.00%, Rate Floor: 4.00%) due 04/03/28 | | | 1,351,613 | | | | 1,333,596 | |
NIC Acquisition Corp. | | | | | | | | |
9.40% (3 Month Term SOFR + 3.75%, Rate Floor: 3.75%) due 12/29/27 | | | 3,528,762 | | | | 2,904,912 | |
INEOS Ltd. | | | | | | | | |
8.18% (1 Month Term SOFR + 2.75%, Rate Floor: 2.75%) due 01/29/26 | | | 2,541,500 | | | | 2,527,522 | |
LSF11 A5 HoldCo LLC | | | | | | | | |
9.67% (1 Month Term SOFR + 4.25%, Rate Floor: 4.25%) due 10/16/28 | | | 2,546,840 | | | | 2,508,637 | |
Vantage Specialty Chemicals, Inc. | | | | | | | | |
10.08% (1 Month Term SOFR + 4.75%, Rate Floor: 4.75%) due 10/26/26 | | | 2,257,938 | | | | 2,206,005 | |
W.R. Grace Holdings LLC | | | | | | | | |
9.40% (3 Month USD SOFR + 3.75%, Rate Floor: 4.25%) due 09/22/28 | | | 1,719,375 | | | | 1,702,903 | |
DCG Acquisition Corp. | | | | | | | | |
9.92% (1 Month Term SOFR + 4.50%, Rate Floor: 4.50%) due 09/30/26 | | | 1,678,550 | | | | 1,660,187 | |
Ineos US Finance LLC | | | | | | | | |
8.92% (1 Month Term SOFR + 3.50%, Rate Floor: 3.50%) due 02/18/30 | | | 1,366,575 | | | | 1,354,617 | |
Trinseo Materials Operating S.C.A. | | | | | | | | |
7.93% (1 Month Term SOFR + 2.50%, Rate Floor: 2.50%) due 05/03/28 | | | 1,564,000 | | | | 1,308,959 | |
Total Basic Materials | | | 38,772,111 | |
| | | | | | | | | |
32 | THE GUGGENHEIM FUNDS ANNUAL REPORT | SEE NOTES TO FINANCIAL STATEMENTS. |
SCHEDULE OF INVESTMENTS (continued) | September 30, 2023 |
FLOATING RATE STRATEGIES FUND | |
| | Face
Amount~ | | | Value | |
Energy - 2.1% |
TransMontaigne Operating Company LP | | | | | | | | |
8.93% (1 Month Term SOFR + 3.50%, Rate Floor: 3.50%) due 11/17/28 | | | 3,602,754 | | | $ | 3,585,389 | |
AL GCX Holdings LLC | | | | | | | | |
8.94% (3 Month Term SOFR + 3.50%, Rate Floor: 3.50%) due 05/17/29 | | | 3,509,143 | | | | 3,509,143 | |
Par Petroleum LLC | | | | | | | | |
9.77% (3 Month Term SOFR + 4.25%, Rate Floor: 4.25%) due 02/28/30 | | | 3,203,900 | | | | 3,194,545 | |
Traverse Midstream Partners LLC | | | | | | | | |
9.22% (3 Month Term SOFR + 3.75%, Rate Floor: 3.75%) due 02/16/28 | | | 3,139,844 | | | | 3,131,021 | |
BANGL LLC | | | | | | | | |
9.83% (1 Month Term SOFR + 4.50%, Rate Floor: 4.50%) due 02/01/29 | | | 2,628,791 | | | | 2,604,159 | |
Buckeye Partners, LP | | | | | | | | |
7.67% (1 Month Term SOFR + 2.25%, Rate Floor: 2.25%) due 11/02/26 | | | 2,396,340 | | | | 2,392,745 | |
UGI Energy Services LLC | | | | | | | | |
8.67% (1 Month Term SOFR + 3.25%, Rate Floor: 3.25%) due 02/22/30 | | | 1,588,257 | | | | 1,583,428 | |
Permian Production Partners LLC | | | | | | | | |
13.43% (3 Month Term SOFR + 6.00%, Rate Floor: 6.00%) (in-kind rate was 2.00%) due 11/24/25†††,3 | | | 823,163 | | | | 819,047 | |
Total Energy | | | 20,819,477 | |
| | | | | | | | | |
Utilities - 0.7% |
Calpine Construction Finance Company, LP | | | | | | | | |
7.57% (1 Month Term SOFR + 2.25%, Rate Floor: 2.25%) due 07/31/30 | | | 4,990,000 | | | | 4,959,711 | |
TerraForm Power Operating LLC | | | | | | | | |
7.99% (3 Month Term SOFR + 2.50%, Rate Floor: 2.50%) due 05/21/29 | | | 1,966,924 | | | | 1,949,103 | |
Granite Generation LLC | | | | | | | | |
9.18% (1 Month Term SOFR + 3.75%, Rate Floor: 3.75%) due 11/09/26 | | | 308,728 | | | | 301,677 | |
Total Utilities | | | 7,210,491 | |
| | | | | | | | | |
Total Senior Floating Rate Interests |
(Cost $933,502,205) | | | 912,354,261 | |
SEE NOTES TO FINANCIAL STATEMENTS. | THE GUGGENHEIM FUNDS ANNUAL REPORT | 33 |
SCHEDULE OF INVESTMENTS (continued) | September 30, 2023 |
FLOATING RATE STRATEGIES FUND | |
| | Face
Amount~ | | | Value | |
CORPORATE BONDS†† - 4.3% |
Consumer, Non-cyclical - 2.1% |
Legends Hospitality Holding Company LLC / Legends Hospitality Co-Issuer, Inc. | | | | | | | | |
5.00% due 02/01/264 | | | 2,875,000 | | | $ | 2,817,500 | |
Cheplapharm Arzneimittel GmbH | | | | | | | | |
5.50% due 01/15/284 | | | 2,975,000 | | | | 2,699,307 | |
CPI CG, Inc. | | | | | | | | |
8.63% due 03/15/264 | | | 2,689,000 | | | | 2,649,176 | |
Sotheby’s | | | | | | | | |
7.38% due 10/15/274 | | | 2,875,000 | | | | 2,646,201 | |
ADT Security Corp. | | | | | | | | |
4.13% due 08/01/294 | | | 2,875,000 | | | | 2,430,841 | |
Tenet Healthcare Corp. | | | | | | | | |
4.38% due 01/15/30 | | | 2,800,000 | | | | 2,408,348 | |
Nathan’s Famous, Inc. | | | | | | | | |
6.63% due 11/01/254 | | | 2,279,000 | | | | 2,267,605 | |
WW International, Inc. | | | | | | | | |
4.50% due 04/15/294 | | | 2,875,000 | | | | 2,019,688 | |
HCA, Inc. | | | | | | | | |
4.50% due 02/15/27 | | | 1,500,000 | | | | 1,431,907 | |
Total Consumer, Non-cyclical | | | 21,370,573 | |
| | | | | | | | | |
Communications - 0.9% |
VZ Secured Financing BV | | | | | | | | |
5.00% due 01/15/324 | | | 3,500,000 | | | | 2,749,440 | |
LCPR Senior Secured Financing DAC | | | | | | | | |
6.75% due 10/15/274 | | | 2,875,000 | | | | 2,640,688 | |
Altice France S.A. | | | | | | | | |
5.50% due 10/15/294 | | | 2,850,000 | | | | 2,049,478 | |
McGraw-Hill Education, Inc. | | | | | | | | |
5.75% due 08/01/284 | | | 1,575,000 | | | | 1,358,831 | |
Total Communications | | | 8,798,437 | |
| | | | | | | | | |
Industrial - 0.6% |
New Enterprise Stone & Lime Company, Inc. | | | | | | | | |
5.25% due 07/15/284 | | | 2,875,000 | | | | 2,579,652 | |
GrafTech Global Enterprises, Inc. | | | | | | | | |
9.88% due 12/15/284 | | | 2,120,000 | | | | 2,008,700 | |
Brundage-Bone Concrete Pumping Holdings, Inc. | | | | | | | | |
6.00% due 02/01/264 | | | 1,412,000 | | | | 1,343,108 | |
Total Industrial | | | 5,931,460 | |
| | | | | | | | | |
Consumer, Cyclical - 0.4% |
Fertitta Entertainment LLC / Fertitta Entertainment Finance Company, Inc. | | | | | | | | |
4.63% due 01/15/294 | | | 5,000,000 | | | | 4,237,500 | |
Basic Materials - 0.2% |
WR Grace Holdings LLC | | | | | | | | |
4.88% due 06/15/274 | | | 1,975,000 | | | | 1,811,939 | |
Mirabela Nickel Ltd. | | | | | | | | |
due 06/24/19†††,5,6 | | | 1,279,819 | | | | 60,792 | |
Total Basic Materials | | | 1,872,731 | |
| | | | | | | | | |
Financial - 0.1% |
Hunt Companies, Inc. | | | | | | | | |
5.25% due 04/15/294 | | | 1,850,000 | | | | 1,452,998 | |
Total Corporate Bonds |
(Cost $50,284,134) | | | 43,663,699 | |
| | | | | | | | | |
COLLATERALIZED MORTGAGE OBLIGATIONS†† - 0.9% |
Residential Mortgage-Backed Securities - 0.9% |
RALI Series Trust | | | | | | | | |
2006-QO6, 5.79% (1 Month Term SOFR + 0.47%, Rate Floor: 0.36%) due 06/25/46◊ | | | 10,472,375 | | | | 2,405,746 | |
34 | THE GUGGENHEIM FUNDS ANNUAL REPORT | SEE NOTES TO FINANCIAL STATEMENTS. |
SCHEDULE OF INVESTMENTS (continued) | September 30, 2023 |
FLOATING RATE STRATEGIES FUND | |
| | Face
Amount~ | | | Value | |
2006-QO2, 5.87% (1 Month Term SOFR + 0.55%, Rate Floor: 0.44%) due 02/25/46◊ | | | 416,751 | | | $ | 80,411 | |
Washington Mutual Mortgage Pass-Through Certificates Trust | | | | | | | | |
2007-OA6, 5.44% (1 Year CMT Rate + 0.81%, Rate Floor: 0.81%) due 07/25/47◊ | | | 2,267,959 | | | | 1,777,267 | |
Washington Mutual Mortgage Pass-Through Certificates WMALT Series Trust | | | | | | | | |
2006-AR9, 5.47% (1 Year CMT Rate + 0.84%, Rate Floor: 0.84%) due 11/25/46◊ | | | 1,514,473 | | | | 1,205,213 | |
American Home Mortgage Assets Trust | | | | | | | | |
2006-4, 5.64% (1 Month Term SOFR + 0.32%, Rate Floor: 0.32%) due 10/25/46◊ | | | 2,221,164 | | | | 1,169,770 | |
Lehman XS Trust Series | | | | | | | | |
2006-16N, 5.81% (1 Month Term SOFR + 0.49%, Rate Floor: 0.38%) due 11/25/46◊ | | | 1,232,232 | | | | 1,040,379 | |
Nomura Resecuritization Trust | | | | | | | | |
2015-4R, 2.73% (1 Month Term SOFR + 0.54%, Rate Floor: 0.43%) due 03/26/36◊,4 | | | 553,124 | | | | 510,202 | |
Alliance Bancorp Trust | | | | | | | | |
2007-OA1, 5.91% (1 Month Term SOFR + 0.59%, Rate Floor: 0.48%) due 07/25/37◊ | | | 351,293 | | | | 290,750 | |
Morgan Stanley Re-REMIC Trust | | | | | | | | |
2010-R5, 3.47% due 06/26/36 | | | 253,967 | | | | 230,215 | |
New Century Home Equity Loan Trust | | | | | | | | |
2004-4, 6.23% (1 Month Term SOFR + 0.91%, Rate Cap/Floor: 12.50%/0.80%) due 02/25/35◊ | | | 114,925 | | | | 110,854 | |
GSAA Home Equity Trust | | | | | | | | |
2007-7, 5.97% (1 Month Term SOFR + 0.65%, Rate Floor: 0.54%) due 07/25/37◊ | | | 105,120 | | | | 95,868 | |
Total Residential Mortgage-Backed Securities | | | 8,916,675 | |
| | | | | | | | | |
Total Collateralized Mortgage Obligations |
(Cost $12,272,865) | | | 8,916,675 | |
SEE NOTES TO FINANCIAL STATEMENTS. | THE GUGGENHEIM FUNDS ANNUAL REPORT | 35 |
SCHEDULE OF INVESTMENTS (continued) | September 30, 2023 |
FLOATING RATE STRATEGIES FUND | |
| | Face
Amount~ | | | Value | |
ASSET-BACKED SECURITIES†† - 0.1% |
Collateralized Loan Obligations - 0.1% |
Octagon Loan Funding Ltd. | | | | | | | | |
2014-1A SUB, due 11/18/314,7 | | | 2,071,948 | | | $ | 508,877 | |
Treman Park CLO Ltd. | | | | | | | | |
2015-1A COM, due 10/20/284,7 | | | 977,702 | | | | 9,816 | |
Total Collateralized Loan Obligations | | | 518,693 | |
| | | | | | | | | |
Total Asset-Backed Securities |
(Cost $15,421) | | | 518,693 | |
| | | | | | | | | |
Total Investments - 98.8% |
(Cost $1,036,472,260) | | $ | 1,002,647,418 | |
Other Assets & Liabilities, net - 1.2% | | | 11,704,452 | |
Total Net Assets - 100.0% | | $ | 1,014,351,870 | |
Forward Foreign Currency Exchange Contracts†† |
Counterparty | | Currency | | | Type | | | Quantity | | | Contract
Amount | | | Settlement
Date | | | Unrealized
Appreciation | |
Barclays Bank plc | | | EUR | | | | Sell | | | | 17,729,000 | | | | 19,065,554 USD | | | | 10/16/23 | | | $ | 308,178 | |
Morgan Stanley Capital Services LLC | | | GBP | | | | Sell | | | | 5,278,000 | | | | 6,592,385 USD | | | | 10/16/23 | | | | 152,422 | |
| | | | | | | | | | | | | | | | | | | | | | | $ | 460,600 | |
36 | THE GUGGENHEIM FUNDS ANNUAL REPORT | SEE NOTES TO FINANCIAL STATEMENTS. |
SCHEDULE OF INVESTMENTS (continued) | September 30, 2023 |
FLOATING RATE STRATEGIES FUND | |
~ | The face amount is denominated in U.S. dollars unless otherwise indicated. |
* | Non-income producing security. |
† | Value determined based on Level 1 inputs — See Note 4. |
†† | Value determined based on Level 2 inputs, unless otherwise noted — See Note 4. |
††† | Value determined based on Level 3 inputs — See Note 4. |
◊ | Variable rate security. Rate indicated is the rate effective at September 30, 2023. In some instances, the effective rate is limited by a minimum rate floor or a maximum rate cap established by the issuer. The settlement status of a position may also impact the effective rate indicated. In some cases, a position may be unsettled at period end and may not have a stated effective rate. In instances where multiple underlying reference rates and spread amounts are shown, the effective rate is based on a weighted average. |
1 | Affiliated issuer. |
2 | Rate indicated is the 7-day yield as of September 30, 2023. |
3 | Payment-in-kind security. |
4 | Security is a 144A or Section 4(a)(2) security. These securities have been determined to be liquid under guidelines established by the Board of Trustees. The total market value of 144A or Section 4(a)(2) securities is $40,791,548 (cost $48,160,952), or 4.0% of total net assets. |
5 | Security is a 144A or Section 4(a)(2) security. These securities have been determined to be illiquid and restricted under guidelines established by the Board of Trustees. The total market value of 144A or Section 4(a)(2) illiquid and restricted securities is $60,792 (cost $1,160,811), or less than 0.1% of total net assets — See Note 9. |
6 | Security is in default of interest and/or principal obligations. |
7 | Security has no stated coupon. However, it is expected to receive residual cash flow payments on defined deal dates. |
| | CMT — Constant Maturity Treasury |
| | EUR — Euro |
| | EURIBOR — European Interbank Offered Rate |
| | GBP — British Pound |
| | plc — Public Limited Company |
| | REMIC — Real Estate Mortgage Investment Conduit |
| | SARL — Société à Responsabilité Limitée |
| | SOFR — Secured Overnight Financing Rate |
| | SONIA — Sterling Overnight Index Average |
| | |
| | See Sector Classification in Other Information section. |
SEE NOTES TO FINANCIAL STATEMENTS. | THE GUGGENHEIM FUNDS ANNUAL REPORT | 37 |
SCHEDULE OF INVESTMENTS (continued) | September 30, 2023 |
FLOATING RATE STRATEGIES FUND | |
The following table summarizes the inputs used to value the Fund’s investments at September 30, 2023 (See Note 4 in the Notes to Financial Statements):
Investments in Securities (Assets) | | Level 1
Quoted
Prices | | | Level 2
Significant
Observable
Inputs | | | Level 3
Significant
Unobservable
Inputs | | | Total | |
Common Stocks | | $ | — | | | $ | — | | | $ | 346,762 | | | $ | 346,762 | |
Preferred Stocks | | | — | | | | — | | | | 493,907 | | | | 493,907 | |
Exchange-Traded Funds | | | 28,354,743 | | | | — | | | | — | | | | 28,354,743 | |
Money Market Fund | | | 7,998,678 | | | | — | | | | — | | | | 7,998,678 | |
Senior Floating Rate Interests | | | — | | | | 895,993,867 | | | | 16,360,394 | | | | 912,354,261 | |
Corporate Bonds | | | — | | | | 43,602,907 | | | | 60,792 | | | | 43,663,699 | |
Collateralized Mortgage Obligations | | | — | | | | 8,916,675 | | | | — | | | | 8,916,675 | |
Asset-Backed Securities | | | — | | | | 518,693 | | | | — | | | | 518,693 | |
Forward Foreign Currency Exchange Contracts** | | | — | | | | 460,600 | | | | — | | | | 460,600 | |
Total Assets | | $ | 36,353,421 | | | $ | 949,492,742 | | | $ | 17,261,855 | | | $ | 1,003,108,018 | |
Investments in Securities (Liabilities) | | Level 1
Quoted
Prices | | | Level 2
Significant
Observable
Inputs | | | Level 3
Significant
Unobservable
Inputs | | | Total | |
Unfunded Loan Commitments (Note 8) | | $ | — | | | $ | — | | | $ | 249 | | | $ | 249 | |
** | This derivative is reported as unrealized appreciation/depreciation at period end. |
The following is a summary of significant unobservable inputs used in the fair valuation of assets and liabilities categorized within Level 3 of the fair value hierarchy:
Category | | Ending
Balance at
September 30,
2023 | | Valuation
Technique | Unobservable
Inputs | | Input
Range | | | Weighted
Average* | |
Assets: | | | | | | | | | | | | | | |
Common Stocks | | $ | 345,043 | | Enterprise Valuation | Valuation Multiple | 2.7x-8.1x | 3.0x |
Common Stocks | | | 1,701 | | Model Price | Liquidation Value | — | — |
Common Stocks | | | 18 | | Third Party Pricing | Trade Price | — | — |
Corporate Bonds | | | 60,792 | | Third Party Pricing | Broker Quote | — | — |
Preferred Stocks | | | 493,907 | | Enterprise Valuation | Valuation Multiple | 4.8x-4.9x | 4.8x |
Senior Floating Rate Interests | | | 11,531,255 | | Third Party Pricing | Broker Quote | — | — |
Senior Floating Rate Interests | | | 4,829,139 | | Model Price | Purchase Price | — | — |
Total Assets | | $ | 17,261,855 | | | | | |
| | | | | | | | | | | | | | | |
Liabilities: | | | | | | | | | | | | | | |
Unfunded Loan Commitments | | $ | 249 | | Yield Analysis | Yield | — | — |
* | Inputs are weighted by the fair value of the instruments. |
38 | THE GUGGENHEIM FUNDS ANNUAL REPORT | SEE NOTES TO FINANCIAL STATEMENTS. |
SCHEDULE OF INVESTMENTS (continued) | September 30, 2023 |
FLOATING RATE STRATEGIES FUND | |
Significant changes in a quote, yield, liquidation value or valuation multiple would generally result in significant changes in the fair value of the security.
The Fund’s fair valuation leveling guidelines classify a single daily broker quote, or a vendor price based on a single daily or monthly broker quote, as Level 3, if such a quote or price cannot be supported with other available market information.
Transfers between Level 2 and Level 3 may occur as markets fluctuate and/or the availability of data used in an investment’s valuation changes. For the year ended September 30, 2023, the Fund had securities with a total value of $60,792 transfer into Level 3 from Level 2 due to a lack of observable inputs and had securities with a total value of $63,007,979 transfer out of Level 3 into Level 2 due to the availability of current and reliable market-based data provided by a third-party pricing service which utilizes significant observable inputs.
Summary of Fair Value Level 3 Activity
Following is a reconciliation of Level 3 assets for which significant unobservable inputs were used to determine fair value for the year ended September 30, 2023:
| | | Assets | | | | | | | Liabilities | |
| | Corporate
Bonds | | | Senior
Floating Rate
Interests | | | Common
Stocks | | | Preferred
Stocks | | | Total
Assets | | | Unfunded
Loan
Commitments | |
Beginning Balance | | $ | — | | | $ | 71,470,738 | | | $ | 568,337 | | | $ | — | * | | $ | 72,039,075 | | | $ | (542,584 | ) |
Purchases/(Receipts) | | | — | | | | 5,043,457 | | | | 1,665 | | | | — | | | | 5,045,122 | | | | (21,173 | ) |
(Sales, maturities and paydowns)/Fundings | | | — | | | | (1,525,226 | ) | | | (34,345 | ) | | | — | | | | (1,559,571 | ) | | | (14,634 | ) |
Amortization of premiums/discounts | | | — | | | | 169,434 | | | | — | | | | — | | | | 169,434 | | | | 4,539 | |
Corporate actions | | | — | | | | (2,371,500 | ) | | | 3,514 | | | | 2,367,986 | | | | — | | | | — | |
Total realized gains (losses) including in earnings | | | — | | | | (103,780 | ) | | | 29,321 | | | | — | | | | (74,459 | ) | | | 94,400 | |
Total change in unrealized appreciation (depreciation) included in earnings | | | — | | | | 6,685,250 | | | | (221,730 | ) | | | (1,874,079 | ) | | | 4,589,441 | | | | 479,203 | |
Transfers into Level 3 | | | 60,792 | | | | — | | | | — | | | | — | | | | 60,792 | | | | — | |
Transfers out of Level 3 | | | — | | | | (63,007,979 | ) | | | — | | | | — | | | | (63,007,979 | ) | | | — | |
Ending Balance | | $ | 60,792 | | | $ | 16,360,394 | | | $ | 346,762 | | | $ | 493,907 | | | $ | 17,261,855 | | | $ | (249 | ) |
Net change in unrealized appreciation (depreciation) for investments in Level 3 securities still held at September 30, 2023 | | $ | — | | | $ | 1,532,404 | | | $ | (194,630 | ) | | $ | (1,874,079 | ) | | $ | (536,305 | ) | | $ | 5,770 | |
* | Security has a market value of $0. |
SEE NOTES TO FINANCIAL STATEMENTS. | THE GUGGENHEIM FUNDS ANNUAL REPORT | 39 |
SCHEDULE OF INVESTMENTS (concluded) | September 30, 2023 |
FLOATING RATE STRATEGIES FUND | |
Affiliated Transactions
Investments representing 5% or more of the outstanding voting shares of a company, or control of or by, or common control under Guggenheim Investments, result in that company being considered an affiliated issuer, as defined in the 1940 Act.
Transactions during the year ended September 30, 2023, in which the company is an affiliated issuer, were as follows:
Security Name | | Value
09/30/22 | | | Additions | | | Reductions | | | Realized
Gain (Loss) | | | Change in
Unrealized
Appreciation
(Depreciation) | | | Value
09/30/23 | | | Shares
09/30/23 | |
Common Stocks | | | | | | | | | | | | | | | | | | | | | | | | | | | | |
BP Holdco LLC* | | $ | 148,128 | | | $ | — | | | $ | — | | | $ | — | | | $ | 165,642 | | | $ | 313,770 | | | | 244,278 | |
Targus Group International Equity, Inc.* | | | 32,125 | | | | — | | | | (34,346 | ) | | | 29,321 | | | | (27,100 | ) | | | — | | | | — | |
| | | $ | 180,253 | | | $ | — | | | $ | (34,346 | ) | | $ | 29,321 | | | $ | 138,542 | | | $ | 313,770 | | | | | |
* | Non-income producing security. |
40 | THE GUGGENHEIM FUNDS ANNUAL REPORT | SEE NOTES TO FINANCIAL STATEMENTS. |
STATEMENT OF ASSETS AND LIABILITIES |
FLOATING RATE STRATEGIES FUND |
September 30, 2023
Assets: |
Investments in unaffiliated issuers, at value (cost $1,036,386,004) | | $ | 1,002,333,648 | |
Investments in affiliated issuers, at value (cost $86,256) | | | 313,770 | |
Foreign currency, at value (cost $315,505) | | | 312,167 | |
Cash | | | 4,107,145 | |
Unrealized appreciation on forward foreign currency exchange contracts | | | 460,600 | |
Prepaid expenses | | | 160,947 | |
Receivables: |
Securities sold | | | 21,411,061 | |
Interest | | | 5,208,471 | |
Fund shares sold | | | 1,990,917 | |
Investment Adviser | | | 498 | |
Total assets | | | 1,036,299,224 | |
| | | | | |
Liabilities: |
Unfunded loan commitments, at value (Note 8) (commitment fees received $6,019) | | | 249 | |
Segregated cash due to broker | | | 280,000 | |
Payable for: |
Securities purchased | | | 15,999,842 | |
Fund shares redeemed | | | 4,012,481 | |
Distributions to shareholders | | | 905,997 | |
Management fees | | | 492,030 | |
Distribution and service fees | | | 67,850 | |
Transfer agent/maintenance fees | | | 20,398 | |
Fund accounting/administration fees | | | 11,871 | |
Trustees’ fees* | | | 6,333 | |
Miscellaneous | | | 150,303 | |
Total liabilities | | | 21,947,354 | |
Net assets | | $ | 1,014,351,870 | |
| | | | | |
Net assets consist of: |
Paid in capital | | $ | 1,218,477,937 | |
Total distributable earnings (loss) | | | (204,126,067 | ) |
Net assets | | $ | 1,014,351,870 | |
| | | | | |
A-Class: |
Net assets | | $ | 139,008,222 | |
Capital shares outstanding | | | 5,669,785 | |
Net asset value per share | | $ | 24.52 | |
Maximum offering price per share (Net asset value divided by 97.00%) | | $ | 25.28 | |
| | | | | |
C-Class: |
Net assets | | $ | 35,818,189 | |
Capital shares outstanding | | | 1,461,470 | |
Net asset value per share | | $ | 24.51 | |
| | | | | |
P-Class: |
Net assets | | $ | 44,294,766 | |
Capital shares outstanding | | | 1,805,855 | |
Net asset value per share | | $ | 24.53 | |
| | | | | |
Institutional Class: |
Net assets | | $ | 793,785,281 | |
Capital shares outstanding | | | 32,348,396 | |
Net asset value per share | | $ | 24.54 | |
| | | | | |
R6-Class: |
Net assets | | $ | 1,445,412 | |
Capital shares outstanding | | | 58,879 | |
Net asset value per share | | $ | 24.55 | |
* | Relates to Trustees not deemed “interested persons” within the meaning of Section 2(a)(19) of the 1940 Act. |
SEE NOTES TO FINANCIAL STATEMENTS. | THE GUGGENHEIM FUNDS ANNUAL REPORT | 41 |
STATEMENT OF OPERATIONS |
FLOATING RATE STRATEGIES FUND |
Year Ended September 30, 2023
Investment Income: |
Dividends from securities of unaffiliated issuers | | $ | 2,225,445 | |
Interest from securities of unaffiliated issuers | | | 92,159,755 | |
Total investment income | | | 94,385,200 | |
| | | | | |
Expenses: |
Management fees | | | 6,968,297 | |
Distribution and service fees: |
A-Class | | | 365,471 | |
C-Class | | | 404,521 | |
P-Class | | | 113,787 | |
Transfer agent fees: |
A-Class | | | 157,773 | |
C-Class | | | 33,647 | |
P-Class | | | 63,774 | |
Institutional Class | | | 810,431 | |
R6-Class | | | 772 | |
Fund accounting/administration fees | | | 447,441 | |
Line of credit fees | | | 261,275 | |
Professional fees | | | 179,022 | |
Custodian fees | | | 88,854 | |
Trustees’ fees* | | | 28,569 | |
Interest expense | | | 5,998 | |
Miscellaneous | | | 187,831 | |
Recoupment of previously waived fees: |
A-Class | | | 38,076 | |
C-Class | | | 17,858 | |
P-Class | | | 11,613 | |
Institutional Class | | | 200,050 | |
R6-Class | | | 1,903 | |
Total expenses | | | 10,386,963 | |
Less: |
Expenses reimbursed by Adviser: |
A-Class | | | (122,023 | ) |
C-Class | | | (29,698 | ) |
P-Class | | | (51,816 | ) |
Institutional Class | | | (513,935 | ) |
R6-Class | | | (302 | ) |
Expenses waived by Adviser | | | (421,649 | ) |
Earnings credits applied | | | (48,322 | ) |
Total waived/reimbursed expenses | | | (1,187,745 | ) |
Net expenses | | | 9,199,218 | |
Net investment income | | | 85,185,982 | |
| | | | | |
Net Realized and Unrealized Gain (Loss): |
Net realized gain (loss) on: |
Investments in unaffiliated issuers | | | (13,441,700 | ) |
Investments in affiliated issuers | | | 29,321 | |
Forward foreign currency exchange contracts | | | (1,637,530 | ) |
Foreign currency transactions | | | (63,224 | ) |
Net realized loss | | | (15,113,133 | ) |
Net change in unrealized appreciation (depreciation) on: |
Investments in unaffiliated issuers | | | 66,928,297 | |
Investments in affiliated issuers | | | 138,542 | |
Forward foreign currency exchange contracts | | | (199,993 | ) |
Foreign currency translations | | | (10,920 | ) |
Net change in unrealized appreciation (depreciation) | | | 66,855,926 | |
Net realized and unrealized gain | | | 51,742,793 | |
Net increase in net assets resulting from operations | | $ | 136,928,775 | |
* | Relates to Trustees not deemed “interested persons” within the meaning of Section 2(a)(19) of the 1940 Act. |
42 | THE GUGGENHEIM FUNDS ANNUAL REPORT | SEE NOTES TO FINANCIAL STATEMENTS. |
STATEMENTS OF CHANGES IN NET ASSETS |
FLOATING RATE STRATEGIES FUND | |
| | Year Ended
September 30,
2023 | | | Year Ended
September 30,
2022 | |
Increase (Decrease) in Net Assets from Operations: | | | | | | | | |
Net investment income | | $ | 85,185,982 | | | $ | 45,428,717 | |
Net realized loss on investments | | | (15,113,133 | ) | | | (713,467 | ) |
Net change in unrealized appreciation (depreciation) on investments | | | 66,855,926 | | | | (93,645,585 | ) |
Net increase (decrease) in net assets resulting from operations | | | 136,928,775 | | | | (48,930,335 | ) |
| | | | | | | | | |
Distribution to shareholders: | | | | | | | | |
A-Class | | | (11,434,737 | ) | | | (5,383,798 | ) |
C-Class | | | (2,844,666 | ) | | | (1,451,264 | ) |
P-Class | | | (3,555,101 | ) | | | (1,548,137 | ) |
Institutional Class | | | (66,543,982 | ) | | | (37,281,786 | ) |
R6-Class | | | (903,249 | ) | | | (115,580 | ) |
Total distributions to shareholders | | | (85,281,735 | ) | | | (45,780,565 | ) |
| | | | | | | | | |
Capital share transactions: | | | | | | | | |
Proceeds from sale of shares | | | | | | | | |
A-Class | | | 37,817,506 | | | | 86,259,585 | |
C-Class | | | 4,906,993 | | | | 18,060,964 | |
P-Class | | | 26,809,190 | | | | 22,630,959 | |
Institutional Class | | | 419,167,716 | | | | 926,922,817 | |
R6-Class | | | 30,694,165 | | | | 21,224,287 | |
Distributions reinvested | | | | | | | | |
A-Class | | | 9,830,459 | | | | 4,723,427 | |
C-Class | | | 2,422,173 | | | | 1,239,205 | |
P-Class | | | 3,544,719 | | | | 1,548,137 | |
Institutional Class | | | 55,637,014 | | | | 31,534,585 | |
R6-Class | | | 898,525 | | | | 113,860 | |
Cost of shares redeemed | | | | | | | | |
A-Class | | | (69,825,528 | ) | | | (49,092,897 | ) |
C-Class | | | (20,716,384 | ) | | | (20,703,994 | ) |
P-Class | | | (31,805,294 | ) | | | (12,692,806 | ) |
Institutional Class | | | (700,163,252 | ) | | | (614,692,477 | ) |
R6-Class | | | (32,266,778 | ) | | | (20,581,634 | ) |
Net increase (decrease) from capital share transactions | | | (263,048,776 | ) | | | 396,494,018 | |
Net increase (decrease) in net assets | | | (211,401,736 | ) | | | 301,783,118 | |
| | | | | | | | | |
Net assets: | | | | | | | | |
Beginning of year | | | 1,225,753,606 | | | | 923,970,488 | |
End of year | | $ | 1,014,351,870 | | | $ | 1,225,753,606 | |
| | | | | | | | | |
SEE NOTES TO FINANCIAL STATEMENTS. | THE GUGGENHEIM FUNDS ANNUAL REPORT | 43 |
STATEMENTS OF CHANGES IN NET ASSETS (concluded) |
FLOATING RATE STRATEGIES FUND | |
| | Year Ended
September 30,
2023 | | | Year Ended
September 30,
2022 | |
Capital share activity: | | | | | | | | |
Shares sold | | | | | | | | |
A-Class | | | 1,569,726 | | | | 3,504,723 | |
C-Class | | | 204,188 | | | | 730,311 | |
P-Class | | | 1,116,540 | | | | 908,598 | |
Institutional Class | | | 17,415,091 | | | | 37,486,066 | |
R6-Class | | | 1,288,449 | | | | 844,995 | |
Shares issued from reinvestment of distributions | | | | | | | | |
A-Class | | | 408,128 | | | | 194,916 | |
C-Class | | | 100,670 | | | | 51,183 | |
P-Class | | | 147,100 | | | | 64,407 | |
Institutional Class | | | 2,308,872 | | | | 1,301,654 | |
R6-Class | | | 37,421 | | | | 4,639 | |
Shares redeemed | | | | | | | | |
A-Class | | | (2,905,865 | ) | | | (2,019,443 | ) |
C-Class | | | (863,523 | ) | | | (846,761 | ) |
P-Class | | | (1,323,129 | ) | | | (519,050 | ) |
Institutional Class | | | (29,241,651 | ) | | | (25,255,077 | ) |
R6-Class | | | (1,340,629 | ) | | | (826,042 | ) |
Net increase (decrease) in shares | | | (11,078,612 | ) | | | 15,625,119 | |
44 | THE GUGGENHEIM FUNDS ANNUAL REPORT | SEE NOTES TO FINANCIAL STATEMENTS. |
FINANCIAL HIGHLIGHTS |
FLOATING RATE STRATEGIES FUND | |
This table is presented to show selected data for a share outstanding throughout each period and to assist shareholders in evaluating a Fund’s performance for the periods presented.
A-Class | | Year
Ended
Sept. 30,
2023 | | | Year
Ended
Sept. 30,
2022 | | | Year
Ended
Sept. 30,
2021 | | | Year
Ended
Sept. 30,
2020 | | | Year
Ended
Sept. 30,
2019 | |
Per Share Data |
Net asset value, beginning of period | | $ | 23.37 | | | $ | 25.09 | | | $ | 24.08 | | | $ | 25.23 | | | $ | 25.92 | |
Income (loss) from investment operations: |
Net investment income (loss)a | | | 1.88 | | | | .87 | | | | .83 | | | | 1.02 | | | | 1.17 | |
Net gain (loss) on investments (realized and unrealized) | | | 1.16 | | | | (1.72 | ) | | | 1.02 | | | | (1.16 | ) | | | (.67 | ) |
Total from investment operations | | | 3.04 | | | | (.85 | ) | | | 1.85 | | | | (.14 | ) | | | .50 | |
Less distributions from: |
Net investment income | | | (1.89 | ) | | | (.87 | ) | | | (.83 | ) | | | (.83 | ) | | | (1.19 | ) |
Return of capital | | | — | | | | — | | | | (.01 | ) | | | (.18 | ) | | | — | |
Total distributions | | | (1.89 | ) | | | (.87 | ) | | | (.84 | ) | | | (1.01 | ) | | | (1.19 | ) |
Net asset value, end of period | | $ | 24.52 | | | $ | 23.37 | | | $ | 25.09 | | | $ | 24.08 | | | $ | 25.23 | |
|
Total Returnb | | | 13.47 | % | | | (3.47 | %) | | | 7.83 | % | | | (0.50 | %) | | | 2.01 | % |
Ratios/Supplemental Data |
Net assets, end of period (in thousands) | | $ | 139,008 | | | $ | 154,160 | | | $ | 123,392 | | | $ | 139,857 | | | $ | 235,752 | |
Ratios to average net assets: |
Net investment income (loss) | | | 7.82 | % | | | 3.57 | % | | | 3.36 | % | | | 4.23 | % | | | 4.60 | % |
Total expensesc | | | 1.15 | % | | | 1.11 | % | | | 1.09 | % | | | 1.25 | % | | | 1.23 | % |
Net expensesd,e,f | | | 1.02 | % | | | 1.02 | % | | | 1.05 | % | | | 1.10 | % | | | 1.07 | % |
Portfolio turnover rate | | | 23 | % | | | 30 | % | | | 57 | % | | | 20 | % | | | 10 | % |
SEE NOTES TO FINANCIAL STATEMENTS. | THE GUGGENHEIM FUNDS ANNUAL REPORT | 45 |
FINANCIAL HIGHLIGHTS (continued) |
FLOATING RATE STRATEGIES FUND | |
This table is presented to show selected data for a share outstanding throughout each period and to assist shareholders in evaluating a Fund’s performance for the periods presented.
C-Class | | Year
Ended
Sept. 30,
2023 | | | Year
Ended
Sept. 30,
2022 | | | Year
Ended
Sept. 30,
2021 | | | Year
Ended
Sept. 30,
2020 | | | Year
Ended
Sept. 30,
2019 | |
Per Share Data |
Net asset value, beginning of period | | $ | 23.36 | | | $ | 25.08 | | | $ | 24.07 | | | $ | 25.22 | | | $ | 25.91 | |
Income (loss) from investment operations: |
Net investment income (loss)a | | | 1.69 | | | | .68 | | | | .65 | | | | .84 | | | | .98 | |
Net gain (loss) on investments (realized and unrealized) | | | 1.16 | | | | (1.71 | ) | | | 1.02 | | | | (1.16 | ) | | | (.67 | ) |
Total from investment operations | | | 2.85 | | | | (1.03 | ) | | | 1.67 | | | | (.32 | ) | | | .31 | |
Less distributions from: |
Net investment income | | | (1.70 | ) | | | (.69 | ) | | | (.65 | ) | | | (.68 | ) | | | (1.00 | ) |
Return of capital | | | — | | | | — | | | | (.01 | ) | | | (.15 | ) | | | — | |
Total distributions | | | (1.70 | ) | | | (.69 | ) | | | (.66 | ) | | | (.83 | ) | | | (1.00 | ) |
Net asset value, end of period | | $ | 24.51 | | | $ | 23.36 | | | $ | 25.08 | | | $ | 24.07 | | | $ | 25.22 | |
|
Total Returnb | | | 12.58 | % | | | (4.15 | %) | | | 7.03 | % | | | (1.24 | %) | | | 1.26 | % |
Ratios/Supplemental Data |
Net assets, end of period (in thousands) | | $ | 35,818 | | | $ | 47,183 | | | $ | 52,308 | | | $ | 63,891 | | | $ | 112,481 | |
Ratios to average net assets: |
Net investment income (loss) | | | 7.02 | % | | | 2.78 | % | | | 2.61 | % | | | 3.47 | % | | | 3.86 | % |
Total expensesc | | | 1.89 | % | | | 1.91 | % | | | 1.86 | % | | | 1.96 | % | | | 1.93 | % |
Net expensesd,e,f | | | 1.78 | % | | | 1.77 | % | | | 1.80 | % | | | 1.85 | % | | | 1.82 | % |
Portfolio turnover rate | | | 23 | % | | | 30 | % | | | 57 | % | | | 20 | % | | | 10 | % |
46 | THE GUGGENHEIM FUNDS ANNUAL REPORT | SEE NOTES TO FINANCIAL STATEMENTS. |
FINANCIAL HIGHLIGHTS (continued) |
FLOATING RATE STRATEGIES FUND |
This table is presented to show selected data for a share outstanding throughout each period and to assist shareholders in evaluating a Fund’s performance for the periods presented.
P-Class | | Year
Ended
Sept. 30,
2023 | | | Year
Ended
Sept. 30,
2022 | | | Year
Ended
Sept. 30,
2021 | | | Year
Ended
Sept. 30,
2020 | | | Year
Ended
Sept. 30,
2019 | |
Per Share Data |
Net asset value, beginning of period | | $ | 23.38 | | | $ | 25.10 | | | $ | 24.09 | | | $ | 25.24 | | | $ | 25.93 | |
Income (loss) from investment operations: |
Net investment income (loss)a | | | 1.88 | | | | .88 | | | | .83 | | | | 1.04 | | | | 1.17 | |
Net gain (loss) on investments (realized and unrealized) | | | 1.16 | | | | (1.73 | ) | | | 1.02 | | | | (1.18 | ) | | | (.67 | ) |
Total from investment operations | | | 3.04 | | | | (.85 | ) | | | 1.85 | | | | (.14 | ) | | | .50 | |
Less distributions from: |
Net investment income | | | (1.89 | ) | | | (.87 | ) | | | (.83 | ) | | | (.83 | ) | | | (1.19 | ) |
Return of capital | | | — | | | | — | | | | (.01 | ) | | | (.18 | ) | | | — | |
Total distributions | | | (1.89 | ) | | | (.87 | ) | | | (.84 | ) | | | (1.01 | ) | | | (1.19 | ) |
Net asset value, end of period | | $ | 24.53 | | | $ | 23.38 | | | $ | 25.10 | | | $ | 24.09 | | | $ | 25.24 | |
|
Total Return | | | 13.46 | % | | | (3.47 | %) | | | 7.83 | % | | | (0.50 | %) | | | 2.01 | % |
Ratios/Supplemental Data |
Net assets, end of period (in thousands) | | $ | 44,295 | | | $ | 43,603 | | | $ | 35,430 | | | $ | 33,251 | | | $ | 135,036 | |
Ratios to average net assets: |
Net investment income (loss) | | | 7.81 | % | | | 3.58 | % | | | 3.36 | % | | | 4.26 | % | | | 4.59 | % |
Total expensesc | | | 1.18 | % | | | 1.14 | % | | | 1.06 | % | | | 1.37 | % | | | 1.22 | % |
Net expensesd,e,f | | | 1.02 | % | | | 1.02 | % | | | 1.05 | % | | | 1.10 | % | | | 1.07 | % |
Portfolio turnover rate | | | 23 | % | | | 30 | % | | | 57 | % | | | 20 | % | | | 10 | % |
SEE NOTES TO FINANCIAL STATEMENTS. | THE GUGGENHEIM FUNDS ANNUAL REPORT | 47 |
FINANCIAL HIGHLIGHTS (continued) |
FLOATING RATE STRATEGIES FUND |
This table is presented to show selected data for a share outstanding throughout each period and to assist shareholders in evaluating a Fund’s performance for the periods presented.
Institutional Class | | Year
Ended
Sept. 30,
2023 | | | Year
Ended
Sept. 30,
2022 | | | Year
Ended
Sept. 30,
2021 | | | Year
Ended
Sept. 30,
2020 | | | Year
Ended
Sept. 30,
2019 | |
Per Share Data |
Net asset value, beginning of period | | $ | 23.39 | | | $ | 25.11 | | | $ | 24.10 | | | $ | 25.25 | | | $ | 25.95 | |
Income (loss) from investment operations: |
Net investment income (loss)a | | | 1.93 | | | | .94 | | | | .89 | | | | 1.09 | | | | 1.23 | |
Net gain (loss) on investments (realized and unrealized) | | | 1.16 | | | | (1.73 | ) | | | 1.02 | | | | (1.17 | ) | | | (.68 | ) |
Total from investment operations | | | 3.09 | | | | (.79 | ) | | | 1.91 | | | | (.08 | ) | | | .55 | |
Less distributions from: |
Net investment income | | | (1.94 | ) | | | (.93 | ) | | | (.89 | ) | | | (.88 | ) | | | (1.25 | ) |
Return of capital | | | — | | | | — | | | | (.01 | ) | | | (.19 | ) | | | — | |
Total distributions | | | (1.94 | ) | | | (.93 | ) | | | (.90 | ) | | | (1.07 | ) | | | (1.25 | ) |
Net asset value, end of period | | $ | 24.54 | | | $ | 23.39 | | | $ | 25.11 | | | $ | 24.10 | | | $ | 25.25 | |
|
Total Return | | | 13.68 | % | | | (3.20 | %) | | | 8.08 | % | | | (0.26 | %) | | | 2.21 | % |
Ratios/Supplemental Data |
Net assets, end of period (in thousands) | | $ | 793,785 | | | $ | 979,086 | | | $ | 711,583 | | | $ | 504,449 | | | $ | 1,065,820 | |
Ratios to average net assets: |
Net investment income (loss) | | | 8.02 | % | | | 3.84 | % | | | 3.59 | % | | | 4.48 | % | | | 4.83 | % |
Total expensesc | | | 0.88 | % | | | 0.87 | % | | | 0.85 | % | | | 0.97 | % | | | 0.92 | % |
Net expensesd,e,f | | | 0.78 | % | | | 0.78 | % | | | 0.81 | % | | | 0.85 | % | | | 0.83 | % |
Portfolio turnover rate | | | 23 | % | | | 30 | % | | | 57 | % | | | 20 | % | | | 10 | % |
48 | THE GUGGENHEIM FUNDS ANNUAL REPORT | SEE NOTES TO FINANCIAL STATEMENTS. |
FINANCIAL HIGHLIGHTS (continued) |
FLOATING RATE STRATEGIES FUND |
This table is presented to show selected data for a share outstanding throughout each period and to assist shareholders in evaluating a Fund’s performance for the periods presented.
R6-Class | | Year
Ended
Sept. 30,
2023 | | | Year
Ended
Sept. 30,
2022 | | | Year
Ended
Sept. 30,
2021 | | | Year
Ended
Sept. 30,
2020 | | | Period
Ended
Sept. 30,
2019g | |
Per Share Data |
Net asset value, beginning of period | | $ | 23.38 | | | $ | 25.11 | | | $ | 24.10 | | | $ | 25.25 | | | $ | 25.38 | |
Income (loss) from investment operations: |
Net investment income (loss)a | | | 1.87 | | | | .82 | | | | .91 | | | | 1.13 | | | | .69 | |
Net gain (loss) on investments (realized and unrealized) | | | 1.27 | | | | (1.62 | ) | | | 1.01 | | | | (1.21 | ) | | | (.14 | ) |
Total from investment operations | | | 3.14 | | | | (.80 | ) | | | 1.92 | | | | (.08 | ) | | | .55 | |
Less distributions from: |
Net investment income | | | (1.97 | ) | | | (.93 | ) | | | (.90 | ) | | | (.88 | ) | | | (.68 | ) |
Return of capital | | | — | | | | — | | | | (.01 | ) | | | (.19 | ) | | | — | |
Total distributions | | | (1.97 | ) | | | (.93 | ) | | | (.91 | ) | | | (1.07 | ) | | | (.68 | ) |
Net asset value, end of period | | $ | 24.55 | | | $ | 23.38 | | | $ | 25.11 | | | $ | 24.10 | | | $ | 25.25 | |
|
Total Return | | | 13.87 | % | | | (3.25 | %) | | | 8.06 | % | | | (0.22 | %) | | | 2.20 | % |
Ratios/Supplemental Data |
Net assets, end of period (in thousands) | | $ | 1,445 | | | $ | 1,722 | | | $ | 1,257 | | | $ | 1,625 | | | $ | 71,680 | |
Ratios to average net assets: |
Net investment income (loss) | | | 7.79 | % | | | 3.31 | % | | | 3.66 | % | | | 4.56 | % | | | 4.89 | % |
Total expensesc | | | 0.78 | % | | | 0.82 | % | | | 0.83 | % | | | 0.86 | % | | | 0.85 | % |
Net expensesd,e,f | | | 0.74 | % | | | 0.79 | % | | | 0.82 | % | | | 0.84 | % | | | 0.84 | % |
Portfolio turnover rate | | | 23 | % | | | 30 | % | | | 57 | % | | | 20 | % | | | 10 | % |
SEE NOTES TO FINANCIAL STATEMENTS. | THE GUGGENHEIM FUNDS ANNUAL REPORT | 49 |
FINANCIAL HIGHLIGHTS (concluded) |
FLOATING RATE STRATEGIES FUND |
a | Net investment income (loss) per share was computed using average shares outstanding throughout the period. |
b | Total return does not reflect the impact of any applicable sales charges. |
c | Does not include expenses of the underlying funds in which the Fund invests. |
d | Net expense information reflects the expense ratios after expense waivers and reimbursements, as applicable. |
e | The portion of the ratios of net expenses to average net assets attributable to recoupments of prior fee reductions or expense reimbursements for the years presented was as follows: |
| | | 09/30/23 | 09/30/22 | 09/30/21 | 09/30/20 | 09/30/19 |
| | A-Class | 0.03% | 0.03% | — | 0.00%* | — |
| | C-Class | 0.04% | 0.04% | — | 0.00%* | — |
| | P-Class | 0.03% | 0.04% | 0.00%* | 0.00%* | — |
| | Institutional Class | 0.02% | 0.04% | 0.00%* | 0.00%* | — |
| | R6-Class | 0.02% | 0.03% | 0.01% | 0.00%* | 0.00%* |
f | Net expenses may include expenses that are excluded from the expense limitation agreement. Excluding these expenses, the net expense ratios for the years presented would be: |
| | | 09/30/23 | 09/30/22 | 09/30/21 | 09/30/20 | 09/30/19 |
| | A-Class | 0.99% | 1.00% | 1.01% | 1.02% | 1.02% |
| | C-Class | 1.75% | 1.75% | 1.76% | 1.77% | 1.77% |
| | P-Class | 0.99% | 1.00% | 1.01% | 1.02% | 1.02% |
| | Institutional Class | 0.75% | 0.76% | 0.77% | 0.78% | 0.78% |
| | R6-Class | 0.71% | 0.76% | 0.77% | 0.78% | 0.78% |
g | Since commencement of operations: March 13, 2019. Percentage amounts for the period, except total return and portfolio turnover rate, have been annualized. |
50 | THE GUGGENHEIM FUNDS ANNUAL REPORT | SEE NOTES TO FINANCIAL STATEMENTS. |
NOTES TO FINANCIAL STATEMENTS |
Note 1 – Organization and Significant Accounting Policies
Organization
Guggenheim Funds Trust (the “Trust”), a Delaware statutory trust, is registered with the U.S. Securities and Exchange Commission (the “SEC”) under the Investment Company Act of 1940 (the “1940 Act”), as an open-ended investment company of the series type. Each series, in effect, is representing a separate fund. The Trust may issue an unlimited number of authorized shares. The Trust accounts for the assets of each fund separately.
The Trust offers a combination of five separate classes of shares: A-Class shares, C-Class shares, P-Class shares, R6-Class shares and Institutional Class shares. Sales of shares of each Class are made without a front-end sales charge at the net asset value per share (“NAV”), with the exception of A-Class shares. A-Class shares are sold at the NAV, plus the applicable front-end sales charge. The sales charge varies depending on the amount purchased. A-Class share purchases of $1 million or more are exempt from the front-end sales charge but have a 1% contingent deferred sales charge (“CDSC”), if shares are redeemed within 12 months of purchase. C-Class shares have a 1% CDSC if shares are redeemed within 12 months of purchase. C-Class shares automatically convert to A-Class shares on or about the 10th day of the month following the 8-year anniversary of the purchase of the C-Class shares. This conversion will be executed without any sales charge, fee or other charge. After the conversion is completed, the shares will be subject to all features and expenses of A-Class shares. Institutional Class shares are offered primarily for direct investment by institutions such as pension and profit sharing plans, endowments, foundations and corporations. Institutional Class shares require a minimum initial investment of $2 million and a minimum account balance of $1 million. R6-Class shares are offered primarily through qualified retirement and benefit plans. R6-Class shares are also offered through certain other plans and platforms sponsored by financial intermediaries. Certain institutional investors and others deemed appropriate by Guggenheim Investments (“GI”) may also be eligible to purchase R6-Class shares subject to a $2 million minimum initial investment. At September 30, 2023, the Trust consisted of nineteen funds (the “Funds”).
This report covers the Floating Rate Strategies Fund (the “Fund”), a diversified investment company. At September 30, 2023, A-Class, C-Class, P-Class, Institutional Class, and R6-Class shares have been issued by the Fund.
Guggenheim Partners Investment Management, LLC (“GPIM” or the “Adviser”), which operates under the name Guggenheim Investments, provides advisory services. Guggenheim Funds Distributors, LLC (“GFD”) serves as distributor of the Fund’s shares. GI and GFD are affiliated entities.
Pursuant to an investment Sub-Advisory Agreement between GPIM and Guggenheim Partners Advisors, LLC (“GPA”) that was in effect during a portion of the Reporting Period, GPA was engaged to provide investment sub-advisory services to the Fund. GPA operated as an investment sub-advisor to the Fund from April 29, 2022 to December 22, 2022.
| | THE GUGGENHEIM FUNDS ANNUAL REPORT | 51 |
NOTES TO FINANCIAL STATEMENTS (continued) |
GPA, under the oversight of the Board and GPIM, assisted GPIM in the supervision and direction of the investment strategies of the Fund in accordance with its investment policies. As compensation for its services, GPIM paid GPA a fee, payable monthly, in an amount equal to 0.005% of the Fund’s average daily net assets.
Significant Accounting Policies
The Fund operates as an investment company and, accordingly, follows the investment company accounting and reporting guidance of the Financial Accounting Standards Board (“FASB”) Accounting Standards Codification Topic 946 Financial Services – Investment Companies.
The following significant accounting policies are in conformity with U.S. generally accepted accounting principles (“U.S. GAAP”) and are consistently followed by the Trust. This requires management to make estimates and assumptions that affect the reported amount of assets and liabilities, contingent assets and liabilities at the date of the financial statements, and the reported amounts of revenues and expenses during the reporting period. Actual results could differ from these estimates. All time references are based on Eastern Time.
The NAV of each share class of the Fund is calculated by dividing the market value of the Fund’s securities and other assets, less all liabilities attributable to the share class by the number of outstanding shares of the share class.
(a) Valuation of Investments
The Board of Trustees of the Fund (the “Board”) has adopted policies and procedures for the valuation of the Fund’s investments (the “Fund Valuation Procedures”). The SEC adopted Rule 2a-5 under the 1940 Act (“Rule 2a-5”) which establishes requirements for determining fair value in good faith. Rule 2a-5 also defines “readily available market quotations” for purposes of the 1940 Act and establishes requirements for determining whether a fund must fair value a security in good faith.
Pursuant to Rule 2a-5, the Board has designated the Adviser as the valuation designee to perform fair valuation determinations for the Fund with respect to all Fund investments and other assets. As the Fund’s valuation designee pursuant to Rule 2a-5, the Adviser has adopted separate procedures (the “Valuation Designee Procedures” and collectively with the Fund Valuation Procedures, the “Valuation Procedures”) reasonably designed to prevent violations of the requirements of Rule 2a-5 and Rule 31a-4. The Adviser, in its role as valuation designee, utilizes the assistance of a valuation committee, consisting of representatives from Guggenheim’s investment management, fund administration, legal and compliance departments (the “Valuation Committee”), in determining the fair value of the Fund’s securities and other assets.
Valuations of the Fund’s securities and other assets are supplied primarily by pricing service providers appointed pursuant to the processes set forth in the Valuation Procedures. The Adviser, with the assistance of the Valuation Committee, convenes monthly, or more frequently as needed, to review the valuation of all assets which have been fair valued. The Adviser, consistent with the
52 | THE GUGGENHEIM FUNDS ANNUAL REPORT | |
NOTES TO FINANCIAL STATEMENTS (continued) |
monitoring and review responsibilities set forth in the Valuation Procedures, regularly reviews the appropriateness of the inputs, methods, models and assumptions employed by the pricing service provider.
If the pricing service provider cannot or does not provide a valuation for a particular investment or such valuation is deemed unreliable, the investment is fair valued by the Adviser.
Equity securities listed or traded on a recognized U.S. securities exchange or the National Association of Securities Dealers Automated Quotations (“NASDAQ”) National Market System will generally be valued on the basis of the last sale price on the primary U.S. exchange or market on which the security is listed or traded; provided, however, that securities listed on NASDAQ will be valued at the NASDAQ official closing price, which may not necessarily represent the last sale price.
Generally, trading in foreign securities markets is substantially completed each day at various times prior to the close of the New York Stock Exchange (“NYSE”). The values of foreign securities are determined as of the close of such foreign markets or the close of the NYSE, if earlier. All investments quoted in foreign currencies are valued in U.S. dollars on the basis of the foreign currency exchange rates prevailing at the close of U.S. business at 4:00 p.m. Investments in foreign securities may involve risks not present in domestic investments. The Adviser will determine the current value of such foreign securities by taking into consideration certain factors which may include the following factors, among others: the value of the securities traded on other foreign markets, American Depositary Receipts (“ADR”) trading, closed-end fund trading, foreign currency exchange activity, and the trading prices of financial products that are tied to foreign securities. In addition, under the Valuation Procedures, the Adviser is authorized to use prices and other information supplied by a pricing service provider in valuing foreign securities.
Open-end investment companies are valued at their NAV as of the close of business, on the valuation date. Exchange-traded funds and closed-end investment companies are generally valued at the last quoted sale price.
Commercial paper and discount notes with a maturity of greater than 60 days at acquisition are valued at prices that reflect broker-dealer supplied valuations or are obtained from pricing service providers, which may consider the trade activity, treasury spreads, yields or price of bonds of comparable quality, coupon, maturity, and type, as well as prices quoted by dealers who make markets in such securities. Commercial paper and discount notes with a maturity of 60 days or less at acquisition are valued at amortized cost, unless the Adviser concludes that amortized cost does not represent the fair value of the applicable asset in which case it will be valued using an independent pricing service.
Typically, loans are valued using information provided by pricing service provider which uses broker quotes, among other inputs. If the pricing service cannot or does not provide a valuation for a particular loan, or such valuation is deemed unreliable, such investment is valued based on a quote from a broker-dealer or is fair valued by the Adviser.
| | THE GUGGENHEIM FUNDS ANNUAL REPORT | 53 |
NOTES TO FINANCIAL STATEMENTS (continued) |
Forward foreign currency exchange contracts are valued daily based on the applicable exchange rate of the underlying currency.
Investments for which market quotations are not readily available are fair valued as determined in good faith by the Adviser. Valuations in accordance with these methods are intended to reflect each security’s (or asset’s or liability’s) “fair value”. Each such determination is based on a consideration of all relevant factors, which are likely to vary from one pricing context to another. Examples of such factors may include, but are not limited to market prices; sale prices; broker quotes; and models which derive prices based on inputs such as prices of securities with comparable maturities and characteristics, or based on inputs such as anticipated cash flows or collateral, spread over U.S. Treasury securities, and other information analysis. In connection with futures contracts and other derivative investments, such factors may include obtaining information as to how (a) these contracts and other derivative investments trade in the futures or other derivative markets, respectively, and (b) the securities underlying these contracts and other derivative investments trade in the cash market.
(b) Senior Floating Rate Interests and Loan Investments
Senior floating rate interests in which the Fund invests generally pay interest rates which are periodically adjusted by reference to a base short-term floating rate, plus a premium. These base lending rates are generally (i) the lending rate offered by one or more major European banks, (ii) the prime rate offered by one or more major United States banks, or (iii) the bank’s certificate of deposit rate. Senior floating rate interests often require prepayments from excess cash flows or permit the borrower to repay at its election. The rate at which the borrower repays cannot be predicted with accuracy. As a result, the actual remaining maturity may be substantially less than the stated maturities disclosed in the Fund’s Schedule of Investments.
The Fund invests in loans and other similar debt obligations (“obligations”). A portion of the Fund’s investments in these obligations is sometimes referred to as “covenant lite” loans or obligations (“covenant lite obligations”), which are obligations that lack covenants or possess fewer or less restrictive covenants or constraints on borrowers than certain other types of obligations. The Fund may also obtain exposure to covenant lite obligations through investment in securitization vehicles and other structured products. Recently, many new or reissued obligations have not featured traditional covenants, which are intended to protect lenders and investors by (i) imposing certain restrictions or other limitations on a borrower’s operations or assets or (ii) providing certain rights to lenders. The Fund may have fewer rights with respect to covenant lite obligations, including fewer protections against the possibility of default and fewer remedies in the event of default. As a result, investments in (or exposure to) covenant lite obligations are subject to more risk than investments in (or exposure to) certain other types of obligations. The Fund is subject to other risks associated with investments in (or exposure to) obligations, including that obligations may not be considered “securities” and, as a result, the Fund may not be entitled to rely on the anti-fraud protections under the federal securities laws and instead may have to resort to state law and direct claims.
54 | THE GUGGENHEIM FUNDS ANNUAL REPORT | |
NOTES TO FINANCIAL STATEMENTS (continued) |
(c) Interest on When-Issued Securities
The Fund may purchase and sell interests in securities on a when-issued and delayed delivery basis, with payment and delivery scheduled for a future date. No income accrues to the Fund on such interests or securities in connection with such transactions prior to the date the Fund actually takes delivery of such interests or securities. These transactions are subject to market fluctuations and are subject to the risk that the value at delivery may be more or less than the trade date purchase price. Although the Fund will generally purchase these securities with the intention of acquiring such securities, it may sell such securities before the settlement date.
(d) Forward Foreign Currency Exchange Contracts
The change in value of a forward foreign currency exchange contract is recorded as unrealized appreciation or depreciation until the contract is closed. When the contract is closed, the Fund records a realized gain or loss equal to the difference between the value at the time the contract was opened and the value at the time it was closed.
(e) Currency Translations
The accounting records of the Fund are maintained in U.S. dollars. All assets and liabilities initially expressed in foreign currencies are converted into U.S. dollars at prevailing exchange rates. Purchases and sales of investment securities, dividend and interest income, and certain expenses are translated at the rates of exchange prevailing on the respective dates of such transactions. Changes in the relationship of these foreign currencies to the U.S. dollar can significantly affect the value of the investments and earnings of the Fund. Foreign investments may also subject the Fund to foreign government exchange restrictions, expropriation, taxation, or other political, social, geopolitical or economic developments, all of which could affect the market and/or credit risk of the investments.
The Fund does not isolate that portion of the results of operations resulting from changes in the foreign exchange rates on investments from the fluctuations arising from changes in the market prices of securities held. Such fluctuations are included with the net realized gain or loss and unrealized appreciation or depreciation on investments.
Reported net realized foreign exchange gains and losses arise from sales of foreign currencies and currency gains or losses realized between the trade and settlement dates on investment transactions. Net unrealized appreciation and depreciation arise from changes in the fair values of assets and liabilities other than investments in securities at the fiscal period end, resulting from changes in exchange rates.
(f) Foreign Taxes
The Fund may be subject to foreign taxes (a portion of which may be reclaimable) on income, stock dividends, capital gains on investments or certain foreign currency transactions. All foreign taxes are recorded in accordance with the applicable foreign tax regulations and rates that exist in the foreign jurisdictions in which the Fund invests. These foreign taxes, if any, are paid by the
| | THE GUGGENHEIM FUNDS ANNUAL REPORT | 55 |
NOTES TO FINANCIAL STATEMENTS (continued) |
Fund and reflected in its Statement of Operations as follows: foreign taxes withheld at source are presented as a reduction of income and foreign taxes on capital gains from sales of investments are included with the net realized gain (loss) on investments. Foreign taxes payable or deferred as of September 30, 2023, if any, are disclosed in the Fund’s Statement of Assets and Liabilities.
(g) Security Transactions
Security transactions are recorded on the trade date for financial reporting purposes. Realized gains and losses from securities transactions are recorded using the identified cost basis. Proceeds from lawsuits related to investment holdings are recorded as a reduction to cost if the securities are still held and as realized gains if no longer held in the Fund. Dividend income is recorded on the ex-dividend date, net of applicable taxes withheld by foreign countries, if any. Taxable non-cash dividends are recorded as dividend income. Interest income, including amortization of premiums and accretion of discounts, is accrued on a daily basis. Interest income also includes paydown gains and losses on mortgage-backed and asset-backed securities and senior and subordinated loans. Amendment fees are earned as compensation for evaluating and accepting changes to the original loan agreement and are recognized when received. Dividend income from Real Estate Investment Trusts (“REITs”) is recorded based on the income included in the distributions received from the REIT investments using published REIT classifications, including some management estimates when actual amounts are not available. Distributions received in excess of this estimated amount are recorded as a reduction of the cost of investments or reclassified to realized gains. The actual amounts of income, return of capital, and realized gains are only determined by each REIT after its fiscal year-end, and may differ from the estimated amounts.
Income from residual collateralized loan obligations is recognized using the effective interest method. At the time of purchase, management estimates the future expected cash flows and determines the effective yield and estimated maturity date based on the estimated cash flows. Subsequent to the purchase, the estimated cash flows are updated periodically and a revised yield is calculated prospectively.
The Fund may receive other income from investments in senior loan interests including amendment fees, consent fees and commitment fees. For funded loans, these fees are recorded as income when received by the Fund and included in interest income on the Statement of Operations. For unfunded loans, commitment fees are included in realized gain on investments on the Statement of Operations at the end of the commitment period.
(h) Distributions
The Fund declares dividends from investment income daily. The Fund pays its shareholders from its net investment income monthly and distributes any net capital gains that it has realized, at least annually. Distributions to shareholders are recorded on the ex-dividend date. Dividends are
56 | THE GUGGENHEIM FUNDS ANNUAL REPORT | |
NOTES TO FINANCIAL STATEMENTS (continued) |
reinvested in additional shares, unless shareholders request payment in cash. The character of distributions made during the year from net investment income or net realized gains may differ from their ultimate characterization for U.S. federal income tax purposes.
(i) Class Allocations
Interest and dividend income, most expenses, all realized gains and losses, and all unrealized appreciation and depreciation are allocated to the share classes based upon the value of the outstanding shares in each share class. Certain costs, such as distribution and service fees are charged directly to specific share classes. In addition, certain expenses have been allocated to the individual Funds in the Trust based on the respective net assets of each Fund included in the Trust.
(j) Earnings Credits
Under the fee arrangement with the custodian, the Fund may earn credits based on overnight custody cash balances. These credits are utilized to reduce related custodial expenses. The custodian fees disclosed in the Statement of Operations are before the reduction in expense from the related earnings credits, if any. Earnings credits for the year ended September 30, 2023, are disclosed in the Statement of Operations.
(k) Cash
The Fund may leave cash overnight in its cash account with the custodian. Periodically, the Fund may have cash due to the custodian bank as an overdraft balance. A fee is incurred on this overdraft, calculated by multiplying the overdraft by a rate based on the federal funds rate, which was 5.33% at September 30, 2023.
(l) Indemnifications
Under the Fund’s organizational documents, its Trustees and Officers are indemnified against certain liabilities arising out of the performance of their duties to the Trust. In addition, throughout the normal course of business, the Fund enters into contracts that contain a variety of representations and warranties which provide general indemnifications. The Fund’s maximum exposure under these arrangements is unknown, as this would involve future claims that may be made against the Fund and/or its affiliates that have not yet occurred. However, based on experience, the Fund expects the risk of loss to be remote.
Note 2 – Derivatives
As part of its investment strategy, the Fund utilizes forward foreign currency exchange contracts. These investments involve, to varying degrees, elements of market risk and risks in excess of amounts recognized on the Fund’s Statement of Assets and Liabilities. Valuation and accounting treatment of these instruments can be found under Significant Accounting Policies in Note 1 of these Notes to Financial Statements.
| | THE GUGGENHEIM FUNDS ANNUAL REPORT | 57 |
NOTES TO FINANCIAL STATEMENTS (continued) |
Derivatives are instruments whose values depend on, or are derived from, in whole or in part, the value of one or more other assets, such as securities, currencies, commodities or indices. Derivative instruments may be used to increase investment flexibility (including to maintain cash reserves while maintaining exposure to certain other assets), for risk management (hedging) purposes, to facilitate trading, to reduce transaction costs and to pursue higher investment returns. Derivative instruments may also be used to mitigate certain investment risks, such as foreign currency exchange rate risk, interest rate risk and credit risk. U.S. GAAP requires disclosures to enable investors to better understand how and why a Fund uses derivative instruments, how these derivative instruments are accounted for and their effects on the Fund’s financial position and results of operations.
The Fund utilized derivatives for the following purposes:
Hedge: an investment made in order to reduce the risk of adverse price movements in a security, by taking an offsetting position to protect against broad market moves.
Forward Foreign Currency Exchange Contracts
A forward foreign currency exchange contract is an agreement between two parties to exchange two designated currencies at a specific time in the future. Certain types of contracts may be cash settled, in an amount equal to the change in exchange rates during the term of the contract. The contracts can be used to hedge or manage exposure to foreign currency risks with portfolio investments or to gain exposure to foreign currencies.
The market value of a forward foreign currency exchange contract changes with fluctuations in foreign currency exchange rates. Furthermore, the Fund may be exposed to risk if the counterparties cannot meet the contract terms or if the currency value changes unfavorably as compared to the U.S. dollar.
The following table represents the Fund’s use and volume of forward foreign currency exchange contracts on a monthly basis:
| | | Average Value | |
Use | | Purchased | | | Sold | |
Hedge | | $ | 62,785 | | | $ | 27,560,779 | |
Derivative Investment Holdings Categorized by Risk Exposure
The following is a summary of the location of derivative investments on the Fund’s Statement of Assets and Liabilities as of September 30, 2023:
Derivative Investment Type | Asset Derivatives | Liability Derivatives |
Currency forward contracts | Unrealized appreciation on forward foreign currency exchange contracts | |
58 | THE GUGGENHEIM FUNDS ANNUAL REPORT | |
NOTES TO FINANCIAL STATEMENTS (continued) |
The following tables set forth the fair value of the Fund’s derivative investments categorized by primary risk exposure at September 30, 2023:
| | Forward Foreign Currency
Exchange Risk | |
Asset Derivative Investments Value | | $ | 460,600 | |
The following is a summary of the location of derivative investments on the Fund’s Statement of Operations for the year ended September 30, 2023:
Derivative Investment Type | Location of Gain (Loss) on Derivatives |
Currency forward contracts | Net realized gain (loss) on forward foreign currency exchange contracts |
| Net change in unrealized appreciation (depreciation) on forward foreign currency exchange contracts |
The following is a summary of the Fund’s realized gain (loss) and change in unrealized appreciation (depreciation) on derivative investments recognized on the Fund’s Statement of Operations categorized by primary risk exposure for the year ended September 30, 2023:
Realized Gain (Loss) on Derivative Investments Recognized on the Statement of Operations |
| | Forward Foreign Currency Exchange Risk | |
| | | $ | (1,637,530 | ) |
Change in Unrealized Appreciation (Depreciation) on Derivative Investments Recognized on the Statement of Operations |
| | Forward Foreign Currency Exchange Risk | |
| | | $ | (199,993 | ) |
In conjunction with the use of derivative instruments, the Fund is required to maintain collateral in various forms. Depending on the financial instrument utilized and the broker involved, the Fund uses margin deposits at the broker, cash and/or securities segregated at the custodian bank, discount notes or repurchase agreements allocated to the Fund as collateral.
Foreign Investments
There are several risks associated with exposure to foreign currencies, foreign issuers and emerging markets. A fund’s indirect and direct exposure to foreign currencies subjects the Fund the risk that those currencies will decline in value relative to the U.S. dollar, or in the case of short positions, that the U.S. dollar will decline in value relative to the currency being hedged. Currency rates in foreign countries may fluctuate significantly over short periods of time for a number of
| | THE GUGGENHEIM FUNDS ANNUAL REPORT | 59 |
NOTES TO FINANCIAL STATEMENTS (continued) |
reasons, including changes in interest rates and the imposition of currency controls or other political developments in the U.S. or abroad. In addition, the Fund may incur transaction costs connection with conversions between various currencies.
The Fund may, but is not obligated to, engage in currency hedging transactions, which generally involve buying currency forward, options or futures contracts. However, not all currency risks may be effectively hedged, and in some cases the costs of hedging techniques may outweigh expected benefits. In such instances, the value of securities denominated in foreign currencies can change significantly when foreign currencies strengthen or weaken relative to the U.S. dollar.
The Fund may invest in securities of foreign companies directly, or in financial instruments, such as ADRs and exchange-traded funds, which are indirectly linked to the performance of foreign issuers. Foreign markets can be more volatile than the U.S. market due to increased risks of adverse issuer, political, regulatory, market, or economic developments and can perform differently from the U.S. market. Investing in securities of foreign companies directly, or in financial instruments that are indirectly linked to the performance of foreign issuers, may involve risks not typically associated with investing in U.S. issuers. The value of securities denominated foreign currencies, and of dividends from such securities, can change significantly when foreign currencies strengthen or weaken relative to the U.S. dollar. Foreign securities markets generally have less trading volume and less liquidity than U.S. markets, and prices in some foreign markets may fluctuate more than those of securities traded on U.S. markets. Many foreign countries lack accounting and disclosure standards comparable to those that apply to U.S. companies, and it may be more difficult to obtain reliable information regarding a foreign issuer’s financial condition and operations. Transaction costs and costs associated with custody services are generally higher for foreign securities than they are for U.S. securities. Some foreign governments levy withholding taxes against dividend and interest income. Although in some countries portions of these taxes are recoverable, the non-recovered portion will reduce the income received by the Fund.
The Trust has established counterparty credit guidelines and enters into transactions only with financial institutions rated/identified as investment grade or better. The Trust monitors the counterparty credit risk.
Note 3 – Offsetting
In the normal course of business, the Fund enters into transactions subject to enforceable master netting arrangements or other similar arrangements. Generally, the right to offset in those agreements allows the Fund to counteract the exposure to a specific counterparty with collateral received from or delivered to that counterparty based on the terms of the arrangements. These arrangements provide for the right to liquidate upon the occurrence of an event of default, credit event upon merger or additional termination event.
60 | THE GUGGENHEIM FUNDS ANNUAL REPORT | |
NOTES TO FINANCIAL STATEMENTS (continued) |
In order to better define its contractual rights and to secure rights that will help the Fund mitigate its counterparty risk, the Fund may enter into an International Swaps and Derivatives Association, Inc. Master Agreement (“ISDA Master Agreement”) or similar agreement with its derivative contract counterparties. An ISDA Master Agreement is a bilateral agreement between a fund and a counterparty that governs OTC derivatives, including foreign exchange contracts, and typically contains, among other things, collateral posting terms and netting provisions in the event of a default and/or termination event. The provisions of the ISDA Master Agreement typically permit a single net payment in the event of a default (close-out netting) or similar event, including the bankruptcy or insolvency of the counterparty.
For derivatives traded under an ISDA Master Agreement, the collateral requirements are typically calculated by netting the mark-to-market amount for each transaction under such agreement and comparing that amount to the value of any collateral currently pledged by the Fund and the counterparty. For financial reporting purposes, cash collateral that has been pledged to cover obligations of the Fund and cash collateral received from the counterparty, if any, are reported separately on the Fund’s Statement of Assets and Liabilities as segregated cash with broker/receivable for variation margin, or payable for swap settlement/variation margin. Cash and/or securities pledged or received as collateral by the Fund in connection with an OTC derivative subject to an ISDA Master Agreement generally may not be invested, sold or rehypothecated by the counterparty or the Fund, as applicable, absent an event of default under such agreement, in which case such collateral generally may be applied towards obligations due to and payable by such counterparty or the Fund, as applicable. Generally, the amount of collateral due from or to a counterparty must exceed a minimum transfer amount threshold (e.g., $300,000) before a transfer is required to be made. To the extent amounts due to the Fund from its counterparties are not fully collateralized, contractually or otherwise, the Fund bears the risk of loss from counterparty nonperformance. The Fund attempts to mitigate counterparty risk by only entering into agreements with counterparties that it believes to be of good standing and by monitoring the financial stability of those counterparties.
For financial reporting purposes, the Fund does not offset derivative assets and derivative liabilities that are subject to netting arrangements in the Fund’s Statement of Assets and Liabilities.
| | THE GUGGENHEIM FUNDS ANNUAL REPORT | 61 |
NOTES TO FINANCIAL STATEMENTS (continued) |
The following tables present derivative financial instruments and secured financing transactions that are subject to enforceable netting arrangements:
| | | | | | | | | | | | | | | Gross Amounts Not
Offset in the Statement
of Assets and Liabilities | | | | | |
Instrument | | Gross
Amounts of
Recognized
Assets | | | Gross
Amounts
Offset in the
Statement of
Assets and
Liabilities | | | Net Amount
of Assets
Presented on
the Statement
of Assets and
Liabilities | | | Financial
Instruments | | | Cash
Collateral
Received | | | Net
Amount | |
Forward foreign currency exchange contracts | | $ | 460,600 | | | $ | — | | | | 460,600 | | | $ | — | | | $ | (280,000 | ) | | $ | 180,600 | |
The Fund has the right to offset deposits against any related derivative liabilities outstanding with each counterparty with the exception of exchange-traded or centrally-cleared derivatives. The following table presents deposits held by others in connection with derivative investments as of September 30, 2023.
| Counterparty | Asset Type | Cash
Pledged | | | Cash
Received | |
| Barclays Bank plc | Forward foreign currency exchange contracts | | $ | — | | | $ | 280,000 | |
Note 4 – Fair Value Measurement
In accordance with U.S. GAAP, fair value is defined as the price that the Fund would receive to sell an investment or pay to transfer a liability in an orderly transaction between market participants at the measurement date. U.S. GAAP establishes a three-tier fair value hierarchy based on the types of inputs used to value assets and liabilities and requires corresponding disclosure. The hierarchy and the corresponding inputs are summarized below:
Level 1 — unadjusted quoted prices in active markets for identical assets or liabilities.
Level 2 — significant other observable inputs (for example quoted prices for securities that are similar based on characteristics such as interest rates, prepayment speeds, credit risk, etc.).
Level 3 — significant unobservable inputs based on the best information available under the circumstances, to the extent observable inputs are not available, which may include assumptions.
62 | THE GUGGENHEIM FUNDS ANNUAL REPORT | |
NOTES TO FINANCIAL STATEMENTS (continued) |
Rule 2a-5 sets forth a definition of “readily available market quotations,” which is consistent with the definition of a Level 1 input under U.S. GAAP. Rule 2a-5 provides that “a market quotation is readily available only when that quotation is a quoted price (unadjusted) in active markets for identical investments that the fund can access at the measurement date, provided that a quotation will not be readily available if it is not reliable.”
Securities for which market quotations are not readily available must be valued at fair value as determined in good faith. Accordingly, any security priced using inputs other than Level 1 inputs will be subject to fair value requirements. The types of inputs available depend on a variety of factors, such as the type of security and the characteristics of the markets in which it trades, if any. Fair valuation determinations that rely on fewer or no observable inputs require greater judgment. Accordingly, fair value determinations for Level 3 securities require the greatest amount of judgment.
Pricing service providers are used to value a majority of the Fund’s investments. When values are not available from a pricing service provider, they will be determined using a variety of sources and techniques, including: market prices; broker quotes; and models which derive prices based on inputs such as prices of securities with comparable maturities and characteristics or based on inputs such as anticipated cash flows or collateral, spread over U.S. Treasury securities, and other information and analysis. A significant portion of the Fund’s assets and liabilities are categorized as Level 2, as indicated in this report.
Quotes from broker-dealers, adjusted for fluctuations in criteria such as credit spreads and interest rates, may also be used to value the Fund’s assets and liabilities, i.e. prices provided by a broker-dealer or other market participant who has not committed to trade at that price. Although quotes are typically received from established market participants, the Fund may not have the transparency to view the underlying inputs which support the market quotations. Significant changes in a quote would generally result in significant changes in the fair value of the security.
Certain fixed income securities are valued by obtaining a monthly quote from a broker-dealer, adjusted for fluctuations in criteria such as credit spreads and interest rates.
Certain loans and other securities are valued using a single daily broker quote or a price from a pricing service provider based on a single daily or monthly broker quote.
The inputs or methodologies selected and applied for valuing securities or other assets are not necessarily an indication of the risk associated with investing in those securities. The suitability, appropriateness and accuracy of the techniques, methodologies and sources employed to determine fair valuation are periodically reviewed and subject to change.
Note 5 – Investment Advisory Agreement and Other Agreements
Under the terms of an investment advisory contract, the Fund pays GI investment advisory fees calculated at an annualized rate of 0.65% of the average daily net assets of the Fund up to $5 billion; and 0.60% of the average daily net assets in excess of $5 billion.
| | THE GUGGENHEIM FUNDS ANNUAL REPORT | 63 |
NOTES TO FINANCIAL STATEMENTS (continued) |
GI pays operating expenses on behalf of the Trust, such as audit and accounting related services, legal services, custody, printing and mailing, among others, on a pass-through basis. Such expenses are allocated to various Funds within the complex based on relative net assets.
The Board has adopted Distribution Plans related to the offering of A-Class, C-Class and P-Class shares pursuant to Rule 12b-1 under the 1940 Act. The plans provide for payments at an annual rate of 0.25% of the average daily net assets of the Fund’s A-Class and P-Class shares, and 1.00% of the average daily net assets of the Fund’s C-Class shares.
The investment advisory contract for the Fund provides that the total expenses be limited to a percentage of average net assets for each class of shares, exclusive of brokerage costs, dividends or interest on securities sold short, expenses of other investment companies in which the Fund invests, interest, taxes, litigation, indemnification and extraordinary expenses. The limits are listed below:
| | Limit | | | Effective
Date | | | Contract
End Date | |
A-Class | | | 1.02 | % | | | 11/30/12 | | | | 02/01/25 | |
C-Class | | | 1.77 | % | | | 11/30/12 | | | | 02/01/25 | |
P-Class | | | 1.02 | % | | | 05/01/15 | | | | 02/01/25 | |
Institutional Class | | | 0.78 | % | | | 11/30/12 | | | | 02/01/25 | |
R6-Class | | | 0.78 | % | | | 03/13/19 | | | | 02/01/25 | |
GI is entitled to reimbursement by the Fund for fees waived or expenses reimbursed during any of the previous 36 months, beginning on the date of the expense limitation agreement, if on any day the estimated operating expenses are less than the indicated percentages. For purposes of this arrangement, GI is entitled to recoupment of previously waived fees or reimbursed expenses for 36 months from the date of the waiver or reimbursement by GI. At September 30, 2023, the amount of fees waived or expenses reimbursed that are subject to recoupment and will expire during the years ended September 30, are presented in the following table:
| | 2024 | | | 2025 | | | 2026 | | | Fund Total | |
A-Class | | $ | 62,574 | | | $ | 114,896 | | | $ | 134,479 | | | $ | 311,949 | |
C-Class | | | 35,328 | | | | 63,710 | | | | 33,051 | | | | 132,089 | |
P-Class | | | 3,944 | | | | 45,054 | | | | 55,729 | | | | 104,727 | |
Institutional Class | | | 224,572 | | | | 717,446 | | | | 582,868 | | | | 1,524,886 | |
R6-Class | | | — | | | | 428 | | | | 966 | | | | 1,394 | |
For the year ended September 30, 2023, GI recouped $269,500 from the Fund.
For the year ended September 30, 2023, GFD retained sales charges of $132,849 relating to sales of A-Class shares of the Trust.
Certain trustees and officers of the Trust are also officers of GI and/or GFD. The Trust does not compensate its officers or trustees who are officers, directors and/or employees of GI or GFD.
64 | THE GUGGENHEIM FUNDS ANNUAL REPORT | |
NOTES TO FINANCIAL STATEMENTS (continued) |
MUFG Investor Services (US), LLC (“MUIS”) acts as the Fund’s administrator, transfer agent and accounting agent. As administrator, transfer agent and accounting agent, MUIS maintains the books and records of the Fund’s securities and cash. The Bank of New York Mellon Corp. (“BNY”) acts as the Fund’s custodian. As custodian, BNY is responsible for the custody of the Fund’s assets. For providing the aforementioned administrative and accounting services, MUIS is entitled to receive a monthly fee equal to a percentage of the Fund’s average daily net assets and out of pocket expenses. For providing the aforementioned transfer agent and custodian services, MUIS and BNY are entitled to receive a monthly fee based on the number of transactions during the month and the number of accounts under management, subject to certain minimum monthly fees, and out of pocket expenses.
Note 6 – Federal Income Tax Information
The Fund intends to comply with the provisions of Subchapter M of the Internal Revenue Code of 1986, as amended (the “Internal Revenue Code”), applicable to regulated investment companies and will distribute substantially all taxable net investment income and capital gains sufficient to relieve the Fund from all, or substantially all, federal income, excise and state income taxes. Therefore, no provision for federal or state income tax or federal excise tax is required.
Tax positions taken or expected to be taken in the course of preparing the Fund’s tax returns are evaluated to determine whether the tax positions are “more-likely-than-not” of being sustained by the applicable tax authority. Tax positions not deemed to meet the more-likely-than-not threshold would be recorded as a tax benefit or expense in the current year. Management has analyzed the Fund’s tax positions taken, or to be taken, on U.S. federal income tax returns for all open tax years, and has concluded that no provision for income tax is required in the Fund’s financial statements. The Fund’s U.S. federal income tax returns are subject to examination by the Internal Revenue Service (“IRS”) for a period of three years after they are filed.
The tax character of distributions paid during the year ended September 30, 2023 was as follows:
| | Ordinary
Income | | | Long-Term
Capital Gain | | | Total
Distributions | |
| | | $ | 85,281,735 | | | $ | — | | | $ | 85,281,735 | |
The tax character of distributions paid during the year ended September 30, 2022 was as follows:
| | Ordinary
Income | | | Long-Term
Capital Gain | | | Total
Distributions | |
| | | $ | 45,780,565 | | | $ | — | | | $ | 45,780,565 | |
Note: For U.S. federal income tax purposes, short-term capital gain distributions are treated as ordinary income distributions.
| | THE GUGGENHEIM FUNDS ANNUAL REPORT | 65 |
NOTES TO FINANCIAL STATEMENTS (continued) |
The tax components of distributable earnings/(loss) as of September 30, 2023 were as follows:
| | Undistributed
Ordinary
Income | | | Undistributed
Long-Term
Capital Gain | | | Net
Unrealized
Appreciation
(Depreciation) | | | Accumulated
Capital and
Other Losses | | | Other
Temporary
Differences | | | Total | |
| | | $ | 3,808,142 | | | $ | — | | | $ | (38,854,610 | ) | | $ | (161,842,490 | ) | | $ | (7,237,109 | ) | | $ | (204,126,067 | ) |
For U.S. federal income tax purposes, capital loss carryforwards represent realized losses of the Fund that may be carried forward and applied against future capital gains. The Fund is permitted to carry forward capital losses for an unlimited period and such capital loss carryforwards retain their character as either short-term or long-term capital losses. As of September 30, 2023, capital loss carryforwards for the Fund were as follows:
| | | Unlimited | | | | |
| | | Short-Term | | | Long-Term | | | Total
Capital Loss
Carryforward | |
| | | $ | (6,153,631 | ) | | $ | (155,688,859 | ) | | $ | (161,842,490 | ) |
Net investment income and net realized gains (losses) may differ for financial statement and tax purposes because of temporary or permanent book/tax differences. These differences are primarily due to foreign currency gains and losses, losses deferred due to wash sales, distributions payable, and investments in CLO securities and partnerships. Additional differences may result from the tax treatment of bond premium/discount amortization and the “mark-to-market” of forward foreign currency exchange contracts. To the extent these differences are permanent and would require a reclassification between Paid in Capital and Total Distributable Earnings (Loss), such reclassifications are made in the period that the differences arise. These reclassifications have no effect on net assets or NAV per share.
The were no adjustments made on the Statement of Assets and Liabilities as of September 30, 2023 for permanent book/tax differences.
66 | THE GUGGENHEIM FUNDS ANNUAL REPORT | |
NOTES TO FINANCIAL STATEMENTS (continued) |
At September 30, 2023, the cost of investments for U.S. federal income tax purposes, the aggregate gross unrealized appreciation for all investments for which there was an excess of value over tax cost and the aggregate gross unrealized depreciation for all investments for which there was an excess of tax cost over value, were as follows:
| | Tax
Cost | | | Tax
Unrealized
Appreciation | | | Tax
Unrealized
Depreciation | | | Net Tax
Unrealized
Appreciation/
(Depreciation) | |
| | | $ | 1,041,495,288 | | | $ | 2,484,557 | | | $ | (41,332,427 | ) | | $ | (38,847,870 | ) |
Note 7 – Securities Transactions
For the year ended September 30, 2023, the cost of purchases and proceeds from sales of investment securities, excluding government securities, short-term investments and derivatives, were as follows:
| | Purchases | | | Sales | |
| | | $ | 236,739,224 | | | $ | 508,774,355 | |
The Fund is permitted to purchase or sell securities from or to certain affiliated funds under specified conditions outlined in procedures adopted by the Board. The procedures have been designed to ensure that any purchase or sale of securities by the Fund from or to another fund or portfolio that is or could be considered an affiliate by virtue of having a common investment adviser (or affiliated investment advisers), common trustees and/or common officers complies with Rule 17a-7 of the 1940 Act. Further, as defined under these procedures, each transaction is effected at the current market price to save costs, where permissible. For the year ended September 30, 2023, the Fund did not engage in purchases and sales of securities, pursuant to Rule 17a-7 of the 1940 Act.
Note 8 – Unfunded Loan Commitments
Pursuant to the terms of certain loan agreements, the Fund held unfunded loan commitments as of September 30, 2023. The Fund is obligated to fund these loan commitments at the borrower’s discretion.
The unfunded loan commitments as of September 30, 2023, were as follows:
Borrower | | Maturity
Date | | | Face
Amount | | | Value | |
Authentic Brands | | | 12/21/28 | | | $ | 401,235 | | | $ | 249 | |
| | THE GUGGENHEIM FUNDS ANNUAL REPORT | 67 |
NOTES TO FINANCIAL STATEMENTS (continued) |
Note 9 – Restricted Securities
The securities below are considered illiquid and restricted under guidelines established by the Board:
Restricted Securities | | Acquisition
Date | | | Cost | | | Value | |
Mirabela Nickel Ltd. due 06/24/191 | | | 12/31/13 | | | $ | 1,160,811 | | | $ | 60,792 | |
1 | Security is in default of interest and/or principal obligations. |
Note 10 – Line of Credit
The Trust, along with other affiliated trusts, secured a 364-day committed, $1,150,000,000 line of credit from Citibank, N.A., which was in place through September 29, 2023, at which time a new line of credit was entered into in the amount of $1,165,000,000. The Fund may draw (borrow) from the line of credit as a temporary measure for emergency purposes, to facilitate redemption requests, or for other short-term liquidity purposes consistent with the Fund’s investment objective and program. For example, it may be advantageous for the Fund to borrow money rather than sell existing portfolio positions to meet redemption requests. Fees related to borrowings, if any, vary under this arrangement between the greater of Citibank’s “base rate”, SOFR plus 1%, or the federal funds rate plus 1/2 of 1%.
The commitment fee that may be paid by the Fund is at an annualized rate of 0.15% of the average daily amount of their allocated unused commitment amount. The commitment fee amount is allocated to the individual Funds based on the respective net assets of each participating Fund and is referenced in the Fund’s Statement of Operations under “Line of credit fees”. The Fund did not have any borrowings under this agreement as of and for the year ended September 30, 2023.
Note 11 – Market Risks
The value of, or income generated by, the investments held by the Fund are subject to the possibility of rapid and unpredictable fluctuation, and loss that may result from various factors. These factors include, among others, developments affecting individual companies, or from broader influences, including real or perceived changes in prevailing interest rates (which have since risen and may continue to rise), changes in inflation rates or expectations about inflation rates (which are currently elevated relative to normal conditions), adverse investor confidence or sentiment, changing economic, political (including geopolitical), social or financial market conditions, increased instability or general uncertainty, environmental disasters, governmental actions, public health emergencies (such as the spread of infectious diseases, pandemics and epidemics), debt crises, actual or threatened wars or other armed conflicts (such as the current Russia-Ukraine conflict and its risk of expansion or collateral economic and other effects) or ratings downgrades, and other similar events, each of which may be temporary or last for extended periods. Moreover, changing economic, political, geopolitical, social, financial market
68 | THE GUGGENHEIM FUNDS ANNUAL REPORT | |
NOTES TO FINANCIAL STATEMENTS (concluded) |
or other conditions in one country or geographic region could adversely affect the value, yield and return of the investments held by the Fund in a different country or geographic region, economy, and market because of the increasingly interconnected global economies and financial markets. The duration and extent of the foregoing types of factors or conditions are highly uncertain and difficult to predict and have in the past, and may in the future, cause volatility and distress in economies and financial markets or other adverse circumstances, which may negatively affect the value of the Fund’s investments and performance of the Fund.
Note 12 – Subsequent Events
The Fund evaluated subsequent events through the date the financial statements are issued and determined there were no material events that would require adjustment to or disclosure in the Fund’s financial statements.
| | THE GUGGENHEIM FUNDS ANNUAL REPORT | 69 |
REPORT OF INDEPENDENT REGISTERED PUBLIC ACCOUNTING FIRM |
To the Shareholders and the Board of Trustees of Guggenheim Floating Rate Strategies Fund
Opinion on the Financial Statements
We have audited the accompanying statement of assets and liabilities of Guggenheim Floating Rate Strategies Fund (the “Fund”), (one of the funds constituting Guggenheim Funds Trust (the “Trust”)), including the schedule of investments, as of September 30, 2023, and the related statement of operations for the year then ended, the statements of changes in net assets for each of the two years in the period then ended, the financial highlights for each of the five years in the period then ended and the related notes (collectively referred to as the “financial statements”). In our opinion, the financial statements present fairly, in all material respects, the financial position of the Fund (one of the funds constituting Guggenheim Funds Trust) at September 30, 2023, the results of its operations for the year then ended, the changes in its net assets for each of the two years in the period then ended and its financial highlights for each of the five years in the period then ended, in conformity with U.S. generally accepted accounting principles.
Basis for Opinion
These financial statements are the responsibility of the Trust’s management. Our responsibility is to express an opinion on the Fund’s financial statements based on our audits. We are a public accounting firm registered with the Public Company Accounting Oversight Board (United States) (“PCAOB”) and are required to be independent with respect to the Trust in accordance with the U.S. federal securities laws and the applicable rules and regulations of the Securities and Exchange Commission and the PCAOB.
We conducted our audits in accordance with the standards of the PCAOB. Those standards require that we plan and perform the audit to obtain reasonable assurance about whether the financial statements are free of material misstatement, whether due to error or fraud. The Trust is not required to have, nor were we engaged to perform, an audit of the Trust’s internal control over financial reporting. As part of our audits, we are required to obtain an understanding of internal control over financial reporting but not for the purpose of expressing an opinion on the effectiveness of the Trust’s internal control over financial reporting. Accordingly, we express no such opinion.
Our audits included performing procedures to assess the risks of material misstatement of the financial statements, whether due to error or fraud, and performing procedures that respond to those risks. Such procedures included examining, on a test basis, evidence regarding the amounts and disclosures in the financial statements. Our procedures included confirmation of securities owned as of September 30, 2023, by correspondence with the custodian, transfer agent, brokers, and paying agents; when replies were not received from brokers or paying agents, we performed
70 | THE GUGGENHEIM FUNDS ANNUAL REPORT | |
REPORT OF INDEPENDENT REGISTERED PUBLIC ACCOUNTING FIRM (concluded) |
other auditing procedures. Our audits also included evaluating the accounting principles used and significant estimates made by management, as well as evaluating the overall presentation of the financial statements. We believe that our audits provide a reasonable basis for our opinion.

We have served as the auditor of one or more Guggenheim investment companies since 1979.
Tysons, Virginia
November 28, 2023
| | THE GUGGENHEIM FUNDS ANNUAL REPORT | 71 |
OTHER INFORMATION (Unaudited) |
Federal Income Tax Information
This information is being provided as required by the Internal Revenue Code. Amounts shown may differ from those elsewhere in the report because of differences in tax and financial reporting practice.
In January 2024, shareholders will be advised on IRS Form 1099 DIV or substitute 1099 DIV as to the federal tax status of the distributions received by shareholders in the calendar year 2023.
The Fund’s investment income (dividend income plus short-term capital gains, if any) qualifies as follows:
Of the taxable ordinary income distributions paid during the fiscal year ended September 30, 2023, the Fund had the corresponding percentages qualify for the reduced tax rate pursuant to the Jobs and Growth Tax Relief and Reconciliation Act of 2003 or for the dividends received deduction for corporations. See the qualified dividend income and dividend received deduction columns, respectively, in the table below.
Additionally, of the taxable ordinary income distributions paid during the fiscal year ended September 30, 2023, the Fund had the corresponding percentages qualify as interest related dividends as permitted by IRC Section 871(k)(1). See the qualified interest income column in the table below.
| | Qualified
Dividend
Income | | | Dividend
Received
Deduction | | | Qualified
Interest
Income | |
| | | | 0.15 | % | | | 0.15 | % | | | 98.37 | % |
Delivery of Shareholder Reports
Paper copies of the Fund’s annual and semi-annual shareholder reports are not sent by mail, unless you specifically request paper copies of the reports from the Fund or from your financial intermediary. Instead, the reports are made available on a website, and you are notified by mail each time a report is posted and provided with a website link to access the report.
You may elect to receive all future shareholder reports in paper free of charge. If you hold shares of the Fund directly, you can inform the Fund that you wish to receive paper copies of reports by calling 800.820.0888. If you hold shares of the Fund through a financial intermediary, please contact the financial intermediary to make this election. Your election to receive reports in paper may apply to all Guggenheim Funds in which you are invested and may apply to all Guggenheim Funds held with your financial intermediary.
72 | THE GUGGENHEIM FUNDS ANNUAL REPORT | |
OTHER INFORMATION (Unaudited)(continued) |
Tailored Shareholder Reports for Open-End Mutual Funds and Exchange-Traded Funds
Effective January 24, 2023, the SEC adopted rule and form amendments to require open-end mutual funds and exchange-traded funds registered on Form N-1A to transmit concise and visually engaging streamlined annual and semi-annual reports to shareholders that highlight key information. Other information, including financial statements, will no longer appear in a streamlined shareholder report but must be available online, delivered free of charge upon request, and filed on a semi-annual basis on Form N-CSR. The rule and form amendments have a compliance date of July 24, 2024. At this time, management is evaluating the impact of these amendments on the shareholder reports for the Fund.
Proxy Voting Information
A description of the policies and procedures that the Trust uses to determine how to vote proxies relating to securities held in the Fund’s portfolio is available, without charge and upon request, by calling 800.820.0888. This information is also available from the EDGAR database on the SEC’s website at https://www.sec.gov.
Information regarding how the Fund voted proxies relating to portfolio securities during the most recent 12-month period ended June 30 is available without charge, upon request, by calling 800.820.0888. This information is also available from the EDGAR database on the SEC’s website at https://www.sec.gov.
Sector Classification
Information in the Consolidated Schedule of Investments is categorized by sectors using sector-level Classifications defined by the Bloomberg Industry Classification System, a widely recognized industry classification system provider. The Fund’s registration statement has investment policies relating to concentration in specific sectors/industries. For purposes of these investment policies, the Fund usually classifies sectors/industries based on industry-level Classifications used by widely recognized industry classification system providers such as Bloomberg Industry Classification System, Global Industry Classification Standards and Barclays Global Classification Scheme.
Quarterly Portfolio Schedules Information
The Trust files its complete schedule of portfolio holdings with the SEC for the first and third quarters of each fiscal year as an exhibit to its reports on Form N-PORT, and for reporting periods ended prior to March 31, 2019, filed such information on Form N-Q. The Fund’s Forms N-PORT and N-Q are available on the SEC’s website at https://www.sec.gov. Copies of the portfolio holdings are also available to shareholders, without charge and upon request, by calling 800.820.0888.
| | THE GUGGENHEIM FUNDS ANNUAL REPORT | 73 |
OTHER INFORMATION (Unaudited)(continued) |
Report of the Guggenheim Funds Trust Board of Trustees
The Board of Trustees of Guggenheim Funds Trust (the “Trust”), including the Independent Trustees, unanimously approved the renewal of the investment management agreements (as applicable to a specific Fund, the “Advisory Agreement” and collectively, the “Advisory Agreements”) with Security Investors, LLC (“Security Investors”) and Guggenheim Partners Investment Management, LLC (“GPIM”) on behalf of the applicable series of the Trust listed below (each a “Fund” and collectively, the “Funds”) and the investment sub-advisory agreement between Security Investors and GPIM on behalf of Guggenheim Municipal Income Fund (the “Sub-Advisory Agreement” and together with the “Advisory Agreements,” the “Agreements”):
● Guggenheim Alpha Opportunity Fund (“Alpha Opportunity Fund”)* | ● Guggenheim Core Bond Fund(“Core Bond Fund”)* |
● Guggenheim Diversified Income Fund (“Diversified Income Fund”)** | ● Guggenheim Floating Rate Strategies Fund (“Floating Rate Strategies Fund”)** |
● Guggenheim High Yield Fund (“High Yield Fund”)* | ● Guggenheim Large Cap Value Fund (“Large Cap Value Fund”)* |
● Guggenheim Limited Duration Fund (“Limited Duration Fund”)** | ● Guggenheim Macro Opportunities Fund (“Macro Opportunities Fund”)**1 |
● Guggenheim Market Neutral Real Estate Fund (“Market Neutral Real Estate Fund”)** | ● Guggenheim Municipal Income Fund (“Municipal Income Fund”)* |
● Guggenheim Risk Managed Real Estate Fund (“Risk Managed Real Estate Fund”)** | ● Guggenheim Small Cap Value Fund (“Small Cap Value Fund”)* |
● Guggenheim SMid Cap Value Fund (“SMid Cap Value Fund”)* | ● Guggenheim StylePlus—Large Core Fund (“StylePlus—Large Core Fund”)* |
● Guggenheim StylePlus—Mid Growth Fund (“StylePlus—Mid Growth Fund”)* | ● Guggenheim Total Return Bond Fund (“Total Return Bond Fund”)** |
● Guggenheim Ultra Short Duration Fund (“Ultra Short Duration Fund”)** | ● Guggenheim World Equity Income Fund (“World Equity Income Fund”)* |
* | Security Investors serves as investment adviser to the Fund. |
** | GPIM serves as investment adviser to the Fund. Unless the context indicates otherwise, GPIM and Security Investors, with respect to their service as investment adviser to the applicable Funds, are each referred to herein as an “Adviser” and together, the “Advisers.” |
1 | GPIM also serves as investment adviser to Guggenheim Macro Opportunities Fund CFC (the “Subsidiary”), a wholly-owned subsidiary of Macro Opportunities Fund that is organized as a limited company under the laws of the Cayman Islands and used by Macro Opportunities Fund to obtain commodities exposure. Pursuant to a separate investment advisory agreement for the Subsidiary (the “Subsidiary Advisory Agreement”), the Subsidiary pays GPIM an advisory fee at the same rate that Macro Opportunities Fund pays GPIM under its Advisory Agreement. The Subsidiary Advisory Agreement does not require annual renewal by the Board and will continue until it is terminated as provided in the Agreement. In addition, GPIM and Macro Opportunities Fund have entered into a separate fee waiver agreement pursuant to which GPIM has contractually agreed to waive the advisory fee it receives from Macro Opportunities Fund in an amount equal to the advisory fee paid to GPIM by the Subsidiary. This undertaking will continue for so long as Macro Opportunities Fund invests in the Subsidiary, and may be terminated only with the approval of the Board. |
74 | THE GUGGENHEIM FUNDS ANNUAL REPORT | |
OTHER INFORMATION (Unaudited)(continued) |
Security Investors and GPIM are each an indirect subsidiary of Guggenheim Partners, LLC, a privately-held, global investment and advisory firm (“Guggenheim Partners”). Guggenheim Partners, Security Investors, GPIM and their affiliates may be referred to herein collectively as “Guggenheim.” Security Investors and GPIM are also known as “Guggenheim Investments,” the global asset management and investment advisory division of Guggenheim Partners that includes other affiliated investment management businesses.
At meetings held in person on April 17-18, 2023 (the “April Meeting”) and meetings held by videoconference on May 15, 2023 and in person on May 24, 2023 (the “May Meeting”), the Contracts Review Committee of the Board (the “Committee”), consisting solely of the Independent Trustees, met separately from Guggenheim to consider the proposed renewal of the Agreements. As part of its review process, the Committee was represented by independent legal counsel to the Independent Trustees (“Independent Legal Counsel”), from whom the Independent Trustees received separate legal advice and with whom they met separately. Independent Legal Counsel reviewed and discussed with the Committee various key aspects of the Trustees’ legal responsibilities relating to the proposed renewal of the Agreements and other principal contracts. The Committee took into account various materials received from Guggenheim and Independent Legal Counsel. The Committee also considered the variety of written materials, reports and oral presentations the Board received throughout the year regarding performance and operating results of the Funds, and other information relevant to its evaluation of the Agreements.
In connection with the contract review process, FUSE Research Network LLC (“FUSE”), an independent, third-party research provider, was engaged to prepare advisory contract renewal reports designed specifically to help the Board fulfill its advisory contract renewal responsibilities. The objective of the FUSE reports is to present the subject funds’ relative position regarding fees, expenses and total return performance, with peer group and universe comparisons. The Committee assessed the data provided in the FUSE reports as well as commentary presented by Guggenheim, including, among other things, a summary of notable distinctions between certain Funds and the applicable peer group identified in the FUSE reports and explanations for custom peer groups created for certain Funds that do not fit well into any particular category. The Committee noted that although FUSE’s process typically results in the identification for each Fund of a universe of similar funds for performance comparisons and a narrower group of similar funds from the universe based on asset levels for comparative fee and expense data evaluation (i.e., the peer group), the peer group constituent funds identified by FUSE for Market Neutral Real Estate Fund were the same as the performance universe constituent funds due to the Fund’s investment strategy.
In addition, Guggenheim provided materials and data in response to formal requests for information sent by Independent Legal Counsel on behalf of the Committee. Guggenheim also made a presentation at the April Meeting. Throughout the process, the Committee asked questions of management and requested certain additional information, which Guggenheim provided (collectively with the foregoing reports and materials, the “Contract Review Materials”).
| | THE GUGGENHEIM FUNDS ANNUAL REPORT | 75 |
OTHER INFORMATION (Unaudited)(continued) |
The Committee considered the Contract Review Materials in the context of its accumulated experience governing the Trust and other Guggenheim funds and weighed the factors and standards discussed with Independent Legal Counsel.
Following an analysis and discussion of relevant factors, including those identified below, and in the exercise of its business judgment, the Committee concluded that it was in the best interest of each Fund to recommend that the Board approve the renewal of the applicable Agreements for an additional annual term. Following its review of the Committee’s recommendation, the Board approved the renewal of the applicable Agreements for each Fund for a one-year period ending August 1, 2024 at a meeting held on May 23-24, 2023 (the “May Board Meeting” and together with the May Meeting, the “May Meetings”) and determined to adopt the Committee’s considerations and conclusions, which follow.
Advisory Agreements
Nature, Extent and Quality of Services Provided by Each Adviser: With respect to the nature, extent and quality of services currently provided by each Adviser, the Committee considered the qualifications, experience and skills of key personnel performing services for the Funds, including those personnel providing compliance and risk oversight, as well as the supervisors and reporting lines for such personnel. The Committee also considered other information, including Guggenheim’s resources and related efforts to retain, attract and motivate capable personnel to serve the Funds. In evaluating Guggenheim’s resources and capabilities, the Committee considered Guggenheim’s commitment to focusing on, and investing resources in support of, funds in the Guggenheim fund complex, including the Funds. The Committee also considered Guggenheim’s discussion of its ongoing review of the Guggenheim fund line-up at the April Meeting and the May Board Meeting. In addition, the Committee considered the acceptability of the terms of each Advisory Agreement, including the scope of services required to be performed by each Adviser.
The Committee’s review of the services provided by Guggenheim to the Funds included consideration of Guggenheim’s investment processes and resulting performance, portfolio oversight and risk management, and the related regular quarterly reports and presentations received by the Board. The Committee took into account the risks borne by Guggenheim in sponsoring and providing services to the Funds, including regulatory, operational, legal and entrepreneurial risks. The Committee considered the resources dedicated by Guggenheim to compliance functions and the reporting made to the Board by Guggenheim compliance personnel regarding Guggenheim’s adherence to regulatory requirements. The Committee also considered the regular reports the Board receives from the Trust’s Chief Compliance Officer regarding compliance policies and procedures established pursuant to Rule 38a-1 under the Investment Company Act of 1940, as amended. In connection with the Committee’s evaluation of the overall package of services provided by Guggenheim, the Committee considered Guggenheim’s administrative services, including its role in supervising, monitoring, coordinating and evaluating the various services provided by the fund administrator, transfer agent, distributor, custodian
76 | THE GUGGENHEIM FUNDS ANNUAL REPORT | |
OTHER INFORMATION (Unaudited)(continued) |
and other service providers to the Funds. The Committee evaluated the Office of Chief Financial Officer (the “OCFO”), established to oversee the fund administration, accounting and transfer agency services provided to the Funds and other Guggenheim funds, including the OCFO’s resources, personnel and services provided.
With respect to Municipal Income Fund, the Committee noted that, although Security Investors delegated certain portfolio management responsibilities to the Sub-Adviser, as affiliated companies, both the Adviser and the Sub-Adviser are part of the Guggenheim organization. Further, the Committee took into account Guggenheim’s explanation that investment advisory-related services are provided by many Guggenheim employees under different related legal entities and thus, the services provided by the Adviser on the one hand and the Sub-Adviser on the other, as well as the risks assumed by each party, cannot be ascribed to distinct legal entities.2 As a result, in evaluating the services provided to the Municipal Income Fund under the Sub-Advisory Agreement, the Committee did not separately consider the contributions under the Advisory Agreement and the Sub-Advisory Agreement.
With respect to Guggenheim’s resources and the ability of each Adviser to carry out its responsibilities under the applicable Advisory Agreement, the Chief Financial Officer of Guggenheim Investments reviewed with the Committee financial information concerning the holding company for Guggenheim Investments, Guggenheim Partners Investment Management Holdings, LLC (“GPIMH”), and the various entities comprising Guggenheim Investments, and provided the audited consolidated financial statements of GPIMH. (Thereafter, the Committee received the audited consolidated financial statements of GPIM.)
Based on the foregoing, and based on other information received (both oral and written) at the April Meeting and the May Meetings, as well as other considerations, including the Committee’s knowledge of how each Adviser performs its duties obtained through Board meetings, discussions and reports throughout the year, the Committee concluded that each Adviser and its personnel were qualified to serve the Funds in such capacity and may reasonably be expected to continue to provide a high quality of services under each Advisory Agreement with respect to the Funds.
Investment Performance: The Committee received, for each Fund, investment returns for the since-inception, ten-year, five-year, three-year, one-year and three-month periods ended December 31, 2022, as applicable. In addition, the Committee received a comparison of each Fund’s performance to the performance of a benchmark, a universe of funds and a narrower peer group of similar funds based on asset levels as identified by FUSE (except as noted above with respect to Market Neutral Real Estate Fund), in each case for the same periods, as applicable. The Committee also received from FUSE a description of the methodology for identifying each Fund’s peer group and universe for performance and expense comparisons. The Committee also received
2 | Consequently, except where the context indicates otherwise, references to “Adviser,” “Advisers” or “Sub-Adviser” should be understood as referring to Guggenheim Investments generally and the services it provides under the Agreements. |
| | THE GUGGENHEIM FUNDS ANNUAL REPORT | 77 |
OTHER INFORMATION (Unaudited)(continued) |
certain performance information as of March 31, 2023. In assessing each Fund’s performance, the Committee considered that the Board receives regular reporting from Guggenheim regarding performance and evaluates performance throughout the year.
In seeking to evaluate Fund performance over a full market cycle, the Committee focused its attention on five-year and three-year performance rankings as compared to the relevant universe of funds. Except as to the individual Funds discussed below, the Committee observed that the returns of each Fund’s Institutional Class shares ranked in the third quartile or better of such Fund’s performance universe for each of the relevant periods considered. In addition, the Committee made the following observations:
Alpha Opportunity Fund: The returns of the Fund’s Institutional Class shares ranked in the 96th and 73rd percentiles of its performance universe for the five-year and three-year periods ended December 31, 2022, respectively. The Committee noted management’s explanation that the Fund’s relative underperformance over the five-year time period was primarily due to the Fund’s beta profile and fundamental factor tilts. The Committee noted management’s statement that the Fund’s lower beta profile to broad market U.S. equities relative to its peers and long exposure to value and short exposure to growth have detracted from investment performance. The Committee also noted management’s statement that as a result of an update in 2021 to the quantitative investment methodology that the Fund employs, as well as the more recent comeback of value-oriented, higher quality names, the Fund experienced performance rankings that compare more favorably relative to its performance universe for the three-year and one-year periods ended December 31, 2022.
Diversified Income Fund: The returns of the Fund’s Institutional Class shares ranked in the 78th and 75th percentiles of its performance universe for the five-year and three-year periods ended December 31, 2022, respectively. The Committee noted management’s explanation that the Fund’s relative underperformance over the five-year time period was primarily due to the Fund’s defensively-positioned portfolio, in particular within its fixed-income sleeve which includes allocations to several Guggenheim fixed-income funds that were defensively positioned beginning in 2018, reflecting Guggenheim’s market views. The Committee also noted management’s statement that the Fund maintained a lower beta profile to equities relative to its peers. The Committee further noted management’s statement that the Fund’s allocation process was updated in 2021, resulting in an increase in the Fund’s equity exposure, and that there was some improvement in the Fund’s performance rankings relative to its performance universe for the three-year and one-year periods ended December 31, 2022. The Committee noted management’s statement that although the Fund’s increased equity exposure was detrimental to the Fund’s performance relative to peers in 2022 due to the poor performance of U.S. equities that year, Guggenheim believes the increased equity exposure will ultimately benefit shareholders and support total return performance in the medium to long term. The Committee also noted the Fund’s small size and considered management’s statements that the Fund continues to be a viable offering and that Guggenheim is able to manage the Fund at its current size.
78 | THE GUGGENHEIM FUNDS ANNUAL REPORT | |
OTHER INFORMATION (Unaudited)(continued) |
Market Neutral Real Estate Fund: The returns of the Fund’s Institutional Class shares ranked in the 44th and 89th percentiles of its performance universe for the five-year and three-year periods ended December 31, 2022, respectively. The Committee noted management’s explanation that the Fund’s relative underperformance over the three-year time period was due to underperforming pairs of offsetting long and short positions as well as several stock- and sector-specific issues, and considered that, despite recent underperformance, the Fund experienced performance that ranks in the top half of its performance universe for the five-year period ended December 31, 2022.
Municipal Income Fund: The returns of the Fund’s Institutional Class shares ranked in the 89th and 83rd percentiles of its performance universe for the five-year and three-year periods ended December 31, 2022, respectively. The Committee noted management’s explanation that the Fund’s conservative positioning in high quality, long-duration assets, which underperformed over the past two years due to a risk-on sentiment in 2021 and due to fears of duration risk in 2022, contributed to relative underperformance over the five-year and three-year time periods. The Committee noted management’s statement that the Fund’s allocation to closed-end funds also contributed to relative underperformance in 2022 as the increased cost of leverage weighed on the performance of such funds. The Committee considered management’s belief that an economic downturn that is likely to follow the Federal Reserve’s tightening of financial conditions will disproportionately affect weaker municipal credits and could lead to distress in names the Fund has avoided. The Committee also took into account management’s further discussions of performance attribution and outlook for the Fund at the April Meeting and the May Board Meeting, during which management highlighted that the Fund’s relative underperformance in 2022 was due to the exceptional volatility in the fixed-income markets that year which also impacted relative performance for the trailing five-year and three-year time periods, and noted the overall low dispersion in absolute investment returns among municipal bond funds.
StylePlus—Mid Growth Fund: The returns of the Fund’s Institutional Class shares ranked in the 76th and 67th percentiles of its performance universe for the five-year and three-year periods ended December 31, 2022, respectively. The Committee noted management’s explanation that the Fund’s relative underperformance over the five-year time period can be attributed to the more conservative positioning of the underlying funds in which the Fund invests, resulting in yields insufficient to offset fund fees and other costs, as well as the strategy’s tilt to value-oriented, lower-growth names within the mid-cap growth segment as growth outperformed value securities from 2018 through 2020. The Committee also noted management’s statement that as a result of the more recent comeback of value-oriented, lower-growth names, the Fund experienced performance rankings that compare more favorably relative to its performance universe for the three-year and one-year periods ended December 31, 2022.
Ultra Short Duration Fund: The returns of the Fund’s Institutional Class shares ranked in the 76th and 63rd percentiles of its performance universe for the five-year and three-year periods ended December 31, 2022, respectively. The Committee noted management’s explanation that the Fund’s overweight duration positioning over the five-year time period relative to its performance universe as well as higher allocations to structured credit during the second half of 2022, which
| | THE GUGGENHEIM FUNDS ANNUAL REPORT | 79 |
OTHER INFORMATION (Unaudited)(continued) |
underperformed corporate credit during that period, contributed to relative underperformance over the five-year time period. The Committee considered management’s expectation that the resetting of higher interest rates should help the Fund to perform well going forward and that the divergence in the relationship between structured and corporate credit should normalize going forward and lead to relative outperformance, noting that there was some improvement in the Fund’s performance ranking relative to its performance universe for the one-year period ended December 31, 2022.
Based on the foregoing, and based on other information received (both oral and written) at the April Meeting and the May Meetings, as well as other considerations, the Committee concluded that, with respect to each Fund other than Municipal Income Fund: (i) the Fund’s performance was acceptable; or (ii) it was satisfied with Guggenheim’s responses and/or efforts to improve investment performance; and, with respect to Municipal Income Fund, it would continue to monitor the Fund’s investment performance.
Comparative Fees, Costs of Services Provided and the Benefits Realized by Each Adviser from Its Relationship with the Funds: The Committee compared each Fund’s contractual advisory fee (which, for Municipal Income Fund, includes the sub-advisory fee paid to the Sub-Adviser), net effective management fee3 and total net expense ratio to the applicable peer group. The Committee also reviewed the median advisory fees and expense ratios, including expense ratio components (e.g., transfer agency fees, administration fees, other operating expenses, distribution fees and fee waivers/reimbursements), of the peer group of funds. In addition, the Committee considered information regarding Guggenheim’s process for evaluating the competitiveness of each Fund’s fees and expenses, noting Guggenheim’s statement that evaluations seek to incorporate a variety of factors with a general focus on ensuring fees and expenses: (i) are competitive; (ii) give consideration to resource support requirements; and (iii) ensure Funds are able to deliver on shareholder return expectations. The Committee also considered Guggenheim’s discussion of information regarding fee and expense trends across the open-end fund industry and its response to those trends with respect to the funds in the Guggenheim fund complex, including the Funds.
As part of its evaluation of each Fund’s advisory fee, the Committee considered how such fees compared to the advisory fee charged by Guggenheim to one or more other clients that it manages pursuant to similar investment strategies, to the extent applicable, noting that, in certain instances, Guggenheim charges a lower advisory fee to such other clients. In this connection, the Committee considered, among other things, Guggenheim’s representations about the significant differences between managing mutual funds as compared to other types of accounts. The Committee also considered Guggenheim’s explanation that lower fees are charged in certain instances due to various other factors, including the scope of contract, type of investors, fee structure, applicable legal, governance and capital structures, tax status and historical pricing
3 | The “net effective management fee” for each Fund represents the combined effective advisory fee and administration fee as a percentage of average net assets for the latest fiscal year, after any waivers and/or reimbursements. |
80 | THE GUGGENHEIM FUNDS ANNUAL REPORT | |
OTHER INFORMATION (Unaudited)(continued) |
reasons. In addition, the Committee took into account Guggenheim’s discussion of the regulatory, operational, legal and entrepreneurial risks involved with the Funds as compared to other types of accounts. The Committee concluded that the information it received demonstrated that the aggregate services provided to, or the specific circumstances of, each Fund were sufficiently different from the services provided to, or the specific circumstances of, other clients with similar investment strategies and/or that the risks borne by Guggenheim were sufficiently greater than those associated with managing other clients with similar investment strategies to support the difference in fees.
In further considering the comparative fee and expense data presented in the Contract Review Materials and addressed by Guggenheim, the Committee took into account those Funds with currently effective expense limitation agreements with the Adviser. Except as to the individual Funds discussed below, the Committee observed that the contractual advisory fee, net effective management fee and total net expense ratio for each Fund’s Institutional Class shares each rank in the third quartile or better of such Fund’s peer group. In addition, the Committee made the following observations:
Floating Rate Strategies Fund: The contractual advisory fee for the Fund’s Institutional Class shares ranks in the third quartile (73rd percentile) of its peer group. Although the net effective management fee for the Fund’s Institutional Class shares ranks in the fourth quartile (80th percentile) of its peer group, the Committee considered that the total net expense ratio for the Fund’s Institutional Class shares ranks in the third quartile (67th percentile) of its peer group. The Committee considered the Adviser’s statement explaining the higher fees that performance is driven by a unique investment approach that requires significant resources. In this regard, the Committee took into consideration the strong investment performance of the Fund’s Institutional Class shares for the three-year period ended December 31, 2022. The Committee also took into account the Fund’s currently effective expense limitation agreement with the Adviser.
Limited Duration Fund: The contractual advisory fee for the Fund’s Institutional Class shares ranks in the fourth quartile (87th percentile) of its peer group. The net effective management fee for the Fund’s Institutional Class shares ranks in the third quartile (73rd percentile) of its peer group. The total net expense ratio for the Fund’s Institutional Class shares ranks in the third quartile (67th percentile) of its peer group. The Committee considered the Adviser’s statement explaining the higher fees that performance is driven by a unique investment approach that requires significant resources. In this regard, the Committee took into consideration the strong investment performance of the Fund’s Institutional Class shares for the five-year and three-year periods ended December 31, 2022. The Committee also took into account the Fund’s currently effective expense limitation agreement with the Adviser.
Macro Opportunities Fund: The contractual advisory fee for the Fund’s Institutional Class shares ranks in the fourth quartile (82nd percentile) of its peer group. The net effective management fee for the Fund’s Institutional Class shares ranks in the third quartile (64th percentile) of its peer group. The total net expense ratio for the Fund’s Institutional Class shares ranks in the third
| | THE GUGGENHEIM FUNDS ANNUAL REPORT | 81 |
OTHER INFORMATION (Unaudited)(continued) |
quartile (73rd percentile) of its peer group. The Committee noted that the Fund is categorized as a non-traditional bond fund which seeks to add value by investing in many non-traditional securities within and outside of fixed income, including equities, currencies, commodities and derivatives, and that peer funds have varying degrees of capability, flexibility and associated fees. The Committee considered the Adviser’s statement explaining the higher fees that performance is driven by a unique investment approach that requires significant resources. In this regard, the Committee took into consideration the strong investment performance of the Fund’s Institutional Class shares for the three-year period ended December 31, 2022. The Committee also took into account the Fund’s currently effective expense limitation agreement and contractual advisory fee breakpoint of 5 basis points on average daily net assets above $5 billion.
Risk Managed Real Estate Fund: The contractual advisory fee for the Fund’s Institutional Class shares ranks in the second quartile (43rd percentile) of its peer group. Although the net effective management fee for the Fund’s Institutional Class shares ranks in the fourth quartile (79th percentile) of its peer group, the Committee considered that the total net expense ratio for the Fund’s Institutional Class shares ranks in the third quartile (57th percentile) of its peer group. The Committee considered the Adviser’s statement that the total expense ratio for the Fund’s Institutional Class shares is competitive and in-line with the peer group average and median and that the Fund’s contractual advisory fee is competitive. The Committee also took into account the Fund’s currently effective expense limitation agreement with the Adviser.
SMid Cap Value Fund: The contractual advisory fee for the Fund’s Institutional Class shares ranks in the first quartile (7th percentile) of its peer group. The net effective management fee for the Fund’s Institutional Class shares ranks in the third quartile (71st percentile) of its peer group. The total net expense ratio for the Fund’s Institutional Class shares ranks in the fourth quartile (79th percentile) of its peer group. The Committee considered that the Fund’s contractual advisory fee ranks favorably in the first quartile of its peer group and reviewed the other expenses that impacted the total net expense ratio. The Committee also took into account the Fund’s currently effective expense limitation agreement with the Adviser.
Total Return Bond Fund: The contractual advisory fee for the Fund’s Institutional Class shares ranks in the fourth quartile (87th percentile) of its peer group. The net effective management fee for the Fund’s Institutional Class shares ranks in the third quartile (67th percentile) of its peer group. The total net expense ratio for the Fund’s Institutional Class shares ranks in the third quartile (73rd percentile) of its peer group. The Committee considered the Adviser’s statement explaining the higher fees that performance is driven by a unique investment approach that requires significant resources. In this regard, the Committee took into consideration the strong investment performance of the Fund’s Institutional Class shares for the three-year period ended December 31, 2022. The Committee also took into account the Fund’s currently effective expense limitation agreement with the Adviser.
82 | THE GUGGENHEIM FUNDS ANNUAL REPORT | |
OTHER INFORMATION (Unaudited)(continued) |
With respect to the costs of services provided and benefits realized by Guggenheim Investments from its relationship with the Funds, the Committee reviewed a profitability analysis and data from management for each Fund setting forth the average assets under management for the twelve months ended December 31, 2022, gross revenues received, and expenses incurred directly or through allocations, by Guggenheim Investments, expense waivers (as applicable), earnings and the operating margin/profitability rate, including variance information relative to the foregoing amounts as of December 31, 2021. In addition, the Chief Financial Officer of Guggenheim Investments reviewed with, and addressed questions from, the Committee concerning the expense allocation methodology employed in producing the profitability analysis. In the course of its review of Guggenheim Investments’ profitability, the Committee took into account the methods used by Guggenheim Investments to determine expenses and profit and the representation by the Chief Financial Officer of Guggenheim Investments that such methods provided a reasonable basis for determining the profitability of the applicable Adviser with respect to each Fund. The Committee considered all of the foregoing, among other things, in evaluating the costs of services provided, the profitability to Guggenheim Investments and the profitability rates presented.
The Committee also considered other benefits available to each Adviser because of its relationship with the Funds and noted Guggenheim’s statement that it does not believe the Advisers derive any such “fall-out” benefits. In this regard, the Committee noted Guggenheim’s statement that, although it does not consider such benefits to be fall-out benefits, the Advisers may benefit from certain economies of scale and synergies, such as enhanced visibility of the Advisers, enhanced leverage in fee negotiations and other synergies arising from offering a broad spectrum of products, including the Funds.
Based on the foregoing, and based on other information received (both oral and written) at the April Meeting and the May Meetings, as well as other considerations, the Committee concluded that the comparative fees and the benefits realized by each Adviser from its relationship with the Funds were appropriate and that each Adviser’s profitability from its relationship with the Funds was not unreasonable.
Economies of Scale: The Committee received and considered information regarding whether there have been economies of scale with respect to the management of the Funds as Fund assets grow, whether the Funds have appropriately benefited from any economies of scale, and whether there is potential for realization of any further economies of scale. The Committee considered whether economies of scale in the provision of services to the Funds were being passed along to and shared with the shareholders. The Committee considered that Guggenheim believes it is appropriately sharing potential economies of scale and that Guggenheim’s decrease in 2022 in overall expenses was attributable to decreased product costs driven by lower average assets under management and lower non-recurring costs related to closed-end fund matters as well as a decrease in compensation and benefits. The Committee also considered that although expenses related to investment resources decreased in 2022, Guggenheim’s shared services expenses and certain other expenses increased in 2022.
| | THE GUGGENHEIM FUNDS ANNUAL REPORT | 83 |
OTHER INFORMATION (Unaudited)(continued) |
The Committee also noted the process employed by the Adviser to evaluate whether it would be appropriate to institute a new breakpoint for a Fund, with consideration given to, among other things: (i) the Fund’s size and trends in asset levels over recent years; (ii) the competitiveness of the expense levels; (iii) whether expense waivers are in place; (iv) changes and trends in revenue and expenses; (v) whether there are any anticipated expenditures that may benefit the Fund in the future; (vi) Fund profit level margins; (vii) relative Fund performance; (viii) the nature, extent and quality of services management provides to the Fund; and (ix) the complexity of the Fund’s investment strategy and the resources required to support the Fund.
As part of its assessment of economies of scale, the Committee took into account Guggenheim’s representation that it seeks to share economies of scale through a number of means, including breakpoints, advisory fees set at competitive rates pre-assuming future asset growth, expense waivers and limitations, and investments in personnel, operations and infrastructure to support the fund business. The Committee also received information regarding amounts that had been shared with shareholders through such breakpoints and expense waivers and limitations. The Committee also noted information from Guggenheim regarding certain challenges and costs associated with managing Funds that have achieved significant scale. Thus, the Committee considered the size of the Funds and the competitiveness of and/or other determinations made regarding the current advisory fee for each Fund, as well as whether a Fund is subject to an expense limitation.
Based on the foregoing, and based on other information received (both oral and written) at the April Meeting and the May Meetings, as well as other considerations, the Committee concluded that the advisory fee for each Fund was reasonable.
Sub-Advisory Agreement for Municipal Income Fund
Nature, Extent and Quality of Services Provided by the Sub-Adviser: As noted above, because both the Adviser and the Sub-Adviser for Municipal Income Fund—Security Investors and GPIM, respectively—are part of and do business as Guggenheim Investments and the services provided by the Adviser on the one hand and the Sub-Adviser on the other cannot be ascribed to distinct legal entities, the Committee did not separately evaluate the services provided under the Advisory Agreement and the Sub-Advisory Agreement. Therefore, the Committee considered the qualifications, experience and skills of the Fund’s portfolio management team in connection with the Committee’s evaluation of Guggenheim’s investment professionals under the Advisory Agreement. With respect to Guggenheim’s resources and the Sub-Adviser’s ability to carry out its responsibilities under the Sub-Advisory Agreement, as noted above, the Committee considered the financial condition of GPIMH and the various entities comprising Guggenheim Investments. The Committee also considered the acceptability of the terms of the Sub-Advisory Agreement, including the scope of services required to be performed by the Sub-Adviser.
Investment Performance: The Committee considered the returns of the Fund under its evaluation of the Advisory Agreement.
84 | THE GUGGENHEIM FUNDS ANNUAL REPORT | |
OTHER INFORMATION (Unaudited)(concluded) |
Comparative Fees, Costs of Services Provided and the Benefits Realized by the Sub-Adviser from Its Relationship with the Fund: The Committee considered that the Sub-Advisory Agreement is with an affiliate of the Adviser, that the Adviser compensates the Sub-Adviser from its own fees so that the sub-advisory fee rate for the Fund does not impact the fees paid by the Fund and that the Sub-Adviser’s revenues were included in the calculation of Guggenheim Investments’ profitability. Given its conclusion of the reasonableness of the advisory fee, the Committee concluded that the sub-advisory fee rate for the Fund was reasonable.
Economies of Scale: The Committee recognized that, because the Sub-Adviser’s fees are paid by the Adviser and not the Fund, the analysis of economies of scale was more appropriate in the context of the Committee’s consideration of the Advisory Agreement, which was separately considered. (See “Advisory Agreements – Economies of Scale” above.)
Overall Conclusions
The Committee concluded that the investment advisory fees are fair and reasonable in light of the extent and quality of the services provided and other benefits received and that the renewal of each applicable Agreement is in the best interest of each Fund. In reaching this conclusion, no single factor was determinative or conclusive and each Committee member, in the exercise of his or her informed business judgment, may afford different weights to different factors.
Following its review of the Committee’s analysis and determinations, the Board adopted the considerations and conclusions of the Committee and determined to approve the renewal of the Agreements.
| | THE GUGGENHEIM FUNDS ANNUAL REPORT | 85 |
INFORMATION ON BOARD OF TRUSTEES AND OFFICERS (Unaudited) |
A Board of Trustees oversees the Trust, as well as other trusts of GI, in which its members have no stated term of service, and continue to serve after election until resignation. The Statement of Additional Information includes further information about Fund Trustees and Officers, and can be obtained without charge by visiting guggenheiminvestments.com or by calling 800.820.0888.
Name, Address*
and Year of Birth | Position(s)
Held with
Trust | Term of Office
and Length of
Time Served** | Principal Occupation(s)
During Past Five Years | Number of
Portfolios
in Fund
Complex
Overseen | Other
Directorships Held
by Trustees*** |
INDEPENDENT TRUSTEES | | | |
Randall C. Barnes (1951) | Trustee and Chair of the Valuation Oversight Committee | Since 2014 (Trustee) Since 2020 (Chair of the Valuation Oversight Committee) | Current: Private Investor (2001-present). Former: Senior Vice President and Treasurer, PepsiCo, Inc. (1993-1997); President, Pizza Hut International (1991-1993); Senior Vice President, Strategic Planning and New Business Development, PepsiCo, Inc. (1987-1990). | 155 | Current: Advent Convertible and Income Fund (2005-present); Purpose Investments Funds (2013-present). Former: Fiduciary/Claymore Energy Infrastructure Fund (2004-2022); Guggenheim Enhanced Equity Income Fund (2005-2021); Guggenheim Credit Allocation Fund (2013-2021). |
Angela Brock-Kyle (1959) | Trustee | Since 2019 | Current: Founder and Chief Executive Officer, B.O.A.R.D.S. (2013-present); Director, Mutual Fund Directors Forum (2022-present). Former: Senior Leader, TIAA (financial services firm) (1987-2012). | 154 | Current: Bowhead Insurance GP, LLC (2020-present); Hunt Companies, Inc. (2019-present). Former: Fiduciary/Claymore Energy Infrastructure Fund (2019-2022); Guggenheim Enhanced Equity Income Fund (2019-2021); Guggenheim Credit Allocation Fund (2019-2021); Infinity Property & Casualty Corp. (2014-2018). |
86 | THE GUGGENHEIM FUNDS ANNUAL REPORT | |
INFORMATION ON BOARD OF TRUSTEES AND OFFICERS (Unaudited)(continued) |
Name, Address*
and Year of Birth | Position(s)
Held with
Trust | Term of Office
and Length of
Time Served** | Principal Occupation(s)
During Past Five Years | Number of
Portfolios
in Fund
Complex
Overseen | Other
Directorships Held
by Trustees*** |
INDEPENDENT TRUSTEES - continued | | |
Thomas F. Lydon, Jr. (1960) | Trustee and Chair of the Contracts Review Committee | Since 2019 (Trustee) Since 2020 (Chair of the Contracts Review Committee) | Current: President, Global Trends Investments (registered investment adviser) (1996-present); Chief Executive Officer, ETF Flows, LLC (financial advisor education and research provider) (2019-present); Chief Executive Officer, Lydon Media (2016-present); Director, GDX Index Partners, LLC (index provider) (2021-present); Vice Chairman, VettaFi (financial advisor content, research and digital distribution provider) (2022-present). | 154 | Current: US Global Investors, Inc. (GROW) (1995-present); The 2023 ETF Series Trust (4) (June 2023-present); The 2023 ETF Series Trust II (1) (August 2023-present). Former: Fiduciary/Claymore Energy Infrastructure Fund (2019-2022); Guggenheim Enhanced Equity Income Fund (2019-2021); Guggenheim Credit Allocation Fund (2019-2021); Harvest Volatility Edge Trust (3) (2017-2019). |
| | THE GUGGENHEIM FUNDS ANNUAL REPORT | 87 |
INFORMATION ON BOARD OF TRUSTEES AND OFFICERS (Unaudited)(continued) |
Name, Address*
and Year of Birth | Position(s)
Held with
Trust | Term of Office
and Length of
Time Served** | Principal Occupation(s)
During Past Five Years | Number of
Portfolios
in Fund
Complex
Overseen | Other
Directorships Held
by Trustees*** |
INDEPENDENT TRUSTEES - continued | | |
Ronald A. Nyberg (1953) | Trustee and Chair of the Nominating and Governance Committee | Since 2014 | Current: Of Counsel, Momkus LLP (law firm) (2016-present). Former: Partner, Nyberg & Cassioppi, LLC (law firm) (2000-2016); Executive Vice President, General Counsel, and Corporate Secretary, Van Kampen Investments (1982-1999). | 155 | Current: Advent Convertible and Income Fund (2003-present); PPM Funds (2) (2018-present); NorthShore-Edward-Elmhurst Health (2012-present). Former: Fiduciary/Claymore Energy Infrastructure Fund (2004-2022); Guggenheim Enhanced Equity Income Fund (2005-2021); Guggenheim Credit Allocation Fund (2013-2021); Western Asset Inflation-Linked Opportunities & Income Fund (2004-2020); Western Asset Inflation-Linked Income Fund (2003-2020). |
88 | THE GUGGENHEIM FUNDS ANNUAL REPORT | |
INFORMATION ON BOARD OF TRUSTEES AND OFFICERS (Unaudited)(continued) |
Name, Address*
and Year of Birth | Position(s)
Held with
Trust | Term of Office
and Length of
Time Served** | Principal Occupation(s)
During Past Five Years | Number of
Portfolios
in Fund
Complex
Overseen | Other
Directorships Held
by Trustees*** |
INDEPENDENT TRUSTEES - continued | | |
Sandra G. Sponem (1958) | Trustee and Chair of the Audit Committee | Since 2019 (Trustee) Since 2020 (Chair of the Audit Committee) | Current: Retired. Former: Senior Vice President and Chief Financial Officer, M.A. Mortenson-Companies, Inc. (construction and real estate development company) (2007-2017). | 154 | Current: SPDR Series Trust (81) (2018-present); SPDR Index Shares Funds (30) (2018-present); SSGA Active Trust (14) (2018-present). Former: Fiduciary/Claymore Energy Infrastructure Fund (2019-2022); Guggenheim Enhanced Equity Income Fund (2019-2021); Guggenheim Credit Allocation Fund (2019-2021); SSGA Master Trust (1) (2018-2020). |
| | THE GUGGENHEIM FUNDS ANNUAL REPORT | 89 |
INFORMATION ON BOARD OF TRUSTEES AND OFFICERS (Unaudited)(continued) |
Name, Address*
and Year of Birth | Position(s)
Held with
Trust | Term of Office
and Length of
Time Served** | Principal Occupation(s)
During Past Five Years | Number of
Portfolios
in Fund
Complex
Overseen | Other
Directorships Held
by Trustees*** |
INDEPENDENT TRUSTEES - concluded | | |
Ronald E. Toupin, Jr. (1958) | Trustee, Chair of the Board and Chair of the Executive Committee | Since 2014 | Current: Portfolio Consultant (2010-present); Member, Governing Council, Independent Directors Council (2013-present); Governor, Board of Governors, Investment Company Institute (2018-present). Former: Member, Executive Committee, Independent Directors Council (2016-2018); Vice President, Manager and Portfolio Manager, Nuveen Asset Management (1998-1999); Vice President, Nuveen Investment Advisory Corp. (1992-1999); Vice President and Manager, Nuveen Unit Investment Trusts (1991-1999); and Assistant Vice President and Portfolio Manager, Nuveen Unit Investment Trusts (1988-1999), each of John Nuveen & Co., Inc. (registered broker dealer) (1982-1999). | 154 | Former: Fiduciary/Claymore Energy Infrastructure Fund (2004-2022); Guggenheim Enhanced Equity Income Fund (2005-2021); Guggenheim Credit Allocation Fund (2013-2021); Western Asset Inflation-Linked Opportunities & Income Fund (2004-2020); Western Asset Inflation-Linked Income Fund (2003-2020). |
90 | THE GUGGENHEIM FUNDS ANNUAL REPORT | |
INFORMATION ON BOARD OF TRUSTEES AND OFFICERS (Unaudited)(continued) |
Name, Address*
and Year of Birth | Position(s)
Held with
Trust | Term of Office
and Length of
Time Served** | Principal Occupation(s)
During Past Five Years | Number of
Portfolios
in Fund
Complex
Overseen | Other
Directorships Held
by Trustees*** |
INTERESTED TRUSTEE | | |
Amy J. Lee**** (1961) | Trustee, Vice President and Chief Legal Officer | Since 2018 (Trustee) Since 2014 (Chief Legal Officer) Since 2007 (Vice President) | Current: Interested Trustee, certain other funds in the Fund Complex (2018-present); Chief Legal Officer, certain other funds in the Fund Complex (2014-present); Vice President, certain other funds in the Fund Complex (2007-present); Senior Managing Director, Guggenheim Investments (2012-present). Former: President and Chief Executive Officer, certain other funds in the Fund Complex (2017-2019); Vice President, Associate General Counsel and Assistant Secretary, Security Benefit Life Insurance Company and Security Benefit Corporation (2004-2012). | 154 | Former: Fiduciary/Claymore Energy Infrastructure Fund (2018-2022); Guggenheim Enhanced Equity Income Fund (2018-2021); Guggenheim Credit Allocation Fund (2018-2021). |
* | The business address of each Trustee is c/o Guggenheim Investments, 227 West Monroe Street, Chicago, Illinois 60606. |
** | Each Trustee serves an indefinite term, until his or her successor is elected and qualified. Time served includes time served in the respective position for the Predecessor Corporation. |
*** | Each Trustee also serves on the Boards of Trustees of Guggenheim Funds Trust, Guggenheim Variable Funds Trust, Guggenheim Strategy Funds Trust, Guggenheim Taxable Municipal Bond & Investment Grade Debt Trust, Guggenheim Strategic Opportunities Fund, Guggenheim Active Allocation Fund, Rydex Series Funds, Rydex Dynamic Funds, Rydex Variable Trust and Transparent Value Trust. Messrs. Barnes and Nyberg also serve on the Board of Trustees of Advent Convertible & Income Fund. |
**** | This Trustee is deemed to be an “interested person” of the Fund under the 1940 Act by reason of her position with the Fund’s Adviser and/or the parent of the Adviser. |
| | THE GUGGENHEIM FUNDS ANNUAL REPORT | 91 |
INFORMATION ON BOARD OF TRUSTEES AND OFFICERS (Unaudited)(continued) |
Name, Address*
and Year of Birth | Position(s)
Held with
Trust | Term of Office
and Length of
Time Served** | Principal Occupation(s)
During Past Five Years |
OFFICERS | | | |
Brian E. Binder (1972) | President and Chief Executive Officer | Since 2018 | Current: President, Mutual Fund Boards, Guggenheim Investments (2022-present); President and Chief Executive Officer, certain other funds in the Fund Complex (2018-present); President, Mutual Funds Boards, Guggenheim Funds Investment Advisors, LLC and Security Investors, LLC (2018-present);Board Member, Guggenheim Partners Investment Funds plc (2022-present); Board Member, Guggenheim Global Investments plc (2022-present); Board Member, Guggenheim Partners Fund Management (Europe) Limited (2018-present). Former: Senior Managing Director and Chief Administrative Officer, Guggenheim Investments (2018-2022); Managing Director and President, Deutsche Funds, and Head of US Product, Trading and Fund Administration, Deutsche Asset Management (2013-2018); Managing Director, Chairman of North American Executive Committee and Head of Business Management and Consulting, Invesco Ltd. (2010-2012). |
James Howley (1972) | Chief Financial Officer, Chief Accounting Officer and Treasurer | Since 2022 | Current: Managing Director, Guggenheim Investments (2004-present); Chief Financial Officer, Chief Accounting Officer, and Treasurer, certain other funds in the Fund Complex (2022-present). Former: Assistant Treasurer, certain other funds in the Fund Complex (2006-2022); Manager, Mutual Fund Administration of Van Kampen Investments, Inc. (1996-2004). |
Mark E. Mathiasen (1978) | Secretary | Since 2014 | Current: Secretary, certain other funds in the Fund Complex (2007-present); Managing Director, Guggenheim Investments (2007-present). |
Glenn McWhinnie (1969) | Assistant Treasurer | Since 2016 | Current: Vice President, Guggenheim Investments (2009-present); Assistant Treasurer, certain other funds in the Fund Complex (2016-present). |
Michael P. Megaris (1984) | Assistant Secretary | Since 2014 | Current: Assistant Secretary, certain other funds in the Fund Complex (2014-present); Managing Director, Guggenheim Investments (2012-present). |
92 | THE GUGGENHEIM FUNDS ANNUAL REPORT | |
INFORMATION ON BOARD OF TRUSTEES AND OFFICERS (Unaudited)(continued) |
Name, Address*
and Year of Birth | Position(s)
Held with
Trust | Term of Office
and Length of
Time Served** | Principal Occupation(s)
During Past Five Years |
OFFICERS - continued | |
Elisabeth Miller (1968) | Chief Compliance Officer | Since 2012 | Current: Chief Compliance Officer, certain other funds in the Fund Complex (2012-present); Senior Managing Director, Guggenheim Investments (2012-present); Senior Managing Director, Guggenheim Funds Distributors, LLC (2014-present). Former: Chief Compliance Officer, Security Investors, LLC and Guggenheim Funds Investment Advisors, LLC (2012-2018); Chief Compliance Officer, Guggenheim Distributors, LLC (2009-2014); Senior Manager, Security Investors, LLC (2004-2014); Senior Manager, Guggenheim Distributors, LLC (2004-2014). |
Margaux Misantone (1978) | AML Officer | Since 2017 | Current: Chief Compliance Officer, Security Investors, LLC and Guggenheim Funds Investment Advisors, LLC (2018-present); AML Officer, Security Investors, LLC and certain other funds in the Fund Complex (2017-present); Managing Director, Guggenheim Investments (2015-present). Former: Assistant Chief Compliance Officer, Security Investors, LLC and Guggenheim Funds Investments Advisors, LLC (2015-2018). |
Kimberly J. Scott (1974) | Assistant Treasurer | Since 2014 | Current: Director, Guggenheim Investments (2012-present); Assistant Treasurer, certain other funds in the Fund Complex (2012-present). Former: Financial Reporting Manager, Invesco, Ltd. (2010-2011); Vice President/Assistant Treasurer, Mutual Fund Administration for Van Kampen Investments, Inc./Morgan Stanley Investment Management (2009-2010); Manager of Mutual Fund Administration, Van Kampen Investments, Inc./Morgan Stanley Investment Management (2005-2009). |
Bryan Stone (1979) | Vice President | Since 2014 | Current: Vice President, certain other funds in the Fund Complex (2014-present); Managing Director, Guggenheim Investments (2013-present). Former: Senior Vice President, Neuberger Berman Group LLC (2009-2013); Vice President, Morgan Stanley (2002-2009). |
| | THE GUGGENHEIM FUNDS ANNUAL REPORT | 93 |
INFORMATION ON BOARD OF TRUSTEES AND OFFICERS (Unaudited)(concluded) |
Name, Address*
and Year of Birth | Position(s)
Held with
Trust | Term of Office
and Length of
Time Served** | Principal Occupation(s)
During Past Five Years |
OFFICERS - concluded | |
Jon Szafran (1989) | Assistant Treasurer | Since 2017 | Current: Director, Guggenheim Investments (2017-present); Assistant Treasurer, certain other funds in the Fund Complex (2017-present). Former: Assistant Treasurer of Henderson Global Funds and Manager of US Fund Administration, Henderson Global Investors (North America) Inc. (“HGINA”), (2017); Senior Analyst of US Fund Administration, HGINA (2014–2017); Senior Associate of Fund Administration, Cortland Capital Market Services, LLC (2013-2014); Experienced Associate, PricewaterhouseCoopers LLP (2012-2013). |
* | The business address of each officer is c/o Guggenheim Investments, 227 West Monroe Street, Chicago, Illinois 60606. |
** | Each officer serves an indefinite term, until his or her successor is duly elected and qualified. |
94 | THE GUGGENHEIM FUNDS ANNUAL REPORT | |
GUGGENHEIM INVESTMENTS PRIVACY NOTICE (Unaudited) |
Who We Are
This Privacy Notice describes the data protection practices of Guggenheim Investments. Guggenheim Investments as used herein refers to the affiliated investment management businesses of Guggenheim Partners, LLC: Guggenheim Funds Investment Advisors, LLC, Guggenheim Partners Investment Management, LLC, Guggenheim Funds Distributors, LLC, Security Investors, LLC, Guggenheim Investment Advisors (Europe) Limited, Guggenheim Real Estate, LLC, GS Gamma Advisors, LLC, Guggenheim Partners India Management, LLC, Guggenheim Partners Europe Limited, as well as the funds in the Guggenheim Funds complex (the “Funds”) (“Guggenheim Investments,” “we,” “us,” or “our”).
Guggenheim Partners Investment Management Holdings, LLC, located at 330 Madison Avenue, New York, New York, 10017 is the data controller for your information. The affiliates who are also controllers of certain of your information are: Guggenheim Investment Advisors (Europe) Limited, Guggenheim Partners Europe Limited, Guggenheim Partners, LLC, Guggenheim Funds Investment Advisors, LLC, Guggenheim Partners Investment Management, LLC, Guggenheim Funds Distributors, LLC and Security Investors, LLC, as well as the Funds.
Our Commitment to You
Guggenheim Investments considers your privacy our utmost concern. When you become our client or investor, you entrust us with not only your hard-earned money but also with your personal and financial information. Because we have access to your private information, we hold ourselves to the highest standards in its safekeeping and use. We strictly limit how we share your information with others, whether you are a current or former Guggenheim Investments client or investor.
The Information We Collect About You
We collect certain nonpublic personal information about you from information you provide on applications, other forms, our website, and/or from third parties including investment advisors. This information includes Social Security or other tax identification number, assets, income, tax information, retirement and estate plan information, transaction history, account balance, payment history, bank account information, marital status, family relationships, information that we collect on our website through the use of “cookies,” and other personal information that you or others provide to us. We may also collect such information through your inquiries by mail, e-mail or telephone. We may also collect customer due diligence information, as required by applicable law and regulation, through third party service providers.
How We Handle Your Personal Information
The legal basis for using your information as set out in this Privacy Notice is as follows: (a) use of your personal data is necessary to perform our obligations under any contract with you (such as a contract for us to provide financial services to you); or (b) where use of your personal data is not necessary for performance of a contract, use of your personal data is necessary for our
| | THE GUGGENHEIM FUNDS ANNUAL REPORT | 95 |
GUGGENHEIM INVESTMENTS PRIVACY NOTICE (Unaudited)(continued) |
legitimate interests or the legitimate interests of others (for example, to enforce the legal terms governing our services, operate and market our website and other services we offer, ensure safe environments for our personnel and others, make and receive payments, prevent fraud and to know the customer to whom we are providing the services). Some processing is done to comply with applicable law.
In addition to the specific uses described above, we also use your information in the following manner:
| | ● | We use your information in connection with servicing your accounts. |
| | ● | We use information to respond to your requests or questions. For example, we might use your information to respond to your customer feedback. |
| | ● | We use information to improve our products and services. We may use your information to make our website and products better. We may use your information to customize your experience with us. |
| | ● | We use information for security purposes. We may use your information to protect our company and our customers. |
| | ● | We use information to communicate with you. For example, we will communicate with you about your account or our relationship. We may contact you about your feedback. We might also contact you about this Privacy Notice. We may also enroll you in our email newsletter. |
| | ● | We use information as otherwise permitted by law, as we may notify you. |
| | ● | Aggregate/Anonymous Data. We may aggregate and/or anonymize any information collected through the website so that such information can no longer be linked to you or your device (“Aggregate/Anonymous Information”). We may use Aggregate/Anonymous Information for any purpose, including without limitation for research and marketing purposes, and may also share such data with any third parties, including advertisers, promotional partners, and sponsors. |
We do not sell information about current or former clients or their accounts to third parties. Nor do we share this information, except when necessary to complete transactions at your request, to make you aware of investment products and services that we or our affiliates offer, or as permitted or required by law. We provide information about you to companies and individuals not affiliated with Guggenheim Investments to complete certain transactions or account changes, or to perform services for us related to your account. For example, if you ask to transfer assets from another financial institution to Guggenheim Investments, we must provide certain information about you to that company to complete the transaction.
96 | THE GUGGENHEIM FUNDS ANNUAL REPORT | |
GUGGENHEIM INVESTMENTS PRIVACY NOTICE (Unaudited)(continued) |
We provide the third party with only the information necessary to carry out its responsibilities and only for that purpose. And we require these third parties to treat your private information with the same high degree of confidentiality that we do. To alert you to other Guggenheim Investments products and services, we share your information within our family of affiliated companies. You may limit our sharing with affiliated companies as set out below. We may also share information with any successor to all or part of our business, or in connection with steps leading up to a merger or acquisition. For example, if part of our business was sold we may give customer information as part of that transaction. We may also share information about you with your consent.
We will release information about you if you direct us to do so, if we are compelled by law to do so, or in other circumstances as permitted by law (for example, to protect your account from fraud).
If you close your account(s) or become an inactive client or investor, we will continue to adhere to the privacy policies and practices described in this notice.
Opt-Out Provisions and Your Data Choices
The law allows you to “opt out” of certain kinds of information sharing with third parties. We do not share personal information about you with any third parties that triggers this opt-out right. This means YOU ARE ALREADY OPTED OUT.
When you are no longer our client or investor, we continue to share your information as described in this notice, and you may contact us at any time to limit our sharing by sending an email to CorporateDataPrivacy@GuggenheimPartners.com.
European Union Data Subjects and certain others: In addition to the choices set forth above, residents of the European Union and certain other jurisdictions have certain rights to (1) request access to or rectification or deletion of information we collect about them, (2) request a restriction on the processing of their information, (3) object to the processing of their information, or (4) request the portability of certain information. To exercise these or other rights, please contact us using the contact information below. We will consider all requests and provide our response within the time period stated by applicable law. Please note, however, that certain information may be exempt from such requests in some circumstances, which may include if we need to keep processing your information for our legitimate interests or to comply with a legal obligation. We may request you provide us with information necessary to confirm your identity before responding to your request.
Residents of France and certain other jurisdictions may also provide us with instructions regarding the manner in which we may continue to store, erase and share your information after your death, and where applicable, the person you have designated to exercise these rights after your death.
How We Protect Privacy Online
We take steps to protect your privacy when you use our web site – www.guggenheiminvestments.com – by using secure forms of online communication, including encryption technology, Secure Socket Layer (SSL) protocol, firewalls and user names and
| | THE GUGGENHEIM FUNDS ANNUAL REPORT | 97 |
GUGGENHEIM INVESTMENTS PRIVACY NOTICE (Unaudited)(concluded) |
passwords. These safeguards vary based on the sensitivity of the information that we collect and store. However, we cannot and do not guarantee that these measures will prevent every unauthorized attempt to access, use, or disclose your information since despite our efforts, no Internet and/or other electronic transmissions can be completely secure. Our web site uses “http cookies”—tiny pieces of information that we ask your browser to store. We use cookies for session management and security features on the Guggenheim Investments web site. We do not use them to pull data from your hard drive, to learn your e-mail address, or to view data in cookies created by other web sites. We will not share the information in our cookies or give others access to it. See the legal information area on our web site for more details about web site security and privacy features.
How We Safeguard Your Personal Information and Data Retention
We restrict access to nonpublic personal information about you to our employees and in some cases to third parties (for example, the service providers described above) as permitted by law. We maintain strict physical, electronic and procedural safeguards that comply with federal standards to guard your nonpublic personal information.
We keep your information for no longer than necessary for the purposes for which it is processed. The length of time for which we retain information depends on the purposes for which we collected and use it and/or as required to comply with applicable laws. Information may persist in copies made for backup and business continuity purposes for additional time.
International Visitors
If you are not a resident of the United States, please be aware that your information may be transferred to, stored and processed in the United States where our servers are located and our databases are operated. The data protection and other laws of the United States and other countries might not be as comprehensive as those in your country.
In such cases, we ensure that a legal basis for such a transfer exists and that adequate protection is provided as required by applicable law, for example, by using standard contractual clauses or by transferring your data to a jurisdiction that has obtained an adequacy finding. Individuals whose data may be transferred on the basis of standard contractual clauses may contact us as described below.
We’ll Keep You Informed
If you have any questions or concerns about how we treat your personal data, we encourage you to consult with us first. You may also contact the relevant supervisory authority. We reserve the right to modify this policy at any time and will inform you promptly of material changes. You may access our privacy policy from our web site at www.guggenheiminvestments.com. Should you have any questions regarding our privacy policy, contact us by email at
CorporateDataPrivacy@GuggenheimPartners.com.
98 | THE GUGGENHEIM FUNDS ANNUAL REPORT | |
LIQUIDITY RISK MANAGEMENT PROGRAM (Unaudited) |
In compliance with SEC Rule 22e-4 under the U.S. Investment Company Act of 1940 (the “Liquidity Rule”), the Guggenheim Funds Trust (the “Trust”) has adopted and implemented a written liquidity risk management program (the “Program”) for each series of the Trust (each, a “Fund” and, collectively, the “Funds”). The Trust’s Board of Trustees (the “Board”) has also designated a Program administrator (the “Administrator”).
The Liquidity Rule requires that the Program be reasonably designed to assess and manage each Fund’s liquidity risk. A Fund’s “liquidity risk” (as defined in the Liquidity Rule) is the risk that the Fund could not meet requests to redeem shares issued by the Fund without significant dilution of the remaining investors’ interests in the Fund. The Program includes a number of elements that support the assessment, management and periodic review of liquidity risk. In accordance with the Program, each Fund’s liquidity risk is assessed, managed, and periodically reviewed no less frequently than annually taking into consideration a variety of factors, including, as applicable, the Fund’s investment strategy and liquidity of portfolio investments, short-term and long-term cash flow projections, and holdings of cash and cash equivalents, as well as borrowing arrangements and other funding sources. Certain factors are considered under both normal and reasonably foreseeable stressed conditions. There is no guarantee that the Program will achieve its objective under all circumstances.
Under the Program, each Fund portfolio investment is classified into one of four liquidity categories. The classification is based on a determination of the number of days a Fund reasonably expects to take to convert the investment into cash, or sell or dispose of the investment, in current market conditions without significantly changing the investment’s market value. The Program is reasonably designed to meet Liquidity Rule requirements relating to “highly liquid investment minimums” (i.e., the minimum amount of a Fund’s net assets to be invested in highly liquid investments that are assets) and to monitor compliance with the Liquidity Rule’s limitations on a Fund’s investments in “illiquid investments” (as defined in the Liquidity Rule). Under the Liquidity Rule, a Fund is prohibited from acquiring any illiquid investment if, immediately after the acquisition, the Fund would have invested more than 15% of its net assets in illiquid investments that are assets.
During the period covered by this shareholder report, the Board received a written report (the “Report”) prepared by the Administrator addressing the Program’s operation and assessing the adequacy and effectiveness of its implementation for the period from March 31, 2022, to March 31, 2023. The Report summarized the Administrator’s assessment of the Program’s implementation and concluded that the Program operated effectively, the Program had been and continued to be reasonably designed to assess and manage each Fund’s liquidity risk, and the Program has been adequately and effectively implemented to monitor and respond to the Funds’ liquidity developments, as applicable.
Please refer to the Fund’s prospectus for more information regarding the Fund’s exposure to liquidity risk and other risks to which an investment in the Fund may be subject.
| | THE GUGGENHEIM FUNDS ANNUAL REPORT | 99 |
This page intentionally left blank.
This page intentionally left blank.
This page intentionally left blank.
This page intentionally left blank.
This page intentionally left blank.
This page intentionally left blank.
9.30.2023
Guggenheim Funds Annual Report
| |
Guggenheim Total Return Bond Fund | | |
GuggenheimInvestments.com | TRB-ANN-0923x0924 |

| | |
DEAR SHAREHOLDER | 2 |
ECONOMIC AND MARKET OVERVIEW | 4 |
ABOUT SHAREHOLDERS’ FUND EXPENSES | 6 |
TOTAL RETURN BOND FUND | 9 |
NOTES TO FINANCIAL STATEMENTS | 89 |
REPORT OF INDEPENDENT REGISTERED PUBLIC ACCOUNTING FIRM | 117 |
OTHER INFORMATION | 119 |
INFORMATION ON BOARD OF TRUSTEES AND OFFICERS | 133 |
GUGGENHEIM INVESTMENTS PRIVACY NOTICE | 142 |
LIQUIDITY RISK MANAGEMENT PROGRAM | 146 |
| | THE GUGGENHEIM FUNDS ANNUAL REPORT | 1 |
Dear Shareholder:
Guggenheim Partners Investment Management, LLC (the “Investment Adviser”), is pleased to present the shareholder report for Guggenheim Total Return Bond Fund (the “Fund”) for the annual fiscal period ended September 30, 2023 (the “Reporting Period”).
The Investment Adviser is part of Guggenheim Investments, which represents the investment management businesses of Guggenheim Partners, LLC (“Guggenheim”), a global, diversified financial services firm.
Guggenheim Funds Distributors, LLC is the distributor of the Funds. Guggenheim Funds Distributors, LLC is affiliated with Guggenheim and the Investment Adviser.
We encourage you to read the Economic and Market Overview section of the report, which follows this letter, and then the Managers’ Commentary for the Fund.
We are committed to providing innovative investment solutions and appreciate the trust you place in us.
Sincerely,
Guggenheim Partners Investment Management, LLC
October 31, 2023
Read a prospectus and summary prospectus (if available) carefully before investing. It contains the investment objectives, risks, charges, expenses and other information, which should be considered carefully before investing. Obtain a prospectus and summary prospectus (if available) at guggenheiminvestments.com or call 800.820.0888.
This material is not intended as a recommendation or as investment advice of any kind, including in connection with rollovers, transfers, and distributions. Such material is not provided in a fiduciary capacity, may not be relied upon for or in connection with the making of investment decisions, and does not constitute a solicitation of an offer to buy or sell securities. All content has been provided for informational or educational purposes only and is not intended to be and should not be construed as legal or tax advice and/or a legal opinion. Always consult a financial, tax and/or legal professional regarding your specific situation.
2 | THE GUGGENHEIM FUNDS ANNUAL REPORT | |
Total Return Bond Fund is subject to a number of risks and is not suitable for all investors ● The Fund’s market value will change in response to interest rate changes and market conditions among other factors. In general, bond prices rise when interest rates fall and vice versa. ● The Fund’s exposure to high yield securities may subject the Fund to greater volatility. ● When market conditions are deemed appropriate, the Fund will leverage to the full extent permitted by its investment policies and restrictions and applicable law. Leveraging will exaggerate the effect on net asset value of any increase or decrease in the market value of the Fund’s portfolio. ● The Fund may invest in derivative instruments, which may be more volatile and less liquid, increasing the risk of loss when compared to traditional securities. Certain of the derivative instruments are also subject to the risks of counterparty default and adverse tax treatment. ● Instruments and strategies (such as borrowing transactions and reverse repurchase agreements) may provide leveraged exposure to a particular investment, which will magnify any gains or losses on those investments. ● Investments in reverse repurchase agreements expose the Fund to the many of the same risks as investments in derivatives. ● The Fund’s investments in other investment vehicles subject the Fund to those risks and expenses affecting the investment vehicle. ●The Fund’s investments in foreign securities carry additional risks when compared to U.S. securities, due to the impact of diplomatic, political, or economic developments in the country in question (investments in emerging markets securities are generally subject to an even greater level of risk). ● Investments in syndicated bank loans generally offer a floating interest rate and involve special types of risks. ●The Fund’s investments in municipal securities can be affected by events that affect the municipal bond market. ●The Fund’s investments in real estate securities subject the Fund to the same risks as direct investments in real estate, which is particularly sensitive to economic downturns. ●The Fund’s investments in restricted securities may involve financial and liquidity risk. ●You may have a gain or loss when you sell your shares. ● It is important to note that the Fund is not guaranteed by the U.S. government. ● Please read the prospectus for more detailed information regarding these and other risks.
| | THE GUGGENHEIM FUNDS ANNUAL REPORT | 3 |
ECONOMIC AND MARKET OVERVIEW (Unaudited) | September 30, 2023 |
Faced with a series of strong economic data releases, the market increasingly appears to be coming to the conclusion that the economy is structurally better able to withstand higher interest rates than it really is. This dynamic can be seen by examining the move in Treasury yields, with the selloff almost entirely being due to real yields rather than inflation expectations, and with the move most pronounced at the long end of the yield curve. Digging further, however, a large portion of this shift is due to a rising term premium (the premium for unknown and unquantified risks in the future, beyond current assumptions on the path of inflation or policy rates), which is indicating greater uncertainty about the outlook.
Many forecasters are extrapolating the current year’s economic strength without recognizing the fact that growth has benefited from a number of factors this year that are unlikely to be repeated, namely an expansion of the fiscal deficit, a slowdown in inflation, and a rebound in labor supply. As these factors fade, the headwinds from tight monetary policy may be more apparent and pronounced. And the longer monetary conditions stay tight, the greater the risk of something breaking (banks and commercial real estate remain key risks). All of this suggests that the recent economic trajectory cannot be assumed to continue, especially given the substantial restraint that could be imposed by the recent rise in long-term borrowing costs.
Uncertainty is elevated given the diverging signals in the data and the fact that many traditional economic models are not “working” as they traditionally would. This uncertainty extends to the U.S. Federal Reserve, which looks set to hold off on further rate hikes while it waits to see if the data start to align with the softening conditions policymakers say they are hearing on the ground. We continue to think the gravitational pull of tight money and credit conditions could result in a slowing economy and cooler inflation over the next year, paving the way for more rate cuts than the market presently expects.
For the Reporting Period, the S&P 500® Index* returned 21.62%. The MSCI Europe-Australasia-Far East (“EAFE”) Index* (gross) returned 25.65%. The return of the MSCI Emerging Markets Index* (gross) was 11.70%.
In the bond market, the Bloomberg U.S. Aggregate Bond Index* posted a 0.64% return for the Reporting Period, while the Bloomberg U.S. Corporate High Yield Index* returned 10.28%. The return of the ICE Bank of America (“BofA”) 3-Month U.S. Treasury Bill Index* was 4.50% for the Reporting Period.
The opinions and forecasts expressed may not actually come to pass. This information is subject to change at any time, based on market and other conditions, and should not be construed as a recommendation of any specific security or strategy.
4 | THE GUGGENHEIM FUNDS ANNUAL REPORT | |
ECONOMIC AND MARKET OVERVIEW (Unaudited)(concluded) | September 30, 2023 |
*Index Definitions:
The following indices are referenced throughout this report. Indices are unmanaged and not available for direct investment. Index performance does not reflect transaction costs, fees, or expenses.
Bloomberg U.S. Aggregate Bond Index is a broad-based flagship benchmark that measures the investment grade, U.S. dollar-denominated, fixed-rate taxable bond market, including U.S. Treasuries, government-related and corporate securities, mortgage-backed securities or “MBS” (agency fixed-rate and hybrid adjustable-rate mortgage, or “ARM”, pass-throughs), asset-backed securities (“ABS”), and commercial mortgage-backed securities (“CMBS”) (agency and non-agency).
Bloomberg U.S. Corporate High Yield Index measures the U.S. dollar-denominated, high yield, fixed-rate corporate bond market. Securities are classified as high yield if the middle rating of Moody’s, Fitch, and S&P is Ba1/BB +/ BB + or below.
ICE BofA 3-Month U.S. Treasury Bill Index is an unmanaged market Index of U.S. Treasury securities maturing in 90 days that assumes reinvestment of all income.
MSCI EAFE Index is a free float-adjusted market capitalization index that is designed to measure the equity market performance of developed markets, excluding the U.S. & Canada.
MSCI Emerging Markets Index is a free float-adjusted market capitalization weighted index that is designed to measure equity market performance in the global emerging markets.
S&P 500® Index is a broad-based index, the performance of which is based on the performance of 500 widely held common stocks chosen for market size, liquidity, and industry group representation.
| | THE GUGGENHEIM FUNDS ANNUAL REPORT | 5 |
ABOUT SHAREHOLDERS’ FUND EXPENSES (Unaudited) |
All mutual funds have operating expenses, and it is important for our shareholders to understand the impact of costs on their investments. Shareholders of a fund incur two types of costs: (i) transaction costs, including sales charges (loads) on purchase payments, reinvested dividends, other distributions, and exchange fees, and (ii) ongoing costs, including management fees, administrative services, and shareholder reports, among others. These ongoing costs, or operating expenses, are deducted from a fund’s gross income and reduce the investment return of the fund.
A fund’s expenses are expressed as a percentage of its average net assets, which is known as the expense ratio. The following examples are intended to help investors understand the ongoing costs (in dollars) of investing in a fund and to compare these costs with the ongoing costs of investing in other mutual funds.
The examples are based on an investment of $1,000 made at the beginning of the period and held for the entire six-month period beginning March 31, 2023 and ending September 30, 2023.
The following tables illustrate the Fund’s costs in two ways:
Table 1. Based on actual Fund return: This section helps investors estimate the actual expenses paid over the period. The “Ending Account Value” shown is derived from the Fund’s actual return, and the fifth column shows the dollar amount that would have been paid by an investor who started with $1,000 in the Fund. Investors may use the information here, together with the amount invested, to estimate the expenses paid over the period. Simply divide the Fund’s account value by $1,000 (for example, an $8,600 account value divided by $1,000 = 8.6), then multiply the result by the number provided under the heading “Expenses Paid During Period.”
Table 2. Based on hypothetical 5% return: This section is intended to help investors compare a fund’s cost with those of other mutual funds. The table provides information about hypothetical account values and hypothetical expenses based on the Fund’s actual expense ratio and an assumed rate of return of 5% per year before expenses, which is not the Fund’s actual return. The hypothetical account values and expenses may not be used to estimate the actual ending account balance or expenses paid during the period. The example is useful in making comparisons because the U.S. Securities and Exchange Commission (the “SEC”) requires all mutual funds to calculate expenses based on the 5% return. Investors can assess a Fund’s costs by comparing this hypothetical example with the hypothetical examples that appear in shareholder reports of other funds.
The calculations illustrated above assume no shares were bought or sold during the period. Actual costs may have been higher or lower, depending on the amount of investment and the timing of any purchases or redemptions.
6 | THE GUGGENHEIM FUNDS ANNUAL REPORT | |
ABOUT SHAREHOLDERS’ FUND EXPENSES (Unaudited)(continued) |
Please note that the expenses shown in the table are meant to highlight your ongoing costs only and do not reflect any transactional costs, such as sales charges (loads) on purchase payments, and contingent deferred sales charges (“CDSC”) on redemptions, if any. Therefore, the second table is useful in comparing ongoing costs only, and will not help you determine the relative total costs of owning different funds. In addition, if these transactional costs were included, your costs would have been higher.
More information about the Fund’s expenses, including annual expense ratios for periods up to five years (subject to the Fund’s inception date), can be found in the Financial Highlights section of this report. For additional information on operating expenses and other shareholder costs, please refer to the Fund’s prospectus.
| | THE GUGGENHEIM FUNDS ANNUAL REPORT | 7 |
ABOUT SHAREHOLDERS’ FUND EXPENSES (Unaudited)(concluded) |
| Expense
Ratio1 | Fund
Return | Beginning
Account Value
March 31,
2023 | Ending
Account Value
September 30,
2023 | Expenses
Paid During
Period2 |
Table 1. Based on actual Fund return3 |
A-Class | 0.95% | (3.54%) | $ 1,000.00 | $ 964.60 | $ 4.68 |
C-Class | 1.71% | (3.91%) | 1,000.00 | 960.90 | 8.41 |
P-Class | 0.95% | (3.54%) | 1,000.00 | 964.60 | 4.68 |
Institutional Class | 0.67% | (3.40%) | 1,000.00 | 966.00 | 3.30 |
R6-Class | 0.62% | (3.37%) | 1,000.00 | 966.30 | 3.06 |
|
Table 2. Based on hypothetical 5% return (before expenses) |
A-Class | 0.95% | 5.00% | $ 1,000.00 | $ 1,020.31 | $ 4.81 |
C-Class | 1.71% | 5.00% | 1,000.00 | 1,016.50 | 8.64 |
P-Class | 0.95% | 5.00% | 1,000.00 | 1,020.31 | 4.81 |
Institutional Class | 0.67% | 5.00% | 1,000.00 | 1,021.71 | 3.40 |
R6-Class | 0.62% | 5.00% | 1,000.00 | 1,021.96 | 3.14 |
1 | Annualized and excludes expenses of the underlying funds in which the Fund invests, if any. This ratio represents net expenses, which may include expenses that are excluded from the expense limitation agreement. Excluding these expenses, the net expense ratio for the Fund would be 0.76%, 1.52%, 0.76%, and 0.47% and 0.42% for the A-Class, C-Class, P-Class, Institutional Class and R6-Class, respectively. |
2 | Expenses are equal to the Fund’s annualized expense ratio, net of any applicable fee waivers, multiplied by the average account value over the period, multiplied by 183/365 (to reflect the one-half year period). |
3 | Actual cumulative return at net asset value for the period March 31, 2023 to September 30, 2023. |
8 | THE GUGGENHEIM FUNDS ANNUAL REPORT | |
MANAGERS’ COMMENTARY (Unaudited) | September 30, 2023 |
To Our Shareholders
Guggenheim Partners Investment Management, LLC (“GPIM”) serves as the investment adviser to Guggenheim Total Return Bond Fund (“Fund”). The Fund is managed by a team of seasoned professionals, including Anne B. Walsh, CFA, JD, Chief Investment Officer and Managing Partner; Steven H. Brown, CFA, Chief Investment Officer, Total Return and Macro Strategies, Senior Managing Director, and Portfolio Manager; Adam J. Bloch, Managing Director and Portfolio Manager; and Evan L. Serdensky, Director and Portfolio Manager. In the subsequent paragraphs, the investment team discusses the Fund’s performance and the market environment for the 12-month period ended September 30, 2023 (“Reporting Period”).
For the Reporting Period, the Fund returned 1.55%1, outperforming the Bloomberg U.S. Aggregate Bond Index, the Fund’s benchmark, (“Benchmark”), which returned 0.64% for the same period
What factors contributed or detracted from the Fund’s performance during the Reporting Period?
For the Reporting Period, the Fund outperformed the Benchmark by 91 basis points. Carry, or earned income, remained a consistent source of relative performance for the Fund. Spreads also added to performance relative to the Benchmark. Credit selection within corporates, the Fund’s allocation to securitized credit, and an underweight to Agency residential mortgage-backed securities (“RMBS”) drove most of the active performance versus the Benchmark. Duration detracted from performance as the Fund was positioned modestly overweight duration while the curve bear steepened. Bear steepening refers to yield-curve widening due to long-term rates increasing more than short-term rates, amid a period of falling bond prices and rising yields.
How did the Fund use derivatives during the Reporting Period?
During the Reporting Period, the Fund used interest rate futures, forwards, options, and swaps to help manage duration positioning, foreign exchange risk, and credit exposure. Over the reporting period, performance from interest rate swaps, caps, and swaptions detracted from performance, and performance from SOFR futures was positive (SOFR is Secured Overnight Financing Rate, which measures the cost of borrowing cash overnight collateralized by Treasury Securities). Options on equities, which functioned as hedges to the Fund’s credit positioning, detracted from performance, and performance from credit default swaps was negative. In addition, the Fund hedged non-USD exposure with foreign-exchange derivatives, which had a negative impact on performance over the Reporting Period.
How was the Fund positioned at the end of the Reporting Period?
Over the past several quarters the Fund has increasingly prioritized diversification, quality, and liquidity as recession concerns continued to persist. To that end, the Fund has steadily moved up-in-quality and positioned more defensively, uniquely, without having to sacrifice yield due to the
| | THE GUGGENHEIM FUNDS ANNUAL REPORT | 9 |
MANAGERS’ COMMENTARY (Unaudited)(continued) | September 30, 2023 |
flatness of the yield curve and the lack of any material decompression witnessed in credit spreads with respect to quality. While spreads for many credit sectors have reverted to long-term-average levels, certain segments remain dislocated and offer attractive relative value. Structured credit spreads are especially cheap, particularly when analyzed in the context of broader fixed income spread levels. Specifically, the basis between structured credit spreads and investment grade corporate spreads currently sits north of the 90th percentile of historically observed data.
Structured credit is the Fund’s largest allocation. Spreads continued their rebound, but broadly remain wide, both compared to similarly rated investment-grade corporate credit and in an absolute sense. Furthermore, the lower dollar prices of these assets following the rise in interest rates sets up the potential for higher total return opportunities than typically exists in the asset class. With much of its active buying base largely coming from income-focused accounts, structured credit spreads should continue to compress from the resetting higher of yields and the resulting increased interest that comes with it. Within securitized credit, we continue to focus on opportunities senior in the capital structure with sufficient credit enhancement and often unique structural features that limit cash flow variability or extension concerns. We believe the focus on superior structures will be paramount in helping mitigate mark-to-market risks that could emerge should volatility rise.
The corporate credit allocation represents roughly 24% of the Fund’s holdings. Investment-grade-rated credit makes up 18% of that allocation while 6% is below-investment-grade-rated. While in our view, overall corporate credit spreads are trading around fair value levels, there remain both idiosyncratic opportunities and risks across certain issuers and industries given tighter credit conditions across capital markets. Primary market offerings have priced at especially attractive levels, as many investors have pulled back from lending activities. The Fund has employed modestly sized credit hedges to protect the portfolio from potential spread widening.
At the end of the Reporting Period, the Fund had a duration of 6.6 years, unchanged versus the end of the previous Reporting Period. During the period, however, we shifted more of the Fund’s duration concentration toward the front end and belly of the curve. While we feel that much of the move in the long end of the Treasury curve has been driven by technical factors, and current yields are above levels justified by fundamentals (e.g., inflation expectations, growth expectations, term premium, etc.), the path to those technical factors dissipating in the near term is unclear. Our conviction on the future path of rates is higher at the front end of the curve at this point in the cycle. On a related note, interest rate volatility has remained elevated, which has presented the Fund with opportunities to tactically add to positions in Agency RMBS, locking in spreads, both static and option adjusted, that are near 15-year wides.
Despite the quarter ended September 30, 2023 continuing a trend of volatility for fixed income returns, our broader macroeconomic views from a fundamental perspective remain consistent. We continue to expect inflation to moderate with time and view the market’s increasingly optimistic expectations of a soft landing as misguided. To that end, we continue to emphasize a defensive tilt to our positioning. From a valuation perspective, the recent move higher in interest rates does
10 | THE GUGGENHEIM FUNDS ANNUAL REPORT | |
MANAGERS’ COMMENTARY (Unaudited)(concluded) | September 30, 2023 |
potentially present an interesting opportunity to extend duration further, but as we noted, the technical backdrop (particularly at the long end of the curve) is fairly precarious at the moment. Our conviction on the future path of rates is higher on the front end of the curve at this point in the cycle, which informed our shift in curve positioning. However, with the yield curve having steepened out, investors can now “lock-in” roughly similar yields to what they are able to earn in overnight rates, which may be a catalyst for some of the nearly $2 trillion growth in money market funds to move back into fixed income. Looking further out into the economic future, we believe the Federal Reserve’s restrictive monetary policy could ultimately shepherd in a recession in the next 6-18 months, which we believe will likely be met with lower rates. Ultimately, the current path of weakening growth, high prices, and high interest rates appears unsustainable, and we are already starting to see signs of pressure on consumers and levered corporate borrowers, which could call into question any soft-landing narrative.
The Fund may invest in certain of the underlying series of Guggenheim Funds Trust and Guggenheim Strategy Funds Trust, including Guggenheim Ultra Short Duration Fund, Guggenheim Strategy Fund II, and Guggenheim Strategy Fund III, (collectively, the “Short Term Investment Vehicles”), each of which are open-end management investment companies managed by Guggenheim Investments. The Short Term Investment Vehicles, which launched on March 11, 2014, are offered as short term investment options only to mutual funds, trusts, and other accounts managed by Guggenheim Investments and/or its affiliates, and are not available to the public, with the exception of Guggenheim Ultra Short Duration Fund, which is available to the public. Guggenheim Strategy Fund II and Guggenheim Strategy Fund III do not charge an investment management fee. Guggenheim Ultra Short Duration Fund charges an investment management fee but that fee is waived by the respective investee fund. For the Reporting Period, investment in the Short Term Investment Vehicles contributed to Fund performance.
Performance displayed represents past performance which is no guarantee of future results.
1 | Performance figures are based on Class A shares and do not reflect taxes that a shareholder would pay on distributions or the redemption of shares. |
The opinions and forecast expressed may not actually come to pass. This information is subject to change at any time, based on market and other conditions, and should not be construed as a recommendation of any specific security or strategy.
| | THE GUGGENHEIM FUNDS ANNUAL REPORT | 11 |
PERFORMANCE REPORT AND FUND PROFILE (Unaudited) | September 30, 2023 |
TOTAL RETURN BOND FUND
OBJECTIVE: Seeks to provide total return, comprised of current income and capital appreciation.
Holdings Diversification (Market Exposure as % of Net Assets)
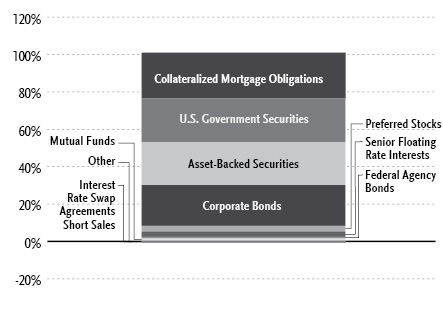
“Holdings Diversification (Market Exposure as % of Net Assets)” excludes any temporary cash investments, investments in Guggenheim Strategy Funds Trust mutual funds, or investments in Guggenheim Ultra Short Duration Fund.
12 | THE GUGGENHEIM FUNDS ANNUAL REPORT | |
PERFORMANCE REPORT AND FUND PROFILE (Unaudited)(continued) | September 30, 2023 |
Inception Dates: |
A-Class | November 30, 2011 |
C-Class | November 30, 2011 |
P-Class | May 1, 2015 |
Institutional Class | November 30, 2011 |
R6-Class | October 19, 2016 |
Portfolio Composition by Quality Rating1 |
Rating | % of Total
Investments |
Fixed Income Instruments | |
AAA | 47.1% |
AA | 7.0% |
A | 12.3% |
BBB | 15.8% |
BB | 3.2% |
B | 2.6% |
CCC | 0.7% |
CC | 1.3% |
C | 0.1% |
NR2 | 5.1% |
Other Instruments | 4.8% |
Total Investments | 100.0% |
Ten Largest Holdings | % of Total Net Assets |
U.S. Treasury Notes, 3.88% due 08/15/33 | 5.0% |
U.S. Treasury Notes, 3.50% due 01/31/28 | 3.4% |
U.S. Treasury Bonds due 05/15/53 | 3.3% |
U.S. Treasury Notes, 4.13% due 07/31/28 | 3.3% |
U.S. Treasury Notes, 4.13% due 06/15/26 | 2.2% |
Fannie Mae, 5.00% due 06/01/53 | 1.3% |
U.S. Treasury Notes, 3.38% due 05/15/33 | 1.2% |
Fannie Mae, 5.50% due 05/01/53 | 1.0% |
Freddie Mac, 5.00% due 04/01/53 | 0.8% |
Fannie Mae, 5.50% due 06/01/53 | 0.7% |
Top Ten Total | 22.2% |
| | |
“Ten Largest Holdings” excludes any temporary cash or derivative investments. |
1 | Source: BlackRock Solutions. Credit quality ratings are measured on a scale that generally ranges from AAA (highest) to D (lowest). All securities except for those labeled “NR” have been rated by Moody’s, Standard & Poor’s (“S&P”), or Fitch, each of which is a Nationally Recognized Statistical Rating Organization (“NRSRO”). For purposes of this presentation, when ratings are available from more than one agency, the highest rating is used. Guggenheim Investments has converted ratings to the equivalent S&P rating. Security ratings are determined at the time of purchase and may change thereafter. |
2 | NR (not rated) securities do not necessarily indicate low credit quality. |
| | THE GUGGENHEIM FUNDS ANNUAL REPORT | 13 |
PERFORMANCE REPORT AND FUND PROFILE (Unaudited)(continued) | September 30, 2023 |
Cumulative Fund Performance*
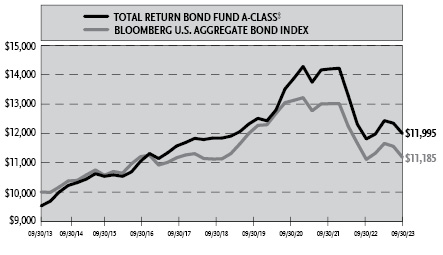
14 | THE GUGGENHEIM FUNDS ANNUAL REPORT | |
PERFORMANCE REPORT AND FUND PROFILE (Unaudited)(concluded) | September 30, 2023 |
Average Annual Returns*
Periods Ended September 30, 2023
| 1 Year | 5 Year | 10 Year |
A-Class Shares | 1.55% | 0.26% | 2.33% |
A-Class Shares with sales charge† | (2.50%) | (0.55%) | 1.84% |
C-Class Shares | 0.74% | (0.49%) | 1.58% |
C-Class Shares with CDSC‡ | (0.23%) | (0.49%) | 1.58% |
Institutional Class Shares | 1.84% | 0.55% | 2.65% |
Bloomberg U.S. Aggregate Bond Index | 0.64% | 0.10% | 1.13% |
| 1 Year | 5 Year | Since
Inception
(05/01/15) |
P-Class Shares | 1.51% | 0.25% | 1.48% |
Bloomberg U.S. Aggregate Bond Index | 0.64% | 0.10% | 0.55% |
| 1 Year | 5 Year | Since
Inception
(10/19/16) |
R6-Class Shares | 1.84% | 0.55% | 1.19% |
Bloomberg U.S. Aggregate Bond Index | 0.64% | 0.10% | (0.04%) |
* | The performance data above represents past performance that is not predictive of future results. The investment return and principal value of an investment in the Fund will fluctuate so that an investor’s shares, when redeemed, may be worth more or less than their original cost. Returns are historical and include changes in principal and reinvested dividends and capital gains and do not reflect the effect of taxes. The Bloomberg U.S. Aggregate Bond Index is an unmanaged index and, unlike the Fund, has no management fees or operating expenses to reduce its reported return. The graph is based on A-Class shares only; performance for C-Class shares, P-Class shares, R6-Class shares and Institutional Class shares will vary due to differences in fee structures. |
† | Effective October 1, 2015, the maximum sales charge decreased from 4.75% to 4.00%. A 4.75% maximum sales charge is used in the calculation of the Average Annual Returns based on subscriptions made prior to October 1, 2015, and a 4.00% maximum sales charge is used to calculate performance for periods based on subscriptions made on or after October 1, 2015. |
‡ | Fund returns include a CDSC of 1% if redeemed within 12 months of purchase. |
| | THE GUGGENHEIM FUNDS ANNUAL REPORT | 15 |
SCHEDULE OF INVESTMENTS | September 30, 2023 |
TOTAL RETURN BOND FUND | |
| | Shares | | | Value | |
COMMON STOCKS† - 0.0% |
| | | | | | | | | |
Communications - 0.0% |
Vacasa, Inc. — Class A* | | | 364,396 | | | $ | 168,023 | |
| | | | | | | | | |
Industrial - 0.0% |
BP Holdco LLC*,†††,1 | | | 532 | | | | 683 | |
YAK BLOCKER 2 LLC*,††† | | | 44,094 | | | | 441 | |
YAK BLOCKER 2 LLC*,††† | | | 40,754 | | | | 408 | |
Vector Phoenix Holdings, LP*,††† | | | 532 | | | | 33 | |
API Heat Transfer Parent LLC*,††† | | | 73,183 | | | | 7 | |
Total Industrial | | | | | | | 1,572 | |
| | | | | | | | | |
Financial - 0.0% |
Pershing Square Tontine Holdings, Ltd. — Class A*,†††,2 | | | 9,315,080 | | | | 931 | |
| | | | | | | | | |
Total Common Stocks | | | | |
(Cost $3,646,916) | | | | | | | 170,526 | |
| | | | | | | | | |
PREFERRED STOCKS†† - 3.0% |
Financial - 2.8% |
Equitable Holdings, Inc. |
4.95%* | | | 71,314,000 | | | | 67,117,970 | |
4.30% | | | 1,051,671 | | | | 15,890,749 | |
Markel Group, Inc. |
6.00%* | | | 72,131,000 | | | | 69,629,627 | |
Bank of New York Mellon Corp. |
3.75%* | | | 65,200,000 | | | | 52,883,290 | |
Charles Schwab Corp. |
4.00%* | | | 73,673,000 | | | | 51,981,532 | |
Citigroup, Inc. |
3.88%* | | | 31,175,000 | | | | 26,602,956 | |
4.00%* | | | 26,571,000 | | | | 23,243,014 | |
7.63%* | | | 2,150,000 | | | | 2,097,544 | |
MetLife, Inc. |
3.85%* | | | 53,467,000 | | | | 49,461,637 | |
Wells Fargo & Co. |
3.90%* | | | 49,842,000 | | | | 43,529,426 | |
7.63%* | | | 4,100,000 | | | | 4,133,485 | |
Bank of America Corp. |
4.38%* | | | 27,700,000 | | | | 23,213,955 | |
6.13%* | | | 11,550,000 | | | | 11,066,318 | |
Goldman Sachs Group, Inc. |
3.80%* | | | 25,830,000 | | | | 21,062,438 | |
7.50%* | | | 11,800,000 | | | | 11,662,630 | |
JPMorgan Chase & Co. |
3.65%*, | | | 37,412,000 | | | | 32,654,609 | |
Kuvare US Holdings, Inc. |
7.00%*,4 | | | 15,731,000 | | | | 16,561,675 | |
Jackson Financial, Inc. |
8.00% | | | 472,000 | | | | 11,823,600 | |
CNO Financial Group, Inc. |
5.13% due 11/25/60 | | | 715,225 | | | | 11,107,444 | |
Assurant, Inc. |
5.25% due 01/15/61 | | | 560,975 | | | | 10,939,013 | |
Lincoln National Corp. |
9.25%*,5 | | | 10,117,000 | | | | 10,420,429 | |
Selective Insurance Group, Inc. |
4.60% | | | 541,225 | | | | 8,832,792 | |
Depository Trust & Clearing Corp. |
3.38%*,4 | | | 4,750,000 | | | | 3,517,078 | |
First Republic Bank |
4.25% | | | 2,368,525 | | | | 237 | |
4.50% | | | 276,775 | | | | 83 | |
Total Financial | | | | | | | 579,433,531 | |
| | | | | | | | | |
Communications - 0.2% |
AT&T Mobility II LLC*,††† | | | 47,000 | | | | 47,000,000 | |
| | | | | | | | | |
Government - 0.0% |
CoBank ACB |
4.25%* | | | 3,300,000 | | | | 2,623,500 | |
| | | | | | | | | |
Industrial - 0.0% |
YAK BLOCKER 2 LLC*,††† | | | 2,422,458 | | | | 606,015 | |
API Heat Transfer Intermediate*,††† | | | 9 | | | | 4,109 | |
Total Industrial | | | | | | | 610,124 | |
| | | | | | | | | |
Total Preferred Stocks | | | | |
(Cost 799,073,386) | | | | | | | 629,667,155 | |
| | | | | | | | | |
16 | THE GUGGENHEIM FUNDS ANNUAL REPORT | SEE NOTES TO FINANCIAL STATEMENTS. |
SCHEDULE OF INVESTMENTS (continued) | September 30, 2023 |
TOTAL RETURN BOND FUND | |
| | Shares | | | Value | |
WARRANTS† - 0.0% |
Ginkgo Bioworks Holdings, Inc. | | | | | | | | |
Expiring 08/01/26* | | | 101,490 | | | $ | 22,835 | |
Acropolis Infrastructure Acquisition Corp. — Class A | | | | | | | | |
Expiring 03/31/26*,2 | | | 133,032 | | | | 7,982 | |
Pershing Square Tontine Holdings, Ltd. | | | | | | | | |
Expiring 07/24/25*,†††,2 | | | 1,035,008 | | | | 104 | |
Total Warrants | | | | |
(Cost $343,224) | | | | | | | 30,921 | |
| | | | | | | | | |
MUTUAL FUNDS† - 0.9% |
Guggenheim Limited Duration Fund — R6-Class1 | | | 5,103,586 | | | | 120,393,598 | |
Guggenheim Strategy Fund II1 | | | 1,170,545 | | | | 28,409,135 | |
Guggenheim Ultra Short Duration Fund — Institutional Class1 | | | 2,862,377 | | | | 27,908,179 | |
Guggenheim Strategy Fund III1 | | | 630,981 | | | | 15,326,528 | |
Total Mutual Funds | | | | |
(Cost $194,120,149) | | | | | | | 192,037,440 | |
| | | | | | | | | |
MONEY MARKET FUNDS† - 1.0% |
Dreyfus Treasury Obligations Cash Management Fund — Institutional Shares, 5.23%6 | | | 216,371,620 | | | | 216,371,620 | |
Federated Hermes U.S. Treasury Cash Reserves Fund — Institutional Shares, 5.20%6 | | | 3,294,772 | | | | 3,294,772 | |
Total Money Market Funds | | | | |
(Cost $219,666,392) | | | | | | | 219,666,392 | |
| | | | | | | | | |
U.S. GOVERNMENT SECURITIES†† - 27.3% |
U.S. Treasury Notes |
3.88% due 08/15/335 | | | 1,103,600,000 | | | | 1,042,729,563 | |
4.63% due 09/30/28 | | | 825,000,000 | | | | 826,482,422 | |
3.50% due 01/31/28 | | | 742,300,000 | | | | 708,403,568 | |
4.13% due 07/31/28 | | | 709,700,000 | | | | 694,397,094 | |
4.13% due 06/15/26 | | | 477,680,000 | | | | 468,835,459 | |
3.38% due 05/15/335 | | | 277,650,000 | | | | 251,793,844 | |
3.75% due 05/31/30 | | | 110,000,000 | | | | 104,431,250 | |
3.75% due 06/30/30 | | | 76,650,000 | | | | 72,751,629 | |
3.63% due 03/31/30 | | | 50,000,000 | | | | 47,162,109 | |
3.50% due 04/30/30 | | | 45,000,000 | | | | 42,115,430 | |
4.63% due 03/15/26 | | | 4,900,000 | | | | 4,865,930 | |
4.00% due 02/15/26 | | | 4,500,000 | | | | 4,404,902 | |
4.00% due 02/28/30 | | | 3,450,000 | | | | 3,327,094 | |
3.63% due 03/31/28 | | | 2,770,000 | | | | 2,655,521 | |
2.63% due 05/31/27 | | | 2,160,000 | | | | 2,007,956 | |
4.13% due 01/31/25 | | | 2,000,000 | | | | 1,969,062 | |
1.50% due 01/31/27 | | | 1,200,000 | | | | 1,080,469 | |
2.13% due 05/15/25 | | | 1,100,000 | | | | 1,047,707 | |
3.88% due 05/15/43 | | | 1,000,000 | | | | 869,375 | |
U.S. Treasury Bonds |
due 05/15/537,11 | | | 2,658,790,000 | | | | 704,010,263 | |
4.00% due 11/15/52 | | | 165,000,000 | | | | 146,244,140 | |
due 02/15/467,11 | | | 355,975,000 | | | | 119,287,034 | |
due 05/15/447,11 | | | 303,295,000 | | | | 110,460,846 | |
due 11/15/517,11 | | | 275,000,000 | | | | 75,414,501 | |
2.38% due 05/15/51 | | | 95,430,000 | | | | 60,523,495 | |
due 02/15/527,11 | | | 144,771,800 | | | | 39,433,919 | |
due 11/15/447,11 | | | 70,890,000 | | | | 25,162,681 | |
due 08/15/517,11 | | | 43,990,000 | | | | 12,151,240 | |
2.88% due 08/15/45 | | | 2,380,000 | | | | 1,723,734 | |
due 08/15/527,11 | | | 3,700,000 | | | | 995,573 | |
due 05/15/527,11 | | | 1,720,000 | | | | 465,363 | |
U.S. Treasury Strip Principal |
due 02/15/517,11 | | | 310,000,000 | | | | 87,178,184 | |
United States Treasury Inflation Indexed Bonds |
1.25% due 04/15/2818 | | | 57,170,388 | | | | 54,371,607 | |
1.38% due 07/15/3318 | | | 28,150,966 | | | | 26,028,097 | |
Total U.S. Government Securities |
(Cost $6,273,400,670) | | | 5,744,781,061 | |
| | | | | | | | | |
SEE NOTES TO FINANCIAL STATEMENTS. | THE GUGGENHEIM FUNDS ANNUAL REPORT | 17 |
SCHEDULE OF INVESTMENTS (continued) | September 30, 2023 |
TOTAL RETURN BOND FUND | |
| | Face
Amount~ | | | Value | |
COLLATERALIZED MORTGAGE OBLIGATIONS†† - 24.5% |
Government Agency - 14.1% | | | | |
Fannie Mae | | | | | | | | |
5.00% due 06/01/53 | | | 323,942,988 | | | $ | 305,755,026 | |
5.00% due 05/01/53 | | | 295,457,533 | | | | 278,957,567 | |
5.50% due 05/01/53 | | | 249,771,342 | | | | 241,470,359 | |
5.00% due 04/01/53 | | | 183,014,429 | | | | 172,732,300 | |
5.50% due 06/01/53 | | | 158,409,122 | | | | 153,231,838 | |
4.00% due 06/01/52 | | | 105,859,624 | | | | 94,796,357 | |
5.00% due 08/01/53 | | | 83,083,991 | | | | 78,416,062 | |
4.00% due 07/01/52 | | | 83,785,431 | | | | 74,838,747 | |
2.50% due 11/01/51 | | | 55,485,887 | | | | 44,303,161 | |
5.00% due 09/01/52 | | | 30,572,530 | | | | 28,877,263 | |
5.00% due 05/01/38 | | | 24,153,588 | | | | 23,544,241 | |
2.40% due 03/01/40 | | | 27,004,000 | | | | 17,290,920 | |
3.83% due 05/01/49 | | | 19,000,000 | | | | 15,203,587 | |
2.27% due 10/01/41 | | | 16,935,000 | | | | 10,366,679 | |
2.57% due 08/01/51 | | | 12,159,948 | | | | 8,040,076 | |
due 12/25/437 | | | 10,493,981 | | | | 7,576,119 | |
3.42% due 09/01/47 | | | 9,479,569 | | | | 7,533,030 | |
2.31% due 10/01/41 | | | 9,435,000 | | | | 5,781,465 | |
1.76% due 08/01/40 | | | 9,360,000 | | | | 5,666,638 | |
2.44% due 10/01/51 | | | 8,500,000 | | | | 5,021,341 | |
2.43% due 12/01/51 | | | 7,401,000 | | | | 4,731,310 | |
2.41% due 12/01/41 | | | 7,100,000 | | | | 4,473,536 | |
3.05% due 03/01/50 | | | 5,879,430 | | | | 4,182,677 | |
2.94% due 03/01/52 | | | 5,691,217 | | | | 4,106,602 | |
2.51% due 10/01/46 | | | 5,522,318 | | | | 3,930,347 | |
4.07% due 05/01/49 | | | 4,593,716 | | | | 3,901,785 | |
due 10/25/437 | | | 5,234,375 | | | | 3,812,305 | |
2.52% due 12/01/41 | | | 5,185,681 | | | | 3,660,202 | |
3.02% due 01/01/38 | | | 4,099,698 | | | | 3,195,056 | |
2.99% due 01/01/40 | | | 4,429,000 | | | | 3,102,016 | |
2.49% due 12/01/39 | | | 4,148,671 | | | | 3,004,538 | |
3.50% due 02/01/48 | | | 3,617,267 | | | | 2,920,271 | |
4.24% due 08/01/48 | | | 3,396,293 | | | | 2,816,673 | |
2.54% due 12/01/39 | | | 3,617,698 | | | | 2,632,284 | |
3.00% due 03/01/52 | | | 2,807,365 | | | | 2,328,483 | |
2.42% due 10/01/51 | | | 3,378,196 | | | | 2,292,178 | |
3.42% due 10/01/47 | | | 2,681,498 | | | | 2,155,467 | |
2.36% due 01/01/42 | | | 3,500,000 | | | | 2,138,852 | |
2.96% due 10/01/49 | | | 2,779,480 | | | | 2,058,874 | |
3.26% due 11/01/46 | | | 2,306,321 | | | | 1,826,900 | |
2.17% due 10/01/50 | | | 2,655,908 | | | | 1,756,051 | |
2.69% due 02/01/52 | | | 2,438,083 | | | | 1,694,114 | |
2.92% due 03/01/50 | | | 2,303,143 | | | | 1,689,920 | |
2.49% due 09/01/51 | | | 2,472,000 | | | | 1,651,049 | |
2.17% due 09/01/50 | | | 2,386,153 | | | | 1,579,439 | |
2.62% due 12/01/51 | | | 2,282,989 | | | | 1,571,940 | |
2.93% due 03/01/52 | | | 2,045,083 | | | | 1,482,423 | |
2.68% due 04/01/50 | | | 1,866,496 | | | | 1,343,943 | |
3.46% due 08/01/49 | | | 1,631,414 | | | | 1,293,291 | |
2.07% due 10/01/40 | | | 1,931,516 | | | | 1,273,996 | |
2.51% due 07/01/50 | | | 1,747,624 | | | | 1,211,223 | |
3.74% due 02/01/48 | | | 1,213,536 | | | | 1,002,029 | |
4.05% due 09/01/48 | | | 1,123,137 | | | | 955,544 | |
2.32% due 07/01/50 | | | 1,337,951 | | | | 901,020 | |
2.34% due 09/01/39 | | | 1,245,067 | | | | 864,666 | |
2.25% due 10/01/50 | | | 1,232,220 | | | | 788,060 | |
3.96% due 06/01/49 | | | 934,296 | | | | 770,329 | |
3.60% due 10/01/47 | | | 898,108 | | | | 729,404 | |
3.01% due 04/01/42 | | | 1,050,000 | | | | 711,484 | |
2.65% due 12/01/51 | | | 975,337 | | | | 669,747 | |
3.50% due 12/01/46 | | | 664,173 | | | | 581,622 | |
2.34% due 03/01/51 | | | 859,662 | | | | 580,058 | |
3.63% due 01/01/37 | | | 694,861 | | | | 569,272 | |
5.32% due 06/01/33 | | | 530,000 | | | | 532,033 | |
3.91% due 07/01/49 | | | 655,529 | | | | 531,466 | |
3.36% due 12/01/39 | | | 673,529 | | | | 524,854 | |
2.75% due 11/01/31 | | | 599,747 | | | | 512,259 | |
3.18% due 09/01/42 | | | 637,301 | | | | 504,195 | |
2.50% due 01/25/52 | | | 835,739 | | | | 474,220 | |
3.50% due 11/01/47 | | | 516,537 | | | | 452,221 | |
2.56% due 05/01/39 | | | 588,482 | | | | 419,458 | |
2.51% due 02/01/48 | | | 569,847 | | | | 403,519 | |
3.00% due 07/01/46 | | | 463,107 | | | | 391,606 | |
4.00% due 01/01/46 | | | 401,639 | | | | 365,503 | |
4.00% due 12/01/38 | | | 373,969 | | | | 342,459 | |
3.50% due 10/01/45 | | | 350,996 | | | | 308,718 | |
4.00% due 11/01/38 | | | 320,155 | | | | 293,970 | |
3.51% due 11/01/47 | | | 362,221 | | | | 293,833 | |
4.33% due 09/01/48 | | | 323,360 | | | | 284,314 | |
4.50% due 02/01/45 | | | 290,642 | | | | 272,760 | |
4.50% due 03/01/48 | | | 282,140 | | | | 264,043 | |
4.22% due 04/01/49 | | | 315,000 | | | | 261,975 | |
2.50% due 11/25/50 | | | 454,854 | | | | 233,249 | |
4.23% due 07/01/39 | | | 267,075 | | | | 226,613 | |
18 | THE GUGGENHEIM FUNDS ANNUAL REPORT | SEE NOTES TO FINANCIAL STATEMENTS. |
SCHEDULE OF INVESTMENTS (continued) | September 30, 2023 |
TOTAL RETURN BOND FUND | |
| | Face
Amount~ | | | Value | |
3.77% due 08/01/45 | | | 282,889 | | | $ | 225,006 | |
4.50% due 04/01/48 | | | 240,189 | | | | 224,593 | |
5.00% due 12/01/44 | | | 226,143 | | | | 218,489 | |
3.50% due 12/01/45 | | | 208,079 | | | | 182,695 | |
3.50% due 08/01/43 | | | 202,302 | | | | 179,170 | |
2.00% due 10/25/51 | | | 333,048 | | | | 154,495 | |
3.95% due 06/01/49 | | | 189,497 | | | | 152,696 | |
4.50% due 05/01/47 | | | 158,339 | | | | 148,596 | |
3.18% due 08/01/42 | | | 182,465 | | | | 144,308 | |
4.00% due 10/01/45 | | | 126,811 | | | | 115,676 | |
5.00% due 05/01/44 | | | 112,505 | | | | 108,697 | |
3.50% due 04/01/48 | | | 112,863 | | | | 98,809 | |
2.06% due 09/01/36 | | | 140,000 | | | | 94,412 | |
5.00% due 04/01/44 | | | 71,065 | | | | 67,992 | |
2.28% due 01/01/51 | | | 68,323 | | | | 46,042 | |
3.50% due 06/01/46 | | | 13,150 | | | | 11,526 | |
Freddie Mac | | | | | | | | |
5.00% due 04/01/53 | | | 199,005,500 | | | | 187,840,554 | |
5.50% due 06/01/53 | | | 175,364,707 | | | | 169,629,191 | |
5.00% due 06/01/53 | | | 179,214,158 | | | | 169,168,436 | |
5.50% due 05/01/53 | | | 152,161,943 | | | | 147,104,943 | |
due 08/01/5317 | | | 127,047,546 | | | | 121,460,569 | |
4.00% due 02/01/53 | | | 126,722,331 | | | | 113,829,757 | |
5.00% due 09/01/52 | | | 81,099,257 | | | | 76,602,591 | |
5.00% due 03/01/53 | | | 70,689,968 | | | | 66,751,224 | |
2.00% due 03/01/52 | | | 63,572,849 | | | | 48,587,103 | |
4.00% due 10/01/52 | | | 47,303,068 | | | | 42,249,604 | |
3.00% due 03/01/52 | | | 40,122,650 | | | | 33,286,543 | |
4.00% due 04/01/52 | | | 31,420,263 | | | | 28,201,087 | |
5.50% due 02/01/53 | | | 13,276,411 | | | | 12,863,240 | |
3.26% due 09/01/45 | | | 2,117,077 | | | | 1,694,746 | |
4.50% due 08/01/52 | | | 1,136,308 | | | | 1,049,554 | |
1.96% due 05/01/50 | | | 1,528,504 | | | | 963,829 | |
3.50% due 01/01/44 | | | 603,717 | | | | 535,944 | |
3.00% due 08/01/46 | | | 493,047 | | | | 417,450 | |
2.00% due 10/25/51 | | | 832,621 | | | | 363,621 | |
4.00% due 02/01/46 | | | 296,178 | | | | 266,859 | |
4.00% due 01/01/46 | | | 274,918 | | | | 250,359 | |
4.00% due 05/25/52 | | | 270,000 | | | | 208,852 | |
4.50% due 06/01/48 | | | 217,212 | | | | 203,466 | |
3.50% due 12/01/45 | | | 186,954 | | | | 164,254 | |
4.00% due 11/01/45 | | | 165,954 | | | | 151,770 | |
4.00% due 08/01/45 | | | 151,286 | | | | 138,539 | |
4.00% due 09/01/45 | | | 143,663 | | | | 131,177 | |
2.50% due 02/25/52 | | | 135,525 | | | | 71,820 | |
4.00% due 01/15/46 | | | 2,978 | | | | 2,967 | |
Fannie Mae-Aces | | | | | | | | |
1.59% (WAC) due 03/25/35◊,8 | | | 201,564,532 | | | | 19,888,957 | |
Ginnie Mae | | | | | | | | |
6.00% due 06/20/47††† | | | 16,125,000 | | | | 16,136,310 | |
Freddie Mac Seasoned Credit Risk Transfer Trust | | | | | | | | |
2.00% due 11/25/59 | | | 11,134,941 | | | | 8,445,014 | |
2.00% due 05/25/60 | | | 9,038,134 | | | | 6,866,784 | |
FARM Mortgage Trust | | | | | | | | |
2.18% (WAC) due 01/25/51◊,4 | | | 10,402,309 | | | | 8,226,019 | |
Freddie Mac Multifamily Structured Pass Through Certificates | | | | | | | | |
0.63% (WAC) due 12/25/24◊,8 | | | 41,086,352 | | | | 220,712 | |
Total Government Agency | | | 2,962,384,071 | |
| | | | | | | | | |
Residential Mortgage-Backed Securities - 8.1% |
CSMC Trust | | | | | | | | |
2020-RPL5, 3.02% (WAC) due 08/25/60◊,4 | | | 63,266,631 | | | | 62,112,103 | |
2021-RPL4, 1.80% (WAC) due 12/27/60◊,4 | | | 61,298,877 | | | | 57,069,788 | |
2021-RPL7, 1.93% (WAC) due 07/27/61◊,4 | | | 55,930,701 | | | | 51,186,827 | |
2021-RPL1, 1.67% (WAC) due 09/27/60◊,4 | | | 25,442,363 | | | | 23,418,929 | |
BRAVO Residential Funding Trust | | | | | | | | |
2022-R1, 3.13% due 01/29/704,9 | | | 79,774,661 | | | | 71,480,027 | |
SEE NOTES TO FINANCIAL STATEMENTS. | THE GUGGENHEIM FUNDS ANNUAL REPORT | 19 |
SCHEDULE OF INVESTMENTS (continued) | September 30, 2023 |
TOTAL RETURN BOND FUND | |
| | Face
Amount~ | | | Value | |
2021-C, 1.62% due 03/01/614,9 | | | 62,243,808 | | | $ | 54,715,756 | |
2021-HE1, 6.82% (30 Day Average SOFR + 1.50%, Rate Floor: 0.00%) due 01/25/70◊,4 | | | 7,500,000 | | | | 7,339,540 | |
PRPM LLC | | | | | | | | |
2021-5, 1.79% due 06/25/264,9 | | | 57,755,050 | | | | 53,269,995 | |
2021-8, 1.74% (WAC) due 09/25/26◊,4 | | | 30,862,146 | | | | 28,299,171 | |
2023-1, 6.88% (WAC) due 02/25/28◊,4 | | | 20,034,542 | | | | 19,975,064 | |
2022-1, 3.72% due 02/25/274,9 | | | 10,771,434 | | | | 10,310,267 | |
Legacy Mortgage Asset Trust | | | | | | | | |
2021-GS2, 1.75% due 04/25/614,9 | | | 37,648,311 | | | | 34,773,964 | |
2021-GS3, 1.75% due 07/25/614,9 | | | 34,168,238 | | | | 31,820,842 | |
2021-GS5, 2.25% due 07/25/674,9 | | | 21,210,511 | | | | 19,571,995 | |
LSTAR Securities Investment Ltd. | | | | | | | | |
2023-1, 8.81% (SOFR + 3.50%, Rate Floor: 0.00%) due 01/01/28◊,4 | | | 48,699,397 | | | | 48,666,116 | |
2021-1, 8.24% (1 Month Term SOFR + 2.91%, Rate Floor: 1.80%) due 02/01/26◊,10 | | | 37,831,085 | | | | 37,130,302 | |
Towd Point Revolving Trust | | | | | | | | |
4.83% due 09/25/6410 | | | 81,500,000 | | | | 79,238,375 | |
Morgan Stanley ABS Capital I Incorporated Trust | | | | | | | | |
2006-NC5, 5.58% (1 Month Term SOFR + 0.26%, Rate Floor: 0.15%) due 10/25/36◊ | | | 25,336,351 | | | | 12,861,309 | |
2007-HE5, 5.77% (1 Month Term SOFR + 0.45%, Rate Floor: 0.34%) due 03/25/37◊ | | | 26,557,443 | | | | 11,159,398 | |
2006-HE6, 5.91% (1 Month Term SOFR + 0.59%, Rate Floor: 0.48%) due 09/25/36◊ | | | 23,179,376 | | | | 8,105,948 | |
2006-HE5, 5.71% (1 Month Term SOFR + 0.39%, Rate Floor: 0.28%) due 08/25/36◊ | | | 13,001,152 | | | | 6,518,000 | |
2007-HE3, 5.54% (1 Month Term SOFR + 0.22%, Rate Floor: 0.11%) due 12/25/36◊ | | | 11,016,205 | | | | 5,288,241 | |
2006-HE4, 5.91% (1 Month Term SOFR + 0.59%, Rate Floor: 0.48%) due 06/25/36◊ | | | 8,161,312 | | | | 4,190,601 | |
2006-HE5, 5.93% (1 Month Term SOFR + 0.61%, Rate Floor: 0.50%) due 08/25/36◊ | | | 7,790,193 | | | | 3,905,346 | |
2007-HE2, 5.56% (1 Month Term SOFR + 0.24%, Rate Floor: 0.13%) due 01/25/37◊ | | | 8,042,855 | | | | 3,506,679 | |
20 | THE GUGGENHEIM FUNDS ANNUAL REPORT | SEE NOTES TO FINANCIAL STATEMENTS. |
SCHEDULE OF INVESTMENTS (continued) | September 30, 2023 |
TOTAL RETURN BOND FUND | |
| | Face
Amount~ | | | Value | |
2007-NC3, 5.62% (1 Month Term SOFR + 0.30%, Rate Floor: 0.19%) due 05/25/37◊ | | | 3,268,062 | | | $ | 2,389,500 | |
2007-HE6, 5.49% (1 Month Term SOFR + 0.17%, Rate Floor: 0.06%) due 05/25/37◊ | | | 2,383,065 | | | | 1,978,194 | |
2007-HE3, 5.56% (1 Month Term SOFR + 0.24%, Rate Floor: 0.13%) due 12/25/36◊,4 | | | 2,013,357 | | | | 1,223,028 | |
2006-HE6, 5.73% (1 Month Term SOFR + 0.41%, Rate Floor: 0.30%) due 09/25/36◊ | | | 2,938,231 | | | | 1,027,573 | |
NYMT Loan Trust | | | | | | | | |
2022-SP1, 5.25% due 07/25/624,9 | | | 61,393,873 | | | | 59,227,369 | |
OSAT Trust | | | | | | | | |
2021-RPL1, 2.12% due 05/25/654,9 | | | 60,106,001 | | | | 55,093,732 | |
Home Equity Loan Trust | | | | | | | | |
2007-FRE1, 5.62% (1 Month Term SOFR + 0.30%, Rate Floor: 0.19%) due 04/25/37◊ | | | 48,199,773 | | | | 44,592,309 | |
JP Morgan Mortgage Acquisition Trust | | | | | | | | |
2006-WMC4, 5.56% (1 Month Term SOFR + 0.24%, Rate Floor: 0.13%) due 12/25/36◊ | | | 61,584,315 | | | | 35,897,608 | |
2006-WMC4, 5.55% (1 Month Term SOFR + 0.23%, Rate Floor: 0.12%) due 12/25/36◊ | | | 12,610,261 | | | | 6,486,789 | |
2006-WMC3, 5.91% (1 Month Term SOFR + 0.59%, Rate Floor: 0.48%) due 08/25/36◊ | | | 1,803,738 | | | | 1,241,444 | |
GCAT Trust | | | | | | | | |
2022-NQM5, 5.71% due 08/25/674,9 | | | 22,210,931 | | | | 21,576,861 | |
2022-NQM3, 4.35% (WAC) due 04/25/67◊,4 | | | 11,288,492 | | | | 10,096,946 | |
GSAMP Trust | | | | | | | | |
2007-NC1, 5.56% (1 Month Term SOFR + 0.24%, Rate Floor: 0.13%) due 12/25/46◊ | | | 25,067,815 | | | | 13,071,575 | |
2006-HE8, 5.66% (1 Month Term SOFR + 0.34%, Rate Floor: 0.23%) due 01/25/37◊ | | | 10,107,000 | | | | 8,003,246 | |
2006-NC2, 5.73% (1 Month Term SOFR + 0.41%, Rate Floor: 0.30%) due 06/25/36◊ | | | 11,708,116 | | | | 6,450,204 | |
2007-NC1, 5.58% (1 Month Term SOFR + 0.26%, Rate Floor: 0.15%) due 12/25/46◊ | | | 5,592,996 | | | | 2,718,713 | |
BRAVO Residential Funding Trust 2023-NQM2 | | | | | | | | |
2023-NQM2, 4.50% due 05/25/624,9 | | | 30,762,437 | | | | 28,523,603 | |
Soundview Home Loan Trust | | | | | | | | |
2006-OPT5, 5.71% (1 Month Term SOFR + 0.39%, Rate Floor: 0.28%) due 07/25/36◊ | | | 29,017,408 | | | | 27,224,306 | |
SEE NOTES TO FINANCIAL STATEMENTS. | THE GUGGENHEIM FUNDS ANNUAL REPORT | 21 |
SCHEDULE OF INVESTMENTS (continued) | September 30, 2023 |
TOTAL RETURN BOND FUND | |
| | Face
Amount~ | | | Value | |
Alternative Loan Trust | | | | | | | | |
2007-OA4, 5.77% (1 Month Term SOFR + 0.45%, Rate Floor: 0.34%) due 05/25/47◊ | | | 14,749,868 | | | $ | 12,391,690 | |
2007-OH3, 6.01% (1 Month Term SOFR + 0.69%, Rate Cap/Floor: 10.00%/0.58%) due 09/25/47◊ | | | 6,256,682 | | | | 5,428,534 | |
2006-43CB, 6.00% (1 Month Term SOFR + 0.61%, Rate Cap/Floor: 6.00%/6.00%) due 02/25/37◊ | | | 5,999,519 | | | | 3,215,044 | |
2007-OA7, 5.79% (1 Month Term SOFR + 0.47%, Rate Floor: 0.36%) due 05/25/47◊ | | | 2,233,844 | | | | 1,871,650 | |
2007-OH3, 5.87% (1 Month Term SOFR + 0.55%, Rate Cap/Floor: 10.00%/0.44%) due 09/25/47◊ | | | 621,937 | | | | 554,284 | |
Citigroup Mortgage Loan Trust, Inc. | | | | | | | | |
2007-AMC1, 5.75% (1 Month Term SOFR + 0.43%, Rate Floor: 0.32%) due 12/25/36◊,4 | | | 20,680,326 | | | | 11,424,122 | |
2006-WF1, 4.96% due 03/25/36 | | | 13,913,592 | | | | 6,802,439 | |
2007-AMC3, 5.61% (1 Month Term SOFR + 0.29%, Rate Floor: 0.18%) due 03/25/37◊ | | | 5,905,372 | | | | 4,800,305 | |
Imperial Fund Mortgage Trust | | | | | | | | |
2022-NQM2, 4.02% (WAC) due 03/25/67◊,4 | | | 12,862,434 | | | | 11,288,122 | |
2022-NQM2, 4.20% (WAC) due 03/25/67◊,4 | | | 12,643,870 | | | | 10,950,141 | |
Angel Oak Mortgage Trust 2023-2 | | | | | | | | |
2023-2, 4.65% due 10/25/674,9 | | | 23,166,127 | | | | 21,631,189 | |
NovaStar Mortgage Funding Trust Series | | | | | | | | |
2007-2, 5.63% (1 Month Term SOFR + 0.31%, Rate Cap/Floor: 11.00%/0.20%) due 09/25/37◊ | | | 20,720,666 | | | | 19,922,779 | |
2007-1, 5.56% (1 Month Term SOFR + 0.24%, Rate Cap/Floor: 11.00%/0.13%) due 03/25/37◊ | | | 2,782,832 | | | | 1,692,515 | |
ACE Securities Corporation Home Equity Loan Trust Series | | | | | | | | |
2006-NC1, 6.05% (1 Month Term SOFR + 0.73%, Rate Floor: 0.62%) due 12/25/35◊ | | | 16,186,529 | | | | 14,622,012 | |
2007-ASP1, 5.83% (1 Month Term SOFR + 0.51%, Rate Floor: 0.40%) due 03/25/37◊ | | | 8,133,774 | | | | 3,382,414 | |
2007-WM2, 5.64% (1 Month Term SOFR + 0.32%, Rate Floor: 0.21%) due 02/25/37◊ | | | 6,275,694 | | | | 2,640,146 | |
22 | THE GUGGENHEIM FUNDS ANNUAL REPORT | SEE NOTES TO FINANCIAL STATEMENTS. |
SCHEDULE OF INVESTMENTS (continued) | September 30, 2023 |
TOTAL RETURN BOND FUND | |
| | Face
Amount~ | | | Value | |
GCAT Trust | | | | | | | | |
2023-NQM3, 6.89% (WAC) due 08/25/68◊,†††,4 | | | 20,250,000 | | | $ | 20,171,376 | |
Structured Asset Securities Corporation Mortgage Loan Trust | | | | | | | | |
2008-BC4, 6.06% (1 Month Term SOFR + 0.74%, Rate Floor: 0.63%) due 11/25/37◊ | | | 18,037,501 | | | | 17,079,396 | |
2006-BC4, 5.77% (1 Month Term SOFR + 0.45%, Rate Floor: 0.34%) due 12/25/36◊ | | | 1,750,296 | | | | 1,666,174 | |
2006-BC6, 5.60% (1 Month Term SOFR + 0.28%, Rate Floor: 0.17%) due 01/25/37◊ | | | 111,781 | | | | 108,730 | |
OBX Trust | | | | | | | | |
2022-NQM9, 6.45% due 09/25/624,9 | | | 9,017,121 | | | | 8,963,220 | |
2023-NQM2, 6.32% due 01/25/624,9 | | | 5,995,287 | | | | 5,977,527 | |
2022-NQM8, 6.10% due 09/25/624,9 | | | 3,738,958 | | | | 3,676,808 | |
SPS Servicer Advance Receivables Trust | | | | | | | | |
2020-T2, 1.83% due 11/15/554 | | | 20,000,000 | | | | 18,017,162 | |
Securitized Asset-Backed Receivables LLC Trust | | | | | | | | |
2006-WM4, 5.59% (1 Month Term SOFR + 0.27%, Rate Floor: 0.16%) due 11/25/36◊ | | | 29,965,092 | | | | 8,353,006 | |
2007-BR2, 5.79% (1 Month Term SOFR + 0.47%, Rate Floor: 0.36%) due 02/25/37◊,4 | | | 10,048,942 | | | | 8,162,229 | |
2006-HE2, 5.73% (1 Month Term SOFR + 0.41%, Rate Floor: 0.30%) due 07/25/36◊ | | | 3,280,767 | | | | 1,284,088 | |
Washington Mutual Mortgage Pass-Through Certificates WMALT Series Trust | | | | | | | | |
2006-AR9, 5.46% (1 Year CMT Rate + 0.83%, Rate Floor: 0.83%) due 11/25/46◊ | | | 8,541,350 | | | | 6,879,361 | |
2006-AR10, 5.60% (1 Month Term SOFR + 0.45%, Rate Floor: 0.34%) due 12/25/36◊ | | | 7,553,900 | | | | 6,083,328 | |
2006-AR9, 5.47% (1 Year CMT Rate + 0.84%, Rate Floor: 0.84%) due 11/25/46◊ | | | 3,775,617 | | | | 3,004,624 | |
2006-7, 4.05% due 09/25/36 | | | 5,265,287 | | | | 1,483,485 | |
2006-8, 4.16% due 10/25/36 | | | 338,125 | | | | 115,009 | |
IXIS Real Estate Capital Trust | | | | | | | | |
2007-HE1, 5.54% (1 Month Term SOFR + 0.22%, Rate Floor: 0.11%) due 05/25/37◊ | | | 32,338,460 | | | | 7,645,365 | |
2006-HE1, 6.03% (1 Month Term SOFR + 0.71%, Rate Floor: 0.60%) due 03/25/36◊ | | | 11,397,804 | | | | 5,905,377 | |
SEE NOTES TO FINANCIAL STATEMENTS. | THE GUGGENHEIM FUNDS ANNUAL REPORT | 23 |
SCHEDULE OF INVESTMENTS (continued) | September 30, 2023 |
TOTAL RETURN BOND FUND | |
| | Face
Amount~ | | | Value | |
2007-HE1, 5.66% (1 Month Term SOFR + 0.34%, Rate Floor: 0.23%) due 05/25/37◊ | | | 6,137,377 | | | $ | 1,450,899 | |
2007-HE1, 5.59% (1 Month Term SOFR + 0.27%, Rate Floor: 0.16%) due 05/25/37◊ | | | 5,764,117 | | | | 1,362,704 | |
2007-HE1, 5.49% (1 Month Term SOFR + 0.17%, Rate Floor: 0.06%) due 05/25/37◊ | | | 4,795,479 | | | | 1,133,760 | |
American Home Mortgage Investment Trust | | | | | | | | |
2007-1, 2.08% due 05/25/478 | | | 125,088,183 | | | | 17,498,086 | |
Citigroup Mortgage Loan Trust | | | | | | | | |
2022-A, 6.17% due 09/25/624,9 | | | 17,302,555 | | | | 17,149,420 | |
Credit Suisse Mortgage Capital Certificates | | | | | | | | |
2021-RPL9, 2.44% (WAC) due 02/25/61◊,4 | | | 17,753,305 | | | | 16,168,788 | |
Starwood Mortgage Residential Trust | | | | | | | | |
2020-1, 2.56% (WAC) due 02/25/50◊,4 | | | 9,285,044 | | | | 8,562,452 | |
2020-1, 2.41% (WAC) due 02/25/50◊,4 | | | 7,142,342 | | | | 6,589,625 | |
Verus Securitization Trust | | | | | | | | |
2022-8, 6.13% due 09/25/674,9 | | | 14,766,823 | | | | 14,482,113 | |
Merrill Lynch Mortgage Investors Trust Series | | | | | | | | |
2007-HE2, 5.95% (1 Month Term SOFR + 0.63%, Rate Floor: 0.52%) due 02/25/37◊ | | | 31,640,311 | | | | 9,305,406 | |
2006-HE6, 5.71% (1 Month Term SOFR + 0.39%, Rate Floor: 0.28%) due 11/25/37◊ | | | 7,863,705 | | | | 3,879,862 | |
RALI Series Trust | | | | | | | | |
2007-QO4, 5.81% (1 Month Term SOFR + 0.49%, Rate Floor: 0.38%) due 05/25/47◊ | | | 3,957,178 | | | | 3,428,696 | |
2006-QO2, 5.87% (1 Month Term SOFR + 0.55%, Rate Floor: 0.44%) due 02/25/46◊ | | | 16,536,210 | | | | 3,190,617 | |
2007-QO2, 5.58% (1 Month Term SOFR + 0.26%, Rate Floor: 0.15%) due 02/25/47◊ | | | 7,420,826 | | | | 2,610,935 | |
2006-QO6, 5.79% (1 Month Term SOFR + 0.47%, Rate Floor: 0.36%) due 06/25/46◊ | | | 4,715,292 | | | | 1,083,212 | |
2006-QO2, 5.97% (1 Month Term SOFR + 0.65%, Rate Floor: 0.54%) due 02/25/46◊ | | | 5,362,610 | | | | 1,062,914 | |
2007-QO3, 5.75% (1 Month Term SOFR + 0.43%, Rate Floor: 0.32%) due 03/25/47◊ | | | 803,841 | | | | 680,301 | |
24 | THE GUGGENHEIM FUNDS ANNUAL REPORT | SEE NOTES TO FINANCIAL STATEMENTS. |
SCHEDULE OF INVESTMENTS (continued) | September 30, 2023 |
TOTAL RETURN BOND FUND | |
| | Face
Amount~ | | | Value | |
2006-QO2, 6.11% (1 Month Term SOFR + 0.79%, Rate Floor: 0.68%) due 02/25/46◊ | | | 1,105,132 | | | $ | 226,541 | |
Angel Oak Mortgage Trust 2023-1 | | | | | | | | |
2023-1, 4.75% due 09/26/674,9 | | | 12,785,779 | | | | 11,903,168 | |
Ameriquest Mortgage Securities Trust | | | | | | | | |
2006-M3, 5.59% (1 Month Term SOFR + 0.27%, Rate Floor: 0.16%) due 10/25/36◊ | | | 26,744,795 | | | | 7,879,979 | |
2006-M3, 5.53% (1 Month Term SOFR + 0.21%, Rate Floor: 0.10%) due 10/25/36◊ | | | 11,234,610 | | | | 3,310,195 | |
ABFC Trust | | | | | | | | |
2007-WMC1, 6.68% (1 Month Term SOFR + 1.36%, Rate Floor: 1.25%) due 06/25/37◊ | | | 14,937,626 | | | | 10,197,209 | |
Master Asset-Backed Securities Trust | | | | | | | | |
2006-WMC4, 5.58% (1 Month Term SOFR + 0.26%, Rate Floor: 0.15%) due 10/25/36◊ | | | 10,611,757 | | | | 3,337,450 | |
2006-NC2, 5.91% (1 Month Term SOFR + 0.59%, Rate Floor: 0.48%) due 08/25/36◊ | | | 7,552,152 | | | | 2,851,579 | |
2006-WMC3, 5.75% (1 Month Term SOFR + 0.43%, Rate Floor: 0.32%) due 08/25/36◊ | | | 5,672,852 | | | | 2,028,504 | |
2007-WMC1, 5.59% (1 Month Term SOFR + 0.27%, Rate Floor: 0.16%) due 01/25/37◊ | | | 5,807,889 | | | | 1,607,449 | |
First NLC Trust | | | | | | | | |
2005-4, 6.21% (1 Month Term SOFR + 0.89%, Rate Cap/Floor: 14.00%/0.78%) due 02/25/36◊ | | | 8,123,796 | | | | 7,781,758 | |
2005-1, 5.89% (1 Month Term SOFR + 0.57%, Rate Cap/Floor: 14.00%/0.46%) due 05/25/35◊ | | | 2,124,724 | | | | 1,826,862 | |
HarborView Mortgage Loan Trust | | | | | | | | |
2006-14, 5.74% (1 Month Term SOFR + 0.41%, Rate Floor: 0.30%) due 01/25/47◊ | | | 6,263,560 | | | | 5,520,304 | |
2006-12, 5.82% (1 Month Term SOFR + 0.49%, Rate Floor: 0.38%) due 01/19/38◊ | | | 4,684,871 | | | | 4,057,132 | |
Angel Oak Mortgage Trust | | | | | | | | |
2023-1, 4.75% due 09/26/674,9 | | | 10,063,615 | | | | 9,504,237 | |
Cascade Funding Mortgage Trust | | | | | | | | |
2018-RM2, 4.00% (WAC) due 10/25/68◊,10 | | | 6,372,821 | | | | 6,282,538 | |
2019-RM3, 2.80% (WAC) due 06/25/69◊,10 | | | 3,262,603 | | | | 3,164,128 | |
SEE NOTES TO FINANCIAL STATEMENTS. | THE GUGGENHEIM FUNDS ANNUAL REPORT | 25 |
SCHEDULE OF INVESTMENTS (continued) | September 30, 2023 |
TOTAL RETURN BOND FUND | |
| | Face
Amount~ | | | Value | |
Bear Stearns Asset-Backed Securities I Trust | | | | | | | | |
2006-HE9, 5.71% (1 Month Term SOFR + 0.39%, Rate Floor: 0.28%) due 11/25/36◊ | | | 9,573,559 | | | $ | 9,259,281 | |
Fremont Home Loan Trust | | | | | | | | |
2006-E, 5.55% (1 Month Term SOFR + 0.23%, Rate Floor: 0.12%) due 01/25/37◊ | | | 11,565,768 | | | | 5,141,257 | |
2006-D, 5.58% (1 Month Term SOFR + 0.26%, Rate Floor: 0.15%) due 11/25/36◊ | | | 10,370,134 | | | | 3,533,701 | |
First Franklin Mortgage Loan Trust | | | | | | | | |
2006-FF16, 5.71% (1 Month Term SOFR + 0.39%, Rate Floor: 0.28%) due 12/25/36◊ | | | 20,279,814 | | | | 8,319,356 | |
Merrill Lynch Alternative Note Asset Trust Series | | | | | | | | |
2007-A1, 5.89% (1 Month Term SOFR + 0.57%, Rate Floor: 0.46%) due 01/25/37◊ | | | 19,212,356 | | | | 5,755,486 | |
2007-A1, 5.73% (1 Month Term SOFR + 0.41%, Rate Floor: 0.30%) due 01/25/37◊ | | | 7,285,646 | | | | 2,171,877 | |
CFMT LLC | | | | | | | | |
2022-HB9, 3.25% (WAC) due 09/25/37◊,10 | | | 8,568,166 | | | | 7,667,814 | |
Asset-Backed Securities Corporation Home Equity Loan Trust Series AEG | | | | | | | | |
2006-HE1, 6.03% (1 Month Term SOFR + 0.71%, Rate Floor: 0.60%) due 01/25/36◊ | | | 7,720,784 | | | | 7,289,530 | |
Towd Point Mortgage Trust 2023-CES1 | | | | | | | | |
2023-CES1, 6.75% (WAC) due 07/25/63◊,4 | | | 7,188,158 | | | | 7,156,271 | |
Argent Securities Incorporated Asset-Backed Pass-Through Certificates Series | | | | | | | | |
2005-W4, 6.19% (1 Month Term SOFR + 0.87%, Rate Floor: 0.76%) due 02/25/36◊ | | | 9,509,147 | | | | 7,141,877 | |
Long Beach Mortgage Loan Trust | | | | | | | | |
2006-8, 5.75% (1 Month Term SOFR + 0.43%, Rate Floor: 0.32%) due 09/25/36◊ | | | 14,577,520 | | | | 3,955,757 | |
2006-6, 5.93% (1 Month Term SOFR + 0.61%, Rate Floor: 0.50%) due 07/25/36◊ | | | 4,537,856 | | | | 1,730,928 | |
2006-8, 5.61% (1 Month Term SOFR + 0.29%, Rate Floor: 0.18%) due 09/25/36◊ | | | 3,890,468 | | | | 1,055,244 | |
26 | THE GUGGENHEIM FUNDS ANNUAL REPORT | SEE NOTES TO FINANCIAL STATEMENTS. |
SCHEDULE OF INVESTMENTS (continued) | September 30, 2023 |
TOTAL RETURN BOND FUND | |
| | Face
Amount~ | | | Value | |
BRAVO Residential Funding Trust 2023-NQM6 | | | | | | | | |
2023-NQM6, 7.06% due 09/25/634,9 | | | 6,612,076 | | | $ | 6,595,553 | |
Option One Mortgage Loan Trust | | | | | | | | |
2007-5, 5.65% (1 Month Term SOFR + 0.33%, Rate Floor: 0.22%) due 05/25/37◊ | | | 6,973,853 | | | | 4,058,237 | |
2007-2, 5.68% (1 Month Term SOFR + 0.36%, Rate Floor: 0.25%) due 03/25/37◊ | | | 4,923,997 | | | | 2,362,959 | |
RCKT Mortgage Trust 2023-CES1 | | | | | | | | |
2023-CES1, 6.52% (WAC) due 06/25/43◊,4 | | | 6,248,796 | | | | 6,187,649 | |
Lehman XS Trust Series | | | | | | | | |
2007-2N, 5.61% (1 Month Term SOFR + 0.29%, Rate Floor: 0.18%) due 02/25/37◊ | | | 4,670,953 | | | | 4,178,238 | |
2007-15N, 5.93% (1 Month Term SOFR + 0.61%, Rate Floor: 0.00%) due 08/25/37◊ | | | 1,300,489 | | | | 1,171,139 | |
2006-10N, 5.85% (1 Month Term SOFR + 0.53%, Rate Floor: 0.42%) due 07/25/46◊ | | | 294,456 | | | | 262,458 | |
Credit-Based Asset Servicing and Securitization LLC | | | | | | | | |
2006-CB2, 5.81% (1 Month Term SOFR + 0.49%, Rate Floor: 0.38%) due 12/25/36◊ | | | 6,042,289 | | | | 5,594,119 | |
CWABS Asset-Backed Certificates Trust 2006-11 | | | | | | | | |
2006-12, 5.69% (1 Month Term SOFR + 0.37%, Rate Floor: 0.26%) due 12/25/36◊ | | | 6,015,978 | | | | 5,356,050 | |
WaMu Asset-Backed Certificates WaMu Series | | | | | | | | |
2007-HE4, 5.60% (1 Month Term SOFR + 0.28%, Rate Floor: 0.28%) due 07/25/47◊ | | | 4,924,776 | | | | 3,402,322 | |
2007-HE4, 5.68% (1 Month Term SOFR + 0.36%, Rate Floor: 0.36%) due 07/25/47◊ | | | 3,330,849 | | | | 1,926,388 | |
American Home Mortgage Assets Trust | | | | | | | | |
2006-4, 5.62% (1 Month Term SOFR + 0.30%, Rate Floor: 0.30%) due 10/25/46◊ | | | 6,839,086 | | | | 3,590,525 | |
2006-6, 5.62% (1 Month Term SOFR + 0.30%, Rate Floor: 0.19%) due 12/25/46◊ | | | 2,083,034 | | | | 1,716,214 | |
SEE NOTES TO FINANCIAL STATEMENTS. | THE GUGGENHEIM FUNDS ANNUAL REPORT | 27 |
SCHEDULE OF INVESTMENTS (continued) | September 30, 2023 |
TOTAL RETURN BOND FUND | |
| | Face
Amount~ | | | Value | |
WaMu Mortgage Pass-Through Certificates Series Trust | | | | | | | | |
2007-OA6, 5.44% (1 Year CMT Rate + 0.81%, Rate Floor: 0.81%) due 07/25/47◊ | | | 4,528,941 | | | $ | 3,549,066 | |
2006-AR13, 5.51% (1 Year CMT Rate + 0.88%, Rate Floor: 0.88%) due 10/25/46◊ | | | 1,381,992 | | | | 1,132,559 | |
2006-AR11, 5.55% (1 Year CMT Rate + 0.92%, Rate Floor: 0.92%) due 09/25/46◊ | | | 622,490 | | | | 522,288 | |
Morgan Stanley IXIS Real Estate Capital Trust | | | | | | | | |
2006-2, 5.58% (1 Month Term SOFR + 0.26%, Rate Floor: 0.15%) due 11/25/36◊ | | | 15,107,588 | | | | 5,184,333 | |
GCAT 2023-NQM3 Trust | | | | | | | | |
2023-NQM3, 7.34% (WAC) due 08/25/68◊,†††,4 | | | 5,150,000 | | | | 5,129,849 | |
RCKT Mortgage Trust 2023-CES2 | | | | | | | | |
2023-CES2, 6.81% (WAC) due 09/25/43◊,4 | | | 5,000,000 | | | | 4,992,989 | |
Deutsche Alt-A Securities Mortgage Loan Trust Series | | | | | | | | |
2006-AR4, 5.69% (1 Month Term SOFR + 0.37%, Rate Floor: 0.26%) due 12/25/36◊ | | | 9,524,714 | | | | 3,131,013 | |
2007-OA2, 5.40% (1 Year CMT Rate + 0.77%, Rate Floor: 0.77%) due 04/25/47◊ | | | 2,106,376 | | | | 1,855,594 | |
PRPM 2023-RCF1 LLC | | | | | | | | |
2023-RCF1, 4.00% due 06/25/534,9 | | | 4,739,452 | | | | 4,462,746 | |
BRAVO Residential Funding Trust 2023-NQM5 | | | | | | | | |
2023-NQM5, 7.01% due 06/25/634,9 | | | 4,460,761 | | | | 4,442,256 | |
GSAA Home Equity Trust | | | | | | | | |
2006-5, 5.79% (1 Month Term SOFR + 0.47%, Rate Floor: 0.36%) due 03/25/36◊ | | | 12,429,458 | | | | 4,234,473 | |
2007-7, 5.97% (1 Month Term SOFR + 0.65%, Rate Floor: 0.54%) due 07/25/37◊ | | | 147,168 | | | | 134,215 | |
Impac Secured Assets CMN Owner Trust | | | | | | | | |
2005-2, 5.93% (1 Month Term SOFR + 0.61%, Rate Floor: 0.50%) due 03/25/36◊ | | | 4,652,064 | | | | 4,141,324 | |
COLT Mortgage Loan Trust | | | | | | | | |
2021-2, 2.38% (WAC) due 08/25/66◊,4 | | | 7,108,000 | | | | 3,889,753 | |
OBX 2023-NQM2 Trust | | | | | | | | |
2023-NQM2, 6.72% due 01/25/624,9 | | | 3,487,412 | | | | 3,465,075 | |
GSAA Trust | | | | | | | | |
2007-3, 5.77% (1 Month Term SOFR + 0.45%, Rate Floor: 0.34%) due 03/25/47◊ | | | 10,823,664 | | | | 3,004,039 | |
28 | THE GUGGENHEIM FUNDS ANNUAL REPORT | SEE NOTES TO FINANCIAL STATEMENTS. |
SCHEDULE OF INVESTMENTS (continued) | September 30, 2023 |
TOTAL RETURN BOND FUND | |
| | Face
Amount~ | | | Value | |
GCAT 2023-NQM2 Trust | | | | | | | | |
2023-NQM2, 6.24% due 11/25/674,9 | | | 2,931,113 | | | $ | 2,883,379 | |
ASG Resecuritization Trust | | | | | | | | |
2010-3, 4.55% (1 Month Term SOFR + 0.29%, Rate Cap/Floor: 10.50%/0.29%) due 12/28/45◊,4 | | | 2,356,629 | | | | 2,140,401 | |
Morgan Stanley Capital I Incorporated Trust | | | | | | | | |
2006-HE1, 6.01% (1 Month Term SOFR + 0.69%, Rate Floor: 0.58%) due 01/25/36◊ | | | 1,690,149 | | | | 1,604,111 | |
Securitized Asset Backed Receivables LLC Trust 2006-WM4 | | | | | | | | |
2006-WM4, 5.75% (1 Month Term SOFR + 0.43%, Rate Floor: 0.32%) due 11/25/36◊ | | | 5,258,834 | | | | 1,465,848 | |
Countrywide Asset-Backed Certificates | | | | | | | | |
2005-15, 6.11% (1 Month Term SOFR + 0.79%, Rate Floor: 0.68%) due 03/25/36◊ | | | 942,587 | | | | 908,214 | |
Residential Mortgage Loan Trust | | | | | | | | |
2020-1, 2.68% (WAC) due 01/26/60◊,4 | | | 692,659 | | | | 649,117 | |
Structured Asset Investment Loan Trust | | | | | | | | |
2004-BNC2, 6.63% (1 Month Term SOFR + 1.31%, Rate Floor: 1.20%) due 12/25/34◊ | | | 371,947 | | | | 363,626 | |
2006-3, 5.73% (1 Month Term SOFR + 0.41%, Rate Floor: 0.30%) due 06/25/36◊ | | | 293,738 | | | | 279,205 | |
Nomura Resecuritization Trust | | | | | | | | |
2015-4R, 2.73% (1 Month Term SOFR + 0.54%, Rate Floor: 0.43%) due 03/26/36◊,4 | | | 553,124 | | | | 510,202 | |
Impac Secured Assets Trust | | | | | | | | |
2006-2, 5.77% (1 Month Term SOFR + 0.45%, Rate Cap/Floor: 11.50%/0.34%) due 08/25/36◊ | | | 507,223 | | | | 480,607 | |
Alliance Bancorp Trust | | | | | | | | |
2007-OA1, 5.91% (1 Month Term SOFR + 0.59%, Rate Floor: 0.48%) due 07/25/37◊ | | | 526,939 | | | | 436,125 | |
Morgan Stanley Re-REMIC Trust | | | | | | | | |
2010-R5, 3.47% due 06/26/369,10 | | | 112,874 | | | | 102,318 | |
UCFC Manufactured Housing Contract | | | | | | | | |
1997-2, 7.38% due 10/15/28 | | | 93,432 | | | | 92,321 | |
SEE NOTES TO FINANCIAL STATEMENTS. | THE GUGGENHEIM FUNDS ANNUAL REPORT | 29 |
SCHEDULE OF INVESTMENTS (continued) | September 30, 2023 |
TOTAL RETURN BOND FUND | |
| | Face
Amount~ | | | Value | |
GreenPoint Mortgage Funding Trust | | | | | | | | |
2006-AR1, 6.01% (1 Month Term SOFR + 0.69%, Rate Cap/Floor: 10.50%/0.58%) due 02/25/36◊ | | | 94,196 | | | $ | 77,401 | |
Irwin Home Equity Loan Trust | | | | | | | | |
2007-1, 6.35% due 08/25/3710 | | | 200 | | | | 197 | |
Total Residential Mortgage-Backed Securities | | | 1,702,894,931 | |
| | | | | | | | | |
Commercial Mortgage-Backed Securities - 1.5% |
BX Commercial Mortgage Trust | | | | | | | | |
2021-VOLT, 7.45% (1 Month Term SOFR + 2.11%, Rate Floor: 2.00%) due 09/15/36◊,4 | | | 60,050,000 | | | | 57,257,267 | |
2021-VOLT, 7.10% (1 Month Term SOFR + 1.76%, Rate Floor: 1.65%) due 09/15/36◊,4 | | | 52,000,000 | | | | 49,601,037 | |
2019-XL, 7.45% (1 Month Term SOFR + 2.11%, Rate Floor: 2.00%) due 10/15/36◊,4 | | | 6,849,516 | | | | 6,775,813 | |
2022-LP2, 7.29% (1 Month Term SOFR + 1.96%, Rate Floor: 1.96%) due 02/15/39◊,4 | | | 5,103,438 | | | | 4,884,430 | |
SMRT | | | | | | | | |
2022-MINI, 7.28% (1 Month Term SOFR + 1.95%, Rate Floor: 1.95%) due 01/15/39◊,4 | | | 32,500,000 | | | | 31,134,201 | |
JP Morgan Chase Commercial Mortgage Securities Trust | | | | | | | | |
2021-NYAH, 7.29% (1 Month Term SOFR + 1.95%, Rate Floor: 1.84%) due 06/15/38◊,4 | | | 14,350,000 | | | | 12,369,908 | |
2016-JP3, 3.55% (WAC) due 08/15/49◊ | | | 10,290,000 | | | | 7,482,571 | |
2021-NYAH, 7.64% (1 Month Term SOFR + 2.30%, Rate Floor: 2.19%) due 06/15/38◊,4 | | | 8,000,000 | | | | 6,825,524 | |
2016-JP3, 1.46% (WAC) due 08/15/49◊,8 | | | 52,739,619 | | | | 1,603,348 | |
Life Mortgage Trust | | | | | | | | |
2021-BMR, 7.80% (1 Month Term SOFR + 2.46%, Rate Floor: 2.35%) due 03/15/38◊,4 | | | 19,167,918 | | | | 18,317,451 | |
2021-BMR, 7.20% (1 Month Term SOFR + 1.86%, Rate Floor: 1.75%) due 03/15/38◊,4 | | | 5,160,593 | | | | 4,966,918 | |
Extended Stay America Trust | | | | | | | | |
2021-ESH, 7.70% (1 Month Term SOFR + 2.36%, Rate Floor: 2.25%) due 07/15/38◊,4 | | | 11,881,095 | | | | 11,687,181 | |
2021-ESH, 7.15% (1 Month Term SOFR + 1.81%, Rate Floor: 1.70%) due 07/15/38◊,4 | | | 6,130,645 | | | | 6,038,997 | |
30 | THE GUGGENHEIM FUNDS ANNUAL REPORT | SEE NOTES TO FINANCIAL STATEMENTS. |
SCHEDULE OF INVESTMENTS (continued) | September 30, 2023 |
TOTAL RETURN BOND FUND | |
| | Face
Amount~ | | | Value | |
Citigroup Commercial Mortgage Trust | | | | | | | | |
2019-GC43, 0.74% (WAC) due 11/10/52◊,8 | | | 218,036,340 | | | $ | 6,138,246 | |
2019-GC41, 1.17% (WAC) due 08/10/56◊,8 | | | 103,121,811 | | | | 4,031,155 | |
2016-P4, 2.05% (WAC) due 07/10/49◊,8 | | | 27,874,919 | | | | 1,075,587 | |
2016-C2, 1.81% (WAC) due 08/10/49◊,8 | | | 30,347,562 | | | | 1,044,806 | |
2016-P5, 1.52% (WAC) due 10/10/49◊,8 | | | 24,959,338 | | | | 767,455 | |
2016-GC37, 1.82% (WAC) due 04/10/49◊,8 | | | 19,249,322 | | | | 583,416 | |
2015-GC35, 0.86% (WAC) due 11/10/48◊,8 | | | 27,836,631 | | | | 318,393 | |
2016-C3, 1.12% (WAC) due 11/15/49◊,8 | | | 9,867,141 | | | | 236,242 | |
2015-GC29, 1.15% (WAC) due 04/10/48◊,8 | | | 18,132,161 | | | | 212,068 | |
GS Mortgage Securities Corporation Trust | | | | | | | | |
2020-UPTN, 3.35% (WAC) due 02/10/37◊,4 | | | 5,350,000 | | | | 4,703,301 | |
2020-DUNE, 6.81% (1 Month Term SOFR + 1.46%, Rate Floor: 1.35%) due 12/15/36◊,4 | | | 3,750,000 | | | | 3,664,663 | |
2020-DUNE, 7.36% (1 Month Term SOFR + 2.01%, Rate Floor: 1.90%) due 12/15/36◊,4 | | | 1,000,000 | | | | 957,658 | |
BENCHMARK Mortgage Trust | | | | | | | | |
2019-B14, 0.90% (WAC) due 12/15/62◊,8 | | | 108,146,228 | | | | 3,001,836 | |
2020-IG3, 3.23% (WAC) due 09/15/48◊,4 | | | 5,232,000 | | | | 2,786,701 | |
2018-B2, 0.60% (WAC) due 02/15/51◊,8 | | | 100,564,047 | | | | 1,418,013 | |
2018-B6, 0.56% (WAC) due 10/10/51◊,8 | | | 59,698,080 | | | | 754,303 | |
2018-B6, 4.75% (WAC) due 10/10/51◊ | | | 750,000 | | | | 622,605 | |
GS Mortgage Securities Trust | | | | | | | | |
2020-GC45, 0.78% (WAC) due 02/13/53◊,8 | | | 152,167,332 | | | | 4,400,694 | |
2019-GC42, 0.93% (WAC) due 09/10/52◊,8 | | | 69,211,889 | | | | 2,345,591 | |
2017-GS6, 1.16% (WAC) due 05/10/50◊,8 | | | 40,865,850 | | | | 1,200,917 | |
2017-GS6, 3.87% due 05/10/50 | | | 521,000 | | | | 423,077 | |
2015-GC28, 1.11% (WAC) due 02/10/48◊,8 | | | 14,560,104 | | | | 120,575 | |
Wells Fargo Commercial Mortgage Trust | | | | | | | | |
2017-C38, 1.09% (WAC) due 07/15/50◊,8 | | | 63,652,058 | | | | 1,651,402 | |
2016-BNK1, 1.86% (WAC) due 08/15/49◊,8 | | | 34,374,352 | | | | 1,211,758 | |
2017-RB1, 1.35% (WAC) due 03/15/50◊,8 | | | 32,823,363 | | | | 999,823 | |
SEE NOTES TO FINANCIAL STATEMENTS. | THE GUGGENHEIM FUNDS ANNUAL REPORT | 31 |
SCHEDULE OF INVESTMENTS (continued) | September 30, 2023 |
TOTAL RETURN BOND FUND | |
| | Face
Amount~ | | | Value | |
2017-C42, 1.01% (WAC) due 12/15/50◊,8 | | | 33,853,505 | | | $ | 983,644 | |
2016-C35, 2.04% (WAC) due 07/15/48◊,8 | | | 21,723,237 | | | | 837,707 | |
2015-NXS4, 1.17% (WAC) due 12/15/48◊,8 | | | 37,030,658 | | | | 623,248 | |
2017-RC1, 1.54% (WAC) due 01/15/60◊,8 | | | 16,400,914 | | | | 619,056 | |
2016-NXS5, 1.57% (WAC) due 01/15/59◊,8 | | | 20,156,482 | | | | 522,162 | |
2015-C30, 1.03% (WAC) due 09/15/58◊,8 | | | 28,368,845 | | | | 365,782 | |
2015-P2, 1.08% (WAC) due 12/15/48◊,8 | | | 22,002,396 | | | | 356,221 | |
2016-C37, 0.95% (WAC) due 12/15/49◊,8 | | | 11,382,263 | | | | 202,793 | |
2015-NXS1, 1.20% (WAC) due 05/15/48◊,8 | | | 7,707,012 | | | | 77,418 | |
JPMDB Commercial Mortgage Securities Trust | | | | | | | | |
2017-C7, 0.97% (WAC) due 10/15/50◊,8 | | | 124,489,077 | | | | 3,118,638 | |
2016-C4, 3.64% (WAC) due 12/15/49◊ | | | 2,650,000 | | | | 2,130,147 | |
2016-C4, 0.86% (WAC) due 12/15/49◊,8 | | | 72,918,100 | | | | 1,282,600 | |
2016-C2, 1.63% (WAC) due 06/15/49◊,8 | | | 23,106,057 | | | | 650,387 | |
2017-C5, 1.04% (WAC) due 03/15/50◊,8 | | | 7,476,535 | | | | 159,843 | |
DBGS Mortgage Trust | | | | | | | | |
2018-C1, 4.80% (WAC) due 10/15/51◊ | | | 7,588,000 | | | | 6,428,592 | |
COMM Mortgage Trust | | | | | | | | |
2018-COR3, 0.57% (WAC) due 05/10/51◊,8 | | | 195,474,798 | | | | 3,204,497 | |
2015-CR26, 1.04% (WAC) due 10/10/48◊,8 | | | 75,304,581 | | | | 980,503 | |
2015-CR24, 0.83% (WAC) due 08/10/48◊,8 | | | 38,704,545 | | | | 374,265 | |
2015-CR23, 1.00% (WAC) due 05/10/48◊,8 | | | 34,843,500 | | | | 357,954 | |
2015-CR27, 1.05% (WAC) due 10/10/48◊,8 | | | 25,029,277 | | | | 352,437 | |
2014-LC15, 1.20% (WAC) due 04/10/47◊,8 | | | 8,727,289 | | | | 8,106 | |
2013-CR13, 0.71% (WAC) due 11/10/46◊,8 | | | 16,972,598 | | | | 5,076 | |
BANK | | | | | | | | |
2020-BN25, 0.53% (WAC) due 01/15/63◊,8 | | | 140,000,000 | | | | 3,205,174 | |
2017-BNK6, 0.91% (WAC) due 07/15/60◊,8 | | | 38,406,267 | | | | 835,947 | |
2017-BNK4, 1.50% (WAC) due 05/15/50◊,8 | | | 10,654,714 | | | | 384,549 | |
CSAIL Commercial Mortgage Trust | | | | | | | | |
2019-C15, 1.19% (WAC) due 03/15/52◊,8 | | | 94,016,939 | | | | 3,534,398 | |
2015-C1, 0.95% (WAC) due 04/15/50◊,8 | | | 48,966,657 | | | | 307,760 | |
32 | THE GUGGENHEIM FUNDS ANNUAL REPORT | SEE NOTES TO FINANCIAL STATEMENTS. |
SCHEDULE OF INVESTMENTS (continued) | September 30, 2023 |
TOTAL RETURN BOND FUND | |
| | Face
Amount~ | | | Value | |
2016-C6, 2.02% (WAC) due 01/15/49◊,8 | | | 4,800,726 | | | $ | 167,887 | |
UBS Commercial Mortgage Trust | | | | | | | | |
2017-C2, 1.22% (WAC) due 08/15/50◊,8 | | | 38,622,887 | �� | | | 1,229,177 | |
2017-C5, 1.22% (WAC) due 11/15/50◊,8 | | | 41,882,889 | | | | 1,142,934 | |
CD Mortgage Trust | | | | | | | | |
2017-CD6, 1.02% (WAC) due 11/13/50◊,8 | | | 40,472,083 | | | | 934,075 | |
2016-CD1, 1.50% (WAC) due 08/10/49◊,8 | | | 28,994,054 | | | | 789,618 | |
2016-CD2, 0.69% (WAC) due 11/10/49◊,8 | | | 29,549,328 | | | | 370,386 | |
BBCMS Mortgage Trust | | | | | | | | |
2018-C2, 0.92% (WAC) due 12/15/51◊,8 | | | 57,131,708 | | | | 1,710,026 | |
KKR Industrial Portfolio Trust | | | | | | | | |
2021-KDIP, 7.00% (1 Month Term SOFR + 1.66%, Rate Floor: 1.55%) due 12/15/37◊,4 | | | 1,629,444 | | | | 1,604,862 | |
CD Commercial Mortgage Trust | | | | | | | | |
2017-CD4, 1.38% (WAC) due 05/10/50◊,8 | | | 25,440,722 | | | | 837,425 | |
2017-CD3, 1.11% (WAC) due 02/10/50◊,8 | | | 31,749,638 | | | | 766,201 | |
CGMS Commercial Mortgage Trust | | | | | | | | |
2017-B1, 0.87% (WAC) due 08/15/50◊,8 | | | 58,546,119 | | | | 1,346,649 | |
JPMCC Commercial Mortgage Securities Trust | | | | | | | | |
2017-JP6, 1.17% (WAC) due 07/15/50◊,8 | | | 47,431,179 | | | | 1,222,074 | |
CFCRE Commercial Mortgage Trust | | | | | | | | |
2016-C3, 1.14% (WAC) due 01/10/48◊,8 | | | 42,909,124 | | | | 759,878 | |
Morgan Stanley Bank of America Merrill Lynch Trust | | | | | | | | |
2015-C27, 1.01% (WAC) due 12/15/47◊,8 | | | 62,297,174 | | | | 732,982 | |
Citigroup Commercial Mortgage Trust 2015-GC35 | | | | | | | | |
2015-GC35, 4.35% (WAC) due 11/10/48◊ | | | 810,679 | | | | 716,279 | |
JPMBB Commercial Mortgage Securities Trust | | | | | | | | |
2015-C27, 1.28% (WAC) due 02/15/48◊,8 | | | 64,517,110 | | | | 685,862 | |
Bank of America Merrill Lynch Commercial Mortgage Trust | | | | | | | | |
2017-BNK3, 1.16% (WAC) due 02/15/50◊,8 | | | 21,065,210 | | | | 561,775 | |
2016-UB10, 1.89% (WAC) due 07/15/49◊,8 | | | 1,555,960 | | | | 49,691 | |
DBJPM Mortgage Trust | | | | | | | | |
2017-C6, 1.05% (WAC) due 06/10/50◊,8 | | | 20,207,112 | | | | 482,663 | |
SEE NOTES TO FINANCIAL STATEMENTS. | THE GUGGENHEIM FUNDS ANNUAL REPORT | 33 |
SCHEDULE OF INVESTMENTS (continued) | September 30, 2023 |
TOTAL RETURN BOND FUND | |
| | Face
Amount~ | | | Value | |
Morgan Stanley Bank of America Merrill Lynch Trust 2014-C18 | | | | | | | | |
2014-C18, 4.00% due 08/15/31 | | | 525,365 | | | $ | 337,232 | |
Morgan Stanley Capital I Trust | | | | | | | | |
2016-UBS9, 4.75% (WAC) due 03/15/49◊ | | | 275,000 | | | | 240,729 | |
SG Commercial Mortgage Securities Trust | | | | | | | | |
2016-C5, 2.02% (WAC) due 10/10/48◊,8 | | | 4,965,126 | | | | 171,424 | |
Total Commercial Mortgage-Backed Securities | | | 312,383,664 | |
| | | | | | | | | |
Military Housing - 0.8% |
Freddie Mac Military Housing Bonds Resecuritization Trust Certificates | | | | | | | | |
2015-R1, 4.66% (WAC) due 11/25/55◊,4 | | | 111,247,556 | | | | 85,323,187 | |
2015-R1, 4.44% (WAC) due 11/25/52◊,4 | | | 20,990,551 | | | | 16,827,464 | |
2015-R1, 0.70% (WAC) due 11/25/55◊,4,8 | | | 167,170,525 | | | | 10,690,037 | |
2015-R1, 4.31% (WAC) due 10/25/52◊,4 | | | 13,235,718 | | | | 9,508,162 | |
Capmark Military Housing Trust | | | | | | | | |
2006-RILY, 6.15% due 07/10/51†††,4 | | | 12,534,838 | | | | 10,780,429 | |
2007-AETC, 5.75% due 02/10/52†††,4 | | | 7,129,558 | | | | 5,968,518 | |
2006-RILY, 5.67% (1 Month Term SOFR + 0.37%, Rate Floor: 0.37%) due 07/10/51◊,†††,4 | | | 6,746,826 | | | | 4,376,341 | |
2007-ROBS, 6.06% due 10/10/52†††,4 | | | 4,512,185 | | | | 3,873,896 | |
2007-AET2, 6.06% due 10/10/52†††,4 | | | 2,964,223 | | | | 2,700,907 | |
GMAC Commercial Mortgage Asset Corp. | | | | | | | | |
2007-HCKM, 6.11% due 08/10/52†††,4 | | | 21,416,558 | | | | 19,798,587 | |
2005-DRUM, 5.47% due 05/10/50†††,4 | | | 4,341,715 | | | | 3,616,106 | |
2005-BLIS, 5.25% due 07/10/50†††,4 | | | 2,500,000 | | | | 1,943,590 | |
Total Military Housing | | | 175,407,224 | |
| | | | | | | | | |
Total Collateralized Mortgage Obligations |
(Cost $5,699,920,822) | | | 5,153,069,890 | |
| | | | | | | | | |
ASSET-BACKED SECURITIES†† - 23.0% |
Collateralized Loan Obligations - 14.2% |
LCCM Trust | | | | | | | | |
2021-FL3 A, 6.90% (1 Month Term SOFR + 1.56%, Rate Floor: 1.56%) due 11/15/38◊,4 | | | 98,500,000 | | | | 96,255,687 | |
2021-FL3 AS, 7.25% (1 Month Term SOFR + 1.91%, Rate Floor: 1.91%) due 11/15/38◊,4 | | | 37,152,000 | | | | 35,232,248 | |
2021-FL3 B, 7.65% (1 Month Term SOFR + 2.31%, Rate Floor: 2.31%) due 11/15/38◊,4 | | | 21,450,000 | | | | 20,193,348 | |
2021-FL2 B, 7.35% (1 Month Term SOFR + 2.01%, Rate Floor: 2.01%) due 12/13/38◊,4 | | | 400,000 | | | | 378,264 | |
34 | THE GUGGENHEIM FUNDS ANNUAL REPORT | SEE NOTES TO FINANCIAL STATEMENTS. |
SCHEDULE OF INVESTMENTS (continued) | September 30, 2023 |
TOTAL RETURN BOND FUND | |
| | Face
Amount~ | | | Value | |
LoanCore Issuer Ltd. | | | | | | | | |
2021-CRE6 B, 7.35% (1 Month Term SOFR + 2.01%, Rate Floor: 1.90%) due 11/15/38◊,4 | | | 44,000,000 | | | $ | 41,912,983 | |
2021-CRE4 C, 7.13% (30 Day Average SOFR + 1.81%, Rate Floor: 1.81%) due 07/15/35◊,4 | | | 25,982,000 | | | | 25,248,697 | |
2021-CRE6 C, 7.75% (1 Month Term SOFR + 2.41%, Rate Floor: 2.30%) due 11/15/38◊,4 | | | 22,825,000 | | | | 21,749,634 | |
2021-CRE5 D, 8.45% (1 Month Term SOFR + 3.00%, Rate Floor: 3.00%) due 07/15/36◊,4 | | | 14,350,000 | | | | 13,107,782 | |
2019-CRE2 B, 7.15% (1 Month Term SOFR + 1.81%, Rate Floor: 1.70%) due 05/15/36◊,4 | | | 11,575,000 | | | | 11,330,610 | |
2019-CRE2 AS, 6.95% (1 Month Term SOFR + 1.61%, Rate Floor: 1.50%) due 05/15/36◊,4 | | | 11,040,296 | | | | 10,802,240 | |
2021-CRE4 D, 7.93% (30 Day Average SOFR + 2.61%, Rate Floor: 2.61%) due 07/15/35◊,4 | | | 5,600,000 | | | | 5,219,787 | |
2019-CRE3 B, 7.05% (1 Month Term SOFR + 1.71%, Rate Floor: 1.60%) due 04/15/34◊,4 | | | 4,410,000 | | | | 4,193,634 | |
BXMT Ltd. | | | | | | | | |
2020-FL2 A, 6.35% (1 Month Term SOFR + 1.01%, Rate Floor: 1.01%) due 02/15/38◊,4 | | | 51,958,293 | | | | 49,376,741 | |
2020-FL3 AS, 7.20% (1 Month Term SOFR + 1.86%, Rate Floor: 1.86%) due 11/15/37◊,4 | | | 23,550,000 | | | | 22,029,916 | |
2020-FL3 C, 8.00% (1 Month Term SOFR + 2.66%, Rate Floor: 2.66%) due 11/15/37◊,4 | | | 16,327,000 | | | | 14,347,333 | |
2020-FL2 B, 6.85% (1 Month Term SOFR + 1.51%, Rate Floor: 1.51%) due 02/15/38◊,4 | | | 16,000,000 | | | | 13,944,085 | |
2020-FL3 B, 7.60% (1 Month Term SOFR + 2.26%, Rate Floor: 2.26%) due 11/15/37◊,4 | | | 10,600,000 | | | | 9,466,740 | |
2020-FL2 AS, 6.60% (1 Month Term SOFR + 1.26%, Rate Floor: 1.26%) due 02/15/38◊,4 | | | 6,008,500 | | | | 5,474,970 | |
2020-FL2 C, 7.10% (1 Month Term SOFR + 1.76%, Rate Floor: 1.76%) due 02/15/38◊,4 | | | 5,360,000 | | | | 4,558,231 | |
Cerberus Loan Funding XXX, LP | | | | | | | | |
2020-3A A, 7.42% (3 Month USD SOFR + 1.85%, Rate Floor: 1.85%) due 01/15/33◊,4 | | | 100,000,000 | | | | 99,653,420 | |
SEE NOTES TO FINANCIAL STATEMENTS. | THE GUGGENHEIM FUNDS ANNUAL REPORT | 35 |
SCHEDULE OF INVESTMENTS (continued) | September 30, 2023 |
TOTAL RETURN BOND FUND | |
| | Face
Amount~ | | | Value | |
2020-3A B, 8.07% (3 Month USD SOFR + 2.50%, Rate Floor: 2.50%) due 01/15/33◊,4 | | | 10,200,000 | | | $ | 10,033,846 | |
Cerberus Loan Funding XXXII, LP | | | | | | | | |
2021-2A A, 7.19% (3 Month Term SOFR + 1.88%, Rate Floor: 1.88%) due 04/22/33◊,4 | | | 65,000,000 | | | | 64,200,871 | |
2021-2A C, 8.42% (3 Month Term SOFR + 3.11%, Rate Floor: 3.11%) due 04/22/33◊,4 | | | 20,925,000 | | | | 20,163,416 | |
2021-2A B, 7.47% (3 Month Term SOFR + 2.16%, Rate Floor: 2.16%) due 04/22/33◊,4 | | | 19,200,000 | | | | 18,602,072 | |
Woodmont Trust | | | | | | | | |
2020-7A A1A, 7.47% (3 Month Term SOFR + 2.16%, Rate Floor: 1.90%) due 01/15/32◊,4 | | | 83,000,000 | | | | 82,770,696 | |
2020-7A B, 8.17% (3 Month Term SOFR + 2.86%, Rate Floor: 2.60%) due 01/15/32◊,4 | | | 13,500,000 | | | | 13,207,401 | |
2020-7A A2, 7.82% (3 Month Term SOFR + 2.51%, Rate Floor: 2.25%) due 01/15/32◊,4 | | | 7,000,000 | | | | 6,933,406 | |
Golub Capital Partners CLO 33M Ltd. | | | | | | | | |
2021-33A AR2, 7.51% (3 Month Term SOFR + 2.12%, Rate Floor: 1.86%) due 08/25/33◊,4 | | | 105,004,127 | | | | 100,840,892 | |
HERA Commercial Mortgage Ltd. | | | | | | | | |
2021-FL1 B, 7.05% (1 Month Term SOFR + 1.71%, Rate Floor: 1.60%) due 02/18/38◊,4 | | | 49,562,000 | | | | 47,396,304 | |
2021-FL1 AS, 6.75% (1 Month Term SOFR + 1.41%, Rate Floor: 1.30%) due 02/18/38◊,4 | | | 28,000,000 | | | | 26,812,733 | |
2021-FL1 C, 7.40% (1 Month Term SOFR + 2.06%, Rate Floor: 1.95%) due 02/18/38◊,4 | | | 19,200,000 | | | | 18,010,453 | |
2021-FL1 A, 6.50% (1 Month Term SOFR + 1.16%, Rate Floor: 1.05%) due 02/18/38◊,4 | | | 8,627,499 | | | | 8,372,390 | |
ABPCI Direct Lending Fund CLO II LLC | | | | | | | | |
2021-1A A1R, 7.19% (3 Month Term SOFR + 1.86%, Rate Floor: 1.60%) due 04/20/32◊,4 | | | 84,258,254 | | | | 83,338,306 | |
Cerberus Loan Funding XLII LLC | | | | | | | | |
2023-3A A1, 7.91% (3 Month Term SOFR + 2.48%, Rate Floor: 2.48%) due 09/13/35◊,4 | | | 54,450,000 | | | | 54,446,183 | |
2023-3A B, 8.78% (3 Month Term SOFR + 3.35%, Rate Floor: 3.35%) due 09/13/35◊,4 | | | 15,700,000 | | | | 15,698,651 | |
36 | THE GUGGENHEIM FUNDS ANNUAL REPORT | SEE NOTES TO FINANCIAL STATEMENTS. |
SCHEDULE OF INVESTMENTS (continued) | September 30, 2023 |
TOTAL RETURN BOND FUND | |
| | Face
Amount~ | | | Value | |
Palmer Square Loan Funding Ltd. | | | | | | | | |
2022-1A A2, 6.91% (3 Month Term SOFR + 1.60%, Rate Floor: 1.60%) due 04/15/30◊,4 | | | 23,000,000 | | | $ | 22,682,540 | |
2021-3A B, 7.34% (3 Month Term SOFR + 2.01%, Rate Floor: 2.01%) due 07/20/29◊,4 | | | 22,500,000 | | | | 22,145,915 | |
2021-2A B, 7.04% (3 Month Term SOFR + 1.66%, Rate Floor: 1.66%) due 05/20/29◊,4 | | | 10,500,000 | | | | 10,308,020 | |
2021-1A B, 7.39% (3 Month Term SOFR + 2.06%, Rate Floor: 2.06%) due 04/20/29◊,4 | | | 7,100,000 | | | | 7,026,313 | |
2021-2A C, 8.04% (3 Month Term SOFR + 2.66%, Rate Floor: 2.66%) due 05/20/29◊,4 | | | 7,000,000 | | | | 6,903,077 | |
Golub Capital Partners CLO 36M Ltd. | | | | | | | | |
2018-36A A, 6.93% (3 Month Term SOFR + 1.56%, Rate Floor: 0.00%) due 02/05/31◊,4 | | | 69,265,946 | | | | 68,850,350 | |
ABPCI Direct Lending Fund CLO V Ltd. | | | | | | | | |
2021-5A A1R, 7.09% (3 Month Term SOFR + 1.76%, Rate Floor: 1.50%) due 04/20/31◊,4 | | | 49,984,686 | | | | 49,370,004 | |
2021-5A A2R, 7.49% (3 Month Term SOFR + 2.16%, Rate Floor: 1.90%) due 04/20/31◊,4 | | | 15,975,000 | | | | 15,493,296 | |
THL Credit Lake Shore MM CLO I Ltd. | | | | | | | | |
2021-1A A1R, 7.27% (3 Month Term SOFR + 1.96%, Rate Floor: 1.70%) due 04/15/33◊,4 | | | 33,500,000 | | | | 33,042,671 | |
2021-1A BR, 7.57% (3 Month Term SOFR + 2.26%, Rate Floor: 2.00%) due 04/15/33◊,4 | | | 30,400,000 | | | | 30,001,444 | |
ABPCI Direct Lending Fund CLO I LLC | | | | | | | | |
2021-1A A1A2, 7.29% (3 Month Term SOFR + 1.96%, Rate Floor: 1.96%) due 07/20/33◊,4 | | | 59,500,000 | | | | 58,989,264 | |
2021-1A B12, 7.59% (3 Month Term SOFR + 2.26%, Rate Floor: 2.26%) due 07/20/33◊,4 | | | 2,500,000 | | | | 2,376,595 | |
Cerberus Loan Funding XL LLC | | | | | | | | |
2023-1A A, 7.71% (3 Month Term SOFR + 2.40%, Rate Floor: 2.40%) due 03/22/35◊,4 | | | 55,500,000 | | | | 55,496,814 | |
2023-1A B, 8.91% (3 Month Term SOFR + 3.60%, Rate Floor: 3.60%) due 03/22/35◊,4 | | | 4,600,000 | | | | 4,605,131 | |
ABPCI Direct Lending Fund IX LLC | | | | | | | | |
2021-9A A1R, 7.02% (3 Month Term SOFR + 1.66%, Rate Floor: 1.40%) due 11/18/31◊,4 | | | 34,150,000 | | | | 33,754,779 | |
SEE NOTES TO FINANCIAL STATEMENTS. | THE GUGGENHEIM FUNDS ANNUAL REPORT | 37 |
SCHEDULE OF INVESTMENTS (continued) | September 30, 2023 |
TOTAL RETURN BOND FUND | |
| | Face
Amount~ | | | Value | |
2021-9A A2R, 7.42% (3 Month Term SOFR + 2.06%, Rate Floor: 1.80%) due 11/18/31◊,4 | | | 26,000,000 | | | $ | 25,261,920 | |
Cerberus Loan Funding XXXI, LP | | | | | | | | |
2021-1A A, 7.07% (3 Month Term SOFR + 1.76%, Rate Floor: 1.50%) due 04/15/32◊,4 | | | 47,227,702 | | | | 47,027,027 | |
2021-1A C, 8.17% (3 Month Term SOFR + 2.86%, Rate Floor: 2.60%) due 04/15/32◊,4 | | | 12,000,000 | | | | 11,680,730 | |
Cerberus Loan Funding XXXIII, LP | | | | | | | | |
2021-3A A, 7.13% (3 Month Term SOFR + 1.82%, Rate Floor: 1.56%) due 07/23/33◊,4 | | | 47,750,000 | | | | 47,029,491 | |
2021-3A B, 7.42% (3 Month Term SOFR + 2.11%, Rate Floor: 1.85%) due 07/23/33◊,4 | | | 9,500,000 | | | | 9,170,517 | |
Owl Rock CLO IV Ltd. | | | | | | | | |
2021-4A A1R, 7.24% (3 Month Term SOFR + 1.86%, Rate Floor: 1.60%) due 08/20/33◊,4 | | | 40,750,000 | | | | 40,138,290 | |
2021-4A A2R, 7.54% (3 Month Term SOFR + 2.16%, Rate Floor: 1.90%) due 08/20/33◊,4 | | | 16,750,000 | | | | 15,898,189 | |
Fortress Credit Opportunities IX CLO Ltd. | | | | | | | | |
2021-9A A2TR, 7.37% (3 Month Term SOFR + 2.06%, Rate Floor: 1.80%) due 10/15/33◊,4 | | | 46,200,000 | | | | 44,990,623 | |
2021-9A BR, 7.52% (3 Month Term SOFR + 2.21%, Rate Floor: 1.95%) due 10/15/33◊,4 | | | 6,700,000 | | | | 6,363,486 | |
2021-9A A1TR, 7.12% (3 Month Term SOFR + 1.81%, Rate Floor: 1.55%) due 10/15/33◊,4 | | | 3,450,000 | | | | 3,385,287 | |
FS Rialto | | | | | | | | |
2021-FL3 C, 7.50% (1 Month Term SOFR + 2.16%, Rate Floor: 2.05%) due 11/16/36◊,4 | | | 31,150,000 | | | | 29,315,645 | |
2021-FL2 C, 7.50% (1 Month Term SOFR + 2.16%, Rate Floor: 2.16%) due 05/16/38◊,4 | | | 15,665,000 | | | | 14,725,650 | |
2021-FL3 B, 7.25% (1 Month Term SOFR + 1.91%, Rate Floor: 1.80%) due 11/16/36◊,4 | | | 8,000,000 | | | | 7,644,171 | |
Cerberus Loan Funding XXXV, LP | | | | | | | | |
2021-5A A, 7.07% (3 Month Term SOFR + 1.76%, Rate Floor: 1.50%) due 09/22/33◊,4 | | | 41,500,000 | | | | 41,126,965 | |
2021-5A B, 7.42% (3 Month Term SOFR + 2.11%, Rate Floor: 1.85%) due 09/22/33◊,4 | | | 8,000,000 | | | | 7,739,591 | |
38 | THE GUGGENHEIM FUNDS ANNUAL REPORT | SEE NOTES TO FINANCIAL STATEMENTS. |
SCHEDULE OF INVESTMENTS (continued) | September 30, 2023 |
TOTAL RETURN BOND FUND | |
| | Face
Amount~ | | | Value | |
ABPCI Direct Lending Fund CLO VII, LP | | | | | | | | |
2021-7A A1R, 7.05% (3 Month Term SOFR + 1.69%, Rate Floor: 1.43%) due 10/20/31◊,4 | | | 39,500,000 | | | $ | 39,011,255 | |
2021-7A A2R, 7.47% (3 Month Term SOFR + 2.11%, Rate Floor: 1.85%) due 10/20/31◊,4 | | | 8,250,000 | | | | 8,022,895 | |
CHCP Ltd. | | | | | | | | |
2021-FL1 AS, 6.75% (1 Month Term SOFR + 1.41%, Rate Floor: 1.30%) due 02/15/38◊,4 | | | 22,250,000 | | | | 21,712,562 | |
2021-FL1 A, 6.50% (1 Month Term SOFR + 1.16%, Rate Floor: 1.05%) due 02/15/38◊,4 | | | 12,808,058 | | | | 12,701,083 | |
2021-FL1 B, 7.10% (1 Month Term SOFR + 1.76%, Rate Floor: 1.65%) due 02/15/38◊,4 | | | 6,600,000 | | | | 6,425,905 | |
2021-FL1 C, 7.55% (1 Month Term SOFR + 2.21%, Rate Floor: 2.10%) due 02/15/38◊,4 | | | 2,950,000 | | | | 2,809,518 | |
Fortress Credit Opportunities XI CLO Ltd. | | | | | | | | |
2018-11A A1T, 6.87% (3 Month Term SOFR + 1.56%, Rate Floor: 0.00%) due 04/15/31◊,4 | | | 40,861,886 | | | | 40,627,710 | |
2018-11A C, 8.07% (3 Month Term SOFR + 2.76%, Rate Floor: 0.00%) due 04/15/31◊,4 | | | 2,300,000 | | | | 2,226,246 | |
KREF Funding V LLC | | | | | | | | |
7.19% (1 Month Term SOFR + 1.86%, Rate Floor: 1.86%) due 06/25/26◊,††† | | | 40,838,489 | | | | 40,505,560 | |
0.15% due 06/25/26†††,8 | | | 313,636,364 | | | | 216,409 | |
GoldenTree Loan Management US CLO 1 Ltd. | | | | | | | | |
2021-9A B, 7.09% (3 Month Term SOFR + 1.76%, Rate Floor: 1.50%) due 01/20/33◊,4 | | | 35,900,000 | | | | 35,548,187 | |
2021-9A C, 7.39% (3 Month Term SOFR + 2.06%, Rate Floor: 1.80%) due 01/20/33◊,4 | | | 3,900,000 | | | | 3,813,984 | |
LCM XXIV Ltd. | | | | | | | | |
2021-24A BR, 6.99% (3 Month Term SOFR + 1.66%, Rate Floor: 0.00%) due 03/20/30◊,4 | | | 24,200,000 | | | | 23,761,482 | |
2021-24A CR, 7.49% (3 Month Term SOFR + 2.16%, Rate Floor: 0.00%) due 03/20/30◊,4 | | | 13,050,000 | | | | 12,753,421 | |
ACRES Commercial Realty Ltd. | | | | | | | | |
2021-FL1 C, 7.45% (1 Month Term SOFR + 2.11%, Rate Floor: 2.11%) due 06/15/36◊,4 | | | 13,092,000 | | | | 12,362,785 | |
2021-FL1 D, 8.10% (1 Month Term SOFR + 2.76%, Rate Floor: 2.76%) due 06/15/36◊,4 | | | 11,750,000 | | | | 10,763,487 | |
SEE NOTES TO FINANCIAL STATEMENTS. | THE GUGGENHEIM FUNDS ANNUAL REPORT | 39 |
SCHEDULE OF INVESTMENTS (continued) | September 30, 2023 |
TOTAL RETURN BOND FUND | |
| | Face
Amount~ | | | Value | |
2021-FL2 B, 7.70% (1 Month Term SOFR + 2.36%, Rate Floor: 2.36%) due 01/15/37◊,4 | | | 10,100,000 | | | $ | 9,787,096 | |
2021-FL2 AS, 7.20% (1 Month Term SOFR + 1.86%, Rate Floor: 1.86%) due 01/15/37◊,4 | | | 3,500,000 | | | | 3,415,517 | |
Golub Capital Partners CLO 16 Ltd. | | | | | | | | |
2021-16A A1R2, 7.22% (3 Month Term SOFR + 1.87%, Rate Floor: 1.61%) due 07/25/33◊,4 | | | 26,750,000 | | | | 26,583,778 | |
2021-16A A2R2, 7.41% (3 Month Term SOFR + 2.06%, Rate Floor: 1.80%) due 07/25/33◊,4 | | | 9,750,000 | | | | 9,457,994 | |
Madison Park Funding XLVIII Ltd. | | | | | | | | |
2021-48A B, 7.03% (3 Month Term SOFR + 1.71%, Rate Floor: 1.71%) due 04/19/33◊,4 | | | 27,500,000 | | | | 27,258,000 | |
2021-48A C, 7.58% (3 Month Term SOFR + 2.26%, Rate Floor: 2.26%) due 04/19/33◊,4 | | | 6,650,000 | | | | 6,575,500 | |
Golub Capital Partners CLO 49M Ltd. | | | | | | | | |
2021-49A BR, 7.49% (3 Month USD SOFR + 1.90%, Rate Floor: 1.90%) due 08/26/33◊,4 | | | 21,695,000 | | | | 20,783,623 | |
2021-49A CR, 8.19% (3 Month USD SOFR + 2.60%, Rate Floor: 2.60%) due 08/26/33◊,4 | | | 12,600,000 | | | | 12,019,049 | |
Palmer Square CLO 2023-4 Ltd. | | | | | | | | |
2023-4A C, due 10/20/334,17 | | | 30,450,000 | | | | 30,450,000 | |
BDS Ltd. | | | | | | | | |
2021-FL9 C, 7.35% (1 Month Term SOFR + 2.01%, Rate Floor: 1.90%) due 11/16/38◊,4 | | | 19,500,000 | | | | 18,600,305 | |
2020-FL5 B, 7.25% (1 Month Term SOFR + 1.91%, Rate Floor: 1.80%) due 02/16/37◊,4 | | | 4,400,000 | | | | 4,271,909 | |
2021-FL9 D, 7.70% (1 Month Term SOFR + 2.36%, Rate Floor: 2.25%) due 11/16/38◊,4 | | | 4,400,000 | | | | 4,118,193 | |
2020-FL5 AS, 6.80% (1 Month Term SOFR + 1.46%, Rate Floor: 1.35%) due 02/16/37◊,4 | | | 3,200,000 | | | | 3,146,116 | |
BCC Middle Market CLO LLC | | | | | | | | |
2021-1A A1R, 7.07% (3 Month Term SOFR + 1.76%, Rate Floor: 1.50%) due 10/15/33◊,4 | | | 30,450,000 | | | | 30,059,911 | |
Neuberger Berman Loan Advisers CLO 40 Ltd. | | | | | | | | |
2021-40A B, 6.97% (3 Month Term SOFR + 1.66%, Rate Floor: 1.40%) due 04/16/33◊,4 | | | 26,700,000 | | | | 26,416,980 | |
40 | THE GUGGENHEIM FUNDS ANNUAL REPORT | SEE NOTES TO FINANCIAL STATEMENTS. |
SCHEDULE OF INVESTMENTS (continued) | September 30, 2023 |
TOTAL RETURN BOND FUND | |
| | Face
Amount~ | | | Value | |
2021-40A C, 7.32% (3 Month Term SOFR + 2.01%, Rate Floor: 1.75%) due 04/16/33◊,4 | | | 2,500,000 | | | $ | 2,445,974 | |
MidOcean Credit CLO VII | | | | | | | | |
2020-7A BR, 7.17% (3 Month Term SOFR + 1.86%, Rate Floor: 0.00%) due 07/15/29◊,4 | | | 27,500,000 | | | | 27,007,750 | |
OCP CLO Ltd. | | | | | | | | |
2020-4A A2RR, 7.06% (3 Month Term SOFR + 1.71%, Rate Floor: 1.45%) due 04/24/29◊,4 | | | 25,500,000 | | | | 25,339,350 | |
Golub Capital Partners CLO 17 Ltd. | | | | | | | | |
2017-17A A1R, 7.26% (3 Month Term SOFR + 1.91%, Rate Floor: 0.00%) due 10/25/30◊,4 | | | 24,289,565 | | | | 24,186,050 | |
BSPDF Issuer Ltd. | | | | | | | | |
2021-FL1 C, 7.70% (1 Month Term SOFR + 2.36%, Rate Floor: 2.25%) due 10/15/36◊,4 | | | 15,300,000 | | | | 14,190,248 | |
2021-FL1 B, 7.25% (1 Month Term SOFR + 1.91%, Rate Floor: 1.80%) due 10/15/36◊,4 | | | 6,500,000 | | | | 6,120,479 | |
2021-FL1 D, 8.20% (1 Month Term SOFR + 2.86%, Rate Floor: 2.75%) due 10/15/36◊,4 | | | 3,500,000 | | | | 3,166,778 | |
Madison Park Funding LIII Ltd. | | | | | | | | |
2022-53A B, 7.08% (3 Month Term SOFR + 1.75%, Rate Floor: 1.75%) due 04/21/35◊,4 | | | 24,000,000 | | | | 23,433,600 | |
STWD Ltd. | | | | | | | | |
2019-FL1 B, 7.05% (1 Month Term SOFR + 1.71%, Rate Floor: 1.71%) due 07/15/38◊,4 | | | 11,210,000 | | | | 10,379,571 | |
2019-FL1 C, 7.40% (1 Month Term SOFR + 2.06%, Rate Floor: 2.06%) due 07/15/38◊,4 | | | 8,800,000 | | | | 8,104,905 | |
2021-FL2 C, 7.55% (1 Month Term SOFR + 2.21%, Rate Floor: 2.10%) due 04/18/38◊,4 | | | 2,820,000 | | | | 2,519,038 | |
2019-FL1 AS, 6.85% (1 Month Term SOFR + 1.51%, Rate Floor: 1.51%) due 07/15/38◊,4 | | | 2,200,000 | | | | 2,122,504 | |
Venture XIV CLO Ltd. | | | | | | | | |
2020-14A CRR, 7.90% (3 Month Term SOFR + 2.51%, Rate Floor: 2.25%) due 08/28/29◊,4 | | | 22,725,000 | | | | 22,706,820 | |
Magnetite XXIX Ltd. | | | | | | | | |
2021-29A B, 6.97% (3 Month Term SOFR + 1.66%, Rate Floor: 1.40%) due 01/15/34◊,4 | | | 15,100,000 | | | | 14,961,080 | |
2021-29A C, 7.22% (3 Month Term SOFR + 1.91%, Rate Floor: 1.65%) due 01/15/34◊,4 | | | 7,700,000 | | | | 7,494,147 | |
SEE NOTES TO FINANCIAL STATEMENTS. | THE GUGGENHEIM FUNDS ANNUAL REPORT | 41 |
SCHEDULE OF INVESTMENTS (continued) | September 30, 2023 |
TOTAL RETURN BOND FUND | |
| | Face
Amount~ | | | Value | |
Apres Static CLO Ltd. | | | | | | | | |
2020-1A A2R, 7.27% (3 Month Term SOFR + 1.96%, Rate Floor: 0.00%) due 10/15/28◊,4 | | | 21,750,000 | | | $ | 21,658,876 | |
Fontainbleau Vegas | | | | | | | | |
10.98% (1 Month Term SOFR + 5.65%, Rate Floor: 5.65%) due 01/31/26◊,††† | | | 20,740,722 | | | | 20,740,722 | |
Golub Capital Partners CLO 54M L.P | | | | | | | | |
2021-54A B, 7.48% (3 Month Term SOFR + 2.11%, Rate Floor: 1.85%) due 08/05/33◊,4 | | | 21,000,000 | | | | 19,930,392 | |
NewStar Fairfield Fund CLO Ltd. | | | | | | | | |
2018-2A A1N, 6.86% (3 Month Term SOFR + 1.53%, Rate Floor: 1.27%) due 04/20/30◊,4 | | | 19,733,407 | | | | 19,555,563 | |
Recette CLO Ltd. | | | | | | | | |
2021-1A BRR, 6.99% (3 Month Term SOFR + 1.66%, Rate Floor: 0.00%) due 04/20/34◊,4 | | | 9,800,000 | | | | 9,619,680 | |
2021-1A CRR, 7.34% (3 Month Term SOFR + 2.01%, Rate Floor: 0.00%) due 04/20/34◊,4 | | | 9,200,000 | | | | 8,880,264 | |
Anchorage Capital CLO 6 Ltd. | | | | | | | | |
2021-6A CRR, 7.77% (3 Month Term SOFR + 2.46%, Rate Floor: 2.20%) due 07/15/30◊,4 | | | 18,585,000 | | | | 18,367,673 | |
Neuberger Berman Loan Advisers CLO 32 Ltd. | | | | | | | | |
2021-32A BR, 6.98% (3 Month Term SOFR + 1.66%, Rate Floor: 1.40%) due 01/20/32◊,4 | | | 14,100,000 | | | | 13,947,721 | |
2021-32A CR, 7.28% (3 Month Term SOFR + 1.96%, Rate Floor: 1.70%) due 01/20/32◊,4 | | | 4,200,000 | | | | 4,099,335 | |
Owl Rock CLO VI Ltd. | | | | | | | | |
2021-6A B1, 7.41% (3 Month Term SOFR + 2.01%, Rate Floor: 1.75%) due 06/21/32◊,4 | | | 17,450,000 | | | | 16,871,334 | |
BSPRT Issuer Ltd. | | | | | | | | |
2021-FL7 C, 7.75% (1 Month Term SOFR + 2.41%, Rate Floor: 2.41%) due 12/15/38◊,4 | | | 7,250,000 | | | | 6,925,981 | |
2021-FL6 C, 7.50% (1 Month Term SOFR + 2.16%, Rate Floor: 2.05%) due 03/15/36◊,4 | | | 5,550,000 | | | | 5,143,032 | |
2021-FL7 B, 7.50% (1 Month Term SOFR + 2.16%, Rate Floor: 2.16%) due 12/15/38◊,4 | | | 4,875,000 | | | | 4,725,161 | |
Cerberus Loan Funding XXXVIII, LP | | | | | | | | |
2022-2A A1, 8.06% (3 Month Term SOFR + 2.75%, Rate Floor: 2.75%) due 10/15/34◊,4 | | | 16,570,000 | | | | 16,555,114 | |
42 | THE GUGGENHEIM FUNDS ANNUAL REPORT | SEE NOTES TO FINANCIAL STATEMENTS. |
SCHEDULE OF INVESTMENTS (continued) | September 30, 2023 |
TOTAL RETURN BOND FUND | |
| | Face
Amount~ | | | Value | |
KREF | | | | | | | | |
2021-FL2 C, 7.45% (1 Month Term SOFR + 2.11%, Rate Floor: 2.00%) due 02/15/39◊,4 | | | 16,600,000 | | | $ | 15,554,673 | |
Owl Rock CLO II Ltd. | | | | | | | | |
2021-2A ALR, 7.14% (3 Month Term SOFR + 1.81%, Rate Floor: 1.55%) due 04/20/33◊,4 | | | 15,600,000 | | | | 15,340,193 | |
Palmer Square Loan Funding 2023-1 Ltd. | | | | | | | | |
2023-1A B, due 07/20/314,17 | | | 15,250,000 | | | | 15,330,781 | |
Dryden 36 Senior Loan Fund | | | | | | | | |
2020-36A CR3, 7.62% (3 Month Term SOFR + 2.31%, Rate Floor: 2.05%) due 04/15/29◊,4 | | | 15,200,000 | | | | 15,070,602 | |
Owl Rock CLO XIII LLC | | | | | | | | |
2023-13A B, 8.77% (3 Month Term SOFR + 3.35%, Rate Floor: 3.35%) due 09/20/35◊,4 | | | 14,750,000 | | | | 14,747,363 | |
Octagon Investment Partners 49 Ltd. | | | | | | | | |
2021-5A B, 7.12% (3 Month Term SOFR + 1.81%, Rate Floor: 1.55%) due 01/15/33◊,4 | | | 12,800,000 | | | | 12,642,560 | |
AMMC CLO XIV Ltd. | | | | | | | | |
2021-14A A2R2, 7.01% (3 Month Term SOFR + 1.66%, Rate Floor: 1.40%) due 07/25/29◊,4 | | | 12,191,165 | | | | 12,186,289 | |
Greystone Commercial Real Estate Notes | | | | | | | | |
2021-FL3 C, 7.45% (1 Month Term SOFR + 2.11%, Rate Floor: 2.00%) due 07/15/39◊,4 | | | 12,000,000 | | | | 11,207,096 | |
Golub Capital Partners CLO 54M, LP | | | | | | | | |
2021-54A A, 7.16% (3 Month Term SOFR + 1.79%, Rate Floor: 1.53%) due 08/05/33◊,4 | | | 10,750,000 | | | | 10,582,805 | |
Neuberger Berman CLO XVI-S Ltd. | | | | | | | | |
2021-16SA BR, 6.97% (3 Month Term SOFR + 1.66%, Rate Floor: 1.40%) due 04/15/34◊,4 | | | 10,200,000 | | | | 10,039,861 | |
Lake Shore MM CLO III LLC | | | | | | | | |
2021-2A A1R, 7.05% (3 Month Term SOFR + 1.74%, Rate Floor: 1.48%) due 10/17/31◊,4 | | | 10,000,000 | | | | 9,859,667 | |
Golub Capital Partners CLO 25M Ltd. | | | | | | | | |
2018-25A AR, 7.01% (3 Month Term SOFR + 1.64%, Rate Floor: 1.38%) due 05/05/30◊,4 | | | 9,726,038 | | | | 9,708,309 | |
Neuberger Berman Loan Advisers CLO 47 Ltd. | | | | | | | | |
2022-47A B, 7.11% (3 Month Term SOFR + 1.80%, Rate Floor: 1.80%) due 04/14/35◊,4 | | | 9,000,000 | | | | 8,892,000 | |
SEE NOTES TO FINANCIAL STATEMENTS. | THE GUGGENHEIM FUNDS ANNUAL REPORT | 43 |
SCHEDULE OF INVESTMENTS (continued) | September 30, 2023 |
TOTAL RETURN BOND FUND | |
| | Face
Amount~ | | | Value | |
Boyce Park CLO Ltd. | | | | | | | | |
2022-1A B1, 7.08% (3 Month Term SOFR + 1.75%, Rate Floor: 1.75%) due 04/21/35◊,4 | | | 8,800,000 | | | $ | 8,671,524 | |
Dryden 37 Senior Loan Fund | | | | | | | | |
2015-37A Q, due 01/15/314,12 | | | 10,000,000 | | | | 7,322,454 | |
Palmer Square Loan Funding 2022-4 Ltd. | | | | | | | | |
2023-4A B, 8.10% (3 Month Term SOFR + 2.75%, Rate Floor: 2.75%) due 07/24/31◊,4 | | | 7,050,000 | | | | 7,098,061 | |
ACRES Commercial Realty 2021-FL1 Ltd. | | | | | | | | |
2021-FL1 AS, 7.05% (1 Month Term SOFR + 1.71%, Rate Floor: 1.71%) due 06/15/36◊,4 | | | 6,425,000 | | | | 6,189,851 | |
ACRE Commercial Mortgage Ltd. | | | | | | | | |
2021-FL4 B, 6.85% (1 Month Term SOFR + 1.51%, Rate Floor: 1.40%) due 12/18/37◊,4 | | | 3,100,000 | | | | 2,955,403 | |
2021-FL4 C, 7.20% (1 Month Term SOFR + 1.86%, Rate Floor: 1.75%) due 12/18/37◊,4 | | | 3,100,000 | | | | 2,858,765 | |
HGI CRE CLO Ltd. | | | | | | | | |
2021-FL2 B, 6.95% (1 Month Term SOFR + 1.61%, Rate Floor: 1.61%) due 09/17/36◊,4 | | | 5,000,000 | | | | 4,772,179 | |
2021-FL2 C, 7.25% (1 Month Term SOFR + 1.91%, Rate Floor: 1.91%) due 09/17/36◊,4 | | | 1,000,000 | | | | 944,541 | |
Owl Rock CLO I Ltd. | | | | | | | | |
2019-1A A, 7.44% (3 Month Term SOFR + 2.06%, Rate Floor: 1.80%) due 05/20/31◊,4 | | | 5,575,431 | | | | 5,554,874 | |
Shackleton CLO Ltd. | | | | | | | | |
2017-8A BR, 6.89% (3 Month Term SOFR + 1.56%, Rate Floor: 0.00%) due 10/20/27◊,4 | | | 5,510,000 | | | | 5,465,220 | |
VOYA CLO | | | | | | | | |
2021-2A BR, 7.72% (3 Month Term SOFR + 2.41%, Rate Floor: 2.15%) due 06/07/30◊,4 | | | 4,950,000 | | | | 4,920,560 | |
STWD 2021-FL2 Ltd. | | | | | | | | |
2021-FL2 A, 6.65% (1 Month Term SOFR + 1.31%, Rate Floor: 1.20%) due 04/18/38◊,4 | | | 5,000,000 | | | | 4,891,197 | |
Atlas Senior Loan Fund III Ltd. | | | | | | | | |
2017-1A BR, 6.94% (3 Month Term SOFR + 1.56%, Rate Floor: 0.00%) due 11/17/27◊,4 | | | 4,300,000 | | | | 4,291,000 | |
Elmwood CLO 19 Ltd. | | | | | | | | |
2022-6A B1, 8.36% (3 Month Term SOFR + 3.05%, Rate Floor: 3.05%) due 10/17/34◊,4 | | | 4,000,000 | | | | 4,020,800 | |
44 | THE GUGGENHEIM FUNDS ANNUAL REPORT | SEE NOTES TO FINANCIAL STATEMENTS. |
SCHEDULE OF INVESTMENTS (continued) | September 30, 2023 |
TOTAL RETURN BOND FUND | |
| | Face
Amount~ | | | Value | |
Northwoods Capital XII-B Ltd. | | | | | | | | |
2018-12BA B, 7.52% (3 Month Term SOFR + 2.11%, Rate Floor: 1.85%) due 06/15/31◊,4 | | | 4,000,000 | | | $ | 3,886,400 | |
BRSP Ltd. | | | | | | | | |
2021-FL1 D, 8.14% (1 Month Term SOFR + 2.81%, Rate Floor: 2.70%) due 08/19/38◊,4 | | | 4,200,000 | | | | 3,714,617 | |
MF1 Multifamily Housing Mortgage Loan Trust | | | | | | | | |
2021-FL6 D, 8.00% (1 Month Term SOFR + 2.66%, Rate Floor: 2.55%) due 07/16/36◊,4 | | | 3,800,000 | | | | 3,616,853 | |
Cerberus Loan Funding XXXVI, LP | | | | | | | | |
2021-6A A, 6.97% (3 Month Term SOFR + 1.66%, Rate Floor: 1.40%) due 11/22/33◊,4 | | | 2,711,877 | | | | 2,703,828 | |
Wellfleet CLO Ltd. | | | | | | | | |
2018-2A A2R, 7.17% (3 Month Term SOFR + 1.84%, Rate Floor: 1.58%) due 10/20/28◊,4 | | | 2,500,000 | | | | 2,488,750 | |
Allegro CLO VII Ltd. | | | | | | | | |
2018-1A C, 7.47% (3 Month Term SOFR + 2.16%, Rate Floor: 1.90%) due 06/13/31◊,4 | | | 2,500,000 | | | | 2,424,891 | |
Carlyle Global Market Strategies CLO Ltd. | | | | | | | | |
2012-3A SUB, due 01/14/324,12 | | | 8,920,000 | | | | 2,363,800 | |
Marathon CLO V Ltd. | | | | | | | | |
2017-5A A2R, 7.09% (3 Month Term SOFR + 1.71%, Rate Floor: 0.00%) due 11/21/27◊,4 | | | 2,117,762 | | | | 2,115,264 | |
Diamond CLO Ltd. | | | | | | | | |
2021-1A CR, 8.01% (3 Month Term SOFR + 2.66%, Rate Floor: 2.66%) due 04/25/29◊,4 | | | 779,803 | | | | 777,253 | |
Voya CLO Ltd. | | | | | | | | |
2013-1A INC, due 10/15/304,12 | | | 10,575,071 | | | | 613,883 | |
TRTX Issuer Ltd. | | | | | | | | |
2019-FL3 B, 7.20% (1 Month Term SOFR + 1.86%, Rate Floor: 1.75%) due 10/15/34◊,4 | | | 431,548 | | | | 430,572 | |
Great Lakes CLO Ltd. | | | | | | | | |
2014-1A SUB, due 10/15/294,12 | | | 461,538 | | | | 177,564 | |
Venture XIII CLO Ltd. | | | | | | | | |
2013-13A SUB, due 09/10/294,12 | | | 3,700,000 | | | | 111,525 | |
Treman Park CLO Ltd. | | | | | | | | |
2015-1A SUB, due 10/20/284,12 | | | 6,859,005 | | | | 68,864 | |
Atlas Senior Loan Fund IX Ltd. | | | | | | | | |
2018-9A SUB, due 04/20/284,12 | | | 1,200,000 | | | | 29,629 | |
Babson CLO Ltd. | | | | | | | | |
2014-IA SUB, due 07/20/254,12 | | | 1,266,687 | | | | 29,514 | |
Copper River CLO Ltd. | | | | | | | | |
2007-1A INC, due 01/20/2110,12 | | | 1,500,000 | | | | 150 | |
Total Collateralized Loan Obligations | | | 2,991,925,352 | |
| | | | | | | | | |
SEE NOTES TO FINANCIAL STATEMENTS. | THE GUGGENHEIM FUNDS ANNUAL REPORT | 45 |
SCHEDULE OF INVESTMENTS (continued) | September 30, 2023 |
TOTAL RETURN BOND FUND | |
| | Face
Amount~ | | | Value | |
Financial - 2.5% |
Project Onyx I | | | | | | | | |
due 01/26/27◊,††† | | | 55,050,000 | | | $ | 55,052,399 | |
7.31% (3 Month Term SOFR + 2.40%, Rate Floor: 2.40%) due /26/27◊,††† | | | 26,000,000 | | | | 26,001,113 | |
KKR Core Holding Company LLC | | | | | | | | |
4.00% due 08/12/31††† | | | 81,770,389 | | | | 70,697,431 | |
Strategic Partners Fund VIII LP | | | | | | | | |
7.93% (1 Month Term SOFR + 2.60%, Rate Floor: 2.60%) due 03/10/26◊,††† | | | 70,377,333 | | | | 70,036,117 | |
HV Eight LLC | | | | | | | | |
7.10% (3 Month EURIBOR + 3.50%, Rate Floor: 3.50%) due 12/31/27◊,††† | | EUR | 64,750,000 | | | | 68,482,280 | |
HarbourVest Structured Solutions IV Holdings, LP | | | | | | | | |
7.61% (3 Month USD LIBOR + 2.45%, Rate Floor: 2.45%) due 09/15/26◊,††† | | | 18,915,420 | | | | 18,918,659 | |
6.05% (3 Month EURIBOR + 2.45%, Rate Floor: 2.45%) due 09/15/26◊,††† | | EUR | 11,100,000 | | | | 11,740,915 | |
Ceamer Finance LLC | | | | | | | | |
3.69% due 03/24/31††† | | | 21,344,080 | | | | 19,802,508 | |
6.92% due 11/15/37††† | | | 7,452,338 | | | | 7,105,085 | |
Lightning A | | | | | | | | |
5.50% due 03/01/37††† | | | 29,464,712 | | | | 26,750,772 | |
Madison Avenue Secured Funding Trust | | | | | | | | |
2023-1, 7.32% (1 Month Term SOFR + 2.00%, Rate Floor: 2.00%) due 03/04/24◊,†††,4 | | | 26,600,000 | | | | 26,600,000 | |
Thunderbird A | | | | | | | | |
5.50% due 03/01/37††† | | | 29,042,333 | | | | 26,364,714 | |
Madison Avenue Secured Funding Trust | | | | | | | | |
2024-1, due 10/15/2417 | | | 25,350,000 | | | | 25,350,000 | |
Project Onyx II | | | | | | | | |
due 01/26/27†††,17 | | | 18,350,000 | | | | 18,349,337 | |
7.31% (3 Month Term SOFR + 2.40%, Rate Floor: 2.40%) due /26/27◊,††† | | | 5,000,000 | | | | 4,999,819 | |
Bib Merchant Voucher Receivables Ltd. | | | | | | | | |
4.18% due 04/07/28††† | | | 16,194,982 | | | | 15,338,229 | |
Station Place Securitization Trust | | | | | | | | |
2024-1, due 10/15/2417 | | | 12,650,000 | | | | 12,650,000 | |
Nassau LLC | | | | | | | | |
2019-1, 3.98% due 08/15/344 | | | 11,391,715 | | | | 10,769,119 | |
Aesf Vi Verdi, LP | | | | | | | | |
7.55% (3 Month Term SOFR + 2.30%, Rate Floor: 2.30%) due 11/25/24◊,††† | | | 6,305,178 | | | | 6,424,991 | |
6.00% (3 Month EURIBOR + 2.40%, Rate Floor: 2.40%) due 11/25/24◊,††† | | EUR | 1,013,463 | | | | 1,087,983 | |
46 | THE GUGGENHEIM FUNDS ANNUAL REPORT | SEE NOTES TO FINANCIAL STATEMENTS. |
SCHEDULE OF INVESTMENTS (continued) | September 30, 2023 |
TOTAL RETURN BOND FUND | |
| | Face
Amount~ | | | Value | |
Oxford Finance Funding | | | | | | | | |
2020-1A, 3.10% due 02/15/284 | | | 6,388,327 | | | $ | 6,161,624 | |
Industrial DPR Funding Ltd. | | | | | | | | |
2016-1A, 5.24% due 04/15/264 | | | 1,746,900 | | | | 1,702,715 | |
Total Financial | | | 530,385,830 | |
| | | | | | | | | |
Transport-Aircraft - 1.7% |
AASET Trust | | | | | | | | |
2021-1A, 2.95% due 11/16/414 | | | 59,134,981 | | | | 52,039,966 | |
2021-2A, 2.80% due 01/15/474 | | | 22,324,667 | | | | 19,082,824 | |
2020-1A, 3.35% due 01/16/404 | | | 14,801,762 | | | | 12,877,533 | |
2019-1, 3.84% due 05/15/394 | | | 5,541,572 | | | | 4,156,332 | |
2019-2, 3.38% due 10/16/394 | | | 1,619,387 | | | | 1,408,763 | |
2017-1A, 3.97% due 05/16/424 | | | 828,516 | | | | 729,085 | |
Navigator Aircraft ABS Ltd. | | | | | | | | |
2021-1, 2.77% due 11/15/464 | | | 47,743,303 | | | | 41,429,251 | |
Castlelake Aircraft Structured Trust | | | | | | | | |
2021-1A, 3.47% due 01/15/464 | | | 42,709,386 | | | | 39,398,555 | |
Lunar Structured Aircraft Portfolio Notes | | | | | | | | |
2021-1, 2.64% due 10/15/464 | | | 34,296,110 | | | | 29,400,340 | |
Sprite Ltd. | | | | | | | | |
2021-1, 3.75% due 11/15/464 | | | 29,390,599 | | | | 26,345,209 | |
AASET US Ltd. | | | | | | | | |
2018-2A, 4.45% due 11/18/384 | | | 28,185,294 | | | | 24,506,513 | |
Sapphire Aviation Finance II Ltd. | | | | | | | | |
2020-1A, 3.23% due 03/15/404 | | | 25,455,421 | | | | 21,540,123 | |
KDAC Aviation Finance Ltd. | | | | | | | | |
2017-1A, 4.21% due 12/15/424 | | | 19,036,733 | | | | 15,783,355 | |
WAVE LLC | | | | | | | | |
2019-1, 3.60% due 09/15/444 | | | 17,070,502 | | | | 14,063,874 | |
Sapphire Aviation Finance I Ltd. | | | | | | | | |
2018-1A, 4.25% due 03/15/404 | | | 14,198,066 | | | | 11,835,366 | |
MAPS Ltd. | | | | | | | | |
2018-1A, 4.21% due 05/15/434 | | | 12,241,546 | | | | 10,972,955 | |
Raspro Trust | | | | | | | | |
2005-1A, 6.18% (3 Month USD SOFR + 0.93%, Rate Floor: 0.93%) due 03/23/24◊,4 | | | 10,637,384 | | | | 10,568,858 | |
Falcon Aerospace Ltd. | | | | | | | | |
2019-1, 3.60% due 09/15/394 | | | 8,239,562 | | | | 7,457,058 | |
2017-1, 4.58% due 02/15/424 | | | 2,552,235 | | | | 2,385,727 | |
Castlelake Aircraft Securitization Trust | | | | | | | | |
2018-1, 4.13% due 06/15/434 | | | 10,610,553 | | | | 9,646,941 | |
Slam 2021-1 Ltd. | | | | | | | | |
2021-1A, 2.43% due 06/15/464 | | | 1,718,800 | | | | 1,462,046 | |
Slam Ltd. | | | | | | | | |
2021-1A, 3.42% due 06/15/464 | | | 1,289,100 | | | | 1,076,424 | |
Total Transport-Aircraft | | | 358,167,098 | |
| | | | | | | | | |
Whole Business - 1.6% |
Arbys Funding LLC | | | | | | | | |
2020-1A, 3.24% due 07/30/504 | | | 94,898,010 | | | | 84,048,700 | |
SEE NOTES TO FINANCIAL STATEMENTS. | THE GUGGENHEIM FUNDS ANNUAL REPORT | 47 |
SCHEDULE OF INVESTMENTS (continued) | September 30, 2023 |
TOTAL RETURN BOND FUND | |
| | Face
Amount~ | | | Value | |
SERVPRO Master Issuer LLC | | | | | | | | |
2021-1A, 2.39% due 04/25/514 | | | 38,350,258 | | | $ | 31,656,642 | |
2022-1A, 3.13% due 01/25/524 | | | 23,147,500 | | | | 19,294,321 | |
2019-1A, 3.88% due 10/25/494 | | | 968,275 | | | | 884,086 | |
Five Guys Funding LLC | | | | | | | | |
2017-1A, 4.60% due 07/25/474 | | | 43,760,595 | | | | 42,966,909 | |
Taco Bell Funding LLC | | | | | | | | |
2021-1A, 2.29% due 08/25/514 | | | 23,157,525 | | | | 18,915,946 | |
2016-1A, 4.97% due 05/25/464 | | | 17,392,559 | | | | 16,762,462 | |
ServiceMaster Funding LLC | | | | | | | | |
2020-1, 3.34% due 01/30/514 | | | 28,000,447 | | | | 21,975,703 | |
2020-1, 2.84% due 01/30/514 | | | 9,314,507 | | | | 7,865,347 | |
Sonic Capital LLC | | | | | | | | |
2021-1A, 2.64% due 08/20/514 | | | 19,419,680 | | | | 14,335,491 | |
2020-1A, 4.34% due 01/20/504 | | | 7,060,379 | | | | 6,098,184 | |
2020-1A, 3.85% due 01/20/504 | | | 4,521,162 | | | | 4,091,046 | |
2021-1A, 2.19% due 08/20/514 | | | 2,646,000 | | | | 2,125,185 | |
Wingstop Funding LLC | | | | | | | | |
2020-1A, 2.84% due 12/05/504 | | | 25,117,500 | | | | 21,731,259 | |
2022-1A, 3.73% due 03/05/524 | | | 3,448,938 | | | | 3,016,127 | |
Applebee’s Funding LLC / IHOP Funding LLC | | | | | | | | |
2019-1A, 4.72% due 06/05/494 | | | 20,938,500 | | | | 19,464,388 | |
Domino’s Pizza Master Issuer LLC | | | | | | | | |
2021-1A, 3.15% due 04/25/514 | | | 9,121,053 | | | | 7,348,303 | |
2017-1A, 4.12% due 07/25/474 | | | 7,843,500 | | | | 7,256,383 | |
Wendy’s Funding LLC | | | | | | | | |
2019-1A, 3.78% due 06/15/494 | | | 12,210,825 | | | | 11,311,522 | |
2019-1A, 4.08% due 06/15/494 | | | 1,511,688 | | | | 1,327,389 | |
DB Master Finance LLC | | | | | | | | |
2021-1A, 2.79% due 11/20/514 | | | 6,631,875 | | | | 5,112,837 | |
Total Whole Business | | | 347,588,230 | |
| | | | | | | | | |
Net Lease - 0.9% |
STORE Master Funding I-VII | | | | | | | | |
2016-1A, 3.96% due 10/20/464 | | | 27,606,923 | | | | 25,424,102 | |
2016-1A, 4.32% due 10/20/464 | | | 10,921,964 | | | | 9,931,489 | |
CF Hippolyta Issuer LLC | | | | | | | | |
2022-1A, 6.11% due 08/15/624 | | | 20,275,457 | | | | 19,563,942 | |
2020-1, 2.28% due 07/15/604 | | | 10,075,718 | | | | 8,846,731 | |
Capital Automotive REIT | | | | | | | | |
2020-1A, 3.48% due 02/15/504 | | | 21,991,098 | | | | 19,293,188 | |
2021-1A, 2.76% due 08/15/514 | | | 6,576,625 | | | | 4,731,411 | |
CARS-DB4, LP | | | | | | | | |
2020-1A, 3.81% due 02/15/504 | | | 20,039,779 | | | | 16,016,016 | |
2020-1A, 3.25% due 02/15/504 | | | 3,398,218 | | | | 2,776,887 | |
SVC ABS LLC | | | | | | | | |
2023-1A, 5.15% due 02/20/534 | | | 15,305,229 | | | | 14,258,416 | |
2023-1A, 5.55% due 02/20/534 | | | 3,494,896 | | | | 3,178,878 | |
CMFT Net Lease Master Issuer LLC | | | | | | | | |
2021-1, 2.91% due 07/20/514 | | | 10,050,000 | | | | 8,061,895 | |
48 | THE GUGGENHEIM FUNDS ANNUAL REPORT | SEE NOTES TO FINANCIAL STATEMENTS. |
SCHEDULE OF INVESTMENTS (continued) | September 30, 2023 |
TOTAL RETURN BOND FUND | |
| | Face
Amount~ | | | Value | |
2021-1, 3.04% due 07/20/514 | | | 5,050,000 | | | $ | 3,737,011 | |
2021-1, 2.51% due 07/20/514 | | | 3,000,000 | | | | 2,437,572 | |
2021-1, 3.44% due 07/20/514 | | | 3,215,000 | | | | 2,365,221 | |
Oak Street Investment Grade Net Lease Fund Series | | | | | | | | |
2020-1A, 2.26% due 11/20/504 | | | 15,000,000 | | | | 13,282,555 | |
STORE Master Funding I LLC | | | | | | | | |
2015-1A, 4.17% due 04/20/454 | | | 9,956,145 | | | | 9,393,863 | |
New Economy Assets Phase 1 Sponsor LLC | | | | | | | | |
2021-1, 2.41% due 10/20/614 | | | 10,000,000 | | | | 8,314,913 | |
CARS-DB7, LP | | | | | | | | |
2023-1A, 5.75% due 09/15/534 | | | 4,550,000 | | | | 4,398,854 | |
CF Hippolyta LLC | | | | | | | | |
2020-1, 2.60% due 07/15/604 | | | 4,312,872 | | | | 3,379,701 | |
STORE Master Funding LLC | | | | | | | | |
2021-1A, 3.70% due 06/20/514 | | | 3,542,691 | | | | 2,571,635 | |
Total Net Lease | | | 181,964,280 | |
| | | | | | | | | |
Single Family Residence - 0.6% |
FirstKey Homes Trust | | | | | | | | |
2020-SFR2, 4.50% due 10/19/374 | | | 21,640,000 | | | | 20,051,808 | |
2020-SFR2, 4.00% due 10/19/374 | | | 20,340,000 | | | | 18,745,200 | |
2020-SFR2, 3.37% due 10/19/374 | | | 13,010,000 | | | | 11,890,950 | |
2021-SFR1, 2.19% due 08/17/384 | | | 8,174,000 | | | | 7,124,538 | |
Home Partners of America Trust | | | | | | | | |
2021-2, 2.65% due 12/17/264 | | | 46,447,870 | | | | 40,703,248 | |
2021-3, 2.80% due 01/17/414 | | | 15,338,356 | | | | 12,881,445 | |
Tricon Residential Trust | | | | | | | | |
2021-SFR1, 2.59% due 07/17/384 | | | 7,000,000 | | | | 6,229,068 | |
Total Single Family Residence | | | 117,626,257 | |
| | | | | | | | | |
Infrastructure - 0.5% |
Hotwire Funding LLC | | | | | | | | |
2023-1A, 8.84% due 05/20/534 | | | 31,200,000 | | | | 29,274,823 | |
2021-1, 2.31% due 11/20/514 | | | 5,350,000 | | | | 4,698,425 | |
2021-1, 2.66% due 11/20/514 | | | 4,025,000 | | | | 3,437,040 | |
VB-S1 Issuer LLC - VBTEL | | | | | | | | |
2022-1A, 4.29% due 02/15/524 | | | 40,900,000 | | | | 35,623,834 | |
Stack Infrastructure Issuer LLC | | | | | | | | |
2020-1A, 1.89% due 08/25/454 | | | 11,624,000 | | | | 10,551,565 | |
2023-1A, 5.90% due 03/25/484 | | | 5,050,000 | | | | 4,807,493 | |
Aligned Data Centers Issuer LLC | | | | | | | | |
2021-1A, 1.94% due 08/15/464 | | | 15,345,000 | | | | 13,422,853 | |
Blue Stream Issuer LLC | | | | | | | | |
2023-1A, 5.40% due 05/20/534 | | | 6,625,000 | | | | 6,207,300 | |
Total Infrastructure | | | 108,023,333 | |
| | | | | | | | | |
Collateralized Debt Obligations - 0.5% |
Anchorage Credit Funding 4 Ltd. | | | | | | | | |
2021-4A AR, 2.72% due 04/27/394 | | | 108,854,127 | | | | 94,019,759 | |
Anchorage Credit Funding Ltd. | | | | | | | | |
2021-13A C2, 3.65% due 07/27/394 | | | 1,950,000 | | | | 1,603,532 | |
Total Collateralized Debt Obligations | | | 95,623,291 | |
| | | | | | | | | |
SEE NOTES TO FINANCIAL STATEMENTS. | THE GUGGENHEIM FUNDS ANNUAL REPORT | 49 |
SCHEDULE OF INVESTMENTS (continued) | September 30, 2023 |
TOTAL RETURN BOND FUND | |
| | Face
Amount~ | | | Value | |
Transport-Container - 0.3% |
Textainer Marine Containers VII Ltd. | | | | | | | | |
2020-1A, 2.73% due 08/21/454 | | | 45,819,993 | | | $ | 41,619,102 | |
2021-2A, 2.23% due 04/20/464 | | | 2,621,667 | | | | 2,238,534 | |
MC Ltd. | | | | | | | | |
2021-1, 2.63% due 11/05/354 | | | 9,984,987 | | | | 8,672,913 | |
CLI Funding VIII LLC | | | | | | | | |
2021-1A, 1.64% due 02/18/464 | | | 2,967,589 | | | | 2,534,266 | |
Total Transport-Container | | | 55,064,815 | |
| | | | | | | | | |
Automotive - 0.1% |
Avis Budget Rental Car Funding AESOP LLC | | | | | | | | |
2023-8A, 6.66% due 02/20/30†††,4 | | | 12,750,000 | | | | 12,647,173 | |
Avis Budget Rental Car Funding AESOP LLC | | | | | | | | |
2023-8A, 6.02% due 02/20/304 | | | 11,000,000 | | | | 10,954,053 | |
Total Automotive | | | 23,601,226 | |
| | | | | | | | | |
Insurance - 0.1% |
CHEST | | | | | | | | |
7.13% due 03/15/43††† | | | 19,100,000 | | | | 18,578,392 | |
JGWPT XXIII LLC | | | | | | | | |
2011-1A, 4.70% due 10/15/564 | | | 2,193,298 | | | | 2,004,596 | |
JGWPT XXIV LLC | | | | | | | | |
2011-2A, 4.94% due 09/15/564 | | | 1,594,423 | | | | 1,453,674 | |
VICOF 2 | | | | | | | | |
4.00% due 02/22/30††† | | | 671,027 | | | | 633,754 | |
321 Henderson Receivables VI LLC | | | | | | | | |
2010-1A, 5.56% due 07/15/594 | | | 640,466 | | | | 627,063 | |
SPSS | | | | | | | | |
5.14% due 11/15/52†††,10 | | | 146,519 | | | | 124,144 | |
Total Insurance | | | 23,421,623 | |
| | | | | | | | | |
Total Asset-Backed Securities |
(Cost $5,085,072,977) | | | 4,833,391,335 | |
| | | | | | | | | |
CORPORATE BONDS†† - 21.9% |
Financial - 11.0% |
Pershing Square Holdings Ltd. | | | | | | | | |
3.25% due 10/01/31 | | | 104,800,000 | | | | 75,963,987 | |
3.25% due 11/15/30 | | | 64,350,000 | | | | 48,659,153 | |
Reliance Standard Life Global Funding II | | | | | | | | |
2.75% due 05/07/254 | | | 93,191,000 | | | | 87,619,209 | |
Wilton RE Ltd. | | | | | | | | |
6.00% 3,4,13 | | | 92,239,000 | | | | 81,029,194 | |
GLP Capital Limited Partnership / GLP Financing II, Inc. | | | | | | | | |
4.00% due 01/15/31 | | | 54,748,000 | | | | 45,578,624 | |
5.30% due 01/15/29 | | | 20,867,000 | | | | 19,344,128 | |
3.25% due 01/15/32 | | | 4,150,000 | | | | 3,220,768 | |
4.00% due 01/15/30 | | | 475,000 | | | | 402,826 | |
FS KKR Capital Corp. | | | | | | | | |
2.63% due 01/15/27 | | | 33,971,000 | | | | 29,090,846 | |
3.25% due 07/15/27 | | | 30,100,000 | | | | 25,917,641 | |
Jefferies Financial Group, Inc. | | | | | | | | |
2.75% due 10/15/32 | | | 40,642,000 | | | | 30,335,316 | |
2.63% due 10/15/31 | | | 27,400,000 | | | | 20,821,646 | |
5.88% due 07/21/28 | | | 3,700,000 | | | | 3,620,948 | |
Host Hotels & Resorts, LP | | | | | | | | |
3.50% due 09/15/30 | | | 44,753,000 | | | | 37,105,571 | |
2.90% due 12/15/31 | | | 20,200,000 | | | | 15,524,924 | |
Safehold GL Holdings LLC | | | | | | | | |
2.85% due 01/15/32 | | | 40,038,000 | | | | 29,410,465 | |
2.80% due 06/15/31 | | | 30,247,000 | | | | 22,605,163 | |
Liberty Mutual Group, Inc. | | | | | | | | |
4.30% due 02/01/614 | | | 74,981,000 | | | | 44,268,265 | |
50 | THE GUGGENHEIM FUNDS ANNUAL REPORT | SEE NOTES TO FINANCIAL STATEMENTS. |
SCHEDULE OF INVESTMENTS (continued) | September 30, 2023 |
TOTAL RETURN BOND FUND | |
| | Face
Amount~ | | | Value | |
4.13% due 12/15/513,4 | | | 3,600,000 | | | $ | 2,959,686 | |
3.95% due 05/15/604 | | | 4,064,000 | | | | 2,549,302 | |
Maple Grove Funding Trust I | | | | | | | | |
4.16% due 08/15/514 | | | 77,700,000 | | | | 48,323,346 | |
Macquarie Bank Ltd. | | | | | | | | |
3.62% due 06/03/304 | | | 59,035,000 | | | | 48,019,639 | |
Fairfax Financial Holdings Ltd. | | | | | | | | |
3.38% due 03/03/31 | | | 41,708,000 | | | | 33,901,886 | |
5.63% due 08/16/32 | | | 13,100,000 | | | | 12,235,535 | |
Global Atlantic Finance Co. | | | | | | | | |
4.70% due 10/15/513,4 | | | 38,462,000 | | | | 27,820,343 | |
3.13% due 06/15/314 | | | 25,602,000 | | | | 18,247,976 | |
Nippon Life Insurance Co. | | | | | | | | |
2.75% due 01/21/513,4 | | | 45,350,000 | | | | 35,673,557 | |
2.90% due 09/16/513,4 | | | 10,380,000 | | | | 8,135,741 | |
Ares Finance Company II LLC | | | | | | | | |
3.25% due 06/15/304 | | | 53,785,000 | | | | 43,542,195 | |
First American Financial Corp. | | | | | | | | |
4.00% due 05/15/30 | | | 40,891,000 | | | | 34,630,186 | |
2.40% due 08/15/31 | | | 11,875,000 | | | | 8,808,520 | |
Blue Owl Capital GP LLC | | | | | | | | |
7.21% due 08/22/43 | | | 28,550,000 | | | | 28,093,451 | |
7.11% due 08/22/43 | | | 15,200,000 | | | | 15,124,416 | |
JPMorgan Chase & Co. | | | | | | | | |
2.52% due 04/22/313 | | | 19,520,000 | | | | 15,822,502 | |
2.96% due 05/13/313 | | | 17,276,000 | | | | 14,194,388 | |
4.49% due 03/24/313 | | | 10,750,000 | | | | 9,842,929 | |
0.82% due 06/01/253 | | | 900,000 | | | | 866,388 | |
2.07% due 06/01/293 | | | 900,000 | | | | 758,347 | |
Nationwide Mutual Insurance Co. | | | | | | | | |
4.35% due 04/30/504 | | | 57,736,000 | | | | 41,250,209 | |
Macquarie Group Ltd. | | | | | | | | |
2.69% due 06/23/323,4 | | | 31,550,000 | | | | 24,172,618 | |
2.87% due 01/14/333,4 | | | 17,431,000 | | | | 13,174,310 | |
5.03% due 01/15/303,4 | | | 800,000 | | | | 763,536 | |
1.63% due 09/23/273,4 | | | 720,000 | | | | 628,991 | |
1.34% due 01/12/273,4 | | | 570,000 | | | | 509,934 | |
Fidelity National Financial, Inc. | | | | | | | | |
3.40% due 06/15/30 | | | 43,590,000 | | | | 37,041,531 | |
2.45% due 03/15/31 | | | 2,540,000 | | | | 1,958,467 | |
Rocket Mortgage LLC / Rocket Mortgage Company-Issuer, Inc. | | | | | | | | |
3.88% due 03/01/314 | | | 46,892,000 | | | | 37,390,274 | |
United Wholesale Mortgage LLC | | | | | | | | |
5.50% due 04/15/294 | | | 32,712,000 | | | | 27,641,640 | |
5.50% due 11/15/254 | | | 10,131,000 | | | | 9,636,381 | |
Bain Capital, LP | | | | | | | | |
3.41% due 04/15/41††† | | | 36,000,000 | | | | 21,992,365 | |
3.72% due 04/15/42††† | | | 20,300,000 | | | | 12,761,600 | |
OneAmerica Financial Partners, Inc. | | | | | | | | |
4.25% due 10/15/504 | | | 54,705,000 | | | | 34,687,553 | |
CBS Studio Center | | | | | | | | |
8.31% (30 Day Average SOFR + 3.00%, Rate Floor: 3.00%) due 01/09/24◊,††† | | | 34,100,000 | | | | 34,100,000 | |
Jefferies Finance LLC / JFIN Company-Issuer Corp. | | | | | | | | |
5.00% due 08/15/284 | | | 39,650,000 | | | | 33,385,546 | |
Sumitomo Life Insurance Co. | | | | | | | | |
3.38% due 04/15/813,4 | | | 39,900,000 | | | | 33,160,280 | |
Reinsurance Group of America, Inc. | | | | | | | | |
3.15% due 06/15/30 | | | 38,983,000 | | | | 32,273,221 | |
SEE NOTES TO FINANCIAL STATEMENTS. | THE GUGGENHEIM FUNDS ANNUAL REPORT | 51 |
SCHEDULE OF INVESTMENTS (continued) | September 30, 2023 |
TOTAL RETURN BOND FUND | |
| | Face
Amount~ | | | Value | |
Mizuho Financial Group, Inc. | | | | | | | | |
5.67% due 05/27/293 | | | 31,200,000 | | | $ | 30,677,542 | |
5.41% due 09/13/283 | | | 1,400,000 | | | | 1,370,241 | |
Belrose Funding Trust | | | | | | | | |
2.33% due 08/15/304 | | | 38,420,000 | | | | 28,630,662 | |
Assurant, Inc. | | | | | | | | |
2.65% due 01/15/32 | | | 36,922,000 | | | | 26,995,467 | |
6.75% due 02/15/34 | | | 1,450,000 | | | | 1,458,269 | |
National Australia Bank Ltd. | | | | | | | | |
2.33% due 08/21/304 | | | 22,400,000 | | | | 16,936,679 | |
3.35% due 01/12/373,4 | | | 14,550,000 | | | | 11,079,810 | |
Stewart Information Services Corp. | | | | | | | | |
3.60% due 11/15/31 | | | 37,221,000 | | | | 27,351,924 | |
Standard Chartered plc | | | | | | | | |
4.64% due 04/01/313,4 | | | 28,908,000 | | | | 26,006,643 | |
Bank of America Corp. | | | | | | | | |
2.59% due 04/29/313 | | | 28,440,000 | | | | 22,854,133 | |
6.06% (SOFR + 0.73%, Rate Floor: 0.00%) due 10/24/24◊ | | | 1,660,000 | | | | 1,660,398 | |
1.73% due 07/22/273 | | | 1,650,000 | | | | 1,462,163 | |
UBS Group AG | | | | | | | | |
2.10% due 02/11/323,4 | | | 33,400,000 | | | | 24,714,336 | |
5.71% due 01/12/273,4 | | | 1,000,000 | | | | 987,303 | |
Iron Mountain, Inc. | | | | | | | | |
4.50% due 02/15/314 | | | 18,937,000 | | | | 15,574,990 | |
5.63% due 07/15/324 | | | 8,431,000 | | | | 7,278,499 | |
4.88% due 09/15/274 | | | 1,938,000 | | | | 1,787,524 | |
5.25% due 07/15/304 | | | 74,000 | | | | 64,650 | |
Americo Life, Inc. | | | | | | | | |
3.45% due 04/15/314 | | | 32,364,000 | | | | 23,352,036 | |
Westpac Banking Corp. | | | | | | | | |
3.02% due 11/18/363 | | | 15,650,000 | | | | 11,578,939 | |
2.96% due 11/16/40 | | | 12,214,000 | | | | 7,428,322 | |
2.67% due 11/15/353 | | | 4,467,000 | | | | 3,346,587 | |
Capital One Financial Corp. | | | | | | | | |
6.38% due 06/08/343 | | | 22,450,000 | | | | 21,186,415 | |
5.47% due 02/01/293 | | | 1,000,000 | | | | 951,901 | |
Trustage Financial Group, Inc. | | | | | | | | |
4.63% due 04/15/324 | | | 26,450,000 | | | | 21,827,115 | |
Dyal Capital Partners III | | | | | | | | |
4.40% due 06/15/40††† | | | 26,750,000 | | | | 21,500,624 | |
LPL Holdings, Inc. | | | | | | | | |
4.00% due 03/15/294 | | | 17,588,000 | | | | 15,334,314 | |
4.38% due 05/15/314 | | | 6,241,000 | | | | 5,338,878 | |
Manulife Financial Corp. | | | | | | | | |
2.48% due 05/19/27 | | | 17,800,000 | | | | 16,073,477 | |
4.06% due 02/24/323 | | | 4,815,000 | | | | 4,457,235 | |
Hunt Companies, Inc. | | | | | | | | |
5.25% due 04/15/294 | | | 25,121,000 | | | | 19,730,139 | |
Brookfield Finance, Inc. | | | | | | | | |
3.50% due 03/30/51 | | | 18,906,000 | | | | 11,759,150 | |
4.70% due 09/20/47 | | | 9,790,000 | | | | 7,625,082 | |
Societe Generale S.A. | | | | | | | | |
2.89% due 06/09/323,4 | | | 21,150,000 | | | | 16,002,556 | |
1.79% due 06/09/273,4 | | | 1,630,000 | | | | 1,436,779 | |
Mitsubishi UFJ Financial Group, Inc. | | | | | | | | |
5.44% due 02/22/343 | | | 16,150,000 | | | | 15,402,816 | |
4.08% due 04/19/283 | | | 1,580,000 | | | | 1,483,737 | |
5.72% due 02/20/263 | | | 500,000 | | | | 497,040 | |
Brookfield Capital Finance LLC | | | | | | | | |
6.09% due 06/14/33 | | | 16,800,000 | | | | 16,325,029 | |
NFP Corp. | | | | | | | | |
7.50% due 10/01/304 | | | 11,950,000 | | | | 11,475,911 | |
6.88% due 08/15/284 | | | 5,617,000 | | | | 4,811,962 | |
Horace Mann Educators Corp. | | | | | | | | |
7.25% due 09/15/28 | | | 11,950,000 | | | | 11,939,921 | |
4.50% due 12/01/25 | | | 4,560,000 | | | | 4,334,776 | |
Corebridge Financial, Inc. | | | | | | | | |
6.88% due 12/15/523 | | | 16,030,000 | | | | 15,356,578 | |
52 | THE GUGGENHEIM FUNDS ANNUAL REPORT | SEE NOTES TO FINANCIAL STATEMENTS. |
SCHEDULE OF INVESTMENTS (continued) | September 30, 2023 |
TOTAL RETURN BOND FUND | |
| | Face
Amount~ | | | Value | |
QBE Insurance Group Ltd. | | | | | | | | |
5.88% 3,4,13 | | | 15,700,000 | | | $ | 14,923,572 | |
ABN AMRO Bank N.V. | | | | | | | | |
2.47% due 12/13/293,4 | | | 18,000,000 | | | | 14,864,213 | |
Central Storage Safety Project Trust | | | | | | | | |
4.82% due 02/01/3810 | | | 17,482,400 | | | | 14,579,738 | |
GA Global Funding Trust | | | | | | | | |
2.90% due 01/06/324 | | | 17,480,000 | | | | 12,814,624 | |
1.25% due 12/08/234 | | | 1,650,000 | | | | 1,633,709 | |
Prudential Financial, Inc. | | | | | | | | |
3.70% due 10/01/503 | | | 17,139,000 | | | | 13,938,904 | |
KKR Group Finance Company VIII LLC | | | | | | | | |
3.50% due 08/25/504 | | | 22,210,000 | | | | 13,854,593 | |
AmFam Holdings, Inc. | | | | | | | | |
2.81% due 03/11/314 | | | 19,050,000 | | | | 13,791,461 | |
Lincoln National Corp. | | | | | | | | |
4.38% due 06/15/505 | | | 18,801,000 | | | | 12,880,504 | |
Kennedy-Wilson, Inc. | | | | | | | | |
4.75% due 03/01/29 | | | 15,662,000 | | | | 12,020,742 | |
4.75% due 02/01/30 | | | 81,000 | | | | 60,435 | |
PartnerRe Finance B LLC | | | | | | | | |
4.50% due 10/01/503 | | | 14,043,000 | | | | 11,910,386 | |
NatWest Group plc | | | | | | | | |
6.02% due 03/02/343 | | | 10,130,000 | | | | 9,722,004 | |
4.45% due 05/08/303 | | | 1,100,000 | | | | 992,848 | |
Sumitomo Mitsui Financial Group, Inc. | | | | | | | | |
2.22% due 09/17/31 | | | 11,900,000 | | | | 9,028,093 | |
5.71% due 01/13/30 | | | 1,000,000 | | | | 978,418 | |
5.52% due 01/13/28 | | | 640,000 | | | | 631,260 | |
CNO Financial Group, Inc. | | | | | | | | |
5.25% due 05/30/29 | | | 11,125,000 | | | | 10,477,998 | |
HSBC Holdings plc | | | | | | | | |
6.16% due 03/09/293 | | | 10,340,000 | | | | 10,236,005 | |
CBRE Services, Inc. | | | | | | | | |
5.95% due 08/15/34 | | | 10,160,000 | | | | 9,583,021 | |
Penn Mutual Life Insurance Co. | | | | | | | | |
3.80% due 04/29/614 | | | 14,970,000 | | | | 8,941,788 | |
KKR Group Finance Company X LLC | | | | | | | | |
3.25% due 12/15/514 | | | 15,150,000 | | | | 8,870,982 | |
Assured Guaranty US Holdings, Inc. | | | | | | | | |
3.60% due 09/15/51 | | | 13,861,000 | | | | 8,493,508 | |
6.13% due 09/15/28 | | | 300,000 | | | | 300,004 | |
Accident Fund Insurance Company of America | | | | | | | | |
8.50% due 08/01/324 | | | 9,000,000 | | | | 8,771,196 | |
Western & Southern Life Insurance Co. | | | | | | | | |
3.75% due 04/28/614 | | | 13,360,000 | | | | 8,076,777 | |
Fidelity & Guaranty Life Holdings, Inc. | | | | | | | | |
5.50% due 05/01/254 | | | 8,050,000 | | | | 7,858,868 | |
American Equity Investment Life Holding Co. | | | | | | | | |
5.00% due 06/15/27 | | | 8,142,000 | | | | 7,647,768 | |
Five Corners Funding Trust III | | | | | | | | |
5.79% due 02/15/334 | | | 7,550,000 | | | | 7,407,098 | |
Kemper Corp. | | | | | | | | |
2.40% due 09/30/30 | | | 10,006,000 | | | | 7,394,214 | |
CNO Global Funding | | | | | | | | |
1.75% due 10/07/264 | | | 7,400,000 | | | | 6,497,778 | |
Cooperatieve Rabobank UA | | | | | | | | |
4.66% due 08/22/283,4 | | | 6,200,000 | | | | 5,886,967 | |
Mid-Atlantic Military Family Communities LLC | | | | | | | | |
5.30% due 08/01/504 | | | 5,888,108 | | | | 4,822,831 | |
5.24% due 08/01/504 | | | 1,074,272 | | | | 945,874 | |
Deloitte LLP | | | | | | | | |
7.33% due 11/20/26††† | | | 4,800,000 | | | | 4,913,488 | |
SEE NOTES TO FINANCIAL STATEMENTS. | THE GUGGENHEIM FUNDS ANNUAL REPORT | 53 |
SCHEDULE OF INVESTMENTS (continued) | September 30, 2023 |
TOTAL RETURN BOND FUND | |
| | Face
Amount~ | | | Value | |
Cushman & Wakefield US Borrower LLC | | | | | | | | |
6.75% due 05/15/284 | | | 4,710,000 | | | $ | 4,345,446 | |
Brookfield Finance LLC / Brookfield Finance, Inc. | | | | | | | | |
3.45% due 04/15/50 | | | 6,852,000 | | | | 4,162,199 | |
HS Wildcat LLC | | | | | | | | |
3.83% due 12/31/50††† | | | 4,982,119 | | | | 3,534,394 | |
Commonwealth Bank of Australia | | | | | | | | |
3.61% due 09/12/343,4 | | | 3,550,000 | | | | 2,984,581 | |
Nasdaq, Inc. | | | | | | | | |
5.95% due 08/15/53 | | | 2,880,000 | | | | 2,690,154 | |
Nationstar Mortgage Holdings, Inc. | | | | | | | | |
5.00% due 02/01/264 | | | 2,780,000 | | | | 2,596,788 | |
Enstar Group Ltd. | | | | | | | | |
3.10% due 09/01/31 | | | 1,670,000 | | | | 1,256,783 | |
4.95% due 06/01/29 | | | 1,250,000 | | | | 1,154,320 | |
KKR Group Finance Company III LLC | | | | | | | | |
5.13% due 06/01/444 | | | 2,710,000 | | | | 2,243,369 | |
Goldman Sachs Group, Inc. | | | | | | | | |
3.65% 3,13 | | | 2,450,000 | | | | 1,974,900 | |
Lloyds Banking Group plc | | | | | | | | |
3.51% due 03/18/263 | | | 1,580,000 | | | | 1,515,329 | |
5.87% due 03/06/293 | | | 300,000 | | | | 293,338 | |
American National Group LLC | | | | | | | | |
6.14% due 06/13/324 | | | 2,000,000 | | | | 1,808,480 | |
Brighthouse Financial Global Funding | | | | | | | | |
1.00% due 04/12/244 | | | 1,620,000 | | | | 1,576,503 | |
Bank of Nova Scotia | | | | | | | | |
2.44% due 03/11/24 | | | 1,600,000 | | | | 1,575,520 | |
Danske Bank A/S | | | | | | | | |
0.98% due 09/10/253,4 | | | 1,660,000 | | | | 1,573,458 | |
Jackson National Life Global Funding | | | | | | | | |
1.75% due 01/12/254 | | | 1,650,000 | | | | 1,549,229 | |
ING Groep N.V. | | | | | | | | |
1.73% due 04/01/273 | | | 1,360,000 | | | | 1,216,779 | |
2.73% due 04/01/323 | | | 400,000 | | | | 314,233 | |
Transatlantic Holdings, Inc. | | | | | | | | |
8.00% due 11/30/39 | | | 1,265,000 | | | | 1,479,014 | |
BNP Paribas S.A. | | | | | | | | |
1.32% due 01/13/273,4 | | | 1,640,000 | | | | 1,468,646 | |
Athene Global Funding | | | | | | | | |
2.67% due 06/07/314 | | | 1,550,000 | | | | 1,169,950 | |
2.65% due 10/04/314 | | | 400,000 | | | | 296,170 | |
Ares Finance Company IV LLC | | | | | | | | |
3.65% due 02/01/524 | | | 2,450,000 | | | | 1,460,325 | |
F&G Global Funding | | | | | | | | |
2.30% due 04/11/274 | | | 790,000 | | | | 688,759 | |
2.00% due 09/20/284 | | | 800,000 | | | | 652,167 | |
Iron Mountain Information Management Services, Inc. | | | | | | | | |
5.00% due 07/15/324 | | | 1,617,000 | | | | 1,329,065 | |
Fort Benning Family Communities LLC | | | | | | | | |
6.09% due 01/15/514 | | | 1,565,145 | | | | 1,299,395 | |
Blackstone Holdings Finance Company LLC | | | | | | | | |
3.20% due 01/30/524 | | | 2,150,000 | | | | 1,284,621 | |
Selective Insurance Group, Inc. | | | | | | | | |
5.38% due 03/01/49 | | | 1,510,000 | | | | 1,281,695 | |
Fort Knox Military Housing Privatization Project | | | | | | | | |
5.79% (1 Month Term SOFR + 0.45%) due 02/15/52◊,4 | | | 1,647,194 | | | | 1,248,350 | |
Midwest Family Housing LLC | | | | | | | | |
5.58% due 01/01/514 | | | 1,279,453 | | | | 1,058,030 | |
54 | THE GUGGENHEIM FUNDS ANNUAL REPORT | SEE NOTES TO FINANCIAL STATEMENTS. |
SCHEDULE OF INVESTMENTS (continued) | September 30, 2023 |
TOTAL RETURN BOND FUND | |
| | Face
Amount~ | | | Value | |
Credit Agricole S.A. | | | | | | | | |
6.32% due 10/03/293,4 | | | 1,000,000 | | | $ | 1,000,116 | |
Atlas Mara Ltd. | | | | | | | | |
due 12/31/21†††,10,14 | | | 2,127,812 | | | | 987,305 | |
Jefferies Group, Inc. | | | | | | | | |
6.25% due 01/15/36 | | | 1,000,000 | | | | 982,899 | |
Banco Santander S.A. | | | | | | | | |
2.96% due 03/25/31 | | | 1,200,000 | | | | 954,277 | |
LXP Industrial Trust | | | | | | | | |
2.38% due 10/01/31 | | | 1,300,000 | | | | 952,738 | |
Realty Income Corp. | | | | | | | | |
3.25% due 01/15/31 | | | 1,100,000 | | | | 924,321 | |
Morgan Stanley | | | | | | | | |
2.51% due 10/20/323 | | | 1,200,000 | | | | 917,715 | |
KKR Group Finance Company II LLC | | | | | | | | |
5.50% due 02/01/434 | | | 1,000,000 | | | | 869,303 | |
Atlantic Marine Corporations Communities LLC | | | | | | | | |
5.37% due 12/01/504 | | | 743,458 | | | | 619,887 | |
Wells Fargo & Co. | | | | | | | | |
2.41% due 10/30/253 | | | 600,000 | | | | 574,983 | |
Pacific Beacon LLC | | | | | | | | |
5.51% due 07/15/364 | | | 500,000 | | | | 458,766 | |
Swiss Re Finance Luxembourg S.A. | | | | | | | | |
5.00% due 04/02/493,4 | | | 300,000 | | | | 281,100 | |
Markel Group, Inc. | | | | | | | | |
4.30% due 11/01/47 | | | 350,000 | | | | 257,170 | |
Pine Street Trust I | | | | | | | | |
4.57% due 02/15/294 | | | 250,000 | | | | 224,958 | |
Peachtree Corners Funding Trust | | | | | | | | |
3.98% due 02/15/254 | | | 215,000 | | | | 207,559 | |
Brown & Brown, Inc. | | | | | | | | |
2.38% due 03/15/31 | | | 57,000 | | | | 44,042 | |
Total Financial | | | 2,313,136,813 | |
| | | | | | | | | |
Consumer, Non-cyclical - 2.4% |
CoStar Group, Inc. | | | | | | | | |
2.80% due 07/15/304 | | | 90,310,000 | | | | 72,766,674 | |
Altria Group, Inc. | | | | | | | | |
3.70% due 02/04/51 | | | 45,968,000 | | | | 28,581,770 | |
3.40% due 05/06/30 | | | 33,130,000 | | | | 28,321,708 | |
4.45% due 05/06/50 | | | 6,160,000 | | | | 4,363,493 | |
Global Payments, Inc. | | | | | | | | |
2.90% due 11/15/31 | | | 30,265,000 | | | | 23,742,025 | |
2.90% due 05/15/30 | | | 19,810,000 | | | | 16,240,764 | |
5.30% due 08/15/29 | | | 4,300,000 | | | | 4,100,678 | |
Smithfield Foods, Inc. | | | | | | | | |
2.63% due 09/13/314 | | | 39,050,000 | | | | 27,999,181 | |
3.00% due 10/15/304 | | | 15,473,000 | | | | 11,827,702 | |
5.20% due 04/01/294 | | | 850,000 | | | | 776,366 | |
JBS USA LUX S.A. / JBS USA Food Company / JBS USA Finance, Inc. | | | | | | | | |
3.00% due 05/15/32 | | | 29,206,000 | | | | 22,032,475 | |
4.38% due 02/02/52 | | | 10,200,000 | | | | 6,778,693 | |
5.13% due 02/01/28 | | | 2,250,000 | | | | 2,141,106 | |
Triton Container International Ltd. | | | | | | | | |
3.15% due 06/15/314 | | | 34,821,000 | | | | 26,250,027 | |
BAT Capital Corp. | | | | | | | | |
3.98% due 09/25/50 | | | 41,652,000 | | | | 26,140,885 | |
Royalty Pharma plc | | | | | | | | |
3.55% due 09/02/50 | | | 39,920,000 | | | | 24,399,078 | |
California Institute of Technology | | | | | | | | |
3.65% due 09/01/19 | | | 32,078,000 | | | | 19,638,539 | |
Kimberly-Clark de Mexico SAB de CV | | | | | | | | |
2.43% due 07/01/314 | | | 22,650,000 | | | | 18,474,310 | |
Yale-New Haven Health Services Corp. | | | | | | | | |
2.50% due 07/01/50 | | | 32,350,000 | | | | 17,352,447 | |
Universal Health Services, Inc. | | | | | | | | |
2.65% due 10/15/30 | | | 18,757,000 | | | | 14,619,544 | |
Catalent Pharma Solutions, Inc. | | | | | | | | |
3.50% due 04/01/304 | | | 9,500,000 | | | | 7,821,540 | |
3.13% due 02/15/294 | | | 6,654,000 | | | | 5,457,577 | |
SEE NOTES TO FINANCIAL STATEMENTS. | THE GUGGENHEIM FUNDS ANNUAL REPORT | 55 |
SCHEDULE OF INVESTMENTS (continued) | September 30, 2023 |
TOTAL RETURN BOND FUND | |
| | Face
Amount~ | | | Value | |
JBS USA LUX S.A. / JBS USA Food Company / JBS Luxembourg SARL | | | | | | | | |
6.75% due 03/15/344 | | | 12,550,000 | | | $ | 12,211,024 | |
Transurban Finance Company Pty Ltd. | | | | | | | | |
2.45% due 03/16/314 | | | 14,400,000 | | | | 11,378,189 | |
Prime Security Services Borrower LLC / Prime Finance, Inc. | | | | | | | | |
3.38% due 08/31/274 | | | 12,642,000 | | | | 11,075,623 | |
WW International, Inc. | | | | | | | | |
4.50% due 04/15/294 | | | 12,846,000 | | | | 9,024,315 | |
HCA, Inc. | | | | | | | | |
3.50% due 07/15/51 | | | 6,175,000 | | | | 3,856,215 | |
3.50% due 09/01/30 | | | 1,600,000 | | | | 1,353,641 | |
5.50% due 06/15/47 | | | 1,100,000 | | | | 938,917 | |
OhioHealth Corp. | | | | | | | | |
3.04% due 11/15/50 | | | 9,100,000 | | | | 5,915,630 | |
TriNet Group, Inc. | | | | | | | | |
7.00% due 08/15/314 | | | 5,350,000 | | | | 5,296,500 | |
Children’s Hospital Corp. | | | | | | | | |
2.59% due 02/01/50 | | | 7,100,000 | | | | 4,072,079 | |
Children’s Health System of Texas | | | | | | | | |
2.51% due 08/15/50 | | | 6,500,000 | | | | 3,617,632 | |
APi Group DE, Inc. | | | | | | | | |
4.13% due 07/15/294 | | | 4,150,000 | | | | 3,487,432 | |
Central Garden & Pet Co. | | | | | | | | |
4.13% due 04/30/314 | | | 3,854,000 | | | | 3,142,139 | |
Sotheby’s/Bidfair Holdings, Inc. | | | | | | | | |
5.88% due 06/01/294 | | | 3,900,000 | | | | 3,129,750 | |
Wisconsin Alumni Research Foundation | | | | | | | | |
3.56% due 10/01/49 | | | 3,775,000 | | | | 2,588,615 | |
Providence St. Joseph Health Obligated Group | | | | | | | | |
2.70% due 10/01/51 | | | 4,250,000 | | | | 2,326,365 | |
CPI CG, Inc. | | | | | | | | |
8.63% due 03/15/264 | | | 2,145,000 | | | | 2,113,233 | |
Tenet Healthcare Corp. | | | | | | | | |
4.63% due 06/15/28 | | | 2,096,000 | | | | 1,886,718 | |
Element Fleet Management Corp. | | | | | | | | |
6.27% due 06/26/264 | | | 1,660,000 | | | | 1,654,332 | |
Quanta Services, Inc. | | | | | | | | |
0.95% due 10/01/24 | | | 1,660,000 | | | | 1,570,164 | |
Beth Israel Lahey Health, Inc. | | | | | | | | |
3.08% due 07/01/51 | | | 2,700,000 | | | | 1,555,818 | |
Molina Healthcare, Inc. | | | | | | | | |
4.38% due 06/15/284 | | | 1,290,000 | | | | 1,155,902 | |
UnitedHealth Group, Inc. | | | | | | | | |
3.50% due 02/15/24 | | | 1,000,000 | | | | 991,632 | |
Nestle Holdings, Inc. | | | | | | | | |
0.38% due 01/15/244 | | | 1,000,000 | | | | 984,821 | |
Wyeth LLC | | | | | | | | |
6.45% due 02/01/24 | | | 978,000 | | | | 979,962 | |
IQVIA, Inc. | | | | | | | | |
5.70% due 05/15/284 | | | 1,000,000 | | | | 971,540 | |
Philip Morris International, Inc. | | | | | | | | |
5.13% due 02/15/30 | | | 1,000,000 | | | | 959,042 | |
Triton Container International Limited / TAL International Container Corp. | | | | | | | | |
3.25% due 03/15/32 | | | 1,050,000 | | | | 785,208 | |
DaVita, Inc. | | | | | | | | |
3.75% due 02/15/314 | | | 149,000 | | | | 113,204 | |
4.63% due 06/01/304 | | | 76,000 | | | | 62,405 | |
Total Consumer, Non-cyclical | | | 509,024,629 | |
| | | | | | | | | |
Industrial - 1. 8% |
FLNG Liquefaction 3 LLC | | | | | | | | |
3.08% due 06/30/39††† | | | 63,623,395 | | | | 47,788,974 | |
TD SYNNEX Corp. | | | | | | | | |
2.65% due 08/09/31 | | | 34,240,000 | | | | 25,458,652 | |
2.38% due 08/09/28 | | | 21,781,000 | | | | 17,898,707 | |
Vontier Corp. | | | | | | | | |
2.95% due 04/01/31 | | | 34,492,000 | | | | 26,602,890 | |
2.40% due 04/01/28 | | | 19,150,000 | | | | 15,941,800 | |
56 | THE GUGGENHEIM FUNDS ANNUAL REPORT | SEE NOTES TO FINANCIAL STATEMENTS. |
SCHEDULE OF INVESTMENTS (continued) | September 30, 2023 |
TOTAL RETURN BOND FUND | |
| | Face
Amount~ | | | Value | |
Boeing Co. | | | | | | | | |
5.81% due 05/01/50 | | | 41,090,000 | | | $ | 37,207,703 | |
Flowserve Corp. | | | | | | | | |
3.50% due 10/01/30 | | | 22,421,000 | | | | 18,693,029 | |
2.80% due 01/15/32 | | | 19,800,000 | | | | 15,149,867 | |
Dyal Capital Partners IV | | | | | | | | |
3.65% due 02/22/41††† | | | 41,800,000 | | | | 31,333,654 | |
Cliffwater Corporate Lending Fund | | | | | | | | |
6.77% due 08/04/28††† | | | 22,700,000 | | | | 22,081,635 | |
Owens Corning | | | | | | | | |
3.88% due 06/01/30 | | | 21,890,000 | | | | 19,336,617 | |
7.00% due 12/01/36 | | | 900,000 | | | | 949,891 | |
Stadco LA, LLC | | | | | | | | |
3.75% due 05/15/56††† | | | 31,000,000 | | | | 19,638,515 | |
Weir Group plc | | | | | | | | |
2.20% due 05/13/264 | | | 13,015,000 | | | | 11,695,366 | |
TFI International, Inc. | | | | | | | | |
3.35% due 01/05/33††† | | | 14,000,000 | | | | 10,161,212 | |
Artera Services LLC | | | | | | | | |
9.03% due 12/04/254 | | | 8,490,000 | | | | 7,832,025 | |
HEICO Corp. | | | | | | | | |
5.35% due 08/01/33 | | | 7,550,000 | | | | 7,150,652 | |
Ingersoll Rand, Inc. | | | | | | | | |
5.70% due 08/14/33 | | | 7,200,000 | | | | 6,948,831 | |
Hillenbrand, Inc. | | | | | | | | |
3.75% due 03/01/31 | | | 7,650,000 | | | | 6,120,000 | |
Norfolk Southern Corp. | | | | | | | | |
4.10% due 05/15/21 | | | 9,100,000 | | | | 5,912,015 | |
Fortune Brands Innovations, Inc. | | | | | | | | |
5.88% due 06/01/33 | | | 4,200,000 | | | | 4,044,972 | |
4.50% due 03/25/52 | | | 1,500,000 | | | | 1,104,906 | |
Virgin Media Vendor Financing Notes III DAC | | | | | | | | |
4.88% due 07/15/28 | | GBP | 5,000,000 | | | | 5,063,198 | |
Mueller Water Products, Inc. | | | | | | | | |
4.00% due 06/15/294 | | | 5,216,000 | | | | 4,542,644 | |
Trinity Industries, Inc. | | | | | | | | |
7.75% due 07/15/284 | | | 3,250,000 | | | | 3,270,313 | |
GrafTech Global Enterprises, Inc. | | | | | | | | |
9.88% due 12/15/284 | | | 3,100,000 | | | | 2,937,250 | |
Jabil, Inc. | | | | | | | | |
5.45% due 02/01/29 | | | 1,870,000 | | | | 1,818,480 | |
GATX Corp. | | | | | | | | |
3.50% due 06/01/32 | | | 1,650,000 | | | | 1,345,453 | |
4.70% due 04/01/29 | | | 400,000 | | | | 373,212 | |
Stanley Black & Decker, Inc. | | | | | | | | |
6.00% due 03/06/28 | | | 1,640,000 | | | | 1,652,764 | |
Penske Truck Leasing Company, LP / PTL Finance Corp. | | | | | | | | |
1.70% due 06/15/264 | | | 1,620,000 | | | | 1,436,170 | |
Ryder System, Inc. | | | | | | | | |
5.65% due 03/01/28 | | | 1,000,000 | | | | 989,789 | |
nVent Finance SARL | | | | | | | | |
2.75% due 11/15/31 | | | 1,300,000 | | | | 989,064 | |
Mohawk Industries, Inc. | | | | | | | | |
3.63% due 05/15/30 | | | 1,100,000 | | | | 959,712 | |
Masco Corp. | | | | | | | | |
4.50% due 05/15/47 | | | 1,200,000 | | | | 895,449 | |
Adevinta ASA | | | | | | | | |
3.00% due 11/15/27 | | EUR | 417,000 | | | | 430,044 | |
Virgin Media Inc. | | | | | | | | |
4.00% due 01/31/29 | | GBP | 150,000 | | | | 149,151 | |
Standard Industries, Inc. | | | | | | | | |
4.38% due 07/15/304 | | | 101,000 | | | | 83,648 | |
3.38% due 01/15/314 | | | 81,000 | | | | 62,611 | |
Total Industrial | | | 386,050,865 | |
| | | | | | | | | |
SEE NOTES TO FINANCIAL STATEMENTS. | THE GUGGENHEIM FUNDS ANNUAL REPORT | 57 |
SCHEDULE OF INVESTMENTS (continued) | September 30, 2023 |
TOTAL RETURN BOND FUND | |
| | Face
Amount~ | | | Value | |
Consumer, Cyclical - 1.8% |
Delta Air Lines, Inc. | | | | | | | | |
7.00% due 05/01/254 | | | 46,883,000 | | | $ | 47,391,967 | |
Hyatt Hotels Corp. | | | | | | | | |
5.75% due 04/23/30 | | | 24,039,000 | | | | 23,304,585 | |
5.38% due 04/23/25 | | | 18,928,000 | | | | 18,717,338 | |
1.30% due 10/01/23 | | | 1,660,000 | | | | 1,660,000 | |
Alt-2 Structured Trust | | | | | | | | |
2.95% due 05/14/31◊,††† | | | 49,194,152 | | | | 42,960,742 | |
Choice Hotels International, Inc. | | | | | | | | |
3.70% due 01/15/31 | | | 39,961,000 | | | | 33,278,882 | |
Delta Air Lines Inc. / SkyMiles IP Ltd. | | | | | | | | |
4.50% due 10/20/254 | | | 33,904,000 | | | | 32,930,899 | |
Warnermedia Holdings, Inc. | | | | | | | | |
5.14% due 03/15/52 | | | 27,431,000 | | | | 20,382,343 | |
6.41% due 03/15/26 | | | 9,250,000 | | | | 9,248,452 | |
Mileage Plus Holdings LLC / Mileage Plus Intellectual Property Assets Ltd. | | | | | | | | |
6.50% due 06/20/274 | | | 29,394,357 | | | | 29,123,973 | |
Ferguson Finance plc | | | | | | | | |
3.25% due 06/02/304 | | | 17,904,000 | | | | 15,175,383 | |
4.65% due 04/20/324 | | | 6,300,000 | | | | 5,656,720 | |
British Airways Class A Pass Through Trust | | | | | | | | |
2.90% due 03/15/354 | | | 14,474,290 | | | | 11,983,608 | |
4.25% due 11/15/324 | | | 4,941,269 | | | | 4,428,630 | |
American Airlines Class AA Pass Through Trust | | | | | | | | |
3.35% due 10/15/29 | | | 8,194,683 | | | | 7,296,322 | |
3.20% due 06/15/28 | | | 5,157,800 | | | | 4,639,185 | |
3.00% due 10/15/28 | | | 3,720,053 | | | | 3,328,382 | |
3.15% due 02/15/32 | | | 149,876 | | | | 128,340 | |
Whirlpool Corp. | | | | | | | | |
4.60% due 05/15/505 | | | 16,920,000 | | | | 13,187,758 | |
Walgreens Boots Alliance, Inc. | | | | | | | | |
4.10% due 04/15/50 | | | 15,203,000 | | | | 9,455,156 | |
Air Canada | | | | | | | | |
3.88% due 08/15/264 | | | 8,650,000 | | | | 7,850,378 | |
United Airlines 2023-1 Class A Pass Through Trust | | | | | | | | |
5.80% due 01/15/36 | | | 7,450,000 | | | | 7,242,071 | |
Steelcase, Inc. | | | | | | | | |
5.13% due 01/18/29 | | | 5,001,000 | | | | 4,438,165 | |
Delta Air Lines, Inc. / SkyMiles IP Ltd. | | | | | | | | |
4.75% due 10/20/284 | | | 3,800,000 | | | | 3,611,303 | |
LKQ Corp. | | | | | | | | |
6.25% due 06/15/334 | | | 2,875,000 | | | | 2,779,960 | |
JB Poindexter & Company, Inc. | | | | | | | | |
7.13% due 04/15/264 | | | 2,850,000 | | | | 2,772,549 | |
Beacon Roofing Supply, Inc. | | | | | | | | |
6.50% due 08/01/304 | | | 1,925,000 | | | | 1,865,537 | |
United Airlines, Inc. | | | | | | | | |
4.38% due 04/15/264 | | | 1,750,000 | | | | 1,618,384 | |
PulteGroup, Inc. | | | | | | | | |
6.38% due 05/15/33 | | | 1,400,000 | | | | 1,406,604 | |
Brunswick Corp. | | | | | | | | |
5.10% due 04/01/52 | | | 2,030,000 | | | | 1,395,791 | |
NVR, Inc. | | | | | | | | |
3.00% due 05/15/30 | | | 1,200,000 | | | | 999,760 | |
Mattel, Inc. | | | | | | | | |
3.75% due 04/01/294 | | | 1,100,000 | | | | 957,477 | |
JetBlue Class A Pass Through Trust | | | | | | | | |
4.00% due 11/15/32 | | | 125,461 | | | | 112,893 | |
Total Consumer, Cyclical | | | 371,329,537 | |
| | | | | | | | | |
Communications - 1.3% |
Level 3 Financing, Inc. | | | | | | | | |
3.63% due 01/15/294 | | | 34,939,000 | | | | 19,565,840 | |
3.88% due 11/15/294 | | | 20,300,000 | | | | 18,702,422 | |
4.25% due 07/01/284 | | | 26,815,000 | | | | 16,706,638 | |
3.75% due 07/15/294 | | | 13,950,000 | | | | 7,797,382 | |
British Telecommunications plc | | | | | | | | |
4.88% due 11/23/813,4 | | | 47,450,000 | | | | 38,065,510 | |
58 | THE GUGGENHEIM FUNDS ANNUAL REPORT | SEE NOTES TO FINANCIAL STATEMENTS. |
SCHEDULE OF INVESTMENTS (continued) | September 30, 2023 |
TOTAL RETURN BOND FUND | |
| | Face
Amount~ | | | Value | |
4.25% due 11/23/813,4 | | | 8,250,000 | | | $ | 7,231,282 | |
9.63% due 12/15/30 | | | 2,391,000 | | | | 2,816,205 | |
Vodafone Group plc | | | | | | | | |
4.13% due 06/04/813 | | | 40,537,000 | | | | 31,299,830 | |
Paramount Global | | | | | | | | |
4.95% due 05/19/50 | | | 39,826,000 | | | | 26,976,100 | |
Rogers Communications, Inc. | | | | | | | | |
4.55% due 03/15/52 | | | 29,725,000 | | | | 21,682,028 | |
Virgin Media Secured Finance plc | | | | | | | | |
4.50% due 08/15/304 | | | 17,850,000 | | | | 14,745,876 | |
Altice France S.A. | | | | | | | | |
5.13% due 07/15/294 | | | 17,800,000 | | | | 12,654,123 | |
5.13% due 01/15/294 | | | 2,290,000 | | | | 1,628,250 | |
Charter Communications Operating LLC / Charter Communications Operating Capital | | | | | | | | |
3.90% due 06/01/52 | | | 21,690,000 | | | | 12,967,993 | |
Sirius XM Radio, Inc. | | | | | | | | |
4.13% due 07/01/304 | | | 12,010,000 | | | | 9,615,326 | |
Go Daddy Operating Company LLC / GD Finance Co., Inc. | | | | | | | | |
3.50% due 03/01/294 | | | 8,203,000 | | | | 6,901,618 | |
Virgin Media Vendor Financing Notes IV DAC | | | | | | | | |
5.00% due 07/15/284 | | | 5,100,000 | | | | 4,400,893 | |
Radiate Holdco LLC / Radiate Finance, Inc. | | | | | | | | |
4.50% due 09/15/264 | | | 5,775,000 | | | | 4,387,066 | |
CSC Holdings LLC | | | | | | | | |
4.13% due 12/01/304 | | | 5,772,000 | | | | 4,084,926 | |
Interpublic Group of Companies, Inc. | | | | | | | | |
3.38% due 03/01/41 | | | 1,950,000 | | | | 1,289,683 | |
2.40% due 03/01/31 | | | 350,000 | | | | 274,667 | |
McGraw-Hill Education, Inc. | | | | | | | | |
5.75% due 08/01/284 | | | 1,549,000 | | | | 1,336,400 | |
Koninklijke KPN N.V. | | | | | | | | |
8.38% due 10/01/30 | | | 1,140,000 | | | | 1,273,830 | |
Match Group Holdings II LLC | | | | | | | | |
4.13% due 08/01/304 | | | 1,250,000 | | | | 1,031,450 | |
Virgin Media Finance plc | | | | | | | | |
5.00% due 07/15/304 | | | 1,050,000 | | | | 825,330 | |
Motorola Solutions, Inc. | | | | | | | | |
5.50% due 09/01/44 | | | 360,000 | | | | 315,590 | |
UPC Broadband Finco BV | | | | | | | | |
4.88% due 07/15/314 | | | 200,000 | | | | 162,296 | |
CCO Holdings LLC / CCO Holdings Capital Corp. | | | | | | | | |
4.25% due 02/01/314 | | | 20,000 | | | | 15,921 | |
Total Communications | | | 268,754,475 | |
| | | | | | | | | |
Energy - 1.2% |
BP Capital Markets plc | | | | | | | | |
4.88% 3,13 | | | 109,924,000 | | | | 98,208,674 | |
ITT Holdings LLC | | | | | | | | |
6.50% due 08/01/294 | | | 38,518,000 | | | | 32,648,770 | |
Galaxy Pipeline Assets Bidco Ltd. | | | | | | | | |
3.25% due 09/30/404 | | | 43,921,000 | | | | 31,957,195 | |
Midwest Connector Capital Company LLC | | | | | | | | |
4.63% due 04/01/294 | | | 16,048,000 | | | | 14,667,545 | |
TransCanada PipeLines Ltd. | | | | | | | | |
6.20% due 03/09/26 | | | 10,900,000 | | | | 10,882,090 | |
4.88% due 05/15/48 | | | 1,200,000 | | | | 966,717 | |
NuStar Logistics, LP | | | | | | | | |
6.38% due 10/01/30 | | | 10,560,000 | | | | 10,003,066 | |
5.63% due 04/28/27 | | | 1,880,000 | | | | 1,791,132 | |
ONEOK, Inc. | | | | | | | | |
6.05% due 09/01/33 | | | 11,350,000 | | | | 11,150,589 | |
4.50% due 03/15/50 | | | 850,000 | | | | 616,341 | |
SEE NOTES TO FINANCIAL STATEMENTS. | THE GUGGENHEIM FUNDS ANNUAL REPORT | 59 |
SCHEDULE OF INVESTMENTS (continued) | September 30, 2023 |
TOTAL RETURN BOND FUND | |
| | Face
Amount~ | | | Value | |
Parkland Corp. | | | | | | | | |
4.63% due 05/01/304 | | | 8,000,000 | | | $ | 6,819,835 | |
Greensaif Pipelines Bidco SARL | | | | | | | | |
6.51% due 02/23/424 | | | 6,500,000 | | | | 6,372,811 | |
Greensaif Pipelines Bidco SARL | | | | | | | | |
6.13% due 02/23/384 | | | 5,550,000 | | | | 5,415,690 | |
Kinder Morgan, Inc. | | | | | | | | |
5.20% due 06/01/33 | | | 4,700,000 | | | | 4,347,141 | |
DT Midstream, Inc. | | | | | | | | |
4.30% due 04/15/324 | | | 3,250,000 | | | | 2,761,850 | |
4.13% due 06/15/294 | | | 550,000 | | | | 475,773 | |
Magellan Midstream Partners, LP | | | | | | | | |
3.95% due 03/01/50 | | | 1,600,000 | | | | 1,070,917 | |
5.15% due 10/15/43 | | | 1,100,000 | | | | 890,255 | |
Marathon Petroleum Corp. | | | | | | | | |
6.50% due 03/01/41 | | | 1,650,000 | | | | 1,632,192 | |
Valero Energy Corp. | | | | | | | | |
7.50% due 04/15/32 | | | 1,350,000 | | | | 1,469,573 | |
Enterprise Products Operating LLC | | | | | | | | |
5.10% due 02/15/45 | | | 1,340,000 | | | | 1,185,672 | |
Enbridge Energy Partners, LP | | | | | | | | |
7.38% due 10/15/45 | | | 1,040,000 | | | | 1,108,479 | |
Phillips 66 Co. | | | | | | | | |
4.90% due 10/01/46 | | | 1,200,000 | | | | 995,652 | |
Targa Resources Corp. | | | | | | | | |
6.50% due 02/15/53 | | | 1,000,000 | | | | 954,379 | |
MPLX, LP | | | | | | | | |
5.50% due 02/15/49 | | | 1,100,000 | | | | 931,007 | |
Eastern Gas Transmission & Storage, Inc. | | | | | | | | |
4.60% due 12/15/44 | | | 500,000 | | | | 385,328 | |
Total Energy | | | 249,708,673 | |
| | | | | | | | | |
Technology - 1.1% |
Broadcom, Inc. | | | | | | | | |
4.93% due 05/15/374 | | | 33,182,000 | | | | 28,600,456 | |
4.15% due 11/15/30 | | | 19,705,000 | | | | 17,453,359 | |
3.19% due 11/15/364 | | | 3,135,000 | | | | 2,250,893 | |
2.60% due 02/15/334 | | | 1,660,000 | | | | 1,237,836 | |
Oracle Corp. | | | | | | | | |
3.95% due 03/25/51 | | | 33,794,000 | | | | 23,167,312 | |
5.55% due 02/06/53 | | | 20,220,000 | | | | 17,716,025 | |
6.13% due 07/08/39 | | | 1,190,000 | | | | 1,149,641 | |
6.90% due 11/09/52 | | | 300,000 | | | | 309,039 | |
CDW LLC / CDW Finance Corp. | | | | | | | | |
3.57% due 12/01/31 | | | 42,361,000 | | | | 34,890,214 | |
3.25% due 02/15/29 | | | 1,100,000 | | | | 937,959 | |
Leidos, Inc. | | | | | | | | |
2.30% due 02/15/31 | | | 20,050,000 | | | | 15,419,010 | |
5.75% due 03/15/33 | | | 9,550,000 | | | | 9,152,342 | |
4.38% due 05/15/30 | | | 2,650,000 | | | | 2,372,317 | |
Qorvo, Inc. | | | | | | | | |
4.38% due 10/15/29 | | | 14,751,000 | | | | 12,972,574 | |
3.38% due 04/01/314 | | | 8,675,000 | | | | 6,871,173 | |
MSCI, Inc. | | | | | | | | |
3.63% due 09/01/304 | | | 17,718,000 | | | | 14,850,186 | |
3.88% due 02/15/314 | | | 1,769,000 | | | | 1,498,706 | |
3.63% due 11/01/314 | | | 1,780,000 | | | | 1,456,176 | |
Booz Allen Hamilton, Inc. | | | | | | | | |
5.95% due 08/04/33 | | | 10,470,000 | | | | 10,214,532 | |
3.88% due 09/01/284 | | | 4,550,000 | | | | 4,076,345 | |
Fiserv, Inc. | | | | | | | | |
5.60% due 03/02/33 | | | 10,250,000 | | | | 9,934,141 | |
5.63% due 08/21/33 | | | 2,300,000 | | | | 2,228,571 | |
CGI, Inc. | | | | | | | | |
2.30% due 09/14/31 | | | 16,050,000 | | | | 12,046,795 | |
Foundry JV Holdco LLC | | | | | | | | |
5.88% due 01/25/344 | | | 5,950,000 | | | | 5,683,751 | |
Microchip Technology, Inc. | | | | | | | | |
0.97% due 02/15/24 | | | 1,650,000 | | | | 1,619,648 | |
Broadridge Financial Solutions, Inc. | | | | | | | | |
2.90% due 12/01/29 | | | 1,200,000 | | | | 1,014,592 | |
NXP BV / NXP Funding LLC / NXP USA, Inc. | | | | | | | | |
3.13% due 02/15/42 | | | 1,400,000 | | | | 911,576 | |
Total Technology | | | 240,035,169 | |
| | | | | | | | | |
60 | THE GUGGENHEIM FUNDS ANNUAL REPORT | SEE NOTES TO FINANCIAL STATEMENTS. |
SCHEDULE OF INVESTMENTS (continued) | September 30, 2023 |
TOTAL RETURN BOND FUND | |
| | Face
Amount~ | | | Value | |
Basic Materials - 0.8% |
Anglo American Capital plc | | | | | | | | |
5.63% due 04/01/304 | | | 21,300,000 | | | $ | 20,570,998 | |
2.63% due 09/10/304 | | | 18,000,000 | | | | 14,379,112 | |
3.95% due 09/10/504 | | | 14,140,000 | | | | 9,610,687 | |
Newcrest Finance Pty Ltd. | | | | | | | | |
3.25% due 05/13/304 | | | 22,451,000 | | | | 19,088,559 | |
4.20% due 05/13/504 | | | 1,300,000 | | | | 949,205 | |
International Flavors & Fragrances, Inc. | | | | | | | | |
1.23% due 10/01/254 | | | 21,520,000 | | | | 19,290,489 | |
Minerals Technologies, Inc. | | | | | | | | |
5.00% due 07/01/284 | | | 18,723,000 | | | | 17,172,736 | |
Alcoa Nederland Holding BV | | | | | | | | |
4.13% due 03/31/294 | | | 8,600,000 | | | | 7,609,400 | |
5.50% due 12/15/274 | | | 6,525,000 | | | | 6,198,058 | |
6.13% due 05/15/284 | | | 2,800,000 | | | | 2,696,069 | |
Valvoline, Inc. | | | | | | | | |
3.63% due 06/15/314 | | | 18,300,000 | | | | 14,177,980 | |
Yamana Gold, Inc. | | | | | | | | |
2.63% due 08/15/31 | | | 14,431,000 | | | | 11,073,180 | |
4.63% due 12/15/27 | | | 3,000,000 | | | | 2,814,322 | |
INEOS Quattro Finance 2 plc | | | | | | | | |
2.50% due 01/15/26 | | EUR | 8,500,000 | | | | 8,166,274 | |
3.38% due 01/15/264 | | | 200,000 | | | | 182,189 | |
Steel Dynamics, Inc. | | | | | | | | |
2.40% due 06/15/25 | | | 5,950,000 | | | | 5,590,238 | |
Southern Copper Corp. | | | | | | | | |
7.50% due 07/27/35 | | | 1,250,000 | | | | 1,375,021 | |
Albemarle Corp. | | | | | | | | |
5.45% due 12/01/44 | | | 1,500,000 | | | | 1,290,133 | |
LYB International Finance BV | | | | | | | | |
4.88% due 03/15/44 | | | 1,100,000 | | | | 883,037 | |
Dow Chemical Co. | | | | | | | | |
6.90% due 05/15/53 | | | 800,000 | | | | 840,243 | |
Carpenter Technology Corp. | | | | | | | | |
6.38% due 07/15/28 | | | 178,000 | | | | 171,675 | |
Total Basic Materials | | | 164,129,605 | |
| | | | | | | | | |
Utilities - 0.5% |
AES Corp. | | | | | | | | |
3.95% due 07/15/304 | | | 28,124,000 | | | | 24,240,638 | |
3.30% due 07/15/254 | | | 3,750,000 | | | | 3,551,911 | |
NRG Energy, Inc. | | | | | | | | |
2.45% due 12/02/274 | | | 26,000,000 | | | | 22,039,337 | |
Alexander Funding Trust | | | | | | | | |
1.84% due 11/15/234 | | | 14,400,000 | | | | 14,304,802 | |
Enel Finance International N.V. | | | | | | | | |
5.00% due 06/15/324 | | | 13,690,000 | | | | 12,385,042 | |
Brooklyn Union Gas Co. | | | | | | | | |
6.39% due 09/15/334 | | | 10,800,000 | | | | 10,593,805 | |
4.27% due 03/15/484 | | | 1,300,000 | | | | 902,820 | |
Black Hills Corp. | | | | | | | | |
5.95% due 03/15/28 | | | 9,200,000 | | | | 9,196,692 | |
4.20% due 09/15/46 | | | 1,200,000 | | | | 860,276 | |
Alexander Funding Trust II | | | | | | | | |
7.47% due 07/31/284 | | | 6,560,000 | | | | 6,568,593 | |
Entergy Texas, Inc. | | | | | | | | |
1.50% due 09/01/26 | | | 1,650,000 | | | | 1,434,093 | |
Indiana Michigan Power Co. | | | | | | | | |
6.05% due 03/15/37 | | | 1,310,000 | | | | 1,289,508 | |
Nevada Power Co. | | | | | | | | |
6.65% due 04/01/36 | | | 1,180,000 | | | | 1,209,683 | |
Southern Power Co. | | | | | | | | |
5.25% due 07/15/43 | | | 1,350,000 | | | | 1,135,124 | |
Consolidated Edison Company of New York, Inc. | | | | | | | | |
5.10% due 06/15/33 | | | 1,080,000 | | | | 1,001,903 | |
Tampa Electric Co. | | | | | | | | |
4.45% due 06/15/49 | | | 1,200,000 | | | | 934,118 | |
Duke Energy Ohio, Inc. | | | | | | | | |
4.30% due 02/01/49 | | | 1,200,000 | | | | 923,944 | |
Washington Gas Light Co. | | | | | | | | |
3.80% due 09/15/46 | | | 1,300,000 | | | | 895,130 | |
Arizona Public Service Co. | | | | | | | | |
3.75% due 05/15/46 | | | 1,300,000 | | | | 887,456 | |
SEE NOTES TO FINANCIAL STATEMENTS. | THE GUGGENHEIM FUNDS ANNUAL REPORT | 61 |
SCHEDULE OF INVESTMENTS (continued) | September 30, 2023 |
TOTAL RETURN BOND FUND | |
| | Face
Amount~ | | | Value | |
Louisville Gas and Electric Co. | | | | | | | | |
4.25% due 04/01/49 | | | 1,100,000 | | | $ | 840,363 | |
Total Utilities | | | 115,195,238 | |
| | | | | | | | | |
Total Corporate Bonds |
(Cost $5,745,652,764) | | | 4,617,365,004 | |
| | | | | | | | | |
SENIOR FLOATING RATE INTERESTS††,◊ - 2.9% |
Consumer, Cyclical - 0.8% |
MB2 Dental Solutions LLC | | | | | | | | |
11.42% (1 Month Term SOFR + 6.00%, Rate Floor: 7.00%) due 01/29/27††† | | | 73,267,611 | | | | 72,426,513 | |
Zephyr Bidco Ltd. | | | | | | | | |
9.97% (1 Month GBP SONIA + 4.75%, Rate Floor: 4.75%) due 07/23/25 | | GBP | 23,950,000 | | | | 28,794,116 | |
First Brands Group LLC | | | | | | | | |
10.88% (6 Month Term SOFR + 5.00%, Rate Floor: 6.00%) due 03/30/27 | | | 14,737,877 | | | | 14,526,094 | |
Pacific Bells LLC | | | | | | | | |
10.15% (3 Month Term SOFR + 4.50%, Rate Floor: 5.00%) due 11/10/28 | | | 13,930,934 | | | | 13,735,065 | |
BCP V Modular Services Holdings IV Ltd. | | | | | | | | |
8.40% (3 Month EURIBOR + 4.43%, Rate Floor: 4.43%) due 12/15/28 | | EUR | 11,600,000 | | | | 11,495,248 | |
Packers Holdings LLC | | | | | | | | |
8.67% (1 Month Term SOFR + 3.25%, Rate Floor: 3.25%) due 03/09/28 | | | 14,544,396 | | | | 8,581,193 | |
Adevinta ASA | | | | | | | | |
6.47% (3 Month EURIBOR + 2.50%, Rate Floor: 2.50%) due 06/26/28 | | EUR | 7,761,111 | | | | 8,197,463 | |
Flamingo | | | | | | | | |
7.46% (3 Month EURIBOR + 3.50%, Rate Floor: 3.50%) due 03/27/28 | | EUR | 7,554,688 | | | | 7,454,273 | |
New Trojan Parent, Inc. | | | | | | | | |
8.69% (1 Month Term SOFR + 3.25%, Rate Floor: 3.25%) due 01/06/28 | | | 13,733,875 | | | | 7,164,551 | |
Rent-A-Center, Inc. | | | | | | | | |
8.88% (3 Month Term SOFR + 3.25%, Rate Floor: 3.25%) due 02/17/28 | | | 463,670 | | | | 461,787 | |
WW International, Inc. | | | | | | | | |
8.93% (1 Month Term SOFR + 3.50%, Rate Floor: 3.50%) due 04/13/28 | | | 200,000 | | | | 150,334 | |
Total Consumer, Cyclical | | | 172,986,637 | |
| | | | | | | | | |
62 | THE GUGGENHEIM FUNDS ANNUAL REPORT | SEE NOTES TO FINANCIAL STATEMENTS. |
SCHEDULE OF INVESTMENTS (continued) | September 30, 2023 |
TOTAL RETURN BOND FUND | |
| | Face
Amount~ | | | Value | |
Consumer, Non-cyclical - 0.7% |
Quirch Foods Holdings LLC | | | | | | | | |
10.45% (3 Month Term SOFR + 4.75%, Rate Floor: 5.75%) due 10/27/27 | | | 28,670,562 | | | $ | 28,509,433 | |
PetIQ LLC | | | | | | | | |
9.84% (3 Month Term SOFR + 4.25%, Rate Floor: 4.25%) due 04/13/28††† | | | 27,696,519 | | | | 27,142,588 | |
Mission Veterinary Partners | | | | | | | | |
9.43% (1 Month Term SOFR + 4.00%, Rate Floor: 4.00%) due 04/27/28 | | | 18,914,000 | | | | 18,701,218 | |
Southern Veterinary Partners LLC | | | | | | | | |
9.43% (1 Month Term SOFR + 4.00%, Rate Floor: 4.00%) due 10/05/27 | | | 15,682,003 | | | | 15,569,249 | |
Women’s Care Holdings, Inc. | | | | | | | | |
10.05% (6 Month Term SOFR + 4.50%, Rate Floor: 4.50%) due 01/17/28 | | | 15,715,715 | | | | 13,908,408 | |
Sigma Holding BV (Flora Food) | | | | | | | | |
7.41% (6 Month EURIBOR + 3.50%, Rate Floor: 3.50%) due 07/02/25 | | EUR | 12,800,882 | | | | 13,482,278 | |
Nidda Healthcare Holding GmbH | | | | | | | | |
7.31% (3 Month EURIBOR + 3.50%, Rate Floor: 3.50%) due 08/21/26 | | EUR | 12,766,306 | | | | 13,379,985 | |
Blue Ribbon LLC | | | | | | | | |
11.44% (1 Month Term SOFR + 6.00%, Rate Floor: 6.00%) due 05/08/28 | | | 13,365,000 | | | | 11,226,600 | |
Confluent Health LLC | | | | | | | | |
9.43% (1 Month Term SOFR + 4.00%, Rate Floor: 4.00%) due 11/30/28 | | | 9,219,343 | | | | 8,742,979 | |
HAH Group Holding Co. LLC | | | | | | | | |
10.42% (1 Month Term SOFR + 5.00%, Rate Floor: 5.00%) due 10/29/27 | | | 4,488,738 | | | | 4,425,133 | |
Elanco Animal Health, Inc. | | | | | | | | |
7.18% (1 Month Term SOFR + 1.75%, Rate Floor: 1.75%) due 08/02/27 | | | 1,706,118 | | | | 1,671,757 | |
Total Consumer, Non-cyclical | | | 156,759,628 | |
| | | | | | | | | |
Technology - 0.4% |
Datix Bidco Ltd. | | | | | | | | |
8.68% (6 Month GBP SONIA + 4.50%, Rate Floor: 4.50%) due 04/28/25††† | | GBP | 45,800,000 | | | | 54,833,268 | |
SEE NOTES TO FINANCIAL STATEMENTS. | THE GUGGENHEIM FUNDS ANNUAL REPORT | 63 |
SCHEDULE OF INVESTMENTS (continued) | September 30, 2023 |
TOTAL RETURN BOND FUND | |
| | Face
Amount~ | | | Value | |
RLDatix | | | | | | | | |
9.53% (6 Month Term SOFR + 4.50%, Rate Floor: 4.50%) due 04/28/25††† | | | 19,781,561 | | | $ | 19,411,645 | |
Team.Blue Finco SARL | | | | | | | | |
7.06% (1 Month EURIBOR + 3.20%, Rate Floor: 3.20%) due 03/30/28 | | EUR | 6,542,484 | | | | 6,738,267 | |
Aston FinCo SARL | | | | | | | | |
9.96% (1 Month GBP SONIA + 4.75%, Rate Floor: 4.75%) due 10/09/26 | | GBP | 5,670,008 | | | | 5,862,734 | |
9.68% (1 Month Term SOFR + 4.25%, Rate Floor: 4.25%) due 10/09/26 | | | 743,571 | | | | 639,471 | |
Emerald TopCo, Inc. (Press Ganey) | | | | | | | | |
9.18% (3 Month Term SOFR + 3.50%, Rate Floor: 3.50%) due 07/24/26 | | | 456,875 | | | | 438,715 | |
Total Technology | | | 87,924,100 | |
| | | | | | | | | |
Industrial - 0.4% |
United Airlines, Inc. | | | | | | | | |
9.18% (1 Month Term SOFR + 3.75%, Rate Floor: 3.75%) due 04/21/28 | | | 31,894,439 | | | | 31,901,774 | |
Mileage Plus Holdings LLC | | | | | | | | |
10.80% (3 Month Term SOFR + 5.25%, Rate Floor: 5.25%) due 06/21/27 | | | 23,269,024 | | | | 24,144,172 | |
CapStone Acquisition Holdings, Inc. | | | | | | | | |
10.17% (1 Month Term SOFR + 4.75%, Rate Floor: 4.75%) due 11/12/27††† | | | 8,552,520 | | | | 8,354,948 | |
Air Canada | | | | | | | | |
9.13% (3 Month Term SOFR + 3.50%, Rate Floor: 3.50%) due 08/11/28 | | | 4,353,008 | | | | 4,352,094 | |
Dispatch Terra Acquisition LLC | | | | | | | | |
9.79% (3 Month Term SOFR + 4.25%, Rate Floor: 4.25%) due 03/27/28 | | | 3,806,040 | | | | 3,501,556 | |
Merlin Buyer, Inc. | | | | | | | | |
9.32% (1 Month Term SOFR + 4.00%, Rate Floor: 4.00%) due 12/14/28 | | | 617,480 | | | | 604,747 | |
API Heat Transfer | | | | | | | | |
16.65% (1 Month Term SOFR, Rate Floor 0.00%) (in-kind rate was 16.65%) due 01/01/24†††,15 | | | 64,580 | | | | 59,235 | |
16.43% (1 Month Term SOFR, Rate Floor 0.00%) (in-kind rate was 16.43%) due 10/31/23†††,15 | | | 11,522 | | | | 11,522 | |
Total Industrial | | | 72,930,048 | |
| | | | | | | | | |
64 | THE GUGGENHEIM FUNDS ANNUAL REPORT | SEE NOTES TO FINANCIAL STATEMENTS. |
SCHEDULE OF INVESTMENTS (continued) | September 30, 2023 |
TOTAL RETURN BOND FUND | |
| | Face
Amount~ | | | Value | |
Financial - 0.4% |
Higginbotham Insurance Agency, Inc. | | | | | | | | |
10.92% (1 Month Term SOFR + 5.35%, Rate Floor: 5.35%) due 11/24/28††† | | | 23,626,880 | | | $ | 23,395,764 | |
10.92% (1 Month Term SOFR + 5.35%, Rate Floor: 5.35%) due 11/25/26††† | | | 11,262,629 | | | | 11,152,459 | |
Jane Street Group LLC | | | | | | | | |
8.18% (1 Month Term SOFR + 2.75%, Rate Floor: 2.75%) due 01/26/28 | | | 15,617,889 | | | | 15,559,321 | |
Citadel Securities, LP | | | | | | | | |
7.93% (1 Month Term SOFR + 2.50%, Rate Floor: 2.50%) due 07/29/30 | | | 14,101,089 | | | | 14,057,094 | |
HighTower Holding LLC | | | | | | | | |
9.61% (3 Month Term SOFR + 4.00%, Rate Floor: 4.00%) due 04/21/28 | | | 8,438,206 | | | | 8,417,111 | |
Total Financial | | | 72,581,749 | |
| | | | | | | | | |
Basic Materials - 0.2% |
INEOS Ltd. | | | | | | | | |
6.61% (1 Month EURIBOR + 2.75%, Rate Floor: 2.75%) due 01/29/26 | | EUR | 31,100,000 | | | | 32,351,300 | |
Trinseo Materials Operating S.C.A. | | | | | | | | |
7.93% (1 Month Term SOFR + 2.50%, Rate Floor: 2.50%) due 05/03/28 | | | 10,850,250 | | | | 9,080,900 | |
Arsenal AIC Parent LLC | | | | | | | | |
9.88% (3 Month Term SOFR + 4.50%, Rate Floor: 4.50%) due 08/19/30 | | | 1,000,000 | | | | 997,080 | |
Total Basic Materials | | | 42,429,280 | |
| | | | | | | | | |
Communications - 0.0% |
Xplornet Communications, Inc. | | | | | | | | |
9.65% (3 Month Term SOFR + 4.00%, Rate Floor: 4.00%) due 10/02/28 | | | 5,966,937 | | | | 4,660,178 | |
Radiate Holdco LLC | | | | | | | | |
8.68% (1 Month Term SOFR + 3.25%, Rate Floor: 3.25%) due 09/25/26 | | | 2,422,592 | | | | 1,975,817 | |
Zayo Group Holdings, Inc. | | | | | | | | |
8.43% (1 Month Term SOFR + 3.00%, Rate Floor: 3.00%) due 03/09/27 | | | 1,652,094 | | | | 1,345,317 | |
Total Communications | | | 7,981,312 | |
| | | | | | | | | |
SEE NOTES TO FINANCIAL STATEMENTS. | THE GUGGENHEIM FUNDS ANNUAL REPORT | 65 |
SCHEDULE OF INVESTMENTS (continued) | September 30, 2023 |
TOTAL RETURN BOND FUND | |
| | Face
Amount~ | | | Value | |
Energy - 0.0% |
Venture Global Calcasieu Pass LLC | | | | | | | | |
8.04% (1 Month Term SOFR + 2.63%, Rate Floor: 2.63%) due 08/19/26 | | | 6,371,023 | | | $ | 6,312,600 | |
Total Senior Floating Rate Interests |
(Cost $666,810,837) | | | 619,905,354 | |
| | | | | | | | | |
FEDERAL AGENCY BONDS†† - 0.9% |
Tennessee Valley Authority |
4.25% due 09/15/65 | | | 138,205,000 | | | | 110,219,455 | |
4.63% due 09/15/60 | | | 42,436,000 | | | | 36,836,697 | |
5.38% due 04/01/56 | | | 9,283,000 | | | | 9,192,611 | |
due 09/15/538,11 | | | 1,612,000 | | | | 301,228 | |
due 09/15/558,11 | | | 1,612,000 | | | | 268,475 | |
due 09/15/568,11 | | | 1,612,000 | | | | 253,829 | |
due 03/15/578,11 | | | 1,612,000 | | | | 246,809 | |
due 09/15/578,11 | | | 1,612,000 | | | | 239,982 | |
due 09/15/588,11 | | | 1,612,000 | | | | 226,120 | |
due 03/15/598,11 | | | 1,612,000 | | | | 219,856 | |
due 09/15/598,11 | | | 1,612,000 | | | | 213,764 | |
due 09/15/608,11 | | | 1,612,000 | | | | 202,082 | |
due 09/15/548,11 | | | 1,020,000 | | | | 179,681 | |
due 03/15/618,11 | | | 1,020,000 | | | | 124,326 | |
due 09/15/618,11 | | | 1,020,000 | | | | 120,881 | |
due 09/15/628,11 | | | 1,020,000 | | | | 113,843 | |
due 03/15/638,11 | | | 1,020,000 | | | | 110,684 | |
due 09/15/638,11 | | | 1,020,000 | | | | 107,612 | |
due 09/15/648,11 | | | 1,020,000 | | | | 101,722 | |
due 03/15/658,11 | | | 1,020,000 | | | | 98,899 | |
due 09/15/658,11 | | | 1,020,000 | | | | 96,547 | |
Tennessee Valley Authority Principal Strips |
due 01/15/487,11 | | | 38,804,000 | | | | 9,959,163 | |
due 12/15/427,11 | | | 23,785,000 | | | | 8,129,998 | |
due 01/15/387,11 | | | 15,800,000 | | | | 7,268,932 | |
due 09/15/657,11 | | | 3,500,000 | | | | 331,289 | |
due 09/15/397,11 | | | 570,000 | | | | 235,470 | |
due 04/01/567,11 | | | 540,000 | | | | 87,231 | |
Federal Farm Credit Bank |
3.00% due 03/08/32 | | | 4,100,000 | | | | 3,469,523 | |
2.04% due 12/22/45 | | | 2,870,000 | | | | 1,553,178 | |
3.11% due 08/05/48 | | | 1,500,000 | | | | 1,011,405 | |
2.43% due 01/29/37 | | | 720,000 | | | | 529,778 | |
2.90% due 12/09/41 | | | 720,000 | | | | 493,146 | |
2.84% due 06/01/46 | | | 720,000 | | | | 456,626 | |
1.99% due 07/30/40 | | | 300,000 | | | | 182,382 | |
2.60% due 09/06/39 | | | 250,000 | | | | 170,642 | |
2.59% due 12/30/41 | | | 180,000 | | | | 116,704 | |
2.74% due 11/01/39 | | | 144,000 | | | | 100,291 | |
2.59% due 08/24/46 | | | 140,000 | | | | 84,823 | |
3.67% due 02/26/44 | | | 70,000 | | | | 54,100 | |
Freddie Mac |
2.05% due 08/19/50 | | | 2,010,000 | | | | 1,027,588 | |
2.02% due 10/05/45 | | | 720,000 | | | | 386,708 | |
2.25% due 09/15/50 | | | 360,000 | | | | 192,802 | |
Federal Home Loan Bank |
6.15% due 07/12/33 | | | 650,000 | | | | 647,378 | |
2.45% due 08/16/41 | | | 540,000 | | | | 344,879 | |
3.63% due 06/22/43 | | | 350,000 | | | | 270,432 | |
Total Federal Agency Bonds |
(Cost $327,540,643) | | | | | | | 196,579,571 | |
| | | | | | | | | |
MUNICIPAL BONDS†† - 0.5% |
California - 0.2% |
California Statewide Communities Development Authority Revenue Bonds | | | | | | | | |
7.14% due 08/15/47 | | | 10,500,000 | | | | 11,004,734 | |
California Public Finance Authority Revenue Bonds | | | | | | | | |
3.07% due 10/15/40 | | | 8,000,000 | | | | 5,487,865 | |
2.55% due 01/01/40 | | | 3,600,000 | | | | 2,388,047 | |
Oakland Unified School District/Alameda County General Obligation Unlimited | | | | | | | | |
2.87% due 08/01/35 | | | 7,405,000 | | | | 5,634,293 | |
San Mateo Foster City School District General Obligation Unlimited | | | | | | | | |
3.06% due 08/01/44 | | | 6,125,000 | | | | 4,167,519 | |
66 | THE GUGGENHEIM FUNDS ANNUAL REPORT | SEE NOTES TO FINANCIAL STATEMENTS. |
SCHEDULE OF INVESTMENTS (continued) | September 30, 2023 |
TOTAL RETURN BOND FUND | |
| | Face
Amount~ | | | Value | |
California State University Revenue Bonds | | | | | | | | |
2.98% due 11/01/51 | | | 5,000,000 | | | $ | 3,172,002 | |
Oakland Redevelopment Agency Successor Agency Tax Allocation | | | | | | | | |
4.00% due 09/01/39 | | | 1,100,000 | | | | 886,107 | |
Hillsborough City School District General Obligation Unlimited | | | | | | | | |
due 09/01/3711 | | | 1,000,000 | | | | 438,169 | |
due 09/01/3911 | | | 1,000,000 | | | | 382,930 | |
Total California | | | 33,561,666 | |
| | | | | | | | | |
New York - 0.1% |
Westchester County Local Development Corp. Revenue Bonds | | | | | | | | |
3.85% due 11/01/50 | | | 40,185,000 | | | | 26,604,809 | |
| | | | | | | | | |
Texas - 0.1% |
Dallas Fort Worth International Airport Revenue Bonds | | | | | | | | |
3.09% due 11/01/40 | | | 13,800,000 | | | | 10,155,100 | |
Central Texas Turnpike System Revenue Bonds | | | | | | | | |
3.03% due 08/15/41 | | | 3,150,000 | | | | 2,148,915 | |
Central Texas Regional Mobility Authority Revenue Bonds | | | | | | | | |
3.17% due 01/01/41 | | | 3,000,000 | | | | 2,110,855 | |
Tarrant County Cultural Education Facilities Finance Corp. Revenue Bonds | | | | | | | | |
3.42% due 09/01/50 | | | 2,500,000 | | | | 1,569,842 | |
Harris County Cultural Education Facilities Finance Corp. Revenue Bonds | | | | | | | | |
3.34% due 11/15/37 | | | 1,500,000 | | | | 1,146,002 | |
Dallas/Fort Worth International Airport Revenue Bonds | | | | | | | | |
2.92% due 11/01/50 | | | 1,300,000 | | | | 875,363 | |
Grand Parkway Transportation Corp. Revenue Bonds | | | | | | | | |
3.31% due 10/01/49 | | | 1,000,000 | | | | 674,392 | |
Total Texas | | | 18,680,469 | |
| | | | | | | | | |
Illinois - 0.0% |
State of Illinois General Obligation Unlimited | | | | | | | | |
5.65% due 12/01/38 | | | 5,200,000 | | | | 4,995,504 | |
6.63% due 02/01/35 | | | 1,680,000 | | | | 1,717,258 | |
City of Chicago Illinois General Obligation Unlimited | | | | | | | | |
6.31% due 01/01/44 | | | 4,500,000 | | | | 4,466,856 | |
Total Illinois | | | 11,179,618 | |
| | | | | | | | | |
Mississippi - 0.1% |
Medical Center Educational Building Corp. Revenue Bonds | | | | | | | | |
2.92% due 06/01/41 | | | 11,800,000 | | | | 8,058,883 | |
| | | | | | | | | |
Alabama - 0.0% |
Auburn University Revenue Bonds | | | | | | | | |
2.68% due 06/01/50 | | | 6,500,000 | | | | 3,857,272 | |
| | | | | | | | | |
Ohio - 0.0% |
County of Franklin Ohio Revenue Bonds | | | | | | | | |
2.88% due 11/01/50 | | | 4,000,000 | | | | 2,416,676 | |
| | | | | | | | | |
SEE NOTES TO FINANCIAL STATEMENTS. | THE GUGGENHEIM FUNDS ANNUAL REPORT | 67 |
SCHEDULE OF INVESTMENTS (continued) | September 30, 2023 |
TOTAL RETURN BOND FUND | |
| | Face
Amount~ | | | Value | |
Washington - 0.0% |
Central Washington University Revenue Bonds | | | | | | | | |
6.95% due 05/01/40 | | | 1,750,000 | | | $ | 1,849,384 | |
| | | | | | | | | |
Arizona - 0.0% |
Northern Arizona University Revenue Bonds | | | | | | | | |
3.09% due 08/01/39 | | | 2,350,000 | | | | 1,707,017 | |
| | | | | | | | | |
Oklahoma - 0.0% |
Tulsa Airports Improvement Trust Revenue Bonds | | | | | | | | |
3.10% due 06/01/45 | | | 1,000,000 | | | | 670,637 | |
Oklahoma Development Finance Authority Revenue Bonds | | | | | | | | |
4.65% due 08/15/30 | | | 450,000 | | | | 395,599 | |
Total Oklahoma | | | 1,066,236 | |
| | | | | | | | | |
Idaho - 0.0% |
Boise State University Revenue Bonds | | | | | | | | |
3.06% due 04/01/40 | | | 250,000 | | | | 181,530 | |
Total Municipal Bonds |
(Cost $150,742,439) | | | 109,163,560 | |
| | | | | | | | | |
FOREIGN GOVERNMENT DEBT†† - 0.1% |
Panama Government International Bond |
4.50% due 04/16/50 | | | 22,700,000 | | | | 15,420,228 | |
Total Foreign Government Debt |
(Cost $25,379,679) | | | | | | | 15,420,228 | |
| | | | | | | | | |
SENIOR FIXED RATE INTERESTS††† - 0.0% |
Industrial - 0.0% |
CTL Logistics | | | | | | | | |
2.65% due 10/10/42 | | | 6,849,961 | | | | 4,997,084 | |
Total Senior Fixed Rate Interests |
(Cost $6,849,961) | | | 4,997,084 | |
| | | | | | | | | |
| |
Notional Value
| | | Value | |
OTC OPTIONS PURCHASED†† - 0.0% |
Call Options on: |
Interest Rate Options |
Morgan Stanley Capital Services LLC 10Y-2Y SOFR CMS CAP Expiring June 2024 with strike price of $0.10 | | USD | 510,300,000 | | | | 1,021,753 | |
Barclays Bank plc 10Y-2Y SOFR CMS CAP Expiring June 2024 with strike price of $0.10 | | USD | 506,250,000 | | | | 1,013,644 | |
Bank of America, N.A. 10Y-2Y SOFR CMS CAP Expiring June 2024 with strike price of $0.10 | | USD | 253,750,000 | | | | 508,073 | |
Goldman Sachs International 10Y-2Y SOFR CMS CAP Expiring June 2024 with strike price of $0.10 | | USD | 207,200,000 | | | | 414,868 | |
Morgan Stanley Capital Services LLC 10Y-2Y SOFR CMS CAP Expiring December 2023 with strike price of $0.10 | | USD | 510,300,000 | | | | 319,759 | |
Barclays Bank plc 10Y-2Y SOFR CMS CAP Expiring December 2023 with strike price of $0.20 | | USD | 508,900,000 | | | | 318,882 | |
68 | THE GUGGENHEIM FUNDS ANNUAL REPORT | SEE NOTES TO FINANCIAL STATEMENTS. |
SCHEDULE OF INVESTMENTS (continued) | September 30, 2023 |
TOTAL RETURN BOND FUND | |
| |
Notional Value
| | | Value | |
Bank of America, N.A. 10Y-2Y SOFR CMS CAP Expiring December 2023 with strike price of $0.20 | | USD | 251,100,000 | | | $ | 157,342 | |
Goldman Sachs International 10Y-2Y SOFR CMS CAP Expiring December 2023 with strike price of $0.20 | | USD | 207,200,000 | | | | 129,834 | |
Total Interest Rate Options | | | 3,884,155 | |
| | | | | | | | | |
Total OTC Options Purchased | | | | |
(Cost $12,606,709) | | | | | | | 3,884,155 | |
| | | | | | | | | |
Total Investments - 106.0% | | | | |
(Cost $25,210,827,568) | | $ | 22,340,129,676 | |
| | | | | | | | | |
OTC INTEREST RATE SWAPTIONS WRITTEN††,16 - (0.0)% |
Put Swaptions on: | | | | | | | | |
Interest Rate Swaptions | | | | | | | | |
Barclays Bank plc 5-Year Interest Rate Swap Expiring October 2023 with exercise rate of 3.93% | | USD | 354,750,000 | | | | (7,082,875 | ) |
Total Interest Rate Swaptions | | | (7,082,875 | ) |
| | | | | | | | | |
Total OTC Interest Rate Swaptions Written |
(Premiums received $2,447,775) | | | (7,082,875 | ) |
Other Assets & Liabilities, net - (6.0)% | | | (1,272,706,457 | ) |
Total Net Assets - 100.0% | | $ | 21,060,340,344 | |
Centrally Cleared Credit Default Swap Agreements Protection Purchased†† |
Counterparty | Exchange | Index | | Protection
Premium
Rate | | | Payment
Frequency | | | Maturity
Date | |
BofA Securities, Inc. | ICE | ITRAXX.EUR.38.V1 | 1.00% | Quarterly | | | 12/20/27 | |
BofA Securities, Inc. | ICE | CDX.NA.HY.40.V1 | 5.00% | Quarterly | | | 06/20/28 | |
| | | | | | | | | | | | | | | |
| | Notional
Amount~ | | | Value | | | Upfront
Premiums Paid
(Received) | | | Unrealized
Depreciation** | |
| | | EUR | 216,100,000 | | | $ | (3,012,500 | ) | | $ | (1,690,867 | ) | | $ | (1,321,633 | ) |
| | | | 196,300,000 | | | | (3,076,777 | ) | | | 812,980 | | | | (3,889,757 | ) |
| | | | | | | $ | (6,089,277 | ) | | $ | (877,887 | ) | | $ | (5,211,390 | ) |
SEE NOTES TO FINANCIAL STATEMENTS. | THE GUGGENHEIM FUNDS ANNUAL REPORT | 69 |
SCHEDULE OF INVESTMENTS (continued) | September 30, 2023 |
TOTAL RETURN BOND FUND | |
Centrally Cleared Interest Rate Swap Agreements†† |
Counterparty | Exchange | Floating
Rate Type | Floating Rate
Index | | Fixed
Rate | | | Payment
Frequency | | | Maturity
Date | |
BofA Securities, Inc. | CME | Pay | U.S. Secured Overnight | | | 4.35 | % | | | Annually | | | | 10/03/28 | |
BofA Securities, Inc. | CME | Pay | U.S. Secured Overnight Financing Rate | | | 3.40 | % | | | Annually | | | | 04/04/28 | |
BofA Securities, Inc. | CME | Pay | U.S. Secured Overnight Financing Rate | | | 2.78 | % | | | Annually | | | | 07/18/27 | |
| | Notional
Amount | | | Value | | | Upfront
Premiums Paid | | | Unrealized
Depreciation** | |
| | | $ | 800,000,000 | | | $ | 3,900 | | | $ | 3,900 | | | $ | — | |
| | | | 900,000,000 | | | | (36,980,289 | ) | | | 3,913 | | | | (36,984,202 | ) |
| | | | 1,803,000,000 | | | | (106,906,307 | ) | | | 6,333 | | | | (106,912,640 | ) |
| | | | | | | $ | (143,882,696 | ) | | $ | 14,146 | | | $ | (143,896,842 | ) |
Forward Foreign Currency Exchange Contracts†† |
Counterparty | | Currency | | | Type | | | Quantity | | | Contract
Amount | | | Settlement
Date | | | Unrealized
Appreciation | |
Barclays Bank plc | | | EUR | | | | Sell | | | | 180,685,000 | | 194,306,481 USD | | | 10/16/23 | | | $ | 3,140,794 | |
Morgan Stanley Capital Services LLC | | | GBP | | | | Sell | | | | 79,980,000 | | 99,897,499 USD | | | 10/16/23 | | | | 2,309,715 | |
| | | | | | | | | | | | | | | | | | | | | | | $ | 5,450,509 | |
OTC Interest Rate Swaptions Written | | | | | | | | | | | | | | | | |
| | | | | | | | | | | | | | | | | |
Counterparty/
Description | Floating
Rate Type | Floating
Rate Index | Payment
Frequency | | Fixed
Rate | | | Expiration
Date | | | Exercise
Rate | | | Swaption
Notional
Amount | | | Swaption
Value | |
Put | | | | | | | | | | | | | | | | | | | | | | | |
Barclays Bank plc 5-Year Interest Rate Swap | Pay | SOFR | Annual | 3.93% | 10/16/23 | 3.93% | | $ | 354,750,000 | | | $ | (7,082,875 | ) |
70 | THE GUGGENHEIM FUNDS ANNUAL REPORT | SEE NOTES TO FINANCIAL STATEMENTS. |
SCHEDULE OF INVESTMENTS (continued) | September 30, 2023 |
TOTAL RETURN BOND FUND | |
~ | The face amount is denominated in U.S. dollars unless otherwise indicated. |
* | Non-income producing security. |
** | Includes cumulative appreciation (depreciation). Variation margin is reported within the Statement of Assets and Liabilities. |
† | Value determined based on Level 1 inputs, unless otherwise noted — See Note 4. |
†† | Value determined based on Level 2 inputs, unless otherwise noted — See Note 4. |
††† | Value determined based on Level 3 inputs — See Note 4. |
◊ | Variable rate security. Rate indicated is the rate effective at September 30, 2023. In some instances, the effective rate is limited by a minimum rate floor or a maximum rate cap established by the issuer. The settlement status of a position may also impact the effective rate indicated. In some cases, a position may be unsettled at period end and may not have a stated effective rate. In instances where multiple underlying reference rates and spread amounts are shown, the effective rate is based on a weighted average. |
1 | Affiliated issuer. |
2 | Special Purpose Acquisition Company (SPAC). |
3 | Security has a fixed rate coupon which will convert to a floating or variable rate coupon on a future date. |
4 | Security is a 144A or Section 4(a)(2) security. These securities have been determined to be liquid under guidelines established by the Board of Trustees. The total market value of 144A or Section 4(a)(2) securities is $7,909,985,004 (cost $8,834,146,219), or 37.6% of total net assets. |
5 | All or a portion of this security has been physically segregated or earmarked in connection with reverse repurchase agreements. At September 30, 2023, the total market value of segregated or earmarked securities was $1,331,012,098. — see Note 6. |
6 | Rate indicated is the 7-day yield as of September 30, 2023. |
7 | Security is a principal-only strip. |
8 | Security is an interest-only strip. |
9 | Security is a step up/down bond. The coupon increases or decreases at regular intervals until the bond reaches full maturity. Rate indicated is the rate at September 30, 2023. See table below for additional step information for each security. |
10 | Security is a 144A or Section 4(a)(2) security. These securities have been determined to be illiquid and restricted under guidelines established by the Board of Trustees. The total market value of 144A or Section 4(a)(2) illiquid and restricted securities is $149,277,009 (cost $157,963,275), or 0.7% of total net assets — See Note 10. |
11 | Zero coupon rate security. |
12 | Security has no stated coupon. However, it is expected to receive residual cash flow payments on defined deal dates. |
13 | Perpetual maturity. |
14 | Security is in default of interest and/or principal obligations. |
15 | Payment-in-kind security. |
16 | Swaptions — See additional disclosure in the swaptions table above for more information on swaptions. |
17 | Security is unsettled at period end and does not have a stated effective rate. |
18 | Face amount of security is adjusted for inflation. |
| | BofA — Bank of America |
| | CDX.NA.HY.40.V1 — Credit Default Swap North American High Yield Series 40 Index Version 1 |
| | CME — Chicago Mercantile Exchange |
| | CMS — Constant Maturity Swap |
| | CMT — Constant Maturity Treasury |
| | EUR — Euro |
| | EURIBOR — European Interbank Offered Rate |
| | GBP — British Pound |
| | ICE — Intercontinental Exchange |
SEE NOTES TO FINANCIAL STATEMENTS. | THE GUGGENHEIM FUNDS ANNUAL REPORT | 71 |
SCHEDULE OF INVESTMENTS (continued) | September 30, 2023 |
TOTAL RETURN BOND FUND | |
| | ITRAXX.EUR.38.V1 — iTraxx Europe Series 38 Index Version 1 |
| | LIBOR — London Interbank Offered Rate |
| | plc — Public Limited Company |
| | REMIC — Real Estate Mortgage Investment Conduit |
| | REIT — Real Estate Investment Trust |
| | SARL — Société à Responsabilité Limitée |
| | SOFR — Secured Overnight Financing Rate |
| | SONIA — Sterling Overnight Index Average |
| | WAC — Weighted Average Coupon |
| | |
| | See Sector Classification in Other Information section. |
72 | THE GUGGENHEIM FUNDS ANNUAL REPORT | SEE NOTES TO FINANCIAL STATEMENTS. |
SCHEDULE OF INVESTMENTS (continued) | September 30, 2023 |
TOTAL RETURN BOND FUND | |
The following table summarizes the inputs used to value the Fund’s investments at September 30, 2023 (See Note 4 in the Notes to Financial Statements):
Investments in Securities (Assets) | | Level 1
Quoted
Prices | | | Level 2
Significant
Observable
Inputs | | | Level 3
Significant
Unobservable
Inputs | | | Total | |
Common Stocks | | $ | 168,023 | | | $ | — | | | $ | 2,503 | | | $ | 170,526 | |
Preferred Stocks | | | — | | | | 582,057,031 | | | | 47,610,124 | | | | 629,667,155 | |
Warrants | | | 30,817 | | | | — | | | | 104 | | | | 30,921 | |
Mutual Funds | | | 192,037,440 | | | | — | | | | — | | | | 192,037,440 | |
Money Market Funds | | | 219,666,392 | | | | — | | | | — | | | | 219,666,392 | |
U.S. Government Securities | | | — | | | | 5,744,781,061 | | | | — | | | | 5,744,781,061 | |
Collateralized Mortgage Obligations | | | — | | | | 5,058,573,981 | | | | 94,495,909 | | | | 5,153,069,890 | |
Asset-Backed Securities | | | — | | | | 4,266,192,809 | | | | 567,198,526 | | | | 4,833,391,335 | |
Corporate Bonds | | | — | | | | 4,300,392,629 | | | | 316,972,375 | | | | 4,617,365,004 | |
Senior Floating Rate Interests | | | — | | | | 403,117,412 | | | | 216,787,942 | | | | 619,905,354 | |
Federal Agency Bonds | | | — | | | | 196,579,571 | | | | — | | | | 196,579,571 | |
Municipal Bonds | | | — | | | | 109,163,560 | | | | — | | | | 109,163,560 | |
Foreign Government Debt | | | — | | | | 15,420,228 | | | | — | | | | 15,420,228 | |
Senior Fixed Rate Interests | | | — | | | | — | | | | 4,997,084 | | | | 4,997,084 | |
Options Purchased | | | — | | | | 3,884,155 | | | | — | | | | 3,884,155 | |
Forward Foreign Currency Exchange Contracts** | | | — | | | | 5,450,509 | | | | — | | | | 5,450,509 | |
Total Assets | | $ | 411,902,672 | | | $ | 20,685,612,946 | | | $ | 1,248,064,567 | | | $ | 22,345,580,185 | |
Investments in Securities (Liabilities) | | Level 1
Quoted
Prices | | | Level 2
Significant
Observable
Inputs | | | Level 3
Significant
Unobservable
Inputs | | | Total | |
Interest Rate Swaptions Written | | $ | — | | | $ | 7,082,875 | | | $ | — | | | $ | 7,082,875 | |
Credit Default Swap Agreements** | | | — | | | | 5,211,390 | | | | — | | | | 5,211,390 | |
Interest Rate Swap Agreements** | | | — | | | | 143,896,842 | | | | — | | | | 143,896,842 | |
Unfunded Loan Commitments (Note 9) | | | — | | | | — | | | | 151,690 | | | | 151,690 | |
Total Liabilities | | $ | — | | | $ | 156,191,107 | | | $ | 151,690 | | | $ | 156,342,797 | |
** | This derivative is reported as unrealized appreciation/depreciation at period end. |
The Fund may hold assets and/or liabilities in which the fair value approximates the carrying amount for financial statement purposes. As of the period end, reverse repurchase agreements of $1,279,248,820 are categorized as Level 2 within the disclosure hierarchy — See Note 6.
SEE NOTES TO FINANCIAL STATEMENTS. | THE GUGGENHEIM FUNDS ANNUAL REPORT | 73 |
SCHEDULE OF INVESTMENTS (continued) | September 30, 2023 |
TOTAL RETURN BOND FUND | |
The following is a summary of significant unobservable inputs used in the fair valuation of assets and liabilities categorized within Level 3 of the fair value hierarchy:
Category | | Ending
Balance at
September 30,
2023 | | | Valuation
Technique | | | Unobservable
Inputs | | | Input
Range | | | Weighted
Average* | |
Assets: | | | | | | | | | | | | | | | | | | | | |
Asset-Backed Securities | | $ | 348,506,786 | | Option adjusted spread off prior month end broker quote | Broker Quote | — | — |
Asset-Backed Securities | | | 179,228,158 | | Yield Analysis | Yield | 4.0%-8.9% | 7.0% |
Asset-Backed Securities | | | 26,816,409 | | Third Party Pricing | Broker Quote | — | — |
Asset-Backed Securities | | | 12,647,173 | | Model Price | Purchase Price | — | — |
Collateralized Mortgage Obligations | | | 53,058,374 | | Option adjusted spread off prior month end broker quote | Broker Quote | — | — |
Collateralized Mortgage Obligations | | | 25,301,225 | | Model Price | Purchase Price | — | — |
Collateralized Mortgage Obligations | | | 16,136,310 | | Model Price | Purchase Price | — | — |
Common Stocks | | | 1,565 | | Enterprise Valuation | Valuation Multiple | 2.7x-8.1x | 4.0x |
Common Stocks | | | 938 | | Model Price | Liquidation Value | — | — |
Corporate Bonds | | | 195,706,461 | | Option adjusted spread off prior month end broker quote | Broker Quote | — | — |
Corporate Bonds | | | 77,060,742 | | Yield Analysis | Yield | 6.7%-7.6% | 7.0% |
Corporate Bonds | | | 44,205,172 | | Model Price | Purchase Price | — | — |
Preferred Stocks | | | 47,000,000 | | Third Party Pricing | Trade Price | — | — |
Preferred Stocks | | | 610,124 | | Enterprise Valuation | Valuation Multiple | 4.8x-4.9x | 4.9x |
Senior Fixed Rate Interests | | | 4,997,084 | | Option adjusted spread off prior month end broker quote | Broker Quote | — | — |
Senior Floating Rate Interests | | | 189,574,597 | | Yield Analysis | Yield | 10.4%-11.8% | 11.4% |
Senior Floating Rate Interests | | | 27,142,588 | | Third Party Pricing | Broker Quote | — | — |
Senior Floating Rate Interests | | | 70,757 | | Model Price | Purchase Price | — | — |
Warrants | | | 104 | | Model Price | Liquidation Value | — | — |
Total Assets | | $ | 1,248,064,567 | | | | | |
Liabilities: | | | | | | | | | | | | | | | | | | | | |
Unfunded Loan Commitments | | $ | 151,690 | | Model Price | Purchase Price | — | — |
* | Inputs are weighted by the fair value of the instruments. |
Significant changes in quote, yield, liquidation value or valuation multiple would generally result in significant changes in the fair value of the security.
74 | THE GUGGENHEIM FUNDS ANNUAL REPORT | SEE NOTES TO FINANCIAL STATEMENTS. |
SCHEDULE OF INVESTMENTS (continued) | September 30, 2023 |
TOTAL RETURN BOND FUND | |
The Fund’s fair valuation leveling guidelines classify a single daily broker quote, or a vendor price based on a single daily or monthly broker quote, as Level 3, if such a quote or price cannot be supported with other available market information.
Transfers between Level 2 and Level 3 may occur as markets fluctuate and/or the availability of data used in an investment’s valuation changes. For the year ended September 30, 2023, the Fund did not have any securities transfer into Level 3 from Level 2 and had securities with a total value of $60,094,003 transfer out of Level 3 into Level 2 due to the availability of current and reliable market-based data provided by a third-party pricing service which utilizes significant observable inputs.
Summary of Fair Value Level 3 Activity
Following is a reconciliation of Level 3 assets for which significant unobservable inputs were used to determine fair value for the year ended September 30, 2023:
| | | Assets | |
| | Asset-Backed
Securities | | | Collateralized
Mortgage
Obligations | | | Corporate
Bonds | | | Senior
Floating Rate
Interests | | | Warrants | |
Beginning Balance | | $ | 648,109,541 | | | $ | 68,443,202 | | | $ | 458,761,982 | | | $ | 332,581,132 | | | $ | 103 | |
Purchases/(Receipts) | | | 259,226,142 | | | | 41,484,496 | | | | 66,450,000 | | | | 11,209,880 | | | | 1 | |
(Sales, maturities and paydowns)/Fundings | | | (348,622,190 | ) | | | (12,897,750 | ) | | | (203,505,276 | ) | | | (73,341,690 | ) | | | — | |
Amortization of premiums/discounts | | | 1,158,702 | | | | (9,880 | ) | | | (19,316 | ) | | | 708,928 | | | | — | |
Corporate actions | | | — | | | | — | | | | — | | | | (5,176,600 | ) | | | — | |
Total realized gains (losses) included in earnings | | | (13,439,624 | ) | | | (2,157,884 | ) | | | (36,187,208 | ) | | | (3,839,061 | ) | | | — | |
Total change in unrealized appreciation (depreciation) included in earnings | | | 20,766,105 | | | | (366,275 | ) | | | 31,472,193 | | | | 14,739,206 | | | | — | |
Transfers into Level 3 | | | — | | | | — | | | | — | | | | — | | | | — | |
Transfers out of Level 3 | | | (150 | ) | | | — | | | | — | | | | (60,093,853 | ) | | | — | |
Ending Balance | | $ | 567,198,526 | | | $ | 94,495,909 | | | $ | 316,972,375 | | | $ | 216,787,942 | | | $ | 104 | |
Net change in unrealized appreciation (depreciation) for investments in Level 3 securities still held at September 30, 2023 | | $ | (6,079,438 | ) | | $ | (2,342,514 | ) | | $ | (8,726,058 | ) | | $ | 6,951,198 | | | $ | — | |
SEE NOTES TO FINANCIAL STATEMENTS. | THE GUGGENHEIM FUNDS ANNUAL REPORT | 75 |
SCHEDULE OF INVESTMENTS (continued) | September 30, 2023 |
TOTAL RETURN BOND FUND | |
| | | Assets | | | | | | | Liabilities | |
| | Common
Stocks | | | Preferred
Stocks | | | Senior Fixed
Rate Interests | | | Total Assets | | | Unfunded Loan
Commitments | |
Beginning Balance | | $ | 1,382 | | | $ | — | | | $ | 5,402,287 | | | $ | 1,513,299,629 | | | $ | (1,043,263 | ) |
Purchases/(Receipts) | | | 6 | | | | 47,000,000 | | | | — | | | | 425,370,525 | | | | (130,141 | ) |
(Sales, maturities and paydowns)/Fundings | | | — | | | | — | | | | (201,511 | ) | | | (638,568,417 | ) | | | 299,073 | |
Amortization of premiums/discounts | | | — | | | | — | | | | — | | | | 1,838,434 | | | | — | |
Corporate actions | | | 7,671 | | | | 5,168,929 | | | | — | | | | — | | | | — | |
Total realized gains (losses) included in earnings | | | — | | | | — | | | | — | | | | (55,623,777 | ) | | | (164,102 | ) |
Total change in unrealized appreciation (depreciation) included in earnings | | | (6,556 | ) | | | (4,558,805 | ) | | | (203,692 | ) | | | 61,842,176 | | | | 886,743 | |
Transfers into Level 3 | | | — | | | | — | | | | — | | | | — | | | | — | |
Transfers out of Level 3 | | | — | | | | — | | | | — | | | | (60,094,003 | ) | | | — | |
Ending Balance | | $ | 2,503 | | | $ | 47,610,124 | | | $ | 4,997,084 | | | $ | 1,248,064,567 | | | $ | (151,690 | ) |
Net change in unrealized appreciation (depreciation) for investments in Level 3 securities still held at September 30, 2023 | | $ | (6,556 | ) | | $ | (4,562,914 | ) | | $ | (203,692 | ) | | $ | (14,969,974 | ) | | $ | 3,139 | |
Step Coupon Bonds
The following table discloses additional information related to step coupon bonds held by the Fund. Certain securities are subject to multiple rate changes prior to maturity. For those securities, a range of rates and corresponding dates have been provided. Rates for all step coupon bonds held by the Fund are scheduled to increase, none are scheduled to decrease.
Name | | Coupon Rate at
Next Reset Date | | | Next Rate
Reset Date | | | Future Reset Rate | | | Future Reset Date | |
Angel Oak Mortgage Trust 2023-1, 4.75% due 09/26/67 | | | 5.75 | % | | | 01/01/27 | | | | — | | | | — | |
Angel Oak Mortgage Trust 2023-1 2023-1, 4.75% due 09/26/67 | | | 5.75 | % | | | 01/01/27 | | | | — | | | | — | |
Angel Oak Mortgage Trust 2023-2 2023-2, 4.65% due 10/25/67 | | | 5.65 | % | | | 02/01/27 | | | | — | | | | — | |
Angel Oak Mortgage Trust 2023-2 2023-2, 4.65% due 10/25/67 | | | 5.65 | % | | | 02/01/27 | | | | — | | | | — | |
BRAVO Residential Funding Trust 2022-R1, 3.13% due 01/29/70 | | | 6.13 | % | | | 01/30/25 | | | | — | | | | — | |
BRAVO Residential Funding Trust 2021-C, 1.62% due 03/01/61 | | | 4.62 | % | | | 09/25/24 | | | | 5.62 | % | | | 09/25/25 | |
BRAVO Residential Funding Trust 2023-NQM2 2023-NQM2, 4.50% due 05/25/62 | | | 5.50 | % | | | 02/01/27 | | | | — | | | | — | |
BRAVO Residential Funding Trust 2023-NQM2 2023-NQM2, 4.50% due 05/25/62 | | | 5.50 | % | | | 02/01/27 | | | | — | | | | — | |
76 | THE GUGGENHEIM FUNDS ANNUAL REPORT | SEE NOTES TO FINANCIAL STATEMENTS. |
SCHEDULE OF INVESTMENTS (continued) | September 30, 2023 |
TOTAL RETURN BOND FUND | |
Name | | Coupon Rate at
Next Reset Date | | | Next Rate
Reset Date | | | Future Reset Rate | | | Future Reset Date | |
BRAVO Residential Funding Trust 2023-NQM2 2023-NQM2, 4.50% due 05/25/62 | | | 5.50 | % | | | 02/01/27 | | | | — | | | | 12/31/99 | |
BRAVO Residential Funding Trust 2023-NQM5 2023-NQM5, 7.01% due 06/25/63 | | | 8.01 | % | | | 07/01/27 | | | | — | | | | — | |
BRAVO Residential Funding Trust 2023-NQM6 2023-NQM6, 7.06% due 09/25/63 | | | 8.06 | % | | | 08/01/27 | | | | — | | | | — | |
Citigroup Mortgage Loan Trust 2022-A, 6.17% due 09/25/62 | | | 9.17 | % | | | 09/25/25 | | | | 10 17 | % | | | 09/25/26 | |
GCAT 2023-NQM2 Trust 2023-NQM2, 6.24% due 11/25/67 | | | 7.24 | % | | | 01/01/27 | | | | — | | | | — | |
GCAT Trust 2022-NQM5, 5.71% due 08/25/67 | | | 6.71 | % | | | 10/01/26 | | | | — | | | | — | |
GCAT Trust 2022-NQM5, 5.71% due 08/25/67 | | | 6.71 | % | | | 10/01/26 | | | | — | | | | — | |
Legacy Mortgage Asset Trust 2021-GS3, 1.75% due 07/25/61 | | | 4.75 | % | | | 05/25/24 | | | | 5.75 | % | | | 05/25/25 | |
Legacy Mortgage Asset Trust 2021-GS5, 2.25% due 07/25/67 | | | 5.25 | % | | | 11/25/24 | | | | 6.25 | % | | | 11/25/25 | |
Legacy Mortgage Asset Trust 2021-GS2, 1.75% due 04/25/61 | | | 4.75 | % | | | 04/25/24 | | | | 5.75 | % | | | 04/25/25 | |
NYMT Loan Trust 2022-SP1, 5.25% due 07/25/62 | | | 8.25 | % | | | 07/01/25 | | | | 9.25 | % | | | 07/01/26 | |
OBX 2023-NQM2 Trust 2023-NQM2, 6.72% due 01/25/62 | | | 7.72 | % | | | 02/01/27 | | | | — | | | | — | |
OBX Trust 2022-NQM8, 6.10% due 09/25/62 | | | 7.10 | % | | | 10/01/26 | | | | — | | | | — | |
OBX Trust 2022-NQM9, 6.45% due 09/25/62 | | | 7.45 | % | | | 11/01/26 | | | | — | | | | — | |
OBX Trust 2023-NQM2, 6.32% due 01/25/62 | | | 7.32 | % | | | 02/01/27 | | | | — | | | | — | |
OSAT Trust 2021-RPL1, 2.12% due 05/25/65 | | | 5.12 | % | | | 06/25/24 | | | | 6.12 | % | | | 06/25/25 | |
PRPM 2023-RCF1 LLC 2023-RCF1, 4.00% due 06/25/53 | | | 5.00 | % | | | 06/25/27 | | | | — | | | | — | |
PRPM LLC 2022-1, 3.72% due 02/25/27 | | | 6.72 | % | | | 02/25/25 | | | | 7.72 | % | | | 02/25/26 | |
PRPM LLC 2021-5, 1.79% due 06/25/26 | | | 4.79 | % | | | 06/25/24 | | | | 5.79 | % | | | 06/25/25 | |
Verus Securitization Trust 2022-8, 6.13% due 09/25/67 | | | 7.13 | % | | | 10/01/26 | | | | — | | | | — | |
Verus Securitization Trust 2022-8, 6.13% due 09/25/67 | | | 7.13 | % | | | 10/01/26 | | | | — | | | | — | |
SEE NOTES TO FINANCIAL STATEMENTS. | THE GUGGENHEIM FUNDS ANNUAL REPORT | 77 |
SCHEDULE OF INVESTMENTS (concluded) | September 30, 2023 |
TOTAL RETURN BOND FUND | |
Affiliated Transactions
Investments representing 5% or more of the outstanding voting shares of a company, or control of or by, or common control under Guggenheim Investments (“GI”), result in that company being considered an affiliated issuer, as defined in the 1940 Act.
The Fund may invest in certain of the underlying series of Guggenheim Strategy Funds Trust, including Guggenheim Strategy Fund II and Guggenheim Strategy Fund III, (collectively, the “Short Term Investment Vehicles”), each of which are open-end management investment companies managed by GI. The Short Term Investment Vehicles, which launched on March 11, 2014, are offered as short term investment options only to mutual funds, trusts, and other accounts managed by GI and/or its affiliates, and are not available to the public. The Short Term Investment Vehicles pay no investment management fees. The Short Term Investment Vehicles’ annual report on Form N-CSR dated September 30, 2022, is available publicly or upon request. This information is available from the EDGAR database on the SEC’s website at https://www.sec.gov/Archives/edgar/data/1601445/000182126822000340/gug84768.htm. The Fund may invest in certain of the underlying series of Guggenheim Funds Trust, which are open-end management investment companies managed by GI, are available to the public and whose most recent annual report on Form N-CSR is available publicly or upon request.
Transactions during the year ended September 30, 2023, in which the company is an affiliated issuer, were as follows:
Security Name | | Value
09/30/22 | | | Additions | | | Reductions | | | Realized
Gain (Loss) | |
Common Stocks | | | | | | | | | | | | | | | | |
BP Holdco LLC * | | $ | 323 | | | $ | — | | | $ | — | | | $ | — | |
Mutual Funds | | | | | | | | | | | | | | | | |
Guggenheim Limited Duration Fund — R6-Class | | | — | | | | 120,801,101 | | | | — | | | | — | |
Guggenheim Strategy Fund II | | | 26,646,371 | | | | 1,424,473 | | | | — | | | | — | |
Guggenheim Strategy Fund III | | | 14,383,324 | | | | 779,080 | | | | — | | | | — | |
Guggenheim Ultra Short Duration Fund — Institutional Class | | | 26,156,766 | | | | 1,309,979 | | | | — | | | | — | |
| | | $ | 67,186,784 | | | $ | 124,314,633 | | | $ | — | | | $ | — | |
Security Name | | Change in
Unrealized
Appreciation
(Depreciation) | | | Value
09/30/23 | | | Shares
09/30/23 | | | Investment
Income | |
Common Stocks | | | | | | | | | | | | | | | | |
BP Holdco LLC * | | $ | 360 | | | $ | 683 | | | | 532 | | | $ | — | |
Mutual Funds | | | | | | | | | | | | | | | | |
Guggenheim Limited Duration Fund — R6-Class | | | (407,503 | ) | | | 120,393,598 | | | | 5,103,586 | | | | 893,942 | |
Guggenheim Strategy Fund II | | | 338,291 | | | | 28,409,135 | | | | 1,170,545 | | | | 1,424,864 | |
Guggenheim Strategy Fund III | | | 164,124 | | | | 15,326,528 | | | | 630,981 | | | | 779,818 | |
Guggenheim Ultra Short Duration Fund — Institutional Class | | | 441,434 | | | | 27,908,179 | | | | 2,862,377 | | | | 1,309,760 | |
| | | $ | 536,706 | | | $ | 192,038,123 | | | | | | | $ | 4,408,384 | |
* | Non-income producing security. |
78 | THE GUGGENHEIM FUNDS ANNUAL REPORT | SEE NOTES TO FINANCIAL STATEMENTS. |
STATEMENT OF ASSETS AND LIABILITIES | |
TOTAL RETURN BOND FUND | |
September 30, 2023
Assets: |
Investments in unaffiliated issuers, at value (cost $25,016,707,231) | | $ | 22,148,091,553 | |
Investments in affiliated issuers, at value (cost $194,120,337) | | | 192,038,123 | |
Foreign currency, at value (cost $1,373,017) | | | 1,371,308 | |
Segregated cash with broker | | | 27,023,144 | |
Cash | | | 4,261,026 | |
Unamortized upfront premiums paid on credit default swap agreements | | | 812,980 | |
Unamortized upfront premiums paid on interest rate swap agreements | | | 14,146 | |
Unrealized appreciation on forward foreign currency exchange contracts | | | 5,450,509 | |
Prepaid expenses | | | 927,151 | |
Receivables: |
Securities sold | | | 905,702,469 | |
Interest | | | 176,042,776 | |
Fund shares sold | | | 34,373,486 | |
Dividends | | | 1,539,604 | |
Foreign tax reclaims | | | 3,300 | |
Investment Adviser | | | 608 | |
Other assets | | | 75 | |
Total assets | | | 23,497,652,258 | |
| | | | | |
Liabilities: |
Unfunded loan commitments, at value (Note 9) (commitment fees received $154,829) | | | 151,690 | |
Reverse repurchase agreements | | | 1,279,248,820 | |
Options written, at value (premiums received $2,447,775) | | | 7,082,875 | |
Segregated cash due to broker | | | 4,086,000 | |
Unamortized upfront premiums received on credit default swap agreements | | | 1,690,867 | |
Payable for: |
Securities purchased | | | 1,038,137,248 | |
Fund shares redeemed | | | 69,813,683 | |
Variation margin on interest rate swap agreements | | | 16,687,044 | |
Distributions to shareholders | | | 6,108,639 | |
Management fees | | | 5,979,187 | |
Transfer agent/maintenance fees | | | 5,260,268 | |
Protection fees on credit default swap agreements | | | 369,725 | |
Distribution and service fees | | | 309,177 | |
Swap Settlement | | | 266,112 | |
Fund accounting/administration fees | | | 159,901 | |
Due to Investment Adviser | | | 66,284 | |
Trustees’ fees* | | | 10,943 | |
Variation margin on credit default swap agreements | | | 615 | |
Miscellaneous | | | 1,882,836 | |
Total liabilities | | | 2,437,311,914 | |
Net assets | | $ | 21,060,340,344 | |
| | | | | |
Net assets consist of: |
Paid in capital | | $ | 26,117,848,412 | |
Total distributable earnings (loss) | | | (5,057,508,068 | ) |
Net assets | | $ | 21,060,340,344 | |
| | | | | |
A-Class: |
Net assets | | $ | 444,453,693 | |
Capital shares outstanding | | | 19,735,607 | |
Net asset value per share | | $ | 22.52 | |
Maximum offering price per share (Net asset value divided by 96.00%) | | $ | 23.46 | |
| | | | | |
C-Class: |
Net assets | | $ | 158,465,895 | |
Capital shares outstanding | | | 7,035,909 | |
Net asset value per share | | $ | 22.52 | |
| | | | | |
P-Class: |
Net assets | | $ | 393,752,403 | |
Capital shares outstanding | | | 17,489,787 | |
Net asset value per share | | $ | 22.51 | |
| | | | | |
Institutional Class: |
Net assets | | $ | 19,802,141,567 | |
Capital shares outstanding | | | 878,521,853 | |
Net asset value per share | | $ | 22.54 | |
| | | | | |
R6-Class: |
Net assets | | $ | 261,526,786 | |
Capital shares outstanding | | | 11,595,853 | |
Net asset value per share | | $ | 22.55 | |
* | Relates to Trustees not deemed “interested persons” within the meaning of Section 2(a)(19) of the 1940 Act. |
SEE NOTES TO FINANCIAL STATEMENTS. | THE GUGGENHEIM FUNDS ANNUAL REPORT | 79 |
STATEMENT OF OPERATIONS |
TOTAL RETURN BOND FUND |
Year Ended September 30, 2023
Investment Income: |
Dividends from securities of unaffiliated issuers | | $ | 14,718,970 | |
Dividends from securities of affiliated issuers | | | 4,408,384 | |
Interest from securities in unaffiliated issuers (net of foreign withholding tax of ($221,231) | | | 1,026,901,130 | |
Total investment income | | | 1,046,028,484 | |
| | | | | |
Expenses: |
Management fees | | | 76,742,003 | |
Distribution and service fees: |
A-Class | | | 1,141,906 | |
C-Class | | | 1,777,813 | |
P-Class | | | 1,113,801 | |
Transfer agent/maintenance fees: |
A-Class | | | 433,470 | |
C-Class | | | 179,980 | |
P-Class | | | 899,191 | |
Institutional Class | | | 19,170,291 | |
R6-Class | | | 25,101 | |
Interest expense | | | 28,802,774 | |
Fund accounting /administration fees | | | 8,036,992 | |
Professional fees | | | 1,512,526 | |
Line of credit fees | | | 1,278,649 | |
Custodian fees | | | 509,353 | |
Trustees’ fees* | | | 290,305 | |
Miscellaneous | | | 1,495,662 | |
Recoupment of previously waived fees: |
A-Class | | | 53,029 | |
C-Class | | | 36,525 | |
P-Class | | | 17,216 | |
Institutional Class | | | 629,048 | |
R6-Class | | | 7,252 | |
Total expenses | | | 144,152,887 | |
Less: |
Expenses reimbursed by Adviser: |
A-Class | | | (56,720 | ) |
C-Class | | | (42,625 | ) |
P-Class | | | (499,697 | ) |
Institutional Class | | | (10,025,149 | ) |
R6-Class | | | (816 | ) |
Expenses waived by Adviser | | | (6,228,246 | ) |
Earnings Credits applied | | | (224,001 | ) |
Total waived/reimbursed expenses | | | (17,077,254 | ) |
Net expenses | | | 127,075,633 | |
Net investment income | | | 918,952,851 | |
| | | | | |
Net Realized and Unrealized Gain (Loss): |
Net realized gain (loss) on: |
Investments in unaffiliated issuers | | | (1,349,884,601 | ) |
Swap agreements | | | (72,704,993 | ) |
Futures contracts | | | 6,650,025 | |
Options purchased | | | (37,392,568 | ) |
Options written | | | 3,962,226 | |
Forward foreign currency exchange contracts | | | (24,237,064 | ) |
Foreign currency transactions | | | 1,056,907 | |
Net realized loss | | | (1,472,550,068 | ) |
Net change in unrealized appreciation (depreciation) on: |
Investments in unaffiliated issuers | | | 814,060,753 | |
Investments in affiliated issuers | | | 536,706 | |
Swap agreements | | | (2,741,186 | ) |
Options purchased | | | (60,803,044 | ) |
Options written | | | 11,748,516 | |
Forward foreign currency exchange contracts | | | (6,880,855 | ) |
Foreign currency translations | | | 163,294 | |
Net change in unrealized appreciation (depreciation) | | | 756,084,184 | |
Net realized and unrealized loss | | | (716,465,884 | ) |
Net increase in net assets resulting from operations | | $ | 202,486,967 | |
* | Relates to Trustees not deemed “interested persons” within the meaning of Section 2(a)(19) of the 1940 Act. |
80 | THE GUGGENHEIM FUNDS ANNUAL REPORT | SEE NOTES TO FINANCIAL STATEMENTS. |
STATEMENTS OF CHANGES IN NET ASSETS | |
TOTAL RETURN BOND FUND | |
| | Year Ended
September 30,
2023 | | | Year Ended
September 30,
2022 | |
Increase (Decrease) in Net Assets from Operations: | | | | | | | | |
Net investment income | | $ | 918,952,851 | | | $ | 759,469,621 | |
Net realized loss on investments | | | (1,472,550,068 | ) | | | (513,869,862 | ) |
Net change in unrealized appreciation (depreciation) on investments | | | 756,084,184 | | | | (4,435,908,740 | ) |
Net increase (decrease) in net assets resulting from operations | | | 202,486,967 | | | | (4,190,308,981 | ) |
| | | | | | | | | |
Distributions to shareholders: | | | | | | | | |
A-Class | | | (19,019,129 | ) | | | (22,845,332 | ) |
C-Class | | | (6,072,905 | ) | | | (8,847,797 | ) |
P-Class | | | (18,625,018 | ) | | | (35,091,237 | ) |
Institutional Class | | | (818,465,001 | ) | | | (948,608,650 | ) |
R6-Class | | | (10,162,965 | ) | | | (9,592,901 | ) |
Total distributions to shareholders | | | (872,345,018 | ) | | | (1,024,985,917 | ) |
| | | | | | | | | |
Capital share transactions: | | | | | | | | |
Proceeds from sale of shares | | | | | | | | |
A-Class | | | 190,008,832 | | | | 162,652,775 | |
C-Class | | | 32,292,309 | | | | 22,676,431 | |
P-Class | | | 143,216,250 | | | | 277,767,413 | |
Institutional Class | | | 9,905,246,248 | | | | 8,822,932,131 | |
R6-Class | | | 140,809,681 | | | | 141,977,419 | |
Distributions reinvested | | | | | | | | |
A-Class | | | 16,394,524 | | | | 19,669,319 | |
C-Class | | | 5,230,841 | | | | 7,577,710 | |
P-Class | | | 18,492,403 | | | | 35,091,237 | |
Institutional Class | | | 725,020,898 | | | | 839,074,338 | |
R6-Class | | | 9,871,684 | | | | 9,497,105 | |
Cost of shares redeemed | | | | | | | | |
A-Class | | | (176,845,859 | ) | | | (310,183,050 | ) |
C-Class | | | (72,847,845 | ) | | | (102,439,268 | ) |
P-Class | | | (327,848,764 | ) | | | (599,756,830 | ) |
Institutional Class | | | (7,698,063,900 | ) | | | (12,268,295,169 | ) |
R6-Class | | | (90,056,671 | ) | | | (141,160,025 | ) |
Net increase (decrease) from capital share transactions | | | 2,820,920,631 | | | | (3,082,918,464 | ) |
Net increase (decrease) in net assets | | | 2,151,062,580 | | | | (8,298,213,362 | ) |
| | | | | | | | | |
Net assets: | | | | | | | | |
Beginning of year | | | 18,909,277,764 | | | | 27,207,491,126 | |
End of year | | $ | 21,060,340,344 | | | $ | 18,909,277,764 | |
| | | | | | | | | |
SEE NOTES TO FINANCIAL STATEMENTS. | THE GUGGENHEIM FUNDS ANNUAL REPORT | 81 |
STATEMENTS OF CHANGES IN NET ASSETS (concluded) | |
TOTAL RETURN BOND FUND | |
| | Year Ended
September 30,
2023 | | | Year Ended
September 30,
2022 | |
Capital share activity: | | | | | | | | |
Shares sold | | | | | | | | |
A-Class | | | 8,094,504 | | | | 6,128,429 | |
C-Class | | | 1,375,517 | | | | 850,424 | |
P-Class | | | 6,070,940 | | | | 10,325,436 | |
Institutional Class | | | 421,456,679 | | | | 335,372,608 | |
R6-Class | | | 5,994,350 | | | | 5,491,289 | |
Shares issued from reinvestment of distributions | | | | | | | | |
A-Class | | | 702,293 | | | | 736,999 | |
C-Class | | | 224,186 | | | | 283,159 | |
P-Class | | | 793,085 | | | | 1,309,242 | |
Institutional Class | | | 31,049,191 | | | | 31,483,958 | |
R6-Class | | | 422,497 | | | | 356,973 | |
Shares redeemed | | | | | | | | |
A-Class | | | (7,564,633 | ) | | | (11,761,205 | ) |
C-Class | | | (3,122,803 | ) | | | (3,897,258 | ) |
P-Class | | | (14,121,799 | ) | | | (22,953,593 | ) |
Institutional Class | | | (330,170,194 | ) | | | (470,717,032 | ) |
R6-Class | | | (3,874,827 | ) | | | (5,318,515 | ) |
Net increase (decrease) in shares | | | 117,328,986 | | | | (122,309,086 | ) |
82 | THE GUGGENHEIM FUNDS ANNUAL REPORT | SEE NOTES TO FINANCIAL STATEMENTS. |
FINANCIAL HIGHLIGHTS (continued) |
TOTAL RETURN BOND FUND |
This table is presented to show selected data for a share outstanding throughout each period and to assist shareholders in evaluating a Fund’s performance for the periods presented.
A-Class | | Year
Ended
Sept. 30,
2023 | | | Year
Ended
Sept. 30,
2022 | | | Year
Ended
Sept. 30,
2021 | | | Year
Ended
Sept. 30,
2020 | | | Year
Ended
Sept. 30,
2019 | |
Per Share Data |
Net asset value, beginning of period | | $ | 23.12 | | | $ | 28.94 | | | $ | 29.76 | | | $ | 27.42 | | | $ | 26.69 | |
Income (loss) from investment operations: |
Net investment income (loss)a | | | 1.03 | | | | .78 | | | | .72 | | | | .56 | | | | .64 | |
Net gain (loss) on investments (realized and unrealized) | | | (.65 | ) | | | (5.53 | ) | | | (.05 | ) | | | 2.41 | | | | .85 | |
Total from investment operations | | | .38 | | | | (4.75 | ) | | | .67 | | | | 2.97 | | | | 1.49 | |
Less distributions from: |
Net investment income | | | (.98 | ) | | | (.80 | ) | | | (.76 | ) | | | (.63 | ) | | | (.65 | ) |
Net realized gains | | | — | | | | (.27 | ) | | | (.73 | ) | | | — | | | | (.11 | ) |
Total distributions | | | (.98 | ) | | | (1.07 | ) | | | (1.49 | ) | | | (.63 | ) | | | (.76 | ) |
Net asset value, end of period | | $ | 22.52 | | | $ | 23.12 | | | $ | 28.94 | | | $ | 29.76 | | | $ | 27.42 | |
|
Total Returnb | | | 1.55 | % | | | (16.82 | %) | | | 2.27 | % | | | 10.96 | % | | | 5.70 | % |
Ratios/Supplemental Data |
Net assets, end of period (in thousands) | | $ | 444,454 | | | $ | 427,870 | | | $ | 677,172 | | | $ | 804,750 | | | $ | 609,602 | |
Ratios to average net assets: |
Net investment income (loss) | | | 4.40 | % | | | 2.94 | % | | | 2.47 | % | | | 1.99 | % | | | 2.37 | % |
Total expensesc | | | 0.96 | % | | | 0.85 | % | | | 0.84 | % | | | 0.87 | % | | | 0.96 | % |
Net expensesd,e,f | | | 0.91 | % | | | 0.81 | % | | | 0.79 | % | | | 0.80 | % | | | 0.80 | % |
Portfolio turnover rate | | | 90 | % | | | 55 | % | | | 92 | % | | | 116 | % | | | 68 | % |
SEE NOTES TO FINANCIAL STATEMENTS. | THE GUGGENHEIM FUNDS ANNUAL REPORT | 83 |
FINANCIAL HIGHLIGHTS (continued) |
TOTAL RETURN BOND FUND |
This table is presented to show selected data for a share outstanding throughout each period and to assist shareholders in evaluating a Fund’s performance for the periods presented.
C-Class | | Year
Ended
Sept. 30,
2023 | | | Year
Ended
Sept. 30,
2022 | | | Year
Ended
Sept. 30,
2021 | | | Year
Ended
Sept. 30,
2020 | | | Year
Ended
Sept. 30,
2019 | |
Per Share Data |
Net asset value, beginning of period | | $ | 23.13 | | | $ | 28.94 | | | $ | 29.76 | | | $ | 27.43 | | | $ | 26.69 | |
Income (loss) from investment operations: |
Net investment income (loss)a | | | .86 | | | | .58 | | | | .50 | | | | .35 | | | | .43 | |
Net gain (loss) on investments (realized and unrealized) | | | (.67 | ) | | | (5.52 | ) | | | (.05 | ) | | | 2.40 | | | | .87 | |
Total from investment operations | | | .19 | | | | (4.94 | ) | | | .45 | | | | 2.75 | | | | 1.30 | |
Less distributions from: |
Net investment income | | | (.80 | ) | | | (.60 | ) | | | (.54 | ) | | | (.42 | ) | | | (.45 | ) |
Net realized gains | | | — | | | | (.27 | ) | | | (.73 | ) | | | — | | | | (.11 | ) |
Total distributions | | | (.80 | ) | | | (.87 | ) | | | (1.27 | ) | | | (.42 | ) | | | (.56 | ) |
Net asset value, end of period | | $ | 22.52 | | | $ | 23.13 | | | $ | 28.94 | | | $ | 29.76 | | | $ | 27.43 | |
|
Total Returnb | | | 0.74 | % | | | (17.41 | %) | | | 1.50 | % | | | 10.10 | % | | | 4.95 | % |
Ratios/Supplemental Data |
Net assets, end of period (in thousands) | | $ | 158,466 | | | $ | 197,933 | | | $ | 327,712 | | | $ | 338,656 | | | $ | 286,050 | |
Ratios to average net assets: |
Net investment income (loss) | | | 3.65 | % | | | 2.18 | % | | | 1.72 | % | | | 1.24 | % | | | 1.62 | % |
Total expensesc | | | 1.72 | % | | | 1.63 | % | | | 1.59 | % | | | 1.59 | % | | | 1.60 | % |
Net expensesd,e,f | | | 1.66 | % | | | 1.56 | % | | | 1.53 | % | | | 1.55 | % | | | 1.55 | % |
Portfolio turnover rate | | | 90 | % | | | 55 | % | | | 92 | % | | | 116 | % | | | 68 | % |
84 | THE GUGGENHEIM FUNDS ANNUAL REPORT | SEE NOTES TO FINANCIAL STATEMENTS. |
FINANCIAL HIGHLIGHTS (continued) |
TOTAL RETURN BOND FUND |
This table is presented to show selected data for a share outstanding throughout each period and to assist shareholders in evaluating a Fund’s performance for the periods presented.
P-Class | | Year
Ended
Sept. 30,
2023 | | | Year
Ended
Sept. 30,
2022 | | | Year
Ended
Sept. 30,
2021 | | | Year
Ended
Sept. 30,
2020 | | | Year
Ended
Sept. 30,
2019 | |
Per Share Data |
Net asset value, beginning of period | | $ | 23.12 | | | $ | 28.93 | | | $ | 29.75 | | | $ | 27.42 | | | $ | 26.69 | |
Income (loss) from investment operations: |
Net investment income (loss)a | | | 1.03 | | | | .77 | | | | .72 | | | | .56 | | | | .63 | |
Net gain (loss) on investments (realized and unrealized) | | | (.66 | ) | | | (5.51 | ) | | | (.05 | ) | | | 2.40 | | | | .86 | |
Total from investment operations | | | .37 | | | | (4.74 | ) | | | .67 | | | | 2.96 | | | | 1.49 | |
Less distributions from: |
Net investment income | | | (.98 | ) | | | (.80 | ) | | | (.76 | ) | | | (.63 | ) | | | (.65 | ) |
Net realized gains | | | — | | | | (.27 | ) | | | (.73 | ) | | | — | | | | (.11 | ) |
Total distributions | | | (.98 | ) | | | (1.07 | ) | | | (1.49 | ) | | | (.63 | ) | | | (.76 | ) |
Net asset value, end of period | | $ | 22.51 | | | $ | 23.12 | | | $ | 28.93 | | | $ | 29.75 | | | $ | 27.42 | |
|
Total Return | | | 1.51 | % | | | (16.79 | %) | | | 2.27 | % | | | 10.92 | % | | | 5.70 | % |
Ratios/Supplemental Data |
Net assets, end of period (in thousands) | | $ | 393,752 | | | $ | 572,113 | | | $ | 1,043,507 | | | $ | 926,745 | | | $ | 819,770 | |
Ratios to average net assets: |
Net investment income (loss) | | | 4.41 | % | | | 2.90 | % | | | 2.47 | % | | | 1.98 | % | | | 2.37 | % |
Total expensesc | | | 1.06 | % | | | 0.93 | % | | | 0.87 | % | | | 0.88 | % | | | 0.87 | % |
Net expensesd,e,f | | | 0.91 | % | | | 0.81 | % | | | 0.79 | % | | | 0.80 | % | | | 0.80 | % |
Portfolio turnover rate | | | 90 | % | | | 55 | % | | | 92 | % | | | 116 | % | | | 68 | % |
SEE NOTES TO FINANCIAL STATEMENTS. | THE GUGGENHEIM FUNDS ANNUAL REPORT | 85 |
FINANCIAL HIGHLIGHTS (continued) |
TOTAL RETURN BOND FUND | |
This table is presented to show selected data for a share outstanding throughout each period and to assist shareholders in evaluating a Fund’s performance for the periods presented.
Institutional Class | | Year
Ended
Sept. 30,
2023 | | | Year
Ended
Sept. 30,
2022 | | | Year
Ended
Sept. 30,
2021 | | | Year
Ended
Sept. 30,
2020 | | | Year
Ended
Sept. 30,
2019 | |
Per Share Data |
Net asset value, beginning of period | | $ | 23.14 | | | $ | 28.97 | | | $ | 29.78 | | | $ | 27.45 | | | $ | 26.71 | |
Income (loss) from investment operations: |
Net investment income (loss)a | | | 1.10 | | | | .86 | | | | .81 | | | | .65 | | | | .71 | |
Net gain (loss) on investments (realized and unrealized) | | | (.66 | ) | | | (5.54 | ) | | | (.05 | ) | | | 2.39 | | | | .87 | |
Total from investment operations | | | .44 | | | | (4.68 | ) | | | .76 | | | | 3.04 | | | | 1.58 | |
Less distributions from: |
Net investment income | | | (1.04 | ) | | | (.88 | ) | | | (.84 | ) | | | (.71 | ) | | | (.73 | ) |
Net realized gains | | | — | | | | (.27 | ) | | | (.73 | ) | | | — | | | | (.11 | ) |
Total distributions | | | (1.04 | ) | | | (1.15 | ) | | | (1.57 | ) | | | (.71 | ) | | | (.84 | ) |
Net asset value, end of period | | $ | 22.54 | | | $ | 23.14 | | | $ | 28.97 | | | $ | 29.78 | | | $ | 27.45 | |
|
Total Return | | | 1.84 | % | | | (16.59 | %) | | | 2.59 | % | | | 11.23 | % | | | 6.03 | % |
Ratios/Supplemental Data |
Net assets, end of period (in thousands) | | $ | 19,802,142 | | | $ | 17,501,690 | | | $ | 24,912,049 | | | $ | 19,152,857 | | | $ | 12,138,270 | |
Ratios to average net assets: |
Net investment income (loss) | | | 4.69 | % | | | 3.23 | % | | | 2.76 | % | | | 2.29 | % | | | 2.64 | % |
Total expensesc | | | 0.71 | % | | | 0.62 | % | | | 0.57 | % | | | 0.57 | % | | | 0.58 | % |
Net expensesd,e,f | | | 0.62 | % | | | 0.52 | % | | | 0.50 | % | | | 0.51 | % | | | 0.51 | % |
Portfolio turnover rate | | | 90 | % | | | 55 | % | | | 92 | % | | | 116 | % | | | 68 | % |
86 | THE GUGGENHEIM FUNDS ANNUAL REPORT | SEE NOTES TO FINANCIAL STATEMENTS. |
FINANCIAL HIGHLIGHTS (continued) |
TOTAL RETURN BOND FUND | |
This table is presented to show selected data for a share outstanding throughout each period and to assist shareholders in evaluating a Fund’s performance for the periods presented.
R6-Class | | Year
Ended
Sept. 30,
2023 | | | Year
Ended
Sept. 30,
2022 | | | Year
Ended
Sept. 30,
2021 | | | Year
Ended
Sept. 30,
2020 | | | Year
Ended
Sept. 30,
2019 | |
Per Share Data |
Net asset value, beginning of period | | $ | 23.16 | | | $ | 28.98 | | | $ | 29.80 | | | $ | 27.46 | | | $ | 26.73 | |
Income (loss) from investment operations: |
Net investment income (loss)a | | | 1.11 | | | | .87 | | | | .81 | | | | .65 | | | | .71 | |
Net gain (loss) on investments (realized and unrealized) | | | (.67 | ) | | | (5.54 | ) | | | (.06 | ) | | | 2.40 | | | | .86 | |
Total from investment operations | | | .44 | | | | (4.67 | ) | | | .75 | | | | 3.05 | | | | 1.57 | |
Less distributions from: |
Net investment income | | | (1.05 | ) | | | (.88 | ) | | | (.84 | ) | | | (.71 | ) | | | (.73 | ) |
Net realized gains | | | — | | | | (.27 | ) | | | (.73 | ) | | | — | | | | (.11 | ) |
Total distributions | | | (1.05 | ) | | | (1.15 | ) | | | (1.57 | ) | | | (.71 | ) | | | (.84 | ) |
Net asset value, end of period | | $ | 22.55 | | | $ | 23.16 | | | $ | 28.98 | | | $ | 29.80 | | | $ | 27.46 | |
|
Total Return | | | 1.84 | % | | | (16.55 | %) | | | 2.56 | % | | | 11.26 | % | | | 5.99 | % |
Ratios/Supplemental Data |
Net assets, end of period (in thousands) | | $ | 261,527 | | | $ | 209,671 | | | $ | 247,051 | | | $ | 167,409 | | | $ | 55,441 | |
Ratios to average net assets: |
Net investment income (loss) | | | 4.73 | % | | | 3.26 | % | | | 2.76 | % | | | 2.28 | % | | | 2.64 | % |
Total expensesc | | | 0.62 | % | | | 0.53 | % | | | 0.50 | % | | | 0.52 | % | | | 0.52 | % |
Net expensesd,e,f | | | 0.58 | % | | | 0.52 | % | | | 0.50 | % | | | 0.51 | % | | | 0.51 | % |
Portfolio turnover rate | | | 90 | % | | | 55 | % | | | 92 | % | | | 116 | % | | | 68 | % |
SEE NOTES TO FINANCIAL STATEMENTS. | THE GUGGENHEIM FUNDS ANNUAL REPORT | 87 |
FINANCIAL HIGHLIGHTS (concluded) |
TOTAL RETURN BOND FUND | |
a | Net investment income (loss) per share was computed using average shares outstanding throughout the period. |
b | Total return does not reflect the impact of any applicable sales charges. |
c | Does not include expenses of the underlying funds in which the Fund invests. |
d | Net expense information reflects the expense ratios after expense waivers and reimbursements, as applicable. |
e | The portion of the ratios of net expenses to average net assets attributable to recoupments of prior fee reductions or expense reimbursements for the years presented was as follows: |
| | | 09/30/23 | 09/30/22 | 09/30/21 | 09/30/20 | 09/30/19 |
| | A-Class | 0.01% | 0.01% | 0.00%* | 0.00%* | — |
| | C-Class | 0.02% | — | 0.00%* | 0.00%* | — |
| | P-Class | 0.00%* | — | — | 0.00%* | 0.00%* |
| | Institutional Class | 0.00%* | — | — | 0.00%* | — |
| | R6-Class | 0.00%* | 0.01% | 0.01% | 0.00%* | 0.00%* |
f | Net expenses may include expenses that are excluded from the expense limitation agreement. Excluding these expenses, the net expense ratios for the years presented would be: |
| | | 09/30/23 | 09/30/22 | 09/30/21 | 09/30/20 | 09/30/19 |
| | A-Class | 0.76% | 0.77% | 0.78% | 0.79% | 0.79% |
| | C-Class | 1.52% | 1.52% | 1.53% | 1.54% | 1.54% |
| | P-Class | 0.76% | 0.77% | 0.78% | 0.79% | 0.79% |
| | Institutional Class | 0.47% | 0.48% | 0.49% | 0.50% | 0.50% |
| | R6-Class | 0.43% | 0.48% | 0.49% | 0.50% | 0.50% |
88 | THE GUGGENHEIM FUNDS ANNUAL REPORT | SEE NOTES TO FINANCIAL STATEMENTS. |
NOTES TO FINANCIAL STATEMENTS |
Note 1 – Organization, and Significant Accounting Policies
Organization
Guggenheim Funds Trust (the “Trust”), a Delaware statutory trust, is registered with the U.S. Securities and Exchange Commission (the “SEC”) under the Investment Company Act of 1940 (the “1940 Act”), as an open-ended investment company of the series type. Each series, in effect, is representing a separate fund. The Trust may issue an unlimited number of authorized shares. The Trust accounts for the assets of each fund separately.
The Trust offers a combination of five separate classes of shares: A-Class shares, C-Class shares, P-Class shares, R6-Class shares and Institutional Class shares. Sales of shares of each Class are made without a front-end sales charge at the net asset value per share (“NAV”), with the exception of A-Class shares. A-Class shares are sold at the NAV, plus the applicable front-end sales charge. The sales charge varies depending on the amount purchased. A-Class share purchases of $1 million or more are exempt from the front-end sales charge but have a 1% contingent deferred sales charge (“CDSC”), if shares are redeemed within 12 months of purchase. C-Class shares have a 1% CDSC if shares are redeemed within 12 months of purchase. C-Class shares automatically convert to A-Class shares on or about the 10th day of the month following the 8-year anniversary of the purchase of the C-Class shares. This conversion will be executed without any sales charge, fee or other charge. After the conversion is completed, the shares will be subject to all features and expenses of A-Class shares. Institutional Class shares are offered primarily for direct investment by institutions such as pension and profit sharing plans, endowments, foundations and corporations. Institutional Class shares require a minimum initial investment of $2 million and a minimum account balance of $1 million. R6-Class shares are offered primarily through qualified retirement and benefit plans. R6-Class shares are also offered through certain other plans and platforms sponsored by financial intermediaries. Certain institutional investors and others deemed appropriate by Guggenheim Investments (“GI” or the “Adviser”) may also be eligible to purchase R6-Class shares subject to a $2 million minimum initial investment. At September 30, 2023, the Trust consisted of nineteen funds (the “Funds”).
This report covers the Total Return Bond Fund (the “Fund”), a Diversified investment company. At September 30, 2023, A-Class, C-Class, P-Class, Institutional Class and R6-Class shares have been issued by the Fund.
Guggenheim Partners Investment Mangagement, LLC (“GPIM” or “the Adviser”), which operates under the name Guggenheim Investments (“GI”), provides advisory services. Guggenheim Funds Distributors, LLC (“GFD”) serves as distributor for the Trust. GI and GFD are affiliated entities.
Pursuant to an investment Sub-Advisory Agreement between GPIM and Guggenheim Partners Advisors, LLC (“GPA”) that was in effect during a portion of the Reporting Period, GPA was engaged to provide investment subadvisory services to the Fund. GPA operated as an investment sub-advisor to the Fund from April 29, 2022 to December 22, 2022.
| | THE GUGGENHEIM FUNDS ANNUAL REPORT | 89 |
NOTES TO FINANCIAL STATEMENTS (continued) |
GPA, under the oversight of the Board and GPIM, assisted GPIM in the supervision and direction of the investment strategies of the Fund in accordance with its investment policies. As compensation for its services, GPIM paid GPA a fee, payable monthly, in an amount equal to 0.005% of the average daily net assets of the Fund.
Significant Accounting Policies
The Fund operates as an investment company and, accordingly, follows the investment company accounting and reporting guidance of the Financial Accounting Standards Board (“FASB”) Accounting Standards Codification Topic 946 Financial Services – Investment Companies.
The following significant accounting policies are in conformity with U.S. generally accepted accounting principles (“U.S. GAAP”) and are consistently followed by the Trust. This requires management to make estimates and assumptions that affect the reported amount of assets and liabilities, contingent assets and liabilities at the date of the financial statements, and the reported amounts of revenues and expenses during the reporting period. Actual results could differ from these estimates. All time references are based on Eastern Time.
The NAV of each share class of the Fund is calculated by dividing the market value of the Fund’s securities and other assets, less all liabilities attributable to the share class by the number of outstanding shares of the share class.
(a) Valuation of Investments
The Board of Trustees of the Fund (the “Board”) has adopted policies and procedures for the valuation of the Fund’s investments (the “Fund Valuation Procedures”). The SEC adopted Rule 2a-5 under the 1940 Act (“Rule 2a-5”) which establishes requirements for determining fair value in good faith. Rule 2a-5 also defines “readily available market quotations” for purposes of the 1940 Act and establishes requirements for determining whether a fund must fair value a security in good faith.
��
Pursuant to Rule 2a-5, the Board has designated the Adviser as the valuation designee to perform fair valuation determinations for the Fund with respect to all Fund investments and other assets. As the Fund’s valuation designee pursuant to Rule 2a-5, the Adviser has adopted separate procedures (the “Valuation Designee Procedures” and collectively with the Fund Valuation Procedures, the “Valuation Procedures”) reasonably designed to prevent violations of the requirements of Rule 2a-5 and Rule 31a-4. The Adviser, in its role as valuation designee, utilizes the assistance of a valuation committee, consisting of representatives from Guggenheim’s investment management, fund administration, legal and compliance departments (the “Valuation Committee”), in determining the fair value of the Fund’s securities and other assets.
Valuations of the Fund’s securities and other assets are supplied primarily by pricing pricing service providers appointed pursuant to the processes set forth in the Valuation Procedures. The Adviser, with the assistance of the Valuation Committee, convenes monthly, or more frequently as needed, to review the valuation of all assets which have been fair valued. The Adviser, consistent
90 | THE GUGGENHEIM FUNDS ANNUAL REPORT | |
NOTES TO FINANCIAL STATEMENTS (continued) |
with the monitoring and review responsibilities set forth in the Valuation Procedures, regularly reviews the appropriateness of the inputs, methods, models and assumptions employed by the pricing service provider.
If the pricing service provider cannot or does not provide a valuation for a particular investment or such valuation is deemed unreliable, such investment is fair valued by the Adviser.
Equity securities listed or traded on a recognized U.S. securities exchange or the National Association of Securities Dealers Automated Quotations (“NASDAQ”) National Market System will generally be valued on the basis of the last sale price on the primary U.S. exchange or market on which the security is listed or traded; provided, however, that securities listed on NASDAQ will be valued at the NASDAQ official closing price, which may not necessarily represent the last sale price.
Generally, trading in foreign securities markets is substantially completed each day at various times prior to the close of the New York Stock Exchange (“NYSE”). The values of foreign securities are determined as of the close of such foreign markets or the close of the NYSE, if earlier. All investments quoted in foreign currencies are valued in U.S. dollars on the basis of the foreign currency exchange rates prevailing at the close of U.S. business at 4:00 p.m. Investments in foreign securities may involve risks not present in domestic investments. The Adviser will determine the current value of such foreign securities by taking into consideration certain factors which may include the following factors, among others: the value of the securities traded on other foreign markets, American Depositary Receipts (“ADR”) trading, closed-end fund trading, foreign currency exchange activity, and the trading prices of financial products that are tied to foreign securities. In addition, under the Valuation Procedures, the Adviser is authorized to use prices and other information supplied by a pricing service provider in valuing foreign securities.
Open-end investment companies are valued at their NAV as of the close of business, on the valuation date. Exchange-traded funds and closed-end investment companies are generally valued at the last quoted sale price.
U.S. Government securities are valued by pricing service providers, the last traded fill price, or at the reported bid price at the close of business.
CLOs, CDOs, MBS, ABS, and other structured finance securities are generally valued using a pricing service provider.
Commercial paper and discount notes with a maturity of greater than 60 days at acquisition are valued at prices that reflect broker-dealer supplied valuations or are obtained from pricing service providers, which may consider the trade activity, treasury spreads, yields or price of bonds of comparable quality, coupon, maturity, and type, as well as prices quoted by dealers who make markets in such securities. Commercial paper and discount notes with a maturity of 60 days or
| | THE GUGGENHEIM FUNDS ANNUAL REPORT | 91 |
NOTES TO FINANCIAL STATEMENTS (continued) |
less at acquisition are valued at amortized cost, unless the Adviser concludes that amortized cost does not represent the fair value of the applicable asset in which case it will be valued using an independent pricing service provider.
Repurchase agreements are valued at amortized cost, provided such amounts approximate market value.
Typically, loans are valued using information provided by pricing service provider which uses broker quotes, among other inputs. If the pricing service cannot or does not provide a valuation for a particular loan, or such valuation is deemed unreliable, such investment is valued based on a quote from a broker-dealer or is fair valued by the Adviser.
Exchange-traded options are valued at the mean of the bid and ask prices on the principal exchange on which they are traded. Over-the-counter (“OTC”) options and options on swaps (“swaptions”) are valued using a price provided by a pricing service.
Interest rate swap agreements entered into by the Fund is valued on the basis of the last sale price on the primary exchange on which the swap is traded.
Other swap agreements entered into by the Fund are generally valued using an evaluated price provided by a pricing service provider.
Forward foreign currency exchange contracts are valued daily based on the applicable exchange rate of the underlying currency.
Investments for which market quotations are not readily available are fair valued as determined in good faith by the Adviser. Valuations in accordance with these methods are intended to reflect each security’s (or asset’s or liability’s) “fair value”. Each such determination is based on a consideration of all relevant factors, which are likely to vary from one pricing context to another. Examples of such factors may include, but are not limited to market prices; sale prices; broker quotes; and models which derive prices based on inputs such as prices of securities with comparable maturities and characteristics, or based on inputs such as anticipated cash flows or collateral, spread over U.S. Treasury securities, and other information analysis. In connection with futures contracts and other derivative investments, such factors may include obtaining information as to how (a) these contracts and other derivative investments trade in the futures or other derivative markets, respectively, and (b) the securities underlying these contracts and other derivative investments trade in the cash market.
(b) U.S. Government and Agency Obligations
Certain U.S. Government and Agency Obligations are traded on a discount basis; the interest rates shown on the Schedule of Investments reflect the effective rates paid at the time of purchase by the Fund. Other securities bear interest at the rates shown, payable at fixed dates through maturity.
92 | THE GUGGENHEIM FUNDS ANNUAL REPORT | |
NOTES TO FINANCIAL STATEMENTS (continued) |
Inflation-Indexed bonds are fixed-income securities whose principal value is periodically adjusted to the rate of inflation. The interest rate on these securities is generally fixed at issuance at a rate lower than typical bonds. Over the life of an inflation-indexed bond however, interest will be paid based on a principal value which is adjusted for inflation. Any increase in the principal amount of an inflation-indexed bond is recognized as a component of Interest on the Fund’s Statement of Operations, even though principal is not received until maturity.
(c) Senior Floating Rate Interests and Loan Investments
Senior floating rate interests in which the Fund invests generally pay interest rates which are periodically adjusted by reference to a base short-term floating rate, plus a premium. These base lending rates are generally (i) the lending rate offered by one or more major European banks, (ii) the prime rate offered by one or more major United States banks, or (iii) the bank’s certificate of deposit rate. Senior floating rate interests often require prepayments from excess cash flows or permit the borrower to repay at its election. The rate at which the borrower repays cannot be predicted with accuracy. As a result, the actual remaining maturity may be substantially less than the stated maturities disclosed in the Fund’s Schedule of Investments.
The Fund invests in loans and other similar debt obligations (“obligations”). A portion of the Fund’s investments in these obligations is sometimes referred to as “covenant lite” loans or obligations (“covenant lite obligations”), which are obligations that lack covenants or possess fewer or less restrictive covenants or constraints on borrowers than certain other types of obligations. The Fund may also obtain exposure to covenant lite obligations through investment in securitization vehicles and other structured products. Recently, many new or reissued obligations have not featured traditional covenants, which are intended to protect lenders and investors by (i) imposing certain restrictions or other limitations on a borrower’s operations or assets or (ii) providing certain rights to lenders. The Fund may have fewer rights with respect to covenant lite obligations, including fewer protections against the possibility of default and fewer remedies in the event of default. As a result, investments in (or exposure to) covenant lite obligations are subject to more risk than investments in (or exposure to) certain other types of obligations. The Fund is subject to other risks associated with investments in (or exposure to) obligations, including that obligations may not be considered “securities” and, as a result, the Fund may not be entitled to rely on the anti-fraud protections under the federal securities laws and instead may have to resort to state law and direct claims.
(d) Interest on When-Issued Securities
The Fund may purchase and sell interests in securities on a when-issued and delayed delivery basis, with payment and delivery scheduled for a future date. No income accrues to the Fund on such interests or securities in connection with such transactions prior to the date the Fund actually takes delivery of such interests or securities. These transactions are subject to market fluctuations and are subject to the risk that the value at delivery may be more or less than the trade date purchase price. Although the Fund will generally purchase these securities with the intention of acquiring such securities, it may sell such securities before the settlement date.
| | THE GUGGENHEIM FUNDS ANNUAL REPORT | 93 |
NOTES TO FINANCIAL STATEMENTS (continued) |
(e) Options
Upon the purchase of an option, the premium paid is recorded as an investment, the value of which is marked-to-market daily. If a purchased option expires, the Fund realizes a loss in the amount of the cost of the option. When the Fund enters into a closing sale transaction, it realizes a gain or loss depending on whether the proceeds from the closing sale transaction are greater or less than the cost of the option. If the Fund exercises a put option, it realizes a gain or loss from the sale of the underlying security and the proceeds from such sale will be decreased by the premium originally paid. When the Fund exercises a call option, the cost of the security purchased by the Fund upon exercise increases by the premium originally paid.
When the Fund writes (sells) an option, an amount equal to the premium received is entered in that Fund’s accounting records as an asset and equivalent liability. The amount of the liability is subsequently marked-to-market to reflect the current value of the option written. When a written option expires, or if the Fund enters into a closing purchase transaction, it realizes a gain (or loss if the cost of a closing purchase transaction exceeds the premium received when the option was sold).
The Fund may purchase and write options on swaps (“swaptions”) primarily to preserve a return or spread on a particular investment or portion of the Fund’s holdings, as a duration management technique or to protect against an increase in the price of securities it anticipates purchasing at a later date. The purchaser and writer of a swaption is buying or granting the right to enter into a previously agreed upon interest rate swap agreement at any time before the expiration of the options. The swaptions are forward premium swaptions which have extended settlement dates.
(f) Futures Contracts
Upon entering into a futures contract, a Fund deposits and maintains as collateral such initial margin as required by the exchange on which the transaction is affected. Pursuant to the contract, the Fund agrees to receive from or pay to the broker an amount of cash equal to the daily fluctuation in value of the contract. Such receipts or payments are known as variation margin and are recorded by the Fund as unrealized appreciation or depreciation. When the contract is closed, the Fund records a realized gain or loss equal to the difference between the value of the contract at the time it was opened and the value at the time it was closed.
(g) Swap Agreements
Swap agreements are marked-to-market daily and the change, if any, is recorded as unrealized appreciation or depreciation. Payments received or made as a result of an agreement or termination of an agreement are recognized as realized gains or losses.
Upon entering into certain centrally-cleared swap transactions, a Fund is required to deposit with its clearing broker an amount of cash or securities as an initial margin. Subsequent variation margin receipts or payments are received or made by the Fund depending on fluctuations in the fair value of the reference entity and are recorded by the Fund as unrealized appreciation or
94 | THE GUGGENHEIM FUNDS ANNUAL REPORT | |
NOTES TO FINANCIAL STATEMENTS (continued) |
depreciation. When the contract is closed, the Fund records a realized gain or loss equal to the difference between the value of the contract at the time it was opened and the value at the time it was closed.
Upfront payments received or made by a Fund on credit default swap agreements and interest rate swap agreements are amortized over the expected life of the agreement. Periodic payments received or paid by a Fund are recorded as realized gains or losses. Payments received or made as a result of a credit event or termination of the contract are recognized, net of a proportional amount of the upfront payment, as realized gains or losses.
(h) Forward Foreign Currency Exchange Contracts
The change in value of a forward foreign currency exchange contract is recorded as unrealized appreciation or depreciation until the contract is closed. When the contract is closed, the Fund records a realized gain or loss equal to the difference between the value at the time the contract was opened and the value at the time it was closed.
(i) Currency Translations
The accounting records of the Fund are maintained in U.S. dollars. All assets and liabilities initially expressed in foreign currencies are converted into U.S. dollars at prevailing exchange rates. Purchases and sales of investment securities, dividend and interest income, and certain expenses are translated at the rates of exchange prevailing on the respective dates of such transactions. Changes in the relationship of these foreign currencies to the U.S. dollar can significantly affect the value of the investments and earnings of the Fund. Foreign investments may also subject the Fund to foreign government exchange restrictions, expropriation, taxation, or other political, social, geopolitical or economic developments, all of which could affect the market and/or credit risk of the investments.
The Fund does not isolate that portion of the results of operations resulting from changes in the foreign exchange rates on investments from the fluctuations arising from changes in the market prices of securities held. Such fluctuations are included with the net realized gain or loss and unrealized appreciation or depreciation on investments.
Reported net realized foreign exchange gains and losses arise from sales of foreign currencies and currency gains or losses realized between the trade and settlement dates on investment transactions. Net unrealized appreciation and depreciation arise from changes in the fair values of assets and liabilities other than investments in securities at the fiscal period end, resulting from changes in exchange rates.
(j) Foreign Taxes
The Fund may be subject to foreign taxes (a portion of which may be reclaimable) on income, stock dividends, capital gains on investments or certain foreign currency transactions. All foreign taxes are recorded in accordance with the applicable foreign tax regulations and rates that exist
| | THE GUGGENHEIM FUNDS ANNUAL REPORT | 95 |
NOTES TO FINANCIAL STATEMENTS (continued) |
in the foreign jurisdictions in which the Fund invests. These foreign taxes, if any, are paid by the Fund and reflected in its Statement of Operations as follows: foreign taxes withheld at source are presented as a reduction of income and foreign taxes on capital gains from sales of investments are included with the net realized gain (loss) on investments. Foreign taxes payable or deferred as of September 30, 2023, if any, are disclosed in the Fund’s Statement of Assets and Liabilities.
(k) Security Transactions
Security transactions are recorded on the trade date for financial reporting purposes. Realized gains and losses from securities transactions are recorded using the identified cost basis. Proceeds from lawsuits related to investment holdings are recorded as a reduction to cost if the securities are still held and as realized gains if no longer held in the Fund. Dividend income is recorded on the ex-dividend date, net of applicable taxes withheld by foreign countries, if any. Taxable non-cash dividends are recorded as dividend income. Interest income, including amortization of premiums and accretion of discounts, is accrued on a daily basis. Interest income also includes paydown gains and losses on mortgage-backed and asset-backed securities and senior and subordinated loans. Amendment fees are earned as compensation for evaluating and accepting changes to the original loan agreement and are recognized when received. Dividend income from Real Estate Investment Trusts (“REITs”) is recorded based on the income included in the distributions received from the REIT investments using published REIT classifications, including some management estimates when actual amounts are not available. Distributions received in excess of this estimated amount are recorded as a reduction of the cost of investments or reclassified to realized gains. The actual amounts of income, return of capital, and realized gains are only determined by each REIT after its fiscal year-end, and may differ from the estimated amounts.
Income from residual collateralized loan obligations is recognized using the effective interest method. At the time of purchase, management estimates the future expected cash flows and determines the effective yield and estimated maturity date based on the estimated cash flows. Subsequent to the purchase, the estimated cash flows are updated periodically and a revised yield is calculated prospectively.
The Fund may receive other income from investments in senior loan interests including amendment fees, consent fees and commitment fees. For funded loans, these fees are recorded as income when received by the Fund and included in interest income on the Fund’s Statement of Operations. For unfunded loans, commitment fees are included in realized gain on investments on the Fund’s Statement of Operations at the end of the commitment period.
(l) Distributions
The Fund declares dividends from investment income daily. The Fund pays its shareholders from its net investment income monthly and distributes any net capital gains that it has realized, at least annually. Distributions to shareholders are recorded on the ex-dividend date. Dividends are
96 | THE GUGGENHEIM FUNDS ANNUAL REPORT | |
NOTES TO FINANCIAL STATEMENTS (continued) |
reinvested in additional shares, unless shareholders request payment in cash. The character of distributions made during the year from net investment income or net realized gains may differ from their ultimate characterization for U.S. federal income tax purposes.
(m) Class Allocations
Interest and dividend income, most expenses, all realized gains and losses, and all unrealized appreciation and depreciation are allocated to the share classes based upon the value of the outstanding shares in each share class. Certain costs, such as distribution and service fees are charged directly to specific share classes. In addition, certain expenses have been allocated to the individual Funds in the Trust based on the respective net assets of each Fund included in the Trust.
(n) Earnings Credits
Under the fee arrangement with the custodian, the Fund may earn credits based on overnight custody cash balances. These credits are utilized to reduce related custodial expenses. The custodian fees disclosed in the Fund’s Statement of Operations are before the reduction in expense from the related earnings credits, if any. Earnings credits for the year ended September 30, 2023, are disclosed in the Fund’s Statement of Operations.
(o) Cash
The Fund may leave cash overnight in its cash account with the custodian. Periodically, the Fund may have cash due to the custodian bank as an overdraft balance. A fee is incurred on this overdraft, calculated by multiplying the overdraft by a rate based on the federal funds rate, which was 5.33% at September 30, 2023.
(p) Indemnifications
Under the Fund’s organizational documents, its Trustees and Officers are indemnified against certain liabilities arising out of the performance of their duties to the Trust. In addition, throughout the normal course of business, the Fund enters into contracts that contain a variety of representations and warranties which provide general indemnifications. The Fund’s maximum exposure under these arrangements is unknown, as this would involve future claims that may be made against the Fund and/or its affiliates that have not yet occurred. However, based on experience, the Fund expects the risk of loss to be remote.
(q) Special Purpose Acquisition Companies
The Fund may acquire an interest in a special purpose acquisition company (“SPAC”) in an initial public offering or a secondary market transaction. SPAC investments carry many of the same risks as investments in initial public offering securities, such as erratic price movements, greater risk of loss, lack of information about the issuer, limited operating and little public or no trading history, and higher transaction costs. An investment in a SPAC is typically subject to a higher risk of dilution by additional later offerings of interests in the SPAC or by other investors exercising existing rights to purchase shares of the SPAC and interests in SPACs may be illiquid and/or
| | THE GUGGENHEIM FUNDS ANNUAL REPORT | 97 |
NOTES TO FINANCIAL STATEMENTS (continued) |
be subject to restrictions on resale. A SPAC is a publicly traded company that raises investment capital for the purpose of acquiring the equity securities of one or more existing companies (or interests therein) via merger, combination, acquisition or other similar transactions. Unless and until an acquisition is completed, a SPAC generally invests its assets (less a portion retained to cover expenses) in U.S. government securities, money market securities and cash and does not typically pay dividends in respect of its common stock. SPAC investments are also subject to the risk that a significant portion of the funds raised by the SPAC may be expended during the search for a target acquisition or merger and that the SPAC may have limited time in which to conduct due diligence on potential business combination targets. Because SPACs are in essence blank check companies without operating history or ongoing business other than seeking acquisitions, the value of their securities is particularly dependent on the ability of the entity’s management to identify and complete a profitable acquisition. Among other conflicts of interest, the economic interests of the management, directors, officers and related parties of a SPAC can differ from the economic interests of public shareholders, which may lead to conflicts as they evaluate, negotiate and recommend business combination transactions to shareholders. This risk may become more acute as the deadline for the completion of a business combination nears. There is no guarantee that the SPACs in which the Fund invests will complete an acquisition or that any acquisitions that are completed will be profitable.
Note 2 – Financial Instruments and Derivatives
As part of its investment strategy, the Fund utilizes short sales and a variety of derivative instruments. These investments involve, to varying degrees, elements of market risk and risks in excess of amounts recognized on the Fund’s Statement of Assets and Liabilities. Valuation and accounting treatment of these instruments can be found under Significant Accounting Policies in Note 1 of these Notes to Financial Statements.
Short Sales
A short sale is a transaction in which the Fund sells a security it does not own. If the security sold short decreases in price between the time the Fund sells the security and closes its short position, the Fund will realize a gain on the transaction. Conversely, if the security increases in price during the period, the Fund will realize a loss on the transaction. The risk of such price increases is the principal risk of engaging in short sales.
Derivatives
Derivatives are instruments whose values depend on, or are derived from, in whole or in part, the value of one or more other assets, such as securities, currencies, commodities or indices. Derivative instruments may be used to increase investment flexibility (including to maintain cash reserves while maintaining exposure to certain other assets), for risk management (hedging) purposes, to facilitate trading, to reduce transaction costs and to pursue higher investment returns. Derivative instruments may also be used to mitigate certain investment risks, such as foreign currency exchange rate risk, interest rate risk and credit risk. U.S. GAAP requires
98 | THE GUGGENHEIM FUNDS ANNUAL REPORT | |
NOTES TO FINANCIAL STATEMENTS (continued) |
disclosures to enable investors to better understand how and why a Fund uses derivative instruments, how these derivative instruments are accounted for and their effects on the Fund’s financial position and results of operations.
The Fund utilized derivatives for the following purposes:
Duration: the use of an instrument to manage the interest rate risk of a portfolio.
Hedge: an investment made in order to reduce the risk of adverse price movements in a security, by taking an offsetting position to protect against broad market moves.
Income: the use of any instrument that distributes cash flows typically based upon some rate of interest.
Options Purchased and Written
A call option on a security gives the purchaser of the option the right to buy, and the writer of a call option the obligation to sell, the underlying security. The purchaser of a put option has the right to sell, and the writer of the put option the obligation to buy, the underlying security at any time during the option period. The risk associated with purchasing options is limited to the premium originally paid.
The following table represents the Fund’s use and volume of call/put options purchased on a monthly basis:
| | | Average Notional Amount | |
Use | | Call | | | Put | |
Duration, Hedge, Income | | $ | 2,462,500,000 | | | $ | 202,973,520 | |
The risk in writing a call option is that a Fund may incur a loss if the market price of the underlying security increases and the option is exercised. The risk in writing a put option is that a Fund may incur a loss if the market price of the underlying security decreases and the option is exercised. In addition, there may be an imperfect correlation between the movement in prices of options and the underlying securities where a Fund may not be able to enter into a closing transaction because of an illiquid secondary market; or, for over-the-counter (“OTC”) options, a Fund may be at risk because of the counterparty’s inability to perform.
The following table represents the Fund’s use and volume of call/put options written on a monthly basis:
| | | Average Notional Amount | |
Use | | Call | | | Put | |
Income, Hedge | | $ | 36,504 | | | $ | 435,140,833 | |
| | THE GUGGENHEIM FUNDS ANNUAL REPORT | 99 |
NOTES TO FINANCIAL STATEMENTS (continued) |
Futures Contracts
A futures contract is an agreement to purchase (long) or sell (short) an agreed amount of securities or other instruments at a set price for delivery at a future date. There are significant risks associated with a Fund’s use of futures contracts, including (i) there may be an imperfect or no correlation between the changes in market value of the underlying asset and the prices of futures contracts; (ii) there may not be a liquid secondary market for a futures contract; (iii) trading restrictions or limitations may be imposed by an exchange; and (iv) government regulations may restrict trading in futures contracts. When investing in futures, there is minimal counterparty credit risk to a Fund because futures are exchange-traded and the exchange’s clearinghouse, as counterparty to all exchange-traded futures, guarantees against default. Cash deposits are shown as segregated cash with broker on the Fund’s Statement of Assets and Liabilities; securities held as collateral are noted on the Fund’s Schedule of Investments.
The following table represents the Fund’s use and volume of futures on a monthly basis:
| | | Average Notional Amount |
Use | | Long | | | Short | |
Duration, Hedge | | $ | 272,105,417 | | | $ | — | |
Swap Agreements
A swap is an agreement that obligates two parties to exchange a series of cash flows at specified intervals based upon or calculated by reference to changes in specified prices or rates for a specified amount of an underlying asset. When utilizing OTC swaps, the Fund bears the risk of loss of the amount expected to be received under a swap agreement in the event of the default or bankruptcy of a swap agreement counterparty or if the underlying asset declines in value. Certain standardized swaps are subject to mandatory central clearing and are executed on a multi-lateral or other trade facility platform, such as a registered exchange. There is limited counterparty credit risk with respect to centrally-cleared swaps as the transaction is facilitated through a central clearinghouse, much like exchange-traded futures contracts. For a Fund utilizing centrally-cleared swaps, the exchange bears the risk of loss resulting from a counterparty not being able to pay. There is no guarantee that a Fund or an underlying fund could eliminate its exposure under an outstanding swap agreement by entering into an offsetting swap agreement with the same or another party.
Interest rate swaps involve the exchange by the Fund with another party for its respective commitment to pay or receive a fixed or variable interest rate on a notional amount of principal. Interest rate swaps are generally centrally-cleared, but central clearing does not make interest rate swap transactions risk free.
100 | THE GUGGENHEIM FUNDS ANNUAL REPORT | |
NOTES TO FINANCIAL STATEMENTS (continued) |
The following table represents the Fund’s use and volume of interest rate swaps on a monthly basis:
| | | Average Notional Amount | |
Use | | Pay Floating Rate | | | Receive Floating Rate | |
Duration, Hedge, Income | | $ | 2,828,783,333 | | | $ | — | |
Credit default swaps are instruments which allow for the full or partial transfer of third party credit risk, with respect to a particular entity or entities, from one counterparty to the other. The Fund enters into credit default swaps as a “seller” or “buyer” of protection primarily to gain or reduce exposure to the investment grade and/or high yield bond market. A seller of credit default swaps is selling credit protection or assuming credit risk with respect to the underlying entity or entities. The buyer in a credit default swap is obligated to pay the seller a periodic stream of payments over the term of the contract provided that no event of default on an underlying reference obligation has occurred. If a credit event occurs, as defined under the terms of the swap agreement, the seller will either (i) pay to the buyer of protection an amount equal to the notional amount of the swap and take delivery of the referenced obligation or underlying securities comprising the referenced index or (ii) pay a net settlement amount in the form of cash or securities equal to the notional amount of the swap less the recovery value of the referenced obligation or underlying securities comprising the referenced index. The notional amount reflects the maximum potential amount the seller of credit protection could be required to pay to the buyer if a credit event occurs. The seller of protection receives periodic premium payments from the buyer and may also receive or pay an upfront premium adjustment to the stated periodic payments. In the event a credit default occurs on a credit default swap referencing an index, a factor adjustment will take place and the buyer of protection will receive a payment reflecting the par less the default recovery rate of the defaulted index component based on its weighting in the index. If no default occurs, the counterparty will pay the stream of payments and have no further obligations to the fund selling the credit protection. For a fund utilizing centrally cleared credit default swaps, the exchange bears the risk of loss resulting from a counterparty not being able to pay. For OTC credit default swaps, a fund bears the risk of loss of the amount expected to be received under a swap agreement in the event of the default or bankruptcy of a swap agreement counterparty, or in the case of a credit default swap in which a fund is selling credit protection, the default of a third party issuer.
The quoted market prices and resulting market values for credit default swap agreements on securities and credit indices serve as an indicator of the current status of the payment/performance risk and represent the likelihood of an expected liability (or profit) for the credit derivative had the notional amount of the swap agreement been closed/sold as of the period end. Increasing market values, in absolute terms when compared to the notional amount of the swap, represent a deterioration of the referenced entity’s credit soundness and a greater likelihood or risk of default or other credit event occurring as defined under the terms of the agreement.
| | THE GUGGENHEIM FUNDS ANNUAL REPORT | 101 |
NOTES TO FINANCIAL STATEMENTS (continued) |
The following table represents the Fund’s use and volume of credit default swaps on a monthly basis:
| | | Average Notional Amount | |
Use | | Protection Sold | | | Protection Purchased | |
Hedge, Income | | $ | — | | | $ | 276,583,333 | |
Forward Foreign Currency Exchange Contracts
A forward foreign currency exchange contract is an agreement between two parties to exchange two designated currencies at a specific time in the future. Certain types of contracts may be cash settled, in an amount equal to the change in exchange rates during the term of the contract. The contracts can be used to hedge or manage exposure to foreign currency risks with portfolio investments or to gain exposure to foreign currencies.
The market value of a forward foreign currency exchange contract changes with fluctuations in foreign currency exchange rates. Furthermore, the Fund may be exposed to risk if the counterparties cannot meet the contract terms or if the currency value changes unfavorably as compared to the U.S. dollar.
The following table represents the Fund’s use and volume of forward foreign currency exchange contracts on a monthly basis:
| | | Average Value | |
Use | | Purchased | | | Sold | |
Hedge, Income | | $ | 8,388,091 | | | $ | 342,961,776 | |
Derivative Investment Holdings Categorized by Risk Exposure
The following is a summary of the location of derivative investments on the Fund’s Statement of Assets and Liabilities as of September 30, 2023:
Derivative Investment Type | Asset Derivatives | Liability Derivatives |
Currency forward contracts | Unrealized appreciation on forward foreign currency exchange contracts | — |
Interest rate swap contracts | Unamortized upfront premiums paid on interest rate swap agreements | Variation margin on interest rate swap agreements |
Credit swap contracts | Unamortized upfront premiums paid on credit default swap agreements | Unamortized upfront premiums received on credit default swap agreements Variation margin on credit default swap agreements |
Equity/Interest rate option contracts | Investments in unaffiliated issuers, at value | Options written, at value |
102 | THE GUGGENHEIM FUNDS ANNUAL REPORT | |
NOTES TO FINANCIAL STATEMENTS (continued) |
The following tables set forth the fair value of the Fund’s derivative investments categorized by primary risk exposure at September 30, 2023:
| | Asset Derivative Investments Value | |
| | | | | | | | | | | Forward
Foreign
Currency
Exchange
Risk | | | Options
Purchased
Interest
Rate
Risk | | | Total Value at
September 30,
2023 | |
| | | | | | | | | | | | | | $ | 5,450,509 | | | $ | 3,884,155 | | | $ | 9,334,664 | |
| | Liability Derivative Investments Value | |
| | | | | | | | Swaps
Interest
Rate
Risk* | | | Swaps
Credit
Risk* | | | Forward
Foreign
Currency
Exchange Risk | | | Options
Written
Interest
Rate Risk | | | Total Value at
September 30,
2023 | |
| | | | | | | | | | $ | 143,896,842 | | | $ | 5,211,390 | | | $ | — | | | $ | 7,082,875 | | | $ | 156,191,107 | |
* | Includes cumulative appreciation (depreciation) of exchange-traded, OTC and centrally-cleared derivatives contracts as reported on the Schedules of Investments. For exchange-traded and centrally-cleared derivatives, variation margin is reported within the Fund’s Statement of Assets and Liabilities. |
The following is a summary of the location of derivative investments on the Fund’s Statement of Operations for the year ended September 30, 2023:
Derivative Investment Type | Location of Gain (Loss) on Derivatives |
Currency forward contracts | Net realized gain (loss) on forward foreign currency exchange contracts |
| Net change in unrealized appreciation (depreciation) on forward foreign currency exchange contracts |
Equity/Interest rate option contracts | Net realized gain (loss) on futures contracts |
| | Net realized gain (loss) on options purchased |
| | Net realized gain (loss) on options written |
| | Net change in unrealized appreciation (depreciation) on options purchased |
| Net change in unrealized appreciation (depreciation) on options written |
Interest rate/Credit swap contracts | Net realized gain (loss) on swap agreements |
| Net change in unrealized appreciation (depreciation) on swap agreements |
| | THE GUGGENHEIM FUNDS ANNUAL REPORT | 103 |
NOTES TO FINANCIAL STATEMENTS (continued) |
The following is a summary of the Fund’s realized gain (loss) and change in unrealized appreciation (depreciation) on derivative investments recognized on the Fund’s Statement of Operations categorized by primary risk exposure for the year ended September 30, 2023:
Realized Gain (Loss) on Derivative Investments Recognized on the Statement of Operations |
| | Futures
Interest
Rate
Risk | | | Swaps
Interest
Rate
Risk | | | Swaps
Credit
Risk | | | Options
Written
Equity
Risk | | | Options
Purchased
Equity
Risk | | | Forward
Foreign
Currency
Exchange
Risk | | | Options
Purchased
Interest
Rate
Risk | | | Options
Written
Interest
Rate
Risk | | | Total | |
| | | $ | 6,650,025 | | | $ | (66,126,116 | ) | | $ | (6,578,877 | ) | | $ | 20,354,103 | | | $ | (36,569,467 | ) | | $ | (24,237,064 | ) | | $ | (823,101 | ) | | $ | (16,391,877 | ) | | $ | (123,722,374 | ) |
Change in Unrealized Appreciation (Depreciation) on Derivative Investments Recognized on the Statement of Operations |
| | Futures
Interest
Rate
Risk | | | Swaps
Interest
Rate
Risk | | | Swaps
Credit
Risk | | | Options
Written
Equity
Risk | | | Options
Purchased
Equity
Risk | | | Forward
Foreign
Currency
Exchange
Risk | | | Options
Purchased
Interest
Rate
Risk | | | Options
Written
Interest
Rate
Risk | | | Total | |
| | | $ | — | | | $ | 2,470,204 | | | $ | (5,211,390 | ) | | $ | 9,535,213 | | | $ | (52,080,490 | ) | | $ | (6,880,855 | ) | | $ | (8,722,554 | ) | | $ | 2,213,303 | | | $ | (58,676,569 | ) |
In conjunction with short sales and the use of derivative instruments, the Fund is required to maintain collateral in various forms. Depending on the financial instrument utilized and the broker involved, the Fund uses margin deposits at the broker, cash and/or securities segregated at the custodian bank, discount notes or repurchase agreements allocated to the Fund as collateral.
Foreign Investments
There are several risks associated with exposure to foreign currencies, foreign issuers and emerging markets. The Fund’s indirect and direct exposure to foreign currencies subjects the Fund to the risk that those currencies will decline in value relative to the U.S. dollar, or in the case of short positions, that the U.S. dollar will decline in value relative to the currency being hedged. Currency rates in foreign countries may fluctuate significantly over short periods of time for a number of reasons, including changes in interest rates and the imposition of currency controls or other political developments in the U.S. or abroad. In addition, the Fund may incur transaction costs in connection with conversions between various currencies. The Fund may, but is not obligated to,engage in currency hedging transactions, which generally involve buying currency forward, options or futures contracts. However, not all currency risks may be effectively hedged, and in some cases the costs of hedging techniques may outweigh expected benefits. In such instances, the value of securities denominated in foreign currencies can change significantly when foreign currencies strengthen or weaken relative to the U.S. dollar.
104 | THE GUGGENHEIM FUNDS ANNUAL REPORT | |
NOTES TO FINANCIAL STATEMENTS (continued) |
The Fund may invest in securities of foreign companies directly, or in financial instruments, such as ADRs and exchange-traded funds, which are indirectly linked to the performance of foreign issuers. Foreign markets can be more volatile than the U.S. market due to increased risks of adverse issuer, political, regulatory, market, or economic developments and can perform differently from the U.S. market. Investing in securities of foreign companies directly, or in financial instruments that are indirectly linked to the performance of foreign issuers, may involve risks not typically associated with investing in U.S. issuers. The value of securities denominated in foreign currencies, and of dividends from such securities, can change significantly when foreign currencies strengthen or weaken relative to the U.S. dollar. Foreign securities markets generally have less trading volume and less liquidity than U.S. markets, and prices in some foreign markets may fluctuate more than those of securities traded on U.S. markets. Many foreign countries lack accounting and disclosure standards comparable to those that apply to U.S. companies, and it may be more difficult to obtain reliable information regarding a foreign issuer’s financial condition and operations. Transaction costs and costs associated with custody services are generally higher for foreign securities than they are for U.S. securities. Some foreign governments levy withholding taxes against dividend and interest income. Although in some countries portions of these taxes are recoverable, the non-recovered portion will reduce the income received by the Fund.
The Trust has established counterparty credit guidelines and enters into transactions only with financial institutions rated/identified as investment grade or better. The Trust monitors the counterparty credit risk associated with each such financial institution.
Note 3 – Offsetting
In the normal course of business, the Fund enters into transactions subject to enforceable master netting arrangements or other similar arrangements. Generally, the right to offset in those agreements allows the Fund to counteract the exposure to a specific counterparty with collateral received from or delivered to that counterparty based on the terms of the arrangements. These arrangements provide for the right to liquidate upon the occurrence of an event of default, credit event upon merger or additional termination event.
In order to better define its contractual rights and to secure rights that will help the Fund mitigate its counterparty risk, the Fund may enter into an International Swaps and Derivatives Association, Inc. Master Agreement (“ISDA Master Agreement”) or similar agreement with its derivative contract counterparties. An ISDA Master Agreement is a bilateral agreement between a fund and a counterparty that governs OTC derivatives, including foreign exchange contracts, and typically contains, among other things, collateral posting terms and netting provisions in the event of a default and/or termination event. The provisions of the ISDA Master Agreement typically permit a single net payment in the event of a default (close-out netting) or similar event, including the bankruptcy or insolvency of the counterparty.
| | THE GUGGENHEIM FUNDS ANNUAL REPORT | 105 |
NOTES TO FINANCIAL STATEMENTS (continued) |
For derivatives traded under an ISDA Master Agreement, the collateral requirements are typically calculated by netting the mark-to-market amount for each transaction under such agreement and comparing that amount to the value of any collateral currently pledged by the Fund and the counterparty. For financial reporting purposes, cash collateral that has been pledged to cover obligations of the Fund and cash collateral received from the counterparty, if any, are reported separately on the Fund’s Statement of Assets and Liabilities as segregated cash with broker/receivable for variation margin, or payable for swap settlement/variation margin. Cash and/or securities pledged or received as collateral by the Fund in connection with an OTC derivative subject to an ISDA Master Agreement generally may not be invested, sold or rehypothecated by the counterparty or the Fund, as applicable, absent an event of default under such agreement, in which case such collateral generally may be applied towards obligations due to and payable by such counterparty or the Fund, as applicable. Generally, the amount of collateral due from or to a counterparty must exceed a minimum transfer amount threshold (e.g., $300,000) before a transfer is required to be made. To the extent amounts due to the Fund from its counterparties are not fully collateralized, contractually or otherwise, the Fund bears the risk of loss from counterparty nonperformance. The Fund attempts to mitigate counterparty risk by only entering into agreements with counterparties that it believes to be of good standing and by monitoring the financial stability of those counterparties.
For financial reporting purposes, the Fund does not offset derivative assets and derivative liabilities that are subject to netting arrangements in the Fund’s Statement of Assets and Liabilities.
The following tables present derivative financial instruments and secured financing transactions that are subject to enforceable netting arrangements:
| | | | | | | | | | | | | | | Gross Amounts Not Offset
in the Statement of
Assets and Liabilities | | | | | |
Instrument | | Gross
Amounts of
Recognized
Assets1 | | | Gross
Amounts
Offset in the
Statement of
Assets and
Liabilities | | | Net Amount
of Assets
Presented on
the Statement
of Assets and
Liabilities | | | Financial
Instruments | | | Cash
Collateral
Received | | | Net
Amount | |
Options purchased | | $ | 3,884,155 | | | $ | — | | | | 3,884,155 | | | $ | (1,332,526 | ) | | $ | (1,776,285 | ) | | $ | 775,344 | |
Forward foreign currency exchange contracts | | | 5,450,509 | | | | — | | | | 5,450,509 | | | | (3,140,794 | ) | | | (2,309,715 | ) | | | — | |
106 | THE GUGGENHEIM FUNDS ANNUAL REPORT | |
NOTES TO FINANCIAL STATEMENTS (continued) |
| | | | | | | | | | | | | | | Gross Amounts Not Offset
in the Statement of
Assets and Liabilities | | | | | |
Instrument | | Gross
Amounts of
Recognized
Liabilities1 | | | Gross
Amounts
Offset in the
Statement of
Assets and
Liabilities | | | Net Amounts
of Assets
Presented on
the Statement
of Assets and
Liabilities | | | Financial
Instruments | | | Cash
Collateral
Pledged | | | Net
Amount | |
Options Written | | $ | 7,082,875 | | | $ | — | | | $ | 7,082,875 | | | $ | (4,473,320 | ) | | $ | — | | | $ | 2,609,555 | |
1 | Exchange-traded or centrally-cleared derivatives are excluded from these reported amounts. |
The Fund has the right to offset deposits against any related derivative liabilities outstanding with each counterparty with the exception of exchange-traded or centrally-cleared derivatives. The following table presents deposits held by others in connection with derivative investments as of September 30, 2023.
Counterparty | Asset Type | | Cash Pledged | | | Cash Received | |
BofA Securities, Inc. | Credit default swap agreements, interest rate swap agreements | | $ | 27,023,144 | | | $ | — | |
Goldman Sachs International | Forward foreign currency exchange contracts, Options | | | — | | | | 440,000 | |
Morgan Stanley Capital Services LLC | Forward foreign currency exchange contracts, Options | | | — | | | | 3,646,000 | |
| | | | 27,023,144 | | | | 4,086,000 | |
Note 4 – Fair Value Measurement
In accordance with U.S. GAAP, fair value is defined as the price that the Fund would receive to sell an investment or pay to transfer a liability in an orderly transaction between market participants at the measurement date. U.S. GAAP establishes a three-tier fair value hierarchy based on the types of inputs used to value assets and liabilities and requires corresponding disclosure. The hierarchy and the corresponding inputs are summarized below:
Level 1 — | unadjusted quoted prices in active markets for identical assets or liabilities. |
Level 2 — | significant other observable inputs (for example quoted prices for securities that are similar based on characteristics such as interest rates, prepayment speeds, credit risk, etc.). |
Level 3 — | significant unobservable inputs based on the best information available under the circumstances, to the extent observable inputs are not available, which may include assumptions. |
| | THE GUGGENHEIM FUNDS ANNUAL REPORT | 107 |
NOTES TO FINANCIAL STATEMENTS (continued) |
Rule 2a-5 sets forth a definition of “readily available market quotations,” which is consistent with the definition of a Level 1 input under U.S. GAAP. Rule 2a-5 provides that “a market quotation is readily available only when that quotation is a quoted price (unadjusted) in active markets for identical investments that the fund can access at the measurement date, provided that a quotation will not be readily available if it is not reliable.”
Securities for which market quotations are not readily available must be valued at fair value as determined in good faith. Accordingly, any security priced using inputs other than Level 1 inputs will be subject to fair value requirements. The types of inputs available depend on a variety of factors, such as the type of security and the characteristics of the markets in which it trades, if any. Fair valuation determinations that rely on fewer or no observable inputs require greater judgment. Accordingly, fair value determinations for Level 3 securities require the greatest amount of judgment.
Pricing service providers are used to value a majority of the Fund’s investments. When values are not available from a pricing service provider, they will be determined using a variety of sources and techniques, including: market prices; broker quotes; and models which derive prices based on inputs such as prices of securities with comparable maturities and characteristics or based on inputs such as anticipated cash flows or collateral, spread over U.S. Treasury securities, and other information and analysis. A significant portion of the Fund’s assets and liabilities are categorized as Level 2, as indicated in this report.
Quotes from broker-dealers, adjusted for fluctuations in criteria such as credit spreads and interest rates, may also be used to value the Fund’s assets and liabilities, i.e. prices provided by a broker-dealer or other market participant who has not committed to trade at that price. Although quotes are typically received from established market participants, the Fund may not have the transparency to view the underlying inputs which support the market quotations. Significant changes in a quote would generally result in significant changes in the fair value of the security.
Certain fixed income securities are valued by obtaining a monthly quote from a broker-dealer, adjusted for fluctuations in criteria such as credit spreads and interest rates.
Certain loans and other securities are valued using a single daily broker quote or a price from a pricing service provider based on a single daily or monthly broker quote.
The inputs or methodologies selected and applied for valuing securities or other assets are not necessarily an indication of the risk associated with investing in those securities. The suitability, appropriateness and accuracy of the techniques, methodologies and sources employed to determine fair valuation are periodically reviewed and subject to change.
Note 5 – Investment Advisory Agreement and Other Agreements
Under the terms of an investment advisory contract, the Fund pays GI investment advisory fees calculated at an annualized rate of 0.39% of the average daily net assets of the Fund.
108 | THE GUGGENHEIM FUNDS ANNUAL REPORT | |
NOTES TO FINANCIAL STATEMENTS (continued) |
GI pays operating expenses on behalf of the Trust, such as audit and accounting related services, legal services, custody, printing and mailing, among others, on a pass-through basis. Such expenses are allocated to various Funds within the complex based on relative net assets.
The Board has adopted Distribution Plans related to the offering of A-Class, C-Class and P-Class shares pursuant to Rule 12b-1 under the 1940 Act. The plans provide for payments at an annual rate of 0.25% of the average daily net assets of the Fund’s A-Class and P-Class shares, and 1.00% of the average daily net assets of the Fund’s C-Class shares.
The investment advisory contract for the Fund provides that the total expenses be limited to a percentage of average net assets for each class of shares, exclusive of brokerage costs, dividends or interest on securities sold short, expenses of other investment companies in which the Fund invests, interest, taxes, litigation, indemnification and extraordinary expenses. The limits are listed below:
| | Limit | | | Effective
Date | | | Contract
End Date | |
A-Class | | | 0.79 | % | | | 11/20/17 | | | | 02/01/25 | |
C-Class | | | 1.54 | % | | | 11/20/17 | | | | 02/01/25 | |
P-Class | | | 0.79 | % | | | 11/20/17 | | | | 02/01/25 | |
Institutional Class | | | 0.50 | % | | | 11/30/12 | | | | 02/01/25 | |
R6-Class | | | 0.50 | % | | | 10/19/16 | | | | 02/01/25 | |
GI is entitled to reimbursement by the Fund for fees waived or expenses reimbursed during any of the previous 36 months, beginning on the date of the expense limitation agreement, if on any day the estimated operating expenses are less than the indicated percentages. For purposes of this arrangement, GI is entitled to recoupment of previously waived fees or reimbursed expenses for 36 months from the date of the waiver or reimbursement by GI. At September 30, 2023, the amount of fees waived or expenses reimbursed that are subject to recoupment and will expire during the years ended September 30, are presented in the following table:
| | 2024 | | | 2025 | | | 2026 | | | Fund
Total | |
A-Class | | $ | 421,811 | | | $ | 196,304 | | | $ | 56,238 | | | $ | 674,353 | |
C-Class | | | 174,119 | | | | 167,978 | | | | 42,447 | | | | 384,544 | |
P-Class | | | 783,250 | | | | 1,002,868 | | | | 499,250 | | | | 2,285,368 | |
Institutional Class | | | 16,070,214 | | | | 19,248,693 | | | | 10,006,046 | | | | 45,324,953 | |
R6-Class | | | — | | | | — | | | | — | | | | — | |
For the year ended September 30, 2023, GI recouped $743,070 from the Fund.
If the Fund invests in a fund that is advised by the same adviser or an affiliated adviser, the investing Fund’s adviser has agreed to waive fees at the investing fund level to the extent necessary to offset the proportionate share of any management fee paid by the Fund with respect to its investment in such affiliated fund. Fee waivers will be calculated at the investing fund level
| | THE GUGGENHEIM FUNDS ANNUAL REPORT | 109 |
NOTES TO FINANCIAL STATEMENTS (continued) |
without regard to any expense cap, if any, in effect for the investing fund. Fees waived under this arrangement are not subject to reimbursement to GI. For the year ended September 30, 2023, the Fund waived $143,179 related to investments in affiliated funds.
For the year ended September 30, 2023, GFD retained sales charges of $132,849 relating to sales of A-Class shares of the Trust.
Certain trustees and officers of the Trust are also officers of GI and/or GFD. The Trust does not compensate its officers or trustees who are officers, directors and/or employees of GI or GFD.
MUFG Investor Services (US), LLC (“MUIS”) acts as the Fund’s administrator, transfer agent and accounting agent. As administrator, transfer agent and accounting agent, MUIS maintains the books and records of the Fund’s securities and cash. The Bank of New York Mellon Corp. (“BNY”) acts as the Fund’s custodian. As custodian, BNY is responsible for the custody of the Fund’s assets. For providing the aforementioned administrative and accounting services, MUIS is entitled to receive a monthly fee equal to a percentage of the Fund’s average daily net assets and out of pocket expenses. For providing the aforementioned transfer agent and custodian services, MUIS and BNY are entitled to receive a monthly fee based on the number of transactions during the month and the number of accounts under management, subject to certain minimum monthly fees, and out of pocket expenses.
Note 6 – Reverse Repurchase Agreements
The Fund may enter into reverse repurchase agreements. Under a reverse repurchase agreement, the Fund sells securities and agrees to repurchase them at a particular price at a future date. In the event the buyer of securities under a reverse repurchase agreement files for bankruptcy or becomes insolvent, such buyer or its trustee or receiver may receive an extension of time to determine whether to enforce the Fund’s obligation to repurchase the securities, and the Fund’s use of the proceeds of the reverse repurchase agreement may effectively be restricted pending such decision.
For the year ended September 30, 2023, the Fund entered into reverse repurchase agreements as follows:
Number of Days
Outstanding | | Balance at
September 30, 2023 | | | Average Balance
Outstanding | | | Average
Interest Rate | |
223 | | $ | 1,279,248,820 | | | $ | 1,089,992,026 | | | | 4.33 | % |
110 | THE GUGGENHEIM FUNDS ANNUAL REPORT | |
NOTES TO FINANCIAL STATEMENTS (continued) |
The following table presents reverse repurchase agreements that are subject to netting arrangements and offset in the Fund’s Statement of Assets of Liabilities in conformity with U.S. GAAP:
| | | | | | | | | | | | | | | Gross Amounts Not Offset
in the Statement of
Assets and Liabilities | | | | | |
Instrument | | Gross
Amounts of
Recognized
Liabilities | | | Gross
Amounts
Offset in the
Statement of
Assets and
Liabilities | | | Net Amount
of Liabilities
Presented on
the Statement
of Assets and
Liabilities | | | Financial
Instruments | | | Cash Collateral
Pledged | | | Net Amount | |
Reverse repurchase agreements | | $ | 1,279,248,820 | | | $ | — | | | $ | 1,279,248,820 | | | $ | (1,279,248,820 | ) | | $ | — | | | $ | — | |
As of September 30, 2023, the Fund had outstanding reverse repurchase agreements with various counterparties. Details of the reverse repurchase agreements by counterparty are as follows:
Counterparty | | Interest Rate(s) | | | Maturity Date(s) | | | Face Value | |
Goldman Sachs & Co. LLC | (2.75%)-(0.25%)* | Open Maturity | | $ | 6,360,066 | |
J.P. Morgan Securities LLC | 1.00%-6.33%* | — | | | 1,272,888,754 | |
Total | | | | | | | $ | 1,279,248,820 | |
* | The rate is adjusted periodically by the counterparty, subject to approval by the Adviser, and is not based upon a set reference rate and spread. Rate indicated is the rate effective as of September 30, 2023. |
The following is a summary of the remaining contractual maturities of the reverse repurchase agreements outstanding as of year end, aggregated by asset class of the related collateral pledged by the Fund:
Asset Type | | Overnight and
continuous | | | Total | |
Corporate Bonds | | $ | 7,201,003 | | | $ | 7,201,003 | |
Federal Agency Notes | | | 1,272,047,817 | | | | 1,272,047,817 | |
Gross amount of recognized liabilities for reverse repurchase agreements | | $ | 1,279,248,820 | | | $ | 1,279,248,820 | |
Note 7– Federal Income Tax Information
The Fund intends to comply with the provisions of Subchapter M of the Internal Revenue Code of 1986, as amended (the “Internal Revenue Code”), applicable to regulated investment companies and will distribute substantially all taxable net investment income and capital gains sufficient to relieve the Fund from all, or substantially all, federal income, excise and state income taxes. Therefore, no provision for federal or state income tax or federal excise tax is required.
| | THE GUGGENHEIM FUNDS ANNUAL REPORT | 111 |
NOTES TO FINANCIAL STATEMENTS (continued) |
Tax positions taken or expected to be taken in the course of preparing the Fund’s tax returns are evaluated to determine whether the tax positions are “more-likely-than-not” of being sustained by the applicable tax authority. Tax positions not deemed to meet the more-likely-than-not threshold would be recorded as a tax benefit or expense in the current year. Management has analyzed the Fund’s tax positions taken, or to be taken, on U.S. federal income tax returns for all open tax years, and has concluded that no provision for income tax is required in the Fund’s financial statements. The Fund’s U.S. federal income tax returns are subject to examination by the Internal Revenue Service (“IRS”) for a period of three years after they are filed.
The tax character of distributions paid during the year ended September 30, 2023 was as follows:
| | Ordinary
Income | | | Long-Term
Capital Gain | | | Total
Distributions | |
| | | $ | 872,345,018 | | | $ | — | | | $ | 872,345,018 | |
The tax character of distributions paid during the year ended September 30, 2022 was as follows:
| | Ordinary
Income | | | Long-Term
Capital Gain | | | Total
Distributions | |
| | | $ | 882,654,723 | | | $ | 142,331,194 | | | $ | 1,024,985,917 | |
Note: For U.S. federal income tax purposes, short-term capital gain distributions are treated as ordinary income distributions.
The tax components of distributable earnings/(loss) as of September 30, 2023 were as follows:
| | Undistributed
Ordinary
Income | | | Undistributed
Long-Term
Capital Gain | | | Net
Unrealized
Appreciation
(Depreciation) | | | Accumulated
Capital and
Other Losses | | | Other
Temporary
Differences | | | Total | |
| | | $ | 32,244,950 | | | $ | — | | | $ | (3,026,959,795 | ) | | $ | (1,977,547,791 | ) | | $ | (85,245,432 | ) | | $ | (5,057,508,068 | ) |
For U.S. federal income tax purposes, capital loss carryforwards represent realized losses of the Fund that may be carried forward and applied against future capital gains. The Fund is permitted to carry forward capital losses for an unlimited period and such capital loss carryforwards retain their character as either short-term or long-term capital losses. As of September 30, 2023, capital loss carryforwards for the Fund were as follows:
| | | Unlimited | | | | | |
| | Short-Term | | | Long-Term | | | Total
Capital Loss
Carryforward | |
| | | $ | (789,045,623 | ) | | $ | (1,188,465,791 | ) | | $ | (1,977,511,414 | ) |
112 | THE GUGGENHEIM FUNDS ANNUAL REPORT | |
NOTES TO FINANCIAL STATEMENTS (continued) |
Net investment income and net realized gains (losses) may differ for financial statement and tax purposes because of temporary or permanent book/tax differences. These differences are primarily due to investments in swap agreements, real estate investment trusts and CLO securities, foreign currency gains and losses, the “mark-to-market” of certain derivatives, losses deferred due to wash sales, dividends payable, and the disposition of certain Passive Foreign Investment Companies (PFICs). Additional differences may result from the tax treatment of bond premium/discount amortization, income accruals on certain investments, the deferral of losses related to tax straddle investments, and the “mark-to-market” of certain investments denominated in foreign currencies. To the extent these differences are permanent and would require a reclassification between Paid in Capital and Total Distributable Earnings (Loss), such reclassifications are made in the period that the differences arise. These reclassifications have no effect on net assets or NAV per share.
There were no adjustments made on the Statement of Assets and Liabilities as of September 30, 2023 for permanent book/tax differences.
At September 30, 2023, the cost of investments for U.S. federal income tax purposes, the aggregate gross unrealized appreciation for all investments for which there was an excess of value over tax cost and the aggregate gross unrealized depreciation for all investments for which there was an excess of tax cost over value, were as follows:
| | Tax
Cost | | | Tax
Unrealized
Appreciation | | | Tax
Unrealized
Depreciation | | | Net Tax
Unrealized
Appreciation/
(Depreciation) | |
| | | $ | 25,210,731,633 | | | $ | — | | | $ | (3,026,793,064 | ) | | $ | (3,026,793,064 | ) |
Note 8 – Securities Transactions
For the year ended September 30, 2023, the cost of purchases and proceeds from sales of investment securities, excluding government securities, short-term investments and derivatives, were as follows:
| | Purchases | | | Sales | |
| | | $ | 9,503,699,725 | | | $ | 10,726,934,687 | |
For the year ended September 30, 2023, the cost of purchases and proceeds from sales of government securities were as follows:
| | Purchases | | | Sales | |
| | | $ | 9,543,039,501 | | | $ | 6,378,899,108 | |
| | THE GUGGENHEIM FUNDS ANNUAL REPORT | 113 |
NOTES TO FINANCIAL STATEMENTS (continued) |
The Fund is permitted to purchase or sell securities from or to certain affiliated funds under specified conditions outlined in procedures adopted by the Board. The procedures have been designed to ensure that any purchase or sale of securities by the Fund from or to another fund or portfolio that is or could be considered an affiliate by virtue of having a common investment adviser (or affiliated investment advisers), common trustees and/or common officers complies with Rule 17a-7 of the 1940 Act. Further, as defined under these procedures, each transaction is effected at the current market price to save costs, where permissible. For the year ended September 30, 2023, the Fund did not engage in purchases and sales of securities, pursuant to Rule 17a-7 of the 1940 Act.
Note 9 – Unfunded Loan Commitments
Pursuant to the terms of certain loan agreements, the Fund held unfunded loan commitments as of September 30, 2023. The Fund is obligated to fund these loan commitments at the borrower’s discretion.
The unfunded loan commitments as of September 30, 2023, were as follows:
Borrower | Maturity Date | | Face Amount* | | | Value | |
Fontainbleau Vegas | 01/31/26 | | $ | 3,651,079 | | | $ | — | |
HAH Group Holding Co. LLC | 10/22/27 | | | 1,093 | | | | 28 | |
Higginbotham Insurance Agency, Inc. | 11/25/28 | | | 15,480,171 | | | | 151,662 | |
Lightning A | 03/01/37 | | | 28,235,288 | | | | — | |
Thunderbird A | 03/01/37 | | | 28,657,667 | | | | — | |
| | | | $ | 76,025,298 | | | $ | 151,690 | |
* | The face amount is denominated in U.S. dollars unless otherwise indicated. |
114 | THE GUGGENHEIM FUNDS ANNUAL REPORT | |
NOTES TO FINANCIAL STATEMENTS (continued) |
Note 10 – Restricted Securities
The securities below are considered illiquid and restricted under guidelines established by the Board:
Restricted Securities | | Acquisition
Date | | | Cost | | | Value | |
Atlas Mara Ltd. | | | | | | | | | | | | |
due 12/31/214 | | | 10/01/15 | | | $ | 2,828,684 | | | $ | 987,305 | |
Cascade Funding Mortgage Trust | | | | | | | | | | | | |
2018-RM2 4.00% (WAC) due 10/25/681 | | | 11/02/18 | | | | 6,372,379 | | | | 6,282,538 | |
Cascade Funding Mortgage Trust | | | | | | | | | | | | |
2019-RM3 2.80% (WAC) due 06/25/691 | | | 06/25/19 | | | | 3,262,590 | | | | 3,164,128 | |
Central Storage Safety Project Trust | | | | | | | | | | | | |
4.82% due 02/01/38 | | | 02/02/18 | | | | 18,003,546 | | | | 14,579,738 | |
CFMT LLC | | | | | | | | | | | | |
2022-HB9 3.25% (WAC) due 09/25/371 | | | 09/23/22 | | | | 7,937,458 | | | | 7,667,814 | |
Copper River CLO Ltd. | | | | | | | | | | | | |
2007-1A INC, due 01/20/212 | | | 05/09/14 | | | | — | | | | 150 | |
Irwin Home Equity Loan Trust | | | | | | | | | | | | |
2007-1 6.35% due 08/25/37 | | | 02/27/15 | | | | 202 | | | | 197 | |
LSTAR Securities Investment Ltd. | | | | | | | | | | | | |
2021-1 8.24% (1 Month Term SOFR + 2.91%, Rate Floor: 1.80%) due 02/01/261 | | | 02/04/21 | | | | 37,831,085 | | | | 37,130,302 | |
Morgan Stanley Re-REMIC Trust | | | | | | | | | | | | |
2010-R5 3.47% due 06/26/363 | | | 07/18/14 | | | | 95,179 | | | | 102,318 | |
SPSS | | | | | | | | | | | | |
5.14% due 11/15/52 | | | 03/30/23 | | | | 132,433 | | | | 124,144 | |
Towd Point Revolving Trust | | | | | | | | | | | | |
4.83% due 09/25/64 | | | 03/17/22 | | | | 81,499,719 | | | | 79,238,375 | |
| | | | | | | $ | 157,963,275 | | | $ | 149,277,009 | |
1 | Variable rate security. Rate indicated is the rate effective at September 30, 2023. In some instances, the effective rate is limited by a minimum rate floor or a maximum rate cap established by the issuer. The settlement status of a position may also impact the effective rate indicated. In some cases, a position may be unsettled at period end and may not have a stated effective rate. In instances where multiple underlying reference rates and spread amounts are shown, the effective rate is based on a weighted average. |
2 | Security has no stated coupon. However, it is expected to receive residual cash flow payments on defined deal dates. |
3 | Security is a step up/down bond. The coupon increases or decreases at regular intervals until the bond reaches full maturity. Rate indicated is the rate at September 30, 2023. See table below for additional step information for each security. |
4 | Security is in default of interest and/or principal obligations. |
Note 11 – Line of Credit
The Trust, along with other affiliated trusts, secured a 364-day committed, $1,150,000,000 line of credit from Citibank, N.A., which was in place through September 29, 2023, at which time a new line of credit was entered into in the amount of $1,165,000,000. The Fund may draw (borrow)
| | THE GUGGENHEIM FUNDS ANNUAL REPORT | 115 |
NOTES TO FINANCIAL STATEMENTS (concluded) |
from the line of credit as a temporary measure for emergency purposes, to facilitate redemption requests, or for other short-term liquidity purposes consistent with the Fund’s investment objective and program. For example, it may be advantageous for the Fund to borrow money rather than sell existing portfolio positions to meet redemption requests. Fees related to borrowings, if any, vary under this arrangement between the greater of Citibank’s “base rate”, SOFR plus 1%, or the federal funds rate plus 1/2 of 1%.
The commitment fee that may be paid by the Fund is at an annualized rate of 0.15% of the average daily amount of its allocated unused commitment amount. The commitment fee amount is allocated to the individual Funds based on the respective net assets of each participating Fund and is referenced in the Fund’s Statement of Operations under “Line of credit fees”. The Fund did not have any borrowings under this agreement as of and for the year ended September 30, 2023.
Note 12 – Market Risks
The value of, or income generated by, the investments held by the Fund are subject to the possibility of rapid and unpredictable fluctuation, and loss that may result from various factors. These factors include, among others, developments affecting individual companies, or from broader influences, including real or perceived changes in prevailing interest rates (which have since risen and may continue to rise), changes in inflation rates or expectations about inflation rates (which are currently elevated relative to normal conditions), adverse investor confidence or sentiment, changing economic, political (including geopolitical), social or financial market conditions, increased instability or general uncertainty, environmental disasters, governmental actions, public health emergencies (such as the spread of infectious diseases, pandemics and epidemics), debt crises, actual or threatened wars or other armed conflicts (such as the current Russia-Ukraine conflict and its risk of expansion or collateral economic and other effects) or ratings downgrades, and other similar events, each of which may be temporary or last for extended periods. Moreover, changing economic, political, geopolitical, social, financial market or other conditions in one country or geographic region could adversely affect the value, yield and return of the investments held by the Fund in a different country or geographic region, economy, and market because of the increasingly interconnected global economies and financial markets. The duration and extent of the foregoing types of factors or conditions are highly uncertain and difficult to predict and have in the past, and may in the future, cause volatility and distress in economies and financial markets or other adverse circumstances, which may negatively affect the value of the Fund’s investments and performance of the Fund.
Note 13 – Subsequent Events
The Fund evaluated subsequent events through the date the financial statements are issued and determined there were no material events that would require adjustment to or disclosure in the Fund’s financial statements.
116 | THE GUGGENHEIM FUNDS ANNUAL REPORT | |
REPORT OF INDEPENDENT REGISTERED PUBLIC ACCOUNTING FIRM |
To the Shareholders and the Board of Trustees of Guggenheim Total Return Bond Fund
Opinion on the Financial Statements
We have audited the accompanying statement of assets and liabilities of Guggenheim Total Return Bond Fund (the “Fund”), (one of the funds constituting Guggenheim Funds Trust (the “Trust”)), including the schedule of investments, as of September 30, 2023, and the related statement of operations for the year then ended, the statements of changes in net assets for each of the two years in the period then ended, the financial highlights for each of the five years in the period then ended and the related notes (collectively referred to as the “financial statements”). In our opinion, the financial statements present fairly, in all material respects, the financial position of the Fund (one of the funds constituting Guggenheim Funds Trust) at September 30, 2023, the results of its operations for the year then ended, the changes in its net assets for each of the two years in the period then ended and its financial highlights for each of the five years in the period then ended, in conformity with U.S. generally accepted accounting principles.
Basis for Opinion
These financial statements are the responsibility of the Trust’s management. Our responsibility is to express an opinion on the Fund’s financial statements based on our audits. We are a public accounting firm registered with the Public Company Accounting Oversight Board (United States) (“PCAOB”) and are required to be independent with respect to the Trust in accordance with the U.S. federal securities laws and the applicable rules and regulations of the Securities and Exchange Commission and the PCAOB.
We conducted our audits in accordance with the standards of the PCAOB. Those standards require that we plan and perform the audit to obtain reasonable assurance about whether the financial statements are free of material misstatement, whether due to error or fraud. The Trust is not required to have, nor were we engaged to perform, an audit of the Trust’s internal control over financial reporting. As part of our audits, we are required to obtain an understanding of internal control over financial reporting but not for the purpose of expressing an opinion on the effectiveness of the Trust’s internal control over financial reporting. Accordingly, we express no such opinion.
Our audits included performing procedures to assess the risks of material misstatement of the financial statements, whether due to error or fraud, and performing procedures that respond to those risks. Such procedures included examining, on a test basis, evidence regarding the amounts and disclosures in the financial statements. Our procedures included confirmation of securities owned as of September 30, 2023, by correspondence with the custodian, transfer agent, brokers, and paying agents; when replies were not received from brokers or paying agents, we performed
| | THE GUGGENHEIM FUNDS ANNUAL REPORT | 117 |
REPORT OF INDEPENDENT REGISTERED PUBLIC ACCOUNTING FIRM (concluded) |
other auditing procedures. Our audits also included evaluating the accounting principles used and significant estimates made by management, as well as evaluating the overall presentation of the financial statements. We believe that our audits provide a reasonable basis for our opinion.

We have served as the auditor of one or more Guggenheim investment companies since 1979.
Tysons, Virginia
November 28, 2023
118 | THE GUGGENHEIM FUNDS ANNUAL REPORT | |
OTHER INFORMATION (Unaudited) |
Federal Income Tax Information
This information is being provided as required by the Internal Revenue Code. Amounts shown may differ from those elsewhere in the report because of differences in tax and financial reporting practice.
In January 2024, shareholders will be advised on IRS Form 1099 DIV or substitute 1099 DIV as to the federal tax status of the distributions received by shareholders in the calendar year 2023.
The Fund’s investment income (dividend income plus short-term capital gains, if any) qualifies as follows:
Of the taxable ordinary income distributions paid during the fiscal year ended September 30, 2023, the Fund had the corresponding percentages qualify for the reduced tax rate pursuant to the Jobs and Growth Tax Relief and Reconciliation Act of 2003 or for the dividends received deduction for corporations. See the qualified dividend income and dividend received deduction columns, respectively, in the table below.
Additionally, of the taxable ordinary income distributions paid during the fiscal year ended September 30, 2023, the Fund had the corresponding percentage qualify as interest related dividends as permitted by IRC Section 871(k)(1). See the qualified interest income column in the table below.
| | Qualified
Dividend
Income | | | Dividend
Received
Deduction | | | Qualified
Interest
Income | |
| | | | 1.49 | % | | | 1.34 | % | | | 84.48 | % |
Delivery of Shareholder Reports
Paper copies of the Fund’s annual and semi-annual shareholder reports are not sent by mail, unless you specifically request paper copies of the reports from a fund or from your financial intermediary. Instead, the reports are made available on a website, and you are notified by mail each time a report is posted and provided with a website link to access the report.
You may elect to receive all future shareholder reports in paper free of charge. If you hold shares of a fund directly, you can inform the Fund that you wish to receive paper copies of reports by calling 800.820.0888. If you hold shares of a fund through a financial intermediary, please contact the financial intermediary to make this election. Your election to receive reports in paper may apply to all Guggenheim Funds in which you are invested and may apply to all Guggenheim funds held with your financial intermediary.
Tailored Shareholder Reports for Open-End Mutual Funds and Exchange-Traded Funds
Effective January 24, 2023, the SEC adopted rule and form amendments to require open-end mutual funds and exchange-traded funds registered on Form N-1A to transmit concise and visually engaging streamlined annual and semi-annual reports to shareholders that highlight
| | THE GUGGENHEIM FUNDS ANNUAL REPORT | 119 |
OTHER INFORMATION (Unaudited)(continued) |
key information. Other information, including financial statements, will no longer appear in a streamlined shareholder report but must be available online, delivered free of charge upon request, and filed on a semi-annual basis on Form N-CSR. The rule and form amendments have a compliance date of July 24, 2024. At this time, management is evaluating the impact of these amendments on the shareholder reports for the Fund.
Proxy Voting Information
A description of the policies and procedures that the Trust uses to determine how to vote proxies relating to securities held in the Fund’s portfolio is available, without charge and upon request, by calling 800.820.0888. This information is also available from the EDGAR database on the SEC’s website at https://www.sec.gov.
Information regarding how the Fund voted proxies relating to portfolio securities during the most recent 12-month period ended June 30 is available without charge, upon request, by calling 800.820.0888. This information is also available from the EDGAR database on the SEC’s website at https://www.sec.gov.
Sector Classification
Information in the Schedule of Investments is categorized by sectors using sector-level Classifications defined by the Bloomberg Industry Classification System, a widely recognized industry classification system provider. The Fund’s registration statement has investment policies relating to concentration in specific sectors/industries. For purposes of these investment policies, the Fund usually classifies sectors/industries based on industry-level Classifications used by widely recognized industry classification system providers such as Bloomberg Industry Classification System, Global Industry Classification Standards and Barclays Global Classification Scheme.
Quarterly Portfolio Schedules Information
The Trust files its complete schedule of portfolio holdings with the SEC for the first and third quarters of each fiscal year as an exhibit to its reports on Form N-PORT, and for reporting periods ended prior to March 31, 2019, filed such information on Form N-Q. The Fund’s Forms N-PORT and N-Q are available on the SEC’s website at https://www.sec.gov. Copies of the portfolio holdings are also available to shareholders, without charge and upon request, by calling 800.820.0888.
Report of the Guggenheim Funds Trust Contracts Review Committee
The Board of Trustees of Guggenheim Funds Trust (the “Trust”), including the Independent Trustees, unanimously approved the renewal of the investment management agreements (as applicable to a specific Fund, the “Advisory Agreement” and collectively, the “Advisory Agreements”) with Security Investors, LLC (“Security Investors”) and Guggenheim Partners Investment Management, LLC (“GPIM”) on behalf of the applicable series of the Trust listed
120 | THE GUGGENHEIM FUNDS ANNUAL REPORT | |
OTHER INFORMATION (Unaudited)(continued) |
below (each a “Fund” and collectively, the “Funds”) and the investment sub-advisory agreement between Security Investors and GPIM on behalf of Guggenheim Municipal Income Fund (the “Sub-Advisory Agreement” and together with the “Advisory Agreements,” the “Agreements”):
● Guggenheim Alpha Opportunity Fund (“Alpha Opportunity Fund”)* ● Guggenheim Diversified Income Fund (“Diversified Income Fund”)** ● Guggenheim High Yield Fund
(“High Yield Fund”)* ● Guggenheim Limited Duration Fund (“Limited Duration Fund”)** ● Guggenheim Market Neutral Real Estate Fund (“Market Neutral Real Estate Fund”)** ● Guggenheim Risk Managed Real Estate Fund (“Risk Managed Real Estate Fund”)** ● Guggenheim SMid Cap Value Fund (“SMid Cap Value Fund”)* ● Guggenheim StylePlus—Mid Growth Fund (“StylePlus—Mid Growth Fund”)* ● Guggenheim Ultra Short Duration Fund (“Ultra Short Duration Fund”)** | ● Guggenheim Core Bond Fund
(“Core Bond Fund”)* ● Guggenheim Floating Rate Strategies Fund (“Floating Rate Strategies Fund”)** ● Guggenheim Large Cap Value Fund (“Large Cap Value Fund”)* ● Guggenheim Macro Opportunities Fund (“Macro Opportunities Fund”)**1 ● Guggenheim Municipal Income Fund (“Municipal Income Fund”)* ● Guggenheim Small Cap Value Fund (“Small Cap Value Fund”)* ● Guggenheim StylePlus—Large Core Fund (“StylePlus—Large Core Fund”)* ● Guggenheim Total Return Bond Fund (“Total Return Bond Fund”)** ● Guggenheim World Equity Income Fund (“World Equity Income Fund”)* |
* | Security Investors serves as investment adviser to the Fund. |
** | GPIM serves as investment adviser to the Fund. Unless the context indicates otherwise, GPIM and Security Investors, with respect to their service as investment adviser to the applicable Funds, are each referred to herein as an “Adviser” and together, the “Advisers.” |
1 | GPIM also serves as investment adviser to Guggenheim Macro Opportunities Fund CFC (the “Subsidiary”), a wholly-owned subsidiary of Macro Opportunities Fund that is organized as a limited company under the laws of the Cayman Islands and used by Macro Opportunities Fund to obtain commodities exposure. Pursuant to a separate investment advisory agreement for the Subsidiary (the “Subsidiary Advisory Agreement”), the Subsidiary pays GPIM an advisory fee at the same rate that Macro Opportunities Fund pays GPIM under its Advisory Agreement. The Subsidiary Advisory Agreement does not require annual renewal by the Board and will continue until it is terminated as provided in the Agreement. In addition, GPIM and Macro Opportunities Fund have entered into a separate fee waiver agreement pursuant to which GPIM has contractually agreed to waive the advisory fee it receives from Macro Opportunities Fund in an amount equal to the advisory fee paid to GPIM by the Subsidiary. This undertaking will continue for so long as Macro Opportunities Fund invests in the Subsidiary, and may be terminated only with the approval of the Board. |
| | THE GUGGENHEIM FUNDS ANNUAL REPORT | 121 |
OTHER INFORMATION (Unaudited)(continued) |
Security Investors and GPIM are each an indirect subsidiary of Guggenheim Partners, LLC, a privately-held, global investment and advisory firm (“Guggenheim Partners”). Guggenheim Partners, Security Investors, GPIM and their affiliates may be referred to herein collectively as “Guggenheim.” Security Investors and GPIM are also known as “Guggenheim Investments,” the global asset management and investment advisory division of Guggenheim Partners that includes other affiliated investment management businesses.
At meetings held in person on April 17-18, 2023 (the “April Meeting”) and meetings held by videoconference on May 15, 2023 and in person on May 24, 2023 (the “May Meeting”), the Contracts Review Committee of the Board (the “Committee”), consisting solely of the Independent Trustees, met separately from Guggenheim to consider the proposed renewal of the Agreements. As part of its review process, the Committee was represented by independent legal counsel to the Independent Trustees (“Independent Legal Counsel”), from whom the Independent Trustees received separate legal advice and with whom they met separately. Independent Legal Counsel reviewed and discussed with the Committee various key aspects of the Trustees’ legal responsibilities relating to the proposed renewal of the Agreements and other principal contracts. The Committee took into account various materials received from Guggenheim and Independent Legal Counsel. The Committee also considered the variety of written materials, reports and oral presentations the Board received throughout the year regarding performance and operating results of the Funds, and other information relevant to its evaluation of the Agreements.
In connection with the contract review process, FUSE Research Network LLC (“FUSE”), an independent, third-party research provider, was engaged to prepare advisory contract renewal reports designed specifically to help the Board fulfill its advisory contract renewal responsibilities. The objective of the FUSE reports is to present the subject funds’ relative position regarding fees, expenses and total return performance, with peer group and universe comparisons. The Committee assessed the data provided in the FUSE reports as well as commentary presented by Guggenheim, including, among other things, a summary of notable distinctions between certain Funds and the applicable peer group identified in the FUSE reports and explanations for custom peer groups created for certain Funds that do not fit well into any particular category. The Committee noted that although FUSE’s process typically results in the identification for each Fund of a universe of similar funds for performance comparisons and a narrower group of similar funds from the universe based on asset levels for comparative fee and expense data evaluation (i.e., the peer group), the peer group constituent funds identified by FUSE for Market Neutral Real Estate Fund were the same as the performance universe constituent funds due to the Fund’s investment strategy.
In addition, Guggenheim provided materials and data in response to formal requests for information sent by Independent Legal Counsel on behalf of the Committee. Guggenheim also made a presentation at the April Meeting. Throughout the process, the Committee asked questions of management and requested certain additional information, which Guggenheim provided (collectively with the foregoing reports and materials, the “Contract Review Materials”).
122 | THE GUGGENHEIM FUNDS ANNUAL REPORT | |
OTHER INFORMATION (Unaudited)(continued) |
The Committee considered the Contract Review Materials in the context of its accumulated experience governing the Trust and other Guggenheim funds and weighed the factors and standards discussed with Independent Legal Counsel.
Following an analysis and discussion of relevant factors, including those identified below, and in the exercise of its business judgment, the Committee concluded that it was in the best interest of each Fund to recommend that the Board approve the renewal of the applicable Agreements for an additional annual term. Following its review of the Committee’s recommendation, the Board approved the renewal of the applicable Agreements for each Fund for a one-year period ending August 1, 2024 at a meeting held on May 23-24, 2023 (the “May Board Meeting” and together with the May Meeting, the “May Meetings”) and determined to adopt the Committee’s considerations and conclusions, which follow.
Advisory Agreements
Nature, Extent and Quality of Services Provided by Each Adviser: With respect to the nature, extent and quality of services currently provided by each Adviser, the Committee considered the qualifications, experience and skills of key personnel performing services for the Funds, including those personnel providing compliance and risk oversight, as well as the supervisors and reporting lines for such personnel. The Committee also considered other information, including Guggenheim’s resources and related efforts to retain, attract and motivate capable personnel to serve the Funds. In evaluating Guggenheim’s resources and capabilities, the Committee considered Guggenheim’s commitment to focusing on, and investing resources in support of, funds in the Guggenheim fund complex, including the Funds. The Committee also considered Guggenheim’s discussion of its ongoing review of the Guggenheim fund line-up at the April Meeting and the May Board Meeting. In addition, the Committee considered the acceptability of the terms of each Advisory Agreement, including the scope of services required to be performed by each Adviser.
The Committee’s review of the services provided by Guggenheim to the Funds included consideration of Guggenheim’s investment processes and resulting performance, portfolio oversight and risk management, and the related regular quarterly reports and presentations received by the Board. The Committee took into account the risks borne by Guggenheim in sponsoring and providing services to the Funds, including regulatory, operational, legal and entrepreneurial risks. The Committee considered the resources dedicated by Guggenheim to compliance functions and the reporting made to the Board by Guggenheim compliance personnel regarding Guggenheim’s adherence to regulatory requirements. The Committee also considered the regular reports the Board receives from the Trust’s Chief Compliance Officer regarding compliance policies and procedures established pursuant to Rule 38a-1 under the Investment Company Act of 1940, as amended. In connection with the Committee���s evaluation of the overall package of services provided by Guggenheim, the Committee considered Guggenheim’s administrative services, including its role in supervising, monitoring, coordinating and evaluating the various services provided by the fund administrator, transfer agent, distributor, custodian
| | THE GUGGENHEIM FUNDS ANNUAL REPORT | 123 |
OTHER INFORMATION (Unaudited)(continued) |
and other service providers to the Funds. The Committee evaluated the Office of Chief Financial Officer (the “OCFO”), established to oversee the fund administration, accounting and transfer agency services provided to the Funds and other Guggenheim funds, including the OCFO’s resources, personnel and services provided.
With respect to Municipal Income Fund, the Committee noted that, although Security Investors delegated certain portfolio management responsibilities to the Sub-Adviser, as affiliated companies, both the Adviser and the Sub-Adviser are part of the Guggenheim organization. Further, the Committee took into account Guggenheim’s explanation that investment advisory-related services are provided by many Guggenheim employees under different related legal entities and thus, the services provided by the Adviser on the one hand and the Sub-Adviser on the other, as well as the risks assumed by each party, cannot be ascribed to distinct legal entities.2 As a result, in evaluating the services provided to the Municipal Income Fund under the Sub-Advisory Agreement, the Committee did not separately consider the contributions under the Advisory Agreement and the Sub-Advisory Agreement.
With respect to Guggenheim’s resources and the ability of each Adviser to carry out its responsibilities under the applicable Advisory Agreement, the Chief Financial Officer of Guggenheim Investments reviewed with the Committee financial information concerning the holding company for Guggenheim Investments, Guggenheim Partners Investment Management Holdings, LLC (“GPIMH”), and the various entities comprising Guggenheim Investments, and provided the audited consolidated financial statements of GPIMH. (Thereafter, the Committee received the audited consolidated financial statements of GPIM.)
Based on the foregoing, and based on other information received (both oral and written) at the April Meeting and the May Meetings, as well as other considerations, including the Committee’s knowledge of how each Adviser performs its duties obtained through Board meetings, discussions and reports throughout the year, the Committee concluded that each Adviser and its personnel were qualified to serve the Funds in such capacity and may reasonably be expected to continue to provide a high quality of services under each Advisory Agreement with respect to the Funds.
Investment Performance: The Committee received, for each Fund, investment returns for the since-inception, ten-year, five-year, three-year, one-year and three-month periods ended December 31, 2022, as applicable. In addition, the Committee received a comparison of each Fund’s performance to the performance of a benchmark, a universe of funds and a narrower peer group of similar funds based on asset levels as identified by FUSE (except as noted above with respect to Market Neutral Real Estate Fund), in each case for the same periods, as applicable. The Committee also received from FUSE a description of the methodology for identifying each Fund’s peer group and universe for performance and expense comparisons. The Committee also received
2 | Consequently, except where the context indicates otherwise, references to “Adviser,” “Advisers” or “Sub-Adviser” should be understood as referring to Guggenheim Investments generally and the services it provides under the Agreements. |
124 | THE GUGGENHEIM FUNDS ANNUAL REPORT | |
OTHER INFORMATION (Unaudited)(continued) |
certain performance information as of March 31, 2023. In assessing each Fund’s performance, the Committee considered that the Board receives regular reporting from Guggenheim regarding performance and evaluates performance throughout the year.
In seeking to evaluate Fund performance over a full market cycle, the Committee focused its attention on five-year and three-year performance rankings as compared to the relevant universe of funds. Except as to the individual Funds discussed below, the Committee observed that the returns of each Fund’s Institutional Class shares ranked in the third quartile or better of such Fund’s performance universe for each of the relevant periods considered. In addition, the Committee made the following observations:
Alpha Opportunity Fund: The returns of the Fund’s Institutional Class shares ranked in the 96th and 73rd percentiles of its performance universe for the five-year and three-year periods ended December 31, 2022, respectively. The Committee noted management’s explanation that the Fund’s relative underperformance over the five-year time period was primarily due to the Fund’s beta profile and fundamental factor tilts. The Committee noted management’s statement that the Fund’s lower beta profile to broad market U.S. equities relative to its peers and long exposure to value and short exposure to growth have detracted from investment performance. The Committee also noted management’s statement that as a result of an update in 2021 to the quantitative investment methodology that the Fund employs, as well as the more recent comeback of value-oriented, higher quality names, the Fund experienced performance rankings that compare more favorably relative to its performance universe for the three-year and one-year periods ended December 31, 2022.
Diversified Income Fund: The returns of the Fund’s Institutional Class shares ranked in the 78th and 75th percentiles of its performance universe for the five-year and three-year periods ended December 31, 2022, respectively. The Committee noted management’s explanation that the Fund’s relative underperformance over the five-year time period was primarily due to the Fund’s defensively-positioned portfolio, in particular within its fixed-income sleeve which includes allocations to several Guggenheim fixed-income funds that were defensively positioned beginning in 2018, reflecting Guggenheim’s market views. The Committee also noted management’s statement that the Fund maintained a lower beta profile to equities relative to its peers. The Committee further noted management’s statement that the Fund’s allocation process was updated in 2021, resulting in an increase in the Fund’s equity exposure, and that there was some improvement in the Fund’s performance rankings relative to its performance universe for the three-year and one-year periods ended December 31, 2022. The Committee noted management’s statement that although the Fund’s increased equity exposure was detrimental to the Fund’s performance relative to peers in 2022 due to the poor performance of U.S. equities that year, Guggenheim believes the increased equity exposure will ultimately benefit shareholders and support total return performance in the medium to long term. The Committee also noted the Fund’s small size and considered management’s statements that the Fund continues to be a viable offering and that Guggenheim is able to manage the Fund at its current size.
| | THE GUGGENHEIM FUNDS ANNUAL REPORT | 125 |
OTHER INFORMATION (Unaudited)(continued) |
Market Neutral Real Estate Fund: The returns of the Fund’s Institutional Class shares ranked in the 44th and 89th percentiles of its performance universe for the five-year and three-year periods ended December 31, 2022, respectively. The Committee noted management’s explanation that the Fund’s relative underperformance over the three-year time period was due to underperforming pairs of offsetting long and short positions as well as several stock- and sector-specific issues, and considered that, despite recent underperformance, the Fund experienced performance that ranks in the top half of its performance universe for the five-year period ended December 31, 2022.
Municipal Income Fund: The returns of the Fund’s Institutional Class shares ranked in the 89th and 83rd percentiles of its performance universe for the five-year and three-year periods ended December 31, 2022, respectively. The Committee noted management’s explanation that the Fund’s conservative positioning in high quality, long-duration assets, which underperformed over the past two years due to a risk-on sentiment in 2021 and due to fears of duration risk in 2022, contributed to relative underperformance over the five-year and three-year time periods. The Committee noted management’s statement that the Fund’s allocation to closed-end funds also contributed to relative underperformance in 2022 as the increased cost of leverage weighed on the performance of such funds. The Committee considered management’s belief that an economic downturn that is likely to follow the Federal Reserve’s tightening of financial conditions will disproportionately affect weaker municipal credits and could lead to distress in names the Fund has avoided. The Committee also took into account management’s further discussions of performance attribution and outlook for the Fund at the April Meeting and the May Board Meeting, during which management highlighted that the Fund’s relative underperformance in 2022 was due to the exceptional volatility in the fixed-income markets that year which also impacted relative performance for the trailing five-year and three-year time periods, and noted the overall low dispersion in absolute investment returns among municipal bond funds.
StylePlus—Mid Growth Fund: The returns of the Fund’s Institutional Class shares ranked in the 76th and 67th percentiles of its performance universe for the five-year and three-year periods ended December 31, 2022, respectively. The Committee noted management’s explanation that the Fund’s relative underperformance over the five-year time period can be attributed to the more conservative positioning of the underlying funds in which the Fund invests, resulting in yields insufficient to offset fund fees and other costs, as well as the strategy’s tilt to value-oriented, lower-growth names within the mid-cap growth segment as growth outperformed value securities from 2018 through 2020. The Committee also noted management’s statement that as a result of the more recent comeback of value-oriented, lower-growth names, the Fund experienced performance rankings that compare more favorably relative to its performance universe for the three-year and one-year periods ended December 31, 2022.
Ultra Short Duration Fund: The returns of the Fund’s Institutional Class shares ranked in the 76th and 63rd percentiles of its performance universe for the five-year and three-year periods ended December 31, 2022, respectively. The Committee noted management’s explanation that the Fund’s overweight duration positioning over the five-year time period relative to its performance universe as well as higher allocations to structured credit during the second half of 2022, which
126 | THE GUGGENHEIM FUNDS ANNUAL REPORT | |
OTHER INFORMATION (Unaudited)(continued) |
underperformed corporate credit during that period, contributed to relative underperformance over the five-year time period. The Committee considered management’s expectation that the resetting of higher interest rates should help the Fund to perform well going forward and that the divergence in the relationship between structured and corporate credit should normalize going forward and lead to relative outperformance, noting that there was some improvement in the Fund’s performance ranking relative to its performance universe for the one-year period ended December 31, 2022.
Based on the foregoing, and based on other information received (both oral and written) at the April Meeting and the May Meetings, as well as other considerations, the Committee concluded that, with respect to each Fund other than Municipal Income Fund: (i) the Fund’s performance was acceptable; or (ii) it was satisfied with Guggenheim’s responses and/or efforts to improve investment performance; and, with respect to Municipal Income Fund, it would continue to monitor the Fund’s investment performance.
Comparative Fees, Costs of Services Provided and the Benefits Realized by Each Adviser from Its Relationship with the Funds: The Committee compared each Fund’s contractual advisory fee (which, for Municipal Income Fund, includes the sub-advisory fee paid to the Sub-Adviser), net effective management fee3 and total net expense ratio to the applicable peer group. The Committee also reviewed the median advisory fees and expense ratios, including expense ratio components (e.g., transfer agency fees, administration fees, other operating expenses, distribution fees and fee waivers/reimbursements), of the peer group of funds. In addition, the Committee considered information regarding Guggenheim’s process for evaluating the competitiveness of each Fund’s fees and expenses, noting Guggenheim’s statement that evaluations seek to incorporate a variety of factors with a general focus on ensuring fees and expenses: (i) are competitive; (ii) give consideration to resource support requirements; and (iii) ensure Funds are able to deliver on shareholder return expectations. The Committee also considered Guggenheim’s discussion of information regarding fee and expense trends across the open-end fund industry and its response to those trends with respect to the funds in the Guggenheim fund complex, including the Funds.
As part of its evaluation of each Fund’s advisory fee, the Committee considered how such fees compared to the advisory fee charged by Guggenheim to one or more other clients that it manages pursuant to similar investment strategies, to the extent applicable, noting that, in certain instances, Guggenheim charges a lower advisory fee to such other clients. In this connection, the Committee considered, among other things, Guggenheim’s representations about the significant differences between managing mutual funds as compared to other types of accounts. The Committee also considered Guggenheim’s explanation that lower fees are charged in certain instances due to various other factors, including the scope of contract, type of investors,
3 | The “net effective management fee” for each Fund represents the combined effective advisory fee and administration fee as a percentage of average net assets for the latest fiscal year, after any waivers and/or reimbursements. |
| | THE GUGGENHEIM FUNDS ANNUAL REPORT | 127 |
OTHER INFORMATION (Unaudited)(continued) |
fee structure, applicable legal, governance and capital structures, tax status and historical pricing reasons. In addition, the Committee took into account Guggenheim’s discussion of the regulatory, operational, legal and entrepreneurial risks involved with the Funds as compared to other types of accounts. The Committee concluded that the information it received demonstrated that the aggregate services provided to, or the specific circumstances of, each Fund were sufficiently different from the services provided to, or the specific circumstances of, other clients with similar investment strategies and/or that the risks borne by Guggenheim were sufficiently greater than those associated with managing other clients with similar investment strategies to support the difference in fees.
In further considering the comparative fee and expense data presented in the Contract Review Materials and addressed by Guggenheim, the Committee took into account those Funds with currently effective expense limitation agreements with the Adviser. Except as to the individual Funds discussed below, the Committee observed that the contractual advisory fee, net effective management fee and total net expense ratio for each Fund’s Institutional Class shares each rank in the third quartile or better of such Fund’s peer group. In addition, the Committee made the following observations:
Floating Rate Strategies Fund: The contractual advisory fee for the Fund’s Institutional Class shares ranks in the third quartile (73rd percentile) of its peer group. Although the net effective management fee for the Fund’s Institutional Class shares ranks in the fourth quartile (80th percentile) of its peer group, the Committee considered that the total net expense ratio for the Fund’s Institutional Class shares ranks in the third quartile (67th percentile) of its peer group. The Committee considered the Adviser’s statement explaining the higher fees that performance is driven by a unique investment approach that requires significant resources. In this regard, the Committee took into consideration the strong investment performance of the Fund’s Institutional Class shares for the three-year period ended December 31, 2022. The Committee also took into account the Fund’s currently effective expense limitation agreement with the Adviser.
Limited Duration Fund: The contractual advisory fee for the Fund’s Institutional Class shares ranks in the fourth quartile (87th percentile) of its peer group. The net effective management fee for the Fund’s Institutional Class shares ranks in the third quartile (73rd percentile) of its peer group. The total net expense ratio for the Fund’s Institutional Class shares ranks in the third quartile (67th percentile) of its peer group. The Committee considered the Adviser’s statement explaining the higher fees that performance is driven by a unique investment approach that requires significant resources. In this regard, the Committee took into consideration the strong investment performance of the Fund’s Institutional Class shares for the five-year and three-year periods ended December 31, 2022. The Committee also took into account the Fund’s currently effective expense limitation agreement with the Adviser.
Macro Opportunities Fund: The contractual advisory fee for the Fund’s Institutional Class shares ranks in the fourth quartile (82nd percentile) of its peer group. The net effective management fee for the Fund’s Institutional Class shares ranks in the third quartile (64th percentile) of its
128 | THE GUGGENHEIM FUNDS ANNUAL REPORT | |
OTHER INFORMATION (Unaudited)(continued) |
peer group. The total net expense ratio for the Fund’s Institutional Class shares ranks in the third quartile (73rd percentile) of its peer group. The Committee noted that the Fund is categorized as a non-traditional bond fund which seeks to add value by investing in many non-traditional securities within and outside of fixed income, including equities, currencies, commodities and derivatives, and that peer funds have varying degrees of capability, flexibility and associated fees. The Committee considered the Adviser’s statement explaining the higher fees that performance is driven by a unique investment approach that requires significant resources. In this regard, the Committee took into consideration the strong investment performance of the Fund’s Institutional Class shares for the three-year period ended December 31, 2022. The Committee also took into account the Fund’s currently effective expense limitation agreement and contractual advisory fee breakpoint of 5 basis points on average daily net assets above $5 billion.
Risk Managed Real Estate Fund: The contractual advisory fee for the Fund’s Institutional Class shares ranks in the second quartile (43rd percentile) of its peer group. Although the net effective management fee for the Fund’s Institutional Class shares ranks in the fourth quartile (79th percentile) of its peer group, the Committee considered that the total net expense ratio for the Fund’s Institutional Class shares ranks in the third quartile (57th percentile) of its peer group. The Committee considered the Adviser’s statement that the total expense ratio for the Fund’s Institutional Class shares is competitive and in-line with the peer group average and median and that the Fund’s contractual advisory fee is competitive. The Committee also took into account the Fund’s currently effective expense limitation agreement with the Adviser.
SMid Cap Value Fund: The contractual advisory fee for the Fund’s Institutional Class shares ranks in the first quartile (7th percentile) of its peer group. The net effective management fee for the Fund’s Institutional Class shares ranks in the third quartile (71st percentile) of its peer group. The total net expense ratio for the Fund’s Institutional Class shares ranks in the fourth quartile (79th percentile) of its peer group. The Committee considered that the Fund’s contractual advisory fee ranks favorably in the first quartile of its peer group and reviewed the other expenses that impacted the total net expense ratio. The Committee also took into account the Fund’s currently effective expense limitation agreement with the Adviser.
Total Return Bond Fund: The contractual advisory fee for the Fund’s Institutional Class shares ranks in the fourth quartile (87th percentile) of its peer group. The net effective management fee for the Fund’s Institutional Class shares ranks in the third quartile (67th percentile) of its peer group. The total net expense ratio for the Fund’s Institutional Class shares ranks in the third quartile (73rd percentile) of its peer group. The Committee considered the Adviser’s statement explaining the higher fees that performance is driven by a unique investment approach that requires significant resources. In this regard, the Committee took into consideration the strong investment performance of the Fund’s Institutional Class shares for the three-year period ended December 31, 2022. The Committee also took into account the Fund’s currently effective expense limitation agreement with the Adviser.
| | THE GUGGENHEIM FUNDS ANNUAL REPORT | 129 |
OTHER INFORMATION (Unaudited)(continued) |
With respect to the costs of services provided and benefits realized by Guggenheim Investments from its relationship with the Funds, the Committee reviewed a profitability analysis and data from management for each Fund setting forth the average assets under management for the twelve months ended December 31, 2022, gross revenues received, and expenses incurred directly or through allocations, by Guggenheim Investments, expense waivers (as applicable), earnings and the operating margin/profitability rate, including variance information relative to the foregoing amounts as of December 31, 2021. In addition, the Chief Financial Officer of Guggenheim Investments reviewed with, and addressed questions from, the Committee concerning the expense allocation methodology employed in producing the profitability analysis. In the course of its review of Guggenheim Investments’ profitability, the Committee took into account the methods used by Guggenheim Investments to determine expenses and profit and the representation by the Chief Financial Officer of Guggenheim Investments that such methods provided a reasonable basis for determining the profitability of the applicable Adviser with respect to each Fund. The Committee considered all of the foregoing, among other things, in evaluating the costs of services provided, the profitability to Guggenheim Investments and the profitability rates presented.
The Committee also considered other benefits available to each Adviser because of its relationship with the Funds and noted Guggenheim’s statement that it does not believe the Advisers derive any such “fall-out” benefits. In this regard, the Committee noted Guggenheim’s statement that, although it does not consider such benefits to be fall-out benefits, the Advisers may benefit from certain economies of scale and synergies, such as enhanced visibility of the Advisers, enhanced leverage in fee negotiations and other synergies arising from offering a broad spectrum of products, including the Funds.
Based on the foregoing, and based on other information received (both oral and written) at the April Meeting and the May Meetings, as well as other considerations, the Committee concluded that the comparative fees and the benefits realized by each Adviser from its relationship with the Funds were appropriate and that each Adviser’s profitability from its relationship with the Funds was not unreasonable.
Economies of Scale: The Committee received and considered information regarding whether there have been economies of scale with respect to the management of the Funds as Fund assets grow, whether the Funds have appropriately benefited from any economies of scale, and whether there is potential for realization of any further economies of scale. The Committee considered whether economies of scale in the provision of services to the Funds were being passed along to and shared with the shareholders. The Committee considered that Guggenheim believes it is appropriately sharing potential economies of scale and that Guggenheim’s decrease in 2022 in overall expenses was attributable to decreased product costs driven by lower average assets under management and lower non-recurring costs related to closed-end fund matters as well as a decrease in compensation and benefits. The Committee also considered that although expenses related to investment resources decreased in 2022, Guggenheim’s shared services expenses and certain other expenses increased in 2022.
130 | THE GUGGENHEIM FUNDS ANNUAL REPORT | |
OTHER INFORMATION (Unaudited)(continued) |
The Committee also noted the process employed by the Adviser to evaluate whether it would be appropriate to institute a new breakpoint for a Fund, with consideration given to, among other things: (i) the Fund’s size and trends in asset levels over recent years; (ii) the competitiveness of the expense levels; (iii) whether expense waivers are in place; (iv) changes and trends in revenue and expenses; (v) whether there are any anticipated expenditures that may benefit the Fund in the future; (vi) Fund profit level margins; (vii) relative Fund performance; (viii) the nature, extent and quality of services management provides to the Fund; and (ix) the complexity of the Fund’s investment strategy and the resources required to support the Fund.
As part of its assessment of economies of scale, the Committee took into account Guggenheim’s representation that it seeks to share economies of scale through a number of means, including breakpoints, advisory fees set at competitive rates pre-assuming future asset growth, expense waivers and limitations, and investments in personnel, operations and infrastructure to support the fund business. The Committee also received information regarding amounts that had been shared with shareholders through such breakpoints and expense waivers and limitations. The Committee also noted information from Guggenheim regarding certain challenges and costs associated with managing Funds that have achieved significant scale. Thus, the Committee considered the size of the Funds and the competitiveness of and/or other determinations made regarding the current advisory fee for each Fund, as well as whether a Fund is subject to an expense limitation.
Based on the foregoing, and based on other information received (both oral and written) at the April Meeting and the May Meetings, as well as other considerations, the Committee concluded that the advisory fee for each Fund was reasonable.
Sub-Advisory Agreement for Municipal Income Fund
Nature, Extent and Quality of Services Provided by the Sub-Adviser: As noted above, because both the Adviser and the Sub-Adviser for Municipal Income Fund—Security Investors and GPIM, respectively—are part of and do business as Guggenheim Investments and the services provided by the Adviser on the one hand and the Sub-Adviser on the other cannot be ascribed to distinct legal entities, the Committee did not separately evaluate the services provided under the Advisory Agreement and the Sub-Advisory Agreement. Therefore, the Committee considered the qualifications, experience and skills of the Fund’s portfolio management team in connection with the Committee’s evaluation of Guggenheim’s investment professionals under the Advisory Agreement. With respect to Guggenheim’s resources and the Sub-Adviser’s ability to carry out its responsibilities under the Sub-Advisory Agreement, as noted above, the Committee considered the financial condition of GPIMH and the various entities comprising Guggenheim Investments. The Committee also considered the acceptability of the terms of the Sub-Advisory Agreement, including the scope of services required to be performed by the Sub-Adviser.
Investment Performance: The Committee considered the returns of the Fund under its evaluation of the Advisory Agreement.
| | THE GUGGENHEIM FUNDS ANNUAL REPORT | 131 |
OTHER INFORMATION (Unaudited)(concluded) |
Comparative Fees, Costs of Services Provided and the Benefits Realized by the Sub-Adviser from Its Relationship with the Fund: The Committee considered that the Sub-Advisory Agreement is with an affiliate of the Adviser, that the Adviser compensates the Sub-Adviser from its own fees so that the sub-advisory fee rate for the Fund does not impact the fees paid by the Fund and that the Sub-Adviser’s revenues were included in the calculation of Guggenheim Investments’ profitability. Given its conclusion of the reasonableness of the advisory fee, the Committee concluded that the sub-advisory fee rate for the Fund was reasonable.
Economies of Scale: The Committee recognized that, because the Sub-Adviser’s fees are paid by the Adviser and not the Fund, the analysis of economies of scale was more appropriate in the context of the Committee’s consideration of the Advisory Agreement, which was separately considered. (See “Advisory Agreements – Economies of Scale” above.)
Overall Conclusions
The Committee concluded that the investment advisory fees are fair and reasonable in light of the extent and quality of the services provided and other benefits received and that the renewal of each applicable Agreement is in the best interest of each Fund. In reaching this conclusion, no single factor was determinative or conclusive and each Committee member, in the exercise of his or her informed business judgment, may afford different weights to different factors.
Following its review of the Committee’s analysis and determinations, the Board adopted the considerations and conclusions of the Committee and determined to approve the renewal of the Agreements.
132 | THE GUGGENHEIM FUNDS ANNUAL REPORT | |
INFORMATION ON BOARD OF TRUSTEES AND OFFICERS (Unaudited) |
A Board of Trustees oversees the Trust, as well as other trusts of GI, in which its members have no stated term of service, and continue to serve after election until resignation. The Fund’s Statement of Additional Information includes further information about Fund Trustees and Officers, and can be obtained without charge by visiting guggenheiminvestments.com or by calling 800.820.0888.
Name, Address*
and Year of Birth | Position(s)
Held with
Trust | Term of Office
and Length of
Time Served** | Principal Occupation(s)
During Past Five Years | Number of
Portfolios
in Fund
Complex
Overseen | Other
Directorships Held
by Trustees*** |
INDEPENDENT TRUSTEES: | | | |
Randall C. Barnes (1951) | Trustee and Chair of the Valuation Oversight Committee | Since 2014 (Trustee) Since 2020 (Chair of the Valuation Oversight Committee) | Current: Private Investor (2001-present). Former: Senior Vice President and Treasurer, PepsiCo, Inc. (1993-1997); President, Pizza Hut International (1991-1993); Senior Vice President, Strategic Planning and New Business Development, PepsiCo, Inc. (1987-1990). | 155 | Current: Advent Convertible and Income Fund (2005-present); Purpose Investments Funds (2013-present). Former: Fiduciary/Claymore Energy Infrastructure Fund (2004-2022); Guggenheim Enhanced Equity Income Fund (2005-2021); Guggenheim Credit Allocation Fund (2013-2021). |
| | THE GUGGENHEIM FUNDS ANNUAL REPORT | 133 |
INFORMATION ON BOARD OF TRUSTEES AND OFFICERS (Unaudited)(continued) |
Name, Address*
and Year of Birth | Position(s)
Held with
Trust | Term of Office
and Length of
Time Served** | Principal Occupation(s)
During Past Five Years | Number of
Portfolios
in Fund
Complex
Overseen | Other
Directorships Held
by Trustees*** |
INDEPENDENT TRUSTEES - continued | | |
Angela Brock-Kyle (1959) | Trustee | Since 2019 | Current: Founder and Chief Executive Officer, B.O.A.R.D.S. (2013-present); Director, Mutual Fund Directors Forum (2022-present). Former: Senior Leader, TIAA (financial services firm) (1987-2012). | 154 | Current: Bowhead Insurance GP, LLC (2020-present); Hunt Companies, Inc. (2019-present). Former: Fiduciary/Claymore Energy Infrastructure Fund (2019-2022); Guggenheim Enhanced Equity Income Fund (2019-2021); Guggenheim Credit Allocation Fund (2019-2021); Infinity Property & Casualty Corp. (2014-2018). |
Thomas F. Lydon, Jr. (1960) | Trustee and Chair of the Contracts Review Committee | Since 2019 (Trustee) Since 2020 (Chair of the Contracts Review Committee) | Current: President, Global Trends Investments (registered investment adviser) (1996-present); Chief Executive Officer, ETF Flows, LLC (financial advisor education and research provider) (2019-present); Chief Executive Officer, Lydon Media (2016-present); Director, GDX Index Partners, LLC (index provider) (2021-present); Vice Chairman, VettaFi (financial advisor content, research and digital distribution provider) (2022-present). | 154 | Current: US Global Investors, Inc. (GROW) (1995-present); The 2023 ETF Series Trust (4) (June 2023-present); The 2023 ETF Series Trust II (1) (August 2023-present). Former: Fiduciary/Claymore Energy Infrastructure Fund (2019-2022); Guggenheim Enhanced Equity Income Fund (2019-2021); Guggenheim Credit Allocation Fund (2019-2021); Harvest Volatility Edge Trust (3) (2017-2019). |
134 | THE GUGGENHEIM FUNDS ANNUAL REPORT | |
INFORMATION ON BOARD OF TRUSTEES AND OFFICERS (Unaudited)(continued) |
Name, Address*
and Year of Birth | Position(s)
Held with
Trust | Term of Office
and Length of
Time Served** | Principal Occupation(s)
During Past Five Years | Number of
Portfolios
in Fund
Complex
Overseen | Other
Directorships Held
by Trustees*** |
INDEPENDENT TRUSTEES - continued | | |
Ronald A. Nyberg (1953) | Trustee and Chair of the Nominating and Governance Committee | Since 2014 | Current: Of Counsel, Momkus LLP (law firm) (2016-present). Former: Partner, Nyberg & Cassioppi, LLC (law firm) (2000-2016); Executive Vice President, General Counsel, and Corporate Secretary, Van Kampen Investments (1982-1999). | 155 | Current: Advent Convertible and Income Fund (2003-present); PPM Funds (2) (2018-present); NorthShore-Edward-Elmhurst Health (2012-present). Former: Fiduciary/Claymore Energy Infrastructure Fund (2004-2022); Guggenheim Enhanced Equity Income Fund (2005-2021); Guggenheim Credit Allocation Fund (2013-2021); Western Asset Inflation-Linked Opportunities & Income Fund (2004-2020); Western Asset Inflation-Linked Income Fund (2003-2020). |
| | THE GUGGENHEIM FUNDS ANNUAL REPORT | 135 |
INFORMATION ON BOARD OF TRUSTEES AND OFFICERS (Unaudited)(continued) |
Name, Address*
and Year of Birth | Position(s)
Held with
Trust | Term of Office
and Length of
Time Served** | Principal Occupation(s)
During Past Five Years | Number of
Portfolios
in Fund
Complex
Overseen | Other
Directorships Held
by Trustees*** |
INDEPENDENT TRUSTEES - continued | | |
Sandra G. Sponem (1958) | Trustee and Chair of the Audit Committee | Since 2019 (Trustee) Since 2020 (Chair of the Audit Committee) | Current: Retired. Former: Senior Vice President and Chief Financial Officer, M.A. Mortenson-Companies, Inc. (construction and real estate development company) (2007-2017). | 154 | Current: SPDR Series Trust (81) (2018-present); SPDR Index Shares Funds (30) (2018-present); SSGA Active Trust (14) (2018-present). Former: Fiduciary/Claymore Energy Infrastructure Fund (2019-2022); Guggenheim Enhanced Equity Income Fund (2019-2021); Guggenheim Credit Allocation Fund (2019-2021); SSGA Master Trust (1) (2018-2020). |
136 | THE GUGGENHEIM FUNDS ANNUAL REPORT | |
INFORMATION ON BOARD OF TRUSTEES AND OFFICERS (Unaudited)(continued) |
Name, Address*
and Year of Birth | Position(s)
Held with
Trust | Term of Office
and Length of
Time Served** | Principal Occupation(s)
During Past Five Years | Number of
Portfolios
in Fund
Complex
Overseen | Other
Directorships Held
by Trustees*** |
INDEPENDENT TRUSTEES - concluded | | |
Ronald E. Toupin, Jr. (1958) | Trustee, Chair of the Board and Chair of the Executive Committee | Since 2014 | Current: Portfolio Consultant (2010-present); Member, Governing Council, Independent Directors Council (2013-present); Governor, Board of Governors, Investment Company Institute (2018-present). Former: Member, Executive Committee, Independent Directors Council (2016-2018); Vice President, Manager and Portfolio Manager, Nuveen Asset Management (1998-1999); Vice President, Nuveen Investment Advisory Corp. (1992-1999); Vice President and Manager, Nuveen Unit Investment Trusts (1991-1999); and Assistant Vice President and Portfolio Manager, Nuveen Unit Investment Trusts (1988-1999), each of John Nuveen & Co., Inc. (registered broker dealer) (1982-1999). | 154 | Former: Fiduciary/Claymore Energy Infrastructure Fund (2004-2022); Guggenheim Enhanced Equity Income Fund (2005-2021); Guggenheim Credit Allocation Fund (2013-2021); Western Asset Inflation-Linked Opportunities & Income Fund (2004-2020); Western Asset Inflation-Linked Income Fund (2003-2020). |
| | THE GUGGENHEIM FUNDS ANNUAL REPORT | 137 |
INFORMATION ON BOARD OF TRUSTEES AND OFFICERS (Unaudited)(continued) |
Name, Address*
and Year of Birth | Position(s)
Held with
Trust | Term of Office
and Length of
Time Served** | Principal Occupation(s)
During Past Five Years | Number of
Portfolios
in Fund
Complex
Overseen | Other
Directorships Held
by Trustees*** |
INTERESTED TRUSTEE: | |
Amy J. Lee**** (1961) | Trustee, Vice President and Chief Legal Officer | Since 2018 (Trustee) Since 2014 (Chief Legal Officer) Since 2007 (Vice President) | Current: Interested Trustee, certain other funds in the Fund Complex (2018-present); Chief Legal Officer, certain other funds in the Fund Complex (2014-present); Vice President, certain other funds in the Fund Complex (2007-present); Senior Managing Director, Guggenheim Investments (2012-present). Former: President and Chief Executive Officer, certain other funds in the Fund Complex (2017-2019); Vice President, Associate General Counsel and Assistant Secretary, Security Benefit Life Insurance Company and Security Benefit Corporation (2004-2012). | 154 | Former: Fiduciary/Claymore Energy Infrastructure Fund (2018-2022); Guggenheim Enhanced Equity Income Fund (2018-2021); Guggenheim Credit Allocation Fund (2018-2021). |
* | The business address of each Trustee is c/o Guggenheim Investments, 227 West Monroe Street, Chicago, Illinois 60606. |
** | Each Trustee serves an indefinite term, until his or her successor is elected and qualified. Time served includes time served in the respective position for the Predecessor Corporation. |
*** | Each Trustee also serves on the Boards of Trustees of Guggenheim Funds Trust, Guggenheim Variable Funds Trust, Guggenheim Strategy Funds Trust, Guggenheim Taxable Municipal Bond & Investment Grade Debt Trust, Guggenheim Strategic Opportunities Fund, Guggenheim Active Allocation Fund, Rydex Series Funds, Rydex Dynamic Funds, Rydex Variable Trust and Transparent Value Trust. Messrs. Barnes and Nyberg also serve on the Board of Trustees of Advent Convertible & Income Fund. |
**** | This Trustee is deemed to be an “interested person” of the Fund under the 1940 Act by reason of her position with the Fund’s Adviser and/or the parent of the Adviser. |
138 | THE GUGGENHEIM FUNDS ANNUAL REPORT | |
INFORMATION ON BOARD OF TRUSTEES AND OFFICERS (Unaudited)(continued) |
Name, Address*
and Year of Birth | Position(s)
Held with
Trust | Term of Office
and Length of
Time Served** | Principal Occupation(s)
During Past Five Years |
OFFICERS | | | |
Brian E. Binder (1972) | President and Chief Executive Officer | Since 2018 | Current: President, Mutual Fund Boards, Guggenheim Investments (2022-present); President and Chief Executive Officer, certain other funds in the Fund Complex (2018-present); President, Mutual Funds Boards, Guggenheim Funds Investment Advisors, LLC and Security Investors, LLC (2018-present);Board Member, Guggenheim Partners Investment Funds plc (2022-present); Board Member, Guggenheim Global Investments plc (2022-present); Board Member, Guggenheim Partners Fund Management (Europe) Limited (2018-present). Former: Senior Managing Director and Chief Administrative Officer, Guggenheim Investments (2018-2022); Managing Director and President, Deutsche Funds, and Head of US Product, Trading and Fund Administration, Deutsche Asset Management (2013-2018); Managing Director, Chairman of North American Executive Committee and Head of Business Management and Consulting, Invesco Ltd. (2010-2012). |
James Howley (1972) | Chief Financial Officer, Chief Accounting Officer and Treasurer | Since 2022 | Current: Managing Director, Guggenheim Investments (2004-present); Chief Financial Officer, Chief Accounting Officer, and Treasurer, certain other funds in the Fund Complex (2022-present). Former: Assistant Treasurer, certain other funds in the Fund Complex (2006-2022); Manager, Mutual Fund Administration of Van Kampen Investments, Inc. (1996-2004). |
Mark E. Mathiasen (1978) | Secretary | Since 2014 | Current: Secretary, certain other funds in the Fund Complex (2007-present); Managing Director, Guggenheim Investments (2007-present). |
Glenn McWhinnie (1969) | Assistant Treasurer | Since 2016 | Current: Vice President, Guggenheim Investments (2009-present); Assistant Treasurer, certain other funds in the Fund Complex (2016-present). |
Michael P. Megaris (1984) | Assistant Secretary | Since 2014 | Current: Assistant Secretary, certain other funds in the Fund Complex (2014-present); Managing Director, Guggenheim Investments (2012-present). |
| | THE GUGGENHEIM FUNDS ANNUAL REPORT | 139 |
INFORMATION ON BOARD OF TRUSTEES AND OFFICERS (Unaudited)(continued) |
Name, Address*
and Year of Birth | Position(s)
Held with
Trust | Term of Office
and Length of
Time Served** | Principal Occupation(s)
During Past Five Years |
OFFICERS - continued | |
Elisabeth Miller (1968) | Chief Compliance Officer | Since 2012 | Current: Chief Compliance Officer, certain other funds in the Fund Complex (2012-present); Senior Managing Director, Guggenheim Investments (2012-present); Senior Managing Director, Guggenheim Funds Distributors, LLC (2014-present). Former: Chief Compliance Officer, Security Investors, LLC and Guggenheim Funds Investment Advisors, LLC (2012-2018); Chief Compliance Officer, Guggenheim Distributors, LLC (2009-2014); Senior Manager, Security Investors, LLC (2004-2014); Senior Manager, Guggenheim Distributors, LLC (2004-2014). |
Margaux Misantone (1978) | AML Officer | Since 2017 | Current: Chief Compliance Officer, Security Investors, LLC and Guggenheim Funds Investment Advisors, LLC (2018-present); AML Officer, Security Investors, LLC and certain other funds in the Fund Complex (2017-present); Managing Director, Guggenheim Investments (2015-present). Former: Assistant Chief Compliance Officer, Security Investors, LLC and Guggenheim Funds Investments Advisors, LLC (2015-2018). |
Kimberly J. Scott (1974) | Assistant Treasurer | Since 2014 | Current: Director, Guggenheim Investments (2012-present); Assistant Treasurer, certain other funds in the Fund Complex (2012-present). Former: Financial Reporting Manager, Invesco, Ltd. (2010-2011); Vice President/Assistant Treasurer, Mutual Fund Administration for Van Kampen Investments, Inc./Morgan Stanley Investment Management (2009-2010); Manager of Mutual Fund Administration, Van Kampen Investments, Inc./Morgan Stanley Investment Management (2005-2009). |
Bryan Stone (1979) | Vice President | Since 2014 | Current: Vice President, certain other funds in the Fund Complex (2014-present); Managing Director, Guggenheim Investments (2013-present). Former: Senior Vice President, Neuberger Berman Group LLC (2009-2013); Vice President, Morgan Stanley (2002-2009). |
140 | THE GUGGENHEIM FUNDS ANNUAL REPORT | |
INFORMATION ON BOARD OF TRUSTEES AND OFFICERS (Unaudited)(concluded) |
Name, Address*
and Year of Birth | Position(s)
Held with
Trust | Term of Office
and Length of
Time Served** | Principal Occupation(s)
During Past Five Years |
OFFICERS - concluded | |
Jon Szafran (1989) | Assistant Treasurer | Since 2017 | Current: Director, Guggenheim Investments (2017-present); Assistant Treasurer, certain other funds in the Fund Complex (2017-present). Former: Assistant Treasurer of Henderson Global Funds and Manager of US Fund Administration, Henderson Global Investors (North America) Inc. (“HGINA”), (2017); Senior Analyst of US Fund Administration, HGINA (2014–2017); Senior Associate of Fund Administration, Cortland Capital Market Services, LLC (2013-2014); Experienced Associate, PricewaterhouseCoopers LLP (2012-2013). |
* | The business address of each officer is c/o Guggenheim Investments, 227 West Monroe Street, Chicago, Illinois 60606. |
** | Each officer serves an indefinite term, until his or her successor is duly elected and qualified. |
| | THE GUGGENHEIM FUNDS ANNUAL REPORT | 141 |
GUGGENHEIM INVESTMENTS PRIVACY NOTICE (Unaudited) |
Who We Are
This Privacy Notice describes the data protection practices of Guggenheim Investments. Guggenheim Investments as used herein refers to the affiliated investment management businesses of Guggenheim Partners, LLC: Guggenheim Funds Investment Advisors, LLC, Guggenheim Partners Investment Management, LLC, Guggenheim Funds Distributors, LLC, Security Investors, LLC, Guggenheim Investment Advisors (Europe) Limited, Guggenheim Real Estate, LLC, GS Gamma Advisors, LLC, Guggenheim Partners India Management, LLC, Guggenheim Partners Europe Limited, as well as the funds in the Guggenheim Funds complex (the “Funds”) (“Guggenheim Investments,” “we,” “us,” or “our”).
Guggenheim Partners Investment Management Holdings, LLC, located at 330 Madison Avenue, New York, New York, 10017 is the data controller for your information. The affiliates who are also controllers of certain of your information are: Guggenheim Investment Advisors (Europe) Limited, Guggenheim Partners Europe Limited, Guggenheim Partners, LLC, Guggenheim Funds Investment Advisors, LLC, Guggenheim Partners Investment Management, LLC, Guggenheim Funds Distributors, LLC and Security Investors, LLC, as well as the Funds.
Our Commitment to You
Guggenheim Investments considers your privacy our utmost concern. When you become our client or investor, you entrust us with not only your hard-earned money but also with your personal and financial information. Because we have access to your private information, we hold ourselves to the highest standards in its safekeeping and use. We strictly limit how we share your information with others, whether you are a current or former Guggenheim Investments client or investor.
The Information We Collect About You
We collect certain nonpublic personal information about you from information you provide on applications, other forms, our website, and/or from third parties including investment advisors. This information includes Social Security or other tax identification number, assets, income, tax information, retirement and estate plan information, transaction history, account balance, payment history, bank account information, marital status, family relationships, information that we collect on our website through the use of “cookies,” and other personal information that you or others provide to us. We may also collect such information through your inquiries by mail, e-mail or telephone. We may also collect customer due diligence information, as required by applicable law and regulation, through third party service providers.
How We Handle Your Personal Information
The legal basis for using your information as set out in this Privacy Notice is as follows: (a) use of your personal data is necessary to perform our obligations under any contract with you (such as a contract for us to provide financial services to you); or (b) where use of your personal data is not necessary for performance of a contract, use of your personal data is necessary for our
142 | THE GUGGENHEIM FUNDS ANNUAL REPORT | |
GUGGENHEIM INVESTMENTS PRIVACY NOTICE (Unaudited)(continued) |
legitimate interests or the legitimate interests of others (for example, to enforce the legal terms governing our services, operate and market our website and other services we offer, ensure safe environments for our personnel and others, make and receive payments, prevent fraud and to know the customer to whom we are providing the services). Some processing is done to comply with applicable law.
In addition to the specific uses described above, we also use your information in the following manner:
| | ● | We use your information in connection with servicing your accounts. |
| | ● | We use information to respond to your requests or questions. For example, we might use your information to respond to your customer feedback. |
| | ● | We use information to improve our products and services. We may use your information to make our website and products better. We may use your information to customize your experience with us. |
| | ● | We use information for security purposes. We may use your information to protect our company and our customers. |
| | ● | We use information to communicate with you. For example, we will communicate with you about your account or our relationship. We may contact you about your feedback. We might also contact you about this Privacy Notice. We may also enroll you in our email newsletter. |
| | ● | We use information as otherwise permitted by law, as we may notify you. |
| | ● | Aggregate/Anonymous Data. We may aggregate and/or anonymize any information collected through the website so that such information can no longer be linked to you or your device (“Aggregate/Anonymous Information”). We may use Aggregate/Anonymous Information for any purpose, including without limitation for research and marketing purposes, and may also share such data with any third parties, including advertisers, promotional partners, and sponsors. We do not sell information about current or former clients or their accounts to third parties. Nor do we share this information, except when necessary to complete transactions at your request, to make you aware of investment products and services that we or our affiliates offer, or as permitted or required by law. |
We provide information about you to companies and individuals not affiliated with Guggenheim Investments to complete certain transactions or account changes, or to perform services for us related to your account. For example, if you ask to transfer assets from another financial institution to Guggenheim Investments, we must provide certain information about you to that company to complete the transaction. We provide the third party with only the information necessary to carry out its responsibilities and only for that purpose. And we require these third parties to treat your private information with the same high degree of confidentiality that we do.
| | THE GUGGENHEIM FUNDS ANNUAL REPORT | 143 |
GUGGENHEIM INVESTMENTS PRIVACY NOTICE (Unaudited)(continued) |
To alert you to other Guggenheim Investments products and services, we share your information within our family of affiliated companies. You may limit our sharing with affiliated companies as set out below. We may also share information with any successor to all or part of our business, or in connection with steps leading up to a merger or acquisition. For example, if part of our business was sold we may give customer information as part of that transaction. We may also share information about you with your consent.
We will release information about you if you direct us to do so, if we are compelled by law to do so, or in other circumstances as permitted by law (for example, to protect your account from fraud).
If you close your account(s) or become an inactive client or investor, we will continue to adhere to the privacy policies and practices described in this notice.
Opt-Out Provisions and Your Data Choices
The law allows you to “opt out” of certain kinds of information sharing with third parties. We do not share personal information about you with any third parties that triggers this opt-out right. This means YOU ARE ALREADY OPTED OUT.
When you are no longer our client or investor, we continue to share your information as described in this notice, and you may contact us at any time to limit our sharing by sending an email to CorporateDataPrivacy@GuggenheimPartners.com.
European Union Data Subjects and certain others: In addition to the choices set forth above, residents of the European Union and certain other jurisdictions have certain rights to (1) request access to or rectification or deletion of information we collect about them, (2) request a restriction on the processing of their information, (3) object to the processing of their information, or (4) request the portability of certain information. To exercise these or other rights, please contact us using the contact information below. We will consider all requests and provide our response within the time period stated by applicable law. Please note, however, that certain information may be exempt from such requests in some circumstances, which may include if we need to keep processing your information for our legitimate interests or to comply with a legal obligation. We may request you provide us with information necessary to confirm your identity before responding to your request.
Residents of France and certain other jurisdictions may also provide us with instructions regarding the manner in which we may continue to store, erase and share your information after your death, and where applicable, the person you have designated to exercise these rights after your death.
How We Protect Privacy Online
We take steps to protect your privacy when you use our web site – www.guggenheiminvestments.com – by using secure forms of online communication, including encryption technology, Secure Socket Layer (SSL) protocol, firewalls and user names and
144 | THE GUGGENHEIM FUNDS ANNUAL REPORT | |
GUGGENHEIM INVESTMENTS PRIVACY NOTICE (Unaudited)(concluded) |
passwords. These safeguards vary based on the sensitivity of the information that we collect and store. However, we cannot and do not guarantee that these measures will prevent every unauthorized attempt to access, use, or disclose your information since despite our efforts, no Internet and/or other electronic transmissions can be completely secure. Our web site uses “http cookies”—tiny pieces of information that we ask your browser to store. We use cookies for session management and security features on the Guggenheim Investments web site. We do not use them to pull data from your hard drive, to learn your e-mail address, or to view data in cookies created by other web sites. We will not share the information in our cookies or give others access to it. See the legal information area on our web site for more details about web site security and privacy features.
How We Safeguard Your Personal Information and Data Retention
We restrict access to nonpublic personal information about you to our employees and in some cases to third parties (for example, the service providers described above) as permitted by law. We maintain strict physical, electronic and procedural safeguards that comply with federal standards to guard your nonpublic personal information.
We keep your information for no longer than necessary for the purposes for which it is processed. The length of time for which we retain information depends on the purposes for which we collected and use it and/or as required to comply with applicable laws. Information may persist in copies made for backup and business continuity purposes for additional time.
International Visitors
If you are not a resident of the United States, please be aware that your information may be transferred to, stored and processed in the United States where our servers are located and our databases are operated. The data protection and other laws of the United States and other countries might not be as comprehensive as those in your country.
In such cases, we ensure that a legal basis for such a transfer exists and that adequate protection is provided as required by applicable law, for example, by using standard contractual clauses or by transferring your data to a jurisdiction that has obtained an adequacy finding. Individuals whose data may be transferred on the basis of standard contractual clauses may contact us as described below.
We’ll Keep You Informed
If you have any questions or concerns about how we treat your personal data, we encourage you to consult with us first. You may also contact the relevant supervisory authority.
We reserve the right to modify this policy at any time and will inform you promptly of material changes. You may access our privacy policy from our web site at www.guggenheiminvestments.com. Should you have any questions regarding our privacy policy, contact us by email at CorporateDataPrivacy@GuggenheimPartners.com.
| | THE GUGGENHEIM FUNDS ANNUAL REPORT | 145 |
LIQUIDITY RISK MANAGEMENT PROGRAM (Unaudited) |
In compliance with SEC Rule 22e-4 under the U.S. Investment Company Act of 1940 (the “Liquidity Rule”), the Guggenheim Funds Trust (the “Trust”) has adopted and implemented a written liquidity risk management program (the “Program”) for each series of the Trust (each, a “Fund” and, collectively, the “Funds”). The Trust’s Board of Trustees (the “Board”) has also designated a Program administrator (the “Administrator”).
The Liquidity Rule requires that the Program be reasonably designed to assess and manage each Fund’s liquidity risk. A Fund’s “liquidity risk” (as defined in the Liquidity Rule) is the risk that the Fund could not meet requests to redeem shares issued by the Fund without significant dilution of the remaining investors’ interests in the Fund. The Program includes a number of elements that support the assessment, management and periodic review of liquidity risk. In accordance with the Program, each Fund’s liquidity risk is assessed, managed, and periodically reviewed no less frequently than annually taking into consideration a variety of factors, including, as applicable, the Fund’s investment strategy and liquidity of portfolio investments, short-term and long-term cash flow projections, and holdings of cash and cash equivalents, as well as borrowing arrangements and other funding sources. Certain factors are considered under both normal and reasonably foreseeable stressed conditions. There is no guarantee that the Program will achieve its objective under all circumstances.
Under the Program, each Fund portfolio investment is classified into one of four liquidity categories. The classification is based on a determination of the number of days a Fund reasonably expects to take to convert the investment into cash, or sell or dispose of the investment, in current market conditions without significantly changing the investment’s market value. The Program is reasonably designed to meet Liquidity Rule requirements relating to “highly liquid investment minimums” (i.e., the minimum amount of a Fund’s net assets to be invested in highly liquid investments that are assets) and to monitor compliance with the Liquidity Rule’s limitations on a Fund’s investments in “illiquid investments” (as defined in the Liquidity Rule). Under the Liquidity Rule, a Fund is prohibited from acquiring any illiquid investment if, immediately after the acquisition, the Fund would have invested more than 15% of its net assets in illiquid investments that are assets.
During the period covered by this shareholder report, the Board received a written report (the “Report”) prepared by the Administrator addressing the Program’s operation and assessing the adequacy and effectiveness of its implementation for the period from March 31, 2022, to March 31, 2023. The Report summarized the Administrator’s assessment of the Program’s implementation and concluded that the Program operated effectively, the Program had been and continued to be reasonably designed to assess and manage each Fund’s liquidity risk, and the Program has been adequately and effectively implemented to monitor and respond to the Funds’ liquidity developments, as applicable.
Please refer to the Fund’s prospectus for more information regarding the Fund’s exposure to liquidity risk and other risks to which an investment in the Fund may be subject.
146 | THE GUGGENHEIM FUNDS ANNUAL REPORT | |
This page intentionally left blank.
This page intentionally left blank.
This page intentionally left blank.
This page intentionally left blank.
This page intentionally left blank.
This page intentionally left blank.
This page intentionally left blank.
9.30.2023
Guggenheim Funds Annual Report
| |
Guggenheim Ultra Short Duration Fund | | |
GuggenheimInvestments.com | USD-ANN-0923x0924 |

| | |
DEAR SHAREHOLDER | 2 |
ECONOMIC AND MARKET OVERVIEW | 4 |
ABOUT SHAREHOLDERS’ FUND EXPENSES | 6 |
ULTRA SHORT DURATION FUND | 12 |
NOTES TO FINANCIAL STATEMENTS | 37 |
REPORT OF INDEPENDENT REGISTERED PUBLIC ACCOUNTING FIRM | 57 |
OTHER INFORMATION | 59 |
INFORMATION ON BOARD OF TRUSTEES AND OFFICERS | 73 |
GUGGENHEIM INVESTMENTS PRIVACY NOTICE | 81 |
LIQUIDITY RISK MANAGEMENT PROGRAM | 85 |
| | THE GUGGENHEIM FUNDS ANNUAL REPORT | 1 |
Dear Shareholder:
Guggenheim Partners Investment Management, LLC (“Investment Adviser”) is pleased to present the shareholder report for Guggenheim Ultra Short Duration Fund (“Fund”) for the annual fiscal period ended September 30, 2023 (“Reporting Period”).
The Investment Adviser is responsible for the management of the Fund’s portfolio of investments. It is an affiliate of Guggenheim Partners, LLC (“Guggenheim”), a global diversified financial services firm.
Guggenheim Funds Distributors, LLC is the distributor of the Fund. Guggenheim Funds Distributors, LLC is affiliated with Guggenheim Partners, LLC and the Investment Adviser.
We encourage you to read the Economic and Market Overview section of the report, which follows this letter and then the Managers’ Commentary for the Fund.
We are committed to providing innovative investment solutions and appreciate the trust you place in us.
Sincerely,
Guggenheim Partners Investment Management, LLC
October 31, 2023
Read a prospectus and summary prospectus (if available) carefully before investing. It contains the investment objectives, risks, charges, expenses and other information, which should be considered carefully before investing. Obtain a prospectus and summary prospectus (if available) at guggenheiminvestments.com or call 800.820.0888.
This material is not intended as a recommendation or as investment advice of any kind, including in connection with rollovers, transfers, and distributions. Such material is not provided in a fiduciary capacity, may not be relied upon for or in connection with the making of investment decisions, and does not constitute a solicitation of an offer to buy or sell securities. All content has been provided for informational or educational purposes only and is not intended to be and should not be construed as legal or tax advice and/or a legal opinion. Always consult a financial, tax and/or legal professional regarding your specific situation.
2 | THE GUGGENHEIM FUNDS ANNUAL REPORT | |
Ultra Short Duration Fund may not be suitable for all investors. The investments in fixed-income instruments are subject to the possibility that interest rates could rise, causing the value of the holdings and share price to decline. Investors in asset- backed securities, including collateralized loan obligations (CLOs) generally receive payments that are part interest and part return of principal. These payments may vary based on the rate loans are repaid. Some asset-backed securities may have structures that make their reaction to interest rates and other factors difficult to predict, making their prices volatile and they are subject to liquidity and valuation risk. CLOs bear similar risks to investing in loans directly. Investments in loans involve special types of risks, including credit, interest rate, counterparty, prepayment, liquidity, and valuation risks. Loans are often below investment grade, may be unrated, and typically offer a fixed or floating interest rate. High yield and unrated debt securities are at a greater risk of default than investment grade bonds and may be less liquid, which may increase volatility. The use of leverage, through borrowings or instruments such as derivatives, may cause the fund to be more volatile and riskier than if it had not been leveraged. The more a fund invests in leveraged instruments, the more the leverage will magnify any gains or losses on those investments. Foreign securities carry unique or additional risks when compared to U.S. securities, including currency fluctuations, adverse political and economic developments, unreliable or untimely information, less liquidity and more volatility, limited legal recourse and higher transactional costs, all of which are enhanced when investing in emerging markets. In addition, investments in emerging markets are subject to risks associated with trading in smaller markets, lower volumes of trading, and being subject to lower levels of government regulation and less extensive accounting, financial and other reporting requirements. It is important to note that the Fund is not guaranteed by the U.S. government. Please read the prospectus for more detailed information regarding these and other risks.
| | THE GUGGENHEIM FUNDS ANNUAL REPORT | 3 |
ECONOMIC AND MARKET OVERVIEW (Unaudited) | September 30, 2023 |
Faced with a series of strong economic data releases, the market increasingly appears to be coming to the conclusion that the economy is structurally better able to withstand higher interest rates than it really is. This dynamic can be seen by examining the move in Treasury yields, with the selloff almost entirely being due to real yields rather than inflation expectations, and with the move most pronounced at the long end of the yield curve. Digging further, however, a large portion of this shift is due to a rising term premium (the premium for unknown and unquantified risks in the future, beyond current assumptions on the path of inflation or policy rates), which is indicating greater uncertainty about the outlook.
Many forecasters are extrapolating the current year’s economic strength without recognizing the fact that growth has benefited from a number of factors this year that are unlikely to be repeated, namely an expansion of the fiscal deficit, a slowdown in inflation, and a rebound in labor supply. As these factors fade, the headwinds from tight monetary policy may be more apparent and pronounced. And the longer monetary conditions stay tight, the greater the risk of something breaking (banks and commercial real estate remain key risks). All of this suggests that the recent economic trajectory cannot be assumed to continue, especially given the substantial restraint that could be imposed by the recent rise in long-term borrowing costs.
Uncertainty is elevated given the diverging signals in the data and the fact that many traditional economic models are not “working” as they traditionally would. This uncertainty extends to the U.S. Federal Reserve, which looks set to hold off on further rate hikes while it waits to see if the data start to align with the softening conditions policymakers say they are hearing on the ground. We continue to think the gravitational pull of tight money and credit conditions could result in a slowing economy and cooler inflation over the next year, paving the way for more rate cuts than the market presently expects.
For the Reporting Period, the S&P 500® Index* returned 21.62%. The MSCI Europe-Australasia-Far East (“EAFE”) Index* returned 25.65%. The return of the MSCI Emerging Markets Index* was 11.70%.
In the bond market, the Bloomberg U.S. Aggregate Bond Index* posted a 0.64% return for the Reporting Period, while the Bloomberg U.S. Corporate High Yield Index* returned 10.28%. The return of the ICE Bank of America (“BofA”) 3-Month U.S. Treasury Bill Index* was 4.50% for the Reporting Period.
4 | THE GUGGENHEIM FUNDS ANNUAL REPORT | |
ECONOMIC AND MARKET OVERVIEW (Unaudited)(concluded) | September 30, 2023 |
The opinions and forecasts expressed may not actually come to pass. This information is subject to change at any time, based on market and other conditions, and should not be construed as a recommendation of any specific security or strategy.
*Index Definitions:
The following indices are referenced throughout this report. Indices are unmanaged and not available for direct investment. Index performance does not reflect transaction costs, fees, or expenses.
Bloomberg U.S. Aggregate Bond Index is a broad-based flagship benchmark that measures the investment grade, U.S. dollar-denominated, fixed-rate taxable bond market, including U.S. Treasuries, government-related and corporate securities, mortgage-backed securities or “MBS” (agency fixed-rate and hybrid adjustable-rate mortgage, or “ARM”, pass-throughs), asset-backed securities (“ABS”), and commercial mortgage-backed securities (“CMBS”) (agency and non-agency).
Bloomberg U.S. Corporate High Yield Index measures the U.S. dollar-denominated, high yield, fixed-rate corporate bond market. Securities are classified as high yield if the middle rating of Moody’s, Fitch, and S&P is Ba1/BB +/BB + or below.
Bloomberg 1-3 Month U.S. Treasury Bill Index includes all publicly issued zero-coupon U.S. Treasury Bills that have a remaining maturity of less than 3 months and more than 1 month, are rated investment grade, and have $250 million or more of outstanding face value. In addition, the securities must be denominated in U.S. dollars and must be fixed rate and nonconvertible. The 1-3 Month U.S. Treasury Bill Index is market capitalization weighted and the securities in the index are updated on the last business day of each month.
ICE BofA 3-Month U.S. Treasury Bill Index is an unmanaged market Index of U.S. Treasury securities maturing in 90 days that assumes reinvestment of all income.
MSCI EAFE Index is a free float-adjusted market capitalization index that is designed to measure the equity market performance of developed markets, excluding the U.S. & Canada.
MSCI Emerging Markets Index is a free float-adjusted market capitalization weighted index that is designed to measure equity market performance in the global emerging markets.
S&P 500® Index is a broad-based index, the performance of which is based on the performance of 500 widely held common stocks chosen for market size, liquidity, and industry group representation.
| | THE GUGGENHEIM FUNDS ANNUAL REPORT | 5 |
ABOUT SHAREHOLDERS’ FUND EXPENSES (Unaudited) |
All mutual funds have operating expenses, and it is important for our shareholders to understand the impact of costs on their investments. Shareholders of a fund incur two types of costs: (i) transaction costs, including sales charges (loads) on purchase payments, reinvested dividends, other distributions, and exchange fees, and (ii) ongoing costs, including management fees, administrative services, and shareholder reports, among others. These ongoing costs, or operating expenses, are deducted from a fund’s gross income and reduce the investment return of the fund.
A fund’s expenses are expressed as a percentage of its average net assets, which is known as the expense ratio. The following examples are intended to help investors understand the ongoing costs (in dollars) of investing in a fund and to compare these costs with the ongoing costs of investing in other mutual funds.
The examples are based on an investment of $1,000 made at the beginning of the period and held for the entire six-month period beginning March 31, 2023 and ending September 30, 2023.
The following tables illustrate the Fund’s costs in two ways:
Table 1. Based on actual Fund return: This section helps investors estimate the actual expenses paid over the period. The “Ending Account Value” shown is derived from the Fund’s actual return, and the fifth column shows the dollar amount that would have been paid by an investor who started with $1,000 in the Fund. Investors may use the information here, together with the amount invested, to estimate the expenses paid over the period. Simply divide the Fund’s account value by $1,000 (for example, an $8,600 account value divided by $1,000 = 8.6), then multiply the result by the number provided under the heading “Expenses Paid During Period.”
Table 2. Based on hypothetical 5% return: This section is intended to help investors compare a fund’s cost with those of other mutual funds. The table provides information about hypothetical account values and hypothetical expenses based on the Fund’s actual expense ratio and an assumed rate of return of 5% per year before expenses, which is not the Fund’s actual return. The hypothetical account values and expenses may not be used to estimate the actual ending account balance or expenses paid during the period. The example is useful in making comparisons because the U.S. Securities and Exchange Commission (the “SEC”) requires all mutual funds to calculate expenses based on the 5% return. Investors can assess a Fund’s costs by comparing this hypothetical example with the hypothetical examples that appear in shareholder reports of other funds.
The calculations illustrated above assume no shares were bought or sold during the period. Actual costs may have been higher or lower, depending on the amount of investment and the timing of any purchases or redemptions.
6 | THE GUGGENHEIM FUNDS ANNUAL REPORT | |
ABOUT SHAREHOLDERS’ FUND EXPENSES (Unaudited)(continued) |
Please note that the expenses shown in the table are meant to highlight your ongoing costs only and do not reflect any transactional costs, such as sales charges (loads) on purchase payments, and contingent deferred sales charges (“CDSC”) on redemptions, if any. Therefore, the second table is useful in comparing ongoing costs only, and will not help you determine the relative total costs of owning different funds. In addition, if these transactional costs were included, your costs would have been higher.
More information about the Fund’s expenses, including annual expense ratios for periods up to five years (subject to the Fund’s inception date), can be found in the Financial Highlights section of this report. For additional information on operating expenses and other shareholder costs, please refer to the Fund’s prospectus.
| | THE GUGGENHEIM FUNDS ANNUAL REPORT | 7 |
ABOUT SHAREHOLDERS’ FUND EXPENSES (Unaudited)(concluded) |
| | Expense
Ratio1 | | | Fund
Return | | | Beginning
Account Value
March 31,
2023 | | | Ending
Account Value
September 30,
2023 | | | Expenses
Paid During
Period2 | |
Table 1. Based on actual Fund return3 |
A-Class | | | 0.58 | % | | | 2.95 | % | | $ | 1,000.00 | | | $ | 1,029.50 | | | $ | 2.95 | |
Institutional Class | | | 0.33 | % | | | 3.08 | % | | | 1,000.00 | | | | 1,030.80 | | | | 1.68 | |
|
Table 2. Based on hypothetical 5% return (before expenses) |
A-Class | | | 0.58 | % | | | 5.00 | % | | $ | 1,000.00 | | | $ | 1,022.16 | | | $ | 2.94 | |
Institutional Class | | | 0.33 | % | | | 5.00 | % | | | 1,000.00 | | | | 1,023.41 | | | | 1.67 | |
1 | This ratio represents annualized net expenses, which may include short interest expense. Excluding these expenses, the operating expense ratios for the Fund would be 0.58% and 0.33% for the A-Class and Institutional Class, respectively. Excludes expenses of the underlying funds in which the Fund invests. |
2 | Expenses are equal to the Fund’s annualized expense ratio, net of any applicable fee waivers, multiplied by the average account value over the period, multiplied by 183/365 (to reflect the one-half year period). |
3 | Actual cumulative return at net asset value for the period March 31, 2023 to September 30, 2023. |
8 | THE GUGGENHEIM FUNDS ANNUAL REPORT | |
MANAGERS’ COMMENTARY (Unaudited) | September 30, 2023 |
To Our Shareholders
Guggenheim Partners Investment Management, LLC (“GPIM”) serves as the investment adviser to Guggenheim Ultra Short Duration Fund (“Fund”). The Fund is managed by a team of seasoned professionals at GPIM, including Anne B. Walsh, CFA, JD, Chief Investment Officer and Managing Partner; Steven H. Brown, CFA, Chief Investment Officer, Total Return and Macro Strategies, Senior Managing Director, and Portfolio Manager; Kris L. Dorr, Managing Director and Portfolio Manager; Adam J. Bloch, Managing Director and Portfolio Manager; and Evan L. Serdensky, Director and Portfolio Manager. In the subsequent paragraphs, the investment team discusses the Fund’s performance and the market environment for the 12-month period ended September 30, 2023 (“Reporting Period”).
For the Reporting Period, the Fund returned 6.32% 1, outperforming the Bloomberg 1-3 Month U.S. Treasury Bill Index, the Fund’s benchmark, (“Benchmark”), which returned 4.63% for the same period.
What factors contributed or detracted from the Fund’s performance during the Reporting Period?
For the Reporting Period, the Fund outperformed the Benchmark by 169 basis points. Carry, or earned income, remained a consistent source of relative performance for the Fund. Spreads also added to performance relative to the Benchmark. A combination of the Fund’s allocation and selection biases within corporates and the Fund’s allocation to securitized credit drove most of the active performance versus the Benchmark. Duration detracted from performance as the Fund was positioned modestly overweight duration while the curve bear steepened. Bear steepening refers to yield-curve widening due to long-term rates increasing more than short-term rates, amid a period of falling bond prices and rising yields.
How did the Fund use derivatives during the Reporting Period?
During the Reporting Period, the Fund used forwards and swaps to help manage duration positioning and foreign exchange risk. Over the Reporting Period, interest rate swaps contributed to performance. In addition, the Fund hedged non-USD exposure with foreign-exchange derivatives, which had a negligible impact on performance over the Reporting Period.
How was the Fund positioned at the end of the Reporting Period?
Over the past several quarters the Fund has increasingly prioritized diversification, quality, and liquidity as recession concerns continued to persist. The Fund has steadily moved up-in-quality and more defensively, uniquely without having to sacrifice yield due to the move higher in interest
| | THE GUGGENHEIM FUNDS ANNUAL REPORT | 9 |
MANAGERS’ COMMENTARY (Unaudited)(continued) | September 30, 2023 |
rates. While spreads for many credit sectors have recovered to long-term-average levels, certain segments remain dislocated and offer attractive relative value. Structured credit spreads are especially cheap, with valuations currently wide of the 90th percentile versus current corporate spreads.
Structured credit, the largest allocation in the Fund, represents roughly 61% of the Fund’s holdings. Spreads continued their rebound, but broadly remain wide, both compared to similarly rated investment-grade corporate credit and in an absolute sense. Furthermore, the lower dollar prices of these assets following the rise in interest rates sets up the potential for higher total return opportunities than typically exists in the asset class. With much of its active buying base largely coming from income-focused accounts, structured credit spreads should continue to compress from the resetting higher of yields and the resulting increased interest that comes with it. Within securitized credit, we continue to focus on opportunities senior in the capital structure with sufficient credit enhancement and often unique structural features that limit cash flow variability or extension concerns. We believe the focus on superior structures will be paramount in helping mitigate mark-to-market risks that could emerge should volatility rise.
The corporate credit allocation, which represents roughly 22% of the Fund’s holdings, has increasingly shifted higher in quality. About 21% is in investment-grade-rated corporate credit, and 1% is in below-investment-grade-rated corporate credit, which are broadly weighted toward BB-rated securities. While in our view, overall corporate credit spreads are trading around fair value levels, there remain both idiosyncratic opportunities across certain issuers and industries given tighter credit conditions across capital markets. Front end primary market offerings have priced at especially attractive levels as many investors have pulled back from lending activities.
As of the end of the Reporting Period, the Fund had a duration of 0.6 years. Duration remained constant over the Reporting Period, and we do not envision major shifts to the duration of the Fund moving forward. Lastly, the Fund ended the period with 15% in cash and cash equivalents. Elevated yields on short duration products have made it more attractive to hold higher balances of liquidity with the added benefit of giving the Fund dry powder to take advantage of future market opportunities.
Despite the quarter ended September 30, 2023 continuing a trend of volatility for fixed income returns, our broader macroeconomic views from a fundamental perspective remain consistent. We continue to expect inflation to moderate with time and view the market’s increasingly optimistic
10 | THE GUGGENHEIM FUNDS ANNUAL REPORT | |
MANAGERS’ COMMENTARY (Unaudited)(concluded) | September 30, 2023 |
expectations of a soft landing as misguided. Looking further out into the economic future, we believe the Fed’s restrictive monetary policy could ultimately shepherd in a recession in the next 6-18 months, which we believe will likely be met with lower rates. Ultimately, the current path of weakening growth, high prices, and high interest rates appears unsustainable, and we are already starting to see signs of pressure on consumers and levered corporate borrowers, which could call into question any soft-landing narrative.
Performance displayed represents past performance which is no guarantee of future results.
1 | Performance figures are based on Class A shares and do not reflect taxes that a shareholder would pay on distributions or the redemption of shares. |
The opinions and forecast expressed may not actually come to pass. This information is subject to change at any time, based on market and other conditions, and should not be construed as a recommendation of any specific security or strategy.
| | THE GUGGENHEIM FUNDS ANNUAL REPORT | 11 |
PERFORMANCE REPORT AND FUND PROFILE (Unaudited) | September 30, 2023 |
ULTRA SHORT DURATION FUND
OBJECTIVE: Seeks a high level of income consistent with the preservation of capital.
Holdings Diversification (Market Exposure as % of Net Assets)

“Holdings Diversification (Market Exposure as % of Net Assets)” excludes any temporary cash investments.
Inception Dates: |
A-Class | November 30, 2018 |
Institutional Class | March 11, 2014 |
Ten Largest Holdings | % of Total
Net Assets |
Lake Shore MM CLO III LLC, 7.05% | 2.2% |
Athene Global Funding, 5.87% | 2.1% |
BX Commercial Mortgage Trust, 7.10% | 1.9% |
F&G Global Funding, 0.90% | 1.8% |
ABPCI Direct Lending Fund CLO V Ltd., 7.09% | 1.6% |
NYMT Loan Trust, 1.67% | 1.3% |
BRAVO Residential Funding Trust, 1.62% | 1.3% |
Golub Capital Partners CLO 49M Ltd., 7.12% | 1.2% |
OSAT Trust, 2.12% | 1.2% |
Oak Street Investment Grade Net Lease Fund Series, 1.85% | 1.1% |
Top Ten Total | 15.7% |
| | |
“Ten Largest Holdings” excludes any temporary cash or derivative investments. |
12 | THE GUGGENHEIM FUNDS ANNUAL REPORT | |
PERFORMANCE REPORT AND FUND PROFILE (Unaudited)(continued) | September 30, 2023 |
Portfolio Composition by Quality Rating1 |
Rating | % of Total
Investments |
Fixed Income Instruments | |
AAA | 44.3% |
AA | 10.2% |
A | 15.6% |
BBB | 15.9% |
BB | 1.4% |
B | 0.1% |
NR2 | 10.6% |
Other Instruments | 1.9% |
Total Investments | 100.0% |
1 | Source: BlackRock Solutions. Credit quality ratings are measured on a scale that generally ranges from AAA (highest) to D (lowest). All securities except for those labeled “NR” have been rated by Moody’s, Standard & Poor’s (“S&P”), or Fitch, each of which is a Nationally Recognized Statistical Rating Organization (“NRSRO”). For purposes of this presentation, when ratings are available from more than one agency, the highest rating is used. Guggenheim Investments has converted ratings to the equivalent S&P rating. Security ratings are determined at the time of purchase and may change thereafter. |
2 | NR (not rated) securities do not necessarily indicate low credit quality. |
| | THE GUGGENHEIM FUNDS ANNUAL REPORT | 13 |
PERFORMANCE REPORT AND FUND PROFILE (Unaudited)(concluded) | September 30, 2023 |
Cumulative Fund Performance*
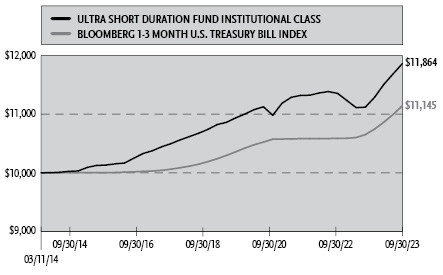
Average Annual Returns*
Periods Ended September 30, 2023
| 1 Year | 5 Year | Since
Inception
(03/11/14) |
Institutional Class Shares | 6.70% | 1.84% | 1.81% |
Bloomberg 1-3 Month U.S. Treasury Bill Index | 4.63% | 1.71% | 1.14% |
| | 1 Year | Since
Inception
(11/30/18) |
A-Class Shares | | 6.32% | 1.59% |
Bloomberg 1-3 Month U.S. Treasury Bill Index | | 4.63% | 1.69% |
* | The performance data above represents past performance that is not predictive of future results. The investment return and principal value of an investment in the Fund will fluctuate so that an investor’s shares, when redeemed, may be worth more or less than their original cost. Returns are historical and include changes in principal and reinvested dividends and capital gains and do not reflect the effect of taxes. The Bloomberg 1-3 Month U.S. Treasury Bill Index is an unmanaged index and, unlike the Fund, has no management fees or operating expenses to reduce its reported return. The graph is based on Institutional Class shares only, performance for A-Class shares will vary due to differences in fee structure. Prior to November 30, 2018, performance for Institutional Class shares reflects the performance of the Guggenheim Strategy Fund I, which did not charge a management fee and was not publicly offered as a separate investment product. |
14 | THE GUGGENHEIM FUNDS ANNUAL REPORT | |
SCHEDULE OF INVESTMENTS | September 30, 2023 |
ULTRA SHORT DURATION FUND | |
| | Shares | | | Value | |
MONEY MARKET FUND† - 2.0% |
Dreyfus Treasury Obligations Cash Management Fund — Institutional Shares, 5.23%1 | | | 10,066,401 | | | $ | 10,066,401 | |
Total Money Market Fund |
(Cost $10,066,401) | | | | | | | 10,066,401 | |
| | | | | | | | | |
| | | Face
Amount | | | | | |
ASSET-BACKED SECURITIES†† - 39.6% |
Collateralized Loan Obligations - 31.2% |
Lake Shore MM CLO III LLC | | | | | | | | |
2021-2A A1R, 7.05% (3 Month Term SOFR + 1.74%, Rate Floor: 1.48%) due 10/17/31◊,2 | | $ | 11,350,000 | | | | 11,190,722 | |
HERA Commercial Mortgage Ltd. | | | | | | | | |
2021-FL1 AS, 6.75% (1 Month Term SOFR + 1.41%, Rate Floor: 1.30%) due 02/18/38◊,2 | | | 5,000,000 | | | | 4,787,988 | |
2021-FL1 A, 6.50% (1 Month Term SOFR + 1.16%, Rate Floor: 1.05%) due 02/18/38◊,2 | | | 3,666,687 | | | | 3,558,266 | |
ABPCI Direct Lending Fund CLO V Ltd. | | | | | | | | |
2021-5A A1R, 7.09% (3 Month Term SOFR + 1.76%, Rate Floor: 1.50%) due 04/20/31◊,2 | | | 8,141,632 | | | | 8,041,511 | |
BXMT Ltd. | | | | | | | | |
2020-FL2 A, 6.35% (1 Month Term SOFR + 1.01%, Rate Floor: 1.01%) due 02/15/38◊,2 | | | 3,408,219 | | | | 3,238,881 | |
2020-FL3 AS, 7.20% (1 Month Term SOFR + 1.86%, Rate Floor: 1.86%) due 11/15/37◊,2 | | | 2,500,000 | | | | 2,338,632 | |
2020-FL2 AS, 6.60% (1 Month Term SOFR + 1.26%, Rate Floor: 1.26%) due 02/15/38◊,2 | | | 2,550,000 | | | | 2,323,570 | |
Palmer Square Loan Funding Ltd. | | | | | | | | |
2021-2A B, 7.04% (3 Month Term SOFR + 1.66%, Rate Floor: 1.66%) due 05/20/29◊,2 | | | 4,500,000 | | | | 4,417,723 | |
2021-1A A1, 6.49% (3 Month Term SOFR + 1.16%, Rate Floor: 1.16%) due 04/20/29◊,2 | | | 1,762,108 | | | | 1,758,393 | |
2022-1A A2, 6.91% (3 Month Term SOFR + 1.60%, Rate Floor: 1.60%) due 04/15/30◊,2 | | | 1,000,000 | | | | 986,197 | |
Golub Capital Partners CLO 49M Ltd. | | | | | | | | |
2021-49A AR, 7.12% (3 Month Term SOFR + 1.53%, Rate Floor: 1.53%) due 08/26/33◊,2 | | | 6,250,000 | | | | 6,135,921 | |
SEE NOTES TO FINANCIAL STATEMENTS. | THE GUGGENHEIM FUNDS ANNUAL REPORT | 15 |
SCHEDULE OF INVESTMENTS (continued) | September 30, 2023 |
ULTRA SHORT DURATION FUND | |
| | Face
Amount | | | Value | |
ABPCI Direct Lending Fund IX LLC | | | | | | | | |
2021-9A A1R, 7.02% (3 Month Term SOFR + 1.66%, Rate Floor: 1.40%) due 11/18/31◊,2 | | $ | 5,700,000 | | | $ | 5,634,033 | |
ABPCI Direct Lending Fund CLO VII, LP | | | | | | | | |
2021-7A A1R, 7.05% (3 Month Term SOFR + 1.69%, Rate Floor: 1.43%) due 10/20/31◊,2 | | | 5,500,000 | | | | 5,431,947 | |
CIFC Funding Ltd. | | | | | | | | |
2018-3A AR, 6.45% (3 Month Term SOFR + 1.13%, Rate Floor: 0.00%) due 04/19/29◊,2 | | | 5,395,904 | | | | 5,386,639 | |
FS Rialto | | | | | | | | |
2021-FL3 B, 7.25% (1 Month Term SOFR + 1.91%, Rate Floor: 1.80%) due 11/16/36◊,2 | | | 5,500,000 | | | | 5,255,368 | |
Cerberus Loan Funding XXXV, LP | | | | | | | | |
2021-5A A, 7.07% (3 Month Term SOFR + 1.76%, Rate Floor: 1.50%) due 09/22/33◊,2 | | | 5,000,000 | | | | 4,955,056 | |
LCCM Trust | | | | | | | | |
2021-FL3 A, 6.90% (1 Month Term SOFR + 1.56%, Rate Floor: 1.56%) due 11/15/38◊,2 | | | 4,100,000 | | | | 4,006,582 | |
2021-FL2 B, 7.35% (1 Month Term SOFR + 2.01%, Rate Floor: 2.01%) due 12/13/38◊,2 | | | 1,000,000 | | | | 945,661 | |
Carlyle Global Market Strategies CLO Ltd. | | | | | | | | |
2018-4A A1RR, 6.57% (3 Month Term SOFR + 1.26%, Rate Floor: 1.00%) due 01/15/31◊,2 | | | 4,769,448 | | | | 4,752,754 | |
Golub Capital Partners CLO 54M, LP | | | | | | | | |
2021-54A A, 7.16% (3 Month Term SOFR + 1.79%, Rate Floor: 1.53%) due 08/05/33◊,2 | | | 4,750,000 | | | | 4,676,123 | |
LCM XXIV Ltd. | | | | | | | | |
2021-24A AR, 6.57% (3 Month Term SOFR + 1.24%, Rate Floor: 0.98%) due 03/20/30◊,2 | | | 4,464,836 | | | | 4,451,442 | |
Owl Rock CLO IV Ltd. | | | | | | | | |
2021-4A A1R, 7.24% (3 Month Term SOFR + 1.86%, Rate Floor: 1.60%) due 08/20/33◊,2 | | | 4,500,000 | | | | 4,432,449 | |
Parliament CLO II Ltd. | | | | | | | | |
2021-2A A, 6.99% (3 Month Term SOFR + 1.61%, Rate Floor: 1.35%) due 08/20/32◊,2 | | | 4,428,536 | | | | 4,378,248 | |
Golub Capital Partners CLO 16 Ltd. | | | | | | | | |
2021-16A A1R2, 7.22% (3 Month Term SOFR + 1.87%, Rate Floor: 1.61%) due 07/25/33◊,2 | | | 4,250,000 | | | | 4,223,591 | |
16 | THE GUGGENHEIM FUNDS ANNUAL REPORT | SEE NOTES TO FINANCIAL STATEMENTS. |
SCHEDULE OF INVESTMENTS (continued) | September 30, 2023 |
ULTRA SHORT DURATION FUND | |
| | Face
Amount | | | Value | |
BRSP Ltd. | | | | | | | | |
2021-FL1 B, 7.34% (1 Month Term SOFR + 2.01%, Rate Floor: 1.90%) due 08/19/38◊,2 | | $ | 4,250,000 | | | $ | 4,035,531 | |
Madison Park Funding XLVIII Ltd. | | | | | | | | |
2021-48A B, 7.03% (3 Month Term SOFR + 1.71%, Rate Floor: 1.71%) due 04/19/33◊,2 | | | 4,000,000 | | | | 3,964,800 | |
Golub Capital Partners CLO 33M Ltd. | | | | | | | | |
2021-33A AR2, 7.51% (3 Month Term SOFR + 2.12%, Rate Floor: 1.86%) due 08/25/33◊,2 | | | 3,750,000 | | | | 3,601,319 | |
Cerberus Loan Funding XXX, LP | | | | | | | | |
2020-3A A, 7.42% (3 Month Term SOFR + 1.85%, Rate Floor: 1.85%) due 01/15/33◊,2 | | | 3,000,000 | | | | 2,989,603 | |
ABPCI Direct Lending Fund CLO II LLC | | | | | | | | |
2021-1A A1R, 7.19% (3 Month Term SOFR + 1.86%, Rate Floor: 1.60%) due 04/20/32◊,2 | | | 3,000,000 | | | | 2,967,245 | |
CHCP Ltd. | | | | | | | | |
2021-FL1 A, 6.50% (1 Month Term SOFR + 1.16%, Rate Floor: 1.05%) due 02/15/38◊,2 | | | 2,973,299 | | | | 2,948,466 | |
BDS Ltd. | | | | | | | | |
2021-FL8 C, 7.00% (1 Month Term SOFR + 1.66%, Rate Floor: 1.55%) due 01/18/36◊,2 | | | 2,000,000 | | | | 1,921,104 | |
2021-FL8 D, 7.35% (1 Month Term SOFR + 2.01%, Rate Floor: 1.90%) due 01/18/36◊,2 | | | 1,000,000 | | | | 946,671 | |
Woodmont Trust | | | | | | | | |
2020-7A A1A, 7.47% (3 Month Term SOFR + 2.16%, Rate Floor: 1.90%) due 01/15/32◊,2 | | | 2,750,000 | | | | 2,742,403 | |
Cerberus Loan Funding XXXII, LP | | | | | | | | |
2021-2A A, 7.19% (3 Month Term SOFR + 1.88%, Rate Floor: 1.88%) due 04/22/33◊,2 | | | 2,500,000 | | | | 2,469,264 | |
ABPCI Direct Lending Fund CLO I LLC | | | | | | | | |
2021-1A A1A2, 7.29% (3 Month Term SOFR + 1.96%, Rate Floor: 1.96%) due 07/20/33◊,2 | | | 2,250,000 | | | | 2,230,686 | |
THL Credit Lake Shore MM CLO I Ltd. | | | | | | | | |
2021-1A A1R, 7.27% (3 Month Term SOFR + 1.96%, Rate Floor: 1.70%) due 04/15/33◊,2 | | | 2,250,000 | | | | 2,219,284 | |
Cerberus Loan Funding XXXIII, LP | | | | | | | | |
2021-3A A, 7.13% (3 Month Term SOFR + 1.82%, Rate Floor: 1.56%) due 07/23/33◊,2 | | | 2,250,000 | | | | 2,216,049 | |
SEE NOTES TO FINANCIAL STATEMENTS. | THE GUGGENHEIM FUNDS ANNUAL REPORT | 17 |
SCHEDULE OF INVESTMENTS (continued) | September 30, 2023 |
ULTRA SHORT DURATION FUND | |
| | Face
Amount | | | Value | |
MidOcean Credit CLO VII | | | | | | | | |
2020-7A A1R, 6.61% (3 Month Term SOFR + 1.30%, Rate Floor: 0.00%) due 07/15/29◊,2 | | $ | 2,206,645 | | | $ | 2,196,793 | |
Shackleton CLO Ltd. | | | | | | | | |
2017-8A A1R, 6.51% (3 Month Term SOFR + 1.18%, Rate Floor: 0.00%) due 10/20/27◊,2 | | | 2,174,601 | | | | 2,171,170 | |
Madison Park Funding LIII Ltd. | | | | | | | | |
2022-53A B, 7.08% (3 Month Term SOFR + 1.75%, Rate Floor: 1.75%) due 04/21/35◊,2 | | | 1,750,000 | | | | 1,708,700 | |
Cerberus Loan Funding XXXI, LP | | | | | | | | |
2021-1A A, 7.07% (3 Month Term SOFR + 1.76%, Rate Floor: 1.50%) due 04/15/32◊,2 | | | 1,680,701 | | | | 1,673,560 | |
Fortress Credit Opportunities XI CLO Ltd. | | | | | | | | |
2018-11A A1T, 6.87% (3 Month Term SOFR + 1.56%, Rate Floor: 0.00%) due 04/15/31◊,2 | | | 1,637,890 | | | | 1,628,503 | |
Allegro CLO IX Ltd. | | | | | | | | |
2018-3A A, 6.74% (3 Month Term SOFR + 1.43%, Rate Floor: 1.17%) due 10/16/31◊,2 | | | 1,500,000 | | | | 1,496,026 | |
BCC Middle Market CLO LLC | | | | | | | | |
2021-1A A1R, 7.07% (3 Month Term SOFR + 1.76%, Rate Floor: 1.50%) due 10/15/33◊,2 | | | 1,250,000 | | | | 1,233,987 | |
Greystone Commercial Real Estate Notes | | | | | | | | |
2021-FL3 B, 7.10% (1 Month Term SOFR + 1.76%, Rate Floor: 1.65%) due 07/15/39◊,2 | | | 1,000,000 | | | | 951,322 | |
STWD Ltd. | | | | | | | | |
2021-FL2 B, 7.25% (1 Month Term SOFR + 1.91%, Rate Floor: 1.80%) due 04/18/38◊,2 | | | 1,000,000 | | | | 909,185 | |
Wellfleet CLO Ltd. | | | | | | | | |
2020-2A A1R, 6.65% (3 Month Term SOFR + 1.32%, Rate Floor: 0.00%) due 10/20/29◊,2 | | | 900,917 | | | | 899,565 | |
ACRE Commercial Mortgage Ltd. | | | | | | | | |
2021-FL4 AS, 6.55% (1 Month Term SOFR + 1.21%, Rate Floor: 1.10%) due 12/18/37◊,2 | | | 850,000 | | | | 820,149 | |
Cerberus Loan Funding XXXVI, LP | | | | | | | | |
2021-6A A, 6.97% (3 Month Term SOFR + 1.66%, Rate Floor: 1.40%) due 11/22/33◊,2 | | | 710,254 | | | | 708,145 | |
18 | THE GUGGENHEIM FUNDS ANNUAL REPORT | SEE NOTES TO FINANCIAL STATEMENTS. |
SCHEDULE OF INVESTMENTS (continued) | September 30, 2023 |
ULTRA SHORT DURATION FUND | |
| | Face
Amount | | | Value | |
LoanCore Issuer Ltd. | | | | | | | | |
2019-CRE2 AS, 6.95% (1 Month Term SOFR + 1.61%, Rate Floor: 1.50%) due 05/15/36◊,2 | | $ | 708,165 | | | $ | 692,895 | |
Venture XIV CLO Ltd. | | | | | | | | |
2020-14A ARR, 6.68% (3 Month Term SOFR + 1.29%, Rate Floor: 1.03%) due 08/28/29◊,2 | | | 664,314 | | | | 662,896 | |
Fortress Credit Opportunities VI CLO Ltd. | | | | | | | | |
2018-6A A2R, 7.14% (3 Month Term SOFR + 1.86%, Rate Floor: 0.00%) due 07/10/30◊,2 | | | 250,000 | | | | 246,927 | |
2018-6A A1TR, 6.90% (3 Month Term SOFR + 1.62%, Rate Floor: 0.00%) due 07/10/30◊,2 | | | 167,680 | | | | 165,557 | |
Golub Capital Partners CLO 17 Ltd. | | | | | | | | |
2017-17A A1R, 7.26% (3 Month Term SOFR + 1.91%, Rate Floor: 0.00%) due 10/25/30◊,2 | | | 281,968 | | | | 280,767 | |
Voya CLO Ltd. | | | | | | | | |
2019-2A X, 6.24% (3 Month Term SOFR + 0.91%, Rate Floor: 0.65%) due 07/20/32◊,2 | | | 93,750 | | | | 93,731 | |
Total Collateralized Loan Obligations | | | 161,100,000 | |
| | | | | | | | | |
Financial - 2.6% |
Madison Avenue Secured Funding Trust | | | | | | | | |
2022-1, 7.18% (1 Month Term SOFR + 1.85%, Rate Floor: 0.00%) due 10/12/23◊,†††,2 | | | 4,075,000 | | | | 4,075,000 | |
2023-1, 7.32% (1 Month Term SOFR + 2.00%, Rate Floor: 2.00%) due 03/04/24◊,†††,2 | | | 2,450,000 | | | | 2,450,000 | |
Station Place Securitization Trust | | | | | | | | |
2022-SP1, 7.18% (1 Month Term SOFR + 1.85%, Rate Floor: 0.00%) due 10/12/23◊,†††,2 | | | 4,075,000 | | | | 4,075,000 | |
Madison Avenue Secured Funding Trust | | | | | | | | |
due 10/15/24◊ | | | 1,800,000 | | | | 1,800,000 | |
Station Place Securitization Trust | | | | | | | | |
due 10/15/24◊ | | | 900,000 | | | | 900,000 | |
Total Financial | | | 13,300,000 | |
| | | | | | | | | |
Whole Business - 1.7% |
Domino’s Pizza Master Issuer LLC | | | | | | | | |
2018-1A, 4.33% due 07/25/482 | | | 4,276,725 | | | | 3,970,216 | |
Taco Bell Funding LLC | | | | | | | | |
2021-1A, 1.95% due 08/25/512 | | | 3,193,125 | | | | 2,760,993 | |
Wingstop Funding LLC | | | | | | | | |
2020-1A, 2.84% due 12/05/502 | | | 1,329,750 | | | | 1,150,478 | |
SEE NOTES TO FINANCIAL STATEMENTS. | THE GUGGENHEIM FUNDS ANNUAL REPORT | 19 |
SCHEDULE OF INVESTMENTS (continued) | September 30, 2023 |
ULTRA SHORT DURATION FUND | |
| | Face
Amount | | | Value | |
SERVPRO Master Issuer LLC | | | | | | | | |
2019-1A, 3.88% due 10/25/492 | | $ | 962,500 | | | $ | 878,814 | |
Total Whole Business | | | 8,760,501 | |
| | | | | | | | | |
Transport-Container - 1.7% |
Triton Container Finance VIII LLC | | | | | | | | |
2021-1A, 1.86% due 03/20/462 | | | 5,709,375 | | | | 4,767,121 | |
CLI Funding VIII LLC | | | | | | | | |
2021-1A, 1.64% due 02/18/462 | | | 2,381,399 | | | | 2,033,670 | |
Textainer Marine Containers VII Ltd. | | | | | | | | |
2021-1A, 1.68% due 02/20/462 | | | 1,666,000 | | | | 1,404,872 | |
2020-1A, 2.73% due 08/21/452 | | | 592,508 | | | | 538,186 | |
Total Transport-Container | | | 8,743,849 | |
| | | | | | | | | |
Net Lease - 1.5% |
Oak Street Investment Grade Net Lease Fund Series | | | | | | | | |
2020-1A, 1.85% due 11/20/502 | | | 6,416,479 | | | | 5,687,766 | |
CF Hippolyta Issuer LLC | | | | | | | | |
2021-1A, 1.98% due 03/15/612 | | | 2,120,507 | | | | 1,815,126 | |
Total Net Lease | | | 7,502,892 | |
| | | | | | | | | |
Transport-Aircraft - 0.9% |
Raspro Trust | | | | | | | | |
2005-1A, 6.18% (3 Month Term SOFR + 0.93%, Rate Floor: 0.93%) due 03/23/24◊,2 | | | 4,727,726 | | | | 4,697,270 | |
Total Asset-Backed Securities |
(Cost $211,103,495) | | | 204,104,512 | |
CORPORATE BONDS†† - 22.6% |
Financial - 11.1% |
Athene Global Funding | | | | | | | | |
5.87% (SOFR Compounded Index + 0.56%) due 08/19/24◊,2 | | | 11,000,000 | | | | 10,892,196 | |
F&G Global Funding | | | | | | | | |
0.90% due 09/20/242 | | | 9,700,000 | | | | 9,159,705 | |
Credit Suisse AG NY | | | | | | | | |
5.73% (SOFR Compounded Index + 0.39%) due 02/02/24◊ | | | 5,250,000 | | | | 5,239,388 | |
Macquarie Group Ltd. | | | | | | | | |
1.20% due 10/14/252,3 | | | 5,250,000 | | | | 4,978,148 | |
Goldman Sachs Group, Inc. | | | | | | | | |
6.02% (SOFR + 0.70%) due 01/24/25◊ | | | 2,600,000 | | | | 2,591,108 | |
Citigroup, Inc. | | | | | | | | |
6.01% (SOFR + 0.69%) due 01/25/26◊ | | | 2,550,000 | | | | 2,539,723 | |
Jackson National Life Global Funding | | | | | | | | |
1.75% due 01/12/252 | | | 2,600,000 | | | | 2,441,210 | |
Starwood Property Trust, Inc. | | | | | | | | |
3.75% due 12/31/242 | | | 2,550,000 | | | | 2,427,746 | |
Bank of Nova Scotia | | | | | | | | |
6.30% (SOFR Compounded Index + 0.96%) due 03/11/24◊ | | | 2,400,000 | | | | 2,405,232 | |
Morgan Stanley | | | | | | | | |
6.26% (SOFR + 0.95%) due 02/18/26◊ | | | 2,400,000 | | | | 2,402,390 | |
FS KKR Capital Corp. | | | | | | | | |
4.25% due 02/14/252 | | | 2,450,000 | | | | 2,345,861 | |
20 | THE GUGGENHEIM FUNDS ANNUAL REPORT | SEE NOTES TO FINANCIAL STATEMENTS. |
SCHEDULE OF INVESTMENTS (continued) | September 30, 2023 |
ULTRA SHORT DURATION FUND | |
| | Face
Amount | | | Value | |
Rocket Mortgage LLC / Rocket Mortgage Company-Issuer, Inc. | | | | | | | | |
2.88% due 10/15/262 | | $ | 2,650,000 | | | $ | 2,333,829 | |
American Equity Investment Life Holding Co. | | | | | | | | |
5.00% due 06/15/27 | | | 2,150,000 | | | | 2,019,492 | |
GA Global Funding Trust | | | | | | | | |
1.63% due 01/15/262 | | | 1,300,000 | | | | 1,160,376 | |
OneMain Finance Corp. | | | | | | | | |
3.50% due 01/15/27 | | | 1,150,000 | | | | 984,687 | |
Brighthouse Financial Global Funding | | | | | | | | |
6.05% (SOFR + 0.76%) due 04/12/24◊,2 | | | 900,000 | | | | 895,752 | |
Peachtree Corners Funding Trust | | | | | | | | |
3.98% due 02/15/252 | | | 650,000 | | | | 627,505 | |
ING Groep N.V. | | | | | | | | |
6.53% (3 Month USD LIBOR + 1.00%) due 10/02/23◊ | | | 500,000 | | | | 500,000 | |
First American Financial Corp. | | | | | | | | |
4.60% due 11/15/24 | | | 500,000 | | | | 490,317 | |
Fidelity & Guaranty Life Holdings, Inc. | | | | | | | | |
5.50% due 05/01/252 | | | 400,000 | | | | 390,503 | |
Apollo Management Holdings, LP | | | | | | | | |
4.00% due 05/30/242 | | | 350,000 | | | | 344,828 | |
Total Financial | | | 57,169,996 | |
| | | | | | | | | |
Industrial - 3.7% |
Ryder System, Inc. | | | | | | | | |
3.35% due 09/01/25 | | | 4,820,000 | | | | 4,595,755 | |
IP Lending V Ltd. | | | | | | | | |
5.13% due 04/02/26†††,2 | | | 4,700,000 | | | | 4,371,000 | |
TD SYNNEX Corp. | | | | | | | | |
1.25% due 08/09/24 | | | 2,400,000 | | | | 2,292,802 | |
Silgan Holdings, Inc. | | | | | | | | |
1.40% due 04/01/262 | | | 2,350,000 | | | | 2,084,463 | |
Vontier Corp. | | | | | | | | |
1.80% due 04/01/26 | | | 2,150,000 | | | | 1,925,714 | |
Jabil, Inc. | | | | | | | | |
1.70% due 04/15/26 | | | 650,000 | | | | 583,913 | |
4.25% due 05/15/27 | | | 600,000 | | | | 567,413 | |
Berry Global, Inc. | | | | | | | | |
1.65% due 01/15/27 | | | 1,100,000 | | | | 945,471 | |
Penske Truck Leasing Company LP / PTL Finance Corp. | | | | | | | | |
2.70% due 11/01/242 | | | 900,000 | | | | 866,372 | |
Stericycle, Inc. | | | | | | | | |
5.38% due 07/15/242 | | | 550,000 | | | | 542,902 | |
Weir Group plc | | | | | | | | |
2.20% due 05/13/262 | | | 440,000 | | | | 395,387 | |
Total Industrial | | | 19,171,192 | |
| | | | | | | | | |
Consumer, Non-cyclical - 2.7% |
Global Payments, Inc. | | | | | | | | |
1.50% due 11/15/24 | | | 5,700,000 | | | | 5,414,274 | |
Element Fleet Management Corp. | | | | | | | | |
1.60% due 04/06/242 | | | 4,900,000 | | | | 4,782,422 | |
Triton Container International Ltd. | | | | | | | | |
2.05% due 04/15/262 | | | 2,200,000 | | | | 1,959,965 | |
1.15% due 06/07/242 | | | 1,700,000 | | | | 1,635,961 | |
General Mills, Inc. | | | | | | | | |
6.58% (3 Month Term SOFR + 1.27%) due 10/17/23◊ | | | 200,000 | | | | 200,053 | |
Total Consumer, Non-cyclical | | | 13,992,675 | |
| | | | | | | | | |
Consumer, Cyclical - 1.7% |
Warnermedia Holdings, Inc. | | | | | | | | |
3.64% due 03/15/25 | | | 5,700,000 | | | | 5,497,592 | |
Hyatt Hotels Corp. | | | | | | | | |
1.80% due 10/01/24 | | | 3,500,000 | | | | 3,357,716 | |
Total Consumer, Cyclical | | | 8,855,308 | |
| | | | | | | | | |
SEE NOTES TO FINANCIAL STATEMENTS. | THE GUGGENHEIM FUNDS ANNUAL REPORT | 21 |
SCHEDULE OF INVESTMENTS (continued) | September 30, 2023 |
ULTRA SHORT DURATION FUND | |
| | Face
Amount | | | Value | |
Communications - 1.2% |
Rogers Communications, Inc. | | | | | | | | |
2.95% due 03/15/25 | | $ | 2,400,000 | | | $ | 2,288,929 | |
T-Mobile USA, Inc. | | | | | | | | |
2.63% due 04/15/26 | | | 1,600,000 | | | | 1,479,734 | |
2.25% due 02/15/26 | | | 600,000 | | | | 552,339 | |
Paramount Global | | | | | | | | |
4.75% due 05/15/25 | | | 982,000 | | | | 955,120 | |
Cogent Communications Group, Inc. | | | | | | | | |
3.50% due 05/01/262 | | | 434,000 | | | | 400,886 | |
Sprint Spectrum Company LLC / Sprint Spectrum Co II LLC / Sprint Spectrum Co III LLC | | | | | | | | |
4.74% due 03/20/252 | | | 337,500 | | | | 333,920 | |
Total Communications | | | 6,010,928 | |
| | | | | | | | | |
Technology - 1.1% |
CDW LLC / CDW Finance Corp. | | | | | | | | |
2.67% due 12/01/26 | | | 4,300,000 | | | | 3,878,192 | |
Qorvo, Inc. | | | | | | | | |
1.75% due 12/15/242 | | | 2,050,000 | | | | 1,926,115 | |
Total Technology | | | 5,804,307 | |
| | | | | | | | | |
Utilities - 0.9% |
Alexander Funding Trust | | | | | | | | |
1.84% due 11/15/232 | | | 4,300,000 | | | | 4,271,573 | |
AES Corp. | | | | | | | | |
3.30% due 07/15/252 | | | 300,000 | | | | 284,153 | |
NRG Energy, Inc. | | | | | | | | |
3.75% due 06/15/242 | | | 275,000 | | | | 269,285 | |
Total Utilities | | | 4,825,011 | |
| | | | | | | | | |
Basic Materials - 0.2% |
International Flavors & Fragrances, Inc. | | | | | | | | |
1.23% due 10/01/252 | | | 540,000 | | | | 484,055 | |
Anglo American Capital plc | | | | | | | | |
5.38% due 04/01/252 | | | 450,000 | | | | 443,964 | |
Total Basic Materials | | | 928,019 | |
| | | | | | | | | |
Total Corporate Bonds |
(Cost $122,909,822) | | | 116,757,436 | |
| | | | | | | | | |
COLLATERALIZED MORTGAGE OBLIGATIONS†† - 20.7% |
Residential Mortgage-Backed Securities - 15.9% |
CSMC Trust | | | | | | | | |
2021-RPL1, 1.67% (WAC) due 09/27/60◊,2 | | | 5,057,819 | | | | 4,655,570 | |
2021-RPL7, 1.93% (WAC) due 07/27/61◊,2 | | | 2,220,941 | | | | 2,032,568 | |
2020-RPL5, 3.02% (WAC) due 08/25/60◊,2 | | | 1,875,957 | | | | 1,841,724 | |
2021-RPL4, 1.80% (WAC) due 12/27/60◊,2 | | | 1,284,322 | | | | 1,195,716 | |
2020-NQM1, 1.21% due 05/25/652,4 | | | 1,136,804 | | | | 1,013,629 | |
BRAVO Residential Funding Trust | | | | | | | | |
2021-C, 1.62% due 03/01/612,4 | | | 7,447,977 | | | | 6,547,185 | |
2022-R1, 3.13% due 01/29/702,4 | | | 2,849,095 | | | | 2,552,858 | |
2021-HE1, 6.17% (30 Day Average SOFR + 0.85%, Rate Floor: 0.00%) due 01/25/70◊,2 | | | 804,629 | | | | 797,695 | |
22 | THE GUGGENHEIM FUNDS ANNUAL REPORT | SEE NOTES TO FINANCIAL STATEMENTS. |
SCHEDULE OF INVESTMENTS (continued) | September 30, 2023 |
ULTRA SHORT DURATION FUND | |
| | Face
Amount | | | Value | |
2021-HE2, 6.17% (30 Day Average SOFR + 0.85%, Rate Floor: 0.00%) due 11/25/69◊,2 | | $ | 367,881 | | | $ | 361,886 | |
PRPM LLC | | | | | | | | |
2021-5, 1.79% due 06/25/262,4 | | | 3,338,442 | | | | 3,079,191 | |
2022-1, 3.72% due 02/25/272,4 | | | 3,195,920 | | | | 3,059,090 | |
2021-RPL2, 2.24% (WAC) due 10/25/51◊,2 | | | 2,000,000 | | | | 1,545,877 | |
2021-8, 1.74% (WAC) due 09/25/26◊,2 | | | 1,670,951 | | | | 1,532,185 | |
NYMT Loan Trust | | | | | | | | |
2021-SP1, 1.67% due 08/25/612,4 | | | 7,402,216 | | | | 6,706,541 | |
2022-SP1, 5.25% due 07/25/622,4 | | | 1,816,387 | | | | 1,752,289 | |
Legacy Mortgage Asset Trust | | | | | | | | |
2021-GS4, 1.65% due 11/25/602,4 | | | 3,173,026 | | | | 2,872,248 | |
2021-GS3, 1.75% due 07/25/612,4 | | | 3,078,562 | | | | 2,867,061 | |
2021-GS2, 1.75% due 04/25/612,4 | | | 1,423,377 | | | | 1,314,706 | |
2021-GS5, 2.25% due 07/25/672,4 | | | 936,860 | | | | 864,487 | |
Verus Securitization Trust | | | | | | | | |
2021-5, 1.37% (WAC) due 09/25/66◊,2 | | | 2,049,583 | | | | 1,611,759 | |
2021-6, 1.89% (WAC) due 10/25/66◊,2 | | | 1,791,698 | | | | 1,422,269 | |
2020-5, 1.22% due 05/25/652,4 | | | 1,495,511 | | | | 1,372,894 | |
2021-4, 1.35% (WAC) due 07/25/66◊,2 | | | 990,611 | | | | 746,492 | |
2021-3, 1.44% (WAC) due 06/25/66◊,2 | | | 593,994 | | | | 489,780 | |
2019-4, 2.85% due 11/25/592,4 | | | 401,773 | | | | 382,984 | |
2020-1, 2.42% due 01/25/602,4 | | | 305,467 | | | | 287,714 | |
2019-4, 2.64% due 11/25/592,4 | | | 199,120 | | | | 189,571 | |
OSAT Trust | | | | | | | | |
2021-RPL1, 2.12% due 05/25/652,4 | | | 6,587,095 | | | | 6,037,794 | |
Imperial Fund Mortgage Trust | | | | | | | | |
2022-NQM2, 4.02% (WAC) due 03/25/67◊,2 | | | 4,220,250 | | | | 3,703,708 | |
Towd Point Revolving Trust | | | | | | | | |
4.83% due 09/25/645 | | | 3,250,000 | | | | 3,159,813 | |
CFMT LLC | | | | | | | | |
2022-HB9, 3.25% (WAC) due 09/25/37◊ | | | 2,315,720 | | | | 2,072,382 | |
2021-HB5, 0.80% (WAC) due 02/25/31◊,2 | | | 1,069,482 | | | | 1,044,060 | |
Structured Asset Securities Corporation Mortgage Loan Trust | | | | | | | | |
2008-BC4, 6.06% (1 Month Term SOFR + 0.74%, Rate Floor: 0.63%) due 11/25/37◊ | | | 1,881,970 | | | | 1,782,005 | |
New Residential Mortgage Loan Trust | | | | | | | | |
2019-1A, 3.50% (WAC) due 10/25/59◊,2 | | | 1,064,781 | | | | 968,354 | |
2018-2A, 3.50% (WAC) due 02/25/58◊,2 | | | 626,588 | | | | 566,938 | |
SEE NOTES TO FINANCIAL STATEMENTS. | THE GUGGENHEIM FUNDS ANNUAL REPORT | 23 |
SCHEDULE OF INVESTMENTS (continued) | September 30, 2023 |
ULTRA SHORT DURATION FUND | |
| | Face
Amount | | | Value | |
LSTAR Securities Investment Ltd. | | | | | | | | |
2021-1, 8.24% (1 Month Term SOFR + 2.91%, Rate Floor: 1.80%) due 02/01/26◊,5 | | $ | 1,320,857 | | | $ | 1,296,390 | |
CSMC | | | | | | | | |
2021-NQM8, 2.41% (WAC) due 10/25/66◊,2 | | | 1,570,620 | | | | 1,242,127 | |
Angel Oak Mortgage Trust | | | | | | | | |
2022-1, 3.29% (WAC) due 12/25/66◊,2 | | | 1,450,360 | | | | 1,197,227 | |
Soundview Home Loan Trust | | | | | | | | |
2006-OPT5, 5.71% (1 Month Term SOFR + 0.39%, Rate Floor: 0.28%) due 07/25/36◊ | | | 1,188,657 | | | | 1,115,205 | |
Towd Point Mortgage Trust | | | | | | | | |
2018-2, 3.25% (WAC) due 03/25/58◊,2 | | | 392,443 | | | | 374,885 | |
2017-6, 2.75% (WAC) due 10/25/57◊,2 | | | 338,174 | | | | 320,807 | |
2017-5, 6.03% (1 Month Term SOFR + 0.71%, Rate Floor: 0.00%) due 02/25/57◊,2 | | | 107,128 | | | | 107,557 | |
Credit Suisse Mortgage Capital Certificates | | | | | | | | |
2021-RPL9, 2.44% (WAC) due 02/25/61◊,2 | | | 825,735 | | | | 752,037 | |
Morgan Stanley ABS Capital I Incorporated Trust | | | | | | | | |
2006-NC1, 6.00% (1 Month Term SOFR + 0.68%, Rate Floor: 0.57%) due 12/25/35◊ | | | 518,990 | | | | 508,853 | |
Ellington Financial Mortgage Trust | | | | | | | | |
2020-2, 1.49% (WAC) due 10/25/65◊,2 | | | 362,205 | | | | 318,348 | |
2020-2, 1.64% (WAC) due 10/25/65◊,2 | | | 208,644 | | | | 185,648 | |
Argent Securities Incorporated Asset-Backed Pass-Through Certificates Series | | | | | | | | |
2005-W2, 6.17% (1 Month Term SOFR + 0.85%, Rate Floor: 0.74%) due 10/25/35◊ | | | 512,085 | | | | 494,684 | |
SG Residential Mortgage Trust | | | | | | | | |
2022-1, 3.68% (WAC) due 03/27/62◊,2 | | | 450,576 | | | | 384,495 | |
Banc of America Funding Trust | | | | | | | | |
2015-R2, 5.69% (1 Month Term SOFR + 0.26%, Rate Floor: 0.26%) due 04/29/37◊,2 | | | 382,290 | | | | 374,695 | |
Residential Mortgage Loan Trust | | | | | | | | |
2020-1, 2.38% (WAC) due 01/26/60◊,2 | | | 354,554 | | | | 335,221 | |
GS Mortgage-Backed Securities Trust | | | | | | | | |
2020-NQM1, 1.38% (WAC) due 09/27/60◊,2 | | | 325,284 | | | | 289,789 | |
24 | THE GUGGENHEIM FUNDS ANNUAL REPORT | SEE NOTES TO FINANCIAL STATEMENTS. |
SCHEDULE OF INVESTMENTS (continued) | September 30, 2023 |
ULTRA SHORT DURATION FUND | |
| | Face
Amount | | | Value | |
CSMC Series | | | | | | | | |
2014-2R, 3.56% (1 Month Term SOFR + 0.31%, Rate Floor: 0.20%) due 02/27/46◊,2 | | $ | 201,236 | | | $ | 199,624 | |
Cascade Funding Mortgage Trust | | | | | | | | |
2019-RM3, 2.80% (WAC) due 06/25/69◊,5 | | | 112,504 | | | | 109,108 | |
CIT Mortgage Loan Trust | | | | | | | | |
2007-1, 6.78% (1 Month Term SOFR + 1.46%, Rate Floor: 1.35%) due 10/25/37◊,2 | | | 86,810 | | | | 86,627 | |
Starwood Mortgage Residential Trust | | | | | | | | |
2020-1, 2.28% (WAC) due 02/25/50◊,2 | | | 48,486 | | | | 44,135 | |
Total Residential Mortgage-Backed Securities | | | 82,168,485 | |
| | | | | | | | | |
Commercial Mortgage-Backed Securities - 4.8% |
BX Commercial Mortgage Trust | | | | | | | | |
2021-VOLT, 7.10% (1 Month Term SOFR + 1.76%, Rate Floor: 1.65%) due 09/15/36◊,2 | | | 10,250,000 | | | | 9,777,128 | |
2022-LP2, 6.89% (1 Month Term SOFR + 1.56%, Rate Floor: 1.56%) due 02/15/39◊,2 | | | 2,146,684 | | | | 2,068,521 | |
JP Morgan Chase Commercial Mortgage Securities Trust | | | | | | | | |
2021-NYAH, 6.99% (1 Month Term SOFR + 1.65%, Rate Floor: 1.54%) due 06/15/38◊,2 | | | 2,700,000 | | | | 2,374,557 | |
Life Mortgage Trust | | | | | | | | |
2021-BMR, 6.55% (1 Month Term SOFR + 1.21%, Rate Floor: 1.10%) due 03/15/38◊,2 | | | 2,408,277 | | | | 2,338,688 | |
WMRK Commercial Mortgage Trust | | | | | | | | |
2022-WMRK, 8.77% (1 Month Term SOFR + 3.44%, Rate Floor: 3.44%) due 11/15/27◊,2 | | | 2,100,000 | | | | 2,097,351 | |
MHP | | | | | | | | |
2022-MHIL, 6.60% (1 Month Term SOFR + 1.26%, Rate Floor: 1.26%) due 01/15/27◊,2 | | | 1,457,488 | | | | 1,409,947 | |
BXHPP Trust | | | | | | | | |
2021-FILM, 6.55% (1 Month Term SOFR + 1.21%, Rate Floor: 1.10%) due 08/15/36◊,2 | | | 1,500,000 | | | | 1,353,072 | |
Morgan Stanley Capital I Trust | | | | | | | | |
2018-H3, 0.96% (WAC) due 07/15/51◊,6 | | | 38,830,032 | | | | 1,124,731 | |
Citigroup Commercial Mortgage Trust | | | | | | | | |
2019-GC41, 1.17% (WAC) due 08/10/56◊,6 | | | 24,552,812 | | | | 959,799 | |
SEE NOTES TO FINANCIAL STATEMENTS. | THE GUGGENHEIM FUNDS ANNUAL REPORT | 25 |
SCHEDULE OF INVESTMENTS (continued) | September 30, 2023 |
ULTRA SHORT DURATION FUND | |
| | Face
Amount | | | Value | |
BENCHMARK Mortgage Trust | | | | | | | | |
2019-B14, 0.90% (WAC) due 12/15/62◊,6 | | $ | 34,410,163 | | | $ | 955,130 | |
JPMDB Commercial Mortgage Securities Trust | | | | | | | | |
2018-C8, 0.77% (WAC) due 06/15/51◊,6 | | | 21,284,691 | | | | 415,234 | |
Total Commercial Mortgage-Backed Securities | | | 24,874,158 | |
| | | | | | | | | |
Total Collateralized Mortgage Obligations |
(Cost $117,041,345) | | | 107,042,643 | |
| | | | | | | | | |
FEDERAL AGENCY DISCOUNT NOTES†† - 14.5% |
Federal Home Loan Bank |
5.20% due 10/02/237 | | | 74,835,000 | | | | 74,824,191 | |
Total Federal Agency Discount Notes |
(Cost $74,824,191) | | | | | | | 74,824,191 | |
| | | | | | | | | |
SENIOR FLOATING RATE INTERESTS††,◊ - 0.5% |
Industrial - 0.3% |
Mileage Plus Holdings LLC | | | | | | | | |
10.80% (3 Month Term SOFR + 5.25%, Rate Floor: 5.25%) due 06/21/27 | | | 1,650,000 | | | | 1,712,057 | |
| | | | | | | | | |
Energy - 0.1% |
ITT Holdings LLC | | | | | | | | |
8.18% (1 Month Term SOFR + 2.75%, Rate Floor: 2.75%) due 07/10/28 | | | 482,160 | | | | 480,853 | |
| |
Consumer, Non-cyclical - 0.1% |
Outcomes Group Holdings, Inc. | | | | | | | | |
9.13% (3 Month Term SOFR + 3.50%, Rate Floor: 3.50%) due 10/24/25 | | | 293,579 | | | | 291,691 | |
Total Senior Floating Rate Interests |
(Cost $2,487,584) | | | 2,484,601 | |
| | | | | | | | | |
Total Investments — 99.9% |
(Cost $538,432,838) | | $ | 515,279,784 | |
Other Assets & Liabilities, net — 0.1% | | | 301,190 | |
Total Net Assets — 100.0% | | $ | 515,580,974 | |
| Centrally Cleared Interest Rate Swap Agreements†† |
| Counterparty | Exchange | Floating
Rate Type | Floating Rate Index | Fixed
Rate | Payment
Frequency |
| BofA Securities, Inc. | CME | Receive | U.S. Secured Overnight Financing Rate | 1.10% | Annually |
| Counterparty | Maturity
Date | | Notional
Amount | | | Value | | | Upfront
Premiums
Paid | | | Unrealized
Appreciation** | |
| BofA Securities, Inc. | 01/10/25 | | $ | 61,000,000 | | | $ | 3,168,127 | | | $ | 122 | | | $ | 3,168,005 | |
26 | THE GUGGENHEIM FUNDS ANNUAL REPORT | SEE NOTES TO FINANCIAL STATEMENTS. |
SCHEDULE OF INVESTMENTS (continued) | September 30, 2023 |
ULTRA SHORT DURATION FUND | |
** | Includes cumulative appreciation (depreciation). Variation margin is reported within the Statement of Assets and Liabilities. |
† | Value determined based on Level 1 inputs — See Note 4. |
†† | Value determined based on Level 2 inputs, unless otherwise noted — See Note 4. |
††† | Value determined based on Level 3 inputs — See Note 4. |
◊ | Variable rate security. Rate indicated is the rate effective at September 30, 2023. In some instances, the effective rate is limited by a minimum rate floor or a maximum rate cap established by the issuer. The settlement status of a position may also impact the effective rate indicated. In some cases, a position may be unsettled at period end and may not have a stated effective rate. In instances where multiple underlying reference rates and spread amounts are shown, the effective rate is based on a weighted average. |
1 | Rate indicated is the 7-day yield as of September 30, 2023. |
2 | Security is a 144A or Section 4(a)(2) security. These securities have been determined to be liquid under guidelines established by the Board of Trustees. The total market value of 144A or Section 4(a)(2) securities is $357,503,903 (cost $376,769,976), or 69.3% of total net assets. |
3 | Security has a fixed rate coupon which will convert to a floating or variable rate coupon on a future date. |
4 | Security is a step up/down bond. The coupon increases or decreases at regular intervals until the bond reaches full maturity. Rate indicated is the rate at September 30, 2023. See table below for additional step information for each security. |
5 | Security is a 144A or Section 4(a)(2) security. These securities have been determined to be illiquid and restricted under guidelines established by the Board of Trustees. The total market value of 144A or Section 4(a)(2) illiquid and restricted securities is $4,565,311 (cost $4,683,341), or 0.9% of total net assets — See Note 8. |
6 | Security is an interest-only strip. |
7 | Rate indicated is the effective yield at the time of purchase. |
| | BofA — Bank of America |
| | CME — Chicago Mercantile Exchange |
| | LIBOR — London Interbank Offered Rate |
| | plc — Public Limited Company |
| | SOFR — Secured Overnight Financing Rate |
| | WAC — Weighted Average Coupon |
| | |
| | See Sector Classification in Other Information section. |
SEE NOTES TO FINANCIAL STATEMENTS. | THE GUGGENHEIM FUNDS ANNUAL REPORT | 27 |
SCHEDULE OF INVESTMENTS (continued) | September 30, 2023 |
ULTRA SHORT DURATION FUND | |
The following table summarizes the inputs used to value the Fund’s investments at September 30, 2023 (See Note 4 in the Notes to Financial Statements):
Investments in Securities (Assets) | | Level 1
Quoted
Prices | | | Level 2
Significant
Observable
Inputs | | | Level 3
Significant
Unobservable
Inputs | | | Total | |
Money Market Fund | | $ | 10,066,401 | | | $ | — | | | $ | — | | | $ | 10,066,401 | |
Asset-Backed Securities | | | — | | | | 193,504,512 | | | | 10,600,000 | | | | 204,104,512 | |
Corporate Bonds | | | — | | | | 112,386,436 | | | | 4,371,000 | | | | 116,757,436 | |
Collateralized Mortgage Obligations | | | — | | | | 107,042,643 | | | | — | | | | 107,042,643 | |
Federal Agency Discount Notes | | | — | | | | 74,824,191 | | | | — | | | | 74,824,191 | |
Senior Floating Rate Interests | | | — | | | | 2,484,601 | | | | — | | | | 2,484,601 | |
Interest Rate Swap Agreements** | | | — | | | | 3,168,005 | | | | — | | | | 3,168,005 | |
Total Assets | | $ | 10,066,401 | | | $ | 493,410,388 | | | $ | 14,971,000 | | | $ | 518,447,789 | |
** | This derivative is reported as unrealized appreciation/depreciation at period end. |
The following is a summary of significant unobservable inputs used in the fair valuation of assets and liabilities categorized within Level 3 of the fair value hierarchy:
Category | | Ending
Balance at
September 30,
2023 | | | Valuation
Technique | | | Unobservable
Inputs | | | Input
Range | | | Weighted
Average* | |
Assets: | | | | | | | | | | | | | | | | | | | | |
Asset-Backed Securities | | $ | 10,600,000 | | Third Party Pricing | Broker Quote | — | — |
Corporate Bonds | | | 4,371,000 | | Third Party Pricing | Broker Quote | — | — |
Total Assets | | $ | 14,971,000 | | | | | |
Significant changes in a quote would generally result in significant changes in the fair value of the security.
The Fund’s fair valuation leveling guidelines classify a single daily broker quote, or a vendor price based on a single daily or monthly broker quote, as Level 3, if such a quote or price cannot be supported with other available market information.
Transfers between Level 2 and Level 3 may occur as markets fluctuate and/or the availability of data used in an investment’s valuation changes. For the year ended September 30, 2023, the Fund had securities with a total value of $8,150,000 transfer into Level 3 from Level 2 due to a lack of observable inputs.
28 | THE GUGGENHEIM FUNDS ANNUAL REPORT | SEE NOTES TO FINANCIAL STATEMENTS. |
SCHEDULE OF INVESTMENTS (continued) | September 30, 2023 |
ULTRA SHORT DURATION FUND | |
Summary of Fair Value Level 3 Activity
Following is a reconciliation of Level 3 assets for which significant unobservable inputs were used to determine fair value for the year ended September 30, 2023:
| | | Assets | | | | | | | Liabilities | |
| | Asset-Backed
Securities | | | Collateralized
Mortgage
Obligations | | | Corporate
Bonds | | | Total Assets | | | Unfunded Loan
Commitments | |
Beginning Balance | | $ | 5,347,691 | | | $ | 4,327,633 | | | $ | 4,448,673 | | | $ | 14,123,997 | | | $ | (2,326 | ) |
Purchases/(Receipts) | | | 2,450,000 | | | | — | | | | — | | | | 2,450,000 | | | | 1,378 | |
(Sales, maturities and paydowns)/Fundings | | | (5,350,000 | ) | | | (4,550,000 | ) | | | — | | | | (9,900,000 | ) | | | 875 | |
Amortization of premiums/discounts | | | — | | | | 22 | | | | — | | | | 22 | | | | — | |
Total realized gains (losses) including in earnings | | | — | | | | — | | | | — | | | | — | | | | (2,020 | ) |
Total change in unrealized appreciation (depreciation) included in earnings | | | 2,309 | | | | 222,345 | | | | (77,673 | ) | | | 146,981 | | | | 2,093 | |
Transfers into Level 3 | | | 8,150,000 | | | | — | | | | — | | | | 8,150,000 | | | | — | |
Transfers out of Level 3 | | | — | | | | — | | | | — | | | | — | | | | — | |
Ending Balance | | $ | 10,600,000 | | | $ | — | | | $ | 4,371,000 | | | $ | 14,971,000 | | | $ | — | |
Net change in unrealized appreciation (depreciation) for investments in Level 3 securities still held at September 30, 2023 | | $ | — | | | $ | — | | | $ | (77,673 | ) | | $ | (77,673 | ) | | $ | — | |
SEE NOTES TO FINANCIAL STATEMENTS. | THE GUGGENHEIM FUNDS ANNUAL REPORT | 29 |
SCHEDULE OF INVESTMENTS (concluded) | September 30, 2023 |
ULTRA SHORT DURATION FUND | |
Step Coupon Bonds
The following table discloses additional information related to step coupon bonds held by the Fund. Certain securities are subject to multiple rate changes prior to maturity. For those securities, a range of rates and corresponding dates have been provided. Rates for all step coupon bonds held by the Fund are scheduled to increase, none are scheduled to decrease.
Name | | Coupon Rate at
Next Reset Date | | | Next Rate
Reset Date | | | Future
Reset Rate(s) | | | Future
Reset Date(s) | |
BRAVO Residential Funding Trust 2022-R1, 3.13% due 01/29/70 | | | 6.13 | % | | | 01/30/25 | | | | — | | | | — | |
BRAVO Residential Funding Trust 2021-C, 1.62% due 03/01/61 | | | 4.62 | % | | | 09/25/24 | | | | 5.62 | % | | | 09/25/25 | |
CSMC Trust 2020-NQM1, 1.21% due 05/25/65 | | | 2.21 | % | | | 09/26/24 | | | | — | | | | — | |
Legacy Mortgage Asset Trust 2021-GS3, 1.75% due 07/25/61 | | | 4.75 | % | | | 05/25/24 | | | | 5.75 | % | | | 05/25/25 | |
Legacy Mortgage Asset Trust 2021-GS4, 1.65% due 11/25/60 | | | 4.65 | % | | | 08/25/24 | | | | 5.65 | % | | | 08/25/25 | |
Legacy Mortgage Asset Trust 2021-GS5, 2.25% due 07/25/67 | | | 5.25 | % | | | 11/25/24 | | | | 6.25 | % | | | 11/25/25 | |
Legacy Mortgage Asset Trust 2021-GS2, 1.75% due 04/25/61 | | | 4.75 | % | | | 04/25/24 | | | | 5.75 | % | | | 04/25/25 | |
NYMT Loan Trust 2021-SP1, 1.67% due 08/25/61 | | | 4.67 | % | | | 08/01/24 | | | | 5.67 | % | | | 08/01/25 | |
NYMT Loan Trust 2022-SP1, 5.25% due 07/25/62 | | | 8.25 | % | | | 07/01/25 | | | | 9.25 | % | | | 07/01/26 | |
OSAT Trust 2021-RPL1, 2.12% due 05/25/65 | | | 5.12 | % | | | 06/25/24 | | | | 6.12 | % | | | 06/25/25 | |
PRPM LLC 2022-1, 3.72% due 02/25/27 | | | 6.72 | % | | | 02/25/25 | | | | 7.72 | % | | | 02/25/26 | |
PRPM LLC 2021-5, 1.79% due 06/25/26 | | | 4.79 | % | | | 06/25/24 | | | | 5.79 | % | | | 06/25/25 | |
Verus Securitization Trust 2020-1, 2.42% due 01/25/60 | | | 3.42 | % | | | 01/26/24 | | | | — | | | | — | |
Verus Securitization Trust 2019-4, 2.64% due 11/25/59 | | | 3.64 | % | | | 10/26/23 | | | | — | | | | — | |
Verus Securitization Trust 2019-4, 2.85% due 11/25/59 | | | 3.85 | % | | | 10/26/23 | | | | — | | | | — | |
Verus Securitization Trust 2020-5, 1.22% due 05/25/65 | | | 2.22 | % | | | 10/26/24 | | | | — | | | | — | |
30 | THE GUGGENHEIM FUNDS ANNUAL REPORT | SEE NOTES TO FINANCIAL STATEMENTS. |
STATEMENT OF ASSETS AND LIABILITIES |
ULTRA SHORT DURATION FUND |
September 30, 2023
Assets: |
Investments, at value (cost $538,432,838) | | $ | 515,279,784 | |
Unamortized upfront premiums paid on interest rate swap agreements | | | 122 | |
Prepaid expenses | | | 27,641 | |
Receivables: |
Interest | | | 3,048,317 | |
Variation margin on interest rate swap agreements | | | 1,714,423 | |
Fund shares sold | | | 466,558 | |
Total assets | | | 520,536,845 | |
| | | | | |
Liabilities: |
Overdraft due to custodian bank | | | 38,490 | |
Segregated cash due to broker | | | 985,143 | |
Payable for: |
Securities purchased | | | 2,700,000 | |
Fund shares redeemed | | | 633,524 | |
Distributions to shareholders | | | 324,342 | |
Management fees | | | 84,905 | |
Transfer agent fees | | | 64,369 | |
Distribution and service fees | | | 20,011 | |
Fund accounting and administration fees | | | 19,368 | |
Trustees’ fees* | | | 2,047 | |
Miscellaneous | | | 83,672 | |
Total liabilities | | | 4,955,871 | |
Net assets | | $ | 515,580,974 | |
| | | | | |
Net assets consist of: |
Paid in capital | | $ | 540,203,199 | |
Total distributable earnings (loss) | | | (24,622,225 | ) |
Net assets | | $ | 515,580,974 | |
| | | | | |
A-Class: |
Net assets | | $ | 96,348,196 | |
Capital shares outstanding | | | 9,877,599 | |
Net asset value per share | | $ | 9.75 | |
| | | | | |
Institutional Class: |
Net assets | | $ | 419,232,778 | |
Capital shares outstanding | | | 42,987,454 | |
Net asset value per share | | $ | 9.75 | |
* | Relates to Trustees not deemed “interested persons” within the meaning of Section 2(a)(19) of the 1940 Act. |
SEE NOTES TO FINANCIAL STATEMENTS. | THE GUGGENHEIM FUNDS ANNUAL REPORT | 31 |
STATEMENT OF OPERATIONS |
ULTRA SHORT DURATION FUND |
Year Ended September 30, 2023
Investment Income: |
Interest | | $ | 24,869,115 | |
Total investment income | | | 24,869,115 | |
| | | | | |
Expenses: |
Management fees | | | 1,421,922 | |
Distribution and service fees: |
A-Class | | | 271,104 | |
Transfer agent and administrative fees | | | 12,001 | |
Transfer agent/maintenance fees: |
A-Class | | | 85,838 | |
Institutional Class | | | 164,989 | |
Fund accounting/administration fees | | | 180,007 | |
Registration fees | | | 129,428 | |
Professional fees | | | 116,438 | |
Custodian fees | | | 38,358 | |
Line of credit fees | | | 30,753 | |
Trustees’ fees* | | | 23,077 | |
Interest expense | | | 15,932 | |
Miscellaneous | | | 35,206 | |
Recoupment of previously waived fees: |
A-Class | | | 2,014 | |
Institutional Class | | | 6,405 | |
Total expenses | | | 2,533,472 | |
Less: Expenses reimbursed by Adviser: |
A-Class | | | (83,064 | ) |
Institutional Class | | | (152,248 | ) |
Expenses waived by Adviser | | | (89,963 | ) |
Earnings credits applied | | | (5,118 | ) |
Total waived/reimbursed expenses | | | (330,393 | ) |
Net expenses | | | 2,203,079 | |
Net investment income | | | 22,666,036 | |
| | | | | |
Net Realized and Unrealized Gain (Loss): |
Net realized gain (loss) on: |
Investments | | | (8,168,442 | ) |
Swap agreements | | | 8,571,752 | |
Forward foreign currency exchange contracts | | | 798,911 | |
Foreign currency transactions | | | (215 | ) |
Net realized gain | | | 1,202,006 | |
Net change in unrealized appreciation (depreciation) on: |
Investments | | | 19,244,100 | |
Swap agreements | | | (6,024,955 | ) |
Forward foreign currency exchange contracts | | | (798,908 | ) |
Net change in unrealized appreciation (depreciation) | | | 12,420,237 | |
Net realized and unrealized gain | | | 13,622,243 | |
Net increase in net assets resulting from operations | | $ | 36,288,279 | |
* | Relates to Trustees not deemed “interested persons” within the meaning of Section 2(a)(19) of the 1940 Act. |
32 | THE GUGGENHEIM FUNDS ANNUAL REPORT | SEE NOTES TO FINANCIAL STATEMENTS. |
STATEMENTS OF CHANGES IN NET ASSETS |
ULTRA SHORT DURATION FUND |
| | Year Ended
September 30,
2023 | | | Year Ended
September 30,
2022 | |
Increase (Decrease) in Net Assets from Operations: | | | | | | | | |
Net investment income | | $ | 22,666,036 | | | $ | 13,162,218 | |
Net realized gain (loss) on investments | | | 1,202,006 | | | | (1,760,878 | ) |
Net change in unrealized appreciation (depreciation) on investments | | | 12,420,237 | | | | (33,327,821 | ) |
Net increase (decrease) in net assets resulting from operations | | | 36,288,279 | | | | (21,926,481 | ) |
| | | | | | | | | |
Distributions to shareholders: | | | | | | | | |
A-Class | | | (4,918,176 | ) | | | (2,015,323 | ) |
Institutional Class | | | (21,914,210 | ) | | | (10,986,326 | ) |
Total distributions to shareholders | | | (26,832,386 | ) | | | (13,001,649 | ) |
| | | | | | | | | |
Capital share transactions: | | | | | | | | |
Proceeds from sale of shares | | | | | | | | |
A-Class | | | 10,686,656 | | | | 104,918,065 | |
Institutional Class | | | 119,682,982 | | | | 393,611,176 | |
Distributions reinvested | | | | | | | | |
A-Class | | | 4,830,340 | | | | 2,012,411 | |
Institutional Class | | | 17,231,019 | | | | 9,182,432 | |
Cost of shares redeemed | | | | | | | | |
A-Class | | | (53,521,575 | ) | | | (156,307,680 | ) |
Institutional Class | | | (342,903,679 | ) | | | (638,832,395 | ) |
Net decrease from capital share transactions | | | (243,994,257 | ) | | | (285,415,991 | ) |
Net decrease in net assets | | | (234,538,364 | ) | | | (320,344,121 | ) |
| | | | | | | | | |
Net assets: | | | | | | | | |
Beginning of year | | | 750,119,338 | | | | 1,070,463,459 | |
End of year | | $ | 515,580,974 | | | $ | 750,119,338 | |
| | | | | | | | | |
Capital share activity: | | | | | | | | |
Shares sold | | | | | | | | |
A-Class | | | 1,102,052 | | | | 10,591,356 | |
Institutional Class | | | 12,352,609 | | | | 39,950,301 | |
Shares issued from reinvestment of distributions | | | | | | | | |
A-Class | | | 497,546 | | | | 206,643 | |
Institutional Class | | | 1,775,408 | | | | 942,256 | |
Shares redeemed | | | | | | | | |
A-Class | | | (5,533,062 | ) | | | (15,890,287 | ) |
Institutional Class | | | (35,519,480 | ) | | | (65,020,480 | ) |
Net decrease in shares | | | (25,324,927 | ) | | | (29,220,211 | ) |
SEE NOTES TO FINANCIAL STATEMENTS. | THE GUGGENHEIM FUNDS ANNUAL REPORT | 33 |
FINANCIAL HIGHLIGHTS |
ULTRA SHORT DURATION FUND |
This table is presented to show selected data for a share outstanding throughout each period and to assist shareholders in evaluating a Fund’s performance for the periods presented.
A-Class | | Year
Ended
Sept. 30,
2023 | | | Year
Ended
Sept. 30,
2022 | | | Year
Ended
Sept. 30,
2021 | | | Year
Ended
Sept. 30,
2020 | | | Period
Ended
Sept. 30,
2019a | |
Per Share Data |
Net asset value, beginning of period | | $ | 9.60 | | | $ | 9.97 | | | $ | 9.98 | | | $ | 9.97 | | | $ | 10.00 | |
Income (loss) from investment operations: |
Net investment income (loss)b | | | .37 | | | | .12 | | | | .06 | | | | .12 | | | | .17 | |
Net gain (loss) on investments (realized and unrealized) | | | .23 | | | | (.37 | ) | | | — | | | | .03 | | | | .02 | h |
Total from investment operations | | | .60 | | | | (.25 | ) | | | .06 | | | | .15 | | | | .19 | |
Less distributions from: |
Net investment income | | | (.45 | ) | | | (.12 | ) | | | (.07 | ) | | | (.14 | ) | | | (.21 | ) |
Net realized gains | | | — | | | | — | | | | — | | | | — | | | | (.01 | ) |
Total distributions | | | (.45 | ) | | | (.12 | ) | | | (.07 | ) | | | (.14 | ) | | | (.22 | ) |
Net asset value, end of period | | $ | 9.75 | | | $ | 9.60 | | | $ | 9.97 | | | $ | 9.98 | | | $ | 9.97 | |
|
Total Return | | | 6.32 | % | | | (2.49 | %) | | | 0.62 | % | | | 1.52 | % | | | 1.89 | % |
Ratios/Supplemental Data |
Net assets, end of period (in thousands) | | $ | 96,348 | | | $ | 132,518 | | | $ | 188,416 | | | $ | 62,956 | | | $ | 31,154 | |
Ratios to average net assets: |
Net investment income (loss) | | | 3.80 | % | | | 1.18 | % | | | 0.63 | % | | | 1.20 | % | | | 2.05 | % |
Total expensesd | | | 0.68 | % | | | 0.65 | % | | | 0.63 | % | | | 0.65 | % | | | 0.61 | % |
Net expensese,f,g | | | 0.59 | % | | | 0.59 | % | | | 0.59 | % | | | 0.61 | % | | | 0.58 | % |
Portfolio turnover rate | | | 2 | % | | | 24 | % | | | 122 | % | | | 129 | % | | | 55 | % |
34 | THE GUGGENHEIM FUNDS ANNUAL REPORT | SEE NOTES TO FINANCIAL STATEMENTS. |
FINANCIAL HIGHLIGHTS (continued) |
ULTRA SHORT DURATION FUND |
This table is presented to show selected data for a share outstanding throughout each period and to assist shareholders in evaluating a Fund’s performance for the periods presented.
Institutional Class | | Year
Ended
Sept. 30,
2023 | | | Year
Ended
Sept. 30,
2022 | | | Year
Ended
Sept. 30,
2021 | | | Year
Ended
Sept. 30,
2020 | | | Year
Ended
Sept. 30,
2019c | |
Per Share Data |
Net asset value, beginning of period | | $ | 9.59 | | | $ | 9.97 | | | $ | 9.98 | | | $ | 9.96 | | | $ | 10.01 | |
Income (loss) from investment operations: |
Net investment income (loss)b | | | .39 | | | | .14 | | | | .09 | | | | .15 | | | | .28 | |
Net gain (loss) on investments (realized and unrealized) | | | .24 | | | | (.37 | ) | | | — | | | | .04 | | | | (.04 | ) |
Total from investment operations | | | .63 | | | | (.23 | ) | | | .09 | | | | .19 | | | | .24 | |
Less distributions from: |
Net investment income | | | (.47 | ) | | | (.15 | ) | | | (.10 | ) | | | (.17 | ) | | | (.28 | ) |
Net realized gains | | | — | | | | — | | | | — | | | | — | | | | (.01 | ) |
Total distributions | | | (.47 | ) | | | (.15 | ) | | | (.10 | ) | | | (.17 | ) | | | (.29 | ) |
Net asset value, end of period | | $ | 9.75 | | | $ | 9.59 | | | $ | 9.97 | | | $ | 9.98 | | | $ | 9.96 | |
|
Total Return | | | 6.70 | % | | | (2.34 | %) | | | 0.87 | % | | | 1.88 | % | | | 2.37 | % |
Ratios/Supplemental Data |
Net assets, end of period (in thousands) | | $ | 419,233 | | | $ | 617,601 | | | $ | 882,047 | | | $ | 440,356 | | | $ | 423,414 | |
Ratios to average net assets: |
Net investment income (loss) | | | 4.03 | % | | | 1.44 | % | | | 0.88 | % | | | 1.47 | % | | | 2.54 | % |
Total expensesd | | | 0.39 | % | | | 0.36 | % | | | 0.34 | % | | | 0.38 | % | | | 0.30 | % |
Net expensese,f,g | | | 0.34 | % | | | 0.34 | % | | | 0.34 | % | | | 0.36 | % | | | 0.29 | % |
Portfolio turnover rate | | | 2 | % | | | 24 | % | | | 122 | % | | | 129 | % | | | 55 | % |
SEE NOTES TO FINANCIAL STATEMENTS. | THE GUGGENHEIM FUNDS ANNUAL REPORT | 35 |
FINANCIAL HIGHLIGHTS (concluded) |
ULTRA SHORT DURATION FUND |
a | Since commencement of operations: November 30, 2018. Percentage amounts for the period, except total return and portfolio turnover rate, have been annualized. |
b | Net investment income (loss) per share was computed using average shares outstanding throughout the period. |
c | The per share data for the years ended September 30, 2017 through September 30, 2018 and the period October 1, 2018 to November 30, 2018 has been restated to reflect the reorganization of the Guggenheim Strategy Fund I with and into the Guggenheim Ultra Short Duration Fund effective November 30, 2018. In conjunction with the reorganization, Guggenheim Ultra Short Duration Fund issued 2.501601322 Institutional Class shares for every 1 share of Guggenheim Strategy Fund I. |
d | Does not include expenses of the underlying funds in which the Fund invests. |
e | Net expense information reflects the expense ratios after expense waivers and reimbursements, as applicable. |
f | The portion of the ratios of net expenses to average net assets attributable to recoupments of prior fee reductions or expense reimbursements for the years presented was as follows: |
| | | 09/30/23 | | 09/30/22 | | 09/30/21 | | 09/30/20 | | 09/30/19 |
| A-Class | | | 0.00 | %* | | | 0.01 | % | | | 0.00 | %* | | | 0.00 | %* | | | — | |
| Institutional Class | | | 0.00 | %* | | | 0.01 | % | | | 0.01 | % | | | 0.00 | %* | | | 0.00 | %* |
g | Net expenses may include expenses that are excluded from the expense limitation agreement. Excluding these expenses, the net expense ratios for the years presented would be: |
| 09/30/23 | 09/30/22 | 09/30/21 | 09/30/20 | 09/30/19 |
A-Class | 0.58% | 0.58% | 0.58% | 0.58% | 0.58% |
Institutional Class | 0.33% | 0.33% | 0.33% | 0.33% | 0.29% |
h | The amount shown for a share outstanding throughout the period does not agree with the aggregate net loss on investments for the period because of the sales and repurchases of Fund shares in relation to fluctuating market value of the investments of the Fund. |
36 | THE GUGGENHEIM FUNDS ANNUAL REPORT | SEE NOTES TO FINANCIAL STATEMENTS. |
NOTES TO FINANCIAL STATEMENTS |
Note 1 – Organization and Significant Accounting Policies
Organization
Guggenheim Funds Trust (the “Trust”), a Delaware statutory trust, is registered with the U.S. Securities and Exchange Commission (the “SEC”) under the Investment Company Act of 1940 (the “1940 Act”), as an open-ended investment company of the series type. Each series, in effect, is representing a separate fund. The Trust may issue an unlimited number of authorized shares. The Trust accounts for the assets of each fund separately.
The Trust offers a combination of five separate classes of shares: A-Class shares, C-Class shares, P-Class shares, R6-Class shares and Institutional Class shares. Sales of shares of each Class are made without a front-end sales charge at the net asset value per share (“NAV”), with the exception of A-Class shares. A-Class shares are sold at the NAV, plus the applicable front-end sales charge. The sales charge varies depending on the amount purchased. A-Class share purchases of $1 million or more are exempt from the front-end sales charge but have a 1% contingent deferred sales charge (“CDSC”), if shares are redeemed within 12 months of purchase. C-Class shares have a 1% CDSC if shares are redeemed within 12 months of purchase. C-Class shares automatically convert to A-Class shares on or about the 10th day of the month following the 8-year anniversary of the purchase of the C-Class shares. This conversion will be executed without any sales charge, fee or other charge. After the conversion is completed, the shares will be subject to all features and expenses of A-Class shares. Institutional Class shares are offered primarily for direct investment by institutions such as pension and profit sharing plans, endowments, foundations and corporations. Institutional Class shares require a minimum initial investment of $2 million and a minimum account balance of $1 million. R6-Class shares are offered primarily through qualified retirement and benefit plans. R6-Class shares are also offered through certain other plans and platforms sponsored by financial intermediaries. Certain institutional investors and others deemed appropriate by Guggenheim Investments (“GI” or the “Adviser”) may also be eligible to purchase R6-Class shares subject to a $2 million minimum initial investment. At September 30, 2023, the Trust consisted of nineteen funds (the “Funds”).
This report covers the Ultra Short Duration Fund (the “Fund”), a diversified investment company. At September 30, 2023, A-Class and Institutional Class shares have been issued by the Fund.
Guggenheim Partners Investment Management LLC (“GPIM” or the “Adviser”), which operates under the name Guggenheim Investments, provides advisory services. Guggenheim Funds Distributors, LLC (“GFD”) serves as distributor for the Fund’s shares. GI and GFD are affiliated entities.
Pursuant to an investment Sub-Advisory Agreement between GPIM and Guggenheim Partners Advisors, LLC (“GPA”), that was in effect during a portion of the Reporting Period, GPA was engaged to provide investment subadvisory services to the Fund. GPA operated as an investment sub-advisor to the Fund from April 29, 2022 to December 22, 2022.
| | THE GUGGENHEIM FUNDS ANNUAL REPORT | 37 |
NOTES TO FINANCIAL STATEMENTS (continued) |
GPA, under the oversight of the Board and GPIM, assisted GPIM in the supervision and direction of the investment strategies of the Fund in accordance with its investment policies. As compensation for its services, GPIM paid GPA a fee, payable monthly, in an amount equal to 0.005% of the average daily net assets of the Fund.
Significant Accounting Policies
The Fund operates as an investment company and, accordingly, follows the investment company accounting and reporting guidance of the Financial Accounting Standards Board (“FASB”) Accounting Standards Codification Topic 946 Financial Services – Investment Companies.
The following significant accounting policies are in conformity with U.S. generally accepted accounting principles (“U.S. GAAP”) and are consistently followed by the Trust. This requires management to make estimates and assumptions that affect the reported amount of assets and liabilities, contingent assets and liabilities at the date of the financial statements, and the reported amounts of revenues and expenses during the reporting period. Actual results could differ from these estimates. All time references are based on Eastern Time.
The NAV of each share class of the Fund is calculated by dividing the market value of the Fund’s securities and other assets, less all liabilities, attributable to the share class by the number of outstanding shares of the Class.
(a) Valuation of Investments
The Board of Trustees of the Fund (the “Board”) has adopted policies and procedures for the valuation of the Fund’s investments (the “Fund Valuation Procedures”). The SEC adopted Rule 2a-5 under the 1940 Act (“Rule 2a-5”) which establishes requirements for determining fair value in good faith. Rule 2a-5 also defines “readily available market quotations” for purposes of the 1940 Act and establishes requirements for determining whether a fund must fair value a security in good faith.
Pursuant to Rule 2a-5, the Board has designated the Adviser as the valuation designee to perform fair valuation determinations for the Fund with respect to all Fund investments and other assets. As the Fund’s valuation designee pursuant to Rule 2a-5, the Adviser has adopted separate procedures (the “Valuation Designee Procedures” and collectively with the Fund Valuation Procedures, the “Valuation Procedures”) reasonably designed to prevent violations of the requirements of Rule 2a-5 and Rule 31a-4. The Adviser, in its role as valuation designee, utilizes the assistance of a valuation committee, consisting of representatives from Guggenheim’s investment management, fund administration, legal and compliance departments (the “Valuation Committee”), in determining the fair value of the Fund’s securities and other assets.
Valuations of the Fund’s securities and other assets are supplied primarily by pricing service providers appointed pursuant to the processes set forth in the Valuation Procedures. The Adviser, with the assistance of the Valuation Committee, convenes monthly, or more frequently as needed, to review the valuation of all assets which have been fair valued.
38 | THE GUGGENHEIM FUNDS ANNUAL REPORT | |
NOTES TO FINANCIAL STATEMENTS (continued) |
The Adviser, consistent with the monitoring and review responsibilities set forth in the Valuation Procedures, regularly reviews the appropriateness of the inputs, methods, models and assumptions employed by the pricing service provider.
If the pricing service provider cannot or does not provide a valuation for a particular investment or such valuation is deemed unreliable, such investment is fair valued by the Adviser.
Generally, trading in foreign securities markets is substantially completed each day at various times prior to the close of the New York Stock Exchange (“NYSE”). The values of foreign securities are determined as of the close of such foreign markets or the close of the NYSE, if earlier. All investments quoted in foreign currencies are valued in U.S. dollars on the basis of the foreign currency exchange rates prevailing at the close of U.S. business at 4:00 p.m. Investments in foreign securities may involve risks not present in domestic investments. The Adviser will determine the current value of such foreign securities by taking into consideration certain factors which may include the following factors, among others: the value of the securities traded on other foreign markets, American Depositary Receipts (“ADR”) trading, closed-end fund trading, foreign currency exchange activity, and the trading prices of financial products that are tied to foreign securities. In addition, under the Valuation Procedures, the Adviser is authorized to use prices and other information supplied by a pricing service provider in valuing foreign securities.
Open-end investment companies are valued at their NAV as of the close of business, on the valuation date. Exchange-traded funds and closed-end investment companies are generally valued at the last quoted sale price.
U.S. Government securities are valued by pricing service providers, the last traded fill price, or at the reported bid price at the close of business.
Commercial paper and discount notes with a maturity of greater than 60 days at acquisition are valued at prices that reflect broker-dealer supplied valuations or are obtained from pricing service providers, which may consider the trade activity, treasury spreads, yields or price of bonds of comparable quality, coupon, maturity, and type, as well as prices quoted by dealers who make markets in such securities. Commercial paper and discount notes with a maturity of 60 days or less at acquisition are valued at amortized cost, unless the Adviser concludes that amortized cost does not represent the fair value of the applicable asset in which case it will be valued using an independent pricing service provider.
Typically, loans are valued using information provided by a pricing service provider which uses broker quotes, among other inputs. If the pricing service provider cannot or does not provide a valuation for a particular loan, or such valuation is deemed unreliable, such investment is valued based on a quote from a broker-dealer or is fair valued by the Adviser.
Interest rate swap agreements entered into by the Fund are valued on the basis of the last sale price on the primary exchange on which the swap is traded.
| | THE GUGGENHEIM FUNDS ANNUAL REPORT | 39 |
NOTES TO FINANCIAL STATEMENTS (continued) |
Investments for which market quotations are not readily available are fair valued as determined in good faith by the Adviser. Valuations in accordance with these methods are intended to reflect each security’s (or asset’s or liability’s) “fair value”. Each such determination is based on a consideration of all relevant factors, which are likely to vary from one pricing context to another. Examples of such factors may include, but are not limited to market prices; sale prices; broker quotes; and models which derive prices based on inputs such as anticipated cash flows or collateral, spread over U.S. Treasury securities, and other information analysis. In connection with futures contracts and other derivative investments, such factors may include obtaining information as to how (a) these contracts and other derivative investments trade in the futures or other derivative markets, respectively, and (b) the securities underlying these contracts and other derivative investments trade in the cash market.
(b) U.S. Government and Agency Obligations
Certain U.S. Government and Agency Obligations are traded on a discount basis; the interest rates shown on the Schedule of Investments reflect the effective rates paid at the time of purchase by the Fund. Other securities bear interest at the rates shown, payable at fixed dates through maturity.
(c) Senior Floating Rate Interests and Loan Investments
Senior floating rate interests in which the Fund invests generally pay interest rates which are periodically adjusted by reference to a base short-term floating rate, plus a premium. These base lending rates are generally (i) a broad measure of the cost of borrowing cash, such as the one-month or three-month Secured Overnight Financing Rate (“SOFR”), (ii) the prime rate offered by one or more major United States banks, or (iii) the bank’s certificate of deposit rate. Senior floating rate interests often require prepayments from excess cash flows or permit the borrower to repay at its election. The rate at which the borrower repays cannot be predicted with accuracy. As a result, the actual remaining maturity may be substantially less than the stated maturities disclosed in the Fund’s Schedule of Investments.
The Fund invests in loans and other similar debt obligations (“obligations”). A portion of the Fund’s investments in these obligations is sometimes referred to as “covenant lite” loans or obligations (“covenant lite obligations”), which are obligations that lack covenants or possess fewer or less restrictive covenants or constraints on borrowers than certain other types of obligations. The Fund may also obtain exposure to covenant lite obligations through investment in securitization vehicles and other structured products. Recently, many new or reissued obligations have not featured traditional covenants, which are intended to protect lenders and investors by (i) imposing certain restrictions or other limitations on a borrower’s operations or assets or (ii) providing certain rights to lenders. The Fund may have fewer rights with respect to covenant lite obligations, including fewer protections against the possibility of default and fewer remedies in the event of default. As a result, investments in (or exposure to) covenant lite obligations are subject to more risk than investments in (or exposure to) certain other types of obligations. The Fund is subject to other risks associated with investments in (or exposure to)
40 | THE GUGGENHEIM FUNDS ANNUAL REPORT | |
NOTES TO FINANCIAL STATEMENTS (continued) |
obligations, including that obligations may not be considered “securities” and, as a result, the Fund may not be entitled to rely on the anti-fraud protections under the federal securities laws and instead may have to resort to state law and direct claims.
(d) Interest on When-Issued Securities
The Fund may purchase and sell interests in securities on a when-issued and delayed delivery basis, with payment and delivery scheduled for a future date. No income accrues to the Fund on such interests or securities in connection with such transactions prior to the date the Fund actually takes delivery of such interests or securities. These transactions are subject to market fluctuations and are subject to the risk that the value at delivery may be more or less than the trade date purchase price. Although the Fund will generally purchase these securities with the intention of acquiring such securities, it may sell such securities before the settlement date.
(e) Swap Agreements
Swap agreements are marked-to-market daily and the change, if any, is recorded as unrealized appreciation or depreciation. Payments received or made as a result of an agreement or termination of an agreement are recognized as realized gains or losses.
Upon entering into certain centrally-cleared swap transactions, a Fund is required to deposit with its clearing broker an amount of cash or securities as an initial margin. Subsequent variation margin receipts or payments are received or made by the Fund depending on fluctuations in the fair value of the reference entity and are recorded by the Fund as unrealized appreciation or depreciation. When the contract is closed, the Fund records a realized gain or loss equal to the difference between the value of the contract at the time it was opened and the value at the time it was closed.
Upfront payments received or made by a Fund on credit default swap agreements and interest rate swap agreements are amortized over the expected life of the agreement. Periodic payments received or paid by a Fund are recorded as realized gains or losses. Payments received or made as a result of a credit event or termination of the contract are recognized, net of a proportional amount of the upfront payment, as realized gains or losses.
(f) Currency Translations
The accounting records of the Fund are maintained in U.S. dollars. All assets and liabilities initially expressed in foreign currencies are converted into U.S. dollars at prevailing exchange rates. Purchases and sales of investment securities, dividend and interest income, and certain expenses are translated at the rates of exchange prevailing on the respective dates of such transactions. Changes in the relationship of these foreign currencies to the U.S. dollar can significantly affect the value of the investments and earnings of the Fund. Foreign investments may also subject the Fund to foreign government exchange restrictions, expropriation, taxation, or other political, social, geopolitical or economic developments, all of which could affect the market and/or credit risk of the investments.
| | THE GUGGENHEIM FUNDS ANNUAL REPORT | 41 |
NOTES TO FINANCIAL STATEMENTS (continued) |
The Fund does not isolate that portion of the results of operations resulting from changes in the foreign exchange rates on investments from the fluctuations arising from changes in the market prices of securities held. Such fluctuations are included with the net realized gain or loss and unrealized appreciation or depreciation on investments.
Reported net realized foreign exchange gains and losses arise from sales of foreign currencies and currency gains or losses realized between the trade and settlement dates on investment transactions. Net unrealized appreciation and depreciation arise from changes in the fair values of assets and liabilities other than investments in securities at the fiscal period end, resulting from changes in exchange rates.
(g) Forward Foreign Currency Exchange Contracts
The change in value of a forward foreign currency exchange contract is recorded as unrealized appreciation or depreciation until the contract is closed. When the contract is closed, the Fund records a realized gain or loss equal to the difference between the value at the time the contract was opened and the value at the time it was closed.
(h) Foreign Taxes
The Fund may be subject to foreign taxes (a portion of which may be reclaimable) on income, stock dividends, capital gains on investments or certain foreign currency transactions. All foreign taxes are recorded in accordance with the applicable foreign tax regulations and rates that exist in the foreign jurisdictions in which the Fund invests. These foreign taxes, if any, are paid by the Fund and reflected in the Fund’s Statement of Operations as follows: foreign taxes withheld at source are presented as a reduction of income and foreign taxes on capital gains from sales of investments are included with the net realized gain (loss) on investments. Foreign taxes payable or deferred as of September 30, 2023, if any, are disclosed in the Fund’s Statement of Assets and Liabilities.
(i) Security Transactions
Security transactions are recorded on the trade date for financial reporting purposes. Realized gains and losses from securities transactions are recorded using the identified cost basis. Proceeds from lawsuits related to investment holdings are recorded as a reduction to cost if the securities are still held and as realized gains if no longer held in the Fund. Dividend income is recorded on the ex-dividend date, net of applicable taxes withheld by foreign countries, if any. Taxable non-cash dividends are recorded as dividend income. Interest income, including amortization of premiums and accretion of discounts, is accrued on a daily basis. Interest income also includes paydown gains and losses on mortgage-backed and asset-backed securities and senior and subordinated loans. Amendment fees are earned as compensation for evaluating and accepting changes to the original loan agreement and are recognized when received.
42 | THE GUGGENHEIM FUNDS ANNUAL REPORT | |
NOTES TO FINANCIAL STATEMENTS (continued) |
Income from residual collateralized loan obligations is recognized using the effective interest method. At the time of purchase, management estimates the future expected cash flows and determines the effective yield and estimated maturity date based on the estimated cash flows. Subsequent to the purchase, the estimated cash flows are updated periodically and a revised yield is calculated prospectively.
The Fund may receive other income from investments in senior loan interests including amendment fees, consent fees and commitment fees. For funded loans, these fees are recorded as income when received by the Fund and included in interest income on the Statement of Operations. For unfunded loans, commitment fees are included in realized gain on investments on the Statement of Operations at the end of the commitment period.
(j) Distributions
The Fund declares dividends from investment income daily. The Fund pays its shareholders from its net investment income monthly and distributes any net capital gains that it has realized, at least annually. Distributions to shareholders are recorded on the ex-dividend date. Dividends are reinvested in additional shares, unless shareholders request payment in cash. The character of distributions made during the year from net investment income or net realized gains may differ from their ultimate characterization for U.S. federal income tax purposes.
(k) Class Allocations
Interest and dividend income, most expenses, all realized gains and losses, and all unrealized appreciation and depreciation are allocated to the share classes based upon the value of the outstanding shares in each share class. Certain costs, such as distribution and service fees are charged directly to specific share classes. In addition, certain expenses have been allocated to the individual Funds in the Trust based on the respective net assets of each Fund included in the Trust.
(l) Earnings Credits
Under the fee arrangement with the custodian, the Fund may earn credits based on overnight custody cash balances. These credits are utilized to reduce related custodial expenses. The custodian fees disclosed in the Statement of Operations are before the reduction in expense from the related earnings credits, if any. Earnings credits for the year ended September 30, 2023, are disclosed in the Fund’s Statement of Operations.
(m) Cash
The Fund may leave cash overnight in its cash account with the custodian. Periodically, the Fund may have cash due to the custodian bank as an overdraft balance. A fee is incurred on this overdraft, calculated by multiplying the overdraft by a rate based on the federal funds rate, which was 5.33% at September 30, 2023.
| | THE GUGGENHEIM FUNDS ANNUAL REPORT | 43 |
NOTES TO FINANCIAL STATEMENTS (continued) |
(n) Indemnifications
Under the Fund’s organizational documents, its Trustees and Officers are indemnified against certain liabilities arising out of the performance of their duties to the Trust. In addition, throughout the normal course of business, the Fund enters into contracts that contain a variety of representations and warranties which provide general indemnifications. The Fund’s maximum exposure under these arrangements is unknown, as this would involve future claims that may be made against the Fund and/or its affiliates that have not yet occurred. However, based on experience, the Fund expects the risk of loss to be remote.
Note 2 – Financial Instruments and Derivatives
As part of its investment strategy, the Fund utilizes a variety of derivative instruments. These investments involve, to varying degrees, elements of market risk and risks in excess of amounts recognized on the Fund’s Statement of Assets and Liabilities. Valuation and accounting treatment of these instruments can be found under Significant Accounting Policies in Note 1 of these Notes to Financial Statements.
Short Sales
A short sale is a transaction in which the Fund sells a security it does not own. If the security sold short decreases in price between the time the Fund sells the security and closes its short position, the Fund will realize a gain on the transaction. Conversely, if the security increases in price during the period, the Fund will realize a loss on the transaction. The risk of such price increases is the principal risk of engaging in short sales.
Derivatives
Derivatives are instruments whose values depend on, or are derived from, in whole or in part, the value of one or more other assets, such as securities, currencies, commodities or indices. Derivative instruments may be used to increase investment flexibility (including to maintain cash reserves while maintaining exposure to certain other assets), for risk management (hedging) purposes, to facilitate trading, to reduce transaction costs and to pursue higher investment returns. Derivative instruments may also be used to mitigate certain investment risks, such as foreign currency exchange rate risk, interest rate risk and credit risk. U.S. GAAP requires disclosures to enable investors to better understand how and why a Fund uses derivative instruments, how these derivative instruments are accounted for and their effects on the Fund’s financial position and results of operations.
The Fund utilized derivatives for the following purposes:
Duration: the use of an instrument to manage the interest rate risk of a portfolio.
Hedge: an investment made in order to reduce the risk of adverse price movements in a security, by taking an offsetting position to protect against broad market moves.
44 | THE GUGGENHEIM FUNDS ANNUAL REPORT | |
NOTES TO FINANCIAL STATEMENTS (continued) |
Income: the use of any instrument that distributes cash flows typically based upon some rate of interest.
Swap Agreements
A swap is an agreement that obligates two parties to exchange a series of cash flows at specified intervals based upon or calculated by reference to changes in specified prices or rates for a specified amount of an underlying asset. When utilizing over-the-counter (“OTC”) swaps, the Fund bears the risk of loss of the amount expected to be received under a swap agreement in the event of the default or bankruptcy of a swap agreement counterparty or if the underlying asset declines in value. Certain standardized swaps are subject to mandatory central clearing and are executed on a multi-lateral or other trade facility platform, such as a registered exchange. There is limited counterparty credit risk with respect to centrally-cleared swaps as the transaction is facilitated through a central clearinghouse, much like exchange-traded futures contracts. For a Fund utilizing centrally-cleared swaps, the exchange bears the risk of loss resulting from a counterparty not being able to pay. There is no guarantee that a Fund or an underlying fund could eliminate its exposure under an outstanding swap agreement by entering into an offsetting swap agreement with the same or another party.
Interest rate swaps involve the exchange by the Fund with another party for its respective commitment to pay or receive a fixed or variable interest rate on a notional amount of principal. Interest rate swaps are generally centrally-cleared, but central clearing does not make interest rate swap transactions risk free.
The following table represents the Fund’s use and volume of interest rate swaps on a monthly basis:
| | | Average Notional Amount | |
Use | | Pay Floating Rate | | | Receive Floating Rate | |
Hedge, Income | | $ | 9,000,000 | | | $ | 123,250,000 | |
Forward Foreign Currency Exchange Contracts
A forward foreign currency exchange contract is an agreement between two parties to exchange two designated currencies at a specific time in the future. Certain types of contracts may be cash settled, in an amount equal to the change in exchange rates during the term of the contract. The contracts can be used to hedge or manage exposure to foreign currency risks with portfolio investments or to gain exposure to foreign currencies.
The market value of a forward foreign currency exchange contract changes with fluctuations in foreign currency exchange rates. Furthermore, the Fund may be exposed to risk if the counterparties cannot meet the contract terms or if the currency value changes unfavorably as compared to the U.S. dollar.
| | THE GUGGENHEIM FUNDS ANNUAL REPORT | 45 |
NOTES TO FINANCIAL STATEMENTS (continued) |
The following table represents the Fund’s use and volume of forward foreign currency exchange contracts on a monthly basis:
| | | Average Value | |
Use | | Purchased | | | Sold | |
Hedge | | $ | 769,631 | | | $ | 769,631 | |
Derivative Investment Holdings Categorized by Risk Exposure
The following is a summary of the location of derivative investments on the Fund’s Statement of Assets and Liabilities as of September 30, 2023:
Derivative Investment Type | Asset Derivatives | Liability Derivatives |
Interest Rate Swap Agreements | Unamortized upfront premiums paid on Interest rate swap agreements | — |
| | Variation margin on interest rate swapAgreements | |
The following tables set forth the fair value of the Fund’s derivative investments categorized by primary risk exposure at September 30, 2023:
Asset Derivative Investments Value |
| | Swaps
Interest Rate
Risk* | | | Total Value at
September 30,
2023 | |
| | | $ | 3,168,005 | | | $ | 3,168,005 | |
* | Includes cumulative appreciation (depreciation) of exchange-traded, OTC and centrally-cleared derivatives contracts as reported on the Fund’s Schedule of Investments. For exchange-traded and centrally-cleared derivatives, variation margin is reported within the Fund’s Statement of Assets and Liabilities. |
The following is a summary of the location of derivative investments on the Fund’s Statement of Operations for the year ended September 30, 2023:
Derivative Investment Type | Location of Gain (Loss) on Derivatives |
Interest rate swap agreements | Net realized gain (loss) on swap agreements Net change in unrealized appreciation (depreciation) on swap agreements |
Currency forward contracts | Net realized gain (loss) on forward foreign currency exchange contracts Net change in unrealized appreciation (depreciation) on forward foreign currency exchange contracts |
46 | THE GUGGENHEIM FUNDS ANNUAL REPORT | |
NOTES TO FINANCIAL STATEMENTS (continued) |
The following is a summary of the Fund’s realized gain (loss) and change in unrealized appreciation (depreciation) on derivative investments recognized on the Fund’s Statement of Operations categorized by primary risk exposure for the year ended September 30, 2023:
Realized Gain (Loss) on Derivative Investments Recognized on the Statements of Operations |
| | Swaps
Interest Rate
Risk | | | Forward
Foreign
Currency
Exchange
Risk | | | Total | |
| | | $ | 8,571,752 | | | $ | 798,911 | | | $ | 9,370,663 | |
Change in Unrealized Appreciation (Depreciation) on Derivative Investments
Recognized on the Statements of Operations |
| | Swaps
Interest Rate
Risk | | | Forward
Foreign
Currency
Exchange
Risk | | | Total | |
| | | $ | (6,024,955 | ) | | $ | (798,908 | ) | | $ | (6,823,863 | ) |
In conjunction with the use of derivative instruments, the Fund is required to maintain collateral in various forms. Depending on the financial instrument utilized and the broker involved, the Fund uses margin deposits at the broker, cash and/or securities segregated at the custodian bank, discount notes or repurchase agreements allocated to the Fund as collateral.
Foreign Investments
There are several risks associated with exposure to foreign currencies, foreign issuers and emerging markets. A fund’s indirect and direct exposure to foreign currencies subjects the Fund the risk that those currencies will decline in value relative to the U.S. dollar, or in the case of short positions, that the U.S. dollar will decline in value relative to the currency being hedged. Currency rates in foreign countries may fluctuate significantly over short periods of time for a number of reasons, including changes in interest rates and the imposition of currency controls or other political developments in the U.S. or abroad. In addition, the Fund may incur transaction costs connection with conversions between various currencies. The Fund may, but is not obligated to, engage in currency hedging transactions, which generally involve buying currency forward, options or futures contracts. However, not all currency risks may be effectively hedged, and in some cases the costs of hedging techniques may outweigh expected benefits. In such instances, the value of securities denominated in foreign currencies can change significantly when foreign currencies strengthen or weaken relative to the U.S. dollar.
| | THE GUGGENHEIM FUNDS ANNUAL REPORT | 47 |
NOTES TO FINANCIAL STATEMENTS (continued) |
The Fund may invest in securities of foreign companies directly, or in financial instruments, such as ADRs and exchange-traded funds, which are indirectly linked to the performance of foreign issuers. Foreign markets can be more volatile than the U.S. market due to increased risks of adverse issuer, political, regulatory, market, or economic developments and can perform differently from the U.S. market. Investing in securities of foreign companies directly, or in financial instruments that are indirectly linked to the performance of foreign issuers, may involve risks not typically associated with investing in U.S. issuers. The value of securities denominated foreign currencies, and of dividends from such securities, can change significantly when foreign currencies strengthen or weaken relative to the U.S. dollar. Foreign securities markets generally have less trading volume and less liquidity than U.S. markets, and prices in some foreign markets may fluctuate more than those of securities traded on U.S. markets. Many foreign countries lack accounting and disclosure standards comparable to those that apply to U.S. companies, and it may be more difficult to obtain reliable information regarding a foreign issuer’s financial condition and operations. Transaction costs and costs associated with custody services are generally higher for foreign securities than they are for U.S. securities. Some foreign governments levy withholding taxes against dividend and interest income. Although in some countries portions of these taxes are recoverable, the non-recovered portion will reduce the income received by the Fund.
The Trust has established counterparty credit guidelines and enters into transactions only with financial institutions of investment grade or better. The Trust monitors the counterparty credit risk.
Note 3 – Offsetting
In the normal course of business, the Fund enters into transactions subject to enforceable master netting arrangements or other similar arrangements. Generally, the right to offset in those agreements allows the Fund to counteract the exposure to a specific counterparty with collateral received from or delivered to that counterparty based on the terms of the arrangements. These arrangements provide for the right to liquidate upon the occurrence of an event of default, credit event upon merger or additional termination event.
In order to better define its contractual rights and to secure rights that will help the Fund mitigate its counterparty risk, the Fund may enter into an International Swaps and Derivatives Association, Inc. Master Agreement (“ISDA Master Agreement”) or similar agreement with its derivative contract counterparties. An ISDA Master Agreement is a bilateral agreement between a fund and a counterparty that governs OTC derivatives, including foreign exchange contracts, and typically contains, among other things, collateral posting terms and netting provisions in the event of a default and/or termination event. The provisions of the ISDA Master Agreement typically permit a single net payment in the event of a default (close-out netting) or similar event, including the bankruptcy or insolvency of the counterparty.
48 | THE GUGGENHEIM FUNDS ANNUAL REPORT | |
NOTES TO FINANCIAL STATEMENTS (continued) |
For derivatives traded under an ISDA Master Agreement, the collateral requirements are typically calculated by netting the mark-to-market amount for each transaction under such agreement and comparing that amount to the value of any collateral currently pledged by the Fund and the counterparty. For financial reporting purposes, cash collateral that has been pledged to cover obligations of the Fund and cash collateral received from the counterparty, if any, are reported separately on the Fund’s Statement of Assets and Liabilities as segregated cash with broker/receivable for variation margin, or payable for swap settlement/variation margin. Cash and/or securities pledged or received as collateral by the Fund in connection with an OTC derivative subject to an ISDA Master Agreement generally may not be invested, sold or rehypothecated by the counterparty or the Fund, as applicable, absent an event of default under such agreement, in which case such collateral generally may be applied towards obligations due to and payable by such counterparty or the Fund, as applicable. Generally, the amount of collateral due from or to a counterparty must exceed a minimum transfer amount threshold (e.g., $300,000) before a transfer is required to be made. To the extent amounts due to the Fund from its counterparties are not fully collateralized, contractually or otherwise, the Fund bears the risk of loss from counterparty nonperformance. The Fund attempts to mitigate counterparty risk by only entering into agreements with counterparties that it believes to be of good standing and by monitoring the financial stability of those counterparties.
For financial reporting purposes, the Fund does not offset derivative assets and derivative liabilities that are subject to netting arrangements in the Fund’s Statement of Assets and Liabilities.
At September 30, 2023, the Fund held no derivative financial instruments or secured financing transactions subject to enforceable netting arrangements.
The Fund has the right to offset deposits against any related derivative liabilities outstanding with each counterparty with the exception of exchange-traded or centrally-cleared derivatives. The following table presents deposits held by others in connection with derivative investments as of September 30, 2023.
Counterparty | | Asset Type | | | Cash Pledged | | | Cash Received | |
BofA Securities, Inc. | Interest rate swap agreements | | $ | — | | | $ | 985,143 | |
Note 4 – Fair Value Measurement
In accordance with U.S. GAAP, fair value is defined as the price that the Fund would receive to sell an investment or pay to transfer a liability in an orderly transaction between market participants at the measurement date. U.S. GAAP establishes a three-tier fair value hierarchy based on the types of inputs used to value assets and liabilities and requires corresponding disclosure. The hierarchy and the corresponding inputs are summarized below:
Level 1 — | unadjusted quoted prices in active markets for identical assets or liabilities. |
| | THE GUGGENHEIM FUNDS ANNUAL REPORT | 49 |
NOTES TO FINANCIAL STATEMENTS (continued) |
Level 2 — | significant other observable inputs (for example quoted prices for securities that are similar based on characteristics such as interest rates, prepayment speeds, credit risk, etc.). |
Level 3 — | significant unobservable inputs based on the best information available under the circumstances, to the extent observable inputs are not available, which may include assumptions. |
Rule 2a-5 sets forth a definition of “readily available market quotations,” which is consistent with the definition of a Level 1 input under U.S. GAAP. Rule 2a-5 provides that “a market quotation is readily available only when that quotation is a quoted price (unadjusted) in active markets for identical investments that the fund can access at the measurement date, provided that a quotation will not be readily available if it is not reliable.”
Securities for which market quotations are not readily available must be valued at fair value as determined in good faith. Accordingly, any security priced using inputs other than Level 1 inputs will be subject to fair value requirements. The types of inputs available depend on a variety of factors, such as the type of security and the characteristics of the markets in which it trades, if any. Fair valuation determinations that rely on fewer or no observable inputs require greater judgment. Accordingly, fair value determinations for Level 3 securities require the greatest amount of judgment.
Pricing service providers are used to value a majority of the Fund’s investments. When values are not available from a pricing service provider, they will be determined using a variety of sources and techniques, including: market prices; broker quotes; and models which derive prices based on inputs such as prices of securities with comparable maturities and characteristics or based on inputs such as anticipated cash flows or collateral, spread over U.S. Treasury securities, and other information and analysis. A significant portion of the Fund’s assets and liabilities are categorized as Level 2, as indicated in this report.
Quotes from broker-dealers, adjusted for fluctuations in criteria such as credit spreads and interest rates, may also be used to value the Fund’s assets and liabilities, i.e. prices provided by a broker-dealer or other market participant who has not committed to trade at that price. Although quotes are typically received from established market participants, the Fund may not have the transparency to view the underlying inputs which support the market quotations. Significant changes in a quote would generally result in significant changes in the fair value of the security.
Certain fixed income securities are valued by obtaining a monthly quote from a broker-dealer, adjusted for fluctuations in criteria such as credit spreads and interest rates. Certain loans and other securities are valued using a single daily broker quote or a price from a pricing service provider based on a single daily or monthly broker quote.
50 | THE GUGGENHEIM FUNDS ANNUAL REPORT | |
NOTES TO FINANCIAL STATEMENTS (continued) |
The inputs or methodologies selected and applied for valuing securities or other assets are not necessarily an indication of the risk associated with investing in those securities. The suitability, appropriateness and accuracy of the techniques, methodologies and sources employed to determine fair valuation are periodically reviewed and subject to change.
Note 5 – Investment Advisory Agreement and Other Agreements
Under the terms of an investment advisory contract, the Fund pays GI investment advisory fees calculated at an annualized rate of 0.25% of the average daily net assets of the Fund.
GI pays operating expenses on behalf of the Trust, such as audit and accounting related services, legal services, custody, printing and mailing, among others, on a pass-through basis. Such expenses are allocated to various Funds within the complex based on relative net assets.
The Board has adopted Distribution Plans related to the offering of A-Class shares pursuant to Rule 12b-1 under the 1940 Act. The plans provide for payments at an annual rate of 0.25% of the average daily net assets of the Fund’s A- Class shares.
The investment advisory contract for the Fund provides that the total expenses be limited to a percentage of average net assets for each class of shares, exclusive of brokerage costs, dividends or interest on securities sold short, expenses of other investment companies in which the Fund invests, interest, taxes, litigation, indemnification and extraordinary expenses. The limits are listed below:
| | Limit | | | Effective
Date | | | Contract
End Date | |
Ultra Short Duration Fund - A-Class | | | 0.58 | % | | | 11/30/18 | | | | 02/01/25 | |
Ultra Short Duration Fund - Institutional Class | | | 0.33 | % | | | 11/30/18 | | | | 02/01/25 | |
GI is entitled to reimbursement by the Fund for fees waived or expenses reimbursed during any of the previous 36 months, beginning on the date of the expense limitation agreement, if on any day the estimated operating expenses are less than the indicated percentages. For purposes of this arrangement, GI is entitled to recoupment of previously waived fees or reimbursed expenses for 36 months from the date of the waiver or reimbursement by GI. At September 30, 2023, the amount of fees waived or expenses reimbursed that are subject to recoupment and will expire during the years ended September 30, are presented in the following table:
| | | 2024 | | | 2025 | | | 2026 | | | Fund Total | |
A-Class | | $ | 36,209 | | | $ | 105,228 | | | $ | 100,752 | | | $ | 242,189 | |
Institutional Class | | | — | | | | 178,138 | | | | 224,523 | | | | 402,661 | |
For the year ended September 30, 2023, GI recouped $8,419 from the Fund.
For the year ended September 30, 2023, GFD retained sales charges of $132,849 relating to sales of A-Class shares of the Trust.
| | THE GUGGENHEIM FUNDS ANNUAL REPORT | 51 |
NOTES TO FINANCIAL STATEMENTS (continued) |
Certain trustees and officers of the Trust are also officers of GI and/or GFD. The Trust does not compensate its officers or trustees who are officers, directors and/or employees of GI or GFD.
MUFG Investor Services (US), LLC (“MUIS”) acts as the Fund’s administrator, transfer agent and accounting agent. As administrator, transfer agent and accounting agent, MUIS maintains the books and records of the Fund’s securities and cash. The Bank of New York Mellon Corp. (“BNY”) acts as the Fund’s custodian. As custodian, BNY is responsible for the custody of the Fund’s assets. For providing the aforementioned administrative and accounting services, MUIS is entitled to receive a monthly fee equal to a percentage of the Fund’s average daily net assets and out of pocket expenses. For providing the aforementioned transfer agent and custodian services, MUIS and BNY are entitled to receive a monthly fee based on the number of transactions during the month and the number of accounts under management, subject to certain minimum monthly fees, and out of pocket expenses.
At September 30 2023, GI and its affiliates owned 42% of the outstanding shares of the Fund.
Note 6 – Federal Income Tax Information
The Fund intends to comply with the provisions of Subchapter M of the Internal Revenue Code of 1986, as amended (the “Internal Revenue Code”), applicable to regulated investment companies and will distribute substantially all taxable net investment income and capital gains sufficient to relieve the Fund from all, or substantially all, federal income, excise and state income taxes. Therefore, no provision for federal or state income tax or federal excise tax is required.
Tax positions taken or expected to be taken in the course of preparing the Fund’s tax returns are evaluated to determine whether the tax positions are “more-likely-than-not” of being sustained by the applicable tax authority. Tax positions not deemed to meet the more-likely-than-not threshold would be recorded as a tax benefit or expense in the current year. Management has analyzed the Fund’s tax positions taken, or to be taken, on U.S. federal income tax returns for all open tax years, and has concluded that no provision for income tax is required in the Fund’s financial statements. The Fund’s U.S. federal income tax returns are subject to examination by the Internal Revenue Service (“IRS”) for a period of three years after they are filed.
The tax character of distributions paid during the year ended September 30, 2023 was as follows:
| | Ordinary
Income | | | Long-Term
Capital Gain | | | Total
Distributions | |
| | | $ | 26,832,386 | | | $ | — | | | $ | 26,832,386 | |
52 | THE GUGGENHEIM FUNDS ANNUAL REPORT | |
NOTES TO FINANCIAL STATEMENTS (continued) |
The tax character of distributions paid during the year ended September 30, 2022 was as follows:
| | Ordinary
Income | | | Long-Term
Capital Gain | | | Total
Distributions | |
| | | $ | 13,001,649 | | | $ | — | | | $ | 13,001,649 | |
Note: For U.S. federal income tax purposes, short-term capital gain distributions are treated as ordinary income distributions.
The tax components of distributable earnings/(loss) as of September 30, 2023 were as follows:
| | Undistributed
Ordinary
Income | | | Undistributed
Long-Term
Capital Gain | | | Net Unrealized
Appreciation
(Depreciation) | | | Accumulated
Capital and
Other Losses | | | Other
Temporary
Differences | | | Total | |
| | | $ | 1,629,987 | | | $ | — | | | $ | (20,056,085 | ) | | $ | (3,865,220 | ) | | $ | (2,330,907 | ) | | $ | (24,622,225 | ) |
For U.S. federal income tax purposes, capital loss carryforwards represent realized losses of the Fund that may be carried forward and applied against future capital gains. The Fund is permitted to carry forward capital losses for an unlimited period and such capital loss carryforwards retain their character as either short-term or long-term capital losses. As of September 30, 2023, capital loss carryforwards for the Fund were as follows:
| | | Unlimited | | | Total
Capital Loss
Carryforward | |
| |
Short-Term | | |
Long-Term | | | |
| | | $ | (1,214,252 | ) | | $ | (2,650,968 | ) | | $ | (3,865,220 | ) |
Net investment income and net realized gains (losses) may differ for financial statement and tax purposes because of temporary or permanent book/tax differences. These differences are primarily due to investments in swap agreements, foreign currency gains and losses, and paydown reclasses. Additional differences may result from the tax treatment of bond premium/discount amortization and dividends payable. To the extent these differences are permanent and would require a reclassification between Paid in Capital and Total Distributable Earnings (Loss), such reclassifications are made in the period that the differences arise. These reclassifications have no effect on net assets or NAV per share.
There were no adjustments made on the Statement of Assets and Liabilities as of September 30, 2023 for permanent book/tax differences.
At September 30, 2023, the cost of investments for U.S. federal income tax purposes, the aggregate gross unrealized appreciation for all investments for which there was an excess of value over tax cost and the aggregate gross unrealized depreciation for all investments for which there was an excess of tax cost over value, were as follows:
| | THE GUGGENHEIM FUNDS ANNUAL REPORT | 53 |
NOTES TO FINANCIAL STATEMENTS (continued) |
| | Tax
Cost | | | Tax
Unrealized
Appreciation | | | Tax
Unrealized
Depreciation | | | Net Tax
Unrealized
Appreciation/
(Depreciation) | |
| | | $ | 538,503,874 | | | $ | 3,281,555 | | | $ | (23,337,640 | ) | | $ | (20,056,085 | ) |
Note 7 – Securities Transactions
For the year ended September 30, 2023, the cost of purchases and proceeds from sales of investment securities, excluding government securities, short-term investments and derivatives, were as follows:
| | Purchases | | | Sales | |
| | | $ | 8,196,207 | | | $ | 224,382,724 | |
The Fund is permitted to purchase or sell securities from or to certain affiliated funds under specified conditions outlined in procedures adopted by the Board. The procedures have been designed to ensure that any purchase or sale of securities by the Fund from or to another fund or portfolio that is or could be considered an affiliate by virtue of having a common investment adviser (or affiliated investment advisers), common trustees and/or common officers complies with Rule 17a-7 of the 1940 Act. Further, as defined under these procedures, each transaction is effected at the current market price to save costs, where permissible. For the year ended September 30, 2023, the Fund did not engage in purchases and sales of securities, pursuant to Rule 17a-7 of the 1940 Act.
Note 8 – Restricted Securities
The securities below are considered illiquid and restricted under guidelines established by the Board:
Restricted
Securities | | Acquisition
Date | | | Cost | | | Value | |
Cascade Funding Mortgage Trust | | | | | | | | | | | | |
2019-RM3 2.80% (WAC) due 06/25/691 | | | 06/25/19 | | | $ | 112,495 | | | $ | 109,108 | |
LSTAR Securities Investment Ltd. | | | | | | | | | | | | |
2021-1 8.24% (1 Month Term SOFR + 2.91%, Rate Floor: 1.80%) due 02/01/261 | | | 02/04/21 | | | | 1,320,857 | | | | 1,296,390 | |
Towd Point Revolving Trust | | | | | | | | | | | | |
4.83% due 09/25/64 | | | 03/17/22 | | | | 3,249,989 | | | | 3,159,813 | |
| | | | | | | $ | 4,683,341 | | | $ | 4,565,311 | |
1 | Variable rate security. Rate indicated is the rate effective at September 30, 2023. In some instances, the effective rate is limited by a minimum rate floor or a maximum rate cap established by the issuer. The settlement status of a position may also impact the effective rate indicated. In some cases, a position may be unsettled at period end and may not have a stated effective rate. In instances where multiple underlying reference rates and spread amounts are shown, the effective rate is based on a weighted average. |
54 | THE GUGGENHEIM FUNDS ANNUAL REPORT | |
NOTES TO FINANCIAL STATEMENTS (continued) |
Note 9 – Line of Credit
The Trust, along with other affiliated trusts, secured a 364-day committed, $1,150,000,000 line of credit from Citibank, N.A., which was in place through September 29, 2023, at which time the a new line of credit was entered into in the amount of $1,165,000,000. The Fund may draw (borrow) from the line of credit as a temporary measure for emergency purposes, to facilitate redemption requests, or for other short-term liquidity purposes consistent with the Fund’s investment objective and program. For example, it may be advantageous for the Fund to borrow money rather than sell existing portfolio positions to meet redemption requests. Fees related to borrowings, if any, vary under this arrangement between the greater of Citibank’s “base rate”, SOFR plus 1%, or the federal funds rate plus 1/2 of 1%.
The commitment fee that may be paid by the Fund is at an annualized rate of 0.15% of the average daily amount of their allocated unused commitment amount. The commitment fee amount is allocated to the individual Funds based on the respective net assets of each participating Fund and is referenced in the Fund’s Statement of Operations under “Line of credit fees”. The Funds did not have any borrowings under this agreement as of and for the year ended September 30, 2023.
Note 10 – Reverse Repurchase Agreements
The Fund may enter into reverse repurchase agreements. Under a reverse repurchase agreement, a Fund sells securities and agrees to repurchase them at a particular price at a future date. In the event the buyer of securities under a reverse repurchase agreement files for bankruptcy or becomes insolvent, such buyer or its trustee or receiver may receive an extension of time to determine whether to enforce the Fund’s obligation to repurchase the securities, and the Fund’s use of the proceeds of the reverse repurchase agreement may effectively be restricted pending such decision.
For the year ended September 30, 2023, the Fund entered into reverse repurchase agreements as follows:
| | Number of
Days Outstanding | | | Balance at
September 30, 2023 | | | Average Balance
Outstanding | | | Average
Interest Rate | |
| | | | 15 | | | $ | — | * | | $ | 9,479,767 | | | | 4.09 | % |
* | As of September 30, 2023, there were no open reverse repurchase agreements. |
Note 11 – Market Risks
The value of, or income generated by, the investments held by the Fund are subject to the possibility of rapid and unpredictable fluctuation, and loss that may result from various factors. These factors include, among others, developments affecting individual companies, or from broader influences, including real or perceived changes in prevailing interest rates (which have since risen and may continue to rise), changes in inflation rates or expectations about inflation rates (which are currently elevated relative to normal conditions), adverse investor confidence
| | THE GUGGENHEIM FUNDS ANNUAL REPORT | 55 |
NOTES TO FINANCIAL STATEMENTS (concluded) |
or sentiment, changing economic, political (including geopolitical), social or financial market conditions, increased instability or general uncertainty, environmental disasters, governmental actions, public health emergencies (such as the spread of infectious diseases, pandemics and epidemics), debt crises, actual or threatened wars or other armed conflicts (such as the current Russia-Ukraine conflict and its risk of expansion or collateral economic and other effects) or ratings downgrades, and other similar events, each of which may be temporary or last for extended periods. Moreover, changing economic, political, geopolitical, social, financial market or other conditions in one country or geographic region could adversely affect the value, yield and return of the investments held by the Fund in a different country or geographic region, economy, and market because of the increasingly interconnected global economies and financial markets. The duration and extent of the foregoing types of factors or conditions are highly uncertain and difficult to predict and have in the past, and may in the future, cause volatility and distress in economies and financial markets or other adverse circumstances, which may negatively affect the value of the Fund’s investments and performance of the Fund.
Note 12 – Subsequent Events
The Fund evaluated subsequent events through the date the financial statements are issued and determined there were no material events that would require adjustment to or disclosure in the Fund’s financial statements.
56 | THE GUGGENHEIM FUNDS ANNUAL REPORT | |
REPORT OF INDEPENDENT REGISTERED PUBLIC ACCOUNTING FIRM |
To the Shareholders and the Board of Trustees of Guggenheim Ultra Short Duration Fund
Opinion on the Financial Statements
We have audited the accompanying statement of assets and liabilities of Guggenheim Ultra Short Duration Fund (the “Fund”), (one of the funds constituting Guggenheim Funds Trust (the “Trust”)), including the schedule of investments, as of September 30, 2023, and the related statement of operations for the year then ended, the statements of changes in net assets for each of the two years in the period then ended, the financial highlights for each of the five years in the period then ended and the related notes (collectively referred to as the “financial statements”). In our opinion, the financial statements present fairly, in all material respects, the financial position of the Fund (one of the funds constituting Guggenheim Funds Trust) at September 30, 2023, the results of its operations for the year then ended, the changes in its net assets for each of the two years in the period then ended and its financial highlights for each of the five years in the period then ended, in conformity with U.S. generally accepted accounting principles.
Basis for Opinion
These financial statements are the responsibility of the Trust’s management. Our responsibility is to express an opinion on the Fund’s financial statements based on our audits. We are a public accounting firm registered with the Public Company Accounting Oversight Board (United States) (“PCAOB”) and are required to be independent with respect to the Trust in accordance with the U.S. federal securities laws and the applicable rules and regulations of the Securities and Exchange Commission and the PCAOB.
We conducted our audits in accordance with the standards of the PCAOB. Those standards require that we plan and perform the audit to obtain reasonable assurance about whether the financial statements are free of material misstatement, whether due to error or fraud. The Trust is not required to have, nor were we engaged to perform, an audit of the Trust’s internal control over financial reporting. As part of our audits, we are required to obtain an understanding of internal control over financial reporting but not for the purpose of expressing an opinion on the effectiveness of the Trust’s internal control over financial reporting. Accordingly, we express no such opinion.
Our audits included performing procedures to assess the risks of material misstatement of the financial statements, whether due to error or fraud, and performing procedures that respond to those risks. Such procedures included examining, on a test basis, evidence regarding the amounts and disclosures in the financial statements. Our procedures included confirmation of securities owned as of September 30, 2023, by correspondence with the custodian, brokers, and paying agents; when replies were not received from brokers, we performed other auditing procedures.
| | THE GUGGENHEIM FUNDS ANNUAL REPORT | 57 |
REPORT OF INDEPENDENT REGISTERED PUBLIC ACCOUNTING FIRM (concluded) |
Our audits also included evaluating the accounting principles used and significant estimates made by management, as well as evaluating the overall presentation of the financial statements. We believe that our audits provide a reasonable basis for our opinion.

We have served as the auditor of one or more Guggenheim investment companies since 1979.
Tysons, Virginia
November 28, 2023
58 | THE GUGGENHEIM FUNDS ANNUAL REPORT | |
OTHER INFORMATION (Unaudited) |
Federal Income Tax Information
This information is being provided as required by the Internal Revenue Code. Amounts shown may differ from those elsewhere in the report because of differences in tax and financial reporting practice.
In January 2024, shareholders will be advised on IRS Form 1099 DIV or substitute 1099 DIV as to the federal tax status of the distributions received by shareholders in the calendar year 2023.
The Fund’s investment income (dividend income plus short-term capital gains, if any) qualifies as follows:
Of the taxable ordinary income distributions paid during the fiscal year ended September 30, 2023, the Fund had the corresponding percentage qualify as interest related dividends as permitted by IRC Section 871(k)(1). See the qualified interest income column in the table below.
| | | | | | | | Qualified
Interest
Income | |
| | | | | | | | | | | | 54.88 | % |
Delivery of Shareholder Reports
Paper copies of the Fund’s annual and semi-annual shareholder reports are not sent by mail, unless you specifically request paper copies of the reports from a fund or from your financial intermediary. Instead, the reports are made available on a website, and you are notified by mail each time a report is posted and provided with a website link to access the report.
You may elect to receive all future shareholder reports in paper free of charge. If you hold shares of a fund directly, you can inform the Fund that you wish to receive paper copies of reports by calling 800.820.0888. If you hold shares of a fund through a financial intermediary, please contact the financial intermediary to make this election. Your election to receive reports in paper may apply to all Guggenheim Funds in which you are invested and may apply to all Guggenheim funds held with your financial intermediary.
Tailored Shareholder Reports for Open-End Mutual Funds and Exchange-Traded Funds
Effective January 24, 2023, the SEC adopted rule and form amendments to require open-end mutual funds and exchange-traded funds registered on Form N-1A to transmit concise and visually engaging streamlined annual and semi-annual reports to shareholders that highlight key information. Other information, including financial statements, will no longer appear in a streamlined shareholder report but must be available online, delivered free of charge upon request, and filed on a semi-annual basis on Form N-CSR. The rule and form amendments have a compliance date of July 24, 2024. At this time, management is evaluating the impact of these amendments on the shareholder reports for the Funds.
| | THE GUGGENHEIM FUNDS ANNUAL REPORT | 59 |
OTHER INFORMATION (Unaudited)(continued) |
Proxy Voting Information
A description of the policies and procedures that the Trust uses to determine how to vote proxies relating to securities held in the Fund’s portfolio is available, without charge and upon request, by calling 800.820.0888. This information is also available from the EDGAR database on the SEC’s website at https://www.sec.gov.
Information regarding how the Fund voted proxies relating to portfolio securities during the most recent 12-month period ended June 30 is available without charge, upon request, by calling 800.820.0888. This information is also available from the EDGAR database on the SEC’s website at https://www.sec.gov.
Sector Classification
Information in the Schedule of Investments is categorized by sectors using sector-level Classifications defined by the Bloomberg Industry Classification System, a widely recognized industry classification system provider. The Fund’s registration statement has investment policies relating to concentration in specific sectors/industries. For purposes of these investment policies, the Fund usually classifies sectors/industries based on industry-level Classifications used by widely recognized industry classification system providers such as Bloomberg Industry Classification System, Global Industry Classification Standards and Barclays Global Classification Scheme.
Quarterly Portfolio Schedules Information
The Trust files its complete schedule of portfolio holdings with the SEC for the first and third quarters of each fiscal year as an exhibit to its reports on Form N-PORT, and for reporting periods ended prior to March 31, 2019, filed such information on Form N-Q. The Fund’s Forms N-PORT and N-Q are available on the SEC’s website at https://www.sec.gov. Copies of the portfolio holdings are also available to shareholders, without charge and upon request, by calling 800.820.0888.
Report of the Guggenheim Funds Trust Board of Trustees
The Board of Trustees of Guggenheim Funds Trust (the “Trust”), including the Independent Trustees, unanimously approved the renewal of the investment management agreements (as applicable to a specific Fund, the “Advisory Agreement” and collectively, the “Advisory Agreements”) with Security Investors, LLC (“Security Investors”) and Guggenheim Partners Investment Management, LLC (“GPIM”) on behalf of the applicable series of the Trust listed
60 | THE GUGGENHEIM FUNDS ANNUAL REPORT | |
OTHER INFORMATION (Unaudited)(continued) |
below (each a “Fund” and collectively, the “Funds”) and the investment sub-advisory agreement between Security Investors and GPIM on behalf of Guggenheim Municipal Income Fund (the “Sub-Advisory Agreement” and together with the “Advisory Agreements,” the “Agreements”):
| | ● Guggenheim Alpha Opportunity Fund (“Alpha Opportunity Fund”)* | ● Guggenheim Core Bond Fund (“Core Bond Fund”)* |
| | | |
| | ● Guggenheim Diversified Income Fund (“Diversified Income Fund”)** | ● Guggenheim Floating Rate Strategies Fund (“Floating Rate Strategies Fund”)** |
| | | |
| | ● Guggenheim High Yield Fund (“High Yield Fund”)* | ● Guggenheim Large Cap Value Fund (“Large Cap Value Fund”)* |
| | | |
| | ● Guggenheim Limited Duration Fund (“Limited Duration Fund”)** | ● Guggenheim Macro Opportunities Fund (“Macro Opportunities Fund”)**1 |
| | | |
| | ● Guggenheim Market Neutral Real Estate Fund (“Market Neutral Real Estate Fund”)** | ● Guggenheim Municipal Income Fund (“Municipal Income Fund”)* |
| | | |
| | ● Guggenheim Risk Managed Real Estate Fund (“Risk Managed Real Estate Fund”)** | ● Guggenheim Small Cap Value Fund (“Small Cap Value Fund”)* |
| | | |
| | ● Guggenheim SMid Cap Value Fund (“SMid Cap Value Fund”)* | ● Guggenheim StylePlus—Large Core Fund (“StylePlus—Large Core Fund”)* |
| | | |
| | ● Guggenheim StylePlus—Mid Growth Fund (“StylePlus—Mid Growth Fund”)* | ● Guggenheim Total Return Bond Fund (“Total Return Bond Fund”)** |
| | | |
| | ● Guggenheim Ultra Short Duration Fund (“Ultra Short Duration Fund”)** | ● Guggenheim World Equity Income Fund (“World Equity Income Fund”)* |
* | Security Investors serves as investment adviser to the Fund. |
** | GPIM serves as investment adviser to the Fund. Unless the context indicates otherwise, GPIM and Security Investors, with respect to their service as investment adviser to the applicable Funds, are each referred to herein as an “Adviser” and together, the “Advisers.” |
1 | GPIM also serves as investment adviser to Guggenheim Macro Opportunities Fund CFC (the “Subsidiary”), a wholly-owned subsidiary of Macro Opportunities Fund that is organized as a limited company under the laws of the Cayman Islands and used by Macro Opportunities Fund to obtain commodities exposure. Pursuant to a separate investment advisory agreement for the Subsidiary (the “Subsidiary Advisory Agreement”), the Subsidiary pays GPIM an advisory fee at the same rate that Macro Opportunities Fund pays GPIM under its Advisory Agreement. The Subsidiary Advisory Agreement does not require annual renewal by the Board and will continue until it is terminated as provided in the Agreement. In addition, GPIM and Macro Opportunities Fund have entered into a separate fee waiver agreement pursuant to which GPIM has contractually agreed to waive the advisory fee it receives from Macro Opportunities Fund in an amount equal to the advisory fee paid to GPIM by the Subsidiary. This undertaking will continue for so long as Macro Opportunities Fund invests in the Subsidiary, and may be terminated only with the approval of the Board. |
| | THE GUGGENHEIM FUNDS ANNUAL REPORT | 61 |
OTHER INFORMATION (Unaudited)(continued) |
Security Investors and GPIM are each an indirect subsidiary of Guggenheim Partners, LLC, a privately-held, global investment and advisory firm (“Guggenheim Partners”). Guggenheim Partners, Security Investors, GPIM and their affiliates may be referred to herein collectively as “Guggenheim.” Security Investors and GPIM are also known as “Guggenheim Investments,” the global asset management and investment advisory division of Guggenheim Partners that includes other affiliated investment management businesses.
At meetings held in person on April 17-18, 2023 (the “April Meeting”) and meetings held by videoconference on May 15, 2023 and in person on May 24, 2023 (the “May Meeting”), the Contracts Review Committee of the Board (the “Committee”), consisting solely of the Independent Trustees, met separately from Guggenheim to consider the proposed renewal of the Agreements. As part of its review process, the Committee was represented by independent legal counsel to the Independent Trustees (“Independent Legal Counsel”), from whom the Independent Trustees received separate legal advice and with whom they met separately. Independent Legal Counsel reviewed and discussed with the Committee various key aspects of the Trustees’ legal responsibilities relating to the proposed renewal of the Agreements and other principal contracts. The Committee took into account various materials received from Guggenheim and Independent Legal Counsel. The Committee also considered the variety of written materials, reports and oral presentations the Board received throughout the year regarding performance and operating results of the Funds, and other information relevant to its evaluation of the Agreements.
In connection with the contract review process, FUSE Research Network LLC (“FUSE”), an independent, third-party research provider, was engaged to prepare advisory contract renewal reports designed specifically to help the Board fulfill its advisory contract renewal responsibilities. The objective of the FUSE reports is to present the subject funds’ relative position regarding fees, expenses and total return performance, with peer group and universe comparisons. The Committee assessed the data provided in the FUSE reports as well as commentary presented by Guggenheim, including, among other things, a summary of notable distinctions between certain Funds and the applicable peer group identified in the FUSE reports and explanations for custom peer groups created for certain Funds that do not fit well into any particular category. The Committee noted that although FUSE’s process typically results in the identification for each Fund of a universe of similar funds for performance comparisons and a narrower group of similar funds from the universe based on asset levels for comparative fee and expense data evaluation (i.e., the peer group), the peer group constituent funds identified by FUSE for Market Neutral Real Estate Fund were the same as the performance universe constituent funds due to the Fund’s investment strategy.
In addition, Guggenheim provided materials and data in response to formal requests for information sent by Independent Legal Counsel on behalf of the Committee. Guggenheim also made a presentation at the April Meeting. Throughout the process, the Committee asked questions of management and requested certain additional information, which Guggenheim provided (collectively with the foregoing reports and materials, the “Contract Review Materials”).
62 | THE GUGGENHEIM FUNDS ANNUAL REPORT | |
OTHER INFORMATION (Unaudited)(continued) |
The Committee considered the Contract Review Materials in the context of its accumulated experience governing the Trust and other Guggenheim funds and weighed the factors and standards discussed with Independent Legal Counsel.
Following an analysis and discussion of relevant factors, including those identified below, and in the exercise of its business judgment, the Committee concluded that it was in the best interest of each Fund to recommend that the Board approve the renewal of the applicable Agreements for an additional annual term. Following its review of the Committee’s recommendation, the Board approved the renewal of the applicable Agreements for each Fund for a one-year period ending August 1, 2024 at a meeting held on May 23-24, 2023 (the “May Board Meeting” and together with the May Meeting, the “May Meetings”) and determined to adopt the Committee’s considerations and conclusions, which follow.
Advisory Agreements
Nature, Extent and Quality of Services Provided by Each Adviser: With respect to the nature, extent and quality of services currently provided by each Adviser, the Committee considered the qualifications, experience and skills of key personnel performing services for the Funds, including those personnel providing compliance and risk oversight, as well as the supervisors and reporting lines for such personnel. The Committee also considered other information, including Guggenheim’s resources and related efforts to retain, attract and motivate capable personnel to serve the Funds. In evaluating Guggenheim’s resources and capabilities, the Committee considered Guggenheim’s commitment to focusing on, and investing resources in support of, funds in the Guggenheim fund complex, including the Funds. The Committee also considered Guggenheim’s discussion of its ongoing review of the Guggenheim fund line-up at the April Meeting and the May Board Meeting. In addition, the Committee considered the acceptability of the terms of each Advisory Agreement, including the scope of services required to be performed by each Adviser.
The Committee’s review of the services provided by Guggenheim to the Funds included consideration of Guggenheim’s investment processes and resulting performance, portfolio oversight and risk management, and the related regular quarterly reports and presentations received by the Board. The Committee took into account the risks borne by Guggenheim in sponsoring and providing services to the Funds, including regulatory, operational, legal and entrepreneurial risks. The Committee considered the resources dedicated by Guggenheim to compliance functions and the reporting made to the Board by Guggenheim compliance personnel regarding Guggenheim’s adherence to regulatory requirements. The Committee also considered the regular reports the Board receives from the Trust’s Chief Compliance Officer regarding compliance policies and procedures established pursuant to Rule 38a-1 under the Investment Company Act of 1940, as amended. In connection with the Committee’s evaluation of the overall package of services provided by Guggenheim, the Committee considered Guggenheim’s administrative services, including its role in supervising, monitoring, coordinating and evaluating the various services provided by the fund administrator, transfer agent, distributor, custodian
| | THE GUGGENHEIM FUNDS ANNUAL REPORT | 63 |
OTHER INFORMATION (Unaudited)(continued) |
and other service providers to the Funds. The Committee evaluated the Office of Chief Financial Officer (the “OCFO”), established to oversee the fund administration, accounting and transfer agency services provided to the Funds and other Guggenheim funds, including the OCFO’s resources, personnel and services provided.
With respect to Municipal Income Fund, the Committee noted that, although Security Investors delegated certain portfolio management responsibilities to the Sub-Adviser, as affiliated companies, both the Adviser and the Sub-Adviser are part of the Guggenheim organization. Further, the Committee took into account Guggenheim’s explanation that investment advisory-related services are provided by many Guggenheim employees under different related legal entities and thus, the services provided by the Adviser on the one hand and the Sub-Adviser on the other, as well as the risks assumed by each party, cannot be ascribed to distinct legal entities.2 As a result, in evaluating the services provided to the Municipal Income Fund under the Sub-Advisory Agreement, the Committee did not separately consider the contributions under the Advisory Agreement and the Sub-Advisory Agreement.
With respect to Guggenheim’s resources and the ability of each Adviser to carry out its responsibilities under the applicable Advisory Agreement, the Chief Financial Officer of Guggenheim Investments reviewed with the Committee financial information concerning the holding company for Guggenheim Investments, Guggenheim Partners Investment Management Holdings, LLC (“GPIMH”), and the various entities comprising Guggenheim Investments, and provided the audited consolidated financial statements of GPIMH. (Thereafter, the Committee received the audited consolidated financial statements of GPIM.)
Based on the foregoing, and based on other information received (both oral and written) at the April Meeting and the May Meetings, as well as other considerations, including the Committee’s knowledge of how each Adviser performs its duties obtained through Board meetings, discussions and reports throughout the year, the Committee concluded that each Adviser and its personnel were qualified to serve the Funds in such capacity and may reasonably be expected to continue to provide a high quality of services under each Advisory Agreement with respect to the Funds.
Investment Performance: The Committee received, for each Fund, investment returns for the since-inception, ten-year, five-year, three-year, one-year and three-month periods ended December 31, 2022, as applicable. In addition, the Committee received a comparison of each Fund’s performance to the performance of a benchmark, a universe of funds and a narrower peer group of similar funds based on asset levels as identified by FUSE (except as noted above with respect to Market Neutral Real Estate Fund), in each case for the same periods, as applicable. The Committee also received from FUSE a description of the methodology for identifying each Fund’s peer group and universe for performance and expense comparisons. The Committee also received
2 | Consequently, except where the context indicates otherwise, references to “Adviser,” “Advisers” or “Sub-Adviser” should be understood as referring to Guggenheim Investments generally and the services it provides under the Agreements. |
64 | THE GUGGENHEIM FUNDS ANNUAL REPORT | |
OTHER INFORMATION (Unaudited)(continued) |
certain performance information as of March 31, 2023. In assessing each Fund’s performance, the Committee considered that the Board receives regular reporting from Guggenheim regarding performance and evaluates performance throughout the year.
In seeking to evaluate Fund performance over a full market cycle, the Committee focused its attention on five-year and three-year performance rankings as compared to the relevant universe of funds. Except as to the individual Funds discussed below, the Committee observed that the returns of each Fund’s Institutional Class shares ranked in the third quartile or better of such Fund’s performance universe for each of the relevant periods considered. In addition, the Committee made the following observations:
Alpha Opportunity Fund: The returns of the Fund’s Institutional Class shares ranked in the 96th and 73rd percentiles of its performance universe for the five-year and three-year periods ended December 31, 2022, respectively. The Committee noted management’s explanation that the Fund’s relative underperformance over the five-year time period was primarily due to the Fund’s beta profile and fundamental factor tilts. The Committee noted management’s statement that the Fund’s lower beta profile to broad market U.S. equities relative to its peers and long exposure to value and short exposure to growth have detracted from investment performance. The Committee also noted management’s statement that as a result of an update in 2021 to the quantitative investment methodology that the Fund employs, as well as the more recent comeback of value-oriented, higher quality names, the Fund experienced performance rankings that compare more favorably relative to its performance universe for the three-year and one-year periods ended December 31, 2022.
Diversified Income Fund: The returns of the Fund’s Institutional Class shares ranked in the 78th and 75th percentiles of its performance universe for the five-year and three-year periods ended December 31, 2022, respectively. The Committee noted management’s explanation that the Fund’s relative underperformance over the five-year time period was primarily due to the Fund’s defensively-positioned portfolio, in particular within its fixed-income sleeve which includes allocations to several Guggenheim fixed-income funds that were defensively positioned beginning in 2018, reflecting Guggenheim’s market views. The Committee also noted management’s statement that the Fund maintained a lower beta profile to equities relative to its peers. The Committee further noted management’s statement that the Fund’s allocation process was updated in 2021, resulting in an increase in the Fund’s equity exposure, and that there was some improvement in the Fund’s performance rankings relative to its performance universe for the three-year and one-year periods ended December 31, 2022. The Committee noted management’s statement that although the Fund’s increased equity exposure was detrimental to the Fund’s performance relative to peers in 2022 due to the poor performance of U.S. equities that year, Guggenheim believes the increased equity exposure will ultimately benefit shareholders and support total return performance in the medium to long term. The Committee also noted the Fund’s small size and considered management’s statements that the Fund continues to be a viable offering and that Guggenheim is able to manage the Fund at its current size.
| | THE GUGGENHEIM FUNDS ANNUAL REPORT | 65 |
OTHER INFORMATION (Unaudited)(continued) |
Market Neutral Real Estate Fund: The returns of the Fund’s Institutional Class shares ranked in the 44th and 89th percentiles of its performance universe for the five-year and three-year periods ended December 31, 2022, respectively. The Committee noted management’s explanation that the Fund’s relative underperformance over the three-year time period was due to underperforming pairs of offsetting long and short positions as well as several stock- and sector-specific issues, and considered that, despite recent underperformance, the Fund experienced performance that ranks in the top half of its performance universe for the five-year period ended December 31, 2022.
Municipal Income Fund: The returns of the Fund’s Institutional Class shares ranked in the 89th and 83rd percentiles of its performance universe for the five-year and three-year periods ended December 31, 2022, respectively. The Committee noted management’s explanation that the Fund’s conservative positioning in high quality, long-duration assets, which underperformed over the past two years due to a risk-on sentiment in 2021 and due to fears of duration risk in 2022, contributed to relative underperformance over the five-year and three-year time periods. The Committee noted management’s statement that the Fund’s allocation to closed-end funds also contributed to relative underperformance in 2022 as the increased cost of leverage weighed on the performance of such funds. The Committee considered management’s belief that an economic downturn that is likely to follow the Federal Reserve’s tightening of financial conditions will disproportionately affect weaker municipal credits and could lead to distress in names the Fund has avoided. The Committee also took into account management’s further discussions of performance attribution and outlook for the Fund at the April Meeting and the May Board Meeting, during which management highlighted that the Fund’s relative underperformance in 2022 was due to the exceptional volatility in the fixed-income markets that year which also impacted relative performance for the trailing five-year and three-year time periods, and noted the overall low dispersion in absolute investment returns among municipal bond funds.
StylePlus—Mid Growth Fund: The returns of the Fund’s Institutional Class shares ranked in the 76th and 67th percentiles of its performance universe for the five-year and three-year periods ended December 31, 2022, respectively. The Committee noted management’s explanation that the Fund’s relative underperformance over the five-year time period can be attributed to the more conservative positioning of the underlying funds in which the Fund invests, resulting in yields insufficient to offset fund fees and other costs, as well as the strategy’s tilt to value-oriented, lower-growth names within the mid-cap growth segment as growth outperformed value securities from 2018 through 2020. The Committee also noted management’s statement that as a result of the more recent comeback of value-oriented, lower-growth names, the Fund experienced performance rankings that compare more favorably relative to its performance universe for the three-year and one-year periods ended December 31, 2022.
Ultra Short Duration Fund: The returns of the Fund’s Institutional Class shares ranked in the 76th and 63rd percentiles of its performance universe for the five-year and three-year periods ended December 31, 2022, respectively. The Committee noted management’s explanation that the Fund’s overweight duration positioning over the five-year time period relative to its performance universe as well as higher allocations to structured credit during the second half of 2022, which
66 | THE GUGGENHEIM FUNDS ANNUAL REPORT | |
OTHER INFORMATION (Unaudited)(continued) |
underperformed corporate credit during that period, contributed to relative underperformance over the five-year time period. The Committee considered management’s expectation that the resetting of higher interest rates should help the Fund to perform well going forward and that the divergence in the relationship between structured and corporate credit should normalize going forward and lead to relative outperformance, noting that there was some improvement in the Fund’s performance ranking relative to its performance universe for the one-year period ended December 31, 2022.
Based on the foregoing, and based on other information received (both oral and written) at the April Meeting and the May Meetings, as well as other considerations, the Committee concluded that, with respect to each Fund other than Municipal Income Fund: (i) the Fund’s performance was acceptable; or (ii) it was satisfied with Guggenheim’s responses and/or efforts to improve investment performance; and, with respect to Municipal Income Fund, it would continue to monitor the Fund’s investment performance.
Comparative Fees, Costs of Services Provided and the Benefits Realized by Each Adviser from Its Relationship with the Funds: The Committee compared each Fund’s contractual advisory fee (which, for Municipal Income Fund, includes the sub-advisory fee paid to the Sub-Adviser), net effective management fee3 and total net expense ratio to the applicable peer group. The Committee also reviewed the median advisory fees and expense ratios, including expense ratio components (e.g., transfer agency fees, administration fees, other operating expenses, distribution fees and fee waivers/reimbursements), of the peer group of funds. In addition, the Committee considered information regarding Guggenheim’s process for evaluating the competitiveness of each Fund’s fees and expenses, noting Guggenheim’s statement that evaluations seek to incorporate a variety of factors with a general focus on ensuring fees and expenses: (i) are competitive; (ii) give consideration to resource support requirements; and (iii) ensure Funds are able to deliver on shareholder return expectations. The Committee also considered Guggenheim’s discussion of information regarding fee and expense trends across the open-end fund industry and its response to those trends with respect to the funds in the Guggenheim fund complex, including the Funds.
As part of its evaluation of each Fund’s advisory fee, the Committee considered how such fees compared to the advisory fee charged by Guggenheim to one or more other clients that it manages pursuant to similar investment strategies, to the extent applicable, noting that, in certain instances, Guggenheim charges a lower advisory fee to such other clients. In this connection, the Committee considered, among other things, Guggenheim’s representations about the significant differences between managing mutual funds as compared to other types of accounts. The Committee also considered Guggenheim’s explanation that lower fees are charged in certain instances due to various other factors, including the scope of contract, type of investors, fee structure, applicable legal, governance and capital structures, tax status and historical pricing
3 | The “net effective management fee” for each Fund represents the combined effective advisory fee and administration fee as a percentage of average net assets for the latest fiscal year, after any waivers and/or reimbursements. |
| | THE GUGGENHEIM FUNDS ANNUAL REPORT | 67 |
OTHER INFORMATION (Unaudited)(continued) |
reasons. In addition, the Committee took into account Guggenheim’s discussion of the regulatory, operational, legal and entrepreneurial risks involved with the Funds as compared to other types of accounts. The Committee concluded that the information it received demonstrated that the aggregate services provided to, or the specific circumstances of, each Fund were sufficiently different from the services provided to, or the specific circumstances of, other clients with similar investment strategies and/or that the risks borne by Guggenheim were sufficiently greater than those associated with managing other clients with similar investment strategies to support the difference in fees.
In further considering the comparative fee and expense data presented in the Contract Review Materials and addressed by Guggenheim, the Committee took into account those Funds with currently effective expense limitation agreements with the Adviser. Except as to the individual Funds discussed below, the Committee observed that the contractual advisory fee, net effective management fee and total net expense ratio for each Fund’s Institutional Class shares each rank in the third quartile or better of such Fund’s peer group. In addition, the Committee made the following observations:
Floating Rate Strategies Fund: The contractual advisory fee for the Fund’s Institutional Class shares ranks in the third quartile (73rd percentile) of its peer group. Although the net effective management fee for the Fund’s Institutional Class shares ranks in the fourth quartile (80th percentile) of its peer group, the Committee considered that the total net expense ratio for the Fund’s Institutional Class shares ranks in the third quartile (67th percentile) of its peer group. The Committee considered the Adviser’s statement explaining the higher fees that performance is driven by a unique investment approach that requires significant resources. In this regard, the Committee took into consideration the strong investment performance of the Fund’s Institutional Class shares for the three-year period ended December 31, 2022. The Committee also took into account the Fund’s currently effective expense limitation agreement with the Adviser.
Limited Duration Fund: The contractual advisory fee for the Fund’s Institutional Class shares ranks in the fourth quartile (87th percentile) of its peer group. The net effective management fee for the Fund’s Institutional Class shares ranks in the third quartile (73rd percentile) of its peer group. The total net expense ratio for the Fund’s Institutional Class shares ranks in the third quartile (67th percentile) of its peer group. The Committee considered the Adviser’s statement explaining the higher fees that performance is driven by a unique investment approach that requires significant resources. In this regard, the Committee took into consideration the strong investment performance of the Fund’s Institutional Class shares for the five-year and three-year periods ended December 31, 2022. The Committee also took into account the Fund’s currently effective expense limitation agreement with the Adviser.
Macro Opportunities Fund: The contractual advisory fee for the Fund’s Institutional Class shares ranks in the fourth quartile (82nd percentile) of its peer group. The net effective management fee for the Fund’s Institutional Class shares ranks in the third quartile (64th percentile) of its peer group. The total net expense ratio for the Fund’s Institutional Class shares ranks in the third
68 | THE GUGGENHEIM FUNDS ANNUAL REPORT | |
OTHER INFORMATION (Unaudited)(continued) |
quartile (73rd percentile) of its peer group. The Committee noted that the Fund is categorized as a non-traditional bond fund which seeks to add value by investing in many non-traditional securities within and outside of fixed income, including equities, currencies, commodities and derivatives, and that peer funds have varying degrees of capability, flexibility and associated fees. The Committee considered the Adviser’s statement explaining the higher fees that performance is driven by a unique investment approach that requires significant resources. In this regard, the Committee took into consideration the strong investment performance of the Fund’s Institutional Class shares for the three-year period ended December 31, 2022. The Committee also took into account the Fund’s currently effective expense limitation agreement and contractual advisory fee breakpoint of 5 basis points on average daily net assets above $5 billion.
Risk Managed Real Estate Fund: The contractual advisory fee for the Fund’s Institutional Class shares ranks in the second quartile (43rd percentile) of its peer group. Although the net effective management fee for the Fund’s Institutional Class shares ranks in the fourth quartile (79th percentile) of its peer group, the Committee considered that the total net expense ratio for the Fund’s Institutional Class shares ranks in the third quartile (57th percentile) of its peer group. The Committee considered the Adviser’s statement that the total expense ratio for the Fund’s Institutional Class shares is competitive and in-line with the peer group average and median and that the Fund’s contractual advisory fee is competitive. The Committee also took into account the Fund’s currently effective expense limitation agreement with the Adviser.
SMid Cap Value Fund: The contractual advisory fee for the Fund’s Institutional Class shares ranks in the first quartile (7th percentile) of its peer group. The net effective management fee for the Fund’s Institutional Class shares ranks in the third quartile (71st percentile) of its peer group. The total net expense ratio for the Fund’s Institutional Class shares ranks in the fourth quartile (79th percentile) of its peer group. The Committee considered that the Fund’s contractual advisory fee ranks favorably in the first quartile of its peer group and reviewed the other expenses that impacted the total net expense ratio. The Committee also took into account the Fund’s currently effective expense limitation agreement with the Adviser.
Total Return Bond Fund: The contractual advisory fee for the Fund’s Institutional Class shares ranks in the fourth quartile (87th percentile) of its peer group. The net effective management fee for the Fund’s Institutional Class shares ranks in the third quartile (67th percentile) of its peer group. The total net expense ratio for the Fund’s Institutional Class shares ranks in the third quartile (73rd percentile) of its peer group. The Committee considered the Adviser’s statement explaining the higher fees that performance is driven by a unique investment approach that requires significant resources. In this regard, the Committee took into consideration the strong investment performance of the Fund’s Institutional Class shares for the three-year period ended December 31, 2022. The Committee also took into account the Fund’s currently effective expense limitation agreement with the Adviser.
| | THE GUGGENHEIM FUNDS ANNUAL REPORT | 69 |
OTHER INFORMATION (Unaudited)(continued) |
With respect to the costs of services provided and benefits realized by Guggenheim Investments from its relationship with the Funds, the Committee reviewed a profitability analysis and data from management for each Fund setting forth the average assets under management for the twelve months ended December 31, 2022, gross revenues received, and expenses incurred directly or through allocations, by Guggenheim Investments, expense waivers (as applicable), earnings and the operating margin/profitability rate, including variance information relative to the foregoing amounts as of December 31, 2021. In addition, the Chief Financial Officer of Guggenheim Investments reviewed with, and addressed questions from, the Committee concerning the expense allocation methodology employed in producing the profitability analysis. In the course of its review of Guggenheim Investments’ profitability, the Committee took into account the methods used by Guggenheim Investments to determine expenses and profit and the representation by the Chief Financial Officer of Guggenheim Investments that such methods provided a reasonable basis for determining the profitability of the applicable Adviser with respect to each Fund. The Committee considered all of the foregoing, among other things, in evaluating the costs of services provided, the profitability to Guggenheim Investments and the profitability rates presented.
The Committee also considered other benefits available to each Adviser because of its relationship with the Funds and noted Guggenheim’s statement that it does not believe the Advisers derive any such “fall-out” benefits. In this regard, the Committee noted Guggenheim’s statement that, although it does not consider such benefits to be fall-out benefits, the Advisers may benefit from certain economies of scale and synergies, such as enhanced visibility of the Advisers, enhanced leverage in fee negotiations and other synergies arising from offering a broad spectrum of products, including the Funds.
Based on the foregoing, and based on other information received (both oral and written) at the April Meeting and the May Meetings, as well as other considerations, the Committee concluded that the comparative fees and the benefits realized by each Adviser from its relationship with the Funds were appropriate and that each Adviser’s profitability from its relationship with the Funds was not unreasonable.
Economies of Scale: The Committee received and considered information regarding whether there have been economies of scale with respect to the management of the Funds as Fund assets grow, whether the Funds have appropriately benefited from any economies of scale, and whether there is potential for realization of any further economies of scale. The Committee considered whether economies of scale in the provision of services to the Funds were being passed along to and shared with the shareholders. The Committee considered that Guggenheim believes it is appropriately sharing potential economies of scale and that Guggenheim’s decrease in 2022 in overall expenses was attributable to decreased product costs driven by lower average assets under management and lower non-recurring costs related to closed-end fund matters as well as a decrease in compensation and benefits. The Committee also considered that although expenses related to investment resources decreased in 2022, Guggenheim’s shared services expenses and certain other expenses increased in 2022.
70 | THE GUGGENHEIM FUNDS ANNUAL REPORT | |
OTHER INFORMATION (Unaudited)(continued) |
The Committee also noted the process employed by the Adviser to evaluate whether it would be appropriate to institute a new breakpoint for a Fund, with consideration given to, among other things: (i) the Fund’s size and trends in asset levels over recent years; (ii) the competitiveness of the expense levels; (iii) whether expense waivers are in place; (iv) changes and trends in revenue and expenses; (v) whether there are any anticipated expenditures that may benefit the Fund in the future; (vi) Fund profit level margins; (vii) relative Fund performance; (viii) the nature, extent and quality of services management provides to the Fund; and (ix) the complexity of the Fund’s investment strategy and the resources required to support the Fund.
As part of its assessment of economies of scale, the Committee took into account Guggenheim’s representation that it seeks to share economies of scale through a number of means, including breakpoints, advisory fees set at competitive rates pre-assuming future asset growth, expense waivers and limitations, and investments in personnel, operations and infrastructure to support the fund business. The Committee also received information regarding amounts that had been shared with shareholders through such breakpoints and expense waivers and limitations. The Committee also noted information from Guggenheim regarding certain challenges and costs associated with managing Funds that have achieved significant scale. Thus, the Committee considered the size of the Funds and the competitiveness of and/or other determinations made regarding the current advisory fee for each Fund, as well as whether a Fund is subject to an expense limitation.
Based on the foregoing, and based on other information received (both oral and written) at the April Meeting and the May Meetings, as well as other considerations, the Committee concluded that the advisory fee for each Fund was reasonable.
Sub-Advisory Agreement for Municipal Income Fund
Nature, Extent and Quality of Services Provided by the Sub-Adviser: As noted above, because both the Adviser and the Sub-Adviser for Municipal Income Fund—Security Investors and GPIM, respectively—are part of and do business as Guggenheim Investments and the services provided by the Adviser on the one hand and the Sub-Adviser on the other cannot be ascribed to distinct legal entities, the Committee did not separately evaluate the services provided under the Advisory Agreement and the Sub-Advisory Agreement. Therefore, the Committee considered the qualifications, experience and skills of the Fund’s portfolio management team in connection with the Committee’s evaluation of Guggenheim’s investment professionals under the Advisory Agreement. With respect to Guggenheim’s resources and the Sub-Adviser’s ability to carry out its responsibilities under the Sub-Advisory Agreement, as noted above, the Committee considered the financial condition of GPIMH and the various entities comprising Guggenheim Investments. The Committee also considered the acceptability of the terms of the Sub-Advisory Agreement, including the scope of services required to be performed by the Sub-Adviser.
Investment Performance: The Committee considered the returns of the Fund under its evaluation of the Advisory Agreement.
| | THE GUGGENHEIM FUNDS ANNUAL REPORT | 71 |
OTHER INFORMATION (Unaudited)(concluded) |
Comparative Fees, Costs of Services Provided and the Benefits Realized by the Sub-Adviser from Its Relationship with the Fund: The Committee considered that the Sub-Advisory Agreement is with an affiliate of the Adviser, that the Adviser compensates the Sub-Adviser from its own fees so that the sub-advisory fee rate for the Fund does not impact the fees paid by the Fund and that the Sub-Adviser’s revenues were included in the calculation of Guggenheim Investments’ profitability. Given its conclusion of the reasonableness of the advisory fee, the Committee concluded that the sub-advisory fee rate for the Fund was reasonable.
Economies of Scale: The Committee recognized that, because the Sub-Adviser’s fees are paid by the Adviser and not the Fund, the analysis of economies of scale was more appropriate in the context of the Committee’s consideration of the Advisory Agreement, which was separately considered. (See “Advisory Agreements – Economies of Scale” above.)
Overall Conclusions
The Committee concluded that the investment advisory fees are fair and reasonable in light of the extent and quality of the services provided and other benefits received and that the renewal of each applicable Agreement is in the best interest of each Fund. In reaching this conclusion, no single factor was determinative or conclusive and each Committee member, in the exercise of his or her informed business judgment, may afford different weights to different factors.
Following its review of the Committee’s analysis and determinations, the Board adopted the considerations and conclusions of the Committee and determined to approve the renewal of the Agreements.
72 | THE GUGGENHEIM FUNDS ANNUAL REPORT | |
INFORMATION ON BOARD OF TRUSTEES AND OFFICERS (Unaudited) |
A Board of Trustees oversees the Trust, as well as other trusts of GI, in which its members have no stated term of service, and continue to serve after election until resignation. The Statement of Additional Information includes further information about Fund Trustees and Officers, and can be obtained without charge by visiting guggenheiminvestments.com or by calling 800.820.0888.
Name,
Address* and
Year of Birth | Position(s)
Held with
Trust | Term of Office
and Length of
Time Served** | Principal Occupation(s)
During Past Five Years | Number of
Portfolios
in Fund
Complex
Overseen | Other
Directorships Held
by Trustees*** |
INDEPENDENT TRUSTEES | | | |
Randall C. Barnes (1951) | Trustee and Chair of the Valuation Oversight Committee | Since 2014 (Trustee) Since 2020 (Chair of the Valuation Oversight Committee) | Current: Private Investor (2001-present). Former: Senior Vice President and Treasurer, PepsiCo, Inc. (1993-1997); President, Pizza Hut International (1991-1993); Senior Vice President, Strategic Planning and New Business Development, PepsiCo, Inc. (1987-1990). | 155 | Current: Advent Convertible and Income Fund (2005-present); Purpose Investments Funds (2013-present). Former: Fiduciary/Claymore Energy Infrastructure Fund (2004-2022); Guggenheim Enhanced Equity Income Fund (2005-2021); Guggenheim Credit Allocation Fund (2013-2021). |
Angela Brock-Kyle (1959) | Trustee | Since 2019 | Current: Founder and Chief Executive Officer, B.O.A.R.D.S. (2013-present); Director, Mutual Fund Directors Forum (2022-present). Former: Senior Leader, TIAA (financial services firm) (1987-2012). | 154 | Current: Bowhead Insurance GP, LLC (2020-present); Hunt Companies, Inc. (2019-present). Former: Fiduciary/Claymore Energy Infrastructure Fund (2019-2022); Guggenheim Enhanced Equity Income Fund (2019-2021); Guggenheim Credit Allocation Fund (2019-2021); Infinity Property & Casualty Corp. (2014-2018). |
| | THE GUGGENHEIM FUNDS ANNUAL REPORT | 73 |
INFORMATION ON BOARD OF TRUSTEES AND OFFICERS (Unaudited)(continued) |
Name,
Address* and
Year of Birth | Position(s)
Held with
Trust | Term of Office
and Length of
Time Served** | Principal Occupation(s)
During Past Five Years | Number of
Portfolios
in Fund
Complex
Overseen | Other
Directorships Held
by Trustees*** |
INDEPENDENT TRUSTEES - continued | | |
Thomas F. Lydon, Jr. (1960) | Trustee and Chair of the Contracts Review Committee | Since 2019 (Trustee) Since 2020 (Chair of the Contracts Review Committee) | Current: President, Global Trends Investments (registered investment adviser) (1996-present); Chief Executive Officer, ETF Flows, LLC (financial advisor education and research provider) (2019-present); Chief Executive Officer, Lydon Media (2016-present); Director, GDX Index Partners, LLC (index provider) (2021-present); Vice Chairman, VettaFi (financial advisor content, research and digital distribution provider) (2022-present). | 154 | Current: US Global Investors, Inc. (GROW) (1995-present); The 2023 ETF Series Trust (4) (June 2023-present); The 2023 ETF Series Trust II (1) (August 2023-present). Former: Fiduciary/Claymore Energy Infrastructure Fund (2019-2022); Guggenheim Enhanced Equity Income Fund (2019-2021); Guggenheim Credit Allocation Fund (2019-2021); Harvest Volatility Edge Trust (3) (2017-2019). |
74 | THE GUGGENHEIM FUNDS ANNUAL REPORT | |
INFORMATION ON BOARD OF TRUSTEES AND OFFICERS (Unaudited)(continued) |
Name,
Address* and
Year of Birth | Position(s)
Held with
Trust | Term of Office
and Length of
Time Served** | Principal Occupation(s)
During Past Five Years | Number of
Portfolios
in Fund
Complex
Overseen | Other
Directorships Held
by Trustees*** |
INDEPENDENT TRUSTEES - continued | | |
Ronald A. Nyberg (1953) | Trustee and Chair of the Nominating and Governance Committee | Since 2014 | Current: Of Counsel, Momkus LLP (law firm) (2016-present). Former: Partner, Nyberg & Cassioppi, LLC (law firm) (2000-2016); Executive Vice President, General Counsel, and Corporate Secretary, Van Kampen Investments (1982-1999). | 155 | Current: Advent Convertible and Income Fund (2003-present); PPM Funds (2) (2018-present); NorthShore-Edward-Elmhurst Health (2012-present). Former: Fiduciary/Claymore Energy Infrastructure Fund (2004-2022); Guggenheim Enhanced Equity Income Fund (2005-2021); Guggenheim Credit Allocation Fund (2013-2021); Western Asset Inflation-Linked Opportunities & Income Fund (2004-2020); Western Asset Inflation-Linked Income Fund (2003-2020). |
Sandra G. Sponem (1958) | Trustee and Chair of the Audit Committee | Since 2019 (Trustee) Since 2020 (Chair of the Audit Committee) | Current: Retired. Former: Senior Vice President and Chief Financial Officer, M.A. Mortenson-Companies, Inc. (construction and real estate development company) (2007-2017). | 154 | Current: SPDR Series Trust (81) (2018-present); SPDR Index Shares Funds (30) (2018-present); SSGA Active Trust (14) (2018-present).
Former: Fiduciary/Claymore Energy Infrastructure Fund (2019-2022); Guggenheim Enhanced Equity Income Fund (2019-2021); Guggenheim Credit Allocation Fund (2019-2021); SSGA Master Trust (1) (2018-2020). |
| | THE GUGGENHEIM FUNDS ANNUAL REPORT | 75 |
INFORMATION ON BOARD OF TRUSTEES AND OFFICERS (Unaudited)(continued) |
Name,
Address* and
Year of Birth | Position(s)
Held with
Trust | Term of Office
and Length of
Time Served** | Principal Occupation(s)
During Past Five Years | Number of
Portfolios
in Fund
Complex
Overseen | Other
Directorships Held
by Trustees*** |
INDEPENDENT TRUSTEES - continued | | |
Ronald E. Toupin, Jr. (1958) | Trustee, Chair of the Board and Chair of the Executive Committee | Since 2014 | Current: Portfolio Consultant (2010-present); Member, Governing Council, Independent Directors Council (2013-present); Governor, Board of Governors, Investment Company Institute (2018-present).
Former: Member, Executive Committee, Independent Directors Council (2016-2018); Vice President, Manager and Portfolio Manager, Nuveen Asset Management (1998-1999); Vice President, Nuveen Investment Advisory Corp. (1992-1999); Vice President and Manager, Nuveen Unit Investment Trusts (1991-1999); and Assistant Vice President and Portfolio Manager, Nuveen Unit Investment Trusts (1988-1999), each of John Nuveen & Co., Inc. (registered broker dealer) (1982-1999). | 154 | Former: Fiduciary/Claymore Energy Infrastructure Fund (2004-2022); Guggenheim Enhanced Equity Income Fund (2005-2021); Guggenheim Credit Allocation Fund (2013-2021); Western Asset Inflation-Linked Opportunities & Income Fund (2004-2020); Western Asset Inflation-Linked Income Fund (2003-2020). |
76 | THE GUGGENHEIM FUNDS ANNUAL REPORT | |
INFORMATION ON BOARD OF TRUSTEES AND OFFICERS (Unaudited)(continued) |
Name,
Address* and
Year of Birth | Position(s)
Held with
Trust | Term of Office
and Length of
Time Served** | Principal Occupation(s)
During Past Five Years | Number of
Portfolios
in Fund
Complex
Overseen | Other
Directorships Held
by Trustees*** |
INDEPENDENT TRUSTEES - concluded | |
Amy J. Lee**** (1961) | Trustee, Vice President and Chief Legal Officer | Since 2018 (Trustee)
Since 2014 (Chief Legal Officer) Since 2007
(Vice President) | Current: Interested Trustee, certain other funds in the Fund Complex (2018-present); Chief Legal Officer, certain other funds in the Fund Complex (2014-present); Vice President, certain other funds in the Fund Complex (2007-present); Senior Managing Director, Guggenheim Investments (2012-present). Former: President and Chief Executive Officer, certain other funds in the Fund Complex (2017-2019); Vice President, Associate General Counsel and Assistant Secretary, Security Benefit Life Insurance Company and Security Benefit Corporation (2004-2012). | 154 | Former: Fiduciary/Claymore Energy Infrastructure Fund (2018-2022); Guggenheim Enhanced Equity Income Fund (2018-2021); Guggenheim Credit Allocation Fund (2018-2021). |
* | The business address of each Trustee is c/o Guggenheim Investments, 227 West Monroe Street, Chicago, Illinois 60606. |
** | Each Trustee serves an indefinite term, until his or her successor is elected and qualified. Time served includes time served in the respective position for the Predecessor Corporation. |
*** | Each Trustee also serves on the Boards of Trustees of Guggenheim Funds Trust, Guggenheim Variable Funds Trust, Guggenheim Strategy Funds Trust, Guggenheim Taxable Municipal Bond & Investment Grade Debt Trust, Guggenheim Strategic Opportunities Fund, Guggenheim Active Allocation Fund, Rydex Series Funds, Rydex Dynamic Funds, Rydex Variable Trust and Transparent Value Trust. Messrs. Barnes and Nyberg also serve on the Board of Trustees of Advent Convertible & Income Fund. |
**** | This Trustee is deemed to be an “interested person” of the Funds under the 1940 Act by reason of her position with the Funds’ Adviser and/or the parent of the Adviser. |
| | THE GUGGENHEIM FUNDS ANNUAL REPORT | 77 |
INFORMATION ON BOARD OF TRUSTEES AND OFFICERS (Unaudited)(continued) |
Name, Address*
and Year of Birth | Position(s)
Held with
Trust | Term of Office
and Length of
Time Served** | Principal Occupation(s)
During Past Five Years |
OFFICERS | | | |
Brian E. Binder (1972) | President and Chief Executive Officer | Since 2018 | Current: President, Mutual Fund Boards, Guggenheim Investments (2022-present); President and Chief Executive Officer, certain other funds in the Fund Complex (2018-present); President, Mutual Funds Boards, Guggenheim Funds Investment Advisors, LLC and Security Investors, LLC (2018-present);Board Member, Guggenheim Partners Investment Funds plc (2022-present); Board Member, Guggenheim Global Investments plc (2022-present); Board Member, Guggenheim Partners Fund Management (Europe) Limited (2018-present). Former: Senior Managing Director and Chief Administrative Officer, Guggenheim Investments (2018-2022); Managing Director and President, Deutsche Funds, and Head of US Product, Trading and Fund Administration, Deutsche Asset Management (2013-2018); Managing Director, Chairman of North American Executive Committee and Head of Business Management and Consulting, Invesco Ltd. (2010-2012). |
James Howley (1972) | Chief Financial Officer, Chief Accounting Officer and Treasurer | Since 2022 | Current: Managing Director, Guggenheim Investments (2004-present); Chief Financial Officer, Chief Accounting Officer, and Treasurer, certain other funds in the Fund Complex (2022-present).
Former: Assistant Treasurer, certain other funds in the Fund Complex (2006-2022); Manager, Mutual Fund Administration of Van Kampen Investments, Inc. (1996-2004). |
Mark E. Mathiasen (1978) | Secretary | Since 2014 | Current: Secretary, certain other funds in the Fund Complex (2007-present); Managing Director, Guggenheim Investments (2007-present). |
Glenn McWhinnie (1969) | Assistant Treasurer | Since 2016 | Current: Vice President, Guggenheim Investments (2009-present); Assistant Treasurer, certain other funds in the Fund Complex (2016-present). |
Michael P. Megaris (1984) | Assistant Secretary | Since 2014 | Current: Assistant Secretary, certain other funds in the Fund Complex (2014-present); Managing Director, Guggenheim Investments (2012-present). |
78 | THE GUGGENHEIM FUNDS ANNUAL REPORT | |
INFORMATION ON BOARD OF TRUSTEES AND OFFICERS (Unaudited)(continued) |
Name, Address*
and Year of Birth | Position(s)
Held with
Trust | Term of Office
and Length of
Time Served** | Principal Occupation(s)
During Past Five Years |
OFFICERS - continued | |
Elisabeth Miller (1968) | Chief Compliance Officer | Since 2012 | Current: Chief Compliance Officer, certain other funds in the Fund Complex (2012-present); Senior Managing Director, Guggenheim Investments (2012-present); Senior Managing Director, Guggenheim Funds Distributors, LLC (2014-present). Former: Chief Compliance Officer, Security Investors, LLC and Guggenheim Funds Investment Advisors, LLC (2012-2018); Chief Compliance Officer, Guggenheim Distributors, LLC (2009-2014); Senior Manager, Security Investors, LLC (2004-2014); Senior Manager, Guggenheim Distributors, LLC (2004-2014). |
Margaux Misantone (1978) | AML Officer | Since 2017 | Current: Chief Compliance Officer, Security Investors, LLC and Guggenheim Funds Investment Advisors, LLC (2018-present); AML Officer, Security Investors, LLC and certain other funds in the Fund Complex (2017-present); Managing Director, Guggenheim Investments (2015-present). Former: Assistant Chief Compliance Officer, Security Investors, LLC and Guggenheim Funds Investments Advisors, LLC (2015-2018). |
Kimberly J. Scott (1974) | Assistant Treasurer | Since 2014 | Current: Director, Guggenheim Investments (2012-present); Assistant Treasurer, certain other funds in the Fund Complex (2012-present). Former: Financial Reporting Manager, Invesco, Ltd. (2010-2011); Vice President/Assistant Treasurer, Mutual Fund Administration for Van Kampen Investments, Inc./Morgan Stanley Investment Management (2009-2010); Manager of Mutual Fund Administration, Van Kampen Investments, Inc./Morgan Stanley Investment Management (2005-2009). |
Bryan Stone (1979) | Vice President | Since 2014 | Current: Vice President, certain other funds in the Fund Complex (2014-present); Managing Director, Guggenheim Investments (2013-present). Former: Senior Vice President, Neuberger Berman Group LLC (2009-2013); Vice President, Morgan Stanley (2002-2009). |
| | THE GUGGENHEIM FUNDS ANNUAL REPORT | 79 |
INFORMATION ON BOARD OF TRUSTEES AND OFFICERS (Unaudited)(concluded) |
Name, Address*
and Year of Birth | Position(s)
Held with
Trust | Term of Office
and Length of
Time Served** | Principal Occupation(s)
During Past Five Years |
OFFICERS - concluded | |
Jon Szafran (1989) | Assistant Treasurer | Since 2017 | Current: Director, Guggenheim Investments (2017-present); Assistant Treasurer, certain other funds in the Fund Complex (2017-present).
Former: Assistant Treasurer of Henderson Global Funds and Manager of US Fund Administration, Henderson Global Investors (North America) Inc. (“HGINA”), (2017); Senior Analyst of US Fund Administration, HGINA (2014–2017); Senior Associate of Fund Administration, Cortland Capital Market Services, LLC (2013-2014); Experienced Associate, PricewaterhouseCoopers LLP (2012-2013). |
* | The business address of each officer is c/o Guggenheim Investments, 227 West Monroe Street, Chicago, Illinois 60606. |
** | Each officer serves an indefinite term, until his or her successor is duly elected and qualified. |
80 | THE GUGGENHEIM FUNDS ANNUAL REPORT | |
GUGGENHEIM INVESTMENTS PRIVACY NOTICE (Unaudited) |
Who We Are
This Privacy Notice describes the data protection practices of Guggenheim Investments. Guggenheim Investments as used herein refers to the affiliated investment management businesses of Guggenheim Partners, LLC: Guggenheim Funds Investment Advisors, LLC, Guggenheim Partners Investment Management, LLC, Guggenheim Funds Distributors, LLC, Security Investors, LLC, Guggenheim Investment Advisors (Europe) Limited, Guggenheim Real Estate, LLC, GS Gamma Advisors, LLC, Guggenheim Partners India Management, LLC, Guggenheim Partners Europe Limited, as well as the funds in the Guggenheim Funds complex (the “Funds”) (“Guggenheim Investments,” “we,” “us,” or “our”).
Guggenheim Partners Investment Management Holdings, LLC, located at 330 Madison Avenue, New York, New York 10017 is the data controller for your information. The affiliates who are also controllers of certain of your information are: Guggenheim Investment Advisors (Europe) Limited, Guggenheim Partners Europe Limited, Guggenheim Partners, LLC, Guggenheim Funds Investment Advisors, LLC, Guggenheim Partners Investment Management, LLC, Guggenheim Funds Distributors, LLC and Security Investors, LLC, as well as the Funds.
Our Commitment to You
Guggenheim Investments considers your privacy our utmost concern. When you become our client or investor, you entrust us with not only your hard-earned money but also with your personal and financial information. Because we have access to your private information, we hold ourselves to the highest standards in its safekeeping and use. We strictly limit how we share your information with others, whether you are a current or former Guggenheim Investments client or investor.
The Information We Collect About You
We collect certain nonpublic personal information about you from information you provide on applications, other forms, our website, and/or from third parties including investment advisors. This information includes Social Security or other tax identification number, assets, income, tax information, retirement and estate plan information, transaction history, account balance, payment history, bank account information, marital status, family relationships, information that we collect on our website through the use of “cookies,” and other personal information that you or others provide to us. We may also collect such information through your inquiries by mail, e-mail or telephone. We may also collect customer due diligence information, as required by applicable law and regulation, through third party service providers.
How We Handle Your Personal Information
The legal basis for using your information as set out in this Privacy Notice is as follows: (a) use of your personal data is necessary to perform our obligations under any contract with you (such as a contract for us to provide financial services to you); or (b) where use of your personal data is not necessary for performance of a contract, use of your personal data is necessary for our
| | THE GUGGENHEIM FUNDS ANNUAL REPORT | 81 |
GUGGENHEIM INVESTMENTS PRIVACY NOTICE (Unaudited)(continued) |
legitimate interests or the legitimate interests of others (for example, to enforce the legal terms governing our services, operate and market our website and other services we offer, ensure safe environments for our personnel and others, make and receive payments, prevent fraud and to know the customer to whom we are providing the services). Some processing is done to comply with applicable law.
In addition to the specific uses described above, we also use your information in the following manner:
| | ● | We use your information in connection with servicing your accounts. |
| | ● | We use information to respond to your requests or questions. For example, we might use your information to respond to your customer feedback. |
| | ● | We use information to improve our products and services. We may use your information to make our website and products better. We may use your information to customize your experience with us. |
| | ● | We use information for security purposes. We may use your information to protect our company and our customers. |
| | ● | We use information to communicate with you. For example, we will communicate with you about your account or our relationship. We may contact you about your feedback. We might also contact you about this Privacy Notice. We may also enroll you in our email newsletter. |
| | ● | We use information as otherwise permitted by law, as we may notify you. |
| | ● | Aggregate/Anonymous Data. We may aggregate and/or anonymize any information collected through the website so that such information can no longer be linked to you or your device (“Aggregate/Anonymous Information”). We may use Aggregate/Anonymous Information for any purpose, including without limitation for research and marketing purposes, and may also share such data with any third parties, including advertisers, promotional partners, and sponsors. |
We do not sell information about current or former clients or their accounts to third parties. Nor do we share this information, except when necessary to complete transactions at your request, to make you aware of investment products and services that we or our affiliates offer, or as permitted or required by law.
We provide information about you to companies and individuals not affiliated with Guggenheim Investments to complete certain transactions or account changes, or to perform services for us related to your account. For example, if you ask to transfer assets from another financial institution to Guggenheim Investments, we must provide certain information about you to that company to complete the transaction. We provide the third party with only the information necessary to carry out its responsibilities and only for that purpose. And we require these third
82 | THE GUGGENHEIM FUNDS ANNUAL REPORT | |
GUGGENHEIM INVESTMENTS PRIVACY NOTICE (Unaudited)(continued) |
parties to treat your private information with the same high degree of confidentiality that we do. To alert you to other Guggenheim Investments products and services, we share your information within our family of affiliated companies. You may limit our sharing with affiliated companies as set out below. We may also share information with any successor to all or part of our business, or in connection with steps leading up to a merger or acquisition. For example, if part of our business was sold we may give customer information as part of that transaction. We may also share information about you with your consent.
We will release information about you if you direct us to do so, if we are compelled by law to do so, or in other circumstances as permitted by law (for example, to protect your account from fraud).
If you close your account(s) or become an inactive client or investor, we will continue to adhere to the privacy policies and practices described in this notice.
Opt-Out Provisions and Your Data Choices
The law allows you to “opt out” of certain kinds of information sharing with third parties. We do not share personal information about you with any third parties that triggers this opt-out right. This means YOU ARE ALREADY OPTED OUT.
When you are no longer our client or investor, we continue to share your information as described in this notice, and you may contact us at any time to limit our sharing by sending an email to CorporateDataPrivacy@GuggenheimPartners.com.
European Union Data Subjects and certain others: In addition to the choices set forth above, residents of the European Union and certain other jurisdictions have certain rights to (1) request access to or rectification or deletion of information we collect about them, (2) request a restriction on the processing of their information, (3) object to the processing of their information, or (4) request the portability of certain information. To exercise these or other rights, please contact us using the contact information below. We will consider all requests and provide our response within the time period stated by applicable law. Please note, however, that certain information may be exempt from such requests in some circumstances, which may include if we need to keep processing your information for our legitimate interests or to comply with a legal obligation. We may request you provide us with information necessary to confirm your identity before responding to your request.
Residents of France and certain other jurisdictions may also provide us with instructions regarding the manner in which we may continue to store, erase and share your information after your death, and where applicable, the person you have designated to exercise these rights after your death.
How We Protect Privacy Online
We take steps to protect your privacy when you use our web site – www.guggenheiminvestments.com – by using secure forms of online communication, including encryption technology, Secure Socket Layer (SSL) protocol, firewalls and user names and
| | THE GUGGENHEIM FUNDS ANNUAL REPORT | 83 |
GUGGENHEIM INVESTMENTS PRIVACY NOTICE (Unaudited)(concluded) |
passwords. These safeguards vary based on the sensitivity of the information that we collect and store. However, we cannot and do not guarantee that these measures will prevent every unauthorized attempt to access, use, or disclose your information since despite our efforts, no Internet and/or other electronic transmissions can be completely secure. Our web site uses “http cookies”—tiny pieces of information that we ask your browser to store. We use cookies for session management and security features on the Guggenheim Investments web site. We do not use them to pull data from your hard drive, to learn your e-mail address, or to view data in cookies created by other web sites. We will not share the information in our cookies or give others access to it. See the legal information area on our web site for more details about web site security and privacy features.
How We Safeguard Your Personal Information and Data Retention
We restrict access to nonpublic personal information about you to our employees and in some cases to third parties (for example, the service providers described above) as permitted by law. We maintain strict physical, electronic and procedural safeguards that comply with federal standards to guard your nonpublic personal information.
We keep your information for no longer than necessary for the purposes for which it is processed. The length of time for which we retain information depends on the purposes for which we collected and use it and/or as required to comply with applicable laws. Information may persist in copies made for backup and business continuity purposes for additional time.
International Visitors
If you are not a resident of the United States, please be aware that your information may be transferred to, stored and processed in the United States where our servers are located and our databases are operated. The data protection and other laws of the United States and other countries might not be as comprehensive as those in your country.
In such cases, we ensure that a legal basis for such a transfer exists and that adequate protection is provided as required by applicable law, for example, by using standard contractual clauses or by transferring your data to a jurisdiction that has obtained an adequacy finding. Individuals whose data may be transferred on the basis of standard contractual clauses may contact us as described below.
We’ll Keep You Informed
If you have any questions or concerns about how we treat your personal data, we encourage you to consult with us first. You may also contact the relevant supervisory authority. We reserve the right to modify this policy at any time and will inform you promptly of material changes. You may access our privacy policy from our web site at www.guggenheiminvestments.com. Should you have any questions regarding our privacy policy, contact us by email at CorporateDataPrivacy@GuggenheimPartners.com.
84 | THE GUGGENHEIM FUNDS ANNUAL REPORT | |
LIQUIDITY RISK MANAGEMENT PROGRAM (Unaudited) |
In compliance with SEC Rule 22e-4 under the U.S. Investment Company Act of 1940 (the “Liquidity Rule”), Guggenheim Funds Trust (the “Trust”) has adopted and implemented a written liquidity risk management program (the “Program”) for each series of the Trust (each, a “Fund” and, collectively, the “Funds”). The Trust’s Board of Trustees (the “Board”) has also designated a Program administrator (the “Administrator”).
The Liquidity Rule requires that the Program be reasonably designed to assess and manage each Fund’s liquidity risk. A Fund’s “liquidity risk” (as defined in the Liquidity Rule) is the risk that the Fund could not meet requests to redeem shares issued by the Fund without significant dilution of the remaining investors’ interests in the Fund. The Program includes a number of elements that support the assessment, management and periodic review of liquidity risk. In accordance with the Program, each Fund’s liquidity risk is assessed, managed, and periodically reviewed no less frequently than annually taking into consideration a variety of factors, including, as applicable, the Fund’s investment strategy and liquidity of portfolio investments, short-term and long-term cash flow projections, and holdings of cash and cash equivalents, as well as borrowing arrangements and other funding sources. Certain factors are considered under both normal and reasonably foreseeable stressed conditions. There is no guarantee that the Program will achieve its objective under all circumstances.
Under the Program, each Fund portfolio investment is classified into one of four liquidity categories. The classification is based on a determination of the number of days a Fund reasonably expects to take to convert the investment into cash, or sell or dispose of the investment, in current market conditions without significantly changing the investment’s market value. The Program is reasonably designed to meet Liquidity Rule requirements relating to “highly liquid investment minimums” (i.e., the minimum amount of a Fund’s net assets to be invested in highly liquid investments that are assets) and to monitor compliance with the Liquidity Rule’s limitations on a Fund’s investments in “illiquid investments” (as defined in the Liquidity Rule). Under the Liquidity Rule, a Fund is prohibited from acquiring any illiquid investment if, immediately after the acquisition, the Fund would have invested more than 15% of its net assets in illiquid investments that are assets.
During the period covered by this shareholder report, the Board received a written report (the “Report”) prepared by the Administrator addressing the Program’s operation and assessing the adequacy and effectiveness of its implementation for the period from March 31, 2022, to March 31, 2023. The Report summarized the Administrator’s assessment of the Program’s implementation and concluded that the Program operated effectively, the Program had been and continued to be reasonably designed to assess and manage each Fund’s liquidity risk, and the Program has been adequately and effectively implemented to monitor and respond to the Funds’ liquidity developments, as applicable.
Please refer to the Fund’s prospectus for more information regarding the Fund’s exposure to liquidity risk and other risks to which an investment in the Fund may be subject.
| | THE GUGGENHEIM FUNDS ANNUAL REPORT | 85 |
This page intentionally left blank.
This page intentionally left blank.
This page intentionally left blank.
This page intentionally left blank.
9.30.2023
Guggenheim Funds Annual Report
| |
Guggenheim Limited Duration Fund | | |
GuggenheimInvestments.com | LD-ANN-0923x0924 |
| | |
DEAR SHAREHOLDER | 2 |
ECONOMIC AND MARKET OVERVIEW | 3 |
ABOUT SHAREHOLDERS’ FUND EXPENSES | 4 |
LIMITED DURATION FUND | 8 |
NOTES TO FINANCIAL STATEMENTS | 36 |
REPORT OF INDEPENDENT REGISTERED PUBLIC ACCOUNTING FIRM | 54 |
OTHER INFORMATION | 55 |
INFORMATION ON BOARD OF TRUSTEES AND OFFICERS | 64 |
GUGGENHEIM INVESTMENTS PRIVACY NOTICE | 70 |
LIQUIDITY RISK MANAGEMENT PROGRAM | 73 |
| | THE GUGGENHEIM FUNDS ANNUAL REPORT | 1 |
Dear Shareholder:
Guggenheim Partners Investment Management, LLC (“Investment Adviser”) is pleased to present the shareholder report for Guggenheim Limited Duration Fund (“Fund”) for the annual fiscal period ended September 30, 2023 (“Reporting Period”).
The Investment Adviser is part of Guggenheim Investments, which represents the investment management businesses of Guggenheim Partners, LLC (“Guggenheim”), a global, diversified financial services firm.
Guggenheim Funds Distributors, LLC is the distributor of the Fund. Guggenheim Funds Distributors, LLC is affiliated with Guggenheim and the Investment Adviser.
We encourage you to read the Economic and Market Overview section of the report, which follows this letter, and then the Managers’ Commentary for the Fund.
We are committed to providing innovative investment solutions and appreciate the trust you place in us.
Sincerely,
Guggenheim Partners Investment Management, LLC
October 31, 2023
Read a prospectus and summary prospectus (if available) carefully before investing. It contains the investment objectives, risks, charges, expenses and other information, which should be considered carefully before investing. Obtain a prospectus and summary prospectus (if available) at guggenheiminvestments.com or call 800.820.0888.
This material is not intended as a recommendation or as investment advice of any kind, including in connection with rollovers, transfers, and distributions. Such material is not provided in a fiduciary capacity, may not be relied upon for or in connection with the making of investment decisions, and does not constitute a solicitation of an offer to buy or sell securities. All content has been provided for informational or educational purposes only and is not intended to be and should not be construed as legal or tax advice and/or a legal opinion. Always consult a financial, tax and/or legal professional regarding your specific situation.
Limited Duration Fund may not be suitable for all investors. ● The Fund’s market value will change in response to interest rate changes and market conditions among other factors. In general, bond prices rise when interest rates fall and vice versa. ● The Fund’s exposure to high yield securities may subject the Fund to greater volatility. ● When market conditions are deemed appropriate, the Fund may use leverage to the full extent permitted by its investment policies and restrictions and applicable law. Leveraging will exaggerate the effect on net asset value of any increase or decrease in the market value of the Fund’s portfolio. ●The Fund may invest in derivative instruments, which may be more volatile and less liquid, increasing the risk of loss when compared to traditional securities. Certain of the derivative instruments are also subject to the risks of counterparty default and adverse tax treatment. ● Instruments and strategies (such as borrowing transactions and reverse repurchase agreements) may provide leveraged exposure to a particular investment, which will magnify any gains or losses on those investments. ● Investments in reverse repurchase agreements expose the Fund to the many of the same risks as investments in derivatives. ● The Fund’s investments in other investment vehicles subject the Fund to those risks and expenses affecting the investment vehicle. ●The Fund’s investments in foreign securities carry additional risks when compared to U.S. securities, due to the impact of diplomatic, political or economic developments in the country in question (investments in emerging markets securities are generally subject to an even greater level of risks). ●Investments in syndicated bank loans generally offer a floating interest rate and involve special types of risks. ●The Fund’s investments in municipal securities can be affected by events that affect the municipal bond market. ●The Fund’s investments in real estate securities subject the Fund to the same risks as direct investments in real estate, which is particularly sensitive to economic downturns. ●The Fund’s investments in restricted securities may involve financial and liquidity risk. ●You may have a gain or loss when you sell your shares. ● It is important to note that the Fund is not guaranteed by the U.S. government. ● Please read the prospectus for more detailed information regarding these and other risks.
2 | THE GUGGENHEIM FUNDS ANNUAL REPORT | |
ECONOMIC AND MARKET OVERVIEW (Unaudited) | September 30, 2023 |
Faced with a series of strong economic data releases, the market increasingly appears to be coming to the conclusion that the economy is structurally better able to withstand higher interest rates than it really is. This dynamic can be seen by examining the move in Treasury yields, with the selloff almost entirely being due to real yields rather than inflation expectations, and with the move most pronounced at the long end of the yield curve. Digging further, however, a large portion of this shift is due to a rising term premium (the premium for unknown and unquantified risks in the future, beyond current assumptions on the path of inflation or policy rates), which is indicating greater uncertainty about the outlook.
Many forecasters are extrapolating the current year’s economic strength without recognizing the fact that growth has benefited from a number of factors this year that are unlikely to be repeated, namely an expansion of the fiscal deficit, a slowdown in inflation, and a rebound in labor supply. As these factors fade, the headwinds from tight monetary policy may be more apparent and pronounced. And the longer monetary conditions stay tight, the greater the risk of something breaking (banks and commercial real estate remain key risks). All of this suggests that the recent economic trajectory cannot be assumed to continue, especially given the substantial restraint that could be imposed by the recent rise in long-term borrowing costs.
Uncertainty is elevated given the diverging signals in the data and the fact that many traditional economic models are not “working” as they traditionally would. This uncertainty extends to the U.S. Federal Reserve, which looks set to hold off on further rate hikes while it waits to see if the data start to align with the softening conditions policymakers say they are hearing on the ground. We continue to think the gravitational pull of tight money and credit conditions could result in a slowing economy and cooler inflation over the next year, paving the way for more rate cuts than the market presently expects.
For the Reporting Period, the S&P 500® Index* returned 21.62%. The MSCI Europe-Australasia-Far East (“EAFE”) Index* returned 25.65%. The return of the MSCI Emerging Markets Index* was 11.70%.
In the bond market, the Bloomberg U.S. Aggregate Bond Index* posted a 0.64% return for the Reporting Period, while the Bloomberg U.S. Corporate High Yield Index* returned 10.28%. The return of the ICE Bank of America (“BofA”) 3-Month U.S. Treasury Bill Index* was 4.50% for the Reporting Period.
The opinions and forecasts expressed may not actually come to pass. This information is subject to change at any time, based on market and other conditions, and should not be construed as a recommendation of any specific security or strategy.
*Index Definitions:
The following indices are referenced throughout this report. Indices are unmanaged and not available for direct investment. Index performance does not reflect transaction costs, fees, or expenses.
Bloomberg U.S. Aggregate Bond Index is a broad-based flagship benchmark that measures the investment grade, U.S. dollar-denominated, fixed-rate taxable bond market, including U.S. Treasuries, government-related and corporate securities, mortgage-backed securities or “MBS” (agency fixed-rate and hybrid adjustable-rate mortgage, or “ARM”, pass-throughs), asset-backed securities (“ABS”), and commercial mortgage-backed securities (“CMBS”) (agency and non-agency).
Bloomberg U.S. Corporate High Yield Index measures the U.S. dollar-denominated, high yield, fixed-rate corporate bond market. Securities are classified as high yield if the middle rating of Moody’s, Fitch, and S&P is Ba1/BB +/BB + or below.
Bloomberg U.S. Aggregate Bond 1-3 Year Total Return Index measures the performance of publicly issued investment grade corporate, U.S. Treasury and government agency securities with remaining maturities of one to three years.
ICE BofA 3-Month U.S. Treasury Bill Index is an unmanaged market Index of U.S. Treasury securities maturing in 90 days that assumes reinvestment of all income.
MSCI EAFE Index is a free float-adjusted market capitalization index that is designed to measure the equity market performance of developed markets, excluding the U.S. & Canada.
MSCI Emerging Markets Index is a free float-adjusted market capitalization weighted index that is designed to measure equity market performance in the global emerging markets.
S&P 500® Index is a broad-based index, the performance of which is based on the performance of 500 widely held common stocks chosen for market size, liquidity, and industry group representation.
| | THE GUGGENHEIM FUNDS ANNUAL REPORT | 3 |
ABOUT SHAREHOLDERS’ FUND EXPENSES (Unaudited) | |
All mutual funds have operating expenses, and it is important for our shareholders to understand the impact of costs on their investments. Shareholders of a fund incur two types of costs: (i) transaction costs, including sales charges (loads) on purchase payments, reinvested dividends, other distributions, and exchange fees, and (ii) ongoing costs, including management fees, administrative services, and shareholder reports, among others. These ongoing costs, or operating expenses, are deducted from a fund’s gross income and reduce the investment return of the fund.
A fund’s expenses are expressed as a percentage of its average net assets, which is known as the expense ratio. The following examples are intended to help investors understand the ongoing costs (in dollars) of investing in a fund and to compare these costs with the ongoing costs of investing in other mutual funds.
The examples are based on an investment of $1,000 made at the beginning of the period and held for the entire six-month period beginning March 31, 2023 and ending September 30, 2023.
The following tables illustrate the Fund’s costs in two ways:
Table 1. Based on actual Fund return: This section helps investors estimate the actual expenses paid over the period. The “Ending Account Value” shown is derived from the Fund’s actual return, and the fifth column shows the dollar amount that would have been paid by an investor who started with $1,000 in the Fund. Investors may use the information here, together with the amount invested, to estimate the expenses paid over the period. Simply divide the Fund’s account value by $1,000 (for example, an $8,600 account value divided by $1,000 = 8.6), then multiply the result by the number provided under the heading “Expenses Paid During Period.”
Table 2. Based on hypothetical 5% return: This section is intended to help investors compare a fund’s cost with those of other mutual funds. The table provides information about hypothetical account values and hypothetical expenses based on the Fund’s actual expense ratio and an assumed rate of return of 5% per year before expenses, which is not the Fund’s actual return. The hypothetical account values and expenses may not be used to estimate the actual ending account balance or expenses paid during the period. The example is useful in making comparisons because the U.S. Securities and Exchange Commission (the “SEC”) requires all mutual funds to calculate expenses based on the 5% return. Investors can assess a Fund’s costs by comparing this hypothetical example with the hypothetical examples that appear in shareholder reports of other funds.
The calculations illustrated above assume no shares were bought or sold during the period. Actual costs may have been higher or lower, depending on the amount of investment and the timing of any purchases or redemptions.
Please note that the expenses shown in the table are meant to highlight your ongoing costs only and do not reflect any transactional costs, such as sales charges (loads) on purchase payments, and contingent deferred sales charges (“CDSC”) on redemptions, if any. Therefore, the second table is useful in comparing ongoing costs only, and will not help you determine the relative total costs of owning different funds. In addition, if these transactional costs were included, your costs would have been higher.
More information about the Fund’s expenses, including annual expense ratios for periods up to five years (subject to the Fund’s inception date), can be found in the Financial Highlights section of this report. For additional information on operating expenses and other shareholder costs, please refer to the Fund’s prospectus.
4 | THE GUGGENHEIM FUNDS ANNUAL REPORT | |
ABOUT SHAREHOLDERS’ FUND EXPENSES (Unaudited)(concluded) | |
| | Expense
Ratio1 | | | Fund
Return | | | Beginning
Account Value
March 31, 2023 | | | Ending
Account Value
September 30, 2023 | | | Expenses
Paid During
Period2 | |
Table 1. Based on actual Fund return3 | | | | | | | | | | | | | | | | | | | | |
Limited Duration Fund | | | | | | | | | | | | | | | | | | | | |
A-Class | | | 0.74 | % | | | 1.33 | % | | $ | 1,000.00 | | | $ | 1,013.30 | | | $ | 3.73 | |
C-Class | | | 1.50 | % | | | 0.95 | % | | | 1,000.00 | | | | 1,009.50 | | | | 7.56 | |
P-Class | | | 0.74 | % | | | 1.33 | % | | | 1,000.00 | | | | 1,013.30 | | | | 3.73 | |
Institutional Class | | | 0.49 | % | | | 1.46 | % | | | 1,000.00 | | | | 1,014.60 | | | | 2.47 | |
R6-Class | | | 0.45 | % | | | 1.48 | % | | | 1,000.00 | | | | 1,014.80 | | | | 2.27 | |
|
Table 2. Based on hypothetical 5% return (before expenses) | | | | | | | | | | | | | | | | |
Limited Duration Fund | | | | | | | | | | | | | | | | | | | | |
A-Class | | | 0.74 | % | | | 5.00 | % | | $ | 1,000.00 | | | $ | 1,021.36 | | | $ | 3.75 | |
C-Class | | | 1.50 | % | | | 5.00 | % | | | 1,000.00 | | | | 1,017.55 | | | | 7.59 | |
P-Class | | | 0.74 | % | | | 5.00 | % | | | 1,000.00 | | | | 1,021.36 | | | | 3.75 | |
Institutional Class | | | 0.49 | % | | | 5.00 | % | | | 1,000.00 | | | | 1,022.61 | | | | 2.48 | |
R6-Class | | | 0.45 | % | | | 5.00 | % | | | 1,000.00 | | | | 1,022.81 | | | | 2.28 | |
1 | Annualized and excludes expenses of the underlying funds in which the Funds invest, if any. This ratio represents net expenses, which may include expenses that are excluded from the expense limitation agreement. Excluding these expenses, the net expense ratio for the Fund would be 0.72%, 1.48%, 0.72%, 0.47% and 0.44% for the A-Class, C-Class, P-Class, Institutional Class and R6-Class, respectively. |
2 | Expenses are equal to the Fund’s annualized expense ratio, net of any applicable fee waivers, multiplied by the average account value over the period, multiplied by 183/365 (to reflect the one-half year period). |
3 | Actual cumulative return at net asset value for the period March 31, 2023 to September 30, 2023. |
| | THE GUGGENHEIM FUNDS ANNUAL REPORT | 5 |
MANAGERS’ COMMENTARY (Unaudited) | September 30, 2023 |
To Our Shareholders
Guggenheim Partners Investment Management, LLC (“GPIM”) serves as the investment adviser to Guggenheim Limited Duration Fund (“Fund”). The Fund is managed by a team of seasoned professionals at GPIM, including Anne B. Walsh, CFA, JD, Chief Investment Officer and Managing Partner; Steven H. Brown, CFA, Chief Investment Officer, Total Return and Macro Strategies, Senior Managing Director, and Portfolio Manager; Adam J. Bloch, Managing Director and Portfolio Manager; and Evan L. Serdensky, Director and Portfolio Manager. In the subsequent paragraphs, the investment team discusses the Fund’s performance and the market environment for the 12-month period ended September 30, 2023 (“Reporting Period”).
For the Reporting Period, the Fund returned 5.31%1, outperforming the Bloomberg U.S. Aggregate Bond 1-3 Year Index, the Fund’s benchmark (“Benchmark”), which returned 2.80% for the same period.
What factors contributed or detracted from the Fund’s performance during the Reporting Period?
For the Reporting Period, the Fund outperformed the Benchmark by 2.51 percentage points. Carry, or earned income, remained a consistent source of relative performance for the Fund. Spreads also added to performance relative the Benchmark. A combination of the Fund’s allocation and selection biases within corporates and the Fund’s allocation to securitized credit drove most of the active performance versus the Benchmark. Duration contributed on a relative basis, largely driven by curve positioning.
How did the Fund use derivatives during the Reporting Period?
During the Reporting Period, the Fund used interest rate futures, forwards, options, and swaps to help manage duration positioning, foreign exchange risk, credit exposure, and generate incremental income. Over the Reporting Period, interest rate curve caps and interest rate swaps detracted from performance, whereas SOFR futures were incrementally positive (SOFR is Secured Overnight Financing Rate, which measures the cost of borrowing cash overnight collateralized by Treasury Securities). Options on equities which functioned as hedges to the Fund’s credit positioning detracted from performance. Performance from credit default swaps was a minor detractor to overall performance. In addition, the Fund hedged non-USD exposure with foreign-exchange derivatives, which were detractors from performance.
How was the Fund positioned at the end of the Reporting Period?
Over the past several quarters the Fund has increasingly prioritized diversification, quality, and liquidity as recession concerns continued to persist. The Fund has steadily moved up-in-quality and more defensively, uniquely, without having to sacrifice yield due to the move higher in interest rates. While spreads for many credit sectors have recovered to long-term-average levels, certain segments remain dislocated and offer attractive relative value. Structured credit spreads are especially cheap, with valuations currently north of the 90th percentile versus current corporate spreads.
Structured credit is the largest allocation in the Fund. Spreads continued their rebound, but broadly remain wide, both compared to similarly rated investment-grade corporate credit and in an absolute sense. Furthermore, the lower dollar prices of these assets following the rise in interest rates sets up the potential for higher total return opportunities than typically exists in the asset class. With much of its active buying base largely coming from income-focused accounts, structured credit spreads should continue to compress from the resetting higher of yields and the resulting increased interest that comes with it. Within securitized credit, we continue to focus on opportunities senior in the capital structure with sufficient credit enhancement and often unique structural features that limit cash flow variability or extension concerns. We believe the focus on superior structures will be paramount in helping mitigate mark-to-market risks that could emerge should volatility rise.
The corporate credit allocation, which represents roughly 28% of the Fund’s holdings, has increasingly shifted higher quality. About 23% is in investment-grade-rated corporate credit, and 5% is in below-investment-grade rated corporate credit, which are broadly weighted toward BB-rated securities. While in our view, overall corporate credit spreads are trading around fair value levels, there remain both idiosyncratic opportunities and risks across certain issuers and industries given tighter credit conditions across capital markets. Primary market offerings have priced at especially attractive levels as many investors have pulled back from lending activities. The Fund has employed modestly sized credit hedges to protect the portfolio from potential spread widening.
6 | THE GUGGENHEIM FUNDS ANNUAL REPORT | |
MANAGERS’ COMMENTARY (Unaudited)(concluded) | September 30, 2023 |
At the end of the Reporting Period, the Fund had a duration of 1.9 years, unchanged versus the end of the previous Reporting Period. Interest rate volatility remains elevated, which has presented the Fund with opportunities to tactically add to positions in Agency residential mortgage-backed securities (“RMBS”), locking in spreads, both static and option adjusted, that are near 15-year wides. Lastly, the Fund ended the period with 10% in cash and cash equivalents. Elevated yields on short duration products have made it more attractive to hold higher balances of liquidity with the added benefit of giving the Fund dry powder to take advantage of future market opportunities.
Despite the quarter ended September 30, 2023 continuing a trend of volatility for fixed income returns, our broader macroeconomic views from a fundamental perspective remain consistent. We continue to expect inflation to moderate with time and view the market’s increasingly optimistic expectations of a soft landing as misguided. Looking further out into the economic future, we believe the Fed’s restrictive monetary policy could ultimately shepherd in a recession in the next 6-18 months, which we believe will likely be met with lower rates. Ultimately, the current path of weakening growth, high prices, and high interest rates appears unsustainable, and we are already starting to see signs of pressure on consumers and levered corporate borrowers, which could call into question any soft-landing narrative.
The Fund may invest in certain of the underlying series of Guggenheim Funds Trust and Guggenheim Strategy Funds Trust, including Guggenheim Ultra Short Duration Fund, Guggenheim Strategy Fund II, and Guggenheim Strategy Fund III, (collectively, the “Short Term Investment Vehicles”), each of which are open-end management investment companies managed by Guggenheim Investments. The Short Term Investment Vehicles, which launched on March 11, 2014, are offered as short term investment options only to mutual funds, trusts, and other accounts managed by Guggenheim Investments and/or its affiliates, and are not available to the public, with the exception of Guggenheim Ultra Short Duration Fund, which is available to the public. Guggenheim Strategy Fund II and Guggenheim Strategy Fund III do not charge an investment management fee. Guggenheim Ultra Short Duration Fund charges an investment management fee but that fee is waived by the respective investee fund. For the Reporting Period investment in the Short Term Investment Vehicles contributed to Fund performance.
Performance displayed represents past performance which is no guarantee of future results.
1 | Performance figures are based on Class A shares and do not reflect taxes that a shareholder would pay on distributions or the redemption of shares. |
The opinions and forecast expressed may not actually come to pass. This information is subject to change at any time, based on market and other conditions, and should not be construed as a recommendation of any specific security or strategy.
| | THE GUGGENHEIM FUNDS ANNUAL REPORT | 7 |
PERFORMANCE REPORT AND FUND PROFILE (Unaudited) | September 30, 2023 |
LIMITED DURATION FUND
OBJECTIVE: Seeks to provide a high level of income consistent with preservation of capital.
Holdings Diversification (Market Exposure as % of Net Assets)
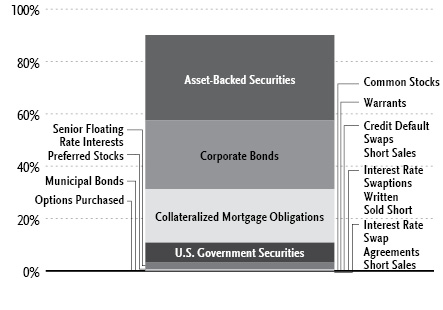
“Holdings Diversification (Market Exposure as % of Net Assets)” excludes any temporary cash investments, investments in Guggenheim Strategy Funds Trust mutual funds, or investments in Guggenheim Ultra Short Duration Fund.
Portfolio Composition by Quality Rating1 |
Rating | % of Total
Investments |
Fixed Income Instruments | |
AAA | 36.5% |
AA | 7.4% |
A | 18.4% |
BBB | 16.6% |
BB | 4.6% |
B | 1.1% |
CCC | 0.5% |
CC | 0.3% |
NR2 | 8.9% |
Other Instruments | 5.7% |
Total Investments | 100.0% |
Inception Dates: |
A-Class | December 16, 2013 |
C-Class | December 16, 2013 |
P-Class | May 1, 2015 |
Institutional Class | December 16, 2013 |
R6-Class | March 13, 2019 |
Ten Largest Holdings | % of Total
Net Assets |
U.S. Treasury Notes, 4.75% | 4.9% |
U.S. Treasury Notes, 4.63% | 2.4% |
THL Credit Lake Shore MM CLO I Ltd., 7.27% | 1.2% |
Freddie Mac, 5.00% | 1.0% |
F&G Global Funding, 0.90% | 1.0% |
Freddie Mac, 5.50% | 0.9% |
OSAT Trust, 2.12% | 0.9% |
Golub Capital Partners CLO 49M Ltd., 7.12% | 0.9% |
Oak Street Investment Grade Net Lease Fund Series, 1.85% | 0.8% |
Freddie Mac, 5.00% | 0.8% |
Top Ten Total | 14.8% |
| | |
“Ten Largest Holdings” excludes any temporary cash or derivative investments. |
1 | Source: BlackRock Solutions. Credit quality ratings are measured on a scale that generally ranges from AAA (highest) to D (lowest). All securities except for those labeled “NR” have been rated by Moody’s, Standard & Poor’s (“S&P”), or Fitch, each of which is a Nationally Recognized Statistical Rating Organization (“NRSRO”). For purposes of this presentation, when ratings are available from more than one agency, the highest rating is used. Guggenheim Investments has converted ratings to the equivalent S&P rating. Security ratings are determined at the time of purchase and may change thereafter. |
2 | NR (not rated) securities do not necessarily indicate low credit quality. |
8 | THE GUGGENHEIM FUNDS ANNUAL REPORT | |
PERFORMANCE REPORT AND FUND PROFILE (Unaudited)(concluded) | September 30, 2023 |
Cumulative Fund Performance*
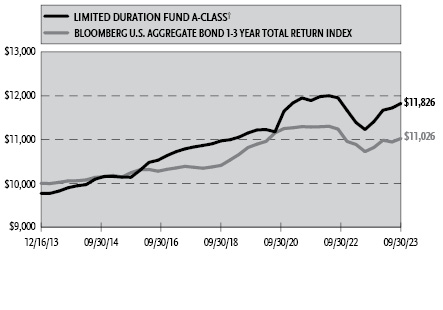
Average Annual Returns*
Periods Ended September 30, 2023
| 1 Year | 5 Year | Since
Inception
(12/16/13) |
A-Class Shares | 5.31% | 1.51% | 1.97% |
A-Class Shares with sales charge† | 2.92% | 1.05% | 1.73% |
C-Class Shares | 4.48% | 0.76% | 1.20% |
C-Class Shares with CDSC‡ | 3.48% | 0.76% | 1.20% |
Institutional Class Shares | 5.53% | 1.77% | 2.23% |
Bloomberg U.S. Aggregate Bond 1-3 Year Total Return Index | 2.80% | 1.16% | 1.00% |
| 1 Year | 5 Year | Since
Inception
(05/01/15) |
P-Class Shares | 5.31% | 1.51% | 1.86% |
Bloomberg U.S. Aggregate Bond 1-3 Year Total Return Index | 2.80% | 1.16% | 1.00% |
| | 1 Year | Since
Inception
(03/13/19) |
R6-Class Shares | | 5.60% | 1.80% |
Bloomberg U.S. Aggregate Bond 1-3 Year Total Return Index | | 2.80% | 0.84% |
* | The performance data above represents past performance that is not predictive of future results. The investment return and principal value of an investment in the Fund will fluctuate so that an investor’s shares, when redeemed, may be worth more or less than their original cost. Returns are historical and include changes in principal and reinvested dividends and capital gains and do not reflect the effect of taxes. The Bloomberg U.S. Aggregate Bond 1-3 Year Total Return Index is an unmanaged index and, unlike the Fund, has no management fees or operating expenses to reduce its reported return. The graph is based on A-Class shares only; performance for C-Class shares, P-Class shares, Institutional Class shares and R6-Class shares will vary due to differences in fee structures. |
† | Fund returns are calculated using the maximum sales charge of 2.25%. |
‡ | Fund returns include a CDSC of 1% if redeemed within 12 months of purchase. |
| | THE GUGGENHEIM FUNDS ANNUAL REPORT | 9 |
SCHEDULE OF INVESTMENTS | September 30, 2023 |
LIMITED DURATION FUND | |
| | Shares | | | Value | |
COMMON STOCKS† - 0.0% |
| | | | | | | | | |
Communications - 0.0% |
Vacasa, Inc. — Class A* | | | 81,407 | | | $ | 37,537 | |
| | | | | | | | | |
Total Common Stocks |
(Cost $813,108) | | | | | | | 37,537 | |
| | | | | | | | | |
PREFERRED STOCKS†† - 0.5% |
Financial - 0.5% |
Wells Fargo & Co. |
3.90% | | | 12,100,000 | | | | 10,567,515 | |
MetLife, Inc. |
3.85% | | | 4,620,000 | | | | 4,273,903 | |
Markel Group, Inc. |
6.00% | | | 4,085,000 | | | | 3,943,339 | |
American Equity Investment Life Holding Co. |
5.95%1 | | | 8,000 | | | | 180,240 | |
Total Financial | | | 18,964,997 | |
| | | | | | | | | |
Total Preferred Stocks |
(Cost $20,988,535) | | | | | | | 18,964,997 | |
| | | | | | | | | |
WARRANTS† - 0.0% |
Ginkgo Bioworks Holdings, Inc. | | | | | | | | |
Expiring 09/16/26 | | | 19,663 | | | | 4,424 | |
Acropolis Infrastructure Acquisition Corp. | | | | | | | | |
Expiring 03/31/262 | | | 28,866 | | | | 1,732 | |
Total Warrants |
(Cost $69,361) | | | | | | | 6,156 | |
| | | | | | | | | |
MUTUAL FUNDS† - 2.3% |
Guggenheim Strategy Fund III3 | | | 1,287,372 | | | | 31,270,271 | |
Guggenheim Strategy Fund II3 | | | 1,284,978 | | | | 31,186,426 | |
Guggenheim Ultra Short Duration Fund — Institutional Class3 | | | 3,124,485 | | | | 30,463,724 | |
Total Mutual Funds |
(Cost $93,876,872) | | | | | | | 92,920,421 | |
| | | | | | | | | |
MONEY MARKET FUND† - 2.0% |
Dreyfus Treasury Obligations Cash Management Fund — Institutional Shares, 5.23%4 | | | 81,400,025 | | | | 81,400,025 | |
Total Money Market Fund |
(Cost $81,400,025) | | | | | | | 81,400,025 | |
| | | | | | | | | |
| | Face
Amount~ | | | | |
ASSET-BACKED SECURITIES†† - 32.6% |
Collateralized Loan Obligations - 21.4% |
THL Credit Lake Shore MM CLO I Ltd. | | | | | | | | |
2021-1A A1R, 7.27% (3 Month Term SOFR + 1.96%, Rate Floor: 1.70%) due 04/15/33◊,5 | | | 48,500,001 | | | | 47,837,898 | |
2021-1A A2R, 7.42% (3 Month Term SOFR + 2.11%, Rate Floor: 1.85%) due 04/15/33◊,5 | | | 6,250,000 | | | | 6,127,636 | |
BXMT Ltd. | | | | | | | | |
2020-FL2 A, 6.35% (1 Month Term SOFR + 1.01%, Rate Floor: 1.01%) due 02/15/38◊,5 | | | 17,124,254 | | | | 16,273,433 | |
2020-FL2 AS, 6.60% (1 Month Term SOFR + 1.26%, Rate Floor: 1.26%) due 02/15/38◊,5 | | | 14,310,000 | | | | 13,039,331 | |
2020-FL3 AS, 7.20% (1 Month Term SOFR + 1.86%, Rate Floor: 1.86%) due 11/15/37◊,5 | | | 4,500,000 | | | | 4,209,538 | |
2020-FL3 B, 7.60% (1 Month Term SOFR + 2.26%, Rate Floor: 2.26%) due 11/15/37◊,5 | | | 2,000,000 | | | | 1,786,177 | |
2020-FL2 B, 6.85% (1 Month Term SOFR + 1.51%, Rate Floor: 1.51%) due 02/15/38◊,5 | | | 2,000,000 | | | | 1,743,011 | |
Golub Capital Partners CLO 49M Ltd. | | | | | | | | |
2021-49A AR, 7.12% (3 Month Term SOFR + 1.53%, Rate Floor: 1.53%) due 08/26/33◊,5 | | | 36,500,000 | | | | 35,833,776 | |
ABPCI Direct Lending Fund IX LLC | | | | | | | | |
2021-9A A1R, 7.02% (3 Month Term SOFR + 1.66%, Rate Floor: 1.40%) due 11/18/31◊,5 | | | 30,750,000 | | | | 30,394,127 | |
Golub Capital Partners CLO 54M, LP | | | | | | | | |
2021-54A A, 7.16% (3 Month Term SOFR + 1.79%, Rate Floor: 1.53%) due 08/05/33◊,5 | | | 29,000,000 | | | | 28,548,963 | |
Golub Capital Partners CLO 16 Ltd. | | | | | | | | |
2021-16A A1R2, 7.22% (3 Month Term SOFR + 1.87%, Rate Floor: 1.61%) due 07/25/33◊,5 | | | 27,650,000 | | | | 27,478,186 | |
LCCM Trust | | | | | | | | |
2021-FL3 A, 6.90% (1 Month Term SOFR + 1.56%, Rate Floor: 1.56%) due 11/15/38◊,5 | | | 22,250,000 | | | | 21,743,036 | |
2021-FL2 B, 7.35% (1 Month Term SOFR + 2.01%, Rate Floor: 2.01%) due 12/13/38◊,5 | | | 6,000,000 | | | | 5,673,966 | |
Owl Rock CLO IV Ltd. | | | | | | | | |
2021-4A A1R, 7.24% (3 Month Term SOFR + 1.86%, Rate Floor: 1.60%) due 08/20/33◊,5 | | | 24,250,000 | | | | 23,885,976 | |
2021-4A A2R, 7.54% (3 Month Term SOFR + 2.16%, Rate Floor: 1.90%) due 08/20/33◊,5 | | | 3,650,000 | | | | 3,464,381 | |
10 | THE GUGGENHEIM FUNDS ANNUAL REPORT | SEE NOTES TO FINANCIAL STATEMENTS. |
SCHEDULE OF INVESTMENTS (continued) | September 30, 2023 |
LIMITED DURATION FUND | |
| | Face
Amount~ | | | Value | |
Parliament CLO II Ltd. | | | | | | | | |
2021-2A B, 7.34% (3 Month Term SOFR + 1.96%, Rate Floor: 1.70%) due 08/20/32◊,5 | | | 22,250,000 | | | $ | 21,540,163 | |
2021-2A A, 6.99% (3 Month Term SOFR + 1.61%, Rate Floor: 1.35%) due 08/20/32◊,5 | | | 5,166,626 | | | | 5,107,956 | |
2021-2A C, 8.19% (3 Month Term SOFR + 2.81%, Rate Floor: 2.55%) due 08/20/32◊,5 | | | 500,000 | | | | 476,675 | |
ABPCI Direct Lending Fund CLO V Ltd. | | | | | | | | |
2021-5A A2R, 7.49% (3 Month Term SOFR + 2.16%, Rate Floor: 1.90%) due 04/20/31◊,5 | | | 15,500,000 | | | | 15,032,619 | |
2021-5A A1R, 7.09% (3 Month Term SOFR + 1.76%, Rate Floor: 1.50%) due 04/20/31◊,5 | | | 11,348,941 | | | | 11,209,379 | |
Golub Capital Partners CLO 36M Ltd. | | | | | | | | |
2018-36A A, 6.93% (3 Month Term SOFR + 1.56%, Rate Floor: 0.00%) due 02/05/31◊,5 | | | 24,964,790 | | | | 24,815,002 | |
LCM XXIV Ltd. | | | | | | | | |
2021-24A AR, 6.57% (3 Month Term SOFR + 1.24%, Rate Floor: 0.98%) due 03/20/30◊,5 | | | 24,265,413 | | | | 24,192,617 | |
Palmer Square Loan Funding Ltd. | | | | | | | | |
2021-1A A1, 6.49% (3 Month Term SOFR + 1.16%, Rate Floor: 1.16%) due 04/20/29◊,5 | | | 9,251,070 | | | | 9,231,564 | |
2022-1A A2, 6.91% (3 Month Term SOFR + 1.60%, Rate Floor: 1.60%) due 04/15/30◊,5 | | | 5,000,000 | | | | 4,930,987 | |
2021-3A B, 7.34% (3 Month Term SOFR + 2.01%, Rate Floor: 2.01%) due 07/20/29◊,5 | | | 5,000,000 | | | | 4,921,315 | |
2021-2A B, 7.04% (3 Month Term SOFR + 1.66%, Rate Floor: 1.66%) due 05/20/29◊,5 | | | 4,000,000 | | | | 3,926,865 | |
HERA Commercial Mortgage Ltd. | | | | | | | | |
2021-FL1 A, 6.50% (1 Month Term SOFR + 1.16%, Rate Floor: 1.05%) due 02/18/38◊,5 | | | 19,627,561 | | | | 19,047,187 | |
2021-FL1 B, 7.05% (1 Month Term SOFR + 1.71%, Rate Floor: 1.60%) due 02/18/38◊,5 | | | 3,750,000 | | | | 3,586,137 | |
Golub Capital Partners CLO 33M Ltd. | | | | | | | | |
2021-33A AR2, 7.51% (3 Month Term SOFR + 2.12%, Rate Floor: 1.86%) due 08/25/33◊,5 | | | 23,000,000 | | | | 22,088,089 | |
Madison Park Funding XLVIII Ltd. | | | | | | | | |
2021-48A B, 7.03% (3 Month Term SOFR + 1.71%, Rate Floor: 1.71%) due 04/19/33◊,5 | | | 22,000,000 | | | | 21,806,400 | |
Cerberus Loan Funding XL LLC | | | | | | | | |
2023-1A A, 7.71% (3 Month Term SOFR + 2.40%, Rate Floor: 2.40%) due 03/22/35◊,5 | | | 16,500,000 | | | | 16,499,053 | |
2023-1A B, 8.91% (3 Month Term SOFR + 3.60%, Rate Floor: 3.60%) due 03/22/35◊,5 | | | 3,250,000 | | | | 3,253,625 | |
LoanCore Issuer Ltd. | | | | | | | | |
2021-CRE5 B, 7.45% (1 Month Term SOFR + 2.00%, Rate Floor: 2.00%) due 07/15/36◊,5 | | | 7,900,000 | | | | 7,489,830 | |
2021-CRE4 B, 6.68% (30 Day Average SOFR + 1.36%, Rate Floor: 1.36%) due 07/15/35◊,5 | | | 7,500,000 | | | | 7,284,844 | |
2019-CRE2 AS, 6.95% (1 Month Term SOFR + 1.61%, Rate Floor: 1.50%) due 05/15/36◊,5 | | | 4,657,548 | | | | 4,557,120 | |
Cerberus Loan Funding XXXI, LP | | | | | | | | |
2021-1A B, 7.47% (3 Month Term SOFR + 2.16%, Rate Floor: 1.90%) due 04/15/32◊,5 | | | 9,600,000 | | | | 9,464,474 | |
2021-1A A, 7.07% (3 Month Term SOFR + 1.76%, Rate Floor: 1.50%) due 04/15/32◊,5 | | | 9,075,786 | | | | 9,037,222 | |
Cerberus Loan Funding XXXII, LP | | | | | | | | |
2021-2A A, 7.19% (3 Month Term SOFR + 1.88%, Rate Floor: 1.88%) due 04/22/33◊,5 | | | 14,250,000 | | | | 14,074,806 | |
2021-2A B, 7.47% (3 Month Term SOFR + 2.16%, Rate Floor: 2.16%) due 04/22/33◊,5 | | | 4,000,000 | | | | 3,875,432 | |
Cerberus Loan Funding XXX, LP | | | | | | | | |
2020-3A A, 7.42% (3 Month Term SOFR + 1.85%, Rate Floor: 1.85%) due 01/15/33◊,5 | | | 18,000,000 | | | | 17,937,616 | |
ABPCI Direct Lending Fund CLO II LLC | | | | | | | | |
2021-1A A1R, 7.19% (3 Month Term SOFR + 1.86%, Rate Floor: 1.60%) due 04/20/32◊,5 | | | 15,250,000 | | | | 15,083,497 | |
2021-1A BR, 7.74% (3 Month Term SOFR + 2.41%, Rate Floor: 2.15%) due 04/20/32◊,5 | | | 2,250,000 | | | | 2,177,133 | |
2021-1A A2R, 7.49% (3 Month Term SOFR + 2.16%, Rate Floor: 1.90%) due 04/20/32◊,5 | | | 300,000 | | | | 297,680 | |
Woodmont Trust | | | | | | | | |
2020-7A A1A, 7.47% (3 Month Term SOFR + 2.16%, Rate Floor: 1.90%) due 01/15/32◊,5 | | | 16,250,000 | | | | 16,205,106 | |
CHCP Ltd. | | | | | | | | |
2021-FL1 A, 6.50% (1 Month Term SOFR + 1.16%, Rate Floor: 1.05%) due 02/15/38◊,5 | | | 15,895,715 | | | | 15,762,951 | |
BRSP Ltd. | | | | | | | | |
2021-FL1 C, 7.59% (1 Month Term SOFR + 2.26%, Rate Floor: 2.15%) due 08/19/38◊,5 | | | 10,000,000 | | | | 9,178,499 | |
2021-FL1 B, 7.34% (1 Month Term SOFR + 2.01%, Rate Floor: 1.90%) due 08/19/38◊,5 | | | 6,400,000 | | | | 6,077,036 | |
SEE NOTES TO FINANCIAL STATEMENTS. | THE GUGGENHEIM FUNDS ANNUAL REPORT | 11 |
SCHEDULE OF INVESTMENTS (continued) | September 30, 2023 |
LIMITED DURATION FUND | |
| | Face
Amount~ | | | Value | |
ACRES Commercial Realty Ltd. | | | | | | | | |
2021-FL1 B, 7.25% (1 Month Term SOFR + 1.91%, Rate Floor: 1.91%) due 06/15/36◊,5 | | | 11,200,000 | | | $ | 10,665,665 | |
2021-FL1 C, 7.45% (1 Month Term SOFR + 2.11%, Rate Floor: 2.11%) due 06/15/36◊,5 | | | 4,800,000 | | | | 4,532,643 | |
Cerberus Loan Funding XXXIII, LP | | | | | | | | |
2021-3A A, 7.13% (3 Month Term SOFR + 1.82%, Rate Floor: 1.56%) due 07/23/33◊,5 | | | 11,500,000 | | | | 11,326,474 | |
2021-3A B, 7.42% (3 Month Term SOFR + 2.11%, Rate Floor: 1.85%) due 07/23/33◊,5 | | | 2,250,000 | | | | 2,171,965 | |
Shackleton CLO Ltd. | | | | | | | | |
2017-8A A1R, 6.51% (3 Month Term SOFR + 1.18%, Rate Floor: 0.00%) due 10/20/27◊,5 | | | 13,228,825 | | | | 13,207,954 | |
BDS Ltd. | | | | | | | | |
2021-FL8 D, 7.35% (1 Month Term SOFR + 2.01%, Rate Floor: 1.90%) due 01/18/36◊,5 | | | 7,000,000 | | | | 6,626,696 | |
2021-FL9 C, 7.35% (1 Month Term SOFR + 2.01%, Rate Floor: 1.90%) due 11/16/38◊,5 | | | 5,000,000 | | | | 4,769,309 | |
2020-FL5 B, 7.25% (1 Month Term SOFR + 1.91%, Rate Floor: 1.80%) due 02/16/37◊,5 | | | 1,400,000 | | | | 1,359,244 | |
Fortress Credit Opportunities XI CLO Ltd. | | | | | | | | |
2018-11A A1T, 6.87% (3 Month Term SOFR + 1.56%, Rate Floor: 0.00%) due 04/15/31◊,5 | | | 12,238,677 | | | | 12,168,539 | |
ABPCI Direct Lending Fund CLO I LLC | | | | | | | | |
2021-1A A1A2, 7.29% (3 Month Term SOFR + 1.96%, Rate Floor: 1.96%) due 07/20/33◊,5 | | | 12,250,000 | | | | 12,144,848 | |
Fortress Credit Opportunities IX CLO Ltd. | | | | | | | | |
2021-9A A2TR, 7.37% (3 Month Term SOFR + 2.06%, Rate Floor: 1.80%) due 10/15/33◊,5 | | | 11,500,000 | | | | 11,198,964 | |
Lake Shore MM CLO III LLC | | | | | | | | |
2021-2A A1R, 7.05% (3 Month Term SOFR + 1.74%, Rate Floor: 1.48%) due 10/17/31◊,5 | | | 11,250,000 | | | | 11,092,125 | |
FS Rialto | | | | | | | | |
2021-FL3 B, 7.25% (1 Month Term SOFR + 1.91%, Rate Floor: 1.80%) due 11/16/36◊,5 | | | 7,500,000 | | | | 7,166,410 | |
2021-FL2 C, 7.50% (1 Month Term SOFR + 2.16%, Rate Floor: 2.16%) due 05/16/38◊,5 | | | 3,250,000 | | | | 3,055,114 | |
KREF | | | | | | | | |
2021-FL2 B, 7.10% (1 Month Term SOFR + 1.76%, Rate Floor: 1.65%) due 02/15/39◊,5 | | | 10,700,000 | | | | 9,968,742 | |
ABPCI Direct Lending Fund CLO VII, LP | | | | | | | | |
2021-7A A1R, 7.05% (3 Month Term SOFR + 1.69%, Rate Floor: 1.43%) due 10/20/31◊,5 | | | 9,250,000 | | | | 9,135,547 | |
PFP Ltd. | | | | | | | | |
2021-7 B, 6.85% (1 Month Term SOFR + 1.51%, Rate Floor: 1.40%) due 04/14/38◊,5 | | | 4,599,770 | | | | 4,404,395 | |
2021-7 D, 7.85% (1 Month Term SOFR + 2.51%, Rate Floor: 2.40%) due 04/14/38◊,5 | | | 4,104,795 | | | | 3,832,731 | |
Cerberus Loan Funding XXXV, LP | | | | | | | | |
2021-5A A, 7.07% (3 Month Term SOFR + 1.76%, Rate Floor: 1.50%) due 09/22/33◊,5 | | | 8,000,000 | | | | 7,928,090 | |
GoldenTree Loan Management US CLO 1 Ltd. | | | | | | | | |
2021-9A B, 7.09% (3 Month Term SOFR + 1.76%, Rate Floor: 1.50%) due 01/20/33◊,5 | | | 7,000,000 | | | | 6,931,401 | |
2021-9A C, 7.39% (3 Month Term SOFR + 2.06%, Rate Floor: 1.80%) due 01/20/33◊,5 | | | 1,000,000 | | | | 977,945 | |
BCC Middle Market CLO LLC | | | | | | | | |
2021-1A A1R, 7.07% (3 Month Term SOFR + 1.76%, Rate Floor: 1.50%) due 10/15/33◊,5 | | | 6,750,000 | | | | 6,663,527 | |
NewStar Fairfield Fund CLO Ltd. | | | | | | | | |
2018-2A A1N, 6.86% (3 Month Term SOFR + 1.53%, Rate Floor: 1.27%) due 04/20/30◊,5 | | | 6,086,004 | | | | 6,031,155 | |
Neuberger Berman Loan Advisers CLO 40 Ltd. | | | | | | | | |
2021-40A B, 6.97% (3 Month Term SOFR + 1.66%, Rate Floor: 1.40%) due 04/16/33◊,5 | | | 6,000,000 | | | | 5,936,400 | |
MF1 Multifamily Housing Mortgage Loan Trust | | | | | | | | |
2021-FL6 B, 7.10% (1 Month Term SOFR + 1.76%, Rate Floor: 1.65%) due 07/16/36◊,5 | | | 6,000,000 | | | | 5,754,902 | |
Cerberus Loan Funding XLII LLC | | | | | | | | |
2023-3A A1, 7.91% (3 Month Term SOFR + 2.48%, Rate Floor: 2.48%) due 09/13/35◊,5 | | | 5,750,000 | | | | 5,749,597 | |
CIFC Funding Ltd. | | | | | | | | |
2021-4A A1B2, 6.84% (3 Month Term SOFR + 1.51%, Rate Floor: 1.51%) due 04/20/34◊,5 | | | 5,000,000 | | | | 4,964,160 | |
STWD Ltd. | | | | | | | | |
2019-FL1 C, 7.40% (1 Month Term SOFR + 2.06%, Rate Floor: 2.06%) due 07/15/38◊,5 | | | 3,200,000 | | | | 2,947,238 | |
2021-FL2 B, 7.25% (1 Month Term SOFR + 1.91%, Rate Floor: 1.80%) due 04/18/38◊,5 | | | 2,187,000 | | | | 1,988,388 | |
12 | THE GUGGENHEIM FUNDS ANNUAL REPORT | SEE NOTES TO FINANCIAL STATEMENTS. |
SCHEDULE OF INVESTMENTS (continued) | September 30, 2023 |
LIMITED DURATION FUND | |
| | Face
Amount~ | | | Value | |
Owl Rock CLO II Ltd. | | | | | | | | |
2021-2A ALR, 7.14% (3 Month Term SOFR + 1.81%, Rate Floor: 1.55%) due 04/20/33◊,5 | | | 5,000,000 | | | $ | 4,916,729 | |
Fontainbleau Vegas | | | | | | | | |
10.98% (1 Month Term SOFR + 5.65%, Rate Floor: 5.65%) due 01/31/26◊,††† | | | 4,777,544 | | | | 4,777,544 | |
BSPRT Issuer Ltd. | | | | | | | | |
2021-FL6 C, 7.50% (1 Month Term SOFR + 2.16%, Rate Floor: 2.05%) due 03/15/36◊,5 | | | 5,000,000 | | | | 4,633,362 | |
Carlyle Global Market Strategies CLO Ltd. | | | | | | | | |
2018-4A A1RR, 6.57% (3 Month Term SOFR + 1.26%, Rate Floor: 1.00%) due 01/15/31◊,5 | | | 4,530,975 | | | | 4,515,117 | |
VOYA CLO | | | | | | | | |
2021-2A BR, 7.72% (3 Month Term SOFR + 2.41%, Rate Floor: 2.15%) due 06/07/30◊,5 | | | 4,500,000 | | | | 4,473,236 | |
ACRE Commercial Mortgage Ltd. | | | | | | | | |
2021-FL4 AS, 6.55% (1 Month Term SOFR + 1.21%, Rate Floor: 1.10%) due 12/18/37◊,5 | | | 4,500,000 | | | | 4,341,963 | |
Magnetite XXIX Ltd. | | | | | | | | |
2021-29A B, 6.97% (3 Month Term SOFR + 1.66%, Rate Floor: 1.40%) due 01/15/34◊,5 | | | 4,000,000 | | | | 3,963,200 | |
Neuberger Berman Loan Advisers CLO 32 Ltd. | | | | | | | | |
2021-32A BR, 6.98% (3 Month Term SOFR + 1.66%, Rate Floor: 1.40%) due 01/20/32◊,5 | | | 4,000,000 | | | | 3,956,800 | |
KREF Funding V LLC | | | | | | | | |
7.19% (1 Month Term SOFR + 1.86%, Rate Floor: 1.86%) due 06/25/26◊,††† | | | 3,353,399 | | | | 3,513,980 | |
0.15% due 06/25/26†††,6 | | | 27,272,727 | | | | 18,818 | |
Owl Rock CLO VI Ltd. | | | | | | | | |
2021-6A B1, 7.41% (3 Month Term SOFR + 2.01%, Rate Floor: 1.75%) due 06/21/32◊,5 | | | 3,500,000 | | | | 3,383,935 | |
AMMC CLO XIV Ltd. | | | | | | | | |
2021-14A A2R2, 7.01% (3 Month Term SOFR + 1.66%, Rate Floor: 1.40%) due 07/25/29◊,5 | | | 2,166,281 | | | | 2,165,415 | |
Greystone Commercial Real Estate Notes | | | | | | | | |
2021-FL3 B, 7.10% (1 Month Term SOFR + 1.76%, Rate Floor: 1.65%) due 07/15/39◊,5 | | | 2,200,000 | | | | 2,092,909 | |
Golub Capital Partners CLO 17 Ltd. | | | | | | | | |
2017-17A A1R, 7.26% (3 Month Term SOFR + 1.91%, Rate Floor: 0.00%) due 10/25/30◊,5 | | | 2,014,060 | | | | 2,005,477 | |
Cerberus Loan Funding XXXVI, LP | | | | | | | | |
2021-6A A, 6.97% (3 Month Term SOFR + 1.66%, Rate Floor: 1.40%) due 11/22/33◊,5 | | | 1,937,055 | | | | 1,931,306 | |
HGI CRE CLO Ltd. | | | | | | | | |
2021-FL2 B, 6.95% (1 Month Term SOFR + 1.61%, Rate Floor: 1.61%) due 09/17/36◊,5 | | | 2,000,000 | | | | 1,908,872 | |
Dryden 37 Senior Loan Fund | | | | | | | | |
2015-37A Q, due 01/15/315,7 | | | 1,500,000 | | | | 1,098,368 | |
Carlyle GMS Finance MM CLO LLC | | | | | | | | |
2018-1A A12R, 7.35% (3 Month Term SOFR + 2.04%, Rate Floor: 0.00%) due 10/15/31◊,5 | | | 250,000 | | | | 247,939 | |
Treman Park CLO Ltd. | | | | | | | | |
2015-1A COM, due 10/20/285,7 | | | 325,901 | | | | 3,272 | |
Copper River CLO Ltd. | | | | | | | | |
2007-1A INC, due 01/20/217,8 | | | 500,000 | | | | 50 | |
Total Collateralized Loan Obligations | | | 866,856,774 | |
| | | | | | | | | |
Financial - 3.9% |
Madison Avenue Secured Funding Trust | | | | | | | | |
2023-1, 7.32% (1 Month Term SOFR + 2.00%, Rate Floor: 2.00%) due 03/04/24◊,†††,5 | | | 18,250,000 | | | | 18,250,000 | |
2022-1, 7.18% (1 Month Term SOFR + 1.85%, Rate Floor: 0.00%) due 10/12/23◊,†††,5 | | | 16,550,000 | | | | 16,550,000 | |
Strategic Partners Fund VIII LP | | | | | | | | |
7.93% (1 Month Term SOFR + 2.60%, Rate Floor: 2.60%) due 03/10/26◊,††† | | | 25,520,343 | | | | 25,388,876 | |
Station Place Securitization Trust | | | | | | | | |
2022-SP1, 7.18% (1 Month Term SOFR + 1.85%, Rate Floor: 0.00%) due 10/12/23◊,†††,5 | | | 16,550,000 | | | | 16,550,000 | |
Project Onyx I | | | | | | | | |
due 01/26/27◊,††† | | | 9,750,000 | | | | 9,750,425 | |
7.31% (3 Month Term SOFR + 2.40%, Rate Floor: 2.40%) due 01/26/27◊,††† | | | 6,000,000 | | | | 6,000,261 | |
KKR Core Holding Company LLC | | | | | | | | |
4.00% due 08/12/31††† | | | 17,807,991 | | | | 15,396,517 | |
Madison Avenue Secured Funding Trust | | | | | | | | |
2024-1, due 10/15/24◊ | | | 15,025,000 | | | | 15,025,000 | |
HV Eight LLC | | | | | | | | |
7.10% (3 Month EURIBOR + 3.50%, Rate Floor: 3.50%) due 12/31/27◊,††† | | EUR | 12,400,000 | | | | 13,114,753 | |
Station Place Securitization Trust | | | | | | | | |
2024-1, due 10/15/24◊ | | | 7,525,000 | | | | 7,525,000 | |
Project Onyx II | | | | | | | | |
due 01/26/27◊,††† | | | 3,250,000 | | | | 3,249,883 | |
7.31% (3 Month Term SOFR + 2.40%, Rate Floor: 2.40%) due 01/26/27◊,††† | | | 1,000,000 | | | | 999,964 | |
Ceamer Finance LLC | | | | | | | | |
3.69% due 03/24/31††† | | | 4,126,675 | | | | 3,828,627 | |
Lightning A | | | | | | | | |
5.50% due 03/01/37††† | | | 3,268,183 | | | | 2,967,157 | |
Thunderbird A | | | | | | | | |
5.50% due 03/01/37††† | | | 3,221,333 | | | | 2,924,336 | |
SEE NOTES TO FINANCIAL STATEMENTS. | THE GUGGENHEIM FUNDS ANNUAL REPORT | 13 |
SCHEDULE OF INVESTMENTS (continued) | September 30, 2023 |
LIMITED DURATION FUND | |
| | Face
Amount~ | | | Value | |
Aesf Vi Verdi, LP | | | | | | | | |
6.00% (3 Month EURIBOR + 2.40%, Rate Floor: 2.40%) due 11/25/24◊,††† | | EUR | 103,023 | | | $ | 110,598 | |
Total Financial | | | 157,631,397 | |
| | | | | | | | | |
Transport-Container - 1.9% |
Triton Container Finance VIII LLC | | | | | | | | |
2021-1A, 1.86% due 03/20/465 | | | 31,893,750 | | | | 26,630,124 | |
Textainer Marine Containers VII Ltd. | | | | | | | | |
2021-1A, 1.68% due 02/20/465 | | | 8,964,667 | | | | 7,559,548 | |
2020-1A, 2.73% due 08/21/455 | | | 3,818,388 | | | | 3,468,308 | |
2020-2A, 2.10% due 09/20/455 | | | 3,552,441 | | | | 3,114,116 | |
CLI Funding VI LLC | | | | | | | | |
2020-3A, 2.07% due 10/18/455 | | | 12,635,000 | | | | 10,967,147 | |
2020-1A, 2.08% due 09/18/455 | | | 1,384,000 | | | | 1,195,342 | |
TIF Funding II LLC | | | | | | | | |
2021-1A, 1.65% due 02/20/465 | | | 14,457,063 | | | | 11,966,550 | |
CLI Funding VIII LLC | | | | | | | | |
2021-1A, 1.64% due 02/18/465 | | | 13,738,840 | | | | 11,732,715 | |
CAL Funding IV Ltd. | | | | | | | | |
2020-1A, 2.22% due 09/25/455 | | | 2,793,750 | | | | 2,431,766 | |
Total Transport-Container | | | 79,065,616 | |
| | | | | | | | | |
Net Lease - 1.7% |
Oak Street Investment Grade Net Lease Fund Series | | | | | | | | |
2020-1A, 1.85% due 11/20/505 | | | 38,736,519 | | | | 34,337,255 | |
STORE Master Funding I LLC | | | | | | | | |
2015-1A, 4.17% due 04/20/455 | | | 10,249,708 | | | | 9,670,847 | |
STORE Master Funding LLC | | | | | | | | |
2021-1A, 2.86% due 06/20/515 | | | 6,871,812 | | | | 5,603,178 | |
CF Hippolyta Issuer LLC | | | | | | | | |
2021-1A, 1.98% due 03/15/615 | | | 5,748,930 | | | | 4,921,007 | |
CARS-DB4, LP | | | | | | | | |
2020-1A, 3.19% due 02/15/505 | | | 3,954,167 | | | | 3,712,677 | |
2020-1A, 3.25% due 02/15/505 | | | 889,586 | | | | 726,934 | |
CMFT Net Lease Master Issuer LLC | | | | | | | | |
2021-1, 2.91% due 07/20/515 | | | 3,000,000 | | | | 2,406,536 | |
2021-1, 2.51% due 07/20/515 | | | 2,500,000 | | | | 2,031,310 | |
New Economy Assets Phase 1 Sponsor LLC | | | | | | | | |
2021-1, 1.91% due 10/20/615 | | | 2,500,000 | | | | 2,155,743 | |
Capital Automotive REIT | | | | | | | | |
2020-1A, 3.48% due 02/15/505 | | | 1,977,083 | | | | 1,734,531 | |
Total Net Lease | | | 67,300,018 | |
| | | | | | | | | |
Whole Business - 1.3% |
Taco Bell Funding LLC | | | | | | | | |
2021-1A, 1.95% due 08/25/515 | | | 18,421,875 | | | | 15,928,806 | |
SERVPRO Master Issuer LLC | | | | | | | | |
2021-1A, 2.39% due 04/25/515 | | | 11,827,750 | | | | 9,763,346 | |
2019-1A, 3.88% due 10/25/495 | | | 6,015,625 | | | | 5,492,585 | |
ServiceMaster Funding LLC | | | | | | | | |
2020-1, 2.84% due 01/30/515 | | | 8,791,754 | | | | 7,423,924 | |
Wingstop Funding LLC | | | | | | | | |
2020-1A, 2.84% due 12/05/505 | | | 7,742,100 | | | | 6,698,341 | |
Arbys Funding LLC | | | | | | | | |
2020-1A, 3.24% due 07/30/505 | | | 7,032,500 | | | | 6,228,502 | |
Domino’s Pizza Master Issuer LLC | | | | | | | | |
2019-1A, 3.67% due 10/25/495 | | | 1,688,750 | | | | 1,461,169 | |
Five Guys Funding LLC | | | | | | | | |
2017-1A, 4.60% due 07/25/475 | | | 1,428,250 | | | | 1,402,346 | |
Total Whole Business | | | 54,399,019 | |
| | | | | | | | | |
Transport-Aircraft - 1.2% |
AASET Trust | | | | | | | | |
2021-1A, 2.95% due 11/16/415 | | | 13,286,657 | | | | 11,692,524 | |
2017-1A, 3.97% due 05/16/425 | | | 415,438 | | | | 365,581 | |
AASET US Ltd. | | | | | | | | |
2018-2A, 4.45% due 11/18/385 | | | 9,442,428 | | | | 8,209,991 | |
Sapphire Aviation Finance II Ltd. | | | | | | | | |
2020-1A, 3.23% due 03/15/405 | | | 5,637,778 | | | | 4,770,631 | |
KDAC Aviation Finance Ltd. | | | | | | | | |
2017-1A, 4.21% due 12/15/425 | | | 5,287,981 | | | | 4,384,265 | |
Sapphire Aviation Finance I Ltd. | | | | | | | | |
2018-1A, 4.25% due 03/15/405 | | | 4,700,049 | | | | 3,917,914 | |
MAPS Ltd. | | | | | | | | |
2018-1A, 4.21% due 05/15/435 | | | 4,139,653 | | | | 3,710,661 | |
Castlelake Aircraft Structured Trust | | | | | | | | |
2021-1A, 3.47% due 01/15/465 | | | 3,694,783 | | | | 3,408,364 | |
Castlelake Aircraft Securitization Trust | | | | | | | | |
2018-1, 4.13% due 06/15/435 | | | 3,468,553 | | | | 3,153,552 | |
Falcon Aerospace Ltd. | | | | | | | | |
2019-1, 3.60% due 09/15/395 | | | 1,708,566 | | | | 1,546,305 | |
2017-1, 4.58% due 02/15/425 | | | 537,690 | | | | 502,611 | |
Raspro Trust | | | | | | | | |
2005-1A, 6.18% (3 Month USD SOFR + 0.93%, Rate Floor: 0.93%) due 03/23/24◊,5 | | | 1,969,886 | | | | 1,957,196 | |
Total Transport-Aircraft | | | 47,619,595 | |
| | | | | | | | | |
Collateralized Debt Obligations - 0.5% |
Anchorage Credit Funding 4 Ltd. | | | | | | | | |
2021-4A AR, 2.72% due 04/27/395 | | | 24,650,000 | | | | 21,290,760 | |
| | | | | | | | | |
Single Family Residence - 0.4% |
FirstKey Homes Trust | | | | | | | | |
2020-SFR2, 4.00% due 10/19/375 | | | 5,050,000 | | | | 4,654,044 | |
2020-SFR2, 4.50% due 10/19/375 | | | 4,900,000 | | | | 4,540,382 | |
2021-SFR1, 2.19% due 08/17/385 | | | 4,000,000 | | | | 3,486,439 | |
2020-SFR2, 3.37% due 10/19/375 | | | 3,200,000 | | | | 2,924,753 | |
Total Single Family Residence | | | 15,605,618 | |
| | | | | | | | | |
Infrastructure - 0.3% |
VB-S1 Issuer LLC - VBTEL | | | | | | | | |
2022-1A, 4.29% due 02/15/525 | | | 9,250,000 | | | | 8,056,735 | |
SBA Tower Trust | | | | | | | | |
2.84% due 01/15/255 | | | 3,550,000 | | | | 3,397,849 | |
Aligned Data Centers Issuer LLC | | | | | | | | |
2021-1A, 1.94% due 08/15/465 | | | 2,950,000 | | | | 2,580,477 | |
Total Infrastructure | | | 14,035,061 | |
| | | | | | | | | |
Total Asset-Backed Securities |
(Cost $1,389,981,066) | | | 1,323,803,858 | |
14 | THE GUGGENHEIM FUNDS ANNUAL REPORT | SEE NOTES TO FINANCIAL STATEMENTS. |
SCHEDULE OF INVESTMENTS (continued) | September 30, 2023 |
LIMITED DURATION FUND | |
| | Face
Amount~ | | | Value | |
CORPORATE BONDS†† - 26.3% |
Financial - 14.4% |
Athene Global Funding | | | | | | | | |
6.00% (SOFR Compounded Index + 0.72%) due 01/07/25◊,5 | | | 30,000,000 | | | $ | 29,491,387 | |
1.99% due 08/19/285 | | | 15,850,000 | | | | 12,924,881 | |
1.73% due 10/02/265 | | | 14,700,000 | | | | 12,811,654 | |
F&G Global Funding | | | | | | | | |
0.90% due 09/20/245 | | | 42,100,000 | | | | 39,755,008 | |
1.75% due 06/30/265 | | | 14,250,000 | | | | 12,580,769 | |
Societe Generale S.A. | | | | | | | | |
1.79% due 06/09/271,5 | | | 28,000,000 | | | | 24,680,859 | |
1.48% due 12/14/261,5 | | | 10,500,000 | | | | 9,374,044 | |
3.88% due 03/28/245 | | | 350,000 | | | | 345,603 | |
GA Global Funding Trust | | | | | | | | |
1.95% due 09/15/285 | | | 16,600,000 | | | | 13,663,238 | |
2.25% due 01/06/275 | | | 15,000,000 | | | | 13,144,015 | |
1.63% due 01/15/265 | | | 7,300,000 | | | | 6,515,959 | |
Macquarie Group Ltd. | | | | | | | | |
1.63% due 09/23/271,5 | | | 16,750,000 | | | | 14,632,765 | |
1.20% due 10/14/251,5 | | | 13,550,000 | | | | 12,848,364 | |
Equitable Financial Life Global Funding | | | | | | | | |
1.40% due 07/07/255 | | | 15,000,000 | | | | 13,776,255 | |
1.80% due 03/08/285 | | | 12,000,000 | | | | 10,042,371 | |
Cooperatieve Rabobank UA | | | | | | | | |
1.34% due 06/24/261,5 | | | 15,000,000 | | | | 13,802,514 | |
1.98% due 12/15/271,5 | | | 10,000,000 | | | | 8,758,538 | |
Reliance Standard Life Global Funding II | | | | | | | | |
2.75% due 05/07/255 | | | 20,850,000 | | | | 19,603,401 | |
BNP Paribas S.A. | | | | | | | | |
1.32% due 01/13/271,5 | | | 21,350,000 | | | | 19,119,266 | |
2.22% due 06/09/261,5 | | | 400,000 | | | | 373,285 | |
Pershing Square Holdings Ltd. | | | | | | | | |
3.25% due 10/01/31 | | | 25,600,000 | | | | 18,556,088 | |
Citizens Bank North America/Providence RI | | | | | | | | |
2.25% due 04/28/25 | | | 20,000,000 | | | | 18,518,069 | |
Credit Agricole S.A. | | | | | | | | |
1.25% due 01/26/271,5 | | | 17,950,000 | | | | 16,032,521 | |
1.91% due 06/16/261,5 | | | 400,000 | | | | 371,848 | |
Ares Finance Company LLC | | | | | | | | |
4.00% due 10/08/245 | | | 14,617,000 | | | | 14,132,829 | |
Jackson National Life Global Funding | | | | | | | | |
1.75% due 01/12/255 | | | 15,000,000 | | | | 14,083,903 | |
FS KKR Capital Corp. | | | | | | | | |
4.25% due 02/14/255 | | | 7,600,000 | | | | 7,276,958 | |
2.63% due 01/15/27 | | | 7,400,000 | | | | 6,336,942 | |
JPMorgan Chase & Co. | | | | | | | | |
1.47% due 09/22/271 | | | 15,000,000 | | | | 13,141,295 | |
Rocket Mortgage LLC / Rocket Mortgage Company-Issuer, Inc. | | | | | | | | |
2.88% due 10/15/265 | | | 10,800,000 | | | | 9,511,452 | |
3.88% due 03/01/315 | | | 4,100,000 | | | | 3,269,217 | |
ABN AMRO Bank N.V. | | | | | | | | |
1.54% due 06/16/271,5 | | | 14,000,000 | | | | 12,335,246 | |
American Equity Investment Life Holding Co. | | | | | | | | |
5.00% due 06/15/27 | | | 13,075,000 | | | | 12,281,327 | |
Deloitte LLP | | | | | | | | |
4.35% due 11/17/23††† | | | 7,300,000 | | | | 7,273,658 | |
3.46% due 05/07/27††† | | | 4,500,000 | | | | 4,073,902 | |
Fidelity & Guaranty Life Holdings, Inc. | | | | | | | | |
5.50% due 05/01/255 | | | 11,450,000 | | | | 11,178,142 | |
CBS Studio Center | | | | | | | | |
8.31% (30 Day Average SOFR + 3.00%, Rate Floor: 3.00%) due 01/09/24◊,††† | | | 10,000,000 | | | | 10,000,000 | |
Iron Mountain, Inc. | | | | | | | | |
4.88% due 09/15/275 | | | 7,360,000 | | | | 6,788,531 | |
5.00% due 07/15/285 | | | 3,085,000 | | | | 2,805,964 | |
ING Groep N.V. | | | | | | | | |
1.73% due 04/01/271 | | | 9,800,000 | | | | 8,767,966 | |
BPCE S.A. | | | | | | | | |
1.65% due 10/06/261,5 | | | 9,500,000 | | | | 8,621,540 | |
Apollo Management Holdings, LP | | | | | | | | |
4.40% due 05/27/265 | | | 7,115,000 | | | | 6,775,327 | |
4.00% due 05/30/245 | | | 1,846,000 | | | | 1,818,723 | |
Corebridge Global Funding | | | | | | | | |
5.75% due 07/02/265 | | | 7,250,000 | | | | 7,162,457 | |
OneMain Finance Corp. | | | | | | | | |
3.50% due 01/15/27 | | | 7,050,000 | | | | 6,036,562 | |
6.13% due 03/15/24 | | | 750,000 | | | | 747,621 | |
7.13% due 03/15/26 | | | 50,000 | | | | 48,969 | |
First American Financial Corp. | | | | | | | | |
4.00% due 05/15/30 | | | 7,860,000 | | | | 6,656,557 | |
LPL Holdings, Inc. | | | | | | | | |
4.00% due 03/15/295 | | | 4,450,000 | | | | 3,879,787 | |
4.63% due 11/15/275 | | | 2,000,000 | | | | 1,847,762 | |
SBA Communications Corp. | | | | | | | | |
3.13% due 02/01/29 | | | 6,500,000 | | | | 5,421,470 | |
Belrose Funding Trust | | | | | | | | |
2.33% due 08/15/305 | | | 7,100,000 | | | | 5,290,934 | |
Starwood Property Trust, Inc. | | | | | | | | |
3.75% due 12/31/245 | | | 5,375,000 | | | | 5,117,307 | |
Brighthouse Financial Global Funding | | | | | | | | |
6.05% (SOFR + 0.76%) due 04/12/24◊,5 | | | 5,050,000 | | | | 5,026,164 | |
SLM Corp. | | | | | | | | |
3.13% due 11/02/26 | | | 5,786,000 | | | | 5,018,740 | |
Horace Mann Educators Corp. | | | | | | | | |
4.50% due 12/01/25 | | | 4,420,000 | | | | 4,201,691 | |
Essex Portfolio, LP | | | | | | | | |
1.70% due 03/01/28 | | | 5,000,000 | | | | 4,179,867 | |
Jefferies Finance LLC / JFIN Company-Issuer Corp. | | | | | | | | |
5.00% due 08/15/285 | | | 4,300,000 | | | | 3,620,627 | |
Peachtree Corners Funding Trust | | | | | | | | |
3.98% due 02/15/255 | | | 3,450,000 | | | | 3,330,603 | |
Fairfax Financial Holdings Ltd. | | | | | | | | |
4.85% due 04/17/28 | | | 3,100,000 | | | | 2,937,627 | |
Hunt Companies, Inc. | | | | | | | | |
5.25% due 04/15/295 | | | 3,250,000 | | | | 2,552,564 | |
United Wholesale Mortgage LLC | | | | | | | | |
5.50% due 11/15/255 | | | 1,940,000 | | | | 1,845,285 | |
5.50% due 04/15/295 | | | 275,000 | | | | 232,375 | |
SEE NOTES TO FINANCIAL STATEMENTS. | THE GUGGENHEIM FUNDS ANNUAL REPORT | 15 |
SCHEDULE OF INVESTMENTS (continued) | September 30, 2023 |
LIMITED DURATION FUND | |
| | Face
Amount~ | | | Value | |
Brookfield Finance, Inc. | | | | | | | | |
3.90% due 01/25/28 | | | 1,400,000 | | | $ | 1,289,474 | |
CNO Financial Group, Inc. | | | | | | | | |
5.25% due 05/30/25 | | | 1,200,000 | | | | 1,175,949 | |
Trinity Acquisition plc | | | | | | | | |
4.40% due 03/15/26 | | | 881,000 | | | | 845,867 | |
Newmark Group, Inc. | | | | | | | | |
6.13% due 11/15/23 | | | 775,000 | | | | 773,450 | |
Old Republic International Corp. | | | | | | | | |
3.88% due 08/26/26 | | | 700,000 | | | | 661,013 | |
Equinix, Inc. | | | | | | | | |
1.55% due 03/15/28 | | | 700,000 | | | | 583,372 | |
Assurant, Inc. | | | | | | | | |
4.90% due 03/27/28 | | | 350,000 | | | | 334,455 | |
Morgan Stanley | | | | | | | | |
3.77% due 01/24/291 | | | 361,000 | | | | 329,179 | |
Total Financial | | | 583,343,352 | |
| | | | | | | | | |
Consumer, Non-cyclical - 3.2% |
Triton Container International Ltd. | | | | | | | | |
1.15% due 06/07/245 | | | 26,000,000 | | | | 25,020,573 | |
2.05% due 04/15/265 | | | 1,800,000 | | | | 1,603,608 | |
Global Payments, Inc. | | | | | | | | |
2.90% due 05/15/30 | | | 31,000,000 | | | | 25,414,624 | |
CoStar Group, Inc. | | | | | | | | |
2.80% due 07/15/305 | | | 15,280,000 | | | | 12,311,757 | |
Laboratory Corporation of America Holdings | | | | | | | | |
1.55% due 06/01/26 | | | 13,700,000 | | | | 12,272,131 | |
Element Fleet Management Corp. | | | | | | | | |
1.60% due 04/06/245 | | | 10,250,000 | | | | 10,004,047 | |
PRA Health Sciences, Inc. | | | | | | | | |
2.88% due 07/15/265 | | | 10,280,000 | | | | 9,275,328 | |
Prime Security Services Borrower LLC / Prime Finance, Inc. | | | | | | | | |
3.38% due 08/31/275 | | | 10,526,000 | | | | 9,221,801 | |
Block, Inc. | | | | | | | | |
2.75% due 06/01/26 | | | 7,600,000 | | | | 6,835,425 | |
BAT Capital Corp. | | | | | | | | |
4.70% due 04/02/27 | | | 4,220,000 | | | | 4,040,435 | |
3.56% due 08/15/27 | | | 527,000 | | | | 482,148 | |
Royalty Pharma plc | | | | | | | | |
1.75% due 09/02/27 | | | 5,150,000 | | | | 4,394,151 | |
JBS USA LUX S.A. / JBS USA Food Company / JBS USA Finance, Inc. | | | | | | | | |
5.13% due 02/01/28 | | | 4,306,000 | | | | 4,097,601 | |
Molina Healthcare, Inc. | | | | | | | | |
4.38% due 06/15/285 | | | 1,115,000 | | | | 999,094 | |
Avantor Funding, Inc. | | | | | | | | |
4.63% due 07/15/285 | | | 1,050,000 | | | | 957,263 | |
US Foods, Inc. | | | | | | | | |
4.75% due 02/15/295 | | | 1,011,000 | | | | 903,599 | |
Catalent Pharma Solutions, Inc. | | | | | | | | |
3.13% due 02/15/295 | | | 1,050,000 | | | | 861,205 | |
IQVIA, Inc. | | | | | | | | |
5.00% due 05/15/275 | | | 850,000 | | | | 801,191 | |
Smithfield Foods, Inc. | | | | | | | | |
4.25% due 02/01/275 | | | 350,000 | | | | 323,552 | |
Performance Food Group, Inc. | | | | | | | | |
5.50% due 10/15/275 | | | 100,000 | | | | 94,744 | |
Total Consumer, Non-cyclical | | | 129,914,277 | |
| | | | | | | | | |
Industrial - 2.9% |
Berry Global, Inc. | | | | | | | | |
1.57% due 01/15/26 | | | 11,750,000 | | | | 10,621,226 | |
4.88% due 07/15/265 | | | 5,165,000 | | | | 4,943,783 | |
Sealed Air Corp. | | | | | | | | |
1.57% due 10/15/265 | | | 16,450,000 | | | | 14,320,031 | |
TD SYNNEX Corp. | | | | | | | | |
1.25% due 08/09/24 | | | 14,400,000 | | | | 13,756,814 | |
GXO Logistics, Inc. | | | | | | | | |
1.65% due 07/15/26 | | | 15,000,000 | | | | 13,180,195 | |
Silgan Holdings, Inc. | | | | | | | | |
1.40% due 04/01/265 | | | 12,600,000 | | | | 11,176,272 | |
Boeing Co. | | | | | | | | |
2.20% due 02/04/26 | | | 10,450,000 | | | | 9,595,018 | |
Vontier Corp. | | | | | | | | |
1.80% due 04/01/26 | | | 7,050,000 | | | | 6,314,551 | |
2.40% due 04/01/28 | | | 3,900,000 | | | | 3,246,633 | |
Graphic Packaging International LLC | | | | | | | | |
1.51% due 04/15/265 | | | 6,500,000 | | | | 5,790,388 | |
Penske Truck Leasing Company LP / PTL Finance Corp. | | | | | | | | |
4.45% due 01/29/265 | | | 5,475,000 | | | | 5,244,659 | |
4.20% due 04/01/275 | | | 500,000 | | | | 465,498 | |
Stericycle, Inc. | | | | | | | | |
5.38% due 07/15/245 | | | 3,925,000 | | | | 3,874,344 | |
IP Lending V Ltd. | | | | | | | | |
5.13% due 04/02/26 †††,5 | | | 3,900,000 | | | | 3,627,000 | |
Jabil, Inc. | | | | | | | | |
1.70% due 04/15/26 | | | 3,800,000 | | | | 3,413,644 | |
GATX Corp. | | | | | | | | |
3.85% due 03/30/27 | | | 2,900,000 | | | | 2,689,959 | |
3.50% due 03/15/28 | | | 200,000 | | | | 179,571 | |
Standard Industries, Inc. | | | | | | | | |
4.75% due 01/15/285 | | | 2,671,000 | | | | 2,409,213 | |
Weir Group plc | | | | | | | | |
2.20% due 05/13/265 | | | 2,610,000 | | | | 2,345,363 | |
Mueller Water Products, Inc. | | | | | | | | |
4.00% due 06/15/295 | | | 1,180,000 | | | | 1,027,669 | |
Brundage-Bone Concrete Pumping Holdings, Inc. | | | | | | | | |
6.00% due 02/01/265 | | | 800,000 | | | | 760,968 | |
Amsted Industries, Inc. | | | | | | | | |
4.63% due 05/15/305 | | | 350,000 | | | | 296,359 | |
5.63% due 07/01/275 | | | 100,000 | | | | 94,251 | |
Summit Materials LLC / Summit Materials Finance Corp. | | | | | | | | |
5.25% due 01/15/295 | | | 275,000 | | | | 249,698 | |
6.50% due 03/15/275 | | | 75,000 | | | | 73,225 | |
Enviri Corp. | | | | | | | | |
5.75% due 07/31/275 | | | 125,000 | | | | 109,941 | |
Total Industrial | | | 119,806,273 | |
| | | | | | | | | |
16 | THE GUGGENHEIM FUNDS ANNUAL REPORT | SEE NOTES TO FINANCIAL STATEMENTS. |
SCHEDULE OF INVESTMENTS (continued) | September 30, 2023 |
LIMITED DURATION FUND | |
| | Face
Amount~ | | | Value | |
Technology - 1.5% |
CDW LLC / CDW Finance Corp. | | | | | | | | |
2.67% due 12/01/26 | | | 22,350,000 | | | | 20,157,580 | |
3.25% due 02/15/29 | | | 810,000 | | | | 690,679 | |
Infor, Inc. | | | | | | | | |
1.75% due 07/15/255 | | | 13,800,000 | | | | 12,688,411 | |
Qorvo, Inc. | | | | | | | | |
1.75% due 12/15/245 | | | 10,600,000 | | | | 9,959,423 | |
3.38% due 04/01/315 | | | 1,200,000 | | | | 950,479 | |
4.38% due 10/15/29 | | | 963,000 | | | | 846,898 | |
NetApp, Inc. | | | | | | | | |
2.38% due 06/22/27 | | | 12,800,000 | | | | 11,429,715 | |
NCR Corp. | | | | | | | | |
5.13% due 04/15/295 | | | 2,850,000 | | | | 2,511,017 | |
Twilio, Inc. | | | | | | | | |
3.63% due 03/15/29 | | | 994,000 | | | | 832,121 | |
MSCI, Inc. | | | | | | | | |
3.88% due 02/15/315 | | | 379,000 | | | | 321,091 | |
Total Technology | | | 60,387,414 | |
| | | | | | | | | |
Consumer, Cyclical - 1.3% |
Alt-2 Structured Trust | | | | | | | | |
2.95% (0 - —%) due 05/14/31◊,††† | | | 9,998,811 | | | | 8,731,858 | |
Warnermedia Holdings, Inc. | | | | | | | | |
6.41% due 03/15/26 | | | 8,050,000 | | | | 8,048,653 | |
Delta Air Lines Inc. / SkyMiles IP Ltd. | | | | | | | | |
4.50% due 10/20/255 | | | 7,502,000 | | | | 7,286,680 | |
Choice Hotels International, Inc. | | | | | | | | |
3.70% due 01/15/31 | | | 7,350,000 | | | | 6,120,962 | |
Delta Air Lines, Inc. | | | | | | | | |
7.00% due 05/01/255 | | | 4,300,000 | | | | 4,346,681 | |
Hyatt Hotels Corp. | | | | | | | | |
5.75% due 04/23/30 | | | 4,320,000 | | | | 4,188,020 | |
American Airlines Class AA Pass Through Trust | | | | | | | | |
3.35% due 10/15/29 | | | 2,552,861 | | | | 2,272,997 | |
3.00% due 10/15/28 | | | 1,568,907 | | | | 1,403,723 | |
Newell Brands, Inc. | | | | | | | | |
6.38% due 09/15/27 | | | 1,548,000 | | | | 1,476,765 | |
4.70% due 04/01/26 | | | 1,552,000 | | | | 1,462,594 | |
Mileage Plus Holdings LLC / Mileage Plus Intellectual Property Assets Ltd. | | | | | | | | |
6.50% due 06/20/275 | | | 2,512,500 | | | | 2,489,389 | |
Suburban Propane Partners Limited Partnership/Suburban Energy Finance Corp. | | | | | | | | |
5.88% due 03/01/27 | | | 2,300,000 | | | | 2,196,500 | |
Air Canada | | | | | | | | |
3.88% due 08/15/265 | | | 2,350,000 | | | | 2,132,762 | |
1011778 BC ULC / New Red Finance, Inc. | | | | | | | | |
5.75% due 04/15/255 | | | 700,000 | | | | 694,632 | |
Tempur Sealy International, Inc. | | | | | | | | |
4.00% due 04/15/295 | | | 375,000 | | | | 312,975 | |
Total Consumer, Cyclical | | | 53,165,191 | |
| | | | | | | | | |
Utilities - 1.0% |
Alexander Funding Trust | | | | | | | | |
1.84% due 11/15/235 | | | 19,050,000 | | | | 18,924,062 | |
CenterPoint Energy, Inc. | | | | | | | | |
5.99% (SOFR Compounded Index + 0.65%) due 05/13/24◊ | | | 10,400,000 | | | | 10,398,088 | |
Terraform Global Operating, LP | | | | | | | | |
6.13% due 03/01/265 | | | 6,170,000 | | | | 6,054,313 | |
AES Corp. | | | | | | | | |
3.30% due 07/15/255 | | | 4,250,000 | | | | 4,025,499 | |
Total Utilities | | | 39,401,962 | |
| | | | | | | | | |
Basic Materials - 0.9% |
Anglo American Capital plc | | | | | | | | |
2.25% due 03/17/285 | | | 14,000,000 | | | | 11,948,353 | |
4.00% due 09/11/275 | | | 750,000 | | | | 700,249 | |
5.38% due 04/01/255 | | | 600,000 | | | | 591,952 | |
Kaiser Aluminum Corp. | | | | | | | | |
4.63% due 03/01/285 | | | 9,643,000 | | | | 8,420,171 | |
Valvoline, Inc. | | | | | | | | |
3.63% due 06/15/315 | | | 7,434,000 | | | | 5,759,514 | |
4.25% due 02/15/305 | | | 125,000 | | | | 122,752 | |
International Flavors & Fragrances, Inc. | | | | | | | | |
1.23% due 10/01/255 | | | 4,130,000 | | | | 3,702,124 | |
Alcoa Nederland Holding BV | | | | | | | | |
5.50% due 12/15/275 | | | 3,675,000 | | | | 3,490,860 | |
Carpenter Technology Corp. | | | | | | | | |
6.38% due 07/15/28 | | | 1,145,000 | | | | 1,104,312 | |
Minerals Technologies, Inc. | | | | | | | | |
5.00% due 07/01/285 | | | 140,000 | | | | 128,408 | |
Total Basic Materials | | | 35,968,695 | |
| | | | | | | | | |
Communications - 0.8% |
Rogers Communications, Inc. | | | | | | | | |
2.95% due 03/15/25 | | | 14,400,000 | | | | 13,733,571 | |
Level 3 Financing, Inc. | | | | | | | | |
3.63% due 01/15/295 | | | 5,070,000 | | | | 2,839,200 | |
4.25% due 07/01/285 | | | 2,277,000 | | | | 1,418,647 | |
3.75% due 07/15/295 | | | 2,150,000 | | | | 1,201,747 | |
Paramount Global | | | | | | | | |
4.75% due 05/15/25 | | | 3,590,000 | | | | 3,491,732 | |
T-Mobile USA, Inc. | | | | | | | | |
2.63% due 04/15/26 | | | 3,200,000 | | | | 2,959,469 | |
Charter Communications Operating LLC / Charter Communications Operating Capital | | | | | | | | |
2.80% due 04/01/31 | | | 3,250,000 | | | | 2,534,535 | |
Cogent Communications Group, Inc. | | | | | | | | |
3.50% due 05/01/265 | | | 2,680,000 | | | | 2,475,516 | |
Virgin Media Vendor Financing Notes IV DAC | | | | | | | | |
5.00% due 07/15/285 | | | 1,850,000 | | | | 1,596,402 | |
TripAdvisor, Inc. | | | | | | | | |
7.00% due 07/15/255 | | | 400,000 | | | | 399,240 | |
CSC Holdings LLC | | | | | | | | |
4.13% due 12/01/305 | | | 250,000 | | | | 176,928 | |
AMC Networks, Inc. | | | | | | | | |
4.25% due 02/15/29 | | | 225,000 | | | | 138,059 | |
SEE NOTES TO FINANCIAL STATEMENTS. | THE GUGGENHEIM FUNDS ANNUAL REPORT | 17 |
SCHEDULE OF INVESTMENTS (continued) | September 30, 2023 |
LIMITED DURATION FUND | |
| | Face
Amount~ | | | Value | |
Match Group Holdings II LLC | | | | | | | | |
4.63% due 06/01/285 | | | 75,000 | | | $ | 67,239 | |
Sirius XM Radio, Inc. | | | | | | | | |
3.88% due 09/01/315 | | | 75,000 | | | | 56,810 | |
Total Communications | | | 33,089,095 | |
| | | | | | | | | |
Energy - 0.3% |
BP Capital Markets plc | | | | | | | | |
4.88% 1,9 | | | 7,500,000 | | | | 6,700,675 | |
Occidental Petroleum Corp. | | | | | | | | |
5.50% due 12/01/25 | | | 5,000,000 | | | | 4,934,615 | |
Gulfstream Natural Gas System LLC | | | | | | | | |
4.60% due 09/15/255 | | | 400,000 | | | | 385,539 | |
Sabine Pass Liquefaction LLC | | | | | | | | |
5.00% due 03/15/27 | | | 300,000 | | | | 291,035 | |
Parkland Corp. | | | | | | | | |
5.88% due 07/15/275 | | | 80,000 | | | | 76,128 | |
Total Energy | | | 12,387,992 | |
| | | | | | | | | |
Total Corporate Bonds |
(Cost $1,184,224,559) | | | 1,067,464,251 | |
| | | | | | | | | |
COLLATERALIZED MORTGAGE OBLIGATIONS†† - 20.4% |
Residential Mortgage-Backed Securities - 12.4% |
CSMC Trust | | | | | | | | |
2021-RPL1, 1.67% (WAC) due 09/27/60◊,5 | | | 27,434,837 | | | | 25,252,942 | |
2021-RPL7, 1.93% (WAC) due 07/27/61◊,5 | | | 12,437,270 | | | | 11,382,378 | |
2020-RPL5, 3.02% (WAC) due 08/25/60◊,5 | | | 11,400,049 | | | | 11,192,014 | |
2021-RPL4, 1.80% (WAC) due 12/27/60◊,5 | | | 7,705,935 | | | | 7,174,292 | |
2018-RPL9, 3.85% (WAC) due 09/25/57◊,5 | | | 4,640,171 | | | | 4,411,944 | |
2020-NQM1, 1.41% due 05/25/655,10 | | | 2,131,720 | | | | 1,896,075 | |
PRPM LLC | | | | | | | | |
2021-5, 1.79% due 06/25/265,10 | | | 20,772,529 | | | | 19,159,407 | |
2022-1, 3.72% due 02/25/275,10 | | | 19,017,697 | | | | 18,203,475 | |
2021-8, 1.74% (WAC) due 09/25/26◊,5 | | | 9,458,212 | | | | 8,672,746 | |
2023-1, 6.88% (WAC) due 02/25/28◊,5 | | | 4,175,818 | | | | 4,163,421 | |
2021-RPL2, 2.49% (WAC) due 10/25/51◊,5 | | | 2,500,000 | | | | 1,907,471 | |
Legacy Mortgage Asset Trust | | | | | | | | |
2021-GS3, 1.75% due 07/25/615,10 | | | 20,941,823 | | | | 19,503,097 | |
2021-GS4, 1.65% due 11/25/605,10 | | | 17,918,264 | | | | 16,219,755 | |
2021-GS2, 1.75% due 04/25/615,10 | | | 7,650,649 | | | | 7,066,543 | |
2021-GS5, 2.25% due 07/25/675,10 | | | 4,871,672 | | | | 4,495,335 | |
BRAVO Residential Funding Trust | | | | | | | | |
2021-C, 1.62% due 03/01/615,10 | | | 21,279,934 | | | | 18,706,241 | |
2022-R1, 3.13% due 01/29/705,10 | | | 17,598,452 | | | | 15,768,639 | |
2021-HE2, 6.17% (30 Day Average SOFR + 0.85%, Rate Floor: 0.00%) due 11/25/69◊,5 | | | 2,225,679 | | | | 2,189,412 | |
2021-HE2, 6.37% (30 Day Average SOFR + 1.05%, Rate Floor: 0.00%) due 11/25/69◊,5 | | | 2,043,782 | | | | 2,014,447 | |
2021-HE1, 6.27% (30 Day Average SOFR + 0.95%, Rate Floor: 0.00%) due 01/25/70◊,5 | | | 1,791,283 | | | | 1,772,754 | |
2021-HE1, 6.17% (30 Day Average SOFR + 0.85%, Rate Floor: 0.00%) due 01/25/70◊,5 | | | 1,344,982 | | | | 1,333,392 | |
NYMT Loan Trust | | | | | | | | |
2021-SP1, 1.67% due 08/25/615,10 | | | 34,420,304 | | | | 31,185,415 | |
2022-SP1, 5.25% due 07/25/625,10 | | | 9,626,850 | | | | 9,287,132 | |
OSAT Trust | | | | | | | | |
2021-RPL1, 2.12% due 05/25/655,10 | | | 40,986,370 | | | | 37,568,496 | |
Verus Securitization Trust | | | | | | | | |
2021-4, 1.35% (WAC) due 07/25/66◊,5 | | | 6,306,890 | | | | 4,752,666 | |
2021-5, 1.37% (WAC) due 09/25/66◊,5 | | | 5,943,789 | | | | 4,674,101 | |
2020-5, 1.58% due 05/25/655,10 | | | 4,523,933 | | | | 4,150,524 | |
2021-3, 1.44% (WAC) due 06/25/66◊,5 | | | 3,615,614 | | | | 2,981,272 | |
2021-6, 1.89% (WAC) due 10/25/66◊,5 | | | 2,817,612 | | | | 2,236,650 | |
2019-4, 2.64% due 11/25/595,10 | | | 1,373,925 | | | | 1,308,043 | |
2020-1, 2.42% due 01/25/605,10 | | | 741,848 | | | | 698,734 | |
Towd Point Revolving Trust | | | | | | | | |
, 4.83% due 09/25/648 | | | 18,500,000 | | | | 17,986,625 | |
LSTAR Securities Investment Ltd. | | | | | | | | |
2023-1, 8.81% (SOFR + 3.50%, Rate Floor: 0.00%) due 01/01/28◊,5 | | | 10,796,779 | | | | 10,789,401 | |
2021-1, 8.24% (1 Month Term SOFR + 2.91%, Rate Floor: 1.80%) due 02/01/26◊,8 | | | 6,824,430 | | | | 6,698,014 | |
Towd Point Mortgage Trust | | | | | | | | |
2017-6, 2.75% (WAC) due 10/25/57◊,5 | | | 6,698,551 | | | | 6,354,557 | |
2018-2, 3.25% (WAC) due 03/25/58◊,5 | | | 3,492,745 | | | | 3,336,474 | |
2017-5, 6.03% (1 Month Term SOFR + 0.71%, Rate Floor: 0.00%) due 02/25/57◊,5 | | | 1,883,013 | | | | 1,890,553 | |
2018-1, 3.00% (WAC) due 01/25/58◊,5 | | | 429,371 | | | | 408,853 | |
Citigroup Mortgage Loan Trust | | | | | | | | |
2022-A, 6.17% due 09/25/625,10 | | | 11,701,048 | | | | 11,597,489 | |
Structured Asset Securities Corporation Mortgage Loan Trust | | | | | | | | |
2008-BC4, 6.06% (1 Month Term SOFR + 0.74%, Rate Floor: 0.63%) due 11/25/37◊ | | | 10,829,041 | | | | 10,253,831 | |
2006-BC4, 5.77% (1 Month Term SOFR + 0.45%, Rate Floor: 0.34%) due 12/25/36◊ | | | 494,911 | | | | 471,125 | |
Imperial Fund Mortgage Trust | | | | | | | | |
2022-NQM2, 4.02% (WAC) due 03/25/67◊,5 | | | 11,994,395 | | | | 10,526,328 | |
Home Equity Loan Trust | | | | | | | | |
2007-FRE1, 5.62% (1 Month Term SOFR + 0.30%, Rate Floor: 0.19%) due 04/25/37◊ | | | 10,253,398 | | | | 9,485,993 | |
Soundview Home Loan Trust | | | | | | | | |
2006-OPT5, 5.71% (1 Month Term SOFR + 0.39%, Rate Floor: 0.28%) due 07/25/36◊ | | | 8,142,298 | | | | 7,639,153 | |
2005-OPT3, 6.14% (1 Month Term SOFR + 0.82%, Rate Floor: 0.71%) due 11/25/35◊ | | | 1,148,489 | | | | 1,116,013 | |
CFMT LLC | | | | | | | | |
2021-HB5, 1.37% (WAC) due 02/25/31◊,5 | | | 6,950,000 | | | | 6,578,545 | |
2022-HB9, 3.25% (WAC) due 09/25/37◊,8 | | | 2,084,148 | | | | 1,865,144 | |
18 | THE GUGGENHEIM FUNDS ANNUAL REPORT | SEE NOTES TO FINANCIAL STATEMENTS. |
SCHEDULE OF INVESTMENTS (continued) | September 30, 2023 |
LIMITED DURATION FUND | |
| | Face
Amount~ | | | Value | |
New Residential Mortgage Loan Trust | | | | | | | | |
2018-2A, 3.50% (WAC) due 02/25/58◊,5 | | | 5,422,393 | | | $ | 4,906,197 | |
2018-1A, 4.00% (WAC) due 12/25/57◊,5 | | | 1,702,102 | | | | 1,580,643 | |
2019-6A, 3.50% (WAC) due 09/25/59◊,5 | | | 1,336,547 | | | | 1,195,619 | |
2017-5A, 6.93% (1 Month Term SOFR + 1.61%, Rate Floor: 1.50%) due 06/25/57◊,5 | | | 501,555 | | | | 498,289 | |
CSMC | | | | | | | | |
2021-NQM8, 2.41% (WAC) due 10/25/66◊,5 | | | 7,854,666 | | | | 6,211,877 | |
NovaStar Mortgage Funding Trust Series | | | | | | | | |
2007-2, 5.63% (1 Month Term SOFR + 0.31%, Rate Cap/Floor: 11.00%/0.20%) due 09/25/37◊ | | | 5,918,963 | | | | 5,691,043 | |
Alternative Loan Trust | | | | | | | | |
2007-OA7, 5.71% (1 Month Term SOFR + 0.39%, Rate Floor: 0.28%) due 05/25/47◊ | | | 4,308,602 | | | | 3,602,005 | |
2007-OH3, 6.01% (1 Month Term SOFR + 0.69%, Rate Cap/Floor: 10.00%/0.58%) due 09/25/47◊ | | | 2,114,584 | | | | 1,834,694 | |
Cascade Funding Mortgage Trust | | | | | | | | |
2018-RM2, 4.00% (WAC) due 10/25/68◊,8 | | | 4,395,049 | | | | 4,332,785 | |
2019-RM3, 2.80% (WAC) due 06/25/69◊,8 | | | 900,029 | | | | 872,863 | |
Morgan Stanley ABS Capital I Incorporated Trust | | | | | | | | |
2007-HE3, 5.68% (1 Month Term SOFR + 0.36%, Rate Floor: 0.25%) due 12/25/36◊ | | | 4,560,443 | | | | 2,189,133 | |
2007-HE3, 5.58% (1 Month Term SOFR + 0.26%, Rate Floor: 0.15%) due 12/25/36◊ | | | 3,267,101 | | | | 1,568,331 | |
2007-HE5, 5.61% (1 Month Term SOFR + 0.29%, Rate Floor: 0.18%) due 03/25/37◊ | | | 1,579,834 | | | | 663,872 | |
2006-NC1, 6.00% (1 Month Term SOFR + 0.68%, Rate Floor: 0.57%) due 12/25/35◊ | | | 305,288 | | | | 299,325 | |
American Home Mortgage Investment Trust | | | | | | | | |
2006-3, 5.79% (1 Month Term SOFR + 0.47%, Rate Cap/Floor: 10.50%/0.36%) due 12/25/46◊ | | | 5,388,873 | | | | 4,281,082 | |
Credit Suisse Mortgage Capital Certificates | | | | | | | | |
2021-RPL9, 2.44% (WAC) due 02/25/61◊,5 | | | 4,128,675 | | | | 3,760,183 | |
SPS Servicer Advance Receivables Trust | | | | | | | | |
2020-T2, 1.83% due 11/15/555 | | | 3,750,000 | | | | 3,378,218 | |
Banc of America Funding Trust | | | | | | | | |
2015-R2, 5.69% (1 Month Term SOFR + 0.26%, Rate Floor: 0.26%) due 04/29/37◊,5 | | | 3,274,314 | | | | 3,209,266 | |
HarborView Mortgage Loan Trust | | | | | | | | |
2006-14, 5.74% (1 Month Term SOFR + 0.41%, Rate Floor: 0.30%) due 01/25/47◊ | | | 1,892,692 | | | | 1,668,099 | |
2006-12, 5.82% (1 Month Term SOFR + 0.49%, Rate Floor: 0.38%) due 01/19/38◊ | | | 1,566,027 | | | | 1,356,191 | |
Bear Stearns Asset-Backed Securities I Trust | | | | | | | | |
2006-HE9, 5.71% (1 Month Term SOFR + 0.39%, Rate Floor: 0.28%) due 11/25/36◊ | | | 3,056,870 | | | | 2,956,574 | |
Securitized Asset Backed Receivables LLC Trust | | | | | | | | |
2007-HE1, 5.65% (1 Month Term SOFR + 0.33%, Rate Floor: 0.22%) due 12/25/36◊ | | | 12,956,598 | | | | 2,859,053 | |
IXIS Real Estate Capital Trust | | | | | | | | |
2006-HE1, 6.03% (1 Month Term SOFR + 0.71%, Rate Floor: 0.60%) due 03/25/36◊ | | | 4,746,159 | | | | 2,459,057 | |
Asset-Backed Securities Corporation Home Equity Loan Trust Series AEG | | | | | | | | |
2006-HE1, 6.03% (1 Month Term SOFR + 0.71%, Rate Floor: 0.60%) due 01/25/36◊ | | | 2,567,973 | | | | 2,424,536 | |
Ellington Financial Mortgage Trust | | | | | | | | |
2021-2, 1.29% (WAC) due 06/25/66◊,5 | | | 2,057,823 | | | | 1,589,022 | |
2020-2, 1.64% (WAC) due 10/25/65◊,5 | | | 938,896 | | | | 835,418 | |
Argent Securities Incorporated Asset-Backed Pass-Through Certificates Series | | | | | | | | |
2005-W2, 6.17% (1 Month Term SOFR + 0.85%, Rate Floor: 0.74%) due 10/25/35◊ | | | 2,395,236 | | | | 2,313,845 | |
OBX Trust | | | | | | | | |
2022-NQM9, 6.45% due 09/25/625,10 | | | 2,197,065 | | | | 2,183,932 | |
First NLC Trust | | | | | | | | |
2005-4, 6.21% (1 Month Term SOFR + 0.89%, Rate Cap/Floor: 14.00%/0.78%) due 02/25/36◊ | | | 2,223,075 | | | | 2,129,476 | |
Angel Oak Mortgage Trust | | | | | | | | |
2021-6, 1.71% (WAC) due 09/25/66◊,5 | | | 2,618,679 | | | | 2,026,949 | |
GS Mortgage-Backed Securities Trust | | | | | | | | |
2020-NQM1, 1.38% (WAC) due 09/27/60◊,5 | | | 2,101,334 | | | | 1,872,039 | |
Citigroup Mortgage Loan Trust, Inc. | | | | | | | | |
2006-WF1, 4.96% due 03/25/36 | | | 3,519,369 | | | | 1,720,641 | |
SG Residential Mortgage Trust | | | | | | | | |
2022-1, 3.68% (WAC) due 03/27/62◊,5 | | | 1,847,360 | | | | 1,576,430 | |
Towd Point Mortgage Trust 2023-CES1 | | | | | | | | |
2023-CES1, 6.75% (WAC) due 07/25/63◊,5 | | | 1,437,632 | | | | 1,431,254 | |
Structured Asset Investment Loan Trust | | | | | | | | |
2006-3, 5.73% (1 Month Term SOFR + 0.41%, Rate Floor: 0.30%) due 06/25/36◊ | | | 1,439,746 | | | | 1,368,516 | |
2005-2, 6.17% (1 Month Term SOFR + 0.85%, Rate Floor: 0.74%) due 03/25/35◊ | | | 25,720 | | | | 25,586 | |
Morgan Stanley IXIS Real Estate Capital Trust | | | | | | | | |
2006-2, 5.58% (1 Month Term SOFR + 0.26%, Rate Floor: 0.15%) due 11/25/36◊ | | | 3,799,537 | | | | 1,303,853 | |
SEE NOTES TO FINANCIAL STATEMENTS. | THE GUGGENHEIM FUNDS ANNUAL REPORT | 19 |
SCHEDULE OF INVESTMENTS (continued) | September 30, 2023 |
LIMITED DURATION FUND | |
| | Face
Amount~ | | | Value | |
Credit-Based Asset Servicing and Securitization LLC | | | | | | | | |
2006-CB2, 5.81% (1 Month Term SOFR + 0.49%, Rate Floor: 0.38%) due 12/25/36◊ | | | 1,353,473 | | | $ | 1,253,083 | |
GSAA Home Equity Trust | | | | | | | | |
2006-3, 6.03% (1 Month Term SOFR + 0.71%, Rate Floor: 0.60%) due 03/25/36◊ | | | 2,256,456 | | | | 1,185,830 | |
Morgan Stanley Home Equity Loan Trust | | | | | | | | |
2006-2, 5.99% (1 Month Term SOFR + 0.67%, Rate Floor: 0.56%) due 02/25/36◊ | | | 1,184,772 | | | | 1,162,837 | |
Lehman XS Trust Series | | | | | | | | |
2006-16N, 5.81% (1 Month Term SOFR + 0.49%, Rate Floor: 0.38%) due 11/25/46◊ | | | 1,240,640 | | | | 1,047,478 | |
ACE Securities Corporation Home Equity Loan Trust Series | | | | | | | | |
2005-HE2, 6.45% (1 Month Term SOFR + 1.13%, Rate Floor: 1.02%) due 04/25/35◊ | | | 885,560 | | | | 841,260 | |
COLT Mortgage Loan Trust | | | | | | | | |
2021-2, 2.38% (WAC) due 08/25/66◊,5 | | | 1,500,000 | | | | 820,854 | |
MFRA Trust | | | | | | | | |
2021-INV1, 1.26% (WAC) due 01/25/56◊,5 | | | 842,347 | | | | 736,601 | |
Nationstar Home Equity Loan Trust | | | | | | | | |
2007-B, 5.65% (1 Month Term SOFR + 0.33%, Rate Floor: 0.22%) due 04/25/37◊ | | | 741,487 | | | | 733,413 | |
Residential Mortgage Loan Trust | | | | | | | | |
2020-1, 2.38% (WAC) due 01/26/60◊,5 | | | 773,571 | | | | 731,390 | |
Morgan Stanley Capital I Incorporated Trust | | | | | | | | |
2006-HE1, 6.01% (1 Month Term SOFR + 0.69%, Rate Floor: 0.58%) due 01/25/36◊ | | | 671,089 | | | | 636,926 | |
Long Beach Mortgage Loan Trust | | | | | | | | |
2006-8, 5.75% (1 Month Term SOFR + 0.43%, Rate Floor: 0.32%) due 09/25/36◊ | | | 2,338,134 | | | | 634,476 | |
CIT Mortgage Loan Trust | | | | | | | | |
2007-1, 6.78% (1 Month Term SOFR + 1.46%, Rate Floor: 1.35%) due 10/25/37◊,5 | | | 408,789 | | | | 407,927 | |
Park Place Securities Incorporated Asset-Backed Pass-Through Certificates Series | | | | | | | | |
2005-WHQ3, 6.38% (1 Month Term SOFR + 1.06%, Rate Floor: 0.95%) due 06/25/35◊ | | | 410,535 | | | | 406,642 | |
Nomura Resecuritization Trust | | | | | | | | |
2015-4R, 2.73% (1 Month Term SOFR + 0.54%, Rate Floor: 0.43%) due 03/26/36◊,5 | | | 368,749 | | | | 340,134 | |
First Franklin Mortgage Loan Trust | | | | | | | | |
2004-FF10, 6.71% (1 Month Term SOFR + 1.39%, Rate Floor: 1.28%) due 07/25/34◊ | | | 341,991 | | | | 328,789 | |
Starwood Mortgage Residential Trust | | | | | | | | |
2020-1, 2.28% (WAC) due 02/25/50◊,5 | | | 290,915 | | | | 264,812 | |
UCFC Manufactured Housing Contract | | | | | | | | |
1997-2, 7.38% due 10/15/28 | | | 55,367 | | | | 54,709 | |
Morgan Stanley Re-REMIC Trust | | | | | | | | |
2010-R5, 3.47% due 06/26/3610 | | | 45,150 | | | | 40,927 | |
CSMC Series | | | | | | | | |
2014-2R, 3.56% (1 Month Term SOFR + 0.31%, Rate Floor: 0.20%) due 02/27/46◊,5 | | | 13,938 | | | | 13,826 | |
Total Residential Mortgage-Backed Securities | | | 504,144,721 | |
| | | | | | | | | |
Government Agency - 5.9% |
Freddie Mac | | | | | | | | |
5.00% due 06/01/38 | | | 41,705,764 | | | | 40,653,610 | |
5.50% due 02/01/53 | | | 39,105,065 | | | | 37,888,088 | |
5.00% due 05/01/38 | | | 33,369,229 | | | | 32,527,390 | |
5.00% due 06/01/53 | | | 20,423,263 | | | | 19,305,208 | |
5.00% due 02/01/53 | | | 18,467,748 | | | | 17,454,209 | |
5.00% due 09/01/52 | | | 7,672,558 | | | | 7,246,514 | |
Fannie Mae | | | | | | | | |
5.00% due 06/01/38 | | | 30,378,415 | | | | 29,612,028 | |
5.00% due 05/01/38 | | | 13,629,256 | | | | 13,285,417 | |
5.00% due 08/01/53 | | | 7,965,169 | | | | 7,517,660 | |
5.00% due 09/01/52 | | | 2,930,955 | | | | 2,768,431 | |
5.00% due 06/01/53 | | | 2,662,421 | | | | 2,514,006 | |
Ginnie Mae | | | | | | | | |
6.00% due 09/20/45††† | | | 20,900,000 | | | | 20,795,628 | |
6.00% due 06/20/47††† | | | 3,100,000 | | | | 3,102,174 | |
Freddie Mac Seasoned Credit Risk Transfer Trust | | | | | | | | |
2.00% due 05/25/60 | | | 3,227,905 | | | | 2,452,423 | |
2.00% due 11/25/59 | | | 1,855,823 | | | | 1,407,502 | |
Fannie Mae-Aces | | | | | | | | |
1.59% (WAC) due 03/25/35◊,6 | | | 6,024,592 | | | | 594,464 | |
Total Government Agency | | | 239,124,752 | |
| | | | | | | | | |
Commercial Mortgage-Backed Securities - 2.1% |
BX Commercial Mortgage Trust | | | | | | | | |
2021-VOLT, 7.10% (1 Month Term SOFR + 1.76%, Rate Floor: 1.65%) due 09/15/36◊,5 | | | 25,000,000 | | | | 23,846,652 | |
2022-LP2, 6.89% (1 Month Term SOFR + 1.56%, Rate Floor: 1.56%) due 02/15/39◊,5 | | | 13,204,132 | | | | 12,723,358 | |
JP Morgan Chase Commercial Mortgage Securities Trust | | | | | | | | |
2021-NYAH, 6.99% (1 Month Term SOFR + 1.65%, Rate Floor: 1.54%) due 06/15/38◊,5 | | | 10,200,000 | | | | 8,970,550 | |
2016-JP2, 1.94% (WAC) due 08/15/49◊,6 | | | 30,418,558 | | | | 1,119,397 | |
MHP | | | | | | | | |
2022-MHIL, 6.60% (1 Month Term SOFR + 1.26%, Rate Floor: 1.26%) due 01/15/27◊,5 | | | 7,773,268 | | | | 7,519,718 | |
BXHPP Trust | | | | | | | | |
2021-FILM, 6.55% (1 Month Term SOFR + 1.21%, Rate Floor: 1.10%) due 08/15/36◊,5 | | | 8,250,000 | | | | 7,441,895 | |
20 | THE GUGGENHEIM FUNDS ANNUAL REPORT | SEE NOTES TO FINANCIAL STATEMENTS. |
SCHEDULE OF INVESTMENTS (continued) | September 30, 2023 |
LIMITED DURATION FUND | |
| | Face
Amount~ | | | Value | |
Life Mortgage Trust | | | | | | | | |
2021-BMR, 6.85% (1 Month Term SOFR + 1.51%, Rate Floor: 1.40%) due 03/15/38◊,5 | | | 6,880,791 | | | $ | 6,656,039 | |
Extended Stay America Trust | | | | | | | | |
2021-ESH, 7.15% (1 Month Term SOFR + 1.81%, Rate Floor: 1.70%) due 07/15/38◊,5 | | | 3,801,950 | | | | 3,745,115 | |
Wells Fargo Commercial Mortgage Trust | | | | | | | | |
2017-C38, 1.09% (WAC) due 07/15/50◊,6 | | | 22,066,047 | | | | 572,486 | |
2016-C37, 0.95% (WAC) due 12/15/49◊,6 | | | 26,321,483 | | | | 468,959 | |
2017-C42, 1.01% (WAC) due 12/15/50◊,6 | | | 14,304,298 | | | | 415,624 | |
2017-RB1, 1.35% (WAC) due 03/15/50◊,6 | | | 7,942,639 | | | | 241,938 | |
2015-LC22, 0.90% (WAC) due 09/15/58◊,6 | | | 18,414,889 | | | | 210,447 | |
2016-NXS5, 1.57% (WAC) due 01/15/59◊,6 | | | 4,551,464 | | | | 117,907 | |
JPMDB Commercial Mortgage Securities Trust | | | | | | | | |
2018-C8, 0.77% (WAC) due 06/15/51◊,6 | | | 30,564,816 | | | | 596,277 | |
2016-C4, 0.86% (WAC) due 12/15/49◊,6 | | | 33,144,591 | | | | 583,000 | |
2016-C2, 1.63% (WAC) due 06/15/49◊,6 | | | 6,238,287 | | | | 175,595 | |
2017-C5, 1.04% (WAC) due 03/15/50◊,6 | | | 3,070,880 | | | | 65,653 | |
BENCHMARK Mortgage Trust | | | | | | | | |
2018-B2, 0.60% (WAC) due 02/15/51◊,6 | | | 93,844,677 | | | | 1,323,266 | |
DBJPM Mortgage Trust | | | | | | | | |
2017-C6, 1.05% (WAC) due 06/10/50◊,6 | | | 50,799,553 | | | | 1,213,388 | |
Bank of America Merrill Lynch Commercial Mortgage Trust | | | | | | | | |
2017-BNK3, 1.16% (WAC) due 02/15/50◊,6 | | | 29,028,887 | | | | 774,154 | |
2016-UB10, 1.89% (WAC) due 07/15/49◊,6 | | | 10,113,741 | | | | 322,988 | |
COMM Mortgage Trust | | | | | | | | |
2018-COR3, 0.57% (WAC) due 05/10/51◊,6 | | | 35,097,572 | | | | 575,369 | |
2015-CR24, 0.83% (WAC) due 08/10/48◊,6 | | | 51,459,452 | | | | 497,603 | |
UBS Commercial Mortgage Trust | | | | | | | | |
2017-C2, 1.22% (WAC) due 08/15/50◊,6 | | | 21,994,508 | | | | 699,977 | |
2017-C5, 1.22% (WAC) due 11/15/50◊,6 | | | 10,786,278 | | | | 294,345 | |
CSAIL Commercial Mortgage Trust | | | | | | | | |
2019-C15, 1.19% (WAC) due 03/15/52◊,6 | | | 19,285,526 | | | | 725,005 | |
2016-C6, 2.02% (WAC) due 01/15/49◊,6 | | | 6,000,908 | | | | 209,859 | |
BBCMS Mortgage Trust | | | | | | | | |
2018-C2, 0.92% (WAC) due 12/15/51◊,6 | | | 29,298,312 | | | | 876,937 | |
Morgan Stanley Bank of America Merrill Lynch Trust | | | | | | | | |
2017-C34, 0.91% (WAC) due 11/15/52◊,6 | | | 23,038,962 | | | | 523,761 | |
2015-C27, 1.01% (WAC) due 12/15/47◊,6 | | | 28,527,061 | | | | 335,647 | |
CGMS Commercial Mortgage Trust | | | | | | | | |
2017-B1, 0.87% (WAC) due 08/15/50◊,6 | | | 19,690,399 | | | | 452,909 | |
CD Mortgage Trust | | | | | | | | |
2017-CD6, 1.02% (WAC) due 11/13/50◊,6 | | | 12,647,526 | | | | 291,899 | |
2016-CD1, 1.50% (WAC) due 08/10/49◊,6 | | | 5,702,432 | | | | 155,299 | |
CD Commercial Mortgage Trust | | | | | | | | |
2017-CD4, 1.38% (WAC) due 05/10/50◊,6 | | | 13,459,464 | | | | 443,041 | |
GS Mortgage Securities Trust | | | | | | | | |
2017-GS6, 1.16% (WAC) due 05/10/50◊,6 | | | 11,037,110 | | | | 324,345 | |
BANK | | | | | | | | |
2017-BNK6, 0.91% (WAC) due 07/15/60◊,6 | | | 13,494,094 | | | | 293,711 | |
Citigroup Commercial Mortgage Trust | | | | | | | | |
2016-C2, 1.81% (WAC) due 08/10/49◊,6 | | | 5,964,261 | | | | 205,338 | |
2016-GC37, 1.82% (WAC) due 04/10/49◊,6 | | | 2,812,757 | | | | 85,250 | |
JPMBB Commercial Mortgage Securities Trust | | | | | | | | |
2013-C17, 0.78% (WAC) due 01/15/47◊,6 | | | 11,107,145 | | | | 706 | |
Total Commercial Mortgage-Backed Securities | | | 86,095,407 | |
| | | | | | | | | |
Total Collateralized Mortgage Obligations |
(Cost $892,853,973) | | | 829,364,880 | |
| | | | | | | | | |
U.S. GOVERNMENT SECURITIES†† - 7.7% |
U.S. Treasury Notes |
4.75% due 07/31/25 | | | 200,000,000 | | | | 198,671,876 | |
4.63% due 06/30/25 | | | 100,000,000 | | | | 99,144,531 | |
United States Treasury Inflation Indexed Bonds |
1.25% due 04/15/2813 | | | 10,496,524 | | | | 9,982,666 | |
1.38% due 07/15/3313 | | | 5,203,450 | | | | 4,811,057 | |
Total U.S. Government Securities |
(Cost $314,181,821) | | | | | | | 312,610,130 | |
| | | | | | | | | |
FEDERAL AGENCY DISCOUNT NOTES†† - 4.7% |
Federal Home Loan Bank |
5.20% due 10/02/2311 | | | 188,722,000 | | | | 188,694,740 | |
Total Federal Agency Discount Notes |
(Cost $188,694,740) | | | | | | | 188,694,740 | |
| | | | | | | | | |
SENIOR FLOATING RATE INTERESTS††,◊ - 2.5% |
Technology - 0.6% |
RLDatix | | | | | | | | |
9.53% (6 Month Term SOFR + 4.50%, Rate Floor: 4.50%) due 04/28/25††† | | | 13,798,857 | | | | 13,540,818 | |
Dun & Bradstreet | | | | | | | | |
8.32% (1 Month Term SOFR + 3.00%, Rate Floor: 3.00%) due 01/18/29 | | | 8,471,000 | | | | 8,445,587 | |
Upland Software, Inc. | | | | | | | | |
9.17% (1 Month Term SOFR + 3.75%, Rate Floor: 3.75%) due 08/06/26 | | | 500,225 | | | | 477,714 | |
Emerald TopCo, Inc. (Press Ganey) | | | | | | | | |
9.18% (3 Month Term SOFR + 3.50%, Rate Floor: 3.50%) due 07/24/26 | | | 191,206 | | | | 183,606 | |
Total Technology | | | 22,647,725 | |
| | | | | | | | | |
Basic Materials - 0.4% |
Trinseo Materials Operating S.C.A. | | | | | | | | |
7.93% (1 Month Term SOFR + 2.50%, Rate Floor: 2.50%) due 05/03/28 | | | 10,850,250 | | | | 9,080,900 | |
INEOS Ltd. | | | | | | | | |
6.61% (1 Month EURIBOR + 2.75%, Rate Floor: 2.75%) due 01/29/26 | | EUR | 8,100,000 | | | | 8,425,901 | |
Total Basic Materials | | | 17,506,801 | |
| | | | | | | | | |
Industrial - 0.4% |
Mileage Plus Holdings LLC | | | | | | | | |
10.80% (3 Month Term SOFR + 5.25%, Rate Floor: 5.25%) due 06/21/27 | | | 7,091,625 | | | | 7,358,341 | |
Harsco Corporation | | | | | | | | |
7.68% (1 Month Term SOFR + 2.25%, Rate Floor: 2.25%) due 03/10/28 | | | 3,910,000 | | | | 3,855,025 | |
Ravago Holdings America, Inc. | | | | | | | | |
8.15% (3 Month Term SOFR + 2.50%, Rate Floor: 2.50%) due 03/04/28 | | | 1,950,000 | | | | 1,911,000 | |
SEE NOTES TO FINANCIAL STATEMENTS. | THE GUGGENHEIM FUNDS ANNUAL REPORT | 21 |
SCHEDULE OF INVESTMENTS (continued) | September 30, 2023 |
LIMITED DURATION FUND | |
| | Face
Amount~ | | | Value | |
CPM Holdings, Inc. | | | | | | | | |
8.94% (1 Month Term SOFR + 3.50%, Rate Floor: 3.50%) due 11/17/25 | | | 1,490,600 | | | $ | 1,485,011 | |
Cushman & Wakefield US Borrower LLC | | | | | | | | |
8.67% (1 Month Term SOFR + 3.25%, Rate Floor: 3.25%) due 01/31/30 | | | 723,515 | | | | 710,253 | |
8.18% (1 Month Term SOFR + 2.75%, Rate Floor: 2.75%) due 08/21/25 | | | 70,924 | | | | 70,765 | |
Total Industrial | | | 15,390,395 | |
| | | | | | | | | |
Consumer, Non-cyclical - 0.4% |
Bombardier Recreational Products, Inc. | | | | | | | | |
7.42% (1 Month Term SOFR + 2.00%, Rate Floor: 2.00%) due 05/24/27 | | | 4,093,448 | | | | 4,064,467 | |
Women’s Care Holdings, Inc. | | | | | | | | |
10.05% (6 Month Term SOFR + 4.50%, Rate Floor: 4.50%) due 01/17/28 | | | 4,548,561 | | | | 4,025,477 | |
Sigma Holding BV (Flora Food) | | | | | | | | |
7.41% (6 Month EURIBOR + 3.50%, Rate Floor: 3.50%) due 07/02/25 | | EUR | 2,786,074 | | | | 2,934,378 | |
Hearthside Group Holdings LLC | | | | | | | | |
9.58% (3 Month USD LIBOR + 4.00%, Rate Floor: 4.00%) due 05/23/25 | | | 2,041,071 | | | | 1,779,569 | |
DaVita, Inc. | | | | | | | | |
7.18% (1 Month Term SOFR + 1.75%, Rate Floor: 1.75%) due 08/12/26 | | | 686,042 | | | | 677,041 | |
Froneri US, Inc. | | | | | | | | |
7.67% (1 Month Term SOFR + 2.25%, Rate Floor: 2.25%) due 01/29/27 | | | 435,375 | | | | 431,761 | |
Pearl Intermediate Parent LLC | | | | | | | | |
8.17% (1 Month Term SOFR + 2.75%, Rate Floor: 2.75%) due 02/14/25 | | | 388,691 | | | | 386,141 | |
Outcomes Group Holdings, Inc. | | | | | | | | |
9.13% (3 Month Term SOFR + 3.50%, Rate Floor: 3.50%) due 10/24/25 | | | 380,721 | | | | 378,273 | |
EyeCare Partners LLC | | | | | | | | |
9.18% (1 Month Term SOFR + 3.75%, Rate Floor: 3.75%) due 02/18/27 | | | 486,250 | | | | 339,403 | |
Total Consumer, Non-cyclical | | | 15,016,510 | |
| | | | | | | | | |
Communications - 0.3% |
Playtika Holding Corp. | | | | | | | | |
8.18% (1 Month Term SOFR + 2.75%, Rate Floor: 2.75%) due 03/13/28 | | | 10,361,500 | | | | 10,342,124 | |
Zayo Group Holdings, Inc. | | | | | | | | |
8.43% (1 Month Term SOFR + 3.00%, Rate Floor: 3.00%) due 03/09/27 | | | 1,500,000 | | | | 1,221,465 | |
Altice US Finance I Corp. | | | | | | | | |
7.70% (1 Month USD LIBOR + 2.25%, Rate Floor: 2.25%) due 01/15/26 | | | 453,759 | | | | 437,650 | |
Ziggo Financing Partnership | | | | | | | | |
7.95% (1 Month Term SOFR + 2.50%, Rate Floor: 2.50%) due 04/28/28 | | | 400,000 | | | | 390,332 | |
Virgin Media Bristol LLC | | | | | | | | |
7.95% (1 Month Term SOFR + 2.50%, Rate Floor: 2.50%) due 01/31/28 | | | 200,000 | | | | 194,026 | |
Total Communications | | | 12,585,597 | |
| | | | | | | | | |
Consumer, Cyclical - 0.3% |
Amaya Holdings BV | | | | | | | | |
6.36% (3 Month EURIBOR + 2.50%, Rate Floor: 2.50%) due 07/21/26 | | EUR | 4,500,000 | | | | 4,756,429 | |
Rent-A-Center, Inc. | | | | | | | | |
8.88% (3 Month Term SOFR + 3.25%, Rate Floor: 3.25%) due 02/17/28 | | | 2,109,698 | | | | 2,101,133 | |
Pacific Bells LLC | | | | | | | | |
10.15% (3 Month Term SOFR + 4.50%, Rate Floor: 5.00%) due 11/10/28 | | | 1,564,598 | | | | 1,542,600 | |
Entain Holdings (Gibraltar) Ltd. | | | | | | | | |
7.99% (3 Month Term SOFR + 2.50%, Rate Floor: 2.50%) due 03/29/27 | | | 1,466,250 | | | | 1,462,320 | |
New Trojan Parent, Inc. | | | | | | | | |
8.69% (1 Month Term SOFR + 3.25%, Rate Floor: 3.25%) due 01/06/28 | | | 2,688,125 | | | | 1,402,314 | |
Packers Holdings LLC | | | | | | | | |
8.67% (1 Month Term SOFR + 3.25%, Rate Floor: 3.25%) due 03/09/28 | | | 1,689,954 | | | | 997,073 | |
Samsonite IP Holdings SARL | | | | | | | | |
8.07% (1 Month Term SOFR + 2.75%, Rate Floor: 2.75%) due 06/21/30 | | | 175,527 | | | | 175,638 | |
Total Consumer, Cyclical | | | 12,437,507 | |
| | | | | | | | | |
Energy - 0.1% |
ITT Holdings LLC | | | | | | | | |
8.18% (1 Month Term SOFR + 2.75%, Rate Floor: 2.75%) due 07/10/28 | | | 2,891,000 | | | | 2,883,165 | |
Venture Global Calcasieu Pass LLC | | | | | | | | |
8.04% (1 Month Term SOFR + 2.63%, Rate Floor: 2.63%) due 08/19/26 | | | 444,419 | | | | 440,344 | |
Total Energy | | | 3,323,509 | |
| | | | | | | | | |
Financial - 0.0% |
Jane Street Group LLC | | | | | | | | |
8.18% (1 Month Term SOFR + 2.75%, Rate Floor: 2.75%) due 01/26/28 | | | 1,940,768 | | | | 1,933,490 | |
Total Senior Floating Rate Interests |
(Cost $108,331,357) | | | 100,841,534 | |
| | | | | | | | | |
U.S. TREASURY BILLS†† - 1.0% |
U.S. Treasury Bills |
5.27% due 10/03/2311 | | | 20,784,000 | | | | 20,780,962 | |
5.28% due 10/17/2311 | | | 14,835,000 | | | | 14,802,409 | |
5.28% due 10/10/2311 | | | 3,915,000 | | | | 3,910,424 | |
Total U.S. Treasury Bills |
(Cost $39,487,974) | | | | | | | 39,493,795 | |
| | | | | | | | | |
MUNICIPAL BONDS†† - 0.1% |
California - 0.1% |
California Public Finance Authority Revenue Bonds | | | | | | | | |
1.55% due 10/15/26 | | | 3,145,000 | | | | 2,747,368 | |
Total Municipal Bonds |
(Cost $3,145,000) | | | 2,747,368 | |
| | | | | | | | | |
22 | THE GUGGENHEIM FUNDS ANNUAL REPORT | SEE NOTES TO FINANCIAL STATEMENTS. |
SCHEDULE OF INVESTMENTS (continued) | September 30, 2023 |
LIMITED DURATION FUND | |
| | Notional
Value | | | Value | |
OTC OPTIONS PURCHASED†† - 0.0% |
Call Options on: |
Interest Rate Options |
Morgan Stanley Capital Services LLC 10Y-2Y SOFR CMS CAP Expiring June 2024 with strike price of $0.10 | | $ | 120,100,000 | | | $ | 240,471 | |
Barclays Bank plc 10Y-2Y SOFR CMS CAP Expiring June 2024 with strike price of $0.10 | | | 119,000,000 | | | | 238,269 | |
Bank of America, N.A. 10Y-2Y SOFR CMS CAP Expiring June 2024 with strike price of $0.10 | | | 59,950,000 | | | | 120,035 | |
Goldman Sachs International 10Y-2Y SOFR CMS CAP Expiring June 2024 with strike price of $0.10 | | | 48,900,000 | | | | 97,911 | |
Morgan Stanley Capital Services LLC 10Y-2Y SOFR CMS CAP Expiring December 2023 with strike price of $0.10 | | | 120,100,000 | | | | 75,256 | |
Barclays Bank plc 10Y-2Y SOFR CMS CAP Expiring December 2023 with strike price of $0.20 | | | 120,000,000 | | | | 75,193 | |
Bank of America, N.A. 10Y-2Y SOFR CMS CAP Expiring December 2023 with strike price of $0.20 | | | 58,950,000 | | | | 36,939 | |
Goldman Sachs International 10Y-2Y SOFR CMS CAP Expiring December 2023 with strike price of $0.20 | | | 48,900,000 | | | | 30,641 | |
Total Interest Rate Options | | | 914,715 | |
| | | | | | | | | |
Total OTC Options Purchased |
(Cost $2,968,935) | | | | | | | 914,715 | |
| | | | | | | | | |
Total Investments - 100.1% |
(Cost $4,321,017,326) | | | 4,059,264,407 | |
| | | | | | | | | |
OTC INTEREST RATE SWAPTIONS WRITTEN††12 - 0.0% |
Put Swaptions on: |
Interest Rate Swaptions |
Barclays Bank plc 5-Year Interest Rate Swap Expiring October 2023 with exercise rate of 3.93% (Notional Value $64,550,000) | | | 64,550,000 | | | | (1,288,794 | ) |
Total OTC Interest Rate Swaptions Written (Premiums Received $445,395) | | | (1,288,794 | ) |
| | | | | | | | | |
Other Assets & Liabilities, net - (0.1)% | | | (3,287,943 | ) |
Total Net Assets - 100.0% | | $ | 4,054,687,670 | |
Centrally Cleared Credit Default Swap Agreements Protection Purchased†† |
Counterparty | Exchange | Index | Protection
Premium Rate | | Payment
Frequency | | | Maturity
Date | | | Notional
Amount | | | Value | | | Upfront
Premiums
Paid
(Received) | | | Unrealized
Depreciation** | |
BofA Securities, Inc. | ICE | ITRAXX. EUR.38.V1 | 1.00% | Quarterly | | | 12/20/27 | | | $ | 24,500,000 | | | $ | (341,538 | ) | | $ | (191,247 | ) | | $ | (150,291 | ) |
BofA Securities, Inc. | ICE | CDX.NA.HY.40.V1 | 5.00% | Quarterly | | | 06/20/28 | | | | 40,800,000 | | | | (639,493 | ) | | | 169,403 | | | | (808,896 | ) |
| | | | | | | | | | | | | | | | | | $ | (981,031 | ) | | $ | (21,844 | ) | | $ | (959,187 | ) |
SEE NOTES TO FINANCIAL STATEMENTS. | THE GUGGENHEIM FUNDS ANNUAL REPORT | 23 |
SCHEDULE OF INVESTMENTS (continued) | September 30, 2023 |
LIMITED DURATION FUND | |
Centrally Cleared Interest Rate Swap Agreements†† |
Counterparty | Exchange | Floating
Rate
Type | Floating
Rate Index | | Fixed
Rate | | | Payment
Frequency | | | Maturity
Date | | | Notional
Amount | | | Value | | | Upfront
Premiums
Paid
(Received) | | | Unrealized
Depreciation** | |
BofA Securities, Inc. | CME | Pay | U.S. Secured Overnight Financing Rate | 4.68% | Annually | 06/29/25 | | $ | 197,000,000 | | | $ | (1,418,445 | ) | | $ | 690 | | | $ | (1,419,135 | ) |
BofA Securities, Inc. | CME | Pay | U.S. Secured Overnight Financing Rate | 3.40% | Annually | 04/04/28 | | | 52,000,000 | | | | (2,136,639 | ) | | | 480 | | | | (2,137,119 | ) |
BofA Securities, Inc. | CME | Pay | U.S. Secured Overnight Financing Rate | 3.79% | Annually | 10/03/27 | | | 106,500,000 | | | | (2,632,083 | ) | | | (33,310 | ) | | | (2,598,773 | ) |
| | | | | | | | | | | | | | | | | | | | | | $ | (6,187,167 | ) | | $ | (32,140 | ) | | $ | (6,155,027 | ) |
Forward Foreign Currency Exchange Contracts†† |
Counterparty | | Currency | | | Type | | | Quantity | | | Contract
Amount | | | Settlement
Date | | | Unrealized
Appreciation | |
Barclays Bank plc | | | EUR | | | | Sell | | | | 29,447,000 | | 31,666,950 USD | | | 10/16/23 | | | $ | 511,868 | |
OTC Interest Rate Swaptions Written12 | | | | | | | | |
Counterparty/Description | | Floating
Rate
Type | | | Floating
Rate
Index | | | Payment
Frequency | | | Fixed
Rate | | | Expiration
Date | | | Exercise
Rate | | | Swaption
Notional
Amount | | | Swaption
Value | |
Put | | | | | | | | | | | | | | | | | | | | | | | | | | | | | | | | |
Barclays Bank plc 5-Year Interest Rate Swap | Pay | SOFR | Annual | | | 3.93 | % | | | 10/16/23 | | | | 3.93 | % | | $ | 64,550,000 | | | $ | (1,288,794 | ) |
24 | THE GUGGENHEIM FUNDS ANNUAL REPORT | SEE NOTES TO FINANCIAL STATEMENTS. |
SCHEDULE OF INVESTMENTS (continued) | September 30, 2023 |
LIMITED DURATION FUND | |
~ | The face amount is denominated in U.S. dollars unless otherwise indicated. |
* | Non-income producing security. |
** | Includes cumulative appreciation (depreciation). Variation margin is reported within the Statement of Assets and Liabilities. |
† | Value determined based on Level 1 inputs — See Note 4. |
†† | Value determined based on Level 2 inputs, unless otherwise noted. — See Note 4. |
††† | Value determined based on Level 3 inputs — See Note 4. |
◊ | Variable rate security. Rate indicated is the rate effective at September 30, 2023. In some instances, the effective rate is limited by a minimum rate floor or a maximum rate cap established by the issuer. The settlement status of a position may also impact the effective rate indicated. In some cases, a position may be unsettled at period end and may not have a stated effective rate. In instances where multiple underlying reference rates and spread amounts are shown, the effective rate is based on a weighted average. |
1 | Security has a fixed rate coupon which will convert to a floating or variable rate coupon on a future date. |
2 | Special Purpose Acquisition Company (SPAC). |
3 | Affiliated issuer. |
4 | Rate indicated is the 7-day yield as of September 30, 2023. |
5 | Security is a 144A or Section 4(a)(2) security. These securities have been determined to be liquid under guidelines established by the Board of Trustees. The total market value of 144A or Section 4(a)(2) securities is $2,381,647,236 (cost $2,566,633,440), or 58.7% of total net assets. |
6 | Security is an interest-only strip. |
7 | Security has no stated coupon. However, it is expected to receive residual cash flow payments on defined deal dates. |
8 | Security is a 144A or Section 4(a)(2) security. These securities have been determined to be illiquid and restricted under guidelines established by the Board of Trustees. The total market value of 144A or Section 4(a)(2) illiquid and restricted securities is $31,755,481 (cost $32,549,805), or 0.8% of total net assets — See Note 9. |
9 | Perpetual maturity. |
10 | Security is a step up/down bond. The coupon increases or decreases at regular intervals until the bond reaches full maturity. Rate indicated is the rate at September 30, 2023. See table below for additional step information for each security. |
11 | Rate indicated is the effective yield at the time of purchase. |
12 | Swaptions — See additional disclosure in the swaptions table above for more information on swaptions. |
13 | Face amount of security is adjusted for inflation. |
| | BofA — Bank of America |
| | CDX.NA.HY.40.V1 — Credit Default Swap North American High Yield Series 40 Index Version 1 |
| | CME — Chicago Mercantile Exchange |
| | CMS — Constant Maturity Swap |
| | EUR — Euro |
| | EURIBOR — European Interbank Offered Rate |
| | ICE — Intercontinental Exchange |
| | ITRAXX.EUR.38.V1 — iTraxx Europe Series 38 Index Version 1 |
| | LIBOR — London Interbank Offered Rate |
| | plc — Public Limited Company |
| | REMIC — Real Estate Mortgage Investment Conduit |
| | REIT — Real Estate Investment Trust |
| | SARL — Société à Responsabilité Limitée |
| | SOFR — Secured Overnight Financing Rate |
| | WAC — Weighted Average Coupon |
| | |
| | See Sector Classification in Other Information section. |
SEE NOTES TO FINANCIAL STATEMENTS. | THE GUGGENHEIM FUNDS ANNUAL REPORT | 25 |
SCHEDULE OF INVESTMENTS (continued) | September 30, 2023 |
LIMITED DURATION FUND | |
The following table summarizes the inputs used to value the Fund’s investments at September 30, 2023 (See Note 4 in the Notes to Financial Statements):
Investments in Securities (Assets) | | Level 1
Quoted
Prices | | | Level 2
Significant
Observable
Inputs | | | Level 3
Significant
Unobservable
Inputs | | | Total | |
Common Stocks | | $ | 37,537 | | | $ | — | | | $ | — | | | $ | 37,537 | |
Preferred Stocks | | | — | | | | 18,964,997 | | | | — | | | | 18,964,997 | |
Warrants | | | 6,156 | | | | — | | | | — | | | | 6,156 | |
Mutual Funds | | | 92,920,421 | | | | — | | | | — | | | | 92,920,421 | |
Money Market Fund | | | 81,400,025 | | | | — | | | | — | | | | 81,400,025 | |
Asset-Backed Securities | | | — | | | | 1,180,412,119 | | | | 143,391,739 | | | | 1,323,803,858 | |
Corporate Bonds | | | — | | | | 1,033,757,833 | | | | 33,706,418 | | | | 1,067,464,251 | |
Collateralized Mortgage Obligations | | | — | | | | 805,467,078 | | | | 23,897,802 | | | | 829,364,880 | |
U.S. Government Securities | | | — | | | | 312,610,130 | | | | — | | | | 312,610,130 | |
Federal Agency Discount Notes | | | — | | | | 188,694,740 | | | | — | | | | 188,694,740 | |
Senior Floating Rate Interests | | | — | | | | 87,300,716 | | | | 13,540,818 | | | | 100,841,534 | |
U.S. Treasury Bills | | | — | | | | 39,493,795 | | | | — | | | | 39,493,795 | |
Municipal Bonds | | | — | | | | 2,747,368 | | | | — | | | | 2,747,368 | |
Options Purchased | | | — | | | | 914,715 | | | | — | | | | 914,715 | |
Forward Foreign Currency Exchange Contracts** | | | — | | | | 511,868 | | | | — | | | | 511,868 | |
Total Assets | | $ | 174,364,139 | | | $ | 3,670,875,359 | | | $ | 214,536,777 | | | $ | 4,059,776,275 | |
Investments in Securities (Liabilities) | | Level 1
Quoted
Prices | | | Level 2
Significant
Observable
Inputs | | | Level 3
Significant
Unobservable
Inputs | | | Total | |
Interest Rate Swaptions Written | | $ | — | | | $ | 1,288,794 | | | $ | — | | | $ | 1,288,794 | |
Credit Default Swap Agreements** | | | — | | | | 959,187 | | | | — | | | | 959,187 | |
Interest Rate Swap Agreements** | | | — | | | | 6,155,027 | | | | — | | | | 6,155,027 | |
Unfunded Loan Commitments (Note 8) | | | — | | | | — | | | | — | * | | | — | |
Total Liabilities | | $ | — | | | $ | 8,403,008 | | | $ | — | | | $ | 8,403,008 | |
* | Security has a market value of $0. |
** | This derivative is reported as unrealized appreciation/depreciation at period end. |
The following is a summary of significant unobservable inputs used in the fair valuation of assets and liabilities categorized within Level 3 of the fair value hierarchy:
Category | | Ending Balance at
September 30, 2023 | | | Valuation Technique | | | Unobservable
Inputs | | | Input
Range | | | Weighted
Average* | |
Assets: | | | | | | | | | | | | | | | | | | | | |
Asset-Backed Securities | | $ | 65,957,367 | | Option adjusted spread off prior month end broker quote | Broker Quote | — | — |
Asset-Backed Securities | | | 51,368,818 | | Third Party Pricing | Broker Quote | — | — |
Asset-Backed Securities | | | 26,065,554 | | Yield Analysis | Yield | 6.2%-7.3% | 6.9% |
Collateralized Mortgage Obligations | | | 23,897,802 | | Model Price | Purchase Price | — | — |
Corporate Bonds | | | 18,731,858 | | Yield Analysis | Yield | 6.7% | — |
Corporate Bonds | | | 11,347,560 | | Option adjusted spread off prior month end broker quote | Broker Quote | — | — |
Corporate Bonds | | | 3,627,000 | | Third Party Pricing | Broker Quote | — | — |
Senior Floating Rate Interests | | | 13,540,818 | | Yield Analysis | Yield | 11.2% | — |
Total Assets | | $ | 214,536,777 | | | | | |
* | Inputs are weighted by the fair value of the instruments. |
26 | THE GUGGENHEIM FUNDS ANNUAL REPORT | SEE NOTES TO FINANCIAL STATEMENTS. |
SCHEDULE OF INVESTMENTS (continued) | September 30, 2023 |
LIMITED DURATION FUND | |
Significant changes in a quote, yield, market comparable yields, liquidation value or valuation multiple would generally result in significant changes in the fair value of the security. Any remaining Level 3 securities held by the Fund and excluded from the table above, were not considered material to the Fund.
The Fund’s fair valuation leveling guidelines classify a single daily broker quote, or a vendor price based on a single daily or monthly broker quote, as Level 3, if such a quote or price cannot be supported with other available market information.
Transfers between Level 2 and Level 3 may occur as markets fluctuate and/or the availability of data used in an investment’s valuation changes. For the year ended September 30, 2023, the Fund had securities with a total value of $33,100,000 transfer into Level 3 from Level 2 due to a lack of observable inputs and had securities with a total value of $1,842,708 transfer out of Level 3 into Level 2 due to the availability of current and reliable market-based data provided by a third-party pricing service which utilizes significant observable inputs.
Summary of Fair Value Level 3 Activity
Following is a reconciliation of Level 3 assets for which significant unobservable inputs were used to determine fair value for the year ended September 30, 2023:
| | | Assets | | | | | |
| | Asset-Backed
Securities | | | Collateralized
Mortgage
Obligations | | | Corporate
Bonds | | | Senior Floating
Rate Interests | | | Total Assets | |
Beginning Balance | | $ | 138,990,860 | | | $ | 24,443,994 | | | $ | 39,180,570 | | | $ | 16,423,965 | | | $ | 219,039,389 | |
Purchases/(Receipts) | | | 59,861,785 | | | | 23,938,368 | | | | — | | | | 137,988 | | | | 83,938,141 | |
(Sales, maturities and paydowns)/Fundings | | | (89,522,656 | ) | | | (25,700,000 | ) | | | (5,529,018 | ) | | | (424,879 | ) | | | (121,176,553 | ) |
Amortization of premiums/discounts | | | 104,943 | | | | 132 | | | | (143,797 | ) | | | 64,481 | | | | 25,759 | |
Total realized gains (losses) included in earnings | | | (2,621,353 | ) | | | — | | | | (503,065 | ) | | | — | | | | (3,124,418 | ) |
Total change in unrealized appreciation (depreciation) included in earnings | | | 3,478,210 | | | | 1,215,308 | | | | 701,728 | | | | (818,079 | ) | | | 4,577,167 | |
Transfers into Level 3 | | | 33,100,000 | | | | — | | | | — | | | | — | | | | 33,100,000 | |
Transfers out of Level 3 | | | (50 | ) | | | — | | | | — | | | | (1,842,658 | ) | | | (1,842,708 | ) |
Ending Balance | | $ | 143,391,739 | | | $ | 23,897,802 | | | $ | 33,706,418 | | | $ | 13,540,818 | | | $ | 214,536,777 | |
Net change in unrealized appreciation (depreciation) for investments in Level 3 securities still held at September 30, 2023 | | $ | (670,436 | ) | | $ | (40,572 | ) | | $ | 150,044 | | | $ | (169,072 | ) | | $ | (730,036 | ) |
Step Coupon Bonds
The following table discloses additional information related to step coupon bonds held by the Fund. Certain securities are subject to multiple rate changes prior to maturity. For those securities, a range of rates and corresponding dates have been provided. Rates for all step coupon bonds held by the Fund are scheduled to increase, none are scheduled to decrease.
Name | | Coupon Rate at
Next Reset Date | | | Next Rate Reset Date | | | Future Reset Rate(s) | | | Future Reset Date(s) | |
BRAVO Residential Funding Trust 2022-R1, 3.13% due 01/29/70 | | | 6.13 | % | | | 01/30/25 | | | | — | | | | — | |
BRAVO Residential Funding Trust 2021-C, 1.62% due 03/01/61 | | | 4.62 | % | | | 09/25/24 | | | | 5.62 | % | | | 09/25/25 | |
Citigroup Mortgage Loan Trust 2022-A, 6.17% due 09/25/62 | | | 9.17 | % | | | 09/25/25 | | | | 10 17 | % | | | 09/25/26 | |
CSMC Trust 2020-NQM1, 1.41% due 05/25/65 | | | 2.41 | % | | | 09/26/24 | | | | — | | | | — | |
Legacy Mortgage Asset Trust 2021-GS3, 1.75% due 07/25/61 | | | 4.75 | % | | | 05/25/24 | | | | 5.75 | % | | | 05/25/25 | |
Legacy Mortgage Asset Trust 2021-GS4, 1.65% due 11/25/60 | | | 4.65 | % | | | 08/25/24 | | | | 5.65 | % | | | 08/25/25 | |
Legacy Mortgage Asset Trust 2021-GS5, 2.25% due 07/25/67 | | | 5.25 | % | | | 11/25/24 | | | | 6.25 | % | | | 11/25/25 | |
SEE NOTES TO FINANCIAL STATEMENTS. | THE GUGGENHEIM FUNDS ANNUAL REPORT | 27 |
SCHEDULE OF INVESTMENTS (concluded) | September 30, 2023 |
LIMITED DURATION FUND | |
Name | | Coupon Rate at
Next Reset Date | | | Next Rate Reset Date | | | Future Reset Rate(s) | | | Future Reset Date(s) | |
Legacy Mortgage Asset Trust 2021-GS2, 1.75% due 04/25/61 | | | 4.75 | % | | | 04/25/24 | | | | 5.75 | % | | | 04/25/25 | |
NYMT Loan Trust 2021-SP1, 1.67% due 08/25/61 | | | 4.67 | % | | | 08/01/24 | | | | 5.67 | % | | | 08/01/25 | |
NYMT Loan Trust 2022-SP1, 5.25% due 07/25/62 | | | 8.25 | % | | | 07/01/25 | | | | 9.25 | % | | | 07/01/26 | |
OBX Trust 2022-NQM9, 6.45% due 09/25/62 | | | 7.45 | % | | | 11/01/26 | | | | — | | | | — | |
OSAT Trust 2021-RPL1, 2.12% due 05/25/65 | | | 5.12 | % | | | 06/25/24 | | | | 6.12 | % | | | 06/25/25 | |
PRPM LLC 2022-1, 3.72% due 02/25/27 | | | 6.72 | % | | | 02/25/25 | | | | 7.72 | % | | | 02/25/26 | |
PRPM LLC 2021-5, 1.79% due 06/25/26 | | | 4.79 | % | | | 06/25/24 | | | | 5.79 | % | | | 06/25/25 | |
Verus Securitization Trust 2020-1, 2.42% due 01/25/60 | | | 3.42 | % | | | 01/26/24 | | | | — | | | | — | |
Verus Securitization Trust 2019-4, 2.64% due 11/25/59 | | | 3.64 | % | | | 10/26/23 | | | | — | | | | — | |
Verus Securitization Trust 2020-5, 1.58% due 05/25/65 | | | 2.58 | % | | | 10/26/24 | | | | — | | | | — | |
Affiliated Transactions
Investments representing 5% or more of the outstanding voting shares of a company, or control of or by, or common control under Guggenheim Investments (“GI”), result in that company being considered an affiliated issuer, as defined in the 1940 Act.
The Fund may invest in certain of the underlying series of Guggenheim Strategy Funds Trust, including Guggenheim Strategy Fund II and Guggenheim Strategy Fund III, (collectively, the “Short Term Investment Vehicles”), each of which are open-end management investment companies managed by GI. The Short Term Investment Vehicles, which launched on March 11, 2014, are offered as short term investment options only to mutual funds, trusts, and other accounts managed by GI and/or its affiliates, and are not available to the public. The Short Term Investment Vehicles pay no investment management fees. The Short Term Investment Vehicles’ annual report on Form N-CSR dated September 30, 2022, is available publicly or upon request. This information is available from the EDGAR database on the SEC’s website at https://www.sec.gov/Archives/edgar/data/1601445/000182126822000340/gug84768.htm. The Fund may invest in certain of the underlying series of Guggenheim Funds Trust, which are open-end management investment companies managed by GI, are available to the public and whose most recent annual report on Form N-CSR is available publicly or upon request.
Transactions during the year ended September 30, 2023, in which the company is an affiliated issuer, were as follows:
Security Name | | Value
09/30/22 | | | Additions | | | Reductions | | | Realized
Gain (Loss) | | | Change in
Unrealized
Appreciation
(Depreciation) | | | Value
09/30/23 | | | Shares
09/30/23 | | | Investment
Income | |
Mutual Funds | | | | | | | | | | | | | | | | | | | | | | | | | | | | | | | | |
Guggenheim Strategy Fund II | | $ | 29,251,332 | | | $ | 1,563,730 | | | $ | — | | | $ | — | | | $ | 371,364 | | | $ | 31,186,426 | | | | 1,284,978 | | | $ | 1,564,080 | |
Guggenheim Strategy Fund III | | | 29,345,878 | | | | 1,589,536 | | | | — | | | | — | | | | 334,857 | | | | 31,270,271 | | | | 1,287,372 | | | | 1,590,994 | |
Guggenheim Ultra Short Duration Fund — Institutional Class | | | 28,551,935 | | | | 1,429,933 | | | | — | | | | — | | | | 481,856 | | | | 30,463,724 | | | | 3,124,485 | | | | 1,429,650 | |
| | | $ | 87,149,145 | | | $ | 4,583,199 | | | $ | — | | | $ | — | | | $ | 1,188,077 | | | $ | 92,920,421 | | | | | | | $ | 4,584,724 | |
28 | THE GUGGENHEIM FUNDS ANNUAL REPORT | SEE NOTES TO FINANCIAL STATEMENTS. |
STATEMENT OF ASSETS AND LIABILITIES |
September 30, 2023 |
Assets: |
Investments in unaffiliated issuers, at value (cost $4,227,140,454) | | $ | 3,966,343,986 | |
Investments in affiliated issuers, at value (cost $93,876,872) | | | 92,920,421 | |
Foreign currency, at value (cost $117,625) | | | 117,625 | |
Cash | | | 296,004 | |
Segregated cash with broker | | | 2,160,603 | |
Unamortized upfront premiums paid on credit default swap agreements | | | 169,403 | |
Unamortized upfront premiums paid on interest rate swap agreements | | | 1,170 | |
Unrealized appreciation on forward foreign currency exchange contracts | | | 511,868 | |
Prepaid expenses | | | 217,568 | |
Receivables: |
Interest | | | 26,365,555 | |
Fund shares sold | | | 5,354,769 | |
Securities sold | | | 4,230,157 | |
Dividends | | | 425,057 | |
Other assets | | | 16 | |
Total assets | | | 4,099,114,202 | |
| | | | | |
Liabilities: |
Unfunded loan commitments, at value (Note 8) (commitment fees received $—) | | | — | |
Options written, at value (premiums received $445,395) | | | 1,288,794 | |
Segregated cash due to broker | | | 400,000 | |
Unamortized upfront premiums received on credit default swap agreements | | | 191,247 | |
Unamortized upfront premiums received on interest rate swap agreements | | | 33,310 | |
Payable for: |
Securities purchased | | | 23,761,335 | |
Fund shares redeemed | | | 12,405,331 | |
Distributions to shareholders | | | 1,891,334 | |
Variation margin on interest rate swap agreements | | | 1,679,662 | |
Management fees | | | 1,160,989 | |
Transfer agent fees | | | 915,158 | |
Distribution and service fees | | | 136,936 | |
Protection fees on credit default swap agreements | | | 70,249 | |
Fund accounting/administration fees | | | 34,235 | |
Due to Investment Adviser | | | 17,608 | |
Trustees’ fees* | | | 4,854 | |
Variation margin on credit default swap agreements | | | 25 | |
Miscellaneous | | | 435,465 | |
Total liabilities | | | 44,426,532 | |
Net assets | | $ | 4,054,687,670 | |
| | | | | |
Net assets consist of: |
Paid in capital | | $ | 4,405,721,450 | |
Total distributable earnings (loss) | | | (351,033,780 | ) |
Net assets | | $ | 4,054,687,670 | |
| | | | | |
A-Class: |
Net assets | | $ | 392,936,506 | |
Capital shares outstanding | | | 16,644,678 | |
Net asset value per share | | $ | 23.61 | |
Maximum offering price per share (Net asset value divided by 97.75%) | | $ | 24.15 | |
| | | | | |
C-Class: |
Net assets | | $ | 53,465,475 | |
Capital shares outstanding | | | 2,266,249 | |
Net asset value per share | | $ | 23.59 | |
| | | | | |
P-Class: |
Net assets | | $ | 54,668,369 | |
Capital shares outstanding | | | 2,315,810 | |
Net asset value per share | | $ | 23.61 | |
| | | | | |
Institutional Class: |
Net assets | | $ | 3,245,438,701 | |
Capital shares outstanding | | | 137,502,665 | |
Net asset value per share | | $ | 23.60 | |
| | | | | |
R6-Class: |
Net assets | | $ | 308,178,619 | |
Capital shares outstanding | | | 13,062,015 | |
Net asset value per share | | $ | 23.59 | |
* | Relates to Trustees not deemed “interested persons” within the meaning of Section 2(a)(19) of the 1940 Act. |
SEE NOTES TO FINANCIAL STATEMENTS. | THE GUGGENHEIM FUNDS ANNUAL REPORT | 29 |
STATEMENT OF OPERATIONS |
Year Ended September 30, 2023 |
Investment Income: |
Dividends from securities of unaffiliated issuers | | $ | 115,420 | |
Dividends from securities of affiliated issuers | | | 4,584,724 | |
Interest | | | 179,307,684 | |
Total investment income | | | 184,007,828 | |
| | | | | |
Expenses: |
Management fees | | | 16,083,765 | |
Distribution and service fees: |
A-Class | | | 1,115,453 | |
C-Class | | | 590,649 | |
P-Class | | | 171,736 | |
Transfer agent fees: |
A-Class | | | 286,438 | |
C-Class | | | 63,750 | |
P-Class | | | 60,563 | |
Institutional Class | | | 3,713,484 | |
R6-Class | | | 3,141 | |
Fund accounting/administration fees | | | 1,694,311 | |
Interest expense | | | 779,082 | |
Professional fees | | | 411,741 | |
Line of credit fees | | | 217,943 | |
Trustees fees* | | | 77,965 | |
Custodian fees | | | 167,106 | |
Miscellaneous | | | 356,491 | |
Recoupment of previously waived fees: |
A-Class | | | 30,384 | |
C-Class | | | 4,274 | |
P-Class | | | 2,293 | |
Institutional Class | | | 77,814 | |
R6-Class | | | 22,663 | |
Total expenses | | | 25,931,046 | |
Less: |
Expenses reimbursed by Adviser: |
A-Class | | | (95,368 | ) |
C-Class | | | (36,276 | ) |
P-Class | | | (28,742 | ) |
Institutional Class | | | (2,123,104 | ) |
R6-Class | | | (1,436 | ) |
Expenses waived by Adviser | | | (1,352,154 | ) |
Earnings credits applied | | | (96,112 | ) |
Total waived/reimbursed expenses | | | (3,733,192 | ) |
Net expenses | | | 22,197,854 | |
Net investment income | | | 161,809,974 | |
| | | | | |
Net Realized and Unrealized Gain (Loss): |
Net realized gain (loss) on: |
Investments in unaffiliated issuers | | $ | (81,672,032 | ) |
Swap agreements | | | 5,050,034 | |
Futures contracts | | | 1,551,516 | |
Options purchased | | | (4,306,390 | ) |
Options written | | | (811,178 | ) |
Forward foreign currency exchange contracts | | | 3,375,053 | |
Foreign currency transactions | | | (129,697 | ) |
Net realized loss | | | (76,942,694 | ) |
Net change in unrealized appreciation (depreciation) on: |
Investments in unaffiliated issuers | | | 167,930,437 | |
Investments in affiliated issuers | | | 1,188,077 | |
Swap agreements | | | (14,074,581 | ) |
Options purchased | | | (10,704,384 | ) |
Options written | | | 1,939,158 | |
Forward foreign currency exchange contracts | | | (8,640,355 | ) |
Foreign currency translations | | | 42,152 | |
Net change in unrealized appreciation (depreciation) | | | 137,680,504 | |
Net realized and unrealized gain | | | 60,737,810 | |
Net increase in net assets resulting from operations | | $ | 222,547,784 | |
* | Relates to Trustees not deemed “interested persons” within the meaning of Section 2(a)(19) of the 1940 Act. |
30 | THE GUGGENHEIM FUNDS ANNUAL REPORT | SEE NOTES TO FINANCIAL STATEMENTS. |
STATEMENTS OF CHANGES IN NET ASSETS |
| | Year Ended
September 30,
2023 | | | Year Ended
September 30,
2022 | |
Increase (Decrease) in Net Assets from Operations: | | | | | | | | |
Net investment income | | $ | 161,809,974 | | | $ | 105,834,694 | |
Net realized gain (loss) on investments | | | (76,942,694 | ) | | | 2,942,839 | |
Net change in unrealized appreciation (depreciation) on investments | | | 137,680,504 | | | | (455,180,176 | ) |
Net increase (decrease) in net assets resulting from operations | | | 222,547,784 | | | | (346,402,643 | ) |
| | | | | | | | | |
Distributions to shareholders: | | | | | | | | |
A-Class | | | (16,755,868 | ) | | | (15,229,714 | ) |
C-Class | | | (1,778,619 | ) | | | (1,053,900 | ) |
P-Class | | | (2,575,520 | ) | | | (2,173,183 | ) |
Institutional Class | | | (136,965,962 | ) | | | (109,271,775 | ) |
R6-Class | | | (5,921,753 | ) | | | (826,365 | ) |
Total distributions to shareholders | | | (163,997,722 | ) | | | (128,554,937 | ) |
| | | | | | | | | |
Capital share transactions: | | | | | | | | |
Proceeds from sale of shares | | | | | | | | |
A-Class | | | 134,134,218 | | | | 160,235,607 | |
C-Class | | | 14,149,452 | | | | 11,936,961 | |
P-Class | | | 9,238,532 | | | | 53,405,339 | |
Institutional Class | | | 1,552,067,621 | | | | 2,719,216,190 | |
R6-Class | | | 339,029,073 | | | | 6,914,200 | |
Distributions reinvested | | | | | | | | |
A-Class | | | 13,736,751 | | | | 12,605,568 | |
C-Class | | | 1,490,112 | | | | 856,214 | |
P-Class | | | 2,558,616 | | | | 2,173,183 | |
Institutional Class | | | 113,710,269 | | | | 90,897,272 | |
R6-Class | | | 5,772,795 | | | | 826,365 | |
Cost of shares redeemed | | | | | | | | |
A-Class | | | (311,444,561 | ) | | | (417,792,556 | ) |
C-Class | | | (25,891,808 | ) | | | (33,537,200 | ) |
P-Class | | | (39,029,342 | ) | | | (121,847,857 | ) |
Institutional Class | | | (2,378,071,191 | ) | | | (3,467,436,046 | ) |
R6-Class | | | (63,202,366 | ) | | | (21,559,738 | ) |
Net decrease from capital share transactions | | | (631,751,829 | ) | | | (1,003,106,498 | ) |
Net decrease in net assets | | | (573,201,767 | ) | | | (1,478,064,078 | ) |
| | | | | | | | | |
Net assets: | | | | | | | | |
Beginning of year | | | 4,627,889,437 | | | | 6,105,953,515 | |
End of year | | $ | 4,054,687,670 | | | $ | 4,627,889,437 | |
| | | | | | | | | |
SEE NOTES TO FINANCIAL STATEMENTS. | THE GUGGENHEIM FUNDS ANNUAL REPORT | 31 |
STATEMENTS OF CHANGES IN NET ASSETS (concluded) |
| | Year Ended
September 30,
2023 | | | Year Ended
September 30,
2022 | |
Capital share activity: | | | | | | | | |
Shares sold | | | | | | | | |
A-Class | | | 5,673,976 | | | | 6,516,599 | |
C-Class | | | 601,182 | | | | 487,090 | |
P-Class | | | 393,536 | | | | 2,172,486 | |
Institutional Class | | | 65,761,074 | | | | 111,021,579 | |
R6-Class | | | 14,311,441 | | | | 280,583 | |
Shares issued from reinvestment of distributions | | | | | | | | |
A-Class | | | 582,051 | | | | 514,766 | |
C-Class | | | 63,143 | | | | 35,053 | |
P-Class | | | 108,402 | | | | 88,801 | |
Institutional Class | | | 4,817,987 | | | | 3,720,350 | |
R6-Class | | | 243,986 | | | | 33,955 | |
Shares redeemed | | | | | | | | |
A-Class | | | (13,221,104 | ) | | | (17,070,775 | ) |
C-Class | | | (1,100,053 | ) | | | (1,370,571 | ) |
P-Class | | | (1,654,015 | ) | | | (4,908,204 | ) |
Institutional Class | | | (100,931,627 | ) | | | (142,043,580 | ) |
R6-Class | | | (2,675,457 | ) | | | (873,618 | ) |
Net decrease in shares | | | (27,025,478 | ) | | | (41,395,486 | ) |
32 | THE GUGGENHEIM FUNDS ANNUAL REPORT | SEE NOTES TO FINANCIAL STATEMENTS. |
This table is presented to show selected data for a share outstanding throughout each period and to assist shareholders in evaluating a Fund’s performance for the periods presented.
A-Class | | Year Ended
September 30,
2023 | | | Year Ended
September 30,
2022 | | | Year Ended
September 30,
2021 | | | Year Ended
September 30,
2020 | | | Year Ended
September 30,
2019 | |
Per Share Data |
Net asset value, beginning of period | | $ | 23.28 | | | $ | 25.42 | | | $ | 25.57 | | | $ | 24.68 | | | $ | 24.70 | |
Income (loss) from investment operations: |
Net investment income (loss)a | | | .87 | | | | .42 | | | | .34 | | | | .40 | | | | .54 | |
Net gain (loss) on investments (realized and unrealized) | | | .35 | | | | (2.04 | ) | | | .01 | i | | | .94 | | | | .01 | |
Total from investment operations | | | 1.22 | | | | (1.62 | ) | | | .35 | | | | 1.34 | | | | .55 | |
Less distributions from: |
Net investment income | | | (.89 | ) | | | (.43 | ) | | | (.38 | ) | | | (.45 | ) | | | (.57 | ) |
Net realized gains | | | — | | | | (.09 | ) | | | (.12 | ) | | | — | | | | — | b |
Total distributions | | | (.89 | ) | | | (.52 | ) | | | (.50 | ) | | | (.45 | ) | | | (.57 | ) |
Net asset value, end of period | | $ | 23.61 | | | $ | 23.28 | | | $ | 25.42 | | | $ | 25.57 | | | $ | 24.68 | |
|
Total Returnc | | | 5.31 | % | | | (6.42 | %) | | | 1.38 | % | | | 5.51 | % | | | 2.27 | % |
Ratios/Supplemental Data |
Net assets, end of period (in thousands) | | $ | 392,937 | | | $ | 549,667 | | | $ | 855,473 | | | $ | 625,386 | | | $ | 570,353 | |
Ratios to average net assets: |
Net investment income (loss) | | | 3.70 | % | | | 1.69 | % | | | 1.32 | % | | | 1.60 | % | | | 2.18 | % |
Total expensesd | | | 0.80 | % | | | 0.80 | % | | | 0.79 | % | | | 0.84 | % | | | 0.83 | % |
Net expensese,f,g | | | 0.75 | % | | | 0.74 | % | | | 0.74 | % | | | 0.77 | % | | | 0.75 | % |
Portfolio turnover rate | | | 28 | % | | | 23 | % | | | 80 | % | | | 123 | % | | | 72 | % |
C-Class | | Year Ended
September 30,
2023 | | | Year Ended
September 30,
2022 | | | Year Ended
September 30,
2021 | | | Year Ended
September 30,
2020 | | | Year Ended
September 30,
2019 | |
Per Share Data |
Net asset value, beginning of period | | $ | 23.27 | | | $ | 25.41 | | | $ | 25.55 | | | $ | 24.66 | | | $ | 24.68 | |
Income (loss) from investment operations: |
Net investment income (loss)a | | | .70 | | | | .24 | | | | .15 | | | | .21 | | | | .35 | |
Net gain (loss) on investments (realized and unrealized) | | | .33 | | | | (2.04 | ) | | | .02 | i | | | .95 | | | | .02 | |
Total from investment operations | | | 1.03 | | | | (1.80 | ) | | | .17 | | | | 1.16 | | | | .37 | |
Less distributions from: |
Net investment income | | | (.71 | ) | | | (.25 | ) | | | (.19 | ) | | | (.27 | ) | | | (.39 | ) |
Net realized gains | | | — | | | | (.09 | ) | | | (.12 | ) | | | — | | | | — | b |
Total distributions | | | (.71 | ) | | | (.34 | ) | | | (.31 | ) | | | (.27 | ) | | | (.39 | ) |
Net asset value, end of period | | $ | 23.59 | | | $ | 23.27 | | | $ | 25.41 | | | $ | 25.55 | | | $ | 24.66 | |
|
Total Returnc | | | 4.48 | % | | | (7.13 | %) | | | 0.67 | % | | | 4.72 | % | | | 1.51 | % |
Ratios/Supplemental Data |
Net assets, end of period (in thousands) | | $ | 53,465 | | | $ | 62,864 | | | $ | 90,205 | | | $ | 86,143 | | | $ | 85,100 | |
Ratios to average net assets: |
Net investment income (loss) | | | 2.96 | % | | | 0.96 | % | | | 0.58 | % | | | 0.85 | % | | | 1.42 | % |
Total expensesd | | | 1.60 | % | | | 1.58 | % | | | 1.58 | % | | | 1.61 | % | | | 1.60 | % |
Net expensese,f,g | | | 1.50 | % | | | 1.49 | % | | | 1.49 | % | | | 1.52 | % | | | 1.50 | % |
Portfolio turnover rate | | | 28 | % | | | 23 | % | | | 80 | % | | | 123 | % | | | 72 | % |
SEE NOTES TO FINANCIAL STATEMENTS. | THE GUGGENHEIM FUNDS ANNUAL REPORT | 33 |
FINANCIAL HIGHLIGHTS (continued) |
This table is presented to show selected data for a share outstanding throughout each period and to assist shareholders in evaluating a Fund’s performance for the periods presented.
P-Class | | Year Ended
September 30,
2023 | | | Year Ended
September 30,
2022 | | | Year Ended
September 30,
2021 | | | Year Ended
September 30,
2020 | | | Year Ended
September 30,
2019 | |
Per Share Data |
Net asset value, beginning of period | | $ | 23.28 | | | $ | 25.42 | | | $ | 25.57 | | | $ | 24.68 | | | $ | 24.70 | |
Income (loss) from investment operations: |
Net investment income (loss)a | | | .87 | | | | .42 | | | | .34 | | | | .40 | | | | .54 | |
Net gain (loss) on investments (realized and unrealized) | | | .35 | | | | (2.04 | ) | | | .01 | i | | | .94 | | | | .01 | |
Total from investment operations | | | 1.22 | | | | (1.62 | ) | | | .35 | | | | 1.34 | | | | .55 | |
Less distributions from: |
Net investment income | | | (.89 | ) | | | (.43 | ) | | | (.38 | ) | | | (.45 | ) | | | (.57 | ) |
Net realized gains | | | — | | | | (.09 | ) | | | (.12 | ) | | | — | | | | — | b |
Total distributions | | | (.89 | ) | | | (.52 | ) | | | (.50 | ) | | | (.45 | ) | | | (.57 | ) |
Net asset value, end of period | | $ | 23.61 | | | $ | 23.28 | | | $ | 25.42 | | | $ | 25.57 | | | $ | 24.68 | |
|
Total Return | | | 5.31 | % | | | (6.42 | %) | | | 1.38 | % | | | 5.50 | % | | | 2.27 | % |
Ratios/Supplemental Data |
Net assets, end of period (in thousands) | | $ | 54,668 | | | $ | 80,735 | | | $ | 155,465 | | | $ | 150,623 | | | $ | 108,691 | |
Ratios to average net assets: |
Net investment income (loss) | | | 3.69 | % | | | 1.67 | % | | | 1.33 | % | | | 1.60 | % | | | 2.18 | % |
Total expensesd | | | 0.82 | % | | | 0.95 | % | | | 0.83 | % | | | 0.90 | % | | | 0.88 | % |
Net expensese,f,g | | | 0.75 | % | | | 0.74 | % | | | 0.74 | % | | | 0.77 | % | | | 0.75 | % |
Portfolio turnover rate | | | 28 | % | | | 23 | % | | | 80 | % | | | 123 | % | | | 72 | % |
Institutional Class | | Year Ended
September 30,
2023 | | | Year Ended
September 30,
2022 | | | Year Ended
September 30,
2021 | | | Year Ended
September 30,
2020 | | | Year Ended
September 30,
2019 | |
Per Share Data |
Net asset value, beginning of period | | $ | 23.28 | | | $ | 25.42 | | | $ | 25.56 | | | $ | 24.67 | | | $ | 24.69 | |
Income (loss) from investment operations: |
Net investment income (loss)a | | | .93 | | | | .49 | | | | .40 | | | | .46 | | | | .60 | |
Net gain (loss) on investments (realized and unrealized) | | | .34 | | | | (2.05 | ) | | | .03 | i | | | .95 | | | | .01 | |
Total from investment operations | | | 1.27 | | | | (1.56 | ) | | | .43 | | | | 1.41 | | | | .61 | |
Less distributions from: |
Net investment income | | | (.95 | ) | | | (.49 | ) | | | (.45 | ) | | | (.52 | ) | | | (.63 | ) |
Net realized gains | | | — | | | | (.09 | ) | | | (.12 | ) | | | — | | | | — | b |
Total distributions | | | (.95 | ) | | | (.58 | ) | | | (.57 | ) | | | (.52 | ) | | | (.63 | ) |
Net asset value, end of period | | $ | 23.60 | | | $ | 23.28 | | | $ | 25.42 | | | $ | 25.56 | | | $ | 24.67 | |
|
Total Return | | | 5.53 | % | | | (6.19 | %) | | | 1.67 | % | | | 5.77 | % | | | 2.52 | % |
Ratios/Supplemental Data |
Net assets, end of period (in thousands) | | $ | 3,245,439 | | | $ | 3,907,125 | | | $ | 4,960,578 | | | $ | 2,911,309 | | | $ | 2,421,315 | |
Ratios to average net assets: |
Net investment income (loss) | | | 3.96 | % | | | 1.97 | % | | | 1.58 | % | | | 1.85 | % | | | 2.43 | % |
Total expensesd | | | 0.59 | % | | | 0.56 | % | | | 0.56 | % | | | 0.59 | % | | | 0.57 | % |
Net expensese,f,g | | | 0.50 | % | | | 0.49 | % | | | 0.49 | % | | | 0.52 | % | | | 0.50 | % |
Portfolio turnover rate | | | 28 | % | | | 23 | % | | | 80 | % | | | 123 | % | | | 72 | % |
34 | THE GUGGENHEIM FUNDS ANNUAL REPORT | SEE NOTES TO FINANCIAL STATEMENTS. |
FINANCIAL HIGHLIGHTS (concluded) |
This table is presented to show selected data for a share outstanding throughout each period and to assist shareholders in evaluating a Fund’s performance for the periods presented.
R6-Class | | Year Ended
September 30,
2023 | | | Year Ended
September 30,
2022 | | | Year Ended
September 30,
2021 | | | Year Ended
September 30,
2020 | | | Period Ended
September 30,
2019h | |
Per Share Data |
Net asset value, beginning of period | | $ | 23.26 | | | $ | 25.40 | | | $ | 25.55 | | | $ | 24.66 | | | $ | 24.58 | |
Income (loss) from investment operations: |
Net investment income (loss)a | | | 1.00 | | | | .48 | | | | .40 | | | | .48 | | | | .31 | |
Net gain (loss) on investments (realized and unrealized) | | | .29 | | | | (2.04 | ) | | | .02 | i | | | .93 | | | | .14 | |
Total from investment operations | | | 1.29 | | | | (1.56 | ) | | | .42 | | | | 1.41 | | | | .45 | |
Less distributions from: |
Net investment income | | | (.96 | ) | | | (.49 | ) | | | (.45 | ) | | | (.52 | ) | | | (.37 | ) |
Net realized gains | | | — | | | | (.09 | ) | | | (.12 | ) | | | — | | | | — | |
Total distributions | | | (.96 | ) | | | (.58 | ) | | | (.57 | ) | | | (.52 | ) | | | (.37 | ) |
Net asset value, end of period | | $ | 23.59 | | | $ | 23.26 | | | $ | 25.40 | | | $ | 25.55 | | | $ | 24.66 | |
|
Total Return | | | 5.60 | % | | | (6.19 | %) | | | 1.64 | % | | | 5.78 | % | | | 1.83 | % |
Ratios/Supplemental Data |
Net assets, end of period (in thousands) | | $ | 308,179 | | | $ | 27,499 | | | $ | 44,232 | | | $ | 31,315 | | | $ | 314,764 | |
Ratios to average net assets: |
Net investment income (loss) | | | 4.22 | % | | | 1.94 | % | | | 1.58 | % | | | 1.96 | % | | | 2.24 | % |
Total expensesd | | | 0.49 | % | | | 0.49 | % | | | 0.49 | % | | | 0.53 | % | | | 0.51 | % |
Net expensese,f,g | | | 0.46 | % | | | 0.49 | % | | | 0.49 | % | | | 0.52 | % | | | 0.50 | % |
Portfolio turnover rate | | | 28 | % | | | 23 | % | | | 80 | % | | | 123 | % | | | 72 | % |
a | Net investment income (loss) per share was computed using average shares outstanding throughout the period. |
b | Less than $0.01 per share. |
c | Total return does not reflect the impact of any applicable sales charges. |
d | Does not include expenses of the underlying funds in which the Fund invests. |
e | Net expense information reflects the expense ratios after expense waivers and reimbursements, as applicable. |
f | The portion of the ratios of net expenses to average net assets attributable to recoupments of prior fee reductions or expense reimbursements for the years presented was as follows: |
| | | 09/30/23 | 09/30/22 | 09/30/21 | 09/30/20 | 09/30/19 |
| | A-Class | 0.01% | 0.00%* | — | 0.00%* | 0.00%* |
| | C-Class | 0.01% | — | — | 0.00%* | — |
| | P-Class | 0.00%* | — | — | 0.00%* | 0.00%* |
| | Institutional Class | 0.00%* | — | — | 0.00%* | 0.00%* |
| | R6-Class | 0.02% | 0.02% | 0.01% | 0.00%* | 0.00%*h |
g | Net expenses may include expenses that are excluded from the expense limitation agreement. Excluding these expenses, the net expense ratios for the years presented would be: |
| | | 09/30/23 | 09/30/22 | 09/30/21 | 09/30/20 | 09/30/19 |
| | A-Class | 0.72% | 0.73% | 0.73% | 0.75% | 0.75% |
| | C-Class | 1.48% | 1.48% | 1.48% | 1.50% | 1.50% |
| | P-Class | 0.72% | 0.73% | 0.73% | 0.75% | 0.75% |
| | Institutional Class | 0.47% | 0.48% | 0.48% | 0.50% | 0.50% |
| | R6-Class | 0.44% | 0.48% | 0.48% | 0.50% | 0.50%h |
h | Since commencement of operations: March 13, 2019. Percentage amounts for the period, except total return and portfolio turnover rate, have been annualized. |
i | The amount shown for a share outstanding throughout the year does not agree with the aggregate net loss on investments for the year because of the sales and purchases of fund shares in relation to fluctuating market value of the investments of the Fund. |
SEE NOTES TO FINANCIAL STATEMENTS. | THE GUGGENHEIM FUNDS ANNUAL REPORT | 35 |
NOTES TO FINANCIAL STATEMENTS |
Note 1 – Organization and Significant Accounting Policies
Organization
Guggenheim Funds Trust (the “Trust”), a Delaware statutory trust, is registered with the SEC under the Investment Company Act of 1940 (the “1940 Act”), as an open-ended investment company of the series type. Each series, in effect, is representing a separate fund. The Trust may issue an unlimited number of authorized shares. The Trust accounts for the assets of each fund separately.
The Trust offers a combination of five separate classes of shares: A-Class shares, C-Class shares, P-Class shares, R6-Class shares and Institutional Class shares. Sales of shares of each Class are made without a front-end sales charge at the net asset value per share (“NAV”), with the exception of A-Class shares. A-Class shares are sold at the NAV, plus the applicable front-end sales charge. The sales charge varies depending on the amount purchased. A-Class share purchases of $1 million or more are exempt from the front-end sales charge but have a 1% contingent deferred sales charge (“CDSC”), if shares are redeemed within 12 months of purchase. C-Class shares have a 1% CDSC if shares are redeemed within 12 months of purchase. C-Class shares automatically convert to A-Class shares on or about the 10th day of the month following the 8-year anniversary of the purchase of the C-Class shares. This conversion will be executed without any sales charge, fee or other charge. After the conversion is completed, the shares will be subject to all features and expenses of A-Class shares. Institutional Class shares are offered primarily for direct investment by institutions such as pension and profit sharing plans, endowments, foundations and corporations. Institutional Class shares require a minimum initial investment of $2 million and a minimum account balance of $1 million. R6-Class shares are offered primarily through qualified retirement and benefit plans. R6-Class shares are also offered through certain other plans and platforms sponsored by financial intermediaries. Certain institutional investors and others deemed appropriate by Guggenheim Investments (“GI” or the “Adviser”) may also be eligible to purchase R6-Class shares subject to a $2 million minimum initial investment. At September 30, 2023, the Trust consisted of nineteen funds (the “Funds”).
This report covers the Limited Duration Fund (the “Fund”), a diversified investment company. At September 30, 2023, A-Class, C-Class, P-Class, Institutional Class and R6-Class shares have been issued by the Fund.
Guggenheim Partners Investment Management LLC (“GPIM” or the “Adviser”), which operates under the name Guggenheim Investments (“GI”), provides advisory services. Guggenheim Funds Distributors, LLC (“GFD”) serves as distributor of the Fund’s shares. GI and GFD are affiliated entities.
Significant Accounting Policies
The Fund operates as an investment company and, accordingly, follows the investment company accounting and reporting guidance of the Financial Accounting Standards Board (“FASB”) Accounting Standards Codification Topic 946 Financial Services – Investment Companies.
The following significant accounting policies are in conformity with U.S. generally accepted accounting principles (“U.S. GAAP”) and are consistently followed by the Trust. This requires management to make estimates and assumptions that affect the reported amount of assets and liabilities, contingent assets and liabilities at the date of the financial statements, and the reported amounts of revenues and expenses during the reporting period. Actual results could differ from these estimates. All time references are based on Eastern Time.
The NAV of each share class of the Fund is calculated by dividing the market value of the Fund’s securities and other assets, less all liabilities attributable to the share class by the number of outstanding shares of the share class.
(a) Valuation of Investments
The Board of Trustees of the Fund (the “Board”) has adopted policies and procedures for the valuation of the Fund’s investments (the “Fund Valuation Procedures”). The SEC adopted Rule 2a-5 under the 1940 Act (“Rule 2a-5”) which establishes requirements for determining fair value in good faith. Rule 2a-5 also defines “readily available market quotations” for purposes of the 1940 Act and establishes requirements for determining whether a fund must fair value a security in good faith.
Pursuant to Rule 2a-5, the Board has designated the Adviser as the valuation designee to perform fair valuation determinations for the Fund with respect to all Fund investments and other assets. As the Fund’s valuation designee pursuant to Rule 2a-5, the Adviser has adopted separate procedures (the “Valuation Designee Procedures” and collectively with the Fund Valuation Procedures, the “Valuation Procedures”) reasonably designed to prevent violations of the requirements of Rule 2a-5 and Rule 31a-4. The Adviser, in its role as valuation designee, utilizes the assistance of a valuation committee, consisting of representatives from Guggenheim’s investment management, fund administration, legal and compliance departments (the “Valuation Committee”), in determining the fair value of the Fund’s securities and other assets.
Valuations of the Fund’s securities and other assets are supplied primarily by pricing service providers appointed pursuant to the processes set forth in the Valuation Procedures. The Adviser, with the assistance of the Valuation Committee, convenes monthly, or more frequently as needed, to review the valuation of all assets which have been fair valued. The Adviser, consistent with the
36 | THE GUGGENHEIM FUNDS ANNUAL REPORT | |
NOTES TO FINANCIAL STATEMENTS (continued) |
monitoring and review responsibilities set forth in the Valuation Procedures, regularly reviews the appropriateness of the inputs, methods, models and assumptions employed by the pricing service provider.
If the pricing service provider cannot or does not provide a valuation for a particular investment or such valuation is deemed unreliable, such investment is fair valued by the Adviser.
Generally, trading in foreign securities markets is substantially completed each day at various times prior to the close of the New York Stock Exchange (“NYSE”). The values of foreign securities are determined as of the close of such foreign markets or the close of the NYSE, if earlier. All investments quoted in foreign currencies are valued in U.S. dollars on the basis of the foreign currency exchange rates prevailing at the close of U.S. business at 4:00 p.m. Investments in foreign securities may involve risks not present in domestic investments. The Adviser will determine the current value of such foreign securities by taking into consideration certain factors which may include the following factors, among others: the value of the securities traded on other foreign markets, American Depositary Receipts (“ADR”) trading, closed-end fund trading, foreign currency exchange activity, and the trading prices of financial products that are tied to foreign securities. In addition, under the Valuation Procedures, the Adviser is authorized to use prices and other information supplied by a pricing service provider in valuing foreign securities.
Open-end investment companies are valued at their NAV as of the close of business, on the valuation date. Exchange-traded funds and closed-end investment companies are generally valued at the last quoted sale price.
U.S. Government securities are valued by pricing service providers, the last traded fill price, or at the reported bid price at the close of business.
Commercial paper and discount notes with a maturity of greater than 60 days at acquisition are valued at prices that reflect broker-dealer supplied valuations or are obtained from pricing service providers, which may consider the trade activity, treasury spreads, yields or price of bonds of comparable quality, coupon, maturity, and type, as well as prices quoted by dealers who make markets in such securities. Commercial paper and discount notes with a maturity of 60 days or less at acquisition are valued at amortized cost, unless the Adviser concludes that amortized cost does not represent the fair value of the applicable asset in which case it will be valued using an independent pricing service.
Repurchase agreements are valued at amortized cost, provided such amounts approximate market value.
Typically, loans are valued using information provided by a pricing service provider which uses broker quotes, among other inputs. If the pricing service provider cannot or does not provide a valuation for a particular loan, or such valuation is deemed unreliable, such investment is valued based on a quote from a broker-dealer or is fair valued by the Adviser.
Exchange-traded options are valued at the mean of the bid and ask prices on the principal exchange on which they are traded. Over-the-counter (“OTC”) options and options on swaps (“swaptions”) are valued using a price provided by a pricing service provider.
Futures contracts are valued on the basis of the last sale price at the 4:00 p.m. price on the valuation date. In the event that the exchange for a specific futures contract closes earlier than 4:00 p.m., the futures contract is valued at the official settlement price of the exchange. However, the underlying securities from which the futures contract value is derived are monitored until 4:00 p.m. to determine if fair valuation would provide a more accurate valuation.
Interest rate swap agreements entered into by the Fund is valued on the basis of the last sale price on the primary exchange on which the swap is traded.
Other swap agreements entered into by the Fund are generally valued using an evaluated price provided by a pricing service provider.
Forward foreign currency exchange contracts are valued daily based on the applicable exchange rate of the underlying currency.
Investments for which market quotations are not readily available are fair valued as determined in good faith by the Adviser. Valuations in accordance with these methods are intended to reflect each security’s (or asset’s or liability’s) “fair value”. Each such determination is based on a consideration of all relevant factors, which are likely to vary from one pricing context to another. Examples of such factors may include, but are not limited to market prices; sale prices; broker quotes; and models which derive prices based on inputs such as prices of securities with comparable maturities and characteristics, or based on inputs such as anticipated cash flows or collateral, spread over U.S. Treasury securities, and other information analysis. In connection with futures contracts and other derivative investments, such factors may include obtaining information as to how (a) these contracts and other derivative investments trade in the futures or other derivative markets, respectively, and (b) the securities underlying these contracts and other derivative investments trade in the cash market.
| | THE GUGGENHEIM FUNDS ANNUAL REPORT | 37 |
NOTES TO FINANCIAL STATEMENTS (continued) |
(b) U.S. Government and Agency Obligations
Certain U.S. Government and Agency Obligations are traded on a discount basis; the interest rates shown on the Schedule of Investments reflect the effective rates paid at the time of purchase by the Fund. Other securities bear interest at the rates shown, payable at fixed dates through maturity.
(c) Senior Floating Rate Interests and Loan Investments
Senior floating rate interests in which the Fund invests generally pay interest rates which are periodically adjusted by reference to a base short-term floating rate, plus a premium. These base lending rates are generally (i) the lending rate offered by one or more major European banks, (ii) the prime rate offered by one or more major United States banks, or (iii) the bank’s certificate of deposit rate. Senior floating rate interests often require prepayments from excess cash flows or permit the borrower to repay at its election. The rate at which the borrower repays cannot be predicted with accuracy. As a result, the actual remaining maturity may be substantially less than the stated maturities disclosed in the Fund’s Schedule of Investments.
The Fund invests in loans and other similar debt obligations (“obligations”). A portion of the Fund’s investments in these obligations is sometimes referred to as “covenant lite” loans or obligations (“covenant lite obligations”), which are obligations that lack covenants or possess fewer or less restrictive covenants or constraints on borrowers than certain other types of obligations. The Fund may also obtain exposure to covenant lite obligations through investment in securitization vehicles and other structured products. Recently, many new or reissued obligations have not featured traditional covenants, which are intended to protect lenders and investors by (i) imposing certain restrictions or other limitations on a borrower’s operations or assets or (ii) providing certain rights to lenders. The Fund may have fewer rights with respect to covenant lite obligations, including fewer protections against the possibility of default and fewer remedies in the event of default. As a result, investments in (or exposure to) covenant lite obligations are subject to more risk than investments in (or exposure to) certain other types of obligations. The Fund is subject to other risks associated with investments in (or exposure to) obligations, including that obligations may not be considered “securities” and, as a result, the Fund may not be entitled to rely on the anti-fraud protections under the federal securities laws and instead may have to resort to state law and direct claims.
(d) Interest on When-Issued Securities
The Fund may purchase and sell interests in securities on a when-issued and delayed delivery basis, with payment and delivery scheduled for a future date. No income accrues to the Fund on such interests or securities in connection with such transactions prior to the date the Fund actually takes delivery of such interests or securities. These transactions are subject to market fluctuations and are subject to the risk that the value at delivery may be more or less than the trade date purchase price. Although the Fund will generally purchase these securities with the intention of acquiring such securities, it may sell such securities before the settlement date.
(e) Short Sales
When the Fund engages in a short sale of a security, an amount equal to the proceeds is reflected as an asset and an equivalent liability. The amount of the liability is subsequently marked-to-market to reflect the market value of the short sale.
Fees, if any, paid to brokers to borrow securities in connection with short sales are recorded as interest expense. In addition, the Fund must pay out the dividend rate of the equity or coupon rate of the obligation to the lender and record this as an expense. Short dividend or interest expense is a cost associated with the investment objective of short sales transactions, rather than an operational cost associated with the day-to-day management of any mutual fund. The Fund may also receive rebate income from the broker resulting from the investment of the proceeds from securities sold short.
(f) Options
Upon the purchase of an option, the premium paid is recorded as an investment, the value of which is marked-to-market daily. If a purchased option expires, the Fund realizes a loss in the amount of the cost of the option. When the Fund enters into a closing sale transaction, it realizes a gain or loss depending on whether the proceeds from the closing sale transaction are greater or less than the cost of the option. If the Fund exercises a put option, it realizes a gain or loss from the sale of the underlying security and the proceeds from such sale will be decreased by the premium originally paid. When the Fund exercises a call option, the cost of the security purchased by the Fund upon exercise increases by the premium originally paid.
When the Fund writes (sells) an option, an amount equal to the premium received is entered in that Fund’s accounting records as an asset and equivalent liability. The amount of the liability is subsequently marked-to-market to reflect the current value of the option written. When a written option expires, or if the Fund enters into a closing purchase transaction, it realizes a gain (or loss if the cost of a closing purchase transaction exceeds the premium received when the option was sold).
The Fund may purchase and write options on swaps (“swaptions”) primarily to preserve a return or spread on a particular investment or portion of the Fund’s holdings, as a duration management technique or to protect against an increase in the price of securities it anticipates purchasing at a later date. The purchaser and writer of a swaption is buying or granting the right to enter into a
38 | THE GUGGENHEIM FUNDS ANNUAL REPORT | |
NOTES TO FINANCIAL STATEMENTS (continued) |
previously agreed upon interest rate swap agreement at any time before the expiration of the options. The swaptions are forward premium swaptions which have extended settlement dates.
(g) Futures Contracts
Upon entering into a futures contract, the Fund deposits and maintains as collateral such initial margin as required by the exchange on which the transaction is affected. Pursuant to the contract, the Fund agrees to receive from or pay to the broker an amount of cash equal to the daily fluctuation in value of the contract. Such receipts or payments are known as variation margin and are recorded by the Fund as unrealized appreciation or depreciation. When the contract is closed, the Fund records a realized gain or loss equal to the difference between the value of the contract at the time it was opened and the value at the time it was closed.
(h) Swap Agreements
Swap agreements are marked-to-market daily and the change, if any, is recorded as unrealized appreciation or depreciation. Payments received or made as a result of an agreement or termination of an agreement are recognized as realized gains or losses.
Upon entering into certain centrally-cleared swap transactions, a Fund is required to deposit with its clearing broker an amount of cash or securities as an initial margin. Subsequent variation margin receipts or payments are received or made by the Fund depending on fluctuations in the fair value of the reference entity and are recorded by the Fund as unrealized appreciation or depreciation. When the contract is closed, the Fund records a realized gain or loss equal to the difference between the value of the contract at the time it was opened and the value at the time it was closed.
Upfront payments received or made by a Fund on credit default swap agreements and interest rate swap agreements are amortized over the expected life of the agreement. Periodic payments received or paid by a Fund are recorded as realized gains or losses. Payments received or made as a result of a credit event or termination of the contract are recognized, net of a proportional amount of the upfront payment, as realized gains or losses.
(i) Currency Translations
The accounting records of the Fund are maintained in U.S. dollars. All assets and liabilities initially expressed in foreign currencies are converted into U.S. dollars at prevailing exchange rates. Purchases and sales of investment securities, dividend and interest income, and certain expenses are translated at the rates of exchange prevailing on the respective dates of such transactions. Changes in the relationship of these foreign currencies to the U.S. dollar can significantly affect the value of the investments and earnings of the Fund. Foreign investments may also subject the Fund to foreign government exchange restrictions, expropriation, taxation, or other political, social, geopolitical or economic developments, all of which could affect the market and/or credit risk of the investments.
The Fund does not isolate that portion of the results of operations resulting from changes in the foreign exchange rates on investments from the fluctuations arising from changes in the market prices of securities held. Such fluctuations are included with the net realized gain or loss and unrealized appreciation or depreciation on investments.
Reported net realized foreign exchange gains and losses arise from sales of foreign currencies and currency gains or losses realized between the trade and settlement dates on investment transactions. Net unrealized appreciation and depreciation arise from changes in the fair values of assets and liabilities other than investments in securities at the fiscal period end, resulting from changes in exchange rates.
(j) Forward Foreign Currency Exchange Contracts
The change in value of a forward foreign currency exchange contract is recorded as unrealized appreciation or depreciation until the contract is closed. When the contract is closed, the Fund records a realized gain or loss equal to the difference between the value at the time the contract was opened and the value at the time it was closed.
(k) Foreign Taxes
The Fund may be subject to foreign taxes (a portion of which may be reclaimable) on income, stock dividends, capital gains on investments or certain foreign currency transactions. All foreign taxes are recorded in accordance with the applicable foreign tax regulations and rates that exist in the foreign jurisdictions in which the Fund invests. These foreign taxes, if any, are paid by the Fund and reflected in its Statement of Operations as follows: foreign taxes withheld at source are presented as a reduction of income and foreign taxes on capital gains from sales of investments are included with the net realized gain (loss) on investments. Foreign taxes payable or deferred as of September 30, 2023, if any, are disclosed in the Fund’s Statement of Assets and Liabilities.
(l) Security Transactions
Security transactions are recorded on the trade date for financial reporting purposes. Realized gains and losses from securities transactions are recorded using the identified cost basis. Proceeds from lawsuits related to investment holdings are recorded as a reduction to cost if the securities are still held and as realized gains if no longer held in the Fund. Dividend income is recorded on the ex-dividend date, net of applicable taxes withheld by
| | THE GUGGENHEIM FUNDS ANNUAL REPORT | 39 |
NOTES TO FINANCIAL STATEMENTS (continued) |
foreign countries, if any. Taxable non-cash dividends are recorded as dividend income. Interest income, including amortization of premiums and accretion of discounts, is accrued on a daily basis. Interest income also includes paydown gains and losses on mortgage-backed and asset-backed securities and senior and subordinated loans. Amendment fees are earned as compensation for evaluating and accepting changes to the original loan agreement and are recognized when received. Dividend income from Real Estate Investment Trusts (“REITs”) is recorded based on the income included in the distributions received from the REIT investments using published REIT classifications, including some management estimates when actual amounts are not available. Distributions received in excess of this estimated amount are recorded as a reduction of the cost of investments or reclassified to realized gains. The actual amounts of income, return of capital, and realized gains are only determined by each REIT after its fiscal year-end, and may differ from the estimated amounts.
Income from residual collateralized loan obligations is recognized using the effective interest method. At the time of purchase, management estimates the future expected cash flows and determines the effective yield and estimated maturity date based on the estimated cash flows. Subsequent to the purchase, the estimated cash flows are updated periodically and a revised yield is calculated prospectively.
The Fund may receive other income from investments in senior loan interests including amendment fees, consent fees and commitment fees. For funded loans, these fees are recorded as income when received by the Fund and included in interest income on the Statement of Operations. For unfunded loans, commitment fees are included in realized gain on investments on the Statement of Operations at the end of the commitment period.
(m) Distributions
The Fund declares dividends from investment income daily. The Fund pays its shareholders from its net investment income monthly and distributes any net capital gains that it has realized, at least annually. Distributions to shareholders are recorded on the ex-dividend date. Dividends are reinvested in additional shares, unless shareholders request payment in cash. The character of distributions made during the year from net investment income or net realized gains may differ from their ultimate characterization for U.S. federal income tax purposes.
(n) Class Allocations
Interest and dividend income, most expenses, all realized gains and losses, and all unrealized appreciation and depreciation are allocated to the share classes based upon the value of the outstanding shares in each share class. Certain costs, such as distribution and service fees are charged directly to specific share classes. In addition, certain expenses have been allocated to the individual Funds in the Trust based on the respective net assets of each Fund included in the Trust.
(o) Earnings Credits
Under the fee arrangement with the custodian, the Fund may earn credits based on overnight custody cash balances. These credits are utilized to reduce related custodial expenses. The custodian fees disclosed in the Statement of Operations are before the reduction in expense from the related earnings credits, if any. Earnings credits for the year ended September 30, 2023, are disclosed in the Statement of Operations.
(p) Cash
The Fund may leave cash overnight in its cash account with the custodian. Periodically, the Fund may have cash due to the custodian bank as an overdraft balance. A fee is incurred on this overdraft, calculated by multiplying the overdraft by a rate based on the federal funds rate, which was 5.33% at September 30, 2023.
(q) Indemnifications
Under the Fund’s organizational documents, its Trustees and Officers are indemnified against certain liabilities arising out of the performance of their duties to the Trust. In addition, throughout the normal course of business, the Fund enters into contracts that contain a variety of representations and warranties which provide general indemnifications. The Fund’s maximum exposure under these arrangements is unknown, as this would involve future claims that may be made against the Fund and/or its affiliates that have not yet occurred. However, based on experience, the Fund expects the risk of loss to be remote.
(r) Special Purpose Acquisition Companies
The Fund may acquire an interest in a special purpose acquisition company (“SPAC”) in an initial public offering or a secondary market transaction. SPAC investments carry many of the same risks as investments in initial public offering securities, such as erratic price movements, greater risk of loss, lack of information about the issuer, limited operating and little public or no trading history, and higher transaction costs. An investment in a SPAC is typically subject to a higher risk of dilution by additional later offerings of interests in the SPAC or by other investors exercising existing rights to purchase shares of the SPAC and interests in SPACs may be illiquid and/or be subject to restrictions on resale. A SPAC is a publicly traded company that raises investment capital for the purpose of acquiring the equity securities of one or more existing companies (or interests therein) via merger, combination, acquisition or other similar transactions. Unless and until an acquisition is completed, a SPAC generally invests its assets (less a portion retained to cover expenses) in U.S. government securities, money market securities and cash and does not typically pay
40 | THE GUGGENHEIM FUNDS ANNUAL REPORT | |
NOTES TO FINANCIAL STATEMENTS (continued) |
dividends in respect of its common stock. SPAC investments are also subject to the risk that a significant portion of the funds raised by the SPAC may be expended during the search for a target acquisition or merger and that the SPAC may have limited time in which to conduct due diligence on potential business combination targets. Because SPACs are in essence blank check companies without operating history or ongoing business other than seeking acquisitions, the value of their securities is particularly dependent on the ability of the entity’s management to identify and complete a profitable acquisition. Among other conflicts of interest, the economic interests of the management, directors, officers and related parties of a SPAC can differ from the economic interests of public shareholders, which may lead to conflicts as they evaluate, negotiate and recommend business combination transactions to shareholders. This risk may become more acute as the deadline for the completion of a business combination nears. There is no guarantee that the SPACs in which the Fund invests will complete an acquisition or that any acquisitions that are completed will be profitable.
Note 2 – Financial Instruments and Derivatives
As part of its investment strategy, the Fund utilizes short sales and a variety of derivative instruments. These investments involve, to varying degrees, elements of market risk and risks in excess of amounts recognized on the Fund’s Statement of Assets and Liabilities. Valuation and accounting treatment of these instruments can be found under Significant Accounting Policies in Note 1 of these Notes to Financial Statements.
Short Sales
A short sale is a transaction in which the Fund sells a security it does not own. If the security sold short decreases in price between the time the Fund sells the security and closes its short position, the Fund will realize a gain on the transaction. Conversely, if the security increases in price during the period, the Fund will realize a loss on the transaction. The risk of such price increases is the principal risk of engaging in short sales.
Derivatives
Derivatives are instruments whose values depend on, or are derived from, in whole or in part, the value of one or more other assets, such as securities, currencies, commodities or indices. Derivative instruments may be used to increase investment flexibility (including to maintain cash reserves while maintaining exposure to certain other assets), for risk management (hedging) purposes, to facilitate trading, to reduce transaction costs and to pursue higher investment returns. Derivative instruments may also be used to mitigate certain investment risks, such as foreign currency exchange rate risk, interest rate risk and credit risk. U.S. GAAP requires disclosures to enable investors to better understand how and why a Fund uses derivative instruments, how these derivative instruments are accounted for and their effects on the Fund’s financial position and results of operations.
The Fund utilized derivatives for the following purposes:
Duration: the use of an instrument to manage the interest rate risk of a portfolio.
Hedge: an investment made in order to reduce the risk of adverse price movements in a security, by taking an offsetting position to protect against broad market moves.
Income: the use of any instrument that distributes cash flows typically based upon some rate of interest.
Index Exposure: the use of an instrument to obtain exposure to a listed or other type of index.
Options Purchased and Written
A call option on a security gives the purchaser of the option the right to buy, and the writer of a call option the obligation to sell, the underlying security. The purchaser of a put option has the right to sell, and the writer of the put option the obligation to buy, the underlying security at any time during the option period. The risk associated with purchasing options is limited to the premium originally paid.
The following table represents the Fund’s use and volume of call/put options purchased on a monthly basis:
| | | Average Notional Amount | |
Use | | Call | | | Put | |
Duration, Hedge | | $ | 579,916,667 | | | $ | 40,382,963 | |
| | THE GUGGENHEIM FUNDS ANNUAL REPORT | 41 |
NOTES TO FINANCIAL STATEMENTS (continued) |
The risk in writing a call option is that a Fund may incur a loss if the market price of the underlying security increases and the option is exercised. The risk in writing a put option is that a Fund may incur a loss if the market price of the underlying security decreases and the option is exercised. In addition, there may be an imperfect correlation between the movement in prices of options and the underlying securities where a Fund may not be able to enter into a closing transaction because of an illiquid secondary market; or, for OTC options, a Fund may be at risk because of the counterparty’s inability to perform.
The following table represents the Fund’s use and volume of call/put options written on a monthly basis:
| | | Average Notional Amount | |
Use | | Call | | | Put | |
Duration, Hedge | | $ | 8,239 | | | $ | 89,875,833 | |
Futures Contracts
A futures contract is an agreement to purchase (long) or sell (short) an agreed amount of securities or other instruments at a set price for delivery at a future date. There are significant risks associated with a Fund’s use of futures contracts, including (i) there may be an imperfect or no correlation between the changes in market value of the underlying asset and the prices of futures contracts; (ii) there may not be a liquid secondary market for a futures contract; (iii) trading restrictions or limitations may be imposed by an exchange; and (iv) government regulations may restrict trading in futures contracts. When investing in futures, there is minimal counterparty credit risk to a Fund because futures are exchange-traded and the exchange’s clearinghouse, as counterparty to all exchange-traded futures, guarantees against default. Cash deposits are shown as segregated cash with broker on the Statement of Assets and Liabilities; securities held as collateral are noted on the Schedule of Investments.
The following table represents the Fund’s use and volume of futures on a monthly basis:
| | | Average Notional Amount | |
Use | | Long | | | Short | |
Index exposure, income | | $ | 64,007,292 | | | $ | — | |
Swap Agreements
A swap is an agreement that obligates two parties to exchange a series of cash flows at specified intervals based upon or calculated by reference to changes in specified prices or rates for a specified amount of an underlying asset. When utilizing over-the-counter (“OTC”) swaps, the Fund bears the risk of loss of the amount expected to be received under a swap agreement in the event of the default or bankruptcy of a swap agreement counterparty or if the underlying asset declines in value. Certain standardized swaps are subject to mandatory central clearing and are executed on a multi-lateral or other trade facility platform, such as a registered exchange. There is limited counterparty credit risk with respect to centrally-cleared swaps as the transaction is facilitated through a central clearinghouse, much like exchange-traded futures contracts. For a Fund utilizing centrally-cleared swaps, the exchange bears the risk of loss resulting from a counterparty not being able to pay. There is no guarantee that a Fund or an underlying fund could eliminate its exposure under an outstanding swap agreement by entering into an offsetting swap agreement with the same or another party.
Total return swaps involve commitments where single or multiple cash flows are exchanged based on the price of an underlying reference asset (such as an index) for a fixed or variable interest rate. Total return swaps will usually be computed based on the current value of the reference asset as of the close of regular trading on the NYSE or other exchange, with the swap value being adjusted to include dividends accrued, financing charges and/or interest associated with the swap agreement. When utilizing total return swaps, the Fund bears the risk of loss of the amount expected to be received under a swap agreement in the event of the default or bankruptcy of a swap agreement counterparty or if the underlying reference asset declines in value.
Interest rate swaps involve the exchange by the Fund with another party for its respective commitment to pay or receive a fixed or variable interest rate on a notional amount of principal. Interest rate swaps are generally centrally-cleared, but central clearing does not make interest rate swap transactions risk free.
42 | THE GUGGENHEIM FUNDS ANNUAL REPORT | |
NOTES TO FINANCIAL STATEMENTS (continued) |
The following table represents the Fund’s use and volume of interest rate swaps on a monthly basis:
| | | Average Notional Amount | |
Use | | Pay Floating Rate | | | Receive Floating Rate | |
Duration, Hedge | | $ | 235,875,000 | | | $ | 10,372,583 | |
Credit default swaps are instruments which allow for the full or partial transfer of third party credit risk, with respect to a particular entity or entities, from one counterparty to the other. The Fund enters into credit default swaps as a “seller” or “buyer” of protection primarily to gain or reduce exposure to the investment grade and/or high yield bond market. A seller of credit default swaps is selling credit protection or assuming credit risk with respect to the underlying entity or entities. The buyer in a credit default swap is obligated to pay the seller a periodic stream of payments over the term of the contract provided that no event of default on an underlying reference obligation has occurred. If a credit event occurs, as defined under the terms of the swap agreement, the seller will either (i) pay to the buyer of protection an amount equal to the notional amount of the swap and take delivery of the referenced obligation or underlying securities comprising the referenced index or (ii) pay a net settlement amount in the form of cash or securities equal to the notional amount of the swap less the recovery value of the referenced obligation or underlying securities comprising the referenced index. The notional amount reflects the maximum potential amount the seller of credit protection could be required to pay to the buyer if a credit event occurs. The seller of protection receives periodic premium payments from the buyer and may also receive or pay an upfront premium adjustment to the stated periodic payments. In the event a credit default occurs on a credit default swap referencing an index, a factor adjustment will take place and the buyer of protection will receive a payment reflecting the par less the default recovery rate of the defaulted index component based on its weighting in the index. If no default occurs, the counterparty will pay the stream of payments and have no further obligations to the fund selling the credit protection. For a fund utilizing centrally cleared credit default swaps, the exchange bears the risk of loss resulting from a counterparty not being able to pay. For OTC credit default swaps, a fund bears the risk of loss of the amount expected to be received under a swap agreement in the event of the default or bankruptcy of a swap agreement counterparty, or in the case of a credit default swap in which a fund is selling credit protection, the default of a third party issuer.
The quoted market prices and resulting market values for credit default swap agreements on securities and credit indices serve as an indicator of the current status of the payment/performance risk and represent the likelihood of an expected liability (or profit) for the credit derivative had the notional amount of the swap agreement been closed/sold as of the period end. Increasing market values, in absolute terms when compared to the notional amount of the swap, represent a deterioration of the referenced entity’s credit soundness and a greater likelihood or risk of default or other credit event occurring as defined under the terms of the agreement.
The following table represents the Fund’s use and volume of credit default swaps on a monthly basis:
| | | Average Notional Amount | |
Use | | Protection Sold | | | Protection Purchased | |
Index exposure, Income | | $ | 12,500,000 | | | $ | 42,175,000 | |
Forward Foreign Currency Exchange Contracts
A forward foreign currency exchange contract is an agreement between two parties to exchange two designated currencies at a specific time in the future. Certain types of contracts may be cash settled, in an amount equal to the change in exchange rates during the term of the contract. The contracts can be used to hedge or manage exposure to foreign currency risks with portfolio investments or to gain exposure to foreign currencies.
The market value of a forward foreign currency exchange contract changes with fluctuations in foreign currency exchange rates. Furthermore, the Fund may be exposed to risk if the counterparties cannot meet the contract terms or if the currency value changes unfavorably as compared to the U.S. dollar.
| | THE GUGGENHEIM FUNDS ANNUAL REPORT | 43 |
NOTES TO FINANCIAL STATEMENTS (continued) |
The following table represents the Fund’s use and volume of forward foreign currency exchange contracts on a monthly basis:
| | | Average Value | |
Use | | Purchased | | | Sold | |
Hedge, Income | | $ | 428,074 | | | $ | 42,089,153 | |
Derivative Investment Holdings Categorized by Risk Exposure
The following is a summary of the location of derivative investments on the Fund’s Statement of Assets and Liabilities as of September 30, 2023:
Derivative Investment Type | Asset Derivatives | Liability Derivatives |
Interest rate swap contracts | Unamortized upfront premiums paid on interest rate swap agreements | Unamortized upfront premiums received on interest rate swap agreements |
| Variation margin on interest rate swap agreements | |
Credit default swap contracts | Unamortized upfront premiums paid on credit default swap agreements | Unamortized upfront premiums received on credit default swap agreements |
| | | Variation margin on credit default swap agreements |
Equity/Interest rate option contracts | Investments in unaffiliated issuers, at value | Options written, at value |
Currency forward contracts | Unrealized appreciation on forward foreign currency exchange contracts | |
The following tables set forth the fair value of the Fund’s derivative investments categorized by primary risk exposure at September 30, 2023:
Asset Derivative Investments Value |
| | Swaps
Interest
Rate
Risk* | | | Swaps
Credit
Risk* | | | Forward
Foreign
Currency
Exchange
Risk | | | Options
Purchased
Interest Rate
Risk | | | Options
Written
Interest
Rate Risk | | | Total Value at
September 30,
2023 | |
| | | $ | — | | | $ | — | | | | 511,868 | | | $ | 914,715 | | | $ | — | | | $ | 1,426,583 | |
Liability Derivative Investments Value |
| | Swaps
Interest
Rate
Risk* | | | Swaps
Credit
Risk* | | | Forward
Foreign
Currency
Exchange
Risk | | | Options
Purchased
Interest Rate
Risk | | | Options
Written
Interest
Rate Risk | | | Total Value at
September 30,
2023 | |
| | | $ | 6,155,027 | | | $ | 959,187 | | | $ | — | | | $ | — | | | $ | 1,288,794 | | | $ | 8,403,008 | |
* | Includes cumulative appreciation (depreciation) of exchange-traded, OTC and centrally-cleared derivatives contracts as reported on the Schedule of Investments. For exchange-traded and centrally-cleared derivatives, variation margin is reported within the Fund’s Statement of Assets and Liabilities. |
44 | THE GUGGENHEIM FUNDS ANNUAL REPORT | |
NOTES TO FINANCIAL STATEMENTS (continued) |
The following is a summary of the location of derivative investments on the Fund’s Statement of Operations for the year ended September 30, 2023:
Derivative Investment Type | Location of Gain (Loss) on Derivatives |
Futures contracts | Net realized gain (loss) on futures contracts |
Interest/Credit swap contracts | Net realized gain (loss) on swap agreements |
| Net change in unrealized appreciation (depreciation) on swap agreements |
Interest rate option contracts | Net realized gain (loss) on options purchased |
| | Net realized gain (loss) on options written |
| | Net change in unrealized appreciation (depreciation) on options purchased |
| | Net change in unrealized appreciation (depreciation) on options written |
Currency forward contracts | Net realized gain (loss) on forward foreign currency exchange contracts |
| | Net change in unrealized appreciation (depreciation) on forward foreign currency exchange contracts |
The following is a summary of the Fund’s realized gain (loss) and change in unrealized appreciation (depreciation) on derivative investments recognized on the Fund’s Statement of Operations categorized by primary risk exposure for the year ended September 30, 2023:
Realized Gain (Loss) on Derivative Investments Recognized on the Statement of Operations |
| | Futures
Interest
Rate Risk | | | Swaps
Interest
Rate Risk | | | Swaps
Credit
Risk | | | Options
Written
Equity
Risk | | | Options
Purchased
Equity
Risk | | | Forward
Foreign
Currency
Exchange
Risk | | | Options
Purchased
Interest Rate
Risk | | | Options
Written
Interest
Rate Risk | | | Total | |
| | | $ | 1,551,516 | | | $ | 6,373,741 | | | $ | (1,323,707 | ) | | $ | 2,719,803 | | | $ | (4,306,390 | ) | | $ | 3,375,053 | | | $ | — | | | $ | (3,530,981 | ) | | $ | 4,859,035 | |
Change in Unrealized Appreciation (Depreciation) on Derivative Investments Recognized on the Statement of Operations |
| | Futures
Interest
Rate Risk | | | Swaps
Interest
Rate Risk | | | Swaps
Credit
Risk | | | Options
Written
Equity
Risk | | | Options
Purchased
Equity
Risk | | | Forward
Foreign
Currency
Exchange
Risk | | | Options
Purchased
Interest
Rate Risk | | | Options
Written
Interest
Rate Risk | | | Total | |
| | | $ | — | | | $ | (13,511,642 | ) | | $ | (562,939 | ) | | $ | 1,113,372 | | | $ | (8,650,164 | ) | | $ | (8,640,355 | ) | | $ | (2,054,220 | ) | | $ | 825,786 | | | $ | (31,480,162 | ) |
In conjunction with short sales and the use of derivative instruments, the Fund is required to maintain collateral in various forms. Depending on the financial instrument utilized and the broker involved, the Fund uses margin deposits at the broker, cash and/or securities segregated at the custodian bank, discount notes or repurchase agreements allocated to the Fund as collateral.
Foreign Investments
There are several risks associated with exposure to foreign currencies, foreign issuers and emerging markets. The Fund’s indirect and direct exposure to foreign currencies subjects the Fund to the risk that those currencies will decline in value relative to the U.S. dollar, or in the case of short positions, that the U.S. dollar will decline in value relative to the currency being hedged. Currency rates in foreign countries may fluctuate significantly over short periods of time for a number of reasons, including changes in interest rates and the imposition of currency controls or other political developments in the U.S. or abroad. In addition, the Fund may incur transaction costs in connection with conversions between various currencies. The Fund may, but is not obligated to, engage in currency hedging transactions, which generally involve buying currency forward, options or futures contracts. However, not all currency risks may be effectively hedged, and in some cases the costs of hedging techniques may outweigh expected benefits. In such instances, the value of securities denominated in foreign currencies can change significantly when foreign currencies strengthen or weaken relative to the U.S. dollar.
The Fund may invest in securities of foreign companies directly, or in financial instruments, such as ADRs and exchange-traded funds, which are indirectly linked to the performance of foreign issuers. Foreign markets can be more volatile than the U.S. market due to increased risks of adverse issuer, political, regulatory, market, or economic developments and can perform differently from the U.S. market. Investing in securities
| | THE GUGGENHEIM FUNDS ANNUAL REPORT | 45 |
NOTES TO FINANCIAL STATEMENTS (continued) |
of foreign companies directly, or in financial instruments that are indirectly linked to the performance of foreign issuers, may involve risks not typically associated with investing in U.S. issuers. The value of securities denominated in foreign currencies, and of dividends from such securities, can change significantly when foreign currencies strengthen or weaken relative to the U.S. dollar. Foreign securities markets generally have less trading volume and less liquidity than U.S. markets, and prices in some foreign markets may fluctuate more than those of securities
traded on U.S. markets. Many foreign countries lack accounting and disclosure standards comparable to those that apply to U.S. companies, and it may be more difficult to obtain reliable information regarding a foreign issuer’s financial condition and operations. Transaction costs and costs associated with custody services are generally higher for foreign securities than they are for U.S. securities. Some foreign governments levy withholding taxes against dividend and interest income. Although in some countries portions of these taxes are recoverable, the non-recovered portion will reduce the income received by the Fund.
The Trust has established counterparty credit guidelines and enters into transactions only with financial institutions rated/identified as investment grade or better. The Trust monitors the counterparty credit risk associated with each such financial institution.
Note 3 – Offsetting
In the normal course of business, the Fund enters into transactions subject to enforceable master netting arrangements or other similar arrangements. Generally, the right to offset in those agreements allows the Fund to counteract the exposure to a specific counterparty with collateral received from or delivered to that counterparty based on the terms of the arrangements. These arrangements provide for the right to liquidate upon the occurrence of an event of default, credit event upon merger or additional termination event.
In order to better define its contractual rights and to secure rights that will help the Fund mitigate its counterparty risk, the Fund may enter into an International Swaps and Derivatives Association, Inc. Master Agreement (“ISDA Master Agreement”) or similar agreement with its derivative contract counterparties. An ISDA Master Agreement is a bilateral agreement between a fund and a counterparty that governs OTC derivatives, including foreign exchange contracts, and typically contains, among other things, collateral posting terms and netting provisions in the event of a default and/or termination event. The provisions of the ISDA Master Agreement typically permit a single net payment in the event of a default (close-out netting) or similar event, including the bankruptcy or insolvency of the counterparty.
For derivatives traded under an ISDA Master Agreement, the collateral requirements are typically calculated by netting the mark-to-market amount for each transaction under such agreement and comparing that amount to the value of any collateral currently pledged by the Fund and the counterparty. For financial reporting purposes, cash collateral that has been pledged to cover obligations of the Fund and cash collateral received from the counterparty, if any, are reported separately on the Fund’s Statement of Assets and Liabilities as segregated cash with broker/receivable for variation margin, or payable for swap settlement/variation margin. Cash and/or securities pledged or received as collateral by the Fund in connection with an OTC derivative subject to an ISDA Master Agreement generally may not be invested, sold or rehypothecated by the counterparty or the Fund, as applicable, absent an event of default under such agreement, in which case such collateral generally may be applied towards obligations due to and payable by such counterparty or the Fund, as applicable. Generally, the amount of collateral due from or to a counterparty must exceed a minimum transfer amount threshold (e.g., $300,000) before a transfer is required to be made. To the extent amounts due to the Fund from its counterparties are not fully collateralized, contractually or otherwise, the Fund bears the risk of loss from counterparty nonperformance. The Fund attempts to mitigate counterparty risk by only entering into agreements with counterparties that it believes to be of good standing and by monitoring the financial stability of those counterparties.
For financial reporting purposes, the Fund does not offset derivative assets and derivative liabilities that are subject to netting arrangements in the Fund’s Statement of Assets and Liabilities.
46 | THE GUGGENHEIM FUNDS ANNUAL REPORT | |
NOTES TO FINANCIAL STATEMENTS (continued) |
The following tables present derivative financial instruments and secured financing transactions that are subject to enforceable netting arrangements:
| | | | | | | | | | | | | | | Gross Amounts Not Offset
in the Statement of
Assets and Liabilities | | | | | |
Instrument | | Gross
Amounts of
Recognized
Assets | | | Gross
Amounts
Offset in the
Statement of
Assets and
Liabilities | | | Net Amount
of Assets
Presented on
the Statement
of Assets and
Liabilities | | | Financial
Instruments | | | Cash
Collateral
Received | | | Net Amount | |
Options Purchased | | $ | 914,715 | | | $ | — | | | | 914,715 | | | $ | (313,462 | ) | | $ | (400,000 | ) | | $ | 201,253 | |
Forward foreign currency exchange contracts | | | 511,868 | | | | — | | | | 511,868 | | | | (511,868 | ) | | | — | | | | — | |
| | | | | | | | | | | | | | | Gross Amounts Not
Offset in the Statement of
Assets and Liabilities | | | | | |
Instrument | | Gross
Amounts of
Recognized
Liabilities | | | Gross
Amounts
Offset in the
Statement of
Assets and
Liabilities | | | Net Amounts
of Assets
Presented on
the Statement
of Assets and
Liabilities | | | Financial
Instruments | | | Cash
Collateral
Pledged | | | Net Amount | |
Options Written | | $ | 1,288,794 | | | $ | — | | | $ | 1,288,794 | | | $ | (825,330 | ) | | $ | — | | | $ | 463,464 | |
The Fund has the right to offset deposits against any related derivative liabilities outstanding with each counterparty with the exception of exchange-traded or centrally-cleared derivatives. The following table presents deposits held by others in connection with derivative investments as of September 30, 2023.
Counterparty | Asset Type | | Cash Pledged | | | Cash Received | |
BofA Securities, Inc. | Credit default swap agreements | | $ | 1,124,856 | | | $ | — | |
BofA Securities, Inc. | Interest rate swap agreements | | | 1,035,747 | | | | — | |
Goldman Sachs International | Options | | | — | | | | 90,000 | |
Morgan Stanley Capital Services LLC | Options | | | — | | | | 310,000 | |
| | | | | 2,160,603 | | | | 400,000 | |
Note 4 – Fair Value Measurement
In accordance with U.S. GAAP, fair value is defined as the price that the Fund would receive to sell an investment or pay to transfer a liability in an orderly transaction between market participants at the measurement date. U.S. GAAP establishes a three-tier fair value hierarchy based on the types of inputs used to value assets and liabilities and requires corresponding disclosure. The hierarchy and the corresponding inputs are summarized below:
Level 1 — | unadjusted quoted prices in active markets for identical assets or liabilities. |
Level 2 — | significant other observable inputs (for example quoted prices for securities that are similar based on characteristics such as interest rates, prepayment speeds, credit risk, etc.). |
Level 3 — | significant unobservable inputs based on the best information available under the circumstances, to the extent observable inputs are not available, which may include assumptions. |
| | THE GUGGENHEIM FUNDS ANNUAL REPORT | 47 |
NOTES TO FINANCIAL STATEMENTS (continued) |
Rule 2a-5 sets forth a definition of “readily available market quotations,” which is consistent with the definition of a Level 1 input under U.S. GAAP. Rule 2a-5 provides that “a market quotation is readily available only when that quotation is a quoted price (unadjusted) in active markets for identical investments that the fund can access at the measurement date, provided that a quotation will not be readily available if it is not reliable.”
Securities for which market quotations are not readily available must be valued at fair value as determined in good faith. Accordingly, any security priced using inputs other than Level 1 inputs will be subject to fair value requirements. The types of inputs available depend on a variety of factors, such as the type of security and the characteristics of the markets in which it trades, if any. Fair valuation determinations that rely on fewer or no observable inputs require greater judgment. Accordingly, fair value determinations for Level 3 securities require the greatest amount of judgment.
Pricing service providers are used to value a majority of the Fund’s investments. When values are not available from a pricing service provider, they will be determined using a variety of sources and techniques, including: market prices; broker quotes; and models which derive prices based on inputs such as prices of securities with comparable maturities and characteristics or based on inputs such as anticipated cash flows or collateral, spread over U.S. Treasury securities, and other information and analysis. A significant portion of the Fund’s assets and liabilities are categorized as Level 2, as indicated in this report.
Quotes from broker-dealers, adjusted for fluctuations in criteria such as credit spreads and interest rates, may also be used to value the Fund’s assets and liabilities, i.e. prices provided by a broker-dealer or other market participant who has not committed to trade at that price. Although quotes are typically received from established market participants, the Fund may not have the transparency to view the underlying inputs which support the market quotations. Significant changes in a quote would generally result in significant changes in the fair value of the security.
Certain fixed income securities are valued by obtaining a monthly quote from a broker-dealer, adjusted for fluctuations in criteria such as credit spreads and interest rates.
Certain loans and other securities are valued using a single daily broker quote or a price from a pricing service provider based on a single daily or monthly broker quote.
The inputs or methodologies selected and applied for valuing securities or other assets are not necessarily an indication of the risk associated with investing in those securities. The suitability, appropriateness and accuracy of the techniques, methodologies and sources employed to determine fair valuation are periodically reviewed and subject to change.
Note 5 – Investment Advisory Agreement and Other Agreements
Under the terms of an investment advisory contract, the Fund pays GI investment advisory fees calculated at an annualized rate of 0.39% of the average daily net assets of the Fund.
GI pays operating expenses on behalf of the Trust, such as audit and accounting related services, legal services, custody, printing and mailing, among others, on a pass-through basis. Such expenses are allocated to various Funds within the complex based on relative net assets.
The Board has adopted Distribution Plans related to the offering of A-Class, C-Class and P-Class shares pursuant to Rule 12b-1 under the 1940 Act. The plans provide for payments at an annual rate of 0.25% of the average daily net assets of the Fund’s A-Class and P-Class shares, and 1.00% of the average daily net assets of the Fund’s C-Class shares.
48 | THE GUGGENHEIM FUNDS ANNUAL REPORT | |
NOTES TO FINANCIAL STATEMENTS (continued) |
The investment advisory contract for the Fund provides that the total expenses be limited to a percentage of average net assets for each class of shares, exclusive of brokerage costs, dividends or interest on securities sold short, expenses of other investment companies in which the Fund invests, interest, taxes, litigation, indemnification and extraordinary expenses. The limits are listed below:
| | Limit | | | Effective
Date | | | Contract
End Date | |
A-Class | | | 0.75 | % | | | 12/01/13 | | | | 02/01/25 | |
C-Class | | | 1.50 | % | | | 12/01/13 | | | | 02/01/25 | |
P-Class | | | 0.75 | % | | | 05/01/15 | | | | 02/01/25 | |
Institutional Class | | | 0.50 | % | | | 12/01/13 | | | | 02/01/25 | |
R6-Class | | | 0.50 | % | | | 03/13/19 | | | | 02/01/25 | |
GI is entitled to reimbursement by the Fund for fees waived or expenses reimbursed during any of the previous 36 months, beginning on the date of the expense limitation agreement, if on any day the estimated operating expenses are less than the indicated percentages. For purposes of this arrangement, GI is entitled to recoupment of previously waived fees or reimbursed expenses for 36 months from the date of the waiver or reimbursement by GI. At September 30, 2023, the amount of fees waived or expenses reimbursed that are subject to recoupment and will expire during the years ended September 30, are presented in the following table:
| | 2024 | | | 2025 | | | 2026 | | | Fund
Total | |
A-Class | | $ | 332,853 | | | $ | 400,848 | | | $ | 95,368 | | | $ | 829,069 | |
C-Class | | | 80,424 | | | | 68,209 | | | | 36,276 | | | | 184,909 | |
P-Class | | | 146,751 | | | | 202,943 | | | | 28,742 | | | | 378,436 | |
Institutional Class | | | 2,560,156 | | | | 3,164,191 | | | | 2,123,104 | | | | 7,847,451 | |
R6-Class | | | — | | | | — | | | | 1,175 | | | | 1,175 | |
For the year ended September 30, 2023, GI recouped $137,428 from the Fund.
If the Fund invests in a fund that is advised by the same adviser or an affiliated adviser, the investing Fund’s adviser has agreed to waive fees at the investing fund level to the extent necessary to offset the proportionate share of any management fee paid by the Fund with respect to its investment in such affiliated fund. Fee waivers will be calculated at the investing fund level without regard to any expense cap, if any, in effect for the investing fund. Fees waived under this arrangement are not subject to reimbursement to GI. For the year ended September 30, 2023, the Fund waived $73,696 related to investments in affiliated funds.
For the year ended September 30, 2023, GFD retained sales charges of $132,849 relating to sales of A-Class shares of the Trust.
Certain trustees and officers of the Trust are also officers of GI and/or GFD. The Trust does not compensate its officers or trustees who are officers, directors and/or employees of GI or GFD.
MUFG Investor Services (US), LLC (“MUIS”) acts as the Fund’s administrator, transfer agent and accounting agent. As administrator, transfer agent and accounting agent, MUIS maintains the books and records of the Fund’s securities and cash. The Bank of New York Mellon Corp. (“BNY”) acts as the Fund’s custodian. As custodian, BNY is responsible for the custody of the Fund’s assets. For providing the aforementioned administrative and accounting services, MUIS is entitled to receive a monthly fee equal to a percentage of the Fund’s average daily net assets and out of pocket expenses. For providing the aforementioned transfer agent and custodian services, MUIS and BNY are entitled to receive a monthly fee based on the number of transactions during the month and the number of accounts under management, subject to certain minimum monthly fees, and out of pocket expenses.
Note 6 – Federal Income Tax Information
The Fund intends to comply with the provisions of Subchapter M of the Internal Revenue Code of 1986, as amended (the “Internal Revenue Code”), applicable to regulated investment companies and will distribute substantially all taxable net investment income and capital gains sufficient to relieve the Fund from all, or substantially all, federal income, excise and state income taxes. Therefore, no provision for federal or state income tax or federal excise tax is required.
| | THE GUGGENHEIM FUNDS ANNUAL REPORT | 49 |
NOTES TO FINANCIAL STATEMENTS (continued) |
Tax positions taken or expected to be taken in the course of preparing the Fund’s tax returns are evaluated to determine whether the tax positions are “more-likely-than-not” of being sustained by the applicable tax authority. Tax positions not deemed to meet the more-likely-than-not threshold would be recorded as a tax benefit or expense in the current year. Management has analyzed the Fund’s tax positions taken, or to be taken, on U.S. federal income tax returns for all open tax years, and has concluded that no provision for income tax is required in the Fund’s financial statements. The Fund’s U.S. federal income tax returns are subject to examination by the Internal Revenue Service (“IRS”) for a period of three years after they are filed.
The tax character of distributions paid during the year ended September 30, 2023 was as follows:
| | Ordinary
Income | | | Long-Term
Capital Gain | | | Total
Distributions | |
| | | $ | 163,997,722 | | | $ | — | | | $ | 163,997,722 | |
The tax character of distributions paid during the year ended September 30, 2022 was as follows:
| | Ordinary
Income | | | Long-Term
Capital Gain | | | Total
Distributions | |
| | | $ | 112,022,155 | | | $ | 16,532,782 | | | $ | 128,554,937 | |
Note: For U.S. federal income tax purposes, short-term capital gain distributions are treated as ordinary income distributions.
The tax components of distributable earnings/(loss) as of September 30, 2023 were as follows:
| | Undistributed
Ordinary
Income | | | Undistributed
Long-Term
Capital Gain | | | Net Unrealized
Appreciation
(Depreciation) | | | Accumulated
Capital and
Other Losses | | | Other
Temporary
Differences | | | Total | |
| | | $ | 17,156,119 | | | $ | — | | | $ | (269,385,190 | ) | | $ | (83,014,525 | ) | | $ | (15,790,184 | ) | | $ | (351,033,780 | ) |
For U.S. federal income tax purposes, capital loss carryforwards represent realized losses of the Fund that may be carried forward and applied against future capital gains. The Fund is permitted to carry forward capital losses for an unlimited period and such capital loss carryforwards retain their character as either short-term or long-term capital losses. As of September 30, 2023, capital loss carryforwards for the Fund were as follows:
| | | Unlimited | | | Total
Capital Loss | |
| | Short-Term | | | Long-Term | | | Carryforward | |
| | | $ | (5,433,608 | ) | | $ | (77,580,917 | ) | | $ | (83,014,525 | ) |
Net investment income and net realized gains (losses) may differ for financial statement and tax purposes because of temporary or permanent book/tax differences. These differences are primarily due to investments in swap agreements and CLO investments, foreign currency gains and losses, the “mark-to-market” of certain derivatives, losses deferred due to wash sales, paydown reclasses, dividends payable, and the disposition of certain Passive Foreign Investment Companies (PFICs). Additional differences may result from the tax treatment of bond premium/discount amortization, income accruals on certain investments, and the “mark-to-market” of certain investments denominated in foreign currencies. To the extent these differences are permanent and would require a reclassification between Paid in Capital and Total Distributable Earnings (Loss), such reclassifications are made in the period that the differences arise. These reclassifications have no effect on net assets or NAV per share.
There were no adjustments made on the Statement of Assets and Liabilities as of September 30, 2023 for permanent book/tax differences.
50 | THE GUGGENHEIM FUNDS ANNUAL REPORT | |
NOTES TO FINANCIAL STATEMENTS (continued) |
At September 30, 2023, the cost of investments for U.S. federal income tax purposes, the aggregate gross unrealized appreciation for all investments for which there was an excess of value over tax cost, and the aggregate gross unrealized depreciation for all investments for which there was an excess of tax cost over value, were as follows:
| | Tax
Cost | | | Tax
Unrealized
Appreciation | | | Tax
Unrealized
Depreciation | | | Net Tax
Unrealized
(Depreciation) | |
| | | $ | 4,320,230,804 | | | $ | — | | | $ | (269,369,405 | ) | | $ | (269,369,405 | ) |
Note 7 – Securities Transactions
For the year ended September 30, 2023, the cost of purchases and proceeds from sales of investment securities, excluding government securities, short-term investments and derivatives, were as follows:
| | Purchases | | | Sales | |
| | | $ | 479,533,734 | | | $ | 1,537,356,280 | |
For the year ended September 30, 2023, the cost of purchases and proceeds from sales of government securities were as follows:
| | Purchases | | | Sales | |
| | | $ | 568,933,362 | | | $ | 251,426,706 | |
The Fund is permitted to purchase or sell securities from or to certain affiliated funds under specified conditions outlined in procedures adopted by the Board. The procedures have been designed to ensure that any purchase or sale of securities by the Fund from or to another fund or portfolio that is or could be considered an affiliate by virtue of having a common investment adviser (or affiliated investment advisers), common trustees and/or common officers complies with Rule 17a-7 of the 1940 Act. Further, as defined under these procedures, each transaction is effected at the current market price to save costs, where permissible. For the year ended September 30, 2023, the Fund did not engage in purchases and sales of securities, pursuant to Rule 17a-7 of the 1940 Act.
Note 8 – Unfunded Loan Commitments
Pursuant to the terms of certain loan agreements, the Fund held unfunded loan commitments as of September 30, 2023. The Fund is obligated to fund these loan commitments at the borrower’s discretion.
The unfunded loan commitments as of September 30, 2023, were as follows:
Borrower | | Maturity Date | | | Face Amount | | | Value | |
Fontainbleau Vegas | | | 01/31/26 | | | $ | 797,724 | | | $ | — | |
Lightning A | | | 03/01/37 | | | | 3,131,817 | | | | — | |
Thunderbird A | | | 03/01/37 | | | | 3,178,667 | | | | — | |
| | | | | | | | | | | $ | — | |
| | THE GUGGENHEIM FUNDS ANNUAL REPORT | 51 |
NOTES TO FINANCIAL STATEMENTS (continued) |
Note 9 – Restricted Securities
The securities below are considered illiquid and restricted under guidelines established by the Board:
Restricted Securities | | Acquisition Date | | | Cost | | | Value | |
Cascade Funding Mortgage Trust | | | | | | | | | | | | |
2018-RM2 4.00% (WAC) due 10/25/681 | | | 11/02/18 | | | $ | 4,394,744 | | | $ | 4,332,785 | |
Cascade Funding Mortgage Trust | | | | | | | | | | | | |
2019-RM3 2.80% (WAC) due 06/25/691 | | | 06/25/19 | | | | 899,962 | | | | 872,863 | |
CFMT LLC | | | | | | | | | | | | |
2022-HB9 3.25% (WAC) due 09/25/371 | | | 09/23/22 | | | | 1,930,733 | | | | 1,865,144 | |
Copper River CLO Ltd. | | | | | | | | | | | | |
2007-1A INC, due 01/20/212 | | | 05/09/14 | | | | — | | | | 50 | |
LSTAR Securities Investment Ltd. | | | | | | | | | | | | |
2021-1 8.24% (1 Month Term SOFR + 2.91%, Rate Floor: 1.80%) due 02/01/261 | | | 02/04/21 | | | | 6,824,430 | | | | 6,698,014 | |
Towd Point Revolving Trust | | | | | | | | | | | | |
4.83% due 09/25/64 | | | 03/17/22 | | | | 18,499,936 | | | | 17,986,625 | |
| | | | | | | $ | 32,549,805 | | | $ | 31,755,481 | |
1 | Variable rate security. Rate indicated is the rate effective at September 30, 2023. In some instances, the effective rate is limited by a minimum rate floor or a maximum rate cap established by the issuer. The settlement status of a position may also impact the effective rate indicated. In some cases, a position may be unsettled at period end and may not have a stated effective rate. In instances where multiple underlying reference rates and spread amounts are shown, the effective rate is based on a weighted average. |
2 | Security has no stated coupon. However, it is expected to receive residual cash flow payments on defined deal dates. |
Note 10 – Reverse Repurchase Agreements
The Fund may enter into reverse repurchase agreements. Under a reverse repurchase agreement, a Fund sells securities and agrees to repurchase them at a particular price at a future date. In the event the buyer of securities under a reverse repurchase agreement files for bankruptcy or becomes insolvent, such buyer or its trustee or receiver may receive an extension of time to determine whether to enforce the Fund’s obligation to repurchase the securities, and the Fund’s use of the proceeds of the reverse repurchase agreement may effectiviely be restricted pending such decision.
For the year ended September 30, 2023, the Fund entered into reverse repurchase agreements as follows:
| | Number of Days
Outstanding | | | Balance at
September 30, 2023 | | | Average Balance
Outstanding | | | Average
Interest Rate | |
| | | | 103 | | | $ | — | * | | $ | 64,506,185 | | | | 4.28 | % |
* | As of September 30, 2023, there were no open reverse repurchase agreements. |
Note 11 – Line of Credit
The Trust, along with other affiliated trusts, secured a 364-day committed, $1,150,000,000 line of credit from Citibank, N.A., which was in place through September 29, 2023, at which time a new line of credit was entered into in the amount of $1,165,000,000. The Fund may draw (borrow) from the line of credit as a temporary measure for emergency purposes, to facilitate redemption requests, or for other short-term liquidity purposes consistent with the Fund’s investment objective and program. For example, it may be advantageous for the Fund to borrow money rather than sell existing portfolio positions to meet redemption requests. Fees related to borrowings, if any, vary under this arrangement between the greater of Citibank’s “base rate”, SOFR plus 1%, or the federal funds rate plus 1/2 of 1%.
The commitment fee that may be paid by the Fund is at an annualized rate of 0.15% of the average daily amount of its allocated unused commitment amount. The commitment fee amount is allocated to the individual Funds based on the respective net assets of each participating Fund and is referenced in the Fund’s Statement of Operations under “Line of credit fees”. The Fund did not have any borrowings under this agreement as of and for the year ended September 30, 2023.
52 | THE GUGGENHEIM FUNDS ANNUAL REPORT | |
NOTES TO FINANCIAL STATEMENTS (concluded) |
Note 12 – Market Risks
The value of, or income generated by, the investments held by the Fund are subject to the possibility of rapid and unpredictable fluctuation, and loss that may result from various factors. These factors include, among others, developments affecting individual companies, or from broader influences, including real or perceived changes in prevailing interest rates (which have since risen and may continue to rise), changes in inflation rates or expectations about inflation rates (which are currently elevated relative to normal conditions), adverse investor confidence or sentiment, changing economic, political (including geopolitical), social or financial market conditions, increased instability or general uncertainty, environmental disasters, governmental actions, public health emergencies (such as the spread of infectious diseases, pandemics and epidemics), debt crises, actual or threatened wars or other armed conflicts (such as the current Russia-Ukraine conflict and its risk of expansion or collateral economic and other effects) or ratings downgrades, and other similar events, each of which may be temporary or last for extended periods. Moreover, changing economic, political, geopolitical, social, financial market or other conditions in one country or geographic region could adversely affect the value, yield and return of the investments held by the Fund in a different country or geographic region, economy, and market because of the increasingly interconnected global economies and financial markets. The duration and extent of the foregoing types of factors or conditions are highly uncertain and difficult to predict and have in the past, and may in the future, cause volatility and distress in economies and financial markets or other adverse circumstances, which may negatively affect the value of the Fund’s investments and performance of the Fund.
Note 13 – Subsequent Events
The Fund evaluated subsequent events through the date the financial statements are issued and determined there were no material events that would require adjustment to or disclosure in the Fund’s financial statements.
| | THE GUGGENHEIM FUNDS ANNUAL REPORT | 53 |
REPORT OF INDEPENDENT REGISTERED PUBLIC ACCOUNTING FIRM |
To the Shareholders and the Board of Trustees of Guggenheim Limited Duration Fund
Opinion on the Financial Statements
We have audited the accompanying statement of assets and liabilities of Guggenheim Limited Duration Fund (the “Fund”), (one of the funds constituting Guggenheim Funds Trust (the “Trust”)), including the schedule of investments, as of September 30, 2023, and the related statement of operations for the year then ended, the statements of changes in net assets for each of the two years in the period then ended, the financial highlights for each of the five years in the period then ended and the related notes (collectively referred to as the “financial statements”). In our opinion, the financial statements present fairly, in all material respects, the financial position of the Fund (one of the funds constituting Guggenheim Funds Trust) at September 30, 2023, the results of its operations for the year then ended, the changes in its net assets for each of the two years in the period then ended and its financial highlights for each of the five years in the period then ended, in conformity with U.S. generally accepted accounting principles.
Basis for Opinion
These financial statements are the responsibility of the Trust’s management. Our responsibility is to express an opinion on the Fund’s financial statements based on our audits. We are a public accounting firm registered with the Public Company Accounting Oversight Board (United States) (“PCAOB”) and are required to be independent with respect to the Trust in accordance with the U.S. federal securities laws and the applicable rules and regulations of the Securities and Exchange Commission and the PCAOB.
We conducted our audits in accordance with the standards of the PCAOB. Those standards require that we plan and perform the audit to obtain reasonable assurance about whether the financial statements are free of material misstatement, whether due to error or fraud. The Trust is not required to have, nor were we engaged to perform, an audit of the Fund’s internal control over financial reporting. As part of our audits, we are required to obtain an understanding of internal control over financial reporting but not for the purpose of expressing an opinion on the effectiveness of the Trust’s internal control over financial reporting. Accordingly, we express no such opinion.
Our audits included performing procedures to assess the risks of material misstatement of the financial statements, whether due to error or fraud, and performing procedures that respond to those risks. Such procedures included examining, on a test basis, evidence regarding the amounts and disclosures in the financial statements. Our procedures included confirmation of securities owned as of September 30, 2023, by correspondence with the custodian, transfer agent, brokers, and paying agents; when replies were not received from brokers or paying agents, we performed other auditing procedures. Our audits also included evaluating the accounting principles used and significant estimates made by management, as well as evaluating the overall presentation of the financial statements. We believe that our audits provide a reasonable basis for our opinion.

We have served as the auditor of one or more Guggenheim investment companies since 1979.
Tysons, Virginia
November 28, 2023
54 | THE GUGGENHEIM FUNDS ANNUAL REPORT | |
OTHER INFORMATION (Unaudited) |
Federal Income Tax Information
This information is being provided as required by the Internal Revenue Code. Amounts shown may differ from those elsewhere in the report because of differences in tax and financial reporting practice.
In January 2024, shareholders will be advised on IRS Form 1099 DIV or substitute 1099 DIV as to the federal tax status of the distributions received by shareholders in the calendar year 2023.
The Fund’s investment income (dividend income plus short-term capital gains, if any) qualifies as follows:
Of the taxable ordinary income distributions paid during the fiscal year ending September 30, 2023, the Fund had the corresponding percentages qualify for the reduced tax rate pursuant to the Jobs and Growth Tax Relief and Reconciliation Act of 2003 or for the dividends received deduction for corporations. See the qualified dividend income and dividend received deduction columns, respectively, in the table below.
Additionally, of the taxable ordinary income distributions paid during the fiscal year ended September 30, 2023, the Fund had the corresponding percentage qualify as interest related dividends as permitted by IRC Section 871(k)(1). See the qualified interest income column in the table below.
| | Qualified
Dividend
Income | | Dividend
Received
Deduction | | Qualified
Interest
Income |
| | | | 0.08 | % | | | 0.08 | % | | | 72.79 | % |
Delivery of Shareholder Reports
Paper copies of the Fund’s annual and semi-annual shareholder reports are not sent by mail, unless you specifically request paper copies of the reports from the Fund or from your financial intermediary. Instead, the reports are made available on a website, and you are notified by mail each time a report is posted and provided with a website link to access the report.
You may elect to receive all future shareholder reports in paper free of charge. If you hold shares of the Fund directly, you can inform the Fund that you wish to receive paper copies of reports by calling 800.820.0888. If you hold shares of the Fund through a financial intermediary, please contact the financial intermediary to make this election. Your election to receive reports in paper may apply to all Guggenheim Funds in which you are invested and may apply to all Guggenheim funds held with your financial intermediary.
Tailored Shareholder Reports for Open-End Mutual Funds and Exchange-Traded Funds
Effective January 24, 2023, the SEC adopted rule and form amendments to require open-end mutual funds and exchange-traded funds registered on Form N-1A to transmit concise and visually engaging streamlined annual and semi-annual reports to shareholders that highlight key information. Other information, including financial statements, will no longer appear in a streamlined shareholder report but must be available online, delivered free of charge upon request, and filed on a semi-annual basis on Form N-CSR. The rule and form amendments have a compliance date of July 24, 2024. At this time, management is evaluating the impact of these amendments on the shareholder reports for the Fund.
Proxy Voting Information
A description of the policies and procedures that the Trust uses to determine how to vote proxies relating to securities held in the Fund’s portfolio is available, without charge and upon request, by calling 800.820.0888. This information is also available from the EDGAR database on the SEC’s website at https://www.sec.gov.
Information regarding how the Fund voted proxies relating to portfolio securities during the most recent 12-month period ended June 30 is available without charge, upon request, by calling 800.820.0888. This information is also available from the EDGAR database on the SEC’s website at https://www.sec.gov.
| | THE GUGGENHEIM FUNDS ANNUAL REPORT | 55 |
OTHER INFORMATION (Unaudited)(continued) |
Sector Classification
Information in the Schedule of Investments is categorized by sectors using sector-level Classifications defined by the Bloomberg Industry Classification System, a widely recognized industry classification system provider. The Fund’s registration statement has investment policies relating to concentration in specific sectors/industries. For purposes of these investment policies, the Fund usually classifies sectors/industries based on industry-level Classifications used by widely recognized industry classification system providers such as Bloomberg Industry Classification System, Global Industry Classification Standards and Barclays Global Classification Scheme.
Quarterly Portfolio Schedules Information
The Trust files its complete schedule of portfolio holdings with the SEC for the first and third quarters of each fiscal year as an exhibit to its reports on Form N-PORT, and for reporting periods ended prior to March 31, 2019, filed such information on Form N-Q. The Fund’s Forms N-PORT and N-Q are available on the SEC’s website at https://www.sec.gov. Copies of the portfolio holdings are also available to shareholders, without charge and upon request, by calling 800.820.0888.
Report of the Guggenheim Funds Trust Board of Trustees
The Board of Trustees of Guggenheim Funds Trust (the “Trust”), including the Independent Trustees, unanimously approved the renewal of the investment management agreements (as applicable to a specific Fund, the “Advisory Agreement” and collectively, the “Advisory Agreements”) with Security Investors, LLC (“Security Investors”) and Guggenheim Partners Investment Management, LLC (“GPIM”) on behalf of the applicable series of the Trust listed below (each a “Fund” and collectively, the “Funds”) and the investment sub-advisory agreement between Security Investors and GPIM on behalf of Guggenheim Municipal Income Fund (the “Sub-Advisory Agreement” and together with the “Advisory Agreements,” the “Agreements”):
● | Guggenheim Alpha Opportunity Fund (“Alpha Opportunity Fund”)* | ● | Guggenheim Core Bond Fund (“Core Bond Fund”)* |
● | Guggenheim Diversified Income Fund (“Diversified Income Fund”)** | ● | Guggenheim Floating Rate Strategies Fund (“Floating Rate Strategies Fund”)** |
● | Guggenheim High Yield Fund (“High Yield Fund”)* | ● | Guggenheim Large Cap Value Fund (“Large Cap Value Fund”)* |
● | Guggenheim Limited Duration Fund (“Limited Duration Fund”)** | ● | Guggenheim Macro Opportunities Fund (“Macro Opportunities Fund”)**1 |
● | Guggenheim Market Neutral Real Estate Fund (“Market Neutral Real Estate Fund”)** | ● | Guggenheim Municipal Income Fund (“Municipal Income Fund”)* |
● | Guggenheim Risk Managed Real Estate Fund (“Risk Managed Real Estate Fund”)** | ● | Guggenheim Small Cap Value Fund (“Small Cap Value Fund”)* |
● | Guggenheim SMid Cap Value Fund (“SMid Cap Value Fund”)* | ● | Guggenheim StylePlus—Large Core Fund (“StylePlus—Large Core Fund”)* |
● | Guggenheim StylePlus—Mid Growth Fund (“StylePlus—Mid Growth Fund”)* | ● | Guggenheim Total Return Bond Fund (“Total Return Bond Fund”)** |
● | Guggenheim Ultra Short Duration Fund (“Ultra Short Duration Fund”)** | ● | Guggenheim World Equity Income Fund (“World Equity Income Fund”)* |
* | Security Investors serves as investment adviser to the Fund. |
** | GPIM serves as investment adviser to the Fund. Unless the context indicates otherwise, GPIM and Security Investors, with respect to their service as investment adviser to the applicable Funds, are each referred to herein as an “Adviser” and together, the “Advisers.” |
1 | GPIM also serves as investment adviser to Guggenheim Macro Opportunities Fund CFC (the “Subsidiary”), a wholly-owned subsidiary of Macro Opportunities Fund that is organized as a limited company under the laws of the Cayman Islands and used by Macro Opportunities Fund to obtain commodities exposure. Pursuant to a separate investment advisory agreement for the Subsidiary (the “Subsidiary Advisory Agreement”), the Subsidiary pays GPIM an advisory fee at the same rate that Macro Opportunities Fund pays GPIM under its Advisory Agreement. The Subsidiary Advisory Agreement does not require annual renewal by the Board and will continue until it is terminated as provided in the Agreement. In addition, GPIM and Macro Opportunities Fund have entered into a separate fee waiver agreement pursuant to which GPIM has contractually agreed to waive the advisory fee it receives from Macro Opportunities Fund in an amount equal to the advisory fee paid to GPIM by the Subsidiary. This undertaking will continue for so long as Macro Opportunities Fund invests in the Subsidiary, and may be terminated only with the approval of the Board. |
56 | THE GUGGENHEIM FUNDS ANNUAL REPORT | |
OTHER INFORMATION (Unaudited)(continued) |
Security Investors and GPIM are each an indirect subsidiary of Guggenheim Partners, LLC, a privately-held, global investment and advisory firm (“Guggenheim Partners”). Guggenheim Partners, Security Investors, GPIM and their affiliates may be referred to herein collectively as “Guggenheim.” Security Investors and GPIM are also known as “Guggenheim Investments,” the global asset management and investment advisory division of Guggenheim Partners that includes other affiliated investment management businesses.
At meetings held in person on April 17-18, 2023 (the “April Meeting”) and meetings held by videoconference on May 15, 2023 and in person on May 24, 2023 (the “May Meeting”), the Contracts Review Committee of the Board (the “Committee”), consisting solely of the Independent Trustees, met separately from Guggenheim to consider the proposed renewal of the Agreements. As part of its review process, the Committee was represented by independent legal counsel to the Independent Trustees (“Independent Legal Counsel”), from whom the Independent Trustees received separate legal advice and with whom they met separately. Independent Legal Counsel reviewed and discussed with the Committee various key aspects of the Trustees’ legal responsibilities relating to the proposed renewal of the Agreements and other principal contracts. The Committee took into account various materials received from Guggenheim and Independent Legal Counsel. The Committee also considered the variety of written materials, reports and oral presentations the Board received throughout the year regarding performance and operating results of the Funds, and other information relevant to its evaluation of the Agreements.
In connection with the contract review process, FUSE Research Network LLC (“FUSE”), an independent, third-party research provider, was engaged to prepare advisory contract renewal reports designed specifically to help the Board fulfill its advisory contract renewal responsibilities. The objective of the FUSE reports is to present the subject funds’ relative position regarding fees, expenses and total return performance, with peer group and universe comparisons. The Committee assessed the data provided in the FUSE reports as well as commentary presented by Guggenheim, including, among other things, a summary of notable distinctions between certain Funds and the applicable peer group identified in the FUSE reports and explanations for custom peer groups created for certain Funds that do not fit well into any particular category. The Committee noted that although FUSE’s process typically results in the identification for each Fund of a universe of similar funds for performance comparisons and a narrower group of similar funds from the universe based on asset levels for comparative fee and expense data evaluation (i.e., the peer group), the peer group constituent funds identified by FUSE for Market Neutral Real Estate Fund were the same as the performance universe constituent funds due to the Fund’s investment strategy.
In addition, Guggenheim provided materials and data in response to formal requests for information sent by Independent Legal Counsel on behalf of the Committee. Guggenheim also made a presentation at the April Meeting. Throughout the process, the Committee asked questions of management and requested certain additional information, which Guggenheim provided (collectively with the foregoing reports and materials, the “Contract Review Materials”). The Committee considered the Contract Review Materials in the context of its accumulated experience governing the Trust and other Guggenheim funds and weighed the factors and standards discussed with Independent Legal Counsel.
Following an analysis and discussion of relevant factors, including those identified below, and in the exercise of its business judgment, the Committee concluded that it was in the best interest of each Fund to recommend that the Board approve the renewal of the applicable Agreements for an additional annual term. Following its review of the Committee’s recommendation, the Board approved the renewal of the applicable Agreements for each Fund for a one-year period ending August 1, 2024 at a meeting held on May 23-24, 2023 (the “May Board Meeting” and together with the May Meeting, the “May Meetings”) and determined to adopt the Committee’s considerations and conclusions, which follow.
Advisory Agreements
Nature, Extent and Quality of Services Provided by Each Adviser: With respect to the nature, extent and quality of services currently provided by each Adviser, the Committee considered the qualifications, experience and skills of key personnel performing services for the Funds, including those personnel providing compliance and risk oversight, as well as the supervisors and reporting lines for such personnel. The Committee also considered other information, including Guggenheim’s resources and related efforts to retain, attract and motivate capable personnel to serve the Funds. In evaluating Guggenheim’s resources and capabilities, the Committee considered Guggenheim’s commitment to focusing on, and investing resources in support of, funds in the Guggenheim fund complex, including the Funds. The Committee also considered Guggenheim’s discussion of its ongoing review of the Guggenheim fund line-up at the April Meeting and the May Board Meeting. In addition, the Committee considered the acceptability of the terms of each Advisory Agreement, including the scope of services required to be performed by each Adviser.
| | THE GUGGENHEIM FUNDS ANNUAL REPORT | 57 |
OTHER INFORMATION (Unaudited)(continued) |
The Committee’s review of the services provided by Guggenheim to the Funds included consideration of Guggenheim’s investment processes and resulting performance, portfolio oversight and risk management, and the related regular quarterly reports and presentations received by the Board. The Committee took into account the risks borne by Guggenheim in sponsoring and providing services to the Funds, including regulatory, operational, legal and entrepreneurial risks. The Committee considered the resources dedicated by Guggenheim to compliance functions and the reporting made to the Board by Guggenheim compliance personnel regarding Guggenheim’s adherence to regulatory requirements. The Committee also considered the regular reports the Board receives from the Trust’s Chief Compliance Officer regarding compliance policies and procedures established pursuant to Rule 38a-1 under the Investment Company Act of 1940, as amended. In connection with the Committee’s evaluation of the overall package of services provided by Guggenheim, the Committee considered Guggenheim’s administrative services, including its role in supervising, monitoring, coordinating and evaluating the various services provided by the fund administrator, transfer agent, distributor, custodian and other service providers to the Funds. The Committee evaluated the Office of Chief Financial Officer (the “OCFO”), established to oversee the fund administration, accounting and transfer agency services provided to the Funds and other Guggenheim funds, including the OCFO’s resources, personnel and services provided.
With respect to Municipal Income Fund, the Committee noted that, although Security Investors delegated certain portfolio management responsibilities to the Sub-Adviser, as affiliated companies, both the Adviser and the Sub-Adviser are part of the Guggenheim organization. Further, the Committee took into account Guggenheim’s explanation that investment advisory-related services are provided by many Guggenheim employees under different related legal entities and thus, the services provided by the Adviser on the one hand and the Sub-Adviser on the other, as well as the risks assumed by each party, cannot be ascribed to distinct legal entities.2 As a result, in evaluating the services provided to the Municipal Income Fund under the Sub-Advisory Agreement, the Committee did not separately consider the contributions under the Advisory Agreement and the Sub-Advisory Agreement.
With respect to Guggenheim’s resources and the ability of each Adviser to carry out its responsibilities under the applicable Advisory Agreement, the Chief Financial Officer of Guggenheim Investments reviewed with the Committee financial information concerning the holding company for Guggenheim Investments, Guggenheim Partners Investment Management Holdings, LLC (“GPIMH”), and the various entities comprising Guggenheim Investments, and provided the audited consolidated financial statements of GPIMH. (Thereafter, the Committee received the audited consolidated financial statements of GPIM.)
Based on the foregoing, and based on other information received (both oral and written) at the April Meeting and the May Meetings, as well as other considerations, including the Committee’s knowledge of how each Adviser performs its duties obtained through Board meetings, discussions and reports throughout the year, the Committee concluded that each Adviser and its personnel were qualified to serve the Funds in such capacity and may reasonably be expected to continue to provide a high quality of services under each Advisory Agreement with respect to the Funds.
Investment Performance: The Committee received, for each Fund, investment returns for the since-inception, ten-year, five-year, three-year, one-year and three-month periods ended December 31, 2022, as applicable. In addition, the Committee received a comparison of each Fund’s performance to the performance of a benchmark, a universe of funds and a narrower peer group of similar funds based on asset levels as identified by FUSE (except as noted above with respect to Market Neutral Real Estate Fund), in each case for the same periods, as applicable. The Committee also received from FUSE a description of the methodology for identifying each Fund’s peer group and universe for performance and expense comparisons. The Committee also received certain performance information as of March 31, 2023. In assessing each Fund’s performance, the Committee considered that the Board receives regular reporting from Guggenheim regarding performance and evaluates performance throughout the year.
In seeking to evaluate Fund performance over a full market cycle, the Committee focused its attention on five-year and three-year performance rankings as compared to the relevant universe of funds. Except as to the individual Funds discussed below, the Committee observed that the returns of each Fund’s Institutional Class shares ranked in the third quartile or better of such Fund’s performance universe for each of the relevant periods considered. In addition, the Committee made the following observations:
2 | Consequently, except where the context indicates otherwise, references to “Adviser,” “Advisers” or “Sub-Adviser” should be understood as referring to Guggenheim Investments generally and the services it provides under the Agreements. |
58 | THE GUGGENHEIM FUNDS ANNUAL REPORT | |
OTHER INFORMATION (Unaudited)(continued) |
Alpha Opportunity Fund: The returns of the Fund’s Institutional Class shares ranked in the 96th and 73rd percentiles of its performance universe for the five-year and three-year periods ended December 31, 2022, respectively. The Committee noted management’s explanation that the Fund’s relative underperformance over the five-year time period was primarily due to the Fund’s beta profile and fundamental factor tilts. The Committee noted management’s statement that the Fund’s lower beta profile to broad market U.S. equities relative to its peers and long exposure to value and short exposure to growth have detracted from investment performance. The Committee also noted management’s statement that as a result of an update in 2021 to the quantitative investment methodology that the Fund employs, as well as the more recent comeback of value-oriented, higher quality names, the Fund experienced performance rankings that compare more favorably relative to its performance universe for the three-year and one-year periods ended December 31, 2022.
Diversified Income Fund: The returns of the Fund’s Institutional Class shares ranked in the 78th and 75th percentiles of its performance universe for the five-year and three-year periods ended December 31, 2022, respectively. The Committee noted management’s explanation that the Fund’s relative underperformance over the five-year time period was primarily due to the Fund’s defensively-positioned portfolio, in particular within its fixed-income sleeve which includes allocations to several Guggenheim fixed-income funds that were defensively positioned beginning in 2018, reflecting Guggenheim’s market views. The Committee also noted management’s statement that the Fund maintained a lower beta profile to equities relative to its peers. The Committee further noted management’s statement that the Fund’s allocation process was updated in 2021, resulting in an increase in the Fund’s equity exposure, and that there was some improvement in the Fund’s performance rankings relative to its performance universe for the three-year and one-year periods ended December 31, 2022. The Committee noted management’s statement that although the Fund’s increased equity exposure was detrimental to the Fund’s performance relative to peers in 2022 due to the poor performance of U.S. equities that year, Guggenheim believes the increased equity exposure will ultimately benefit shareholders and support total return performance in the medium to long term. The Committee also noted the Fund’s small size and considered management’s statements that the Fund continues to be a viable offering and that Guggenheim is able to manage the Fund at its current size.
Market Neutral Real Estate Fund: The returns of the Fund’s Institutional Class shares ranked in the 44th and 89th percentiles of its performance universe for the five-year and three-year periods ended December 31, 2022, respectively. The Committee noted management’s explanation that the Fund’s relative underperformance over the three-year time period was due to underperforming pairs of offsetting long and short positions as well as several stock- and sector-specific issues, and considered that, despite recent underperformance, the Fund experienced performance that ranks in the top half of its performance universe for the five-year period ended December 31, 2022.
Municipal Income Fund: The returns of the Fund’s Institutional Class shares ranked in the 89th and 83rd percentiles of its performance universe for the five-year and three-year periods ended December 31, 2022, respectively. The Committee noted management’s explanation that the Fund’s conservative positioning in high quality, long-duration assets, which underperformed over the past two years due to a risk-on sentiment in 2021 and due to fears of duration risk in 2022, contributed to relative underperformance over the five-year and three-year time periods. The Committee noted management’s statement that the Fund’s allocation to closed-end funds also contributed to relative underperformance in 2022 as the increased cost of leverage weighed on the performance of such funds. The Committee considered management’s belief that an economic downturn that is likely to follow the Federal Reserve’s tightening of financial conditions will disproportionately affect weaker municipal credits and could lead to distress in names the Fund has avoided. The Committee also took into account management’s further discussions of performance attribution and outlook for the Fund at the April Meeting and the May Board Meeting, during which management highlighted that the Fund’s relative underperformance in 2022 was due to the exceptional volatility in the fixed-income markets that year which also impacted relative performance for the trailing five-year and three-year time periods, and noted the overall low dispersion in absolute investment returns among municipal bond funds.
StylePlus—Mid Growth Fund: The returns of the Fund’s Institutional Class shares ranked in the 76th and 67th percentiles of its performance universe for the five-year and three-year periods ended December 31, 2022, respectively. The Committee noted management’s explanation that the Fund’s relative underperformance over the five-year time period can be attributed to the more conservative positioning of the underlying funds in which the Fund invests, resulting in yields insufficient to offset fund fees and other costs, as well as the strategy’s tilt to value-oriented, lower-growth names within the mid-cap growth segment as growth outperformed value securities from 2018 through 2020. The Committee also noted management’s statement that as a result of the more recent comeback of value-oriented, lower-growth names, the Fund experienced performance rankings that compare more favorably relative to its performance universe for the three-year and one-year periods ended December 31, 2022.
Ultra Short Duration Fund: The returns of the Fund’s Institutional Class shares ranked in the 76th and 63rd percentiles of its performance universe for the five-year and three-year periods ended December 31, 2022, respectively. The Committee noted management’s explanation that the Fund’s overweight duration positioning over the five-year time period relative to its performance universe as well as higher allocations
| | THE GUGGENHEIM FUNDS ANNUAL REPORT | 59 |
OTHER INFORMATION (Unaudited)(continued) |
to structured credit during the second half of 2022, which underperformed corporate credit during that period, contributed to relative underperformance over the five-year time period. The Committee considered management’s expectation that the resetting of higher interest rates should help the Fund to perform well going forward and that the divergence in the relationship between structured and corporate credit should normalize going forward and lead to relative outperformance, noting that there was some improvement in the Fund’s performance ranking relative to its performance universe for the one-year period ended December 31, 2022.
Based on the foregoing, and based on other information received (both oral and written) at the April Meeting and the May Meetings, as well as other considerations, the Committee concluded that, with respect to each Fund other than Municipal Income Fund: (i) the Fund’s performance was acceptable; or (ii) it was satisfied with Guggenheim’s responses and/or efforts to improve investment performance; and, with respect to Municipal Income Fund, it would continue to monitor the Fund’s investment performance.
Comparative Fees, Costs of Services Provided and the Benefits Realized by Each Adviser from Its Relationship with the Funds: The Committee compared each Fund’s contractual advisory fee (which, for Municipal Income Fund, includes the sub-advisory fee paid to the Sub-Adviser), net effective management fee3 and total net expense ratio to the applicable peer group. The Committee also reviewed the median advisory fees and expense ratios, including expense ratio components (e.g., transfer agency fees, administration fees, other operating expenses, distribution fees and fee waivers/reimbursements), of the peer group of funds. In addition, the Committee considered information regarding Guggenheim’s process for evaluating the competitiveness of each Fund’s fees and expenses, noting Guggenheim’s statement that evaluations seek to incorporate a variety of factors with a general focus on ensuring fees and expenses: (i) are competitive; (ii) give consideration to resource support requirements; and (iii) ensure Funds are able to deliver on shareholder return expectations. The Committee also considered Guggenheim’s discussion of information regarding fee and expense trends across the open-end fund industry and its response to those trends with respect to the funds in the Guggenheim fund complex, including the Funds.
As part of its evaluation of each Fund’s advisory fee, the Committee considered how such fees compared to the advisory fee charged by Guggenheim to one or more other clients that it manages pursuant to similar investment strategies, to the extent applicable, noting that, in certain instances, Guggenheim charges a lower advisory fee to such other clients. In this connection, the Committee considered, among other things, Guggenheim’s representations about the significant differences between managing mutual funds as compared to other types of accounts. The Committee also considered Guggenheim’s explanation that lower fees are charged in certain instances due to various other factors, including the scope of contract, type of investors, fee structure, applicable legal, governance and capital structures, tax status and historical pricing reasons. In addition, the Committee took into account Guggenheim’s discussion of the regulatory, operational, legal and entrepreneurial risks involved with the Funds as compared to other types of accounts. The Committee concluded that the information it received demonstrated that the aggregate services provided to, or the specific circumstances of, each Fund were sufficiently different from the services provided to, or the specific circumstances of, other clients with similar investment strategies and/or that the risks borne by Guggenheim were sufficiently greater than those associated with managing other clients with similar investment strategies to support the difference in fees.
In further considering the comparative fee and expense data presented in the Contract Review Materials and addressed by Guggenheim, the Committee took into account those Funds with currently effective expense limitation agreements with the Adviser. Except as to the individual Funds discussed below, the Committee observed that the contractual advisory fee, net effective management fee and total net expense ratio for each Fund’s Institutional Class shares each rank in the third quartile or better of such Fund’s peer group. In addition, the Committee made the following observations:
Floating Rate Strategies Fund: The contractual advisory fee for the Fund’s Institutional Class shares ranks in the third quartile (73rd percentile) of its peer group. Although the net effective management fee for the Fund’s Institutional Class shares ranks in the fourth quartile (80th percentile) of its peer group, the Committee considered that the total net expense ratio for the Fund’s Institutional Class shares ranks in the third quartile (67th percentile) of its peer group. The Committee considered the Adviser’s statement explaining the higher fees that performance is driven by a unique investment approach that requires significant resources. In this regard, the Committee took into consideration the strong investment performance of the Fund’s Institutional Class shares for the three-year period ended December 31, 2022. The Committee also took into account the Fund’s currently effective expense limitation agreement with the Adviser.
3 | The “net effective management fee” for each Fund represents the combined effective advisory fee and administration fee as a percentage of average net assets for the latest fiscal year, after any waivers and/or reimbursements. |
60 | THE GUGGENHEIM FUNDS ANNUAL REPORT | |
OTHER INFORMATION (Unaudited)(continued) |
Limited Duration Fund: The contractual advisory fee for the Fund’s Institutional Class shares ranks in the fourth quartile (87th percentile) of its peer group. The net effective management fee for the Fund’s Institutional Class shares ranks in the third quartile (73rd percentile) of its peer group. The total net expense ratio for the Fund’s Institutional Class shares ranks in the third quartile (67th percentile) of its peer group. The Committee considered the Adviser’s statement explaining the higher fees that performance is driven by a unique investment approach that requires significant resources. In this regard, the Committee took into consideration the strong investment performance of the Fund’s Institutional Class shares for the five-year and three-year periods ended December 31, 2022. The Committee also took into account the Fund’s currently effective expense limitation agreement with the Adviser.
Macro Opportunities Fund: The contractual advisory fee for the Fund’s Institutional Class shares ranks in the fourth quartile (82nd percentile) of its peer group. The net effective management fee for the Fund’s Institutional Class shares ranks in the third quartile (64th percentile) of its peer group. The total net expense ratio for the Fund’s Institutional Class shares ranks in the third quartile (73rd percentile) of its peer group. The Committee noted that the Fund is categorized as a non-traditional bond fund which seeks to add value by investing in many non-traditional securities within and outside of fixed income, including equities, currencies, commodities and derivatives, and that peer funds have varying degrees of capability, flexibility and associated fees. The Committee considered the Adviser’s statement explaining the higher fees that performance is driven by a unique investment approach that requires significant resources. In this regard, the Committee took into consideration the strong investment performance of the Fund’s Institutional Class shares for the three-year period ended December 31, 2022. The Committee also took into account the Fund’s currently effective expense limitation agreement and contractual advisory fee breakpoint of 5 basis points on average daily net assets above $5 billion.
Risk Managed Real Estate Fund: The contractual advisory fee for the Fund’s Institutional Class shares ranks in the second quartile (43rd percentile) of its peer group. Although the net effective management fee for the Fund’s Institutional Class shares ranks in the fourth quartile (79th percentile) of its peer group, the Committee considered that the total net expense ratio for the Fund’s Institutional Class shares ranks in the third quartile (57th percentile) of its peer group. The Committee considered the Adviser’s statement that the total expense ratio for the Fund’s Institutional Class shares is competitive and in-line with the peer group average and median and that the Fund’s contractual advisory fee is competitive. The Committee also took into account the Fund’s currently effective expense limitation agreement with the Adviser.
SMid Cap Value Fund: The contractual advisory fee for the Fund’s Institutional Class shares ranks in the first quartile (7th percentile) of its peer group. The net effective management fee for the Fund’s Institutional Class shares ranks in the third quartile (71st percentile) of its peer group. The total net expense ratio for the Fund’s Institutional Class shares ranks in the fourth quartile (79th percentile) of its peer group. The Committee considered that the Fund’s contractual advisory fee ranks favorably in the first quartile of its peer group and reviewed the other expenses that impacted the total net expense ratio. The Committee also took into account the Fund’s currently effective expense limitation agreement with the Adviser.
Total Return Bond Fund: The contractual advisory fee for the Fund’s Institutional Class shares ranks in the fourth quartile (87th percentile) of its peer group. The net effective management fee for the Fund’s Institutional Class shares ranks in the third quartile (67th percentile) of its peer group. The total net expense ratio for the Fund’s Institutional Class shares ranks in the third quartile (73rd percentile) of its peer group. The Committee considered the Adviser’s statement explaining the higher fees that performance is driven by a unique investment approach that requires significant resources. In this regard, the Committee took into consideration the strong investment performance of the Fund’s Institutional Class shares for the three-year period ended December 31, 2022. The Committee also took into account the Fund’s currently effective expense limitation agreement with the Adviser.
With respect to the costs of services provided and benefits realized by Guggenheim Investments from its relationship with the Funds, the Committee reviewed a profitability analysis and data from management for each Fund setting forth the average assets under management for the twelve months ended December 31, 2022, gross revenues received, and expenses incurred directly or through allocations, by Guggenheim Investments, expense waivers (as applicable), earnings and the operating margin/profitability rate, including variance information relative to the foregoing amounts as of December 31, 2021. In addition, the Chief Financial Officer of Guggenheim Investments reviewed with, and addressed questions from, the Committee concerning the expense allocation methodology employed in producing the profitability analysis. In the course of its review of Guggenheim Investments’ profitability, the Committee took into account the methods used by Guggenheim Investments to determine expenses and profit and the representation by the Chief Financial Officer of Guggenheim Investments that such methods provided a reasonable basis for determining the profitability of the applicable Adviser with respect to each Fund. The Committee considered all of the foregoing, among other things, in evaluating the costs of services provided, the profitability to Guggenheim Investments and the profitability rates presented.
| | THE GUGGENHEIM FUNDS ANNUAL REPORT | 61 |
OTHER INFORMATION (Unaudited)(continued) |
The Committee also considered other benefits available to each Adviser because of its relationship with the Funds and noted Guggenheim’s statement that it does not believe the Advisers derive any such “fall-out” benefits. In this regard, the Committee noted Guggenheim’s statement that, although it does not consider such benefits to be fall-out benefits, the Advisers may benefit from certain economies of scale and synergies, such as enhanced visibility of the Advisers, enhanced leverage in fee negotiations and other synergies arising from offering a broad spectrum of products, including the Funds.
Based on the foregoing, and based on other information received (both oral and written) at the April Meeting and the May Meetings, as well as other considerations, the Committee concluded that the comparative fees and the benefits realized by each Adviser from its relationship with the Funds were appropriate and that each Adviser’s profitability from its relationship with the Funds was not unreasonable.
Economies of Scale: The Committee received and considered information regarding whether there have been economies of scale with respect to the management of the Funds as Fund assets grow, whether the Funds have appropriately benefited from any economies of scale, and whether there is potential for realization of any further economies of scale. The Committee considered whether economies of scale in the provision of services to the Funds were being passed along to and shared with the shareholders. The Committee considered that Guggenheim believes it is appropriately sharing potential economies of scale and that Guggenheim’s decrease in 2022 in overall expenses was attributable to decreased product costs driven by lower average assets under management and lower non-recurring costs related to closed-end fund matters as well as a decrease in compensation and benefits. The Committee also considered that although expenses related to investment resources decreased in 2022, Guggenheim’s shared services expenses and certain other expenses increased in 2022.
The Committee also noted the process employed by the Adviser to evaluate whether it would be appropriate to institute a new breakpoint for a Fund, with consideration given to, among other things: (i) the Fund’s size and trends in asset levels over recent years; (ii) the competitiveness of the expense levels; (iii) whether expense waivers are in place; (iv) changes and trends in revenue and expenses; (v) whether there are any anticipated expenditures that may benefit the Fund in the future; (vi) Fund profit level margins; (vii) relative Fund performance; (viii) the nature, extent and quality of services management provides to the Fund; and (ix) the complexity of the Fund’s investment strategy and the resources required to support the Fund.
As part of its assessment of economies of scale, the Committee took into account Guggenheim’s representation that it seeks to share economies of scale through a number of means, including breakpoints, advisory fees set at competitive rates pre-assuming future asset growth, expense waivers and limitations, and investments in personnel, operations and infrastructure to support the fund business. The Committee also received information regarding amounts that had been shared with shareholders through such breakpoints and expense waivers and limitations. The Committee also noted information from Guggenheim regarding certain challenges and costs associated with managing Funds that have achieved significant scale. Thus, the Committee considered the size of the Funds and the competitiveness of and/or other determinations made regarding the current advisory fee for each Fund, as well as whether a Fund is subject to an expense limitation.
Based on the foregoing, and based on other information received (both oral and written) at the April Meeting and the May Meetings, as well as other considerations, the Committee concluded that the advisory fee for each Fund was reasonable.
Sub-Advisory Agreement for Municipal Income Fund
Nature, Extent and Quality of Services Provided by the Sub-Adviser: As noted above, because both the Adviser and the Sub-Adviser for Municipal Income Fund—Security Investors and GPIM, respectively—are part of and do business as Guggenheim Investments and the services provided by the Adviser on the one hand and the Sub-Adviser on the other cannot be ascribed to distinct legal entities, the Committee did not separately evaluate the services provided under the Advisory Agreement and the Sub-Advisory Agreement. Therefore, the Committee considered the qualifications, experience and skills of the Fund’s portfolio management team in connection with the Committee’s evaluation of Guggenheim’s investment professionals under the Advisory Agreement. With respect to Guggenheim’s resources and the Sub-Adviser’s ability to carry out its responsibilities under the Sub-Advisory Agreement, as noted above, the Committee considered the financial condition of GPIMH and the various entities comprising Guggenheim Investments. The Committee also considered the acceptability of the terms of the Sub-Advisory Agreement, including the scope of services required to be performed by the Sub-Adviser.
Investment Performance: The Committee considered the returns of the Fund under its evaluation of the Advisory Agreement.
62 | THE GUGGENHEIM FUNDS ANNUAL REPORT | |
OTHER INFORMATION (Unaudited)(concluded) |
Comparative Fees, Costs of Services Provided and the Benefits Realized by the Sub-Adviser from Its Relationship with the Fund: The Committee considered that the Sub-Advisory Agreement is with an affiliate of the Adviser, that the Adviser compensates the Sub-Adviser from its own fees so that the sub-advisory fee rate for the Fund does not impact the fees paid by the Fund and that the Sub-Adviser’s revenues were included in the calculation of Guggenheim Investments’ profitability. Given its conclusion of the reasonableness of the advisory fee, the Committee concluded that the sub-advisory fee rate for the Fund was reasonable.
Economies of Scale: The Committee recognized that, because the Sub-Adviser’s fees are paid by the Adviser and not the Fund, the analysis of economies of scale was more appropriate in the context of the Committee’s consideration of the Advisory Agreement, which was separately considered. (See “Advisory Agreements – Economies of Scale” above.)
Overall Conclusions
The Committee concluded that the investment advisory fees are fair and reasonable in light of the extent and quality of the services provided and other benefits received and that the renewal of each applicable Agreement is in the best interest of each Fund. In reaching this conclusion, no single factor was determinative or conclusive and each Committee member, in the exercise of his or her informed business judgment, may afford different weights to different factors.
Following its review of the Committee’s analysis and determinations, the Board adopted the considerations and conclusions of the Committee and determined to approve the renewal of the Agreements.
| | THE GUGGENHEIM FUNDS ANNUAL REPORT | 63 |
INFORMATION ON BOARD OF TRUSTEES AND OFFICERS (Unaudited) |
A Board of Trustees oversees the Trust, as well as other trusts of GI, in which its members have no stated term of service, and continue to serve after election until resignation. The Statement of Additional Information includes further information about Fund Trustees and Officers, and can be obtained without charge by visiting guggenheiminvestments.com or by calling 800.820.0888.
Name, Address*
and Year of Birth | Position(s)
Held with
Trust | Term of Office
and Length of
Time Served** | Principal Occupation(s)
During Past Five Years | Number of
Portfolios
in Fund
Complex
Overseen | Other
Directorships Held
by Trustees*** |
INDEPENDENT TRUSTEES | | | |
Randall C. Barnes (1951) | Trustee and Chair of the Valuation Oversight Committee | Since 2014 (Trustee) Since 2020 (Chair of the Valuation Oversight Committee) | Current: Private Investor (2001-present). Former: Senior Vice President and Treasurer, PepsiCo, Inc. (1993-1997); President, Pizza Hut International (1991-1993); Senior Vice President, Strategic Planning and New Business Development, PepsiCo, Inc. (1987-1990). | 155 | Current: Advent Convertible and Income Fund (2005-present); Purpose Investments Funds (2013-present). Former: Fiduciary/Claymore Energy Infrastructure Fund (2004-2022); Guggenheim Enhanced Equity Income Fund (2005-2021); Guggenheim Credit Allocation Fund (2013-2021). |
Angela Brock-Kyle (1959) | Trustee | Since 2019 | Current: Founder and Chief Executive Officer, B.O.A.R.D.S. (2013-present); Director, Mutual Fund Directors Forum (2022-present). Former: Senior Leader, TIAA (financial services firm) (1987-2012). | 154 | Current: Bowhead Insurance GP, LLC (2020-present); Hunt Companies, Inc. (2019-present). Former: Fiduciary/Claymore Energy Infrastructure Fund (2019-2022); Guggenheim Enhanced Equity Income Fund (2019-2021); Guggenheim Credit Allocation Fund (2019-2021); Infinity Property & Casualty Corp. (2014-2018). |
64 | THE GUGGENHEIM FUNDS ANNUAL REPORT | |
INFORMATION ON BOARD OF TRUSTEES AND OFFICERS (Unaudited)(continued) |
Name, Address*
and Year of Birth | Position(s)
Held with
Trust | Term of Office
and Length of
Time Served** | Principal Occupation(s)
During Past Five Years | Number of
Portfolios
in Fund
Complex
Overseen | Other
Directorships Held
by Trustees*** |
INDEPENDENT TRUSTEES - continued | | | |
Thomas F. Lydon, Jr. (1960) | Trustee and Chair of the Contracts Review Committee | Since 2019 (Trustee) Since 2020 (Chair of the Contracts Review Committee) | Current: President, Global Trends Investments (registered investment adviser) (1996-present); Chief Executive Officer, ETF Flows, LLC (financial advisor education and research provider) (2019-present); Chief Executive Officer, Lydon Media (2016-present); Director, GDX Index Partners, LLC (index provider) (2021-present); Vice Chairman, VettaFi (financial advisor content, research and digital distribution provider) (2022-present). | 154 | Current: US Global Investors, Inc. (GROW) (1995-present); The 2023 ETF Series Trust (4) (June 2023-present); The 2023 ETF Series Trust II (1) (August 2023-present). Former: Fiduciary/Claymore Energy Infrastructure Fund (2019-2022); Guggenheim Enhanced Equity Income Fund (2019-2021); Guggenheim Credit Allocation Fund (2019-2021); Harvest Volatility Edge Trust (3) (2017-2019). |
Ronald A. Nyberg (1953) | Trustee and Chair of the Nominating and Governance Committee | Since 2014 | Current: Of Counsel, Momkus LLP (law firm) (2016-present). Former: Partner, Nyberg & Cassioppi, LLC (law firm) (2000-2016); Executive Vice President, General Counsel, and Corporate Secretary, Van Kampen Investments (1982-1999). | 155 | Current: Advent Convertible and Income Fund (2003-present); PPM Funds (2) (2018-present); NorthShore-Edward-Elmhurst Health (2012-present). Former: Fiduciary/Claymore Energy Infrastructure Fund (2004-2022); Guggenheim Enhanced Equity Income Fund (2005-2021); Guggenheim Credit Allocation Fund (2013-2021); Western Asset Inflation-Linked Opportunities & Income Fund (2004-2020); Western Asset Inflation-Linked Income Fund (2003-2020). |
| | THE GUGGENHEIM FUNDS ANNUAL REPORT | 65 |
INFORMATION ON BOARD OF TRUSTEES AND OFFICERS (Unaudited)(continued) |
Name, Address*
and Year of Birth | Position(s)
Held with
Trust | Term of Office
and Length of
Time Served** | Principal Occupation(s)
During Past Five Years | Number of
Portfolios
in Fund
Complex
Overseen | Other
Directorships Held
by Trustees*** |
INDEPENDENT TRUSTEES - concluded | | | |
Sandra G. Sponem (1958) | Trustee and Chair of the Audit Committee | Since 2019 (Trustee) Since 2020 (Chair of the Audit Committee) | Current: Retired. Former: Senior Vice President and Chief Financial Officer, M.A. Mortenson-Companies, Inc. (construction and real estate development company) (2007-2017). | 154 | Current: SPDR Series Trust (81) (2018-present); SPDR Index Shares Funds (30) (2018-present); SSGA Active Trust (14) (2018-present). Former: Fiduciary/Claymore Energy Infrastructure Fund (2019-2022); Guggenheim Enhanced Equity Income Fund (2019-2021); Guggenheim Credit Allocation Fund (2019-2021); SSGA Master Trust (1) (2018-2020). |
Ronald E. Toupin, Jr. (1958) | Trustee, Chair of the Board and Chair of the Executive Committee | Since 2014 | Current: Portfolio Consultant (2010-present); Member, Governing Council, Independent Directors Council (2013-present); Governor, Board of Governors, Investment Company Institute (2018-present). Former: Member, Executive Committee, Independent Directors Council (2016-2018); Vice President, Manager and Portfolio Manager, Nuveen Asset Management (1998-1999); Vice President, Nuveen Investment Advisory Corp. (1992-1999); Vice President and Manager, Nuveen Unit Investment Trusts (1991-1999); and Assistant Vice President and Portfolio Manager, Nuveen Unit Investment Trusts (1988-1999), each of John Nuveen & Co., Inc. (registered broker dealer) (1982-1999). | 154 | Former: Fiduciary/Claymore Energy Infrastructure Fund (2004-2022); Guggenheim Enhanced Equity Income Fund (2005-2021); Guggenheim Credit Allocation Fund (2013-2021); Western Asset Inflation-Linked Opportunities & Income Fund (2004-2020); Western Asset Inflation-Linked Income Fund (2003-2020). |
66 | THE GUGGENHEIM FUNDS ANNUAL REPORT | |
INFORMATION ON BOARD OF TRUSTEES AND OFFICERS (Unaudited)(continued) |
Name, Address*
and Year of Birth | Position(s)
Held with
Trust | Term of Office
and Length of
Time Served** | Principal Occupation(s)
During Past Five Years | Number of
Portfolios
in Fund
Complex
Overseen | Other
Directorships Held
by Trustees*** |
INTERESTED TRUSTEE | | | | |
Amy J. Lee**** (1961) | Trustee, Vice President and Chief Legal Officer | Since 2018 (Trustee) Since 2014 (Chief Legal Officer) Since 2007 (Vice President) | Current: Interested Trustee, certain other funds in the Fund Complex (2018-present); Chief Legal Officer, certain other funds in the Fund Complex (2014-present); Vice President, certain other funds in the Fund Complex (2007-present); Senior Managing Director, Guggenheim Investments (2012-present). Former: President and Chief Executive Officer, certain other funds in the Fund Complex (2017-2019); Vice President, Associate General Counsel and Assistant Secretary, Security Benefit Life Insurance Company and Security Benefit Corporation (2004-2012). | 154 | Former: Fiduciary/Claymore Energy Infrastructure Fund (2018-2022); Guggenheim Enhanced Equity Income Fund (2018-2021); Guggenheim Credit Allocation Fund (2018-2021). |
* | The business address of each Trustee is c/o Guggenheim Investments, 227 West Monroe Street, Chicago, Illinois 60606. |
** | Each Trustee serves an indefinite term, until his or her successor is elected and qualified. Time served includes time served in the respective position for the Predecessor Corporation. |
*** | Each Trustee also serves on the Boards of Trustees of Guggenheim Funds Trust, Guggenheim Variable Funds Trust, Guggenheim Strategy Funds Trust, Guggenheim Taxable Municipal Bond & Investment Grade Debt Trust, Guggenheim Strategic Opportunities Fund, Guggenheim Active Allocation Fund, Rydex Series Funds, Rydex Dynamic Funds, Rydex Variable Trust and Transparent Value Trust. Messrs. Barnes and Nyberg also serve on the Board of Trustees of Advent Convertible & Income Fund. |
**** | This Trustee is deemed to be an “interested person” of the Fund under the 1940 Act by reason of her position with the Fund’s Adviser and/or the parent of the Adviser. |
| | THE GUGGENHEIM FUNDS ANNUAL REPORT | 67 |
INFORMATION ON BOARD OF TRUSTEES AND OFFICERS (Unaudited)(continued) |
Name, Address*
and Year of Birth | Position(s)
Held with
Trust | Term of Office
and Length of
Time Served** | Principal Occupation(s)
During Past Five Years |
OFFICERS | | | |
Brian E. Binder (1972) | President and Chief Executive Officer | Since 2018 | Current: President, Mutual Fund Boards, Guggenheim Investments (2022-present); President and Chief Executive Officer, certain other funds in the Fund Complex (2018-present); President, Mutual Funds Boards, Guggenheim Funds Investment Advisors, LLC and Security Investors, LLC (2018-present);Board Member, Guggenheim Partners Investment Funds plc (2022-present); Board Member, Guggenheim Global Investments plc (2022-present); Board Member, Guggenheim Partners Fund Management (Europe) Limited (2018-present). Former: Senior Managing Director and Chief Administrative Officer, Guggenheim Investments (2018-2022); Managing Director and President, Deutsche Funds, and Head of US Product, Trading and Fund Administration, Deutsche Asset Management (2013-2018); Managing Director, Chairman of North American Executive Committee and Head of Business Management and Consulting, Invesco Ltd. (2010-2012). |
James Howley (1972) | Chief Financial Officer, Chief Accounting Officer and Treasurer | Since 2022 | Current: Managing Director, Guggenheim Investments (2004-present); Chief Financial Officer, Chief Accounting Officer, and Treasurer, certain other funds in the Fund Complex (2022-present). Former: Assistant Treasurer, certain other funds in the Fund Complex (2006-2022); Manager, Mutual Fund Administration of Van Kampen Investments, Inc. (1996-2004). |
Mark E. Mathiasen (1978) | Secretary | Since 2014 | Current: Secretary, certain other funds in the Fund Complex (2007-present); Managing Director, Guggenheim Investments (2007-present). |
Glenn McWhinnie (1969) | Assistant Treasurer | Since 2016 | Current: Vice President, Guggenheim Investments (2009-present); Assistant Treasurer, certain other funds in the Fund Complex (2016-present). |
Michael P. Megaris (1984) | Assistant Secretary | Since 2014 | Current: Assistant Secretary, certain other funds in the Fund Complex (2014-present); Managing Director, Guggenheim Investments (2012-present). |
Elisabeth Miller (1968) | Chief Compliance Officer | Since 2012 | Current: Chief Compliance Officer, certain other funds in the Fund Complex (2012-present); Senior Managing Director, Guggenheim Investments (2012-present); Senior Managing Director, Guggenheim Funds Distributors, LLC (2014-present). Former: Chief Compliance Officer, Security Investors, LLC and Guggenheim Funds Investment Advisors, LLC (2012-2018); Chief Compliance Officer, Guggenheim Distributors, LLC (2009-2014); Senior Manager, Security Investors, LLC (2004-2014); Senior Manager, Guggenheim Distributors, LLC (2004-2014). |
Margaux Misantone (1978) | AML Officer | Since 2017 | Current: Chief Compliance Officer, Security Investors, LLC and Guggenheim Funds Investment Advisors, LLC (2018-present); AML Officer, Security Investors, LLC and certain other funds in the Fund Complex (2017-present); Managing Director, Guggenheim Investments (2015-present). Former: Assistant Chief Compliance Officer, Security Investors, LLC and Guggenheim Funds Investments Advisors, LLC (2015-2018). |
68 | THE GUGGENHEIM FUNDS ANNUAL REPORT | |
INFORMATION ON BOARD OF TRUSTEES AND OFFICERS (Unaudited)(concluded) |
Name, Address*
and Year of Birth | Position(s)
Held with
Trust | Term of Office
and Length of
Time Served** | Principal Occupation(s)
During Past Five Years |
OFFICERS - concluded | |
Kimberly J. Scott (1974) | Assistant Treasurer | Since 2014 | Current: Director, Guggenheim Investments (2012-present); Assistant Treasurer, certain other funds in the Fund Complex (2012-present). Former: Financial Reporting Manager, Invesco, Ltd. (2010-2011); Vice President/Assistant Treasurer, Mutual Fund Administration for Van Kampen Investments, Inc./Morgan Stanley Investment Management (2009-2010); Manager of Mutual Fund Administration, Van Kampen Investments, Inc./Morgan Stanley Investment Management (2005-2009). |
Bryan Stone (1979) | Vice President | Since 2014 | Current: Vice President, certain other funds in the Fund Complex (2014-present); Managing Director, Guggenheim Investments (2013-present). Former: Senior Vice President, Neuberger Berman Group LLC (2009-2013); Vice President, Morgan Stanley (2002-2009). |
Jon Szafran (1989) | Assistant Treasurer | Since 2017 | Current: Director, Guggenheim Investments (2017-present); Assistant Treasurer, certain other funds in the Fund Complex (2017-present). Former: Assistant Treasurer of Henderson Global Funds and Manager of US Fund Administration, Henderson Global Investors (North America) Inc. (“HGINA”), (2017); Senior Analyst of US Fund Administration, HGINA (2014–2017); Senior Associate of Fund Administration, Cortland Capital Market Services, LLC (2013-2014); Experienced Associate, PricewaterhouseCoopers LLP (2012-2013). |
* | The business address of each officer is c/o Guggenheim Investments, 227 West Monroe Street, Chicago, Illinois 60606. |
** | Each officer serves an indefinite term, until his or her successor is duly elected and qualified. |
| | THE GUGGENHEIM FUNDS ANNUAL REPORT | 69 |
GUGGENHEIM INVESTMENTS PRIVACY NOTICE (Unaudited) |
Who We Are
This Privacy Notice describes the data protection practices of Guggenheim Investments. Guggenheim Investments as used herein refers to the affiliated investment management businesses of Guggenheim Partners, LLC: Guggenheim Funds Investment Advisors, LLC, Guggenheim Partners Investment Management, LLC, Guggenheim Funds Distributors, LLC, Security Investors, LLC, Guggenheim Investment Advisors (Europe) Limited, Guggenheim Real Estate, LLC, GS Gamma Advisors, LLC, Guggenheim Partners India Management, LLC, Guggenheim Partners Europe Limited, as well as the funds in the Guggenheim Funds complex (the “Funds”) (“Guggenheim Investments,” “we,” “us,” or “our”).
Guggenheim Partners Investment Management Holdings, LLC, located at 330 Madison Avenue, New York, New York 10017, is the data controller for your information. The affiliates who are also controllers of certain of your information are: Guggenheim Investment Advisors (Europe) Limited, Guggenheim Partners Europe Limited, Guggenheim Partners, LLC, Guggenheim Funds Investment Advisors, LLC, Guggenheim Partners Investment Management, LLC, Guggenheim Funds Distributors, LLC and Security Investors, LLC, as well as the Funds.
Our Commitment to You
Guggenheim Investments considers your privacy our utmost concern. When you become our client or investor, you entrust us with not only your hard-earned money but also with your personal and financial information. Because we have access to your private information, we hold ourselves to the highest standards in its safekeeping and use. We strictly limit how we share your information with others, whether you are a current or former Guggenheim Investments client or investor.
The Information We Collect About You
We collect certain nonpublic personal information about you from information you provide on applications, other forms, our website, and/or from third parties including investment advisors. This information includes Social Security or other tax identification number, assets, income, tax information, retirement and estate plan information, transaction history, account balance, payment history, bank account information, marital status, family relationships, information that we collect on our website through the use of “cookies,” and other personal information that you or others provide to us. We may also collect such information through your inquiries by mail, e-mail or telephone. We may also collect customer due diligence information, as required by applicable law and regulation, through third party service providers.
How We Handle Your Personal Information
The legal basis for using your information as set out in this Privacy Notice is as follows: (a) use of your personal data is necessary to perform our obligations under any contract with you (such as a contract for us to provide financial services to you); or (b) where use of your personal data is not necessary for performance of a contract, use of your personal data is necessary for our legitimate interests or the legitimate interests of others (for example, to enforce the legal terms governing our services, operate and market our website and other services we offer, ensure safe environments for our personnel and others, make and receive payments, prevent fraud and to know the customer to whom we are providing the services). Some processing is done to comply with applicable law.
In addition to the specific uses described above, we also use your information in the following manner:
| | ● | We use your information in connection with servicing your accounts. |
| | ● | We use information to respond to your requests or questions. For example, we might use your information to respond to your customer feedback. |
| | ● | We use information to improve our products and services. We may use your information to make our website and products better. We may use your information to customize your experience with us. |
| | ● | We use information for security purposes. We may use your information to protect our company and our customers. |
| | ● | We use information to communicate with you. For example, we will communicate with you about your account or our relationship. We may contact you about your feedback. We might also contact you about this Privacy Notice. We may also enroll you in our email newsletter. |
70 | THE GUGGENHEIM FUNDS ANNUAL REPORT | |
GUGGENHEIM INVESTMENTS PRIVACY NOTICE (Unaudited)(continued) |
| | ● | We use information as otherwise permitted by law, as we may notify you. |
| | ● | Aggregate/Anonymous Data. We may aggregate and/or anonymize any information collected through the website so that such information can no longer be linked to you or your device (“Aggregate/Anonymous Information”). We may use Aggregate/Anonymous Information for any purpose, including without limitation for research and marketing purposes, and may also share such data with any third parties, including advertisers, promotional partners, and sponsors. |
We do not sell information about current or former clients or their accounts to third parties. Nor do we share this information, except when necessary to complete transactions at your request, to make you aware of investment products and services that we or our affiliates offer, or as permitted or required by law.
We provide information about you to companies and individuals not affiliated with Guggenheim Investments to complete certain transactions or account changes, or to perform services for us related to your account. For example, if you ask to transfer assets from another financial institution to Guggenheim Investments, we must provide certain information about you to that company to complete the transaction. We provide the third party with only the information necessary to carry out its responsibilities and only for that purpose. And we require these third parties to treat your private information with the same high degree of confidentiality that we do. To alert you to other Guggenheim Investments products and services, we share your information within our family of affiliated companies. You may limit our sharing with affiliated companies as set out below. We may also share information with any successor to all or part of our business, or in connection with steps leading up to a merger or acquisition. For example, if part of our business was sold we may give customer information as part of that transaction. We may also share information about you with your consent.
We will release information about you if you direct us to do so, if we are compelled by law to do so, or in other circumstances as permitted by law (for example, to protect your account from fraud).
If you close your account(s) or become an inactive client or investor, we will continue to adhere to the privacy policies and practices described in this notice.
Opt-Out Provisions and Your Data Choices
The law allows you to “opt out” of certain kinds of information sharing with third parties. We do not share personal information about you with any third parties that triggers this opt-out right. This means YOU ARE ALREADY OPTED OUT.
When you are no longer our client or investor, we continue to share your information as described in this notice, and you may contact us at any time to limit our sharing by sending an email to CorporateDataPrivacy@GuggenheimPartners.com.
European Union Data Subjects and certain others: In addition to the choices set forth above, residents of the European Union and certain other jurisdictions have certain rights to (1) request access to or rectification or deletion of information we collect about them, (2) request a restriction on the processing of their information, (3) object to the processing of their information, or (4) request the portability of certain information. To exercise these or other rights, please contact us using the contact information below. We will consider all requests and provide our response within the time period stated by
applicable law. Please note, however, that certain information may be exempt from such requests in some circumstances, which may include if we need to keep processing your information for our legitimate interests or to comply with a legal obligation. We may request you provide us with information necessary to confirm your identity before responding to your request.
Residents of France and certain other jurisdictions may also provide us with instructions regarding the manner in which we may continue to store, erase and share your information after your death, and where applicable, the person you have designated to exercise these rights after your death.
| | THE GUGGENHEIM FUNDS ANNUAL REPORT | 71 |
GUGGENHEIM INVESTMENTS PRIVACY NOTICE (Unaudited)(concluded) |
How We Protect Privacy Online
We take steps to protect your privacy when you use our web site – www.guggenheiminvestments.com – by using secure forms of online communication, including encryption technology, Secure Socket Layer (SSL) protocol, firewalls and user names and passwords. These safeguards vary based on the sensitivity of the information that we collect and store. However, we cannot and do not guarantee that these measures will prevent every unauthorized attempt to access, use, or disclose your information since despite our efforts, no Internet and/or other electronic transmissions can be completely secure. Our web site uses “http cookies”—tiny pieces of information that we ask your browser to store. We use cookies for session management and security features on the Guggenheim Investments web site. We do not use them to pull data from your hard drive, to learn your e-mail address, or to view data in cookies created by other web sites. We will not share the information in our cookies or give others access to it. See the legal information area on our web site for more details about web site security and privacy features.
How We Safeguard Your Personal Information and Data Retention
We restrict access to nonpublic personal information about you to our employees and in some cases to third parties (for example, the service providers described above) as permitted by law. We maintain strict physical, electronic and procedural safeguards that comply with federal standards to guard your nonpublic personal information.
We keep your information for no longer than necessary for the purposes for which it is processed. The length of time for which we retain information depends on the purposes for which we collected and use it and/or as required to comply with applicable laws. Information may persist in copies made for backup and business continuity purposes for additional time.
International Visitors
If you are not a resident of the United States, please be aware that your information may be transferred to, stored and processed in the United States where our servers are located and our databases are operated. The data protection and other laws of the United States and other countries might not be as comprehensive as those in your country.
In such cases, we ensure that a legal basis for such a transfer exists and that adequate protection is provided as required by applicable law, for example, by using standard contractual clauses or by transferring your data to a jurisdiction that has obtained an adequacy finding. Individuals whose data may be transferred on the basis of standard contractual clauses may contact us as described below.
We’ll Keep You Informed
If you have any questions or concerns about how we treat your personal data, we encourage you to consult with us first. You may also contact the relevant supervisory authority.
We reserve the right to modify this policy at any time and will inform you promptly of material changes.
You may access our privacy policy from our web site at www.guggenheiminvestments.com. Should you have any questions regarding our privacy policy, contact us by email at CorporateDataPrivacy@GuggenheimPartners.com.
72 | THE GUGGENHEIM FUNDS ANNUAL REPORT | |
LIQUIDITY RISK MANAGEMENT PROGRAM (Unaudited) |
In compliance with SEC Rule 22e-4 under the U.S. Investment Company Act of 1940 (the “Liquidity Rule”), the Guggenheim Funds Trust (the “Trust”) has adopted and implemented a written liquidity risk management program (the “Program”) for each series of the Trust (each, a “Fund” and, collectively, the “Funds”). The Trust’s Board of Trustees (the “Board”) has also designated a Program administrator (the “Administrator”).
The Liquidity Rule requires that the Program be reasonably designed to assess and manage each Fund’s liquidity risk. A Fund’s “liquidity risk” (as defined in the Liquidity Rule) is the risk that the Fund could not meet requests to redeem shares issued by the Fund without significant dilution of the remaining investors’ interests in the Fund. The Program includes a number of elements that support the assessment, management and periodic review of liquidity risk. In accordance with the Program, each Fund’s liquidity risk is assessed, managed, and periodically reviewed no less frequently than annually taking into consideration a variety of factors, including, as applicable, the Fund’s investment strategy and liquidity of portfolio investments, short-term and long-term cash flow projections, and holdings of cash and cash equivalents, as well as borrowing arrangements and other funding sources. Certain factors are considered under both normal and reasonably foreseeable stressed conditions. There is no guarantee that the Program will achieve its objective under all circumstances.
Under the Program, each Fund portfolio investment is classified into one of four liquidity categories. The classification is based on a determination of the number of days a Fund reasonably expects to take to convert the investment into cash, or sell or dispose of the investment, in current market conditions without significantly changing the investment’s market value. The Program is reasonably designed to meet Liquidity Rule requirements relating to “highly liquid investment minimums” (i.e., the minimum amount of a Fund’s net assets to be invested in highly liquid investments that are assets) and to monitor compliance with the Liquidity Rule’s limitations on a Fund’s investments in “illiquid investments” (as defined in the Liquidity Rule). Under the Liquidity Rule, a Fund is prohibited from acquiring any illiquid investment if, immediately after the acquisition, the Fund would have invested more than 15% of its net assets in illiquid investments that are assets.
During the period covered by this shareholder report, the Board received a written report (the “Report”) prepared by the Administrator addressing the Program’s operation and assessing the adequacy and effectiveness of its implementation for the period from March 31, 2022, to March 31, 2023. The Report summarized the Administrator’s assessment of the Program’s implementation and concluded that the Program operated effectively, the Program had been and continued to be reasonably designed to assess and manage each Fund’s liquidity risk, and the Program has been adequately and effectively implemented to monitor and respond to the Funds’ liquidity developments, as applicable.
Please refer to the Fund’s prospectus for more information regarding the Fund’s exposure to liquidity risk and other risks to which an investment in the Fund may be subject.
| | THE GUGGENHEIM FUNDS ANNUAL REPORT | 73 |
This page intentionally left blank.
This page intentionally left blank.
This page intentionally left blank.
This page intentionally left blank.
The registrant’s Board of Trustees has adopted a code of ethics that applies to the registrant’s principal executive officer and principal financial officer. No substantive amendments were approved or waivers were granted to the code of ethics during the period covered by this report. The code of ethics is filed as an exhibit to this Form N-CSR.
| Item 3. | Audit Committee Financial Expert. |
The registrant's Board of Trustees has determined that it has at least one audit committee financial expert serving on its audit committee (the “Audit Committee”), Sandra G. Sponem. Ms. Sponem is “independent,” meaning that she is not an “interested person” of the Registrant (as that term is defined in Section 2(a)(19) of the Investment Company Act) and she does not accept any consulting, advisory, or other compensatory fee from the Registrant (except in her capacity as a Board or committee member).
(Under applicable securities laws, a person who is determined to be an audit committee financial expert will not be deemed an "expert" for any purpose, including without limitation for the purposes of Section 11 of the Securities Act of 1933, as amended, as a result of being designated or identified as an audit committee financial expert. The designation or identification of a person as an audit committee financial expert does not impose on such person any duties, obligations, or liabilities that are greater than the duties, obligations, and liabilities imposed on such person as a member of the Audit Committee and Board of Trustees in the absence of such designation or identification. The designation or identification of a person as an audit committee financial expert does not affect the duties, obligations or liability of any other member of the audit committee or Board of Trustees.)
| Item 4. | Principal Accountant Fees and Services. |
| (a) | Audit Fees: the aggregate Audit Fees billed by the registrant’s principal accountant for professional services rendered for the audit of the annual financial statements, or services that are normally provided by the accountant in connection with statutory and regulatory filings or engagements were $705,059 and $705,059 for the fiscal years ended September 30, 2023 and September 30, 2022, respectively. |
| (b) | Audit-Related Fees: the aggregate Audit-Related Fees billed by the registrant’s principal accountant for assurance and related services that are reasonably related to the performance of the audit of the registrant’s financial statements and are not reported under paragraph (a) of this Item 4 were $0 and $0 for fiscal years ended September 30, 2023 and September 30, 2022, respectively. |
| (c) | Tax Fees: the aggregate Tax Fees billed by the registrant’s principal accountant for professional services rendered for tax compliance, tax advice and tax planning including preparation of tax returns and distribution assistance were $260,077 and $252,455 for the fiscal years ended September 30, 2023 and September 30, 2022, respectively. These services consisted of (i) preparation of U.S. federal, state and excise tax returns; (ii) U.S. federal and state tax planning, advice and assistance regarding statutory, regulatory or administrative developments, (iii) tax advice regarding tax qualification matters and/or treatment of various financial instruments held or proposed to be acquired and (iv) review of U.S. federal excise distribution calculations. |
| (d) | All Other Fees: the aggregate All Other Fees billed by the registrant’s principal accountant for products and services provided by the principal accountant, other than the services reported in paragraphs (a) through (c) of this Item 4, were $0 and $0 for the fiscal years ended September 30, 2023 and September 30, 2022, respectively. |
| (e) | Audit Committee Pre-Approval Policies and Procedures. |
(1) Audit Committee pre-approval policies and procedures:
To fulfill its responsibilities and duties the Audit Committee (the “Committee”) shall:
| 1. | Pre-Approval Policy (Trusts). Pre-approve any engagement of the independent auditors to provide any services, other than “prohibited non-audit services,” to the Trust, including the fees and other compensation to be paid to the independent auditors (unless an exception is available under Rule 2-01 of Regulation S-X). |
| (a) | The categories of services to be reviewed and considered for pre-approval include those services set forth under Section II.A.1. of the Background and Definitions for Audit Committee Charter (collectively, “Identified Services”). |
| (b) | The Committee has pre-approved Identified Services for which the estimated fees are less than $25,000. |
| (c) | For Identified Services with estimated fees of $25,000 or more, but less than $50,000, the Chair or any member of the Committee designated by the Chair is hereby authorized to pre-approve such Identified Services on behalf of the Committee. |
| (d) | For Identified Services with estimated fees of $50,000 or more, such Identified Services require pre-approval by the Committee. |
| (e) | All requests for Identified Services to be provided by the independent auditor that were pre-approved by the Committee shall be submitted to the Chief Accounting Officer (“CAO”) of the Trust by the independent auditor using the pre-approval request form. The Trust’s CAO will determine whether such services are included within the list of services that have received the general pre-approval of the Committee. |
| (f) | The independent auditors or the CAO of the Trust (or an officer of the Trust who reports to the CAO) shall report to the Committee at each of its regular scheduled meetings all audit, audit-related and permissible non-audit services initiated since the last such report (unless the services were contained in the initial audit plan, as previously presented to, and approved by, the Committee). The report shall include a general description of the services and projected fees, and the means by which such services were approved by the Committee (including the particular category of Identified Services under which pre-approval was obtained). |
| 2. | Pre-Approval Policy (Adviser or Any Control Affiliate). Pre-approve any engagement of the independent auditors, including the fees and other compensation to be paid to the independent auditors, to provide any non-audit services to the Adviser (or any “control affiliate” of the Adviser providing ongoing services to the Trust), if the engagement relates directly to the operations or financial reporting of the Trust (unless an exception is available under Rule 2-01 of Regulation S-X). |
| (a) | The Chair or any member of the Committee designated by the Chair may grant the pre-approval for non-audit services to the Adviser (or any “control affiliate” of the Adviser providing ongoing services to the Trust) relating directly to the operations or financial reporting of the Trust for which the estimated fees are less than $25,000. All such delegated pre-approvals shall be presented to the Committee no later than the next regularly scheduled Committee meeting. |
| (b) | For non-audit services to the Adviser (or any “control affiliate” of the Adviser providing ongoing services to the Trust) relating directly to the operations or financial reporting of the Trust for which the estimated fees are $25,000 or more, such services require pre-approval by the Committee. |
| a. | Pre-Approval Requirements |
| i. | Categories of Services to be Reviewed and Considered for Pre-Approval |
| a. | Annual financial statement audits |
| b. | Seed audits (related to new product filings, as required) |
| c. | SEC and regulatory filings and consents |
| a. | Accounting consultations |
| b. | Fund merger/reorganization support services |
| c. | Other accounting related matters |
| d. | Agreed upon procedures reports |
| f. | Other internal control reports |
| a. | Recurring tax services: |
| i. | Preparation of Federal and state income tax returns, including extensions |
| ii. | Preparation of calculations of taxable income, including fiscal year tax designations |
| iii. | Preparation of annual Federal excise tax returns (if applicable) |
| iv. | Preparation of calendar year excise distribution calculations |
| v. | Calculation of tax equalization on an as-needed basis |
| vi. | Preparation of monthly/quarterly estimates of tax undistributed position for closed-end funds |
| vii. | Preparation of the estimated excise distribution calculations on an as-needed basis |
| viii. | Preparation of calendar year shareholder reporting designations on Form 1099 |
| ix. | Preparation of quarterly Federal, state and local and franchise tax estimated tax payments on an as-needed basis |
| x. | Preparation of state apportionment calculations to properly allocate Fund taxable income among the states for state tax filing purposes |
| xi. | Assistance with management’s identification of passive foreign investment companies (PFICs) for tax purposes |
| b. | Permissible non-recurring tax services upon request: |
| i. | Assistance with determining ownership changes which impact a Fund’s utilization of loss carryforwards |
| ii. | Assistance with corporate actions and tax treatment of complex securities and structured products |
| iii. | Assistance with IRS ruling requests and calculation of deficiency dividends |
| iv. | Conduct training sessions for the Adviser’s internal tax resources |
| v. | Assistance with Federal, state, local and international tax planning and advice regarding the tax consequences of proposed or actual transactions |
| vi. | Tax services related to amendments to Federal, state and local returns and sales and use tax compliance |
| vii. | RIC qualification reviews |
| viii. | Tax distribution analysis and planning |
| ix. | Tax authority examination services |
| x. | Tax appeals support services |
| xi. | Tax accounting methods studies |
| xii. | Fund merger, reorganization and liquidation support services |
| xiii. | Tax compliance, planning and advice services and related projects |
| xiv. | Assistance with out of state residency status |
| xv. | Provision of tax compliance services in India for Funds with direct investments in India |
| B. | Pre-Approval Not Required |
Under Section 10A(h)(i)(1)(B) of the Exchange Act and Rule 2-01 under Regulation S-X (Section (c)(7)), pre-approval of non-audit services for the Trust pursuant to Section V.B.2 is not required, if:
| 1. | the aggregate amount of all non-audit services provided to the Trust is no more than 5% of the total fees paid by the Trust to the independent auditors during the fiscal year in which the non-audit services are provided; |
| 2. | the services were not recognized by Trust management at the time of the engagement as non-audit services; and |
| 3. | such services are promptly brought to the attention of the Audit Committee by Trust management and the Committee approves them (which may be by delegation) prior to the completion of the audit. |
Under Section 10A(h)(i)(1)(B) of the Exchange Act and Rule 2-01 under Regulation S-X (Section (c)(7)), pre-approval of non-audit services for the Adviser (or any affiliate of the Adviser providing ongoing services to the Trust) pursuant to Section V.B.3 is not required, if:
| 1. | the aggregate amount of all non-audit services provided is no more than 5% of the total fees paid to the Trust’s independent auditors by the Trust, the Adviser and any “control affiliate” of the Adviser providing ongoing services to the Trust during the fiscal year in which the non-audit services are provided; |
| 2. | the services were not recognized by Trust management at the time of the engagement as non-audit services; and |
| 3. | such services are promptly brought to the attention of the Audit Committee by Trust management and the Committee approves them (which may be by delegation) prior to the completion of the audit. |
(2) None of the services described in each of Items 4(b) through (d) were approved by the Audit Committee pursuant to paragraph (c)(7)(i)(C) of Rule 2-01 of Regulation S-X.
| (g) | Non-Audit Fees. The aggregate non-audit fees billed by the registrant's accountant for the most recent fiscal year and the preceding years for services rendered to the registrant, the investment adviser and any entity controlling, controlled by, or under common control with the adviser that provides ongoing services to the registrant were $260,077 and $252,455, respectively. These aggregate fees were less than the aggregate fees billed for the same periods by the registrant’s principal accountant for audit services rendered to the registrant, the investment advisor, and any entity controlling, controlled by, or under common control with the advisor that provides ongoing services to the registrant. |
| (h) | Auditor Independence. The registrant’s Audit Committee was provided with information relating to the provision of non-audit services by Ernst & Young, LLP to the registrant’s investment adviser (not including any sub adviser whose role is primarily portfolio management and is subcontracted with or overseen by another investment adviser), and any entity controlling, controlled by, or under common control with the investment adviser that provides ongoing services to the registrant that were not pre-approved by the Audit Committee so that a determination could be made whether the provision of such services is compatible with maintaining Ernst & Young, LLP’s independence. |
| Item 5. | Audit Committee of Listed Registrants. |
Not applicable.
(a) The Schedule of Investments is included under Item 1 of this Form.
(b) Not applicable.
| Item 7. | Disclosure of Proxy Voting Policies and Procedures for Closed-End Management Investment Companies. |
Not applicable.
| Item 8. | Portfolio Managers of Closed-end Management Investment Companies |
Not applicable.
| Item 9. | Purchases of Equity Securities by Closed-End Management Investment Company and Affiliated Purchasers. |
Not applicable.
| Item 10. | Submission of Matters to a Vote of Security Holders. |
The registrant does not currently have in place procedures by which shareholders may recommend nominees to the registrant’s board.
There have been no changes to the procedures by which shareholders may recommend nominees to the registrant’s board.
| Item 11. | Controls and Procedures. |
| (a) | The registrant’s President (principal executive officer) and Treasurer (principal financial officer) have evaluated the registrant’s disclosure controls and procedures (as defined in Rule 30a-3(c) under the Investment Company Act) as of a date within 90 days of this filing and have concluded that based on such evaluation as required by Rule 30a-3(b) under the Investment Company Act, that the registrant’s disclosure controls and procedures were effective as of that date in ensuring that information required to be disclosed by the registrant in this Form N-CSR was recorded, processed, summarized, and reported within the time periods specified in the Securities and Exchange Commission’s rules and forms. |
| (b) | There were no changes in the registrant’s internal control over financial reporting (as defined in Rule 30a-3(d) under the Investment Company Act) that occurred during the period covered by this report that have materially affected, or are reasonably likely to materially affect, the registrant’s internal control over financial reporting. |
| Item 12. | Disclosure of Securities Lending Activities for Closed-End Management Investment Companies. |
Not applicable.
SIGNATURES
Pursuant to the requirements of the Securities Exchange Act of 1934 and the Investment Company Act of 1940, the registrant has duly caused this report to be signed on its behalf by the undersigned, thereunto duly authorized.
| (Registrant) | Guggenheim Funds Trust | |
| | | |
| By (Signature and Title)* | /s/ Brian E. Binder | |
| | Brian E. Binder, President and Chief Executive Officer | |
| | | |
| Date | December 6, 2023 | |
Pursuant to the requirements of the Securities Exchange Act of 1934 and the Investment Company Act of 1940, this report has been signed below by the following persons on behalf of the registrant and in the capacities and on the dates indicated.
| By (Signature and Title)* | /s/ Brian E. Binder | |
| | Brian E. Binder, President and Chief Executive Officer | |
| | | |
| Date | December 6, 2023 | |
| | | |
| By (Signature and Title)* | /s/ James Howley | |
| | James Howley, Chief Financial Officer, Chief Accounting Officer and Treasurer | |
| | | |
| Date | December 6, 2023 | |
| * | Print the name and title of each signing officer under his or her signature. |


