UNITED STATES
SECURITIES AND EXCHANGE COMMISSION
Washington, D.C. 20549
FORM N-CSR
CERTIFIED SHAREHOLDER REPORT OF REGISTERED MANAGEMENT
INVESTMENT COMPANIES
Investment Company Act file number 811- 01136
Guggenheim Funds Trust
(Exact name of registrant as specified in charter)
702 King Farm Boulevard, Suite 200
Rockville, Maryland 20850
(Address of principal executive offices) (Zip code)
Amy J. Lee
Guggenheim Funds Trust
702 King Farm Boulevard, Suite 200
Rockville, Maryland 20850
(Name and address of agent for service)
Registrant's telephone number, including area code: (301) 296-5100
Date of fiscal year end: September 30
Date of reporting period: October 1, 2023 – March 31, 2024
| Item 1. | Reports to Stockholders. |
The registrant’s semi-annual report transmitted to shareholders pursuant to Rule 30e-1 under the Investment Company Act of 1940, as amended (the “Investment Company Act”), is as follows:
3.31.2024
Guggenheim Funds Semi-Annual Report
Guggenheim Funds Trust-Equity |
Guggenheim Alpha Opportunity Fund | | |
Guggenheim Large Cap Value Fund | | |
Guggenheim Market Neutral Real Estate Fund | | |
Guggenheim Risk Managed Real Estate Fund | | |
Guggenheim Small Cap Value Fund | | |
Guggenheim StylePlus—Large Core Fund | | |
Guggenheim StylePlus—Mid Growth Fund | | |
Guggenheim World Equity Income Fund | | |
GuggenheimInvestments.com | SBE-SEMI-0324x0924 |
| | |
DEAR SHAREHOLDER | 2 |
ECONOMIC AND MARKET OVERVIEW | 5 |
ABOUT SHAREHOLDERS’ FUND EXPENSES | 7 |
ALPHA OPPORTUNITY FUND | 10 |
LARGE CAP VALUE FUND | 28 |
MARKET NEUTRAL REAL ESTATE FUND | 37 |
RISK MANAGED REAL ESTATE FUND | 47 |
SMALL CAP VALUE FUND | 61 |
STYLEPLUS—LARGE CORE FUND | 70 |
STYLEPLUS—MID GROWTH FUND | 80 |
WORLD EQUITY INCOME FUND | 91 |
NOTES TO FINANCIAL STATEMENTS | 101 |
OTHER INFORMATION | 116 |
INFORMATION ON BOARD OF TRUSTEES AND OFFICERS | 117 |
GUGGENHEIM INVESTMENTS PRIVACY NOTICE | 123 |
| | THE GUGGENHEIM FUNDS SEMI-ANNUAL REPORT | 1 |
Dear Shareholder:
Security Investors, LLC and Guggenheim Partners Investment Management, LLC (the “Investment Advisers”) are pleased to present the shareholder report for a selection of our Funds (the “Funds”) for the semi-annual fiscal period ended March 31, 2024 (the “Reporting Period”).
The Investment Advisers are part of Guggenheim Investments, which represents the investment management businesses of Guggenheim Partners, LLC (“Guggenheim”), a global, diversified financial services firm.
Guggenheim Funds Distributors, LLC is the distributor of the Funds. Guggenheim Funds Distributors, LLC is affiliated with Guggenheim and the Investment Advisers.
We encourage you to read the Economic and Market Overview section of the report, which follows this letter.
We are committed to providing innovative investment solutions and appreciate the trust you place in us.
Sincerely,
Security Investors, LLC,
Guggenheim Partners Investment Management, LLC,
April 30, 2024
Read a prospectus and summary prospectus (if available) carefully before investing. It contains the investment objectives, risks, charges, expenses and other information, which should be considered carefully before investing. Obtain a prospectus and summary prospectus (if available) at guggenheiminvestments.com or call 800.820.0888.
This material is not intended as a recommendation or as investment advice of any kind, including in connection with rollovers, transfers, and distributions. Such material is not provided in a fiduciary capacity, may not be relied upon for or in connection with the making of investment decisions, and does not constitute a solicitation of an offer to buy or sell securities. All content has been provided for informational or educational purposes only and is not intended to be and should not be construed as legal or tax advice and/or a legal opinion. Always consult a financial, tax and/ or legal professional regarding your specific situation.
The Alpha Opportunity Fund may not be suitable for all investors. ● Investments in securities and derivatives, in general, are subject to market risks that may cause their prices to fluctuate over time. An investment in the Fund may lose money. There can be no guarantee the Fund will achieve its investment objective. ●The Fund’s use of derivatives such as futures, options and swap agreements may expose the Fund to additional risks that it would not be subject to if it invested directly in the securities underlying those derivatives. ● Certain of the derivative instruments, such as swaps and structured notes, are also subject to the risks of counterparty default and adverse tax treatment. ●The more the Fund invests in leveraged instruments, the more the leverage will magnify any gains or losses on those investments. ● The Fund’s use of short selling involves increased risk and costs, including paying more for a security than it received from its sale and the risk of unlimited losses. ●In certain circumstances the Fund may be subject to liquidity risk and it may be difficult for the Fund to purchase and sell particular investments within a reasonable time at a fair price. ●In certain circumstances, it may be difficult for the Fund to purchase and sell particular investments within a reasonable time at a fair price. ●The Fund’s fixed income investments
2 | THE GUGGENHEIM FUNDS SEMI-ANNUAL REPORT | |
will change in value in response to interest rate changes and other factors. ● The Fund is subject to active trading risks that may increase volatility and impact its ability to achieve its investment objective. ●You may have a gain or loss when you sell your shares. ● It is important to note that the Fund is not guaranteed by the U.S. government. ● Please read the prospectus for more detailed information regarding these and other risks.
The StylePlus Funds may not be suitable for all investors. ●An investment in the Funds will fluctuate and is subject to investment risks, which means investors could lose money. ● There can be no guarantee the Funds will achieve their investment objectives. ● Investments in large capitalization stocks may underperform other segments of the equity market or the equity market as a whole. ● Investments in small- and mid-sized-sized company securities may present additional risks such as less predictable earnings, higher volatility and less liquidity than larger, more established companies. ● Growth stocks may be more volatile than other stocks because they are more sensitive to investor perceptions regarding the growth potential of the issuing companies. ● The Funds may invest in derivative instruments, which may be more volatile and less liquid, increasing the risk of loss when compared to traditional securities. Certain of the derivative instruments are also subject to the risks of counterparty default and adverse tax treatment. ● The Funds’ use of leverage, through borrowings or instruments such as derivatives, may cause the Funds to be more volatile than if they had not been leveraged. ● The Funds’ investments in other investment vehicles subject the Funds to those risks and expenses affecting the investment vehicle. ●The Funds may invest in foreign securities which carry additional risks when compared to U.S. securities, due to the impact of diplomatic, political or economic developments in the country in question (investments in emerging markets securities are generally subject to an even greater level of risks). ●The Funds may invest in fixed income securities whose market value will change in response to interest rate changes and market and economic conditions among other factors. In general, bond prices rise when interest rates fall and vice versa. ● The Funds’ exposure to high yield securities may subject the Funds to greater volatility. ● The Funds may invest in bank loans and asset-backed securities, including mortgage backed, which involve special types of risks. ●The Funds may invest in restricted securities which may involve financial and liquidity risk. ● The Funds are subject to active trading risks that may increase volatility and impact their ability to achieve their investment objectives. ●You may have a gain or loss when you sell your shares. ● It is important to note that the Funds are not guaranteed by the U.S. government. ● Please read the prospectus for more detailed information regarding these and other risks.
The Value Funds may not be suitable for all investors.●An investment in the Funds will fluctuate and is subject to investment risks, which means investors could lose money. ● There can be no guarantee the Funds will achieve their investment objectives ● The intrinsic value of the underlying stocks may never be realized or the stocks may decline in value. ● The Large Cap Value Fund is subject to risk that large-capitalization stocks may underperform other segments of the equity market or the equity markets as a whole. ● The Small Cap Value Fund is subject to the risk that investments in small- and/or mid-sized company securities may present additional risks such as less predictable earnings, higher volatility and less liquidity than larger, more established companies. ● The Funds are subject to active trading risks that may increase volatility and impact their ability to achieve their investment objectives. ●You may have a gain or loss when you sell your shares. ● It is important to note that the Funds are not guaranteed by the U.S. government.● Please read the prospectus for more detailed information regarding these and other risks.
Market Neutral Real Estate Fund may not be suitable for all investors ●An investment in the Fund will fluctuate and is subject to investment risks, which means investors could lose money.● There are no assurances that the Fund will achieve its objective and/or strategy. ● The Fund’s investments in real estate securities subject the Fund to the same risks as direct investments in real estate, which is particularly sensitive to economic downturns. ● The Fund’s use of derivatives such as futures, options, and swap agreements may expose the Fund to additional risks that it would not be subject to if it invested directly in the securities underlying those derivatives. ● When market conditions are deemed appropriate, the Fund may use leverage to the full extent permitted by its investment policies and restrictions and applicable law. Leveraging will exaggerate the effect on net asset value of any increase or decrease in the market value of the Fund’s portfolio. ● The more the Fund invests in leveraged instruments, the more the leverage will magnify any gains or losses on those investments. ● The Fund’s use of short selling involves increased risk and costs. The Fund risks paying more for a security than it received from its sale. ● The Fund’s investments in other investment vehicles subject the Fund to those risks and expenses affecting the investment vehicle. ● The Fund’s investments in foreign securities carry additional risks when compared to U.S. securities, due to the impact of diplomatic, political, or economic developments in the country in question (investments in emerging markets securities are generally subject to an even greater level of risk). ● The Fund may invest in derivative instruments, which may be more volatile and less liquid, increasing the risk of loss when compared to traditional securities. Certain of the derivative instruments are also subject to the risks of counterparty default and adverse tax treatment. ● Investing in sector funds is more volatile than investing in broadly diversified funds, as there is a greater risk due to the concentration of the funds’ holdings in issuers of the same or similar offerings. ● The Fund will concentrate its investments in the real estate industry, which may subject the Fund to risks specifically affecting that industry more than a fund that invests across a variety of industries. ● Short selling involves increased risks and costs. You risk paying more for a security than you received from its sale. This strategy may not be suitable for all investors. ● The Fund is subject to active trading risks that may increase volatility and impact its ability to achieve its investment objective. ● You may have a gain or loss when you sell your shares. ● It is important to note that the Fund is not guaranteed by the U.S. government. ● Please read the prospectus for more detailed information regarding these and other risks.
Risk Managed Real Estate Fund may not be suitable for all investors. ● An investment in the Fund will fluctuate and is subject to investment risks, which means investors could lose money.● There are no assurances that any fund will achieve its objective and/or strategy. ● The Fund’s investments in real estate securities subject the Fund to the same risks as direct investments in real estate, which is particularly sensitive to economic downturns. ● The Fund’s use of derivatives such as futures, options and swap agreements may expose the Fund to additional risks that it would not be subject to if it invested directly in the securities underlying those derivatives. ● When market conditions are deemed appropriate, the Fund may use leverage to the full extent permitted by its investment policies and restrictions and applicable law. Leveraging will exaggerate the effect on net asset value of any increase or decrease in the market value of the Fund’s portfolio. ● The more the Fund invests in leveraged instruments, the more the leverage will magnify any gains or losses on those investments. ● The Fund’s use of short selling involves increased risk and costs. The Fund risks paying more for a security than it received from its sale. ● The Fund’s investments in other investment vehicles subject the Fund to those risks and expenses affecting the investment vehicle. ● The Fund’s investments in foreign securities carry additional risks when compared to U.S. securities, due to the impact of diplomatic, political or economic developments in the country in question (investments in emerging markets securities are generally subject to an even greater level of risk). ● The Fund may invest in derivative instruments, which may be more volatile and less liquid, increasing the risk of loss when compared to traditional securities. Certain of the derivative instruments are also subject to the risks of counterparty default and adverse tax treatment. ● Investing in sector funds is more volatile than investing in broadly diversified funds, as there is a greater risk due to the concentration of the funds’ holdings in issuers of the same or similar offerings. ● The Fund will concentrate its investments in the real estate industry, which may subject the Fund to risks specifically affecting that industry more than a fund that invests across a variety of industries. ● Short selling involves increased risks and costs. You risk paying more for a security than you received from its sale. This strategy may not be suitable for all investors. ● The Fund is subject to active trading risks that may increase volatility and impact its ability to achieve its investment objective. ● You may have a gain or loss when you sell your shares. ● It is important to note that the Fund is not guaranteed by the U.S. government. ● Please read the prospectus for more detailed information regarding these and other risks.
| | THE GUGGENHEIM FUNDS SEMI-ANNUAL REPORT | 3 |
World Equity Income Fund may not be suitable for all investors. ● An investment in the Fund will fluctuate and is subject to investment risks, which means investors could lose money. ● There can be no guarantee the Fund will achieve its investment objective. ●The Fund’s investments in foreign securities carry additional risks when compared to U.S. securities, due to the impact of diplomatic, political or economic developments in the country in question (investments in emerging markets are generally subject to an even greater level of risk). Additionally, the Fund’s exposure to foreign currencies subjects the Fund to the risk that those currencies will decline in value relative to the U.S. Dollar. ● The Fund’s investments in derivatives may pose risks in addition to those associated with investing directly in securities or other investments, including illiquidity of the derivatives, imperfect correlations with underlying investments or the Fund’s other portfolio holdings, lack of availability and counterparty risk. ●The Fund’s use of leverage, through instruments such as derivatives, may cause the Fund to be more volatile than if it had not been leveraged. ●The Fund’s investments in other investment vehicles subject the Fund to those risks and expenses affecting the investment vehicle. ●The Fund may have significant exposure to securities in a particular capitalization range e.g., large-, mid- or small-cap securities. As a result, the Fund may be subject to the risk that the pre-denominate capitalization range may underperform other segments of the equity market or the equity market as a whole. ● The Fund is subject to active trading risks that may increase volatility and impact its ability to achieve its investment objective. ●You may have a gain or loss when you sell your shares. ● It is important to note that the Fund is not guaranteed by the U.S. government. ● Please read the prospectus for more detailed information regarding these and other risks.
4 | THE GUGGENHEIM FUNDS SEMI-ANNUAL REPORT | |
ECONOMIC AND MARKET OVERVIEW (Unaudited) | March 31, 2024 |
While job growth remains robust, recent labor data brought increased confidence in a labor market in better balance, allowing for inflation to soften further. Labor force growth remains strong, aided by high immigration flows, helping bring labor supply in line with gradually cooling demand. The Small Business Survey indicates that plans to increase compensation have returned to pre-COVID levels. Additionally, Bureau of Labor Statistics data reveal a continued decline in the “quits rate,” reducing the pressure on businesses to raise wages to attract or retain employees. These developments suggest wage pressures may ease further by year end. And despite some speculation against any Federal Reserve (“Fed”) rate cuts materializing in 2024, we continue to anticipate cuts later this year.
Following the stronger-than-expected March Consumer Price Index, we believe that there is a high probability that the easing cycle will start in the second half of the year, since the Fed will likely need more time to gather confirming data. In the latest Summary of Economic Projections, the Federal Open Market Committee (“FOMC”) significantly increased the median forecast for 2024 U.S. gross domestic product, slightly increased it for core personal consumption expenditures year over year, and continues to expect no material increase in the unemployment rate. These adjustments left the median view for three rate cuts for 2024, which suggests the bar is very high for the Fed to keep rates where they are all year, and even higher for more rate hikes to materialize.
Amid this macroeconomic backdrop, in the first quarter of 2024 the two-year Treasury yield increased to 4.59% from 4.23%, and the 10-year Treasury yield increased to 4.20% from 3.88%, keeping the inverted 2s/10s yield curve consistent at 39 basis points as of the end of the Reporting Period, up four basis points since the start of the year. One basis point equals 0.01%. In general, spreads to Treasurys have remained tight across sectors. In investment-grade corporate bonds, BBB-rated bonds continued to remain attractive relative to A and BB-rated bonds, and supply slowed toward the end of the first quarter of 2024, which we believe should support spreads in the near term. High yield bond spreads tightened during the first quarter of 2024 to 301 basis points from 323 basis points at the start of the year, while leveraged loans’ discount margins to maturity tightened to 509 basis points from 528 basis points. Structured credit spreads tightened marginally amid strong demand. Investor demand and an improved arbitrage led to robust new collateralized loan obligation issuance, and tightening liabilities led to an increase in refinances/resets.
Looking forward, Fed officials continue to advocate for a patient approach. A conventional easing cycle is therefore far from guaranteed. Market expectations have already adjusted significantly from market-implied expectations of six rate cuts in 2024 just two months ago to only three as of the end of the Reporting Period, aligning more closely with the FOMC’s views. So far, the market has taken this delay in stride, but its patience and assessment of credit risk could be tested.
For the Reporting Period, the S&P 500® Index* returned 23.48%. The MSCI Europe-Australasia-Far East (“EAFE”) Index* returned 17.01%. The return of the MSCI Emerging Markets Index* was 10.56%.
In the bond market, the Bloomberg U.S. Aggregate Bond Index* posted a 5.99% return for the Reporting Period, while the Bloomberg U.S. Corporate High Yield Index* returned 8.75%. The return of the ICE Bank of America (“BofA”) 3-Month U.S. Treasury Bill Index* was 2.69% for the Reporting Period.
The opinions and forecasts expressed may not actually come to pass. This information is subject to change at any time, based on market and other conditions, and should not be construed as a recommendation of any specific security or strategy.
*Index Definitions:
The following indices are referenced throughout this report. Indices are unmanaged and not available for direct investment. Index performance does not reflect transaction costs, fees, or expenses.
Bloomberg U.S. Aggregate Bond Index is a broad-based flagship benchmark that measures the investment grade, U.S. dollar-denominated, fixed-rate taxable bond market, including U.S. Treasuries, government-related and corporate securities, mortgage-backed securities or “MBS” (agency fixed-rate and hybrid adjustable-rate mortgage, or “ARM”, pass-throughs), asset-backed securities (“ABS”), and commercial mortgage-backed securities (“CMBS”) (agency and non-agency).
Bloomberg U.S. Corporate High Yield Index measures the U.S. dollar-denominated, high yield, fixed-rate corporate bond market. Securities are classified as high yield if the middle rating of Moody’s, Fitch, and S&P is Ba1/BB +/BB + or below.
| | THE GUGGENHEIM FUNDS SEMI-ANNUAL REPORT | 5 |
ECONOMIC AND MARKET OVERVIEW (Unaudited)(concluded) | March 31, 2024 |
FTSE NAREIT Equity REITs Index (“FNRE”) is one of the FTSE NAREIT U.S. Real Estate Index Series that contains all Equity REITs not designated as Timber REITs or Infrastructure REITs. FTSE NAREIT US Real Estate Index Series is designed to present investors with a comprehensive family of REIT performance indexes that spans the commercial real estate space across the U.S. economy. The index series provides investors with exposure to all investment and property sectors. In addition, the more narrowly focused property sector and sub-sector indexes provide the facility to concentrate commercial real estate exposure in more selected markets. The National Association of Real Estate Investment Trusts (NAREIT) is the trade association for REITs and publicly traded real estate companies with an interest in the U.S. property and investment markets.
ICE BofA 3-Month U.S. Treasury Bill Index is an unmanaged market index of U.S. Treasury securities maturing in 90 days that assumes reinvestment of all income.
Morningstar Long/Short Equity Category Average is the average return of funds Morningstar places in a given category based on their portfolio statistics and compositions over the past three years. Long-short portfolios hold sizeable stakes in both long and short positions in equities, exchange traded funds, and related derivatives. Some funds that fall into this category will shift their exposure to long and short positions depending on their macro outlook or the opportunities they uncover through bottom-up research. At least 75% of the assets are in equity securities or derivatives, and funds in the category will typically have beta values to relevant benchmarks of between 0.3 and 0.8 over a three-year period.
MSCI EAFE Index is a free float-adjusted market capitalization index that is designed to measure the equity market performance of developed markets, excluding the U.S. & Canada.
MSCI Emerging Markets Index is a free float-adjusted market capitalization weighted index that is designed to measure equity market performance in the global emerging markets.
MSCI World Index (Net) is calculated with net dividends reinvested. It is a free float-adjusted market capitalization weighted index that is designed to measure the equity market performance of developed markets.
Russell 1000® Value Index measures the performance of the large-cap value segment of the U.S. equity universe. It includes those Russell 1000 companies with lower price-to-book ratios and lower expected growth values.
Russell 2000® Value Index measures the performance of the small-cap value segment of the U.S. equity universe. It includes those Russell 2000 companies with lower price-to-book ratios and lower forecasted growth values.
Russell Midcap Growth® Index measures the performance of the mid-cap growth segment of the U.S. equity universe. It includes those Russell Midcap Index companies with higher price-to-book ratios and higher forecasted growth values.
S&P 500® Index is a broad-based index, the performance of which is based on the performance of 500 widely held common stocks chosen for market size, liquidity, and industry group representation.
6 | THE GUGGENHEIM FUNDS SEMI-ANNUAL REPORT | |
ABOUT SHAREHOLDERS’ FUND EXPENSES (Unaudited) | |
All mutual funds have operating expenses, and it is important for our shareholders to understand the impact of costs on their investments. Shareholders of a fund incur two types of costs: (i) transaction costs, including sales charges (loads) on purchase payments, reinvested dividends, other distributions, and exchange fees, and (ii) ongoing costs, including management fees, administrative services, and shareholder reports, among others. These ongoing costs, or operating expenses, are deducted from a fund’s gross income and reduce the investment return of the fund.
A fund’s expenses are expressed as a percentage of its average net assets, which is known as the expense ratio. The following examples are intended to help investors understand the ongoing costs (in dollars) of investing in a fund and to compare these costs with the ongoing costs of investing in other mutual funds.
The examples are based on an investment of $1,000 made at the beginning of the period and held for the entire six-month period beginning September 30, 2023 and ending March 31, 2024.
The following tables illustrate the Funds’ costs in two ways:
Table 1. Based on actual Fund return: This section helps investors estimate the actual expenses paid over the period. The “Ending Account Value” shown is derived from the Fund’s actual return, and the fifth column shows the dollar amount that would have been paid by an investor who started with $1,000 in the Fund. Investors may use the information here, together with the amount invested, to estimate the expenses paid over the period. Simply divide the Fund’s account value by $1,000 (for example, an $8,600 account value divided by $1,000 = 8.6), then multiply the result by the number provided under the heading “Expenses Paid During Period.”
Table 2. Based on hypothetical 5% return: This section is intended to help investors compare a fund’s cost with those of other mutual funds. The table provides information about hypothetical account values and hypothetical expenses based on the Fund’s actual expense ratio and an assumed rate of return of 5% per year before expenses, which is not the Fund’s actual return. The hypothetical account values and expenses may not be used to estimate the actual ending account balance or expenses paid during the period. The example is useful in making comparisons because the U.S. Securities and Exchange Commission (the “SEC”) requires all mutual funds to calculate expenses based on the 5% return. Investors can assess a fund’s costs by comparing this hypothetical example with the hypothetical examples that appear in shareholder reports of other funds.
The calculations illustrated above assume no shares were bought or sold during the period. Actual costs may have been higher or lower, depending on the amount of investment and the timing of any purchases or redemptions.
Please note that the expenses shown in the table are meant to highlight your ongoing costs only and do not reflect any transactional costs, such as sales charges (loads) on purchase payments, and contingent deferred sales charges (“CDSC”) on redemptions, if any. Therefore, the second table is useful in comparing ongoing costs only, and will not help you determine the relative total costs of owning different funds. In addition, if these transactional costs were included, your costs would have been higher.
More information about the Funds’ expenses, including annual expense ratios for periods up to five years (subject to the Fund’s inception date), can be found in the Financial Highlights section of this report. For additional information on operating expenses and other shareholder costs, please refer to the appropriate Fund prospectus.
| | THE GUGGENHEIM FUNDS SEMI-ANNUAL REPORT | 7 |
ABOUT SHAREHOLDERS’ FUND EXPENSES (Unaudited)(continued) | |
| Expense
Ratio1 | Fund
Return | Beginning
Account Value
September 30, 2023 | Ending
Account Value
March 31, 2024 | Expenses
Paid During
Period2 |
Table 1. Based on actual Fund return3 | | | | | |
Alpha Opportunity Fund | | | | | |
Class A | 1.74% | 12.15% | $ 1,000.00 | $ 1,121.50 | $ 9.23 |
Class C | 2.49% | 11.73% | 1,000.00 | 1,117.30 | 13.18 |
Class P | 1.74% | 12.12% | 1,000.00 | 1,121.20 | 9.23 |
Institutional Class | 1.41% | 12.33% | 1,000.00 | 1,123.30 | 7.48 |
Large Cap Value Fund | | | | | |
Class A | 1.13% | 17.48% | 1,000.00 | 1,174.80 | 6.14 |
Class C | 1.88% | 17.05% | 1,000.00 | 1,170.50 | 10.20 |
Class P | 1.13% | 17.48% | 1,000.00 | 1,174.80 | 6.14 |
Institutional Class | 0.87% | 17.64% | 1,000.00 | 1,176.40 | 4.73 |
Market Neutral Real Estate Fund | | | | | |
Class A | 1.67% | 2.29% | 1,000.00 | 1,022.90 | 8.45 |
Class C | 2.45% | 1.91% | 1,000.00 | 1,019.10 | 12.37 |
Class P | 1.66% | 2.32% | 1,000.00 | 1,023.20 | 8.40 |
Institutional Class | 1.41% | 2.41% | 1,000.00 | 1,024.10 | 7.13 |
Risk Managed Real Estate Fund | | | | | |
Class A | 1.59% | 15.04% | 1,000.00 | 1,150.40 | 8.55 |
Class C | 2.29% | 14.66% | 1,000.00 | 1,146.60 | 12.29 |
Class P | 1.63% | 15.07% | 1,000.00 | 1,150.70 | 8.76 |
Institutional Class | 1.27% | 15.27% | 1,000.00 | 1,152.70 | 6.83 |
Small Cap Value Fund | | | | | |
Class A | 1.28% | 16.69% | 1,000.00 | 1,166.90 | 6.93 |
Class C | 2.03% | 16.25% | 1,000.00 | 1,162.50 | 10.97 |
Class P | 1.27% | 16.74% | 1,000.00 | 1,167.40 | 6.88 |
Institutional Class | 1.03% | 16.90% | 1,000.00 | 1,169.00 | 5.59 |
StylePlus—Large Core Fund | | | | | |
Class A | 1.65% | 24.43% | 1,000.00 | 1,244.30 | 9.26 |
Class C | 2.57% | 23.84% | 1,000.00 | 1,238.40 | 14.38 |
Class P | 1.71% | 24.40% | 1,000.00 | 1,244.00 | 9.59 |
Institutional Class | 1.44% | 24.59% | 1,000.00 | 1,245.90 | 8.09 |
StylePlus—Mid Growth Fund | | | | | |
Class A | 1.77% | 27.48% | 1,000.00 | 1,274.80 | 10.07 |
Class C | 2.74% | 26.85% | 1,000.00 | 1,268.50 | 15.54 |
Class P | 1.91% | 27.40% | 1,000.00 | 1,274.00 | 10.86 |
Institutional Class | 1.55% | 27.65% | 1,000.00 | 1,276.50 | 8.82 |
World Equity Income Fund | | | | | |
Class A | 1.19% | 17.52% | 1,000.00 | 1,175.20 | 6.47 |
Class C | 1.95% | 17.03% | 1,000.00 | 1,170.30 | 10.58 |
Class P | 1.19% | 17.55% | 1,000.00 | 1,175.50 | 6.47 |
Institutional Class | 0.94% | 17.61% | 1,000.00 | 1,176.10 | 5.11 |
8 | THE GUGGENHEIM FUNDS SEMI-ANNUAL REPORT | |
ABOUT SHAREHOLDERS’ FUND EXPENSES (Unaudited)(concluded) | |
| Expense
Ratio1 | Fund
Return | Beginning
Account Value
September 30, 2023 | Ending
Account Value
March 31, 2024 | Expenses
Paid During
Period |
Table 2. Based on hypothetical 5% return (before expenses) | | | |
Alpha Opportunity Fund | | | | | |
Class A | 1.74% | 5.00% | $ 1,000.00 | $ 1,016.30 | $ 8.77 |
Class C | 2.49% | 5.00% | 1,000.00 | 1,012.55 | 12.53 |
Class P | 1.74% | 5.00% | 1,000.00 | 1,016.30 | 8.77 |
Institutional Class | 1.41% | 5.00% | 1,000.00 | 1,017.95 | 7.11 |
Large Cap Value Fund | | | | | |
Class A | 1.13% | 5.00% | 1,000.00 | 1,019.35 | 5.70 |
Class C | 1.88% | 5.00% | 1,000.00 | 1,015.60 | 9.47 |
Class P | 1.13% | 5.00% | 1,000.00 | 1,019.35 | 5.70 |
Institutional Class | 0.87% | 5.00% | 1,000.00 | 1,020.65 | 4.39 |
Market Neutral Real Estate Fund | | | | | |
Class A | 1.67% | 5.00% | 1,000.00 | 1,016.65 | 8.42 |
Class C | 2.45% | 5.00% | 1,000.00 | 1,012.75 | 12.33 |
Class P | 1.66% | 5.00% | 1,000.00 | 1,016.70 | 8.37 |
Institutional Class | 1.41% | 5.00% | 1,000.00 | 1,017.95 | 7.11 |
Risk Managed Real Estate Fund | | | | | |
Class A | 1.59% | 5.00% | 1,000.00 | 1,017.05 | 8.02 |
Class C | 2.29% | 5.00% | 1,000.00 | 1,013.55 | 11.53 |
Class P | 1.63% | 5.00% | 1,000.00 | 1,016.85 | 8.22 |
Institutional Class | 1.27% | 5.00% | 1,000.00 | 1,018.65 | 6.41 |
Small Cap Value Fund | | | | | |
Class A | 1.28% | 5.00% | 1,000.00 | 1,018.60 | 6.46 |
Class C | 2.03% | 5.00% | 1,000.00 | 1,014.85 | 10.23 |
Class P | 1.27% | 5.00% | 1,000.00 | 1,018.65 | 6.41 |
Institutional Class | 1.03% | 5.00% | 1,000.00 | 1,019.85 | 5.20 |
StylePlus—Large Core Fund | | | | | |
Class A | 1.65% | 5.00% | 1,000.00 | 1,016.75 | 8.32 |
Class C | 2.57% | 5.00% | 1,000.00 | 1,012.15 | 12.93 |
Class P | 1.71% | 5.00% | 1,000.00 | 1,016.45 | 8.62 |
Institutional Class | 1.44% | 5.00% | 1,000.00 | 1,017.80 | 7.26 |
StylePlus—Mid Growth Fund | | | | | |
Class A | 1.77% | 5.00% | 1,000.00 | 1,016.15 | 8.92 |
Class C | 2.74% | 5.00% | 1,000.00 | 1,011.30 | 13.78 |
Class P | 1.91% | 5.00% | 1,000.00 | 1,015.45 | 9.62 |
Institutional Class | 1.55% | 5.00% | 1,000.00 | 1,017.25 | 7.82 |
World Equity Income Fund | | | | | |
Class A | 1.19% | 5.00% | 1,000.00 | 1,019.05 | 6.01 |
Class C | 1.95% | 5.00% | 1,000.00 | 1,015.25 | 9.82 |
Class P | 1.19% | 5.00% | 1,000.00 | 1,019.05 | 6.01 |
Institutional Class | 0.94% | 5.00% | 1,000.00 | 1,020.30 | 4.75 |
1 | This ratio represents annualized net expenses, which may include short dividend and interest expense. Excluding these expenses, the operating expense ratio for the Risk Managed Real Estate Fund would be 1.24%, 1.94%, 1.27% and 0.91% for the Class A, Class C, Class P and Institutional Class, respectively. Excludes expenses of the underlying funds in which the Funds invest, if any. |
2 | Expenses are equal to the Fund’s annualized expense ratio, net of any applicable fee waivers, multiplied by the average account value over the period, multiplied by 183/366 (to reflect the one-half year period). |
3 | Actual cumulative return at net asset value for the period September 30, 2023 to March 31, 2024. |
| | THE GUGGENHEIM FUNDS SEMI-ANNUAL REPORT | 9 |
PERFORMANCE REPORT AND FUND PROFILE (Unaudited) | March 31, 2024 |
ALPHA OPPORTUNITY FUND
OBJECTIVE: Seeks long-term growth of capital.
Holdings Diversification (Market Exposure as % of Net Assets)
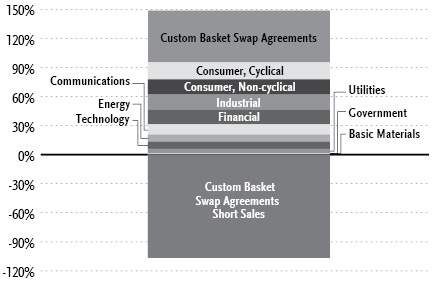
“Holdings Diversification (Market Exposure as % of Net Assets)” excludes any temporary cash investments.
Inception Dates: |
Class A | July 7, 2003 |
Class C | July 7, 2003 |
Class P | May 1, 2015 |
Institutional Class | November 7, 2008 |
Ten Largest Holdings | % of Total Net Assets |
Marathon Petroleum Corp. | 1.1% |
MGIC Investment Corp. | 1.1% |
Owens Corning | 1.0% |
Caterpillar, Inc. | 1.0% |
NMI Holdings, Inc. — Class A | 1.0% |
Essent Group Ltd. | 1.0% |
Hartford Financial Services Group, Inc. | 1.0% |
Taylor Morrison Home Corp. — Class A | 1.0% |
Merck & Company, Inc. | 1.0% |
Lennar Corp. — Class A | 1.0% |
Top Ten Total | 10.2% |
| | |
“Ten Largest Holdings” excludes any temporary cash or derivative investments. |
10 | THE GUGGENHEIM FUNDS SEMI-ANNUAL REPORT | |
PERFORMANCE REPORT AND FUND PROFILE (Unaudited)(concluded) | March 31, 2024 |
Average Annual Returns*
Periods Ended March 31, 2024
| 6 Month† | 1 Year | 5 Year | 10 Year |
Class A Shares | 12.15% | 18.13% | 4.49% | 3.33% |
Class A Shares with sales charge‡ | 6.80% | 12.50% | 3.48% | 2.83% |
Class C Shares | 11.73% | 17.22% | 3.69% | 2.54% |
Class C Shares with CDSC§ | 10.73% | 16.22% | 3.69% | 2.54% |
Institutional Class Shares | 12.33% | 18.43% | 4.79% | 3.70% |
Morningstar Long/Short Equity Category Average | 13.40% | 14.54% | 5.47% | 3.81% |
S&P 500 Index | 23.48% | 29.88% | 15.05% | 12.96% |
S&P 500 Index Blended** | 2.68% | 5.23% | 2.02% | 4.42% |
ICE BofA 3-Month U.S. Treasury Bill Index | 2.69% | 5.27% | 2.03% | 1.38% |
| 6 Month† | 1 Year | 5 Year | Since
Inception
(05/01/15) |
Class P Shares | 12.12% | 18.11% | 4.50% | 2.82% |
Morningstar Long/Short Equity Category Average | 13.40% | 14.54% | 5.47% | 3.77% |
S&P 500 Index | 23.48% | 29.88% | 15.05% | 12.85% |
S&P 500 Index Blended** | 2.68% | 5.23% | 2.02% | 8.45% |
ICE BofA 3-Month U.S. Treasury Bill Index | 2.69% | 5.27% | 2.03% | 1.55% |
* | The performance data above represents past performance that is not predictive of future results. The investment return and principal value of an investment in the Fund will fluctuate so that an investor’s shares, when redeemed, may be worth more or less than their original cost. Returns are historical and include changes in principal and reinvested dividends and capital gains and do not reflect the effect of taxes. The ICE BofA 3-Month U.S. Treasury Bill Index, S&P 500 Index and the Morningstar Long/Short Equity Category Average are unmanaged indices and, unlike the Fund, have no management fees or operating expenses to reduce their reported returns. |
** | Effective March 13, 2017, the Fund changed its principal investment strategy. As a result of the investment strategy change, the Fund’s new benchmark is the ICE BofA 3-Month U.S. Treasury Bill Index. The Fund’s performance was previously compared to the S&P 500 Index. The S&P 500 Index-Blended uses performance data for the S&P 500 Index for periods prior to March 13, 2017, and the ICE BofA 3-Month U.S. Treasury Bill index beginning on March 13, 2017. |
† | 6 month returns are not annualized. |
‡ | Fund returns are calculated using the maximum sales charge of 4.75%. |
§ | Fund returns include a CDSC of 1% if redeemed within 12 months of purchase. |
| | THE GUGGENHEIM FUNDS SEMI-ANNUAL REPORT | 11 |
SCHEDULE OF INVESTMENTS (Unaudited) | March 31, 2024 |
ALPHA OPPORTUNITY FUND | |
| | Shares | | | Value | |
COMMON STOCKS† - 95.3% |
| | | | | | | | | |
Consumer, Cyclical - 17.4% |
Taylor Morrison Home Corp. — Class A* | | | 6,338 | | | $ | 394,033 | |
Lennar Corp. — Class A1 | | | 2,281 | | | | 392,286 | |
Lowe’s Companies, Inc. | | | 1,515 | | | | 385,916 | |
GMS, Inc.* | | | 3,814 | | | | 371,255 | |
McDonald’s Corp. | | | 1,255 | | | | 353,847 | |
MSC Industrial Direct Company, Inc. — Class A1 | | | 3,617 | | | | 350,994 | |
Monarch Casino & Resort, Inc. | | | 4,604 | | | | 345,254 | |
Allison Transmission Holdings, Inc.1 | | | 3,975 | | | | 322,611 | |
PACCAR, Inc.1 | | | 2,267 | | | | 280,859 | |
Autoliv, Inc. | | | 1,992 | | | | 239,897 | |
Brunswick Corp. | | | 2,399 | | | | 231,551 | |
Wabash National Corp. | | | 7,575 | | | | 226,795 | |
Polaris, Inc. | | | 2,236 | | | | 223,868 | |
M/I Homes, Inc.*,1 | | | 1,641 | | | | 223,652 | |
Ethan Allen Interiors, Inc. | | | 6,423 | | | | 222,043 | |
Golden Entertainment, Inc.1 | | | 5,965 | | | | 219,691 | |
Harley-Davidson, Inc. | | | 4,985 | | | | 218,044 | |
Boyd Gaming Corp. | | | 2,770 | | | | 186,476 | |
Tri Pointe Homes, Inc.*,1 | | | 4,795 | | | | 185,375 | |
PulteGroup, Inc.1 | | | 1,445 | | | | 174,296 | |
KB Home | | | 2,409 | | | | 170,750 | |
Build-A-Bear Workshop, Inc. — Class A1 | | | 5,166 | | | | 154,308 | |
Aptiv plc* | | | 1,773 | | | | 141,219 | |
Buckle, Inc. | | | 3,455 | | | | 139,133 | |
MasterCraft Boat Holdings, Inc.*,1 | | | 5,748 | | | | 136,343 | |
Oxford Industries, Inc. | | | 1,187 | | | | 133,419 | |
BorgWarner, Inc. | | | 3,462 | | | | 120,270 | |
Visteon Corp.* | | | 946 | | | | 111,259 | |
Standard Motor Products, Inc. | | | 3,190 | | | | 107,025 | |
Dine Brands Global, Inc. | | | 1,724 | | | | 80,132 | |
Total Consumer, Cyclical | | | | | | | 6,842,601 | |
| | | | | | | | | |
Consumer, Non-cyclical - 15.9% |
Merck & Company, Inc.1 | | | 2,979 | | | | 393,079 | |
HCA Healthcare, Inc. | | | 1,158 | | | | 386,228 | |
Bristol-Myers Squibb Co.1 | | | 7,079 | | | | 383,894 | |
Exelixis, Inc.*,1 | | | 16,017 | | | | 380,084 | |
United Therapeutics Corp.* | | | 1,596 | | | | 366,633 | |
Incyte Corp.*,1 | | | 6,225 | | | | 354,638 | |
Abbott Laboratories1 | | | 3,073 | | | | 349,277 | |
Johnson & Johnson | | | 1,839 | | | | 290,911 | |
PayPal Holdings, Inc.*,1 | | | 4,127 | | | | 276,468 | |
Royalty Pharma plc — Class A | | | 9,054 | | | | 274,970 | |
Hologic, Inc.*,1 | | | 2,869 | | | | 223,667 | |
Perdoceo Education Corp.1 | | | 12,172 | | | | 213,740 | |
Molina Healthcare, Inc.*,1 | | | 461 | | | | 189,392 | |
AbbVie, Inc. | | | 1,026 | | | | 186,835 | |
Biogen, Inc.* | | | 850 | | | | 183,286 | |
Jazz Pharmaceuticals plc* | | | 1,506 | | | | 181,352 | |
Innoviva, Inc.*,1 | | | 11,389 | | | | 173,568 | |
Dynavax Technologies Corp.*,1 | | | 12,430 | | | | 154,256 | |
Amgen, Inc. | | | 528 | | | | 150,121 | |
Supernus Pharmaceuticals, Inc.* | | | 3,542 | | | | 120,818 | |
Viatris, Inc.1 | | | 9,868 | | | | 117,824 | |
Alarm.com Holdings, Inc.* | | | 1,601 | | | | 116,025 | |
Collegium Pharmaceutical, Inc.* | | | 2,970 | | | | 115,295 | |
Organon & Co. | | | 5,887 | | | | 110,676 | |
Vertex Pharmaceuticals, Inc.* | | | 253 | | | | 105,757 | |
Neurocrine Biosciences, Inc.* | | | 654 | | | | 90,200 | |
Agilent Technologies, Inc. | | | 552 | | | | 80,322 | |
Cross Country Healthcare, Inc.*,1 | | | 4,057 | | | | 75,947 | |
Thermo Fisher Scientific, Inc. | | | 126 | | | | 73,232 | |
Lantheus Holdings, Inc.* | | | 1,144 | | | | 71,203 | |
Alkermes plc* | | | 2,491 | | | | 67,431 | |
Total Consumer, Non-cyclical | | | | | | | 6,257,129 | |
| | | | | | | | | |
Industrial - 15.4% |
Owens Corning | | | 2,411 | | | | 402,155 | |
Caterpillar, Inc. | | | 1,090 | | | | 399,409 | |
Apogee Enterprises, Inc. | | | 6,524 | | | | 386,221 | |
Masco Corp. | | | 4,722 | | | | 372,471 | |
UFP Industries, Inc. | | | 2,989 | | | | 367,677 | |
Mueller Industries, Inc.1 | | | 6,350 | | | | 342,456 | |
International Seaways, Inc. | | | 6,293 | | | | 334,788 | |
Boise Cascade Co. | | | 2,014 | | | | 308,887 | |
AGCO Corp.1 | | | 2,367 | | | | 291,188 | |
TD SYNNEX Corp. | | | 2,574 | | | | 291,119 | |
Encore Wire Corp.1 | | | 1,031 | | | | 270,926 | |
Scorpio Tankers, Inc. | | | 3,770 | | | | 269,743 | |
Teekay Corp.* | | | 35,919 | | | | 261,490 | |
Ardmore Shipping Corp. | | | 13,304 | | | | 218,452 | |
Deere & Co. | | | 484 | | | | 198,798 | |
Atkore, Inc.1 | | | 1,040 | | | | 197,975 | |
Snap-on, Inc.1 | | | 636 | | | | 188,396 | |
Teekay Tankers Ltd. — Class A | | | 3,224 | | | | 188,314 | |
Argan, Inc.1 | | | 3,559 | | | | 179,872 | |
Keysight Technologies, Inc.* | | | 883 | | | | 138,084 | |
Fortune Brands Innovations, Inc. | | | 1,486 | | | | 125,820 | |
Frontdoor, Inc.* | | | 2,735 | | | | 89,106 | |
Terex Corp. | | | 1,313 | | | | 84,557 | |
Mettler-Toledo International, Inc.* | | | 63 | | | | 83,871 | |
Vishay Intertechnology, Inc. | | | 3,593 | | | | 81,489 | |
Total Industrial | | | | | | | 6,073,264 | |
| | | | | | | | | |
Financial - 15.3% |
MGIC Investment Corp.1 | | | 18,556 | | | | 414,954 | |
NMI Holdings, Inc. — Class A* | | | 12,342 | | | | 399,140 | |
Essent Group Ltd. | | | 6,695 | | | | 398,419 | |
Hartford Financial Services Group, Inc. | | | 3,842 | | | | 395,918 | |
Travelers Companies, Inc. | | | 1,676 | | | | 385,715 | |
Apartment Income REIT Corp. | | | 11,754 | | | | 381,653 | |
Ambac Financial Group, Inc.*,1 | | | 21,376 | | | | 334,107 | |
Synchrony Financial1 | | | 7,636 | | | | 329,264 | |
Enact Holdings, Inc.1 | | | 10,451 | | | | 325,862 | |
Walker & Dunlop, Inc. | | | 3,048 | | | | 308,031 | |
Janus Henderson Group plc | | | 7,500 | | | | 246,675 | |
Bread Financial Holdings, Inc. | | | 6,393 | | | | 238,076 | |
OneMain Holdings, Inc. | | | 4,481 | | | | 228,934 | |
International Bancshares Corp. | | | 3,932 | | | | 220,742 | |
Regions Financial Corp.1 | | | 10,163 | | | | 213,830 | |
12 | THE GUGGENHEIM FUNDS SEMI-ANNUAL REPORT | SEE NOTES TO FINANCIAL STATEMENTS. |
SCHEDULE OF INVESTMENTS (Unaudited)(continued) | March 31, 2024 |
ALPHA OPPORTUNITY FUND | |
| | Shares | | | Value | |
Innovative Industrial Properties, Inc. REIT | | | 2,047 | | | $ | 211,946 | |
Preferred Bank/Los Angeles CA | | | 2,658 | | | | 204,055 | |
Mr Cooper Group, Inc.* | | | 2,542 | | | | 198,149 | |
Everest Group Ltd. | | | 498 | | | | 197,955 | |
Affiliated Managers Group, Inc. | | | 1,013 | | | | 169,647 | |
Employers Holdings, Inc. | | | 3,152 | | | | 143,069 | |
Hanmi Financial Corp. | | | 4,835 | | | | 76,973 | |
Total Financial | | | | | | | 6,023,114 | |
| | | | | | | | | |
Communications - 10.6% |
Motorola Solutions, Inc. | | | 1,101 | | | | 390,833 | |
Verizon Communications, Inc.1 | | | 9,051 | | | | 379,780 | |
Cisco Systems, Inc.1 | | | 7,530 | | | | 375,822 | |
InterDigital, Inc. | | | 3,471 | | | | 369,523 | |
Alphabet, Inc. — Class C* | | | 2,316 | | | | 352,634 | |
AT&T, Inc.1 | | | 18,454 | | | | 324,790 | |
eBay, Inc.1 | | | 5,897 | | | | 311,244 | |
IDT Corp. — Class B1 | | | 7,750 | | | | 293,028 | |
T-Mobile US, Inc. | | | 1,772 | | | | 289,226 | |
Comcast Corp. — Class A1 | | | 6,118 | | | | 265,215 | |
Gogo, Inc.*,1 | | | 26,902 | | | | 236,200 | |
Ooma, Inc.*,1 | | | 19,895 | | | | 169,704 | |
VeriSign, Inc.* | | | 726 | | | | 137,584 | |
Match Group, Inc.* | | | 2,812 | | | | 102,019 | |
Spok Holdings, Inc.1 | | | 5,614 | | | | 89,543 | |
A10 Networks, Inc.1 | | | 6,197 | | | | 84,837 | |
Total Communications | | | | | | | 4,171,982 | |
| | | | | | | | | |
Energy - 7.5% |
Marathon Petroleum Corp.1 | | | 2,092 | | | | 421,538 | |
Cheniere Energy, Inc.1 | | | 2,391 | | | | 385,620 | |
Devon Energy Corp. | | | 7,191 | | | | 360,844 | |
CNX Resources Corp.*,1 | | | 13,955 | | | | 331,013 | |
CVR Energy, Inc.1 | | | 7,957 | | | | 283,747 | |
Valero Energy Corp.1 | | | 1,613 | | | | 275,323 | |
PBF Energy, Inc. — Class A | | | 3,811 | | | | 219,399 | |
Chevron Corp. | | | 1,199 | | | | 189,130 | |
SandRidge Energy, Inc.1 | | | 11,264 | | | | 164,117 | |
Par Pacific Holdings, Inc.* | | | 3,816 | | | | 141,421 | |
SolarEdge Technologies, Inc.* | | | 1,102 | | | | 78,220 | |
RPC, Inc.1 | | | 9,987 | | | | 77,299 | |
Total Energy | | | | | | | 2,927,671 | |
| | | | | | | | | |
Technology - 7.2% |
Amdocs Ltd. | | | 4,006 | | | | 362,022 | |
Dropbox, Inc. — Class A* | | | 11,246 | | | | 273,278 | |
Skyworks Solutions, Inc.1 | | | 2,081 | | | | 225,414 | |
Applied Materials, Inc. | | | 1,026 | | | | 211,592 | |
Accenture plc — Class A | | | 586 | | | | 203,114 | |
Immersion Corp.1 | | | 26,605 | | | | 199,005 | |
Insight Enterprises, Inc.* | | | 894 | | | | 165,855 | |
Adobe, Inc.* | | | 305 | | | | 153,903 | |
NetScout Systems, Inc.*,1 | | | 6,399 | | | | 139,754 | |
Box, Inc. — Class A* | | | 3,806 | | | | 107,786 | |
Zoom Video Communications, Inc. — Class A* | | | 1,631 | | | | 106,619 | |
Progress Software Corp. | | | 1,980 | | | | 105,554 | |
Photronics, Inc.* | | | 3,486 | | | | 98,723 | |
Playtika Holding Corp. | | | 12,703 | | | | 89,556 | |
Adeia, Inc. | | | 7,916 | | | | 86,443 | |
Cirrus Logic, Inc.* | | | 864 | | | | 79,972 | |
Teradata Corp.* | | | 2,032 | | | | 78,577 | |
Crane NXT Co. | | | 1,257 | | | | 77,808 | |
Xerox Holdings Corp. | | | 3,873 | | | | 69,327 | |
Total Technology | | | | | | | 2,834,302 | |
| | | | | | | | | |
Utilities - 4.7% |
National Fuel Gas Co.1 | | | 7,261 | | | | 390,061 | |
Atmos Energy Corp.1 | | | 3,188 | | | | 378,958 | |
Public Service Enterprise Group, Inc.1 | | | 5,655 | | | | 377,641 | |
OGE Energy Corp. | | | 10,825 | | | | 371,297 | |
Black Hills Corp. | | | 6,348 | | | | 346,601 | |
Total Utilities | | | | | | | 1,864,558 | |
| | | | | | | | | |
Government - 0.8% |
Banco Latinoamericano de Comercio Exterior S.A. — Class E | | | 10,017 | | | | 296,704 | |
| | | | | | | | | |
Basic Materials - 0.5% |
Olin Corp. | | | 3,210 | | | | 188,748 | |
| | | | | | | | | |
Total Common Stocks | | | | |
(Cost $33,791,176) | | | | | | | 37,480,073 | |
| | | | | | | | | |
MONEY MARKET FUND† - 3.2% |
Goldman Sachs Financial Square Treasury Instruments Fund — Institutional Shares, 5.22%2 | | | 1,258,523 | | | | 1,258,523 | |
Total Money Market Fund | | | | |
(Cost $1,258,523) | | | | | | | 1,258,523 | |
| | | | | | | | | |
Total Investments - 98.5% | | | | |
(Cost $35,049,699) | | $ | 38,738,596 | |
Other Assets & Liabilities, net - 1.5% | | | 583,205 | |
Total Net Assets - 100.0% | | $ | 39,321,801 | |
SEE NOTES TO FINANCIAL STATEMENTS. | THE GUGGENHEIM FUNDS SEMI-ANNUAL REPORT | 13 |
SCHEDULE OF INVESTMENTS (Unaudited)(continued) | March 31, 2024 |
ALPHA OPPORTUNITY FUND | |
Custom Basket Swap Agreements |
Counterparty | Reference Obligation | Type | Financing
Rate | | Payment
Frequency | | | Maturity
Date | | | Notional
Amount | | | Value and
Unrealized
Appreciation
(Depreciation) | |
OTC Custom Basket Swap Agreements†† |
Morgan Stanley Capital Services LLC | MS Equity Custom Basket | Pay | 5.73% (Federal
Funds Rate +
0.40%) | | | At Maturity | | | | 02/03/25 | | | $ | 10,452,182 | | | $ | 1,199,405 | |
Goldman Sachs International | GS Equity Custom Basket | Pay | 5.78% (Federal
Funds Rate +
0.45%) | | | At Maturity | | | | 05/06/24 | | | | 10,452,182 | | | | 1,196,534 | |
| | | | | | | | | | | | | | $ | 20,904,364 | | | $ | 2,395,939 | |
OTC Custom Basket Swap Agreements Sold Short†† |
Morgan Stanley Capital Services LLC | MS Equity Custom Basket | Receive | 5.02% (Federal
Funds Rate -
0.31%) | | | At Maturity | | | | 02/03/25 | | | $ | 20,999,097 | | | $ | (911,525 | ) |
Goldman Sachs International | GS Equity Custom Basket | Receive | 5.12% (Federal
Funds Rate -
0.21%) | | | At Maturity | | | | 05/06/24 | | | | 20,791,325 | | | | (933,089 | ) |
| | | | | | | | | | | | | | $ | 41,790,422 | | | $ | (1,844,614 | ) |
| | Shares | | | Percentage
Notional
Amount | | | Value and
Unrealized
Appreciation
(Depreciation) | |
MS EQUITY LONG CUSTOM BASKET | | | | | | | | |
Industrial | | | | | | | | | | | | |
Boise Cascade Co. | | | 562 | | | | 0.82 | % | | $ | 44,396 | |
Mueller Industries, Inc. | | | 1,771 | | | | 0.91 | % | | | 33,805 | |
Encore Wire Corp. | | | 288 | | | | 0.72 | % | | | 23,660 | |
Apogee Enterprises, Inc. | | | 1,819 | | | | 1.03 | % | | | 20,215 | |
Owens Corning | | | 672 | | | | 1.07 | % | | | 19,187 | |
Scorpio Tankers, Inc. | | | 1,051 | | | | 0.72 | % | | | 18,963 | |
International Seaways, Inc. | | | 1,755 | | | | 0.89 | % | | | 18,247 | |
Snap-on, Inc. | | | 177 | | | | 0.50 | % | | | 16,755 | |
Atkore, Inc. | | | 290 | | | | 0.53 | % | | | 16,463 | |
TD SYNNEX Corp. | | | 718 | | | | 0.78 | % | | | 13,422 | |
UFP Industries, Inc. | | | 833 | | | | 0.98 | % | | | 12,370 | |
Ardmore Shipping Corp. | | | 3,709 | | | | 0.58 | % | | | 11,894 | |
Teekay Tankers Ltd. — Class A | | | 899 | | | | 0.50 | % | | | 11,112 | |
Argan, Inc. | | | 992 | | | | 0.48 | % | | | 9,877 | |
Caterpillar, Inc. | | | 304 | | | | 1.07 | % | | | 9,523 | |
Masco Corp. | | | 1,317 | | | | 0.99 | % | | | 9,399 | |
Deere & Co. | | | 135 | | | | 0.53 | % | | | 5,724 | |
Terex Corp. | | | 366 | | | | 0.23 | % | | | 5,669 | |
Teekay Corp. | | | 10,015 | | | | 0.70 | % | | | 4,836 | |
Fortune Brands Innovations, Inc. | | | 414 | | | | 0.34 | % | | | 3,390 | |
AGCO Corp. | | | 660 | | | | 0.78 | % | | | 2,863 | |
Frontdoor, Inc. | | | 763 | | | | 0.24 | % | | | 1,716 | |
Mettler-Toledo International, Inc. | | | 17 | | | | 0.22 | % | | | 705 | |
Keysight Technologies, Inc. | | | 246 | | | | 0.37 | % | | | 69 | |
Vishay Intertechnology, Inc. | | | 1,002 | | | | 0.22 | % | | | (160 | ) |
Total Industrial | | | | | | | | | | | 314,100 | |
| | | | | | | | | | | | | |
Communications | | | | | | | | | | | | |
IDT Corp. — Class B | | | 2,161 | | | | 0.78 | % | | | 25,939 | |
InterDigital, Inc. | | | 968 | | | | 0.99 | % | | | 21,872 | |
eBay, Inc. | | | 1,644 | | | | 0.83 | % | | | 18,464 | |
Verizon Communications, Inc. | | | 2,523 | | | | 1.01 | % | | | 15,712 | |
AT&T, Inc. | | | 5,145 | | | | 0.87 | % | | | 12,892 | |
Alphabet, Inc. — Class C | | | 646 | | | | 0.94 | % | | | 11,984 | |
T-Mobile US, Inc. | | | 494 | | | | 0.77 | % | | | 8,387 | |
Motorola Solutions, Inc. | | | 307 | | | | 1.04 | % | | | 7,275 | |
A10 Networks, Inc. | | | 1,728 | | | | 0.23 | % | | | 3,188 | |
Cisco Systems, Inc. | | | 2,099 | | | | 1.00 | % | | | 2,606 | |
Match Group, Inc. | | | 784 | | | | 0.27 | % | | | 1,010 | |
Spok Holdings, Inc. | | | 1,565 | | | | 0.24 | % | | | (551 | ) |
VeriSign, Inc. | | | 202 | | | | 0.37 | % | | | (2,029 | ) |
Comcast Corp. — Class A | | | 1,706 | | | | 0.71 | % | | | (2,900 | ) |
Gogo, Inc. | | | 7,501 | | | | 0.63 | % | | | (5,681 | ) |
Ooma, Inc. | | | 5,547 | | | | 0.45 | % | | | (14,621 | ) |
Total Communications | | | | | | | | | | | 103,547 | |
| | | | | | | | | | | | | |
Consumer, Non-cyclical | | | | | | | | | | | | |
Merck & Company, Inc. | | | 831 | | | | 1.05 | % | | | 23,012 | |
Perdoceo Education Corp. | | | 3,394 | | | | 0.57 | % | | | 18,814 | |
Exelixis, Inc. | | | 4,466 | | | | 1.01 | % | | | 17,082 | |
Innoviva, Inc. | | | 3,175 | | | | 0.46 | % | | | 10,934 | |
PayPal Holdings, Inc. | | | 1,151 | | | | 0.74 | % | | | 8,636 | |
Molina Healthcare, Inc. | | | 129 | | | | 0.51 | % | | | 7,833 | |
HCA Healthcare, Inc. | | | 323 | | | | 1.03 | % | | | 6,305 | |
Viatris, Inc. | | | 2,751 | | | | 0.31 | % | | | 6,252 | |
Alarm.com Holdings, Inc. | | | 446 | | | | 0.31 | % | | | 6,166 | |
Hologic, Inc. | | | 800 | | | | 0.60 | % | | | 6,078 | |
14 | THE GUGGENHEIM FUNDS SEMI-ANNUAL REPORT | SEE NOTES TO FINANCIAL STATEMENTS. |
SCHEDULE OF INVESTMENTS (Unaudited)(continued) | March 31, 2024 |
ALPHA OPPORTUNITY FUND | |
| | Shares | | | Percentage
Notional
Amount | | | Value and
Unrealized
Appreciation
(Depreciation) | |
Supernus Pharmaceuticals, Inc. | | | 987 | | | | 0.32 | % | | $ | 5,636 | |
Collegium Pharmaceutical, Inc. | | | 828 | | | | 0.31 | % | | | 5,627 | |
AbbVie, Inc. | | | 286 | | | | 0.50 | % | | | 4,706 | |
Royalty Pharma plc — Class A | | | 2,524 | | | | 0.73 | % | | | 3,619 | |
United Therapeutics Corp. | | | 445 | | | | 0.98 | % | | | 3,003 | |
Agilent Technologies, Inc. | | | 154 | | | | 0.21 | % | | | 2,191 | |
Dynavax Technologies Corp. | | | 3,466 | | | | 0.41 | % | | | 2,139 | |
Organon & Co. | | | 1,641 | | | | 0.30 | % | | | 1,698 | |
Abbott Laboratories | | | 857 | | | | 0.93 | % | | | 1,290 | |
Alkermes plc | | | 695 | | | | 0.18 | % | | | 1,256 | |
Johnson & Johnson | | | 513 | | | | 0.78 | % | | | 1,173 | |
Amgen, Inc. | | | 147 | | | | 0.40 | % | | | 1,058 | |
Neurocrine Biosciences, Inc. | | | 182 | | | | 0.24 | % | | | 790 | |
Vertex Pharmaceuticals, Inc. | | | 70 | | | | 0.28 | % | | | 134 | |
Thermo Fisher Scientific, Inc. | | | 35 | | | | 0.19 | % | | | (104 | ) |
Biogen, Inc. | | | 237 | | | | 0.49 | % | | | (371 | ) |
Lantheus Holdings, Inc. | | | 319 | | | | 0.19 | % | | | (716 | ) |
Jazz Pharmaceuticals plc | | | 420 | | | | 0.48 | % | | | (1,098 | ) |
Cross Country Healthcare, Inc. | | | 1,131 | | | | 0.20 | % | | | (4,479 | ) |
Bristol-Myers Squibb Co. | | | 1,974 | | | | 1.02 | % | | | (7,839 | ) |
Incyte Corp. | | | 1,736 | | | | 0.95 | % | | | (8,886 | ) |
Total Consumer, Non-cyclical | | | | | | | | | | | 121,939 | |
| | | | | | | | | | | | | |
Technology | | | | | | | | | | | | |
Applied Materials, Inc. | | | 286 | | | | 0.56 | % | | | 14,094 | |
Skyworks Solutions, Inc. | | | 580 | | | | 0.60 | % | | | 7,186 | |
Immersion Corp. | | | 7,418 | | | | 0.53 | % | | | 4,788 | |
Amdocs Ltd. | | | 1,117 | | | | 0.97 | % | | | 4,726 | |
Cirrus Logic, Inc. | | | 241 | | | | 0.21 | % | | | 3,786 | |
NetScout Systems, Inc. | | | 1,784 | | | | 0.37 | % | | | 1,512 | |
Accenture plc — Class A | | | 163 | | | | 0.54 | % | | | 1,456 | |
Dropbox, Inc. — Class A | | | 3,135 | | | | 0.73 | % | | | 1,189 | |
Box, Inc. — Class A | | | 1,061 | | | | 0.29 | % | | | 1,048 | |
Crane NXT Co. | | | 350 | | | | 0.21 | % | | | 906 | |
Zoom Video Communications, Inc. — Class A | | | 455 | | | | 0.28 | % | | | 776 | |
Playtika Holding Corp. | | | 3,542 | | | | 0.24 | % | | | 731 | |
Progress Software Corp. | | | 552 | | | | 0.28 | % | | | 530 | |
Insight Enterprises, Inc. | | | 249 | | | | 0.44 | % | | | 374 | |
Xerox Holdings Corp. | | | 1,080 | | | | 0.18 | % | | | 31 | |
Photronics, Inc. | | | 972 | | | | 0.26 | % | | | (145 | ) |
Adeia, Inc. | | | 2,207 | | | | 0.23 | % | | | (839 | ) |
Teradata Corp. | | | 567 | | | | 0.21 | % | | | (2,304 | ) |
Adobe, Inc. | | | 85 | | | | 0.41 | % | | | (10,456 | ) |
Total Technology | | | | | | | | | | | 29,389 | |
| | | | | | | | | | | | | |
Financial | | | | | | | | | | | | |
MGIC Investment Corp. | | | 5,174 | | | | 1.11 | % | | | 39,818 | |
Essent Group Ltd. | | | 1,971 | | | | 1.12 | % | | | 28,907 | |
Ambac Financial Group, Inc. | | | 5,755 | | | | 0.86 | % | | | 15,231 | |
International Bancshares Corp. | | | 1,096 | | | | 0.59 | % | | | 11,591 | |
Mr Cooper Group, Inc. | | | 709 | | | | 0.53 | % | | | 10,598 | |
Preferred Bank/Los Angeles CA | | | 741 | | | | 0.54 | % | | | 10,415 | |
Synchrony Financial | | | 2,129 | | | | 0.88 | % | | | 10,226 | |
Enact Holdings, Inc. | | | 2,914 | | | | 0.87 | % | | | 9,651 | |
NMI Holdings, Inc. — Class A | | | 3,441 | | | | 1.06 | % | | | 9,123 | |
Regions Financial Corp. | | | 2,834 | | | | 0.57 | % | | | 8,637 | |
Hartford Financial Services Group, Inc. | | | 1,071 | | | | 1.06 | % | | | 7,727 | |
Affiliated Managers Group, Inc. | | | 283 | | | | 0.45 | % | | | 7,114 | |
Walker & Dunlop, Inc. | | | 850 | | | | 0.82 | % | | | 6,616 | |
Travelers Companies, Inc. | | | 467 | | | | 1.03 | % | | | 5,021 | |
OneMain Holdings, Inc. | | | 1,249 | | | | 0.61 | % | | | 3,837 | |
Innovative Industrial Properties, Inc. | | | 571 | | | | 0.57 | % | | | 3,823 | |
Everest Group Ltd. | | | 139 | | | | 0.53 | % | | | 3,711 | |
Bread Financial Holdings, Inc. | | | 1,783 | | | | 0.64 | % | | | 2,136 | |
Janus Henderson Group plc | | | 2,091 | | | | 0.66 | % | | | 1,608 | |
Employers Holdings, Inc. | | | 879 | | | | 0.38 | % | | | (173 | ) |
Hanmi Financial Corp. | | | 1,348 | | | | 0.21 | % | | | (3,456 | ) |
Apartment Income REIT Corp. | | | 3,277 | | | | 1.02 | % | | | (5,279 | ) |
Total Financial | | | | | | | | | | | 186,882 | |
| | | | | | | | | | | | | |
Consumer, Cyclical | | | | | | | | | | | | |
Allison Transmission Holdings, Inc. | | | 1,108 | | | | 0.86 | % | | | 47,431 | |
Taylor Morrison Home Corp. — Class A | | | 1,767 | | | | 1.05 | % | | | 25,881 | |
Lennar Corp. — Class A | | | 636 | | | | 1.05 | % | | | 24,318 | |
M/I Homes, Inc. | | | 457 | | | | 0.60 | % | | | 21,833 | |
PulteGroup, Inc. | | | 403 | | | | 0.47 | % | | | 17,930 | |
Brunswick Corp. | | | 669 | | | | 0.62 | % | | | 15,193 | |
KB Home | | | 672 | | | | 0.46 | % | | | 14,981 | |
PACCAR, Inc. | | | 632 | | | | 0.75 | % | | | 12,526 | |
Monarch Casino & Resort, Inc. | | | 1,284 | | | | 0.92 | % | | | 11,574 | |
Build-A-Bear Workshop, Inc. — Class A | | | 1,440 | | | | 0.41 | % | | | 10,599 | |
Tri Pointe Homes, Inc. | | | 1,337 | | | | 0.49 | % | | | 10,200 | |
GMS, Inc. | | | 1,063 | | | | 0.99 | % | | | 9,831 | |
SEE NOTES TO FINANCIAL STATEMENTS. | THE GUGGENHEIM FUNDS SEMI-ANNUAL REPORT | 15 |
SCHEDULE OF INVESTMENTS (Unaudited)(continued) | March 31, 2024 |
ALPHA OPPORTUNITY FUND | |
| | Shares | | | Percentage
Notional
Amount | | | Value and
Unrealized
Appreciation
(Depreciation) | |
MSC Industrial Direct Company, Inc. — Class A | | | 1,008 | | | | 0.94 | % | | $ | 8,280 | |
Ethan Allen Interiors, Inc. | | | 1,791 | | | | 0.59 | % | | | 7,648 | |
Autoliv, Inc. | | | 556 | | | | 0.64 | % | | | 6,216 | |
Wabash National Corp. | | | 2,112 | | | | 0.60 | % | | | 5,948 | |
Harley-Davidson, Inc. | | | 1,390 | | | | 0.58 | % | | | 5,313 | |
Lowe’s Companies, Inc. | | | 422 | | | | 1.03 | % | | | 5,295 | |
Oxford Industries, Inc. | | | 331 | | | | 0.36 | % | | | 5,124 | |
Boyd Gaming Corp. | | | 772 | | | | 0.50 | % | | | 3,849 | |
BorgWarner, Inc. | | | 965 | | | | 0.32 | % | | | 2,967 | |
Buckle, Inc. | | | 963 | | | | 0.37 | % | | | 2,228 | |
MasterCraft Boat Holdings, Inc. | | | 1,603 | | | | 0.36 | % | | | 476 | |
Visteon Corp. | | | 264 | | | | 0.30 | % | | | 231 | |
Polaris, Inc. | | | 624 | | | | 0.60 | % | | | (25 | ) |
Golden Entertainment, Inc. | | | 1,663 | | | | 0.59 | % | | | (243 | ) |
Aptiv plc | | | 494 | | | | 0.38 | % | | | (339 | ) |
Dine Brands Global, Inc. | | | 481 | | | | 0.21 | % | | | (1,730 | ) |
Standard Motor Products, Inc. | | | 890 | | | | 0.29 | % | | | (1,814 | ) |
McDonald’s Corp. | | | 350 | | | | 0.94 | % | | | (3,738 | ) |
Total Consumer, Cyclical | | | | | | | | | | | 267,983 | |
| | | | | | | | | | | | | |
Utilities | | | | | | | | | | | | |
Public Service Enterprise Group, Inc. | | | 1,577 | | | | 1.01 | % | | | 12,849 | |
Atmos Energy Corp. | | | 889 | | | | 1.01 | % | | | 6,157 | |
National Fuel Gas Co. | | | 2,025 | | | | 1.04 | % | | | 4,616 | |
Black Hills Corp. | | | 1,770 | | | | 0.92 | % | | | 3,888 | |
OGE Energy Corp. | | | 3,018 | | | | 0.99 | % | | | 1,974 | |
Total Utilities | | | | | | | | | | | 29,484 | |
| | | | | | | | | | | | | |
Energy | | | | | | | | | | | | |
Marathon Petroleum Corp. | | | 583 | | | | 1.12 | % | | | 38,990 | |
Valero Energy Corp. | | | 450 | | | | 0.73 | % | | | 25,640 | |
PBF Energy, Inc. — Class A | | | 1,063 | | | | 0.59 | % | | | 16,517 | |
CNX Resources Corp. | | | 3,891 | | | | 0.88 | % | | | 11,013 | |
Devon Energy Corp. | | | 2,005 | | | | 0.96 | % | | | 9,875 | |
CVR Energy, Inc. | | | 2,218 | | | | 0.76 | % | | | 8,113 | |
Cheniere Energy, Inc. | | | 667 | | | | 1.03 | % | | | 3,133 | |
SandRidge Energy, Inc. | | | 3,141 | | | | 0.44 | % | | | 3,013 | |
Chevron Corp. | | | 334 | | | | 0.50 | % | | | 2,525 | |
RPC, Inc. | | | 2,785 | | | | 0.21 | % | | | 2,189 | |
Par Pacific Holdings, Inc. | | | 1,064 | | | | 0.38 | % | | | (2 | ) |
SolarEdge Technologies, Inc. | | | 307 | | | | 0.21 | % | | | (821 | ) |
Total Energy | | | | | | | | | | | 120,185 | |
| | | | | | | | | | | | | |
Basic Materials | | | | | | | | | | | | |
Olin Corp. | | | 895 | | | | 0.50 | % | | | 6,193 | |
| | | | | | | | | | | | | |
Government | | | | | | | | | | | | |
Banco Latinoamericano de Comercio Exterior S.A. — Class E | | | 2,793 | | | | 0.79 | % | | | 19,703 | |
Total MS Equity Long Custom Basket | | | | | | $ | 1,199,405 | |
| | | | | | | | | |
MS EQUITY SHORT CUSTOM BASKET | | | | | | | | |
Utilities | | | | | | | | | | | | |
AES Corp. | | | 14,820 | | | | (1.35 | )% | | $ | 37,445 | |
Portland General Electric Co. | | | 6,041 | | | | (1.21 | )% | | | 23,938 | |
Middlesex Water Co. | | | 3,298 | | | | (0.82 | )% | | | 19,210 | |
California Water Service Group | | | 5,365 | | | | (1.19 | )% | | | 18,730 | |
Alliant Energy Corp. | | | 2,180 | | | | (0.52 | )% | | | 3,328 | |
Ormat Technologies, Inc. | | | 2,731 | | | | (0.86 | )% | | | (4,369 | ) |
American Electric Power Company, Inc. | | | 2,938 | | | | (1.20 | )% | | | (4,457 | ) |
PNM Resources, Inc. | | | 2,537 | | | | (0.45 | )% | | | (6,070 | ) |
FirstEnergy Corp. | | | 3,974 | | | | (0.73 | )% | | | (8,180 | ) |
Pinnacle West Capital Corp. | | | 1,937 | | | | (0.69 | )% | | | (12,715 | ) |
Eversource Energy | | | 4,500 | | | | (1.28 | )% | | | (13,944 | ) |
NRG Energy, Inc. | | | 4,753 | | | | (1.53 | )% | | | (36,240 | ) |
Avangrid, Inc. | | | 8,315 | | | | (1.44 | )% | | | (49,663 | ) |
Total Utilities | | | | | | | | | | | (32,987 | ) |
| | | | | | | | | | | | | |
Consumer, Non-cyclical | | | | | | | | | | | | |
ICF International, Inc. | | | 623 | | | | (0.45 | )% | | | 2,602 | |
Acadia Healthcare Company, Inc. | | | 1,984 | | | | (0.75 | )% | | | (919 | ) |
Insmed, Inc. | | | 4,661 | | | | (0.60 | )% | | | (1,107 | ) |
Tyson Foods, Inc. — Class A | | | 1,600 | | | | (0.45 | )% | | | (1,928 | ) |
Flowers Foods, Inc. | | | 5,328 | | | | (0.60 | )% | | | (2,853 | ) |
CBIZ, Inc. | | | 1,278 | | | | (0.48 | )% | | | (3,467 | ) |
Paylocity Holding Corp. | | | 677 | | | | (0.55 | )% | | | (5,138 | ) |
U-Haul Holding Co. | | | 1,559 | | | | (0.50 | )% | | | (11,584 | ) |
Clorox Co. | | | 1,255 | | | | (0.92 | )% | | | (11,597 | ) |
Utz Brands, Inc. | | | 7,322 | | | | (0.64 | )% | | | (13,113 | ) |
RB Global, Inc. | | | 2,260 | | | | (0.82 | )% | | | (27,762 | ) |
RxSight, Inc. | | | 1,793 | | | | (0.44 | )% | | | (28,361 | ) |
GXO Logistics, Inc. | | | 5,825 | | | | (1.49 | )% | | | (29,692 | ) |
Spectrum Brands Holdings, Inc. | | | 3,286 | | | | (1.39 | )% | | | (40,903 | ) |
TransUnion | | | 2,471 | | | | (0.94 | )% | | | (44,440 | ) |
Pilgrim’s Pride Corp. | | | 8,197 | | | | (1.34 | )% | | | (84,183 | ) |
Total Consumer, Non-cyclical | | | | | | | | | | | (304,445 | ) |
| | | | | | | | | | | | | |
Basic Materials | | | | | | | | | | | | |
Piedmont Lithium, Inc. | | | 9,682 | | | | (0.61 | )% | | | 165,117 | |
Compass Minerals International, Inc. | | | 6,383 | | | | (0.48 | )% | | | 48,799 | |
Novagold Resources, Inc. | | | 43,110 | | | | (0.62 | )% | | | 43,362 | |
Hecla Mining Co. | | | 30,282 | | | | (0.69 | )% | | | 23,268 | |
16 | THE GUGGENHEIM FUNDS SEMI-ANNUAL REPORT | SEE NOTES TO FINANCIAL STATEMENTS. |
SCHEDULE OF INVESTMENTS (Unaudited)(continued) | March 31, 2024 |
ALPHA OPPORTUNITY FUND | |
| | Shares | | | Percentage
Notional
Amount | | | Value and
Unrealized
Appreciation
(Depreciation) | |
Air Products and Chemicals, Inc. | | | 417 | | | | (0.48 | )% | | $ | (1,156 | ) |
Ecolab, Inc. | | | 271 | | | | (0.30 | )% | | | (9,363 | ) |
Kaiser Aluminum Corp. | | | 1,283 | | | | (0.55 | )% | | | (12,480 | ) |
Stepan Co. | | | 1,709 | | | | (0.73 | )% | | | (14,066 | ) |
ATI, Inc. | | | 2,496 | | | | (0.61 | )% | | | (17,275 | ) |
Element Solutions, Inc. | | | 7,977 | | | | (0.95 | )% | | | (26,306 | ) |
Kronos Worldwide, Inc. | | | 18,117 | | | | (1.02 | )% | | | (48,116 | ) |
Century Aluminum Co. | | | 13,840 | | | | (1.01 | )% | | | (110,512 | ) |
Total Basic Materials | | | | | | | | | | | 41,272 | |
| | | | | | | | | | | | | |
Financial | | | | | | | | | | | | |
Kennedy-Wilson Holdings, Inc. | | | 27,827 | | | | (1.14 | )% | | | 163,577 | |
Americold Realty Trust, Inc. | | | 9,461 | | | | (1.12 | )% | | | 70,933 | |
Sun Communities, Inc. | | | 2,031 | | | | (1.24 | )% | | | 69,081 | |
New York Mortgage Trust, Inc. | | | 22,815 | | | | (0.78 | )% | | | 35,695 | |
Marcus & Millichap, Inc. | | | 8,204 | | | | (1.33 | )% | | | 17,962 | |
Ellington Financial, Inc. | | | 17,846 | | | | (1.00 | )% | | | 16,112 | |
TFS Financial Corp. | | | 18,331 | | | | (1.10 | )% | | | 9,848 | |
Equity LifeStyle Properties, Inc. | | | 845 | | | | (0.26 | )% | | | 2,795 | |
Ventas, Inc. | | | 2,854 | | | | (0.59 | )% | | | 2,140 | |
UMH Properties, Inc. | | | 7,817 | | | | (0.60 | )% | | | (2,857 | ) |
Terreno Realty Corp. | | | 1,433 | | | | (0.45 | )% | | | (3,336 | ) |
Iron Mountain, Inc. | | | 2,756 | | | | (1.05 | )% | | | (4,051 | ) |
PotlatchDeltic Corp. | | | 5,453 | | | | (1.22 | )% | | | (4,238 | ) |
Elme Communities | | | 15,124 | | | | (1.00 | )% | | | (4,912 | ) |
Allstate Corp. | | | 366 | | | | (0.30 | )% | | | (5,817 | ) |
Equinix, Inc. | | | 268 | | | | (1.05 | )% | | | (6,072 | ) |
American Tower Corp. — Class A | | | 796 | | | | (0.75 | )% | | | (6,915 | ) |
Moelis & Co. — Class A | | | 2,923 | | | | (0.79 | )% | | | (7,689 | ) |
Howard Hughes Holdings, Inc. | | | 3,269 | | | | (1.13 | )% | | | (8,334 | ) |
State Street Corp. | | | 2,855 | | | | (1.05 | )% | | | (12,449 | ) |
Cannae Holdings, Inc. | | | 7,118 | | | | (0.75 | )% | | | (13,099 | ) |
Jones Lang LaSalle, Inc. | | | 487 | | | | (0.45 | )% | | | (13,494 | ) |
Macerich Co. | | | 10,437 | | | | (0.86 | )% | | | (14,015 | ) |
Digital Realty Trust, Inc. | | | 1,372 | | | | (0.94 | )% | | | (14,537 | ) |
Brighthouse Financial, Inc. | | | 6,194 | | | | (1.52 | )% | | | (16,019 | ) |
Global Net Lease, Inc. | | | 28,951 | | | | (1.07 | )% | | | (16,528 | ) |
Apartment Investment and Management Co. — Class A | | | 31,671 | | | | (1.24 | )% | | | (25,855 | ) |
CBRE Group, Inc. — Class A | | | 1,484 | | | | (0.69 | )% | | | (29,069 | ) |
Welltower, Inc. | | | 3,072 | | | | (1.37 | )% | | | (39,660 | ) |
FTAI Infrastructure, Inc. | | | 15,620 | | | | (0.47 | )% | | | (40,501 | ) |
Carlyle Group, Inc. | | | 4,972 | | | | (1.11 | )% | | | (52,340 | ) |
PennyMac Financial Services, Inc. | | | 2,397 | | | | (1.04 | )% | | | (60,340 | ) |
KKR & Company, Inc. — Class A | | | 2,555 | | | | (1.22 | )% | | | (102,788 | ) |
Total Financial | | | | | | | | | | | (116,772 | ) |
| | | | | | | | | | | | | |
Energy | | | | | | | | | | | | |
NOV, Inc. | | | 16,792 | | | | (1.56 | )% | | | (6,417 | ) |
Dril-Quip, Inc. | | | 11,208 | | | | (1.20 | )% | | | (10,275 | ) |
Antero Resources Corp. | | | 9,141 | | | | (1.26 | )% | | | (18,558 | ) |
Sitio Royalties Corp. — Class A | | | 7,317 | | | | (0.86 | )% | | | (19,166 | ) |
Valaris Ltd. | | | 4,322 | | | | (1.55 | )% | | | (41,410 | ) |
TechnipFMC plc | | | 13,112 | | | | (1.57 | )% | | | (71,415 | ) |
Archrock, Inc. | | | 11,150 | | | | (1.04 | )% | | | (73,356 | ) |
Total Energy | | | | | | | | | | | (240,597 | ) |
| | | | | | | | | | | | | |
Industrial | | | | | | | | | | | | |
NV5 Global, Inc. | | | 1,060 | | | | (0.49 | )% | | | 7,419 | |
Knight-Swift Transportation Holdings, Inc. | | | 1,903 | | | | (0.50 | )% | | | 3,513 | |
Boeing Co. | | | 719 | | | | (0.66 | )% | | | 2,978 | |
XPO, Inc. | | | 1,168 | | | | (0.68 | )% | | | 1,638 | |
RXO, Inc. | | | 10,999 | | | | (1.15 | )% | | | 1,437 | |
J.B. Hunt Transport Services, Inc. | | | 448 | | | | (0.43 | )% | | | 627 | |
Exponent, Inc. | | | 2,193 | | | | (0.86 | )% | | | 291 | |
Stericycle, Inc. | | | 3,869 | | | | (0.97 | )% | | | (101 | ) |
Tetra Tech, Inc. | | | 523 | | | | (0.46 | )% | | | (1,206 | ) |
Norfolk Southern Corp. | | | 489 | | | | (0.59 | )% | | | (1,794 | ) |
Republic Services, Inc. — Class A | | | 1,244 | | | | (1.13 | )% | | | (10,129 | ) |
Vulcan Materials Co. | | | 288 | | | | (0.37 | )% | | | (17,534 | ) |
Trinity Industries, Inc. | | | 6,069 | | | | (0.80 | )% | | | (22,919 | ) |
Casella Waste Systems, Inc. — Class A | | | 2,701 | | | | (1.27 | )% | | | (70,360 | ) |
Total Industrial | | | | | | | | | | | (106,140 | ) |
| | | | | | | | | | | | | |
Communications | | | | | | | | | | | | |
Boston Omaha Corp. — Class A | | | 8,025 | | | | (0.59 | )% | | | (4,351 | ) |
DoorDash, Inc. — Class A | | | 983 | | | | (0.64 | )% | | | (42,881 | ) |
Total Communications | | | | | | | | | | | (47,232 | ) |
| | | | | | | | | | | | | |
Technology | | | | | | | | | | | | |
Paycor HCM, Inc. | | | 12,919 | | | | (1.20 | )% | | | 31,452 | |
Privia Health Group, Inc. | | | 10,606 | | | | (0.99 | )% | | | 23,766 | |
Braze, Inc. — Class A | | | 4,417 | | | | (0.93 | )% | | | 13,038 | |
Take-Two Interactive Software, Inc. | | | 2,009 | | | | (1.42 | )% | | | 9,839 | |
ROBLOX Corp. — Class A | | | 2,322 | | | | (0.42 | )% | | | 5,202 | |
KBR, Inc. | | | 3,264 | | | | (0.99 | )% | | | (12,782 | ) |
Evolent Health, Inc. — Class A | | | 4,636 | | | | (0.72 | )% | | | (19,912 | ) |
Micron Technology, Inc. | | | 1,675 | | | | (0.94 | )% | | | (40,143 | ) |
SEE NOTES TO FINANCIAL STATEMENTS. | THE GUGGENHEIM FUNDS SEMI-ANNUAL REPORT | 17 |
SCHEDULE OF INVESTMENTS (Unaudited)(continued) | March 31, 2024 |
ALPHA OPPORTUNITY FUND | |
| | Shares | | | Percentage
Notional
Amount | | | Value and
Unrealized
Appreciation
(Depreciation) | |
Parsons Corp. | | | 2,086 | | | | (0.82 | )% | | $ | (55,332 | ) |
Total Technology | | | | | | | | | | | (44,872 | ) |
| | | | | | | | | | | | | |
Consumer, Cyclical | | | | | | | | | | | | |
Walgreens Boots Alliance, Inc. | | | 8,344 | | | | (0.86 | )% | | | 36,305 | |
Tesla, Inc. | | | 455 | | | | (0.38 | )% | | | 13,061 | |
Dollar Tree, Inc. | | | 923 | | | | (0.59 | )% | | | 6,263 | |
Hyatt Hotels Corp. — Class A | | | 878 | | | | (0.67 | )% | | | (1,601 | ) |
MarineMax, Inc. | | | 4,377 | | | | (0.69 | )% | | | (4,619 | ) |
Dollar General Corp. | | | 592 | | | | (0.44 | )% | | | (12,998 | ) |
DraftKings, Inc. — Class A | | | 2,640 | | | | (0.57 | )% | | | (16,016 | ) |
Copart, Inc. | | | 4,029 | | | | (1.11 | )% | | | (16,732 | ) |
CarMax, Inc. | | | 3,051 | | | | (1.27 | )% | | | (63,415 | ) |
Total Consumer, Cyclical | | | | | | | | | | | (59,752 | ) |
Total MS Equity Short Custom Basket | | | | | | $ | (911,525 | ) |
| | | | | | | | | | | | | |
GS EQUITY LONG CUSTOM BASKET | | | | | | | | |
Industrial | | | | | | | | | | | | |
Boise Cascade Co. | | | 562 | | | | 0.82 | % | | $ | 44,432 | |
Mueller Industries, Inc. | | | 1,771 | | | | 0.91 | % | | | 33,785 | |
Encore Wire Corp. | | | 288 | | | | 0.72 | % | | | 23,673 | |
Apogee Enterprises, Inc. | | | 1,819 | | | | 1.03 | % | | | 20,188 | |
Owens Corning | | | 672 | | | | 1.07 | % | | | 19,218 | |
Scorpio Tankers, Inc. | | | 1,051 | | | | 0.72 | % | | | 18,961 | |
International Seaways, Inc. | | | 1,755 | | | | 0.89 | % | | | 18,108 | |
Snap-on, Inc. | | | 177 | | | | 0.50 | % | | | 16,741 | |
Atkore, Inc. | | | 290 | | | | 0.53 | % | | | 16,439 | |
TD SYNNEX Corp. | | | 718 | | | | 0.78 | % | | | 13,599 | |
UFP Industries, Inc. | | | 833 | | | | 0.98 | % | | | 12,025 | |
Ardmore Shipping Corp. | | | 3,709 | | | | 0.58 | % | | | 11,740 | |
Teekay Tankers Ltd. — Class A | | | 899 | | | | 0.50 | % | | | 11,067 | |
Argan, Inc. | | | 992 | | | | 0.48 | % | | | 9,985 | |
Caterpillar, Inc. | | | 304 | | | | 1.07 | % | | | 9,435 | |
Masco Corp. | | | 1,317 | | | | 0.99 | % | | | 9,405 | |
Terex Corp. | | | 366 | | | | 0.23 | % | | | 5,758 | |
Deere & Co. | | | 135 | | | | 0.53 | % | | | 5,753 | |
Teekay Corp. | | | 10,015 | | | | 0.70 | % | | | 4,753 | |
Fortune Brands Innovations, Inc. | | | 414 | | | | 0.34 | % | | | 3,380 | |
AGCO Corp. | | | 660 | | | | 0.78 | % | | | 2,837 | |
Frontdoor, Inc. | | | 763 | | | | 0.24 | % | | | 1,600 | |
Mettler-Toledo International, Inc. | | | 17 | | | | 0.22 | % | | | 678 | |
Keysight Technologies, Inc. | | | 246 | | | | 0.37 | % | | | 41 | |
Vishay Intertechnology, Inc. | | | 1,002 | | | | 0.22 | % | | | (180 | ) |
Total Industrial | | | | | | | | | | | 313,421 | |
| | | | | | | | | | | | | |
Communications | | | | | | | | | | | | |
IDT Corp. — Class B | | | 2,161 | | | | 0.78 | % | | | 25,894 | |
InterDigital, Inc. | | | 968 | | | | 0.99 | % | | | 21,923 | |
eBay, Inc. | | | 1,644 | | | | 0.83 | % | | | 18,405 | |
Verizon Communications, Inc. | | | 2,523 | | | | 1.01 | % | | | 15,593 | |
AT&T, Inc. | | | 5,145 | | | | 0.87 | % | | | 12,874 | |
Alphabet, Inc. — Class C | | | 646 | | | | 0.94 | % | | | 11,990 | |
T-Mobile US, Inc. | | | 494 | | | | 0.77 | % | | | 8,353 | |
Motorola Solutions, Inc. | | | 307 | | | | 1.04 | % | | | 7,177 | |
A10 Networks, Inc. | | | 1,728 | | | | 0.23 | % | | | 2,986 | |
Cisco Systems, Inc. | | | 2,099 | | | | 1.00 | % | | | 2,671 | |
Match Group, Inc. | | | 784 | | | | 0.27 | % | | | 936 | |
Spok Holdings, Inc. | | | 1,565 | | | | 0.24 | % | | | (802 | ) |
VeriSign, Inc. | | | 202 | | | | 0.37 | % | | | (2,075 | ) |
Comcast Corp. — Class A | | | 1,706 | | | | 0.71 | % | | | (2,878 | ) |
Gogo, Inc. | | | 7,501 | | | | 0.63 | % | | | (6,061 | ) |
Ooma, Inc. | | | 5,547 | | | | 0.45 | % | | | (14,573 | ) |
Total Communications | | | | | | | | | | | 102,413 | |
| | | | | | | | | | | | | |
Consumer, Non-cyclical | | | | | | | | | | | | |
Merck & Company, Inc. | | | 831 | | | | 1.05 | % | | | 23,044 | |
Perdoceo Education Corp. | | | 3,394 | | | | 0.57 | % | | | 18,722 | |
Exelixis, Inc. | | | 4,466 | | | | 1.01 | % | | | 17,101 | |
Innoviva, Inc. | | | 3,175 | | | | 0.46 | % | | | 10,959 | |
PayPal Holdings, Inc. | | | 1,151 | | | | 0.74 | % | | | 8,612 | |
Molina Healthcare, Inc. | | | 129 | | | | 0.51 | % | | | 7,968 | |
Viatris, Inc. | | | 2,751 | | | | 0.31 | % | | | 6,358 | |
HCA Healthcare, Inc. | | | 323 | | | | 1.03 | % | | | 6,346 | |
Alarm.com Holdings, Inc. | | | 446 | | | | 0.31 | % | | | 6,215 | |
Hologic, Inc. | | | 800 | | | | 0.60 | % | | | 6,102 | |
Collegium Pharmaceutical, Inc. | | | 828 | | | | 0.31 | % | | | 5,792 | |
Supernus Pharmaceuticals, Inc. | | | 987 | | | | 0.32 | % | | | 5,679 | |
AbbVie, Inc. | | | 286 | | | | 0.50 | % | | | 4,747 | |
Royalty Pharma plc — Class A | | | 2,524 | | | | 0.73 | % | | | 3,616 | |
United Therapeutics Corp. | | | 445 | | | | 0.98 | % | | | 3,110 | |
Agilent Technologies, Inc. | | | 154 | | | | 0.21 | % | | | 2,177 | |
Dynavax Technologies Corp. | | | 3,466 | | | | 0.41 | % | | | 2,170 | |
Organon & Co. | | | 1,641 | | | | 0.30 | % | | | 1,578 | |
Abbott Laboratories | | | 857 | | | | 0.93 | % | | | 1,388 | |
Alkermes plc | | | 695 | | | | 0.18 | % | | | 1,241 | |
Johnson & Johnson | | | 513 | | | | 0.78 | % | | | 1,078 | |
Amgen, Inc. | | | 147 | | | | 0.40 | % | | | 1,038 | |
Neurocrine Biosciences, Inc. | | | 182 | | | | 0.24 | % | | | 770 | |
Vertex Pharmaceuticals, Inc. | | | 70 | | | | 0.28 | % | | | 145 | |
Thermo Fisher Scientific, Inc. | | | 35 | | | | 0.19 | % | | | (103 | ) |
Biogen, Inc. | | | 237 | | | | 0.49 | % | | | (336 | ) |
Lantheus Holdings, Inc. | | | 319 | | | | 0.19 | % | | | (753 | ) |
Jazz Pharmaceuticals plc | | | 420 | | | | 0.48 | % | | | (1,019 | ) |
18 | THE GUGGENHEIM FUNDS SEMI-ANNUAL REPORT | SEE NOTES TO FINANCIAL STATEMENTS. |
SCHEDULE OF INVESTMENTS (Unaudited)(continued) | March 31, 2024 |
ALPHA OPPORTUNITY FUND | |
| | Shares | | | Percentage
Notional
Amount | | | Value and
Unrealized
Appreciation
(Depreciation) | |
Cross Country Healthcare, Inc. | | | 1,131 | | | | 0.20 | % | | $ | (4,698 | ) |
Bristol-Myers Squibb Co. | | | 1,974 | | | | 1.02 | % | | | (7,773 | ) |
Incyte Corp. | | | 1,736 | | | | 0.95 | % | | | (8,717 | ) |
Total Consumer, Non-cyclical | | | | | | | | | | | 122,557 | |
| | | | | | | | | | | | | |
Technology | | | | | | | | | | | | |
Applied Materials, Inc. | | | 286 | | | | 0.56 | % | | | 14,097 | |
Skyworks Solutions, Inc. | | | 580 | | | | 0.60 | % | | | 7,284 | |
Amdocs Ltd. | | | 1,117 | | | | 0.97 | % | | | 4,724 | |
Immersion Corp. | | | 7,418 | | | | 0.53 | % | | | 4,705 | |
Cirrus Logic, Inc. | | | 241 | | | | 0.21 | % | | | 3,828 | |
NetScout Systems, Inc. | | | 1,784 | | | | 0.37 | % | | | 1,536 | |
Accenture plc — Class A | | | 163 | | | | 0.54 | % | | | 1,477 | |
Dropbox, Inc. — Class A | | | 3,135 | | | | 0.73 | % | | | 1,099 | |
Box, Inc. — Class A | | | 1,061 | | | | 0.29 | % | | | 1,033 | |
Playtika Holding Corp. | | | 3,542 | | | | 0.24 | % | | | 810 | |
Crane NXT Co. | | | 350 | | | | 0.21 | % | | | 789 | |
Zoom Video Communications, Inc. — Class A | | | 455 | | | | 0.28 | % | | | 727 | |
Progress Software Corp. | | | 552 | | | | 0.28 | % | | | 578 | |
Insight Enterprises, Inc. | | | 249 | | | | 0.44 | % | | | 426 | |
Xerox Holdings Corp. | | | 1,080 | | | | 0.18 | % | | | 32 | |
Photronics, Inc. | | | 972 | | | | 0.26 | % | | | (263 | ) |
Adeia, Inc. | | | 2,207 | | | | 0.23 | % | | | (826 | ) |
Teradata Corp. | | | 567 | | | | 0.21 | % | | | (2,345 | ) |
Adobe, Inc. | | | 85 | | | | 0.41 | % | | | (10,440 | ) |
Total Technology | | | | | | | | | | | 29,271 | |
| | | | | | | | | | | | | |
Financial | | | | | | | | | | | | |
MGIC Investment Corp. | | | 5,174 | | | | 1.11 | % | | | 39,794 | |
Essent Group Ltd. | | | 1,971 | | | | 1.12 | % | | | 28,978 | |
Ambac Financial Group, Inc. | | | 5,755 | | | | 0.86 | % | | | 15,229 | |
International Bancshares Corp. | | | 1,096 | | | | 0.59 | % | | | 11,630 | |
Mr Cooper Group, Inc. | | | 709 | | | | 0.53 | % | | | 10,607 | |
Synchrony Financial | | | 2,129 | | | | 0.88 | % | | | 10,374 | |
Preferred Bank/Los Angeles CA | | | 741 | | | | 0.54 | % | | | 10,373 | |
Enact Holdings, Inc. | | | 2,914 | | | | 0.87 | % | | | 9,688 | |
NMI Holdings, Inc. — Class A | | | 3,441 | | | | 1.06 | % | | | 8,838 | |
Regions Financial Corp. | | | 2,834 | | | | 0.57 | % | | | 8,694 | |
Hartford Financial Services Group, Inc. | | | 1,071 | | | | 1.06 | % | | | 7,729 | |
Affiliated Managers Group, Inc. | | | 283 | | | | 0.45 | % | | | 7,126 | |
Walker & Dunlop, Inc. | | | 850 | | | | 0.82 | % | | | 6,410 | |
Travelers Companies, Inc. | | | 467 | | | | 1.03 | % | | | 4,957 | |
OneMain Holdings, Inc. | | | 1,249 | | | | 0.61 | % | | | 3,745 | |
Everest Group Ltd. | | | 139 | | | | 0.53 | % | | | 3,695 | |
Innovative Industrial Properties, Inc. | | | 571 | | | | 0.57 | % | | | 3,552 | |
Bread Financial Holdings, Inc. | | | 1,783 | | | | 0.64 | % | | | 1,602 | |
Janus Henderson Group plc | | | 2,091 | | | | 0.66 | % | | | 1,422 | |
Employers Holdings, Inc. | | | 879 | | | | 0.38 | % | | | (185 | ) |
Hanmi Financial Corp. | | | 1,348 | | | | 0.21 | % | | | (3,461 | ) |
Apartment Income REIT Corp. | | | 3,277 | | | | 1.02 | % | | | (4,831 | ) |
Total Financial | | | | | | | | | | | 185,966 | |
| | | | | | | | | | | | | |
Consumer, Cyclical | | | | | | | | | | | | |
Allison Transmission Holdings, Inc. | | | 1,108 | | | | 0.86 | % | | | 47,410 | |
Taylor Morrison Home Corp. — Class A | | | 1,767 | | | | 1.05 | % | | | 25,899 | |
Lennar Corp. — Class A | | | 636 | | | | 1.05 | % | | | 24,428 | |
M/I Homes, Inc. | | | 457 | | | | 0.60 | % | | | 21,921 | |
PulteGroup, Inc. | | | 403 | | | | 0.47 | % | | | 17,972 | |
Brunswick Corp. | | | 669 | | | | 0.62 | % | | | 15,272 | |
KB Home | | | 672 | | | | 0.46 | % | | | 14,879 | |
PACCAR, Inc. | | | 632 | | | | 0.75 | % | | | 12,541 | |
Monarch Casino & Resort, Inc. | | | 1,284 | | | | 0.92 | % | | | 11,511 | |
Build-A-Bear Workshop, Inc. — Class A | | | 1,440 | | | | 0.41 | % | | | 10,652 | |
Tri Pointe Homes, Inc. | | | 1,337 | | | | 0.49 | % | | | 10,231 | |
GMS, Inc. | | | 1,063 | | | | 0.99 | % | | | 9,735 | |
MSC Industrial Direct Company, Inc. — Class A | | | 1,008 | | | | 0.94 | % | | | 8,219 | |
Ethan Allen Interiors, Inc. | | | 1,791 | | | | 0.59 | % | | | 7,523 | |
Autoliv, Inc. | | | 556 | | | | 0.64 | % | | | 6,154 | |
Wabash National Corp. | | | 2,112 | | | | 0.60 | % | | | 5,963 | |
Harley-Davidson, Inc. | | | 1,390 | | | | 0.58 | % | | | 5,618 | |
Oxford Industries, Inc. | | | 331 | | | | 0.36 | % | | | 5,264 | |
Lowe’s Companies, Inc. | | | 422 | | | | 1.03 | % | | | 5,233 | |
Boyd Gaming Corp. | | | 772 | | | | 0.50 | % | | | 3,956 | |
BorgWarner, Inc. | | | 965 | | | | 0.32 | % | | | 2,982 | |
Buckle, Inc. | | | 963 | | | | 0.37 | % | | | 2,287 | |
MasterCraft Boat Holdings, Inc. | | | 1,603 | | | | 0.36 | % | | | 424 | |
Visteon Corp. | | | 264 | | | | 0.30 | % | | | 235 | |
Polaris, Inc. | | | 624 | | | | 0.60 | % | | | (61 | ) |
Golden Entertainment, Inc. | | | 1,663 | | | | 0.59 | % | | | (219 | ) |
Aptiv plc | | | 494 | | | | 0.38 | % | | | (328 | ) |
Dine Brands Global, Inc. | | | 481 | | | | 0.21 | % | | | (1,699 | ) |
Standard Motor Products, Inc. | | | 890 | | | | 0.29 | % | | | (1,841 | ) |
McDonald’s Corp. | | | 350 | | | | 0.94 | % | | | (3,787 | ) |
Total Consumer, Cyclical | | | | | | | | | | | 268,374 | |
| | | | | | | | | | | | | |
Utilities | | | | | | | | | | | | |
Public Service Enterprise Group, Inc. | | | 1,577 | | | | 1.01 | % | | | 13,040 | |
Atmos Energy Corp. | | | 889 | | | | 1.01 | % | | | 6,246 | |
SEE NOTES TO FINANCIAL STATEMENTS. | THE GUGGENHEIM FUNDS SEMI-ANNUAL REPORT | 19 |
SCHEDULE OF INVESTMENTS (Unaudited)(continued) | March 31, 2024 |
ALPHA OPPORTUNITY FUND | |
| | Shares | | | Percentage
Notional
Amount | | | Value and
Unrealized
Appreciation
(Depreciation) | |
National Fuel Gas Co. | | | 2,025 | | | | 1.04 | % | | $ | 4,561 | |
Black Hills Corp. | | | 1,770 | | | | 0.92 | % | | | 3,566 | |
OGE Energy Corp. | | | 3,018 | | | | 0.99 | % | | | 1,718 | |
Total Utilities | | | | | | | | | | | 29,131 | |
| | | | | | | | | | | | | |
Energy | | | | | | | | | | | | |
Marathon Petroleum Corp. | | | 583 | | | | 1.12 | % | | | 38,992 | |
Valero Energy Corp. | | | 450 | | | | 0.73 | % | | | 25,624 | |
PBF Energy, Inc. — Class A | | | 1,063 | | | | 0.59 | % | | | 16,481 | |
CNX Resources Corp. | | | 3,891 | | | | 0.88 | % | | | 10,892 | |
Devon Energy Corp. | | | 2,005 | | | | 0.96 | % | | | 9,739 | |
CVR Energy, Inc. | | | 2,218 | | | | 0.76 | % | | | 8,165 | |
Cheniere Energy, Inc. | | | 667 | | | | 1.03 | % | | | 3,042 | |
SandRidge Energy, Inc. | | | 3,141 | | | | 0.44 | % | | | 2,937 | |
Chevron Corp. | | | 334 | | | | 0.50 | % | | | 2,471 | |
RPC, Inc. | | | 2,785 | | | | 0.21 | % | | | 2,126 | |
Par Pacific Holdings, Inc. | | | 1,064 | | | | 0.38 | % | | | 269 | |
SolarEdge Technologies, Inc. | | | 307 | | | | 0.21 | % | | | (805 | ) |
Total Energy | | | | | | | | | | | 119,933 | |
| | | | | | | | | | | | | |
Basic Materials | | | | | | | | | | | | |
Olin Corp. | | | 895 | | | | 0.50 | % | | | 6,184 | |
| | | | | | | | | | | | | |
Government | | | | | | | | | | | | |
Banco Latinoamericano de Comercio Exterior S.A. — Class E | | | 2,793 | | | | 0.79 | % | | | 19,284 | |
Total GS Equity Long Custom Basket | | | | | | $ | 1,196,534 | |
| | | | | | | | | |
GS EQUITY SHORT CUSTOM BASKET | | | | | | | | |
Utilities | | | | | | | | | | | | |
AES Corp. | | | 14,820 | | | | (1.32 | )% | | $ | 39,043 | |
Portland General Electric Co. | | | 6,041 | | | | (1.22 | )% | | | 23,979 | |
Middlesex Water Co. | | | 3,298 | | | | (0.83 | )% | | | 19,425 | |
California Water Service Group | | | 5,365 | | | | (1.20 | )% | | | 18,524 | |
Alliant Energy Corp. | | | 2,180 | | | | (0.53 | )% | | | 3,310 | |
Ormat Technologies, Inc. | | | 2,731 | | | | (0.87 | )% | | | (3,871 | ) |
American Electric Power Company, Inc. | | | 2,938 | | | | (1.22 | )% | | | (3,978 | ) |
PNM Resources, Inc. | | | 2,537 | | | | (0.46 | )% | | | (6,002 | ) |
FirstEnergy Corp. | | | 3,974 | | | | (0.74 | )% | | | (8,477 | ) |
Pinnacle West Capital Corp. | | | 1,937 | | | | (0.70 | )% | | | (12,923 | ) |
Eversource Energy | | | 4,500 | | | | (1.29 | )% | | | (14,690 | ) |
NRG Energy, Inc. | | | 4,753 | | | | (1.55 | )% | | | (37,048 | ) |
Avangrid, Inc. | | | 8,315 | | | | (1.46 | )% | | | (49,184 | ) |
Total Utilities | | | | | | | | | | | (31,892 | ) |
| | | | | | | | | | | | | |
Consumer, Non-cyclical | | | | | | | | | | | | |
ICF International, Inc. | | | 623 | | | | (0.45 | )% | | | 2,550 | |
Acadia Healthcare Company, Inc. | | | 1,984 | | | | (0.76 | )% | | | (924 | ) |
Insmed, Inc. | | | 4,661 | | | | (0.61 | )% | | | (1,155 | ) |
Tyson Foods, Inc. — Class A | | | 1,600 | | | | (0.45 | )% | | | (1,734 | ) |
Flowers Foods, Inc. | | | 5,328 | | | | (0.61 | )% | | | (2,709 | ) |
CBIZ, Inc. | | | 1,278 | | | | (0.48 | )% | | | (2,975 | ) |
Paylocity Holding Corp. | | | 677 | | | | (0.56 | )% | | | (4,705 | ) |
U-Haul Holding Co. | | | 1,559 | | | | (0.51 | )% | | | (11,367 | ) |
Clorox Co. | | | 1,255 | | | | (0.92 | )% | | | (11,755 | ) |
Utz Brands, Inc. | | | 7,322 | | | | (0.65 | )% | | | (12,959 | ) |
GXO Logistics, Inc. | | | 5,825 | | | | (1.51 | )% | | | (27,502 | ) |
RxSight, Inc. | | | 1,793 | | | | (0.44 | )% | | | (27,779 | ) |
RB Global, Inc. | | | 2,260 | | | | (0.83 | )% | | | (27,941 | ) |
Spectrum Brands Holdings, Inc. | | | 3,286 | | | | (1.41 | )% | | | (41,423 | ) |
TransUnion | | | 2,471 | | | | (0.95 | )% | | | (44,442 | ) |
Pilgrim’s Pride Corp. | | | 8,197 | | | | (1.35 | )% | | | (84,243 | ) |
Total Consumer, Non-cyclical | | | | | | | | | | | (301,063 | ) |
| | | | | | | | | | | | | |
Basic Materials | | | | | | | | | | | | |
Piedmont Lithium, Inc. | | | 9,682 | | | | (0.62 | )% | | | 164,721 | |
Compass Minerals International, Inc. | | | 6,383 | | | | (0.48 | )% | | | 48,321 | |
Novagold Resources, Inc. | | | 43,110 | | | | (0.62 | )% | | | 43,339 | |
Hecla Mining Co. | | | 30,282 | | | | (0.70 | )% | | | 23,356 | |
Air Products and Chemicals, Inc. | | | 417 | | | | (0.49 | )% | | | (1,062 | ) |
Ecolab, Inc. | | | 271 | | | | (0.30 | )% | | | (9,371 | ) |
Kaiser Aluminum Corp. | | | 1,283 | | | | (0.55 | )% | | | (12,603 | ) |
Stepan Co. | | | 1,709 | | | | (0.74 | )% | | | (14,165 | ) |
ATI, Inc. | | | 2,496 | | | | (0.61 | )% | | | (17,039 | ) |
Element Solutions, Inc. | | | 7,977 | | | | (0.96 | )% | | | (26,482 | ) |
Kronos Worldwide, Inc. | | | 18,117 | | | | (1.03 | )% | | | (48,474 | ) |
Century Aluminum Co. | | | 13,840 | | | | (1.02 | )% | | | (111,092 | ) |
Total Basic Materials | | | | | | | | | | | 39,449 | |
| | | | | | | | | | | | | |
Financial | | | | | | | | | | | | |
Kennedy-Wilson Holdings, Inc. | | | 27,827 | | | | (1.15 | )% | | | 163,020 | |
Americold Realty Trust, Inc. | | | 9,461 | | | | (1.13 | )% | | | 70,598 | |
Sun Communities, Inc. | | | 2,031 | | | | (1.26 | )% | | | 68,834 | |
New York Mortgage Trust, Inc. | | | 22,815 | | | | (0.79 | )% | | | 35,398 | |
Marcus & Millichap, Inc. | | | 8,204 | | | | (1.35 | )% | | | 17,779 | |
Ellington Financial, Inc. | | | 17,846 | | | | (1.01 | )% | | | 16,043 | |
TFS Financial Corp. | | | 18,331 | | | | (1.11 | )% | | | 9,620 | |
Equity LifeStyle Properties, Inc. | | | 845 | | | | (0.26 | )% | | | 2,920 | |
Ventas, Inc. | | | 2,854 | | | | (0.60 | )% | | | 1,640 | |
Terreno Realty Corp. | | | 1,433 | | | | (0.46 | )% | | | (2,580 | ) |
UMH Properties, Inc. | | | 7,817 | | | | (0.61 | )% | | | (2,741 | ) |
Iron Mountain, Inc. | | | 2,756 | | | | (1.06 | )% | | | (3,764 | ) |
PotlatchDeltic Corp. | | | 5,453 | | | | (1.23 | )% | | | (4,073 | ) |
Elme Communities | | | 15,124 | | | | (1.01 | )% | | | (4,533 | ) |
Allstate Corp. | | | 366 | | | | (0.30 | )% | | | (5,862 | ) |
Equinix, Inc. | | | 268 | | | | (1.06 | )% | | | (6,196 | ) |
20 | THE GUGGENHEIM FUNDS SEMI-ANNUAL REPORT | SEE NOTES TO FINANCIAL STATEMENTS. |
SCHEDULE OF INVESTMENTS (Unaudited)(continued) | March 31, 2024 |
ALPHA OPPORTUNITY FUND | |
| | Shares | | | Percentage
Notional
Amount | | | Value and
Unrealized
Appreciation
(Depreciation) | |
American Tower Corp. — Class A | | | 796 | | | | (0.76 | )% | | $ | (6,926 | ) |
Moelis & Co. — Class A | | | 2,923 | | | | (0.80 | )% | | | (7,518 | ) |
Howard Hughes Holdings, Inc. | | | 3,269 | | | | (1.14 | )% | | | (8,265 | ) |
State Street Corp. | | | 2,855 | | | | (1.06 | )% | | | (12,455 | ) |
Cannae Holdings, Inc. | | | 7,118 | | | | (0.76 | )% | | | (13,173 | ) |
Jones Lang LaSalle, Inc. | | | 487 | | | | (0.46 | )% | | | (13,569 | ) |
Macerich Co. | | | 10,437 | | | | (0.86 | )% | | | (14,391 | ) |
Digital Realty Trust, Inc. | | | 1,372 | | | | (0.95 | )% | | | (14,489 | ) |
Brighthouse Financial, Inc. | | | 6,194 | | | | (1.54 | )% | | | (16,344 | ) |
Global Net Lease, Inc. | | | 28,951 | | | | (1.08 | )% | | | (16,617 | ) |
Apartment Investment and Management Co. — Class A | | | 31,671 | | | | (1.25 | )% | | | (26,224 | ) |
CBRE Group, Inc. — Class A | | | 1,484 | | | | (0.69 | )% | | | (29,069 | ) |
Welltower, Inc. | | | 3,072 | | | | (1.38 | )% | | | (39,798 | ) |
FTAI Infrastructure, Inc. | | | 15,620 | | | | (0.47 | )% | | | (40,459 | ) |
Carlyle Group, Inc. | | | 4,972 | | | | (1.12 | )% | | | (52,876 | ) |
PennyMac Financial Services, Inc. | | | 2,397 | | | | (1.05 | )% | | | (60,268 | ) |
KKR & Company, Inc. — Class A | | | 2,555 | | | | (1.24 | )% | | | (102,881 | ) |
Total Financial | | | | | | | | | | | (119,219 | ) |
| | | | | | | | | | | | | |
Energy | | | | | | | | | | | | |
NOV, Inc. | | | 16,793 | | | | (1.58 | )% | | | (6,519 | ) |
Dril-Quip, Inc. | | | 11,208 | | | | (1.21 | )% | | | (10,713 | ) |
Antero Resources Corp. | | | 9,141 | | | | (1.27 | )% | | | (18,941 | ) |
Sitio Royalties Corp. — Class A | | | 7,317 | | | | (0.87 | )% | | | (19,078 | ) |
Valaris Ltd. | | | 4,322 | | | | (1.56 | )% | | | (41,308 | ) |
TechnipFMC plc | | | 13,112 | | | | (1.58 | )% | | | (71,237 | ) |
Archrock, Inc. | | | 11,150 | | | | (1.05 | )% | | | (73,713 | ) |
Total Energy | | | | | | | | | | | (241,509 | ) |
| | | | | | | | | | | | | |
Industrial | | | | | | | | | | | | |
NV5 Global, Inc. | | | 1,060 | | | | (0.50 | )% | | | 7,240 | |
Knight-Swift Transportation Holdings, Inc. | | | 1,903 | | | | (0.50 | )% | | | 3,488 | |
Boeing Co. | | | 719 | | | | (0.67 | )% | | | 3,052 | |
XPO, Inc. | | | 1,168 | | | | (0.69 | )% | | | 2,629 | |
J.B. Hunt Transport Services, Inc. | | | 448 | | | | (0.43 | )% | | | 1,084 | |
Exponent, Inc. | | | 2,193 | | | | (0.87 | )% | | | 1,066 | |
RXO, Inc. | | | 10,999 | | | | (1.16 | )% | | | 773 | |
Stericycle, Inc. | | | 3,869 | | | | (0.98 | )% | | | 109 | |
Tetra Tech, Inc. | | | 523 | | | | (0.46 | )% | | | (842 | ) |
Norfolk Southern Corp. | | | 489 | | | | (0.60 | )% | | | (1,769 | ) |
Republic Services, Inc. — Class A | | | 1,244 | | | | (1.15 | )% | | | (9,899 | ) |
Vulcan Materials Co. | | | 288 | | | | (0.38 | )% | | | (17,462 | ) |
Trinity Industries, Inc. | | | 6,069 | | | | (0.81 | )% | | | (22,926 | ) |
Casella Waste Systems, Inc. — Class A | | | 2,701 | | | | (1.28 | )% | | | (70,311 | ) |
Total Industrial | | | | | | | | | | | (103,768 | ) |
| | | | | | | | | | | | | |
Communications | | | | | | | | | | | | |
Boston Omaha Corp. — Class A | | | 8,025 | | | | (0.60 | )% | | | (4,922 | ) |
DoorDash, Inc. — Class A | | | 983 | | | | (0.65 | )% | | | (42,797 | ) |
Total Communications | | | | | | | | | | | (47,719 | ) |
| | | | | | | | | | | | | |
Technology | | | | | | | | | | | | |
Paycor HCM, Inc. | | | 12,919 | | | | (1.21 | )% | | | 31,279 | |
Braze, Inc. — Class A | | | 4,417 | | | | (0.94 | )% | | | 13,414 | |
Take-Two Interactive Software, Inc. | | | 2,009 | | | | (1.43 | )% | | | 9,804 | |
ROBLOX Corp. — Class A | | | 2,322 | | | | (0.43 | )% | | | 5,599 | |
KBR, Inc. | | | 3,264 | | | | (1.00 | )% | | | (12,617 | ) |
Evolent Health, Inc. — Class A | | | 4,636 | | | | (0.73 | )% | | | (19,888 | ) |
Micron Technology, Inc. | | | 1,675 | | | | (0.95 | )% | | | (40,103 | ) |
Parsons Corp. | | | 2,086 | | | | (0.83 | )% | | | (55,346 | ) |
Total Technology | | | | | | | | | | | (67,858 | ) |
| | | | | | | | | | | | | |
Consumer, Cyclical | | | | | | | | | | | | |
Walgreens Boots Alliance, Inc. | | | 8,344 | | | | (0.87 | )% | | | 36,530 | |
Tesla, Inc. | | | 455 | | | | (0.38 | )% | | | 13,096 | |
Dollar Tree, Inc. | | | 923 | | | | (0.59 | )% | | | 6,420 | |
Hyatt Hotels Corp. — Class A | | | 878 | | | | (0.67 | )% | | | (1,284 | ) |
MarineMax, Inc. | | | 4,377 | | | | (0.70 | )% | | | (5,301 | ) |
Dollar General Corp. | | | 592 | | | | (0.44 | )% | | | (13,021 | ) |
DraftKings, Inc. — Class A | | | 2,640 | | | | (0.58 | )% | | | (15,945 | ) |
Copart, Inc. | | | 4,029 | | | | (1.12 | )% | | | (16,461 | ) |
CarMax, Inc. | | | 3,051 | | | | (1.28 | )% | | | (63,544 | ) |
Total Consumer, Cyclical | | | | | | | | | | | (59,510 | ) |
Total GS Equity Short Custom Basket | | | | | | $ | (933,089 | ) |
SEE NOTES TO FINANCIAL STATEMENTS. | THE GUGGENHEIM FUNDS SEMI-ANNUAL REPORT | 21 |
SCHEDULE OF INVESTMENTS (Unaudited)(concluded) | March 31, 2024 |
ALPHA OPPORTUNITY FUND | |
* | Non-income producing security. |
† | Value determined based on Level 1 inputs — See Note 4. |
†† | Value determined based on Level 2 inputs — See Note 4. |
1 | All or a portion of this security is pledged as equity custom basket swap collateral at March 31, 2024. |
2 | Rate indicated is the 7-day yield as of March 31, 2024. |
| | GS — Goldman Sachs International |
| | MS — Morgan Stanley Capital Services LLC |
| | plc — Public Limited Company |
| | REIT — Real Estate Investment Trust |
| | |
| | See Sector Classification in Other Information section. |
The following table summarizes the inputs used to value the Fund’s investments at March 31, 2024 (See Note 4 in the Notes to Financial Statements):
Investments in Securities (Assets) | | Level 1
Quoted
Prices | | | Level 2
Significant
Observable
Inputs | | | Level 3
Significant
Unobservable
Inputs | | | Total | |
Common Stocks | | $ | 37,480,073 | | | $ | — | | | $ | — | | | $ | 37,480,073 | |
Money Market Fund | | | 1,258,523 | | | | — | | | | — | | | | 1,258,523 | |
Equity Custom Basket Swap Agreements** | | | — | | | | 2,395,939 | | | | — | | | | 2,395,939 | |
Total Assets | | $ | 38,738,596 | | | $ | 2,395,939 | | | $ | — | | | $ | 41,134,535 | |
Investments in Securities (Liabilities) | | Level 1
Quoted
Prices | | | Level 2
Significant
Observable
Inputs | | | Level 3
Significant
Unobservable
Inputs | | | Total | |
Equity Custom Basket Swap Agreements** | | $ | — | | | $ | 1,844,614 | | | $ | — | | | $ | 1,844,614 | |
** | This derivative is reported as unrealized appreciation/depreciation at period end. |
22 | THE GUGGENHEIM FUNDS SEMI-ANNUAL REPORT | SEE NOTES TO FINANCIAL STATEMENTS. |
STATEMENT OF ASSETS AND LIABILITIES (Unaudited) |
March 31, 2024 |
Assets: |
Investments, at value (cost $35,049,699) | | $ | 38,738,596 | |
Cash | | | 10,597 | |
Unrealized appreciation on OTC swap agreements | | | 2,395,939 | |
Prepaid expenses | | | 53,425 | |
Receivables: |
Dividends | | | 24,762 | |
Interest | | | 5,228 | |
Total assets | | | 41,228,547 | |
| | | | | |
Liabilities: |
Unrealized depreciation on OTC swap agreements | | | 1,844,614 | |
Payable for: |
Management fees | | | 25,264 | |
Swap settlement | | | 10,942 | |
Fund accounting/administration fees | | | 3,049 | |
Trustees’ fees* | | | 2,638 | |
Transfer agent/maintenance fees | | | 2,632 | |
Distribution and service fees | | | 1,257 | |
Fund shares redeemed | | | 16 | |
Miscellaneous | | | 16,334 | |
Total liabilities | | | 1,906,746 | |
Net assets | | $ | 39,321,801 | |
| | | | | |
Net assets consist of: |
Paid in capital | | $ | 60,040,265 | |
Total distributable earnings (loss) | | | (20,718,464 | ) |
Net assets | | $ | 39,321,801 | |
Class A: |
Net assets | | $ | 3,063,682 | |
Capital shares outstanding | | | 141,916 | |
Net asset value per share | | $ | 21.59 | |
Maximum offering price per share (Net asset value divided by 95.25%) | | $ | 22.67 | |
Class C: |
Net assets | | $ | 216,930 | |
Capital shares outstanding | | | 11,500 | |
Net asset value per share | | $ | 18.86 | |
Class P: |
Net assets | | $ | 2,070,398 | |
Capital shares outstanding | | | 95,140 | |
Net asset value per share | | $ | 21.76 | |
| | | | | |
Institutional Class: |
Net assets | | $ | 33,970,791 | |
Capital shares outstanding | | | 1,064,911 | |
Net asset value per share | | $ | 31.90 | |
STATEMENT OF OPERATIONS (Unaudited) |
Six Months Ended March 31, 2024 |
Investment Income: |
Dividends | | $ | 367,783 | |
Interest | | | 34,957 | |
Total investment income | | | 402,740 | |
| | | | | |
Expenses: |
Management fees | | | 163,261 | |
Distribution and service fees: |
Class A | | | 3,617 | |
Class C | | | 985 | |
Class P | | | 2,410 | |
Transfer agent/maintenance fees: |
Class A | | | 3,812 | |
Class C | | | 305 | |
Class P | | | 988 | |
Institutional Class | | | 10,342 | |
Professional fees | | | 21,917 | |
Registration fees | | | 17,416 | |
Fund accounting/administration fees | | | 11,640 | |
Custodian fees | | | 9,285 | |
Trustees’ fees* | | | 8,958 | |
Line of credit fees | | | 692 | |
Miscellaneous | | | 10,096 | |
Recoupment of previously waived fees: |
Class A | | | 392 | |
Class C | | | 26 | |
Class P | | | 1,086 | |
Institutional Class | | | 9,799 | |
Total expenses | | | 277,027 | |
Less: |
Expenses reimbursed by Adviser: |
Class A | | | (1,574 | ) |
Class C | | | (153 | ) |
Class P | | | (329 | ) |
Institutional Class | | | (3,562 | ) |
Expenses waived by Adviser | | | (6,599 | ) |
Total waived/reimbursed expenses | | | (12,217 | ) |
Net expenses | | | 264,810 | |
Net investment income | | | 137,930 | |
| | | | | |
Net Realized and Unrealized Gain (Loss): |
Net realized gain (loss) on: |
Investments | | | 2,157,298 | |
Swap agreements | | | (282,820 | ) |
Net realized gain | | | 1,874,478 | |
Net change in unrealized appreciation (depreciation) on: |
Investments | | | 3,925,275 | |
Swap agreements | | | (1,629,464 | ) |
Net change in unrealized appreciation (depreciation) | | | 2,295,811 | |
Net realized and unrealized gain | | | 4,170,289 | |
Net increase in net assets resulting from operations | | $ | 4,308,219 | |
* | Relates to Trustees not deemed “interested persons” within the meaning of Section 2(a)(19) of the 1940 Act. |
SEE NOTES TO FINANCIAL STATEMENTS. | THE GUGGENHEIM FUNDS SEMI-ANNUAL REPORT | 23 |
STATEMENTS OF CHANGES IN NET ASSETS |
| | Six Months Ended
March 31, 2024
(Unaudited) | | | Year Ended
September 30,
2023 | |
Increase (Decrease) in Net Assets from Operations: | | | | | | | | |
Net investment income | | $ | 137,930 | | | $ | 199,681 | |
Net realized gain on investments | | | 1,874,478 | | | | 2,370,224 | |
Net change in unrealized appreciation (depreciation) on investments | | | 2,295,811 | | | | 2,491,104 | |
Net increase in net assets resulting from operations | | | 4,308,219 | | | | 5,061,009 | |
| | | | | | | | | |
Distributions to shareholders: | | | | | | | | |
Class A | | | (17,013 | ) | | | (19,964 | ) |
Class P | | | (11,717 | ) | | | (12,413 | ) |
Institutional Class | | | (170,951 | ) | | | (173,553 | ) |
Total distributions to shareholders | | | (199,681 | ) | | | (205,930 | ) |
| | | | | | | | | |
Capital share transactions: | | | | | | | | |
Proceeds from sale of shares | | | | | | | | |
Class A | | | 252,675 | | | | 143,300 | |
Class C | | | 27,176 | | | | 2,880 | |
Class P | | | — | | | | 51,362 | |
Institutional Class | | | 162,832 | | | | 779,910 | |
Distributions reinvested | | | | | | | | |
Class A | | | 14,054 | | | | 17,789 | |
Class P | | | 11,717 | | | | 12,413 | |
Institutional Class | | | 170,951 | | | | 173,553 | |
Cost of shares redeemed | | | | | | | | |
Class A | | | (365,123 | ) | | | (329,547 | ) |
Class C | | | (25,826 | ) | | | (34,599 | ) |
Class P | | | (35,663 | ) | | | (89,028 | ) |
Institutional Class | | | (210,564 | ) | | | (459,238 | ) |
Net increase from capital share transactions | | | 2,229 | | | | 268,795 | |
Net increase in net assets | | | 4,110,767 | | | | 5,123,874 | |
| | | | | | | | | |
Net assets: | | | | | | | | |
Beginning of period | | | 35,211,034 | | | | 30,087,160 | |
End of period | | $ | 39,321,801 | | | $ | 35,211,034 | |
| | | | | | | | | |
Capital share activity: | | | | | | | | |
Shares sold | | | | | | | | |
Class A | | | 12,309 | | | | 7,772 | |
Class C | | | 1,502 | | | | 179 | |
Class P | | | — | | | | 2,642 | |
Institutional Class | | | 5,415 | | | | 28,646 | |
Shares issued from reinvestment of distributions | | | | | | | | |
Class A | | | 732 | | | | 1,004 | |
Class P | | | 605 | | | | 695 | |
Institutional Class | | | 6,030 | | | | 6,660 | |
Shares redeemed | | | | | | | | |
Class A | | | (17,852 | ) | | | (18,034 | ) |
Class C | | | (1,475 | ) | | | (2,086 | ) |
Class P | | | (1,762 | ) | | | (4,858 | ) |
Institutional Class | | | (7,371 | ) | | | (16,727 | ) |
Net increase (decrease) in shares | | | (1,867 | ) | | | 5,893 | |
24 | THE GUGGENHEIM FUNDS SEMI-ANNUAL REPORT | SEE NOTES TO FINANCIAL STATEMENTS. |
This table is presented to show selected data for a share outstanding throughout each period and to assist shareholders in evaluating a Fund’s performance for the periods presented.
Class A | | Six Months Ended
March 31, 2024a | | | Year Ended
September 30,
2023 | | | Year Ended
September 30,
2022 | | | Year Ended
September 30,
2021 | | | Year Ended
September 30,
2020 | | | Year Ended
September 30,
2019 | |
Per Share Data |
Net asset value, beginning of period | | $ | 19.37 | | | $ | 16.73 | | | $ | 18.05 | | | $ | 16.89 | | | $ | 17.42 | | | $ | 19.15 | |
Income (loss) from investment operations: |
Net investment income (loss)b | | | .05 | | | | .07 | | | | .07 | | | | .10 | | | | .11 | | | | .12 | |
Net gain (loss) on investments (realized and unrealized) | | | 2.29 | | | | 2.70 | | | | (1.23 | ) | | | 1.27 | | | | (.48 | ) | | | (1.64 | ) |
Total from investment operations | | | 2.34 | | | | 2.77 | | | | (1.16 | ) | | | 1.37 | | | | (.37 | ) | | | (1.52 | ) |
Less distributions from: |
Net investment income | | | (.12 | ) | | | (.13 | ) | | | (.16 | ) | | | (.21 | ) | | | (.16 | ) | | | (.21 | ) |
Total distributions | | | (.12 | ) | | | (.13 | ) | | | (.16 | ) | | | (.21 | ) | | | (.16 | ) | | | (.21 | ) |
Net asset value, end of period | | $ | 21.59 | | | $ | 19.37 | | | $ | 16.73 | | | $ | 18.05 | | | $ | 16.89 | | | $ | 17.42 | |
|
Total Returnc | | | 12.15 | % | | | 16.62 | % | | | (6.55 | %) | | | 8.17 | % | | | (2.15 | %) | | | (7.97 | %) |
Ratios/Supplemental Data |
Net assets, end of period (in thousands) | | $ | 3,064 | | | $ | 2,842 | | | $ | 2,610 | | | $ | 3,042 | | | $ | 3,429 | | | $ | 7,326 | |
Ratios to average net assets: |
Net investment income (loss) | | | 0.49 | % | | | 0.39 | % | | | 0.39 | % | | | 0.56 | % | | | 0.65 | % | | | 0.64 | % |
Total expensesd | | | 1.88 | % | | | 1.94 | % | | | 1.91 | % | | | 1.94 | % | | | 1.73 | % | | | 1.65 | % |
Net expensese,f,g | | | 1.74 | % | | | 1.74 | % | | | 1.76 | % | | | 1.76 | % | | | 1.69 | % | | | 1.64 | % |
Portfolio turnover rate | | | 165 | % | | | 309 | % | | | 283 | % | | | 169 | % | | | 209 | % | | | 126 | % |
Class C | | Six Months Ended
March 31, 2024a | | | Year Ended
September 30,
2023 | | | Year Ended
September 30,
2022 | | | Year Ended
September 30,
2021 | | | Year Ended
September 30,
2020 | | | Year Ended
September 30,
2019 | |
Per Share Data |
Net asset value, beginning of period | | $ | 16.88 | | | $ | 14.59 | | | $ | 15.76 | | | $ | 14.71 | | | $ | 15.16 | | | $ | 16.61 | |
Income (loss) from investment operations: |
Net investment income (loss)b | | | (.02 | ) | | | (.06 | ) | | | (.06 | ) | | | (.03 | ) | | | (.02 | ) | | | (.03 | ) |
Net gain (loss) on investments (realized and unrealized) | | | 2.00 | | | | 2.35 | | | | (1.08 | ) | | | 1.11 | | | | (.43 | ) | | | (1.42 | ) |
Total from investment operations | | | 1.98 | | | | 2.29 | | | | (1.14 | ) | | | 1.08 | | | | (.45 | ) | | | (1.45 | ) |
Less distributions from: |
Net investment income | | | — | | | | — | | | | (.03 | ) | | | (.03 | ) | | | — | | | | — | |
Total distributions | | | — | | | | — | | | | (.03 | ) | | | (.03 | ) | | | — | | | | — | |
Net asset value, end of period | | $ | 18.86 | | | $ | 16.88 | | | $ | 14.59 | | | $ | 15.76 | | | $ | 14.71 | | | $ | 15.16 | |
|
Total Returnc | | | 11.73 | % | | | 15.70 | % | | | (7.25 | %) | | | 7.37 | % | | | (2.97 | %) | | | (8.73 | %) |
Ratios/Supplemental Data |
Net assets, end of period (in thousands) | | $ | 217 | | | $ | 194 | | | $ | 195 | | | $ | 277 | | | $ | 354 | | | $ | 702 | |
Ratios to average net assets: |
Net investment income (loss) | | | (0.28 | %) | | | (0.36 | %) | | | (0.37 | %) | | | (0.19 | %) | | | (0.15 | %) | | | (0.20 | %) |
Total expensesd | | | 2.68 | % | | | 2.77 | % | | | 2.75 | % | | | 2.75 | % | | | 2.72 | % | | | 2.55 | % |
Net expensese,f,g | | | 2.49 | % | | | 2.50 | % | | | 2.51 | % | | | 2.51 | % | | | 2.51 | % | | | 2.48 | % |
Portfolio turnover rate | | | 165 | % | | | 309 | % | | | 283 | % | | | 169 | % | | | 209 | % | | | 126 | % |
SEE NOTES TO FINANCIAL STATEMENTS. | THE GUGGENHEIM FUNDS SEMI-ANNUAL REPORT | 25 |
FINANCIAL HIGHLIGHTS (continued) |
This table is presented to show selected data for a share outstanding throughout each period and to assist shareholders in evaluating a Fund’s performance for the periods presented.
Class P | | Six Months Ended
March 31, 2024a | | | Year Ended
September 30,
2023 | | | Year Ended
September 30,
2022 | | | Year Ended
September 30,
2021 | | | Year Ended
September 30,
2020 | | | Year Ended
September 30,
2019 | |
Per Share Data |
Net asset value, beginning of period | | $ | 19.52 | | | $ | 16.87 | | | $ | 18.21 | | | $ | 17.06 | | | $ | 17.56 | | | $ | 19.23 | |
Income (loss) from investment operations: |
Net investment income (loss)b | | | .05 | | | | .07 | | | | .07 | | | | .10 | | | | .12 | | | | .11 | |
Net gain (loss) on investments (realized and unrealized) | | | 2.31 | | | | 2.71 | | | | (1.24 | ) | | | 1.28 | | | | (.49 | ) | | | (1.64 | ) |
Total from investment operations | | | 2.36 | | | | 2.78 | | | | (1.17 | ) | | | 1.38 | | | | (.37 | ) | | | (1.53 | ) |
Less distributions from: |
Net investment income | | | (.12 | ) | | | (.13 | ) | | | (.17 | ) | | | (.23 | ) | | | (.13 | ) | | | (.14 | ) |
Total distributions | | | (.12 | ) | | | (.13 | ) | | | (.17 | ) | | | (.23 | ) | | | (.13 | ) | | | (.14 | ) |
Net asset value, end of period | | $ | 21.76 | | | $ | 19.52 | | | $ | 16.87 | | | $ | 18.21 | | | $ | 17.06 | | | $ | 17.56 | |
|
Total Return | | | 12.12 | % | | | 16.60 | % | | | (6.54 | %) | | | 8.17 | % | | | (2.11 | %) | | | (7.99 | %) |
Ratios/Supplemental Data |
Net assets, end of period (in thousands) | | $ | 2,070 | | | $ | 1,880 | | | $ | 1,650 | | | $ | 1,855 | | | $ | 1,161 | | | $ | 1,905 | |
Ratios to average net assets: |
Net investment income (loss) | | | 0.48 | % | | | 0.39 | % | | | 0.39 | % | | | 0.54 | % | | | 0.70 | % | | | 0.59 | % |
Total expensesd | | | 1.81 | % | | | 1.87 | % | | | 1.82 | % | | | 1.96 | % | | | 1.67 | % | | | 1.67 | % |
Net expensese,f,g | | | 1.74 | % | | | 1.74 | % | | | 1.76 | % | | | 1.76 | % | | | 1.64 | % | | | 1.66 | % |
Portfolio turnover rate | | | 165 | % | | | 309 | % | | | 283 | % | | | 169 | % | | | 209 | % | | | 126 | % |
26 | THE GUGGENHEIM FUNDS SEMI-ANNUAL REPORT | SEE NOTES TO FINANCIAL STATEMENTS. |
FINANCIAL HIGHLIGHTS (concluded) |
This table is presented to show selected data for a share outstanding throughout each period and to assist shareholders in evaluating a Fund’s performance for the periods presented.
Institutional Class | | Six Months Ended
March 31, 2024a | | | Year Ended
September 30,
2023 | | | Year Ended
September 30,
2022 | | | Year Ended
September 30,
2021 | | | Year Ended
September 30,
2020 | | | Year Ended
September 30,
2019 | |
Per Share Data |
Net asset value, beginning of period | | $ | 28.56 | | | $ | 24.59 | | | $ | 26.44 | | | $ | 24.65 | | | $ | 25.37 | | | $ | 27.77 | |
Income (loss) from investment operations: |
Net investment income (loss)b | | | .12 | | | | .17 | | | | .17 | | | | .22 | | | | .25 | | | | .28 | |
Net gain (loss) on investments (realized and unrealized) | | | 3.38 | | | | 3.97 | | | | (1.81 | ) | | | 1.85 | | | | (.72 | ) | | | (2.37 | ) |
Total from investment operations | | | 3.50 | | | | 4.14 | | | | (1.64 | ) | | | 2.07 | | | | (.47 | ) | | | (2.09 | ) |
Less distributions from: |
Net investment income | | | (.16 | ) | | | (.17 | ) | | | (.21 | ) | | | (.28 | ) | | | (.25 | ) | | | (.31 | ) |
Total distributions | | | (.16 | ) | | | (.17 | ) | | | (.21 | ) | | | (.28 | ) | | | (.25 | ) | | | (.31 | ) |
Net asset value, end of period | | $ | 31.90 | | | $ | 28.56 | | | $ | 24.59 | | | $ | 26.44 | | | $ | 24.65 | | | $ | 25.37 | |
|
Total Return | | | 12.33 | % | | | 16.89 | % | | | (6.31 | %) | | | 8.46 | % | | | (1.87 | %) | | | (7.57 | %) |
Ratios/Supplemental Data |
Net assets, end of period (in thousands) | | $ | 33,971 | | | $ | 30,296 | | | $ | 25,632 | | | $ | 29,778 | | | $ | 32,260 | | | $ | 79,318 | |
Ratios to average net assets: |
Net investment income (loss) | | | 0.81 | % | | | 0.64 | % | | | 0.64 | % | | | 0.82 | % | | | 1.00 | % | | | 1.05 | % |
Total expensesd | | | 1.47 | % | | | 1.56 | % | | | 1.54 | % | | | 1.58 | % | | | 1.36 | % | | | 1.22 | % |
Net expensese,f,g | | | 1.41 | % | | | 1.49 | % | | | 1.51 | % | | | 1.50 | % | | | 1.36 | % | | | 1.21 | % |
Portfolio turnover rate | | | 165 | % | | | 309 | % | | | 283 | % | | | 169 | % | | | 209 | % | | | 126 | % |
a | Unaudited figures for the period ended March 31, 2024. Percentage amounts for the period, except total return and portfolio turnover rate, have been annualized. |
b | Net investment income (loss) per share was computed using average shares outstanding throughout the period. |
c | Total return does not reflect the impact of any applicable sales charges. |
d | Does not include expenses of the underlying funds in which the Fund invests. |
e | Net expense information reflects the expense ratios after expense waivers and reimbursements, as applicable. |
f | The portion of the ratios of net expenses to average net assets attributable to recoupments of prior fee reductions or expense reimbursements for the years presented was as follows: |
| | | 03/31/24 | 09/30/23 | 09/30/22 | 09/30/21 | 09/30/20 | 09/30/19 |
| | Class A | 0.03% | 0.02% | 0.02% | 0.01% | 0.02% | 0.09% |
| | Class C | 0.03% | 0.02% | 0.03% | 0.01% | 0.01% | 0.04% |
| | Class P | 0.11% | 0.02% | 0.03% | 0.01% | 0.01% | 0.03% |
| | Institutional Class | 0.06% | 0.04% | 0.06% | 0.02% | 0.00%* | 0.00%* |
g | Net expenses may include expenses that are excluded from the expense limitation agreement. Excluding these expenses, the net expense ratios for the years presented would be: |
| | | 03/31/24 | 09/30/23 | 09/30/22 | 09/30/21 | 09/30/20 | 09/30/19 |
| | Class A | 1.73% | 1.74% | 1.76% | 1.76% | 1.69% | 1.64% |
| | Class C | 2.48% | 2.49% | 2.51% | 2.51% | 2.51% | 2.48% |
| | Class P | 1.73% | 1.74% | 1.76% | 1.76% | 1.64% | 1.66% |
| | Institutional Class | 1.41% | 1.48% | 1.50% | 1.50% | 1.36% | 1.21% |
SEE NOTES TO FINANCIAL STATEMENTS. | THE GUGGENHEIM FUNDS SEMI-ANNUAL REPORT | 27 |
PERFORMANCE REPORT AND FUND PROFILE (Unaudited) | March 31, 2024 |
LARGE CAP VALUE FUND
OBJECTIVE: Seeks long-term growth of capital.
Holdings Diversification (Market Exposure as % of Net Assets)
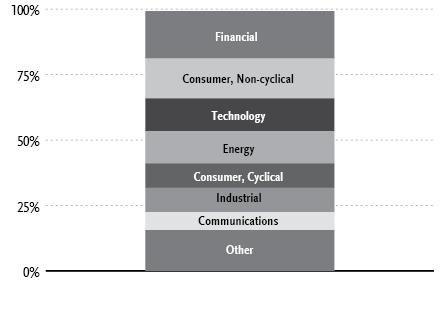
“Holdings Diversification (Market Exposure as % of Net Assets)” excludes any temporary cash investments.
Inception Dates: |
Class A | August 7, 1944 |
Class C | January 29, 1999 |
Class P | May 1, 2015 |
Institutional Class | June 7, 2013 |
Ten Largest Holdings | % of Total Net Assets |
iShares Russell 1000 Value ETF | 3.6% |
Berkshire Hathaway, Inc. — Class B | 2.7% |
Verizon Communications, Inc. | 2.6% |
ConocoPhillips | 2.6% |
Bank of America Corp. | 2.6% |
Chevron Corp. | 2.5% |
Walmart, Inc. | 2.0% |
JPMorgan Chase & Co. | 1.8% |
Diamondback Energy, Inc. | 1.8% |
Alphabet, Inc. — Class A | 1.7% |
Top Ten Total | 23.9% |
| | |
“Ten Largest Holdings” excludes any temporary cash investments. |
28 | THE GUGGENHEIM FUNDS SEMI-ANNUAL REPORT | |
PERFORMANCE REPORT AND FUND PROFILE (Unaudited)(concluded) | March 31, 2024 |
Average Annual Returns*
Periods Ended March 31, 2024
| 6 Month† | 1 Year | 5 Year | 10 Year |
Class A Shares | 17.48% | 18.73% | 10.79% | 8.82% |
Class A Shares with sales charge‡ | 11.90% | 13.10% | 9.72% | 8.29% |
Class C Shares | 17.05% | 17.83% | 9.97% | 8.00% |
Class C Shares with CDSC§ | 16.05% | 16.83% | 9.97% | 8.00% |
Institutional Class Shares | 17.64% | 19.02% | 11.07% | 9.08% |
Russell 1000 Value Index | 19.34% | 20.27% | 10.32% | 9.01% |
| 6 Month† | 1 Year | 5 Year | Since
Inception
(05/01/15) |
Class P Shares | 17.48% | 18.70% | 10.79% | 9.10% |
Russell 1000 Value Index | 19.34% | 20.27% | 10.32% | 8.84% |
* | The performance data above represents past performance that is not predictive of future results. The investment return and principal value of an investment in the Fund will fluctuate so that an investor’s shares, when redeemed, may be worth more or less than their original cost. Returns are historical and include changes in principal and reinvested dividends and capital gains and do not reflect the effect of taxes. The Russell 1000 Value Index is an unmanaged index and, unlike the Fund, has no management fees or operating expenses to reduce its reported return. |
† | 6 month returns are not annualized. |
‡ | Fund returns are calculated using the maximum charge of 4.75%. |
§ | Fund returns include a CDSC of 1% if redeemed within 12 months of purchase. |
| | THE GUGGENHEIM FUNDS SEMI-ANNUAL REPORT | 29 |
SCHEDULE OF INVESTMENTS (Unaudited) | March 31, 2024 |
LARGE CAP VALUE FUND | |
| | Shares | | | Value | |
COMMON STOCKS† - 95.7% |
| | | | | | | | | |
Financial - 18.2% |
Berkshire Hathaway, Inc. — Class B* | | | 2,471 | | | $ | 1,039,105 | |
Bank of America Corp. | | | 26,532 | | | | 1,006,093 | |
JPMorgan Chase & Co. | | | 3,590 | | | | 719,077 | |
Jefferies Financial Group, Inc. | | | 12,178 | | | | 537,050 | |
Charles Schwab Corp. | | | 6,546 | | | | 473,537 | |
First Horizon Corp. | | | 30,507 | | | | 469,808 | |
Goldman Sachs Group, Inc. | | | 1,059 | | | | 442,334 | |
Wells Fargo & Co. | | | 7,241 | | | | 419,688 | |
Unum Group | | | 7,213 | | | | 387,050 | |
American Tower Corp. — Class A REIT | | | 1,929 | | | | 381,151 | |
Mastercard, Inc. — Class A | | | 789 | | | | 379,959 | |
Synovus Financial Corp. | | | 9,411 | | | | 377,005 | |
STAG Industrial, Inc. REIT | | | 6,837 | | | | 262,814 | |
Markel Group, Inc.* | | | 144 | | | | 219,093 | |
Total Financial | | | | | | | 7,113,764 | |
| | | | | | | | | |
Consumer, Non-cyclical - 15.2% |
Johnson & Johnson | | | 4,170 | | | | 659,652 | |
Tyson Foods, Inc. — Class A | | | 11,064 | | | | 649,789 | |
Medtronic plc | | | 6,416 | | | | 559,154 | |
PayPal Holdings, Inc.* | | | 7,205 | | | | 482,663 | |
Humana, Inc. | | | 1,306 | | | | 452,816 | |
Encompass Health Corp. | | | 5,404 | | | | 446,262 | |
Merck & Company, Inc. | | | 3,339 | | | | 440,581 | |
Archer-Daniels-Midland Co. | | | 6,265 | | | | 393,505 | |
HCA Healthcare, Inc. | | | 1,156 | | | | 385,561 | |
Ingredion, Inc. | | | 3,299 | | | | 385,488 | |
Coca-Cola Co. | | | 6,081 | | | | 372,036 | |
Bunge Global S.A. | | | 3,038 | | | | 311,456 | |
Euronet Worldwide, Inc.* | | | 2,372 | | | | 260,754 | |
Pfizer, Inc. | | | 4,745 | | | | 131,674 | |
Total Consumer, Non-cyclical | | | | | | | 5,931,391 | |
| | | | | | | | | |
Technology - 12.6% |
QUALCOMM, Inc. | | | 3,447 | | | | 583,577 | |
Microsoft Corp. | | | 1,371 | | | | 576,807 | |
Leidos Holdings, Inc. | | | 4,014 | | | | 526,195 | |
Fortinet, Inc.* | | | 7,101 | | | | 485,070 | |
Teradyne, Inc. | | | 4,240 | | | | 478,399 | |
KLA Corp. | | | 684 | | | | 477,822 | |
Fiserv, Inc.* | | | 2,949 | | | | 471,309 | |
NXP Semiconductor N.V. | | | 1,826 | | | | 452,428 | |
Applied Materials, Inc. | | | 1,742 | | | | 359,253 | |
Intel Corp. | | | 5,968 | | | | 263,606 | |
Amdocs Ltd. | | | 2,549 | | | | 230,353 | |
Total Technology | | | | | | | 4,904,819 | |
| | | | | | | | | |
Energy - 12.2% |
ConocoPhillips | | | 7,974 | | | | 1,014,931 | |
Chevron Corp. | | | 6,300 | | | | 993,762 | |
Diamondback Energy, Inc. | | | 3,541 | | | | 701,720 | |
Pioneer Natural Resources Co. | | | 1,695 | | | | 444,937 | |
Coterra Energy, Inc. — Class A | | | 15,804 | | | | 440,615 | |
Equities Corp. | | | 9,397 | | | | 348,347 | |
Marathon Oil Corp. | | | 12,079 | | | | 342,319 | |
Kinder Morgan, Inc. | | | 16,847 | | | | 308,974 | |
Range Resources Corp. | | | 5,505 | | | | 189,537 | |
Total Energy | | | | | | | 4,785,142 | |
| | | | | | | | | |
Consumer, Cyclical - 9.4% |
Walmart, Inc. | | | 12,996 | | | | 781,970 | |
Delta Air Lines, Inc. | | | 11,162 | | | | 534,325 | |
Ferguson plc | | | 1,981 | | | | 432,710 | |
Levi Strauss & Co. — Class A | | | 21,539 | | | | 430,565 | |
Lear Corp. | | | 2,877 | | | | 416,820 | |
Crocs, Inc.* | | | 2,290 | | | | 329,302 | |
Whirlpool Corp. | | | 2,259 | | | | 270,244 | |
Southwest Airlines Co. | | | 9,056 | | | | 264,344 | |
Advance Auto Parts, Inc. | | | 2,570 | | | | 218,681 | |
Total Consumer, Cyclical | | | | | | | 3,678,961 | |
| | | | | | | | | |
Industrial - 9.3% |
Eagle Materials, Inc. | | | 2,488 | | | | 676,114 | |
Curtiss-Wright Corp. | | | 2,347 | | | | 600,691 | |
Johnson Controls International plc | | | 8,932 | | | | 583,438 | |
Knight-Swift Transportation Holdings, Inc. | | | 9,555 | | | | 525,716 | |
L3Harris Technologies, Inc. | | | 2,153 | | | | 458,805 | |
Advanced Energy Industries, Inc. | | | 4,251 | | | | 433,517 | |
Teledyne Technologies, Inc.* | | | 840 | | | | 360,629 | |
Total Industrial | | | | | | | 3,638,910 | |
| | | | | | | | | |
Communications - 6.8% |
Verizon Communications, Inc. | | | 24,434 | | | | 1,025,251 | |
Alphabet, Inc. — Class A* | | | 4,480 | | | | 676,166 | |
Walt Disney Co. | | | 4,030 | | | | 493,111 | |
T-Mobile US, Inc. | | | 1,466 | | | | 239,280 | |
AT&T, Inc. | | | 12,462 | | | | 219,331 | |
Total Communications | | | | | | | 2,653,139 | |
| | | | | | | | | |
Utilities - 6.2% |
OGE Energy Corp. | | | 18,873 | | | | 647,344 | |
Edison International | | | 7,613 | | | | 538,468 | |
Pinnacle West Capital Corp. | | | 6,179 | | | | 461,757 | |
Exelon Corp. | | | 11,169 | | | | 419,619 | |
Duke Energy Corp. | | | 3,475 | | | | 336,067 | |
Total Utilities | | | | | | | 2,403,255 | |
| | | | | | | | | |
Basic Materials - 5.8% |
Nucor Corp. | | | 2,541 | | | | 502,864 | |
Freeport-McMoRan, Inc. | | | 9,272 | | | | 435,970 | |
Westlake Corp. | | | 2,839 | | | | 433,799 | |
Reliance, Inc. | | | 1,014 | | | | 338,858 | |
DuPont de Nemours, Inc. | | | 4,043 | | | | 309,977 | |
Huntsman Corp. | | | 8,911 | | | | 231,953 | |
Total Basic Materials | | | | | | | 2,253,421 | |
| | | | | | | | | |
Total Common Stocks | | | | |
(Cost $28,945,466) | | | | | | | 37,362,802 | |
| | | | | | | | | |
30 | THE GUGGENHEIM FUNDS SEMI-ANNUAL REPORT | SEE NOTES TO FINANCIAL STATEMENTS. |
SCHEDULE OF INVESTMENTS (Unaudited)(concluded) | March 31, 2024 |
LARGE CAP VALUE FUND | |
| | Shares | | | Value | |
EXCHANGE-TRADED FUNDS† - 3.6% |
iShares Russell 1000 Value ETF | | | 7,953 | | | $ | 1,424,462 | |
Total Exchange-Traded Funds | | | | |
(Cost $1,121,233) | | | | | | | 1,424,462 | |
| | | | | | | | | |
MONEY MARKET FUND† - 0.6% |
Dreyfus Treasury Securities Cash Management Fund — Institutional Shares, 5.19%1 | | | 237,699 | | | | 237,699 | |
Total Money Market Fund | | | | |
(Cost $237,699) | | | | | | | 237,699 | |
| | | | | | | | | |
Total Investments - 99.9% | | | | |
(Cost $30,304,398) | | $ | 39,024,963 | |
Other Assets & Liabilities, net - 0.1% | | | 31,520 | |
Total Net Assets - 100.0% | | $ | 39,056,483 | |
* | Non-income producing security. |
† | Value determined based on Level 1 inputs — See Note 4. |
1 | Rate indicated is the 7-day yield as of March 31, 2024. |
| | plc — Public Limited Company |
| | REIT — Real Estate Investment Trust |
| | |
| | See Sector Classification in Other Information section. |
The following table summarizes the inputs used to value the Fund’s investments at March 31, 2024 (See Note 4 in the Notes to Financial Statements):
Investments in Securities (Assets) | | Level 1
Quoted
Prices | | | Level 2
Significant
Observable
Inputs | | | Level 3
Significant
Unobservable
Inputs | | | Total | |
Common Stocks | | $ | 37,362,802 | | | $ | — | | | $ | — | | | $ | 37,362,802 | |
Exchange-Traded Funds | | | 1,424,462 | | | | — | | | | — | | | | 1,424,462 | |
Money Market Fund | | | 237,699 | | | | — | | | | — | | | | 237,699 | |
Total Assets | | $ | 39,024,963 | | | $ | — | | | $ | — | | | $ | 39,024,963 | |
SEE NOTES TO FINANCIAL STATEMENTS. | THE GUGGENHEIM FUNDS SEMI-ANNUAL REPORT | 31 |
STATEMENT OF ASSETS AND LIABILITIES (Unaudited) |
March 31, 2024 |
Assets: |
Investments, at value (cost $30,304,398) | | $ | 39,024,963 | |
Cash | | | 10,145 | |
Prepaid expenses | | | 43,337 | |
Receivables: |
Dividends | | | 42,245 | |
Interest | | | 1,431 | |
Fund shares sold | | | 477 | |
Total assets | | | 39,122,598 | |
| | | | | |
Liabilities: |
Payable for: |
Fund shares redeemed | | | 20,109 | |
Management fees | | | 14,553 | |
Professional fees | | | 12,777 | |
Distribution and service fees | | | 8,273 | |
Printing fees | | | 3,557 | |
Fund accounting /administration fees | | | 2,960 | |
Transfer agent/maintenance fees | | | 2,111 | |
Trustees’ fees* | | | 144 | |
Due to Investment Adviser | | | 36 | |
Miscellaneous | | | 1,595 | |
Total liabilities | | | 66,115 | |
Net assets | | $ | 39,056,483 | |
| | | | | |
Net assets consist of: |
Paid in capital | | $ | 29,561,390 | |
Total distributable earnings (loss) | | | 9,495,093 | |
Net assets | | $ | 39,056,483 | |
Class A: |
Net assets | | $ | 35,281,900 | |
Capital shares outstanding | | | 737,548 | |
Net asset value per share | | $ | 47.84 | |
Maximum offering price per share (Net asset value divided by 95.25%) | | $ | 50.23 | |
Class C: |
Net assets | | $ | 1,156,323 | |
Capital shares outstanding | | | 27,329 | |
Net asset value per share | | $ | 42.31 | |
Class P: |
Net assets | | $ | 94,062 | |
Capital shares outstanding | | | 1,973 | |
Net asset value per share | | $ | 47.67 | |
| | | | | |
Institutional Class: |
Net assets | | $ | 2,524,198 | |
Capital shares outstanding | | | 53,847 | |
Net asset value per share | | $ | 46.88 | |
STATEMENT OF OPERATIONS (Unaudited) |
Six Months Ended March 31, 2024 |
Investment Income: |
Dividends (net of foreign withholding tax of $555) | | $ | 442,324 | |
Interest | | | 16,452 | |
Total investment income | | | 458,776 | |
| | | | | |
Expenses: |
Management fees | | | 116,975 | |
Distribution and service fees: |
Class A | | | 40,863 | |
Class C | | | 5,857 | |
Class P | | | 108 | |
Transfer agent/maintenance fees: |
Class A | | | 26,693 | |
Class C | | | 1,499 | |
Class P | | | 118 | |
Institutional Class | | | 2,488 | |
Professional fees | | | 19,127 | |
Registration fees | | | 16,545 | |
Fund accounting/administration fees | | | 11,583 | |
Trustees’ fees* | | | 6,408 | |
Custodian fees | | | 1,790 | |
Line of credit fees | | | 730 | |
Miscellaneous | | | 14,008 | |
Recoupment of previously waived fees: |
Class A | | | 58 | |
Class C | | | 3 | |
Total expenses | | | 264,853 | |
Less: |
Expenses reimbursed by Adviser: |
Class A | | | (26,627 | ) |
Class C | | | (1,490 | ) |
Class P | | | (121 | ) |
Institutional Class | | | (2,489 | ) |
Expenses waived by Adviser | | | (29,798 | ) |
Total waived/reimbursed expenses | | | (60,525 | ) |
Net expenses | | | 204,328 | |
Net investment income | | | 254,448 | |
| | | | | |
Net Realized and Unrealized Gain (Loss): |
Net realized gain (loss) on: |
Investments | | | 567,086 | |
Net realized gain | | | 567,086 | |
Net change in unrealized appreciation (depreciation) on: |
Investments | | | 5,081,803 | |
Net change in unrealized appreciation (depreciation) | | | 5,081,803 | |
Net realized and unrealized gain | | | 5,648,889 | |
Net increase in net assets resulting from operations | | $ | 5,903,337 | |
* | Relates to Trustees not deemed “interested persons” within the meaning of Section 2(a)(19) of the 1940 Act. |
32 | THE GUGGENHEIM FUNDS SEMI-ANNUAL REPORT | SEE NOTES TO FINANCIAL STATEMENTS. |
STATEMENTS OF CHANGES IN NET ASSETS |
| | Six Months Ended
March 31, 2024
(Unaudited) | | | Year Ended
September 30,
2023 | |
Increase (Decrease) in Net Assets from Operations: | | | | | | | | |
Net investment income | | $ | 254,448 | | | $ | 513,399 | |
Net realized gain on investments | | | 567,086 | | | | 4,048,731 | |
Net change in unrealized appreciation (depreciation) on investments | | | 5,081,803 | | | | 863,434 | |
Net increase in net assets resulting from operations | | | 5,903,337 | | | | 5,425,564 | |
| | | | | | | | | |
Distributions to shareholders: | | | | | | | | |
Class A | | | (3,614,984 | ) | | | (2,952,899 | ) |
Class C | | | (133,562 | ) | | | (151,235 | ) |
Class P | | | (9,665 | ) | | | (8,525 | ) |
Institutional Class | | | (215,928 | ) | | | (518,877 | ) |
Total distributions to shareholders | | | (3,974,139 | ) | | | (3,631,536 | ) |
| | | | | | | | | |
Capital share transactions: | | | | | | | | |
Proceeds from sale of shares | | | | | | | | |
Class A | | | 422,904 | | | | 1,050,924 | |
Class C | | | 86,141 | | | | 236,441 | |
Class P | | | 85 | | | | 5,872 | |
Institutional Class | | | 865,614 | | | | 1,317,443 | |
Distributions reinvested | | | | | | | | |
Class A | | | 3,537,482 | | | | 2,884,298 | |
Class C | | | 133,562 | | | | 137,939 | |
Class P | | | 9,665 | | | | 8,525 | |
Institutional Class | | | 215,928 | | | | 518,877 | |
Cost of shares redeemed | | | | | | | | |
Class A | | | (2,288,462 | ) | | | (4,238,196 | ) |
Class C | | | (336,060 | ) | | | (876,269 | ) |
Class P | | | (3,906 | ) | | | (33,478 | ) |
Institutional Class | | | (714,946 | ) | | | (5,335,058 | ) |
Net increase (decrease) from capital share transactions | | | 1,928,007 | | | | (4,322,682 | ) |
Net increase (decrease) in net assets | | | 3,857,205 | | | | (2,528,654 | ) |
| | | | | | | | | |
Net assets: | | | | | | | | |
Beginning of period | | | 35,199,278 | | | | 37,727,932 | |
End of period | | $ | 39,056,483 | | | $ | 35,199,278 | |
| | | | | | | | | |
Capital share activity: | | | | | | | | |
Shares sold | | | | | | | | |
Class A | | | 9,371 | | | | 22,456 | |
Class C | | | 2,158 | | | | 5,650 | |
Class P | | | 2 | | | | 129 | |
Institutional Class | | | 19,561 | | | | 29,033 | |
Shares issued from reinvestment of distributions | | | | | | | | |
Class A | | | 80,968 | | | | 63,832 | |
Class C | | | 3,449 | | | | 3,405 | |
Class P | | | 222 | | | | 189 | |
Institutional Class | | | 5,047 | | | | 11,697 | |
Shares redeemed | | | | | | | | |
Class A | | | (50,643 | ) | | | (90,872 | ) |
Class C | | | (8,393 | ) | | | (20,843 | ) |
Class P | | | (88 | ) | | | (706 | ) |
Institutional Class | | | (15,931 | ) | | | (117,251 | ) |
Net increase (decrease) in shares | | | 45,723 | | | | (93,281 | ) |
SEE NOTES TO FINANCIAL STATEMENTS. | THE GUGGENHEIM FUNDS SEMI-ANNUAL REPORT | 33 |
This table is presented to show selected data for a share outstanding throughout each period and to assist shareholders in evaluating a Fund’s performance for the periods presented.
Class A | | Six Months Ended
March 31, 2024a | | | Year Ended
September 30,
2023 | | | Year Ended
September 30,
2022 | | | Year Ended
September 30,
2021 | | | Year Ended
September 30,
2020 | | | Year Ended
September 30,
2019 | |
Per Share Data |
Net asset value, beginning of period | | $ | 45.66 | | | $ | 43.75 | | | $ | 50.08 | | | $ | 38.17 | | | $ | 43.56 | | | $ | 48.08 | |
Income (loss) from investment operations: |
Net investment income (loss)b | | | .32 | | | | .61 | | | | .56 | | | | .41 | | | | .97 | | | | .62 | |
Net gain (loss) on investments (realized and unrealized) | | | 7.16 | | | | 5.55 | | | | (3.40 | ) | | | 14.51 | | | | (2.97 | ) | | | (2.66 | ) |
Total from investment operations | | | 7.48 | | | | 6.16 | | | | (2.84 | ) | | | 14.92 | | | | (2.00 | ) | | | (2.04 | ) |
Less distributions from: |
Net investment income | | | (.70 | ) | | | (.52 | ) | | | (.43 | ) | | | (1.30 | ) | | | (.70 | ) | | | (.36 | ) |
Net realized gains | | | (4.60 | ) | | | (3.73 | ) | | | (3.06 | ) | | | (1.71 | ) | | | (2.69 | ) | | | (2.12 | ) |
Total distributions | | | (5.30 | ) | | | (4.25 | ) | | | (3.49 | ) | | | (3.01 | ) | | | (3.39 | ) | | | (2.48 | ) |
Net asset value, end of period | | $ | 47.84 | | | $ | 45.66 | | | $ | 43.75 | | | $ | 50.08 | | | $ | 38.17 | | | $ | 43.56 | |
|
Total Returnc | | | 17.48 | % | | | 14.19 | % | | | (6.43 | %) | | | 40.59 | % | | | (5.58 | %) | | | (3.59 | %) |
Ratios/Supplemental Data |
Net assets, end of period (in thousands) | | $ | 35,282 | | | $ | 31,862 | | | $ | 30,733 | | | $ | 36,678 | | | $ | 28,548 | | | $ | 53,248 | |
Ratios to average net assets: |
Net investment income (loss) | | | 1.42 | % | | | 1.32 | % | | | 1.11 | % | | | 0.88 | % | | | 2.40 | % | | | 1.42 | % |
Total expensesd | | | 1.45 | % | | | 1.47 | % | | | 1.41 | % | | | 1.47 | % | | | 1.46 | % | | | 1.31 | % |
Net expensese,f,g | | | 1.13 | % | | | 1.12 | % | | | 1.13 | % | | | 1.15 | % | | | 1.15 | % | | | 1.15 | % |
Portfolio turnover rate | | | 10 | % | | | 19 | % | | | 33 | % | | | 19 | % | | | 25 | % | | | 37 | % |
Class C | | Six Months Ended
March 31, 2024a | | | Year Ended
September 30,
2023 | | | Year Ended
September 30,
2022 | | | Year Ended
September 30,
2021 | | | Year Ended
September 30,
2020 | | | Year Ended
September 30,
2019 | |
Per Share Data |
Net asset value, beginning of period | | $ | 40.68 | | | $ | 39.44 | | | $ | 45.43 | | | $ | 34.79 | | | $ | 39.77 | | | $ | 44.03 | |
Income (loss) from investment operations: |
Net investment income (loss)b | | | .13 | | | | .24 | | | | .18 | | | | .05 | | | | .62 | | | | .26 | |
Net gain (loss) on investments (realized and unrealized) | | | 6.36 | | | | 5.00 | | | | (3.07 | ) | | | 13.23 | | | | (2.74 | ) | | | (2.40 | ) |
Total from investment operations | | | 6.49 | | | | 5.24 | | | | (2.89 | ) | | | 13.28 | | | | (2.12 | ) | | | (2.14 | ) |
Less distributions from: |
Net investment income | | | (.26 | ) | | | (.27 | ) | | | (.04 | ) | | | (.93 | ) | | | (.17 | ) | | | — | |
Net realized gains | | | (4.60 | ) | | | (3.73 | ) | | | (3.06 | ) | | | (1.71 | ) | | | (2.69 | ) | | | (2.12 | ) |
Total distributions | | | (4.86 | ) | | | (4.00 | ) | | | (3.10 | ) | | | (2.64 | ) | | | (2.86 | ) | | | (2.12 | ) |
Net asset value, end of period | | $ | 42.31 | | | $ | 40.68 | | | $ | 39.44 | | | $ | 45.43 | | | $ | 34.79 | | | $ | 39.77 | |
|
Total Returnc | | | 17.05 | % | | | 13.33 | % | | | (7.13 | %) | | | 39.55 | % | | | (6.30 | %) | | | (4.28 | %) |
Ratios/Supplemental Data |
Net assets, end of period (in thousands) | | $ | 1,156 | | | $ | 1,225 | | | $ | 1,653 | | | $ | 1,191 | | | $ | 911 | | | $ | 1,533 | |
Ratios to average net assets: |
Net investment income (loss) | | | 0.67 | % | | | 0.57 | % | | | 0.39 | % | | | 0.12 | % | | | 1.69 | % | | | 0.66 | % |
Total expensesd | | | 2.30 | % | | | 2.28 | % | | | 2.29 | % | | | 2.36 | % | | | 2.43 | % | | | 2.18 | % |
Net expensese,f,g | | | 1.88 | % | | | 1.87 | % | | | 1.88 | % | | | 1.89 | % | | | 1.90 | % | | | 1.90 | % |
Portfolio turnover rate | | | 10 | % | | | 19 | % | | | 33 | % | | | 19 | % | | | 25 | % | | | 37 | % |
34 | THE GUGGENHEIM FUNDS SEMI-ANNUAL REPORT | SEE NOTES TO FINANCIAL STATEMENTS. |
FINANCIAL HIGHLIGHTS (continued) |
This table is presented to show selected data for a share outstanding throughout each period and to assist shareholders in evaluating a Fund’s performance for the periods presented.
Class P | | Six Months Ended
March 31, 2024a | | | Year Ended
September 30,
2023 | | | Year Ended
September 30,
2022 | | | Year Ended
September 30,
2021 | | | Year Ended
September 30,
2020 | | | Year Ended
September 30,
2019 | |
Per Share Data |
Net asset value, beginning of period | | $ | 45.53 | | | $ | 43.59 | | | $ | 49.91 | | | $ | 38.06 | | | $ | 43.46 | | | $ | 48.00 | |
Income (loss) from investment operations: |
Net investment income (loss)b | | | .32 | | | | .62 | | | | .53 | | | | .41 | | | | .83 | | | | .61 | |
Net gain (loss) on investments (realized and unrealized) | | | 7.12 | | | | 5.52 | | | | (3.34 | ) | | | 14.46 | | | | (2.82 | ) | | | (2.64 | ) |
Total from investment operations | | | 7.44 | | | | 6.14 | | | | (2.81 | ) | | | 14.87 | | | | (1.99 | ) | | | (2.03 | ) |
Less distributions from: |
Net investment income | | | (.70 | ) | | | (.47 | ) | | | (.45 | ) | | | (1.31 | ) | | | (.72 | ) | | | (.39 | ) |
Net realized gains | | | (4.60 | ) | | | (3.73 | ) | | | (3.06 | ) | | | (1.71 | ) | | | (2.69 | ) | | | (2.12 | ) |
Total distributions | | | (5.30 | ) | | | (4.20 | ) | | | (3.51 | ) | | | (3.02 | ) | | | (3.41 | ) | | | (2.51 | ) |
Net asset value, end of period | | $ | 47.67 | | | $ | 45.53 | | | $ | 43.59 | | | $ | 49.91 | | | $ | 38.06 | | | $ | 43.46 | |
|
Total Return | | | 17.48 | % | | | 14.19 | % | | | (6.44 | %) | | | 40.60 | % | | | (5.58 | %) | | | (3.58 | %) |
Ratios/Supplemental Data |
Net assets, end of period (in thousands) | | $ | 94 | | | $ | 84 | | | $ | 97 | | | $ | 194 | | | $ | 170 | | | $ | 155 | |
Ratios to average net assets: |
Net investment income (loss) | | | 1.43 | % | | | 1.33 | % | | | 1.05 | % | | | 0.87 | % | | | 2.12 | % | | | 1.41 | % |
Total expensesd | | | 1.56 | % | | | 1.70 | % | | | 1.67 | % | | | 1.71 | % | | | 1.72 | % | | | 1.60 | % |
Net expensese,f,g | | | 1.13 | % | | | 1.12 | % | | | 1.14 | % | | | 1.15 | % | | | 1.15 | % | | | 1.15 | % |
Portfolio turnover rate | | | 10 | % | | | 19 | % | | | 33 | % | | | 19 | % | | | 25 | % | | | 37 | % |
SEE NOTES TO FINANCIAL STATEMENTS. | THE GUGGENHEIM FUNDS SEMI-ANNUAL REPORT | 35 |
FINANCIAL HIGHLIGHTS (concluded) |
This table is presented to show selected data for a share outstanding throughout each period and to assist shareholders in evaluating a Fund’s performance for the periods presented.
Institutional Class | | Six Months Ended
March 31, 2024a | | | Year Ended
September 30,
2023 | | | Year Ended
September 30,
2022 | | | Year Ended
September 30,
2021 | | | Year Ended
September 30,
2020 | | | Year Ended
September 30,
2019 | |
Per Share Data |
Net asset value, beginning of period | | $ | 44.90 | | | $ | 43.11 | | | $ | 49.39 | | | $ | 37.71 | | | $ | 43.08 | | | $ | 47.60 | |
Income (loss) from investment operations: |
Net investment income (loss)b | | | .37 | | | | .74 | | | | .71 | | | | .52 | | | | .98 | | | | .71 | |
Net gain (loss) on investments (realized and unrealized) | | | 7.04 | | | | 5.43 | | | | (3.38 | ) | | | 14.31 | | | | (2.84 | ) | | | (2.63 | ) |
Total from investment operations | | | 7.41 | | | | 6.17 | | | | (2.67 | ) | | | 14.83 | | | | (1.86 | ) | | | (1.92 | ) |
Less distributions from: |
Net investment income | | | (.83 | ) | | | (.65 | ) | | | (.55 | ) | | | (1.44 | ) | | | (.82 | ) | | | (.48 | ) |
Net realized gains | | | (4.60 | ) | | | (3.73 | ) | | | (3.06 | ) | | | (1.71 | ) | | | (2.69 | ) | | | (2.12 | ) |
Total distributions | | | (5.43 | ) | | | (4.38 | ) | | | (3.61 | ) | | | (3.15 | ) | | | (3.51 | ) | | | (2.60 | ) |
Net asset value, end of period | | $ | 46.88 | | | $ | 44.90 | | | $ | 43.11 | | | $ | 49.39 | | | $ | 37.71 | | | $ | 43.08 | |
|
Total Return | | | 17.64 | % | | | 14.48 | % | | | (6.20 | %) | | | 40.93 | % | | | (5.35 | %) | | | (3.33 | %) |
Ratios/Supplemental Data |
Net assets, end of period (in thousands) | | $ | 2,524 | | | $ | 2,028 | | | $ | 5,246 | | | $ | 1,364 | | | $ | 477 | | | $ | 798 | |
Ratios to average net assets: |
Net investment income (loss) | | | 1.67 | % | | | 1.61 | % | | | 1.46 | % | | | 1.10 | % | | | 2.50 | % | | | 1.65 | % |
Total expensesd | | | 1.28 | % | | | 1.21 | % | | | 1.15 | % | | | 1.24 | % | | | 1.35 | % | | | 1.14 | % |
Net expensese,f,g | | | 0.87 | % | | | 0.87 | % | | | 0.88 | % | | | 0.89 | % | | | 0.90 | % | | | 0.90 | % |
Portfolio turnover rate | | | 10 | % | | | 19 | % | | | 33 | % | | | 19 | % | | | 25 | % | | | 37 | % |
a | Unaudited figures for the period ended March 31, 2024. Percentage amounts for the period, except total return and portfolio turnover rate, have been annualized. |
b | Net investment income (loss) per share was computed using average shares outstanding throughout the period. |
c | Total return does not reflect the impact of any applicable sales charges. |
d | Does not include expenses of the underlying funds in which the Fund invests. |
e | Net expense information reflects the expense ratios after expense waivers and reimbursements, as applicable. |
f | The portion of the ratios of net expenses to average net assets attributable to recoupments of prior fee reductions or expense reimbursements for the years presented was as follows: |
| | | 03/31/24a | 09/30/23 | 09/30/22 | 09/30/21 | 09/30/20 | 09/30/19 |
| | Class A | 0.00%* | — | — | 0.00%* | 0.00%* | 0.00%* |
| | Class C | 0.00%* | — | — | 0.00%* | — | 0.00%* |
| | Class P | — | — | — | — | — | — |
| | Institutional Class | — | — | — | — | — | — |
g | Net expenses may include expenses that are excluded from the expense limitation agreement. Excluding these expenses, the net expense ratios for the years presented would be: |
| | | 03/31/24a | 09/30/23 | 09/30/22 | 09/30/21 | 09/30/20 | 09/30/19 |
| | Class A | 1.12% | 1.12% | 1.13% | 1.14% | 1.15% | 1.15% |
| | Class C | 1.87% | 1.87% | 1.88% | 1.89% | 1.90% | 1.90% |
| | Class P | 1.12% | 1.12% | 1.13% | 1.14% | 1.15% | 1.15% |
| | Institutional Class | 0.87% | 0.87% | 0.88% | 0.89% | 0.90% | 0.90% |
36 | THE GUGGENHEIM FUNDS SEMI-ANNUAL REPORT | SEE NOTES TO FINANCIAL STATEMENTS. |
PERFORMANCE REPORT AND FUND PROFILE (Unaudited) | March 31, 2024 |
MARKET NEUTRAL REAL ESTATE FUND
OBJECTIVE: Seeks to provide capital appreciation, while limiting exposure to general stock market risk.
Holdings Diversification (Market Exposure as % of Net Assets)
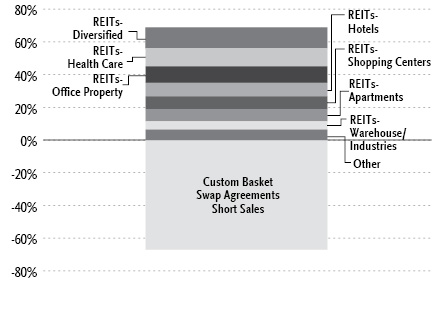
“Holdings Diversification (Market Exposure as % of Net Assets)” excludes any temporary cash investments.
Inception Dates: |
Class A | February 26, 2016 |
Class C | February 26, 2016 |
Class P | February 26, 2016 |
Institutional Class | February 26, 2016 |
Ten Largest Holdings | % of Total Net Assets |
Ryman Hospitality Properties, Inc. | 5.0% |
Invitation Homes, Inc. | 4.1% |
Rexford Industrial Realty, Inc. | 3.7% |
Alexandria Real Estate Equities, Inc. | 3.4% |
Host Hotels & Resorts, Inc. | 3.2% |
Sabra Health Care REIT, Inc. | 3.2% |
Ventas, Inc. | 3.2% |
VICI Properties, Inc. | 3.2% |
Digital Realty Trust, Inc. | 3.1% |
Gaming and Leisure Properties, Inc. | 3.1% |
Top Ten Total | 35.2% |
| | |
“Ten Largest Holdings” excludes any temporary cash or derivative investments. |
| | THE GUGGENHEIM FUNDS SEMI-ANNUAL REPORT | 37 |
PERFORMANCE REPORT AND FUND PROFILE (Unaudited)(concluded) | March 31, 2024 |
Average Annual Returns*
Periods Ended March 31, 2024
| 6 Month† | 1 Year | 5 Year | Since
Inception
(02/26/16) |
Class A Shares | 2.29% | 2.33% | 2.33% | 2.68% |
Class A Shares with sales charge‡ | (2.57%) | (2.53%) | 1.34% | 2.07% |
Class C Shares | 1.91% | 1.56% | 1.55% | 1.90% |
Class C Shares with CDSC§ | 0.91% | 0.56% | 1.55% | 1.90% |
Class P Shares | 2.32% | 2.32% | 2.32% | 2.63% |
Institutional Class Shares | 2.41% | 2.59% | 2.57% | 2.91% |
ICE BofA 3-Month U.S. Treasury Bill Index | 2.69% | 5.27% | 2.03% | 1.70% |
* | The performance data above represents past performance that is not predictive of future results. The investment return and principal value of an investment in the Fund will fluctuate so that an investor’s shares, when redeemed, may be worth more or less than their original cost. Returns are historical and include changes in principal and reinvested dividends and capital gains and do not reflect the effect of taxes. The ICE BofA 3-Month U.S. Treasury Bill Index is an unmanaged index and, unlike the Fund, has no management fees or operating expenses to reduce its reported return. |
† | 6 month returns are not annualized. |
‡ | Fund returns are calculated using the maximum sales charge of 4.75%. |
§ | Fund returns include a CDSC of 1% if redeemed within 12 months of purchase. |
38 | THE GUGGENHEIM FUNDS SEMI-ANNUAL REPORT | |
SCHEDULE OF INVESTMENTS (Unaudited) | March 31, 2024 |
MARKET NEUTRAL REAL ESTATE FUND | |
| | Shares | | | Value | |
COMMON STOCKS† - 68.9% |
| | | | | | | | | |
REITs - 68.9% |
REITs-Diversified — 12.9% |
VICI Properties, Inc. | | | 44,913 | | | $ | 1,337,958 | |
Digital Realty Trust, Inc. | | | 9,093 | | | | 1,309,756 | |
Gaming and Leisure Properties, Inc. | | | 28,121 | | | | 1,295,535 | |
InvenTrust Properties Corp. | | | 33,508 | | | | 861,491 | |
Equinix, Inc. | | | 795 | | | | 656,137 | |
Total REITs-Diversified | | | | | | | 5,460,877 | |
| | | | | | | | | |
REITs-Health Care - 10.9% |
Sabra Health Care REIT, Inc. | | | 92,653 | | | | 1,368,485 | |
Ventas, Inc. | | | 31,371 | | | | 1,365,893 | |
CareTrust REIT, Inc. | | | 44,118 | | | | 1,075,156 | |
Healthpeak Properties, Inc. | | | 43,024 | | | | 806,700 | |
Total REITs-Health Care | | | | | | | 4,616,234 | |
| | | | | | | | | |
REITs-Office Property - 10.2% |
Alexandria Real Estate Equities, Inc. | | | 11,256 | | | | 1,451,011 | |
Vornado Realty Trust | | | 31,077 | | | | 894,085 | |
Boston Properties, Inc. | | | 13,235 | | | | 864,378 | |
Kilroy Realty Corp. | | | 18,629 | | | | 678,654 | |
Highwoods Properties, Inc. | | | 17,817 | | | | 466,449 | |
Total REITs-Office Property | | | | | | | 4,354,577 | |
| | | | | | | | | |
REITs-Hotels - 8.2% |
Ryman Hospitality Properties, Inc. | | | 18,265 | | | | 2,111,617 | |
Host Hotels & Resorts, Inc. | | | 66,388 | | | | 1,372,904 | |
Total REITs-Hotels | | | | | | | 3,484,521 | |
| | | | | | | | | |
REITs-Shopping Centers - 7.8% |
Brixmor Property Group, Inc. | | | 37,277 | | | | 874,146 | |
Kite Realty Group Trust | | | 39,177 | | | | 849,357 | |
Kimco Realty Corp. | | | 41,566 | | | | 815,109 | |
Retail Opportunity Investments Corp. | | | 60,549 | | | | 776,238 | |
Total REITs-Shopping Centers | | | | | | | 3,314,850 | |
| | | | | | | | | |
REITs- 68.9% |
REITs-Apartments - 7.5% |
Invitation Homes, Inc. | | | 49,040 | | | | 1,746,314 | |
Equity Residential | | | 11,196 | | | | 706,580 | |
American Homes 4 Rent — Class A | | | 18,964 | | | | 697,496 | |
Total REITs-Apartments | | | | | | | 3,150,390 | |
| | | | | | | | | |
REITs-Warehouse/Industries - 5.1% |
Rexford Industrial Realty, Inc. | | | 31,156 | | | | 1,567,147 | |
Americold Realty Trust, Inc. | | | 23,563 | | | | 587,190 | |
Total REITs-Warehouse/Industries | | | | | | | 2,154,337 | |
| | | | | | | | | |
REITs-Regional Malls - 3.0% |
Simon Property Group, Inc. | | | 8,165 | | | | 1,277,741 | |
| | | | | | | | | |
REITs-Manufactured Homes - 1.8% |
Sun Communities, Inc. | | | 6,030 | | | | 775,337 | |
| | | | | | | | | |
REITs-Storage - 1.5% |
Extra Space Storage, Inc. | | | 4,346 | | | | 638,862 | |
Total REITs | | | | | | | 29,227,726 | |
| | | | | | | | | |
Total Common Stocks | | | | |
(Cost $26,687,876) | | | | | | | 29,227,726 | |
| | | | | | | | | |
MONEY MARKET FUND† - 29.1% |
Goldman Sachs Financial Square Treasury Instruments Fund — Institutional Shares, 5.22%1 | | | 12,357,801 | | | | 12,357,801 | |
Total Money Market Fund | | | | |
(Cost $12,357,801) | | | | | | | 12,357,801 | |
| | | | | | | | | |
Total Investments - 98.0% | | | | |
(Cost $39,045,677) | | $ | 41,585,527 | |
Other Assets & Liabilities, net - 2.0% | | | 856,457 | |
Total Net Assets - 100.0% | | $ | 42,441,984 | |
Custom Basket Swap Agreements |
Counterparty | Reference Obligation | Type | Financing
Rate | | Payment
Frequency | | | Maturity
Date | | | Notional
Amount | | | Value and
Unrealized
Appreciation | |
OTC Custom Basket Swap Agreements Sold Short†† |
Goldman Sachs International | GS Equity Custom Basket | Receive | 5.13% (Federal
Funds Rate -
0.20%) | | | At Maturity | | | | 05/06/24 | | | $ | 14,239,518 | | | $ | 503,916 | |
Morgan Stanley Capital Services LLC | MS Equity Custom Basket | Receive | 5.00% (Federal
Funds Rate -
0.33%) | | | At Maturity | | | | 11/22/24 | | | | 14,239,511 | | | | 503,320 | |
| | | | | | | | | | | | | | $ | 28,479,029 | | | $ | 1,007,236 | |
SEE NOTES TO FINANCIAL STATEMENTS. | THE GUGGENHEIM FUNDS SEMI-ANNUAL REPORT | 39 |
SCHEDULE OF INVESTMENTS (Unaudited)(continued) | March 31, 2024 |
MARKET NEUTRAL REAL ESTATE FUND | |
| | Shares | | | Percentage
Notional
Amount | | | Value and
Unrealized
Appreciation
(Depreciation) | |
MS EQUITY SHORT CUSTOM BASKET | | | | | | | | |
Financial | | | | | | | | | | | | |
Douglas Emmett, Inc. | | | 61,781 | | | | (6.02 | )% | | $ | 502,110 | |
Broadstone Net Lease, Inc. | | | 29,595 | | | | (3.26 | )% | | | 235,319 | |
Realty Income Corp. | | | 17,050 | | | | (6.48 | )% | | | 224,333 | |
Camden Property Trust | | | 6,678 | | | | (4.61 | )% | | | 131,368 | |
Apartment Income REIT Corp. | | | 13,996 | | | | (3.19 | )% | | | 113,490 | |
Service Properties Trust | | | 29,743 | | | | (1.42 | )% | | | 70,399 | |
Mid-America Apartment Communities, Inc. | | | 4,928 | | | | (4.55 | )% | | | 65,878 | |
JBG SMITH Properties | | | 53,233 | | | | (6.00 | )% | | | 50,481 | |
LTC Properties, Inc. | | | 16,292 | | | | (3.72 | )% | | | 5,735 | |
Cousins Properties, Inc. | | | 9,786 | | | | (1.65 | )% | | | (21,996 | ) |
Federal Realty Investment Trust | | | 9,656 | | | | (6.92 | )% | | | (31,785 | ) |
Pebblebrook Hotel Trust | | | 32,629 | | | | (3.53 | )% | | | (37,368 | ) |
EastGroup Properties, Inc. | | | 2,002 | | | | (2.53 | )% | | | (45,764 | ) |
Sunstone Hotel Investors, Inc. | | | 67,787 | | | | (5.30 | )% | | | (92,962 | ) |
Omega Healthcare Investors, Inc. | | | 28,689 | | | | (6.38 | )% | | | (100,892 | ) |
National Health Investors, Inc. | | | 10,162 | | | | (4.48 | )% | | | (102,666 | ) |
Phillips Edison & Company, Inc. | | | 31,953 | | | | (8.05 | )% | | | (108,612 | ) |
STAG Industrial, Inc. | | | 21,912 | | | | (5.92 | )% | | | (116,011 | ) |
Macerich Co. | | | 40,705 | | | | (4.93 | )% | | | (256,528 | ) |
Total Financial | | | | | | | | | | | 484,529 | |
| | | | | | | | | | | | | |
Exchange-Traded Funds | | | | | | | | | | | | |
Vanguard Real Estate ETF | | | 18,209 | | | | (11.06 | )% | | | 18,791 | |
Total MS Equity Short Custom Basket | | | | | | $ | 503,320 | |
| | Shares | | | Percentage
Notional
Amount | | | Value and
Unrealized
Appreciation
(Depreciation) | |
GS EQUITY SHORT CUSTOM BASKET | | | | | | | | |
Financial | | | | | | | | | | | | |
Douglas Emmett, Inc. | | | 61,781 | | | | (6.02 | )% | | $ | 503,690 | |
Broadstone Net Lease, Inc. | | | 29,595 | | | | (3.26 | )% | | | 228,209 | |
Realty Income Corp. | | | 17,050 | | | | (6.48 | )% | | | 223,408 | |
Camden Property Trust | | | 6,678 | | | | (4.61 | )% | | | 131,163 | |
Apartment Income REIT Corp. | | | 13,996 | | | | (3.19 | )% | | | 113,123 | |
Service Properties Trust | | | 29,743 | | | | (1.42 | )% | | | 71,480 | |
Mid-America Apartment Communities, Inc. | | | 4,928 | | | | (4.55 | )% | | | 66,082 | |
JBG SMITH Properties | | | 53,233 | | | | (6.00 | )% | | | 48,438 | |
LTC Properties, Inc. | | | 16,292 | | | | (3.72 | )% | | | 3,841 | |
Cousins Properties, Inc. | | | 9,786 | | | | (1.65 | )% | | | (21,973 | ) |
Federal Realty Investment Trust | | | 9,656 | | | | (6.92 | )% | | | (33,140 | ) |
Pebblebrook Hotel Trust | | | 32,629 | | | | (3.53 | )% | | | (35,967 | ) |
EastGroup Properties, Inc. | | | 2,002 | | | | (2.53 | )% | | | (46,085 | ) |
Sunstone Hotel Investors, Inc. | | | 67,787 | | | | (5.30 | )% | | | (91,279 | ) |
Omega Healthcare Investors, Inc. | | | 28,689 | | | | (6.38 | )% | | | (103,138 | ) |
National Health Investors, Inc. | | | 10,162 | | | | (4.48 | )% | | | (105,021 | ) |
Phillips Edison & Company, Inc. | | | 31,953 | | | | (8.05 | )% | | | (115,218 | ) |
STAG Industrial, Inc. | | | 21,912 | | | | (5.92 | )% | | | (116,941 | ) |
Macerich Co. | | | 40,705 | | | | (4.93 | )% | | | (241,544 | ) |
Total Financial | | | | | | | | | | | 479,128 | |
| | | | | | | | | | | | | |
Exchange-Traded Funds | | | | | | | | | | | | |
Vanguard Real Estate ETF | | | 18,209 | | | | (11.06 | )% | | | 24,788 | |
Total GS Equity Short Custom Basket | | | | | | $ | 503,916 | |
40 | THE GUGGENHEIM FUNDS SEMI-ANNUAL REPORT | SEE NOTES TO FINANCIAL STATEMENTS. |
SCHEDULE OF INVESTMENTS (Unaudited)(concluded) | March 31, 2024 |
MARKET NEUTRAL REAL ESTATE FUND | |
† | Value determined based on Level 1 inputs — See Note 4. |
†† | Value determined based on Level 2 inputs — See Note 4. |
1 | Rate indicated is the 7-day yield as of March 31, 2024. |
| | GS — Goldman Sachs International |
| | MS — Morgan Stanley Capital Services LLC |
| | REIT — Real Estate Investment Trust |
| | |
| | See Sector Classification in Other Information section. |
The following table summarizes the inputs used to value the Fund’s investments at March 31, 2024 (See Note 4 in the Notes to Financial Statements):
Investments in Securities (Assets) | | Level 1
Quoted
Prices | | | Level 2
Significant
Observable
Inputs | | | Level 3
Significant
Unobservable
Inputs | | | Total | |
Common Stocks | | $ | 29,227,726 | | | $ | — | | | $ | — | | | $ | 29,227,726 | |
Money Market Fund | | | 12,357,801 | | | | — | | | | — | | | | 12,357,801 | |
Equity Custom Basket Swap Agreements** | | | — | | | | 1,007,236 | | | | — | | | | 1,007,236 | |
Total Assets | | $ | 41,585,527 | | | $ | 1,007,236 | | | $ | — | | | $ | 42,592,763 | |
** | This derivative is reported as unrealized appreciation/depreciation at period end. |
SEE NOTES TO FINANCIAL STATEMENTS. | THE GUGGENHEIM FUNDS SEMI-ANNUAL REPORT | 41 |
MARKET NEUTRAL REAL ESTATE FUND | |
STATEMENT OF ASSETS AND LIABILITIES (Unaudited) |
March 31, 2024 |
Assets: |
Investments, at value (cost $39,045,677) | | $ | 41,585,527 | |
Cash | | | 246,238 | |
Segregated cash with broker | | | 410,000 | |
Unrealized appreciation on OTC swap agreements | | | 1,007,236 | |
Prepaid expenses | | | 50,438 | |
Receivables: |
Dividends | | | 170,490 | |
Fund shares sold | | | 61,268 | |
Interest | | | 49,275 | |
Total assets | | | 43,580,472 | |
| | | | | |
Liabilities: |
Segregated cash due to broker | | | 500,000 | |
Payable for: |
Swap settlement | | | 284,950 | |
Securities purchased | | | 270,000 | |
Management fees | | | 35,567 | |
Fund shares redeemed | | | 7,613 | |
Transfer agent/maintenance fees | | | 4,451 | |
Fund accounting/administration fees | | | 2,975 | |
Trustees’ fees* | | | 2,381 | |
Distribution and service fees | | | 302 | |
Due to Investment Adviser | | | 6 | |
Miscellaneous | | | 30,243 | |
Total liabilities | | | 1,138,488 | |
Net assets | | $ | 42,441,984 | |
| | | | | |
Net assets consist of: |
Paid in capital | | $ | 43,312,023 | |
Total distributable earnings (loss) | | | (870,039 | ) |
Net assets | | $ | 42,441,984 | |
Class A: |
Net assets | | $ | 324,326 | |
Capital shares outstanding | | | 11,901 | |
Net asset value per share | | $ | 27.25 | |
Maximum offering price per share (Net asset value divided by 95.25%) | | $ | 28.61 | |
Class C: |
Net assets | | $ | 44,323 | |
Capital shares outstanding | | | 1,702 | |
Net asset value per share | | $ | 26.04 | |
Class P: |
Net assets | | $ | 746,317 | |
Capital shares outstanding | | | 28,380 | |
Net asset value per share | | $ | 26.30 | |
| | | | | |
Institutional Class: |
Net assets | | $ | 41,327,018 | |
Capital shares outstanding | | | 1,532,894 | |
Net asset value per share | | $ | 26.96 | |
STATEMENT OF OPERATIONS (Unaudited) |
Six Months Ended March 31, 2024 |
Investment Income: |
Dividends | | $ | 635,257 | |
Interest | | | 315,216 | |
Total investment income | | | 950,473 | |
| | | | | |
Expenses: |
Management fees | | | 243,602 | |
Distribution and service fees: |
Class A | | | 444 | |
Class C | | | 644 | |
Class P | | | 1,108 | |
Transfer agent/maintenance fees: |
Class A | | | 482 | |
Class C | | | 193 | |
Class P | | | 317 | |
Institutional Class | | | 31,549 | |
Registration fees | | | 37,372 | |
Professional fees | | | 23,865 | |
Fund accounting/administration fees | | | 13,231 | |
Trustees’ fees* | | | 8,784 | |
Interest expense | | | 7,014 | |
Custodian fees | | | 3,611 | |
Line of credit fees | | | 933 | |
Miscellaneous | | | 7,313 | |
Total expenses | | | 380,462 | |
Less: |
Expenses reimbursed by Adviser: |
Class A | | | (469 | ) |
Class C | | | (189 | ) |
Class P | | | (294 | ) |
Institutional Class | | | (30,042 | ) |
Expenses waived by Adviser | | | (35,562 | ) |
Total waived/reimbursed expenses | | | (66,556 | ) |
Net expenses | | | 313,906 | |
Net investment income | | | 636,567 | |
| | | | | |
Net Realized and Unrealized Gain (Loss): |
Net realized gain (loss) on: |
Investments | | | (734,420 | ) |
Swap agreements | | | (657,885 | ) |
Net realized loss | | | (1,392,305 | ) |
Net change in unrealized appreciation (depreciation) on: |
Investments | | | 4,813,544 | |
Swap agreements | | | (2,892,951 | ) |
Net change in unrealized appreciation (depreciation) | | | 1,920,593 | |
Net realized and unrealized gain | | | 528,288 | |
Net increase in net assets resulting from operations | | $ | 1,164,855 | |
* | Relates to Trustees not deemed “interested persons” within the meaning of Section 2(a)(19) of the 1940 Act. |
42 | THE GUGGENHEIM FUNDS SEMI-ANNUAL REPORT | SEE NOTES TO FINANCIAL STATEMENTS. |
MARKET NEUTRAL REAL ESTATE FUND | |
STATEMENTS OF CHANGES IN NET ASSETS |
| | Six Months Ended
March 31, 2024
(Unaudited) | | | Year Ended
September 30,
2023 | |
Increase (Decrease) in Net Assets from Operations: | | | | | | | | |
Net investment income | | $ | 636,567 | | | $ | 1,127,209 | |
Net realized gain (loss) on investments | | | (1,392,305 | ) | | | 272,163 | |
Net change in unrealized appreciation (depreciation) on investments | | | 1,920,593 | | | | (836,795 | ) |
Net increase in net assets resulting from operations | | | 1,164,855 | | | | 562,577 | |
| | | | | | | | | |
Distributions to shareholders: | | | | | | | | |
Class A | | | (7,322 | ) | | | — | |
Class C | | | (614 | ) | | | — | |
Class P | | | (22,159 | ) | | | — | |
Institutional Class | | | (1,109,073 | ) | | | (111,384 | ) |
Total distributions to shareholders | | | (1,139,168 | ) | | | (111,384 | ) |
| | | | | | | | | |
Capital share transactions: | | | | | | | | |
Proceeds from sale of shares | | | | | | | | |
Class A | | | — | | | | 9,606 | |
Class C | | | 180 | | | | 360 | |
Class P | | | 2,030 | | | | 9,676 | |
Institutional Class | | | 4,474,929 | | | | 14,559,299 | |
Distributions reinvested | | | | | | | | |
Class A | | | 7,322 | | | | — | |
Class C | | | 614 | | | | — | |
Class P | | | 22,159 | | | | — | |
Institutional Class | | | 1,108,787 | | | | 111,379 | |
Cost of shares redeemed | | | | | | | | |
Class A | | | (124,891 | ) | | | (15,667 | ) |
Class C | | | (171,889 | ) | | | (19,120 | ) |
Class P | | | (361,229 | ) | | | (636,059 | ) |
Institutional Class | | | (11,532,119 | ) | | | (11,897,103 | ) |
Net increase (decrease) from capital share transactions | | | (6,574,107 | ) | | | 2,122,371 | |
Net increase (decrease) in net assets | | | (6,548,420 | ) | | | 2,573,564 | |
| | | | | | | | | |
Net assets: | | | | | | | | |
Beginning of period | | | 48,990,404 | | | | 46,416,840 | |
End of period | | $ | 42,441,984 | | | $ | 48,990,404 | |
| | | | | | | | | |
Capital share activity: | | | | | | | | |
Shares sold | | | | | | | | |
Class A | | | — | | | | 359 | |
Class C | | | 7 | | | | 14 | |
Class P | | | 78 | | | | 368 | |
Institutional Class | | | 166,129 | | | | 543,333 | |
Shares issued from reinvestment of distributions | | | | | | | | |
Class A | | | 271 | | | | — | |
Class C | | | 24 | | | | — | |
Class P | | | 850 | | | | — | |
Institutional Class | | | 41,543 | | | | 4,185 | |
Shares redeemed | | | | | | | | |
Class A | | | (4,488 | ) | | | (579 | ) |
Class C | | | (6,578 | ) | | | (753 | ) |
Class P | | | (13,667 | ) | | | (24,402 | ) |
Institutional Class | | | (422,921 | ) | | | (444,521 | ) |
Net increase (decrease) in shares | | | (238,752 | ) | | | 78,004 | |
SEE NOTES TO FINANCIAL STATEMENTS. | THE GUGGENHEIM FUNDS SEMI-ANNUAL REPORT | 43 |
MARKET NEUTRAL REAL ESTATE FUND | |
This table is presented to show selected data for a share outstanding throughout each period and to assist shareholders in evaluating a Fund’s performance for the periods presented.
Class A | | Six Months Ended
March 31, 2024a | | | Year Ended
September 30,
2023 | | | Year Ended
September 30,
2022 | | | Year Ended
September 30,
2021 | | | Year Ended
September 30,
2020 | | | Year Ended
September 30,
2019 | |
Per Share Data |
Net asset value, beginning of period | | $ | 27.26 | | | $ | 27.00 | | | $ | 27.78 | | | $ | 28.18 | | | $ | 26.95 | | | $ | 25.16 | |
Income (loss) from investment operations: |
Net investment income (loss)b | | | .35 | | | | .57 | | | | (.07 | ) | | | (.08 | ) | | | (.02 | ) | | | .25 | |
Net gain (loss) on investments (realized and unrealized) | | | .27 | | | | (.31 | ) | | | (.71 | ) | | | (.24 | ) | | | 2.30 | | | | 1.78 | |
Total from investment operations | | | .62 | | | | .26 | | | | (.78 | ) | | | (.32 | ) | | | 2.28 | | | | 2.03 | |
Less distributions from: |
Net investment income | | | (.63 | ) | | | — | | | | — | | | | (.02 | ) | | | (.25 | ) | | | (.01 | ) |
Net realized gains | | | — | | | | — | | | | — | | | | (.06 | ) | | | (.80 | ) | | | (.23 | ) |
Total distributions | | | (.63 | ) | | | — | | | | — | | | | (.08 | ) | | | (1.05 | ) | | | (.24 | ) |
Net asset value, end of period | | $ | 27.25 | | | $ | 27.26 | | | $ | 27.00 | | | $ | 27.78 | | | $ | 28.18 | | | $ | 26.95 | |
|
Total Returnc | | | 2.29 | % | | | 0.96 | % | | | (2.81 | %) | | | (1.14 | %) | | | 8.81 | % | | | 8.12 | % |
Ratios/Supplemental Data |
Net assets, end of period (in thousands) | | $ | 324 | | | $ | 439 | | | $ | 441 | | | $ | 1,867 | | | $ | 11,723 | | | $ | 2,766 | |
Ratios to average net assets: |
Net investment income (loss) | | | 2.55 | % | | | 2.11 | % | | | (0.25 | %) | | | (0.29 | %) | | | (0.06 | %) | | | 0.96 | % |
Total expensesd | | | 2.09 | % | | | 2.20 | % | | | 2.42 | % | | | 2.08 | % | | | 2.38 | % | | | 3.99 | % |
Net expensese,f,g | | | 1.67 | % | | | 1.63 | % | | | 1.64 | % | | | 1.64 | % | | | 1.65 | % | | | 1.62 | % |
Portfolio turnover rate | | | 56 | % | | | 55 | % | | | 49 | % | | | 264 | % | | | 355 | % | | | 180 | % |
Class C | | Six Months Ended
March 31, 2024a | | | Year Ended
September 30,
2023 | | | Year Ended
September 30,
2022 | | | Year Ended
September 30,
2021 | | | Year Ended
September 30,
2020 | | | Year Ended
September 30,
2019 | |
Per Share Data |
Net asset value, beginning of period | | $ | 25.72 | | | $ | 25.67 | | | $ | 26.61 | | | $ | 27.20 | | | $ | 26.07 | | | $ | 24.67 | |
Income (loss) from investment operations: |
Net investment income (loss)b | | | .17 | | | | .34 | | | | (.19 | ) | | | (.22 | ) | | | (.15 | ) | | | .05 | |
Net gain (loss) on investments (realized and unrealized) | | | .31 | | | | (.29 | ) | | | (.75 | ) | | | (.29 | ) | | | 2.16 | | | | 1.70 | |
Total from investment operations | | | .48 | | | | .05 | | | | (.94 | ) | | | (.51 | ) | | | 2.01 | | | | 1.75 | |
Less distributions from: |
Net investment income | | | (.16 | ) | | | — | | | | — | | | | (.02 | ) | | | (.08 | ) | | | (.12 | ) |
Net realized gains | | | — | | | | — | | | | — | | | | (.06 | ) | | | (.80 | ) | | | (.23 | ) |
Total distributions | | | (.16 | ) | | | — | | | | — | | | | (.08 | ) | | | (.88 | ) | | | (.35 | ) |
Net asset value, end of period | | $ | 26.04 | | | $ | 25.72 | | | $ | 25.67 | | | $ | 26.61 | | | $ | 27.20 | | | $ | 26.07 | |
|
Total Returnc | | | 1.91 | % | | | 0.19 | % | | | (3.53 | %) | | | (1.88 | %) | | | 7.99 | % | | | 7.15 | % |
Ratios/Supplemental Data |
Net assets, end of period (in thousands) | | $ | 44 | | | $ | 212 | | | $ | 231 | | | $ | 242 | | | $ | 333 | | | $ | 135 | |
Ratios to average net assets: |
Net investment income (loss) | | | 1.29 | % | | | 1.33 | % | | | (0.72 | %) | | | (0.83 | %) | | | (0.56 | %) | | | 0.18 | % |
Total expensesd | | | 2.89 | % | | | 2.66 | % | | | 2.72 | % | | | 2.71 | % | | | 3.17 | % | | | 4.66 | % |
Net expensese,f,g | | | 2.45 | % | | | 2.38 | % | | | 2.39 | % | | | 2.39 | % | | | 2.40 | % | | | 2.40 | % |
Portfolio turnover rate | | | 56 | % | | | 55 | % | | | 49 | % | | | 264 | % | | | 355 | % | | | 180 | % |
44 | THE GUGGENHEIM FUNDS SEMI-ANNUAL REPORT | SEE NOTES TO FINANCIAL STATEMENTS. |
MARKET NEUTRAL REAL ESTATE FUND | |
FINANCIAL HIGHLIGHTS (continued) |
This table is presented to show selected data for a share outstanding throughout each period and to assist shareholders in evaluating a Fund’s performance for the periods presented.
Class P | | Six Months Ended
March 31, 2024a | | | Year Ended
September 30,
2023 | | | Year Ended
September 30,
2022 | | | Year Ended
September 30,
2021 | | | Year Ended
September 30,
2020 | | | Year Ended
September 30,
2019 | |
Per Share Data |
Net asset value, beginning of period | | $ | 26.32 | | | $ | 26.07 | | | $ | 26.83 | | | $ | 27.23 | | | $ | 26.10 | | | $ | 25.14 | |
Income (loss) from investment operations: |
Net investment income (loss)b | | | .35 | | | | .52 | | | | (.03 | ) | | | (.04 | ) | | | — | | | | .20 | |
Net gain (loss) on investments (realized and unrealized) | | | .25 | | | | (.27 | ) | | | (.73 | ) | | | (.28 | ) | | | 2.20 | | | | 1.71 | |
Total from investment operations | | | .60 | | | | .25 | | | | (.76 | ) | | | (.32 | ) | | | 2.20 | | | | 1.91 | |
Less distributions from: |
Net investment income | | | (.62 | ) | | | — | | | | — | | | | (.02 | ) | | | (.27 | ) | | | (.72 | ) |
Net realized gains | | | — | | | | — | | | | — | | | | (.06 | ) | | | (.80 | ) | | | (.23 | ) |
Total distributions | | | (.62 | ) | | | — | | | | — | | | | (.08 | ) | | | (1.07 | ) | | | (.95 | ) |
Net asset value, end of period | | $ | 26.30 | | | $ | 26.32 | | | $ | 26.07 | | | $ | 26.83 | | | $ | 27.23 | | | $ | 26.10 | |
|
Total Return | | | 2.32 | % | | | 0.96 | % | | | (2.83 | %) | | | (1.17 | %) | | | 8.79 | % | | | 7.80 | % |
Ratios/Supplemental Data |
Net assets, end of period (in thousands) | | $ | 746 | | | $ | 1,082 | | | $ | 1,699 | | | $ | 2,727 | | | $ | 8,360 | | | $ | 332 | |
Ratios to average net assets: |
Net investment income (loss) | | | 2.63 | % | | | 1.99 | % | | | (0.11 | %) | | | (0.16 | %) | | | 0.00 | % | | | 0.77 | % |
Total expensesd | | | 1.88 | % | | | 1.94 | % | | | 1.95 | % | | | 1.91 | % | | | 2.00 | % | | | 4.05 | % |
Net expensese,f,g | | | 1.66 | % | | | 1.63 | % | | | 1.64 | % | | | 1.64 | % | | | 1.65 | % | | | 1.65 | % |
Portfolio turnover rate | | | 56 | % | | | 55 | % | | | 49 | % | | | 264 | % | | | 355 | % | | | 180 | % |
SEE NOTES TO FINANCIAL STATEMENTS. | THE GUGGENHEIM FUNDS SEMI-ANNUAL REPORT | 45 |
MARKET NEUTRAL REAL ESTATE FUND | |
FINANCIAL HIGHLIGHTS (concluded) |
This table is presented to show selected data for a share outstanding throughout each period and to assist shareholders in evaluating a Fund’s performance for the periods presented.
Institutional Class | | Six Months Ended
March 31, 2024a | | | Year Ended
September 30,
2023 | | | Year Ended
September 30,
2022 | | | Year Ended
September 30,
2021 | | | Year Ended
September 30,
2020 | | | Year Ended
September 30,
2019 | |
Per Share Data |
Net asset value, beginning of period | | $ | 27.03 | | | $ | 26.77 | | | $ | 27.57 | | | $ | 27.92 | | | $ | 26.74 | | | $ | 25.32 | |
Income (loss) from investment operations: |
Net investment income (loss)b | | | .39 | | | | .63 | | | | .06 | | | | .07 | | | | .09 | | | | .31 | |
Net gain (loss) on investments (realized and unrealized) | | | .27 | | | | (.31 | ) | | | (.78 | ) | | | (.31 | ) | | | 2.23 | | | | 1.73 | |
Total from investment operations | | | .66 | | | | .32 | | | | (.72 | ) | | | (.24 | ) | | | 2.32 | | | | 2.04 | |
Less distributions from: |
Net investment income | | | (.73 | ) | | | (.06 | ) | | | (.08 | ) | | | (.05 | ) | | | (.34 | ) | | | (.39 | ) |
Net realized gains | | | — | | | | — | | | | — | | | | (.06 | ) | | | (.80 | ) | | | (.23 | ) |
Total distributions | | | (.73 | ) | | | (.06 | ) | | | (.08 | ) | | | (.11 | ) | | | (1.14 | ) | | | (.62 | ) |
Net asset value, end of period | | $ | 26.96 | | | $ | 27.03 | | | $ | 26.77 | | | $ | 27.57 | | | $ | 27.92 | | | $ | 26.74 | |
|
Total Return | | | 2.41 | % | | | 1.21 | % | | | (2.57 | %) | | | (0.87 | %) | | | 9.06 | % | | | 8.19 | % |
Ratios/Supplemental Data |
Net assets, end of period (in thousands) | | $ | 41,327 | | | $ | 47,257 | | | $ | 44,047 | | | $ | 53,609 | | | $ | 37,399 | | | $ | 5,479 | |
Ratios to average net assets: |
Net investment income (loss) | | | 2.89 | % | | | 2.36 | % | | | 0.21 | % | | | 0.27 | % | | | 0.32 | % | | | 1.18 | % |
Total expensesd | | | 1.71 | % | | | 1.62 | % | | | 1.64 | % | | | 1.58 | % | | | 1.85 | % | | | 3.57 | % |
Net expensese,f,g | | | 1.41 | % | | | 1.38 | % | | | 1.39 | % | | | 1.39 | % | | | 1.40 | % | | | 1.40 | % |
Portfolio turnover rate | | | 56 | % | | | 55 | % | | | 49 | % | | | 264 | % | | | 355 | % | | | 180 | % |
a | Unaudited figures for the period ended March 31, 2024. Percentage amounts for the period, except total return and portfolio turnover rate, have been annualized. |
b | Net investment income (loss) per share was computed using average shares outstanding throughout the period. |
c | Total return does not reflect the impact of any applicable sales charges. |
d | Does not include expenses of the underlying funds in which the Fund invests. |
e | Net expense information reflects the expense ratios after expense waivers and reimbursements, as applicable. |
f | The portion of the ratios of net expenses to average net assets attributable to recoupments of prior fee reductions or expense reimbursements for the years presented was as follows: |
| | | 03/31/24a | 09/30/23 | 09/30/22 | 09/30/21 | 09/30/20 | 09/30/19 |
| | Class A | — | 0.00%* | — | — | 0.00%* | 0.00%* |
| | Class C | — | 0.00%* | 0.00%* | — | 0.00%* | 0.02% |
| | Class P | — | 0.00%* | 0.01% | — | 0.00%* | 0.01% |
| | Institutional Class | — | 0.00%* | 0.01% | — | 0.00%* | 0.03% |
g | Net expenses may include expenses that are excluded from the expense limitation agreement. Excluding these expenses, the net expense ratios for the years presented would be: |
| | | 03/31/24a | 09/30/23 | 09/30/22 | 09/30/21 | 09/30/20 | 09/30/19 |
| | Class A | 1.62% | 1.62% | 1.63% | 1.63% | 1.65% | 1.62% |
| | Class C | 2.37% | 2.37% | 2.38% | 2.38% | 2.40% | 2.40% |
| | Class P | 1.62% | 1.62% | 1.63% | 1.63% | 1.64% | 1.65% |
| | Institutional Class | 1.37% | 1.37% | 1.38% | 1.39% | 1.40% | 1.40% |
46 | THE GUGGENHEIM FUNDS SEMI-ANNUAL REPORT | SEE NOTES TO FINANCIAL STATEMENTS. |
PERFORMANCE REPORT AND FUND PROFILE (Unaudited) | March 31, 2024 |
RISK MANAGED REAL ESTATE FUND
OBJECTIVE: Seeks to provide total return, comprised of capital appreciation and current income.
Holdings Diversification (Market Exposure as % of Net Assets)

“Holdings Diversification (Market Exposure as % of Net Assets)” excludes any temporary cash investments.
Inception Dates: |
Class A | March 28, 2014 |
Class C | March 28, 2014 |
Class P | May 1, 2015 |
Institutional Class | March 28, 2014 |
Ten Largest Holdings | % of Total Net Assets |
Prologis, Inc. | 10.4% |
Equinix, Inc. | 6.8% |
Digital Realty Trust, Inc. | 4.8% |
Simon Property Group, Inc. | 4.6% |
Invitation Homes, Inc. | 4.0% |
Public Storage | 3.7% |
VICI Properties, Inc. | 3.7% |
Extra Space Storage, Inc. | 3.0% |
Alexandria Real Estate Equities, Inc. | 2.8% |
Welltower, Inc. | 2.8% |
Top Ten Total | 46.6% |
| | |
“Ten Largest Holdings” excludes any temporary cash or derivative investments. |
| | THE GUGGENHEIM FUNDS SEMI-ANNUAL REPORT | 47 |
PERFORMANCE REPORT AND FUND PROFILE (Unaudited)(concluded) | March 31, 2024 |
Average Annual Returns*
Periods Ended March 31, 2024
| 6 Month† | 1 Year | 5 Year | 10 Year |
Class A Shares | 15.04% | 8.84% | 5.90% | 8.27% |
Class A Shares with sales charge‡ | 9.56% | 3.66% | 4.88% | 7.74% |
Class C Shares | 14.66% | 8.12% | 5.10% | 7.46% |
Class C Shares with CDSC§ | 13.66% | 7.12% | 5.10% | 7.46% |
Institutional Class Shares | 15.27% | 9.27% | 6.23% | 8.59% |
FTSE NAREIT Equity REITs Index | 15.99% | 10.54% | 4.15% | 6.61% |
| 6 Month† | 1 Year | 5 Year | Since
Inception
(05/01/15) |
Class P Shares | 15.07% | 8.87% | 5.86% | 6.71% |
FTSE NAREIT Equity REITs Index | 15.99% | 10.54% | 4.15% | 5.45% |
* | The performance data above represents past performance that is not predictive of future results. The investment return and principal value of an investment in the Fund will fluctuate so that an investor’s shares, when redeemed, may be worth more or less than their original cost. Returns are historical and include changes in principal and reinvested dividends and capital gains and do not reflect the effect of taxes. The FTSE NAREIT Equity REITs Index is an unmanaged index and, unlike the Fund, has no management fees or operating expenses to reduce its reported return. |
† | 6 month returns are not annualized. |
‡ | Fund returns are calculated using the maximum sales charge of 4.75%. |
§ | Fund returns include a CDSC of 1% if redeemed within 12 months of purchase. |
48 | THE GUGGENHEIM FUNDS SEMI-ANNUAL REPORT | |
SCHEDULE OF INVESTMENTS (Unaudited) | March 31, 2024 |
RISK MANAGED REAL ESTATE FUND | |
| | Shares | | | Value | |
COMMON STOCKS† - 95.4% |
| | | | | | | | | |
REITs - 95.4% |
REITs-Diversified - 19.9% |
Equinix, Inc. | | | 28,431 | | | $ | 23,464,957 | |
Digital Realty Trust, Inc. | | | 115,321 | | | | 16,610,837 | |
VICI Properties, Inc. | | | 424,874 | | | | 12,656,997 | |
Gaming and Leisure Properties, Inc. | | | 152,474 | | | | 7,024,477 | |
WP Carey, Inc. | | | 55,444 | | | | 3,129,259 | |
InvenTrust Properties Corp. | | | 120,956 | | | | 3,109,779 | |
Outfront Media, Inc. | | | 66,670 | | | | 1,119,389 | |
Lamar Advertising Co. — Class A | | | 8,961 | | | | 1,070,033 | |
EPR Properties | | | 18,603 | | | | 789,697 | |
Total REITs-Diversified | | | | | | | 68,975,425 | |
| | | | | | | | | |
REITs-Warehouse/Industries - 14.2% |
Prologis, Inc.1 | | | 275,603 | | | | 35,889,023 | |
Rexford Industrial Realty, Inc. | | | 132,248 | | | | 6,652,074 | |
Americold Realty Trust, Inc.1 | | | 147,445 | | | | 3,674,329 | |
First Industrial Realty Trust, Inc. | | | 33,586 | | | | 1,764,608 | |
Terreno Realty Corp. | | | 19,714 | | | | 1,309,010 | |
Total REITs-Warehouse/Industries | | | | | | | 49,289,044 | |
| | | | | | | | | |
REITs-Apartments - 13.4% |
Invitation Homes, Inc. | | | 392,460 | | | | 13,975,501 | |
Equity Residential1 | | | 139,202 | | | | 8,785,038 | |
AvalonBay Communities, Inc. | | | 46,203 | | | | 8,573,429 | |
American Homes 4 Rent — Class A | | | 154,155 | | | | 5,669,821 | |
Essex Property Trust, Inc. | | | 13,872 | | | | 3,396,004 | |
UDR, Inc. | | | 66,885 | | | | 2,502,168 | |
Mid-America Apartment Communities, Inc. | | | 16,524 | | | | 2,174,228 | |
Camden Property Trust | | | 11,506 | | | | 1,132,190 | |
Total REITs-Apartments | | | | | | | 46,208,379 | |
| | | | | | | | | |
REITs-Health Care - 10.8% |
Welltower, Inc. | | | 102,693 | | | | 9,595,634 | |
Ventas, Inc. | | | 200,929 | | | | 8,748,449 | |
Healthpeak Properties, Inc. | | | 343,030 | | | | 6,431,813 | |
Sabra Health Care REIT, Inc. | | | 362,913 | | | | 5,360,225 | |
CareTrust REIT, Inc. | | | 203,738 | | | | 4,965,095 | |
Healthcare Realty Trust, Inc. | | | 104,090 | | | | 1,472,874 | |
Medical Properties Trust, Inc. | | | 161,476 | | | | 758,937 | |
Total REITs-Health Care | | | | | | | 37,333,027 | |
| | | | | | | | | |
REITs-Storage - 9.2% |
Public Storage | | | 44,372 | | | | 12,870,542 | |
Extra Space Storage, Inc. | | | 70,837 | | | | 10,413,039 | |
Iron Mountain, Inc. | | | 77,208 | | | | 6,192,854 | |
CubeSmart | | | 32,152 | | | | 1,453,913 | |
National Storage Affiliates Trust | | | 23,836 | | | | 933,418 | |
Total REITs-Storage | | | | | | | 31,863,766 | |
| | | | | | | | | |
REITs-Office Property - 6.8% |
Alexandria Real Estate Equities, Inc. | | | 75,252 | | | | 9,700,735 | |
Boston Properties, Inc. | | | 75,150 | | | | 4,908,047 | |
Vornado Realty Trust | | | 110,229 | | | | 3,171,288 | |
Kilroy Realty Corp. | | | 83,370 | | | | 3,037,169 | |
Highwoods Properties, Inc. | | | 76,983 | | | | 2,015,415 | |
Empire State Realty Trust, Inc. — Class A1 | | | 38,819 | | | | 393,237 | |
Hudson Pacific Properties, Inc. | | | 41,005 | | | | 264,482 | |
Total REITs-Office Property | | | | | | | 23,490,373 | |
| | | | | | | | | |
REITs-Shopping Centers - 6.1% |
Kimco Realty Corp. | | | 307,094 | | | | 6,022,113 | |
Brixmor Property Group, Inc. | | | 196,321 | | | | 4,603,727 | |
Kite Realty Group Trust | | | 178,342 | | | | 3,866,455 | |
Retail Opportunity Investments Corp. | | | 219,515 | | | | 2,814,182 | |
Regency Centers Corp. | | | 46,274 | | | | 2,802,353 | |
Federal Realty Investment Trust | | | 8,280 | | | | 845,554 | |
Acadia Realty Trust | | | 25,449 | | | | 432,888 | |
Total REITs-Shopping Centers | | | | | | | 21,387,272 | |
| | | | | | | | | |
REITs-Regional Malls - 4.6% |
Simon Property Group, Inc. | | | 100,635 | | | | 15,748,371 | |
| | | | | | | | | |
REITs-Hotels - 3.8% |
Ryman Hospitality Properties, Inc. | | | 57,362 | | | | 6,631,621 | |
Host Hotels & Resorts, Inc. | | | 243,062 | | | | 5,026,522 | |
Apple Hospitality REIT, Inc. | | | 53,156 | | | | 870,695 | |
Pebblebrook Hotel Trust | | | 35,055 | | | | 540,198 | |
Total REITs-Hotels | | | | | | | 13,069,036 | |
| | | | | | | | | |
REITs-Single Tenant - 3.7% |
Realty Income Corp. | | | 120,579 | | | | 6,523,324 | |
Four Corners Property Trust, Inc. | | | 102,513 | | | | 2,508,493 | |
NNN REIT, Inc. | | | 50,683 | | | | 2,166,191 | |
Agree Realty Corp. | | | 26,955 | | | | 1,539,670 | |
Total REITs-Single Tenant | | | | | | | 12,737,678 | |
| | | | | | | | | |
REITs-Manufactured Homes - 2.9% |
Sun Communities, Inc. | | | 54,265 | | | | 6,977,394 | |
Equity LifeStyle Properties, Inc. | | | 47,314 | | | | 3,047,022 | |
Total REITs-Manufactured Homes | | | | | | | 10,024,416 | |
| | | | | | | | | |
Total REITs | | | | | | | 330,126,787 | |
| | | | | | | | | |
Total Common Stocks | | | | |
(Cost $330,660,095) | | | | | | | 330,126,787 | |
| | | | | | | | | |
MONEY MARKET FUND† - 2.9% |
Dreyfus Treasury Securities Cash Management Fund — Institutional Shares, 5.19%2 | | | 10,068,852 | | | | 10,068,852 | |
Total Money Market Fund | | | | |
(Cost $10,068,852) | | | | | | | 10,068,852 | |
| | | | | | | | | |
Total Investments - 98.3% | | | | |
(Cost $340,728,947) | | $ | 340,195,639 | |
| | | | | | | | | |
COMMON STOCKS SOLD SHORT† - (9.9)% |
REITs - (9.9)% |
REITs-Diversified - (0.4)% |
WP Carey, Inc. | | | 2,288 | | | | (129,135 | ) |
Broadstone Net Lease, Inc. | | | 79,695 | | | | (1,248,821 | ) |
Total REITs-Diversified | | | | | | | (1,377,956 | ) |
| | | | | | | | | |
SEE NOTES TO FINANCIAL STATEMENTS. | THE GUGGENHEIM FUNDS SEMI-ANNUAL REPORT | 49 |
SCHEDULE OF INVESTMENTS (Unaudited)(continued) | March 31, 2024 |
RISK MANAGED REAL ESTATE FUND | |
| | Shares | | | Value | |
REITs-Regional Malls - (0.5)% |
Macerich Co. | | | 110,287 | | | $ | (1,900,245 | ) |
| | | | | | | | | |
REITs-Single Tenant - (0.7)% |
Realty Income Corp. | | | 46,195 | | | | (2,499,149 | ) |
| | | | | | | | | |
REITs-Warehouse/Industries - (0.9)% |
EastGroup Properties, Inc. | | | 5,426 | | | | (975,432 | ) |
STAG Industrial, Inc. | | | 59,370 | | | | (2,282,183 | ) |
Total REITs-Warehouse/Industries | | | | | | | (3,257,615 | ) |
| | | | | | | | | |
REITs-Hotels - (1.1)% |
Service Properties Trust | | | 80,587 | | | | (546,380 | ) |
Pebblebrook Hotel Trust | | | 88,406 | | | | (1,362,336 | ) |
Sunstone Hotel Investors, Inc. | | | 183,664 | | | | (2,046,017 | ) |
Total REITs-Hotels | | | | | | | (3,954,733 | ) |
| | | | | | | | | |
REITs-Apartments - (1.4)% |
Apartment Income REIT Corp. | | | 37,920 | | | | (1,231,262 | ) |
Mid-America Apartment Communities, Inc. | | | 13,270 | | | | (1,746,067 | ) |
Camden Property Trust | | | 17,983 | | | | (1,769,527 | ) |
Total REITs-Apartments | | | | | | | (4,746,856 | ) |
| | | | | | | | | |
REITs-Office Property - (1.6)% |
Cousins Properties, Inc. | | | 26,514 | | | | (637,397 | ) |
JBG SMITH Properties | | | 144,232 | | | | (2,314,924 | ) |
Douglas Emmett, Inc. | | | 167,391 | | | | (2,321,713 | ) |
Total REITs-Office Property | | | | | | | (5,274,034 | ) |
| | | | | | | | | |
REITs-Health Care - (1.6)% |
LTC Properties, Inc. | | | 44,143 | | | | (1,435,089 | ) |
National Health Investors, Inc. | | | 27,533 | | | | (1,729,898 | ) |
Omega Healthcare Investors, Inc. | | | 78,351 | | | | (2,481,376 | ) |
Total REITs-Health Care | | | | | | | (5,646,363 | ) |
| | | | | | | | | |
REITs-Shopping Centers - (1.7)% |
Federal Realty Investment Trust | | | 26,164 | | | | (2,671,868 | ) |
Phillips Edison & Company, Inc. | | | 86,575 | | | | (3,105,445 | ) |
Total REITs-Shopping Centers | | | | | | | (5,777,313 | ) |
| | | | | | | | | |
Total REITs | | | | | | | (34,434,264 | ) |
| | | | | | | | | |
Total Common Stocks Sold Short | | | | |
(Proceeds $33,739,246) | | | | | | | (34,434,264 | ) |
| | | | | | | | | |
EXCHANGE-TRADED FUNDS SOLD SHORT† - (1.3)% |
Vanguard Real Estate ETF | | | 49,732 | | | | (4,300,823 | ) |
Total Exchange-Traded Funds Sold Short | | | | |
(Proceeds $4,207,045) | | | | | | | (4,300,823 | ) |
| | | | | | | | | |
Total Securities Sold Short - (11.2)% | | | | |
(Proceeds $37,946,291) | | $ | (38,735,087 | ) |
Other Assets & Liabilities, net - 12.9% | | | 44,607,987 | |
Total Net Assets - 100.0% | | $ | 346,068,539 | |
Custom Basket Swap Agreements |
Counterparty | Reference Obligation | Type | Financing
Rate | | Payment
Frequency | | | Maturity
Date | | | Notional
Amount | | | Value and
Unrealized
Appreciation | |
OTC Custom Basket Swap Agreements†† |
Morgan Stanley Capital Services LLC | MS Equity Custom Basket | Pay | 5.73% (Federal
Funds Rate +
0.40%) | | | At Maturity | | | | 11/12/24 | | | $ | 26,959,781 | | | $ | 2,829,834 | |
Goldman Sachs International | GS Equity Custom Basket | Pay | 5.78% (Federal
Funds Rate +
0.45%) | | | At Maturity | | | | 05/06/24 | | | | 26,959,789 | | | | 2,828,419 | |
Morgan Stanley Capital Services LLC | MS Equity Custom Basket | Pay | 5.73% (Federal
Funds Rate +
0.40%) | | | At Maturity | | | | 08/03/28 | | | | 9,127,940 | | | | 1,321,564 | |
Goldman Sachs International | GS Equity Custom Basket | Pay | 5.78% (Federal
Funds Rate +
0.45%) | | | At Maturity | | | | 05/17/28 | | | | 9,127,940 | | | | 1,321,376 | |
| | | | | | | | | | | | | | $ | 72,175,450 | | | $ | 8,301,193 | |
OTC Custom Basket Swap Agreements Sold Short†† |
Goldman Sachs International | GS Equity Custom Basket | Receive | 5.13% (Federal
Funds Rate -
0.20%) | | | At Maturity | | | | 05/06/24 | | | $ | 26,203,245 | | | $ | 2,247,700 | |
Morgan Stanley Capital Services LLC | MS Equity Custom Basket | Receive | 5.00% (Federal
Funds Rate -
0.33%) | | | At Maturity | | | | 11/12/24 | | | | 26,203,236 | | | | 2,223,238 | |
| | | | | | | | | | | | | | $ | 52,406,481 | | | $ | 4,470,938 | |
50 | THE GUGGENHEIM FUNDS SEMI-ANNUAL REPORT | SEE NOTES TO FINANCIAL STATEMENTS. |
SCHEDULE OF INVESTMENTS (Unaudited)(continued) | March 31, 2024 |
RISK MANAGED REAL ESTATE FUND | |
| | Shares | | | Percentage
Notional
Amount | | | Value and
Unrealized
Appreciation
(Depreciation) | |
MS EQUITY LONG CUSTOM BASKET | | | | | | | | |
Financial | | | | | | | | | | | | |
Ryman Hospitality Properties, Inc. | | | 16,795 | | | | 7.21 | % | | $ | 649,267 | |
Simon Property Group, Inc. | | | 7,508 | | | | 4.36 | % | | | 348,840 | |
CareTrust REIT, Inc. | | | 41,335 | | | | 3.74 | % | | | 286,715 | |
Host Hotels & Resorts, Inc. | | | 61,044 | | | | 4.68 | % | | | 280,053 | |
Gaming and Leisure Properties, Inc. | | | 25,857 | | | | 4.42 | % | | | 227,893 | |
Digital Realty Trust, Inc. | | | 8,425 | | | | 4.50 | % | | | 162,194 | |
Invitation Homes, Inc. | | | 44,814 | | | | 5.92 | % | | | 160,427 | |
Boston Properties, Inc. | | | 12,373 | | | | 3.00 | % | | | 134,655 | |
Sun Communities, Inc. | | | 5,545 | | | | 2.64 | % | | | 131,405 | |
Vornado Realty Trust | | | 29,055 | | | | 3.10 | % | | | 109,520 | |
InvenTrust Properties Corp. | | | 31,056 | | | | 2.96 | % | | | 106,881 | |
Brixmor Property Group, Inc. | | | 34,550 | | | | 3.01 | % | | | 103,958 | |
Kimco Realty Corp. | | | 38,526 | | | | 2.80 | % | | | 94,788 | |
Extra Space Storage, Inc. | | | 3,972 | | | | 2.17 | % | | | 87,184 | |
Sabra Health Care REIT, Inc. | | | 85,195 | | | | 4.67 | % | | | 78,193 | |
Highwoods Properties, Inc. | | | 16,658 | | | | 1.62 | % | | | 62,058 | |
VICI Properties, Inc. | | | 41,298 | | | | 4.56 | % | | | 59,934 | |
American Homes 4 Rent — Class A | | | 17,437 | | | | 2.38 | % | | | 54,869 | |
Ventas, Inc. | | | 28,846 | | | | 4.66 | % | | | 41,665 | |
Kilroy Realty Corp. | | | 17,417 | | | | 2.35 | % | | | 38,913 | |
Kite Realty Group Trust | | | 36,311 | | | | 2.92 | % | | | 29,649 | |
Equinix, Inc. | | | 726 | | | | 2.22 | % | | | 16,684 | |
Equity Residential | | | 10,231 | | | | 2.39 | % | | | 7,874 | |
Americold Realty Trust, Inc. | | | 21,665 | | | | 2.00 | % | | | (41,455 | ) |
Retail Opportunity Investments Corp. | | | 56,350 | | | | 2.68 | % | | | (43,097 | ) |
Healthpeak Properties, Inc. | | | 39,562 | | | | 2.75 | % | | | (79,697 | ) |
Alexandria Real Estate Equities, Inc. | | | 10,350 | | | | 4.95 | % | | | (104,645 | ) |
Rexford Industrial Realty, Inc. | | | 28,648 | | | | 5.34 | % | | | (174,891 | ) |
Total Financial | | | | | | | | | | | 2,829,834 | |
Total MS Equity Long Custom Basket | | | | | | $ | 2,829,834 | |
| | | | | | | | | |
MS EQUITY SHORT CUSTOM BASKET | | | | | | | | |
Financial | | | | | | | | | | | | |
Douglas Emmett, Inc. | | | 113,615 | | | | (6.02 | )% | | $ | 1,344,449 | |
Realty Income Corp. | | | 31,354 | | | | (6.47 | )% | | | 508,668 | |
Broadstone Net Lease, Inc. | | | 54,088 | | | | (3.23 | )% | | | 439,445 | |
Mid-America Apartment Communities, Inc. | | | 9,006 | | | | (4.52 | )% | | | 343,801 | |
Apartment Income REIT Corp. | | | 25,738 | | | | (3.19 | )% | | | 341,597 | |
Camden Property Trust | | | 12,205 | | | | (4.58 | )% | | | 306,553 | |
Service Properties Trust | | | 54,698 | | | | (1.42 | )% | | | 130,182 | |
JBG SMITH Properties | | | 97,896 | | | | (6.00 | )% | | | 104,070 | |
STAG Industrial, Inc. | | | 40,297 | | | | (5.91 | )% | | | 13,228 | |
LTC Properties, Inc. | | | 29,962 | | | | (3.72 | )% | | | 10,427 | |
Federal Realty Investment Trust | | | 17,759 | | | | (6.92 | )% | | | (36,627 | ) |
Cousins Properties, Inc. | | | 17,996 | | | | (1.65 | )% | | | (40,450 | ) |
Pebblebrook Hotel Trust | | | 60,005 | | | | (3.53 | )% | | | (67,393 | ) |
EastGroup Properties, Inc. | | | 3,683 | | | | (2.53 | )% | | | (81,268 | ) |
Phillips Edison & Company, Inc. | | | 58,762 | | | | (8.04 | )% | | | (132,950 | ) |
Sunstone Hotel Investors, Inc. | | | 124,660 | | | | (5.30 | )% | | | (175,915 | ) |
Omega Healthcare Investors, Inc. | | | 53,180 | | | | (6.43 | )% | | | (179,999 | ) |
National Health Investors, Inc. | | | 18,688 | | | | (4.48 | )% | | | (187,303 | ) |
Macerich Co. | | | 74,856 | | | | (4.92 | )% | | | (471,258 | ) |
Total Financial | | | | | | | | | | | 2,169,257 | |
| | | | | | | | | | | | | |
Exchange Traded Funds | | | | | | | | | | | | |
Vanguard Real Estate ETF | | | 33,755 | | | | (11.14 | )% | | | 53,981 | |
Total MS Equity Short Custom Basket | | | | | | $ | 2,223,238 | |
| | | | | | | | | | | | | |
MS EQUITY LONG CUSTOM BASKET | | | | | | | | |
Financial | | | | | | | | | | | | |
Prologis, Inc. | | | 8,673 | | | | 12.38 | % | | $ | 197,421 | |
Simon Property Group, Inc. | | | 2,819 | | | | 4.83 | % | | | 150,023 | |
Equinix, Inc. | | | 857 | | | | 7.75 | % | | | 103,567 | |
Digital Realty Trust, Inc. | | | 3,238 | | | | 5.11 | % | | | 87,394 | |
Extra Space Storage, Inc. | | | 2,045 | | | | 3.29 | % | | | 61,741 | |
Alexandria Real Estate Equities, Inc. | | | 1,888 | | | | 2.67 | % | | | 59,896 | |
Iron Mountain, Inc. | | | 2,430 | | | | 2.14 | % | | | 55,950 | |
Public Storage | | | 1,390 | | | | 4.42 | % | | | 47,847 | |
Invitation Homes, Inc. | | | 10,272 | | | | 4.01 | % | | | 46,626 | |
Welltower, Inc. | | | 3,232 | | | | 3.31 | % | | | 45,675 | |
Ryman Hospitality Properties, Inc. | | | 1,026 | | | | 1.30 | % | | | 34,549 | |
AvalonBay Communities, Inc. | | | 1,454 | | | | 2.96 | % | | | 26,476 | |
Sun Communities, Inc. | | | 1,451 | | | | 2.04 | % | | | 25,545 | |
Host Hotels & Resorts, Inc. | | | 4,819 | | | | 1.09 | % | | | 25,095 | |
Equity Residential | | | 3,906 | | | | 2.70 | % | | | 24,874 | |
Kimco Realty Corp. | | | 7,866 | | | | 1.69 | % | | | 21,916 | |
Boston Properties, Inc. | | | 1,791 | | | | 1.28 | % | | | 20,177 | |
VICI Properties, Inc. | | | 11,455 | | | | 3.74 | % | | | 20,044 | |
Realty Income Corp. | | | 3,794 | | | | 2.25 | % | | | 19,848 | |
CareTrust REIT, Inc. | | | 4,495 | | | | 1.20 | % | | | 19,587 | |
Ventas, Inc. | | | 4,986 | | | | 2.38 | % | | | 17,391 | |
Brixmor Property Group, Inc. | | | 4,569 | | | | 1.17 | % | | | 16,985 | |
Healthpeak Properties, Inc. | | | 8,960 | | | | 1.84 | % | | | 16,392 | |
SEE NOTES TO FINANCIAL STATEMENTS. | THE GUGGENHEIM FUNDS SEMI-ANNUAL REPORT | 51 |
SCHEDULE OF INVESTMENTS (Unaudited)(continued) | March 31, 2024 |
RISK MANAGED REAL ESTATE FUND | |
| | Shares | | | Percentage
Notional
Amount | | | Value and
Unrealized
Appreciation
(Depreciation) | |
Essex Property Trust, Inc. | | | 437 | | | | 1.17 | % | | $ | 16,351 | |
American Homes 4 Rent — Class A | | | 4,043 | | | | 1.63 | % | | | 16,033 | |
Sabra Health Care REIT, Inc. | | | 7,470 | | | | 1.21 | % | | | 9,463 | |
NNN REIT, Inc. | | | 1,589 | | | | 0.74 | % | | | 9,379 | |
Highwoods Properties, Inc. | | | 1,647 | | | | 0.47 | % | | | 9,198 | |
Rexford Industrial Realty, Inc. | | | 2,833 | | | | 1.56 | % | | | 9,110 | |
WP Carey, Inc. | | | 1,673 | | | | 1.03 | % | | | 8,814 | |
Vornado Realty Trust | | | 2,119 | | | | 0.67 | % | | | 8,702 | |
Kilroy Realty Corp. | | | 1,816 | | | | 0.72 | % | | | 8,594 | |
Four Corners Property Trust, Inc. | | | 3,226 | | | | 0.86 | % | | | 8,224 | |
First Industrial Realty Trust, Inc. | | | 1,057 | | | | 0.61 | % | | | 7,458 | |
UDR, Inc. | | | 2,105 | | | | 0.86 | % | | | 7,312 | |
Terreno Realty Corp. | | | 620 | | | | 0.45 | % | | | 7,203 | |
InvenTrust Properties Corp. | | | 2,363 | | | | 0.67 | % | | | 6,827 | |
National Storage Affiliates Trust | | | 750 | | | | 0.32 | % | | | 6,542 | |
Gaming and Leisure Properties, Inc. | | | 3,599 | | | | 1.82 | % | | | 6,483 | |
Regency Centers Corp. | | | 1,456 | | | | 0.97 | % | | | 5,259 | |
Kite Realty Group Trust | | | 3,923 | | | | 0.93 | % | | | 4,844 | |
Equity LifeStyle Properties, Inc. | | | 1,489 | | | | 1.05 | % | | | 4,147 | |
Federal Realty Investment Trust | | | 261 | | | | 0.29 | % | | | 4,017 | |
Mid-America Apartment Communities, Inc. | | | 520 | | | | 0.75 | % | | | 3,858 | |
Empire State Realty Trust, Inc. — Class A | | | 1,222 | | | | 0.14 | % | | | 3,254 | |
Pebblebrook Hotel Trust | | | 1,103 | | | | 0.19 | % | | | 3,144 | |
Camden Property Trust | | | 362 | | | | 0.39 | % | | | 2,893 | |
Acadia Realty Trust | | | 801 | | | | 0.15 | % | | | 2,809 | |
Apple Hospitality REIT, Inc. | | | 1,673 | | | | 0.30 | % | | | 2,662 | |
Agree Realty Corp. | | | 845 | | | | 0.53 | % | | | 2,627 | |
CubeSmart | | | 1,010 | | | | 0.50 | % | | | 2,278 | |
Outfront Media, Inc. | | | 2,089 | | | | 0.38 | % | | | 1,790 | |
EPR Properties | | | 585 | | | | 0.27 | % | | | 1,191 | |
Hudson Pacific Properties, Inc. | | | 1,290 | | | | 0.09 | % | | | 1,138 | |
Lamar Advertising Co. — Class A | | | 281 | | | | 0.37 | % | | | 371 | |
Medical Properties Trust, Inc. | | | 5,081 | | | | 0.26 | % | | | (479 | ) |
Retail Opportunity Investments Corp. | | | 4,289 | | | | 0.60 | % | | | (1,101 | ) |
Healthcare Realty Trust, Inc. | | | 3,276 | | | | 0.51 | % | | | (1,293 | ) |
Americold Realty Trust, Inc. | | | 3,635 | | | | 0.99 | % | | | (12,557 | ) |
Total Financial | | | | | | | | | | | 1,321,564 | |
Total MS Equity Long Custom Basket | | | | | | $ | 1,321,564 | |
| | Shares | | | Percentage
Notional
Amount | | | Value and
Unrealized
Appreciation
(Depreciation) | |
GS EQUITY LONG CUSTOM BASKET | | | | | | | | |
Financial | | | | | | | | | | | | |
Ryman Hospitality Properties, Inc. | | | 16,795 | | | | 7.21 | % | | $ | 650,055 | |
Simon Property Group, Inc. | | | 7,508 | | | | 4.36 | % | | | 335,412 | |
CareTrust REIT, Inc. | | | 41,335 | | | | 3.74 | % | | | 286,741 | |
Host Hotels & Resorts, Inc. | | | 61,044 | | | | 4.68 | % | | | 280,413 | |
Gaming and Leisure Properties, Inc. | | | 25,857 | | | | 4.42 | % | | | 228,433 | |
Digital Realty Trust, Inc. | | | 8,425 | | | | 4.50 | % | | | 162,992 | |
Invitation Homes, Inc. | | | 44,814 | | | | 5.92 | % | | | 157,003 | |
Boston Properties, Inc. | | | 12,373 | | | | 3.00 | % | | | 135,349 | |
Sun Communities, Inc. | | | 5,545 | | | | 2.64 | % | | | 131,030 | |
InvenTrust Properties Corp. | | | 31,056 | | | | 2.96 | % | | | 110,971 | |
Vornado Realty Trust | | | 29,055 | | | | 3.10 | % | | | 108,102 | |
Brixmor Property Group, Inc. | | | 34,550 | | | | 3.01 | % | | | 104,054 | |
Kimco Realty Corp. | | | 38,526 | | | | 2.80 | % | | | 96,339 | |
Extra Space Storage, Inc. | | | 3,972 | | | | 2.17 | % | | | 87,229 | |
Sabra Health Care REIT, Inc. | | | 85,195 | | | | 4.67 | % | | | 74,708 | |
Highwoods Properties, Inc. | | | 16,658 | | | | 1.62 | % | | | 71,053 | |
VICI Properties, Inc. | | | 41,298 | | | | 4.56 | % | | | 58,930 | |
American Homes 4 Rent — Class A | | | 17,437 | | | | 2.38 | % | | | 54,925 | |
Ventas, Inc. | | | 28,846 | | | | 4.66 | % | | | 42,418 | |
Kilroy Realty Corp. | | | 17,417 | | | | 2.35 | % | | | 36,587 | |
Kite Realty Group Trust | | | 36,311 | | | | 2.92 | % | | | 34,498 | |
Equinix, Inc. | | | 726 | | | | 2.22 | % | | | 16,106 | |
Equity Residential | | | 10,231 | | | | 2.39 | % | | | 8,590 | |
Americold Realty Trust, Inc. | | | 21,665 | | | | 2.00 | % | | | (37,567 | ) |
Retail Opportunity Investments Corp. | | | 56,350 | | | | 2.68 | % | | | (52,935 | ) |
Healthpeak Properties, Inc. | | | 39,562 | | | | 2.75 | % | | | (76,604 | ) |
Alexandria Real Estate Equities, Inc. | | | 10,350 | | | | 4.95 | % | | | (104,238 | ) |
Rexford Industrial Realty, Inc. | | | 28,648 | | | | 5.34 | % | | | (172,175 | ) |
Total Financial | | | | | | | | | | | 2,828,419 | |
Total GS Equity Long Custom Basket | | | | | | $ | 2,828,419 | |
| | | | | | | | | |
GS EQUITY SHORT CUSTOM BASKET | | | | | | | | |
Financial | | | | | | | | | | | | |
Douglas Emmett, Inc. | | | 113,615 | | | | (6.02 | )% | | $ | 1,347,945 | |
Realty Income Corp. | | | 31,354 | | | | (6.47 | )% | | | 508,768 | |
Broadstone Net Lease, Inc. | | | 54,088 | | | | (3.23 | )% | | | 432,933 | |
Mid-America Apartment Communities, Inc. | | | 9,006 | | | | (4.52 | )% | | | 344,902 | |
Apartment Income REIT Corp. | | | 25,738 | | | | (3.19 | )% | | | 341,381 | |
Camden Property Trust | | | 12,205 | | | | (4.58 | )% | | | 306,471 | |
Service Properties Trust | | | 54,698 | | | | (1.42 | )% | | | 132,593 | |
52 | THE GUGGENHEIM FUNDS SEMI-ANNUAL REPORT | SEE NOTES TO FINANCIAL STATEMENTS. |
SCHEDULE OF INVESTMENTS (Unaudited)(continued) | March 31, 2024 |
RISK MANAGED REAL ESTATE FUND | |
| | Shares | | | Percentage
Notional
Amount | | | Value and
Unrealized
Appreciation
(Depreciation) | |
JBG SMITH Properties | | | 97,896 | | | | (6.00 | )% | | $ | 99,841 | |
STAG Industrial, Inc. | | | 40,297 | | | | (5.91 | )% | | | 13,679 | |
LTC Properties, Inc. | | | 29,962 | | | | (3.72 | )% | | | 7,542 | |
Federal Realty Investment Trust | | | 17,759 | | | | (6.92 | )% | | | (39,009 | ) |
Cousins Properties, Inc. | | | 17,996 | | | | (1.65 | )% | | | (40,406 | ) |
Pebblebrook Hotel Trust | | | 60,005 | | | | (3.53 | )% | | | (65,594 | ) |
EastGroup Properties, Inc. | | | 3,683 | | | | (2.53 | )% | | | (81,754 | ) |
Phillips Edison & Company, Inc. | | | 58,762 | | | | (8.04 | )% | | | (134,790 | ) |
Sunstone Hotel Investors, Inc. | | | 124,660 | | | | (5.30 | )% | | | (172,358 | ) |
Omega Healthcare Investors, Inc. | | | 53,180 | | | | (6.43 | )% | | | (184,276 | ) |
National Health Investors, Inc. | | | 18,688 | | | | (4.48 | )% | | | (191,518 | ) |
Macerich Co. | | | 74,856 | | | | (4.92 | )% | | | (444,373 | ) |
Total Financial | | | | | | | | | | | 2,181,977 | |
| | | | | | | | | | | | | |
Exchange Traded Funds | | | | | | | | | | | | |
Vanguard Real Estate ETF | | | 33,755 | | | | (11.14 | )% | | | 65,723 | |
Total GS Equity Short Custom Basket | | | | | | $ | 2,247,700 | |
| | | | | | | | | | | | | |
GS EQUITY LONG CUSTOM BASKET | | | | | | | | |
Financial | | | | | | | | | | | | |
Prologis, Inc. | | | 8,673 | | | | 12.38 | % | | $ | 197,624 | |
Simon Property Group, Inc. | | | 2,819 | | | | 4.83 | % | | | 150,109 | |
Equinix, Inc. | | | 857 | | | | 7.75 | % | | | 103,258 | |
Digital Realty Trust, Inc. | | | 3,238 | | | | 5.11 | % | | | 87,545 | |
Extra Space Storage, Inc. | | | 2,045 | | | | 3.29 | % | | | 61,764 | |
Alexandria Real Estate Equities, Inc. | | | 1,888 | | | | 2.67 | % | | | 59,943 | |
Iron Mountain, Inc. | | | 2,430 | | | | 2.14 | % | | | 55,920 | |
Public Storage | | | 1,390 | | | | 4.42 | % | | | 47,917 | |
Invitation Homes, Inc. | | | 10,272 | | | | 4.01 | % | | | 46,648 | |
Welltower, Inc. | | | 3,232 | | | | 3.31 | % | | | 45,711 | |
Ryman Hospitality Properties, Inc. | | | 1,026 | | | | 1.30 | % | | | 34,537 | |
AvalonBay Communities, Inc. | | | 1,454 | | | | 2.96 | % | | | 26,499 | |
Sun Communities, Inc. | | | 1,451 | | | | 2.04 | % | | | 25,504 | |
Host Hotels & Resorts, Inc. | | | 4,819 | | | | 1.09 | % | | | 25,078 | |
Equity Residential | | | 3,906 | | | | 2.70 | % | | | 24,903 | |
Kimco Realty Corp. | | | 7,866 | | | | 1.69 | % | | | 21,941 | |
Boston Properties, Inc. | | | 1,791 | | | | 1.28 | % | | | 20,151 | |
VICI Properties, Inc. | | | 11,455 | | | | 3.74 | % | | | 20,057 | |
Realty Income Corp. | | | 3,794 | | | | 2.25 | % | | | 19,866 | |
CareTrust REIT, Inc. | | | 4,495 | | | | 1.20 | % | | | 19,627 | |
Ventas, Inc. | | | 4,986 | | | | 2.38 | % | | | 17,367 | |
Brixmor Property Group, Inc. | | | 4,569 | | | | 1.17 | % | | | 16,982 | |
Healthpeak Properties, Inc. | | | 8,960 | | | | 1.84 | % | | | 16,392 | |
Essex Property Trust, Inc. | | | 437 | | | | 1.17 | % | | | 16,374 | |
American Homes 4 Rent — Class A | | | 4,043 | | | | 1.63 | % | | | 16,042 | |
Sabra Health Care REIT, Inc. | | | 7,470 | | | | 1.21 | % | | | 9,451 | |
NNN REIT, Inc. | | | 1,589 | | | | 0.74 | % | | | 9,394 | |
Highwoods Properties, Inc. | | | 1,647 | | | | 0.47 | % | | | 9,188 | |
Rexford Industrial Realty, Inc. | | | 2,833 | | | | 1.56 | % | | | 9,128 | |
WP Carey, Inc. | | | 1,673 | | | | 1.03 | % | | | 8,786 | |
Vornado Realty Trust | | | 2,119 | | | | 0.67 | % | | | 8,689 | |
Four Corners Property Trust, Inc. | | | 3,226 | | | | 0.86 | % | | | 8,272 | |
Kilroy Realty Corp. | | | 1,816 | | | | 0.72 | % | | | 8,024 | |
First Industrial Realty Trust, Inc. | | | 1,057 | | | | 0.61 | % | | | 7,459 | |
UDR, Inc. | | | 2,105 | | | | 0.86 | % | | | 7,308 | |
Terreno Realty Corp. | | | 620 | | | | 0.45 | % | | | 7,204 | |
InvenTrust Properties Corp. | | | 2,363 | | | | 0.67 | % | | | 6,800 | |
National Storage Affiliates Trust | | | 750 | | | | 0.32 | % | | | 6,545 | |
Gaming and Leisure Properties, Inc. | | | 3,599 | | | | 1.82 | % | | | 6,489 | |
Regency Centers Corp. | | | 1,456 | | | | 0.97 | % | | | 5,211 | |
Kite Realty Group Trust | | | 3,923 | | | | 0.93 | % | | | 4,857 | |
Equity LifeStyle Properties, Inc. | | | 1,489 | | | | 1.05 | % | | | 4,168 | |
Federal Realty Investment Trust | | | 261 | | | | 0.29 | % | | | 4,024 | |
Mid-America Apartment Communities, Inc. | | | 520 | | | | 0.75 | % | | | 3,870 | |
Empire State Realty Trust, Inc. — Class A | | | 1,222 | | | | 0.14 | % | | | 3,254 | |
Pebblebrook Hotel Trust | | | 1,103 | | | | 0.19 | % | | | 3,145 | |
Camden Property Trust | | | 362 | | | | 0.39 | % | | | 2,899 | |
Acadia Realty Trust | | | 801 | | | | 0.15 | % | | | 2,810 | |
Apple Hospitality REIT, Inc. | | | 1,673 | | | | 0.30 | % | | | 2,665 | |
Agree Realty Corp. | | | 845 | | | | 0.53 | % | | | 2,577 | |
CubeSmart | | | 1,010 | | | | 0.50 | % | | | 2,257 | |
Outfront Media, Inc. | | | 2,089 | | | | 0.38 | % | | | 1,833 | |
EPR Properties | | | 585 | | | | 0.27 | % | | | 1,191 | |
Hudson Pacific Properties, Inc. | | | 1,290 | | | | 0.09 | % | | | 1,136 | |
Lamar Advertising Co. — Class A | | | 281 | | | | 0.37 | % | | | 367 | |
Medical Properties Trust, Inc. | | | 5,081 | | | | 0.26 | % | | | (469 | ) |
Retail Opportunity Investments Corp. | | | 4,289 | | | | 0.60 | % | | | (1,086 | ) |
Healthcare Realty Trust, Inc. | | | 3,276 | | | | 0.51 | % | | | (1,289 | ) |
Americold Realty Trust, Inc. | | | 3,635 | | | | 0.99 | % | | | (12,540 | ) |
Total Financial | | | | | | | | | | | 1,321,376 | |
Total GS Equity Long Custom Basket | | | | | | $ | 1,321,376 | |
SEE NOTES TO FINANCIAL STATEMENTS. | THE GUGGENHEIM FUNDS SEMI-ANNUAL REPORT | 53 |
SCHEDULE OF INVESTMENTS (Unaudited)(concluded) | March 31, 2024 |
RISK MANAGED REAL ESTATE FUND | |
† | Value determined based on Level 1 inputs — See Note 4. |
†† | Value determined based on Level 2 inputs — See Note 4. |
1 | All or a portion of this security is pledged as short security collateral at March 31, 2024. |
2 | Rate indicated is the 7-day yield as of March 31, 2024. |
| | GS — Goldman Sachs International |
| | MS — Morgan Stanley Capital Services LLC |
| | REIT — Real Estate Investment Trust |
| | |
| | See Sector Classification in Other Information section. |
The following table summarizes the inputs used to value the Fund’s investments at March 31, 2024 (See Note 4 in the Notes to Financial Statements):
Investments in Securities (Assets) | | Level 1
Quoted
Prices | | | Level 2
Significant
Observable
Inputs | | | Level 3
Significant
Unobservable
Inputs | | | Total | |
Common Stocks | | $ | 330,126,787 | | | $ | — | | | $ | — | | | $ | 330,126,787 | |
Money Market Fund | | | 10,068,852 | | | | — | | | | — | | | | 10,068,852 | |
Equity Custom Basket Swap Agreements** | | | — | | | | 12,772,131 | | | | — | | | | 12,772,131 | |
Total Assets | | $ | 340,195,639 | | | $ | 12,772,131 | | | $ | — | | | $ | 352,967,770 | |
Investments in Securities (Liabilities) | | Level 1
Quoted
Prices | | | Level 2
Significant
Observable
Inputs | | | Level 3
Significant
Unobservable
Inputs | | | Total | |
Common Stocks | | $ | 34,434,264 | | | $ | — | | | $ | — | | | $ | 34,434,264 | |
Exchange-Traded Funds | | | 4,300,823 | | | | — | | | | — | | | | 4,300,823 | |
Total Liabilities | | $ | 38,735,087 | | | $ | — | | | $ | — | | | $ | 38,735,087 | |
** | This derivative is reported as unrealized appreciation/depreciation at period end. |
54 | THE GUGGENHEIM FUNDS SEMI-ANNUAL REPORT | SEE NOTES TO FINANCIAL STATEMENTS. |
RISK MANAGED REAL ESTATE FUND | |
STATEMENT OF ASSETS AND LIABILITIES (Unaudited) |
March 31, 2024 |
Assets: |
Investments, at value (cost $340,728,947) | | $ | 340,195,639 | |
Cash | | | 38,843,695 | |
Unrealized appreciation on OTC swap agreements | | | 12,772,131 | |
Prepaid expenses | | | 70,048 | |
Receivables: |
Dividends | | | 1,283,671 | |
Fund shares sold | | | 220,662 | |
Interest | | | 33,372 | |
Other assets | | | 122,912 | |
Total assets | | | 393,542,130 | |
| | | | | |
Liabilities: |
Securities sold short, at value (proceeds $37,946,291) | | | 38,735,087 | |
Segregated cash due to broker | | | 7,333,030 | |
Payable for: |
Fund shares redeemed | | | 590,788 | |
Swap settlement | | | 392,423 | |
Management fees | | | 177,256 | |
Distributions to shareholders | | | 89,881 | |
Transfer agent/maintenance fees | | | 23,765 | |
Distribution and service fees | | | 7,125 | |
Fund accounting/administration fees | | | 4,307 | |
Trustees’ fees* | | | 2,333 | |
Miscellaneous | | | 117,596 | |
Total liabilities | | | 47,473,591 | |
Net assets | | $ | 346,068,539 | |
| | | | | |
Net assets consist of: |
Paid in capital | | $ | 348,318,150 | |
Total distributable earnings (loss) | | | (2,249,611 | ) |
Net assets | | $ | 346,068,539 | |
Class A: |
Net assets | | $ | 4,390,873 | |
Capital shares outstanding | | | 139,940 | |
Net asset value per share | | $ | 31.38 | |
Maximum offering price per share (Net asset value divided by 95.25%) | | $ | 32.94 | |
Class C: |
Net assets | | $ | 4,976,408 | |
Capital shares outstanding | | | 159,921 | |
Net asset value per share | | $ | 31.12 | |
Class P: |
Net assets | | $ | 9,858,888 | |
Capital shares outstanding | | | 312,275 | |
Net asset value per share | | $ | 31.57 | |
| | | | | |
Institutional Class: |
Net assets | | $ | 326,842,370 | |
Capital shares outstanding | | | 10,263,993 | |
Net asset value per share | | $ | 31.84 | |
* | Relates to Trustees not deemed “interested persons” within the meaning of Section 2(a)(19) of the 1940 Act. |
SEE NOTES TO FINANCIAL STATEMENTS. | THE GUGGENHEIM FUNDS SEMI-ANNUAL REPORT | 55 |
RISK MANAGED REAL ESTATE FUND | |
STATEMENT OF OPERATIONS (Unaudited) |
Six Months Ended March 31, 2024 |
Investment Income: |
Dividends (net of foreign withholding tax of $19,888) | | $ | 6,247,506 | |
Interest | | | 726,237 | |
Total investment income | | | 6,973,743 | |
| | | | | |
Expenses: |
Management fees | | | 1,292,897 | |
Distribution and service fees: |
Class A | | | 5,497 | |
Class C | | | 24,563 | |
Class P | | | 11,788 | |
Transfer agent/maintenance fees: |
Class A | | | 2,803 | |
Class C | | | 2,205 | |
Class P | | | 7,227 | |
Institutional Class | | | 136,181 | |
Short sale dividend expense | | | 604,909 | |
Fund accounting/administration fees | | | 72,271 | |
Professional fees | | | 41,964 | |
Custodian fees | | | 10,537 | |
Trustees’ fees* | | | 10,065 | |
Line of credit fees | | | 5,409 | |
Miscellaneous | | | 42,519 | |
Recoupment of previously waived fees: |
Class A | | | 854 | |
Class C | | | 645 | |
Class P | | | 2,229 | |
Institutional Class | | | 11,683 | |
Total expenses | | | 2,286,246 | |
Less: |
Expenses reimbursed by Adviser: |
Class A | | | (39 | ) |
Class P | | | (5 | ) |
Expenses waived by Adviser | | | (53,539 | ) |
Total waived/reimbursed expenses | | | (53,583 | ) |
Net expenses | | | 2,232,663 | |
Net investment income | | | 4,741,080 | |
| | | | | |
Net Realized and Unrealized Gain (Loss): |
Net realized gain (loss) on: |
Investments | | $ | (2,614,700 | ) |
Investments sold short | | | 4,733,050 | |
Swap agreements | | | (1,506,844 | ) |
Net realized gain | | | 611,506 | |
Net change in unrealized appreciation (depreciation) on: |
Investments | | | 42,469,927 | |
Investments sold short | | | (5,514,995 | ) |
Swap agreements | | | 5,692,304 | |
Net change in unrealized appreciation (depreciation) | | | 42,647,236 | |
Net realized and unrealized gain | | | 43,258,742 | |
Net increase in net assets resulting from operations | | $ | 47,999,822 | |
* | Relates to Trustees not deemed “interested persons” within the meaning of Section 2(a)(19) of the 1940 Act. |
56 | THE GUGGENHEIM FUNDS SEMI-ANNUAL REPORT | SEE NOTES TO FINANCIAL STATEMENTS. |
RISK MANAGED REAL ESTATE FUND | |
STATEMENTS OF CHANGES IN NET ASSETS |
| | Six Months Ended
March 31, 2024
(Unaudited) | | | Year Ended
September 30,
2023 | |
Increase (Decrease) in Net Assets from Operations: | | | | | | | | |
Net investment income | | $ | 4,741,080 | | | $ | 9,991,453 | |
Net realized gain on investments | | | 611,506 | | | | 1,677,521 | |
Net change in unrealized appreciation (depreciation) on investments | | | 42,647,236 | | | | (4,167,625 | ) |
Net increase in net assets resulting from operations | | | 47,999,822 | | | | 7,501,349 | |
| | | | | | | | | |
Distributions to shareholders: | | | | | | | | |
Class A | | | (56,092 | ) | | | (347,557 | ) |
Class C | | | (46,039 | ) | | | (302,170 | ) |
Class P | | | (119,823 | ) | | | (683,918 | ) |
Institutional Class | | | (4,637,428 | ) | | | (26,554,622 | ) |
Return of Capital | | | | | | | | |
Class A | | | — | | | | (34,317 | ) |
Class C | | | — | | | | (34,101 | ) |
Class P | | | — | | | | (67,335 | ) |
Institutional Class | | | — | | | | (2,503,050 | ) |
Total distributions to shareholders | | | (4,859,382 | ) | | | (30,527,070 | ) |
| | | | | | | | | |
Capital share transactions: | | | | | | | | |
Proceeds from sale of shares | | | | | | | | |
Class A | | | 363,510 | | | | 1,251,126 | |
Class C | | | 371,378 | | | | 693,027 | |
Class P | | | 1,153,271 | | | | 1,230,119 | |
Institutional Class | | | 31,903,722 | | | | 89,132,585 | |
Distributions reinvested | | | | | | | | |
Class A | | | 51,431 | | | | 353,469 | |
Class C | | | 44,417 | | | | 322,373 | |
Class P | | | 119,823 | | | | 751,253 | |
Institutional Class | | | 4,424,999 | | | | 25,711,484 | |
Cost of shares redeemed | | | | | | | | |
Class A | | | (862,433 | ) | | | (6,232,246 | ) |
Class C | | | (757,635 | ) | | | (1,422,158 | ) |
Class P | | | (1,337,786 | ) | | | (5,440,837 | ) |
Institutional Class | | | (85,452,958 | ) | | | (167,277,680 | ) |
Net decrease from capital share transactions | | | (49,978,261 | ) | | | (60,927,485 | ) |
Net decrease in net assets | | | (6,837,821 | ) | | | (83,953,206 | ) |
| | | | | | | | | |
Net assets: | | | | | | | | |
Beginning of period | | | 352,906,360 | | | | 436,859,566 | |
End of period | | $ | 346,068,539 | | | $ | 352,906,360 | |
| | | | | | | | | |
Capital share activity: | | | | | | | | |
Shares sold | | | | | | | | |
Class A | | | 12,075 | | | | 42,057 | |
Class C | | | 12,860 | | | | 23,748 | |
Class P | | | 37,730 | | | | 40,388 | |
Institutional Class | | | 1,040,432 | | | | 2,917,549 | |
Shares issued from reinvestment of distributions | | | | | | | | |
Class A | | | 1,626 | | | | 12,164 | |
Class C | | | 1,415 | | | | 11,190 | |
Class P | | | 3,767 | | | | 25,698 | |
Institutional Class | | | 137,914 | | | | 872,328 | |
Shares redeemed | | | | | | | | |
Class A | | | (28,787 | ) | | | (205,886 | ) |
Class C | | | (24,789 | ) | | | (48,660 | ) |
Class P | | | (44,023 | ) | | | (180,387 | ) |
Institutional Class | | | (2,880,949 | ) | | | (5,535,082 | ) |
Net decrease in shares | | | (1,730,729 | ) | | | (2,024,893 | ) |
SEE NOTES TO FINANCIAL STATEMENTS. | THE GUGGENHEIM FUNDS SEMI-ANNUAL REPORT | 57 |
RISK MANAGED REAL ESTATE FUND | |
This table is presented to show selected data for a share outstanding throughout each period and to assist shareholders in evaluating a Fund’s performance for the periods presented.
Class A | | Six Months Ended
March 31, 2024a | | | Year Ended
September 30,
2023 | | | Year Ended
September 30,
2022 | | | Year Ended
September 30,
2021 | | | Year Ended
September 30,
2020 | | | Year Ended
September 30,
2019 | |
Per Share Data |
Net asset value, beginning of period | | $ | 27.61 | | | $ | 29.48 | | | $ | 36.87 | | | $ | 29.97 | | | $ | 34.11 | | | $ | 28.93 | |
Income (loss) from investment operations: |
Net investment income (loss)b | | | .37 | | | | .56 | | | | .23 | | | | .32 | | | | .31 | | | | .34 | |
Net gain (loss) on investments (realized and unrealized) | | | 3.79 | | | | (.31 | ) | | | (5.35 | ) | | | 8.86 | | | | (2.53 | ) | | | 5.65 | |
Total from investment operations | | | 4.16 | | | | .25 | | | | (5.12 | ) | | | 9.18 | | | | (2.22 | ) | | | 5.99 | |
Less distributions from: |
Net investment income | | | (.39 | ) | | | (.63 | ) | | | (.55 | ) | | | (.54 | ) | | | (.63 | ) | | | (.55 | ) |
Return of capital | | | — | | | | (.20 | ) | | | — | | | | — | | | | — | | | | — | |
Net realized gains | | | — | | | | (1.29 | ) | | | (1.72 | ) | | | (1.74 | ) | | | (1.29 | ) | | | (.26 | ) |
Total distributions | | | (.39 | ) | | | (2.12 | ) | | | (2.27 | ) | | | (2.28 | ) | | | (1.92 | ) | | | (.81 | ) |
Net asset value, end of period | | $ | 31.38 | | | $ | 27.61 | | | $ | 29.48 | | | $ | 36.87 | | | $ | 29.97 | | | $ | 34.11 | |
|
Total Returnc | | | 15.04 | % | | | 0.58 | % | | | (15.31 | %) | | | 32.13 | % | | | (6.73 | %) | | | 21.12 | % |
Ratios/Supplemental Data |
Net assets, end of period (in thousands) | | $ | 4,391 | | | $ | 4,280 | | | $ | 9,043 | | | $ | 10,098 | | | $ | 15,857 | | | $ | 16,682 | |
Ratios to average net assets: |
Net investment income (loss) | | | 2.48 | % | | | 1.86 | % | | | 0.62 | % | | | 0.95 | % | | | 0.99 | % | | | 1.09 | % |
Total expensesd | | | 1.62 | % | | | 1.72 | % | | | 1.62 | % | | | 1.39 | % | | | 1.71 | % | | | 1.89 | % |
Net expensese,f,g | | | 1.59 | % | | | 1.66 | % | | | 1.58 | % | | | 1.38 | % | | | 1.70 | % | | | 1.88 | % |
Portfolio turnover rate | | | 28 | % | | | 21 | % | | | 47 | % | | | 80 | % | | | 180 | % | | | 122 | % |
Class C | | Six Months Ended
March 31, 2024a | | | Year Ended
September 30,
2023 | | | Year Ended
September 30,
2022 | | | Year Ended
September 30,
2021 | | | Year Ended
September 30,
2020 | | | Year Ended
September 30,
2019 | |
Per Share Data |
Net asset value, beginning of period | | $ | 27.38 | | | $ | 29.23 | | | $ | 36.55 | | | $ | 29.76 | | | $ | 33.88 | | | $ | 28.75 | |
Income (loss) from investment operations: |
Net investment income (loss)b | | | .26 | | | | .42 | | | | (.01 | ) | | | .05 | | | | .08 | | | | .11 | |
Net gain (loss) on investments (realized and unrealized) | | | 3.76 | | | | (.38 | ) | | | (5.30 | ) | | | 8.76 | | | | (2.53 | ) | | | 5.60 | |
Total from investment operations | | | 4.02 | | | | .04 | | | | (5.31 | ) | | | 8.81 | | | | (2.45 | ) | | | 5.71 | |
Less distributions from: |
Net investment income | | | (.28 | ) | | | (.40 | ) | | | (.29 | ) | | | (.28 | ) | | | (.38 | ) | | | (.32 | ) |
Return of capital | | | — | | | | (.20 | ) | | | — | | | | — | | | | — | | | | — | |
Net realized gains | | | — | | | | (1.29 | ) | | | (1.72 | ) | | | (1.74 | ) | | | (1.29 | ) | | | (.26 | ) |
Total distributions | | | (.28 | ) | | | (1.89 | ) | | | (2.01 | ) | | | (2.02 | ) | | | (1.67 | ) | | | (.58 | ) |
Net asset value, end of period | | $ | 31.12 | | | $ | 27.38 | | | $ | 29.23 | | | $ | 36.55 | | | $ | 29.76 | | | $ | 33.88 | |
|
Total Returnc | | | 14.66 | % | | | (0.10 | %) | | | (15.93 | %) | | | 31.05 | % | | | (7.48 | %) | | | 20.23 | % |
Ratios/Supplemental Data |
Net assets, end of period (in thousands) | | $ | 4,976 | | | $ | 4,667 | | | $ | 5,382 | | | $ | 5,029 | | | $ | 2,446 | | | $ | 1,721 | |
Ratios to average net assets: |
Net investment income (loss) | | | 1.79 | % | | | 1.40 | % | | | (0.03 | %) | | | 0.16 | % | | | 0.26 | % | | | 0.35 | % |
Total expensesd | | | 2.33 | % | | | 2.36 | % | | | 2.34 | % | | | 2.21 | % | | | 2.54 | % | | | 2.73 | % |
Net expensese,f,g | | | 2.29 | % | | | 2.32 | % | | | 2.31 | % | | | 2.20 | % | | | 2.51 | % | | | 2.65 | % |
Portfolio turnover rate | | | 28 | % | | | 21 | % | | | 47 | % | | | 80 | % | | | 180 | % | | | 122 | % |
58 | THE GUGGENHEIM FUNDS SEMI-ANNUAL REPORT | SEE NOTES TO FINANCIAL STATEMENTS. |
RISK MANAGED REAL ESTATE FUND | |
FINANCIAL HIGHLIGHTS (continued) |
This table is presented to show selected data for a share outstanding throughout each period and to assist shareholders in evaluating a Fund’s performance for the periods presented.
Class P | | Six Months Ended
March 31, 2024a | | | Year Ended
September 30,
2023 | | | Year Ended
September 30,
2022 | | | Year Ended
September 30,
2021 | | | Year Ended
September 30,
2020 | | | Year Ended
September 30,
2019 | |
Per Share Data |
Net asset value, beginning of period | | $ | 27.77 | | | $ | 29.63 | | | $ | 37.04 | | | $ | 30.12 | | | $ | 34.30 | | | $ | 29.09 | |
Income (loss) from investment operations: |
Net investment income (loss)b | | | .37 | | | | .60 | | | | .18 | | | | .29 | | | | .22 | | | | .60 | |
Net gain (loss) on investments (realized and unrealized) | | | 3.82 | | | | (.36 | ) | | | (5.35 | ) | | | 8.91 | | | | (2.48 | ) | | | 5.42 | |
Total from investment operations | | | 4.19 | | | | .24 | | | | (5.17 | ) | | | 9.20 | | | | (2.26 | ) | | | 6.02 | |
Less distributions from: |
Net investment income | | | (.39 | ) | | | (.61 | ) | | | (.52 | ) | | | (.54 | ) | | | (.63 | ) | | | (.55 | ) |
Return of capital | | | — | | | | (.20 | ) | | | — | | | | — | | | | — | | | | — | |
Net realized gains | | | — | | | | (1.29 | ) | | | (1.72 | ) | | | (1.74 | ) | | | (1.29 | ) | | | (.26 | ) |
Total distributions | | | (.39 | ) | | | (2.10 | ) | | | (2.24 | ) | | | (2.28 | ) | | | (1.92 | ) | | | (.81 | ) |
Net asset value, end of period | | $ | 31.57 | | | $ | 27.77 | | | $ | 29.63 | | | $ | 37.04 | | | $ | 30.12 | | | $ | 34.30 | |
|
Total Return | | | 15.07 | % | | | 0.55 | % | | | (15.35 | %) | | | 32.03 | % | | | (6.81 | %) | | | 21.12 | % |
Ratios/Supplemental Data |
Net assets, end of period (in thousands) | | $ | 9,859 | | | $ | 8,743 | | | $ | 12,716 | | | $ | 14,830 | | | $ | 12,152 | | | $ | 33,894 | |
Ratios to average net assets: |
Net investment income (loss) | | | 2.49 | % | | | 1.99 | % | | | 0.48 | % | | | 0.86 | % | | | 0.70 | % | | | 1.87 | % |
Total expensesd | | | 1.66 | % | | | 1.73 | % | | | 1.69 | % | | | 1.47 | % | | | 1.84 | % | | | 1.93 | % |
Net expensese,f,g | | | 1.63 | % | | | 1.66 | % | | | 1.64 | % | | | 1.45 | % | | | 1.78 | % | | | 1.89 | % |
Portfolio turnover rate | | | 28 | % | | | 21 | % | | | 47 | % | | | 80 | % | | | 180 | % | | | 122 | % |
SEE NOTES TO FINANCIAL STATEMENTS. | THE GUGGENHEIM FUNDS SEMI-ANNUAL REPORT | 59 |
RISK MANAGED REAL ESTATE FUND | |
FINANCIAL HIGHLIGHTS (concluded) |
This table is presented to show selected data for a share outstanding throughout each period and to assist shareholders in evaluating a Fund’s performance for the periods presented.
Institutional Class | | Six Months Ended
March 31, 2024a | | | Year Ended
September 30,
2023 | | | Year Ended
September 30,
2022 | | | Year Ended
September 30,
2021 | | | Year Ended
September 30,
2020 | | | Year Ended
September 30,
2019 | |
Per Share Data |
Net asset value, beginning of period | | $ | 28.01 | | | $ | 29.88 | | | $ | 37.34 | | | $ | 30.34 | | | $ | 34.51 | | | $ | 29.27 | |
Income (loss) from investment operations: |
Net investment income (loss)b | | | .42 | | | | .74 | | | | .34 | | | | .41 | | | | .41 | | | | .43 | |
Net gain (loss) on investments (realized and unrealized) | | | 3.86 | | | | (.39 | ) | | | (5.42 | ) | | | 8.98 | | | | (2.58 | ) | | | 5.71 | |
Total from investment operations | | | 4.28 | | | | .35 | | | | (5.08 | ) | | | 9.39 | | | | (2.17 | ) | | | 6.14 | |
Less distributions from: |
Net investment income | | | (.45 | ) | | | (.73 | ) | | | (.66 | ) | | | (.65 | ) | | | (.71 | ) | | | (.64 | ) |
Return of capital | | | — | | | | (.20 | ) | | | — | | | | — | | | | — | | | | — | |
Net realized gains | | | — | | | | (1.29 | ) | | | (1.72 | ) | | | (1.74 | ) | | | (1.29 | ) | | | (.26 | ) |
Total distributions | | | (.45 | ) | | | (2.22 | ) | | | (2.38 | ) | | | (2.39 | ) | | | (2.00 | ) | | | (.90 | ) |
Net asset value, end of period | | $ | 31.84 | | | $ | 28.01 | | | $ | 29.88 | | | $ | 37.34 | | | $ | 30.34 | | | $ | 34.51 | |
|
Total Return | | | 15.27 | % | | | 0.91 | % | | | (15.05 | %) | | | 32.52 | % | | | (6.48 | %) | | | 21.46 | % |
Ratios/Supplemental Data |
Net assets, end of period (in thousands) | | $ | 326,842 | | | $ | 335,217 | | | $ | 409,719 | | | $ | 465,267 | | | $ | 290,551 | | | $ | 200,301 | |
Ratios to average net assets: |
Net investment income (loss) | | | 2.78 | % | | | 2.43 | % | | | 0.92 | % | | | 1.18 | % | | | 1.31 | % | | | 1.38 | % |
Total expensesd | | | 1.30 | % | | | 1.34 | % | | | 1.30 | % | | | 1.10 | % | | | 1.43 | % | | | 1.61 | % |
Net expensese,f,g | | | 1.27 | % | | | 1.29 | % | | | 1.28 | % | | | 1.10 | % | | | 1.43 | % | | | 1.60 | % |
Portfolio turnover rate | | | 28 | % | | | 21 | % | | | 47 | % | | | 80 | % | | | 180 | % | | | 122 | % |
a | Unaudited figures for the period ended March 31, 2024. Percentage amounts for the period, except total return and portfolio turnover rate, have been annualized. |
b | Net investment income (loss) per share was computed using average shares outstanding throughout the period. |
c | Total return does not reflect the impact of any applicable sales charges. |
d | Does not include expenses of the underlying funds in which the Fund invests. |
e | Net expense information reflects the expense ratios after expense waivers and reimbursements, as applicable. |
f | The portion of the ratios of net expenses to average net assets attributable to recoupments of prior fee reductions or expense reimbursements for the years presented was as follows: |
| | | 03/31/24 | 09/30/23 | 09/30/22 | 09/30/21 | 09/30/20 | 09/30/19 |
| | Class A | 0.04% | 0.03% | 0.02% | 0.01% | 0.02% | 0.03% |
| | Class C | 0.03% | 0.01% | 0.03% | 0.06% | 0.04% | 0.01% |
| | Class P | 0.05% | 0.01% | 0.05% | 0.06% | 0.02% | 0.02% |
| | Institutional Class | 0.01% | 0.02% | 0.01% | 0.00%* | 0.01% | 0.01% |
g | Net expenses may include expenses that are excluded from the expense limitation agreement. Excluding these expenses, the net expense ratios for the years presented would be: |
| | | 03/31/24 | 09/30/23 | 09/30/22 | 09/30/21 | 09/30/20 | 09/30/19 |
| | Class A | 1.24% | 1.27% | 1.22% | 1.21% | 1.23% | 1.27% |
| | Class C | 1.94% | 1.93% | 1.95% | 2.04% | 2.05% | 2.05% |
| | Class P | 1.27% | 1.27% | 1.28% | 1.29% | 1.30% | 1.30% |
| | Institutional Class | 0.91% | 0.90% | 0.92% | 0.94% | 0.96% | 1.00% |
60 | THE GUGGENHEIM FUNDS SEMI-ANNUAL REPORT | SEE NOTES TO FINANCIAL STATEMENTS. |
PERFORMANCE REPORT AND FUND PROFILE (Unaudited) | March 31, 2024 |
SMALL CAP VALUE FUND
OBJECTIVE: Seeks long-term capital appreciation.
Holdings Diversification (Market Exposure as % of Net Assets)
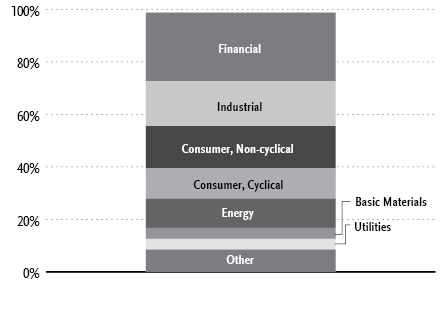
“Holdings Diversification (Market Exposure as % of Net Assets)” excludes any temporary cash investments.
Inception Dates: |
Class A | July 11, 2008 |
Class C | July 11, 2008 |
Class P | May 1, 2015 |
Institutional Class | July 11, 2008 |
Ten Largest Holdings | % of Total Net Assets |
SPDR S&P Biotech ETF | 3.1% |
Pioneer Natural Resources Co. | 2.8% |
Rush Enterprises, Inc. — Class A | 2.3% |
MGP Ingredients, Inc. | 2.1% |
Encompass Health Corp. | 2.1% |
Stifel Financial Corp. | 2.1% |
Liberty Energy, Inc. — Class A | 2.0% |
H&E Equipment Services, Inc. | 1.9% |
Murphy Oil Corp. | 1.8% |
Enovis Corp. | 1.7% |
Top Ten Total | 21.9% |
| | |
“Ten Largest Holdings” excludes any temporary cash investments. |
| | THE GUGGENHEIM FUNDS SEMI-ANNUAL REPORT | 61 |
PERFORMANCE REPORT AND FUND PROFILE (Unaudited)(concluded) | March 31, 2024 |
Average Annual Returns*
Periods Ended March 31, 2024
| 6 Month† | 1 Year | 5 Year | 10 Year |
Class A Shares | 16.69% | 16.15% | 9.12% | 5.66% |
Class A Shares with sales charge‡ | 11.15% | 10.66% | 8.07% | 5.14% |
Class C Shares | 16.25% | 15.32% | 8.31% | 4.87% |
Class C Shares with CDSC§ | 15.25% | 14.32% | 8.31% | 4.87% |
Institutional Class Shares | 16.90% | 16.47% | 9.40% | 5.92% |
Russell 2000 Value Index | 18.60% | 18.75% | 8.17% | 6.87% |
| 6 Month† | 1 Year | 5 Year | Since
Inception
(05/01/15) |
Class P Shares | 16.74% | 16.13% | 9.13% | 6.72% |
Russell 2000 Value Index | 18.60% | 18.75% | 8.17% | 7.44% |
* | The performance data above represents past performance that is not predictive of future results. The investment return and principal value of an investment in the Fund will fluctuate so that an investor’s shares, when redeemed, may be worth more or less than their original cost. Returns are historical and include changes in principal and reinvested dividends and capital gains and do not reflect the effect of taxes. The Russell 2000 Value Index is an unmanaged index and, unlike the Fund, has no management fees or operating expenses to reduce its reported return. |
† | 6 month returns are not annualized. |
‡ | Fund returns are calculated using the maximum sales charge of 4.75%. |
§ | Fund returns include a CDSC of 1% if redeemed within 12 months of purchase. |
62 | THE GUGGENHEIM FUNDS SEMI-ANNUAL REPORT | |
SCHEDULE OF INVESTMENTS (Unaudited) | March 31, 2024 |
SMALL CAP VALUE FUND | |
| | Shares | | | Value | |
COMMON STOCKS† - 95.6% |
| | | | | | | | | |
Financial - 26.2% |
Stifel Financial Corp. | | | 1,437 | | | $ | 112,330 | |
Old National Bancorp | | | 4,783 | | | | 83,272 | |
First Merchants Corp. | | | 2,378 | | | | 82,992 | |
STAG Industrial, Inc. REIT | | | 1,972 | | | | 75,804 | |
Cathay General Bancorp | | | 1,919 | | | | 72,596 | |
Unum Group | | | 1,349 | | | | 72,387 | |
First Horizon Corp. | | | 4,469 | | | | 68,822 | |
Healthpeak Properties, Inc. REIT | | | 3,164 | | | | 59,320 | |
Old Republic International Corp. | | | 1,838 | | | | 56,463 | |
LXP Industrial Trust REIT | | | 5,801 | | | | 52,325 | |
First American Financial Corp. | | | 853 | | | | 52,076 | |
Prosperity Bancshares, Inc. | | | 785 | | | | 51,637 | |
Hanmi Financial Corp. | | | 3,167 | | | | 50,419 | |
Hancock Whitney Corp. | | | 1,085 | | | | 49,953 | |
Jefferies Financial Group, Inc. | | | 958 | | | | 42,248 | |
Apple Hospitality REIT, Inc. | | | 2,566 | | | | 42,031 | |
Simmons First National Corp. — Class A | | | 2,108 | | | | 41,022 | |
Synovus Financial Corp. | | | 948 | | | | 37,977 | |
WisdomTree, Inc. | | | 4,021 | | | | 36,953 | |
Sunstone Hotel Investors, Inc. REIT | | | 2,939 | | | | 32,741 | |
BOK Financial Corp. | | | 335 | | | | 30,820 | |
MGIC Investment Corp. | | | 1,349 | | | | 30,164 | |
Stewart Information Services Corp. | | | 461 | | | | 29,993 | |
Independent Bank Group, Inc. | | | 636 | | | | 29,033 | |
Jones Lang LaSalle, Inc.* | | | 148 | | | | 28,873 | |
United Bankshares, Inc. | | | 711 | | | | 25,447 | |
First Hawaiian, Inc. | | | 1,095 | | | | 24,046 | |
United Community Banks, Inc. | | | 793 | | | | 20,872 | |
RMR Group, Inc. — Class A | | | 752 | | | | 18,048 | |
Piedmont Office Realty Trust, Inc. — Class A REIT | | | 2,170 | | | | 15,255 | |
Total Financial | | | | | | | 1,425,919 | |
| | | | | | | | | |
Industrial - 17.0% |
Arcosa, Inc. | | | 1,029 | | | | 88,350 | |
Summit Materials, Inc. — Class A* | | | 1,911 | | | | 85,173 | |
Kirby Corp.* | | | 890 | | | | 84,835 | |
Moog, Inc. — Class A | | | 519 | | | | 82,858 | |
Knight-Swift Transportation Holdings, Inc. | | | 1,220 | | | | 67,124 | |
Curtiss-Wright Corp. | | | 258 | | | | 66,033 | |
Esab Corp. | | | 577 | | | | 63,799 | |
Advanced Energy Industries, Inc. | | | 603 | | | | 61,494 | |
MDU Resources Group, Inc. | | | 2,345 | | | | 59,094 | |
Sonoco Products Co. | | | 919 | | | | 53,155 | |
Graphic Packaging Holding Co. | | | 1,704 | | | | 49,723 | |
Belden, Inc. | | | 486 | | | | 45,008 | |
Park Aerospace Corp. | | | 2,491 | | | | 41,425 | |
Littelfuse, Inc. | | | 139 | | | | 33,687 | |
Timken Co. | | | 172 | | | | 15,038 | |
NVE Corp. | | | 164 | | | | 14,790 | |
Stoneridge, Inc.* | | | 580 | | | | 10,695 | |
Total Industrial | | | | | | | 922,281 | |
| | | | | | | | | |
Consumer, Non-cyclical - 16.0% |
MGP Ingredients, Inc. | | | 1,353 | | | | 116,534 | |
Encompass Health Corp. | | | 1,385 | | | | 114,373 | |
Enovis Corp.* | | | 1,511 | | | | 94,362 | |
Euronet Worldwide, Inc.* | | | 829 | | | | 91,132 | |
Central Garden & Pet Co. — Class A* | | | 1,676 | | | | 61,887 | |
Ingredion, Inc. | | | 439 | | | | 51,297 | |
LivaNova plc* | | | 906 | | | | 50,682 | |
Certara, Inc.* | | | 2,690 | | | | 48,097 | |
Addus HomeCare Corp.* | | | 438 | | | | 45,263 | |
RadNet, Inc.* | | | 925 | | | | 45,011 | |
ICF International, Inc. | | | 286 | | | | 43,080 | |
Integer Holdings Corp.* | | | 271 | | | | 31,620 | |
Perdoceo Education Corp. | | | 1,747 | | | | 30,677 | |
Azenta, Inc.* | | | 474 | | | | 28,573 | |
Ginkgo Bioworks Holdings, Inc.* | | | 16,037 | | | | 18,603 | |
Total Consumer, Non-cyclical | | | | | | | 871,191 | |
| | | | | | | | | |
Consumer, Cyclical - 11.7% |
Rush Enterprises, Inc. — Class A | | | 2,335 | | | | 124,969 | |
H&E Equipment Services, Inc. | | | 1,617 | | | | 103,779 | |
Crocs, Inc.* | | | 451 | | | | 64,854 | |
Alaska Air Group, Inc.* | | | 1,064 | | | | 45,741 | |
Sonic Automotive, Inc. — Class A | | | 775 | | | | 44,129 | |
MSC Industrial Direct Company, Inc. — Class A | | | 393 | | | | 38,137 | |
Advance Auto Parts, Inc. | | | 401 | | | | 34,121 | |
Lakeland Industries, Inc. | | | 1,779 | | | | 32,556 | |
AutoNation, Inc.* | | | 184 | | | | 30,467 | |
MarineMax, Inc.* | | | 886 | | | | 29,468 | |
Whirlpool Corp. | | | 182 | | | | 21,773 | |
Macy’s, Inc. | | | 1,063 | | | | 21,249 | |
Newell Brands, Inc. | | | 2,347 | | | | 18,846 | |
Century Communities, Inc. | | | 152 | | | | 14,668 | |
Methode Electronics, Inc. | | | 987 | | | | 12,022 | |
Total Consumer, Cyclical | | | | | | | 636,779 | |
| | | | | | | | | |
Energy - 11.1% |
Pioneer Natural Resources Co. | | | 580 | | | | 152,250 | |
Liberty Energy, Inc. — Class A | | | 5,306 | | | | 109,940 | |
Murphy Oil Corp. | | | 2,104 | | | | 96,153 | |
CNX Resources Corp.* | | | 3,432 | | | | 81,407 | |
Diamondback Energy, Inc. | | | 202 | | | | 40,030 | |
Baytex Energy Corp. | | | 10,566 | | | | 38,355 | |
Talos Energy, Inc.* | | | 2,585 | | | | 36,009 | |
Range Resources Corp. | | | 792 | | | | 27,269 | |
Patterson-UTI Energy, Inc. | | | 1,930 | | | | 23,044 | |
Total Energy | | | | | | | 604,457 | |
| | | | | | | | | |
Utilities - 4.2% |
OGE Energy Corp. | | | 2,711 | | | | 92,987 | |
Spire, Inc. | | | 624 | | | | 38,295 | |
Black Hills Corp. | | | 659 | | | | 35,982 | |
Avista Corp. | | | 883 | | | | 30,923 | |
ALLETE, Inc. | | | 491 | | | | 29,283 | |
Total Utilities | | | | | | | 227,470 | |
| | | | | | | | | |
SEE NOTES TO FINANCIAL STATEMENTS. | THE GUGGENHEIM FUNDS SEMI-ANNUAL REPORT | 63 |
SCHEDULE OF INVESTMENTS (Unaudited)(concluded) | March 31, 2024 |
SMALL CAP VALUE FUND | |
| | Shares | | | Value | |
Basic Materials - 4.1% |
Avient Corp. | | | 1,552 | | | $ | 67,357 | |
Ashland, Inc. | | | 565 | | | | 55,014 | |
Commercial Metals Co. | | | 805 | | | | 47,310 | |
Huntsman Corp. | | | 1,256 | | | | 32,693 | |
MP Materials Corp.* | | | 1,563 | | | | 22,351 | |
Total Basic Materials | | | | | | | 224,725 | |
| | | | | | | | | |
Technology - 3.1% |
Science Applications International Corp. | | | 682 | | | | 88,926 | |
Amkor Technology, Inc. | | | 1,605 | | | | 51,745 | |
Wolfspeed, Inc.* | | | 991 | | | | 29,235 | |
Total Technology | | | | | | | 169,906 | |
| | | | | | | | | |
Communications - 2.2% |
Ciena Corp.* | | | 743 | | | | 36,741 | |
Calix, Inc.* | | | 918 | | | | 30,441 | |
TEGNA, Inc. | | | 1,694 | | | | 25,308 | |
Gray Television, Inc. | | | 2,729 | | | | 17,247 | |
Luna Innovations, Inc.* | | | 3,890 | | | | 12,468 | |
Total Communications | | | | | | | 122,205 | |
| | | | | | | | | |
Total Common Stocks | | | | |
(Cost $4,669,123) | | | | | | | 5,204,933 | |
| | | | | | | | | |
CONVERTIBLE PREFERRED STOCKS††† - 0.0% |
Industrial - 0.0% |
Thermoenergy Corp.*, 1 | | | 6,250 | | | | 2 | |
Total Convertible Preferred Stocks | | | | |
(Cost $5,968) | | | | | | | 2 | |
| | | | | | | | | |
RIGHTS† - 0.2% |
Basic Materials - 0.2% |
Pan American Silver Corp.* | | | 17,705 | | | | 7,932 | |
Total Rights | | | | |
(Cost $—) | | | | | | | 7,932 | |
| | | | | | | | | |
EXCHANGE-TRADED FUNDS† - 3.1% |
SPDR S&P Biotech ETF | | | 1,778 | | | | 168,714 | |
Total Exchange-Traded Funds | | | | |
(Cost $147,369) | | | | | | | 168,714 | |
| | | | | | | | | |
MONEY MARKET FUND† - 0.0% |
Dreyfus Treasury Securities Cash Management Fund — Institutional Shares, 5.19%2 | | | 2,255 | | | | 2,255 | |
Total Money Market Fund | | | | |
(Cost $2,255) | | | | | | | 2,255 | |
| | | | | | | | | |
Total Investments - 98.9% | | | | |
(Cost $4,824,715) | | $ | 5,383,836 | |
Other Assets & Liabilities, net - 1.1% | | | 58,508 | |
Total Net Assets - 100.0% | | $ | 5,442,344 | |
* | Non-income producing security. |
† | Value determined based on Level 1 inputs — See Note 4. |
††† | Value determined based on Level 3 inputs — See Note 4. |
1 | PIPE (Private Investment in Public Equity) — Stock issued by a company in the secondary market as a means of raising capital more quickly and less expensively than through registration of a secondary public offering. |
2 | Rate indicated is the 7-day yield as of March 31, 2024. |
| | plc — Public Limited Company |
| | REIT — Real Estate Investment Trust |
| | |
| | See Sector Classification in Other Information section. |
The following table summarizes the inputs used to value the Fund’s investments at March 31, 2024 (See Note 4 in the Notes to Financial Statements):
Investments in Securities (Assets) | | Level 1
Quoted
Prices | | | Level 2
Significant
Observable
Inputs | | | Level 3
Significant
Unobservable
Inputs | | | Total | |
Common Stocks | | $ | 5,204,933 | | | $ | — | | | $ | — | | | $ | 5,204,933 | |
Convertible Preferred Stocks | | | — | | | | — | | | | 2 | | | | 2 | |
Rights | | | 7,932 | | | | — | | | | — | | | | 7,932 | |
Exchange-Traded Funds | | | 168,714 | | | | — | | | | — | | | | 168,714 | |
Money Market Fund | | | 2,255 | | | | — | | | | — | | | | 2,255 | |
Total Assets | | $ | 5,383,834 | | | $ | — | | | $ | 2 | | | $ | 5,383,836 | |
64 | THE GUGGENHEIM FUNDS SEMI-ANNUAL REPORT | SEE NOTES TO FINANCIAL STATEMENTS. |
STATEMENT OF ASSETS AND LIABILITIES (Unaudited) |
March 31, 2024 |
Assets: |
Investments, at value (cost $4,824,715) | | $ | 5,383,836 | |
Cash | | | 23,972 | |
Prepaid expenses | | | 16,151 | |
Receivables: |
Securities sold | | | 26,923 | |
Investment Adviser | | | 7,218 | |
Dividends | | | 6,833 | |
Interest | | | 215 | |
Fund shares sold | | | 71 | |
Total assets | | | 5,465,219 | |
| | | | | |
Liabilities: |
Payable for: |
Professional fees | | | 10,173 | |
Transfer agent fees | | | 4,775 | |
Fund accounting/administration fees | | | 3,856 | |
Trustees’ fees* | | | 1,300 | |
Distribution and service fees | | | 1,289 | |
Fund shares redeemed | | | 38 | |
Due to Investment Adviser | | | 6 | |
Miscellaneous | | | 1,438 | |
Total liabilities | | | 22,875 | |
Net assets | | $ | 5,442,344 | |
| | | | | |
Net assets consist of: |
Paid in capital | | $ | 4,835,326 | |
Total distributable earnings (loss) | | | 607,018 | |
Net assets | | $ | 5,442,344 | |
Class A: |
Net assets | | $ | 4,270,657 | |
Capital shares outstanding | | | 262,903 | |
Net asset value per share | | $ | 16.24 | |
Maximum offering price per share (Net asset value divided by 95.25%) | | $ | 17.05 | |
Class C: |
Net assets | | $ | 459,125 | |
Capital shares outstanding | | | 31,377 | |
Net asset value per share | | $ | 14.63 | |
Class P: |
Net assets | | $ | 63,320 | |
Capital shares outstanding | | | 3,872 | |
Net asset value per share | | $ | 16.35 | |
| | | | | |
Institutional Class: |
Net assets | | $ | 649,242 | |
Capital shares outstanding | | | 45,941 | |
Net asset value per share | | $ | 14.13 | |
STATEMENT OF OPERATIONS (Unaudited) |
Six Months Ended March 31, 2024 |
Investment Income: |
Dividends (net of foreign withholding tax of $53) | | $ | 51,439 | |
Interest | | | 3,172 | |
Total investment income | | | 54,611 | |
| | | | | |
Expenses: |
Management fees | | | 19,484 | |
Distribution and service fees: | | | | |
Class A | | | 5,133 | |
Class C | | | 2,116 | |
Class P | | | 73 | |
Transfer agent fees: |
Class A | | | 11,983 | |
Class C | | | 1,507 | |
Class P | | | 310 | |
Institutional Class | | | 2,870 | |
Registration fees | | | 59,983 | |
Professional fees | | | 17,456 | |
Trustees’ fees* | | | 6,903 | |
Fund accounting/administration fees | | | 6,639 | |
Custodian fees | | | 1,785 | |
Line of credit fees | | | 106 | |
Miscellaneous | | | 5,184 | |
Total expenses | | | 141,532 | |
Less: |
Expenses reimbursed by Adviser: |
Class A | | | (67,866 | ) |
Class C | | | (7,276 | ) |
Class P | | | (1,104 | ) |
Institutional Class | | | (11,043 | ) |
Expenses waived by Adviser | | | (20,280 | ) |
Total waived/reimbursed expenses | | | (107,569 | ) |
Net expenses | | | 33,963 | |
Net investment income | | | 20,648 | |
| | | | | |
Net Realized and Unrealized Gain (Loss): |
Net realized gain (loss) on: |
Investments | | | 80,159 | |
Net realized gain | | | 80,159 | |
Net change in unrealized appreciation (depreciation) on: |
Investments | | | 696,186 | |
Net change in unrealized appreciation (depreciation) | | | 696,186 | |
Net realized and unrealized gain | | | 776,345 | |
Net increase in net assets resulting from operations | | $ | 796,993 | |
* | Relates to Trustees not deemed “interested persons” within the meaning of Section 2(a)(19) of the 1940 Act. |
SEE NOTES TO FINANCIAL STATEMENTS. | THE GUGGENHEIM FUNDS SEMI-ANNUAL REPORT | 65 |
STATEMENTS OF CHANGES IN NET ASSETS |
| | Six Months Ended
March 31, 2024
(Unaudited) | | | Year Ended
September 30,
2023 | |
Increase (Decrease) in Net Assets from Operations: | | | | | | | | |
Net investment income | | $ | 20,648 | | | $ | 77,392 | |
Net realized gain on investments | | | 80,159 | | | | 613,023 | |
Net change in unrealized appreciation (depreciation) on investments | | | 696,186 | | | | 16,529 | |
Net increase in net assets resulting from operations | | | 796,993 | | | | 706,944 | |
| | | | | | | | | |
Distributions to shareholders: | | | | | | | | |
Class A | | | (327,764 | ) | | | (204,624 | ) |
Class C | | | (33,404 | ) | | | (21,650 | ) |
Class P | | | (4,828 | ) | | | (7,239 | ) |
Institutional Class | | | (64,551 | ) | | | (95,567 | ) |
Total distributions to shareholders | | | (430,547 | ) | | | (329,080 | ) |
| | | | | | | | | |
Capital share transactions: | | | | | | | | |
Proceeds from sale of shares | | | | | | | | |
Class A | | | 84,405 | | | | 329,795 | |
Class C | | | 12,566 | | | | 12,037 | |
Class P | | | 7,323 | | | | 48,131 | |
Institutional Class | | | 2,502 | | | | 3,266,307 | |
Distributions reinvested | | | | | | | | |
Class A | | | 322,243 | | | | 199,088 | |
Class C | | | 33,404 | | | | 21,650 | |
Class P | | | 4,828 | | | | 7,117 | |
Institutional Class | | | 64,551 | | | | 95,567 | |
Cost of shares redeemed | | | | | | | | |
Class A | | | (434,964 | ) | | | (706,211 | ) |
Class C | | | (23,411 | ) | | | (138,572 | ) |
Class P | | | (7,671 | ) | | | (144,193 | ) |
Institutional Class | | | (507,586 | ) | | | (4,379,888 | ) |
Net decrease from capital share transactions | | | (441,810 | ) | | | (1,389,172 | ) |
Net decrease in net assets | | | (75,364 | ) | | | (1,011,308 | ) |
| | | | | | | | | |
Net assets: | | | | | | | | |
Beginning of period | | | 5,517,708 | | | | 6,529,016 | |
End of period | | $ | 5,442,344 | | | $ | 5,517,708 | |
| | | | | | | | | |
Capital share activity: | | | | | | | | |
Shares sold | | | | | | | | |
Class A | | | 5,567 | | | | 20,904 | |
Class C | | | 919 | | | | 855 | |
Class P | | | 478 | | | | 3,028 | |
Institutional Class | | | 187 | | | | 231,463 | |
Shares issued from reinvestment of distributions | | | | | | | | |
Class A | | | 21,007 | | | | 13,229 | |
Class C | | | 2,412 | | | | 1,581 | |
Class P | | | 313 | | | | 467 | |
Institutional Class | | | 4,839 | | | | 7,100 | |
Shares redeemed | | | | | | | | |
Class A | | | (28,145 | ) | | | (45,344 | ) |
Class C | | | (1,688 | ) | | | (9,606 | ) |
Class P | | | (493 | ) | | | (9,549 | ) |
Institutional Class | | | (38,830 | ) | | | (320,156 | ) |
Net decrease in shares | | | (33,434 | ) | | | (106,028 | ) |
66 | THE GUGGENHEIM FUNDS SEMI-ANNUAL REPORT | SEE NOTES TO FINANCIAL STATEMENTS. |
This table is presented to show selected data for a share outstanding throughout each period and to assist shareholders in evaluating a Fund’s performance for the periods presented.
Class A | | Six Months Ended
March 31, 2024a | | | Year Ended
September 30,
2023 | | | Year Ended
September 30,
2022 | | | Year Ended
September 30,
2021 | | | Year Ended
September 30,
2020 | | | Year Ended
September 30,
2019 | |
Per Share Data |
Net asset value, beginning of period | | $ | 15.06 | | | $ | 14.06 | | | $ | 15.93 | | | $ | 10.61 | | | $ | 12.86 | | | $ | 15.56 | |
Income (loss) from investment operations: |
Net investment income (loss)b | | | .06 | | | | .16 | | | | .13 | | | | .07 | | | | .06 | | | | .10 | |
Net gain (loss) on investments (realized and unrealized) | | | 2.38 | | | | 1.58 | | | | (1.93 | ) | | | 5.37 | | | | (1.87 | ) | | | (1.28 | ) |
Total from investment operations | | | 2.44 | | | | 1.74 | | | | (1.80 | ) | | | 5.44 | | | | (1.81 | ) | | | (1.18 | ) |
Less distributions from: |
Net investment income | | | (.16 | ) | | | (.17 | ) | | | — | | | | (.12 | ) | | | (.18 | ) | | | (.19 | ) |
Net realized gains | | | (1.10 | ) | | | (.57 | ) | | | (.07 | ) | | | — | | | | (.26 | ) | | | (1.33 | ) |
Total distributions | | | (1.26 | ) | | | (.74 | ) | | | (.07 | ) | | | (.12 | ) | | | (.44 | ) | | | (1.52 | ) |
Net asset value, end of period | | $ | 16.24 | | | $ | 15.06 | | | $ | 14.06 | | | $ | 15.93 | | | $ | 10.61 | | | $ | 12.86 | |
|
Total Returnc | | | 16.69 | % | | | 12.38 | % | | | (11.36 | %) | | | 51.48 | % | | | (14.79 | %) | | | (6.14 | %) |
Ratios/Supplemental Data |
Net assets, end of period (in thousands) | | $ | 4,271 | | | $ | 3,982 | | | $ | 3,876 | | | $ | 4,521 | | | $ | 3,390 | | | $ | 9,751 | |
Ratios to average net assets: |
Net investment income (loss) | | | 0.83 | % | | | 1.06 | % | | | 0.80 | % | | | 0.47 | % | | | 0.54 | % | | | 0.75 | % |
Total expensesd | | | 5.36 | % | | | 3.43 | % | | | 3.50 | % | | | 4.07 | % | | | 3.23 | % | | | 2.27 | % |
Net expensese,f,g | | | 1.28 | % | | | 1.27 | % | | | 1.30 | % | | | 1.30 | % | | | 1.30 | % | | | 1.30 | % |
Portfolio turnover rate | | | 17 | % | | | 72 | % | | | 37 | % | | | 28 | % | | | 40 | % | | | 78 | % |
Class C | | Six Months Ended
March 31, 2024a | | | Year Ended
September 30,
2023 | | | Year Ended
September 30,
2022 | | | Year Ended
September 30,
2021 | | | Year Ended
September 30,
2020 | | | Year Ended
September 30,
2019 | |
Per Share Data |
Net asset value, beginning of period | | $ | 13.62 | | | $ | 12.76 | | | $ | 14.57 | | | $ | 9.69 | | | $ | 11.75 | | | $ | 14.30 | |
Income (loss) from investment operations: |
Net investment income (loss)b | | | .01 | | | | .04 | | | | — | h | | | (.03 | ) | | | (.02 | ) | | | — | h |
Net gain (loss) on investments (realized and unrealized) | | | 2.14 | | | | 1.44 | | | | (1.74 | ) | | | 4.91 | | | | (1.73 | ) | | | (1.18 | ) |
Total from investment operations | | | 2.15 | | | | 1.48 | | | | (1.74 | ) | | | 4.88 | | | | (1.75 | ) | | | (1.18 | ) |
Less distributions from: |
Net investment income | | | (.04 | ) | | | (.05 | ) | | | — | | | | — | | | | (.05 | ) | | | (.04 | ) |
Net realized gains | | | (1.10 | ) | | | (.57 | ) | | | (.07 | ) | | | — | | | | (.26 | ) | | | (1.33 | ) |
Total distributions | | | (1.14 | ) | | | (.62 | ) | | | (.07 | ) | | | — | | | | (.31 | ) | | | (1.37 | ) |
Net asset value, end of period | | $ | 14.63 | | | $ | 13.62 | | | $ | 12.76 | | | $ | 14.57 | | | $ | 9.69 | | | $ | 11.75 | |
|
Total Returnc | | | 16.25 | % | | | 11.57 | % | | | (12.02 | %) | | | 50.36 | % | | | (15.43 | %) | | | (6.89 | %) |
Ratios/Supplemental Data |
Net assets, end of period (in thousands) | | $ | 459 | | | $ | 405 | | | $ | 471 | | | $ | 762 | | | $ | 765 | | | $ | 1,593 | |
Ratios to average net assets: |
Net investment income (loss) | | | 0.08 | % | | | 0.30 | % | | | (0.02 | %) | | | (0.25 | %) | | | (0.14 | %) | | | 0.01 | % |
Total expensesd | | | 6.25 | % | | | 4.26 | % | | | 4.41 | % | | | 5.04 | % | | | 4.33 | % | | | 3.09 | % |
Net expensese,f,g | | | 2.03 | % | | | 2.02 | % | | | 2.05 | % | | | 2.05 | % | | | 2.06 | % | | | 2.05 | % |
Portfolio turnover rate | | | 17 | % | | | 72 | % | | | 37 | % | | | 28 | % | | | 40 | % | | | 78 | % |
SEE NOTES TO FINANCIAL STATEMENTS. | THE GUGGENHEIM FUNDS SEMI-ANNUAL REPORT | 67 |
FINANCIAL HIGHLIGHTS (continued) |
This table is presented to show selected data for a share outstanding throughout each period and to assist shareholders in evaluating a Fund’s performance for the periods presented.
Class P | | Six Months Ended
March 31, 2024a | | | Year Ended
September 30,
2023 | | | Year Ended
September 30,
2022 | | | Year Ended
September 30,
2021 | | | Year Ended
September 30,
2020 | | | Year Ended
September 30,
2019 | |
Per Share Data |
Net asset value, beginning of period | | $ | 15.24 | | | $ | 14.17 | | | $ | 16.05 | | | $ | 10.75 | | | $ | 13.01 | | | $ | 15.73 | |
Income (loss) from investment operations: |
Net investment income (loss)b | | | .06 | | | | .18 | | | | .16 | | | | .07 | | | | .05 | | | | .09 | |
Net gain (loss) on investments (realized and unrealized) | | | 2.41 | | | | 1.57 | | | | (1.97 | ) | | | 5.42 | | | | (1.86 | ) | | | (1.29 | ) |
Total from investment operations | | | 2.47 | | | | 1.75 | | | | (1.81 | ) | | | 5.49 | | | | (1.81 | ) | | | (1.20 | ) |
Less distributions from: |
Net investment income | | | (.26 | ) | | | (.11 | ) | | | — | | | | (.19 | ) | | | (.19 | ) | | | (.19 | ) |
Net realized gains | | | (1.10 | ) | | | (.57 | ) | | | (.07 | ) | | | — | | | | (.26 | ) | | | (1.33 | ) |
Total distributions | | | (1.36 | ) | | | (.68 | ) | | | (.07 | ) | | | (.19 | ) | | | (.45 | ) | | | (1.52 | ) |
Net asset value, end of period | | $ | 16.35 | | | $ | 15.24 | | | $ | 14.17 | | | $ | 16.05 | | | $ | 10.75 | | | $ | 13.01 | |
|
Total Return | | | 16.74 | % | | | 12.32 | % | | | (11.34 | %) | | | 51.46 | % | | | (14.66 | %) | | | (6.18 | %) |
Ratios/Supplemental Data |
Net assets, end of period (in thousands) | | $ | 63 | | | $ | 54 | | | $ | 136 | | | $ | 49 | | | $ | 26 | | | $ | 47 | |
Ratios to average net assets: |
Net investment income (loss) | | | 0.82 | % | | | 1.15 | % | | | 1.00 | % | | | 0.48 | % | | | 0.46 | % | | | 0.72 | % |
Total expensesd | | | 5.87 | % | | | 3.68 | % | | | 3.82 | % | | | 4.39 | % | | | 4.07 | % | | | 2.73 | % |
Net expensese,f,g | | | 1.27 | % | | | 1.27 | % | | | 1.29 | % | | | 1.30 | % | | | 1.30 | % | | | 1.28 | % |
Portfolio turnover rate | | | 17 | % | | | 72 | % | | | 37 | % | | | 28 | % | | | 40 | % | | | 78 | % |
68 | THE GUGGENHEIM FUNDS SEMI-ANNUAL REPORT | SEE NOTES TO FINANCIAL STATEMENTS. |
FINANCIAL HIGHLIGHTS (concluded) |
This table is presented to show selected data for a share outstanding throughout each period and to assist shareholders in evaluating a Fund’s performance for the periods presented.
Institutional Class | | Six Months Ended
March 31, 2024a | | | Year Ended
September 30,
2023 | | | Year Ended
September 30,
2022 | | | Year Ended
September 30,
2021 | | | Year Ended
September 30,
2020 | | | Year Ended
September 30,
2019 | |
Per Share Data |
Net asset value, beginning of period | | $ | 13.50 | | | $ | 12.68 | | | $ | 14.33 | | | $ | 9.54 | | | $ | 11.60 | | | $ | 14.24 | |
Income (loss) from investment operations: |
Net investment income (loss)b | | | .07 | | | | .19 | | | | .16 | | | | .10 | | | | .09 | | | | .12 | |
Net gain (loss) on investments (realized and unrealized) | | | 2.11 | | | | 1.42 | | | | (1.74 | ) | | | 4.81 | | | | (1.68 | ) | | | (1.20 | ) |
Total from investment operations | | | 2.18 | | | | 1.61 | | | | (1.58 | ) | | | 4.91 | | | | (1.59 | ) | | | (1.08 | ) |
Less distributions from: |
Net investment income | | | (.45 | ) | | | (.22 | ) | | | — | | | | (.12 | ) | | | (.21 | ) | | | (.23 | ) |
Net realized gains | | | (1.10 | ) | | | (.57 | ) | | | (.07 | ) | | | — | | | | (.26 | ) | | | (1.33 | ) |
Total distributions | | | (1.55 | ) | | | (.79 | ) | | | (.07 | ) | | | (.12 | ) | | | (.47 | ) | | | (1.56 | ) |
Net asset value, end of period | | $ | 14.13 | | | $ | 13.50 | | | $ | 12.68 | | | $ | 14.33 | | | $ | 9.54 | | | $ | 11.60 | |
|
Total Return | | | 16.90 | % | | | 12.63 | % | | | (11.10 | %) | | | 51.78 | % | | | (14.54 | %) | | | (5.96 | %) |
Ratios/Supplemental Data |
Net assets, end of period (in thousands) | | $ | 649 | | | $ | 1,076 | | | $ | 2,046 | | | $ | 1,522 | | | $ | 892 | | | $ | 3,143 | |
Ratios to average net assets: |
Net investment income (loss) | | | 1.07 | % | | | 1.40 | % | | | 1.13 | % | | | 0.75 | % | | | 0.82 | % | | | 0.99 | % |
Total expensesd | | | 5.44 | % | | | 3.17 | % | | | 3.24 | % | | | 3.80 | % | | | 2.86 | % | | | 2.09 | % |
Net expensese,f,g | | | 1.03 | % | | | 1.02 | % | | | 1.04 | % | | | 1.05 | % | | | 1.05 | % | | | 1.05 | % |
Portfolio turnover rate | | | 17 | % | | | 72 | % | | | 37 | % | | | 28 | % | | | 40 | % | | | 78 | % |
a | Unaudited figures for the period ended March 31, 2024. Percentage amounts for the period, except total return and portfolio turnover rate, have been annualized. |
b | Net investment income (loss) per share was computed using average shares outstanding throughout the period. |
c | Total return does not reflect the impact of any applicable sales charges. |
d | Does not include expenses of the underlying funds in which the Fund invests. |
e | Net expense information reflects the expense ratios after expense waivers and reimbursements, as applicable. |
f | The portion of the ratios of net expenses to average net assets attributable to recoupments of prior fee reductions or expense reimbursements for the years presented was as follows: |
| | | 03/31/24 | 09/30/23 | 09/30/22 | 09/30/21 | 09/30/20 | 09/30/19 |
| | Class A | — | — | 0.01% | — | — | — |
| | Class C | — | — | 0.01% | — | — | — |
| | Class P | — | — | 0.02% | — | — | — |
| | Institutional Class | — | — | 0.02% | — | — | — |
g | Net expenses may include expenses that are excluded from the expense limitation agreement. Excluding these expenses, the net expense ratios for the years presented would be: |
| | | 03/31/24 | 09/30/23 | 09/30/22 | 09/30/21 | 09/30/20 | 09/30/19 |
| | Class A | 1.27% | 1.26% | 1.29% | 1.30% | 1.30% | 1.30% |
| | Class C | 2.02% | 2.01% | 2.04% | 2.05% | 2.05% | 2.05% |
| | Class P | 1.27% | 1.26% | 1.29% | 1.30% | 1.30% | 1.28% |
| | Institutional Class | 1.02% | 1.01% | 1.04% | 1.05% | 1.05% | 1.05% |
h | Less than $0.01 per share. |
SEE NOTES TO FINANCIAL STATEMENTS. | THE GUGGENHEIM FUNDS SEMI-ANNUAL REPORT | 69 |
PERFORMANCE REPORT AND FUND PROFILE (Unaudited) | March 31, 2024 |
STYLEPLUS—LARGE CORE FUND
OBJECTIVE: Seeks long-term growth of capital.
Holdings Diversification (Market Exposure as % of Net Assets)
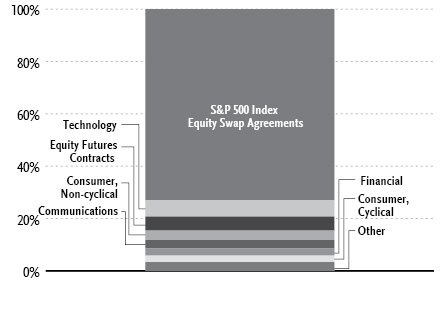
“Holdings Diversification (Market Exposure as % of Net Assets)” excludes any temporary cash investments, investments in Guggenheim Strategy Funds Trust mutual funds, or investments in Guggenheim Ultra Short Duration Fund.
Inception Dates: |
Class A | September 10, 1962 |
Class C | January 29, 1999 |
Class P | May 1, 2015 |
Institutional Class | March 1, 2012 |
Ten Largest Holdings | % of Total Net Assets |
Guggenheim Strategy Fund III | 33.7% |
Guggenheim Strategy Fund II | 28.6% |
Guggenheim Ultra Short Duration Fund — Institutional Class | 13.0% |
Microsoft Corp. | 1.6% |
Apple, Inc. | 1.3% |
Alphabet, Inc. — Class C | 0.9% |
NVIDIA Corp. | 0.8% |
Amazon.com, Inc. | 0.8% |
Berkshire Hathaway, Inc. — Class B | 0.6% |
Merck & Company, Inc. | 0.4% |
Top Ten Total | 81.7% |
| | |
“Ten Largest Holdings” excludes any temporary cash or derivative investments. |
70 | THE GUGGENHEIM FUNDS SEMI-ANNUAL REPORT | |
PERFORMANCE REPORT AND FUND PROFILE (Unaudited)(concluded) | March 31, 2024 |
Average Annual Returns*
Periods Ended March 31, 2024
| 6 Month† | 1 Year | 5 Year | 10 Year |
Class A Shares | 24.43% | 30.37% | 13.88% | 12.14% |
Class A Shares with sales charge‡ | 18.52% | 24.16% | 12.77% | 11.59% |
Class C Shares | 23.84% | 29.20% | 12.85% | 11.12% |
Class C Shares with CDSC§ | 22.84% | 28.20% | 12.85% | 11.12% |
Institutional Class Shares | 24.59% | 30.70% | 14.11% | 12.43% |
S&P 500 Index | 23.48% | 29.88% | 15.05% | 12.96% |
| 6 Month† | 1 Year | 5 Year | Since
Inception
(05/01/15) |
Class P Shares | 24.40% | 30.25% | 13.72% | 11.69% |
S&P 500 Index | 23.48% | 29.88% | 15.05% | 12.85% |
* | The performance data above represents past performance that is not predictive of future results. The investment return and principal value of an investment in the Fund will fluctuate so that an investor’s shares, when redeemed, may be worth more or less than their original cost. Returns are historical and include changes in principal and reinvested dividends and capital gains and do not reflect the effect of taxes. The S&P 500 Index is an unmanaged index and, unlike the Fund, has no management fees or operating expenses to reduce its reported return. |
† | 6 month returns are not annualized. |
‡ | Fund returns are calculated using the maximum sales charge of 4.75%. |
§ | Fund returns include a CDSC of 1% if redeemed within 12 months of purchase. |
| | THE GUGGENHEIM FUNDS SEMI-ANNUAL REPORT | 71 |
SCHEDULE OF INVESTMENTS (Unaudited) | March 31, 2024 |
STYLEPLUS—LARGE CORE FUND | |
| | Shares | | | Value | |
COMMON STOCKS† - 21.6% |
| | | | | | | | | |
Technology - 6.2% |
Microsoft Corp. | | | 9,837 | | | $ | 4,138,266 | |
Apple, Inc. | | | 19,069 | | | | 3,269,952 | |
NVIDIA Corp. | | | 2,270 | | | | 2,051,081 | |
Adobe, Inc.* | | | 1,548 | | | | 781,121 | |
QUALCOMM, Inc. | | | 4,541 | | | | 768,791 | |
International Business Machines Corp. | | | 3,817 | | | | 728,894 | |
Applied Materials, Inc. | | | 3,515 | | | | 724,899 | |
NXP Semiconductor N.V. | | | 2,408 | | | | 596,630 | |
Skyworks Solutions, Inc. | | | 5,377 | | | | 582,437 | |
Broadcom, Inc. | | | 439 | | | | 581,855 | |
KLA Corp. | | | 677 | | | | 472,932 | |
HP, Inc. | | | 14,614 | | | | 441,635 | |
NetApp, Inc. | | | 2,274 | | | | 238,702 | |
Intuit, Inc. | | | 246 | | | | 159,900 | |
Total Technology | | | | | | | 15,537,095 | |
| | | | | | | | | |
Consumer, Non-cyclical - 3.7% |
Merck & Company, Inc. | | | 7,478 | | | | 986,722 | |
Johnson & Johnson | | | 5,292 | | | | 837,141 | |
Bristol-Myers Squibb Co. | | | 12,582 | | | | 682,322 | |
Vertex Pharmaceuticals, Inc.* | | | 1,578 | | | | 659,620 | |
Gilead Sciences, Inc. | | | 8,773 | | | | 642,622 | |
HCA Healthcare, Inc. | | | 1,898 | | | | 633,040 | |
Amgen, Inc. | | | 2,163 | | | | 614,984 | |
United Rentals, Inc. | | | 845 | | | | 609,338 | |
Molina Healthcare, Inc.* | | | 1,446 | | | | 594,060 | |
Incyte Corp.* | | | 9,221 | | | | 525,320 | |
Altria Group, Inc. | | | 11,419 | | | | 498,097 | |
AbbVie, Inc. | | | 2,134 | | | | 388,601 | |
Eli Lilly & Co. | | | 410 | | | | 318,964 | |
PayPal Holdings, Inc.* | | | 4,431 | | | | 296,833 | |
Biogen, Inc.* | | | 1,325 | | | | 285,710 | |
CVS Health Corp. | | | 2,126 | | | | 169,570 | |
PepsiCo, Inc. | | | 962 | | | | 168,360 | |
UnitedHealth Group, Inc. | | | 333 | | | | 164,735 | |
Thermo Fisher Scientific, Inc. | | | 271 | | | | 157,508 | |
Total Consumer, Non-cyclical | | | | | | | 9,233,547 | |
| | | | | | | | | |
Communications - 3.1% |
Alphabet, Inc. — Class C* | | | 14,092 | | | | 2,145,648 | |
Amazon.com, Inc.* | | | 10,902 | | | | 1,966,503 | |
Meta Platforms, Inc. — Class A | | | 1,767 | | | | 858,020 | |
Cisco Systems, Inc. | | | 15,721 | | | | 784,635 | |
Motorola Solutions, Inc. | | | 1,778 | | | | 631,154 | |
F5, Inc.* | | | 2,851 | | | | 540,521 | |
eBay, Inc. | | | 9,051 | | | | 477,712 | |
Booking Holdings, Inc. | | | 122 | | | | 442,601 | |
Total Communications | | | | | | | 7,846,794 | |
| | | | | | | | | |
Financial - 2.8% |
Berkshire Hathaway, Inc. — Class B* | | | 3,581 | | | | 1,505,882 | |
Wells Fargo & Co. | | | 13,656 | | | | 791,502 | |
Travelers Companies, Inc. | | | 2,684 | | | | 617,696 | |
Hartford Financial Services Group, Inc. | | | 5,872 | | | | 605,110 | |
Arch Capital Group Ltd.* | | | 6,459 | | | | 597,070 | |
Everest Group Ltd. | | | 1,476 | | | | 586,710 | |
Fifth Third Bancorp | | | 15,292 | | | | 569,015 | |
Loews Corp. | | | 5,853 | | | | 458,231 | |
Synchrony Financial | | | 10,597 | | | | 456,943 | |
JPMorgan Chase & Co. | | | 1,674 | | | | 335,302 | |
Visa, Inc. — Class A | | | 939 | | | | 262,056 | |
Capital One Financial Corp. | | | 1,144 | | | | 170,330 | |
Bank of America Corp. | | | 4,436 | | | | 168,213 | |
Total Financial | | | | | | | 7,124,060 | |
| | | | | | | | | |
Consumer, Cyclical - 2.5% |
McDonald’s Corp. | | | 2,689 | | | | 758,164 | |
Lowe’s Companies, Inc. | | | 2,873 | | | | 731,839 | |
PACCAR, Inc. | | | 5,171 | | | | 640,635 | |
Lennar Corp. — Class A | | | 3,569 | | | | 613,796 | |
PulteGroup, Inc. | | | 4,474 | | | | 539,654 | |
DR Horton, Inc. | | | 3,107 | | | | 511,257 | |
Cummins, Inc. | | | 1,603 | | | | 472,324 | |
Ford Motor Co. | | | 33,817 | | | | 449,090 | |
General Motors Co. | | | 9,665 | | | | 438,308 | |
United Airlines Holdings, Inc.* | | | 7,778 | | | | 372,411 | |
AutoZone, Inc.* | | | 99 | | | | 312,013 | |
Home Depot, Inc. | | | 415 | | | | 159,194 | |
Tesla, Inc.* | | | 902 | | | | 158,562 | |
Walmart, Inc. | | | 2,622 | | | | 157,766 | |
Total Consumer, Cyclical | | | | | | | 6,315,013 | |
| | | | | | | | | |
Industrial - 2.4% |
Caterpillar, Inc. | | | 2,182 | | | | 799,550 | |
Deere & Co. | | | 1,754 | | | | 720,438 | |
Lockheed Martin Corp. | | | 1,478 | | | | 672,298 | |
Illinois Tool Works, Inc. | | | 2,371 | | | | 636,211 | |
Otis Worldwide Corp. | | | 6,022 | | | | 597,804 | |
Builders FirstSource, Inc.* | | | 2,774 | | | | 578,518 | |
Snap-on, Inc. | | | 1,901 | | | | 563,114 | |
Masco Corp. | | | 7,034 | | | | 554,842 | |
Allegion plc | | | 2,665 | | | | 359,002 | |
A O Smith Corp. | | | 3,540 | | | | 316,688 | |
L3Harris Technologies, Inc. | | | 731 | | | | 155,776 | |
Total Industrial | | | | | | | 5,954,241 | |
| | | | | | | | | |
Energy - 0.7% |
Marathon Petroleum Corp. | | | 3,445 | | | | 694,168 | |
Valero Energy Corp. | | | 4,016 | | | | 685,491 | |
Exxon Mobil Corp. | | | 2,831 | | | | 329,075 | |
Total Energy | | | | | | | 1,708,734 | |
| | | | | | | | | |
Basic Materials - 0.2% |
CF Industries Holdings, Inc. | | | 6,808 | | | | 566,494 | |
| | | | | | | | | |
Total Common Stocks | | | | |
(Cost $44,785,297) | | | | | | | 54,285,978 | |
| | | | | | | | | |
72 | THE GUGGENHEIM FUNDS SEMI-ANNUAL REPORT | SEE NOTES TO FINANCIAL STATEMENTS. |
SCHEDULE OF INVESTMENTS (Unaudited)(continued) | March 31, 2024 |
STYLEPLUS—LARGE CORE FUND | |
| | Shares | | | Value | |
MUTUAL FUNDS† - 75.3% |
Guggenheim Strategy Fund III1 | | | 3,425,710 | | | $ | 84,512,278 | |
Guggenheim Strategy Fund II1 | | | 2,920,412 | | | | 71,842,120 | |
Guggenheim Ultra Short Duration Fund — Institutional Class1 | | | 3,299,303 | | | | 32,696,095 | |
Total Mutual Funds | | | | |
(Cost $189,040,235) | | | | | | | 189,050,493 | |
| | | | | | | | | |
MONEY MARKET FUND† - 2.8% |
Dreyfus Treasury Securities Cash Management Fund — Institutional Shares, 5.19%2 | | | 7,128,927 | | | | 7,128,927 | |
Total Money Market Fund | | | | |
(Cost $7,128,927) | | | | | | | 7,128,927 | |
| | | | | | | | | |
Total Investments - 99.7% | | | | |
(Cost $240,954,459) | | $ | 250,465,398 | |
Other Assets & Liabilities, net - 0.3% | | | 690,721 | |
Total Net Assets - 100.0% | | $ | 251,156,119 | |
Futures Contracts |
Description | | Number of
Contracts | | | Expiration
Date | | | Notional
Amount | | | Value and
Unrealized
Appreciation** | |
Equity Futures Contracts Purchased† |
S&P 500 Index Mini Futures Contracts | | | 50 | | | | Jun 2024 | | | $ | 13,263,750 | | | $ | 161,245 | |
Total Return Swap Agreements |
Counterparty | Index | Type | Financing
Rate | | Payment
Frequency | | | Maturity
Date | | | Units | | | Notional
Amount | | | Value and
Unrealized
Appreciation | |
OTC Equity Index Swap Agreements†† |
Wells Fargo Bank, N.A. | S&P 500 Index | Pay | 5.89% (Federal
Funds Rate +
0.56%) | | | At Maturity | | | | 03/03/25 | | | | 16,086 | | | $ | 183,661,905 | | | $ | 14,737,060 | |
* | Non-income producing security. |
** | Includes cumulative appreciation (depreciation). Variation margin is reported within the Statement of Assets and Liabilities. |
† | Value determined based on Level 1 inputs — See Note 4. |
†† | Value determined based on Level 2 inputs — See Note 4. |
1 | Affiliated issuer. |
2 | Rate indicated is the 7-day yield as of March 31, 2024. |
| | plc — Public Limited Company |
| | |
| | See Sector Classification in Other Information section. |
SEE NOTES TO FINANCIAL STATEMENTS. | THE GUGGENHEIM FUNDS SEMI-ANNUAL REPORT | 73 |
SCHEDULE OF INVESTMENTS (Unaudited)(concluded) | March 31, 2024 |
STYLEPLUS—LARGE CORE FUND | |
The following table summarizes the inputs used to value the Fund’s investments at March 31, 2024 (See Note 4 in the Notes to Financial Statements):
Investments in Securities (Assets) | | Level 1
Quoted
Prices | | | Level 2
Significant
Observable
Inputs | | | Level 3
Significant
Unobservable
Inputs | | | Total | |
Common Stocks | | $ | 54,285,978 | | | $ | — | | | $ | — | | | $ | 54,285,978 | |
Mutual Funds | | | 189,050,493 | | | | — | | | | — | | | | 189,050,493 | |
Money Market Fund | | | 7,128,927 | | | | — | | | | — | | | | 7,128,927 | |
Equity Futures Contracts** | | | 161,245 | | | | — | | | | — | | | | 161,245 | |
Equity Index Swap Agreements** | | | — | | | | 14,737,060 | | | | — | | | | 14,737,060 | |
Total Assets | | $ | 250,626,643 | | | $ | 14,737,060 | | | $ | — | | | $ | 265,363,703 | |
** | This derivative is reported as unrealized appreciation/depreciation at period end. |
Affiliated Transactions
Investments representing 5% or more of the outstanding voting shares of a company, or control of or by, or common control under Guggenheim Investments (“GI”), result in that company being considered an affiliated issuer, as defined in the 1940 Act.
The Fund may invest in certain of the underlying series of Guggenheim Strategy Funds Trust, including Guggenheim Strategy Fund II and Guggenheim Strategy Fund III (collectively, the “Guggenheim Strategy Funds”), each of which are open-end management investment companies managed by GI. The Guggenheim Strategy Funds, which launched on March 11, 2014, are offered as short term investment options only to mutual funds, trusts, and other accounts managed by GI and/or its affiliates, and are not available to the public. The Guggenheim Strategy Funds pay no investment management fees. The Guggenheim Strategy Funds’ annual report on Form N-CSR dated September 30, 2023 is available publicly or upon request. This information is available from the EDGAR database on the SEC’s website at https://www.sec.gov/Archives/edgar/data/1601445/000182126823000217/gug86449-ncsr.htm. The Fund may invest in certain of the underlying series of Guggenheim Funds Trust, which are open-end management investment companies managed by GI, are available to the public and whose most recent annual report on Form N-CSR is available publicly or upon request.
Transactions during the period ended March 31, 2024, in which the company is an affiliated issuer, were as follows:
Security Name | | Value
09/30/23 | | | Additions | | | Reductions | | | Realized
Gain (Loss) | | | Change in
Unrealized
Appreciation
(Depreciation) | | | Value
03/31/24 | | | Shares
03/31/24 | | | Investment
Income | |
Mutual Funds | | | | | | | | | | | | | | | | | | | | | | | | | | | | | | | | |
Guggenheim Strategy Fund II | | $ | 59,650,586 | | | $ | 14,370,806 | | | $ | (3,051,720 | ) | | $ | (75,120 | ) | | $ | 947,568 | | | $ | 71,842,120 | | | | 2,920,412 | | | $ | 1,822,958 | |
Guggenheim Strategy Fund III | | | 72,469,308 | | | | 17,904,276 | | | | (6,939,120 | ) | | | (169,594 | ) | | | 1,247,408 | | | | 84,512,278 | | | | 3,425,710 | | | | 1,930,857 | |
Guggenheim Ultra Short Duration Fund — Institutional Class | | | 31,420,533 | | | | 753,613 | | | | — | | | | — | | | | 521,949 | | | | 32,696,095 | | | | 3,299,303 | | | | 898,291 | |
| | | $ | 163,540,427 | | | $ | 33,028,695 | | | $ | (9,990,840 | ) | | $ | (244,714 | ) | | $ | 2,716,925 | | | $ | 189,050,493 | | | | | | | $ | 4,652,106 | |
74 | THE GUGGENHEIM FUNDS SEMI-ANNUAL REPORT | SEE NOTES TO FINANCIAL STATEMENTS. |
STYLEPLUS—LARGE CORE FUND | |
STATEMENT OF ASSETS AND LIABILITIES (Unaudited) |
March 31, 2024 |
Assets: |
Investments in unaffiliated issuers, at value (cost $51,914,224) | | $ | 61,414,905 | |
Investments in affiliated issuers, at value (cost $189,040,235) | | | 189,050,493 | |
Cash | | | 8,576 | |
Segregated cash with broker | | | 640,000 | |
Unrealized appreciation on OTC swap agreements | | | 14,737,060 | |
Prepaid expenses | | | 55,349 | |
Receivables: |
Dividends | | | 891,276 | |
Interest | | | 43,697 | |
Fund shares sold | | | 971 | |
Total assets | | | 266,842,327 | |
| | | | | |
Liabilities: |
Segregated cash due to broker | | | 13,020,000 | |
Payable for: |
Swap settlement | | | 1,630,641 | |
Securities purchased | | | 705,301 | |
Management fees | | | 150,158 | |
Distribution and service fees | | | 51,417 | |
Fund shares redeemed | | | 34,488 | |
Fund accounting/administration fees | | | 10,000 | |
Variation margin on futures contracts | | | 6,875 | |
Trustees’ fees* | | | 1,142 | |
Transfer agent fees | | | 1,075 | |
Miscellaneous | | | 75,111 | |
Total liabilities | | | 15,686,208 | |
Net assets | | $ | 251,156,119 | |
| | | | | |
Net assets consist of: |
Paid in capital | | $ | 221,585,870 | |
Total distributable earnings (loss) | | | 29,570,249 | |
Net assets | | $ | 251,156,119 | |
CLASS A: |
Net assets | | $ | 242,640,576 | |
Capital shares outstanding | | | 10,839,728 | |
Net asset value per share | | $ | 22.38 | |
Maximum offering price per share (Net asset value divided by 95.25%) | | $ | 23.50 | |
CLASS C: |
Net assets | | $ | 931,872 | |
Capital shares outstanding | | | 85,862 | |
Net asset value per share | | $ | 10.85 | |
CLASS P: |
Net assets | | $ | 251,827 | |
Capital shares outstanding | | | 11,497 | |
Net asset value per share | | $ | 21.90 | |
| | | | | |
Institutional Class: |
Net assets | | $ | 7,331,844 | |
Capital shares outstanding | | | 332,739 | |
Net asset value per share | | $ | 22.03 | |
STATEMENT OF OPERATIONS (Unaudited) |
Six Months Ended March 31, 2024 |
Investment Income: |
Dividends from securities of unaffiliated issuers (net of foreign withholding tax of $754) | | $ | 411,114 | |
Dividends from securities of affiliated issuers | | | 4,652,106 | |
Interest | | | 268,389 | |
Total investment income | | | 5,331,609 | |
| | | | | |
Expenses: |
Management fees | | | 850,258 | |
Distribution and service fees: |
Class A | | | 273,695 | |
Class C | | | 4,240 | |
Class P | | | 285 | |
Transfer agent fees: |
Class A | | | 94,473 | |
Class C | | | 1,074 | |
Class P | | | 159 | |
Institutional Class | | | 3,969 | |
Interest expense | | | 528,575 | |
Fund accounting/administration fees | | | 49,026 | |
Professional fees | | | 26,485 | |
Custodian fees | | | 6,762 | |
Trustees’ fees* | | | 5,533 | |
Line of credit fees | | | 2,531 | |
Miscellaneous | | | 64,471 | |
Total expenses | | | 1,911,536 | |
Less: |
Expenses waived by Adviser | | | (40,056 | ) |
Net expenses | | | 1,871,480 | |
Net investment income | | | 3,460,129 | |
| | | | | |
Net Realized and Unrealized Gain (Loss): |
Net realized gain (loss) on: |
Investments in unaffiliated issuers | | | 3,427,220 | |
Investments in affiliated issuers | | | (244,714 | ) |
Investments sold short | | | (467 | ) |
Swap agreements | | | 38,377,185 | |
Futures contracts | | | 1,146,190 | |
Net realized gain | | | 42,705,414 | |
Net change in unrealized appreciation (depreciation) on: |
Investments in unaffiliated issuers | | | 7,171,263 | |
Investments in affiliated issuers | | | 2,716,925 | |
Swap agreements | | | (6,351,715 | ) |
Futures contracts | | | 217,586 | |
Net change in unrealized appreciation (depreciation) | | | 3,754,059 | |
Net realized and unrealized gain | | | 46,459,473 | |
Net increase in net assets resulting from operations | | $ | 49,919,602 | |
* | Relates to Trustees not deemed “interested persons” within the meaning of Section 2(a)(19) of the 1940 Act. |
SEE NOTES TO FINANCIAL STATEMENTS. | THE GUGGENHEIM FUNDS SEMI-ANNUAL REPORT | 75 |
STYLEPLUS—LARGE CORE FUND | |
STATEMENTS OF CHANGES IN NET ASSETS |
| | Six Months Ended
March 31, 2024
(Unaudited) | | | Year Ended
September 30,
2023 | |
Increase (Decrease) in Net Assets from Operations: | | | | | | | | |
Net investment income | | $ | 3,460,129 | | | $ | 6,276,519 | |
Net realized gain (loss) on investments | | | 42,705,414 | | | | (36,981,624 | ) |
Net change in unrealized appreciation (depreciation) on investments | | | 3,754,059 | | | | 71,070,811 | |
Net increase in net assets resulting from operations | | | 49,919,602 | | | | 40,365,706 | |
| | | | | | | | | |
Distributions to shareholders: | | | | | | | | |
Class A | | | (5,405,491 | ) | | | (57,362,413 | ) |
Class C | | | (36,849 | ) | | | (480,274 | ) |
Class P | | | (5,396 | ) | | | (80,505 | ) |
Institutional Class | | | (182,850 | ) | | | (1,403,582 | ) |
Total distributions to shareholders | | | (5,630,586 | ) | | | (59,326,774 | ) |
| | | | | | | | | |
Capital share transactions: | | | | | | | | |
Proceeds from sale of shares | | | | | | | | |
Class A | | | 4,725,446 | | | | 2,166,582 | |
Class C | | | 36,215 | | | | 125,050 | |
Class P | | | 210 | | | | 7,830 | |
Institutional Class | | | 770,684 | | | | 1,924,452 | |
Distributions reinvested | | | | | | | | |
Class A | | | 5,134,767 | | | | 54,015,082 | |
Class C | | | 36,186 | | | | 480,152 | |
Class P | | | 5,396 | | | | 80,505 | |
Institutional Class | | | 181,876 | | | | 1,391,827 | |
Cost of shares redeemed | | | | | | | | |
Class A | | | (11,603,212 | ) | | | (23,234,130 | ) |
Class C | | | (83,540 | ) | | | (520,369 | ) |
Class P | | | (4,639 | ) | | | (102,107 | ) |
Institutional Class | | | (1,080,853 | ) | | | (1,714,715 | ) |
Net increase (decrease) from capital share transactions | | | (1,881,464 | ) | | | 34,620,159 | |
Net increase in net assets | | | 42,407,552 | | | | 15,659,091 | |
| | | | | | | | | |
Net assets: | | | | | | | | |
Beginning of period | | | 208,748,567 | | | | 193,089,476 | |
End of period | | $ | 251,156,119 | | | $ | 208,748,567 | |
| | | | | | | | | |
Capital share activity: | | | | | | | | |
Shares sold | | | | | | | | |
Class A | | | 227,377 | | | | 118,847 | |
Class C | | | 3,771 | | | | 13,926 | |
Class P | | | 10 | | | | 451 | |
Institutional Class | | | 40,329 | | | | 110,833 | |
Shares issued from reinvestment of distributions | | | | | | | | |
Class A | | | 257,382 | | | | 3,255,882 | |
Class C | | | 3,730 | | | | 57,850 | |
Class P | | | 276 | | | | 4,957 | |
Institutional Class | | | 9,265 | | | | 85,231 | |
Shares redeemed | | | | | | | | |
Class A | | | (577,176 | ) | | | (1,271,366 | ) |
Class C | | | (8,676 | ) | | | (58,377 | ) |
Class P | | | (221 | ) | | | (6,243 | ) |
Institutional Class | | | (55,499 | ) | | | (89,973 | ) |
Net increase (decrease) in shares | | | (99,432 | ) | | | 2,222,018 | |
76 | THE GUGGENHEIM FUNDS SEMI-ANNUAL REPORT | SEE NOTES TO FINANCIAL STATEMENTS. |
STYLEPLUS—LARGE CORE FUND | |
This table is presented to show selected data for a share outstanding throughout each period and to assist shareholders in evaluating a Fund’s performance for the periods presented.
Class A | | Six Months Ended
March 31, 2024a | | | Year Ended
September 30,
2023 | | | Year Ended
September 30,
2022 | | | Year Ended
September 30,
2021 | | | Year Ended
September 30,
2020 | | | Year Ended
September 30,
2019 | |
Per Share Data |
Net asset value, beginning of period | | $ | 18.44 | | | $ | 21.18 | | | $ | 27.35 | | | $ | 23.01 | | | $ | 20.48 | | | $ | 24.78 | |
Income (loss) from investment operations: |
Net investment income (loss)b | | | .31 | | | | .56 | | | | .18 | | | | .06 | | | | .17 | | | | .30 | |
Net gain (loss) on investments (realized and unrealized) | | | 4.13 | | | | 3.32 | | | | (5.02 | ) | | | 6.46 | | | | 2.70 | | | | (.72 | ) |
Total from investment operations | | | 4.44 | | | | 3.88 | | | | (4.84 | ) | | | 6.52 | | | | 2.87 | | | | (.42 | ) |
Less distributions from: |
Net investment income | | | (.50 | ) | | | (.22 | ) | | | (.08 | ) | | | (.19 | ) | | | (.31 | ) | | | (.30 | ) |
Net realized gains | | | — | | | | (6.40 | ) | | | (1.25 | ) | | | (1.99 | ) | | | (.03 | ) | | | (3.58 | ) |
Total distributions | | | (.50 | ) | | | (6.62 | ) | | | (1.33 | ) | | | (2.18 | ) | | | (.34 | ) | | | (3.88 | ) |
Net asset value, end of period | | $ | 22.38 | | | $ | 18.44 | | | $ | 21.18 | | | $ | 27.35 | | | $ | 23.01 | | | $ | 20.48 | |
|
Total Returnc | | | 24.43 | % | | | 21.81 | % | | | (18.94 | %) | | | 29.91 | % | | | 14.18 | % | | | 1.50 | % |
Ratios/Supplemental Data |
Net assets, end of period (in thousands) | | $ | 242,641 | | | $ | 201,587 | | | $ | 186,957 | | | $ | 247,243 | | | $ | 204,428 | | | $ | 196,563 | |
Ratios to average net assets: |
Net investment income (loss) | | | 3.05 | % | | | 3.01 | % | | | 0.68 | % | | | 0.23 | % | | | 0.79 | % | | | 1.48 | % |
Total expensesd | | | 1.69 | % | | | 1.48 | % | | | 1.20 | % | | | 1.23 | % | | | 1.32 | % | | | 1.31 | % |
Net expensese | | | 1.65 | % | | | 1.44 | % | | | 1.15 | % | | | 1.17 | % | | | 1.28 | % | | | 1.28 | % |
Portfolio turnover rate | | | 27 | % | | | 56 | % | | | 62 | % | | | 25 | % | | | 69 | % | | | 51 | % |
Class C | | Six Months Ended
March 31, 2024a | | | Year Ended
September 30,
2023 | | | Year Ended
September 30,
2022 | | | Year Ended
September 30,
2021 | | | Year Ended
September 30,
2020 | | | Year Ended
September 30,
2019 | |
Per Share Data |
Net asset value, beginning of period | | $ | 9.16 | | | $ | 13.57 | | | $ | 18.03 | | | $ | 15.87 | | | $ | 14.22 | | | $ | 18.41 | |
Income (loss) from investment operations: |
Net investment income (loss)b | | | .11 | | | | .21 | | | | (.02 | ) | | | (.11 | ) | | | (.02 | ) | | | .08 | |
Net gain (loss) on investments (realized and unrealized) | | | 2.02 | | | | 1.93 | | | | (3.20 | ) | | | 4.34 | | | | 1.87 | | | | (.69 | ) |
Total from investment operations | | | 2.13 | | | | 2.14 | | | | (3.22 | ) | | | 4.23 | | | | 1.85 | | | | (.61 | ) |
Less distributions from: |
Net investment income | | | (.44 | ) | | | (.15 | ) | | | — | | | | (.08 | ) | | | (.17 | ) | | | — | |
Net realized gains | | | — | | | | (6.40 | ) | | | (1.24 | ) | | | (1.99 | ) | | | (.03 | ) | | | (3.58 | ) |
Total distributions | | | (.44 | ) | | | (6.55 | ) | | | (1.24 | ) | | | (2.07 | ) | | | (.20 | ) | | | (3.58 | ) |
Net asset value, end of period | | $ | 10.85 | | | $ | 9.16 | | | $ | 13.57 | | | $ | 18.03 | | | $ | 15.87 | | | $ | 14.22 | |
|
Total Returnc | | | 23.84 | % | | | 20.81 | % | | | (19.69 | %) | | | 28.69 | % | | | 13.11 | % | | | 0.60 | % |
Ratios/Supplemental Data |
Net assets, end of period (in thousands) | | $ | 932 | | | $ | 797 | | | $ | 999 | | | $ | 869 | | | $ | 1,019 | | | $ | 973 | |
Ratios to average net assets: |
Net investment income (loss) | | | 2.13 | % | | | 2.14 | % | | | (0.10 | %) | | | (0.67 | %) | | | (0.15 | %) | | | 0.58 | % |
Total expensesd | | | 2.61 | % | | | 2.32 | % | | | 2.10 | % | | | 2.15 | % | | | 2.24 | % | | | 2.23 | % |
Net expensese | | | 2.57 | % | | | 2.28 | % | | | 2.04 | % | | | 2.09 | % | | | 2.20 | % | | | 2.19 | % |
Portfolio turnover rate | | | 27 | % | | | 56 | % | | | 62 | % | | | 25 | % | | | 69 | % | | | 51 | % |
SEE NOTES TO FINANCIAL STATEMENTS. | THE GUGGENHEIM FUNDS SEMI-ANNUAL REPORT | 77 |
STYLEPLUS—LARGE CORE FUND | |
FINANCIAL HIGHLIGHTS (continued) |
This table is presented to show selected data for a share outstanding throughout each period and to assist shareholders in evaluating a Fund’s performance for the periods presented.
Class P | | Six Months Ended
March 31, 2024a | | | Year Ended
September 30,
2023 | | | Year Ended
September 30,
2022 | | | Year Ended
September 30,
2021 | | | Year Ended
September 30,
2020 | | | Year Ended
September 30,
2019 | |
Per Share Data |
Net asset value, beginning of period | | $ | 18.03 | | | $ | 20.83 | | | $ | 26.93 | | | $ | 22.69 | | | $ | 20.21 | | | $ | 24.49 | |
Income (loss) from investment operations: |
Net investment income (loss)b | | | .30 | | | | .53 | | | | .13 | | | | .02 | | | | .14 | | | | .29 | |
Net gain (loss) on investments (realized and unrealized) | | | 4.04 | | | | 3.25 | | | | (4.94 | ) | | | 6.38 | | | | 2.67 | | | | (.73 | ) |
Total from investment operations | | | 4.34 | | | | 3.78 | | | | (4.81 | ) | | | 6.40 | | | | 2.81 | | | | (.44 | ) |
Less distributions from: |
Net investment income | | | (.47 | ) | | | (.18 | ) | | | (.05 | ) | | | (.17 | ) | | | (.30 | ) | | | (.26 | ) |
Net realized gains | | | — | | | | (6.40 | ) | | | (1.24 | ) | | | (1.99 | ) | | | (.03 | ) | | | (3.58 | ) |
Total distributions | | | (.47 | ) | | | (6.58 | ) | | | (1.29 | ) | | | (2.16 | ) | | | (.33 | ) | | | (3.84 | ) |
Net asset value, end of period | | $ | 21.90 | | | $ | 18.03 | | | $ | 20.83 | | | $ | 26.93 | | | $ | 22.69 | | | $ | 20.21 | |
|
Total Return | | | 24.40 | % | | | 21.62 | % | | | (19.09 | %) | | | 29.79 | % | | | 13.98 | % | | | 1.47 | % |
Ratios/Supplemental Data |
Net assets, end of period (in thousands) | | $ | 252 | | | $ | 206 | | | $ | 255 | | | $ | 347 | | | $ | 224 | | | $ | 236 | |
Ratios to average net assets: |
Net investment income (loss) | | | 3.00 | % | | | 2.83 | % | | | 0.53 | % | | | 0.09 | % | | | 0.67 | % | | | 1.45 | % |
Total expensesd | | | 1.74 | % | | | 1.64 | % | | | 1.36 | % | | | 1.36 | % | | | 1.46 | % | | | 1.36 | % |
Net expensese | | | 1.71 | % | | | 1.59 | % | | | 1.31 | % | | | 1.30 | % | | | 1.42 | % | | | 1.33 | % |
Portfolio turnover rate | | | 27 | % | | | 56 | % | | | 62 | % | | | 25 | % | | | 69 | % | | | 51 | % |
78 | THE GUGGENHEIM FUNDS SEMI-ANNUAL REPORT | SEE NOTES TO FINANCIAL STATEMENTS. |
STYLEPLUS—LARGE CORE FUND | |
FINANCIAL HIGHLIGHTS (concluded) |
This table is presented to show selected data for a share outstanding throughout each period and to assist shareholders in evaluating a Fund’s performance for the periods presented.
Institutional Class | | Six Months Ended
March 31, 2024a | | | Year Ended
September 30,
2023 | | | Year Ended
September 30,
2022 | | | Year Ended
September 30,
2021 | | | Year Ended
September 30,
2020 | | | Year Ended
September 30,
2019 | |
Per Share Data |
Net asset value, beginning of period | | $ | 18.18 | | | $ | 20.98 | | | $ | 27.10 | | | $ | 22.83 | | | $ | 20.31 | | | $ | 24.65 | |
Income (loss) from investment operations: |
Net investment income (loss)b | | | .32 | | | | .60 | | | | .23 | | | | .10 | | | | .21 | | | | .35 | |
Net gain (loss) on investments (realized and unrealized) | | | 4.08 | | | | 3.27 | | | | (4.97 | ) | | | 6.40 | | | | 2.70 | | | | (.75 | ) |
Total from investment operations | | | 4.40 | | | | 3.87 | | | | (4.74 | ) | | | 6.50 | | | | 2.91 | | | | (.40 | ) |
Less distributions from: |
Net investment income | | | (.55 | ) | | | (.27 | ) | | | (.14 | ) | | | (.24 | ) | | | (.36 | ) | | | (.36 | ) |
Net realized gains | | | — | | | | (6.40 | ) | | | (1.24 | ) | | | (1.99 | ) | | | (.03 | ) | | | (3.58 | ) |
Total distributions | | | (.55 | ) | | | (6.67 | ) | | | (1.38 | ) | | | (2.23 | ) | | | (.39 | ) | | | (3.94 | ) |
Net asset value, end of period | | $ | 22.03 | | | $ | 18.18 | | | $ | 20.98 | | | $ | 27.10 | | | $ | 22.83 | | | $ | 20.31 | |
|
Total Return | | | 24.59 | % | | | 22.06 | % | | | (18.78 | %) | | | 30.12 | % | | | 14.44 | % | | | 1.74 | % |
Ratios/Supplemental Data |
Net assets, end of period (in thousands) | | $ | 7,332 | | | $ | 6,158 | | | $ | 4,878 | | | $ | 6,260 | | | $ | 3,344 | | | $ | 3,747 | |
Ratios to average net assets: |
Net investment income (loss) | | | 3.27 | % | | | 3.23 | % | | | 0.88 | % | | | 0.38 | % | | | 1.01 | % | | | 1.73 | % |
Total expensesd | | | 1.47 | % | | | 1.27 | % | | | 1.00 | % | | | 1.06 | % | | | 1.08 | % | | | 1.09 | % |
Net expensese | | | 1.44 | % | | | 1.23 | % | | | 0.95 | % | | | 0.99 | % | | | 1.04 | % | | | 1.06 | % |
Portfolio turnover rate | | | 27 | % | | | 56 | % | | | 62 | % | | | 25 | % | | | 69 | % | | | 51 | % |
a | Unaudited figures for the period ended March 31, 2024. Percentage amounts for the period, except total return and portfolio turnover rate, have been annualized. |
b | Net investment income (loss) per share was computed using average shares outstanding throughout the period. |
c | Total return does not reflect the impact of any applicable sales charges. |
d | Does not include expenses of the underlying funds in which the Fund invests. |
e | Net expense information reflects the expense ratios after expense waivers and reimbursements, as applicable. |
SEE NOTES TO FINANCIAL STATEMENTS. | THE GUGGENHEIM FUNDS SEMI-ANNUAL REPORT | 79 |
PERFORMANCE REPORT AND FUND PROFILE (Unaudited) | March 31, 2024 |
STYLEPLUS—MID GROWTH FUND
OBJECTIVE: Seeks long-term growth of capital.
Holdings Diversification (Market Exposure as % of Net Assets)

“Holdings Diversification (Market Exposure as % of Net Assets)” excludes any temporary cash investments, investments in Guggenheim Strategy Funds Trust mutual funds, or investments in Guggenheim Ultra Short Duration Fund.
Inception Dates: |
Class A | September 17, 1969 |
Class C | January 29, 1999 |
Class P | May 1, 2015 |
Institutional Class | March 1, 2012 |
Ten Largest Holdings | % of Total Net Assets |
Guggenheim Strategy Fund II | 33.3% |
Guggenheim Strategy Fund III | 33.2% |
Guggenheim Ultra Short Duration Fund — Institutional Class | 2.8% |
Owens Corning | 0.5% |
Lincoln Electric Holdings, Inc. | 0.5% |
Advanced Drainage Systems, Inc. | 0.4% |
Toll Brothers, Inc. | 0.4% |
Neurocrine Biosciences, Inc. | 0.4% |
Lennox International, Inc. | 0.4% |
GoDaddy, Inc. — Class A | 0.4% |
Top Ten Total | 72.3% |
| | |
“Ten Largest Holdings” excludes any temporary cash or derivative investments. |
80 | THE GUGGENHEIM FUNDS SEMI-ANNUAL REPORT | |
PERFORMANCE REPORT AND FUND PROFILE (Unaudited)(concluded) | March 31, 2024 |
Average Annual Returns*
Periods Ended March 31, 2024
| 6 Month† | 1 Year | 5 Year | 10 Year |
Class A Shares | 27.48% | 29.30% | 11.27% | 10.61% |
Class A Shares with sales charge‡ | 21.44% | 23.17% | 10.19% | 10.07% |
Class C Shares | 26.85% | 28.14% | 10.27% | 9.64% |
Class C Shares with CDSC§ | 25.85% | 27.14% | 10.27% | 9.64% |
Institutional Class Shares | 27.65% | 29.61% | 11.44% | 10.75% |
Russell Midcap Growth Index | 25.42% | 26.28% | 11.82% | 11.35% |
| 6 Month† | 1 Year | 5 Year | Since
Inception
(05/01/15) |
Class P Shares | 27.40% | 28.99% | 11.05% | 9.91% |
Russell Midcap Growth Index | 25.42% | 26.28% | 11.82% | 10.96% |
* | The performance data above represents past performance that is not predictive of future results. The investment return and principal value of an investment in the Fund will fluctuate so that an investor’s shares, when redeemed, may be worth more or less than their original cost. Returns are historical and include changes in principal and reinvested dividends and capital gains and do not reflect the effect of taxes. The Russell Midcap Growth Index is an unmanaged index and, unlike the Fund, has no management fees or operating expenses to reduce its reported return. |
† | 6 month returns are not annualized. |
‡ | Fund returns are calculated using the maximum sales charge of 4.75%. |
§ | Fund returns include a CDSC of 1% if redeemed within 12 months of purchase. |
| | THE GUGGENHEIM FUNDS SEMI-ANNUAL REPORT | 81 |
SCHEDULE OF INVESTMENTS (Unaudited) | March 31, 2024 |
STYLEPLUS—MID GROWTH FUND | |
| | Shares | | | Value | |
COMMON STOCKS† - 25.3% |
| | | | | | | | | |
Industrial - 7.3% |
Owens Corning | | | 2,446 | | | $ | 407,993 | |
Lincoln Electric Holdings, Inc. | | | 1,519 | | | | 388,013 | |
Advanced Drainage Systems, Inc. | | | 2,047 | | | | 352,575 | |
Lennox International, Inc. | | | 679 | | | | 331,868 | |
UFP Industries, Inc. | | | 2,510 | | | | 308,755 | |
Fortune Brands Innovations, Inc. | | | 3,017 | | | | 255,449 | |
Terex Corp. | | | 3,933 | | | | 253,285 | |
Simpson Manufacturing Company, Inc. | | | 1,192 | | | | 244,575 | |
Graco, Inc. | | | 2,488 | | | | 232,529 | |
Boise Cascade Co. | | | 1,442 | | | | 221,160 | |
Carlisle Companies, Inc. | | | 546 | | | | 213,950 | |
Mueller Industries, Inc. | | | 3,702 | | | | 199,649 | |
Otis Worldwide Corp. | | | 2,008 | | | | 199,334 | |
Snap-on, Inc. | | | 669 | | | | 198,171 | |
Masco Corp. | | | 2,460 | | | | 194,045 | |
Illinois Tool Works, Inc. | | | 653 | | | | 175,220 | |
TopBuild Corp.* | | | 391 | | | | 172,326 | |
Timken Co. | | | 1,900 | | | | 166,117 | |
Saia, Inc.* | | | 249 | | | | 145,665 | |
Builders FirstSource, Inc.* | | | 677 | | | | 141,188 | |
EMCOR Group, Inc. | | | 352 | | | | 123,270 | |
Donaldson Company, Inc. | | | 1,611 | | | | 120,309 | |
Acuity Brands, Inc. | | | 436 | | | | 117,166 | |
nVent Electric plc | | | 1,511 | | | | 113,929 | |
Applied Industrial Technologies, Inc. | | | 533 | | | | 105,294 | |
Allegion plc | | | 773 | | | | 104,131 | |
Mettler-Toledo International, Inc.* | | | 72 | | | | 95,853 | |
Universal Display Corp. | | | 373 | | | | 62,832 | |
ITT, Inc. | | | 303 | | | | 41,217 | |
Trex Company, Inc.* | | | 404 | | | | 40,299 | |
Comfort Systems USA, Inc. | | | 125 | | | | 39,714 | |
Tetra Tech, Inc. | | | 160 | | | | 29,554 | |
Total Industrial | | | | | | | 5,795,435 | |
| | | | | | | | | |
Consumer, Cyclical - 6.0% |
Toll Brothers, Inc. | | | 2,640 | | | | 341,537 | |
Williams-Sonoma, Inc. | | | 986 | | | | 313,084 | |
Boyd Gaming Corp. | | | 3,968 | | | | 267,126 | |
Brunswick Corp. | | | 2,700 | | | | 260,604 | |
Core & Main, Inc. — Class A* | | | 4,485 | | | | 256,766 | |
MSC Industrial Direct Company, Inc. — Class A | | | 2,223 | | | | 215,720 | |
PACCAR, Inc. | | | 1,657 | | | | 205,286 | |
Autoliv, Inc. | | | 1,669 | | | | 200,998 | |
Yum! Brands, Inc. | | | 1,378 | | | | 191,060 | |
Gentex Corp. | | | 4,972 | | | | 179,589 | |
Visteon Corp.* | | | 1,458 | | | | 171,475 | |
Wingstop, Inc. | | | 461 | | | | 168,910 | |
KB Home | | | 2,374 | | | | 168,269 | |
Crocs, Inc.* | | | 1,136 | | | | 163,357 | |
Travel + Leisure Co. | | | 3,087 | | | | 151,139 | |
Murphy USA, Inc. | | | 346 | | | | 145,043 | |
PulteGroup, Inc. | | | 1,194 | | | | 144,020 | |
Lennar Corp. — Class A | | | 832 | | | | 143,087 | |
Tempur Sealy International, Inc. | | | 2,359 | | | | 134,038 | |
AutoZone, Inc.* | | | 40 | | | | 126,066 | |
Meritage Homes Corp. | | | 699 | | | | 122,647 | |
Dick’s Sporting Goods, Inc. | | | 431 | | | | 96,915 | |
Deckers Outdoor Corp.* | | | 79 | | | | 74,359 | |
NVR, Inc.* | | | 9 | | | | 72,900 | |
Floor & Decor Holdings, Inc. — Class A* | | | 556 | | | | 72,069 | |
Skechers USA, Inc. — Class A* | | | 1,084 | | | | 66,406 | |
Domino’s Pizza, Inc. | | | 131 | | | | 65,091 | |
DR Horton, Inc. | | | 385 | | | | 63,352 | |
Five Below, Inc.* | | | 289 | | | | 52,419 | |
Watsco, Inc. | | | 119 | | | | 51,405 | |
Texas Roadhouse, Inc. — Class A | | | 252 | | | | 38,926 | |
Casey’s General Stores, Inc. | | | 95 | | | | 30,253 | |
Total Consumer, Cyclical | | | | | | | 4,753,916 | |
| | | | | | | | | |
Consumer, Non-cyclical - 3.7% |
Neurocrine Biosciences, Inc.* | | | 2,465 | | | | 339,973 | |
Exelixis, Inc.* | | | 12,604 | | | | 299,093 | |
H&R Block, Inc. | | | 5,802 | | | | 284,936 | |
United Therapeutics Corp.* | | | 1,114 | | | | 255,908 | |
Jazz Pharmaceuticals plc* | | | 1,997 | | | | 240,478 | |
HCA Healthcare, Inc. | | | 604 | | | | 201,452 | |
United Rentals, Inc. | | | 277 | | | | 199,748 | |
Shockwave Medical, Inc.* | | | 473 | | | | 154,023 | |
Halozyme Therapeutics, Inc.* | | | 3,479 | | | | 141,526 | |
Euronet Worldwide, Inc.* | | | 1,211 | | | | 133,125 | |
Celsius Holdings, Inc.* | | | 1,407 | | | | 116,669 | |
elf Beauty, Inc.* | | | 490 | | | | 96,055 | |
Lantheus Holdings, Inc.* | | | 1,517 | | | | 94,418 | |
Alkermes plc* | | | 2,914 | | | | 78,882 | |
WEX, Inc.* | | | 257 | | | | 61,045 | |
Coca-Cola Consolidated, Inc. | | | 69 | | | | 58,402 | |
Ingredion, Inc. | | | 489 | | | | 57,140 | |
Cytokinetics, Inc.* | | | 632 | | | | 44,309 | |
Repligen Corp.* | | | 199 | | | | 36,600 | |
Total Consumer, Non-cyclical | | | | | | | 2,893,782 | |
| | | | | | | | | |
Technology - 2.9% |
Dropbox, Inc. — Class A* | | | 11,593 | | | | 281,696 | |
Pure Storage, Inc. — Class A* | | | 4,140 | | | | 215,238 | |
Manhattan Associates, Inc.* | | | 832 | | | | 208,191 | |
Teradata Corp.* | | | 5,103 | | | | 197,333 | |
NXP Semiconductor N.V. | | | 762 | | | | 188,801 | |
Cirrus Logic, Inc.* | | | 1,958 | | | | 181,232 | |
KLA Corp. | | | 235 | | | | 164,164 | |
Fair Isaac Corp.* | | | 117 | | | | 146,205 | |
Microchip Technology, Inc. | | | 1,485 | | | | 133,219 | |
Rambus, Inc.* | | | 2,038 | | | | 125,969 | |
Qualys, Inc.* | | | 749 | | | | 124,986 | |
Lattice Semiconductor Corp.* | | | 1,161 | | | | 90,825 | |
NetApp, Inc. | | | 746 | | | | 78,308 | |
Allegro MicroSystems, Inc.* | | | 2,465 | | | | 66,456 | |
ON Semiconductor Corp.* | | | 738 | | | | 54,280 | |
Dynatrace, Inc.* | | | 834 | | | | 38,731 | |
Total Technology | | | | | | | 2,295,634 | |
| | | | | | | | | |
82 | THE GUGGENHEIM FUNDS SEMI-ANNUAL REPORT | SEE NOTES TO FINANCIAL STATEMENTS. |
SCHEDULE OF INVESTMENTS (Unaudited)(continued) | March 31, 2024 |
STYLEPLUS—MID GROWTH FUND | |
| | Shares | | | Value | |
Financial - 1.6% |
Interactive Brokers Group, Inc. — Class A | | | 2,599 | | | $ | 290,334 | |
MGIC Investment Corp. | | | 11,109 | | | | 248,397 | |
International Bancshares Corp. | | | 3,856 | | | | 216,476 | |
Kinsale Capital Group, Inc. | | | 273 | | | | 143,254 | |
American Homes 4 Rent — Class A REIT | | | 2,696 | | | | 99,159 | |
Arch Capital Group Ltd.* | | | 1,058 | | | | 97,802 | |
RenaissanceRe Holdings Ltd. | | | 394 | | | | 92,602 | |
East West Bancorp, Inc. | | | 1,001 | | | | 79,189 | |
Total Financial | | | | | | | 1,267,213 | |
| | | | | | | | | |
Energy - 1.6% |
CNX Resources Corp.* | | | 11,057 | | | | 262,272 | |
Marathon Petroleum Corp. | | | 1,090 | | | | 219,635 | |
Range Resources Corp. | | | 5,096 | | | | 175,455 | |
Ovintiv, Inc. | | | 3,055 | | | | 158,555 | |
Permian Resources Corp. | | | 5,646 | | | | 99,708 | |
Chord Energy Corp. | | | 558 | | | | 99,458 | |
Civitas Resources, Inc. | | | 1,159 | | | | 87,980 | |
SM Energy Co. | | | 1,657 | | | | 82,601 | |
SolarEdge Technologies, Inc.* | | | 861 | | | | 61,114 | |
Total Energy | | | | | | | 1,246,778 | |
| | | | | | | | | |
Communications - 1.0% |
GoDaddy, Inc. — Class A* | | | 2,691 | | | | 319,368 | |
Motorola Solutions, Inc. | | | 574 | | | | 203,758 | |
VeriSign, Inc.* | | | 614 | | | | 116,359 | |
Etsy, Inc.* | | | 1,565 | | | | 107,547 | |
Ciena Corp.* | | | 1,782 | | | | 88,120 | |
Total Communications | | | | | | | 835,152 | |
| | | | | | | | | |
Basic Materials - 0.8% |
Cabot Corp. | | | 2,013 | | | | 185,599 | |
Reliance, Inc. | | | 487 | | | | 162,746 | |
Olin Corp. | | | 2,426 | | | | 142,649 | |
CF Industries Holdings, Inc. | | | 717 | | | | 59,661 | |
RPM International, Inc. | | | 492 | | | | 58,523 | |
Total Basic Materials | | | | | | | 609,178 | |
| | | | | | | | | |
Utilities - 0.4% |
Vistra Corp. | | | 4,255 | | | | 296,361 | |
| | | | | | | | | |
Total Common Stocks | | | | |
(Cost $16,763,364) | | | | | | | 19,993,449 | |
| | | | | | | | | |
MUTUAL FUNDS† - 69.3% |
Guggenheim Strategy Fund II1 | | | 1,068,301 | | | | 26,280,204 | |
Guggenheim Strategy Fund III1 | | | 1,064,804 | | | | 26,268,707 | |
Guggenheim Ultra Short Duration Fund — Institutional Class1 | | | 224,225 | | | | 2,222,068 | |
Total Mutual Funds | | | | |
(Cost $54,390,103) | | | | | | | 54,770,979 | |
| | | | | | | | | |
MONEY MARKET FUND† - 5.2% |
Dreyfus Treasury Securities Cash Management Fund — Institutional Shares, 5.19%2 | | | 4,074,372 | | | | 4,074,372 | |
Total Money Market Fund | | | | |
(Cost $4,074,372) | | | | | | | 4,074,372 | |
| | | | | | | | | |
Total Investments - 99.8% | | | | |
(Cost $75,227,839) | | $ | 78,838,800 | |
Other Assets & Liabilities, net - 0.2% | | | 181,521 | |
Total Net Assets - 100.0% | | $ | 79,020,321 | |
Futures Contracts |
Description | | Number of
Contracts | | | Expiration
Date | | | Notional
Amount | | | Value and
Unrealized
Appreciation
(Depreciation)** | |
Equity Futures Contracts Purchased† |
S&P MidCap 400 Index Mini Futures Contracts | | | 7 | | | | Jun 2024 | | | $ | 2,153,060 | | | $ | 61,232 | |
S&P 500 Index Mini Futures Contracts | | | 3 | | | | Jun 2024 | | | | 795,825 | | | | 9,674 | |
NASDAQ-100 Index Mini Futures Contracts | | | 2 | | | | Jun 2024 | | | | 738,500 | | | | (459 | ) |
| | | | | | | | | | | $ | 3,687,385 | | | $ | 70,447 | |
Total Return Swap Agreements |
Counterparty | Index | Type | | Financing
Rate | | Payment
Frequency | | | Maturity
Date | | | Units | | | Notional
Amount | | | Value and
Unrealized
Appreciation | |
OTC Equity Index Swap Agreements†† |
Wells Fargo Bank, N.A. | Russell MidCap Growth Index | Pay | | 5.88% (Federal
Funds Rate +
0.55%) | | | At Maturity | | | | 03/03/25 | | | | 10,144 | | | $ | 57,246,041 | | | $ | 5,246,517 | |
SEE NOTES TO FINANCIAL STATEMENTS. | THE GUGGENHEIM FUNDS SEMI-ANNUAL REPORT | 83 |
SCHEDULE OF INVESTMENTS (Unaudited)(continued) | March 31, 2024 |
STYLEPLUS—MID GROWTH FUND | |
* | Non-income producing security. |
** | Includes cumulative appreciation (depreciation). Variation margin is reported within the Statement of Assets and Liabilities. |
† | Value determined based on Level 1 inputs — See Note 4. |
†† | Value determined based on Level 2 inputs — See Note 4. |
1 | Affiliated issuer. |
2 | Rate indicated is the 7-day yield as of March 31, 2024. |
| | plc — Public Limited Company |
| | REIT — Real Estate Investment Trust |
| | |
| | See Sector Classification in Other Information section. |
The following table summarizes the inputs used to value the Fund’s investments at March 31, 2024 (See Note 4 in the Notes to Financial Statements):
Investments in Securities (Assets) | | Level 1
Quoted
Prices | | | Level 2
Significant
Observable
Inputs | | | Level 3
Significant
Unobservable
Inputs | | | Total | |
Common Stocks | | $ | 19,993,449 | | | $ | — | | | $ | — | | | $ | 19,993,449 | |
Mutual Funds | | | 54,770,979 | | | | — | | | | — | | | | 54,770,979 | |
Money Market Fund | | | 4,074,372 | | | | — | | | | — | | | | 4,074,372 | |
Equity Futures Contracts** | | | 70,906 | | | | — | | | | — | | | | 70,906 | |
Equity Index Swap Agreements** | | | — | | | | 5,246,517 | | | | — | | | | 5,246,517 | |
Total Assets | | $ | 78,909,706 | | | $ | 5,246,517 | | | $ | — | | | $ | 84,156,223 | |
Investments in Securities (Liabilities) | | Level 1
Quoted
Prices | | | Level 2
Significant
Observable
Inputs | | | Level 3
Significant
Unobservable
Inputs | | | Total | |
Equity Futures Contracts** | | $ | 459 | | | $ | — | | | $ | — | | | $ | 459 | |
** | This derivative is reported as unrealized appreciation/depreciation at period end. |
84 | THE GUGGENHEIM FUNDS SEMI-ANNUAL REPORT | SEE NOTES TO FINANCIAL STATEMENTS. |
SCHEDULE OF INVESTMENTS (Unaudited)(concluded) | March 31, 2024 |
STYLEPLUS—MID GROWTH FUND | |
Affiliated Transactions
Investments representing 5% or more of the outstanding voting shares of a company, or control of or by, or common control under Guggenheim Investments (“GI”), result in that company being considered an affiliated issuer, as defined in the 1940 Act.
The Fund may invest in certain of the underlying series of Guggenheim Strategy Funds Trust, including Guggenheim Strategy Fund II and Guggenheim Strategy Fund III (collectively, the “Guggenheim Strategy Funds”), each of which are open-end management investment companies managed by GI. The Guggenheim Strategy Funds, which launched on March 11, 2014, are offered as short term investment options only to mutual funds, trusts, and other accounts managed by GI and/or its affiliates, and are not available to the public. The Guggenheim Strategy Funds pay no investment management fees. The Guggenheim Strategy Funds’ annual report on Form N-CSR dated September 30, 2023 is available publicly or upon request. This information is available from the EDGAR database on the SEC’s website at https://www.sec.gov/Archives/edgar/data/1601445/000182126823000217/gug86449-ncsr.htm. The Fund may invest in certain of the underlying series of Guggenheim Funds Trust, which are open-end management investment companies managed by GI, are available to the public and whose most recent annual report on Form N-CSR is available publicly or upon request.
Transactions during the period ended March 31, 2024, in which the company is an affiliated issuer, were as follows:
Security Name | | Value
09/30/23 | | | Additions | | | Reductions | | | Realized
Gain (Loss) | | | Change in
Unrealized
Appreciation
(Depreciation) | | | Value
03/31/24 | | | Shares
03/31/24 | | | Investment
Income | |
Mutual Funds | | | | | | | | | | | | | | | | | | | | | | | | | | | | | | | | |
Guggenheim Strategy Fund II | | $ | 22,166,962 | | | $ | 5,348,417 | | | $ | (1,550,080 | ) | | $ | (38,065 | ) | | $ | 352,970 | | | $ | 26,280,204 | | | | 1,068,301 | | | $ | 668,157 | |
Guggenheim Strategy Fund III | | | 23,628,764 | | | | 3,876,927 | | | | (1,601,310 | ) | | | (58,566 | ) | | | 422,892 | | | | 26,268,707 | | | | 1,064,804 | | | | 644,627 | |
Guggenheim Ultra Short Duration Fund — Institutional Class | | | 2,126,306 | | | | 60,440 | | | | — | | | | — | | | | 35,322 | | | | 2,222,068 | | | | 224,225 | | | | 60,790 | |
| | | $ | 47,922,032 | | | $ | 9,285,784 | | | $ | (3,151,390 | ) | | $ | (96,631 | ) | | $ | 811,184 | | | $ | 54,770,979 | | | | | | | $ | 1,373,574 | |
SEE NOTES TO FINANCIAL STATEMENTS. | THE GUGGENHEIM FUNDS SEMI-ANNUAL REPORT | 85 |
STYLEPLUS—MID GROWTH FUND | |
STATEMENT OF ASSETS AND LIABILITIES (Unaudited) |
March 31, 2024 |
Assets: |
Investments in unaffiliated issuers, at value (cost $20,837,736) | | $ | 24,067,821 | |
Investments in affiliated issuers, at value (cost $54,390,103) | | | 54,770,979 | |
Cash | | | 5,506 | |
Segregated cash with broker | | | 221,898 | |
Unrealized appreciation on OTC swap agreements | | | 5,246,517 | |
Prepaid expenses | | | 44,900 | |
Receivables: |
Dividends | | | 263,077 | |
Variation margin on futures contracts | | | 4,377 | |
Interest | | | 3,528 | |
Fund shares sold | | | 379 | |
Total assets | | | 84,628,982 | |
| | | | | |
Liabilities: |
Segregated cash due to broker | | | 4,740,000 | |
Payable for: |
Swap settlement | | | 501,102 | |
Securities purchased | | | 254,207 | |
Management fees | | | 48,863 | |
Fund shares redeemed | | | 18,633 | |
Distribution and service fees | | | 16,612 | |
Transfer agent/maintenance fees | | | 6,538 | |
Fund accounting/administration fees | | | 5,183 | |
Trustees’ fees* | | | 615 | |
Miscellaneous | | | 16,908 | |
Total liabilities | | | 5,608,661 | |
Net assets | | $ | 79,020,321 | |
| | | | | |
Net assets consist of: |
Paid in capital | | $ | 83,693,074 | |
Total distributable earnings (loss) | | | (4,672,753 | ) |
Net assets | | $ | 79,020,321 | |
Class A: |
Net assets | | $ | 77,209,025 | |
Capital shares outstanding | | | 2,127,566 | |
Net asset value per share | | $ | 36.29 | |
Maximum offering price per share (Net asset value divided by 95.25%) | | $ | 38.10 | |
Class C: |
Net assets | | $ | 633,534 | |
Capital shares outstanding | | | 48,694 | |
Net asset value per share | | $ | 13.01 | |
Class P: |
Net assets | | $ | 63,600 | |
Capital shares outstanding | | | 1,790 | |
Net asset value per share | | $ | 35.53 | |
| | | | | |
Institutional Class: |
Net assets | | $ | 1,114,162 | |
Capital shares outstanding | | | 30,714 | |
Net asset value per share | | $ | 36.28 | |
STATEMENT OF OPERATIONS (Unaudited) |
Six Months Ended March 31, 2024 |
Investment Income: |
Dividends from securities of unaffiliated issuers (net of foreign withholding tax of $224) | | $ | 104,505 | |
Dividends from securities of affiliated issuers | | | 1,373,574 | |
Interest | | | 91,610 | |
Total investment income | | | 1,569,689 | |
| | | | | |
Expenses: |
Management fees | | | 263,768 | |
Distribution and service fees: |
Class A | | | 85,862 | |
Class C | | | 2,959 | |
Class P | | | 70 | |
Transfer agent/maintenance fees: |
Class A | | | 41,282 | |
Class C | | | 998 | |
Class P | | | 72 | |
Institutional Class | | | 736 | |
Interest Expense | | | 141,360 | |
Professional fees | | | 21,385 | |
Fund accounting/administration fees | | | 18,319 | |
Custodian fees | | | 7,904 | |
Trustees’ fees* | | | 7,375 | |
Line of credit fees | | | 906 | |
Miscellaneous | | | 34,700 | |
Total expenses | | | 627,696 | |
Less: |
Expenses waived by Adviser | | | (2,711 | ) |
Net expenses | | | 624,985 | |
Net investment income | | | 944,704 | |
| | | | | |
Net Realized and Unrealized Gain (Loss): |
Net realized gain (loss) on: |
Investments in unaffiliated issuers | | | 1,910,391 | |
Investments in affiliated issuers | | | (96,631 | ) |
Swap agreements | | | 10,533,166 | |
Futures contracts | | | 428,914 | |
Net realized gain | | | 12,775,840 | |
Net change in unrealized appreciation (depreciation) on: |
Investments in unaffiliated issuers | | | 2,534,709 | |
Investments in affiliated issuers | | | 811,184 | |
Swap agreements | | | 97,165 | |
Futures contracts | | | 179,858 | |
Net change in unrealized appreciation (depreciation) | | | 3,622,916 | |
Net realized and unrealized gain | | | 16,398,756 | |
Net increase in net assets resulting from operations | | $ | 17,343,460 | |
* | Relates to Trustees not deemed “interested persons” within the meaning of Section 2(a)(19) of the 1940 Act. |
86 | THE GUGGENHEIM FUNDS SEMI-ANNUAL REPORT | SEE NOTES TO FINANCIAL STATEMENTS. |
STYLEPLUS—MID GROWTH FUND | |
STATEMENTS OF CHANGES IN NET ASSETS |
| | Six Months Ended
March 31, 2024
(Unaudited) | | | Year Ended
September 30,
2023 | |
Increase (Decrease) in Net Assets from Operations: | | | | | | | | |
Net investment income | | $ | 944,704 | | | $ | 1,660,859 | |
Net realized gain (loss) on investments | | | 12,775,840 | | | | (22,978,263 | ) |
Net change in unrealized appreciation (depreciation) on investments | | | 3,622,916 | | | | 33,116,667 | |
Net increase in net assets resulting from operations | | | 17,343,460 | | | | 11,799,263 | |
| | | | | | | | | |
Distributions to shareholders: | | | | | | | | |
Class A | | | (1,599,572 | ) | | | (18,424,696 | ) |
Class C | | | (35,883 | ) | | | (356,411 | ) |
Class P | | | (1,001 | ) | | | (34,001 | ) |
Institutional Class | | | (25,329 | ) | | | (258,969 | ) |
Total distributions to shareholders | | | (1,661,785 | ) | | | (19,074,077 | ) |
| | | | | | | | | |
Capital share transactions: | | | | | | | | |
Proceeds from sale of shares | | | | | | | | |
Class A | | | 520,989 | | | | 1,044,582 | |
Class C | | | 11,834 | | | | 26,052 | |
Class P | | | 2,348 | | | | 5,957 | |
Institutional Class | | | 28,740 | | | | 374,605 | |
Distributions reinvested | | | | | | | | |
Class A | | | 1,520,104 | | | | 17,671,252 | |
Class C | | | 35,883 | | | | 298,799 | |
Class P | | | 1,001 | | | | 34,001 | |
Institutional Class | | | 25,262 | | | | 250,941 | |
Cost of shares redeemed | | | | | | | | |
Class A | | | (3,395,711 | ) | | | (15,576,440 | ) |
Class C | | | (77,223 | ) | | | (213,354 | ) |
Class P | | | (2,384 | ) | | | (80,078 | ) |
Institutional Class | | | (80,455 | ) | | | (508,296 | ) |
Net increase (decrease) from capital share transactions | | | (1,409,612 | ) | | | 3,328,021 | |
Net increase (decrease) in net assets | | | 14,272,063 | | | | (3,946,793 | ) |
| | | | | | | | | |
Net assets: | | | | | | | | |
Beginning of period | | | 64,748,258 | | | | 68,695,051 | |
End of period | | $ | 79,020,321 | | | $ | 64,748,258 | |
| | | | | | | | | |
Capital share activity: | | | | | | | | |
Shares sold | | | | | | | | |
Class A | | | 16,135 | | | | 34,720 | |
Class C | | | 1,018 | | | | 2,227 | |
Class P | | | 75 | | | | 203 | |
Institutional Class | | | 918 | | | | 13,235 | |
Shares issued from reinvestment of distributions | | | | | | | | |
Class A | | | 47,135 | | | | 659,621 | |
Class C | | | 3,096 | | | | 29,643 | |
Class P | | | 32 | | | | 1,299 | |
Institutional Class | | | 784 | | | | 9,384 | |
Shares redeemed | | | | | | | | |
Class A | | | (106,297 | ) | | | (481,994 | ) |
Class C | | | (6,498 | ) | | | (17,169 | ) |
Class P | | | (73 | ) | | | (2,987 | ) |
Institutional Class | | | (2,467 | ) | | | (16,939 | ) |
Net increase (decrease) in shares | | | (46,142 | ) | | | 231,243 | |
SEE NOTES TO FINANCIAL STATEMENTS. | THE GUGGENHEIM FUNDS SEMI-ANNUAL REPORT | 87 |
STYLEPLUS—MID GROWTH FUND | |
This table is presented to show selected data for a share outstanding throughout each period and to assist shareholders in evaluating a Fund’s performance for the periods presented.
Class A | | Six Months Ended
March 31, 2024a | | | Year Ended
September 30,
2023 | | | Year Ended
September 30,
2022 | | | Year Ended
September 30,
2021 | | | Year Ended
September 30,
2020 | | | Year Ended
September 30,
2019 | |
Per Share Data |
Net asset value, beginning of period | | $ | 29.13 | | | $ | 34.22 | | | $ | 52.73 | | | $ | 45.98 | | | $ | 39.64 | | | $ | 49.70 | |
Income (loss) from investment operations: |
Net investment income (loss)b | | | .43 | | | | .76 | | | | .16 | | | | (.02 | ) | | | .19 | | | | .45 | |
Net gain (loss) on investments (realized and unrealized) | | | 7.48 | | | | 5.07 | | | | (15.32 | ) | | | 13.67 | | | | 7.06 | | | | (1.58 | ) |
Total from investment operations | | | 7.91 | | | | 5.83 | | | | (15.16 | ) | | | 13.65 | | | | 7.25 | | | | (1.13 | ) |
Less distributions from: |
Net investment income | | | (.75 | ) | | | (.19 | ) | | | — | | | | (.20 | ) | | | (.45 | ) | | | (.41 | ) |
Net realized gains | | | — | | | | (10.73 | ) | | | (3.35 | ) | | | (6.70 | ) | | | (.46 | ) | | | (8.52 | ) |
Total distributions | | | (.75 | ) | | | (10.92 | ) | | | (3.35 | ) | | | (6.90 | ) | | | (.91 | ) | | | (8.93 | ) |
Net asset value, end of period | | $ | 36.29 | | | $ | 29.13 | | | $ | 34.22 | | | $ | 52.73 | | | $ | 45.98 | | | $ | 39.64 | |
|
Total Returnc | | | 27.48 | % | | | 19.84 | % | | | (30.68 | %) | | | 31.07 | % | | | 18.57 | % | | | 2.34 | % |
Ratios/Supplemental Data |
Net assets, end of period (in thousands) | | $ | 77,209 | | | $ | 63,225 | | | $ | 67,014 | | | $ | 107,983 | | | $ | 89,469 | | | $ | 83,027 | |
Ratios to average net assets: |
Net investment income (loss) | | | 2.69 | % | | | 2.52 | % | | | 0.36 | % | | | (0.04 | %) | | | 0.46 | % | | | 1.13 | % |
Total expensesd | | | 1.78 | % | | | 1.66 | % | | | 1.32 | % | | | 1.34 | % | | | 1.45 | % | | | 1.44 | % |
Net expensese | | | 1.77 | % | | | 1.65 | % | | | 1.30 | % | | | 1.28 | % | | | 1.40 | % | | | 1.41 | % |
Portfolio turnover rate | | | 38 | % | | | 82 | % | | | 72 | % | | | 44 | % | | | 82 | % | | | 73 | % |
Class C | | Six Months Ended
March 31, 2024a | | | Year Ended
September 30,
2023 | | | Year Ended
September 30,
2022 | | | Year Ended
September 30,
2021 | | | Year Ended
September 30,
2020 | | | Year Ended
September 30,
2019 | |
Per Share Data |
Net asset value, beginning of period | | $ | 10.89 | | | $ | 18.92 | | | $ | 30.92 | | | $ | 29.40 | | | $ | 25.66 | | | $ | 35.78 | |
Income (loss) from investment operations: |
Net investment income (loss)b | | | .10 | | | | .20 | | | | (.15 | ) | | | (.29 | ) | | | (.10 | ) | | | .08 | |
Net gain (loss) on investments (realized and unrealized) | | | 2.74 | | | | 2.50 | | | | (8.50 | ) | | | 8.51 | | | | 4.53 | | | | (1.68 | ) |
Total from investment operations | | | 2.84 | | | | 2.70 | | | | (8.65 | ) | | | 8.22 | | | | 4.43 | | | | (1.60 | ) |
Less distributions from: |
Net investment income | | | (.72 | ) | | | — | | | | — | | | | — | | | | (.23 | ) | | | — | |
Net realized gains | | | — | | | | (10.73 | ) | | | (3.35 | ) | | | (6.70 | ) | | | (.46 | ) | | | (8.52 | ) |
Total distributions | | | (.72 | ) | | | (10.73 | ) | | | (3.35 | ) | | | (6.70 | ) | | | (.69 | ) | | | (8.52 | ) |
Net asset value, end of period | | $ | 13.01 | | | $ | 10.89 | | | $ | 18.92 | | | $ | 30.92 | | | $ | 29.40 | | | $ | 25.66 | |
|
Total Returnc | | | 26.85 | % | | | 18.85 | % | | | (31.33 | %) | | | 29.88 | % | | | 17.53 | % | | | 1.46 | % |
Ratios/Supplemental Data |
Net assets, end of period (in thousands) | | $ | 634 | | | $ | 556 | | | $ | 688 | | | $ | 1,327 | | | $ | 1,510 | | | $ | 1,683 | |
Ratios to average net assets: |
Net investment income (loss) | | | 1.72 | % | | | 1.66 | % | | | (0.59 | %) | | | (0.94 | %) | | | (0.39 | %) | | | 0.30 | % |
Total expensesd | | | 2.75 | % | | | 2.49 | % | | | 2.25 | % | | | 2.26 | % | | | 2.32 | % | | | 2.27 | % |
Net expensese | | | 2.74 | % | | | 2.48 | % | | | 2.23 | % | | | 2.20 | % | | | 2.28 | % | | | 2.24 | % |
Portfolio turnover rate | | | 38 | % | | | 82 | % | | | 72 | % | | | 44 | % | | | 82 | % | | | 73 | % |
88 | THE GUGGENHEIM FUNDS SEMI-ANNUAL REPORT | SEE NOTES TO FINANCIAL STATEMENTS. |
STYLEPLUS—MID GROWTH FUND | |
FINANCIAL HIGHLIGHTS (continued) |
This table is presented to show selected data for a share outstanding throughout each period and to assist shareholders in evaluating a Fund’s performance for the periods presented.
Class P | | Six Months Ended
March 31, 2024a | | | Year Ended
September 30,
2023 | | | Year Ended
September 30,
2022 | | | Year Ended
September 30,
2021 | | | Year Ended
September 30,
2020 | | | Year Ended
September 30,
2019 | |
Per Share Data |
Net asset value, beginning of period | | $ | 28.38 | | | $ | 33.58 | | | $ | 51.96 | | | $ | 45.45 | | | $ | 39.17 | | | $ | 49.12 | |
Income (loss) from investment operations: |
Net investment income (loss)b | | | .40 | | | | .64 | | | | — | | | | (.07 | ) | | | .15 | | | | .41 | |
Net gain (loss) on investments (realized and unrealized) | | | 7.32 | | | | 4.96 | | | | (15.03 | ) | | | 13.51 | | | | 6.99 | | | | (1.58 | ) |
Total from investment operations | | | 7.72 | | | | 5.60 | | | | (15.03 | ) | | | 13.44 | | | | 7.14 | | | | (1.17 | ) |
Less distributions from: |
Net investment income | | | (.57 | ) | | | (.07 | ) | | | — | | | | (.23 | ) | | | (.40 | ) | | | (.26 | ) |
Net realized gains | | | — | | | | (10.73 | ) | | | (3.35 | ) | | | (6.70 | ) | | | (.46 | ) | | | (8.52 | ) |
Total distributions | | | (.57 | ) | | | (10.80 | ) | | | (3.35 | ) | | | (6.93 | ) | | | (.86 | ) | | | (8.78 | ) |
Net asset value, end of period | | $ | 35.53 | | | $ | 28.38 | | | $ | 33.58 | | | $ | 51.96 | | | $ | 45.45 | | | $ | 39.17 | |
|
Total Return | | | 27.40 | % | | | 19.40 | % | | | (30.90 | %) | | | 30.92 | % | | | 18.48 | % | | | 2.22 | % |
Ratios/Supplemental Data |
Net assets, end of period (in thousands) | | $ | 64 | | | $ | 50 | | | $ | 109 | | | $ | 237 | | | $ | 116 | | | $ | 93 | |
Ratios to average net assets: |
Net investment income (loss) | | | 2.53 | % | | | 2.09 | % | | | 0.01 | % | | | (0.14 | %) | | | 0.36 | % | | | 1.04 | % |
Total expensesd | | | 1.91 | % | | | 1.97 | % | | | 1.56 | % | | | 1.43 | % | | | 1.54 | % | | | 1.55 | % |
Net expensese | | | 1.91 | % | | | 1.96 | % | | | 1.54 | % | | | 1.37 | % | | | 1.50 | % | | | 1.51 | % |
Portfolio turnover rate | | | 38 | % | | | 82 | % | | | 72 | % | | | 44 | % | | | 82 | % | | | 73 | % |
SEE NOTES TO FINANCIAL STATEMENTS. | THE GUGGENHEIM FUNDS SEMI-ANNUAL REPORT | 89 |
STYLEPLUS—MID GROWTH FUND | |
FINANCIAL HIGHLIGHTS (concluded) |
This table is presented to show selected data for a share outstanding throughout each period and to assist shareholders in evaluating a Fund’s performance for the periods presented.
Institutional Class | | Six Months Ended
March 31, 2024a | | | Year Ended
September 30,
2023 | | | Year Ended
September 30,
2022 | | | Year Ended
September 30,
2021 | | | Year Ended
September 30,
2020 | | | Year Ended
September 30,
2019 | |
Per Share Data |
Net asset value, beginning of period | | $ | 29.13 | | | $ | 34.25 | | | $ | 52.71 | | | $ | 45.98 | | | $ | 39.64 | | | $ | 49.80 | |
Income (loss) from investment operations: |
Net investment income (loss)b | | | .46 | | | | .82 | | | | .22 | | | | .07 | | | | .24 | | | | .51 | |
Net gain (loss) on investments (realized and unrealized) | | | 7.49 | | | | 5.05 | | | | (15.33 | ) | | | 13.65 | | | | 7.09 | | | | (1.63 | ) |
Total from investment operations | | | 7.95 | | | | 5.87 | | | | (15.11 | ) | | | 13.72 | | | | 7.33 | | | | (1.12 | ) |
Less distributions from: |
Net investment income | | | (.80 | ) | | | (.26 | ) | | | — | | | | (.29 | ) | | | (.53 | ) | | | (.52 | ) |
Net realized gains | | | — | | | | (10.73 | ) | | | (3.35 | ) | | | (6.70 | ) | | | (.46 | ) | | | (8.52 | ) |
Total distributions | | | (.80 | ) | | | (10.99 | ) | | | (3.35 | ) | | | (6.99 | ) | | | (.99 | ) | | | (9.04 | ) |
Net asset value, end of period | | $ | 36.28 | | | $ | 29.13 | | | $ | 34.25 | | | $ | 52.71 | | | $ | 45.98 | | | $ | 39.64 | |
|
Total Return | | | 27.65 | % | | | 20.02 | % | | | (30.60 | %) | | | 31.26 | % | | | 18.79 | % | | | 2.42 | % |
Ratios/Supplemental Data |
Net assets, end of period (in thousands) | | $ | 1,114 | | | $ | 917 | | | $ | 884 | | | $ | 1,390 | | | $ | 1,311 | | | $ | 972 | |
Ratios to average net assets: |
Net investment income (loss) | | | 2.91 | % | | | 2.72 | % | | | 0.50 | % | | | 0.14 | % | | | 0.58 | % | | | 1.28 | % |
Total expensesd | | | 1.56 | % | | | 1.49 | % | | | 1.20 | % | | | 1.17 | % | | | 1.26 | % | | | 1.31 | % |
Net expensese | | | 1.55 | % | | | 1.49 | % | | | 1.18 | % | | | 1.11 | % | | | 1.22 | % | | | 1.28 | % |
Portfolio turnover rate | | | 38 | % | | | 82 | % | | | 72 | % | | | 44 | % | | | 82 | % | | | 73 | % |
a | Unaudited figures for the period ended March 31, 2024. Percentage amounts for the period, except total return and portfolio turnover rate, have been annualized. |
b | Net investment income (loss) per share was computed using average shares outstanding throughout the period. |
c | Total return does not reflect the impact of any applicable sales charges. |
d | Does not include expenses of the underlying funds in which the Fund invests. |
e | Net expense information reflects the expense ratios after expense waivers and reimbursements, as applicable. |
90 | THE GUGGENHEIM FUNDS SEMI-ANNUAL REPORT | SEE NOTES TO FINANCIAL STATEMENTS. |
PERFORMANCE REPORT AND FUND PROFILE (Unaudited) | March 31, 2024 |
WORLD EQUITY INCOME FUND
OBJECTIVE: Seeks to provide total return, comprised of capital appreciation and income.
Holdings Diversification (Market Exposure as % of Net Assets)
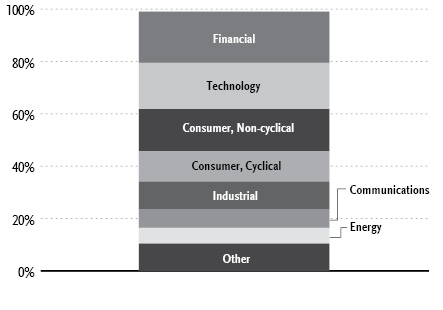
“Holdings Diversification (Market Exposure as % of Net Assets)” excludes any temporary cash investments.
COUNTRY DIVERSIFICATION
Country | | % of Long-Term Investments | |
United States | | | 67.2 | % |
Canada | | | 5.4 | % |
Australia | | | 4.8 | % |
Japan | | | 4.6 | % |
Netherlands | | | 3.6 | % |
Italy | | | 1.9 | % |
Singapore | | | 1.7 | % |
Other | | | 10.8 | % |
Total Long-Term Investments | | | 100.0 | % |
Inception Dates: |
Class A | October 1, 1993 |
Class C | January 29, 1999 |
Class P | May 1, 2015 |
Institutional Class | May 2, 2011 |
Ten Largest Holdings | % of Total Net Assets |
Microsoft Corp. | 3.0% |
Apple, Inc. | 2.8% |
NVIDIA Corp. | 2.6% |
Alphabet, Inc. — Class C | 2.0% |
Amazon.com, Inc. | 1.8% |
UnitedHealth Group, Inc. | 1.4% |
Berkshire Hathaway, Inc. — Class B | 1.4% |
PepsiCo, Inc. | 1.1% |
Citigroup, Inc. | 1.1% |
Broadcom, Inc. | 1.1% |
Top Ten Total | 18.3% |
| | |
“Ten Largest Holdings” excludes any temporary cash or derivative investments. |
| | THE GUGGENHEIM FUNDS SEMI-ANNUAL REPORT | 91 |
PERFORMANCE REPORT AND FUND PROFILE (Unaudited)(concluded) | March 31, 2024 |
Average Annual Returns*
Periods Ended March 31, 2024
| 6 Month† | 1 Year | 5 Year | 10 Year |
Class A Shares | 17.52% | 19.75% | 9.33% | 7.06% |
Class A Shares with sales charge‡ | 11.92% | 14.06% | 8.28% | 6.54% |
Class C Shares | 17.03% | 18.87% | 8.52% | 6.26% |
Class C Shares with CDSC§ | 16.03% | 17.87% | 8.52% | 6.26% |
Institutional Class Shares | 17.61% | 20.07% | 9.62% | 7.34% |
MSCI World Index (Net) | 21.28% | 25.07% | 12.07% | 9.39% |
| 6 Month† | 1 Year | 5 Year | Since
Inception
(05/01/15) |
Class P Shares | 17.55% | 19.79% | 9.33% | 7.46% |
MSCI World Index (Net) | 21.28% | 25.07% | 12.07% | 9.52% |
* | The performance data above represents past performance that is not predictive of future results. The investment return and principal value of an investment in the Fund will fluctuate so that an investor’s shares, when redeemed, may be worth more or less than their original cost. Returns are historical and include changes in principal and reinvested dividends and capital gains and do not reflect the effect of taxes. The MSCI World Index (Net) is an unmanaged index and, unlike the Fund, has no management fees or operating expenses to reduce its reported return. |
† | 6 month returns are not annualized. |
‡ | Fund returns are calculated using the maximum sales charge of 4.75%. |
§ | Fund returns include a CDSC of 1% if redeemed within 12 months of purchase. |
92 | THE GUGGENHEIM FUNDS SEMI-ANNUAL REPORT | |
SCHEDULE OF INVESTMENTS (Unaudited) | March 31, 2024 |
WORLD EQUITY INCOME FUND | |
| | Shares | | | Value | |
COMMON STOCKS† - 97.1% |
| | | | | | | | | |
Financial - 19.6% |
Berkshire Hathaway, Inc. — Class B* | | | 1,590 | | | $ | 668,627 | |
Citigroup, Inc. | | | 8,470 | | | | 535,643 | |
Banco Bilbao Vizcaya Argentaria S.A. | | | 43,570 | | | | 519,004 | |
Intesa Sanpaolo SpA | | | 131,700 | | | | 477,888 | |
Capital One Financial Corp. | | | 3,200 | | | | 476,448 | |
Goldman Sachs Group, Inc. | | | 1,100 | | | | 459,459 | |
AXA S.A. | | | 12,000 | | | | 450,777 | |
ANZ Group Holdings Ltd. | | | 22,520 | | | | 431,496 | |
ING Groep N.V. | | | 26,000 | | | | 427,704 | |
Simon Property Group, Inc. REIT | | | 2,690 | | | | 420,958 | |
Westpac Banking Corp. | | | 24,660 | | | | 419,464 | |
National Australia Bank Ltd. | | | 16,450 | | | | 371,369 | |
United Overseas Bank Ltd. | | | 17,000 | | | | 369,141 | |
AvalonBay Communities, Inc. REIT | | | 1,971 | | | | 365,739 | |
VICI Properties, Inc. REIT | | | 12,000 | | | | 357,480 | |
First Citizens BancShares, Inc. — Class A | | | 200 | | | | 327,000 | |
Swedbank AB — Class A | | | 16,000 | | | | 317,344 | |
Swiss Life Holding AG | | | 450 | | | | 315,511 | |
Skandinaviska Enskilda Banken AB — Class A | | | 23,000 | | | | 311,463 | |
Public Storage REIT | | | 1,063 | | | | 308,334 | |
FirstService Corp. | | | 1,500 | | | | 248,427 | |
Aon plc — Class A | | | 700 | | | | 233,604 | |
Mediobanca Banca di Credito Finanziario SpA | | | 12,070 | | | | 179,852 | |
Assicurazioni Generali SpA | | | 6,000 | | | | 151,877 | |
Synchrony Financial | | | 3,000 | | | | 129,360 | |
BNP Paribas S.A. | | | 1,800 | | | | 127,911 | |
Zurich Insurance Group AG | | | 200 | | | | 107,865 | |
American International Group, Inc. | | | 1,200 | | | | 93,804 | |
Gaming and Leisure Properties, Inc. REIT | | | 2,000 | | | | 92,140 | |
Total Financial | | | | | | | 9,695,689 | |
| | | | | | | | | |
Technology - 17.7% |
Microsoft Corp. | | | 3,559 | | | | 1,497,350 | |
Apple, Inc. | | | 8,074 | | | | 1,384,529 | |
NVIDIA Corp. | | | 1,450 | | | | 1,310,162 | |
Broadcom, Inc. | | | 402 | | | | 532,815 | |
Texas Instruments, Inc. | | | 2,762 | | | | 481,168 | |
NXP Semiconductor N.V. | | | 1,700 | | | | 421,209 | |
CGI, Inc.* | | | 3,500 | | | | 386,287 | |
Workday, Inc. — Class A* | | | 1,400 | | | | 381,850 | |
Cognizant Technology Solutions Corp. — Class A | | | 5,100 | | | | 373,779 | |
Skyworks Solutions, Inc. | | | 3,200 | | | | 346,624 | |
Dell Technologies, Inc. — Class C | | | 2,900 | | | | 330,919 | |
Constellation Software, Inc. | | | 110 | | | | 300,586 | |
MongoDB, Inc.* | | | 800 | | | | 286,912 | |
Crowdstrike Holdings, Inc. — Class A* | | | 800 | | | | 256,472 | |
Intel Corp. | | | 5,598 | | | | 247,264 | |
Accenture plc — Class A | | | 300 | | | | 103,983 | |
ASML Holding N.V. | | | 100 | | | | 96,267 | |
Total Technology | | | | | | | 8,738,176 | |
| | | | | | | | | |
Consumer, Non-cyclical - 16.2% |
UnitedHealth Group, Inc. | | | 1,377 | | | | 681,202 | |
PepsiCo, Inc. | | | 3,124 | | | | 546,731 | |
Bristol-Myers Squibb Co. | | | 8,600 | | | | 466,378 | |
Novo Nordisk A/S — Class B | | | 3,600 | | | | 458,894 | |
Amgen, Inc. | | | 1,498 | | | | 425,911 | |
Elevance Health, Inc. | | | 800 | | | | 414,832 | |
Johnson & Johnson | | | 2,592 | | | | 410,028 | |
CVS Health Corp. | | | 5,100 | | | | 406,776 | |
Colgate-Palmolive Co. | | | 4,465 | | | | 402,073 | |
Sysco Corp. | | | 4,860 | | | | 394,535 | |
Altria Group, Inc. | | | 9,000 | | | | 392,580 | |
Archer-Daniels-Midland Co. | | | 5,800 | | | | 364,298 | |
Bunge Global S.A. | | | 3,400 | | | | 348,568 | |
Japan Tobacco, Inc. | | | 12,900 | | | | 343,234 | |
CK Hutchison Holdings Ltd. | | | 62,468 | | | | 301,704 | |
Imperial Brands plc | | | 13,140 | | | | 293,462 | |
McKesson Corp. | | | 530 | | | | 284,531 | |
HCA Healthcare, Inc. | | | 700 | | | | 233,471 | |
Eli Lilly & Co. | | | 200 | | | | 155,592 | |
Kraft Heinz Co. | | | 4,000 | | | | 147,600 | |
Molina Healthcare, Inc.* | | | 300 | | | | 123,249 | |
Tesco plc | | | 32,000 | | | | 119,791 | |
Philip Morris International, Inc. | | | 1,300 | | | | 119,106 | |
Medtronic plc | | | 1,000 | | | | 87,150 | |
Pfizer, Inc. | | | 3,000 | | | | 83,250 | |
Total Consumer, Non-cyclical | | | | | | | 8,004,946 | |
| | | | | | | | | |
Consumer, Cyclical - 11.5% |
Walmart, Inc. | | | 8,700 | | | | 523,479 | |
Stellantis N.V. | | | 16,000 | | | | 454,812 | |
General Motors Co. | | | 10,000 | | | | 453,500 | |
Home Depot, Inc. | | | 1,009 | | | | 387,052 | |
WW Grainger, Inc. | | | 380 | | | | 386,574 | |
Dollarama, Inc. | | | 4,900 | | | | 373,430 | |
Sumitomo Corp. | | | 13,900 | | | | 333,298 | |
Walgreens Boots Alliance, Inc. | | | 15,000 | | | | 325,350 | |
Sekisui House Ltd. | | | 12,930 | | | | 293,299 | |
Aristocrat Leisure Ltd. | | | 10,000 | | | | 280,240 | |
Lear Corp. | | | 1,640 | | | | 237,603 | |
Jardine Cycle & Carriage Ltd. | | | 13,000 | | | | 232,781 | |
Singapore Airlines Ltd. | | | 48,000 | | | | 227,588 | |
Isuzu Motors Ltd. | | | 16,100 | | | | 216,848 | |
Bayerische Motoren Werke AG | | | 1,800 | | | | 207,734 | |
Cummins, Inc. | | | 600 | | | | 176,790 | |
Mercedes-Benz Group AG — Class D | | | 1,700 | | | | 135,387 | |
Aptiv plc* | | | 1,600 | | | | 127,440 | |
Tesla, Inc.* | | | 700 | | | | 123,053 | |
Lowe’s Companies, Inc. | | | 460 | | | | 117,176 | |
Toromont Industries Ltd. | | | 900 | | | | 86,642 | |
Total Consumer, Cyclical | | | | | | | 5,700,076 | |
| | | | | | | | | |
Industrial - 10.5% |
Lockheed Martin Corp. | | | 989 | | | | 449,866 | |
Illinois Tool Works, Inc. | | | 1,538 | | | | 412,692 | |
Deere & Co. | | | 1,000 | | | | 410,740 | |
WSP Global, Inc. | | | 2,200 | | | | 366,813 | |
SEE NOTES TO FINANCIAL STATEMENTS. | THE GUGGENHEIM FUNDS SEMI-ANNUAL REPORT | 93 |
SCHEDULE OF INVESTMENTS (Unaudited)(continued) | March 31, 2024 |
WORLD EQUITY INCOME FUND | |
| | Shares | | | Value | |
Snap-on, Inc. | | | 1,090 | | | $ | 322,880 | |
Waste Connections, Inc. | | | 1,800 | | | | 309,618 | |
Obayashi Corp. | | | 26,000 | | | | 308,025 | |
Amphenol Corp. — Class A | | | 2,580 | | | | 297,603 | |
Mitsui OSK Lines Ltd. | | | 9,720 | | | | 296,119 | |
FedEx Corp. | | | 1,000 | | | | 289,740 | |
AP Moller - Maersk A/S — Class B | | | 220 | | | | 286,195 | |
Nippon Yusen K.K. | | | 9,890 | | | | 271,116 | |
Kawasaki Kisen Kaisha Ltd. | | | 15,000 | | | | 201,388 | |
Stantec, Inc. | | | 2,200 | | | | 182,724 | |
Parker-Hannifin Corp. | | | 300 | | | | 166,737 | |
SITC International Holdings Company Ltd. | | | 80,000 | | | | 146,170 | |
Owens Corning | | | 800 | | | | 133,440 | |
TE Connectivity Ltd. | | | 800 | | | | 116,192 | |
General Dynamics Corp. | | | 400 | | | | 112,996 | |
Poste Italiane SpA1 | | | 9,000 | | | | 112,694 | |
Total Industrial | | | | | | | 5,193,748 | |
| | | | | | | | | |
Communications - 7.3% |
Alphabet, Inc. — Class C* | | | 6,435 | | | | 979,793 | |
Amazon.com, Inc.* | | | 4,838 | | | | 872,678 | |
Cisco Systems, Inc. | | | 9,900 | | | | 494,109 | |
Meta Platforms, Inc. — Class A | | | 900 | | | | 437,022 | |
Verizon Communications, Inc. | | | 8,381 | | | | 351,667 | |
Telstra Group Ltd. | | | 90,000 | | | | 226,408 | |
HKT Trust & HKT Ltd. | | | 110,000 | | | | 128,320 | |
Thomson Reuters Corp. | | | 800 | | | | 124,548 | |
Total Communications | | | | | | | 3,614,545 | |
| | | | | | | | | |
Energy - 6.0% |
Phillips 66 | | | 3,040 | | | | 496,554 | |
Marathon Petroleum Corp. | | | 2,451 | | | | 493,876 | |
Valero Energy Corp. | | | 2,640 | | | | 450,622 | |
Woodside Energy Group Ltd. | | | 18,040 | | | | 358,590 | |
Cheniere Energy, Inc. | | | 1,900 | | | | 306,432 | |
HF Sinclair Corp. | | | 4,260 | | | | 257,176 | |
Parkland Corp. | | | 8,000 | | | | 254,885 | |
Ampol Ltd. | | | 9,800 | | | | 254,133 | |
DCC plc | | | 1,100 | | | | 79,969 | |
Total Energy | | | | | | | 2,952,237 | |
| | | | | | | | | |
Utilities - 5.4% |
Southern Co. | | | 5,875 | | | | 421,472 | |
Duke Energy Corp. | | | 4,175 | | | | 403,764 | |
Consolidated Edison, Inc. | | | 4,112 | | | | 373,411 | |
Exelon Corp. | | | 9,010 | | | | 338,506 | |
DTE Energy Co. | | | 2,980 | | | | 334,177 | |
Power Assets Holdings Ltd. | | | 46,000 | | | | 269,188 | |
Entergy Corp. | | | 1,600 | | | | 169,088 | |
Sempra | | | 1,800 | | | | 129,294 | |
FirstEnergy Corp. | | | 3,000 | | | | 115,860 | |
Public Service Enterprise Group, Inc. | | | 1,700 | | | | 113,526 | |
Total Utilities | | | | | | | 2,668,286 | |
| | | | | | | | | |
Basic Materials - 2.9% |
Reliance, Inc. | | | 1,200 | | | | 401,016 | |
Dow, Inc. | | | 6,500 | | | | 376,545 | |
LyondellBasell Industries N.V. — Class A | | | 3,362 | | | | 343,865 | |
Nucor Corp. | | | 900 | | | | 178,110 | |
Celanese Corp. — Class A | | | 600 | | | | 103,116 | |
Total Basic Materials | | | | | | | 1,402,652 | |
| | | | | | | | | |
Total Common Stocks | | | | |
(Cost $41,068,039) | | | | | | | 47,970,355 | |
| | | | | | | | | |
PREFERRED STOCKS† - 0.2% |
Consumer, Cyclical - 0.2% |
Volkswagen AG | | | 800 | | | | 106,034 | |
Total Preferred Stocks | | | | |
(Cost $96,904) | | | | | | | 106,034 | |
| | | | | | | | | |
EXCHANGE-TRADED FUNDS† - 1.9% |
iShares MSCI EAFE ETF | | | 5,860 | | | | 467,980 | |
SPDR S&P 500 ETF Trust | | | 893 | | | | 467,101 | |
Total Exchange-Traded Funds | | | | |
(Cost $911,437) | | | | | | | 935,081 | |
| | | | | | | | | |
MONEY MARKET FUND† - 0.3% |
Goldman Sachs Financial Square Treasury Instruments Fund Institutional Shares, 5.22%2 | | | 136,535 | | | | 136,535 | |
Total Money Market Fund | | | | |
(Cost $136,535) | | | | | | | 136,535 | |
| | | | | | | | | |
Total Investments - 99.5% | | | | |
(Cost $42,212,915) | | $ | 49,148,005 | |
Other Assets & Liabilities, net - 0.5% | | | 266,031 | |
Total Net Assets - 100.0% | | $ | 49,414,036 | |
94 | THE GUGGENHEIM FUNDS SEMI-ANNUAL REPORT | SEE NOTES TO FINANCIAL STATEMENTS. |
SCHEDULE OF INVESTMENTS (Unaudited)(concluded) | March 31, 2024 |
WORLD EQUITY INCOME FUND | |
Futures Contracts |
Description | | Number of
Contracts | | | Expiration
Date | | | Notional
Amount | | | Value and
Unrealized
Appreciation** | |
Currency Futures Contracts Sold Short† |
Canadian Dollar Futures Contracts | | | 33 | | | | Jun 2024 | | | $ | 2,439,195 | | | $ | 12,249 | |
* | Non-income producing security. |
** | Includes cumulative appreciation (depreciation). Variation margin is reported within the Statement of Assets and Liabilities. |
† | Value determined based on Level 1 inputs — See Note 4. |
1 | Security is a 144A or Section 4(a)(2) security. These securities have been determined to be liquid under guidelines established by the Board of Trustees. The total market value of 144A or Section 4(a)(2) securities is $112,694 (cost $96,855), or 0.2% of total net assets. |
2 | Rate indicated is the 7-day yield as of March 31, 2024. |
| | |
| | See Sector Classification in Other Information section. |
The following table summarizes the inputs used to value the Fund’s investments at March 31, 2024 (See Note 4 in the Notes to Financial Statements):
Investments in Securities (Assets) | | Level 1
Quoted
Prices | | | Level 2
Significant
Observable
Inputs | | | Level 3
Significant
Unobservable
Inputs | | | Total | |
Common Stocks | | $ | 47,970,355 | | | $ | — | | | $ | — | | | $ | 47,970,355 | |
Preferred Stocks | | | 106,034 | | | | — | | | | — | | | | 106,034 | |
Exchange-Traded Funds | | | 935,081 | | | | — | | | | — | | | | 935,081 | |
Money Market Fund | | | 136,535 | | | | — | | | | — | | | | 136,535 | |
Currency Futures Contracts** | | | 12,249 | | | | — | | | | — | | | | 12,249 | |
Total Assets | | $ | 49,160,254 | | | $ | — | | | $ | — | | | $ | 49,160,254 | |
** | This derivative is reported as unrealized appreciation/depreciation at period end. |
SEE NOTES TO FINANCIAL STATEMENTS. | THE GUGGENHEIM FUNDS SEMI-ANNUAL REPORT | 95 |
STATEMENT OF ASSETS AND LIABILITIES (Unaudited) |
March 31, 2024 |
Assets: |
Investments, at value (cost $42,212,915) | | $ | 49,148,005 | |
Foreign currency, at value (cost $17,295) | | | 17,269 | |
Cash | | | 16,765 | |
Segregated cash with broker | | | 37,000 | |
Prepaid expenses | | | 27,028 | |
Receivables: |
Securities sold | | | 102,539 | |
Dividends | | | 102,361 | |
Foreign tax reclaims | | | 87,184 | |
Interest | | | 837 | |
Fund shares sold | | | 420 | |
Total assets | | | 49,539,408 | |
| | | | | |
Liabilities: |
Payable for: |
Fund shares redeemed | | | 44,964 | |
Professional fees | | | 17,660 | |
Management fees | | | 16,591 | |
Printing fees | | | 12,010 | |
Distribution and service fees | | | 11,682 | |
Variation margin on futures contracts | | | 5,610 | |
Transfer agent/maintenance fees | | | 4,921 | |
Distributions to shareholders | | | 4,473 | |
Fund accounting/administration fees | | | 3,681 | |
Trustees’ fees* | | | 1,926 | |
Due to Investment Adviser | | | 50 | |
Miscellaneous | | | 1,804 | |
Total liabilities | | | 125,372 | |
Net assets | | $ | 49,414,036 | |
| | | | | |
Net assets consist of: |
Paid in capital | | $ | 41,806,276 | |
Total distributable earnings (loss) | | | 7,607,760 | |
Net assets | | $ | 49,414,036 | |
Class A: |
Net assets | | $ | 44,042,692 | |
Capital shares outstanding | | | 2,660,809 | |
Net asset value per share | | $ | 16.55 | |
Maximum offering price per share (Net asset value divided by 95.25%) | | $ | 17.38 | |
Class C: |
Net assets | | $ | 2,946,157 | |
Capital shares outstanding | | | 218,061 | |
Net asset value per share | | $ | 13.51 | |
Class P: |
Net assets | | $ | 93,454 | |
Capital shares outstanding | | | 5,591 | |
Net asset value per share | | $ | 16.72 | |
| | | | | |
Institutional Class: |
Net assets | | $ | 2,331,733 | |
Capital shares outstanding | | | 141,982 | |
Net asset value per share | | $ | 16.42 | |
STATEMENT OF OPERATIONS (Unaudited) |
Six Months Ended March 31, 2024 |
Investment Income: |
Dividends (net of foreign withholding tax of $50,866) | | $ | 633,858 | |
Interest | | | 8,848 | |
Total investment income | | | 642,706 | |
| | | | | |
Expenses: |
Management fees | | | 163,049 | |
Distribution and service fees: |
Class A | | | 51,210 | |
Class C | | | 14,153 | |
Class P | | | 120 | |
Transfer agent/maintenance fees: |
Class A | | | 34,284 | |
Class C | | | 1,741 | |
Class P | | | 86 | |
Institutional Class | | | 2,070 | |
Registration fees | | | 44,926 | |
Printing expenses | | | 22,855 | |
Professional fees | | | 22,017 | |
Fund accounting/administration fees | | | 13,664 | |
Custodian fees | | | 8,407 | |
Trustees’ fees* | | | 7,869 | |
Line of credit fees | | | 767 | |
Miscellaneous | | | 2,472 | |
Recoupment of previously waived fees: |
Class A | | | 78 | |
Total expenses | | | 389,768 | |
Less: |
Expenses reimbursed by Adviser: |
Class A | | | (34,123 | ) |
Class C | | | (1,708 | ) |
Class P | | | (86 | ) |
Institutional Class | | | (2,070 | ) |
Expenses waived by Adviser | | | (66,191 | ) |
Total waived/reimbursed expenses | | | (104,178 | ) |
Net expenses | | | 285,590 | |
Net investment income | | | 357,116 | |
| | | | | |
Net Realized and Unrealized Gain (Loss): |
Net realized gain (loss) on: |
Investments | | | 941,665 | |
Futures contracts | | | 23,981 | |
Foreign currency transactions | | | 31,145 | |
Net realized gain | | | 996,791 | |
Net change in unrealized appreciation (depreciation) on: |
Investments | | | 6,388,859 | |
Futures contracts | | | (171,176 | ) |
Foreign currency translations | | | 564 | |
Net change in unrealized appreciation (depreciation) | | | 6,218,247 | |
Net realized and unrealized gain | | | 7,215,038 | |
Net increase in net assets resulting from operations | | $ | 7,572,154 | |
* | Relates to Trustees not deemed “interested persons” within the meaning of Section 2(a)(19) of the 1940 Act. |
96 | THE GUGGENHEIM FUNDS SEMI-ANNUAL REPORT | SEE NOTES TO FINANCIAL STATEMENTS. |
STATEMENTS OF CHANGES IN NET ASSETS |
| | Six Months Ended
March 31, 2024
(Unaudited) | | | Year Ended
September 30,
2023 | |
Increase (Decrease) in Net Assets from Operations: | | | | | | | | |
Net investment income | | $ | 357,116 | | | $ | 827,459 | |
Net realized gain on investments | | | 996,791 | | | | 196,753 | |
Net change in unrealized appreciation (depreciation) on investments | | | 6,218,247 | | | | 5,558,023 | |
Net increase in net assets resulting from operations | | | 7,572,154 | | | | 6,582,235 | |
| | | | | | | | | |
Distributions to shareholders: | | | | | | | | |
Class A | | | (319,485 | ) | | | (722,703 | ) |
Class C | | | (11,719 | ) | | | (29,606 | ) |
Class P | | | (742 | ) | | | (1,387 | ) |
Institutional Class | | | (23,569 | ) | | | (62,449 | ) |
Total distributions to shareholders | | | (355,515 | ) | | | (816,145 | ) |
| | | | | | | | | |
Capital share transactions: | | | | | | | | |
Proceeds from sale of shares | | | | | | | | |
Class A | | | 795,487 | | | | 1,839,546 | |
Class C | | | 186,823 | | | | 303,253 | |
Class P | | | 853 | | | | 23,194 | |
Institutional Class | | | 318,860 | | | | 359,897 | |
Distributions reinvested | | | | | | | | |
Class A | | | 307,485 | | | | 695,071 | |
Class C | | | 11,719 | | | | 29,606 | |
Class P | | | 576 | | | | 1,233 | |
Institutional Class | | | 23,424 | | | | 62,113 | |
Cost of shares redeemed | | | | | | | | |
Class A | | | (2,603,448 | ) | | | (4,132,861 | ) |
Class C | | | (339,100 | ) | | | (536,800 | ) |
Class P | | | (17,393 | ) | | | (275 | ) |
Institutional Class | | | (1,212,252 | ) | | | (3,906,719 | ) |
Net decrease from capital share transactions | | | (2,526,966 | ) | | | (5,262,742 | ) |
Net increase in net assets | | | 4,689,673 | | | | 503,348 | |
| | | | | | | | | |
Net assets: | | | | | | | | |
Beginning of period | | | 44,724,363 | | | | 44,221,015 | |
End of period | | $ | 49,414,036 | | | $ | 44,724,363 | |
| | | | | | | | | |
Capital share activity: | | | | | | | | |
Shares sold | | | | | | | | |
Class A | | | 52,802 | | | | 130,111 | |
Class C | | | 15,954 | | | | 26,132 | |
Class P | | | 55 | | | | 1,612 | |
Institutional Class | | | 21,297 | | | | 25,667 | |
Shares issued from reinvestment of distributions | | | | | | | | |
Class A | | | 19,515 | | | | 48,930 | |
Class C | | | 922 | | | | 2,549 | |
Class P | | | 36 | | | | 86 | |
Institutional Class | | | 1,503 | | | | 4,415 | |
Shares redeemed | | | | | | | | |
Class A | | | (172,517 | ) | | | (292,035 | ) |
Class C | | | (27,070 | ) | | | (47,251 | ) |
Class P | | | (1,090 | ) | | | (18 | ) |
Institutional Class | | | (79,855 | ) | | | (293,795 | ) |
Net decrease in shares | | | (168,448 | ) | | | (393,597 | ) |
SEE NOTES TO FINANCIAL STATEMENTS. | THE GUGGENHEIM FUNDS SEMI-ANNUAL REPORT | 97 |
This table is presented to show selected data for a share outstanding throughout each period and to assist shareholders in evaluating a Fund’s performance for the periods presented.
Class A | | Six Months Ended
March 31, 2024a | | | Year Ended
September 30,
2023 | | | Year Ended
September 30,
2022 | | | Year Ended
September 30,
2021 | | | Year Ended
September 30,
2020 | | | Year Ended
September 30,
2019 | |
Per Share Data |
Net asset value, beginning of period | | $ | 14.19 | | | $ | 12.49 | | | $ | 18.73 | | | $ | 15.03 | | | $ | 15.26 | | | $ | 15.77 | |
Income (loss) from investment operations: |
Net investment income (loss)b | | | .12 | | | | .26 | | | | .29 | | | | .28 | | | | .20 | | | | .35 | |
Net gain (loss) on investments (realized and unrealized) | | | 2.36 | | | | 1.70 | | | | (1.97 | ) | | | 3.79 | | | | (.12 | )h | | | (.36 | ) |
Total from investment operations | | | 2.48 | | | | 1.96 | | | | (1.68 | ) | | | 4.07 | | | | .08 | | | | (.01 | ) |
Less distributions from: |
Net investment income | | | (.12 | ) | | | (.25 | ) | | | (.34 | ) | | | (.34 | ) | | | (.27 | ) | | | (.37 | ) |
Net realized gains | | | — | | | | (.01 | ) | | | (4.22 | ) | | | (.03 | ) | | | (.04 | ) | | | (.13 | ) |
Total distributions | | | (.12 | ) | | | (.26 | ) | | | (4.56 | ) | | | (.37 | ) | | | (.31 | ) | | | (.50 | ) |
Net asset value, end of period | | $ | 16.55 | | | $ | 14.19 | | | $ | 12.49 | | | $ | 18.73 | | | $ | 15.03 | | | $ | 15.26 | |
|
Total Returnc | | | 17.52 | % | | | 15.69 | % | | | (13.44 | %) | | | 27.13 | % | | | 0.60 | % | | | 0.14 | % |
Ratios/Supplemental Data |
Net assets, end of period (in thousands) | | $ | 44,043 | | | $ | 39,183 | | | $ | 35,905 | | | $ | 44,337 | | | $ | 37,911 | | | $ | 60,639 | |
Ratios to average net assets: |
Net investment income (loss) | | | 1.57 | % | | | 1.84 | % | | | 1.87 | % | | | 1.55 | % | | | 1.36 | % | | | 2.39 | % |
Total expensesd | | | 1.65 | % | | | 1.50 | % | | | 1.39 | % | | | 1.45 | % | | | 1.48 | % | | | 1.37 | % |
Net expensese,f,g | | | 1.19 | % | | | 1.19 | % | | | 1.20 | % | | | 1.21 | % | | | 1.22 | % | | | 1.22 | % |
Portfolio turnover rate | | | 59 | % | | | 156 | % | | | 162 | % | | | 191 | % | | | 192 | % | | | 127 | % |
Class C | | Six Months Ended
March 31, 2024a | | | Year Ended
September 30,
2023 | | | Year Ended
September 30,
2022 | | | Year Ended
September 30,
2021 | | | Year Ended
September 30,
2020 | | | Year Ended
September 30,
2019 | |
Per Share Data |
Net asset value, beginning of period | | $ | 11.59 | | | $ | 10.20 | | | $ | 16.03 | | | $ | 12.87 | | | $ | 13.06 | | | $ | 13.53 | |
Income (loss) from investment operations: |
Net investment income (loss)b | | | .05 | | | | .13 | | | | .14 | | | | .13 | | | | .08 | | | | .21 | |
Net gain (loss) on investments (realized and unrealized) | | | 1.92 | | | | 1.39 | | | | (1.56 | ) | | | 3.24 | | | | (.10 | )h | | | (.33 | ) |
Total from investment operations | | | 1.97 | | | | 1.52 | | | | (1.42 | ) | | | 3.37 | | | | (.02 | ) | | | (.12 | ) |
Less distributions from: |
Net investment income | | | (.05 | ) | | | (.12 | ) | | | (.19 | ) | | | (.18 | ) | | | (.13 | ) | | | (.22 | ) |
Net realized gains | | | — | | | | (.01 | ) | | | (4.22 | ) | | | (.03 | ) | | | (.04 | ) | | | (.13 | ) |
Total distributions | | | (.05 | ) | | | (.13 | ) | | | (4.41 | ) | | | (.21 | ) | | | (.17 | ) | | | (.35 | ) |
Net asset value, end of period | | $ | 13.51 | | | $ | 11.59 | | | $ | 10.20 | | | $ | 16.03 | | | $ | 12.87 | | | $ | 13.06 | |
|
Total Returnc | | | 17.03 | % | | | 14.87 | % | | | (14.11 | %) | | | 26.22 | % | | | (0.13 | %) | | | (0.69 | %) |
Ratios/Supplemental Data |
Net assets, end of period (in thousands) | | $ | 2,946 | | | $ | 2,645 | | | $ | 2,518 | | | $ | 3,230 | | | $ | 2,893 | | | $ | 3,366 | |
Ratios to average net assets: |
Net investment income (loss) | | | 0.82 | % | | | 1.10 | % | | | 1.12 | % | | | 0.81 | % | | | 0.67 | % | | | 1.64 | % |
Total expensesd | | | 2.35 | % | | | 2.25 | % | | | 2.20 | % | | | 2.28 | % | | | 2.40 | % | | | 2.28 | % |
Net expensese,f,g | | | 1.95 | % | | | 1.94 | % | | | 1.95 | % | | | 1.96 | % | | | 1.97 | % | | | 1.97 | % |
Portfolio turnover rate | | | 59 | % | | | 156 | % | | | 162 | % | | | 191 | % | | | 192 | % | | | 127 | % |
98 | THE GUGGENHEIM FUNDS SEMI-ANNUAL REPORT | SEE NOTES TO FINANCIAL STATEMENTS. |
FINANCIAL HIGHLIGHTS (continued) |
This table is presented to show selected data for a share outstanding throughout each period and to assist shareholders in evaluating a Fund’s performance for the periods presented.
Class P | | Six Months Ended
March 31, 2024a | | | Year Ended
September 30,
2023 | | | Year Ended
September 30,
2022 | | | Year Ended
September 30,
2021 | | | Year Ended
September 30,
2020 | | | Year Ended
September 30,
2019 | |
Per Share Data |
Net asset value, beginning of period | | $ | 14.33 | | | $ | 12.60 | | | $ | 18.91 | | | $ | 15.17 | | | $ | 15.38 | | | $ | 15.92 | |
Income (loss) from investment operations: |
Net investment income (loss)b | | | .12 | | | | .26 | | | | .29 | | | | .30 | | | | .20 | | | | .36 | |
Net gain (loss) on investments (realized and unrealized) | | | 2.39 | | | | 1.71 | | | | (1.99 | ) | | | 3.80 | | | | (.11 | )h | | | (.39 | ) |
Total from investment operations | | | 2.51 | | | | 1.97 | | | | (1.70 | ) | | | 4.10 | | | | .09 | | | | (.03 | ) |
Less distributions from: |
Net investment income | | | (.12 | ) | | | (.23 | ) | | | (.39 | ) | | | (.33 | ) | | | (.26 | ) | | | (.38 | ) |
Net realized gains | | | — | | | | (.01 | ) | | | (4.22 | ) | | | (.03 | ) | | | (.04 | ) | | | (.13 | ) |
Total distributions | | | (.12 | ) | | | (.24 | ) | | | (4.61 | ) | | | (.36 | ) | | | (.30 | ) | | | (.51 | ) |
Net asset value, end of period | | $ | 16.72 | | | $ | 14.33 | | | $ | 12.60 | | | $ | 18.91 | | | $ | 15.17 | | | $ | 15.38 | |
|
Total Return | | | 17.55 | % | | | 15.65 | % | | | (13.44 | %) | | | 27.10 | % | | | 0.66 | % | | | 0.06 | % |
Ratios/Supplemental Data |
Net assets, end of period (in thousands) | | $ | 93 | | | $ | 94 | | | $ | 62 | | | $ | 118 | | | $ | 94 | | | $ | 129 | |
Ratios to average net assets: |
Net investment income (loss) | | | 1.53 | % | | | 1.80 | % | | | 1.82 | % | | | 1.61 | % | | | 1.36 | % | | | 2.38 | % |
Total expensesd | | | 1.66 | % | | | 1.74 | % | | | 1.62 | % | | | 1.53 | % | | | 1.56 | % | | | 1.44 | % |
Net expensese,f,g | | | 1.19 | % | | | 1.19 | % | | | 1.20 | % | | | 1.21 | % | | | 1.22 | % | | | 1.22 | % |
Portfolio turnover rate | | | 59 | % | | | 156 | % | | | 162 | % | | | 191 | % | | | 192 | % | | | 127 | % |
SEE NOTES TO FINANCIAL STATEMENTS. | THE GUGGENHEIM FUNDS SEMI-ANNUAL REPORT | 99 |
FINANCIAL HIGHLIGHTS (concluded) |
This table is presented to show selected data for a share outstanding throughout each period and to assist shareholders in evaluating a Fund’s performance for the periods presented.
Institutional Class | | Six Months Ended
March 31, 2024a | | | Year Ended
September 30,
2023 | | | Year Ended
September 30,
2022 | | | Year Ended
September 30,
2021 | | | Year Ended
September 30,
2020 | | | Year Ended
September 30,
2019 | |
Per Share Data |
Net asset value, beginning of period | | $ | 14.08 | | | $ | 12.40 | | | $ | 18.61 | | | $ | 14.94 | | | $ | 15.16 | | | $ | 15.71 | |
Income (loss) from investment operations: |
Net investment income (loss)b | | | .13 | | | | .28 | | | | .36 | | | | .33 | | | | .25 | | | | .39 | |
Net gain (loss) on investments (realized and unrealized) | | | 2.34 | | | | 1.70 | | | | (1.98 | ) | | | 3.75 | | | | (.13 | )h | | | (.37 | ) |
Total from investment operations | | | 2.47 | | | | 1.98 | | | | (1.62 | ) | | | 4.08 | | | | .12 | | | | .02 | |
Less distributions from: |
Net investment income | | | (.13 | ) | | | (.29 | ) | | | (.37 | ) | | | (.38 | ) | | | (.30 | ) | | | (.44 | ) |
Net realized gains | | | — | | | | (.01 | ) | | | (4.22 | ) | | | (.03 | ) | | | (.04 | ) | | | (.13 | ) |
Total distributions | | | (.13 | ) | | | (.30 | ) | | | (4.59 | ) | | | (.41 | ) | | | (.34 | ) | | | (.57 | ) |
Net asset value, end of period | | $ | 16.42 | | | $ | 14.08 | | | $ | 12.40 | | | $ | 18.61 | | | $ | 14.94 | | | $ | 15.16 | |
|
Total Return | | | 17.61 | % | | | 15.97 | % | | | (13.18 | %) | | | 27.38 | % | | | 0.92 | % | | | 0.40 | % |
Ratios/Supplemental Data |
Net assets, end of period (in thousands) | | $ | 2,332 | | | $ | 2,802 | | | $ | 5,736 | | | $ | 2,985 | | | $ | 2,513 | | | $ | 3,458 | |
Ratios to average net assets: |
Net investment income (loss) | | | 1.73 | % | | | 1.99 | % | | | 2.36 | % | | | 1.82 | % | | | 1.66 | % | | | 2.67 | % |
Total expensesd | | | 1.39 | % | | | 1.24 | % | | | 1.13 | % | | | 1.21 | % | | | 1.50 | % | | | 1.17 | % |
Net expensese,f,g | | | 0.94 | % | | | 0.94 | % | | | 0.95 | % | | | 0.96 | % | | | 0.97 | % | | | 0.97 | % |
Portfolio turnover rate | | | 59 | % | | | 156 | % | | | 162 | % | | | 191 | % | | | 192 | % | | | 127 | % |
a | Unaudited figures for the period ended March 31, 2024. Percentage amounts for the period, except total return and portfolio turnover rate, have been annualized. |
b | Net investment income (loss) per share was computed using average shares outstanding throughout the period. |
c | Total return does not reflect the impact of any applicable sales charges. |
d | Does not include expenses of the underlying funds in which the Fund invests. |
e | Net expense information reflects the expense ratios after expense waivers and reimbursements, as applicable. |
f | The portion of the ratios of net expenses to average net assets attributable to recoupments of prior fee reductions or expense reimbursements for the years presented was as follows: |
| | | 03/31/24 | 09/30/23 | 09/30/22 | 09/30/21 | 09/30/20 | 09/30/19 |
| | Class A | 0.00%* | — | 0.01% | — | — | 0.00%* |
| | Class C | — | — | 0.00%* | — | — | — |
| | Class P | — | — | 0.00%* | — | — | — |
| | Institutional Class | — | — | 0.01% | 0.02% | — | — |
g | Net expenses may include expenses that are excluded from the expense limitation agreement. Excluding these expenses, the net expense ratios for the years presented would be: |
| | | 03/31/24 | 09/30/23 | 09/30/22 | 09/30/21 | 09/30/20 | 09/30/19 |
| | Class A | 1.19% | 1.18% | 1.20% | 1.21% | 1.22% | 1.22% |
| | Class C | 1.94% | 1.93% | 1.95% | 1.96% | 1.97% | 1.97% |
| | Class P | 1.19% | 1.18% | 1.20% | 1.21% | 1.22% | 1.22% |
| | Institutional Class | 0.94% | 0.93% | 0.95% | 0.96% | 0.97% | 0.97% |
h | The amount shown for a share outstanding throughout the year does not agree with the aggregate net gain on investments for the year because of the sales and repurchases of fund shares in relation to the fluctuating market value of the investments of the Fund. |
100 | THE GUGGENHEIM FUNDS SEMI-ANNUAL REPORT | SEE NOTES TO FINANCIAL STATEMENTS. |
NOTES TO FINANCIAL STATEMENTS (Unaudited) |
Note 1 – Organization and Significant Accounting Policies
Organization
Guggenheim Funds Trust (the “Trust”), a Delaware statutory trust, is registered with the U.S. Securities and Exchange Commission (the “SEC”) under the Investment Company Act of 1940 (the “1940 Act”), as an open-ended investment company of the series type. Each series, in effect, is representing a separate fund (each, a “Fund”). The Trust may issue an unlimited number of authorized shares. The Trust accounts for the assets of each Fund separately.
The Trust offers a combination of five separate classes of shares: Class A shares, Class C shares, Class P shares, Class R6 shares and Institutional Class shares. Sales of shares of each Class are made without a front-end sales charge at the net asset value per share (“NAV”), with the exception of Class A shares. Class A shares are sold at the NAV, plus the applicable front-end sales charge. The sales charge varies depending on the amount purchased. Class A share purchases of $1 million or more are exempt from the front-end sales charge but have a 1% contingent deferred sales charge (“CDSC”), if shares are redeemed within 12 months of purchase. Class C shares have a 1% CDSC if shares are redeemed within 12 months of purchase. Class C shares of each Fund automatically convert to Class A shares of the same Fund on or about the 10th day of the month following the 8-year anniversary of the purchase of the Class C shares. This conversion will be executed without any sales charge, fee or other charge. After the conversion is completed, the shares will be subject to all features and expenses of Class A shares. Institutional Class shares are offered primarily for direct investment by institutions such as pension and profit sharing plans, endowments, foundations and corporations. Institutional Class shares require a minimum initial investment of $2 million and a minimum account balance of $1 million. Class R6 shares are offered primarily through qualified retirement and benefit plans. Class R6 shares are also offered through certain other plans and platforms sponsored by financial intermediaries. Certain institutional investors and others deemed appropriate by Guggenheim Investments (“GI”or the “Adviser”) may also be eligible to purchase Class R6 shares subject to a $2 million minimum initial investment. At March 31, 2024, the Trust consisted of eighteen funds.
This report covers the following funds (collectively, the “Funds”):
Fund Name | Investment
Company Type |
Alpha Opportunity Fund | Diversified |
Large Cap Value Fund | Diversified |
Market Neutral Real Estate Fund | Diversified |
Risk Managed Real Estate Fund | Diversified |
Small Cap Value Fund | Diversified |
StylePlus—Large Core Fund | Diversified |
StylePlus—Mid Growth Fund | Diversified |
World Equity Income Fund | Diversified |
At March 31, 2024, Class A, Class C, Class P and Institutional Class shares have been issued by the Funds.
Security Investors, LLC (“SI” or the “Adviser”) and Guggenheim Partners Investment Management, LLC (“GPIM” or the “Adviser”), which operate under the name Guggenheim Investments (“GI”), provide advisory services. Guggenheim Funds Distributors, LLC (“GFD”) serves as the distributor for the Trust. GI and GFD are affiliated entities.
Significant Accounting Policies
The Funds operate as investment companies and, accordingly, follow the investment company accounting and reporting guidance of the Financial Accounting Standards Board (“FASB”) Accounting Standards Codification Topic 946 Financial Services – Investment Companies.
The following significant accounting policies are in conformity with U.S. generally accepted accounting principles (“U.S. GAAP”) and are consistently followed by the Trust. This requires management to make estimates and assumptions that affect the reported amount of assets and liabilities, contingent assets and liabilities at the date of the financial statements, and the reported amounts of revenues and expenses during the reporting period. Actual results could differ from these estimates. All time references are based on Eastern Time.
The NAV of each share class of a fund is calculated by dividing the market value of a fund’s securities and other assets, less all liabilities, attributable to the class by the number of outstanding shares of the class on the specified date.
(a) Valuation of Investments
The Board of Trustees of the Funds (the “Board”) adopted policies and procedures for the valuation of the Funds’ investments (the “Fund Valuation Procedures”). The SEC adopted Rule 2a-5 under the 1940 Act (“Rule 2a-5”) which establishes requirements for determining fair value in good faith. Rule 2a-5 also defines “readily available market quotations” for purposes of the 1940 Act and establishes requirements for determining whether a fund must fair value a security in good faith.
Pursuant to Rule 2a-5, the Board has designated the Adviser as the valuation designee to perform fair valuation determinations for the Funds with respect to all Fund investments and other assets. As the Funds’ valuation designee pursuant to Rule 2a-5, the Adviser has adopted separate procedures (the “Valuation Designee Procedures” and collectively with the Fund Valuation Procedures, the “Valuation Procedures”) reasonably designed to prevent violations of the requirements of Rule 2a-5 and Rule 31a-4. The Adviser, in its role as valuation designee, utilizes the assistance of a valuation committee, consisting of representatives from
| | THE GUGGENHEIM FUNDS SEMI-ANNUAL REPORT | 101 |
NOTES TO FINANCIAL STATEMENTS (Unaudited)(continued) |
Guggenheim’s investment management, fund administration, legal and compliance departments (the “Valuation Committee”), in determining the fair value of the Funds’ securities and other assets.
Valuations of the Funds’ securities and other assets are supplied primarily by pricing service providers appointed pursuant to the processes set forth in the Valuation Procedures. The Adviser, with the assistance of the Valuation Committee, convenes monthly, or more frequently as needed, to review the valuation of all assets which have been fair valued. The Adviser, consistent with the monitoring and review responsibilities set forth in the Valuation Procedures, regularly reviews the appropriateness of the inputs, methods, models and assumptions employed by the pricing service provider.
If the pricing service provider cannot or does not provide a valuation for a particular investment or such valuation is deemed unreliable, such investment is fair valued by the Adviser.
Equity securities listed or traded on a recognized U.S. securities exchange or the Nasdaq Stock Market (“NASDAQ”) will generally be valued on the basis of the last sale price on the primary U.S. exchange or market on which the security is listed or traded; provided, however, that securities listed on NASDAQ will be valued at the NASDAQ official closing price, which may not necessarily represent the last sale price.
Generally, trading in foreign securities markets is substantially completed each day at various times prior to the close of the New York Stock Exchange (“NYSE”). The values of foreign securities are determined as of the close of such foreign markets or the close of the NYSE, if earlier. All investments quoted in foreign currencies are valued in U.S. dollars on the basis of the foreign currency exchange rates prevailing at the close of U.S. business at 4:00 p.m. Investments in foreign securities may involve risks not present in domestic investments. The Adviser will determine the current value of such foreign securities by taking into consideration certain factors which may include the following factors, among others: the value of the securities traded on other foreign markets, American Depositary Receipts (“ADR”) trading, closed-end fund trading, foreign currency exchange activity, and the trading prices of financial products that are tied to foreign securities. In addition, under the Valuation Procedures, the Adviser is authorized to use prices and other information supplied by a pricing service provider in valuing foreign securities.
Open-end investment companies are valued at their NAV as of the close of business, on the valuation date. Exchange-traded funds and closed-end investment companies are generally valued at the last quoted sale price.
Futures contracts are valued on the basis of the last sale price as of 4:00 p.m. on the valuation date. In the event that the exchange for a specific futures contract closes earlier than 4:00 p.m., the futures contract is valued at the official settlement price of the exchange. However, the underlying securities from which the futures contract value is derived are monitored until 4:00 p.m. to determine if fair valuation of the underlying securities would provide a more accurate valuation of the futures contract.
Swap agreements entered into by a Fund are generally valued using an evaluated price provided by a pricing service provider.
Investments for which market quotations are not readily available are fair valued as determined in good faith by the Adviser. Valuations in accordance with these methods are intended to reflect each security’s (or asset’s or liability’s) “fair value”. Each such determination is based on a consideration of all relevant factors, which are likely to vary from one pricing context to another. Examples of such factors may include, but are not limited to market prices; sale prices; broker quotes; and models which derive prices based on inputs such as anticipated cash flows or collateral, spread over U.S. Treasury securities, and other information analysis. In connection with futures contracts and other derivative investments, such factors may include obtaining information as to how (a) these contracts and other derivative investments trade in the futures or other derivative markets, respectively, and (b) the securities underlying these contracts and other derivative investments trade in the cash market.
(b) Short Sales
When a Fund engages in a short sale of a security, an amount equal to the proceeds is reflected as an asset and an equivalent liability. The amount of the liability is subsequently marked-to-market to reflect the market value of the short sale. The Fund maintains a segregated account of cash and/or securities as collateral for short sales.
Fees, if any, paid to brokers to borrow securities in connection with short sales are recorded as interest expense. In addition, the Fund must pay out the dividend rate of the equity or coupon rate of the obligation to the lender and record this as an expense. Short dividend or interest expense is a cost associated with the investment objective of short sales transactions, rather than an operational cost associated with the day-to-day management of any mutual fund. The Fund may also receive rebate income from the broker resulting from the investment of the proceeds from securities sold short.
(c) Futures Contracts
Upon entering into a futures contract, a Fund deposits and maintains as collateral such initial margin as required by the exchange on which the transaction is affected. Pursuant to the
102 | THE GUGGENHEIM FUNDS SEMI-ANNUAL REPORT | |
NOTES TO FINANCIAL STATEMENTS (Unaudited)(continued) |
contract, the Fund agrees to receive from or pay to the broker an amount of cash equal to the daily fluctuation in value of the contract. Such receipts or payments are known as variation margin and are recorded by the Fund as unrealized appreciation or depreciation. When the contract is closed, the Fund records a realized gain or loss equal to the difference between the value of the contract at the time it was opened and the value at the time it was closed.
(d) Swap Agreements
Swap agreements are marked-to-market daily and the change, if any, is recorded as unrealized appreciation or depreciation. Payments received or made as a result of an agreement or termination of an agreement are recognized as realized gains or losses.
(e) Currency Translations
The accounting records of the Funds are maintained in U.S. dollars. All assets and liabilities initially expressed in foreign currencies are converted into U.S. dollars at prevailing exchange rates. Purchases and sales of investment securities, dividend and interest income, and certain expenses are translated at the rates of exchange prevailing on the respective dates of such transactions. Changes in the relationship of these foreign currencies to the U.S. dollar can significantly affect the value of the investments and earnings of the Funds. Foreign investments may also subject the Funds to foreign government exchange restrictions, expropriation, taxation, or other political, social, geopolitical or economic developments, all of which could affect the market and/or credit risk of the investments.
The Funds do not isolate that portion of the results of operations resulting from changes in the foreign exchange rates on investments from the fluctuations arising from changes in the market prices of securities held. Such fluctuations are included with the net realized gain or loss and unrealized appreciation or depreciation on investments.
Reported net realized foreign exchange gains and losses arise from sales of foreign currencies and currency gains or losses realized between the trade and settlement dates on investment transactions. Net unrealized appreciation and depreciation arise from changes in the fair values of assets and liabilities other than investments in securities at the fiscal period end, resulting from changes in exchange rates.
(f) Foreign Taxes
The Funds may be subject to foreign taxes (a portion of which may be reclaimable) on income, stock dividends, capital gains on investments or certain foreign currency transactions. All foreign taxes are recorded in accordance with the applicable foreign tax regulations and rates that exist in the foreign jurisdictions in which the Funds invest. These foreign taxes, if any, are paid by the Funds and reflected in their Statements of Operations as follows: foreign taxes withheld at source are presented as a reduction of income and foreign taxes on capital gains from sales of investments are included with the net realized gain (loss) on investments. Foreign taxes payable or deferred as of March 31, 2024, if any, are disclosed in the Funds’ Statements of Assets and Liabilities.
(g) Security Transactions
Security transactions are recorded on the trade date for financial reporting purposes. Realized gains and losses from securities transactions are recorded using the identified cost basis. Proceeds from lawsuits related to investment holdings are recorded as a reduction to cost if the securities are still held and as realized gains if no longer held in the respective Fund. Taxable non-cash dividends are recorded as dividend income. Interest income, including amortization of premiums and accretion of discounts, is accrued on a daily basis. Amendment fees are earned as compensation for evaluating and accepting changes to the original loan agreement and are recognized when received. Dividend income from Real Estate Investment Trusts (“REITs”) is recorded based on the income included in the distributions received from the REIT investments using published REIT classifications, including some management estimates when actual amounts are not available. Distributions received in excess of this estimated amount are recorded as a reduction of the cost of investments or reclassified to realized gains. The actual amounts of income, return of capital, and realized gains are only determined by each REIT after its fiscal year-end, and may differ from the estimated amounts.
(h) Distributions
Dividends from net investment income are declared quarterly in the World Equity Income Fund and Risk Managed Real Estate Fund. Dividends are reinvested in additional shares, unless shareholders request payment in cash. Distributions of net investment income in the remaining Funds and distributions of net realized gains, if any, in all Funds are declared at least annually and recorded on the ex-dividend date and are determined in accordance with U.S. federal income tax regulations which may differ from U.S. GAAP.
(i) Class Allocations
Interest and dividend income, most expenses, all realized gains and losses, and all unrealized appreciation and depreciation are allocated to the share classes based upon the value of the outstanding shares in each share class. Certain costs, such as distribution and service fees are charged directly to specific share classes. In addition, certain expenses have been allocated to the individual Funds in the Trust based on the respective net assets of each Fund included in the Trust.
| | THE GUGGENHEIM FUNDS SEMI-ANNUAL REPORT | 103 |
NOTES TO FINANCIAL STATEMENTS (Unaudited)(continued) |
(j) Earnings Credits
Under the fee arrangement with the custodian, the Funds may earn credits based on overnight custody cash balances. These credits are utilized to reduce related custodial expenses. The custodian fees disclosed in the Funds’ Statements of Operations are before the reduction in expense from the related earnings credits, if any. Earnings credits for the period ended March 31, 2024, are disclosed in the Funds’ Statements of Operations.
(k) Cash
The Funds may leave cash overnight in their cash account with the custodian. Periodically, a Fund may have cash due to the custodian bank as an overdraft balance. A fee is incurred on this overdraft, calculated by multiplying the overdraft by a rate based on the federal funds rate, which was 5.33% at March 31, 2024.
(l) Indemnifications
Under the Funds’ organizational documents, the Trustees and Officers are indemnified against certain liabilities arising out of the performance of their duties to the Trust. In addition, throughout the normal course of business, the Funds enter into contracts that contain a variety of representations and warranties which provide general indemnifications. The Funds’ maximum exposure under these arrangements is unknown, as this would involve future claims that may be made against the Funds and/or their affiliates that have not yet occurred. However, based on experience, the Funds expect the risk of loss to be remote.
Note 2 – Financial Instruments and Derivatives
As part of their investment strategies, the Funds may utilize short sales and a variety of derivative instruments. These investments involve, to varying degrees, elements of market risk and risks in excess of amounts recognized on the Funds’ Statements of Assets and Liabilities. Valuation and accounting treatment of these instruments can be found under Significant Accounting Policies in Note 1 of these Notes to Financial Statements.
Short Sales
A short sale is a transaction in which a Fund sells a security it does not own. If the security sold short decreases in price between the time the Fund sells the security and closes its short position, the Fund will realize a gain on the transaction. Conversely, if the security increases in price during the period, the Fund will realize a loss on the transaction. The risk of such price increases is the principal risk of engaging in short sales.
Derivatives
Derivatives are instruments whose values depend on, or are derived from, in whole or in part, the value of one or more other assets, such as securities, currencies, commodities or indices. Derivative instruments may be used for investment purposes (including to maintain cash reserves while maintaining exposure to certain other assets), for risk management (hedging) purposes, to facilitate trading, to reduce transaction costs and to pursue higher investment returns. Derivative instruments may also be used to seek to mitigate certain investment risks, such as foreign currency exchange rate risk, interest rate risk and credit risk. U.S. GAAP requires disclosures to enable investors to better understand how and why a Fund uses derivative instruments, how these derivative instruments are accounted for and their effects on the Fund’s financial position and results of operations.
The Funds may utilize derivatives for the following purposes:
Hedge: an investment made in order to reduce the risk of adverse price movements in a security, by taking an offsetting position to protect against broad market moves.
Income: the use of any instrument that distributes cash flows typically based upon some rate of interest.
Index Exposure: the use of an instrument to obtain exposure to a listed or other type of index.
Leverage: gaining total exposure to equities or other assets on the long and short sides at greater than 100% of invested capital.
If a Fund’s investment strategy consistently involves applying leverage, the value of the Fund’s shares will tend to increase or decrease more than the value of any increase or decrease in the underlying index or other asset. In addition, because an investment in derivative instruments generally requires a small investment relative to the amount of investment exposure assumed, an opportunity for increased net income is created; but, at the same time, leverage risk will increase. The Fund’s use of leverage, through borrowings or instruments such as derivatives, may cause the Fund to be more volatile and riskier than if they had not been leveraged.
Futures Contracts
A futures contract is an agreement to purchase (long) or sell (short) an agreed amount of securities or other instruments at a set price for delivery at a future date. There are significant risks associated with a Fund’s use of futures contracts, including (i) there may be an imperfect or no correlation between the changes in market value of the underlying asset and the prices of futures contracts; (ii) there may not be a liquid secondary market for a futures contract; (iii) trading restrictions or limitations may be imposed by an exchange; and (iv) government regulations may restrict trading in futures contracts. When investing in futures, there is minimal counterparty credit risk to a Fund because futures
104 | THE GUGGENHEIM FUNDS SEMI-ANNUAL REPORT | |
NOTES TO FINANCIAL STATEMENTS (Unaudited)(continued) |
are exchange-traded and the exchange’s clearinghouse, as counterparty to all exchange-traded futures, guarantees against default. Cash deposits are shown as segregated cash with broker on the Funds’ Statements of Assets and Liabilities; securities held as collateral are noted on the Funds’ Schedules of Investments.
The following table represents the Funds’ use and volume of futures on a monthly basis:
| | | | Average Notional Amount | |
Fund | Use | | Long | | | Short | |
StylePlus—Large Core Fund | Index exposure | | $ | 7,368,300 | | | $ | — | |
StylePlus—Mid Growth Fund | Index exposure | | | 2,604,046 | | | | — | |
World Equity Income Fund | Hedge | | | — | | | | 2,811,996 | |
Swap Agreements
A swap is an agreement that obligates two parties to exchange a series of cash flows at specified intervals based upon or calculated by reference to changes in specified prices or rates for a specified amount of an underlying asset. When utilizing over-the-counter (“OTC”) swaps, a Fund bears the risk of loss of the amount expected to be received under a swap agreement in the event of the default or bankruptcy of a swap agreement counterparty or if the underlying asset declines in value. Certain standardized swaps are subject to mandatory central clearing and are executed on a multi-lateral or other trade facility platform, such as a registered exchange. There is limited counterparty credit risk with respect to centrally-cleared swaps as the transaction is facilitated through a central clearinghouse, much like exchange-traded futures contracts. For a Fund utilizing centrally-cleared swaps, the exchange bears the risk of loss resulting from a counterparty not being able to pay. There is no guarantee that a Fund or an underlying fund could eliminate its exposure under an outstanding swap agreement by entering into an offsetting swap agreement with the same or another party.
Total return and custom basket swaps involve commitments where single or multiple cash flows are exchanged based on the price of an underlying reference asset (such as an index or custom basket of securities) for a fixed or variable interest rate. Total return and custom basket swaps will usually be computed based on the current value of the reference asset as of the close of regular trading on the NYSE or other exchange, with the swap value being adjusted to include dividends accrued, financing charges and/or interest associated with the swap agreement. When utilizing total return or custom basket swaps, a Fund bears the risk of loss of the amount expected to be received under a swap agreement in the event of the default or bankruptcy of a swap agreement counterparty or if the underlying reference asset declines in value.
The following table represents the Funds’ use and volume of total return swaps on a monthly basis:
| | | | Average Notional Amount | |
Fund | Use | | Long | | | Short | |
StylePlus—Large Core Fund | Index exposure | | $ | 173,668,791 | | | $ | — | |
StylePlus—Mid Growth Fund | Index exposure | | | 53,391,786 | | | | — | |
The following table represents the Funds’ use and volume of custom basket swaps on a monthly basis:
| | | | Average Notional Amount | |
Fund | Use | | Long | | | Short | |
Alpha Opportunity Fund | Hedge, Leverage | | $ | 19,838,206 | | | $ | 39,682,735 | |
Market Neutral Real Estate Fund | Hedge | | | — | | | | 29,452,560 | |
Risk Managed Real Estate Fund | Hedge, Leverage | | | 76,287,916 | | | | 54,895,221 | |
Derivative Investment Holdings Categorized by Risk Exposure
The following is a summary of the location of derivative investments on the Funds’ Statements of Assets and Liabilities as of March 31, 2024:
Derivative Investment Type | Asset Derivatives | Liability Derivatives |
Currency/Equity futures contracts | Variation margin on futures contracts | Variation margin on futures contracts |
Equity swap agreements | Unrealized appreciation on OTC swap agreements | Unrealized depreciation on OTC swap agreements |
| | THE GUGGENHEIM FUNDS SEMI-ANNUAL REPORT | 105 |
NOTES TO FINANCIAL STATEMENTS (Unaudited)(continued) |
The following tables set forth the fair value of the Funds’ derivative investments categorized by primary risk exposure at March 31, 2024:
Asset Derivative Investments Value |
Fund | | Futures
Equity
Risk* | | | Swaps
Equity
Risk | | | Futures
Foreign
Currency
Exchange
Risk* | | | Total Value at
March 31,
2024 | |
Alpha Opportunity Fund | | $ | — | | | $ | 2,395,939 | | | $ | — | | | $ | 2,395,939 | |
Market Neutral Real Estate Fund | | | — | | | | 1,007,236 | | | | — | | | | 1,007,236 | |
Risk Managed Real Estate Fund | | | — | | | | 12,772,131 | | | | — | | | | 12,772,131 | |
StylePlus—Large Core Fund | | | 161,245 | | | | 14,737,060 | | | | — | | | | 14,898,305 | |
StylePlus—Mid Growth Fund | | | 70,906 | | | | 5,246,517 | | | | — | | | | 5,317,423 | |
World Equity Income Fund | | | — | | | | — | | | | 12,249 | | | | 12,249 | |
Liability Derivative Investments Value |
Fund | | Futures
Equity
Risk | | | Swaps
Equity
Risk | | | Futures
Foreign
Currency
Exchange
Risk | | | Total | |
Alpha Opportunity Fund | | $ | — | | | $ | 1,844,614 | | | $ | — | | | $ | 1,844,614 | |
StylePlus—Mid Growth Fund | | | 459 | | | | — | | | | — | | | | 459 | |
* | Includes cumulative appreciation (depreciation) of exchange-traded, OTC and centrally-cleared derivatives contracts as reported on the Schedules of Investments. For exchange-traded and centrally-cleared derivatives, variation margin is reported within the Funds’ Statements of Assets and Liabilities. |
The following is a summary of the location of derivative investments on the Funds’ Statements of Operations for the period ended March 31, 2024:
Derivative Investment Type | Location of Gain (Loss) on Derivatives |
Currency/Equity futures contracts | Net realized gain (loss) on futures contracts Net change in unrealized appreciation (depreciation) on futures contracts |
Equity swap agreements | Net realized gain (loss) on swap agreements Net change in unrealized appreciation (depreciation) on swap agreements |
The following is a summary of the Funds’ realized gain (loss) and change in unrealized appreciation (depreciation) on derivative investments recognized on the Funds’ Statements of Operations categorized by primary risk exposure for the period ended March 31, 2024:
Realized Gain (Loss) on Derivative Investments Recognized on the Statements of Operations |
Fund | | Futures
Equity
Risk | | | Swaps
Equity
Risk | | | Futures
Foreign
Currency
Exchange
Risk | | | Total | |
Alpha Opportunity Fund | | $ | — | | | $ | (282,820 | ) | | $ | — | | | $ | (282,820 | ) |
Market Neutral Real Estate Fund | | | — | | | | (657,885 | ) | | | — | | | | (657,885 | ) |
Risk Managed Real Estate Fund | | | — | | | | (1,506,844 | ) | | | — | | | | (1,506,844 | ) |
StylePlus—Large Core Fund | | | 1,146,190 | | | | 38,377,185 | | | | — | | | | 39,523,375 | |
StylePlus—Mid Growth Fund | | | 428,914 | | | | 10,533,166 | | | | — | | | | 10,962,080 | |
World Equity Income Fund | | | — | | | | — | | | | 23,981 | | | | 23,981 | |
106 | THE GUGGENHEIM FUNDS SEMI-ANNUAL REPORT | |
NOTES TO FINANCIAL STATEMENTS (Unaudited)(continued) |
Change in Unrealized Appreciation (Depreciation) on Derivative Investments Recognized on the Statements of Operations |
Fund | | Futures
Equity
Risk | | | Swaps
Equity
Risk | | | Futures
Foreign
Currency
Exchange
Risk | | | Total | |
Alpha Opportunity Fund | | $ | — | | | $ | (1,629,464 | ) | | $ | — | | | $ | (1,629,464 | ) |
Market Neutral Real Estate Fund | | | — | | | | (2,892,951 | ) | | | — | | | | (2,892,951 | ) |
Risk Managed Real Estate Fund | | | — | | | | 5,692,304 | | | | — | | | | 5,692,304 | |
StylePlus—Large Core Fund | | | 217,586 | | | | (6,351,715 | ) | | | — | | | | (6,134,129 | ) |
StylePlus—Mid Growth Fund | | | 179,858 | | | | 97,165 | | | | — | | | | 277,023 | |
World Equity Income Fund | | | — | | | | — | | | | (171,176 | ) | | | (171,176 | ) |
In conjunction with short sales and the use of derivative instruments, the Funds are required to maintain collateral in various forms. Depending on the financial instrument utilized and the broker involved, the Funds use margin deposits at the broker, cash and/or securities segregated at the custodian bank, discount notes or repurchase agreements allocated to the Funds as collateral.
Foreign Investments
There are several risks associated with exposure to foreign currencies, foreign issuers and emerging markets. A fund’s indirect and direct exposure to foreign currencies subjects the Fund to the risk that those currencies will decline in value relative to the U.S. dollar, or in the case of short positions, that the U.S. dollar will decline in value relative to the currency being hedged. Currency rates in foreign countries may fluctuate significantly over short periods of time for a number of reasons, including changes in interest rates and the imposition of currency controls or other political developments in the U.S. or abroad. In addition, the Funds may incur transaction costs in connection with conversions between various currencies. The Funds may, but is not obligated to, engage in currency hedging transactions, which generally involve buying currency forward, options or futures contracts. However, not all currency risks may be effectively hedged, and in some cases the costs of hedging techniques may outweigh expected benefits. In such instances, the value of securities denominated in foreign currencies can change significantly when foreign currencies strengthen or weaken relative to the U.S. dollar.
The Funds may invest in securities of foreign companies directly, or in financial instruments, such as ADRs and exchange-traded funds, which are indirectly linked to the performance of foreign issuers. Foreign markets can be more volatile than the U.S. market due to increased risks of adverse issuer, political, regulatory, market, or economic developments and can perform differently from the U.S. market. Investing in securities of foreign companies directly, or in financial instruments that are indirectly linked to the performance of foreign issuers, may involve risks not typically associated with investing in U.S. issuers. The value of securities denominated in foreign currencies, and of dividends from such securities, can change significantly when foreign currencies strengthen or weaken relative to the U.S. dollar. Foreign securities markets generally have less trading volume and less liquidity than U.S. markets, and prices in some foreign markets may fluctuate more than those of securities traded on U.S. markets. Many foreign countries lack accounting and disclosure standards comparable to those that apply to U.S. companies, and it may be more difficult to obtain reliable information regarding a foreign issuer’s financial condition and operations. Transaction costs and costs associated with custody services are generally higher for foreign securities than they are for U.S. securities. Some foreign governments levy withholding taxes against dividend and interest income. Although in some countries portions of these taxes are recoverable, the non-recovered portion will reduce the income received by the Funds.
The Trust has established counterparty credit guidelines and enters into transactions only with financial institutions rated/identified as investment grade or better. The Trust monitors the counterparty credit risk associated with each such financial institution.
Note 3 – Offsetting
In the normal course of business, the Funds enter into transactions subject to enforceable master netting arrangements or other similar arrangements. Generally, the right to offset in those agreements allows the Funds to counteract the exposure to a specific counterparty with collateral received from or delivered to that counterparty based on the terms of the arrangements. These arrangements provide for the right to liquidate upon the occurrence of an event of default, credit event upon merger or additional termination event.
| | THE GUGGENHEIM FUNDS SEMI-ANNUAL REPORT | 107 |
NOTES TO FINANCIAL STATEMENTS (Unaudited)(continued) |
In order to better define their contractual rights and to secure rights that will help the Funds mitigate their counterparty risk, the Funds may enter into an International Swaps and Derivatives Association, Inc. Master Agreement (“ISDA Master Agreement”) or similar agreement with their derivative contract counterparties. An ISDA Master Agreement is a bilateral agreement between a fund and a counterparty that governs OTC derivatives, including foreign exchange contracts, and typically contains, among other things, collateral posting terms and netting provisions in the event of a default and/or termination event. The provisions of the ISDA Master Agreement typically permit a single net payment in the event of a default (close-out netting) or similar event, including the bankruptcy or insolvency of the counterparty.
For derivatives traded under an ISDA Master Agreement, the collateral requirements are typically calculated by netting the mark-to-market amount for each transaction under such agreement and comparing that amount to the value of any collateral currently pledged by the Funds and the counterparty. For financial reporting purposes, cash collateral that has been pledged to cover obligations of the Funds and cash collateral received from the counterparty, if any, are reported separately on the Funds’ Statements of Assets and Liabilities as segregated cash with broker/receivable for variation margin, or payable for swap settlement/variation margin. Cash and/or securities pledged or received as collateral by the Funds in connection with an OTC derivative subject to an ISDA Master Agreement generally may not be invested, sold or rehypothecated by the counterparty or the Funds, as applicable, absent an event of default under such agreement, in which case such collateral generally may be applied towards obligations due to and payable by such counterparty or the Funds, as applicable. Generally, the amount of collateral due from or to a counterparty must exceed a minimum transfer amount threshold (e.g., $300,000) before a transfer is required to be made. To the extent amounts due to the Funds from their counterparties are not fully collateralized, contractually or otherwise, the Funds bear the risk of loss from counterparty nonperformance. The Funds attempt to mitigate counterparty risk by only entering into agreements with counterparties that they believe to be of good standing and by monitoring the financial stability of those counterparties.
For financial reporting purposes, the Funds do not offset derivative assets and derivative liabilities that are subject to netting arrangements in the Funds’ Statements of Assets and Liabilities.
The following tables present derivative financial instruments and secured financing transactions that are subject to enforceable netting arrangements:
| | | | | | | | | | | | | | | | Gross Amounts Not Offset
in the Statements of
Assets and Liabilities | | | | | |
Fund | Instrument | | Gross
Amounts of
Recognized
Assets1 | | | Gross
Amounts
Offset in the
Statements
of Assets and
Liabilities | | | Net Amount
of Assets
Presented on
the Statements
of Assets and
Liabilities | | | Financial
Instruments | | | Cash
Collateral
Received | | | Net
Amount | |
Alpha Opportunity Fund | Custom basket swap agreements | | $ | 2,395,939 | | | $ | — | | | $ | 2,395,939 | | | $ | (1,844,614 | ) | | $ | — | | | $ | 551,325 | |
Market Neutral Real Estate Fund | Custom basket swap agreements | | | 1,007,236 | | | | — | | | | 1,007,236 | | | | — | | | | (500,000 | ) | | | 507,236 | |
Risk Managed Real Estate Fund | Custom basket swap agreements | | | 12,772,131 | | | | — | | | | 12,772,131 | | | | — | | | | (7,333,030 | ) | | | 5,439,101 | |
StylePlus—Large Core Fund | Swap equity agreements | | | 14,737,060 | | | | — | | | | 14,737,060 | | | | — | | | | (13,020,000 | ) | | | 1,717,060 | |
StylePlus—Mid Growth Fund | Swap equity agreements | | | 5,246,517 | | | | — | | | | 5,246,517 | | | | — | | | | (4,740,000 | ) | | | 506,517 | |
108 | THE GUGGENHEIM FUNDS SEMI-ANNUAL REPORT | |
NOTES TO FINANCIAL STATEMENTS (Unaudited)(continued) |
| | | | | | | | | | | | | | | | Gross Amounts Not Offset
in the Statements of
Assets and Liabilities | | | | | |
Fund | Instrument | | Gross
Amounts of
Recognized
Liabilities1 | | | Gross
Amounts
Offset in the
Statements
of Assets and
Liabilities | | | Net Amounts
of Liabilities
Presented on
the Statements
of Assets and
Liabilities | | | Financial
Instruments | | | Cash
Collateral
Pledged | | | Net
Amount | |
Alpha Opportunity Fund | Custom basket swap agreements | | $ | 1,844,614 | | | $ | — | | | $ | 1,844,614 | | | $ | (1,844,614 | ) | | $ | — | | | $ | — | |
1 | Exchange-traded or centrally-cleared derivatives are excluded from these reported amounts. |
The Funds have the right to offset deposits against any related derivative liabilities outstanding with each counterparty with the exception of exchange-traded or centrally-cleared derivatives. The following table presents deposits held by others in connection with derivative investments as of March 31, 2024.
Fund | Counterparty | Asset Type | | Cash Pledged | | | Cash Received | |
Market Neutral Real Estate Fund | Goldman Sachs International | Custom basket swap agreements | | $ | 410,000 | | | $ | — | |
| Morgan Stanley Capital Services LLC | Custom basket swap agreements | | | — | | | | 500,000 | |
| | | | | 410,000 | | | | 500,000 | |
Risk Managed Real Estate Fund | Goldman Sachs International | Custom basket swap agreements | | | — | | | | 1,350,000 | |
| Morgan Stanley Capital Services LLC | Custom basket swap agreements | | | — | | | | 5,983,030 | |
| | | | | — | | | | 7,333,030 | |
StylePlus—Large Core Fund | Morgan Stanley Capital Services LLC | Futures contracts | | | 640,000 | | | | — | |
| Wells Fargo Bank, N.A. | Total return swap agreements | | | — | | | | 13,020,000 | |
| | | | | 640,000 | | | | 13,020,000 | |
StylePlus—Mid Growth Fund | Morgan Stanley Capital Services LLC | Futures contracts | | | 221,898 | | | | — | |
| Wells Fargo Bank, N.A. | Total return swap agreements | | | — | | | | 4,740,000 | |
| | | | | 221,898 | | | | 4,740,000 | |
World Equity Income Fund | BofA Securities, Inc. | Futures contracts | | | 37,000 | | | | — | |
Note 4 – Fair Value Measurement
In accordance with U.S. GAAP, fair value is defined as the price that the Funds would receive to sell an investment or pay to transfer a liability in an orderly transaction between market participants at the measurement date. U.S. GAAP establishes a three-tier fair value hierarchy based on the types of inputs used to value assets and liabilities and requires corresponding disclosure. The hierarchy and the corresponding inputs are summarized below:
Level 1 — | unadjusted quoted prices in active markets for identical assets or liabilities. |
Level 2 — | significant other observable inputs (for example quoted prices for securities that are similar based on characteristics such as interest rates, prepayment speeds, credit risk, etc.). |
Level 3 — | significant unobservable inputs based on the best information available under the circumstances, to the extent observable inputs are not available, which may include assumptions. |
Rule 2a-5 sets forth a definition of “readily available market quotations,” which is consistent with the definition of a Level 1 input under U.S. GAAP. Rule 2a-5 provides that “a market quotation is readily available only when that quotation is a quoted price (unadjusted) in active markets for identical investments that the fund can access at the measurement date, provided that a quotation will not be readily available if it is not reliable.”
| | THE GUGGENHEIM FUNDS SEMI-ANNUAL REPORT | 109 |
NOTES TO FINANCIAL STATEMENTS (Unaudited)(continued) |
Securities for which market quotations are not readily available must be valued at fair value as determined in good faith. Accordingly, any security priced using inputs other than Level 1 inputs will be subject to fair value requirements. The types of inputs available depend on a variety of factors, such as the type of security and the characteristics of the markets in which it trades, if any. Fair valuation determinations that rely on fewer or no observable inputs require greater judgment. Accordingly, fair value determinations for Level 3 securities require the greatest amount of judgment.
The inputs or methodologies selected and applied for valuing securities or other assets are not necessarily an indication of the risk associated with investing in those securities. The suitability, appropriateness and accuracy of the techniques, methodologies and sources employed to determine fair valuation are periodically reviewed and subject to change.
Note 5 – Investment Advisory Agreement and Other Agreements
Under the terms of an investment advisory contract, the Funds pay GI investment advisory fees on a monthly basis calculated daily at the annualized rates below, based on the average daily net assets of the Funds:
Fund | | Management Fees
(as a % of Net Assets) | |
Alpha Opportunity Fund | | | 0.90 | % |
Large Cap Value Fund | | | 0.65 | % |
Market Neutral Real Estate Fund | | | 1.10 | % |
Risk Managed Real Estate Fund | | | 0.75 | % |
Small Cap Value Fund | | | 0.75 | % |
StylePlus—Large Core Fund | | | 0.75 | % |
StylePlus—Mid Growth Fund | | | 0.75 | % |
World Equity Income Fund | | | 0.70 | % |
GI pays operating expenses on behalf of the Trust, such as audit and accounting related services, legal services, custody, printing and mailing, among others, on a pass-through basis. Such expenses are allocated to various Funds within the complex based on relative net assets.
The Board has adopted Distribution Plans related to the offering of Class A, Class C and Class P shares pursuant to Rule 12b-1 under the 1940 Act. The plans provide for payments at an annual rate of 0.25% of the average daily net assets of the Fund’s Class A and Class P shares, and 1.00% of the average daily net assets of the Fund’s Class C shares.
110 | THE GUGGENHEIM FUNDS SEMI-ANNUAL REPORT | |
NOTES TO FINANCIAL STATEMENTS (Unaudited)(continued) |
Contractual expense limitation agreements for the following Funds provide that the total expenses be limited to a percentage of average net assets for each class of shares, exclusive of brokerage costs, dividends or interest on securities sold short, expenses of other investment companies in which a Fund invests, interest, taxes, litigation, indemnification and extraordinary expenses. The limits are listed below:
Fund | | Limit | | | Effective
Date | | | Contract
End Date | |
Alpha Opportunity Fund – Class A | | | 1.76 | % | | | 05/31/17 | | | | 02/01/25 | |
Alpha Opportunity Fund – Class C | | | 2.51 | % | | | 05/31/17 | | | | 02/01/25 | |
Alpha Opportunity Fund– Class P | | | 1.76 | % | | | 05/31/17 | | | | 02/01/25 | |
Alpha Opportunity Fund – Institutional Class | | | 1.51 | % | | | 05/31/17 | | | | 02/01/25 | |
Large Cap Value Fund – Class A | | | 1.15 | % | | | 11/30/12 | | | | 02/01/25 | |
Large Cap Value Fund – Class C | | | 1.90 | % | | | 11/30/12 | | | | 02/01/25 | |
Large Cap Value Fund – Class P | | | 1.15 | % | | | 05/01/15 | | | | 02/01/25 | |
Large Cap Value Fund – Institutional Class | | | 0.90 | % | | | 06/05/13 | | | | 02/01/25 | |
Market Neutral Real Estate Fund – Class A | | | 1.65 | % | | | 02/26/16 | | | | 02/01/25 | |
Market Neutral Real Estate Fund – Class C | | | 2.40 | % | | | 02/26/16 | | | | 02/01/25 | |
Market Neutral Real Estate Fund – Class P | | | 1.65 | % | | | 02/26/16 | | | | 02/01/25 | |
Market Neutral Real Estate Fund – Institutional Class | | | 1.40 | % | | | 02/26/16 | | | | 02/01/25 | |
Risk Managed Real Estate Fund – Class A | | | 1.30 | % | | | 03/26/14 | | | | 02/01/25 | |
Risk Managed Real Estate Fund – Class C | | | 2.05 | % | | | 03/26/14 | | | | 02/01/25 | |
Risk Managed Real Estate Fund – Class P | | | 1.30 | % | | | 05/01/15 | | | | 02/01/25 | |
Risk Managed Real Estate Fund – Institutional Class | | | 1.10 | % | | | 03/26/14 | | | | 02/01/25 | |
Small Cap Value Fund – Class A | | | 1.30 | % | | | 11/30/12 | | | | 02/01/25 | |
Small Cap Value Fund – Class C | | | 2.05 | % | | | 11/30/12 | | | | 02/01/25 | |
Small Cap Value Fund – Class P | | | 1.30 | % | | | 05/01/15 | | | | 02/01/25 | |
Small Cap Value Fund – Institutional Class | | | 1.05 | % | | | 11/30/12 | | | | 02/01/25 | |
World Equity Income Fund – Class A | | | 1.22 | % | | | 08/15/13 | | | | 02/01/25 | |
World Equity Income Fund – Class C | | | 1.97 | % | | | 08/15/13 | | | | 02/01/25 | |
World Equity Income Fund – Class P | | | 1.22 | % | | | 05/01/15 | | | | 02/01/25 | |
World Equity Income Fund – Institutional Class | | | 0.97 | % | | | 08/15/13 | | | | 02/01/25 | |
| | THE GUGGENHEIM FUNDS SEMI-ANNUAL REPORT | 111 |
NOTES TO FINANCIAL STATEMENTS (Unaudited)(continued) |
GI and GPIM are entitled to reimbursement by the Funds for fees waived or expenses reimbursed during any of the previous 36 months, beginning on the date of the expense limitation agreement, if on any day the estimated operating expenses are less than the indicated percentages. For purposes of this arrangement, GI and GPIM are entitled to recoupment of previously waived fees or reimbursed expenses for 36 months from the date of the waiver or reimbursement by GI or GPIM. At March 31, 2024, the amount of fees waived or expenses reimbursed that are subject to recoupment and will expire during the years ended September 30, are presented in the following table:
| Fund | | 2024 | | | 2025 | | | 2026 | | | 2027 | | | Fund
Total | |
| Alpha Opportunity Fund | | | | | | | | | | | | | | | | | | | | |
| Class A | | $ | 5,323 | | | $ | 4,189 | | | $ | 4,612 | | | $ | 1,649 | | | $ | 15,773 | |
| Class C | | | 709 | | | | 584 | | | | 502 | | | | 158 | | | | 1,953 | |
| Class P | | | 1,824 | | | | 971 | | | | 1,774 | | | | 379 | | | | 4,948 | |
| Institutional Class | | | — | | | | — | | | | — | | | | 3,327 | | | | 3,327 | |
| Large Cap Value Fund | | | | | | | | | | | | | | | | | | | | |
| Class A | | | — | | | | 99,072 | | | | 106,239 | | | | 48,632 | | | | 253,943 | |
| Class C | | | 3,805 | | | | 5,729 | | | | 5,870 | | | | 2,292 | | | | 17,696 | |
| Class P | | | 695 | | | | 796 | | | | 522 | | | | 176 | | | | 2,189 | |
| Institutional Class | | | 2,105 | | | | 6,589 | | | | 11,209 | | | | 3,835 | | | | 23,738 | |
| Market Neutral Real Estate Fund | | | | | | | | | | | | | | | | | | | | |
| Class A | | | 18,159 | | | | 7,180 | | | | 2,380 | | | | 693 | | | | 28,412 | |
| Class C | | | 790 | | | | 689 | | | | 524 | | | | 263 | | | | 2,266 | |
| Class P | | | 13,266 | | | | 6,928 | | | | 3,895 | | | | 852 | | | | 24,941 | |
| Institutional Class | | | 86,986 | | | | 121,875 | | | | 95,116 | | | | 57,871 | | | | 361,848 | |
| Risk Managed Real Estate Fund | | | | | | | | | | | | | | | | | | | | |
| Class A | | | — | | | | — | | | | 460 | | | | 39 | | | | 499 | |
| Class C | | | — | | | | — | | | | 270 | | | | — | | | | 270 | |
| Class P | | | — | | | | 5,446 | | | | 4,114 | | | | 5 | | | | 9,565 | |
| Institutional Class | | | — | | | | — | | | | — | | | | — | | | | — | |
| Small Cap Value Fund | | | | | | | | | | | | | | | | | | | | |
| Class A | | | 110,382 | | | | 98,289 | | | | 91,810 | | | | 83,256 | | | | 383,737 | |
| Class C | | | 21,442 | | | | 14,817 | | | | 10,065 | | | | 8,861 | | | | 55,185 | |
| Class P | | | 1,154 | | | | 2,097 | | | | 2,852 | | | | 1,321 | | | | 7,424 | |
| Institutional Class | | | 33,331 | | | | 44,992 | | | | 44,148 | | | | 13,323 | | | | 135,794 | |
| World Equity Income Fund | | | | | | | | | | | | | | | | | | | | |
| Class A | | | — | | | | 78,363 | | | | 111,813 | | | | 85,923 | | | | 276,099 | |
| Class C | | | 7,118 | | | | 7,540 | | | | 7,790 | | | | 5,293 | | | | 27,741 | |
| Class P | | | 236 | | | | 408 | | | | 411 | | | | 209 | | | | 1,264 | |
| Institutional Class | | | 4,320 | | | | 7,859 | | | | 8,688 | | | | 5,521 | | | | 26,388 | |
For the period ended March 31, 2024, GI recouped amounts from the Funds as follows:
Alpha Opportunity Fund | | $ | 11,303 | |
Large Cap Value Fund | | | 61 | |
Risk Managed Real Estate Fund | | | 15,411 | |
World Equity Income Fund | | | 78 | |
If a Fund invests in a fund that is advised by the same adviser or an affiliated adviser, the investing Fund’s adviser has agreed to waive fees at the investing fund level to the extent necessary to offset the proportionate share of any management fee paid by each Fund with respect to its investment in such affiliated fund. Fee waivers will be calculated at the investing fund level without regard to any expense cap in effect for the investing fund. Fees waived under this arrangement are not subject to reimbursement to GI. For the period ended March 31, 2024, the investing Fund’s adviser waived fees related to investments in affiliated funds for the following Funds:
Fund | | Amount Waived | |
StylePlus—Large Core Fund | | $ | 40,056 | |
StylePlus—Mid Growth Fund | | | 2,711 | |
For the period ended March 31, 2024, GFD retained sales charges of $77,213 relating to sales of A-Class shares of the Trust.
112 | THE GUGGENHEIM FUNDS SEMI-ANNUAL REPORT | |
NOTES TO FINANCIAL STATEMENTS (Unaudited)(continued) |
Certain trustees and officers of the Trust are also officers of GI and/or GFD. The Trust does not compensate its officers or trustees who are officers, directors and/or employees of GI or GFD.
MUFG Investor Services (US), LLC (“MUIS”) acts as the Funds’ administrator, transfer agent and accounting agent. As administrator, transfer agent and accounting agent, MUIS maintains the books and records of the Funds’ securities and cash. The Bank of New York Mellon Corp. (“BNY”) acts as the Funds’ custodian. As custodian, BNY is responsible for the custody of the Funds’ assets. For providing the aforementioned administrative and accounting services, MUIS is entitled to receive a monthly fee equal to a percentage of the Funds’ average daily net assets and out of pocket expenses. For providing the aforementioned transfer agent and custodian services, MUIS and BNY are entitled to receive a monthly fee based on the number of transactions during the month and the number of accounts under management, subject to certain minimum monthly fees, and out of pocket expenses.
At March 31, 2024, GI and its affiliates owned over twenty percent of the outstanding shares of the Funds, as follows:
Fund | | Percent of Outstanding
Shares Owned | |
Alpha Opportunity Fund | | | 78 | % |
Note 6 – Federal Income Tax Information
The Funds intend to comply with the provisions of Subchapter M of the Internal Revenue Code of 1986, as amended (the “Internal Revenue
Code”), applicable to regulated investment companies and will distribute substantially all taxable net investment income and capital gains sufficient to relieve the Funds from all, or substantially all, federal income, excise and state income taxes. Therefore, no provision for federal or state income tax or federal excise tax is required.
Tax positions taken or expected to be taken in the course of preparing the Funds’ tax returns are evaluated to determine whether the tax positions are “more-likely-than-not” of being sustained by the applicable tax authority. Tax positions not deemed to meet the “more-likely-than-not” threshold would be recorded as a tax benefit or expense in the current year. Management has analyzed the Funds’ tax positions taken, or to be taken, on U.S. federal income tax returns for all open tax years, and has concluded that no provision for income tax is required in the Funds’ financial statements. The Funds’ U.S. federal income tax returns are subject to examination by the Internal Revenue Service (“IRS”) for a period of three years after they are filed.
At March 31, 2024, the cost of investments for U.S. federal income tax purposes, the aggregate gross unrealized appreciation for all investments for which there was an excess of value over tax cost, and the aggregate gross unrealized depreciation for all investments for which there was an excess of tax cost over value, were as follows:
Fund | | Tax
Cost | | | Tax
Unrealized
Appreciation | | | Tax
Unrealized
Depreciation | | | Net Tax
Unrealized
Appreciation
(Depreciation) | |
Alpha Opportunity Fund | | $ | 35,215,660 | | | $ | 6,320,454 | | | $ | (2,246,193 | ) | | $ | 4,074,261 | |
Large Cap Value Fund | | | 30,312,993 | | | | 9,653,053 | | | | (941,083 | ) | | | 8,711,970 | |
Market Neutral Real Estate Fund | | | 39,114,713 | | | | 3,955,492 | | | | (477,442 | ) | | | 3,478,050 | |
Risk Managed Real Estate Fund | | | 311,159,475 | | | | 31,910,717 | | | | (28,837,509 | ) | | | 3,073,208 | |
Small Cap Value Fund | | | 4,848,368 | | | | 886,737 | | | | (351,269 | ) | | | 535,468 | |
StylePlus—Large Core Fund | | | 241,593,265 | | | | 24,860,986 | | | | (1,090,548 | ) | | | 23,770,438 | |
StylePlus—Mid Growth Fund | | | 75,816,586 | | | | 8,500,480 | | | | (161,302 | ) | | | 8,339,178 | |
World Equity Income Fund | | | 42,305,470 | | | | 7,621,351 | | | | (766,567 | ) | | | 6,854,784 | |
| | THE GUGGENHEIM FUNDS SEMI-ANNUAL REPORT | 113 |
NOTES TO FINANCIAL STATEMENTS (Unaudited)(continued) |
Note 7 – Securities Transactions
For the period ended March 31, 2024, the cost of purchases and proceeds from sales of investment securities, excluding government securities, short-term investments and derivatives, were as follows:
Fund | | Purchases | | | Sales | |
Alpha Opportunity Fund | | $ | 55,905,257 | | | $ | 56,449,595 | |
Large Cap Value Fund | | | 3,415,456 | | | | 4,404,722 | |
Market Neutral Real Estate Fund | | | 16,925,957 | | | | 16,323,948 | |
Risk Managed Real Estate Fund | | | 98,793,715 | | | | 161,299,843 | |
Small Cap Value Fund | | | 873,929 | | | | 1,586,458 | |
StylePlus—Large Core Fund | | | 82,112,387 | | | | 58,857,565 | |
StylePlus—Mid Growth Fund | | | 31,894,873 | | | | 25,643,515 | |
World Equity Income Fund | | | 27,275,957 | | | | 29,749,330 | |
Note 8 – Line of Credit
The Trust, along with other affiliated trusts, secured a 364-day committed, $1,150,000,000 line of credit from Citibank, N.A., which was in place through September 29, 2023, at which time a new line of credit was entered into in the amount of $1,165,000,000 line of credit. A Fund may draw (borrow) from the line of credit as a temporary measure for emergency purposes, to facilitate redemption requests, or for other short-term liquidity purposes consistent with the Fund’s investment objective and program. For example, it may be advantageous for the Fund to borrow money rather than sell existing portfolio positions to meet redemption requests. Fees related to borrowings, if any, vary under this arrangement between the greater of Citibank’s “base rate”, SOFR plus 1%, or the federal funds rate plus 1/2 of 1%.
The commitment fee that may be paid by the Funds is at an annualized rate of 0.15% of the average daily amount of their allocated unused commitment amount. The commitment fee amount is allocated to the individual Funds based on the respective net assets of each participating Fund and is referenced in the Funds’ Statement of Operations under “Line of credit fees”. The Funds did not have any borrowings under this agreement as of and for the period ended March 31, 2024.
Note 9 – Large Shareholder Risk
As of March 31, 2024, 77.9% of the Alpha Opportunity Fund (the “Fund”) was held by Guggenheim Macro Opportunities Fund. The Fund may experience adverse effects if a large number of shares of the Fund are held by a single shareholder (e.g., an institutional investor, financial intermediary or another GI Fund). The Fund is subject to the risk that a redemption by those shareholders of all or a large portion of the Fund could cause the Fund to liquidate its assets at inopportune times, or at a loss or depressed value, which could adversely impact the Fund’s performance and cause the value of a shareholder’s investment to decline. Redemptions of a large number of shares also may increase transaction costs or, by necessitating a sale of portfolio securities, have adverse tax consequences for shareholders. They also potentially limit the use of any capital loss carryforwards and certain other losses to offset future realized capital gains (if any) and may limit or prevent a Fund’s use of tax equalization.
Note 10 – Market Risks
The value of, or income generated by, the investments held by the Funds are subject to the possibility of rapid and unpredictable fluctuation, and loss that may result from various factors. These factors include, among others, developments affecting individual companies, or from broader influences, including real or perceived changes in prevailing interest rates (which may change at any time based on changes in monetary policies and various market and other economic conditions), changes in inflation rates or expectations about inflation rates, adverse investor confidence or sentiment, changing economic, political (including geopolitical), social or financial market conditions, increased instability or general uncertainty, environmental disasters, governmental actions, public health emergencies (such as the spread of infectious diseases, pandemics and epidemics), debt crises, actual or threatened wars or other armed conflicts (such as the ongoing Russia-Ukraine conflict and its collateral economic and other effects, including, but not limited to, sanctions and other international trade barriers) or ratings downgrades, and other similar events, each of which may be temporary or last for extended periods. Moreover, changing economic, political, geopolitical, social, financial market or other conditions in one country, geographic region or industry could adversely affect the value, yield and return of the investments held by the Funds in a different country, geographic region, economy, industry or market because of the increasingly interconnected
114 | THE GUGGENHEIM FUNDS SEMI-ANNUAL REPORT | |
NOTES TO FINANCIAL STATEMENTS (Unaudited)(concluded) |
global economies and financial markets. The duration and extent of the foregoing types of factors or conditions are highly uncertain and difficult to predict and have in the past, and may in the future, cause volatility and distress in economies and financial markets or other adverse circumstances, which may negatively affect the value of the Funds’ investments and performance of the Funds.
Note 11 – Subsequent Events
The Funds evaluated subsequent events through the date the financial statements are issued and determined there were no material events that would require adjustment to or disclosure in the Funds’ financial statements.
| | THE GUGGENHEIM FUNDS SEMI-ANNUAL REPORT | 115 |
OTHER INFORMATION (Unaudited) |
Delivery of Shareholder Reports
Paper copies of the Funds’ annual and semi-annual shareholder reports are not sent by mail, unless you specifically request paper copies of the reports from a fund or from your financial intermediary. Instead, the reports are made available on a website, and you are notified by mail each time a report is posted and provided with a website link to access the report.
You may elect to receive all future shareholder reports in paper free of charge. If you hold shares of a fund directly, you can inform the Fund that you wish to receive paper copies of reports by calling 800.820.0888. If you hold shares of a fund through a financial intermediary, please contact the financial intermediary to make this election. Your election to receive reports in paper may apply to all Guggenheim Funds in which you are invested and may apply to all Guggenheim funds held with your financial intermediary.
Tailored Shareholder Reports for Open-End Mutual Funds and Exchange-Traded Funds
Effective January 24, 2023, the SEC adopted rule and form amendments to require open-end mutual funds and exchange-traded funds registered on Form N-1A to transmit concise and visually engaging streamlined annual and semi-annual reports to shareholders that highlight key information. Other information, including financial statements, will no longer appear in a streamlined shareholder report but must be available online, delivered free of charge upon request, and filed on a semi-annual basis on Form N-CSR. The rule and form amendments have a compliance date of July 24, 2024. At this time, management is evaluating the impact of these amendments on the shareholder reports for the Fund.
Proxy Voting Information
A description of the policies and procedures that the Trust uses to determine how to vote proxies relating to securities held in the Funds’ portfolios is available, without charge and upon request, by calling 800.820.0888. This information is also available from the EDGAR database on the SEC’s website at https://www.sec.gov.
Information regarding how the Funds’ voted proxies relating to portfolio securities during the most recent 12-month period ended June 30 is available without charge, upon request, by calling 800.820.0888. This information is also available from the EDGAR database on the SEC’s website at https://www.sec.gov.
Sector Classification
Information in the “Schedule of Investments” is categorized by sectors using sector-level Classifications defined by the Bloomberg Industry Classification System, a widely recognized industry classification system provider. Each Fund’s registration statement has investment policies relating to concentration in specific sectors/industries. For purposes of these investment policies, the Funds usually classify sectors/industries based on industry-level Classifications used by widely recognized industry classification system providers such as Bloomberg Industry Classification System, Global Industry Classification Standards and Barclays Global Classification Scheme.
Quarterly Portfolio Schedules Information
The Trust files its complete schedule of portfolio holdings with the SEC for the first and third quarters of each fiscal year as an exhibit to its reports on Form N-PORT. The Fund’s Form N-PORT is available on the SEC’s website at https://www.sec.gov. The Fund’s complete schedule of securities holdings as of the end of each fiscal quarter will be made available to the public on the SEC’s website at www.sec.gov and on our website at www.guggenheiminvestments.com, and will be made available, upon request and without charge, by calling 800.820.0888.
116 | THE GUGGENHEIM FUNDS SEMI-ANNUAL REPORT | |
INFORMATION ON BOARD OF TRUSTEES AND OFFICERS (Unaudited) |
A Board of Trustees oversees the Trust, as well as other trusts of GI, in which its members have no stated term of service, and continue to serve after election until resignation. The Funds’ Statement of Additional Information includes further information about Fund Trustees and Officers, and can be obtained without charge by visiting guggenheiminvestments.com or by calling 800.820.0888.
Name, Address*
and Year of Birth | Position(s) Held
with Trust | Term of Office
and Length of
Time Served** | Principal Occupation(s)
During Past Five Years | Number of
Portfolios
in Fund
Complex
Overseen | Other
Directorships Held
by Trustees*** |
INDEPENDENT TRUSTEES | | | |
Randall C. Barnes (1951) | Trustee and Chair of the Valuation Oversight Committee | Since 2014 (Trustee)
Since 2020 (Chair of the Valuation Oversight Committee) | Current: Private Investor (2001-present). Former: Senior Vice President and Treasurer, PepsiCo, Inc. (1993-1997); President, Pizza Hut International (1991-1993); Senior Vice President, Strategic Planning and New Business Development, PepsiCo, Inc. (1987-1990). | 153 | Current: Advent Convertible and Income Fund (2005-present); Purpose Investments Funds (2013-present). Former: Guggenheim Energy & Income Fund (2015-2023); Fiduciary/Claymore Energy Infrastructure Fund (2004-2022); Guggenheim Enhanced Equity Income Fund (2005-2021); Guggenheim Credit Allocation Fund (2013-2021). |
Angela Brock-Kyle (1959) | Trustee | Since 2019 | Current: Founder and Chief Executive Officer, B.O.A.R.D.S. (consulting firm) (2013-present); Director, Mutual Fund Directors Forum (2022-present). Former: Senior Leader, TIAA (financial services firm) (1987-2012). | 152 | Current: Bowhead Insurance GP, LLC (2020-present); Hunt Companies, Inc. (2019-present). Former: Guggenheim Energy & Income Fund (2019-2023); Fiduciary/Claymore Energy Infrastructure Fund (2019-2022); Guggenheim Enhanced Equity Income Fund (2019-2021); Guggenheim Credit Allocation Fund (2019-2021); Infinity Property & Casualty Corp. (2014-2018). |
| | THE GUGGENHEIM FUNDS SEMI-ANNUAL REPORT | 117 |
INFORMATION ON BOARD OF TRUSTEES AND OFFICERS (Unaudited)(continued) |
Name, Address*
and Year of Birth | Position(s) Held
with Trust | Term of Office
and Length of
Time Served** | Principal Occupation(s)
During Past Five Years | Number of
Portfolios
in Fund
Complex
Overseen | Other
Directorships Held
by Trustees*** |
INDEPENDENT TRUSTEES - continued | | |
Thomas F. Lydon, Jr. (1960) | Trustee and Chair of the Contracts Review Committee | Since 2019 (Trustee)
Since 2020 (Chair of the Contracts Review Committee) | Current: President, Global Trends Investments (registered investment adviser) (1996-present); Chief Executive Officer, Lydon Media (2016-present); Vice Chairman, VettaFi, a wholly owned subsidiary of The TMX Group (financial advisor content, research and digital distribution provider) (2022-present). Former: Chief Executive Officer, ETF Flows, LLC (financial advisor education and research provider) (2019-2023); Director, GDX Index Partners, LLC (index provider) (2021-2023). | 152 | Current: US Global Investors, Inc. (GROW) (1995-present); The 2023 ETF Series Trust (4) (2023-present); The 2023 ETF Series II (1) (2023-present). Former: Guggenheim Energy & Income Fund (2019-2023); Fiduciary/Claymore Energy Infrastructure Fund (2019-2022); Guggenheim Enhanced Equity Income Fund (2019-2021); Guggenheim Credit Allocation Fund (2019-2021); Harvest Volatility Edge Trust (3) (2017-2019). |
Ronald A. Nyberg (1953) | Trustee and Chair of the Nominating and Governance Committee | Since 2014 | Current: Of Counsel (formerly Partner), Momkus LLP (law firm) (2016-present). Former: Partner, Nyberg & Cassioppi, LLC (law firm) (2000-2016); Executive Vice President, General Counsel, and Corporate Secretary, Van Kampen Investments (1982-1999). | 153 | Current: Advent Convertible and Income Fund (2003-present); PPM Funds (2) (2018-present); Endeavor Health (2012-present). Former: Guggenheim Energy & Income Fund (2015-2023); Fiduciary/Claymore Energy Infrastructure Fund (2004-2022); Guggenheim Enhanced Equity Income Fund (2005-2021); Guggenheim Credit Allocation Fund (2013-2021); Western Asset Inflation-Linked Opportunities & Income Fund (2004-2020); Western Asset Inflation-Linked Income Fund (2003-2020). |
118 | THE GUGGENHEIM FUNDS SEMI-ANNUAL REPORT | |
INFORMATION ON BOARD OF TRUSTEES AND OFFICERS (Unaudited)(continued) |
Name, Address*
and Year of Birth | Position(s) Held
with Trust | Term of Office
and Length of
Time Served** | Principal Occupation(s)
During Past Five Years | Number of
Portfolios
in Fund
Complex
Overseen | Other
Directorships Held
by Trustees*** |
INDEPENDENT TRUSTEES - concluded | | |
Sandra G. Sponem (1958) | Trustee and Chair of the Audit Committee | Since 2019 (Trustee)
Since 2020 (Chair of the Audit Committee) | Current: Retired. Former: Senior Vice President and Chief Financial Officer, M.A. Mortenson-Companies, Inc. (construction and real estate development company) (2007-2017). | 152 | Current: SPDR Series Trust (81) (2018-present); SPDR Index Shares Funds (30) (2018-present); SSGA Active Trust (14) (2018-present). Former: Guggenheim Energy & Income Fund (2019-2023); Fiduciary/Claymore Energy Infrastructure Fund (2019-2022); Guggenheim Enhanced Equity Income Fund (2019-2021); Guggenheim Credit Allocation Fund (2019-2021); SSGA Master Trust (1) (2018-2020). |
Ronald E. Toupin, Jr. (1958) | Trustee, Chair of the Board and Chair of the Executive Committee | Since 2014 | Current: Portfolio Consultant (2010-present); Member, Governing Council, Independent Directors Council (2013-present); Governor, Board of Governors, Investment Company Institute (2018-present). Former: Member, Executive Committee, Independent Directors Council (2016-2018); Vice President, Manager and Portfolio Manager, Nuveen Asset Management (1998-1999); Vice President, Nuveen Investment Advisory Corp. (1992-1999); Vice President and Manager, Nuveen Unit Investment Trusts (1991-1999); and Assistant Vice President and Portfolio Manager, Nuveen Unit Investment Trusts (1988-1999), each of John Nuveen & Co., Inc. (registered broker dealer) (1982-1999). | 152 | Former: Guggenheim Energy & Income Fund (2015-2023); Fiduciary/Claymore Energy Infrastructure Fund (2004-2022); Guggenheim Enhanced Equity Income Fund (2005-2021); Guggenheim Credit Allocation Fund (2013-2021); Western Asset Inflation-Linked Opportunities & Income Fund (2004-2020); Western Asset Inflation-Linked Income Fund (2003-2020). |
| | THE GUGGENHEIM FUNDS SEMI-ANNUAL REPORT | 119 |
INFORMATION ON BOARD OF TRUSTEES AND OFFICERS (Unaudited)(continued) |
Name, Address*
and Year of Birth | Position(s) Held
with Trust | Term of Office
and Length of
Time Served** | Principal Occupation(s)
During Past Five Years | Number of
Portfolios
in Fund
Complex
Overseen | Other
Directorships Held
by Trustees*** |
INTERESTED TRUSTEE | | | | |
Amy J. Lee**** (1961) | Trustee, Vice President and Chief Legal Officer | Since 2018 (Trustee)
Since 2014
(Chief Legal Officer)
Since 2007
(Vice President) | Current: Interested Trustee, certain other funds in the Fund Complex (2018-present); Chief Legal Officer, certain other funds in the Fund Complex (2014-present); Vice President, certain other funds in the Fund Complex (2007-present); Senior Managing Director, Guggenheim Investments (2012-present). Former: President and/or Chief Executive Officer, certain other funds in the Fund Complex (2017-2019); Vice President, Associate General Counsel and Assistant Secretary, Security Benefit Life Insurance Company and Security Benefit Corporation (2004-2012). | 152 | Former: Guggenheim Energy & Income Fund (2018-2023); Fiduciary/Claymore Energy Infrastructure Fund (2018-2022); Guggenheim Enhanced Equity Income Fund (2018-2021); Guggenheim Credit Allocation Fund (2018-2021). |
* | The business address of each Trustee is c/o Guggenheim Investments, 227 West Monroe Street, Chicago, Illinois 60606. |
** | Each Trustee serves an indefinite term, until his or her successor is elected and qualified. Time served includes time served in the respective position for the Predecessor Corporation. |
*** | Each Trustee also serves on the Boards of Trustees of Guggenheim Funds Trust, Guggenheim Variable Funds Trust, Guggenheim Strategy Funds Trust, Guggenheim Taxable Municipal Bond & Investment Grade Debt Trust, Guggenheim Strategic Opportunities Fund, Guggenheim Active Allocation Fund, Rydex Series Funds, Rydex Dynamic Funds, Rydex Variable Trust and Transparent Value Trust. Messrs. Barnes and Nyberg also serve on the Board of Trustees of Advent Convertible & Income Fund. |
**** | This Trustee is deemed to be an “interested person” of the Funds under the 1940 Act by reason of her position with the Funds’ Adviser and/or the parent of the Adviser. |
120 | THE GUGGENHEIM FUNDS SEMI-ANNUAL REPORT | |
INFORMATION ON BOARD OF TRUSTEES AND OFFICERS (Unaudited)(continued) |
Name, Address*
and Year of Birth | Position(s) Held
with Trust | Term of Office
and Length of
Time Served** | Principal Occupation(s)
During Past Five Years |
OFFICERS | | | |
Brian E. Binder (1972) | President and Chief Executive Officer | Since 2018 | Current: President, Mutual Fund Boards, Guggenheim Investments (2022-present); President and Chief Executive Officer, certain other funds in the Fund Complex (2018-present); President, Mutual Funds Boards and Senior Managing Director, Guggenheim Funds Investment Advisors, LLC and Security Investors, LLC (2018-present); Board Member, Guggenheim Partners Investment Funds plc (2022-present); Board Member, Guggenheim Global Investments plc (2022-present); Board Member, Guggenheim Partners Fund Management (Europe) Limited (2018-present). Former: Senior Managing Director and Chief Administrative Officer, Guggenheim Investments (2018-2022); Managing Director and President, Deutsche Funds, and Head of US Product, Trading and Fund Administration, Deutsche Asset Management (2013-2018); Managing Director, Chairman of North American Executive Committee and Head of Business Management and Consulting, Invesco Ltd. (2010-2012). |
James Howley (1972) | Chief Financial Officer, Chief Accounting Officer and Treasurer | Since 2022 | Current: Managing Director, Guggenheim Investments (2004-present); Chief Financial Officer, Chief Accounting Officer, and Treasurer, certain other funds in the Fund Complex (2022-present). Former: Assistant Treasurer, certain other funds in the Fund Complex (2006-2022); Manager, Mutual Fund Administration of Van Kampen Investments, Inc. (1996-2004). |
Mark E. Mathiasen (1978) | Secretary | Since 2014 | Current: Secretary, certain other funds in the Fund Complex (2007-present); Managing Director, Guggenheim Investments (2007-present). |
Glenn McWhinnie (1969) | Assistant Treasurer | Since 2016 | Current: Vice President, Guggenheim Investments (2009-present); Assistant Treasurer, certain other funds in the Fund Complex (2016-present). |
Michael P. Megaris (1984) | Assistant Secretary | Since 2014 | Current: Assistant Secretary, certain other funds in the Fund Complex (2014-present); Managing Director, Guggenheim Investments (2012-present). |
Elisabeth Miller (1968) | Chief Compliance Officer | Since 2012 | Current: Chief Compliance Officer, certain other funds in the Fund Complex (2012-present); Senior Managing Director, Guggenheim Investments (2012-present); Senior Managing Director, Guggenheim Funds Distributors, LLC (2014-present).
Former: Chief Compliance Officer, Security Investors, LLC and Guggenheim Funds Investment Advisors, LLC (2012-2018); Chief Compliance Officer, Guggenheim Distributors, LLC (2009-2014); Senior Manager, Security Investors, LLC (2004-2014); Senior Manager, Guggenheim Distributors, LLC (2004-2014). |
Margaux Misantone (1978) | AML Officer | Since 2017 | Current: Chief Compliance Officer, Security Investors, LLC and Guggenheim Funds Investment Advisors, LLC (2018-present); AML Officer, Security Investors, LLC and certain other funds in the Fund Complex (2017-present); Managing Director, Guggenheim Investments (2015-present).
Former: Assistant Chief Compliance Officer, Security Investors, LLC and Guggenheim Funds Investments Advisors, LLC (2015-2018). |
| | THE GUGGENHEIM FUNDS SEMI-ANNUAL REPORT | 121 |
INFORMATION ON BOARD OF TRUSTEES AND OFFICERS (Unaudited)(concluded) |
Name, Address*
and Year of Birth | Position(s) Held
with Trust | Term of Office
and Length of
Time Served** | Principal Occupation(s)
During Past Five Years |
OFFICERS - concluded | |
Kimberly J. Scott (1974) | Assistant Treasurer | Since 2014 | Current: Director, Guggenheim Investments (2012-present); Assistant Treasurer, certain other funds in the Fund Complex (2012-present). Former: Financial Reporting Manager, Invesco, Ltd. (2010-2011); Vice President/Assistant Treasurer, Mutual Fund Administration for Van Kampen Investments, Inc./Morgan Stanley Investment Management (2009-2010); Manager of Mutual Fund Administration, Van Kampen Investments, Inc./Morgan Stanley Investment Management (2005-2009). |
Jon Szafran (1989) | Assistant Treasurer | Since 2017 | Current: Director, Guggenheim Investments (2017-present); Assistant Treasurer, certain other funds in the Fund Complex (2017-present). Former: Assistant Treasurer of Henderson Global Funds and Manager of US Fund Administration, Henderson Global Investors (North America) Inc. (“HGINA”), (2017); Senior Analyst of US Fund Administration, HGINA (2014–2017); Senior Associate of Fund Administration, Cortland Capital Market Services, LLC (2013-2014); Experienced Associate, PricewaterhouseCoopers LLP (2012-2013). |
* | The business address of each officer is c/o Guggenheim Investments, 227 West Monroe Street, Chicago, Illinois 60606. |
** | Each officer serves an indefinite term, until his or her successor is duly elected and qualified. |
122 | THE GUGGENHEIM FUNDS SEMI-ANNUAL REPORT | |
GUGGENHEIM INVESTMENTS PRIVACY NOTICE (Unaudited) |
Who We Are
This Privacy Notice describes the data protection practices of Guggenheim Investments. Guggenheim Investments as used herein refers to the affiliated investment management businesses of Guggenheim Partners, LLC: Guggenheim Funds Investment Advisors, LLC, Guggenheim Partners Investment Management, LLC, Guggenheim Funds Distributors, LLC, Security Investors, LLC, Guggenheim Investment Advisors (Europe) Limited, Guggenheim Real Estate, LLC, GS Gamma Advisors, LLC, Guggenheim Partners India Management, LLC, Guggenheim Partners Europe Limited, as well as the funds in the Guggenheim Funds complex (the “Funds”) (“Guggenheim Investments,” “we,” “us,” or “our”).
Guggenheim Partners Investment Management Holdings, LLC, located at 330 Madison Avenue, New York, New York 10017 is the data controller for your information. The affiliates who are also controllers of certain of your information are: Guggenheim Investment Advisors (Europe) Limited, Guggenheim Partners Europe Limited, Guggenheim Partners, LLC, Guggenheim Funds Investment Advisors, LLC, Guggenheim Partners Investment Management, LLC, Guggenheim Funds Distributors, LLC and Security Investors, LLC, as well as the Funds.
Our Commitment to You
Guggenheim Investments considers your privacy our utmost concern. When you become our client or investor, you entrust us with not only your hard-earned money but also with your personal and financial information. Because we have access to your private information, we hold ourselves to the highest standards in its safekeeping and use. We strictly limit how we share your information with others, whether you are a current or former Guggenheim Investments client or investor.
The Information We Collect About You
We collect certain nonpublic personal information about you from information you provide on applications, other forms, our website, and/or from third parties including investment advisors. This information includes Social Security or other tax identification number, assets, income, tax information, retirement and estate plan information, transaction history, account balance, payment history, bank account information, marital status, family relationships, information that we collect on our website through the use of “cookies,” and other personal information that you or others provide to us. We may also collect such information through your inquiries by mail, e-mail or telephone. We may also collect customer due diligence information, as required by applicable law and regulation, through third party service providers.
How We Handle Your Personal Information
The legal basis for using your information as set out in this Privacy Notice is as follows: (a) use of your personal data is necessary to perform our obligations under any contract with you (such as a contract for us to provide financial services to you); or (b) where use of your personal data is not necessary for performance of a contract, use of your personal data is necessary for our legitimate interests or the legitimate interests of others (for example, to enforce the legal terms governing our services, operate and market our website and other services we offer, ensure safe environments for our personnel and others, make and receive payments, prevent fraud and to know the customer to whom we are providing the services). Some processing is done to comply with applicable law.
In addition to the specific uses described above, we also use your information in the following manner:
| | ● | We use your information in connection with servicing your accounts. |
| | ● | We use information to respond to your requests or questions. For example, we might use your information to respond to your customer feedback. |
| | ● | We use information to improve our products and services. We may use your information to make our website and products better. We may use your information to customize your experience with us. |
| | ● | We use information for security purposes. We may use your information to protect our company and our customers. |
| | ● | We use information to communicate with you. For example, we will communicate with you about your account or our relationship. We may contact you about your feedback. We might also contact you about this Privacy Notice. We may also enroll you in our email newsletter. |
| | THE GUGGENHEIM FUNDS SEMI-ANNUAL REPORT | 123 |
GUGGENHEIM INVESTMENTS PRIVACY NOTICE (Unaudited)(continued) |
| | ● | We use information as otherwise permitted by law, as we may notify you. |
| | ● | Aggregate/Anonymous Data. We may aggregate and/or anonymize any information collected through the website so that such information can no longer be linked to you or your device (“Aggregate/Anonymous Information”). We may use Aggregate/Anonymous Information for any purpose, including without limitation for research and marketing purposes, and may also share such data with any third parties, including advertisers, promotional partners, and sponsors. |
We do not sell information about current or former clients or their accounts to third parties. Nor do we share this information, except when necessary to complete transactions at your request, to make you aware of investment products and services that we or our affiliates offer, or as permitted or required by law.
We provide information about you to companies and individuals not affiliated with Guggenheim Investments to complete certain transactions or account changes, or to perform services for us related to your account. For example, if you ask to transfer assets from another financial institution to Guggenheim Investments, we must provide certain information about you to that company to complete the transaction. We provide the third party with only the information necessary to carry out its responsibilities and only for that purpose. And we require these third parties to treat your private information with the same high degree of confidentiality that we do. To alert you to other Guggenheim Investments products and services, we share your information within our family of affiliated companies. You may limit our sharing with affiliated companies as set out below. We may also share information with any successor to all or part of our business, or in connection with steps leading up to a merger or acquisition. For example, if part of our business was sold we may give customer information as part of that transaction. We may also share information about you with your consent.
We will release information about you if you direct us to do so, if we are compelled by law to do so, or in other circumstances as permitted by law (for example, to protect your account from fraud).
If you close your account(s) or become an inactive client or investor, we will continue to adhere to the privacy policies and practices described in this notice.
Opt-Out Provisions and Your Data Choices
The law allows you to “opt out” of certain kinds of information sharing with third parties. We do not share personal information about you with any third parties that triggers this opt-out right. This means YOU ARE ALREADY OPTED OUT.
When you are no longer our client or investor, we continue to share your information as described in this notice, and you may contact us at any time to limit our sharing by sending an email to CorporateDataPrivacy@GuggenheimPartners.com.
European Union Data Subjects and certain others: In addition to the choices set forth above, residents of the European Union and certain other jurisdictions have certain rights to (1) request access to or rectification or deletion of information we collect about them, (2) request a restriction on the processing of their information, (3) object to the processing of their information, or (4) request the portability of certain information. To exercise these or other rights, please contact us using the contact information below. We will consider all requests and provide our response within the time period stated by applicable law. Please note, however, that certain information may be exempt from such requests in some circumstances, which may include if we need to keep processing your information for our legitimate interests or to comply with a legal obligation. We may request you provide us with information necessary to confirm your identity before responding to your request.
Residents of France and certain other jurisdictions may also provide us with instructions regarding the manner in which we may continue to store, erase and share your information after your death, and where applicable, the person you have designated to exercise these rights after your death.
How We Protect Privacy Online
We take steps to protect your privacy when you use our web site – www.guggenheiminvestments.com – by using secure forms of online communication, including encryption technology, Secure Socket Layer (SSL) protocol, firewalls and user names and passwords. These safeguards vary based on the sensitivity of the information that we collect and store. However, we cannot and do not guarantee that these measures will prevent every unauthorized attempt to access, use, or disclose your information since despite our efforts, no Internet and/or other
124 | THE GUGGENHEIM FUNDS SEMI-ANNUAL REPORT | |
GUGGENHEIM INVESTMENTS PRIVACY NOTICE (Unaudited)(concluded) |
electronic transmissions can be completely secure. Our web site uses “http cookies”—tiny pieces of information that we ask your browser to store. We use cookies for session management and security features on the Guggenheim Investments web site. We do not use them to pull data from your hard drive, to learn your e-mail address, or to view data in cookies created by other web sites. We will not share the information in our cookies or give others access to it. See the legal information area on our web site for more details about web site security and privacy features.
How We Safeguard Your Personal Information and Data Retention
We restrict access to nonpublic personal information about you to our employees and in some cases to third parties (for example, the service providers described above) as permitted by law. We maintain strict physical, electronic and procedural safeguards that comply with federal standards to guard your nonpublic personal information.
We keep your information for no longer than necessary for the purposes for which it is processed. The length of time for which we retain information depends on the purposes for which we collected and use it and/or as required to comply with applicable laws. Information may persist in copies made for backup and business continuity purposes for additional time.
International Visitors
If you are not a resident of the United States, please be aware that your information may be transferred to, stored and processed in the United States where our servers are located and our databases are operated. The data protection and other laws of the United States and other countries might not be as comprehensive as those in your country.
In such cases, we ensure that a legal basis for such a transfer exists and that adequate protection is provided as required by applicable law, for example, by using standard contractual clauses or by transferring your data to a jurisdiction that has obtained an adequacy finding. Individuals whose data may be transferred on the basis of standard contractual clauses may contact us as described below.
We’ll Keep You Informed
If you have any questions or concerns about how we treat your personal data, we encourage you to consult with us first. You may also contact the relevant supervisory authority.
We reserve the right to modify this policy at any time and will inform you promptly of material changes. You may access our privacy policy from our web site at www.guggenheiminvestments.com. Should you have any questions regarding our privacy policy, contact us by email at CorporateDataPrivacy@GuggenheimPartners.com.
| | THE GUGGENHEIM FUNDS SEMI-ANNUAL REPORT | 125 |
3.31.2024
Guggenheim Funds Semi-Annual Report
| |
Guggenheim High Yield Fund | | |
Guggenheim Core Bond Fund | | |
Guggenheim Municipal Income Fund | | |
GuggenheimInvestments.com | SBINC-SEMI-0324x0924 |
| | |
DEAR SHAREHOLDER | 2 |
ECONOMIC AND MARKET OVERVIEW | 4 |
ABOUT SHAREHOLDERS’ FUND EXPENSES | 6 |
HIGH YIELD FUND | 9 |
CORE BOND FUND | 28 |
MUNICIPAL INCOME FUND | 56 |
NOTES TO FINANCIAL STATEMENTS | 68 |
OTHER INFORMATION | 87 |
INFORMATION ON BOARD OF TRUSTEES AND OFFICERS | 88 |
GUGGENHEIM INVESTMENTS PRIVACY NOTICE | 94 |
| | THE GUGGENHEIM FUNDS SEMI-ANNUAL REPORT | 1 |
Dear Shareholder:
Security Investors, LLC (the “Investment Adviser”) is pleased to present the shareholder report for a selection of our Funds (the “Funds”) for the semi-annual fiscal period ended March 31, 2024 (the “Reporting Period”).
The Investment Adviser is part of Guggenheim Investments, which represents the investment management businesses of Guggenheim Partners, LLC (“Guggenheim”), a global, diversified financial services firm.
Guggenheim Funds Distributors, LLC is the distributor of the Funds. Guggenheim Funds Distributors, LLC is affiliated with Guggenheim and the Investment Adviser.
We encourage you to read the Economic and Market Overview section of the report, which follows this letter.
We are committed to providing innovative investment solutions and appreciate the trust you place in us.
Sincerely,
Security Investors, LLC,
April 30, 2024
Read a prospectus and summary prospectus (if available) carefully before investing. It contains the investment objectives, risks, charges, expenses and other information, which should be considered carefully before investing. Obtain a prospectus and summary prospectus (if available) at guggenheiminvestments.com or call 800.820.0888.
This material is not intended as a recommendation or as investment advice of any kind, including in connection with rollovers, transfers, and distributions. Such material is not provided in a fiduciary capacity, may not be relied upon for or in connection with the making of investment decisions, and does not constitute a solicitation of an offer to buy or sell securities. All content has been provided for informational or educational purposes only and is not intended to be and should not be construed as legal or tax advice and/or a legal opinion. Always consult a financial, tax and/or legal professional regarding your specific situation.
The High Yield Fund may not be suitable for all investors.● An investment in the Fund will fluctuate and is subject to investment risks, which means investors could lose money. ● There can be no guarantee the Fund will achieve its investment objective. ● The Fund’s share price, or the income generated by the Fund’s holdings, could change in response to interest rate changes and market and economic conditions among other factors. In general, bond prices rise when interest rates fall and vice versa. ● The Fund’s exposure to high yield securities may subject the Fund to greater volatility. ● The Fund may invest in derivative instruments, which may be more volatile and less liquid, increasing the risk of loss when compared to traditional securities. Certain of the derivative instruments are also subject to the risks of counterparty default and adverse tax treatment. ●The Fund’s use of leverage, through borrowings or instruments such as derivatives, may cause the Fund to be more volatile than if it had not been leveraged. ● Instruments and strategies (such as borrowing transactions and reverse repurchase agreements) may provide leveraged exposure to a particular investment, which will magnify any gains or losses on those investments. ● The Fund may invest in foreign securities which carry additional risks when compared to U.S. securities, due to the impact of diplomatic, political or economic developments in the country in question (investments in emerging markets securities are generally subject to an even greater level of risks). ● Investments in syndicated bank loans generally offer a floating interest rate and involve special types of risks. ●The Fund’s investments in other investment vehicles subject the Fund to those risks and expenses affecting the investment vehicle. ●The Fund’s investments in restricted securities may involve financial and liquidity risk. ● The Fund is subject to active trading risks that may increase volatility and impact its ability to achieve its investment objective. ●You may have a gain or loss when you sell your shares. ● It is important to note that the Fund is not guaranteed by the U.S. government. ● Please read the prospectus for more detailed information regarding these and other risks.
2 | THE GUGGENHEIM FUNDS SEMI-ANNUAL REPORT | |
The Core Bond Fund may not be suitable for all investors. ● An investment in the Fund will fluctuate and is subject to investment risks, which means investors could lose money. ● There can be no guarantee the Fund will achieve its investment objective. ● The Fund’s share price, or the income generated by the Fund’s holdings, could change in response to interest rate changes and market and economic conditions among other factors. In general, bond prices rise when interest rates fall and vice versa. ● The Fund’s exposure to high yield securities may subject the Fund to greater volatility. ● When market conditions are deemed appropriate, the Fund may use leverage to the full extent permitted by its investment policies and restrictions and applicable law. Leveraging will exaggerate the effect on net asset value of any increase or decrease in the market value of the Fund’s portfolio. ● The Fund may invest in derivative instruments, which may be more volatile and less liquid, increasing the risk of loss when compared to traditional securities. Certain of the derivative instruments are also subject to the risks of counterparty default and adverse tax treatment. ● Instruments and strategies (such as borrowing transactions and reverse repurchase agreements) may provide leveraged exposure to a particular investment, which will magnify any gains or losses on those investments. ● Investments in reverse repurchase agreements expose the Fund to the many of the same risks as investments in derivatives. ● The Fund’s investments in other investment vehicles subject the Fund to those risks and expenses affecting the investment vehicle. ● The Fund’s investments in foreign securities carry additional risks when compared to U.S. securities, due to the impact of diplomatic, political or economic developments in the country in question (investments in emerging markets securities are generally subject to an even greater level of risk). ● Investments in syndicated bank loans generally offer a floating interest rate and involve special types of risks. ● The Fund’s investments in municipal securities can be affected by events that affect the municipal bond market. ● The Fund’s investments in real estate securities subject the Fund to the same risks as direct investments in real estate, which is particularly sensitive to economic downturns. ● The Fund’s investments in restricted securities may involve financial and liquidity risk. ● The Fund is subject to active trading risks that may increase volatility and impact its ability to achieve its investment objective. ● You may have a gain or loss when you sell your shares. ● It is important to note that the Fund is not guaranteed by the U.S. government. ● Please read the prospectus for more detailed information regarding these and other risks.
The Municipal Income Fund may not be suitable for all investors. ● An investment in the Fund will fluctuate and is subject to investment risks, which means investors could lose money. ● There can be no guarantee the Fund will achieve its investment objective. ● The Fund will be significantly affected by events that affect the municipal bond market, which could include unfavorable legislative or political developments and adverse changes in the financial conditions of state and municipal issuers or the federal government in case it provides financial support to the municipality. Income from municipal bonds held by the Fund could be declared taxable because of changes in tax laws. The Fund may invest in securities that generate taxable income. A portion of the Fund’s otherwise tax-exempt dividends may be taxable to those shareholders subject to the alternative minimum tax. ● Certain sectors of the municipal bond market have special risks that can affect them more significantly than the market as a whole. Because many municipal instruments are issued to finance similar projects, conditions in these industries can significantly affect the Fund and the overall municipal market. ● Municipalities currently experience budget shortfalls, which could cause them to default on their debt and thus subject the Fund to unforeseen losses. ● The Fund’s share price, or the income generated by the Fund’s holdings, could change in response to interest rate changes and market and economic conditions among other factors. In general, bond prices rise when interest rates fall and vice versa. ● The Fund’s exposure to high-yield securities may subject the Fund to greater volatility. ● When market conditions are deemed appropriate, the Fund may use leverage to the full extent permitted by its investment policies and restrictions and applicable law. Leveraging will exaggerate the effect on net asset value of any increase or decrease in the market value of the Fund’s portfolio. ● The Fund may invest in derivative instruments, which may be more volatile and less liquid, increasing the risk of loss when compared to traditional securities. Certain of the derivative instruments are also subject to the risks of counterparty default and adverse tax treatment. ●Instruments and strategies (such as reverse repurchase agreements, unfunded commitments, tender option bonds, and borrowings) may expose the Fund to many of the same risks as investments in derivatives and may provide leveraged exposure to a particular investment, which will magnify any gains or losses on those investments. ● The Fund’s investments in other investment vehicles subject the Fund to those risks and expenses affecting the investment vehicle. ● The Fund’s investments in foreign securities carry additional risks when compared to U.S. securities, due to the impact of diplomatic, political, or economic developments in the country in question (investments in emerging markets securities are generally subject to an even greater level of risks). ● Investments in syndicated bank loans generally offer a floating interest rate and involve special types of risks. ● The Fund is subject to active trading risks that may increase volatility and impact its ability to achieve its investment objective. ● You may have a gain or loss when you sell your shares. ● It is important to note that the Fund is not guaranteed by the U.S. government. ● Please read the prospectus for more detailed information regarding these and other risks.
| | THE GUGGENHEIM FUNDS SEMI-ANNUAL REPORT | 3 |
ECONOMIC AND MARKET OVERVIEW (Unaudited) | March 31, 2024 |
While job growth remains robust, recent labor data brought increased confidence in a labor market in better balance, allowing for inflation to soften further. Labor force growth remains strong, aided by high immigration flows, helping bring labor supply in line with gradually cooling demand. The Small Business Survey indicates that plans to increase compensation have returned to pre-COVID levels. Additionally, Bureau of Labor Statistics data reveal a continued decline in the “quits rate,” reducing the pressure on businesses to raise wages to attract or retain employees. These developments suggest wage pressures may ease further by year end. And despite some speculation against any Federal Reserve (“Fed”) rate cuts materializing in 2024, we continue to anticipate cuts later this year.
Following the stronger-than-expected March Consumer Price Index, we believe that there is a high probability that the easing cycle will start in the second half of the year, since the Fed will likely need more time to gather confirming data. In the latest Summary of Economic Projections, the Federal Open Market Committee (“FOMC”) significantly increased the median forecast for 2024 U.S. gross domestic product, slightly increased it for core personal consumption expenditures year over year, and continues to expect no material increase in the unemployment rate. These adjustments left the median view for three rate cuts for 2024, which suggests the bar is very high for the Fed to keep rates where they are all year, and even higher for more rate hikes to materialize.
Amid this macroeconomic backdrop, in the first quarter of 2024 the two-year Treasury yield increased to 4.59% from 4.23%, and the 10-year Treasury yield increased to 4.20% from 3.88%, keeping the inverted 2s/10s yield curve consistent at 39 basis points as of the end of the Reporting Period, up four basis points since the start of the year. One basis point equals 0.01%. In general, spreads to Treasurys have remained tight across sectors. In investment-grade corporate bonds, BBB-rated bonds continued to remain attractive relative to A and BB-rated bonds, and supply slowed toward the end of the first quarter of 2024, which we believe should support spreads in the near term. High yield bond spreads tightened during the first quarter of 2024 to 301 basis points from 323 basis points at the start of the year, while leveraged loans’ discount margins to maturity tightened to 509 basis points from 528 basis points. Structured credit spreads tightened marginally amid strong demand. Investor demand and an improved arbitrage led to robust new collateralized loan obligation issuance, and tightening liabilities led to an increase in refinances/resets.
Looking forward, Fed officials continue to advocate for a patient approach. A conventional easing cycle is therefore far from guaranteed. Market expectations have already adjusted significantly from market-implied expectations of six rate cuts in 2024 just two months ago to only three as of the end of the Reporting Period, aligning more closely with the FOMC’s views. So far, the market has taken this delay in stride, but its patience and assessment of credit risk could be tested.
For the Reporting Period, the S&P 500® Index* returned 23.48%. The MSCI Europe-Australasia-Far East (“EAFE”) Index* returned 17.01%. The return of the MSCI Emerging Markets Index* was 10.56%.
In the bond market, the Bloomberg U.S. Aggregate Bond Index* posted a 5.99% return for the Reporting Period, while the Bloomberg U.S. Corporate High Yield Index* returned 8.75%. The return of the ICE Bank of America (“BofA”) 3-Month U.S. Treasury Bill Index* was 2.69% for the Reporting Period.
The opinions and forecasts expressed may not actually come to pass. This information is subject to change at any time, based on market and other conditions, and should not be construed as a recommendation of any specific security or strategy.
4 | THE GUGGENHEIM FUNDS SEMI-ANNUAL REPORT | |
ECONOMIC AND MARKET OVERVIEW (Unaudited)(concluded) | March 31, 2024 |
*Index Definitions
The following indices are referenced throughout this report. Indices are unmanaged and not available for direct investment. Index performance does not reflect transaction costs, fees, or expenses.
Bloomberg U.S. Aggregate Bond Index is a broad-based flagship benchmark that measures the investment grade, U.S. dollar-denominated, fixed-rate taxable bond market, including U.S. Treasuries, government-related and corporate securities, mortgage-backed securities or “MBS” (agency fixed-rate and hybrid adjustable-rate mortgage, or “ARM”, pass-throughs), asset-backed securities (“ABS”), and commercial mortgage-backed securities (“CMBS”) (agency and non-agency).
Bloomberg U.S. Corporate High Yield Index measures the U.S. dollar-denominated, high yield, fixed-rate corporate bond market. Securities are classified as high yield if the middle rating of Moody’s, Fitch, and S&P is Ba1/BB +/BB + or below.
Bloomberg Municipal Bond Index is a broad market performance benchmark for the tax-exempt bond market. The bonds included in this index must have a minimum credit rating of at least Baa.
ICE BofA 3-Month U.S. Treasury Bill Index is an unmanaged market index of U.S. Treasury securities maturing in 90 days that assumes reinvestment of all income.
MSCI EAFE Index is a free float-adjusted market capitalization index that is designed to measure the equity market performance of developed markets, excluding the U.S. & Canada.
MSCI Emerging Markets Index is a free float-adjusted market capitalization-weighted index that is designed to measure equity market performance in the global emerging markets.
S&P 500® Index is a broad-based index, the performance of which is based on the performance of 500 widely held common stocks chosen for market size, liquidity, and industry group representation.
| | THE GUGGENHEIM FUNDS SEMI-ANNUAL REPORT | 5 |
ABOUT SHAREHOLDERS’ FUND EXPENSES (Unaudited) | |
All mutual funds have operating expenses, and it is important for our shareholders to understand the impact of costs on their investments. Shareholders of a fund incur two types of costs: (i) transaction costs, including sales charges (loads) on purchase payments, reinvested dividends, other distributions, and exchange fees, and (ii) ongoing costs, including management fees, administrative services, and shareholder reports, among others. These ongoing costs, or operating expenses, are deducted from a fund’s gross income and reduce the investment return of the fund.
A fund’s expenses are expressed as a percentage of its average net assets, which is known as the expense ratio. The following examples are intended to help investors understand the ongoing costs (in dollars) of investing in a fund and to compare these costs with the ongoing costs of investing in other mutual funds.
The examples are based on an investment of $1,000 made at the beginning of the period and held for the entire six-month period beginning September 30, 2023 and ending March 31, 2024.
The following tables illustrate the Funds’ costs in two ways:
Table 1. Based on actual Fund return: This section helps investors estimate the actual expenses paid over the period. The “Ending Account Value” shown is derived from the Fund’s actual return, and the fifth column shows the dollar amount that would have been paid by an investor who started with $1,000 in the Fund. Investors may use the information here, together with the amount invested, to estimate the expenses paid over the period. Simply divide the Fund’s account value by $1,000 (for example, an $8,600 account value divided by $1,000 = 8.6), then multiply the result by the number provided under the heading “Expenses Paid During Period.”
Table 2. Based on hypothetical 5% return: This section is intended to help investors compare a fund’s cost with those of other mutual funds. The table provides information about hypothetical account values and hypothetical expenses based on the Fund’s actual expense ratio and an assumed rate of return of 5% per year before expenses, which is not the Fund’s actual return. The hypothetical account values and expenses may not be used to estimate the actual ending account balance or expenses paid during the period. The example is useful in making comparisons because the U.S. Securities and Exchange Commission (the “SEC”) requires all mutual funds to calculate expenses based on the 5% return. Investors can assess a fund’s costs by comparing this hypothetical example with the hypothetical examples that appear in shareholder reports of other funds.
The calculations illustrated above assume no shares were bought or sold during the period. Actual costs may have been higher or lower, depending on the amount of investment and the timing of any purchases or redemptions.
Please note that the expenses shown in the table are meant to highlight your ongoing costs only and do not reflect any transactional costs, such as sales charges (loads) on purchase payments, and contingent deferred sales charges (“CDSC”) on redemptions, if any. Therefore, the second table is useful in comparing ongoing costs only, and will not help you determine the relative total costs of owning different funds. In addition, if these transactional costs were included, your costs would have been higher.
More information about the Funds’ expenses, including annual expense ratios for periods up to five years (subject to the Fund’s inception date), can be found in the Financial Highlights section of this report. For additional information on operating expenses and other shareholder costs, please refer to the appropriate Fund prospectus.
6 | THE GUGGENHEIM FUNDS SEMI-ANNUAL REPORT | |
ABOUT SHAREHOLDERS’ FUND EXPENSES (Unaudited)(continued) | |
| | Expense
Ratio1 | | | Fund
Return | | | Beginning
Account Value
September 30, 2023 | | | Ending
Account Value
March 31, 2024 | | | Expenses
Paid During
Period2 | |
Table 1. Based on actual Fund return3 | | | | | | | | | | | | | | | | | | | | |
High Yield Fund | | | | | | | | | | | | | | | | | | | | |
Class A | | | 1.11 | % | | | 7.83 | % | | $ | 1,000.00 | | | $ | 1,078.30 | | | $ | 5.77 | |
Class C | | | 1.87 | % | | | 7.40 | % | | | 1,000.00 | | | | 1,074.00 | | | | 9.70 | |
Class P | | | 1.11 | % | | | 7.74 | % | | | 1,000.00 | | | | 1,077.40 | | | | 5.76 | |
Institutional Class | | | 0.86 | % | | | 8.07 | % | | | 1,000.00 | | | | 1,080.70 | | | | 4.47 | |
Class R6 | | | 0.78 | % | | | 7.99 | % | | | 1,000.00 | | | | 1,079.90 | | | | 4.06 | |
Core Bond Fund | | | | | | | | | | | | | | | | | | | | |
Class A | | | 0.83 | % | | | 6.24 | % | | | 1,000.00 | | | | 1,062.40 | | | | 4.28 | |
Class C | | | 1.58 | % | | | 5.94 | % | | | 1,000.00 | | | | 1,059.40 | | | | 8.13 | |
Class P | | | 0.83 | % | | | 6.23 | % | | | 1,000.00 | | | | 1,062.30 | | | | 4.28 | |
Institutional Class | | | 0.53 | % | | | 6.47 | % | | | 1,000.00 | | | | 1,064.70 | | | | 2.74 | |
Municipal Income Fund | | | | | | | | | | | | | | | | | | | | |
Class A | | | 0.79 | % | | | 7.54 | % | | | 1,000.00 | | | | 1,075.40 | | | | 4.10 | |
Class C | | | 1.54 | % | | | 7.15 | % | | | 1,000.00 | | | | 1,071.50 | | | | 7.98 | |
Class P | | | 0.78 | % | | | 7.64 | % | | | 1,000.00 | | | | 1,076.40 | | | | 4.05 | |
Institutional Class | | | 0.53 | % | | | 7.68 | % | | | 1,000.00 | | | | 1,076.80 | | | | 2.75 | |
| | THE GUGGENHEIM FUNDS SEMI-ANNUAL REPORT | 7 |
ABOUT SHAREHOLDERS’ FUND EXPENSES (Unaudited)(concluded) | |
| | Expense
Ratio1 | | | Fund
Return | | | Beginning
Account Value
September 30, 2023 | | | Ending
Account Value
March 31, 2024 | | | Expenses
Paid During
Period2 | |
Table 2. Based on hypothetical 5% return (before expenses) | | | | | | | | | | | | | |
High Yield Fund | | | | | | | | | | | | | | | | | | | | |
Class A | | | 1.11 | % | | | 5.00 | % | | $ | 1,000.00 | | | $ | 1,019.45 | | | $ | 5.60 | |
Class C | | | 1.87 | % | | | 5.00 | % | | | 1,000.00 | | | | 1,015.65 | | | | 9.42 | |
Class P | | | 1.11 | % | | | 5.00 | % | | | 1,000.00 | | | | 1,019.45 | | | | 5.60 | |
Institutional Class | | | 0.86 | % | | | 5.00 | % | | | 1,000.00 | | | | 1,020.70 | | | | 4.34 | |
Class R6 | | | 0.78 | % | | | 5.00 | % | | | 1,000.00 | | | | 1,021.10 | | | | 3.94 | |
Core Bond Fund | | | | | | | | | | | | | | | | | | | | |
Class A | | | 0.83 | % | | | 5.00 | % | | | 1,000.00 | | | | 1,020.85 | | | | 4.19 | |
Class C | | | 1.58 | % | | | 5.00 | % | | | 1,000.00 | | | | 1,017.10 | | | | 7.97 | |
Class P | | | 0.83 | % | | | 5.00 | % | | | 1,000.00 | | | | 1,020.85 | | | | 4.19 | |
Institutional Class | | | 0.53 | % | | | 5.00 | % | | | 1,000.00 | | | | 1,022.35 | | | | 2.68 | |
Municipal Income Fund | | | | | | | | | | | | | | | | | | | | |
Class A | | | 0.79 | % | | | 5.00 | % | | | 1,000.00 | | | | 1,021.05 | | | | 3.99 | |
Class C | | | 1.54 | % | | | 5.00 | % | | | 1,000.00 | | | | 1,017.30 | | | | 7.77 | |
Class P | | | 0.78 | % | | | 5.00 | % | | | 1,000.00 | | | | 1,021.10 | | | | 3.94 | |
Institutional Class | | | 0.53 | % | | | 5.00 | % | | | 1,000.00 | | | | 1,022.35 | | | | 2.68 | |
1 | Annualized and excludes expenses of the underlying funds in which the Funds invest, if any. This ratio represents net expenses, which may include expenses that are excluded from the expense limitation agreement. Excluding these expenses, the net expense ratios for the period would be: |
| | | Class A | Class C | Class P | Institutional
Class | Class R6 |
| | High Yield Fund | 1.08% | 1.84% | 1.08% | 0.83% | 0.75% |
| | Core Bond Fund | 0.76% | 1.51% | 0.76% | 0.47% | N/A |
| | Municipal Income Fund | 0.77% | 1.52% | 0.77% | 0.52% | N/A |
2 | Expenses are equal to the Fund’s annualized expense ratio, net of any applicable fee waivers, multiplied by the average account value over the period, multiplied by 183/366 (to reflect the one-half year period). |
3 | Actual cumulative return at net asset value for the period September 30, 2023 to March 31, 2024. |
8 | THE GUGGENHEIM FUNDS SEMI-ANNUAL REPORT | |
PERFORMANCE REPORT AND FUND PROFILE (Unaudited) | March 31, 2024 |
HIGH YIELD FUND
OBJECTIVE: Seeks high current income. Capital appreciation is a secondary objective.
Holdings Diversification (Market Exposure as % of Net Assets)

“Holdings Diversification (Market Exposure as % of Net Assets)” excludes any temporary cash investments.
Portfolio Composition by Quality Rating1 |
Rating | % of Total Investments |
Fixed Income Instruments | |
A | 0.3% |
BBB | 3.7% |
BB | 46.4% |
B | 36.5% |
CCC | 7.2% |
NR2 | 2.2% |
Other Instruments | 3.7% |
Total Investments | 100.0% |
Inception Dates: |
Class A | August 5, 1996 |
Class C | May 1, 2000 |
Class P | May 1, 2015 |
Institutional Class | July 11, 2008 |
Class R6 | May 15, 2017 |
Ten Largest Holdings | % of Total Net Assets |
CPI CG, Inc., 8.63% | 1.3% |
Upbound Group, Inc., 6.38% | 1.1% |
Brundage-Bone Concrete Pumping Holdings, Inc., 6.00% | 1.1% |
Jefferies Finance LLC / JFIN Company-Issuer Corp., 5.00% | 1.0% |
Terraform Global Operating, LP, 6.13% | 1.0% |
VZ Secured Financing BV, 5.00% | 1.0% |
Cheplapharm Arzneimittel GmbH, 5.50% | 1.0% |
ITT Holdings LLC, 6.50% | 0.9% |
Datix Bidco Ltd., 9.69% | 0.9% |
CVR Energy, Inc., 5.75% | 0.8% |
Top Ten Total | 10.1% |
| | |
“Ten Largest Holdings” excludes any temporary cash or derivative investments. |
1 | Source: BlackRock Solutions. Credit quality ratings are measured on a scale that generally ranges from AAA (highest) to D (lowest). All securities except for those labeled “NR” have been rated by Moody’s, Standard & Poor’s (“S&P”), or Fitch, each of which is a Nationally Recognized Statistical Rating Organization (“NRSRO”). For purposes of this presentation, when ratings are available from more than one agency, the highest rating is used. Guggenheim Investments has converted ratings to the equivalent S&P rating. Security ratings are determined at the time of purchase and may change thereafter. |
2 | NR (not rated) securities do not necessarily indicate low credit quality. |
| | THE GUGGENHEIM FUNDS SEMI-ANNUAL REPORT | 9 |
PERFORMANCE REPORT AND FUND PROFILE (Unaudited)(concluded) | March 31, 2024 |
Average Annual Returns*
Periods Ended March 31, 2024
| 6 Month† | 1 Year | 5 Year | 10 Year |
Class A Shares | 7.83% | 10.48% | 3.95% | 4.02% |
Class A Shares with sales charge‡ | 3.55% | 6.01% | 3.10% | 3.52% |
Class C Shares | 7.40% | 9.63% | 3.13% | 3.22% |
Class C Shares with CDSC§ | 6.40% | 8.63% | 3.13% | 3.22% |
Institutional Class Shares | 8.07% | 10.85% | 4.21% | 4.28% |
Bloomberg U.S. Corporate High Yield Index | 8.75% | 11.15% | 4.21% | 4.44% |
| 6 Month† | 1 Year | 5 Year | Since
Inception
(05/01/15) |
Class P Shares | 7.74% | 10.50% | 3.91% | 4.18% |
Bloomberg U.S. Corporate High Yield Index | 8.75% | 11.15% | 4.21% | 4.62% |
| 6 Month† | 1 Year | 5 Year | Since
Inception
(05/15/17) |
Class R6 Shares | 7.99% | 10.84% | 4.30% | 3.93% |
Bloomberg U.S. Corporate High Yield Index | 8.75% | 11.15% | 4.21% | 4.24% |
* | The performance data above represents past performance that is not predictive of future results. The investment return and principal value of an investment in the Fund will fluctuate so that an investor’s shares, when redeemed, may be worth more or less than their original cost. Returns are historical and include changes in principal and reinvested dividends and capital gains and do not reflect the effect of taxes. The Bloomberg U.S. Corporate High Yield Index is an unmanaged index and, unlike the Fund, has no management fees or operating expenses to reduce its reported return. |
† | 6 month returns are not annualized. |
‡ | Effective October 1, 2015, the maximum sales charge decreased from 4.75% to 4.00%. A 4.75% maximum sales charge is used in the calculation of the Average Annual Returns based on subscriptions made prior to October 1, 2015, and a 4.00% maximum sales charge is used to calculate performance for periods based on subscriptions made on or after October 2, 2015. |
§ | Fund returns include a CDSC of 1% if redeemed within 12 months of purchase. |
10 | THE GUGGENHEIM FUNDS SEMI-ANNUAL REPORT | |
SCHEDULE OF INVESTMENTS (Unaudited) | March 31, 2024 |
HIGH YIELD FUND | |
| | Shares | | | Value | |
COMMON STOCKS† - 0.0% |
| | | | | | | | | |
Industrial - 0.0% |
BP Holdco LLC*,†††,1 | | | 23,711 | | | $ | 28,741 | |
YAK BLOCKER 2 LLC*,††† | | | 6,243 | | | | 12,514 | |
YAK BLOCKER 2 LLC*,††† | | | 5,770 | | | | 11,566 | |
Targus, Inc.*,††† | | | 12,825 | | | | 504 | |
Targus, Inc.*,††† | | | 12,825 | | | | 378 | |
Targus, Inc.*,††† | | | 12,825 | | | | 292 | |
Vector Phoenix Holdings, LP*,††† | | | 23,711 | | | | 117 | |
Targus, Inc.*,††† | | | 12,825 | | | | — | |
Total Industrial | | | | | | | 54,112 | |
| | | | | | | | | |
Utilities - 0.0% |
Mountain Creek Power LLC*,†† | | | 26,665 | | | | 26,665 | |
| | | | | | | | | |
Energy - 0.0% |
Legacy Reserves, Inc.*,††† | | | 3,452 | | | | 16,397 | |
Permian Production Partners LLC*,††† | | | 57,028 | | | | 2,415 | |
Total Energy | | | | | | | 18,812 | |
| | | | | | | | | |
Consumer, Non-cyclical - 0.0% |
Save-A-Lot*,††† | | | 797,632 | | | | 5,863 | |
| | | | | | | | | |
Financial - 0.0% |
Tensor Ltd.*,††† | | | 158,811 | | | | 16 | |
| | | | | | | | | |
Total Common Stocks | | | | |
(Cost $70,529) | | | | | | | 105,468 | |
| | | | | | | | | |
PREFERRED STOCKS†† - 1.7% |
Financial - 1.5% |
Charles Schwab Corp. |
4.00%* | | | 1,325,000 | | | | 1,117,975 | |
Citigroup, Inc. |
7.63% | | | 775,000 | | | | 813,647 | |
American Equity Investment Life Holding Co. |
5.95% | | | 21,500 | | | | 520,945 | |
Goldman Sachs Group, Inc. |
7.50% | | | 475,000 | | | | 504,374 | |
Assurant, Inc. |
5.25% due 01/15/61 | | | 2,700 | | | | 61,560 | |
Total Financial | | | | | | | 3,018,501 | |
| | | | | | | | | |
Industrial - 0.2% |
YAK BLOCKER 2 LLC*,††† | | | 342,958 | | | | 338,260 | |
U.S. Shipping Corp.*,††† | | | 14,718 | | | | 2 | |
Total Industrial | | | | | | | 338,262 | |
| | | | | | | | | |
Total Preferred Stocks | | | | |
(Cost $4,478,255) | | | | | | | 3,356,763 | |
| | | | | | | | | |
WARRANTS† - 0.0% |
Ginkgo Bioworks Holdings, Inc. | | | | | | | | |
Expiring 09/16/26* | | | 4 | | | | — | |
Total Warrants | | | | |
(Cost $9) | | | | | | | — | |
| | | | | | | | | |
MONEY MARKET FUND† - 1.9% |
Dreyfus Treasury Securities Cash Management Fund — Institutional Shares, 5.19%2 | | | 3,606,650 | | | | 3,606,650 | |
Total Money Market Fund | | | | |
(Cost $3,606,650) | | | | | | | 3,606,650 | |
| | | Face
Amount~ | | | | | |
CORPORATE BONDS†† - 84.0% |
Consumer, Cyclical - 14.2% | | | | | | | | |
United Airlines, Inc. | | | | | | | | |
4.63% due 04/15/293 | | | 1,025,000 | | | | 953,250 | |
4.38% due 04/15/263 | | | 325,000 | | | | 314,190 | |
Ferrellgas Limited Partnership / Ferrellgas Finance Corp. | | | | | | | | |
5.38% due 04/01/263 | | | 1,225,000 | | | | 1,198,470 | |
Clarios Global Limited Partnership / Clarios US Finance Co. | | | | | | | | |
8.50% due 05/15/273 | | | 475,000 | | | | 475,718 | |
6.75% due 05/15/283 | | | 350,000 | | | | 354,770 | |
6.25% due 05/15/263 | | | 325,000 | | | | 324,835 | |
PetSmart, Inc. / PetSmart Finance Corp. | | | | | | | | |
4.75% due 02/15/283 | | | 1,150,000 | | | | 1,076,682 | |
CD&R Smokey Buyer, Inc. | | | | | | | | |
6.75% due 07/15/253 | | | 1,075,000 | | | | 1,065,102 | |
Scientific Games Holdings Limited Partnership/Scientific Games US FinCo, Inc. | | | | | | | | |
6.63% due 03/01/303 | | | 1,100,000 | | | | 1,063,420 | |
Penn Entertainment, Inc. | | | | | | | | |
4.13% due 07/01/293 | | | 1,204,000 | | | | 1,035,380 | |
Ritchie Bros Holdings, Inc. | | | | | | | | |
6.75% due 03/15/283 | | | 550,000 | | | | 561,025 | |
7.75% due 03/15/313 | | | 450,000 | | | | 470,810 | |
Allwyn Entertainment Financing UK plc | | | | | | | | |
7.88% due 04/30/293 | | | 1,000,000 | | | | 1,024,790 | |
Hanesbrands, Inc. | | | | | | | | |
4.88% due 05/15/263 | | | 1,050,000 | | | | 1,022,308 | |
Fertitta Entertainment LLC / Fertitta Entertainment Finance Company, Inc. | | | | | | | | |
4.63% due 01/15/293 | | | 1,100,000 | | | | 1,008,674 | |
Crocs, Inc. | | | | | | | | |
4.25% due 03/15/293 | | | 1,094,000 | | | | 1,000,159 | |
Wolverine World Wide, Inc. | | | | | | | | |
4.00% due 08/15/293 | | | 1,200,000 | | | | 963,125 | |
Air Canada | | | | | | | | |
3.88% due 08/15/263 | | | 1,000,000 | | | | 954,421 | |
Wabash National Corp. | | | | | | | | |
4.50% due 10/15/283 | | | 1,025,000 | | | | 939,963 | |
Scotts Miracle-Gro Co. | | | | | | | | |
4.38% due 02/01/32 | | | 1,050,000 | | | | 905,244 | |
Live Nation Entertainment, Inc. | | | | | | | | |
6.50% due 05/15/273 | | | 875,000 | | | | 884,563 | |
SEE NOTES TO FINANCIAL STATEMENTS. | THE GUGGENHEIM FUNDS SEMI-ANNUAL REPORT | 11 |
SCHEDULE OF INVESTMENTS (Unaudited)(continued) | March 31, 2024 |
HIGH YIELD FUND | |
| | Face
Amount~ | | | Value | |
Hawaiian Brand Intellectual Property Ltd. / HawaiianMiles Loyalty Ltd. | | | | | | | | |
5.75% due 01/20/263 | | | 875,000 | | | $ | 821,149 | |
Tempur Sealy International, Inc. | | | | | | | | |
3.88% due 10/15/313 | | | 875,000 | | | | 743,055 | |
Suburban Propane Partners Limited Partnership/Suburban Energy Finance Corp. | | | | | | | | |
5.00% due 06/01/313 | | | 800,000 | | | | 729,347 | |
Newell Brands, Inc. | | | | | | | | |
6.38% due 09/15/27 | | | 500,000 | | | | 491,699 | |
5.20% due 04/01/26 | | | 200,000 | | | | 196,435 | |
Amer Sports Co. | | | | | | | | |
6.75% due 02/16/313 | | | 675,000 | | | | 673,283 | |
Ontario Gaming GTA, LP | | | | | | | | |
8.00% due 08/01/303 | | | 625,000 | | | | 643,733 | |
Station Casinos LLC | | | | | | | | |
4.63% due 12/01/313 | | | 700,000 | | | | 629,157 | |
Park River Holdings, Inc. | | | | | | | | |
5.63% due 02/01/293 | | | 675,000 | | | | 573,908 | |
Advance Auto Parts, Inc. | | | | | | | | |
5.90% due 03/09/26 | | | 550,000 | | | | 549,130 | |
Michaels Companies, Inc. | | | | | | | | |
5.25% due 05/01/283 | | | 600,000 | | | | 511,248 | |
Asbury Automotive Group, Inc. | | | | | | | | |
5.00% due 02/15/323 | | | 550,000 | | | | 498,323 | |
JB Poindexter & Company, Inc. | | | | | | | | |
8.75% due 12/15/313 | | | 475,000 | | | | 490,975 | |
Hilton Domestic Operating Company, Inc. | | | | | | | | |
6.13% due 04/01/323 | | | 425,000 | | | | 426,808 | |
Evergreen Acqco 1 Limited Partnership / TVI, Inc. | | | | | | | | |
9.75% due 04/26/283 | | | 383,000 | | | | 411,749 | |
Superior Plus, LP | | | | | | | | |
4.25% due 05/18/283 | | CAD | 550,000 | | | | 381,826 | |
Aramark Services, Inc. | | | | | | | | |
5.00% due 04/01/253 | | | 275,000 | | | | 272,950 | |
Papa John’s International, Inc. | | | | | | | | |
3.88% due 09/15/293 | | | 275,000 | | | | 243,877 | |
Six Flags Theme Parks, Inc. | | | | | | | | |
7.00% due 07/01/253 | | | 215,000 | | | | 215,310 | |
Allison Transmission, Inc. | | | | | | | | |
4.75% due 10/01/273 | | | 200,000 | | | | 192,471 | |
Caesars Entertainment, Inc. | | | | | | | | |
6.50% due 02/15/323 | | | 150,000 | | | | 151,321 | |
Vail Resorts, Inc. | | | | | | | | |
6.25% due 05/15/253 | | | 125,000 | | | | 125,033 | |
Total Consumer, Cyclical | | | | | | | 27,569,686 | |
| | | | | | | | | |
Consumer, Non-cyclical - 14.1% | | | | | | | | |
CPI CG, Inc. | | | | | | | | |
8.63% due 03/15/263 | | | 2,572,000 | | | | 2,561,987 | |
Upbound Group, Inc. | | | | | | | | |
6.38% due 02/15/293,4 | | | 2,281,000 | | | | 2,214,428 | |
Cheplapharm Arzneimittel GmbH | | | | | | | | |
5.50% due 01/15/283 | | | 1,953,000 | | | | 1,860,958 | |
Tenet Healthcare Corp. | | | | | | | | |
6.75% due 05/15/313 | | | 675,000 | | | | 687,305 | |
4.38% due 01/15/30 | | | 625,000 | | | | 577,670 | |
6.13% due 06/15/30 | | | 275,000 | | | | 274,369 | |
Kronos Acquisition Holdings, Inc. / KIK Custom Products, Inc. | | | | | | | | |
7.00% due 12/31/273 | | | 961,000 | | | | 954,620 | |
5.00% due 12/31/263 | | | 350,000 | | | | 343,091 | |
Legends Hospitality Holding Company LLC / Legends Hospitality Co-Issuer, Inc. | | | | | | | | |
5.00% due 02/01/263 | | | 1,250,000 | | | | 1,238,370 | |
Post Holdings, Inc. | | | | | | | | |
4.63% due 04/15/303 | | | 600,000 | | | | 550,805 | |
5.50% due 12/15/293 | | | 500,000 | | | | 483,176 | |
DaVita, Inc. | | | | | | | | |
3.75% due 02/15/313 | | | 1,225,000 | | | | 1,025,646 | |
Sotheby’s/Bidfair Holdings, Inc. | | | | | | | | |
5.88% due 06/01/293 | | | 1,200,000 | | | | 1,008,615 | |
ADT Security Corp. | | | | | | | | |
4.13% due 08/01/293 | | | 1,050,000 | | | | 961,980 | |
Carriage Services, Inc. | | | | | | | | |
4.25% due 05/15/293 | | | 1,075,000 | | | | 953,201 | |
Boost Newco Borrower LLC | | | | | | | | |
7.50% due 01/15/313 | | | 850,000 | | | | 889,791 | |
Medline Borrower, LP | | | | | | | | |
5.25% due 10/01/293 | | | 850,000 | | | | 803,393 | |
Par Pharmaceutical, Inc. | | | | | | | | |
due 04/01/273,5 | | | 1,210,000 | | | | 793,221 | |
Williams Scotsman, Inc. | | | | | | | | |
7.38% due 10/01/313 | | | 725,000 | | | | 753,532 | |
BCP V Modular Services Finance II plc | | | | | | | | |
4.75% due 10/30/283 | | EUR | 736,000 | | | | 742,512 | |
TriNet Group, Inc. | | | | | | | | |
7.00% due 08/15/313 | | | 650,000 | | | | 666,961 | |
Bausch Health Companies, Inc. | | | | | | | | |
4.88% due 06/01/283 | | | 1,200,000 | | | | 654,845 | |
Albertsons Companies Incorporated / Safeway Inc / New Albertsons Limited Partnership / Albertsons LLC | | | | | | | | |
5.88% due 02/15/283 | | | 475,000 | | | | 470,269 | |
6.50% due 02/15/283 | | | 175,000 | | | | 176,857 | |
Central Garden & Pet Co. | | | | | | | | |
4.13% due 10/15/30 | | | 711,000 | | | | 637,837 | |
Endo Luxembourg Finance Company I SARL / Endo US, Inc. | | | | | | | | |
due 04/01/293,5 | | | 950,000 | | | | 617,500 | |
Champions Financing, Inc. | | | | | | | | |
8.75% due 02/15/293 | | | 575,000 | | | | 602,397 | |
AMN Healthcare, Inc. | | | | | | | | |
4.63% due 10/01/273 | | | 575,000 | | | | 546,129 | |
US Foods, Inc. | | | | | | | | |
7.25% due 01/15/323 | | | 500,000 | | | | 520,365 | |
Valvoline, Inc. | | | | | | | | |
3.63% due 06/15/313 | | | 600,000 | | | | 517,206 | |
Grifols S.A. | | | | | | | | |
4.75% due 10/15/283 | | | 600,000 | | | | 496,416 | |
12 | THE GUGGENHEIM FUNDS SEMI-ANNUAL REPORT | SEE NOTES TO FINANCIAL STATEMENTS. |
SCHEDULE OF INVESTMENTS (Unaudited)(continued) | March 31, 2024 |
HIGH YIELD FUND | |
| | Face
Amount~ | | | Value | |
IQVIA, Inc. | | | | | | | | |
5.00% due 05/15/273 | | | 395,000 | | | $ | 385,688 | |
Sabre GLBL, Inc. | | | | | | | | |
7.38% due 09/01/256 | | | 320,000 | | | | 310,179 | |
9.25% due 04/15/256 | | | 31,000 | | | | 30,528 | |
Neogen Food Safety Corp. | | | | | | | | |
8.63% due 07/20/303 | | | 300,000 | | | | 323,176 | |
Service Corporation International | | | | | | | | |
3.38% due 08/15/30 | | | 325,000 | | | | 281,465 | |
WW International, Inc. | | | | | | | | |
4.50% due 04/15/293 | | | 690,000 | | | | 272,494 | |
Graham Holdings Co. | | | | | | | | |
5.75% due 06/01/263 | | | 125,000 | | | | 123,798 | |
Ingles Markets, Inc. | | | | | | | | |
4.00% due 06/15/313 | | | 75,000 | | | | 65,464 | |
Endo Dac / Endo Finance LLC / Endo Finco, Inc. | | | | | | | | |
due 07/31/273,5 | | | 171,000 | | | | 11,115 | |
Total Consumer, Non-cyclical | | | | | | | 27,389,359 | |
| | | | | | | | | |
Industrial - 13.5% | | | | | | | | |
Brundage-Bone Concrete Pumping Holdings, Inc. | | | | | | | | |
6.00% due 02/01/263 | | | 2,076,000 | | | | 2,050,304 | |
New Enterprise Stone & Lime Company, Inc. | | | | | | | | |
9.75% due 07/15/283 | | | 1,225,000 | | | | 1,253,267 | |
5.25% due 07/15/283 | | | 675,000 | | | | 646,644 | |
Trinity Industries, Inc. | | | | | | | | |
7.75% due 07/15/283 | | | 1,175,000 | | | | 1,206,623 | |
4.55% due 10/01/24 | | | 550,000 | | | | 544,575 | |
TransDigm, Inc. | | | | | | | | |
6.88% due 12/15/303 | | | 925,000 | | | | 942,941 | |
6.75% due 08/15/283 | | | 425,000 | | | | 430,609 | |
6.38% due 03/01/293 | | | 250,000 | | | | 250,778 | |
GrafTech Finance, Inc. | | | | | | | | |
4.63% due 12/15/283 | | | 2,500,000 | | | | 1,607,677 | |
Mauser Packaging Solutions Holding Co. | | | | | | | | |
7.88% due 08/15/263 | | | 1,025,000 | | | | 1,044,220 | |
9.25% due 04/15/273 | | | 500,000 | | | | 496,018 | |
Enviri Corp. | | | | | | | | |
5.75% due 07/31/273 | | | 1,575,000 | | | | 1,482,987 | |
Great Lakes Dredge & Dock Corp. | | | | | | | | |
5.25% due 06/01/293 | | | 1,525,000 | | | | 1,356,781 | |
Clearwater Paper Corp. | | | | | | | | |
4.75% due 08/15/283 | | | 1,375,000 | | | | 1,275,229 | |
Sealed Air Corporation/Sealed Air Corp US | | | | | | | | |
6.13% due 02/01/283 | | | 825,000 | | | | 826,712 | |
7.25% due 02/15/313 | | | 350,000 | | | | 363,890 | |
Builders FirstSource, Inc. | | | | | | | | |
6.38% due 06/15/323 | | | 750,000 | | | | 761,089 | |
6.38% due 03/01/343 | | | 200,000 | | | | 200,826 | |
4.25% due 02/01/323 | | | 100,000 | | | | 89,687 | |
Masonite International Corp. | | | | | | | | |
5.38% due 02/01/283 | | | 850,000 | | | | 851,141 | |
Emerald Debt Merger Sub LLC | | | | | | | | |
6.63% due 12/15/303 | | | 825,000 | | | | 832,914 | |
Amsted Industries, Inc. | | | | | | | | |
4.63% due 05/15/303 | | | 900,000 | | | | 821,924 | |
Artera Services LLC | | | | | | | | |
8.50% due 02/15/313 | | | 725,000 | | | | 743,301 | |
Pactiv Evergreen Group Issuer Incorporated/Pactiv Evergreen Group Issuer LLC | | | | | | | | |
4.00% due 10/15/273 | | | 700,000 | | | | 652,985 | |
Arcosa, Inc. | | | | | | | | |
4.38% due 04/15/293 | | | 700,000 | | | | 645,073 | |
Summit Materials LLC / Summit Materials Finance Corp. | | | | | | | | |
6.50% due 03/15/273 | | | 425,000 | | | | 423,944 | |
7.25% due 01/15/313 | | | 175,000 | | | | 181,893 | |
Advanced Drainage Systems, Inc. | | | | | | | | |
6.38% due 06/15/303 | | | 575,000 | | | | 577,976 | |
Standard Industries, Inc. | | | | | | | | |
4.38% due 07/15/303 | | | 550,000 | | | | 494,200 | |
Howmet Aerospace, Inc. | | | | | | | | |
5.95% due 02/01/37 | | | 475,000 | | | | 491,592 | |
Ardagh Metal Packaging Finance USA LLC / Ardagh Metal Packaging Finance plc | | | | | | | | |
6.00% due 06/15/273 | | | 500,000 | | | | 485,384 | |
Calderys Financing LLC | | | | | | | | |
11.25% due 06/01/283 | | | 425,000 | | | | 457,219 | |
Ball Corp. | | | | | | | | |
6.00% due 06/15/29 | | | 425,000 | | | | 429,037 | |
Hillenbrand, Inc. | | | | | | | | |
6.25% due 02/15/29 | | | 425,000 | | | | 428,646 | |
AmeriTex HoldCo Intermediate LLC | | | | | | | | |
10.25% due 10/15/283 | | | 300,000 | | | | 322,097 | |
Clean Harbors, Inc. | | | | | | | | |
6.38% due 02/01/313 | | | 225,000 | | | | 226,653 | |
EnerSys | | | | | | | | |
6.63% due 01/15/323 | | | 175,000 | | | | 176,270 | |
Miter Brands Acquisition Holdco Incorporated / MIWD Borrower LLC | | | | | | | | |
6.75% due 04/01/323 | | | 175,000 | | | | 175,598 | |
Total Industrial | | | | | | | 26,248,704 | |
| | | | | | | | | |
Communications - 12.4% | | | | | | | | |
CCO Holdings LLC / CCO Holdings Capital Corp. | | | | | | | | |
4.50% due 05/01/32 | | | 1,850,000 | | | | 1,486,649 | |
4.25% due 01/15/343 | | | 975,000 | | | | 735,983 | |
4.25% due 02/01/313 | | | 400,000 | | | | 326,660 | |
6.38% due 09/01/293 | | | 275,000 | | | | 260,888 | |
Altice France S.A. | | | | | | | | |
5.13% due 07/15/293 | | | 1,450,000 | | | | 980,249 | |
5.50% due 10/15/293 | | | 1,250,000 | | | | 848,416 | |
8.13% due 02/01/273 | | | 900,000 | | | | 703,492 | |
Level 3 Financing, Inc. | | | | | | | | |
3.88% due 10/15/303 | | | 1,825,000 | | | | 1,076,750 | |
4.50% due 04/01/303 | | | 1,325,000 | | | | 821,500 | |
11.00% due 11/15/293 | | | 520,747 | | | | 541,577 | |
SEE NOTES TO FINANCIAL STATEMENTS. | THE GUGGENHEIM FUNDS SEMI-ANNUAL REPORT | 13 |
SCHEDULE OF INVESTMENTS (Unaudited)(continued) | March 31, 2024 |
HIGH YIELD FUND | |
| | Face
Amount~ | | | Value | |
McGraw-Hill Education, Inc. | | | | | | | | |
5.75% due 08/01/283 | | | 1,675,000 | | | $ | 1,577,779 | |
8.00% due 08/01/293 | | | 775,000 | | | | 728,437 | |
Vmed O2 UK Financing I plc | | | | | | | | |
4.25% due 01/31/313 | | | 1,125,000 | | | | 952,624 | |
4.75% due 07/15/313 | | | 850,000 | | | | 732,602 | |
7.75% due 04/15/323 | | | 350,000 | | | | 351,013 | |
CSC Holdings LLC | | | | | | | | |
4.13% due 12/01/303 | | | 975,000 | | | | 697,174 | |
3.38% due 02/15/313 | | | 1,025,000 | | | | 696,686 | |
4.63% due 12/01/303 | | | 950,000 | | | | 482,423 | |
VZ Secured Financing BV | | | | | | | | |
5.00% due 01/15/323 | | | 2,175,000 | | | | 1,867,462 | |
LCPR Senior Secured Financing DAC | | | | | | | | |
6.75% due 10/15/273 | | | 1,417,000 | | | | 1,329,881 | |
Telenet Finance Luxembourg Notes SARL | | | | | | | | |
5.50% due 03/01/28 | | | 1,400,000 | | | | 1,315,355 | |
AMC Networks, Inc. | | | | | | | | |
4.25% due 02/15/29 | | | 1,550,000 | | | | 1,098,496 | |
Sunrise FinCo I BV | | | | | | | | |
4.88% due 07/15/313 | | | 1,200,000 | | | | 1,070,973 | |
Sirius XM Radio, Inc. | | | | | | | | |
4.13% due 07/01/303 | | | 800,000 | | | | 699,334 | |
5.50% due 07/01/293 | | | 325,000 | | | | 309,550 | |
3.88% due 09/01/313 | | | 50,000 | | | | 41,691 | |
Cogent Communications Group, Inc. | | | | | | | | |
7.00% due 06/15/273 | | | 975,000 | | | | 970,689 | |
Match Group Holdings II LLC | | | | | | | | |
4.63% due 06/01/283 | | | 600,000 | | | | 566,228 | |
Outfront Media Capital LLC / Outfront Media Capital Corp. | | | | | | | | |
4.25% due 01/15/293 | | | 550,000 | | | | 498,288 | |
Zayo Group Holdings, Inc. | | | | | | | | |
4.00% due 03/01/273 | | | 300,000 | | | | 246,943 | |
Go Daddy Operating Company LLC / GD Finance Co., Inc. | | | | | | | | |
3.50% due 03/01/293 | | | 200,000 | | | | 180,380 | |
Total Communications | | | | | | | 24,196,172 | |
| | | | | | | | | |
Financial - 9.5% | | | | | | | | |
NFP Corp. | | | | | | | | |
6.88% due 08/15/283 | | | 1,425,000 | | | | 1,443,187 | |
8.50% due 10/01/313 | | | 600,000 | | | | 660,335 | |
Jefferies Finance LLC / JFIN Company-Issuer Corp. | | | | | | | | |
5.00% due 08/15/283 | | | 2,100,000 | | | | 1,931,134 | |
OneMain Finance Corp. | | | | | | | | |
3.88% due 09/15/28 | | | 1,225,000 | | | | 1,092,793 | |
4.00% due 09/15/30 | | | 750,000 | | | | 641,885 | |
Alliant Holdings Intermediate LLC / Alliant Holdings Company-Issuer | | | | | | | | |
7.00% due 01/15/313 | | | 950,000 | | | | 959,518 | |
4.25% due 10/15/273 | | | 475,000 | | | | 447,193 | |
6.75% due 04/15/283 | | | 50,000 | | | | 50,353 | |
HUB International Ltd. | | | | | | | | |
7.38% due 01/31/323 | | | 1,075,000 | | | | 1,082,239 | |
5.63% due 12/01/293 | | | 375,000 | | | | 351,610 | |
Hunt Companies, Inc. | | | | | | | | |
5.25% due 04/15/293 | | | 1,225,000 | | | | 1,118,549 | |
United Wholesale Mortgage LLC | | | | | | | | |
5.75% due 06/15/273 | | | 675,000 | | | | 656,284 | |
5.50% due 04/15/293 | | | 475,000 | | | | 449,254 | |
Rocket Mortgage LLC / Rocket Mortgage Company-Issuer, Inc. | | | | | | | | |
3.88% due 03/01/313 | | | 875,000 | | | | 762,299 | |
4.00% due 10/15/333 | | | 350,000 | | | | 296,482 | |
Jones Deslauriers Insurance Management, Inc. | | | | | | | | |
10.50% due 12/15/303 | | | 725,000 | | | | 765,042 | |
8.50% due 03/15/303 | | | 200,000 | | | | 208,476 | |
Starwood Property Trust, Inc. | | | | | | | | |
4.38% due 01/15/273 | | | 550,000 | | | | 517,358 | |
7.25% due 04/01/293 | | | 425,000 | | | | 428,382 | |
SLM Corp. | | | | | | | | |
3.13% due 11/02/26 | | | 1,000,000 | | | | 928,759 | |
Iron Mountain Information Management Services, Inc. | | | | | | | | |
5.00% due 07/15/323 | | | 1,000,000 | | | | 913,271 | |
Jane Street Group / JSG Finance, Inc. | | | | | | | | |
4.50% due 11/15/293 | | | 700,000 | | | | 647,636 | |
Encore Capital Group, Inc. | | | | | | | | |
9.25% due 04/01/293 | | | 600,000 | | | | 614,626 | |
Kennedy-Wilson, Inc. | | | | | | | | |
4.75% due 02/01/30 | | | 450,000 | | | | 358,956 | |
4.75% due 03/01/29 | | | 150,000 | | | | 123,484 | |
Liberty Mutual Group, Inc. | | | | | | | | |
4.30% due 02/01/613 | | | 750,000 | | | | 477,313 | |
PennyMac Financial Services, Inc. | | | | | | | | |
7.88% due 12/15/293 | | | 325,000 | | | | 333,952 | |
USI, Inc. | | | | | | | | |
7.50% due 01/15/323 | | | 300,000 | | | | 300,553 | |
Total Financial | | | | | | | 18,560,923 | |
| | | | | | | | | |
Energy - 7.7% | | | | | | | | |
Global Partners Limited Partnership / GLP Finance Corp. | | | | | | | | |
7.00% due 08/01/27 | | | 1,200,000 | | | | 1,200,678 | |
6.88% due 01/15/29 | | | 900,000 | | | | 892,746 | |
CVR Energy, Inc. | | | | | | | | |
5.75% due 02/15/283 | | | 1,725,000 | | | | 1,617,604 | |
8.50% due 01/15/293 | | | 350,000 | | | | 354,384 | |
ITT Holdings LLC | | | | | | | | |
6.50% due 08/01/293 | | | 1,875,000 | | | | 1,711,124 | |
Kinetik Holdings, LP | | | | | | | | |
6.63% due 12/15/283 | | | 1,025,000 | | | | 1,043,198 | |
5.88% due 06/15/303 | | | 350,000 | | | | 342,344 | |
HF Sinclair Corp. | | | | | | | | |
6.38% due 04/15/273 | | | 1,050,000 | | | | 1,055,907 | |
Viper Energy, Inc. | | | | | | | | |
7.38% due 11/01/313 | | | 1,015,000 | | | | 1,055,170 | |
TransMontaigne Partners Limited Partnership / TLP Finance Corp. | | | | | | | | |
6.13% due 02/15/26 | | | 1,000,000 | | | | 947,500 | |
14 | THE GUGGENHEIM FUNDS SEMI-ANNUAL REPORT | SEE NOTES TO FINANCIAL STATEMENTS. |
SCHEDULE OF INVESTMENTS (Unaudited)(continued) | March 31, 2024 |
HIGH YIELD FUND | |
| | Face
Amount~ | | | Value | |
EnLink Midstream LLC | | | | | | | | |
5.38% due 06/01/29 | | | 925,000 | | | $ | 908,131 | |
Parkland Corp. | | | | | | | | |
4.50% due 10/01/293 | | | 750,000 | | | | 693,689 | |
CQP Holdco Limited Partnership / BIP-V Chinook Holdco LLC | | | | | | | | |
7.50% due 12/15/333 | | | 600,000 | | | | 617,530 | |
NuStar Logistics, LP | | | | | | | | |
5.63% due 04/28/27 | | | 610,000 | | | | 603,729 | |
Venture Global LNG, Inc. | | | | | | | | |
9.50% due 02/01/293 | | | 525,000 | | | | 565,878 | |
Buckeye Partners, LP | | | | | | | | |
3.95% due 12/01/26 | | | 550,000 | | | | 525,815 | |
Venture Global Calcasieu Pass LLC | | | | | | | | |
6.25% due 01/15/303 | | | 500,000 | | | | 503,031 | |
Southwestern Energy Co. | | | | | | | | |
5.38% due 02/01/29 | | | 425,000 | | | | 412,775 | |
Basic Energy Services, Inc. | | | | | | | | |
due 10/15/235 | | | 1,175,000 | | | | 5,875 | |
Total Energy | | | | | | | 15,057,108 | |
| | | | | | | | | |
Basic Materials - 7.5% | | | | | | | | |
Carpenter Technology Corp. | | | | | | | | |
6.38% due 07/15/28 | | | 1,325,000 | | | | 1,322,767 | |
7.63% due 03/15/30 | | | 650,000 | | | | 670,572 | |
SCIL IV LLC / SCIL USA Holdings LLC | | | | | | | | |
5.38% due 11/01/263 | | | 1,650,000 | | | | 1,601,376 | |
Minerals Technologies, Inc. | | | | | | | | |
5.00% due 07/01/283 | | | 1,547,000 | | | | 1,479,164 | |
Kaiser Aluminum Corp. | | | | | | | | |
4.63% due 03/01/283 | | | 790,000 | | | | 741,285 | |
4.50% due 06/01/313 | | | 725,000 | | | | 641,429 | |
SK Invictus Intermediate II SARL | | | | | | | | |
5.00% due 10/30/293 | | | 1,350,000 | | | | 1,203,342 | |
INEOS Finance plc | | | | | | | | |
6.75% due 05/15/283 | | | 1,100,000 | | | | 1,086,086 | |
Ingevity Corp. | | | | | | | | |
3.88% due 11/01/283 | | | 1,150,000 | | | | 1,038,647 | |
WR Grace Holdings LLC | | | | | | | | |
4.88% due 06/15/273 | | | 1,000,000 | | | | 950,381 | |
Novelis Corp. | | | | | | | | |
4.75% due 01/30/303 | | | 1,025,000 | | | | 945,688 | |
Illuminate Buyer LLC / Illuminate Holdings IV, Inc. | | | | | | | | |
9.00% due 07/01/283 | | | 900,000 | | | | 887,848 | |
Compass Minerals International, Inc. | | | | | | | | |
6.75% due 12/01/273 | | | 875,000 | | | | 845,902 | |
Arsenal AIC Parent LLC | | | | | | | | |
8.00% due 10/01/303 | | | 675,000 | | | | 708,673 | |
Alcoa Nederland Holding BV | | | | | | | | |
7.13% due 03/15/313 | | | 275,000 | | | | 280,130 | |
Axalta Coating Systems Dutch Holding B BV | | | | | | | | |
7.25% due 02/15/313 | | | 250,000 | | | | 260,052 | |
Mirabela Nickel Ltd. | | | | | | | | |
due 06/24/19†††,5,6 | | | 278,115 | | | | 1,391 | |
Total Basic Materials | | | | | | | 14,664,733 | |
| | | | | | | | | |
Technology - 3.5% | | | | | | | | |
NCR Voyix Corp. | | | | | | | | |
5.13% due 04/15/293 | | | 1,500,000 | | | | 1,391,179 | |
Boxer Parent Company, Inc. | | | | | | | | |
7.13% due 10/02/253 | | | 1,025,000 | | | | 1,025,915 | |
Capstone Borrower, Inc. | | | | | | | | |
8.00% due 06/15/303 | | | 950,000 | | | | 985,765 | |
Central Parent Incorporated / CDK Global, Inc. | | | | | | | | |
7.25% due 06/15/293 | | | 875,000 | | | | 893,206 | |
Dun & Bradstreet Corp. | | | | | | | | |
5.00% due 12/15/293 | | | 925,000 | | | | 853,832 | |
Qorvo, Inc. | | | | | | | | |
3.38% due 04/01/313 | | | 600,000 | | | | 516,008 | |
Cloud Software Group, Inc. | | | | | | | | |
6.50% due 03/31/293 | | | 525,000 | | | | 498,205 | |
Playtika Holding Corp. | | | | | | | | |
4.25% due 03/15/293 | | | 500,000 | | | | 432,857 | |
Central Parent LLC / CDK Global II LLC / CDK Financing Company, Inc. | | | | | | | | |
8.00% due 06/15/293 | | | 200,000 | | | | 207,327 | |
Total Technology | | | | | | | 6,804,294 | |
| | | | | | | | | |
Utilities - 1.6% | | | | | | | | |
Terraform Global Operating, LP | | | | | | | | |
6.13% due 03/01/263 | | | 1,955,000 | | | | 1,927,635 | |
AmeriGas Partners Limited Partnership / AmeriGas Finance Corp. | | | | | | | | |
5.50% due 05/20/25 | | | 625,000 | | | | 625,247 | |
Atlantica Sustainable Infrastructure plc | | | | | | | | |
4.13% due 06/15/283 | | | 400,000 | | | | 367,537 | |
Clearway Energy Operating LLC | | | | | | | | |
4.75% due 03/15/283 | | | 175,000 | | | | 166,345 | |
Total Utilities | | | | | | | 3,086,764 | |
| | | | | | | | | |
Total Corporate Bonds | | | | |
(Cost $175,202,933) | | | 163,577,743 | |
| |
SENIOR FLOATING RATE INTERESTS††,◊ - 11.2% |
Consumer, Non-cyclical - 2.7% | | | | | | | | |
Blue Ribbon LLC | | | | | | | | |
11.44% (1 Month Term SOFR + 6.00%, Rate Floor: 6.75%) due 05/08/28 | | | 1,010,680 | | | | 878,787 | |
Gibson Brands, Inc. | | | | | | | | |
10.58% (3 Month Term SOFR + 5.00%, Rate Floor: 5.75%) due 08/11/28 | | | 852,600 | | | | 801,981 | |
Women’s Care Holdings, Inc. | | | | | | | | |
9.91% (3 Month Term SOFR + 4.50%, Rate Floor: 5.25%) due 01/17/28 | | | 651,626 | | | | 581,172 | |
Moran Foods LLC | | | | | | | | |
12.66% (3 Month Term SOFR + 7.25%, Rate Floor: 8.25%) due 06/30/26††† | | | 472,753 | | | | 357,159 | |
17.97% (3 Month Term SOFR + 2.00%, Rate Floor: 7.31%) (in-kind rate was 10.66%) due 06/30/26†††,7 | | | 284,192 | | | | 148,196 | |
PlayCore | | | | | | | | |
9.84% (3 Month Term SOFR + 4.50%, Rate Floor: 5.50%) due 02/14/30 | | | 500,000 | | | | 501,565 | |
SEE NOTES TO FINANCIAL STATEMENTS. | THE GUGGENHEIM FUNDS SEMI-ANNUAL REPORT | 15 |
SCHEDULE OF INVESTMENTS (Unaudited)(continued) | March 31, 2024 |
HIGH YIELD FUND | |
| | Face
Amount~ | | | Value | |
Confluent Health LLC | | | | | | | | |
9.44% (1 Month Term SOFR + 4.00%, Rate Floor: 4.50%) due 11/30/28 | | | 491,725 | | | $ | 485,578 | |
IVI America LLC | | | | | | | | |
due 03/15/318 | | | 425,000 | | | | 424,469 | |
Balrog Acquisition, Inc. | | | | | | | | |
9.94% (1 Month Term SOFR + 4.50%, Rate Floor: 5.25%) due 09/05/28††† | | | 347,375 | | | | 347,375 | |
Kronos Acquisition Holdings, Inc. | | | | | | | | |
11.49% (3 Month Term SOFR + 6.00%, Rate Floor: 7.00%) due 12/22/26 | | | 294,000 | | | | 294,368 | |
TGP Holdings LLC | | | | | | | | |
8.68% (1 Month Term SOFR + 3.25%, Rate Floor: 4.00%) due 06/29/28 | | | 235,381 | | | | 222,304 | |
Florida Food Products LLC | | | | | | | | |
10.44% (1 Month Term SOFR + 5.00%, Rate Floor: 5.75%) due 10/18/28 | | | 220,500 | | | | 194,040 | |
Total Consumer, Non-cyclical | | | | | | | 5,236,994 | |
| | | | | | | | | |
Technology - 2.3% | | | | | | | | |
Datix Bidco Ltd. | | | | | | | | |
9.69% (6 Month GBP SONIA + 4.50%, Rate Floor: 5.19%) due 04/28/25††† | | GBP | 1,300,000 | | | | 1,640,772 | |
12.94% (6 Month GBP SONIA + 7.75%, Rate Floor: 8.44%) due 04/27/26††† | | GBP | 650,000 | | | | 820,386 | |
Atlas CC Acquisition Corp. | | | | | | | | |
9.85% (3 Month Term SOFR + 4.25%, Rate Floor: 5.00%) due 05/25/28 | | | 560,625 | | | | 523,220 | |
Blackhawk Network Holdings, Inc. | | | | | | | | |
10.33% (1 Month Term SOFR + 5.00%, Rate Floor: 6.00%) due 02/23/29 | | | 500,000 | | | | 500,310 | |
Cloud Software Group, Inc. | | | | | | | | |
9.91% (3 Month Term SOFR + 4.50%, Rate Floor: 5.00%) due 09/29/28 | | | 494,392 | | | | 491,989 | |
Central Parent LLC | | | | | | | | |
9.31% (3 Month Term SOFR + 4.00%, Rate Floor: 4.00%) due 07/06/29 | | | 275,000 | | | | 275,701 | |
24-7 Intouch, Inc. | | | | | | | | |
10.18% (1 Month Term SOFR + 4.75%, Rate Floor: 4.75%) due 08/25/25 | | | 264,404 | | | | 256,721 | |
Total Technology | | | | | | | 4,509,099 | |
| | | | | | | | | |
Consumer, Cyclical - 2.1% | | | | | | | | |
Alexander Mann | | | | | | | | |
11.41% (1 Month SOFR + 6.00%, Rate Floor: 6.00%) due 06/29/27 | | | 956,451 | | | | 928,953 | |
American Tire Distributors, Inc. | | | | | | | | |
11.83% (3 Month Term SOFR + 6.25%, Rate Floor: 7.00%) due 10/20/28 | | | 909,309 | | | | 783,142 | |
Holding SOCOTEC | | | | | | | | |
9.31% (3 Month SOFR + 4.00%, Rate Floor: 4.75%) due 06/30/28 | | | 597,800 | | | | 590,327 | |
ScribeAmerica Intermediate Holdco LLC (Healthchannels) | | | | | | | | |
9.94% (1 Month Term SOFR + 4.50%, Rate Floor: 5.50%) due 04/03/25 | | | 740,384 | | | | 533,817 | |
Accuride Corp. | | | | | | | | |
12.20% (1 Month Term SOFR + 1.00%, Rate Floor: 6.33%) (in-kind rate was 5.87%) due 05/18/267 | | | 490,730 | | | | 380,316 | |
First Brands Group LLC | | | | | | | | |
10.57% (3 Month Term SOFR + 5.00%, Rate Floor: 6.00%) due 03/30/27 | | | 300,000 | | | | 299,874 | |
CCRR Parent, Inc. | | | | | | | | |
9.19% (1 Month Term SOFR + 3.75%, Rate Floor: 4.50%) due 03/06/28 | | | 299,231 | | | | 267,312 | |
WW International, Inc. | | | | | | | | |
8.94% (1 Month Term SOFR + 3.50%, Rate Floor: 4.00%) due 04/13/28 | | | 491,625 | | | | 214,678 | |
Total Consumer, Cyclical | | | | | | | 3,998,419 | |
| | | | | | | | | |
Industrial - 1.8% | | | | | | | | |
Dispatch Terra Acquisition LLC | | | | | | | | |
9.70% (3 Month Term SOFR + 4.25%, Rate Floor: 5.00%) due 03/27/28 | | | 1,170,611 | | | | 1,084,278 | |
Aegion Corp. | | | | | | | | |
9.58% (1 Month Term SOFR + 4.25%, Rate Floor: 5.00%) due 05/17/28 | | | 683,112 | | | | 685,250 | |
Pelican Products, Inc. | | | | | | | | |
9.81% (3 Month Term SOFR + 4.25%, Rate Floor: 4.75%) due 12/29/28 | | | 645,955 | | | | 596,972 | |
STS Operating, Inc. | | | | | | | | |
due 03/15/318 | | | 400,000 | | | | 400,752 | |
Arcline FM Holdings LLC | | | | | | | | |
10.32% (3 Month Term SOFR + 4.75%, Rate Floor: 5.50%) due 06/23/28 | | | 273,611 | | | | 273,611 | |
Patriot Container Corp. (Wastequip) | | | | | | | | |
9.18% (1 Month Term SOFR + 3.75%, Rate Floor: 4.75%) due 03/20/25 | | | 224,405 | | | | 217,031 | |
MI Windows And Doors LLC | | | | | | | | |
due 03/20/318 | | | 175,000 | | | | 175,656 | |
Anchor Packaging LLC | | | | | | | | |
8.93% (1 Month Term SOFR + 3.50%, Rate Floor: 4.50%) due 07/20/26 | | | 148,184 | | | | 147,999 | |
Total Industrial | | | | | | | 3,581,549 | |
| | | | | | | | | |
Financial - 1.0% | | | | | | | | |
Franchise Group, Inc. | | | | | | | | |
10.36% (6 Month Term SOFR + 4.75%, Rate Floor: 4.75%) due 03/10/26 | | | 938,947 | | | | 836,836 | |
Eisner Advisory Group | | | | | | | | |
9.33% (1 Month Term SOFR + 4.00%, Rate Floor: 4.50%) due 02/22/31 | | | 500,000 | | | | 501,250 | |
Cobham Ultra SeniorCo SARL | | | | | | | | |
9.01% (6 Month Term SOFR + 3.93%, Rate Floor: 4.43%) due 08/06/29 | | | 396,015 | | | | 388,344 | |
Avison Young (Canada), Inc. | | | | | | | | |
11.95% (3 Month Term SOFR + 6.61%, Rate Floor: 6.61%) due 01/31/26 | | | 525,250 | | | | 197,846 | |
13.08% (3 Month Term SOFR + 7.50%, Rate Floor: 8.50%) due 11/24/27 | | | 83,959 | | | | 82,123 | |
Total Financial | | | | | | | 2,006,399 | |
| | | | | | | | | |
16 | THE GUGGENHEIM FUNDS SEMI-ANNUAL REPORT | SEE NOTES TO FINANCIAL STATEMENTS. |
SCHEDULE OF INVESTMENTS (Unaudited)(continued) | March 31, 2024 |
HIGH YIELD FUND | |
| | Face
Amount~ | | | Value | |
Basic Materials - 0.8% | | | | | | | | |
LTI Holdings, Inc. | | | | | | | | |
10.19% (1 Month Term SOFR + 4.75%, Rate Floor: 4.75%) due 07/24/26 | | | 735,633 | | | $ | 727,357 | |
NIC Acquisition Corp. | | | | | | | | |
9.32% (3 Month Term SOFR + 3.75%, Rate Floor: 4.50%) due 12/29/27 | | | 653,766 | | | | 549,490 | |
DCG Acquisition Corp. | | | | | | | | |
9.93% (1 Month Term SOFR + 4.50%, Rate Floor: 5.50%) due 09/30/26 | | | 244,949 | | | | 244,492 | |
Total Basic Materials | | | | | | | 1,521,339 | |
| | | | | | | | | |
Communications - 0.4% | | | | | | | | |
Cengage Learning, Inc. | | | | | | | | |
due 03/15/318 | | | 850,000 | | | | 848,138 | |
| | | | | | | | | |
Energy - 0.1% | | | | | | | | |
Permian Production Partners LLC | | | | | | | | |
7.72% (1 Month Term SOFR + 2.00%, Rate Floor: 5.72%) (in-kind rate was 2.00%) due 11/24/257 | | | 97,935 | | | | 94,508 | |
Total Senior Floating Rate Interests | | | | |
(Cost $23,617,585) | | | 21,796,445 | |
| |
ASSET-BACKED SECURITIES†† - 0.5% |
Collateralized Loan Obligations - 0.3% | | | | | | | | |
WhiteHorse X Ltd. | | | | | | | | |
2015-10A E, 10.88% (3 Month Term SOFR + 5.56%, Rate Floor: 5.30%) due 04/17/27◊,3 | | | 536,365 | | | | 536,317 | |
| | | | | | | | | |
Infrastructure - 0.2% | | | | | | | | |
Hotwire Funding LLC | | | | | | | | |
2021-1, 4.46% due 11/20/513 | | | 400,000 | | | | 359,566 | |
Total Asset-Backed Securities | | | | |
(Cost $893,636) | | | 895,883 | |
| | | | | | | | | |
Total Investments - 99.3% | | | | |
(Cost $207,869,597) | | $ | 193,338,952 | |
Other Assets & Liabilities, net - 0.7% | | | 1,356,947 | |
Total Net Assets - 100.0% | | $ | 194,695,899 | |
Forward Foreign Currency Exchange Contracts†† |
Counterparty | | Currency | | | Type | | | Quantity | | | Contract
Amount | | | Settlement
Date | | | Unrealized
Appreciation | |
Bank of America, N.A. | | | GBP | | | | Sell | | | | 2,035,000 | | | | 2,603,264 USD | | | | 04/15/24 | | | $ | 34,635 | |
Barclays Bank plc | | | EUR | | | | Sell | | | | 705,000 | | | | 771,068 USD | | | | 04/15/24 | | | | 9,985 | |
Bank of America, N.A. | | | CAD | | | | Sell | | | | 522,000 | | | | 386,901 USD | | | | 04/15/24 | | | | 1,308 | |
| | | | | | | | | | | | | | | | | | | | | | | $ | 45,928 | |
SEE NOTES TO FINANCIAL STATEMENTS. | THE GUGGENHEIM FUNDS SEMI-ANNUAL REPORT | 17 |
SCHEDULE OF INVESTMENTS (Unaudited)(continued) | March 31, 2024 |
HIGH YIELD FUND | |
~ | The face amount is denominated in U.S. dollars unless otherwise indicated. |
* | Non-income producing security. |
† | Value determined based on Level 1 inputs, unless otherwise noted — See Note 4. |
†† | Value determined based on Level 2 inputs, unless otherwise noted — See Note 4. |
††† | Value determined based on Level 3 inputs — See Note 4. |
◊ | Variable rate security. Rate indicated is the rate effective at March 31, 2024. In some instances, the effective rate is limited by a minimum rate floor or a maximum rate cap established by the issuer. The settlement status of a position may also impact the effective rate indicated. In some cases, a position may be unsettled at period end and may not have a stated effective rate. In instances where multiple underlying reference rates and spread amounts are shown, the effective rate is based on a weighted average. |
1 | Affiliated issuer. |
2 | Rate indicated is the 7-day yield as of March 31, 2024. |
3 | Security is a 144A or Section 4(a)(2) security. These securities have been determined to be liquid under guidelines established by the Board of Trustees. The total market value of 144A or Section 4(a)(2) securities is $143,161,617 (cost $152,053,804), or 73.5% of total net assets. |
4 | All or a portion of this security has been physically segregated or earmarked in connection with reverse repurchase agreements. At March 31, 2024, the total market value of segregated or earmarked securities was $2,214,428— See Note 6. |
5 | Security is in default of interest and/or principal obligations. |
6 | Security is a 144A or Section 4(a)(2) security. These securities have been determined to be illiquid and restricted under guidelines established by the Board of Trustees. The total market value of 144A or Section 4(a)(2) illiquid and restricted securities is $342,098 (cost $605,527), or 0.2% of total net assets — See Note 10. |
7 | Payment-in-kind security. |
8 | Security is unsettled at period end and does not have a stated effective rate. CAD — Canadian Dolla |
| | EUR — Euro |
| | GBP — British Pound |
| | plc — Public Limited Company |
| | SARL — Société à Responsabilité Limitée |
| | SOFR — Secured Overnight Financing Rate |
| | SONIA — Sterling Overnight Index Average |
| | |
| | See Sector Classification in Other Information section. |
The following table summarizes the inputs used to value the Fund’s investments at March 31, 2024 (See Note 4 in the Notes to Financial Statements):
Investments in Securities (Assets) | | Level 1
Quoted
Prices | | | Level 2
Significant
Observable
Inputs | | | Level 3
Significant
Unobservable
Inputs | | | Total | |
Common Stocks | | $ | — | | | $ | 26,665 | | | $ | 78,803 | | | $ | 105,468 | |
Preferred Stocks | | | — | | | | 3,018,501 | | | | 338,262 | | | | 3,356,763 | |
Warrants | | | — | * | | | — | | | | — | | | | — | |
Money Market Fund | | | 3,606,650 | | | | — | | | | — | | | | 3,606,650 | |
Corporate Bonds | | | — | | | | 163,576,352 | | | | 1,391 | | | | 163,577,743 | |
Senior Floating Rate Interests | | | — | | | | 18,482,557 | | | | 3,313,888 | | | | 21,796,445 | |
Asset-Backed Securities | | | — | | | | 895,883 | | | | — | | | | 895,883 | |
Forward Foreign Currency Exchange Contracts** | | | — | | | | 45,928 | | | | — | | | | 45,928 | |
Total Assets | | $ | 3,606,650 | | | $ | 186,045,886 | | | $ | 3,732,344 | | | $ | 193,384,880 | |
* | Security has a market value of $0. |
** | This derivative is reported as unrealized appreciation/depreciation at period end. |
18 | THE GUGGENHEIM FUNDS SEMI-ANNUAL REPORT | SEE NOTES TO FINANCIAL STATEMENTS. |
SCHEDULE OF INVESTMENTS (Unaudited)(continued) | March 31, 2024 |
HIGH YIELD FUND | |
The Fund may hold assets and/or liabilities in which the fair value approximates the carrying amount for financial statement purposes. As of the period end, reverse repurchase agreements of $1,460,329 are categorized as Level 2 within the disclosure hierarchy — See Note 6.
The following is a summary of significant unobservable inputs used in the fair valuation of assets and liabilities categorized within Level 3 of the fair value hierarchy:
Category | | Ending Balance at
March 31, 2024 | | Valuation Technique | Unobservable Inputs | | Input Range | | | Weighted Average* | |
Assets: | | | | | | | | |
Common Stocks | | $ | 71,749 | | Enterprise Value | Valuation Multiple | | | 2.9x-8.2x | | | | 3.9x | |
Common Stocks | | | 7,054 | | Model Price | Liquidation Value | | | — | | | | — | |
Corporate Bonds | | | 1,391 | | Third Party Pricing | Trade Price | | | — | | | | — | |
Preferred Stocks | | | 338,260 | | Enterprise Value | Valuation Multiple | | | 5.0x | | | | — | |
Preferred Stocks | | | 2 | | Model Price | Liquidation Value | | | — | | | | — | |
Senior Floating Rate Interests | | | 2,461,158 | | Yield Analysis | Yield | | | 10.3%-13.0% | | | | 11.2 | % |
Senior Floating Rate Interests | | | 505,355 | | Model Price | Liquidation Value | | | — | | | | — | |
Senior Floating Rate Interests | | | 347,375 | | Third Party Pricing | Broker Quote | | | — | | | | — | |
Total Assets | | $ | 3,732,344 | | | | | | | | | | | |
* | Inputs are weighted by the fair value of the instruments. |
Significant changes in a quote, yield, liquidation value or valuation multiple would generally result in significant changes in the fair value of the security. Any remaining Level 3 securities held by the Fund and excluded from the table above, were not considered material to the Fund.
The Fund’s fair valuation leveling guidelines classify a single daily broker quote, or a vendor price based on a single daily or monthly broker quote, as Level 3, if such a quote or price cannot be supported with other available market information.
Transfers between Level 2 and Level 3 may occur as markets fluctuate and/or the availability of data used in an investment’s valuation changes. For the period ended March 31, 2024, the Fund had securities with a total value of $5,863 transfer into Level 3 from Level 2 due to a lack of observable inputs and had securities with a total value of $94,508 transfer out of Level 3 into Level 2 due to the availability of current and reliable market-based data provided by a third-party pricing service which utilizes significant observable inputs.
Summary of Fair Value Level 3 Activity
Following is a reconciliation of Level 3 assets for which significant unobservable inputs were used to determine fair value for the period ended March 31, 2024:
| | | Assets | | | | | |
| | Corporate
Bonds | | | Senior Floating
Rate Interests | | | Common
Stocks | | | Preferred
Stocks | | | Total Assets | |
Beginning Balance | | $ | 13,211 | | | $ | 3,744,601 | | | $ | 64,125 | | | $ | 85,798 | | | $ | 3,907,735 | |
Purchases/(Receipts) | | | — | | | | 8,799 | | | | — | | | | — | | | | 8,799 | |
(Sales, maturities and paydowns)/Fundings | | | — | | | | (368,902 | ) | | | (592 | ) | | | — | | | | (369,494 | ) |
Amortization of premiums/discounts | | | — | | | | 53,976 | | | | — | | | | — | | | | 53,976 | |
Total realized gains (losses) including in earnings | | | — | | | | 24,663 | | | | (24,765 | ) | | | — | | | | (102 | ) |
Total change in unrealized appreciation (depreciation) included in earnings | | | (11,820 | ) | | | (54,741 | ) | | | 34,172 | | | | 252,464 | | | | 220,075 | |
Transfers into Level 3 | | | — | | | | — | | | | 5,863 | | | | — | | | | 5,863 | |
Transfers out of Level 3 | | | — | | | | (94,508 | ) | | | — | | | | — | | | | (94,508 | ) |
Ending Balance | | $ | 1,391 | | | $ | 3,313,888 | | | $ | 78,803 | | | $ | 338,262 | | | $ | 3,732,344 | |
Net change in unrealized appreciation (depreciation) for investments in Level 3 securities still held at March 31, 2024 | | $ | (11,820 | ) | | $ | (25,673 | ) | | $ | 9,941 | | | $ | 252,464 | | | $ | 224,912 | |
SEE NOTES TO FINANCIAL STATEMENTS. | THE GUGGENHEIM FUNDS SEMI-ANNUAL REPORT | 19 |
SCHEDULE OF INVESTMENTS (Unaudited)(concluded) | March 31, 2024 |
HIGH YIELD FUND | |
Affiliated Transactions
Investments representing 5% or more of the outstanding voting shares of a company, or control of or by, or common control under Guggenheim Investments (“GI”), result in that company being considered an affiliated issuer, as defined in the 1940 Act.
Transactions during the period ended March 31, 2024, in which the company is an affiliated issuer, were as follows:
Security Name | | Value
09/30/23 | | | Additions | | | Reductions | | | Realized
Gain (Loss) | | | Change in
Unrealized
Appreciation
(Depreciation) | | | Value
03/31/24 | | | Shares
03/31/24 | | | Investment
Income | | | Capital Gain
Distributions | |
Common Stocks | | | | | | | | | | | | | | | | | | | | | | | | | | | | | | |
BP Holdco LLC * | | $ | 30,456 | | | $ | — | | | $ | — | | | $ | — | | | $ | (1,715 | ) | | $ | 28,741 | | | | 23,711 | | | $ | — | | | $ | — | |
* | Non-income producing security. |
20 | THE GUGGENHEIM FUNDS SEMI-ANNUAL REPORT | SEE NOTES TO FINANCIAL STATEMENTS. |
STATEMENT OF ASSETS AND LIABILITIES (Unaudited) |
March 31, 2024 |
Assets: |
Investments in unaffiliated issuers, at value (cost $207,861,224) | | $ | 193,310,211 | |
Investments in affiliated issuers, at value (cost $8,373) | | | 28,741 | |
Foreign currency, at value (cost $945) | | | 937 | |
Cash | | | 62,409 | |
Unrealized appreciation on forward foreign currency exchange contracts | | | 45,928 | |
Prepaid expenses | | | 46,482 | |
Receivables: |
Interest | | | 3,003,375 | |
Securities sold | | | 1,766,950 | |
Fund shares sold | | | 197,341 | |
Foreign tax reclaims | | | 2,369 | |
Dividends | | | 1,050 | |
Total assets | | | 198,465,793 | |
| | | | | |
Liabilities: |
Reverse repurchase agreements (Note 6) | | | 1,460,329 | |
Payable for: |
Securities purchased | | | 1,469,313 | |
Fund shares redeemed | | | 480,130 | |
Distributions to shareholders | | | 157,893 | |
Management fees | | | 81,292 | |
Transfer agent/maintenance fees | | | 25,710 | |
Distribution and service fees | | | 18,531 | |
Trustees’ fees* | | | 6,340 | |
Fund accounting/administration fees | | | 3,693 | |
Miscellaneous | | | 66,663 | |
Total liabilities | | | 3,769,894 | |
Net assets | | $ | 194,695,899 | |
| | | | | |
Net assets consist of: |
Paid in capital | | $ | 241,128,680 | |
Total distributable earnings (loss) | | | (46,432,781 | ) |
Net assets | | $ | 194,695,899 | |
Class A: |
Net assets | | $ | 47,071,095 | |
Capital shares outstanding | | | 4,773,437 | |
Net asset value per share | | $ | 9.86 | |
Maximum offering price per share (Net asset value divided by 96.00%) | | $ | 10.27 | |
Class C: |
Net assets | | $ | 8,837,239 | |
Capital shares outstanding | | | 889,061 | |
Net asset value per share | | $ | 9.94 | |
Class P: |
Net assets | | $ | 5,093,705 | |
Capital shares outstanding | | | 516,656 | |
Net asset value per share | | $ | 9.86 | |
| | | | | |
Institutional Class: |
Net assets | | $ | 133,640,521 | |
Capital shares outstanding | | | 16,636,760 | |
Net asset value per share | | $ | 8.03 | |
Class R6: |
Net assets | | $ | 53,339 | |
Capital shares outstanding | | | 5,365 | |
Net asset value per share | | $ | 9.94 | |
* | Relates to Trustees not deemed “interested persons” within the meaning of Section 2(a)(19) of the 1940 Act. |
SEE NOTES TO FINANCIAL STATEMENTS. | THE GUGGENHEIM FUNDS SEMI-ANNUAL REPORT | 21 |
STATEMENT OF OPERATIONS (Unaudited) |
Six Months Ended March 31, 2024 |
Investment Income: |
Dividends | | $ | 52,213 | |
Interest | | | 7,410,084 | |
Total investment income | | | 7,462,297 | |
| | | | | |
Expenses: |
Management fees | | | 578,727 | |
Distribution and service fees: |
Class A | | | 56,971 | |
Class C | | | 45,358 | |
Class P | | | 6,572 | |
Transfer agent/maintenance fees: |
Class A | | | 28,516 | |
Class C | | | 7,389 | |
Class P | | | 3,555 | |
Institutional Class | | | 51,881 | |
Class R6 | | | 481 | |
Fund accounting/administration fees | | | 42,425 | |
Professional fees | | | 25,410 | |
Interest expense | | | 24,415 | |
Trustees’ fees* | | | 11,112 | |
Custodian fees | | | 10,508 | |
Line of credit fees | | | 5,096 | |
Miscellaneous | | | 44,789 | |
Recoupment of previously waived fees: |
Class A | | | 9,256 | |
Class C | | | 1,125 | |
Class P | | | 953 | |
Institutional Class | | | 42,954 | |
Total expenses | | | 997,493 | |
Less: |
Expenses reimbursed by Adviser: |
Class A | | | (8,803 | ) |
Class C | | | (2,594 | ) |
Class P | | | (1,102 | ) |
Institutional Class | | | (11,525 | ) |
Class R6 | | | (326 | ) |
Expenses waived by Adviser | | | (33,590 | ) |
Total waived/reimbursed expenses | | | (57,940 | ) |
Net expenses | | | 939,553 | |
Net investment income | | | 6,522,744 | |
| | | | | |
Net Realized and Unrealized Gain (Loss): |
Net realized gain (loss) on: |
Investments in unaffiliated issuers | | $ | (45,848 | ) |
Forward foreign currency exchange contracts | | | (60,468 | ) |
Foreign currency transactions | | | (4,034 | ) |
Net realized loss | | | (110,350 | ) |
Net change in unrealized appreciation (depreciation) on: |
Investments in unaffiliated issuers | | | 8,619,936 | |
Investments in affiliated issuers | | | (1,715 | ) |
Forward foreign currency exchange contracts | | | (23,611 | ) |
Foreign currency translations | | | 3,759 | |
Net change in unrealized appreciation (depreciation) | | | 8,598,369 | |
Net realized and unrealized gain | | | 8,488,019 | |
Net increase in net assets resulting from operations | | $ | 15,010,763 | |
* | Relates to Trustees not deemed “interested persons” within the meaning of Section 2(a)(19) of the 1940 Act. |
22 | THE GUGGENHEIM FUNDS SEMI-ANNUAL REPORT | SEE NOTES TO FINANCIAL STATEMENTS. |
STATEMENTS OF CHANGES IN NET ASSETS |
| | Six Months Ended
March 31, 2024
(Unaudited) | | | Year Ended
September 30,
2023 | |
Increase (Decrease) in Net Assets from Operations: | | | | | | | | |
Net investment income | | $ | 6,522,744 | | | $ | 11,429,443 | |
Net realized loss on investments | | | (110,350 | ) | | | (4,445,420 | ) |
Net change in unrealized appreciation (depreciation) on investments | | | 8,598,369 | | | | 9,908,149 | |
Net increase in net assets resulting from operations | | | 15,010,763 | | | | 16,892,172 | |
| | | | | | | | | |
Distributions to shareholders: | | | | | | | | |
Class A | | | (1,465,305 | ) | | | (2,681,360 | ) |
Class C | | | (259,047 | ) | | | (531,795 | ) |
Class P | | | (170,603 | ) | | | (302,555 | ) |
Institutional Class | | | (4,406,586 | ) | | | (7,690,867 | ) |
Class R6 | | | (43,362 | ) | | | (126,227 | ) |
Return of capital | | | | | | | | |
Class A | | | — | | | | (27,032 | ) |
Class C | | | — | | | | (5,361 | ) |
Class P | | | — | | | | (3,050 | ) |
Institutional Class | | | — | | | | (77,534 | ) |
Class R6 | | | — | | | | (1,273 | ) |
Total distributions to shareholders | | | (6,344,903 | ) | | | (11,447,054 | ) |
| | | | | | | | | |
Capital share transactions: | | | | | | | | |
Proceeds from sale of shares | | | | | | | | |
Class A | | | 2,681,238 | | | | 4,413,398 | |
Class C | | | 147,695 | | | | 1,181,267 | |
Class P | | | 136,091 | | | | 1,437,731 | |
Institutional Class | | | 18,647,765 | | | | 39,343,841 | |
Class R6 | | | 19,719 | | | | 2,663 | |
Redemption fees collected | | | | | | | | |
Class A | | | 385 | | | | 133 | |
Class C | | | 72 | | | | 29 | |
Class P | | | 42 | | | | 15 | |
Institutional Class | | | 1,093 | | | | 387 | |
Class R6 | | | — | | | | 6 | |
Distributions reinvested | | | | | | | | |
Class A | | | 1,316,585 | | | | 2,472,792 | |
Class C | | | 253,501 | | | | 524,910 | |
Class P | | | 169,669 | | | | 305,110 | |
Institutional Class | | | 3,650,853 | | | | 6,336,875 | |
Class R6 | | | 43,005 | | | | 127,232 | |
Cost of shares redeemed | | | | | | | | |
Class A | | | (3,783,208 | ) | | | (7,261,678 | ) |
Class C | | | (1,377,534 | ) | | | (2,518,867 | ) |
Class P | | | (647,959 | ) | | | (1,100,898 | ) |
Institutional Class | | | (22,267,179 | ) | | | (35,208,501 | ) |
Class R6 | | | (2,060,918 | ) | | | (113,880 | ) |
Net increase (decrease) from capital share transactions | | | (3,069,085 | ) | | | 9,942,565 | |
Net increase in net assets | | | 5,596,775 | | | | 15,387,683 | |
| | | | | | | | | |
Net assets: | | | | | | | | |
Beginning of period | | | 189,099,124 | | | | 173,711,441 | |
End of period | | $ | 194,695,899 | | | $ | 189,099,124 | |
| | | | | | | | | |
SEE NOTES TO FINANCIAL STATEMENTS. | THE GUGGENHEIM FUNDS SEMI-ANNUAL REPORT | 23 |
STATEMENTS OF CHANGES IN NET ASSETS (concluded)
| | Six Months Ended
March 31, 2024
(Unaudited) | | | Year Ended
September 30,
2023 | |
Capital share activity: | | | | | | | | |
Shares sold | | | | | | | | |
Class A | | | 277,713 | | | | 466,658 | |
Class C | | | 15,010 | | | | 123,430 | |
Class P | | | 13,978 | | | | 152,312 | |
Institutional Class | | | 2,393,657 | | | | 5,099,917 | |
Class R6 | | | 2,074 | | | | 283 | |
Shares issued from reinvestment of distributions | | | | | | | | |
Class A | | | 136,153 | | | | 261,165 | |
Class C | | | 26,007 | | | | 54,963 | |
Class P | | | 17,535 | | | | 32,203 | |
Institutional Class | | | 463,121 | | | | 821,359 | |
Class R6 | | | 4,496 | | | | 13,463 | |
Shares redeemed | | | | | | | | |
Class A | | | (395,005 | ) | | | (767,705 | ) |
Class C | | | (141,958 | ) | | | (264,048 | ) |
Class P | | | (66,508 | ) | | | (116,881 | ) |
Institutional Class | | | (2,832,939 | ) | | | (4,570,555 | ) |
Class R6 | | | (211,719 | ) | | | (12,038 | ) |
Net increase (decrease) in shares | | | (298,385 | ) | | | 1,294,526 | |
24 | THE GUGGENHEIM FUNDS SEMI-ANNUAL REPORT | SEE NOTES TO FINANCIAL STATEMENTS. |
This table is presented to show selected data for a share outstanding throughout each period and to assist shareholders in evaluating a Fund’s performance for the periods presented.
Class A | | Six Months Ended
March 31, 2024a | | | Year Ended
September 30,
2023 | | | Year Ended
September 30,
2022 | | | Year Ended
September 30,
2021 | | | Year Ended
September 30,
2020 | | | Year Ended
September 30,
2019 | |
Per Share Data |
Net asset value, beginning of period | | $ | 9.43 | | | $ | 9.14 | | | $ | 10.98 | | | $ | 10.37 | | | $ | 10.90 | | | $ | 11.04 | |
Income (loss) from investment operations: |
Net investment income (loss)c | | | .31 | | | | .57 | | | | .56 | | | | .49 | | | | .57 | | | | .64 | |
Net gain (loss) on investments (realized and unrealized) | | | .43 | | | | .30 | | | | (1.86 | ) | | | .63 | | | | (.50 | ) | | | (.12 | ) |
Total from investment operations | | | .74 | | | | .87 | | | | (1.30 | ) | | | 1.12 | | | | .07 | | | | .52 | |
Less distributions from: |
Net investment income | | | (.31 | ) | | | (.57 | ) | | | (.52 | ) | | | (.48 | ) | | | (.60 | ) | | | (.66 | ) |
Return of capital | | | — | | | | (.01 | ) | | | (.02 | ) | | | (.03 | ) | | | — | | | | — | |
Total distributions | | | (.31 | ) | | | (.58 | ) | | | (.54 | ) | | | (.51 | ) | | | (.60 | ) | | | (.66 | ) |
Redemption fees collected | | | — | b | | | — | b | | | — | b | | | — | b | | | — | b | | | — | b |
Net asset value, end of period | | $ | 9.86 | | | $ | 9.43 | | | $ | 9.14 | | | $ | 10.98 | | | $ | 10.37 | | | $ | 10.90 | |
|
Total Returnd | | | 7.83 | % | | | 9.60 | % | | | (12.10 | %) | | | 11.02 | % | | | 0.84 | % | | | 4.99 | % |
Ratios/Supplemental Data |
Net assets, end of period (in thousands) | | $ | 47,071 | | | $ | 44,846 | | | $ | 43,822 | | | $ | 55,550 | | | $ | 53,997 | | | $ | 67,916 | |
Ratios to average net assets: |
Net investment income (loss) | | | 6.50 | % | | | 6.07 | % | | | 5.46 | % | | | 4.51 | % | | | 5.44 | % | | | 5.94 | % |
Total expensese | | | 1.19 | % | | | 1.22 | % | | | 1.14 | % | | | 1.07 | % | | | 1.21 | % | | | 1.27 | % |
Net expensesf,g,h | | | 1.11 | % | | | 1.16 | % | | | 1.10 | % | | | 1.05 | % | | | 1.20 | % | | | 1.26 | % |
Portfolio turnover rate | | | 17 | % | | | 31 | % | | | 42 | % | | | 86 | % | | | 81 | % | | | 61 | % |
Class C | | Six Months Ended
March 31, 2024a | | | Year Ended
September 30,
2023 | | | Year Ended
September 30,
2022 | | | Year Ended
September 30,
2021 | | | Year Ended
September 30,
2020 | | | Year Ended
September 30,
2019 | |
Per Share Data |
Net asset value, beginning of period | | $ | 9.51 | | | $ | 9.22 | | | $ | 11.07 | | | $ | 10.46 | | | $ | 10.99 | | | $ | 11.14 | |
Income (loss) from investment operations: |
Net investment income (loss)c | | | .28 | | | | .51 | | | | .47 | | | | .40 | | | | .49 | | | | .56 | |
Net gain (loss) on investments (realized and unrealized) | | | .43 | | | | .29 | | | | (1.85 | ) | | | .64 | | | | (.49 | ) | | | (.12 | ) |
Total from investment operations | | | .71 | | | | .80 | | | | (1.38 | ) | | | 1.04 | | | | — | | | | .44 | |
Less distributions from: |
Net investment income | | | (.28 | ) | | | (.50 | ) | | | (.45 | ) | | | (.40 | ) | | | (.53 | ) | | | (.59 | ) |
Return of capital | | | — | | | | (.01 | ) | | | (.02 | ) | | | (.03 | ) | | | — | | | | — | |
Total distributions | | | (.28 | ) | | | (.51 | ) | | | (.47 | ) | | | (.43 | ) | | | (.53 | ) | | | (.59 | ) |
Redemption fees collected | | | — | b | | | — | b | | | — | b | | | — | b | | | — | b | | | — | b |
Net asset value, end of period | | $ | 9.94 | | | $ | 9.51 | | | $ | 9.22 | | | $ | 11.07 | | | $ | 10.46 | | | $ | 10.99 | |
|
Total Returnd | | | 7.40 | % | | | 8.75 | % | | | (12.76 | %) | | | 10.04 | % | | | 0.09 | % | | | 4.12 | % |
Ratios/Supplemental Data |
Net assets, end of period (in thousands) | | $ | 8,837 | | | $ | 9,417 | | | $ | 9,915 | | | $ | 16,242 | | | $ | 16,437 | | | $ | 21,935 | |
Ratios to average net assets: |
Net investment income (loss) | | | 5.76 | % | | | 5.30 | % | | | 4.55 | % | | | 3.67 | % | | | 4.68 | % | | | 5.17 | % |
Total expensese | | | 1.96 | % | | | 1.97 | % | | | 1.94 | % | | | 1.91 | % | | | 2.00 | % | | | 2.03 | % |
Net expensesf,g,h | | | 1.87 | % | | | 1.92 | % | | | 1.90 | % | | | 1.89 | % | | | 1.99 | % | | | 2.02 | % |
Portfolio turnover rate | | | 17 | % | | | 31 | % | | | 42 | % | | | 86 | % | | | 81 | % | | | 61 | % |
SEE NOTES TO FINANCIAL STATEMENTS. | THE GUGGENHEIM FUNDS SEMI-ANNUAL REPORT | 25 |
FINANCIAL HIGHLIGHTS (continued) |
This table is presented to show selected data for a share outstanding throughout each period and to assist shareholders in evaluating a Fund’s performance for the periods presented.
Class P | | Six Months Ended
March 31, 2024a | | | Year Ended
September 30,
2023 | | | Year Ended
September 30,
2022 | | | Year Ended
September 30,
2021 | | | Year Ended
September 30,
2020 | | | Year Ended
September 30,
2019 | |
Per Share Data |
Net asset value, beginning of period | | $ | 9.44 | | | $ | 9.14 | | | $ | 10.98 | | | $ | 10.38 | | | $ | 10.91 | | | $ | 11.05 | |
Income (loss) from investment operations: |
Net investment income (loss)c | | | .32 | | | | .57 | | | | .55 | | | | .48 | | | | .57 | | | | .64 | |
Net gain (loss) on investments (realized and unrealized) | | | .41 | | | | .30 | | | | (1.85 | ) | | | .62 | | | | (.50 | ) | | | (.12 | ) |
Total from investment operations | | | .73 | | | | .87 | | | | (1.30 | ) | | | 1.10 | | | | .07 | | | | .52 | |
Less distributions from: |
Net investment income | | | (.31 | ) | | | (.56 | ) | | | (.52 | ) | | | (.47 | ) | | | (.60 | ) | | | (.66 | ) |
Return of capital | | | — | | | | (.01 | ) | | | (.02 | ) | | | (.03 | ) | | | — | | | | — | |
Total distributions | | | (.31 | ) | | | (.57 | ) | | | (.54 | ) | | | (.50 | ) | | | (.60 | ) | | | (.66 | ) |
Redemption fees collected | | | — | b | | | — | b | | | — | b | | | — | b | | | — | b | | | — | b |
Net asset value, end of period | | $ | 9.86 | | | $ | 9.44 | | | $ | 9.14 | | | $ | 10.98 | | | $ | 10.38 | | | $ | 10.91 | |
|
Total Return | | | 7.74 | % | | | 9.71 | % | | | (12.13 | %) | | | 10.80 | % | | | 0.80 | % | | | 4.98 | % |
Ratios/Supplemental Data |
Net assets, end of period (in thousands) | | $ | 5,094 | | | $ | 5,205 | | | $ | 4,426 | | | $ | 5,660 | | | $ | 5,837 | | | $ | 8,170 | |
Ratios to average net assets: |
Net investment income (loss) | | | 6.55 | % | | | 6.07 | % | | | 5.37 | % | | | 4.40 | % | | | 5.42 | % | | | 5.93 | % |
Total expensese | | | 1.19 | % | | | 1.22 | % | | | 1.28 | % | | | 1.20 | % | | | 1.26 | % | | | 1.30 | % |
Net expensesf,g,h | | | 1.11 | % | | | 1.16 | % | | | 1.15 | % | | | 1.16 | % | | | 1.25 | % | | | 1.28 | % |
Portfolio turnover rate | | | 17 | % | | | 31 | % | | | 42 | % | | | 86 | % | | | 81 | % | | | 61 | % |
Institutional Class | | Six Months Ended
March 31, 2024a | | | Year Ended
September 30,
2023 | | | Year Ended
September 30,
2022 | | | Year Ended
September 30,
2021 | | | Year Ended
September 30,
2020 | | | Year Ended
September 30,
2019 | |
Per Share Data |
Net asset value, beginning of period | | $ | 7.68 | | | $ | 7.45 | | | $ | 8.94 | | | $ | 8.45 | | | $ | 8.88 | | | $ | 9.01 | |
Income (loss) from investment operations: |
Net investment income (loss)c | | | .27 | | | | .49 | | | | .47 | | | | .41 | | | | .48 | | | | .54 | |
Net gain (loss) on investments (realized and unrealized) | | | .34 | | | | .23 | | | | (1.50 | ) | | | .51 | | | | (.39 | ) | | | (.10 | ) |
Total from investment operations | | | .61 | | | | .72 | | | | (1.03 | ) | | | .92 | | | | .09 | | | | .44 | |
Less distributions from: |
Net investment income | | | (.26 | ) | | | (.48 | ) | | | (.44 | ) | | | (.40 | ) | | | (.52 | ) | | | (.57 | ) |
Return of capital | | | — | | | | (.01 | ) | | | (.02 | ) | | | (.03 | ) | | | — | | | | — | |
Total distributions | | | (.26 | ) | | | (.49 | ) | | | (.46 | ) | | | (.43 | ) | | | (.52 | ) | | | (.57 | ) |
Redemption fees collected | | | — | b | | | — | b | | | — | b | | | — | b | | | — | b | | | — | b |
Net asset value, end of period | | $ | 8.03 | | | $ | 7.68 | | | $ | 7.45 | | | $ | 8.94 | | | $ | 8.45 | | | $ | 8.88 | |
|
Total Return | | | 8.07 | % | | | 9.78 | % | | | (11.80 | %) | | | 11.14 | % | | | 1.14 | % | | | 5.15 | % |
Ratios/Supplemental Data |
Net assets, end of period (in thousands) | | $ | 133,641 | | | $ | 127,649 | | | $ | 113,644 | | | $ | 167,486 | | | $ | 171,641 | | | $ | 180,442 | |
Ratios to average net assets: |
Net investment income (loss) | | | 6.91 | % | | | 6.32 | % | | | 5.63 | % | | | 4.71 | % | | | 5.67 | % | | | 6.17 | % |
Total expensese | | | 0.91 | % | | | 0.95 | % | | | 0.95 | % | | | 0.88 | % | | | 0.98 | % | | | 0.99 | % |
Net expensesf,g,h | | | 0.86 | % | | | 0.91 | % | | | 0.88 | % | | | 0.85 | % | | | 0.96 | % | | | 0.97 | % |
Portfolio turnover rate | | | 17 | % | | | 31 | % | | | 42 | % | | | 86 | % | | | 81 | % | | | 61 | % |
26 | THE GUGGENHEIM FUNDS SEMI-ANNUAL REPORT | SEE NOTES TO FINANCIAL STATEMENTS. |
FINANCIAL HIGHLIGHTS (concluded) |
This table is presented to show selected data for a share outstanding throughout each period and to assist shareholders in evaluating a Fund’s performance for the periods presented.
Class R6 | | Six Months Ended
March 31, 2024a | | | Year Ended
September 30,
2023 | | | Year Ended
September 30,
2022 | | | Year Ended
September 30,
2021 | | | Year Ended
September 30,
2020 | | | Year Ended
September 30,
2019 | |
Per Share Data |
Net asset value, beginning of period | | $ | 9.41 | | | $ | 9.12 | | | $ | 10.97 | | | $ | 10.36 | | | $ | 10.89 | | | $ | 11.03 | |
Income (loss) from investment operations: |
Net investment income (loss)c | | | .44 | | | | .61 | | | | .50 | | | | .52 | | | | .60 | | | | .68 | |
Net gain (loss) on investments (realized and unrealized) | | | .40 | | | | .29 | | | | (1.77 | ) | | | .63 | | | | (.49 | ) | | | (.12 | ) |
Total from investment operations | | | .84 | | | | .90 | | | | (1.27 | ) | | | 1.15 | | | | .11 | | | | .56 | |
Less distributions from: |
Net investment income | | | (.31 | ) | | | (.60 | ) | | | (.56 | ) | | | (.51 | ) | | | (.64 | ) | | | (.70 | ) |
Return of capital | | | — | | | | (.01 | ) | | | (.02 | ) | | | (.03 | ) | | | — | | | | — | |
Total distributions | | | (.31 | ) | | | (.61 | ) | | | (.58 | ) | | | (.54 | ) | | | (.64 | ) | | | (.70 | ) |
Redemption fees collected | | | — | b | | | — | b | | | — | b | | | — | b | | | — | b | | | — | b |
Net asset value, end of period | | $ | 9.94 | | | $ | 9.41 | | | $ | 9.12 | | | $ | 10.97 | | | $ | 10.36 | | | $ | 10.89 | |
|
Total Return | | | 7.99 | % | | | 10.00 | % | | | (11.91 | %) | | | 11.35 | % | | | 1.19 | % | | | 5.39 | % |
Ratios/Supplemental Data |
Net assets, end of period (in thousands) | | $ | 53 | | | $ | 1,982 | | | $ | 1,905 | | | $ | 126,683 | | | $ | 127,037 | | | $ | 151,558 | |
Ratios to average net assets: |
Net investment income (loss) | | | 9.15 | % | | | 6.43 | % | | | 4.70 | % | | | 4.80 | % | | | 5.79 | % | | | 6.31 | % |
Total expensese | | | 0.86 | % | | | 0.84 | % | | | 0.75 | % | | | 0.77 | % | | | 0.85 | % | | | 0.89 | % |
Net expensesf,g,h | | | 0.78 | % | | | 0.80 | % | | | 0.75 | % | | | 0.76 | % | | | 0.85 | % | | | 0.88 | % |
Portfolio turnover rate | | | 17 | % | | | 31 | % | | | 42 | % | | | 86 | % | | | 81 | % | | | 61 | % |
a | Unaudited figures for the period ended March 31, 2024. Percentage amounts for the period, except total return and portfolio turnover rate, have been annualized. |
b | Redemption fees collected are less than $0.01 per share. |
c | Net investment income (loss) per share was computed using average shares outstanding throughout the period. |
d | Total return does not reflect the impact of any applicable sales charges. |
e | Does not include expenses of the underlying funds in which the Fund invests. |
f | Net expense information reflects the expense ratios after expense waivers and reimbursements, as applicable. |
g | The portion of the ratios of net expenses to average net assets attributable to recoupments of prior fee reductions or expense reimbursements for the years presented was as follows: |
| | | 03/31/24a | 09/30/23 | 09/30/22 | 09/30/21 | 09/30/20 | 09/30/19 |
| | Class A | 0.04% | 0.04% | 0.01% | 0.00%* | 0.05% | 0.05% |
| | Class C | 0.02% | 0.04% | 0.00%* | 0.01% | 0.04% | 0.05% |
| | Class P | 0.04% | 0.01% | 0.04% | 0.04% | 0.02% | 0.01% |
| | Institutional Class | 0.07% | 0.03% | 0.02% | 0.01% | 0.02% | 0.02% |
| | Class R6 | — | — | — | — | 0.00%* | 0.00%* |
h | Net expenses may include expenses that are excluded from the expense limitation agreement. Excluding these expenses, the net expense ratios for the years presented would be: |
| | | 03/31/24a | 09/30/23 | 09/30/22 | 09/30/21 | 09/30/20 | 09/30/19 |
| | Class A | 1.08% | 1.13% | 1.09% | 1.03% | 1.12% | 1.15% |
| | Class C | 1.84% | 1.89% | 1.89% | 1.87% | 1.90% | 1.91% |
| | Class P | 1.08% | 1.13% | 1.14% | 1.14% | 1.16% | 1.16% |
| | Institutional Class | 0.83% | 0.88% | 0.87% | 0.83% | 0.87% | 0.88% |
| | Class R6 | 0.75% | 0.77% | 0.75% | 0.74% | 0.77% | 0.77% |
SEE NOTES TO FINANCIAL STATEMENTS. | THE GUGGENHEIM FUNDS SEMI-ANNUAL REPORT | 27 |
PERFORMANCE REPORT AND FUND PROFILE (Unaudited) | March 31, 2024 |
CORE BOND FUND
OBJECTIVE: Seeks to provide current income.
Holdings Diversification (Market Exposure as % of Net Assets)
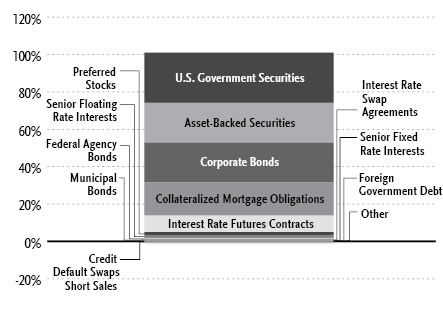
“Holdings Diversification (Market Exposure as % of Net Assets)” excludes any temporary cash investments.
Portfolio Composition by Quality Rating1 |
Rating | % of Total Investments |
Fixed Income Instruments | |
AAA | 51.5% |
AA | 7.4% |
A | 18.6% |
BBB | 16.6% |
BB | 1.3% |
B | 0.3% |
CCC | 0.1% |
CC | 0.1% |
C | 0.0% |
NR2 | 0.6% |
Other Instruments | 3.5% |
Total Investments | 100.0% |
Inception Dates: |
Class A | August 15, 1985 |
Class C | May 1, 2000 |
Class P | May 1, 2015 |
Institutional Class | January 29, 2013 |
Ten Largest Holdings | % of Total Net Assets |
U.S. Treasury Notes, 4.13% | 12.5% |
U.S. Treasury Notes, 3.50% | 3.0% |
U.S. Treasury Bonds, 4.38% | 2.6% |
U.S. Treasury Bonds due 05/15/53 | 2.4% |
Fannie Mae, 5.50% due 05/01/53 | 1.4% |
Fannie Mae, 5.00% due 06/01/53 | 1.3% |
U.S. Treasury Notes, 3.63% | 1.1% |
Fannie Mae, 5.00% due 05/15/53 | 0.8% |
United States Treasury Inflation Indexed Bonds, 0.13% | 0.8% |
Freddie Mac, 5.50% due 09/01/53 | 0.8% |
Top Ten Total | 26.7% |
| | |
“Ten Largest Holdings” excludes any temporary cash or derivative investments. |
* | Less than 0.10% of Total Investments |
1 | Source: BlackRock Solutions. Credit quality ratings are measured on a scale that generally ranges from AAA (highest) to D (lowest). All securities except for those labeled “NR” have been rated by Moody’s, Standard & Poor’s (“S&P”), or Fitch, each of which is a Nationally Recognized Statistical Rating Organization (“NRSRO”). For purposes of this presentation, when ratings are available from more than one agency, the highest rating is used. Guggenheim Investments has converted ratings to the equivalent S&P rating. Security ratings are determined at the time of purchase and may change thereafter. |
2 | NR (not rated) securities do not necessarily indicate low credit quality. |
28 | THE GUGGENHEIM FUNDS SEMI-ANNUAL REPORT | |
PERFORMANCE REPORT AND FUND PROFILE (Unaudited)(concluded) | March 31, 2024 |
Average Annual Returns*
Periods Ended March 31, 2024
| 6 Month† | 1 Year | 5 Year | 10 Year |
Class A Shares | 6.24% | 2.45% | 0.88% | 2.32% |
Class A Shares with sales charge‡ | 1.98% | (1.67%) | 0.06% | 1.82% |
Class C Shares | 5.94% | 1.77% | 0.15% | 1.58% |
Class C Shares with CDSC§ | 4.94% | 0.78% | 0.15% | 1.58% |
Institutional Class Shares | 6.47% | 2.82% | 1.18% | 2.62% |
Bloomberg U.S. Aggregate Bond Index | 5.99% | 1.70% | 0.36% | 1.54% |
| 6 Month† | 1 Year | 5 Year | Since
Inception
(05/01/15) |
Class P Shares | 6.23% | 2.45% | 0.87% | 1.95% |
Bloomberg U.S. Aggregate Bond Index | 5.99% | 1.70% | 0.36% | 1.18% |
* | The performance data above represents past performance that is not predictive of future results. The investment return and principal value of an investment in the Fund will fluctuate so that an investor’s shares, when redeemed, may be worth more or less than their original cost. Returns are historical and include changes in principal and reinvested dividends and capital gains and do not reflect the effect of taxes. The Bloomberg U.S. Aggregate Bond Index is an unmanaged index and, unlike the Fund, has no management fees or operating expenses to reduce its reported return. |
† | 6 month returns are not annualized. |
‡ | Effective October 1, 2015, the maximum sales charge decreased from 4.75% to 4.00%. A 4.75% maximum sales charge is used in the calculation of the Average Annual Returns based on subscriptions made prior to October 1, 2015, and a 4.00% maximum sales charge is used to calculated performance for the periods based on subscriptions made on or after October 1, 2015. |
§ | Fund returns include a CDSC of 1% if redeemed within 12 months of purchase. |
| | THE GUGGENHEIM FUNDS SEMI-ANNUAL REPORT | 29 |
SCHEDULE OF INVESTMENTS (Unaudited) | March 31, 2024 |
CORE BOND FUND | |
| | Shares | | | Value | |
COMMON STOCKS† - 0.0% |
| | | | | | | | | |
Communications - 0.0% |
Vacasa, Inc. — Class A* | | | 1,596 | | | $ | 10,885 | |
| | | | | | | | | |
Financial - 0.0% |
Pershing Square Tontine Holdings, Ltd. — Class A*,†††,1 | | | 622,890 | | | | 62 | |
| | | | | | | | | |
Industrial - 0.0% |
Constar International Holdings LLC*,††† | | | 68 | | | | — | |
| | | | | | | | | |
Total Common Stocks | | | | |
(Cost $318,203) | | | | | | | 10,947 | |
| | | | | | | | | |
PREFERRED STOCKS†† - 1.7% |
Financial - 1.7% |
Charles Schwab Corp. |
4.00% | | | 8,500,000 | | | | 7,171,915 | |
Wells Fargo & Co. |
3.90% | | | 5,550,000 | | | | 5,280,416 | |
State Street Corp. |
6.70% | | | 4,870,000 | | | | 4,941,696 | |
JPMorgan Chase & Co. |
3.65%2 | | | 2,350,000 | | | | 2,231,883 | |
6.88% | | | 1,400,000 | | | | 1,448,681 | |
Bank of New York Mellon Corp. |
3.75% | | | 3,900,000 | | | | 3,574,740 | |
MetLife, Inc. |
3.85% | | | 3,520,000 | | | | 3,383,436 | |
Bank of America Corp. |
6.13% | | | 1,650,000 | | | | 1,654,506 | |
Markel Group, Inc. |
6.00% | | | 1,360,000 | | | | 1,348,860 | |
CNO Financial Group, Inc. |
5.13% due 11/25/60 | | | 48,000 | | | | 1,046,880 | |
Kuvare US Holdings, Inc. |
7.00%2 | | | 1,000,000 | | | | 1,010,000 | |
Depository Trust & Clearing Corp. |
3.38%2 | | | 1,000,000 | | | | 887,500 | |
Assurant, Inc. |
5.25% due 01/15/61 | | | 3,350 | | | | 76,380 | |
First Republic Bank |
4.25%* | | | 77,975 | | | | 16 | |
Total Financial | | | | | | | 34,056,909 | |
| | | | | | | | | |
Industrial - 0.0% |
Constar International Holdings LLC*,††† | | | 7 | | | | — | |
Total Preferred Stocks | | | | |
(Cost $38,040,925) | | | | | | | 34,056,909 | |
| | | | | | | | | |
WARRANTS† - 0.0% |
Ginkgo Bioworks Holdings, Inc. | | | | | | | | |
Expiring 09/16/26* | | | 6,510 | | | | 586 | |
Pershing Square Tontine Holdings, Ltd. | | | | | | | | |
Expiring 07/24/25*,†††,1 | | | 69,210 | | | | 7 | |
Total Warrants | | | | |
(Cost $15,075) | | | | | | | 593 | |
| | | | | | | | | |
MONEY MARKET FUNDS† - 1.6% |
Dreyfus Treasury Securities Cash Management Fund — Institutional Shares, 5.19%3 | | | 22,344,604 | | | | 22,344,604 | |
Dreyfus Treasury Obligations Cash Management Fund — Institutional Shares, 5.20%3 | | | 10,342,190 | | | | 10,342,190 | |
Total Money Market Funds | | | | |
(Cost $32,686,794) | | | | | | | 32,686,794 | |
| | | Face
Amount~ | | | | | |
U.S. GOVERNMENT SECURITIES†† - 26.9% |
U.S. Treasury Notes |
4.13% due 03/31/31 | | | 248,880,000 | | | | 247,480,050 | |
3.50% due 01/31/28 | | | 61,817,000 | | | | 60,008,370 | |
3.63% due 05/15/26 | | | 22,000,000 | | | | 21,563,438 | |
2.75% due 02/15/28 | | | 8,370,000 | | | | 7,901,149 | |
4.13% due 06/15/26 | | | 260,000 | | | | 257,441 | |
U.S. Treasury Bonds |
4.38% due 11/15/39 | | | 51,880,000 | | | | 52,338,003 | |
due 05/15/534,5 | | | 164,480,000 | | | | 48,217,269 | |
due 11/15/534,5 | | | 46,000,000 | | | | 13,521,586 | |
due 08/15/534,5 | | | 35,000,000 | | | | 10,236,282 | |
due 02/15/524,5 | | | 29,980,000 | | | | 9,086,723 | |
due 02/15/464,6 | | | 23,500,000 | | | | 8,566,336 | |
due 05/15/444,6 | | | 20,000,000 | | | | 7,880,707 | |
due 02/15/544,5 | | | 14,000,000 | | | | 4,035,862 | |
4.75% due 11/15/53 | | | 3,000,000 | | | | 3,202,500 | |
due 11/15/444,6 | | | 4,600,000 | | | | 1,769,113 | |
United States Treasury Inflation Indexed Bonds |
0.13% due 10/15/2514 | | | 16,638,020 | | | | 16,148,029 | |
0.13% due 04/15/2514 | | | 16,152,249 | | | | 15,752,036 | |
1.25% due 04/15/2814 | | | 4,009,395 | | | | 3,894,731 | |
1.38% due 07/15/3314 | | | 1,959,587 | | | | 1,880,574 | |
Total U.S. Government Securities | | | | |
(Cost $543,817,504) | | | | | | | 533,740,199 | |
| | | | | | | | | |
ASSET-BACKED SECURITIES†† - 21.4% |
Collateralized Loan Obligations - 12.5% | | | | | | | | |
Woodmont Trust | | | | | | | | |
2020-7A A1A, 7.48% (3 Month Term SOFR + 2.16%, Rate Floor: 1.90%) due 01/15/32◊,2 | | | 12,000,000 | | | | 12,043,048 | |
2020-7A B, 8.18% (3 Month Term SOFR + 2.86%, Rate Floor: 2.60%) due 01/15/32◊,2 | | | 3,750,000 | | | | 3,785,066 | |
Palmer Square Loan Funding Ltd. | | | | | | | | |
2021-1A B, 7.38% (3 Month Term SOFR + 2.06%, Rate Floor: 2.06%) due 04/20/29◊,2 | | | 2,000,000 | | | | 2,001,560 | |
2021-1A A2, 6.83% (3 Month Term SOFR + 1.51%, Rate Floor: 1.51%) due 04/20/29◊,2 | | | 2,000,000 | | | | 2,001,203 | |
30 | THE GUGGENHEIM FUNDS SEMI-ANNUAL REPORT | SEE NOTES TO FINANCIAL STATEMENTS. |
SCHEDULE OF INVESTMENTS (Unaudited)(continued) | March 31, 2024 |
CORE BOND FUND | |
| | Face
Amount~ | | | Value | |
2021-3A C, 8.08% (3 Month Term SOFR + 2.76%, Rate Floor: 2.76%) due 07/20/29◊,2 | | | 2,000,000 | | | $ | 1,971,325 | |
2023-2A A2, 7.65% (3 Month Term SOFR + 2.30%, Rate Floor: 2.30%) due 01/25/32◊,2 | | | 1,500,000 | | | | 1,500,057 | |
2024-3A BR, 7.32% (3 Month Term SOFR + 2.00%, Rate Floor: 2.00%) due 04/15/31◊,2 | | | 1,500,000 | | | | 1,498,483 | |
2023-1A B, 8.12% (3 Month Term SOFR + 2.80%, Rate Floor: 2.80%) due 07/20/31◊,2 | | | 1,250,000 | | | | 1,250,875 | |
2023-4A B, 8.07% (3 Month Term SOFR + 2.75%, Rate Floor: 2.75%) due 07/24/31◊,2 | | | 1,000,000 | | | | 1,000,920 | |
2023-2A B, 8.05% (3 Month Term SOFR + 2.70%, Rate Floor: 2.70%) due 01/25/32◊,2 | | | 1,000,000 | | | | 999,403 | |
2021-2A C, 7.98% (3 Month Term SOFR + 2.66%, Rate Floor: 2.66%) due 05/20/29◊,2 | | | 1,000,000 | | | | 990,849 | |
LCCM Trust | | | | | | | | |
2021-FL3 A, 6.89% (1 Month Term SOFR + 1.56%, Rate Floor: 1.56%) due 11/15/38◊,2 | | | 5,934,820 | | | | 5,851,573 | |
2021-FL3 AS, 7.24% (1 Month Term SOFR + 1.91%, Rate Floor: 1.91%) due 11/15/38◊,2 | | | 3,950,000 | | | | 3,799,339 | |
2021-FL2 C, 7.59% (1 Month Term SOFR + 2.26%, Rate Floor: 2.26%) due 12/13/38◊,2 | | | 3,100,000 | | | | 2,874,514 | |
Cerberus Loan Funding XLIV LLC | | | | | | | | |
2024-5A A, 7.45% (3 Month Term SOFR + 2.35%, Rate Floor: 2.35%) due 01/15/36◊,2 | | | 8,900,000 | | | | 8,992,603 | |
2024-5A B, 8.30% (3 Month Term SOFR + 3.20%, Rate Floor: 3.20%) due 01/15/36◊,2 | | | 3,000,000 | | | | 3,001,653 | |
LoanCore Issuer Ltd. | | | | | | | | |
2021-CRE5 C, 7.79% (1 Month Term SOFR + 2.46%, Rate Floor: 2.46%) due 07/15/36◊,2 | | | 7,500,000 | | | | 7,099,615 | |
2021-CRE6 C, 7.74% (1 Month Term SOFR + 2.41%, Rate Floor: 2.30%) due 11/15/38◊,2 | | | 4,000,000 | | | | 3,847,108 | |
Octagon Investment Partners 49 Ltd. | | | | | | | | |
2024-5A BR, 7.24% (3 Month Term SOFR + 1.95%, Rate Floor: 1.95%) due 04/15/37◊,2 | | | 8,500,000 | | | | 8,508,690 | |
Dryden 36 Senior Loan Fund | | | | | | | | |
2020-36A CR3, 7.63% (3 Month Term SOFR + 2.31%, Rate Floor: 2.05%) due 04/15/29◊,2 | | | 8,000,000 | | | | 8,009,707 | |
Madison Park Funding XLVIII Ltd. | | | | | | | | |
2021-48A C, 7.57% (3 Month Term SOFR + 2.26%, Rate Floor: 2.26%) due 04/19/33◊,2 | | | 4,000,000 | | | | 4,001,878 | |
2021-48A B, 7.02% (3 Month Term SOFR + 1.71%, Rate Floor: 1.71%) due 04/19/33◊,2 | | | 4,000,000 | | | | 3,993,688 | |
GoldenTree Loan Management US CLO 1 Ltd. | | | | | | | | |
2024-9A BR, due 04/20/37◊,2 | | | 5,000,000 | | | | 5,000,000 | |
2021-9A C, 7.38% (3 Month Term SOFR + 2.06%, Rate Floor: 1.80%) due 01/20/33◊,2 | | | 3,000,000 | | | | 2,972,288 | |
Cerberus Loan Funding XLV LLC | | | | | | | | |
2024-1A A, 7.29% (3 Month Term SOFR + 1.90%, Rate Floor: 1.90%) due 04/15/36◊,2 | | | 6,500,000 | | | | 6,501,071 | |
2024-1A B, 7.72% (3 Month Term SOFR + 2.40%, Rate Floor: 2.40%) due 04/15/36◊,2 | | | 1,000,000 | | | | 999,997 | |
MF1 Multifamily Housing Mortgage Loan Trust | | | | | | | | |
2021-FL6 D, 7.99% (1 Month Term SOFR + 2.66%, Rate Floor: 2.55%) due 07/16/36◊,2 | | | 4,000,000 | | | | 3,835,893 | |
2021-FL6 C, 7.29% (1 Month Term SOFR + 1.96%, Rate Floor: 1.85%) due 07/16/36◊,2 | | | 3,400,000 | | | | 3,263,026 | |
Owl Rock CLO III Ltd. | | | | | | | | |
2024-3A AR, due 04/20/36◊,2 | | | 6,750,000 | | | | 6,750,000 | |
Golub Capital Partners CLO 33M Ltd. | | | | | | | | |
2021-33A AR2, 7.45% (3 Month Term SOFR + 2.12%, Rate Floor: 1.86%) due 08/25/33◊,2 | | | 6,500,000 | | | | 6,461,374 | |
FS Rialto | | | | | | | | |
2021-FL2 A, 6.66% (1 Month Term SOFR + 1.33%, Rate Floor: 1.33%) due 05/16/38◊,2 | | | 4,595,665 | | | | 4,545,914 | |
2021-FL3 C, 7.49% (1 Month Term SOFR + 2.16%, Rate Floor: 2.16%) due 11/16/36◊,2 | | | 2,000,000 | | | | 1,902,264 | |
Owl Rock CLO XVI | | | | | | | | |
2024-16A A, 7.32% (3 Month Term SOFR + 2.00%, Rate Floor: 2.00%) due 04/20/36◊,2 | | | 5,000,000 | | | | 5,027,883 | |
2024-16A B, 7.82% (3 Month Term SOFR + 2.50%, Rate Floor: 2.50%) due 04/20/36◊,2 | | | 1,000,000 | | | | 1,010,067 | |
Golub Capital Partners CLO 16 Ltd. | | | | | | | | |
2021-16A A1R2, 7.20% (3 Month Term SOFR + 1.87%, Rate Floor: 1.61%) due 07/25/33◊,2 | | | 4,000,000 | | | | 4,021,115 | |
2021-16A A2R2, 7.39% (3 Month Term SOFR + 2.06%, Rate Floor: 1.80%) due 07/25/33◊,2 | | | 2,000,000 | | | | 2,006,110 | |
ABPCI Direct Lending Fund CLO II LLC | | | | | | | | |
2021-1A A1R, 7.18% (3 Month Term SOFR + 1.86%, Rate Floor: 1.60%) due 04/20/32◊,2 | | | 5,500,000 | | | | 5,506,382 | |
SEE NOTES TO FINANCIAL STATEMENTS. | THE GUGGENHEIM FUNDS SEMI-ANNUAL REPORT | 31 |
SCHEDULE OF INVESTMENTS (Unaudited)(continued) | March 31, 2024 |
CORE BOND FUND | |
| | Face
Amount~ | | | Value | |
Cerberus Loan Funding XXXII, LP | | | | | | | | |
2021-2A A, 7.20% (3 Month Term SOFR + 1.88%, Rate Floor: 1.88%) due 04/22/33◊,2 | | | 4,250,000 | | | $ | 4,235,134 | |
2021-2A C, 8.43% (3 Month Term SOFR + 3.11%, Rate Floor: 3.11%) due 04/22/33◊,2 | | | 1,250,000 | | | | 1,231,453 | |
Cerberus Loan Funding XLII LLC | | | | | | | | |
2023-3A A1, 7.79% (3 Month Term SOFR + 2.48%, Rate Floor: 2.48%) due 09/13/35◊,2 | | | 3,750,000 | | | | 3,786,337 | |
2023-3A B, 8.66% (3 Month Term SOFR + 3.35%, Rate Floor: 3.35%) due 09/13/35◊,2 | | | 1,250,000 | | | | 1,250,008 | |
Fortress Credit Opportunities IX CLO Ltd. | | | | | | | | |
2021-9A A2TR, 7.38% (3 Month Term SOFR + 2.06%, Rate Floor: 1.80%) due 10/15/33◊,2 | | | 3,250,000 | | | | 3,283,448 | |
2021-9A A1TR, 7.13% (3 Month Term SOFR + 1.81%, Rate Floor: 1.55%) due 10/15/33◊,2 | | | 1,000,000 | | | | 1,002,595 | |
THL Credit Lake Shore MM CLO I Ltd. | | | | | | | | |
2021-1A A1R, 7.28% (3 Month Term SOFR + 1.96%, Rate Floor: 1.70%) due 04/15/33◊,2 | | | 4,250,000 | | | | 4,248,866 | |
ACRES Commercial Realty Ltd. | | | | | | | | |
2021-FL2 AS, 7.19% (1 Month Term SOFR + 1.86%, Rate Floor: 1.86%) due 01/15/37◊,2 | | | 2,000,000 | | | | 1,976,080 | |
2021-FL1 AS, 7.04% (1 Month Term SOFR + 1.71%, Rate Floor: 1.71%) due 06/15/36◊,2 | | | 2,000,000 | | | | 1,966,793 | |
ABPCI Direct Lending Fund CLO I LLC | | | | | | | | |
2021-1A A1A2, 7.28% (3 Month Term SOFR + 1.96%, Rate Floor: 1.96%) due 07/20/33◊,2 | | | 3,750,000 | | | | 3,750,405 | |
Owl Rock CLO IV Ltd. | | | | | | | | |
2021-4A A1R, 7.18% (3 Month Term SOFR + 1.86%, Rate Floor: 1.60%) due 08/20/33◊,2 | | | 3,750,000 | | | | 3,748,824 | |
BSPDF Issuer Ltd. | | | | | | | | |
2021-FL1 C, 7.69% (1 Month Term SOFR + 2.36%, Rate Floor: 2.25%) due 10/15/36◊,2 | | | 4,000,000 | | | | 3,668,859 | |
Cerberus Loan Funding XL LLC | | | | | | | | |
2023-1A A, 7.71% (3 Month Term SOFR + 2.40%, Rate Floor: 2.40%) due 03/22/35◊,2 | | | 3,500,000 | | | | 3,535,645 | |
Cerberus Loan Funding XXXIII, LP | | | | | | | | |
2021-3A B, 7.43% (3 Month Term SOFR + 2.11%, Rate Floor: 1.85%) due 07/23/33◊,2 | | | 2,000,000 | | | | 1,999,450 | |
2021-3A A, 7.14% (3 Month Term SOFR + 1.82%, Rate Floor: 1.56%) due 07/23/33◊,2 | | | 1,250,000 | | | | 1,252,698 | |
Golub Capital Partners CLO 36M Ltd. | | | | | | | | |
2018-36A A, 6.83% (3 Month Term SOFR + 1.56%, Rate Floor: 0.00%) due 02/05/31◊,2 | | | 3,222,082 | | | | 3,218,677 | |
PFP Ltd. | | | | | | | | |
2021-7 D, 7.84% (1 Month Term SOFR + 2.51%, Rate Floor: 2.40%) due 04/14/38◊,2 | | | 3,321,780 | | | | 3,186,129 | |
Owl Rock CLO II Ltd. | | | | | | | | |
2021-2A ALR, 7.13% (3 Month Term SOFR + 1.81%, Rate Floor: 1.55%) due 04/20/33◊,2 | | | 3,000,000 | | | | 3,002,911 | |
Golub Capital Partners CLO 54M LP | | | | | | | | |
2021-54A A, 7.06% (3 Month Term SOFR + 1.79%, Rate Floor: 1.53%) due 08/05/33◊,2 | | | 1,500,000 | | | | 1,502,798 | |
2021-54A B, 7.38% (3 Month Term SOFR + 2.11%, Rate Floor: 1.85%) due 08/05/33◊,2 | | | 1,500,000 | | | | 1,497,059 | |
Cerberus Loan Funding XXXI, LP | | | | | | | | |
2021-1A A, 7.08% (3 Month Term SOFR + 1.76%, Rate Floor: 1.50%) due 04/15/32◊,2 | | | 2,763,833 | | | | 2,766,764 | |
VOYA CLO | | | | | | | | |
2021-2A A2AR, 7.23% (3 Month Term SOFR + 1.91%, Rate Floor: 1.65%) due 06/07/30◊,2 | | | 2,550,000 | | | | 2,553,286 | |
KREF Ltd. | | | | | | | | |
2021-FL2 AS, 6.74% (1 Month Term SOFR + 1.41%, Rate Floor: 1.30%) due 02/15/39◊,2 | | | 1,500,000 | | | | 1,442,798 | |
2021-FL2 C, 7.44% (1 Month Term SOFR + 2.11%, Rate Floor: 2.00%) due 02/15/39◊,2 | | | 1,000,000 | | | | 930,545 | |
Palmer Square CLO Ltd. | | | | | | | | |
2023-4A C, 8.01% (3 Month Term SOFR + 2.60%, Rate Floor: 2.60%) due 10/20/33◊,2 | | | 1,250,000 | | | | 1,253,028 | |
2023-4A B, 7.56% (3 Month Term SOFR + 2.15%, Rate Floor: 2.15%) due 10/20/33◊,2 | | | 1,000,000 | | | | 1,004,841 | |
BXMT Ltd. | | | | | | | | |
2020-FL2 A, 6.34% (1 Month Term SOFR + 1.01%, Rate Floor: 1.01%) due 02/15/38◊,2 | | | 2,153,305 | | | | 2,067,173 | |
Owl Rock CLO I LLC | | | | | | | | |
2024-1A ANR, 7.74% (3 Month Term SOFR + 2.40%, Rate Floor: 2.40%) due 02/20/36◊,2 | | | 2,000,000 | | | | 2,020,490 | |
Magnetite XXIX Ltd. | | | | | | | | |
2021-29A C, 7.23% (3 Month Term SOFR + 1.91%, Rate Floor: 1.65%) due 01/15/34◊,2 | | | 2,000,000 | | | | 2,002,725 | |
Madison Park Funding LVIII Ltd. | | | | | | | | |
2024-58A B, due 04/25/37◊,2 | | | 2,000,000 | | | | 2,000,000 | |
32 | THE GUGGENHEIM FUNDS SEMI-ANNUAL REPORT | SEE NOTES TO FINANCIAL STATEMENTS. |
SCHEDULE OF INVESTMENTS (Unaudited)(continued) | March 31, 2024 |
CORE BOND FUND | |
| | Face
Amount~ | | | Value | |
HPS Loan Management Ltd. | | | | | | | | |
2018-2016 BR, 7.18% (3 Month Term SOFR + 1.86%, Rate Floor: 1.60%) due 07/20/30◊,2 | | | 2,000,000 | | | $ | 1,999,478 | |
ABPCI Direct Lending Fund IX LLC | | | | | | | | |
2021-9A A2R, 7.38% (3 Month Term SOFR + 2.06%, Rate Floor: 1.80%) due 11/18/31◊,2 | | | 2,000,000 | | | | 1,996,060 | |
MidOcean Credit CLO VII | | | | | | | | |
2020-7A BR, 7.18% (3 Month Term SOFR + 1.86%, Rate Floor: 0.00%) due 07/15/29◊,2 | | | 2,000,000 | | | | 1,993,876 | |
Sound Point CLO XXXI Ltd. | | | | | | | | |
2021-3A B, 7.24% (3 Month Term SOFR + 1.91%, Rate Floor: 1.65%) due 10/25/34◊,2 | | | 2,000,000 | | | | 1,988,038 | |
Neuberger Berman Loan Advisers CLO 40 Ltd. | | | | | | | | |
2021-40A C, 7.33% (3 Month Term SOFR + 2.01%, Rate Floor: 1.75%) due 04/16/33◊,2 | | | 2,000,000 | | | | 1,979,998 | |
Canyon Capital CLO Ltd. | | | | | | | | |
2018-1A A2R, 7.08% (3 Month Term SOFR + 1.76%, Rate Floor: 1.50%) due 01/30/31◊,2 | | | 1,900,000 | | | | 1,887,154 | |
BRSP Ltd. | | | | | | | | |
2021-FL1 C, 7.59% (1 Month Term SOFR + 2.26%, Rate Floor: 2.15%) due 08/19/38◊,2 | | | 2,000,000 | | | | 1,862,373 | |
KREF Funding V LLC | | | | | | | | |
7.18% (1 Month Term SOFR + 1.86%, Rate Floor: 1.86%) due 06/25/26◊,††† | | | 1,536,115 | | | | 1,526,322 | |
0.15% due 06/25/26†††,6 | | | 21,818,182 | | | | 18,327 | |
Fortress Credit Opportunities XI CLO Ltd. | | | | | | | | |
2018-11A A1T, 6.88% (3 Month Term SOFR + 1.56%, Rate Floor: 0.00%) due 04/15/31◊,2 | | | 1,424,480 | | | | 1,420,510 | |
STWD Ltd. | | | | | | | | |
2019-FL1 D, 7.79% (1 Month Term SOFR + 2.46%, Rate Floor: 2.46%) due 07/15/38◊,2 | | | 1,459,000 | | | | 1,373,334 | |
Owl Rock CLO XIII LLC | | | | | | | | |
2023-13A B, 8.68% (3 Month Term SOFR + 3.35%, Rate Floor: 3.35%) due 09/20/35◊,2 | | | 1,000,000 | | | | 1,015,365 | |
Cerberus Loan Funding XXXVIII, LP | | | | | | | | |
2022-2A A1, 8.06% (3 Month Term SOFR + 2.75%, Rate Floor: 2.75%) due 10/15/34◊,2 | | | 1,000,000 | | | | 1,010,390 | |
Cerberus Loan Funding XXXV, LP | | | | | | | | |
2021-5A A, 7.08% (3 Month Term SOFR + 1.76%, Rate Floor: 1.50%) due 09/22/33◊,2 | | | 1,000,000 | | | | 1,002,652 | |
Northwoods Capital XII-B Ltd. | | | | | | | | |
2018-12BA B, 7.44% (3 Month Term SOFR + 2.11%, Rate Floor: 1.85%) due 06/15/31◊,2 | | | 1,000,000 | | | | 1,001,667 | |
Golub Capital Partners CLO 46 Ltd. | | | | | | | | |
2019-46A, due 04/20/3713 | | | 1,000,000 | | | | 1,000,000 | |
GoldenTree Loan Management US CLO 12 Ltd. | | | | | | | | |
2022-12A B, 7.27% (3 Month Term SOFR + 1.95%, Rate Floor: 1.95%) due 04/20/34◊,2 | | | 1,000,000 | | | | 998,472 | |
BSPRT Issuer Ltd. | | | | | | | | |
2021-FL7 C, 7.74% (1 Month Term SOFR + 2.41%, Rate Floor: 2.41%) due 12/15/38◊,2 | | | 1,000,000 | | | | 962,206 | |
ACRE Commercial Mortgage Ltd. | | | | | | | | |
2021-FL4 D, 8.04% (1 Month Term SOFR + 2.71%, Rate Floor: 2.60%) due 12/18/37◊,2 | | | 773,000 | | | | 732,468 | |
Dryden 37 Senior Loan Fund | | | | | | | | |
2015-37A Q, due 01/15/312,7 | | | 1,000,000 | | | | 708,313 | |
NewStar Fairfield Fund CLO Ltd. | | | | | | | | |
2018-2A A1N, 6.85% (3 Month Term SOFR + 1.53%, Rate Floor: 1.27%) due 04/20/30◊,2 | | | 629,646 | | | | 630,699 | |
Golub Capital Partners CLO 17 Ltd. | | | | | | | | |
2017-17A A1R, 7.24% (3 Month Term SOFR + 1.91%, Rate Floor: 0.00%) due 10/25/30◊,2 | | | 482,035 | | | | 486,445 | |
Cerberus Loan Funding XXXVI, LP | | | | | | | | |
2021-6A A, 6.98% (3 Month Term SOFR + 1.66%, Rate Floor: 1.40%) due 11/22/33◊,2 | | | 58,608 | | | | 58,673 | |
Babson CLO Ltd. | | | | | | | | |
2014-IA SUB, due 07/20/252,7 | | | 633,344 | | | | 18,766 | |
Treman Park CLO Ltd. | | | | | | | | |
2015-1A COM, due 10/20/282,7 | | | 162,950 | | | | 567 | |
Copper River CLO Ltd. | | | | | | | | |
2007-1A INC, due 01/20/217,8 | | | 700,000 | | | | 70 | |
Total Collateralized Loan Obligations | | | | | | | 247,884,583 | |
| | | | | | | | | |
Financial - 1.7% | | | | | | | | |
Project Onyx I | | | | | | | | |
8.48% (3 Month Term SOFR + 3.15%, Rate Floor: 3.15%) due 01/26/27◊,††† | | | 5,276,084 | | | | 5,275,097 | |
KKR Core Holding Company LLC | | | | | | | | |
4.00% due 08/12/31††† | | | 5,053,573 | | | | 4,491,993 | |
HV Eight LLC | | | | | | | | |
7.48% (3 Month EURIBOR + 3.50%, Rate Floor: 3.50%) due 12/31/27◊,††† | | EUR | 4,041,039 | | | | 4,359,802 | |
Strategic Partners Fund VIII, LP | | | | | | | | |
7.93% (1 Month Term SOFR + 2.60%, Rate Floor: 2.60%) due 03/10/26◊,††† | | | 4,144,127 | | | | 4,120,995 | |
LVNV Funding LLC | | | | | | | | |
7.80% due 11/05/28††† | | | 2,900,000 | | | | 2,975,313 | |
HarbourVest Structured Solutions IV Holdings, LP | | | | | | | | |
8.11% (3 Month USD LIBOR + 2.45%, Rate Floor: 2.45%) due 09/15/26◊,††† | | | 1,637,251 | | | | 1,592,393 | |
6.05% (3 Month EURIBOR + 2.45%, Rate Floor: 2.45%) due 09/15/26◊,††† | | EUR | 1,000,000 | | | | 1,079,097 | |
SEE NOTES TO FINANCIAL STATEMENTS. | THE GUGGENHEIM FUNDS SEMI-ANNUAL REPORT | 33 |
SCHEDULE OF INVESTMENTS (Unaudited)(continued) | March 31, 2024 |
CORE BOND FUND | |
| | Face
Amount~ | | | Value | |
Thunderbird A | | | | | | | | |
5.50% due 03/01/37††† | | | 2,210,000 | | | $ | 2,038,130 | |
Lightning A | | | | | | | | |
5.50% due 03/01/37††† | | | 2,210,000 | | | | 2,038,130 | |
Ceamer Finance LLC | | | | | | | | |
6.92% due 11/15/37††† | | | 1,933,271 | | | | 1,881,229 | |
Project Onyx II | | | | | | | | |
8.48% (3 Month Term SOFR + 3.15%, Rate Floor: 3.15%) due 01/26/27◊,††† | | | 1,702,804 | | | | 1,702,551 | |
Madison Avenue Secured Funding Trust | | | | | | | | |
2023-2, 7.17% (1 Month Term SOFR + 1.85%, Rate Floor: 1.85%) due 10/15/24◊,†††,2 | | | 1,175,000 | | | | 1,175,000 | |
Bib Merchant Voucher Receivables Ltd. | | | | | | | | |
4.18% due 04/07/28††† | | | 683,969 | | | | 661,340 | |
Station Place Securitization Trust | | | | | | | | |
2023-SP1, 7.17% (1 Month Term SOFR + 1.85%, Rate Floor: 1.85%) due 10/15/24◊,†††,2 | | | 575,000 | | | | 575,000 | |
Nassau LLC | | | | | | | | |
2019-1, 3.98% due 08/15/342 | | | 590,830 | | | | 564,750 | |
Total Financial | | | | | | | 34,530,820 | |
| | | | | | | | | |
Whole Business - 1.7% | | | | | | | | |
SERVPRO Master Issuer LLC | | | | | | | | |
2021-1A, 2.39% due 04/25/512 | | | 4,230,375 | | | | 3,713,815 | |
2019-1A, 3.88% due 10/25/492 | | | 1,532,000 | | | | 1,452,986 | |
2024-1A, 6.17% due 01/25/542 | | | 1,400,000 | | | | 1,415,260 | |
Arbys Funding LLC | | | | | | | | |
2020-1A, 3.24% due 07/30/502 | | | 6,513,750 | | | | 6,022,589 | |
Sonic Capital LLC | | | | | | | | |
2020-1A, 3.85% due 01/20/502 | | | 2,193,479 | | | | 2,076,616 | |
2021-1A, 2.19% due 08/20/512 | | | 2,237,625 | | | | 1,937,085 | |
2020-1A, 4.34% due 01/20/502 | | | 964,167 | | | | 897,294 | |
Domino’s Pizza Master Issuer LLC | | | | | | | | |
2017-1A, 4.12% due 07/25/472 | | | 5,076,000 | | | | 4,858,642 | |
Taco Bell Funding LLC | | | | | | | | |
2016-1A, 4.97% due 05/25/462 | | | 3,515,625 | | | | 3,462,757 | |
ServiceMaster Funding LLC | | | | | | | | |
2020-1, 2.84% due 01/30/512 | | | 3,781,840 | | | | 3,376,718 | |
Applebee’s Funding LLC / IHOP Funding LLC | | | | | | | | |
2019-1A, 4.72% due 06/05/492 | | | 1,732,500 | | | | 1,666,518 | |
Wingstop Funding LLC | | | | | | | | |
2020-1A, 2.84% due 12/05/502 | | | 1,231,250 | | | | 1,117,407 | |
2022-1A, 3.73% due 03/05/522 | | | 248,125 | | | | 226,891 | |
Wendy’s Funding LLC | | | | | | | | |
2019-1A, 3.78% due 06/15/492 | | | 1,313,893 | | | | 1,260,283 | |
Total Whole Business | | | | | | | 33,484,861 | |
| | | | | | | | | |
Net Lease - 1.3% | | | | | | | | |
CARS-DB4, LP | | | | | | | | |
2020-1A, 3.81% due 02/15/502 | | | 2,218,594 | | | | 1,900,081 | |
2020-1A, 2.69% due 02/15/502 | | | 1,774,426 | | | | 1,722,927 | |
2020-1A, 4.95% due 02/15/502 | | | 1,500,000 | | | | 1,251,967 | |
CF Hippolyta Issuer LLC | | | | | | | | |
2022-1A, 6.11% due 08/15/622 | | | 2,687,109 | | | | 2,607,929 | |
2020-1, 2.28% due 07/15/602 | | | 674,589 | | | | 620,554 | |
SVC ABS LLC | | | | | | | | |
2023-1A, 5.15% due 02/20/532 | | | 3,232,396 | | | | 3,084,315 | |
CMFT Net Lease Master Issuer LLC | | | | | | | | |
2021-1, 3.44% due 07/20/512 | | | 3,570,000 | | | | 2,781,650 | |
STORE Master Funding I-VII | | | | | | | | |
2016-1A, 3.96% due 10/20/462 | | | 2,467,910 | | | | 2,322,837 | |
Oak Street Investment Grade Net Lease Fund Series | | | | | | | | |
2020-1A, 2.26% due 11/20/502 | | | 2,495,833 | | | | 2,261,336 | |
CF Hippolyta LLC | | | | | | | | |
2020-1, 2.60% due 07/15/602 | | | 2,479,789 | | | | 2,037,750 | |
Capital Automotive REIT | | | | | | | | |
2020-1A, 3.48% due 02/15/502 | | | 1,232,552 | | | | 1,128,098 | |
2021-1A, 2.76% due 08/15/512 | | | 993,958 | | | | 734,291 | |
STORE Master Funding LLC | | | | | | | | |
2021-1A, 2.96% due 06/20/512 | | | 1,972,500 | | | | 1,496,525 | |
AFN ABSPROP001 LLC | | | | | | | | |
2021-1A, 2.21% due 05/20/512 | | | 1,575,469 | | | | 1,329,653 | |
Total Net Lease | | | | | | | 25,279,913 | |
| | | | | | | | | |
Transport-Aircraft - 1.1% | | | | | | | | |
AASET Trust | | | | | | | | |
2021-1A, 2.95% due 11/16/412 | | | 3,342,176 | | | | 3,030,017 | |
2021-2A, 2.80% due 01/15/472 | | | 3,185,904 | | | | 2,789,163 | |
2020-1A, 3.35% due 01/16/402 | | | 825,467 | | | | 737,476 | |
Navigator Aircraft ABS Ltd. | | | | | | | | |
2021-1, 2.77% due 11/15/462 | | | 2,927,083 | | | | 2,611,920 | |
Castlelake Aircraft Structured Trust | | | | | | | | |
2021-1A, 3.47% due 01/15/462 | | | 2,031,539 | | | | 1,910,366 | |
Lunar Structured Aircraft Portfolio Notes | | | | | | | | |
2021-1, 2.64% due 10/15/462 | | | 1,984,968 | | | | 1,760,468 | |
MACH 1 Cayman Ltd. | | | | | | | | |
2019-1, 3.47% due 10/15/392 | | | 1,662,537 | | | | 1,502,966 | |
Sprite Ltd. | | | | | | | | |
2021-1, 3.75% due 11/15/462 | | | 1,578,216 | | | | 1,466,131 | |
Sapphire Aviation Finance II Ltd. | | | | | | | | |
2020-1A, 3.23% due 03/15/402 | | | 1,491,544 | | | | 1,357,350 | |
AASET US Ltd. | | | | | | | | |
2018-2A, 4.45% due 11/18/382 | | | 1,380,126 | | | | 1,218,897 | |
Falcon Aerospace Ltd. | | | | | | | | |
2019-1, 3.60% due 09/15/392 | | | 949,846 | | | | 864,360 | |
2017-1, 4.58% due 02/15/422 | | | 139,706 | | | | 131,999 | |
Slam Ltd. | | | | | | | | |
2021-1A, 2.43% due 06/15/462 | | | 828,100 | | | | 723,250 | |
WAVE LLC | | | | | | | | |
2019-1, 3.60% due 09/15/442 | | | 688,684 | | | | 612,950 | |
Sapphire Aviation Finance I Ltd. | | | | | | | | |
2018-1A, 4.25% due 03/15/402 | | | 610,558 | | | | 560,505 | |
MAPS Ltd. | | | | | | | | |
2018-1A, 4.21% due 05/15/432 | | | 429,545 | | | | 396,260 | |
Castlelake Aircraft Securitization Trust | | | | | | | | |
2018-1, 4.13% due 06/15/432 | | | 304,008 | | | | 277,158 | |
Total Transport-Aircraft | | | | | | | 21,951,236 | |
| | | | | | | | | |
34 | THE GUGGENHEIM FUNDS SEMI-ANNUAL REPORT | SEE NOTES TO FINANCIAL STATEMENTS. |
SCHEDULE OF INVESTMENTS (Unaudited)(continued) | March 31, 2024 |
CORE BOND FUND | |
| | Face
Amount~ | | | Value | |
Infrastructure - 1.0% | | | | | | | | |
Stack Infrastructure Issuer LLC | | | | | | | | |
2023-3A, 5.90% due 10/25/482 | | | 3,000,000 | | | $ | 3,010,345 | |
2024-1A, 5.90% due 03/25/492 | | | 1,250,000 | | | | 1,252,935 | |
2023-1A, 5.90% due 03/25/482 | | | 1,000,000 | | | | 996,654 | |
2020-1A, 1.89% due 08/25/452 | | | 1,000,000 | | | | 942,327 | |
Hotwire Funding LLC | | | | | | | | |
2021-1, 2.31% due 11/20/512 | | | 2,000,000 | | | | 1,808,120 | |
2023-1A, 5.69% due 05/20/532 | | | 1,005,000 | | | | 983,609 | |
SBA Tower Trust | | | | | | | | |
1.84% due 04/15/272 | | | 3,000,000 | | | | 2,688,298 | |
Vantage Data Centers Issuer LLC | | | | | | | | |
2020-1A, 1.65% due 09/15/452 | | | 1,366,000 | | | | 1,279,719 | |
2019-1A, 3.19% due 07/15/442 | | | 1,071,289 | | | | 1,061,220 | |
Aligned Data Centers Issuer LLC | | | | | | | | |
2021-1A, 1.94% due 08/15/462 | | | 2,500,000 | | | | 2,272,324 | |
VB-S1 Issuer LLC - VBTEL | | | | | | | | |
2022-1A, 4.29% due 02/15/522 | | | 2,500,000 | | | | 2,222,676 | |
Switch ABS Issuer LLC | | | | | | | | |
2024-1A, 6.28% due 03/25/542 | | | 500,000 | | | | 496,271 | |
Total Infrastructure | | | | | | | 19,014,498 | |
| | | | | | | | | |
Single Family Residence - 0.8% | | | | | | | | |
Tricon Residential Trust | | | | | | | | |
2023-SFR1, 5.10% due 07/17/402 | | | 2,722,000 | | | | 2,646,498 | |
2021-SFR1, 2.34% due 07/17/382 | | | 2,850,000 | | | | 2,629,634 | |
2023-SFR2, 5.00% due 12/17/402 | | | 2,550,000 | | | | 2,483,353 | |
2024-SFR1, due 04/17/292,13 | | | 1,000,000 | | | | 961,668 | |
FirstKey Homes Trust | | | | | | | | |
2020-SFR2, 2.67% due 10/19/372 | | | 2,250,000 | | | | 2,123,886 | |
2020-SFR2, 4.00% due 10/19/372 | | | 1,400,000 | | | | 1,330,091 | |
2020-SFR2, 4.50% due 10/19/372 | | | 1,350,000 | | | | 1,285,798 | |
2020-SFR2, 3.37% due 10/19/372 | | | 900,000 | | | | 849,791 | |
Home Partners of America Trust | | | | | | | | |
2021-3, 2.80% due 01/17/412 | | | 915,365 | | | | 800,549 | |
2021-2, 2.40% due 12/17/262 | | | 480,720 | | | | 437,369 | |
Total Single Family Residence | | | | | | | 15,548,637 | |
| | | | | | | | | |
Transport-Container - 0.6% | | | | | | | | |
Textainer Marine Containers VII Ltd. | | | | | | | | |
2020-1A, 2.73% due 08/21/452 | | | 2,796,642 | | | | 2,614,349 | |
2021-2A, 2.23% due 04/20/462 | | | 1,510,333 | | | | 1,353,022 | |
MC Ltd. | | | | | | | | |
2021-1, 2.63% due 11/05/352 | | | 3,099,178 | | | | 2,789,904 | |
TIF Funding III LLC | | | | | | | | |
2024-1A, due 05/22/342,13 | | | 2,750,000 | | | | 2,751,313 | |
Textainer Marine Containers Ltd. | | | | | | | | |
2021-3A, 1.94% due 08/20/462 | | | 1,586,667 | | | | 1,366,066 | |
CLI Funding VI LLC | | | | | | | | |
2020-1A, 2.08% due 09/18/452 | | | 1,093,360 | | | | 983,857 | |
TIF Funding II LLC | | | | | | | | |
2021-1A, 1.65% due 02/20/462 | | | 711,313 | | | | 617,534 | |
Total Transport-Container | | | | | | | 12,476,045 | |
| | | | | | | | | |
Collateralized Debt Obligations - 0.4% | | | | | | | | |
Anchorage Credit Funding 4 Ltd. | | | | | | | | |
2021-4A AR, 2.72% due 04/27/392 | | | 7,250,000 | | | | 6,551,924 | |
Anchorage Credit Funding 13 Ltd. | | | | | | | | |
2021-13A A2, 2.80% due 07/27/392 | | | 1,000,000 | | | | 892,800 | |
Total Collateralized Debt Obligations | | | | | | | 7,444,724 | |
| | | | | | | | | |
Automotive - 0.2% | | | | | | | | |
Avis Budget Rental Car Funding AESOP LLC | | | | | | | | |
2023-8A, 6.66% due 02/20/302 | | | 1,600,000 | | | | 1,660,810 | |
2024-1A, 5.85% due 06/20/302 | | | 1,300,000 | | | | 1,300,654 | |
Total Automotive | | | | | | | 2,961,464 | |
| | | | | | | | | |
Unsecured Consumer Loans - 0.1% | | | | | | | | |
Foundation Finance Trust | | | | | | | | |
2024-1A, due 12/15/492,13 | | | 2,220,000 | | | | 2,220,923 | |
| | | | | | | | | |
Insurance - 0.0% | | | | | | | | |
CHEST | | | | | | | | |
7.13% due 03/15/43††† | | | 950,000 | | | | 961,998 | |
Total Asset-Backed Securities | | | | |
(Cost $433,426,267) | | | 423,759,702 | |
| |
CORPORATE BONDS†† - 21.2% |
Financial - 11.7% | | | | | | | | |
Pershing Square Holdings Ltd. | | | | | | | | |
3.25% due 10/01/312 | | | 6,200,000 | | | | 5,030,221 | |
3.25% due 11/15/30 | | | 4,000,000 | | | | 3,363,960 | |
Nippon Life Insurance Co. | | | | | | | | |
2.75% due 01/21/512,9 | | | 8,150,000 | | | | 6,783,616 | |
BPCE S.A. | | | | | | | | |
2.28% due 01/20/322,9 | | | 8,200,000 | | | | 6,647,107 | |
Societe Generale S.A. | | | | | | | | |
5.52% due 01/19/282,9 | | | 5,500,000 | | | | 5,462,169 | |
2.89% due 06/09/322,9 | | | 721,000 | | | | 592,579 | |
3.34% due 01/21/332,9 | | | 579,000 | | | | 485,515 | |
Morgan Stanley | | | | | | | | |
6.63% due 11/01/349 | | | 4,000,000 | | | | 4,376,425 | |
5.94% due 02/07/399 | | | 1,950,000 | | | | 1,938,238 | |
Reliance Standard Life Global Funding II | | | | | | | | |
5.24% due 02/02/262 | | | 5,989,000 | | | | 5,926,845 | |
Wilton RE Ltd. | | | | | | | | |
6.00% 2,9,10 | | | 6,237,000 | | | | 5,548,578 | |
Liberty Mutual Group, Inc. | | | | | | | | |
4.13% due 12/15/512,9 | | | 5,800,000 | | | | 5,235,960 | |
Blue Owl Capital GP LLC | | | | | | | | |
7.21% due 08/22/43††† | | | 5,000,000 | | | | 5,158,941 | |
GA Global Funding Trust | | | | | | | | |
1.63% due 01/15/262 | | | 5,450,000 | | | | 5,052,683 | |
GLP Capital Limited Partnership / GLP Financing II, Inc. | | | | | | | | |
4.00% due 01/15/31 | | | 4,650,000 | | | | 4,149,271 | |
5.30% due 01/15/29 | | | 900,000 | | | | 884,956 | |
Safehold GL Holdings LLC | | | | | | | | |
2.85% due 01/15/32 | | | 2,428,000 | | | | 1,972,206 | |
2.80% due 06/15/31 | | | 1,931,000 | | | | 1,592,253 | |
6.10% due 04/01/34 | | | 1,400,000 | | | | 1,390,997 | |
SEE NOTES TO FINANCIAL STATEMENTS. | THE GUGGENHEIM FUNDS SEMI-ANNUAL REPORT | 35 |
SCHEDULE OF INVESTMENTS (Unaudited)(continued) | March 31, 2024 |
CORE BOND FUND | |
| | Face
Amount~ | | | Value | |
American Equity Investment Life Holding Co. | | | | | | | | |
5.00% due 06/15/27 | | | 5,036,000 | | | $ | 4,901,056 | |
Citigroup, Inc. | | | | | | | | |
5.83% due 02/13/359 | | | 4,900,000 | | | | 4,850,932 | |
CNA Financial Corp. | | | | | | | | |
5.13% due 02/15/34 | | | 4,950,000 | | | | 4,816,058 | |
Allianz SE | | | | | | | | |
3.20% 2,9,10 | | | 5,000,000 | | | | 4,093,079 | |
Iron Mountain, Inc. | | | | | | | | |
4.50% due 02/15/312 | | | 1,917,000 | | | | 1,729,590 | |
5.25% due 07/15/302 | | | 1,283,000 | | | | 1,213,689 | |
5.63% due 07/15/322 | | | 1,000,000 | | | | 944,584 | |
PartnerRe Finance B LLC | | | | | | | | |
4.50% due 10/01/509 | | | 4,040,000 | | | | 3,682,020 | |
FS KKR Capital Corp. | | | | | | | | |
2.63% due 01/15/27 | | | 2,150,000 | | | | 1,950,372 | |
3.25% due 07/15/27 | | | 1,800,000 | | | | 1,638,888 | |
Macquarie Group Ltd. | | | | | | | | |
2.87% due 01/14/332,9 | | | 2,150,000 | | | | 1,788,194 | |
2.69% due 06/23/322,9 | | | 2,000,000 | | | | 1,665,937 | |
Jefferies Financial Group, Inc. | | | | | | | | |
2.75% due 10/15/32 | | | 2,720,000 | | | | 2,209,448 | |
2.63% due 10/15/31 | | | 1,400,000 | | | | 1,153,554 | |
Maple Grove Funding Trust I | | | | | | | | |
4.16% due 08/15/512 | | | 4,750,000 | | | | 3,296,137 | |
Lazard Group LLC | | | | | | | | |
6.00% due 03/15/31 | | | 3,230,000 | | | | 3,260,681 | |
Ares Finance Company II LLC | | | | | | | | |
3.25% due 06/15/302 | | | 3,660,000 | | | | 3,224,574 | |
Fairfax Financial Holdings Ltd. | | | | | | | | |
3.38% due 03/03/31 | | | 2,500,000 | | | | 2,173,607 | |
5.63% due 08/16/32 | | | 1,000,000 | | | | 998,990 | |
Macquarie Bank Ltd. | | | | | | | | |
3.62% due 06/03/302 | | | 3,570,000 | | | | 3,170,203 | |
Host Hotels & Resorts, LP | | | | | | | | |
3.50% due 09/15/30 | | | 3,385,000 | | | | 3,010,033 | |
Prudential Financial, Inc. | | | | | | | | |
6.75% due 03/15/549 | | | 1,900,000 | | | | 1,926,267 | |
3.70% due 10/01/509 | | | 1,160,000 | | | | 1,013,949 | |
Nationwide Mutual Insurance Co. | | | | | | | | |
4.35% due 04/30/502 | | | 3,687,000 | | | | 2,920,247 | |
First American Financial Corp. | | | | | | | | |
4.00% due 05/15/30 | | | 3,180,000 | | | | 2,890,873 | |
Old Republic International Corp. | | | | | | | | |
5.75% due 03/28/34 | | | 2,850,000 | | | | 2,862,449 | |
Brookfield Finance, Inc. | | | | | | | | |
5.97% due 03/04/54 | | | 1,300,000 | | | | 1,344,725 | |
4.70% due 09/20/47 | | | 650,000 | | | | 562,493 | |
3.50% due 03/30/51 | | | 630,000 | | | | 454,082 | |
3.63% due 02/15/52 | | | 620,000 | | | | 450,267 | |
Fidelity National Financial, Inc. | | | | | | | | |
3.40% due 06/15/30 | | | 3,085,000 | | | | 2,739,105 | |
2.45% due 03/15/31 | | | 70,000 | | | | 57,610 | |
Pacific Beacon LLC | | | | | | | | |
5.51% due 07/15/362 | | | 2,900,000 | | | | 2,770,992 | |
Rocket Mortgage LLC / Rocket Mortgage Company-Issuer, Inc. | | | | | | | | |
3.88% due 03/01/312 | | | 3,150,000 | | | | 2,744,278 | |
OneAmerica Financial Partners, Inc. | | | | | | | | |
4.25% due 10/15/502 | | | 3,620,000 | | | | 2,540,460 | |
UBS Group AG | | | | | | | | |
3.09% due 05/14/322,9 | | | 2,950,000 | | | | 2,509,177 | |
Credit Agricole S.A. | | | | | | | | |
5.37% due 03/11/342 | | | 1,950,000 | | | | 1,955,693 | |
5.34% due 01/10/302,9 | | | 500,000 | | | | 498,575 | |
Accident Fund Insurance Company of America | | | | | | | | |
8.50% due 08/01/322 | | | 2,450,000 | | | | 2,413,130 | |
TPG Operating Group II, LP | | | | | | | | |
5.88% due 03/05/34 | | | 2,300,000 | | | | 2,332,498 | |
Jefferies Finance LLC / JFIN Company-Issuer Corp. | | | | | | | | |
5.00% due 08/15/282 | | | 2,450,000 | | | | 2,252,989 | |
Belrose Funding Trust | | | | | | | | |
2.33% due 08/15/302 | | | 2,780,000 | | | | 2,233,555 | |
Sumitomo Life Insurance Co. | | | | | | | | |
3.38% due 04/15/812,9 | | | 2,500,000 | | | | 2,163,257 | |
Standard Chartered plc | | | | | | | | |
4.64% due 04/01/312,9 | | | 2,250,000 | | | | 2,161,691 | |
Voya Financial, Inc. | | | | | | | | |
4.80% due 06/15/46 | | | 2,500,000 | | | | 2,149,250 | |
LPL Holdings, Inc. | | | | | | | | |
4.38% due 05/15/312 | | | 2,310,000 | | | | 2,102,427 | |
Capital One Financial Corp. | | | | | | | | |
6.05% due 02/01/359 | | | 2,000,000 | | | | 2,036,214 | |
Aon North America, Inc. | | | | | | | | |
5.45% due 03/01/34 | | | 1,900,000 | | | | 1,921,931 | |
Assurant, Inc. | | | | | | | | |
2.65% due 01/15/32 | | | 2,300,000 | | | | 1,889,124 | |
Mid-Atlantic Military Family Communities LLC | | | | | | | | |
5.30% due 08/01/502 | | | 2,145,464 | | | | 1,871,259 | |
Stewart Information Services Corp. | | | | | | | | |
3.60% due 11/15/31 | | | 2,250,000 | | | | 1,835,827 | |
Westpac Banking Corp. | | | | | | | | |
3.02% due 11/18/369 | | | 1,200,000 | | | | 985,720 | |
2.96% due 11/16/40 | | | 805,000 | | | | 568,147 | |
2.67% due 11/15/359 | | | 295,000 | | | | 243,322 | |
QBE Insurance Group Ltd. | | | | | | | | |
5.88% 2,9,10 | | | 1,750,000 | | | | 1,732,275 | |
Lincoln National Corp. | | | | | | | | |
5.85% due 03/15/34 | | | 1,700,000 | | | | 1,678,176 | |
Manulife Financial Corp. | | | | | | | | |
2.48% due 05/19/27 | | | 1,800,000 | | | | 1,670,445 | |
KKR Group Finance Company VIII LLC | | | | | | | | |
3.50% due 08/25/502 | | | 2,360,000 | | | | 1,657,722 | |
Americo Life, Inc. | | | | | | | | |
3.45% due 04/15/312 | | | 2,060,000 | | | | 1,611,743 | |
Bank of America Corp. | | | | | | | | |
2.59% due 04/29/319 | | | 1,800,000 | | | | 1,551,865 | |
Dyal Capital Partners III | | | | | | | | |
4.40% due 06/15/40††† | | | 1,750,000 | | | | 1,537,021 | |
36 | THE GUGGENHEIM FUNDS SEMI-ANNUAL REPORT | SEE NOTES TO FINANCIAL STATEMENTS. |
SCHEDULE OF INVESTMENTS (Unaudited)(continued) | March 31, 2024 |
CORE BOND FUND | |
| | Face
Amount~ | | | Value | |
Trustage Financial Group, Inc. | | | | | | | | |
4.63% due 04/15/322 | | | 1,750,000 | | | $ | 1,522,893 | |
Reinsurance Group of America, Inc. | | | | | | | | |
3.15% due 06/15/30 | | | 1,697,000 | | | | 1,513,272 | |
Lloyds Banking Group plc | | | | | | | | |
5.46% due 01/05/289 | | | 1,500,000 | | | | 1,500,331 | |
Australia & New Zealand Banking Group Ltd. | | | | | | | | |
2.57% due 11/25/352,9 | | | 1,800,000 | | | | 1,474,695 | |
Global Atlantic Finance Co. | | | | | | | | |
7.95% due 06/15/332 | | | 701,000 | | | | 777,917 | |
6.75% due 03/15/542 | | | 639,000 | | | | 655,495 | |
HS Wildcat LLC | | | | | | | | |
3.83% due 12/31/50††† | | | 1,988,211 | | | | 1,414,793 | |
BNP Paribas S.A. | | | | | | | | |
5.50% due 05/20/302,9 | | | 1,400,000 | | | | 1,403,060 | |
Muenchener Rueckversicherungs-Gesellschaft AG in Muenchen | | | | | | | | |
5.88% due 05/23/422,9 | | | 1,350,000 | | | | 1,367,882 | |
AmFam Holdings, Inc. | | | | | | | | |
2.81% due 03/11/312 | | | 1,750,000 | | | | 1,335,883 | |
National Australia Bank Ltd. | | | | | | | | |
2.99% due 05/21/312 | | | 975,000 | | | | 821,373 | |
2.33% due 08/21/302 | | | 502,000 | | | | 413,420 | |
ABN AMRO Bank N.V. | | | | | | | | |
2.47% due 12/13/292,9 | | | 1,400,000 | | | | 1,226,278 | |
Brookfield Capital Finance LLC | | | | | | | | |
6.09% due 06/14/33 | | | 1,100,000 | | | | 1,152,189 | |
Horace Mann Educators Corp. | | | | | | | | |
7.25% due 09/15/28 | | | 950,000 | | | | 1,014,686 | |
RGA Global Funding | | | | | | | | |
5.50% due 01/11/312 | | | 1,000,000 | | | | 1,002,749 | |
Corebridge Financial, Inc. | | | | | | | | |
6.88% due 12/15/529 | | | 1,000,000 | | | | 1,001,199 | |
JPMorgan Chase & Co. | | | | | | | | |
2.96% due 05/13/319 | | | 1,093,000 | | | | 955,454 | |
Belvoir Land LLC | | | | | | | | |
5.60% due 12/15/352 | | | 1,000,000 | | | | 949,989 | |
VICI Properties Limited Partnership / VICI Note Company, Inc. | | | | | | | | |
4.13% due 08/15/302 | | | 1,000,000 | | | | 909,306 | |
Mutual of Omaha Insurance Co. | | | | | | | | |
6.14% due 01/16/642,9 | | | 850,000 | | | | 862,229 | |
Sumitomo Mitsui Financial Group, Inc. | | | | | | | | |
2.22% due 09/17/31 | | | 1,050,000 | | | | 858,943 | |
Athene Global Funding | | | | | | | | |
5.58% due 01/09/292 | | | 850,000 | | | | 855,520 | |
Fort Moore Family Communities LLC | | | | | | | | |
6.09% due 01/15/512 | | | 868,306 | | | | 798,908 | |
Apollo Management Holdings, LP | | | | | | | | |
2.65% due 06/05/302 | | | 930,000 | | | | 797,587 | |
Dyal Capital Partners III (B) LP | | | | | | | | |
6.55% due 06/15/44††† | | | 770,000 | | | | 765,058 | |
Central Storage Safety Project Trust | | | | | | | | |
4.82% due 02/01/388 | | | 823,360 | | | | 710,834 | |
CNO Financial Group, Inc. | | | | | | | | |
5.25% due 05/30/29 | | | 700,000 | | | | 681,948 | |
Brown & Brown, Inc. | | | | | | | | |
2.38% due 03/15/31 | | | 800,000 | | | | 663,006 | |
Protective Life Corp. | | | | | | | | |
3.40% due 01/15/302 | | | 740,000 | | | | 653,197 | |
Penn Mutual Life Insurance Co. | | | | | | | | |
3.80% due 04/29/612 | | | 950,000 | | | | 631,170 | |
Assured Guaranty US Holdings, Inc. | | | | | | | | |
3.60% due 09/15/51 | | | 800,000 | | | | 579,111 | |
Western & Southern Life Insurance Co. | | | | | | | | |
3.75% due 04/28/612 | | | 850,000 | | | | 574,240 | |
Kemper Corp. | | | | | | | | |
2.40% due 09/30/30 | | | 675,000 | | | | 541,937 | |
Hanover Insurance Group, Inc. | | | | | | | | |
2.50% due 09/01/30 | | | 480,000 | | | | 402,255 | |
Fidelity & Guaranty Life Holdings, Inc. | | | | | | | | |
5.50% due 05/01/252 | | | 400,000 | | | | 396,627 | |
Cooperatieve Rabobank UA | | | | | | | | |
4.66% due 08/22/282,9 | | | 400,000 | | | | 391,590 | |
Brookfield Finance LLC / Brookfield Finance, Inc. | | | | | | | | |
3.45% due 04/15/50 | | | 470,000 | | | | 329,342 | |
Cushman & Wakefield US Borrower LLC | | | | | | | | |
6.75% due 05/15/282 | | | 296,000 | | | | 292,295 | |
KKR Group Finance Company III LLC | | | | | | | | |
5.13% due 06/01/442 | | | 100,000 | | | | 92,332 | |
Total Financial | | | | | | | 232,495,969 | |
| | | | | | | | | |
Consumer, Cyclical - 2.1% | | | | | | | | |
Hyatt Hotels Corp. | | | | | | | | |
5.38% due 04/23/25 | | | 3,950,000 | | | | 3,939,003 | |
5.75% due 04/23/30 | | | 3,010,000 | | | | 3,086,442 | |
Choice Hotels International, Inc. | | | | | | | | |
3.70% due 01/15/31 | | | 7,340,000 | | | | 6,431,308 | |
Advance Auto Parts, Inc. | | | | | | | | |
5.90% due 03/09/26 | | | 4,972,000 | | | | 4,964,139 | |
Whirlpool Corp. | | | | | | | | |
4.60% due 05/15/50 | | | 4,840,000 | | | | 3,967,503 | |
Delta Air Lines, Inc. | | | | | | | | |
7.00% due 05/01/252 | | | 3,014,000 | | | | 3,053,545 | |
Smithsonian Institution | | | | | | | | |
2.70% due 09/01/44 | | | 4,000,000 | | | | 2,891,130 | |
Alt-2 Structured Trust | | | | | | | | |
2.95 due 05/14/31◊,††† | | | 3,014,454 | | | | 2,695,128 | |
British Airways Class A Pass Through Trust | | | | | | | | |
4.25% due 11/15/322 | | | 1,908,394 | | | | 1,779,631 | |
2.90% due 03/15/352 | | | 773,214 | | | | 667,697 | |
Delta Air Lines, Inc. / SkyMiles IP Ltd. | | | | | | | | |
4.50% due 10/20/252 | | | 1,835,750 | | | | 1,817,080 | |
Mileage Plus Holdings LLC / Mileage Plus Intellectual Property Assets Ltd. | | | | | | | | |
6.50% due 06/20/272 | | | 1,654,996 | | | | 1,664,125 | |
Ferguson Finance plc | | | | | | | | |
3.25% due 06/02/302 | | | 1,204,000 | | | | 1,077,052 | |
4.65% due 04/20/322 | | | 600,000 | | | | 572,288 | |
United Airlines 2023-1 Class A Pass Through Trust | | | | | | | | |
5.80% due 01/15/36 | | | 1,450,000 | | | | 1,474,360 | |
SEE NOTES TO FINANCIAL STATEMENTS. | THE GUGGENHEIM FUNDS SEMI-ANNUAL REPORT | 37 |
SCHEDULE OF INVESTMENTS (Unaudited)(continued) | March 31, 2024 |
CORE BOND FUND | |
| | Face
Amount~ | | | Value | |
Polaris, Inc. | | | | | | | | |
6.95% due 03/15/29 | | | 1,050,000 | | | $ | 1,116,877 | |
American Airlines Class AA Pass Through Trust | | | | | | | | |
3.20% due 06/15/28 | | | 674,500 | | | | 619,377 | |
Warnermedia Holdings, Inc. | | | | | | | | |
6.41% due 03/15/26 | | | 600,000 | | | | 600,010 | |
LKQ Corp. | | | | | | | | |
6.25% due 06/15/33 | | | 300,000 | | | | 312,372 | |
Total Consumer, Cyclical | | | | | | | 42,729,067 | |
| | | | | | | | | |
Consumer, Non-cyclical - 2.0% | | | | | | | | |
Philip Morris International, Inc. | | | | | | | | |
5.13% due 02/13/31 | | | 4,900,000 | | | | 4,867,878 | |
5.25% due 02/13/34 | | | 750,000 | | | | 743,351 | |
BAT Capital Corp. | | | | | | | | |
6.00% due 02/20/34 | | | 3,000,000 | | | | 3,037,636 | |
3.98% due 09/25/50 | | | 2,800,000 | | | | 1,969,235 | |
JBS USA LUX S.A. / JBS USA Food Company / JBS USA Finance, Inc. | | | | | | | | |
5.50% due 01/15/30 | | | 2,200,000 | | | | 2,168,134 | |
3.00% due 05/15/32 | | | 1,750,000 | | | | 1,427,231 | |
4.38% due 02/02/52 | | | 600,000 | | | | 435,721 | |
Smithfield Foods, Inc. | | | | | | | | |
2.63% due 09/13/312 | | | 2,400,000 | | | | 1,879,487 | |
5.20% due 04/01/292 | | | 1,200,000 | | | | 1,154,331 | |
3.00% due 10/15/302 | | | 970,000 | | | | 803,022 | |
CoStar Group, Inc. | | | | | | | | |
2.80% due 07/15/302 | | | 4,130,000 | | | | 3,520,679 | |
Global Payments, Inc. | | | | | | | | |
2.90% due 05/15/30 | | | 1,620,000 | | | | 1,406,819 | |
2.90% due 11/15/31 | | | 1,650,000 | | | | 1,384,678 | |
Altria Group, Inc. | | | | | | | | |
4.45% due 05/06/50 | | | 1,365,000 | | | | 1,085,348 | |
3.70% due 02/04/51 | | | 1,280,000 | | | | 894,483 | |
Royalty Pharma plc | | | | | | | | |
3.55% due 09/02/50 | | | 2,690,000 | | | | 1,853,265 | |
Triton Container International Ltd. | | | | | | | | |
3.15% due 06/15/312 | | | 2,100,000 | | | | 1,693,063 | |
Element Fleet Management Corp. | | | | | | | | |
6.32% due 12/04/282 | | | 1,500,000 | | | | 1,549,265 | |
AZ Battery Property LLC | | | | | | | | |
6.73% due 02/20/46††† | | | 1,420,000 | | | | 1,440,187 | |
Yale-New Haven Health Services Corp. | | | | | | | | |
2.50% due 07/01/50 | | | 2,250,000 | | | | 1,366,554 | |
Universal Health Services, Inc. | | | | | | | | |
2.65% due 10/15/30 | | | 1,320,000 | | | | 1,119,290 | |
Transurban Finance Company Pty Ltd. | | | | | | | | |
2.45% due 03/16/312 | | | 1,300,000 | | | | 1,089,018 | |
Wisconsin Alumni Research Foundation | | | | | | | | |
3.56% due 10/01/49 | | | 1,000,000 | | | | 773,255 | |
Kraft Heinz Foods Co. | | | | | | | | |
7.13% due 08/01/392 | | | 650,000 | | | | 745,873 | |
OhioHealth Corp. | | | | | | | | |
3.04% due 11/15/50 | | | 1,000,000 | | | | 712,219 | |
Children’s Hospital Corp. | | | | | | | | |
2.59% due 02/01/50 | | | 1,000,000 | | | | 638,542 | |
Tyson Foods, Inc. | | | | | | | | |
5.70% due 03/15/34 | | | 400,000 | | | | 405,276 | |
Catalent Pharma Solutions, Inc. | | | | | | | | |
3.13% due 02/15/292 | | | 250,000 | | | | 238,895 | |
Triton Container International Limited / TAL International Container Corp. | | | | | | | | |
3.25% due 03/15/32 | | | 200,000 | | | | 162,302 | |
Total Consumer, Non-cyclical | | | | | | | 40,565,037 | |
| | | | | | | | | |
Industrial - 1.6% | | | | | | | | |
Howmet Aerospace, Inc. | | | | | | | | |
3.00% due 01/15/29 | | | 3,800,000 | | | | 3,431,493 | |
TD SYNNEX Corp. | | | | | | | | |
2.65% due 08/09/31 | | | 2,142,000 | | | | 1,726,031 | |
2.38% due 08/09/28 | | | 1,600,000 | | | | 1,413,212 | |
FLNG Liquefaction 3 LLC | | | | | | | | |
3.08% due 06/30/39††† | | | 4,015,830 | | | | 3,100,186 | |
Vontier Corp. | | | | | | | | |
2.95% due 04/01/31 | | | 3,450,000 | | | | 2,883,840 | |
Flowserve Corp. | | | | | | | | |
3.50% due 10/01/30 | | | 1,810,000 | | | | 1,606,967 | |
2.80% due 01/15/32 | | | 1,150,000 | | | | 945,344 | |
Berry Global, Inc. | | | | | | | | |
4.88% due 07/15/262 | | | 2,156,000 | | | | 2,112,899 | |
Penske Truck Leasing Company Lp / PTL Finance Corp. | | | | | | | | |
5.35% due 03/30/292 | | | 2,100,000 | | | | 2,101,437 | |
Fortune Brands Innovations, Inc. | | | | | | | | |
4.00% due 03/25/32 | | | 2,050,000 | | | | 1,873,061 | |
Smurfit Kappa Treasury ULC | | | | | | | | |
5.44% due 04/03/342 | | | 1,850,000 | | | | 1,850,704 | |
Cliffwater Corporate Lending Fund | | | | | | | | |
6.77% due 08/04/28††† | | | 1,550,000 | | | | 1,544,217 | |
Stadco LA LLC | | | | | | | | |
3.75% due 05/15/56††† | | | 2,000,000 | | | | 1,373,176 | |
Cellnex Finance Company S.A. | | | | | | | | |
3.88% due 07/07/412 | | | 1,372,000 | | | | 1,076,875 | |
Amcor Flexibles North America, Inc. | | | | | | | | |
2.63% due 06/19/30 | | | 1,230,000 | | | | 1,059,170 | |
IP Lending V Ltd. | | | | | | | | |
5.13% due 04/02/26†††,2 | | | 1,050,000 | | | | 1,015,140 | |
Dyal Capital Partners III (A) LP | | | | | | | | |
6.55% due 06/15/44††† | | | 980,000 | | | | 973,710 | |
Westinghouse Air Brake Technologies Corp. | | | | | | | | |
5.61% due 03/11/34 | | | 500,000 | | | | 506,468 | |
Norfolk Southern Corp. | | | | | | | | |
4.10% due 05/15/21 | | | 600,000 | | | | 437,553 | |
Total Industrial | | | | | | | 31,031,483 | |
| | | | | | | | | |
Energy - 1.3% | | | | | | | | |
BP Capital Markets plc | | | | | | | | |
4.88% 9,10 | | | 6,348,000 | | | | 6,056,122 | |
ONEOK, Inc. | | | | | | | | |
6.05% due 09/01/33 | | | 3,800,000 | | | | 3,963,225 | |
3.95% due 03/01/50 | | | 2,000,000 | | | | 1,474,906 | |
Galaxy Pipeline Assets Bidco Ltd. | | | | | | | | |
3.25% due 09/30/402 | | | 2,986,000 | | | | 2,272,270 | |
38 | THE GUGGENHEIM FUNDS SEMI-ANNUAL REPORT | SEE NOTES TO FINANCIAL STATEMENTS. |
SCHEDULE OF INVESTMENTS (Unaudited)(continued) | March 31, 2024 |
CORE BOND FUND | |
| | Face
Amount~ | | | Value | |
Targa Resources Partners Limited Partnership / Targa Resources Partners Finance Corp. | | | | | | | | |
6.88% due 01/15/29 | | | 2,158,000 | | | $ | 2,220,441 | |
Boardwalk Pipelines, LP | | | | | | | | |
5.63% due 08/01/34 | | | 2,000,000 | | | | 2,000,889 | |
Midwest Connector Capital Company LLC | | | | | | | | |
4.63% due 04/01/292 | | | 1,050,000 | | | | 1,013,654 | |
Cheniere Energy, Inc. | | | | | | | | |
5.65% due 04/15/342 | | | 1,000,000 | | | | 1,007,141 | |
Viper Energy, Inc. | | | | | | | | |
7.38% due 11/01/312 | | | 850,000 | | | | 883,640 | |
Greensaif Pipelines Bidco SARL | | | | | | | | |
6.51% due 02/23/422 | | | 400,000 | | | | 415,694 | |
6.13% due 02/23/382 | | | 350,000 | | | | 355,886 | |
Cheniere Energy Partners, LP | | | | | | | | |
5.95% due 06/30/33 | | | 750,000 | | | | 766,780 | |
Energy Transfer, LP | | | | | | | | |
7.38% due 02/01/312 | | | 710,000 | | | | 742,674 | |
NuStar Logistics, LP | | | | | | | | |
6.38% due 10/01/30 | | | 534,000 | | | | 537,453 | |
6.00% due 06/01/26 | | | 200,000 | | | | 199,107 | |
Kinder Morgan Energy Partners, LP | | | | | | | | |
5.80% due 03/15/35 | | | 725,000 | | | | 735,629 | |
TransCanada PipeLines Ltd. | | | | | | | | |
6.20% due 03/09/26 | | | 700,000 | | | | 700,131 | |
Total Energy | | | | | | | 25,345,642 | |
| | | | | | | | | |
Communications - 1.0% | | | | | | | | |
British Telecommunications plc | | | | | | | | |
4.88% due 11/23/812,9 | | | 2,900,000 | | | | 2,576,694 | |
4.25% due 11/23/812,9 | | | 500,000 | | | | 471,074 | |
9.63% due 12/15/30 | | | 150,000 | | | | 183,995 | |
Vodafone Group plc | | | | | | | | |
4.13% due 06/04/819 | | | 2,550,000 | | | | 2,196,376 | |
Charter Communications Operating LLC / Charter Communications Operating Capital | | | | | | | | |
3.90% due 06/01/52 | | | 3,350,000 | | | | 2,130,486 | |
Paramount Global | | | | | | | | |
4.90% due 08/15/44 | | | 1,035,000 | | | | 739,939 | |
5.90% due 10/15/40 | | | 666,000 | | | | 558,386 | |
5.25% due 04/01/44 | | | 358,000 | | | | 266,221 | |
2.90% due 01/15/27 | | | 236,000 | | | | 215,862 | |
4.85% due 07/01/42 | | | 281,000 | | | | 205,840 | |
4.60% due 01/15/45 | | | 150,000 | | | | 103,332 | |
Virgin Media Secured Finance plc | | | | | | | | |
4.50% due 08/15/302 | | | 2,350,000 | | | | 2,026,520 | |
Fox Corp. | | | | | | | | |
6.50% due 10/13/33 | | | 1,650,000 | | | | 1,747,652 | |
Level 3 Financing, Inc. | | | | | | | | |
4.50% due 04/01/302 | | | 2,175,000 | | | | 1,348,500 | |
11.00% due 11/15/292 | | | 359,563 | | | | 373,945 | |
Rogers Communications, Inc. | | | | | | | | |
4.55% due 03/15/52 | | | 2,000,000 | | | | 1,682,859 | |
Discovery Communications LLC | | | | | | | | |
5.20% due 09/20/47 | | | 1,637,000 | | | | 1,375,372 | |
CSC Holdings LLC | | | | | | | | |
4.13% due 12/01/302 | | | 600,000 | | | | 429,030 | |
Telenet Finance Luxembourg Notes SARL | | | | | | | | |
5.50% due 03/01/28 | | | 200,000 | | | | 187,908 | |
Altice France S.A. | | | | | | | | |
5.13% due 01/15/292 | | | 250,000 | | | | 171,201 | |
Total Communications | | | | | | | 18,991,192 | |
| | | | | | | | | |
Technology - 0.9% | | | | | | | | |
Entegris, Inc. | | | | | | | | |
4.75% due 04/15/292 | | | 3,700,000 | | | | 3,545,917 | |
Fiserv, Inc. | | | | | | | | |
5.35% due 03/15/31 | | | 1,850,000 | | | | 1,871,568 | |
5.63% due 08/21/33 | | | 1,000,000 | | | | 1,021,583 | |
Broadcom, Inc. | | | | | | | | |
4.93% due 05/15/372 | | | 2,306,000 | | | | 2,188,546 | |
3.19% due 11/15/362 | | | 217,000 | | | | 172,700 | |
Leidos, Inc. | | | | | | | | |
2.30% due 02/15/31 | | | 1,750,000 | | | | 1,446,490 | |
5.75% due 03/15/33 | | | 500,000 | | | | 512,579 | |
4.38% due 05/15/30 | | | 200,000 | | | | 189,510 | |
Foundry JV Holdco LLC | | | | | | | | |
5.88% due 01/25/342 | | | 1,700,000 | | | | 1,702,563 | |
Oracle Corp. | | | | | | | | |
3.95% due 03/25/51 | | | 2,128,000 | | | | 1,621,400 | |
MSCI, Inc. | | | | | | | | |
3.63% due 11/01/312 | | | 1,300,000 | | | | 1,128,237 | |
Constellation Software, Inc. | | | | | | | | |
5.16% due 02/16/292 | | | 700,000 | | | | 699,256 | |
5.46% due 02/16/342 | | | 350,000 | | | | 352,285 | |
CGI, Inc. | | | | | | | | |
2.30% due 09/14/31 | | | 1,300,000 | | | | 1,046,543 | |
Booz Allen Hamilton, Inc. | | | | | | | | |
5.95% due 08/04/33 | | | 700,000 | | | | 724,155 | |
Total Technology | | | | | | | 18,223,332 | |
| | | | | | | | | |
Utilities - 0.4% | | | | | | | | |
Liberty Utilities Co. | | | | | | | | |
5.58% due 01/31/292 | | | 1,400,000 | | | | 1,407,553 | |
5.87% due 01/31/342 | | | 550,000 | | | | 555,609 | |
AES Corp. | | | | | | | | |
3.95% due 07/15/302 | | | 1,760,000 | | | | 1,600,703 | |
NRG Energy, Inc. | | | | | | | | |
2.45% due 12/02/272 | | | 1,750,000 | | | | 1,573,010 | |
Brooklyn Union Gas Co. | | | | | | | | |
6.39% due 09/15/332 | | | 800,000 | | | | 826,420 | |
Enel Finance International N.V. | | | | | | | | |
5.00% due 06/15/322 | | | 850,000 | | | | 823,799 | |
Alexander Funding Trust II | | | | | | | | |
7.47% due 07/31/282 | | | 450,000 | | | | 475,785 | |
Total Utilities | | | | | | | 7,262,879 | |
| | | | | | | | | |
Basic Materials - 0.2% | | | | | | | | |
Anglo American Capital plc | | | | | | | | |
5.63% due 04/01/302 | | | 1,800,000 | | | | 1,823,998 | |
3.95% due 09/10/502 | | | 970,000 | | | | 729,298 | |
2.63% due 09/10/302 | | | 250,000 | | | | 212,820 | |
SEE NOTES TO FINANCIAL STATEMENTS. | THE GUGGENHEIM FUNDS SEMI-ANNUAL REPORT | 39 |
SCHEDULE OF INVESTMENTS (Unaudited)(continued) | March 31, 2024 |
CORE BOND FUND | |
| | Face
Amount~ | | | Value | |
Yamana Gold, Inc. | | | | | | | | |
2.63% due 08/15/31 | | | 1,200,000 | | | $ | 1,000,134 | |
Total Basic Materials | | | | | | | 3,766,250 | |
| | | | | | | | | |
Total Corporate Bonds | | | | |
(Cost $469,442,605) | | | 420,410,851 | |
| |
COLLATERALIZED MORTGAGE OBLIGATIONS†† - 17.8% |
Government Agency - 10.7% | | | | | | | | |
Fannie Mae | | | | | | | | |
5.50% due 05/01/53 | | | 28,400,531 | | | | 28,288,322 | |
5.00% due 06/01/53 | | | 26,534,136 | | | | 25,936,517 | |
5.00% due 05/01/53 | | | 17,272,051 | | | | 16,864,221 | |
5.00% due 04/01/53 | | | 12,872,431 | | | | 12,571,317 | |
4.00% due 06/01/52 | | | 6,916,791 | | | | 6,460,748 | |
5.00% due 08/01/53 | | | 5,753,790 | | | | 5,619,272 | |
4.00% due 07/01/52 | | | 5,713,537 | | | | 5,318,267 | |
5.00% due 12/01/53 | | | 5,100,984 | | | | 4,976,639 | |
6.50% due 04/25/49 | | | 3,635,613 | | | | 3,636,002 | |
2.36% due 08/01/50 | | | 4,409,523 | | | | 3,053,018 | |
5.00% due 09/01/52 | | | 2,084,686 | | | | 2,037,093 | |
2.78% due 05/01/51 | | | 2,630,754 | | | | 1,971,923 | |
5.00% due 01/01/54 | | | 1,563,987 | | | | 1,525,861 | |
2.32% due 02/01/51 | | | 1,990,004 | | | | 1,425,105 | |
2.00% due 09/01/50 | | | 2,013,899 | | | | 1,393,230 | |
2.11% due 10/01/50 | | | 1,776,404 | | | | 1,249,767 | |
2.27% due 02/01/51 | | | 1,657,021 | | | | 1,179,292 | |
2.39% due 02/01/51 | | | 1,379,588 | | | | 998,891 | |
4.24% due 08/01/48 | | | 991,725 | | | | 887,322 | |
2.58% due 10/01/51 | | | 1,154,495 | | | | 848,243 | |
3.46% due 08/01/49 | | | 924,673 | | | | 778,104 | |
2.68% due 04/01/50 | | | 922,729 | | | | 706,776 | |
4.07% due 05/01/49 | | | 744,619 | | | | 670,587 | |
4.37% due 10/01/48 | | | 693,947 | | | | 646,648 | |
4.25% due 05/01/48 | | | 609,295 | | | | 555,622 | |
due 12/25/435 | | | 674,917 | | | | 506,887 | |
Freddie Mac | | | | | | | | |
5.50% due 09/01/53 | | | 15,657,869 | | | | 15,765,041 | |
5.50% due 06/01/53 | | | 12,587,057 | | | | 12,554,903 | |
5.00% due 04/01/53 | | | 12,742,067 | | | | 12,439,996 | |
5.00% due 06/01/53 | | | 10,969,760 | | | | 10,702,080 | |
4.00% due 02/01/53 | | | 7,642,156 | | | | 7,152,535 | |
5.00% due 09/01/52 | | | 5,537,721 | | | | 5,410,767 | |
5.00% due 03/01/53 | | | 4,289,403 | | | | 4,189,534 | |
4.00% due 10/01/52 | | | 3,031,289 | | | | 2,823,994 | |
4.00% due 04/01/52 | | | 1,943,059 | | | | 1,818,556 | |
5.00% due 01/01/54 | | | 1,620,738 | | | | 1,581,161 | |
1.98% due 05/01/50 | | | 1,324,830 | | | | 902,945 | |
Freddie Mac Seasoned Credit Risk Transfer Trust | | | | | | | | |
2.00% due 05/25/60 | | | 3,151,980 | | | | 2,481,342 | |
2.00% due 11/25/59 | | | 1,197,517 | | | | 941,271 | |
Fannie Mae-Aces | | | | | | | | |
1.49% (WAC) due 03/25/35◊,6 | | | 17,489,536 | | | | 1,674,648 | |
Ginnie Mae | | | | | | | | |
6.00% due 06/20/47 | | | 1,114,718 | | | | 1,115,989 | |
FARM Mortgage Trust | | | | | | | | |
2.18% (WAC) due 01/25/51◊,2 | | | 833,979 | | | | 651,786 | |
Total Government Agency | | | | | | | 212,312,222 | |
| | | | | | | | | |
Residential Mortgage-Backed Securities - 4.3% | | | | | | | | |
OBX Trust | | | | | | | | |
2023-NQM9, 7.66% due 10/25/632,11 | | | 3,744,276 | | | | 3,810,118 | |
2024-NQM4, 6.22% due 01/25/642,11 | | | 3,000,000 | | | | 2,998,517 | |
2024-NQM5, due 03/25/282,11,13 | | | 1,750,000 | | | | 1,749,981 | |
2024-NQM5, due 03/25/282,11,13 | | | 1,500,000 | | | | 1,499,990 | |
2024-NQM3, 6.33% due 12/25/632,11 | | | 1,000,000 | | | | 1,000,550 | |
2024-NQM3, 6.13% due 12/25/632,11 | | | 1,000,000 | | | | 1,000,546 | |
2024-NQM3, 6.43% due 12/25/632,11 | | | 1,000,000 | | | | 1,000,543 | |
2024-NQM5, due 03/25/282,11,13 | | | 1,000,000 | | | | 999,983 | |
2022-NQM8, 6.10% due 09/25/622,11 | | | 840,940 | | | | 830,219 | |
2022-NQM9, 6.45% due 09/25/622,11 | | | 568,733 | | | | 570,208 | |
2024-NQM2, 6.18% due 12/25/632,11 | | | 490,194 | | | | 488,045 | |
COLT Mortgage Loan Trust | | | | | | | | |
2023-4, 7.62% due 10/25/682,11 | | | 3,886,252 | | | | 3,940,575 | |
2023-3, 7.18% due 09/25/682,11 | | | 3,002,333 | | | | 3,058,689 | |
2021-2, 2.38% (WAC) due 08/25/66◊,2 | | | 4,000,000 | | | | 2,622,992 | |
2024-1, 6.14% due 02/25/692,11 | | | 1,457,632 | | | | 1,446,978 | |
2023-3, 7.58% due 09/25/682,11 | | | 968,495 | | | | 980,897 | |
Angel Oak Mortgage Trust | | | | | | | | |
2024-2, 6.25% due 01/25/692,11 | | | 4,953,951 | | | | 4,915,199 | |
2024-3, 4.80% due 11/26/682,11 | | | 2,000,000 | | | | 1,932,865 | |
2023-1, 4.75% due 09/26/672,11 | | | 1,468,229 | | | | 1,399,010 | |
2020-1, 2.77% (WAC) due 12/25/59◊,2 | | | 284,611 | | | | 266,462 | |
Verus Securitization Trust | | | | | | | | |
2024-1, 6.12% due 01/25/692,11 | | | 4,764,656 | | | | 4,743,193 | |
2023-2, 6.85% due 03/25/682,11 | | | 1,637,315 | | | | 1,645,408 | |
2023-7, 7.42% due 10/25/682,11 | | | 1,421,710 | | | | 1,440,118 | |
2019-4, 3.85% due 11/25/592 | | | 445,509 | | | | 431,372 | |
GCAT Trust | | | | | | | | |
2022-NQM3, 4.35% (WAC) due 04/25/67◊,2 | | | 3,115,804 | | | | 2,876,819 | |
2023-NQM3, 6.89% due 08/25/682,11 | | | 1,859,080 | | | | 1,886,167 | |
2023-NQM3, 7.34% due 08/25/682,11 | | | 1,859,080 | | | | 1,875,591 | |
BRAVO Residential Funding Trust | | | | | | | | |
2023-NQM2, 4.50% due 05/25/622,11 | | | 1,815,957 | | | | 1,741,650 | |
2024-NQM3, 6.39% due 03/25/642,11 | | | 1,700,000 | | | | 1,698,448 | |
2023-NQM8, 7.10% due 10/25/632,11 | | | 1,447,075 | | | | 1,457,410 | |
2021-HE1, 6.82% (30 Day Average SOFR + 1.50%, Rate Floor: 0.00%) due 01/25/70◊,2 | | | 1,000,000 | | | | 995,426 | |
Mill City Mortgage Loan Trust | | | | | | | | |
2021-NMR1, 2.50% (WAC) due 11/25/60◊,2 | | | 4,800,000 | | | | 3,959,677 | |
RCKT Mortgage Trust | | | | | | | | |
2023-CES2, 6.81% (WAC) due 09/25/43◊,2 | | | 3,691,283 | | | | 3,735,038 | |
FIGRE Trust | | | | | | | | |
2024-HE1, 6.17% (WAC) due 03/25/54◊,2 | | | 3,000,000 | | | | 3,001,260 | |
40 | THE GUGGENHEIM FUNDS SEMI-ANNUAL REPORT | SEE NOTES TO FINANCIAL STATEMENTS. |
SCHEDULE OF INVESTMENTS (Unaudited)(continued) | March 31, 2024 |
CORE BOND FUND | |
| | Face
Amount~ | | | Value | |
PRPM LLC | | | | | | | | |
2021-RPL2, 2.93% (WAC) due 10/25/51◊,2 | | | 2,472,000 | | | $ | 2,077,789 | |
2023-RCF1, 4.00% due 06/25/532,11 | | | 883,283 | | | | 848,846 | |
Towd Point Mortgage Trust | | | | | | | | |
2023-CES2, 7.29% (WAC) due 10/25/63◊,2 | | | 1,988,177 | | | | 2,024,809 | |
2023-CES1, 6.75% (WAC) due 07/25/63◊,2 | | | 871,674 | | | | 878,256 | |
CFMT LLC | | | | | | | | |
2022-HB9, 3.25% (WAC) due 09/25/37◊ | | | 2,624,346 | | | | 2,510,200 | |
Saluda Grade Alternative Mortgage Trust | | | | | | | | |
2023-FIG4, 6.72% (WAC) due 11/25/53◊,2 | | | 1,764,824 | | | | 1,799,275 | |
Imperial Fund Mortgage Trust | | | | | | | | |
2022-NQM2, 4.20% (WAC) due 03/25/67◊,2 | | | 851,966 | | | | 784,180 | |
2022-NQM2, 4.02% (WAC) due 03/25/67◊,2 | | | 851,966 | | | | 781,059 | |
Starwood Mortgage Residential Trust | | | | | | | | |
2020-1, 2.41% (WAC) due 02/25/50◊,2 | | | 689,633 | | | | 643,752 | |
2020-1, 2.56% (WAC) due 02/25/50◊,2 | | | 689,633 | | | | 643,268 | |
SPS Servicer Advance Receivables Trust | | | | | | | | |
2020-T2, 1.83% due 11/15/552 | | | 1,250,000 | | | | 1,171,159 | |
CSMC Trust | | | | | | | | |
2018-RPL9, 3.85% (WAC) due 09/25/57◊,2 | | | 703,160 | | | | 678,771 | |
2020-NQM1, 1.72% due 05/25/652,11 | | | 190,690 | | | | 171,936 | |
American Home Mortgage Investment Trust | | | | | | | | |
2007-1, 2.08% due 05/25/476 | | | 5,924,149 | | | | 849,845 | |
MFRA Trust | | | | | | | | |
2021-INV1, 2.29% (WAC) due 01/25/56◊,2 | | | 700,000 | | | | 614,036 | |
Securitized Asset-Backed Receivables LLC Trust | | | | | | | | |
2006-HE2, 5.74% (1 Month Term SOFR + 0.41%, Rate Floor: 0.30%) due 07/25/36◊ | | | 1,376,182 | | | | 546,083 | |
New Residential Mortgage Loan Trust | | | | | | | | |
2019-6A, 3.50% (WAC) due 09/25/59◊,2 | | | 415,649 | | | | 384,945 | |
RALI Series Trust | | | | | | | | |
2006-QO2, 5.88% (1 Month Term SOFR + 0.55%, Rate Floor: 0.44%) due 02/25/46◊ | | | 1,487,218 | | | | 263,925 | |
MASTR Adjustable Rate Mortgages Trust | | | | | | | | |
2003-5, 2.65% (WAC) due 11/25/33◊ | | | 217,463 | | | | 187,714 | |
Washington Mutual Mortgage Pass-Through Certificates WMALT Series Trust | | | | | | | | |
2006-AR9, 5.93% (1 Year CMT Rate + 0.84%, Rate Floor: 0.84%) due 11/25/46◊ | | | 224,624 | | | | 179,051 | |
GS Mortgage-Backed Securities Trust | | | | | | | | |
2020-NQM1, 1.79% (WAC) due 09/27/60◊,2 | | | 168,112 | | | | 153,239 | |
Residential Mortgage Loan Trust | | | | | | | | |
2020-1, 2.68% (WAC) due 01/26/60◊ | | | 112,444 | | | | 106,368 | |
UCFC Manufactured Housing Contract | | | | | | | | |
1997-2, 7.38% due 10/15/28 | | | 13,164 | | | | 13,075 | |
Total Residential Mortgage-Backed Securities | | | | | | | 86,311,525 | |
| | | | | | | | | |
Commercial Mortgage-Backed Securities - 2.1% | | | | | | | | |
GS Mortgage Securities Trust | | | | | | | | |
2020-GSA2, 2.34% due 12/12/53 | | | 8,000,000 | | | | 5,975,597 | |
2020-GC45, 0.66% (WAC) due 02/13/53◊,6 | | | 18,693,352 | | | | 519,909 | |
2019-GC42, 0.82% (WAC) due 09/10/52◊,6 | | | 13,914,025 | | | | 473,590 | |
BX Commercial Mortgage Trust | | | | | | | | |
2021-VOLT, 6.54% (1 Month Term SOFR + 1.21%, Rate Floor: 1.10%) due 09/15/36◊,2 | | | 3,490,000 | | | | 3,437,650 | |
2021-VOLT, 7.44% (1 Month Term SOFR + 2.11%, Rate Floor: 2.00%) due 09/15/36◊,2 | | | 3,450,000 | | | | 3,400,406 | |
JP Morgan Chase Commercial Mortgage Securities Trust | | | | | | | | |
2021-NYAH, 7.27% (1 Month Term SOFR + 1.95%, Rate Floor: 1.84%) due 06/15/38◊,2 | | | 4,000,000 | | | | 3,438,654 | |
2016-JP3, 3.42% (WAC) due 08/15/49◊ | | | 4,000,000 | | | | 3,316,355 | |
DBGS Mortgage Trust | | | | | | | | |
2018-C1, 4.65% (WAC) due 10/15/51◊ | | | 7,000,000 | | | | 6,356,801 | |
CD Mortgage Trust | | | | | | | | |
2017-CD4, 3.95% (WAC) due 05/10/50◊ | | | 4,750,000 | | | | 4,253,949 | |
2016-CD1, 1.37% (WAC) due 08/10/49◊,6 | | | 2,068,554 | | | | 44,394 | |
SMRT | | | | | | | | |
2022-MINI, 7.28% (1 Month Term SOFR + 1.95%, Rate Floor: 1.95%) due 01/15/39◊,2 | | | 2,000,000 | | | | 1,964,849 | |
Life Mortgage Trust | | | | | | | | |
2021-BMR, 6.84% (1 Month Term SOFR + 1.51%, Rate Floor: 1.40%) due 03/15/38◊,2 | | | 1,965,940 | | | | 1,938,909 | |
GS Mortgage Securities Corporation Trust | | | | | | | | |
2020-DUNE, 6.95% (1 Month Term SOFR + 1.61%, Rate Floor: 1.35%) due 12/15/36◊,2 | | | 1,000,000 | | | | 987,012 | |
2020-UPTN, 3.25% (WAC) due 02/10/37◊,2 | | | 1,000,000 | | | | 930,649 | |
Extended Stay America Trust | | | | | | | | |
2021-ESH, 7.69% (1 Month Term SOFR + 2.36%, Rate Floor: 2.25%) due 07/15/38◊,2 | | | 1,005,681 | | | | 1,004,424 | |
BENCHMARK Mortgage Trust | | | | | | | | |
2019-B14, 0.77% (WAC) due 12/15/62◊,6 | | | 19,605,738 | | | | 491,336 | |
2018-B6, 0.40% (WAC) due 10/10/51◊,6 | | | 28,473,052 | | | | 330,771 | |
Citigroup Commercial Mortgage Trust | | | | | | | | |
2019-GC43, 0.62% (WAC) due 11/10/52◊,6 | | | 19,783,133 | | | | 525,478 | |
2016-GC37, 1.65% (WAC) due 04/10/49◊,6 | | | 2,776,922 | | | | 64,736 | |
2016-C2, 1.66% (WAC) due 08/10/49◊,6 | | | 2,171,596 | | | | 60,485 | |
2016-P5, 1.38% (WAC) due 10/10/49◊,6 | | | 1,544,588 | | | | 38,941 | |
CSAIL Commercial Mortgage Trust | | | | | | | | |
2019-C15, 0.99% (WAC) due 03/15/52◊,6 | | | 11,024,299 | | | | 421,499 | |
COMM Mortgage Trust | | | | | | | | |
2015-CR24, 0.69% (WAC) due 08/10/48◊,6 | | | 36,390,389 | | | | 234,216 | |
2015-CR26, 0.89% (WAC) due 10/10/48◊,6 | | | 8,090,720 | | | | 70,939 | |
UBS Commercial Mortgage Trust | | | | | | | | |
2017-C2, 1.07% (WAC) due 08/15/50◊,6 | | | 7,837,114 | | | | 218,637 | |
SG Commercial Mortgage Securities Trust | | | | | | | | |
2016-C5, 1.86% (WAC) due 10/10/48◊,6 | | | 7,615,495 | | | | 214,950 | |
Morgan Stanley Capital I Trust | | | | | | | | |
2016-UB11, 1.44% (WAC) due 08/15/49◊,6 | | | 5,673,427 | | | | 149,368 | |
JPMDB Commercial Mortgage Securities Trust | | | | | | | | |
2016-C2, 1.48% (WAC) due 06/15/49◊,6 | | | 6,174,545 | | | | 138,340 | |
SEE NOTES TO FINANCIAL STATEMENTS. | THE GUGGENHEIM FUNDS SEMI-ANNUAL REPORT | 41 |
SCHEDULE OF INVESTMENTS (Unaudited)(continued) | March 31, 2024 |
CORE BOND FUND | |
| | Face
Amount~ | | | Value | |
Wells Fargo Commercial Mortgage Trust | | | | | | | | |
2016-NXS5, 1.40% (WAC) due 01/15/59◊,6 | | | 3,205,837 | | | $ | 64,059 | |
2016-C37, 0.78% (WAC) due 12/15/49◊,6 | | | 2,392,398 | | | | 37,266 | |
CFCRE Commercial Mortgage Trust | | | | | | | | |
2016-C3, 0.98% (WAC) due 01/10/48◊,6 | | | 5,236,937 | | | | 69,235 | |
Total Commercial Mortgage-Backed Securities | | | | | | | 41,173,404 | |
| | | | | | | | | |
Military Housing - 0.7% | | | | | | | | |
Freddie Mac Military Housing Bonds Resecuritization Trust Certificates | | | | | | | | |
2015-R1, 5.00% (WAC) due 11/25/55◊,†††,2 | | | 4,361,632 | | | | 3,836,886 | |
2015-R1, 4.44% (WAC) due 11/25/52◊,†††,2 | | | 2,729,717 | | | | 2,474,118 | |
Capmark Military Housing Trust | | | | | | | | |
2006-RILY, 6.15% due 07/10/51†††,2 | | | 2,223,378 | | | | 2,008,556 | |
2007-ROBS, 6.06% due 10/10/52†††,2 | | | 448,427 | | | | 404,249 | |
2007-AETC, 5.75% due 02/10/52†††,2 | | | 263,631 | | | | 232,194 | |
Freddie Mac Military Housing Bonds Resecuritization Trust Certificates | | | | | | | | |
2015-R1, 5.00% (WAC) due 11/25/55◊,2 | | | 2,428,125 | | | | 1,927,913 | |
2015-R1, 0.70% (WAC) due 11/25/55◊,2,6 | | | 9,937,327 | | | | 628,878 | |
GMAC Commercial Mortgage Asset Corp. | | | | | | | | |
2007-HCKM, 6.11% due 08/10/52†††,2 | | | 1,409,714 | | | | 1,368,387 | |
Total Military Housing | | | | | | | 12,881,181 | |
| | | | | | | | | |
Total Collateralized Mortgage Obligations | | | | |
(Cost $376,396,719) | | | 352,678,332 | |
| | | | | | | | | |
SENIOR FLOATING RATE INTERESTS††,◊ - 1.4% |
Industrial - 0.6% | | | | | | | | |
Mileage Plus Holdings LLC | | | | | | | | |
10.73% (3 Month Term SOFR + 5.25%, Rate Floor: 6.25%) due 06/21/27 | | | 5,492,500 | | | | 5,649,146 | |
XPO, Inc. | | | | | | | | |
7.32% (1 Month Term SOFR + 2.00%, Rate Floor: 2.00%) due 02/03/31 | | | 2,475,000 | | | | 2,471,906 | |
United Rentals, Inc. | | | | | | | | |
7.08% (1 Month Term SOFR + 1.75%, Rate Floor: 1.75%) due 02/14/31 | | | 1,500,000 | | | | 1,502,820 | |
SkyMiles IP Ltd. | | | | | | | | |
9.07% (3 Month Term SOFR + 3.75%, Rate Floor: 4.75%) due 10/20/27 | | | 1,275,000 | | | | 1,313,786 | |
Total Industrial | | | | | | | 10,937,658 | |
| | | | | | | | | |
Technology - 0.2% | | | | | | | | |
Datix Bidco Ltd. | | | | | | | | |
9.69% (6 Month GBP SONIA + 4.50%, Rate Floor: 5.19%) due 04/28/25††† | | GBP | 2,900,000 | | | | 3,660,184 | |
RLDatix | | | | | | | | |
9.94% (6 Month Term SOFR + 4.50%, Rate Floor: 4.50%) due 04/28/25††† | | | 1,252,544 | | | | 1,252,544 | |
Total Technology | | | | | | | 4,912,728 | |
Consumer, Cyclical - 0.2% | | | | | | | | |
Amaya Holdings BV | | | | | | | | |
6.33% (3 Month EURIBOR + 2.50%, Rate Floor: 2.50%) due 07/21/26 | | EUR | 4,000,000 | | | | 4,311,739 | |
| | | | | | | | | |
Utilities - 0.2% | | | | | | | | |
NRG Energy, Inc. | | | | | | | | |
due 03/26/31 | | | 3,000,000 | | | | 2,994,390 | |
| | | | | | | | | |
Financial - 0.1% | | | | | | | | |
Citadel Securities, LP | | | | | | | | |
7.58% (1 Month Term SOFR + 2.25%, Rate Floor: 2.25%) due 07/29/30 | | | 2,042,865 | | | | 2,040,188 | |
| | | | | | | | | |
Consumer, Non-cyclical - 0.1% | | | | | | | | |
Southern Veterinary Partners LLC | | | | | | | | |
9.44% (1 Month Term SOFR + 4.00%, Rate Floor: 5.00%) due 10/05/27 | | | 1,051,778 | | | | 1,051,778 | |
HAH Group Holding Co. LLC | | | | | | | | |
10.44% (1 Month Term SOFR + 5.00%, Rate Floor: 6.00%) due 10/29/27 | | | 259,973 | | | | 258,348 | |
Total Consumer, Non-cyclical | | | | | | | 1,310,126 | |
| | | | | | | | | |
Energy - 0.0% | | | | | | | | |
Venture Global Calcasieu Pass LLC | | | | | | | | |
8.05% (1 Month Term SOFR + 2.63%, Rate Floor: 3.63%) due 08/19/26 | | | 428,758 | | | | 427,150 | |
Total Senior Floating Rate Interests | | | | |
(Cost $27,579,336) | | | 26,933,979 | |
| |
FEDERAL AGENCY BONDS†† - 0.9% |
Tennessee Valley Authority Principal Strips |
due 06/15/384,5 | | | 9,400,000 | | | | 4,628,955 | |
due 01/15/484,5 | | | 9,700,000 | | | | 2,900,795 | |
due 01/15/384 | | | 4,000,000 | | | | 2,013,832 | |
due 06/15/354,5 | | | 1,583,000 | | | | 917,594 | |
due 12/15/424,5 | | | 1,600,000 | | | | 620,416 | |
Federal Farm Credit Bank |
3.51% due 06/11/40 | | | 3,300,000 | | | | 2,817,903 | |
Tennessee Valley Authority |
4.25% due 09/15/65 | | | 2,450,000 | | | | 2,149,387 | |
5.38% due 04/01/56 | | | 600,000 | | | | 642,830 | |
U.S. International Development Finance Corp. |
due 01/17/264 | | | 800,000 | | | | 838,349 | |
Total Federal Agency Bonds | | | | |
(Cost $24,828,003) | | | | | | | 17,530,061 | |
| | | | | | | | | |
FEDERAL AGENCY DISCOUNT NOTES†† - 0.5% |
Federal Home Loan Bank |
5.20% due 04/03/2412 | | | 10,000,000 | | | | 9,997,111 | |
Total Federal Agency Discount Notes | | | | |
(Cost $9,997,111) | | | | | | | 9,997,111 | |
| | | | | | | | | |
MUNICIPAL BONDS†† - 0.4% |
Texas - 0.2% | | | | | | | | |
Tarrant County Cultural Education Facilities Finance Corp. Revenue Bonds | | | | | | | | |
3.29% due 09/01/40 | | | 2,100,000 | | | | 1,657,692 | |
2.78% due 09/01/34 | | | 700,000 | | | | 564,566 | |
42 | THE GUGGENHEIM FUNDS SEMI-ANNUAL REPORT | SEE NOTES TO FINANCIAL STATEMENTS. |
SCHEDULE OF INVESTMENTS (Unaudited)(continued) | March 31, 2024 |
CORE BOND FUND | |
| | Face
Amount~ | | | Value | |
2.69% due 09/01/33 | | | 500,000 | | | $ | 408,961 | |
2.57% due 09/01/32 | | | 475,000 | | | | 393,314 | |
2.41% due 09/01/31 | | | 450,000 | | | | 377,327 | |
Grand Parkway Transportation Corp. Revenue Bonds | | | | | | | | |
3.31% due 10/01/49 | | | 1,500,000 | | | | 1,120,158 | |
Total Texas | | | | | | | 4,522,018 | |
| | | | | | | | | |
California - 0.2% | | | | | | | | |
California Statewide Communities Development Authority Revenue Bonds | | | | | | | | |
7.14% due 08/15/47 | | | 1,200,000 | | | | 1,291,329 | |
2.68% due 02/01/39 | | | 1,200,000 | | | | 904,627 | |
Total California | | | | | | | 2,195,956 | |
| | | | | | | | | |
Mississippi - 0.0% | | | | | | | | |
Medical Center Educational Building Corp. Revenue Bonds | | | | | | | | |
2.92% due 06/01/41 | | | 1,000,000 | | | | 766,780 | |
| | | | | | | | | |
Ohio - 0.0% | | | | | | | | |
County of Franklin Ohio Revenue Bonds | | | | | | | | |
2.88% due 11/01/50 | | | 1,000,000 | | | | 672,413 | |
| | | | | | | | | |
Illinois - 0.0% | | | | | | | | |
State of Illinois General Obligation Unlimited | | | | | | | | |
5.65% due 12/01/38 | | | 416,667 | | | | 422,892 | |
Total Municipal Bonds | | | | |
(Cost $10,606,789) | | | 8,580,059 | |
| |
SENIOR FIXED RATE INTERESTS††† - 0.1% |
Industrial - 0.1% | | | | | | | | |
CTL Logistics | | | | | | | | |
2.65% due 10/10/42 | | | 3,478,044 | | | | 2,738,499 | |
Total Senior Fixed Rate Interests | | | | |
(Cost $3,478,044) | | | 2,738,499 | |
| |
FOREIGN GOVERNMENT DEBT†† - 0.1% |
Panama Government International Bond |
4.50% due 01/19/63 | | | 2,600,000 | | | | 1,662,896 | |
4.50% due 04/16/50 | | | 1,450,000 | | | | 976,952 | |
Total Foreign Government Debt | | | | |
(Cost $4,203,280) | | | | | | | 2,639,848 | |
| | Notional
Value | | | | |
OTC OPTIONS PURCHASED†† - 0.0% |
Call Options on: |
Interest Rate Options | | | | | | | | |
Morgan Stanley Capital Services LLC 10Y-2Y SOFR CMS CAP Expiring June 2024 with strike price of $0.10 | | USD | 34,200,000 | | | | 2,046 | |
Barclays Bank plc 10Y-2Y SOFR CMS CAP Expiring June 2024 with strike price of $0.10 | | USD | 33,900,000 | | | | 2,029 | |
Bank of America, N.A. 10Y-2Y SOFR CMS CAP Expiring June 2024 with strike price of $0.10 | | USD | 17,150,000 | | | | 1,026 | |
Goldman Sachs International 10Y-2Y SOFR CMS CAP Expiring June 2024 with strike price of $0.10 | | USD | 13,950,000 | | | | 835 | |
Total OTC Options Purchased | | | | |
(Cost $447,756) | | | | | | | 5,936 | |
| | | | | | | | | |
Total Investments - 94.0% | | | | |
(Cost $1,975,284,411) | | $ | 1,865,769,820 | |
Other Assets & Liabilities, net - 6.0% | | | 120,019,925 | |
Total Net Assets - 100.0% | | $ | 1,985,789,745 | |
Futures Contracts |
Description | | Number of
Contracts | | | Expiration
Date | | | Notional
Amount | | | Value and
Unrealized
Depreciation** | |
Interest Rate Futures Contracts Purchased† |
3-Month SOFR Futures Contracts | | | 726 | | | | Jun 2025 | | | $ | 173,668,275 | | | $ | (279,768 | ) |
SEE NOTES TO FINANCIAL STATEMENTS. | THE GUGGENHEIM FUNDS SEMI-ANNUAL REPORT | 43 |
SCHEDULE OF INVESTMENTS (Unaudited)(continued) | March 31, 2024 |
CORE BOND FUND | |
Centrally Cleared Credit Default Swap Agreements Protection Purchased†† |
Counterparty | Exchange | Index | Protection
Premium
Rate | | Payment
Frequency | | | Maturity
Date | | | Notional
Amount~ | | | Value | | | Upfront
Premiums
Paid
(Received) | | | Unrealized
Appreciation
(Depreciation)** | |
BofA Securities, Inc. | ICE | ITRAXX.EUR.41.V1 | 1.00% | | | Quarterly | | | | 06/20/29 | | | | EUR 7,030,000 | | | $ | (167,296 | ) | | $ | (169,604 | ) | | $ | 2,308 | |
BofA Securities, Inc. | ICE | CDX.NA.HY.41.V2 | 5.00% | | | Quarterly | | | | 12/20/28 | | | | 9,108,000 | | | | (670,536 | ) | | | 32,147 | | | | (702,683 | ) |
| | | | | | | | | | | | | | | | | | $ | (837,832 | ) | | $ | (137,457 | ) | | $ | (700,375 | ) |
Centrally Cleared Interest Rate Swap Agreements†† |
Counterparty | Exchange | Floating
Rate
Type | Floating
Rate Index | | Fixed
Rate | | | Payment
Frequency | | | Maturity
Date | | | Notional
Amount | | | Value | | | Upfront
Premiums
Paid | | | Unrealized
Appreciation
(Depreciation)** | |
BofA Securities, Inc. | CME | Pay | U.S. Secured Overnight Financing Rate | 4.48% | Annually | 11/02/33 | | $ | 80,000,000 | | | $ | 4,076,046 | | | $ | 869 | | | $ | 4,075,177 | |
BofA Securities, Inc. | CME | Pay | U.S. Secured Overnight Financing Rate | 4.35% | Annually | 10/03/28 | | | 75,000,000 | | | | 992,230 | | | | 557 | | | | 991,673 | |
BofA Securities, Inc. | CME | Pay | U.S. Secured Overnight Financing Rate | 4.51% | Annually | 10/11/28 | | | 41,851,000 | | | | 833,736 | | | | 442 | | | | 833,294 | |
BofA Securities, Inc. | CME | Pay | U.S. Secured Overnight Financing Rate | 4.50% | Annually | 11/02/30 | | | 23,900,000 | | | | 811,494 | | | | 417 | | | | 811,077 | |
BofA Securities, Inc. | CME | Pay | U.S. Secured Overnight Financing Rate | 4.25% | Annually | 11/08/30 | | $ | 38,000,000 | | | | 761,456 | | | | 498 | | | | 760,958 | |
BofA Securities, Inc. | CME | Pay | U.S. Secured Overnight Financing Rate | 4.28% | Annually | 11/08/30 | | | 26,000,000 | | | | 555,444 | | | | 430 | | | | 555,014 | |
BofA Securities, Inc. | CME | Pay | U.S. Secured Overnight Financing Rate | 4.99% | Annually | 10/11/25 | | | 98,748,000 | | | | 330,169 | | | | 416 | | | | 329,753 | |
BofA Securities, Inc. | CME | Pay | U.S. Secured Overnight Financing Rate | 4.96% | Annually | 10/16/25 | | | 95,000,000 | | | | 288,429 | | | | 412 | | | | 288,017 | |
BofA Securities, Inc. | CME | Pay | U.S. Secured Overnight Financing Rate | 3.98% | Annually | 02/06/27 | | | 70,000,000 | | | | (589,150 | ) | | | 451 | | | | (589,601 | ) |
| | | | | | | | | | | | | | | | | | | | | | $ | 8,059,854 | | | $ | 4,492 | | | $ | 8,055,362 | |
Forward Foreign Currency Exchange Contracts†† |
Counterparty | | Currency | | | Type | | | Quantity | | | Contract
Amount | | | Settlement Date | | | Unrealized
Appreciation
(Depreciation) | |
Barclays Bank plc | | | EUR | | | | Sell | | | | 8,845,000 | | | | 9,673,903 USD | | | | 04/15/24 | | | $ | 125,282 | |
Bank of America, N.A. | | | GBP | | | | Sell | | | | 3,015,000 | | | | 3,856,924 USD | | | | 04/15/24 | | | | 51,314 | |
Morgan Stanley Capital Services LLC | | | EUR | | | | Buy | | | | 255,000 | | | | 276,621 USD | | | | 04/15/24 | | | | (1,336 | ) |
| | | | | | | | | | | | | | | | | | | | | | | $ | 175,260 | |
44 | THE GUGGENHEIM FUNDS SEMI-ANNUAL REPORT | SEE NOTES TO FINANCIAL STATEMENTS. |
SCHEDULE OF INVESTMENTS (Unaudited)(continued) | March 31, 2024 |
CORE BOND FUND | |
~ | The face amount is denominated in U.S. dollars unless otherwise indicated. |
* | Non-income producing security. |
** | Includes cumulative appreciation (depreciation). Variation margin is reported within the Statement of Assets and Liabilities. |
† | Value determined based on Level 1 inputs, unless otherwise noted — See Note 4. |
†† | Value determined based on Level 2 inputs, unless otherwise noted — See Note 4. |
††† | Value determined based on Level 3 inputs — See Note 4. |
◊ | Variable rate security. Rate indicated is the rate effective at March 31, 2024. In some instances, the effective rate is limited by a minimum rate floor or a maximum rate cap established by the issuer. The settlement status of a position may also impact the effective rate indicated. In some cases, a position may be unsettled at period end and may not have a stated effective rate. In instances where multiple underlying reference rates and spread amounts are shown, the effective rate is based on a weighted average. |
1 | Special Purpose Acquisition Company (SPAC). |
2 | Security is a 144A or Section 4(a)(2) security. These securities have been determined to be liquid under guidelines established by the Board of Trustees. The total market value of 144A or Section 4(a)(2) securities is $691,831,092 (cost $731,481,576), or 34.8% of total net assets. |
3 | Rate indicated is the 7-day yield as of March 31, 2024. |
4 | Zero coupon rate security. |
5 | Security is a principal-only strip. |
6 | Security is an interest-only strip. |
7 | Security has no stated coupon. However, it is expected to receive residual cash flow payments on defined deal dates. |
8 | Security is a 144A or Section 4(a)(2) security. These securities have been determined to be illiquid and restricted under guidelines established by the Board of Trustees. The total market value of 144A or Section 4(a)(2) illiquid and restricted securities is $710,904 (cost $840,674), or 0.0% of total net assets — See Note 10. |
9 | Security has a fixed rate coupon which will convert to a floating or variable rate coupon on a future date. |
10 | Perpetual maturity. |
11 | Security is a step up/down bond. The coupon increases or decreases at regular intervals until the bond reaches full maturity. Rate indicated is the rate at March 31, 2024. See table below for additional step information for each security. |
12 | Rate indicated is the effective yield at the time of purchase. |
13 | Security is unsettled at period end and does not have a stated effective rate. |
14 | Face amount of security is adjusted for inflation. |
| | BofA — Bank of America |
| | CDX.NA.HY.41.V2 — Credit Default Swap North American High Yield Series 41 Index Version2X |
| | CME — Chicago Mercantile Exchange |
| | CMS — Constant Maturity Swap |
| | CMT — Constant Maturity Treasury |
| | EUR — Euro |
| | EURIBOR — European Interbank Offered Rate |
| | GBP — British Pound |
| | ICE — Intercontinental Exchange |
| | ITRAXX.EUR.41.V1 — iTraxx Europe Series 41 Index Version1X |
| | LIBOR — London Interbank Offered Rate |
| | plc — Public Limited Company |
| | REIT — Real Estate Investment Trust |
| | SARL — Société à Responsabilité Limitée |
| | SOFR — Secured Overnight Financing Rate |
| | SONIA — Sterling Overnight Index Average |
| | WAC — Weighted Average Coupon |
| | |
| | See Sector Classification in Other Information section. |
SEE NOTES TO FINANCIAL STATEMENTS. | THE GUGGENHEIM FUNDS SEMI-ANNUAL REPORT | 45 |
SCHEDULE OF INVESTMENTS (Unaudited)(continued) | March 31, 2024 |
CORE BOND FUND | |
The following table summarizes the inputs used to value the Fund’s investments at March 31, 2024 (See Note 4 in the Notes to Financial Statements):
Investments in Securities (Assets) | | Level 1
Quoted
Prices | | | Level 2
Significant
Observable
Inputs | | | Level 3
Significant
Unobservable
Inputs | | | Total | |
Common Stocks | | $ | 10,885 | | | $ | — | | | $ | 62 | | | $ | 10,947 | |
Preferred Stocks | | | — | | | | 34,056,909 | | | | — | * | | | 34,056,909 | |
Warrants | | | 586 | | | | — | | | | 7 | | | | 593 | |
Money Market Funds | | | 32,686,794 | | | | — | | | | — | | | | 32,686,794 | |
U.S. Government Securities | | | — | | | | 533,740,199 | | | | — | | | | 533,740,199 | |
Asset-Backed Securities | | | — | | | | 387,286,985 | | | | 36,472,717 | | | | 423,759,702 | |
Corporate Bonds | | | — | | | | 399,393,294 | | | | 21,017,557 | | | | 420,410,851 | |
Collateralized Mortgage Obligations | | | — | | | | 342,353,942 | | | | 10,324,390 | | | | 352,678,332 | |
Senior Floating Rate Interests | | | — | | | | 22,021,251 | | | | 4,912,728 | | | | 26,933,979 | |
Federal Agency Bonds | | | — | | | | 17,530,061 | | | | — | | | | 17,530,061 | |
Federal Agency Discount Notes | | | — | | | | 9,997,111 | | | | — | | | | 9,997,111 | |
Municipal Bonds | | | — | | | | 8,580,059 | | | | — | | | | 8,580,059 | |
Senior Fixed Rate Interests | | | — | | | | — | | | | 2,738,499 | | | | 2,738,499 | |
Foreign Government Debt | | | — | | | | 2,639,848 | | | | — | | | | 2,639,848 | |
Options Purchased | | | — | | | | 5,936 | | | | — | | | | 5,936 | |
Credit Default Swap Agreements** | | | — | | | | 2,308 | | | | — | | | | 2,308 | |
Interest Rate Swap Agreements** | | | — | | | | 8,644,963 | | | | — | | | | 8,644,963 | |
Forward Foreign Currency Exchange Contracts** | | | — | | | | 176,596 | | | | — | | | | 176,596 | |
Total Assets | | $ | 32,698,265 | | | $ | 1,766,429,462 | | | $ | 75,465,960 | | | $ | 1,874,593,687 | |
Investments in Securities (Liabilities) | | Level 1
Quoted
Prices | | | Level 2
Significant
Observable
Inputs | | | Level 3
Significant
Unobservable
Inputs | | | Total | |
Interest Rate Futures Contracts** | | $ | 279,768 | | | $ | — | | | $ | — | | | $ | 279,768 | |
Credit Default Swap Agreements** | | | — | | | | 702,683 | | | | — | | | | 702,683 | |
Interest Rate Swap Agreements** | | | — | | | | 589,601 | | | | — | | | | 589,601 | |
Forward Foreign Currency Exchange Contracts** | | | — | | | | 1,336 | | | | — | | | | 1,336 | |
Total Liabilities | | $ | 279,768 | | | $ | 1,293,620 | | | $ | — | | | $ | 1,573,388 | |
* | Security has a market value of $0. |
** | This derivative is reported as unrealized appreciation/depreciation at period end. |
46 | THE GUGGENHEIM FUNDS SEMI-ANNUAL REPORT | SEE NOTES TO FINANCIAL STATEMENTS. |
SCHEDULE OF INVESTMENTS (Unaudited)(continued) | March 31, 2024 |
CORE BOND FUND | |
The following is a summary of significant unobservable inputs used in the fair valuation of assets and liabilities categorized within Level 3 of the fair value hierarchy:
Category | | Ending Balance at
March 31, 2024 | | | Valuation Technique | | | Unobservable Inputs | | | Input Range | | | Weighted Average* | |
Assets: | | | | | | | | | | | | | | | | | | | | |
Asset-Backed Securities | | $ | 21,537,486 | | Option adjusted spread off prior month end broker quote | Broker Quote | | | — | | | | — | |
Asset-Backed Securities | | | 13,166,904 | | Yield Analysis | Yield | | | 6.2%—7.2% | | | | 6.4 | % |
Asset-Backed Securities | | | 1,768,327 | | Third Party Pricing | Broker Quote | | | — | | | | — | |
Collateralized Mortgage Obligations | | | 6,311,004 | | Yield Analysis | Yield | | | 5.6%—5.7% | | | | 6.4 | % |
Collateralized Mortgage Obligations | | | 4,013,386 | | Option adjusted spread off prior month end broker quote | Broker Quote | | | — | | | | — | |
Common Stocks | | | 62 | | Model Price | Liquidation Value | | | — | | | | — | |
Corporate Bonds | | | 14,128,334 | | Option adjusted spread off prior month end broker quote | Broker Quote | | | — | | | | — | |
Corporate Bonds | | | 2,695,128 | | Yield Analysis | Yield | | | 6.2%—7.2% | | | | 6.7 | % |
Corporate Bonds | | | 2,455,327 | | Third Party Pricing | Broker Quote | | | — | | | | — | |
Corporate Bonds | | | 1,738,768 | | Third Party Pricing | Trade Price | | | — | | | | — | |
Senior Fixed Rate Interests | | | 2,738,499 | | Option adjusted spread off prior month end broker quote | Broker Quote | | | — | | | | — | |
Senior Floating Rate Interests | | | 4,912,728 | | Yield Analysis | Yield | | | 10.3 | % | | | — | |
Warrants | | | 7 | | Model Price | Liquidation Value | | | — | | | | — | |
Total Assets | | $ | 75,465,960 | | | | | | | | | | | |
* | Inputs are weighted by the fair value of the instruments. |
Significant changes in a quote, yield or liquidation value would generally result in significant changes in the fair value of the security. Any remaining Level 3 securities held by the Fund and excluded from the table above, were not considered material to the Fund.
The Fund’s fair valuation leveling guidelines classify a single daily broker quote, or a vendor price based on a single daily or monthly broker quote, as Level 3, if such a quote or price cannot be supported with other available market information.
Transfers between Level 2 and Level 3 may occur as markets fluctuate and/or the availability of data used in an investment’s valuation changes. For the period ended March 31, 2024, the Fund had securities with a total value of $6,311,004 transfer into Level 3 from Level 2 due to a lack of observable inputs and had securities with a total value of $6,538,557 transfer out of Level 3 into Level 2 due to the availability of current and reliable market-based data provided by a third-party pricing service which utilizes significant observable inputs.
SEE NOTES TO FINANCIAL STATEMENTS. | THE GUGGENHEIM FUNDS SEMI-ANNUAL REPORT | 47 |
SCHEDULE OF INVESTMENTS (Unaudited)(continued) | March 31, 2024 |
CORE BOND FUND | |
Summary of Fair Value Level 3 Activity
Following is a reconciliation of Level 3 assets for which significant unobservable inputs were used to determine fair value for the period ended March 31, 2024:
| | | Assets | | | | | | | Liabilities | |
| | Asset-
Backed
Securities | | | Collateralized
Mortgage
Obligations | | | Corporate
Bonds | | | Senior
Floating
Rate
Interests | | | Warrants | | | Common
Stocks | | | Senior
Fixed
Rate
Interests | | | Total
Assets | | | Unfunded
Loan
Commitments | |
Beginning Balance | | $ | 38,332,615 | | | $ | 8,981,359 | | | $ | 17,372,298 | | | $ | 4,701,097 | | | $ | 7 | | | $ | 62 | | | $ | 2,572,239 | | | $ | 71,959,677 | | | $ | — | |
Purchases/(Receipts) | | | 5,639,822 | | | | — | | | | 3,170,000 | | | | — | | | | — | | | | — | | | | — | | | | 8,809,822 | | | | — | |
(Sales, maturities and paydowns)/Fundings | | | (6,321,708 | ) | | | (345,635 | ) | | | (283,076 | ) | | | — | | | | — | | | | — | | | | (47,960 | ) | | | (6,998,379 | ) | | | — | |
Amortization of premiums/discounts | | | 32,694 | | | | (7,227 | ) | | | 1,777 | | | | 16,445 | | | | — | | | | — | | | | — | | | | 43,689 | | | | — | |
Total realized gains (losses) included in earnings | | | 11,586 | | | | — | | | | — | | | | — | | | | — | | | | — | | | | — | | | | 11,586 | | | | — | |
Total change in unrealized appreciation (depreciation) included in earnings | | | 438,518 | | | | 262,636 | | | | 756,558 | | | | 195,186 | | | | — | | | | — | | | | 214,220 | | | | 1,867,118 | | | | — | |
Transfers into Level 3 | | | — | | | | 6,311,004 | | | | — | | | | — | | | | — | | | | — | | | | — | | | | 6,311,004 | | | | — | |
Transfers out of
Level 3 | | | (1,660,810 | ) | | | (4,877,747 | ) | | | — | | | | — | | | | — | | | | — | | | | — | | | | (6,538,557 | ) | | | — | |
Ending Balance | | $ | 36,472,717 | | | $ | 10,324,390 | | | $ | 21,017,557 | | | $ | 4,912,728 | | | $ | 7 | | | $ | 62 | | | $ | 2,738,499 | | | $ | 75,465,960 | | | $ | — | |
Net change in unrealized appreciation (depreciation) for investments in Level 3 securities still held at March 31, 2024 | | $ | 363,972 | | | $ | 203,392 | | | $ | 756,558 | | | $ | 195,186 | | | $ | — | | | $ | — | | | $ | 214,220 | | | $ | 1,733,328 | | | $ | — | |
48 | THE GUGGENHEIM FUNDS SEMI-ANNUAL REPORT | SEE NOTES TO FINANCIAL STATEMENTS. |
SCHEDULE OF INVESTMENTS (Unaudited)(concluded) | March 31, 2024 |
CORE BOND FUND | |
Step Coupon Bonds
The following table discloses additional information related to step coupon bonds held by the Fund. Certain securities are subject to multiple rate changes prior to maturity. For those securities, a range of rates and corresponding dates have been provided. Rates for all step coupon bonds held by the Fund are scheduled to increase, none are scheduled to decrease.
Name | | Coupon Rate at
Next Reset Date | | | Next Rate Reset Date | |
Angel Oak Mortgage Trust 2023-1, 4.75% due 09/26/67 | | | 5.75 | % | | | 01/01/27 | |
Angel Oak Mortgage Trust 2024-3, 4.80% due 11/26/68 | | | 5.80 | % | | | 02/01/28 | |
Angel Oak Mortgage Trust 2024-2, 6.25% due 01/25/69 | | | 7.25 | % | | | 01/01/28 | |
BRAVO Residential Funding Trust 2023-NQM8, 7.10% due 10/25/63 | | | 8.10 | % | | | 11/01/27 | |
BRAVO Residential Funding Trust 2024-NQM3, 6.39% due 03/25/64 | | | 7.39 | % | | | 03/01/28 | |
BRAVO Residential Funding Trust 2023-NQM2, 4.50% due 05/25/62 | | | 5.50 | % | | | 02/01/27 | |
COLT Mortgage Loan Trust 2024-1, 6.14% due 02/25/69 | | | 7.14 | % | | | 01/01/28 | |
COLT Mortgage Loan Trust 2023-3, 7.58% due 09/25/68 | | | 8.58 | % | | | 09/01/27 | |
COLT Mortgage Loan Trust 2023-3, 7.18% due 09/25/68 | | | 8.18 | % | | | 09/01/27 | |
COLT Mortgage Loan Trust 2023-4, 7.62% due 10/25/68 | | | 8.62 | % | | | 10/01/27 | |
CSMC Trust 2020-NQM1, 1.72% due 05/25/65 | | | 2.72 | % | | | 09/26/24 | |
GCAT Trust 2023-NQM3, 6.89% due 08/25/68 | | | 7.89 | % | | | 09/01/27 | |
GCAT Trust 2023-NQM3, 7.34% due 08/25/68 | | | 8.34 | % | | | 09/01/27 | |
OBX Trust 2024-NQM5, due 03/25/28 | | | 7.39 | % | | | 03/01/28 | |
OBX Trust 2024-NQM5, due 03/25/28 | | | 7.29 | % | | | 03/01/28 | |
OBX Trust 2024-NQM5, due 03/25/28 | | | 6.99 | % | | | 03/01/28 | |
OBX Trust 2023-NQM9, 7.66% due 10/25/63 | | | 8.66 | % | | | 10/01/27 | |
OBX Trust 2024-NQM4, 6.22% due 01/25/64 | | | 7.22 | % | | | 02/01/28 | |
OBX Trust 2022-NQM8, 6.10% due 09/25/62 | | | 7.10 | % | | | 10/01/26 | |
OBX Trust 2024-NQM3, 6.43% due 12/25/63 | | | 7.43 | % | | | 02/01/28 | |
OBX Trust 2024-NQM3, 6.33% due 12/25/63 | | | 7.33 | % | | | 02/01/28 | |
OBX Trust 2024-NQM3, 6.13% due 12/25/63 | | | 7.13 | % | | | 02/01/28 | |
OBX Trust 2024-NQM2, 6.18% due 12/25/63 | | | 7.18 | % | | | 01/01/28 | |
OBX Trust 2022-NQM9, 6.45% due 09/25/62 | | | 7.45 | % | | | 11/01/26 | |
PRPM LLC 2023-RCF1, 4.00% due 06/25/53 | | | 5.00 | % | | | 06/25/27 | |
Verus Securitization Trust 2023-7, 7.42% due 10/25/68 | | | 8.42 | % | | | 10/01/27 | |
Verus Securitization Trust 2023-2, 6.85% due 03/25/68 | | | 7.85 | % | | | 03/01/27 | |
Verus Securitization Trust 2024-1, 6.12% due 01/25/69 | | | 7.12 | % | | | 01/01/28 | |
SEE NOTES TO FINANCIAL STATEMENTS. | THE GUGGENHEIM FUNDS SEMI-ANNUAL REPORT | 49 |
STATEMENT OF ASSETS AND LIABILITIES (Unaudited) |
March 31, 2024 |
Assets: |
Investments, at value (cost $1,975,284,411) | | $ | 1,865,769,820 | |
Cash | | | 2,991,218 | |
Segregated cash with broker | | | 2,429,507 | |
Unamortized upfront premiums paid on credit default swap agreements | | | 32,147 | |
Unamortized upfront premiums paid on interest rate swap agreements | | | 4,492 | |
Unrealized appreciation on forward foreign currency exchange contracts | | | 176,596 | |
Prepaid expenses | | | 109,015 | |
Receivables: |
Securities sold | | | 442,883,424 | |
Interest | | | 13,904,338 | |
Fund shares sold | | | 2,268,246 | |
Dividends | | | 13,635 | |
Foreign tax reclaims | | | 2,235 | |
Total assets | | | 2,330,584,673 | |
| | | | | |
Liabilities: |
Unfunded loan commitments, at value (Note 9) (commitment fees received $—) | | | — | |
Segregated cash due to broker | | | 94,581 | |
Unamortized upfront premiums received on credit default swap agreements | | | 169,604 | |
Unrealized depreciation on forward foreign currency exchange contracts | | | 1,336 | |
Payable for: |
Securities purchased | | | 333,454,979 | |
Fund shares redeemed | | | 7,411,364 | |
Variation margin on interest rate swap agreements | | | 2,190,980 | |
Management fees | | | 649,863 | |
Distributions to shareholders | | | 337,779 | |
Variation margin on futures contracts | | | 136,125 | |
Transfer agent/maintenance fees | | | 96,830 | |
Distribution and service fees | | | 50,359 | |
Due to Investment Adviser | | | 26,134 | |
Protection fees on credit default swap agreements | | | 17,708 | |
Fund accounting/administration fees | | | 12,079 | |
Swap settlement | | | 7,651 | |
Variation margin on credit default swap agreements | | | 326 | |
Trustees’ fees* | | | 1,304 | |
Miscellaneous | | | 135,926 | |
Total liabilities | | | 344,794,928 | |
Net assets | | $ | 1,985,789,745 | |
| | | | | |
Net assets consist of: |
Paid in capital | | $ | 2,244,815,407 | |
Total distributable earnings (loss) | | | (259,025,662 | ) |
Net assets | | $ | 1,985,789,745 | |
| |
Class A: |
Net assets | | $ | 125,166,018 | |
Capital shares outstanding | | | 7,743,179 | |
Net asset value per share | | $ | 16.16 | |
Maximum offering price per share (Net asset value divided by 96.00%) | | $ | 16.83 | |
| |
Class C: |
Net assets | | $ | 22,728,257 | |
Capital shares outstanding | | | 1,411,869 | |
Net asset value per share | | $ | 16.10 | |
| |
Class P: |
Net assets | | $ | 24,727,129 | |
Capital shares outstanding | | | 1,527,971 | |
Net asset value per share | | $ | 16.18 | |
| | | | | |
Institutional Class: |
Net assets | | $ | 1,813,168,341 | |
Capital shares outstanding | | | 112,292,378 | |
Net asset value per share | | $ | 16.15 | |
* | Relates to Trustees not deemed “interested persons” within the meaning of Section 2(a)(19) of the 1940 Act. |
50 | THE GUGGENHEIM FUNDS SEMI-ANNUAL REPORT | SEE NOTES TO FINANCIAL STATEMENTS. |
STATEMENT OF OPERATIONS (Unaudited) |
Six Months Ended March 31, 2024 |
Investment Income: |
Dividends | | $ | 46,152 | |
Interest | | | 48,078,771 | |
Total investment income | | | 48,124,923 | |
| | | | | |
Expenses: |
Management fees | | | 3,579,688 | |
Distribution and service fees: |
Class A | | | 149,882 | |
Class C | | | 109,587 | |
Class P | | | 33,287 | |
Transfer agent/maintenance fees: |
Class A | | | 95,167 | |
Class C | | | 6,419 | |
Class P | | | 6,394 | |
Institutional Class | | | 402,977 | |
Interest expense | | | 507,552 | |
Fund accounting and administration fees | | | 364,826 | |
Professional fees | | | 65,880 | |
Line of credit fees | | | 46,465 | |
Custodian fees | | | 16,961 | |
Trustees’ fees* | | | 15,906 | |
Miscellaneous | | | 98,733 | |
Recoupment of previously waived fees: |
Class C | | | 4,346 | |
Class P | | | 5,770 | |
Institutional Class | | | 85,564 | |
Total expenses | | | 5,595,404 | |
Less: |
Expense reimbursed by adviser: |
Class A | | | (41,148 | ) |
Class C | | | (972 | ) |
Class P | | | (281 | ) |
Institutional Class | | | (74,911 | ) |
Expenses waived by Adviser | | | (285,073 | ) |
Total waived/reimbursed expenses | | | (402,385 | ) |
Net expenses | | | 5,193,019 | |
Net investment income | | | 42,931,904 | |
| | | | | |
Net Realized and Unrealized Gain (Loss): |
Net realized gain (loss) on: |
Investments | | $ | (34,072,772 | ) |
Swap agreements | | | (4,625,170 | ) |
Options purchased | | | (398,717 | ) |
Options written | | | (398,842 | ) |
Forward foreign currency exchange contracts | | | (165,383 | ) |
Foreign currency transactions | | | (13,406 | ) |
Net realized loss | | | (39,674,290 | ) |
Net change in unrealized appreciation (depreciation) on: |
Investments | | | 96,089,952 | |
Swap agreements | | | 13,629,040 | |
Futures contracts | | | (279,768 | ) |
Options purchased | | | 143,869 | |
Options written | | | 318,806 | |
Forward foreign currency exchange contracts | | | (75,484 | ) |
Foreign currency translations | | | 6,730 | |
Net change in unrealized appreciation (depreciation) | | | 109,833,145 | |
Net realized and unrealized gain | | | 70,158,855 | |
Net increase in net assets resulting from operations | | $ | 113,090,759 | |
* | Relates to Trustees not deemed “interested persons” within the meaning of Section 2(a)(19) of the 1940 Act. |
SEE NOTES TO FINANCIAL STATEMENTS. | THE GUGGENHEIM FUNDS SEMI-ANNUAL REPORT | 51 |
STATEMENTS OF CHANGES IN NET ASSETS |
| | Six Months Ended
March 31, 2024
(Unaudited) | | | Year Ended
September 30,
2023 | |
Increase (Decrease) in Net Assets from Operations: | | | | | | | | |
Net investment income | | $ | 42,931,904 | | | $ | 58,090,969 | |
Net realized loss on investments | | | (39,674,290 | ) | | | (83,396,652 | ) |
Net change in unrealized appreciation (depreciation) on investments | | | 109,833,145 | | | | 34,192,240 | |
Net increase in net assets resulting from operations | | | 113,090,759 | | | | 8,886,557 | |
| | | | | | | | | |
Distributions to shareholders: | | | | | | | | |
Class A | | | (2,671,469 | ) | | | (4,628,669 | ) |
Class C | | | (408,219 | ) | | | (690,054 | ) |
Class P | | | (596,635 | ) | | | (1,494,786 | ) |
Institutional Class | | | (39,405,812 | ) | | | (49,253,737 | ) |
Total distributions to shareholders | | | (43,082,135 | ) | | | (56,067,246 | ) |
| | | | | | | | | |
Capital share transactions: | | | | | | | | |
Proceeds from sale of shares | | | | | | | | |
Class A | | | 16,583,276 | | | | 27,585,227 | |
Class C | | | 3,324,964 | | | | 9,484,399 | |
Class P | | | 3,618,869 | | | | 6,643,720 | |
Institutional Class | | | 697,091,487 | | | | 875,193,068 | |
Distributions reinvested | | | | | | | | |
Class A | | | 2,437,084 | | | | 4,189,176 | |
Class C | | | 365,174 | | | | 610,361 | |
Class P | | | 592,318 | | | | 1,488,895 | |
Institutional Class | | | 37,515,438 | | | | 46,738,789 | |
Cost of shares redeemed | | | | | | | | |
Class A | | | (15,519,646 | ) | | | (23,834,759 | ) |
Class C | | | (3,816,195 | ) | | | (8,402,408 | ) |
Class P | | | (9,387,336 | ) | | | (32,056,257 | ) |
Institutional Class | | | (363,782,610 | ) | | | (582,763,645 | ) |
Net increase from capital share transactions | | | 369,022,823 | | | | 324,876,566 | |
Net increase in net assets | | | 439,031,447 | | | | 277,695,877 | |
| | | | | | | | | |
Net assets: | | | | | | | | |
Beginning of period | | | 1,546,758,298 | | | | 1,269,062,421 | |
End of period | | $ | 1,985,789,745 | | | $ | 1,546,758,298 | |
| | | | | | | | | |
Capital share activity: | | | | | | | | |
Shares sold | | | | | | | | |
Class A | | | 1,036,984 | | | | 1,708,895 | |
Class C | | | 208,254 | | | | 586,868 | |
Class P | | | 224,362 | | | | 410,906 | |
Institutional Class | | | 44,136,729 | | | | 54,190,672 | |
Shares issued from reinvestment of distributions | | | | | | | | |
Class A | | | 152,546 | | | | 259,787 | |
Class C | | | 22,963 | | | | 38,033 | |
Class P | | | 37,078 | | | | 92,259 | |
Institutional Class | | | 2,347,330 | | | | 2,904,961 | |
Shares redeemed | | | | | | | | |
Class A | | | (973,564 | ) | | | (1,470,307 | ) |
Class C | | | (241,460 | ) | | | (523,605 | ) |
Class P | | | (588,616 | ) | | | (1,981,473 | ) |
Institutional Class | | | (22,939,533 | ) | | | (36,342,037 | ) |
Net increase in shares | | | 23,423,073 | | | | 19,874,959 | |
52 | THE GUGGENHEIM FUNDS SEMI-ANNUAL REPORT | SEE NOTES TO FINANCIAL STATEMENTS. |
This table is presented to show selected data for a share outstanding throughout each period and to assist shareholders in evaluating a Fund’s performance for the periods presented.
Class A | | Six Months Ended
March 31, 2024a | | | Year Ended
September 30,
2023 | | | Year Ended
September 30,
2022 | | | Year Ended
September 30,
2021 | | | Year Ended
September 30,
2020 | | | Year Ended
September 30,
2019 | |
Per Share Data |
Net asset value, beginning of period | | $ | 15.56 | | | $ | 15.95 | | | $ | 20.06 | | | $ | 20.53 | | | $ | 18.94 | | | $ | 18.33 | |
Income (loss) from investment operations: |
Net investment income (loss)b | | | .35 | | | | .67 | | | | .46 | | | | .44 | | | | .37 | | | | .41 | |
Net gain (loss) on investments (realized and unrealized) | | | .60 | | | | (.41 | ) | | | (3.84 | ) | | | (.01 | ) | | | 1.63 | | | | .63 | |
Total from investment operations | | | .95 | | | | .26 | | | | (3.38 | ) | | | .43 | | | | 2.00 | | | | 1.04 | |
Less distributions from: |
Net investment income | | | (.35 | ) | | | (.65 | ) | | | (.47 | ) | | | (.47 | ) | | | (.41 | ) | | | (.43 | ) |
Net realized gains | | | — | | | | — | | | | (.26 | ) | | | (.43 | ) | | | — | | | | — | |
Total distributions | | | (.35 | ) | | | (.65 | ) | | | (.73 | ) | | | (.90 | ) | | | (.41 | ) | | | (.43 | ) |
Net asset value, end of period | | $ | 16.16 | | | $ | 15.56 | | | $ | 15.95 | | | $ | 20.06 | | | $ | 20.53 | | | $ | 18.94 | |
|
Total Returnc | | | 6.24 | % | | | 1.46 | % | | | (17.30 | %) | | | 2.09 | % | | | 10.68 | % | | | 5.72 | % |
Ratios/Supplemental Data |
Net assets, end of period (in thousands) | | $ | 125,166 | | | $ | 117,100 | | | $ | 112,084 | | | $ | 151,026 | | | $ | 218,856 | | | $ | 149,442 | |
Ratios to average net assets: |
Net investment income (loss) | | | 4.42 | % | | | 4.12 | % | | | 2.53 | % | | | 2.20 | % | | | 1.87 | % | | | 2.23 | % |
Total expensesd | | | 0.92 | % | | | 0.92 | % | | | 0.82 | % | | | 0.85 | % | | | 0.85 | % | | | 0.89 | % |
Net expensese,f,g | | | 0.83 | % | | | 0.83 | % | | | 0.78 | % | | | 0.79 | % | | | 0.79 | % | | | 0.80 | % |
Portfolio turnover rate | | | 49 | % | | | 88 | % | | | 49 | % | | | 103 | % | | | 126 | % | | | 77 | % |
Class C | | Six Months Ended
March 31, 2024a | | | Year Ended
September 30,
2023 | | | Year Ended
September 30,
2022 | | | Year Ended
September 30,
2021 | | | Year Ended
September 30,
2020 | | | Year Ended
September 30,
2019 | |
Per Share Data |
Net asset value, beginning of period | | $ | 15.49 | | | $ | 15.88 | | | $ | 19.97 | | | $ | 20.45 | | | $ | 18.86 | | | $ | 18.25 | |
Income (loss) from investment operations: |
Net investment income (loss)b | | | .29 | | | | .55 | | | | .33 | | | | .29 | | | | .22 | | | | .28 | |
Net gain (loss) on investments (realized and unrealized) | | | .62 | | | | (.42 | ) | | | (3.83 | ) | | | (.03 | ) | | | 1.64 | | | | .62 | |
Total from investment operations | | | .91 | | | | .13 | | | | (3.50 | ) | | | .26 | | | | 1.86 | | | | .90 | |
Less distributions from: |
Net investment income | | | (.30 | ) | | | (.52 | ) | | | (.33 | ) | | | (.31 | ) | | | (.27 | ) | | | (.29 | ) |
Net realized gains | | | — | | | | — | | | | (.26 | ) | | | (.43 | ) | | | — | | | | — | |
Total distributions | | | (.30 | ) | | | (.52 | ) | | | (.59 | ) | | | (.74 | ) | | | (.27 | ) | | | (.29 | ) |
Net asset value, end of period | | $ | 16.10 | | | $ | 15.49 | | | $ | 15.88 | | | $ | 19.97 | | | $ | 20.45 | | | $ | 18.86 | |
|
Total Returnc | | | 5.94 | % | | | 0.68 | % | | | (17.90 | %) | | | 1.34 | % | | | 9.86 | % | | | 4.96 | % |
Ratios/Supplemental Data |
Net assets, end of period (in thousands) | | $ | 22,728 | | | $ | 22,027 | | | $ | 20,970 | | | $ | 33,407 | | | $ | 33,163 | | | $ | 22,531 | |
Ratios to average net assets: |
Net investment income (loss) | | | 3.68 | % | | | 3.39 | % | | | 1.78 | % | | | 1.46 | % | | | 1.13 | % | | | 1.50 | % |
Total expensesd | | | 1.62 | % | | | 1.66 | % | | | 1.61 | % | | | 1.61 | % | | | 1.62 | % | | | 1.67 | % |
Net expensese,f,g | | | 1.58 | % | | | 1.59 | % | | | 1.53 | % | | | 1.54 | % | | | 1.54 | % | | | 1.55 | % |
Portfolio turnover rate | | | 49 | % | | | 88 | % | | | 49 | % | | | 103 | % | | | 126 | % | | | 77 | % |
SEE NOTES TO FINANCIAL STATEMENTS. | THE GUGGENHEIM FUNDS SEMI-ANNUAL REPORT | 53 |
FINANCIAL HIGHLIGHTS (continued) |
This table is presented to show selected data for a share outstanding throughout each period and to assist shareholders in evaluating a Fund’s performance for the periods presented.
Class P | | Six Months Ended
March 31, 2024a | | | Year Ended
September 30,
2023 | | | Year Ended
September 30,
2022 | | | Year Ended
September 30,
2021 | | | Year Ended
September 30,
2020 | | | Year Ended
September 30,
2019 | |
Per Share Data |
Net asset value, beginning of period | | $ | 15.57 | | | $ | 15.96 | | | $ | 20.07 | | | $ | 20.55 | | | $ | 18.96 | | | $ | 18.34 | |
Income (loss) from investment operations: |
Net investment income (loss)b | | | .35 | | | | .66 | | | | .46 | | | | .44 | | | | .36 | | | | .41 | |
Net gain (loss) on investments (realized and unrealized) | | | .61 | | | | (.41 | ) | | | (3.84 | ) | | | (.02 | ) | | | 1.64 | | | | .63 | |
Total from investment operations | | | .96 | | | | .25 | | | | (3.38 | ) | | | .42 | | | | 2.00 | | | | 1.04 | |
Less distributions from: |
Net investment income | | | (.35 | ) | | | (.64 | ) | | | (.47 | ) | | | (.47 | ) | | | (.41 | ) | | | (.42 | ) |
Net realized gains | | | — | | | | — | | | | (.26 | ) | | | (.43 | ) | | | — | | | | — | |
Total distributions | | | (.35 | ) | | | (.64 | ) | | | (.73 | ) | | | (.90 | ) | | | (.41 | ) | | | (.42 | ) |
Net asset value, end of period | | $ | 16.18 | | | $ | 15.57 | | | $ | 15.96 | | | $ | 20.07 | | | $ | 20.55 | | | $ | 18.96 | |
|
Total Return | | | 6.23 | % | | | 1.50 | % | | | (17.30 | %) | | | 2.04 | % | | | 10.67 | % | | | 5.77 | % |
Ratios/Supplemental Data |
Net assets, end of period (in thousands) | | $ | 24,727 | | | $ | 28,885 | | | $ | 53,203 | | | $ | 89,223 | | | $ | 60,534 | | | $ | 50,258 | |
Ratios to average net assets: |
Net investment income (loss) | | | 4.42 | % | | | 4.10 | % | | | 2.49 | % | | | 2.17 | % | | | 1.86 | % | | | 2.24 | % |
Total expensesd | | | 0.86 | % | | | 1.01 | % | | | 0.94 | % | | | 0.90 | % | | | 0.91 | % | | | 0.93 | % |
Net expensese,f,g | | | 0.83 | % | | | 0.82 | % | | | 0.78 | % | | | 0.79 | % | | | 0.79 | % | | | 0.80 | % |
Portfolio turnover rate | | | 49 | % | | | 88 | % | | | 49 | % | | | 103 | % | | | 126 | % | | | 77 | % |
54 | THE GUGGENHEIM FUNDS SEMI-ANNUAL REPORT | SEE NOTES TO FINANCIAL STATEMENTS. |
FINANCIAL HIGHLIGHTS (concluded) |
This table is presented to show selected data for a share outstanding throughout each period and to assist shareholders in evaluating a Fund’s performance for the periods presented.
Institutional Class | | Six Months Ended
March 31, 2024a | | | Year Ended
September 30,
2023 | | | Year Ended
September 30,
2022 | | | Year Ended
September 30,
2021 | | | Year Ended
September 30,
2020 | | | Year Ended
September 30,
2019 | |
Per Share Data |
Net asset value, beginning of period | | $ | 15.54 | | | $ | 15.92 | | | $ | 20.03 | | | $ | 20.51 | | | $ | 18.91 | | | $ | 18.30 | |
Income (loss) from investment operations: |
Net investment income (loss)b | | | .38 | | | | .71 | | | | .52 | | | | .50 | | | | .42 | | | | .47 | |
Net gain (loss) on investments (realized and unrealized) | | | .61 | | | | (.40 | ) | | | (3.85 | ) | | | (.03 | ) | | | 1.65 | | | | .62 | |
Total from investment operations | | | .99 | | | | .31 | | | | (3.33 | ) | | | .47 | | | | 2.07 | | | | 1.09 | |
Less distributions from: |
Net investment income | | | (.38 | ) | | | (.69 | ) | | | (.52 | ) | | | (.52 | ) | | | (.47 | ) | | | (.48 | ) |
Net realized gains | | | — | | | | — | | | | (.26 | ) | | | (.43 | ) | | | — | | | | — | |
Total distributions | | | (.38 | ) | | | (.69 | ) | | | (.78 | ) | | | (.95 | ) | | | (.47 | ) | | | (.48 | ) |
Net asset value, end of period | | $ | 16.15 | | | $ | 15.54 | | | $ | 15.92 | | | $ | 20.03 | | | $ | 20.51 | | | $ | 18.91 | |
|
Total Return | | | 6.47 | % | | | 1.80 | % | | | (17.09 | %) | | | 2.34 | % | | | 11.07 | % | | | 6.03 | % |
Ratios/Supplemental Data |
Net assets, end of period (in thousands) | | $ | 1,813,168 | | | $ | 1,378,747 | | | $ | 1,082,805 | | | $ | 1,382,711 | | | $ | 1,139,109 | | | $ | 613,571 | |
Ratios to average net assets: |
Net investment income (loss) | | | 4.71 | % | | | 4.43 | % | | | 2.84 | % | | | 2.49 | % | | | 2.17 | % | | | 2.52 | % |
Total expensesd | | | 0.57 | % | | | 0.65 | % | | | 0.60 | % | | | 0.60 | % | | | 0.58 | % | | | 0.62 | % |
Net expensese,f,g | | | 0.53 | % | | | 0.55 | % | | | 0.49 | % | | | 0.50 | % | | | 0.50 | % | | | 0.51 | % |
Portfolio turnover rate | | | 49 | % | | | 88 | % | | | 49 | % | | | 103 | % | | | 126 | % | | | 77 | % |
a | Unaudited figures for the period ended March 31, 2024. Percentage amounts for the period, except total return and portfolio turnover rate, have been annualized. |
b | Net investment income (loss) per share was computed using average shares outstanding throughout the period. |
c | Total return does not reflect the impact of any applicable sales charges. |
d | Does not include expenses of the underlying funds in which the Fund invests. |
e | Net expense information reflects the expense ratios after expense waivers and reimbursements, as applicable. |
f | The portion of the ratios of net expenses to average net assets attributable to recoupments of prior fee reductions or expense reimbursements for the years presented was as follows: |
| | | 03/31/24a | 09/30/23 | 09/30/22 | 09/30/21 | 09/30/20 | 09/30/19 |
| | Class A | — | 0.01% | 0.01% | 0.01% | 0.00%* | — |
| | Class C | 0.04% | 0.01% | 0.00%* | — | 0.00%* | — |
| | Class P | 0.04% | 0.00%* | — | — | 0.00%* | 0.00%* |
| | Institutional Class | 0.01% | 0.00%* | — | — | 0.00%* | — |
g | Net expenses may include expenses that are excluded from the expense limitation agreement. Excluding these expenses, the net expense ratios for the years presented would be: |
| | | 03/31/24a | 09/30/23 | 09/30/22 | 09/30/21 | 09/30/20 | 09/30/19 |
| | Class A | 0.76% | 0.76% | 0.77% | 0.78% | 0.78% | 0.79% |
| | Class C | 1.51% | 1.52% | 1.52% | 1.53% | 1.53% | 1.54% |
| | Class P | 0.76% | 0.76% | 0.77% | 0.78% | 0.78% | 0.79% |
| | Institutional Class | 0.47% | 0.47% | 0.48% | 0.49% | 0.49% | 0.50% |
SEE NOTES TO FINANCIAL STATEMENTS. | THE GUGGENHEIM FUNDS SEMI-ANNUAL REPORT | 55 |
PERFORMANCE REPORT AND FUND PROFILE (Unaudited) | March 31, 2024 |
MUNICIPAL INCOME FUND
OBJECTIVE: Seeks to provide current income with an emphasis on income exempt from federal income tax, while also considering capital appreciation.
Holdings Diversification (Market Exposure as % of Net Assets)
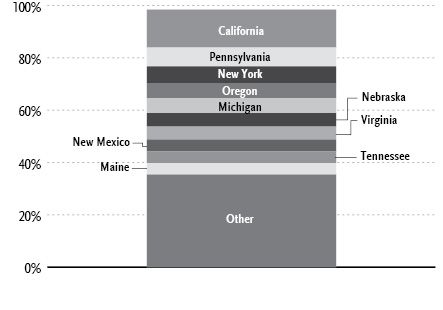
“Holdings Diversification (Market Exposure as % of Net Assets)” excludes any temporary cash investments.
Portfolio Composition by Quality Rating1 |
Rating | % of Total Investments |
Fixed Income Instruments | |
AAA | 27.4% |
AA | 49.3% |
A | 13.5% |
BBB | 4.3% |
BB | 1.5% |
NR2 | 0.2% |
Other Instruments | 3.8% |
Total Investments | 100.0% |
Inception Dates: |
Class A | April 28, 2004 |
Class C | January 13, 2012 |
Class P | May 1, 2015 |
Institutional Class | January 13, 2012 |
Ten Largest Holdings | % of Total Net Assets |
Michigan Technological University Revenue Bonds, 5.25% | 4.4% |
Maine Health & Higher Educational Facilities Authority Revenue Bonds, 5.25% | 4.4% |
Freddie Mac Multifamily Variable Rate Certificate Revenue Bonds, 3.15% | 4.4% |
Nebraska Investment Finance Authority Revenue Bonds, 4.95% | 4.4% |
Pennsylvania Housing Finance Agency Revenue Bonds, 4.95% | 4.3% |
Metropolitan Government Nashville & Davidson County Health & Educational Facilities Board Revenue Bonds, 2.25% | 3.8% |
Westchester County Local Development Corp. Revenue Bonds, 5.75% | 3.5% |
New Mexico Finance Authority Revenue Bonds, 5.25% | 3.4% |
Newport Mesa Unified School District General Obligation Unlimited | 2.9% |
Inlivian Revenue Bonds, 2.02% | 2.6% |
Top Ten Total | 38.1% |
| | |
“Ten Largest Holdings” excludes any temporary cash or derivative investments. |
1 | Source: BlackRock Solutions. Credit quality ratings are measured on a scale that generally ranges from AAA (highest) to D (lowest). All securities except for those labeled “NR” have been rated by Moody’s, Standard & Poor’s (“S&P”), or Fitch, each of which is a Nationally Recognized Statistical Rating Organization (“NRSRO”). For purposes of this presentation, when ratings are available from more than one agency, the highest rating is used. Guggenheim Investments has converted ratings to the equivalent S&P rating. Security ratings are determined at the time of purchase and may change thereafter. |
2 | NR (not rated) securities do not necessarily indicate low credit quality. |
56 | THE GUGGENHEIM FUNDS SEMI-ANNUAL REPORT | |
PERFORMANCE REPORT AND FUND PROFILE (Unaudited)(concluded) | March 31, 2024 |
Average Annual Returns*
Periods Ended March 31, 2024
| 6 Month† | 1 Year | 5 Year | 10 Year |
Class A Shares~ | 7.54% | 1.86% | 0.15% | 1.97% |
Class A Shares with sales charge‡ | 3.24% | (2.22%) | (0.66%) | 1.47% |
Class C Shares | 7.15% | 1.10% | (0.60%) | 1.21% |
Class C Shares with CDSC§ | 6.15% | 0.11% | (0.60%) | 1.21% |
Institutional Class Shares | 7.68% | 2.12% | 0.40% | 2.22% |
Bloomberg Municipal Bond Index | 7.48% | 3.13% | 1.59% | 2.66% |
| 6 Month† | 1 Year | 5 Year | Since
Inception
(05/01/15) |
Class P Shares | 7.64% | 1.95% | 0.15% | 1.25% |
Bloomberg Municipal Bond Index | 7.48% | 3.13% | 1.59% | 2.32% |
* | The performance data above represents past performance that is not predictive of future results. The investment return and principal value of an investment in the Fund will fluctuate so that an investor’s shares, when redeemed, may be worth more or less than their original cost. Returns are historical and include changes in principal and reinvested dividends and capital gains and do not reflect the effect of taxes. The Bloomberg Municipal Bond Index is an unmanaged index and, unlike the Fund, has no management fees or operating expenses to reduce its reported return. |
† | 6 month returns are not annualized. |
‡ | Effective October 1, 2015, the maximum sales charge decreased from 4.75% to 4.00%. A 4.75% maximum sales charge is used in the calculation of the Average Annual Returns based on subscriptions made prior to October 1, 2015, and a 4.00% maximum sales charge is used to calculate performance for periods based on subscriptions made on or after October 1, 2015 |
§ | Fund returns include a CDSC of 1% if redeemed within 12 months of purchase. |
| | THE GUGGENHEIM FUNDS SEMI-ANNUAL REPORT | 57 |
SCHEDULE OF INVESTMENTS (Unaudited) | March 31, 2024 |
MUNICIPAL INCOME FUND | |
| | Shares | | | Value | |
MONEY MARKET FUND† - 3.8% |
Dreyfus AMT-Free Tax Exempt Cash Management Fund — Institutional Shares, 3.54%1 | | | 932,926 | | | $ | 932,926 | |
Total Money Market Fund | | | | |
(Cost $932,926) | | | | | | | 932,926 | |
| | | Face
Amount | | | | | |
MUNICIPAL BONDS†† - 94.0% |
California - 14.7% | | | | | | | | |
Newport Mesa Unified School District General Obligation Unlimited | | | | | | | | |
due 08/01/392 | | $ | 1,300,000 | | | | 722,320 | |
San Diego Unified School District General Obligation Unlimited | | | | | | | | |
due 07/01/462 | | | 1,360,000 | | | | 543,801 | |
California Statewide Communities Development Authority Revenue Bonds | | | | | | | | |
5.25% due 08/15/52 | | | 500,000 | | | | 542,595 | |
Compton Unified School District General Obligation Unlimited | | | | | | | | |
due 06/01/402 | | | 1,000,000 | | | | 511,266 | |
Alameda Corridor Transportation Authority Revenue Bonds | | | | | | | | |
due 10/01/512 | | | 500,000 | | | | 276,046 | |
El Monte Union High School District General Obligation Unlimited | | | | | | | | |
due 06/01/432 | | | 500,000 | | | | 213,216 | |
M-S-R Energy Authority Revenue Bonds | | | | | | | | |
6.13% due 11/01/29 | | | 160,000 | | | | 171,020 | |
Westside Elementary School District General Obligation Unlimited | | | | | | | | |
5.00% due 08/01/48 | | | 155,000 | | | | 162,814 | |
Freddie Mac Multifamily VRD Certificates Revenue Bonds | | | | | | | | |
2.40% due 10/15/29 | | | 150,000 | | | | 137,457 | |
Coast Community College District General Obligation Unlimited | | | | | | | | |
due 08/01/402 | | | 250,000 | | | | 128,847 | |
Stockton Unified School District General Obligation Unlimited | | | | | | | | |
due 08/01/422 | | | 250,000 | | | | 116,767 | |
Department of Veterans Affairs Veteran’s Farm & Home Purchase Program Revenue Bonds | | | | | | | | |
3.45% due 12/01/39 | | | 110,000 | | | | 106,345 | |
Total California | | | | | | | 3,632,494 | |
| | | | | | | | | |
Pennsylvania - 7.0% | | | | | | | | |
Pennsylvania Housing Finance Agency Revenue Bonds | | | | | | | | |
4.95% due 10/01/38 | | | 1,000,000 | | | | 1,076,443 | |
School District of Philadelphia General Obligation Limited | | | | | | | | |
5.25% due 09/01/43 | | | 575,000 | | | | 638,753 | |
Total Pennsylvania | | | | | | | 1,715,196 | |
| | | | | | | | | |
New York - 6.4% | | | | | | | | |
Westchester County Local Development Corp. Revenue Bonds | | | | | | | | |
5.75% due 11/01/53 | | | 750,000 | | | | 861,547 | |
New York Power Authority Revenue Bonds | | | | | | | | |
5.25% due 11/15/41 | | | 250,000 | | | | 293,356 | |
New York State Dormitory Authority Revenue Bonds | | | | | | | | |
4.00% due 08/01/43 | | | 220,000 | | | | 216,417 | |
New York Transportation Development Corp. Revenue Bonds | | | | | | | | |
5.00% due 07/01/34 | | | 200,000 | | | | 200,235 | |
Total New York | | | | | | | 1,571,555 | |
| | | | | | | | | |
Oregon - 5.8% | | | | | | | | |
Clackamas & Washington Counties School District No. 3 General Obligation Unlimited | | | | | | | | |
due 06/15/482 | | | 2,000,000 | | | | 626,648 | |
due 06/15/502 | | | 400,000 | | | | 112,120 | |
due 06/15/492 | | | 350,000 | | | | 103,711 | |
Salem-Keizer School District No. 24J General Obligation Unlimited | | | | | | | | |
due 06/15/402 | | | 1,250,000 | | | | 585,576 | |
Total Oregon | | | | | | | 1,428,055 | |
| | | | | | | | | |
Michigan - 5.6% | | | | | | | | |
Michigan Technological University Revenue Bonds | | | | | | | | |
5.25% due 10/01/53 | | | 1,000,000 | | | | 1,090,788 | |
Michigan State Housing Development Authority Revenue Bonds | | | | | | | | |
3.35% due 12/01/34 | | | 200,000 | | | | 197,038 | |
Flint Hospital Building Authority Revenue Bonds | | | | | | | | |
5.00% due 07/01/25 | | | 100,000 | | | | 100,115 | |
Total Michigan | | | | | | | 1,387,941 | |
| | | | | | | | | |
Nebraska - 5.2% | | | | | | | | |
Nebraska Investment Finance Authority Revenue Bonds | | | | | | | | |
4.95% due 09/01/38 | | | 1,000,000 | | | | 1,078,234 | |
Central Plains Energy Project Revenue Bonds | | | | | | | | |
5.00% due 09/01/29 | | | 200,000 | | | | 210,414 | |
Total Nebraska | | | | | | | 1,288,648 | |
| | | | | | | | | |
Virginia - 5.0% | | | | | | | | |
Freddie Mac Multifamily Variable Rate Certificate Revenue Bonds | | | | | | | | |
3.15% due 10/15/36 | | | 1,280,000 | | | | 1,081,740 | |
58 | THE GUGGENHEIM FUNDS SEMI-ANNUAL REPORT | SEE NOTES TO FINANCIAL STATEMENTS. |
SCHEDULE OF INVESTMENTS (Unaudited)(continued) | March 31, 2024 |
MUNICIPAL INCOME FUND | |
| | Face
Amount | | | Value | |
Loudoun County Economic Development Authority Revenue Bonds | | | | | | | | |
due 07/01/492 | | $ | 500,000 | | | $ | 155,698 | |
Total Virginia | | | | | | | 1,237,438 | |
| | | | | | | | | |
New Mexico - 4.5% | | | | | | | | |
New Mexico Finance Authority Revenue Bonds | | | | | | | | |
5.25% due 06/01/48 | | | 750,000 | | | | 835,732 | |
New Mexico Mortgage Finance Authority Revenue Bonds | | | | | | | | |
4.95% due 09/01/38 | | | 250,000 | | | | 269,559 | |
City of Albuquerque New Mexico Gross Receipts Tax Revenue Bonds | | | | | | | | |
5.00% due 07/01/25 | | | 20,000 | | | | 19,920 | |
Total New Mexico | | | | | | | 1,125,211 | |
| | | | | | | | | |
Tennessee - 4.5% | | | | | | | | |
Metropolitan Government Nashville & Davidson County Health & Educational Facilities Board Revenue Bonds | | | | | | | | |
2.25% due 07/01/45 | | | 1,500,000 | | | | 948,933 | |
2.48% due 12/01/37 | | | 200,000 | | | | 163,002 | |
Total Tennessee | | | | | | | 1,111,935 | |
| | | | | | | | | |
Maine - 4.4% | | | | | | | | |
Maine Health & Higher Educational Facilities Authority Revenue Bonds | | | | | | | | |
5.25% due 07/01/48 | | | 1,000,000 | | | | 1,086,807 | |
| | | | | | | | | |
North Carolina - 3.9% | | | | | | | | |
Inlivian Revenue Bonds | | | | | | | | |
2.02% due 04/01/42 | | | 1,000,000 | | | | 642,458 | |
North Carolina Central University Revenue Bonds | | | | | | | | |
5.00% due 04/01/44 | | | 300,000 | | | | 316,593 | |
Total North Carolina | | | | | | | 959,051 | |
| | | | | | | | | |
Arizona - 3.0% | | | | | | | | |
Arizona Industrial Development Authority Revenue Bonds | | | | | | | | |
5.25% due 11/01/48 | | | 500,000 | | | | 536,998 | |
Salt Verde Financial Corp. Revenue Bonds | | | | | | | | |
5.00% due 12/01/32 | | | 200,000 | | | | 213,405 | |
Total Arizona | | | | | | | 750,403 | |
| | | | | | | | | |
Texas - 2.6% | | | | | | | | |
Harris County-Houston Sports Authority Revenue Bonds | | | | | | | | |
due 11/15/532 | | | 1,000,000 | | | | 237,356 | |
Arlington Higher Education Finance Corp. Revenue Bonds | | | | | | | | |
5.00% due 12/01/46 | | | 200,000 | | | | 200,370 | |
Hutto Independent School District General Obligation Unlimited | | | | | | | | |
5.00% due 08/01/49 | | | 100,000 | | | | 104,361 | |
Texas Municipal Gas Acquisition and Supply Corporation I Revenue Bonds | | | | | | | | |
6.25% due 12/15/26 | | | 90,000 | | | | 93,403 | |
Tarrant County Health Facilities Development Corp. Revenue Bonds | | | | | | | | |
6.00% due 09/01/24 | | | 5,000 | | | | 4,995 | |
Leander Independent School District General Obligation Unlimited | | | | | | | | |
due 08/15/242 | | | 5,000 | | | | 2,909 | |
Total Texas | | | | | | | 643,394 | |
| | | | | | | | | |
Oklahoma - 2.3% | | | | | | | | |
Oklahoma Development Finance Authority Revenue Bonds | | | | | | | | |
5.00% due 08/15/28 | | | 350,000 | | | | 361,786 | |
Oklahoma City Airport Trust Revenue Bonds | | | | | | | | |
5.00% due 07/01/30 | | | 200,000 | | | | 212,125 | |
Total Oklahoma | | | | | | | 573,911 | |
| | | | | | | | | |
North Dakota - 2.3% | | | | | | | | |
City of Grand Forks North Dakota Revenue Bonds | | | | | | | | |
5.00% due 12/01/33 | | | 500,000 | | | | 569,835 | |
| | | | | | | | | |
Georgia - 2.2% | | | | | | | | |
Columbia County Hospital Authority Revenue Bonds | | | | | | | | |
5.00% due 04/01/48 | | | 500,000 | | | | 538,912 | |
| | | | | | | | | |
Colorado - 1.9% | | | | | | | | |
City & County of Denver Colorado Airport System Revenue Bonds | | | | | | | | |
5.00% due 12/01/28 | | | 200,000 | | | | 214,085 | |
City & County of Denver Colorado Pledged Excise Tax Revenue Bonds | | | | | | | | |
due 08/01/302 | | | 200,000 | | | | 156,601 | |
Colorado School of Mines Revenue Bonds | | | | | | | | |
5.00% due 12/01/47 | | | 100,000 | | | | 103,054 | |
Total Colorado | | | | | | | 473,740 | |
| | | | | | | | | |
Ohio - 1.7% | | | | | | | | |
County of Miami Ohio Revenue Bonds | | | | | | | | |
5.00% due 08/01/33 | | | 200,000 | | | | 213,386 | |
American Municipal Power, Inc. Revenue Bonds | | | | | | | | |
5.00% due 02/15/41 | | | 200,000 | | | | 202,901 | |
Total Ohio | | | | | | | 416,287 | |
| | | | | | | | | |
Illinois - 1.7% | | | | | | | | |
City of Chicago Illinois Wastewater Transmission Revenue Bonds | | | | | | | | |
5.25% due 01/01/42 | | | 400,000 | | | | 415,037 | |
| | | | | | | | | |
Washington - 1.6% | | | | | | | | |
Central Puget Sound Regional Transit Authority Revenue Bonds | | | | | | | | |
5.00% due 11/01/41 | | | 200,000 | | | | 206,134 | |
SEE NOTES TO FINANCIAL STATEMENTS. | THE GUGGENHEIM FUNDS SEMI-ANNUAL REPORT | 59 |
SCHEDULE OF INVESTMENTS (Unaudited)(continued) | March 31, 2024 |
MUNICIPAL INCOME FUND | |
| | Face
Amount | | | Value | |
Washington State Convention Center Public Facilities District Revenue Bonds | | | | | | | | |
4.00% due 07/01/48 | | $ | 210,000 | | | $ | 199,863 | |
Total Washington | | | | | | | 405,997 | |
| | | | | | | | | |
Arkansas - 1.3% | | | | | | | | |
County of Baxter Arkansas Revenue Bonds | | | | | | | | |
5.00% due 09/01/26 | | | 330,000 | | | | 332,174 | |
| | | | | | | | | |
West Virginia - 1.3% | | | | | | | | |
West Virginia Hospital Finance Authority Revenue Bonds | | | | | | | | |
5.00% due 06/01/42 | | | 300,000 | | | | 309,567 | |
| | | | | | | | | |
Alaska - 1.1% | | | | | | | | |
University of Alaska Revenue Bonds | | | | | | | | |
5.00% due 10/01/40 | | | 260,000 | | | | 265,146 | |
| | | | | | | | | |
South Carolina - 0.9% | | | | | | | | |
Charleston County Airport District Revenue Bonds | | | | | | | | |
5.00% due 07/01/43 | | | 200,000 | | | | 213,603 | |
| | | | | | | | | |
Vermont - 0.8% | | | | | | | | |
Vermont Educational & Health Buildings Financing Agency Revenue Bonds | | | | | | | | |
5.00% due 12/01/46 | | | 200,000 | | | | 202,585 | |
| | | | | | | | | |
Connecticut - 0.8% | | | | | | | | |
New Haven Housing Authority Revenue Bonds | | | | | | | | |
2.26% due 05/01/38 | | | 242,424 | | | | 187,420 | |
| | | | | | | | | |
Massachusetts - 0.7% | | | | | | | | |
Massachusetts Development Finance Agency Revenue Bonds | | | | | | | | |
5.00% due 10/01/34 | | | 150,000 | | | | 161,587 | |
| | | | | | | | | |
Kansas - 0.4% | | | | | | | | |
University of Kansas Hospital Authority Revenue Bonds | | | | | | | | |
5.00% due 09/01/48 | | | 100,000 | | | | 103,243 | |
| | | | | | | | | |
Iowa - 0.4% | | | | | | | | |
PEFA, Inc. Revenue Bonds | | | | | | | | |
5.00% due 09/01/263 | | | 100,000 | | | | 102,380 | |
| | | | | | | | | |
Louisiana - 0.0% | | | | | | | | |
Louisiana Public Facilities Authority Revenue Bonds | | | | | | | | |
5.00% due 05/15/26 | | | 5,000 | | | | 5,126 | |
| | | | | | | | | |
Maryland - 0.0% | | | | | | | | |
Maryland Health & Higher Educational Facilities Authority Revenue Bonds | | | | | | | | |
5.00% due 07/01/27 | | | 5,000 | | | | 5,095 | |
Total Municipal Bonds | | | | |
(Cost $25,321,129) | | | 23,219,773 | |
| | | | | | | | | |
Total Investments - 97.8% | | | | |
(Cost $26,254,055) | | $ | 24,152,699 | |
Other Assets & Liabilities, net - 2.2% | | | 543,721 | |
Total Net Assets - 100.0% | | $ | 24,696,420 | |
60 | THE GUGGENHEIM FUNDS SEMI-ANNUAL REPORT | SEE NOTES TO FINANCIAL STATEMENTS. |
SCHEDULE OF INVESTMENTS (Unaudited)(continued) | March 31, 2024 |
MUNICIPAL INCOME FUND | |
Centrally Cleared Interest Rate Swap Agreements†† |
Counterparty | Exchange | Floating
Rate
Type | Floating
Rate Index | | Fixed
Rate | | | Payment
Frequency | | | Maturity
Date | | | Notional
Amount | | | Value | | | Upfront
Premiums
Paid
(Received) | | | Unrealized
Appreciation
(Depreciation)** | |
BofA Securities, Inc. | CME | Receive | U.S. Secured Overnight Financing Rate | 1.67% | Quarterly | 09/27/51 | | $ | 2,550,000 | | | $ | 980,014 | | | $ | (738 | ) | | $ | 980,752 | |
BofA Securities, Inc. | CME | Receive | U.S. Secured Overnight Financing Rate | 3.26% | Annually | 05/24/53 | | | 1,150,000 | | | | 71,053 | | | | 311 | | | | 70,742 | |
BofA Securities, Inc. | CME | Pay | U.S. Secured Overnight Financing Rate | 4.68% | Annually | 10/20/28 | | | 2,600,000 | | | | 70,374 | | | | 284 | | | | 70,090 | |
BofA Securities, Inc. | CME | Pay | U.S. Secured Overnight Financing Rate | 4.50% | Annually | 10/25/30 | | | 1,000,000 | | | | 34,228 | | | | 67 | | | | 34,161 | |
BofA Securities, Inc. | CME | Pay | U.S. Secured Overnight Financing Rate | 4.98% | Annually | 10/11/25 | | | 9,000,000 | | | | 27,336 | | | | 245 | | | | 27,091 | |
BofA Securities, Inc. | CME | Receive | U.S. Secured Overnight Financing Rate | 3.37% | Annually | 12/20/53 | | | 260,000 | | | | 11,800 | | | | 302 | | | | 11,498 | |
BofA Securities, Inc. | CME | Receive | U.S. Secured Overnight Financing Rate | 4.11% | Annually | 11/20/33 | | | 1,500,000 | | | | (32,137 | ) | | | 300 | | | | (32,437 | ) |
BofA Securities, Inc. | CME | Receive | U.S. Secured Overnight Financing Rate | 4.31% | Annually | 11/06/33 | | | 1,000,000 | | | | (37,423 | ) | | | 295 | | | | (37,718 | ) |
BofA Securities, Inc. | CME | Receive | U.S. Secured Overnight Financing Rate | 4.65% | Annually | 10/23/33 | | | 1,000,000 | | | | (63,660 | ) | | | 294 | | | | (63,954 | ) |
| | | | | | | | | | | | | | | | | | | | | | $ | 1,061,585 | | | $ | 1,360 | | | $ | 1,060,225 | |
** | Includes cumulative appreciation (depreciation). Variation margin is reported within the Statement of Assets and Liabilities. |
† | Value determined based on Level 1 inputs — See Note 4. |
†† | Value determined based on Level 2 inputs — See Note 4. |
1 | Rate indicated is the 7-day yield as of March 31, 2024. |
2 | Zero coupon rate security. |
3 | The rate is adjusted periodically by the issuer, allows the holder to tender the security upon a rate reset, and is not based upon a set reference rate and spread. |
| | BofA — Bank of America |
| | CME — Chicago Mercantile Exchange |
| | |
| | See Sector Classification in Other Information section. |
SEE NOTES TO FINANCIAL STATEMENTS. | THE GUGGENHEIM FUNDS SEMI-ANNUAL REPORT | 61 |
SCHEDULE OF INVESTMENTS (Unaudited)(concluded) | March 31, 2024 |
MUNICIPAL INCOME FUND | |
The following table summarizes the inputs used to value the Fund’s investments at March 31, 2024 (See Note 4 in the Notes to Financial Statements):
Investments in Securities (Assets) | | Level 1
Quoted
Prices | | | Level 2
Significant
Observable
Inputs | | | Level 3
Significant
Unobservable
Inputs | | | Total | |
Money Market Fund | | $ | 932,926 | | | $ | — | | | $ | — | | | $ | 932,926 | |
Municipal Bonds | | | — | | | | 23,219,773 | | | | — | | | | 23,219,773 | |
Interest Rate Swap Agreements** | | | — | | | | 1,194,334 | | | | — | | | | 1,194,334 | |
Total Assets | | $ | 932,926 | | | $ | 24,414,107 | | | $ | — | | | $ | 25,347,033 | |
Investments in Securities (Liabilities) | | Level 1
Quoted
Prices | | | Level 2
Significant
Observable
Inputs | | | Level 3
Significant
Unobservable
Inputs | | | Total | |
Interest Rate Swap Agreements** | | $ | — | | | $ | 134,109 | | | $ | — | | | $ | 134,109 | |
** | This derivative is reported as unrealized appreciation/depreciation at period end. |
62 | THE GUGGENHEIM FUNDS SEMI-ANNUAL REPORT | SEE NOTES TO FINANCIAL STATEMENTS. |
STATEMENT OF ASSETS AND LIABILITIES (Unaudited) |
March 31, 2024 |
Assets: |
Investments, at value (cost $26,254,055) | | $ | 24,152,699 | |
Segregated cash with broker | | | 391,630 | |
Unamortized upfront premiums paid on interest rate swap agreements | | | 2,098 | |
Prepaid expenses | | | 37,999 | |
Receivables: |
Interest | | | 216,616 | |
Variation margin on interest rate swap agreements | | | 17,562 | |
Investment Adviser | | | 5,646 | |
Fund shares sold | | | 293 | |
Total assets | | | 24,824,543 | |
| | | | | |
Liabilities: |
Due to custodian bank | | | 5,554 | |
Unamortized upfront premiums received on interest rate swap agreements | | | 738 | |
Payable for: |
Fund shares redeemed | | | 61,461 | |
Professional fees | | | 15,721 | |
Transfer agent/maintenance fees | | | 9,451 | |
Distributions to shareholders | | | 8,223 | |
Pricing fees | | | 8,001 | |
Distribution and service fees | | | 4,694 | |
Fund accounting/administration fees | | | 2,928 | |
Trustees’ fees* | | | 2,745 | |
Miscellaneous | | | 8,607 | |
Total liabilities | | | 128,123 | |
Net assets | | $ | 24,696,420 | |
| | | | | |
Net assets consist of: |
Paid in capital | | $ | 31,556,425 | |
Total distributable earnings (loss) | | | (6,860,005 | ) |
Net assets | | $ | 24,696,420 | |
Class A: |
Net assets | | $ | 18,339,989 | |
Capital shares outstanding | | | 1,611,324 | |
Net asset value per share | | $ | 11.38 | |
Maximum offering price per share (Net asset value divided by 96.00%) | | $ | 11.85 | |
Class C: |
Net assets | | $ | 878,220 | |
Capital shares outstanding | | | 77,213 | |
Net asset value per share | | $ | 11.37 | |
Class P: |
Net assets | | $ | 124,692 | |
Capital shares outstanding | | | 10,960 | |
Net asset value per share | | $ | 11.38 | |
| | | | | |
Institutional Class: |
Net assets | | $ | 5,353,519 | |
Capital shares outstanding | | | 470,264 | |
Net asset value per share | | $ | 11.38 | |
STATEMENT OF OPERATIONS (Unaudited) |
Six Months Ended March 31, 2024 |
Investment Income: |
Interest | | $ | 582,464 | |
Total investment income | | | 582,464 | |
| | | | | |
Expenses: |
Management fees | | | 80,914 | |
Distribution and service fees: |
Class A | | | 29,732 | |
Class C | | | 4,608 | |
Class P | | | 152 | |
Transfer agent/maintenance fees: |
Class A | | | 12,854 | |
Class C | | | 788 | |
Class P | | | 166 | |
Institutional Class | | | 7,172 | |
Registration fees | | | 44,507 | |
Professional fees | | | 20,751 | |
Fund accounting/administration fees | | | 10,903 | |
Trustees’ fees* | | | 8,235 | |
Custodian fees | | | 2,226 | |
Line of credit fees | | | 1,801 | |
Interest expense | | | 575 | |
Miscellaneous | | | 11,555 | |
Total expenses | | | 236,939 | |
Less: |
Expenses reimbursed by Adviser: |
Class A | | | (27,116 | ) |
Class C | | | (1,451 | ) |
Class P | | | (256 | ) |
Institutional Class | | | (11,181 | ) |
Expenses waived by Adviser | | | (75,821 | ) |
Total waived/reimbursed expenses | | | (115,825 | ) |
Net expenses | | | 121,114 | |
Net investment income | | | 461,350 | |
| | | | | |
Net Realized and Unrealized Gain (Loss): |
Net realized gain (loss) on: |
Investments | | | (4,559,055 | ) |
Swap agreements | | | (232,639 | ) |
Net realized loss | | | (4,791,694 | ) |
Net change in unrealized appreciation (depreciation) on: |
Investments | | | 7,565,497 | |
Swap agreements | | | (343,625 | ) |
Net change in unrealized appreciation (depreciation) | | | 7,221,872 | |
Net realized and unrealized gain | | | 2,430,178 | |
Net increase in net assets resulting from operations | | $ | 2,891,528 | |
* | Relates to Trustees not deemed “interested persons” within the meaning of Section 2(a)(19) of the 1940 Act. |
SEE NOTES TO FINANCIAL STATEMENTS. | THE GUGGENHEIM FUNDS SEMI-ANNUAL REPORT | 63 |
STATEMENTS OF CHANGES IN NET ASSETS |
| | Six Months Ended
March 31, 2024
(Unaudited) | | | Year Ended
September 30,
2023 | |
Increase (Decrease) in Net Assets from Operations: | | | | | | | | |
Net investment income | | $ | 461,350 | | | $ | 1,080,466 | |
Net realized loss on investments | | | (4,791,694 | ) | | | (788,039 | ) |
Net change in unrealized appreciation (depreciation) on investments | | | 7,221,872 | | | | 804,518 | |
Net increase in net assets resulting from operations | | | 2,891,528 | | | | 1,096,945 | |
| | | | | | | | | |
Distributions to shareholders: | | | | | | | | |
Class A | | | (424,107 | ) | | | (1,453,969 | ) |
Class C | | | (12,940 | ) | | | (31,189 | ) |
Class P | | | (2,156 | ) | | | (4,574 | ) |
Institutional Class | | | (142,849 | ) | | | (364,176 | ) |
Total distributions to shareholders | | | (582,052 | ) | | | (1,853,908 | ) |
| | | | | | | | | |
Capital share transactions: | | | | | | | | |
Proceeds from sale of shares | | | | | | | | |
Class A | | | 116,663 | | | | 3,606,381 | |
Class C | | | 78,675 | | | | 346,333 | |
Class P | | | 4,000 | | | | 846,126 | |
Institutional Class | | | 707,665 | | | | 12,725,440 | |
Distributions reinvested | | | | | | | | |
Class A | | | 372,656 | | | | 1,328,775 | |
Class C | | | 12,397 | | | | 30,159 | |
Class P | | | 2,147 | | | | 4,569 | |
Institutional Class | | | 140,594 | | | | 359,627 | |
Cost of shares redeemed | | | | | | | | |
Class A | | | (12,705,711 | ) | | | (19,006,404 | ) |
Class C | | | (112,155 | ) | | | (581,224 | ) |
Class P | | | (2,468 | ) | | | (867,839 | ) |
Institutional Class | | | (6,923,330 | ) | | | (6,514,995 | ) |
Net decrease from capital share transactions | | | (18,308,867 | ) | | | (7,723,052 | ) |
Net decrease in net assets | | | (15,999,391 | ) | | | (8,480,015 | ) |
| | | | | | | | | |
Net assets: | | | | | | | | |
Beginning of period | | | 40,695,811 | | | | 49,175,826 | |
End of period | | $ | 24,696,420 | | | $ | 40,695,811 | |
| | | | | | | | | |
Capital share activity: | | | | | | | | |
Shares sold | | | | | | | | |
Class A | | | 10,259 | | | | 316,903 | |
Class C | | | 7,278 | | | | 30,364 | |
Class P | | | 358 | | | | 75,140 | |
Institutional Class | | | 63,966 | | | | 1,120,796 | |
Shares issued from reinvestment of distributions | | | | | | | | |
Class A | | | 33,164 | | | | 117,206 | |
Class C | | | 1,100 | | | | 2,659 | |
Class P | | | 190 | | | | 404 | |
Institutional Class | | | 12,533 | | | | 31,729 | |
Shares redeemed | | | | | | | | |
Class A | | | (1,116,006 | ) | | | (1,700,924 | ) |
Class C | | | (9,878 | ) | | | (51,290 | ) |
Class P | | | (218 | ) | | | (76,692 | ) |
Institutional Class | | | (611,161 | ) | | | (569,408 | ) |
Net decrease in shares | | | (1,608,415 | ) | | | (703,113 | ) |
64 | THE GUGGENHEIM FUNDS SEMI-ANNUAL REPORT | SEE NOTES TO FINANCIAL STATEMENTS. |
This table is presented to show selected data for a share outstanding throughout each period and to assist shareholders in evaluating a Fund’s performance for the periods presented.
Class A | | Six Months Ended
March 31, 2024a | | | Year Ended
September 30,
2023 | | | Year Ended
September 30,
2022 | | | Year Ended
September 30,
2021 | | | Year Ended
September 30,
2020 | | | Year Ended
September 30,
2019 | |
Per Share Data |
Net asset value, beginning of period | | $ | 10.77 | | | $ | 10.97 | | | $ | 13.46 | | | $ | 13.23 | | | $ | 13.12 | | | $ | 12.46 | |
Income (loss) from investment operations: |
Net investment income (loss)b | | | .16 | | | | .23 | | | | .23 | | | | .25 | | | | .26 | | | | .30 | |
Net gain (loss) on investments (realized and unrealized) | | | .65 | | | | (.04 | ) | | | (2.44 | ) | | | .23 | | | | .11 | | | | .70 | |
Total from investment operations | | | .81 | | | | .19 | | | | (2.21 | ) | | | .48 | | | | .37 | | | | 1.00 | |
Less distributions from: |
Net investment income | | | (.20 | ) | | | (.25 | ) | | | (.22 | ) | | | (.23 | ) | | | (.26 | ) | | | (.30 | ) |
Net realized gains | | | — | | | | (.14 | ) | | | (.06 | ) | | | (.02 | ) | | | — | | | | (.04 | ) |
Total distributions | | | (.20 | ) | | | (.39 | ) | | | (.28 | ) | | | (.25 | ) | | | (.26 | ) | | | (.34 | ) |
Net asset value, end of period | | $ | 11.38 | | | $ | 10.77 | | | $ | 10.97 | | | $ | 13.46 | | | $ | 13.23 | | | $ | 13.12 | |
|
Total Returnc | | | 7.54 | % | | | 1.67 | % | | | (16.67 | %) | | | 3.67 | % | | | 2.85 | % | | | 8.13 | % |
Ratios/Supplemental Data |
Net assets, end of period (in thousands) | | $ | 18,340 | | | $ | 28,909 | | | $ | 43,354 | | | $ | 63,359 | | | $ | 62,583 | | | $ | 42,512 | |
Ratios to average net assets: |
Net investment income (loss) | | | 2.82 | % | | | 2.06 | % | | | 1.84 | % | | | 1.82 | % | | | 1.95 | % | | | 2.31 | % |
Total expensesd | | | 1.48 | % | | | 1.20 | % | | | 1.18 | % | | | 1.17 | % | | | 1.21 | % | | | 1.34 | % |
Net expensese,f,g | | | 0.79 | % | | | 0.78 | % | | | 0.79 | % | | | 0.80 | % | | | 0.81 | % | | | 0.81 | % |
Portfolio turnover rate | | | 43 | % | | | 11 | % | | | 14 | % | | | 22 | % | | | 58 | % | | | 30 | % |
Class C | | Six Months Ended
March 31, 2024a | | | Year Ended
September 30,
2023 | | | Year Ended
September 30,
2022 | | | Year Ended
September 30,
2021 | | | Year Ended
September 30,
2020 | | | Year Ended
September 30,
2019 | |
Per Share Data |
Net asset value, beginning of period | | $ | 10.76 | | | $ | 10.96 | | | $ | 13.45 | | | $ | 13.22 | | | $ | 13.11 | | | $ | 12.45 | |
Income (loss) from investment operations: |
Net investment income (loss)b | | | .12 | | | | .15 | | | | .14 | | | | .15 | | | | .16 | | | | .21 | |
Net gain (loss) on investments (realized and unrealized) | | | .65 | | | | (.04 | ) | | | (2.45 | ) | | | .23 | | | | .11 | | | | .69 | |
Total from investment operations | | | .77 | | | | .11 | | | | (2.31 | ) | | | .38 | | | | .27 | | | | .90 | |
Less distributions from: |
Net investment income | | | (.16 | ) | | | (.17 | ) | | | (.12 | ) | | | (.13 | ) | | | (.16 | ) | | | (.20 | ) |
Net realized gains | | | — | | | | (.14 | ) | | | (.06 | ) | | | (.02 | ) | | | — | | | | (.04 | ) |
Total distributions | | | (.16 | ) | | | (.31 | ) | | | (.18 | ) | | | (.15 | ) | | | (.16 | ) | | | (.24 | ) |
Net asset value, end of period | | $ | 11.37 | | | $ | 10.76 | | | $ | 10.96 | | | $ | 13.45 | | | $ | 13.22 | | | $ | 13.11 | |
|
Total Returnc | | | 7.15 | % | | | 0.91 | % | | | (17.23 | %) | | | 2.91 | % | | | 2.09 | % | | | 7.33 | % |
Ratios/Supplemental Data |
Net assets, end of period (in thousands) | | $ | 878 | | | $ | 847 | | | $ | 1,063 | | | $ | 1,769 | | | $ | 2,177 | | | $ | 1,981 | |
Ratios to average net assets: |
Net investment income (loss) | | | 2.12 | % | | | 1.30 | % | | | 1.08 | % | | | 1.08 | % | | | 1.23 | % | | | 1.63 | % |
Total expensesd | | | 2.33 | % | | | 2.00 | % | | | 1.97 | % | | | 1.97 | % | | | 1.97 | % | | | 2.12 | % |
Net expensese,f,g | | | 1.54 | % | | | 1.54 | % | | | 1.54 | % | | | 1.55 | % | | | 1.56 | % | | | 1.56 | % |
Portfolio turnover rate | | | 43 | % | | | 11 | % | | | 14 | % | | | 22 | % | | | 58 | % | | | 30 | % |
SEE NOTES TO FINANCIAL STATEMENTS. | THE GUGGENHEIM FUNDS SEMI-ANNUAL REPORT | 65 |
FINANCIAL HIGHLIGHTS (continued) |
This table is presented to show selected data for a share outstanding throughout each period and to assist shareholders in evaluating a Fund’s performance for the periods presented.
Class P | | Six Months Ended
March 31, 2024a | | | Year Ended
September 30,
2023 | | | Year Ended
September 30,
2022 | | | Year Ended
September 30,
2021 | | | Year Ended
September 30,
2020 | | | Year Ended
September 30,
2019 | |
Per Share Data |
Net asset value, beginning of period | | $ | 10.76 | | | $ | 10.97 | | | $ | 13.45 | | | $ | 13.22 | | | $ | 13.13 | | | $ | 12.46 | |
Income (loss) from investment operations: |
Net investment income (loss)b | | | .16 | | | | .23 | | | | .23 | | | | .25 | | | | .26 | | | | .29 | |
Net gain (loss) on investments (realized and unrealized) | | | .66 | | | | (.05 | ) | | | (2.43 | ) | | | .23 | | | | .09 | | | | .72 | |
Total from investment operations | | | .82 | | | | .18 | | | | (2.20 | ) | | | .48 | | | | .35 | | | | 1.01 | |
Less distributions from: |
Net investment income | | | (.20 | ) | | | (.25 | ) | | | (.22 | ) | | | (.23 | ) | | | (.26 | ) | | | (.30 | ) |
Net realized gains | | | — | | | | (.14 | ) | | | (.06 | ) | | | (.02 | ) | | | — | | | | (.04 | ) |
Total distributions | | | (.20 | ) | | | (.39 | ) | | | (.28 | ) | | | (.25 | ) | | | (.26 | ) | | | (.34 | ) |
Net asset value, end of period | | $ | 11.38 | | | $ | 10.76 | | | $ | 10.97 | | | $ | 13.45 | | | $ | 13.22 | | | $ | 13.13 | |
|
Total Return | | | 7.64 | % | | | 1.58 | % | | | (16.61 | %) | | | 3.67 | % | | | 2.69 | % | | | 8.20 | % |
Ratios/Supplemental Data |
Net assets, end of period (in thousands) | | $ | 125 | | | $ | 114 | | | $ | 129 | | | $ | 220 | | | $ | 202 | | | $ | 207 | |
Ratios to average net assets: |
Net investment income (loss) | | | 2.87 | % | | | 2.04 | % | | | 1.81 | % | | | 1.83 | % | | | 1.96 | % | | | 2.25 | % |
Total expensesd | | | 1.69 | % | | | 1.51 | % | | | 1.47 | % | | | 1.38 | % | | | 1.40 | % | | | 1.55 | % |
Net expensese,f,g | | | 0.78 | % | | | 0.78 | % | | | 0.79 | % | | | 0.80 | % | | | 0.81 | % | | | 0.81 | % |
Portfolio turnover rate | | | 43 | % | | | 11 | % | | | 14 | % | | | 22 | % | | | 58 | % | | | 30 | % |
66 | THE GUGGENHEIM FUNDS SEMI-ANNUAL REPORT | SEE NOTES TO FINANCIAL STATEMENTS. |
FINANCIAL HIGHLIGHTS (concluded) |
This table is presented to show selected data for a share outstanding throughout each period and to assist shareholders in evaluating a Fund’s performance for the periods presented.
Institutional Class | | Six Months Ended
March 31, 2024a | | | Year Ended
September 30,
2023 | | | Year Ended
September 30,
2022 | | | Year Ended
September 30,
2021 | | | Year Ended
September 30,
2020 | | | Year Ended
September 30,
2019 | |
Per Share Data |
Net asset value, beginning of period | | $ | 10.77 | | | $ | 10.97 | | | $ | 13.46 | | | $ | 13.23 | | | $ | 13.13 | | | $ | 12.46 | |
Income (loss) from investment operations: |
Net investment income (loss)b | | | .17 | | | | .26 | | | | .26 | | | | .28 | | | | .29 | | | | .33 | |
Net gain (loss) on investments (realized and unrealized) | | | .65 | | | | (.03 | ) | | | (2.44 | ) | | | .24 | | | | .10 | | | | .71 | |
Total from investment operations | | | .82 | | | | .23 | | | | (2.18 | ) | | | .52 | | | | .39 | | | | 1.04 | |
Less distributions from: |
Net investment income | | | (.21 | ) | | | (.29 | ) | | | (.25 | ) | | | (.27 | ) | | | (.29 | ) | | | (.33 | ) |
Net realized gains | | | — | | | | (.14 | ) | | | (.06 | ) | | | (.02 | ) | | | — | | | | (.04 | ) |
Total distributions | | | (.21 | ) | | | (.43 | ) | | | (.31 | ) | | | (.29 | ) | | | (.29 | ) | | | (.37 | ) |
Net asset value, end of period | | $ | 11.38 | | | $ | 10.77 | | | $ | 10.97 | | | $ | 13.46 | | | $ | 13.23 | | | $ | 13.13 | |
|
Total Return | | | 7.68 | % | | | 1.93 | % | | | (16.46 | %) | | | 3.93 | % | | | 3.03 | % | | | 8.48 | % |
Ratios/Supplemental Data |
Net assets, end of period (in thousands) | | $ | 5,354 | | | $ | 10,826 | | | $ | 4,629 | | | $ | 12,772 | | | $ | 13,406 | | | $ | 13,970 | |
Ratios to average net assets: |
Net investment income (loss) | | | 3.03 | % | | | 2.30 | % | | | 2.04 | % | | | 2.08 | % | | | 2.23 | % | | | 2.59 | % |
Total expensesd | | | 1.29 | % | | | 0.96 | % | | | 0.98 | % | | | 0.96 | % | | | 1.00 | % | | | 1.08 | % |
Net expensese,f,g | | | 0.53 | % | | | 0.53 | % | | | 0.54 | % | | | 0.55 | % | | | 0.56 | % | | | 0.56 | % |
Portfolio turnover rate | | | 43 | % | | | 11 | % | | | 14 | % | | | 22 | % | | | 58 | % | | | 30 | % |
a | Unaudited figures for the period ended March 31, 2024. Percentage amounts for the period, except total return and portfolio turnover rate, have been annualized. |
b | Net investment income (loss) per share was computed using average shares outstanding throughout the period. |
c | Total return does not reflect the impact of any applicable sales charges. |
d | Does not include expenses of the underlying funds in which the Fund invests. |
e | Net expense information reflects the expense ratios after expense waivers and reimbursements, as applicable. |
f | The portion of the ratios of net expenses to average net assets attributable to recoupments of prior fee reductions or expense reimbursements for the years presented was as follows: |
| | | 03/31/24a | 09/30/23 | 09/30/22 | 09/30/21 | 09/30/20 | 09/30/19 |
| | Class A | — | 0.00%* | 0.02% | — | 0.00%* | 0.00%* |
| | Class C | — | 0.01% | 0.01% | — | 0.00%* | — |
| | Class P | — | 0.00%* | 0.01% | — | 0.00%* | — |
| | Institutional Class | — | 0.00%* | 0.01% | — | 0.00%* | — |
g | Net expenses may include expenses that are excluded from the expense limitation agreement. Excluding these expenses, the net expense ratios for the years presented would be: |
| | | 03/31/24a | 09/30/23 | 09/30/22 | 09/30/21 | 09/30/20 | 09/30/19 |
| | Class A | 0.77% | 0.77% | 0.78% | 0.79% | 0.80% | 0.80% |
| | Class C | 1.52% | 1.53% | 1.53% | 1.54% | 1.55% | 1.55% |
| | Class P | 0.77% | 0.77% | 0.78% | 0.79% | 0.80% | 0.80% |
| | Institutional Class | 0.52% | 0.52% | 0.53% | 0.54% | 0.55% | 0.55% |
SEE NOTES TO FINANCIAL STATEMENTS. | THE GUGGENHEIM FUNDS SEMI-ANNUAL REPORT | 67 |
NOTES TO FINANCIAL STATEMENTS (Unaudited) |
Note 1 – Organization and Significant Accounting Policies
Organization
Guggenheim Funds Trust (the “Trust”), a Delaware statutory trust, is registered with the U.S. Securities and Exchange Commission (the “SEC”) under the Investment Company Act of 1940 (the “1940 Act”), as an open-ended investment company of the series type. Each series, in effect, is representing a separate fund (each, a “Fund”). The Trust may issue an unlimited number of authorized shares. The Trust accounts for the assets of each Fund separately.
The Trust offers a combination of five separate classes of shares: Class A shares, Class C shares, Class P shares, Class R6 shares and Institutional Class shares. Sales of shares of each Class are made without a front-end sales charge at the net asset value per share (“NAV”), with the exception of Class A shares. Class A shares are sold at the NAV, plus the applicable front-end sales charge. The sales charge varies depending on the amount purchased. Class A share purchases of $1 million or more are exempt from the front-end sales charge but have a 1% contingent deferred sales charge (“CDSC”), if shares are redeemed within 12 months of purchase. Class C shares have a 1% CDSC if shares are redeemed within 12 months of purchase. Class C shares of each Fund automatically convert to Class A shares of the same Fund on or about the 10th day of the month following the 8-year anniversary of the purchase of the Class C shares. This conversion will be executed without any sales charge, fee or other charge. After the conversion is completed, the shares will be subject to all features and expenses of Class A shares. Institutional Class shares are offered primarily for direct investment by institutions such as pension and profit sharing plans, endowments, foundations and corporations. Institutional Class shares require a minimum initial investment of $2 million and a minimum account balance of $1 million. Class R6 shares are offered primarily through qualified retirement and benefit plans. Class R6 shares are also offered through certain other plans and platforms sponsored by financial intermediaries. Certain institutional investors and others deemed appropriate by Guggenheim Investments (“GI”or the “Adviser”) may also be eligible to purchase Class R6 shares subject to a $2 million minimum initial investment. At March 31, 2024, the Trust consisted of eighteen funds.
As of January 1, 2012, Class A, Class C and Institutional Class shares of High Yield Fund are subject to a 2% redemption fee when shares are redeemed or exchanged within 90 days of purchase.
This report covers the following funds (collectively, the “Funds”):
Fund Name | Investment
Company Type |
High Yield Fund | Diversified |
Core Bond Fund | Diversified |
Municipal Income Fund | Diversified |
Security Investors, LLC and Guggenheim Partners Investment Management, LLC (“GPIM”), which operate under the name Guggenheim Investments, provide advisory services. Security Investors, LLC (“SI” or the “Adviser”) provides advisory services to High Yield Fund, Core Bond Fund and Municipal Income Fund. Guggenheim Funds Distributors, LLC (“GFD”) serves as distributor of the Funds’ shares. GI and GFD are affiliated entities. GPIM, an affiliate of GI, serves as investment sub-advisor (the “Sub-Advisor”) to the Municipal Income Fund and is responsible for the day-to-day management of the Fund’s portfolio.
Significant Accounting Policies
The Funds operate as investment companies and, accordingly, follow the investment company accounting and reporting guidance of the Financial Accounting Standards Board (“FASB”) Accounting Standards Codification Topic 946 Financial Services – Investment Companies.
The following significant accounting policies are in conformity with U.S. generally accepted accounting principles (“U.S. GAAP”) and are consistently followed by the Trust. This requires management to make estimates and assumptions that affect the reported amount of assets and liabilities, contingent assets and liabilities at the date of the financial statements, and the reported amounts of revenues and expenses during the reporting period. Actual results could differ from these estimates. All time references are based on Eastern Time.
The NAV of each share class of a fund is calculated by dividing the market value of a fund’s securities and other assets, less all liabilities attributable to the share class by the number of outstanding shares of the share class on the specified date.
(a) Valuation of Investments
The Board of Trustees of the Funds (the “Board”) has adopted policies and procedures for the valuation of the Funds’ investments (the “Fund Valuation Procedures”). The SEC adopted Rule 2a-5 under the 1940 Act (“Rule 2a-5”) which establishes requirements for determining fair value in good faith. Rule 2a-5 also defines “readily available market quotations” for purposes of the 1940 Act and establishes requirements for determining whether a fund must fair value a security in good faith.
Pursuant to Rule 2a-5, the Board has designated the Adviser as the valuation designee to perform fair valuation determinations for the Funds with respect to all Fund investments and other assets. As the Funds’ valuation designee pursuant to Rule 2a-5, the Adviser has adopted separate procedures (the “Valuation Designee Procedures” and collectively with the Fund Valuation Procedures, the “Valuation Procedures”) reasonably designed to prevent violations of the requirements of Rule 2a-5 and Rule 31a-4. The Adviser, in its role as valuation designee, utilizes the assistance
68 | THE GUGGENHEIM FUNDS SEMI-ANNUAL REPORT | |
NOTES TO FINANCIAL STATEMENTS (Unaudited)(continued) |
of a valuation committee, consisting of representatives from Guggenheim’s investment management, fund administration, legal and compliance departments (the “Valuation Committee”), in determining the fair value of the Funds’ securities and other assets.
Valuations of the Funds’ securities and other assets are supplied primarily by pricing service providers appointed pursuant to the processes set forth in the Valuation Procedures. The Adviser, with the assistance of the Valuation Committee, convenes monthly, or more frequently as needed, to review the valuation of all assets which have been fair valued. The Adviser, consistent with the monitoring and review responsibilities set forth in the Valuation Procedures, regularly reviews the appropriateness of the inputs, methods, models and assumptions employed by the pricing service providers.
If the pricing service provider cannot or does not provide a valuation for a particular investment or such valuation is deemed unreliable, such investment is fair valued by the Adviser.
Equity securities listed or traded on a recognized U.S. securities exchange or the Nasdaq Stock Market (“NASDAQ”) will generally be valued on the basis of the last sale price on the primary U.S. exchange or market on which the security is listed or traded; provided, however, that securities listed on NASDAQ will be valued at the NASDAQ official closing price, which may not necessarily represent the last sale price.
Generally, trading in foreign securities markets is substantially completed each day at various times prior to the close of the New York Stock Exchange (“NYSE”). The values of foreign securities are determined as of the close of such foreign markets or the close of the NYSE, if earlier. All investments quoted in foreign currencies are valued in U.S. dollars on the basis of the foreign currency exchange rates prevailing at the close of U.S. business at 4:00 p.m. Investments in foreign securities may involve risks not present in domestic investments. The Adviser will determine the current value of such foreign securities by taking into consideration certain factors which may include the following factors, among others: the value of the securities traded on other foreign markets, American Depositary Receipts (“ADR”) trading, closed-end fund trading, foreign currency exchange activity, and the trading prices of financial products that are tied to foreign securities. In addition, under the Valuation Procedures, the Adviser is authorized to use prices and other information supplied by a pricing service provider in valuing foreign securities.
Open-end investment companies are valued at their NAV as of the close of business, on the valuation date. Exchange-traded funds and closed-end investment companies are generally valued at the last quoted sale price.
U.S. Government securities are valued by pricing service providers, using the last traded fill price, or at the reported bid price at the close of business on the valuation date.
CLOs, CDOs, MBS, ABS, and other structured finance securities are generally valued using an independent third party pricing service.
Commercial paper and discount notes with a maturity of greater than 60 days at acquisition are valued at prices that reflect broker-dealer supplied valuations or are obtained from pricing service providers, which may consider the trade activity, treasury spreads, yields or price of bonds of comparable quality, coupon, maturity, and type, as well as prices quoted by dealers who make markets in such securities. Commercial paper and discount notes with a maturity of 60 days or less at acquisition are valued at amortized cost, unless the Adviser concludes that amortized cost does not represent the fair value of the applicable asset in which case it will be valued using an independent pricing service provider.
Typically, loans are valued using information provided by a pricing service provider which uses broker quotes, among other inputs. If the pricing service cannot or does not provide a valuation for a particular loan, or such valuation is deemed unreliable, such investment is valued based on a quote from a broker-dealer or is fair valued by the Adviser.
Exchange-traded options are valued at the mean of the bid and ask prices on the principal exchange on which they are traded. Over-the-counter (“OTC”) options and options on swaps (“swaptions”) are valued using a price provided by a pricing service.
Futures contracts are valued on the basis of the last sale price at the 4:00 p.m. price on the valuation date. In the event that the exchange for a specific futures contract closes earlier than 4:00 p.m., the futures contract is valued at the official settlement price of the exchange. However, the underlying securities from which the futures contract value is derived are monitored until 4:00 p.m. to determine if fair valuation of the underlying securities would provide a more accurate valuation of the futures contract.
Interest rate swap agreements entered into by a Fund are valued on the basis of the last sale price on the primary exchange on which the swap is traded.
Swap agreements entered into by a Fund are generally valued using an evaluated price provided by a pricing service provider.
Forward foreign currency exchange contracts are valued daily based on the applicable exchange rate of the underlying currency.
| | THE GUGGENHEIM FUNDS SEMI-ANNUAL REPORT | 69 |
NOTES TO FINANCIAL STATEMENTS (Unaudited)(continued) |
Investments for which market quotations are not readily available are fair valued as determined in good faith by the Adviser. Valuations in accordance with these methods are intended to reflect each security’s (or asset’s or liability’s) “fair value”. Each such determination is based on a consideration of all relevant factors, which are likely to vary from one pricing context to another. Examples of such factors may include, but are not limited to market prices; sale prices; broker quotes; and models which derive prices based on inputs such as anticipated cash flows or collateral, spread over U.S. Treasury securities, and other information analysis. In connection with futures contracts and other derivative investments, such factors may include obtaining information as to how (a) these contracts and other derivative investments trade in the futures or other derivative markets, respectively, and (b) the securities underlying these contracts and other derivative investments trade in the cash market.
(b) U.S. Government and Agency Obligations
Certain U.S. Government and Agency Obligations are traded on a discount basis; the interest rates shown on the Schedules of Investments reflect the effective rates paid at the time of purchase by the Funds. Other securities bear interest at the rates shown, payable at fixed dates through maturity.
Inflation-Indexed bonds are fixed-income securities whose principal value is periodically adjusted to the rate of inflation.
The interest rate on these securities is generally fixed at issuance at a rate lower than typical bonds. Over the life of an inflation indexed bond however, interest will be paid based on a principal value which is adjusted for inflation. Any increase in the principal amount of an inflation-indexed bond is recognized as a component of Interest on the Fund’s Statements of Operations, even though principal is not received until maturity.
(c) Senior Floating Rate Interests and Loan Investments
Senior floating rate interests in which the Trust invests generally pay interest rates which are periodically adjusted by reference to a base short-term floating rate, plus a premium. These base lending rates are generally (i) the lending rate offered by one or more major European banks, (ii) the prime rate offered by one or more major United States banks, or (iii) the bank’s certificate of deposit rate. Senior floating rate interests often require prepayments from excess cash flows or permit the borrower to repay at its election. The rate at which the borrower repays cannot be predicted with accuracy. As a result, the actual remaining maturity may be substantially less than the stated maturities disclosed in the Funds’ Schedules of Investments.
The Funds invest in loans and other similar debt obligations (“obligations”). A portion of the Funds’ investments in these obligations is sometimes referred to as “covenant lite” loans or obligations (“covenant lite obligations”), which are obligations that lack covenants or possess fewer or less restrictive covenants or constraints on borrowers than certain other types of obligations. The Funds may also obtain exposure to covenant lite obligations through investment in securitization vehicles and other structured products. Recently, many new or reissued obligations have not featured traditional covenants, which are intended to protect lenders and investors by (i) imposing certain restrictions or other limitations on a borrower’s operations or assets or (ii) providing certain rights to lenders. The Funds may have fewer rights with respect to covenant lite obligations, including fewer protections against the possibility of default and fewer remedies in the event of default. As a result, investments in (or exposure to) covenant lite obligations are subject to more risk than investments in (or exposure to) certain other types of obligations. The Funds are subject to other risks associated with investments in (or exposure to) obligations, including that obligations may not be considered “securities” and, as a result, the Funds may not be entitled to rely on the anti-fraud protections under the federal securities laws and instead may have to resort to state law and direct claims.
(d) Interest on When-Issued Securities
The Funds may purchase and sell interests in securities on a when-issued and delayed delivery basis, with payment and delivery scheduled for a future date. No income accrues to the Funds on such interests or securities in connection with such transactions prior to the date the Funds actually take delivery of such interests or securities. These transactions are subject to market fluctuations and are subject to the risk that the value at delivery may be more or less than the trade date purchase price. Although the Funds will generally purchase these securities with the intention of acquiring such securities, they may sell such securities before the settlement date.
(e) Short Sales
When a Fund engages in a short sale of a security, an amount equal to the proceeds is reflected as an asset and an equivalent liability. The amount of the liability is subsequently marked-to-market to reflect the market value of the short sale. The Fund maintains a segregated account of cash and/or securities as collateral for short sales.
(f) Options
Upon the purchase of an option, the premium paid is recorded as an investment, the value of which is marked-to-market daily. If a purchased option expires, the Fund realizes a loss in the amount of the cost of the option. When the Fund enters into a closing sale transaction, it realizes a gain or loss depending on whether the proceeds from the closing sale transaction are greater or less than the cost of the option. If the Fund exercises a put option, it realizes a gain or loss from the sale of the underlying security and
70 | THE GUGGENHEIM FUNDS SEMI-ANNUAL REPORT | |
NOTES TO FINANCIAL STATEMENTS (Unaudited)(continued) |
the proceeds from such sale will be decreased by the premium originally paid. When the Fund exercises a call option, the cost of the security purchased by the Fund upon exercise increases by the premium originally paid.
When the Fund writes (sells) an option, an amount equal to the premium received is entered in that Fund’s accounting records as an asset and equivalent liability. The amount of the liability is subsequently marked-to-market to reflect the current value of the option written. When a written option expires, or if the Fund enters into a closing purchase transaction, it realizes a gain (or loss if the cost of a closing purchase transaction exceeds the premium received when the option was sold).
The Fund may purchase and write swaptions primarily to preserve a return or spread on a particular investment or portion of the Funds’ holdings, as a duration management technique or to protect against an increase in the price of securities it anticipates purchasing at a later date. The purchaser and writer of a swaption is buying or granting the right to enter into a previously agreed upon interest rate swap agreement at any time before the expiration of the options. The swaptions are forward premium swaptions which have extended settlement dates.
(g) Swap Agreements
Swap agreements are marked-to-market daily and the change, if any, is recorded as unrealized appreciation or depreciation. Payments received or made as a result of an agreement or termination of an agreement are recognized as realized gains or losses.
Upon entering into certain centrally-cleared swap transactions, a Fund is required to deposit with its clearing broker an amount of cash or securities as an initial margin. Subsequent variation margin receipts or payments are received or made by the Fund depending on fluctuations in the fair value of the reference entity and are recorded by the Fund as unrealized appreciation or depreciation. When the contract is closed, the Fund records a realized gain or loss equal to the difference between the value of the contract at the time it was opened and the value at the time it was closed.
Upfront payments received or made by a Fund on credit default swap agreements and interest rate swap agreements are amortized over the expected life of the agreement. Periodic payments received or paid by a Fund are recorded as realized gains or losses. Payments received or made as a result of a credit event or termination of the contract are recognized, net of a proportional amount of the upfront payment, as realized gains or losses.
(h) Currency Translations
The accounting records of the Funds are maintained in U.S. dollars. All assets and liabilities initially expressed in foreign currencies are converted into U.S. dollars at prevailing exchange rates. Purchases and sales of investment securities, dividend and interest income, and certain expenses are translated at the rates of exchange prevailing on the respective dates of such transactions. Changes in the relationship of these foreign currencies to the U.S. dollar can significantly affect the value of the investments and earnings of the Funds. Foreign investments may also subject the Funds to foreign government exchange restrictions, expropriation, taxation, or other political, social, geopolitical or economic developments, all of which could affect the market and/or credit risk of the investments.
The Funds do not isolate that portion of the results of operations resulting from changes in the foreign exchange rates on investments from the fluctuations arising from changes in the market prices of securities held. Such fluctuations are included with the net realized gain or loss and unrealized appreciation or depreciation on investments.
Reported net realized foreign exchange gains and losses arise from sales of foreign currencies and currency gains or losses realized between the trade and settlement dates on investment transactions. Net unrealized appreciation and depreciation arise from changes in the fair values of assets and liabilities other than investments in securities at the fiscal period end, resulting from changes in exchange rates.
(i) Forward Foreign Currency Exchange Contracts
The change in value of a forward foreign currency exchange contract is recorded as unrealized appreciation or depreciation until the contract is closed. When the contract is closed, the Funds record a realized gain or loss equal to the difference between the value at the time the contract was opened and the value at the time it was closed.
(j) Foreign Taxes
The Funds may be subject to foreign taxes (a portion of which may be reclaimable) on income, stock dividends, capital gains on investments or certain foreign currency transactions. All foreign taxes are recorded in accordance with the applicable foreign tax regulations and rates that exist in the foreign jurisdictions in which the Funds invest. These foreign taxes, if any, are paid by the Funds and reflected in their Statements of Operations as follows: foreign taxes withheld at source are presented as a reduction of income and foreign taxes on capital gains from sales of investments are included with the net realized gain (loss) on investments. Foreign taxes payable or deferred as of March 31, 2024, if any, are disclosed in the Funds’ Statements of Assets and Liabilities.
| | THE GUGGENHEIM FUNDS SEMI-ANNUAL REPORT | 71 |
NOTES TO FINANCIAL STATEMENTS (Unaudited)(continued) |
(k) Security Transactions
Security transactions are recorded on the trade date for financial reporting purposes. Realized gains and losses from securities transactions are recorded using the identified cost basis. Proceeds from lawsuits related to investment holdings are recorded as a reduction to cost if the securities are still held and as realized gains if no longer held in the respective Fund. Dividend income is recorded on the ex-dividend date, net of applicable taxes withheld by foreign countries, if any. Taxable non-cash dividends are recorded as dividend income. Interest income, including amortization of premiums and accretion of discounts, is accrued on a daily basis. Interest income also includes paydown gains and losses on mortgage-backed and asset-backed securities and senior and subordinated loans. Amendment fees are earned as compensation for evaluating and accepting changes to the original loan agreement and are recognized when received. Dividend income from Real Estate Investment Trusts (“REITs”) is recorded based on the income included in the distributions received from the REIT investments using published REIT classifications, including some management estimates when actual amounts are not available. Distributions received in excess of this estimated amount are recorded as a reduction of the cost of investments or reclassified to realized gains. The actual amounts of income, return of capital, and realized gains are only determined by each REIT after its fiscal year-end, and may differ from the estimated amounts.
Income from residual collateralized loan obligations is recognized using the effective interest method. At the time of purchase, management estimates the future expected cash flows and determines the effective yield and estimated maturity date based on the estimated cash flows. Subsequent to the purchase, the estimated cash flows are updated periodically and a revised yield is calculated prospectively.
Certain Funds may receive other income from investments in senior loan interests including amendment fees, consent fees and commitment fees. For funded loans, these fees are recorded as income when received by the Funds and included in interest income on the Funds’ Statements of Operations. For unfunded loans, commitment fees are included in realized gain on investments on the Funds’ Statements of Operations at the end of the commitment period.
(l) Distributions
The Funds declare dividends from investment income daily. Each Fund pays its shareholders from its net investment income monthly and distributes any net capital gains that it has realized, at least annually. Distributions to shareholders are recorded on the ex-dividend date. Dividends are reinvested in additional shares, unless shareholders request payment in cash. The character of distributions made during the year from net investment income or net realized gains may differ from their ultimate characterization for U.S. federal income tax purposes.
(m) Class Allocations
Interest and dividend income, most expenses, all realized gains and losses, and all unrealized appreciation and depreciation are allocated to the share classes based upon the value of the outstanding shares in each share class. Certain costs, such as distribution and service fees are charged directly to specific share classes. In addition, certain expenses have been allocated to the individual Funds in the Trust based on the respective net assets of each Fund included in the Trust.
(n) Earnings Credits
Under the fee arrangement with the custodian, the Funds may earn credits based on overnight custody cash balances. These credits are utilized to reduce related custodial expenses. The custodian fees disclosed in the Statements of Operations are before the reduction in expense from the related earnings credits, if any. Earnings credits for the period ended March 31, 2024, are disclosed in the Funds’ Statements of Operations.
(o) Cash
The Funds may leave cash overnight in their cash account with the custodian. Periodically, a Fund may have cash due to the custodian bank as an overdraft balance. A fee is incurred on this overdraft, calculated by multiplying the overdraft by a rate based on the federal funds rate, which was 5.33% at March 31, 2024.
(p) Indemnifications
Under the Funds’ organizational documents, the Trustees and Officers are indemnified against certain liabilities arising out of the performance of their duties to the Trust. In addition, throughout the normal course of business, the Funds enter into contracts that contain a variety of representations and warranties which provide general indemnifications. The Funds’ maximum exposure under these arrangements is unknown, as this would involve future claims that may be made against the Funds and/or their affiliates that have not yet occurred. However, based on experience, the Funds expect the risk of loss to be remote.
(q) Special Purpose Acquisition Companies
The Funds may acquire an interest in a special purpose acquisition company (“SPAC”) in an initial public offering or a secondary market transaction. SPAC investments carry many of the same risks as investments in initial public offering securities, such as erratic price movements, greater risk of loss, lack of information about the issuer, limited operating and little public or no trading history, and higher transaction costs. An investment in a SPAC
72 | THE GUGGENHEIM FUNDS SEMI-ANNUAL REPORT | |
NOTES TO FINANCIAL STATEMENTS (Unaudited)(continued) |
is typically subject to a higher risk of dilution by additional later offerings of interests in the SPAC or by other investors exercising existing rights to purchase shares of the SPAC and interests in SPACs may be illiquid and/or be subject to restrictions on resale. A SPAC is a publicly traded company that raises investment capital for the purpose of acquiring the equity securities of one or more existing companies (or interests therein) via merger, combination, acquisition or other similar transactions. Unless and until an acquisition is completed, a SPAC generally invests its assets (less a portion retained to cover expenses) in U.S. government securities, money market securities and cash and does not typically pay dividends in respect of its common stock. SPAC investments are also subject to the risk that a significant portion of the funds raised by the SPAC may be expended during the search for a target acquisition or merger and that the SPAC may have limited time in which to conduct due diligence on potential business combination targets. Because SPACs are in essence blank check companies without operating history or ongoing business other than seeking acquisitions, the value of their securities is particularly dependent on the ability of the entity’s management to identify and complete a profitable acquisition. Among other conflicts of interest, the economic interests of the management, directors, officers and related parties of a SPAC can differ from the economic interests of public shareholders, which may lead to conflicts as they evaluate, negotiate and recommend business combination transactions to shareholders. This risk may become more acute as the deadline for the completion of a business combination nears. There is no guarantee that the SPACs in which the Funds invest will complete an acquisition or that any acquisitions that are completed will be profitable.
Note 2 – Financial Instruments and Derivatives
As part of their investment strategies, the Funds may utilize short sales and a variety of derivative instruments. These investments involve, to varying degrees, elements of market risk and risks in excess of amounts recognized on the Funds’ Statements of Assets and Liabilities. Valuation and accounting treatment of these instruments can be found under Significant Accounting Policies in Note 1 of these Notes to Financial Statements.
Short Sales
A short sale is a transaction in which a Fund sells a security it does not own. If the security sold short decreases in price between the time the Fund sells the security and closes its short position, the Fund will realize a gain on the transaction. Conversely, if the security increases in price during the period, the Fund will realize a loss on the transaction. The risk of such price increases is the principal risk of engaging in short sales.
Derivatives
Derivatives are instruments whose values depend on, or are derived from, in whole or in part, the value of one or more other assets, such as securities, currencies, commodities or indices. Derivative instruments may be used to increase investment flexibility (including to maintain cash reserves while maintaining exposure to certain other assets), for risk management (hedging) purposes, to facilitate trading, to reduce transaction costs and to pursue higher investment returns. Derivative instruments may also be used to mitigate certain investment risks, such as foreign currency exchange rate risk, interest rate risk and credit risk. U.S. GAAP requires disclosures to enable investors to better understand how and why a Fund uses derivative instruments, how these derivative instruments are accounted for and their effects on the Fund’s financial position and results of operations.
The Funds may utilize derivatives for the following purposes:
Duration: the use of an instrument to manage the interest rate risk of a portfolio.
Hedge: an investment made in order to reduce the risk of adverse price movements in a security, by taking an offsetting position to protect against broad market moves.
Income: the use of any instrument that distributes cash flows typically based upon some rate of interest.
Index Exposure: the use of an instrument to obtain exposure to a listed or other type of index.
| | THE GUGGENHEIM FUNDS SEMI-ANNUAL REPORT | 73 |
NOTES TO FINANCIAL STATEMENTS (Unaudited)(continued) |
Options Purchased and Written
A call option on a security gives the purchaser of the option the right to buy, and the writer of a call option the obligation to sell, the underlying security. The purchaser of a put option has the right to sell, and the writer of the put option the obligation to buy, the underlying security at any time during the option period. The risk associated with purchasing options is limited to the premium originally paid.
The following table represents the Funds’ use and volume of call/put options purchased on a monthly basis:
| | | | Average Notional Amount | |
Fund | Use | | Call | | | Put | |
Core Bond Fund | Duration, Hedge, Income | | $ | 99,200,000 | | | $ | — | |
Core Bond Fund held written call options for 17 days during the period. The average notional amount of call options written during the days held was $24,400,000.
Futures Contracts
A futures contract is an agreement to purchase (long) or sell (short) an agreed amount of securities or other instruments at a set price for delivery at a future date. There are significant risks associated with a Fund’s use of futures contracts, including (i) there may be an imperfect or no correlation between the changes in market value of the underlying asset and the prices of futures contracts; (ii) there may not be a liquid secondary market for a futures contract; (iii) trading restrictions or limitations may be imposed by an exchange; and (iv) government regulations may restrict trading in futures contracts. When investing in futures, there is minimal counterparty credit risk to a Fund because futures are exchange-traded and the exchange’s clearinghouse, as counterparty to all exchange-traded futures, guarantees against default. Cash deposits are shown as segregated cash with broker on the Funds’ Statements of Assets and Liabilities; securities held as collateral are noted on the Funds’ Schedule of Investments.
The following table represents the Funds’ use and volume of futures on a monthly basis:
| | | | Average Notional Amount | |
Fund | Use | | Long | | | Short | |
Core Bond Fund | Duration, Hedge | | $ | 145,392,088 | | | $ | — | |
Swap Agreements
A swap is an agreement that obligates two parties to exchange a series of cash flows at specified intervals based upon or calculated by reference to changes in specified prices or rates for a specified amount of an underlying asset. When utilizing OTC swaps, a Fund bears the risk of loss of the amount expected to be received under a swap agreement in the event of the default or bankruptcy of a swap agreement counterparty or if the underlying asset declines in value. Certain standardized swaps are subject to mandatory central clearing and are executed on a multi-lateral or other trade facility platform, such as a registered exchange. There is limited counterparty credit risk with respect to centrally-cleared swaps as the transaction is facilitated through a central clearinghouse, much like exchange-traded futures contracts. For a Fund utilizing centrally-cleared swaps, the exchange bears the risk of loss resulting from a counterparty not being able to pay. There is no guarantee that a Fund or an underlying fund could eliminate its exposure under an outstanding swap agreement by entering into an offsetting swap agreement with the same or another party.
Total return swaps involve commitments where single or multiple cash flows are exchanged based on the price of an underlying reference asset (such as an index) for a fixed or variable interest rate. Total return swaps will usually be computed based on the current value of the reference asset as of the close of regular trading on the NYSE or other exchange, with the swap value being adjusted to include dividends accrued, financing charges and/or interest associated with the swap agreement. When utilizing total return swaps, a fund bears the risk of loss of the amount expected to be received under a swap agreement in the event of the default or bankruptcy of a swap agreement counterparty or if the underlying reference asset declines in value.
74 | THE GUGGENHEIM FUNDS SEMI-ANNUAL REPORT | |
NOTES TO FINANCIAL STATEMENTS (Unaudited)(continued) |
The following table represents the Funds’ use and volume of total return swaps on a monthly basis:
| | | | Average Notional Amount | |
Fund | Use | | Long | | | Short | |
Core Bond Fund | Index exposure, Hedge | | $ | 3,408,670 | | | $ | 1,892,675 | |
Interest rate swaps involve the exchange by the Funds with another party for their respective commitment to pay or receive a fixed or variable interest rate on a notional amount of principal. Interest rate swaps are generally centrally-cleared, but central clearing does not make interest rate swap transactions risk free.
The following table represents the Funds’ use and volume of interest rate swaps on a monthly basis:
| | | | Average Notional Amount | |
Fund | Use | | Pay Floating Rate | | | Receive Floating Rate | |
Core Bond Fund | Duration, Income | | $ | 513,815,667 | | | $ | — | |
Municipal Income Fund | Duration | | | 14,000,000 | | | | 8,938,333 | |
Credit default swaps are instruments which allow for the full or partial transfer of third party credit risk, with respect to a particular entity or entities, from one counterparty to the other. A fund enters into credit default swaps as a “seller” or “buyer” of protection primarily to gain or reduce exposure to the investment grade and/or high yield bond market. A seller of credit default swaps is selling credit protection or assuming credit risk with respect to the underlying entity or entities. The buyer in a credit default swap is obligated to pay the seller a periodic stream of payments over the term of the contract provided that no event of default on an underlying reference obligation has occurred. If a credit event occurs, as defined under the terms of the swap agreement, the seller will either (i) pay to the buyer of protection an amount equal to the notional amount of the swap and take delivery of the referenced obligation or underlying securities comprising the referenced index or (ii) pay a net settlement amount in the form of cash or securities equal to the notional amount of the swap less the recovery value of the referenced obligation or underlying securities comprising the referenced index. The notional amount reflects the maximum potential amount the seller of credit protection could be required to pay to the buyer if a credit event occurs. The seller of protection receives periodic premium payments from the buyer and may also receive or pay an upfront premium adjustment to the stated periodic payments. In the event a credit default occurs on a credit default swap referencing an index, a factor adjustment will take place and the buyer of protection will receive a payment reflecting the par less the default recovery rate of the defaulted index component based on its weighting in the index. If no default occurs, the counterparty will pay the stream of payments and have no further obligations to the fund selling the credit protection. For a fund utilizing centrally cleared credit default swaps, the exchange bears the risk of loss resulting from a counterparty not being able to pay. For OTC credit default swaps, a fund bears the risk of loss of the amount expected to be received under a swap agreement in the event of the default or bankruptcy of a swap agreement counterparty, or in the case of a credit default swap in which a fund is selling credit protection, the default of a third party issuer.
The quoted market prices and resulting market values for credit default swap agreements on securities and credit indices serve as an indicator of the current status of the payment/performance risk and represent the likelihood of an expected liability (or profit) for the credit derivative had the notional amount of the swap agreement been closed/sold as of the period end. Increasing market values, in absolute terms when compared to the notional amount of the swap, represent a deterioration of the referenced entity’s credit soundness and a greater likelihood or risk of default or other credit event occurring as defined under the terms of the agreement.
The following table represents the Funds’ use and volume of credit default swaps on a monthly basis:
| | | | Average Notional Amount | |
Fund | Use | | Protection Sold | | | Protection Purchased | |
Core Bond Fund | Index exposure, Hedge | | $ | — | | | $ | 22,961,667 | |
| | THE GUGGENHEIM FUNDS SEMI-ANNUAL REPORT | 75 |
NOTES TO FINANCIAL STATEMENTS (Unaudited)(continued) |
Forward Foreign Currency Exchange Contracts
A forward foreign currency exchange contract is an agreement between two parties to exchange two designated currencies at a specific time in the future. Certain types of contracts may be cash settled, in an amount equal to the change in exchange rates during the term of the contract. The contracts can be used to hedge or manage exposure to foreign currency risks with portfolio investments or to gain exposure to foreign currencies.
The market value of a forward foreign currency exchange contract changes with fluctuations in foreign currency exchange rates. Furthermore, the Funds may be exposed to risk if the counterparties cannot meet the contract terms or if the currency value changes unfavorably as compared to the U.S. dollar.
The following table represents the Funds’ use and volume of forward foreign currency exchange contracts on a monthly basis:
| | | | Average Value | |
Fund | Use | | Purchased | | | Sold | |
High Yield Fund | Hedge | | $ | — | | | $ | 3,608,430 | |
Core Bond Fund | Hedge | | | 45,881 | | | | 13,426,264 | |
Derivative Investment Holdings Categorized by Risk Exposure
The following is a summary of the location of derivative investments on the Funds’ Statements of Assets and Liabilities as of March 31, 2024:
Derivative Investment Type | Asset Derivatives | Liability Derivatives |
Interest rate futures contracts | — | Variation margin on futures contracts |
Currency forward contracts | Unrealized appreciation on forward foreign currency exchange contracts | Unrealized depreciation on forward foreign currency exchange contracts |
Interest rate swap agreements | Unamortized upfront premiums paid on interest rate swap agreements Variation margin on interest rate swap agreements | Unamortized upfront premiums received on interest rate swap agreements Variation margin on interest rate swap agreements |
Credit default swap agreements | Unamortized upfront premiums paid on credit default swap agreements | Unamortized upfront premiums received on credit default swap agreements Variation margin on credit default swap agreements |
Interest rate option contracts | Investments in unaffiliated issuers, at value | — |
The following tables set forth the fair value of the Funds’ derivative investments categorized by primary risk exposure at March 31, 2024:
Asset Derivative Investments Value |
Fund | | Futures
Interest
Rate
Risk* | | | Swaps
Interest Rate
Risk* | | | Swaps
Credit
Risk* | | | Forward
Foreign
Currency
Exchange
Risk | | | Options
Purchased
Interest
Rate Risk | | | Total
Value at
March 31,
2024 | |
High Yield Fund | | $ | — | | | $ | — | | | $ | — | | | $ | 45,928 | | | $ | — | | | $ | 45,928 | |
Core Bond Fund | | | — | | | | 8,644,963 | | | | 2,308 | | | | 176,596 | | | | 5,936 | | | | 8,829,803 | |
Municipal Income Fund | | | — | | | | 1,194,334 | | | | — | | | | — | | | | — | | | | 1,194,334 | |
Liability Derivative Investments Value |
Fund | | Futures
Interest
Rate
Risk* | | | Swaps
Interest
Rate
Risk* | | | Swaps
Credit
Risk* | | | Forward
Foreign
Currency
Exchange
Risk | | | Options
Purchased
Interest
Rate Risk | | | Total
Value at
March 31,
2024 | |
Core Bond Fund | | $ | 279,768 | | | $ | 589,601 | | | $ | 702,683 | | | $ | 1,336 | | | $ | — | | | $ | 1,573,388 | |
Municipal Income Fund | | | — | | | | 134,109 | | | | — | | | | — | | | | — | | | | 134,109 | |
76 | THE GUGGENHEIM FUNDS SEMI-ANNUAL REPORT | |
NOTES TO FINANCIAL STATEMENTS (Unaudited)(continued) |
* | Includes cumulative appreciation (depreciation) of OTC and centrally-cleared derivatives contracts as reported on the Schedules of Investments. For centrally-cleared derivatives, variation margin is reported within the Funds’ Statements of Assets and Liabilities. |
The following is a summary of the location of derivative investments on the Funds’ Statements of Operations for the period ended March 31, 2024:
Derivative Investment Type | Location of Gain (Loss) on Derivatives |
Interest rate futures contracts | Net change in unrealized appreciation (depreciation) on futures contracts |
Currency forward contracts | Net realized gain (loss) on forward foreign currency exchange contracts |
| | Net change in unrealized appreciation (depreciation) on forward foreign currency exchange contracts |
Interest rate option contracts | Net realized gain (loss) on options purchased |
| | Net change in unrealized appreciation (depreciation) on options purchased |
| | Net realized gain (loss) on options written |
| | Net change in unrealized appreciation (depreciation) on options written |
Credit/Interest rate swap agreements | Net realized gain (loss) on swap agreements |
| | Net change in unrealized appreciation (depreciation) on swap agreements |
The following is a summary of the Funds’ realized gain (loss) and change in unrealized appreciation (depreciation) on derivative investments recognized on the Funds’ Statements of Operations categorized by primary risk exposure for the period ended March 31, 2024:
Realized Gain (Loss) on Derivative Investments Recognized on the Statements of Operations |
Fund | | Futures
Interest
Rate
Risk* | | | Swaps
Interest
Rate
Risk* | | | Swaps
Credit
Risk* | | | Forward
Foreign
Currency
Exchange
Risk | | | Options
Purchased
Interest
Rate Risk | | | Options
Written
Interest
Rate Risk | | | Total
Value at
March 31,
2024 | |
High Yield Fund | | $ | — | | | $ | — | | | $ | — | | | $ | (60,468 | ) | | $ | — | | | $ | — | | | $ | (60,468 | ) |
Core Bond Fund | | | — | | | | (3,871,258 | ) | | | (753,912 | ) | | | (165,383 | ) | | | (398,717 | ) | | | (398,842 | ) | | | (5,588,112 | ) |
Municipal Income Fund | | | — | | | | (232,639 | ) | | | — | | | | — | | | | — | | | | — | | | | (232,639 | ) |
| | | | | | | | | | | | | | | | | | | | | | | | | | | | | |
Change in Unrealized Appreciation (Depreciation) on Derivative Investments Recognized on the Statements of Operations |
Fund | | Futures
Interest
Rate
Risk* | | | Swaps
Interest
Rate
Risk* | | | Swaps
Credit
Risk* | | | Forward
Foreign
Currency
Exchange
Risk | | | Options
Purchased
Interest
Rate Risk | | | Options
Written
Interest
Rate Risk | | | Total
Value at
March 31,
2024 | |
High Yield Fund | | $ | — | | | $ | — | | | $ | — | | | $ | (23,611 | ) | | $ | — | | | $ | — | | | $ | (23,611 | ) |
Core Bond Fund | | | (279,768 | ) | | | 13,988,097 | | | | (359,057 | ) | | | (75,484 | ) | | | 143,869 | | | | 318,806 | | | | 13,736,463 | |
Municipal Income Fund | | | — | | | | (343,625 | ) | | | — | | | | — | | | | — | | | | — | | | | (343,625 | ) |
In conjunction with short sales and the use of derivative instruments, the Funds are required to maintain collateral in various forms. Depending on the financial instrument utilized and the broker involved, the Funds use margin deposits at the broker, cash and/or securities segregated at the custodian bank, discount notes or repurchase agreements allocated to the Funds as collateral.
Foreign Investments
There are several risks associated with exposure to foreign currencies, foreign issuers and emerging markets. A fund’s indirect and direct exposure to foreign currencies subjects the Fund to the risk that those currencies will decline in value relative to the U.S. dollar, or in the case of short positions, that the U.S. dollar will decline in value relative to the currency being hedged. Currency rates in foreign countries may fluctuate significantly over short periods of time for a number of reasons, including changes in interest rates and the imposition of currency controls or other political developments in the U.S. or abroad. In addition, the Fund may incur transaction costs in connection with conversions between various currencies. The Fund may, but is not obligated to, engage in currency hedging transactions, which generally involve buying currency
| | THE GUGGENHEIM FUNDS SEMI-ANNUAL REPORT | 77 |
NOTES TO FINANCIAL STATEMENTS (Unaudited)(continued) |
forward, options or futures contracts. However, not all currency risks may be effectively hedged, and in some cases the costs of hedging techniques may outweigh expected benefits. In such instances, the value of securities denominated in foreign currencies can change significantly when foreign currencies strengthen or weaken relative to the U.S. dollar.
The Fund may invest in securities of foreign companies directly, or in financial instruments, such as ADRs and exchange-traded funds, which are indirectly linked to the performance of foreign issuers. Foreign markets can be more volatile than the U.S. market due to increased risks of adverse issuer, political, regulatory, market, or economic developments and can perform differently from the U.S. market. Investing in securities of foreign companies directly, or in financial instruments that are indirectly linked to the performance of foreign issuers, may involve risks not typically associated with investing in U.S. issuers. The value of securities denominated in foreign currencies, and of dividends from such securities, can change significantly when foreign currencies strengthen or weaken relative to the U.S. dollar. Foreign securities markets generally have less trading volume and less liquidity than U.S. markets, and prices in some foreign markets may fluctuate more than those of securities traded on U.S. markets. Many foreign countries lack accounting and disclosure standards comparable to those that apply to U.S. companies, and it may be more difficult to obtain reliable information regarding a foreign issuer’s financial condition and operations. Transaction costs and costs associated with custody services are generally higher for foreign securities than they are for U.S. securities. Some foreign governments levy withholding taxes against dividend and interest income. Although in some countries portions of these taxes are recoverable, the non-recovered portion will reduce the income received by the Funds.
The Trust has established counterparty credit guidelines and enters into transactions only with financial institutions rated/identified as investment grade or better. The Trust monitors the counterparty credit risk associated with each such financial institution.
Note 3 – Offsetting
In the normal course of business, the Funds enter into transactions subject to enforceable master netting arrangements or other similar arrangements. Generally, the right to offset in those agreements allows the Funds to counteract the exposure to a specific counterparty with collateral received from or delivered to that counterparty based on the terms of the arrangements. These arrangements provide for the right to liquidate upon the occurrence of an event of default, credit event upon merger or additional termination event.
In order to better define their contractual rights and to secure rights that will help the Funds mitigate their counterparty risk, the Funds may enter into an International Swaps and Derivatives Association, Inc. Master Agreement (“ISDA Master Agreement”) or similar agreement with their derivative contract counterparties. An ISDA Master Agreement is a bilateral agreement between a fund and a counterparty that governs OTC derivatives, including foreign exchange contracts, and typically contains, among other things, collateral posting terms and netting provisions in the event of a default and/or termination event. The provisions of the ISDA Master Agreement typically permit a single net payment in the event of a default (close-out netting) or similar event, including the bankruptcy or insolvency of the counterparty.
For derivatives traded under an ISDA Master Agreement, the collateral requirements are typically calculated by netting the mark-to-market amount for each transaction under such agreement and comparing that amount to the value of any collateral currently pledged by the Funds and the counterparty. For financial reporting purposes, cash collateral that has been pledged to cover obligations of the Funds and cash collateral received from the counterparty, if any, are reported separately on the Funds’ Statements of Assets and Liabilities as segregated cash with broker/receivable for variation margin, or payable for swap settlement/variation margin. Cash and/or securities pledged or received as collateral by the Funds in connection with an OTC derivative subject to an ISDA Master Agreement generally may not be invested, sold or rehypothecated by the counterparty or the Funds, as applicable, absent an event of default under such agreement, in which case such collateral generally may be applied towards obligations due to and payable by such counterparty or the Funds, as applicable. Generally, the amount of collateral due from or to a counterparty must exceed a minimum transfer amount threshold (e.g., $300,000) before a transfer is required to be made. To the extent amounts due to the Funds from their counterparties are not fully collateralized, contractually or otherwise, the Funds bear the risk of loss from counterparty nonperformance. The Funds attempt to mitigate counterparty risk by only entering into agreements with counterparties that they believe to be of good standing and by monitoring the financial stability of those counterparties.
For financial reporting purposes, the Funds do not offset derivative assets and derivative liabilities that are subject to netting arrangements in the Funds’ Statements of Assets and Liabilities.
78 | THE GUGGENHEIM FUNDS SEMI-ANNUAL REPORT | |
NOTES TO FINANCIAL STATEMENTS (Unaudited)(continued) |
The following tables present derivative financial instruments and secured financing transactions that are subject to enforceable netting arrangements:
| | | | | | | | | | | | | | | | Gross Amounts Not Offset
in the Statements of
Assets and Liabilities | | | | | |
Fund | Instrument | | Gross
Amounts of
Recognized
Assets1 | | | Gross
Amounts
Offset in the
Statements
of Assets and
Liabilities | | | Net Amount
of Assets
Presented on
the Statements
of Assets and
Liabilities | | | Financial
Instruments | | | Cash
Collateral
Received | | | Net
Amount | |
High Yield Fund | Forward foreign currency exchange contracts | | $ | 45,928 | | | $ | — | | | $ | 45,928 | | | $ | — | | | $ | — | | | $ | — | |
Core Bond Fund | Forward foreign currency exchange contracts | | | 176,596 | | | | — | | | | 176,596 | | | | — | | | | — | | | | — | |
Core Bond Fund | Options purchased | | | 5,936 | | | | — | | | | 5,936 | | | | (1,336 | ) | | | (710 | ) | | | 3,890 | |
| | | | | | | | | | | | | | | | | | | Gross Amounts Not Offset
in the Statements of
Assets and Liabilities | | | | | |
Fund | | Instrument | | | Gross
Amounts of
Recognized
Liabilities1 | | | Gross
Amounts
Offset in the
Statements
of Assets and
Liabilities | | | Net Amount
of Liabilities
Presented on
the Statements
of Assets and
Liabilities | | | Financial
Instruments | | | Cash
Collateral
Pledged | | | Net
Amount | |
Core Bond Fund | Forward foreign currency exchange contracts | | $ | 1,336 | | | $ | — | | | $ | 1,336 | | | $ | (1,336 | ) | | $ | — | | | $ | — | |
1 | Exchange traded or centrally-cleared derivatives are excluded from these reported amounts. |
The Funds have the right to offset deposits against any related derivative liabilities outstanding with each counterparty with the exception of exchange-traded or centrally-cleared derivatives. The following table presents deposits held by others in connection with derivative investments as of March 31, 2024.
Fund | Counterparty | Asset Type | | Cash Pledged | | | Cash Received | |
Core Bond Fund | BofA Securities, Inc. | Credit default swap agreements | | $ | 141,880 | | | $ | — | |
| | BofA Securities, Inc. | Futures contracts | | | 680,000 | | | | — | |
| | BofA Securities, Inc. | Interest rate swap agreements | | | 1,607,627 | | | | — | |
| Morgan Stanley Capital Services LLC | Forward foreign currency exchange contracts, Options | | | — | | | | 94,581 | |
| | | | | 2,429,507 | | | | 94,581 | |
Municipal Income Fund | BofA Securities, Inc. | Interest rate swap agreements | | | 391,630 | | | | — | |
| | THE GUGGENHEIM FUNDS SEMI-ANNUAL REPORT | 79 |
NOTES TO FINANCIAL STATEMENTS (Unaudited)(continued) |
Note 4 – Fair Value Measurement
In accordance with U.S. GAAP, fair value is defined as the price that the Funds would receive to sell an investment or pay to transfer a liability in an orderly transaction between market participants at the measurement date. U.S. GAAP establishes a three-tier fair value hierarchy based on the types of inputs used to value assets and liabilities and requires corresponding disclosure. The hierarchy and the corresponding inputs are summarized below:
Level 1 — | unadjusted quoted prices in active markets for identical assets or liabilities. |
Level 2 — | significant other observable inputs (for example quoted prices for securities that are similar based on characteristics such as interest rates, prepayment speeds, credit risk, etc.). |
Level 3 — | significant unobservable inputs based on the best information available under the circumstances, to the extent observable inputs are not available, which may include assumptions. |
Rule 2a-5 sets forth a definition of “readily available market quotations,” which is consistent with the definition of a Level 1 input under U.S. GAAP. Rule 2a-5 provides that “a market quotation is readily available only when that quotation is a quoted price (unadjusted) in active markets for identical investments that the fund can access at the measurement date, provided that a quotation will not be readily available if it is not reliable.”
Securities for which market quotations are not readily available must be valued at fair value as determined in good faith. Accordingly, any security priced using inputs other than Level 1 inputs will be subject to fair value requirements. The types of inputs available depend on a variety of factors, such as the type of security and the characteristics of the markets in which it trades, if any. Fair valuation determinations that rely on fewer or no observable inputs require greater judgment. Accordingly, fair value determinations for Level 3 securities require the greatest amount of judgment.
Pricing service providers are used to value a majority of the Funds’ investments. When values are not available from a pricing service provider, they will be determined using a variety of sources and techniques, including: market prices; broker quotes; and models which derive prices based on inputs such as prices of securities with comparable maturities and characteristics or based on inputs such as anticipated cash flows or collateral, spread over U.S. Treasury securities, and other information and analysis. A significant portion of the Funds’ assets and liabilities are categorized as Level 2, as indicated in this report.
Quotes from broker-dealers, adjusted for fluctuations in criteria such as credit spreads and interest rates, may also be used to value the Funds’ assets and liabilities, i.e. prices provided by a broker-dealer or other market participant who has not committed to trade at that price. Although quotes are typically received from established market participants, the Funds may not have the transparency to view the underlying inputs which support the market quotations. Significant changes in a quote would generally result in significant changes in the fair value of the security.
Certain fixed income securities are valued by obtaining a monthly quote from a broker-dealer, adjusted for fluctuations in criteria such as credit spreads and interest rates. Certain loans and other securities are valued using a single daily broker quote or a price from a pricing service provider based on a single daily or monthly broker quote.
The inputs or methodologies selected and applied for valuing securities or other assets are not necessarily an indication of the risk associated with investing in those securities. The suitability, appropriateness and accuracy of the techniques, methodologies and sources employed to determine fair valuation are periodically reviewed and subject to change.
Note 5 – Investment Advisory Agreement and Other Agreements
Under the terms of an investment advisory contract, the Funds pay GI investment advisory fees on a monthly basis calculated daily at the annualized rates below, based on the average daily net assets of the Funds:
Fund | | Management Fees
(as a % of Net Assets) | |
High Yield Fund | | | 0.60 | % |
Core Bond Fund | | | 0.39 | % |
Municipal Income Fund | | | 0.50 | % |
80 | THE GUGGENHEIM FUNDS SEMI-ANNUAL REPORT | |
NOTES TO FINANCIAL STATEMENTS (Unaudited)(continued) |
GI pays operating expenses on behalf of the Trust, such as audit and accounting related services, legal services, custody, printing and mailing, among others, on a pass-through basis. Such expenses are allocated to various Funds within the complex based on relative net assets.
The Board has adopted Distribution Plans related to the offering of Class A, Class C and Class P shares pursuant to Rule 12b-1 under the 1940 Act. The plans provide for payments at an annual rate of 0.25% of the average daily net assets of the Fund’s Class A and Class P shares, and 1.00% of the average daily net assets of the Fund’s Class C shares.
The investment advisory contract for the Funds provide that the total expenses be limited to a percentage of average net assets for each class of shares, exclusive of brokerage costs, dividends or interest on securities sold short, expenses of other investment companies in which a Fund invests, interest, taxes, litigation, indemnification and extraordinary expenses. The limits are listed below:
| | Limit | | | Effective
Date | | | Contract
End Date | |
High Yield Fund - Class A | | | 0.94 | %* | | | 02/21/24 | | | | 02/01/25 | |
High Yield Fund - Class C | | | 1.69 | %* | | | 02/21/24 | | | | 02/01/25 | |
High Yield Fund - Class P | | | 0.94 | %* | | | 02/21/24 | | | | 02/01/25 | |
High Yield Fund - Class R6 | | | 0.69 | %* | | | 02/21/24 | | | | 02/01/25 | |
High Yield Fund - Institutional Class | | | 0.69 | %* | | | 02/21/24 | | | | 02/01/25 | |
Core Bond Fund - Class A | | | 0.79 | % | | | 11/30/12 | | | | 02/01/25 | |
Core Bond Fund - Class C | | | 1.54 | % | | | 11/30/12 | | | | 02/01/25 | |
Core Bond Fund - Class P | | | 0.79 | % | | | 05/01/15 | | | | 02/01/25 | |
Core Bond Fund - Institutional Class | | | 0.50 | % | | | 11/30/12 | | | | 02/01/25 | |
Municipal Income Fund - Class A | | | 0.80 | % | | | 11/30/12 | | | | 02/01/25 | |
Municipal Income Fund - Class C | | | 1.55 | % | | | 11/30/12 | | | | 02/01/25 | |
Municipal Income Fund - Class P | | | 0.80 | % | | | 05/01/15 | | | | 02/01/25 | |
Municipal Income Fund - Institutional Class | | | 0.55 | % | | | 11/30/12 | | | | 02/01/25 | |
* | Prior to February 21, 2024, the limits for High Yield Fund were 1.16%, 1.91%, 1.16%, 0.91% and 0.91% for Class A, Class C, Class P, Institutional Class, and Class R6, respectively. |
GI is entitled to reimbursement by the Funds for fees waived or expenses reimbursed during any of the previous 36 months, beginning on the date of the expense limitation agreement, if on any day the estimated operating expenses are less than the indicated percentages. For purposes of this arrangement, GI is entitled to recoupment of previously waived fees or reimbursed expenses for 36 months from the date of the waiver or reimbursement by GI. At March 31, 2024, the amount of fees waived or expenses reimbursed that are subject to recoupment and will expire during the years ended September 30, are presented in the following table:
Fund | | 2024 | | | 2025 | | | 2026 | | | 2027 | | | Fund
Total | |
High Yield Fund | | | | | | | | | | | | | | | | | | | | |
Class A | | $ | — | | | $ | — | | | $ | — | | | $ | 8,407 | | | $ | 8,407 | |
Class C | | | — | | | | — | | | | 2,408 | | | | 2,760 | | | | 5,168 | |
Class P | | | 581 | | | | 5,764 | | | | 1,432 | | | | 1,200 | | | | 8,977 | |
Institutional Class | | | — | | | | 15,381 | | | | 11,083 | | | | 14,020 | | | | 40,484 | |
Class R6 | | | — | | | | 150 | | | | 143 | | | | 327 | | | | 620 | |
Core Bond Fund | | | | | | | | | | | | | | | | | | | | |
Class A | | | 90,393 | | | | 35,811 | | | | 66,528 | | | | 41,148 | | | | 233,880 | |
Class C | | | 18,667 | | | | 19,268 | | | | 7,997 | | | | 972 | | | | 46,904 | |
Class P | | | 75,146 | | | | 114,700 | | | | 56,610 | | | | 281 | | | | 246,737 | |
Institutional Class | | | 1,251,112 | | | | 1,278,995 | | | | 773,981 | | | | 74,911 | | | | 3,378,999 | |
Municipal Income Fund | | | | | | | | | | | | | | | | | | | | |
Class A | | | — | | | | 204,037 | | | | 158,775 | | | | 79,323 | | | | 442,135 | |
Class C | | | — | | | | 6,809 | | | | 4,657 | | | | 3,521 | | | | 14,987 | |
Class P | | | 917 | | | | 1,160 | | | | 1,024 | | | | 529 | | | | 3,630 | |
Institutional Class | | | — | | | | 39,988 | | | | 37,249 | | | | 27,425 | | | | 104,662 | |
| | THE GUGGENHEIM FUNDS SEMI-ANNUAL REPORT | 81 |
NOTES TO FINANCIAL STATEMENTS (Unaudited)(continued) |
For the period ended March 31, 2024, GI recouped amounts from the Funds as follows:
High Yield Fund | | $ | 54,288 | |
Core Bond Fund | | | 95,680 | |
Municipal Income Fund | | | — | |
If a Fund invests in a fund that is advised by the same adviser or an affiliated adviser, the investing Fund’s adviser has agreed to waive fees at the investing fund level to the extent necessary to offset the proportionate share of any management fee paid by each Fund with respect to its investment in such affiliated fund. Fee waivers will be calculated at the investing fund level without regard to any expense cap in effect for the investing fund. Fees waived under this arrangement are not subject to reimbursement to GI. For the period ended March 31, 2024, none of the Funds waived fees related to investments in affiliated funds.
For the period ended March 31, 2024, GFD retained sales charges of $77,213 relating to sales of Class A shares of the Trust.
Certain trustees and officers of the Trust are also officers of GI and/or GFD. The Trust does not compensate its officers or trustees who are officers, directors and/or employees of GI or GFD.
MUFG Investor Services (US), LLC (“MUIS”) acts as the Funds’ administrator, transfer agent and accounting agent. As administrator, transfer agent and accounting agent, MUIS maintains the books and records of the Funds’ securities and cash. The Bank of New York Mellon Corp. (“BNY”) acts as the Funds’ custodian. As custodian, BNY is responsible for the custody of the Funds’ assets. For providing the aforementioned administrative and accounting services, MUIS is entitled to receive a monthly fee equal to a percentage of the Funds’ average daily net assets and out of pocket expenses. For providing the aforementioned transfer agent and custodian services, MUIS and BNY are entitled to receive a monthly fee based on the number of transactions during the month and the number of accounts under management, subject to certain minimum monthly fees, and out of pocket expenses.
Note 6 – Reverse Repurchase Agreements
Each of the Funds may enter into reverse repurchase agreements. Under a reverse repurchase agreement, a Fund sells securities and agrees to repurchase them at a particular price at a future date. In the event the buyer of securities under a reverse repurchase agreement files for bankruptcy or becomes insolvent, such buyer or its trustee or receiver may receive an extension of time to determine whether to enforce the Fund’s obligation to repurchase the securities, and the Fund’s use of the proceeds of the reverse repurchase agreement may effectively be restricted pending such decision.
For the period ended March 31, 2024, the Funds entered into reverse repurchase agreements:
Fund | | Number of Days
Outstanding | | | Balance at
March 31, 2024 | | | Average Balance
Outstanding | | | Average Interest Rate | |
High Yield Fund | | | 183 | | | $ | 1,460,329 | | | $ | 1,443,782 | | | | 3.38 | % |
Core Bond Fund | | | 54 | | | | — | * | | | 47,401,102 | | | | 5.36 | % |
Municipal Income Fund | | | 1 | | | | — | * | | | 3,600,000 | | | | 5.85 | % |
* | As of March 31, 2024, the Core Bond Fund and Municipal Income Fund had no open reverse repurchase agreements. |
82 | THE GUGGENHEIM FUNDS SEMI-ANNUAL REPORT | |
NOTES TO FINANCIAL STATEMENTS (Unaudited)(continued) |
The following table presents reverse repurchase agreements that are subject to netting arrangements and offset in the Funds’ Statements of Assets and Liabilities in conformity with U.S. GAAP:
| | | | | | | | | | | | | | | | Gross Amounts Not Offset
in the Statements of
Assets and Liabilities | | | | | |
Fund | Instrument | | Gross
Amounts of
Recognized
Liabilities | | | Gross
Amounts
Offset in the
Statements of
Assets and
Liabilities | | | Net Amounts
of Liabilities
Presented on
the Statements
of Assets and
Liabilities | | | Financial
Instruments | | | Cash
Collateral
Pledged | | | Net Amount | |
High Yield Fund | Reverse Repurchase Agreements | | $ | 1,460,329 | | | $ | — | | | $ | 1,460,329 | | | $ | (1,460,329 | ) | | $ | — | | | $ | — | |
As of March 31, 2024, the High Yield Fund had $1,460,329 in reverse repurchase agreements outstanding with one counterparty. Details of the reverse repurchase agreement by counterparty is as follows:
Fund | Counterparty | Interest Rate | | Maturity Date | | | Face Value | |
High Yield Fund | Goldman Sachs & Co. LLC | 3.25%* | Open Maturity | | $ | 1,460,329 | |
* | The rate is adjusted periodically by the counterparty, subject to approval by the Adviser, and is not based upon a set reference rate and spread. Rate indicated is the rate effective as of March 31, 2024. |
The following is a summary of the remaining contractual maturities of the reverse repurchase agreement outstanding as of period-end, as aggregated by asset class of the related collateral pledged by the Funds:
Fund | Asset Type | | Overnight and
continuous | | | Total | |
High Yield Fund | Corporate Bonds | | $ | 1,460,329 | | | $ | 1,460,329 | |
Gross amount of recognized liabilities for reverse repurchase agreements | | | $ | 1,460,329 | | | $ | 1,460,329 | |
Note 7 – Federal Income Tax Information
The Funds intend to comply with the provisions of Subchapter M of the Internal Revenue Code of 1986, as amended (the “Internal Revenue Code”), applicable to regulated investment companies and will distribute substantially all taxable net investment income and capital gains sufficient to relieve the Funds from all, or substantially all, federal income, excise and state income taxes. Therefore, no provision for federal or state income tax or federal excise tax is required.
Tax positions taken or expected to be taken in the course of preparing the Funds’ tax returns are evaluated to determine whether the tax positions are “more-likely-than-not” of being sustained by the applicable tax authority. Tax positions not deemed to meet the “more-likely-than-not” threshold would be recorded as a tax benefit or expense in the current year. Management has analyzed the Funds’ tax positions taken, or to be taken, on U.S. federal income tax returns for all open tax years, and has concluded that no provision for income tax is required in the Funds’ financial statements. The Funds’ U.S. federal income tax returns are subject to examination by the Internal Revenue Service (“IRS”) for a period of three years after they are filed.
| | THE GUGGENHEIM FUNDS SEMI-ANNUAL REPORT | 83 |
NOTES TO FINANCIAL STATEMENTS (Unaudited)(continued) |
At March 31, 2024, the cost of investments for U.S. federal income tax purposes, the aggregate gross unrealized appreciation for all investments for which there was an excess of value over tax cost, and the aggregate gross unrealized depreciation for all investments for which there was an excess of tax cost over value, were as follows:
Fund | | Tax Cost | | | Tax Unrealized
Appreciation | | | Tax Unrealized
Depreciation | | | Net Tax
Unrealized
Appreciation
(Depreciation) | |
High Yield Fund | | $ | 207,943,441 | | | $ | 2,350,497 | | | $ | (16,909,058 | ) | | $ | (14,558,561 | ) |
Core Bond Fund | | | 1,975,288,920 | | | | 15,756,890 | | | | (118,025,511 | ) | | | (102,268,621 | ) |
Municipal Income Fund | | | 26,254,055 | | | | 1,917,983 | | | | (2,959,114 | ) | | | (1,041,131 | ) |
Note 8 – Securities Transactions
For the period ended March 31, 2024, the cost of purchases and proceeds from sales of investment securities, excluding government securities, short-term investments and derivatives, were as follows:
Fund | | Purchases | | | Sales | |
High Yield Fund | | $ | 31,181,737 | | | $ | 39,086,631 | |
Core Bond Fund | | | 382,172,969 | | | | 245,935,232 | |
Municipal Income Fund | | | 13,167,811 | | | | 32,009,084 | |
For the period ended March 31, 2024, the cost of purchases and proceeds from sales of government securities were as follows:
Fund | | Purchases | | | Sales | |
Core Bond Fund | | $ | 755,092,566 | | | $ | 607,270,841 | |
The Funds are permitted to purchase or sell securities from or to certain affiliated funds under specified conditions outlined in procedures adopted by the Board. The procedures have been designed to ensure that any purchase or sale of securities by a Fund from or to another fund or portfolio that is or could be considered an affiliate by virtue of having a common investment adviser (or affiliated investment advisers), common trustees and/or common officers complies with Rule 17a-7 of the 1940 Act. Further, as defined under these procedures, each transaction is effected at the current market price to save costs, where permissible. For the period ended March 31, 2024, the Funds did not engage in purchases and sales of securities, pursuant to Rule 17a-7 of the 1940 Act.
Note 9 – Unfunded Loan Commitments
Pursuant to the terms of certain loan agreements, certain Funds held unfunded loan commitments as of March 31, 2024. The Funds are obligated to fund these loan commitments at the borrower’s discretion.
Fund | | Borrower | | | Maturity Date | | | Face Amount | | | Value | |
Core Bond Fund | | | Lightning A | | | | 03/01/37 | | | $ | 1,663,778 | | | $ | — | |
| | | | Thunderbird A | | | | 03/01/37 | | | | 1,688,667 | | | | — | |
| | | | | | | | | | | | | | | $ | — | |
84 | THE GUGGENHEIM FUNDS SEMI-ANNUAL REPORT | |
NOTES TO FINANCIAL STATEMENTS (Unaudited)(continued) |
Note 10– Restricted Securities
The securities below are considered illiquid and restricted under guidelines established by the Board:
Fund | Restricted Securities | | Acquisition Date | | | Cost | | | Value | |
High Yield Fund | | | | | | | | | | | | | |
| | Mirabela Nickel Ltd. | | | | | | | | | | | | |
| | due 06/24/192 | | | 12/31/13 | | | $ | 252,369 | | | $ | 1,391 | |
| | Sabre GLBL, Inc. | | | | | | | | | | | | |
| | 7.38% due 09/01/25 | | | 08/20/20 | | | | 320,846 | | | | 310,179 | |
| | Sabre GLBL, Inc. | | | | | | | | | | | | |
| | 9.25% due 04/15/25 | | | 01/05/22 | | | | 32,312 | | | | 30,528 | |
| | | | | | | | $ | 605,527 | | | $ | 342,098 | |
| | | | | | | | | | | | | |
Core Bond Fund | | | | | | | | | | | | |
| | Central Storage Safety Project Trust | | | | | | | | | | | | |
| | 4.82% due 02/01/38 | | | 03/20/18 | | | $ | 840,674 | | | $ | 710,834 | |
| | Copper River CLO Ltd. | | | | | | | | | | | | |
| | 2007-1A INC, due 01/20/211 | | | 05/09/14 | | | | — | | | | 70 | |
| | | | | | | | $ | 840,674 | | | $ | 710,904 | |
1 | Security has no stated coupon. However, it is expected to receive residual cash flow payments on defined deal dates. |
2 | Security is in default of interest and/or principal obligations. |
Note 11 – Line of Credit
The Trust, along with other affiliated trusts, secured a 364-day committed, $1,150,000,000 line of credit from Citibank, N.A., which was in place through September 29, 2023, at which time a new line of credit was entered into in the amount of $1,165,000,000. A Fund may draw (borrow) from the line of credit as a temporary measure for emergency purposes, to facilitate redemption requests, or for other short-term liquidity purposes consistent with the Fund’s investment objective and program. For example, it may be advantageous for the Fund to borrow money rather than sell existing portfolio positions to meet redemption requests. Fees related to borrowings, if any, vary under this arrangement between the greater of Citibank’s “base rate”, SOFR plus 1%, or the federal funds rate plus 1/2 of 1%.
The commitment fee that may be paid by the Funds is at an annualized rate of 0.15% of the average daily amount of their allocated unused commitment amount. The commitment fee amount is allocated to the individual Funds based on the respective net assets of each participating Fund and is referenced in the Funds’ Statements of Operations under “Line of credit fees”. The Funds did not have any borrowings under this agreement as of and for the period ended March 31, 2024.
Note 12 – Market Risks
The value of, or income generated by, the investments held by the Funds are subject to the possibility of rapid and unpredictable fluctuation, and loss that may result from various factors. These factors include, among others, developments affecting individual companies, or from broader influences, including real or perceived changes in prevailing interest rates (which may change at any time based on changes in monetary policies and various market and other economic conditions), changes in inflation rates or expectations about inflation rates, adverse investor confidence or sentiment, changing economic, political (including geopolitical), social or financial market conditions, increased instability or general uncertainty, environmental disasters, governmental actions, public health emergencies (such as the spread of infectious diseases, pandemics and epidemics), debt crises, actual or threatened wars or other armed conflicts (such as the ongoing Russia-Ukraine conflict and its collateral economic and other effects, including, but not limited to, sanctions and other international trade barriers) or ratings downgrades, and other similar events, each of which may be temporary or last for extended periods. Moreover, changing economic, political, geopolitical, social, financial market or other conditions in one country, geographic region or industry could adversely affect the value, yield and return of the investments held by the Funds in a different country, geographic region, economy, industry or market because of the increasingly interconnected global economies and financial markets. The duration and extent of the foregoing types of factors or conditions are highly uncertain and difficult to predict and have in the past, and may in the future, cause volatility and distress in economies and financial markets or other adverse circumstances, which may negatively affect the value of the Funds’ investments and performance of the Funds.
| | THE GUGGENHEIM FUNDS SEMI-ANNUAL REPORT | 85 |
NOTES TO FINANCIAL STATEMENTS (Unaudited)(concluded) |
Note 13 – Subsequent Events
The Funds evaluated subsequent events through the date the financial statements are issued and determined there were no material events that would require adjustment to or disclosure in the Funds’ financial statements.
86 | THE GUGGENHEIM FUNDS SEMI-ANNUAL REPORT | |
OTHER INFORMATION (Unaudited) |
Delivery of Shareholder Reports
Paper copies of the Funds’ annual and semi-annual shareholder reports are not sent by mail, unless you specifically request paper copies of the reports from a fund or from your financial intermediary. Instead, the reports are made available on a website, and you are notified by mail each time a report is posted and provided with a website link to access the report.
You may elect to receive all future shareholder reports in paper free of charge. If you hold shares of a fund directly, you can inform the Fund that you wish to receive paper copies of reports by calling 800.820.0888. If you hold shares of a fund through a financial intermediary, please contact the financial intermediary to make this election. Your election to receive reports in paper may apply to all Guggenheim Funds in which you are invested and may apply to all Guggenheim funds held with your financial intermediary.
Tailored Shareholder Reports for Open-End Mutual Funds and Exchange-Traded Funds
Effective January 24, 2023, the SEC adopted rule and form amendments to require open-end mutual funds and exchange-traded funds registered on Form N-1A to transmit concise and visually engaging streamlined annual and semi-annual reports to shareholders that highlight key information. Other information, including financial statements, will no longer appear in a streamlined shareholder report but must be available online, delivered free of charge upon request, and filed on a semi-annual basis on Form N-CSR. The rule and form amendments have a compliance date of July 24, 2024. At this time, management is evaluating the impact of these amendments on the shareholder reports for the Funds.
Proxy Voting Information
A description of the policies and procedures that the Trust uses to determine how to vote proxies relating to securities held in the Funds’ portfolios is available, without charge and upon request, by calling 800.820.0888. This information is also available from the EDGAR database on the SEC’s website at https://www.sec.gov.
Information regarding how the Funds’ voted proxies relating to portfolio securities during the most recent 12-month period ended June 30 is available without charge, upon request, by calling 800.820.0888. This information is also available from the EDGAR database on the SEC’s website at https://www.sec.gov.
Sector Classification
Information in the “Schedule of Investments” is categorized by sectors using sector-level Classifications defined by the Bloomberg Industry Classification System, a widely recognized industry classification system provider. Each Fund’s registration statement has investment policies relating to concentration in specific sectors/industries. For purposes of these investment policies, the Funds usually classify sectors/industries based on industry-level Classifications used by widely recognized industry classification system providers such as Bloomberg Industry Classification System, Global Industry Classification Standards and Barclays Global Classification Scheme.
Quarterly Portfolio Schedules Information
The Trust files its complete schedule of portfolio holdings with the SEC for the first and third quarters of each fiscal year as an exhibit to its reports on Form N-PORT. The Funds’ Form N-PORT is available on the SEC’s website at https://www.sec.gov. The Funds’ complete schedules of securities holdings as of the end of each fiscal quarter will be made available to the public on the SEC’s website at www.sec.gov and on our website at www.guggenheiminvestments.com, and will be made available, upon request and without charge, by calling 800.820.0888.
| | THE GUGGENHEIM FUNDS SEMI-ANNUAL REPORT | 87 |
INFORMATION ON BOARD OF TRUSTEES AND OFFICERS (Unaudited) |
A Board of Trustees oversees the Trust, as well as other trusts of GI, in which its members have no stated term of service, and continue to serve after election until resignation. The Funds’ Statement of Additional Information includes further information about Fund Trustees and Officers, and can be obtained without charge by visiting guggenheiminvestments.com or by calling 800.820.0888.
Name, Address*
and Year of Birth | Position(s)
Held with
Trust | Term of Office
and Length of
Time Served** | Principal Occupation(s)
During Past Five Years | Number of
Portfolios
in Fund
Complex
Overseen | Other
Directorships Held
by Trustees*** |
INDEPENDENT TRUSTEES | | | |
Randall C. Barnes (1951) | Trustee and Chair of the Valuation Oversight Committee | Since 2014 (Trustee) Since 2020 (Chair of the Valuation Oversight Committee) | Current: Private Investor (2001-present). Former: Senior Vice President and Treasurer, PepsiCo, Inc. (1993-1997); President, Pizza Hut International (1991-1993); Senior Vice President, Strategic Planning and New Business Development, PepsiCo, Inc. (1987-1990). | 153 | Current: Advent Convertible and Income Fund (2005-present); Purpose Investments Funds (2013-present). Former: Guggenheim Energy & Income Fund (2015-2023); Fiduciary/Claymore Energy Infrastructure Fund (2004-2022); Guggenheim Enhanced Equity Income Fund (2005-2021); Guggenheim Credit Allocation Fund (2013-2021). |
Angela Brock-Kyle (1959) | Trustee | Since 2019 | Current: Founder and Chief Executive Officer, B.O.A.R.D.S. (consulting firm) (2013-present); Director, Mutual Fund Directors Forum (2022-present). Former: Senior Leader, TIAA (financial services firm) (1987-2012). | 152 | Current: Bowhead Insurance GP, LLC (2020-present); Hunt Companies, Inc. (2019-present). Former: Guggenheim Energy & Income Fund (2019-2023); Fiduciary/Claymore Energy Infrastructure Fund (2019-2022); Guggenheim Enhanced Equity Income Fund (2019-2021); Guggenheim Credit Allocation Fund (2019-2021); Infinity Property & Casualty Corp. (2014-2018). |
88 | THE GUGGENHEIM FUNDS SEMI-ANNUAL REPORT | |
INFORMATION ON BOARD OF TRUSTEES AND OFFICERS (Unaudited)(continued) |
Name, Address*
and Year of Birth | Position(s)
Held with
Trust | Term of Office
and Length of
Time Served** | Principal Occupation(s)
During Past Five Years | Number of
Portfolios
in Fund
Complex
Overseen | Other
Directorships Held
by Trustees*** |
INDEPENDENT TRUSTEES - continued | | |
Thomas F. Lydon, Jr. (1960) | Trustee and Chair of the Contracts Review Committee | Since 2019 (Trustee) Since 2020 (Chair of the Contracts Review Committee) | Current: President, Global Trends Investments (registered investment adviser) (1996-present); Chief Executive Officer, Lydon Media (2016-present); Vice Chairman, VettaFi, a wholly owned subsidiary of The TMX Group (financial advisor content, research and digital distribution provider) (2022-present). Former: Chief Executive Officer, ETF Flows, LLC (financial advisor education and research provider) (2019-2023); Director, GDX Index Partners, LLC (index provider) (2021-2023). | 152 | Current: US Global Investors, Inc. (GROW) (1995-present); The 2023 ETF Series Trust (4) (2023-present); The 2023 ETF Series II (1) (2023-present). Former: Guggenheim Energy & Income Fund (2019-2023); Fiduciary/Claymore Energy Infrastructure Fund (2019-2022); Guggenheim Enhanced Equity Income Fund (2019-2021); Guggenheim Credit Allocation Fund (2019-2021); Harvest Volatility Edge Trust (3) (2017-2019). |
Ronald A. Nyberg (1953) | Trustee and Chair of the Nominating and Governance Committee | Since 2014 | Current: Of Counsel (formerly Partner), Momkus LLP (law firm) (2016-present). Former: Partner, Nyberg & Cassioppi, LLC (law firm) (2000-2016); Executive Vice President, General Counsel, and Corporate Secretary, Van Kampen Investments (1982-1999). | 153 | Current: Advent Convertible and Income Fund (2003-present); PPM Funds (2) (2018-present); Endeavor Health (2012-present). Former: Guggenheim Energy & Income Fund (2015-2023); Fiduciary/Claymore Energy Infrastructure Fund (2004-2022); Guggenheim Enhanced Equity Income Fund (2005-2021); Guggenheim Credit Allocation Fund (2013-2021); Western Asset Inflation-Linked Opportunities & Income Fund (2004-2020); Western Asset Inflation-Linked Income Fund (2003-2020). |
| | THE GUGGENHEIM FUNDS SEMI-ANNUAL REPORT | 89 |
INFORMATION ON BOARD OF TRUSTEES AND OFFICERS (Unaudited)(continued) |
Name, Address*
and Year of Birth | Position(s)
Held with
Trust | Term of Office
and Length of
Time Served** | Principal Occupation(s)
During Past Five Years | Number of
Portfolios
in Fund
Complex
Overseen | Other
Directorships Held
by Trustees*** |
INDEPENDENT TRUSTEES - concluded | | |
Sandra G. Sponem (1958) | Trustee and Chair of the Audit Committee | Since 2019 (Trustee) Since 2020 (Chair of the Audit Committee) | Current: Retired. Former: Senior Vice President and Chief Financial Officer, M.A. Mortenson-Companies, Inc. (construction and real estate development company) (2007-2017). | 152 | Current: SPDR Series Trust (81) (2018-present); SPDR Index Shares Funds (30) (2018-present); SSGA Active Trust (14) (2018-present). Former: Guggenheim Energy & Income Fund (2019-2023); Fiduciary/Claymore Energy Infrastructure Fund (2019-2022); Guggenheim Enhanced Equity Income Fund (2019-2021); Guggenheim Credit Allocation Fund (2019-2021); SSGA Master Trust (1) (2018-2020). |
Ronald E. Toupin, Jr. (1958) | Trustee, Chair of the Board and Chair of the Executive Committee | Since 2014 | Current: Portfolio Consultant (2010-present); Member, Governing Council, Independent Directors Council (2013-present); Governor, Board of Governors, Investment Company Institute (2018-present). Former: Member, Executive Committee, Independent Directors Council (2016-2018); Vice President, Manager and Portfolio Manager, Nuveen Asset Management (1998-1999); Vice President, Nuveen Investment Advisory Corp. (1992-1999); Vice President and Manager, Nuveen Unit Investment Trusts (1991-1999); and Assistant Vice President and Portfolio Manager, Nuveen Unit Investment Trusts (1988-1999), each of John Nuveen & Co., Inc. (registered broker dealer) (1982-1999). | 152 | Former: Guggenheim Energy & Income Fund (2015-2023); Fiduciary/Claymore Energy Infrastructure Fund (2004-2022); Guggenheim Enhanced Equity Income Fund (2005-2021); Guggenheim Credit Allocation Fund (2013-2021); Western Asset Inflation-Linked Opportunities & Income Fund (2004-2020); Western Asset Inflation-Linked Income Fund (2003-2020). |
90 | THE GUGGENHEIM FUNDS SEMI-ANNUAL REPORT | |
INFORMATION ON BOARD OF TRUSTEES AND OFFICERS (Unaudited)(continued) |
Name, Address*
and Year of Birth | Position(s)
Held with
Trust | Term of Office
and Length of
Time Served** | Principal Occupation(s)
During Past Five Years | Number of
Portfolios
in Fund
Complex
Overseen | Other
Directorships Held
by Trustees*** |
INTERESTED TRUSTEE | | | | |
Amy J. Lee**** (1961) | Trustee, Vice President and Chief Legal Officer | Since 2018 (Trustee) Since 2014 (Chief Legal Officer) Since 2007 (Vice President) | Current: Interested Trustee, certain other funds in the Fund Complex (2018-present); Chief Legal Officer, certain other funds in the Fund Complex (2014-present); Vice President, certain other funds in the Fund Complex (2007-present); Senior Managing Director, Guggenheim Investments (2012-present). Former: President and/or Chief Executive Officer, certain other funds in the Fund Complex (2017-2019); Vice President, Associate General Counsel and Assistant Secretary, Security Benefit Life Insurance Company and Security Benefit Corporation (2004-2012). | 152 | Former: Guggenheim Energy & Income Fund (2018-2023); Fiduciary/Claymore Energy Infrastructure Fund (2018-2022); Guggenheim Enhanced Equity Income Fund (2018-2021); Guggenheim Credit Allocation Fund (2018-2021). |
* | The business address of each Trustee is c/o Guggenheim Investments, 227 West Monroe Street, Chicago, Illinois 60606. |
** | Each Trustee serves an indefinite term, until his or her successor is elected and qualified. Time served includes time served in the respective position for the Predecessor Corporation. |
*** | Each Trustee also serves on the Boards of Trustees of Guggenheim Funds Trust, Guggenheim Variable Funds Trust, Guggenheim Strategy Funds Trust, Guggenheim Taxable Municipal Bond & Investment Grade Debt Trust, Guggenheim Strategic Opportunities Fund, Guggenheim Active Allocation Fund, Rydex Series Funds, Rydex Dynamic Funds, Rydex Variable Trust and Transparent Value Trust. Messrs. Barnes and Nyberg also serve on the Board of Trustees of Advent Convertible & Income Fund. |
**** | This Trustee is deemed to be an “interested person” of the Funds under the 1940 Act by reason of her position with the Funds’ Adviser and/or the parent of the Adviser. |
| | THE GUGGENHEIM FUNDS SEMI-ANNUAL REPORT | 91 |
INFORMATION ON BOARD OF TRUSTEES AND OFFICERS (Unaudited)(continued) |
Name, Address*
and Year of Birth | Position(s)
Held with
Trust | Term of Office
and Length of
Time Served** | Principal Occupation(s)
During Past Five Years |
OFFICERS | | | |
Brian E. Binder (1972) | President and Chief Executive Officer | Since 2018 | Current: President, Mutual Fund Boards, Guggenheim Investments (2022-present); President and Chief Executive Officer, certain other funds in the Fund Complex (2018-present); President, Mutual Funds Boards and Senior Managing Director, Guggenheim Funds Investment Advisors, LLC and Security Investors, LLC (2018-present); Board Member, Guggenheim Partners Investment Funds plc (2022-present); Board Member, Guggenheim Global Investments plc (2022-present); Board Member, Guggenheim Partners Fund Management (Europe) Limited (2018-present). Former: Senior Managing Director and Chief Administrative Officer, Guggenheim Investments (2018-2022); Managing Director and President, Deutsche Funds, and Head of US Product, Trading and Fund Administration, Deutsche Asset Management (2013-2018); Managing Director, Chairman of North American Executive Committee and Head of Business Management and Consulting, Invesco Ltd. (2010-2012). |
James Howley (1972) | Chief Financial Officer, Chief Accounting Officer and Treasurer | Since 2022 | Current: Managing Director, Guggenheim Investments (2004-present); Chief Financial Officer, Chief Accounting Officer, and Treasurer, certain other funds in the Fund Complex (2022-present). Former: Assistant Treasurer, certain other funds in the Fund Complex (2006-2022); Manager, Mutual Fund Administration of Van Kampen Investments, Inc. (1996-2004). |
Mark E. Mathiasen (1978) | Secretary | Since 2014 | Current: Secretary, certain other funds in the Fund Complex (2007-present); Managing Director, Guggenheim Investments (2007-present). |
Glenn McWhinnie (1969) | Assistant Treasurer | Since 2016 | Current: Vice President, Guggenheim Investments (2009-present); Assistant Treasurer, certain other funds in the Fund Complex (2016-present). |
Michael P. Megaris (1984) | Assistant Secretary | Since 2014 | Current: Assistant Secretary, certain other funds in the Fund Complex (2014-present); Managing Director, Guggenheim Investments (2012-present). |
Elisabeth Miller (1968) | Chief Compliance Officer | Since 2012 | Current: Chief Compliance Officer, certain other funds in the Fund Complex (2012-present); Senior Managing Director, Guggenheim Investments (2012-present); Senior Managing Director, Guggenheim Funds Distributors, LLC (2014-present). Former: Chief Compliance Officer, Security Investors, LLC and Guggenheim Funds Investment Advisors, LLC (2012-2018); Chief Compliance Officer, Guggenheim Distributors, LLC (2009-2014); Senior Manager, Security Investors, LLC (2004-2014); Senior Manager, Guggenheim Distributors, LLC (2004-2014). |
Margaux Misantone (1978) | AML Officer | Since 2017 | Current: Chief Compliance Officer, Security Investors, LLC and Guggenheim Funds Investment Advisors, LLC (2018-present); AML Officer, Security Investors, LLC and certain other funds in the Fund Complex (2017-present); Managing Director, Guggenheim Investments (2015-present). Former: Assistant Chief Compliance Officer, Security Investors, LLC and Guggenheim Funds Investments Advisors, LLC (2015-2018). |
92 | THE GUGGENHEIM FUNDS SEMI-ANNUAL REPORT | |
INFORMATION ON BOARD OF TRUSTEES AND OFFICERS (Unaudited)(concluded) |
Name, Address*
and Year of Birth | Position(s)
Held with
Trust | Term of Office
and Length of
Time Served** | Principal Occupation(s)
During Past Five Years |
OFFICERS - concluded | |
Kimberly J. Scott (1974) | Assistant Treasurer | Since 2014 | Current: Director, Guggenheim Investments (2012-present); Assistant Treasurer, certain other funds in the Fund Complex (2012-present). Former: Financial Reporting Manager, Invesco, Ltd. (2010-2011); Vice President/Assistant Treasurer, Mutual Fund Administration for Van Kampen Investments, Inc./Morgan Stanley Investment Management (2009-2010); Manager of Mutual Fund Administration, Van Kampen Investments, Inc./Morgan Stanley Investment Management (2005-2009). |
Jon Szafran (1989) | Assistant Treasurer | Since 2017 | Current: Director, Guggenheim Investments (2017-present); Assistant Treasurer, certain other funds in the Fund Complex (2017-present). Former: Assistant Treasurer of Henderson Global Funds and Manager of US Fund Administration, Henderson Global Investors (North America) Inc. (“HGINA”), (2017); Senior Analyst of US Fund Administration, HGINA (2014–2017); Senior Associate of Fund Administration, Cortland Capital Market Services, LLC (2013-2014); Experienced Associate, PricewaterhouseCoopers LLP (2012-2013). |
* | The business address of each officer is c/o Guggenheim Investments, 227 West Monroe Street, Chicago, Illinois 60606. |
** | Each officer serves an indefinite term, until his or her successor is duly elected and qualified. |
| | THE GUGGENHEIM FUNDS SEMI-ANNUAL REPORT | 93 |
GUGGENHEIM INVESTMENTS PRIVACY NOTICE (Unaudited) |
Who We Are
This Privacy Notice describes the data protection practices of Guggenheim Investments. Guggenheim Investments as used herein refers to the affiliated investment management businesses of Guggenheim Partners, LLC: Guggenheim Funds Investment Advisors, LLC, Guggenheim Partners Investment Management, LLC, Guggenheim Funds Distributors, LLC, Security Investors, LLC, Guggenheim Investment Advisors (Europe) Limited, Guggenheim Real Estate, LLC, GS Gamma Advisors, LLC, Guggenheim Partners India Management, LLC, Guggenheim Partners Europe Limited, as well as the funds in the Guggenheim Funds complex (the “Funds”) (“Guggenheim Investments,” “we,” “us,” or “our”).
Guggenheim Partners Investment Management Holdings, LLC, located at 330 Madison Avenue, New York, New York, 10017, is the data controller for your information. The affiliates who are also controllers of certain of your information are: Guggenheim Investment Advisors (Europe) Limited, Guggenheim Partners Europe Limited, Guggenheim Partners, LLC, Guggenheim Funds Investment Advisors, LLC, Guggenheim Partners Investment Management, LLC, Guggenheim Funds Distributors, LLC and Security Investors, LLC, as well as the Funds.
Our Commitment to You
Guggenheim Investments considers your privacy our utmost concern. When you become our client or investor, you entrust us with not only your hard-earned money but also with your personal and financial information. Because we have access to your private information, we hold ourselves to the highest standards in its safekeeping and use. We strictly limit how we share your information with others, whether you are a current or former Guggenheim Investments client or investor.
The Information We Collect About You
We collect certain nonpublic personal information about you from information you provide on applications, other forms, our website, and/or from third parties including investment advisors. This information includes Social Security or other tax identification number, assets, income, tax information, retirement and estate plan information, transaction history, account balance, payment history, bank account information, marital status, family relationships, information that we collect on our website through the use of “cookies,” and other personal information that you or others provide to us. We may also collect such information through your inquiries by mail, e-mail or telephone. We may also collect customer due diligence information, as required by applicable law and regulation, through third party service providers.
How We Handle Your Personal Information
The legal basis for using your information as set out in this Privacy Notice is as follows: (a) use of your personal data is necessary to perform our obligations under any contract with you (such as a contract for us to provide financial services to you); or (b) where use of your personal data is not necessary for performance of a contract, use of your personal data is necessary for our legitimate interests or the legitimate interests of others (for example, to enforce the legal terms governing our services, operate and market our website and other services we offer, ensure safe environments for our personnel and others, make and receive payments, prevent fraud and to know the customer to whom we are providing the services). Some processing is done to comply with applicable law.
In addition to the specific uses described above, we also use your information in the following manner:
| | ● | We use your information in connection with servicing your accounts. |
| | ● | We use information to respond to your requests or questions. For example, we might use your information to respond to your customer feedback. |
| | ● | We use information to improve our products and services. We may use your information to make our website and products better. We may use your information to customize your experience with us. |
| | ● | We use information for security purposes. We may use your information to protect our company and our customers. |
| | ● | We use information to communicate with you. For example, we will communicate with you about your account or our relationship. We may contact you about your feedback. We might also contact you about this Privacy Notice. We may also enroll you in our email newsletter. |
94 | THE GUGGENHEIM FUNDS SEMI-ANNUAL REPORT | |
GUGGENHEIM INVESTMENTS PRIVACY NOTICE (Unaudited)(continued) |
| | ● | We use information as otherwise permitted by law, as we may notify you. |
| | ● | Aggregate/Anonymous Data. We may aggregate and/or anonymize any information collected through the website so that such information can no longer be linked to you or your device (“Aggregate/Anonymous Information”). We may use Aggregate/Anonymous Information for any purpose, including without limitation for research and marketing purposes, and may also share such data with any third parties, including advertisers, promotional partners, and sponsors. |
We do not sell information about current or former clients or their accounts to third parties. Nor do we share this information, except when necessary to complete transactions at your request, to make you aware of investment products and services that we or our affiliates offer, or as permitted or required by law.
We provide information about you to companies and individuals not affiliated with Guggenheim Investments to complete certain transactions or account changes, or to perform services for us related to your account. For example, if you ask to transfer assets from another financial institution to Guggenheim Investments, we must provide certain information about you to that company to complete the transaction. We provide the third party with only the information necessary to carry out its responsibilities and only for that purpose. And we require these third parties to treat your private information with the same high degree of confidentiality that we do. To alert you to other Guggenheim Investments products and services, we share your information within our family of affiliated companies. You may limit our sharing with affiliated companies as set out below. We may also share information with any successor to all or part of our business, or in connection with steps leading up to a merger or acquisition. For example, if part of our business was sold we may give customer information as part of that transaction. We may also share information about you with your consent.
We will release information about you if you direct us to do so, if we are compelled by law to do so, or in other circumstances as permitted by law (for example, to protect your account from fraud).
If you close your account(s) or become an inactive client or investor, we will continue to adhere to the privacy policies and practices described in this notice.
Opt-Out Provisions and Your Data Choices
The law allows you to “opt out” of certain kinds of information sharing with third parties. We do not share personal information about you with any third parties that triggers this opt-out right. This means YOU ARE ALREADY OPTED OUT.
When you are no longer our client or investor, we continue to share your information as described in this notice, and you may contact us at any time to limit our sharing by sending an email to CorporateDataPrivacy@GuggenheimPartners.com.
European Union Data Subjects and certain others: In addition to the choices set forth above, residents of the European Union and certain other jurisdictions have certain rights to (1) request access to or rectification or deletion of information we collect about them, (2) request a restriction on the processing of their information, (3) object to the processing of their information, or (4) request the portability of certain information. To exercise these or other rights, please contact us using the contact information below. We will consider all requests and provide our response within the time period stated by applicable law. Please note, however, that certain information may be exempt from such requests in some circumstances, which may include if we need to keep processing your information for our legitimate interests or to comply with a legal obligation. We may request you provide us with information necessary to confirm your identity before responding to your request.
Residents of France and certain other jurisdictions may also provide us with instructions regarding the manner in which we may continue to store, erase and share your information after your death, and where applicable, the person you have designated to exercise these rights after your death.
| | THE GUGGENHEIM FUNDS SEMI-ANNUAL REPORT | 95 |
GUGGENHEIM INVESTMENTS PRIVACY NOTICE (Unaudited)(concluded) |
How We Protect Privacy Online
We take steps to protect your privacy when you use our web site – www.guggenheiminvestments.com – by using secure forms of online communication, including encryption technology, Secure Socket Layer (SSL) protocol, firewalls and user names and passwords. These safeguards vary based on the sensitivity of the information that we collect and store. However, we cannot and do not guarantee that these measures will prevent every unauthorized attempt to access, use, or disclose your information since despite our efforts, no Internet and/or other electronic transmissions can be completely secure. Our web site uses “http cookies”—tiny pieces of information that we ask your browser to store. We use cookies for session management and security features on the Guggenheim Investments web site. We do not use them to pull data from your hard drive, to learn your e-mail address, or to view data in cookies created by other web sites. We will not share the information in our cookies or give others access to it. See the legal information area on our web site for more details about web site security and privacy features.
How We Safeguard Your Personal Information and Data Retention
We restrict access to nonpublic personal information about you to our employees and in some cases to third parties (for example, the service providers described above) as permitted by law. We maintain strict physical, electronic and procedural safeguards that comply with federal standards to guard your nonpublic personal information.
We keep your information for no longer than necessary for the purposes for which it is processed. The length of time for which we retain information depends on the purposes for which we collected and use it and/or as required to comply with applicable laws. Information may persist in copies made for backup and business continuity purposes for additional time.
International Visitors
If you are not a resident of the United States, please be aware that your information may be transferred to, stored and processed in the United States where our servers are located and our databases are operated. The data protection and other laws of the United States and other countries might not be as comprehensive as those in your country.
In such cases, we ensure that a legal basis for such a transfer exists and that adequate protection is provided as required by applicable law, for example, by using standard contractual clauses or by transferring your data to a jurisdiction that has obtained an adequacy finding. Individuals whose data may be transferred on the basis of standard contractual clauses may contact us as described below.
We’ll Keep You Informed
If you have any questions or concerns about how we treat your personal data, we encourage you to consult with us first. You may also contact the relevant supervisory authority.
We reserve the right to modify this policy at any time and will inform you promptly of material changes. You may access our privacy policy from our web site at www.guggenheiminvestments.com. Should you have any questions regarding our privacy policy, contact us by email at CorporateDataPrivacy@GuggenheimPartners.com.
96 | THE GUGGENHEIM FUNDS SEMI-ANNUAL REPORT | |
This page intentionally left blank.
This page intentionally left blank.
This page intentionally left blank.
This page intentionally left blank.
This page intentionally left blank.
3.31.2024
Guggenheim Funds Semi-Annual Report
Guggenheim Ultra Short Duration Fund | | |
GuggenheimInvestments.com | USD-SEMI-0324x0924 |

| | |
DEAR SHAREHOLDER | 2 |
ECONOMIC AND MARKET OVERVIEW | 4 |
ABOUT SHAREHOLDERS’ FUND EXPENSES | 6 |
ULTRA SHORT DURATION FUND | 9 |
NOTES TO FINANCIAL STATEMENTS | 32 |
OTHER INFORMATION | 49 |
INFORMATION ON BOARD OF TRUSTEES AND OFFICERS | 51 |
GUGGENHEIM INVESTMENTS PRIVACY NOTICE | 59 |
| | THE GUGGENHEIM FUNDS SEMI-ANNUAL REPORT | 1 |
Dear Shareholder:
Guggenheim Partners Investment Management, LLC (the “Investment Adviser”) is pleased to present the shareholder report for Guggenheim Ultra Short Duration Fund (the “Fund”) for the semi-annual fiscal period ended March 31, 2024 (the “Reporting Period”).
The Investment Adviser is responsible for the management of the Funds’ portfolio of investments. It is an affiliate of Guggenheim Partners, LLC (“Guggenheim”), a global diversified financial services firm.
Guggenheim Funds Distributors, LLC is the distributor of the Fund. Guggenheim Funds Distributors, LLC is affiliated with Guggenheim Partners, LLC and the Investment Adviser.
We encourage you to read the Economic and Market Overview section of the report, which follows this letter.
We are committed to providing innovative investment solutions and appreciate the trust you place in us.
Sincerely,
Guggenheim Partners Investment Management, LLC
April 30, 2024
Read a prospectus and summary prospectus (if available) carefully before investing. It contains the investment objectives, risks, charges, expenses and other information, which should be considered carefully before investing. Obtain a prospectus and summary prospectus (if available) at guggenheiminvestments.com or call 800.820.0888.
This material is not intended as a recommendation or as investment advice of any kind, including in connection with rollovers, transfers, and distributions. Such material is not provided in a fiduciary capacity, may not be relied upon for or in connection with the making of investment decisions, and does not constitute a solicitation of an offer to buy or sell securities. All content has been provided for informational or educational purposes only and is not intended to be and should not be construed as legal or tax advice and/or a legal opinion. Always consult a financial, tax and/or legal professional regarding your specific situation.
2 | THE GUGGENHEIM FUNDS SEMI-ANNUAL REPORT | |
Ultra Short Duration Fund may not be suitable for all investors. An investment in the Fund will fluctuate and is subject to investment risks, which means investors could lose money. ● The Fund’s share price, or the income generated by the Fund’s holdings, could change in response to interest rate changes and market and economic conditions among other factors. Investors in asset- backed securities, including collateralized loan obligations (CLOs) generally receive payments that are part interest and part return of principal. These payments may vary based on the rate loans are repaid. Some asset-backed securities may have structures that make their reaction to interest rates and other factors difficult to predict, making their prices volatile and they are subject to liquidity and valuation risk. CLOs bear similar risks to investing in loans directly. Investments in loans involve special types of risks, including credit, interest rate, counterparty, prepayment, liquidity, and valuation risks. Loans are often below investment grade, may be unrated, and typically offer a fixed or floating interest rate. High yield and unrated debt securities are at a greater risk of default than investment grade bonds and may be less liquid, which may increase volatility. The use of leverage, through borrowings or instruments such as derivatives, may cause the fund to be more volatile and riskier than if it had not been leveraged. The more a fund invests in leveraged instruments, the more the leverage will magnify any gains or losses on those investments. Foreign securities carry unique or additional risks when compared to U.S. securities, including currency fluctuations, adverse political and economic developments, unreliable or untimely information, less liquidity and more volatility, limited legal recourse and higher transactional costs, all of which are enhanced when investing in emerging markets. In addition, investments in emerging markets are subject to risks associated with trading in smaller markets, lower volumes of trading, and being subject to lower levels of government regulation and less extensive accounting, financial and other reporting requirements. ● The Fund is subject to active trading risks that may increase volatility and impact its ability to achieve its investment objective. You may have a gain or loss when you sell your shares. It is important to note that the Fund is not guaranteed by the U.S. government. Please read the prospectus for more detailed information regarding these and other risks.
| | THE GUGGENHEIM FUNDS SEMI-ANNUAL REPORT | 3 |
ECONOMIC AND MARKET OVERVIEW (Unaudited) | March 31, 2024 |
While job growth remains robust, recent labor data brought increased confidence in a labor market in better balance, allowing for inflation to soften further. Labor force growth remains strong, aided by high immigration flows, helping bring labor supply in line with gradually cooling demand. The Small Business Survey indicates that plans to increase compensation have returned to pre-COVID levels. Additionally, Bureau of Labor Statistics data reveal a continued decline in the “quits rate,” reducing the pressure on businesses to raise wages to attract or retain employees. These developments suggest wage pressures may ease further by year end. And despite some speculation against any Federal Reserve (“Fed”) rate cuts materializing in 2024, we continue to anticipate cuts later this year.
Following the stronger-than-expected March Consumer Price Index, we believe that there is a high probability that the easing cycle will start in the second half of the year, since the Fed will likely need more time to gather confirming data. In the latest Summary of Economic Projections, the Federal Open Market Committee (“FOMC”) significantly increased the median forecast for 2024 U.S. gross domestic product, slightly increased it for core personal consumption expenditures year over year, and continues to expect no material increase in the unemployment rate. These adjustments left the median view for three rate cuts for 2024, which suggests the bar is very high for the Fed to keep rates where they are all year, and even higher for more rate hikes to materialize.
Amid this macroeconomic backdrop, in the first quarter of 2024 the two-year Treasury yield increased to 4.59% from 4.23%, and the 10-year Treasury yield increased to 4.20% from 3.88%, keeping the inverted 2s/10s yield curve consistent at 39 basis points as of the end of the Reporting Period, up four basis points since the start of the year. One basis point equals 0.01%. In general, spreads to Treasurys have remained tight across sectors. In investment-grade corporate bonds, BBB-rated bonds continued to remain attractive relative to A and BB-rated bonds, and supply slowed toward the end of the first quarter of 2024, which we believe should support spreads in the near term. High yield bond spreads tightened during the first quarter of 2024 to 301 basis points from 323 basis at the start of the year, while leveraged loans’ discount margins to maturity tightened to 509 basis points from 528 basis points. Structured credit spreads tightened marginally amid strong demand. Investor demand and an improved arbitrage led to robust new collateralized loan obligation issuance, and tightening liabilities led to an increase in refinances/resets.
Looking forward, Fed officials continue to advocate for a patient approach. A conventional easing cycle is therefore far from guaranteed. Market expectations have already adjusted significantly from market-implied expectations of six rate cuts in 2024 just two months ago to only three as of the end of the Reporting Period, aligning more closely with the FOMC’s views. So far, the market has taken this delay in stride, but its patience and assessment of credit risk could be tested.
For the Reporting Period, the S&P 500® Index* returned 23.48%. The MSCI Europe-Australasia-Far East (“EAFE”) Index* returned 17.01%. The return of the MSCI Emerging Markets Index* was 10.56%.
4 | THE GUGGENHEIM FUNDS SEMI-ANNUAL REPORT | |
ECONOMIC AND MARKET OVERVIEW (Unaudited)(concluded) | March 31, 2024 |
In the bond market, the Bloomberg U.S. Aggregate Bond Index* posted a 5.99% return for the Reporting Period, while the Bloomberg U.S. Corporate High Yield Index* returned 8.75%. The return of the ICE Bank of America (“BofA”) 3-Month U.S. Treasury Bill Index* was 2.69% for the Reporting Period.
The opinions and forecasts expressed may not actually come to pass. This information is subject to change at any time, based on market and other conditions, and should not be construed as a recommendation of any specific security or strategy.
*Index Definitions:
The following indices are referenced throughout this report. Indices are unmanaged and not available for direct investment. Index performance does not reflect transaction costs, fees, or expenses.
Bloomberg U.S. Aggregate Bond Index is a broad-based flagship benchmark that measures the investment grade, U.S. dollar-denominated, fixed-rate taxable bond market, including U.S. Treasuries, government-related and corporate securities, mortgage-backed securities or “MBS” (agency fixed-rate and hybrid adjustable-rate mortgage, or “ARM”, pass-throughs), asset-backed securities (“ABS”), and commercial mortgage-backed securities (“CMBS”) (agency and non-agency).
Bloomberg U.S. Corporate High Yield Index measures the U.S. dollar-denominated, high yield, fixed-rate corporate bond market. Securities are classified as high yield if the middle rating of Moody’s, Fitch, and S&P is Ba1/BB +/BB + or below.
Bloomberg 1-3 Month U.S. Treasury Bill Index includes all publicly issued zero-coupon U.S. Treasury Bills that have a remaining maturity of less than 3 months and more than 1 month, are rated investment grade, and have $250 million or more of outstanding face value. In addition, the securities must be denominated in U.S. dollars and must be fixed rate and nonconvertible. The 1-3 Month U.S. Treasury Bill Index is market capitalization weighted and the securities in the index are updated on the last business day of each month.
ICE BofA 3-Month U.S. Treasury Bill Index is an unmanaged market Index of U.S. Treasury securities maturing in 90 days that assumes reinvestment of all income.
MSCI EAFE Index is a free float-adjusted market capitalization index that is designed to measure the equity market performance of developed markets, excluding the U.S. & Canada.
MSCI Emerging Markets Index is a free float-adjusted market capitalization weighted index that is designed to measure equity market performance in the global emerging markets.
S&P 500® Index is a broad-based index, the performance of which is based on the performance of 500 widely held common stocks chosen for market size, liquidity, and industry group representation.
| | THE GUGGENHEIM FUNDS SEMI-ANNUAL REPORT | 5 |
ABOUT SHAREHOLDERS’ FUND EXPENSES (Unaudited) |
All mutual funds have operating expenses, and it is important for our shareholders to understand the impact of costs on their investments. Shareholders of a fund incur two types of costs: (i) transaction costs, including sales charges (loads) on purchase payments, reinvested dividends, other distributions, and exchange fees, and (ii) ongoing costs, including management fees, administrative services, and shareholder reports, among others. These ongoing costs, or operating expenses, are deducted from a fund’s gross income and reduce the investment return of the fund.
A fund’s expenses are expressed as a percentage of its average net assets, which is known as the expense ratio. The following examples are intended to help investors understand the ongoing costs (in dollars) of investing in a fund and to compare these costs with the ongoing costs of investing in other mutual funds.
The examples are based on an investment of $1,000 made at the beginning of the period and held for the entire six-month period beginning September 30, 2023 and ending March 31, 2024.
The following tables illustrate the Fund’s costs in two ways:
Table 1. Based on actual Fund return: This section helps investors estimate the actual expenses paid over the period. The “Ending Account Value” shown is derived from the Fund’s actual return, and the fifth column shows the dollar amount that would have been paid by an investor who started with $1,000 in the Fund. Investors may use the information here, together with the amount invested, to estimate the expenses paid over the period. Simply divide the Fund’s account value by $1,000 (for example, an $8,600 account value divided by $1,000 = 8.6), then multiply the result by the number provided under the heading “Expenses Paid During Period.”
Table 2. Based on hypothetical 5% return: This section is intended to help investors compare a fund’s cost with those of other mutual funds. The table provides information about hypothetical account values and hypothetical expenses based on the Fund’s actual expense ratio and an assumed rate of return of 5% per year before expenses, which is not the Fund’s actual return. The hypothetical account values and expenses may not be used to estimate the actual ending account balance or expenses paid during the period. The example is useful in making comparisons because the U.S. Securities and Exchange Commission (the “SEC”) requires all mutual funds to calculate expenses based on the 5% return. Investors can assess a Fund’s costs by comparing this hypothetical example with the hypothetical examples that appear in shareholder reports of other funds.
The calculations illustrated above assume no shares were bought or sold during the period. Actual costs may have been higher or lower, depending on the amount of investment and the timing of any purchases or redemptions.
6 | THE GUGGENHEIM FUNDS SEMI-ANNUAL REPORT | |
ABOUT SHAREHOLDERS’ FUND EXPENSES (Unaudited)(continued) |
Please note that the expenses shown in the table are meant to highlight your ongoing costs only and do not reflect any transactional costs, such as sales charges (loads) on purchase payments, and contingent deferred sales charges (“CDSC”) on redemptions, if any. Therefore, the second table is useful in comparing ongoing costs only, and will not help you determine the relative total costs of owning different funds. In addition, if these transactional costs were included, your costs would have been higher.
More information about the Fund’s expenses, including annual expense ratios for periods up to five years (subject to the Fund’s inception date), can be found in the Financial Highlights section of this report. For additional information on operating expenses and other shareholder costs, please refer to the Fund’s prospectus.
| | THE GUGGENHEIM FUNDS SEMI-ANNUAL REPORT | 7 |
ABOUT SHAREHOLDERS’ FUND EXPENSES (Unaudited)(concluded) |
| | Expense
Ratio1 | | | Fund
Return | | | Beginning
Account Value
September 30,
2023 | | | Ending
Account Value
March 31,
2024 | | | Expenses
Paid During
Period2 | |
Table 1. Based on actual Fund return3 |
Class A | | | 0.59 | % | | | 4.37 | % | | $ | 1,000.00 | | | $ | 1,043.70 | | | $ | 3.01 | |
Institutional Class | | | 0.34 | % | | | 4.50 | % | | | 1,000.00 | | | | 1,045.00 | | | | 1.74 | |
| |
Table 2. Based on hypothetical 5% return (before expenses) |
Class A | | | 0.59 | % | | | 5.00 | % | | $ | 1,000.00 | | | $ | 1,022.05 | | | $ | 2.98 | |
Institutional Class | | | 0.34 | % | | | 5.00 | % | | | 1,000.00 | | | | 1,023.30 | | | | 1.72 | |
1 | This ratio represents annualized net expenses, which may include short interest expense. Excluding these expenses, the operating expense ratios for the Fund would be 0.58% and 0.33% for Class A and Institutional Class, respectively. Excludes expenses of the underlying funds in which the Fund invests. |
2 | Expenses are equal to the Fund’s annualized expense ratio, net of any applicable fee waivers, multiplied by the average account value over the period, multiplied by 183/366 (to reflect the one-half year period). |
3 | Actual cumulative return at net asset value for the period September 30, 2023 to March 31, 2024. |
8 | THE GUGGENHEIM FUNDS SEMI-ANNUAL REPORT | |
PERFORMANCE REPORT AND FUND PROFILE (Unaudited) | March 31, 2024 |
ULTRA SHORT DURATION FUND
OBJECTIVE: Seeks a high level of income consistent with the preservation of capital.
Holdings Diversification (Market Exposure as % of Net Assets)
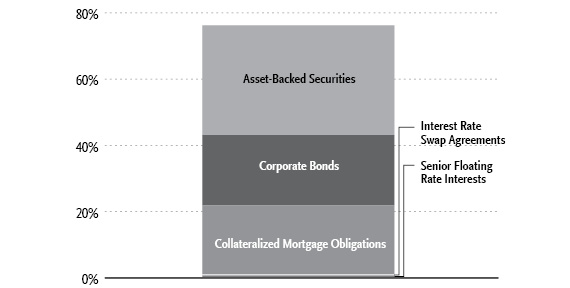
“Holdings Diversification (Market Exposure as % of Net Assets)” excludes any temporary cash investments.
Inception Dates: |
Class A | November 30, 2018 |
Institutional Class | March 11, 2014 |
Ten Largest Holdings | % of Total Net Assets |
Athene Global Funding, 5.88% | 2.2% |
Lake Shore MM CLO III LLC, 7.06% | 2.1% |
BX Commercial Mortgage Trust, 7.09% | 2.0% |
F&G Global Funding, 0.90% | 1.9% |
NYMT Loan Trust, 1.67% | 1.3% |
BRAVO Residential Funding Trust, 1.62% | 1.3% |
Golub Capital Partners CLO 49M Ltd., 7.11% | 1.3% |
OSAT Trust, 2.12% | 1.2% |
Oak Street Investment Grade Net Lease Fund Series, 1.85% | 1.2% |
Warnermedia Holdings, Inc., 3.64% | 1.1% |
Top Ten Total | 15.6% |
| | |
“Ten Largest Holdings” excludes any temporary cash or derivative investments. |
| | THE GUGGENHEIM FUNDS SEMI-ANNUAL REPORT | 9 |
PERFORMANCE REPORT AND FUND PROFILE (Unaudited)(continued) | March 31, 2024 |
Portfolio Composition by Quality Rating1 |
Rating | % of Total Investments |
Fixed Income Instruments | |
AAA | 24.2% |
AA | 10.5% |
A | 13.6% |
BBB | 13.7% |
BB | 1.3% |
B | 0.0%* |
NR2 | 10.6% |
Other Instruments | 26.1% |
Total Investments | 100.0% |
* | Less than 0.10% of Total Investments |
1 | Source: BlackRock Solutions. Credit quality ratings are measured on a scale that generally ranges from AAA (highest) to D (lowest). All securities except for those labeled “NR” have been rated by Moody’s, Standard & Poor’s (“S&P”), or Fitch, each of which is a Nationally Recognized Statistical Rating Organization (“NRSRO”). For purposes of this presentation, when ratings are available from more than one agency, the highest rating is used. Guggenheim Investments has converted ratings to the equivalent S&P rating. Security ratings are determined at the time of purchase and may change thereafter. |
2 | NR (not rated) securities do not necessarily indicate low credit quality. |
10 | THE GUGGENHEIM FUNDS SEMI-ANNUAL REPORT | |
PERFORMANCE REPORT AND FUND PROFILE (Unaudited)(concluded) | March 31, 2024 |
Average Annual Returns*
Periods Ended March 31, 2024
| 6 Month† | 1 Year | 5 Year | 10 Year |
Institutional Class Shares | 4.50% | 7.72% | 2.54% | 1.99% |
Bloomberg 1-3 Month U.S. Treasury Bill Index | 2.72% | 5.38% | 2.02% | 1.36% |
| 6 Month† | 1 Year | 5 Year | Since
Inception
(11/30/18) |
Class A Class Shares | 4.37% | 7.45% | 2.28% | 2.26% |
Bloomberg 1-3 Month U.S. Treasury Bill Index | 2.72% | 5.38% | 2.02% | 2.04% |
* | The performance data above represents past performance that is not predictive of future results. The investment return and principal value of an investment in the Fund will fluctuate so that an investor’s shares, when redeemed, may be worth more or less than their original cost. Returns are historical and include changes in principal and reinvested dividends and capital gains and do not reflect the effect of taxes. The Bloomberg 1-3 Month U.S. Treasury Bill Index is an unmanaged index and, unlike the Fund, has no management fees or operating expenses to reduce its reported return. Prior to November 30, 2018, performance for Institutional Class shares reflects the performance of the Guggenheim Strategy Fund I, which did not charge a management fee and was not publicly offered as a separate investment product. |
| | THE GUGGENHEIM FUNDS SEMI-ANNUAL REPORT | 11 |
SCHEDULE OF INVESTMENTS (Unaudited) | March 31, 2024 |
ULTRA SHORT DURATION FUND | |
| | Shares | | | Value | |
MONEY MARKET FUNDS† - 26.3% |
Dreyfus Treasury Securities Cash Management Fund — Institutional Shares, 5.19%1 | | | 121,541,407 | | | $ | 121,541,407 | |
Dreyfus Treasury Obligations Cash Management Fund — Institutional Shares, 5.20%1 | | | 8,798,484 | | | | 8,798,484 | |
Total Money Market Funds | | | | |
(Cost $130,339,891) | | | | | | | 130,339,891 | |
| | | | | | | | | |
| | | Face
Amount | | | | | |
ASSET-BACKED SECURITIES†† - 32.0% |
Collateralized Loan Obligations - 26.4% |
Lake Shore MM CLO III LLC | | | | | | | | |
2021-2A A1R, 7.06% (3 Month Term SOFR + 1.74%, Rate Floor: 1.48%) due 10/17/31◊,2 | | $ | 10,347,945 | | | | 10,263,853 | |
HERA Commercial Mortgage Ltd. | | | | | | | | |
2021-FL1 AS, 6.73% (1 Month Term SOFR + 1.41%, Rate Floor: 1.30%) due 02/18/38◊,2 | | | 5,000,000 | | | | 4,834,270 | |
2021-FL1 A, 6.48% (1 Month Term SOFR + 1.16%, Rate Floor: 1.05%) due 02/18/38◊,2 | | | 3,154,392 | | | | 3,062,419 | |
BXMT Ltd. | | | | | | | | |
2020-FL2 A, 6.34% (1 Month Term SOFR + 1.01%, Rate Floor: 1.01%) due 02/15/38◊,2 | | | 2,533,300 | | | | 2,431,968 | |
2020-FL2 AS, 6.59% (1 Month Term SOFR + 1.26%, Rate Floor: 1.26%) due 02/15/38◊,2 | | | 2,550,000 | | | | 2,404,205 | |
2020-FL3 AS, 7.19% (1 Month Term SOFR + 1.86%, Rate Floor: 1.86%) due 11/15/37◊,2 | | | 2,500,000 | | | | 2,357,370 | |
Palmer Square Loan Funding Ltd. | | | | | | | | |
2021-2A B, 6.98% (3 Month Term SOFR + 1.66%, Rate Floor: 1.66%) due 05/20/29◊,2 | | | 4,500,000 | | | | 4,499,916 | |
2021-1A A1, 6.48% (3 Month Term SOFR + 1.16%, Rate Floor: 1.16%) due 04/20/29◊,2 | | | 1,159,975 | | | | 1,158,136 | |
2022-1A A2, 6.92% (3 Month Term SOFR + 1.60%, Rate Floor: 1.60%) due 04/15/30◊,2 | | | 1,000,000 | | | | 998,898 | |
Golub Capital Partners CLO 49M Ltd. | | | | | | | | |
2021-49A AR, 7.11% (3 Month Term SOFR + 1.79%, Rate Floor: 1.79%) due 08/26/33◊,2 | | | 6,250,000 | | | | 6,269,631 | |
12 | THE GUGGENHEIM FUNDS SEMI-ANNUAL REPORT | SEE NOTES TO FINANCIAL STATEMENTS. |
SCHEDULE OF INVESTMENTS (Unaudited)(continued) | March 31, 2024 |
ULTRA SHORT DURATION FUND | |
| | Face
Amount | | | Value | |
FS Rialto | | | | | | | | |
2021-FL3 B, 7.24% (1 Month Term SOFR + 1.91%, Rate Floor: 1.91%) due 11/16/36◊,2 | | $ | 5,500,000 | | | $ | 5,427,976 | |
ABPCI Direct Lending Fund IX LLC | | | | | | | | |
2021-9A A1R, 6.98% (3 Month Term SOFR + 1.66%, Rate Floor: 1.40%) due 11/18/31◊,2 | | | 5,369,051 | | | | 5,366,057 | |
Cerberus Loan Funding XXXV, LP | | | | | | | | |
2021-5A A, 7.08% (3 Month Term SOFR + 1.76%, Rate Floor: 1.50%) due 09/22/33◊,2 | | | 5,000,000 | | | | 5,013,260 | |
LCCM Trust | | | | | | | | |
2021-FL3 A, 6.89% (1 Month Term SOFR + 1.56%, Rate Floor: 1.56%) due 11/15/38◊,2 | | | 4,055,461 | | | | 3,998,575 | |
2021-FL2 B, 7.34% (1 Month Term SOFR + 2.01%, Rate Floor: 2.01%) due 12/13/38◊,2 | | | 1,000,000 | | | | 955,286 | |
Golub Capital Partners CLO 54M LP | | | | | | | | |
2021-54A A, 7.06% (3 Month Term SOFR + 1.79%, Rate Floor: 1.53%) due 08/05/33◊,2 | | | 4,750,000 | | | | 4,758,861 | |
Owl Rock CLO IV Ltd. | | | | | | | | |
2021-4A A1R, 7.18% (3 Month Term SOFR + 1.86%, Rate Floor: 1.60%) due 08/20/33◊,2 | | | 4,500,000 | | | | 4,498,589 | |
Golub Capital Partners CLO 16 Ltd. | | | | | | | | |
2021-16A A1R2, 7.20% (3 Month Term SOFR + 1.87%, Rate Floor: 1.61%) due 07/25/33◊,2 | | | 4,250,000 | | | | 4,272,434 | |
BRSP Ltd. | | | | | | | | |
2021-FL1 B, 7.34% (1 Month Term SOFR + 2.01%, Rate Floor: 1.90%) due 08/19/38◊,2 | | | 4,250,000 | | | | 4,073,392 | |
Madison Park Funding XLVIII Ltd. | | | | | | | | |
2021-48A B, 7.02% (3 Month Term SOFR + 1.71%, Rate Floor: 1.71%) due 04/19/33◊,2 | | | 4,000,000 | | | | 3,993,688 | |
Carlyle Global Market Strategies CLO Ltd. | | | | | | | | |
2018-4A A1RR, 6.58% (3 Month Term SOFR + 1.26%, Rate Floor: 1.00%) due 01/15/31◊,2 | | | 3,888,960 | | | | 3,872,395 | |
CIFC Funding Ltd. | | | | | | | | |
2018-3A AR, 6.44% (3 Month Term SOFR + 1.13%, Rate Floor: 0.00%) due 04/19/29◊,2 | | | 3,793,941 | | | | 3,795,453 | |
Parliament CLO II Ltd. | | | | | | | | |
2021-2A A, 6.93% (3 Month Term SOFR + 1.61%, Rate Floor: 1.35%) due 08/20/32◊,2 | | | 3,776,711 | | | | 3,777,662 | |
SEE NOTES TO FINANCIAL STATEMENTS. | THE GUGGENHEIM FUNDS SEMI-ANNUAL REPORT | 13 |
SCHEDULE OF INVESTMENTS (Unaudited)(continued) | March 31, 2024 |
ULTRA SHORT DURATION FUND | |
| | Face
Amount | | | Value | |
Golub Capital Partners CLO 33M Ltd. | | | | | | | | |
2021-33A AR2, 7.45% (3 Month Term SOFR + 2.12%, Rate Floor: 1.86%) due 08/25/33◊,2 | | $ | 3,750,000 | | | $ | 3,727,716 | |
LCM XXIV Ltd. | | | | | | | | |
2021-24A AR, 6.56% (3 Month Term SOFR + 1.24%, Rate Floor: 0.98%) due 03/20/30◊,2 | | | 3,334,378 | | | | 3,334,378 | |
ABPCI Direct Lending Fund CLO II LLC | | | | | | | | |
2021-1A A1R, 7.18% (3 Month Term SOFR + 1.86%, Rate Floor: 1.60%) due 04/20/32◊,2 | | | 3,000,000 | | | | 3,003,481 | |
BDS Ltd. | | | | | | | | |
2021-FL8 C, 6.99% (1 Month Term SOFR + 1.66%, Rate Floor: 1.55%) due 01/18/36◊,2 | | | 2,000,000 | | | | 1,942,706 | |
2021-FL8 D, 7.34% (1 Month Term SOFR + 2.01%, Rate Floor: 1.90%) due 01/18/36◊,2 | | | 1,000,000 | | | | 969,593 | |
Woodmont Trust | | | | | | | | |
2020-7A A1A, 7.48% (3 Month Term SOFR + 2.16%, Rate Floor: 1.90%) due 01/15/32◊,2 | | | 2,750,000 | | | | 2,759,865 | |
Cerberus Loan Funding XXXII, LP | | | | | | | | |
2021-2A A, 7.20% (3 Month Term SOFR + 1.88%, Rate Floor: 1.88%) due 04/22/33◊,2 | | | 2,500,000 | | | | 2,491,255 | |
Cerberus Loan Funding XXXIII, LP | | | | | | | | |
2021-3A A, 7.14% (3 Month Term SOFR + 1.82%, Rate Floor: 1.56%) due 07/23/33◊,2 | | | 2,250,000 | | | | 2,254,857 | |
ABPCI Direct Lending Fund CLO I LLC | | | | | | | | |
2021-1A A1A2, 7.28% (3 Month Term SOFR + 1.96%, Rate Floor: 1.96%) due 07/20/33◊,2 | | | 2,250,000 | | | | 2,250,243 | |
THL Credit Lake Shore MM CLO I Ltd. | | | | | | | | |
2021-1A A1R, 7.28% (3 Month Term SOFR + 1.96%, Rate Floor: 1.70%) due 04/15/33◊,2 | | | 2,250,000 | | | | 2,249,399 | |
Madison Park Funding LIII Ltd. | | | | | | | | |
2022-53A B, 7.07% (3 Month Term SOFR + 1.75%, Rate Floor: 1.75%) due 04/21/35◊,2 | | | 1,750,000 | | | | 1,742,622 | |
Allegro CLO IX Ltd. | | | | | | | | |
2018-3A A, 6.74% (3 Month Term SOFR + 1.43%, Rate Floor: 1.17%) due 10/16/31◊,2 | | | 1,456,064 | | | | 1,456,598 | |
14 | THE GUGGENHEIM FUNDS SEMI-ANNUAL REPORT | SEE NOTES TO FINANCIAL STATEMENTS. |
SCHEDULE OF INVESTMENTS (Unaudited)(continued) | March 31, 2024 |
ULTRA SHORT DURATION FUND | |
| | Face
Amount | | | Value | |
MidOcean Credit CLO VII | | | | | | | | |
2020-7A A1R, 6.62% (3 Month Term SOFR + 1.30%, Rate Floor: 0.00%) due 07/15/29◊,2 | | $ | 1,314,433 | | | $ | 1,315,105 | |
Fortress Credit Opportunities XI CLO Ltd. | | | | | | | | |
2018-11A A1T, 6.88% (3 Month Term SOFR + 1.56%, Rate Floor: 0.00%) due 04/15/31◊,2 | | | 1,282,032 | | | | 1,278,459 | |
Cerberus Loan Funding XXXI, LP | | | | | | | | |
2021-1A A, 7.08% (3 Month Term SOFR + 1.76%, Rate Floor: 1.50%) due 04/15/32◊,2 | | | 1,262,024 | | | | 1,263,363 | |
BCC Middle Market CLO LLC | | | | | | | | |
2021-1A A1R, 7.08% (3 Month Term SOFR + 1.76%, Rate Floor: 1.50%) due 10/15/33◊,2 | | | 1,250,000 | | | | 1,250,154 | |
CHCP Ltd. | | | | | | | | |
2021-FL1 A, 6.49% (1 Month Term SOFR + 1.16%, Rate Floor: 1.05%) due 02/15/38◊,2 | | | 1,120,281 | | | | 1,117,157 | |
Greystone Commercial Real Estate Notes | | | | | | | | |
2021-FL3 B, 7.09% (1 Month Term SOFR + 1.76%, Rate Floor: 1.65%) due 07/15/39◊,2 | | | 1,000,000 | | | | 961,315 | |
STWD Ltd. | | | | | | | | |
2021-FL2 B, 7.24% (1 Month Term SOFR + 1.91%, Rate Floor: 1.80%) due 04/18/38◊,2 | | | 1,000,000 | | | | 923,958 | |
ACRE Commercial Mortgage Ltd. | | | | | | | | |
2021-FL4 AS, 6.54% (1 Month Term SOFR + 1.21%, Rate Floor: 1.10%) due 12/18/37◊,2 | | | 850,000 | | | | 846,232 | |
Wellfleet CLO Ltd. | | | | | | | | |
2020-2A A1R, 6.64% (3 Month Term SOFR + 1.32%, Rate Floor: 0.00%) due 10/20/29◊,2 | | | 446,591 | | | | 446,612 | |
Fortress Credit Opportunities VI CLO Ltd. | | | | | | | | |
2018-6A A2R, 7.19% (3 Month Term SOFR + 1.86%, Rate Floor: 0.00%) due 07/10/30◊,2 | | | 250,000 | | | | 249,843 | |
2018-6A A1TR, 6.95% (3 Month Term SOFR + 1.62%, Rate Floor: 0.00%) due 07/10/30◊,2 | | | 119,416 | | | | 119,124 | |
Cerberus Loan Funding XXXVI, LP | | | | | | | | |
2021-6A A, 6.98% (3 Month Term SOFR + 1.66%, Rate Floor: 1.40%) due 11/22/33◊,2 | | | 257,875 | | | | 258,161 | |
Golub Capital Partners CLO 17 Ltd. | | | | | | | | |
2017-17A A1R, 7.24% (3 Month Term SOFR + 1.91%, Rate Floor: 0.00%) due 10/25/30◊,2 | | | 224,950 | | | | 227,008 | |
SEE NOTES TO FINANCIAL STATEMENTS. | THE GUGGENHEIM FUNDS SEMI-ANNUAL REPORT | 15 |
SCHEDULE OF INVESTMENTS (Unaudited)(continued) | March 31, 2024 |
ULTRA SHORT DURATION FUND | |
| | Face
Amount | | | Value | |
Venture XIV CLO Ltd. | | | | | | | | |
2020-14A ARR, 6.63% (3 Month Term SOFR + 1.29%, Rate Floor: 1.03%) due 08/28/29◊,2 | | $ | 72,453 | | | $ | 72,371 | |
Total Collateralized Loan Obligations | | | 130,595,869 | |
| | | | | | | | | |
Whole Business - 1.8% | | | | |
Domino’s Pizza Master Issuer LLC | | | | | | | | |
2018-1A, 4.33% due 07/25/482 | | | 4,254,275 | | | | 4,100,836 | |
Taco Bell Funding LLC | | | | | | | | |
2021-1A, 1.95% due 08/25/512 | | | 3,193,125 | | | | 2,888,282 | |
Wingstop Funding LLC | | | | | | | | |
2020-1A, 2.84% due 12/05/502 | | | 1,329,750 | | | | 1,206,799 | |
SERVPRO Master Issuer LLC | | | | | | | | |
2019-1A, 3.88% due 10/25/492 | | | 957,500 | | | | 908,116 | |
Total Whole Business | | | | | | | 9,104,033 | |
| | | | | | | | | |
Transport-Container - 1.7% | | | | |
Triton Container Finance VIII LLC | | | | | | | | |
2021-1A, 1.86% due 03/20/462 | | | 5,401,250 | | | | 4,739,249 | |
CLI Funding VIII LLC | | | | | | | | |
2021-1A, 1.64% due 02/18/462 | | | 2,207,756 | | | | 1,958,348 | |
Textainer Marine Containers VII Ltd. | | | | | | | | |
2021-1A, 1.68% due 02/20/462 | | | 1,582,000 | | | | 1,395,910 | |
2020-1A, 2.73% due 08/21/452 | | | 541,286 | | | | 506,003 | |
Total Transport-Container | | | 8,599,510 | |
| | | | | | | | | |
Net Lease - 1.6% | | | | | | | | |
Oak Street Investment Grade Net Lease Fund Series | | | | | | | | |
2020-1A, 1.85% due 11/20/502 | | | 6,385,610 | | | | 5,922,561 | |
CF Hippolyta Issuer LLC | | | | | | | | |
2021-1A, 1.98% due 03/15/612 | | | 2,120,507 | | | | 1,865,843 | |
Total Net Lease | | | | | | | 7,788,404 | |
| | | | | | | | | |
Financial - 0.5% | | | | | | | | |
Madison Avenue Secured Funding Trust | | | | | | | | |
2023-2, 7.17% (1 Month Term SOFR + 1.85%, Rate Floor: 1.85%) due 10/15/24◊,†††,2 | | | 1,800,000 | | | | 1,800,000 | |
Station Place Securitization Trust | | | | | | | | |
2023-SP1, 7.17% (1 Month Term SOFR + 1.85%, Rate Floor: 1.85%) due 10/15/24◊,†††,2 | | | 900,000 | | | | 900,000 | |
Total Financial | | | | | | | 2,700,000 | |
| | | | | | | | | |
Total Asset-Backed Securities | | | | |
(Cost $162,709,308) | | | 158,787,816 | |
| | | | | |
CORPORATE BONDS†† - 21.2% |
Financial -9.9% | | | | | | | | |
Athene Global Funding | | | | | | | | |
5.88% (SOFR Compounded Index + 0.56%) due 08/19/24◊,2 | | | 11,000,000 | | | | 11,006,715 | |
F&G Global Funding | | | | | | | | |
0.90% due 09/20/242 | | | 9,700,000 | | | | 9,464,938 | |
Macquarie Group Ltd. | | | | | | | | |
1.20% due 10/14/252,3 | | | 5,250,000 | | | | 5,118,981 | |
16 | THE GUGGENHEIM FUNDS SEMI-ANNUAL REPORT | SEE NOTES TO FINANCIAL STATEMENTS. |
SCHEDULE OF INVESTMENTS (Unaudited)(continued) | March 31, 2024 |
ULTRA SHORT DURATION FUND | |
| | Face
Amount | | | Value | |
Citigroup, Inc. | | | | | | | | |
6.03% (SOFR + 0.69%) due 01/25/26◊ | | $ | 2,550,000 | | | $ | 2,552,768 | |
Jackson National Life Global Funding | | | | | | | | |
1.75% due 01/12/252 | | | 2,600,000 | | | | 2,521,713 | |
Starwood Property Trust, Inc. | | | | | | | | |
3.75% due 12/31/242 | | | 2,550,000 | | | | 2,500,527 | |
Rocket Mortgage LLC / Rocket Mortgage Company-Issuer, Inc. | | | | | | | | |
2.88% due 10/15/262 | | | 2,650,000 | | | | 2,448,396 | |
Morgan Stanley Bank North America | | | | | | | | |
5.88% due 10/30/26 | | | 2,400,000 | | | | 2,446,268 | |
FS KKR Capital Corp. | | | | | | | | |
4.25% due 02/14/252 | | | 2,450,000 | | | | 2,409,775 | |
American Equity Investment Life Holding Co. | | | | | | | | |
5.00% due 06/15/27 | | | 2,150,000 | | | | 2,092,389 | |
Societe Generale S.A. | | | | | | | | |
5.52% due 01/19/282,3 | | | 1,300,000 | | | | 1,291,058 | |
GA Global Funding Trust | | | | | | | | |
1.63% due 01/15/262 | | | 1,300,000 | | | | 1,205,227 | |
OneMain Finance Corp. | | | | | | | | |
3.50% due 01/15/27 | | | 1,150,000 | | | | 1,067,545 | |
Brighthouse Financial Global Funding | | | | | | | | |
6.11% (SOFR + 0.76%) due 04/12/24◊,2 | | | 900,000 | | | | 900,082 | |
Peachtree Corners Funding Trust | | | | | | | | |
3.98% due 02/15/252 | | | 650,000 | | | | 637,663 | |
First American Financial Corp. | | | | | | | | |
4.60% due 11/15/24 | | | 500,000 | | | | 495,376 | |
Fidelity & Guaranty Life Holdings, Inc. | | | | | | | | |
5.50% due 05/01/252 | | | 400,000 | | | | 396,627 | |
Apollo Management Holdings, LP | | | | | | | | |
4.00% due 05/30/242 | | | 350,000 | | | | 348,964 | |
Total Financial | | | | | | | 48,905,012 | |
| | | | | | | | | |
Industrial - 3.9% | | | | | | | | |
Ryder System, Inc. | | | | | | | | |
3.35% due 09/01/25 | | | 4,820,000 | | | | 4,681,832 | |
IP Lending V Ltd. | | | | | | | | |
5.13% due 04/02/26†††,2 | | | 4,700,000 | | | | 4,543,960 | |
TD SYNNEX Corp. | | | | | | | | |
1.25% due 08/09/24 | | | 2,400,000 | | | | 2,361,079 | |
Silgan Holdings, Inc. | | | | | | | | |
1.40% due 04/01/262 | | | 2,350,000 | | | | 2,152,500 | |
Vontier Corp. | | | | | | | | |
1.80% due 04/01/26 | | | 2,150,000 | | | | 1,995,247 | |
Jabil, Inc. | | | | | | | | |
1.70% due 04/15/26 | | | 650,000 | | | | 603,358 | |
4.25% due 05/15/27 | | | 600,000 | | | | 581,464 | |
Berry Global, Inc. | | | | | | | | |
1.65% due 01/15/27 | | | 1,100,000 | | | | 998,581 | |
Penske Truck Leasing Company LP / PTL Finance Corp. | | | | | | | | |
2.70% due 11/01/242 | | | 900,000 | | | | 884,054 | |
Weir Group plc | | | | | | | | |
2.20% due 05/13/262 | | | 440,000 | | | | 408,425 | |
Total Industrial | | | | | | | 19,210,500 | |
| | | | | | | | | |
Consumer, Non-cyclical - 3.1% | | | | |
Element Fleet Management Corp. | | | | | | | | |
1.60% due 04/06/242 | | | 4,900,000 | | | | 4,897,438 | |
6.27% due 06/26/262 | | | 1,200,000 | | | | 1,214,004 | |
Global Payments, Inc. | | | | | | | | |
1.50% due 11/15/24 | | | 5,700,000 | | | | 5,554,981 | |
Triton Container International Ltd. | | | | | | | | |
2.05% due 04/15/262 | | | 2,200,000 | | | | 2,027,227 | |
1.15% due 06/07/242 | | | 1,700,000 | | | | 1,684,766 | |
Total Consumer, Non-cyclical | | | 15,378,416 | |
| | | | | | | | | |
SEE NOTES TO FINANCIAL STATEMENTS. | THE GUGGENHEIM FUNDS SEMI-ANNUAL REPORT | 17 |
SCHEDULE OF INVESTMENTS (Unaudited)(continued) | March 31, 2024 |
ULTRA SHORT DURATION FUND | |
| | Face
Amount | | | Value | |
Consumer, Cyclical - 1.8% | | | | |
Warnermedia Holdings, Inc. | | | | | | | | |
3.64% due 03/15/25 | | $ | 5,700,000 | | | $ | 5,586,749 | |
Hyatt Hotels Corp. | | | | | | | | |
1.80% due 10/01/24 | | | 3,500,000 | | | | 3,426,348 | |
Total Consumer, Cyclical | | | 9,013,097 | |
| | | | | | | | | |
Technology - 1.2% | | | | | | | | |
CDW LLC / CDW Finance Corp. | | | | | | | | |
2.67% due 12/01/26 | | | 4,300,000 | | | | 3,992,883 | |
Qorvo, Inc. | | | | | | | | |
1.75% due 12/15/24 | | | 2,050,000 | | | | 1,989,375 | |
Total Technology | | | | | | | 5,982,258 | |
| | | | | | | | | |
Communications - 1.0% | | | | |
Rogers Communications, Inc. | | | | | | | | |
2.95% due 03/15/25 | | | 2,400,000 | | | | 2,339,565 | |
T-Mobile USA, Inc. | | | | | | | | |
2.63% due 04/15/26 | | | 1,600,000 | | | | 1,519,837 | |
2.25% due 02/15/26 | | | 600,000 | | | | 567,755 | |
Cogent Communications Group, Inc. | | | | | | | | |
3.50% due 05/01/262 | | | 434,000 | | | | 413,112 | |
Sprint Spectrum Company LLC / Sprint Spectrum Co II LLC / Sprint Spectrum Co III LLC | | | | | | | | |
4.74% due 03/20/252 | | | 225,000 | | | | 223,760 | |
Total Communications | | | | | | | 5,064,029 | |
| | | | | | | | | |
Basic Materials - 0.2% | | | | |
International Flavors & Fragrances, Inc. | | | | | | | | |
1.23% due 10/01/252 | | | 540,000 | | | | 505,440 | |
Anglo American Capital plc | | | | | | | | |
5.38% due 04/01/252 | | | 450,000 | | | | 446,811 | |
Total Basic Materials | | | | | | | 952,251 | |
| | | | | | | | | |
Utilities - 0.1% | | | | | | | | |
AES Corp. | | | | | | | | |
3.30% due 07/15/252 | | | 300,000 | | | | 290,620 | |
NRG Energy, Inc. | | | | | | | | |
3.75% due 06/15/242 | | | 275,000 | | | | 273,540 | |
Total Utilities | | | | | | | 564,160 | |
| | | | | | | | | |
Total Corporate Bonds | | | | |
(Cost $108,351,677) | | | 105,069,723 | |
| | | | | |
COLLATERALIZED MORTGAGE OBLIGATIONS†† - 20.8% |
Residential Mortgage-Backed Securities - 15.7% |
CSMC Trust | | | | | | | | |
2021-RPL1, 4.04% (WAC) due 09/27/60◊,2 | | | 4,743,782 | | | | 4,580,944 | |
2021-RPL7, 1.93% (WAC) due 07/27/61◊,2 | | | 2,071,435 | | | | 1,982,332 | |
2020-RPL5, 4.68% (WAC) due 08/25/60◊,2 | | | 1,756,677 | | | | 1,740,024 | |
2021-RPL4, 1.80% (WAC) due 12/27/60◊,2 | | | 1,222,623 | | | | 1,185,425 | |
2020-NQM1, 1.21% due 05/25/652,4 | | | 972,386 | | | | 881,474 | |
BRAVO Residential Funding Trust | | | | | | | | |
2021-C, 1.62% due 03/01/612,4 | | | 7,036,927 | | | | 6,653,065 | |
2022-R1, 3.13% due 01/29/702,4 | | | 2,825,516 | | | | 2,645,644 | |
2021-HE1, 6.17% (30 Day Average SOFR + 0.85%, Rate Floor: 0.00%) due 01/25/70◊,2 | | | 638,619 | | | | 637,130 | |
2021-HE2, 6.17% (30 Day Average SOFR + 0.85%, Rate Floor: 0.00%) due 11/25/69◊,2 | | | 289,651 | | | | 287,201 | |
PRPM LLC | | | | | | | | |
2021-5, 1.79% due 06/25/262,4 | | | 3,106,877 | | | | 3,037,903 | |
18 | THE GUGGENHEIM FUNDS SEMI-ANNUAL REPORT | SEE NOTES TO FINANCIAL STATEMENTS. |
SCHEDULE OF INVESTMENTS (Unaudited)(continued) | March 31, 2024 |
ULTRA SHORT DURATION FUND | |
| | Face
Amount | | | Value | |
2022-1, 3.72% due 02/25/272,4 | | $ | 2,981,395 | | | $ | 2,895,779 | |
2021-RPL2, 2.24% (WAC) due 10/25/51◊,2 | | | 2,000,000 | | | | 1,660,944 | |
2021-8, 1.74% (WAC) due 09/25/26◊,2 | | | 1,549,692 | | | | 1,488,047 | |
NYMT Loan Trust | | | | | | | | |
2021-SP1, 1.67% due 08/25/612,4 | | | 6,969,910 | | | | 6,653,569 | |
2022-SP1, 5.25% due 07/25/622,4 | | | 1,728,736 | | | | 1,686,881 | |
Legacy Mortgage Asset Trust | | | | | | | | |
2021-GS4, 1.65% due 11/25/602,4 | | | 2,983,104 | | | | 2,885,207 | |
2021-GS3, 1.75% due 07/25/612,4 | | | 2,905,347 | | | | 2,809,232 | |
2021-GS2, 1.75% due 04/25/612,4 | | | 1,335,599 | | | | 1,294,320 | |
2021-GS5, 2.25% due 07/25/672,4 | | | 900,511 | | | | 868,865 | |
Verus Securitization Trust | | | | | | | | |
2021-5, 1.37% (WAC) due 09/25/66◊,2 | | | 1,939,411 | | | | 1,606,823 | |
2021-6, 1.89% (WAC) due 10/25/66◊,2 | | | 1,722,667 | | | | 1,438,680 | |
2020-5, 1.22% due 05/25/652,4 | | | 1,335,728 | | | | 1,250,914 | |
2021-4, 1.35% (WAC) due 07/25/66◊,2 | | | 942,390 | | | | 745,500 | |
2021-3, 1.44% (WAC) due 06/25/66◊,2 | | | 557,784 | | | | 458,044 | |
2019-4, 3.85% due 11/25/592 | | | 343,678 | | | | 332,773 | |
2020-1, 3.42% due 01/25/602 | | | 260,743 | | | | 248,527 | |
2019-4, 3.64% due 11/25/592 | | | 170,328 | | | | 164,804 | |
OSAT Trust | | | | | | | | |
2021-RPL1, 2.12% due 05/25/652,4 | | | 6,214,776 | | | | 6,050,875 | |
Imperial Fund Mortgage Trust | | | | | | | | |
2022-NQM2, 4.02% (WAC) due 03/25/67◊,2 | | | 4,046,840 | | | | 3,710,028 | |
Towd Point Revolving Trust | | | | | | | | |
4.83% due 09/25/645 | | | 3,250,000 | | | | 3,232,125 | |
CFMT LLC | | | | | | | | |
2022-HB9, 3.25% (WAC) due 09/25/37◊ | | | 2,186,955 | | | | 2,091,833 | |
Structured Asset Securities Corporation Mortgage Loan Trust | | | | | | | | |
2008-BC4, 6.07% (1 Month Term SOFR + 0.74%, Rate Floor: 0.63%) due 11/25/37◊ | | | 1,732,198 | | | | 1,641,772 | |
New Residential Mortgage Loan Trust | | | | | | | | |
2019-1A, 3.50% (WAC) due 10/25/59◊,2 | | | 998,568 | | | | 920,489 | |
2018-2A, 3.50% (WAC) due 02/25/58◊,2 | | | 576,502 | | | | 535,534 | |
CSMC | | | | | | | | |
2021-NQM8, 2.41% (WAC) due 10/25/66◊,2 | | | 1,514,750 | | | | 1,279,957 | |
Angel Oak Mortgage Trust | | | | | | | | |
2022-1, 3.29% (WAC) due 12/25/66◊,2 | | | 1,395,071 | | | | 1,209,415 | |
Soundview Home Loan Trust | | | | | | | | |
2006-OPT5, 5.72% (1 Month Term SOFR + 0.39%, Rate Floor: 0.28%) due 07/25/36◊ | | | 1,045,914 | | | | 989,008 | |
SEE NOTES TO FINANCIAL STATEMENTS. | THE GUGGENHEIM FUNDS SEMI-ANNUAL REPORT | 19 |
SCHEDULE OF INVESTMENTS (Unaudited)(continued) | March 31, 2024 |
ULTRA SHORT DURATION FUND | |
| | Face
Amount | | | Value | |
Credit Suisse Mortgage Capital Certificates | | | | | | | | |
2021-RPL9, 2.44% (WAC) due 02/25/61◊,2 | | $ | 781,546 | | | $ | 754,867 | |
Towd Point Mortgage Trust | | | | | | | | |
2018-2, 3.25% (WAC) due 03/25/58◊,2 | | | 339,316 | | | | 328,218 | |
2017-6, 2.75% (WAC) due 10/25/57◊,2 | | | 293,616 | | | | 282,925 | |
2017-5, 6.04% (1 Month Term SOFR + 0.71%, Rate Floor: 0.00%) due 02/25/57◊,2 | | | 77,510 | | | | 78,760 | |
Ellington Financial Mortgage Trust | | | | | | | | |
2020-2, 1.49% (WAC) due 10/25/65◊,2 | | | 337,684 | | | | 301,245 | |
2020-2, 1.64% (WAC) due 10/25/65◊,2 | | | 196,987 | | | | 178,229 | |
Argent Securities Incorporated Asset-Backed Pass-Through Certificates Series | | | | | | | | |
2005-W2, 6.18% (1 Month Term SOFR + 0.85%, Rate Floor: 0.74%) due 10/25/35◊ | | | 413,321 | | | | 402,668 | |
SG Residential Mortgage Trust | | | | | | | | |
2022-1, 3.68% (WAC) due 03/27/62◊,2 | | | 434,909 | | | | 389,704 | |
Morgan Stanley ABS Capital I Incorporated Trust | | | | | | | | |
2006-NC1, 6.01% (1 Month Term SOFR + 0.68%, Rate Floor: 0.57%) due 12/25/35◊ | | | 332,352 | | | | 327,988 | |
Banc of America Funding Trust | | | | | | | | |
2015-R2, 5.70% (1 Month Term SOFR + 0.37%, Rate Floor: 0.26%) due 04/29/37◊,2 | | | 318,702 | | | | 314,009 | |
Residential Mortgage Loan Trust | | | | | | | | |
2020-1, 2.38% (WAC) due 01/26/60◊,2 | | | 307,929 | | | | 293,424 | |
GS Mortgage-Backed Securities Trust | | | | | | | | |
2020-NQM1, 1.38% (WAC) due 09/27/60◊,2 | | | 285,732 | | | | 261,460 | |
Cascade Funding Mortgage Trust | | | | | | | | |
2019-RM3, 2.80% (WAC) due 06/25/69◊,5 | | | 56,057 | | | | 54,802 | |
Starwood Mortgage Residential Trust | | | | | | | | |
2020-1, 2.28% (WAC) due 02/25/50◊,2 | | | 46,816 | | | | 43,167 | |
Total Residential Mortgage-Backed Securities | | | 77,792,553 | |
| | | | | | | | | |
Commercial Mortgage-Backed Securities - 5.1% |
BX Commercial Mortgage Trust | | | | | | | | |
2021-VOLT, 7.09% (1 Month Term SOFR + 1.76%, Rate Floor: 1.65%) due 09/15/36◊,2 | | | 10,250,000 | | | | 10,099,913 | |
2022-LP2, 6.89% (1 Month Term SOFR + 1.56%, Rate Floor: 1.56%) due 02/15/39◊,2 | | | 2,133,468 | | | | 2,112,273 | |
20 | THE GUGGENHEIM FUNDS SEMI-ANNUAL REPORT | SEE NOTES TO FINANCIAL STATEMENTS. |
SCHEDULE OF INVESTMENTS (Unaudited)(continued) | March 31, 2024 |
ULTRA SHORT DURATION FUND | |
| | Face
Amount | | | Value | |
JP Morgan Chase Commercial Mortgage Securities Trust | | | | | | | | |
2021-NYAH, 6.97% (1 Month Term SOFR + 1.65%, Rate Floor: 1.54%) due 06/15/38◊,2 | | $ | 2,700,000 | | | $ | 2,496,324 | |
Life Mortgage Trust | | | | | | | | |
2021-BMR, 6.54% (1 Month Term SOFR + 1.21%, Rate Floor: 1.10%) due 03/15/38◊,2 | | | 2,408,277 | | | | 2,375,916 | |
WMRK Commercial Mortgage Trust | | | | | | | | |
2022-WMRK, 8.76% (1 Month Term SOFR + 3.44%, Rate Floor: 3.44%) due 11/15/27◊,2 | | | 2,100,000 | | | | 2,107,223 | |
BXHPP Trust | | | | | | | | |
2021-FILM, 6.54% (1 Month Term SOFR + 1.21%, Rate Floor: 1.10%) due 08/15/36◊,2 | | | 1,500,000 | | | | 1,402,341 | |
MHP | | | | | | | | |
2022-MHIL, 6.59% (1 Month Term SOFR + 1.26%, Rate Floor: 1.26%) due 01/15/27◊,2 | | | 1,367,421 | | | | 1,351,183 | |
Morgan Stanley Capital I Trust | | | | | | | | |
2018-H3, 0.80% (WAC) due 07/15/51◊,6 | | | 38,567,485 | | | | 1,022,656 | |
Citigroup Commercial Mortgage Trust | | | | | | | | |
2019-GC41, 1.04% (WAC) due 08/10/56◊,6 | | | 24,507,419 | | | | 895,550 | |
BENCHMARK Mortgage Trust | | | | | | | | |
2019-B14, 0.77% (WAC) due 12/15/62◊,6 | | | 34,310,041 | | | | 859,837 | |
JPMDB Commercial Mortgage Securities Trust | | | | | | | | |
2018-C8, 0.61% (WAC) due 06/15/51◊,6 | | | 21,007,457 | | | | 370,998 | |
Total Commercial Mortgage-Backed Securities | | | 25,094,214 | |
| | | | | | | | | |
Total Collateralized Mortgage Obligations | | | | |
(Cost $108,452,711) | | | 102,886,767 | |
| | | | | |
SENIOR FLOATING RATE INTERESTS††,◊ - 0.4% |
Industrial - 0.3% | | | | | | | | |
Mileage Plus Holdings LLC | | | | | | | | |
10.73% (3 Month Term SOFR + 5.25%, Rate Floor: 6.25%) due 06/21/27 | | | 1,430,000 | | | | 1,470,783 | |
| | | | | | | | | |
Consumer, Non-cyclical - 0.1% | | | | |
Outcomes Group Holdings, Inc. | | | | | | | | |
8.69% (1 Month Term SOFR + 3.25%, Rate Floor: 4.25%) due 10/24/25 | | | 292,038 | | | | 291,542 | |
Total Senior Floating Rate Interests | | | | |
(Cost $1,769,540) | | | 1,762,325 | |
| | | | | | | | | |
Total Investments - 100.7% | | | | |
(Cost $511,623,127) | | $ | 498,846,522 | |
Other Assets & Liabilities, net - (0.7)% | | | (3,271,039 | ) |
Total Net Assets - 100.0% | | $ | 495,575,483 | |
SEE NOTES TO FINANCIAL STATEMENTS. | THE GUGGENHEIM FUNDS SEMI-ANNUAL REPORT | 21 |
SCHEDULE OF INVESTMENTS (Unaudited)(continued) | March 31, 2024 |
ULTRA SHORT DURATION FUND | |
Centrally Cleared Interest Rate Swap Agreements†† |
Counterparty | Exchange | Floating
Rate Type | Floating Rate Index | Fixed
Rate | Payment
Frequency |
BofA Securities, Inc. | CME | Receive | U.S. Secured Overnight Financing Rate | 1.10% | Annually |
Counterparty | | Maturity
Date | | | Notional
Amount | | | Value | | | Upfront
Premiums Paid
(Received) | | | Unrealized
Appreciation** | |
BofA Securities, Inc. | 01/10/25 | | $ | 61,000,000 | | | $ | 1,895,532 | | | $ | 74 | | | $ | 1,895,458 | |
** | Includes cumulative appreciation (depreciation). Variation margin is reported within the Statement of Assets and Liabilities. |
† | Value determined based on Level 1 inputs — See Note 4. |
†† | Value determined based on Level 2 inputs, unless otherwise noted — See Note 4. |
††† | Value determined based on Level 3 inputs — See Note 4. |
◊ | Variable rate security. Rate indicated is the rate effective at March 31, 2024. In some instances, the effective rate is limited by a minimum rate floor or a maximum rate cap established by the issuer. The settlement status of a position may also impact the effective rate indicated. In some cases, a position may be unsettled at period end and may not have a stated effective rate. In instances where multiple underlying reference rates and spread amounts are shown, the effective rate is based on a weighted average. |
1 | Rate indicated is the 7-day yield as of March 31, 2024. |
2 | Security is a 144A or Section 4(a)(2) security. These securities have been determined to be liquid under guidelines established by the Board of Trustees. The total market value of 144A or Section 4(a)(2) securities is $310,001,669 (cost $320,320,214), or 62.6% of total net assets. |
3 | Security has a fixed rate coupon which will convert to a floating or variable rate coupon on a future date. |
4 | Security is a step up/down bond. The coupon increases or decreases at regular intervals until the bond reaches full maturity. Rate indicated is the rate at March 31, 2024. See table below for additional step information for each security. |
5 | Security is a 144A or Section 4(a)(2) security. These securities have been determined to be illiquid and restricted under guidelines established by the Board of Trustees. The total market value of 144A or Section 4(a)(2) illiquid and restricted securities is $3,286,927 (cost $3,306,054), or 0.7% of total net assets — See Note 8. |
6 | Security is an interest-only strip. |
| | BofA — Bank of America |
| | CME — Chicago Mercantile Exchange |
| | plc — Public Limited Company |
| | SOFR — Secured Overnight Financing Rate |
| | WAC — Weighted Average Coupon |
| | |
| | See Sector Classification in Other Information section. |
22 | THE GUGGENHEIM FUNDS SEMI-ANNUAL REPORT | SEE NOTES TO FINANCIAL STATEMENTS. |
SCHEDULE OF INVESTMENTS (Unaudited)(continued) | March 31, 2024 |
ULTRA SHORT DURATION FUND | |
The following table summarizes the inputs used to value the Fund’s investments at March 31, 2024 (See Note 4 in the Notes to Financial Statements):
Investments in Securities (Assets) | | Level 1
Quoted
Prices | | | Level 2
Significant
Observable
Inputs | | | Level 3
Significant
Unobservable
Inputs | | | Total | |
Money Market Funds | | $ | 130,339,891 | | | $ | — | | | $ | — | | | $ | 130,339,891 | |
Asset-Backed Securities | | | — | | | | 156,087,816 | | | | 2,700,000 | | | | 158,787,816 | |
Corporate Bonds | | | — | | | | 100,525,763 | | | | 4,543,960 | | | | 105,069,723 | |
Collateralized Mortgage Obligations | | | — | | | | 102,886,767 | | | | — | | | | 102,886,767 | |
Senior Floating Rate Interests | | | — | | | | 1,762,325 | | | | — | | | | 1,762,325 | |
Interest Rate Swap Agreements** | | | — | | | | 1,895,458 | | | | — | | | | 1,895,458 | |
Total Assets | | $ | 130,339,891 | | | $ | 363,158,129 | | | $ | 7,243,960 | | | $ | 500,741,980 | |
** | This derivative is reported as unrealized appreciation/depreciation at period end. |
The following is a summary of significant unobservable inputs used in the fair valuation of assets and liabilities categorized within Level 3 of the fair value hierarchy:
Category | | Ending
Balance at
March 31,
2024 | | | Valuation
Technique | | | Unobservable
Inputs | | | Input
Range | | | Weighted
Average* | |
Assets: | | | | | | | | | | | | | | | | | | | | |
Asset-Backed Securities | | $ | 2,700,000 | | Third Party Pricing | Broker Quote | — | — |
Corporate Bonds | | | 4,543,960 | | Third Party Pricing | Broker Quote | — | — |
Total Assets | | $ | 7,243,960 | | | | | |
Significant changes in a quote would generally result in significant changes in the fair value of the security.
The Fund’s fair valuation leveling guidelines classify a single daily broker quote, or a vendor price based on a single daily or monthly broker quote, as Level 3, if such a quote or price cannot be supported with other available market information.
Transfers between Level 2 and Level 3 may occur as markets fluctuate and/or the availability of data used in an investment’s valuation changes. For the period ended March 31, 2024, the Fund had no securities transfer between levels.
SEE NOTES TO FINANCIAL STATEMENTS. | THE GUGGENHEIM FUNDS SEMI-ANNUAL REPORT | 23 |
SCHEDULE OF INVESTMENTS (Unaudited)(concluded) | March 31, 2024 |
ULTRA SHORT DURATION FUND | |
Summary of Fair Value Level 3 Activity
Following is a reconciliation of Level 3 assets for which significant unobservable inputs were used to determine fair value for the period ended March 31, 2024:
| | | Assets | | | | | |
| | Asset-Backed
Securities | | | Corporate
Bonds | | | Total Assets | |
Beginning Balance | | $ | 10,600,000 | | | $ | 4,371,000 | | | $ | 14,971,000 | |
Purchases/(Receipts) | | | 2,700,000 | | | | — | | | | 2,700,000 | |
(Sales, maturities and paydowns)/Fundings | | | (10,600,000 | ) | | | — | | | | (10,600,000 | ) |
Total change in unrealized appreciation (depreciation) included in earnings | | | — | | | | 172,960 | | | | 172,960 | |
Ending Balance | | $ | 2,700,000 | | | $ | 4,543,960 | | | $ | 7,243,960 | |
Net change in unrealized appreciation (depreciation) for investments in Level 3 securities still held at March 31, 2024 | | $ | — | | | $ | 172,960 | | | $ | 172,960 | |
24 | THE GUGGENHEIM FUNDS SEMI-ANNUAL REPORT | SEE NOTES TO FINANCIAL STATEMENTS. |
SCHEDULE OF INVESTMENTS (Unaudited)(concluded) | March 31, 2024 |
ULTRA SHORT DURATION FUND | |
Step Coupon Bonds
The following table discloses additional information related to step coupon bonds held by the Fund. Certain securities are subject to multiple rate changes prior to maturity. For those securities, a range of rates and corresponding dates have been provided. Rates for all step coupon bonds held by the Fund are scheduled to increase, none are scheduled to decrease.
Name | | Coupon Rate at
Next Reset Date | | | Next Rate
Reset Date | | | Future
Reset Rate(s) | | | Future
Reset Date(s) | |
BRAVO Residential Funding Trust 2022-R1, 3.13% due 01/29/70 | | | 6.13 | % | | | 01/30/25 | | | | — | | | | — | |
BRAVO Residential Funding Trust 2021-C, 1.62% due 03/01/61 | | | 4.62 | % | | | 09/25/24 | | | | 5.62 | % | | | 09/25/25 | |
CSMC Trust 2020-NQM1, 1.21% due 05/25/65 | | | 2.21 | % | | | 09/26/24 | | | | — | | | | — | |
Legacy Mortgage Asset Trust 2021-GS3, 1.75% due 07/25/61 | | | 4.75 | % | | | 05/25/24 | | | | 5.75 | % | | | 05/25/25 | |
Legacy Mortgage Asset Trust 2021-GS4, 1.65% due 11/25/60 | | | 4.65 | % | | | 08/25/24 | | | | 5.65 | % | | | 08/25/25 | |
Legacy Mortgage Asset Trust 2021-GS5, 2.25% due 07/25/67 | | | 5.25 | % | | | 11/25/24 | | | | 6.25 | % | | | 11/25/25 | |
Legacy Mortgage Asset Trust 2021-GS2, 1.75% due 04/25/61 | | | 4.75 | % | | | 04/25/24 | | | | 5.75 | % | | | 04/25/25 | |
NYMT Loan Trust 2021-SP1, 1.67% due 08/25/61 | | | 4.67 | % | | | 08/01/24 | | | | 5.67 | % | | | 08/01/25 | |
NYMT Loan Trust 2022-SP1, 5.25% due 07/25/62 | | | 8.25 | % | | | 07/01/25 | | | | 9.25 | % | | | 07/01/26 | |
OSAT Trust 2021-RPL1, 2.12% due 05/25/65 | | | 5.12 | % | | | 06/25/24 | | | | 6.12 | % | | | 06/25/25 | |
PRPM LLC 2022-1, 3.72% due 02/25/27 | | | 6.72 | % | | | 02/25/25 | | | | 7.72 | % | | | 02/25/26 | |
PRPM LLC 2021-5, 1.79% due 06/25/26 | | | 4.79 | % | | | 06/25/24 | | | | 5.79 | % | | | 06/25/25 | |
Verus Securitization Trust 2020-5, 1.22% due 05/25/65 | | | 2.22 | % | | | 10/26/24 | | | | — | | | | — | |
SEE NOTES TO FINANCIAL STATEMENTS. | THE GUGGENHEIM FUNDS SEMI-ANNUAL REPORT | 25 |
STATEMENT OF ASSETS AND LIABILITIES (Unaudited) |
ULTRA SHORT DURATION FUND |
March 31, 2024
Assets: |
Investments, at value (cost $511,623,127) | | $ | 498,846,522 | |
Unamortized upfront premiums paid on interest rate swap agreements | | | 74 | |
Prepaid expenses | | | 42,183 | |
Receivables: |
Interest | | | 2,446,652 | |
Variation margin on interest rate swap agreements | | | 594,065 | |
Fund shares sold | | | 437,015 | |
Total assets | | | 502,366,511 | |
| | | | | |
Liabilities: |
Due to custodian bank | | | 4,719,481 | |
Segregated cash due to broker | | | 156,361 | |
Payable for: |
Fund shares redeemed | | | 1,306,881 | |
Distributions to shareholders | | | 350,212 | |
Management fees | | | 99,451 | |
Transfer agent fees | | | 44,712 | |
Distribution and service fees | | | 16,748 | |
Fund accounting and administration fees | | | 16,582 | |
Trustees’ fees* | | | 2,138 | |
Due to Investment Adviser | | | 151 | |
Miscellaneous | | | 78,311 | |
Total liabilities | | | 6,791,028 | |
Net assets | | $ | 495,575,483 | |
| | | | | |
Net assets consist of: |
Paid in capital | | $ | 512,100,027 | |
Total distributable earnings (loss) | | | (16,524,544 | ) |
Net assets | | $ | 495,575,483 | |
| | | | | |
Class A: |
Net assets | | $ | 78,963,624 | |
Capital shares outstanding | | | 7,967,340 | |
Net asset value per share | | $ | 9.91 | |
| | | | | |
Institutional Class: |
Net assets | | $ | 416,611,859 | |
Capital shares outstanding | | | 42,041,672 | |
Net asset value per share | | $ | 9.91 | |
* | Relates to Trustees not deemed “interested persons” within the meaning of Section 2(a)(19) of the 1940 Act. |
26 | THE GUGGENHEIM FUNDS SEMI-ANNUAL REPORT | SEE NOTES TO FINANCIAL STATEMENTS. |
STATEMENT OF OPERATIONS (Unaudited) |
ULTRA SHORT DURATION FUND |
Six Months Ended March 31, 2024
Investment Income: |
Interest | | $ | 12,702,909 | |
Total investment income | | | 12,702,909 | |
| | | | | |
Expenses: |
Management fees | | | 631,306 | |
Distribution and service fees: |
Class A | | | 107,784 | |
Transfer agent fees | | | 6,001 | |
Transfer agent/maintenance fees: |
Class A | | | 21,097 | |
Institutional Class | | | 47,920 | |
Fund accounting/administration fees | | | 80,251 | |
Professional fees | | | 48,567 | |
Custodian fees | | | 17,792 | |
Line of credit fees | | | 11,377 | |
Trustees’ fees* | | | 10,522 | |
Miscellaneous | | | 29,855 | |
Recoupment of previously waived fees: |
Class A | | | 155 | |
Institutional Class | | | 278 | |
Total expenses | | | 1,012,905 | |
Less: |
Class A | | | (17,438 | ) |
Institutional Class | | | (31,273 | ) |
Expenses waived by Adviser | | | (8,286 | ) |
Earnings credits applied | | | (1,126 | ) |
Total waived/reimbursed expenses | | | (58,123 | ) |
Net expenses | | | 954,782 | |
Net investment income | | | 11,748,127 | |
| | | | | |
Net Realized and Unrealized Gain (Loss): |
Net realized gain (loss) on: |
Investments | | $ | (64,552 | ) |
Swap agreements | | | 1,384,934 | |
Net realized gain | | | 1,320,382 | |
Net change in unrealized appreciation (depreciation) on: |
Investments | | | 10,376,449 | |
Swap agreements | | | (1,272,547 | ) |
Net change in unrealized appreciation (depreciation) | | | 9,103,902 | |
Net realized and unrealized gain | | | 10,424,384 | |
Net increase in net assets resulting from operations | | $ | 22,172,411 | |
* | Relates to Trustees not deemed “interested persons” within the meaning of Section 2(a)(19) of the 1940 Act. |
SEE NOTES TO FINANCIAL STATEMENTS. | THE GUGGENHEIM FUNDS SEMI-ANNUAL REPORT | 27 |
STATEMENTS OF CHANGES IN NET ASSETS |
ULTRA SHORT DURATION FUND |
| | Six Months Ended
March 31, 2024
(Unaudited) | | | Year Ended
September 30,
2023 | |
Increase (Decrease) in Net Assets from Operations: | | | | | | | | |
Net investment income | | $ | 11,748,127 | | | $ | 22,666,036 | |
Net realized gain on investments | | | 1,320,382 | | | | 1,202,006 | |
Net change in unrealized appreciation (depreciation) on investments | | | 9,103,902 | | | | 12,420,237 | |
Net increase in net assets resulting from operations | | | 22,172,411 | | | | 36,288,279 | |
| | | | | | | | | |
Distributions to shareholders: | | | | | | | | |
Class A | | | (2,320,235 | ) | | | (4,918,176 | ) |
Institutional Class | | | (11,754,495 | ) | | | (21,914,210 | ) |
Total distributions to shareholders | | | (14,074,730 | ) | | | (26,832,386 | ) |
| | | | | | | | | |
Capital share transactions: | | | | | | | | |
Proceeds from sale of shares | | | | | | | | |
Class A | | | 2,177,320 | | | | 10,686,656 | |
Institutional Class | | | 51,458,918 | | | | 119,682,982 | |
Distributions reinvested | | | | | | | | |
Class A | | | 2,281,462 | | | | 4,830,340 | |
Institutional Class | | | 9,357,331 | | | | 17,231,019 | |
Cost of shares redeemed | | | | | | | | |
Class A | | | (23,215,100 | ) | | | (53,521,575 | ) |
Institutional Class | | | (70,163,103 | ) | | | (342,903,679 | ) |
Net decrease from capital share transactions | | | (28,103,172 | ) | | | (243,994,257 | ) |
Net decrease in net assets | | | (20,005,491 | ) | | | (234,538,364 | ) |
| | | | | | | | | |
Net assets: | | | | | | | | |
Beginning of period | | | 515,580,974 | | | | 750,119,338 | |
End of period | | $ | 495,575,483 | | | $ | 515,580,974 | |
| | | | | | | | | |
Capital share activity: | | | | | | | | |
Shares sold | | | | | | | | |
Class A | | | 221,122 | | | | 1,102,052 | |
Institutional Class | | | 5,237,806 | | | | 12,352,609 | |
Shares issued from reinvestment of distributions | | | | | | | | |
Class A | | | 231,915 | | | | 497,546 | |
Institutional Class | | | 950,979 | | | | 1,775,408 | |
Shares redeemed | | | | | | | | |
Class A | | | (2,363,296 | ) | | | (5,533,062 | ) |
Institutional Class | | | (7,134,567 | ) | | | (35,519,480 | ) |
Net decrease in shares | | | (2,856,041 | ) | | | (25,324,927 | ) |
28 | THE GUGGENHEIM FUNDS SEMI-ANNUAL REPORT | SEE NOTES TO FINANCIAL STATEMENTS. |
FINANCIAL HIGHLIGHTS |
ULTRA SHORT DURATION FUND |
This table is presented to show selected data for a share outstanding throughout each period and to assist shareholders in evaluating a Fund’s performance for the periods presented.
Class A | | Six Months Ended
March 31, 2024a | | | Year
Ended
Sept. 30,
2023 | | | Year
Ended
Sept. 30,
2022 | | | Year
Ended
Sept. 30,
2021 | | | Year
Ended
Sept. 30,
2020 | | | Period
Ended
Sept. 30,
2019b | |
Per Share Data |
Net asset value, beginning of period | | $ | 9.75 | | | $ | 9.60 | | | $ | 9.97 | | | $ | 9.98 | | | $ | 9.97 | | | $ | 10.00 | |
Income (loss) from investment operations: |
Net investment income (loss)c | | | .22 | | | | .37 | | | | .12 | | | | .06 | | | | .12 | | | | .17 | |
Net gain (loss) on investments (realized and unrealized) | | | .20 | | | | .23 | | | | (.37 | ) | | | — | | | | .03 | | | | .02 | i |
Total from investment operations | | | .42 | | | | .60 | | | | (.25 | ) | | | .06 | | | | .15 | | | | .19 | |
Less distributions from: |
Net investment income | | | (.26 | ) | | | (.45 | ) | | | (.12 | ) | | | (.07 | ) | | | (.14 | ) | | | (.21 | ) |
Net realized gains | | | — | | | | — | | | | — | | | | — | | | | — | | | | (.01 | ) |
Total distributions | | | (.26 | ) | | | (.45 | ) | | | (.12 | ) | | | (.07 | ) | | | (.14 | ) | | | (.22 | ) |
Net asset value, end of period | | $ | 9.91 | | | $ | 9.75 | | | $ | 9.60 | | | $ | 9.97 | | | $ | 9.98 | | | $ | 9.97 | |
|
Total Returnd | | | 4.37 | % | | | 6.32 | % | | | (2.49 | %) | | | 0.62 | % | | | 1.52 | % | | | 1.89 | % |
Ratios/Supplemental Data |
Net assets, end of period (in thousands) | | $ | 78,964 | | | $ | 96,348 | | | $ | 132,518 | | | $ | 188,416 | | | $ | 62,956 | | | $ | 31,154 | |
Ratios to average net assets: |
Net investment income (loss) | | | 4.45 | % | | | 3.80 | % | | | 1.18 | % | | | 0.63 | % | | | 1.20 | % | | | 2.05 | % |
Total expensese | | | 0.63 | % | | | 0.68 | % | | | 0.65 | % | | | 0.63 | % | | | 0.65 | % | | | 0.61 | % |
Net expensesf,g,h | | | 0.59 | % | | | 0.59 | % | | | 0.59 | % | | | 0.59 | % | | | 0.61 | % | | | 0.58 | % |
Portfolio turnover rate | | | 1 | % | | | 2 | % | | | 24 | % | | | 122 | % | | | 129 | % | | | 55 | % |
SEE NOTES TO FINANCIAL STATEMENTS. | THE GUGGENHEIM FUNDS SEMI-ANNUAL REPORT | 29 |
FINANCIAL HIGHLIGHTS (continued) |
ULTRA SHORT DURATION FUND |
This table is presented to show selected data for a share outstanding throughout each period and to assist shareholders in evaluating a Fund’s performance for the periods presented.
Institutional Class | | Six Months Ended
March 31, 2024a | | | Year
Ended
Sept. 30,
2023 | | | Year
Ended
Sept. 30,
2022 | | | Year
Ended
Sept. 30,
2021 | | | Year
Ended
Sept. 30,
2020 | | | Year
Ended
Sept. 30,
2019d | |
Per Share Data |
Net asset value, beginning of period | | $ | 9.75 | | | $ | 9.59 | | | $ | 9.97 | | | $ | 9.98 | | | $ | 9.96 | | | $ | 10.01 | |
Income (loss) from investment operations: |
Net investment income (loss)c | | | .23 | | | | .39 | | | | .14 | | | | .09 | | | | .15 | | | | .28 | |
Net gain (loss) on investments (realized and unrealized) | | | .21 | | | | .24 | | | | (.37 | ) | | | — | | | | .04 | | | | (.04 | ) |
Total from investment operations | | | .44 | | | | .63 | | | | (.23 | ) | | | .09 | | | | .19 | | | | .24 | |
Less distributions from: |
Net investment income | | | (.28 | ) | | | (.47 | ) | | | (.15 | ) | | | (.10 | ) | | | (.17 | ) | | | (.28 | ) |
Net realized gains | | | — | | | | — | | | | — | | | | — | | | | — | | | | (.01 | ) |
Total distributions | | | (.28 | ) | | | (.47 | ) | | | (.15 | ) | | | (.10 | ) | | | (.17 | ) | | | (.29 | ) |
Net asset value, end of period | | $ | 9.91 | | | $ | 9.75 | | | $ | 9.59 | | | $ | 9.97 | | | $ | 9.98 | | | $ | 9.96 | |
|
Total Return | | | 4.50 | % | | | 6.70 | % | | | (2.34 | %) | | | 0.87 | % | | | 1.88 | % | | | 2.37 | % |
Ratios/Supplemental Data |
Net assets, end of period (in thousands) | | $ | 416,612 | | | $ | 419,233 | | | $ | 617,601 | | | $ | 882,047 | | | $ | 440,356 | | | $ | 423,414 | |
Ratios to average net assets: |
Net investment income (loss) | | | 4.69 | % | | | 4.03 | % | | | 1.44 | % | | | 0.88 | % | | | 1.47 | % | | | 2.54 | % |
Total expensese | | | 0.35 | % | | | 0.39 | % | | | 0.36 | % | | | 0.34 | % | | | 0.38 | % | | | 0.30 | % |
Net expensesf,g,h | | | 0.34 | % | | | 0.34 | % | | | 0.34 | % | | | 0.34 | % | | | 0.36 | % | | | 0.29 | % |
Portfolio turnover rate | | | 1 | % | | | 2 | % | | | 24 | % | | | 122 | % | | | 129 | % | | | 55 | % |
30 | THE GUGGENHEIM FUNDS SEMI-ANNUAL REPORT | SEE NOTES TO FINANCIAL STATEMENTS. |
FINANCIAL HIGHLIGHTS (concluded) |
ULTRA SHORT DURATION FUND |
a | Unaudited figures for the period ended March 31, 2024. Percentage amounts for the period, except total return and portfolio turnover rate, have been annualized. |
b | Since commencement of operations: November 30, 2018. Percentage amounts for the period, except total return and portfolio turnover rate, have been annualized. |
c | Net investment income (loss) per share was computed using average shares outstanding throughout the period. |
d | The per share data for the years ended September 30, 2017 through September 30, 2018 and the period October 1, 2018 to November 30, 2018 has been restated to reflect the reorganization of the Guggenheim Strategy Fund I with and into the Guggenheim Ultra Short Duration Fund effective November 30, 2018. In conjunction with the reorganization, Guggenheim Ultra Short Duration Fund issued 2.501601322 Institutional Class shares for every 1 share of Guggenheim Strategy Fund I. |
e | Does not include expenses of the underlying funds in which the Fund invests. |
f | Net expense information reflects the expense ratios after expense waivers and reimbursements, as applicable. |
g | The portion of the ratios of net expenses to average net assets attributable to recoupments of prior fee reductions or expense reimbursements for the years presented was as follows: |
| 03/31/24a | 09/30/23 | 09/30/22 | 09/30/21 | 09/30/20 | 09/30/19 |
Class A | 0.00%* | 0.00%* | 0.01% | 0.00%* | 0.00%* | — |
Institutional Class | 0.00%* | 0.00%* | 0.01% | 0.01% | 0.00%* | 0.00%* |
h | Net expenses may include expenses that are excluded from the expense limitation agreement. Excluding these expenses, the net expense ratios for the years presented would be: |
| 03/31/24a | 09/30/23 | 09/30/22 | 09/30/21 | 09/30/20 | 09/30/19 |
Class A | 0.58% | 0.58% | 0.58% | 0.58% | 0.58% | 0.58% |
Institutional Class | 0.33% | 0.33% | 0.33% | 0.33% | 0.33% | 0.29% |
i | The amount shown for a share outstanding throughout the period does not agree with the aggregate net loss on investments for the period because of the sales and repurchases of Fund shares in relation to fluctuating market value of the investments of the Fund. |
SEE NOTES TO FINANCIAL STATEMENTS. | THE GUGGENHEIM FUNDS SEMI-ANNUAL REPORT | 31 |
NOTES TO FINANCIAL STATEMENTS (Unaudited) |
Note 1 – Organization and Significant Accounting Policies
Organization
Guggenheim Funds Trust (the “Trust”), a Delaware statutory trust, is registered with the U.S. Securities and Exchange Commission (the “SEC”) under the Investment Company Act of 1940 (the “1940 Act”), as an open-ended investment company of the series type. Each series, in effect, is representing a separate fund. The Trust may issue an unlimited number of authorized shares. The Trust accounts for the assets of each fund separately.
The Trust offers a combination of five separate classes of shares: Class A shares,Class C shares, Class P shares, Class R6 shares and Institutional Class shares. Sales of shares of each Class are made without a front-end sales charge at the net asset value per share (“NAV”), with the exception of Class A shares. Class A shares are sold at the NAV, plus the applicable front-end sales charge. The sales charge varies depending on the amount purchased Class A share purchases of $1 million or more are exempt from the front-end sales charge but have a 1% contingent deferred sales charge (“CDSC”), if shares are redeemed within 12 months of purchase. Class C shares have a 1% CDSC if shares are redeemed within 12 months of purchase. Class C shares automatically convert to Class A shares on or about the 10th day of the month following the 8-year anniversary of the purchase of the Class C shares. This conversion will be executed without any sales charge, fee or other charge. After the conversion is completed, the shares will be subject to all features and expenses of Class A shares. Institutional Class shares are offered primarily for direct investment by institutions such as pension and profit sharing plans, endowments, foundations and corporations. Institutional Class shares require a minimum initial investment of $2 million and a minimum account balance of $1 million. Class R6 shares are offered primarily through qualified retirement and benefit plans. Class R6 shares are also offered through certain other plans and platforms sponsored by financial intermediaries. Certain institutional investors and others deemed appropriate by Guggenheim Investments (“GI” or the “Adviser”) may also be eligible to purchase Class R6 shares subject to a $2 million minimum initial investment. At March 31, 2024, the Trust consisted of eighteen funds (the “Funds”).
This report covers the Ultra Short Duration Fund (the “Fund”), a diversified investment company. At March 31, 2024, Class A and Institutional Class shares have been issued by the Fund.
Guggenheim Partners Investment Management, LLC (“GPIM” or “the Adviser”), which operates under the name Guggenheim Investments (“GI”), provides advisory services. Guggenheim Funds Distributors, LLC (“GFD”) serves as distributor for the Fund’s shares. GI and GFD are affiliated entities.
Significant Accounting Policies
The Fund operates as an investment company and, accordingly, follows the investment company accounting and reporting guidance of the Financial Accounting Standards Board (“FASB”) Accounting Standards Codification Topic 946 Financial Services – Investment Companies.
32 | THE GUGGENHEIM FUNDS SEMI-ANNUAL REPORT | |
NOTES TO FINANCIAL STATEMENTS (Unaudited)(continued) |
The following significant accounting policies are in conformity with U.S. generally accepted accounting principles (“U.S. GAAP”) and are consistently followed by the Trust. This requires management to make estimates and assumptions that affect the reported amount of assets and liabilities, contingent assets and liabilities at the date of the financial statements, and the reported amounts of revenues and expenses during the reporting period. Actual results could differ from these estimates. All time references are based on Eastern Time.
The NAV of each share class of the Fund is calculated by dividing the market value of the Fund’s securities and other assets, less all liabilities attributable to the share class by the number of outstanding shares of the share class on the specified date.
(a) Valuation of Investments
The Board of Trustees of the Fund (the “Board”) adopted policies and procedures for the valuation of the Fund’s investments (the “Fund Valuation Procedures”). The SEC adopted Rule 2a-5 under the 1940 Act (“Rule 2a-5”) which establishes requirements for determining fair value in good faith. Rule 2a-5 also defines “readily available market quotations” for purposes of the 1940 Act and establishes requirements for determining whether a fund must fair value a security in good faith.
Pursuant to Rule 2a-5, the Board has designated the Adviser as the valuation designee to perform fair valuation determinations for the Fund with respect to all Fund investments and other assets. As the Fund’s valuation designee pursuant to Rule 2a-5, the Adviser has adopted separate procedures (the “Valuation Designee Procedures” and collectively with the Fund Valuation Procedures, the “Valuation Procedures”) reasonably designed to prevent violations of the requirements of Rule 2a-5 and Rule 31a-4. The Adviser, in its role as valuation designee, utilizes the assistance of a valuation committee, consisting of representatives from Guggenheim’s investment management, fund administration, legal and compliance departments (the “Valuation Committee”), in determining the fair value of the Fund’s securities and other assets.
Valuations of the Fund’s securities and other assets are supplied primarily by pricing service providers appointed pursuant to the processes set forth in the Valuation Procedures. The Adviser, with the assistance of the Valuation Committee, convenes monthly, or more frequently as needed, to review the valuation of all assets which have been fair valued. The Adviser, consistent with the monitoring and review responsibilities set forth in the Valuation Procedures, regularly reviews the appropriateness of the inputs, methods, models and assumptions employed by the pricing service providers.
If a pricing service provider cannot or does not provide a valuation for a particular investment or such valuation is deemed unreliable, such investment is fair valued by the Adviser.
Generally, trading in foreign securities markets is substantially completed each day at various times prior to the close of the New York Stock Exchange (“NYSE”). The values of foreign securities are determined as of the close of such foreign markets or the close of the NYSE, if earlier. All investments quoted in foreign currencies are valued in U.S. dollars on the basis of the foreign
| | THE GUGGENHEIM FUNDS SEMI-ANNUAL REPORT | 33 |
NOTES TO FINANCIAL STATEMENTS (Unaudited)(continued) |
currency exchange rates prevailing at the close of U.S. business at 4:00 p.m. Investments in foreign securities may involve risks not present in domestic investments. The Adviser will determine the current value of such foreign securities by taking into consideration certain factors which may include the following factors, among others: the value of the securities traded on other foreign markets, American Depositary Receipts (“ADR”) trading, closed-end fund trading, foreign currency exchange activity, and the trading prices of financial products that are tied to foreign securities. In addition, under the Valuation Procedures, the Adviser is authorized to use prices and other information supplied by a pricing service provider in valuing foreign securities.
Open-end investment companies are valued at their NAV as of the close of business, on the valuation date. Exchange-traded funds and closed-end investment companies are generally valued at the last quoted sale price.
U.S. Government securities are valued by pricing service providers, the last traded fill price, or at the reported bid price at the close of business.
Commercial paper and discount notes with a maturity of greater than 60 days at acquisition are valued at prices that reflect broker-dealer supplied valuations or are obtained from pricing service providers, which may consider the trade activity, treasury spreads, yields or price of bonds of comparable quality, coupon, maturity, and type, as well as prices quoted by dealers who make markets in such securities. Commercial paper and discount notes with a maturity of 60 days or less at acquisition are valued at amortized cost, unless the Adviser concludes that amortized cost does not represent the fair value of the applicable asset in which case it will be valued using a pricing service provider.
Typically, loans are valued using information provided by a pricing service provider which uses broker quotes, among other inputs. If the pricing service provider cannot or does not provide a valuation for a particular loan, or such valuation is deemed unreliable, such investment is valued based on a quote from a broker-dealer or is fair valued by the Adviser.
Interest rate swap agreements entered into by the Fund are valued on the basis of the last sale price on the primary exchange on which the swap is traded.
Investments for which market quotations are not readily available are fair valued as determined in good faith by the Adviser. Valuations in accordance with these methods are intended to reflect each security’s (or asset’s or liability’s) “fair value”. Each such determination is based on a consideration of all relevant factors, which are likely to vary from one pricing context to another. Examples of such factors may include, but are not limited to market prices; sale prices; broker quotes; and models which derive prices based on inputs such as anticipated cash flows or collateral, spread over U.S. Treasury securities, and other information analysis. In connection with futures contracts and other derivative investments, such factors may include obtaining information as to how (a) these contracts and other derivative investments trade in the futures or other derivative markets, respectively, and (b) the securities underlying these contracts and other derivative investments trade in the cash market.
34 | THE GUGGENHEIM FUNDS SEMI-ANNUAL REPORT | |
NOTES TO FINANCIAL STATEMENTS (Unaudited)(continued) |
(b) U.S. Government and Agency Obligations
Certain U.S. Government and Agency Obligations are traded on a discount basis; the interest rates shown on the Fund’s Schedule of Investments reflect the effective rates paid at the time of purchase by the Fund. Other securities bear interest at the rates shown, payable at fixed dates through maturity.
(c) Senior Floating Rate Interests and Loan Investments
Senior floating rate interests in which the Fund invests generally pay interest rates which are periodically adjusted by reference to a base short-term floating rate, plus a premium. These base lending rates are generally (i) a broad measure of the cost of borrowing cash, such as the one-month or three-month Secured Overnight Financing Rate (“SOFR”),(ii) the prime rate offered by one or more major United States banks, or (iii) the bank’s certificate of deposit rate. Senior floating rate interests often require prepayments from excess cash flows or permit the borrower to repay at its election. The rate at which the borrower repays cannot be predicted with accuracy. As a result, the actual remaining maturity may be substantially less than the stated maturities disclosed in the Fund’s Schedule of Investments.
The Fund invests in loans and other similar debt obligations (“obligations”). A portion of the Fund’s investments in these obligations is sometimes referred to as “covenant lite” loans or obligations (“covenant lite obligations”), which are obligations that lack covenants or possess fewer or less restrictive covenants or constraints on borrowers than certain other types of obligations. The Fund may also obtain exposure to covenant lite obligations through investment in securitization vehicles and other structured products. Recently, many new or reissued obligations have not featured traditional covenants, which are intended to protect lenders and investors by (i) imposing certain restrictions or other limitations on a borrower’s operations or assets or (ii) providing certain rights to lenders. The Fund may have fewer rights with respect to covenant lite obligations, including fewer protections against the possibility of default and fewer remedies in the event of default. As a result, investments in (or exposure to) covenant lite obligations are subject to more risk than investments in (or exposure to) certain other types of obligations. The Fund is subject to other risks associated with investments in (or exposure to) obligations, including that obligations may not be considered “securities” and, as a result, the Fund may not be entitled to rely on the anti-fraud protections under the federal securities laws and instead may have to resort to state law and direct claims.
(d) Interest on When-Issued Securities
The Fund may purchase and sell interests in securities on a when-issued and delayed delivery basis, with payment and delivery scheduled for a future date. No income accrues to the Fund on such interests or securities in connection with such transactions prior to the date the Fund actually takes delivery of such interests or securities. These transactions are subject to market
| | THE GUGGENHEIM FUNDS SEMI-ANNUAL REPORT | 35 |
NOTES TO FINANCIAL STATEMENTS (Unaudited)(continued) |
fluctuations and are subject to the risk that the value at delivery may be more or less than the trade date purchase price. Although the Fund will generally purchase these securities with the intention of acquiring such securities, it may sell such securities before the settlement date.
(e) Swap Agreements
Swap agreements are marked-to-market daily and the change, if any, is recorded as unrealized appreciation or depreciation. Payments received or made as a result of an agreement or termination of an agreement are recognized as realized gains or losses.
Upon entering into certain centrally-cleared swap transactions, a Fund is required to deposit with its clearing broker an amount of cash or securities as an initial margin. Subsequent variation margin receipts or payments are received or made by the Fund depending on fluctuations in the fair value of the reference entity and are recorded by the Fund as unrealized appreciation or depreciation. When the contract is closed, the Fund records a realized gain or loss equal to the difference between the value of the contract at the time it was opened and the value at the time it was closed.
Upfront payments received or made by a Fund on credit default swap agreements and interest rate swap agreements are amortized over the expected life of the agreement. Periodic payments received or paid by a Fund are recorded as realized gains or losses. Payments received or made as a result of a credit event or termination of the contract are recognized, net of a proportional amount of the upfront payment, as realized gains or losses.
(f) Currency Translations
The accounting records of the Fund are maintained in U.S. dollars. All assets and liabilities initially expressed in foreign currencies are converted into U.S. dollars at prevailing exchange rates. Purchases and sales of investment securities, dividend and interest income, and certain expenses are translated at the rates of exchange prevailing on the respective dates of such transactions. Changes in the relationship of these foreign currencies to the U.S. dollar can significantly affect the value of the investments and earnings of the Fund. Foreign investments may also subject the Fund to foreign government exchange restrictions, expropriation, taxation, or other political, social, geopolitical or economic developments, all of which could affect the market and/or credit risk of the investments.
The Fund does not isolate that portion of the results of operations resulting from changes in the foreign exchange rates on investments from the fluctuations arising from changes in the market prices of securities held. Such fluctuations are included with the net realized gain or loss and unrealized appreciation or depreciation on investments.
36 | THE GUGGENHEIM FUNDS SEMI-ANNUAL REPORT | |
NOTES TO FINANCIAL STATEMENTS (Unaudited)(continued) |
Reported net realized foreign exchange gains and losses arise from sales of foreign currencies and currency gains or losses realized between the trade and settlement dates on investment transactions. Net unrealized appreciation and depreciation arise from changes in the fair values of assets and liabilities other than investments in securities at the fiscal period end, resulting from changes in exchange rates.
(g) Forward Foreign Currency Exchange Contracts
The change in value of a forward foreign currency exchange contract is recorded as unrealized appreciation or depreciation until the contract is closed. When the contract is closed, the Fund records a realized gain or loss equal to the difference between the value at the time the contract was opened and the value at the time it was closed.
(h) Foreign Taxes
The Fund may be subject to foreign taxes (a portion of which may be reclaimable) on income, stock dividends, capital gains on investments or certain foreign currency transactions. All foreign taxes are recorded in accordance with the applicable foreign tax regulations and rates that exist in the foreign jurisdictions in which the Fund invests. These foreign taxes, if any, are paid by the Fund and reflected in the Fund’s Statement of Operations as follows: foreign taxes withheld at source are presented as a reduction of income and foreign taxes on capital gains from sales of investments are included with the net realized gain (loss) on investments. Foreign taxes payable or deferred as of March 31, 2024, if any, are disclosed in the Fund’s Statement of Assets and Liabilities.
(i) Security Transactions
Security transactions are recorded on the trade date for financial reporting purposes. Realized gains and losses from securities transactions are recorded using the identified cost basis. Proceeds from lawsuits related to investment holdings are recorded as a reduction to cost if the securities are still held and as realized gains if no longer held in the Fund. Dividend income is recorded on the ex-dividend date, net of applicable taxes withheld by foreign countries, if any. Taxable non-cash dividends are recorded as dividend income. Interest income, including amortization of premiums and accretion of discounts, is accrued on a daily basis. Interest income also includes paydown gains and losses on mortgage-backed and asset-backed securities and senior and subordinated loans. Amendment fees are earned as compensation for evaluating and accepting changes to the original loan agreement and are recognized when received.
Income from residual collateralized loan obligations is recognized using the effective interest method. At the time of purchase, management estimates the future expected cash flows and determines the effective yield and estimated maturity date based on the estimated cash flows. Subsequent to the purchase, the estimated cash flows are updated periodically and a revised yield is calculated prospectively.
| | THE GUGGENHEIM FUNDS SEMI-ANNUAL REPORT | 37 |
NOTES TO FINANCIAL STATEMENTS (Unaudited)(continued) |
The Fund may receive other income from investments in senior loan interests including amendment fees, consent fees and commitment fees. For funded loans, these fees are recorded as income when received by the Fund and included in interest income on the Statement of Operations. For unfunded loans, commitment fees are included in realized gain on investments on the Statement of Operations at the end of the commitment period.
(j) Distributions
The Fund declares dividends from investment income daily. The Fund pays its shareholders from its net investment income monthly and distributes any net capital gains that it has realized, at least annually. Distributions to shareholders are recorded on the ex-dividend date. Dividends are reinvested in additional shares, unless shareholders request payment in cash. The character of distributions made during the year from net investment income or net realized gains may differ from their ultimate characterization for U.S. federal income tax purposes.
(k) Class Allocations
Interest and dividend income, most expenses, all realized gains and losses, and all unrealized appreciation and depreciation are allocated to the share classes based upon the value of the outstanding shares in each share class. Certain costs, such as distribution and service fees are charged directly to specific share classes. In addition, certain expenses have been allocated to the individual Funds in the Trust based on the respective net assets of each Fund included in the Trust.
(l) Earnings Credits
Under the fee arrangement with the custodian, the Fund may earn credits based on overnight custody cash balances. These credits are utilized to reduce related custodial expenses. The custodian fees disclosed in the Statement of Operations are before the reduction in expense from the related earnings credits, if any. Earnings credits for the period ended March 31, 2024, are disclosed in the Fund’s Statement of Operations.
(m) Cash
The Fund may leave cash overnight in its cash account with the custodian. Periodically, the Fund may have cash due to the custodian bank as an overdraft balance. A fee is incurred on this overdraft, calculated by multiplying the overdraft by a rate based on the federal funds rate, which was 5.33% at March 31, 2024.
(n) Indemnifications
Under the Fund’s organizational documents, its Trustees and Officers are indemnified against certain liabilities arising out of the performance of their duties to the Trust. In addition, throughout the normal course of business, the Fund enters into contracts that contain a variety of representations and warranties which provide general indemnifications. The Fund’s maximum
38 | THE GUGGENHEIM FUNDS SEMI-ANNUAL REPORT | |
NOTES TO FINANCIAL STATEMENTS (Unaudited)(continued) |
exposure under these arrangements is unknown, as this would involve future claims that may be made against the Fund and/or its affiliates that have not yet occurred. However, based on experience, the Fund expects the risk of loss to be remote.
Note 2 –Financial Instruments and Derivatives
As part of its investment strategy, the Fund utilizes a variety of derivative instruments. These investments involve, to varying degrees, elements of market risk and risks in excess of amounts recognized on the Fund’s Statement of Assets and Liabilities. Valuation and accounting treatment of these instruments can be found under Significant Accounting Policies in Note 1 of these Notes to Financial Statements.
Derivatives
Derivatives are instruments whose values depend on, or are derived from, in whole or in part, the value of one or more other assets, such as securities, currencies, commodities or indices. Derivative instruments may be used for investment purposes (including to maintain cash reserves while maintaining exposure to certain other assets), for risk management (hedging) purposes, to facilitate trading, to reduce transaction costs and to pursue higher investment returns. Derivative instruments may also be used to seek to mitigate certain investment risks, such as foreign currency exchange rate risk, interest rate risk and credit risk. U.S. GAAP requires disclosures to enable investors to better understand how and why the Fund uses derivative instruments, how these derivative instruments are accounted for and their effects on the Fund’s financial position and results of operations.
The Fund utilized derivatives for the following purposes:
Duration: the use of an instrument to manage the interest rate risk of a portfolio.
Hedge: an investment made in order to reduce the risk of adverse price movements in a security, by taking an offsetting position to protect against broad market moves.
Income: the use of any instrument that distributes cash flows typically based upon some rate of interest.
Swap Agreements
A swap is an agreement that obligates two parties to exchange a series of cash flows at specified intervals based upon or calculated by reference to changes in specified prices or rates for a specified amount of an underlying asset. When utilizing over-the-counter (“OTC”) swaps, the Fund bears the risk of loss of the amount expected to be received under a swap agreement in the event of the default or bankruptcy of a swap agreement counterparty or if the underlying asset declines in value. Certain standardized swaps are subject to mandatory central clearing and are executed on a multi-lateral or other trade facility platform, such as a registered exchange. There is limited counterparty credit risk with respect to centrally-cleared swaps as the transaction is facilitated through a central clearinghouse, much like exchange-traded futures contracts. For
| | THE GUGGENHEIM FUNDS SEMI-ANNUAL REPORT | 39 |
NOTES TO FINANCIAL STATEMENTS (Unaudited)(continued) |
a Fund utilizing centrally-cleared swaps, the exchange bears the risk of loss resulting from a counterparty not being able to pay. There is no guarantee that a Fund or an underlying fund could eliminate its exposure under an outstanding swap agreement by entering into an offsetting swap agreement with the same or another party.
Interest rate swaps involve the exchange by the Fund with another party for its respective commitment to pay or receive a fixed or variable interest rate on a notional amount of principal. Interest rate swaps are generally centrally-cleared, but central clearing does not make interest rate swap transactions risk free.
The following table represents the Fund’s use and volume of interest rate swaps on a monthly basis:
| | | Average Notional Amount | |
Use | | Pay Floating Rate | | | Receive Floating Rate | |
Hedge, Income | | $ | — | | | $ | 61,000,000 | |
Derivative Investment Holdings Categorized by Risk Exposure
The following is a summary of the location of derivative investments on the Fund’s Statement of Assets and Liabilities as of March 31, 2024:
Derivative Investment Type | Asset Derivatives | Liability Derivatives |
Interest Rate Swap Agreements | Unamortized upfront premiums paid on interest rate swap agreements Variation margin interest rate swap agreements | — |
The following tables set forth the fair value of the Fund’s derivative investments categorized by primary risk exposure at March 31, 2024:
Asset Derivative Investments Value |
| | Swaps
Interest Rate
Risk* | | | Total Value at
March 31,
2024 | |
| | | $ | 1,895,458 | | | $ | 1,895,458 | |
* | Includes cumulative appreciation (depreciation) of exchange-traded, OTC and centrally-cleared derivatives contracts as reported on the Schedule of Investments. For exchange-traded and centrally-cleared derivatives, variation margin is reported within the Fund’s Statement of Assets and Liabilities. |
40 | THE GUGGENHEIM FUNDS SEMI-ANNUAL REPORT | |
NOTES TO FINANCIAL STATEMENTS (Unaudited)(continued) |
The following is a summary of the location of derivative investments on the Fund’s Statement of Operations for the period ended March 31, 2024:
Derivative Investment Type | Location of Gain (Loss) on Derivatives |
Interest rate swap agreements | Net realized gain (loss) on swap agreements Net change in unrealized appreciation (depreciation) on swap agreements |
The following is a summary of the Fund’s realized gain (loss) and change in unrealized appreciation (depreciation) on derivative investments recognized on the Fund’s Statement of Operations categorized by primary risk exposure for the period ended March 31, 2024:
Realized Gain (Loss) on Derivative Investments Recognized on the Statement of Operations |
| | Swaps
Interest Rate
Risk | | | Total | |
| | | $ | 1,384,934 | | | $ | 1,384,934 | |
Change in Unrealized Appreciation (Depreciation) on Derivative Investments Recognized on the Statement of Operations |
| | Swaps
Interest Rate
Risk | | | Total | |
| | | $ | (1,272,547 | ) | | $ | (1,272,547 | ) |
In conjunction with the use of derivative instruments, the Fund is required to maintain collateral in various forms. Depending on the financial instrument utilized and the broker involved, the Fund uses margin deposits at the broker, cash and/or securities segregated at the custodian bank, discount notes or repurchase agreements allocated to the Fund as collateral.
Foreign Investments
There are several risks associated with exposure to foreign currencies, foreign issuers and emerging markets. A fund’s indirect and direct exposure to foreign currencies subjects the Fund to the risk that those currencies will decline in value relative to the U.S. dollar, or in the case of short positions, that the U.S. dollar will decline in value relative to the currency being hedged. Currency rates in foreign countries may fluctuate significantly over short periods of time for a number of reasons, including changes in interest rates and the imposition of currency controls or other political developments in the U.S. or abroad. In addition, the Fund may incur transaction costs in connection with conversions between various currencies. The Fund may, but is not obligated to, engage in currency hedging transactions, which generally involve buying currency forward, options or futures contracts. However, not all currency risks may be effectively hedged, and in some cases
| | THE GUGGENHEIM FUNDS SEMI-ANNUAL REPORT | 41 |
NOTES TO FINANCIAL STATEMENTS (Unaudited)(continued) |
the costs of hedging techniques may outweigh expected benefits. In such instances, the value of securities denominated in foreign currencies can change significantly when foreign currencies strengthen or weaken relative to the U.S. dollar.
The Fund may invest in securities of foreign companies directly, or in financial instruments, such as ADRs and exchange-traded funds, which are indirectly linked to the performance of foreign issuers. Foreign markets can be more volatile than the U.S. market due to increased risks of adverse issuer, political, regulatory, market, or economic developments and can perform differently from the U.S. market. Investing in securities of foreign companies directly, or in financial instruments that are indirectly linked to the performance of foreign issuers, may involve risks not typically associated with investing in U.S. issuers. The value of securities denominated foreign currencies, and of dividends from such securities, can change significantly when foreign currencies strengthen or weaken relative to the U.S. dollar. Foreign securities markets generally have less trading volume and less liquidity than U.S. markets, and prices in some foreign markets may fluctuate more than those of securities traded on U.S. markets. Many foreign countries lack accounting and disclosure standards comparable to those that apply to U.S. companies, and it may be more difficult to obtain reliable information regarding a foreign issuer’s financial condition and operations. Transaction costs and costs associated with custody services are generally higher for foreign securities than they are for U.S. securities. Some foreign governments levy withholding taxes against dividend and interest income. Although in some countries portions of these taxes are recoverable, the non-recovered portion will reduce the income received by the Fund.
The Trust has established counterparty credit guidelines and enters into transactions only with financial institutions rated/identified as investment grade or better. The Trust monitors the counterparty credit risk associated with each such financial institution.
Note 3 – Offsetting
In the normal course of business, the Fund enters into transactions subject to enforceable master netting arrangements or other similar arrangements. Generally, the right to offset in those agreements allows the Fund to counteract the exposure to a specific counterparty with collateral received from or delivered to that counterparty based on the terms of the arrangements. These arrangements provide for the right to liquidate upon the occurrence of an event of default, credit event upon merger or additional termination event.
In order to better define its contractual rights and to secure rights that will help the Fund mitigate its counterparty risk, the Fund may enter into an International Swaps and Derivatives Association, Inc. Master Agreement (“ISDA Master Agreement”) or similar agreement with its derivative contract counterparties. An ISDA Master Agreement is a bilateral agreement between a fund and a counterparty that governs OTC derivatives, including foreign exchange contracts, and typically contains, among other things, collateral posting terms and netting provisions in the event of a default and/or termination event. The provisions of the ISDA
42 | THE GUGGENHEIM FUNDS SEMI-ANNUAL REPORT | |
NOTES TO FINANCIAL STATEMENTS (Unaudited)(continued) |
Agreement typically permit a single net payment in the event of a default (close-out netting) or similar event, including the bankruptcy or insolvency of the counterparty.
For derivatives traded under an ISDA Master Agreement, the collateral requirements are typically calculated by netting the mark-to-market amount for each transaction under such agreement and comparing that amount to the value of any collateral currently pledged by the Fund and the counterparty. For financial reporting purposes, cash collateral that has been pledged to cover obligations of the Fund and cash collateral received from the counterparty, if any, are reported separately on the Fund’s Statement of Assets and Liabilities as segregated cash with broker/receivable for variation margin, or payable for swap settlement/variation margin. Cash and/or securities pledged or received as collateral by the Fund in connection with an OTC derivative subject to an ISDA Master Agreement generally may not be invested, sold or rehypothecated by the counterparty or the Fund, as applicable, absent an event of default under such agreement, in which case such collateral generally may be applied towards obligations due to and payable by such counterparty or the Fund, as applicable. Generally, the amount of collateral due from or to a counterparty must exceed a minimum transfer amount threshold (e.g., $300,000) before a transfer is required to be made. To the extent amounts due to the Fund from its counterparties are not fully collateralized, contractually or otherwise, the Fund bears the risk of loss from counterparty nonperformance. The Fund attempts to mitigate counterparty risk by only entering into agreements with counterparties that it believes to be of good standing and by monitoring the financial stability of those counterparties.
For financial reporting purposes, the Fund does not offset derivative assets and derivative liabilities that are subject to netting arrangements in the Fund’s Statement of Assets and Liabilities.
At March 31, 2024, the Fund held no derivative financial instruments or secured financing transactions subject to enforceable netting arrangements.
The Fund has the right to offset deposits against any related derivative liabilities outstanding with each counterparty with the exception of exchange-traded or centrally-cleared derivatives. The following table presents deposits held by others in connection with derivative investments as of March 31, 2024.
Counterparty | | Asset Type | | | Cash Pledged | | | Cash Received | |
BofA Securities, Inc. | Interest rate swap agreements | | $ | — | | | $ | 156,361 | |
Note 4 – Fair Value Measurement
In accordance with U.S. GAAP, fair value is defined as the price that the Fund would receive to sell an investment or pay to transfer a liability in an orderly transaction between market participants at the measurement date. U.S. GAAP establishes a three-tier fair value hierarchy based on the types of inputs used to value assets and liabilities and requires corresponding disclosure. The hierarchy and the corresponding inputs are summarized below:
| | THE GUGGENHEIM FUNDS SEMI-ANNUAL REPORT | 43 |
NOTES TO FINANCIAL STATEMENTS (Unaudited)(continued) |
Level 1 — | unadjusted quoted prices in active markets for identical assets or liabilities. |
Level 2 — | significant other observable inputs (for example quoted prices for securities that are similar based on characteristics such as interest rates, prepayment speeds, credit risk, etc.). |
Level 3 — | significant unobservable inputs based on the best information available under the circumstances, to the extent observable inputs are not available, which may include assumptions. |
Rule 2a-5 sets forth a definition of “readily available market quotations,” which is consistent with the definition of a Level 1 input under U.S. GAAP. Rule 2a-5 provides that “a market quotation is readily available only when that quotation is a quoted price (unadjusted) in active markets for identical investments that the fund can access at the measurement date, provided that a quotation will not be readily available if it is not reliable.”
Securities for which market quotations are not readily available must be valued at fair value as determined in good faith. Accordingly, any security priced using inputs other than Level 1 inputs will be subject to fair value requirements. The types of inputs available depend on a variety of factors, such as the type of security and the characteristics of the markets in which it trades, if any. Fair valuation determinations that rely on fewer or no observable inputs require greater judgment. Accordingly, fair value determinations for Level 3 securities require the greatest amount of judgment.
Pricing service providers are used to value a majority of the Fund’s investments. When values are not available from a pricing service provider, they will be determined using a variety of sources and techniques, including: market prices; broker quotes; and models which derive prices based on inputs such as prices of securities with comparable maturities and characteristics or based on inputs such as anticipated cash flows or collateral, spread over U.S. Treasury securities, and other information and analysis. A significant portion of the Fund’s assets and liabilities are categorized as Level 2, as indicated in this report. Quotes from broker-dealers, adjusted for fluctuations in criteria such as credit spreads and interest rates, may also be used to value the Fund’s assets and liabilities, i.e. prices provided by a broker-dealer or other market participant who has not committed to trade at that price. Although quotes are typically received from established market participants, the Fund may not have the transparency to view the underlying inputs which support the market quotations. Significant changes in a quote would generally result in significant changes in the fair value of the security. Certain fixed income securities are valued by obtaining a monthly quote from a broker-dealer, adjusted for fluctuations in criteria such as credit spreads and interest rates.Certain loans and other securities are valued using a single daily broker quote or a price from a pricing service provider based on a single daily or monthly broker quote.
The inputs or methodologies selected and applied for valuing securities or other assets are not necessarily an indication of the risk associated with investing in those securities. The suitability, appropriateness and accuracy of the techniques, methodologies and sources employed to determine fair valuation are periodically reviewed and subject to change.
44 | THE GUGGENHEIM FUNDS SEMI-ANNUAL REPORT | |
NOTES TO FINANCIAL STATEMENTS (Unaudited)(continued) |
Note 5 – Investment Advisory Agreement and Other Agreements
Under the terms of an investment advisory contract, the Fund pays GI investment advisory fees on a monthly basis calculated daily at an annualized rate of 0.25% of the average daily net assets of the Fund.
GI pays operating expenses on behalf of the Trust, such as audit and accounting related services, legal services, custody, printing and mailing, among others, on a pass-through basis. Such expenses are allocated to various Funds within the complex based on relative net assets.
The Board has adopted Distribution Plans related to the offering of Class A shares pursuant to Rule 12b-1 under the 1940 Act. The plans provide for payments at an annual rate of 0.25% of the average daily net assets of the Fund’s Class A shares.
The investment advisory contract for the Fund provides that the total expenses be limited to a percentage of average net assets for each class of shares, exclusive of brokerage costs, dividends or interest on securities sold short, expenses of other investment companies in which the Fund invests, interest, taxes, litigation, indemnification and extraordinary expenses. The limits are listed below:
| | Limit | | | Effective
Date | | | Contract
End Date | |
Class A | | | 0.58 | % | | | 11/30/18 | | | | 02/01/25 | |
Institutional Class | | | 0.33 | % | | | 11/30/18 | | | | 02/01/25 | |
GI is entitled to reimbursement by the Fund for fees waived or expenses reimbursed during any of the previous 36 months, beginning on the date of the expense limitation agreement, if on any day the estimated operating expenses are less than the indicated percentages. For purposes of this arrangement, GI is entitled to recoupment of previously waived fees or reimbursed expenses for 36 months from the date of the waiver or reimbursement by GI. At March 31, 2024, the amount of fees waived or expenses reimbursed that are subject to recoupment and will expire during the years ended September 30, are presented in the following table:
| | 2024 | | | 2025 | | | 2026 | | | 2027 | | | Fund Total | |
A-Class | | $ | 35,681 | | | $ | 105,228 | | | $ | 100,752 | | | $ | 18,948 | | | $ | 260,609 | |
Institutional Class | | | — | | | | 177,859 | | | | 224,523 | | | | 38,049 | | | | 440,431 | |
For the period ended March 31, 2024, GI recouped $433 from the Fund.
For the period ended March 31, 2024, GFD retained sales charges of $77,213 relating to sales of Class A shares of the Trust.
Certain trustees and officers of the Trust are also officers of GI and/or GFD. The Trust does not compensate its officers or trustees who are officers, directors and/or employees of GI or GFD.
| | THE GUGGENHEIM FUNDS SEMI-ANNUAL REPORT | 45 |
NOTES TO FINANCIAL STATEMENTS (Unaudited)(continued) |
MUFG Investor Services (US), LLC (“MUIS”) acts as the Fund’s administrator, transfer agent and accounting agent. As administrator, transfer agent and accounting agent, MUIS maintains the books and records of the Fund’s securities and cash. The Bank of New York Mellon Corp. (“BNY”) acts as the Fund’s custodian. As custodian, BNY is responsible for the custody of the Fund’s assets. For providing the aforementioned administrative and accounting services, MUIS is entitled to receive a monthly fee equal to a percentage of the Fund’s average daily net assets and out of pocket expenses. For providing the aforementioned transfer agent and custodian services, MUIS and BNY are entitled to receive a monthly fee based on the number of transactions during the month and the number of accounts under management, subject to certain minimum monthly fees, and out of pocket expenses.
At March 31, 2024, GI and its affiliates owned 46% of the outstanding shares of the Fund.
Note 6 – Federal Income Tax Information
The Fund intends to comply with the provisions of Subchapter M of the Internal Revenue Code of 1986, as amended (the “Internal Revenue Code”), applicable to regulated investment companies and will distribute substantially all taxable net investment income and capital gains sufficient to relieve the Fund from all, or substantially all, federal income, excise and state income taxes. Therefore, no provision for federal or state income tax or federal excise tax is required.
Tax positions taken or expected to be taken in the course of preparing the Fund’s tax returns are evaluated to determine whether the tax positions are “more-likely-than-not” of being sustained by the applicable tax authority. Tax positions not deemed to meet the “more-likely-than-not” threshold would be recorded as a tax benefit or expense in the current year. Management has analyzed the Fund’s tax positions taken, or to be taken, on U.S. federal income tax returns for all open tax years, and has concluded that no provision for income tax is required in the Fund’s financial statements. The Fund’s U.S. federal income tax returns are subject to examination by the Internal Revenue Service (“IRS”) for a period of three years after they are filed.
At March 31, 2024, the cost of investments for U.S. federal income tax purposes, the aggregate gross unrealized appreciation for all investments for which there was an excess of value over tax cost, and the aggregate gross unrealized depreciation for all investments for which there was an excess of tax cost over value, were as follows:
| | Tax
Cost | | | Tax
Unrealized
Appreciation | | | Tax
Unrealized
Depreciation | | | Net Tax
Unrealized
Appreciation
(Depreciation) | |
| | | $ | 511,623,127 | | | $ | 2,158,145 | | | $ | (13,039,292 | ) | | $ | (10,881,147 | ) |
46 | THE GUGGENHEIM FUNDS SEMI-ANNUAL REPORT | |
NOTES TO FINANCIAL STATEMENTS (Unaudited)(continued) |
Note 7– Securities Transactions
For the period ended March 31 2024, the cost of purchases and proceeds from sales of investment securities, excluding government securities, short-term investments and derivatives, were as follows:
| | Purchases | | | Sales | |
| | | $ | 4,913,889 | | | $ | 71,942,897 | |
The Fund is permitted to purchase or sell securities from or to certain affiliated funds under specified conditions outlined in procedures adopted by the Board. The procedures have been designed to ensure that any purchase or sale of securities by the Fund from or to another fund or portfolio that is or could be considered an affiliate by virtue of having a common investment adviser (or affiliated investment advisers), common trustees and/or common officers complies with Rule 17a-7 of the 1940 Act. Further, as defined under these procedures, each transaction is effected at the current market price to save costs, where permissible. For the period ended March 31, 2024, the Fund did not engage in purchases and sales of securities pursuant to Rule 17a-7 of the 1940 Act.
Note 8– Restricted Securities
The securities below are considered illiquid and restricted under guidelines established by the Board:
Restricted
Securities | | Acquisition
Date | | | Cost | | | Value | |
Cascade Funding Mortgage Trust | | | | | | | | | | | | |
2019-RM3 2.80% (WAC) due 06/25/691 | | | 06/25/19 | | | $ | 56,054 | | | $ | 54,802 | |
Towd Point Revolving Trust | | | | | | | | | | | | |
4.83% due 09/25/64 | | | 03/17/22 | | | | 3,250,000 | | | | 3,232,125 | |
| | | | | | | $ | 3,306,054 | | | $ | 3,286,927 | |
1 | Variable rate security. Rate indicated is the rate effective at March 31, 2024. In some instances, the effective rate is limited by a minimum rate floor or a maximum rate cap established by the issuer. The settlement status of a position may also impact the effective rate indicated. In some cases, a position may be unsettled at period end and may not have a stated effective rate. In instances where multiple underlying reference rates and spread amounts are shown, the effective rate is based on a weighted average. |
Note 9 – Line of Credit
The Trust, along with other affiliated trusts, secured a 364-day committed, $1,150,000,000 line of credit from Citibank, N.A., which was in place through September 29, 2023, at which time a new line of credit was entered into in the amount of $1,165,000,000. The Fund may draw (borrow) from the line of credit as a temporary measure for emergency purposes, to facilitate redemption requests, or for other short-term liquidity purposes consistent with the Fund’s investment
| | THE GUGGENHEIM FUNDS SEMI-ANNUAL REPORT | 47 |
NOTES TO FINANCIAL STATEMENTS (Unaudited)(concluded) |
objective and program. For example, it may be advantageous for the Fund to borrow money rather than sell existing portfolio positions to meet redemption requests. Fees related to borrowings, if any, vary under this arrangement between the greater of Citibank’s “base rate”, SOFR plus 1%, or the federal funds rate plus 1/2 of 1%.
The commitment fee that may be paid by the Fund is at an annualized rate of 0.15% of the average daily amount of its allocated unused commitment amount. The commitment fee amount is allocated to the individual Funds based on the respective net assets of each participating Fund and is referenced in the Fund’s Statement of Operations under “Line of credit fees”. The Fund did not have any borrowings under this agreement as of and for the period ended March 31, 2024.
Note 10 – Market Risks
The value of, or income generated by, the investments held by the Fund are subject to the possibility of rapid and unpredictable fluctuation, and loss that may result from various factors. These factors include, among others, developments affecting individual companies, or from broader influences, including real or perceived changes in prevailing interest rates (which may change at any time based on changes in monetary policies and various market and other economic conditions), changes in inflation rates or expectations about inflation rates, adverse investor confidence or sentiment, changing economic, political (including geopolitical), social or financial market conditions, increased instability or general uncertainty, environmental disasters, governmental actions, public health emergencies (such as the spread of infectious diseases, pandemics and epidemics), debt crises, actual or threatened wars or other armed conflicts (such as the ongoing Russia-Ukraine conflict and its collateral economic and other effects, including, but not limited to, sanctions and other international trade barriers) or ratings downgrades, and other similar events, each of which may be temporary or last for extended periods. Moreover, changing economic, political, geopolitical, social, financial market or other conditions in one country, geographic region or industry could adversely affect the value, yield and return of the investments held by the Fund in a different country, geographic region, economy, industry or market because of the increasingly interconnected global economies and financial markets. The duration and extent of the foregoing types of factors or conditions are highly uncertain and difficult to predict and have in the past, and may in the future, cause volatility and distress in economies and financial markets or other adverse circumstances, which may negatively affect the value of the Fund’s investments and performance of the Fund.
Note 11 – Subsequent Events
The Fund evaluated subsequent events through the date the financial statements are issued and determined there were no material events that would require adjustment to or disclosure in the Fund’s financial statements.
48 | THE GUGGENHEIM FUNDS SEMI-ANNUAL REPORT | |
OTHER INFORMATION (Unaudited) |
Delivery of Shareholder Reports
Paper copies of the Fund’s annual and semi-annual shareholder reports are not sent by mail, unless you specifically request paper copies of the reports from a fund or from your financial intermediary. Instead, the reports are made available on a website, and you are notified by mail each time a report is posted and provided with a website link to access the report.
You may elect to receive all future shareholder reports in paper free of charge. If you hold shares of a fund directly, you can inform the Fund that you wish to receive paper copies of reports by calling 800.820.0888. If you hold shares of a fund through a financial intermediary, please contact the financial intermediary to make this election. Your election to receive reports in paper may apply to all Guggenheim Funds in which you are invested and may apply to all Guggenheim funds held with your financial intermediary.
Tailored Shareholder Reports for Open-End Mutual Funds and Exchange-Traded Funds
Effective January 24, 2023, the SEC adopted rule and form amendments to require open-end mutual funds and exchange-traded funds registered on Form N-1A to transmit concise and visually engaging streamlined annual and semi-annual reports to shareholders that highlight key information. Other information, including financial statements, will no longer appear in a streamlined shareholder report but must be available online, delivered free of charge upon request, and filed on a semi-annual basis on Form N-CSR. The rule and form amendments have a compliance date of July 24, 2024. At this time, management is evaluating the impact of these amendments on the shareholder reports for the Fund.
Proxy Voting Information
A description of the policies and procedures that the Trust uses to determine how to vote proxies relating to securities held in the Fund’s portfolio is available, without charge and upon request, by calling 800.820.0888. This information is also available from the EDGAR database on the SEC’s website at https://www.sec.gov.
Information regarding how the Fund voted proxies relating to portfolio securities during the most recent 12-month period ended June 30 is available without charge, upon request, by calling 800.820.0888. This information is also available from the EDGAR database on the SEC’s website at https://www.sec.gov.
Sector Classification
Information in the Schedule of Investments is categorized by sectors using sector-level Classifications defined by the Bloomberg Industry Classification System, a widely recognized industry classification system provider. The Fund’s registration statement has investment policies relating to concentration in specific sectors/industries. For purposes of these investment policies, the Fund usually classifies sectors/industries based on industry-level Classifications
| | THE GUGGENHEIM FUNDS SEMI-ANNUAL REPORT | 49 |
OTHER INFORMATION (Unaudited) (concluded) |
used by widely recognized industry classification system providers such as Bloomberg Industry Classification System, Global Industry Classification Standards and Barclays Global Classification Scheme.
Quarterly Portfolio Schedules Information
The Trust files its complete schedule of portfolio holdings with the SEC for the first and third quarters of each fiscal year as an exhibit to its reports on Form N-PORT. The Fund’s Form N-PORT is available on the SEC’s website at https://www.sec.gov. The Fund’s complete schedule of securities holdings as of the end of each fiscal quarter will be made available to the public on the SEC’s website at www.sec.gov and on our website at www.guggenheiminvestments.com, and will be made available, upon request and without charge, by calling 800.820.0888.
50 | THE GUGGENHEIM FUNDS SEMI-ANNUAL REPORT | |
INFORMATION ON BOARD OF TRUSTEES AND OFFICERS (Unaudited) |
A Board of Trustees oversees the Trust, as well as other trusts of GI, in which its members have no stated term of service, and continue to serve after election until resignation. The Statement of Additional Information includes further information about Fund Trustees and Officers, and can be obtained without charge by visiting guggenheiminvestments.com or by calling 800.820.0888.
Name,
Address* and
Year of Birth | Position(s)
Held with
Trust | Term of Office
and Length of
Time Served** | Principal Occupation(s)
During Past Five Years | Number of
Portfolios
in Fund
Complex
Overseen | Other
Directorships Held
by Trustees*** |
INDEPENDENT TRUSTEES | | | |
Randall C. Barnes (1951) | Trustee and Chair of the Valuation Oversight Committee | Since 2014 (Trustee) Since 2020 (Chair of the Valuation Oversight Committee) | Current: Private Investor (2001-present). Former: Senior Vice President and Treasurer, PepsiCo, Inc. (1993-1997); President, Pizza Hut International (1991-1993); Senior Vice President, Strategic Planning and New Business Development, PepsiCo, Inc. (1987-1990). | 153 | Current: Advent Convertible and Income Fund (2005-present); Purpose Investments Funds (2013-present). Former: Guggenheim Energy & Income Fund (2015-2023); Fiduciary/Claymore Energy Infrastructure Fund (2004-2022); Guggenheim Enhanced Equity Income Fund (2005-2021); Guggenheim Credit Allocation Fund (2013-2021). |
Angela Brock-Kyle (1959) | Trustee | Since 2019 | Current: Founder and Chief Executive Officer, B.O.A.R.D.S. (consulting firm) (2013-present); Director, Mutual Fund Directors Forum (2022-present). Former: Senior Leader, TIAA (financial services firm) (1987-2012). | 152 | Current: Bowhead Insurance GP, LLC (2020-present); Hunt Companies, Inc. (2019-present). Former: Guggenheim Energy & Income Fund (2019-2023); Fiduciary/Claymore Energy Infrastructure Fund (2019-2022); Guggenheim Enhanced Equity Income Fund (2019-2021); Guggenheim Credit Allocation Fund (2019-2021); Infinity Property & Casualty Corp. (2014-2018). |
| | THE GUGGENHEIM FUNDS SEMI-ANNUAL REPORT | 51 |
INFORMATION ON BOARD OF TRUSTEES AND OFFICERS (Unaudited)(continued) |
Name,
Address* and
Year of Birth | Position(s)
Held with
Trust | Term of Office
and Length of
Time Served** | Principal Occupation(s)
During Past Five Years | Number of
Portfolios
in Fund
Complex
Overseen | Other
Directorships Held
by Trustees*** |
INDEPENDENT TRUSTEES - continued | | |
Thomas F. Lydon, Jr. (1960) | Trustee and Chair of the Contracts Review Committee | Since 2019 (Trustee) Since 2020 (Chair of the Contracts Review Committee) | Current: President, Global Trends Investments (registered investment adviser) (1996-present); Chief Executive Officer, Lydon Media (2016-present); Vice Chairman, VettaFi, a wholly owned subsidiary of The TMX Group (financial advisor content, research and digital distribution provider) (2022-present). Former: Chief Executive Officer, ETF Flows, LLC (financial advisor education and research provider) (2019-2023); Director, GDX Index Partners, LLC (index provider) (2021-2023). | 152 | Current: US Global Investors, Inc. (GROW) (1995-present); The 2023 ETF Series Trust (4) (2023-present); The 2023 ETF Series II (1) (2023-present). Former: Guggenheim Energy & Income Fund (2019-2023); Fiduciary/Claymore Energy Infrastructure Fund (2019-2022); Guggenheim Enhanced Equity Income Fund (2019-2021); Guggenheim Credit Allocation Fund (2019-2021); Harvest Volatility Edge Trust (3) (2017-2019). |
52 | THE GUGGENHEIM FUNDS SEMI-ANNUAL REPORT | |
INFORMATION ON BOARD OF TRUSTEES AND OFFICERS (Unaudited)(continued) |
Name,
Address* and
Year of Birth | Position(s)
Held with
Trust | Term of Office
and Length of
Time Served** | Principal Occupation(s)
During Past Five Years | Number of
Portfolios
in Fund
Complex
Overseen | Other
Directorships Held
by Trustees*** |
INDEPENDENT TRUSTEES - continued | | |
Ronald A. Nyberg (1953) | Trustee and Chair of the Nominating and Governance Committee | Since 2014 | Current: Of Counsel (formerly Partner), Momkus LLP (law firm) (2016-present). Former: Partner, Nyberg & Cassioppi, LLC (law firm) (2000-2016); Executive Vice President, General Counsel, and Corporate Secretary, Van Kampen Investments (1982-1999). | 153 | Current: Advent Convertible and Income Fund (2003-present); PPM Funds (2) (2018-present); Endeavor Health (2012-present). Former: Guggenheim Energy & Income Fund (2015-2023); Fiduciary/Claymore Energy Infrastructure Fund (2004-2022); Guggenheim Enhanced Equity Income Fund (2005-2021); Guggenheim Credit Allocation Fund (2013-2021); Western Asset Inflation-Linked Opportunities & Income Fund (2004-2020); Western Asset Inflation-Linked Income Fund (2003-2020). |
Sandra G. Sponem (1958) | Trustee and Chair of the Audit Committee | Since 2019 (Trustee) Since 2020 (Chair of the Audit Committee) | Current: Retired. Former: Senior Vice President and Chief Financial Officer, M.A. Mortenson-Companies, Inc. (construction and real estate development company) (2007-2017). | 152 | Current: SPDR Series Trust (81) (2018-present); SPDR Index Shares Funds (30) (2018-present); SSGA Active Trust (14) (2018-present). Former: Guggenheim Energy & Income Fund (2019-2023); Fiduciary/Claymore Energy Infrastructure Fund (2019-2022); Guggenheim Enhanced Equity Income Fund (2019-2021); Guggenheim Credit Allocation Fund (2019-2021); SSGA Master Trust (1) (2018-2020). |
| | THE GUGGENHEIM FUNDS SEMI-ANNUAL REPORT | 53 |
INFORMATION ON BOARD OF TRUSTEES AND OFFICERS (Unaudited)(continued) |
Name,
Address* and
Year of Birth | Position(s)
Held with
Trust | Term of Office
and Length of
Time Served** | Principal Occupation(s)
During Past Five Years | Number of
Portfolios
in Fund
Complex
Overseen | Other
Directorships Held
by Trustees*** |
INDEPENDENT TRUSTEES - continued | | |
Ronald E. Toupin, Jr. (1958) | Trustee, Chair of the Board and Chair of the Executive Committee | Since 2014 | Current: Portfolio Consultant (2010-present); Member, Governing Council, Independent Directors Council (2013-present); Governor, Board of Governors, Investment Company Institute (2018-present). Former: Member, Executive Committee, Independent Directors Council (2016-2018); Vice President, Manager and Portfolio Manager, Nuveen Asset Management (1998-1999); Vice President, Nuveen Investment Advisory Corp. (1992-1999); Vice President and Manager, Nuveen Unit Investment Trusts (1991-1999); and Assistant Vice President and Portfolio Manager, Nuveen Unit Investment Trusts (1988-1999), each of John Nuveen & Co., Inc. (registered broker dealer) (1982-1999). | 152 | Former: Guggenheim Energy & Income Fund (2015-2023); Fiduciary/Claymore Energy Infrastructure Fund (2004-2022); Guggenheim Enhanced Equity Income Fund (2005-2021); Guggenheim Credit Allocation Fund (2013-2021); Western Asset Inflation-Linked Opportunities & Income Fund (2004-2020); Western Asset Inflation-Linked Income Fund (2003-2020). |
54 | THE GUGGENHEIM FUNDS SEMI-ANNUAL REPORT | |
INFORMATION ON BOARD OF TRUSTEES AND OFFICERS (Unaudited)(continued) |
Name,
Address* and
Year of Birth | Position(s)
Held with
Trust | Term of Office
and Length of
Time Served** | Principal Occupation(s)
During Past Five Years | Number of
Portfolios
in Fund
Complex
Overseen | Other
Directorships Held
by Trustees*** |
INDEPENDENT TRUSTEES - concluded | |
Amy J. Lee**** (1961) | Trustee, Vice President and Chief Legal Officer | Since 2018 (Trustee)
Since 2014 (Chief Legal Officer) Since 2007
(Vice President) | Current: Interested Trustee, certain other funds in the Fund Complex (2018-present); Chief Legal Officer, certain other funds in the Fund Complex (2014-present); Vice President, certain other funds in the Fund Complex (2007-present); Senior Managing Director, Guggenheim Investments (2012-present). Former: President and/or Chief Executive Officer, certain other funds in the Fund Complex (2017-2019); Vice President, Associate General Counsel and Assistant Secretary, Security Benefit Life Insurance Company and Security Benefit Corporation (2004-2012). | 152 | Former: Guggenheim Energy & Income Fund (2018-2023); Fiduciary/Claymore Energy Infrastructure Fund (2018-2022); Guggenheim Enhanced Equity Income Fund (2018-2021); Guggenheim Credit Allocation Fund (2018-2021). |
* | The business address of each Trustee is c/o Guggenheim Investments, 227 West Monroe Street, Chicago, Illinois 60606. |
** | Each Trustee serves an indefinite term, until his or her successor is elected and qualified. Time served includes time served in the respective position for the Predecessor Corporation. |
*** | Each Trustee also serves on the Boards of Trustees of Guggenheim Funds Trust, Guggenheim Variable Funds Trust, Guggenheim Strategy Funds Trust, Guggenheim Taxable Municipal Bond & Investment Grade Debt Trust, Guggenheim Strategic Opportunities Fund, Guggenheim Active Allocation Fund, Rydex Series Funds, Rydex Dynamic Funds, Rydex Variable Trust and Transparent Value Trust. Messrs. Barnes and Nyberg also serve on the Board of Trustees of Advent Convertible & Income Fund. |
**** | This Trustee is deemed to be an “interested person” of the Funds under the 1940 Act by reason of her position with the Funds’ Adviser and/or the parent of the Adviser. |
| | THE GUGGENHEIM FUNDS SEMI-ANNUAL REPORT | 55 |
INFORMATION ON BOARD OF TRUSTEES AND OFFICERS (Unaudited)(continued) |
Name, Address*
and Year of Birth | Position(s)
Held with
Trust | Term of Office
and Length of
Time Served** | Principal Occupation(s)
During Past Five Years |
OFFICERS | | | |
Brian E. Binder (1972) | President and Chief Executive Officer | Since 2018 | Current: President, Mutual Fund Boards, Guggenheim Investments (2022-present); President and Chief Executive Officer, certain other funds in the Fund Complex (2018-present); President, Mutual Funds Boards and Senior Managing Director, Guggenheim Funds Investment Advisors, LLC and Security Investors, LLC (2018-present); Board Member, Guggenheim Partners Investment Funds plc (2022-present); Board Member, Guggenheim Global Investments plc (2022-present); Board Member, Guggenheim Partners Fund Management (Europe) Limited (2018-present). Former: Senior Managing Director and Chief Administrative Officer, Guggenheim Investments (2018-2022); Managing Director and President, Deutsche Funds, and Head of US Product, Trading and Fund Administration, Deutsche Asset Management (2013-2018); Managing Director, Chairman of North American Executive Committee and Head of Business Management and Consulting, Invesco Ltd. (2010-2012). |
James Howley (1972) | Chief Financial Officer, Chief Accounting Officer and Treasurer | Since 2022 | Current: Managing Director, Guggenheim Investments (2004-present); Chief Financial Officer, Chief Accounting Officer, and Treasurer, certain other funds in the Fund Complex (2022-present). Former: Assistant Treasurer, certain other funds in the Fund Complex (2006-2022); Manager, Mutual Fund Administration of Van Kampen Investments, Inc. (1996-2004). |
Mark E. Mathiasen (1978) | Secretary | Since 2014 | Current: Secretary, certain other funds in the Fund Complex (2007-present); Managing Director, Guggenheim Investments (2007-present). |
Glenn McWhinnie (1969) | Assistant Treasurer | Since 2016 | Current: Vice President, Guggenheim Investments (2009-present); Assistant Treasurer, certain other funds in the Fund Complex (2016-present). |
Michael P. Megaris (1984) | Assistant Secretary | Since 2014 | Current: Assistant Secretary, certain other funds in the Fund Complex (2014-present); Managing Director, Guggenheim Investments (2012-present). |
56 | THE GUGGENHEIM FUNDS SEMI-ANNUAL REPORT | |
INFORMATION ON BOARD OF TRUSTEES AND OFFICERS (Unaudited)(continued) |
Name, Address*
and Year of Birth | Position(s)
Held with
Trust | Term of Office
and Length of
Time Served** | Principal Occupation(s)
During Past Five Years |
OFFICERS - continued | |
Elisabeth Miller (1968) | Chief Compliance Officer | Since 2012 | Current: Chief Compliance Officer, certain other funds in the Fund Complex (2012-present); Senior Managing Director, Guggenheim Investments (2012-present); Senior Managing Director, Guggenheim Funds Distributors, LLC (2014-present). Former: Chief Compliance Officer, Security Investors, LLC and Guggenheim Funds Investment Advisors, LLC (2012-2018); Chief Compliance Officer, Guggenheim Distributors, LLC (2009-2014); Senior Manager, Security Investors, LLC (2004-2014); Senior Manager, Guggenheim Distributors, LLC (2004-2014). |
Margaux Misantone (1978) | AML Officer | Since 2017 | Current: Chief Compliance Officer, Security Investors, LLC and Guggenheim Funds Investment Advisors, LLC (2018-present); AML Officer, Security Investors, LLC and certain other funds in the Fund Complex (2017-present); Managing Director, Guggenheim Investments (2015-present). Former: Assistant Chief Compliance Officer, Security Investors, LLC and Guggenheim Funds Investments Advisors, LLC (2015-2018). |
Kimberly J. Scott (1974) | Assistant Treasurer | Since 2014 | Current: Director, Guggenheim Investments (2012-present); Assistant Treasurer, certain other funds in the Fund Complex (2012-present). Former: Financial Reporting Manager, Invesco, Ltd. (2010-2011); Vice President/Assistant Treasurer, Mutual Fund Administration for Van Kampen Investments, Inc./Morgan Stanley Investment Management (2009-2010); Manager of Mutual Fund Administration, Van Kampen Investments, Inc./Morgan Stanley Investment Management (2005-2009). |
| | THE GUGGENHEIM FUNDS SEMI-ANNUAL REPORT | 57 |
INFORMATION ON BOARD OF TRUSTEES AND OFFICERS (Unaudited)(concluded) |
Name, Address*
and Year of Birth | Position(s)
Held with
Trust | Term of Office
and Length of
Time Served** | Principal Occupation(s)
During Past Five Years |
OFFICERS - concluded | |
Jon Szafran (1989) | Assistant Treasurer | Since 2017 | Current: Director, Guggenheim Investments (2017-present); Assistant Treasurer, certain other funds in the Fund Complex (2017-present). Former: Assistant Treasurer of Henderson Global Funds and Manager of US Fund Administration, Henderson Global Investors (North America) Inc. (“HGINA”), (2017); Senior Analyst of US Fund Administration, HGINA (2014–2017); Senior Associate of Fund Administration, Cortland Capital Market Services, LLC (2013-2014); Experienced Associate, PricewaterhouseCoopers LLP (2012-2013). |
* | The business address of each officer is c/o Guggenheim Investments, 227 West Monroe Street, Chicago, Illinois 60606. |
** | Each officer serves an indefinite term, until his or her successor is duly elected and qualified. |
58 | THE GUGGENHEIM FUNDS SEMI-ANNUAL REPORT | |
GUGGENHEIM INVESTMENTS PRIVACY NOTICE (Unaudited) |
Who We Are
This Privacy Notice describes the data protection practices of Guggenheim Investments. Guggenheim Investments as used herein refers to the affiliated investment management businesses of Guggenheim Partners, LLC: Guggenheim Funds Investment Advisors, LLC, Guggenheim Partners Investment Management, LLC, Guggenheim Funds Distributors, LLC, Security Investors, LLC, Guggenheim Investment Advisors (Europe) Limited, Guggenheim Real Estate, LLC, GS Gamma Advisors, LLC, Guggenheim Partners India Management, LLC, Guggenheim Partners Europe Limited, as well as the funds in the Guggenheim Funds complex (the “Funds”) (“Guggenheim Investments,” “we,” “us,” or “our”).
Guggenheim Partners Investment Management Holdings, LLC, located at 330 Madison Avenue, New York, New York 10017 is the data controller for your information. The affiliates who are also controllers of certain of your information are: Guggenheim Investment Advisors (Europe) Limited, Guggenheim Partners Europe Limited, Guggenheim Partners, LLC, Guggenheim Funds Investment Advisors, LLC, Guggenheim Partners Investment Management, LLC, Guggenheim Funds Distributors, LLC and Security Investors, LLC, as well as the Funds.
Our Commitment to You
Guggenheim Investments considers your privacy our utmost concern. When you become our client or investor, you entrust us with not only your hard-earned money but also with your personal and financial information. Because we have access to your private information, we hold ourselves to the highest standards in its safekeeping and use. We strictly limit how we share your information with others, whether you are a current or former Guggenheim Investments client or investor.
The Information We Collect About You
We collect certain nonpublic personal information about you from information you provide on applications, other forms, our website, and/or from third parties including investment advisors. This information includes Social Security or other tax identification number, assets, income, tax information, retirement and estate plan information, transaction history, account balance, payment history, bank account information, marital status, family relationships, information that we collect on our website through the use of “cookies,” and other personal information that you or others provide to us. We may also collect such information through your inquiries by mail, e-mail or telephone. We may also collect customer due diligence information, as required by applicable law and regulation, through third party service providers.
How We Handle Your Personal Information
The legal basis for using your information as set out in this Privacy Notice is as follows: (a) use of your personal data is necessary to perform our obligations under any contract with you (such as a contract for us to provide financial services to you); or (b) where use of your personal data is not necessary for performance of a contract, use of your personal data is necessary for our
| | THE GUGGENHEIM FUNDS SEMI-ANNUAL REPORT | 59 |
GUGGENHEIM INVESTMENTS PRIVACY NOTICE (Unaudited)(continued) |
legitimate interests or the legitimate interests of others (for example, to enforce the legal terms governing our services, operate and market our website and other services we offer, ensure safe environments for our personnel and others, make and receive payments, prevent fraud and to know the customer to whom we are providing the services). Some processing is done to comply with applicable law.
In addition to the specific uses described above, we also use your information in the following manner:
| | ● | We use your information in connection with servicing your accounts. |
| | ● | We use information to respond to your requests or questions. For example, we might use your information to respond to your customer feedback. |
| | ● | We use information to improve our products and services. We may use your information to make our website and products better. We may use your information to customize your experience with us. |
| | ● | We use information for security purposes. We may use your information to protect our company and our customers. |
| | ● | We use information to communicate with you. For example, we will communicate with you about your account or our relationship. We may contact you about your feedback. We might also contact you about this Privacy Notice. We may also enroll you in our email newsletter. |
| | ● | We use information as otherwise permitted by law, as we may notify you. |
| | ● | Aggregate/Anonymous Data. We may aggregate and/or anonymize any information collected through the website so that such information can no longer be linked to you or your device (“Aggregate/Anonymous Information”). We may use Aggregate/Anonymous Information for any purpose, including without limitation for research and marketing purposes, and may also share such data with any third parties, including advertisers, promotional partners, and sponsors. |
We do not sell information about current or former clients or their accounts to third parties. Nor do we share this information, except when necessary to complete transactions at your request, to make you aware of investment products and services that we or our affiliates offer, or as permitted or required by law.
We provide information about you to companies and individuals not affiliated with Guggenheim Investments to complete certain transactions or account changes, or to perform services for us related to your account. For example, if you ask to transfer assets from another financial institution to Guggenheim Investments, we must provide certain information about you to that company to complete the transaction. We provide the third party with only the information necessary to carry out its responsibilities and only for that purpose. And we require these third
60 | THE GUGGENHEIM FUNDS SEMI-ANNUAL REPORT | |
GUGGENHEIM INVESTMENTS PRIVACY NOTICE (Unaudited)(continued) |
parties to treat your private information with the same high degree of confidentiality that we do. To alert you to other Guggenheim Investments products and services, we share your information within our family of affiliated companies. You may limit our sharing with affiliated companies as set out below. We may also share information with any successor to all or part of our business, or in connection with steps leading up to a merger or acquisition. For example, if part of our business was sold we may give customer information as part of that transaction. We may also share information about you with your consent.
We will release information about you if you direct us to do so, if we are compelled by law to do so, or in other circumstances as permitted by law (for example, to protect your account from fraud).
If you close your account(s) or become an inactive client or investor, we will continue to adhere to the privacy policies and practices described in this notice.
Opt-Out Provisions and Your Data Choices
The law allows you to “opt out” of certain kinds of information sharing with third parties. We do not share personal information about you with any third parties that triggers this opt-out right. This means YOU ARE ALREADY OPTED OUT.
When you are no longer our client or investor, we continue to share your information as described in this notice, and you may contact us at any time to limit our sharing by sending an email to CorporateDataPrivacy@GuggenheimPartners.com.
European Union Data Subjects and certain others: In addition to the choices set forth above, residents of the European Union and certain other jurisdictions have certain rights to (1) request access to or rectification or deletion of information we collect about them, (2) request a restriction on the processing of their information, (3) object to the processing of their information, or (4) request the portability of certain information. To exercise these or other rights, please contact us using the contact information below. We will consider all requests and provide our response within the time period stated by applicable law. Please note, however, that certain information may be exempt from such requests in some circumstances, which may include if we need to keep processing your information for our legitimate interests or to comply with a legal obligation. We may request you provide us with information necessary to confirm your identity before responding to your request.
Residents of France and certain other jurisdictions may also provide us with instructions regarding the manner in which we may continue to store, erase and share your information after your death, and where applicable, the person you have designated to exercise these rights after your death.
How We Protect Privacy Online
We take steps to protect your privacy when you use our web site – www.guggenheiminvestments.com – by using secure forms of online communication, including encryption technology, Secure Socket Layer (SSL) protocol, firewalls and user names and
| | THE GUGGENHEIM FUNDS SEMI-ANNUAL REPORT | 61 |
GUGGENHEIM INVESTMENTS PRIVACY NOTICE (Unaudited)(concluded) |
passwords. These safeguards vary based on the sensitivity of the information that we collect and store. However, we cannot and do not guarantee that these measures will prevent every unauthorized attempt to access, use, or disclose your information since despite our efforts, no Internet and/or other electronic transmissions can be completely secure. Our web site uses “http cookies”—tiny pieces of information that we ask your browser to store. We use cookies for session management and security features on the Guggenheim Investments web site. We do not use them to pull data from your hard drive, to learn your e-mail address, or to view data in cookies created by other web sites. We will not share the information in our cookies or give others access to it. See the legal information area on our web site for more details about web site security and privacy features.
How We Safeguard Your Personal Information and Data Retention
We restrict access to nonpublic personal information about you to our employees and in some cases to third parties (for example, the service providers described above) as permitted by law. We maintain strict physical, electronic and procedural safeguards that comply with federal standards to guard your nonpublic personal information.
We keep your information for no longer than necessary for the purposes for which it is processed. The length of time for which we retain information depends on the purposes for which we collected and use it and/or as required to comply with applicable laws. Information may persist in copies made for backup and business continuity purposes for additional time.
International Visitors
If you are not a resident of the United States, please be aware that your information may be transferred to, stored and processed in the United States where our servers are located and our databases are operated. The data protection and other laws of the United States and other countries might not be as comprehensive as those in your country.
In such cases, we ensure that a legal basis for such a transfer exists and that adequate protection is provided as required by applicable law, for example, by using standard contractual clauses or by transferring your data to a jurisdiction that has obtained an adequacy finding. Individuals whose data may be transferred on the basis of standard contractual clauses may contact us as described below.
We’ll Keep You Informed
If you have any questions or concerns about how we treat your personal data, we encourage you to consult with us first. You may also contact the relevant supervisory authority.
We reserve the right to modify this policy at any time and will inform you promptly of material changes. You may access our privacy policy from our web site at www.guggenheiminvestments.com. Should you have any questions regarding our privacy policy, contact us by email at CorporateDataPrivacy@GuggenheimPartners.com.
62 | THE GUGGENHEIM FUNDS SEMI-ANNUAL REPORT | |
This page intentionally left blank.
This page intentionally left blank.
This page intentionally left blank.
3.31.2024
Guggenheim Funds Semi-Annual Report
| |
Guggenheim Limited Duration Fund | | |
GuggenheimInvestments.com | LD-SEMI-0324x0924 |
| | |
DEAR SHAREHOLDER | 2 |
ECONOMIC AND MARKET OVERVIEW | 3 |
ABOUT SHAREHOLDERS’ FUND EXPENSES | 4 |
LIMITED DURATION FUND | 6 |
NOTES TO FINANCIAL STATEMENTS | 34 |
OTHER INFORMATION | 51 |
INFORMATION ON BOARD OF TRUSTEES AND OFFICERS | 52 |
GUGGENHEIM INVESTMENTS PRIVACY NOTICE | 58 |
| | THE GUGGENHEIM FUNDS SEMI-ANNUAL REPORT | 1 |
Dear Shareholder:
Guggenheim Partners Investment Management, LLC (the “Investment Adviser”) is pleased to present the shareholder report for Guggenheim Limited Duration Fund (the “Fund”) for the semi-annual fiscal period ended March 31, 2024 (the “Reporting Period”).
The Investment Adviser is part of Guggenheim Investments, which represents the investment management businesses of Guggenheim Partners, LLC (“Guggenheim”), a global, diversified financial services firm.
Guggenheim Funds Distributors, LLC is the distributor of the Fund. Guggenheim Funds Distributors, LLC is affiliated with Guggenheim and the Investment Adviser.
We encourage you to read the Economic and Market Overview section of the report, which follows this letter.
We are committed to providing innovative investment solutions and appreciate the trust you place in us.
Sincerely,
Guggenheim Partners Investment Management, LLC,
April 30, 2024
Read a prospectus and summary prospectus (if available) carefully before investing. It contains the investment objectives, risks, charges, expenses and other information, which should be considered carefully before investing. Obtain a prospectus and summary prospectus (if available) at guggenheiminvestments.com or call 800.820.0888.
This material is not intended as a recommendation or as investment advice of any kind, including in connection with rollovers, transfers, and distributions. Such material is not provided in a fiduciary capacity, may not be relied upon for or in connection with the making of investment decisions, and does not constitute a solicitation of an offer to buy or sell securities. All content has been provided for informational or educational purposes only and is not intended to be and should not be construed as legal or tax advice and/or a legal opinion. Always consult a financial, tax and/or legal professional regarding your specific situation.
Limited Duration Fund may not be suitable for all investors. ● An investment in the Fund will fluctuate and is subject to investment risks, which means investors could lose money. ● There can be no guarantee the Fund will achieve its investment objective. ● The Fund’s share price, or the income generated by the Fund’s holdings, could change in response to interest rate changes and market and economic conditions among other factors. In general, bond prices rise when interest rates fall and vice versa. ● The Fund’s exposure to high yield securities may subject the Fund to greater volatility. ● When market conditions are deemed appropriate, the Fund may use leverage to the full extent permitted by its investment policies and restrictions and applicable law. Leveraging will exaggerate the effect on net asset value of any increase or decrease in the market value of the Fund’s portfolio. ● The Fund may invest in derivative instruments, which may be more volatile and less liquid, increasing the risk of loss when compared to traditional securities. Certain of the derivative instruments are also subject to the risks of counterparty default and adverse tax treatment. ● Instruments and strategies (such as borrowing transactions and reverse repurchase agreements) may provide leveraged exposure to a particular investment, which will magnify any gains or losses on those investments. ● Investments in reverse repurchase agreements expose the Fund to the many of the same risks as investments in derivatives. ● The Fund’s investments in other investment vehicles subject the Fund to those risks and expenses affecting the investment vehicle. ● The Fund’s investments in foreign securities carry additional risks when compared to U.S. securities, due to the impact of diplomatic, political or economic developments in the country in question (investments in emerging markets securities are generally subject to an even greater level of risks). ● Investments in syndicated bank loans generally offer a floating interest rate and involve special types of risks. ● The Fund’s investments in municipal securities can be affected by events that affect the municipal bond market. ● The Fund’s investments in real estate securities subject the Fund to the same risks as direct investments in real estate, which is particularly sensitive to economic downturns. ● The Fund’s investments in restricted securities may involve financial and liquidity risk. ● You may have a gain or loss when you sell your shares. ● The Fund is subject to active trading risks that may increase volatility and impact its ability to achieve its investment objective.● It is important to note that the Fund is not guaranteed by the U.S. government. ● Please read the prospectus for more detailed information regarding these and other risks.
2 | THE GUGGENHEIM FUNDS SEMI-ANNUAL REPORT | |
ECONOMIC AND MARKET OVERVIEW (Unaudited) | March 31, 2024 |
While job growth remains robust, recent labor data brought increased confidence in a labor market in better balance, allowing for inflation to soften further. Labor force growth remains strong, aided by high immigration flows, helping bring labor supply in line with gradually cooling demand. The Small Business Survey indicates that plans to increase compensation have returned to pre-COVID levels. Additionally, Bureau of Labor Statistics data reveal a continued decline in the “quits rate,” reducing the pressure on businesses to raise wages to attract or retain employees. These developments suggest wage pressures may ease further by year end. And despite some speculation against any Federal Reserve (“Fed”) rate cuts materializing in 2024, we continue to anticipate cuts later this year.
Following the stronger-than-expected March Consumer Price Index, we believe that there is a high probability that the easing cycle will start in the second half of the year, since the Fed will likely need more time to gather confirming data. In the latest Summary of Economic Projections, the Federal Open Market Committee (“FOMC”) significantly increased the median forecast for 2024 U.S. gross domestic product, slightly increased it for core personal consumption expenditures year over year, and continues to expect no material increase in the unemployment rate. These adjustments left the median view for three rate cuts for 2024, which suggests the bar is very high for the Fed to keep rates where they are all year, and even higher for more rate hikes to materialize.
Amid this macroeconomic backdrop, in the first quarter of 2024 the two-year Treasury yield increased to 4.59% from 4.23%, and the 10-year Treasury yield increased to 4.20% from 3.88%, keeping the inverted 2s/10s yield curve consistent at 39 basis points as of the end of the Reporting Period, up four basis points since the start of the year. One basis point equals 0.01%. In general, spreads to Treasurys have remained tight across sectors. In investment-grade corporate bonds, BBB-rated bonds continued to remain attractive relative to A and BB-rated bonds, and supply slowed toward the end of the first quarter of 2024, which we believe should support spreads in the near term. High yield bond spreads tightened during the first quarter of 2024 to 301 basis points from 323 basis points at the start of the year, while leveraged loans’ discount margins to maturity tightened to 509 basis points from 528 basis points. Structured credit spreads tightened marginally amid strong demand. Investor demand and an improved arbitrage led to robust new collateralized loan obligation issuance, and tightening liabilities led to an increase in refinances/resets.
Looking forward, Fed officials continue to advocate for a patient approach. A conventional easing cycle is therefore far from guaranteed. Market expectations have already adjusted significantly from market-implied expectations of six rate cuts in 2024 just two months ago to only three as of the end of the Reporting Period, aligning more closely with the FOMC’s views. So far, the market has taken this delay in stride, but its patience and assessment of credit risk could be tested.
For the Reporting Period, the S&P 500® Index* returned 23.48%. The MSCI Europe-Australasia-Far East (“EAFE”) Index* returned 17.01%. The return of the MSCI Emerging Markets Index* was 10.56%.
In the bond market, the Bloomberg U.S. Aggregate Bond Index* posted a 5.99% return for the Reporting Period, while the Bloomberg U.S. Corporate High Yield Index* returned 8.75%. The return of the ICE Bank of America (“BofA”) 3-Month U.S. Treasury Bill Index* was 2.69% for the Reporting Period.
The opinions and forecasts expressed may not actually come to pass. This information is subject to change at any time, based on market and other conditions, and should not be construed as a recommendation of any specific security or strategy.
*Index Definitions:
The following indices are referenced throughout this report. Indices are unmanaged and not available for direct investment. Index performance does not reflect transaction costs, fees, or expenses.
Bloomberg U.S. Aggregate Bond Index is a broad-based flagship benchmark that measures the investment grade, U.S. dollar-denominated, fixed-rate taxable bond market, including U.S. Treasuries, government-related and corporate securities, mortgage-backed securities or “MBS” (agency fixed-rate and hybrid adjustable-rate mortgage, or “ARM”, pass-throughs), asset-backed securities (“ABS”), and commercial mortgage-backed securities (“CMBS”) (agency and non-agency).
Bloomberg U.S. Corporate High Yield Index measures the U.S. dollar-denominated, high yield, fixed-rate corporate bond market. Securities are classified as high yield if the middle rating of Moody’s, Fitch, and S&P is Ba1/BB +/BB + or below.
Bloomberg U.S. Aggregate Bond 1-3 Year Total Return Index measures the performance of publicly issued investment grade corporate, U.S. Treasury and government agency securities with remaining maturities of one to three years.
ICE BofA 3-Month U.S. Treasury Bill Index is an unmanaged market Index of U.S. Treasury securities maturing in 90 days that assumes reinvestment of all income.
MSCI EAFE Index is a free float-adjusted market capitalization index that is designed to measure the equity market performance of developed markets, excluding the U.S. & Canada.
MSCI Emerging Markets Index is a free float-adjusted market capitalization weighted index that is designed to measure equity market performance in the global emerging markets.
S&P 500® Index is a broad-based index, the performance of which is based on the performance of 500 widely held common stocks chosen for market size, liquidity, and industry group representation.
| | THE GUGGENHEIM FUNDS SEMI-ANNUAL REPORT | 3 |
ABOUT SHAREHOLDERS’ FUND EXPENSES (Unaudited) | |
All mutual funds have operating expenses, and it is important for our shareholders to understand the impact of costs on their investments. Shareholders of a fund incur two types of costs: (i) transaction costs, including sales charges (loads) on purchase payments, reinvested dividends, other distributions, and exchange fees, and (ii) ongoing costs, including management fees, administrative services, and shareholder reports, among others. These ongoing costs, or operating expenses, are deducted from a fund’s gross income and reduce the investment return of the fund.
A fund’s expenses are expressed as a percentage of its average net assets, which is known as the expense ratio. The following examples are intended to help investors understand the ongoing costs (in dollars) of investing in a fund and to compare these costs with the ongoing costs of investing in other mutual funds.
The examples are based on an investment of $1,000 made at the beginning of the period and held for the entire six-month period beginning September 30, 2023 and ending March 31, 2024.
The following tables illustrate the Fund’s costs in two ways:
Table 1. Based on actual Fund return: This section helps investors estimate the actual expenses paid over the period. The “Ending Account Value” shown is derived from the Fund’s actual return, and the fifth column shows the dollar amount that would have been paid by an investor who started with $1,000 in the Fund. Investors may use the information here, together with the amount invested, to estimate the expenses paid over the period. Simply divide the Fund’s account value by $1,000 (for example, an $8,600 account value divided by $1,000 = 8.6), then multiply the result by the number provided under the heading “Expenses Paid During Period.”
Table 2. Based on hypothetical 5% return: This section is intended to help investors compare a fund’s cost with those of other mutual funds. The table provides information about hypothetical account values and hypothetical expenses based on the Fund’s actual expense ratio and an assumed rate of return of 5% per year before expenses, which is not the Fund’s actual return. The hypothetical account values and expenses may not be used to estimate the actual ending account balance or expenses paid during the period. The example is useful in making comparisons because the U.S. Securities and Exchange Commission (the “SEC”) requires all mutual funds to calculate expenses based on the 5% return. Investors can assess a Fund’s costs by comparing this hypothetical example with the hypothetical examples that appear in shareholder reports of other funds.
The calculations illustrated above assume no shares were bought or sold during the period. Actual costs may have been higher or lower, depending on the amount of investment and the timing of any purchases or redemptions.
Please note that the expenses shown in the table are meant to highlight your ongoing costs only and do not reflect any transactional costs, such as sales charges (loads) on purchase payments, and contingent deferred sales charges (“CDSC”) on redemptions, if any. Therefore, the second table is useful in comparing ongoing costs only, and will not help you determine the relative total costs of owning different funds. In addition, if these transactional costs were included, your costs would have been higher.
More information about the Fund’s expenses, including annual expense ratios for periods up to five years (subject to the Fund’s inception date), can be found in the Financial Highlights section of this report. For additional information on operating expenses and other shareholder costs, please refer to the Fund’s prospectus.
4 | THE GUGGENHEIM FUNDS SEMI-ANNUAL REPORT | |
ABOUT SHAREHOLDERS’ FUND EXPENSES (Unaudited)(concluded) | |
| | Expense
Ratio1 | | | Fund
Return | | | Beginning
Account Value
September 30, 2023 | | | Ending
Account Value
March 31, 2024 | | | Expenses
Paid During
Period2 | |
Table 1. Based on actual Fund return3 | | | | | | | | | | | | | | | | | | | | |
Class A | | | 0.73 | % | | | 4.42 | % | | $ | 1,000.00 | | | $ | 1,044.20 | | | $ | 3.73 | |
Class C | | | 1.48 | % | | | 4.04 | % | | | 1,000.00 | | | | 1,040.40 | | | | 7.55 | |
Class P | | | 0.73 | % | | | 4.42 | % | | | 1,000.00 | | | | 1,044.20 | | | | 3.73 | |
Institutional Class | | | 0.48 | % | | | 4.59 | % | | | 1,000.00 | | | | 1,045.90 | | | | 2.46 | |
Class R6 | | | 0.44 | % | | | 4.62 | % | | | 1,000.00 | | | | 1,046.20 | | | | 2.25 | |
|
Table 2. Based on hypothetical 5% return (before expenses) | | | | | | | | | | | | | | | | |
Class A | | | 0.73 | % | | | 5.00 | % | | $ | 1,000.00 | | | $ | 1,021.35 | | | $ | 3.69 | |
Class C | | | 1.48 | % | | | 5.00 | % | | | 1,000.00 | | | | 1,017.60 | | | | 7.47 | |
Class P | | | 0.73 | % | | | 5.00 | % | | | 1,000.00 | | | | 1,021.35 | | | | 3.69 | |
Institutional Class | | | 0.48 | % | | | 5.00 | % | | | 1,000.00 | | | | 1,022.60 | | | | 2.43 | |
Class R6 | | | 0.44 | % | | | 5.00 | % | | | 1,000.00 | | | | 1,022.80 | | | | 2.23 | |
1 | Annualized and excludes expenses of the underlying funds in which the Funds invest, if any. This ratio represents net expenses, which may include expenses that are excluded from the expense limitation agreement. Excluding these expenses, the net expense ratio for the Fund would be 0.72%, 1.47%, 0.72%, 0.47%, and 0.42% for Class A, Class C, Class P, Institutional Class and R6 Class, respectively. |
2 | Expenses are equal to the Fund’s annualized expense ratio, net of any applicable fee waivers, multiplied by the average account value over the period, multiplied by 183/366 (to reflect the one-half year period). |
3 | Actual cumulative return at net asset value for the period September 30, 2023 to March 31, 2024. |
| | THE GUGGENHEIM FUNDS SEMI-ANNUAL REPORT | 5 |
PERFORMANCE REPORT AND FUND PROFILE (Unaudited) | March 31, 2024 |
LIMITED DURATION FUND
OBJECTIVE: Seeks to provide a high level of income consistent with preservation of capital.
Holdings Diversification (Market Exposure as % of Net Assets)
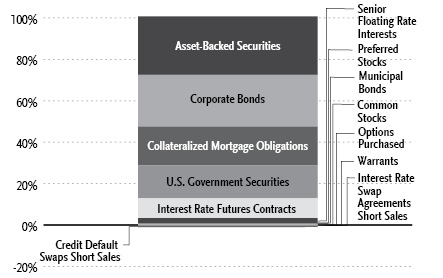
“Holdings Diversification (Market Exposure as % of Net Assets)” excludes any temporary cash investments, investments in Guggenheim Strategy Funds Trust mutual funds, or investments in Guggenheim Ultra Short Duration Fund.
Portfolio Composition by Quality Rating1 |
Rating | % of Total Investments |
Fixed Income Instruments | |
AAA | 37.2% |
AA | 7.3% |
A | 16.2% |
BBB | 14.1% |
BB | 4.4% |
B | 0.9% |
CCC | 0.5% |
CC | 0.3% |
NR2 | 7.5% |
Other Instruments | 11.6% |
Total Investments | 100.0% |
Inception Dates: |
Class A | December 16, 2013 |
Class C | December 16, 2013 |
Class P | May 1, 2015 |
Institutional Class | December 16, 2013 |
Class R6 | March 13, 2019 |
Ten Largest Holdings | % of Total Net Assets |
U.S. Treasury Notes, 4.75% due 07/31/25 | 4.6% |
U.S. Treasury Notes, 4.25% due 01/31/26 | 3.4% |
U.S. Treasury Notes, 4.63% due 02/28/26 | 3.4% |
Uniform MBS 15 Year | 2.6% |
U.S. Treasury Notes, 4.63% due 06/30/25 | 2.3% |
THL Credit Lake Shore MM CLO I Ltd., 7.28% | 1.1% |
F&G Global Funding, 0.90% | 0.9% |
U.S. Treasury Inflation Indexed Bonds, 0.13% due 10/15/25 | 0.9% |
U.S. Treasury Inflation Indexed Bonds, 0.13% due 04/15/25 | 0.9% |
OSAT Trust, 2.12% | 0.9% |
Top Ten Total | 21.0% |
| | |
“Ten Largest Holdings” excludes any temporary cash or derivative investments. |
1 | Source: BlackRock Solutions. Credit quality ratings are measured on a scale that generally ranges from AAA (highest) to D (lowest). All securities except for those labeled “NR” have been rated by Moody’s, Standard & Poor’s (“S&P”), or Fitch, each of which is a Nationally Recognized Statistical Rating Organization (“NRSRO”). For purposes of this presentation, when ratings are available from more than one agency, the highest rating is used. Guggenheim Investments has converted ratings to the equivalent S&P rating. Security ratings are determined at the time of purchase and may change thereafter. |
2 | NR (not rated) securities do not necessarily indicate low credit quality. |
6 | THE GUGGENHEIM FUNDS SEMI-ANNUAL REPORT | |
PERFORMANCE REPORT AND FUND PROFILE (Unaudited)(concluded) | March 31, 2024 |
Average Annual Returns*
Periods Ended March 31, 2024
| 6 Month† | 1 Year | 5 Year | 10 Year |
Class A Shares | 4.42% | 5.81% | 2.24% | 2.31% |
Class A Shares with sales charge‡ | 2.08% | 3.42% | 1.77% | 2.08% |
Class C Shares | 4.04% | 5.02% | 1.48% | 1.55% |
Class C Shares with CDSC§ | 3.04% | 4.02% | 1.48% | 1.55% |
Institutional Class Shares | 4.59% | 6.12% | 2.50% | 2.58% |
Bloomberg U.S. Aggregate Bond 1-3 Year Total Return Index | 3.17% | 3.56% | 1.31% | 1.27% |
| 6 Month† | 1 Year | 5 Year | Since
Inception
(05/01/15) |
Class P Shares | 4.42% | 5.81% | 2.24% | 2.25% |
Bloomberg U.S. Aggregate Bond 1-3 Year Total Return Index | 3.17% | 3.56% | 1.31% | 1.30% |
| 6 Month† | 1 Year | 5 Year | Since
Inception
(03/13/19) |
Class R6 Shares | 4.62% | 6.16% | 2.52% | 2.53% |
Bloomberg U.S. Aggregate Bond 1-3 Year Total Return Index | 3.17% | 3.56% | 1.31% | 1.38% |
* | The performance data above represents past performance that is not predictive of future results. The investment return and principal value of an investment in the Fund will fluctuate so that an investor’s shares, when redeemed, may be worth more or less than their original cost. Returns are historical and include changes in principal and reinvested dividends and capital gains and do not reflect the effect of taxes. The Bloomberg U.S. Aggregate Bond 1-3 Year Total Return Index is an unmanaged index and, unlike the Fund, has no management fees or operating expenses to reduce its reported return. |
† | 6 month returns are not annualized. |
‡ | Fund returns are calculated using the maximum sales charge of 2.25%. |
§ | Fund returns include a CDSC of 1% if redeemed within 12 months of purchase. |
| | THE GUGGENHEIM FUNDS SEMI-ANNUAL REPORT | 7 |
SCHEDULE OF INVESTMENTS (Unaudited) | March 31, 2024 |
LIMITED DURATION FUND | |
| | Shares | | | Value | |
COMMON STOCKS† - 0.0% |
| | | | | | | | | |
Communications - 0.0% |
Vacasa, Inc. — Class A* | | | 4,070 | | | $ | 27,757 | |
| | | | | | | | | |
Total Common Stocks | | | | |
(Cost $813,037) | | | | | | | 27,757 | |
| | | | | | | | | |
PREFERRED STOCKS†† - 0.5% |
Financial - 0.5% |
Wells Fargo & Co. |
3.90% | | | 12,100,000 | | | | 11,512,258 | |
MetLife, Inc. |
3.85% | | | 4,620,000 | | | | 4,440,761 | |
Markel Group, Inc. |
6.00% | | | 4,085,000 | | | | 4,051,538 | |
American Equity Investment Life Holding Co. |
5.95% | | | 8,000 | | | | 193,840 | |
Total Financial | | | | | | | 20,198,397 | |
| | | | | | | | | |
Total Preferred Stocks | | | | |
(Cost $20,988,646) | | | | | | | 20,198,397 | |
| | | | | | | | | |
WARRANTS† - 0.0% |
Ginkgo Bioworks Holdings, Inc. | | | | | | | | |
Expiring 09/16/26* | | | 19,663 | | | | 1,770 | |
Total Warrants | | | | |
(Cost $45,530) | | | | | | | 1,770 | |
| | | | | | | | | |
MUTUAL FUNDS† - 2.2% |
Guggenheim Strategy Fund III1 | | | 1,316,150 | | | | 32,469,417 | |
Guggenheim Strategy Fund II1 | | | 1,315,012 | | | | 32,349,286 | |
Guggenheim Ultra Short Duration Fund — Institutional Class1 | | | 3,198,834 | | | | 31,700,443 | |
Total Mutual Funds | | | | |
(Cost $96,046,241) | | | | | | | 96,519,146 | |
| | | | | | | | | |
MONEY MARKET FUNDS† - 7.4% |
Dreyfus Treasury Securities Cash Management Fund — Institutional Shares, 5.19%2 | | | 272,934,168 | | | | 272,934,168 | |
Dreyfus Treasury Obligations Cash Management Fund — Institutional Shares, 5.20%2 | | | 49,125,971 | | | | 49,125,971 | |
Federated Hermes U.S. Treasury Cash Reserves Fund — Institutional Shares, 5.19%2 | | | 284,769 | | | | 284,769 | |
Total Money Market Funds | | | | |
(Cost $322,344,908) | | | | | | | 322,344,908 | |
| | Face
Amount~ | | | | |
ASSET-BACKED SECURITIES†† - 28.0% |
Collateralized Loan Obligations - 18.2% | | | | | | | | |
THL Credit Lake Shore MM CLO I Ltd. | | | | | | | | |
2021-1A A1R, 7.28% (3 Month Term SOFR + 1.96%, Rate Floor: 1.70%) due 04/15/33◊,3 | | | 48,500,000 | | | | 48,487,055 | |
2021-1A A2R, 7.43% (3 Month Term SOFR + 2.11%, Rate Floor: 1.85%) due 04/15/33◊,3 | | | 6,250,000 | | | | 6,266,769 | |
Golub Capital Partners CLO 49M Ltd. | | | | | | | | |
2021-49A AR, 7.11% (3 Month Term SOFR + 1.79%, Rate Floor: 1.79%) due 08/26/33◊,3 | | | 36,500,000 | | | | 36,614,646 | |
BXMT Ltd. | | | | | | | | |
2020-FL2 AS, 6.59% (1 Month Term SOFR + 1.26%, Rate Floor: 1.26%) due 02/15/38◊,3 | | | 14,310,000 | | | | 13,491,831 | |
2020-FL2 A, 6.34% (1 Month Term SOFR + 1.01%, Rate Floor: 1.01%) due 02/15/38◊,3 | | | 12,728,314 | | | | 12,219,182 | |
2020-FL3 AS, 7.19% (1 Month Term SOFR + 1.86%, Rate Floor: 1.86%) due 11/15/37◊,3 | | | 4,500,000 | | | | 4,243,266 | |
2020-FL3 B, 7.59% (1 Month Term SOFR + 2.26%, Rate Floor: 2.26%) due 11/15/37◊,3 | | | 2,000,000 | | | | 1,842,813 | |
2020-FL2 B, 6.84% (1 Month Term SOFR + 1.51%, Rate Floor: 1.51%) due 02/15/38◊,3 | | | 2,000,000 | | | | 1,823,436 | |
Golub Capital Partners CLO 54M LP | | | | | | | | |
2021-54A A, 7.06% (3 Month Term SOFR + 1.79%, Rate Floor: 1.53%) due 08/05/33◊,3 | | | 29,000,000 | | | | 29,054,097 | |
ABPCI Direct Lending Fund IX LLC | | | | | | | | |
2021-9A A1R, 6.98% (3 Month Term SOFR + 1.66%, Rate Floor: 1.40%) due 11/18/31◊,3 | | | 28,964,618 | | | | 28,948,465 | |
Owl Rock CLO IV Ltd. | | | | | | | | |
2021-4A A1R, 7.18% (3 Month Term SOFR + 1.86%, Rate Floor: 1.60%) due 08/20/33◊,3 | | | 24,250,000 | | | | 24,242,398 | |
2021-4A A2R, 7.48% (3 Month Term SOFR + 2.16%, Rate Floor: 1.90%) due 08/20/33◊,3 | | | 3,650,000 | | | | 3,624,513 | |
Golub Capital Partners CLO 16 Ltd. | | | | | | | | |
2021-16A A1R2, 7.20% (3 Month Term SOFR + 1.87%, Rate Floor: 1.61%) due 07/25/33◊,3 | | | 27,650,000 | | | | 27,795,956 | |
LCCM Trust | | | | | | | | |
2021-FL3 A, 6.89% (1 Month Term SOFR + 1.56%, Rate Floor: 1.56%) due 11/15/38◊,3 | | | 22,008,292 | | | | 21,699,581 | |
2021-FL2 B, 7.34% (1 Month Term SOFR + 2.01%, Rate Floor: 2.01%) due 12/13/38◊,3 | | | 6,000,000 | | | | 5,731,718 | |
8 | THE GUGGENHEIM FUNDS SEMI-ANNUAL REPORT | SEE NOTES TO FINANCIAL STATEMENTS. |
SCHEDULE OF INVESTMENTS (Unaudited)(continued) | March 31, 2024 |
LIMITED DURATION FUND | |
| | Face
Amount~ | | | Value | |
Parliament CLO II Ltd. | | | | | | | | |
2021-2A B, 7.28% (3 Month Term SOFR + 1.96%, Rate Floor: 1.70%) due 08/20/32◊,3 | | | 22,250,000 | | | $ | 22,197,040 | |
2021-2A A, 6.93% (3 Month Term SOFR + 1.61%, Rate Floor: 1.35%) due 08/20/32◊,3 | | | 4,406,162 | | | | 4,407,273 | |
2021-2A C, 8.13% (3 Month Term SOFR + 2.81%, Rate Floor: 2.55%) due 08/20/32◊,3 | | | 500,000 | | | | 482,337 | |
Golub Capital Partners CLO 33M Ltd. | | | | | | | | |
2021-33A AR2, 7.45% (3 Month Term SOFR + 2.12%, Rate Floor: 1.86%) due 08/25/33◊,3 | | | 23,000,000 | | | | 22,863,325 | |
Palmer Square Loan Funding Ltd. | | | | | | | | |
2021-1A A1, 6.48% (3 Month Term SOFR + 1.16%, Rate Floor: 1.16%) due 04/20/29◊,3 | | | 6,089,867 | | | | 6,080,212 | |
2021-3A B, 7.33% (3 Month Term SOFR + 2.01%, Rate Floor: 2.01%) due 07/20/29◊,3 | | | 5,000,000 | | | | 5,005,371 | |
2022-1A A2, 6.92% (3 Month Term SOFR + 1.60%, Rate Floor: 1.60%) due 04/15/30◊,3 | | | 5,000,000 | | | | 4,994,488 | |
2021-2A B, 6.98% (3 Month Term SOFR + 1.66%, Rate Floor: 1.66%) due 05/20/29◊,3 | | | 4,000,000 | | | | 3,999,926 | |
2023-2A A2, 7.65% (3 Month Term SOFR + 2.30%, Rate Floor: 2.30%) due 01/25/32◊,3 | | | 2,000,000 | | | | 2,000,076 | |
Madison Park Funding XLVIII Ltd. | | | | | | | | |
2021-48A B, 7.02% (3 Month Term SOFR + 1.71%, Rate Floor: 1.71%) due 04/19/33◊,3 | | | 22,000,000 | | | | 21,965,282 | |
Golub Capital Partners CLO 36M Ltd. | | | | | | | | |
2018-36A A, 6.83% (3 Month Term SOFR + 1.56%, Rate Floor: 0.00%) due 02/05/31◊,3 | | | 21,611,524 | | | | 21,588,685 | |
Cerberus Loan Funding XLIV LLC | | | | | | | | |
2024-5A A, 7.45% (3 Month Term SOFR + 2.35%, Rate Floor: 2.35%) due 01/15/36◊,3 | | | 20,000,000 | | | | 20,208,096 | |
HERA Commercial Mortgage Ltd. | | | | | | | | |
2021-FL1 A, 6.48% (1 Month Term SOFR + 1.16%, Rate Floor: 1.05%) due 02/18/38◊,3 | | | 16,885,275 | | | | 16,392,948 | |
2021-FL1 B, 7.03% (1 Month Term SOFR + 1.71%, Rate Floor: 1.60%) due 02/18/38◊,3 | | | 3,750,000 | | | | 3,612,250 | |
Cerberus Loan Funding XL LLC | | | | | | | | |
2023-1A A, 7.71% (3 Month Term SOFR + 2.40%, Rate Floor: 2.40%) due 03/22/35◊,3 | | | 16,500,000 | | | | 16,668,043 | |
2023-1A B, 8.91% (3 Month Term SOFR + 3.60%, Rate Floor: 3.60%) due 03/22/35◊,3 | | | 3,250,000 | | | | 3,250,014 | |
Cerberus Loan Funding XXXII, LP | | | | | | | | |
2021-2A A, 7.20% (3 Month Term SOFR + 1.88%, Rate Floor: 1.88%) due 04/22/33◊,3 | | | 14,250,000 | | | | 14,200,155 | |
2021-2A B, 7.48% (3 Month Term SOFR + 2.16%, Rate Floor: 2.16%) due 04/22/33◊,3 | | | 4,000,000 | | | | 3,976,274 | |
LCM XXIV Ltd. | | | | | | | | |
2021-24A AR, 6.56% (3 Month Term SOFR + 1.24%, Rate Floor: 0.98%) due 03/20/30◊,3 | | | 18,121,619 | | | | 18,121,619 | |
ABPCI Direct Lending Fund CLO II LLC | | | | | | | | |
2021-1A A1R, 7.18% (3 Month Term SOFR + 1.86%, Rate Floor: 1.60%) due 04/20/32◊,3 | | | 15,250,000 | | | | 15,267,695 | |
2021-1A BR, 7.73% (3 Month Term SOFR + 2.41%, Rate Floor: 2.15%) due 04/20/32◊,3 | | | 2,250,000 | | | | 2,262,054 | |
2021-1A A2R, 7.48% (3 Month Term SOFR + 2.16%, Rate Floor: 1.90%) due 04/20/32◊,3 | | | 300,000 | | | | 301,074 | |
Cerberus Loan Funding XXXI, LP | | | | | | | | |
2021-1A B, 7.48% (3 Month Term SOFR + 2.16%, Rate Floor: 1.90%) due 04/15/32◊,3 | | | 9,600,000 | | | | 9,703,728 | |
2021-1A A, 7.08% (3 Month Term SOFR + 1.76%, Rate Floor: 1.50%) due 04/15/32◊,3 | | | 6,814,931 | | | | 6,822,159 | |
Woodmont Trust | | | | | | | | |
2020-7A A1A, 7.48% (3 Month Term SOFR + 2.16%, Rate Floor: 1.90%) due 01/15/32◊,3 | | | 16,250,000 | | | | 16,308,294 | |
GoldenTree Loan Management US CLO 1 Ltd. | | | | | | | | |
2024-9A BR, due 04/20/37◊,3 | | | 8,250,000 | | | | 8,250,000 | |
2021-9A B, 7.08% (3 Month Term SOFR + 1.76%, Rate Floor: 1.50%) due 01/20/33◊,3 | | | 7,000,000 | | | | 7,000,000 | |
2021-9A C, 7.38% (3 Month Term SOFR + 2.06%, Rate Floor: 1.80%) due 01/20/33◊,3 | | | 1,000,000 | | | | 990,763 | |
BRSP Ltd. | | | | | | | | |
2021-FL1 C, 7.59% (1 Month Term SOFR + 2.26%, Rate Floor: 2.15%) due 08/19/38◊,3 | | | 10,000,000 | | | | 9,311,864 | |
2021-FL1 B, 7.34% (1 Month Term SOFR + 2.01%, Rate Floor: 1.90%) due 08/19/38◊,3 | | | 6,400,000 | | | | 6,134,050 | |
ACRES Commercial Realty Ltd. | | | | | | | | |
2021-FL1 B, 7.24% (1 Month Term SOFR + 1.91%, Rate Floor: 1.91%) due 06/15/36◊,3 | | | 11,200,000 | | | | 10,748,650 | |
2021-FL1 C, 7.44% (1 Month Term SOFR + 2.11%, Rate Floor: 2.11%) due 06/15/36◊,3 | | | 4,800,000 | | | | 4,575,360 | |
SEE NOTES TO FINANCIAL STATEMENTS. | THE GUGGENHEIM FUNDS SEMI-ANNUAL REPORT | 9 |
SCHEDULE OF INVESTMENTS (Unaudited)(continued) | March 31, 2024 |
LIMITED DURATION FUND | |
| | Face
Amount~ | | | Value | |
Cerberus Loan Funding XXXIII, LP | | | | | | | | |
2021-3A A, 7.14% (3 Month Term SOFR + 1.82%, Rate Floor: 1.56%) due 07/23/33◊,3 | | | 11,500,000 | | | $ | 11,524,824 | |
2021-3A B, 7.43% (3 Month Term SOFR + 2.11%, Rate Floor: 1.85%) due 07/23/33◊,3 | | | 2,250,000 | | | | 2,249,381 | |
BDS Ltd. | | | | | | | | |
2021-FL8 D, 7.34% (1 Month Term SOFR + 2.01%, Rate Floor: 1.90%) due 01/18/36◊,3 | | | 7,000,000 | | | | 6,787,150 | |
2021-FL9 C, 7.34% (1 Month Term SOFR + 2.01%, Rate Floor: 1.90%) due 11/16/38◊,3 | | | 5,000,000 | | | | 4,809,042 | |
2020-FL5 B, 7.24% (1 Month Term SOFR + 1.91%, Rate Floor: 1.80%) due 02/16/37◊,3 | | | 900,046 | | | | 891,150 | |
ABPCI Direct Lending Fund CLO I LLC | | | | | | | | |
2021-1A A1A2, 7.28% (3 Month Term SOFR + 1.96%, Rate Floor: 1.96%) due 07/20/33◊,3 | | | 12,250,000 | | | | 12,251,324 | |
Fortress Credit Opportunities IX CLO Ltd. | | | | | | | | |
2021-9A A2TR, 7.38% (3 Month Term SOFR + 2.06%, Rate Floor: 1.80%) due 10/15/33◊,3 | | | 11,500,000 | | | | 11,618,356 | |
ALM 2020 Ltd. | | | | | | | | |
2020-1A A1B, 6.98% (3 Month Term SOFR + 1.66%, Rate Floor: 1.40%) due 10/15/29◊,3 | | | 10,500,000 | | | | 10,549,779 | |
Owl Rock CLO II Ltd. | | | | | | | | |
2021-2A ALR, 7.13% (3 Month Term SOFR + 1.81%, Rate Floor: 1.55%) due 04/20/33◊,3 | | | 10,500,000 | | | | 10,510,187 | |
FS Rialto | | | | | | | | |
2021-FL3 B, 7.24% (1 Month Term SOFR + 1.91%, Rate Floor: 1.91%) due 11/16/36◊,3 | | | 7,500,000 | | | | 7,401,785 | |
2021-FL2 C, 7.49% (1 Month Term SOFR + 2.16%, Rate Floor: 2.16%) due 05/16/38◊,3 | | | 3,250,000 | | | | 3,088,454 | |
Lake Shore MM CLO III LLC | | | | | | | | |
2021-2A A1R, 7.06% (3 Month Term SOFR + 1.74%, Rate Floor: 1.48%) due 10/17/31◊,3 | | | 10,256,774 | | | | 10,173,422 | |
KREF | | | | | | | | |
2021-FL2 B, 7.09% (1 Month Term SOFR + 1.76%, Rate Floor: 1.65%) due 02/15/39◊,3 | | | 10,700,000 | | | | 9,922,028 | |
Fortress Credit Opportunities XI CLO Ltd. | | | | | | | | |
2018-11A A1T, 6.88% (3 Month Term SOFR + 1.56%, Rate Floor: 0.00%) due 04/15/31◊,3 | | | 9,579,630 | | | | 9,552,929 | |
Cerberus Loan Funding XXXV, LP | | | | | | | | |
2021-5A A, 7.08% (3 Month Term SOFR + 1.76%, Rate Floor: 1.50%) due 09/22/33◊,3 | | | 8,000,000 | | | | 8,021,216 | |
LoanCore Issuer Ltd. | | | | | | | | |
2021-CRE5 B, 7.44% (1 Month Term SOFR + 2.11%, Rate Floor: 2.11%) due 07/15/36◊,3 | | | 7,900,000 | | | | 7,528,244 | |
BCC Middle Market CLO LLC | | | | | | | | |
2021-1A A1R, 7.08% (3 Month Term SOFR + 1.76%, Rate Floor: 1.50%) due 10/15/33◊,3 | | | 6,750,000 | | | | 6,750,830 | |
HGI CRE CLO Ltd. | | | | | | | | |
2021-FL2 A, 6.44% (1 Month Term SOFR + 1.11%, Rate Floor: 1.11%) due 09/17/36◊,3 | | | 4,116,977 | | | | 4,088,277 | |
2021-FL2 B, 6.94% (1 Month Term SOFR + 1.61%, Rate Floor: 1.61%) due 09/17/36◊,3 | | | 2,000,000 | | | | 1,925,149 | |
Neuberger Berman Loan Advisers CLO 40 Ltd. | | | | | | | | |
2021-40A B, 6.98% (3 Month Term SOFR + 1.66%, Rate Floor: 1.40%) due 04/16/33◊,3 | | | 6,000,000 | | | | 5,979,197 | |
CHCP Ltd. | | | | | | | | |
2021-FL1 A, 6.49% (1 Month Term SOFR + 1.16%, Rate Floor: 1.05%) due 02/15/38◊,3 | | | 5,989,193 | | | | 5,972,491 | |
Fontainbleau Vegas | | | | | | | | |
10.97% (1 Month Term SOFR + 5.65%, Rate Floor: 5.65%) due 01/31/26◊,††† | | | 5,954,764 | | | | 5,954,764 | |
Cerberus Loan Funding XLII LLC | | | | | | | | |
2023-3A A1, 7.79% (3 Month Term SOFR + 2.48%, Rate Floor: 2.48%) due 09/13/35◊,3 | | | 5,750,000 | | | | 5,805,717 | |
MF1 Multifamily Housing Mortgage Loan Trust | | | | | | | | |
2021-FL6 B, 7.09% (1 Month Term SOFR + 1.76%, Rate Floor: 1.65%) due 07/16/36◊,3 | | | 6,000,000 | | | | 5,797,306 | |
STWD Ltd. | | | | | | | | |
2019-FL1 C, 7.39% (1 Month Term SOFR + 2.06%, Rate Floor: 2.06%) due 07/15/38◊,3 | | | 3,200,000 | | | | 3,033,661 | |
2021-FL2 B, 7.24% (1 Month Term SOFR + 1.91%, Rate Floor: 1.80%) due 04/18/38◊,3 | | | 2,187,000 | | | | 2,020,696 | |
CIFC Funding Ltd. | | | | | | | | |
2021-4A A1B2, 6.83% (3 Month Term SOFR + 1.51%, Rate Floor: 1.51%) due 04/20/34◊,3 | | | 5,000,000 | | | | 4,991,145 | |
BSPRT Issuer Ltd. | | | | | | | | |
2021-FL6 C, 7.49% (1 Month Term SOFR + 2.16%, Rate Floor: 2.05%) due 03/15/36◊,3 | | | 5,000,000 | | | | 4,670,528 | |
10 | THE GUGGENHEIM FUNDS SEMI-ANNUAL REPORT | SEE NOTES TO FINANCIAL STATEMENTS. |
SCHEDULE OF INVESTMENTS (Unaudited)(continued) | March 31, 2024 |
LIMITED DURATION FUND | |
| | Face
Amount~ | | | Value | |
VOYA CLO | | | | | | | | |
2021-2A BR, 7.73% (3 Month Term SOFR + 2.41%, Rate Floor: 2.15%) due 06/07/30◊,3 | | | 4,500,000 | | | $ | 4,500,147 | |
ACRE Commercial Mortgage Ltd. | | | | | | | | |
2021-FL4 AS, 6.54% (1 Month Term SOFR + 1.21%, Rate Floor: 1.10%) due 12/18/37◊,3 | | | 4,500,000 | | | | 4,480,054 | |
NewStar Fairfield Fund CLO Ltd. | | | | | | | | |
2018-2A A1N, 6.85% (3 Month Term SOFR + 1.53%, Rate Floor: 1.27%) due 04/20/30◊,3 | | | 4,155,662 | | | | 4,162,611 | |
Magnetite XXIX Ltd. | | | | | | | | |
2021-29A B, 6.98% (3 Month Term SOFR + 1.66%, Rate Floor: 1.40%) due 01/15/34◊,3 | | | 4,000,000 | | | | 3,992,783 | |
Neuberger Berman Loan Advisers CLO 32 Ltd. | | | | | | | | |
2021-32A BR, 6.97% (3 Month Term SOFR + 1.66%, Rate Floor: 1.40%) due 01/20/32◊,3 | | | 4,000,000 | | | | 3,986,155 | |
Carlyle Global Market Strategies CLO Ltd. | | | | | | | | |
2018-4A A1RR, 6.58% (3 Month Term SOFR + 1.26%, Rate Floor: 1.00%) due 01/15/31◊,3 | | | 3,694,512 | | | | 3,678,775 | |
PFP Ltd. | | | | | | | | |
2021-7 D, 7.84% (1 Month Term SOFR + 2.51%, Rate Floor: 2.40%) due 04/14/38◊,3 | | | 3,636,242 | | | | 3,487,749 | |
Greystone Commercial Real Estate Notes | | | | | | | | |
2021-FL3 B, 7.09% (1 Month Term SOFR + 1.76%, Rate Floor: 1.65%) due 07/15/39◊,3 | | | 2,200,000 | | | | 2,114,894 | |
KREF Funding V LLC | | | | | | | | |
7.18% (1 Month Term SOFR + 1.86%, Rate Floor: 1.86%) due 06/25/26◊,††† | | | 1,920,143 | | | | 1,907,903 | |
0.15% due 06/25/26†††,4 | | | 27,272,727 | | | | 22,909 | |
Golub Capital Partners CLO 17 Ltd. | | | | | | | | |
2017-17A A1R, 7.24% (3 Month Term SOFR + 1.91%, Rate Floor: 0.00%) due 10/25/30◊,3 | | | 1,606,784 | | | | 1,621,485 | |
Dryden 37 Senior Loan Fund | | | | | | | | |
2015-37A Q, due 01/15/313,5 | | | 1,500,000 | | | | 1,062,470 | |
Cerberus Loan Funding XXXVI, LP | | | | | | | | |
2021-6A A, 6.98% (3 Month Term SOFR + 1.66%, Rate Floor: 1.40%) due 11/22/33◊,3 | | | 703,295 | | | | 704,075 | |
Carlyle GMS Finance MM CLO LLC | | | | | | | | |
2018-1A A12R, 7.36% (3 Month Term SOFR + 2.04%, Rate Floor: 0.00%) due 10/15/31◊,3 | | | 231,218 | | | | 232,716 | |
Treman Park CLO Ltd. | | | | | | | | |
2015-1A COM, due 10/20/283,5 | | | 325,901 | | | | 1,134 | |
Copper River CLO Ltd. | | | | | | | | |
2007-1A INC, due 01/20/215,6 | | | 500,000 | | | | 50 | |
Total Collateralized Loan Obligations | | | | | | | 795,599,773 | |
| | | | | | | | | |
Financial - 2.3% | | | | | | | | |
Strategic Partners Fund VIII, LP | | | | | | | | |
7.93% (1 Month Term SOFR + 2.60%, Rate Floor: 2.60%) due 03/10/26◊,††† | | | 23,742,396 | | | | 23,609,869 | |
KKR Core Holding Company LLC | | | | | | | | |
4.00% due 08/12/31††† | | | 17,567,182 | | | | 15,615,025 | |
Madison Avenue Secured Funding Trust | | | | | | | | |
2023-2, 7.17% (1 Month Term SOFR + 1.85%, Rate Floor: 1.85%) due 10/15/24◊,†††,3 | | | 15,025,000 | | | | 15,025,000 | |
Project Onyx I | | | | | | | | |
8.48% (3 Month Term SOFR + 3.15%, Rate Floor: 3.15%) due 01/26/27◊,††† | | | 14,578,652 | | | | 14,575,926 | |
HV Eight LLC | | | | | | | | |
7.48% (3 Month EURIBOR + 3.50%, Rate Floor: 3.50%) due 12/31/27◊,††† | | EUR | 10,644,548 | | | | 11,548,667 | |
Station Place Securitization Trust | | | | | | | | |
2023-SP1, 7.17% (1 Month Term SOFR + 1.85%, Rate Floor: 1.85%) due 10/15/24◊,†††,3 | | | 7,525,000 | | | | 7,525,000 | |
Lightning A | | | | | | | | |
5.50% due 03/01/37††† | | | 4,160,000 | | | | 3,836,479 | |
Thunderbird A | | | | | | | | |
5.50% due 03/01/37††† | | | 4,160,000 | | | | 3,836,479 | |
Project Onyx II | | | | | | | | |
8.48% (3 Month Term SOFR + 3.15%, Rate Floor: 3.15%) due 01/26/27◊,††† | | | 3,808,903 | | | | 3,808,336 | |
Ceamer Finance LLC | | | | | | | | |
3.69% due 03/24/31††† | | | 3,729,792 | | | | 3,508,874 | |
Total Financial | | | | | | | 102,889,655 | |
| | | | | | | | | |
Transport-Container - 1.8% | | | | | | | | |
Triton Container Finance VIII LLC | | | | | | | | |
2021-1A, 1.86% due 03/20/463 | | | 30,172,500 | | | | 26,474,426 | |
Textainer Marine Containers VII Ltd. | | | | | | | | |
2021-1A, 1.68% due 02/20/463 | | | 8,512,666 | | | | 7,511,328 | |
2020-1A, 2.73% due 08/21/453 | | | 3,849,142 | | | | 3,598,244 | |
2020-2A, 2.10% due 09/20/453 | | | 3,303,277 | | | | 2,999,879 | |
TIF Funding II LLC | | | | | | | | |
2021-1A, 1.65% due 02/20/463 | | | 13,702,125 | | | | 11,895,661 | |
CLI Funding VI LLC | | | | | | | | |
2020-3A, 2.07% due 10/18/453 | | | 11,685,000 | | | | 10,552,978 | |
2020-1A, 2.08% due 09/18/453 | | | 1,286,306 | | | | 1,157,480 | |
CLI Funding VIII LLC | | | | | | | | |
2021-1A, 1.64% due 02/18/463 | | | 12,737,054 | | | | 11,298,162 | |
CAL Funding IV Ltd. | | | | | | | | |
2020-1A, 2.22% due 09/25/453 | | | 2,660,937 | | | | 2,408,465 | |
Total Transport-Container | | | | | | | 77,896,623 | |
| | | | | | | | | |
Net Lease - 1.6% | | | | | | | | |
Oak Street Investment Grade Net Lease Fund Series | | | | | | | | |
2020-1A, 1.85% due 11/20/503 | | | 38,550,163 | | | | 35,754,717 | |
STORE Master Funding I LLC | | | | | | | | |
2015-1A, 4.17% due 04/20/453 | | | 10,222,958 | | | | 9,826,341 | |
SEE NOTES TO FINANCIAL STATEMENTS. | THE GUGGENHEIM FUNDS SEMI-ANNUAL REPORT | 11 |
SCHEDULE OF INVESTMENTS (Unaudited)(continued) | March 31, 2024 |
LIMITED DURATION FUND | |
| | Face
Amount~ | | | Value | |
STORE Master Funding LLC | | | | | | | | |
2021-1A, 2.86% due 06/20/513 | | | 6,854,437 | | | $ | 5,818,292 | |
CF Hippolyta Issuer LLC | | | | | | | | |
2021-1A, 1.98% due 03/15/613 | | | 5,748,930 | | | | 5,058,508 | |
CMFT Net Lease Master Issuer LLC | | | | | | | | |
2021-1, 2.91% due 07/20/513 | | | 3,000,000 | | | | 2,524,228 | |
2021-1, 2.51% due 07/20/513 | | | 2,500,000 | | | | 2,099,242 | |
CARS-DB4, LP | | | | | | | | |
2020-1A, 3.19% due 02/15/503 | | | 3,944,167 | | | | 3,809,854 | |
2020-1A, 3.25% due 02/15/503 | | | 887,213 | | | | 777,182 | |
New Economy Assets Phase 1 Sponsor LLC | | | | | | | | |
2021-1, 1.91% due 10/20/613 | | | 2,500,000 | | | | 2,189,351 | |
Capital Automotive REIT | | | | | | | | |
2020-1A, 3.48% due 02/15/503 | | | 1,972,083 | | | | 1,804,956 | |
Total Net Lease | | | | | | | 69,662,671 | |
| | | | | | | | | |
Whole Business - 1.3% | | | | | | | | |
Taco Bell Funding LLC | | | | | | | | |
2021-1A, 1.95% due 08/25/513 | | | 18,421,875 | | | | 16,663,164 | |
SERVPRO Master Issuer LLC | | | | | | | | |
2021-1A, 2.39% due 04/25/513 | | | 11,767,250 | | | | 10,330,381 | |
2019-1A, 3.88% due 10/25/493 | | | 6,367,375 | | | | 6,038,972 | |
ServiceMaster Funding LLC | | | | | | | | |
2020-1, 2.84% due 01/30/513 | | | 8,745,504 | | | | 7,808,661 | |
Wingstop Funding LLC | | | | | | | | |
2020-1A, 2.84% due 12/05/503 | | | 7,742,100 | | | | 7,026,255 | |
Arbys Funding LLC | | | | | | | | |
2020-1A, 3.24% due 07/30/503 | | | 6,996,250 | | | | 6,468,707 | |
Domino’s Pizza Master Issuer LLC | | | | | | | | |
2017-1A, 4.12% due 07/25/473 | | | 1,692,000 | | | | 1,619,548 | |
Total Whole Business | | | | | | | 55,955,688 | |
| | | | | | | | | |
Transport-Aircraft - 0.9% | | | | | | | | |
AASET Trust | | | | | | | | |
2021-1A, 2.95% due 11/16/413 | | | 12,489,186 | | | | 11,322,696 | |
AASET US Ltd. | | | | | | | | |
2018-2A, 4.45% due 11/18/383 | | | 6,403,144 | | | | 5,655,115 | |
Sapphire Aviation Finance II Ltd. | | | | | | | | |
2020-1A, 3.23% due 03/15/403 | | | 5,236,271 | | | | 4,765,164 | |
KDAC Aviation Finance Ltd. | | | | | | | | |
2017-1A, 4.21% due 12/15/423 | | | 5,199,693 | | | | 4,472,457 | |
Sapphire Aviation Finance I Ltd. | | | | | | | | |
2018-1A, 4.25% due 03/15/403 | | | 3,729,954 | | | | 3,357,222 | |
Castlelake Aircraft Structured Trust | | | | | | | | |
2021-1A, 3.47% due 01/15/463 | | | 2,708,719 | | | | 2,547,154 | |
Falcon Aerospace Ltd. | | | | | | | | |
2019-1, 3.60% due 09/15/393 | | | 1,583,077 | | | | 1,440,600 | |
2017-1, 4.58% due 02/15/423 | | | 476,272 | | | | 449,995 | |
Castlelake Aircraft Securitization Trust | | | | | | | | |
2018-1, 4.13% due 06/15/433 | | | 2,001,385 | | | | 1,824,626 | |
MAPS Ltd. | | | | | | | | |
2018-1A, 4.21% due 05/15/433 | | | 1,804,089 | | | | 1,664,294 | |
Total Transport-Aircraft | | | | | | | 37,499,323 | |
| | | | | | | | | |
Infrastructure - 0.8% | | | | | | | | |
SBA Tower Trust | | | | | | | | |
1.63% due 11/15/263 | | | 5,373,000 | | | | 4,861,665 | |
2.84% due 01/15/253 | | | 3,550,000 | | | | 3,464,891 | |
1.84% due 04/15/273 | | | 1,200,000 | | | | 1,075,319 | |
VB-S1 Issuer LLC - VBTEL | | | | | | | | |
2022-1A, 4.29% due 02/15/523 | | | 9,250,000 | | | | 8,223,901 | |
Stack Infrastructure Issuer LLC | | | | | | | | |
2020-1A, 1.89% due 08/25/453 | | | 5,169,000 | | | | 4,870,890 | |
2021-1A, 1.88% due 03/26/463 | | | 2,750,000 | | | | 2,536,195 | |
Crown Castle Towers LLC | | | | | | | | |
3.66% due 05/15/253 | | | 5,850,000 | | | | 5,719,661 | |
Aligned Data Centers Issuer LLC | | | | | | | | |
2021-1A, 1.94% due 08/15/463 | | | 2,950,000 | | | | 2,681,342 | |
Total Infrastructure | | | | | | | 33,433,864 | |
| | | | | | | | | |
Collateralized Debt Obligations - 0.5% | | | | | | | | |
Anchorage Credit Funding 4 Ltd. | | | | | | | | |
2021-4A AR, 2.72% due 04/27/393 | | | 24,650,000 | | | | 22,276,543 | |
| | | | | | | | | |
Single Family Residence - 0.4% | | | | | | | | |
FirstKey Homes Trust | | | | | | | | |
2020-SFR2, 4.00% due 10/19/373 | | | 5,050,000 | | | | 4,797,826 | |
2020-SFR2, 4.50% due 10/19/373 | | | 4,900,000 | | | | 4,666,969 | |
2020-SFR2, 1.67% due 10/19/373 | | | 3,950,000 | | | | 3,695,961 | |
2021-SFR1, 2.19% due 08/17/383 | | | 4,000,000 | | | | 3,631,361 | |
2020-SFR2, 3.37% due 10/19/373 | | | 3,200,000 | | | | 3,021,479 | |
Total Single Family Residence | | | | | | | 19,813,596 | |
| | | | | | | | | |
Automotive - 0.2% | | | | | | | | |
Avis Budget Rental Car Funding AESOP LLC | | | | | | | | |
2021-1A, 1.38% due 08/20/273 | | | 5,675,000 | | | | 5,213,705 | |
2020-2A, 2.02% due 02/20/273 | | | 4,550,000 | | | | 4,294,173 | |
Total Automotive | | | | | | | 9,507,878 | |
| | | | | | | | | |
Total Asset-Backed Securities | | | | |
(Cost $1,263,756,211) | | | 1,224,535,614 | |
| |
CORPORATE BONDS†† - 25.0% |
Financial - 13.3% | | | | | | | | |
Athene Global Funding | | | | | | | | |
6.06% (SOFR Compounded Index + 0.72%) due 01/07/25◊,3 | | | 30,000,000 | | | | 30,039,333 | |
1.99% due 08/19/283 | | | 15,850,000 | | | | 13,686,870 | |
1.73% due 10/02/263 | | | 14,700,000 | | | | 13,340,239 | |
5.68% due 02/23/263 | | | 4,750,000 | | | | 4,767,674 | |
F&G Global Funding | | | | | | | | |
0.90% due 09/20/243 | | | 42,100,000 | | | | 41,079,782 | |
1.75% due 06/30/263 | | | 14,250,000 | | | | 12,919,719 | |
Societe Generale S.A. | | | | | | | | |
1.79% due 06/09/273,7 | | | 28,000,000 | | | | 25,646,902 | |
1.49% due 12/14/263,7 | | | 10,500,000 | | | | 9,754,383 | |
Macquarie Group Ltd. | | | | | | | | |
1.63% due 09/23/273,7 | | | 16,750,000 | | | | 15,197,984 | |
1.20% due 10/14/253,7 | | | 13,550,000 | | | | 13,211,847 | |
Equitable Financial Life Global Funding | | | | | | | | |
1.40% due 07/07/253 | | | 15,000,000 | | | | 14,222,095 | |
1.80% due 03/08/283 | | | 12,000,000 | | | | 10,566,254 | |
Cooperatieve Rabobank UA | | | | | | | | |
1.34% due 06/24/263,7 | | | 15,000,000 | | | | 14,246,354 | |
1.98% due 12/15/273,7 | | | 10,000,000 | | | | 9,115,092 | |
12 | THE GUGGENHEIM FUNDS SEMI-ANNUAL REPORT | SEE NOTES TO FINANCIAL STATEMENTS. |
SCHEDULE OF INVESTMENTS (Unaudited)(continued) | March 31, 2024 |
LIMITED DURATION FUND | |
| | Face
Amount~ | | | Value | |
JPMorgan Chase & Co. | | | | | | | | |
1.47% due 09/22/277 | | | 15,000,000 | | | $ | 13,686,762 | |
5.04% due 01/23/287 | | | 7,600,000 | | | | 7,573,793 | |
Pershing Square Holdings Ltd. | | | | | | | | |
3.25% due 10/01/313 | | | 25,600,000 | | | | 20,769,946 | |
Reliance Standard Life Global Funding II | | | | | | | | |
5.24% due 02/02/263 | | | 20,850,000 | | | | 20,633,616 | |
GA Global Funding Trust | | | | | | | | |
2.25% due 01/06/273 | | | 15,000,000 | | | | 13,725,746 | |
1.63% due 01/15/263 | | | 7,300,000 | | | | 6,767,815 | |
BNP Paribas S.A. | | | | | | | | |
1.32% due 01/13/273,7 | | | 21,350,000 | | | | 19,845,694 | |
2.22% due 06/09/263,7 | | | 400,000 | | | | 384,601 | |
Credit Agricole S.A. | | | | | | | | |
1.25% due 01/26/273,7 | | | 17,950,000 | | | | 16,634,850 | |
1.91% due 06/16/263,7 | | | 400,000 | | | | 382,402 | |
Jackson National Life Global Funding | | | | | | | | |
1.75% due 01/12/253 | | | 15,000,000 | | | | 14,548,346 | |
Ares Finance Company LLC | | | | | | | | |
4.00% due 10/08/243 | | | 14,617,000 | | | | 14,379,853 | |
FS KKR Capital Corp. | | | | | | | | |
4.25% due 02/14/253 | | | 7,600,000 | | | | 7,475,219 | |
2.63% due 01/15/27 | | | 7,400,000 | | | | 6,712,909 | |
Rocket Mortgage LLC / Rocket Mortgage Company-Issuer, Inc. | | | | | | | | |
2.88% due 10/15/263 | | | 10,800,000 | | | | 9,978,367 | |
3.88% due 03/01/313 | | | 4,100,000 | | | | 3,571,917 | |
ABN AMRO Bank N.V. | | | | | | | | |
1.54% due 06/16/273,7 | | | 14,000,000 | | | | 12,756,512 | |
American Equity Investment Life Holding Co. | | | | | | | | |
5.00% due 06/15/27 | | | 13,075,000 | | | | 12,724,644 | |
Fidelity & Guaranty Life Holdings, Inc. | | | | | | | | |
5.50% due 05/01/253 | | | 11,450,000 | | | | 11,353,438 | |
CBS Studio Center | | | | | | | | |
8.32% (1 Month Term SOFR + 3.00%, Rate Floor: 3.00%) due 01/09/25◊,††† | | | 10,000,000 | | | | 10,082,009 | |
Iron Mountain, Inc. | | | | | | | | |
4.88% due 09/15/273 | | | 7,360,000 | | | | 7,115,951 | |
5.00% due 07/15/283 | | | 3,085,000 | | | | 2,951,362 | |
ING Groep N.V. | | | | | | | | |
1.73% due 04/01/277 | | | 9,800,000 | | | | 9,096,041 | |
BPCE S.A. | | | | | | | | |
1.65% due 10/06/263,7 | | | 9,500,000 | | | | 8,919,216 | |
SLM Corp. | | | | | | | | |
3.13% due 11/02/26 | | | 9,596,000 | | | | 8,912,367 | |
OneMain Finance Corp. | | | | | | | | |
3.50% due 01/15/27 | | | 7,050,000 | | | | 6,544,516 | |
6.88% due 03/15/25 | | | 2,220,000 | | | | 2,243,210 | |
7.13% due 03/15/26 | | | 50,000 | | | | 50,907 | |
Apollo Management Holdings, LP | | | | | | | | |
4.40% due 05/27/263 | | | 7,115,000 | | | | 6,954,101 | |
4.00% due 05/30/243 | | | 1,846,000 | | | | 1,840,534 | |
United Wholesale Mortgage LLC | | | | | | | | |
5.50% due 11/15/253 | | | 7,120,000 | | | | 7,055,815 | |
5.50% due 04/15/293 | | | 275,000 | | | | 260,095 | |
Corebridge Global Funding | | | | | | | | |
5.75% due 07/02/263 | | | 7,250,000 | | | | 7,257,323 | |
First American Financial Corp. | | | | | | | | |
4.00% due 05/15/30 | | | 7,860,000 | | | | 7,145,365 | |
LPL Holdings, Inc. | | | | | | | | |
4.00% due 03/15/293 | | | 4,450,000 | | | | 4,091,327 | |
4.63% due 11/15/273 | | | 2,000,000 | | | | 1,919,366 | |
SBA Communications Corp. | | | | | | | | |
3.13% due 02/01/29 | | | 6,500,000 | | | | 5,736,286 | |
Belrose Funding Trust | | | | | | | | |
2.33% due 08/15/303 | | | 7,100,000 | | | | 5,704,403 | |
Brighthouse Financial Global Funding | | | | | | | | |
6.11% (SOFR + 0.76%) due 04/12/24◊,3 | | | 5,050,000 | | | | 5,050,463 | |
Horace Mann Educators Corp. | | | | | | | | |
4.50% due 12/01/25 | | | 4,420,000 | | | | 4,318,051 | |
Deloitte LLP | | | | | | | | |
3.46% due 05/07/27††† | | | 4,500,000 | | | | 4,187,813 | |
Corebridge Financial, Inc. | | | | | | | | |
3.50% due 04/04/25 | | | 4,260,000 | | | | 4,170,260 | |
Jefferies Finance LLC / JFIN Company-Issuer Corp. | | | | | | | | |
5.00% due 08/15/283 | | | 4,300,000 | | | | 3,954,226 | |
Peachtree Corners Funding Trust | | | | | | | | |
3.98% due 02/15/253 | | | 3,450,000 | | | | 3,384,519 | |
Hunt Companies, Inc. | | | | | | | | |
5.25% due 04/15/293 | | | 3,250,000 | | | | 2,967,579 | |
AMC East Communities LLC | | | | | | | | |
5.74% due 01/15/283 | | | 1,673,157 | | | | 1,659,124 | |
Brookfield Finance, Inc. | | | | | | | | |
3.90% due 01/25/28 | | | 1,400,000 | | | | 1,348,044 | |
CNO Financial Group, Inc. | | | | | | | | |
5.25% due 05/30/25 | | | 1,200,000 | | | | 1,193,460 | |
Trinity Acquisition plc | | | | | | | | |
4.40% due 03/15/26 | | | 881,000 | | | | 864,214 | |
Old Republic International Corp. | | | | | | | | |
3.88% due 08/26/26 | | | 700,000 | | | | 676,603 | |
Equinix, Inc. | | | | | | | | |
1.55% due 03/15/28 | | | 700,000 | | | | 607,156 | |
Belvoir Land LLC | | | | | | | | |
5.03% due 12/15/253 | | | 579,953 | | | | 574,084 | |
Assurant, Inc. | | | | | | | | |
4.90% due 03/27/28 | | | 350,000 | | | | 345,463 | |
Morgan Stanley | | | | | | | | |
3.77% due 01/24/297 | | | 361,000 | | | | 343,627 | |
Total Financial | | | | | | | 581,225,838 | |
| | | | | | | | | |
Consumer, Non-cyclical - 3.8% | | | | | | | | |
Triton Container International Ltd. | | | | | | | | |
1.15% due 06/07/243 | | | 26,000,000 | | | | 25,767,005 | |
2.05% due 04/15/263 | | | 1,800,000 | | | | 1,658,640 | |
Global Payments, Inc. | | | | | | | | |
2.90% due 05/15/30 | | | 31,000,000 | | | | 26,920,607 | |
Element Fleet Management Corp. | | | | | | | | |
1.60% due 04/06/243 | | | 10,250,000 | | | | 10,244,640 | |
5.64% due 03/13/273 | | | 9,925,000 | | | | 9,955,766 | |
6.27% due 06/26/263 | | | 4,400,000 | | | | 4,451,348 | |
GXO Logistics, Inc. | | | | | | | | |
1.65% due 07/15/26 | | | 15,000,000 | | | | 13,753,216 | |
SEE NOTES TO FINANCIAL STATEMENTS. | THE GUGGENHEIM FUNDS SEMI-ANNUAL REPORT | 13 |
SCHEDULE OF INVESTMENTS (Unaudited)(continued) | March 31, 2024 |
LIMITED DURATION FUND | |
| | Face
Amount~ | | | Value | |
CoStar Group, Inc. | | | | | | | | |
2.80% due 07/15/303 | | | 15,280,000 | | | $ | 13,025,660 | |
Laboratory Corporation of America Holdings | | | | | | | | |
1.55% due 06/01/26 | | | 10,571,000 | | | | 9,790,767 | |
PRA Health Sciences, Inc. | | | | | | | | |
2.88% due 07/15/263 | | | 10,280,000 | | | | 9,584,044 | |
Block, Inc. | | | | | | | | |
2.75% due 06/01/26 | | | 7,600,000 | | | | 7,147,676 | |
Danone S.A. | | | | | | | | |
2.95% due 11/02/263 | | | 6,952,000 | | | | 6,598,996 | |
Valvoline, Inc. | | | | | | | | |
3.63% due 06/15/313 | | | 7,434,000 | | | | 6,408,179 | |
4.25% due 02/15/303 | | | 125,000 | | | | 124,717 | |
BAT Capital Corp. | | | | | | | | |
4.70% due 04/02/27 | | | 4,220,000 | | | | 4,149,794 | |
3.56% due 08/15/27 | | | 527,000 | | | | 499,041 | |
Royalty Pharma plc | | | | | | | | |
1.75% due 09/02/27 | | | 5,150,000 | | | | 4,599,037 | |
JBS USA LUX S.A. / JBS USA Food Company / JBS USA Finance, Inc. | | | | | | | | |
5.13% due 02/01/28 | | | 4,306,000 | | | | 4,240,361 | |
IQVIA, Inc. | | | | | | | | |
5.00% due 05/15/273 | | | 2,300,000 | | | | 2,245,779 | |
Molina Healthcare, Inc. | | | | | | | | |
4.38% due 06/15/283 | | | 1,115,000 | | | | 1,048,132 | |
Catalent Pharma Solutions, Inc. | | | | | | | | |
3.13% due 02/15/293 | | | 1,050,000 | | | | 1,003,358 | |
Avantor Funding, Inc. | | | | | | | | |
4.63% due 07/15/283 | | | 1,050,000 | | | | 994,995 | |
Smithfield Foods, Inc. | | | | | | | | |
4.25% due 02/01/273 | | | 350,000 | | | | 336,102 | |
Performance Food Group, Inc. | | | | | | | | |
5.50% due 10/15/273 | | | 100,000 | | | | 98,166 | |
Total Consumer, Non-cyclical | | | | | | | 164,646,026 | |
| | | | | | | | | |
Industrial - 2.5% | | | | | | | | |
Berry Global, Inc. | | | | | | | | |
1.57% due 01/15/26 | | | 11,750,000 | | | | 10,983,754 | |
4.88% due 07/15/263 | | | 5,165,000 | | | | 5,061,746 | |
Sealed Air Corp. | | | | | | | | |
1.57% due 10/15/263 | | | 16,450,000 | | | | 14,858,847 | |
TD SYNNEX Corp. | | | | | | | | |
1.25% due 08/09/24 | | | 14,400,000 | | | | 14,166,475 | |
Amcor Flexibles North America, Inc. | | | | | | | | |
4.00% due 05/17/25 | | | 13,690,000 | | | | 13,441,407 | |
Silgan Holdings, Inc. | | | | | | | | |
1.40% due 04/01/263 | | | 12,600,000 | | | | 11,541,064 | |
Vontier Corp. | | | | | | | | |
1.80% due 04/01/26 | | | 7,050,000 | | | | 6,542,553 | |
2.40% due 04/01/28 | | | 3,900,000 | | | | 3,443,411 | |
Graphic Packaging International LLC | | | | | | | | |
1.51% due 04/15/263 | | | 6,500,000 | | | | 6,024,243 | |
Penske Truck Leasing Company LP / PTL Finance Corp. | | | | | | | | |
4.45% due 01/29/263 | | | 5,475,000 | | | | 5,360,968 | |
4.20% due 04/01/273 | | | 500,000 | | | | 485,531 | |
IP Lending V Ltd. | | | | | | | | |
5.13% due 04/02/26†††,3 | | | 3,900,000 | | | | 3,770,520 | |
Jabil, Inc. | | | | | | | | |
1.70% due 04/15/26 | | | 3,800,000 | | | | 3,527,324 | |
GATX Corp. | | | | | | | | |
3.85% due 03/30/27 | | | 2,900,000 | | | | 2,793,062 | |
3.50% due 03/15/28 | | | 200,000 | | | | 188,398 | |
Standard Industries, Inc. | | | | | | | | |
4.75% due 01/15/283 | | | 2,671,000 | | | | 2,549,153 | |
Weir Group plc | | | | | | | | |
2.20% due 05/13/263 | | | 2,610,000 | | | | 2,422,703 | |
Crown Americas LLC / Crown Americas Capital Corporation VI | | | | | | | | |
4.75% due 02/01/26 | | | 1,038,000 | | | | 1,020,762 | |
Brundage-Bone Concrete Pumping Holdings, Inc. | | | | | | | | |
6.00% due 02/01/263 | | | 800,000 | | | | 790,098 | |
Amsted Industries, Inc. | | | | | | | | |
4.63% due 05/15/303 | | | 350,000 | | | | 319,637 | |
5.63% due 07/01/273 | | | 100,000 | | | | 98,498 | |
Summit Materials LLC / Summit Materials Finance Corp. | | | | | | | | |
5.25% due 01/15/293 | | | 275,000 | | | | 267,970 | |
6.50% due 03/15/273 | | | 75,000 | | | | 74,814 | |
Enviri Corp. | | | | | | | | |
5.75% due 07/31/273 | | | 125,000 | | | | 117,697 | |
Total Industrial | | | | | | | 109,850,635 | |
| | | | | | | | | |
Consumer, Cyclical - 1.7% | | | | | | | | |
Alt-2 Structured Trust | | | | | | | | |
2.95% (0 - —%) due 05/14/31◊,††† | | | 9,420,169 | | | | 8,422,275 | |
Warnermedia Holdings, Inc. | | | | | | | | |
6.41% due 03/15/26 | | | 8,050,000 | | | | 8,050,137 | |
United Airlines, Inc. | | | | | | | | |
4.38% due 04/15/263 | | | 8,125,000 | | | | 7,854,749 | |
Choice Hotels International, Inc. | | | | | | | | |
3.70% due 01/15/31 | | | 7,350,000 | | | | 6,440,070 | |
Delta Air Lines, Inc. / SkyMiles IP Ltd. | | | | | | | | |
4.50% due 10/20/253 | | | 5,834,500 | | | | 5,775,163 | |
CD&R Smokey Buyer, Inc. | | | | | | | | |
6.75% due 07/15/253 | | | 4,654,000 | | | | 4,611,149 | |
Hyatt Hotels Corp. | | | | | | | | |
5.75% due 04/23/30 | | | 4,320,000 | | | | 4,429,711 | |
Delta Air Lines, Inc. | | | | | | | | |
7.00% due 05/01/253 | | | 4,300,000 | | | | 4,356,418 | |
Clarios Global, LP | | | | | | | | |
6.75% due 05/15/253 | | | 4,300,000 | | | | 4,303,827 | |
American Airlines Class AA Pass Through Trust | | | | | | | | |
3.35% due 10/15/29 | | | 2,458,147 | | | | 2,248,732 | |
3.00% due 10/15/28 | | | 1,512,532 | | | | 1,377,243 | |
Newell Brands, Inc. | | | | | | | | |
5.20% due 04/01/26 | | | 1,552,000 | | | | 1,524,333 | |
6.38% due 09/15/27 | | | 1,548,000 | | | | 1,522,301 | |
14 | THE GUGGENHEIM FUNDS SEMI-ANNUAL REPORT | SEE NOTES TO FINANCIAL STATEMENTS. |
SCHEDULE OF INVESTMENTS (Unaudited)(continued) | March 31, 2024 |
LIMITED DURATION FUND | |
| | Face
Amount~ | | | Value | |
Beacon Roofing Supply, Inc. | | | | | | | | |
4.50% due 11/15/263 | | | 2,404,000 | | | $ | 2,335,815 | |
Suburban Propane Partners Limited Partnership/Suburban Energy Finance Corp. | | | | | | | | |
5.88% due 03/01/27 | | | 2,300,000 | | | | 2,273,862 | |
Air Canada | | | | | | | | |
3.88% due 08/15/263 | | | 2,350,000 | | | | 2,242,889 | |
Mileage Plus Holdings LLC / Mileage Plus Intellectual Property Assets Ltd. | | | | | | | | |
6.50% due 06/20/273 | | | 2,174,211 | | | | 2,186,203 | |
Walgreens Boots Alliance, Inc. | | | | | | | | |
3.45% due 06/01/26 | | | 1,650,000 | | | | 1,573,602 | |
1011778 BC ULC / New Red Finance, Inc. | | | | | | | | |
5.75% due 04/15/253 | | | 700,000 | | | | 698,299 | |
Advance Auto Parts, Inc. | | | | | | | | |
5.90% due 03/09/26 | | | 514,000 | | | | 513,187 | |
Tempur Sealy International, Inc. | | | | | | | | |
4.00% due 04/15/293 | | | 375,000 | | | | 340,316 | |
Total Consumer, Cyclical | | | | | | | 73,080,281 | |
| | | | | | | | | |
Technology - 1.5% | | | | | | | | |
CDW LLC / CDW Finance Corp. | | | | | | | | |
2.67% due 12/01/26 | | | 22,350,000 | | | | 20,753,708 | |
3.25% due 02/15/29 | | | 810,000 | | | | 733,383 | |
NetApp, Inc. | | | | | | | | |
1.88% due 06/22/25 | | | 18,082,000 | | | | 17,294,017 | |
Infor, Inc. | | | | | | | | |
1.75% due 07/15/253 | | | 13,800,000 | | | | 13,064,737 | |
Qorvo, Inc. | | | | | | | | |
1.75% due 12/15/24 | | | 10,600,000 | | | | 10,286,523 | |
3.38% due 04/01/313 | | | 1,200,000 | | | | 1,032,017 | |
4.38% due 10/15/29 | | | 963,000 | | | | 902,623 | |
NCR Voyix Corp. | | | | | | | | |
5.13% due 04/15/293 | | | 2,183,000 | | | | 2,024,630 | |
Twilio, Inc. | | | | | | | | |
3.63% due 03/15/29 | | | 994,000 | | | | 894,027 | |
MSCI, Inc. | | | | | | | | |
3.88% due 02/15/313 | | | 379,000 | | | | 338,025 | |
Total Technology | | | | | | | 67,323,690 | |
| | | | | | | | | |
Basic Materials - 0.7% | | | | | | | | |
Anglo American Capital plc | | | | | | | | |
2.25% due 03/17/283 | | | 14,000,000 | | | | 12,442,164 | |
4.00% due 09/11/273 | | | 750,000 | | | | 715,715 | |
5.38% due 04/01/253 | | | 600,000 | | | | 595,749 | |
Kaiser Aluminum Corp. | | | | | | | | |
4.63% due 03/01/283 | | | 9,643,000 | | | | 9,048,372 | |
International Flavors & Fragrances, Inc. | | | | | | | | |
1.23% due 10/01/253 | | | 4,130,000 | | | | 3,865,679 | |
Alcoa Nederland Holding BV | | | | | | | | |
5.50% due 12/15/273 | | | 3,675,000 | | | | 3,638,783 | |
Carpenter Technology Corp. | | | | | | | | |
6.38% due 07/15/28 | | | 1,145,000 | | | | 1,143,070 | |
Minerals Technologies, Inc. | | | | | | | | |
5.00% due 07/01/283 | | | 140,000 | | | | 133,861 | |
Total Basic Materials | | | | | | | 31,583,393 | |
Utilities - 0.6% | | | | | | | | |
Terraform Global Operating, LP | | | | | | | | |
6.13% due 03/01/263 | | | 9,020,000 | | | | 8,893,743 | |
Algonquin Power & Utilities Corp. | | | | | | | | |
5.37% due 06/15/26 | | | 8,200,000 | | | | 8,155,608 | |
CenterPoint Energy, Inc. | | | | | | | | |
6.00% (SOFR Compounded Index + 0.65%) due 05/13/24◊ | | | 5,202,000 | | | | 5,202,624 | |
AES Corp. | | | | | | | | |
3.30% due 07/15/253 | | | 4,250,000 | | | | 4,117,108 | |
Total Utilities | | | | | | | 26,369,083 | |
| | | | | | | | | |
Communications - 0.5% | | | | | | | | |
Level 3 Financing, Inc. | | | | | | | | |
3.88% due 10/15/303 | | | 5,070,000 | | | | 2,991,300 | |
11.00% due 11/15/293 | | | 1,570,009 | | | | 1,632,809 | |
4.50% due 04/01/303 | | | 2,277,000 | | | | 1,411,740 | |
4.00% due 04/15/313 | | | 2,150,000 | | | | 1,300,750 | |
NTT Finance Corp. | | | | | | | | |
1.16% due 04/03/263 | | | 7,598,000 | | | | 7,025,845 | |
Charter Communications Operating LLC / Charter Communications Operating Capital | | | | | | | | |
2.80% due 04/01/31 | | | 3,250,000 | | | | 2,662,959 | |
Cogent Communications Group, Inc. | | | | | | | | |
3.50% due 05/01/263 | | | 2,680,000 | | | | 2,551,015 | |
TripAdvisor, Inc. | | | | | | | | |
7.00% due 07/15/253 | | | 460,000 | | | | 458,736 | |
CSC Holdings LLC | | | | | | | | |
4.13% due 12/01/303 | | | 250,000 | | | | 178,763 | |
AMC Networks, Inc. | | | | | | | | |
4.25% due 02/15/29 | | | 225,000 | | | | 159,459 | |
Match Group Holdings II LLC | | | | | | | | |
4.63% due 06/01/283 | | | 75,000 | | | | 70,779 | |
Sirius XM Radio, Inc. | | | | | | | | |
3.88% due 09/01/313 | | | 75,000 | | | | 62,536 | |
Total Communications | | | | | | | 20,506,691 | |
| | | | | | | | | |
Energy - 0.4% | | | | | | | | |
BP Capital Markets plc | | | | | | | | |
4.88% 7,8 | | | 7,500,000 | | | | 7,155,154 | |
Occidental Petroleum Corp. | | | | | | | | |
5.50% due 12/01/25 | | | 5,000,000 | | | | 4,996,531 | |
Venture Global LNG, Inc. | | | | | | | | |
9.50% due 02/01/293 | | | 4,600,000 | | | | 4,958,170 | |
Targa Resources Partners Limited Partnership / Targa Resources Partners Finance Corp. | | | | | | | | |
6.88% due 01/15/29 | | | 1,250,000 | | | | 1,286,168 | |
Gulfstream Natural Gas System LLC | | | | | | | | |
4.60% due 09/15/253 | | | 400,000 | | | | 393,243 | |
Sabine Pass Liquefaction LLC | | | | | | | | |
5.00% due 03/15/27 | | | 300,000 | | | | 299,123 | |
SEE NOTES TO FINANCIAL STATEMENTS. | THE GUGGENHEIM FUNDS SEMI-ANNUAL REPORT | 15 |
SCHEDULE OF INVESTMENTS (Unaudited)(continued) | March 31, 2024 |
LIMITED DURATION FUND | |
| | Face
Amount~ | | | Value | |
Parkland Corp. | | | | | | | | |
5.88% due 07/15/273 | | | 80,000 | | | $ | 79,307 | |
Total Energy | | | | | | | 19,167,696 | |
| | | | | | | | | |
Total Corporate Bonds | | | | |
(Cost $1,160,411,778) | | | 1,093,753,333 | |
| |
COLLATERALIZED MORTGAGE OBLIGATIONS†† - 18.6% |
Residential Mortgage-Backed Securities - 11.1% |
CSMC Trust | | | | | | | | |
2021-RPL1, 4.04% (WAC) due 09/27/60◊,3 | | | 25,731,424 | | | | 24,848,149 | |
2021-RPL7, 1.93% (WAC) due 07/27/61◊,3 | | | 11,600,035 | | | | 11,101,060 | |
2020-RPL5, 4.68% (WAC) due 08/25/60◊,3 | | | 10,675,190 | | | | 10,573,990 | |
2021-RPL4, 1.80% (WAC) due 12/27/60◊,3 | | | 7,335,738 | | | | 7,112,552 | |
2018-RPL9, 3.85% (WAC) due 09/25/57◊,3 | | | 4,218,961 | | | | 4,072,628 | |
2020-NQM1, 1.41% due 05/25/653,9 | | | 1,823,600 | | | | 1,660,753 | |
PRPM LLC | | | | | | | | |
2021-5, 1.79% due 06/25/263,9 | | | 19,331,681 | | | | 18,902,510 | |
2022-1, 3.72% due 02/25/273,9 | | | 17,741,143 | | | | 17,231,670 | |
2021-8, 1.74% (WAC) due 09/25/26◊,3 | | | 8,771,843 | | | | 8,422,905 | |
2023-1, 6.88% (WAC) due 02/25/28◊,3 | | | 3,919,632 | | | | 3,940,309 | |
2021-RPL2, 2.49% (WAC) due 10/25/51◊,3 | | | 2,500,000 | | | | 2,067,463 | |
Legacy Mortgage Asset Trust | | | | | | | | |
2021-GS3, 1.75% due 07/25/613,9 | | | 19,763,532 | | | | 19,109,715 | |
2021-GS4, 1.65% due 11/25/603,9 | | | 16,845,765 | | | | 16,292,934 | |
2021-GS2, 1.75% due 04/25/613,9 | | | 7,178,842 | | | | 6,956,972 | |
2021-GS5, 2.25% due 07/25/673,9 | | | 4,615,912 | | | | 4,453,702 | |
BRAVO Residential Funding Trust | | | | | | | | |
2021-C, 1.62% due 03/01/613,9 | | | 20,105,505 | | | | 19,008,756 | |
2022-R1, 3.13% due 01/29/703,9 | | | 17,424,016 | | | | 16,314,807 | |
2021-HE2, 6.17% (30 Day Average SOFR + 0.85%, Rate Floor: 0.00%) due 11/25/69◊,3 | | | 1,752,389 | | | | 1,737,569 | |
2021-HE2, 6.37% (30 Day Average SOFR + 1.05%, Rate Floor: 0.00%) due 11/25/69◊,3 | | | 1,609,172 | | | | 1,598,599 | |
2021-HE1, 6.27% (30 Day Average SOFR + 0.95%, Rate Floor: 0.00%) due 01/25/70◊,3 | | | 1,421,709 | | | | 1,416,380 | |
2021-HE1, 6.17% (30 Day Average SOFR + 0.85%, Rate Floor: 0.00%) due 01/25/70◊,3 | | | 1,113,385 | | | | 1,110,789 | |
NYMT Loan Trust | | | | | | | | |
2021-SP1, 1.67% due 08/25/613,9 | | | 32,410,081 | | | | 30,939,094 | |
2022-SP1, 5.25% due 07/25/623,9 | | | 9,194,594 | | | | 8,971,985 | |
OSAT Trust | | | | | | | | |
2021-RPL1, 2.12% due 05/25/653,9 | | | 38,669,718 | | | | 37,649,889 | |
OBX Trust | | | | | | | | |
2024-NQM5, due 03/25/283,9 | | | 22,000,000 | | | | 21,999,860 | |
2022-NQM9, 6.45% due 09/25/623,9 | | | 2,099,938 | | | | 2,105,383 | |
Verus Securitization Trust | | | | | | | | |
2021-4, 1.35% (WAC) due 07/25/66◊,3 | | | 5,999,886 | | | | 4,746,349 | |
2021-5, 1.37% (WAC) due 09/25/66◊,3 | | | 5,624,291 | | | | 4,659,786 | |
2020-5, 1.58% due 05/25/653,9 | | | 4,040,587 | | | | 3,790,005 | |
2021-3, 1.44% (WAC) due 06/25/66◊,3 | | | 3,395,207 | | | | 2,788,096 | |
2021-6, 1.89% (WAC) due 10/25/66◊,3 | | | 2,709,053 | | | | 2,262,457 | |
2019-4, 3.64% due 11/25/593 | | | 1,175,260 | | | | 1,137,145 | |
2020-1, 3.42% due 01/25/603 | | | 633,233 | | | | 603,565 | |
Towd Point Revolving Trust | | | | | | | | |
4.83% due 09/25/646 | | | 18,500,000 | | | | 18,398,250 | |
Towd Point Mortgage Trust | | | | | | | | |
2017-6, 2.75% (WAC) due 10/25/57◊,3 | | | 5,815,952 | | | | 5,604,181 | |
2018-2, 3.25% (WAC) due 03/25/58◊,3 | | | 3,019,913 | | | | 2,921,139 | |
2017-5, 6.04% (1 Month Term SOFR + 0.71%, Rate Floor: 0.00%) due 02/25/57◊,3 | | | 1,362,414 | | | | 1,384,382 | |
2023-CES1, 6.75% (WAC) due 07/25/63◊,3 | | | 1,307,511 | | | | 1,317,383 | |
2018-1, 3.00% (WAC) due 01/25/58◊,3 | | | 359,236 | | | | 346,849 | |
Citigroup Mortgage Loan Trust | | | | | | | | |
2022-A, 6.17% due 09/25/623,9 | | | 11,256,597 | | | | 11,252,620 | |
Imperial Fund Mortgage Trust | | | | | | | | |
2022-NQM2, 4.02% (WAC) due 03/25/67◊,3 | | | 11,501,546 | | | | 10,544,291 | |
Structured Asset Securities Corporation Mortgage Loan Trust | | | | | | | | |
2008-BC4, 6.07% (1 Month Term SOFR + 0.74%, Rate Floor: 0.63%) due 11/25/37◊ | | | 9,967,235 | | | | 9,446,916 | |
2006-BC4, 5.78% (1 Month Term SOFR + 0.45%, Rate Floor: 0.34%) due 12/25/36◊ | | | 460,161 | | | | 439,211 | |
Home Equity Loan Trust | | | | | | | | |
2007-FRE1, 5.63% (1 Month Term SOFR + 0.30%, Rate Floor: 0.19%) due 04/25/37◊ | | | 9,858,180 | | | | 9,189,040 | |
New Residential Mortgage Loan Trust | | | | | | | | |
2018-2A, 3.50% (WAC) due 02/25/58◊,3 | | | 4,988,957 | | | | 4,634,430 | |
2018-1A, 4.00% (WAC) due 12/25/57◊,3 | | | 1,601,012 | | | | 1,514,890 | |
2019-6A, 3.50% (WAC) due 09/25/59◊,3 | | | 1,257,891 | | | | 1,164,969 | |
2017-5A, 6.94% (1 Month Term SOFR + 1.61%, Rate Floor: 1.50%) due 06/25/57◊,3 | | | 460,576 | | | | 460,612 | |
Soundview Home Loan Trust | | | | | | | | |
2006-OPT5, 5.72% (1 Month Term SOFR + 0.39%, Rate Floor: 0.28%) due 07/25/36◊ | | | 7,164,508 | | | | 6,774,708 | |
2005-OPT3, 6.15% (1 Month Term SOFR + 0.82%, Rate Floor: 0.71%) due 11/25/35◊ | | | 920,798 | | | | 896,208 | |
CSMC | | | | | | | | |
2021-NQM8, 2.41% (WAC) due 10/25/66◊,3 | | | 7,575,261 | | | | 6,401,061 | |
Alternative Loan Trust | | | | | | | | |
2007-OA7, 5.72% (1 Month Term SOFR + 0.39%, Rate Floor: 0.28%) due 05/25/47◊ | | | 4,190,044 | | | | 3,788,559 | |
2007-OH3, 6.02% (1 Month Term SOFR + 0.69%, Rate Cap/Floor: 10.00%/0.58%) due 09/25/47◊ | | | 2,056,067 | | | | 1,832,043 | |
NovaStar Mortgage Funding Trust Series | | | | | | | | |
2007-2, 5.64% (1 Month Term SOFR + 0.31%, Rate Cap/Floor: 11.00%/0.20%) due 09/25/37◊ | | | 5,557,951 | | | | 5,337,310 | |
16 | THE GUGGENHEIM FUNDS SEMI-ANNUAL REPORT | SEE NOTES TO FINANCIAL STATEMENTS. |
SCHEDULE OF INVESTMENTS (Unaudited)(continued) | March 31, 2024 |
LIMITED DURATION FUND | |
| | Face
Amount~ | | | Value | |
Cascade Funding Mortgage Trust | | | | | | | | |
2018-RM2, 4.00% (WAC) due 10/25/68◊,6 | | | 4,316,511 | | | $ | 4,265,428 | |
2019-RM3, 2.80% (WAC) due 06/25/69◊,6 | | | 448,458 | | | | 438,416 | |
Morgan Stanley ABS Capital I Incorporated Trust | | | | | | | | |
2007-HE3, 5.69% (1 Month Term SOFR + 0.36%, Rate Floor: 0.25%) due 12/25/36◊ | | | 4,436,740 | | | | 2,200,157 | |
2007-HE3, 5.59% (1 Month Term SOFR + 0.26%, Rate Floor: 0.15%) due 12/25/36◊ | | | 3,178,480 | | | | 1,576,218 | |
2007-HE5, 5.62% (1 Month Term SOFR + 0.29%, Rate Floor: 0.18%) due 03/25/37◊ | | | 1,561,481 | | | | 662,209 | |
2006-NC1, 6.01% (1 Month Term SOFR + 0.68%, Rate Floor: 0.57%) due 12/25/35◊ | | | 212,541 | | | | 209,751 | |
American Home Mortgage Investment Trust | | | | | | | | |
2006-3, 5.80% (1 Month Term SOFR + 0.47%, Rate Cap/Floor: 10.50%/0.36%) due 12/25/46◊ | | | 5,240,703 | | | | 4,167,886 | |
Credit Suisse Mortgage Capital Certificates | | | | | | | | |
2021-RPL9, 2.44% (WAC) due 02/25/61◊,3 | | | 3,944,726 | | | | 3,810,070 | |
SPS Servicer Advance Receivables Trust | | | | | | | | |
2020-T2, 1.83% due 11/15/553 | | | 3,750,000 | | | | 3,513,478 | |
HarborView Mortgage Loan Trust | | | | | | | | |
2006-14, 5.74% (1 Month Term SOFR + 0.41%, Rate Floor: 0.30%) due 01/25/47◊ | | | 1,804,930 | | | | 1,593,714 | |
2006-12, 5.82% (1 Month Term SOFR + 0.49%, Rate Floor: 0.38%) due 01/19/38◊ | | | 1,507,869 | | | | 1,306,049 | |
Securitized Asset Backed Receivables LLC Trust | | | | | | | | |
2007-HE1, 5.66% (1 Month Term SOFR + 0.33%, Rate Floor: 0.22%) due 12/25/36◊ | | | 12,898,660 | | | | 2,876,877 | |
Banc of America Funding Trust | | | | | | | | |
2015-R2, 5.70% (1 Month Term SOFR + 0.37%, Rate Floor: 0.26%) due 04/29/37◊,3 | | | 2,729,681 | | | | 2,689,491 | |
Bear Stearns Asset-Backed Securities I Trust | | | | | | | | |
2006-HE9, 5.72% (1 Month Term SOFR + 0.39%, Rate Floor: 0.28%) due 11/25/36◊ | | | 2,604,248 | | | | 2,543,306 | |
IXIS Real Estate Capital Trust | | | | | | | | |
2006-HE1, 6.04% (1 Month Term SOFR + 0.71%, Rate Floor: 0.60%) due 03/25/36◊ | | | 4,652,427 | | | | 2,407,632 | |
Ellington Financial Mortgage Trust | | | | | | | | |
2021-2, 1.29% (WAC) due 06/25/66◊,3 | | | 1,981,640 | | | | 1,590,607 | |
2020-2, 1.64% (WAC) due 10/25/65◊,3 | | | 889,436 | | | | 804,739 | |
Asset-Backed Securities Corporation Home Equity Loan Trust Series AEG | | | | | | | | |
2006-HE1, 4.20% (1 Month Term SOFR + 0.71%, Rate Floor: 0.60%) due 01/25/36◊ | | | 2,444,167 | | | | 2,340,345 | |
Angel Oak Mortgage Trust | | | | | | | | |
2021-6, 1.71% (WAC) due 09/25/66◊,3 | | | 2,484,571 | | | | 2,022,650 | |
CFMT LLC | | | | | | | | |
2022-HB9, 3.25% (WAC) due 09/25/37◊,6 | | | 1,998,711 | | | | 1,911,777 | |
First NLC Trust | | | | | | | | |
2005-4, 6.22% (1 Month Term SOFR + 0.89%, Rate Cap/Floor: 14.00%/0.78%) due 02/25/36◊ | | | 1,953,303 | | | | 1,887,964 | |
Argent Securities Incorporated Asset-Backed Pass-Through Certificates Series | | | | | | | | |
2005-W2, 6.18% (1 Month Term SOFR + 0.85%, Rate Floor: 0.74%) due 10/25/35◊ | | | 1,998,711 | | | | 1,883,446 | |
GS Mortgage-Backed Securities Trust | | | | | | | | |
2020-NQM1, 1.38% (WAC) due 09/27/60◊,3 | | | 1,845,831 | | | | 1,689,031 | |
Citigroup Mortgage Loan Trust, Inc. | | | | | | | | |
2006-WF1, 4.98% due 03/25/36 | | | 3,420,415 | | | | 1,675,638 | |
SG Residential Mortgage Trust | | | | | | | | |
2022-1, 3.68% (WAC) due 03/27/62◊,3 | | | 1,797,856 | | | | 1,610,985 | |
Morgan Stanley IXIS Real Estate Capital Trust | | | | | | | | |
2006-2, 5.59% (1 Month Term SOFR + 0.26%, Rate Floor: 0.15%) due 11/25/36◊ | | | 3,760,797 | | | | 1,197,060 | |
Credit-Based Asset Servicing and Securitization LLC | | | | | | | | |
2006-CB2, 3.64% (1 Month Term SOFR + 0.49%, Rate Floor: 0.38%) due 12/25/36◊ | | | 1,215,042 | | | | 1,135,837 | |
GSAA Home Equity Trust | | | | | | | | |
2006-3, 6.04% (1 Month Term SOFR + 0.71%, Rate Floor: 0.60%) due 03/25/36◊ | | | 2,210,350 | | | | 1,075,676 | |
Structured Asset Investment Loan Trust | | | | | | | | |
2006-3, 5.74% (1 Month Term SOFR + 0.41%, Rate Floor: 0.30%) due 06/25/36◊ | | | 1,153,315 | | | | 1,070,822 | |
Lehman XS Trust Series | | | | | | | | |
2006-16N, 5.82% (1 Month Term SOFR + 0.49%, Rate Floor: 0.38%) due 11/25/46◊ | | | 1,192,833 | | | | 1,016,039 | |
COLT Mortgage Loan Trust | | | | | | | | |
2021-2, 2.38% (WAC) due 08/25/66◊,3 | | | 1,500,000 | | | | 983,622 | |
ACE Securities Corporation Home Equity Loan Trust Series | | | | | | | | |
2005-HE2, 6.46% (1 Month Term SOFR + 1.13%, Rate Floor: 1.02%) due 04/25/35◊ | | | 760,981 | | | | 729,405 | |
Morgan Stanley Home Equity Loan Trust | | | | | | | | |
2006-2, 6.00% (1 Month Term SOFR + 0.67%, Rate Floor: 0.56%) due 02/25/36◊ | | | 723,117 | | | | 711,821 | |
SEE NOTES TO FINANCIAL STATEMENTS. | THE GUGGENHEIM FUNDS SEMI-ANNUAL REPORT | 17 |
SCHEDULE OF INVESTMENTS (Unaudited)(continued) | March 31, 2024 |
LIMITED DURATION FUND | |
| | Face
Amount~ | | | Value | |
Residential Mortgage Loan Trust | | | | | | | | |
2020-1, 2.38% (WAC) due 01/26/60◊,3 | | | 671,846 | | | $ | 640,198 | |
Long Beach Mortgage Loan Trust | | | | | | | | |
2006-8, 5.76% (1 Month Term SOFR + 0.43%, Rate Floor: 0.32%) due 09/25/36◊ | | | 2,313,142 | | | | 625,627 | |
MFRA Trust | | | | | | | | |
2021-INV1, 1.26% (WAC) due 01/25/56◊,3 | | | 647,903 | | | | 600,660 | |
Morgan Stanley Capital I Incorporated Trust | | | | | | | | |
2006-HE1, 6.02% (1 Month Term SOFR + 0.69%, Rate Floor: 0.58%) due 01/25/36◊ | | | 626,039 | | | | 595,780 | |
Nationstar Home Equity Loan Trust | | | | | | | | |
2007-B, 5.66% (1 Month Term SOFR + 0.33%, Rate Floor: 0.22%) due 04/25/37◊ | | | 470,390 | | | | 466,249 | |
Nomura Resecuritization Trust | | | | | | | | |
2015-4R, 3.04% (1 Month Term SOFR + 0.54%, Rate Floor: 0.43%) due 03/26/36◊ | | | 318,970 | | | | 299,774 | |
First Franklin Mortgage Loan Trust | | | | | | | | |
2004-FF10, 6.72% (1 Month Term SOFR + 1.39%, Rate Floor: 1.28%) due 07/25/34◊ | | | 294,980 | | | | 287,057 | |
Starwood Mortgage Residential Trust | | | | | | | | |
2020-1, 2.28% (WAC) due 02/25/50◊,3 | | | 280,895 | | | | 259,004 | |
Morgan Stanley Re-REMIC Trust | | | | | | | | |
2010-R5, 4.12% due 06/26/36 | | | 41,021 | | | | 35,604 | |
UCFC Manufactured Housing Contract | | | | | | | | |
1997-2, 7.38% due 10/15/28 | | | 33,699 | | | | 33,472 | |
Total Residential Mortgage-Backed Securities | | | | | | | 486,678,449 | |
| | | | | | | | | |
Government Agency - 5.6% | | | | | | | | |
Uniform MBS 15 Year | | | | | | | | |
due 05/02/2411 | | | 113,550,000 | | | | 113,397,275 | |
Freddie Mac | | | | | | | | |
5.50% due 02/01/53 | | | 37,726,941 | | | | 37,762,463 | |
5.00% due 06/01/53 | | | 19,738,580 | | | | 19,367,063 | |
5.00% due 02/01/53 | | | 17,508,677 | | | | 17,191,248 | |
5.00% due 09/01/52 | | | 7,506,689 | | | | 7,334,595 | |
Ginnie Mae | | | | | | | | |
6.00% due 09/20/45 | | | 20,384,454 | | | | 20,383,820 | |
6.00% due 06/20/47 | | | 3,004,891 | | | | 3,008,320 | |
Fannie Mae | | | | | | | | |
6.50% due 04/25/49 | | | 9,089,033 | | | | 9,090,005 | |
5.00% due 08/01/53 | | | 7,799,583 | | | | 7,617,237 | |
5.00% due 09/01/52 | | | 2,825,910 | | | | 2,761,394 | |
5.00% due 06/01/53 | | | 2,611,282 | | | | 2,548,928 | |
Freddie Mac Seasoned Credit Risk Transfer Trust | | | | | | | | |
2.00% due 05/25/60 | | | 3,151,980 | | | | 2,481,342 | |
2.00% due 11/25/59 | | | 1,796,275 | | | | 1,411,907 | |
Fannie Mae-Aces | | | | | | | | |
1.49% (WAC) due 03/25/35◊,4 | | | 6,007,856 | | | | 575,260 | |
Total Government Agency | | | | | | | 244,930,857 | |
| | | | | | | | | |
Commercial Mortgage-Backed Securities - 1.9% | | | | | | | | |
BX Commercial Mortgage Trust | | | | | | | | |
2021-VOLT, 7.09% (1 Month Term SOFR + 1.76%, Rate Floor: 1.65%) due 09/15/36◊,3 | | | 25,000,000 | | | | 24,633,935 | |
2022-LP2, 6.89% (1 Month Term SOFR + 1.56%, Rate Floor: 1.56%) due 02/15/39◊,3 | | | 13,122,839 | | | | 12,992,471 | |
JP Morgan Chase Commercial Mortgage Securities Trust | | | | | | | | |
2021-NYAH, 6.97% (1 Month Term SOFR + 1.65%, Rate Floor: 1.54%) due 06/15/38◊,3 | | | 10,200,000 | | | | 9,430,559 | |
2016-JP2, 1.79% (WAC) due 08/15/49◊,4 | | | 30,103,418 | | | | 879,354 | |
BXHPP Trust | | | | | | | | |
2021-FILM, 6.54% (1 Month Term SOFR + 1.21%, Rate Floor: 1.10%) due 08/15/36◊,3 | | | 8,250,000 | | | | 7,712,874 | |
MHP | | | | | | | | |
2022-MHIL, 6.59% (1 Month Term SOFR + 1.26%, Rate Floor: 1.26%) due 01/15/27◊,3 | | | 7,292,911 | | | | 7,206,308 | |
Life Mortgage Trust | | | | | | | | |
2021-BMR, 6.84% (1 Month Term SOFR + 1.51%, Rate Floor: 1.40%) due 03/15/38◊,3 | | | 6,880,791 | | | | 6,786,180 | |
Extended Stay America Trust | | | | | | | | |
2021-ESH, 7.14% (1 Month Term SOFR + 1.81%, Rate Floor: 1.70%) due 07/15/38◊,3 | | | 3,657,023 | | | | 3,653,595 | |
Wells Fargo Commercial Mortgage Trust | | | | | | | | |
2017-C38, 0.93% (WAC) due 07/15/50◊,4 | | | 21,922,035 | | | | 497,295 | |
2016-C37, 0.78% (WAC) due 12/15/49◊,4 | | | 23,831,964 | | | | 371,228 | |
2017-C42, 0.86% (WAC) due 12/15/50◊,4 | | | 14,203,406 | | | | 369,931 | |
2017-RB1, 1.19% (WAC) due 03/15/50◊,4 | | | 7,891,739 | | | | 216,706 | |
2015-LC22, 0.74% (WAC) due 09/15/58◊,4 | | | 17,921,448 | | | | 147,802 | |
2016-NXS5, 1.40% (WAC) due 01/15/59◊,4 | | | 4,488,168 | | | | 89,679 | |
JPMDB Commercial Mortgage Securities Trust | | | | | | | | |
2018-C8, 0.61% (WAC) due 06/15/51◊,4 | | | 30,166,708 | | | | 532,753 | |
2016-C4, 0.70% (WAC) due 12/15/49◊,4 | | | 32,869,497 | | | | 482,347 | |
2016-C2, 1.48% (WAC) due 06/15/49◊,4 | | | 6,174,545 | | | | 138,340 | |
2017-C5, 0.87% (WAC) due 03/15/50◊,4 | | | 2,992,846 | | | | 54,703 | |
BENCHMARK Mortgage Trust | | | | | | | | |
2018-B2, 0.45% (WAC) due 02/15/51◊,4 | | | 91,750,452 | | | | 1,134,283 | |
DBJPM Mortgage Trust | | | | | | | | |
2017-C6, 0.91% (WAC) due 06/10/50◊,4 | | | 50,317,177 | | | | 1,044,897 | |
Bank of America Merrill Lynch Commercial Mortgage Trust | | | | | | | | |
2017-BNK3, 1.01% (WAC) due 02/15/50◊,4 | | | 28,832,114 | | | | 652,926 | |
2016-UB10, 1.73% (WAC) due 07/15/49◊,4 | | | 9,966,955 | | | | 246,220 | |
UBS Commercial Mortgage Trust | | | | | | | | |
2017-C2, 1.07% (WAC) due 08/15/50◊,4 | | | 21,682,682 | | | | 604,897 | |
2017-C5, 1.07% (WAC) due 11/15/50◊,4 | | | 10,686,339 | | | | 267,836 | |
COMM Mortgage Trust | | | | | | | | |
2018-COR3, 0.43% (WAC) due 05/10/51◊,4 | | | 35,014,226 | | | | 537,959 | |
2015-CR24, 0.69% (WAC) due 08/10/48◊,4 | | | 50,686,613 | | | | 326,229 | |
18 | THE GUGGENHEIM FUNDS SEMI-ANNUAL REPORT | SEE NOTES TO FINANCIAL STATEMENTS. |
SCHEDULE OF INVESTMENTS (Unaudited)(continued) | March 31, 2024 |
LIMITED DURATION FUND | |
| | Face
Amount~ | | | Value | |
CSAIL Commercial Mortgage Trust | | | | | | | | |
2019-C15, 0.99% (WAC) due 03/15/52◊,4 | | | 17,638,878 | | | $ | 674,398 | |
2016-C6, 1.86% (WAC) due 01/15/49◊,4 | | | 5,937,080 | | | | 159,896 | |
BBCMS Mortgage Trust | | | | | | | | |
2018-C2, 0.75% (WAC) due 12/15/51◊,4 | | | 29,148,256 | | | | 808,523 | |
Morgan Stanley Bank of America Merrill Lynch Trust | | | | | | | | |
2017-C34, 0.77% (WAC) due 11/15/52◊,4 | | | 22,741,750 | | | | 458,128 | |
2015-C27, 0.85% (WAC) due 12/15/47◊,4 | | | 27,785,901 | | | | 222,726 | |
CGMS Commercial Mortgage Trust | | | | | | | | |
2017-B1, 0.73% (WAC) due 08/15/50◊,4 | | | 19,580,683 | | | | 394,087 | |
CD Mortgage Trust | | | | | | | | |
2017-CD6, 0.87% (WAC) due 11/13/50◊,4 | | | 12,536,814 | | | | 266,884 | |
2016-CD1, 1.37% (WAC) due 08/10/49◊,4 | | | 5,648,745 | | | | 121,229 | |
CD Commercial Mortgage Trust | | | | | | | | |
2017-CD4, 1.22% (WAC) due 05/10/50◊,4 | | | 13,321,779 | | | | 376,179 | |
GS Mortgage Securities Trust | | | | | | | | |
2017-GS6, 1.01% (WAC) due 05/10/50◊,4 | | | 10,984,501 | | | | 275,500 | |
BANK | | | | | | | | |
2017-BNK6, 0.77% (WAC) due 07/15/60◊,4 | | | 13,323,167 | | | | 251,120 | |
Citigroup Commercial Mortgage Trust | | | | | | | | |
2016-C2, 1.66% (WAC) due 08/10/49◊,4 | | | 5,906,741 | | | | 164,518 | |
2016-GC37, 1.65% (WAC) due 04/10/49◊,4 | | | 2,777,158 | | | | 64,972 | |
Total Commercial Mortgage-Backed Securities | | | | | | | 85,249,467 | |
| | | | | | | | | |
Total Collateralized Mortgage Obligations | | | | |
(Cost $851,802,238) | | | 816,858,773 | |
| |
U.S. GOVERNMENT SECURITIES†† - 15.9% |
U.S. Treasury Notes |
4.75% due 07/31/25 | | | 200,000,000 | | | | 199,648,438 | |
4.25% due 01/31/26 | | | 151,500,000 | | | | 150,304,571 | |
4.63% due 02/28/26 | | | 150,400,000 | | | | 150,276,625 | |
4.63% due 06/30/25 | | | 100,000,000 | | | | 99,636,719 | |
U.S. Treasury Inflation Indexed Bonds |
0.13% due 10/15/25 | | | 41,773,315 | | | | 40,543,086 | |
0.13% due 04/15/25 | | | 40,529,850 | | | | 39,525,620 | |
1.25% due 04/15/28 | | | 10,588,915 | | | | 10,286,085 | |
1.38% due 07/15/33 | | | 5,249,256 | | | | 5,037,600 | |
Total U.S. Government Securities | | | | |
(Cost $695,059,081) | | | | | | | 695,258,744 | |
| | | | | | | | | |
SENIOR FLOATING RATE INTERESTS††,◊ - 2.5% |
Technology - 0.5% | | | | | | | | |
RLDatix | | | | | | | | |
9.94% (6 Month Term SOFR + 4.50%, Rate Floor: 4.50%) due 04/28/25††† | | | 13,798,857 | | | | 13,798,857 | |
Dun & Bradstreet | | | | | | | | |
8.08% (1 Month Term SOFR + 2.75%, Rate Floor: 2.75%) due 01/18/29 | | | 8,449,500 | | | | 8,445,529 | |
Upland Software, Inc. | | | | | | | | |
9.18% (1 Month Term SOFR + 3.75%, Rate Floor: 4.75%) due 08/06/26 | | | 497,431 | | | | 471,783 | |
Emerald TopCo, Inc. (Press Ganey) | | | | | | | | |
8.94% (1 Month Term SOFR + 3.50%, Rate Floor: 4.50%) due 07/24/26 | | | 190,708 | | | | 189,476 | |
Total Technology | | | | | | | 22,905,645 | |
| | | | | | | | | |
Industrial - 0.4% | | | | | | | | |
Mileage Plus Holdings LLC | | | | | | | | |
10.73% (3 Month Term SOFR + 5.25%, Rate Floor: 6.25%) due 06/21/27 | | | 6,146,075 | | | | 6,321,361 | |
Harsco Corporation | | | | | | | | |
7.69% (1 Month Term SOFR + 2.25%, Rate Floor: 2.75%) due 03/10/28 | | | 3,900,000 | | | | 3,851,250 | |
United Rentals, Inc. | | | | | | | | |
7.08% (1 Month Term SOFR + 1.75%, Rate Floor: 1.75%) due 02/14/31 | | | 3,350,000 | | | | 3,356,298 | |
Ravago Holdings America, Inc. | | | | | | | | |
8.06% (3 Month Term SOFR + 2.50%, Rate Floor: 3.50%) due 03/06/28 | | | 1,945,000 | | | | 1,936,890 | |
CPM Holdings, Inc. | | | | | | | | |
9.83% (1 Month Term SOFR + 4.50%, Rate Floor: 5.00%) due 09/22/28 | | | 1,486,874 | | | | 1,487,409 | |
Total Industrial | | | | | | | 16,953,208 | |
| | | | | | | | | |
Communications - 0.3% | | | | | | | | |
Playtika Holding Corp. | | | | | | | | |
8.19% (1 Month Term SOFR + 2.75%, Rate Floor: 3.75%) due 03/13/28 | | | 10,308,500 | | | | 10,309,531 | |
Zayo Group Holdings, Inc. | | | | | | | | |
8.44% (1 Month Term SOFR + 3.00%, Rate Floor: 3.00%) due 03/09/27 | | | 1,500,000 | | | | 1,312,785 | |
SBA Senior Finance II LLC | | | | | | | | |
7.34% (1 Month Term SOFR + 2.00%, Rate Floor: 2.00%) due 01/27/31 | | | 750,000 | | | | 751,170 | |
Ziggo Financing Partnership | | | | | | | | |
7.94% (1 Month Term SOFR + 2.50%, Rate Floor: 2.50%) due 04/28/28 | | | 400,000 | | | | 393,928 | |
Virgin Media Bristol LLC | | | | | | | | |
7.94% (1 Month Term SOFR + 2.50%, Rate Floor: 2.50%) due 01/31/28 | | | 200,000 | | | | 196,826 | |
Total Communications | | | | | | | 12,964,240 | |
| | | | | | | | | |
Basic Materials - 0.3% | | | | | | | | |
Trinseo Materials Operating S.C.A. | | | | | | | | |
8.10% (3 Month Term SOFR + 2.50%, Rate Floor: 3.50%) due 05/03/28 | | | 10,822,500 | | | | 7,989,494 | |
INEOS Ltd. | | | | | | | | |
6.63% (1 Month EURIBOR + 2.75%, Rate Floor: 2.75%) due 01/29/26 | | EUR | 4,627,115 | | | | 4,969,955 | |
Total Basic Materials | | | | | | | 12,959,449 | |
| | | | | | | | | |
Consumer, Cyclical - 0.3% | | | | | | | | |
Amaya Holdings BV | | | | | | | | |
6.33% (3 Month EURIBOR + 2.50%, Rate Floor: 2.50%) due 07/21/26 | | EUR | 4,500,000 | | | | 4,850,707 | |
SEE NOTES TO FINANCIAL STATEMENTS. | THE GUGGENHEIM FUNDS SEMI-ANNUAL REPORT | 19 |
SCHEDULE OF INVESTMENTS (Unaudited)(continued) | March 31, 2024 |
LIMITED DURATION FUND | |
| | Face
Amount~ | | | Value | |
Rent-A-Center, Inc. | | | | | | | | |
9.12% (6 Month Term SOFR + 3.25%, Rate Floor: 3.75%) due 02/17/28 | | | 2,104,024 | | | $ | 2,100,510 | |
Pacific Bells LLC | | | | | | | | |
10.06% (3 Month Term SOFR + 4.50%, Rate Floor: 5.00%) due 11/10/28 | | | 1,560,617 | | | | 1,548,522 | |
Entain Holdings (Gibraltar) Ltd. | | | | | | | | |
7.91% (3 Month Term SOFR + 2.50%, Rate Floor: 3.00%) due 03/29/27 | | | 1,458,750 | | | | 1,459,669 | |
Packers Holdings LLC | | | | | | | | |
8.68% (1 Month Term SOFR + 3.25%, Rate Floor: 4.00%) due 03/09/28 | | | 1,681,430 | | | | 1,065,606 | |
Cushman & Wakefield US Borrower LLC | | | | | | | | |
8.68% (1 Month Term SOFR + 3.25%, Rate Floor: 3.75%) due 01/31/30 | | | 721,702 | | | | 718,995 | |
8.19% (1 Month Term SOFR + 2.75%, Rate Floor: 3.75%) due 08/21/25 | | | 52,543 | | | | 52,396 | |
Samsonite IP Holdings SARL | | | | | | | | |
8.08% (1 Month Term SOFR + 2.75%, Rate Floor: 3.25%) due 06/21/30 | | | 174,647 | | | | 174,976 | |
Total Consumer, Cyclical | | | | | | | 11,971,381 | |
| | | | | | | | | |
Consumer, Non-cyclical - 0.3% | | | | | | | | |
Bombardier Recreational Products, Inc. | | | | | | | | |
8.08% (1 Month Term SOFR + 2.75%, Rate Floor: 2.75%) due 01/22/31 | | | 4,072,636 | | | | 4,067,545 | |
Women’s Care Holdings, Inc. | | | | | | | | |
9.91% (3 Month Term SOFR + 4.50%, Rate Floor: 5.25%) due 01/17/28 | | | 4,525,295 | | | | 4,036,020 | |
Hearthside Group Holdings LLC | | | | | | | | |
9.60% (3 Month Term SOFR + 4.00%, Rate Floor: 5.00%) due 05/23/25 | | | 2,035,714 | | | | 1,472,086 | |
DaVita, Inc. | | | | | | | | |
7.19% (1 Month Term SOFR + 1.75%, Rate Floor: 1.75%) due 08/12/26 | | | 684,240 | | | | 683,946 | |
Froneri US, Inc. | | | | | | | | |
7.68% (1 Month Term SOFR + 2.25%, Rate Floor: 2.25%) due 01/29/27 | | | 433,125 | | | | 433,212 | |
Outcomes Group Holdings, Inc. | | | | | | | | |
8.69% (1 Month Term SOFR + 3.25%, Rate Floor: 4.25%) due 10/24/25 | | | 378,722 | | | | 378,078 | |
EyeCare Partners LLC | | | | | | | | |
9.32% (3 Month Term SOFR + 3.75%, Rate Floor: 4.75%) due 02/18/27 | | | 483,750 | | | | 253,969 | |
Total Consumer, Non-cyclical | | | | | | | 11,324,856 | |
| | | | | | | | | |
Energy - 0.2% | | | | | | | | |
ITT Holdings LLC | | | | | | | | |
8.68% (1 Month Term SOFR + 3.25%, Rate Floor: 3.75%) due 10/11/30 | | | 10,324,125 | | | | 10,329,287 | |
Venture Global Calcasieu Pass LLC | | | | | | | | |
8.05% (1 Month Term SOFR + 2.63%, Rate Floor: 3.63%) due 08/19/26 | | | 428,758 | | | | 427,150 | |
Total Energy | | | | | | | 10,756,437 | |
| | | | | | | | | |
Financial - 0.2% | | | | | | | | |
Jane Street Group LLC | | | | | | | | |
7.94% (1 Month Term SOFR + 2.50%, Rate Floor: 2.50%) due 01/26/28 | | | 5,135,779 | | | | 5,137,062 | |
Citadel Securities, LP | | | | | | | | |
due 07/29/30 | | | 4,250,000 | | | | 4,244,433 | |
Total Financial | | | | | | | 9,381,495 | |
| | | | | | | | | |
Total Senior Floating Rate Interests | | | | |
(Cost $114,792,076) | | | 109,216,711 | |
| | | | | | | | | |
U.S. TREASURY BILLS†† - 2.0% |
U.S. Treasury Bills |
5.28% due 04/16/2410 | | | 50,030,000 | | | | 49,920,153 | |
4.99% due 04/16/2410 | | | 36,000,000 | | | | 35,920,957 | |
Total U.S. Treasury Bills | | | | |
(Cost $85,841,099) | | | | | | | 85,841,110 | |
| | | | | | | | | |
FEDERAL AGENCY DISCOUNT NOTES†† - 0.6% |
Federal Home Loan Bank |
5.07% due 04/24/2410 | | | 28,000,000 | | | | 27,906,083 | |
Total Federal Agency Discount Notes | | | | |
(Cost $27,906,083) | | | | | | | 27,906,083 | |
| | | | | | | | | |
MUNICIPAL BONDS†† - 0.2% |
Colorado - 0.2% | | | | | | | | |
Fort Carson Family Housing LLC Revenue Bonds | | | | | | | | |
7.86% due 11/15/29 | | | 7,515,000 | | | | 7,996,561 | |
| | | | | | | | | |
California - 0.0% | | | | | | | | |
California Public Finance Authority Revenue Bonds | | | | | | | | |
1.55% due 10/15/26 | | | 3,145,000 | | | | 2,884,386 | |
Total Municipal Bonds | | | | |
(Cost $11,154,955) | | | 10,880,947 | |
20 | THE GUGGENHEIM FUNDS SEMI-ANNUAL REPORT | SEE NOTES TO FINANCIAL STATEMENTS. |
SCHEDULE OF INVESTMENTS (Unaudited)(continued) | March 31, 2024 |
LIMITED DURATION FUND | |
| | Notional
Value | | | Value | |
OTC OPTIONS PURCHASED†† - 0.0% |
Call Options on: | | | | | | | | |
Interest Rate Options | | | | | | | | |
Morgan Stanley Capital Services LLC 10Y-2Y SOFR CMS CAP Expiring June 2024 with strike price of $0.10 | | $ | 120,100,000 | | | $ | 7,187 | |
Barclays Bank plc 10Y-2Y SOFR CMS CAP Expiring June 2024 with strike price of $0.10 | | | 119,000,000 | | | | 7,121 | |
Bank of America, N.A. 10Y-2Y SOFR CMS CAP Expiring June 2024 with strike price of $0.10 | | | 59,950,000 | | | | 3,587 | |
Goldman Sachs International 10Y-2Y SOFR CMS CAP Expiring June 2024 with strike price of $0.10 | | | 48,900,000 | | | | 2,926 | |
Total Interest Rate Options | | | | | | | 20,821 | |
| | | | | | | | | |
Total OTC Options Purchased | | | | |
(Cost $1,570,470) | | | | | | | 20,821 | |
| | | | | | | | | |
Total Investments - 102.9% | | | | |
(Cost $4,652,532,353) | | $ | 4,503,364,114 | |
Other Assets & Liabilities, net - (2.9)% | | | (125,925,077 | ) |
Total Net Assets - 100.0% | | $ | 4,377,439,037 | |
Futures Contracts |
Description | | Number of
Contracts | | | Expiration
Date | | | Notional
Amount | | | Value and
Unrealized
Depreciation** | |
Interest Rate Futures Contracts Purchased† |
3-Month SOFR Futures Contracts | | | 1,754 | | | | Jun 2025 | | | $ | 419,578,725 | | | $ | (675,902 | ) |
Centrally Cleared Credit Default Swap Agreements Protection Purchased†† |
Counterparty | Exchange | Index | | Protection
Premium Rate | | Payment
Frequency | Maturity
Date | | | | | Notional
Amount | | | Value | | | Upfront
Premiums
Paid(Received) | | | Unrealized
Appreciation
(Depreciation)** | |
BofA Securities, Inc. | ICE | ITRAXX.EUR.41.V1 | | | 1.00 | % | Quarterly | 06/20/29 | EUR | | | 7,690,000 | | | $ | (183,003 | ) | | $ | (185,557 | ) | | $ | 2,554 | |
BofA Securities, Inc. | ICE | CDX.NA.HY.41.V2 | | | 5.00 | % | Quarterly | 12/20/28 | | | | | | | 29,205,000 | | | | (2,150,087 | ) | | | 102,476 | | | | (2,252,563 | ) |
| | | | | | | | | | | | | | | | | | | $ | (2,333,090 | ) | | $ | (83,081 | ) | | $ | (2,250,009 | ) |
SEE NOTES TO FINANCIAL STATEMENTS. | THE GUGGENHEIM FUNDS SEMI-ANNUAL REPORT | 21 |
SCHEDULE OF INVESTMENTS (Unaudited)(continued) | March 31, 2024 |
LIMITED DURATION FUND | |
Centrally Cleared Interest Rate Swap Agreements†† |
Counterparty | Exchange | Floating
Rate
Type | Floating
Rate Index | | Fixed
Rate | | | Payment
Frequency | | | Maturity
Date | | | Notional
Amount | | | Value | | | Upfront
Premiums
Paid
(Received) | | | Unrealized
Appreciation
(Depreciation)** | |
BofA Securities, Inc. | CME | Pay | U.S. Secured Overnight Financing Rate | 4.96% | Annually | 10/16/25 | | $ | 530,000,000 | | | $ | 1,589,597 | | | $ | 1,246 | | | $ | 1,588,351 | |
BofA Securities, Inc. | CME | Pay | U.S. Secured Overnight Financing Rate | 5.06% | Annually | 10/05/25 | | | 325,000,000 | | | | 1,265,387 | | | | 839 | | | | 1,264,548 | |
BofA Securities, Inc. | CME | Pay | U.S. Secured Overnight Financing Rate | 4.68% | Annually | 06/29/25 | | | 197,000,000 | | | | (561,820 | ) | | | 491 | | | | (562,311 | ) |
BofA Securities, Inc. | CME | Pay | U.S. Secured Overnight Financing Rate | 3.79% | Annually | 10/03/27 | | | 106,500,000 | | | | (1,226,022 | ) | | | (29,143 | ) | | | (1,196,879 | ) |
BofA Securities, Inc. | CME | Pay | U.S. Secured Overnight Financing Rate | 3.40% | Annually | 04/04/28 | | | 52,000,000 | | | | (1,287,641 | ) | | | 427 | | | | (1,288,068 | ) |
BofA Securities, Inc. | CME | Receive | U.S. Secured Overnight Financing Rate | 4.36% | Annually | 10/16/30 | | | 168,000,000 | | | | (4,491,137 | ) | | | 1,221 | | | | (4,492,358 | ) |
| | | | | | | | | | | | | | | | | | | | | | $ | (4,711,636 | ) | | $ | (24,919 | ) | | $ | (4,686,717 | ) |
Forward Foreign Currency Exchange Contracts†† |
Counterparty | | Currency | | | Type | | | Quantity | | | Contract
Amount | | | Settlement Date | | | Unrealized
Appreciation
(Depreciation) | |
Barclays Bank plc | | | EUR | | | | Sell | | | | 23,480,000 | | | | 25,680,412 USD | | | | 04/15/24 | | | $ | 332,573 | |
Barclays Bank plc | | | EUR | | | | Buy | | | | 4,000,000 | | | | 4,330,197 USD | | | | 04/15/24 | | | | (11,996 | ) |
| | | | | | | | | | | | | | | | | | | | | | | $ | 320,577 | |
22 | THE GUGGENHEIM FUNDS SEMI-ANNUAL REPORT | SEE NOTES TO FINANCIAL STATEMENTS. |
SCHEDULE OF INVESTMENTS (Unaudited)(continued) | March 31, 2024 |
LIMITED DURATION FUND | |
~ | The face amount is denominated in U.S. dollars unless otherwise indicated. |
* | Non-income producing security. |
** | Includes cumulative appreciation (depreciation). Variation margin is reported within the Statement of Assets and Liabilities. |
† | Value determined based on Level 1 inputs, unless otherwise noted — See Note 4. |
†† | Value determined based on Level 2 inputs, unless otherwise noted — See Note 4. |
††† | Value determined based on Level 3 inputs — See Note 4. |
◊ | Variable rate security. Rate indicated is the rate effective at March 31, 2024. In some instances, the effective rate is limited by a minimum rate floor or a maximum rate cap established by the issuer. The settlement status of a position may also impact the effective rate indicated. In some cases, a position may be unsettled at period end and may not have a stated effective rate. In instances where multiple underlying reference rates and spread amounts are shown, the effective rate is based on a weighted average. |
1 | Affiliated issuer. |
2 | Rate indicated is the 7-day yield as of March 31, 2024. |
3 | Security is a 144A or Section 4(a)(2) security. These securities have been determined to be liquid under guidelines established by the Board of Trustees. The total market value of 144A or Section 4(a)(2) securities is $2,333,757,181 (cost $2,440,720,740), or 53.3% of total net assets. |
4 | Security is an interest-only strip. |
5 | Security has no stated coupon. However, it is expected to receive residual cash flow payments on defined deal dates. |
6 | Security is a 144A or Section 4(a)(2) security. These securities have been determined to be illiquid and restricted under guidelines established by the Board of Trustees. The total market value of 144A or Section 4(a)(2) illiquid and restricted securities is $25,013,921 (cost $25,118,853), or 0.6% of total net assets — See Note 9. |
7 | Security has a fixed rate coupon which will convert to a floating or variable rate coupon on a future date. |
8 | Perpetual maturity. |
9 | Security is a step up/down bond. The coupon increases or decreases at regular intervals until the bond reaches full maturity. Rate indicated is the rate at March 31, 2024. See table below for additional step information for each security. |
10 | Rate indicated is the effective yield at the time of purchase. |
11 | Security is unsettled at period end and does not have a stated effective rate. |
| | BofA — Bank of America |
| | CDX.NA.HY.41.V2 — Credit Default Swap North American High Yield Series 41 Index Version 2 |
| | CME — Chicago Mercantile Exchange |
| | CMS — Constant Maturity Swap |
| | EUR — Euro |
| | EURIBOR — European Interbank Offered Rate |
| | ICE — Intercontinental Exchange |
| | ITRAXX.EUR.41.V1 — iTraxx Europe Series 41 Index Version 1 |
| | plc — Public Limited Company |
| | REMIC — Real Estate Mortgage Investment Conduit |
| | REIT — Real Estate Investment Trust |
| | SARL — Société à Responsabilité Limitée |
| | SOFR — Secured Overnight Financing Rate |
| | WAC — Weighted Average Coupon |
| | |
| | See Sector Classification in Other Information section. |
SEE NOTES TO FINANCIAL STATEMENTS. | THE GUGGENHEIM FUNDS SEMI-ANNUAL REPORT | 23 |
SCHEDULE OF INVESTMENTS (Unaudited)(continued) | March 31, 2024 |
LIMITED DURATION FUND | |
The following table summarizes the inputs used to value the Fund’s investments at March 31, 2024 (See Note 4 in the Notes to Financial Statements):
Investments in Securities (Assets) | | Level 1
Quoted
Prices | | | Level 2
Significant
Observable
Inputs | | | Level 3
Significant
Unobservable
Inputs | | | Total | |
Common Stocks | | $ | 27,757 | | | $ | — | | | $ | — | | | $ | 27,757 | |
Preferred Stocks | | | — | | | | 20,198,397 | | | | — | | | | 20,198,397 | |
Warrants | | | 1,770 | | | | — | | | | — | | | | 1,770 | |
Mutual Funds | | | 96,519,146 | | | | — | | | | — | | | | 96,519,146 | |
Money Market Fund | | | 322,344,908 | | | | — | | | | — | | | | 322,344,908 | |
Asset-Backed Securities | | | — | | | | 1,113,760,383 | | | | 110,775,231 | | | | 1,224,535,614 | |
Corporate Bonds | | | — | | | | 1,067,290,716 | | | | 26,462,617 | | | | 1,093,753,333 | |
Collateralized Mortgage Obligations | | | — | | | | 816,858,773 | | | | — | | | | 816,858,773 | |
U.S. Government Securities | | | — | | | | 695,258,744 | | | | — | | | | 695,258,744 | |
Senior Floating Rate Interests | | | — | | | | 95,417,854 | | | | 13,798,857 | | | | 109,216,711 | |
U.S. Treasury Bills | | | — | | | | 85,841,110 | | | | — | | | | 85,841,110 | |
Federal Agency Discount Notes | | | — | | | | 27,906,083 | | | | — | | | | 27,906,083 | |
Municipal Bonds | | | — | | | | 10,880,947 | | | | — | | | | 10,880,947 | |
Options Purchased | | | — | | | | 20,821 | | | | — | | | | 20,821 | |
Credit Default Swap Agreements** | | | — | | | | 2,554 | | | | — | | | | 2,554 | |
Interest Rate Swap Agreements** | | | — | | | | 2,852,899 | | | | — | | | | 2,852,899 | |
Forward Foreign Currency Exchange Contracts** | | | — | | | | 332,573 | | | | — | | | | 332,573 | |
Total Assets | | $ | 418,893,581 | | | $ | 3,936,621,854 | | | $ | 151,036,705 | | | $ | 4,506,552,140 | |
Investments in Securities (Liabilities) | | Level 1
Quoted
Prices | | | Level 2
Significant
Observable
Inputs | | | Level 3
Significant
Unobservable
Inputs | | | Total | |
Interest Rate Futures Contracts** | | $ | 675,902 | | | $ | — | | | $ | — | | | $ | 675,902 | |
Credit Default Swap Agreements** | | | — | | | | 2,252,563 | | | | — | | | | 2,252,563 | |
Interest Rate Swap Agreements** | | | — | | | | 7,539,616 | | | | — | | | | 7,539,616 | |
Forward Foreign Currency Exchange Contracts** | | | — | | | | 11,996 | | | | — | | | | 11,996 | |
Unfunded Loan Commitments (Note 8) | | | — | | | | — | | | | — | * | | | — | |
Total Liabilities | | $ | 675,902 | | | $ | 9,804,175 | | | $ | — | | | $ | 10,480,077 | |
* | Security has a market value of $0. |
** | This derivative is reported as unrealized appreciation/depreciation at period end. |
The following is a summary of significant unobservable inputs used in the fair valuation of assets and liabilities categorized within Level 3 of the fair value hierarchy:
Category | | Ending Balance at
March 31, 2024 | | | Valuation Technique | | | Unobservable
Inputs | | | Input
Range | | | Weighted
Average* | |
Assets: | | | | | | | | | | | | | | | | | | | | |
Asset-Backed Securities | | $ | 58,959,575 | | Option adjusted spread off prior month end broker quote | Broker Quote | — | — |
Asset-Backed Securities | | | 29,242,747 | | Yield Analysis | Yield | 6.2%-7.2% | 6.6% |
Asset-Backed Securities | | | 22,572,909 | | Third Party Pricing | Broker Quote | — | — |
Corporate Bonds | | | 18,504,284 | | Yield Analysis | Yield | 6.2%-6.7% | 6.5% |
Corporate Bonds | | | 4,187,813 | | Option adjusted spread off prior month end broker quote | Broker Quote | — | — |
Corporate Bonds | | | 3,770,520 | | Third Party Pricing | Broker Quote | — | — |
Senior Floating Rate Interests | | | 13,798,857 | | Yield Analysis | Yield | 10.3% | — |
Total Assets | | $ | 151,036,705 | | | | | |
24 | THE GUGGENHEIM FUNDS SEMI-ANNUAL REPORT | SEE NOTES TO FINANCIAL STATEMENTS. |
SCHEDULE OF INVESTMENTS (Unaudited)(continued) | March 31, 2024 |
LIMITED DURATION FUND | |
The Fund’s fair valuation leveling guidelines classify a single daily broker quote, or a vendor price based on a single daily or monthly broker quote, as Level 3 rather than Level 2, if such a quote or price cannot be supported with other available market information.
Significant changes in a quote, yield, market comparable yields, liquidation value or valuation multiple would generally result in significant changes in the fair value of the security. Any remaining Level 3 securities held by the Fund and excluded from the table above, were not considered material to the Fund.
The Fund’s fair valuation leveling guidelines classify a single daily broker quote, or a vendor price based on a single daily or monthly broker quote, as Level 3, if such a quote or price cannot be supported with other available market information.
Transfers between Level 2 and Level 3 may occur as markets fluctuate and/or the availability of data used in an investment’s valuation changes. For the period ended March 31, 2024, the Fund had securities with a total value of $23,392,140 transfer out of Level 3 into Level 2 due to the availability of current and reliable market-based data provided by a third-party pricing service which utilizes significant observable inputs.
Summary of Fair Value Level 3 Activity
Following is a reconciliation of Level 3 assets for which significant unobservable inputs were used to determine fair value for the period ended March 31, 2024:
| | | Assets | | | | | |
| | Asset-Backed
Securities | | | Collateralized
Mortgage
Obligations | | | Corporate
Bonds | | | Senior Floating
Rate Interests | | | Total Assets | |
Beginning Balance | | $ | 143,391,739 | | | $ | 23,897,802 | | | $ | 33,706,418 | | | $ | 13,540,818 | | | $ | 214,536,777 | |
Purchases/(Receipts) | | | 25,874,215 | | | | — | | | | — | | | | — | | | | 25,874,215 | |
(Sales, maturities and paydowns)/Fundings | | | (59,324,934 | ) | | | (610,655 | ) | | | (7,878,642 | ) | | | — | | | | (67,814,231 | ) |
Amortization of premiums/discounts | | | 55,797 | | | | 7,255 | | | | (22,578 | ) | | | 28,237 | | | | 68,711 | |
Total realized gains (losses) included in earnings | | | 69,591 | | | | — | | | | — | | | | — | | | | 69,591 | |
Total change in unrealized appreciation (depreciation) included in earnings | | | 708,823 | | | | 97,738 | | | | 657,419 | | | | 229,802 | | | | 1,693,782 | |
Transfers out of Level 3 | | | — | | | | (23,392,140 | ) | | | — | | | | — | | | | (23,392,140 | ) |
Ending Balance | | $ | 110,775,231 | | | $ | — | | | $ | 26,462,617 | | | $ | 13,798,857 | | | $ | 151,036,705 | |
Net change in unrealized appreciation (depreciation) for investments in Level 3 securities still held at March 31, 2024 | | $ | 708,002 | | | $ | — | | | $ | 608,086 | | | $ | 229,802 | | | $ | 1,545,890 | |
Step Coupon Bonds
The following table discloses additional information related to step coupon bonds held by the Fund. Certain securities are subject to multiple rate changes prior to maturity. For those securities, a range of rates and corresponding dates have been provided. Rates for all step coupon bonds held by the Fund are scheduled to increase, none are scheduled to decrease.
Name | | Coupon Rate at
Next Reset Date | | | Next Rate Reset Date | | | Future Reset Rate(s) | | | Future Reset Date(s) | |
BRAVO Residential Funding Trust 2022-R1, 3.13% due 01/29/70 | | | 6.13 | % | | | 01/30/25 | | | | — | | | | — | |
BRAVO Residential Funding Trust 2021-C, 1.62% due 03/01/61 | | | 4.62 | % | | | 09/25/24 | | | | 5.62 | % | | | 09/25/25 | |
Citigroup Mortgage Loan Trust 2022-A, 6.17% due 09/25/62 | | | 9.17 | % | | | 09/25/25 | | | | 10.17 | % | | | 09/25/26 | |
CSMC Trust 2020-NQM1, 1.41% due 05/25/65 | | | 2.41 | % | | | 09/26/24 | | | | — | | | | — | |
Legacy Mortgage Asset Trust 2021-GS3, 1.75% due 07/25/61 | | | 4.75 | % | | | 05/25/24 | | | | 5.75 | % | | | 05/25/25 | |
Legacy Mortgage Asset Trust 2021-GS4, 1.65% due 11/25/60 | | | 4.65 | % | | | 08/25/24 | | | | 5.65 | % | | | 08/25/25 | |
SEE NOTES TO FINANCIAL STATEMENTS. | THE GUGGENHEIM FUNDS SEMI-ANNUAL REPORT | 25 |
SCHEDULE OF INVESTMENTS (Unaudited)(concluded) | March 31, 2024 |
LIMITED DURATION FUND | |
Name | | Coupon Rate at
Next Reset Date | | | Next Rate Reset Date | | | Future Reset Rate(s) | | | Future Reset Date(s) | |
Legacy Mortgage Asset Trust 2021-GS5, 2.25% due 07/25/67 | | | 5.25 | % | | | 11/25/24 | | | | 6.25 | % | | | 11/25/25 | |
Legacy Mortgage Asset Trust 2021-GS2, 1.75% due 04/25/61 | | | 4.75 | % | | | 04/25/24 | | | | 5.75 | % | | | 04/25/25 | |
NYMT Loan Trust 2021-SP1, 1.67% due 08/25/61 | | | 4.67 | % | | | 08/01/24 | | | | 5.67 | % | | | 08/01/25 | |
NYMT Loan Trust 2022-SP1, 5.25% due 07/25/62 | | | 8.25 | % | | | 07/01/25 | | | | 9.25 | % | | | 07/01/26 | |
OBX Trust 2022-NQM9, 6.45% due 09/25/62 | | | 7.45 | % | | | 11/01/26 | | | | — | | | | — | |
OBX Trust 2024-NQM5, due 03/25/28 | | | 6.99 | % | | | 03/01/28 | | | | — | | | | — | |
OSAT Trust 2021-RPL1, 2.12% due 05/25/65 | | | 5.12 | % | | | 06/25/24 | | | | 6.12 | % | | | 06/25/25 | |
PRPM LLC 2022-1, 3.72% due 02/25/27 | | | 6.72 | % | | | 02/25/25 | | | | 7.72 | % | | | 02/25/26 | |
PRPM LLC 2021-5, 1.79% due 06/25/26 | | | 4.79 | % | | | 06/25/24 | | | | 5.79 | % | | | 06/25/25 | |
Verus Securitization Trust 2020-5, 1.58% due 05/25/65 | | | 2.58 | % | | | 10/26/24 | | | | — | | | | — | |
Affiliated Transactions
Investments representing 5% or more of the outstanding voting shares of a company, or control of or by, or common control under Guggenheim Investments (“GI”), result in that company being considered an affiliated issuer, as defined in the 1940 Act.
The Fund may invest in certain of the underlying series of Guggenheim Strategy Funds Trust, including Guggenheim Strategy Fund II and Guggenheim Strategy Fund III (collectively, the “Guggenheim Strategy Funds”), each of which are open-end management investment companies managed by GI. The Guggenheim Strategy Funds, which launched on March 11, 2014, are offered as short term investment options only to mutual funds, trusts, and other accounts managed by GI and/or its affiliates, and are not available to the public. The Guggenheim Strategy Funds pay no investment management fees. The Guggenheim Strategy Funds’ annual report on Form N-CSR dated September 30, 2023 is available publicly or upon request. This information is available from the EDGAR database on the SEC’s website at https://www.sec.gov/Archives/edgar/data/1601445/000182126823000217/gug86449-ncsr.htm. The Fund may invest in certain of the underlying series of Guggenheim Funds Trust, which are open-end management investment companies managed by GI, are available to the public and whose most recent annual report on Form N-CSR is available publicly or upon request.
Transactions during the period ended March 31, 2024, in which the company is an affiliated issuer, were as follows:
Security Name | | Value
09/30/23 | | | Additions | | | Reductions | | | Realized
Gain (Loss) | | | Change in
Unrealized
Appreciation
(Depreciation) | | | Value
03/31/24 | | | Shares
03/31/24 | | | Investment
Income | |
Mutual Funds | | | | | | | | | | | | | | | | | | | | | | | | | | | | | | | | |
Guggenheim Strategy Fund II | | $ | 31,186,426 | | | $ | 733,933 | | | $ | — | | | $ | — | | | $ | 428,927 | | | $ | 32,349,286 | | | | 1,315,012 | | | $ | 894,510 | |
Guggenheim Strategy Fund III | | | 31,270,271 | | | | 704,772 | | | | — | | | | — | | | | 494,374 | | | | 32,469,417 | | | | 1,316,150 | | | | 858,748 | |
Guggenheim Ultra Short Duration Fund — Institutional Class | | | 30,463,724 | | | | 730,664 | | | | — | | | | — | | | | 506,055 | | | | 31,700,443 | | | | 3,198,834 | | | | 870,939 | |
| | | $ | 92,920,421 | | | $ | 2,169,369 | | | $ | — | | | $ | — | | | $ | 1,429,356 | | | $ | 96,519,146 | | | | | | | $ | 2,624,197 | |
26 | THE GUGGENHEIM FUNDS SEMI-ANNUAL REPORT | SEE NOTES TO FINANCIAL STATEMENTS. |
STATEMENT OF ASSETS AND LIABILITIES (Unaudited) |
March 31, 2024 |
Assets: |
Investments in unaffiliated issuers, at value (cost $4,556,486,112) | | $ | 4,406,844,968 | |
Investments in affiliated issuers, at value (cost $96,046,241) | | | 96,519,146 | |
Segregated cash with broker | | | 5,912,809 | |
Unamortized upfront premiums paid on credit default swap agreements | | | 102,476 | |
Unamortized upfront premiums paid on interest rate swap agreements | | | 4,224 | |
Unrealized appreciation on forward foreign currency exchange contracts | | | 332,573 | |
Prepaid expenses | | | 104,624 | |
Receivables: |
Interest | | | 27,045,603 | |
Fund shares sold | | | 6,783,829 | |
Securities sold | | | 758,000 | |
Dividends | | | 439,738 | |
Due from Investment Adviser | | | 2,980 | |
Variation margin on credit default swap agreements | | | 3,931 | |
Total assets | | | 4,544,854,901 | |
| | | | | |
Liabilities: |
Unfunded loan commitments, at value (Note 8) (commitment fees received $—) | | | — | |
Due to custodian bank | | | 1,055,335 | |
Segregated cash due to broker | | | 915,383 | |
Unamortized upfront premiums received on credit default swap agreements | | | 185,557 | |
Unamortized upfront premiums received on interest rate swap agreements | | | 29,143 | |
Unrealized depreciation on forward foreign currency exchange contracts | | | 11,996 | |
Payable for: |
Securities purchased | | | 147,588,921 | |
Fund shares redeemed | | | 8,916,365 | |
Variation margin on interest rate swap agreements | | | 4,425,570 | |
Distributions to shareholders | | | 1,860,441 | |
Management fees | | | 1,007,570 | |
Variation margin on futures contracts | | | 328,875 | |
Transfer agent fees | | | 170,632 | |
Distribution and service fees | | | 135,085 | |
Protection fees on credit default swap agreements | | | 51,441 | |
Fund accounting/administration fees | | | 26,450 | |
Trustees’ fees* | | | 9,659 | |
Miscellaneous | | | 697,441 | |
Total liabilities | | | 167,415,864 | |
Net assets | | $ | 4,377,439,037 | |
Net assets consist of: |
Paid in capital | | $ | 4,640,632,394 | |
Total distributable earnings (loss) | | | (263,193,357 | ) |
Net assets | | $ | 4,377,439,037 | |
Class A: |
Net assets | | $ | 395,365,572 | |
Capital shares outstanding | | | 16,402,335 | |
Net asset value per share | | $ | 24.10 | |
Maximum offering price per share (Net asset value divided by 97.75%) | | $ | 24.65 | |
Class C: |
Net assets | | $ | 50,504,252 | |
Capital shares outstanding | | | 2,096,627 | |
Net asset value per share | | $ | 24.09 | |
Class P: |
Net assets | | $ | 42,710,373 | |
Capital shares outstanding | | | 1,771,950 | |
Net asset value per share | | $ | 24.10 | |
| | | | | |
Institutional Class: |
Net assets | | $ | 3,539,138,077 | |
Capital shares outstanding | | | 146,854,787 | |
Net asset value per share | | $ | 24.10 | |
Class R6: |
Net assets | | $ | 349,720,763 | |
Capital shares outstanding | | | 14,517,172 | |
Net asset value per share | | $ | 24.09 | |
* | Relates to Trustees not deemed “interested persons” within the meaning of Section 2(a)(19) of the 1940 Act. |
SEE NOTES TO FINANCIAL STATEMENTS. | THE GUGGENHEIM FUNDS SEMI-ANNUAL REPORT | 27 |
STATEMENT OF OPERATIONS (Unaudited) |
Six Months Ended March 31, 2024 |
Investment Income: |
Dividends from securities of unaffiliated issuers | | $ | 5,953 | |
Dividends from securities of affiliated issuers | | | 2,624,197 | |
Interest | | | 103,052,121 | |
Total investment income | | | 105,682,271 | |
| | | | | |
Expenses: |
Management fees | | | 8,212,256 | |
Distribution and service fees: |
Class A | | | 493,451 | |
Class C | | | 259,992 | |
Class P | | | 62,648 | |
Transfer agent/maintenance fees: |
Institutional Class | | | 762,104 | |
Class A | | | 86,140 | |
Class C | | | 14,544 | |
Class P | | | 23,760 | |
Class R6 | | | 3,238 | |
Fund accounting/administration fees | | | 832,054 | |
Interest expense | | | 204,336 | |
Professional fees | | | 177,524 | |
Line of credit fees | | | 84,799 | |
Trustees’ fees* | | | 40,610 | |
Custodian fees | | | 9,150 | |
Miscellaneous | | | 297,931 | |
Recoupment of previously waived fees: |
Class A | | | 10,347 | |
Class C | | | 1,507 | |
Institutional Class | | | 496,384 | |
Class R6 | | | 2,576 | |
Total expenses | | | 12,075,351 | |
Less: |
Class A | | | (3,811 | ) |
Class C | | | (3,636 | ) |
Class P | | | (12,008 | ) |
Institutional Class | | | (469,344 | ) |
Class R6 | | | (886 | ) |
Expenses waived by Adviser | | | (692,856 | ) |
Total waived/reimbursed expenses | | | (1,182,541 | ) |
Net expenses | | | 10,892,810 | |
Net investment income | | | 94,789,461 | |
| | | | | |
Net Realized and Unrealized Gain (Loss): |
Net realized gain (loss) on: |
Investments in unaffiliated issuers | | $ | (11,773,844 | ) |
Swap agreements | | | (4,287,978 | ) |
Options purchased | | | (1,398,465 | ) |
Options written | | | (1,055,134 | ) |
Forward foreign currency exchange contracts | | | (183,748 | ) |
Foreign currency transactions | | | (32,169 | ) |
Net realized loss | | | (18,731,338 | ) |
Net change in unrealized appreciation (depreciation) on: |
Investments in unaffiliated issuers | | | 110,650,753 | |
Investments in affiliated issuers | | | 1,429,356 | |
Swap agreements | | | 177,488 | |
Futures contracts | | | (675,902 | ) |
Options purchased | | | 504,571 | |
Options written | | | 843,399 | |
Forward foreign currency exchange contracts | | | (191,291 | ) |
Foreign currency translations | | | 17,418 | |
Net change in unrealized appreciation (depreciation) | | | 112,755,792 | |
Net realized and unrealized gain | | | 94,024,454 | |
Net increase in net assets resulting from operations | | $ | 188,813,915 | |
* | Relates to Trustees not deemed “interested persons” within the meaning of Section 2(a)(19) of the 1940 Act. |
28 | THE GUGGENHEIM FUNDS SEMI-ANNUAL REPORT | SEE NOTES TO FINANCIAL STATEMENTS. |
STATEMENTS OF CHANGES IN NET ASSETS |
| | Six Months Ended
March 31, 2024
(Unaudited) | | | Year Ended
September 30,
2023 | |
Increase (Decrease) in Net Assets from Operations: | | | | | | | | |
Net investment income | | $ | 94,789,461 | | | $ | 161,809,974 | |
Net realized loss on investments | | | (18,731,338 | ) | | | (76,942,694 | ) |
Net change in unrealized appreciation (depreciation) on investments | | | 112,755,792 | | | | 137,680,504 | |
Net increase in net assets resulting from operations | | | 188,813,915 | | | | 222,547,784 | |
| | | | | | | | | |
Distributions to shareholders: | | | | | | | | |
Class A | | | (9,061,525 | ) | | | (16,755,868 | ) |
Class C | | | (1,000,695 | ) | | | (1,778,619 | ) |
Class P | | | (1,157,868 | ) | | | (2,575,520 | ) |
Institutional Class | | | (81,958,790 | ) | | | (136,965,962 | ) |
Class R6 | | | (7,794,614 | ) | | | (5,921,753 | ) |
Total distributions to shareholders | | | (100,973,492 | ) | | | (163,997,722 | ) |
| | | | | | | | | |
Capital share transactions: | | | | | | | | |
Proceeds from sale of shares | | | | | | | | |
Class A | | | 97,235,024 | | | | 134,134,218 | |
Class C | | | 6,397,841 | | | | 14,149,452 | |
Class P | | | 1,302,159 | | | | 9,238,532 | |
Institutional Class | | | 972,043,877 | | | | 1,552,067,621 | |
Class R6 | | | 34,904,300 | | | | 339,029,073 | |
Distributions reinvested | | | | | | | | |
Class A | | | 7,648,179 | | | | 13,736,751 | |
Class C | | | 868,011 | | | | 1,490,112 | |
Class P | | | 1,148,447 | | | | 2,558,616 | |
Institutional Class | | | 69,768,724 | | | | 113,710,269 | |
Class R6 | | | 7,673,328 | | | | 5,772,795 | |
Cost of shares redeemed | | | | | | | | |
Class A | | | (110,755,337 | ) | | | (311,444,561 | ) |
Class C | | | (11,316,419 | ) | | | (25,891,808 | ) |
Class P | | | (15,472,359 | ) | | | (39,029,342 | ) |
Institutional Class | | | (818,889,150 | ) | | | (2,378,071,191 | ) |
Class R6 | | | (7,645,681 | ) | | | (63,202,366 | ) |
Net increase (decrease) from capital share transactions | | | 234,910,944 | | | | (631,751,829 | ) |
Net increase (decrease) in net assets | | | 322,751,367 | | | | (573,201,767 | ) |
| | | | | | | | | |
Net assets: | | | | | | | | |
Beginning of period | | | 4,054,687,670 | | | | 4,627,889,437 | |
End of period | | $ | 4,377,439,037 | | | $ | 4,054,687,670 | |
SEE NOTES TO FINANCIAL STATEMENTS. | THE GUGGENHEIM FUNDS SEMI-ANNUAL REPORT | 29 |
STATEMENTS OF CHANGES IN NET ASSETS (concluded) |
| | Six Months Ended
March 31, 2024
(Unaudited) | | | Year Ended
September 30,
2023 | |
Capital share activity: | | | | | | | | |
Shares sold | | | | | | | | |
Class A | | | 4,066,393 | | | | 5,673,976 | |
Class C | | | 267,801 | | | | 601,182 | |
Class P | | | 54,395 | | | | 393,536 | |
Institutional Class | | | 40,743,084 | | | | 65,761,074 | |
Class R6 | | | 1,454,756 | | | | 14,311,441 | |
Shares issued from reinvestment of distributions | | | | | | | | |
Class A | | | 319,658 | | | | 582,051 | |
Class C | | | 36,314 | | | | 63,143 | |
Class P | | | 48,025 | | | | 108,402 | |
Institutional Class | | | 2,916,031 | | | | 4,817,987 | |
Class R6 | | | 320,850 | | | | 243,986 | |
Shares redeemed | | | | | | | | |
Class A | | | (4,628,394 | ) | | | (13,221,104 | ) |
Class C | | | (473,737 | ) | | | (1,100,053 | ) |
Class P | | | (646,280 | ) | | | (1,654,015 | ) |
Institutional Class | | | (34,306,993 | ) | | | (100,931,627 | ) |
Class R6 | | | (320,449 | ) | | | (2,675,457 | ) |
Net increase (decrease) in shares | | | 9,851,454 | | | | (27,025,478 | ) |
30 | THE GUGGENHEIM FUNDS SEMI-ANNUAL REPORT | SEE NOTES TO FINANCIAL STATEMENTS. |
This table is presented to show selected data for a share outstanding throughout each period and to assist shareholders in evaluating a Fund’s performance for the periods presented.
Class A | | Six Months Ended
March 31, 2024a | | | Year Ended
September 30,
2023 | | | Year Ended
September 30,
2022 | | | Year Ended
September 30,
2021 | | | Year Ended
September 30,
2020 | | | Year Ended
September 30,
2019 | |
Per Share Data |
Net asset value, beginning of period | | $ | 23.61 | | | $ | 23.28 | | | $ | 25.42 | | | $ | 25.57 | | | $ | 24.68 | | | $ | 24.70 | |
Income (loss) from investment operations: |
Net investment income (loss)b | | | .51 | | | | .87 | | | | .42 | | | | .34 | | | | .40 | | | | .54 | |
Net gain (loss) on investments (realized and unrealized) | | | .53 | | | | .35 | | | | (2.04 | ) | | | .01 | j | | | .94 | | | | .01 | |
Total from investment operations | | | 1.04 | | | | 1.22 | | | | (1.62 | ) | | | .35 | | | | 1.34 | | | | .55 | |
Less distributions from: |
Net investment income | | | (.55 | ) | | | (.89 | ) | | | (.43 | ) | | | (.38 | ) | | | (.45 | ) | | | (.57 | ) |
Net realized gains | | | — | | | | — | | | | (.09 | ) | | | (.12 | ) | | | — | | | | — | c |
Total distributions | | | (.55 | ) | | | (.89 | ) | | | (.52 | ) | | | (.50 | ) | | | (.45 | ) | | | (.57 | ) |
Net asset value, end of period | | $ | 24.10 | | | $ | 23.61 | | | $ | 23.28 | | | $ | 25.42 | | | $ | 25.57 | | | $ | 24.68 | |
|
Total Returnd | | | 4.42 | % | | | 5.31 | % | | | (6.42 | %) | | | 1.38 | % | | | 5.51 | % | | | 2.27 | % |
Ratios/Supplemental Data |
Net assets, end of period (in thousands) | | $ | 395,366 | | | $ | 392,937 | | | $ | 549,667 | | | $ | 855,473 | | | $ | 625,386 | | | $ | 570,353 | |
Ratios to average net assets: |
Net investment income (loss) | | | 4.29 | % | | | 3.70 | % | | | 1.69 | % | | | 1.32 | % | | | 1.60 | % | | | 2.18 | % |
Total expensese | | | 0.77 | % | | | 0.80 | % | | | 0.80 | % | | | 0.79 | % | | | 0.84 | % | | | 0.83 | % |
Net expensesf,g,h | | | 0.73 | % | | | 0.75 | % | | | 0.74 | % | | | 0.74 | % | | | 0.77 | % | | | 0.75 | % |
Portfolio turnover rate | | | 17 | % | | | 28 | % | | | 23 | % | | | 80 | % | | | 123 | % | | | 72 | % |
Class C | | Six Months Ended
March 31, 2024a | | | Year Ended
September 30,
2023 | | | Year Ended
September 30,
2022 | | | Year Ended
September 30,
2021 | | | Year Ended
September 30,
2020 | | | Year Ended
September 30,
2019 | |
Per Share Data |
Net asset value, beginning of period | | $ | 23.59 | | | $ | 23.27 | | | $ | 25.41 | | | $ | 25.55 | | | $ | 24.66 | | | $ | 24.68 | |
Income (loss) from investment operations: |
Net investment income (loss)b | | | .42 | | | | .70 | | | | .24 | | | | .15 | | | | .21 | | | | .35 | |
Net gain (loss) on investments (realized and unrealized) | | | .54 | | | | .33 | | | | (2.04 | ) | | | .02 | j | | | .95 | | | | .02 | |
Total from investment operations | | | .96 | | | | 1.03 | | | | (1.80 | ) | | | .17 | | | | 1.16 | | | | .37 | |
Less distributions from: |
Net investment income | | | (.46 | ) | | | (.71 | ) | | | (.25 | ) | | | (.19 | ) | | | (.27 | ) | | | (.39 | ) |
Net realized gains | | | — | | | | — | | | | (.09 | ) | | | (.12 | ) | | | — | | | | — | c |
Total distributions | | | (.46 | ) | | | (.71 | ) | | | (.34 | ) | | | (.31 | ) | | | (.27 | ) | | | (.39 | ) |
Net asset value, end of period | | $ | 24.09 | | | $ | 23.59 | | | $ | 23.27 | | | $ | 25.41 | | | $ | 25.55 | | | $ | 24.66 | |
|
Total Returnd | | | 4.04 | % | | | 4.48 | % | | | (7.13 | %) | | | 0.67 | % | | | 4.72 | % | | | 1.51 | % |
Ratios/Supplemental Data |
Net assets, end of period (in thousands) | | $ | 50,504 | | | $ | 53,465 | | | $ | 62,864 | | | $ | 90,205 | | | $ | 86,143 | | | $ | 85,100 | |
Ratios to average net assets: |
Net investment income (loss) | | | 3.54 | % | | | 2.96 | % | | | 0.96 | % | | | 0.58 | % | | | 0.85 | % | | | 1.42 | % |
Total expensese | | | 1.53 | % | | | 1.60 | % | | | 1.58 | % | | | 1.58 | % | | | 1.61 | % | | | 1.60 | % |
Net expensesf,g,h | | | 1.48 | % | | | 1.50 | % | | | 1.49 | % | | | 1.49 | % | | | 1.52 | % | | | 1.50 | % |
Portfolio turnover rate | | | 17 | % | | | 28 | % | | | 23 | % | | | 80 | % | | | 123 | % | | | 72 | % |
SEE NOTES TO FINANCIAL STATEMENTS. | THE GUGGENHEIM FUNDS SEMI-ANNUAL REPORT | 31 |
FINANCIAL HIGHLIGHTS (continued) |
This table is presented to show selected data for a share outstanding throughout each period and to assist shareholders in evaluating a Fund’s performance for the periods presented.
Class P | | Six Months Ended
March 31, 2024a | | | Year Ended
September 30,
2023 | | | Year Ended
September 30,
2022 | | | Year Ended
September 30,
2021 | | | Year Ended
September 30,
2020 | | | Year Ended
September 30,
2019 | |
Per Share Data |
Net asset value, beginning of period | | $ | 23.61 | | | $ | 23.28 | | | $ | 25.42 | | | $ | 25.57 | | | $ | 24.68 | | | $ | 24.70 | |
Income (loss) from investment operations: |
Net investment income (loss)b | | | .51 | | | | .87 | | | | .42 | | | | .34 | | | | .40 | | | | .54 | |
Net gain (loss) on investments (realized and unrealized) | | | .53 | | | | .35 | | | | (2.04 | ) | | | .01 | j | | | .94 | | | | .01 | |
Total from investment operations | | | 1.04 | | | | 1.22 | | | | (1.62 | ) | | | .35 | | | | 1.34 | | | | .55 | |
Less distributions from: |
Net investment income | | | (.55 | ) | | | (.89 | ) | | | (.43 | ) | | | (.38 | ) | | | (.45 | ) | | | (.57 | ) |
Net realized gains | | | — | | | | — | | | | (.09 | ) | | | (.12 | ) | | | — | | | | — | c |
Total distributions | | | (.55 | ) | | | (.89 | ) | | | (.52 | ) | | | (.50 | ) | | | (.45 | ) | | | (.57 | ) |
Net asset value, end of period | | $ | 24.10 | | | $ | 23.61 | | | $ | 23.28 | | | $ | 25.42 | | | $ | 25.57 | | | $ | 24.68 | |
|
Total Return | | | 4.42 | % | | | 5.31 | % | | | (6.42 | %) | | | 1.38 | % | | | 5.50 | % | | | 2.27 | % |
Ratios/Supplemental Data |
Net assets, end of period (in thousands) | | $ | 42,710 | | | $ | 54,668 | | | $ | 80,735 | | | $ | 155,465 | | | $ | 150,623 | | | $ | 108,691 | |
Ratios to average net assets: |
Net investment income (loss) | | | 4.28 | % | | | 3.69 | % | | | 1.67 | % | | | 1.33 | % | | | 1.60 | % | | | 2.18 | % |
Total expensese | | | 0.81 | % | | | 0.82 | % | | | 0.95 | % | | | 0.83 | % | | | 0.90 | % | | | 0.88 | % |
Net expensesf,g,h | | | 0.73 | % | | | 0.75 | % | | | 0.74 | % | | | 0.74 | % | | | 0.77 | % | | | 0.75 | % |
Portfolio turnover rate | | | 17 | % | | | 28 | % | | | 23 | % | | | 80 | % | | | 123 | % | | | 72 | % |
Institutional Class | | Six Months Ended
March 31, 2024a | | | Year Ended
September 30,
2023 | | | Year Ended
September 30,
2022 | | | Year Ended
September 30,
2021 | | | Year Ended
September 30,
2020 | | | Year Ended
September 30,
2019 | |
Per Share Data |
Net asset value, beginning of period | | $ | 23.60 | | | $ | 23.28 | | | $ | 25.42 | | | $ | 25.56 | | | $ | 24.67 | | | $ | 24.69 | |
Income (loss) from investment operations: |
Net investment income (loss)b | | | .54 | | | | .93 | | | | .49 | | | | .40 | | | | .46 | | | | .60 | |
Net gain (loss) on investments (realized and unrealized) | | | .54 | | | | .34 | | | | (2.05 | ) | | | .03 | J | | | .95 | | | | .01 | |
Total from investment operations | | | 1.08 | | | | 1.27 | | | | (1.56 | ) | | | .43 | | | | 1.41 | | | | .61 | |
Less distributions from: |
Net investment income | | | (.58 | ) | | | (.95 | ) | | | (.49 | ) | | | (.45 | ) | | | (.52 | ) | | | (.63 | ) |
Net realized gains | | | — | | | | — | | | | (.09 | ) | | | (.12 | ) | | | — | | | | — | c |
Total distributions | | | (.58 | ) | | | (.95 | ) | | | (.58 | ) | | | (.57 | ) | | | (.52 | ) | | | (.63 | ) |
Net asset value, end of period | | $ | 24.10 | | | $ | 23.60 | | | $ | 23.28 | | | $ | 25.42 | | | $ | 25.56 | | | $ | 24.67 | |
|
Total Return | | | 4.59 | % | | | 5.53 | % | | | (6.19 | %) | | | 1.67 | % | | | 5.77 | % | | | 2.52 | % |
Ratios/Supplemental Data |
Net assets, end of period (in thousands) | | $ | 3,539,138 | | | $ | 3,245,439 | | | $ | 3,907,125 | | | $ | 4,960,578 | | | $ | 2,911,309 | | | $ | 2,421,315 | |
Ratios to average net assets: |
Net investment income (loss) | | | 4.54 | % | | | 3.96 | % | | | 1.97 | % | | | 1.58 | % | | | 1.85 | % | | | 2.43 | % |
Total expensese | | | 0.54 | % | | | 0.59 | % | | | 0.56 | % | | | 0.56 | % | | | 0.59 | % | | | 0.57 | % |
Net expensesf,g,h | | | 0.48 | % | | | 0.50 | % | | | 0.49 | % | | | 0.49 | % | | | 0.52 | % | | | 0.50 | % |
Portfolio turnover rate | | | 17 | % | | | 28 | % | | | 23 | % | | | 80 | % | | | 123 | % | | | 72 | % |
32 | THE GUGGENHEIM FUNDS SEMI-ANNUAL REPORT | SEE NOTES TO FINANCIAL STATEMENTS. |
FINANCIAL HIGHLIGHTS (concluded) |
This table is presented to show selected data for a share outstanding throughout each period and to assist shareholders in evaluating a Fund’s performance for the periods presented.
Class R6 | | Six Months Ended
March 31, 2024a | | | Year Ended
September 30,
2023 | | | Year Ended
September 30,
2022 | | | Year Ended
September 30,
2021 | | | Year Ended
September 30,
2020 | | | Period Ended
September 30,
2019i | |
Per Share Data |
Net asset value, beginning of period | | $ | 23.59 | | | $ | 23.26 | | | $ | 25.40 | | | $ | 25.55 | | | $ | 24.66 | | | $ | 24.58 | |
Income (loss) from investment operations: |
Net investment income (loss)b | | | .55 | | | | 1.00 | | | | .48 | | | | .40 | | | | .48 | | | | .31 | |
Net gain (loss) on investments (realized and unrealized) | | | .53 | | | | .29 | | | | (2.04 | ) | | | .02 | J | | | .93 | | | | .14 | |
Total from investment operations | | | 1.08 | | | | 1.29 | | | | (1.56 | ) | | | .42 | | | | 1.41 | | | | .45 | |
Less distributions from: |
Net investment income | | | (.58 | ) | | | (.96 | ) | | | (.49 | ) | | | (.45 | ) | | | (.52 | ) | | | (.37 | ) |
Net realized gains | | | — | | | | — | | | | (.09 | ) | | | (.12 | ) | | | — | | | | — | c |
Total distributions | | | (.58 | ) | | | (.96 | ) | | | (.58 | ) | | | (.57 | ) | | | (.52 | ) | | | (.37 | ) |
Net asset value, end of period | | $ | 24.09 | | | $ | 23.59 | | | $ | 23.26 | | | $ | 25.40 | | | $ | 25.55 | | | $ | 24.66 | |
|
Total Return | | | 4.62 | % | | | 5.60 | % | | | (6.19 | %) | | | 1.64 | % | | | 5.78 | % | | | 1.83 | % |
Ratios/Supplemental Data |
Net assets, end of period (in thousands) | | $ | 349,721 | | | $ | 308,179 | | | $ | 27,499 | | | $ | 44,232 | | | $ | 31,315 | | | $ | 314,764 | |
Ratios to average net assets: |
Net investment income (loss) | | | 4.58 | % | | | 4.22 | % | | | 1.94 | % | | | 1.58 | % | | | 1.96 | % | | | 2.24 | % |
Total expensese | | | 0.47 | % | | | 0.49 | % | | | 0.49 | % | | | 0.49 | % | | | 0.53 | % | | | 0.51 | % |
Net expensesf,g,h | | | 0.44 | % | | | 0.46 | % | | | 0.49 | % | | | 0.49 | % | | | 0.52 | % | | | 0.50 | % |
Portfolio turnover rate | | | 17 | % | | | 28 | % | | | 23 | % | | | 80 | % | | | 123 | % | | | 72 | % |
a | Unaudited figures for the period ended March 31, 2024. Percentage amounts for the period, except total return and portfolio turnover rate, have been annualized. |
b | Net investment income (loss) per share was computed using average shares outstanding throughout the period. |
c | Less than $0.01 per share. |
d | Total return does not reflect the impact of any applicable sales charges. |
e | Does not include expenses of the underlying funds in which the Fund invests. |
f | Net expense information reflects the expense ratios after expense waivers and reimbursements, as applicable. |
g | The portion of the ratios of net expenses to average net assets attributable to recoupments of prior fee reductions or expense reimbursements for the years presented was as follows: |
| | | 03/31/24a | 09/30/23 | 09/30/22 | 09/30/21 | 09/30/20 | 09/30/19 |
| | Class A | 0.01% | 0.01% | 0.00%* | — | 0.00%* | 0.00%* |
| | Class C | 0.01% | 0.01% | — | — | 0.00%* | — |
| | Class P | — | 0.00%* | — | — | 0.00%* | 0.00%* |
| | Institutional Class | 0.03% | 0.00%* | — | — | 0.00%* | 0.00%* |
| | Class R6 | 0.00%* | 0.02% | 0.02% | 0.01% | 0.00%* | 0.00%* |
h | Net expenses may include expenses that are excluded from the expense limitation agreement. Excluding these expenses, the net expense ratios for the years presented would be: |
| | | 03/31/24a | 09/30/23 | 09/30/22 | 09/30/21 | 09/30/20 | 09/30/19 |
| | Class A | 0.72% | 0.72% | 0.73% | 0.73% | 0.75% | 0.75% |
| | Class C | 1.47% | 1.48% | 1.48% | 1.48% | 1.50% | 1.50% |
| | Class P | 0.72% | 0.72% | 0.73% | 0.73% | 0.75% | 0.75% |
| | Institutional Class | 0.47% | 0.47% | 0.48% | 0.48% | 0.50% | 0.50% |
| | Class R6 | 0.42% | 0.44% | 0.48% | 0.48% | 0.50% | 0.50%i |
i | Since commencement of operations: March 13, 2019. Percentage amounts for the period, except total return and portfolio turnover rate, have been annualized. |
j | The amount shown for a share outstanding throughout the year does not agree with the aggregate net loss on investments for the year because of the sales and purchases of fund shares in relation to fluctuating market value of the investments of the Fund. |
SEE NOTES TO FINANCIAL STATEMENTS. | THE GUGGENHEIM FUNDS SEMI-ANNUAL REPORT | 33 |
NOTES TO FINANCIAL STATEMENTS (Unaudited) |
Note 1 – Organization and Significant Accounting Policies
Organization
Guggenheim Funds Trust (the “Trust”), a Delaware statutory trust, is registered with the U.S. Securities and Exchange Commission (the “SEC”) under the Investment Company Act of 1940 (the “1940 Act”), as an open-ended investment company of the series type. Each series, in effect, is representing a separate fund. The Trust may issue an unlimited number of authorized shares. The Trust accounts for the assets of each fund separately.
The Trust offers a combination of five separate classes of shares: Class A shares, Class C shares, Class P shares, Class R6 shares and Institutional Class shares. Sales of shares of each Class are made without a front-end sales charge at the net asset value per share (“NAV”), with the exception of Class A shares. Class A shares are sold at the NAV, plus the applicable front-end sales charge. The sales charge varies depending on the amount purchased. Class A share purchases of $1 million or more are exempt from the front-end sales charge but have a 1% contingent deferred sales charge (“CDSC”), if shares are redeemed within 12 months of purchase. Class C shares have a 1% CDSC if shares are redeemed within 12 months of purchase. Class C shares automatically convert to Class A shares on or about the 10th day of the month following the 8-year anniversary of the purchase of the Class C shares. This conversion will be executed without any sales charge, fee or other charge. After the conversion is completed, the shares will be subject to all features and expenses of Class A shares. Institutional Class shares are offered primarily for direct investment by institutions such as pension and profit sharing plans, endowments, foundations and corporations. Institutional Class shares require a minimum initial investment of $2 million and a minimum account balance of $1 million. Class R6 shares are offered primarily through qualified retirement and benefit plans. Class R6 shares are also offered through certain other plans and platforms sponsored by financial intermediaries. Certain institutional investors and others deemed appropriate by Guggenheim Investments (“GI” or the “Adviser”) may also be eligible to purchase Class R6 shares subject to a $2 million minimum initial investment. At March 31, 2024, the Trust consisted of eighteen funds (the “Funds”).
This report covers the Limited Duration Fund (the “Fund”), a diversified investment company. At March 31, 2024, Class A, Class C, Class P, Institutional Class, and Class R6 shares have been issued by the Fund.
Guggenheim Partners Investment Management, LLC (“GPIM” or the “Adviser”), which operates under the name Guggenheim Investments (“GI”), provides advisory services. Guggenheim Funds Distributors, LLC (“GFD”) serves as distributor of the Fund’s shares. GI and GFD are affiliated entities.
Significant Accounting Policies
The Fund operates as an investment company and, accordingly, follows the investment company accounting and reporting guidance of the Financial Accounting Standards Board (“FASB”) Accounting Standards Codification Topic 946 Financial Services – Investment Companies.
The following significant accounting policies are in conformity with U.S. generally accepted accounting principles (“U.S. GAAP”) and are consistently followed by the Trust. This requires management to make estimates and assumptions that affect the reported amount of assets and liabilities, contingent assets and liabilities at the date of the financial statements, and the reported amounts of revenues and expenses during the reporting period. Actual results could differ from these estimates. All time references are based on Eastern Time.
The NAV of each share class of the Fund is calculated by dividing the market value of the Fund’s securities and other assets, less all liabilities attributable to the share class by the number of outstanding shares of the share class on the specified date.
(a) Valuation of Investments
The Board of Trustees of the Fund (the “Board”) adopted policies and procedures for the valuation of the Fund’s investments (the “Fund Valuation Procedures”). The SEC adopted Rule 2a-5 under the 1940 Act (“Rule 2a-5”) which establishes requirements for determining fair value in good faith. Rule 2a-5 also defines “readily available market quotations” for purposes of the 1940 Act and establishes requirements for determining whether a fund must fair value a security in good faith.
Pursuant to Rule 2a-5, the Board has designated the Adviser as the valuation designee to perform fair valuation determinations for the Fund with respect to all Fund investments and other assets. As the Fund’s valuation designee pursuant to Rule 2a-5, the Adviser has adopted separate procedures (the “Valuation Designee Procedures” and collectively with the Fund Valuation Procedures, the “Valuation Procedures”) reasonably designed to prevent violations of the requirements of Rule 2a-5 and Rule 31a-4. The Adviser, in its role as valuation designee, utilizes the assistance of a valuation committee, consisting of representatives from Guggenheim’s investment management, fund administration, legal and compliance departments (the “Valuation Committee”), in determining the fair value of the Fund’s securities and other assets.
Valuations of the Fund’s securities and other assets are supplied primarily by pricing service providers appointed pursuant to the processes set forth in the Valuation Procedures. The Adviser, with the assistance of the Valuation Committee, convenes monthly, or more frequently as needed, to review the valuation of all assets which have been fair valued. The Adviser, consistent with the
34 | THE GUGGENHEIM FUNDS SEMI-ANNUAL REPORT | |
NOTES TO FINANCIAL STATEMENTS (Unaudited)(continued) |
monitoring and review responsibilities set forth in the Valuation Procedures, regularly reviews the appropriateness of the inputs, methods, models and assumptions employed by the pricing service providers.
If the pricing service provider cannot or does not provide a valuation for a particular investment or such valuation is deemed unreliable, such investment is fair valued by the Adviser.
Generally, trading in foreign securities markets is substantially completed each day at various times prior to the close of the New York Stock Exchange (“NYSE”). The values of foreign securities are determined as of the close of such foreign markets or the close of the NYSE, if earlier. All investments quoted in foreign currencies are valued in U.S. dollars on the basis of the foreign currency exchange rates prevailing at the close of U.S. business at 4:00 p.m. Investments in foreign securities may involve risks not present in domestic investments. The Adviser will determine the current value of such foreign securities by taking into consideration certain factors which may include the following factors, among others: the value of the securities traded on other foreign markets, American Depositary Receipts (“ADR”) trading, closed-end fund trading, foreign currency exchange activity, and the trading prices of financial products that are tied to foreign securities. In addition, under the Valuation Procedures, the Adviser is authorized to use prices and other information supplied by a pricing service provider in valuing foreign securities.
Open-end investment companies are valued at their NAV as of the close of business, on the valuation date. Exchange-traded funds and closed-end investment companies are generally valued at the last quoted sale price.
U.S. Government securities are valued by pricing service providers, using the last traded fill price, or at the reported bid price at the close of business on the valuation date.
Commercial paper and discount notes with a maturity of greater than 60 days at acquisition are valued at prices that reflect broker-dealer supplied valuations or are obtained from pricing service providers, which may consider the trade activity, treasury spreads, yields or price of bonds of comparable quality, coupon, maturity, and type, as well as prices quoted by dealers who make markets in such securities. Commercial paper and discount notes with a maturity of 60 days or less at acquisition are valued at amortized cost, unless the Adviser concludes that amortized cost does not represent the fair value of the applicable asset in which case it will be valued using a pricing service provider.
Repurchase agreements are valued at amortized cost, provided such amounts approximate market value.
Typically, loans are valued using information provided by a pricing service provider which uses broker quotes, among other inputs. If the pricing service provider cannot or does not provide a valuation for a particular loan, or such valuation is deemed unreliable, such investment is valued based on a quote from a broker-dealer or is fair valued by the Adviser.
Exchange-traded options are valued at the mean of the bid and ask prices on the principal exchange on which they are traded. Over-the-counter (“OTC”) options and options on swaps (“swaptions”) are valued using a price provided by a pricing service provider.
Futures contracts are valued on the basis of the last sale price as of 4:00 p.m. on the valuation date. In the event that the exchange for a specific futures contract closes earlier than 4:00 p.m., the futures contract is valued at the official settlement price of the exchange. However, the underlying securities from which the futures contract value is derived are monitored until 4:00 p.m. to determine if fair valuation of the underlying securities would provide a more accurate valuation of the futures contract.
Interest rate swap agreements entered into by the Fund are valued on the basis of the last sale price on the primary exchange on which the swap is traded.
Other swap agreements entered into by the Fund are generally valued using an evaluated price provided by a pricing service provider.
Forward foreign currency exchange contracts are valued daily based on the applicable exchange rate of the underlying currency.
Investments for which market quotations are not readily available are fair valued as determined in good faith by the Adviser. Valuations in accordance with these methods are intended to reflect each security’s (or asset’s or liability’s) “fair value”. Each such determination is based on a consideration of all relevant factors, which are likely to vary from one pricing context to another. Examples of such factors may include, but are not limited to market prices; sale prices; broker quotes; and models which derive prices based on inputs such as anticipated cash flows or collateral, spread over U.S. Treasury securities, and other information analysis. In connection with futures contracts and other derivative investments, such factors may include obtaining information as to how (a) these contracts and other derivative investments trade in the futures or other derivative markets, respectively, and (b) the securities underlying these contracts and other derivative investments trade in the cash market.
| | THE GUGGENHEIM FUNDS SEMI-ANNUAL REPORT | 35 |
NOTES TO FINANCIAL STATEMENTS (Unaudited)(continued) |
(b) U.S. Government and Agency Obligations
Certain U.S. Government and Agency Obligations are traded on a discount basis; the interest rates shown on the Fund’s Schedule of Investments reflect the effective rates paid at the time of purchase by the Fund. Other securities bear interest at the rates shown, payable at fixed dates through maturity.
(c) Senior Floating Rate Interests and Loan Investments
Senior floating rate interests in which the Fund invests generally pay interest rates which are periodically adjusted by reference to a base short-term floating rate, plus a premium. These base lending rates are generally (i) the lending rate offered by one or more major European banks, (ii) the prime rate offered by one or more major United States banks, or (iii) the bank’s certificate of deposit rate. Senior floating rate interests often require prepayments from excess cash flows or permit the borrower to repay at its election. The rate at which the borrower repays cannot be predicted with accuracy. As a result, the actual remaining maturity may be substantially less than the stated maturities disclosed in the Fund’s Schedule of Investments.
The Fund invests in loans and other similar debt obligations (“obligations”). A portion of the Fund’s investments in these obligations is sometimes referred to as “covenant lite” loans or obligations (“covenant lite obligations”), which are obligations that lack covenants or possess fewer or less restrictive covenants or constraints on borrowers than certain other types of obligations. The Fund may also obtain exposure to covenant lite obligations through investment in securitization vehicles and other structured products. Recently, many new or reissued obligations have not featured traditional covenants, which are intended to protect lenders and investors by (i) imposing certain restrictions or other limitations on a borrower’s operations or assets or (ii) providing certain rights to lenders. The Fund may have fewer rights with respect to covenant lite obligations, including fewer protections against the possibility of default and fewer remedies in the event of default. As a result, investments in (or exposure to) covenant lite obligations are subject to more risk than investments in (or exposure to) certain other types of obligations. The Fund is subject to other risks associated with investments in (or exposure to) obligations, including that obligations may not be considered “securities” and, as a result, the Fund may not be entitled to rely on the anti-fraud protections under the federal securities laws and instead may have to resort to state law and direct claims.
(d) Interest on When-Issued Securities
The Fund may purchase and sell interests in securities on a when-issued and delayed delivery basis, with payment and delivery scheduled for a future date. No income accrues to the Fund on such interests or securities in connection with such transactions prior to the date the Fund actually takes delivery of such interests or securities. These transactions are subject to market fluctuations and are subject to the risk that the value at delivery may be more or less than the trade date purchase price. Although the Fund will generally purchase these securities with the intention of acquiring such securities, it may sell such securities before the settlement date.
(e) Short Sales
When the Fund engages in a short sale of a security, an amount equal to the proceeds is reflected as an asset and an equivalent liability. The amount of the liability is subsequently marked-to-market to reflect the market value of the short sale.
Fees, if any, paid to brokers to borrow securities in connection with short sales are recorded as interest expense. In addition, the Fund must pay out the dividend rate of the equity or coupon rate of the obligation to the lender and record this as an expense. Short dividend or interest expense is a cost associated with the investment objective of short sales transactions, rather than an operational cost associated with the day-to-day management of any mutual fund. The Fund may also receive rebate income from the broker resulting from the investment of the proceeds from securities sold short.
(f) Options
Upon the purchase of an option, the premium paid is recorded as an investment, the value of which is marked-to-market daily. If a purchased option expires, the Fund realizes a loss in the amount of the cost of the option. When the Fund enters into a closing sale transaction, it realizes a gain or loss depending on whether the proceeds from the closing sale transaction are greater or less than the cost of the option. If the Fund exercises a put option, it realizes a gain or loss from the sale of the underlying security and the proceeds from such sale will be decreased by the premium originally paid. When the Fund exercises a call option, the cost of the security purchased by the Fund upon exercise increases by the premium originally paid.
When the Fund writes (sells) an option, an amount equal to the premium received is entered in that Fund’s accounting records as an asset and equivalent liability. The amount of the liability is subsequently marked-to-market to reflect the current value of the option written. When a written option expires, or if the Fund enters into a closing purchase transaction, it realizes a gain (or loss if the cost of a closing purchase transaction exceeds the premium received when the option was sold).
The Fund may purchase and write options on swaptions primarily to preserve a return or spread on a particular investment or portion of the Fund’s holdings, as a duration management technique or to protect against an increase in the price of securities it anticipates purchasing at a later date. The purchaser and writer of a swaption is buying or granting the right to enter into a previously
36 | THE GUGGENHEIM FUNDS SEMI-ANNUAL REPORT | |
NOTES TO FINANCIAL STATEMENTS (Unaudited)(continued) |
agreed upon interest rate swap agreement at any time before the expiration of the options. The swaptions are forward premium swaptions which have extended settlement dates.
(g) Futures Contracts
Upon entering into a futures contract, the Fund deposits and maintains as collateral such initial margin as required by the exchange on which the transaction is affected. Pursuant to the contract, the Fund agrees to receive from or pay to the broker an amount of cash equal to the daily fluctuation in value of the contract. Such receipts or payments are known as variation margin and are recorded by the Fund as unrealized appreciation or depreciation. When the contract is closed, the Fund records a realized gain or loss equal to the difference between the value of the contract at the time it was opened and the value at the time it was closed.
(h) Swap Agreements
Swap agreements are marked-to-market daily and the change, if any, is recorded as unrealized appreciation or depreciation. Payments received or made as a result of an agreement or termination of an agreement are recognized as realized gains or losses.
Upon entering into certain centrally-cleared swap transactions, a Fund is required to deposit with its clearing broker an amount of cash or securities as an initial margin. Subsequent variation margin receipts or payments are received or made by the Fund depending on fluctuations in the fair value of the reference entity and are recorded by the Fund as unrealized appreciation or depreciation. When the contract is closed, the Fund records a realized gain or loss equal to the difference between the value of the contract at the time it was opened and the value at the time it was closed.
Upfront payments received or made by a Fund on credit default swap agreements and interest rate swap agreements are amortized over the expected life of the agreement. Periodic payments received or paid by a Fund are recorded as realized gains or losses. Payments received or made as a result of a credit event or termination of the contract are recognized, net of a proportional amount of the upfront payment, as realized gains or losses.
(i) Currency Translations
The accounting records of the Fund are maintained in U.S. dollars. All assets and liabilities initially expressed in foreign currencies are converted into U.S. dollars at prevailing exchange rates. Purchases and sales of investment securities, dividend and interest income, and certain expenses are translated at the rates of exchange prevailing on the respective dates of such transactions. Changes in the relationship of these foreign currencies to the U.S. dollar can significantly affect the value of the investments and earnings of the Fund. Foreign investments may also subject the Fund to foreign government exchange restrictions, expropriation, taxation, or other political, social, geopolitical or economic developments, all of which could affect the market and/or credit risk of the investments.
The Fund does not isolate that portion of the results of operations resulting from changes in the foreign exchange rates on investments from the fluctuations arising from changes in the market prices of securities held. Such fluctuations are included with the net realized gain or loss and unrealized appreciation or depreciation on investments.
Reported net realized foreign exchange gains and losses arise from sales of foreign currencies and currency gains or losses realized between the trade and settlement dates on investment transactions. Net unrealized appreciation and depreciation arise from changes in the fair values of assets and liabilities other than investments in securities at the fiscal period end, resulting from changes in exchange rates.
(j) Forward Foreign Currency Exchange Contracts
The change in value of a forward foreign currency exchange contract is recorded as unrealized appreciation or depreciation until the contract is closed. When the contract is closed, the Fund records a realized gain or loss equal to the difference between the value at the time the contract was opened and the value at the time it was closed.
(k) Foreign Taxes
The Fund may be subject to foreign taxes (a portion of which may be reclaimable) on income, stock dividends, capital gains on investments or certain foreign currency transactions. All foreign taxes are recorded in accordance with the applicable foreign tax regulations and rates that exist in the foreign jurisdictions in which the Fund invests. These foreign taxes, if any, are paid by the Fund and reflected in its Statement of Operations as follows: foreign taxes withheld at source are presented as a reduction of income and foreign taxes on capital gains from sales of investments are included with the net realized gain (loss) on investments. Foreign taxes payable or deferred as of March 31, 2024, if any, are disclosed in the Fund’s Statement of Assets and Liabilities.
(l) Security Transactions
Security transactions are recorded on the trade date for financial reporting purposes. Realized gains and losses from securities transactions are recorded using the identified cost basis. Proceeds from lawsuits related to investment holdings are recorded as a reduction to cost if the securities are still held and as realized gains if no longer held in the Fund. Dividend income is recorded on the ex-dividend date, net of applicable taxes withheld by
| | THE GUGGENHEIM FUNDS SEMI-ANNUAL REPORT | 37 |
NOTES TO FINANCIAL STATEMENTS (Unaudited)(continued) |
foreign countries, if any. Taxable non-cash dividends are recorded as dividend income. Interest income, including amortization of premiums and accretion of discounts, is accrued on a daily basis. Interest income also includes paydown gains and losses on mortgage-backed and asset-backed securities and senior and subordinated loans. Amendment fees are earned as compensation for evaluating and accepting changes to the original loan agreement and are recognized when received. Dividend income from Real Estate Investment Trusts (“REITs”) is recorded based on the income included in the distributions received from the REIT investments using published REIT classifications, including some management estimates when actual amounts are not available. Distributions received in excess of this estimated amount are recorded as a reduction of the cost of investments or reclassified to realized gains. The actual amounts of income, return of capital, and realized gains are only determined by each REIT after its fiscal year-end, and may differ from the estimated amounts.
Income from residual collateralized loan obligations is recognized using the effective interest method. At the time of purchase, management estimates the future expected cash flows and determines the effective yield and estimated maturity date based on the estimated cash flows. Subsequent to the purchase, the estimated cash flows are updated periodically and a revised yield is calculated prospectively.
The Fund may receive other income from investments in senior loan interests including amendment fees, consent fees and commitment fees. For funded loans, these fees are recorded as income when received by the Fund and included in interest income on the Statement of Operations. For unfunded loans, commitment fees are included in realized gain on investments on the Statement of Operations at the end of the commitment period.
(m) Distributions
The Fund declares dividends from investment income daily. The Fund pays its shareholders from its net investment income monthly and distributes any net capital gains that it has realized, at least annually. Distributions to shareholders are recorded on the ex-dividend date. Dividends are reinvested in additional shares, unless shareholders request payment in cash. The character of distributions made during the year from net investment income or net realized gains may differ from their ultimate characterization for U.S. federal income tax purposes.
(n) Class Allocations
Interest and dividend income, most expenses, all realized gains and losses, and all unrealized appreciation and depreciation are allocated to the share classes based upon the value of the outstanding shares in each share class. Certain costs, such as distribution and service fees are charged directly to specific share classes. In addition, certain expenses have been allocated to the individual Funds in the Trust based on the respective net assets of each Fund included in the Trust.
(o) Earnings Credits
Under the fee arrangement with the custodian, the Fund may earn credits based on overnight custody cash balances. These credits are utilized to reduce related custodial expenses. The custodian fees disclosed in the Statement of Operations are before the reduction in expense from the related earnings credits, if any. Earnings credits for the period ended March 31, 2024, are disclosed in the Statement of Operations.
(p) Cash
The Fund may leave cash overnight in its cash account with the custodian. Periodically, the Fund may have cash due to the custodian bank as an overdraft balance. A fee is incurred on this overdraft, calculated by multiplying the overdraft by a rate based on the federal funds rate, which was 5.33% at March 31, 2024.
(q) Indemnifications
Under the Fund’s organizational documents, its Trustees and Officers are indemnified against certain liabilities arising out of the performance of their duties to the Trust. In addition, throughout the normal course of business, the Fund enters into contracts that contain a variety of representations and warranties which provide general indemnifications. The Fund’s maximum exposure under these arrangements is unknown, as this would involve future claims that may be made against the Fund and/or its affiliates that have not yet occurred. However, based on experience, the Fund expects the risk of loss to be remote.
(r) Special Purpose Acquisition Companies
The Fund may acquire an interest in a special purpose acquisition company (“SPAC”) in an initial public offering or a secondary market transaction. SPAC investments carry many of the same risks as investments in initial public offering securities, such as erratic price movements, greater risk of loss, lack of information about the issuer, limited operating and little public or no trading history, and higher transaction costs. An investment in a SPAC is typically subject to a higher risk of dilution by additional later offerings of interests in the SPAC or by other investors exercising existing rights to purchase shares of the SPAC and interests in SPACs may be illiquid and/or be subject to restrictions on resale. A SPAC is a publicly traded company that raises investment capital for the purpose of acquiring the equity securities of one or more existing companies (or interests therein) via merger, combination, acquisition or other similar transactions. Unless and until an acquisition is completed, a SPAC generally invests its assets (less a portion retained to cover expenses) in U.S. government securities, money market securities and cash and does not typically pay
38 | THE GUGGENHEIM FUNDS SEMI-ANNUAL REPORT | |
NOTES TO FINANCIAL STATEMENTS (Unaudited)(continued) |
dividends in respect of its common stock. SPAC investments are also subject to the risk that a significant portion of the funds raised by the SPAC may be expended during the search for a target acquisition or merger and that the SPAC may have limited time in which to conduct due diligence on potential business combination targets. Because SPACs are in essence blank check companies without operating history or ongoing business other than seeking acquisitions, the value of their securities is particularly dependent on the ability of the entity’s management to identify and complete a profitable acquisition. Among other conflicts of interest, the economic interests of the management, directors, officers and related parties of a SPAC can differ from the economic interests of public shareholders, which may lead to conflicts as they evaluate, negotiate and recommend business combination transactions to shareholders. This risk may become more acute as the deadline for the completion of a business combination nears. There is no guarantee that the SPACs in which the Fund invests will complete an acquisition or that any acquisitions that are completed will be profitable.
Note 2 – Financial Instruments and Derivatives
As part of its investment strategy, the Fund utilizes a variety of derivative instruments. These investments involve, to varying degrees, elements of market risk and risks in excess of amounts recognized on the Fund’s Statement of Assets and Liabilities. Valuation and accounting treatment of these instruments can be found under Significant Accounting Policies in Note 1 of these Notes to Financial Statements.
Short Sales
A short sale is a transaction in which the Fund sells a security it does not own. If the security sold short decreases in price between the time the Fund sells the security and closes its short position, the Fund will realize a gain on the transaction. Conversely, if the security increases in price during the period, the Fund will realize a loss on the transaction. The risk of such price increases is the principal risk of engaging in short sales.
Derivatives
Derivatives are instruments whose values depend on, or are derived from, in whole or in part, the value of one or more other assets, such as securities, currencies, commodities or indices. Derivative instruments may be used for investment purposes (including to maintain cash reserves while maintaining exposure to certain other assets), for risk management (hedging) purposes, to facilitate trading, to reduce transaction costs and to pursue higher investment returns. Derivative instruments may also be used to seek to mitigate certain investment risks, such as foreign currency exchange rate risk, interest rate risk and credit risk. U.S. GAAP requires disclosures to enable investors to better understand how and why a Fund uses derivative instruments, how these derivative instruments are accounted for and their effects on the Fund’s financial position and results of operations.
The Fund utilized derivatives for the following purposes:
Duration: the use of an instrument to manage the interest rate risk of a portfolio.
Hedge: an investment made in order to reduce the risk of adverse price movements in a security, by taking an offsetting position to protect against broad market moves.
Income: the use of any instrument that distributes cash flows typically based upon some rate of interest.
Index Exposure: the use of an instrument to obtain exposure to a listed or other type of index.
Options Purchased and Written
A call option on a security gives the purchaser of the option the right to buy, and the writer of a call option the obligation to sell, the underlying security. The purchaser of a put option has the right to sell, and the writer of the put option the obligation to buy, the underlying security at any time during the option period. The risk associated with purchasing options is limited to the premium originally paid.
The following table represents the Fund’s use and volume of call/put options purchased on a monthly basis:
| | | Average Notional Amount | |
Use | | Call | | | Put | |
Duration, Hedge, | | $ | 463,933,333 | | | $ | — | |
| | THE GUGGENHEIM FUNDS SEMI-ANNUAL REPORT | 39 |
NOTES TO FINANCIAL STATEMENTS (Unaudited)(continued) |
The Fund held written call options for 17 days during the period. The average notional amount of call options written during the days held was $64,550,000.
Futures Contracts
A futures contract is an agreement to purchase (long) or sell (short) an agreed amount of securities or other instruments at a set price for delivery at a future date. There are significant risks associated with the Fund’s use of futures contracts, including (i) there may be an imperfect or no correlation between the changes in market value of the underlying asset and the prices of futures contracts; (ii) there may not be a liquid secondary market for a futures contract; (iii) trading restrictions or limitations may be imposed by an exchange; and (iv) government regulations may restrict trading in futures contracts. When investing in futures, there is minimal counterparty credit risk to the Fund because futures are exchange-traded and the exchange’s clearinghouse, as counterparty to all exchange-traded futures, guarantees against default. Cash deposits are shown as segregated cash with broker on the Fund’s Statement of Assets and Liabilities; securities held as collateral are noted on the Fund’s Schedule of Investments.
The following table represents the Fund’s use and volume of futures on a monthly basis:
| | | Average Notional Amount | |
Use | | Long | | | Short | |
Index exposure, Income | | $ | 351,264,079 | | | $ | — | |
Swap Agreements
A swap is an agreement that obligates two parties to exchange a series of cash flows at specified intervals based upon or calculated by reference to changes in specified prices or rates for a specified amount of an underlying asset. When utilizing OTC swaps, the Fund bears the risk of loss of the amount expected to be received under a swap agreement in the event of the default or bankruptcy of a swap agreement counterparty or if the underlying asset declines in value. Certain standardized swaps are subject to mandatory central clearing and are executed on a multi-lateral or other trade facility platform, such as a registered exchange. There is limited counterparty credit risk with respect to centrally-cleared swaps as the transaction is facilitated through a central clearinghouse, much like exchange-traded futures contracts. For a Fund utilizing centrally-cleared swaps, the exchange bears the risk of loss resulting from a counterparty not being able to pay. There is no guarantee that a Fund or an underlying fund could eliminate its exposure under an outstanding swap agreement by entering into an offsetting swap agreement with the same or another party.
Total return swaps involve commitments where single or multiple cash flows are exchanged based on the price of an underlying reference asset (such as an index) for a fixed or variable interest rate. Total return swaps will usually be computed based on the current value of the reference asset as of the close of regular trading on the NYSE or other exchange, with the swap value being adjusted to include dividends accrued, financing charges and/or interest associated with the swap agreement. When utilizing total return swaps, the Fund bears the risk of loss of the amount expected to be received under a swap agreement in the event of the default or bankruptcy of a swap agreement counterparty or if the underlying reference asset declines in value.
Interest rate swaps involve the exchange by the Fund with another party for its respective commitment to pay or receive a fixed or variable interest rate on a notional amount of principal. Interest rate swaps are generally centrally-cleared, but central clearing does not make interest rate swap transactions risk free.
The following table represents the Fund’s use and volume of interest rate swaps on a monthly basis:
| | | Average Notional Amount | |
Use | | Pay Floating Rate | | | Receive Floating Rate | |
Duration, Hedge | | $ | 1,210,500,000 | | | $ | 168,000,000 | |
Credit default swaps are instruments which allow for the full or partial transfer of third party credit risk, with respect to a particular entity or entities, from one counterparty to the other. The Fund enters into credit default swaps as a “seller” or “buyer” of protection primarily to gain or reduce exposure to the investment grade and/or high yield bond market. A seller of credit default swaps is selling credit protection or assuming credit risk with respect to the underlying entity or entities. The buyer in a credit default swap is obligated to pay the seller a periodic stream
40 | THE GUGGENHEIM FUNDS SEMI-ANNUAL REPORT | |
NOTES TO FINANCIAL STATEMENTS (Unaudited)(continued) |
of payments over the term of the contract provided that no event of default on an underlying reference obligation has occurred. If a credit event occurs, as defined under the terms of the swap agreement, the seller will either (i) pay to the buyer of protection an amount equal to the notional amount of the swap and take delivery of the referenced obligation or underlying securities comprising the referenced index or (ii) pay a net settlement amount in the form of cash or securities equal to the notional amount of the swap less the recovery value of the referenced obligation or underlying securities comprising the referenced index. The notional amount reflects the maximum potential amount the seller of credit protection could be required to pay to the buyer if a credit event occurs. The seller of protection receives periodic premium payments from the buyer and may also receive or pay an upfront premium adjustment to the stated periodic payments. In the event a credit default occurs on a credit default swap referencing an index, a factor adjustment will take place and the buyer of protection will receive a payment reflecting the par less the default recovery rate of the defaulted index component based on its weighting in the index. If no default occurs, the counterparty will pay the stream of payments and have no further obligations to the fund selling the credit protection. For a fund utilizing centrally cleared credit default swaps, the exchange bears the risk of loss resulting from a counterparty not being able to pay. For OTC credit default swaps, a fund bears the risk of loss of the amount expected to be received under a swap agreement in the event of the default or bankruptcy of a swap agreement counterparty, or in the case of a credit default swap in which a fund is selling credit protection, the default of a third party issuer.
The quoted market prices and resulting market values for credit default swap agreements on securities and credit indices serve as an indicator of the current status of the payment/performance risk and represent the likelihood of an expected liability (or profit) for the credit derivative had the notional amount of the swap agreement been closed/sold as of the period end. Increasing market values, in absolute terms when compared to the notional amount of the swap, represent a deterioration of the referenced entity’s credit soundness and a greater likelihood or risk of default or other credit event occurring as defined under the terms of the agreement.
The following table represents the Fund’s use and volume of credit default swaps on a monthly basis:
| | | Average Notional Amount | |
Use | | Protection Sold | | | Protection Purchased | |
Index exposure, Income | | $ | — | | | $ | 52,835,833 | |
Forward Foreign Currency Exchange Contracts
A forward foreign currency exchange contract is an agreement between two parties to exchange two designated currencies at a specific time in the future. Certain types of contracts may be cash settled, in an amount equal to the change in exchange rates during the term of the contract. The contracts can be used to hedge or manage exposure to foreign currency risks with portfolio investments or to gain exposure to foreign currencies.
The market value of a forward foreign currency exchange contract changes with fluctuations in foreign currency exchange rates. Furthermore, the Fund may be exposed to risk if the counterparties cannot meet the contract terms or if the currency value changes unfavorably as compared to the U.S. dollar.
The following table represents the Fund’s use and volume of forward foreign currency exchange contracts on a monthly basis:
Use | | Purchased | | | Sold | |
Index exposure, Income | | $ | 1,034,747 | | | $ | 27,724,955 | |
| | THE GUGGENHEIM FUNDS SEMI-ANNUAL REPORT | 41 |
NOTES TO FINANCIAL STATEMENTS (Unaudited)(continued) |
Derivative Investment Holdings Categorized by Risk Exposure
The following is a summary of the location of derivative investments on the Fund’s Statement of Assets and Liabilities as of March 31, 2024:
Derivative Investment Type | Asset Derivatives | Liability Derivatives |
Interest rate futures contracts | — | Variation margin on futures contracts |
Interest rate swap contracts | Unamortized upfront premiums paid on interest rate swap agreements | Unamortized upfront premium received on interest rate swap agreements |
| | | Variation margin on interest rate swap agreements |
Credit default swap contracts | Unamortized upfront premiums paid on credit default swap agreements | Unamortized upfront premiums received on credit default swap agreements |
| | Variation margin on credit default swap agreements | |
Currency forward contracts | Unrealized appreciation on forward foreign currency exchange contracts | Unrealized depreciation on forward foreign currency exchange contracts |
The following tables set forth the fair value of the Fund’s derivative investments categorized by primary risk exposure at March 31, 2024:
Asset Derivative Investments Value |
| | Futures
Interest
Rate
Risk* | | | Swaps
Interest
Rate
Risk* | | | Swaps
Credit
Risk* | | | Forward
Foreign
Currency
Exchange
Risk | | | Options
Purchased
Interest Rate
Risk | | | Total Value at
March 31,
2024 | |
| | | $ | — | | | $ | 2,852,899 | | | $ | 2,554 | | | $ | 332,573 | | | $ | 20,821 | | | $ | 3,208,847 | |
Liability Derivative Investments Value |
| | Futures
Interest
Rate
Risk* | | | Swaps
Interest
Rate
Risk* | | | Swaps
Credit
Risk* | | | Forward
Foreign
Currency
Exchange
Risk | | | Options
Purchased
Interest Rate
Risk | | | Total Value at
March 31,
2024 | |
| | | $ | 675,902 | | | $ | 7,539,616 | | | $ | 2,252,563 | | | $ | 11,996 | | | $ | — | | | $ | 10,480,077 | |
* | Includes cumulative appreciation (depreciation) of exchange-traded, OTC and centrally-cleared derivatives contracts as reported on the Schedule of Investments. For exchange-traded and centrally-cleared derivatives, variation margin is reported within the Fund’s Statement of Assets and Liabilities. |
The following is a summary of the location of derivative investments on the Fund’s Statement of Operations for the period ended March 31, 2024:
Derivative Investment Type | Location of Gain (Loss) on Derivatives |
Interest rate futures contracts | Net change in unrealized appreciation (depreciation) on futures contracts |
Interest/Credit swap agreements | Net realized gain (loss) on swap agreements |
| Net change in unrealized appreciation (depreciation) on swap agreements |
Interest rate option contracts | Net realized gain (loss) on options purchased |
| | Net realized gain (loss) on options written |
| | Net change in unrealized appreciation (depreciation) on options purchased |
| | Net change in unrealized appreciation (depreciation) on options written |
Currency forward contracts | Net realized gain (loss) on forward foreign currency exchange contracts |
| | Net change in unrealized appreciation (depreciation) on forward foreign currency exchange contracts |
42 | THE GUGGENHEIM FUNDS SEMI-ANNUAL REPORT | |
NOTES TO FINANCIAL STATEMENTS (Unaudited)(continued) |
The following is a summary of the Fund’s realized gain (loss) and change in unrealized appreciation (depreciation) on derivative investments recognized on the Fund’s Statement of Operations categorized by primary risk exposure for the period ended March 31, 2024:
Realized Gain (Loss) on Derivative Investments Recognized on the Statement of Operations |
| | Futures
Interest
Rate Risk | | | Swaps
Interest
Rate Risk | | | Swaps
Credit
Risk | | | Forward
Foreign
Currency
Exchange
Risk | | | Options
Purchased
Interest Rate
Risk | | | Options
Written
Interest
Rate Risk | | | Total | |
| | | $ | — | | | $ | (2,891,863 | ) | | $ | (1,396,115 | ) | | $ | (183,748 | ) | | $ | (1,398,465 | ) | | $ | (1,055,134 | ) | | $ | (6,925,325 | ) |
Change in Unrealized Appreciation (Depreciation) on Derivative Investments Recognized on the Statement of Operations |
| | Futures
Interest
Rate Risk | | | Swaps
Interest
Rate Risk | | | Swaps
Credit
Risk | | | Forward
Foreign
Currency
Exchange
Risk | | | Options
Purchased
Interest Rate
Risk | | | Options
Written
Interest
Rate Risk | | | Total | |
| | | $ | (675,902 | ) | | $ | 1,468,310 | | | $ | (1,290,822 | ) | | $ | (191,291 | ) | | $ | 504,571 | | | $ | 843,399 | | | $ | 658,265 | |
In conjunction with the use of derivative instruments, the Fund is required to maintain collateral in various forms. Depending on the financial instrument utilized and the broker involved, the Fund uses margin deposits at the broker, cash and/or securities segregated at the custodian bank, discount notes or repurchase agreements allocated to the Fund as collateral.
Foreign Investments
There are several risks associated with exposure to foreign currencies, foreign issuers and emerging markets. The Fund’s indirect and direct exposure to foreign currencies subjects the Fund to the risk that those currencies will decline in value relative to the U.S. dollar, or in the case of short positions, that the U.S. dollar will decline in value relative to the currency being hedged. Currency rates in foreign countries may fluctuate significantly over short periods of time for a number of reasons, including changes in interest rates and the imposition of currency controls or other political developments in the U.S. or abroad. In addition, the Fund may incur transaction costs in connection with conversions between various currencies. The Fund may, but is not obligated to, engage in currency hedging transactions, which generally involve buying currency forward, options or futures contracts. However, not all currency risks may be effectively hedged, and in some cases the costs of hedging techniques may outweigh expected benefits. In such instances, the value of securities denominated in foreign currencies can change significantly when foreign currencies strengthen or weaken relative to the U.S. dollar.
The Fund may invest in securities of foreign companies directly, or in financial instruments, such as ADRs and exchange-traded funds, which are indirectly linked to the performance of foreign issuers. Foreign markets can be more volatile than the U.S. market due to increased risks of adverse issuer, political, regulatory, market, or economic developments and can perform differently from the U.S. market. Investing in securities of foreign companies directly, or in financial instruments that are indirectly linked to the performance of foreign issuers, may involve risks not typically associated with investing in U.S. issuers. The value of securities denominated in foreign currencies, and of dividends from such securities, can change significantly when foreign currencies strengthen or weaken relative to the U.S. dollar. Foreign securities markets generally have less trading volume and less liquidity than U.S. markets, and prices in some foreign markets may fluctuate more than those of securities traded on U.S. markets. Many foreign countries lack accounting and disclosure standards comparable to those that apply to U.S. companies, and it may be more difficult to obtain reliable information regarding a foreign issuer’s financial condition and operations. Transaction costs and costs associated with custody services are generally higher for foreign securities than they are for U.S. securities. Some foreign governments levy withholding taxes against dividend and interest income. Although in some countries portions of these taxes are recoverable, the non-recovered portion will reduce the income received by the Fund.
The Trust has established counterparty credit guidelines and enters into transactions only with financial institutions rated/identified as investment grade or better. The Trust monitors the counterparty credit risk associated with each such financial institution.
| | THE GUGGENHEIM FUNDS SEMI-ANNUAL REPORT | 43 |
NOTES TO FINANCIAL STATEMENTS (Unaudited)(continued) |
Note 3 – Offsetting
In the normal course of business, the Fund enters into transactions subject to enforceable master netting arrangements or other similar arrangements. Generally, the right to offset in those agreements allows the Fund to counteract the exposure to a specific counterparty with collateral received from or delivered to that counterparty based on the terms of the arrangements. These arrangements provide for the right to liquidate upon the occurrence of an event of default, credit event upon merger or additional termination event.
In order to better define its contractual rights and to secure rights that will help the Fund mitigate its counterparty risk, the Fund may enter into an International Swaps and Derivatives Association, Inc. Master Agreement (“ISDA Master Agreement”) or similar agreement with its derivative contract counterparties. An ISDA Master Agreement is a bilateral agreement between a fund and a counterparty that governs OTC derivatives, including foreign exchange contracts, and typically contains, among other things, collateral posting terms and netting provisions in the event of a default and/or termination event. The provisions of the ISDA Master Agreement typically permit a single net payment in the event of a default (close-out netting) or similar event, including the bankruptcy or insolvency of the counterparty.
For derivatives traded under an ISDA Master Agreement, the collateral requirements are typically calculated by netting the mark-to-market amount for each transaction under such agreement and comparing that amount to the value of any collateral currently pledged by the Fund and the counterparty. For financial reporting purposes, cash collateral that has been pledged to cover obligations of the Fund and cash collateral received from the counterparty, if any, are reported separately on the Fund’s Statement of Assets and Liabilities as segregated cash with broker/receivable for variation margin, or payable for swap settlement/variation margin. Cash and/or securities pledged or received as collateral by the Fund in connection with an OTC derivative subject to an ISDA Master Agreement generally may not be invested, sold or rehypothecated by the counterparty or the Fund, as applicable, absent an event of default under such agreement, in which case such collateral generally may be applied towards obligations due to and payable by such counterparty or the Fund, as applicable. Generally, the amount of collateral due from or to a counterparty must exceed a minimum transfer amount threshold (e.g., $300,000) before a transfer is required to be made. To the extent amounts due to the Fund from its counterparties are not fully collateralized, contractually or otherwise, the Fund bears the risk of loss from counterparty nonperformance. The Fund attempts to mitigate counterparty risk by only entering into agreements with counterparties that it believes to be of good standing and by monitoring the financial stability of those counterparties.
For financial reporting purposes, the Fund does not offset derivative assets and derivative liabilities that are subject to netting arrangements in the Fund’s Statement of Assets and Liabilities.
The following tables present derivative financial instruments and secured financing transactions that are subject to enforceable netting arrangements:
| | | | | | | | | | | | | | | Gross Amounts Not Offset
in the Statement of
Assets and Liabilities | | | | | |
Instrument | | Gross
Amounts of
Recognized
Assets | | | Gross
Amounts
Offset in the
Statement of
Assets and
Liabilities | | | Net Amount
of Assets
Presented on
the Statement
of Assets and
Liabilities | | | Financial
Instruments | | | Cash
Collateral
Received | | | Net Amount | |
Forward foreign currency exchange contracts | | $ | 332,573 | | | $ | — | | | $ | 332,573 | | | $ | (11,996 | ) | | $ | (280,000 | ) | | $ | 40,577 | |
Options Purchased | | | 20,821 | | | | — | | | | 20,821 | | | | — | | | | (10,113 | ) | | | 10,708 | |
44 | THE GUGGENHEIM FUNDS SEMI-ANNUAL REPORT | |
NOTES TO FINANCIAL STATEMENTS (Unaudited)(continued) |
| | | | | | | | | | | | | | | Gross Amounts Not
Offset in the Statement of
Assets and Liabilities | | | | | |
Instrument | | Gross
Amounts of
Recognized
Liabilities | | | Gross
Amounts
Offset in the
Statement of
Assets and
Liabilities | | | Net Amount
of Assets
Presented on
the Statement
of Assets and
Liabilities | | | Financial
Instruments | | | Cash
Collateral
Pledged | | | Net Amount | |
Forward foreign currency exchange contracts | | $ | 11,996 | | | $ | — | | | $ | 11,996 | | | $ | (11,996 | ) | | $ | — | | | $ | — | |
The Fund has the right to offset deposits against any related derivative liabilities outstanding with each counterparty with the exception of exchange-traded or centrally-cleared derivatives. The following table presents deposits held by others in connection with derivative investments as of March 31, 2024.
Counterparty | Asset Type | | Cash Pledged | | | Cash Received | |
Barclays Bank plc | Forward foreign currency exchange contracts, Options | | $ | — | | | $ | 280,000 | |
BofA Securities, Inc. | Credit default swap agreements | | | 2,842,630 | | | | 485,383 | |
BofA Securities, Inc. | Futures contracts | | | 1,640,000 | | | | — | |
BofA Securities, Inc. | Interest rate swap agreements | | | 1,430,179 | | | | — | |
Goldman Sachs International | Options | | | — | | | | 90,000 | |
Morgan Stanley Capital Services LLC | Options | | | — | | | | 60,000 | |
| | | | | 5,912,809 | | | | 915,383 | |
Note 4 – Fair Value Measurement
In accordance with U.S. GAAP, fair value is defined as the price that the Fund would receive to sell an investment or pay to transfer a liability in an orderly transaction between market participants at the measurement date. U.S. GAAP establishes a three-tier fair value hierarchy based on the types of inputs used to value assets and liabilities and requires corresponding disclosure. The hierarchy and the corresponding inputs are summarized below:
Level 1 — | unadjusted quoted prices in active markets for identical assets or liabilities. |
Level 2 — | significant other observable inputs (for example quoted prices for securities that are similar based on characteristics such as interest rates, prepayment speeds, credit risk, etc.). |
Level 3 — | significant unobservable inputs based on the best information available under the circumstances, to the extent observable inputs are not available, which may include assumptions. |
Rule 2a-5 sets forth a definition of “readily available market quotations,” which is consistent with the definition of a Level 1 input under U.S. GAAP. Rule 2a-5 provides that “a market quotation is readily available only when that quotation is a quoted price (unadjusted) in active markets for identical investments that the fund can access at the measurement date, provided that a quotation will not be readily available if it is not reliable.”
Securities for which market quotations are not readily available must be valued at fair value as determined in good faith. Accordingly, any security priced using inputs other than Level 1 inputs will be subject to fair value requirements. The types of inputs available depend on a variety of factors, such as the type of security and the characteristics of the markets in which it trades, if any. Fair valuation determinations that rely on fewer or no observable inputs require greater judgment. Accordingly, fair value determinations for Level 3 securities require the greatest amount of judgment.
| | THE GUGGENHEIM FUNDS SEMI-ANNUAL REPORT | 45 |
NOTES TO FINANCIAL STATEMENTS (Unaudited)(continued) |
Pricing service providers are used to value a majority of the Fund’s investments. When values are not available from a pricing service provider, they will be determined using a variety of sources and techniques, including: market prices; broker quotes; and models which derive prices based on inputs such as prices of securities with comparable maturities and characteristics or based on inputs such as anticipated cash flows or collateral, spread over U.S. Treasury securities, and other information and analysis. A significant portion of the Fund’s assets and liabilities are categorized as Level 2, as indicated in this report.
Quotes from broker-dealers, adjusted for fluctuations in criteria such as credit spreads and interest rates, may also be used to value the Fund’s assets and liabilities, i.e. prices provided by a broker-dealer or other market participant who has not committed to trade at that price. Although quotes are typically received from established market participants, the Fund may not have the transparency to view the underlying inputs which support the market quotations. Significant changes in a quote would generally result in significant changes in the fair value of the security.
Certain fixed income securities are valued by obtaining a monthly quote from a broker-dealer, adjusted for fluctuations in criteria such as credit spreads and interest rates.
Certain loans and other securities are valued using a single daily broker quote or a price from a pricing service provider based on a single daily or monthly broker quote.
The inputs or methodologies selected and applied for valuing securities or other assets are not necessarily an indication of the risk associated with investing in those securities. The suitability, appropriateness and accuracy of the techniques, methodologies and sources employed to determine fair valuation are periodically reviewed and subject to change.
Note 5 – Investment Advisory Agreement and Other Agreements
Under the terms of an investment advisory contract, the Fund pays GI investment advisory fees on a monthly basis calculated daily at an annualized rate of 0.39% of the average daily net assets of the Fund.
GI pays operating expenses on behalf of the Trust, such as audit and accounting related services, legal services, custody, printing and mailing, among others, on a pass-through basis. Such expenses are allocated to various Funds within the complex based on relative net assets.
The Board has adopted Distribution Plans related to the offering of Class A, Class C and Class P shares pursuant to Rule 12b-1 under the 1940 Act. The plans provide for payments at an annual rate of 0.25% of the average daily net assets of the Fund’s Class A and Class P shares, and 1.00% of the average daily net assets of the Fund’s Class C shares.
The investment advisory contract for the Fund provides that the total expenses be limited to a percentage of average net assets for each class of shares, exclusive of brokerage costs, dividends or interest on securities sold short, expenses of other investment companies in which the Fund invests, interest, taxes, litigation, indemnification and extraordinary expenses. The limits are listed below:
| | Limit | | | Effective
Date | | | Contract
End Date | |
Class A | | | 0.75 | % | | | 12/01/13 | | | | 02/01/25 | |
Class C | | | 1.50 | % | | | 12/01/13 | | | | 02/01/25 | |
Class P | | | 0.75 | % | | | 05/01/15 | | | | 02/01/25 | |
Institutional Class | | | 0.50 | % | | | 12/01/13 | | | | 02/01/25 | |
Class R6 | | | 0.50 | % | | | 03/13/19 | | | | 02/01/25 | |
46 | THE GUGGENHEIM FUNDS SEMI-ANNUAL REPORT | |
NOTES TO FINANCIAL STATEMENTS (Unaudited)(continued) |
GI is entitled to reimbursement by the Fund for fees waived or expenses reimbursed during any of the previous 36 months, beginning on the date of the expense limitation agreement, if on any day the estimated operating expenses are less than the indicated percentages. For purposes of this arrangement, GI is entitled to recoupment of previously waived fees or reimbursed expenses for 36 months from the date of the waiver or reimbursement by GI. At March 31, 2024, the amount of fees waived or expenses reimbursed that are subject to recoupment and will expire during the years ended September 30, are presented in the following table:
| | 2024 | | | 2025 | | | 2026 | | | 2027 | | | Fund
Total | |
Class A | | $ | 322,506 | | | $ | 400,848 | | | $ | 95,368 | | | $ | 3,811 | | | $ | 822,533 | |
Class C | | | 78,917 | | | | 68,209 | | | | 36,276 | | | | 3,636 | | | | 187,038 | |
Class P | | | 146,208 | | | | 202,943 | | | | 28,742 | | | | 12,008 | | | | 389,901 | |
Institutional Class | | | 2,063,773 | | | | 3,164,191 | | | | 2,123,104 | | | | 469,344 | | | | 7,820,412 | |
Class R6 | | | — | | | | — | | | | — | | | | — | | | | — | |
For the period ended March 31, 2024, GI recouped $510,814 from the Fund.
If the Fund invests in a fund that is advised by the same adviser or an affiliated adviser, the investing Fund’s adviser has agreed to waive fees at the investing fund level to the extent necessary to offset the proportionate share of any management fee paid by the Fund with respect to its investment in such affiliated fund. Fee waivers will be calculated at the investing fund level without regard to any expense cap, if any, in effect for the investing fund. Fees waived under this arrangement are not subject to reimbursement to GI. For the period ended March 31, 2024, the Fund waived $38,837 related to investments in affiliated funds.
For the period ended March 31, 2024, GFD retained sales charges of $77,213 relating to sales of Class A shares of the Trust.
Certain trustees and officers of the Trust are also officers of GI and/or GFD. The Trust does not compensate its officers or trustees who are officers, directors and/or employees of GI or GFD.
MUFG Investor Services (US), LLC (“MUIS”) acts as the Fund’s administrator, transfer agent and accounting agent. As administrator, transfer agent and accounting agent, MUIS maintains the books and records of the Fund’s securities and cash. The Bank of New York Mellon Corp. (“BNY”) acts as the Fund’s custodian. As custodian, BNY is responsible for the custody of the Fund’s assets. For providing the aforementioned administrative and accounting services, MUIS is entitled to receive a monthly fee equal to a percentage of the Fund’s average daily net assets and out of pocket expenses. For providing the aforementioned transfer agent and custodian services, MUIS and BNY are entitled to receive a monthly fee based on the number of transactions during the month and the number of accounts under management, subject to certain minimum monthly fees, and out of pocket expenses.
Note 6 – Federal Income Tax Information
The Fund intends to comply with the provisions of Subchapter M of the Internal Revenue Code of 1986, as amended (the “Internal Revenue Code”), applicable to regulated investment companies and will distribute substantially all taxable net investment income and capital gains sufficient to relieve the Fund from all, or substantially all, federal income, excise and state income taxes. Therefore, no provision for federal or state income tax or federal excise tax is required.
Tax positions taken or expected to be taken in the course of preparing the Fund’s tax returns are evaluated to determine whether the tax positions are “more-likely-than-not” of being sustained by the applicable tax authority. Tax positions not deemed to meet the “more-likely-than-not” threshold would be recorded as a tax benefit or expense in the current year. Management has analyzed the Fund’s tax positions taken, or to be taken, on U.S. federal income tax returns for all open tax years, and has concluded that no provision for income tax is required in the Fund’s financial statements. The Fund’s U.S. federal income tax returns are subject to examination by the Internal Revenue Service (“IRS”) for a period of three years after they are filed.
| | THE GUGGENHEIM FUNDS SEMI-ANNUAL REPORT | 47 |
NOTES TO FINANCIAL STATEMENTS (Unaudited)(continued) |
At March 31, 2024, the cost of investments for U.S. federal income tax purposes, the aggregate gross unrealized appreciation for all investments for which there was an excess of value over tax cost, and the aggregate gross unrealized depreciation for all investments for which there was an excess of tax cost over value, were as follows:
| | Tax
Cost | | | Tax
Unrealized
Appreciation | | | Tax
Unrealized
Depreciation | | | Net Tax
Unrealized
Appreciation
(Depreciation) | |
| | | $ | 4,652,532,451 | | | $ | 9,245,908 | | | $ | (165,706,296 | ) | | $ | (156,460,388 | ) |
Note 7 – Securities Transactions
For the period ended March 31, 2024, the cost of purchases and proceeds from sales of investment securities, excluding government securities, short-term investments and derivatives, were as follows:
| | Purchases | | | Sales | |
| | | $ | 366,102,738 | | | $ | 625,342,861 | |
For the period ended March 31, 2024, the cost of purchases and proceeds from sales of government securities were as follows:
| | Purchases | | | Sales | |
| | | $ | 378,860,407 | | | $ | — | |
The Fund is permitted to purchase or sell securities from or to certain affiliated funds under specified conditions outlined in procedures adopted by the Board. The procedures have been designed to ensure that any purchase or sale of securities by the Fund from or to another fund or portfolio that is or could be considered an affiliate by virtue of having a common investment adviser (or affiliated investment advisers), common trustees and/or common officers complies with Rule 17a-7 of the 1940 Act. Further, as defined under these procedures, each transaction is effected at the current market price. For the period ended March 31, 2024, the Fund did not engage in purchases and sales of securities pursuant to Rule 17a-7 of the 1940 Act.
Note 8 – Unfunded Loan Commitments
Pursuant to the terms of certain loan agreements, the Fund held unfunded loan commitments as of March 31, 2024. The Fund is obligated to fund these loan commitments at the borrower’s discretion.
The unfunded loan commitments as of March 31, 2024, were as follows:
Borrower | | Maturity Date | | | Face Amount | | | Value | |
Datix Bidco Ltd. | | | 05/16/24 | | | $ | 4,720,000 | | | $ | — | |
Fontainbleau Vegas | | | 01/31/26 | | | | 45,236 | | | | — | |
Lightning A | | | 03/01/37 | | | | 2,240,000 | | | | — | |
Thunderbird A | | | 03/01/37 | | | | 2,240,000 | | | | — | |
| | | | | | | | | | | $ | — | |
48 | THE GUGGENHEIM FUNDS SEMI-ANNUAL REPORT | |
NOTES TO FINANCIAL STATEMENTS (Unaudited)(continued) |
Note 9 – Restricted Securities
The securities below are considered illiquid and restricted under guidelines established by the Board:
Restricted Securities | | Acquisition Date | | | Cost | | | Value | |
Cascade Funding Mortgage Trust | | | | | | | | | | | | |
2018-RM2 4.00% (WAC) due 10/25/681 | | | 11/02/18 | | | $ | 4,301,158 | | | $ | 4,265,428 | |
Cascade Funding Mortgage Trust | | | | | | | | | | | | |
2019-RM3 2.80% (WAC) due 06/25/691 | | | 06/25/19 | | | | 448,435 | | | | 438,416 | |
CFMT LLC | | | | | | | | | | | | |
2022-HB9 3.25% (WAC) due 09/25/371 | | | 09/23/22 | | | | 1,869,261 | | | | 1,911,777 | |
Copper River CLO Ltd. | | | | | | | | | | | | |
2007-1A INC, due 01/20/212 | | | 05/09/14 | | | | — | | | | 50 | |
Towd Point Revolving Trust | | | | | | | | | | | | |
4.83% due 09/25/64 | | | 03/17/22 | | | | 18,499,999 | | | | 18,398,250 | |
| | | | | | | $ | 25,118,853 | | | $ | 25,013,921 | |
1 | Variable rate security. Rate indicated is the rate effective at March 31, 2024. In some instances, the effective rate is limited by a minimum rate floor or a maximum rate cap established by the issuer. The settlement status of a position may also impact the effective rate indicated. In some cases, a position may be unsettled at period end and may not have a stated effective rate. In instances where multiple underlying reference rates and spread amounts are shown, the effective rate is based on a weighted average. |
2 | Security has no stated coupon. However, it is expected to receive residual cash flow payments on defined deal dates. |
Note 10 – Reverse Repurchase Agreements
The Fund may enter into reverse repurchase agreements. Under a reverse repurchase agreement, a Fund sells securities and agrees to repurchase them at a particular price at a future date. In the event the buyer of securities under a reverse repurchase agreement files for bankruptcy or becomes insolvent, such buyer or its trustee or receiver may receive an extension of time to determine whether to enforce the Fund’s obligation to repurchase the securities, and the Fund’s use of the proceeds of the reverse repurchase agreement may effectively be restricted pending such decision.
For the period ended March 31, 2024, the Fund entered into reverse repurchase agreements as follows:
| | Number of Days
Outstanding | | | Balance at
March 31, 2024 | | | Average Balance
Outstanding | | | Average
Interest Rate | |
| | | | 8 | | | $ | — | * | | $ | 171,652,188 | | | | 5.45 | % |
* | As of March 31, 2024, the Fund had no open reverse repurchase agreements. |
Note 11 – Line of Credit
The Trust, along with other affiliated trusts, secured a 364-day committed, $1,150,000,000 line of credit from Citibank, N.A., which was in place through September 29, 2023, at which time a new line of credit was entered into in the amount of $1,165,000,000. The Fund may draw (borrow) from the line of credit as a temporary measure for emergency purposes, to facilitate redemption requests, or for other short-term liquidity purposes consistent with the Fund’s investment objective and program. For example, it may be advantageous for the Fund to borrow money rather than sell existing portfolio positions to meet redemption requests. Fees related to borrowings, if any, vary under this arrangement between the greater of Citibank’s “base rate”, SOFR plus 1%, or the federal funds rate plus 1/2 of 1%.
The commitment fee that may be paid by the Fund is at an annualized rate of 0.15% of the average daily amount of its allocated unused commitment amount. The commitment fee amount is allocated to the individual Funds based on the respective net assets of each participating Fund and is referenced in the Fund’s Statement of Operations under “Line of credit fees”. The Fund did not have any borrowings under this agreement as of and for the period ended March 31, 2024.
| | THE GUGGENHEIM FUNDS SEMI-ANNUAL REPORT | 49 |
NOTES TO FINANCIAL STATEMENTS (Unaudited)(concluded) |
Note 12 – Market Risks
The value of, or income generated by, the investments held by the Fund are subject to the possibility of rapid and unpredictable fluctuation, and loss that may result from various factors. These factors include, among others, developments affecting individual companies, or from broader influences, including real or perceived changes in prevailing interest rates (which may change at any time based on changes in monetary policies and various market and other economic conditions), changes in inflation rates or expectations about inflation rates, adverse investor confidence or sentiment, changing economic, political (including geopolitical), social orfinancial market conditions, increased instability or general uncertainty, environmental disasters, governmental actions, public health emergencies (such as the spread of infectious diseases, pandemics and epidemics), debt crises, actual or threatened wars or other armed conflicts (such as the ongoing Russia-Ukraine conflict and its collateral economic and other effects, including, but not limited to, sanctions and other international trade barriers) or ratings downgrades, and other similar events, each of which may be temporary or last for extended periods. Moreover, changing economic, political, geopolitical, social, financial market or other conditions in one country, geographic region or industry could adversely affect the value, yield and return of the investments held by the Fund in a different country, geographic region, economy, industry or market because of the increasingly interconnected global economies and financial markets. The duration and extent of the foregoing types of factors or conditions are highly uncertain and difficult to predict and have in the past, and may in the future, cause volatility and distress in economies and financial markets or other adverse circumstances, which may negatively affect the value of the Fund’s investments and performance of the Fund.
Note 13 – Subsequent Events
The Fund evaluated subsequent events through the date the financial statements are issued and determined there were no material events that would require adjustment to or disclosure in the Fund’s financial statements.
50 | THE GUGGENHEIM FUNDS SEMI-ANNUAL REPORT | |
OTHER INFORMATION (Unaudited) |
Delivery of Shareholder Reports
Paper copies of the Fund’s annual and semi-annual shareholder reports are not sent by mail, unless you specifically request paper copies of the reports from a fund or from your financial intermediary. Instead, the reports are made available on a website, and you are notified by mail each time a report is posted and provided with a website link to access the report.
You may elect to receive all future shareholder reports in paper free of charge. If you hold shares of a fund directly, you can inform the Fund that you wish to receive paper copies of reports by calling 800.820.0888. If you hold shares of a fund through a financial intermediary, please contact the financial intermediary to make this election. Your election to receive reports in paper may apply to all Guggenheim Funds in which you are invested and may apply to all Guggenheim funds held with your financial intermediary.
Tailored Shareholder Reports for Open-End Mutual Funds and Exchange-Traded Funds
Effective January 24, 2023, the SEC adopted rule and form amendments to require open-end mutual funds and exchange-traded funds registered on Form N-1A to transmit concise and visually engaging streamlined annual and semi-annual reports to shareholders that highlight key information. Other information, including financial statements, will no longer appear in a streamlined shareholder report but must be available online, delivered free of charge upon request, and filed on a semi-annual basis on Form N-CSR. The rule and form amendments have a compliance date of July 24, 2024. At this time, management is evaluating the impact of these amendments on the shareholder reports for the Fund.
Proxy Voting Information
A description of the policies and procedures that the Trust uses to determine how to vote proxies relating to securities held in the Fund’s portfolio is available, without charge and upon request, by calling 800.820.0888. This information is also available from the EDGAR database on the SEC’s website at https://www.sec.gov.
Information regarding how the Fund voted proxies relating to portfolio securities during the most recent 12-month period ended June 30 is available without charge, upon request, by calling 800.820.0888. This information is also available from the EDGAR database on the SEC’s website at https://www.sec.gov.
Sector Classification
Information in the Schedule of Investments is categorized by sectors using sector-level Classifications defined by the Bloomberg Industry Classification System, a widely recognized industry classification system provider. The Fund’s registration statement has investment policies relating to concentration in specific sectors/industries. For purposes of these investment policies, the Fund usually classifies sectors/industries based on industry-level Classifications used by widely recognized industry classification system providers such as Bloomberg Industry Classification System, Global Industry Classification Standards and Barclays Global Classification Scheme.
Quarterly Portfolio Schedules Information
The Trust files its complete schedule of portfolio holdings with the SEC for the first and third quarters of each fiscal year as an exhibit to its reports on Form N-PORT. The Fund’s Form N-PORT is available on the SEC’s website at https://www.sec.gov. The Fund’s complete schedule of securities holdings as of the end of each fiscal quarter will be made available to the public on the SEC’s website at www.sec.gov and on our website at www.guggenheiminvestments.com, and will be made available, upon request and without charge, by calling 800.820.0888.
| | THE GUGGENHEIM FUNDS SEMI-ANNUAL REPORT | 51 |
INFORMATION ON BOARD OF TRUSTEES AND OFFICERS (Unaudited) |
A Board of Trustees oversees the Trust, as well as other trusts of GI, in which its members have no stated term of service, and continue to serve after election until resignation. The Statement of Additional Information includes further information about Fund Trustees and Officers, and can be obtained without charge by visiting guggenheiminvestments.com or by calling 800.820.0888.
Name, Address*
and Year of Birth | Position(s)
Held with
Trust | Term of Office
and Length of
Time Served** | Principal Occupation(s)
During Past Five Years | Number of
Portfolios
in Fund
Complex
Overseen | Other
Directorships Held
by Trustees*** |
INDEPENDENT TRUSTEES | | | |
Randall C. Barnes (1951) | Trustee and Chair of the Valuation Oversight Committee | Since 2014 (Trustee) Since 2020 (Chair of the Valuation Oversight Committee) | Current: Private Investor (2001-present). Former: Senior Vice President and Treasurer, PepsiCo, Inc. (1993-1997); President, Pizza Hut International (1991-1993); Senior Vice President, Strategic Planning and New Business Development, PepsiCo, Inc. (1987-1990). | 153 | Current: Advent Convertible and Income Fund (2005-present); Purpose Investments Funds (2013-present). Former: Guggenheim Energy & Income Fund (2015-2023); Fiduciary/Claymore Energy Infrastructure Fund (2004-2022); Guggenheim Enhanced Equity Income Fund (2005-2021); Guggenheim Credit Allocation Fund (2013-2021). |
Angela Brock-Kyle (1959) | Trustee | Since 2019 | Current: Founder and Chief Executive Officer, B.O.A.R.D.S. (consulting firm) (2013-present); Director, Mutual Fund Directors Forum (2022-present). Former: Senior Leader, TIAA (financial services firm) (1987-2012). | 152 | Current: Bowhead Insurance GP, LLC (2020-present); Hunt Companies, Inc. (2019-present). Former: Guggenheim Energy & Income Fund (2019-2023); Fiduciary/Claymore Energy Infrastructure Fund (2019-2022); Guggenheim Enhanced Equity Income Fund (2019-2021); Guggenheim Credit Allocation Fund (2019-2021); Infinity Property & Casualty Corp. (2014-2018). |
52 | THE GUGGENHEIM FUNDS SEMI-ANNUAL REPORT | |
INFORMATION ON BOARD OF TRUSTEES AND OFFICERS (Unaudited)(continued) |
Name, Address*
and Year of Birth | Position(s)
Held with
Trust | Term of Office
and Length of
Time Served** | Principal Occupation(s)
During Past Five Years | Number of
Portfolios
in Fund
Complex
Overseen | Other
Directorships Held
by Trustees*** |
INDEPENDENT TRUSTEES - continued | | | |
Thomas F. Lydon, Jr. (1960) | Trustee and Chair of the Contracts Review Committee | Since 2019 (Trustee) Since 2020 (Chair of the Contracts Review Committee) | Current: President, Global Trends Investments (registered investment adviser) (1996-present); Chief Executive Officer, Lydon Media (2016-present); Vice Chairman, VettaFi, a wholly owned subsidiary of The TMX Group (financial advisor content, research and digital distribution provider) (2022-present). Former: Chief Executive Officer, ETF Flows, LLC (financial advisor education and research provider) (2019-2023); Director, GDX Index Partners, LLC (index provider) (2021-2023). | 152 | Current: US Global Investors, Inc. (GROW) (1995-present); The 2023 ETF Series Trust (4) (2023-present); The 2023 ETF Series II (1) (2023-present). Former: Guggenheim Energy & Income Fund (2019-2023); Fiduciary/Claymore Energy Infrastructure Fund (2019-2022); Guggenheim Enhanced Equity Income Fund (2019-2021); Guggenheim Credit Allocation Fund (2019-2021); Harvest Volatility Edge Trust (3) (2017-2019). |
Ronald A. Nyberg (1953) | Trustee and Chair of the Nominating and Governance Committee | Since 2014 | Current: Of Counsel (formerly Partner), Momkus LLP (law firm) (2016-present). Former: Partner, Nyberg & Cassioppi, LLC (law firm) (2000-2016); Executive Vice President, General Counsel, and Corporate Secretary, Van Kampen Investments (1982-1999). | 153 | Current: Advent Convertible and Income Fund (2003-present); PPM Funds (2) (2018-present); Endeavor Health (2012-present). Former: Guggenheim Energy & Income Fund (2015-2023); Fiduciary/Claymore Energy Infrastructure Fund (2004-2022); Guggenheim Enhanced Equity Income Fund (2005-2021); Guggenheim Credit Allocation Fund (2013-2021); Western Asset Inflation-Linked Opportunities & Income Fund (2004-2020); Western Asset Inflation-Linked Income Fund (2003-2020). |
| | THE GUGGENHEIM FUNDS SEMI-ANNUAL REPORT | 53 |
INFORMATION ON BOARD OF TRUSTEES AND OFFICERS (Unaudited)(continued) |
Name, Address*
and Year of Birth | Position(s)
Held with
Trust | Term of Office
and Length of
Time Served** | Principal Occupation(s)
During Past Five Years | Number of
Portfolios
in Fund
Complex
Overseen | Other
Directorships Held
by Trustees*** |
INDEPENDENT TRUSTEES - concluded | | | |
Sandra G. Sponem (1958) | Trustee and Chair of the Audit Committee | Since 2019 (Trustee) Since 2020 (Chair of the Audit Committee) | Current: Retired. Former: Senior Vice President and Chief Financial Officer, M.A. Mortenson-Companies, Inc. (construction and real estate development company) (2007-2017). | 152 | Current: SPDR Series Trust (81) (2018-present); SPDR Index Shares Funds (30) (2018-present); SSGA Active Trust (14) (2018-present). Former: Guggenheim Energy & Income Fund (2019-2023); Fiduciary/Claymore Energy Infrastructure Fund (2019-2022); Guggenheim Enhanced Equity Income Fund (2019-2021); Guggenheim Credit Allocation Fund (2019-2021); SSGA Master Trust (1) (2018-2020). |
Ronald E. Toupin, Jr. (1958) | Trustee, Chair of the Board and Chair of the Executive Committee | Since 2014 | Current: Portfolio Consultant (2010-present); Member, Governing Council, Independent Directors Council (2013-present); Governor, Board of Governors, Investment Company Institute (2018-present). Former: Member, Executive Committee, Independent Directors Council (2016-2018); Vice President, Manager and Portfolio Manager, Nuveen Asset Management (1998-1999); Vice President, Nuveen Investment Advisory Corp. (1992-1999); Vice President and Manager, Nuveen Unit Investment Trusts (1991-1999); and Assistant Vice President and Portfolio Manager, Nuveen Unit Investment Trusts (1988-1999), each of John Nuveen & Co., Inc. (registered broker dealer) (1982-1999). | 152 | Former: Guggenheim Energy & Income Fund (2015-2023); Fiduciary/Claymore Energy Infrastructure Fund (2004-2022); Guggenheim Enhanced Equity Income Fund (2005-2021); Guggenheim Credit Allocation Fund (2013-2021); Western Asset Inflation-Linked Opportunities & Income Fund (2004-2020); Western Asset Inflation-Linked Income Fund (2003-2020). |
54 | THE GUGGENHEIM FUNDS SEMI-ANNUAL REPORT | |
INFORMATION ON BOARD OF TRUSTEES AND OFFICERS (Unaudited)(continued) |
Name, Address*
and Year of Birth | Position(s)
Held with
Trust | Term of Office
and Length of
Time Served** | Principal Occupation(s)
During Past Five Years | Number of
Portfolios
in Fund
Complex
Overseen | Other
Directorships Held
by Trustees*** |
INTERESTED TRUSTEE | | | | |
Amy J. Lee**** (1961) | Trustee, Vice President and Chief Legal Officer | Since 2018 (Trustee) Since 2014 (Chief Legal Officer) Since 2007 (Vice President) | Current: Interested Trustee, certain other funds in the Fund Complex (2018-present); Chief Legal Officer, certain other funds in the Fund Complex (2014-present); Vice President, certain other funds in the Fund Complex (2007-present); Senior Managing Director, Guggenheim Investments (2012-present). Former: President and/or Chief Executive Officer, certain other funds in the Fund Complex (2017-2019); Vice President, Associate General Counsel and Assistant Secretary, Security Benefit Life Insurance Company and Security Benefit Corporation (2004-2012). | 152 | Former: Guggenheim Energy & Income Fund (2018-2023); Fiduciary/Claymore Energy Infrastructure Fund (2018-2022); Guggenheim Enhanced Equity Income Fund (2018-2021); Guggenheim Credit Allocation Fund (2018-2021). |
* | The business address of each Trustee is c/o Guggenheim Investments, 227 West Monroe Street, Chicago, Illinois 60606. |
** | Each Trustee serves an indefinite term, until his or her successor is elected and qualified. Time served includes time served in the respective position for the Predecessor Corporation. |
*** | Each Trustee also serves on the Boards of Trustees of Guggenheim Funds Trust, Guggenheim Variable Funds Trust, Guggenheim Strategy Funds Trust, Guggenheim Taxable Municipal Bond & Investment Grade Debt Trust, Guggenheim Strategic Opportunities Fund, Guggenheim Active Allocation Fund, Rydex Series Funds, Rydex Dynamic Funds, Rydex Variable Trust and Transparent Value Trust. Messrs. Barnes and Nyberg also serve on the Board of Trustees of Advent Convertible & Income Fund. |
**** | This Trustee is deemed to be an “interested person” of the Fund under the 1940 Act by reason of her position with the Fund’s Adviser and/or the parent of the Adviser. |
| | THE GUGGENHEIM FUNDS SEMI-ANNUAL REPORT | 55 |
INFORMATION ON BOARD OF TRUSTEES AND OFFICERS (Unaudited)(continued) |
Name, Address*
and Year of Birth | Position(s)
Held with
Trust | Term of Office
and Length of
Time Served** | Principal Occupation(s)
During Past Five Years |
OFFICERS | | | |
Brian E. Binder (1972) | President and Chief Executive Officer | Since 2018 | Current: President, Mutual Fund Boards, Guggenheim Investments (2022-present); President and Chief Executive Officer, certain other funds in the Fund Complex (2018-present); President, Mutual Funds Boards and Senior Managing Director, Guggenheim Funds Investment Advisors, LLC and Security Investors, LLC (2018-present); Board Member, Guggenheim Partners Investment Funds plc (2022-present); Board Member, Guggenheim Global Investments plc (2022-present); Board Member, Guggenheim Partners Fund Management (Europe) Limited (2018-present). Former: Senior Managing Director and Chief Administrative Officer, Guggenheim Investments (2018-2022); Managing Director and President, Deutsche Funds, and Head of US Product, Trading and Fund Administration, Deutsche Asset Management (2013-2018); Managing Director, Chairman of North American Executive Committee and Head of Business Management and Consulting, Invesco Ltd. (2010-2012). |
James Howley (1972) | Chief Financial Officer, Chief Accounting Officer and Treasurer | Since 2022 | Current: Managing Director, Guggenheim Investments (2004-present); Chief Financial Officer, Chief Accounting Officer, and Treasurer, certain other funds in the Fund Complex (2022-present). Former: Assistant Treasurer, certain other funds in the Fund Complex (2006-2022); Manager, Mutual Fund Administration of Van Kampen Investments, Inc. (1996-2004). |
Mark E. Mathiasen (1978) | Secretary | Since 2014 | Current: Secretary, certain other funds in the Fund Complex (2007-present); Managing Director, Guggenheim Investments (2007-present). |
Glenn McWhinnie (1969) | Assistant Treasurer | Since 2016 | Current: Vice President, Guggenheim Investments (2009-present); Assistant Treasurer, certain other funds in the Fund Complex (2016-present). |
Michael P. Megaris (1984) | Assistant Secretary | Since 2014 | Current: Assistant Secretary, certain other funds in the Fund Complex (2014-present); Managing Director, Guggenheim Investments (2012-present). |
Elisabeth Miller (1968) | Chief Compliance Officer | Since 2012 | Current: Chief Compliance Officer, certain other funds in the Fund Complex (2012-present); Senior Managing Director, Guggenheim Investments (2012-present); Senior Managing Director, Guggenheim Funds Distributors, LLC (2014-present). Former: Chief Compliance Officer, Security Investors, LLC and Guggenheim Funds Investment Advisors, LLC (2012-2018); Chief Compliance Officer, Guggenheim Distributors, LLC (2009-2014); Senior Manager, Security Investors, LLC (2004-2014); Senior Manager, Guggenheim Distributors, LLC (2004-2014). |
Margaux Misantone (1978) | AML Officer | Since 2017 | Current: Chief Compliance Officer, Security Investors, LLC and Guggenheim Funds Investment Advisors, LLC (2018-present); AML Officer, Security Investors, LLC and certain other funds in the Fund Complex (2017-present); Managing Director, Guggenheim Investments (2015-present). Former: Assistant Chief Compliance Officer, Security Investors, LLC and Guggenheim Funds Investments Advisors, LLC (2015-2018). |
56 | THE GUGGENHEIM FUNDS SEMI-ANNUAL REPORT | |
INFORMATION ON BOARD OF TRUSTEES AND OFFICERS (Unaudited)(concluded) |
Name, Address*
and Year of Birth | Position(s)
Held with
Trust | Term of Office
and Length of
Time Served** | Principal Occupation(s)
During Past Five Years |
OFFICERS - concluded | |
Kimberly J. Scott (1974) | Assistant Treasurer | Since 2014 | Current: Director, Guggenheim Investments (2012-present); Assistant Treasurer, certain other funds in the Fund Complex (2012-present). Former: Financial Reporting Manager, Invesco, Ltd. (2010-2011); Vice President/Assistant Treasurer, Mutual Fund Administration for Van Kampen Investments, Inc./Morgan Stanley Investment Management (2009-2010); Manager of Mutual Fund Administration, Van Kampen Investments, Inc./Morgan Stanley Investment Management (2005-2009). |
Jon Szafran (1989) | Assistant Treasurer | Since 2017 | Current: Director, Guggenheim Investments (2017-present); Assistant Treasurer, certain other funds in the Fund Complex (2017-present). Former: Assistant Treasurer of Henderson Global Funds and Manager of US Fund Administration, Henderson Global Investors (North America) Inc. (“HGINA”), (2017); Senior Analyst of US Fund Administration, HGINA (2014–2017); Senior Associate of Fund Administration, Cortland Capital Market Services, LLC (2013-2014); Experienced Associate, PricewaterhouseCoopers LLP (2012-2013). |
* | The business address of each officer is c/o Guggenheim Investments, 227 West Monroe Street, Chicago, Illinois 60606. |
** | Each officer serves an indefinite term, until his or her successor is duly elected and qualified. |
| | THE GUGGENHEIM FUNDS SEMI-ANNUAL REPORT | 57 |
GUGGENHEIM INVESTMENTS PRIVACY NOTICE (Unaudited) |
Who We Are
This Privacy Notice describes the data protection practices of Guggenheim Investments. Guggenheim Investments as used herein refers to the affiliated investment management businesses of Guggenheim Partners, LLC: Guggenheim Funds Investment Advisors, LLC, Guggenheim Partners Investment Management, LLC, Guggenheim Funds Distributors, LLC, Security Investors, LLC, Guggenheim Investment Advisors (Europe) Limited, Guggenheim Real Estate, LLC, GS Gamma Advisors, LLC, Guggenheim Partners India Management, LLC, Guggenheim Partners Europe Limited, as well as the funds in the Guggenheim Funds complex (the “Funds”) (“Guggenheim Investments,” “we,” “us,” or “our”).
Guggenheim Partners Investment Management Holdings, LLC, located at 330 Madison Avenue, New York, New York 10017 is the data controller for your information. The affiliates who are also controllers of certain of your information are: Guggenheim Investment Advisors (Europe) Limited, Guggenheim Partners Europe Limited, Guggenheim Partners, LLC, Guggenheim Funds Investment Advisors, LLC, Guggenheim Partners Investment Management, LLC, Guggenheim Funds Distributors, LLC and Security Investors, LLC, as well as the Funds.
Our Commitment to You
Guggenheim Investments considers your privacy our utmost concern. When you become our client or investor, you entrust us with not only your hard-earned money but also with your personal and financial information. Because we have access to your private information, we hold ourselves to the highest standards in its safekeeping and use. We strictly limit how we share your information with others, whether you are a current or former Guggenheim Investments client or investor.
The Information We Collect About You
We collect certain nonpublic personal information about you from information you provide on applications, other forms, our website, and/or from third parties including investment advisors. This information includes Social Security or other tax identification number, assets, income, tax information, retirement and estate plan information, transaction history, account balance, payment history, bank account information, marital status, family relationships, information that we collect on our website through the use of “cookies,” and other personal information that you or others provide to us. We may also collect such information through your inquiries by mail, e-mail or telephone. We may also collect customer due diligence information, as required by applicable law and regulation, through third party service providers.
How We Handle Your Personal Information
The legal basis for using your information as set out in this Privacy Notice is as follows: (a) use of your personal data is necessary to perform our obligations under any contract with you (such as a contract for us to provide financial services to you); or (b) where use of your personal data is not necessary for performance of a contract, use of your personal data is necessary for our legitimate interests or the legitimate interests of others (for example, to enforce the legal terms governing our services, operate and market our website and other services we offer, ensure safe environments for our personnel and others, make and receive payments, prevent fraud and to know the customer to whom we are providing the services). Some processing is done to comply with applicable law.
In addition to the specific uses described above, we also use your information in the following manner:
| | ● | We use your information in connection with servicing your accounts. |
| | ● | We use information to respond to your requests or questions. For example, we might use your information to respond to your customer feedback. |
| | ● | We use information to improve our products and services. We may use your information to make our website and products better. We may use your information to customize your experience with us. |
| | ● | We use information for security purposes. We may use your information to protect our company and our customers. |
| | ● | We use information to communicate with you. For example, we will communicate with you about your account or our relationship. We may contact you about your feedback. We might also contact you about this Privacy Notice. We may also enroll you in our email newsletter. |
58 | THE GUGGENHEIM FUNDS SEMI-ANNUAL REPORT | |
GUGGENHEIM INVESTMENTS PRIVACY NOTICE (Unaudited)(continued) |
| | ● | We use information as otherwise permitted by law, as we may notify you. |
| | ● | Aggregate/Anonymous Data. We may aggregate and/or anonymize any information collected through the website so that such information can no longer be linked to you or your device (“Aggregate/Anonymous Information”). We may use Aggregate/Anonymous Information for any purpose, including without limitation for research and marketing purposes, and may also share such data with any third parties, including advertisers, promotional partners, and sponsors. |
We do not sell information about current or former clients or their accounts to third parties. Nor do we share this information, except when necessary to complete transactions at your request, to make you aware of investment products and services that we or our affiliates offer, or as permitted or required by law.
We provide information about you to companies and individuals not affiliated with Guggenheim Investments to complete certain transactions or account changes, or to perform services for us related to your account. For example, if you ask to transfer assets from another financial institution to Guggenheim Investments, we must provide certain information about you to that company to complete the transaction. We provide the third party with only the information necessary to carry out its responsibilities and only for that purpose. And we require these third parties to treat your private information with the same high degree of confidentiality that we do. To alert you to other Guggenheim Investments products and services, we share your information within our family of affiliated companies. You may limit our sharing with affiliated companies as set out below. We may also share information with any successor to all or part of our business, or in connection with steps leading up to a merger or acquisition. For example, if part of our business was sold we may give customer information as part of that transaction. We may also share information about you with your consent.
We will release information about you if you direct us to do so, if we are compelled by law to do so, or in other circumstances as permitted by law (for example, to protect your account from fraud).
If you close your account(s) or become an inactive client or investor, we will continue to adhere to the privacy policies and practices described in this notice.
Opt-Out Provisions and Your Data Choices
The law allows you to “opt out” of certain kinds of information sharing with third parties. We do not share personal information about you with any third parties that triggers this opt-out right. This means YOU ARE ALREADY OPTED OUT.
When you are no longer our client or investor, we continue to share your information as described in this notice, and you may contact us at any time to limit our sharing by sending an email to CorporateDataPrivacy@GuggenheimPartners.com.
European Union Data Subjects and certain others: In addition to the choices set forth above, residents of the European Union and certain other jurisdictions have certain rights to (1) request access to or rectification or deletion of information we collect about them, (2) request a restriction on the processing of their information, (3) object to the processing of their information, or (4) request the portability of certain information. To exercise these or other rights, please contact us using the contact information below. We will consider all requests and provide our response within the time period stated by applicable law. Please note, however, that certain information may be exempt from such requests in some circumstances, which may include if we need to keep processing your information for our legitimate interests or to comply with a legal obligation. We may request you provide us with information necessary to confirm your identity before responding to your request.
Residents of France and certain other jurisdictions may also provide us with instructions regarding the manner in which we may continue to store, erase and share your information after your death, and where applicable, the person you have designated to exercise these rights after your death.
How We Protect Privacy Online
We take steps to protect your privacy when you use our web site – www.guggenheiminvestments.com – by using secure forms of online communication, including encryption technology, Secure Socket Layer (SSL) protocol, firewalls and user names and passwords. These safeguards vary based on the sensitivity of the information that we collect and store. However, we cannot and do not guarantee that these measures will prevent every unauthorized attempt to access, use, or disclose your information since despite our efforts, no Internet and/or other
| | THE GUGGENHEIM FUNDS SEMI-ANNUAL REPORT | 59 |
GUGGENHEIM INVESTMENTS PRIVACY NOTICE (Unaudited)(concluded) |
electronic transmissions can be completely secure. Our web site uses “http cookies”—tiny pieces of information that we ask your browser to store. We use cookies for session management and security features on the Guggenheim Investments web site. We do not use them to pull data from your hard drive, to learn your e-mail address, or to view data in cookies created by other web sites. We will not share the information in our cookies or give others access to it. See the legal information area on our web site for more details about web site security and privacy features.
How We Safeguard Your Personal Information and Data Retention
We restrict access to nonpublic personal information about you to our employees and in some cases to third parties (for example, the service providers described above) as permitted by law. We maintain strict physical, electronic and procedural safeguards that comply with federal standards to guard your nonpublic personal information. We keep your information for no longer than necessary for the purposes for which it is processed. The length of time for which we retain information depends on the purposes for which we collected and use it and/or as required to comply with applicable laws. Information may persist in copies made for backup and business continuity purposes for additional time.
International Visitors
If you are not a resident of the United States, please be aware that your information may be transferred to, stored and processed in the United States where our servers are located and our databases are operated. The data protection and other laws of the United States and other countries might not be as comprehensive as those in your country.
In such cases, we ensure that a legal basis for such a transfer exists and that adequate protection is provided as required by applicable law, for example, by using standard contractual clauses or by transferring your data to a jurisdiction that has obtained an adequacy finding. Individuals whose data may be transferred on the basis of standard contractual clauses may contact us as described below.
We’ll Keep You Informed
If you have any questions or concerns about how we treat your personal data, we encourage you to consult with us first. You may also contact the relevant supervisory authority.
We reserve the right to modify this policy at any time and will inform you promptly of material changes. You may access our privacy policy from our web site at www.guggenheiminvestments.com. Should you have any questions regarding our privacy policy, contact us by email at CorporateDataPrivacy@GuggenheimPartners.com.
60 | THE GUGGENHEIM FUNDS SEMI-ANNUAL REPORT | |
This page intentionally left blank.
3.31.2024
Guggenheim Funds Semi-Annual Report
Guggenheim Macro Opportunities Fund | | |
GuggenheimInvestments.com | MO-SEMI-0324x0924 |

| | |
DEAR SHAREHOLDER | 2 |
ECONOMIC AND MARKET OVERVIEW | 4 |
ABOUT SHAREHOLDERS’ FUND EXPENSES | 6 |
MACRO OPPORTUNITIES FUND | 9 |
NOTES TO CONSOLIDATED FINANCIAL STATEMENTS | 71 |
OTHER INFORMATION | 98 |
INFORMATION ON BOARD OF TRUSTEES AND OFFICERS | 100 |
GUGGENHEIM INVESTMENTS PRIVACY NOTICE | 110 |
| | THE GUGGENHEIM FUNDS SEMI-ANNUAL REPORT | 1 |
Dear Shareholder:
Guggenheim Partners Investment Management, LLC (“GPIM” or the “Investment Adviser”), is pleased to present the shareholder report for Guggenheim Macro Opportunities Fund (the “Fund”) for the semi-annual fiscal period ended March 31, 2024 (the “Reporting Period”).
The Investment Adviser is part of Guggenheim Investments, which represents the investment management businesses of Guggenheim Partners, LLC (“Guggenheim”), a global, diversified financial services firm.
Guggenheim Funds Distributors, LLC is the distributor of the Fund. Guggenheim Funds Distributors, LLC is affiliated with Guggenheim and the Investment Adviser.
We encourage you to read the Economic and Market Overview section of the report, which follows this letter.
We are committed to providing innovative investment solutions and appreciate the trust you place in us.
Sincerely,
Guggenheim Partners Investment Management, LLC
April 30, 2024
Read a prospectus and summary prospectus (if available) carefully before investing. It contains the investment objectives, risks, charges, expenses and other information, which should be considered carefully before investing. Obtain a prospectus and summary prospectus (if available) at guggenheiminvestments.com or call 800.820.0888.
This material is not intended as a recommendation or as investment advice of any kind, including in connection with rollovers, transfers, and distributions. Such material is not provided in a fiduciary capacity, may not be relied upon for or in connection with the making of investment decisions, and does not constitute a solicitation of an offer to buy or sell securities. All content has been provided for informational or educational purposes only and is not intended to be and should not be construed as legal or tax advice and/or a legal opinion. Always consult a financial, tax and/or legal professional regarding your specific situation.
Macro Opportunities Fund may not be suitable for all investors. ● An investment in the Fund will fluctuate and is subject to investment risks, which means investors could lose money. ● There can be no guarantee the Fund will achieve its investment objective. ● The Fund’s market value will change in response to interest rate changes and market and economic conditions among other factors. In general, bond prices rise when interest rates fall and vice versa. ● The Fund’s exposure to high yield securities may subject the Fund to greater volatility. ● The intrinsic value of the underlying stocks in which the Fund invests may never be realized or the stock may decline in value. ● When market conditions are deemed appropriate,
2 | THE GUGGENHEIM FUNDS SEMI-ANNUAL REPORT | |
the Fund may use leverage to the full extent permitted by its investment policies and restrictions and applicable law. Leveraging will exaggerate the effect on net asset value of any increase or decrease in the market value of the Fund’s portfolio. ● The use of short selling involves increased risks and costs. You risk paying more for a security than you received from its sale. Theoretically, stocks sold short have the risk of unlimited losses. ● The Fund may invest in derivative instruments, which may be more volatile and less liquid, increasing the risk of loss when compared to traditional securities. Certain of the derivative instruments are also subject to the risks of counterparty default and adverse tax treatment. ● Instruments and strategies (such as borrowing transactions and reverse repurchase agreements) may provide leveraged exposure to a particular investment, which will magnify any gains or losses on those investments. ● Investments in reverse repurchase agreements expose the Fund to the many of the same risks as investments in derivatives. ●The Fund’s investments in other investment vehicles subject the Fund to those risks and expenses affecting the investment vehicle. ● The Fund’s investments in foreign securities carry additional risks when compared to U.S. securities, due to the impact of diplomatic, political or economic developments in the country in question (investments in emerging markets securities are generally subject to an even greater level of risks). ● Investments in syndicated bank loans generally offer a floating interest rate and involve special types of risks. ● A highly liquid secondary market may not exist for the commodity-linked structured notes the Fund may invest in, and there can be no assurance that a highly liquid secondary market will develop. ● The Fund’s exposure to the commodity markets may subject the Fund to greater volatility as commodity-linked investments may be affected by changes in overall market movements, commodity index volatility, changes in interest rates or factors affecting a particular industry or commodity such as droughts, floods, weather, embargos, tariffs and international economic, political and regulatory developments. ● The Fund’s investments in municipal securities can be affected by events that affect the municipal bond market. ● The Fund’s investments in real estate securities subject the Fund to the same risks as direct investments in real estate, which is particularly sensitive to economic downturns. ● The Fund’s investments in restricted securities may involve financial and liquidity risk. ● The Fund is subject to active trading risks that may increase volatility and impact its ability to achieve its investment objective. ● You may have a gain or loss when you sell your shares. ●It is important to note that the Fund is not guaranteed by the U.S. government. ● Please read the prospectus for more detailed information regarding these and other risks.
| | THE GUGGENHEIM FUNDS SEMI-ANNUAL REPORT | 3 |
ECONOMIC AND MARKET OVERVIEW (Unaudited) | March 31, 2024 |
While job growth remains robust, recent labor data brought increased confidence in a labor market in better balance, allowing for inflation to soften further. Labor force growth remains strong, aided by high immigration flows, helping bring labor supply in line with gradually cooling demand. The Small Business Survey indicates that plans to increase compensation have returned to pre-COVID levels. Additionally, Bureau of Labor Statistics data reveal a continued decline in the “quits rate,” reducing the pressure on businesses to raise wages to attract or retain employees. These developments suggest wage pressures may ease further by year end. And despite some speculation against any Federal Reserve (the “Fed”) rate cuts materializing in 2024, we continue to anticipate cuts later this year.
Following the stronger-than-expected March Consumer Price Index, we believe that there is a high probability that the easing cycle will start in the second half of the year, since the Fed will likely need more time to gather confirming data. In the latest Summary of Economic Projections, the Federal Open Market Committee (“FOMC”) significantly increased the median forecast for 2024 U.S. gross domestic product, slightly increased it for core personal consumption expenditures year over year, and continues to expect no material increase in the unemployment rate. These adjustments left the median view for three rate cuts for 2024, which suggests the bar is very high for the Fed to keep rates where they are all year, and even higher for more rate hikes to materialize.
Amid this macroeconomic backdrop, in the first quarter of 2024 the two-year Treasury yield increased to 4.59% from 4.23%, and the 10-year Treasury yield increased to 4.20% from 3.88%, keeping the inverted 2s/10s yield curve consistent at 39 basis points as of the end of the Reporting Period, up four basis points since the start of the year. One basis point equals 0.01%. In general, spreads to Treasurys have remained tight across sectors. In investment-grade corporate bonds, BBB-rated bonds continued to remain attractive relative to A and BB-rated bonds, and supply slowed toward the end of the first quarter of 2024, which we believe should support spreads in the near term. High yield bond spreads tightened during the first quarter of 2024 to 301 basis points from 323 basis points at the start of the year, while leveraged loans’ discount margins to maturity tightened to 509 basis points from 528 basis points. Structured credit spreads tightened marginally amid strong demand. Investor demand and an improved arbitrage led to robust new collateralized loan obligation issuance, and tightening liabilities led to an increase in refinances/resets.
Looking forward, Fed officials continue to advocate for a patient approach. A conventional easing cycle is therefore far from guaranteed. Market expectations have already adjusted significantly from market-implied expectations of six rate cuts in 2024 just two months ago to only three as of the end of the Reporting Period, aligning more closely with the FOMC’s views. So far, the market has taken this delay in stride, but its patience and assessment of credit risk could be tested.
For the Reporting Period, the S&P 500® Index* returned 23.48%. The MSCI Europe-Australasia-Far East (“EAFE”) Index* returned 17.01%. The return of the MSCI Emerging Markets Index* was 10.56%.
4 | THE GUGGENHEIM FUNDS SEMI-ANNUAL REPORT | |
ECONOMIC AND MARKET OVERVIEW (Unaudited)(concluded) | March 31, 2024 |
In the bond market, the Bloomberg U.S. Aggregate Bond Index* posted a 5.99% return for the Reporting Period, while the Bloomberg U.S. Corporate High Yield Index* returned 8.75%. The return of the ICE Bank of America (“BofA”) 3-Month U.S. Treasury Bill Index* was 2.69% for the Reporting Period.
The opinions and forecasts expressed may not actually come to pass. This information is subject to change at any time, based on market and other conditions, and should not be construed as a recommendation of any specific security or strategy.
*Index Definitions:
The following indices are referenced throughout this report. Indices are unmanaged and not available for direct investment. Index performance does not reflect transaction costs, fees, or expenses.
Bloomberg U.S. Aggregate Bond Index is a broad-based flagship benchmark that measures the investment grade, U.S. dollar-denominated, fixed-rate taxable bond market, including U.S. Treasuries, government-related and corporate securities, mortgage-backed securities or “MBS” (agency fixed-rate and hybrid adjustable-rate mortgage, or “ARM”, pass-throughs), asset-backed securities (“ABS”), and commercial mortgage-backed securities (“CMBS”) (agency and non-agency).
Bloomberg U.S. Corporate High Yield Index measures the U.S. dollar-denominated, high yield, fixed-rate corporate bond market. Securities are classified as high yield if the middle rating of Moody’s, Fitch, and S&P is Ba1/BB +/BB + or below.
ICE BofA 3-Month U.S. Treasury Bill Index is an unmanaged market index of U.S. Treasury securities maturing in 90 days that assumes reinvestment of all income.
MSCI EAFE Index is a free float-adjusted market capitalization index that is designed to measure the equity market performance of developed markets, excluding the U.S. & Canada.
MSCI Emerging Markets Index is a free float-adjusted market capitalization weighted index that is designed to measure equity market performance in the global emerging markets.
S&P 500® Index is a broad-based index, the performance of which is based on the performance of 500 widely held common stocks chosen for market size, liquidity, and industry group representation.
| | THE GUGGENHEIM FUNDS SEMI-ANNUAL REPORT | 5 |
ABOUT SHAREHOLDERS’ FUND EXPENSES (Unaudited) |
All mutual funds have operating expenses, and it is important for our shareholders to understand the impact of costs on their investments. Shareholders of a fund incur two types of costs: (i) transaction costs, including sales charges (loads) on purchase payments, reinvested dividends, other distributions, and exchange fees, and (ii) ongoing costs, including management fees, administrative services, and shareholder reports, among others. These ongoing costs, or operating expenses, are deducted from a fund’s gross income and reduce the investment return of the fund.
A fund’s expenses are expressed as a percentage of its average net assets, which is known as the expense ratio. The following examples are intended to help investors understand the ongoing costs (in dollars) of investing in a fund and to compare these costs with the ongoing costs of investing in other mutual funds.
The examples are based on an investment of $1,000 made at the beginning of the period and held for the entire six-month period beginning September 30, 2023 and ending March 31, 2024.
The following tables illustrate the Fund’s costs in two ways:
Table 1. Based on actual Fund return: This section helps investors estimate the actual expenses paid over the period. The “Ending Account Value” shown is derived from the Fund’s actual return, and the fifth column shows the dollar amount that would have been paid by an investor who started with $1,000 in the Fund. Investors may use the information here, together with the amount invested, to estimate the expenses paid over the period. Simply divide the Fund’s account value by $1,000 (for example, an $8,600 account value divided by $1,000 = 8.6), then multiply the result by the number provided under the heading “Expenses Paid During Period.”
Table 2. Based on hypothetical 5% return: This section is intended to help investors compare a fund’s cost with those of other mutual funds. The table provides information about hypothetical account values and hypothetical expenses based on the Fund’s actual expense ratio and an assumed rate of return of 5% per year before expenses, which is not the Fund’s actual return. The hypothetical account values and expenses may not be used to estimate the actual ending account balance or expenses paid during the period. The example is useful in making comparisons because the U.S. Securities and Exchange Commission (the “SEC”) requires all mutual funds to calculate expenses based on the 5% return. Investors can assess a Fund’s costs by comparing this hypothetical example with the hypothetical examples that appear in shareholder reports of other funds.
The calculations illustrated above assume no shares were bought or sold during the period. Actual costs may have been higher or lower, depending on the amount of investment and the timing of any purchases or redemptions.
6 | THE GUGGENHEIM FUNDS SEMI-ANNUAL REPORT | |
ABOUT SHAREHOLDERS’ FUND EXPENSES (Unaudited)(continued) |
Please note that the expenses shown in the table are meant to highlight your ongoing costs only and do not reflect any transactional costs, such as sales charges (loads) on purchase payments, and contingent deferred sales charges (“CDSC”) on redemptions, if any. Therefore, the second table is useful in comparing ongoing costs only, and will not help you determine the relative total costs of owning different funds. In addition, if these transactional costs were included, your costs would have been higher.
More information about the Fund’s expenses, including annual expense ratios for periods up to five years (subject to the Fund’s inception date), can be found in the Financial Highlights section of this report. For additional information on operating expenses and other shareholder costs, please refer to the Fund’s prospectus.
| | THE GUGGENHEIM FUNDS SEMI-ANNUAL REPORT | 7 |
ABOUT SHAREHOLDERS’ FUND EXPENSES (Unaudited)(concluded) |
| | Expense
Ratio1 | | | Fund
Return | | | Beginning
Account Value
September 30,
2023 | | | Ending
Account Value
March 31,
2024 | | | Expenses
Paid During
Period2 | |
Table 1. Based on actual Fund return3 |
Class A | | | 1.30 | % | | | 6.39 | % | | $ | 1,000.00 | | | $ | 1,063.90 | | | $ | 6.71 | |
Class C | | | 2.03 | % | | | 6.02 | % | | | 1,000.00 | | | | 1,060.20 | | | | 10.46 | |
Class P | | | 1.32 | % | | | 6.38 | % | | | 1,000.00 | | | | 1,063.80 | | | | 6.81 | |
Institutional Class | | | 0.91 | % | | | 6.59 | % | | | 1,000.00 | | | | 1,065.90 | | | | 4.70 | |
Class R6 | | | 0.91 | % | | | 6.59 | % | | | 1,000.00 | | | | 1,065.90 | | | | 4.70 | |
|
Table 2. Based on hypothetical 5% return (before expenses) |
Class A | | | 1.30 | % | | | 5.00 | % | | $ | 1,000.00 | | | $ | 1,018.50 | | | $ | 6.56 | |
Class C | | | 2.03 | % | | | 5.00 | % | | | 1,000.00 | | | | 1,014.85 | | | | 10.23 | |
Class P | | | 1.32 | % | | | 5.00 | % | | | 1,000.00 | | | | 1,018.40 | | | | 6.66 | |
Institutional Class | | | 0.91 | % | | | 5.00 | % | | | 1,000.00 | | | | 1,020.45 | | | | 4.60 | |
Class R6 | | | 0.91 | % | | | 5.00 | % | | | 1,000.00 | | | | 1,020.45 | | | | 4.60 | |
1 | This ratio represents annualized net expenses, which may include short interest expense. Excluding these expenses, the operating expense ratios for the Fund would be 1.29%, 2.02%, 1.31%, 0.90% and 0.90% for the Class A, Class C, Class P, Institutional Class and Class R6, respectively. Excludes expenses of the underlying funds in which the Fund invests. |
2 | Expenses are equal to the Fund’s annualized expense ratio, net of any applicable fee waivers, multiplied by the average account value over the period, multiplied by 183/366 (to reflect the one-half year period). |
3 | Actual cumulative return at net asset value for the period September 30, 2023 to March 31, 2024. |
8 | THE GUGGENHEIM FUNDS SEMI-ANNUAL REPORT | |
PERFORMANCE REPORT AND FUND PROFILE (Unaudited) | March 31, 2024 |
MACRO OPPORTUNITIES FUND
OBJECTIVE: Seeks to provide total return, comprised of current income and capital appreciation.
Consolidated Holdings Diversification (Market Exposure as % of Net Assets)
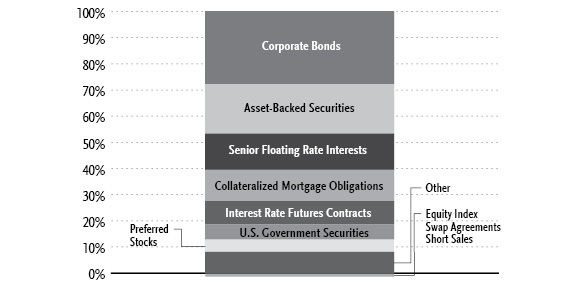
“Consolidated Holdings Diversification (Market Exposure as % of Net Assets)” excludes any temporary cash investments, investments in Guggenheim Strategy Funds Trust mutual funds, or investments in Guggenheim Ultra Short Duration Fund.
Inception Dates: |
Class A | November 30, 2011 |
Class C | November 30, 2011 |
Class P | May 1, 2015 |
Institutional Class | November 30, 2011 |
Class R6 | March 13, 2019 |
Ten Largest Holdings | % of Total Net Assets |
U.S. Treasury Notes, 4.25% | 5.5% |
Guggenheim Limited Duration Fund — Class R6 | 2.0% |
Fannie Mae, 5.50% | 1.6% |
SPDR S&P 500 ETF Trust | 1.0% |
Freddie Mac, 5.50% | 0.8% |
Guggenheim Ultra Short Duration Fund — Institutional Class | 0.8% |
VanEck Gold Miners ETF | 0.6% |
BP Capital Markets plc, 4.88% | 0.6% |
Guggenheim Strategy Fund III | 0.5% |
Fortress Credit Opportunities IX CLO Ltd., 8.38% | 0.5% |
Top Ten Total | 13.9% |
| | |
“Ten Largest Holdings” excludes any temporary cash or derivative investments. |
| | THE GUGGENHEIM FUNDS SEMI-ANNUAL REPORT | 9 |
PERFORMANCE REPORT AND FUND PROFILE (Unaudited)(continued) | March 31, 2024 |
Portfolio Composition by Quality Rating1 |
Rating | % of Total Investments |
Fixed Income Instruments | |
AAA | 15.5% |
AA | 1.2% |
A | 10.2% |
BBB | 15.5% |
BB | 14.6% |
B | 15.0% |
CCC | 2.3% |
CC | 2.6% |
C | 0.1% |
NR2 | 4.6% |
Other Instruments | 18.4% |
Total Investments | 100.0% |
1 | Source: BlackRock Solutions. Credit quality ratings are measured on a scale that generally ranges from AAA (highest) to D (lowest). All securities except for those labeled “NR” have been rated by Moody’s, Standard & Poor’s (“S&P”), or Fitch, each of which is a Nationally Recognized Statistical Rating Organization (“NRSRO”). For purposes of this presentation, when ratings are available from more than one agency, the highest rating is used. Guggenheim Investments has converted ratings to the equivalent S&P rating. Security ratings are determined at the time of purchase and may change thereafter. |
2 | NR (not rated) securities do not necessarily indicate low credit quality. |
10 | THE GUGGENHEIM FUNDS SEMI-ANNUAL REPORT | |
PERFORMANCE REPORT AND FUND PROFILE (Unaudited)(concluded) | March 31, 2024 |
Average Annual Returns*
Periods Ended March 31, 2024
| 6 Month† | 1 Year | 5 Year | 10 Year |
Class A Shares | 6.39% | 7.91% | 3.08% | 3.16% |
Class A Shares with sales charge‡ | 2.12% | 3.59% | 2.24% | 2.66% |
Class C Shares | 6.02% | 7.13% | 2.31% | 2.40% |
Class C Shares with CDSC§ | 5.02% | 6.13% | 2.31% | 2.40% |
Institutional Class Shares | 6.59% | 8.32% | 3.48% | 3.55% |
ICE BofA 3-Month U.S. Treasury Bill Index | 2.69% | 5.27% | 2.03% | 1.38% |
| 6 Month† | 1 Year | 5 Year | Since
Inception
(05/01/15) |
Class P Shares | 6.38% | 7.89% | 3.08% | 3.15% |
ICE BofA 3-Month U.S. Treasury Bill Index | 2.69% | 5.27% | 2.03% | 1.55% |
| 6 Month† | 1 Year | 5 Year | Since
Inception
(03/13/19) |
Class R6 Shares | 6.59% | 8.32% | 3.49% | 3.47% |
ICE BofA 3-Month U.S. Treasury Bill Index | 2.69% | 5.27% | 2.03% | 2.04% |
* | The performance data above represents past performance that is not predictive of future results. The investment return and principal value of an investment in the Fund will fluctuate so that an investor’s shares, when redeemed, may be worth more or less than their original cost. Returns are historical and include changes in principal and reinvested dividends and capital gains and do not reflect the effect of taxes. The ICE BofA 3-Month U.S. Treasury Bill Index is an unmanaged index and, unlike the Fund, has no management fees or operating expenses to reduce its reported return. |
† | 6 month returns are not annualized. |
‡ | Effective October 1, 2015, the maximum sales charge decreased from 4.75% to 4.00%. A 4.75% maximum sales charge is used in the calculation of the Average Annual Returns based on subscriptions made prior to October 1, 2015, and a 4.00% maximum sales charge is used to calculate performance for periods based on subscriptions made on or after October 1, 2015. |
§ | Fund returns include a CDSC of 1% if redeemed within 12 months of purchase. |
| | THE GUGGENHEIM FUNDS SEMI-ANNUAL REPORT | 11 |
CONSOLIDATED SCHEDULE OF INVESTMENTS (Unaudited) | March 31, 2024 |
MACRO OPPORTUNITIES FUND | |
| | Shares | | | Value | |
COMMON STOCKS† - 0.1% |
| | | | | | | | | |
Industrial - 0.1% |
API Heat Transfer Intermediate*,††† | | | 743 | | | $ | 1,135,916 | |
Schur Flexibles GesmbH*,†† | | | 1,661 | | | | 350,552 | |
YAK BLOCKER 2 LLC*,††† | | | 74,424 | | | | 149,183 | |
YAK BLOCKER 2 LLC*,††† | | | 68,788 | | | | 137,886 | |
BP Holdco LLC*,†††,1 | | | 37,539 | | | | 45,503 | |
Targus, Inc.*,††† | | | 12,773 | | | | 502 | |
Targus, Inc.*,††† | | | 12,773 | | | | 377 | |
Targus, Inc.*,††† | | | 12,773 | | | | 290 | |
Vector Phoenix Holdings, LP*,††† | | | 37,539 | | | | 186 | |
Targus, Inc.*,††† | | | 12,773 | | | | 1 | |
Total Industrial | | | | | | | 1,820,396 | |
| | | | | | | | | |
Consumer, Cyclical - 0.0% |
ATD New Holdings, Inc.*,†† | | | 42,478 | | | | 1,260,195 | |
| | | | | | | | | |
Financial - 0.0% |
Checkers Holdings, Inc.*,††† | | | 158,620 | | | | 631,308 | |
Pershing Square Tontine Holdings, Ltd. — Class A*,†††,2 | | | 6,864,930 | | | | 686 | |
Tensor Ltd.*,††† | | | 1,173,803 | | | | 117 | |
Total Financial | | | | | | | 632,111 | |
| | | | | | | | | |
Technology - 0.0% |
Qlik Technologies, Inc. - Class A*,††† | | | 177 | | | | 289,164 | |
Qlik Technologies, Inc. - Class B*,††† | | | 43,738 | | | | 4 | |
Total Technology | | | | | | | 289,168 | |
| | | | | | | | | |
Consumer, Non-cyclical - 0.0% |
Cengage Learning Holdings II, Inc.*,†† | | | 21,660 | | | | 259,920 | |
Save-A-Lot*,††† | | | 1,053,728 | | | | 7,745 | |
Total Consumer, Non-cyclical | | | 267,665 | |
| | | | | | | | | |
Utilities - 0.0% |
Mountain Creek Power LLC*,†† | | | 180,169 | | | | 180,169 | |
| | | | | | | | | |
Communications - 0.0% |
Vacasa, Inc. — Class A* | | | 25,191 | | | | 171,802 | |
| | | | | | | | | |
Energy - 0.0% |
Permian Production Partners LLC*,††† | | | 573,522 | | | | 24,286 | |
| | | | | | | | | |
Total Common Stocks | | | | |
(Cost $10,251,489) | | | | | | | 4,645,792 | |
| | | | | | | | | |
PREFERRED STOCKS†† - 4.7% |
Financial - 3.9% |
Citigroup, Inc. |
3.88% | | | 30,600,000 | | | | 28,879,454 | |
4.00% | | | 13,100,000 | | | | 12,559,576 | |
7.38% | | | 1,400,000 | | | | 1,455,667 | |
Markel Group, Inc. |
6.00% | | | 29,050,000 | | | | 28,812,040 | |
Wells Fargo & Co. |
3.90% | | | 25,750,000 | | | | 24,499,227 | |
Equitable Holdings, Inc. |
4.95% | | | 24,550,000 | | | | 23,992,452 | |
Kuvare US Holdings, Inc. |
7.00% due 02/17/513 | | | 19,150,000 | | | | 19,341,500 | |
Goldman Sachs Group, Inc. |
4.13% | | | 20,500,000 | | | | 19,027,669 | |
Bank of New York Mellon Corp. |
3.75% | | | 20,550,000 | | | | 18,836,132 | |
Bank of America Corp. |
4.38% | | | 13,850,000 | | | | 12,983,579 | |
6.13% | | | 5,800,000 | | | | 5,815,840 | |
Charles Schwab Corp. |
4.00% | | | 18,700,000 | | | | 15,778,213 | |
12 | THE GUGGENHEIM FUNDS SEMI-ANNUAL REPORT | SEE NOTES TO CONSOLIDATED FINANCIAL STATEMENTS. |
CONSOLIDATED SCHEDULE OF INVESTMENTS (Unaudited)(continued) | March 31, 2024 |
MACRO OPPORTUNITIES FUND | |
| | Shares | | | Value | |
MetLife, Inc. |
3.85% | | | 12,200,000 | | | $ | 11,726,683 | |
JPMorgan Chase & Co. |
6.88% | | | 10,310,000 | | | | 10,668,502 | |
Jackson Financial, Inc. |
8.00% | | | 284,000 | | | | 7,545,880 | |
CNO Financial Group, Inc. |
5.13% due 11/25/60 | | | 324,000 | | | | 7,066,440 | |
Selective Insurance Group, Inc. |
4.60% | | | 246,000 | | | | 4,639,560 | |
Assurant, Inc. |
5.25% due 01/15/61 | | | 22,750 | | | | 518,700 | |
Reinsurance Group of America, Inc. |
7.13% due 10/15/52 | | | 5,650 | | | | 146,278 | |
First Republic Bank |
4.50%* | | | 238,300 | | | | 7,149 | |
4.25%* | | | 803,675 | | | | 161 | |
Total Financial | | | | | | | 254,300,702 | |
| | | | | | | | | |
Communications - 0.4% |
AT&T Mobility II LLC |
6.80%*,††† | | | 27,000 | | | | 27,088,560 | |
| | | | | | | | | |
Government - 0.4% |
CoBank ACB |
4.25% | | | 20,000,000 | | | | 17,083,077 | |
Farmer Mac |
5.75% | | | 355,705 | | | | 8,544,070 | |
Total Government | | | | | | | 25,627,147 | |
| | | | | | | | | |
Industrial - 0.0% |
YAK BLOCKER 2 LLC *,††† | | | 4,088,802 | | | | 4,032,789 | |
Total Preferred Stocks | | | | |
(Cost $358,981,065) | | | | | | | 311,049,198 | |
| | | | | | | | | |
WARRANTS† - 0.0% |
Ginkgo Bioworks Holdings, Inc. | | | | | | | | |
Expiring 09/16/26* | | | 128,004 | | | | 11,521 | |
Pershing Square Tontine Holdings, Ltd. — Class A | | | | | | | | |
Expiring 07/24/25*,†††,2 | | | 762,770 | | | | 76 | |
Total Warrants | | | | |
(Cost $296,403) | | | | | | | 11,597 | |
| | | | | | | | | |
EXCHANGE-TRADED FUNDS† - 1.6% |
SPDR S&P 500 ETF Trust | | | 125,000 | | | | 65,383,750 | |
VanEck Gold Miners ETF | | | 1,313,402 | | | | 41,529,771 | |
Total Exchange-Traded Funds | | | | |
(Cost $115,546,461) | | | | | | | 106,913,521 | |
| | | | | | | | | |
MUTUAL FUNDS† - 4.6% |
Guggenheim Limited Duration Fund — Class R61 | | | 5,334,644 | | | | 128,511,579 | |
Guggenheim Ultra Short Duration Fund — Institutional Class1 | | | 5,151,315 | | | | 51,049,534 | |
Guggenheim Strategy Fund III1 | | | 1,409,355 | | | | 34,768,794 | |
Guggenheim Risk Managed Real Estate Fund — Institutional Class1 | | | 1,069,627 | | | | 34,046,231 | |
Guggenheim Alpha Opportunity Fund — Institutional Class1 | | | 1,022,808 | | | | 32,627,564 | |
Guggenheim Strategy Fund II1 | | | 809,915 | | | | 19,923,913 | |
Total Mutual Funds | | | | |
(Cost $298,321,689) | | | | | | | 300,927,615 | |
| | | | | | | | | |
SEE NOTES TO CONSOLIDATED FINANCIAL STATEMENTS. | THE GUGGENHEIM FUNDS SEMI-ANNUAL REPORT | 13 |
CONSOLIDATED SCHEDULE OF INVESTMENTS (Unaudited)(continued) | March 31, 2024 |
MACRO OPPORTUNITIES FUND | |
| | Shares | | | Value | |
MONEY MARKET FUNDS† - 3.5% |
Federated Hermes U.S. Treasury Cash Reserves Fund — Institutional Shares, 5.17%4 | | | 126,805,399 | | | $ | 126,805,399 | |
Dreyfus Treasury Obligations Cash Management Fund — Institutional Shares, 5.20%4 | | | 100,695,163 | | | | 100,695,163 | |
Western Asset Institutional U.S. Treasury Reserves — Institutional Shares, 5.19%4 | | | 585,304 | | | | 585,304 | |
Total Money Market Funds | | | | |
(Cost $228,085,866) | | | | | | | 228,085,866 | |
| | | | | | | | | |
| | | Face
Amount~ | | | | | |
CORPORATE BONDS†† - 28.0% |
Financial - 8.5% | | | | | | | | |
Pershing Square Holdings Ltd. | | | | | | | | |
3.25% due 10/01/313 | | | 31,500,000 | | | | 25,556,769 | |
3.25% due 11/15/30 | | | 13,320,000 | | | | 11,201,987 | |
Wilton RE Ltd. | | | | | | | | |
6.00%3,5,6 | | | 31,350,000 | | | | 27,889,679 | |
Rocket Mortgage LLC / Rocket Mortgage Company-Issuer, Inc. | | | | | | | | |
3.88% due 03/01/313 | | | 21,650,000 | | | | 18,861,464 | |
2.88% due 10/15/263 | | | 9,250,000 | | | | 8,546,287 | |
GLP Capital Limited Partnership / GLP Financing II, Inc. | | | | | | | | |
4.00% due 01/15/31 | | | 22,640,000 | | | | 20,202,041 | |
5.30% due 01/15/29 | | | 6,950,000 | | | | 6,833,824 | |
NFP Corp. | | | | | | | | |
6.88% due 08/15/283 | | | 16,700,000 | | | | 16,913,142 | |
7.50% due 10/01/303 | | | 4,150,000 | | | | 4,372,050 | |
4.88% due 08/15/283 | | | 3,950,000 | | | | 3,958,943 | |
Liberty Mutual Group, Inc. | | | | | | | | |
4.30% due 02/01/613 | | | 36,940,000 | | | | 23,509,277 | |
CBS Studio Center | | | | | | | | |
8.32% (1 Month Term SOFR + 3.00%, Rate Floor: 3.00%) due 01/09/25◊,††† | | | 22,000,000 | | | | 22,180,419 | |
Host Hotels & Resorts, LP | | | | | | | | |
3.50% due 09/15/30 | | | 24,000,000 | | | | 21,341,444 | |
Jefferies Finance LLC / JFIN Company-Issuer Corp. | | | | | | | | |
5.00% due 08/15/283 | | | 23,000,000 | | | | 21,150,510 | |
Iron Mountain, Inc. | | | | | | | | |
5.63% due 07/15/323 | | | 20,000,000 | | | | 18,891,690 | |
4.50% due 02/15/313 | | | 925,000 | | | | 834,570 | |
FS KKR Capital Corp. | | | | | | | | |
3.25% due 07/15/27 | | | 21,000,000 | | | | 19,120,353 | |
LPL Holdings, Inc. | | | | | | | | |
4.00% due 03/15/293 | | | 14,788,000 | | | | 13,596,077 | |
4.38% due 05/15/313 | | | 5,500,000 | | | | 5,005,779 | |
Mitsubishi UFJ Financial Group, Inc. | | | | | | | | |
5.42% due 02/22/296 | | | 18,050,000 | | | | 18,239,060 | |
Starwood Property Trust, Inc. | | | | | | | | |
4.38% due 01/15/273 | | | 19,000,000 | | | | 17,872,359 | |
United Wholesale Mortgage LLC | | | | | | | | |
5.50% due 04/15/293 | | | 7,150,000 | | | | 6,762,462 | |
5.50% due 11/15/253 | | | 6,300,000 | | | | 6,243,207 | |
5.75% due 06/15/273 | | | 4,550,000 | | | | 4,423,843 | |
OneMain Finance Corp. | | | | | | | | |
9.00% due 01/15/29 | | | 7,150,000 | | | | 7,586,951 | |
4.00% due 09/15/30 | | | 7,250,000 | | | | 6,204,884 | |
7.88% due 03/15/30 | | | 2,225,000 | | | | 2,295,245 | |
Global Atlantic Finance Co. | | | | | | | | |
4.70% due 10/15/513,6 | | | 11,350,000 | | | | 10,228,891 | |
7.95% due 06/15/333 | | | 2,289,000 | | | | 2,540,159 | |
14 | THE GUGGENHEIM FUNDS SEMI-ANNUAL REPORT | SEE NOTES TO CONSOLIDATED FINANCIAL STATEMENTS. |
CONSOLIDATED SCHEDULE OF INVESTMENTS (Unaudited)(continued) | March 31, 2024 |
MACRO OPPORTUNITIES FUND | |
| | Face
Amount~ | | | Value | |
6.75% due 03/15/543 | | | 2,091,000 | | | $ | 2,144,975 | |
Hampton Roads PPV LLC | | | | | | | | |
6.62% due 06/15/53†††,3 | | | 16,560,000 | | | | 13,767,312 | |
Sherwood Financing plc | | | | | | | | |
4.50% due 11/15/263 | | EUR | 13,600,000 | | | | 13,490,971 | |
Hunt Companies, Inc. | | | | | | | | |
5.25% due 04/15/293 | | | 13,700,000 | | | | 12,509,489 | |
Lloyds Banking Group plc | | | | | | | | |
5.87% due 03/06/296 | | | 12,100,000 | | | | 12,295,696 | |
Kennedy-Wilson, Inc. | | | | | | | | |
5.00% due 03/01/31 | | | 14,669,000 | | | | 11,414,735 | |
4.75% due 02/01/30 | | | 250,000 | | | | 199,420 | |
4.75% due 03/01/29 | | | 25,000 | | | | 20,581 | |
Corebridge Financial, Inc. | | | | | | | | |
6.88% due 12/15/526 | | | 10,750,000 | | | | 10,762,884 | |
First American Financial Corp. | | | | | | | | |
4.00% due 05/15/30 | | | 11,760,000 | | | | 10,690,775 | |
Nationstar Mortgage Holdings, Inc. | | | | | | | | |
5.00% due 02/01/263 | | | 9,810,000 | | | | 9,600,109 | |
Jane Street Group / JSG Finance, Inc. | | | | | | | | |
4.50% due 11/15/293 | | | 9,650,000 | | | | 8,928,123 | |
SLM Corp. | | | | | | | | |
3.13% due 11/02/26 | | | 8,914,000 | | | | 8,278,953 | |
OneAmerica Financial Partners, Inc. | | | | | | | | |
4.25% due 10/15/503 | | | 11,550,000 | | | | 8,105,610 | |
QBE Insurance Group Ltd. | | | | | | | | |
5.88% 3,5,6 | | | 7,550,000 | | | | 7,473,530 | |
Toronto-Dominion Bank | | | | | | | | |
8.13% due 10/31/826 | | | 6,300,000 | | | | 6,607,774 | |
PartnerRe Finance B LLC | | | | | | | | |
4.50% due 10/01/506 | | | 6,460,000 | | | | 5,887,587 | |
Cushman & Wakefield US Borrower LLC | | | | | | | | |
6.75% due 05/15/283 | | | 5,303,000 | | | | 5,236,624 | |
Blue Owl Capital GP LLC | | | | | | | | |
7.11% due 08/22/43††† | | | 5,000,000 | | | | 5,120,976 | |
Bank of Nova Scotia | | | | | | | | |
8.63% due 10/27/826 | | | 4,650,000 | | | | 4,841,585 | |
American Equity Investment Life Holding Co. | | | | | | | | |
5.00% due 06/15/27 | | | 4,813,000 | | | | 4,684,032 | |
Encore Capital Group, Inc. | | | | | | | | |
9.25% due 04/01/293 | | | 4,450,000 | | | | 4,558,476 | |
Horace Mann Educators Corp. | | | | | | | | |
7.25% due 09/15/28 | | | 3,600,000 | | | | 3,845,126 | |
PennyMac Financial Services, Inc. | | | | | | | | |
7.88% due 12/15/293 | | | 3,675,000 | | | | 3,776,228 | |
Alliant Holdings Intermediate LLC / Alliant Holdings Company-Issuer | | | | | | | | |
7.00% due 01/15/313 | | | 3,475,000 | | | | 3,509,816 | |
Accident Fund Insurance Company of America | | | | | | | | |
8.50% due 08/01/323 | | | 3,000,000 | | | | 2,954,853 | |
SBA Communications Corp. | | | | | | | | |
3.13% due 02/01/29 | | | 3,100,000 | | | | 2,735,767 | |
Prudential Financial, Inc. | | | | | | | | |
5.13% due 03/01/526 | | | 2,750,000 | | | | 2,577,695 | |
Jones Deslauriers Insurance Management, Inc. | | | | | | | | |
10.50% due 12/15/303 | | | 1,700,000 | | | | 1,793,891 | |
SEE NOTES TO CONSOLIDATED FINANCIAL STATEMENTS. | THE GUGGENHEIM FUNDS SEMI-ANNUAL REPORT | 15 |
CONSOLIDATED SCHEDULE OF INVESTMENTS (Unaudited)(continued) | March 31, 2024 |
MACRO OPPORTUNITIES FUND | |
| | Face
Amount~ | | | Value | |
Iron Mountain Information Management Services, Inc. | | | | | | | | |
5.00% due 07/15/323 | | | 1,726,000 | | | $ | 1,576,305 | |
Atlas Mara Ltd. | | | | | | | | |
due 12/31/21†††,7,8 | | | 1,299,836 | | | | 118,579 | |
Total Financial | | | 561,871,843 | |
| | | | | | | | | |
Communications - 3.9% |
British Telecommunications plc | | | | | | | | |
4.88% due 11/23/813,6 | | | 28,200,000 | | | | 25,056,132 | |
4.25% due 11/23/813,6 | | | 5,250,000 | | | | 4,946,276 | |
McGraw-Hill Education, Inc. | | | | | | | | |
8.00% due 08/01/293 | | | 22,634,000 | | | | 21,274,120 | |
5.75% due 08/01/283 | | | 4,600,000 | | | | 4,333,004 | |
Level 3 Financing, Inc. | | | | | | | | |
4.50% due 04/01/303 | | | 19,794,000 | | | | 12,272,280 | |
11.00% due 11/15/293 | | | 5,431,914 | | | | 5,649,191 | |
4.00% due 04/15/313 | | | 7,600,000 | | | | 4,598,000 | |
10.75% due 12/15/303 | | | 2,600,000 | | | | 2,665,000 | |
Sunrise FinCo I BV | | | | | | | | |
4.88% due 07/15/313 | | | 20,200,000 | | | | 18,028,052 | |
Altice France S.A. | | | | | | | | |
5.13% due 07/15/293 | | | 13,250,000 | | | | 8,957,445 | |
5.50% due 10/15/293 | | | 11,760,000 | | | | 7,981,900 | |
CSC Holdings LLC | | | | | | | | |
4.13% due 12/01/303 | | | 20,672,000 | | | | 14,781,516 | |
4.63% due 12/01/303 | | | 2,715,000 | | | | 1,378,715 | |
LCPR Senior Secured Financing DAC | | | | | | | | |
5.13% due 07/15/293 | | | 16,250,000 | | | | 13,608,946 | |
Vodafone Group plc | | | | | | | | |
5.13% due 06/04/816 | | | 16,875,000 | | | | 12,736,249 | |
CCO Holdings LLC / CCO Holdings Capital Corp. | | | | | | | | |
4.50% due 06/01/333 | | | 14,265,000 | | | | 11,142,694 | |
Cable One, Inc. | | | | | | | | |
4.00% due 11/15/303 | | | 12,575,000 | | | | 9,813,867 | |
Virgin Media Finance plc | | | | | | | | |
5.00% due 07/15/303 | | | 11,400,000 | | | | 9,646,200 | |
AMC Networks, Inc. | | | | | | | | |
4.25% due 02/15/29 | | | 10,200,000 | | | | 7,228,813 | |
10.25% due 01/15/293 | | | 2,125,000 | | | | 2,140,427 | |
Sirius XM Radio, Inc. | | | | | | | | |
4.13% due 07/01/303 | | | 8,900,000 | | | | 7,780,097 | |
3.13% due 09/01/263 | | | 850,000 | | | | 796,216 | |
Paramount Global | | | | | | | | |
4.85% due 07/01/42 | | | 3,667,000 | | | | 2,686,168 | |
5.90% due 10/15/40 | | | 2,765,000 | | | | 2,318,226 | |
4.90% due 08/15/44 | | | 1,797,000 | | | | 1,284,706 | |
5.25% due 04/01/44 | | | 1,488,000 | | | | 1,106,526 | |
4.60% due 01/15/45 | | | 624,000 | | | | 429,862 | |
Match Group Holdings II LLC | | | | | | | | |
4.63% due 06/01/283 | | | 7,700,000 | | | | 7,266,591 | |
Cogent Communications Group, Inc. | | | | | | | | |
7.00% due 06/15/273 | | | 7,250,000 | | | | 7,217,945 | |
Virgin Media Secured Finance plc | | | | | | | | |
4.50% due 08/15/303 | | | 7,950,000 | | | | 6,855,674 | |
Telenet Finance Luxembourg Notes SARL | | | | | | | | |
5.50% due 03/01/28 | | | 7,000,000 | | | | 6,576,774 | |
VZ Secured Financing BV | | | | | | | | |
5.00% due 01/15/323 | | | 6,830,000 | | | | 5,864,261 | |
Virgin Media Vendor Financing Notes IV DAC | | | | | | | | |
5.00% due 07/15/283 | | | 3,650,000 | | | | 3,348,805 | |
Charter Communications Operating LLC / Charter Communications Operating Capital | | | | | | | | |
3.90% due 06/01/52 | | | 3,500,000 | | | | 2,225,881 | |
16 | THE GUGGENHEIM FUNDS SEMI-ANNUAL REPORT | SEE NOTES TO CONSOLIDATED FINANCIAL STATEMENTS. |
CONSOLIDATED SCHEDULE OF INVESTMENTS (Unaudited)(continued) | March 31, 2024 |
MACRO OPPORTUNITIES FUND | |
| | Face
Amount~ | | | Value | |
TripAdvisor, Inc. | | | | | | | | |
7.00% due 07/15/253 | | | 1,800,000 | | | $ | 1,795,055 | |
Ziggo BV | | | | | | | | |
4.88% due 01/15/303 | | | 1,685,000 | | | | 1,512,685 | |
Zayo Group Holdings, Inc. | | | | | | | | |
4.00% due 03/01/273 | | | 700,000 | | | | 576,200 | |
Total Communications | | | 257,880,499 | |
| | | | | | | | | |
Energy - 3.3% |
BP Capital Markets plc | | | | | | | | |
4.88%5,6 | | | 39,360,000 | | | | 37,550,247 | |
Parkland Corp. | | | | | | | | |
4.63% due 05/01/303 | | | 20,000,000 | | | | 18,437,964 | |
Midwest Connector Capital Company LLC | | | | | | | | |
4.63% due 04/01/293 | | | 18,763,000 | | | | 18,113,520 | |
Targa Resources Partners Limited Partnership / Targa Resources Partners Finance Corp. | | | | | | | | |
6.88% due 01/15/29 | | | 12,632,000 | | | | 12,997,502 | |
4.88% due 02/01/31 | | | 5,000,000 | | | | 4,786,432 | |
ITT Holdings LLC | | | | | | | | |
6.50% due 08/01/293 | | | 19,477,000 | | | | 17,774,699 | |
Occidental Petroleum Corp. | | | | | | | | |
7.95% due 06/15/39 | | | 12,735,000 | | | | 14,978,628 | |
4.50% due 07/15/44 | | | 2,850,000 | | | | 2,231,711 | |
CVR Energy, Inc. | | | | | | | | |
8.50% due 01/15/293 | | | 15,975,000 | | | | 16,175,116 | |
NuStar Logistics, LP | | | | | | | | |
6.38% due 10/01/30 | | | 14,506,000 | | | | 14,599,796 | |
5.63% due 04/28/27 | | | 450,000 | | | | 445,374 | |
Venture Global LNG, Inc. | | | | | | | | |
9.50% due 02/01/293 | | | 8,700,000 | | | | 9,377,408 | |
9.88% due 02/01/323 | | | 3,000,000 | | | | 3,233,232 | |
Global Partners Limited Partnership / GLP Finance Corp. | | | | | | | | |
6.88% due 01/15/29 | | | 7,750,000 | | | | 7,687,533 | |
8.25% due 01/15/323 | | | 2,200,000 | | | | 2,281,497 | |
7.00% due 08/01/27 | | | 2,200,000 | | | | 2,201,243 | |
CQP Holdco Limited Partnership / BIP-V Chinook Holdco LLC | | | | | | | | |
7.50% due 12/15/333 | | | 6,550,000 | | | | 6,741,371 | |
Viper Energy, Inc. | | | | | | | | |
7.38% due 11/01/313 | | | 6,100,000 | | | | 6,341,416 | |
Kinetik Holdings, LP | | | | | | | | |
5.88% due 06/15/303 | | | 6,100,000 | | | | 5,966,570 | |
DT Midstream, Inc. | | | | | | | | |
4.13% due 06/15/293 | | | 5,250,000 | | | | 4,826,493 | |
TransCanada PipeLines Ltd. | | | | | | | | |
6.20% due 03/09/26 | | | 3,300,000 | | | | 3,300,617 | |
HF Sinclair Corp. | | | | | | | | |
6.38% due 04/15/273 | | | 2,689,000 | | | | 2,704,128 | |
Buckeye Partners, LP | | | | | | | | |
4.13% due 03/01/253 | | | 2,000,000 | | | | 1,954,111 | |
TransMontaigne Partners Limited Partnership / TLP Finance Corp. | | | | | | | | |
6.13% due 02/15/26 | | | 700,000 | | | | 663,250 | |
Basic Energy Services, Inc. | | | | | | | | |
due 10/15/237 | | | 1,438,000 | | | | 7,190 | |
Total Energy | | | 215,377,048 | |
| | | | | | | | | |
Consumer, Cyclical - 3.1% |
Hilton Domestic Operating Company, Inc. | | | | | | | | |
4.00% due 05/01/313 | | | 15,900,000 | | | | 14,210,886 | |
3.63% due 02/15/323 | | | 4,150,000 | | | | 3,573,157 | |
5.75% due 05/01/283 | | | 525,000 | | | | 524,220 | |
Mileage Plus Holdings LLC / Mileage Plus Intellectual Property Assets Ltd. | | | | | | | | |
6.50% due 06/20/273 | | | 12,785,657 | | | | 12,856,182 | |
Suburban Propane Partners Limited Partnership/Suburban Energy Finance Corp. | | | | | | | | |
5.00% due 06/01/313 | | | 11,350,000 | | | | 10,347,607 | |
5.88% due 03/01/27 | | | 660,000 | | | | 652,499 | |
SEE NOTES TO CONSOLIDATED FINANCIAL STATEMENTS. | THE GUGGENHEIM FUNDS SEMI-ANNUAL REPORT | 17 |
CONSOLIDATED SCHEDULE OF INVESTMENTS (Unaudited)(continued) | March 31, 2024 |
MACRO OPPORTUNITIES FUND | |
| | Face
Amount~ | | | Value | |
Delta Air Lines, Inc. | | | | | | | | |
7.00% due 05/01/253 | | | 10,536,000 | | | $ | 10,674,238 | |
Ferrellgas Limited Partnership / Ferrellgas Finance Corp. | | | | | | | | |
5.38% due 04/01/263 | | | 10,468,000 | | | | 10,241,293 | |
1011778 BC ULC / New Red Finance, Inc. | | | | | | | | |
4.00% due 10/15/303 | | | 9,333,000 | | | | 8,315,719 | |
Evergreen Acqco 1 Limited Partnership / TVI, Inc. | | | | | | | | |
9.75% due 04/26/283 | | | 7,086,000 | | | | 7,617,903 | |
Warnermedia Holdings, Inc. | | | | | | | | |
6.41% due 03/15/26 | | | 7,200,000 | | | | 7,200,123 | |
Clarios Global Limited Partnership / Clarios US Finance Co. | | | | | | | | |
6.25% due 05/15/263 | | | 6,799,000 | | | | 6,795,550 | |
Hyatt Hotels Corp. | | | | | | | | |
5.75% due 04/23/30 | | | 6,530,000 | | | | 6,695,836 | |
British Airways Class A Pass Through Trust | | | | | | | | |
4.25% due 11/15/323 | | | 7,164,701 | | | | 6,681,283 | |
Hanesbrands, Inc. | | | | | | | | |
9.00% due 02/15/313 | | | 6,100,000 | | | | 6,267,415 | |
Hawaiian Brand Intellectual Property Ltd. / HawaiianMiles Loyalty Ltd. | | | | | | | | |
5.75% due 01/20/263 | | | 6,645,000 | | | | 6,236,041 | |
Papa John’s International, Inc. | | | | | | | | |
3.88% due 09/15/293 | | | 7,025,000 | | | | 6,229,940 | |
CD&R Smokey Buyer, Inc. | | | | | | | | |
6.75% due 07/15/253 | | | 6,250,000 | | | | 6,192,455 | |
Penn Entertainment, Inc. | | | | | | | | |
4.13% due 07/01/293 | | | 6,975,000 | | | | 5,998,154 | |
JB Poindexter & Company, Inc. | | | | | | | | |
8.75% due 12/15/313 | | | 5,100,000 | | | | 5,271,518 | |
Beacon Roofing Supply, Inc. | | | | | | | | |
4.13% due 05/15/293 | | | 4,117,000 | | | | 3,734,159 | |
4.50% due 11/15/263 | | | 1,450,000 | | | | 1,408,874 | |
Boyne USA, Inc. | | | | | | | | |
4.75% due 05/15/293 | | | 5,484,000 | | | | 5,083,516 | |
American Airlines Class AA Pass Through Trust | | | | | | | | |
3.58% due 01/15/28 | | | 2,094,740 | | | | 1,961,290 | |
3.35% due 10/15/29 | | | 1,123,724 | | | | 1,027,992 | |
3.65% due 02/15/29 | | | 981,825 | | | | 926,406 | |
3.15% due 02/15/32 | | | 939,598 | | | | 839,439 | |
Ontario Gaming GTA, LP | | | | | | | | |
8.00% due 08/01/303 | | | 4,375,000 | | | | 4,506,129 | |
Superior Plus Limited Partnership / Superior General Partner, Inc. | | | | | | | | |
4.50% due 03/15/293 | | | 4,800,000 | | | | 4,437,830 | |
Asbury Automotive Group, Inc. | | | | | | | | |
4.63% due 11/15/293 | | | 4,472,000 | | | | 4,126,875 | |
Air Canada | | | | | | | | |
4.63% due 08/15/293 | | CAD | 5,550,000 | | | | 3,902,509 | |
Allwyn Entertainment Financing UK plc | | | | | | | | |
7.88% due 04/30/293 | | | 3,450,000 | | | | 3,535,526 | |
Station Casinos LLC | | | | | | | | |
4.63% due 12/01/313 | | | 3,800,000 | | | | 3,415,421 | |
Scientific Games Holdings Limited Partnership/Scientific Games US FinCo, Inc. | | | | | | | | |
6.63% due 03/01/303 | | | 3,500,000 | | | | 3,383,609 | |
Walgreens Boots Alliance, Inc. | | | | | | | | |
3.45% due 06/01/26 | | | 3,350,000 | | | | 3,194,888 | |
Ritchie Bros Holdings, Inc. | | | | | | | | |
6.75% due 03/15/283 | | | 2,950,000 | | | | 3,009,136 | |
18 | THE GUGGENHEIM FUNDS SEMI-ANNUAL REPORT | SEE NOTES TO CONSOLIDATED FINANCIAL STATEMENTS. |
CONSOLIDATED SCHEDULE OF INVESTMENTS (Unaudited)(continued) | March 31, 2024 |
MACRO OPPORTUNITIES FUND | |
| | Face
Amount~ | | | Value | |
Six Flags Theme Parks, Inc. | | | | | | | | |
7.00% due 07/01/253 | | | 2,757,000 | | | $ | 2,760,978 | |
PetSmart, Inc. / PetSmart Finance Corp. | | | | | | | | |
4.75% due 02/15/283 | | | 2,800,000 | | | | 2,621,487 | |
Clarios Global, LP | | | | | | | | |
6.75% due 05/15/253 | | | 2,476,000 | | | | 2,478,204 | |
Air Canada Class A Pass Through Trust | | | | | | | | |
5.25% due 04/01/293 | | | 2,326,495 | | | | 2,285,906 | |
United Airlines, Inc. | | | | | | | | |
4.63% due 04/15/293 | | | 1,700,000 | | | | 1,581,000 | |
Acushnet Co. | | | | | | | | |
7.38% due 10/15/283 | | | 1,500,000 | | | | 1,554,409 | |
United Airlines Class AA Pass Through Trust | | | | | | | | |
4.15% due 08/25/31 | | | 914,983 | | | | 855,871 | |
Wyndham Hotels & Resorts, Inc. | | | | | | | | |
4.38% due 08/15/283 | | | 700,000 | | | | 650,735 | |
International Game Technology plc | | | | | | | | |
4.13% due 04/15/263 | | | 624,000 | | | | 604,908 | |
Total Consumer, Cyclical | | | 206,469,116 | |
| | | | | | | | | |
Industrial - 2.8% |
Great Lakes Dredge & Dock Corp. | | | | | | | | |
5.25% due 06/01/293 | | | 17,160,000 | | | | 15,267,118 | |
XPO, Inc. | | | | | | | | |
6.25% due 06/01/283 | | | 14,085,000 | | | | 14,201,441 | |
New Enterprise Stone & Lime Company, Inc. | | | | | | | | |
5.25% due 07/15/283 | | | 9,081,000 | | | | 8,699,520 | |
9.75% due 07/15/283 | | | 5,350,000 | | | | 5,473,451 | |
TransDigm, Inc. | | | | | | | | |
6.75% due 08/15/283 | | | 7,000,000 | | | | 7,092,386 | |
6.88% due 12/15/303 | | | 4,050,000 | | | | 4,128,550 | |
Standard Industries, Inc. | | | | | | | | |
4.38% due 07/15/303 | | | 6,200,000 | | | | 5,570,980 | |
3.38% due 01/15/313 | | | 6,552,000 | | | | 5,493,613 | |
IP Lending X Ltd. | | | | | | | | |
7.75% due 07/02/29†††,3 | | | 9,275,000 | | | | 9,414,125 | |
Boxer Parent Co, Inc. | | | | | | | | |
6.50% due 10/02/25 | | EUR | 8,550,000 | | | | 9,214,959 | |
Flowserve Corp. | | | | | | | | |
3.50% due 10/01/30 | | | 10,270,000 | | | | 9,117,982 | |
Dyal Capital Partners IV | | | | | | | | |
3.65% due 02/22/41††† | | | 10,950,000 | | | | 9,070,082 | |
Arcosa, Inc. | | | | | | | | |
4.38% due 04/15/293 | | | 9,400,000 | | | | 8,662,411 | |
Pactiv Evergreen Group Issuer Incorporated/Pactiv Evergreen Group Issuer LLC | | | | | | | | |
4.00% due 10/15/273 | | | 7,943,000 | | | | 7,409,516 | |
GrafTech Finance, Inc. | | | | | | | | |
4.63% due 12/15/283 | | | 10,000,000 | | | | 6,430,707 | |
Deuce FinCo plc | | | | | | | | |
5.50% due 06/15/273 | | GBP | 5,350,000 | | | | 6,388,466 | |
Atkore, Inc. | | | | | | | | |
4.25% due 06/01/313 | | | 6,875,000 | | | | 6,096,850 | |
Masonite International Corp. | | | | | | | | |
3.50% due 02/15/303 | | | 6,350,000 | | | | 5,617,980 | |
TopBuild Corp. | | | | | | | | |
3.63% due 03/15/293 | | | 5,550,000 | | | | 5,041,644 | |
GrafTech Global Enterprises, Inc. | | | | | | | | |
9.88% due 12/15/283 | | | 6,520,000 | | | | 4,839,780 | |
Artera Services LLC | | | | | | | | |
8.50% due 02/15/313 | | | 4,525,000 | | | | 4,639,225 | |
SCIL IV LLC / SCIL USA Holdings LLC | | | | | | | | |
9.50% due 07/15/28 | | EUR | 3,500,000 | | | | 4,115,257 | |
Enviri Corp. | | | | | | | | |
5.75% due 07/31/273 | | | 4,125,000 | | | | 3,884,015 | |
Adevinta ASA | | | | | | | | |
3.00% due 11/15/273 | | EUR | 3,433,000 | | | | 3,722,664 | |
Summit Materials LLC / Summit Materials Finance Corp. | | | | | | | | |
7.25% due 01/15/313 | | | 3,150,000 | | | | 3,274,069 | |
SEE NOTES TO CONSOLIDATED FINANCIAL STATEMENTS. | THE GUGGENHEIM FUNDS SEMI-ANNUAL REPORT | 19 |
CONSOLIDATED SCHEDULE OF INVESTMENTS (Unaudited)(continued) | March 31, 2024 |
MACRO OPPORTUNITIES FUND | |
| | Face
Amount~ | | | Value | |
Miter Brands Acquisition Holdco Incorporated / MIWD Borrower LLC | | | | | | | | |
6.75% due 04/01/323 | | | 2,950,000 | | | $ | 2,960,083 | |
TK Elevator US Newco, Inc. | | | | | | | | |
5.25% due 07/15/273 | | | 3,000,000 | | | | 2,898,269 | |
AmeriTex HoldCo Intermediate LLC | | | | | | | | |
10.25% due 10/15/283 | | | 2,450,000 | | | | 2,630,457 | |
Trinity Industries, Inc. | | | | | | | | |
4.55% due 10/01/24 | | | 2,577,000 | | | | 2,551,584 | |
Hillenbrand, Inc. | | | | | | | | |
5.75% due 06/15/25 | | | 2,000,000 | | | | 1,997,019 | |
Builders FirstSource, Inc. | | | | | | | | |
6.38% due 06/15/323 | | | 800,000 | | | | 811,829 | |
Brundage-Bone Concrete Pumping Holdings, Inc. | | | | | | | | |
6.00% due 02/01/263 | | | 525,000 | | | | 518,502 | |
Total Industrial | | | 187,234,534 | |
| | | | | | | | | |
Consumer, Non-cyclical - 2.6% |
JBS USA LUX S.A. / JBS USA Food Company / JBS USA Finance, Inc. | | | | | | | | |
4.38% due 02/02/52 | | | 6,500,000 | | | | 4,720,308 | |
5.50% due 01/15/30 | | | 4,500,000 | | | | 4,434,820 | |
3.75% due 12/01/31 | | | 3,400,000 | | | | 2,939,720 | |
DaVita, Inc. | | | | | | | | |
4.63% due 06/01/303 | | | 8,678,000 | | | | 7,769,274 | |
3.75% due 02/15/313 | | | 4,892,000 | | | | 4,095,886 | |
AZ Battery Property LLC | | | | | | | | |
6.73% due 02/20/46††† | | | 11,600,000 | | | | 11,764,908 | |
US Foods, Inc. | | | | | | | | |
4.75% due 02/15/293 | | | 6,550,000 | | | | 6,217,616 | |
6.88% due 09/15/283 | | | 3,875,000 | | | | 3,966,671 | |
Prime Security Services Borrower LLC / Prime Finance, Inc. | | | | | | | | |
3.38% due 08/31/273 | | | 6,861,000 | | | | 6,301,991 | |
5.75% due 04/15/263 | | | 3,000,000 | | | | 2,991,249 | |
Bausch Health Companies, Inc. | | | | | | | | |
4.88% due 06/01/283 | | | 15,600,000 | | | | 8,512,979 | |
Sotheby’s/Bidfair Holdings, Inc. | | | | | | | | |
5.88% due 06/01/293 | | | 9,400,000 | | | | 7,900,817 | |
Cheplapharm Arzneimittel GmbH | | | | | | | | |
5.50% due 01/15/283 | | | 8,085,000 | | | | 7,703,968 | |
Option Care Health, Inc. | | | | | | | | |
4.38% due 10/31/293 | | | 7,736,000 | | | | 7,092,816 | |
BCP V Modular Services Finance II plc | | | | | | | | |
4.75% due 10/30/283 | | EUR | 7,000,000 | | | | 7,061,934 | |
HealthEquity, Inc. | | | | | | | | |
4.50% due 10/01/293 | | | 6,555,000 | | | | 6,047,889 | |
Medline Borrower, LP | | | | | | | | |
3.88% due 04/01/293 | | | 6,596,000 | | | | 6,003,722 | |
Smithfield Foods, Inc. | | | | | | | | |
3.00% due 10/15/303 | | | 7,000,000 | | | | 5,795,003 | |
Boost Newco Borrower LLC | | | | | | | | |
7.50% due 01/15/313 | | | 5,275,000 | | | | 5,521,939 | |
Central Garden & Pet Co. | | | | | | | | |
4.13% due 04/30/313 | | | 5,300,000 | | | | 4,671,527 | |
ADT Security Corp. | | | | | | | | |
4.88% due 07/15/323 | | | 5,150,000 | | | | 4,661,526 | |
Chrome Bidco | | | | | | | | |
3.50% due 05/31/283 | | EUR | 4,800,000 | | | | 4,461,804 | |
Carriage Services, Inc. | | | | | | | | |
4.25% due 05/15/293 | | | 4,575,000 | | | | 4,056,646 | |
CAB SELAS | | | | | | | | |
3.38% due 02/01/283 | | EUR | 4,100,000 | | | | 3,998,809 | |
Williams Scotsman, Inc. | | | | | | | | |
7.38% due 10/01/313 | | | 1,950,000 | | | | 2,026,740 | |
6.13% due 06/15/253 | | | 1,738,000 | | | | 1,729,920 | |
20 | THE GUGGENHEIM FUNDS SEMI-ANNUAL REPORT | SEE NOTES TO CONSOLIDATED FINANCIAL STATEMENTS. |
CONSOLIDATED SCHEDULE OF INVESTMENTS (Unaudited)(continued) | March 31, 2024 |
MACRO OPPORTUNITIES FUND | |
| | Face
Amount~ | | | Value | |
Kronos Acquisition Holdings, Inc. / KIK Custom Products, Inc. | | | | | | | | |
7.00% due 12/31/273 | | | 3,061,000 | | | $ | 3,040,677 | |
Endo Luxembourg Finance Company I SARL / Endo US, Inc. | | | | | | | | |
due 04/01/293,7 | | | 4,400,000 | | | | 2,860,000 | |
Legends Hospitality Holding Company LLC / Legends Hospitality Co-Issuer, Inc. | | | | | | | | |
5.00% due 02/01/263 | | | 2,775,000 | | | | 2,749,182 | |
Catalent Pharma Solutions, Inc. | | | | | | | | |
3.13% due 02/15/293 | | | 2,825,000 | | | | 2,699,511 | |
WW International, Inc. | | | | | | | | |
4.50% due 04/15/293 | | | 6,335,000 | | | | 2,501,812 | |
Darling Ingredients, Inc. | | | | | | | | |
6.00% due 06/15/303 | | | 2,350,000 | | | | 2,328,858 | |
CPI CG, Inc. | | | | | | | | |
8.63% due 03/15/263 | | | 2,005,000 | | | | 1,997,194 | |
Molina Healthcare, Inc. | | | | | | | | |
4.38% due 06/15/283 | | | 1,770,000 | | | | 1,663,850 | |
Tenet Healthcare Corp. | | | | | | | | |
4.63% due 06/15/28 | | | 975,000 | | | | 928,386 | |
5.13% due 11/01/27 | | | 550,000 | | | | 537,970 | |
Upbound Group, Inc. | | | | | | | | |
6.38% due 02/15/293 | | | 1,450,000 | | | | 1,407,681 | |
Altria Group, Inc. | | | | | | | | |
4.45% due 05/06/50 | | | 1,670,000 | | | | 1,327,862 | |
Par Pharmaceutical, Inc. | | | | | | | | |
due 04/01/273,7 | | | 1,825,000 | | | | 1,196,386 | |
Graham Holdings Co. | | | | | | | | |
5.75% due 06/01/263 | | | 420,000 | | | | 415,961 | |
Performance Food Group, Inc. | | | | | | | | |
6.88% due 05/01/253 | | | 304,000 | | | | 303,994 | |
Total Consumer, Non-cyclical | | | 168,409,806 | |
| | | | | | | | | |
Basic Materials - 1.7% |
Alcoa Nederland Holding BV | | | | | | | | |
5.50% due 12/15/273 | | | 15,125,000 | | | | 14,975,944 | |
6.13% due 05/15/283 | | | 7,450,000 | | | | 7,461,131 | |
4.13% due 03/31/293 | | | 4,900,000 | | | | 4,498,656 | |
Kaiser Aluminum Corp. | | | | | | | | |
4.50% due 06/01/313 | | | 13,250,000 | | | | 11,722,669 | |
4.63% due 03/01/283 | | | 650,000 | | | | 609,918 | |
International Flavors & Fragrances, Inc. | | | | | | | | |
1.23% due 10/01/253 | | | 11,950,000 | | | | 11,185,195 | |
Minerals Technologies, Inc. | | | | | | | | |
5.00% due 07/01/283 | | | 11,280,000 | | | | 10,785,372 | |
SK Invictus Intermediate II SARL | | | | | | | | |
5.00% due 10/30/293 | | | 11,525,000 | | | | 10,272,977 | |
SCIL IV LLC / SCIL USA Holdings LLC | | | | | | | | |
5.38% due 11/01/263 | | | 10,375,000 | | | | 10,069,255 | |
Carpenter Technology Corp. | | | | | | | | |
6.38% due 07/15/28 | | | 8,315,000 | | | | 8,300,985 | |
HB Fuller Co. | | | | | | | | |
4.25% due 10/15/28 | | | 5,250,000 | | | | 4,864,793 | |
Novelis Corp. | | | | | | | | |
3.25% due 11/15/263 | | | 5,125,000 | | | | 4,775,373 | |
Novelis Sheet Ingot GmbH | | | | | | | | |
3.38% due 04/15/29 | | EUR | 4,500,000 | | | | 4,564,577 | |
Arsenal AIC Parent LLC | | | | | | | | |
8.00% due 10/01/303 | | | 3,800,000 | | | | 3,989,563 | |
Ingevity Corp. | | | | | | | | |
3.88% due 11/01/283 | | | 1,000,000 | | | | 903,172 | |
Mirabela Nickel Ltd. | | | | | | | | |
due 06/24/19†††,7,8 | | | 1,885,418 | | | | 9,427 | |
Total Basic Materials | | | 108,989,007 | |
| | | | | | | | | |
Technology - 1.2% |
Qorvo, Inc. | | | | | | | | |
3.38% due 04/01/313 | | | 9,225,000 | | | | 7,933,627 | |
4.38% due 10/15/29 | | | 7,833,000 | | | | 7,341,897 | |
NCR Voyix Corp. | | | | | | | | |
5.25% due 10/01/303 | | | 10,325,000 | | | | 9,341,735 | |
5.13% due 04/15/293 | | | 3,850,000 | | | | 3,570,694 | |
SEE NOTES TO CONSOLIDATED FINANCIAL STATEMENTS. | THE GUGGENHEIM FUNDS SEMI-ANNUAL REPORT | 21 |
CONSOLIDATED SCHEDULE OF INVESTMENTS (Unaudited)(continued) | March 31, 2024 |
MACRO OPPORTUNITIES FUND | |
| | Face
Amount~ | | | Value | |
TeamSystem SpA | | | | | | | | |
7.69% (3 Month EURIBOR + 3.75%, Rate Floor: 3.75%) due 02/15/28◊ | | EUR | 11,750,000 | | | $ | 12,678,032 | |
Booz Allen Hamilton, Inc. | | | | | | | | |
3.88% due 09/01/283 | | | 11,800,000 | | | | 11,053,561 | |
Boxer Parent Company, Inc. | | | | | | | | |
6.50% due 10/02/25 | | EUR | 5,500,000 | | | | 5,927,751 | |
Playtika Holding Corp. | | | | | | | | |
4.25% due 03/15/293 | | | 5,850,000 | | | | 5,064,422 | |
Cloud Software Group, Inc. | | | | | | | | |
6.50% due 03/31/293 | | | 5,300,000 | | | | 5,029,496 | |
Twilio, Inc. | | | | | | | | |
3.88% due 03/15/31 | | | 4,000,000 | | | | 3,491,959 | |
Central Parent LLC / CDK Global II LLC / CDK Financing Company, Inc. | | | | | | | | |
8.00% due 06/15/293 | | | 3,050,000 | | | | 3,161,740 | |
ACI Worldwide, Inc. | | | | | | | | |
5.75% due 08/15/263 | | | 1,900,000 | | | | 1,868,115 | |
MSCI, Inc. | | | | | | | | |
3.88% due 02/15/313 | | | 883,000 | | | | 787,536 | |
Total Technology | | | 77,250,565 | |
| | | | | | | | | |
Utilities - 0.9% |
Algonquin Power & Utilities Corp. | | | | | | | | |
5.37% due 06/15/26 | | | 12,300,000 | | | | 12,233,412 | |
Terraform Global Operating, LP | | | | | | | | |
6.13% due 03/01/263 | | | 10,010,000 | | | | 9,869,886 | |
AES Corp. | | | | | | | | |
3.95% due 07/15/303 | | | 9,760,000 | | | | 8,876,624 | |
Alexander Funding Trust II | | | | | | | | |
7.47% due 07/31/283 | | | 7,750,000 | | | | 8,194,079 | |
Clearway Energy Operating LLC | | | | | | | | |
3.75% due 02/15/313 | | | 9,409,000 | | | | 8,075,650 | |
NRG Energy, Inc. | | | | | | | | |
7.00% due 03/15/333 | | | 6,950,000 | | | | 7,416,039 | |
AmeriGas Partners Limited Partnership / AmeriGas Finance Corp. | | | | | | | | |
5.88% due 08/20/26 | | | 1,695,000 | | | | 1,692,193 | |
Atlantica Sustainable Infrastructure plc | | | | | | | | |
4.13% due 06/15/283 | | | 1,550,000 | | | | 1,424,207 | |
DPL, Inc. | | | | | | | | |
4.13% due 07/01/25 | | | 280,000 | | | | 273,710 | |
Total Utilities | | | 58,055,800 | |
| | | | | | | | | |
Total Corporate Bonds |
(Cost $2,029,860,513) | | | 1,841,538,218 | |
| | | | | | | | | |
ASSET-BACKED SECURITIES†† - 18.6% |
Collateralized Loan Obligations - 11.2% |
Fortress Credit Opportunities IX CLO Ltd. | | | | | | | | |
2021-9A CR, 8.38% (3 Month Term SOFR + 3.06%, Rate Floor: 2.80%) due 10/15/33◊,3 | | | 35,000,000 | | | | 34,736,558 | |
2021-9A DR, 9.53% (3 Month Term SOFR + 4.21%, Rate Floor: 3.95%) due 10/15/33◊,3 | | | 7,750,000 | | | | 7,708,464 | |
2021-9A A2TR, 7.38% (3 Month Term SOFR + 2.06%, Rate Floor: 1.80%) due 10/15/33◊,3 | | | 2,950,000 | | | | 2,980,361 | |
22 | THE GUGGENHEIM FUNDS SEMI-ANNUAL REPORT | SEE NOTES TO CONSOLIDATED FINANCIAL STATEMENTS. |
CONSOLIDATED SCHEDULE OF INVESTMENTS (Unaudited)(continued) | March 31, 2024 |
MACRO OPPORTUNITIES FUND | |
| | Face
Amount~ | | | Value | |
FS Rialto | | | | | | | | |
2021-FL3 D, 7.94% (1 Month Term SOFR + 2.61%, Rate Floor: 2.61%) due 11/16/36◊,3 | | | 36,500,000 | | | $ | 34,446,459 | |
2021-FL2 D, 8.24% (1 Month Term SOFR + 2.91%, Rate Floor: 2.91%) due 05/16/38◊,3 | | | 8,850,000 | | | | 8,372,332 | |
Palmer Square Loan Funding Ltd. | | | | | | | | |
2022-1A B, 7.32% (3 Month Term SOFR + 2.00%, Rate Floor: 2.00%) due 04/15/30◊,3 | | | 26,200,000 | | | | 25,938,272 | |
2021-3A C, 8.08% (3 Month Term SOFR + 2.76%, Rate Floor: 2.76%) due 07/20/29◊,3 | | | 8,300,000 | | | | 8,180,998 | |
2022-1A C, 7.92% (3 Month Term SOFR + 2.60%, Rate Floor: 2.60%) due 04/15/30◊,3 | | | 3,400,000 | | | | 3,347,355 | |
LCCM Trust | | | | | | | | |
2021-FL3 C, 8.04% (1 Month Term SOFR + 2.71%, Rate Floor: 2.71%) due 11/15/38◊,3 | | | 28,865,000 | | | | 27,560,986 | |
2021-FL2 D, 8.34% (1 Month Term SOFR + 3.01%, Rate Floor: 3.01%) due 12/13/38◊,3 | | | 5,750,000 | | | | 5,381,470 | |
Fontainbleau Vegas | | | | | | | | |
10.97% (1 Month Term SOFR + 5.65%, Rate Floor: 5.65%) due 01/31/26◊,††† | | | 26,499,999 | | | | 26,499,999 | |
BXMT Ltd. | | | | | | | | |
2020-FL2 C, 7.09% (1 Month Term SOFR + 1.76%, Rate Floor: 1.76%) due 02/15/38◊,3 | | | 15,640,000 | | | | 13,768,267 | |
2020-FL2 D, 7.39% (1 Month Term SOFR + 2.06%, Rate Floor: 2.06%) due 02/15/38◊,3 | | | 8,000,000 | | | | 6,472,980 | |
2020-FL3 D, 8.24% (1 Month Term SOFR + 2.91%, Rate Floor: 2.91%) due 11/15/37◊,3 | | | 7,350,000 | | | | 6,121,229 | |
LoanCore Issuer Ltd. | | | | | | | | |
2021-CRE6 D, 8.29% (1 Month Term SOFR + 2.96%, Rate Floor: 2.85%) due 11/15/38◊,3 | | | 11,300,000 | | | | 10,090,885 | |
2021-CRE5 D, 8.44% (1 Month Term SOFR + 3.11%, Rate Floor: 3.11%) due 07/15/36◊,3 | | | 8,250,000 | | | | 7,762,182 | |
2022-CRE7 D, 8.42% (30 Day Average SOFR + 3.10%, Rate Floor: 3.10%) due 01/17/37◊,3 | | | 6,400,000 | | | | 6,072,013 | |
ACRES Commercial Realty Ltd. | | | | | | | | |
2021-FL2 D, 8.54% (1 Month Term SOFR + 3.21%, Rate Floor: 3.21%) due 01/15/37◊,3 | | | 8,350,000 | | | | 7,726,886 | |
2021-FL1 D, 8.09% (1 Month Term SOFR + 2.76%, Rate Floor: 2.76%) due 06/15/36◊,3 | | | 7,250,000 | | | | 6,388,831 | |
SEE NOTES TO CONSOLIDATED FINANCIAL STATEMENTS. | THE GUGGENHEIM FUNDS SEMI-ANNUAL REPORT | 23 |
CONSOLIDATED SCHEDULE OF INVESTMENTS (Unaudited)(continued) | March 31, 2024 |
MACRO OPPORTUNITIES FUND | |
| | Face
Amount~ | | | Value | |
2021-FL2 C, 8.09% (1 Month Term SOFR + 2.76%, Rate Floor: 2.76%) due 01/15/37◊,3 | | | 6,500,000 | | | $ | 6,106,742 | |
2021-FL2 B, 7.69% (1 Month Term SOFR + 2.36%, Rate Floor: 2.36%) due 01/15/37◊,3 | | | 3,500,000 | | | | 3,411,599 | |
Cerberus Loan Funding XLIV LLC | | | | | | | | |
2024-5A C, 9.30% (3 Month Term SOFR + 4.20%, Rate Floor: 4.20%) due 01/15/36◊,3 | | | 22,800,000 | | | | 22,788,821 | |
Cerberus Loan Funding XLII LLC | | | | | | | | |
2023-3A C, 9.46% (3 Month Term SOFR + 4.15%, Rate Floor: 4.15%) due 09/13/35◊,3 | | | 21,550,000 | | | | 21,435,753 | |
MidOcean Credit CLO VII | | | | | | | | |
2020-7A CR, 7.78% (3 Month Term SOFR + 2.46%, Rate Floor: 0.00%) due 07/15/29◊,3 | | | 21,000,000 | | | | 21,013,446 | |
Golub Capital Partners CLO Ltd. | | | | | | | | |
2018-36A C, 7.63% (3 Month Term SOFR + 2.36%, Rate Floor: 0.00%) due 02/05/31◊,3 | | | 20,000,000 | | | | 19,479,162 | |
BSPDF Issuer Ltd. | | | | | | | | |
2021-FL1 D, 8.19% (1 Month Term SOFR + 2.86%, Rate Floor: 2.75%) due 10/15/36◊,3 | | | 19,975,000 | | | | 18,314,237 | |
BSPRT Issuer Ltd. | | | | | | | | |
2021-FL6 D, 8.44% (1 Month Term SOFR + 3.11%, Rate Floor: 3.00%) due 03/15/36◊,3 | | | 18,425,000 | | | | 16,594,462 | |
2021-FL7 D, 8.19% (1 Month Term SOFR + 2.86%, Rate Floor: 2.86%) due 12/15/38◊,3 | | | 1,600,000 | | | | 1,509,770 | |
Golub Capital Partners CLO 49M Ltd. | | | | | | | | |
2021-49A D, 9.43% (3 Month Term SOFR + 4.11%, Rate Floor: 4.11%) due 08/26/33◊,3 | | | 18,100,000 | | | | 18,000,531 | |
Voya CLO Ltd. | | | | | | | | |
2021-2A CR, 9.18% (3 Month Term SOFR + 3.86%, Rate Floor: 3.60%) due 06/07/30◊,3 | | | 16,500,000 | | | | 16,507,951 | |
2013-1A INC, due 10/15/303,9 | | | 28,970,307 | | | | 1,111,880 | |
Owl Rock CLO I LLC | | | | | | | | |
2024-1A C, 9.59% (3 Month Term SOFR + 4.25%, Rate Floor: 4.25%) due 02/20/36◊,3 | | | 17,250,000 | | | | 17,342,867 | |
Anchorage Capital CLO 6 Ltd. | | | | | | | | |
2021-6A DRR, 9.03% (3 Month Term SOFR + 3.71%, Rate Floor: 3.45%) due 07/15/30◊,3 | | | 17,350,000 | | | | 17,306,766 | |
Cerberus Loan Funding XLV LLC | | | | | | | | |
2024-1A C, 8.47% (3 Month Term SOFR + 3.15%, Rate Floor: 3.15%) due 04/15/36◊,3 | | | 17,150,000 | | | | 17,151,127 | |
24 | THE GUGGENHEIM FUNDS SEMI-ANNUAL REPORT | SEE NOTES TO CONSOLIDATED FINANCIAL STATEMENTS. |
CONSOLIDATED SCHEDULE OF INVESTMENTS (Unaudited)(continued) | March 31, 2024 |
MACRO OPPORTUNITIES FUND | |
| | Face
Amount~ | | | Value | |
STWD Ltd. | | | | | | | | |
2022-FL3 D, 8.07% (30 Day Average SOFR + 2.75%, Rate Floor: 2.75%) due 11/15/38◊,3 | | | 11,900,000 | | | $ | 10,891,955 | |
2021-FL2 D, 8.24% (1 Month Term SOFR + 2.91%, Rate Floor: 2.80%) due 04/18/38◊,3 | | | 3,750,000 | | | | 3,273,033 | |
GoldentTree Loan Management US CLO 1 Ltd. | | | | | | | | |
2024-9A DR, due 04/20/37◊,3 | | | 13,500,000 | | | | 13,500,000 | |
Cerberus Loan Funding XL LLC | | | | | | | | |
2023-1A C, 9.71% (3 Month Term SOFR + 4.40%, Rate Floor: 4.40%) due 03/22/35◊,3 | | | 12,750,000 | | | | 12,792,682 | |
Neuberger Berman Loan Advisers CLO 32 Ltd. | | | | | | | | |
2021-32A DR, 8.27% (3 Month Term SOFR + 2.96%, Rate Floor: 2.70%) due 01/20/32◊,3 | | | 11,500,000 | | | | 11,395,311 | |
ABPCI Direct Lending Fund IX LLC | | | | | | | | |
2021-9A BR, 8.08% (3 Month Term SOFR + 2.76%, Rate Floor: 2.50%) due 11/18/31◊,3 | | | 11,550,000 | | | | 11,328,711 | |
KREF Ltd. | | | | | | | | |
2021-FL2 AS, 6.74% (1 Month Term SOFR + 1.41%, Rate Floor: 1.30%) due 02/15/39◊,3 | | | 11,000,000 | | | | 10,580,521 | |
Owl Rock CLO XVI | | | | | | | | |
2024-16A C, 8.62% (3 Month Term SOFR + 3.30%, Rate Floor: 3.30%) due 04/20/36◊,3 | | | 10,150,000 | | | | 10,204,262 | |
GoldenTree Loan Management US CLO 1 Ltd. | | | | | | | | |
2021-9A D, 8.48% (3 Month Term SOFR + 3.16%, Rate Floor: 2.90%) due 01/20/33◊,3 | | | 9,950,000 | | | | 9,922,657 | |
THL Credit Lake Shore MM CLO I Ltd. | | | | | | | | |
2021-1A CR, 8.58% (3 Month Term SOFR + 3.26%, Rate Floor: 3.00%) due 04/15/33◊,3 | | | 9,900,000 | | | | 9,741,859 | |
Golub Capital Partners CLO 16 Ltd. | | | | | | | | |
2021-16A CR2, 8.49% (3 Month Term SOFR + 3.16%, Rate Floor: 2.90%) due 07/25/33◊,3 | | | 9,300,000 | | | | 9,202,536 | |
BCC Middle Market CLO LLC | | | | | | | | |
2021-1A A1R, 7.08% (3 Month Term SOFR + 1.76%, Rate Floor: 1.50%) due 10/15/33◊,3 | | | 9,000,000 | | | | 9,001,106 | |
Cerberus Loan Funding XXXVI, LP | | | | | | | | |
2021-6A B, 7.33% (3 Month Term SOFR + 2.01%, Rate Floor: 1.75%) due 11/22/33◊,3 | | | 9,000,000 | | | | 8,989,249 | |
SEE NOTES TO CONSOLIDATED FINANCIAL STATEMENTS. | THE GUGGENHEIM FUNDS SEMI-ANNUAL REPORT | 25 |
CONSOLIDATED SCHEDULE OF INVESTMENTS (Unaudited)(continued) | March 31, 2024 |
MACRO OPPORTUNITIES FUND | |
| | Face
Amount~ | | | Value | |
Magnetite XXIX Ltd. | | | | | | | | |
2021-29A D, 8.18% (3 Month Term SOFR + 2.86%, Rate Floor: 2.60%) due 01/15/34◊,3 | | | 8,800,000 | | | $ | 8,744,913 | |
Atlas Senior Loan Fund IX Ltd. | | | | | | | | |
2018-9A C, 7.38% (3 Month Term SOFR + 2.06%, Rate Floor: 1.80%) due 04/20/28◊,3 | | | 8,463,101 | | | | 8,461,988 | |
2018-9A SUB, due 04/20/283,9 | | | 9,600,000 | | | | 178,666 | |
CIFC Funding Ltd. | | | | | | | | |
2021-2A DR, 8.68% (3 Month Term SOFR + 3.36%, Rate Floor: 3.10%) due 04/20/30◊,3 | | | 8,100,000 | | | | 8,039,546 | |
Venture XIV CLO Ltd. | | | | | | | | |
2020-14A CRR, 7.85% (3 Month Term SOFR + 2.51%, Rate Floor: 2.25%) due 08/28/29◊,3 | | | 8,000,000 | | | | 7,992,577 | |
Madison Park Funding XLVIII Ltd. | | | | | | | | |
2021-48A D, 8.57% (3 Month Term SOFR + 3.26%, Rate Floor: 3.26%) due 04/19/33◊,3 | | | 7,500,000 | | | | 7,484,755 | |
ACRE Commercial Mortgage Ltd. | | | | | | | | |
2021-FL4 D, 8.04% (1 Month Term SOFR + 2.71%, Rate Floor: 2.60%) due 12/18/37◊,3 | | | 7,350,000 | | | | 6,964,607 | |
FS Rialto Issuer LLC | | | | | | | | |
2022-FL5 C, 9.25% (1 Month Term SOFR + 3.92%, Rate Floor: 3.92%) due 06/19/37◊,3 | | | 6,950,000 | | | | 6,823,801 | |
Dryden 37 Senior Loan Fund | | | | | | | | |
2015-37A Q, due 01/15/313,9 | | | 9,500,000 | | | | 6,728,977 | |
Madison Park Funding LVIII Ltd. | | | | | | | | |
2024-58A D, due 04/25/37◊,3 | | | 6,600,000 | | | | 6,600,000 | |
Cerberus Loan Funding XXXIII, LP | | | | | | | | |
2021-3A C, 8.38% (3 Month Term SOFR + 3.06%, Rate Floor: 2.80%) due 07/23/33◊,3 | | | 5,900,000 | | | | 5,832,397 | |
ABPCI Direct Lending Fund CLO I LLC | | | | | | | | |
2021-1A C2, 8.58% (3 Month Term SOFR + 3.26%, Rate Floor: 3.26%) due 07/20/33◊,3 | | | 5,550,000 | | | | 5,500,099 | |
CHCP Ltd. | | | | | | | | |
2021-FL1 D, 8.44% (1 Month Term SOFR + 3.11%, Rate Floor: 3.00%) due 02/15/38◊,3 | | | 5,500,000 | | | | 5,284,129 | |
KREF Funding V LLC | | | | | | | | |
7.18% (1 Month Term SOFR + 1.86%, Rate Floor: 1.86%) due 06/25/26◊,††† | | | 5,184,387 | | | | 5,151,337 | |
0.15% due 06/25/26†††,10 | | | 73,636,363 | | | | 61,855 | |
26 | THE GUGGENHEIM FUNDS SEMI-ANNUAL REPORT | SEE NOTES TO CONSOLIDATED FINANCIAL STATEMENTS. |
CONSOLIDATED SCHEDULE OF INVESTMENTS (Unaudited)(continued) | March 31, 2024 |
MACRO OPPORTUNITIES FUND | |
| | Face
Amount~ | | | Value | |
Cerberus Loan Funding XXXV, LP | | | | | | | | |
2021-5A C, 8.18% (3 Month Term SOFR + 2.86%, Rate Floor: 2.60%) due 09/22/33◊,3 | | | 5,150,000 | | | $ | 5,085,102 | |
Neuberger Berman Loan Advisers CLO 40 Ltd. | | | | | | | | |
2021-40A D, 8.33% (3 Month Term SOFR + 3.01%, Rate Floor: 2.75%) due 04/16/33◊,3 | | | 4,050,000 | | | | 4,022,147 | |
WhiteHorse X Ltd. | | | | | | | | |
2015-10A E, 10.88% (3 Month Term SOFR + 5.56%, Rate Floor: 5.30%) due 04/17/27◊,3 | | | 3,561,466 | | | | 3,561,148 | |
Wellfleet CLO Ltd. | | | | | | | | |
2021-3A C, 7.83% (3 Month Term SOFR + 2.51%, Rate Floor: 2.25%) due 01/15/35◊,3 | | | 3,400,000 | | | | 3,377,357 | |
Wind River CLO Ltd. | | | | | | | | |
2018-1A ARR, 6.61% (3 Month Term SOFR + 1.31%, Rate Floor: 1.05%) due 07/18/31◊,3 | | | 3,225,576 | | | | 3,231,948 | |
Octagon Loan Funding Ltd. | | | | | | | | |
2014-1A SUB, due 11/18/313,9 | | | 19,435,737 | | | | 3,106,643 | |
HGI CRE CLO Ltd. | | | | | | | | |
2021-FL2 D, 7.59% (1 Month Term SOFR + 2.26%, Rate Floor: 2.26%) due 09/17/36◊,3 | | | 1,600,000 | | | | 1,507,584 | |
2021-FL2 E, 7.89% (1 Month Term SOFR + 2.56%, Rate Floor: 2.56%) due 09/17/36◊,3 | | | 1,200,000 | | | | 1,132,526 | |
BDS Ltd. | | | | | | | | |
2021-FL9 E, 8.04% (1 Month Term SOFR + 2.71%, Rate Floor: 2.60%) due 11/16/38◊,3 | | | 2,700,000 | | | | 2,519,322 | |
Denali Capital CLO XI Ltd. | | | | | | | | |
2018-1A BRR, 7.73% (3 Month Term SOFR + 2.41%, Rate Floor: 0.26%) due 10/20/28◊,3 | | | 2,500,000 | | | | 2,499,817 | |
BNPP IP CLO Ltd. | | | | | | | | |
2014-2A E, 10.83% (3 Month Term SOFR + 5.51%, Rate Floor: 0.00%) due 10/30/25◊,3 | | | 6,381,574 | | | | 2,230,360 | |
Carlyle Global Market Strategies CLO Ltd. | | | | | | | | |
2012-3A SUB, due 01/14/323,9 | | | 6,400,000 | | | | 1,966,080 | |
2013-3X SUB, due 10/15/309 | | | 4,938,326 | | | | 231,114 | |
Dryden 50 Senior Loan Fund | | | | | | | | |
2017-50A SUB, due 07/15/303,9 | | | 7,895,000 | | | | 2,148,940 | |
Goldentree Loan Management US CLO 4 Ltd. | | | | | | | | |
2021-4A DR, 8.73% (3 Month Term SOFR + 3.41%, Rate Floor: 3.15%) due 04/24/31◊,3 | | | 2,000,000 | | | | 1,991,118 | |
SEE NOTES TO CONSOLIDATED FINANCIAL STATEMENTS. | THE GUGGENHEIM FUNDS SEMI-ANNUAL REPORT | 27 |
CONSOLIDATED SCHEDULE OF INVESTMENTS (Unaudited)(continued) | March 31, 2024 |
MACRO OPPORTUNITIES FUND | |
| | Face
Amount~ | | | Value | |
PFP Ltd. | | | | | | | | |
2021-7 E, 8.44% (1 Month Term SOFR + 3.11%, Rate Floor: 3.00%) due 04/14/38◊,3 | | | 1,789,911 | | | $ | 1,711,982 | |
AMMC CLO XI Ltd. | | | | | | | | |
2012-11A SUB, due 04/30/313,9 | | | 5,650,000 | | | | 1,128,221 | |
Diamond CLO Ltd. | | | | | | | | |
2021-1A DR, 8.99% (3 Month Term SOFR + 3.66%, Rate Floor: 3.66%) due 04/25/29◊,3 | | | 885,008 | | | | 880,775 | |
Dryden 41 Senior Loan Fund | | | | | | | | |
2015-41A SUB, due 04/15/313,9 | | | 11,700,000 | | | | 832,833 | |
KVK CLO Ltd. | | | | | | | | |
2013-1A SUB, due 01/14/283,9 | | | 11,900,000 | | | | 607,019 | |
Great Lakes CLO Ltd. | | | | | | | | |
2014-1A SUB, due 10/15/293,9 | | | 1,500,000 | | | | 584,438 | |
Venture XIII CLO Ltd. | | | | | | | | |
2013-13A SUB, due 09/10/293,9 | | | 13,790,000 | | | | 414,003 | |
Babson CLO Ltd. | | | | | | | | |
2014-IA SUB, due 07/20/253,9 | | | 11,595,061 | | | | 343,562 | |
Marathon CLO V Ltd. | | | | | | | | |
2013-5A SUB, due 11/21/273,9 | | | 5,500,000 | | | | 195,564 | |
Dryden Senior Loan Fund | | | | | | | | |
2015-37X, due 01/15/319 | | | 1,897,598 | | | | 141,590 | |
Treman Park CLO Ltd. | | | | | | | | |
2015-1A SUB, due 10/20/283,9 | | | 18,918,010 | | | | 65,835 | |
Copper River CLO Ltd. | | | | | | | | |
2007-1A INC, due 01/20/218,9 | | | 8,150,000 | | | | 815 | |
West CLO Ltd. | | | | | | | | |
2013-1A SUB, due 11/07/253,9 | | | 5,300,000 | | | | 530 | |
Total Collateralized Loan Obligations | | | 733,823,543 | |
| | | | | | | | | |
Financial - 2.4% |
HarbourVest Structured Solutions IV Holdings, LP | | | | | | | | |
8.11% (3 Month USD LIBOR + 2.45%, Rate Floor: 2.45%) due 09/15/26◊,††† | | | 20,201,548 | | | | 20,198,252 | |
6.05% (3 Month EURIBOR + 2.45%, Rate Floor: 2.45%) due 09/15/26◊,††† | | EUR | 12,900,000 | | | | 13,920,352 | |
KKR Core Holding Company LLC | | | | | | | | |
4.00% due 08/12/31††† | | | 23,487,082 | | | | 20,877,074 | |
Lightning A | | | | | | | | |
5.50% due 03/01/37††† | | | 22,620,000 | | | | 20,860,857 | |
Thunderbird A | | | | | | | | |
5.50% due 03/01/37††† | | | 22,620,000 | | | | 20,860,856 | |
Project Onyx I | | | | | | | | |
8.48% (3 Month Term SOFR + 3.15%, Rate Floor: 3.15%) due 01/26/27◊,††† | | | 15,967,095 | | | | 15,964,109 | |
Ceamer Finance LLC | | | | | | | | |
6.92% due 11/15/37††† | | | 10,681,320 | | | | 10,393,791 | |
3.69% due 03/24/31††† | | | 4,973,055 | | | | 4,678,499 | |
Bib Merchant Voucher Receivables Ltd. | | | | | | | | |
4.18% due 04/07/28††† | | | 10,464,719 | | | | 10,118,503 | |
Nassau LLC | | | | | | | | |
2019-1, 3.98% due 08/15/343 | | | 9,807,770 | | | | 9,374,852 | |
28 | THE GUGGENHEIM FUNDS SEMI-ANNUAL REPORT | SEE NOTES TO CONSOLIDATED FINANCIAL STATEMENTS. |
CONSOLIDATED SCHEDULE OF INVESTMENTS (Unaudited)(continued) | March 31, 2024 |
MACRO OPPORTUNITIES FUND | |
| | Face
Amount~ | | | Value | |
Project Onyx II | | | | | | | | |
8.48% (3 Month Term SOFR + 3.15%, Rate Floor: 3.15%) due 01/26/27◊,††† | | | 5,153,221 | | | $ | 5,152,455 | |
Lightning B | | | | | | | | |
7.50% due 03/01/37††† | | | 4,550,000 | | | | 4,239,862 | |
Thunderbird B | | | | | | | | |
7.50% due 03/01/37††† | | | 4,550,000 | | | | 4,239,862 | |
Total Financial | | | 160,879,324 | |
| | | | | | | | | |
Transport-Aircraft - 2.4% |
AASET Trust | | | | | | | | |
2021-1A, 2.95% due 11/16/413 | | | 16,359,074 | | | | 14,831,137 | |
2020-1A, 3.35% due 01/16/403 | | | 4,954,454 | | | | 4,426,333 | |
2021-2A, 3.54% due 01/15/473 | | | 3,198,085 | | | | 2,691,026 | |
2020-1A, 4.34% due 01/16/403 | | | 3,751,347 | | | | 2,101,410 | |
KDAC Aviation Finance Ltd. | | | | | | | | |
2017-1A, 4.21% due 12/15/423 | | | 27,495,979 | | | | 23,650,353 | |
GAIA Aviation Ltd. | | | | | | | | |
2019-1, 3.97% due 12/15/443,11 | | | 10,670,809 | | | | 9,951,009 | |
2019-1, 5.19% due 12/15/443,11 | | | 4,716,821 | | | | 4,174,387 | |
Sprite Ltd. | | | | | | | | |
2021-1, 3.75% due 11/15/463 | | | 14,028,589 | | | | 13,032,271 | |
Falcon Aerospace Ltd. | | | | | | | | |
2017-1, 4.58% due 02/15/423 | | | 6,883,077 | | | | 6,503,333 | |
2019-1, 3.60% due 09/15/393 | | | 3,888,037 | | | | 3,538,114 | |
2017-1, 6.30% due 02/15/423 | | | 1,999,655 | | | | 1,774,708 | |
Castlelake Aircraft Securitization Trust | | | | | | | | |
2019-1A, 3.97% due 04/15/393 | | | 5,365,177 | | | | 4,829,244 | |
2018-1, 4.13% due 06/15/433 | | | 5,252,580 | | | | 4,788,680 | |
JOL Air Ltd. | | | | | | | | |
2019-1, 3.97% due 04/15/443 | | | 9,094,710 | | | | 8,323,297 | |
Labrador Aviation Finance Ltd. | | | | | | | | |
2016-1A, 4.30% due 01/15/423 | | | 8,336,570 | | | | 7,424,549 | |
Sapphire Aviation Finance I Ltd. | | | | | | | | |
2018-1A, 4.25% due 03/15/403 | | | 7,593,121 | | | | 6,970,637 | |
AASET US Ltd. | | | | | | | | |
2018-2A, 4.45% due 11/18/383 | | | 7,221,591 | | | | 6,377,949 | |
Sapphire Aviation Finance II Ltd. | | | | | | | | |
2020-1A, 4.34% due 03/15/403 | | | 7,443,209 | | | | 5,639,943 | |
2020-1A, 3.23% due 03/15/403 | | | 476,025 | | | | 433,197 | |
WAVE LLC | | | | | | | | |
2019-1, 3.60% due 09/15/443 | | | 6,156,835 | | | | 5,479,768 | |
Project Silver | | | | | | | | |
2019-1, 3.97% due 07/15/443 | | | 5,248,184 | | | | 4,618,560 | |
Navigator Aircraft ABS Ltd. | | | | | | | | |
2021-1, 3.57% due 11/15/463 | | | 5,343,639 | | | | 4,617,438 | |
Lunar Structured Aircraft Portfolio Notes | | | | | | | | |
2021-1, 3.43% due 10/15/463 | | | 4,895,712 | | | | 4,206,396 | |
MACH 1 Cayman Ltd. | | | | | | | | |
2019-1, 3.47% due 10/15/393 | | | 3,273,784 | | | | 2,959,566 | |
SEE NOTES TO CONSOLIDATED FINANCIAL STATEMENTS. | THE GUGGENHEIM FUNDS SEMI-ANNUAL REPORT | 29 |
CONSOLIDATED SCHEDULE OF INVESTMENTS (Unaudited)(continued) | March 31, 2024 |
MACRO OPPORTUNITIES FUND | |
| | Face
Amount~ | | | Value | |
Slam Ltd. | | | | | | | | |
2021-1A, 3.42% due 06/15/463 | | | 2,981,160 | | | $ | 2,532,495 | |
MAPS Ltd. | | | | | | | | |
2018-1A, 4.21% due 05/15/433 | | | 1,366,125 | | | | 1,260,266 | |
MAPS Trust | | | | | | | | |
2021-1A, 2.52% due 06/15/463 | | | 1,195,983 | | | | 1,064,796 | |
Castlelake Aircraft Structured Trust | | | | | | | | |
2021-1A, 6.66% due 01/15/463 | | | 967,443 | | | | 897,303 | |
Total Transport-Aircraft | | | 159,098,165 | |
| | | | | | | | | |
Infrastructure - 1.2% |
VB-S1 Issuer LLC - VBTEL | | | | | | | | |
2022-1A, 5.27% due 02/15/523 | | | 39,650,000 | | | | 34,220,745 | |
Hotwire Funding LLC | | | | | | | | |
2023-1A, 8.84% due 05/20/533 | | | 20,000,000 | | | | 19,795,398 | |
2021-1, 4.46% due 11/20/513 | | | 11,750,000 | | | | 10,562,250 | |
Vault DI Issuer LLC | | | | | | | | |
2021-1A, 2.80% due 07/15/463 | | | 7,150,000 | | | | 6,244,104 | |
Aligned Data Centers Issuer LLC | | | | | | | | |
2021-1A, 2.48% due 08/15/463 | | | 4,250,000 | | | | 3,797,329 | |
Blue Stream Issuer LLC | | | | | | | | |
2023-1A, 6.90% due 05/20/533 | | | 3,400,000 | | | | 3,288,702 | |
Total Infrastructure | | | 77,908,528 | |
| | | | | | | | | |
Net Lease - 0.6% |
CARS-DB4, LP | | | | | | | | |
2020-1A, 4.95% due 02/15/503 | | | 27,799,000 | | | | 23,202,294 | |
CARS-DB7, LP | | | | | | | | |
2023-1A, 6.50% due 09/15/533 | | | 11,229,375 | | | | 11,170,129 | |
SVC ABS LLC | | | | | | | | |
2023-1A, 5.55% due 02/20/533 | | | 5,933,885 | | | | 5,553,754 | |
Total Net Lease | | | 39,926,177 | |
| | | | | | | | | |
Single Family Residence - 0.5% |
FirstKey Homes Trust | | | | | | | | |
2020-SFR2, 4.00% due 10/19/373 | | | 13,550,000 | | | | 12,873,375 | |
2020-SFR2, 4.50% due 10/19/373 | | | 13,250,000 | | | | 12,619,866 | |
2020-SFR2, 3.37% due 10/19/373 | | | 8,550,000 | | | | 8,073,013 | |
Total Single Family Residence | | | 33,566,254 | |
| | | | | | | | | |
Whole Business - 0.2% |
Applebee’s Funding LLC / IHOP Funding LLC | | | | | | | | |
2019-1A, 4.72% due 06/05/493 | | | 9,742,590 | | | | 9,371,546 | |
Taco Bell Funding LLC | | | | | | | | |
2016-1A, 4.97% due 05/25/463 | | | 2,648,438 | | | | 2,608,610 | |
Wendy’s Funding LLC | | | | | | | | |
2018-1A, 3.88% due 03/15/483 | | | 374,976 | | | | 353,836 | |
Total Whole Business | | | 12,333,992 | |
| | | | | | | | | |
Insurance - 0.1% |
CHEST | | | | | | | | |
7.13% due 03/15/43††† | | | 5,700,000 | | | | 5,771,985 | |
| | | | | | | | | |
Collateralized Debt Obligations - 0.0% |
Anchorage Credit Funding 4 Ltd. | | | | | | | | |
2021-4A CR, 3.52% due 04/27/393 | | | 4,250,000 | | | | 3,516,901 | |
Total Asset-Backed Securities |
(Cost $1,275,882,087) | | | 1,226,824,869 | |
30 | THE GUGGENHEIM FUNDS SEMI-ANNUAL REPORT | SEE NOTES TO CONSOLIDATED FINANCIAL STATEMENTS. |
CONSOLIDATED SCHEDULE OF INVESTMENTS (Unaudited)(continued) | March 31, 2024 |
MACRO OPPORTUNITIES FUND | |
| | Face
Amount~ | | | Value | |
SENIOR FLOATING RATE INTERESTS††,◊ - 13.8% |
Consumer, Cyclical - 3.6% |
Zephyr Bidco Ltd. | | | | | | | | |
11.19% (3 Month GBP SONIA + 6.00%, Rate Floor: 6.00%) due 07/31/28 | | GBP | 20,850,000 | | | $ | 26,224,143 | |
FR Refuel LLC | | | | | | | | |
10.19% (1 Month Term SOFR + 4.75%, Rate Floor: 5.50%) due 11/08/28 | | | 20,876,954 | | | | 20,407,223 | |
First Brands Group LLC | | | | | | | | |
10.57% (3 Month Term SOFR + 5.00%, Rate Floor: 6.00%) due 03/30/27 | | | 16,472,612 | | | | 16,472,678 | |
Alexander Mann | | | | | | | | |
11.41% (1 Month SOFR + 6.00%, Rate Floor: 6.00%) due 06/29/27 | | | 16,025,787 | | | | 15,565,046 | |
MB2 Dental Solutions, LLC | | | | | | | | |
11.32% (1 Month Term SOFR + 6.00%, Rate Floor: 6.75%) due 01/29/31††† | | | 14,536,524 | | | | 14,506,928 | |
Fertitta Entertainment LLC | | | | | | | | |
9.08% (1 Month Term SOFR + 3.75%, Rate Floor: 4.25%) due 01/29/29 | | | 12,575,000 | | | | 12,598,641 | |
Pacific Bells LLC | | | | | | | | |
10.06% (3 Month Term SOFR + 4.50%, Rate Floor: 5.00%) due 11/10/28 | | | 12,004,738 | | | | 11,911,701 | |
Crash Champions Inc. | | | | | | | | |
10.07% (3 Month Term SOFR + 4.75%, Rate Floor: 4.75%) due 02/06/29 | | | 11,850,000 | | | | 11,879,625 | |
Casper Bidco SAS (B&B Hotels) | | | | | | | | |
due 02/21/31 | | EUR | 10,496,376 | | | | 11,264,691 | |
Rent-A-Center, Inc. | | | | | | | | |
9.12% (6 Month Term SOFR + 3.25%, Rate Floor: 3.75%) due 02/17/28 | | | 9,810,109 | | | | 9,793,726 | |
Caesars Entertainment, Inc. | | | | | | | | |
8.04% (3 Month Term SOFR + 2.75%, Rate Floor: 3.25%) due 01/24/31 | | | 9,350,000 | | | | 9,350,000 | |
The Facilities Group | | | | | | | | |
11.19% (3 Month Term SOFR + 5.75%, Rate Floor: 6.75%) due 11/30/27††† | | | 8,372,338 | | | | 8,213,051 | |
NFM & J LLC | | | | | | | | |
11.16% (3 Month Term SOFR + 5.75%, Rate Floor: 6.75%) due 11/30/27††† | | | 8,236,702 | | | | 8,079,995 | |
Holding SOCOTEC | | | | | | | | |
9.31% (3 Month SOFR + 4.00%, Rate Floor: 4.75%) due 06/30/28 | | | 7,007,000 | | | | 6,919,413 | |
SEE NOTES TO CONSOLIDATED FINANCIAL STATEMENTS. | THE GUGGENHEIM FUNDS SEMI-ANNUAL REPORT | 31 |
CONSOLIDATED SCHEDULE OF INVESTMENTS (Unaudited)(continued) | March 31, 2024 |
MACRO OPPORTUNITIES FUND | |
| | Face
Amount~ | | | Value | |
BCP V Modular Services Holdings IV Ltd. | | | | | | | | |
8.33% (3 Month EURIBOR + 4.43%, Rate Floor: 4.43%) due 12/15/28 | | EUR | 6,400,000 | | | $ | 6,837,117 | |
Shaw Development LLC | | | | | | | | |
11.16% (6 Month Term SOFR + 6.00%, Rate Floor: 6.00%) due 10/30/29††† | | | 6,165,957 | | | | 6,051,077 | |
Packers Holdings LLC | | | | | | | | |
8.68% (1 Month Term SOFR + 3.25%, Rate Floor: 4.00%) due 03/09/28 | | | 9,150,060 | | | | 5,798,850 | |
Accuride Corp. | | | | | | | | |
12.20% (1 Month Term SOFR + 1.00%, Rate Floor: 6.33%) (in-kind rate was 5.87%) due 05/18/2612 | | | 5,895,151 | | | | 4,568,742 | |
ImageFIRST Holdings LLC | | | | | | | | |
9.57% (3 Month Term SOFR + 4.25%, Rate Floor: 5.00%) due 04/27/28 | | | 3,872,955 | | | | 3,863,273 | |
Orion Group | | | | | | | | |
11.82% ((1 Month Term SOFR + 6.25%) and (3 Month Term SOFR + 6.25%), Rate Floor: 7.25%) due 03/19/27††† | | | 2,035,499 | | | | 1,986,383 | |
11.81% (3 Month Term SOFR + 6.36%, Rate Floor: 7.36%) due 03/19/27††† | | | 1,417,916 | | | | 1,383,702 | |
11.46% ((3 Month Term SOFR + 6.00%) and (Commercial Prime Lending Rate + 5.00%), Rate Floor: 7.00%) due 03/19/27††† | | | 154,662 | | | | 141,986 | |
Peer Holding III BV | | | | | | | | |
8.56% (3 Month Term SOFR + 3.25%, Rate Floor: 3.25%) due 10/18/30 | | | 3,500,000 | | | | 3,504,375 | |
ScribeAmerica Intermediate Holdco LLC (Healthchannels) | | | | | | | | |
9.94% (1 Month Term SOFR + 4.50%, Rate Floor: 5.50%) due 04/03/25 | | | 4,649,777 | | | | 3,352,489 | |
Tacala Investment Corp. | | | | | | | | |
9.33% (1 Month Term SOFR + 4.00%, Rate Floor: 4.75%) due 01/31/31 | | | 3,000,000 | | | | 2,999,070 | |
Congruex Group LLC | | | | | | | | |
11.21% (3 Month Term SOFR + 5.75%, Rate Floor: 6.50%) due 05/03/29 | | | 2,759,654 | | | | 2,594,075 | |
32 | THE GUGGENHEIM FUNDS SEMI-ANNUAL REPORT | SEE NOTES TO CONSOLIDATED FINANCIAL STATEMENTS. |
CONSOLIDATED SCHEDULE OF INVESTMENTS (Unaudited)(continued) | March 31, 2024 |
MACRO OPPORTUNITIES FUND | |
| | Face
Amount~ | | | Value | |
Albion Financing 3 SARL | | | | | | | | |
9.21% (3 Month EURIBOR + 5.25%, Rate Floor: 5.25%) due 08/17/26 | | EUR | 2,300,000 | | | $ | 2,486,372 | |
SHO Holding I Corp. | | | | | | | | |
10.82% ((1 Month Term SOFR + 5.24%) and (3 Month Term SOFR + 5.24%), Rate Floor: 6.24%) due 04/29/24 | | | 3,653,248 | | | | 2,070,186 | |
Adevinta ASA | | | | | | | | |
6.33% (1 Month EURIBOR + 2.50%, Rate Floor: 2.50%) due 06/26/28 | | EUR | 1,545,556 | | | | 1,665,541 | |
Alterra Mountain Co. | | | | | | | | |
due 08/17/28 | | | 1,440,000 | | | | 1,444,205 | |
Checkers Holdings, Inc. | | | | | | | | |
14.72% (6 Month Term SOFR + 3.00%, Rate Floor: 8.72%) (in-kind rate was 6.00%) due 06/16/28†††,12 | | | 1,260,423 | | | | 1,260,423 | |
12.72% (6 Month Term SOFR + 3.00%, Rate Floor: 8.72%) (in-kind rate was 4.00%) due 06/16/27†††,12 | | | 177,900 | | | | 177,900 | |
EG Finco Ltd. | | | | | | | | |
11.72% (1 Month GBP SONIA + 6.53%, Rate Floor: 6.53%) due 02/07/28 | | GBP | 565,657 | | | | 692,517 | |
Verisure Holding AB | | | | | | | | |
6.90% (3 Month EURIBOR + 3.00%, Rate Floor: 3.00%) due 03/27/28 | | EUR | 370,000 | | | | 397,151 | |
WW International, Inc. | | | | | | | | |
8.94% (1 Month Term SOFR + 3.50%, Rate Floor: 4.00%) due 04/13/28 | | | 750,000 | | | | 327,502 | |
Total Consumer, Cyclical | | | 236,789,797 | |
| | | | | | | | | |
Consumer, Non-cyclical - 3.3% |
Women’s Care Holdings, Inc. | | | | | | | | |
9.91% (3 Month Term SOFR + 4.50%, Rate Floor: 5.25%) due 01/17/28 | | | 30,519,431 | | | | 27,219,670 | |
Mission Veterinary Partners | | | | | | | | |
9.44% (1 Month Term SOFR + 4.00%, Rate Floor: 4.75%) due 04/27/28 | | | 20,913,750 | | | | 20,874,850 | |
Quirch Foods Holdings LLC | | | | | | | | |
10.32% (3 Month Term SOFR + 4.75%, Rate Floor: 5.75%) due 10/27/27 | | | 15,099,675 | | | | 15,118,550 | |
PlayCore | | | | | | | | |
9.84% (3 Month Term SOFR + 4.50%, Rate Floor: 5.50%) due 02/14/30 | | | 14,325,000 | | | | 14,369,837 | |
SEE NOTES TO CONSOLIDATED FINANCIAL STATEMENTS. | THE GUGGENHEIM FUNDS SEMI-ANNUAL REPORT | 33 |
CONSOLIDATED SCHEDULE OF INVESTMENTS (Unaudited)(continued) | March 31, 2024 |
MACRO OPPORTUNITIES FUND | |
| | Face
Amount~ | | | Value | |
Dhanani Group, Inc. | | | | | | | | |
11.43% (1 Month Term SOFR + 6.00%, Rate Floor: 7.00%) due 06/10/27††† | | | 14,299,091 | | | $ | 14,156,100 | |
PetIQ LLC | | | | | | | | |
10.17% (6 Month Term SOFR + 4.25%, Rate Floor: 4.75%) due 04/13/28 | | | 14,101,502 | | | | 13,960,487 | |
Southern Veterinary Partners LLC | | | | | | | | |
9.44% (1 Month Term SOFR + 4.00%, Rate Floor: 5.00%) due 10/05/27 | | | 13,938,426 | | | | 13,938,426 | |
Blue Ribbon LLC | | | | | | | | |
11.44% (1 Month Term SOFR + 6.00%, Rate Floor: 6.75%) due 05/08/28 | | | 15,579,487 | | | | 13,546,364 | |
LaserAway Intermediate Holdings II LLC | | | | | | | | |
11.33% (3 Month Term SOFR + 5.75%, Rate Floor: 6.50%) due 10/14/27 | | | 12,283,843 | | | | 12,201,910 | |
HAH Group Holding Co. LLC | | | | | | | | |
10.44% (1 Month Term SOFR + 5.00%, Rate Floor: 6.00%) due 10/29/27 | | | 10,639,680 | | | | 10,573,182 | |
Rainbow Finco SARL | | | | | | | | |
due 02/01/29 | | GBP | 7,000,000 | | | | 8,625,096 | |
Nidda Healthcare Holding GmbH | | | | | | | | |
7.45% (3 Month EURIBOR + 3.50%, Rate Floor: 3.50%) due 08/21/26 | | EUR | 7,897,239 | | | | 8,452,551 | |
Florida Food Products LLC | | | | | | | | |
10.44% (1 Month Term SOFR + 5.00%, Rate Floor: 5.75%) due 10/18/28 | | | 8,711,998 | | | | 7,666,559 | |
Gibson Brands, Inc. | | | | | | | | |
10.58% (3 Month Term SOFR + 5.00%, Rate Floor: 5.75%) due 08/11/28 | | | 8,134,000 | | | | 7,651,084 | |
Hearthside Group Holdings LLC | | | | | | | | |
9.60% (3 Month Term SOFR + 4.00%, Rate Floor: 5.00%) due 05/23/25 | | | 4,923,437 | | | | 3,560,285 | |
9.29% (3 Month Term SOFR + 3.69%, Rate Floor: 4.69%) due 05/23/25 | | | 3,516,631 | | | | 2,542,981 | |
EyeCare Partners LLC | | | | | | | | |
9.32% (3 Month Term SOFR + 3.75%, Rate Floor: 4.25%) due 11/15/28 | | | 7,962,500 | | | | 4,132,538 | |
9.32% (3 Month Term SOFR + 3.75%, Rate Floor: 4.75%) due 02/18/27 | | | 2,117,705 | | | | 1,111,795 | |
34 | THE GUGGENHEIM FUNDS SEMI-ANNUAL REPORT | SEE NOTES TO CONSOLIDATED FINANCIAL STATEMENTS. |
CONSOLIDATED SCHEDULE OF INVESTMENTS (Unaudited)(continued) | March 31, 2024 |
MACRO OPPORTUNITIES FUND | |
| | Face
Amount~ | | | Value | |
Endo Luxembourg Finance Company I SARL | | | | | | | | |
14.50% (3 Month Term SOFR + 6.00%, Rate Floor: 6.00%) due 03/27/28 | | | 7,653,125 | | | $ | 5,001,853 | |
IVI America LLC | | | | | | | | |
due 03/15/31 | | | 4,000,000 | | | | 3,995,000 | |
Medical Solutions Parent Holdings, Inc. | | | | | | | | |
8.68% (1 Month Term SOFR + 3.25%, Rate Floor: 3.75%) due 11/01/28 | | | 2,234,705 | | | | 1,988,887 | |
Resonetics LLC | | | | | | | | |
9.60% (3 Month Term SOFR + 4.00%, Rate Floor: 4.75%) due 04/28/28 | | | 1,761,914 | | | | 1,763,482 | |
Heritage Grocers Group LLC | | | | | | | | |
12.16% (3 Month Term SOFR + 6.75%, Rate Floor: 7.50%) due 08/01/29 | | | 1,682,915 | | | | 1,689,226 | |
Pacific Dental Services LLC | | | | | | | | |
due 03/07/31 | | | 1,400,000 | | | | 1,397,088 | |
Moran Foods LLC | | | | | | | | |
12.66% (3 Month Term SOFR + 7.25%, Rate Floor: 8.25%) due 06/30/26††† | | | 624,540 | | | | 471,832 | |
17.97% (3 Month Term SOFR + 2.00%, Rate Floor: 7.31%) (in-kind rate was 10.66%) due 06/30/26†††,12 | | | 375,437 | | | | 195,778 | |
Weber-Stephen Products LLC | | | | | | | | |
9.68% (1 Month Term SOFR + 4.25%, Rate Floor: 5.00%) due 10/29/27 | | | 417,563 | | | | 385,201 | |
TGP Holdings LLC | | | | | | | | |
8.68% (1 Month Term SOFR + 3.25%, Rate Floor: 4.00%) due 06/29/28 | | | 211,665 | | | | 199,905 | |
Total Consumer, Non-cyclical | | | 216,790,517 | |
| | | | | | | | | |
Industrial - 2.1% |
Merlin Buyer, Inc. | | | | | | | | |
10.08% (1 Month Term SOFR + 4.75%, RateFloor: 5.25%) due 12/14/28††† | | | 8,329,020 | | | | 8,329,020 | |
9.33% (1 Month Term SOFR + 4.00%, Rate Floor: 4.50%) due 12/14/28 | | | 6,916,797 | | | | 6,882,213 | |
CapStone Acquisition Holdings, Inc. | | | | | | | | |
10.18% (1 Month Term SOFR + 4.75%, Rate Floor: 5.75%) due 11/12/27††† | | | 12,363,936 | | | | 12,300,140 | |
SEE NOTES TO CONSOLIDATED FINANCIAL STATEMENTS. | THE GUGGENHEIM FUNDS SEMI-ANNUAL REPORT | 35 |
CONSOLIDATED SCHEDULE OF INVESTMENTS (Unaudited)(continued) | March 31, 2024 |
MACRO OPPORTUNITIES FUND | |
| | Face
Amount~ | | | Value | |
Mileage Plus Holdings LLC | | | | | | | | |
10.73% (3 Month Term SOFR + 5.25%, Rate Floor: 6.25%) due 06/21/27 | | | 9,912,500 | | | $ | 10,195,205 | |
Arcline FM Holdings LLC | | | | | | | | |
10.32% (3 Month Term SOFR + 4.75%, Rate Floor: 5.50%) due 06/23/28 | | | 9,475,703 | | | | 9,475,703 | |
Dispatch Terra Acquisition LLC | | | | | | | | |
9.70% (3 Month Term SOFR + 4.25%, Rate Floor: 5.00%) due 03/27/28 | | | 10,137,249 | | | | 9,389,627 | |
Foundation Building Materials Holding Company LLC | | | | | | | | |
9.31% (3 Month Term SOFR + 4.00%, Rate Floor: 4.00%) due 01/25/31 | | | 8,200,000 | | | | 8,228,700 | |
Fugue Finance LLC | | | | | | | | |
9.07% (3 Month Term SOFR + 3.75%, Rate Floor: 4.25%) due 02/13/31 | | | 8,050,000 | | | | 8,062,558 | |
Quikrete Holdings, Inc. | | | | | | | | |
due 03/18/31 | | | 7,900,000 | | | | 7,903,318 | |
Boluda Towage S.L. | | | | | | | | |
due 01/22/30 | | EUR | 7,215,385 | | | | 7,768,217 | |
DXP Enterprises, Inc. | | | | | | | | |
10.29% (6 Month Term SOFR + 4.75%, Rate Floor: 5.75%) due 10/05/30 | | | 5,935,125 | | | | 5,931,445 | |
United Airlines Inc. | | | | | | | | |
8.08% (3 Month Term SOFR + 2.75%, Rate Floor: 2.75%) due 02/15/31 | | | 5,250,000 | | | | 5,249,160 | |
Geo Parent Corp. | | | | | | | | |
10.50% (6 Month Term SOFR + 5.25%, Rate Floor: 5.25%) due 12/19/28 | | | 4,900,000 | | | | 4,863,250 | |
Valcour Packaging LLC | | | | | | | | |
9.19% (1 Month Term SOFR + 3.75%, Rate Floor: 4.25%) due 10/04/28 | | | 6,189,750 | | | | 4,673,261 | |
TK Elevator Midco GmbH | | | | | | | | |
6.58% (1 Month EURIBOR + 2.75%, Rate Floor: 2.75%) due 01/29/27††† | | EUR | 4,334,275 | | | | 4,450,195 | |
Integrated Power Services Holdings, Inc. | | | | | | | | |
9.95% (1 Month Term SOFR + 4.50%, Rate Floor: 5.25%) due 11/22/28††† | | | 3,432,953 | | | | 3,410,130 | |
Artera Services LLC | | | | | | | | |
9.81% (3 Month Term SOFR + 4.50%, Rate Floor: 4.50%) due 02/06/31 | | | 3,350,000 | | | | 3,360,050 | |
Aegion Corp. | | | | | | | | |
9.58% (1 Month Term SOFR + 4.25%, Rate Floor: 5.00%) due 05/17/28 | | | 3,132,911 | | | | 3,142,717 | |
36 | THE GUGGENHEIM FUNDS SEMI-ANNUAL REPORT | SEE NOTES TO CONSOLIDATED FINANCIAL STATEMENTS. |
CONSOLIDATED SCHEDULE OF INVESTMENTS (Unaudited)(continued) | March 31, 2024 |
MACRO OPPORTUNITIES FUND | |
| | Face
Amount~ | | | Value | |
MI Windows And Doors LLC | | | | | | | | |
due 03/20/31 | | | 3,125,000 | | | $ | 3,136,719 | |
Inspired Finco Holdings Ltd. | | | | | | | | |
7.83% (1 Month EURIBOR + 4.00%, Rate Floor: 4.00%) due 02/17/31 | | EUR | 2,643,532 | | | | 2,844,849 | |
ILPEA Parent, Inc. | | | | | | | | |
9.94% (1 Month Term SOFR + 4.50%, Rate Floor: 5.25%) due 06/22/28††† | | | 2,559,795 | | | | 2,543,796 | |
NA Rail Hold Co. LLC | | | | | | | | |
9.57% (3 Month Term SOFR + 4.00%, Rate Floor: 4.25%) due 10/19/26 | | | 1,939,895 | | | | 1,937,470 | |
EMRLD Borrower, LP | | | | | | | | |
7.79% (3 Month Term SOFR + 2.50%, Rate Floor: 2.50%) due 05/31/30 | | | 1,268,027 | | | | 1,266,759 | |
Air Canada | | | | | | | | |
7.83% (3 Month Term SOFR + 2.50%, Rate Floor: 2.50%) due 03/14/31 | | | 1,000,000 | | | | 1,000,630 | |
API Heat Transfer Thermasys Corp. | | | | | | | | |
13.58% (3 Month Term SOFR + 8.00%, Rate Floor: 10.00%) due 11/10/27††† | | | 489,649 | | | | 489,649 | |
10.58% (3 Month Term SOFR + 5.00%, Rate Floor: 7.00%) due 11/10/27††† | | | 283,401 | | | | 283,401 | |
Total Industrial | | | 137,118,182 | |
| | | | | | | | | |
Technology - 2.0% |
Sitecore Holding III A/S | | | | | | | | |
13.38% (6 Month Term SOFR + 7.75%, Rate Floor: 8.25%) due 03/12/29††† | | | 13,405,774 | | | | 13,281,384 | |
11.83% (6 Month EURIBOR + 7.75%, Rate Floor: 7.75%) due 03/12/29††† | | EUR | 9,463,929 | | | | 10,116,653 | |
Datix Bidco Ltd. | | | | | | | | |
9.94% (6 Month Term SOFR + 4.50%, Rate Floor: 4.50%) due 04/28/25††† | | | 9,112,505 | | | | 9,112,505 | |
12.94% (6 Month GBP SONIA + 7.75%, Rate Floor: 8.44%) due 04/27/26††† | | GBP | 4,225,000 | | | | 5,332,509 | |
9.69% (6 Month GBP SONIA + 4.50%, Rate Floor: 5.19%) due 04/28/25††† | | GBP | 1,000,000 | | | | 1,262,132 | |
13.19% (6 Month Term SOFR + 7.75%, Rate Floor: 8.26%) due 04/27/26††† | | | 461,709 | | | | 461,709 | |
Avalara, Inc. | | | | | | | | |
12.56% (3 Month Term SOFR + 7.25%, Rate Floor: 8.00%) due 10/19/28††† | | | 16,000,000 | | | | 15,825,037 | |
SEE NOTES TO CONSOLIDATED FINANCIAL STATEMENTS. | THE GUGGENHEIM FUNDS SEMI-ANNUAL REPORT | 37 |
CONSOLIDATED SCHEDULE OF INVESTMENTS (Unaudited)(continued) | March 31, 2024 |
MACRO OPPORTUNITIES FUND | |
| | Face
Amount~ | | | Value | |
Aston FinCo SARL | | | | | | | | |
9.96% (1 Month GBP SONIA + 4.75%, Rate Floor: 4.75%) due 10/09/26 | | GBP | 12,643,963 | | | $ | 14,841,268 | |
Polaris Newco LLC | | | | | | | | |
8.82% ((1 Month Term SOFR + 3.50%) and (3 Month Term SOFR + 3.50%), Rate Floor: 3.50%) due 06/04/26††† | | | 14,755,415 | | | | 13,949,362 | |
Wrench Group LLC | | | | | | | | |
9.57% (3 Month Term SOFR + 4.00%, Rate Floor: 5.00%) due 10/30/28 | | | 13,000,000 | | | | 13,032,500 | |
RLDatix | | | | | | | | |
9.69% (3 Month GBP SONIA + 4.50%, Rate Floor: 4.50%) due 10/28/24††† | | GBP | 2,991,635 | | | | 3,758,349 | |
9.94% (6 Month Term SOFR + 4.50%, Rate Floor: 4.50%) due 04/28/25††† | | | 3,400,533 | | | | 3,400,533 | |
13.19% (6 Month Term SOFR + 7.75%, Rate Floor: 7.75%) due 04/27/26††† | | | 912,001 | | | | 912,001 | |
Finastra | | | | | | | | |
12.46% (6 Month Term SOFR + 7.25%, Rate Floor: 8.25%) due 09/13/29††† | | | 7,669,000 | | | | 7,606,203 | |
IRIS Software Group | | | | | | | | |
9.22% (1 Month GBP SONIA + 4.00%, Rate Floor: 4.00%) due 09/08/25 | | GBP | 5,700,000 | | | | 7,173,938 | |
Team.Blue Finco SARL | | | | | | | | |
7.04% (1 Month EURIBOR + 3.20%, Rate Floor: 3.20%) due 03/30/28 | | EUR | 4,026,144 | | | | 4,185,574 | |
Blackhawk Network Holdings, Inc. | | | | | | | | |
10.33% (1 Month Term SOFR + 5.00%, Rate Floor: 6.00%) due 02/23/29 | | | 3,940,000 | | | | 3,942,443 | |
Atlas CC Acquisition Corp. | | | | | | | | |
9.85% (3 Month Term SOFR + 4.25%, Rate Floor: 5.00%) due 05/25/28 | | | 3,045,792 | | | | 2,842,577 | |
24-7 Intouch, Inc. | | | | | | | | |
10.18% (1 Month Term SOFR + 4.75%, Rate Floor: 4.75%) due 08/25/25 | | | 2,186,559 | | | | 2,123,017 | |
Cloud Software Group, Inc. | | | | | | | | |
9.91% (3 Month Term SOFR + 4.50%, Rate Floor: 5.00%) due 09/29/28 | | | 992,186 | | | | 987,364 | |
Finastra USA, Inc. | | | | | | | | |
12.57% (1 Month Term SOFR + 7.25%, Rate Floor: 8.25%) due 09/13/29 | | | 204,542 | | | | 181,555 | |
Total Technology | | | 134,328,613 | |
| | | | | | | | | |
38 | THE GUGGENHEIM FUNDS SEMI-ANNUAL REPORT | SEE NOTES TO CONSOLIDATED FINANCIAL STATEMENTS. |
CONSOLIDATED SCHEDULE OF INVESTMENTS (Unaudited)(continued) | March 31, 2024 |
MACRO OPPORTUNITIES FUND | |
| | Face
Amount~ | | | Value | |
Financial - 1.5% |
Higginbotham Insurance Agency, Inc. | | | | | | | | |
10.93% (1 Month Term SOFR + 5.50%, Rate Floor: 6.50%) due 11/24/28††† | | | 20,896,502 | | | $ | 20,711,732 | |
Eisner Advisory Group | | | | | | | | |
9.33% (1 Month Term SOFR + 4.00%, Rate Floor: 4.50%) due 02/22/31 | | | 16,200,000 | | | | 16,240,500 | |
Aretec Group, Inc. | | | | | | | | |
9.93% (1 Month Term SOFR + 4.50%, Rate Floor: 4.50%) due 08/09/30 | | | 12,343,985 | | | | 12,405,705 | |
HighTower Holding LLC | | | | | | | | |
9.59% (3 Month Term SOFR + 4.00%, Rate Floor: 4.75%) due 04/21/28 | | | 9,410,189 | | | | 9,410,189 | |
AqGen Island Holdings, Inc. | | | | | | | | |
8.94% (1 Month Term SOFR + 3.50%, Rate Floor: 4.00%) due 08/02/28 | | | 9,126,058 | | | | 9,080,428 | |
Osaic Holdings, Inc. | | | | | | | | |
due 08/17/28 | | | 5,460,000 | | | | 5,478,073 | |
Tegra118 Wealth Solutions, Inc. | | | | | | | | |
9.32% (3 Month Term SOFR + 4.00%, Rate Floor: 4.00%) due 02/18/27 | | | 5,638,264 | | | | 5,372,194 | |
Ardonagh Midco 3 plc | | | | | | | | |
10.04% (6 Month Term SOFR + 4.75%, Rate Floor: 4.75%) due 02/16/31††† | | | 4,807,229 | | | | 4,735,120 | |
Duff & Phelps | | | | | | | | |
9.06% (3 Month Term SOFR + 3.75%, Rate Floor: 4.75%) due 04/09/27 | | | 4,268,605 | | | | 4,245,469 | |
HUB International Ltd. | | | | | | | | |
8.57% (3 Month Term SOFR + 3.25%, Rate Floor: 4.00%) due 06/20/30 | | | 3,190,000 | | | | 3,190,574 | |
Worldpay | | | | | | | | |
8.31% (3 Month Term SOFR + 3.00%, Rate Floor: 3.50%) due 01/31/31 | | | 3,000,000 | | | | 3,008,130 | |
Asurion LLC | | | | | | | | |
9.68% (1 Month Term SOFR + 4.25%, Rate Floor: 4.25%) due 08/20/28 | | | 2,089,474 | | | | 2,013,208 | |
Capstone Borrower, Inc. | | | | | | | | |
9.05% (3 Month Term SOFR + 3.75%, Rate Floor: 3.75%) due 06/17/30 | | | 374,279 | | | | 374,436 | |
Total Financial | | | 96,265,758 | |
| | | | | | | | | |
Communications - 0.9% |
Syndigo LLC | | | | | | | | |
9.94% (1 Month Term SOFR + 4.50%, Rate Floor: 5.25%) due 12/15/27 | | | 22,155,547 | | | | 22,044,769 | |
SEE NOTES TO CONSOLIDATED FINANCIAL STATEMENTS. | THE GUGGENHEIM FUNDS SEMI-ANNUAL REPORT | 39 |
CONSOLIDATED SCHEDULE OF INVESTMENTS (Unaudited)(continued) | March 31, 2024 |
MACRO OPPORTUNITIES FUND | |
| | Face
Amount~ | | | Value | |
FirstDigital Communications LLC | | | | | | | | |
9.69% (1 Month Term SOFR + 4.25%, Rate Floor: 5.00%) due 12/17/26††† | | | 10,497,250 | | | $ | 10,219,756 | |
Simon & Schuster | | | | | | | | |
9.32% (3 Month Term SOFR + 4.00%, Rate Floor: 4.00%) due 10/30/30 | | | 9,900,000 | | | | 9,929,700 | |
Xplornet Communications, Inc. | | | | | | | | |
9.57% (3 Month Term SOFR + 4.00%, Rate Floor: 4.50%) due 10/02/28 | | | 15,095,771 | | | | 6,833,252 | |
Zayo Group Holdings, Inc. | | | | | | | | |
8.44% (1 Month Term SOFR + 3.00%, Rate Floor: 3.00%) due 03/09/27 | | | 6,146,447 | | | | 5,379,309 | |
Cengage Learning, Inc. | | | | | | | | |
due 03/15/31 | | | 5,375,000 | | | | 5,363,229 | |
Cincinnati Bell, Inc. | | | | | | | | |
8.68% (1 Month Term SOFR + 3.25%, Rate Floor: 3.75%) due 11/22/28 | | | 980,000 | | | | 980,304 | |
Total Communications | | | 60,750,319 | |
| | | | | | | | | |
Energy - 0.3% |
BANGL LLC | | | | | | | | |
9.83% (3 Month Term SOFR + 4.50%, Rate Floor: 4.50%) due 02/01/29 | | | 10,024,875 | | | | 10,071,892 | |
Bip PipeCo Holdings LLC | | | | | | | | |
8.58% (3 Month Term SOFR + 3.25%, Rate Floor: 3.25%) due 12/06/30 | | | 3,075,000 | | | | 3,076,937 | |
Venture Global Calcasieu Pass LLC | | | | | | | | |
8.05% (1 Month Term SOFR + 2.63%, Rate Floor: 3.63%) due 08/19/26 | | | 2,786,924 | | | | 2,776,473 | |
Permian Production Partners LLC | | | | | | | | |
7.72% (1 Month Term SOFR + 2.00%, Rate Floor: 5.72%) (in-kind rate was 2.00%) due 11/24/2512 | | | 967,600 | | | | 933,734 | |
Total Energy | | | 16,859,036 | |
| | | | | | | | | |
Basic Materials - 0.1% |
LTI Holdings, Inc. | | | | | | | | |
10.19% (1 Month Term SOFR + 4.75%, Rate Floor: 4.75%) due 07/24/26 | | | 3,825,292 | | | | 3,782,257 | |
Arsenal AIC Parent LLC | | | | | | | | |
9.08% (1 Month Term SOFR + 3.75%, Rate Floor: 3.75%) due 08/19/30 | | | 3,383,021 | | | | 3,390,633 | |
40 | THE GUGGENHEIM FUNDS SEMI-ANNUAL REPORT | SEE NOTES TO CONSOLIDATED FINANCIAL STATEMENTS. |
CONSOLIDATED SCHEDULE OF INVESTMENTS (Unaudited)(continued) | March 31, 2024 |
MACRO OPPORTUNITIES FUND | |
| | Face
Amount~ | | | Value | |
Schur Flexibles GmbH | | | | | | | | |
9.36% (6 Month EURIBOR + 5.50%, Rate Floor: 5.50%) due 09/28/27 | | EUR | 787,500 | | | $ | 574,965 | |
Total Basic Materials | | | 7,747,855 | |
| | | | | | | | | |
Total Senior Floating Rate Interests |
(Cost $942,924,087) | | | 906,650,077 | |
| | | | | | | | | |
COLLATERALIZED MORTGAGE OBLIGATIONS†† - 12.5% |
Residential Mortgage-Backed Securities - 6.0% |
OBX Trust | | | | | | | | |
2024-NQM5, due 03/25/283,15 | | | 12,495,000 | | | | 12,494,862 | |
2022-NQM9, 6.45% due 09/25/623,11 | | | 7,349,791 | | | | 7,355,369 | |
2023-NQM2, 6.80% due 01/25/623,11 | | | 6,130,603 | | | | 6,146,972 | |
2024-NQM4, 6.62% (WAC) due 01/25/64◊,3 | | | 5,250,000 | | | | 5,251,568 | |
2022-NQM8, 6.10% due 09/25/623,11 | | | 4,120,605 | | | | 4,085,914 | |
LSTAR Securities Investment Ltd. | | | | | | | | |
2024-1, 8.42% (30 Day Average SOFR + 3.10%, Rate Floor: 3.10%) due 01/01/29◊,†††,3 | | | 29,549,455 | | | | 29,592,241 | |
JP Morgan Mortgage Acquisition Trust | | | | | | | | |
2006-WMC4, 5.59% (1 Month Term SOFR + 0.26%, Rate Floor: 0.15%) due 12/25/36◊ | | | 20,416,458 | | | | 10,722,720 | |
2006-WMC3, 5.74% (1 Month Term SOFR + 0.41%, Rate Floor: 0.30%) due 08/25/36◊ | | | 8,037,126 | | | | 5,741,009 | |
2006-HE3, 4.61% (1 Month Term SOFR + 0.43%, Rate Floor: 0.32%) due 11/25/36◊ | | | 4,866,454 | | | | 4,208,023 | |
2006-WMC4, 5.56% (1 Month Term SOFR + 0.23%, Rate Floor: 0.12%) due 12/25/36◊ | | | 7,027,525 | | | | 3,687,294 | |
2006-WMC4, 5.52% (1 Month Term SOFR + 0.19%, Rate Floor: 0.08%) due 12/25/36◊ | | | 2,971,484 | | | | 1,555,979 | |
BRAVO Residential Funding Trust | | | | | | | | |
2022-R1, 3.13% due 01/29/703,11 | | | 24,723,266 | | | | 23,149,388 | |
Ameriquest Mortgage Securities Trust | | | | | | | | |
2006-M3, 5.62% (1 Month Term SOFR + 0.29%, Rate Floor: 0.18%) due 10/25/36◊ | | | 18,768,103 | | | | 10,197,745 | |
2006-M3, 5.68% (1 Month Term SOFR + 0.35%, Rate Floor: 0.24%) due 10/25/36◊ | | | 31,001,433 | | | | 9,011,459 | |
2006-M3, 5.54% (1 Month Term SOFR + 0.21%, Rate Floor: 0.10%) due 10/25/36◊ | | | 12,887,868 | | | | 3,746,381 | |
WaMu Asset-Backed Certificates WaMu Series | | | | | | | | |
2007-HE2, 5.80% (1 Month Term SOFR + 0.47%, Rate Floor: 0.47%) due 04/25/37◊ | | | 23,409,172 | | | | 8,745,514 | |
SEE NOTES TO CONSOLIDATED FINANCIAL STATEMENTS. | THE GUGGENHEIM FUNDS SEMI-ANNUAL REPORT | 41 |
CONSOLIDATED SCHEDULE OF INVESTMENTS (Unaudited)(continued) | March 31, 2024 |
MACRO OPPORTUNITIES FUND | |
| | Face
Amount~ | | | Value | |
2007-HE2, 5.63% (1 Month Term SOFR + 0.30%, Rate Floor: 0.30%) due 04/25/37◊ | | | 17,837,582 | | | $ | 6,659,426 | |
2007-HE4, 5.61% (1 Month Term SOFR + 0.28%, Rate Floor: 0.28%) due 07/25/47◊ | | | 6,338,826 | | | | 4,495,893 | |
2007-HE4, 5.69% (1 Month Term SOFR + 0.36%, Rate Floor: 0.36%) due 07/25/47◊ | | | 1,938,169 | | | | 1,137,993 | |
RALI Series Trust | | | | | | | | |
2006-QO6, 5.62% (1 Month Term SOFR + 0.47%, Rate Floor: 0.36%) due 06/25/46◊ | | | 30,674,404 | | | | 7,063,668 | |
2007-QO2, 5.59% (1 Month Term SOFR + 0.26%, Rate Floor: 0.15%) due 02/25/47◊ | | | 12,852,328 | | | | 4,387,993 | |
2006-QO8, 5.84% (1 Month Term SOFR + 0.51%, Rate Floor: 0.40%) due 10/25/46◊ | | | 3,215,523 | | | | 2,983,705 | |
2006-QO6, 5.67% (1 Month Term SOFR + 0.57%, Rate Floor: 0.46%) due 06/25/46◊ | | | 7,981,062 | | | | 1,880,639 | |
2006-QO6, 5.70% (1 Month Term SOFR + 0.63%, Rate Floor: 0.52%) due 06/25/46◊ | | | 5,035,370 | | | | 1,202,758 | |
2006-QO2, 5.98% (1 Month Term SOFR + 0.65%, Rate Floor: 0.54%) due 02/25/46◊ | | | 5,947,913 | | | | 1,077,711 | |
2006-QO2, 6.12% (1 Month Term SOFR + 0.79%, Rate Floor: 0.68%) due 02/25/46◊ | | | 3,182,638 | | | | 592,387 | |
2006-QO2, 5.88% (1 Month Term SOFR + 0.55%, Rate Floor: 0.44%) due 02/25/46◊ | | | 213,333 | | | | 37,859 | |
Long Beach Mortgage Loan Trust | | | | | | | | |
2006-6, 5.94% (1 Month Term SOFR + 0.61%, Rate Floor: 0.50%) due 07/25/36◊ | | | 13,588,307 | | | | 5,193,168 | |
2006-8, 5.76% (1 Month Term SOFR + 0.43%, Rate Floor: 0.32%) due 09/25/36◊ | | | 16,191,992 | | | | 4,379,392 | |
2006-1, 5.82% (1 Month Term SOFR + 0.49%, Rate Floor: 0.38%) due 02/25/36◊ | | | 3,631,938 | | | | 2,978,392 | |
2006-4, 5.76% (1 Month Term SOFR + 0.43%, Rate Floor: 0.32%) due 05/25/36◊ | | | 9,722,054 | | | | 2,876,482 | |
2006-6, 5.74% (1 Month Term SOFR + 0.41%, Rate Floor: 0.30%) due 07/25/36◊ | | | 4,231,234 | | | | 1,612,589 | |
42 | THE GUGGENHEIM FUNDS SEMI-ANNUAL REPORT | SEE NOTES TO CONSOLIDATED FINANCIAL STATEMENTS. |
CONSOLIDATED SCHEDULE OF INVESTMENTS (Unaudited)(continued) | March 31, 2024 |
MACRO OPPORTUNITIES FUND | |
| | Face
Amount~ | | | Value | |
2006-8, 5.62% (1 Month Term SOFR + 0.29%, Rate Floor: 0.18%) due 09/25/36◊ | | | 4,387,726 | | | $ | 1,183,827 | |
2006-6, 5.64% (1 Month Term SOFR + 0.31%, Rate Floor: 0.20%) due 07/25/36◊ | | | 2,449,372 | | | | 930,789 | |
American Home Mortgage Assets Trust | | | | | | | | |
2006-6, 5.65% (1 Month Term SOFR + 0.32%, Rate Floor: 0.21%) due 12/25/46◊ | | | 7,124,807 | | | | 5,825,850 | |
2006-1, 5.63% (1 Month Term SOFR + 0.30%, Rate Floor: 0.19%) due 05/25/46◊ | | | 5,974,819 | | | | 5,106,712 | |
2006-3, 6.03% (1 Year CMT Rate + 0.94%, Rate Floor: 0.94%) due 10/25/46◊ | | | 4,707,785 | | | | 3,103,154 | |
Morgan Stanley IXIS Real Estate Capital Trust | | | | | | | | |
2006-2, 5.66% (1 Month Term SOFR + 0.33%, Rate Floor: 0.22%) due 11/25/36◊ | | | 21,376,595 | | | | 6,804,035 | |
2006-2, 5.59% (1 Month Term SOFR + 0.26%, Rate Floor: 0.15%) due 11/25/36◊ | | | 18,797,629 | | | | 5,983,278 | |
NYMT Loan Trust | | | | | | | | |
2022-SP1, 5.25% due 07/25/623,11 | | | 12,577,511 | | | | 12,272,998 | |
GCAT Trust | | | | | | | | |
2022-NQM5, 5.71% due 08/25/673,11 | | | 8,579,178 | | | | 8,467,853 | |
2023-NQM2, 6.60% due 11/25/673,11 | | | 2,907,444 | | | | 2,917,918 | |
Morgan Stanley ABS Capital I Incorporated Trust | | | | | | | | |
2006-HE8, 5.66% (1 Month Term SOFR + 0.33%, Rate Floor: 0.22%) due 10/25/36◊ | | | 18,597,577 | | | | 7,918,188 | |
2006-HE6, 5.64% (1 Month Term SOFR + 0.31%, Rate Floor: 0.20%) due 09/25/36◊ | | | 4,248,378 | | | | 1,470,230 | |
2007-HE4, 5.67% (1 Month Term SOFR + 0.34%, Rate Floor: 0.23%) due 02/25/37◊ | | | 3,719,319 | | | | 1,201,503 | |
IXIS Real Estate Capital Trust | | | | | | | | |
2007-HE1, 5.60% (1 Month Term SOFR + 0.27%, Rate Floor: 0.16%) due 05/25/37◊ | | | 23,417,500 | | | | 5,488,212 | |
2007-HE1, 5.67% (1 Month Term SOFR + 0.34%, Rate Floor: 0.23%) due 05/25/37◊ | | | 16,590,970 | | | | 3,888,233 | |
GSAMP Trust | | | | | | | | |
2007-NC1, 5.57% (1 Month Term SOFR + 0.24%, Rate Floor: 0.13%) due 12/25/46◊ | | | 17,673,620 | | | | 9,105,163 | |
SEE NOTES TO CONSOLIDATED FINANCIAL STATEMENTS. | THE GUGGENHEIM FUNDS SEMI-ANNUAL REPORT | 43 |
CONSOLIDATED SCHEDULE OF INVESTMENTS (Unaudited)(continued) | March 31, 2024 |
MACRO OPPORTUNITIES FUND | |
| | Face
Amount~ | | | Value | |
Master Asset-Backed Securities Trust | | | | | | | | |
2006-WMC3, 5.76% (1 Month Term SOFR + 0.43%, Rate Floor: 0.32%) due 08/25/36◊ | | | 9,860,375 | | | $ | 3,423,628 | |
2006-HE3, 5.64% (1 Month Term SOFR + 0.31%, Rate Floor: 0.20%) due 08/25/36◊ | | | 9,282,009 | | | | 2,829,648 | |
2006-HE3, 5.74% (1 Month Term SOFR + 0.41%, Rate Floor: 0.30%) due 08/25/36◊ | | | 7,803,953 | | | | 2,379,058 | |
CFMT LLC | | | | | | | | |
2022-HB9, 3.25% (WAC) due 09/25/37◊,8 | | | 8,650,000 | | | | 7,727,760 | |
Citigroup Mortgage Loan Trust, Inc. | | | | | | | | |
2007-AMC3, 5.69% (1 Month Term SOFR + 0.36%, Rate Floor: 0.25%) due 03/25/37◊ | | | 9,363,595 | | | | 7,696,078 | |
GSAA Home Equity Trust | | | | | | | | |
2006-3, 6.04% (1 Month Term SOFR + 0.71%, Rate Floor: 0.60%) due 03/25/36◊ | | | 9,871,468 | | | | 4,803,990 | |
2006-9, 5.92% (1 Month Term SOFR + 0.59%, Rate Floor: 0.48%) due 06/25/36◊ | | | 7,172,879 | | | | 1,942,679 | |
2007-7, 5.98% (1 Month Term SOFR + 0.65%, Rate Floor: 0.54%) due 07/25/37◊ | | | 338,555 | | | | 312,885 | |
OSAT Trust | | | | | | | | |
2021-RPL1, 2.12% due 05/25/653,11 | | | 6,948,674 | | | | 6,765,418 | |
PRPM LLC | | | | | | | | |
2023-1, 6.88% (WAC) due 02/25/28◊,3 | | | 5,792,180 | | | | 5,822,735 | |
Home Equity Loan Trust | | | | | | | | |
2007-FRE1, 5.63% (1 Month Term SOFR + 0.30%, Rate Floor: 0.19%) due 04/25/37◊ | | | 6,171,539 | | | | 5,752,635 | |
First NLC Trust | | | | | | | | |
2007-1, 5.72% (1 Month Term SOFR + 0.39%, Rate Floor: 0.28%) due 08/25/37◊,3 | | | 6,358,833 | | | | 3,159,097 | |
2007-1, 5.51% (1 Month Term SOFR + 0.18%, Rate Floor: 0.07%) due 08/25/37◊,3 | | | 4,822,106 | | | | 2,395,727 | |
Argent Securities Trust | | | | | | | | |
2006-W5, 5.74% (1 Month Term SOFR + 0.41%, Rate Floor: 0.30%) due 06/25/36◊ | | | 8,578,452 | | | | 5,452,584 | |
Alternative Loan Trust | | | | | | | | |
2007-OA7, 5.80% (1 Month Term SOFR + 0.47%, Rate Floor: 0.36%) due 05/25/47◊ | | | 5,855,317 | | | | 5,325,452 | |
Lehman XS Trust Series | | | | | | | | |
2006-18N, 5.80% (1 Month Term SOFR + 0.47%, Rate Floor: 0.36%) due 12/25/36◊ | | | 3,478,832 | | | | 3,265,925 | |
44 | THE GUGGENHEIM FUNDS SEMI-ANNUAL REPORT | SEE NOTES TO CONSOLIDATED FINANCIAL STATEMENTS. |
CONSOLIDATED SCHEDULE OF INVESTMENTS (Unaudited)(continued) | March 31, 2024 |
MACRO OPPORTUNITIES FUND | |
| | Face
Amount~ | | | Value | |
2006-10N, 5.86% (1 Month Term SOFR + 0.53%, Rate Floor: 0.42%) due 07/25/46◊ | | | 2,253,656 | | | $ | 2,020,728 | |
Saluda Grade Alternative Mortgage Trust | | | | | | | | |
2023-FIG4, 7.12% (WAC) due 11/25/53◊,3 | | | 4,906,599 | | | | 4,971,530 | |
Merrill Lynch Mortgage Investors Trust Series | | | | | | | | |
2007-HE2, 5.86% (1 Month Term SOFR + 0.53%, Rate Floor: 0.42%) due 02/25/37◊ | | | 6,788,113 | | | | 1,940,824 | |
2007-HE2, 5.96% (1 Month Term SOFR + 0.63%, Rate Floor: 0.52%) due 02/25/37◊ | | | 4,913,621 | | | | 1,404,869 | |
2007-HE2, 5.68% (1 Month Term SOFR + 0.35%, Rate Floor: 0.24%) due 02/25/37◊ | | | 3,906,833 | | | | 1,116,989 | |
2007-HE2, 6.28% (1 Month Term SOFR + 0.95%, Rate Floor: 0.84%) due 02/25/37◊ | | | 1,589,830 | | | | 454,528 | |
WaMu Asset-Backed Certificates WaMu Series Trust | | | | | | | | |
2007-HE1, 5.67% (1 Month Term SOFR + 0.34%, Rate Floor: 0.34%) due 01/25/37◊ | | | 7,047,555 | | | | 3,245,191 | |
2007-HE4, 5.61% (1 Month Term SOFR + 0.28%, Rate Floor: 0.28%) due 07/25/47◊ | | | 2,714,522 | | | | 1,593,845 | |
Citigroup Mortgage Loan Trust | | | | | | | | |
2022-A, 6.17% due 09/25/623,11 | | | 4,547,513 | | | | 4,545,906 | |
Verus Securitization Trust | | | | | | | | |
2022-8, 6.13% due 09/25/673,11 | | | 4,376,118 | | | | 4,335,132 | |
ACE Securities Corporation Home Equity Loan Trust Series | | | | | | | | |
2007-ASP1, 6.20% (1 Month Term SOFR + 0.87%, Rate Floor: 0.76%) due 03/25/37◊ | | | 10,427,091 | | | | 4,255,374 | |
HSI Asset Securitization Corporation Trust | | | | | | | | |
2007-HE1, 5.63% (1 Month Term SOFR + 0.30%, Rate Floor: 0.19%) due 01/25/37◊ | | | 5,608,369 | | | | 3,905,695 | |
Finance of America HECM Buyout | | | | | | | | |
2022-HB2, 6.00% (WAC) due 08/01/32◊,3 | | | 3,850,000 | | | | 3,685,750 | |
CSMC Trust | | | | | | | | |
2020-RPL5, 4.68% (WAC) due 08/25/60◊,3 | | | 3,206,930 | | | | 3,176,528 | |
First Franklin Mortgage Loan Trust | | | | | | | | |
2006-FF16, 5.86% (1 Month Term SOFR + 0.53%, Rate Floor: 0.42%) due 12/25/36◊ | | | 7,200,125 | | | | 2,955,998 | |
SEE NOTES TO CONSOLIDATED FINANCIAL STATEMENTS. | THE GUGGENHEIM FUNDS SEMI-ANNUAL REPORT | 45 |
CONSOLIDATED SCHEDULE OF INVESTMENTS (Unaudited)(continued) | March 31, 2024 |
MACRO OPPORTUNITIES FUND | |
| | Face
Amount~ | | | Value | |
Washington Mutual Mortgage Pass-Through Certificates WMALT Series Trust | | | | | | | | |
2006-AR9, 5.93% (1 Year CMT Rate + 0.84%, Rate Floor: 0.84%) due 11/25/46◊ | | | 3,526,600 | | | $ | 2,811,096 | |
Morgan Stanley Mortgage Loan Trust | | | | | | | | |
2006-9AR, 5.74% (1 Month Term SOFR + 0.41%, Rate Floor: 0.30%) due 08/25/36◊ | | | 8,010,066 | | | | 1,942,354 | |
Alliance Bancorp Trust | | | | | | | | |
2007-OA1, 5.92% (1 Month Term SOFR + 0.59%, Rate Floor: 0.48%) due 07/25/37◊ | | | 1,887,897 | | | | 1,577,181 | |
Nomura Resecuritization Trust | | | | | | | | |
2015-4R, 3.04% (1 Month Term SOFR + 0.54%, Rate Floor: 0.43%) due 03/26/36◊ | | | 1,231,805 | | | | 1,157,671 | |
Morgan Stanley Re-REMIC Trust | | | | | | | | |
2010-R5, 4.12% due 06/26/36 | | | 446,108 | | | | 387,186 | |
Asset-Backed Securities Corporation Home Equity Loan Trust | | | | | | | | |
2006-HE5, 3.24% (1 Month Term SOFR + 0.39%, Rate Floor: 0.28%) due 07/25/36◊ | | | 7,863 | | | | 7,863 | |
Total Residential Mortgage-Backed Securities | | | 396,467,973 | |
| | | | | | | | | |
Government Agency - 5.0% |
Fannie Mae | | | | | | | | |
5.50% due 05/01/53 | | | 108,245,989 | | | | 107,837,059 | |
5.00% due 05/01/53 | | | 35,498,720 | | | | 34,665,283 | |
5.00% due 08/01/53 | | | 22,540,249 | | | | 22,013,279 | |
5.00% due 09/01/52 | | | 8,166,681 | | | | 7,980,234 | |
5.00% due 06/01/53 | | | 7,546,423 | | | | 7,366,223 | |
Freddie Mac | | | | | | | | |
5.50% due 02/01/53 | | | 55,298,978 | | | | 55,351,046 | |
5.00% due 06/01/53 | | | 28,632,831 | | | | 28,093,908 | |
5.00% due 02/01/53 | | | 25,081,235 | | | | 24,626,516 | |
5.00% due 09/01/52 | | | 21,693,803 | | | | 21,196,464 | |
5.00% due 03/01/53 | | | 19,377,717 | | | | 18,926,549 | |
Total Government Agency | | | 328,056,561 | |
| | | | | | | | | |
Commercial Mortgage-Backed Securities - 1.2% |
BX Commercial Mortgage Trust | | | | | | | | |
2021-VOLT, 7.44% (1 Month Term SOFR + 2.11%, Rate Floor: 2.00%) due 09/15/36◊,3 | | | 20,653,968 | | | | 20,357,124 | |
GS Mortgage Securities Corporation Trust | | | | | | | | |
2020-UPTN, 3.25% (WAC) due 02/10/37◊,3 | | | 8,256,000 | | | | 7,618,723 | |
2020-DUNE, 8.10% (1 Month Term SOFR + 2.76%, Rate Floor: 2.65%) due 12/15/36◊,3 | | | 7,340,000 | | | | 7,047,211 | |
2020-DUNE, 7.50% (1 Month Term SOFR + 2.16%, Rate Floor: 1.90%) due 12/15/36◊,3 | | | 2,750,000 | | | | 2,675,404 | |
46 | THE GUGGENHEIM FUNDS SEMI-ANNUAL REPORT | SEE NOTES TO CONSOLIDATED FINANCIAL STATEMENTS. |
CONSOLIDATED SCHEDULE OF INVESTMENTS (Unaudited)(continued) | March 31, 2024 |
MACRO OPPORTUNITIES FUND | |
| | Face
Amount~ | | | Value | |
JP Morgan Chase Commercial Mortgage Securities Trust | | | | | | | | |
2021-NYAH, 8.07% (1 Month Term SOFR + 2.75%, Rate Floor: 2.64%) due 06/15/38◊,3 | | | 15,000,000 | | | $ | 11,363,367 | |
BX Trust | | | | | | | | |
2023-DELC, 8.66% (1 Month Term SOFR + 3.34%, Rate Floor: 3.34%) due 05/15/38◊,3 | | | 10,650,000 | | | | 10,769,813 | |
SMRT | | | | | | | | |
2022-MINI, 7.28% (1 Month Term SOFR + 1.95%, Rate Floor: 1.95%) due 01/15/39◊,3 | | | 10,000,000 | | | | 9,824,246 | |
MHP | | | | | | | | |
2022-MHIL, 7.94% (1 Month Term SOFR + 2.61%, Rate Floor: 2.61%) due 01/15/27◊,3 | | | 8,204,525 | | | | 8,137,863 | |
Total Commercial Mortgage-Backed Securities | | | 77,793,751 | |
| | | | | | | | | |
Military Housing - 0.3% |
Freddie Mac Military Housing Bonds Resecuritization Trust Certificates | | | | | | | | |
2015-R1, 0.70% (WAC) due 11/25/52◊,3,10 | | | 151,513,797 | | | | 8,554,121 | |
2015-R1, 0.70% (WAC) due 11/25/55◊,3,10 | | | 63,358,623 | | | | 4,009,612 | |
Capmark Military Housing Trust | | | | | | | | |
2007-AET2, 6.06% due 10/10/52†††,3 | | | 5,438,586 | | | | 5,254,063 | |
Total Military Housing | | | 17,817,796 | |
Total Collateralized Mortgage Obligations |
(Cost $959,681,664) | | | 820,136,081 | |
| | | | | | | | | |
U.S. GOVERNMENT SECURITIES†† - 5.8% |
U.S. Treasury Notes |
4.25% due 03/15/27 | | | 360,000,000 | | | | 358,340,623 | |
4.63% due 02/28/25 | | | 21,000,000 | | | | 20,914,688 | |
Total U.S. Government Securities |
(Cost $380,396,629) | | | | | | | 379,255,311 | |
| | | | | | | | | |
U.S. TREASURY BILLS†† - 4.2% |
U.S. Treasury Bills |
4.99% due 04/16/2413 | | | 195,000,000 | | | | 194,571,852 | |
4.55% due 04/04/2413 | | | 30,000,000 | | | | 29,987,022 | |
5.28% due 04/16/2413 | | | 26,095,000 | | | | 26,037,705 | |
5.27% due 04/16/2413 | | | 17,170,000 | | | | 17,132,301 | |
5.26% due 04/18/2413 | | | 8,720,000 | | | | 8,698,325 | |
Total U.S. Treasury Bills |
(Cost $276,428,537) | | | | | | | 276,427,205 | |
| | | | | | | | | |
FEDERAL AGENCY DISCOUNT NOTES†† - 4.1% |
Federal Home Loan Bank |
5.25% due 04/22/2413 | | | 100,000,000 | | | | 99,693,750 | |
5.15% due 04/01/2413 | | | 82,030,000 | | | | 82,030,000 | |
5.25% due 04/19/2413 | | | 51,600,000 | | | | 51,464,550 | |
5.07% due 04/24/2413 | | | 30,000,000 | | | | 29,899,375 | |
5.25% due 04/24/2413 | | | 7,000,000 | | | | 6,976,521 | |
Total Federal Agency Discount Notes |
(Cost $270,064,196) | | | | | | | 270,064,196 | |
SEE NOTES TO CONSOLIDATED FINANCIAL STATEMENTS. | THE GUGGENHEIM FUNDS SEMI-ANNUAL REPORT | 47 |
CONSOLIDATED SCHEDULE OF INVESTMENTS (Unaudited)(continued) | March 31, 2024 |
MACRO OPPORTUNITIES FUND | |
| | Face
Amount~ | | | Value | |
CONVERTIBLE BONDS†† - 0.4% |
Consumer, Non-cyclical - 0.3% |
Block, Inc. | | | | | | | | |
due 05/01/2614 | | | 21,951,000 | | | $ | 19,604,438 | |
| | | | | | | | | |
Communications - 0.1% |
Cable One, Inc. | | | | | | | | |
due 03/15/2614 | | | 5,750,000 | | | | 5,008,250 | |
Total Convertible Bonds |
(Cost $24,743,307) | | | 24,612,688 | |
| | | | | | | | | |
MUNICIPAL BONDS†† - 0.1% |
District of Columbia - 0.1% |
District of Columbia Revenue Bonds | | | | | | | | |
6.73% due 09/01/473 | | | 9,950,000 | | | | 10,429,097 | |
Total Municipal Bonds |
(Cost $10,613,802) | | | 10,429,097 | |
| | | | | | | | | |
SENIOR FIXED RATE INTERESTS†† - 0.0% |
Industrial - 0.0% |
Schur Flexibles GmbH | | | | | | | | |
13.40% due 09/30/26††† | | EUR | 421,556 | | | | 418,463 | |
9.36% due 09/30/26††† | | EUR | 286,149 | | | | 284,050 | |
Schur Flexibles GmbH | | | | | | | | |
13.48% due 09/30/26 | | EUR | 146,102 | | | | 145,031 | |
Total Industrial | | | 847,544 | |
| | | | | | | | | |
Total Senior Fixed Rate Interests |
(Cost $874,737) | | | 847,544 | |
| | Contracts/
Notional Value~ | | | | |
LISTED OPTIONS PURCHASED† - 0.1% |
Put Options on: |
Equity Options |
SPDR S&P Regional Banking ETF Expiring January 2025 with strike price of $43.00 (Notional Value $43,366,500) | | | 8,625 | | | | 1,932,000 | |
SPDR S&P Regional Banking ETF Expiring December 2024 with strike price of $42.00 (Notional Value $71,236,704 ) | | | 14,168 | | | | 2,507,736 | |
Total Listed Options Purchased |
(Cost $6,959,763) | | | | | | | 4,439,736 | |
| | | | | | | | | |
OTC OPTIONS PURCHASED†† - 0.0% |
Call Options on: |
Interest Rate Options |
Morgan Stanley Capital Services LLC 10Y-2Y SOFR CMS CAP Expiring June 2024 with strike price of $0.10 | | | 164,200,000 | | | | 9,826 | |
Barclays Bank plc 10Y-2Y SOFR CMS CAP Expiring June 2024 with strike price of $0.10 | | | 162,650,000 | | | | 9,733 | |
Bank of America, N.A. 10Y-2Y SOFR CMS CAP Expiring June 2024 with strike price of $0.10 | | | 82,100,000 | | | | 4,913 | |
48 | THE GUGGENHEIM FUNDS SEMI-ANNUAL REPORT | SEE NOTES TO CONSOLIDATED FINANCIAL STATEMENTS. |
CONSOLIDATED SCHEDULE OF INVESTMENTS (Unaudited)(continued) | March 31, 2024 |
MACRO OPPORTUNITIES FUND | |
| | Contracts/
Notional Value~ | | | Value | |
Goldman Sachs International 10Y-2Y SOFR CMS CAP Expiring June 2024 with strike price of $0.10 | | | 66,950,000 | | | $ | 4,006 | |
| | | | | | | | | |
Total OTC Options Purchased |
(Cost $2,147,996) | | | | | | | 28,478 | |
| | | | | | | | | |
Total Investments - 102.1% |
(Cost $7,192,060,291) | | $ | 6,712,887,089 | |
Other Assets & Liabilities, net -(2.1)% | | | (140,861,117 | ) |
Total Net Assets - 100.0% | | $ | 6,572,025,972 | |
Futures Contracts |
Description | | Number of
Contracts | | | Expiration
Date | | | Notional
Amount | | | Value and
Unrealized
Depreciation** | |
Interest Rate Futures Contracts Purchased† |
3-Month SOFR Futures Contracts | | | 2,440 | | | | Jun 2025 | | | $ | 583,678,500 | | | $ | (940,616 | ) |
Centrally Cleared Credit Default Swap Agreements Protection Purchased†† |
Counterparty | Exchange | Index | | Protection
Premium Rate | | | Payment
Frequency | | | Maturity
Date | |
J.P. Morgan Securities LLC | ICE | ITRAXX.EUR.41.V1 | | | 1.00 | % | | | Quarterly | | | | 06/20/29 | |
J.P. Morgan Securities LLC | ICE | CDX.NA.HY.41.V2 | | | 5.00 | % | | | Quarterly | | | | 12/20/28 | |
| | Notional
Amount~ | | Value | | | Upfront
Premiums Paid
(Received) | | | Unrealized
Appreciation
(Depreciation)** | |
| | EUR 92,730,000 | | $ | (2,206,742 | ) | | $ | (2,242,051 | ) | | $ | 35,309 | |
| | 41,085,000 | | | (3,024,699 | ) | | | 143,777 | | | | (3,168,476 | ) |
| | | | $ | (5,231,441 | ) | | $ | (2,098,274 | ) | | $ | (3,133,167 | ) |
SEE NOTES TO CONSOLIDATED FINANCIAL STATEMENTS. | THE GUGGENHEIM FUNDS SEMI-ANNUAL REPORT | 49 |
CONSOLIDATED SCHEDULE OF INVESTMENTS (Unaudited)(continued) | March 31, 2024 |
MACRO OPPORTUNITIES FUND | |
Centrally Cleared Interest Rate Swap Agreements†† |
Counterparty | Exchange | Floating
Rate Type | Floating
Rate Index | | | Fixed
Rate | | Payment
Frequency | | | Maturity
Date | |
J.P. Morgan Securities LLC | CME | Receive | U.S. Secured Overnight Financing Rate | | | 3.55% | | Annually | | | 03/14/54 | |
Notional
Amount | | Value | | | Upfront
Premiums
Paid | | | Unrealized
Appreciation** | |
$ | 3,060,000 | | $ | 34,985 | | | $ | 303 | | | $ | 34,682 | |
Total Return Swap Agreements |
Counterparty | Reference
Obligation | Type | Financing Rate | Payment
Frequency |
OTC Equity Index Swap Agreements Sold Short†† |
Bank of America, N.A. | SPDR S&P 500 ETF Trust | Receive | 5.79% (Federal Funds Rate + 0.46%) | At Maturity |
OTC Interest Rate Swap Agreements†† |
Goldman Sachs International | Goldman Sachs Swaption Forward Volatility Index | Pay | 6.33% (Federal Funds Rate + 1.00%) | At Maturity |
Maturity Date | | Units | | | Notional
Amount | | | Value and
Unrealized
Appreciation
(Depreciation) | |
07/01/24 | | | 125,000 | | | $ | 65,383,750 | | | $ | 12,500 | |
04/11/25 | | | 37,000,000 | | | | 52,995,100 | | | | (1,234,801 | ) |
Forward Foreign Currency Exchange Contracts†† |
Counterparty | | Currency | | | Type | | | Quantity | | | Contract
Amount | | | Settlement
Date | | | Unrealized
Appreciation
(Depreciation) | |
Barclays Bank plc | | | EUR | | | | Sell | | | | 114,755,000 | | 125,516,306 USD | | | 04/15/24 | | | $ | 1,632,524 | |
Bank of America, N.A. | | | GBP | | | | Sell | | | | 54,265,000 | | 69,418,230 USD | | | 04/15/24 | | | | 923,566 | |
Bank of America, N.A. | | | CAD | | | | Sell | | | | 5,275,000 | | 3,909,272 USD | | | 04/15/24 | | | | 12,711 | |
Bank of America, N.A. | | | EUR | | | | Sell | | | | 72,000 | | 78,863 USD | | | 04/15/24 | | | | 1,136 | |
Barclays Bank plc | | | EUR | | | | Buy | | | | 60,000 | | 64,953 USD | | | 04/15/24 | | | | (180 | ) |
Morgan Stanley Capital Services LLC | | | GBP | | | | Buy | | | | 1,025,000 | | 1,295,465 USD | | | 04/15/24 | | | | (1,684 | ) |
| | | | | | | | | | | | | | | | | | | | | | | $ | 2,568,073 | |
50 | THE GUGGENHEIM FUNDS SEMI-ANNUAL REPORT | SEE NOTES TO CONSOLIDATED FINANCIAL STATEMENTS. |
CONSOLIDATED SCHEDULE OF INVESTMENTS (Unaudited)(continued) | March 31, 2024 |
MACRO OPPORTUNITIES FUND | |
~ | The face amount is denominated in U.S. dollars unless otherwise indicated. |
* | Non-income producing security. |
** | Includes cumulative appreciation (depreciation). Variation margin is reported within the Consolidated Statement of Assets and Liabilities. |
† | Value determined based on Level 1 inputs, unless otherwise noted — See Note 4. |
†† | Value determined based on Level 2 inputs, unless otherwise noted — See Note 4. |
††† | Value determined based on Level 3 inputs — See Note 4. |
◊ | Variable rate security. Rate indicated is the rate effective at March 31, 2024. In some instances, the effective rate is limited by a minimum rate floor or a maximum rate cap established by the issuer. The settlement status of a position may also impact the effective rate indicated. In some cases, a position may be unsettled at period end and may not have a stated effective rate. In instances where multiple underlying reference rates and spread amounts are shown, the effective rate is based on a weighted average. |
1 | Affiliated issuer. |
2 | Special Purpose Acquisition Company (SPAC). |
3 | Security is a 144A or Section 4(a)(2) security. These securities have been determined to be liquid under guidelines established by the Board of Trustees. The total market value of 144A or Section 4(a)(2) securities is $2,644,451,875 (cost $2,845,633,548), or 40.2% of total net assets. |
4 | Rate indicated is the 7-day yield as of March 31, 2024. |
5 | Perpetual maturity. |
6 | Security has a fixed rate coupon which will convert to a floating or variable rate coupon on a future date. |
7 | Security is in default of interest and/or principal obligations. |
8 | Security is a 144A or Section 4(a)(2) security. These securities have been determined to be illiquid and restricted under guidelines established by the Board of Trustees. The total market value of 144A or Section 4(a)(2) illiquid and restricted securities is $7,856,581 (cost $12,883,775), or 0.1% of total net assets — See Note 9. |
9 | Security has no stated coupon. However, it is expected to receive residual cash flow payments on defined deal dates. |
10 | Security is an interest-only strip. |
11 | Security is a step up/down bond. The coupon increases or decreases at regular intervals until the bond reaches full maturity. Rate indicated is the rate at March 31, 2024. See table below for additional step information for each security. |
12 | Payment-in-kind security. |
13 | Rate indicated is the effective yield at the time of purchase. |
14 | Zero coupon rate security. |
15 | Security is unsettled at period end and does not have a stated effective rate. |
| | CAD — Canadian Dollar |
| | CDX.NA.HY.41.V2 — Credit Default Swap North American High Yield Series 41 Index Version 2 |
| | CME — Chicago Mercantile Exchange |
| | CMS — Constant Maturity Swap |
| | CMT — Constant Maturity Treasury |
| | EUR — Euro |
| | EURIBOR — European Interbank Offered Rate |
| | GBP — British Pound |
| | ICE — Intercontinental Exchange |
| | ITRAXX.EUR.41.V1 — iTraxx Europe Series 41 Index Version 1 |
| | LIBOR — London Interbank Offered Rate |
| | plc — Public Limited Company |
| | PPV — Public-Private Venture |
| | REMIC — Real Estate Mortgage Investment Conduit |
SEE NOTES TO CONSOLIDATED FINANCIAL STATEMENTS. | THE GUGGENHEIM FUNDS SEMI-ANNUAL REPORT | 51 |
CONSOLIDATED SCHEDULE OF INVESTMENTS (Unaudited)(continued) | March 31, 2024 |
MACRO OPPORTUNITIES FUND | |
| | SARL — Société à Responsabilité Limitée |
| | SOFR — Secured Overnight Financing Rate |
| | SONIA — Sterling Overnight Index Average |
| | WAC — Weighted Average Coupon |
| | |
| | See Sector Classification in Other Information section. |
The following table summarizes the inputs used to value the Fund’s investments at March 31, 2024 (See Note 4 in the Notes to Consolidated Financial Statements):
Investments in Securities (Assets) | | Level 1
Quoted
Prices | | | Level 2
Significant
Observable
Inputs | | | Level 3
Significant
Unobservable
Inputs | | | Total | |
Common Stocks | | $ | 171,802 | | | $ | 2,050,836 | | | $ | 2,423,154 | | | $ | 4,645,792 | |
Preferred Stocks | | | — | | | | 279,927,849 | | | | 31,121,349 | | | | 311,049,198 | |
Warrants | | | 11,521 | | | | — | | | | 76 | | | | 11,597 | |
Exchange-Traded Funds | | | 106,913,521 | | | | — | | | | — | | | | 106,913,521 | |
Mutual Funds | | | 300,927,615 | | | | — | | | | — | | | | 300,927,615 | |
Money Market Funds | | | 228,085,866 | | | | — | | | | — | | | | 228,085,866 | |
Corporate Bonds | | | — | | | | 1,770,092,390 | | | | 71,445,828 | | | | 1,841,538,218 | |
Asset-Backed Securities | | | — | | | | 1,037,835,221 | | | | 188,989,648 | | | | 1,226,824,869 | |
Senior Floating Rate Interests | | | — | | | | 697,533,606 | | | | 209,116,471 | | | | 906,650,077 | |
Collateralized Mortgage Obligations | | | — | | | | 785,289,777 | | | | 34,846,304 | | | | 820,136,081 | |
U.S. Government Securities | | | — | | | | 379,255,311 | | | | — | | | | 379,255,311 | |
U.S. Treasury Bills | | | — | | | | 276,427,205 | | | | — | | | | 276,427,205 | |
Federal Agency Discount Notes | | | — | | | | 270,064,196 | | | | — | | | | 270,064,196 | |
Convertible Bonds | | | — | | | | 24,612,688 | | | | — | | | | 24,612,688 | |
Municipal Bonds | | | — | | | | 10,429,097 | | | | — | | | | 10,429,097 | |
Senior Fixed Rate Interests | | | — | | | | 145,031 | | | | 702,513 | | | | 847,544 | |
Options Purchased | | | 4,439,736 | | | | 28,478 | | | | — | | | | 4,468,214 | |
Credit Default Swap Agreements** | | | — | | | | 35,309 | | | | — | | | | 35,309 | |
Interest Rate Swap Agreements** | | | — | | | | 34,682 | | | | — | | | | 34,682 | |
Forward Foreign Currency Exchange Contracts** | | | — | | | | 2,569,937 | | | | — | | | | 2,569,937 | |
Equity Index Swap Agreements** | | | — | | | | 12,500 | | | | — | | | | 12,500 | |
Total Assets | | $ | 640,550,061 | | | $ | 5,536,344,113 | | | $ | 538,645,343 | | | $ | 6,715,539,517 | |
52 | THE GUGGENHEIM FUNDS SEMI-ANNUAL REPORT | SEE NOTES TO CONSOLIDATED FINANCIAL STATEMENTS. |
CONSOLIDATED SCHEDULE OF INVESTMENTS (Unaudited)(continued) | March 31, 2024 |
MACRO OPPORTUNITIES FUND | |
Investments in Securities (Liabilities) | | Level 1
Quoted
Prices | | | Level 2
Significant
Observable
Inputs | | | Level 3
Significant
Unobservable
Inputs | | | Total | |
Interest Rate Futures Contracts** | | $ | 940,616 | | | $ | — | | | $ | — | | | $ | 940,616 | |
Credit Default Swap Agreements** | | | — | | | | 3,168,476 | | | | — | | | | 3,168,476 | |
Forward Foreign Currency Exchange Contracts** | | | — | | | | 1,864 | | | | — | | | | 1,864 | |
Interest Rate Swap Agreements** | | | — | | | | 1,234,801 | | | | — | | | | 1,234,801 | |
Unfunded Loan Commitments (Note 8) | | | — | | | | — | | | | 1,636,967 | | | | 1,636,967 | |
Total Liabilities | | $ | 940,616 | | | $ | 4,405,141 | | | $ | 1,636,967 | | | $ | 6,982,724 | |
** | This derivative is reported as unrealized appreciation/depreciation at period end. |
The following is a summary of significant unobservable inputs used in the fair valuation of assets and liabilities categorized within Level 3 of the fair value hierarchy:
Category | | Ending
Balance at
March 31, 2024 | | Valuation
Technique | Unobservable
Inputs | | Input Range | | | Weighted
Average* | |
Assets: | | | | | | | | | | | | | | |
Asset-Backed Securities | | $ | 113,468,998 | | Yield Analysis | Yield | 6.2%-8.7% | 6.8% |
Asset-Backed Securities | | | 75,458,795 | | Option adjusted spread off prior month end broker quote | Broker Quote | — | — |
Asset-Backed Securities | | | 61,855 | | Third Party Pricing | Broker Quote | — | — |
Collateralized Mortgage Obligations | | | 29,592,241 | | Third Party Pricing | Trade Price | — | — |
Collateralized Mortgage Obligations | | | 5,254,063 | | Option adjusted spread off prior month end broker quote | Broker Quote | — | — |
Common Stocks | | | 2,413,432 | | Enterprise Value | Valuation Multiple | 2.2x-16.0x | 5.5x |
Common Stocks | | | 9,722 | | Model Price | Liquidation Value | — | — |
Corporate Bonds | | | 27,958,370 | | Option adjusted spread off prior month end broker quote | Broker Quote | — | — |
Corporate Bonds | | | 22,180,419 | | Yield Analysis | Yield | 6.7% | — |
Corporate Bonds | | | 21,179,033 | | Third Party Pricing | Broker Quote | — | — |
Corporate Bonds | | | 118,579 | | Model Price | Purchase Price | — | — |
SEE NOTES TO CONSOLIDATED FINANCIAL STATEMENTS. | THE GUGGENHEIM FUNDS SEMI-ANNUAL REPORT | 53 |
CONSOLIDATED SCHEDULE OF INVESTMENTS (Unaudited)(continued) | March 31, 2024 |
MACRO OPPORTUNITIES FUND | |
Category | | Ending
Balance at
March 31, 2024 | | Valuation
Technique | Unobservable
Inputs | | Input Range | | | Weighted
Average* | |
Corporate Bonds | | $ | 9,427 | | Third Party Pricing | Trade Price | — | — |
Preferred Stocks | | | 27,088,560 | | Yield Analysis | Yield | 6.8% | — |
Preferred Stocks | | | 4,032,789 | | Enterprise Value | Valuation Multiple | 5.0x | — |
Senior Fixed Rate Interests | | | 702,513 | | Third Party Pricing | Broker Quote | — | — |
Senior Floating Rate Interests | | | 157,843,281 | | Yield Analysis | Yield | 10.3%-14.2% | 11.6% |
Senior Floating Rate Interests | | | 34,997,644 | | Model Price | Purchase Price | — | — |
Senior Floating Rate Interests | | | 10,872,816 | | Third Party Pricing | Broker Quote | — | — |
Senior Floating Rate Interests | | | 4,735,120 | | Third Party Pricing | Trade Price | — | — |
Senior Floating Rate Interests | | | 667,610 | | Model Price | Liquidation Value | — | — |
Warrants | | | 76 | | Model Price | Liquidation Value | — | — |
Total Assets | | $ | 538,645,343 | | | | | |
Liabilities: | | | | | | | | | | | | | | |
Unfunded Loan Commitments | | $ | 1,636,967 | | Model Price | Purchase Price | — | — |
* | Inputs are weighted by the fair value of the instruments. |
Significant changes in a quote, yield, liquidation value or valuation multiple would generally result in significant changes in the fair value of the security.
The Fund’s fair valuation leveling guidelines classify a single daily broker quote, or a vendor price based on a single daily or monthly broker quote, as Level 3, if such a quote or price cannot be supported with other available market information.
Transfers between Level 2 and Level 3 may occur as markets fluctuate and/or the availability of data used in an investment’s valuation changes. For the period ended March 31, 2024, the Fund had securities with a total value of $19,069,751 transfer into Level 3 from Level 2 due to a lack of observable inputs and had securities with a total value of $46,471,573 transfer out of Level 3 into Level 2 due to the availability of current and reliable market-based data provided by a third-party pricing service which utilizes significant observable inputs.
54 | THE GUGGENHEIM FUNDS SEMI-ANNUAL REPORT | SEE NOTES TO CONSOLIDATED FINANCIAL STATEMENTS. |
CONSOLIDATED SCHEDULE OF INVESTMENTS (Unaudited)(continued) | March 31, 2024 |
MACRO OPPORTUNITIES FUND | |
Summary of Fair Value Level 3 Activity
Following is a reconciliation of Level 3 assets for which significant unobservable inputs were used to determine fair value for the period ended March 31, 2024:
| | | Assets | |
| | Asset-Backed
Securities | | | Collateralized
Mortgage
Obligations | | | Corporate
Bonds | | | Senior
Floating Rate
Interests | | | Warrants | |
Beginning Balance | | $ | 223,348,932 | | | $ | 4,986,289 | | | $ | 59,850,234 | | | $ | 243,686,805 | | | $ | 76 | |
Purchases/(Receipts) | | | 17,354,525 | | | | 30,070,000 | | | | 12,475,000 | | | | 57,413,057 | | | | — | |
(Sales, maturities and paydowns)/Fundings | | | (49,310,097 | ) | | | (554,370 | ) | | | (17,376,522 | ) | | | (63,398,446 | ) | | | — | |
Amortization of premiums/discounts | | | 128,794 | | | | (58 | ) | | | 563,954 | | | | 915,952 | | | | — | |
Corporate actions | | | — | | | | — | | | | — | | | | (1,027,205 | ) | | | — | |
Total realized gains (losses) included in earnings | | | (5,183 | ) | | | (56 | ) | | | (1,313,672 | ) | | | (158,186 | ) | | | — | |
Total change in unrealized appreciation (depreciation) included in earnings | | | 8,642,806 | | | | 344,499 | | | | 3,479,522 | | | | 2,393,757 | | | | — | |
Transfers into Level 3 | | | — | | | | — | | | | 13,767,312 | | | | 4,592,181 | | | | — | |
Transfers out of Level 3 | | | (11,170,129 | ) | | | — | | | | — | | | | (35,301,444 | ) | | | — | |
Ending Balance | | $ | 188,989,648 | | | $ | 34,846,304 | | | $ | 71,445,828 | | | $ | 209,116,471 | | | $ | 76 | |
Net change in unrealized appreciation (depreciation) for investments in Level 3 securities still held at March 31, 2024 | | $ | 1,490,465 | | | $ | 344,499 | | | $ | 2,283,949 | | | $ | 1,191,415 | | | $ | — | |
SEE NOTES TO CONSOLIDATED FINANCIAL STATEMENTS. | THE GUGGENHEIM FUNDS SEMI-ANNUAL REPORT | 55 |
CONSOLIDATED SCHEDULE OF INVESTMENTS (Unaudited)(continued) | March 31, 2024 |
MACRO OPPORTUNITIES FUND | |
| | | Assets | | | | | | | Liabilities | |
| | Common
Stocks | | | Preferred
Stocks | | | Senior
Fixed Rate
Interests | | | Total
Assets | | | Unfunded
Loan
Commitments | |
Beginning Balance | | $ | 995,145 | | | $ | 28,121,912 | | | $ | — | | | $ | 560,989,393 | | | $ | (1,990,229 | ) |
Purchases/(Receipts) | | | — | | | | — | | | | — | | | | 117,312,582 | | | | (808,949 | ) |
(Sales, maturities and paydowns)/Fundings | | | (158 | ) | | | — | | | | — | | | | (130,639,593 | ) | | | 741,320 | |
Amortization of premiums/discounts | | | — | | | | — | | | | — | | | | 1,608,642 | | | | 62,102 | |
Corporate actions | | | 1,201,617 | | | | (174,412 | ) | | | — | | | | — | | | | — | |
Total realized gains (losses) included in earnings | | | (503,051 | ) | | | — | | | | — | | | | (1,980,148 | ) | | | 380,608 | |
Total change in unrealized appreciation (depreciation) included in earnings | | | 721,856 | | | | 3,173,849 | | | | — | | | | 18,756,289 | | | | (21,819 | ) |
Transfers into Level 3 | | | 7,745 | | | | — | | | | 702,513 | | | | 19,069,751 | | | | — | |
Transfers out of Level 3 | | | — | | | | — | | | | — | | | | (46,471,573 | ) | | | — | |
Ending Balance | | $ | 2,423,154 | | | $ | 31,121,349 | | | $ | 702,513 | | | $ | 538,645,343 | | | $ | (1,636,967 | ) |
Net change in unrealized appreciation (depreciation) for investments in Level 3 securities still held at March 31, 2024 | | $ | 218,965 | | | $ | 3,098,473 | | | $ | — | | | $ | 8,627,766 | | | $ | (25,850 | ) |
Step Coupon Bonds
The following table discloses additional information related to step coupon bonds held by the Fund. Certain securities are subject to multiple rate changes prior to maturity. For those securities, a range of rates and corresponding dates have been provided. Rates for all step coupon bonds held by the Fund are scheduled to increase, except GAIA Aviation Ltd. which is scheduled to decrease.
Name | | Coupon Rate at
Next Reset Date | | | Next Rate
Reset Date | | | Future Reset Rate | | | Future Reset Date | |
BRAVO Residential Funding Trust 2022-R1, 3.13% due 01/29/70 | | | 6.13 | % | | | 01/30/25 | | | | — | | | | — | |
Citigroup Mortgage Loan Trust 2022-A, 6.17% due 09/25/62 | | | 9.17 | % | | | 09/25/25 | | | | 10.17 | % | | | 09/25/26 | |
GAIA Aviation Ltd. 2019-1, 3.97% due 12/15/44 | | | 2.00 | % | | | 11/15/26 | | | | — | | | | — | |
GAIA Aviation Ltd. 2019-1, 5.19% due 12/15/44 | | | 2.00 | % | | | 10/15/26 | | | | — | | | | — | |
GCAT Trust 2022-NQM5, 5.71% due 08/25/67 | | | 6.71 | % | | | 10/01/26 | | | | — | | | | — | |
GCAT Trust 2023-NQM2, 6.60% due 11/25/67 | | | 7.60 | % | | | 01/01/27 | | | | — | | | | — | |
NYMT Loan Trust 2022-SP1, 5.25% due 07/25/62 | | | 8.25 | % | | | 07/01/25 | | | | 9.25 | % | | | 07/01/26 | |
56 | THE GUGGENHEIM FUNDS SEMI-ANNUAL REPORT | SEE NOTES TO CONSOLIDATED FINANCIAL STATEMENTS. |
CONSOLIDATED SCHEDULE OF INVESTMENTS (Unaudited)(continued) | March 31, 2024 |
MACRO OPPORTUNITIES FUND | |
Name | | Coupon Rate at
Next Reset Date | | | Next Rate
Reset Date | | | Future Reset Rate | | | Future Reset Date | |
OBX Trust 2023-NQM2, 6.80% due 01/25/62 | | | 7.80 | % | | | 02/01/27 | | | | — | | | | — | |
OBX Trust 2022-NQM8, 6.10% due 09/25/62 | | | 7.10 | % | | | 10/01/26 | | | | — | | | | — | |
OBX Trust 2022-NQM9, 6.45% due 09/25/62 | | | 7.45 | % | | | 11/01/26 | | | | — | | | | — | |
OSAT Trust 2021-RPL1, 2.12% due 05/25/65 | | | 5.12 | % | | | 06/25/24 | | | | 6.12 | % | | | 06/25/25 | |
Verus Securitization Trust 2022-8, 6.13% due 09/25/67 | | | 7.13 | % | | | 10/01/26 | | | | — | | | | — | |
Affiliated Transactions
Investments representing 5% or more of the outstanding voting shares of a company, or control of or by, or common control under Guggenheim Investments (“GI”), result in that company being considered an affiliated issuer, as defined in the 1940 Act.
The Fund may invest in certain of the underlying series of Guggenheim Strategy Funds Trust, including Guggenheim Strategy Fund II and Guggenheim Strategy Fund III (collectively, the “Guggenheim Strategy Funds”), each of which are open-end management investment companies managed by GI. The Guggenheim Strategy Funds, which launched on March 11, 2014, are offered as short term investment options only to mutual funds, trusts, and other accounts managed by GI and/or its affiliates, and are not available to the public. The Guggenheim Strategy Funds pay no investment management fees. The Guggenheim Strategy Funds’ annual report on Form N-CSR dated September 30, 2023 is available publicly or upon request. This information is available from the EDGAR database on the SEC’s website at https://www.sec.gov/Archives/edgar/data/1601445/000182126823000217/gug86449-ncsr.htm. The Fund may invest in certain of the underlying series of Guggenheim Funds Trust, which are open-end management investment companies managed by GI, are available to the public and whose most recent annual report on Form N-CSR is available publicly or upon request.
Transactions during the period ended March 31, 2024, in which the company is an affiliated issuer, were as follows:
Security Name | | Value
09/30/23 | | | Additions | | | Reductions | | | Realized
Gain (Loss) | |
Common Stock | | | | | | | | | | | | | | | | |
BP Holdco LLC* | | $ | 48,218 | | | $ | — | | | $ | — | | | $ | — | |
Mutual Funds | | | | | | | | | | | | | | | | |
Guggenheim Alpha Opportunity Fund — Institutional Class | | | 29,045,744 | | | | 164,424 | | | | — | | | | — | |
Guggenheim Limited Duration Fund — Class R6 | | | 122,839,898 | | | | 3,045,514 | | | | — | | | | — | |
Guggenheim Risk Managed Real Estate Fund — Institutional Class | | | 29,711,644 | | | | 274,197 | | | | — | | | | — | |
Guggenheim Strategy Fund II | | | 19,207,708 | | | | 452,029 | | | | — | | | | — | |
Guggenheim Strategy Fund III | | | 33,331,353 | | | | 910,483 | | | | — | | | | — | |
Guggenheim Ultra Short Duration Fund — Institutional Class | | | 48,849,509 | | | | 1,388,550 | | | | — | | | | — | |
| | | $ | 283,034,074 | | | $ | 6,235,197 | | | $ | — | | | $ | — | |
SEE NOTES TO CONSOLIDATED FINANCIAL STATEMENTS. | THE GUGGENHEIM FUNDS SEMI-ANNUAL REPORT | 57 |
CONSOLIDATED SCHEDULE OF INVESTMENTS (Unaudited)(concluded) | March 31, 2024 |
MACRO OPPORTUNITIES FUND | |
Security Name | | Change in
Unrealized
Appreciation
(Depreciation) | | | Value
03/31/24 | | | Shares
03/31/24 | | | Investment
Income | |
Common Stock | | | | | | | | | | | | | | | | |
BP Holdco LLC* | | $ | (2,715 | ) | | $ | 45,503 | | | | 37,539 | | | $ | — | |
Mutual Funds | | | | | | | | | | | | | | | | |
Guggenheim Alpha Opportunity Fund — Institutional Class | | | 3,417,396 | | | | 32,627,564 | | | | 1,022,808 | | | | 164,424 | |
Guggenheim Limited Duration Fund — Class R6 | | | 2,626,167 | | | | 128,511,579 | | | | 5,334,644 | | | | 3,064,501 | |
Guggenheim Risk Managed Real Estate Fund — Institutional Class | | | 4,060,390 | | | | 34,046,231 | | | | 1,069,627 | | | | 476,442 | |
Guggenheim Strategy Fund II | | | 264,176 | | | | 19,923,913 | | | | 809,915 | | | | 550,928 | |
Guggenheim Strategy Fund III | | | 526,958 | | | | 34,768,794 | | | | 1,409,355 | | | | 915,349 | |
Guggenheim Ultra Short Duration Fund — Institutional Class | | | 811,475 | | | | 51,049,534 | | | | 5,151,315 | | | | 1,396,578 | |
| | | $ | 11,703,847 | | | $ | 300,973,118 | | | | | | | $ | 6,568,222 | |
* | Non-income producing security. |
58 | THE GUGGENHEIM FUNDS SEMI-ANNUAL REPORT | SEE NOTES TO CONSOLIDATED FINANCIAL STATEMENTS. |
CONSOLIDATED STATEMENT OF ASSETS AND LIABILITIES (Unaudited) |
MACRO OPPORTUNITIES FUND |
March 31, 2024
Assets: |
Investments in unaffiliated issuers, at value (cost $6,893,725,347) | | $ | 6,411,913,971 | |
Investments in affiliated issuers, at value (cost $298,334,944) | | | 300,973,118 | |
Foreign currency, at value (cost $1,476,601) | | | 1,476,588 | |
Segregated cash with broker | | | 4,557,708 | |
Unamortized upfront premiums paid on credit default swap agreements | | | 143,777 | |
Unamortized upfront premiums paid on interest rate swap agreements | | | 303 | |
Unrealized appreciation on OTC swap agreements | | | 12,500 | |
Unrealized appreciation on forward foreign currency exchange contracts | | | 2,569,937 | |
Prepaid expenses | | | 159,647 | |
Receivables: |
Interest | | | 54,130,110 | |
Securities sold | | | 20,147,713 | |
Fund shares sold | | | 9,782,112 | |
Dividends | | | 1,433,576 | |
Total assets | | | 6,807,301,060 | |
| | | | | |
| | | | | |
Liabilities: |
Unfunded loan commitments, at value (Note 8) (commitment fees received $2,210,534) | | $ | 1,636,967 | |
Due to custodian bank | | | 13,431,367 | |
Segregated cash due to broker | | | 70,157 | |
Unamortized upfront premiums received on credit default swap agreements | | | 2,242,051 | |
Unrealized depreciation on OTC swap agreements | | | 1,234,801 | |
Unrealized depreciation on forward foreign currency exchange contracts | | | 1,864 | |
Payable for: |
Securities purchased | | | 187,977,171 | |
Fund shares redeemed | | | 16,927,510 | |
Management fees | | | 4,472,603 | |
Distributions to shareholders | | | 4,090,565 | |
Transfer agent/maintenance fees | | | 566,919 | |
Variation margin on futures contracts | | | 457,500 | |
Swap settlement | | | 194,206 | |
Distribution and service fees | | | 157,601 | |
Protection fees on credit default swap agreements | | | 101,826 | |
Fund accounting/administration fees | | | 39,804 | |
Variation margin on credit default swap agreements | | | 21,929 | |
Variation margin on interest rate swap agreements | | | 9,939 | |
Trustees’ fees* | | | 9,046 | |
Due to Investment Adviser | | | 7,208 | |
Miscellaneous | | | 1,624,054 | |
Total liabilities | | | 235,275,088 | |
Net assets | | $ | 6,572,025,972 | |
* | Relates to Trustees not deemed “interested persons” within the meaning of Section 2(a)(19) of the 1940 Act. |
SEE NOTES TO CONSOLIDATED FINANCIAL STATEMENTS. | THE GUGGENHEIM FUNDS SEMI-ANNUAL REPORT | 59 |
CONSOLIDATED STATEMENT OF ASSETS AND LIABILITIES (Unaudited)(concluded) |
MACRO OPPORTUNITIES FUND |
March 31, 2024
| | | | | |
Net assets consist of: |
Paid in capital | | $ | 7,481,113,095 | |
Total distributable earnings (loss) | | | (909,087,123 | ) |
Net assets | | $ | 6,572,025,972 | |
| | | | | |
Class A: |
Net assets | | $ | 284,567,169 | |
Capital shares outstanding | | | 11,697,979 | |
Net asset value per share | | $ | 24.33 | |
Maximum offering price per share (Net asset value divided by 96.00%) | | $ | 25.34 | |
| | | | | |
Class C: |
Net assets | | $ | 102,588,861 | |
Capital shares outstanding | | | 4,220,256 | |
Net asset value per share | | $ | 24.31 | |
| | | | | |
Class P: |
Net assets | | $ | 49,669,343 | |
Capital shares outstanding | | | 2,040,960 | |
Net asset value per share | | $ | 24.34 | |
| | | | | |
Institutional Class: |
Net assets | | $ | 6,004,654,790 | |
Capital shares outstanding | | | 246,475,668 | |
Net asset value per share | | $ | 24.36 | |
| | | | | |
Class R6: |
Net assets | | $ | 130,545,809 | |
Capital shares outstanding | | | 5,359,484 | |
Net asset value per share | | $ | 24.36 | |
60 | THE GUGGENHEIM FUNDS SEMI-ANNUAL REPORT | SEE NOTES TO CONSOLIDATED FINANCIAL STATEMENTS. |
CONSOLIDATED STATEMENT OF OPERATIONS (Unaudited) |
MACRO OPPORTUNITIES FUND |
Six Months Ended March 31, 2024
Investment Income: |
Dividends from securities of unaffiliated issuers | | $ | 2,552,851 | |
Dividends from securities of affiliated issuers | | | 6,568,222 | |
Interest from securities of unaffiliated issuers | | | 211,006,817 | |
Total investment income | | | 220,127,890 | |
| | | | | |
Expenses: |
Management fees | | | 27,013,354 | |
Distribution and service fees: |
Class A | | | 351,017 | |
Class C | | | 513,878 | |
Class P | | | 61,402 | |
Transfer agent/maintenance fees: |
Class A | | | 112,602 | |
Class C | | | 25,202 | |
Class P | | | 19,334 | |
Institutional Class | | | 2,416,928 | |
Class R6 | | | 3,318 | |
Fund accounting/administration fees | | | 1,216,480 | |
Professional fees | | $ | 266,505 | |
Line of credit fees | | | 161,632 | |
Interest expense | | | 151,840 | |
Trustees’ fees* | | | 53,107 | |
Custodian fees | | | 51,801 | |
Miscellaneous | | | 373,807 | |
Recoupment of previously waived fees: |
Class A | | | 96,035 | |
Class C | | | 39,223 | |
Class P | | | 21,718 | |
Institutional Class | | | 14,563 | |
Class R6 | | | 4,087 | |
Total expenses | | | 32,967,833 | |
Less: |
Expenses reimbursed by Adviser: |
Class A | | | (295 | ) |
Class C | | | (265 | ) |
Institutional Class | | | (2,225,964 | ) |
Class R6 | | | (1,684 | ) |
Expenses waived by Adviser | | | (1,550,621 | ) |
Earnings credits applied | | | (2,859 | ) |
Total waived/reimbursed expenses | | | (3,781,688 | ) |
Net expenses | | | 29,186,145 | |
Net investment income | | | 190,941,745 | |
* | Relates to Trustees not deemed “interested persons” within the meaning of Section 2(a)(19) of the 1940 Act. |
SEE NOTES TO CONSOLIDATED FINANCIAL STATEMENTS. | THE GUGGENHEIM FUNDS SEMI-ANNUAL REPORT | 61 |
CONSOLIDATED STATEMENT OF OPERATIONS (Unaudited)(concluded) |
MACRO OPPORTUNITIES FUND |
Six Months Ended March 31, 2024
Net Realized and Unrealized Gain (Loss): |
Net realized gain (loss) on: |
Investments in unaffiliated issuers | | $ | (24,836,490 | ) |
Swap agreements | | | (24,806,926 | ) |
Options purchased | | | (1,912,741 | ) |
Forward foreign currency exchange contracts | | | (2,532,688 | ) |
Foreign currency transactions | | | (3,922,467 | ) |
Net realized loss | | | (58,011,312 | ) |
Net change in unrealized appreciation (depreciation) on: |
Investments in unaffiliated issuers | | | 232,455,435 | |
Investments in affiliated issuers | | | 11,703,847 | |
Swap agreements | | | 18,694,720 | |
Futures contracts | | | (940,616 | ) |
Options purchased | | | (1,829,887 | ) |
Forward foreign currency exchange contracts | | | (1,134,982 | ) |
Foreign currency translations | | | 182,261 | |
Net change in unrealized appreciation (depreciation) | | | 259,130,778 | |
Net realized and unrealized gain | | | 201,119,466 | |
Net increase in net assets resulting from operations | | $ | 392,061,211 | |
62 | THE GUGGENHEIM FUNDS SEMI-ANNUAL REPORT | SEE NOTES TO CONSOLIDATED FINANCIAL STATEMENTS. |
CONSOLIDATED STATEMENTS OF CHANGES IN NET ASSETS |
MACRO OPPORTUNITIES FUND | |
| | Six Months Ended
March 31, 2024
(Unaudited) | | | Year Ended
September 30,
2023 | |
Increase (Decrease) in Net Assets from Operations: | | | | | | | | |
Net investment income | | $ | 190,941,745 | | | $ | 339,429,107 | |
Net realized loss on investments | | | (58,011,312 | ) | | | (210,856,113 | ) |
Net change in unrealized appreciation (depreciation) on investments | | | 259,130,778 | | | | 292,518,294 | |
Net increase in net assets resulting from operations | | | 392,061,211 | | | | 421,091,288 | |
| | | | | | | | | |
Distributions to shareholders: | | | | | | | | |
Class A | | | (9,780,911 | ) | | | (16,952,857 | ) |
Class C | | | (3,210,097 | ) | | | (5,928,309 | ) |
Class P | | | (1,707,298 | ) | | | (4,987,662 | ) |
Institutional Class | | | (202,403,946 | ) | | | (310,664,175 | ) |
Class R6 | | | (5,594,995 | ) | | | (8,818,791 | ) |
Total distributions to shareholders | | | (222,697,247 | ) | | | (347,351,794 | ) |
| | | | | | | | | |
Capital share transactions: | | | | | | | | |
Proceeds from sale of shares | | | | | | | | |
Class A | | | 51,620,354 | | | | 88,917,715 | |
Class C | | | 15,255,684 | | | | 12,403,253 | |
Class P | | | 4,782,232 | | | | 16,822,252 | |
Institutional Class | | | 1,359,680,164 | | | | 2,128,695,437 | |
Class R6 | | | 34,285,781 | | | | 83,550,238 | |
Distributions reinvested | | | | | | | | |
Class A | | | 8,250,769 | | | | 14,302,558 | |
Class C | | | 2,888,525 | | | | 5,285,062 | |
Class P | | | 1,687,273 | | | | 4,948,543 | |
Institutional Class | | | 175,479,510 | | | | 268,719,399 | |
Class R6 | | | 5,442,400 | | | | 8,818,791 | |
Cost of shares redeemed | | | | | | | | |
Class A | | | (63,343,319 | ) | | | (154,649,331 | ) |
Class C | | | (21,742,677 | ) | | | (61,940,389 | ) |
Class P | | | (13,090,678 | ) | | | (130,394,089 | ) |
Institutional Class | | | (912,510,850 | ) | | | (2,629,895,397 | ) |
Class R6 | | | (101,014,923 | ) | | | (30,444,262 | ) |
Net increase (decrease) from capital share transactions | | | 547,670,245 | | | | (374,860,220 | ) |
Net increase (decrease) in net assets | | | 717,034,209 | | | | (301,120,726 | ) |
| | | | | | | | | |
Net assets: | | | | | | | | |
Beginning of period | | | 5,854,991,763 | | | | 6,156,112,489 | |
End of period | | $ | 6,572,025,972 | | | $ | 5,854,991,763 | |
SEE NOTES TO CONSOLIDATED FINANCIAL STATEMENTS. | THE GUGGENHEIM FUNDS SEMI-ANNUAL REPORT | 63 |
CONSOLIDATED STATEMENTS OF CHANGES IN NET ASSETS (concluded) |
MACRO OPPORTUNITIES FUND | |
| | Six Months Ended
March 31, 2024
(Unaudited) | | | Year Ended
September 30,
2023 | |
Capital share activity: | | | | | | | | |
Shares sold | | | | | | | | |
Class A | | | 2,149,676 | | | | 3,734,087 | |
Class C | | | 637,605 | | | | 521,851 | |
Class P | | | 199,141 | | | | 707,632 | |
Institutional Class | | | 56,560,713 | | | | 89,245,962 | |
Class R6 | | | 1,430,674 | | | | 3,495,646 | |
Shares issued from reinvestment of distributions | | | | | | | | |
Class A | | | 344,120 | | | | 600,755 | |
Class C | | | 120,580 | | | | 222,238 | |
Class P | | | 70,370 | | | | 208,213 | |
Institutional Class | | | 7,303,347 | | | | 11,271,078 | |
Class R6 | | | 227,422 | | | | 370,155 | |
Shares redeemed | | | | | | | | |
Class A | | | (2,641,382 | ) | | | (6,501,599 | ) |
Class C | | | (908,275 | ) | | | (2,604,191 | ) |
Class P | | | (551,593 | ) | | | (5,490,413 | ) |
Institutional Class | | | (38,058,589 | ) | | | (110,513,346 | ) |
Class R6 | | | (4,223,081 | ) | | | (1,280,546 | ) |
Net increase (decrease) in shares | | | 22,660,728 | | | | (16,012,478 | ) |
64 | THE GUGGENHEIM FUNDS SEMI-ANNUAL REPORT | SEE NOTES TO CONSOLIDATED FINANCIAL STATEMENTS. |
CONSOLIDATED FINANCIAL HIGHLIGHTS |
MACRO OPPORTUNITIES FUND | |
This table is presented to show selected data for a share outstanding throughout each period and to assist shareholders in evaluating a Fund’s performance for the periods presented.
Class A | | Six Months Ended
March 31, 2024a | | | Year
Ended
Sept. 30,
2023 | | | Year
Ended
Sept. 30,
2022 | | | Year
Ended
Sept. 30,
2021 | | | Year
Ended
Sept. 30,
2020 | | | Year
Ended
Sept. 30,
2019 | |
Per Share Data |
Net asset value, beginning of period | | $ | 23.66 | | | $ | 23.36 | | | $ | 27.19 | | | $ | 26.31 | | | $ | 25.82 | | | $ | 26.53 | |
Income (loss) from investment operations: |
Net investment income (loss)b | | | .71 | | | | 1.30 | | | | .89 | | | | .91 | | | | .74 | | | | .72 | |
Net gain (loss) on investments (realized and unrealized) | | | .79 | | | | .33 | | | | (3.77 | ) | | | 1.04 | | | | .61 | | | | (.62 | ) |
Total from investment operations | | | 1.50 | | | | 1.63 | | | | (2.88 | ) | | | 1.95 | | | | 1.35 | | | | .10 | |
Less distributions from: |
Net investment income | | | (.83 | ) | | | (1.33 | ) | | | (.95 | ) | | | (1.07 | ) | | | (.86 | ) | | | (.79 | ) |
Net realized gains | | | — | | | | — | | | | — | | | | — | | | | — | | | | (.02 | ) |
Total distributions | | | (.83 | ) | | | (1.33 | ) | | | (.95 | ) | | | (1.07 | ) | | | (.86 | ) | | | (.81 | ) |
Net asset value, end of period | | $ | 24.33 | | | $ | 23.66 | | | $ | 23.36 | | | $ | 27.19 | | | $ | 26.31 | | | $ | 25.82 | |
|
Total Returnc | | | 6.39 | % | | | 7.09 | % | | | (10.77 | %) | | | 7.49 | % | | | 5.39 | % | | | 0.41 | % |
Ratios/Supplemental Data |
Net assets, end of period (in thousands) | | $ | 284,567 | | | $ | 280,275 | | | $ | 327,393 | | | $ | 435,293 | | | $ | 312,986 | | | $ | 461,781 | |
Ratios to average net assets: |
Net investment income (loss) | | | 5.89 | % | | | 5.46 | % | | | 3.46 | % | | | 3.35 | % | | | 2.90 | % | | | 2.76 | % |
Total expensesd | | | 1.36 | % | | | 1.50 | % | | | 1.42 | % | | | 1.43 | % | | | 1.51 | % | | | 1.47 | % |
Net expensese,f,g | | | 1.30 | % | | | 1.44 | % | | | 1.37 | % | | | 1.37 | % | | | 1.39 | % | | | 1.39 | % |
Portfolio turnover rate | | | 17 | % | | | 32 | % | | | 25 | % | | | 84 | % | | | 130 | % | | | 46 | % |
SEE NOTES TO CONSOLIDATED FINANCIAL STATEMENTS. | THE GUGGENHEIM FUNDS SEMI-ANNUAL REPORT | 65 |
CONSOLIDATED FINANCIAL HIGHLIGHTS (continued) |
MACRO OPPORTUNITIES FUND | |
This table is presented to show selected data for a share outstanding throughout each period and to assist shareholders in evaluating a Fund’s performance for the periods presented.
Class C | | Six Months Ended
March 31, 2024a | | | Year
Ended
Sept. 30,
2023 | | | Year
Ended
Sept. 30,
2022 | | | Year
Ended
Sept. 30,
2021 | | | Year
Ended
Sept. 30,
2020 | | | Year
Ended
Sept. 30,
2019 | |
Per Share Data |
Net asset value, beginning of period | | $ | 23.64 | | | $ | 23.35 | | | $ | 27.17 | | | $ | 26.29 | | | $ | 25.80 | | | $ | 26.52 | |
Income (loss) from investment operations: |
Net investment income (loss)b | | | .62 | | | | 1.12 | | | | .70 | | | | .72 | | | | .55 | | | | .52 | |
Net gain (loss) on investments (realized and unrealized) | | | .80 | | | | .32 | | | | (3.76 | ) | | | 1.03 | | | | .61 | | | | (.62 | ) |
Total from investment operations | | | 1.42 | | | | 1.44 | | | | (3.06 | ) | | | 1.75 | | | | 1.16 | | | | (.10 | ) |
Less distributions from: |
Net investment income | | | (.75 | ) | | | (1.15 | ) | | | (.76 | ) | | | (.87 | ) | | | (.67 | ) | | | (.60 | ) |
Net realized gains | | | — | | | | — | | | | — | | | | — | | | | — | | | | (.02 | ) |
Total distributions | | | (.75 | ) | | | (1.15 | ) | | | (.76 | ) | | | (.87 | ) | | | (.67 | ) | | | (.62 | ) |
Net asset value, end of period | | $ | 24.31 | | | $ | 23.64 | | | $ | 23.35 | | | $ | 27.17 | | | $ | 26.29 | | | $ | 25.80 | |
|
Total Returnc | | | 6.02 | % | | | 6.25 | % | | | (11.41 | %) | | | 6.70 | % | | | 4.60 | % | | | (0.37 | %) |
Ratios/Supplemental Data |
Net assets, end of period (in thousands) | | $ | 102,589 | | | $ | 103,332 | | | $ | 145,469 | | | $ | 207,739 | | | $ | 219,866 | | | $ | 321,576 | |
Ratios to average net assets: |
Net investment income (loss) | | | 5.17 | % | | | 4.72 | % | | | 2.70 | % | | | 2.64 | % | | | 2.15 | % | | | 2.00 | % |
Total expensesd | | | 2.08 | % | | | 2.27 | % | | | 2.17 | % | | | 2.18 | % | | | 2.25 | % | | | 2.20 | % |
Net expensese,f,g | | | 2.03 | % | | | 2.21 | % | | | 2.12 | % | | | 2.12 | % | | | 2.15 | % | | | 2.13 | % |
Portfolio turnover rate | | | 17 | % | | | 32 | % | | | 25 | % | | | 84 | % | | | 130 | % | | | 46 | % |
66 | THE GUGGENHEIM FUNDS SEMI-ANNUAL REPORT | SEE NOTES TO CONSOLIDATED FINANCIAL STATEMENTS. |
CONSOLIDATED FINANCIAL HIGHLIGHTS (continued) |
MACRO OPPORTUNITIES FUND |
This table is presented to show selected data for a share outstanding throughout each period and to assist shareholders in evaluating a Fund’s performance for the periods presented.
Class P | | Six Months Ended
March 31, 2024a | | | Year
Ended
Sept. 30,
2023 | | | Year
Ended
Sept. 30,
2022 | | | Year
Ended
Sept. 30,
2021 | | | Year
Ended
Sept. 30,
2020 | | | Year
Ended
Sept. 30,
2019 | |
Per Share Data |
Net asset value, beginning of period | | $ | 23.67 | | | $ | 23.38 | | | $ | 27.20 | | | $ | 26.32 | | | $ | 25.82 | | | $ | 26.54 | |
Income (loss) from investment operations: |
Net investment income (loss)b | | | .70 | | | | 1.30 | | | | .90 | | | | .91 | | | | .74 | | | | .71 | |
Net gain (loss) on investments (realized and unrealized) | | | .80 | | | | .32 | | | | (3.77 | ) | | | 1.04 | | | | .62 | | | | (.62 | ) |
Total from investment operations | | | 1.50 | | | | 1.62 | | | | (2.87 | ) | | | 1.95 | | | | 1.36 | | | | .09 | |
Less distributions from: |
Net investment income | | | (.83 | ) | | | (1.33 | ) | | | (.95 | ) | | | (1.07 | ) | | | (.86 | ) | | | (.79 | ) |
Net realized gains | | | — | | | | — | | | | — | | | | — | | | | — | | | | (.02 | ) |
Total distributions | | | (.83 | ) | | | (1.33 | ) | | | (.95 | ) | | | (1.07 | ) | | | (.86 | ) | | | (.81 | ) |
Net asset value, end of period | | $ | 24.34 | | | $ | 23.67 | | | $ | 23.38 | | | $ | 27.20 | | | $ | 26.32 | | | $ | 25.82 | |
|
Total Return | | | 6.38 | % | | | 7.09 | % | | | (10.77 | %) | | | 7.48 | % | | | 5.42 | % | | | 0.37 | % |
Ratios/Supplemental Data |
Net assets, end of period (in thousands) | | $ | 49,669 | | | $ | 54,987 | | | $ | 161,232 | | | $ | 162,928 | | | $ | 99,575 | | | $ | 126,334 | |
Ratios to average net assets: |
Net investment income (loss) | | | 5.87 | % | | | 5.49 | % | | | 3.51 | % | | | 3.33 | % | | | 2.91 | % | | | 2.73 | % |
Total expensesd | | | 1.37 | % | | | 1.66 | % | | | 1.45 | % | | | 1.45 | % | | | 1.50 | % | | | 1.46 | % |
Net expensese,f,g | | | 1.32 | % | | | 1.49 | % | | | 1.37 | % | | | 1.37 | % | | | 1.40 | % | | | 1.39 | % |
Portfolio turnover rate | | | 17 | % | | | 32 | % | | | 25 | % | | | 84 | % | | | 130 | % | | | 46 | % |
SEE NOTES TO CONSOLIDATED FINANCIAL STATEMENTS. | THE GUGGENHEIM FUNDS SEMI-ANNUAL REPORT | 67 |
CONSOLIDATED FINANCIAL HIGHLIGHTS (continued) |
MACRO OPPORTUNITIES FUND | |
This table is presented to show selected data for a share outstanding throughout each period and to assist shareholders in evaluating a Fund’s performance for the periods presented.
Institutional Class | | Six Months Ended
March 31, 2024a | | | Year
Ended
Sept. 30,
2023 | | | Year
Ended
Sept. 30,
2022 | | | Year
Ended
Sept. 30,
2021 | | | Year
Ended
Sept. 30,
2020 | | | Year
Ended
Sept. 30,
2019 | |
Per Share Data |
Net asset value, beginning of period | | $ | 23.69 | | | $ | 23.40 | | | $ | 27.23 | | | $ | 26.34 | | | $ | 25.85 | | | $ | 26.57 | |
Income (loss) from investment operations: |
Net investment income (loss)b | | | .75 | | | | 1.40 | | | | .99 | | | | 1.02 | | | | .85 | | | | .81 | |
Net gain (loss) on investments (realized and unrealized) | | | .80 | | | | .32 | | | | (3.76 | ) | | | 1.05 | | | | .60 | | | | (.61 | ) |
Total from investment operations | | | 1.55 | | | | 1.72 | | | | (2.77 | ) | | | 2.07 | | | | 1.45 | | | | .20 | |
Less distributions from: |
Net investment income | | | (.88 | ) | | | (1.43 | ) | | | (1.06 | ) | | | (1.18 | ) | | | (.96 | ) | | | (.90 | ) |
Net realized gains | | | — | | | | — | | | | — | | | | — | | | | — | | | | (.02 | ) |
Total distributions | | | (.88 | ) | | | (1.43 | ) | | | (1.06 | ) | | | (1.18 | ) | | | (.96 | ) | | | (.92 | ) |
Net asset value, end of period | | $ | 24.36 | | | $ | 23.69 | | | $ | 23.40 | | | $ | 27.23 | | | $ | 26.34 | | | $ | 25.85 | |
|
Total Return | | | 6.59 | % | | | 7.47 | % | | | (10.39 | %) | | | 7.91 | % | | | 5.84 | % | | | 0.77 | % |
Ratios/Supplemental Data |
Net assets, end of period (in thousands) | | $ | 6,004,655 | | | $ | 5,228,680 | | | $ | 5,397,131 | | | $ | 6,906,534 | | | $ | 4,097,303 | | | $ | 5,396,868 | |
Ratios to average net assets: |
Net investment income (loss) | | | 6.26 | % | | | 5.86 | % | | | 3.85 | % | | | 3.74 | % | | | 3.32 | % | | | 3.12 | % |
Total expensesd | | | 1.04 | % | | | 1.18 | % | | | 1.09 | % | | | 1.08 | % | | | 1.17 | % | | | 1.13 | % |
Net expensese,f,g | | | 0.91 | % | | | 1.03 | % | | | 0.96 | % | | | 0.96 | % | | | 0.99 | % | | | 0.98 | % |
Portfolio turnover rate | | | 17 | % | | | 32 | % | | | 25 | % | | | 84 | % | | | 130 | % | | | 46 | % |
68 | THE GUGGENHEIM FUNDS SEMI-ANNUAL REPORT | SEE NOTES TO CONSOLIDATED FINANCIAL STATEMENTS. |
CONSOLIDATED FINANCIAL HIGHLIGHTS (continued) |
MACRO OPPORTUNITIES FUND | |
This table is presented to show selected data for a share outstanding throughout each period and to assist shareholders in evaluating a Fund’s performance for the periods presented.
Class R6 | | Six Months Ended
March 31, 2024a | | | Year
Ended
Sept. 30,
2023 | | | Year
Ended
Sept. 30,
2022 | | | Year
Ended
Sept. 30,
2021 | | | Year
Ended
Sept. 30,
2020 | | | Period
Ended
Sept. 30,
2019h | |
Per Share Data |
Net asset value, beginning of period | | $ | 23.69 | | | $ | 23.39 | | | $ | 27.22 | | | $ | 26.34 | | | $ | 25.84 | | | $ | 25.98 | |
Income (loss) from investment operations: |
Net investment income (loss)b | | | .75 | | | | 1.40 | | | | .98 | | | | 1.02 | | | | .87 | | | | .36 | |
Net gain (loss) on investments (realized and unrealized) | | | .80 | | | | .33 | | | | (3.75 | ) | | | 1.04 | | | | .58 | | | | (.03 | ) |
Total from investment operations | | | 1.55 | | | | 1.73 | | | | (2.77 | ) | | | 2.06 | | | | 1.45 | | | | .33 | |
Less distributions from: |
Net investment income | | | (.88 | ) | | | (1.43 | ) | | | (1.06 | ) | | | (1.18 | ) | | | (.95 | ) | | | (.47 | ) |
Total distributions | | | (.88 | ) | | | (1.43 | ) | | | (1.06 | ) | | | (1.18 | ) | | | (.95 | ) | | | (.47 | ) |
Net asset value, end of period | | $ | 24.36 | | | $ | 23.69 | | | $ | 23.39 | | | $ | 27.22 | | | $ | 26.34 | | | $ | 25.84 | |
|
Total Return | | | 6.59 | % | | | 7.51 | % | | | (10.39 | %) | | | 7.91 | % | | | 5.81 | % | | | 1.30 | % |
Ratios/Supplemental Data |
Net assets, end of period (in thousands) | | $ | 130,546 | | | $ | 187,717 | | | $ | 124,888 | | | $ | 197,067 | | | $ | 136,669 | | | $ | 676 | |
Ratios to average net assets: |
Net investment income (loss) | | | 6.28 | % | | | 5.85 | % | | | 3.79 | % | | | 3.74 | % | | | 3.41 | % | | | 2.79 | % |
Total expensesd | | | 0.96 | % | | | 1.07 | % | | | 1.00 | % | | | 1.01 | % | | | 1.09 | % | | | 1.11 | % |
Net expensese,f,g | | | 0.91 | % | | | 1.01 | % | | | 0.96 | % | | | 0.96 | % | | | 0.99 | % | | | 1.03 | % |
Portfolio turnover rate | | | 17 | % | | | 32 | % | | | 25 | % | | | 84 | % | | | 130 | % | | | 46 | % |
SEE NOTES TO CONSOLIDATED FINANCIAL STATEMENTS. | THE GUGGENHEIM FUNDS SEMI-ANNUAL REPORT | 69 |
CONSOLIDATED FINANCIAL HIGHLIGHTS (concluded) |
MACRO OPPORTUNITIES FUND |
a | Unaudited figures for the period ended March 31, 2024. Percentage amounts for the period, except total return and portfolio turnover rate, have been annualized. |
b | Net investment income (loss) per share was computed using average shares outstanding throughout the period. |
c | Total return does not reflect the impact of any applicable sales charges. |
d | Does not include expenses of the underlying funds in which the Fund invests. |
e | Net expense information reflects the expense ratios after expense waivers and reimbursements, as applicable. |
f | The portion of the ratios of net expenses to average net assets attributable to recoupments of prior fee reductions or expense reimbursements for the periods presented was as follows: |
| 03/31/24a | 09/30/23 | 09/30/22 | 09/30/21 | 09/30/20 | 09/30/19 |
Class A | 0.07% | 0.05% | 0.06% | 0.10% | 0.03% | 0.02% |
Class C | 0.08% | 0.04% | 0.06% | 0.08% | 0.05% | 0.05% |
Class P | 0.09% | 0.01% | 0.05% | 0.09% | 0.03% | 0.04% |
Institutional Class | 0.00%* | 0.00%* | — | — | 0.00%* | 0.00%* |
Class R6 | 0.01% | 0.01% | 0.00%* | 0.00%* | 0.00%* | 0.00%*,h |
g | Net expenses may include expenses that are excluded from the expense limitation agreement. Excluding these expenses, the net expense ratios for the periods presented would be: |
| 03/31/24a | 09/30/23 | 09/30/22 | 09/30/21 | 09/30/20 | 09/30/19 |
Class A | 1.29% | 1.32% | 1.33% | 1.33% | 1.33% | 1.33% |
Class C | 2.02% | 2.07% | 2.08% | 2.08% | 2.08% | 2.07% |
Class P | 1.31% | 1.32% | 1.33% | 1.33% | 1.33% | 1.33% |
Institutional Class | 0.90% | 0.91% | 0.92% | 0.92% | 0.92% | 0.92% |
Class R6 | 0.90% | 0.91% | 0.92% | 0.92% | 0.92% | 0.92%h |
h | Since commencement of operations: March 13, 2019. Percentage amounts for the period, except total return and portfolio turnover rate, have been annualized. |
70 | THE GUGGENHEIM FUNDS SEMI-ANNUAL REPORT | SEE NOTES TO CONSOLIDATED FINANCIAL STATEMENTS. |
NOTES TO CONSOLIDATED FINANCIAL STATEMENTS (Unaudited) |
Note 1 – Organization, Consolidation of Subsidiary and Significant Accounting Policies
Organization
Guggenheim Funds Trust (the “Trust”), a Delaware statutory trust, is registered with the U.S. Securities and Exchange Commission (the “SEC”) under the Investment Company Act of 1940 (the “1940 Act”), as an open-ended investment company of the series type. Each series, in effect, is representing a separate fund. The Trust may issue an unlimited number of authorized shares. The Trust accounts for the assets of each fund separately.
The Trust offers a combination of five separate classes of shares: Class A shares, Class C shares, Class P shares, Class R6 shares and Institutional Class shares. Sales of shares of each Class are made without a front-end sales charge at the net asset value per share (“NAV”), with the exception of Class A shares. Class A shares are sold at the NAV, plus the applicable front-end sales charge. The sales charge varies depending on the amount purchased. Class A share purchases of $1 million or more are exempt from the front-end sales charge but have a 1% contingent deferred sales charge (“CDSC”), if shares are redeemed within 12 months of purchase. Class C shares have a 1% CDSC if shares are redeemed within 12 months of purchase. Class C shares automatically convert to Class A shares on or about the 10th day of the month following the 8-year anniversary of the purchase of the Class C shares. This conversion will be executed without any sales charge, fee or other charge. After the conversion is completed, the shares will be subject to all features and expenses of Class A shares. Institutional Class shares are offered primarily for direct investment by institutions such as pension and profit sharing plans, endowments, foundations and corporations. Institutional Class shares require a minimum initial investment of $2 million and a minimum account balance of $1 million. Class R6 shares are offered primarily through qualified retirement and benefit plans. Class R6 shares are also offered through certain other plans and platforms sponsored by financial intermediaries. Certain institutional investors and others deemed appropriate by Guggenheim Investments (“GI” ) may also be eligible to purchase Class R6 shares subject to a $2 million minimum initial investment. At March 31, 2024, the Trust consisted of eighteen funds (the “Funds”).
This report covers the Macro Opportunities Fund (the “Fund”), a diversified investment company. At March 31, 2024, Class A, Class C, Class P, Institutional Class and Class R6 shares have been issued by the Fund.
Guggenheim Partners Investment Management, LLC (“GPIM” or the “Adviser”), which operates under the name Guggenheim Investments, provides advisory services. Guggenheim Funds Distributors, LLC (“GFD”) serves as distributor of the Fund’s shares. GI and GFD are affiliated entities.
Consolidation of Subsidiary
The consolidated financial statements of the Fund include the accounts of a wholly-owned and controlled Cayman Islands subsidiary (the “Subsidiary”). Significant inter-company accounts and transactions have been eliminated in consolidation for the Fund.
| | THE GUGGENHEIM FUNDS SEMI-ANNUAL REPORT | 71 |
NOTES TO CONSOLIDATED FINANCIAL STATEMENTS (Unaudited)(continued) |
The Fund may invest up to 25% of its total assets in its Subsidiary which acts as an investment vehicle in order to effect certain investments consistent with the Fund’s investment objective and policies.
A summary of the Fund’s investment in its Subsidiary is as follows:
| | Inception Date
of Subsidiary | | | Subsidiary
Net Assets at
March 31, 2024 | | | % of Net Assets
of the Fund at
March 31, 2024 | |
| | | | 01/08/15 | | | $ | 534,385 | | | | 0.01 | % |
Significant Accounting Policies
The Fund operates as an investment company and, accordingly, follows the investment company accounting and reporting guidance of the Financial Accounting Standards Board (“FASB”) Accounting Standards Codification Topic 946 Financial Services – Investment Companies.
The following significant accounting policies are in conformity with U.S. generally accepted accounting principles (“U.S. GAAP”) and are consistently followed by the Trust. This requires management to make estimates and assumptions that affect the reported amount of assets and liabilities, contingent assets and liabilities at the date of the consolidated financial statements, and the reported amounts of revenues and expenses during the reporting period. Actual results could differ from these estimates. All time references are based on Eastern Time.
The NAV of each share class of the Fund is calculated by dividing the market value of the Fund’s securities and other assets, less all liabilities attributable to the share class by the number of outstanding shares of the share class on the specified date.
(a) Valuation of Investments
The Board of Trustees of the Trust (the “Board”) adopted policies and procedures for the valuation of the Fund’s investments (the “Fund Valuation Procedures”). The SEC adopted Rule 2a-5 under the 1940 Act (“Rule 2a-5”) which establishes requirements for determining fair value in good faith. Rule 2a-5 also defines “readily available market quotations” for purposes of the 1940 Act and establishes requirements for determining whether a fund must fair value a security in good faith.
Pursuant to Rule 2a-5, the Board has designated the Adviser as the valuation designee to perform fair valuation determinations for the Fund with respect to all Fund investments and other assets. As the Fund’s valuation designee pursuant to Rule 2a-5, the Adviser has adopted separate procedures (the “Valuation Designee Procedures” and collectively with the Fund Valuation Procedures, the “Valuation Procedures”) reasonably designed to prevent violations of the requirements of Rule 2a-5 and Rule 31a-4. The Adviser, in its role as valuation designee, utilizes the assistance of a valuation committee, consisting of representatives from Guggenheim’s investment management, fund administration, legal and compliance departments (the “Valuation Committee”), in determining the fair value of the Fund’s securities and other assets.
72 | THE GUGGENHEIM FUNDS SEMI-ANNUAL REPORT | |
NOTES TO CONSOLIDATED FINANCIAL STATEMENTS (Unaudited)(continued) |
Valuations of the Fund’s securities and other assets are supplied primarily by pricing service providers appointed pursuant to the processes set forth in the Valuation Procedures. The Adviser, with the assistance of the Valuation Committee, convenes monthly, or more frequently as needed, to review the valuation of all assets which have been fair valued. The Adviser, consistent with the monitoring and review responsibilities set forth in the Valuation Procedures, regularly reviews the appropriateness of the inputs, methods, models and assumptions employed by the pricing service provider.
If a pricing service provider cannot or does not provide a valuation for a particular investment or such valuation is deemed unreliable, such investment is fair valued by the Adviser.
Equity securities listed or traded on a recognized U.S. securities exchange or the Nasdaq Stock Market (“NASDAQ”) will generally be valued on the basis of the last sale price on the primary U.S. exchange or market on which the security is listed or traded; provided, however, that securities listed on NASDAQ will be valued at the NASDAQ official closing price, which may not necessarily represent the last sale price.
Generally, trading in foreign securities markets is substantially completed each day at various times prior to the close of the New York Stock Exchange (“NYSE”). The values of foreign securities are determined as of the close of such foreign markets or the close of the NYSE, if earlier. All investments quoted in foreign currencies are valued in U.S. dollars on the basis of the foreign currency exchange rates prevailing at the close of U.S. business at 4:00 p.m. Investments in foreign securities may involve risks not present in domestic investments. The Adviser will determine the current value of such foreign securities by taking into consideration certain factors which may include the following factors, among others: the value of the securities traded on other foreign markets, American Depositary Receipts (“ADR”) trading, closed-end fund trading, foreign currency exchange activity, and the trading prices of financial products that are tied to foreign securities. In addition, under the Valuation Procedures, the Adviser is authorized to use prices and other information supplied by a pricing service provider in valuing foreign securities.
Open-end investment companies are valued at their NAV as of the close of business, on the valuation date. Exchange-traded funds and closed-end investment companies are generally valued at the last quoted sale price.
U.S. Government securities are valued by pricing service providers, using the last traded fill price, or at the reported bid price at the close of business on the valuation date.
Repurchase agreements are generally valued at amortized cost, provided such amounts approximate market value.
Commercial paper and discount notes with a maturity of greater than 60 days at acquisition are valued at prices that reflect broker-dealer supplied valuations or are obtained from pricing service providers, which may consider the trade activity, treasury spreads, yields or price of bonds of comparable quality, coupon, maturity, and type, as well as prices quoted by dealers who make
| | THE GUGGENHEIM FUNDS SEMI-ANNUAL REPORT | 73 |
NOTES TO CONSOLIDATED FINANCIAL STATEMENTS (Unaudited)(continued) |
markets in such securities. Commercial paper and discount notes with a maturity of 60 days or less at acquisition are valued at amortized cost, unless the Adviser concludes that amortized cost does not represent the fair value of the applicable asset in which case it will be valued using a pricing service provider.
Typically, loans are valued using information provided by a pricing service provider which uses broker quotes, among other inputs. If the pricing service cannot or does not provide a valuation for a particular loan, or such valuation is deemed unreliable, such investment is valued based on a quote from a broker-dealer or is fair valued by the Adviser.
Exchange-traded options are valued at the mean of the bid and ask prices on the principal exchange on which they are traded. Over-the-counter (“OTC”) options and options on swaps (“swaptions”) are valued using a price provided by a pricing service provider.
Futures contracts are valued on the basis of the last sale price as of 4:00 p.m. on the valuation date. In the event that the exchange for a specific futures contract closes earlier than 4:00 p.m., the futures contract is valued at the official settlement price of the exchange. However, the underlying securities from which the futures contract value is derived are monitored until 4:00 p.m. to determine if fair valuation of the underlying securities would provide a more accurate valuation of the futures contract.
Interest rate swap agreements entered into by the Fund are valued on the basis of the last sale price on the primary exchange on which the swap is traded.
Other swap agreements entered into by the Fund are generally valued using an evaluated price provided by a pricing service provider.
Forward foreign currency exchange contracts are valued daily based on the applicable exchange rate of the underlying currency.
Investments for which market quotations are not readily available are fair valued as determined in good faith by the Adviser. Valuations in accordance with these methods are intended to reflect each security’s (or asset’s or liability’s) “fair value”. Each such determination is based on a consideration of all relevant factors, which are likely to vary from one pricing context to another. Examples of such factors may include, but are not limited to market prices; sale prices; broker quotes; and models which derive prices based on inputs such as prices of securities with comparable maturities and characteristics, or on inputs such as anticipated cash flows or collateral, spread over U.S. Treasury securities, and other information analysis. In connection with futures contracts and other derivative investments, such factors may include obtaining information as to how (a) these contracts and other derivative investments trade in the futures or other derivative markets, respectively, and (b) the securities underlying these contracts and other derivative investments trade in the cash market.
74 | THE GUGGENHEIM FUNDS SEMI-ANNUAL REPORT | |
NOTES TO CONSOLIDATED FINANCIAL STATEMENTS (Unaudited)(continued) |
(b) Special Purpose Acquisition Companies
The Fund may acquire an interest in a special purpose acquisition company (“SPAC”) in an initial public offering or a secondary market transaction. SPAC investments carry many of the same risks as investments in initial public offering securities, such as erratic price movements, greater risk of loss, lack of information about the issuer, limited operating and little public or no trading history, and higher transaction costs. An investment in a SPAC is typically subject to a higher risk of dilution by additional later offerings of interests in the SPAC or by other investors exercising existing rights to purchase shares of the SPAC and interests in SPACs may be illiquid and/or be subject to restrictions on resale. A SPAC is a publicly traded company that raises investment capital for the purpose of acquiring the equity securities of one or more existing companies (or interests therein) via merger, combination, acquisition or other similar transactions. Unless and until an acquisition is completed, a SPAC generally invests its assets (less a portion retained to cover expenses) in U.S. government securities, money market securities and cash and does not typically pay dividends in respect of its common stock. SPAC investments are also subject to the risk that a significant portion of the funds raised by the SPAC may be expended during the search for a target acquisition or merger and that the SPAC may have limited time in which to conduct due diligence on potential business combination targets. Because SPACs are in essence blank check companies without operating history or ongoing business other than seeking acquisitions, the value of their securities is particularly dependent on the ability of the entity’s management to identify and complete a profitable acquisition. Among other conflicts of interest, the economic interests of the management, directors, officers and related parties of a SPAC can differ from the economic interests of public shareholders, which may lead to conflicts as they evaluate, negotiate and recommend business combination transactions to shareholders. This risk may become more acute as the deadline for the completion of a business combination nears. There is no guarantee that the SPACs in which the Fund invests will complete an acquisition or that any acquisitions that are completed will be profitable.
(c) U.S. Government and Agency Obligations
Certain U.S. Government and Agency Obligations are traded on a discount basis; the interest rates shown on the Consolidated Schedule of Investments reflect the effective rates paid at the time of purchase by the Fund. Other securities bear interest at the rates shown, payable at fixed dates through maturity.
Inflation-Indexed bonds are fixed-income securities whose principal value is periodically adjusted to the rate of inflation. The interest rate on these securities is generally fixed at issuance at a rate lower than typical bonds. Over the life of an inflation-indexed bond however, interest will be paid based on a principal value which is adjusted for inflation. Any increase in the principal amount of an inflation-indexed bond is recognized as a component of Interest on the Fund’s Consolidated Statement of Operations, even though principal is not received until maturity.
| | THE GUGGENHEIM FUNDS SEMI-ANNUAL REPORT | 75 |
NOTES TO CONSOLIDATED FINANCIAL STATEMENTS (Unaudited)(continued) |
(d) Senior Floating Rate Interests and Loan Investments
Senior floating rate interests in which the Fund invests generally pay interest rates which are periodically adjusted by reference to a base short-term floating rate, plus a premium. These base lending rates are generally (i) a broad measure of the cost of borrowing cash, such as the one-month or three-month Secured Overnight Financing Rate (“SOFR”), (ii) the prime rate offered by one or more major United States banks, or (iii) the bank’s certificate of deposit rate. Senior floating rate interests often require prepayments from excess cash flows or permit the borrower to repay at its election. The rate at which the borrower repays cannot be predicted with accuracy. As a result, the actual remaining maturity may be substantially less than the stated maturities disclosed in the Fund’s Consolidated Schedule of Investments.
The Fund invests in loans and other similar debt obligations (“obligations”). A portion of the Fund’s investments in these obligations is sometimes referred to as “covenant lite” loans or obligations (“covenant lite obligations”), which are obligations that lack covenants or possess fewer or less restrictive covenants or constraints on borrowers than certain other types of obligations. The Fund may also obtain exposure to covenant lite obligations through investment in securitization vehicles and other structured products. Recently, many new or reissued obligations have not featured traditional covenants, which are intended to protect lenders and investors by (i) imposing certain restrictions or other limitations on a borrower’s operations or assets or (ii) providing certain rights to lenders. The Fund may have fewer rights with respect to covenant lite obligations, including fewer protections against the possibility of default and fewer remedies in the event of default. As a result, investments in (or exposure to) covenant lite obligations are subject to more risk than investments in (or exposure to) certain other types of obligations. The Fund is subject to other risks associated with investments in (or exposure to) obligations, including that obligations may not be considered “securities” and, as a result, the Fund may not be entitled to rely on the anti-fraud protections under the federal securities laws and instead may have to resort to state law and direct claims.
(e) Interest on When-Issued Securities
The Fund may purchase and sell interests in securities on a when-issued and delayed delivery basis, with payment and delivery scheduled for a future date. No income accrues to the Fund on such interests or securities in connection with such transactions prior to the date the Fund actually takes delivery of such interests or securities. These transactions are subject to market fluctuations and are subject to the risk that the value at delivery may be more or less than the trade date purchase price. Although the Fund will generally purchase these securities with the intention of acquiring such securities, it may sell such securities before the settlement date.
(f) Short Sales
When the Fund engages in a short sale of a security, an amount equal to the proceeds is reflected as an asset and an equivalent liability. The amount of the liability is subsequently marked-to-market to reflect the market value of the short sale.
76 | THE GUGGENHEIM FUNDS SEMI-ANNUAL REPORT | |
NOTES TO CONSOLIDATED FINANCIAL STATEMENTS (Unaudited)(continued) |
Fees, if any, paid to brokers to borrow securities in connection with short sales are recorded as interest expense. In addition, the Fund must pay out the dividend rate of the equity or coupon rate of the obligation to the lender and record this as an expense. Short dividend or interest expense is a cost associated with the investment objective of short sales transactions, rather than an operational cost associated with the day-to-day management of any mutual fund. The Fund may also receive rebate income from the broker resulting from the investment of the proceeds from securities sold short.
(g) Options
Upon the purchase of an option, the premium paid is recorded as an investment, the value of which is marked-to-market daily. If a purchased option expires, the Fund realizes a loss in the amount of the cost of the option. When the Fund enters into a closing sale transaction, it realizes a gain or loss depending on whether the proceeds from the closing sale transaction are greater or less than the cost of the option. If the Fund exercises a put option, it realizes a gain or loss from the sale of the underlying security and the proceeds from such sale will be decreased by the premium originally paid. When the Fund exercises a call option, the cost of the security purchased by the Fund upon exercise increases by the premium originally paid.
When the Fund writes (sells) an option, an amount equal to the premium received is entered in that Fund’s accounting records as an asset and equivalent liability. The amount of the liability is subsequently marked-to-market to reflect the current value of the option written. When a written option expires, or if the Fund enters into a closing purchase transaction, it realizes a gain (or loss if the cost of a closing purchase transaction exceeds the premium received when the option was sold).
The Fund may purchase and write swaptions primarily to preserve a return or spread on a particular investment or portion of the Funds’ holdings, as a duration management technique or to protect against an increase in the price of securities it anticipates purchasing at a later date. The purchaser and writer of a swaption is buying or granting the right to enter into a previously agreed upon interest rate swap agreement at any time before the expiration of the options. The swaptions are forward premium swaptions which have extended settlement dates.
(h) Futures Contracts
Upon entering into a futures contract, the Fund deposits and maintains as collateral such initial margin as required by the exchange on which the transaction is affected. Pursuant to the contract, the Fund agrees to receive from or pay to the broker an amount of cash equal to the daily fluctuation in value of the contract. Such receipts or payments are known as variation margin and are recorded by the Fund as unrealized appreciation or depreciation. When the contract is closed, the Fund records a realized gain or loss equal to the difference between the value of the contract at the time it was opened and the value at the time it was closed.
| | THE GUGGENHEIM FUNDS SEMI-ANNUAL REPORT | 77 |
NOTES TO CONSOLIDATED FINANCIAL STATEMENTS (Unaudited)(continued) |
(i) Swap Agreements
Swap agreements are marked-to-market daily and the change, if any, is recorded as unrealized appreciation or depreciation. Payments received or made as a result of an agreement or termination of an agreement are recognized as realized gains or losses.
Upon entering into certain centrally-cleared swap transactions, the Fund is required to deposit with its clearing broker an amount of cash or securities as an initial margin. Subsequent variation margin receipts or payments are received or made by the Fund depending on fluctuations in the fair value of the reference entity and are recorded by the Fund as unrealized appreciation or depreciation. When the contract is closed, the Fund records a realized gain or loss equal to the difference between the value of the contract at the time it was opened and the value at the time it was closed.
Upfront payments received or made by the Fund on credit default swap agreements and interest rate swap agreements are amortized over the expected life of the agreement. Periodic payments received or paid by the Fund are recorded as realized gains or losses. Payments received or made as a result of a credit event or termination of the contract are recognized, net of a proportional amount of the upfront payment, as realized gains or losses.
(j) Currency Translations
The accounting records of the Fund are maintained in U.S. dollars. All assets and liabilities initially expressed in foreign currencies are converted into U.S. dollars at prevailing exchange rates. Purchases and sales of investment securities, dividend and interest income, and certain expenses are translated at the rates of exchange prevailing on the respective dates of such transactions. Changes in the relationship of these foreign currencies to the U.S. dollar can significantly affect the value of the investments and earnings of the Fund. Foreign investments may also subject the Fund to foreign government exchange restrictions, expropriation, taxation, or other political, social, geopolitical or economic developments, all of which could affect the market and/or credit risk of the investments.
The Fund does not isolate that portion of the results of operations resulting from changes in the foreign exchange rates on investments from the fluctuations arising from changes in the market prices of securities held. Such fluctuations are included with the net realized gain or loss and unrealized appreciation or depreciation on investments.
Reported net realized foreign exchange gains and losses arise from sales of foreign currencies and currency gains or losses realized between the trade and settlement dates on investment transactions. Net unrealized appreciation and depreciation arise from changes in the fair values of assets and liabilities other than investments in securities at the fiscal period end, resulting from changes in exchange rates.
78 | THE GUGGENHEIM FUNDS SEMI-ANNUAL REPORT | |
NOTES TO CONSOLIDATED FINANCIAL STATEMENTS (Unaudited)(continued) |
(k) Forward Foreign Currency Exchange Contracts
The change in value of a forward foreign currency exchange contract is recorded as unrealized appreciation or depreciation until the contract is closed. When the contract is closed, the Fund records a realized gain or loss equal to the difference between the value at the time the contract was opened and the value at the time it was closed.
(l) Foreign Taxes
The Fund may be subject to foreign taxes (a portion of which may be reclaimable) on income, stock dividends, capital gains on investments or certain foreign currency transactions. All foreign taxes are recorded in accordance with the applicable foreign tax regulations and rates that exist in the foreign jurisdictions in which the Fund invests. These foreign taxes, if any, are paid by the Fund and reflected in its Consolidated Statement of Operations as follows: foreign taxes withheld at source are presented as a reduction of income and foreign taxes on capital gains from sales of investments are included with the net realized gain (loss) on investments. Foreign taxes payable or deferred as of March 31, 2024, if any, are disclosed in the Fund’s Consolidated Statement of Assets and Liabilities.
(m) Security Transactions
Security transactions are recorded on the trade date for financial reporting purposes. Realized gains and losses from securities transactions are recorded using the identified cost basis. Proceeds from lawsuits related to investment holdings are recorded as a reduction to cost if the securities are still held and as realized gains if no longer held in the Fund. Dividend income is recorded on the ex-dividend date, net of applicable taxes withheld by foreign countries, if any. Taxable non-cash dividends are recorded as dividend income. Interest income, including amortization of premiums and accretion of discounts, is accrued on a daily basis. Interest income also includes paydown gains and losses on mortgage-backed and asset-backed securities and senior and subordinated loans. Amendment fees are earned as compensation for evaluating and accepting changes to the original loan agreement and are recognized when received. Dividend income from Real Estate Investment Trusts (“REITs”) is recorded based on the income included in the distributions received from the REIT investments using published REIT classifications, including some management estimates when actual amounts are not available. Distributions received in excess of this estimated amount are recorded as a reduction of the cost of investments or reclassified to realized gains. The actual amounts of income, return of capital, and realized gains are only determined by each REIT after its fiscal year-end, and may differ from the estimated amounts.
Income from residual collateralized loan obligations is recognized using the effective interest method. At the time of purchase, management estimates the future expected cash flows and determines the effective yield and estimated maturity date based on the estimated cash flows. Subsequent to the purchase, the estimated cash flows are updated periodically and a revised yield is calculated prospectively.
| | THE GUGGENHEIM FUNDS SEMI-ANNUAL REPORT | 79 |
NOTES TO CONSOLIDATED FINANCIAL STATEMENTS (Unaudited)(continued) |
The Fund may receive other income from investments in senior loan interests including amendment fees, consent fees and commitment fees. For funded loans, these fees are recorded as income when received by the Fund and included in interest income on the Fund’s Consolidated Statement of Operations. For unfunded loans, commitment fees are included in realized gain on investments on the Fund’s Consolidated Statement of Operations at the end of the commitment period.
(n) Distributions
The Fund declares dividends from investment income daily. The Fund pays its shareholders from its net investment income monthly and distributes any net capital gains that it has realized, at least annually. Distributions to shareholders are recorded on the ex-dividend date. Dividends are reinvested in additional shares, unless shareholders request payment in cash. The character of distributions made during the year from net investment income or net realized gains may differ from their ultimate characterization for U.S. federal income tax purposes.
(o) Class Allocations
Interest and dividend income, most expenses, all realized gains and losses, and all unrealized appreciation and depreciation are allocated to the share classes based upon the value of the outstanding shares in each share class. Certain costs, such as distribution and service fees are charged directly to specific share classes. In addition, certain expenses have been allocated to the individual Funds in the Trust based on the respective net assets of each Fund included in the Trust.
(p) Earnings Credits
Under the fee arrangement with the custodian, the Fund may earn credits based on overnight custody cash balances. These credits are utilized to reduce related custodial expenses. The custodian fees disclosed in the Fund’s Consolidated Statement of Operations are before the reduction in expense from the related earnings credits, if any. Earnings credits for the period ended March 31, 2024, are disclosed in the Fund’s Consolidated Statement of Operations.
(q) Cash
The Fund may leave cash overnight in its cash account with the custodian. Periodically, the Fund may have cash due to the custodian bank as an overdraft balance. A fee is incurred on this overdraft, calculated by multiplying the overdraft by a rate based on the federal funds rate, which was 5.33% at March 31, 2024.
(r) Indemnifications
Under the Trust’s organizational documents, its Trustees and Officers of the Trust are indemnified against certain liabilities arising out of the performance of their duties to the Trust. In addition, throughout the normal course of business, the Trust, on behalf of the Fund, enters into contracts that contain a variety of representations and warranties which provide general indemnifications.
80 | THE GUGGENHEIM FUNDS SEMI-ANNUAL REPORT | |
NOTES TO CONSOLIDATED FINANCIAL STATEMENTS (Unaudited)(continued) |
The Fund’s maximum exposure under these arrangements is unknown, as this would involve future claims that may be made against the Fund and/or its affiliates that have not yet occurred. However, based on experience, the Fund expects the risk of loss to be remote.
Note 2 – Derivatives
As part of its investment strategies, the Fund utilizes a variety of derivative instruments. These investments involve, to varying degrees, elements of market risk and risks in excess of amounts recognized on the Fund’s Consolidated Statement of Assets and Liabilities. Valuation and accounting treatment of these instruments can be found under Significant Accounting Policies in Note 1 of these Notes to Consolidated Financial Statements.
Derivatives
Derivatives are instruments whose values depend on, or are derived from, in whole or in part, the value of one or more other assets, such as securities, currencies, commodities or indices. Derivative instruments may be used for investment purposes (including to maintain cash reserves while maintaining exposure to certain other assets), for risk management (hedging) purposes, to facilitate trading, to reduce transaction costs and to pursue higher investment returns. Derivative instruments may also be used to seek to mitigate certain investment risks, such as foreign currency exchange rate risk, interest rate risk and credit risk. U.S. GAAP requires disclosures to enable investors to better understand how and why the Fund uses derivative instruments, how these derivative instruments are accounted for and their effects on the Fund’s financial position and results of operations.
The Fund utilized derivatives for the following purposes:
Duration: the use of an instrument to manage the interest rate risk of a portfolio.
Hedge: an investment made in order to reduce the risk of adverse price movements in a security, by taking an offsetting position to protect against broad market moves.
Income: the use of any instrument that distributes cash flows typically based upon some rate of interest.
Index Exposure: the use of an instrument to obtain exposure to a listed or other type of index.
Speculation: the use of an instrument to express macro-economic and other investment views.
Options Purchased and Written
A call option on a security gives the purchaser of the option the right to buy, and the writer of a call option the obligation to sell, the underlying security. The purchaser of a put option has the right to sell, and the writer of the put option the obligation to buy, the underlying security at any time during the option period. The risk associated with purchasing options is limited to the premium originally paid.
| | THE GUGGENHEIM FUNDS SEMI-ANNUAL REPORT | 81 |
NOTES TO CONSOLIDATED FINANCIAL STATEMENTS (Unaudited)(continued) |
The following table represents the Fund’s use and volume of call/put options purchased on a monthly basis:
| | | Average Notional Amount | |
Use | | Call | | | Put | |
Duration, Hedge, Speculation, Income | | $ | 634,533,333 | | | $ | 37,388,118 | |
The risk in writing a call option is that the Fund may incur a loss if the market price of the underlying security increases and the option is exercised. The risk in writing a put option is that the Fund may incur a loss if the market price of the underlying security decreases and the option is exercised. In addition, there may be an imperfect correlation between the movement in prices of options and the underlying securities where the Fund may not be able to enter into a closing transaction because of an illiquid secondary market; or, for OTC options, the Fund may be at risk because of the counterparty’s inability to perform.
Futures Contracts
A futures contract is an agreement to purchase (long) or sell (short) an agreed amount of securities or other instruments at a set price for delivery at a future date. There are significant risks associated with the Fund’s use of futures contracts, including (i) there may be an imperfect or no correlation between the changes in market value of the underlying asset and the prices of futures contracts; (ii) there may not be a liquid secondary market for a futures contract; (iii) trading restrictions or limitations may be imposed by an exchange; and (iv) government regulations may restrict trading in futures contracts. When investing in futures, there is minimal counterparty credit risk to the Fund because futures are exchange-traded and the exchange’s clearinghouse, as counterparty to all exchange-traded futures, guarantees against default. Cash deposits are shown as segregated cash with broker on the Fund’s Consolidated Statement of Assets and Liabilities; securities held as collateral are noted on the Fund’s Consolidated Schedule of Investments.
The following table represents the Fund’s use and volume of futures on a monthly basis:
| | | Average Notional Amount | |
Use | | Long | | | Short | |
Duration, Hedge, Speculation | | $ | 488,645,583 | | | $ | — | |
Swap Agreements
A swap is an agreement that obligates two parties to exchange a series of cash flows at specified intervals based upon or calculated by reference to changes in specified prices or rates for a specified amount of an underlying asset. When utilizing OTC swaps, the Fund bears the risk of loss of the amount expected to be received under a swap agreement in the event of the default or bankruptcy of a swap agreement counterparty or if the underlying asset declines in value. Certain
82 | THE GUGGENHEIM FUNDS SEMI-ANNUAL REPORT | |
NOTES TO CONSOLIDATED FINANCIAL STATEMENTS (Unaudited)(continued) |
standardized swaps are subject to mandatory central clearing and are executed on a multi-lateral or other trade facility platform, such as a registered exchange. There is limited counterparty credit risk with respect to centrally-cleared swaps as the transaction is facilitated through a central clearinghouse, much like exchange-traded futures contracts. For a Fund utilizing centrally-cleared swaps, the exchange bears the risk of loss resulting from a counterparty not being able to pay. There is no guarantee that the Fund or an underlying fund could eliminate its exposure under an outstanding swap agreement by entering into an offsetting swap agreement with the same or another party.
Total return swaps involve commitments where single or multiple cash flows are exchanged based on the price of an underlying reference asset (such as an index) for a fixed or variable interest rate. Total return swaps will usually be computed based on the current value of the reference asset as of the close of regular trading on the NYSE or other exchange, with the swap value being adjusted to include dividends accrued, financing charges and/or interest associated with the swap agreement. When utilizing total return swaps, the Fund bears the risk of loss of the amount expected to be received under a swap agreement in the event of the default or bankruptcy of a swap agreement counterparty or if the underlying reference asset declines in value.
The following table represents the Fund’s use and volume of total return swaps on a monthly basis:
| | | Average Notional Amount | |
Use | | Long | | | Short | |
Hedge, Index exposure, Income | | $ | 34,779,081 | | | $ | 25,304,242 | |
Interest rate swaps involve the exchange by the Fund with another party for its respective commitment to pay or receive a fixed or variable interest rate on a notional amount of principal. Interest rate swaps are generally centrally-cleared, but central clearing does not make interest rate swap transactions risk free.
The following table represents the Fund’s use and volume of interest rate swaps on a monthly basis:
| | | Average Notional Amount | |
Use | | Pay Floating Rate | | | Receive Floating Rate | |
Duration | | $ | 276,791,667 | | | $ | 510,000 | |
Credit default swaps are instruments which allow for the full or partial transfer of third party credit risk, with respect to a particular entity or entities, from one counterparty to the other. The Fund enters into credit default swaps as a “seller” or “buyer” of protection primarily to gain or reduce exposure to the investment grade and/or high yield bond market. A seller of credit default swaps is selling credit protection or assuming credit risk with respect to the underlying entity or entities. The buyer in a credit default swap is obligated to pay the seller a periodic stream of payments over
| | THE GUGGENHEIM FUNDS SEMI-ANNUAL REPORT | 83 |
NOTES TO CONSOLIDATED FINANCIAL STATEMENTS (Unaudited)(continued) |
the term of the contract provided that no event of default on an underlying reference obligation has occurred. If a credit event occurs, as defined under the terms of the swap agreement, the seller will either (i) pay to the buyer of protection an amount equal to the notional amount of the swap and take delivery of the referenced obligation or underlying securities comprising the referenced index or (ii) pay a net settlement amount in the form of cash or securities equal to the notional amount of the swap less the recovery value of the referenced obligation or underlying securities comprising the referenced index. The notional amount reflects the maximum potential amount the seller of credit protection could be required to pay to the buyer if a credit event occurs. The seller of protection receives periodic premium payments from the buyer and may also receive or pay an upfront premium adjustment to the stated periodic payments. In the event a credit default occurs on a credit default swap referencing an index, a factor adjustment will take place and the buyer of protection will receive a payment reflecting the par less the default recovery rate of the defaulted index component based on its weighting in the index. If no default occurs, the counterparty will pay the stream of payments and have no further obligations to the fund selling the credit protection. For a fund utilizing centrally cleared credit default swaps, the exchange bears the risk of loss resulting from a counterparty not being able to pay. For OTC credit default swaps, a fund bears the risk of loss of the amount expected to be received under a swap agreement in the event of the default or bankruptcy of a swap agreement counterparty, or in the case of a credit default swap in which a fund is selling credit protection, the default of a third party issuer.
The quoted market prices and resulting market values for credit default swap agreements on securities and credit indices serve as an indicator of the current status of the payment/performance risk and represent the likelihood of an expected liability (or profit) for the credit derivative had the notional amount of the swap agreement been closed/sold as of the period end. Increasing market values, in absolute terms when compared to the notional amount of the swap, represent a deterioration of the referenced entity’s credit soundness and a greater likelihood or risk of default or other credit event occurring as defined under the terms of the agreement.
The following table represents the Fund’s use and volume of credit default swaps on a monthly basis:
| | | Average Notional Amount | |
Use | | Protection Sold | | | Protection Purchased | |
Hedge, Index exposure | | $ | — | | | $ | 270,842,500 | |
Forward Foreign Currency Exchange Contracts
A forward foreign currency exchange contract is an agreement between two parties to exchange two designated currencies at a specific time in the future. Certain types of contracts may be cash settled, in an amount equal to the change in exchange rates during the term of the contract. The contracts can be used to hedge or manage exposure to foreign currency risks with portfolio investments or to gain exposure to foreign currencies.
84 | THE GUGGENHEIM FUNDS SEMI-ANNUAL REPORT | |
NOTES TO CONSOLIDATED FINANCIAL STATEMENTS (Unaudited)(continued) |
The market value of a forward foreign currency exchange contract changes with fluctuations in foreign currency exchange rates. Furthermore, the Fund may be exposed to risk if the counterparties cannot meet the contract terms or if the currency value changes unfavorably as compared to the U.S. dollar.
The following table represents the Fund’s use and volume of forward foreign currency exchange contracts on a monthly basis:
| | | Average Value | |
Use | | Purchased | | | Sold | |
Hedge | | $ | 3,422,119 | | | $ | 195,737,454 | |
Derivative Investment Holdings Categorized by Risk Exposure
The following is a summary of the location of derivative investments on the Fund’s Consolidated Statement of Assets and Liabilities as of March 31, 2024:
Derivative Investment Type | Asset Derivatives | Liability Derivatives |
Interest rate futures contracts | — | Variation margin on futures contracts |
Credit/Equity/Interest rate swap agreements | Unamortized upfront premiums paid on interest rate swap agreements | Unamortized upfront premiums received on credit default swap agreements |
| | Unamortized upfront premiums paid on credit default swap agreements | Variation margin on interest rate swap agreements |
| | Unrealized appreciation on OTC swap agreements | Variation margin on credit default swap agreements |
| | | Unrealized depreciation on OTC swap agreements |
Equity/Interest rate option contracts | Investments in unaffiliated issuers, at value | — |
Currency forward contracts | Unrealized appreciation on forward foreign currency exchange contracts | Unrealized depreciation on forward foreign currency exchange contracts |
The following tables set forth the fair value of the Fund’s derivative investments categorized by primary risk exposure at March 31, 2024:
| | Asset Derivative Investments Value | |
| | Futures
Interest
Rate Risk* | | | Swaps
Equity Risk | | | Swaps
Interest
Rate Risk* | | | Swaps
Credit Risk* | | | Forward
Foreign
Currency
Exchange
Risk | | | Options
Purchased
Equity Risk | | | Options
Purchased
Interest
Rate Risk | | | Total Value at
March 31,
2024 | |
| | $ | — | | | $ | 12,500 | | | $ | 34,682 | | | $ | 35,309 | | | $ | 2,569,937 | | | $ | 4,439,736 | | | $ | 28,478 | | | $ | 7,120,642 | |
| | THE GUGGENHEIM FUNDS SEMI-ANNUAL REPORT | 85 |
NOTES TO CONSOLIDATED FINANCIAL STATEMENTS (Unaudited)(continued) |
| | Liability Derivative Investments Value | |
| | Futures
Interest
Rate Risk* | | | Swaps
Equity Risk | | | Swaps
Interest
Rate Risk* | | | Swaps
Credit Risk* | | | Forward
Foreign
Currency
Exchange
Risk | | | Options
Written
Equity Risk | | | Options
Written
Interest
Rate Risk | | | Total Value at
March 31,
2024 | |
| | $ | 940,616 | | | $ | — | | | $ | 1,234,801 | | | $ | 3,168,476 | | | $ | 1,864 | | | $ | — | | | $ | — | | | $ | 5,345,757 | |
* | Includes cumulative appreciation (depreciation) of exchange-traded, OTC and centrally-cleared derivatives contracts as reported on the Fund’s Consolidated Schedule of Investments. For exchange-traded and centrally-cleared derivatives, variation margin is reported within the Fund’s Consolidated Statement of Assets and Liabilities |
The following is a summary of the location of derivative investments on the Fund’s Consolidated Statement of Operations for the period ended March 31, 2024:
Derivative Investment Type | Location of Gain (Loss) on Derivatives |
Interest rate futures contracts | Net change in unrealized appreciation (depreciation) on futures contracts |
Credit/Equity/Interest rate swap agreements | Net realized gain (loss) on swap agreements |
| Net change in unrealized appreciation (depreciation) on swap agreements |
Equity/Interest rate option contracts | Net realized gain (loss) on options purchased |
| Net change in unrealized appreciation (depreciation) on options purchased |
Currency forward contracts | Net realized gain (loss) on forward foreign currency exchange contracts |
| Net change in unrealized appreciation (depreciation) on forward foreign currency exchange contracts |
The following is a summary of the Fund’s realized gain (loss) and change in unrealized appreciation (depreciation) on derivative investments recognized on the Fund’s Consolidated Statement of Operations categorized by primary risk exposure for the period ended March 31, 2024:
| | Realized Gain (Loss) on Derivative Investments Recognized on the Consolidated Statement of Operations | |
| | Futures
Interest
Rate Risk | | | Swaps
Interest
Rate Risk | | | Swaps
Equity Risk | | | Swaps
Credit Risk | | | Forward
Foreign
Currency
Exchange
Risk | | | Options
Purchased
Equity Risk | | | Options
Purchased
Interest
Rate Risk | | | Total | |
| | $ | — | | | $ | (17,841,063 | ) | | $ | 1,530,416 | | | $ | (8,496,279 | ) | | $ | (2,532,688 | ) | | $ | — | | | $ | (1,912,741 | ) | | $ | (29,252,355 | ) |
86 | THE GUGGENHEIM FUNDS SEMI-ANNUAL REPORT | |
NOTES TO CONSOLIDATED FINANCIAL STATEMENTS (Unaudited)(continued) |
| | Change in Unrealized Appreciation (Depreciation) on Derivative Investments
Recognized on the Consolidated Statement of Operations | |
| | Futures
Interest
Rate Risk | | | Swaps
Interest
Rate Risk | | | Swaps
Equity Risk | | | Swaps
Credit Risk | | | Forward
Foreign
Currency
Exchange
Risk | | | Options
Purchased
Equity Risk | | | Options
Purchased
Interest
Rate Risk | | | Total | |
| | $ | (940,616 | ) | | $ | 18,495,467 | | | $ | 12,500 | | | $ | 186,753 | | | $ | (1,134,982 | ) | | $ | (2,520,027 | ) | | $ | 690,140 | | | $ | 14,789,235 | |
In conjunction with the use of derivative instruments, the Fund is required to maintain collateral in various forms. Depending on the financial instrument utilized and the broker involved, the Fund uses margin deposits at the broker, cash and/or securities segregated at the custodian bank, discount notes or repurchase agreements allocated to the Fund as collateral.
The Trust has established counterparty credit guidelines and enters into transactions only with financial institutions rated/identified as investment grade or better. The Trust monitors the counterparty credit risk associated with each such financial institution.
Foreign Investments
There are several risks associated with exposure to foreign currencies, foreign issuers and emerging markets. The Fund’s indirect and direct exposure to foreign currencies subjects the Fund to the risk that those currencies will decline in value relative to the U.S. dollar, or in the case of short positions, that the U.S. dollar will decline in value relative to the currency being hedged. Currency rates in foreign countries may fluctuate significantly over short periods of time for a number of reasons, including changes in interest rates and the imposition of currency controls or other political developments in the U.S. or abroad. In addition, the Fund may incur transaction costs in connection with conversions between various currencies. The Fund may, but is not obligated to, engage in currency hedging transactions, which generally involve buying currency forward, options or futures contracts. However, not all currency risks may be effectively hedged, and in some cases the costs of hedging techniques may outweigh expected benefits. In such instances, the value of securities denominated in foreign currencies can change significantly when foreign currencies strengthen or weaken relative to the U.S. dollar.
The Fund may invest in securities of foreign companies directly, or in financial instruments, such as ADRs and exchange-traded funds, which are indirectly linked to the performance of foreign issuers. Foreign markets can be more volatile than the U.S. market due to increased risks of adverse issuer, political, regulatory, market, or economic developments and can perform differently from the U.S. market. Investing in securities of foreign companies directly, or in financial instruments that are indirectly linked to the performance of foreign issuers, may involve risks not typically associated with investing in U.S. issuers. The value of securities denominated in foreign currencies, and of dividends from such securities, can change significantly when foreign currencies strengthen or weaken relative to the U.S. dollar. Foreign securities markets generally
| | THE GUGGENHEIM FUNDS SEMI-ANNUAL REPORT | 87 |
NOTES TO CONSOLIDATED FINANCIAL STATEMENTS (Unaudited)(continued) |
have less trading volume and less liquidity than U.S. markets, and prices in some foreign markets may fluctuate more than those of securities traded on U.S. markets. Many foreign countries lack accounting and disclosure standards comparable to those that apply to U.S. companies, and it may be more difficult to obtain reliable information regarding a foreign issuer’s financial condition and operations. Transaction costs and costs associated with custody services are generally higher for foreign securities than they are for U.S. securities. Some foreign governments levy withholding taxes against dividend and interest income. Although in some countries portions of these taxes are recoverable, the non-recovered portion will reduce the income received by the Fund.
Note 3 – Offsetting
In the normal course of business, the Fund enters into transactions subject to enforceable master netting arrangements or other similar arrangements. Generally, the right to offset in those agreements allows the Fund to counteract the exposure to a specific counterparty with collateral received from or delivered to that counterparty based on the terms of the arrangements. These arrangements provide for the right to liquidate upon the occurrence of an event of default, credit event upon merger or additional termination event.
In order to better define its contractual rights and to secure rights that will help the Fund mitigate its counterparty risk, the Fund may enter into an International Swaps and Derivatives Association, Inc. Master Agreement (“ISDA Master Agreement”) or similar agreement with its derivative contract counterparties. An ISDA Master Agreement is a bilateral agreement between a fund and a counterparty that governs OTC derivatives, including foreign exchange contracts, and typically contains, among other things, collateral posting terms and netting provisions in the event of a default and/or termination event. The provisions of the ISDA Master Agreement typically permit a single net payment in the event of a default (close-out netting) or similar event, including the bankruptcy or insolvency of the counterparty.
For derivatives traded under an ISDA Master Agreement, the collateral requirements are typically calculated by netting the mark-to-market amount for each transaction under such agreement and comparing that amount to the value of any collateral currently pledged by the Fund and the counterparty. For financial reporting purposes, cash collateral that has been pledged to cover obligations of the Fund and cash collateral received from the counterparty, if any, are reported separately on the Fund’s Consolidated Statement of Assets and Liabilities as segregated cash with broker/receivable for variation margin, or payable for swap settlement/variation margin. Cash and/or securities pledged or received as collateral by the Fund in connection with an OTC derivative subject to an ISDA Master Agreement generally may not be invested, sold or rehypothecated by the counterparty or the Fund, as applicable, absent an event of default under such agreement, in which case such collateral generally may be applied towards obligations due to and payable by such counterparty or the Fund, as applicable. Generally, the amount of collateral due from or to a counterparty must exceed a minimum transfer amount threshold (e.g., $300,000) before a transfer is required to be made. To the extent amounts due to the Fund from
88 | THE GUGGENHEIM FUNDS SEMI-ANNUAL REPORT | |
NOTES TO CONSOLIDATED FINANCIAL STATEMENTS (Unaudited)(continued) |
its counterparties are not fully collateralized, contractually or otherwise, the Fund bears the risk of loss from counterparty nonperformance. The Fund attempts to mitigate counterparty risk by only entering into agreements with counterparties that it believes to be of good standing and by monitoring the financial stability of those counterparties.
For financial reporting purposes, the Fund does not offset derivative assets and derivative liabilities that are subject to netting arrangements in the Fund’s Consolidated Statement of Assets and Liabilities.
The following tables present derivative financial instruments and secured financing transactions that are subject to enforceable netting arrangements:
| | | | | | | | | | | | | | | Gross Amounts Not Offset
in the Consolidated Statement
of Assets and Liabilities | |
Instrument | | Gross
Amounts of
Recognized
Assets1 | | | Gross
Amounts
Offset in the
Consolidated
Statement of
Assets and
Liabilities | | | Net Amount
of Assets
Presented
on the
Consolidated
Statement of
Assets and
Liabilities | | | Financial
Instruments | | | Cash
Collateral
Received | | | Net Amount | |
Forward foreign currency exchange contracts | | $ | 2,569,937 | | | $ | — | | | $ | 2,569,937 | | | $ | (180 | ) | | $ | — | | | $ | 2,569,757 | |
Options purchased | | | 28,478 | | | | — | | | | 28,478 | | | | (5,690 | ) | | | (8,142 | ) | | | 14,646 | |
Swap equity agreements | | | 12,500 | | | | — | | | | 12,500 | | | | — | | | | — | | | | 12,500 | |
| | | | | | | | | | | | | | | Gross Amounts Not Offset
in the Consolidated Statement
of Assets and Liabilities | |
Instrument | | Gross
Amounts of
Recognized
Liabilities1 | | | Gross
Amounts
Offset in the
Consolidated
Statement of
Assets and
Liabilities | | | Net Amounts
of Liabilities
Presented
on the
Consolidated
Statement of
Assets and
Liabilities | | | Financial
Instruments | | | Cash
Collateral
Pledged | | | Net Amount | |
Forward foreign currency exchange contracts | | $ | 1,864 | | | $ | — | | | $ | 1,864 | | | $ | (1,864 | ) | | $ | — | | | $ | — | |
Swap interest rate agreements | | | 1,234,801 | | | | — | | | | 1,234,801 | | | | (4,006 | ) | | | — | | | | 1,230,795 | |
1 | Exchange-traded or centrally-cleared derivatives are excluded from these reported amounts. |
| | THE GUGGENHEIM FUNDS SEMI-ANNUAL REPORT | 89 |
NOTES TO CONSOLIDATED FINANCIAL STATEMENTS (Unaudited)(continued) |
The Fund has the right to offset deposits against any related derivative liabilities outstanding with each counterparty with the exception of exchange-traded or centrally-cleared derivatives. The following table presents deposits held by others in connection with derivative investments as of March 31, 2024.
Counterparty | Asset Type | | Cash Pledged | | | Cash Received | |
J.P. Morgan Securities LLC | Credit default swap agreements | | $ | 2,257,708 | | | $ | — | |
J.P. Morgan Securities LLC | Interest rate swap agreements | | | — | | | | 38,157 | |
JP Morgan Chase and Co. | Futures contracts | | | 2,300,000 | | | | — | |
Morgan Stanley Capital Services LLC | Forward foreign currency exchange contracts, Options | | | — | | | | 32,000 | |
| | | | $ | 4,557,708 | | | $ | 70,157 | |
Note 4 – Fair Value Measurement
In accordance with U.S. GAAP, fair value is defined as the price that the Fund would receive to sell an investment or pay to transfer a liability in an orderly transaction between market participants at the measurement date. U.S. GAAP establishes a three-tier fair value hierarchy based on the types of inputs used to value assets and liabilities and requires corresponding disclosure. The hierarchy and the corresponding inputs are summarized below:
Level 1 — | unadjusted quoted prices in active markets for identical assets or liabilities. |
Level 2 — | significant other observable inputs (for example quoted prices for securities that are similar based on characteristics such as interest rates, prepayment speeds, credit risk, etc.). |
Level 3 — | significant unobservable inputs based on the best information available under the circumstances, to the extent observable inputs are not available, which may include assumptions. |
Rule 2a-5 sets forth a definition of “readily available market quotations,” which is consistent with the definition of a Level 1 input under U.S. GAAP. Rule 2a-5 provides that “a market quotation is readily available only when that quotation is a quoted price (unadjusted) in active markets for identical investments that the fund can access at the measurement date, provided that a quotation will not be readily available if it is not reliable.”
Securities for which market quotations are not readily available must be valued at fair value as determined in good faith. Accordingly, any security priced using inputs other than Level 1 inputs will be subject to fair value requirements. The types of inputs available depend on a variety of factors, such as the type of security and the characteristics of the markets in which it trades, if any. Fair valuation determinations that rely on fewer or no observable inputs require greater judgment. Accordingly, fair value determinations for Level 3 securities require the greatest amount of judgment.
90 | THE GUGGENHEIM FUNDS SEMI-ANNUAL REPORT | |
NOTES TO CONSOLIDATED FINANCIAL STATEMENTS (Unaudited)(continued) |
Pricing service providers are used to value a majority of the Fund’s investments. When values are not available from a pricing service provider, they will be determined using a variety of sources and techniques, including: market prices; broker quotes; and models which derive prices based on inputs such as prices of securities with comparable maturities and characteristics or based on inputs such as anticipated cash flows or collateral, spread over U.S. Treasury securities, and other information and analysis. A significant portion of the Fund’s assets and liabilities are categorized as Level 2, as indicated in this report.
Quotes from broker-dealers, adjusted for fluctuations in criteria such as credit spreads and interest rates, may also be used to value the Fund’s assets and liabilities, i.e. prices provided by a broker-dealer or other market participant who has not committed to trade at that price. Although quotes are typically received from established market participants, the Fund may not have the transparency to view the underlying inputs which support the market quotations. Significant changes in a quote would generally result in significant changes in the fair value of the security.
Certain fixed income securities are valued by obtaining a monthly quote from a broker-dealer, adjusted for fluctuations in criteria such as credit spreads and interest rates.
Certain loans and other securities are valued using a single daily broker quote or a price from a pricing service provider based on a single daily or monthly broker quote.
The inputs or methodologies selected and applied for valuing securities or other assets are not necessarily an indication of the risk associated with investing in those securities. The suitability, appropriateness and accuracy of the techniques, methodologies and sources employed to determine fair valuation are periodically reviewed and subject to change.
Note 5 – Investment Advisory Agreement and Other Agreements
Under the terms of an investment advisory contract, the Fund pays GI investment advisory fees on a monthly basis calculated daily at an annualized rate based on the average daily net assets as follows:
Average Daily Net Assets
| | Annualized
Rate | |
$5 billion or less | | | 0.89 | % |
> $5 billion | | | 0.84 | % |
GI has contractually agreed to waive the management fee it receives from the Subsidiary in an amount equal to the management fee paid to GI by the Subsidiary. This undertaking will continue in effect for so long as the Fund invests in the Subsidiary, and may not be terminated by GI unless GI obtains the prior approval of the Fund’s Board for such termination. Fees waived under this arrangement are not subject to reimbursement to GI. For the period ended March 31, 2024, the Fund waived $2,931 related to advisory fees in the Subsidiary.
| | THE GUGGENHEIM FUNDS SEMI-ANNUAL REPORT | 91 |
NOTES TO CONSOLIDATED FINANCIAL STATEMENTS (Unaudited)(continued) |
GI pays operating expenses on behalf of the Trust, such as audit and accounting related services, legal services, custody, printing and mailing, among others, on a pass-through basis. Such expenses are allocated to various Funds within the complex based on relative net assets.
The Board has adopted Distribution Plans related to the offering of Class A, Class C and Class P shares pursuant to Rule 12b-1 under the 1940 Act. The plans provide for payments at an annual rate of 0.25% of the average daily net assets of the Fund’s Class A and Class P shares, and 1.00% of the average daily net assets of the Fund’s Class C shares.
The investment advisory contract for the Fund provides that the total expenses be limited to a percentage of average net assets for each class of shares, exclusive of brokerage costs, dividends or interest on securities sold short, expenses of other investment companies in which the Fund invests, interest, taxes, litigation, indemnification and extraordinary expenses. The limits are listed below:
| | Limit | | | Effective
Date | | | Contract
End Date | |
Class A | | | 1.36 | % | | | 11/30/12 | | | | 02/01/25 | |
Class C | | | 2.11 | % | | | 11/30/12 | | | | 02/01/25 | |
Class P | | | 1.36 | % | | | 05/01/15 | | | | 02/01/25 | |
Institutional Class | | | 0.95 | % | | | 11/30/12 | | | | 02/01/25 | |
Class R6 | | | 0.95 | % | | | 03/13/19 | | | | 02/01/25 | |
GI is entitled to reimbursement by the Fund for fees waived or expenses reimbursed during any of the previous 36 months, beginning on the date of the expense limitation agreement, if on any day the estimated operating expenses are less than the indicated percentages. For purposes of this arrangement, GI is entitled to recoupment of previously waived fees or reimbursed expenses for 36 months from the date of the waiver or reimbursement by GI. At March 31, 2024, the amount of fees waived or expenses reimbursed that are subject to recoupment and will expire during the years ended September 30, are presented in the following table:
| | 2024 | | | 2025 | | | 2026 | | | 2027 | | | Fund
Total | |
Class A | | $ | 100,134 | | | $ | 80,282 | | | $ | 15,216 | | | $ | 1,734 | | | $ | 197,366 | |
Class C | | | 57,263 | | | | 37,685 | | | | 6,309 | | | | 794 | | | | 102,051 | |
Class P | | | 60,083 | | | | 101,516 | | | | 99,081 | | | | 252 | | | | 260,932 | |
Institutional Class | | | 5,276,465 | | | | 7,075,307 | | | | 4,861,940 | | | | 2,254,667 | | | | 19,468,379 | |
Class R6 | | | 55,376 | | | | 38,182 | | | | 9,192 | | | | 2,315 | | | | 105,065 | |
For the period ended March 31, 2024, GI recouped $175,626 from the Fund.
If the Fund invests in a fund that is advised by the same adviser or an affiliated adviser, the investing Fund’s adviser has agreed to waive fees at the investing fund level to the extent necessary to offset the proportionate share of any management fee paid by the Fund with respect to its investment in such affiliated fund. Fee waivers will be calculated at the investing fund level
92 | THE GUGGENHEIM FUNDS SEMI-ANNUAL REPORT | |
NOTES TO CONSOLIDATED FINANCIAL STATEMENTS (Unaudited)(continued) |
without regard to any expense cap, if any, in effect for the investing fund. Fees waived under this arrangement are not subject to reimbursement to GI. For the period ended March 31, 2024, the Fund waived $563,707 related to investments in affiliated funds.
For the period ended March 31, 2024, GFD retained sales charges of $77,213 relating to sales of Class A shares of the Trust.
Certain trustees and officers of the Trust are also officers of GI and/or GFD. The Trust does not compensate its officers or trustees who are officers, directors and/or employees of GI or GFD.
MUFG Investor Services (US), LLC (“MUIS”) acts as the Fund’s administrator, transfer agent and accounting agent. As administrator, transfer agent and accounting agent, MUIS maintains the books and records of the Fund’s securities and cash. The Bank of New York Mellon Corp. (“BNY”) acts as the Fund’s custodian. As custodian, BNY is responsible for the custody of the Fund’s assets. For providing the aforementioned administrative and accounting services, MUIS is entitled to receive a monthly fee equal to a percentage of the Fund’s average daily net assets and out of pocket expenses. For providing the aforementioned transfer agent and custodian services, MUIS and BNY are entitled to receive a monthly fee based on the number of transactions during the month and the number of accounts under management, subject to certain minimum monthly fees, and out of pocket expenses.
Note 6 – Federal Income Tax Information
The Fund intends to comply with the provisions of Subchapter M of the Internal Revenue Code of 1986, as amended (the “Internal Revenue Code”), applicable to regulated investment companies and will distribute substantially all taxable net investment income and capital gains sufficient to relieve the Fund from all, or substantially all, federal income, excise and state income taxes. Therefore, no provision for federal or state income tax or federal excise tax is required.
Tax positions taken or expected to be taken in the course of preparing the Fund’s tax returns are evaluated to determine whether the tax positions are “more-likely-than-not” of being sustained by the applicable tax authority. Tax positions not deemed to meet the “more-likely-than-not” threshold would be recorded as a tax benefit or expense in the current year. Management has analyzed the Fund’s tax positions taken, or to be taken, on U.S. federal income tax returns for all open tax years, and has concluded that no provision for income tax is required in the Fund’s consolidated financial statements. The Fund’s U.S. federal income tax returns are subject to examination by the Internal Revenue Service (“IRS”) for a period of three years after they are filed.
The Fund intends to invest up to 25% of its assets in the Subsidiary which is expected to provide the Fund with exposure to the commodities markets within the limitations of the U.S. federal income tax requirements under Subchapter M of the Internal Revenue Code. The Fund has received a private letter ruling from the IRS that concludes that the income the Fund receives from the Subsidiary will constitute qualifying income for purposes of Subchapter M of the Internal Revenue Code. The Subsidiary is classified as a corporation for U.S. federal income tax purposes.
| | THE GUGGENHEIM FUNDS SEMI-ANNUAL REPORT | 93 |
NOTES TO CONSOLIDATED FINANCIAL STATEMENTS (Unaudited)(continued) |
A foreign corporation, such as the Subsidiary, will generally not be subject to U.S. federal income taxation unless it is deemed to be engaged in a U.S. trade or business. If, during a taxable year, the Subsidiary’s taxable losses (and other deductible items) exceed its income and gains, the net loss will not pass through to the Fund as a deductible amount for U.S. federal income tax purposes and cannot be carried forward to reduce future income from the Subsidiary in subsequent years.
At March 31, 2024, the cost of investments for U.S. federal income tax purposes, the aggregate gross unrealized appreciation for all investments for which there was an excess of value over tax cost, and the aggregate gross unrealized depreciation for all investments for which there was an excess of tax cost over value, were as follows:
| | Tax
Cost | | | Tax
Unrealized
Appreciation | | | Tax
Unrealized
Depreciation | | | Net Tax
Unrealized
Appreciation
(Depreciation) | |
| | | $ | 7,192,632,192 | | | $ | 35,805,663 | | | $ | (518,244,095 | ) | | $ | (482,438,432 | ) |
Note 7 – Securities Transactions
For the period ended March 31, 2024, the cost of purchases and proceeds from sales of investment securities, excluding government securities, short-term investments and derivatives, were as follows:
| | Purchases | | | Sales | |
| | | $ | 953,819,239 | | | $ | 891,754,727 | |
For the period ended March 31, 2024, the cost of purchases and proceeds from sales of government securities were as follows:
| | Purchases | | | Sales | |
| | | $ | 359,296,875 | | | $ | 22,834,906 | |
The Fund is permitted to purchase or sell securities from or to certain affiliated funds under specified conditions outlined in procedures adopted by the Board. The procedures have been designed to ensure that any purchase or sale of securities by the Fund from or to another fund or portfolio that is or could be considered an affiliate by virtue of having a common investment adviser (or affiliated investment advisers), common trustees and/or common officers complies with Rule 17a-7 of the 1940 Act. Further, as defined under these procedures, each transaction is effected at the current market price. For the period ended March 31, 2024, the Fund did not engage in purchases and sales of securities pursuant to Rule 17a-7 of the 1940 Act.
94 | THE GUGGENHEIM FUNDS SEMI-ANNUAL REPORT | |
NOTES TO CONSOLIDATED FINANCIAL STATEMENTS (Unaudited)(continued) |
Note 8 – Unfunded Loan Commitments
Pursuant to the terms of certain loan agreements, the Fund held unfunded loan commitments as of March 31, 2024. The Fund is obligated to fund these loan commitments at the borrower’s discretion.
The unfunded loan commitments as of March 31, 2024, were as follows:
Borrower | | Maturity Date | | | Face Amount* | | | Value | |
Ardonagh Midco 3 plc | | | 02/16/25 | | | | 442,771 | | | $ | 6,642 | |
Avalara, Inc. | | | 10/19/28 | | | | 1,600,000 | | | | 17,496 | |
Care BidCo | | | 05/04/28 | | | | EUR 9,200,000 | | | | 541,771 | |
Checkers Holdings, Inc. | | | 06/16/27 | | | | 262,053 | | | | — | |
Datix Bidco Ltd. | | | 05/16/24 | | | | 25,400,000 | | | | — | |
Finastra USA, Inc. | | | 09/13/29 | | | | 761,458 | | | | 85,574 | |
Inspired Finco Holdings Ltd. | | | 02/17/31 | | | | EUR 2,556,468 | | | | — | |
Lightning A | | | 03/01/37 | | | | 12,180,000 | | | | — | |
Lightning B | | | 03/01/37 | | | | 2,450,000 | | | | — | |
MB2 Dental Solutions, LLC | | | 01/29/31 | | | | 9,063,476 | | | | 236,985 | |
Orion Group | | | 03/19/27 | | | | 2,165,273 | | | | 58,725 | |
Polaris Newco LLC | | | 06/04/26 | | | | 3,875,159 | | | | 211,691 | |
RLDatix | | | 10/28/24 | | | | GBP 5,508,364 | | | | — | |
Schur Flexibles GmbH | | | 09/30/26 | | | | EUR 143,170 | | | | 12,358 | |
Shaw Development LLC | | | 10/30/29 | | | | 734,043 | | | | — | |
Thunderbird A | | | 03/01/37 | | | | 12,180,000 | | | | — | |
Thunderbird B | | | 03/01/37 | | | | 2,450,000 | | | | — | |
TK Elevator Midco GmbH | | | 01/29/27 | | | | EUR 8,915,725 | | | $ | 465,725 | |
| | | | | | | | | | | $ | 1,636,967 | |
* | The face amount is denominated in U.S. dollars unless otherwise indicated. |
| | EUR — Euro |
| | GBP — British Pound |
Note 9 – Restricted Securities
The securities below are considered illiquid and restricted under guidelines established by the Board:
Restricted
Securities | | Acquisition
Date | | | Cost | | | Value | |
Atlas Mara Ltd. | | | | | | | | | | | | |
due 12/31/211 | | | 10/01/15 | | | $ | 3,476,550 | | | $ | 118,579 | |
CFMT LLC | | | | | | | | | | | | |
2022-HB9, 3.25% (WAC) due 09/25/372 | | | 09/23/22 | | | | 7,696,742 | | | | 7,727,760 | |
Copper River CLO Ltd. | | | | | | | | | | | | |
2007-1A INC, due 01/20/213 | | | 05/09/14 | | | | — | | | | 815 | |
Mirabela Nickel Ltd. | | | | | | | | | | | | |
due 06/24/191 | | | 12/31/13 | | | | 1,710,483 | | | | 9,427 | |
| | THE GUGGENHEIM FUNDS SEMI-ANNUAL REPORT | 95 |
NOTES TO CONSOLIDATED FINANCIAL STATEMENTS (Unaudited)(continued) |
Restricted
Securities | | Acquisition
Date | | | Cost | | | Value | |
| | | | | | | $ | 12,883,775 | | | $ | 7,856,581 | |
1 | Security is in default of interest and/or principal obligations. |
2 | Variable rate security. Rate indicated is the rate effective at March 31, 2024. In some instances, the effective rate is limited by a minimum rate floor or a maximum rate cap established by the issuer. The settlement status of a position may also impact the effective rate indicated. In some cases, a position may be unsettled at period end and may not have a stated effective rate. In instances where multiple underlying reference rates and spread amounts are shown, the effective rate is based on a weighted average. |
3 | Security has no stated coupon. However, it is expected to receive residual cash flow payments on defined deal dates. |
Note 10 – Line of Credit
The Trust, along with other affiliated trusts, secured a 364-day committed, $1,150,000,000 line of credit from Citibank, N.A., which was in place through September 29, 2023, at which time a new line of credit was entered into in the amount of $1,165,000,000. The Fund may draw (borrow) from the line of credit as a temporary measure for emergency purposes, to facilitate redemption requests, or for other short-term liquidity purposes consistent with the Fund’s investment objective and program. For example, it may be advantageous for the Fund to borrow money rather than sell existing portfolio positions to meet redemption requests. Fees related to borrowings, if any, vary under this arrangement between the greater of Citibank’s “base rate”, SOFR plus 1%, or the federal funds rate plus 1/2 of 1%.
The commitment fee that may be paid by the Fund is at an annualized rate of 0.15% of the average daily amount of their allocated unused commitment amount. The commitment fee amount is allocated to the individual Funds based on the respective net assets of each participating Fund and is referenced in the Fund’s Consolidated Statement of Operations under “Line of credit fees”. The Fund did not have any borrowings under this agreement as of and for the period ended March 31, 2024.
Note 11 – Market Risks
The value of, or income generated by, the investments held by the Fund are subject to the possibility of rapid and unpredictable fluctuation, and loss that may result from various factors. These factors include, among others, developments affecting individual companies, or from broader influences, including real or perceived changes in prevailing interest rates (which may change at any time based on changes in monetary policies and various market and other economic conditions), changes in inflation rates or expectations about inflation rates, adverse investor confidence or sentiment, changing economic, political (including geopolitical), social or financial market conditions, increased instability or general uncertainty, environmental disasters, governmental actions, public health emergencies (such as the spread of infectious diseases, pandemics and epidemics), debt crises, actual or threatened wars or other armed conflicts (such as the ongoing Russia-Ukraine conflict and its collateral economic and other effects, including, but
96 | THE GUGGENHEIM FUNDS SEMI-ANNUAL REPORT | |
NOTES TO CONSOLIDATED FINANCIAL STATEMENTS (Unaudited)(concluded) |
not limited to, sanctions and other international trade barriers) or ratings downgrades, and other similar events, each of which may be temporary or last for extended periods. Moreover, changing economic, political, geopolitical, social, financial market or other conditions in one country, geographic region or industry could adversely affect the value, yield and return of the investments held by the Fund in a different country, geographic region, economy, industry or market because of the increasingly interconnected global economies and financial markets. The duration and extent of the foregoing types of factors or conditions are highly uncertain and difficult to predict and have in the past, and may in the future, cause volatility and distress in economies and financial markets or other adverse circumstances, which may negatively affect the value of the Fund’s investments and performance of the Fund.
Note 12 – Subsequent Events
The Fund evaluated subsequent events through the date the consolidated financial statements are issued and determined there were no material events that would require adjustment to or disclosure in the Fund’s consolidated financial statements.
| | THE GUGGENHEIM FUNDS SEMI-ANNUAL REPORT | 97 |
OTHER INFORMATION (Unaudited) |
Delivery of Shareholder Reports
Paper copies of the Fund’s annual and semi-annual shareholder reports are not sent by mail, unless you specifically request paper copies of the reports from the Fund or from your financial intermediary. Instead, the reports are made available on a website, and you are notified by mail each time a report is posted and provided with a website link to access the report.
You may elect to receive all future shareholder reports in paper free of charge. If you hold shares of the Fund directly, you can inform the Fund that you wish to receive paper copies of reports by calling 800.820.0888. If you hold shares of the Fund through a financial intermediary, please contact the financial intermediary to make this election. Your election to receive reports in paper may apply to all Guggenheim funds in which you are invested and may apply to all Guggenheim funds held with your financial intermediary.
Tailored Shareholder Reports for Open-End Mutual Funds and Exchange-Traded Funds
Effective January 24, 2023, the SEC adopted rule and form amendments to require open-end mutual funds and exchange-traded funds registered on Form N-1A to transmit concise and visually engaging streamlined annual and semi-annual reports to shareholders that highlight key information. Other information, including financial statements, will no longer appear in a streamlined shareholder report but must be available online, delivered free of charge upon request, and filed on a semi-annual basis on Form N-CSR. The rule and form amendments have a compliance date of July 24, 2024. At this time, management is evaluating the impact of these amendments on the shareholder reports for the Fund.
Proxy Voting Information
A description of the policies and procedures that the Trust uses to determine how to vote proxies relating to securities held in the Fund’s portfolio is available, without charge and upon request, by calling 800.820.0888. This information is also available from the EDGAR database on the SEC’s website at https://www.sec.gov.
Information regarding how the Fund voted proxies relating to portfolio securities during the most recent 12-month period ended June 30 is available without charge, upon request, by calling 800.820.0888. This information is also available from the EDGAR database on the SEC’s website at https://www.sec.gov.
Sector Classification
Information in the Consolidated Schedule of Investments is categorized by sectors using sector-level Classifications defined by the Bloomberg Industry Classification System, a widely recognized industry classification system provider. The Fund’s registration statement has investment policies relating to concentration in specific sectors/industries. For purposes of these investment policies, the Fund usually classifies sectors/industries based on industry-level Classifications
98 | THE GUGGENHEIM FUNDS SEMI-ANNUAL REPORT | |
OTHER INFORMATION (Unaudited)(concluded) |
used by widely recognized industry classification system providers such as Bloomberg Industry Classification System, Global Industry Classification Standards and Barclays Global Classification Scheme.
Quarterly Portfolio Schedules Information
The Trust files its complete schedule of portfolio holdings with the SEC for the first and third quarters of each fiscal year as an exhibit to its reports on Form N-PORT. The Fund’s Form N-PORT is available on the SEC’s website at https://www.sec.gov. The Fund’s complete schedule of securities holdings as of the end of each fiscal quarter will be made available to the public on the SEC’s website at www.sec.gov and on our website at www.guggenheiminvestments.com, and will be made available, upon request and without charge, by calling 800.820.0888.
| | THE GUGGENHEIM FUNDS SEMI-ANNUAL REPORT | 99 |
INFORMATION ON BOARD OF TRUSTEES AND OFFICERS (Unaudited) |
A Board of Trustees oversees the Trust, as well as other trusts of GI, in which its members have no stated term of service, and continue to serve after election until resignation. The Statement of Additional Information includes further information about Fund Trustees and Officers, and can be obtained without charge by visiting guggenheiminvestments.com or by calling 800.820.0888.
Name, Address*
and Year of Birth | Position(s)
Held with
Trust | Term of Office
and Length of
Time Served** | Principal Occupation(s)
During Past Five Years | Number of
Portfolios
in Fund
Complex
Overseen | Other Directorships
Held by Trustees*** |
INDEPENDENT TRUSTEES | | | |
Randall C. Barnes (1951) | Trustee and Chair of the Valuation Oversight Committee | Since 2014 (Trustee) Since 2020 (Chair of the Valuation Oversight Committee) | Current: Private Investor (2001-present). Former: Senior Vice President and Treasurer, PepsiCo, Inc. (1993-1997); President, Pizza Hut International (1991-1993); Senior Vice President, Strategic Planning and New Business Development, PepsiCo, Inc. (1987-1990). | 153 | Current: Advent Convertible and Income Fund (2005-present); Purpose Investments Funds (2013-present). Former: Guggenheim Energy & Income Fund (2015-2023); Fiduciary/Claymore Energy Infrastructure Fund (2004-2022); Guggenheim Enhanced Equity Income Fund (2005-2021); Guggenheim Credit Allocation Fund (2013-2021). |
100 | THE GUGGENHEIM FUNDS SEMI-ANNUAL REPORT | |
INFORMATION ON BOARD OF TRUSTEES AND OFFICERS (Unaudited)(continued) |
Name, Address*
and Year of Birth | Position(s)
Held with
Trust | Term of Office
and Length of
Time Served** | Principal Occupation(s)
During Past Five Years | Number of
Portfolios
in Fund
Complex
Overseen | Other Directorships
Held by Trustees*** |
INDEPENDENT TRUSTEES - continued | | |
Angela Brock-Kyle (1959) | Trustee | Since 2019 | Current: Founder and Chief Executive Officer, B.O.A.R.D.S. (consulting firm) (2013-present); Director, Mutual Fund Directors Forum (2022-present). Former: Senior Leader, TIAA (financial services firm) (1987-2012). | 152 | Current: Bowhead Insurance GP, LLC (2020-present); Hunt Companies, Inc. (2019-present). Former: Guggenheim Energy & Income Fund (2019-2023); Fiduciary/Claymore Energy Infrastructure Fund (2019-2022); Guggenheim Enhanced Equity Income Fund (2019-2021); Guggenheim Credit Allocation Fund (2019-2021); Infinity Property & Casualty Corp. (2014-2018). |
| | THE GUGGENHEIM FUNDS SEMI-ANNUAL REPORT | 101 |
INFORMATION ON BOARD OF TRUSTEES AND OFFICERS (Unaudited)(continued) |
Name, Address*
and Year of Birth | Position(s)
Held with
Trust | Term of Office
and Length of
Time Served** | Principal Occupation(s)
During Past Five Years | Number of
Portfolios
in Fund
Complex
Overseen | Other Directorships
Held by Trustees*** |
INDEPENDENT TRUSTEES - continued | | |
Thomas F. Lydon, Jr. (1960) | Trustee and Chair of the Contracts Review Committee | Since 2019 (Trustee) Since 2020 (Chair of the Contracts Review Committee) | Current: President, Global Trends Investments (registered investment adviser) (1996-present); Chief Executive Officer, Lydon Media (2016-present); Vice Chairman, VettaFi, a wholly owned subsidiary of The TMX Group (financial advisor content, research and digital distribution provider) (2022-present). Former: Chief Executive Officer, ETF Flows, LLC (financial advisor education and research provider) (2019-2023); Director, GDX Index Partners, LLC (index provider) (2021-2023). | 152 | Current: US Global Investors, Inc. (GROW) (1995-present); The 2023 ETF Series Trust (4) (2023-present); The 2023 ETF Series II (1) (2023-present). Former: Guggenheim Energy & Income Fund (2019-2023); Fiduciary/Claymore Energy Infrastructure Fund (2019-2022); Guggenheim Enhanced Equity Income Fund (2019-2021); Guggenheim Credit Allocation Fund (2019-2021); Harvest Volatility Edge Trust (3) (2017-2019). |
102 | THE GUGGENHEIM FUNDS SEMI-ANNUAL REPORT | |
INFORMATION ON BOARD OF TRUSTEES AND OFFICERS (Unaudited)(continued) |
Name, Address*
and Year of Birth | Position(s)
Held with
Trust | Term of Office
and Length of
Time Served** | Principal Occupation(s)
During Past Five Years | Number of
Portfolios
in Fund
Complex
Overseen | Other Directorships
Held by Trustees*** |
INDEPENDENT TRUSTEES - continued | | |
Ronald A. Nyberg (1953) | Trustee and Chair of the Nominating and Governance Committee | Since 2014 | Current: Of Counsel (formerly Partner), Momkus LLP (law firm) (2016-present). Former: Partner, Nyberg & Cassioppi, LLC (law firm) (2000-2016); Executive Vice President, General Counsel, and Corporate Secretary, Van Kampen Investments (1982-1999). | 153 | Current: Advent Convertible and Income Fund (2003-present); PPM Funds (2) (2018-present); Endeavor Health (2012-present). Former: Guggenheim Energy & Income Fund (2015-2023); Fiduciary/Claymore Energy Infrastructure Fund (2004-2022); Guggenheim Enhanced Equity Income Fund (2005-2021); Guggenheim Credit Allocation Fund (2013-2021); Western Asset Inflation-Linked Opportunities & Income Fund (2004-2020); Western Asset Inflation-Linked Income Fund (2003-2020). |
| | THE GUGGENHEIM FUNDS SEMI-ANNUAL REPORT | 103 |
INFORMATION ON BOARD OF TRUSTEES AND OFFICERS (Unaudited)(continued) |
Name, Address*
and Year of Birth | Position(s)
Held with
Trust | Term of Office
and Length of
Time Served** | Principal Occupation(s)
During Past Five Years | Number of
Portfolios
in Fund
Complex
Overseen | Other Directorships
Held by Trustees*** |
INDEPENDENT TRUSTEES - continued | | |
Sandra G. Sponem (1958) | Trustee and Chair of the Audit Committee | Since 2019 (Trustee) Since 2020 (Chair of the Audit Committee) | Current: Retired. Former: Senior Vice President and Chief Financial Officer, M.A. Mortenson-Companies, Inc. (construction and real estate development company) (2007-2017). | 152 | Current: SPDR Series Trust (81) (2018-present); SPDR Index Shares Funds (30) (2018-present); SSGA Active Trust (14) (2018-present). Former: Guggenheim Energy & Income Fund (2019-2023); Fiduciary/Claymore Energy Infrastructure Fund (2019-2022); Guggenheim Enhanced Equity Income Fund (2019-2021); Guggenheim Credit Allocation Fund (2019-2021); SSGA Master Trust (1) (2018-2020). |
104 | THE GUGGENHEIM FUNDS SEMI-ANNUAL REPORT | |
INFORMATION ON BOARD OF TRUSTEES AND OFFICERS (Unaudited)(continued) |
Name, Address*
and Year of Birth | Position(s)
Held with
Trust | Term of Office
and Length of
Time Served** | Principal Occupation(s)
During Past Five Years | Number of
Portfolios
in Fund
Complex
Overseen | Other Directorships
Held by Trustees*** |
INDEPENDENT TRUSTEES - concluded | | |
Ronald E. Toupin, Jr. (1958) | Trustee, Chair of the Board and Chair of the Executive Committee | Since 2014 | Current: Portfolio Consultant (2010-present); Member, Governing Council, Independent Directors Council (2013-present); Governor, Board of Governors, Investment Company Institute (2018-present). Former: Member, Executive Committee, Independent Directors Council (2016-2018); Vice President, Manager and Portfolio Manager, Nuveen Asset Management (1998-1999); Vice President, Nuveen Investment Advisory Corp. (1992-1999); Vice President and Manager, Nuveen Unit Investment Trusts (1991-1999); and Assistant Vice President and Portfolio Manager, Nuveen Unit Investment Trusts (1988-1999), each of John Nuveen & Co., Inc. (registered broker dealer) (1982-1999). | 152 | Former: Guggenheim Energy & Income Fund (2015-2023); Fiduciary/Claymore Energy Infrastructure Fund (2004-2022); Guggenheim Enhanced Equity Income Fund (2005-2021); Guggenheim Credit Allocation Fund (2013-2021); Western Asset Inflation-Linked Opportunities & Income Fund (2004-2020); Western Asset Inflation-Linked Income Fund (2003-2020). |
| | THE GUGGENHEIM FUNDS SEMI-ANNUAL REPORT | 105 |
INFORMATION ON BOARD OF TRUSTEES AND OFFICERS (Unaudited)(continued) |
Name, Address*
and Year of Birth | Position(s)
Held with
Trust | Term of Office
and Length of
Time Served** | Principal Occupation(s)
During Past Five Years | Number of
Portfolios
in Fund
Complex
Overseen | Other Directorships
Held by Trustees*** |
INTERESTED TRUSTEE | |
Amy J. Lee**** (1961) | Trustee, Vice President and Chief Legal Officer | Since 2018 (Trustee) Since 2014 (Chief Legal Officer) Since 2007
(Vice President) | Current: Interested Trustee, certain other funds in the Fund Complex (2018-present); Chief Legal Officer, certain other funds in the Fund Complex (2014-present); Vice President, certain other funds in the Fund Complex (2007-present); Senior Managing Director, Guggenheim Investments (2012-present). Former: President and/or Chief Executive Officer, certain other funds in the Fund Complex (2017-2019); Vice President, Associate General Counsel and Assistant Secretary, Security Benefit Life Insurance Company and Security Benefit Corporation (2004-2012). | 152 | Former: Guggenheim Energy & Income Fund (2018-2023); Fiduciary/Claymore Energy Infrastructure Fund (2018-2022); Guggenheim Enhanced Equity Income Fund (2018-2021); Guggenheim Credit Allocation Fund (2018-2021). |
* | The business address of each Trustee is c/o Guggenheim Investments, 227 West Monroe Street, Chicago, Illinois 60606. |
** | Each Trustee serves an indefinite term, until his or her successor is elected and qualified. Time served includes time served in the respective position for the Predecessor Corporation. |
*** | Each Trustee also serves on the Boards of Trustees of Guggenheim Funds Trust, Guggenheim Variable Funds Trust, Guggenheim Strategy Funds Trust, Guggenheim Taxable Municipal Bond & Investment Grade Debt Trust, Guggenheim Strategic Opportunities Fund, Guggenheim Active Allocation Fund, Rydex Series Funds, Rydex Dynamic Funds, Rydex Variable Trust and Transparent Value Trust. Messrs. Barnes and Nyberg also serve on the Board of Trustees of Advent Convertible & Income Fund. |
**** | This Trustee is deemed to be an “interested person” of the Fund under the 1940 Act by reason of her position with the Fund’s Adviser and/or the parent of the Adviser. |
106 | THE GUGGENHEIM FUNDS SEMI-ANNUAL REPORT | |
INFORMATION ON BOARD OF TRUSTEES AND OFFICERS (Unaudited)(continued) |
Name, Address*
and Year of Birth | Position(s)
Held with
Trust | Term of Office
and Length of
Time Served** | Principal Occupation(s)
During Past Five Years |
OFFICERS | | | |
Brian E. Binder (1972) | President and Chief Executive Officer | Since 2018 | Current: President, Mutual Funds Boards, Guggenheim Investments (2022-present); President and Chief Executive Officer, certain other funds in the Fund Complex (2018-present); President, Mutual Funds Boards and Senior Managing Director, Guggenheim Funds Investment Advisors, LLC and Security Investors, LLC (2018-present); Board Member, Guggenheim Partners Investment Funds plc (2022-present); Board Member, Guggenheim Global Investments plc (2022-present); Board Member, Guggenheim Partners Fund Management (Europe) Limited (2018-present). Former: Senior Managing Director and Chief Administrative Officer, Guggenheim Investments (2018-2022); Managing Director and President, Deutsche Funds, and Head of US Product, Trading and Fund Administration, Deutsche Asset Management (2013-2018); Managing Director, Chairman of North American Executive Committee and Head of Business Management and Consulting, Invesco Ltd. (2010-2012). |
James Howley (1972) | Chief Financial Officer, Chief Accounting Officer and Treasurer | Since 2022 | Current: Managing Director, Guggenheim Investments (2004-present); Chief Financial Officer, Chief Accounting Officer, and Treasurer, certain other funds in the Fund Complex (2022-present). Former: Assistant Treasurer, certain other funds in the Fund Complex (2006-2022); Manager, Mutual Fund Administration of Van Kampen Investments, Inc. (1996-2004). |
Mark E. Mathiasen (1978) | Secretary | Since 2014 | Current: Secretary, certain other funds in the Fund Complex (2007-present); Managing Director, Guggenheim Investments (2007-present). |
Glenn McWhinnie (1969) | Assistant Treasurer | Since 2016 | Current: Vice President, Guggenheim Investments (2009-present); Assistant Treasurer, certain other funds in the Fund Complex (2016-present). |
Michael P. Megaris (1984) | Assistant Secretary | Since 2014 | Current: Assistant Secretary, certain other funds in the Fund Complex (2014-present); Managing Director, Guggenheim Investments (2012-present). |
| | THE GUGGENHEIM FUNDS SEMI-ANNUAL REPORT | 107 |
INFORMATION ON BOARD OF TRUSTEES AND OFFICERS (Unaudited)(continued) |
Name, Address*
and Year of Birth | Position(s)
Held with
Trust | Term of Office
and Length of
Time Served** | Principal Occupation(s)
During Past Five Years |
OFFICERS - continued | |
Elisabeth Miller (1968) | Chief Compliance Officer | Since 2012 | Current: Chief Compliance Officer, certain other funds in the Fund Complex (2012-present); Senior Managing Director, Guggenheim Investments (2012-present); Senior Managing Director, Guggenheim Funds Distributors, LLC (2014-present). Former: Chief Compliance Officer, Security Investors, LLC and Guggenheim Funds Investment Advisors, LLC (2012-2018); Chief Compliance Officer, Guggenheim Distributors, LLC (2009-2014); Senior Manager, Security Investors, LLC (2004-2014); Senior Manager, Guggenheim Distributors, LLC (2004-2014). |
Margaux Misantone (1978) | AML Officer | Since 2017 | Current: Chief Compliance Officer, Security Investors, LLC and Guggenheim Funds Investment Advisors, LLC (2018-present); AML Officer, Security Investors, LLC and certain other funds in the Fund Complex (2017-present); Managing Director, Guggenheim Investments (2015-present). Former: Assistant Chief Compliance Officer, Security Investors, LLC and Guggenheim Funds Investments Advisors, LLC (2015-2018). |
Kimberly J. Scott (1974) | Assistant Treasurer | Since 2014 | Current: Director, Guggenheim Investments (2012-present); Assistant Treasurer, certain other funds in the Fund Complex (2012-present). Former: Financial Reporting Manager, Invesco, Ltd. (2010-2011); Vice President/Assistant Treasurer, Mutual Fund Administration for Van Kampen Investments, Inc./Morgan Stanley Investment Management (2009-2010); Manager of Mutual Fund Administration, Van Kampen Investments, Inc./Morgan Stanley Investment Management (2005-2009). |
108 | THE GUGGENHEIM FUNDS SEMI-ANNUAL REPORT | |
INFORMATION ON BOARD OF TRUSTEES AND OFFICERS (Unaudited)(concluded) |
Name, Address*
and Year of Birth | Position(s)
Held with
Trust | Term of Office
and Length of
Time Served** | Principal Occupation(s)
During Past Five Years |
OFFICERS - concluded | |
Jon Szafran (1989) | Assistant Treasurer | Since 2017 | Current: Director, Guggenheim Investments (2017-present); Assistant Treasurer, certain other funds in the Fund Complex (2017-present). Former: Assistant Treasurer of Henderson Global Funds and Manager of US Fund Administration, Henderson Global Investors (North America) Inc. (“HGINA”), (2017); Senior Analyst of US Fund Administration, HGINA (2014–2017); Senior Associate of Fund Administration, Cortland Capital Market Services, LLC (2013-2014); Experienced Associate, PricewaterhouseCoopers LLP (2012-2013). |
* | The business address of each officer is c/o Guggenheim Investments, 227 West Monroe Street, Chicago, Illinois 60606. |
** | Each officer serves an indefinite term, until his or her successor is duly elected and qualified. |
| | THE GUGGENHEIM FUNDS SEMI-ANNUAL REPORT | 109 |
GUGGENHEIM INVESTMENTS PRIVACY NOTICE (Unaudited) |
Who We Are
This Privacy Notice describes the data protection practices of Guggenheim Investments. Guggenheim Investments as used herein refers to the affiliated investment management businesses of Guggenheim Partners, LLC: Guggenheim Funds Investment Advisors, LLC, Guggenheim Partners Investment Management, LLC, Guggenheim Funds Distributors, LLC, Security Investors, LLC, Guggenheim Investment Advisors (Europe) Limited, Guggenheim Real Estate, LLC, GS Gamma Advisors, LLC, Guggenheim Partners India Management, LLC, Guggenheim Partners Europe Limited, as well as the funds in the Guggenheim Funds complex (the “Funds”) (“Guggenheim Investments,” “we,” “us,” or “our”).
Guggenheim Partners Investment Management Holdings, LLC, located at 330 Madison Avenue, New York, New York, 10017, is the data controller for your information. The affiliates who are also controllers of certain of your information are: Guggenheim Investment Advisors (Europe) Limited, Guggenheim Partners Europe Limited, Guggenheim Partners, LLC, Guggenheim Funds Investment Advisors, LLC, Guggenheim Partners Investment Management, LLC, Guggenheim Funds Distributors, LLC and Security Investors, LLC, as well as the Funds.
Our Commitment to You
Guggenheim Investments considers your privacy our utmost concern. When you become our client or investor, you entrust us with not only your hard-earned money but also with your personal and financial information. Because we have access to your private information, we hold ourselves to the highest standards in its safekeeping and use. We strictly limit how we share your information with others, whether you are a current or former Guggenheim Investments client or investor.
The Information We Collect About You
We collect certain nonpublic personal information about you from information you provide on applications, other forms, our website, and/or from third parties including investment advisors. This information includes Social Security or other tax identification number, assets, income, tax information, retirement and estate plan information, transaction history, account balance, payment history, bank account information, marital status, family relationships, information that we collect on our website through the use of “cookies,” and other personal information that you or others provide to us. We may also collect such information through your inquiries by mail, e-mail or telephone. We may also collect customer due diligence information, as required by applicable law and regulation, through third party service providers.
How We Handle Your Personal Information
The legal basis for using your information as set out in this Privacy Notice is as follows: (a) use of your personal data is necessary to perform our obligations under any contract with you (such as a contract for us to provide financial services to you); or (b) where use of your personal data is not necessary for performance of a contract, use of your personal data is necessary for our
110 | THE GUGGENHEIM FUNDS SEMI-ANNUAL REPORT | |
GUGGENHEIM INVESTMENTS PRIVACY NOTICE (Unaudited)(continued) |
legitimate interests or the legitimate interests of others (for example, to enforce the legal terms governing our services, operate and market our website and other services we offer, ensure safe environments for our personnel and others, make and receive payments, prevent fraud and to know the customer to whom we are providing the services). Some processing is done to comply with applicable law.
In addition to the specific uses described above, we also use your information in the following manner:
| | ● | We use your information in connection with servicing your accounts. |
| | ● | We use information to respond to your requests or questions. For example, we might use your information to respond to your customer feedback. |
| | ● | We use information to improve our products and services. We may use your information to make our website and products better. We may use your information to customize your experience with us. |
| | ● | We use information for security purposes. We may use your information to protect our company and our customers. |
| | ● | We use information to communicate with you. For example, we will communicate with you about your account or our relationship. We may contact you about your feedback. We might also contact you about this Privacy Notice. We may also enroll you in our email newsletter. |
| | ● | We use information as otherwise permitted by law, as we may notify you. |
| | ● | Aggregate/Anonymous Data. We may aggregate and/or anonymize any information collected through the website so that such information can no longer be linked to you or your device (“Aggregate/Anonymous Information”). We may use Aggregate/Anonymous Information for any purpose, including without limitation for research and marketing purposes, and may also share such data with any third parties, including advertisers, promotional partners, and sponsors. |
We do not sell information about current or former clients or their accounts to third parties. Nor do we share this information, except when necessary to complete transactions at your request, to make you aware of investment products and services that we or our affiliates offer, or as permitted or required by law.
We provide information about you to companies and individuals not affiliated with Guggenheim Investments to complete certain transactions or account changes, or to perform services for us related to your account. For example, if you ask to transfer assets from another financial institution to Guggenheim Investments, we must provide certain information about you to that company to complete the transaction. We provide the third party with only the information necessary to carry out its responsibilities and only for that purpose. And we require these third
| | THE GUGGENHEIM FUNDS SEMI-ANNUAL REPORT | 111 |
GUGGENHEIM INVESTMENTS PRIVACY NOTICE (Unaudited)(continued) |
parties to treat your private information with the same high degree of confidentiality that we do. To alert you to other Guggenheim Investments products and services, we share your information within our family of affiliated companies. You may limit our sharing with affiliated companies as set out below. We may also share information with any successor to all or part of our business, or in connection with steps leading up to a merger or acquisition. For example, if part of our business was sold we may give customer information as part of that transaction. We may also share information about you with your consent.
We will release information about you if you direct us to do so, if we are compelled by law to do so, or in other circumstances as permitted by law (for example, to protect your account from fraud).
If you close your account(s) or become an inactive client or investor, we will continue to adhere to the privacy policies and practices described in this notice.
Opt-Out Provisions and Your Data Choices
The law allows you to “opt out” of certain kinds of information sharing with third parties. We do not share personal information about you with any third parties that triggers this opt-out right. This means YOU ARE ALREADY OPTED OUT.
When you are no longer our client or investor, we continue to share your information as described in this notice, and you may contact us at any time to limit our sharing by sending an email to CorporateDataPrivacy@GuggenheimPartners.com.
European Union Data Subjects and certain others: In addition to the choices set forth above, residents of the European Union and certain other jurisdictions have certain rights to (1) request access to or rectification or deletion of information we collect about them, (2) request a restriction on the processing of their information, (3) object to the processing of their information, or (4) request the portability of certain information. To exercise these or other rights, please contact us using the contact information below. We will consider all requests and provide our response within the time period stated by applicable law. Please note, however, that certain information may be exempt from such requests in some circumstances, which may include if we need to keep processing your information for our legitimate interests or to comply with a legal obligation. We may request you provide us with information necessary to confirm your identity before responding to your request.
Residents of France and certain other jurisdictions may also provide us with instructions regarding the manner in which we may continue to store, erase and share your information after your death, and where applicable, the person you have designated to exercise these rights after your death.
How We Protect Privacy Online
We take steps to protect your privacy when you use our web site – www.guggenheiminvestments.com – by using secure forms of online communication, including encryption technology, Secure Socket Layer (SSL) protocol, firewalls and user names and passwords. These safeguards vary based
112 | THE GUGGENHEIM FUNDS SEMI-ANNUAL REPORT | |
GUGGENHEIM INVESTMENTS PRIVACY NOTICE (Unaudited)(concluded) |
on the sensitivity of the information that we collect and store. However, we cannot and do not guarantee that these measures will prevent every unauthorized attempt to access, use, or disclose your information since despite our efforts, no Internet and/or other electronic transmissions can be completely secure. Our web site uses “http cookies”—tiny pieces of information that we ask your browser to store. We use cookies for session management and security features on the Guggenheim Investments web site. We do not use them to pull data from your hard drive, to learn your e-mail address, or to view data in cookies created by other web sites. We will not share the information in our cookies or give others access to it. See the legal information area on our web site for more details about web site security and privacy features.
How We Safeguard Your Personal Information and Data Retention
We restrict access to nonpublic personal information about you to our employees and in some cases to third parties (for example, the service providers described above) as permitted by law. We maintain strict physical, electronic and procedural safeguards that comply with federal standards to guard your nonpublic personal information.
We keep your information for no longer than necessary for the purposes for which it is processed. The length of time for which we retain information depends on the purposes for which we collected and use it and/or as required to comply with applicable laws. Information may persist in copies made for backup and business continuity purposes for additional time.
International Visitors
If you are not a resident of the United States, please be aware that your information may be transferred to, stored and processed in the United States where our servers are located and our databases are operated. The data protection and other laws of the United States and other countries might not be as comprehensive as those in your country.
In such cases, we ensure that a legal basis for such a transfer exists and that adequate protection is provided as required by applicable law, for example, by using standard contractual clauses or by transferring your data to a jurisdiction that has obtained an adequacy finding. Individuals whose data may be transferred on the basis of standard contractual clauses may contact us as described below.
We’ll Keep You Informed
If you have any questions or concerns about how we treat your personal data, we encourage you to consult with us first. You may also contact the relevant supervisory authority.
We reserve the right to modify this policy at any time and will inform you promptly of material changes. You may access our privacy policy from our web site at www.guggenheiminvestments.com. Should you have any questions regarding our privacy policy, contact us by email at CorporateDataPrivacy@GuggenheimPartners.com.
| | THE GUGGENHEIM FUNDS SEMI-ANNUAL REPORT | 113 |
3.31.2024
Guggenheim Funds Semi-Annual Report
Guggenheim Floating Rate Strategies Fund | | |
GuggenheimInvestments.com | FR-SEMI-0324x0924 |
| | |
DEAR SHAREHOLDER | 2 |
ECONOMIC AND MARKET OVERVIEW | 4 |
ABOUT SHAREHOLDERS’ FUND EXPENSES | 6 |
FLOATING RATE STRATEGIES FUND | 9 |
NOTES TO FINANCIAL STATEMENTS | 48 |
OTHER INFORMATION | 65 |
INFORMATION ON BOARD OF TRUSTEES AND OFFICERS | 67 |
GUGGENHEIM INVESTMENTS PRIVACY NOTICE | 75 |
| | THE GUGGENHEIM FUNDS SEMI-ANNUAL REPORT | 1 |
Dear Shareholder:
Guggenheim Partners Investment Management, LLC (“GPIM” or the “Investment Adviser”), is pleased to present the shareholder report for Guggenheim Floating Rate Strategies Fund (the “Fund”) for the semi-annual fiscal period ended March 31, 2024 (the “Reporting Period”).
The Investment Adviser is part of Guggenheim Investments, which represents the investment management businesses of Guggenheim Partners, LLC (“Guggenheim”), a global, diversified financial services firm.
Guggenheim Funds Distributors, LLC is the distributor of the Fund. Guggenheim Funds Distributors, LLC is affiliated with Guggenheim and the Investment Adviser.
We encourage you to read the Economic and Market Overview section of the report, which follows this letter.
We are committed to providing innovative investment solutions and appreciate the trust you place in us.
Sincerely,
Guggenheim Partners Investment Management, LLC
April 30, 2024
Read a prospectus and summary prospectus (if available) carefully before investing. It contains the investment objectives, risks, charges, expenses and other information, which should be considered carefully before investing. Obtain a prospectus and summary prospectus (if available) at guggenheiminvestments.com or call 800.820.0888.
This material is not intended as a recommendation or as investment advice of any kind, including in connection with rollovers, transfers, and distributions. Such material is not provided in a fiduciary capacity, may not be relied upon for or in connection with the making of investment decisions, and does not constitute a solicitation of an offer to buy or sell securities. All content has been provided for informational or educational purposes only and is not intended to be and should not be construed as legal or tax advice and/or a legal opinion. Always consult a financial, tax and/or legal professional regarding your specific situation.
2 | THE GUGGENHEIM FUNDS SEMI-ANNUAL REPORT | |
The Floating Rate Strategies Fund may not be suitable for all investors. ● An investment in the Fund will fluctuate and is subject to investment risks, which means investors could lose money. ● There can be no guarantee the Fund will achieve its investment objective ● Investments in floating rate senior secured syndicated bank loans and other floating rate securities involve special types of risks, including credit rate risk, interest rate risk, liquidity risk, prepayment and extension risk. ● The Fund’s share price, or the income generated by the Fund’s holdings, could change in response to interest rate changes and market and economic conditions among other factors. In general, bond prices rise when interest rates fall and vice versa. ● The Fund’s exposure to high yield securities may subject the Fund to greater volatility. ● When market conditions are deemed appropriate, the Fund may use leverage to the full extent permitted by its investment policies and restrictions and applicable law. Leveraging will exaggerate the effect on net asset value of any increase or decrease in the market value of the Fund’s portfolio. ● The Fund may invest in derivative instruments, which may be more volatile and less liquid, increasing the risk of loss when compared to traditional securities. Certain of the derivative instruments are also subject to the risks of counterparty default and adverse tax treatment. ● Instruments and strategies (such as borrowing transactions and reverse repurchase agreements) may provide leveraged exposure to a particular investment, which will magnify any gains or losses on those investments. ● Investments in reverse repurchase agreements and synthetic instruments (such as synthetic collateralized debt obligations) expose the Fund to many of the same risks as investments in derivatives. ●The Fund’s investments in other investment vehicles subject the Fund to those risks and expenses affecting the investment vehicle. ● The Fund’s investments in foreign securities carry additional risks when compared to U.S. securities, due to the impact of diplomatic, political or economic developments in the country in question (investments in emerging markets securities are generally subject to an even greater level of risk). ● The Fund’s investments in real estate securities subject the Fund to the same risks as direct investments in real estate, which is particularly sensitive to economic downturns. ● The Fund’s investments in restricted securities may involve financial and liquidity risk. ●The Fund is subject to active trading risks that may increase volatility and impact its ability to achieve its investment objective. ● You may have a gain or loss when you sell your shares. ● It is important to note that the Fund is not guaranteed by the U.S. government.● Please read the prospectus for more detailed information regarding these and other risks.
| | THE GUGGENHEIM FUNDS SEMI-ANNUAL REPORT | 3 |
ECONOMIC AND MARKET OVERVIEW (Unaudited) | March 31, 2024 |
While job growth remains robust, recent labor data brought increased confidence in a labor market in better balance, allowing for inflation to soften further. Labor force growth remains strong, aided by high immigration flows, helping bring labor supply in line with gradually cooling demand. The Small Business Survey indicates that plans to increase compensation have returned to pre-COVID levels. Additionally, Bureau of Labor Statistics data reveal a continued decline in the “quits rate,” reducing the pressure on businesses to raise wages to attract or retain employees. These developments suggest wage pressures may ease further by year end. And despite some speculation against any Federal Reserve (“Fed”) rate cuts materializing in 2024, we continue to anticipate cuts later this year.
Following the stronger-than-expected March Consumer Price Index, we believe that there is a high probability that the easing cycle will start in the second half of the year, since the Fed will likely need more time to gather confirming data. In the latest Summary of Economic Projections, the Federal Open Market Committee (“FOMC”) significantly increased the median forecast for 2024 U.S. gross domestic product, slightly increased it for core personal consumption expenditures year over year, and continues to expect no material increase in the unemployment rate. These adjustments left the median view for three rate cuts for 2024, which suggests the bar is very high for the Fed to keep rates where they are all year, and even higher for more rate hikes to materialize.
Amid this macroeconomic backdrop, in the first quarter of 2024 the two-year Treasury yield increased to 4.59% from 4.23%, and the 10-year Treasury yield increased to 4.20% from 3.88%, keeping the inverted 2s/10s yield curve consistent at 39 basis points as of the end of the Reporting Period, up four basis points since the start of the year. One basis point equals 0.01%. In general, spreads to Treasurys have remained tight across sectors. In investment-grade corporate bonds, BBB-rated bonds continued to remain attractive relative to A and BB-rated bonds, and supply slowed toward the end of the first quarter of 2024, which we believe should support spreads in the near term. High yield bond spreads tightened during the first quarter of 2024 to 301 basis points from 323 basis points at the start of the year, while leveraged loans’ discount margins to maturity tightened to 509 basis points from 528 basis points. Structured credit spreads tightened marginally amid strong demand. Investor demand and an improved arbitrage led to robust new collateralized loan obligation issuance, and tightening liabilities led to an increase in refinances/resets.
Looking forward, Fed officials continue to advocate for a patient approach. A conventional easing cycle is therefore far from guaranteed. Market expectations have already adjusted significantly from market-implied expectations of six rate cuts in 2024 just two months ago to only three as of the end of the Reporting Period, aligning more closely with the FOMC’s views. So far, the market has taken this delay in stride, but its patience and assessment of credit risk could be tested.
For the Reporting Period, the S&P 500® Index* returned 23.48%. The MSCI Europe-Australasia-Far East (“EAFE”) Index* returned 17.01%. The return of the MSCI Emerging Markets Index* was 10.56%.
4 | THE GUGGENHEIM FUNDS SEMI-ANNUAL REPORT | |
ECONOMIC AND MARKET OVERVIEW (Unaudited)(concluded) | March 31, 2024 |
In the bond market, the Bloomberg U.S. Aggregate Bond Index* posted a 5.99% return for the Reporting Period, while the Bloomberg U.S. Corporate High Yield Index* returned 8.75%. The return of the ICE Bank of America (“BofA”) 3-Month U.S. Treasury Bill Index* was 2.69% for the Reporting Period.
The opinions and forecasts expressed may not actually come to pass. This information is subject to change at any time, based on market and other conditions, and should not be construed as a recommendation of any specific security or strategy.
*Index Definitions:
The following indices are referenced throughout this report. Indices are unmanaged and not available for direct investment. Index performance does not reflect transaction costs, fees, or expenses.
Bloomberg U.S. Aggregate Bond Index is a broad-based flagship benchmark that measures the investment grade, U.S. dollar-denominated, fixed-rate taxable bond market, including U.S. Treasuries, government-related and corporate securities, mortgage-backed securities or “MBS” (agency fixed-rate and hybrid adjustable-rate mortgage, or “ARM”, pass-throughs), asset-backed securities (“ABS”), and commercial mortgage-backed securities (“CMBS”) (agency and non-agency).
Bloomberg U.S. Corporate High Yield Index measures the U.S. dollar-denominated, high yield, fixed-rate corporate bond market. Securities are classified as high yield if the middle rating of Moody’s, Fitch, and S&P is Ba1/BB +/BB + or below.
Credit Suisse Leveraged Loan Index tracks the investable market of the U.S. dollar denominated leveraged loan market. It consists of issues rated “5B” or lower, meaning that the highest rated issues included in this index are Moody’s/S&P ratings of Baa1/BB+ or Ba1/BBB+. All loans are funded term loans with a tenor of at least one year and are made by issuers domiciled in developed countries.
ICE BofA 3-Month U.S. Treasury Bill Index is an unmanaged market index of U.S. Treasury securities maturing in 90 days that assumes reinvestment of all income.
MSCI EAFE Index is a free float-adjusted market capitalization index that is designed to measure the equity market performance of developed markets, excluding the U.S. & Canada.
MSCI Emerging Markets Index is a free float-adjusted market capitalization weighted index that is designed to measure equity market performance in the global emerging markets.
S&P 500® Index is a broad-based index, the performance of which is based on the performance of 500 widely held common stocks chosen for market size, liquidity, and industry group representation.
| | THE GUGGENHEIM FUNDS SEMI-ANNUAL REPORT | 5 |
ABOUT SHAREHOLDERS’ FUND EXPENSES (Unaudited) |
All mutual funds have operating expenses, and it is important for our shareholders to understand the impact of costs on their investments. Shareholders of a fund incur two types of costs: (i) transaction costs, including sales charges (loads) on purchase payments, reinvested dividends, other distributions, and exchange fees, and (ii) ongoing costs, including management fees, administrative services, and shareholder reports, among others. These ongoing costs, or operating expenses, are deducted from a fund’s gross income and reduce the investment return of the fund.
A fund’s expenses are expressed as a percentage of its average net assets, which is known as the expense ratio. The following examples are intended to help investors understand the ongoing costs (in dollars) of investing in a fund and to compare these costs with the ongoing costs of investing in other mutual funds.
The examples are based on an investment of $1,000 made at the beginning of the period and held for the entire six-month period beginning September 30, 2023 and ending March 31, 2024.
The following tables illustrate the Fund’s costs in two ways:
Table 1. Based on actual Fund return: This section helps investors estimate the actual expenses paid over the period. The “Ending Account Value” shown is derived from the Fund’s actual return, and the fifth column shows the dollar amount that would have been paid by an investor who started with $1,000 in the Fund. Investors may use the information here, together with the amount invested, to estimate the expenses paid over the period. Simply divide the Fund’s account value by $1,000 (for example, an $8,600 account value divided by $1,000 = 8.6), then multiply the result by the number provided under the heading “Expenses Paid During Period.”
Table 2. Based on hypothetical 5% return: This section is intended to help investors compare a fund’s cost with those of other mutual funds. The table provides information about hypothetical account values and hypothetical expenses based on the Fund’s actual expense ratio and an assumed rate of return of 5% per year before expenses, which is not the Fund’s actual return. The hypothetical account values and expenses may not be used to estimate the actual ending account balance or expenses paid during the period. The example is useful in making comparisons because the U.S. Securities and Exchange Commission (the “SEC”) requires all mutual funds to calculate expenses based on the 5% return. Investors can assess a Fund’s costs by comparing this hypothetical example with the hypothetical examples that appear in shareholder reports of other funds.
The calculations illustrated above assume no shares were bought or sold during the period. Actual costs may have been higher or lower, depending on the amount of investment and the timing of any purchases or redemptions.
6 | THE GUGGENHEIM FUNDS SEMI-ANNUAL REPORT | |
ABOUT SHAREHOLDERS’ FUND EXPENSES (Unaudited)(continued) |
Please note that the expenses shown in the table are meant to highlight your ongoing costs only and do not reflect any transactional costs, such as sales charges (loads) on purchase payments, and contingent deferred sales charges (“CDSC”) on redemptions, if any. Therefore, the second table is useful in comparing ongoing costs only, and will not help you determine the relative total costs of owning different funds. In addition, if these transactional costs were included, your costs would have been higher.
More information about the Fund’s expenses, including annual expense ratios for periods up to five years (subject to the Fund’s inception date), can be found in the Financial Highlights section of this report. For additional information on operating expenses and other shareholder costs, please refer to the Fund’s prospectus.
| | THE GUGGENHEIM FUNDS SEMI-ANNUAL REPORT | 7 |
ABOUT SHAREHOLDERS’ FUND EXPENSES (Unaudited)(concluded) |
| | Expense
Ratio1 | | | Fund
Return | | | Beginning
Account Value
September 30,
2023 | | | Ending
Account Value
March 31,
2024 | | | Expenses
Paid During
Period2 | |
Table 1. Based on actual Fund return3 |
Class A | | | 1.01 | % | | | 4.50 | % | | $ | 1,000.00 | | | $ | 1,045.00 | | | $ | 5.16 | |
Class C | | | 1.76 | % | | | 4.11 | % | | | 1,000.00 | | | | 1,041.10 | | | | 8.98 | |
Class P | | | 1.01 | % | | | 4.50 | % | | | 1,000.00 | | | | 1,045.00 | | | | 5.16 | |
Institutional Class | | | 0.77 | % | | | 4.62 | % | | | 1,000.00 | | | | 1,046.20 | | | | 3.94 | |
Class R6 | | | 0.77 | % | | | 4.64 | % | | | 1,000.00 | | | | 1,046.40 | | | | 3.94 | |
|
Table 2. Based on hypothetical 5% return (before expenses) |
Class A | | | 1.01 | % | | | 5.00 | % | | $ | 1,000.00 | | | $ | 1,019.95 | | | $ | 5.10 | |
Class C | | | 1.76 | % | | | 5.00 | % | | | 1,000.00 | | | | 1,016.20 | | | | 8.87 | |
Class P | | | 1.01 | % | | | 5.00 | % | | | 1,000.00 | | | | 1,019.95 | | | | 5.10 | |
Institutional Class | | | 0.77 | % | | | 5.00 | % | | | 1,000.00 | | | | 1,021.15 | | | | 3.89 | |
Class R6 | | | 0.77 | % | | | 5.00 | % | | | 1,000.00 | | | | 1,021.15 | | | | 3.89 | |
1 | Annualized and excludes expenses of the underlying funds in which the Fund invest, if any. |
2 | Expenses are equal to the Fund’s annualized expense ratio, net of any applicable fee waivers, multiplied by the average account value over the period, multiplied by 183/366 (to reflect the one-half year period). |
3 | Actual cumulative return at net asset value for the period September 30, 2023 to March 31, 2024. |
8 | THE GUGGENHEIM FUNDS SEMI-ANNUAL REPORT | |
PERFORMANCE REPORT AND FUND PROFILE (Unaudited) | March 31, 2024 |
FLOATING RATE STRATEGIES FUND
OBJECTIVE: Seeks to provide a high level of current income while maximizing total return.
Holdings Diversification (Market Exposure as % of Net Assets)
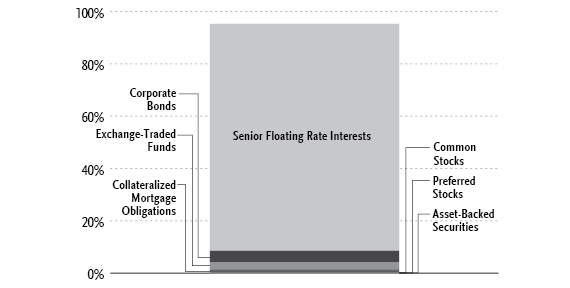
“Holdings Diversification (Market Exposure as % of Net Assets)” excludes any temporary cash investments.
Inception Dates: |
Class A | November 30, 2011 |
Class C | November 30, 2011 |
Class P | May 1, 2015 |
Institutional Class | November 30, 2011 |
Class R6 | March 13, 2019 |
Ten Largest Holdings | % of Total Net Assets |
SPDR Blackstone Senior Loan ETF | 2.8% |
Bombardier Recreational Products, Inc., 8.08% | 1.0% |
Arcline FM Holdings LLC, 10.32% | 0.9% |
Osmosis Holdings Australia II Pty Ltd., 9.07% | 0.9% |
Ascend Learning LLC, 8.93% | 0.9% |
American Bath Group LLC, 9.18% | 0.8% |
McGraw Hill LLC, 10.19% | 0.8% |
Athenahealth Group, Inc., 8.58% | 0.8% |
Emerald TopCo, Inc. (Press Ganey), 8.94% | 0.8% |
Pelican Products, Inc., 9.81% | 0.8% |
Top Ten Total | 10.5% |
| | |
“Ten Largest Holdings” excludes any temporary cash or derivative investments. |
| | THE GUGGENHEIM FUNDS SEMI-ANNUAL REPORT | 9 |
PERFORMANCE REPORT AND FUND PROFILE (Unaudited)(continued) | March 31, 2024 |
Portfolio Composition by Quality Rating1 |
Rating | % of Total Investments |
Fixed Income Instruments | |
BBB | 6.9% |
BB | 27.9% |
B | 55.7% |
CCC | 2.1% |
CC | 0.5% |
NR2 | 1.2% |
Other Instruments | 5.7% |
Total Investments | 100.0% |
1 | Source: BlackRock Solutions. Credit quality ratings are measured on a scale that generally ranges from AAA (highest) to D (lowest). All securities except for those labeled “NR” have been rated by Moody’s, Standard & Poor’s (“S&P”), or Fitch, each of which is a Nationally Recognized Statistical Rating Organization (“NRSRO”). For purposes of this presentation, when ratings are available from more than one agency, the highest rating is used. Guggenheim Investments has converted ratings to the equivalent S&P rating. Security ratings are determined at the time of purchase and may change thereafter. |
2 | NR (not rated) securities do not necessarily indicate low credit quality. |
10 | THE GUGGENHEIM FUNDS SEMI-ANNUAL REPORT | |
PERFORMANCE REPORT AND FUND PROFILE (Unaudited)(concluded) | March 31, 2024 |
Average Annual Returns*
Periods Ended March 31, 2024
| 6 Month† | 1 Year | 5 Year | 10 Year |
Class A Shares | 4.50% | 11.19% | 4.66% | 3.87% |
Class A Shares with sales charge‡ | 1.36% | 7.87% | 4.03% | 3.37% |
Class C Shares | 4.11% | 10.37% | 3.88% | 3.10% |
Class C Shares with CDSC§ | 3.11% | 9.37% | 3.88% | 3.10% |
Institutional Class Shares | 4.62% | 11.45% | 4.90% | 4.12% |
Credit Suisse Leveraged Loan Index | 5.45% | 12.40% | 5.30% | 4.56% |
| 6 Month† | 1 Year | 5 Year | Since
Inception
(05/01/15) |
Class P Shares | 4.50% | 11.19% | 4.66% | 3.92% |
Credit Suisse Leveraged Loan Index | 5.45% | 12.40% | 5.30% | 4.70% |
| 6 Month† | 1 Year | 5 Year | Since
Inception
(03/13/19) |
Class R6 Shares | 4.64% | 11.47% | 4.94% | 4.85% |
Credit Suisse Leveraged Loan Index | 5.45% | 12.40% | 5.30% | 5.22% |
* | The performance data above represents past performance that is not predictive of future results. The investment return and principal value of an investment in the Fund will fluctuate so that an investor’s shares, when redeemed, may be worth more or less than their original cost. Returns are historical and include changes in principal and reinvested dividends and capital gains and do not reflect the effect of taxes. The Credit Suisse Leveraged Loan Index is an unmanaged index and, unlike the Fund, has no management fees or operating expenses to reduce its reported return. |
† | 6 month returns are not annualized. |
‡ | Effective October 1, 2015, the maximum sales charge decreased from 4.75% to 3.00%. A 4.75% maximum sales charge is used in the calculation of the Average Annual Returns based on subscriptions made prior to October 1, 2015, and a 3.00% maximum sales charge is used to calculate performance for periods based on subscriptions made on or after October 1, 2015. |
§ | Fund returns include a CDSC of 1% if redeemed within 12 months of purchase. |
| | THE GUGGENHEIM FUNDS SEMI-ANNUAL REPORT | 11 |
SCHEDULE OF INVESTMENTS (Unaudited) | March 31, 2024 |
FLOATING RATE STRATEGIES FUND | |
| | Shares | | | Value | |
COMMON STOCKS††† - 0.4% |
| | | | | | | | | |
Industrial - 0.4% |
API Heat Transfer Intermediate* | | | 2,105 | | | $ | 3,218,174 | |
BP Holdco LLC*,1 | | | 244,278 | | | | 296,099 | |
YAK BLOCKER 2 LLC* | | | 15,530 | | | | 31,130 | |
YAK BLOCKER 2 LLC* | | | 14,354 | | | | 28,773 | |
Vector Phoenix Holdings, LP* | | | 244,278 | | | | 1,207 | |
Targus, Inc.* | | | 12,773 | | | | 502 | |
Targus, Inc.* | | | 12,773 | | | | 377 | |
Targus, Inc.* | | | 12,773 | | | | 290 | |
Targus, Inc.* | | | 12,773 | | | | 1 | |
Total Industrial | | | | | | | 3,576,553 | |
| | | | | | | | | |
Energy - 0.0% |
Permian Production Partners LLC* | | | 401,481 | | | | 17,001 | |
| | | | | | | | | |
Financial - 0.0% |
Tensor Ltd.* | | | 177,413 | | | | 18 | |
| | | | | | | | | |
Total Common Stocks | | | | |
(Cost $3,514,633) | | | | | | | 3,593,572 | |
| | | | | | | | | |
PREFERRED STOCKS††† - 0.1% |
Industrial - 0.1% |
YAK BLOCKER 2 LLC* | | | 853,214 | | | | 841,526 | |
| | | | | | | | | |
Total Preferred Stocks | | | | |
(Cost $2,367,986) | | | | | | | 841,526 | |
| | | | | | | | | |
EXCHANGE-TRADED FUNDS† - 2.8% |
SPDR Blackstone Senior Loan ETF | | | 676,240 | | | | 28,476,467 | |
Total Exchange-Traded Funds | | | | |
(Cost $28,000,558) | | | | | | | 28,476,467 | |
| | | | | | | | | |
MONEY MARKET FUND† - 2.3% |
Federated Hermes U.S. Treasury Cash Reserves Fund — Institutional Shares, 5.17%2 | | | 24,176,377 | | | | 24,176,377 | |
Total Money Market Fund | | | | |
(Cost $24,176,377) | | | | | | | 24,176,377 | |
| | | | | | | | | |
| | | Face
Amount~ | | | | | |
SENIOR FLOATING RATE INTERESTS††,◊ - 86.7% |
Consumer, Cyclical - 17.1% | | | | |
First Brands Group LLC | | | | | | | | |
10.57% (3 Month Term SOFR + 5.00%, Rate Floor: 6.00%) due 03/30/27 | | | 10,332,486 | | | | 10,334,843 | |
WIRB - Copernicus Group, Inc. | | | | | | | | |
9.44% (1 Month Term SOFR + 4.00%, Rate Floor: 5.00%) due 01/08/27 | | | 7,257,251 | | | | 7,255,509 | |
Congruex Group LLC | | | | | | | | |
11.21% (3 Month Term SOFR + 5.75%, Rate Floor: 6.50%) due 05/03/29 | | | 6,895,000 | | | | 6,481,300 | |
Eagle Parent Corp. | | | | | | | | |
9.55% (3 Month Term SOFR + 4.25%, Rate Floor: 4.75%) due 04/02/29 | | | 6,263,438 | | | | 6,203,434 | |
12 | THE GUGGENHEIM FUNDS SEMI-ANNUAL REPORT | SEE NOTES TO FINANCIAL STATEMENTS. |
SCHEDULE OF INVESTMENTS (Unaudited)(continued) | March 31, 2024 |
FLOATING RATE STRATEGIES FUND | |
| | Face
Amount~ | | | Value | |
Thevelia US LLC | | | | | | | | |
9.46% (3 Month Term SOFR + 4.00%, Rate Floor: 4.50%) due 06/18/29 | | | 6,176,207 | | | $ | 6,182,074 | |
PetSmart LLC | | | | | | | | |
9.18% (1 Month Term SOFR + 3.75%, Rate Floor: 4.50%) due 02/11/28 | | | 6,191,250 | | | | 6,169,333 | |
American Tire Distributors, Inc. | | | | | | | | |
11.83% (3 Month Term SOFR + 6.25%, Rate Floor: 7.00%) due 10/20/28 | | | 6,877,500 | | | | 5,923,247 | |
Truck Hero, Inc. | | | | | | | | |
8.94% (1 Month Term SOFR + 3.50%, Rate Floor: 4.25%) due 01/31/28 | | | 5,830,125 | | | | 5,774,739 | |
Fertitta Entertainment LLC | | | | | | | | |
9.08% (1 Month Term SOFR + 3.75%, Rate Floor: 4.25%) due 01/29/29 | | | 5,248,826 | | | | 5,258,694 | |
Flutter Financing B.V. | | | | | | | | |
7.66% (3 Month Term SOFR + 2.25%, Rate Floor: 2.75%) due 11/18/30 | | | 5,010,000 | | | | 4,994,776 | |
Prime Security Services Borrower LLC | | | | | | | | |
7.83% (3 Month Term SOFR + 2.50%, Rate Floor: 2.50%) due 10/13/30 | | | 5,000,000 | | | | 5,000,000 | |
Restaurant Brands | | | | | | | | |
7.58% (1 Month Term SOFR + 2.25%, Rate Floor: 2.25%) due 09/20/30 | | | 4,998,995 | | | | 4,993,996 | |
Petco Health And Wellness Company, Inc. | | | | | | | | |
8.82% (3 Month Term SOFR + 3.25%, Rate Floor: 4.00%) due 03/03/28 | | | 5,179,248 | | | | 4,781,741 | |
Alterra Mountain Co. | | | | | | | | |
8.94% (1 Month Term SOFR + 3.50%, Rate Floor: 4.00%) due 08/17/28 | | | 3,570,457 | | | | 3,580,882 | |
due 08/17/28 | | | 1,100,000 | | | | 1,103,212 | |
CCRR Parent, Inc. | | | | | | | | |
9.19% (1 Month Term SOFR + 3.75%, Rate Floor: 4.50%) due 03/06/28 | | | 4,659,107 | | | | 4,162,120 | |
Ontario Gaming GTA, LP | | | | | | | | |
9.56% (3 Month Term SOFR + 4.25%, Rate Floor: 4.75%) due 08/01/30 | | | 3,977,906 | | | | 3,989,999 | |
Belron Finance US LLC | | | | | | | | |
7.66% (3 Month Term SOFR + 2.25%, Rate Floor: 2.75%) due 04/13/29 | | | 3,980,000 | | | | 3,980,000 | |
SEE NOTES TO FINANCIAL STATEMENTS. | THE GUGGENHEIM FUNDS SEMI-ANNUAL REPORT | 13 |
SCHEDULE OF INVESTMENTS (Unaudited)(continued) | March 31, 2024 |
FLOATING RATE STRATEGIES FUND | |
| | Face
Amount~ | | | Value | |
Peer Holding III BV | | | | | | | | |
8.56% (3 Month Term SOFR + 3.25%, Rate Floor: 3.25%) due 10/18/30 | | | 3,770,000 | | | $ | 3,774,712 | |
Caesars Entertainment, Inc. | | | | | | | | |
8.04% (3 Month Term SOFR + 2.75%, Rate Floor: 3.25%) due 01/24/31 | | | 2,075,000 | | | | 2,075,000 | |
8.66% (3 Month Term SOFR + 3.25%, Rate Floor: 3.75%) due 02/06/30 | | | 1,687,250 | | | | 1,690,068 | |
BCPE Empire Holdings, Inc. | | | | | | | | |
9.33% (1 Month Term SOFR + 4.00%, Rate Floor: 4.50%) due 12/11/28 | | | 3,719,353 | | | | 3,720,989 | |
Scientific Games Holdings, LP | | | | | | | | |
8.58% (3 Month Term SOFR + 3.25%, Rate Floor: 3.75%) due 04/04/29 | | | 3,706,240 | | | | 3,703,275 | |
Galaxy US Opco, Inc. | | | | | | | | |
10.06% (3 Month Term SOFR + 4.75%, Rate Floor: 5.25%) due 04/30/29††† | | | 4,088,688 | | | | 3,690,041 | |
Guardian US HoldCo LLC | | | | | | | | |
8.81% (3 Month Term SOFR + 3.50%, Rate Floor: 4.00%) due 01/31/30 | | | 3,236,250 | | | | 3,244,341 | |
BIFM CA Buyer, Inc. | | | | | | | | |
9.57% (1 Month Term SOFR + 4.25%, Rate Floor: 4.75%) due 05/31/28 | | | 3,198,187 | | | | 3,210,180 | |
Rent-A-Center, Inc. | | | | | | | | |
9.12% (6 Month Term SOFR + 3.25%, Rate Floor: 3.75%) due 02/17/28 | | | 3,053,139 | | | | 3,048,040 | |
Clarios Global, LP | | | | | | | | |
8.33% (1 Month Term SOFR + 3.00%, Rate Floor: 3.00%) due 05/06/30 | | | 2,892,808 | | | | 2,897,320 | |
Michaels Stores, Inc. | | | | | | | | |
9.82% (3 Month Term SOFR + 4.25%, Rate Floor: 5.00%) due 04/15/28 | | | 3,195,308 | | | | 2,859,800 | |
Packers Holdings LLC | | | | | | | | |
8.68% (1 Month Term SOFR + 3.25%, Rate Floor: 4.00%) due 03/09/28 | | | 4,428,643 | | | | 2,806,652 | |
Mavis Tire Express Services TopCo Corp. | | | | | | | | |
9.08% (1 Month Term SOFR + 3.75%, Rate Floor: 4.50%) due 05/04/28 | | | 2,689,386 | | | | 2,691,215 | |
TTF Holdings Intermediate LLC | | | | | | | | |
9.44% (1 Month Term SOFR + 4.00%, Rate Floor: 4.75%) due 03/31/28 | | | 2,661,120 | | | | 2,661,120 | |
14 | THE GUGGENHEIM FUNDS SEMI-ANNUAL REPORT | SEE NOTES TO FINANCIAL STATEMENTS. |
SCHEDULE OF INVESTMENTS (Unaudited)(continued) | March 31, 2024 |
FLOATING RATE STRATEGIES FUND | |
| | Face
Amount~ | | | Value | |
Entain Holdings (Gibraltar) Ltd. | | | | | | | | |
7.91% (3 Month Term SOFR + 2.50%, Rate Floor: 3.00%) due 03/29/27 | | | 2,653,722 | | | $ | 2,655,394 | |
Wyndham Hotels & Resorts, Inc. | | | | | | | | |
7.68% (1 Month Term SOFR + 2.25%, Rate Floor: 2.25%) due 05/24/30 | | | 2,526,187 | | | | 2,533,134 | |
AlixPartners, LLP | | | | | | | | |
7.94% (1 Month Term SOFR + 2.50%, Rate Floor: 3.00%) due 02/04/28 | | | 2,481,011 | | | | 2,483,021 | |
Peloton Interactive, Inc. | | | | | | | | |
12.48% (6 Month Term SOFR + 7.00%, Rate Floor: 7.50%) due 05/25/27 | | | 2,462,500 | | | | 2,470,208 | |
Hanesbrands, Inc. | | | | | | | | |
9.08% (1 Month Term SOFR + 3.75%, Rate Floor: 4.25%) due 03/08/30 | | | 2,425,500 | | | | 2,422,468 | |
EG Finco Ltd. | | | | | | | | |
9.40% (3 Month EURIBOR + 5.50%, Rate Floor: 5.50%) due 02/07/28 | | EUR | 1,953,738 | | | | 2,093,122 | |
11.24% (6 Month Term SOFR + 5.93%, Rate Floor: 5.93%) due 02/07/28 | | | 158,467 | | | | 157,278 | |
Crash Champions Inc. | | | | | | | | |
10.07% (3 Month Term SOFR + 4.75%, Rate Floor: 4.75%) due 02/06/29 | | | 2,235,000 | | | | 2,240,587 | |
Seren BidCo AB | | | | | | | | |
8.46% (3 Month SOFR + 3.15%, Rate Floor: 3.65%) due 11/16/28 | | | 2,150,500 | | | | 2,148,715 | |
Match Group, Inc. | | | | | | | | |
7.23% (3 Month Term SOFR + 1.75%, Rate Floor: 1.75%) due 02/13/27 | | | 2,000,000 | | | | 1,995,000 | |
Sweetwater Sound | | | | | | | | |
9.69% (1 Month Term SOFR + 4.25%, Rate Floor: 5.00%) due 08/07/28 | | | 1,974,089 | | | | 1,976,557 | |
Alexander Mann | | | | | | | | |
11.41% (1 Month SOFR + 6.00%, Rate Floor: 6.00%) due 06/29/27 | | | 1,966,272 | | | | 1,909,742 | |
TMF Sapphire Bidco BV | | | | | | | | |
9.33% (3 Month Term SOFR + 4.00%, Rate Floor: 4.00%) due 05/03/28 | | | 1,858,571 | | | | 1,861,470 | |
Burlington Stores, Inc. | | | | | | | | |
7.44% (1 Month Term SOFR + 2.00%, Rate Floor: 3.00%) due 06/26/28 | | | 1,808,562 | | | | 1,805,741 | |
SEE NOTES TO FINANCIAL STATEMENTS. | THE GUGGENHEIM FUNDS SEMI-ANNUAL REPORT | 15 |
SCHEDULE OF INVESTMENTS (Unaudited)(continued) | March 31, 2024 |
FLOATING RATE STRATEGIES FUND | |
| | Face
Amount~ | | | Value | |
Hilton Worldwide Finance LLC | | | | | | | | |
7.43% (1 Month Term SOFR + 2.00%, Rate Floor: 2.00%) due 11/08/30 | | | 1,720,000 | | | $ | 1,722,546 | |
Go Daddy Operating Company LLC | | | | | | | | |
7.33% (1 Month Term SOFR + 2.00%, Rate Floor: 2.00%) due 11/09/29 | | | 1,712,084 | | | | 1,710,167 | |
TransNetwork LLC | | | | | | | | |
10.81% (3 Month Term SOFR + 5.50%, Rate Floor: 6.00%) due 12/30/30 | | | 1,607,407 | | | | 1,613,435 | |
ImageFIRST Holdings LLC | | | | | | | | |
9.57% (3 Month Term SOFR + 4.25%, Rate Floor: 5.00%) due 04/27/28 | | | 1,240,000 | | | | 1,236,900 | |
American Trailer World Corp. | | | | | | | | |
9.18% (1 Month Term SOFR + 3.75%, Rate Floor: 4.50%) due 03/03/28 | | | 1,085,951 | | | | 1,058,172 | |
Station Casinos LLC | | | | | | | | |
due 03/07/31 | | | 835,000 | | | | 833,388 | |
WW International, Inc. | | | | | | | | |
8.94% (1 Month Term SOFR + 3.50%, Rate Floor: 4.00%) due 04/13/28 | | | 1,653,750 | | | | 722,143 | |
SHO Holding I Corp. | | | | | | | | |
10.82% ((1 Month Term SOFR + 5.24%) and (3 Month Term SOFR + 5.24%), Rate Floor: 6.24%) due 04/29/24 | | | 566,223 | | | | 320,862 | |
Total Consumer, Cyclical | | | | | | | 176,212,702 | |
| | | | | | | | | |
Industrial - 16.7% | | | | | | | | |
Arcline FM Holdings LLC | | | | | | | | |
10.32% (3 Month Term SOFR + 4.75%, Rate Floor: 5.50%) due 06/23/28 | | | 9,374,625 | | | | 9,374,625 | |
American Bath Group LLC | | | | | | | | |
9.18% (1 Month Term SOFR + 3.75%, Rate Floor: 4.25%) due 11/23/27 | | | 8,737,671 | | | | 8,621,460 | |
Pelican Products, Inc. | | | | | | | | |
9.81% (3 Month Term SOFR + 4.25%, Rate Floor: 4.75%) due 12/29/28 | | | 8,982,214 | | | | 8,301,092 | |
Aegion Corp. | | | | | | | | |
9.58% (1 Month Term SOFR + 4.25%, Rate Floor: 5.00%) due 05/17/28 | | | 6,865,442 | | | | 6,886,931 | |
LTI Holdings, Inc. | | | | | | | | |
8.94% (1 Month Term SOFR + 3.50%, Rate Floor: 3.50%) due 09/08/25 | | | 6,811,904 | | | | 6,740,583 | |
16 | THE GUGGENHEIM FUNDS SEMI-ANNUAL REPORT | SEE NOTES TO FINANCIAL STATEMENTS. |
SCHEDULE OF INVESTMENTS (Unaudited)(continued) | March 31, 2024 |
FLOATING RATE STRATEGIES FUND | |
| | Face
Amount~ | | | Value | |
Hunter Douglas, Inc. | | | | | | | | |
8.82% (3 Month Term SOFR + 3.50%, Rate Floor: 4.00%) due 02/26/29 | | | 6,578,615 | | | $ | 6,491,251 | |
Park River Holdings, Inc. | | | | | | | | |
8.84% (3 Month Term SOFR + 3.25%, Rate Floor: 4.00%) due 12/28/27 | | | 5,954,052 | | | | 5,899,453 | |
USIC Holding, Inc. | | | | | | | | |
9.06% (3 Month Term SOFR + 3.50%, Rate Floor: 4.25%) due 05/12/28 | | | 5,236,975 | | | | 5,222,678 | |
White Cap Supply Holdings LLC | | | | | | | | |
9.08% (1 Month Term SOFR + 3.75%, Rate Floor: 4.25%) due 10/19/27 | | | 4,937,028 | | | | 4,949,864 | |
Titan Acquisition Ltd. (Husky) | | | | | | | | |
8.44% (1 Month Term SOFR + 3.00%, Rate Floor: 4.00%) due 03/28/25 | | | 4,924,361 | | | | 4,918,205 | |
Duran Group Holding GmbH | | | | | | | | |
9.38% (6 Month EURIBOR + 5.25%, Rate Floor: 5.25%) due 05/29/26 | | EUR | 4,527,760 | | | | 4,677,741 | |
TricorBraun Holdings, Inc. | | | | | | | | |
8.69% (1 Month Term SOFR + 3.25%, Rate Floor: 3.75%) due 03/03/28 | | | 4,402,444 | | | | 4,347,414 | |
United Airlines Inc. | | | | | | | | |
8.08% (3 Month Term SOFR + 2.75%, Rate Floor: 2.75%) due 02/15/31 | | | 4,020,000 | | | | 4,019,357 | |
Fugue Finance LLC | | | | | | | | |
9.34% (3 Month Term SOFR + 4.00%, Rate Floor: 4.50%) due 01/31/28 | | | 2,109,487 | | | | 2,112,124 | |
9.07% (3 Month Term SOFR + 3.75%, Rate Floor: 4.25%) due 02/13/31 | | | 1,730,000 | | | | 1,732,699 | |
Brown Group Holding LLC | | | | | | | | |
8.18% (1 Month Term SOFR + 2.75%, Rate Floor: 3.25%) due 06/07/28 | | | 3,633,608 | | | | 3,629,175 | |
8.32% ((1 Month Term SOFR + 3.00%) and (3 Month Term SOFR + 3.00%), Rate Floor: 3.50%) due 07/02/29 | | | 187,500 | | | | 187,406 | |
SEE NOTES TO FINANCIAL STATEMENTS. | THE GUGGENHEIM FUNDS SEMI-ANNUAL REPORT | 17 |
SCHEDULE OF INVESTMENTS (Unaudited)(continued) | March 31, 2024 |
FLOATING RATE STRATEGIES FUND | |
| | Face
Amount~ | | | Value | |
DG Investment Intermediate Holdings 2, Inc. | | | | | | | | |
9.19% (1 Month Term SOFR + 3.75%, Rate Floor: 4.50%) due 03/31/28 | | | 3,802,626 | | | $ | 3,793,804 | |
DXP Enterprises, Inc. | | | | | | | | |
10.29% (6 Month Term SOFR + 4.75%, Rate Floor: 5.75%) due 10/05/30 | | | 3,785,513 | | | | 3,783,165 | |
United Rentals, Inc. | | | | | | | | |
7.08% (1 Month Term SOFR + 1.75%, Rate Floor: 1.75%) due 02/14/31 | | | 3,700,000 | | | | 3,706,956 | |
Ravago Holdings America, Inc. | | | | | | | | |
8.06% (3 Month Term SOFR + 2.50%, Rate Floor: 3.50%) due 03/06/28 | | | 3,661,671 | | | | 3,646,402 | |
CPG International LLC | | | | | | | | |
7.93% (1 Month Term SOFR + 2.50%, Rate Floor: 3.00%) due 04/28/29 | | | 3,492,500 | | | | 3,495,783 | |
Engineered Machinery Holdings, Inc. | | | | | | | | |
9.32% (3 Month Term SOFR + 3.75%, Rate Floor: 4.50%) due 05/19/28 | | | 3,484,952 | | | | 3,469,723 | |
Berlin Packaging LLC | | | | | | | | |
9.20% ((1 Month Term SOFR + 3.75%) and (3 Month Term SOFR + 3.75%), Rate Floor: 4.25%) due 03/13/28 | | | 3,363,750 | | | | 3,365,667 | |
TransDigm, Inc. | | | | | | | | |
8.56% (3 Month Term SOFR + 3.25%, Rate Floor: 3.25%) due 02/28/31 | | | 3,207,205 | | | | 3,222,086 | |
Icebox Holdco III, Inc. | | | | | | | | |
9.07% (3 Month Term SOFR + 3.50%, Rate Floor: 4.00%) due 12/22/28 | | | 3,139,460 | | | | 3,138,141 | |
Mirion Technologies, Inc. | | | | | | | | |
8.31% (3 Month Term SOFR + 2.75%, Rate Floor: 3.25%) due 10/20/28 | | | 3,065,287 | | | | 3,069,119 | |
Merlin Buyer, Inc. | | | | | | | | |
10.08% (1 Month Term SOFR + 4.75%, Rate Floor: 5.25%) due 12/14/28††† | | | 2,962,538 | | | | 2,962,538 | |
Quikrete Holdings, Inc. | | | | | | | | |
8.19% (1 Month Term SOFR + 2.75%, Rate Floor: 2.75%) due 03/18/29 | | | 2,915,377 | | | | 2,915,377 | |
18 | THE GUGGENHEIM FUNDS SEMI-ANNUAL REPORT | SEE NOTES TO FINANCIAL STATEMENTS. |
SCHEDULE OF INVESTMENTS (Unaudited)(continued) | March 31, 2024 |
FLOATING RATE STRATEGIES FUND | |
| | Face
Amount~ | | | Value | |
Alliance Laundry Systems LLC | | | | | | | | |
8.93% ((1 Month Term SOFR + 3.50%) and (3 Month Term SOFR + 3.50%), Rate Floor: 4.25%) due 10/08/27 | | | 2,735,094 | | | $ | 2,740,400 | |
Service Logic Acquisition, Inc. | | | | | | | | |
9.57% (3 Month Term SOFR + 4.00%, Rate Floor: 4.75%) due 10/29/27 | | | 2,728,954 | | | | 2,725,543 | |
Standard Industries, Inc. | | | | | | | | |
7.69% (1 Month Term SOFR + 2.25%, Rate Floor: 2.75%) due 09/22/28 | | | 2,481,825 | | | | 2,481,825 | |
EMRLD Borrower, LP | | | | | | | | |
7.79% (3 Month Term SOFR + 2.50%, Rate Floor: 2.50%) due 05/31/30 | | | 2,467,518 | | | | 2,465,051 | |
Barnes Group, Inc. | | | | | | | | |
8.43% (1 Month Term SOFR + 3.00%, Rate Floor: 3.00%) due 09/03/30 | | | 1,521,188 | | | | 1,521,948 | |
7.83% (1 Month Term SOFR + 2.50%, Rate Floor: 2.50%) due 08/30/30 | | | 790,000 | | | | 790,395 | |
Foundation Building Materials Holding Company LLC | | | | | | | | |
9.31% (3 Month Term SOFR + 4.00%, Rate Floor: 4.00%) due 01/25/31 | | | 2,300,000 | | | | 2,308,050 | |
Michael Baker International LLC | | | | | | | | |
10.44% (1 Month Term SOFR + 5.00%, Rate Floor: 5.75%) due 12/01/28††† | | | 2,238,579 | | | | 2,246,973 | |
API Heat Transfer. | | | | | | | | |
13.58% (3 Month Term SOFR + 8.00%, Rate Floor: 10.00%) due 11/10/27††† | | | 1,386,660 | | | | 1,386,660 | |
10.58% (3 Month Term SOFR + 5.00%, Rate Floor: 7.00%) due 11/10/27††† | | | 802,577 | | | | 802,577 | |
Charter Next Generation Inc. | | | | | | | | |
8.83% (1 Month Term SOFR + 3.50%, Rate Floor: 4.25%) due 12/01/27 | | | 2,137,002 | | | | 2,140,165 | |
STS Operating, Inc. | | | | | | | | |
due 03/15/31 | | | 2,016,000 | | | | 2,019,790 | |
American Builders & Contractors Supply Co., Inc. | | | | | | | | |
7.33% (1 Month Term SOFR + 2.00%, Rate Floor: 2.00%) due 01/25/31 | | | 1,987,100 | | | | 1,987,001 | |
SEE NOTES TO FINANCIAL STATEMENTS. | THE GUGGENHEIM FUNDS SEMI-ANNUAL REPORT | 19 |
SCHEDULE OF INVESTMENTS (Unaudited)(continued) | March 31, 2024 |
FLOATING RATE STRATEGIES FUND | |
| | Face
Amount~ | | | Value | |
Artera Services LLC | | | | | | | | |
9.81% (3 Month Term SOFR + 4.50%, Rate Floor: 4.50%) due 02/06/31 | | | 1,955,000 | | | $ | 1,960,865 | |
Sundyne (Star US Bidco) | | | | | | | | |
9.68% (1 Month Term SOFR + 4.25%, Rate Floor: 5.25%) due 03/17/27 | | | 1,945,554 | | | | 1,951,021 | |
Mileage Plus Holdings LLC | | | | | | | | |
10.73% (3 Month Term SOFR + 5.25%, Rate Floor: 6.25%) due 06/21/27 | | | 1,820,000 | | | | 1,871,906 | |
Protective Industrial Products, Inc. | | | | | | | | |
9.44% (1 Month Term SOFR + 4.00%, Rate Floor: 4.75%) due 12/29/27 | | | 1,808,981 | | | | 1,804,458 | |
ASP Dream Acquisiton Co. LLC | | | | | | | | |
9.43% (1 Month Term SOFR + 4.00%, Rate Floor: 4.75%) due 12/15/28 | | | 1,703,171 | | | | 1,705,300 | |
Air Canada | | | | | | | | |
7.83% (3 Month Term SOFR + 2.50%, Rate Floor: 2.50%) due 03/14/31 | | | 1,660,000 | | | | 1,661,046 | |
CPM Holdings, Inc. | | | | | | | | |
9.83% (1 Month Term SOFR + 4.50%, Rate Floor: 5.00%) due 09/22/28 | | | 1,572,085 | | | | 1,572,651 | |
XPO, Inc. | | | | | | | | |
7.32% (1 Month Term SOFR + 2.00%, Rate Floor: 2.00%) due 02/03/31 | | | 1,290,000 | | | | 1,288,388 | |
ProAmpac PG Borrower LLC | | | | | | | | |
9.81% (3 Month Term SOFR + 4.50%, Rate Floor: 5.25%) due 09/15/28 | | | 661,500 | | | | 661,500 | |
due 09/15/28 | | | 565,000 | | | | 565,000 | |
MI Windows And Doors LLC | | | | | | | | |
due 03/20/31 | | | 730,000 | | | | 732,738 | |
Patriot Container Corp. (Wastequip) | | | | | | | | |
9.18% (1 Month Term SOFR + 3.75%, Rate Floor: 4.75%) due 03/20/25 | | | 714,116 | | | | 690,650 | |
Bleriot US Bidco LLC | | | | | | | | |
9.57% (3 Month Term SOFR + 4.00%, Rate Floor: 4.00%) due 10/31/28 | | | 595,746 | | | | 597,658 | |
Osmose Utility Services, Inc. | | | | | | | | |
8.69% (1 Month Term SOFR + 3.25%, Rate Floor: 3.75%) due 06/23/28 | | | 483,851 | | | | 476,593 | |
Total Industrial | | | | | | | 171,836,971 | |
| | | | | | | | | |
20 | THE GUGGENHEIM FUNDS SEMI-ANNUAL REPORT | SEE NOTES TO FINANCIAL STATEMENTS. |
SCHEDULE OF INVESTMENTS (Unaudited)(continued) | March 31, 2024 |
FLOATING RATE STRATEGIES FUND | |
| | Face
Amount~ | | | Value | |
Consumer, Non-cyclical - 16.0% | | | | |
Bombardier Recreational Products, Inc. | | | | | | | | |
8.08% (1 Month Term SOFR + 2.75%, Rate Floor: 2.75%) due 01/22/31 | | | 9,801,084 | | | $ | 9,788,833 | |
Osmosis Holdings Australia II Pty Ltd. | | | | | | | | |
9.07% (1 Month Term SOFR + 3.75%, Rate Floor: 4.25%) due 07/30/28 | | | 9,115,508 | | | | 9,125,991 | |
National Mentor Holdings, Inc. | | | | | | | | |
9.18% ((1 Month Term SOFR + 3.75%) and (3 Month Term SOFR + 3.75%), Rate Floor: 4.50%) due 03/02/28 | | | 8,709,749 | | | | 8,184,726 | |
9.16% (3 Month Term SOFR + 3.75%, Rate Floor: 4.50%) due 03/02/28 | | | 276,228 | | | | 259,577 | |
Medical Solutions Parent Holdings, Inc. | | | | | | | | |
8.68% (1 Month Term SOFR + 3.25%, Rate Floor: 3.75%) due 11/01/28 | | | 9,144,721 | | | | 8,138,802 | |
Hayward Industries, Inc. | | | | | | | | |
8.19% (1 Month Term SOFR + 2.75%, Rate Floor: 3.25%) due 05/30/28 | | | 7,605,000 | | | | 7,608,574 | |
VC GB Holdings I Corp. | | | | | | | | |
8.57% (3 Month Term SOFR + 3.00%, Rate Floor: 3.50%) due 07/21/28 | | | 7,251,441 | | | | 7,225,409 | |
Quirch Foods Holdings LLC | | | | | | | | |
10.32% (3 Month Term SOFR + 4.75%, Rate Floor: 5.75%) due 10/27/27 | | | 6,583,899 | | | | 6,592,129 | |
Mission Veterinary Partners | | | | | | | | |
9.44% (1 Month Term SOFR + 4.00%, Rate Floor: 4.75%) due 04/27/28 | | | 6,344,849 | | | | 6,333,048 | |
Kronos Acquisition Holdings, Inc. | | | | | | | | |
9.31% (3 Month Term SOFR + 3.75%, Rate Floor: 4.25%) due 12/22/26 | | | 6,229,071 | | | | 6,231,438 | |
HAH Group Holding Co. LLC | | | | | | | | |
10.44% (1 Month Term SOFR + 5.00%, Rate Floor: 6.00%) due 10/29/27 | | | 6,180,150 | | | | 6,141,524 | |
Weber-Stephen Products LLC | | | | | | | | |
8.69% (1 Month Term SOFR + 3.25%, Rate Floor: 4.00%) due 10/29/27 | | | 6,359,840 | | | | 5,863,009 | |
SEE NOTES TO FINANCIAL STATEMENTS. | THE GUGGENHEIM FUNDS SEMI-ANNUAL REPORT | 21 |
SCHEDULE OF INVESTMENTS (Unaudited)(continued) | March 31, 2024 |
FLOATING RATE STRATEGIES FUND | |
| | Face
Amount~ | | | Value | |
Grifols Worldwide Operations USA, Inc. | | | | | | | | |
7.46% (3 Month Term SOFR + 2.00%, Rate Floor: 3.00%) due 11/15/27 | | | 5,998,978 | | | $ | 5,801,732 | |
Triton Water Holdings, Inc. | | | | | | | | |
8.81% (3 Month Term SOFR + 3.51%, Rate Floor: 4.01%) due 03/31/28 | | | 5,319,101 | | | | 5,258,623 | |
Southern Veterinary Partners LLC | | | | | | | | |
9.44% (1 Month Term SOFR + 4.00%, Rate Floor: 5.00%) due 10/05/27 | | | 5,042,085 | | | | 5,042,085 | |
Dermatology Intermediate Holdings III, Inc. | | | | | | | | |
9.56% (3 Month Term SOFR + 4.25%, Rate Floor: 4.75%) due 04/02/29 | | | 5,162,970 | | | | 5,036,477 | |
Chefs’ Warehouse, Inc. | | | | | | | | |
9.33% (1 Month Term SOFR + 4.00%, Rate Floor: 4.50%) due 08/23/29 | | | 4,401,375 | | | | 4,399,174 | |
Perrigo Investments LLC | | | | | | | | |
7.68% (1 Month Term SOFR + 2.25%, Rate Floor: 2.75%) due 04/20/29 | | | 4,422,600 | | | | 4,396,817 | |
PlayCore | | | | | | | | |
9.84% (3 Month Term SOFR + 4.50%, Rate Floor: 5.50%) due 02/14/30 | | | 4,210,000 | | | | 4,223,177 | |
Phoenix Newco, Inc. | | | | | | | | |
8.69% (1 Month Term SOFR + 3.25%, Rate Floor: 3.75%) due 11/15/28 | | | 4,050,048 | | | | 4,057,824 | |
Resonetics LLC | | | | | | | | |
9.60% (3 Month Term SOFR + 4.00%, Rate Floor: 4.75%) due 04/28/28 | | | 3,805,071 | | | | 3,808,457 | |
Froneri US, Inc. | | | | | | | | |
7.68% (1 Month Term SOFR + 2.25%, Rate Floor: 2.25%) due 01/29/27 | | | 3,413,864 | | | | 3,414,547 | |
CHG PPC Parent LLC | | | | | | | | |
8.44% (3 Month Term SOFR + 3.11%, Rate Floor: 3.61%) due 12/08/28 | | | 2,910,811 | | | | 2,907,173 | |
Elanco Animal Health, Inc. | | | | | | | | |
7.18% (1 Month Term SOFR + 1.75%, Rate Floor: 1.75%) due 08/02/27 | | | 2,913,135 | | | | 2,901,162 | |
TGP Holdings LLC | | | | | | | | |
8.68% (1 Month Term SOFR + 3.25%, Rate Floor: 4.00%) due 06/29/28 | | | 3,048,815 | | | | 2,879,423 | |
22 | THE GUGGENHEIM FUNDS SEMI-ANNUAL REPORT | SEE NOTES TO FINANCIAL STATEMENTS. |
SCHEDULE OF INVESTMENTS (Unaudited)(continued) | March 31, 2024 |
FLOATING RATE STRATEGIES FUND | |
| | Face
Amount~ | | | Value | |
Topgolf Callaway Brands Corp. | | | | | | | | |
8.33% (3 Month Term SOFR + 3.60%, Rate Floor: 3.60%) due 03/15/30 | | | 2,858,400 | | | $ | 2,859,000 | |
Del Monte Foods, Inc. | | | | | | | | |
9.68% (1 Month Term SOFR + 4.25%, Rate Floor: 4.75%) due 05/16/29 | | | 3,371,892 | | | | 2,843,618 | |
Balrog Acquisition, Inc. | | | | | | | | |
9.94% (1 Month Term SOFR + 4.50%, Rate Floor: 5.25%) due 09/05/28††† | | | 2,575,793 | | | | 2,575,793 | |
Heritage Grocers Group LLC | | | | | | | | |
12.16% (3 Month Term SOFR + 6.75%, Rate Floor: 7.50%) due 08/01/29 | | | 2,471,702 | | | | 2,480,971 | |
Blue Ribbon LLC | | | | | | | | |
11.44% (1 Month Term SOFR + 6.00%, Rate Floor: 6.75%) due 05/08/28 | | | 2,512,821 | | | | 2,184,897 | |
Cambrex Corp. | | | | | | | | |
8.93% (1 Month Term SOFR + 3.50%, Rate Floor: 4.25%) due 12/04/26 | | | 2,097,867 | | | | 2,040,175 | |
Energizer Holdings, Inc. | | | | | | | | |
7.69% (1 Month Term SOFR + 2.25%, Rate Floor: 2.75%) due 12/22/27 | | | 1,997,375 | | | | 1,992,381 | |
Pacific Dental Services LLC | | | | | | | | |
due 03/07/31 | | | 1,905,000 | | | | 1,901,038 | |
Summit Behavioral Healthcare LLC | | | | | | | | |
10.35% (3 Month Term SOFR + 4.75%, Rate Floor: 5.50%) due 11/24/28 | | | 1,671,472 | | | | 1,671,472 | |
Electron BidCo, Inc. | | | | | | | | |
8.44% (1 Month Term SOFR + 3.00%, Rate Floor: 3.76%) due 11/01/28 | | | 1,510,331 | | | | 1,512,687 | |
IVI America LLC | | | | | | | | |
due 03/15/31 | | | 1,502,030 | | | | 1,500,152 | |
Aramark Services, Inc. | | | | | | | | |
7.95% (1 Month Term SOFR + 2.50%, Rate Floor: 2.50%) due 06/22/30 | | | 1,492,500 | | | | 1,491,575 | |
DaVita, Inc. | | | | | | | | |
7.19% (1 Month Term SOFR + 1.75%, Rate Floor: 1.75%) due 08/12/26 | | | 1,488,241 | | | | 1,487,601 | |
Endo Luxembourg Finance Company I SARL | | | | | | | | |
14.50% (3 Month Term SOFR + 6.00%, Rate Floor: 6.00%) due 03/27/28 | | | 1,896,000 | | | | 1,239,169 | |
Amer Sports, Inc. | | | | | | | | |
8.58% (3 Month Term SOFR + 3.25%, Rate Floor: 3.25%) due 02/08/31 | | | 750,000 | | | | 750,000 | |
SEE NOTES TO FINANCIAL STATEMENTS. | THE GUGGENHEIM FUNDS SEMI-ANNUAL REPORT | 23 |
SCHEDULE OF INVESTMENTS (Unaudited)(continued) | March 31, 2024 |
FLOATING RATE STRATEGIES FUND | |
| | Face
Amount~ | | | Value | |
Upstream Newco, Inc. | | | | | | | | |
9.82% (3 Month Term SOFR + 4.25%, Rate Floor: 4.25%) due 11/20/26 | | | 729,375 | | | $ | 684,701 | |
Mamba Purchaser, Inc. | | | | | | | | |
8.94% (1 Month Term SOFR + 3.50%, Rate Floor: 4.00%) due 10/16/28 | | | 312,188 | | | | 312,095 | |
Total Consumer, Non-cyclical | | | | | | | 165,147,056 | |
| | | | | | | | | |
Technology - 11.9% | | | | | | | | |
Ascend Learning LLC | | | | | | | | |
8.93% (1 Month Term SOFR + 3.50%, Rate Floor: 4.00%) due 12/11/28 | | | 8,918,000 | | | | 8,836,363 | |
Athenahealth Group, Inc. | | | | | | | | |
8.58% (1 Month Term SOFR + 3.25%, Rate Floor: 3.75%) due 02/15/29 | | | 8,557,400 | | | | 8,465,152 | |
Emerald TopCo, Inc. (Press Ganey) | | | | | | | | |
8.94% (1 Month Term SOFR + 3.50%, Rate Floor: 4.50%) due 07/24/26 | | | 8,397,222 | | | | 8,342,975 | |
CoreLogic, Inc. | | | | | | | | |
8.94% (1 Month Term SOFR + 3.50%, Rate Floor: 4.00%) due 06/02/28 | | | 8,500,338 | | | | 8,291,825 | |
Peraton Corp. | | | | | | | | |
9.18% (1 Month Term SOFR + 3.75%, Rate Floor: 4.50%) due 02/01/28 | | | 7,356,829 | | | | 7,343,071 | |
Atlas CC Acquisition Corp. | | | | | | | | |
9.85% (3 Month Term SOFR + 4.25%, Rate Floor: 5.00%) due 05/25/28 | | | 6,735,451 | | | | 6,286,062 | |
Polaris Newco LLC | | | | | | | | |
9.57% (3 Month Term SOFR + 4.00%, Rate Floor: 4.50%) due 06/02/28 | | | 5,954,315 | | | | 5,893,819 | |
Wrench Group LLC | | | | | | | | |
9.57% (3 Month Term SOFR + 4.00%, Rate Floor: 5.00%) due 10/30/28 | | | 5,383,725 | | | | 5,397,185 | |
Cloud Software Group, Inc. | | | | | | | | |
9.91% (3 Month Term SOFR + 4.50%, Rate Floor: 5.00%) due 09/29/28 | | | 4,910,725 | | | | 4,886,858 | |
Conair Holdings LLC | | | | | | | | |
9.19% (1 Month Term SOFR + 3.75%, Rate Floor: 4.25%) due 05/17/28 | | | 4,793,837 | | | | 4,742,926 | |
Xerox Corp. | | | | | | | | |
9.33% (1 Month Term SOFR + 4.00%, Rate Floor: 4.50%) due 11/19/29 | | | 4,535,113 | | | | 4,545,045 | |
24 | THE GUGGENHEIM FUNDS SEMI-ANNUAL REPORT | SEE NOTES TO FINANCIAL STATEMENTS. |
SCHEDULE OF INVESTMENTS (Unaudited)(continued) | March 31, 2024 |
FLOATING RATE STRATEGIES FUND | |
| | Face
Amount~ | | | Value | |
Central Parent LLC | | | | | | | | |
9.31% (3 Month Term SOFR + 4.00%, Rate Floor: 4.00%) due 07/06/29 | | | 4,399,065 | | | $ | 4,410,283 | |
Project Ruby Ultimate Parent Corp. | | | | | | | | |
8.69% (1 Month Term SOFR + 3.25%, Rate Floor: 4.00%) due 03/10/28 | | | 3,403,750 | | | | 3,397,079 | |
8.94% (1 Month Term SOFR + 3.61%, Rate Floor: 3.61%) due 03/10/28 | | | 910,000 | | | | 910,000 | |
Sabre GLBL, Inc. | | | | | | | | |
10.43% (1 Month Term SOFR + 5.00%, Rate Floor: 5.50%) due 06/30/28 | | | 3,296,299 | | | | 2,858,155 | |
8.94% (1 Month Term SOFR + 3.50%, Rate Floor: 4.00%) due 12/17/27 | | | 1,350,528 | | | | 1,137,334 | |
CCC Intelligent Solutions, Inc. | | | | | | | | |
7.69% (1 Month Term SOFR + 2.25%, Rate Floor: 2.75%) due 09/21/28 | | | 3,910,151 | | | | 3,903,621 | |
Taxware Holdings (Sovos Compliance LLC) | | | | | | | | |
9.94% (1 Month Term SOFR + 4.50%, Rate Floor: 5.00%) due 08/11/28 | | | 3,717,298 | | | | 3,679,716 | |
Iron Mountain Information Management Services, Inc. | | | | | | | | |
7.58% (1 Month Term SOFR + 2.25%, Rate Floor: 2.25%) due 01/31/31 | | | 3,152,100 | | | | 3,123,195 | |
Indicor, LLC | | | | | | | | |
9.30% (3 Month Term SOFR + 4.00%, Rate Floor: 4.50%) due 11/22/29 | | | 3,047,042 | | | | 3,063,557 | |
Planview Parent, Inc. | | | | | | | | |
9.56% (3 Month Term SOFR + 4.00%, Rate Floor: 4.75%) due 12/17/27 | | | 2,948,134 | | | | 2,938,051 | |
Instructure Holdings, Inc. | | | | | | | | |
8.09% (3 Month Term SOFR + 2.75%, Rate Floor: 3.25%) due 10/30/28 | | | 2,908,480 | | | | 2,904,844 | |
RealPage, Inc. | | | | | | | | |
8.44% (1 Month Term SOFR + 3.00%, Rate Floor: 3.50%) due 04/24/28 | | | 2,970,707 | | | | 2,888,181 | |
Blackhawk Network Holdings, Inc. | | | | | | | | |
10.33% (1 Month Term SOFR + 5.00%, Rate Floor: 6.00%) due 02/23/29 | | | 2,490,000 | | | | 2,491,544 | |
Boxer Parent Co., Inc. | | | | | | | | |
SEE NOTES TO FINANCIAL STATEMENTS. | THE GUGGENHEIM FUNDS SEMI-ANNUAL REPORT | 25 |
SCHEDULE OF INVESTMENTS (Unaudited)(continued) | March 31, 2024 |
FLOATING RATE STRATEGIES FUND | |
| | Face
Amount~ | | | Value | |
9.58% (3 Month Term SOFR + 4.25%, Rate Floor: 4.25%) due 12/06/28 | | | 2,471,331 | | | $ | 2,485,245 | |
DCert Buyer, Inc. | | | | | | | | |
9.33% (3 Month Term SOFR + 4.00%, Rate Floor: 4.00%) due 10/16/26 | | | 2,474,409 | | | | 2,460,824 | |
Gen Digital, Inc. | | | | | | | | |
7.43% (1 Month Term SOFR + 2.00%, Rate Floor: 2.50%) due 09/12/29 | | | 1,732,399 | | | | 1,731,169 | |
Dun & Bradstreet | | | | | | | | |
8.08% (1 Month Term SOFR + 2.75%, Rate Floor: 2.75%) due 01/18/29 | | | 1,651,248 | | | | 1,650,472 | |
World Wide Technology Holding Co. LLC | | | | | | | | |
8.08% (1 Month Term SOFR + 2.75%, Rate Floor: 3.25%) due 03/01/30††† | | | 1,401,225 | | | | 1,409,983 | |
iSolved, Inc. | | | | | | | | |
9.33% (6 Month Term SOFR + 4.00%, Rate Floor: 4.50%) due 10/14/30 | | | 1,332,000 | | | | 1,337,834 | |
Imprivata, Inc. | | | | | | | | |
9.56% (3 Month Term SOFR + 4.25%, Rate Floor: 4.75%) due 12/01/27 | | | 640,250 | | | | 640,653 | |
Total Technology | | | | | | | 122,453,022 | |
| | | | | | | | | |
Financial - 9.6% | | | | | | | | |
USI, Inc. | | | | | | | | |
8.31% (3 Month Term SOFR + 3.00%, Rate Floor: 3.00%) due 11/22/29 | | | 5,494,167 | | | | 5,493,398 | |
8.55% (3 Month Term SOFR + 3.25%, Rate Floor: 3.25%) due 09/30/30 | | | 1,493,785 | | | | 1,494,248 | |
AqGen Island Holdings, Inc. | | | | | | | | |
8.94% (1 Month Term SOFR + 3.50%, Rate Floor: 4.00%) due 08/02/28 | | | 6,868,332 | | | | 6,833,990 | |
Citadel Securities, LP | | | | | | | | |
7.58% (1 Month Term SOFR + 2.25%, Rate Floor: 2.25%) due 07/29/30 | | | 6,429,074 | | | | 6,420,652 | |
Nexus Buyer LLC | | | | | | | | |
9.18% (1 Month Term SOFR + 3.75%, Rate Floor: 3.75%) due 11/09/26 | | | 4,577,313 | | | | 4,560,972 | |
9.83% (1 Month Term SOFR + 4.50%, Rate Floor: 4.50%) due 12/13/28 | | | 300,000 | | | | 297,282 | |
Duff & Phelps | | | | | | | | |
9.06% (3 Month Term SOFR + 3.75%, Rate Floor: 4.75%) due 04/09/27 | | | 4,859,917 | | | | 4,833,576 | |
26 | THE GUGGENHEIM FUNDS SEMI-ANNUAL REPORT | SEE NOTES TO FINANCIAL STATEMENTS. |
SCHEDULE OF INVESTMENTS (Unaudited)(continued) | March 31, 2024 |
FLOATING RATE STRATEGIES FUND | |
| | Face
Amount~ | | | Value | |
Jane Street Group LLC | | | | | | | | |
7.94% (1 Month Term SOFR + 2.50%, Rate Floor: 2.50%) due 01/26/28 | | | 4,827,765 | | | $ | 4,828,972 | |
AmWINS Group, Inc. | | | | | | | | |
7.69% (1 Month Term SOFR + 2.25%, Rate Floor: 3.00%) due 02/22/28 | | | 4,548,670 | | | | 4,547,897 | |
Focus Financial Partners, LLC | | | | | | | | |
8.08% (1 Month Term SOFR + 2.75%, Rate Floor: 3.25%) due 06/30/28 | | | 4,186,383 | | | | 4,170,684 | |
Worldpay | | | | | | | | |
8.31% (3 Month Term SOFR + 3.00%, Rate Floor: 3.50%) due 01/31/31 | | | 3,530,000 | | | | 3,539,566 | |
Franchise Group, Inc. | | | | | | | | |
10.36% (6 Month Term SOFR + 4.75%, Rate Floor: 4.75%) due 03/10/26 | | | 3,955,564 | | | | 3,525,397 | |
Virtu Financial | | | | | | | | |
8.43% (1 Month Term SOFR + 3.00%, Rate Floor: 3.50%) due 01/12/29 | | | 3,454,000 | | | | 3,444,294 | |
Apex Group Treasury LLC | | | | | | | | |
9.33% (3 Month Term SOFR + 3.75%, Rate Floor: 4.25%) due 07/27/28 | | | 3,412,500 | | | | 3,405,402 | |
Cobham Ultra SeniorCo SARL | | | | | | | | |
9.01% (6 Month Term SOFR + 3.93%, Rate Floor: 4.43%) due 08/06/29 | | | 3,250,808 | | | | 3,187,840 | |
Asurion LLC | | | | | | | | |
9.68% (1 Month Term SOFR + 4.25%, Rate Floor: 4.25%) due 08/20/28 | | | 3,166,075 | | | | 3,050,513 | |
Zodiac Pool Solutions LLC | | | | | | | | |
7.36% (1 Month Term SOFR + 1.93%, Rate Floor: 2.43%) due 01/29/29 | | | 2,999,427 | | | | 2,992,679 | |
FleetCor Technologies Operating Company LLC | | | | | | | | |
7.18% (1 Month Term SOFR + 1.75%, Rate Floor: 1.75%) due 04/28/28 | | | 2,960,699 | | | | 2,957,560 | |
Delos Aircraft Leasing | | | | | | | | |
7.30% (3 Month Term SOFR + 2.00%, Rate Floor: 2.00%) due 11/01/27 | | | 2,808,571 | | | | 2,813,487 | |
Capstone Borrower, Inc. | | | | | | | | |
9.05% (3 Month Term SOFR + 3.75%, Rate Floor: 3.75%) due 06/17/30 | | | 2,757,942 | | | | 2,759,100 | |
SEE NOTES TO FINANCIAL STATEMENTS. | THE GUGGENHEIM FUNDS SEMI-ANNUAL REPORT | 27 |
SCHEDULE OF INVESTMENTS (Unaudited)(continued) | March 31, 2024 |
FLOATING RATE STRATEGIES FUND | |
| | Face
Amount~ | | | Value | |
Tegra118 Wealth Solutions, Inc. | | | | | | | | |
9.32% (3 Month Term SOFR + 4.00%, Rate Floor: 4.00%) due 02/18/27 | | | 2,805,921 | | | $ | 2,673,510 | |
HighTower Holding LLC | | | | | | | | |
9.59% (3 Month Term SOFR + 4.00%, Rate Floor: 4.75%) due 04/21/28 | | | 2,632,500 | | | | 2,632,500 | |
Aretec Group, Inc. | | | | | | | | |
9.93% (1 Month Term SOFR + 4.50%, Rate Floor: 4.50%) due 08/09/30 | | | 2,616,440 | | | | 2,629,522 | |
HarbourVest Partners, LP | | | | | | | | |
7.84% (1 Month Term SOFR + 2.50%, Rate Floor: 2.50%) due 04/19/30 | | | 2,577,890 | | | | 2,577,890 | |
Alliant Holdings Intermediate LLC | | | | | | | | |
8.83% (1 Month Term SOFR + 3.50%, Rate Floor: 4.00%) due 11/06/30 | | | 2,510,992 | | | | 2,520,408 | |
Ryan Specialty Group LLC | | | | | | | | |
8.08% (1 Month Term SOFR + 2.75%, Rate Floor: 3.50%) due 09/01/27 | | | 2,479,155 | | | | 2,480,394 | |
Eisner Advisory Group | | | | | | | | |
9.33% (1 Month Term SOFR + 4.00%, Rate Floor: 4.50%) due 02/22/31 | | | 2,345,000 | | | | 2,350,863 | |
Apex Group Treasury LLC | | | | | | | | |
10.32% (3 Month Term SOFR + 5.00%, Rate Floor: 5.50%) due 07/27/28††† | | | 2,073,750 | | | | 2,078,934 | |
GIP Pilot Acquisition Partners, LP | | | | | | | | |
8.33% (3 Month Term SOFR + 3.00%, Rate Floor: 3.00%) due 10/04/30 | | | 1,609,650 | | | | 1,613,272 | |
HUB International Ltd. | | | | | | | | |
8.57% (3 Month Term SOFR + 3.25%, Rate Floor: 4.00%) due 06/20/30 | | | 1,602,623 | | | | 1,602,912 | |
Total Financial | | | | | | | 98,317,714 | |
| | | | | | | | | |
Communications - 8.1% | | | | |
Zayo Group Holdings, Inc. | | | | | | | | |
8.44% (1 Month Term SOFR + 3.00%, Rate Floor: 3.00%) due 03/09/27 | | | 6,648,468 | | | | 5,818,672 | |
9.66% (1 Month Term SOFR + 4.33%, Rate Floor: 4.83%) due 03/09/27 | | | 3,920,000 | | | | 3,492,054 | |
28 | THE GUGGENHEIM FUNDS SEMI-ANNUAL REPORT | SEE NOTES TO FINANCIAL STATEMENTS. |
SCHEDULE OF INVESTMENTS (Unaudited)(continued) | March 31, 2024 |
FLOATING RATE STRATEGIES FUND | |
| | Face
Amount~ | | | Value | |
McGraw Hill LLC | | | | | | | | |
10.19% (1 Month Term SOFR + 4.75%, Rate Floor: 5.25%) due 07/28/28 | | | 8,508,170 | | | $ | 8,520,337 | |
Virgin Media Bristol LLC | | | | | | | | |
7.94% (1 Month Term SOFR + 2.50%, Rate Floor: 2.50%) due 01/31/28 | | | 7,916,233 | | | | 7,790,602 | |
Ziggo Financing Partnership | | | | | | | | |
7.94% (1 Month Term SOFR + 2.50%, Rate Floor: 2.50%) due 04/28/28 | | | 6,685,000 | | | | 6,583,522 | |
CSC Holdings LLC | | | | | | | | |
9.83% (1 Month Term SOFR + 4.50%, Rate Floor: 4.50%) due 01/18/28 | | | 6,694,454 | | | | 6,428,752 | |
Titan AcquisitionCo New Zealand Ltd. (Trade Me) | | | | | | | | |
9.57% (3 Month Term SOFR + 4.26%, Rate Floor: 4.76%) due 10/18/28 | | | 5,944,217 | | | | 5,933,101 | |
WMG Acquisition Corp. | | | | | | | | |
7.33% (1 Month Term SOFR + 2.00%, Rate Floor: 2.00%) due 01/24/31 | | | 4,521,175 | | | | 4,509,872 | |
Cengage Learning, Inc. | | | | | | | | |
due 03/15/31 | | | 4,090,000 | | | | 4,081,043 | |
Telenet Financing USD LLC | | | | | | | | |
7.44% (1 Month Term SOFR + 2.00%, Rate Floor: 2.00%) due 04/28/28 | | | 4,000,000 | | | | 3,883,320 | |
Altice France SA | | | | | | | | |
10.81% (3 Month Term SOFR + 5.50%, Rate Floor: 5.50%) due 08/15/28 | | | 4,905,272 | | | | 3,878,255 | |
Xplornet Communications, Inc. | | | | | | | | |
9.57% (3 Month Term SOFR + 4.00%, Rate Floor: 4.50%) due 10/02/28 | | | 8,441,151 | | | | 3,820,971 | |
Playtika Holding Corp. | | | | | | | | |
8.19% (1 Month Term SOFR + 2.75%, Rate Floor: 3.75%) due 03/13/28 | | | 3,524,291 | | | | 3,524,643 | |
Charter Communications Operating LLC | | | | | | | | |
7.33% (3 Month Term SOFR + 2.00%, Rate Floor: 2.00%) due 12/09/30 | | | 3,250,000 | | | | 3,216,493 | |
Cincinnati Bell, Inc. | | | | | | | | |
8.68% (1 Month Term SOFR + 3.25%, Rate Floor: 3.75%) due 11/22/28 | | | 2,840,759 | | | | 2,841,640 | |
SEE NOTES TO FINANCIAL STATEMENTS. | THE GUGGENHEIM FUNDS SEMI-ANNUAL REPORT | 29 |
SCHEDULE OF INVESTMENTS (Unaudited)(continued) | March 31, 2024 |
FLOATING RATE STRATEGIES FUND | |
| | Face
Amount~ | | | Value | |
Level 3 Financing, Inc. | | | | | | | | |
7.19% (3 Month Term SOFR + 1.86%, Rate Floor: 1.86%) due 03/01/27 | | | 2,588,000 | | | $ | 2,545,945 | |
Simon & Schuster | | | | | | | | |
9.32% (3 Month Term SOFR + 4.00%, Rate Floor: 4.00%) due 10/30/30 | | | 2,066,400 | | | | 2,072,599 | |
UPC Broadband Holding BV | | | | | | | | |
8.44% (1 Month Term SOFR + 3.00%, Rate Floor: 3.00%) due 01/31/29 | | | 1,464,906 | | | | 1,457,582 | |
Planet US Buyer LLC | | | | | | | | |
8.81% (3 Month Term SOFR + 3.50%, Rate Floor: 3.50%) due 01/31/31 | | | 1,400,000 | | | | 1,404,200 | |
SBA Senior Finance II LLC | | | | | | | | |
7.34% (1 Month Term SOFR + 2.00%, Rate Floor: 2.00%) due 01/27/31 | | | 1,350,000 | | | | 1,352,106 | |
Total Communications | | | | | | | 83,155,709 | |
| | | | | | | | | |
Basic Materials - 4.0% | | | | |
CTEC III GmbH | | | | | | | | |
7.45% (3 Month EURIBOR + 3.50%, Rate Floor: 3.50%) due 03/16/29 | | EUR | 7,500,000 | | | | 7,987,807 | |
Arsenal AIC Parent LLC | | | | | | | | |
9.08% (1 Month Term SOFR + 3.75%, Rate Floor: 3.75%) due 08/19/30 | | | 4,908,172 | | | | 4,919,215 | |
Illuminate Buyer LLC | | | | | | | | |
8.94% (1 Month Term SOFR + 3.50%, Rate Floor: 3.50%) due 12/31/29 | | | 4,386,162 | | | | 4,388,926 | |
Nouryon USA LLC | | | | | | | | |
9.42% (3 Month Term SOFR + 4.00%, Rate Floor: 4.00%) due 04/03/28 | | | 3,149,002 | | | | 3,155,070 | |
NIC Acquisition Corp. | | | | | | | | |
9.32% (3 Month Term SOFR + 3.75%, Rate Floor: 4.50%) due 12/29/27 | | | 3,528,762 | | | | 2,965,924 | |
LSF11 A5 HoldCo LLC | | | | | | | | |
9.68% (1 Month Term SOFR + 4.25%, Rate Floor: 4.75%) due 10/16/28 | | | 2,540,457 | | | | 2,541,727 | |
Platform Specialty Products | | | | | | | | |
7.33% (1 Month Term SOFR + 2.00%, Rate Floor: 2.00%) due 12/18/30 | | | 2,360,000 | | | | 2,360,000 | |
Vantage Specialty Chemicals, Inc. | | | | | | | | |
10.07% (3 Month Term SOFR + 4.75%, Rate Floor: 5.25%) due 10/26/26 | | | 2,252,250 | | | | 2,220,583 | |
30 | THE GUGGENHEIM FUNDS SEMI-ANNUAL REPORT | SEE NOTES TO FINANCIAL STATEMENTS. |
SCHEDULE OF INVESTMENTS (Unaudited)(continued) | March 31, 2024 |
FLOATING RATE STRATEGIES FUND | |
| | Face
Amount~ | | | Value | |
W.R. Grace Holdings LLC | | | | | | | | |
9.32% (3 Month Term SOFR + 3.75%, Rate Floor: 4.25%) due 09/22/28 | | | 1,715,000 | | | $ | 1,715,000 | |
HB Fuller Co. | | | | | | | | |
7.33% (1 Month Term SOFR + 2.00%, Rate Floor: 2.50%) due 02/15/30 | | | 1,700,000 | | | | 1,701,275 | |
DCG Acquisition Corp. | | | | | | | | |
9.93% (1 Month Term SOFR + 4.50%, Rate Floor: 5.50%) due 09/30/26 | | | 1,669,942 | | | | 1,666,820 | |
INEOS Ltd. | | | | | | | | |
8.19% (1 Month Term SOFR + 2.75%, Rate Floor: 3.25%) due 01/29/26 | | | 1,484,794 | | | | 1,483,309 | |
Barentz Midco BV | | | | | | | | |
due 03/29/31 | | | 1,365,000 | | | | 1,368,412 | |
Ineos US Finance LLC | | | | | | | | |
8.93% (1 Month Term SOFR + 3.50%, Rate Floor: 3.50%) due 02/18/30 | | | 1,359,725 | | | | 1,357,781 | |
Trinseo Materials Operating S.C.A. | | | | | | | | |
8.10% (3 Month Term SOFR + 2.50%, Rate Floor: 3.50%) due 05/03/28 | | | 1,560,000 | | | | 1,151,639 | |
Total Basic Materials | | | | | | | 40,983,488 | |
| | | | | | | | | |
Energy - 2.3% | | | | | | | | |
AL GCX Holdings LLC | | | | | | | | |
8.57% (1 Month Term SOFR + 3.25%, Rate Floor: 3.75%) due 05/17/29 | | | 3,504,821 | | | | 3,511,831 | |
Par Petroleum LLC | | | | | | | | |
9.69% (3 Month Term SOFR + 4.25%, Rate Floor: 4.75%) due 02/28/30 | | | 3,195,850 | | | | 3,196,841 | |
TransMontaigne Operating Company, LP | | | | | | | | |
8.94% (1 Month Term SOFR + 3.50%, Rate Floor: 4.00%) due 11/17/28 | | | 3,062,018 | | | | 3,059,844 | |
BANGL LLC | | | | | | | | |
9.83% (3 Month Term SOFR + 4.50%, Rate Floor: 4.50%) due 02/01/29 | | | 2,622,219 | | | | 2,634,517 | |
Buckeye Partners, LP | | | | | | | | |
7.33% (1 Month Term SOFR + 2.00%, Rate Floor: 2.00%) due 11/02/26 | | | 1,562,605 | | | | 1,565,324 | |
7.83% (1 Month Term SOFR + 2.50%, Rate Floor: 2.50%) due 11/22/30 | | | 825,505 | | | | 826,240 | |
WhiteWater DBR HoldCo LLC | | | | | | | | |
8.06% (1 Month Term SOFR + 2.75%, Rate Floor: 2.75%) due 02/16/31 | | | 1,865,000 | | | | 1,867,331 | |
SEE NOTES TO FINANCIAL STATEMENTS. | THE GUGGENHEIM FUNDS SEMI-ANNUAL REPORT | 31 |
SCHEDULE OF INVESTMENTS (Unaudited)(continued) | March 31, 2024 |
FLOATING RATE STRATEGIES FUND | |
| | Face
Amount~ | | | Value | |
ITT Holdings LLC | | | | | | | | |
8.68% (1 Month Term SOFR + 3.25%, Rate Floor: 3.75%) due 10/11/30 | | | 1,800,488 | | | $ | 1,801,388 | |
Traverse Midstream Partners LLC | | | | | | | | |
8.82% (3 Month Term SOFR + 3.50%, Rate Floor: 4.00%) due 02/16/28 | | | 1,626,172 | | | | 1,627,700 | |
UGI Energy Services LLC | | | | | | | | |
8.68% (1 Month Term SOFR + 3.25%, Rate Floor: 3.75%) due 02/22/30 | | | 1,580,255 | | | | 1,585,897 | |
Bip PipeCo Holdings LLC | | | | | | | | |
8.58% (3 Month Term SOFR + 3.25%, Rate Floor: 3.25%) due 12/06/30 | | | 1,330,000 | | | | 1,330,838 | |
Permian Production Partners LLC | | | | | | | | |
7.72% (1 Month Term SOFR + 2.00%, Rate Floor: 3.00%) (in-kind rate was 2.00%) due 11/24/253 | | | 689,464 | | | | 665,333 | |
Total Energy | | | | | | | 23,673,084 | |
| | | | | | | | | |
Utilities - 1.0% | | | | | | | | |
Calpine Construction Finance Company, LP | | | | | | | | |
7.58% (1 Month Term SOFR + 2.25%, Rate Floor: 2.25%) due 07/31/30 | | | 4,965,050 | | | | 4,957,603 | |
NRG Energy, Inc. | | | | | | | | |
due 03/26/31 | | | 2,713,178 | | | | 2,708,104 | |
TerraForm Power Operating LLC | | | | | | | | |
7.90% (3 Month Term SOFR + 2.50%, Rate Floor: 3.00%) due 05/21/29 | | | 2,561,891 | | | | 2,542,676 | |
Total Utilities | | | | | | | 10,208,383 | |
| | | | | | | | | |
Total Senior Floating Rate Interests | | | | |
(Cost $907,645,930) | | | 891,988,129 | |
| |
CORPORATE BONDS†† - 4.3% |
Consumer, Non-cyclical - 2.0% | | | | |
Legends Hospitality Holding Company LLC / Legends Hospitality Co-Issuer, Inc. | | | | | | | | |
5.00% due 02/01/264 | | | 2,875,000 | | | | 2,848,252 | |
Cheplapharm Arzneimittel GmbH | | | | | | | | |
5.50% due 01/15/284 | | | 2,975,000 | | | | 2,834,793 | |
CPI CG, Inc. | | | | | | | | |
8.63% due 03/15/264 | | | 2,689,000 | | | | 2,678,531 | |
Sotheby’s | | | | | | | | |
7.38% due 10/15/274 | | | 2,875,000 | | | | 2,676,858 | |
ADT Security Corp. | | | | | | | | |
4.13% due 08/01/294 | | | 2,875,000 | | | | 2,633,993 | |
Tenet Healthcare Corp. | | | | | | | | |
4.38% due 01/15/30 | | | 2,800,000 | | | | 2,587,960 | |
Nathan’s Famous, Inc. | | | | | | | | |
6.63% due 11/01/254 | | | 1,709,000 | | | | 1,703,358 | |
HCA, Inc. | | | | | | | | |
4.50% due 02/15/27 | | | 1,500,000 | | | | 1,470,697 | |
WW International, Inc. | | | | | | | | |
4.50% due 04/15/294 | | | 2,875,000 | | | | 1,135,392 | |
Total Consumer, Non-cyclical | | | | | | | 20,569,834 | |
| | | | | | | | | |
Communications - 1.0% | | | | |
VZ Secured Financing BV | | | | | | | | |
5.00% due 01/15/324 | | | 3,500,000 | | | | 3,005,112 | |
32 | THE GUGGENHEIM FUNDS SEMI-ANNUAL REPORT | SEE NOTES TO FINANCIAL STATEMENTS. |
SCHEDULE OF INVESTMENTS (Unaudited)(continued) | March 31, 2024 |
FLOATING RATE STRATEGIES FUND | |
| | Face
Amount~ | | | Value | |
LCPR Senior Secured Financing DAC | | | | | | | | |
6.75% due 10/15/274 | | | 2,875,000 | | | $ | 2,698,240 | |
Altice France S.A. | | | | | | | | |
5.50% due 10/15/294 | | | 2,850,000 | | | | 1,934,389 | |
McGraw-Hill Education, Inc. | | | | | | | | |
5.75% due 08/01/284 | | | 1,575,000 | | | | 1,483,583 | |
Level 3 Financing, Inc. | | | | | | | | |
11.00% due 11/15/294 | | | 899,070 | | | | 935,033 | |
Total Communications | | | | | | | 10,056,357 | |
| | | | | | | | | |
Industrial - 0.5% | | | | | | | | |
New Enterprise Stone & Lime Company, Inc. | | | | | | | | |
5.25% due 07/15/284 | | | 2,875,000 | | | | 2,754,225 | |
GrafTech Global Enterprises, Inc. | | | | | | | | |
9.88% due 12/15/284 | | | 2,120,000 | | | | 1,573,671 | |
Brundage-Bone Concrete Pumping Holdings, Inc. | | | | | | | | |
6.00% due 02/01/264 | | | 1,412,000 | | | | 1,394,523 | |
Total Industrial | | | | | | | 5,722,419 | |
| | | | | | | | | |
Consumer, Cyclical - 0.4% | | | | |
Fertitta Entertainment LLC / Fertitta Entertainment Finance Company, Inc. | | | | | | | | |
4.63% due 01/15/294 | | | 5,000,000 | | | | 4,584,880 | |
| | | | | |
Basic Materials - 0.2% | | | | |
WR Grace Holdings LLC | | | | | | | | |
4.88% due 06/15/274 | | | 1,975,000 | | | | 1,877,003 | |
Mirabela Nickel Ltd. | | | | | | | | |
due 06/24/19†††,5,6 | | | 1,279,819 | | | | 6,399 | |
Total Basic Materials | | | | | | | 1,883,402 | |
| | | | | | | | | |
Financial - 0.2% | | | | | | | | |
Hunt Companies, Inc. | | | | | | | | |
5.25% due 04/15/294 | | | 1,850,000 | | | | 1,689,238 | |
Total Corporate Bonds | | | | |
(Cost $50,637,105) | | | 44,506,130 | |
| |
COLLATERALIZED MORTGAGE OBLIGATIONS†† - 0.8% |
Residential Mortgage-Backed Securities - 0.8% |
RALI Series Trust | | | | | | | | |
2006-QO6, 5.62% (1 Month Term SOFR + 0.47%, Rate Floor: 0.36%) due 06/25/46◊ | | | 10,472,375 | | | | 2,411,567 | |
2006-QO2, 5.88% (1 Month Term SOFR + 0.55%, Rate Floor: 0.44%) due 02/25/46◊ | | | 416,751 | | | | 73,958 | |
Washington Mutual Mortgage Pass-Through Certificates Trust | | | | | | | | |
2007-OA6, 5.90% (1 Year CMT Rate + 0.81%, Rate Floor: 0.81%) due 07/25/47◊ | | | 2,171,729 | | | | 1,713,411 | |
Washington Mutual Mortgage Pass-Through Certificates WMALT Series Trust | | | | | | | | |
2006-AR9, 5.93% (1 Year CMT Rate + 0.84%, Rate Floor: 0.84%) due 11/25/46◊ | | | 1,448,826 | | | | 1,154,877 | |
American Home Mortgage Assets Trust | | | | | | | | |
2006-4, 5.65% (1 Month Term SOFR + 0.32%, Rate Floor: 0.32%) due 10/25/46◊ | | | 2,179,238 | | | | 1,108,460 | |
SEE NOTES TO FINANCIAL STATEMENTS. | THE GUGGENHEIM FUNDS SEMI-ANNUAL REPORT | 33 |
SCHEDULE OF INVESTMENTS (Unaudited)(continued) | March 31, 2024 |
FLOATING RATE STRATEGIES FUND | |
| | Face
Amount~ | | | Value | |
Lehman XS Trust Series | | | | | | | | |
2006-16N, 5.82% (1 Month Term SOFR + 0.49%, Rate Floor: 0.38%) due 11/25/46◊ | | | 1,184,748 | | | $ | 1,009,153 | |
Nomura Resecuritization Trust | | | | | | | | |
2015-4R, 3.04% (1 Month Term SOFR + 0.54%, Rate Floor: 0.43%) due 03/26/36◊ | | | 478,455 | | | | 449,660 | |
Alliance Bancorp Trust | | | | | | | | |
2007-OA1, 5.92% (1 Month Term SOFR + 0.59%, Rate Floor: 0.48%) due 07/25/37◊ | | | 343,254 | | | | 286,760 | |
Morgan Stanley Re-REMIC Trust | | | | | | | | |
2010-R5, 4.12% due 06/26/36 | | | 230,746 | | | | 200,269 | |
New Century Home Equity Loan Trust | | | | | | | | |
2004-4, 6.24% (1 Month Term SOFR + 0.91%, Rate Cap/Floor: 12.50%/0.80%) due 02/25/35◊ | | | 88,746 | | | | 88,248 | |
GSAA Home Equity Trust | | | | | | | | |
2007-7, 5.98% (1 Month Term SOFR + 0.65%, Rate Floor: 0.54%) due 07/25/37◊ | | | 89,683 | | | | 82,883 | |
Total Residential Mortgage-Backed Securities | | | 8,579,246 | |
| | | | | | | | | |
Total Collateralized Mortgage Obligations | | | | |
(Cost $11,990,455) | | | 8,579,246 | |
| |
ASSET-BACKED SECURITIES†† - 0.0% |
Collateralized Loan Obligations - 0.0% |
Octagon Loan Funding Ltd. | | | | | | | | |
2014-1A SUB, due 11/18/314,7 | | | 2,071,948 | | | | 331,184 | |
Treman Park CLO Ltd. | | | | | | | | |
2015-1A COM, due 10/20/284,7 | | | 977,702 | | | | 3,402 | |
Total Collateralized Loan Obligations | | | | | | | 334,586 | |
| | | | | | | | | |
Total Asset-Backed Securities | | | | |
(Cost $3,402) | | | 334,586 | |
| | | | | | | | | |
Total Investments - 97.4% | | | | |
(Cost $1,028,336,446) | | $ | 1,002,496,033 | |
Other Assets & Liabilities, net - 2.6% | | | 26,727,040 | |
Total Net Assets - 100.0% | | $ | 1,029,223,073 | |
34 | THE GUGGENHEIM FUNDS SEMI-ANNUAL REPORT | SEE NOTES TO FINANCIAL STATEMENTS. |
SCHEDULE OF INVESTMENTS (Unaudited)(continued) | March 31, 2024 |
FLOATING RATE STRATEGIES FUND | |
Forward Foreign Currency Exchange Contracts†† |
Counterparty | | Currency | | | Type | | | Quantity | | | Contract
Amount | | | Settlement
Date | | | Unrealized
Appreciation | |
Barclays Bank plc | | | EUR | | | | Sell | | | | 14,035,000 | | | | 15,350,280 USD | | | | 04/15/24 | | | $ | 198,793 | |
~ | The face amount is denominated in U.S. dollars unless otherwise indicated. |
* | Non-income producing security. |
† | Value determined based on Level 1 inputs — See Note 4. |
†† | Value determined based on Level 2 inputs, unless otherwise noted — See Note 4. |
††† | Value determined based on Level 3 inputs — See Note 4. |
◊ | Variable rate security. Rate indicated is the rate effective at March 31, 2024. In some instances, the effective rate is limited by a minimum rate floor or a maximum rate cap established by the issuer. The settlement status of a position may also impact the effective rate indicated. In some cases, a position may be unsettled at period end and may not have a stated effective rate. In instances where multiple underlying reference rates and spread amounts are shown, the effective rate is based on a weighted average. |
1 | Affiliated issuer. |
2 | Rate indicated is the 7-day yield as of March 31, 2024. |
3 | Payment-in-kind security. |
4 | Security is a 144A or Section 4(a)(2) security. These securities have been determined to be liquid under guidelines established by the Board of Trustees. The total market value of 144A or Section 4(a)(2) securities is $40,775,660 (cost $47,930,046), or 4.0% of total net assets. |
5 | Security is in default of interest and/or principal obligations. |
6 | Security is a 144A or Section 4(a)(2) security. These securities have been determined to be illiquid and restricted under guidelines established by the Board of Trustees. The total market value of 144A or Section 4(a)(2) illiquid and restricted securities is $6,399 (cost $1,160,811), or less than 0.1% of total net assets — See Note 8. |
7 | Security has no stated coupon. However, it is expected to receive residual cash flow payments on defined deal dates. |
| | CMT — Constant Maturity Treasury |
| | EUR — Euro |
| | EURIBOR — European Interbank Offered Rate |
| | plc — Public Limited Company |
| | REMIC — Real Estate Mortgage Investment Conduit |
| | SARL — Société à Responsabilité Limitée |
| | SOFR — Secured Overnight Financing Rate |
| | |
| | See Sector Classification in Other Information section. |
SEE NOTES TO FINANCIAL STATEMENTS. | THE GUGGENHEIM FUNDS SEMI-ANNUAL REPORT | 35 |
SCHEDULE OF INVESTMENTS (Unaudited)(continued) | March 31, 2024 |
FLOATING RATE STRATEGIES FUND | |
The following table summarizes the inputs used to value the Fund’s investments at March 31, 2024 (See Note 4 in the Notes to Financial Statements):
Investments in Securities (Assets) | | Level 1
Quoted
Prices | | | Level 2
Significant
Observable
Inputs | | | Level 3
Significant
Unobservable
Inputs | | | Total | |
Common Stocks | | $ | — | | | $ | — | | | $ | 3,593,572 | | | $ | 3,593,572 | |
Preferred Stocks | | | — | | | | — | | | | 841,526 | | | | 841,526 | |
Exchange-Traded Funds | | | 28,476,467 | | | | — | | | | — | | | | 28,476,467 | |
Money Market Fund | | | 24,176,377 | | | | — | | | | — | | | | 24,176,377 | |
Senior Floating Rate Interests | | | — | | | | 874,834,630 | | | | 17,153,499 | | | | 891,988,129 | |
Corporate Bonds | | | — | | | | 44,499,731 | | | | 6,399 | | | | 44,506,130 | |
Collateralized Mortgage Obligations | | | — | | | | 8,579,246 | | | | — | | | | 8,579,246 | |
Asset-Backed Securities | | | — | | | | 334,586 | | | | — | | | | 334,586 | |
Forward Foreign Currency Exchange Contracts** | | | — | | | | 198,793 | | | | — | | | | 198,793 | |
Total Assets | | $ | 52,652,844 | | | $ | 928,446,986 | | | $ | 21,594,996 | | | $ | 1,002,694,826 | |
** | This derivative is reported as unrealized appreciation/depreciation at period end. |
The following is a summary of significant unobservable inputs used in the fair valuation of assets and liabilities categorized within Level 3 of the fair value hierarchy:
Category | | Ending
Balance at
March 31,
2024 | | Valuation
Technique | Unobservable
Inputs | | Input
Range | | | Weighted
Average* | |
Assets: | | | | | | | | | | | | | | |
Common Stocks | | $ | 3,592,384 | | Enterprise Value | Valuation Multiple | 2.9x-8.2x | 4.8x |
Common Stocks | | | 1,188 | | Model Price | Liquidation Value | — | — |
Corporate Bonds | | | 6,399 | | Third Party Pricing | Trade Price | — | — |
Preferred Stocks | | | 841,526 | | Enterprise Value | Valuation Multiple | 5.0x | — |
Senior Floating Rate Interests | | | 14,964,262 | | Third Party Pricing | Broker Quote | — | — |
Senior Floating Rate Interests | | | 2,189,237 | | Model Price | Purchase Price | — | — |
Total Assets | | $ | 21,594,996 | | | | | |
* | Inputs are weighted by the fair value of the instruments. |
Significant changes in a quote, liquidation value or valuation multiple would generally result in significant changes in the fair value of the security.
The Fund’s fair valuation leveling guidelines classify a single daily broker quote, or a vendor price based on a single daily or monthly broker quote, as Level 3, if such a quote or price cannot be supported with other available market information.
Transfers between Level 2 and Level 3 may occur as markets fluctuate and/or the availability of data used in an investment’s valuation changes. For the period ended March 31, 2024, the Fund had securities with a total value of $5,937,014 transfer into Level 3 from Level 2 due to a lack of observable inputs and had securities with a total value of $7,476,909 transfer out of Level 3 into Level 2 due to the availability of current and reliable market-based data provided by a third-party pricing service which utilizes significant observable inputs.
36 | THE GUGGENHEIM FUNDS SEMI-ANNUAL REPORT | SEE NOTES TO FINANCIAL STATEMENTS. |
SCHEDULE OF INVESTMENTS (Unaudited)(concluded) | March 31, 2024 |
FLOATING RATE STRATEGIES FUND | |
Summary of Fair Value Level 3 Activity
Following is a reconciliation of Level 3 assets for which significant unobservable inputs were used to determine fair value for the period ended March 31, 2024:
| | | Assets | | | | | | | Liabilities | |
| | Corporate
Bonds | | | Senior
Floating Rate
Interests | | | Common
Stocks | | | Preferred
Stocks | | | Total
Assets | | | Unfunded
Loan
Commitments | |
Beginning Balance | | $ | 60,792 | | | $ | 16,360,394 | | | $ | 346,762 | | | $ | 493,907 | | | $ | 17,261,855 | | | $ | (249 | ) |
Purchases/(Receipts) | | | — | | | | 6,059,780 | | | | — | | | | — | | | | 6,059,780 | | | | — | |
(Sales, maturities and paydowns)/Fundings | | | — | | | | (2,548,582 | ) | | | (158 | ) | | | — | | | | (2,548,740 | ) | | | — | |
Amortization of premiums/discounts | | | — | | | | 101,300 | | | | — | | | | — | | | | 101,300 | | | | — | |
Corporate actions | | | — | | | | (1,521,779 | ) | | | 3,402,912 | | | | (493,920 | ) | | | 1,387,213 | | | | — | |
Total realized gains (losses) included in earnings | | | — | | | | 18,975 | | | | (1,424,615 | ) | | | — | | | | (1,405,640 | ) | | | 6,019 | |
Total change in unrealized appreciation (depreciation) included in earnings | | | (54,393 | ) | | | 223,306 | | | | 1,268,671 | | | | 841,539 | | | | 2,279,123 | | | | (5,770 | ) |
Transfers into Level 3 | | | — | | | | 5,937,014 | | | | — | | | | — | | | | 5,937,014 | | | | — | |
Transfers out of Level 3 | | | — | | | | (7,476,909 | ) | | | — | | | | — | | | | (7,476,909 | ) | | | — | |
Ending Balance | | $ | 6,399 | | | $ | 17,153,499 | | | $ | 3,593,572 | | | $ | 841,526 | | | $ | 21,594,996 | | | $ | — | |
Net change in unrealized appreciation (depreciation) for investments in Level 3 securities still held at March 31, 2024 | | $ | (54,393 | ) | | $ | (37,381 | ) | | $ | (155,462 | ) | | $ | 628,081 | | | $ | 380,845 | | | $ | — | |
Affiliated Transactions
Investments representing 5% or more of the outstanding voting shares of a company, or control of or by, or common control under Guggenheim Investments, result in that company being considered an affiliated issuer, as defined in the 1940 Act.
Transactions during the period ended March 31, 2024, in which the company is an affiliated issuer, were as follows:
Security Name | | Value
09/30/23 | | | Additions | | | Reductions | | | Realized
Gain (Loss) | | | Change in
Unrealized
Appreciation
(Depreciation) | | | Value
03/31/24 | | | Shares
03/31/24 | |
Common Stocks | | | | | | | | | | | | | | | | | | | | | | | | | | | | |
BP Holdco LLC* | | $ | 313,770 | | | $ | — | | | $ | — | | | $ | — | | | $ | (17,671 | ) | | $ | 296,099 | | | | 244,278 | |
* | Non-income producing security. |
SEE NOTES TO FINANCIAL STATEMENTS. | THE GUGGENHEIM FUNDS SEMI-ANNUAL REPORT | 37 |
STATEMENT OF ASSETS AND LIABILITIES (Unaudited) |
FLOATING RATE STRATEGIES FUND |
March 31, 2024
Assets: |
Investments in unaffiliated issuers, at value (cost $1,028,250,190) | | $ | 1,002,199,934 | |
Investments in affiliated issuers, at value (cost $86,256) | | | 296,099 | |
Cash | | | 2,008,329 | |
Unrealized appreciation on forward foreign currency exchange contracts | | | 198,793 | |
Prepaid expenses | | | 77,951 | |
Receivables: |
Fund shares sold | | | 31,489,164 | |
Interest | | | 7,682,760 | |
Securities sold | | | 7,638,774 | |
Investment Adviser | | | 498 | |
Total assets | | | 1,051,592,302 | |
| | | | | |
Liabilities: |
Payable for: |
Securities purchased | | | 17,043,026 | |
Fund shares redeemed | | | 3,400,790 | |
Distributions to shareholders | | | 1,157,320 | |
Management fees | | | 495,096 | |
Distribution and service fees | | | 65,170 | |
Transfer agent/maintenance fees | | | 39,520 | |
Fund accounting/administration fees | | | 7,235 | |
Trustees’ fees* | | | 6,964 | |
Miscellaneous | | | 154,108 | |
Total liabilities | | | 22,369,229 | |
Net assets | | $ | 1,029,223,073 | |
Net assets consist of: |
Paid in capital | | $ | 1,231,411,438 | |
Total distributable earnings (loss) | | | (202,188,365 | ) |
Net assets | | $ | 1,029,223,073 | |
Class A: |
Net assets | | $ | 137,484,794 | |
Capital shares outstanding | | | 5,597,932 | |
Net asset value per share | | $ | 24.56 | |
Maximum offering price per share (Net asset value divided by 97.00%) | | $ | 25.32 | |
| |
Class C: |
Net assets | | $ | 30,989,927 | |
Capital shares outstanding | | | 1,262,295 | |
Net asset value per share | | $ | 24.55 | |
| |
Class P: |
Net assets | | $ | 45,641,952 | |
Capital shares outstanding | | | 1,857,571 | |
Net asset value per share | | $ | 24.57 | |
| | | | | |
Institutional Class: |
Net assets | | $ | 814,780,835 | |
Capital shares outstanding | | | 33,137,278 | |
Net asset value per share | | $ | 24.59 | |
| |
Class R6: |
Net assets | | $ | 325,565 | |
Capital shares outstanding | | | 13,242 | |
Net asset value per share | | $ | 24.59 | |
* | Relates to Trustees not deemed “interested persons” within the meaning of Section 2(a)(19) of the 1940 Act. |
38 | THE GUGGENHEIM FUNDS SEMI-ANNUAL REPORT | SEE NOTES TO FINANCIAL STATEMENTS. |
STATEMENT OF OPERATIONS (Unaudited) |
FLOATING RATE STRATEGIES FUND |
Six Months Ended March 31, 2024
Investment Income: |
Dividends from securities of unaffiliated issuers | | $ | 1,287,653 | |
Interest from securities of unaffiliated issuers | | | 46,555,711 | |
Total investment income | | | 47,843,364 | |
| | | | | |
Expenses: |
Management fees | | | 3,247,042 | |
Distribution and service fees: |
Class A | | | 170,546 | |
Class C | | | 165,477 | |
Class P | | | 55,125 | |
Transfer agent/maintenance fees: |
Class A | | | 78,429 | |
Class C | | | 19,483 | |
Class P | | | 34,106 | |
Institutional Class | | | 396,604 | |
Class R6 | | | 319 | |
Fund accounting/administration fees | | | 200,914 | |
Line of credit fees | | | 96,524 | |
Professional fees | | | 70,844 | |
Custodian fees | | | 16,465 | |
Trustees’ fees* | | | 14,457 | |
Miscellaneous | | | 185,099 | |
Recoupment of previously waived fees: |
Class R6 | | | 135 | |
Total expenses | | | 4,751,569 | |
Less: |
Expenses reimbursed by Adviser: |
Class A | | $ | (61,804 | ) |
Class C | | | (15,280 | ) |
Class P | | | (28,684 | ) |
Institutional Class | | | (261,176 | ) |
Class R6 | | | (270 | ) |
Expenses waived by Adviser | | | (155,154 | ) |
Total waived/reimbursed expenses | | | (522,368 | ) |
Net expenses | | | 4,229,201 | |
Net investment income | | | 43,614,163 | |
| | | | | |
Net Realized and Unrealized Gain (Loss): |
Net realized gain (loss) on: |
Investments in unaffiliated issuers | | | (9,449,525 | ) |
Forward foreign currency exchange contracts | | | (50,690 | ) |
Foreign currency transactions | | | 3,534,060 | |
Net realized loss | | | (5,966,155 | ) |
Net change in unrealized appreciation (depreciation) on: |
Investments in unaffiliated issuers | | | 7,996,330 | |
Investments in affiliated issuers | | | (17,671 | ) |
Forward foreign currency exchange contracts | | | (261,807 | ) |
Foreign currency translations | | | 11,409 | |
Net change in unrealized appreciation (depreciation) | | | 7,728,261 | |
Net realized and unrealized gain | | | 1,762,106 | |
Net increase in net assets resulting from operations | | $ | 45,376,269 | |
* | Relates to Trustees not deemed “interested persons” within the meaning of Section 2(a)(19) of the 1940 Act. |
SEE NOTES TO FINANCIAL STATEMENTS. | THE GUGGENHEIM FUNDS SEMI-ANNUAL REPORT | 39 |
STATEMENTS OF CHANGES IN NET ASSETS |
FLOATING RATE STRATEGIES FUND | |
| | Six Months Ended
March 31, 2024
(Unaudited) | | | Year Ended
September 30,
2023 | |
Increase (Decrease) in Net Assets from Operations: | | | | | | | | |
Net investment income | | $ | 43,614,163 | | | $ | 85,185,982 | |
Net realized loss on investments | | | (5,966,155 | ) | | | (15,113,133 | ) |
Net change in unrealized appreciation (depreciation) on investments | | | 7,728,261 | | | | 66,855,926 | |
Net increase in net assets resulting from operations | | | 45,376,269 | | | | 136,928,775 | |
| | | | | | | | | |
Distributions to shareholders: | | | | | | | | |
Class A | | | (5,824,914 | ) | | | (11,434,737 | ) |
Class C | | | (1,290,040 | ) | | | (2,844,666 | ) |
Class P | | | (1,881,957 | ) | | | (3,555,101 | ) |
Institutional Class | | | (34,394,812 | ) | | | (66,543,982 | ) |
Class R6 | | | (46,844 | ) | | | (903,249 | ) |
Total distributions to shareholders | | | (43,438,567 | ) | | | (85,281,735 | ) |
| | | | | | | | | |
Capital share transactions: | | | | | | | | |
Proceeds from sale of shares | | | | | | | | |
Class A | | | 15,823,062 | | | | 37,817,506 | |
Class C | | | 2,799,202 | | | | 4,906,993 | |
Class P | | | 6,765,061 | | | | 26,809,190 | |
Institutional Class | | | 211,230,640 | | | | 419,167,716 | |
Class R6 | | | 38,450 | | | | 30,694,165 | |
Distributions reinvested | | | | | | | | |
Class A | | | 5,045,940 | | | | 9,830,459 | |
Class C | | | 1,106,007 | | | | 2,422,173 | |
Class P | | | 1,873,181 | | | | 3,544,719 | |
Institutional Class | | | 28,636,668 | | | | 55,637,014 | |
Class R6 | | | 46,135 | | | | 898,525 | |
Cost of shares redeemed | | | | | | | | |
Class A | | | (22,613,362 | ) | | | (69,825,528 | ) |
Class C | | | (8,776,601 | ) | | | (20,716,384 | ) |
Class P | | | (7,363,784 | ) | | | (31,805,294 | ) |
Institutional Class | | | (220,470,032 | ) | | | (700,163,252 | ) |
Class R6 | | | (1,207,066 | ) | | | (32,266,778 | ) |
Net increase (decrease) from capital share transactions | | | 12,933,501 | | | | (263,048,776 | ) |
Net increase (decrease) in net assets | | | 14,871,203 | | | | (211,401,736 | ) |
| | | | | | | | | |
Net assets: | | | | | | | | |
Beginning of period | | | 1,014,351,870 | | | | 1,225,753,606 | |
End of period | | $ | 1,029,223,073 | | | $ | 1,014,351,870 | |
| | | | | | | | | |
40 | THE GUGGENHEIM FUNDS SEMI-ANNUAL REPORT | SEE NOTES TO FINANCIAL STATEMENTS. |
STATEMENTS OF CHANGES IN NET ASSETS (concluded) |
FLOATING RATE STRATEGIES FUND | |
| | Six Months Ended
March 31, 2024
(Unaudited) | | | Year Ended
September 30,
2023 | |
Capital share activity: | | | | | | | | |
Shares sold | | | | | | | | |
Class A | | | 646,087 | | | | 1,569,726 | |
Class C | | | 114,398 | | | | 204,188 | |
Class P | | | 276,040 | | | | 1,116,540 | |
Institutional Class | | | 8,618,920 | | | | 17,415,091 | |
Class R6 | | | 1,567 | | | | 1,288,449 | |
Shares issued from reinvestment of distributions | | | | | | | | |
Class A | | | 206,244 | | | | 408,128 | |
Class C | | | 45,230 | | | | 100,670 | |
Class P | | | 76,526 | | | | 147,100 | |
Institutional Class | | | 1,169,481 | | | | 2,308,872 | |
Class R6 | | | 1,885 | | | | 37,421 | |
Shares redeemed | | | | | | | | |
Class A | | | (924,184 | ) | | | (2,905,865 | ) |
Class C | | | (358,803 | ) | | | (863,523 | ) |
Class P | | | (300,850 | ) | | | (1,323,129 | ) |
Institutional Class | | | (8,999,519 | ) | | | (29,241,651 | ) |
Class R6 | | | (49,089 | ) | | | (1,340,629 | ) |
Net increase (decrease) in shares | | | 523,933 | | | | (11,078,612 | ) |
SEE NOTES TO FINANCIAL STATEMENTS. | THE GUGGENHEIM FUNDS SEMI-ANNUAL REPORT | 41 |
FINANCIAL HIGHLIGHTS |
FLOATING RATE STRATEGIES FUND | |
This table is presented to show selected data for a share outstanding throughout each period and to assist shareholders in evaluating a Fund’s performance for the periods presented.
Class A | | Six Months Ended
March 31, 2024a | | | Year
Ended
Sept. 30,
2023 | | | Year
Ended
Sept. 30,
2022 | | | Year
Ended
Sept. 30,
2021 | | | Year
Ended
Sept. 30,
2020 | | | Year
Ended
Sept. 30,
2019 | |
Per Share Data |
Net asset value, beginning of period | | $ | 24.52 | | | $ | 23.37 | | | $ | 25.09 | | | $ | 24.08 | | | $ | 25.23 | | | $ | 25.92 | |
Income (loss) from investment operations: |
Net investment income (loss)b | | | 1.05 | | | | 1.88 | | | | .87 | | | | .83 | | | | 1.02 | | | | 1.17 | |
Net gain (loss) on investments (realized and unrealized) | | | .03 | | | | 1.16 | | | | (1.72 | ) | | | 1.02 | | | | (1.16 | ) | | | (.67 | ) |
Total from investment operations | | | 1.08 | | | | 3.04 | | | | (.85 | ) | | | 1.85 | | | | (.14 | ) | | | .50 | |
Less distributions from: |
Net investment income | | | (1.04 | ) | | | (1.89 | ) | | | (.87 | ) | | | (.83 | ) | | | (.83 | ) | | | (1.19 | ) |
Return of capital | | | — | | | | — | | | | — | | | | (.01 | ) | | | (.18 | ) | | | — | |
Total distributions | | | (1.04 | ) | | | (1.89 | ) | | | (.87 | ) | | | (.84 | ) | | | (1.01 | ) | | | (1.19 | ) |
Net asset value, end of period | | $ | 24.56 | | | $ | 24.52 | | | $ | 23.37 | | | $ | 25.09 | | | $ | 24.08 | | | $ | 25.23 | |
|
Total Returnc | | | 4.50 | % | | | 13.47 | % | | | (3.47 | %) | | | 7.83 | % | | | (0.50 | %) | | | 2.01 | % |
Ratios/Supplemental Data |
Net assets, end of period (in thousands) | | $ | 137,485 | | | $ | 139,008 | | | $ | 154,160 | | | $ | 123,392 | | | $ | 139,857 | | | $ | 235,752 | |
Ratios to average net assets: |
Net investment income (loss) | | | 8.57 | % | | | 7.82 | % | | | 3.57 | % | | | 3.36 | % | | | 4.23 | % | | | 4.60 | % |
Total expensesd | | | 1.13 | % | | | 1.15 | % | | | 1.11 | % | | | 1.09 | % | | | 1.25 | % | | | 1.23 | % |
Net expensese,f,g | | | 1.01 | % | | | 1.02 | % | | | 1.02 | % | | | 1.05 | % | | | 1.10 | % | | | 1.07 | % |
Portfolio turnover rate | | | 15 | % | | | 23 | % | | | 30 | % | | | 57 | % | | | 20 | % | | | 10 | % |
42 | THE GUGGENHEIM FUNDS SEMI-ANNUAL REPORT | SEE NOTES TO FINANCIAL STATEMENTS. |
FINANCIAL HIGHLIGHTS (continued) |
FLOATING RATE STRATEGIES FUND | |
This table is presented to show selected data for a share outstanding throughout each period and to assist shareholders in evaluating a Fund’s performance for the periods presented.
Class C | | Six Months Ended
March 31, 2024a | | | Year
Ended
Sept. 30,
2023 | | | Year
Ended
Sept. 30,
2022 | | | Year
Ended
Sept. 30,
2021 | | | Year
Ended
Sept. 30,
2020 | | | Year
Ended
Sept. 30,
2019 | |
Per Share Data |
Net asset value, beginning of period | | $ | 24.51 | | | $ | 23.36 | | | $ | 25.08 | | | $ | 24.07 | | | $ | 25.22 | | | $ | 25.91 | |
Income (loss) from investment operations: |
Net investment income (loss)b | | | .96 | | | | 1.69 | | | | .68 | | | | .65 | | | | .84 | | | | .98 | |
Net gain (loss) on investments (realized and unrealized) | | | .03 | | | | 1.16 | | | | (1.71 | ) | | | 1.02 | | | | (1.16 | ) | | | (.67 | ) |
Total from investment operations | | | .99 | | | | 2.85 | | | | (1.03 | ) | | | 1.67 | | | | (.32 | ) | | | .31 | |
Less distributions from: |
Net investment income | | | (.95 | ) | | | (1.70 | ) | | | (.69 | ) | | | (.65 | ) | | | (.68 | ) | | | (1.00 | ) |
Return of capital | | | — | | | | — | | | | — | | | | (.01 | ) | | | (.15 | ) | | | — | |
Total distributions | | | (.95 | ) | | | (1.70 | ) | | | (.69 | ) | | | (.66 | ) | | | (.83 | ) | | | (1.00 | ) |
Net asset value, end of period | | $ | 24.55 | | | $ | 24.51 | | | $ | 23.36 | | | $ | 25.08 | | | $ | 24.07 | | | $ | 25.22 | |
|
Total Returnc | | | 4.11 | % | | | 12.58 | % | | | (4.15 | %) | | | 7.03 | % | | | (1.24 | %) | | | 1.26 | % |
Ratios/Supplemental Data |
Net assets, end of period (in thousands) | | $ | 30,990 | | | $ | 35,818 | | | $ | 47,183 | | | $ | 52,308 | | | $ | 63,891 | | | $ | 112,481 | |
Ratios to average net assets: |
Net investment income (loss) | | | 7.83 | % | | | 7.02 | % | | | 2.78 | % | | | 2.61 | % | | | 3.47 | % | | | 3.86 | % |
Total expensesd | | | 1.89 | % | | | 1.89 | % | | | 1.91 | % | | | 1.86 | % | | | 1.96 | % | | | 1.93 | % |
Net expensese,f,g | | | 1.76 | % | | | 1.78 | % | | | 1.77 | % | | | 1.80 | % | | | 1.85 | % | | | 1.82 | % |
Portfolio turnover rate | | | 15 | % | | | 23 | % | | | 30 | % | | | 57 | % | | | 20 | % | | | 10 | % |
SEE NOTES TO FINANCIAL STATEMENTS. | THE GUGGENHEIM FUNDS SEMI-ANNUAL REPORT | 43 |
FINANCIAL HIGHLIGHTS (continued) |
FLOATING RATE STRATEGIES FUND |
This table is presented to show selected data for a share outstanding throughout each period and to assist shareholders in evaluating a Fund’s performance for the periods presented.
Class P | | Six Months Ended
March 31, 2024a | | | Year
Ended
Sept. 30,
2023 | | | Year
Ended
Sept. 30,
2022 | | | Year
Ended
Sept. 30,
2021 | | | Year
Ended
Sept. 30,
2020 | | | Year
Ended
Sept. 30,
2019 | |
Per Share Data |
Net asset value, beginning of period | | $ | 24.53 | | | $ | 23.38 | | | $ | 25.10 | | | $ | 24.09 | | | $ | 25.24 | | | $ | 25.93 | |
Income (loss) from investment operations: |
Net investment income (loss)b | | | 1.05 | | | | 1.88 | | | | .88 | | | | .83 | | | | 1.04 | | | | 1.17 | |
Net gain (loss) on investments (realized and unrealized) | | | .03 | | | | 1.16 | | | | (1.73 | ) | | | 1.02 | | | | (1.18 | ) | | | (.67 | ) |
Total from investment operations | | | 1.08 | | | | 3.04 | | | | (.85 | ) | | | 1.85 | | | | (.14 | ) | | | .50 | |
Less distributions from: |
Net investment income | | | (1.04 | ) | | | (1.89 | ) | | | (.87 | ) | | | (.83 | ) | | | (.83 | ) | | | (1.19 | ) |
Return of capital | | | — | | | | — | | | | — | | | | (.01 | ) | | | (.18 | ) | | | — | |
Total distributions | | | (1.04 | ) | | | (1.89 | ) | | | (.87 | ) | | | (.84 | ) | | | (1.01 | ) | | | (1.19 | ) |
Net asset value, end of period | | $ | 24.57 | | | $ | 24.53 | | | $ | 23.38 | | | $ | 25.10 | | | $ | 24.09 | | | $ | 25.24 | |
|
Total Return | | | 4.50 | % | | | 13.46 | % | | | (3.47 | %) | | | 7.83 | % | | | (0.50 | %) | | | 2.01 | % |
Ratios/Supplemental Data |
Net assets, end of period (in thousands) | | $ | 45,642 | | | $ | 44,295 | | | $ | 43,603 | | | $ | 35,430 | | | $ | 33,251 | | | $ | 135,036 | |
Ratios to average net assets: |
Net investment income (loss) | | | 8.57 | % | | | 7.81 | % | | | 3.58 | % | | | 3.36 | % | | | 4.26 | % | | | 4.59 | % |
Total expensesd | | | 1.17 | % | | | 1.18 | % | | | 1.14 | % | | | 1.06 | % | | | 1.37 | % | | | 1.22 | % |
Net expensese,f,g | | | 1.01 | % | | | 1.02 | % | | | 1.02 | % | | | 1.05 | % | | | 1.10 | % | | | 1.07 | % |
Portfolio turnover rate | | | 15 | % | | | 23 | % | | | 30 | % | | | 57 | % | | | 20 | % | | | 10 | % |
44 | THE GUGGENHEIM FUNDS SEMI-ANNUAL REPORT | SEE NOTES TO FINANCIAL STATEMENTS. |
FINANCIAL HIGHLIGHTS (continued) |
FLOATING RATE STRATEGIES FUND |
This table is presented to show selected data for a share outstanding throughout each period and to assist shareholders in evaluating a Fund’s performance for the periods presented.
Institutional Class | | Six Months Ended
March 31, 2024a | | | Year
Ended
Sept. 30,
2023 | | | Year
Ended
Sept. 30,
2022 | | | Year
Ended
Sept. 30,
2021 | | | Year
Ended
Sept. 30,
2020 | | | Year
Ended
Sept. 30,
2019 | |
Per Share Data |
Net asset value, beginning of period | | $ | 24.54 | | | $ | 23.39 | | | $ | 25.11 | | | $ | 24.10 | | | $ | 25.25 | | | $ | 25.95 | |
Income (loss) from investment operations: |
Net investment income (loss)b | | | 1.08 | | | | 1.93 | | | | .94 | | | | .89 | | | | 1.09 | | | | 1.23 | |
Net gain (loss) on investments (realized and unrealized) | | | .04 | | | | 1.16 | | | | (1.73 | ) | | | 1.02 | | | | (1.17 | ) | | | (.68 | ) |
Total from investment operations | | | 1.12 | | | | 3.09 | | | | (.79 | ) | | | 1.91 | | | | (.08 | ) | | | .55 | |
Less distributions from: |
Net investment income | | | (1.07 | ) | | | (1.94 | ) | | | (.93 | ) | | | (.89 | ) | | | (.88 | ) | | | (1.25 | ) |
Return of capital | | | — | | | | — | | | | — | | | | (.01 | ) | | | (.19 | ) | | | — | |
Total distributions | | | (1.07 | ) | | | (1.94 | ) | | | (.93 | ) | | | (.90 | ) | | | (1.07 | ) | | | (1.25 | ) |
Net asset value, end of period | | $ | 24.59 | | | $ | 24.54 | | | $ | 23.39 | | | $ | 25.11 | | | $ | 24.10 | | | $ | 25.25 | |
|
Total Return | | | 4.62 | % | | | 13.68 | % | | | (3.20 | %) | | | 8.08 | % | | | (0.26 | %) | | | 2.21 | % |
Ratios/Supplemental Data |
Net assets, end of period (in thousands) | | $ | 814,781 | | | $ | 793,785 | | | $ | 979,086 | | | $ | 711,583 | | | $ | 504,449 | | | $ | 1,065,820 | |
Ratios to average net assets: |
Net investment income (loss) | | | 8.81 | % | | | 8.02 | % | | | 3.84 | % | | | 3.59 | % | | | 4.48 | % | | | 4.83 | % |
Total expensesd | | | 0.87 | % | | | 0.88 | % | | | 0.87 | % | | | 0.85 | % | | | 0.97 | % | | | 0.92 | % |
Net expensese,f,g | | | 0.77 | % | | | 0.78 | % | | | 0.78 | % | | | 0.81 | % | | | 0.85 | % | | | 0.83 | % |
Portfolio turnover rate | | | 15 | % | | | 23 | % | | | 30 | % | | | 57 | % | | | 20 | % | | | 10 | % |
SEE NOTES TO FINANCIAL STATEMENTS. | THE GUGGENHEIM FUNDS SEMI-ANNUAL REPORT | 45 |
FINANCIAL HIGHLIGHTS (continued) |
FLOATING RATE STRATEGIES FUND |
This table is presented to show selected data for a share outstanding throughout each period and to assist shareholders in evaluating a Fund’s performance for the periods presented.
Class R6 | | Six Months Ended
March 31, 2024a | | | Year
Ended
Sept. 30,
2023 | | | Year
Ended
Sept. 30,
2022 | | | Year
Ended
Sept. 30,
2021 | | | Year
Ended
Sept. 30,
2020 | | | Period
Ended
Sept. 30,
2019h | |
Per Share Data |
Net asset value, beginning of period | | $ | 24.55 | | | $ | 23.38 | | | $ | 25.11 | | | $ | 24.10 | | | $ | 25.25 | | | $ | 25.38 | |
Income (loss) from investment operations: |
Net investment income (loss)b | | | 1.07 | | | | 1.87 | | | | .82 | | | | .91 | | | | 1.13 | | | | .69 | |
Net gain (loss) on investments (realized and unrealized) | | | .05 | | | | 1.27 | | | | (1.62 | ) | | | 1.01 | | | | (1.21 | ) | | | (.14 | ) |
Total from investment operations | | | 1.12 | | | | 3.14 | | | | (.80 | ) | | | 1.92 | | | | (.08 | ) | | | .55 | |
Less distributions from: |
Net investment income | | | (1.08 | ) | | | (1.97 | ) | | | (.93 | ) | | | (.90 | ) | | | (.88 | ) | | | (.68 | ) |
Return of capital | | | — | | | | — | | | | — | | | | (.01 | ) | | | (.19 | ) | | | — | |
Total distributions | | | (1.08 | ) | | | (1.97 | ) | | | (.93 | ) | | | (.91 | ) | | | (1.07 | ) | | | (.68 | ) |
Net asset value, end of period | | $ | 24.59 | | | $ | 24.55 | | | $ | 23.38 | | | $ | 25.11 | | | $ | 24.10 | | | $ | 25.25 | |
|
Total Return | | | 4.64 | % | | | 13.87 | % | | | (3.25 | %) | | | 8.06 | % | | | (0.22 | %) | | | 2.20 | % |
Ratios/Supplemental Data |
Net assets, end of period (in thousands) | | $ | 326 | | | $ | 1,445 | | | $ | 1,722 | | | $ | 1,257 | | | $ | 1,625 | | | $ | 71,680 | |
Ratios to average net assets: |
Net investment income (loss) | | | 8.76 | % | | | 7.79 | % | | | 3.31 | % | | | 3.66 | % | | | 4.56 | % | | | 4.89 | % |
Total expensesd | | | 0.85 | % | | | 0.78 | % | | | 0.82 | % | | | 0.83 | % | | | 0.86 | % | | | 0.85 | % |
Net expensese,f,g | | | 0.77 | % | | | 0.74 | % | | | 0.79 | % | | | 0.82 | % | | | 0.84 | % | | | 0.84 | % |
Portfolio turnover rate | | | 15 | % | | | 23 | % | | | 30 | % | | | 57 | % | | | 20 | % | | | 10 | % |
46 | THE GUGGENHEIM FUNDS SEMI-ANNUAL REPORT | SEE NOTES TO FINANCIAL STATEMENTS. |
FINANCIAL HIGHLIGHTS (concluded) |
FLOATING RATE STRATEGIES FUND |
a | Unaudited figures for the period ended March 31, 2024. Percentage amounts for the period, except total return and portfolio turnover rate, have been annualized. |
b | Net investment income (loss) per share was computed using average shares outstanding throughout the period. |
c | Total return does not reflect the impact of any applicable sales charges. |
d | Does not include expenses of the underlying funds in which the Fund invests. |
e | Net expense information reflects the expense ratios after expense waivers and reimbursements, as applicable. |
f | The portion of the ratios of net expenses to average net assets attributable to recoupments of prior fee reductions or expense reimbursements for the years presented was as follows: |
| 03/31/24a | 09/30/23 | 09/30/22 | 09/30/21 | 09/30/20 | 09/30/19 |
A-Class | — | 0.03% | 0.03% | — | 0.00%* | — |
C-Class | — | 0.04% | 0.04% | — | 0.00%* | — |
P-Class | — | 0.03% | 0.04% | 0.00%* | 0.00%* | — |
Institutional Class | — | 0.02% | 0.04% | 0.00%* | 0.00%* | — |
R6-Class | 0.03% | 0.02% | 0.03% | 0.01% | 0.00%* | 0.00%* |
g | Net expenses may include expenses that are excluded from the expense limitation agreement. Excluding these expenses, the net expense ratios for the years presented would be: |
| 03/31/24a | 09/30/23 | 09/30/22 | 09/30/21 | 09/30/20 | 09/30/19 |
A-Class | 0.99% | 0.99% | 1.00% | 1.01% | 1.02% | 1.02% |
C-Class | 1.74% | 1.75% | 1.75% | 1.76% | 1.77% | 1.77% |
P-Class | 0.99% | 0.99% | 1.00% | 1.01% | 1.02% | 1.02% |
Institutional Class | 0.75% | 0.75% | 0.76% | 0.77% | 0.78% | 0.78% |
R6-Class | 0.75% | 0.71% | 0.76% | 0.77% | 0.78% | 0.78% |
h | Since commencement of operations: March 13, 2019. Percentage amounts for the period, except total return and portfolio turnover rate, have been annualized. |
SEE NOTES TO FINANCIAL STATEMENTS. | THE GUGGENHEIM FUNDS SEMI-ANNUAL REPORT | 47 |
NOTES TO FINANCIAL STATEMENTS (Unaudited) |
Note 1 – Organization and Significant Accounting Policies
Organization
Guggenheim Funds Trust (the “Trust”), a Delaware statutory trust, is registered with the U.S. Securities and Exchange Commission (the “SEC”) under the Investment Company Act of 1940 (the “1940 Act”), as an open-ended investment company of the series type. Each series, in effect, is representing a separate fund. The Trust may issue an unlimited number of authorized shares. The Trust accounts for the assets of each fund separately.
The Trust offers a combination of five separate classes of shares: Class A shares, Class C shares, Class P shares, Class R6 shares and Institutional Class shares. Sales of shares of each Class are made without a front-end sales charge at the net asset value per share (“NAV”), with the exception of Class A shares. Class A shares are sold at the NAV, plus the applicable front-end sales charge. The sales charge varies depending on the amount purchased. Class A share purchases of $1 million or more are exempt from the front-end sales charge but have a 1% contingent deferred sales charge (“CDSC”), if shares are redeemed within 12 months of purchase. Class C shares have a 1% CDSC if shares are redeemed within 12 months of purchase. Class C shares automatically convert to Class A shares on or about the 10th day of the month following the 8-year anniversary of the purchase of the Class C shares. This conversion will be executed without any sales charge, fee or other charge. After the conversion is completed, the shares will be subject to all features and expenses of Class A shares. Institutional Class shares are offered primarily for direct investment by institutions such as pension and profit sharing plans, endowments, foundations and corporations. Institutional Class shares require a minimum initial investment of $2 million and a minimum account balance of $1 million. Class R6 shares are offered primarily through qualified retirement and benefit plans. Class R6 shares are also offered through certain other plans and platforms sponsored by financial intermediaries. Certain institutional investors and others deemed appropriate by Guggenheim Investments (“GI”) may also be eligible to purchase Class R6 shares subject to a $2 million minimum initial investment. At March 31, 2024, the Trust consisted of eighteen funds (the “Funds”).
This report covers the Floating Rate Strategies Fund (the “Fund”), a diversified investment company. At March 31, 2024, Class A, Class C, Class P, Institutional Class, and Class R6 shares have been issued by the Fund.
Guggenheim Partners Investment Management, LLC (“GPIM” or the “Adviser”), which operates under the name Guggenheim Investments, provides advisory services. Guggenheim Funds Distributors, LLC (“GFD”) serves as distributor of the Fund’s shares. GI and GFD are affiliated entities.
48 | THE GUGGENHEIM FUNDS SEMI-ANNUAL REPORT | |
NOTES TO FINANCIAL STATEMENTS (Unaudited)(continued) |
Significant Accounting Policies
The Fund operates as an investment company and, accordingly, follows the investment company accounting and reporting guidance of the Financial Accounting Standards Board (“FASB”) Accounting Standards Codification Topic 946 Financial Services – Investment Companies.
The following significant accounting policies are in conformity with U.S. generally accepted accounting principles (“U.S. GAAP”) and are consistently followed by the Trust. This requires management to make estimates and assumptions that affect the reported amount of assets and liabilities, contingent assets and liabilities at the date of the financial statements, and the reported amounts of revenues and expenses during the reporting period. Actual results could differ from these estimates. All time references are based on Eastern Time.
The NAV of each share class of the Fund is calculated by dividing the market value of the Fund’s securities and other assets, less all liabilities attributable to the share class by the number of outstanding shares of the share class.
(a) Valuation of Investments
The Board of Trustees of the Trust (the “Board”) adopted policies and procedures for the valuation of the Fund’s investments (the “Fund Valuation Procedures”). The SEC adopted Rule 2a-5 under the 1940 Act (“Rule 2a-5”) which establishes requirements for determining fair value in good faith. Rule 2a-5 defines “readily available market quotations” for purposes of the 1940 Act and establishes requirements for determining whether a fund must fair value a security in good faith.
Pursuant to Rule 2a-5, the Board has designated the Adviser as the valuation designee to perform fair valuation determinations for the Fund with respect to all Fund investments and other assets. As the Fund’s valuation designee pursuant to Rule 2a-5, the Adviser has adopted separate procedures (the “Valuation Designee Procedures” and collectively with the Fund Valuation Procedures, the “Valuation Procedures”) reasonably designed to prevent violations of the requirements of Rule 2a-5 and Rule 31a-4. The Adviser, in its role as valuation designee, utilizes the assistance of a valuation committee, consisting of representatives from Guggenheim’s investment management, fund administration, legal and compliance departments (the “Valuation Committee”), in determining the fair value of the Fund’s securities and other assets.
Valuations of the Fund’s securities and other assets are supplied primarily by pricing service providers appointed pursuant to the processes set forth in the Valuation Procedures. The Adviser, with the assistance of the Valuation Committee, convenes monthly, or more frequently as needed, to review the valuation of all assets which have been fair valued. The Adviser, consistent with the monitoring and review responsibilities set forth in the Valuation Procedures, regularly reviews the appropriateness of the inputs, methods, models and assumptions employed by the pricing service providers.
If the pricing service provider cannot or does not provide a valuation for a particular investment or such valuation is deemed unreliable, such investment is fair valued by the Adviser.
| | THE GUGGENHEIM FUNDS SEMI-ANNUAL REPORT | 49 |
NOTES TO FINANCIAL STATEMENTS (Unaudited)(continued) |
Equity securities listed or traded on a recognized U.S. securities exchange or the Nasdaq Stock Market (“NASDAQ”) will generally be valued on the basis of the last sale price on the primary U.S. exchange or market on which the security is listed or traded; provided, however, that securities listed on NASDAQ will be valued at the NASDAQ official closing price, which may not necessarily represent the last sale price.
Generally, trading in foreign securities markets is substantially completed each day at various times prior to the close of the New York Stock Exchange (“NYSE”). The values of foreign securities are determined as of the close of such foreign markets or the close of the NYSE, if earlier. All investments quoted in foreign currencies are valued in U.S. dollars on the basis of the foreign currency exchange rates prevailing at the close of U.S. business at 4:00 p.m. Investments in foreign securities may involve risks not present in domestic investments. The Adviser will determine the current value of such foreign securities by taking into consideration certain factors which may include the following factors, among others: the value of the securities traded on other foreign markets, American Depositary Receipts (“ADR”) trading, closed-end fund trading, foreign currency exchange activity, and the trading prices of financial products that are tied to foreign securities. In addition, under the Valuation Procedures, the Adviser is authorized to use prices and other information supplied by a pricing service provider in valuing foreign securities.
Open-end investment companies are valued at their NAV as of the close of business, on the valuation date. Exchange-traded funds and closed-end investment companies are generally valued at the last quoted sale price.
Commercial paper and discount notes with a maturity of greater than 60 days at acquisition are valued at prices that reflect broker-dealer supplied valuations or are obtained from pricing service providers, which may consider the trade activity, treasury spreads, yields or price of bonds of comparable quality, coupon, maturity, and type, as well as prices quoted by dealers who make markets in such securities. Commercial paper and discount notes with a maturity of 60 days or less at acquisition are valued at amortized cost, unless the Adviser concludes that amortized cost does not represent the fair value of the applicable asset in which case it will be valued using a pricing service provider.
Typically, loans are valued using information provided by a pricing service provider which uses broker quotes, among other inputs. If the pricing service cannot or does not provide a valuation for a particular loan, or such valuation is deemed unreliable, such investment is valued based on a quote from a broker-dealer or is fair valued by the Adviser.
Forward foreign currency exchange contracts are valued daily based on the applicable exchange rate of the underlying currency.
Investments for which market quotations are not readily available are fair valued as determined in good faith by the Adviser. Valuations in accordance with these methods are intended to reflect each security’s (or asset’s or liability’s) “fair value”. Each such determination is based on a consideration of all relevant factors, which are likely to vary from one pricing context to
50 | THE GUGGENHEIM FUNDS SEMI-ANNUAL REPORT | |
NOTES TO FINANCIAL STATEMENTS (Unaudited)(continued) |
another. Examples of such factors may include, but are not limited to market prices; sale prices; broker quotes; and models which derive prices based on inputs such as prices of securities with comparable maturities and characteristics, or on inputs such as anticipated cash flows or collateral, spread over U.S. Treasury securities, and other information analysis. In connection with futures contracts and other derivative investments, such factors may include obtaining information as to how (a) these contracts and other derivative investments trade in the futures or other derivative markets, respectively, and (b) the securities underlying these contracts and other derivative investments trade in the cash market.
(b) Senior Floating Rate Interests and Loan Investments
Senior floating rate interests in which the Fund invests generally pay interest rates which are periodically adjusted by reference to a base short-term floating rate, plus a premium. These base lending rates are generally (i) the lending rate offered by one or more major European banks, (ii) the prime rate offered by one or more major United States banks, or (iii) the bank’s certificate of deposit rate. Senior floating rate interests often require prepayments from excess cash flows or permit the borrower to repay at its election. The rate at which the borrower repays cannot be predicted with accuracy. As a result, the actual remaining maturity may be substantially less than the stated maturities disclosed in the Fund’s Schedule of Investments.
The Fund invests in loans and other similar debt obligations (“obligations”). A portion of the Fund’s investments in these obligations is sometimes referred to as “covenant lite” loans or obligations (“covenant lite obligations”), which are obligations that lack covenants or possess fewer or less restrictive covenants or constraints on borrowers than certain other types of obligations. The Fund may also obtain exposure to covenant lite obligations through investment in securitization vehicles and other structured products. Recently, many new or reissued obligations have not featured traditional covenants, which are intended to protect lenders and investors by (i) imposing certain restrictions or other limitations on a borrower’s operations or assets or (ii) providing certain rights to lenders. The Fund may have fewer rights with respect to covenant lite obligations, including fewer protections against the possibility of default and fewer remedies in the event of default. As a result, investments in (or exposure to) covenant lite obligations are subject to more risk than investments in (or exposure to) certain other types of obligations. The Fund is subject to other risks associated with investments in (or exposure to) obligations, including that obligations may not be considered “securities” and, as a result, the Fund may not be entitled to rely on the anti-fraud protections under the federal securities laws and instead may have to resort to state law and direct claims.
(c) Interest on When-Issued Securities
The Fund may purchase and sell interests in securities on a when-issued and delayed delivery basis, with payment and delivery scheduled for a future date. No income accrues to the Fund on such interests or securities in connection with such transactions prior to the date the Fund actually takes delivery of such interests or securities. These transactions are subject to market
| | THE GUGGENHEIM FUNDS SEMI-ANNUAL REPORT | 51 |
NOTES TO FINANCIAL STATEMENTS (Unaudited)(continued) |
fluctuations and are subject to the risk that the value at delivery may be more or less than the trade date purchase price. Although the Fund will generally purchase these securities with the intention of acquiring such securities, it may sell such securities before the settlement date.
(d) Forward Foreign Currency Exchange Contracts
The change in value of a forward foreign currency exchange contract is recorded as unrealized appreciation or depreciation until the contract is closed. When the contract is closed, the Fund records a realized gain or loss equal to the difference between the value at the time the contract was opened and the value at the time it was closed.
(e) Currency Translations
The accounting records of the Fund are maintained in U.S. dollars. All assets and liabilities initially expressed in foreign currencies are converted into U.S. dollars at prevailing exchange rates. Purchases and sales of investment securities, dividend and interest income, and certain expenses are translated at the rates of exchange prevailing on the respective dates of such transactions. Changes in the relationship of these foreign currencies to the U.S. dollar can significantly affect the value of the investments and earnings of the Fund. Foreign investments may also subject the Fund to foreign government exchange restrictions, expropriation, taxation, or other political, social, geopolitical or economic developments, all of which could affect the market and/or credit risk of the investments.
The Fund does not isolate that portion of the results of operations resulting from changes in the foreign exchange rates on investments from the fluctuations arising from changes in the market prices of securities held. Such fluctuations are included with the net realized gain or loss and unrealized appreciation or depreciation on investments.
Reported net realized foreign exchange gains and losses arise from sales of foreign currencies and currency gains or losses realized between the trade and settlement dates on investment transactions. Net unrealized appreciation and depreciation arise from changes in the fair values of assets and liabilities other than investments in securities at the fiscal period end, resulting from changes in exchange rates.
(f) Foreign Taxes
The Fund may be subject to foreign taxes (a portion of which may be reclaimable) on income, stock dividends, capital gains on investments or certain foreign currency transactions. All foreign taxes are recorded in accordance with the applicable foreign tax regulations and rates that exist in the foreign jurisdictions in which the Fund invests. These foreign taxes, if any, are paid by the Fund and reflected in its Statement of Operations as follows: foreign taxes withheld at source are presented as a reduction of income and foreign taxes on capital gains from sales of investments are included with the net realized gain (loss) on investments. Foreign taxes payable or deferred as of March 31, 2024, if any, are disclosed in the Fund’s Statement of Assets and Liabilities.
52 | THE GUGGENHEIM FUNDS SEMI-ANNUAL REPORT | |
NOTES TO FINANCIAL STATEMENTS (Unaudited)(continued) |
(g) Security Transactions
Security transactions are recorded on the trade date for financial reporting purposes. Realized gains and losses from securities transactions are recorded using the identified cost basis. Proceeds from lawsuits related to investment holdings are recorded as a reduction to cost if the securities are still held and as realized gains if no longer held in the Fund. Dividend income is recorded on the ex-dividend date, net of applicable taxes withheld by foreign countries, if any. Taxable non-cash dividends are recorded as dividend income. Interest income, including amortization of premiums and accretion of discounts, is accrued on a daily basis. Interest income also includes paydown gains and losses on mortgage-backed and asset-backed securities and senior and subordinated loans. Amendment fees are earned as compensation for evaluating and accepting changes to the original loan agreement and are recognized when received. Dividend income from Real Estate Investment Trusts (“REITs”) is recorded based on the income included in the distributions received from the REIT investments using published REIT classifications, including some management estimates when actual amounts are not available. Distributions received in excess of this estimated amount are recorded as a reduction of the cost of investments or reclassified to realized gains. The actual amounts of income, return of capital, and realized gains are only determined by each REIT after its fiscal year-end, and may differ from the estimated amounts.
Income from residual collateralized loan obligations is recognized using the effective interest method. At the time of purchase, management estimates the future expected cash flows and determines the effective yield and estimated maturity date based on the estimated cash flows. Subsequent to the purchase, the estimated cash flows are updated periodically and a revised yield is calculated prospectively.
The Fund may receive other income from investments in senior loan interests including amendment fees, consent fees and commitment fees. For funded loans, these fees are recorded as income when received by the Fund and included in interest income on the Statement of Operations. For unfunded loans, commitment fees are included in realized gain on investments on the Fund’s Statement of Operations at the end of the commitment period.
(h) Distributions
The Fund declares dividends from investment income daily. The Fund pays its shareholders from its net investment income monthly and distributes any net capital gains that it has realized, at least annually. Distributions to shareholders are recorded on the ex-dividend date. Dividends are reinvested in additional shares, unless shareholders request payment in cash. The character of distributions made during the year from net investment income or net realized gains may differ from their ultimate characterization for U.S. federal income tax purposes.
| | THE GUGGENHEIM FUNDS SEMI-ANNUAL REPORT | 53 |
NOTES TO FINANCIAL STATEMENTS (Unaudited)(continued) |
(i) Class Allocations
Interest and dividend income, most expenses, all realized gains and losses, and all unrealized appreciation and depreciation are allocated to the share classes based upon the value of the outstanding shares in each share class. Certain costs, such as distribution and service fees are charged directly to specific share classes. In addition, certain expenses have been allocated to the individual Funds in the Trust based on the respective net assets of each Fund included in the Trust.
(j) Earnings Credits
Under the fee arrangement with the custodian, the Fund may earn credits based on overnight custody cash balances. These credits are utilized to reduce related custodial expenses. The custodian fees disclosed in the Fund’s Statement of Operations are before the reduction in expense from the related earnings credits, if any. Earnings credits for the period ended March 31, 2024, are disclosed in the Statement of Operations.
(k) Cash
The Fund may leave cash overnight in its cash account with the custodian. Periodically, the Fund may have cash due to the custodian bank as an overdraft balance. A fee is incurred on this overdraft, calculated by multiplying the overdraft by a rate based on the federal funds rate, which was 5.33% at March 31, 2024.
(l) Indemnifications
Under the Fund’s organizational documents, its Trustees and Officers are indemnified against certain liabilities arising out of the performance of their duties to the Trust. In addition, throughout the normal course of business, the Fund enters into contracts that contain a variety of representations and warranties which provide general indemnifications. The Fund’s maximum exposure under these arrangements is unknown, as this would involve future claims that may be made against the Fund and/or its affiliates that have not yet occurred. However, based on experience, the Fund expects the risk of loss to be remote.
Note 2 – Derivatives
As part of its investment strategy, the Fund utilizes forward foreign currency exchange contracts. These investments involve, to varying degrees, elements of market risk and risks in excess of amounts recognized on the Fund’s Statement of Assets and Liabilities. Valuation and accounting treatment of these instruments can be found under Significant Accounting Policies in Note 1 of these Notes to Financial Statements.
Derivatives are instruments whose values depend on, or are derived from, in whole or in part, the value of one or more other assets, such as securities, currencies, commodities or indices. Derivative instruments may be used to increase investment flexibility (including to maintain cash reserves while maintaining exposure to certain other assets), for risk management (hedging) purposes, to facilitate trading, to reduce transaction costs and to pursue higher investment
54 | THE GUGGENHEIM FUNDS SEMI-ANNUAL REPORT | |
NOTES TO FINANCIAL STATEMENTS (Unaudited)(continued) |
returns. Derivative instruments may also be used to mitigate certain investment risks, such as foreign currency exchange rate risk, interest rate risk and credit risk. U.S. GAAP requires disclosures to enable investors to better understand how and why a Fund uses derivative instruments, how these derivative instruments are accounted for and their effects on the Fund’s financial position and results of operations.
The Fund utilized derivatives for the following purposes:
Hedge: an investment made in order to reduce the risk of adverse price movements in a security, by taking an offsetting position to protect against broad market moves.
Forward Foreign Currency Exchange Contracts
A forward foreign currency exchange contract is an agreement between two parties to exchange two designated currencies at a specific time in the future. Certain types of contracts may be cash settled, in an amount equal to the change in exchange rates during the term of the contract. The contracts can be used to hedge or manage exposure to foreign currency risks with portfolio investments or to gain exposure to foreign currencies.
The market value of a forward foreign currency exchange contract changes with fluctuations in foreign currency exchange rates. Furthermore, the Fund may be exposed to risk if the counterparties cannot meet the contract terms or if the currency value changes unfavorably as compared to the U.S. dollar.
The following table represents the Fund’s use and volume of forward foreign currency exchange contracts on a monthly basis:
| | | Average Value | |
Use | | Purchased | | | Sold | |
Hedge | | $ | 63,110 | | | $ | 17,749,311 | |
Derivative Investment Holdings Categorized by Risk Exposure
The following is a summary of the location of derivative investments on the Fund’s Statement of Assets and Liabilities as of March 31, 2024:
Derivative Investment Type | Asset Derivatives | Liability Derivatives |
Currency forward contracts | Unrealized appreciation on forward foreign currency exchange contracts | — |
| | THE GUGGENHEIM FUNDS SEMI-ANNUAL REPORT | 55 |
NOTES TO FINANCIAL STATEMENTS (Unaudited)(continued) |
The following tables set forth the fair value of the Fund’s derivative investments categorized by primary risk exposure at March 31, 2024:
| | Forward Foreign Currency
Exchange Risk | |
Asset Derivative Investments Value | | $ | 198,793 | |
The following is a summary of the location of derivative investments on the Fund’s Statement of Operations for the period ended March 31, 2024:
Derivative Investment Type | Location of Gain (Loss) on Derivatives |
Currency forward contracts | Net realized gain (loss) on forward foreign currency exchange contracts |
| Net change in unrealized appreciation (depreciation) on forward foreign currency exchange contracts |
The following is a summary of the Fund’s realized gain (loss) and change in unrealized appreciation (depreciation) on derivative investments recognized on the Fund’s Statement of Operations categorized by primary risk exposure for the period ended March 31, 2024:
Realized Gain (Loss) on Derivative Investments Recognized on the Statement of Operations |
| | Forward Foreign Currency Exchange Risk | |
| | | $ | (50,690 | ) |
Change in Unrealized Appreciation (Depreciation) on Derivative Investments Recognized on the Statement of Operations |
| | Forward Foreign Currency Exchange Risk | |
| | | $ | (261,807 | ) |
In conjunction with the use of derivative instruments, the Fund is required to maintain collateral in various forms. Depending on the financial instrument utilized and the broker involved, the Fund uses margin deposits at the broker, cash and/or securities segregated at the custodian bank, discount notes or repurchase agreements allocated to the Fund as collateral.
Foreign Investments
There are several risks associated with exposure to foreign currencies, foreign issuers and emerging markets. A fund’s indirect and direct exposure to foreign currencies subjects the Fund the risk that those currencies will decline in value relative to the U.S. dollar, or in the case of short positions, that the U.S. dollar will decline in value relative to the currency being hedged. Currency rates in foreign countries may fluctuate significantly over short periods of time for a number of
56 | THE GUGGENHEIM FUNDS SEMI-ANNUAL REPORT | |
NOTES TO FINANCIAL STATEMENTS (Unaudited)(continued) |
reasons, including changes in interest rates and the imposition of currency controls or other political developments in the U.S. or abroad. In addition, the Fund may incur transaction costs connection with conversions between various currencies.
The Fund may, but is not obligated to, engage in currency hedging transactions, which generally involve buying currency forward, options or futures contracts. However, not all currency risks may be effectively hedged, and in some cases the costs of hedging techniques may outweigh expected benefits. In such instances, the value of securities denominated in foreign currencies can change significantly when foreign currencies strengthen or weaken relative to the U.S. dollar.
The Fund may invest in securities of foreign companies directly, or in financial instruments, such as ADRs and exchange-traded funds, which are indirectly linked to the performance of foreign issuers. Foreign markets can be more volatile than the U.S. market due to increased risks of adverse issuer, political, regulatory, market, or economic developments and can perform differently from the U.S. market. Investing in securities of foreign companies directly, or in financial instruments that are indirectly linked to the performance of foreign issuers, may involve risks not typically associated with investing in U.S. issuers. The value of securities denominated foreign currencies, and of dividends from such securities, can change significantly when foreign currencies strengthen or weaken relative to the U.S. dollar. Foreign securities markets generally have less trading volume and less liquidity than U.S. markets, and prices in some foreign markets may fluctuate more than those of securities traded on U.S. markets. Many foreign countries lack accounting and disclosure standards comparable to those that apply to U.S. companies, and it may be more difficult to obtain reliable information regarding a foreign issuer’s financial condition and operations. Transaction costs and costs associated with custody services are generally higher for foreign securities than they are for U.S. securities. Some foreign governments levy withholding taxes against dividend and interest income. Although in some countries portions of these taxes are recoverable, the non-recovered portion will reduce the income received by the Fund.
The Trust has established counterparty credit guidelines and enters into transactions only with financial institutions rated/identified as investment grade or better. The Trust monitors the counterparty credit risk associated with each such financial institution.
Note 3 – Offsetting
In the normal course of business, the Fund enters into transactions subject to enforceable master netting arrangements or other similar arrangements. Generally, the right to offset in those agreements allows the Fund to counteract the exposure to a specific counterparty with collateral received from or delivered to that counterparty based on the terms of the arrangements. These arrangements provide for the right to liquidate upon the occurrence of an event of default, credit event upon merger or additional termination event.
| | THE GUGGENHEIM FUNDS SEMI-ANNUAL REPORT | 57 |
NOTES TO FINANCIAL STATEMENTS (Unaudited)(continued) |
In order to better define its contractual rights and to secure rights that will help the Fund mitigate its counterparty risk, the Fund may enter into an International Swaps and Derivatives Association, Inc. Master Agreement (“ISDA Master Agreement”) or similar agreement with its derivative contract counterparties. An ISDA Master Agreement is a bilateral agreement between a fund and a counterparty that governs OTC derivatives, including foreign exchange contracts, and typically contains, among other things, collateral posting terms and netting provisions in the event of a default and/or termination event. The provisions of the ISDA Master Agreement typically permit a single net payment in the event of a default (close-out netting) or similar event, including the bankruptcy or insolvency of the counterparty.
For derivatives traded under an ISDA Master Agreement, the collateral requirements are typically calculated by netting the mark-to-market amount for each transaction under such agreement and comparing that amount to the value of any collateral currently pledged by the Fund and the counterparty. For financial reporting purposes, cash collateral that has been pledged to cover obligations of the Fund and cash collateral received from the counterparty, if any, are reported separately on the Fund’s Statement of Assets and Liabilities as segregated cash with broker/receivable for variation margin, or payable for swap settlement/variation margin. Cash and/or securities pledged or received as collateral by the Fund in connection with an OTC derivative subject to an ISDA Master Agreement generally may not be invested, sold or rehypothecated by the counterparty or the Fund, as applicable, absent an event of default under such agreement, in which case such collateral generally may be applied towards obligations due to and payable by such counterparty or the Fund, as applicable. Generally, the amount of collateral due from or to a counterparty must exceed a minimum transfer amount threshold (e.g., $300,000) before a transfer is required to be made. To the extent amounts due to the Fund from its counterparties are not fully collateralized, contractually or otherwise, the Fund bears the risk of loss from counterparty nonperformance. The Fund attempts to mitigate counterparty risk by only entering into agreements with counterparties that it believes to be of good standing and by monitoring the financial stability of those counterparties.
For financial reporting purposes, the Fund does not offset derivative assets and derivative liabilities that are subject to netting arrangements in the Fund’s Statement of Assets and Liabilities.
58 | THE GUGGENHEIM FUNDS SEMI-ANNUAL REPORT | |
NOTES TO FINANCIAL STATEMENTS (Unaudited)(continued) |
The following tables present derivative financial instruments and secured financing transactions that are subject to enforceable netting arrangements:
| | | | | | | | | | | | | | | Gross Amounts Not
Offset in the Statement
of Assets and Liabilities | | | | | |
Instrument | | Gross
Amounts of
Recognized
Assets | | | Gross
Amounts
Offset in the
Statement
of Assets and
Liabilities | | | Net Amount
of Assets
Presented
on the
Statement
of Assets and
Liabilities | | | Financial
Instruments | | | Cash
Collateral
Received | | | Net
Amount | |
Forward foreign currency exchange contracts | | $ | 198,793 | | | $ | — | | | | 198,793 | | | $ | — | | | $ | — | | | $ | 198,793 | |
The Fund has the right to offset deposits against any related derivative liabilities outstanding with each counterparty with the exception of exchange-traded or centrally-cleared derivatives.
Note 4 – Fair Value Measurement
In accordance with U.S. GAAP, fair value is defined as the price that the Fund would receive to sell an investment or pay to transfer a liability in an orderly transaction between market participants at the measurement date. U.S. GAAP establishes a three-tier fair value hierarchy based on the types of inputs used to value assets and liabilities and requires corresponding disclosure. The hierarchy and the corresponding inputs are summarized below:
| Level 1 — | unadjusted quoted prices in active markets for identical assets or liabilities. |
| Level 2 — | significant other observable inputs (for example quoted prices for securities that are similar based on characteristics such as interest rates, prepayment speeds, credit risk, etc.). |
| Level 3 — | significant unobservable inputs based on the best information available under the circumstances, to the extent observable inputs are not available, which may include assumptions. |
Rule 2a-5 sets forth a definition of “readily available market quotations,” which is consistent with the definition of a Level 1 input under U.S. GAAP. Rule 2a-5 provides that “a market quotation is readily available only when that quotation is a quoted price (unadjusted) in active markets for identical investments that the fund can access at the measurement date, provided that a quotation will not be readily available if it is not reliable.”
Securities for which market quotations are not readily available must be valued at fair value as determined in good faith. Accordingly, any security priced using inputs other than Level 1 inputs will be subject to fair value requirements. The types of inputs available depend on a variety of
| | THE GUGGENHEIM FUNDS SEMI-ANNUAL REPORT | 59 |
NOTES TO FINANCIAL STATEMENTS (Unaudited)(continued) |
factors, such as the type of security and the characteristics of the markets in which it trades, if any. Fair valuation determinations that rely on fewer or no observable inputs require greater judgment. Accordingly, fair value determinations for Level 3 securities require the greatest amount of judgment.
Pricing service providers are used to value a majority of the Fund’s investments. When values are not available from a pricing service provider, they will be determined using a variety of sources and techniques, including: market prices; broker quotes; and models which derive prices based on inputs such as prices of securities with comparable maturities and characteristics or based on inputs such as anticipated cash flows or collateral, spread over U.S. Treasury securities, and other information and analysis. A significant portion of the Fund’s assets and liabilities are categorized as Level 2, as indicated in this report.
Quotes from broker-dealers, adjusted for fluctuations in criteria such as credit spreads and interest rates, may also be used to value the Fund’s assets and liabilities, i.e. prices provided by a broker-dealer or other market participant who has not committed to trade at that price. Although quotes are typically received from established market participants, the Fund may not have the transparency to view the underlying inputs which support the market quotations. Significant changes in a quote would generally result in significant changes in the fair value of the security.
Certain fixed income securities are valued by obtaining a monthly quote from a broker-dealer, adjusted for fluctuations in criteria such as credit spreads and interest rates.
Certain loans and other securities are valued using a single daily broker quote or a price from a pricing service provider based on a single daily or monthly broker quote.
The inputs or methodologies selected and applied for valuing securities or other assets are not necessarily an indication of the risk associated with investing in those securities. The suitability, appropriateness and accuracy of the techniques, methodologies and sources employed to determine fair valuation are periodically reviewed and subject to change.
Note 5 – Investment Advisory Agreement and Other Agreements
Under the terms of an investment advisory contract, the Fund pays GI investment advisory fees on a monthly basis calculated daily at an annualized rate of 0.65% of the average daily net assets of the Fund up to $5 billion; and 0.60% of the average daily net assets in excess of $5 billion.
GI pays operating expenses on behalf of the Trust, such as audit and accounting related services, legal services, custody, printing and mailing, among others, on a pass-through basis. Such expenses are allocated to various Funds within the complex based on relative net assets.
The Board has adopted Distribution Plans related to the offering of Class A, Class C and Class P shares pursuant to Rule 12b-1 under the 1940 Act. The plans provide for payments at an annual rate of 0.25% of the average daily net assets of the Fund’s Class A and Class P shares, and 1.00% of the average daily net assets of the Fund’s Class C shares.
60 | THE GUGGENHEIM FUNDS SEMI-ANNUAL REPORT | |
NOTES TO FINANCIAL STATEMENTS (Unaudited)(continued) |
The investment advisory contract for the Fund provides that the total expenses be limited to a percentage of average net assets for each class of shares, exclusive of brokerage costs, dividends or interest on securities sold short, expenses of other investment companies in which the Fund invests, interest, taxes, litigation, indemnification and extraordinary expenses. The limits are listed below:
| | Limit | | | Effective
Date | | | Contract
End Date | |
Class A | | | 1.02 | % | | | 11/30/12 | | | | 02/01/25 | |
Class C | | | 1.77 | % | | | 11/30/12 | | | | 02/01/25 | |
Class P | | | 1.02 | % | | | 05/01/15 | | | | 02/01/25 | |
Institutional Class | | | 0.78 | % | | | 11/30/12 | | | | 02/01/25 | |
Class R6 | | | 0.78 | % | | | 03/13/19 | | | | 02/01/25 | |
GI is entitled to reimbursement by the Fund for fees waived or expenses reimbursed during any of the previous 36 months, beginning on the date of the expense limitation agreement, if on any day the estimated operating expenses are less than the indicated percentages. For purposes of this arrangement, GI is entitled to recoupment of previously waived fees or reimbursed expenses for 36 months from the date of the waiver or reimbursement by GI. At March 31, 2024, the amount of fees waived or expenses reimbursed that are subject to recoupment and will expire during the years ended September 30, are presented in the following table:
| | 2024 | | | 2025 | | | 2026 | | | 2027 | | | Fund Total | |
Class A | | $ | 59,889 | | | $ | 114,896 | | | $ | 134,479 | | | $ | 61,804 | | | $ | 371,068 | |
Class C | | | 34,125 | | | | 63,710 | | | | 33,051 | | | | 15,280 | | | | 146,166 | |
Class P | | | 3,307 | | | | 45,054 | | | | 55,729 | | | | 28,684 | | | | 132,774 | |
Institutional Class | | | 214,851 | | | | 717,446 | | | | 582,868 | | | | 261,176 | | | | 1,776,341 | |
Class R6 | | | — | | | | 293 | | | | 966 | | | | 270 | | | | 1,529 | |
For the period ended March 31, 2024, GI recouped $135 from the Fund.
For the period ended March 31, 2023, GFD retained sales charges of $77,213 relating to sales of Class A shares of the Trust.
Certain trustees and officers of the Trust are also officers of GI and/or GFD. The Trust does not compensate its officers or trustees who are officers, directors and/or employees of GI or GFD.
MUFG Investor Services (US), LLC (“MUIS”) acts as the Fund’s administrator, transfer agent and accounting agent. As administrator, transfer agent and accounting agent, MUIS maintains the books and records of the Fund’s securities and cash. The Bank of New York Mellon Corp. (“BNY”) acts as the Fund’s custodian. As custodian, BNY is responsible for the custody of the Fund’s assets. For providing the aforementioned administrative and accounting services, MUIS is entitled to receive a monthly fee equal to a percentage of the Fund’s average daily net assets and out of pocket expenses. For providing the aforementioned transfer agent and custodian services,
| | THE GUGGENHEIM FUNDS SEMI-ANNUAL REPORT | 61 |
NOTES TO FINANCIAL STATEMENTS (Unaudited)(continued) |
MUIS and BNY are entitled to receive a monthly fee based on the number of transactions during the month and the number of accounts under management, subject to certain minimum monthly fees, and out of pocket expenses.
Note 6 – Federal Income Tax Information
The Fund intends to comply with the provisions of Subchapter M of the Internal Revenue Code of 1986, as amended (the “Internal Revenue Code”), applicable to regulated investment companies and will distribute substantially all taxable net investment income and capital gains sufficient to relieve the Fund from all, or substantially all, federal income, excise and state income taxes. Therefore, no provision for federal or state income tax or federal excise tax is required.
Tax positions taken or expected to be taken in the course of preparing the Fund’s tax returns are evaluated to determine whether the tax positions are “more-likely-than-not” of being sustained by the applicable tax authority. Tax positions not deemed to meet the more-likely-than-not threshold would be recorded as a tax benefit or expense in the current year. Management has analyzed the Fund’s tax positions taken, or to be taken, on U.S. federal income tax returns for all open tax years, and has concluded that no provision for income tax is required in the Fund’s financial statements. The Fund’s U.S. federal income tax returns are subject to examination by the Internal Revenue Service (“IRS”) for a period of three years after they are filed.
At March 31, 2024, the cost of investments for U.S. federal income tax purposes, the aggregate gross unrealized appreciation for all investments for which there was an excess of value over tax cost, and the aggregate gross unrealized depreciation for all investments for which there was an excess of tax cost over value, were as follows:
| | Tax
Cost | | | Tax
Unrealized
Appreciation | | | Tax
Unrealized
Depreciation | | | Net Tax
Unrealized
Appreciation
(Depreciation) | |
| | | $ | 1,029,717,970 | | | $ | 5,751,459 | | | $ | (32,774,603 | ) | | $ | (27,023,144 | ) |
Note 7 – Securities Transactions
For the period ended March 31, 2024, the cost of purchases and proceeds from sales of investment securities, excluding government securities, short-term investments and derivatives, were as follows:
| | Purchases | | | Sales | |
| | | $ | 142,803,883 | | | $ | 161,367,519 | |
The Fund is permitted to purchase or sell securities from or to certain affiliated funds under specified conditions outlined in procedures adopted by the Board. The procedures have been designed to ensure that any purchase or sale of securities by the Fund from or to another fund
62 | THE GUGGENHEIM FUNDS SEMI-ANNUAL REPORT | |
NOTES TO FINANCIAL STATEMENTS (Unaudited)(continued) |
or portfolio that is or could be considered an affiliate by virtue of having a common investment adviser (or affiliated investment advisers), common trustees and/or common officers complies with Rule 17a-7 of the 1940 Act. Further, as defined under these procedures, each transaction is effected at the current market price to save cost, where permissible. For the period ended March 31, 2024, the Fund did not engage in purchases and sales of securities pursuant to Rule 17a-7 of the 1940 Act.
Note 8 – Restricted Securities
The securities below are considered illiquid and restricted under guidelines established by the Board:
Restricted Securities | | Acquisition
Date | | | Cost | | | Value | |
Mirabela Nickel Ltd. due 06/24/191 | | | 12/31/13 | | | $ | 1,160,811 | | | $ | 6,399 | |
1 | Security is in default of interest and/or principal obligations. |
Note 9 – Line of Credit
The Trust, along with other affiliated trusts, secured a 364-day committed, $1,150,000,000 line of credit from Citibank, N.A., which was in place through September 29, 2023, at which time a new line of credit was entered into in the amount of $1,165,000,000. The Fund may draw (borrow) from the line of credit as a temporary measure for emergency purposes, to facilitate redemption requests, or for other short-term liquidity purposes consistent with the Fund’s investment objective and program. For example, it may be advantageous for the Fund to borrow money rather than sell existing portfolio positions to meet redemption requests. Fees related to borrowings, if any, vary under this arrangement between the greater of Citibank’s “base rate”, SOFR plus 1%, or the federal funds rate plus 1/2 of 1%.
The commitment fee that may be paid by the Fund is at an annualized rate of 0.15% of the average daily amount of its allocated unused commitment amount. The commitment fee amount is allocated to the individual Funds based on the respective net assets of each participating Fund and is referenced in the Fund’s Statement of Operations under “Line of credit fees”. The Fund did not have any borrowings under this agreement as of and for the period ended March 31, 2024.
Note 10 – Market Risks
The value of, or income generated by, the investments held by the Fund are subject to the possibility of rapid and unpredictable fluctuation, and loss that may result from various factors. These factors include, among others, developments affecting individual companies, or from broader influences, including real or perceived changes in prevailing interest rates (which may change at any time based on changes in monetary policies and various market and other economic conditions), changes in inflation rates or expectations about inflation rates, adverse
| | THE GUGGENHEIM FUNDS SEMI-ANNUAL REPORT | 63 |
NOTES TO FINANCIAL STATEMENTS (Unaudited)(concluded) |
investor confidence or sentiment, changing economic, political (including geopolitical), social or financial market conditions, increased instability or general uncertainty, environmental disasters, governmental actions, public health emergencies (such as the spread of infectious diseases, pandemics and epidemics), debt crises, actual or threatened wars or other armed conflicts (such as the ongoing Russia-Ukraine conflict and its collateral economic and other effects, including, but not limited to, sanctions and other international trade barriers) or ratings downgrades, and other similar events, each of which may be temporary or last for extended periods. Moreover, changing economic, political, geopolitical, social, financial market or other conditions in one country or geographic region could adversely affect the value, yield and return of the investments held by the Fund in a different country, geographic region, economy, industry or market because of the increasingly interconnected global economies and financial markets. The duration and extent of the foregoing types of factors or conditions are highly uncertain and difficult to predict and have in the past, and may in the future, cause volatility and distress in economies and financial markets or other adverse circumstances, which may negatively affect the value of the Fund’s investments and performance of the Fund.
Note 11 – Subsequent Events
The Fund evaluated subsequent events through the date the financial statements are issued and determined there were no material events that would require adjustment to or disclosure in the Fund’s financial statements.
64 | THE GUGGENHEIM FUNDS SEMI-ANNUAL REPORT | |
OTHER INFORMATION (Unaudited) |
Delivery of Shareholder Reports
Paper copies of the Fund’s annual and semi-annual shareholder reports are not sent by mail, unless you specifically request paper copies of the reports from the Fund or from your financial intermediary. Instead, the reports are made available on a website, and you are notified by mail each time a report is posted and provided with a website link to access the report.
You may elect to receive all future shareholder reports in paper free of charge. If you hold shares of the Fund directly, you can inform the Fund that you wish to receive paper copies of reports by calling 800.820.0888. If you hold shares of the Fund through a financial intermediary, please contact the financial intermediary to make this election. Your election to receive reports in paper may apply to all Guggenheim funds in which you are invested and may apply to all Guggenheim funds held with your financial intermediary.
Tailored Shareholder Reports for Open-End Mutual Funds and Exchange-Traded Funds
Effective January 24, 2023, the SEC adopted rule and form amendments to require open-end mutual funds and exchange-traded funds registered on Form N-1A to transmit concise and visually engaging streamlined annual and semi-annual reports to shareholders that highlight key information. Other information, including financial statements, will no longer appear in a streamlined shareholder report but must be available online, delivered free of charge upon request, and filed on a semi-annual basis on Form N-CSR. The rule and form amendments have a compliance date of July 24, 2024. At this time, management is evaluating the impact of these amendments on the shareholder reports for the Fund.
Proxy Voting Information
A description of the policies and procedures that the Trust uses to determine how to vote proxies relating to securities held in the Fund’s portfolio is available, without charge and upon request, by calling 800.820.0888. This information is also available from the EDGAR database on the SEC’s website at https://www.sec.gov.
Information regarding how the Fund voted proxies relating to portfolio securities during the most recent 12-month period ended June 30 is available without charge, upon request, by calling 800.820.0888. This information is also available from the EDGAR database on the SEC’s website at https://www.sec.gov.
Sector Classification
Information in the Consolidated Schedule of Investments is categorized by sectors using sector-level Classifications defined by the Bloomberg Industry Classification System, a widely recognized industry classification system provider. The Fund’s registration statement has investment policies relating to concentration in specific sectors/industries. For purposes of these investment policies, the Fund usually classifies sectors/industries based on industry-level Classifications
| | THE GUGGENHEIM FUNDS SEMI-ANNUAL REPORT | 65 |
OTHER INFORMATION (Unaudited)(concluded) |
used by widely recognized industry classification system providers such as Bloomberg Industry Classification System, Global Industry Classification Standards and Barclays Global Classification Scheme.
Quarterly Portfolio Schedules Information
The Trust files its complete schedule of portfolio holdings with the SEC for the first and third quarters of each fiscal year as an exhibit to its reports on Form N-PORT. The Fund’s Form N-PORT is available on the SEC’s website at https://www.sec.gov. The Fund’s complete schedule of securities holdings as of the end of each fiscal quarter will be made available to the public on the SEC’s website at www.sec.gov and on our website at www.guggenheiminvestments.com, and will be made available, upon request and without charge, by calling 800.820.0888.
66 | THE GUGGENHEIM FUNDS SEMI-ANNUAL REPORT | |
INFORMATION ON BOARD OF TRUSTEES AND OFFICERS (Unaudited) |
A Board of Trustees oversees the Trust, as well as other trusts of GI, in which its members have no stated term of service, and continue to serve after election until resignation. The Statement of Additional Information includes further information about Fund Trustees and Officers, and can be obtained without charge by visiting guggenheiminvestments.com or by calling 800.820.0888.
Name, Address*
and Year of Birth | Position(s)
Held with
Trust | Term of Office
and Length of
Time Served** | Principal Occupation(s)
During Past Five Years | Number of
Portfolios
in Fund
Complex
Overseen | Other
Directorships Held
by Trustees*** |
INDEPENDENT TRUSTEES | | | |
Randall C. Barnes (1951) | Trustee and Chair of the Valuation Oversight Committee | Since 2014 (Trustee) Since 2020 (Chair of the Valuation Oversight Committee) | Current: Private Investor (2001-present). Former: Senior Vice President and Treasurer, PepsiCo, Inc. (1993-1997); President, Pizza Hut International (1991-1993); Senior Vice President, Strategic Planning and New Business Development, PepsiCo, Inc. (1987-1990). | 153 | Current: Advent Convertible and Income Fund (2005-present); Purpose Investments Funds (2013-present). Former: Guggenheim Energy & Income Fund (2015-2023); Fiduciary/Claymore Energy Infrastructure Fund (2004-2022); Guggenheim Enhanced Equity Income Fund (2005-2021); Guggenheim Credit Allocation Fund (2013-2021). |
| | THE GUGGENHEIM FUNDS SEMI-ANNUAL REPORT | 67 |
INFORMATION ON BOARD OF TRUSTEES AND OFFICERS (Unaudited)(continued) |
Name, Address*
and Year of Birth | Position(s)
Held with
Trust | Term of Office
and Length of
Time Served** | Principal Occupation(s)
During Past Five Years | Number of
Portfolios
in Fund
Complex
Overseen | Other
Directorships Held
by Trustees*** |
INDEPENDENT TRUSTEES - continued | | |
Angela Brock-Kyle (1959) | Trustee | Since 2019 | Current: Founder and Chief Executive Officer, B.O.A.R.D.S. (consulting firm) (2013-present); Director, Mutual Fund Directors Forum (2022-present). Former: Senior Leader, TIAA (financial services firm) (1987-2012). | 152 | Current: Bowhead Insurance GP, LLC (2020-present); Hunt Companies, Inc. (2019-present). Former: Guggenheim Energy & Income Fund (2019-2023); Fiduciary/Claymore Energy Infrastructure Fund (2019-2022); Guggenheim Enhanced Equity Income Fund (2019-2021); Guggenheim Credit Allocation Fund (2019-2021); Infinity Property & Casualty Corp. (2014-2018). |
Thomas F. Lydon, Jr. (1960) | Trustee and Chair of the Contracts Review Committee | Since 2019 (Trustee) Since 2020 (Chair of the Contracts Review Committee) | Current: President, Global Trends Investments (registered investment adviser) (1996-present); Chief Executive Officer, Lydon Media (2016-present); Vice Chairman, VettaFi, a wholly owned subsidiary of The TMX Group (financial advisor content, research and digital distribution provider) (2022-present). Former: Chief Executive Officer, ETF Flows, LLC (financial advisor education and research provider) (2019-2023); Director, GDX Index Partners, LLC (index provider) (2021-2023). | 152 | Current: US Global Investors, Inc. (GROW) (1995-present); The 2023 ETF Series Trust (4) (2023-present); The 2023 ETF Series II (1) (2023-present). Former: Guggenheim Energy & Income Fund (2019-2023); Fiduciary/Claymore Energy Infrastructure Fund (2019-2022); Guggenheim Enhanced Equity Income Fund (2019-2021); Guggenheim Credit Allocation Fund (2019-2021); Harvest Volatility Edge Trust (3) (2017-2019). |
68 | THE GUGGENHEIM FUNDS SEMI-ANNUAL REPORT | |
INFORMATION ON BOARD OF TRUSTEES AND OFFICERS (Unaudited)(continued) |
Name, Address*
and Year of Birth | Position(s)
Held with
Trust | Term of Office
and Length of
Time Served** | Principal Occupation(s)
During Past Five Years | Number of
Portfolios
in Fund
Complex
Overseen | Other
Directorships Held
by Trustees*** |
INDEPENDENT TRUSTEES - continued | | |
Ronald A. Nyberg (1953) | Trustee and Chair of the Nominating and Governance Committee | Since 2014 | Current: Of Counsel (formerly Partner), Momkus LLP (law firm) (2016-present). Former: Partner, Nyberg & Cassioppi, LLC (law firm) (2000-2016); Executive Vice President, General Counsel, and Corporate Secretary, Van Kampen Investments (1982-1999). | 153 | Current: Advent Convertible and Income Fund (2003-present); PPM Funds (2) (2018-present); Endeavor Health (2012-present). Former: Guggenheim Energy & Income Fund (2015-2023); Fiduciary/Claymore Energy Infrastructure Fund (2004-2022); Guggenheim Enhanced Equity Income Fund (2005-2021); Guggenheim Credit Allocation Fund (2013-2021); Western Asset Inflation-Linked Opportunities & Income Fund (2004-2020); Western Asset Inflation-Linked Income Fund (2003-2020). |
| | THE GUGGENHEIM FUNDS SEMI-ANNUAL REPORT | 69 |
INFORMATION ON BOARD OF TRUSTEES AND OFFICERS (Unaudited)(continued) |
Name, Address*
and Year of Birth | Position(s)
Held with
Trust | Term of Office
and Length of
Time Served** | Principal Occupation(s)
During Past Five Years | Number of
Portfolios
in Fund
Complex
Overseen | Other
Directorships Held
by Trustees*** |
INDEPENDENT TRUSTEES - continued | | |
Sandra G. Sponem (1958) | Trustee and Chair of the Audit Committee | Since 2019 (Trustee) Since 2020 (Chair of the Audit Committee) | Current: Retired. Former: Senior Vice President and Chief Financial Officer, M.A. Mortenson-Companies, Inc. (construction and real estate development company) (2007-2017). | 152 | Current: SPDR Series Trust (81) (2018-present); SPDR Index Shares Funds (30) (2018-present); SSGA Active Trust (14) (2018-present). Former: Guggenheim Energy & Income Fund (2019-2023); Fiduciary/Claymore Energy Infrastructure Fund (2019-2022); Guggenheim Enhanced Equity Income Fund (2019-2021); Guggenheim Credit Allocation Fund (2019-2021); SSGA Master Trust (1) (2018-2020). |
70 | THE GUGGENHEIM FUNDS SEMI-ANNUAL REPORT | |
INFORMATION ON BOARD OF TRUSTEES AND OFFICERS (Unaudited)(continued) |
Name, Address*
and Year of Birth | Position(s)
Held with
Trust | Term of Office
and Length of
Time Served** | Principal Occupation(s)
During Past Five Years | Number of
Portfolios
in Fund
Complex
Overseen | Other
Directorships Held
by Trustees*** |
INDEPENDENT TRUSTEES - concluded | | |
Ronald E. Toupin, Jr. (1958) | Trustee, Chair of the Board and Chair of the Executive Committee | Since 2014 | Current: Portfolio Consultant (2010-present); Member, Governing Council, Independent Directors Council (2013-present); Governor, Board of Governors, Investment Company Institute (2018-present). Former: Member, Executive Committee, Independent Directors Council (2016-2018); Vice President, Manager and Portfolio Manager, Nuveen Asset Management (1998-1999); Vice President, Nuveen Investment Advisory Corp. (1992-1999); Vice President and Manager, Nuveen Unit Investment Trusts (1991-1999); and Assistant Vice President and Portfolio Manager, Nuveen Unit Investment Trusts (1988-1999), each of John Nuveen & Co., Inc. (registered broker dealer) (1982-1999). | 152 | Former: Guggenheim Energy & Income Fund (2015-2023); Fiduciary/Claymore Energy Infrastructure Fund (2004-2022); Guggenheim Enhanced Equity Income Fund (2005-2021); Guggenheim Credit Allocation Fund (2013-2021); Western Asset Inflation-Linked Opportunities & Income Fund (2004-2020); Western Asset Inflation-Linked Income Fund (2003-2020). |
| | THE GUGGENHEIM FUNDS SEMI-ANNUAL REPORT | 71 |
INFORMATION ON BOARD OF TRUSTEES AND OFFICERS (Unaudited)(continued) |
Name, Address*
and Year of Birth | Position(s)
Held with
Trust | Term of Office
and Length of
Time Served** | Principal Occupation(s)
During Past Five Years | Number of
Portfolios
in Fund
Complex
Overseen | Other
Directorships Held
by Trustees*** |
INTERESTED TRUSTEE | | |
Amy J. Lee**** (1961) | Trustee, Vice President and Chief Legal Officer | Since 2018 (Trustee) Since 2014 (Chief Legal Officer) Since 2007 (Vice President) | Current: Interested Trustee, certain other funds in the Fund Complex (2018-present); Chief Legal Officer, certain other funds in the Fund Complex (2014-present); Vice President, certain other funds in the Fund Complex (2007-present); Senior Managing Director, Guggenheim Investments (2012-present). Former: President and/or Chief Executive Officer, certain other funds in the Fund Complex (2017-2019); Vice President, Associate General Counsel and Assistant Secretary, Security Benefit Life Insurance Company and Security Benefit Corporation (2004-2012). | 152 | Former: Guggenheim Energy & Income Fund (2018-2023); Fiduciary/Claymore Energy Infrastructure Fund (2018-2022); Guggenheim Enhanced Equity Income Fund (2018-2021); Guggenheim Credit Allocation Fund (2018-2021). |
* | The business address of each Trustee is c/o Guggenheim Investments, 227 West Monroe Street, Chicago, Illinois 60606. |
** | Each Trustee serves an indefinite term, until his or her successor is elected and qualified. Time served includes time served in the respective position for the Predecessor Corporation. |
*** | Each Trustee also serves on the Boards of Trustees of Guggenheim Funds Trust, Guggenheim Variable Funds Trust, Guggenheim Strategy Funds Trust, Guggenheim Taxable Municipal Bond & Investment Grade Debt Trust, Guggenheim Strategic Opportunities Fund, Guggenheim Active Allocation Fund, Rydex Series Funds, Rydex Dynamic Funds, Rydex Variable Trust and Transparent Value Trust. Messrs. Barnes and Nyberg also serve on the Board of Trustees of Advent Convertible & Income Fund. |
**** | This Trustee is deemed to be an “interested person” of the Fund under the 1940 Act by reason of her position with the Fund’s Adviser and/or the parent of the Adviser. |
72 | THE GUGGENHEIM FUNDS SEMI-ANNUAL REPORT | |
INFORMATION ON BOARD OF TRUSTEES AND OFFICERS (Unaudited)(continued) |
Name, Address*
and Year of Birth | Position(s)
Held with
Trust | Term of Office
and Length of
Time Served** | Principal Occupation(s)
During Past Five Years |
OFFICERS | | | |
Brian E. Binder (1972) | President and Chief Executive Officer | Since 2018 | Current: President, Mutual Funds Boards, Guggenheim Investments (2022-present); President and Chief Executive Officer, certain other funds in the Fund Complex (2018-present); President, Mutual Funds Boards and Senior Managing Director, Guggenheim Funds Investment Advisors, LLC and Security Investors, LLC (2018-present); Board Member, Guggenheim Partners Investment Funds plc (2022-present); Board Member, Guggenheim Global Investments plc (2022-present); Board Member, Guggenheim Partners Fund Management (Europe) Limited (2018-present). Former: Senior Managing Director and Chief Administrative Officer, Guggenheim Investments (2018-2022); Managing Director and President, Deutsche Funds, and Head of US Product, Trading and Fund Administration, Deutsche Asset Management (2013-2018); Managing Director, Chairman of North American Executive Committee and Head of Business Management and Consulting, Invesco Ltd. (2010-2012). |
James Howley (1972) | Chief Financial Officer, Chief Accounting Officer and Treasurer | Since 2022 | Current: Managing Director, Guggenheim Investments (2004-present); Chief Financial Officer, Chief Accounting Officer, and Treasurer, certain other funds in the Fund Complex (2022-present). Former: Assistant Treasurer, certain other funds in the Fund Complex (2006-2022); Manager, Mutual Fund Administration of Van Kampen Investments, Inc. (1996-2004). |
Mark E. Mathiasen (1978) | Secretary | Since 2014 | Current: Secretary, certain other funds in the Fund Complex (2007-present); Managing Director, Guggenheim Investments (2007-present). |
Glenn McWhinnie (1969) | Assistant Treasurer | Since 2016 | Current: Vice President, Guggenheim Investments (2009-present); Assistant Treasurer, certain other funds in the Fund Complex (2016-present). |
Michael P. Megaris (1984) | Assistant Secretary | Since 2014 | Current: Assistant Secretary, certain other funds in the Fund Complex (2014-present); Managing Director, Guggenheim Investments (2012-present). |
| | THE GUGGENHEIM FUNDS SEMI-ANNUAL REPORT | 73 |
INFORMATION ON BOARD OF TRUSTEES AND OFFICERS (Unaudited)(concluded) |
Name, Address*
and Year of Birth | Position(s)
Held with
Trust | Term of Office
and Length of
Time Served** | Principal Occupation(s)
During Past Five Years |
OFFICERS - continued | |
Elisabeth Miller (1968) | Chief Compliance Officer | Since 2012 | Current: Chief Compliance Officer, certain other funds in the Fund Complex (2012-present); Senior Managing Director, Guggenheim Investments (2012-present); Senior Managing Director, Guggenheim Funds Distributors, LLC (2014-present). Former: Chief Compliance Officer, Security Investors, LLC and Guggenheim Funds Investment Advisors, LLC (2012-2018); Chief Compliance Officer, Guggenheim Distributors, LLC (2009-2014); Senior Manager, Security Investors, LLC (2004-2014); Senior Manager, Guggenheim Distributors, LLC (2004-2014). |
Margaux Misantone (1978) | AML Officer | Since 2017 | Current: Chief Compliance Officer, Security Investors, LLC and Guggenheim Funds Investment Advisors, LLC (2018-present); AML Officer, Security Investors, LLC and certain other funds in the Fund Complex (2017-present); Managing Director, Guggenheim Investments (2015-present). Former: Assistant Chief Compliance Officer, Security Investors, LLC and Guggenheim Funds Investments Advisors, LLC (2015-2018). |
Kimberly J. Scott (1974) | Assistant Treasurer | Since 2014 | Current: Director, Guggenheim Investments (2012-present); Assistant Treasurer, certain other funds in the Fund Complex (2012-present). Former: Financial Reporting Manager, Invesco, Ltd. (2010-2011); Vice President/Assistant Treasurer, Mutual Fund Administration for Van Kampen Investments, Inc./Morgan Stanley Investment Management (2009-2010); Manager of Mutual Fund Administration, Van Kampen Investments, Inc./Morgan Stanley Investment Management (2005-2009). |
Jon Szafran (1989) | Assistant Treasurer | Since 2017 | Current: Director, Guggenheim Investments (2017-present); Assistant Treasurer, certain other funds in the Fund Complex (2017-present). Former: Assistant Treasurer of Henderson Global Funds and Manager of US Fund Administration, Henderson Global Investors (North America) Inc. (“HGINA”), (2017); Senior Analyst of US Fund Administration, HGINA (2014–2017); Senior Associate of Fund Administration, Cortland Capital Market Services, LLC (2013-2014); Experienced Associate, PricewaterhouseCoopers LLP (2012-2013). |
* | The business address of each officer is c/o Guggenheim Investments, 227 West Monroe Street, Chicago, Illinois 60606. |
** | Each officer serves an indefinite term, until his or her successor is duly elected and qualified. |
74 | THE GUGGENHEIM FUNDS SEMI-ANNUAL REPORT | |
GUGGENHEIM INVESTMENTS PRIVACY NOTICE (Unaudited) |
Who We Are
This Privacy Notice describes the data protection practices of Guggenheim Investments. Guggenheim Investments as used herein refers to the affiliated investment management businesses of Guggenheim Partners, LLC: Guggenheim Funds Investment Advisors, LLC, Guggenheim Partners Investment Management, LLC, Guggenheim Funds Distributors, LLC, Security Investors, LLC, Guggenheim Investment Advisors (Europe) Limited, Guggenheim Real Estate, LLC, GS Gamma Advisors, LLC, Guggenheim Partners India Management, LLC, Guggenheim Partners Europe Limited, as well as the funds in the Guggenheim Funds complex (the “Funds”) (“Guggenheim Investments,” “we,” “us,” or “our”).
Guggenheim Partners Investment Management Holdings, LLC, located at 330 Madison Avenue, New York, New York, 10017 is the data controller for your information. The affiliates who are also controllers of certain of your information are: Guggenheim Investment Advisors (Europe) Limited, Guggenheim Partners Europe Limited, Guggenheim Partners, LLC, Guggenheim Funds Investment Advisors, LLC, Guggenheim Partners Investment Management, LLC, Guggenheim Funds Distributors, LLC and Security Investors, LLC, as well as the Funds.
Our Commitment to You
Guggenheim Investments considers your privacy our utmost concern. When you become our client or investor, you entrust us with not only your hard-earned money but also with your personal and financial information. Because we have access to your private information, we hold ourselves to the highest standards in its safekeeping and use. We strictly limit how we share your information with others, whether you are a current or former Guggenheim Investments client or investor.
The Information We Collect About You
We collect certain nonpublic personal information about you from information you provide on applications, other forms, our website, and/or from third parties including investment advisors. This information includes Social Security or other tax identification number, assets, income, tax information, retirement and estate plan information, transaction history, account balance, payment history, bank account information, marital status, family relationships, information that we collect on our website through the use of “cookies,” and other personal information that you or others provide to us. We may also collect such information through your inquiries by mail, e-mail or telephone. We may also collect customer due diligence information, as required by applicable law and regulation, through third party service providers.
How We Handle Your Personal Information
The legal basis for using your information as set out in this Privacy Notice is as follows: (a) use of your personal data is necessary to perform our obligations under any contract with you (such as a contract for us to provide financial services to you); or (b) where use of your personal data is not necessary for performance of a contract, use of your personal data is necessary for our
| | THE GUGGENHEIM FUNDS SEMI-ANNUAL REPORT | 75 |
GUGGENHEIM INVESTMENTS PRIVACY NOTICE (Unaudited)(continued) |
legitimate interests or the legitimate interests of others (for example, to enforce the legal terms governing our services, operate and market our website and other services we offer, ensure safe environments for our personnel and others, make and receive payments, prevent fraud and to know the customer to whom we are providing the services). Some processing is done to comply with applicable law.
In addition to the specific uses described above, we also use your information in the following manner:
| | ● | We use your information in connection with servicing your accounts. |
| | ● | We use information to respond to your requests or questions. For example, we might use your information to respond to your customer feedback. |
| | ● | We use information to improve our products and services. We may use your information to make our website and products better. We may use your information to customize your experience with us. |
| | ● | We use information for security purposes. We may use your information to protect our company and our customers. |
| | ● | We use information to communicate with you. For example, we will communicate with you about your account or our relationship. We may contact you about your feedback. We might also contact you about this Privacy Notice. We may also enroll you in our email newsletter. |
| | ● | We use information as otherwise permitted by law, as we may notify you. |
| | ● | Aggregate/Anonymous Data. We may aggregate and/or anonymize any information collected through the website so that such information can no longer be linked to you or your device (“Aggregate/Anonymous Information”). We may use Aggregate/Anonymous Information for any purpose, including without limitation for research and marketing purposes, and may also share such data with any third parties, including advertisers, promotional partners, and sponsors. |
We do not sell information about current or former clients or their accounts to third parties. Nor do we share this information, except when necessary to complete transactions at your request, to make you aware of investment products and services that we or our affiliates offer, or as permitted or required by law. We provide information about you to companies and individuals not affiliated with Guggenheim Investments to complete certain transactions or account changes, or to perform services for us related to your account. For example, if you ask to transfer assets from another financial institution to Guggenheim Investments, we must provide certain information about you to that company to complete the transaction.
76 | THE GUGGENHEIM FUNDS SEMI-ANNUAL REPORT | |
GUGGENHEIM INVESTMENTS PRIVACY NOTICE (Unaudited)(continued) |
We provide the third party with only the information necessary to carry out its responsibilities and only for that purpose. And we require these third parties to treat your private information with the same high degree of confidentiality that we do. To alert you to other Guggenheim Investments products and services, we share your information within our family of affiliated companies. You may limit our sharing with affiliated companies as set out below. We may also share information with any successor to all or part of our business, or in connection with steps leading up to a merger or acquisition. For example, if part of our business was sold we may give customer information as part of that transaction. We may also share information about you with your consent.
We will release information about you if you direct us to do so, if we are compelled by law to do so, or in other circumstances as permitted by law (for example, to protect your account from fraud).
If you close your account(s) or become an inactive client or investor, we will continue to adhere to the privacy policies and practices described in this notice.
Opt-Out Provisions and Your Data Choices
The law allows you to “opt out” of certain kinds of information sharing with third parties. We do not share personal information about you with any third parties that triggers this opt-out right. This means YOU ARE ALREADY OPTED OUT.
When you are no longer our client or investor, we continue to share your information as described in this notice, and you may contact us at any time to limit our sharing by sending an email to CorporateDataPrivacy@GuggenheimPartners.com.
European Union Data Subjects and certain others: In addition to the choices set forth above, residents of the European Union and certain other jurisdictions have certain rights to (1) request access to or rectification or deletion of information we collect about them, (2) request a restriction on the processing of their information, (3) object to the processing of their information, or (4) request the portability of certain information. To exercise these or other rights, please contact us using the contact information below. We will consider all requests and provide our response within the time period stated by applicable law. Please note, however, that certain information may be exempt from such requests in some circumstances, which may include if we need to keep processing your information for our legitimate interests or to comply with a legal obligation. We may request you provide us with information necessary to confirm your identity before responding to your request.
Residents of France and certain other jurisdictions may also provide us with instructions regarding the manner in which we may continue to store, erase and share your information after your death, and where applicable, the person you have designated to exercise these rights after your death.
How We Protect Privacy Online
We take steps to protect your privacy when you use our web site – www.guggenheiminvestments.com – by using secure forms of online communication, including encryption technology, Secure Socket Layer (SSL) protocol, firewalls and user names and
| | THE GUGGENHEIM FUNDS SEMI-ANNUAL REPORT | 77 |
GUGGENHEIM INVESTMENTS PRIVACY NOTICE (Unaudited)(concluded) |
passwords. These safeguards vary based on the sensitivity of the information that we collect and store. However, we cannot and do not guarantee that these measures will prevent every unauthorized attempt to access, use, or disclose your information since despite our efforts, no Internet and/or other electronic transmissions can be completely secure. Our web site uses “http cookies”—tiny pieces of information that we ask your browser to store. We use cookies for session management and security features on the Guggenheim Investments web site. We do not use them to pull data from your hard drive, to learn your e-mail address, or to view data in cookies created by other web sites. We will not share the information in our cookies or give others access to it. See the legal information area on our web site for more details about web site security and privacy features.
How We Safeguard Your Personal Information and Data Retention
We restrict access to nonpublic personal information about you to our employees and in some cases to third parties (for example, the service providers described above) as permitted by law. We maintain strict physical, electronic and procedural safeguards that comply with federal standards to guard your nonpublic personal information.
We keep your information for no longer than necessary for the purposes for which it is processed. The length of time for which we retain information depends on the purposes for which we collected and use it and/or as required to comply with applicable laws. Information may persist in copies made for backup and business continuity purposes for additional time.
International Visitors
If you are not a resident of the United States, please be aware that your information may be transferred to, stored and processed in the United States where our servers are located and our databases are operated. The data protection and other laws of the United States and other countries might not be as comprehensive as those in your country.
In such cases, we ensure that a legal basis for such a transfer exists and that adequate protection is provided as required by applicable law, for example, by using standard contractual clauses or by transferring your data to a jurisdiction that has obtained an adequacy finding. Individuals whose data may be transferred on the basis of standard contractual clauses may contact us as described below.
We’ll Keep You Informed
If you have any questions or concerns about how we treat your personal data, we encourage you to consult with us first. You may also contact the relevant supervisory authority. We reserve the right to modify this policy at any time and will inform you promptly of material changes. You may access our privacy policy from our web site at www.guggenheiminvestments.com. Should you have any questions regarding our privacy policy, contact us by email at
CorporateDataPrivacy@GuggenheimPartners.com.
78 | THE GUGGENHEIM FUNDS SEMI-ANNUAL REPORT | |
This page intentionally left blank.
This page intentionally left blank.
This page intentionally left blank.
3.31.2024
Guggenheim Funds Semi-Annual Report
Guggenheim SMid Cap Value Fund | | |
GuggenheimInvestments.com | SBMCV-SEMI-0324x0924 |
| | |
DEAR SHAREHOLDER | 2 |
ECONOMIC AND MARKET OVERVIEW | 3 |
ABOUT SHAREHOLDERS’ FUND EXPENSES | 5 |
SMID CAP VALUE FUND | 8 |
NOTES TO FINANCIAL STATEMENTS | 23 |
OTHER INFORMATION | 32 |
INFORMATION ON BOARD OF TRUSTEES AND OFFICERS | 34 |
GUGGENHEIM INVESTMENTS PRIVACY NOTICE | 44 |
| | THE GUGGENHEIM FUNDS SEMI-ANNUAL REPORT | 1 |
Dear Shareholder:
Security Investors, LLC (the “Investment Adviser”) is pleased to present the shareholder report for Guggenheim SMid Cap Value Fund (the “Fund”) for the semi-annual period ended March 31, 2024 (the “Reporting Period”).
The Investment Adviser is part of Guggenheim Investments, which represents the investment management businesses of Guggenheim Partners, LLC (“Guggenheim”), a global, diversified financial services firm.
Guggenheim Funds Distributors, LLC is the distributor of the Fund. Guggenheim Funds Distributors, LLC is affiliated with Guggenheim and the Investment Adviser.
We encourage you to read the Economic and Market Overview section of the report, which follows this letter.
We are committed to providing innovative investment solutions and appreciate the trust you place in us.
Sincerely,
Security Investors, LLC
April 30, 2024
Read a prospectus and summary prospectus (if available) carefully before investing. It contains the investment objectives, risks, charges, expenses and other information, which should be considered carefully before investing. Obtain a prospectus and summary prospectus (if available) at guggenheiminvestments.com or call 800.820.0888.
This material is not intended as a recommendation or as investment advice of any kind, including in connection with rollovers, transfers, and distributions. Such material is not provided in a fiduciary capacity, may not be relied upon for or in connection with the making of investment decisions, and does not constitute a solicitation of an offer to buy or sell securities. All content has been provided for informational or educational purposes only and is not intended to be and should not be construed as legal or tax advice and/or a legal opinion. Always consult a financial, tax and/or legal professional regarding your specific situation.
SMid Cap Value Fund may not be suitable for all investors. ● An investment in the Fund will fluctuate and is subject to investment risks, which means investors could lose money. ● There can be no guarantee the Fund will achieve its investment objective. ● The intrinsic value of the underlying stocks may never be realized, or the stock may decline in value. ● Investments in small- and/or mid-sized company securities may present additional risks such as less predictable earnings, higher volatility and less liquidity than larger, more established companies. ● You may have a gain or loss when you sell your shares. ● The Fund is subject to active trading risks that may increase volatility and impact its ability to achieve its investment objective. ● It is important to note that the Fund is not guaranteed by the U.S. government. ● Please read the prospectus for more detailed information regarding these and other risks
2 | THE GUGGENHEIM FUNDS SEMI-ANNUAL REPORT | |
ECONOMIC AND MARKET OVERVIEW (Unaudited) | March 31, 2024 |
While job growth remains robust, recent labor data brought increased confidence in a labor market in better balance, allowing for inflation to soften further. Labor force growth remains strong, aided by high immigration flows, helping bring labor supply in line with gradually cooling demand. The Small Business Survey indicates that plans to increase compensation have returned to pre-COVID levels. Additionally, Bureau of Labor Statistics data reveal a continued decline in the “quits rate,” reducing the pressure on businesses to raise wages to attract or retain employees. These developments suggest wage pressures may ease further by year end. And despite some speculation against any Federal Reserve (“Fed”) rate cuts materializing in 2024, we continue to anticipate cuts later this year.
Following the stronger-than-expected March Consumer Price Index, we believe that there is a high probability that the easing cycle will start in the second half of the year, since the Fed will likely need more time to gather confirming data. In the latest Summary of Economic Projections, the Federal Open Market Committee (“FOMC”) significantly increased the median forecast for 2024 U.S. gross domestic product, slightly increased it for core personal consumption expenditures year over year, and continues to expect no material increase in the unemployment rate. These adjustments left the median view for three rate cuts for 2024, which suggests the bar is very high for the Fed to keep rates where they are all year, and even higher for more rate hikes to materialize.
Amid this macroeconomic backdrop, in the first quarter of 2024 the two-year Treasury yield increased to 4.59% from 4.23%, and the 10-year Treasury yield increased to 4.20% from 3.88%, keeping the inverted 2s/10s yield curve consistent at 39 basis points as of the end of the Reporting Period, up four basis points since the start of the year. One basis point equals 0.01%. In general, spreads to Treasurys have remained tight across sectors. In investment-grade corporate bonds, BBB-rated bonds continued to remain attractive relative to A and BB-rated bonds, and supply slowed toward the end of the first quarter of 2024, which we believe should support spreads in the near term. High yield bond spreads tightened during the first quarter of 2024 to 301 basis points from 323 basis points at the start of the year, while leveraged loans’ discount margins to maturity tightened to 509 basis points from 528 basis points. Structured credit spreads tightened marginally amid strong demand. Investor demand and an improved arbitrage led to robust new collateralized loan obligation issuance, and tightening liabilities led to an increase in refinances/resets.
Looking forward, Fed officials continue to advocate for a patient approach. A conventional easing cycle is therefore far from guaranteed. Market expectations have already adjusted significantly from market-implied expectations of six rate cuts in 2024 just two months ago to only three as of the end of the Reporting Period, aligning more closely with the FOMC’s views. So far, the market has taken this delay in stride, but its patience and assessment of credit risk could be tested.
For the Reporting Period, the S&P 500® Index* returned 23.48%. The MSCI Europe-Australasia-Far East (“EAFE”) Index* returned 17.01%. The return of the MSCI Emerging Markets Index* was 10.56%.
| | THE GUGGENHEIM FUNDS SEMI-ANNUAL REPORT | 3 |
ECONOMIC AND MARKET OVERVIEW (Unaudited)(concluded) | March 31, 2024 |
In the bond market, the Bloomberg U.S. Aggregate Bond Index* posted a 5.99% return for the Reporting Period, while the Bloomberg U.S. Corporate High Yield Index* returned 8.75%. The return of the ICE Bank of America (“BofA”) 3-Month U.S. Treasury Bill Index* was 2.69% for the Reporting Period.
The opinions and forecasts expressed may not actually come to pass. This information is subject to change at any time, based on market and other conditions, and should not be construed as a recommendation of any specific security or strategy.
*Index Definitions:
The following indices are referenced throughout this report. Indices are unmanaged and not available for direct investment. Index performance does not reflect transaction costs, fees, or expenses.
Bloomberg U.S. Aggregate Bond Index is a broad-based flagship benchmark that measures the investment grade, U.S. dollar-denominated, fixed-rate taxable bond market, including U.S. Treasuries, government-related and corporate securities, mortgage-backed securities or “MBS” (agency fixed-rate and hybrid adjustable-rate mortgage, or “ARM”, pass-throughs), asset-backed securities (“ABS”), and commercial mortgage-backed securities (“CMBS”) (agency and non-agency).
Bloomberg U.S. Corporate High Yield Index measures the U.S. dollar-denominated, high yield, fixed-rate corporate bond market. Securities are classified as high yield if the middle rating of Moody’s, Fitch, and S&P is Ba1/BB +/BB + or below.
ICE BofA 3-Month U.S. Treasury Bill Index is an unmanaged market index of U.S. Treasury securities maturing in 90 days that assumes reinvestment of all income.
MSCI EAFE Index is a free float-adjusted market capitalization index that is designed to measure the equity market performance of developed markets, excluding the U.S. & Canada.
MSCI Emerging Markets Index is a free float-adjusted market capitalization weighted index that is designed to measure equity market performance in the global emerging markets.
Russell 2500® Value Index measures the performance of the small-to mid-cap value segment of the U.S. equity universe. It includes those Russell 2500 companies with lower price-to-book ratios and lower forecasted growth values.
S&P 500® Index is a broad-based index, the performance of which is based on the performance of 500 widely held common stocks chosen for market size, liquidity, and industry group representation.
4 | THE GUGGENHEIM FUNDS SEMI-ANNUAL REPORT | |
ABOUT SHAREHOLDERS’ FUND EXPENSES (Unaudited) |
All mutual funds have operating expenses, and it is important for our shareholders to understand the impact of costs on their investments. Shareholders of a fund incur two types of costs: (i) transaction costs, including sales charges (loads) on purchase payments, reinvested dividends, other distributions, and exchange fees, and (ii) ongoing costs, including management fees, administrative services, and shareholder reports, among others. These ongoing costs, or operating expenses, are deducted from a fund’s gross income and reduce the investment return of the fund.
A fund’s expenses are expressed as a percentage of its average net assets, which is known as the expense ratio. The following examples are intended to help investors understand the ongoing costs (in dollars) of investing in a fund and to compare these costs with the ongoing costs of investing in other mutual funds.
The examples are based on an investment of $1,000 made at the beginning of the period and held for the entire six-month period beginning September 30, 2023 and ending March 31, 2024.
The following tables illustrate the Fund’s costs in two ways:
Table 1. Based on actual Fund return: This section helps investors estimate the actual expenses paid over the period. The “Ending Account Value” shown is derived from the Fund’s actual return, and the fifth column shows the dollar amount that would have been paid by an investor who started with $1,000 in the Fund. Investors may use the information here, together with the amount invested, to estimate the expenses paid over the period. Simply divide the Fund’s account value by $1,000 (for example, an $8,600 account value divided by $1,000 = 8.6), then multiply the result by the number provided under the heading “Expenses Paid During Period.”
Table 2. Based on hypothetical 5% return: This section is intended to help investors compare a fund’s cost with those of other mutual funds. The table provides information about hypothetical account values and hypothetical expenses based on the Fund’s actual expense ratio and an assumed rate of return of 5% per year before expenses, which is not the Fund’s actual return. The hypothetical account values and expenses may not be used to estimate the actual ending account balance or expenses paid during the period. The example is useful in making comparisons because the U.S. Securities and Exchange Commission (the “SEC”) requires all mutual funds to calculate expenses based on the 5% return. Investors can assess a Fund’s costs by comparing this hypothetical example with the hypothetical examples that appear in shareholder reports of other funds.
The calculations illustrated above assume no shares were bought or sold during the period. Actual costs may have been higher or lower, depending on the amount of investment and the timing of any purchases or redemptions.
| | THE GUGGENHEIM FUNDS SEMI-ANNUAL REPORT | 5 |
ABOUT SHAREHOLDERS’ FUND EXPENSES (Unaudited)(continued) |
Please note that the expenses shown in the table are meant to highlight your ongoing costs only and do not reflect any transactional costs, such as sales charges (loads) on purchase payments, and contingent deferred sales charges (“CDSC”) on redemptions, if any. Therefore, the second table is useful in comparing ongoing costs only, and will not help you determine the relative total costs of owning different funds. In addition, if these transactional costs were included, your costs would have been higher.
More information about the Fund’s expenses, including annual expense ratios for periods up to five years (subject to the Fund’s inception date), can be found in the Financial Highlights section of this report. For additional information on operating expenses and other shareholder costs, please refer to the Fund’s prospectus.
6 | THE GUGGENHEIM FUNDS SEMI-ANNUAL REPORT | |
ABOUT SHAREHOLDERS’ FUND EXPENSES (Unaudited)(concluded) |
| Expense
Ratio1 | Fund
Return | Beginning
Account Value
September 30,
2023 | Ending
Account Value
March 31,
2024 | Expenses
Paid During
Period2 |
Table 1. Based on actual Fund return3 |
Class A | 1.19% | 16.99% | $ 1,000.00 | $ 1,169.90 | $ 6.46 |
Class C | 2.03% | 16.49% | 1,000.00 | 1,164.90 | 10.99 |
Class P | 1.21% | 16.97% | 1,000.00 | 1,169.70 | 6.56 |
Institutional Class | 0.92% | 17.09% | 1,000.00 | 1,170.90 | 4.99 |
| | | | | |
Table 2. Based on hypothetical 5% return (before expenses) |
Class A | 1.19% | 5.00% | $ 1,000.00 | $ 1,019.05 | $ 6.01 |
Class C | 2.03% | 5.00% | 1,000.00 | 1,014.85 | 10.23 |
Class P | 1.21% | 5.00% | 1,000.00 | 1,018.95 | 6.11 |
Institutional Class | 0.92% | 5.00% | 1,000.00 | 1,020.40 | 4.65 |
1 | Annualized and excludes expenses of the underlying funds in which the Fund invests, if any. |
2 | Expenses are equal to the Fund’s annualized expense ratio, net of any applicable fee waivers, multiplied by the average account value over the period, multiplied by 183/366 (to reflect the one-half year period). |
3 | Actual cumulative return at net asset value for the period September 30, 2023 to March 31, 2024. |
| | THE GUGGENHEIM FUNDS SEMI-ANNUAL REPORT | 7 |
PERFORMANCE REPORT AND FUND PROFILE (Unaudited) | March 31, 2024 |
SMID CAP VALUE FUND
OBJECTIVE: Seeks long-term growth of capital.
Holdings Diversification (Market Exposure as % of Net Assets)
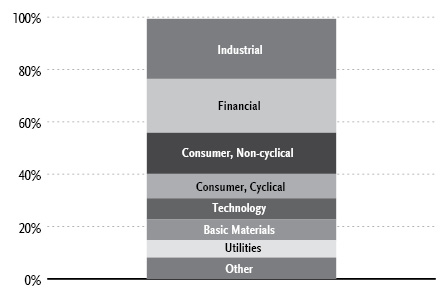
“Holdings Diversification (Market Exposure as % of Net Assets)” excludes any temporary cash investments.
Inception Dates: |
Class A | May 1, 1997 |
Class C | January 29, 1999 |
Class P | May 1, 2015 |
Institutional Class | January 3, 2020 |
Ten Largest Holdings | % of Total Net Assets |
Unum Group | 2.8% |
Teledyne Technologies, Inc. | 2.3% |
Pinnacle West Capital Corp. | 2.1% |
MGP Ingredients, Inc. | 2.1% |
Evergy, Inc. | 2.1% |
Old Republic International Corp. | 2.1% |
Jefferies Financial Group, Inc. | 2.1% |
Graphic Packaging Holding Co. | 2.0% |
Stifel Financial Corp. | 2.0% |
Diamondback Energy, Inc. | 2.0% |
Top Ten Total | 21.6% |
| | |
“Ten Largest Holdings” excludes any temporary cash investments. |
8 | THE GUGGENHEIM FUNDS SEMI-ANNUAL REPORT | |
PERFORMANCE REPORT AND FUND PROFILE (Unaudited)(concluded) | March 31, 2024 |
Average Annual Returns*
Periods Ended March 31, 2024
| 6 Month† | 1 Year | 5 Year | 10 Year |
Class A Shares | 16.99% | 15.72% | 10.66% | 7.65% |
Class A Shares with sales charge‡ | 11.45% | 10.24% | 9.59% | 7.13% |
Class C Shares | 16.49% | 14.75% | 9.75% | 6.80% |
Class C Shares with CDSC§ | 15.49% | 13.75% | 9.75% | 6.80% |
Institutional Class Shares1 | 17.09% | 15.95% | 11.00% | 8.02% |
Russell 2500 Value Index | 20.66% | 21.33% | 9.38% | 7.68% |
| 6 Month† | 1 Year | 5 Year | Since
Inception
(05/01/15) |
Class P Shares | 16.97% | 15.66% | 10.59% | 8.82% |
Russell 2500 Value Index | 20.66% | 21.33% | 9.38% | 7.99% |
* | The performance data above represents past performance that is not predictive of future results. The investment return and principal value of an investment in the Fund will fluctuate so that an investor’s shares, when redeemed, may be worth more or less than their original cost. Returns are historical and include changes in principal and reinvested dividends and capital gains and do not reflect the effect of taxes. The Russell 2500 Value Index is an unmanaged index and, unlike the Fund, has no management fees or operating expenses to reduce its reported return. |
1 | The Institutional Class shares commenced operations on January 3, 2020 in connection with the reorganization of the SMid Cap Value Institutional Fund. The performance of the Institutional Class shares of the Fund for periods prior to January 3, 2020 reflects the performance of the Guggenheim SMid Cap Value Institutional Fund. The returns for the SMid Cap Value Institutional Fund have not been restated to reflect the fees and expenses applicable to the Institutional Class shares of the Fund. The SMid Cap Value Institutional Fund commenced operations on July 11, 2008. |
† | 6 month returns are not annualized. |
‡ | Fund returns are calculated using the maximum sales charge of 4.75%. |
§ | Fund returns include a CDSC of 1% if redeemed within 12 months of purchase. |
| | THE GUGGENHEIM FUNDS SEMI-ANNUAL REPORT | 9 |
SCHEDULE OF INVESTMENTS (Unaudited) | March 31, 2024 |
SMID CAP VALUE FUND | |
| | Shares | | | Value | |
COMMON STOCKS† - 99.4% |
| | | | | | | | | |
Industrial - 23.0% |
Teledyne Technologies, Inc.* | | | 21,670 | | | $ | 9,303,364 | |
Graphic Packaging Holding Co. | | | 279,720 | | | | 8,162,230 | |
Curtiss-Wright Corp. | | | 27,782 | | | | 7,110,525 | |
Summit Materials, Inc. — Class A* | | | 141,380 | | | | 6,301,307 | |
Kirby Corp.* | | | 64,915 | | | | 6,187,698 | |
Knight-Swift Transportation Holdings, Inc. | | | 99,408 | | | | 5,469,428 | |
Johnson Controls International plc | | | 76,754 | | | | 5,013,571 | |
Daseke, Inc.* | | | 576,933 | | | | 4,788,544 | |
Arcosa, Inc. | | | 55,422 | | | | 4,758,533 | |
Coherent Corp.* | | | 77,157 | | | | 4,677,257 | |
Esab Corp. | | | 41,571 | | | | 4,596,505 | |
Advanced Energy Industries, Inc. | | | 42,919 | | | | 4,376,880 | |
MDU Resources Group, Inc. | | | 160,895 | | | | 4,054,554 | |
Park Aerospace Corp. | | | 174,887 | | | | 2,908,371 | |
NEXTracker, Inc. — Class A* | | | 44,013 | | | | 2,476,611 | |
Littelfuse, Inc. | | | 9,911 | | | | 2,401,931 | |
Timken Co. | | | 24,565 | | | | 2,147,718 | |
Sonoco Products Co. | | | 34,129 | | | | 1,974,021 | |
GATX Corp. | | | 8,247 | | | | 1,105,345 | |
NVE Corp. | | | 11,642 | | | | 1,049,876 | |
A O Smith Corp. | | | 11,110 | | | | 993,901 | |
Regal Rexnord Corp. | | | 5,480 | | | | 986,948 | |
Stoneridge, Inc.* | | | 41,338 | | | | 762,273 | |
Total Industrial | | | 91,607,391 | |
| | | | | | | | | |
Financial - 20.6% |
Unum Group | | | 205,355 | | | | 11,019,349 | |
Old Republic International Corp. | | | 266,805 | | | | 8,196,250 | |
Jefferies Financial Group, Inc. | | | 185,403 | | | | 8,176,272 | |
Stifel Financial Corp. | | | 104,308 | | | | 8,153,757 | |
Markel Group, Inc.* | | | 4,955 | | | | 7,538,933 | |
First Merchants Corp. | | | 169,562 | | | | 5,917,714 | |
Alexandria Real Estate Equities, Inc. REIT | | | 45,826 | | | | 5,907,430 | |
Prosperity Bancshares, Inc. | | | 74,846 | | | | 4,923,370 | |
Jones Lang LaSalle, Inc.* | | | 21,074 | | | | 4,111,327 | |
Stewart Information Services Corp. | | | 49,893 | | | | 3,246,039 | |
Apple Hospitality REIT, Inc. | | | 191,498 | | | | 3,136,737 | |
WisdomTree, Inc. | | | 285,549 | | | | 2,624,195 | |
Synovus Financial Corp. | | | 61,975 | | | | 2,482,718 | |
Axos Financial, Inc.* | | | 42,006 | | | | 2,270,004 | |
BOK Financial Corp. | | | 24,063 | | | | 2,213,796 | |
First Horizon Corp. | | | 135,452 | | | | 2,085,961 | |
Total Financial | | | 82,003,852 | |
| | | | | | | | | |
Consumer, Non-cyclical - 15.7% |
MGP Ingredients, Inc. | | | 98,283 | | | | 8,465,115 | |
Encompass Health Corp. | | | 96,089 | | | | 7,935,030 | |
Ingredion, Inc. | | | 66,822 | | | | 7,808,151 | |
Euronet Worldwide, Inc.* | | | 66,598 | | | | 7,321,118 | |
Enovis Corp.* | | | 108,056 | | | | 6,748,097 | |
Integer Holdings Corp.* | | | 53,596 | | | | 6,253,581 | |
Central Garden & Pet Co. — Class A* | | | 110,835 | | | | 4,092,028 | |
RadNet, Inc.* | | | 66,669 | | | | 3,244,113 | |
ICF International, Inc. | | | 19,374 | | | | 2,918,306 | |
LivaNova plc* | | | 39,390 | | | | 2,203,477 | |
Azenta, Inc.* | | | 33,889 | | | | 2,042,829 | |
Certara, Inc.* | | | 109,254 | | | | 1,953,461 | |
Ginkgo Bioworks Holdings, Inc.* | | | 1,169,788 | | | | 1,356,954 | |
Total Consumer, Non-cyclical | | | 62,342,260 | |
| | | | | | | | | |
10 | THE GUGGENHEIM FUNDS SEMI-ANNUAL REPORT | SEE NOTES TO FINANCIAL STATEMENTS. |
SCHEDULE OF INVESTMENTS (Unaudited)(continued) | March 31, 2024 |
SMID CAP VALUE FUND | |
| | Shares | | | Value | |
Consumer, Cyclical - 9.3% |
H&E Equipment Services, Inc. | | | 115,711 | | | $ | 7,426,332 | |
MSC Industrial Direct Company, Inc. — Class A | | | 53,460 | | | | 5,187,758 | |
Crocs, Inc.* | | | 28,304 | | | | 4,070,115 | |
Whirlpool Corp. | | | 28,650 | | | | 3,427,399 | |
Sonic Automotive, Inc. — Class A | | | 56,308 | | | | 3,206,177 | |
Ralph Lauren Corp. — Class A | | | 13,201 | | | | 2,478,620 | |
Advance Auto Parts, Inc. | | | 28,844 | | | | 2,454,336 | |
AutoNation, Inc.* | | | 13,370 | | | | 2,213,805 | |
Lear Corp. | | | 14,734 | | | | 2,134,662 | |
Lakeland Industries, Inc. | | | 82,219 | | | | 1,504,608 | |
Newell Brands, Inc. | | | 141,095 | | | | 1,132,993 | |
Century Communities, Inc. | | | 11,018 | | | | 1,063,237 | |
Methode Electronics, Inc. | | | 68,189 | | | | 830,542 | |
Total Consumer, Cyclical | | | 37,130,584 | |
| | | | | | | | | |
Technology - 8.1% |
Evolent Health, Inc. — Class A* | | | 213,537 | | | | 7,001,878 | |
Teradyne, Inc. | | | 59,776 | | | | 6,744,526 | |
Leidos Holdings, Inc. | | | 45,214 | | | | 5,927,103 | |
Science Applications International Corp. | | | 43,533 | | | | 5,676,268 | |
MACOM Technology Solutions Holdings, Inc.* | | | 50,130 | | | | 4,794,434 | |
Wolfspeed, Inc.* | | | 71,482 | | | | 2,108,719 | |
Total Technology | | | 32,252,928 | |
| | | | | | | | | |
Basic Materials - 7.9% |
Reliance, Inc. | | | 20,537 | | | | 6,863,054 | |
Westlake Corp. | | | 36,815 | | | | 5,625,332 | |
Nucor Corp. | | | 24,912 | | | | 4,930,085 | |
Avient Corp. | | | 109,330 | | | | 4,744,922 | |
Ashland, Inc. | | | 41,548 | | | | 4,045,529 | |
Huntsman Corp. | | | 111,621 | | | | 2,905,494 | |
MP Materials Corp.* | | | 169,089 | | | | 2,417,973 | |
Total Basic Materials | | | 31,532,389 | |
| | | | | | | | | |
Utilities - 6.7% |
Pinnacle West Capital Corp. | | | 113,431 | | | | 8,476,699 | |
Evergy, Inc. | | | 154,154 | | | | 8,228,741 | |
OGE Energy Corp. | | | 233,750 | | | | 8,017,625 | |
Black Hills Corp. | | | 35,919 | | | | 1,961,177 | |
Total Utilities | | | 26,684,242 | |
| | | | | | | | | |
Energy - 6.7% |
Diamondback Energy, Inc. | | | 40,485 | | | | 8,022,913 | |
Murphy Oil Corp. | | | 98,302 | | | | 4,492,401 | |
Liberty Energy, Inc. — Class A | | | 165,250 | | | | 3,423,980 | |
Equities Corp. | | | 73,308 | | | | 2,717,528 | |
Talos Energy, Inc.* | | | 188,175 | | | | 2,621,278 | |
Kinder Morgan, Inc. | | | 112,598 | | | | 2,065,047 | |
Range Resources Corp. | | | 56,484 | | | | 1,944,744 | |
Patterson-UTI Energy, Inc. | | | 116,563 | | | | 1,391,761 | |
HydroGen Corp.*,†††,1 | | | 1,265,700 | | | | 2 | |
Total Energy | | | 26,679,654 | |
| | | | | | | | | |
Communications - 1.4% |
Ciena Corp.* | | | 47,396 | | | | 2,343,732 | |
Calix, Inc.* | | | 65,690 | | | | 2,178,281 | |
Luna Innovations, Inc.* | | | 278,235 | | | | 891,743 | |
Total Communications | | | 5,413,756 | |
| | | | | | | | | |
Total Common Stocks |
(Cost $310,461,694) | | | | | | | 395,647,056 | |
| | | | | | | | | |
CONVERTIBLE PREFERRED STOCKS††† - 0.0% |
Industrial - 0.0% |
Thermoenergy Corp.*,2 | | | 1,652,084 | | | | 482 | |
Total Convertible Preferred Stocks |
(Cost $1,577,634) | | | | | | | 482 | |
| | | | | | | | | |
SEE NOTES TO FINANCIAL STATEMENTS. | THE GUGGENHEIM FUNDS SEMI-ANNUAL REPORT | 11 |
SCHEDULE OF INVESTMENTS (Unaudited)(continued) | March 31, 2024 |
SMID CAP VALUE FUND | |
| | Shares | | | Value | |
RIGHTS† - 0.0% |
Basic Materials - 0.0% |
Pan American Silver Corp. | | | | | | | | |
| | | | 516,551 | | | $ | 231,415 | |
Total Rights |
(Cost $—) | | | | | | | 231,415 | |
| | | | | | | | | |
MONEY MARKET FUND† - 0.6% |
Dreyfus Treasury Securities Cash Management Fund — Institutional Shares, 5.19%3 | | | 2,206,178 | | | | 2,206,178 | |
Total Money Market Fund |
(Cost $2,206,178) | | | | | | | 2,206,178 | |
| | | | | | | | | |
Total Investments - 100.0% |
(Cost $314,245,506) | | $ | 398,085,131 | |
Other Assets & Liabilities, net - 0.0% | | | 553 | |
Total Net Assets - 100.0% | | $ | 398,085,684 | |
* | Non-income producing security. |
† | Value determined based on Level 1 inputs, unless otherwise noted — See Note 4. |
††† | Value determined based on Level 3 inputs — See Note 4. |
1 | Affiliated issuer. |
2 | PIPE (Private Investment in Public Equity) — Stock issued by a company in the secondary market as a means of raising capital more quickly and less expensively than through registration of a secondary public offering. |
3 | Rate indicated is the 7-day yield as of March 31, 2024. |
| | plc — Public Limited Company |
| | REIT — Real Estate Investment Trust |
| | |
| | See Sector Classification in Other Information section. |
12 | THE GUGGENHEIM FUNDS SEMI-ANNUAL REPORT | SEE NOTES TO FINANCIAL STATEMENTS. |
SCHEDULE OF INVESTMENTS (Unaudited)(concluded) | March 31, 2024 |
SMID CAP VALUE FUND | |
The following table summarizes the inputs used to value the Fund’s investments at March 31, 2024 (See Note 4 in the Notes to Financial Statements):
Investments in Securities (Assets) | | Level 1
Quoted
Prices | | | Level 2
Significant
Observable
Inputs | | | Level 3
Significant
Unobservable
Inputs | | | Total | |
Common Stocks | | $ | 395,647,054 | | | $ | — | | | $ | 2 | | | $ | 395,647,056 | |
Convertible Preferred Stocks | | | — | | | | — | | | | 482 | | | | 482 | |
Rights | | | 231,415 | | | | — | | | | — | | | | 231,415 | |
Money Market Fund | | | 2,206,178 | | | | — | | | | — | | | | 2,206,178 | |
Total Assets | | $ | 398,084,647 | | | $ | — | | | $ | 484 | | | $ | 398,085,131 | |
Affiliated Transactions
Investments representing 5% or more of the outstanding voting shares of a company, or control of or by, or common control under Guggenheim Investments, result in that company being considered an affiliated issuer, as defined in the 1940 Act.
Transactions during the period ended March 31, 2024, in which the company is an affiliated issuer, were as follows:
Security Name | | Value
09/30/23 | | | Additions | | | Reductions | | | Realized
Gain (Loss) | | | Change in
Unrealized
Appreciation
(Depreciation) | | | Value
03/31/24 | | | Shares
03/31/24 | |
Common Stocks | | | | | | | | | | | | | | | | | | | | | | | | | | | | |
HydroGen Corp.* | | $ | 2 | | | $ | — | | | $ | — | | | $ | — | | | $ | — | | | $ | 2 | | | | 1,265,700 | |
* | Non-income producing security. |
SEE NOTES TO FINANCIAL STATEMENTS. | THE GUGGENHEIM FUNDS SEMI-ANNUAL REPORT | 13 |
STATEMENT OF ASSETS AND LIABILITIES (Unaudited) |
SMID CAP VALUE FUND |
March 31, 2024
Assets: |
Investments in unaffiliated issuers, at value (cost $314,242,975) | | $ | 398,085,129 | |
Investments in affiliated issuers, at value (cost $2,531) | | | 2 | |
Cash | | | 48,999 | |
Prepaid expenses | | | 44,154 | |
Receivables: |
Dividends | | | 383,398 | |
Interest | | | 12,366 | |
Fund shares sold | | | 6,951 | |
Foreign tax reclaims | | | 302 | |
Total assets | | | 398,581,301 | |
| | | | | |
Liabilities: |
Payable for: |
Management fees | | | 230,241 | |
Fund shares redeemed | | | 138,730 | |
Distribution and service fees | | | 66,725 | |
Transfer agent fees | | | 34,104 | |
Fund accounting and administration fees | | | 4,516 | |
Trustees’ fees* | | | 1,254 | |
Due to Investment Adviser | | | 200 | |
Miscellaneous | | | 19,847 | |
Total liabilities | | | 495,617 | |
Net assets | | $ | 398,085,684 | |
| | | | | |
Net assets consist of: |
Paid in capital | | $ | 297,997,004 | |
Total distributable earnings (loss) | | | 100,088,680 | |
Net assets | | $ | 398,085,684 | |
| |
Class A: |
Net assets | | $ | 299,623,814 | |
Capital shares outstanding | | | 7,481,017 | |
Net asset value per share | | $ | 40.05 | |
Maximum offering price per share (Net asset value divided by 95.25%) | | $ | 42.05 | |
| |
Class C: |
Net assets | | $ | 4,162,901 | |
Capital shares outstanding | | | 173,156 | |
Net asset value per share | | $ | 24.04 | |
| |
Class P: |
Net assets | | $ | 5,081,176 | |
Capital shares outstanding | | | 127,953 | |
Net asset value per share | | $ | 39.71 | |
| | | | | |
Institutional Class: |
Net assets | | $ | 89,217,793 | |
Capital shares outstanding | | | 10,227,695 | |
Net asset value per share | | $ | 8.72 | |
* | Relates to Trustees not deemed “interested persons” within the meaning of Section 2(a)(19) of the 1940 Act. |
14 | THE GUGGENHEIM FUNDS SEMI-ANNUAL REPORT | SEE NOTES TO FINANCIAL STATEMENTS. |
STATEMENT OF OPERATIONS (Unaudited) |
SMID CAP VALUE FUND |
Six Months Ended March 31, 2024
Investment Income: |
Dividends from securities of unaffiliated issuers | | $ | 3,588,815 | |
Interest from securities of unaffiliated issuers | | | 125,970 | |
Total investment income | | | 3,714,785 | |
| | | | | |
Expenses: |
Management fees | | | 1,393,767 | |
Distribution and service fees: |
Class A | | | 349,428 | |
Class C | | | 20,075 | |
Class P | | | 6,530 | |
Transfer agent fees: |
Class A | | | 198,486 | |
Class C | | | 4,023 | |
Class P | | | 3,958 | |
Institutional Class | | | 49,050 | |
Fund accounting and administration fees | | | 77,520 | |
Professional fees | | | 30,178 | |
Trustees’ fees* | | | 9,446 | |
Line of credit fees | | | 7,176 | |
Custodian fees | | | 4,199 | |
Miscellaneous | | | 48,538 | |
Recoupment of previously waived fees: |
Class C | | | 1,138 | |
Total expenses | | | 2,203,512 | |
Less: |
Expenses reimbursed by Adviser: |
Class A | | | (12,072 | ) |
Class C | | | (819 | ) |
Class P | | | (133 | ) |
Institutional Class | | | (3,031 | ) |
Expenses waived by Adviser | | | (65,816 | ) |
Total waived/reimbursed expenses | | | (81,871 | ) |
Net expenses | | | 2,121,641 | |
Net investment income | | | 1,593,144 | |
| | | | | |
Net Realized and Unrealized Gain (Loss): |
Net realized gain (loss) on: |
Investments in unaffiliated issuers | | $ | 14,779,448 | |
Net realized gain | | | 14,779,448 | |
Net change in unrealized appreciation (depreciation) on: |
Investments in unaffiliated issuers | | | 42,876,287 | |
Net change in unrealized appreciation (depreciation) | | | 42,876,287 | |
Net realized and unrealized gain | | | 57,655,735 | |
Net increase in net assets resulting from operations | | $ | 59,248,879 | |
* | Relates to Trustees not deemed “interested persons” within the meaning of Section 2(a)(19) of the 1940 Act. |
SEE NOTES TO FINANCIAL STATEMENTS. | THE GUGGENHEIM FUNDS SEMI-ANNUAL REPORT | 15 |
STATEMENTS OF CHANGES IN NET ASSETS |
SMID CAP VALUE FUND | |
| | Six Months Ended
March 31, 2024
(Unaudited) | | | Year Ended
September 30,
2023 | |
Increase (Decrease) in Net Assets from Operations: | | | | | | | | |
Net investment income | | $ | 1,593,144 | | | $ | 4,203,907 | |
Net realized gain on investments | | | 14,779,448 | | | | 12,000,716 | |
Net change in unrealized appreciation (depreciation) on investments | | | 42,876,287 | | | | 29,280,726 | |
Net increase in net assets resulting from operations | | | 59,248,879 | | | | 45,485,349 | |
| | | | | | | | | |
Distributions to shareholders: | | | | | | | | |
Class A | | | (4,519,035 | ) | | | (15,287,730 | ) |
Class C | | | (90,028 | ) | | | (400,511 | ) |
Class P | | | (83,545 | ) | | | (319,757 | ) |
Institutional Class | | | (6,882,413 | ) | | | (17,898,014 | ) |
Total distributions to shareholders | | | (11,575,021 | ) | | | (33,906,012 | ) |
| | | | | | | | | |
Capital share transactions: | | | | | | | | |
Proceeds from sale of shares | | | | | | | | |
Class A | | | 2,879,700 | | | | 9,197,883 | |
Class C | | | 64,168 | | | | 485,848 | |
Class P | | | 44,986 | | | | 151,281 | |
Institutional Class | | | 10,850,568 | | | | 21,824,839 | |
Distributions reinvested | | | | | | | | |
Class A | | | 4,392,317 | | | | 14,853,499 | |
Class C | | | 83,920 | | | | 379,175 | |
Class P | | | 83,545 | | | | 319,757 | |
Institutional Class | | | 5,463,438 | | | | 13,919,483 | |
Cost of shares redeemed | | | | | | | | |
Class A | | | (20,785,557 | ) | | | (32,127,530 | ) |
Class C | | | (704,382 | ) | | | (2,161,822 | ) |
Class P | | | (1,069,413 | ) | | | (1,145,194 | ) |
Institutional Class | | | (14,255,102 | ) | | | (29,487,889 | ) |
Net decrease from capital share transactions | | | (12,951,812 | ) | | | (3,790,670 | ) |
Net increase in net assets | | | 34,722,046 | | | | 7,788,667 | |
| | | | | | | | | |
Net assets: | | | | | | | | |
Beginning of period | | | 363,363,638 | | | | 355,574,971 | |
End of period | | $ | 398,085,684 | | | $ | 363,363,638 | |
| | | | | | | | | |
16 | THE GUGGENHEIM FUNDS SEMI-ANNUAL REPORT | SEE NOTES TO FINANCIAL STATEMENTS. |
STATEMENTS OF CHANGES IN NET ASSETS (concluded) |
SMID CAP VALUE FUND | |
| | Six Months Ended
March 31, 2024
(Unaudited) | | | Year Ended
September 30,
2023 | |
Capital share activity: | | | | | | | | |
Shares sold | | | | | | | | |
Class A | | | 79,221 | | | | 253,740 | |
Class C | | | 2,972 | | | | 22,243 | |
Class P | | | 1,200 | | | | 4,170 | |
Institutional Class | | | 1,332,966 | | | | 2,544,475 | |
Shares issued from reinvestment of distributions | | | | | | | | |
Class A | | | 118,391 | | | | 428,425 | |
Class C | | | 3,758 | | | | 17,903 | |
Class P | | | 2,271 | | | | 9,303 | |
Institutional Class | | | 677,006 | | | | 1,726,983 | |
Shares redeemed | | | | | | | | |
Class A | | | (570,323 | ) | | | (898,347 | ) |
Class C | | | (32,886 | ) | | | (98,361 | ) |
Class P | | | (29,495 | ) | | | (32,403 | ) |
Institutional Class | | | (1,743,609 | ) | | | (3,417,401 | ) |
Net increase (decrease) in shares | | | (158,528 | ) | | | 560,730 | |
SEE NOTES TO FINANCIAL STATEMENTS. | THE GUGGENHEIM FUNDS SEMI-ANNUAL REPORT | 17 |
FINANCIAL HIGHLIGHTS |
SMID CAP VALUE FUND | |
This table is presented to show selected data for a share outstanding throughout each period and to assist shareholders in evaluating a Fund’s performance for the periods presented.
Class A | | Six Months Ended
March 31, 2024a | | | Year
Ended
Sept. 30,
2023 | | | Year
Ended
Sept. 30,
2022 | | | Year
Ended
Sept. 30,
2021 | | | Year
Ended
Sept. 30,
2020 | | | Year
Ended
Sept. 30,
2019 | |
Per Share Data |
Net asset value, beginning of period | | $ | 34.78 | | | $ | 32.58 | | | $ | 38.00 | | | $ | 26.27 | | | $ | 30.52 | | | $ | 36.20 | |
Income (loss) from investment operations: |
Net investment income (loss)b | | | .15 | | | | .37 | | | | .36 | | | | .19 | | | | .46 | | | | .22 | |
Net gain (loss) on investments (realized and unrealized) | | | 5.71 | | | | 3.75 | | | | (3.16 | ) | | | 11.54 | | | | (3.37 | ) | | | (1.89 | ) |
Total from investment operations | | | 5.86 | | | | 4.12 | | | | (2.80 | ) | | | 11.73 | | | | (2.91 | ) | | | (1.67 | ) |
Less distributions from: |
Net investment income | | | (.09 | ) | | | (.22 | ) | | | (.10 | ) | | | — | | | | (.26 | ) | | | (.03 | ) |
Net realized gains | | | (.50 | ) | | | (1.70 | ) | | | (2.52 | ) | | | — | | | | (1.04 | ) | | | (3.98 | ) |
Return of capital | | | — | | | | — | | | | — | | | | — | | | | (.04 | ) | | | — | |
Total distributions | | | (.59 | ) | | | (1.92 | ) | | | (2.62 | ) | | | — | | | | (1.34 | ) | | | (4.01 | ) |
Net asset value, end of period | | $ | 40.05 | | | $ | 34.78 | | | $ | 32.58 | | | $ | 38.00 | | | $ | 26.27 | | | $ | 30.52 | |
|
Total Returnc | | | 16.99 | % | | | 12.65 | % | | | (8.08 | %) | | | 44.65 | % | | | (10.25 | %) | | | (2.51 | %) |
Ratios/Supplemental Data |
Net assets, end of period (in thousands) | | $ | 299,624 | | | $ | 273,173 | | | $ | 262,943 | | | $ | 315,323 | | | $ | 243,072 | | | $ | 335,806 | |
Ratios to average net assets: |
Net investment income (loss) | | | 0.81 | % | | | 1.05 | % | | | 0.96 | % | | | 0.53 | % | | | 1.64 | % | | | 0.72 | % |
Total expensesd | | | 1.24 | % | | | 1.20 | % | | | 1.19 | % | | | 1.20 | % | | | 1.25 | % | | | 1.23 | % |
Net expensese,f,g | | | 1.19 | % | | | 1.15 | % | | | 1.18 | % | | | 1.19 | % | | | 1.24 | % | | | 1.23 | % |
Portfolio turnover rate | | | 21 | % | | | 28 | % | | | 39 | % | | | 34 | % | | | 41 | % | | | 45 | % |
18 | THE GUGGENHEIM FUNDS SEMI-ANNUAL REPORT | SEE NOTES TO FINANCIAL STATEMENTS. |
FINANCIAL HIGHLIGHTS (continued) |
SMID CAP VALUE FUND | |
This table is presented to show selected data for a share outstanding throughout each period and to assist shareholders in evaluating a Fund’s performance for the periods presented.
Class C | | Six Months Ended
March 31, 2024a | | | Year
Ended
Sept. 30,
2023 | | | Year
Ended
Sept. 30,
2022 | | | Year
Ended
Sept. 30,
2021 | | | Year
Ended
Sept. 30,
2020 | | | Year
Ended
Sept. 30,
2019 | |
Per Share Data |
Net asset value, beginning of period | | $ | 21.10 | | | $ | 20.41 | | | $ | 24.85 | | | $ | 17.32 | | | $ | 20.48 | | | $ | 26.05 | |
Income (loss) from investment operations: |
Net investment income (loss)b | | | — | i | | | .04 | | | | .01 | | | | (.06 | ) | | | .16 | | | | (.02 | ) |
Net gain (loss) on investments (realized and unrealized) | | | 3.44 | | | | 2.35 | | | | (1.93 | ) | | | 7.59 | | | | (2.22 | ) | | | (1.57 | ) |
Total from investment operations | | | 3.44 | | | | 2.39 | | | | (1.92 | ) | | | 7.53 | | | | (2.06 | ) | | | (1.59 | ) |
Less distributions from: |
Net investment income | | | — | | | | — | | | | — | | | | — | | | | (.03 | ) | | | — | |
Net realized gains | | | (.50 | ) | | | (1.70 | ) | | | (2.52 | ) | | | — | | | | (1.04 | ) | | | (3.98 | ) |
Return of capital | | | — | | | | — | | | | — | | | | — | | | | (.03 | ) | | | — | |
Total distributions | | | (.50 | ) | | | (1.70 | ) | | | (2.52 | ) | | | — | | | | (1.10 | ) | | | (3.98 | ) |
Net asset value, end of period | | $ | 24.04 | | | $ | 21.10 | | | $ | 20.41 | | | $ | 24.85 | | | $ | 17.32 | | | $ | 20.48 | |
|
Total Returnc | | | 16.49 | % | | | 11.67 | % | | | (8.85 | %) | | | 43.48 | % | | | (10.95 | %) | | | (3.35 | %) |
Ratios/Supplemental Data |
Net assets, end of period (in thousands) | | $ | 4,163 | | | $ | 4,205 | | | $ | 5,256 | | | $ | 10,015 | | | $ | 14,276 | | | $ | 31,221 | |
Ratios to average net assets: |
Net investment income (loss) | | | (0.04 | %) | | | 0.18 | % | | | 0.04 | % | | | (0.27 | %) | | | 0.86 | % | | | (0.11 | %) |
Total expensesd | | | 2.10 | % | | | 2.10 | % | | | 2.09 | % | | | 2.05 | % | | | 2.14 | % | | | 2.07 | % |
Net expensese,f,g | | | 2.03 | % | | | 2.02 | % | | | 2.02 | % | | | 2.02 | % | | | 2.07 | % | | | 2.06 | % |
Portfolio turnover rate | | | 21 | % | | | 28 | % | | | 39 | % | | | 34 | % | | | 41 | % | | | 45 | % |
SEE NOTES TO FINANCIAL STATEMENTS. | THE GUGGENHEIM FUNDS SEMI-ANNUAL REPORT | 19 |
FINANCIAL HIGHLIGHTS (continued) |
SMID CAP VALUE FUND |
This table is presented to show selected data for a share outstanding throughout each period and to assist shareholders in evaluating a Fund’s performance for the periods presented.
Class P | | Six Months Ended
March 31, 2024a | | | Year
Ended
Sept. 30,
2023 | | | Year
Ended
Sept. 30,
2022 | | | Year
Ended
Sept. 30,
2021 | | | Year
Ended
Sept. 30,
2020 | | | Year
Ended
Sept. 30,
2019 | |
Per Share Data |
Net asset value, beginning of period | | $ | 34.46 | | | $ | 32.30 | | | $ | 37.67 | | | $ | 26.06 | | | $ | 30.25 | | | $ | 35.94 | |
Income (loss) from investment operations: |
Net investment income (loss)b | | | .14 | | | | .34 | | | | .33 | | | | .15 | | | | .46 | | | | .19 | |
Net gain (loss) on investments (realized and unrealized) | | | 5.66 | | | | 3.71 | | | | (3.12 | ) | | | 11.46 | | | | (3.37 | ) | | | (1.88 | ) |
Total from investment operations | | | 5.80 | | | | 4.05 | | | | (2.79 | ) | | | 11.61 | | | | (2.91 | ) | | | (1.69 | ) |
Less distributions from: |
Net investment income | | | (.05 | ) | | | (.19 | ) | | | (.06 | ) | | | — | | | | (.20 | ) | | | (.02 | ) |
Net realized gains | | | (.50 | ) | | | (1.70 | ) | | | (2.52 | ) | | | — | | | | (1.04 | ) | | | (3.98 | ) |
Return of capital | | | — | | | | — | | | | — | | | | — | | | | (.04 | ) | | | — | |
Total distributions | | | (.55 | ) | | | (1.89 | ) | | | (2.58 | ) | | | — | | | | (1.28 | ) | | | (4.00 | ) |
Net asset value, end of period | | $ | 39.71 | | | $ | 34.46 | | | $ | 32.30 | | | $ | 37.67 | | | $ | 26.06 | | | $ | 30.25 | |
|
Total Return | | | 16.97 | % | | | 12.57 | % | | | (8.16 | %) | | | 44.55 | % | | | (10.30 | %) | | | (2.61 | %) |
Ratios/Supplemental Data |
Net assets, end of period (in thousands) | | $ | 5,081 | | | $ | 5,306 | | | $ | 5,584 | | | $ | 6,907 | | | $ | 7,662 | | | $ | 14,165 | |
Ratios to average net assets: |
Net investment income (loss) | | | 0.78 | % | | | 0.96 | % | | | 0.90 | % | | | 0.43 | % | | | 1.64 | % | | | 0.63 | % |
Total expensesd | | | 1.25 | % | | | 1.27 | % | | | 1.30 | % | | | 1.32 | % | | | 1.33 | % | | | 1.35 | % |
Net expensese,f,g | | | 1.21 | % | | | 1.24 | % | | | 1.26 | % | | | 1.28 | % | | | 1.31 | % | | | 1.32 | % |
Portfolio turnover rate | | | 21 | % | | | 28 | % | | | 39 | % | | | 34 | % | | | 41 | % | | | 45 | % |
20 | THE GUGGENHEIM FUNDS SEMI-ANNUAL REPORT | SEE NOTES TO FINANCIAL STATEMENTS. |
FINANCIAL HIGHLIGHTS (continued) |
SMID CAP VALUE FUND |
This table is presented to show selected data for a share outstanding throughout each period and to assist shareholders in evaluating a Fund’s performance for the periods presented.
Institutional Class | | Six Months Ended
March 31, 2024a | | | Year
Ended
Sept. 30,
2023 | | | Year
Ended
Sept. 30,
2022 | | | Year
Ended
Sept. 30,
2021 | | | Period
Ended
Sept. 30,
2020h | |
Per Share Data |
Net asset value, beginning of period | | $ | 8.10 | | | $ | 8.98 | | | $ | 12.42 | | | $ | 8.57 | | | $ | 10.20 | |
Income (loss) from investment operations: |
Net investment income (loss)b | | | .04 | | | | .11 | | | | .12 | | | | .08 | | | | .11 | |
Net gain (loss) on investments (realized and unrealized) | | | 1.29 | | | | 1.04 | | | | (.82 | ) | | | 3.77 | | | | (1.74 | ) |
Total from investment operations | | | 1.33 | | | | 1.15 | | | | (.70 | ) | | | 3.85 | | | | (1.63 | ) |
Less distributions from: |
Net investment income | | | (.21 | ) | | | (.33 | ) | | | (.22 | ) | | | — | | | | — | |
Net realized gains | | | (.50 | ) | | | (1.70 | ) | | | (2.52 | ) | | | — | | | | — | |
Total distributions | | | (.71 | ) | | | (2.03 | ) | | | (2.74 | ) | | | — | | | | — | |
Net asset value, end of period | | $ | 8.72 | | | $ | 8.10 | | | $ | 8.98 | | | $ | 12.42 | | | $ | 8.57 | |
|
Total Return | | | 17.09 | % | | | 12.91 | % | | | (7.93 | %) | | | 44.92 | % | | | (15.98 | %) |
Ratios/Supplemental Data |
Net assets, end of period (in thousands) | | $ | 89,218 | | | $ | 80,679 | | | $ | 81,792 | | | $ | 96,973 | | | $ | 60,783 | |
Ratios to average net assets: |
Net investment income (loss) | | | 1.08 | % | | | 1.26 | % | | | 1.14 | % | | | 0.70 | % | | | 1.87 | % |
Total expensesd | | | 0.96 | % | | | 0.98 | % | | | 1.03 | % | | | 1.06 | % | | | 1.09 | % |
Net expensese,f,g | | | 0.92 | % | | | 0.94 | % | | | 1.01 | % | | | 1.02 | % | | | 1.03 | % |
Portfolio turnover rate | | | 21 | % | | | 28 | % | | | 39 | % | | | 34 | % | | | 41 | % |
SEE NOTES TO FINANCIAL STATEMENTS. | THE GUGGENHEIM FUNDS SEMI-ANNUAL REPORT | 21 |
FINANCIAL HIGHLIGHTS (concluded) |
SMID CAP VALUE FUND |
a | Unaudited figures for the period ended March 31, 2024. Percentage amounts for the period, except total return and portfolio turnover rate, have been annualized. |
b | Net investment income (loss) per share was computed using average shares outstanding throughout the period. |
c | Total return does not reflect the impact of any applicable sales charges. |
d | Does not include expenses of the underlying funds in which the Fund invests, if any. |
e | Net expense information reflects the expense ratios after expense waivers and reimbursements, as applicable. |
f | The portion of the ratios of net expenses to average net assets attributable to recoupments of prior fee reductions or expense reimbursements for the periods presented was as follows: |
| | | 03/31/24a | 09/30/23 | 09/30/22 | 09/30/21 | 09/30/20 | 09/30/19 |
| | Class A | 0.00% | 0.00%* | 0.01% | 0.00% | 0.00%* | 0.00%* |
| | Class C | 0.06% | 0.04% | 0.00%* | 0.00%* | 0.00%* | 0.01% |
| | Class P | 0.00% | 0.01% | 0.02% | 0.07% | 0.01% | 0.04% |
| | Institutional Class | 0.00% | 0.04% | 0.00%* | 0.00% | 0.00%*h | N/A |
g | Net expenses may include expenses that are excluded from the expense limitation agreement. Excluding these expenses, the net expense ratios for the periods presented would be: |
| | | 03/31/24a | 09/30/23 | 09/30/22 | 09/30/21 | 09/30/20 | 09/30/19 |
| | Class A | 1.19% | 1.15% | 1.18% | 1.19% | 1.24% | 1.23% |
| | Class C | 2.02% | 2.02% | 2.02% | 2.01% | 2.07% | 2.06% |
| | Class P | 1.20% | 1.23% | 1.25% | 1.28% | 1.30% | 1.32% |
| | Institutional Class | 0.92% | 0.94% | 1.01% | 1.02% | 1.03%h | N/A |
h | Since commencement of operations: January 3, 2020. Percentage amounts for the period, except total return and portfolio turnover rate, have been annualized. |
i | Less than $0.01 per share. |
22 | THE GUGGENHEIM FUNDS SEMI-ANNUAL REPORT | SEE NOTES TO FINANCIAL STATEMENTS. |
NOTES TO FINANCIAL STATEMENTS (Unaudited) |
Note 1 – Organization and Significant Accounting Policies
Organization
Guggenheim Funds Trust (the “Trust”), a Delaware statutory trust, is registered with the U.S. Securities and Exchange Commission (the “SEC”) under the Investment Company Act of 1940 (the “1940 Act”), as an open-ended investment company of the series type. Each series, in effect, is representing a separate fund. The Trust may issue an unlimited number of authorized shares. The Trust accounts for the assets of each fund separately.
The Trust offers a combination of five separate classes of shares: Class A shares, Class C shares, Class P shares, Class R6 shares and Institutional Class shares. Sales of shares of each Class are made without a front-end sales charge at the net asset value per share (“NAV”), with the exception of Class A shares. Class A shares are sold at the NAV, plus the applicable front-end sales charge. The sales charge varies depending on the amount purchased. Class A share purchases of $1 million or more are exempt from the front-end sales charge but have a 1% contingent deferred sales charge (“CDSC”), if shares are redeemed within 12 months of purchase. Class C shares have a 1% CDSC if shares are redeemed within 12 months of purchase. Class C shares automatically convert to Class A shares on or about the 10th day of the month following the 8-year anniversary of the purchase of the Class C shares. This conversion will be executed without any sales charge, fee or other charge. After the conversion is completed, the shares will be subject to all features and expenses of Class A shares. Institutional Class shares are offered primarily for direct investment by institutions such as pension and profit sharing plans, endowments, foundations and corporations. Institutional Class shares require a minimum initial investment of $2 million and a minimum account balance of $1 million. Class R6 shares are offered primarily through qualified retirement and benefit plans. Class R6 shares are also offered through certain other plans and platforms sponsored by financial intermediaries. Certain institutional investors and others deemed appropriate by Guggenheim Investments (“GI” or the “Adviser”) may also be eligible to purchase Class R6 shares subject to a $2 million minimum initial investment. At March 31, 2024, the Trust consisted of eighteen funds (the “Funds”).
This report covers the SMid Cap Value Fund (the “Fund”), a diversified investment company. At March 31, 2024, Class A, Class C, Class P and Institutional Class shares have been issued by the Fund.
Security Investors, LLC which operates under the name Guggenheim Investments (“GI” or the “Adviser”), provides advisory services. Guggenheim Funds Distributors, LLC (“GFD”) serves as distributor of the Fund’s shares. GI and GFD are affiliated entities.
Significant Accounting Policies
The Fund operates as an investment company and, accordingly, follows the investment company accounting and reporting guidance of the Financial Accounting Standards Board (“FASB”) Accounting Standards Codification Topic 946 Financial Services – Investment Companies.
| | THE GUGGENHEIM FUNDS SEMI-ANNUAL REPORT | 23 |
NOTES TO FINANCIAL STATEMENTS (Unaudited)(continued) |
The following significant accounting policies are in conformity with U.S. generally accepted accounting principles (“U.S. GAAP”) and are consistently followed by the Trust. This requires management to make estimates and assumptions that affect the reported amount of assets and liabilities, contingent assets and liabilities at the date of the financial statements, and the reported amounts of revenues and expenses during the reporting period. Actual results could differ from these estimates. All time references are based on Eastern Time.
The NAV of each share class of the Fund is calculated by dividing the market value of the Fund’s securities and other assets, less all liabilities attributable to the share class by the number of outstanding shares of the share class on the specified date.
(a) Valuation of Investments
The Board of Trustees of the Fund (the “Board”) adopted policies and procedures for the valuation of the Fund’s investments (the “Fund Valuation Procedures”). The SEC adopted Rule 2a-5 under the 1940 Act (“Rule 2a-5”) which establishes requirements for determining fair value in good faith. Rule 2a-5 also defines “readily available market quotations” for purposes of the 1940 Act and establishes requirements for determining whether a fund must fair value a security in good faith.
Pursuant to Rule 2a-5, the Board has designated the Adviser as the valuation designee to perform fair valuation determinations for the Fund with respect to all Fund investments and other assets. As the Fund’s valuation designee pursuant to Rule 2a-5, the Adviser has adopted separate procedures (the “Valuation Designee Procedures” and collectively with the Fund Valuation Procedures, the “Valuation Procedures”) reasonably designed to prevent violations of the requirements of Rule 2a-5 and Rule 31a-4. The Adviser, in its role as valuation designee, utilizes the assistance of a valuation committee, consisting of representatives from Guggenheim’s investment management, fund administration, legal and compliance departments (the “Valuation Committee”), in determining the fair value of the Fund’s securities and other assets.
Valuations of the Fund’s securities and other assets are supplied primarily by pricing service providers appointed pursuant to the processes set forth in the Valuation Procedures. The Adviser, with the assistance of the Valuation Committee, convenes monthly, or more frequently as needed, to review the valuation of all assets which have been fair valued. The Adviser, consistent with the monitoring and review responsibilities set forth in the Valuation Procedures, regularly reviews the appropriateness of the inputs, methods, models and assumptions employed by the pricing service provider.
If the pricing service provider cannot or does not provide a valuation for a particular investment or such valuation is deemed unreliable, such investment is fair valued by the Adviser.
24 | THE GUGGENHEIM FUNDS SEMI-ANNUAL REPORT | |
NOTES TO FINANCIAL STATEMENTS (Unaudited)(continued) |
Equity securities listed or traded on a recognized U.S. securities exchange or the Nasdaq Stock Market (“NASDAQ”) will generally be valued on the basis of the last sale price on the primary U.S. exchange or market on which the security is listed or traded; provided, however, that securities listed on NASDAQ will be valued at the NASDAQ official closing price, which may not necessarily represent the last sale price.
Open-end investment companies are valued at their NAV as of the close of business, on the valuation date. Exchange-traded funds and closed-end investment companies are generally valued at the last quoted sale price.
Investments for which market quotations are not readily available are fair valued as determined in good faith by the Adviser. Valuations in accordance with these methods are intended to reflect each security’s (or asset’s or liability’s) “fair value”. Each such determination is based on a consideration of all relevant factors, which are likely to vary from one pricing context to another. Examples of such factors may include, but are not limited to market prices; sale prices; broker quotes; and models which derive prices based on inputs such as anticipated cash flows or collateral, spread over U.S. Treasury securities, and other information analysis.
(b) Foreign Taxes
The Fund may be subject to foreign taxes (a portion of which may be reclaimable) on income, stock dividends, capital gains on investments or certain foreign currency transactions. All foreign taxes are recorded in accordance with the applicable foreign tax regulations and rates that exist in the foreign jurisdictions in which the Fund invests. These foreign taxes, if any, are paid by the Fund and reflected in its Statement of Operations as follows: foreign taxes withheld at source are presented as a reduction of income and foreign taxes on capital gains from sales of investments are included with the net realized gain (loss) on investments. Foreign taxes payable or deferred as of March 31, 2024, if any, are disclosed in the Fund’s Statement of Assets and Liabilities.
(c) Security Transactions
Security transactions are recorded on the trade date for financial reporting purposes. Realized gains and losses from securities transactions are recorded using the identified cost basis. Proceeds from lawsuits related to investment holdings are recorded as a reduction to cost if the securities are still held and as realized gains if no longer held in the Fund. Dividend income is recorded on the ex-dividend date, net of applicable taxes withheld by foreign countries, if any. Taxable non-cash dividends are recorded as dividend income. Interest income, including amortization of premiums and accretion of discounts, is accrued on a daily basis. Dividend income from Real Estate Investment Trusts (“REITs”) is recorded based on the income included in the distributions received from the REIT investments using published REIT classifications, including some management estimates when actual amounts are not available. Distributions received in excess of this estimated amount are recorded as a reduction of the cost of investments
| | THE GUGGENHEIM FUNDS SEMI-ANNUAL REPORT | 25 |
NOTES TO FINANCIAL STATEMENTS (Unaudited)(continued) |
or reclassified to realized gains. The actual amounts of income, return of capital, and realized gains are only determined by each REIT after its fiscal year-end, and may differ from the estimated amounts.
(d) Distributions
Distributions of net investment income and net realized gains, if any, are declared and paid at least annually. Dividends are reinvested in additional shares, unless shareholders request payment in cash. Distributions are recorded on the ex-dividend date and are determined in accordance with U.S. federal income tax regulations which may differ from U.S. GAAP.
(e) Class Allocations
Interest and dividend income, most expenses, all realized gains and losses, and all unrealized appreciation and depreciation are allocated to the share classes based upon the value of the outstanding shares in each share class. Certain costs, such as distribution and service fees are charged directly to specific share classes. In addition, certain expenses have been allocated to the individual Funds in the Trust based on the respective net assets of each Fund included in the Trust.
(f) Earnings Credits
Under the fee arrangement with the custodian, the Fund may earn credits based on overnight custody cash balances. These credits are utilized to reduce related custodial expenses. The custodian fees disclosed in the Statement of Operations are before the reduction in expense from the related earnings credits, if any. Earnings credits for the period ended March 31, 2024, are disclosed in the Fund’s Statement of Operations.
(g) Cash
The Fund may leave cash overnight in its cash account with the custodian. Periodically, the Fund may have cash due to the custodian bank as an overdraft balance. A fee is incurred on this overdraft, calculated by multiplying the overdraft by a rate based on the federal funds rate, which was 5.33% at March 31, 2024.
(h) Indemnifications
Under the Fund’s organizational documents, its Trustees and Officers are indemnified against certain liabilities arising out of the performance of their duties to the Trust. In addition, throughout the normal course of business, the Fund enters into contracts that contain a variety of representations and warranties which provide general indemnifications. The Fund’s maximum exposure under these arrangements is unknown, as this would involve future claims that may be made against the Fund and/or its affiliates that have not yet occurred. However, based on experience, the Fund expects the risk of loss to be remote.
26 | THE GUGGENHEIM FUNDS SEMI-ANNUAL REPORT | |
NOTES TO FINANCIAL STATEMENTS (Unaudited)(continued) |
Note 2 – Investment Advisory Agreement and Other Agreements
Under the terms of an investment advisory contract, the Fund pays GI investment advisory fees on a monthly basis calculated daily at an annualized rate of 0.75% of the average daily net assets of the Fund.
GI pays operating expenses on behalf of the Trust, such as audit and accounting related services, legal services, custody, printing and mailing, among others, on a pass-through basis. Such expenses are allocated to various Funds within the complex based on relative net assets.
The Board has adopted Distribution Plans related to the offering of Class A, Class C and Class P shares pursuant to Rule 12b-1 under the 1940 Act. The plans provide for payments at an annual rate of 0.25% of the average daily net assets of the Fund’s Class A and Class P shares, and 1.00% of the average daily net assets of the Fund’s Class C shares.
The investment advisory contract for the Fund provides that the total expenses be limited to a percentage of average net assets for each class of shares, exclusive of brokerage costs, dividends or interest on securities sold short, expenses of other investment companies in which the Fund invests, interest, taxes, litigation, indemnification and extraordinary expenses. The limits are listed below:
| | Limit | | | Effective
Date | | | Contract
End Date | |
Class A | | | 1.30 | %1 | | | 01/03/20 | | | | 02/01/25 | |
Class C | | | 2.05 | %1 | | | 01/03/20 | | | | 02/01/25 | |
Class P | | | 1.30 | %1 | | | 01/03/20 | | | | 02/01/25 | |
Institutional Class | | | 1.05 | % | | | 01/03/20 | | | | 02/01/25 | |
1 | Prior to January 3, 2020, the expense limit for Class A, Class C and Class P shares of the Fund was 1.42%, 2.12% and 1.32%, respectively. |
GI is entitled to reimbursement by the Fund for fees waived or expenses reimbursed during any of the previous 36 months, beginning on the date of the expense limitation agreement, if on any day the estimated operating expenses are less than the indicated percentages. For purposes of this arrangement, GI is entitled to recoupment of previously waived fees or reimbursed expenses for 36 months from the date of the waiver or reimbursement by GI. At March 31, 2024, the amount of fees waived or expenses reimbursed that are subject to recoupment are presented in the following table:
| | 2024 | | | 2025 | | | 2026 | | | 2027 | | | Total | |
Class A | | $ | — | | | $ | 380 | | | $ | 59,194 | | | $ | 18,183 | | | $ | 77,757 | |
Class C | | | 3,122 | | | | 4,648 | | | | 2,172 | | | | 904 | | | | 10,846 | |
Class P | | | 2,972 | | | | 2,276 | | | | 104 | | | | 236 | | | | 5,588 | |
Institutional Class | | | 17,379 | | | | 17,866 | | | | 1,842 | | | | 4,851 | | | | 41,938 | |
For the period ended March 31, 2024, GI recouped $1,138 from the Fund.
| | THE GUGGENHEIM FUNDS SEMI-ANNUAL REPORT | 27 |
NOTES TO FINANCIAL STATEMENTS (Unaudited)(continued) |
During the period ended March 31, 2024, GFD retained sales charges of $77,213 relating to sales of Class A shares of the Trust.
Certain trustees and officers of the Trust are also officers of GI and/or GFD. The Trust does not compensate its officers or trustees who are officers, directors and/or employees of GI or GFD.
MUFG Investor Services (US), LLC (“MUIS”) acts as the Fund’s administrator, transfer agent and accounting agent. As administrator, transfer agent and accounting agent, MUIS maintains the books and records of the Fund’s securities and cash. The Bank of New York Mellon Corp. (“BNY”) acts as the Fund’s custodian. As custodian, BNY is responsible for the custody of the Fund’s assets. For providing the aforementioned administrative and accounting services, MUIS is entitled to receive a monthly fee equal to a percentage of the Fund’s average daily net assets and out of pocket expenses. For providing the aforementioned transfer agent and custodian services, MUIS and BNY are entitled to receive a monthly fee based on the number of transactions during the month and the number of accounts under management, subject to certain minimum monthly fees, and out of pocket expenses.
Note 3 – Federal Income Tax Information
The Fund intends to comply with the provisions of Subchapter M of the Internal Revenue Code of 1986, as amended (the “Internal Revenue Code”), applicable to regulated investment companies and will distribute substantially all taxable net investment income and capital gains sufficient to relieve the Fund from all, or substantially all, federal income, excise and state income taxes. Therefore, no provision for federal or state income tax or federal excise tax is required.
Tax positions taken or expected to be taken in the course of preparing the Fund’s tax returns are evaluated to determine whether the tax positions are “more-likely-than-not” of being sustained by the applicable tax authority. Tax positions not deemed to meet the “more-likely-than-not” threshold would be recorded as a tax benefit or expense in the current year. Management has analyzed the Fund’s tax positions taken, or to be taken, on U.S. federal income tax returns for all open tax years, and has concluded that no provision for income tax is required in the Fund’s financial statements. The Fund’s U.S. federal income tax returns are subject to examination by the Internal Revenue Service (“IRS”) for a period of three years after they are filed.
At March 31, 2024, the cost of investments for U.S. federal income tax purposes, the aggregate gross unrealized appreciation for all investments for which there was an excess of value over tax cost, and the aggregate gross unrealized depreciation for all investments for which there was an excess of tax cost over value, were as follows:
| | Tax Cost | | | Tax
Unrealized
Appreciation | | | Tax
Unrealized
Depreciation | | | Net Tax
Unrealized
Appreciation
(Depreciation) | |
| | | $ | 314,313,279 | | | $ | 97,321,400 | | | $ | (13,549,548 | ) | | $ | 83,771,852 | |
28 | THE GUGGENHEIM FUNDS SEMI-ANNUAL REPORT | |
NOTES TO FINANCIAL STATEMENTS (Unaudited)(continued) |
Note 4 – Fair Value Measurement
In accordance with U.S. GAAP, fair value is defined as the price that the Fund would receive to sell an investment or pay to transfer a liability in an orderly transaction between market participants at the measurement date. U.S. GAAP establishes a three-tier fair value hierarchy based on the types of inputs used to value assets and liabilities and requires corresponding disclosure. The hierarchy and the corresponding inputs are summarized below:
Level 1 — | unadjusted quoted prices in active markets for identical assets or liabilities. |
Level 2 — | significant other observable inputs (for example quoted prices for securities that are similar based on characteristics such as interest rates, prepayment speeds, credit risk, etc.). |
Level 3 — | significant unobservable inputs based on the best information available under the circumstances, to the extent observable inputs are not available, which may include assumptions. |
Rule 2a-5 sets forth a definition of “readily available market quotations,” which is consistent with the definition of a Level 1 input under U.S. GAAP. Rule 2a-5 provides that “a market quotation is readily available only when that quotation is a quoted price (unadjusted) in active markets for identical investments that the fund can access at the measurement date, provided that a quotation will not be readily available if it is not reliable.”
Securities for which market quotations are not readily available must be valued at fair value as determined in good faith. Accordingly, any security priced using inputs other than Level 1 inputs will be subject to fair value requirements. The types of inputs available depend on a variety of factors, such as the type of security and the characteristics of the markets in which it trades, if any. Fair valuation determinations that rely on fewer or no observable inputs require greater judgment. Accordingly, fair value determinations for Level 3 securities require the greatest amount of judgment.
The inputs or methodologies selected and applied for valuing securities or other assets are not necessarily an indication of the risk associated with investing in those securities. The suitability, appropriateness and accuracy of the techniques, methodologies and sources employed to determine fair valuation are periodically reviewed and subject to change.
Note 5 – Securities Transactions
For the period ended March 31, 2024, the cost of purchases and proceeds from sales of investment securities, excluding short-term investments were as follows:
| | Purchases | | | Sales | |
| | | $ | 77,846,423 | | | $ | 99,391,711 | |
| | THE GUGGENHEIM FUNDS SEMI-ANNUAL REPORT | 29 |
NOTES TO FINANCIAL STATEMENTS (Unaudited)(continued) |
Note 6 – Line of Credit
The Trust, along with other affiliated trusts, secured a 364-day committed, $1,150,000,000 line of credit from Citibank, N.A., which was in place through September 29, 2023, at which time a new line of credit was entered into in the amount of $1,165,000,000. The Fund may draw (borrow) from the line of credit as a temporary measure for emergency purposes, to facilitate redemption requests, or for other short-term liquidity purposes consistent with the Fund’s investment objective and program. For example, it may be advantageous for the Fund to borrow money rather than sell existing portfolio positions to meet redemption requests. Fees related to borrowings, if any, vary under this arrangement between the greater of Citibank’s “base rate”, SOFR plus 1%, or the federal funds rate plus 1/2 of 1%.
The commitment fee that may be paid by the Fund is at an annualized rate of 0.15% of the average daily amount of its allocated unused commitment amount. The commitment fee amount is allocated to the individual Funds based on the respective net assets of each participating Fund and is referenced in the Fund’s Statement of Operations under “Line of credit fees”. The Fund did not have any borrowings under this agreement as of and for the period ended March 31, 2024.
Note 7 – Market Risks
The value of, or income generated by, the investments held by the Fund are subject to the possibility of rapid and unpredictable fluctuation, and loss that may result from various factors. These factors include, among others, developments affecting individual companies, or from broader influences, including real or perceived changes in prevailing interest rates (which may change at any time based on changes in monetary policies and various market and other economic conditions), changes in inflation rates or expectations about inflation rates, adverse investor confidence or sentiment, changing economic, political (including geopolitical), social or financial market conditions, increased instability or general uncertainty, environmental disasters, governmental actions, public health emergencies (such as the spread of infectious diseases, pandemics and epidemics), debt crises, actual or threatened wars or other armed conflicts (such as the ongoing Russia-Ukraine conflict and its collateral economic and other effects, including, but not limited to, sanctions and other international trade barriers) or ratings downgrades, and other similar events, each of which may be temporary or last for extended periods. Moreover, changing economic, political, geopolitical, social, financial market or other conditions in one country, geographic region or industry could adversely affect the value, yield and return of the investments held by the Fund in a different country, geographic region, economy, industry or market because of the increasingly interconnected global economies and financial markets. The duration and extent of the foregoing types of factors or conditions are highly uncertain and difficult to predict and have in the past, and may in the future, cause volatility and distress in economies and financial markets or other adverse circumstances, which may negatively affect the value of the Fund’s investments and performance of the Fund.
30 | THE GUGGENHEIM FUNDS SEMI-ANNUAL REPORT | |
NOTES TO FINANCIAL STATEMENTS (Unaudited)(concluded) |
Note 8 – Subsequent Events
The Fund evaluated subsequent events through the date the financial statements are issued and determined there were no material events that would require adjustment to or disclosure in the Fund’s financial statements.
| | THE GUGGENHEIM FUNDS SEMI-ANNUAL REPORT | 31 |
OTHER INFORMATION (Unaudited) |
Delivery of Shareholder Reports
Paper copies of the Fund’s annual and semi-annual shareholder reports are not sent by mail, unless you specifically request paper copies of the reports from a fund or from your financial intermediary. Instead, the reports are made available on a website, and you are notified by mail each time a report is posted and provided with a website link to access the report.
You may elect to receive all future shareholder reports in paper free of charge. If you hold shares of a fund directly, you can inform the Fund that you wish to receive paper copies of reports by calling 800.820.0888. If you hold shares of a fund through a financial intermediary, please contact the financial intermediary to make this election. Your election to receive reports in paper may apply to all Guggenheim Funds in which you are invested and may apply to all Guggenheim funds held with your financial intermediary.
Tailored Shareholder Reports for Open-End Mutual Funds and Exchange-Traded Funds
Effective January 24, 2023, the SEC adopted rule and form amendments to require open-end mutual funds and exchange-traded funds registered on Form N-1A to transmit concise and visually engaging streamlined annual and semi-annual reports to shareholders that highlight key information. Other information, including financial statements, will no longer appear in a streamlined shareholder report but must be available online, delivered free of charge upon request, and filed on a semi-annual basis on Form N-CSR. The rule and form amendments have a compliance date of July 24, 2024. At this time, management is evaluating the impact of these amendments on the shareholder reports for the Fund.
Proxy Voting Information
A description of the policies and procedures that the Trust uses to determine how to vote proxies relating to securities held in the Fund’s portfolio is available, without charge and upon request, by calling 800.820.0888. This information is also available from the EDGAR database on the SEC’s website at https://www.sec.gov.
Information regarding how the Fund voted proxies relating to portfolio securities during the most recent 12-month period ended June 30 is available without charge, upon request, by calling 800.820.0888. This information is also available from the EDGAR database on the SEC’s website at https://www.sec.gov.
Sector Classification
Information in the Schedule of Investments is categorized by sectors using sector-level Classifications defined by the Bloomberg Industry Classification System, a widely recognized industry classification system provider. The Fund’s registration statement has investment policies relating to concentration in specific sectors/industries. For purposes of these investment policies, the Fund usually classifies sectors/industries based on industry-level Classifications
32 | THE GUGGENHEIM FUNDS SEMI-ANNUAL REPORT | |
OTHER INFORMATION (Unaudited)(concluded) |
used by widely recognized industry classification system providers such as Bloomberg Industry Classification System, Global Industry Classification Standards and Barclays Global Classification Scheme.
Quarterly Portfolio Schedules Information
The Trust files its complete schedule of portfolio holdings with the SEC for the first and third quarters of each fiscal year as an exhibit to its reports on Form N-PORT. The Fund’s Form N-PORT is available on the SEC’s website at https://www.sec.gov. The Fund’s complete schedule of securities holdings as of the end of each fiscal quarter will be made available to the public on the SEC’s website at www.sec.gov and on our website at www.guggenheiminvestments.com, and will be made available, upon request and without charge, by calling 800.820.0888.
| | THE GUGGENHEIM FUNDS SEMI-ANNUAL REPORT | 33 |
INFORMATION ON BOARD OF TRUSTEES AND OFFICERS (Unaudited) |
A Board of Trustees oversees the Trust, as well as other trusts of GI, in which its members have no stated term of service, and continue to serve after election until resignation. The Statement of Additional Information includes further information about Fund Trustees and Officers, and can be obtained without charge by visiting guggenheiminvestments.com or by calling 800.820.0888.
Name, Address*
and Year of Birth | Position(s)
Held with
Trust | Term of Office
and Length of
Time Served** | Principal Occupation(s)
During Past Five Years | Number of
Portfolios
in Fund
Complex
Overseen | Other
Directorships Held
by Trustees*** |
Independent Trustees: | | | |
Randall C. Barnes (1951) | Trustee and Chair of the Valuation Oversight Committee | Since 2014 (Trustee) Since 2020 (Chair of the Valuation Oversight Committee) | Current: Private Investor (2001-present). Former: Senior Vice President and Treasurer, PepsiCo, Inc. (1993-1997); President, Pizza Hut International (1991-1993); Senior Vice President, Strategic Planning and New Business Development, PepsiCo, Inc. (1987-1990). | 153 | Current: Advent Convertible and Income Fund (2005-present); Purpose Investments Funds (2013-present). Former: Guggenheim Energy & Income Fund (2015-2023); Fiduciary/Claymore Energy Infrastructure Fund (2004-2022); Guggenheim Enhanced Equity Income Fund (2005-2021); Guggenheim Credit Allocation Fund (2013-2021). |
34 | THE GUGGENHEIM FUNDS SEMI-ANNUAL REPORT | |
INFORMATION ON BOARD OF TRUSTEES AND OFFICERS (Unaudited)(continued) |
Name, Address*
and Year of Birth | Position(s)
Held with
Trust | Term of Office
and Length of
Time Served** | Principal Occupation(s)
During Past Five Years | Number of
Portfolios
in Fund
Complex
Overseen | Other
Directorships Held
by Trustees*** |
Independent Trustees - continued | | | |
Angela Brock-Kyle (1959) | Trustee | Since 2019 | Current: Founder and Chief Executive Officer, B.O.A.R.D.S. (consulting firm) (2013-present); Director, Mutual Fund Directors Forum (2022-present). Former: Senior Leader, TIAA (financial services firm) (1987-2012). | 152 | Current: Bowhead Insurance GP, LLC (2020-present); Hunt Companies, Inc. (2019-present). Former: Guggenheim Energy & Income Fund (2019-2023); Fiduciary/Claymore Energy Infrastructure Fund (2019-2022); Guggenheim Enhanced Equity Income Fund (2019-2021); Guggenheim Credit Allocation Fund (2019-2021); Infinity Property & Casualty Corp. (2014-2018). |
| | THE GUGGENHEIM FUNDS SEMI-ANNUAL REPORT | 35 |
INFORMATION ON BOARD OF TRUSTEES AND OFFICERS (Unaudited)(continued) |
Name, Address*
and Year of Birth | Position(s)
Held with
Trust | Term of Office
and Length of
Time Served** | Principal Occupation(s)
During Past Five Years | Number of
Portfolios
in Fund
Complex
Overseen | Other
Directorships Held
by Trustees*** |
Independent Trustees - continued | | | |
Thomas F. Lydon, Jr. (1960) | Trustee and Chair of the Contracts Review Committee | Since 2019 (Trustee) Since 2020 (Chair of the Contracts Review Committee) | Current: President, Global Trends Investments (registered investment adviser) (1996-present); Chief Executive Officer, Lydon Media (2016-present); Vice Chairman, VettaFi, a wholly owned subsidiary of The TMX Group (financial advisor content, research and digital distribution provider) (2022-present). Former: Chief Executive Officer, ETF Flows, LLC (financial advisor education and research provider) (2019-2023); Director, GDX Index Partners, LLC (index provider) (2021-2023). | 152 | Current: US Global Investors, Inc. (GROW) (1995-present); The 2023 ETF Series Trust (4) (2023-present); The 2023 ETF Series II (1) (2023-present). Former: Guggenheim Energy & Income Fund (2019-2023); Fiduciary/Claymore Energy Infrastructure Fund (2019-2022); Guggenheim Enhanced Equity Income Fund (2019-2021); Guggenheim Credit Allocation Fund (2019-2021); Harvest Volatility Edge Trust (3) (2017-2019). |
36 | THE GUGGENHEIM FUNDS SEMI-ANNUAL REPORT | |
INFORMATION ON BOARD OF TRUSTEES AND OFFICERS (Unaudited)(continued) |
Name, Address*
and Year of Birth | Position(s)
Held with
Trust | Term of Office
and Length of
Time Served** | Principal Occupation(s)
During Past Five Years | Number of
Portfolios
in Fund
Complex
Overseen | Other
Directorships Held
by Trustees*** |
Independent Trustees - continued | | | |
Ronald A. Nyberg (1953) | Trustee and Chair of the Nominating and Governance Committee | Since 2014 | Current: Of Counsel (formerly Partner), Momkus LLP (law firm) (2016-present). Former: Partner, Nyberg & Cassioppi, LLC (law firm) (2000-2016); Executive Vice President, General Counsel, and Corporate Secretary, Van Kampen Investments (1982-1999). | 153 | Current: Advent Convertible and Income Fund (2003-present); PPM Funds (2) (2018-present); Endeavor Health (2012-present). Former: Guggenheim Energy & Income Fund (2015-2023); Fiduciary/Claymore Energy Infrastructure Fund (2004-2022); Guggenheim Enhanced Equity Income Fund (2005-2021); Guggenheim Credit Allocation Fund (2013-2021); Western Asset Inflation-Linked Opportunities & Income Fund (2004-2020); Western Asset Inflation-Linked Income Fund (2003-2020). |
| | THE GUGGENHEIM FUNDS SEMI-ANNUAL REPORT | 37 |
INFORMATION ON BOARD OF TRUSTEES AND OFFICERS (Unaudited)(continued) |
Name, Address*
and Year of Birth | Position(s)
Held with
Trust | Term of Office
and Length of
Time Served** | Principal Occupation(s)
During Past Five Years | Number of
Portfolios
in Fund
Complex
Overseen | Other
Directorships Held
by Trustees*** |
Independent Trustees - continued | | | |
Sandra G. Sponem (1958) | Trustee and Chair of the Audit Committee | Since 2019 (Trustee) Since 2020 (Chair of the Audit Committee) | Current: Retired. Former: Senior Vice President and Chief Financial Officer, M.A. Mortenson-Companies, Inc. (construction and real estate development company) (2007-2017). | 152 | Current: SPDR Series Trust (81) (2018-present); SPDR Index Shares Funds (30) (2018-present); SSGA Active Trust (14) (2018-present). Former: Guggenheim Energy & Income Fund (2019-2023); Fiduciary/Claymore Energy Infrastructure Fund (2019-2022); Guggenheim Enhanced Equity Income Fund (2019-2021); Guggenheim Credit Allocation Fund (2019-2021); SSGA Master Trust (1) (2018-2020). |
38 | THE GUGGENHEIM FUNDS SEMI-ANNUAL REPORT | |
INFORMATION ON BOARD OF TRUSTEES AND OFFICERS (Unaudited)(continued) |
Name, Address*
and Year of Birth | Position(s)
Held with
Trust | Term of Office
and Length of
Time Served** | Principal Occupation(s)
During Past Five Years | Number of
Portfolios
in Fund
Complex
Overseen | Other
Directorships Held
by Trustees*** |
Independent Trustees - concluded | | | |
Ronald E. Toupin, Jr. (1958) | Trustee, Chair of the Board and Chair of the Executive Committee | Since 2014 | Current: Portfolio Consultant (2010-present); Member, Governing Council, Independent Directors Council (2013-present); Governor, Board of Governors, Investment Company Institute (2018-present). Former: Member, Executive Committee, Independent Directors Council (2016-2018); Vice President, Manager and Portfolio Manager, Nuveen Asset Management (1998-1999); Vice President, Nuveen Investment Advisory Corp. (1992-1999); Vice President and Manager, Nuveen Unit Investment Trusts (1991-1999); and Assistant Vice President and Portfolio Manager, Nuveen Unit Investment Trusts (1988-1999), each of John Nuveen & Co., Inc. (registered broker dealer) (1982-1999). | 152 | Former: Guggenheim Energy & Income Fund (2015-2023); Fiduciary/Claymore Energy Infrastructure Fund (2004-2022); Guggenheim Enhanced Equity Income Fund (2005-2021); Guggenheim Credit Allocation Fund (2013-2021); Western Asset Inflation-Linked Opportunities & Income Fund (2004-2020); Western Asset Inflation-Linked Income Fund (2003-2020). |
| | THE GUGGENHEIM FUNDS SEMI-ANNUAL REPORT | 39 |
INFORMATION ON BOARD OF TRUSTEES AND OFFICERS (Unaudited)(continued) |
Name, Address*
and Year of Birth | Position(s)
Held with
Trust | Term of Office
and Length of
Time Served** | Principal Occupation(s)
During Past Five Years | Number of
Portfolios
in Fund
Complex
Overseen | Other
Directorships Held
by Trustees*** |
Interested Trustee: | | |
Amy J. Lee**** (1961) | Trustee, Vice President and Chief Legal Officer | Since 2018 (Trustee) Since 2014 (Chief Legal Officer) Since 2007
(Vice President) | Current: Interested Trustee, certain other funds in the Fund Complex (2018-present); Chief Legal Officer, certain other funds in the Fund Complex (2014-present); Vice President, certain other funds in the Fund Complex (2007-present); Senior Managing Director, Guggenheim Investments (2012-present). Former: President and/or Chief Executive Officer, certain other funds in the Fund Complex (2017-2019); Vice President, Associate General Counsel and Assistant Secretary, Security Benefit Life Insurance Company and Security Benefit Corporation (2004-2012). | 152 | Former: Guggenheim Energy & Income Fund (2018-2023); Fiduciary/Claymore Energy Infrastructure Fund (2018-2022); Guggenheim Enhanced Equity Income Fund (2018-2021); Guggenheim Credit Allocation Fund (2018-2021). |
* | The business address of each Trustee is c/o Guggenheim Investments, 227 West Monroe Street, Chicago, Illinois 60606. |
** | Each Trustee serves an indefinite term, until his or her successor is elected and qualified. Time served includes time served in the respective position for the Predecessor Corporation. |
*** | Each Trustee also serves on the Boards of Trustees of Guggenheim Funds Trust, Guggenheim Variable Funds Trust, Guggenheim Strategy Funds Trust, Guggenheim Taxable Municipal Bond & Investment Grade Debt Trust, Guggenheim Strategic Opportunities Fund, Guggenheim Active Allocation Fund, Rydex Series Funds, Rydex Dynamic Funds, Rydex Variable Trust and Transparent Value Trust. Messrs. Barnes and Nyberg also serve on the Board of Trustees of Advent Convertible & Income Fund. |
**** | This Trustee is deemed to be an “interested person” of the Fund under the 1940 Act by reason of her position with the Fund’s Adviser and/or the parent of the Adviser. |
40 | THE GUGGENHEIM FUNDS SEMI-ANNUAL REPORT | |
INFORMATION ON BOARD OF TRUSTEES AND OFFICERS (Unaudited)(continued) |
Name, Address*
and Year of Birth | Position(s)
Held with
Trust | Term of Office
and Length of
Time Served** | Principal Occupation(s)
During Past Five Years |
Officers | | | |
Brian E. Binder (1972) | President and Chief Executive Officer | Since 2018 | Current: President, Mutual Fund Boards, Guggenheim Investments (2022-present); President and Chief Executive Officer, certain other funds in the Fund Complex (2018-present); President, Mutual Funds Boards and Senior Managing Director, Guggenheim Funds Investment Advisors, LLC and Security Investors, LLC (2018-present); Board Member, Guggenheim Partners Investment Funds plc (2022-present); Board Member, Guggenheim Global Investments plc (2022-present); Board Member, Guggenheim Partners Fund Management (Europe) Limited (2018-present). Former: Senior Managing Director and Chief Administrative Officer, Guggenheim Investments (2018-2022); Managing Director and President, Deutsche Funds, and Head of US Product, Trading and Fund Administration, Deutsche Asset Management (2013-2018); Managing Director, Chairman of North American Executive Committee and Head of Business Management and Consulting, Invesco Ltd. (2010-2012). |
James Howley (1972) | Chief Financial Officer, Chief Accounting Officer and Treasurer | Since 2022 | Current: Managing Director, Guggenheim Investments (2004-present); Chief Financial Officer, Chief Accounting Officer, and Treasurer, certain other funds in the Fund Complex (2022-present). Former: Assistant Treasurer, certain other funds in the Fund Complex (2006-2022); Manager, Mutual Fund Administration of Van Kampen Investments, Inc. (1996-2004). |
Mark E. Mathiasen (1978) | Secretary | Since 2014 | Current: Secretary, certain other funds in the Fund Complex (2007-present); Managing Director, Guggenheim Investments (2007-present). |
Glenn McWhinnie (1969) | Assistant Treasurer | Since 2016 | Current: Vice President, Guggenheim Investments (2009-present); Assistant Treasurer, certain other funds in the Fund Complex (2016-present). |
Michael P. Megaris (1984) | Assistant Secretary | Since 2014 | Current: Assistant Secretary, certain other funds in the Fund Complex (2014-present); Managing Director, Guggenheim Investments (2012-present). |
| | THE GUGGENHEIM FUNDS SEMI-ANNUAL REPORT | 41 |
INFORMATION ON BOARD OF TRUSTEES AND OFFICERS (Unaudited)(continued) |
Name, Address*
and Year of Birth | Position(s)
Held with
Trust | Term of Office
and Length of
Time Served** | Principal Occupation(s)
During Past Five Years |
Officers - continued | |
Elisabeth Miller (1968) | Chief Compliance Officer | Since 2012 | Current: Chief Compliance Officer, certain other funds in the Fund Complex (2012-present); Senior Managing Director, Guggenheim Investments (2012-present); Senior Managing Director, Guggenheim Funds Distributors, LLC (2014-present). Former: Chief Compliance Officer, Security Investors, LLC and Guggenheim Funds Investment Advisors, LLC (2012-2018); Chief Compliance Officer, Guggenheim Distributors, LLC (2009-2014); Senior Manager, Security Investors, LLC (2004-2014); Senior Manager, Guggenheim Distributors, LLC (2004-2014). |
Margaux Misantone (1978) | AML Officer | Since 2017 | Current: Chief Compliance Officer, Security Investors, LLC and Guggenheim Funds Investment Advisors, LLC (2018-present); AML Officer, Security Investors, LLC and certain other funds in the Fund Complex (2017-present); Managing Director, Guggenheim Investments (2015-present). Former: Assistant Chief Compliance Officer, Security Investors, LLC and Guggenheim Funds Investments Advisors, LLC (2015-2018). |
Kimberly J. Scott (1974) | Assistant Treasurer | Since 2014 | Current: Director, Guggenheim Investments (2012-present); Assistant Treasurer, certain other funds in the Fund Complex (2012-present). Former: Financial Reporting Manager, Invesco, Ltd. (2010-2011); Vice President/Assistant Treasurer, Mutual Fund Administration for Van Kampen Investments, Inc./Morgan Stanley Investment Management (2009-2010); Manager of Mutual Fund Administration, Van Kampen Investments, Inc./Morgan Stanley Investment Management (2005-2009). |
42 | THE GUGGENHEIM FUNDS SEMI-ANNUAL REPORT | |
INFORMATION ON BOARD OF TRUSTEES AND OFFICERS (Unaudited)(concluded) |
Name, Address*
and Year of Birth | Position(s)
Held with
Trust | Term of Office
and Length of
Time Served** | Principal Occupation(s)
During Past Five Years |
Officers - concluded | |
Jon Szafran (1989) | Assistant Treasurer | Since 2017 | Current: Director, Guggenheim Investments (2017-present); Assistant Treasurer, certain other funds in the Fund Complex (2017-present). Former: Assistant Treasurer of Henderson Global Funds and Manager of US Fund Administration, Henderson Global Investors (North America) Inc. (“HGINA”), (2017); Senior Analyst of US Fund Administration, HGINA (2014–2017); Senior Associate of Fund Administration, Cortland Capital Market Services, LLC (2013-2014); Experienced Associate, PricewaterhouseCoopers LLP (2012-2013). |
* | The business address of each officer is c/o Guggenheim Investments, 227 West Monroe Street, Chicago, Illinois 60606. |
** | Each officer serves an indefinite term, until his or her successor is duly elected and qualified. |
| | THE GUGGENHEIM FUNDS SEMI-ANNUAL REPORT | 43 |
GUGGENHEIM INVESTMENTS PRIVACY NOTICE (Unaudited) |
Who We Are
This Privacy Notice describes the data protection practices of Guggenheim Investments. Guggenheim Investments as used herein refers to the affiliated investment management businesses of Guggenheim Partners, LLC: Guggenheim Funds Investment Advisors, LLC, Guggenheim Partners Investment Management, LLC, Guggenheim Funds Distributors, LLC, Security Investors, LLC, Guggenheim Investment Advisors (Europe) Limited, Guggenheim Real Estate, LLC, GS Gamma Advisors, LLC, Guggenheim Partners India Management, LLC, Guggenheim Partners Europe Limited, as well as the funds in the Guggenheim Funds complex (the “Funds”) (“Guggenheim Investments,” “we,” “us,” or “our”).
Guggenheim Partners Investment Management Holdings, LLC, located at 330 Madison Avenue, New York, New York 10017 is the data controller for your information. The affiliates who are also controllers of certain of your information are: Guggenheim Investment Advisors (Europe) Limited, Guggenheim Partners Europe Limited, Guggenheim Partners, LLC, Guggenheim Funds Investment Advisors, LLC, Guggenheim Partners Investment Management, LLC, Guggenheim Funds Distributors, LLC and Security Investors, LLC, as well as the Funds.
Our Commitment to You
Guggenheim Investments considers your privacy our utmost concern. When you become our client or investor, you entrust us with not only your hard-earned money but also with your personal and financial information. Because we have access to your private information, we hold ourselves to the highest standards in its safekeeping and use. We strictly limit how we share your information with others, whether you are a current or former Guggenheim Investments client or investor.
The Information We Collect About You
We collect certain nonpublic personal information about you from information you provide on applications, other forms, our website, and/or from third parties including investment advisors. This information includes Social Security or other tax identification number, assets, income, tax information, retirement and estate plan information, transaction history, account balance, payment history, bank account information, marital status, family relationships, information that we collect on our website through the use of “cookies,” and other personal information that you or others provide to us. We may also collect such information through your inquiries by mail, e-mail or telephone. We may also collect customer due diligence information, as required by applicable law and regulation, through third party service providers.
How We Handle Your Personal Information
The legal basis for using your information as set out in this Privacy Notice is as follows: (a) use of your personal data is necessary to perform our obligations under any contract with you (such as a contract for us to provide financial services to you); or (b) where use of your personal data is not necessary for performance of a contract, use of your personal data is necessary for our legitimate interests or the legitimate interests of others (for example, to enforce the legal terms
44 | THE GUGGENHEIM FUNDS SEMI-ANNUAL REPORT | |
GUGGENHEIM INVESTMENTS PRIVACY NOTICE (Unaudited)(continued) |
governing our services, operate and market our website and other services we offer, ensure safe environments for our personnel and others, make and receive payments, prevent fraud and to know the customer to whom we are providing the services). Some processing is done to comply with applicable law.
In addition to the specific uses described above, we also use your information in the following manner:
| | ● | We use your information in connection with servicing your accounts. |
| | ● | We use information to respond to your requests or questions. For example, we might use your information to respond to your customer feedback. |
| | ● | We use information to improve our products and services. We may use your information to make our website and products better. We may use your information to customize your experience with us. |
| | ● | We use information for security purposes. We may use your information to protect our company and our customers. |
| | ● | We use information to communicate with you. For example, we will communicate with you about your account or our relationship. We may contact you about your feedback. We might also contact you about this Privacy Notice. We may also enroll you in our email newsletter. |
| | ● | We use information as otherwise permitted by law, as we may notify you. |
| | ● | Aggregate/Anonymous Data. We may aggregate and/or anonymize any information collected through the website so that such information can no longer be linked to you or your device (“Aggregate/Anonymous Information”). We may use Aggregate/Anonymous Information for any purpose, including without limitation for research and marketing purposes, and may also share such data with any third parties, including advertisers, promotional partners, and sponsors. |
We do not sell information about current or former clients or their accounts to third parties. Nor do we share this information, except when necessary to complete transactions at your request, to make you aware of investment products and services that we or our affiliates offer, or as permitted or required by law.
We provide information about you to companies and individuals not affiliated with Guggenheim Investments to complete certain transactions or account changes, or to perform services for us related to your account. For example, if you ask to transfer assets from another financial institution to Guggenheim Investments, we must provide certain information about you to that company to complete the transaction. We provide the third party with only the information necessary to carry out its responsibilities and only for that purpose. And we require these third parties to treat your private information with the same high degree of confidentiality that we do.
| | THE GUGGENHEIM FUNDS SEMI-ANNUAL REPORT | 45 |
GUGGENHEIM INVESTMENTS PRIVACY NOTICE (Unaudited)(continued) |
To alert you to other Guggenheim Investments products and services, we share your information within our family of affiliated companies. You may limit our sharing with affiliated companies as set out below. We may also share information with any successor to all or part of our business, or in connection with steps leading up to a merger or acquisition. For example, if part of our business was sold we may give customer information as part of that transaction. We may also share information about you with your consent.
We will release information about you if you direct us to do so, if we are compelled by law to do so, or in other circumstances as permitted by law (for example, to protect your account from fraud).
If you close your account(s) or become an inactive client or investor, we will continue to adhere to the privacy policies and practices described in this notice.
Opt-Out Provisions and Your Data Choices
The law allows you to “opt out” of certain kinds of information sharing with third parties. We do not share personal information about you with any third parties that triggers this opt-out right. This means YOU ARE ALREADY OPTED OUT.
When you are no longer our client or investor, we continue to share your information as described in this notice, and you may contact us at any time to limit our sharing by sending an email to CorporateDataPrivacy@GuggenheimPartners.com.
European Union Data Subjects and certain others: In addition to the choices set forth above, residents of the European Union and certain other jurisdictions have certain rights to (1) request access to or rectification or deletion of information we collect about them, (2) request a restriction on the processing of their information, (3) object to the processing of their information, or (4) request the portability of certain information. To exercise these or other rights, please contact us using the contact information below. We will consider all requests and provide our response within the time period stated by applicable law. Please note, however, that certain information may be exempt from such requests in some circumstances, which may include if we need to keep processing your information for our legitimate interests or to comply with a legal obligation. We may request you provide us with information necessary to confirm your identity before responding to your request.
Residents of France and certain other jurisdictions may also provide us with instructions regarding the manner in which we may continue to store, erase and share your information after your death, and where applicable, the person you have designated to exercise these rights after your death.
How We Protect Privacy Online
We take steps to protect your privacy when you use our web site – www.guggenheiminvestments.com – by using secure forms of online communication, including encryption technology, Secure Socket Layer (SSL) protocol, firewalls and user names and
46 | THE GUGGENHEIM FUNDS SEMI-ANNUAL REPORT | |
GUGGENHEIM INVESTMENTS PRIVACY NOTICE (Unaudited)(concluded) |
passwords. These safeguards vary based on the sensitivity of the information that we collect and store. However, we cannot and do not guarantee that these measures will prevent every unauthorized attempt to access, use, or disclose your information since despite our efforts, no Internet and/or other electronic transmissions can be completely secure. Our web site uses “http cookies”—tiny pieces of information that we ask your browser to store. We use cookies for session management and security features on the Guggenheim Investments web site. We do not use them to pull data from your hard drive, to learn your e-mail address, or to view data in cookies created by other web sites. We will not share the information in our cookies or give others access to it. See the legal information area on our web site for more details about web site security and privacy features.
How We Safeguard Your Personal Information and Data Retention
We restrict access to nonpublic personal information about you to our employees and in some cases to third parties (for example, the service providers described above) as permitted by law. We maintain strict physical, electronic and procedural safeguards that comply with federal standards to guard your nonpublic personal information.
We keep your information for no longer than necessary for the purposes for which it is processed. The length of time for which we retain information depends on the purposes for which we collected and use it and/or as required to comply with applicable laws. Information may persist in copies made for backup and business continuity purposes for additional time.
International Visitors
If you are not a resident of the United States, please be aware that your information may be transferred to, stored and processed in the United States where our servers are located and our databases are operated. The data protection and other laws of the United States and other countries might not be as comprehensive as those in your country.
In such cases, we ensure that a legal basis for such a transfer exists and that adequate protection is provided as required by applicable law, for example, by using standard contractual clauses or by transferring your data to a jurisdiction that has obtained an adequacy finding. Individuals whose data may be transferred on the basis of standard contractual clauses may contact us as described below.
We’ll Keep You Informed
If you have any questions or concerns about how we treat your personal data, we encourage you to consult with us first. You may also contact the relevant supervisory authority.
We reserve the right to modify this policy at any time and will inform you promptly of material changes. You may access our privacy policy from our web site at www.guggenheiminvestments.com. Should you have any questions regarding our privacy policy, contact us by email at CorporateDataPrivacy@GuggenheimPartners.com.
| | THE GUGGENHEIM FUNDS SEMI-ANNUAL REPORT | 47 |
This page intentionally left blank.
This page intentionally left blank.
3.31.2024
Guggenheim Funds Semi-Annual Report
| |
Guggenheim Capital Stewardship Fund | | |
GuggenheimInvestments.com | CSF-SEMI-0324x0924 |

| | |
DEAR SHAREHOLDER | 2 |
ECONOMIC AND MARKET OVERVIEW | 3 |
ABOUT SHAREHOLDERS’ FUND EXPENSES | 4 |
CAPITAL STEWARDSHIP FUND | 6 |
NOTES TO FINANCIAL STATEMENTS | 13 |
OTHER INFORMATION | 17 |
INFORMATION ON BOARD OF TRUSTEES AND OFFICERS | 18 |
GUGGENHEIM INVESTMENTS PRIVACY NOTICE | 24 |
| | THE GUGGENHEIM FUNDS SEMI-ANNUAL REPORT | 1 |
Dear Shareholder:
Guggenheim Partners Investment Management, LLC (“GPIM” or the “Investment Adviser”), is pleased to present the shareholder report for Guggenheim Capital Stewardship Fund (the “Fund”). The report covers the semiannual fiscal period ended March 31, 2024 (“the “Reporting Period”).
Concinnity Advisors, LP, serves as the Fund’s sub-adviser (the “Sub-Adviser”).
The Investment Adviser is part of Guggenheim Investments, which represents the investment management businesses of Guggenheim Partners, LLC, (“Guggenheim”) a global, diversified financial services firm.
Guggenheim Funds Distributors, LLC is the distributor of the Fund. Guggenheim Funds Distributors, LLC is affiliated with Guggenheim and the Investment Adviser.
We encourage you to read the Economic and Market Overview section of the report, which follows this letter.
We are committed to providing innovative investment solutions and appreciate the trust you place in us.
Sincerely,
Guggenheim Partners Investment Management, LLC
April 30, 2024
Read a prospectus and summary prospectus (if available) carefully before investing. It contains the investment objectives, risks, charges, expenses and other information, which should be considered carefully before investing. Obtain a prospectus and summary prospectus (if available) by calling 800.820.0888.
This material is not intended as a recommendation or as investment advice of any kind, including in connection with rollovers, transfers, and distributions. Such material is not provided in a fiduciary capacity, may not be relied upon for or in connection with the making of investment decisions, and does not constitute a solicitation of an offer to buy or sell securities. All content has been provided for informational or educational purposes only and is not intended to be and should not be construed as legal or tax advice and/or a legal opinion. Always consult a financial, tax and/or legal professional regarding your specific situation.
Capital Stewardship Fund may not be suitable for all investors. ●An investment in the Fund will fluctuate and is subject to investment risks, which means an investor could lose money ● There can be no guarantee the Fund will achieve its investment objective ●The intrinsic value of the underlying stocks may never be realized, or the stock may decline in value ●The Fund is subject to risk that stocks in which the Fund invests may under perform the equity markets as a whole ● The Fund is subject to active trading risks that may increase volatility and impact its ability to achieve its investment objective ● You may have a gain or loss when you sell your shares. ● It is important to note that the Fund is not guaranteed by the U.S. government. ● Please read the prospectus for more detailed information regarding these and other risks.
2 | THE GUGGENHEIM FUNDS SEMI-ANNUAL REPORT | |
ECONOMIC AND MARKET OVERVIEW (Unaudited) | March 31, 2024 |
While job growth remains robust, recent labor data brought increased confidence in a labor market in better balance, allowing for inflation to soften further. Labor force growth remains strong, aided by high immigration flows, helping bring labor supply in line with gradually cooling demand. The Small Business Survey indicates that plans to increase compensation have returned to pre-COVID levels. Additionally, Bureau of Labor Statistics data reveal a continued decline in the “quits rate,” reducing the pressure on businesses to raise wages to attract or retain employees. These developments suggest wage pressures may ease further by year end. And despite some speculation against any Federal Reserve (“Fed”) rate cuts materializing in 2024, we continue to anticipate cuts later this year.
Following the stronger-than-expected March Consumer Price Index, we believe that there is a high probability that the easing cycle will start in the second half of the year, since the Fed will likely need more time to gather confirming data. In the latest Summary of Economic Projections, the Federal Open Market Committee (“FOMC”) significantly increased the median forecast for 2024 U.S. gross domestic product, slightly increased it for core personal consumption expenditures year over year, and continues to expect no material increase in the unemployment rate. These adjustments left the median view for three rate cuts for 2024, which suggests the bar is very high for the Fed to keep rates where they are all year, and even higher for more rate hikes to materialize.
Amid this macroeconomic backdrop, in the first quarter of 2024 the two-year Treasury yield increased to 4.59% from 4.23%, and the 10-year Treasury yield increased to 4.20% from 3.88%, keeping the inverted 2s/10s yield curve consistent at 39 basis points as of the end of the Reporting Period, up four basis points since the start of the year. One basis point equals 0.01%. In general, spreads to Treasurys have remained tight across sectors. In investment-grade corporate bonds, BBB-rated bonds continued to remain attractive relative to A and BB-rated bonds, and supply slowed toward the end of the first quarter of 2024, which we believe should support spreads in the near term. High yield bond spreads tightened during the first quarter of 2024 to 301 basis points from 323 basis points at the start of the year, while leveraged loans’ discount margins to maturity tightened to 509 basis points from 528 basis points. Structured credit spreads tightened marginally amid strong demand. Investor demand and an improved arbitrage led to robust new collateralized loan obligation issuance, and tightening liabilities led to an increase in refinances/resets.
Looking forward, Fed officials continue to advocate for a patient approach. A conventional easing cycle is therefore far from guaranteed. Market expectations have already adjusted significantly from market-implied expectations of six rate cuts in 2024 just two months ago to only three as of the end of the Reporting Period, aligning more closely with the FOMC’s views. So far, the market has taken this delay in stride, but its patience and assessment of credit risk could be tested.
For the Reporting Period, the S&P 500® Index* returned 23.48%. The MSCI Europe-Australasia-Far East (“EAFE”) Index* returned 17.01%. The return of the MSCI Emerging Markets Index* was 10.56%.
In the bond market, the Bloomberg U.S. Aggregate Bond Index* posted a 5.99% return for the Reporting Period, while the Bloomberg U.S. Corporate High Yield Index* returned 8.75%. The return of the ICE Bank of America (“BofA”) 3-Month U.S. Treasury Bill Index* was 2.69% for the Reporting Period.
The opinions and forecasts expressed may not actually come to pass. This information is subject to change at any time, based on market and other conditions, and should not be construed as a recommendation of any specific security or strategy.
*Index Definitions:
The following indices are referenced throughout this report. Indices are unmanaged and not available for direct investment. Index performance does not reflect transaction costs, fees, or expenses.
Bloomberg U.S. Aggregate Bond Index is a broad-based flagship benchmark that measures the investment grade, U.S. dollar-denominated, fixed-rate taxable bond market, including U.S. Treasuries, government-related and corporate securities, mortgage-backed securities or “MBS”(agency fixed-rate and hybrid adjustable-rate mortgage, or “ARM”, pass-throughs), asset-backed securities (“ABS”), and commercial mortgage-backed securities (“CMBS”) (agency and non-agency).
Bloomberg U.S. Corporate High Yield Index measures the U.S. dollar-denominated, high yield, fixed-rate corporate bond market. Securities are classified as high yield if the middle rating of Moody’s, Fitch, and S&P is Ba1/BB +/BB + or below.
ICE BofA 3-Month U.S. Treasury Bill Index is an unmanaged market Index of U.S. Treasury securities maturing in 90 days that assumes reinvestment of all income.
MSCI EAFE Index is a free float-adjusted market capitalization index that is designed to measure the equity market performance of developed markets, excluding the U.S. & Canada.
MSCI Emerging Markets Index is a free float-adjusted market capitalization weighted index that is designed to measure equity market performance in the global emerging markets.
S&P 500® Index is a broad-based index, the performance of which is based on the performance of 500 widely held common stocks chosen for market size, liquidity, and industry group representation.
| | THE GUGGENHEIM FUNDS SEMI-ANNUAL REPORT | 3 |
ABOUT SHAREHOLDERS’ FUND EXPENSES (Unaudited) | |
All mutual funds have operating expenses, and it is important for our shareholders to understand the impact of costs on their investments. Shareholders of a fund incur two types of costs: (i) transaction costs, including sales charges (loads) on purchase payments, reinvested dividends, other distributions, and exchange fees, and (ii) ongoing costs, including management fees, administrative services, and shareholder reports, among others. These ongoing costs, or operating expenses, are deducted from a fund’s gross income and reduce the investment return of the fund.
A fund’s expenses are expressed as a percentage of its average net assets, which is known as the expense ratio. The following examples are intended to help investors understand the ongoing costs (in dollars) of investing in a fund and to compare these costs with the ongoing costs of investing in other mutual funds.
The examples are based on an investment of $1,000 made at the beginning of the period and held for the entire six-month period beginning September 30, 2023 and ending March 31, 2024.
The following tables illustrate the Fund’s costs in two ways:
Table 1. Based on actual Fund return: This section helps investors estimate the actual expenses paid over the period. The “Ending Account Value” shown is derived from the Fund’s actual return, and the fifth column shows the dollar amount that would have been paid by an investor who started with $1,000 in the Fund. Investors may use the information here, together with the amount invested, to estimate the expenses paid over the period. Simply divide the Fund’s account value by $1,000 (for example, an $8,600 account value divided by $1,000 = 8.6), then multiply the result by the number provided under the heading “Expenses Paid During Period.”
Table 2. Based on hypothetical 5% return: This section is intended to help investors compare a fund’s cost with those of other mutual funds. The table provides information about hypothetical account values and hypothetical expenses based on the Fund’s actual expense ratio and an assumed rate of return of 5% per year before expenses, which is not the Fund’s actual return. The hypothetical account values and expenses may not be used to estimate the actual ending account balance or expenses paid during the period. The example is useful in making comparisons because the U.S. Securities and Exchange Commission (the “SEC”) requires all mutual funds to calculate expenses based on the 5% return. Investors can assess a Fund’s costs by comparing this hypothetical example with the hypothetical examples that appear in shareholder reports of other funds.
The calculations illustrated above assume no shares were bought or sold during the period. Actual costs may have been higher or lower, depending on the amount of investment and the timing of any purchases or redemptions.
Please note that the expenses shown in the table are meant to highlight your ongoing costs only and do not reflect any transactional costs, such as sales charges (loads) on purchase payments, and contingent deferred sales charges (“CDSC”) on redemptions, if any. Therefore, the second table is useful in comparing ongoing costs only, and will not help you determine the relative total costs of owning different funds. In addition, if these transactional costs were included, your costs would have been higher.
More information about the Fund’s expenses, including annual expense ratios for periods up to five years (subject to the Fund’s inception date), can be found in the Financial Highlights section of this report. For additional information on operating expenses and other shareholder costs, please refer to the Fund’s prospectus.
4 | THE GUGGENHEIM FUNDS SEMI-ANNUAL REPORT | |
ABOUT SHAREHOLDERS’ FUND EXPENSES (Unaudited)(concluded) | |
| | Expense
Ratio1 | | | Fund
Return | | | Beginning
Account Value
September 30, 2023 | | | Ending
Account Value
March 31, 2024 | | | Expenses
Paid During
Period2 | |
Table 1. Based on actual Fund return3 | | | | | | | | | | | | | | | | |
Institutional Class | | | 1.01 | % | | | 21.92 | % | | $ | 1,000.00 | | | $ | 1,219.20 | | | $ | 5.60 | |
| | | | | | | | | | | | | | | | | | | | | |
Table 2. Based on hypothetical 5% return (before expenses) | | | | | | | | | | | | | | | | |
Institutional Class | | | 1.01 | % | | | 5.00 | % | | $ | 1,000.00 | | | $ | 1,019.95 | | | $ | 5.10 | |
1 | Annualized and excludes expenses of the underlying funds in which the Fund invest, if any. |
2 | Expenses are equal to the Fund’s annualized expense ratio, net of any applicable fee waivers, multiplied by the average account value over the period, multiplied by 183/366 (to reflect the one-half year period). |
3 | Actual cumulative return at net asset value for the period September 30, 2023 to March 31, 2024. |
| | THE GUGGENHEIM FUNDS SEMI-ANNUAL REPORT | 5 |
PERFORMANCE REPORT AND FUND PROFILE (Unaudited) | March 31, 2024 |
CAPITAL STEWARDSHIP FUND
OBJECTIVE: Seeks long-term capital appreciation.
Holdings Diversification (Market Exposure as % of Net Assets)
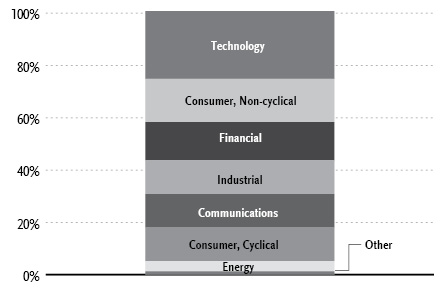
“Holdings Diversification (Market Exposure as % of Net Assets)” excludes any temporary cash investments.
Inception Date: September 26, 2014 |
Ten Largest Holdings | % of Total Net Assets |
Microsoft Corp. | 6.2% |
Apple, Inc. | 5.1% |
Berkshire Hathaway, Inc. — Class B | 3.3% |
NVIDIA Corp. | 3.3% |
Amazon.com, Inc. | 2.8% |
Alphabet, Inc. — Class A | 2.7% |
Valero Energy Corp. | 2.2% |
Home Depot, Inc. | 2.1% |
Lowe’s Companies, Inc. | 2.0% |
Lockheed Martin Corp. | 2.0% |
Top Ten Total | 31.7% |
| | |
“Ten Largest Holdings” excludes any temporary cash investments. |
Average Annual Returns*
Periods Ended March 31, 2024
| 6 Month† | 1 Year | 5 Year | Since
Inception
(09/26/14) |
Capital Stewardship Fund | 21.92% | 23.91% | 12.27% | 10.29% |
S&P 500 Index | 23.48% | 29.88% | 15.05% | 12.87% |
* | The performance data above represents past performance that is not predictive of future results. The investment return and principal value of an investment in the Fund will fluctuate so that an investor’s shares, when redeemed, may be worth more or less than their original cost. Returns are historical and include changes in principal and reinvested dividends and capital gains and do not reflect the effect of taxes. The S&P 500 Index is an unmanaged index and, unlike the Fund, has no management fees or operating expenses to reduce its reported return. |
† | 6 month returns are not annualized. |
6 | THE GUGGENHEIM FUNDS SEMI-ANNUAL REPORT | |
SCHEDULE OF INVESTMENTS (Unaudited) | March 31, 2024 |
CAPITAL STEWARDSHIP FUND | |
| | Shares | | | Value | |
COMMON STOCKS† - 100.0% |
| | | | | | | | | |
Technology - 25.9% |
Microsoft Corp. | | | 31,783 | | | $ | 13,371,744 | |
Apple, Inc. | | | 64,226 | | | | 11,013,475 | |
NVIDIA Corp. | | | 7,957 | | | | 7,189,627 | |
Broadcom, Inc. | | | 2,406 | | | | 3,188,552 | |
Applied Materials, Inc. | | | 10,618 | | | | 2,189,750 | |
Cognizant Technology Solutions Corp. — Class A | | | 26,248 | | | | 1,923,716 | |
Cadence Design Systems, Inc.* | | | 6,121 | | | | 1,905,345 | |
Adobe, Inc.* | | | 3,327 | | | | 1,678,804 | |
Dropbox, Inc. — Class A* | | | 65,307 | | | | 1,586,960 | |
QUALCOMM, Inc. | | | 9,166 | | | | 1,551,804 | |
Texas Instruments, Inc. | | | 7,626 | | | | 1,328,525 | |
Crowdstrike Holdings, Inc. — Class A* | | | 4,016 | | | | 1,287,489 | |
Dell Technologies, Inc. — Class C | | | 10,197 | | | | 1,163,580 | |
Workday, Inc. — Class A* | | | 3,664 | | | | 999,356 | |
MongoDB, Inc.* | | | 2,487 | | | | 891,938 | |
Manhattan Associates, Inc.* | | | 3,275 | | | | 819,503 | |
Zoom Video Communications, Inc. — Class A* | | | 12,065 | | | | 788,689 | |
Atlassian Corp. — Class A* | | | 3,771 | | | | 735,760 | |
NetApp, Inc. | | | 5,518 | | | | 579,224 | |
KLA Corp. | | | 784 | | | | 547,679 | |
HubSpot, Inc.* | | | 708 | | | | 443,604 | |
HP, Inc. | | | 13,780 | | | | 416,432 | |
Twilio, Inc. — Class A* | | | 5,182 | | | | 316,879 | |
Total Technology | | | | | | | 55,918,435 | |
| | | | | | | | | |
Consumer, Non-cyclical - 16.6% |
Amgen, Inc. | | | 13,597 | | | | 3,865,899 | |
UnitedHealth Group, Inc. | | | 6,652 | | | | 3,290,745 | |
Merck & Company, Inc. | | | 19,057 | | | | 2,514,571 | |
Vertex Pharmaceuticals, Inc.* | | | 6,009 | | | | 2,511,822 | |
Bristol-Myers Squibb Co. | | | 43,879 | | | | 2,379,558 | |
McKesson Corp. | | | 4,264 | | | | 2,289,128 | |
Humana, Inc. | | | 6,300 | | | | 2,184,336 | |
Johnson & Johnson | | | 12,945 | | | | 2,047,770 | |
HCA Healthcare, Inc. | | | 5,493 | | | | 1,832,080 | |
Gilead Sciences, Inc. | | | 24,829 | | | | 1,818,724 | |
United Rentals, Inc. | | | 2,371 | | | | 1,709,752 | |
United Therapeutics Corp.* | | | 6,422 | | | | 1,475,262 | |
AbbVie, Inc. | | | 7,268 | | | | 1,323,503 | |
Elevance Health, Inc. | | | 2,266 | | | | 1,175,012 | |
Eli Lilly & Co. | | | 1,163 | | | | 904,767 | |
CVS Health Corp. | | | 10,306 | | | | 822,007 | |
Neurocrine Biosciences, Inc.* | | | 5,372 | | | | 740,906 | |
Cigna Group | | | 2,019 | | | | 733,281 | |
PayPal Holdings, Inc.* | | | 8,747 | | | | 585,961 | |
Centene Corp.* | | | 4,957 | | | | 389,025 | |
Cardinal Health, Inc. | | | 3,204 | | | | 358,528 | |
PepsiCo, Inc. | | | 1,903 | | | | 333,044 | |
Booz Allen Hamilton Holding Corp. | | | 1,780 | | | | 264,223 | |
Biogen, Inc.* | | | 1,113 | | | | 239,996 | |
Total Consumer, Non-cyclical | | | | | | | 35,789,900 | |
| | | | | | | | | |
Financial - 14.6% |
Berkshire Hathaway, Inc. — Class B* | | | 17,211 | | | | 7,237,570 | |
Hartford Financial Services Group, Inc. | | | 36,239 | | | | 3,734,429 | |
Travelers Companies, Inc. | | | 15,710 | | | | 3,615,499 | |
Capital One Financial Corp. | | | 19,263 | | | | 2,868,068 | |
Citigroup, Inc. | | | 40,022 | | | | 2,530,991 | |
JPMorgan Chase & Co. | | | 11,792 | | | | 2,361,938 | |
Synchrony Financial | | | 45,132 | | | | 1,946,092 | |
Progressive Corp. | | | 9,129 | | | | 1,888,060 | |
Royal Bank of Canada | | | 10,997 | | | | 1,109,377 | |
Toronto-Dominion Bank | | | 17,245 | | | | 1,041,253 | |
Ameriprise Financial, Inc. | | | 1,846 | | | | 809,360 | |
Cboe Global Markets, Inc. | | | 4,033 | | | | 740,983 | |
Prudential Financial, Inc. | | | 6,273 | | | | 736,450 | |
Visa, Inc. — Class A | | | 2,074 | | | | 578,812 | |
Aflac, Inc. | | | 2,918 | | | | 250,540 | |
Total Financial | | | | | | | 31,449,422 | |
| | | | | | | | | |
Industrial - 12.9% |
Lockheed Martin Corp. | | | 9,403 | | | | 4,277,142 | |
Deere & Co. | | | 9,086 | | | | 3,731,984 | |
Illinois Tool Works, Inc. | | | 11,842 | | | | 3,177,564 | |
Snap-on, Inc. | | | 9,424 | | | | 2,791,577 | |
Amphenol Corp. — Class A | | | 20,022 | | | | 2,309,538 | |
FedEx Corp. | | | 7,575 | | | | 2,194,780 | |
Caterpillar, Inc. | | | 5,881 | | | | 2,154,975 | |
Owens Corning | | | 10,300 | | | | 1,718,040 | |
Masco Corp. | | | 20,752 | | | | 1,636,918 | |
General Dynamics Corp. | | | 5,469 | | | | 1,544,938 | |
TD SYNNEX Corp. | | | 8,586 | | | | 971,077 | |
Waste Management, Inc. | | | 3,588 | | | | 764,782 | |
Avnet, Inc. | | | 14,270 | | | | 707,506 | |
Total Industrial | | | | | | | 27,980,821 | |
| | | | | | | | | |
Communications - 12.8% |
Amazon.com, Inc.* | | | 33,228 | | | | 5,993,667 | |
Alphabet, Inc. — Class A* | | | 38,674 | | | | 5,837,067 | |
Meta Platforms, Inc. — Class A | | | 7,409 | | | | 3,597,662 | |
Cisco Systems, Inc. | | | 58,140 | | | | 2,901,767 | |
Motorola Solutions, Inc. | | | 6,325 | | | | 2,245,249 | |
Arista Networks, Inc.* | | | 6,511 | | | | 1,888,060 | |
eBay, Inc. | | | 29,118 | | | | 1,536,848 | |
Booking Holdings, Inc. | | | 389 | | | | 1,411,245 | |
Comcast Corp. — Class A | | | 17,460 | | | | 756,891 | |
Pinterest, Inc. — Class A* | | | 19,145 | | | | 663,757 | |
F5, Inc.* | | | 3,250 | | | | 616,167 | |
Etsy, Inc.* | | | 4,648 | | | | 319,411 | |
Total Communications | | | | | | | 27,767,791 | |
| | | | | | | | | |
Consumer, Cyclical - 12.8% |
Home Depot, Inc. | | | 11,758 | | | | 4,510,369 | |
Lowe’s Companies, Inc. | | | 17,272 | | | | 4,399,696 | |
PulteGroup, Inc. | | | 24,388 | | | | 2,941,680 | |
WW Grainger, Inc. | | | 2,700 | | | | 2,746,710 | |
DR Horton, Inc. | | | 14,014 | | | | 2,306,004 | |
SEE NOTES TO FINANCIAL STATEMENTS. | THE GUGGENHEIM FUNDS SEMI-ANNUAL REPORT | 7 |
SCHEDULE OF INVESTMENTS (Unaudited)(continued) | March 31, 2024 |
CAPITAL STEWARDSHIP FUND | |
| | Shares | | | Value | |
Lear Corp. | | | 13,229 | | | $ | 1,916,618 | |
Cummins, Inc. | | | 5,386 | | | | 1,586,985 | |
Walmart, Inc. | | | 21,290 | | | | 1,281,019 | |
Lululemon Athletica, Inc.* | | | 2,631 | | | | 1,027,800 | |
Brunswick Corp. | | | 9,654 | | | | 931,804 | |
AutoZone, Inc.* | | | 264 | | | | 832,036 | |
Murphy USA, Inc. | | | 1,981 | | | | 830,435 | |
Dick’s Sporting Goods, Inc. | | | 3,463 | | | | 778,690 | |
Yum! Brands, Inc. | | | 5,135 | | | | 711,968 | |
BorgWarner, Inc. | | | 15,177 | | | | 527,249 | |
Starbucks Corp. | | | 3,404 | | | | 311,092 | |
Total Consumer, Cyclical | | | | | | | 27,640,155 | |
| | | | | | | | | |
Energy - 3.9% |
Valero Energy Corp. | | | 28,256 | | | | 4,823,017 | |
Cheniere Energy, Inc. | | | 11,446 | | | | 1,846,011 | |
Suncor Energy, Inc. | | | 36,574 | | | | 1,349,946 | |
Williams Companies, Inc. | | | 10,344 | | | | 403,106 | |
Total Energy | | | | | | | 8,422,080 | |
| | | | | | | | | |
Basic Materials - 0.5% |
Reliance, Inc. | | | 3,454 | | | | 1,154,258 | |
| | | | | | | | | |
Total Common Stocks | | | | |
(Cost $176,896,665) | | | | | | | 216,122,862 | |
| | | | | | | | | |
EXCHANGE-TRADED FUNDS† - 0.8% |
SPDR S&P 500 ETF Trust | | | 3,375 | | | | 1,765,361 | |
Total Exchange-Traded Funds | | | | |
(Cost $1,462,073) | | | | | | | 1,765,361 | |
| | | | | | | | | |
MONEY MARKET FUND† - 0.2% |
Dreyfus Treasury Securities Cash Management Fund — Institutional Shares, 5.19%1 | | | 389,283 | | | | 389,283 | |
Total Money Market Fund | | | | |
(Cost $389,283) | | | | | | | 389,283 | |
| | | | | | | | | |
Total Investments - 101.0% | | | | |
(Cost $178,748,021) | | $ | 218,277,506 | |
Other Assets & Liabilities, net - (1.0)% | | | (2,179,153 | ) |
Total Net Assets - 100.0% | | $ | 216,098,353 | |
* | Non-income producing security. |
† | Value determined based on Level 1 inputs — See Note 4. |
1 | Rate indicated is the 7-day yield as of March 31, 2024. |
| | |
| | See Sector Classification in Other Information section. |
8 | THE GUGGENHEIM FUNDS SEMI-ANNUAL REPORT | SEE NOTES TO FINANCIAL STATEMENTS. |
SCHEDULE OF INVESTMENTS (Unaudited)(concluded) | March 31, 2024 |
CAPITAL STEWARDSHIP FUND | |
The following table summarizes the inputs used to value the Fund’s investments at March 31, 2024 (See Note 4 in the Notes to Financial Statements):
Investments in Securities (Assets) | | Level 1
Quoted
Prices | | | Level 2
Significant
Observable
Inputs | | | Level 3
Significant
Unobservable
Inputs | | | Total | |
Common Stocks | | $ | 216,122,862 | | | $ | — | | | $ | — | | | $ | 216,122,862 | |
Exchange-Traded Funds | | | 1,765,361 | | | | — | | | | — | | | | 1,765,361 | |
Money Market Fund | | | 389,283 | | | | — | | | | — | | | | 389,283 | |
Total Assets | | $ | 218,277,506 | | | $ | — | | | $ | — | | | $ | 218,277,506 | |
SEE NOTES TO FINANCIAL STATEMENTS. | THE GUGGENHEIM FUNDS SEMI-ANNUAL REPORT | 9 |
STATEMENT OF ASSETS AND LIABILITIES (Unaudited) |
March 31, 2024 |
Assets: |
Investments, at value (cost $178,748,021) | | $ | 218,277,506 | |
Cash | | | 73,429 | |
Prepaid expenses | | | 1,542 | |
Receivables: |
Dividends | | | 122,316 | |
Foreign tax reclaims | | | 22,165 | |
Interest | | | 1,646 | |
Total assets | | | 218,498,604 | |
| | | | | |
Liabilities: |
Payable for: |
Fund shares redeemed | | | 2,208,872 | |
Management fees | | | 162,889 | |
Fund accounting and administration fees | | | 9,379 | |
Trustees’ fees* | | | 2,906 | |
Transfer agent/maintenance fees | | | 1,922 | |
Miscellaneous | | | 14,283 | |
Total liabilities | | | 2,400,251 | |
Net assets | | $ | 216,098,353 | |
| | | | | |
Net assets consist of: |
Paid in capital | | $ | 170,372,382 | |
Total distributable earnings (loss) | | | 45,725,971 | |
Net assets | | $ | 216,098,353 | |
| | | | | |
Institutional Class: |
Net assets | | $ | 216,098,353 | |
Capital shares outstanding | | | 6,531,727 | |
Net asset value per share | | $ | 33.08 | |
STATEMENT OF OPERATIONS (Unaudited) |
Six Months Ended March 31, 2024 |
Investment Income: |
Dividends (net of foreign withholding tax of $8,521) | | $ | 1,502,622 | |
Interest | | | 18,093 | |
Total investment income | | | 1,520,715 | |
| | | | | |
Expenses: |
Management fees | | | 886,826 | |
Transfer agent/maintenance fees | | | 12,383 | |
Fund accounting and administration fees | | | 43,208 | |
Professional fees | | | 26,437 | |
Trustees’ fees* | | | 10,444 | |
Custodian fees | | | 5,626 | |
Miscellaneous | | | 7,044 | |
Total expenses | | | 991,968 | |
Less: | | | | |
Earnings credits applied | | | (676 | ) |
Net expenses | | | 991,292 | |
Net investment income | | | 529,423 | |
| | | | | |
Net Realized and Unrealized Gain (Loss): |
Net realized gain (loss) on: |
Investments | | | 7,852,931 | |
Net realized gain | | | 7,852,931 | |
Net change in unrealized appreciation (depreciation) on: |
Investments | | | 31,139,565 | |
Net change in unrealized appreciation (depreciation) | | | 31,139,565 | |
Net realized and unrealized gain | | | 38,992,496 | |
Net increase in net assets resulting from operations | | $ | 39,521,919 | |
* | Relates to Trustees not deemed “interested persons” within the meaning of Section 2(a)(19) of the 1940 Act. |
10 | THE GUGGENHEIM FUNDS SEMI-ANNUAL REPORT | SEE NOTES TO FINANCIAL STATEMENTS. |
STATEMENTS OF CHANGES IN NET ASSETS |
| | Six Months Ended
March 31, 2024
(Unaudited) | | | Year Ended
September 30,
2023 | |
Increase (Decrease) in Net Assets from Operations: | | | | | | | | |
Net investment income | | $ | 529,423 | | | $ | 1,432,087 | |
Net realized gain on investments | | | 7,852,931 | | | | 512,684 | |
Net change in unrealized appreciation (depreciation) on investments | | | 31,139,565 | | | | 22,342,898 | |
Net increase in net assets resulting from operations | | | 39,521,919 | | | | 24,287,669 | |
| | | | | | | | | |
Distributions to shareholders | | | (1,501,649 | ) | | | (291,687 | ) |
| | | | | | | | | |
Capital share transactions: | | | | | | | | |
Distributions reinvested | | | 1,489,067 | | | | 289,248 | |
Cost of shares redeemed | | | (5,709,534 | ) | | | (8,455,439 | ) |
Net decrease from capital share transactions | | | (4,220,467 | ) | | | (8,166,191 | ) |
Net increase in net assets | | | 33,799,803 | | | | 15,829,791 | |
| | | | | | | | | |
Net assets: | | | | | | | | |
Beginning of period | | | 182,298,550 | | | | 166,468,759 | |
End of period | | $ | 216,098,353 | | | $ | 182,298,550 | |
| | | | | | | | | |
Capital share activity: | | | | | | | | |
Shares issued from reinvestment of distributions | | | 50,323 | | | | 10,990 | |
Shares redeemed | | | (185,125 | ) | | | (311,973 | ) |
Net decrease in shares | | | (134,802 | ) | | | (300,983 | ) |
SEE NOTES TO FINANCIAL STATEMENTS. | THE GUGGENHEIM FUNDS SEMI-ANNUAL REPORT | 11 |
This table is presented to show selected data for a share outstanding throughout each period and to assist shareholders in evaluating a Fund’s performance for the periods presented.
Institutional Class | | Six Months Ended
March 31, 2024a | | | Year Ended
September 30,
2023 | | | Year Ended
September 30,
2022 | | | Year Ended
September 30,
2021 | | | Year Ended
September 30,
2020 | | | Year Ended
September 30,
2019 | |
Per Share Data |
Net asset value, beginning of period | | $ | 27.35 | | | $ | 23.89 | | | $ | 36.69 | | | $ | 31.08 | | | $ | 28.23 | | | $ | 31.23 | |
Income (loss) from investment operations: |
Net investment income (loss)b | | | .08 | | | | .21 | | | | .27 | | | | .25 | | | | .28 | | | | .33 | |
Net gain (loss) on investments (realized and unrealized) | | | 5.88 | | | | 3.29 | | | | (4.05 | ) | | | 7.28 | | | | 3.43 | | | | .05 | |
Total from investment operations | | | 5.96 | | | | 3.50 | | | | (3.78 | ) | | | 7.53 | | | | 3.71 | | | | .38 | |
Less distributions from: |
Net investment income | | | (.23 | ) | | | (.04 | ) | | | (.18 | ) | | | (.28 | ) | | | (.39 | ) | | | (.32 | ) |
Net realized gains | | | — | | | | — | | | | (8.84 | ) | | | (1.64 | ) | | | (.47 | ) | | | (3.06 | ) |
Total distributions | | | (.23 | ) | | | (.04 | ) | | | (9.02 | ) | | | (1.92 | ) | | | (.86 | ) | | | (3.38 | ) |
Net asset value, end of period | | $ | 33.08 | | | $ | 27.35 | | | $ | 23.89 | | | $ | 36.69 | | | $ | 31.08 | | | $ | 28.23 | |
|
Total Return | | | 21.92 | % | | | 14.62 | % | | | (15.74 | %) | | | 25.11 | % | | | 13.31 | % | | | 3.56 | % |
Ratios/Supplemental Data |
Net assets, end of period (in thousands) | | $ | 216,098 | | | $ | 182,299 | | | $ | 166,469 | | | $ | 226,113 | | | $ | 206,751 | | | $ | 210,053 | |
Ratios to average net assets: |
Net investment income (loss) | | | 0.54 | % | | | 0.78 | % | | | 0.90 | % | | | 0.70 | % | | | 0.96 | % | | | 1.23 | % |
Total expensesc | | | 1.01 | % | | | 1.01 | % | | | 1.02 | % | | | 1.02 | % | | | 1.04 | % | | | 1.05 | % |
Portfolio turnover rate | | | 87 | % | | | 164 | % | | | 162 | % | | | 154 | % | | | 147 | % | | | 131 | % |
a | Unaudited figures for the period ended March 31, 2024. Percentage amounts for the period, except total return and portfolio turnover rate, have been annualized. |
b | Net investment income (loss) per share was computed using average shares outstanding throughout the period. |
c | Does not include expenses of the underlying funds in which the Fund invests. |
12 | THE GUGGENHEIM FUNDS SEMI-ANNUAL REPORT | SEE NOTES TO FINANCIAL STATEMENTS. |
NOTES TO FINANCIAL STATEMENTS (Unaudited) |
Note 1 – Organization, and Significant Accounting Policies
Organization
Guggenheim Funds Trust (the “Trust”), a Delaware statutory trust, is registered with the U.S. Securities and Exchange Commission (the “SEC”) under the Investment Company Act of 1940 (the “1940 Act”), as an open-ended investment company of the series type. Each series, in effect, is representing a separate fund. The Trust may issue an unlimited number of authorized shares. The Trust accounts for the assets of each fund separately.
The Trust offers a combination of five separate classes of shares: Class A shares, Class C shares, Class P shares, Class R6 shares and Institutional Class shares. Sales of shares of each Class are made without a front-end sales charge at the net asset value per share (“NAV”), with the exception of Class A shares. Class A shares are sold at the NAV, plus the applicable front-end sales charge. The sales charge varies depending on the amount purchased. Class A share purchases of $1 million or more are exempt from the front-end sales charge but have a 1% contingent deferred sales charge (“CDSC”), if shares are redeemed within 12 months of purchase. Class C shares have a 1% CDSC if shares are redeemed within 12 months of purchase. Class C shares automatically convert to Class A shares on or about the 10th day of the month following the 8-year anniversary of the purchase of the Class C shares. This conversion will be executed without any sales charge, fee or other charge. After the conversion is completed, the shares will be subject to all features and expenses of Class A shares. Institutional Class shares are offered primarily for direct investment by institutions such as pension and profit sharing plans, endowments, foundations and corporations. Institutional Class shares require a minimum initial investment of $2 million and a minimum account balance of $1 million. Class R6 shares are offered primarily through qualified retirement and benefit plans. Class R6 shares are also offered through certain other plans and platforms sponsored by financial intermediaries. Certain institutional investors and others deemed appropriate by Guggenheim Investments (“GI”) may also be eligible to purchase Class R6 shares subject to a $2 million minimum initial investment. At March 31, 2024, the Trust consisted of eighteen funds (the “Funds”).
This report covers the Capital Stewardship Fund (the “Fund”), a diversified investment company. At March 31, 2024, Institutional Class shares have been issued by the Fund.
Guggenheim Partners Investment Management, LLC (“GPIM” or the “Adviser”), which operates under the name Guggenheim Investments, provide advisory services. Guggenheim Funds Distributors, LLC (“GFD”) acts as principal underwriter for the Trust. GI and GFD are affiliated entities.
Concinnity Advisors, LP (the “Sub-Adviser”) serves as the subadviser to the Fund.
Significant Accounting Policies
The Fund operates as an investment company and, accordingly, follows the investment company accounting and reporting guidance of the Financial Accounting Standards Board (“FASB”) Accounting Standards Codification Topic 946 Financial Services – Investment Companies.
The following significant accounting policies are in conformity with U.S. generally accepted accounting principles (“U.S. GAAP”) and are consistently followed by the Trust. This requires management to make estimates and assumptions that affect the reported amount of assets and liabilities, contingent assets and liabilities at the date of the financial statements, and the reported amounts of revenues and expenses during the reporting period. Actual results could differ from these estimates. All time references are based on Eastern Time.
The NAV of the Fund is calculated by dividing the market value of the Fund’s securities and other assets, less all liabilities, by the number of outstanding shares of the Fund.
(a) Valuation of Investments
The Board of Trustees of the Fund (the “Board”) adopted policies and procedures for the valuation of the Fund’s investments (the “Fund Valuation Procedures”). The SEC adopted Rule 2a-5 under the 1940 Act (“Rule 2a-5”) which establishes requirements for determining fair value in good faith. Rule 2a-5 also defines “readily available market quotations” for purposes of the 1940 Act and establishes requirements for determining whether a fund must fair value a security in good faith.
Pursuant to Rule 2a-5, the Board has designated the Adviser as the valuation designee to perform fair valuation determinations for the Fund with respect to all Fund investments and other assets. As the Fund’s valuation designee pursuant to Rule 2a-5, the Adviser has adopted separate procedures (the “Valuation Designee Procedures” and collectively with the Fund Valuation Procedures, the “Valuation Procedures”) reasonably designed to prevent violations of the requirements of Rule 2a-5 and Rule 31a-4. The Adviser, in its role as valuation designee, utilizes the assistance of a valuation committee, consisting of representatives from Guggenheim’s investment management, fund administration, legal and compliance departments (the “Valuation Committee”), in determining the fair value of the Fund’s securities and other assets.
Valuations of the Fund’s securities and other assets are supplied primarily by pricing service providers appointed pursuant to the processes set forth in the Valuation Procedures. The Adviser, with the assistance of the Valuation Committee, convenes monthly, or more frequently as needed, to review the valuation of all assets which have been fair valued. The Adviser, consistent with the monitoring and review responsibilities set forth in the Valuation
| | THE GUGGENHEIM FUNDS SEMI-ANNUAL REPORT | 13 |
NOTES TO FINANCIAL STATEMENTS (Unaudited)(continued) |
Procedures, regularly reviews the appropriateness of the inputs, methods, models and assumptions employed by the pricing service provider.
If the pricing service provider cannot or does not provide a valuation for a particular investment or such valuation is deemed unreliable, such investment is fair valued by the Adviser.
Equity securities listed or traded on a recognized U.S. securities exchange or the National Association of Securities Dealers Automated Quotations (“NASDAQ”) National Market system will generally be valued on the basis of the last sale price on the primary U.S. exchange or market on which the security is listed or traded; provided, however, that securities listed on NASDAQ will be valued at the NASDAQ official closing price, which may not necessarily represent the last sale price.
Open-end investment companies are valued at their NAV as of the close of business, on the valuation date. Exchange-traded funds and closed-end investment companies are generally valued at the last quoted sale price.
Investments for which market quotations are not readily available are fair valued as determined in good faith by the Adviser. Valuations in accordance with these methods are intended to reflect each security’s (or asset’s or liability’s) “fair value”. Each such determination is based on a consideration of all relevant factors, which are likely to vary from one pricing context to another. Examples of such factors may include, but are not limited to market prices; sale prices; broker quotes; and models which derive prices based on inputs such as anticipated cash flows or collateral, spread over U.S. Treasury securities, and other information analysis.
(b) Security Transactions
Security transactions are recorded on the trade date for financial reporting purposes. Realized gains and losses from securities transactions are recorded using the identified cost basis. Proceeds from lawsuits related to investment holdings are recorded as a reduction to cost if the securities are still held and as realized gains if no longer held in the Fund. Taxable non-cash dividends are recorded as dividend income. Interest income, including amortization of premiums and accretion of discounts, is accrued on a daily basis. Dividend income from Real Estate Investment Trusts (“REITs”) is recorded based on the income included in the distributions received from the REIT investments using published REIT classifications, including some management estimates when actual amounts are not available. Distributions received in excess of this estimated amount are recorded as a reduction of the cost of investments or reclassified to realized gains. The actual amounts of income, return of capital, and realized gains are only determined by each REIT after its fiscal year-end, and may differ from the estimated amounts.
(c) Distributions
Distributions of net investment income and net realized gains, if any, are declared and paid at least annually. Dividends are reinvested in additional shares, unless shareholders request payment in cash. Distributions are recorded on the ex-dividend date and are determined in accordance with U.S. federal income tax regulations which may differ from U.S. GAAP.
(d) Expenses
Certain expenses have been allocated to the individual Funds in the Trust based on the respective net assets of each Fund included in the Trust.
(e) Earnings Credits
Under the fee arrangement with the custodian, the Fund may earn credits based on overnight custody cash balances. These credits are utilized to reduce related custodial expenses. The custodian fees disclosed in the Fund’s Statement of Operations are before the reduction in expense from the related earnings credits, if any. Earnings credits for the period ended March 31, 2024, are disclosed in the Fund’s Statement of Operations.
(f) Cash
The Fund may leave cash overnight in its cash account with the custodian. Periodically, the Fund may have cash due to the custodian bank as an overdraft balance. A fee is incurred on this overdraft, calculated by multiplying the overdraft by a rate based on the federal funds rate, which was 5.33% at March 31, 2024.
(g) Indemnifications
Under the Fund’s organizational documents, its Trustees and Officers are indemnified against certain liabilities arising out of the performance of their duties to the Trust. In addition, throughout the normal course of business, the Fund enters into contracts that contain a variety of representations and warranties which provide general indemnifications. The Fund’s maximum exposure under these arrangements is unknown, as this would involve future claims that may be made against the Fund and/or its affiliates that have not yet occurred. However, based on experience, the Fund expects the risk of loss to be remote.
14 | THE GUGGENHEIM FUNDS SEMI-ANNUAL REPORT | |
NOTES TO FINANCIAL STATEMENTS (Unaudited)(continued) |
Note 2 – Investment Advisory Agreement and Other Agreements
Under the terms of an investment advisory contract, the Fund pays GI investment advisory fees on a monthly basis calculated daily at an annualized rate of 0.90% of the average daily net assets of the Fund.
GI pays operating expenses on behalf of the Trust, such as audit and accounting related services, legal services, custody, printing and mailing, among others, on a pass-through basis. Such expenses are allocated to various Funds within the complex based on relative net assets.
Certain trustees and officers of the Trust are also officers of GI and/or GFD. The Trust does not compensate its officers or trustees who are officers, directors and/or employees of GI or GFD.
MUFG Investor Services (US), LLC (“MUIS”) acts as the Fund’s administrator, transfer agent and accounting agent. As administrator, transfer agent and accounting agent, MUIS maintains the books and records of the Fund’s securities and cash. The Bank of New York Mellon Corp. (“BNY”) acts as the Fund’s custodian. As custodian, BNY is responsible for the custody of the Fund’s assets. For providing the aforementioned administrative and accounting services, MUIS is entitled to receive a monthly fee equal to a percentage of the Fund’s average daily net assets and out of pocket expenses. For providing the aforementioned transfer agent and custodian services, MUIS and BNY are entitled to receive a monthly fee based on the number of transactions during the month and the number of accounts under management, subject to certain minimum monthly fees, and out of pocket expenses.
Note 3 – Federal Income Tax Information
The Fund intends to comply with the provisions of Subchapter M of the Internal Revenue Code of 1986, as amended (the “Internal Revenue Code”), applicable to regulated investment companies and will distribute substantially all taxable net investment income and capital gains sufficient to relieve the Fund from all, or substantially all, federal income, excise and state income taxes. Therefore, no provision for federal or state income tax or federal excise tax is required.
Tax positions taken or expected to be taken in the course of preparing the Fund’s tax returns are evaluated to determine whether the tax positions are “more-likely-than-not” of being sustained by the applicable tax authority. Tax positions not deemed to meet the “more-likely-than-not” threshold would be recorded as a tax benefit or expense in the current year. Management has analyzed the Fund’s tax positions taken, or to be taken, on U.S. federal income tax returns for all open tax years, and has concluded that no provision for income tax is required in the Fund’s financial statements. The Fund’s U.S. federal income tax returns are subject to examination by the Internal Revenue Service (“IRS”) for a period of three years after they are filed.
At March 31, 2024, the cost of investments for U.S. federal income tax purposes, the aggregate gross unrealized appreciation for all investments for which there was an excess of value over tax cost, and the aggregate gross unrealized depreciation for all investments for which there was an excess of tax cost over value, were as follows:
| | Tax
Cost | | | Tax
Unrealized
Appreciation | | | Tax
Unrealized
Depreciation | | | Net Tax
Unrealized
Appreciation
(Depreciation) | |
| | | $ | 180,312,373 | | | $ | 39,276,576 | | | $ | (1,311,443 | ) | | $ | 37,965,133 | |
Note 4 – Fair Value Measurement
In accordance with U.S. GAAP, fair value is defined as the price that the Fund would receive to sell an investment or pay to transfer a liability in an orderly transaction between market participants at the measurement date. U.S. GAAP establishes a three-tier fair value hierarchy based on the types of inputs used to value assets and liabilities and requires corresponding disclosure. The hierarchy and the corresponding inputs are summarized below:
Level 1 — | unadjusted quoted prices in active markets for identical assets or liabilities. |
Level 2 — | significant other observable inputs (for example quoted prices for securities that are similar based on characteristics such as interest rates, prepayment speeds, credit risk, etc.). |
| | THE GUGGENHEIM FUNDS SEMI-ANNUAL REPORT | 15 |
NOTES TO FINANCIAL STATEMENTS (Unaudited)(concluded) |
Level 3 — | significant unobservable inputs based on the best information available under the circumstances, to the extent observable inputs are not available, which may include assumptions. |
Rule 2a-5 sets forth a definition of “readily available market quotations,” which is consistent with the definition of a Level 1 input under U.S. GAAP. Rule 2a-5 provides that “a market quotation is readily available only when that quotation is a quoted price (unadjusted) in active markets for identical investments that the fund can access at the measurement date, provided that a quotation will not be readily available if it is not reliable.”
Securities for which market quotations are not readily available must be valued at fair value as determined in good faith. Accordingly, any security priced using inputs other than Level 1 inputs will be subject to fair value requirements. The types of inputs available depend on a variety of factors, such as the type of security and the characteristics of the markets in which it trades, if any. Fair valuation determinations that rely on fewer or no observable inputs require greater judgment. Accordingly, fair value determinations for Level 3 securities require the greatest amount of judgment.
The inputs or methodologies selected and applied for valuing securities or other assets are not necessarily an indication of the risk associated with investing in those securities. The suitability, appropriateness and accuracy of the techniques, methodologies and sources employed to determine fair valuation are periodically reviewed and subject to change.
Note 5 – Securities Transactions
For the period ended March 31, 2024, the cost of purchases and proceeds from sales of investment securities, excluding short-term investments, were as follows:
| | Purchases | | | Sales | |
| | | $ | 170,784,230 | | | $ | 174,879,165 | |
Note 6 – Market Risks
The value of, or income generated by, the investments held by the Fund are subject to the possibility of rapid and unpredictable fluctuation, and loss that may result from various factors. These factors include, among others, developments affecting individual companies, or from broader influences, including real or perceived changes in prevailing interest rates (which have since risen and may continue to rise), changes in inflation rates or expectations about inflation rates (which are currently elevated relative to normal conditions), adverse investor confidence or sentiment, changing economic, political (including geopolitical), social or financial market conditions, increased instability or general uncertainty, environmental disasters, governmental actions, public health emergencies (such as the spread of infectious diseases, pandemics and epidemics), debt crises, actual or threatened wars or other armed conflicts (such as the current Russia-Ukraine conflict and its risk of expansion or collateral economic and other effects) or ratings downgrades, and other similar events, each of which may be temporary or last for extended periods. Moreover, changing economic, political, geopolitical, social, financial market or other conditions in one country or geographic region could adversely affect the value, yield and return of the investments held by the Fund in a different country or geographic region, economy, industry or market because of the increasingly interconnected global economies and financial markets. The duration and extent of the foregoing types of factors or conditions are highly uncertain and difficult to predict and have in the past, and may in the future, cause volatility and distress in economies and financial markets or other adverse circumstances, which may negatively affect the value of the Fund’s investments and performance of the Fund.
Note 7 – Subsequent Events
The Fund evaluated subsequent events through the date the financial statements are issued and determined there were no material events that would require adjustment to or disclosure in the Fund’s financial statements.
16 | THE GUGGENHEIM FUNDS SEMI-ANNUAL REPORT | |
OTHER INFORMATION (Unaudited) |
Delivery of Shareholder Reports
Paper copies of the Fund’s annual and semi-annual shareholder reports are not sent by mail, unless you specifically request paper copies of the reports from a fund or from your financial intermediary. Instead, the reports are made available on a website, and you are notified by mail each time a report is posted and provided with a website link to access the report.
You may elect to receive all future shareholder reports in paper free of charge. If you hold shares of a fund directly, you can inform the Fund that you wish to receive paper copies of reports by calling 800.820.0888. If you hold shares of a fund through a financial intermediary, please contact the financial intermediary to make this election. Your election to receive reports in paper may apply to all Guggenheim Funds in which you are invested and may apply to all Guggenheim funds held with your financial intermediary.
Tailored Shareholder Reports for Open-End Mutual Funds and Exchange-Traded Funds
Effective January 24, 2023, the SEC adopted rule and form amendments to require open-end mutual funds and exchange-traded funds registered on Form N-1A to transmit concise and visually engaging streamlined annual and semi-annual reports to shareholders that highlight key information. Other information, including financial statements, will no longer appear in a streamlined shareholder report but must be available online, delivered free of charge upon request, and filed on a semi-annual basis on Form N-CSR. The rule and form amendments have a compliance date of July 24, 2024. At this time, management is evaluating the impact of these amendments on the shareholder reports for the Fund.
Proxy Voting Information
A description of the policies and procedures that the Trust uses to determine how to vote proxies relating to securities held in the Fund’s portfolio is available, without charge and upon request, by calling 800.820.0888. This information is also available from the EDGAR database on the SEC’s website at https://www.sec.gov.
Information regarding how the Fund voted proxies relating to portfolio securities during the most recent 12-month period ended June 30 is available without charge, upon request, by calling 800.820.0888. This information is also available from the EDGAR database on the SEC’s website at https://www.sec.gov.
Sector Classification
Information in the Schedule of Investments is categorized by sectors using sector-level Classifications defined by the Bloomberg Industry Classification System, a widely recognized industry classification system provider. The Fund’s registration statement has investment policies relating to concentration in specific sectors/industries. For purposes of these investment policies, the Fund usually classifies sectors/industries based on industry-level Classifications used by widely recognized industry classification system providers such as Bloomberg Industry Classification System, Global Industry Classification Standards and Barclays Global Classification Scheme.
Quarterly Portfolio Schedules Information
The Trust files its complete schedule of portfolio holdings with the SEC for the first and third quarters of each fiscal year as an exhibit to its reports on Form N-PORT. The Fund’s Form N-PORT is available on the SEC’s website at https://www.sec.gov. The Fund’s complete schedule of securities holdings as of the end of each fiscal quarter will be made available to the public on the SEC’s website at www.sec.gov and will be made available, upon request and without charge, by calling 800.820.0888.
| | THE GUGGENHEIM FUNDS SEMI-ANNUAL REPORT | 17 |
INFORMATION ON BOARD OF TRUSTEES AND OFFICERS (Unaudited) |
A Board of Trustees oversees the Trust, as well as other trusts of GI, in which its members have no stated term of service, and continue to serve after election until resignation. The Statement of Additional Information includes further information about Fund Trustees and Officers, and can be obtained without charge by visiting guggenheiminvestments.com or by calling 800.820.0888.
Name, Address*
and Year of Birth | Position(s)
Held with
Trust | Term of Office
and Length of
Time Served** | Principal Occupation(s)
During Past Five Years | Number of
Portfolios
in Fund
Complex
Overseen | Other
Directorships Held
by Trustees*** |
INDEPENDENT TRUSTEES | | | |
Randall C. Barnes (1951) | Trustee and Chair of the Valuation Oversight Committee | Since 2014 (Trustee) Since 2020 (Chair of the Valuation Oversight Committee) | Current: Private Investor (2001-present). Former: Senior Vice President and Treasurer, PepsiCo, Inc. (1993-1997); President, Pizza Hut International (1991-1993); Senior Vice President, Strategic Planning and New Business Development, PepsiCo, Inc. (1987-1990). | 153 | Current: Advent Convertible and Income Fund (2005-present); Purpose Investments Funds (2013-present). Former: Guggenheim Energy & Income Fund (2015-2023); Fiduciary/Claymore Energy Infrastructure Fund (2004-2022); Guggenheim Enhanced Equity Income Fund (2005-2021); Guggenheim Credit Allocation Fund (2013-2021). |
Angela Brock-Kyle (1959) | Trustee | Since 2019 | Current: Founder and Chief Executive Officer, B.O.A.R.D.S. (consulting firm) (2013-present); Director, Mutual Fund Directors Forum (2022-present). Former: Senior Leader, TIAA (financial services firm) (1987-2012). | 152 | Current: Bowhead Insurance GP, LLC (2020-present); Hunt Companies, Inc. (2019-present). Former: Guggenheim Energy & Income Fund (2019-2023); Fiduciary/Claymore Energy Infrastructure Fund (2019-2022); Guggenheim Enhanced Equity Income Fund (2019-2021); Guggenheim Credit Allocation Fund (2019-2021); Infinity Property & Casualty Corp. (2014-2018). |
18 | THE GUGGENHEIM FUNDS SEMI-ANNUAL REPORT | |
INFORMATION ON BOARD OF TRUSTEES AND OFFICERS (Unaudited)(continued) |
Name, Address*
and Year of Birth | Position(s)
Held with
Trust | Term of Office
and Length of
Time Served** | Principal Occupation(s)
During Past Five Years | Number of
Portfolios
in Fund
Complex
Overseen | Other
Directorships Held
by Trustees*** |
INDEPENDENT TRUSTEES - continued | | | |
Thomas F. Lydon, Jr. (1960) | Trustee and Chair of the Contracts Review Committee | Since 2019 (Trustee) Since 2020 (Chair of the Contracts Review Committee) | Current: President, Global Trends Investments (registered investment adviser) (1996-present); Chief Executive Officer, Lydon Media (2016-present); Vice Chairman, VettaFi, a wholly owned subsidiary of The TMX Group (financial advisor content, research and digital distribution provider) (2022-present). Former: Chief Executive Officer, ETF Flows, LLC (financial advisor education and research provider) (2019-2023); Director, GDX Index Partners, LLC (index provider) (2021-2023). | 152 | Current: US Global Investors, Inc. (GROW) (1995-present); The 2023 ETF Series Trust (4) (2023-present); The 2023 ETF Series II (1) (2023-present). Former: Guggenheim Energy & Income Fund (2019-2023); Fiduciary/Claymore Energy Infrastructure Fund (2019-2022); Guggenheim Enhanced Equity Income Fund (2019-2021); Guggenheim Credit Allocation Fund (2019-2021); Harvest Volatility Edge Trust (3) (2017-2019). |
Ronald A. Nyberg (1953) | Trustee and Chair of the Nominating and Governance Committee | Since 2014 | Current: Of Counsel (formerly Partner), Momkus LLP (law firm) (2016-present). Former: Partner, Nyberg & Cassioppi, LLC (law firm) (2000-2016); Executive Vice President, General Counsel, and Corporate Secretary, Van Kampen Investments (1982-1999). | 153 | Current: Advent Convertible and Income Fund (2003-present); PPM Funds (2) (2018-present); Endeavor Health (2012-present). Former: Guggenheim Energy & Income Fund (2015-2023); Fiduciary/Claymore Energy Infrastructure Fund (2004-2022); Guggenheim Enhanced Equity Income Fund (2005-2021); Guggenheim Credit Allocation Fund (2013-2021); Western Asset Inflation-Linked Opportunities & Income Fund (2004-2020); Western Asset Inflation-Linked Income Fund (2003-2020). |
| | THE GUGGENHEIM FUNDS SEMI-ANNUAL REPORT | 19 |
INFORMATION ON BOARD OF TRUSTEES AND OFFICERS (Unaudited)(continued) |
Name, Address*
and Year of Birth | Position(s)
Held with
Trust | Term of Office
and Length of
Time Served** | Principal Occupation(s)
During Past Five Years | Number of
Portfolios
in Fund
Complex
Overseen | Other
Directorships Held
by Trustees*** |
INDEPENDENT TRUSTEES - concluded | | |
Sandra G. Sponem (1958) | Trustee and Chair of the Audit Committee | Since 2019 (Trustee) Since 2020 (Chair of the Audit Committee) | Current: Retired. Former: Senior Vice President and Chief Financial Officer, M.A. Mortenson-Companies, Inc. (construction and real estate development company) (2007-2017). | 152 | Current: SPDR Series Trust (81) (2018-present); SPDR Index Shares Funds (30) (2018-present); SSGA Active Trust (14) (2018-present). Former: Guggenheim Energy & Income Fund (2019-2023); Fiduciary/Claymore Energy Infrastructure Fund (2019-2022); Guggenheim Enhanced Equity Income Fund (2019-2021); Guggenheim Credit Allocation Fund (2019-2021); SSGA Master Trust (1) (2018-2020). |
Ronald E. Toupin, Jr. (1958) | Trustee, Chair of the Board and Chair of the Executive Committee | Since 2014 | Current: Portfolio Consultant (2010-present); Member, Governing Council, Independent Directors Council (2013-present); Governor, Board of Governors, Investment Company Institute (2018-present). Former: Member, Executive Committee, Independent Directors Council (2016-2018); Vice President, Manager and Portfolio Manager, Nuveen Asset Management (1998-1999); Vice President, Nuveen Investment Advisory Corp. (1992-1999); Vice President and Manager, Nuveen Unit Investment Trusts (1991-1999); and Assistant Vice President and Portfolio Manager, Nuveen Unit Investment Trusts (1988-1999), each of John Nuveen & Co., Inc. (registered broker dealer) (1982-1999). | 152 | Former: Guggenheim Energy & Income Fund (2015-2023); Fiduciary/Claymore Energy Infrastructure Fund (2004-2022); Guggenheim Enhanced Equity Income Fund (2005-2021); Guggenheim Credit Allocation Fund (2013-2021); Western Asset Inflation-Linked Opportunities & Income Fund (2004-2020); Western Asset Inflation-Linked Income Fund (2003-2020). |
20 | THE GUGGENHEIM FUNDS SEMI-ANNUAL REPORT | |
INFORMATION ON BOARD OF TRUSTEES AND OFFICERS (Unaudited)(continued) |
Name, Address*
and Year of Birth | Position(s)
Held with
Trust | Term of Office
and Length of
Time Served** | Principal Occupation(s)
During Past Five Years | Number of
Portfolios
in Fund
Complex
Overseen | Other
Directorships Held
by Trustees*** |
INTERESTED TRUSTEE | | | | |
Amy J. Lee**** (1961) | Trustee, Vice President and Chief Legal Officer | Since 2018 (Trustee) Since 2014
(Chief Legal Officer) Since 2007
(Vice President) | Current: Interested Trustee, certain other funds in the Fund Complex (2018-present); Chief Legal Officer, certain other funds in the Fund Complex (2014-present); Vice President, certain other funds in the Fund Complex (2007-present); Senior Managing Director, Guggenheim Investments (2012-present). Former: President and/or Chief Executive Officer, certain other funds in the Fund Complex (2017-2019); Vice President, Associate General Counsel and Assistant Secretary, Security Benefit Life Insurance Company and Security Benefit Corporation (2004-2012). | 152 | Former: Guggenheim Energy & Income Fund (2018-2023); Fiduciary/Claymore Energy Infrastructure Fund (2018-2022); Guggenheim Enhanced Equity Income Fund (2018-2021); Guggenheim Credit Allocation Fund (2018-2021). |
* | The business address of each Trustee is c/o Guggenheim Investments, 227 West Monroe Street, Chicago, Illinois 60606. |
** | Each Trustee serves an indefinite term, until his or her successor is elected and qualified. Time served includes time served in the respective position for the Predecessor Corporation. |
*** | Each Trustee also serves on the Boards of Trustees of Guggenheim Funds Trust, Guggenheim Variable Funds Trust, Guggenheim Strategy Funds Trust, Guggenheim Taxable Municipal Bond & Investment Grade Debt Trust, Guggenheim Strategic Opportunities Fund, Guggenheim Active Allocation Fund, Rydex Series Funds, Rydex Dynamic Funds, Rydex Variable Trust and Transparent Value Trust. Messrs. Barnes and Nyberg also serve on the Board of Trustees of Advent Convertible & Income Fund. |
**** | This Trustee is deemed to be an “interested person” of the Fund under the 1940 Act by reason of her position with the Fund’s Adviser and/or the parent of the Adviser. |
| | THE GUGGENHEIM FUNDS SEMI-ANNUAL REPORT | 21 |
INFORMATION ON BOARD OF TRUSTEES AND OFFICERS (Unaudited)(continued) |
Name, Address*
and Year of Birth | Position(s)
Held
with Trust | Term of Office
and Length of
Time Served** | Principal Occupation(s)
During Past Five Years |
OFFICERS | | | |
Brian E. Binder (1972) | President and Chief Executive Officer | Since 2018 | Current: President, Mutual Fund Boards, Guggenheim Investments (2022-present); President and Chief Executive Officer, certain other funds in the Fund Complex (2018-present); President, Mutual Funds Boards and Senior Managing Director, Guggenheim Funds Investment Advisors, LLC and Security Investors, LLC (2018-present); Board Member, Guggenheim Partners Investment Funds plc (2022-present); Board Member, Guggenheim Global Investments plc (2022-present); Board Member, Guggenheim Partners Fund Management (Europe) Limited (2018-present). Former: Senior Managing Director and Chief Administrative Officer, Guggenheim Investments (2018-2022); Managing Director and President, Deutsche Funds, and Head of US Product, Trading and Fund Administration, Deutsche Asset Management (2013-2018); Managing Director, Chairman of North American Executive Committee and Head of Business Management and Consulting, Invesco Ltd. (2010-2012). |
James Howley (1972) | Chief Financial Officer, Chief Accounting Officer and Treasurer | Since 2022 | Current: Managing Director, Guggenheim Investments (2004-present); Chief Financial Officer, Chief Accounting Officer, and Treasurer, certain other funds in the Fund Complex (2022-present). Former: Assistant Treasurer, certain other funds in the Fund Complex (2006-2022); Manager, Mutual Fund Administration of Van Kampen Investments, Inc. (1996-2004). |
Mark E. Mathiasen (1978) | Secretary | Since 2014 | Current: Secretary, certain other funds in the Fund Complex (2007-present); Managing Director, Guggenheim Investments (2007-present). |
Glenn McWhinnie (1969) | Assistant Treasurer | Since 2016 | Current: Vice President, Guggenheim Investments (2009-present); Assistant Treasurer, certain other funds in the Fund Complex (2016-present). |
Michael P. Megaris (1984) | Assistant Secretary | Since 2014 | Current: Assistant Secretary, certain other funds in the Fund Complex (2014-present); Managing Director, Guggenheim Investments (2012-present). |
Elisabeth Miller (1968) | Chief Compliance Officer | Since 2012 | Current: Chief Compliance Officer, certain other funds in the Fund Complex (2012-present); Senior Managing Director, Guggenheim Investments (2012-present); Senior Managing Director, Guggenheim Funds Distributors, LLC (2014-present). Former: Chief Compliance Officer, Security Investors, LLC and Guggenheim Funds Investment Advisors, LLC (2012-2018); Chief Compliance Officer, Guggenheim Distributors, LLC (2009-2014); Senior Manager, Security Investors, LLC (2004-2014); Senior Manager, Guggenheim Distributors, LLC (2004-2014). |
Margaux Misantone (1978) | AML Officer | Since 2017 | Current: Chief Compliance Officer, Security Investors, LLC and Guggenheim Funds Investment Advisors, LLC (2018-present); AML Officer, Security Investors, LLC and certain other funds in the Fund Complex (2017-present); Managing Director, Guggenheim Investments (2015-present). Former: Assistant Chief Compliance Officer, Security Investors, LLC and Guggenheim Funds Investments Advisors, LLC (2015-2018). |
22 | THE GUGGENHEIM FUNDS SEMI-ANNUAL REPORT | |
INFORMATION ON BOARD OF TRUSTEES AND OFFICERS (Unaudited)(concluded) |
Name, Address*
and Year of Birth | Position(s)
Held
with Trust | Term of Office
and Length of
Time Served** | Principal Occupation(s)
During Past Five Years |
OFFICERS - concluded | |
Kimberly J. Scott (1974) | Assistant Treasurer | Since 2014 | Current: Director, Guggenheim Investments (2012-present); Assistant Treasurer, certain other funds in the Fund Complex (2012-present). Former: Financial Reporting Manager, Invesco, Ltd. (2010-2011); Vice President/Assistant Treasurer, Mutual Fund Administration for Van Kampen Investments, Inc./Morgan Stanley Investment Management (2009-2010); Manager of Mutual Fund Administration, Van Kampen Investments, Inc./Morgan Stanley Investment Management (2005-2009). |
Jon Szafran (1989) | Assistant Treasurer | Since 2017 | Current: Director, Guggenheim Investments (2017-present); Assistant Treasurer, certain other funds in the Fund Complex (2017-present). Former: Assistant Treasurer of Henderson Global Funds and Manager of US Fund Administration, Henderson Global Investors (North America) Inc. (“HGINA”), (2017); Senior Analyst of US Fund Administration, HGINA (2014–2017); Senior Associate of Fund Administration, Cortland Capital Market Services, LLC (2013-2014); Experienced Associate, PricewaterhouseCoopers LLP (2012-2013). |
* | The business address of each officer is c/o Guggenheim Investments, 227 West Monroe Street, Chicago, Illinois 60606. |
** | Each officer serves an indefinite term, until his or her successor is duly elected and qualified. |
| | THE GUGGENHEIM FUNDS SEMI-ANNUAL REPORT | 23 |
GUGGENHEIM INVESTMENTS PRIVACY NOTICE (Unaudited) |
Who We Are
This Privacy Notice describes the data protection practices of Guggenheim Investments. Guggenheim Investments as used herein refers to the affiliated investment management businesses of Guggenheim Partners, LLC: Guggenheim Funds Investment Advisors, LLC, Guggenheim Partners Investment Management, LLC, Guggenheim Funds Distributors, LLC, Security Investors, LLC, Guggenheim Investment Advisors (Europe) Limited, Guggenheim Real Estate, LLC, GS Gamma Advisors, LLC, Guggenheim Partners India Management, LLC, Guggenheim Partners Europe Limited, as well as the funds in the Guggenheim Funds complex (the “Funds”) (“Guggenheim Investments,” “we,” “us,” or “our”).
Guggenheim Partners Investment Management Holdings, LLC, located at 330 Madison Avenue, New York, New York, 10017, is the data controller for your information. The affiliates who are also controllers of certain of your information are: Guggenheim Investment Advisors (Europe) Limited, Guggenheim Partners Europe Limited, Guggenheim Partners, LLC, Guggenheim Funds Investment Advisors, LLC, Guggenheim Partners Investment Management, LLC, Guggenheim Funds Distributors, LLC and Security Investors, LLC, as well as the Funds.
Our Commitment to You
Guggenheim Investments considers your privacy our utmost concern. When you become our client or investor, you entrust us with not only your hard-earned money but also with your personal and financial information. Because we have access to your private information, we hold ourselves to the highest standards in its safekeeping and use. We strictly limit how we share your information with others, whether you are a current or former Guggenheim Investments client or investor.
The Information We Collect About You
We collect certain nonpublic personal information about you from information you provide on applications, other forms, our website, and/or from third parties including investment advisors. This information includes Social Security or other tax identification number, assets, income, tax information, retirement and estate plan information, transaction history, account balance, payment history, bank account information, marital status, family relationships, information that we collect on our website through the use of “cookies,” and other personal information that you or others provide to us. We may also collect such information through your inquiries by mail, e-mail or telephone. We may also collect customer due diligence information, as required by applicable law and regulation, through third party service providers.
How We Handle Your Personal Information
The legal basis for using your information as set out in this Privacy Notice is as follows: (a) use of your personal data is necessary to perform our obligations under any contract with you (such as a contract for us to provide financial services to you); or (b) where use of your personal data is not necessary for performance of a contract, use of your personal data is necessary for our legitimate interests or the legitimate interests of others (for example, to enforce the legal terms governing our services, operate and market our website and other services we offer, ensure safe environments for our personnel and others, make and receive payments, prevent fraud and to know the customer to whom we are providing the services). Some processing is done to comply with applicable law.
In addition to the specific uses described above, we also use your information in the following manner:
| | ● | We use your information in connection with servicing your accounts. |
| | ● | We use information to respond to your requests or questions. For example, we might use your information to respond to your customer feedback. |
| | ● | We use information to improve our products and services. We may use your information to make our website and products better. We may use your information to customize your experience with us. |
| | ● | We use information for security purposes. We may use your information to protect our company and our customers. |
| | ● | We use information to communicate with you. For example, we will communicate with you about your account or our relationship. We may contact you about your feedback. We might also contact you about this Privacy Notice. We may also enroll you in our email newsletter. |
24 | THE GUGGENHEIM FUNDS SEMI-ANNUAL REPORT | |
GUGGENHEIM INVESTMENTS PRIVACY NOTICE (Unaudited)(continued) |
| | ● | We use information as otherwise permitted by law, as we may notify you. |
| | ● | Aggregate/Anonymous Data. We may aggregate and/or anonymize any information collected through the website so that such information can no longer be linked to you or your device (“Aggregate/Anonymous Information”). We may use Aggregate/Anonymous Information for any purpose, including without limitation for research and marketing purposes, and may also share such data with any third parties, including advertisers, promotional partners, and sponsors. |
We do not sell information about current or former clients or their accounts to third parties. Nor do we share this information, except when necessary to complete transactions at your request, to make you aware of investment products and services that we or our affiliates offer, or as permitted or required by law.
We provide information about you to companies and individuals not affiliated with Guggenheim Investments to complete certain transactions or account changes, or to perform services for us related to your account. For example, if you ask to transfer assets from another financial institution to Guggenheim Investments, we must provide certain information about you to that company to complete the transaction. We provide the third party with only the information necessary to carry out its responsibilities and only for that purpose. And we require these third parties to treat your private information with the same high degree of confidentiality that we do. To alert you to other Guggenheim Investments products and services, we share your information within our family of affiliated companies. You may limit our sharing with affiliated companies as set out below. We may also share information with any successor to all or part of our business, or in connection with steps leading up to a merger or acquisition. For example, if part of our business was sold we may give customer information as part of that transaction. We may also share information about you with your consent.
We will release information about you if you direct us to do so, if we are compelled by law to do so, or in other circumstances as permitted by law (for example, to protect your account from fraud).
If you close your account(s) or become an inactive client or investor, we will continue to adhere to the privacy policies and practices described in this notice.
Opt-Out Provisions and Your Data Choices
The law allows you to “opt out” of certain kinds of information sharing with third parties. We do not share personal information about you with any third parties that triggers this opt-out right. This means YOU ARE ALREADY OPTED OUT.
When you are no longer our client or investor, we continue to share your information as described in this notice, and you may contact us at any time to limit our sharing by sending an email to CorporateDataPrivacy@GuggenheimPartners.com.
European Union Data Subjects and certain others: In addition to the choices set forth above, residents of the European Union and certain other jurisdictions have certain rights to (1) request access to or rectification or deletion of information we collect about them, (2) request a restriction on the processing of their information, (3) object to the processing of their information, or (4) request the portability of certain information. To exercise these or other rights, please contact us using the contact information below. We will consider all requests and provide our response within the time period stated by applicable law. Please note, however, that certain information may be exempt from such requests in some circumstances, which may include if we need to keep processing your information for our legitimate interests or to comply with a legal obligation. We may request you provide us with information necessary to confirm your identity before responding to your request.
Residents of France and certain other jurisdictions may also provide us with instructions regarding the manner in which we may continue to store, erase and share your information after your death, and where applicable, the person you have designated to exercise these rights after your death.
How We Protect Privacy Online
We take steps to protect your privacy when you use our web site – www.guggenheiminvestments.com – by using secure forms of online communication, including encryption technology, Secure Socket Layer (SSL) protocol, firewalls and user names and passwords. These safeguards vary based on the sensitivity of the information that we collect and store. However, we cannot and do not guarantee that these measures will prevent every unauthorized attempt to access, use, or disclose your information since despite our efforts, no Internet and/or other
| | THE GUGGENHEIM FUNDS SEMI-ANNUAL REPORT | 25 |
GUGGENHEIM INVESTMENTS PRIVACY NOTICE (Unaudited)(concluded) |
electronic transmissions can be completely secure. Our web site uses “http cookies”—tiny pieces of information that we ask your browser to store. We use cookies for session management and security features on the Guggenheim Investments web site. We do not use them to pull data from your hard drive, to learn your e-mail address, or to view data in cookies created by other web sites. We will not share the information in our cookies or give others access to it. See the legal information area on our web site for more details about web site security and privacy features.
How We Safeguard Your Personal Information and Data Retention
We restrict access to nonpublic personal information about you to our employees and in some cases to third parties (for example, the service providers described above) as permitted by law. We maintain strict physical, electronic and procedural safeguards that comply with federal standards to guard your nonpublic personal information.
We keep your information for no longer than necessary for the purposes for which it is processed. The length of time for which we retain information depends on the purposes for which we collected and use it and/or as required to comply with applicable laws. Information may persist in copies made for backup and business continuity purposes for additional time.
International Visitors
If you are not a resident of the United States, please be aware that your information may be transferred to, stored and processed in the United States where our servers are located and our databases are operated. The data protection and other laws of the United States and other countries might not be as comprehensive as those in your country.
In such cases, we ensure that a legal basis for such a transfer exists and that adequate protection is provided as required by applicable law, for example, by using standard contractual clauses or by transferring your data to a jurisdiction that has obtained an adequacy finding. Individuals whose data may be transferred on the basis of standard contractual clauses may contact us as described below.
We’ll Keep You Informed
If you have any questions or concerns about how we treat your personal data, we encourage you to consult with us first. You may also contact the relevant supervisory authority.
We reserve the right to modify this policy at any time and will inform you promptly of material changes. You may access our privacy policy from our web site at www.guggenheiminvestments.com. Should you have any questions regarding our privacy policy, contact us by email at CorporateDataPrivacy@GuggenheimPartners.com.
26 | THE GUGGENHEIM FUNDS SEMI-ANNUAL REPORT | |
This page intentionally left blank.
This page intentionally left blank.
This page intentionally left blank.
3.31.2024
Guggenheim Funds Semi-Annual Report
| |
Guggenheim Total Return Bond Fund | | |
GuggenheimInvestments.com | TRB-SEMI-0324x0924 |

| | |
DEAR SHAREHOLDER | 2 |
ECONOMIC AND MARKET OVERVIEW | 4 |
ABOUT SHAREHOLDERS’ FUND EXPENSES | 6 |
TOTAL RETURN BOND FUND | 9 |
NOTES TO FINANCIAL STATEMENTS | 90 |
OTHER INFORMATION | 118 |
INFORMATION ON BOARD OF TRUSTEES AND OFFICERS | 120 |
GUGGENHEIM INVESTMENTS PRIVACY NOTICE | 129 |
| | THE GUGGENHEIM FUNDS SEMI-ANNUAL REPORT | 1 |
Dear Shareholder:
Guggenheim Partners Investment Management, LLC (“GPIM” or the “Investment Adviser”), is pleased to present the shareholder report for Guggenheim Total Return Bond Fund (the “Fund”) for the semi-annual fiscal period ended March 31, 2024 (the “Reporting Period”).
The Investment Adviser is part of Guggenheim Investments, which represents the investment management businesses of Guggenheim Partners, LLC (“Guggenheim”), a global, diversified financial services firm.
Guggenheim Funds Distributors, LLC is the distributor of the Fund. Guggenheim Funds Distributors, LLC is affiliated with Guggenheim and the Investment Adviser.
We encourage you to read the Economic and Market Overview section of the report, which follows this letter.
We are committed to providing innovative investment solutions and appreciate the trust you place in us.
Sincerely,
Guggenheim Partners Investment Management, LLC
April 30, 2024
Read a prospectus and summary prospectus (if available) carefully before investing. It contains the investment objectives, risks, charges, expenses and other information, which should be considered carefully before investing. Obtain a prospectus and summary prospectus (if available) at guggenheiminvestments.com or call 800.820.0888.
This material is not intended as a recommendation or as investment advice of any kind, including in connection with rollovers, transfers, and distributions. Such material is not provided in a fiduciary capacity, may not be relied upon for or in connection with the making of investment decisions, and does not constitute a solicitation of an offer to buy or sell securities. All content has been provided for informational or educational purposes only and is not intended to be and should not be construed as legal or tax advice and/or a legal opinion. Always consult a financial, tax and/or legal professional regarding your specific situation.
2 | THE GUGGENHEIM FUNDS SEMI-ANNUAL REPORT | |
The Total Return Bond Fund may not be suitable for all investors. ● An investment in the Fund will fluctuate and is subject to investment risks, which means investors could lose money. ● The Fund’s share price, or the income generated by the Fund’s holdings, could change in response to interest rate changes and market and economic conditions among other factors. In general, bond prices rise when interest rates fall and vice versa. ● The Fund’s exposure to high yield securities may subject the Fund to greater volatility. ● When market conditions are deemed appropriate, the Fund may use leverage to the full extent permitted by its investment policies and restrictions and applicable law. Leveraging will exaggerate the effect on net asset value of any increase or decrease in the market value of the Fund’s portfolio. ●The Fund may invest in derivative instruments, which may be more volatile and less liquid, increasing the risk of loss when compared to traditional securities. Certain of the derivative instruments are also subject to the risks of counterparty default and adverse tax treatment. ● Instruments and strategies (such as borrowing transactions and reverse repurchase agreements) may provide leveraged exposure to a particular investment, which will magnify any gains or losses on those investments. ● Investments in reverse repurchase agreements expose the Fund to many of the same risks as investments in derivatives. ● The Fund’s investments in other investment vehicles subject the Fund to those risks and expenses affecting the investment vehicle. ●The Fund’s investments in foreign securities carry additional risks when compared to U.S. securities, due to the impact of diplomatic, political, or economic developments in the country in question (investments in emerging markets securities are generally subject to an even greater level of risk). ●Investments in syndicated bank loans generally offer a floating interest rate and involve special types of risks. ●The Fund’s investments in municipal securities can be affected by events that affect the municipal bond market. ●The Fund’s investments in real estate securities subject the Fund to the same risks as direct investments in real estate, which is particularly sensitive to economic downturns. ● The Fund is subject to active trading risks that may increase volatility and impact its ability to achieve its investment objective. ●The Fund’s investments in restricted securities may involve financial and liquidity risk. ● You may have a gain or loss when you sell your shares. ● It is important to note that the Fund is not guaranteed by the U.S. government. ● Please read the prospectus for more detailed information regarding these and other risks.
| | THE GUGGENHEIM FUNDS SEMI-ANNUAL REPORT | 3 |
ECONOMIC AND MARKET OVERVIEW (Unaudited) | March 31, 2024 |
While job growth remains robust, recent labor data brought increased confidence in a labor market in better balance, allowing for inflation to soften further. Labor force growth remains strong, aided by high immigration flows, helping bring labor supply in line with gradually cooling demand. The Small Business Survey indicates that plans to increase compensation have returned to pre-COVID levels. Additionally, Bureau of Labor Statistics data reveal a continued decline in the “quits rate,” reducing the pressure on businesses to raise wages to attract or retain employees. These developments suggest wage pressures may ease further by year end. And despite some speculation against any Federal Reserve (“Fed”) rate cuts materializing in 2024, we continue to anticipate cuts later this year.
Following the stronger-than-expected March Consumer Price Index, we believe that there is a high probability that the easing cycle will start in the second half of the year, since the Fed will likely need more time to gather confirming data. In the latest Summary of Economic Projections, the Federal Open Market Committee (“FOMC”) significantly increased the median forecast for 2024 U.S. gross domestic product, slightly increased it for core personal consumption expenditures year over year, and continues to expect no material increase in the unemployment rate. These adjustments left the median view for three rate cuts for 2024, which suggests the bar is very high for the Fed to keep rates where they are all year, and even higher for more rate hikes to materialize.
Amid this macroeconomic backdrop, in the first quarter of 2024 the two-year Treasury yield increased to 4.59% from 4.23%, and the 10-year Treasury yield increased to 4.20% from 3.88%, keeping the inverted 2s/10s yield curve consistent at 39 basis points as of the end of the Reporting Period, up four basis points since the start of the year. One basis point equals 0.01%. In general, spreads to Treasurys have remained tight across sectors. In investment-grade corporate bonds, BBB-rated bonds continued to remain attractive relative to A and BB-rated bonds, and supply slowed toward the end of the first quarter of 2024, which we believe should support spreads in the near term. High yield bond spreads tightened during the first quarter of 2024 to 301 basis points from 323 basis at the start of the year, while leveraged loans’ discount margins to maturity tightened to 509 basis points from 528 basis points. Structured credit spreads tightened marginally amid strong demand. Investor demand and an improved arbitrage led to robust new collateralized loan obligation issuance, and tightening liabilities led to an increase in refinances/resets.
Looking forward, Fed officials continue to advocate for a patient approach. A conventional easing cycle is therefore far from guaranteed. Market expectations have already adjusted significantly from market-implied expectations of six rate cuts in 2024 just two months ago to only three as of the end of the Reporting Period, aligning more closely with the FOMC’s views. So far, the market has taken this delay in stride, but its patience and assessment of credit risk could be tested.
For the Reporting Period, the S&P 500® Index* returned 23.48%. The MSCI Europe-Australasia-Far East (“EAFE”) Index* returned 17.01%. The return of the MSCI Emerging Markets Index* was 10.56%.
4 | THE GUGGENHEIM FUNDS SEMI-ANNUAL REPORT | |
ECONOMIC AND MARKET OVERVIEW (Unaudited)(concluded) | March 31, 2024 |
In the bond market, the Bloomberg U.S. Aggregate Bond Index* posted a 5.99% return for the Reporting Period, while the Bloomberg U.S. Corporate High Yield Index* returned 8.75%. The return of the ICE Bank of America (“BofA”) 3-Month U.S. Treasury Bill Index* was 2.69% for the Reporting Period.
The opinions and forecasts expressed may not actually come to pass. This information is subject to change at any time, based on market and other conditions, and should not be construed as a recommendation of any specific security or strategy.
*Index Definitions:
The following indices are referenced throughout this report. Indices are unmanaged and not available for direct investment. Index performance does not reflect transaction costs, fees, or expenses.
Bloomberg U.S. Aggregate Bond Index is a broad-based flagship benchmark that measures the investment grade, U.S. dollar-denominated, fixed-rate taxable bond market, including U.S. Treasuries, government-related and corporate securities, mortgage-backed securities or “MBS” (agency fixed-rate and hybrid adjustable-rate mortgage, or “ARM”, pass-throughs), asset-backed securities (“ABS”), and commercial mortgage-backed securities (“CMBS”) (agency and non-agency).
Bloomberg U.S. Corporate High Yield Index measures the U.S. dollar-denominated, high yield, fixed-rate corporate bond market. Securities are classified as high yield if the middle rating of Moody’s, Fitch, and S&P is Ba1/BB +/ BB + or below.
ICE BofA 3-Month U.S. Treasury Bill Index is an unmanaged market Index of U.S. Treasury securities maturing in 90 days that assumes reinvestment of all income.
MSCI EAFE Index is a free float-adjusted market capitalization index that is designed to measure the equity market performance of developed markets, excluding the U.S. & Canada.
MSCI Emerging Markets Index is a free float-adjusted market capitalization weighted index that is designed to measure equity market performance in the global emerging markets.
S&P 500® Index is a broad-based index, the performance of which is based on the performance of 500 widely held common stocks chosen for market size, liquidity, and industry group representation.
| | THE GUGGENHEIM FUNDS SEMI-ANNUAL REPORT | 5 |
ABOUT SHAREHOLDERS’ FUND EXPENSES (Unaudited) |
All mutual funds have operating expenses, and it is important for our shareholders to understand the impact of costs on their investments. Shareholders of a fund incur two types of costs: (i) transaction costs, including sales charges (loads) on purchase payments, reinvested dividends, other distributions, and exchange fees, and (ii) ongoing costs, including management fees, administrative services, and shareholder reports, among others. These ongoing costs, or operating expenses, are deducted from a fund’s gross income and reduce the investment return of the fund.
A fund’s expenses are expressed as a percentage of its average net assets, which is known as the expense ratio. The following examples are intended to help investors understand the ongoing costs (in dollars) of investing in a fund and to compare these costs with the ongoing costs of investing in other mutual funds.
The examples are based on an investment of $1,000 made at the beginning of the period and held for the entire six-month period beginning September 30, 2023 and ending March 31, 2024.
The following tables illustrate the Fund’s costs in two ways:
Table 1. Based on actual Fund return: This section helps investors estimate the actual expenses paid over the period. The “Ending Account Value” shown is derived from the Fund’s actual return, and the fifth column shows the dollar amount that would have been paid by an investor who started with $1,000 in the Fund. Investors may use the information here, together with the amount invested, to estimate the expenses paid over the period. Simply divide the Fund’s account value by $1,000 (for example, an $8,600 account value divided by $1,000 = 8.6), then multiply the result by the number provided under the heading “Expenses Paid During Period.”
Table 2. Based on hypothetical 5% return: This section is intended to help investors compare a fund’s cost with those of other mutual funds. The table provides information about hypothetical account values and hypothetical expenses based on the Fund’s actual expense ratio and an assumed rate of return of 5% per year before expenses, which is not the Fund’s actual return. The hypothetical account values and expenses may not be used to estimate the actual ending account balance or expenses paid during the period. The example is useful in making comparisons because the U.S. Securities and Exchange Commission (the “SEC”) requires all mutual funds to calculate expenses based on the 5% return. Investors can assess a Fund’s costs by comparing this hypothetical example with the hypothetical examples that appear in shareholder reports of other funds.
The calculations illustrated above assume no shares were bought or sold during the period. Actual costs may have been higher or lower, depending on the amount of investment and the timing of any purchases or redemptions.
6 | THE GUGGENHEIM FUNDS SEMI-ANNUAL REPORT | |
ABOUT SHAREHOLDERS’ FUND EXPENSES (Unaudited)(continued) |
Please note that the expenses shown in the table are meant to highlight your ongoing costs only and do not reflect any transactional costs, such as sales charges (loads) on purchase payments, and contingent deferred sales charges (“CDSC”) on redemptions, if any. Therefore, the second table is useful in comparing ongoing costs only, and will not help you determine the relative total costs of owning different funds. In addition, if these transactional costs were included, your costs would have been higher.
More information about the Fund’s expenses, including annual expense ratios for periods up to five years (subject to the Fund’s inception date), can be found in the Financial Highlights section of this report. For additional information on operating expenses and other shareholder costs, please refer to the Fund’s prospectus.
| | THE GUGGENHEIM FUNDS SEMI-ANNUAL REPORT | 7 |
ABOUT SHAREHOLDERS’ FUND EXPENSES (Unaudited)(concluded) |
| Expense
Ratio1 | Fund
Return | Beginning
Account Value
September 30,
2023 | Ending
Account Value
March 31,
2024 | Expenses
Paid During
Period2 |
Table 1. Based on actual Fund return3 |
Class A | 0.93% | 6.80% | $ 1,000.00 | $ 1,068.00 | $ 4.81 |
Class C | 1.69% | 6.40% | 1,000.00 | 1,064.00 | 8.72 |
Class P | 0.93% | 6.80% | 1,000.00 | 1,068.00 | 4.81 |
Institutional Class | 0.64% | 6.95% | 1,000.00 | 1,069.50 | 3.31 |
Class R6 | 0.60% | 6.96% | 1,000.00 | 1,069.60 | 3.10 |
|
Table 2. Based on hypothetical 5% return (before expenses) |
Class A | 0.93% | 5.00% | $ 1,000.00 | $ 1,020.35 | $ 4.70 |
Class C | 1.69% | 5.00% | 1,000.00 | 1,016.55 | 8.52 |
Class P | 0.93% | 5.00% | 1,000.00 | 1,020.35 | 4.70 |
Institutional Class | 0.64% | 5.00% | 1,000.00 | 1,021.80 | 3.23 |
Class R6 | 0.60% | 5.00% | 1,000.00 | 1,022.00 | 3.03 |
1 | Annualized and excludes expenses of the underlying funds in which the Fund invests, if any. This ratio represents net expenses, which may include expenses that are excluded from the expense limitation agreement. Excluding these expenses, the net expense ratio for the Fund would be 0.76%, 1.51%, 0.76%, 0.47% and 0.43% for the Class A, Class C, Class P, Institutional Class and Class R6, respectively |
2 | Expenses are equal to the Fund’s annualized expense ratio, net of any applicable fee waivers, multiplied by the average account value over the period, multiplied by 183/366 (to reflect the one-half year period). |
3 | Actual cumulative return at net asset value for the period September 30, 2023 to March 31, 2024. |
8 | THE GUGGENHEIM FUNDS SEMI-ANNUAL REPORT | |
PERFORMANCE REPORT AND FUND PROFILE (Unaudited) | March 31, 2024 |
TOTAL RETURN BOND FUND
OBJECTIVE: Seeks to provide total return, comprised of current income and capital appreciation.
Holdings Diversification (Market Exposure as % of Net Assets)
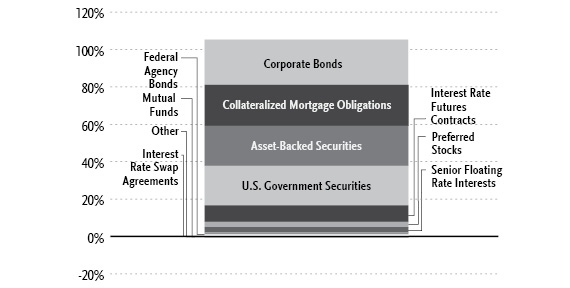
“Holdings Diversification (Market Exposure as % of Net Assets)” excludes any temporary cash investments, investments in Guggenheim Strategy Funds Trust mutual funds, or investments in Guggenheim Ultra Short Duration Fund.
| | THE GUGGENHEIM FUNDS SEMI-ANNUAL REPORT | 9 |
PERFORMANCE REPORT AND FUND PROFILE (Unaudited)(continued) | March 31, 2024 |
Inception Dates: |
Class A | November 30, 2011 |
Class C | November 30, 2011 |
Class P | May 1, 2015 |
Institutional Class | November 30, 2011 |
Class R6 | October 19, 2016 |
Portfolio Composition by Quality Rating1 |
Rating | % of Total
Investments |
Fixed Income Instruments | |
AAA | 44.5% |
AA | 7.1% |
A | 13.8% |
BBB | 15.4% |
BB | 5.3% |
B | 2.4% |
CCC | 0.8% |
CC | 1.2% |
C | 0.1% |
D | 0.0%* |
NR2 | 4.4% |
Other Instruments | 5.0% |
Total Investments | 100.0% |
Ten Largest Holdings | % of Total Net Assets |
U.S. Treasury Notes, 4.13% due 03/31/31 | 5.1% |
U.S. Treasury Notes, 3.50% due 01/31/28 | 3.0% |
U.S. Treasury Bonds due 05/15/53 | 2.7% |
U.S. Treasury Bonds, 4.38% due 11/15/39 | 2.0% |
U.S. Treasury Notes, 4.13% due 06/15/26 | 2.0% |
U.S. Treasury Notes, 3.75% due 12/31/30 | 1.4% |
Fannie Mae, 5.00% due 05/01/53 | 1.2% |
U.S. Treasury Notes, 4.25% due 02/28/31 | 0.9% |
United States Treasury Inflation Indexed Bonds, 0.13% due 10/15/25 | 0.9% |
Freddie Mac, 5.50% due 09/01/53 | 0.9% |
Top Ten Total | 20.1% |
| | |
“Ten Largest Holdings” excludes any temporary cash or derivative investments. |
1 | Source: BlackRock Solutions. Credit quality ratings are measured on a scale that generally ranges from AAA (highest) to D (lowest). All securities except for those labeled “NR” have been rated by Moody’s, Standard & Poor’s (“S&P”), or Fitch, each of which is a Nationally Recognized Statistical Rating Organization (“NRSRO”). For purposes of this presentation, when ratings are available from more than one agency, the highest rating is used. Guggenheim Investments has converted ratings to the equivalent S&P rating. Security ratings are determined at the time of purchase and may change thereafter. |
2 | NR (not rated) securities do not necessarily indicate low credit quality. |
* | Less than 0.01%. |
10 | THE GUGGENHEIM FUNDS SEMI-ANNUAL REPORT | |
PERFORMANCE REPORT AND FUND PROFILE (Unaudited)(concluded) | March 31, 2024 |
Average Annual Returns*
Periods Ended March 31, 2024
| 6 Month† | 1 Year | 5 Year | 10 Year |
Class A Shares | 6.80% | 3.02% | 1.21% | 2.51% |
Class A Shares with sales charge‡ | 2.53% | (1.09%) | 0.39% | 2.01% |
Class C Shares | 6.40% | 2.25% | 0.46% | 1.75% |
Class C Shares with CDSC§ | 5.40% | 1.26% | 0.46% | 1.75% |
Institutional Class Shares | 6.95% | 3.31% | 1.50% | 2.83% |
Bloomberg U.S. Aggregate Bond Index | 5.99% | 1.70% | 0.36% | 1.54% |
| 6 Month† | 1 Year | 5 Year | Since
Inception
(05/01/15) |
Class P Shares | 6.80% | 3.02% | 1.21% | 2.15% |
Bloomberg U.S. Aggregate Bond Index | 5.99% | 1.70% | 0.36% | 1.18% |
| 6 Month† | 1 Year | 5 Year | Since
Inception
(10/19/16) |
Class R6 Shares | 6.96% | 3.36% | 1.51% | 2.03% |
Bloomberg U.S. Aggregate Bond Index | 5.99% | 1.70% | 0.36% | 0.75% |
* | The performance data above represents past performance that is not predictive of future results. The investment return and principal value of an investment in the Fund will fluctuate so that an investor’s shares, when redeemed, may be worth more or less than their original cost. Returns are historical and include changes in principal and reinvested dividends and capital gains and do not reflect the effect of taxes. The Bloomberg U.S. Aggregate Bond Index is an unmanaged index and, unlike the Fund, has no management fees or operating expenses to reduce its reported return. |
† | 6 month returns are not annualized. |
‡ | Effective October 1, 2015, the maximum sales charge decreased from 4.75% to 4.00%. A 4.75% maximum sales charge is used in the calculation of the Average Annual Returns based on subscriptions made prior to October 1, 2015, and a 4.00% maximum sales charge is used to calculate performance for periods based on subscriptions made on or after October 1, 2015. |
§ | Fund returns include a CDSC of 1% if redeemed within 12 months of purchase. |
| | THE GUGGENHEIM FUNDS SEMI-ANNUAL REPORT | 11 |
SCHEDULE OF INVESTMENTS (Unaudited) | March 31, 2024 |
TOTAL RETURN BOND FUND | |
| | Shares | | | Value | |
COMMON STOCKS† - 0.0% |
| | | | | | | | | |
Industrial - 0.0% |
YAK BLOCKER 2 LLC*,††† | | | 44,094 | | | $ | 88,385 | |
YAK BLOCKER 2 LLC*,††† | | | 40,754 | | | | 81,692 | |
API Heat Transfer Intermediate*,††† | | | 31 | | | | 47,378 | |
BP Holdco LLC*,†††,1 | | | 532 | | | | 645 | |
Vector Phoenix Holdings, LP*,††† | | | 532 | | | | 3 | |
Total Industrial | | | | | | | 218,103 | |
| | | | | | | | | |
Communications - 0.0% |
Vacasa, Inc. — Class A* | | | 18,219 | | | | 124,254 | |
| | | | | | | | | |
Financial - 0.0% |
Pershing Square Tontine Holdings, Ltd. — Class A*,†††,2 | | | 9,315,080 | | | | 931 | |
| | | | | | | | | |
Total Common Stocks | | | | |
(Cost $3,675,744) | | | | | | | 343,288 | |
| | | | | | | | | |
PREFERRED STOCKS†† - 2.9% |
Financial - 2.7% |
Markel Group, Inc. |
6.00% | | | 72,131,000 | | | | 71,540,146 | |
Citigroup, Inc. |
3.88% | | | 31,175,000 | | | | 29,422,123 | |
4.00% | | | 26,571,000 | | | | 25,474,848 | |
7.63% | | | 14,300,000 | | | | 15,013,098 | |
Equitable Holdings, Inc. |
4.95% | | | 71,314,000 | | | | 69,694,409 | |
Wells Fargo & Co. |
3.90% | | | 66,688,000 | | | | 63,448,717 | |
7.63% | | | 4,100,000 | | | | 4,381,703 | |
Charles Schwab Corp. |
4.00% | | | 73,673,000 | | | | 62,161,940 | |
Bank of New York Mellon Corp. |
3.75% | | | 65,200,000 | | | | 59,762,327 | |
MetLife, Inc. |
3.85% | | | 53,467,000 | | | | 51,392,668 | |
JPMorgan Chase & Co. |
3.65% | | | 37,412,000 | | | | 35,531,568 | |
6.88% | | | 9,200,000 | | | | 9,519,905 | |
Goldman Sachs Group, Inc. |
3.80% | | | 25,830,000 | | | | 24,058,886 | |
7.50% | | | 11,800,000 | | | | 12,529,724 | |
3.65% | | | 2,450,000 | | | | 2,237,738 | |
Bank of America Corp. |
4.38% | | | 27,700,000 | | | | 25,967,157 | |
6.13% | | | 11,550,000 | | | | 11,581,543 | |
Kuvare US Holdings, Inc. |
7.00% due 02/17/513 | | | 15,731,000 | | | | 15,888,310 | |
CNO Financial Group, Inc. |
5.13% due 11/25/60 | | | 715,225 | | | | 15,599,057 | |
Jackson Financial, Inc. |
8.00% | | | 472,000 | | | | 12,541,040 | |
Selective Insurance Group, Inc. |
4.60% | | | 541,225 | | | | 10,207,503 | |
Depository Trust & Clearing Corp. |
3.38%3 | | | 4,750,000 | | | | 4,215,625 | |
State Street Corp. |
6.70% | | | 2,645,000 | | | | 2,683,940 | |
Assurant, Inc. |
5.25% due 01/15/61 | | | 49,375 | | | | 1,125,750 | |
First Republic Bank |
4.50%* | | | 276,775 | | | | 8,303 | |
4.25%* | | | 2,368,525 | | | | 474 | |
Total Financial | | | | | | | 635,988,502 | |
| | | | | | | | | |
Communications - 0.2% |
AT&T Mobility II LLC |
6.80%*,††† | | | 47,000 | | | | 47,154,160 | |
| | | | | | | | | |
Government - 0.0% |
CoBank ACB |
4.25% | | | 3,300,000 | | | | 2,818,708 | |
| | | | | | | | | |
Industrial - 0.0% |
YAK BLOCKER 2 LLC*,††† | | | 2,422,458 | | | | 2,389,273 | |
Total Industrial | | | | | | | 2,389,273 | |
| | | | | | | | | |
Total Preferred Stocks | | | | |
(Cost $790,924,970) | | | | | | | 688,350,643 | |
| | | | | | | | | |
12 | THE GUGGENHEIM FUNDS SEMI-ANNUAL REPORT | SEE NOTES TO FINANCIAL STATEMENTS. |
SCHEDULE OF INVESTMENTS (Unaudited)(continued) | March 31, 2024 |
TOTAL RETURN BOND FUND | |
| | Shares | | | Value | |
WARRANTS† - 0.0% |
Ginkgo Bioworks Holdings, Inc. | | | | | | | | |
Expiring 09/16/26* | | | 101,490 | | | $ | 9,134 | |
Pershing Square Tontine Holdings, Ltd. | | | | | | | | |
Expiring 07/24/25*,†††,2 | | | 1,035,008 | | | | 104 | |
Total Warrants | | | | |
(Cost $233,835) | | | | | | | 9,238 | |
| | | | | | | | | |
MUTUAL FUNDS† - 0.9% |
Guggenheim Limited Duration Fund — Class R61 | | | 5,228,407 | | | | 125,952,330 | |
Guggenheim Strategy Fund II1 | | | 1,197,904 | | | | 29,468,438 | |
Guggenheim Ultra Short Duration Fund — Institutional Class1 | | | 2,942,994 | | | | 29,165,074 | |
Guggenheim Strategy Fund III1 | | | 648,054 | | | | 15,987,497 | |
Total Mutual Funds | | | | |
(Cost $198,985,539) | | | | | | | 200,573,339 | |
| | | | | | | | | |
MONEY MARKET FUNDS† - 1.1% |
Dreyfus Treasury Obligations Cash Management Fund — Institutional Shares, 5.20%4 | | | 154,672,267 | | | | 154,672,268 | |
Dreyfus Treasury Securities Cash Management Fund — Institutional Shares, 5.19%4 | | | 108,814,819 | | | | 108,814,819 | |
Federated Hermes U.S. Treasury Cash Reserves Fund — Institutional Shares, 5.17%4 | | | 4,383,929 | | | | 4,383,928 | |
Total Money Market Funds | | | | |
(Cost $267,871,015) | | | | | | | 267,871,015 | |
| | | Face
Amount~ | | | | | |
CORPORATE BONDS†† - 24.2% |
Financial - 11.9% | | | | | | | | |
Pershing Square Holdings Ltd. | | | | | | | | |
3.25% due 10/01/313 | | | 101,800,000 | | | | 82,592,987 | |
3.25% due 11/15/30 | | | 58,230,000 | | | | 48,970,848 | |
Reliance Standard Life Global Funding II | | | | | | | | |
5.24% due 02/02/263 | | | 93,191,000 | | | | 92,223,851 | |
Wilton RE Ltd. | | | | | | | | |
6.00% 3,5,6 | | | 92,239,000 | | | | 82,057,931 | |
GLP Capital Limited Partnership / GLP Financing II, Inc. | | | | | | | | |
4.00% due 01/15/31 | | | 54,748,000 | | | | 48,852,533 | |
5.30% due 01/15/29 | | | 20,867,000 | | | | 20,518,187 | |
3.25% due 01/15/32 | | | 4,150,000 | | | | 3,493,585 | |
4.00% due 01/15/30 | | | 475,000 | | | | 433,655 | |
Jefferies Financial Group, Inc. | | | | | | | | |
2.75% due 10/15/32 | | | 40,642,000 | | | | 33,013,372 | |
2.63% due 10/15/31 | | | 27,400,000 | | | | 22,576,692 | |
5.88% due 07/21/28 | | | 3,700,000 | | | | 3,766,528 | |
6.25% due 01/15/36 | | | 1,000,000 | | | | 1,034,929 | |
Morgan Stanley | | | | | | | | |
6.63% due 11/01/346 | | | 31,480,000 | | | | 34,442,468 | |
5.94% due 02/07/396 | | | 23,310,000 | | | | 23,169,396 | |
2.51% due 10/20/326 | | | 1,200,000 | | | | 992,602 | |
FS KKR Capital Corp. | | | | | | | | |
2.63% due 01/15/27 | | | 33,971,000 | | | | 30,816,786 | |
3.25% due 07/15/27 | | | 30,100,000 | | | | 27,405,839 | |
SEE NOTES TO FINANCIAL STATEMENTS. | THE GUGGENHEIM FUNDS SEMI-ANNUAL REPORT | 13 |
SCHEDULE OF INVESTMENTS (Unaudited)(continued) | March 31, 2024 |
TOTAL RETURN BOND FUND | |
| | Face
Amount~ | | | Value | |
Safehold GL Holdings LLC | | | | | | | | |
2.80% due 06/15/31 | | | 30,247,000 | | | $ | 24,940,897 | |
2.85% due 01/15/32 | | | 27,008,000 | | | | 21,937,953 | |
6.10% due 04/01/34 | | | 10,480,000 | | | | 10,412,606 | |
Host Hotels & Resorts, LP | | | | | | | | |
3.50% due 09/15/30 | | | 44,753,000 | | | | 39,795,568 | |
2.90% due 12/15/31 | | | 20,200,000 | | | | 16,786,172 | |
United Wholesale Mortgage LLC | | | | | | | | |
5.50% due 04/15/293 | | | 32,712,000 | | | | 30,938,974 | |
5.50% due 11/15/253 | | | 23,739,000 | | | | 23,524,998 | |
Maple Grove Funding Trust I | | | | | | | | |
4.16% due 08/15/513 | | | 77,700,000 | | | | 53,917,854 | |
Liberty Mutual Group, Inc. | | | | | | | | |
4.30% due 02/01/613 | | | 74,981,000 | | | | 47,719,251 | |
4.13% due 12/15/513,6 | | | 3,600,000 | | | | 3,249,907 | |
3.95% due 05/15/603 | | | 4,064,000 | | | | 2,947,916 | |
Macquarie Bank Ltd. | | | | | | | | |
3.62% due 06/03/303 | | | 59,035,000 | | | | 52,423,787 | |
Fairfax Financial Holdings Ltd. | | | | | | | | |
3.38% due 03/03/31 | | | 41,708,000 | | | | 36,262,716 | |
5.63% due 08/16/32 | | | 13,100,000 | | | | 13,086,774 | |
Global Atlantic Finance Co. | | | | | | | | |
4.70% due 10/15/513,6 | | | 35,662,000 | | | | 32,139,445 | |
7.95% due 06/15/333 | | | 5,424,000 | | | | 6,019,146 | |
3.13% due 06/15/313 | | | 6,871,000 | | | | 5,690,152 | |
6.75% due 03/15/543 | | | 4,956,000 | | | | 5,083,929 | |
Ares Finance Company II LLC | | | | | | | | |
3.25% due 06/15/303 | | | 53,785,000 | | | | 47,386,256 | |
First American Financial Corp. | | | | | | | | |
4.00% due 05/15/30 | | | 40,891,000 | | | | 37,173,169 | |
2.40% due 08/15/31 | | | 11,875,000 | | | | 9,393,491 | |
Nippon Life Insurance Co. | | | | | | | | |
2.75% due 01/21/513,6 | | | 45,350,000 | | | | 37,746,868 | |
2.90% due 09/16/513,6 | | | 10,380,000 | | | | 8,632,466 | |
Nationwide Mutual Insurance Co. | | | | | | | | |
4.35% due 04/30/503 | | | 57,736,000 | | | | 45,729,150 | |
Macquarie Group Ltd. | | | | | | | | |
2.69% due 06/23/323,6 | | | 31,550,000 | | | | 26,280,156 | |
2.87% due 01/14/333,6 | | | 17,431,000 | | | | 14,497,680 | |
1.63% due 09/23/273,6 | | | 4,845,000 | | | | 4,396,073 | |
1.34% due 01/12/273,6 | | | 570,000 | | | | 528,677 | |
Blue Owl Capital GP LLC | | | | | | | | |
7.21% due 08/22/43††† | | | 28,550,000 | | | | 29,457,553 | |
7.11% due 08/22/43††† | | | 15,200,000 | | | | 15,567,768 | |
Rocket Mortgage LLC / Rocket Mortgage Company-Issuer, Inc. | | | | | | | | |
3.88% due 03/01/313 | | | 46,892,000 | | | | 40,852,275 | |
2.88% due 10/15/263 | | | 2,196,000 | | | | 2,028,935 | |
Fidelity National Financial, Inc. | | | | | | | | |
3.40% due 06/15/30 | | | 43,590,000 | | | | 38,702,618 | |
2.45% due 03/15/31 | | | 2,540,000 | | | | 2,090,410 | |
Lazard Group LLC | | | | | | | | |
6.00% due 03/15/31 | | | 38,620,000 | | | | 38,986,847 | |
Bain Capital, LP | | | | | | | | |
3.41% due 04/15/41††† | | | 36,000,000 | | | | 24,622,354 | |
3.72% due 04/15/42††† | | | 20,300,000 | | | | 14,284,816 | |
OneAmerica Financial Partners, Inc. | | | | | | | | |
4.25% due 10/15/503 | | | 54,705,000 | | | | 38,391,117 | |
14 | THE GUGGENHEIM FUNDS SEMI-ANNUAL REPORT | SEE NOTES TO FINANCIAL STATEMENTS. |
SCHEDULE OF INVESTMENTS (Unaudited)(continued) | March 31, 2024 |
TOTAL RETURN BOND FUND | |
| | Face
Amount~ | | | Value | |
Jefferies Finance LLC / JFIN Company-Issuer Corp. | | | | | | | | |
5.00% due 08/15/283 | | | 39,650,000 | | | $ | 36,461,640 | |
Sumitomo Life Insurance Co. | | | | | | | | |
3.38% due 04/15/813,6 | | | 39,900,000 | | | | 34,525,589 | |
CBS Studio Center | | | | | | | | |
8.32% (1 Month Term SOFR + 3.00%, Rate Floor: 3.00%) due 01/09/25◊,††† | | | 34,100,000 | | | | 34,379,649 | |
Old Republic International Corp. | | | | | | | | |
5.75% due 03/28/34 | | | 33,750,000 | | | | 33,897,419 | |
Prudential Financial, Inc. | | | | | | | | |
6.75% due 03/15/546 | | | 17,300,000 | | | | 17,539,173 | |
3.70% due 10/01/506 | | | 17,139,000 | | | | 14,981,092 | |
Assurant, Inc. | | | | | | | | |
2.65% due 01/15/32 | | | 36,922,000 | | | | 30,326,192 | |
6.75% due 02/15/34 | | | 1,450,000 | | | | 1,537,647 | |
Belrose Funding Trust | | | | | | | | |
2.33% due 08/15/303 | | | 38,420,000 | | | | 30,868,051 | |
National Australia Bank Ltd. | | | | | | | | |
3.35% due 01/12/373,6 | | | 14,550,000 | | | | 12,306,001 | |
2.99% due 05/21/313 | | | 14,525,000 | | | | 12,236,344 | |
2.33% due 08/21/303 | | | 7,498,000 | | | | 6,174,949 | |
Stewart Information Services Corp. | | | | | | | | |
3.60% due 11/15/31 | | | 37,221,000 | | | | 30,369,470 | |
Credit Agricole S.A. | | | | | | | | |
5.37% due 03/11/343 | | | 22,200,000 | | | | 22,264,815 | |
5.34% due 01/10/303,6 | | | 7,780,000 | | | | 7,757,824 | |
UBS Group AG | | | | | | | | |
3.09% due 05/14/323,6 | | | 33,400,000 | | | | 28,408,992 | |
5.71% due 01/12/273,6 | | | 1,000,000 | | | | 1,003,087 | |
TPG Operating Group II, LP | | | | | | | | |
5.88% due 03/05/34 | | | 28,630,000 | | | | 29,034,532 | |
Brookfield Finance, Inc. | | | | | | | | |
4.70% due 09/20/47 | | | 9,790,000 | | | | 8,472,007 | |
3.50% due 03/30/51 | | | 9,526,000 | | | | 6,866,001 | |
3.63% due 02/15/52 | | | 9,380,000 | | | | 6,812,101 | |
5.97% due 03/04/54 | | | 4,425,000 | | | | 4,577,237 | |
6.35% due 01/05/34 | | | 1,640,000 | | | | 1,744,646 | |
Societe Generale S.A. | | | | | | | | |
2.89% due 06/09/323,6 | | | 11,729,000 | | | | 9,639,894 | |
6.07% due 01/19/353,6 | | | 8,750,000 | | | | 8,802,104 | |
3.34% due 01/21/333,6 | | | 9,421,000 | | | | 7,899,890 | |
1.79% due 06/09/273,6 | | | 1,630,000 | | | | 1,493,016 | |
Standard Chartered plc | | | | | | | | |
4.64% due 04/01/313,6 | | | 28,908,000 | | | | 27,773,399 | |
Iron Mountain, Inc. | | | | | | | | |
4.50% due 02/15/313 | | | 18,937,000 | | | | 17,085,675 | |
5.63% due 07/15/323 | | | 8,431,000 | | | | 7,963,792 | |
4.88% due 09/15/273 | | | 1,938,000 | | | | 1,873,738 | |
5.25% due 07/15/303 | | | 74,000 | | | | 70,002 | |
Capital One Financial Corp. | | | | | | | | |
6.38% due 06/08/346 | | | 22,450,000 | | | | 23,314,640 | |
6.05% due 02/01/356 | | | 2,570,000 | | | | 2,616,536 | |
5.47% due 02/01/296 | | | 1,000,000 | | | | 996,737 | |
Bank of America Corp. | | | | | | | | |
2.59% due 04/29/316 | | | 28,440,000 | | | | 24,519,469 | |
1.73% due 07/22/276 | | | 1,650,000 | | | | 1,521,217 | |
Americo Life, Inc. | | | | | | | | |
3.45% due 04/15/313 | | | 32,364,000 | | | | 25,321,572 | |
Westpac Banking Corp. | | | | | | | | |
3.02% due 11/18/366 | | | 15,650,000 | | | | 12,855,434 | |
2.96% due 11/16/40 | | | 12,214,000 | | | | 8,620,314 | |
2.67% due 11/15/356 | | | 4,467,000 | | | | 3,684,468 | |
LPL Holdings, Inc. | | | | | | | | |
4.00% due 03/15/293 | | | 17,588,000 | | | | 16,170,395 | |
4.38% due 05/15/313 | | | 9,541,000 | | | | 8,683,662 | |
SEE NOTES TO FINANCIAL STATEMENTS. | THE GUGGENHEIM FUNDS SEMI-ANNUAL REPORT | 15 |
SCHEDULE OF INVESTMENTS (Unaudited)(continued) | March 31, 2024 |
TOTAL RETURN BOND FUND | |
| | Face
Amount~ | | | Value | |
Dyal Capital Partners III | | | | | | | | |
4.40% due 06/15/40††† | | | 26,750,000 | | | $ | 23,494,457 | |
Trustage Financial Group, Inc. | | | | | | | | |
4.63% due 04/15/323 | | | 26,450,000 | | | | 23,017,440 | |
Hunt Companies, Inc. | | | | | | | | |
5.25% due 04/15/293 | | | 25,121,000 | | | | 22,938,020 | |
Aon North America, Inc. | | | | | | | | |
5.45% due 03/01/34 | | | 22,300,000 | | | | 22,557,405 | |
NFP Corp. | | | | | | | | |
7.50% due 10/01/303 | | | 11,950,000 | | | | 12,589,397 | |
6.88% due 08/15/283 | | | 5,617,000 | | | | 5,688,690 | |
8.50% due 10/01/313 | | | 3,500,000 | | | | 3,851,953 | |
Manulife Financial Corp. | | | | | | | | |
2.48% due 05/19/27 | | | 17,800,000 | | | | 16,518,845 | |
4.06% due 02/24/326 | | | 4,815,000 | | | | 4,611,828 | |
Reinsurance Group of America, Inc. | | | | | | | | |
3.15% due 06/15/30 | | | 21,830,000 | | | | 19,466,552 | |
PartnerRe Finance B LLC | | | | | | | | |
4.50% due 10/01/506 | | | 21,056,000 | | | | 19,190,251 | |
Lloyds Banking Group plc | | | | | | | | |
5.46% due 01/05/286 | | | 17,200,000 | | | | 17,203,792 | |
3.51% due 03/18/266 | | | 1,580,000 | | | | 1,545,685 | |
5.87% due 03/06/296 | | | 300,000 | | | | 304,852 | |
JPMorgan Chase & Co. | | | | | | | | |
2.96% due 05/13/316 | | | 17,276,000 | | | | 15,101,949 | |
6.55% (SOFR + 1.20%) due 01/23/28◊ | | | 1,850,000 | | | | 1,869,715 | |
0.82% due 06/01/256 | | | 900,000 | | | | 892,211 | |
2.07% due 06/01/296 | | | 900,000 | | | | 798,348 | |
Corebridge Financial, Inc. | | | | | | | | |
6.88% due 12/15/526 | | | 16,030,000 | | | | 16,049,213 | |
3.90% due 04/05/32 | | | 1,950,000 | | | | 1,753,875 | |
Brookfield Capital Finance LLC | | | | | | | | |
6.09% due 06/14/33 | | | 16,800,000 | | | | 17,597,074 | |
BNP Paribas S.A. | | | | | | | | |
5.50% due 05/20/303,6 | | | 15,990,000 | | | | 16,024,951 | |
1.32% due 01/13/273,6 | | | 1,640,000 | | | | 1,524,447 | |
Horace Mann Educators Corp. | | | | | | | | |
7.25% due 09/15/28 | | | 11,950,000 | | | | 12,763,681 | |
4.50% due 12/01/25 | | | 4,560,000 | | | | 4,454,822 | |
ABN AMRO Bank N.V. | | | | | | | | |
2.47% due 12/13/293,6 | | | 18,000,000 | | | | 15,766,434 | |
Lincoln National Corp. | | | | | | | | |
5.85% due 03/15/34 | | | 15,925,000 | | | | 15,720,558 | |
KKR Group Finance Company VIII LLC | | | | | | | | |
3.50% due 08/25/503 | | | 22,210,000 | | | | 15,600,847 | |
QBE Insurance Group Ltd. | | | | | | | | |
5.88% 3,5,6 | | | 15,700,000 | | | | 15,540,984 | |
Central Storage Safety Project Trust | | | | | | | | |
4.82% due 02/01/387 | | | 16,878,880 | | | | 14,572,095 | |
AmFam Holdings, Inc. | | | | | | | | |
2.81% due 03/11/313 | | | 19,050,000 | | | | 14,542,039 | |
RGA Global Funding | | | | | | | | |
5.50% due 01/11/313 | | | 14,420,000 | | | | 14,459,637 | |
GA Global Funding Trust | | | | | | | | |
2.90% due 01/06/323 | | | 17,480,000 | | | | 14,328,478 | |
Kennedy-Wilson, Inc. | | | | | | | | |
4.75% due 03/01/29 | | | 15,662,000 | | | | 12,893,358 | |
4.75% due 02/01/30 | | | 81,000 | | | | 64,612 | |
SLM Corp. | | | | | | | | |
4.20% due 10/29/25 | | | 6,900,000 | | | | 6,733,317 | |
3.13% due 11/02/26 | | | 6,632,000 | | | | 6,159,526 | |
Athene Global Funding | | | | | | | | |
5.58% due 01/09/293 | | | 9,750,000 | | | | 9,813,320 | |
2.67% due 06/07/313 | | | 1,550,000 | | | | 1,284,069 | |
6.56% (SOFR Compounded Index + 1.21%) due 03/25/27◊,3 | | | 500,000 | | | | 500,373 | |
2.65% due 10/04/313 | | | 400,000 | | | | 326,363 | |
16 | THE GUGGENHEIM FUNDS SEMI-ANNUAL REPORT | SEE NOTES TO FINANCIAL STATEMENTS. |
SCHEDULE OF INVESTMENTS (Unaudited)(continued) | March 31, 2024 |
TOTAL RETURN BOND FUND | |
| | Face
Amount~ | | | Value | |
NatWest Group plc | | | | | | | | |
6.02% due 03/02/346 | | | 10,130,000 | | | $ | 10,451,180 | |
4.45% due 05/08/306 | | | 1,100,000 | | | | 1,047,564 | |
BPCE S.A. | | | | | | | | |
7.00% due 10/19/343,6 | | | 10,000,000 | | | | 10,885,585 | |
CNO Financial Group, Inc. | | | | | | | | |
5.25% due 05/30/29 | | | 11,125,000 | | | | 10,838,099 | |
Sumitomo Mitsui Financial Group, Inc. | | | | | | | | |
2.22% due 09/17/31 | | | 11,900,000 | | | | 9,734,681 | |
5.71% due 01/13/30 | | | 1,000,000 | | | | 1,031,968 | |
HSBC Holdings plc | | | | | | | | |
6.16% due 03/09/296 | | | 10,340,000 | | | | 10,623,914 | |
Atlantic Marine Corporations Communities LLC | | | | | | | | |
5.34% due 12/01/503 | | | 10,860,779 | | | | 9,787,951 | |
5.37% due 12/01/503 | | | 737,388 | | | | 642,551 | |
Assured Guaranty US Holdings, Inc. | | | | | | | | |
3.60% due 09/15/51 | | | 13,861,000 | | | | 10,033,822 | |
6.13% due 09/15/28 | | | 300,000 | | | | 311,012 | |
Mutual of Omaha Insurance Co. | | | | | | | | |
6.14% due 01/16/643,6 | | | 10,150,000 | | | | 10,296,028 | |
KKR Group Finance Company X LLC | | | | | | | | |
3.25% due 12/15/513 | | | 15,150,000 | | | | 10,192,420 | |
PennyMac Financial Services, Inc. | | | | | | | | |
5.38% due 10/15/253 | | | 10,221,000 | | | | 10,101,662 | |
Penn Mutual Life Insurance Co. | | | | | | | | |
3.80% due 04/29/613 | | | 14,970,000 | | | | 9,945,914 | |
OneMain Finance Corp. | | | | | | | | |
7.13% due 03/15/26 | | | 7,564,000 | | | | 7,701,256 | |
6.88% due 03/15/25 | | | 2,000,000 | | | | 2,020,910 | |
Western & Southern Life Insurance Co. | | | | | | | | |
3.75% due 04/28/613 | | | 13,360,000 | | | | 9,025,706 | |
Aretec Group, Inc. | | | | | | | | |
10.00% due 08/15/303 | | | 8,200,000 | | | | 8,956,639 | |
Accident Fund Insurance Company of America | | | | | | | | |
8.50% due 08/01/323 | | | 9,000,000 | | | | 8,864,559 | |
CBRE Services, Inc. | | | | | | | | |
5.95% due 08/15/34 | | | 8,500,000 | | | | 8,723,382 | |
Kemper Corp. | | | | | | | | |
2.40% due 09/30/30 | | | 10,006,000 | | | | 8,033,513 | |
Fidelity & Guaranty Life Holdings, Inc. | | | | | | | | |
5.50% due 05/01/253 | | | 8,050,000 | | | | 7,982,112 | |
American Equity Investment Life Holding Co. | | | | | | | | |
5.00% due 06/15/27 | | | 8,142,000 | | | | 7,923,828 | |
Five Corners Funding Trust III | | | | | | | | |
5.79% due 02/15/333 | | | 7,550,000 | | | | 7,783,725 | |
CNO Global Funding | | | | | | | | |
1.75% due 10/07/263 | | | 7,400,000 | | | | 6,744,369 | |
VICI Properties Limited Partnership / VICI Note Company, Inc. | | | | | | | | |
4.63% due 12/01/293 | | | 3,500,000 | | | | 3,310,037 | |
4.13% due 08/15/303 | | | 3,600,000 | | | | 3,273,502 | |
Cooperatieve Rabobank UA | | | | | | | | |
4.66% due 08/22/283,6 | | | 6,200,000 | | | | 6,069,651 | |
Mid-Atlantic Military Family Communities LLC | | | | | | | | |
5.30% due 08/01/503 | | | 5,835,662 | | | | 5,089,825 | |
5.24% due 08/01/503 | | | 1,066,934 | | | | 965,520 | |
Ohana Military Communities LLC | | | | | | | | |
5.56% due 10/01/363 | | | 3,820,000 | | | | 3,743,188 | |
5.78% due 10/01/363 | | | 2,200,000 | | | | 2,204,620 | |
Belvoir Land LLC | | | | | | | | |
5.60% due 12/15/353 | | | 5,600,000 | | | | 5,319,938 | |
SEE NOTES TO FINANCIAL STATEMENTS. | THE GUGGENHEIM FUNDS SEMI-ANNUAL REPORT | 17 |
SCHEDULE OF INVESTMENTS (Unaudited)(continued) | March 31, 2024 |
TOTAL RETURN BOND FUND | |
| | Face
Amount~ | | | Value | |
Deloitte LLP | | | | | | | | |
7.33% due 11/20/26††† | | | 4,800,000 | | | $ | 4,954,270 | |
Brookfield Finance LLC / Brookfield Finance, Inc. | | | | | | | | |
3.45% due 04/15/50 | | | 6,852,000 | | | | 4,801,388 | |
Cushman & Wakefield US Borrower LLC | | | | | | | | |
6.75% due 05/15/283 | | | 4,710,000 | | | | 4,651,046 | |
Dyal Capital Partners III (B) LP | | | | | | | | |
6.55% due 06/15/44††† | | | 4,620,000 | | | | 4,590,348 | |
HS Wildcat LLC | | | | | | | | |
3.83% due 12/31/50††† | | | 4,970,527 | | | | 3,536,982 | |
Commonwealth Bank of Australia | | | | | | | | |
3.61% due 09/12/343,6 | | | 3,550,000 | | | | 3,196,695 | |
Nationstar Mortgage Holdings, Inc. | | | | | | | | |
5.00% due 02/01/263 | | | 2,780,000 | | | | 2,720,520 | |
Enstar Group Ltd. | | | | | | | | |
3.10% due 09/01/31 | | | 1,670,000 | | | | 1,386,494 | |
4.95% due 06/01/29 | | | 1,250,000 | | | | 1,220,927 | |
KKR Group Finance Company III LLC | | | | | | | | |
5.13% due 06/01/443 | | | 2,710,000 | | | | 2,502,191 | |
Aurora Military Housing LLC | | | | | | | | |
5.82% due 07/15/343 | | | 2,200,617 | | | | 2,131,955 | |
Mitsubishi UFJ Financial Group, Inc. | | | | | | | | |
4.08% due 04/19/286 | | | 1,580,000 | | | | 1,534,182 | |
5.72% due 02/20/266 | | | 500,000 | | | | 500,410 | |
American National Group LLC | | | | | | | | |
6.14% due 06/13/323 | | | 2,000,000 | | | | 1,887,598 | |
Jackson Financial, Inc. | | | | | | | | |
4.00% due 11/23/51 | | | 2,610,000 | | | | 1,834,201 | |
Apollo Global Management, Inc. | | | | | | | | |
6.38% due 11/15/33 | | | 1,640,000 | | | | 1,764,112 | |
Deutsche Bank AG NY | | | | | | | | |
3.55% due 09/18/316 | | | 1,990,000 | | | | 1,752,474 | |
Skandinaviska Enskilda Banken AB | | | | | | | | |
6.24% (SOFR + 0.89%) due 03/05/27◊,3 | | | 1,730,000 | | | | 1,733,794 | |
Ares Finance Company IV LLC | | | | | | | | |
3.65% due 02/01/523 | | | 2,450,000 | | | | 1,719,942 | |
Danske Bank A/S | | | | | | | | |
0.98% due 09/10/253,6 | | | 1,660,000 | | | | 1,623,068 | |
Brighthouse Financial Global Funding | | | | | | | | |
1.00% due 04/12/243 | | | 1,620,000 | | | | 1,617,773 | |
Transatlantic Holdings, Inc. | | | | | | | | |
8.00% due 11/30/39 | | | 1,265,000 | | | | 1,613,053 | |
ING Groep N.V. | | | | | | | | |
1.73% due 04/01/276 | | | 1,360,000 | | | | 1,262,308 | |
2.73% due 04/01/326 | | | 400,000 | | | | 339,510 | |
Jackson National Life Global Funding | | | | | | | | |
1.75% due 01/12/253 | | | 1,650,000 | | | | 1,600,318 | |
Iron Mountain Information Management Services, Inc. | | | | | | | | |
5.00% due 07/15/323 | | | 1,617,000 | | | | 1,476,759 | |
Blackstone Holdings Finance Company LLC | | | | | | | | |
3.20% due 01/30/523 | | | 2,150,000 | | | | 1,464,814 | |
Selective Insurance Group, Inc. | | | | | | | | |
5.38% due 03/01/49 | | | 1,510,000 | | | | 1,443,416 | |
Mizuho Financial Group, Inc. | | | | | | | | |
5.41% due 09/13/286 | | | 1,400,000 | | | | 1,411,806 | |
F&G Global Funding | | | | | | | | |
2.30% due 04/11/273 | | | 790,000 | | | | 709,169 | |
2.00% due 09/20/283 | | | 800,000 | | | | 680,509 | |
18 | THE GUGGENHEIM FUNDS SEMI-ANNUAL REPORT | SEE NOTES TO FINANCIAL STATEMENTS. |
SCHEDULE OF INVESTMENTS (Unaudited)(continued) | March 31, 2024 |
TOTAL RETURN BOND FUND | |
| | Face
Amount~ | | | Value | |
Fort Moore Family Communities LLC | | | | | | | | |
6.09% due 01/15/513 | | | 1,553,811 | | | $ | 1,352,527 | |
Fort Knox Military Housing Privatization Project | | | | | | | | |
5.77% (1 Month Term SOFR + 0.45%) due 02/15/52◊,3 | | | 1,636,325 | | | | 1,272,149 | |
Banco Santander S.A. | | | | | | | | |
6.94% due 11/07/33 | | | 1,000,000 | | | | 1,104,541 | |
Midwest Family Housing LLC | | | | | | | | |
5.58% due 01/01/513 | | | 1,269,879 | | | | 1,103,408 | |
Willis North America, Inc. | | | | | | | | |
5.90% due 03/05/54 | | | 1,060,000 | | | | 1,073,078 | |
Barclays plc | | | | | | | | |
6.84% (SOFR + 1.49%) due 03/12/28◊ | | | 1,000,000 | | | | 1,005,960 | |
KKR Group Finance Company II LLC | | | | | | | | |
5.50% due 02/01/433 | | | 1,000,000 | | | | 968,610 | |
Wells Fargo & Co. | | | | | | | | |
2.41% due 10/30/256 | | | 600,000 | | | | 588,571 | |
Pacific Beacon LLC | | | | | | | | |
5.51% due 07/15/363 | | | 500,000 | | | | 477,757 | |
Swiss Re Finance Luxembourg S.A. | | | | | | | | |
5.00% due 04/02/493,6 | | | 300,000 | | | | 291,000 | |
Markel Group, Inc. | | | | | | | | |
4.30% due 11/01/47 | | | 350,000 | | | | 284,645 | |
Pine Street Trust I | | | | | | | | |
4.57% due 02/15/293 | | | 250,000 | | | | 237,605 | |
Peachtree Corners Funding Trust | | | | | | | | |
3.98% due 02/15/253 | | | 215,000 | | | | 210,919 | |
Atlas Mara Ltd. | | | | | | | | |
8.00% due 12/31/21†††,7,8 | | | 595,758 | | | | 54,349 | |
Brown & Brown, Inc. | | | | | | | | |
2.38% due 03/15/31 | | | 57,000 | | | | 47,239 | |
Total Financial | | | 2,822,359,461 | |
| | | | | | | | | |
Consumer, Non-cyclical - 2.6% |
CoStar Group, Inc. | | | | | | | | |
2.80% due 07/15/303 | | | 90,310,000 | | | | 76,986,085 | |
JBS USA LUX S.A. / JBS USA Food Company / JBS USA Finance, Inc. | | | | | | | | |
3.00% due 05/15/32 | | | 29,206,000 | | | | 23,819,271 | |
5.50% due 01/15/30 | | | 12,550,000 | | | | 12,368,221 | |
4.38% due 02/02/52 | | | 12,630,000 | | | | 9,171,921 | |
5.13% due 02/01/28 | | | 2,250,000 | | | | 2,215,702 | |
Global Payments, Inc. | | | | | | | | |
2.90% due 11/15/31 | | | 30,265,000 | | | | 25,398,358 | |
2.90% due 05/15/30 | | | 19,810,000 | | | | 17,203,136 | |
5.30% due 08/15/29 | | | 4,300,000 | | | | 4,279,491 | |
Smithfield Foods, Inc. | | | | | | | | |
2.63% due 09/13/313 | | | 39,050,000 | | | | 30,580,815 | |
3.00% due 10/15/303 | | | 15,473,000 | | | | 12,809,440 | |
5.20% due 04/01/293 | | | 850,000 | | | | 817,651 | |
Altria Group, Inc. | | | | | | | | |
4.45% due 05/06/50 | | | 25,185,000 | | | | 20,025,277 | |
3.70% due 02/04/51 | | | 25,038,000 | | | | 17,496,917 | |
BAT Capital Corp. | | | | | | | | |
3.98% due 09/25/50 | | | 41,652,000 | | | | 29,293,770 | |
6.00% due 02/20/34 | | | 5,925,000 | | | | 5,999,331 | |
Royalty Pharma plc | | | | | | | | |
3.55% due 09/02/50 | | | 39,920,000 | | | | 27,502,735 | |
1.20% due 09/02/25 | | | 1,875,000 | | | | 1,764,824 | |
Triton Container International Ltd. | | | | | | | | |
3.15% due 06/15/313 | | | 34,821,000 | | | | 28,073,402 | |
Element Fleet Management Corp. | | | | | | | | |
6.32% due 12/04/283 | | | 23,260,000 | | | | 24,023,930 | |
Yale-New Haven Health Services Corp. | | | | | | | | |
2.50% due 07/01/50 | | | 32,350,000 | | | | 19,648,014 | |
Universal Health Services, Inc. | | | | | | | | |
2.65% due 10/15/30 | | | 18,757,000 | | | | 15,904,936 | |
2.65% due 01/15/32 | | | 2,140,000 | | | | 1,750,763 | |
SEE NOTES TO FINANCIAL STATEMENTS. | THE GUGGENHEIM FUNDS SEMI-ANNUAL REPORT | 19 |
SCHEDULE OF INVESTMENTS (Unaudited)(continued) | March 31, 2024 |
TOTAL RETURN BOND FUND | |
| | Face
Amount~ | | | Value | |
IQVIA, Inc. | | | | | | | | |
5.00% due 05/15/273 | | | 9,374,000 | | | $ | 9,153,014 | |
5.00% due 10/15/263 | | | 6,950,000 | | | | 6,800,493 | |
5.70% due 05/15/28 | | | 1,000,000 | | | | 1,013,869 | |
AZ Battery Property LLC | | | | | | | | |
6.73% due 02/20/46††† | | | 16,480,000 | | | | 16,714,282 | |
Valvoline, Inc. | | | | | | | | |
3.63% due 06/15/313 | | | 18,300,000 | | | | 15,774,776 | |
Catalent Pharma Solutions, Inc. | | | | | | | | |
3.50% due 04/01/303 | | | 9,500,000 | | | | 9,047,892 | |
3.13% due 02/15/293 | | | 6,654,000 | | | | 6,358,423 | |
Prime Security Services Borrower LLC / Prime Finance, Inc. | | | | | | | | |
5.75% due 04/15/263 | | | 14,437,000 | | | | 14,394,886 | |
Williams Scotsman, Inc. | | | | | | | | |
6.13% due 06/15/253 | | | 14,075,000 | | | | 14,009,562 | |
HCA, Inc. | | | | | | | | |
6.00% due 04/01/54 | | | 8,960,000 | | | | 9,094,234 | |
5.88% due 02/15/26 | | | 2,775,000 | | | | 2,786,856 | |
3.50% due 09/01/30 | | | 1,600,000 | | | | 1,446,971 | |
Transurban Finance Company Pty Ltd. | | | | | | | | |
2.45% due 03/16/313 | | | 14,400,000 | | | | 12,062,967 | |
Medline Borrower Limited Partnership/Medline Company-Issuer, Inc. | | | | | | | | |
6.25% due 04/01/293 | | | 8,875,000 | | | | 8,914,740 | |
OhioHealth Corp. | | | | | | | | |
3.04% due 11/15/50 | | | 9,100,000 | | | | 6,481,195 | |
TriNet Group, Inc. | | | | | | | | |
7.00% due 08/15/313 | | | 5,350,000 | | | | 5,489,603 | |
Albertsons Companies Incorporated / Safeway Inc / New Albertsons Limited Partnership / Albertsons LLC | | | | | | | | |
3.25% due 03/15/263 | | | 5,690,000 | | | | 5,426,102 | |
Tyson Foods, Inc. | | | | | | | | |
5.70% due 03/15/34 | | | 4,900,000 | | | | 4,964,630 | |
Graham Holdings Co. | | | | | | | | |
5.75% due 06/01/263 | | | 4,767,000 | | | | 4,721,153 | |
WW International, Inc. | | | | | | | | |
4.50% due 04/15/293 | | | 11,651,000 | | | | 4,601,201 | |
Children’s Hospital Corp. | | | | | | | | |
2.59% due 02/01/50 | | | 7,100,000 | | | | 4,533,646 | |
APi Group DE, Inc. | | | | | | | | |
4.13% due 07/15/293 | | | 4,150,000 | | | | 3,739,076 | |
Central Garden & Pet Co. | | | | | | | | |
4.13% due 04/30/313 | | | 3,854,000 | | | | 3,396,994 | |
Darling Ingredients, Inc. | | | | | | | | |
6.00% due 06/15/303 | | | 3,394,000 | | | | 3,363,465 | |
Sotheby’s/Bidfair Holdings, Inc. | | | | | | | | |
5.88% due 06/01/293 | | | 3,900,000 | | | | 3,277,999 | |
Wisconsin Alumni Research Foundation | | | | | | | | |
3.56% due 10/01/49 | | | 3,775,000 | | | | 2,919,037 | |
Boost Newco Borrower LLC | | | | | | | | |
7.50% due 01/15/313 | | | 2,600,000 | | | | 2,721,714 | |
Providence St. Joseph Health Obligated Group | | | | | | | | |
2.70% due 10/01/51 | | | 4,250,000 | | | | 2,604,090 | |
Medline Borrower, LP | | | | | | | | |
3.88% due 04/01/293 | | | 2,800,000 | | | | 2,548,578 | |
Tenet Healthcare Corp. | | | | | | | | |
4.63% due 06/15/28 | | | 2,096,000 | | | | 1,995,793 | |
Cardinal Health, Inc. | | | | | | | | |
4.50% due 11/15/44 | | | 2,100,000 | | | | 1,806,773 | |
Beth Israel Lahey Health, Inc. | | | | | | | | |
3.08% due 07/01/51 | | | 2,700,000 | | | | 1,745,707 | |
Quanta Services, Inc. | | | | | | | | |
0.95% due 10/01/24 | | | 1,660,000 | | | | 1,619,693 | |
Molina Healthcare, Inc. | | | | | | | | |
4.38% due 06/15/283 | | | 1,290,000 | | | | 1,212,637 | |
20 | THE GUGGENHEIM FUNDS SEMI-ANNUAL REPORT | SEE NOTES TO FINANCIAL STATEMENTS. |
SCHEDULE OF INVESTMENTS (Unaudited)(continued) | March 31, 2024 |
TOTAL RETURN BOND FUND | |
| | Face
Amount~ | | | Value | |
Triton Container International Limited / TAL International Container Corp. | | | | | | | | |
3.25% due 03/15/32 | | | 1,050,000 | | | $ | 852,088 | |
DaVita, Inc. | | | | | | | | |
3.75% due 02/15/313 | | | 149,000 | | | | 124,752 | |
4.63% due 06/01/303 | | | 76,000 | | | | 68,042 | |
Total Consumer, Non-cyclical | | | 604,920,923 | |
| | | | | | | | | |
Industrial - 2.2% |
Builders FirstSource, Inc. | | | | | | | | |
6.38% due 03/01/343 | | | 52,000,000 | | | | 52,214,656 | |
FLNG Liquefaction 3 LLC | | | | | | | | |
3.08% due 06/30/39††† | | | 62,179,170 | | | | 48,001,779 | |
Vontier Corp. | | | | | | | | |
2.95% due 04/01/31 | | | 36,612,000 | | | | 30,603,813 | |
2.40% due 04/01/28 | | | 19,150,000 | | | | 16,908,031 | |
TD SYNNEX Corp. | | | | | | | | |
2.65% due 08/09/31 | | | 34,240,000 | | | | 27,590,709 | |
2.38% due 08/09/28 | | | 21,781,000 | | | | 19,238,231 | |
Flowserve Corp. | | | | | | | | |
3.50% due 10/01/30 | | | 22,421,000 | | | | 19,905,966 | |
2.80% due 01/15/32 | | | 19,800,000 | | | | 16,276,365 | |
Dyal Capital Partners IV | | | | | | | | |
3.65% due 02/22/41††† | | | 41,800,000 | | | | 34,623,692 | |
Mauser Packaging Solutions Holding Co. | | | | | | | | |
7.88% due 08/15/263 | | | 23,759,000 | | | | 24,204,505 | |
Cliffwater Corporate Lending Fund | | | | | | | | |
6.77% due 08/04/28††† | | | 22,700,000 | | | | 22,615,303 | |
Smurfit Kappa Treasury ULC | | | | | | | | |
5.44% due 04/03/343 | | | 22,000,000 | | | | 22,008,379 | |
Stadco LA LLC | | | | | | | | |
3.75% due 05/15/56††† | | | 31,000,000 | | | | 21,284,233 | |
Hillenbrand, Inc. | | | | | | | | |
3.75% due 03/01/31 | | | 7,650,000 | | | | 6,638,766 | |
6.25% due 02/15/29 | | | 4,250,000 | | | | 4,286,461 | |
5.75% due 06/15/25 | | | 2,091,000 | | | | 2,087,884 | |
TransDigm, Inc. | | | | | | | | |
6.63% due 03/01/323 | | | 7,300,000 | | | | 7,375,124 | |
6.88% due 12/15/303 | | | 5,375,000 | | | | 5,479,248 | |
Weir Group plc | | | | | | | | |
2.20% due 05/13/263 | | | 13,015,000 | | | | 12,081,024 | |
TFI International, Inc. | | | | | | | | |
3.35% due 01/05/33††† | | | 14,000,000 | | | | 11,310,092 | |
Textron, Inc. | | | | | | | | |
6.10% due 11/15/33 | | | 10,000,000 | | | | 10,483,564 | |
Crown Americas LLC / Crown Americas Capital Corporation VI | | | | | | | | |
4.75% due 02/01/26 | | | 9,770,000 | | | | 9,607,752 | |
Berry Global, Inc. | | | | | | | | |
5.65% due 01/15/343 | | | 9,050,000 | | | | 9,000,568 | |
Masonite International Corp. | | | | | | | | |
3.50% due 02/15/303 | | | 8,760,000 | | | | 7,750,158 | |
Norfolk Southern Corp. | | | | | | | | |
4.10% due 05/15/21 | | | 9,100,000 | | | | 6,636,220 | |
Penske Truck Leasing Company Lp / PTL Finance Corp. | | | | | | | | |
5.35% due 03/30/293 | | | 6,000,000 | | | | 6,004,104 | |
Dyal Capital Partners III (A) LP | | | | | | | | |
6.55% due 06/15/44††† | | | 5,880,000 | | | | 5,842,261 | |
Westinghouse Air Brake Technologies Corp. | | | | | | | | |
5.61% due 03/11/34 | | | 5,650,000 | | | | 5,723,085 | |
Virgin Media Vendor Financing Notes III DAC | | | | | | | | |
4.88% due 07/15/28 | | | GBP 5,000,000 | | | | 5,648,421 | |
SEE NOTES TO FINANCIAL STATEMENTS. | THE GUGGENHEIM FUNDS SEMI-ANNUAL REPORT | 21 |
SCHEDULE OF INVESTMENTS (Unaudited)(continued) | March 31, 2024 |
TOTAL RETURN BOND FUND | |
| | Face
Amount~ | | | Value | |
Fortune Brands Innovations, Inc. | | | | | | | | |
5.88% due 06/01/33 | | | 4,200,000 | | | $ | 4,285,188 | |
4.50% due 03/25/52 | | | 1,500,000 | | | | 1,232,202 | |
Enpro, Inc. | | | | | | | | |
5.75% due 10/15/26 | | | 5,007,000 | | | | 4,990,610 | |
EnerSys | | | | | | | | |
6.63% due 01/15/323 | | | 4,725,000 | | | | 4,759,299 | |
Mueller Water Products, Inc. | | | | | | | | |
4.00% due 06/15/293 | | | 5,216,000 | | | | 4,731,076 | |
Sealed Air Corporation/Sealed Air Corp US | | | | | | | | |
6.13% due 02/01/283 | | | 4,293,000 | | | | 4,301,908 | |
Sealed Air Corp. | | | | | | | | |
5.50% due 09/15/253 | | | 4,150,000 | | | | 4,134,932 | |
Trinity Industries, Inc. | | | | | | | | |
7.75% due 07/15/283 | | | 3,250,000 | | | | 3,337,467 | |
Ball Corp. | | | | | | | | |
6.88% due 03/15/28 | | | 2,350,000 | | | | 2,412,259 | |
GrafTech Global Enterprises, Inc. | | | | | | | | |
9.88% due 12/15/283 | | | 3,100,000 | | | | 2,301,122 | |
GATX Corp. | | | | | | | | |
3.50% due 06/01/32 | | | 1,650,000 | | | | 1,442,166 | |
4.70% due 04/01/29 | | | 400,000 | | | | 392,149 | |
nVent Finance SARL | | | | | | | | |
2.75% due 11/15/31 | | | 1,300,000 | | | | 1,070,517 | |
Ryder System, Inc. | | | | | | | | |
6.30% due 12/01/28 | | | 1,000,000 | | | | 1,046,663 | |
Masco Corp. | | | | | | | | |
4.50% due 05/15/47 | | | 1,200,000 | | | | 1,021,484 | |
Owens Corning | | | | | | | | |
7.00% due 12/01/36 | | | 900,000 | | | | 1,012,551 | |
Adevinta ASA | | | | | | | | |
3.00% due 11/15/27 | | EUR | 417,000 | | | | 452,185 | |
Virgin Media Inc. | | | | | | | | |
4.00% due 01/31/29 | | GBP | 150,000 | | | | 165,655 | |
Standard Industries, Inc. | | | | | | | | |
4.38% due 07/15/303 | | | 101,000 | | | | 90,753 | |
3.38% due 01/15/313 | | | 81,000 | | | | 67,915 | |
Total Industrial | | | 514,678,495 | |
| | | | | | | | | |
Consumer, Cyclical - 2.1% |
Delta Air Lines, Inc. | | | | | | | | |
7.00% due 05/01/253 | | | 46,883,000 | | | | 47,498,129 | |
Hyatt Hotels Corp. | | | | | | | | |
5.75% due 04/23/30 | | | 24,039,000 | | | | 24,649,494 | |
5.38% due 04/23/25 | | | 18,928,000 | | | | 18,875,304 | |
Alt-2 Structured Trust | | | | | | | | |
2.95% due 05/14/31◊,††† | | | 46,347,232 | | | | 41,437,594 | |
Choice Hotels International, Inc. | | | | | | | | |
3.70% due 01/15/31 | | | 39,961,000 | | | | 35,013,829 | |
Delta Air Lines, Inc. / SkyMiles IP Ltd. | | | | | | | | |
4.50% due 10/20/253 | | | 26,374,250 | | | | 26,106,022 | |
4.75% due 10/20/283 | | | 3,800,000 | | | | 3,716,617 | |
Mileage Plus Holdings LLC / Mileage Plus Intellectual Property Assets Ltd. | | | | | | | | |
6.50% due 06/20/273 | | | 25,436,626 | | | | 25,576,935 | |
Walgreens Boots Alliance, Inc. | | | | | | | | |
3.45% due 06/01/26 | | | 11,825,000 | | | | 11,277,476 | |
4.10% due 04/15/50 | | | 15,203,000 | | | | 11,147,979 | |
Ferguson Finance plc | | | | | | | | |
3.25% due 06/02/303 | | | 17,904,000 | | | | 16,016,234 | |
4.65% due 04/20/323 | | | 6,300,000 | | | | 6,009,021 | |
Air Canada | | | | | | | | |
3.88% due 08/15/263 | | | 20,329,000 | | | | 19,402,420 | |
Whirlpool Corp. | | | | | | | | |
4.60% due 05/15/509 | | | 13,326,000 | | | | 10,923,750 | |
5.75% due 03/01/34 | | | 8,070,000 | | | | 8,095,646 | |
CD&R Smokey Buyer, Inc. | | | | | | | | |
6.75% due 07/15/253 | | | 17,620,000 | | | | 17,457,768 | |
International Game Technology plc | | | | | | | | |
4.13% due 04/15/263 | | | 17,834,000 | | | | 17,288,358 | |
Clarios Global, LP | | | | | | | | |
6.75% due 05/15/253 | | | 17,071,000 | | | | 17,086,193 | |
22 | THE GUGGENHEIM FUNDS SEMI-ANNUAL REPORT | SEE NOTES TO FINANCIAL STATEMENTS. |
SCHEDULE OF INVESTMENTS (Unaudited)(continued) | March 31, 2024 |
TOTAL RETURN BOND FUND | |
| | Face
Amount~ | | | Value | |
Cedar Fair, LP / Canada’s Wonderland Co. / Magnum Management Corp. / Millennium Operations LLC | | | | | | | | |
5.50% due 05/01/253 | | | 17,013,000 | | | $ | 16,942,501 | |
British Airways Class A Pass Through Trust | | | | | | | | |
2.90% due 03/15/353 | | | 14,008,814 | | | | 12,097,093 | |
4.25% due 11/15/323 | | | 4,761,902 | | | | 4,440,606 | |
American Airlines Class AA Pass Through Trust | | | | | | | | |
3.35% due 10/15/29 | | | 7,890,651 | | | | 7,218,429 | |
3.20% due 06/15/28 | | | 4,991,300 | | | | 4,583,391 | |
3.00% due 10/15/28 | | | 3,586,383 | | | | 3,265,597 | |
3.15% due 02/15/32 | | | 144,855 | | | | 129,413 | |
Polaris, Inc. | | | | | | | | |
6.95% due 03/15/29 | | | 13,000,000 | | | | 13,827,996 | |
Hilton Domestic Operating Company, Inc. | | | | | | | | |
6.13% due 04/01/323 | | | 12,925,000 | | | | 12,979,984 | |
United Airlines, Inc. | | | | | | | | |
4.38% due 04/15/263 | | | 12,700,000 | | | | 12,277,576 | |
Clarios Global Limited Partnership / Clarios US Finance Co. | | | | | | | | |
6.25% due 05/15/263 | | | 10,527,000 | | | | 10,521,659 | |
1011778 BC ULC / New Red Finance, Inc. | | | | | | | | |
5.75% due 04/15/253 | | | 9,968,000 | | | | 9,943,779 | |
Warnermedia Holdings, Inc. | | | | | | | | |
6.41% due 03/15/26 | | | 9,250,000 | | | | 9,250,158 | |
Beacon Roofing Supply, Inc. | | | | | | | | |
4.50% due 11/15/263 | | | 6,120,000 | | | | 5,946,418 | |
6.50% due 08/01/303 | | | 1,925,000 | | | | 1,953,359 | |
United Airlines 2023-1 Class A Pass Through Trust | | | | | | | | |
5.80% due 01/15/36 | | | 7,450,000 | | | | 7,575,161 | |
Live Nation Entertainment, Inc. | | | | | | | | |
6.50% due 05/15/273 | | | 4,635,000 | | | | 4,685,656 | |
LKQ Corp. | | | | | | | | |
6.25% due 06/15/33 | | | 3,412,000 | | | | 3,552,711 | |
Brunswick Corp. | | | | | | | | |
5.10% due 04/01/52 | | | 2,030,000 | | | | 1,666,561 | |
PulteGroup, Inc. | | | | | | | | |
6.38% due 05/15/33 | | | 1,400,000 | | | | 1,485,956 | |
JB Poindexter & Company, Inc. | | | | | | | | |
8.75% due 12/15/313 | | | 1,230,000 | | | | 1,271,366 | |
NVR, Inc. | | | | | | | | |
3.00% due 05/15/30 | | | 1,200,000 | | | | 1,065,619 | |
Mattel, Inc. | | | | | | | | |
3.75% due 04/01/293 | | | 1,100,000 | | | | 1,012,639 | |
JetBlue Class A Pass Through Trust | | | | | | | | |
4.00% due 11/15/32 | | | 120,553 | | | | 111,701 | |
Total Consumer, Cyclical | | | 505,384,098 | |
| | | | | | | | | |
Communications - 1.7% |
Level 3 Financing, Inc. | | | | | | | | |
10.75% due 12/15/303 | | | 20,300,000 | | | | 20,807,500 | |
3.88% due 10/15/303 | | | 34,939,000 | | | | 20,614,010 | |
11.00% due 11/15/293 | | | 19,567,314 | | | | 20,350,007 | |
4.50% due 04/01/303 | | | 26,815,000 | | | | 16,625,300 | |
4.00% due 04/15/313 | | | 13,950,000 | | | | 8,439,750 | |
British Telecommunications plc | | | | | | | | |
4.88% due 11/23/813,6 | | | 47,450,000 | | | | 42,160,051 | |
4.25% due 11/23/813,6 | | | 8,250,000 | | | | 7,772,719 | |
9.63% due 12/15/30 | | | 2,391,000 | | | | 2,932,874 | |
Vodafone Group plc | | | | | | | | |
4.13% due 06/04/816 | | | 40,537,000 | | | | 34,915,487 | |
Sirius XM Radio, Inc. | | | | | | | | |
3.13% due 09/01/263 | | | 24,325,000 | | | | 22,785,823 | |
4.13% due 07/01/303 | | | 12,010,000 | | | | 10,498,760 | |
Paramount Global | | | | | | | | |
5.90% due 10/15/40 | | | 20,648,000 | | | | 17,311,653 | |
SEE NOTES TO FINANCIAL STATEMENTS. | THE GUGGENHEIM FUNDS SEMI-ANNUAL REPORT | 23 |
SCHEDULE OF INVESTMENTS (Unaudited)(continued) | March 31, 2024 |
TOTAL RETURN BOND FUND | |
| | Face
Amount~ | | | Value | |
4.90% due 08/15/44 | | | 6,518,000 | | | $ | 4,659,829 | |
5.25% due 04/01/44 | | | 5,731,000 | | | | 4,261,760 | |
4.85% due 07/01/42 | | | 4,496,000 | | | | 3,293,431 | |
4.60% due 01/15/45 | | | 2,403,000 | | | | 1,655,383 | |
Rogers Communications, Inc. | | | | | | | | |
4.55% due 03/15/52 | | | 29,725,000 | | | | 25,011,492 | |
Cogent Communications Group, Inc. | | | | | | | | |
3.50% due 05/01/263 | | | 16,765,000 | | | | 15,958,121 | |
7.00% due 06/15/273 | | | 8,285,000 | | | | 8,248,369 | |
Discovery Communications LLC | | | | | | | | |
5.20% due 09/20/47 | | | 27,282,000 | | | | 22,921,740 | |
Fox Corp. | | | | | | | | |
6.50% due 10/13/33 | | | 19,400,000 | | | | 20,548,151 | |
Virgin Media Secured Finance plc | | | | | | | | |
4.50% due 08/15/303 | | | 17,850,000 | | | | 15,392,928 | |
Charter Communications Operating LLC / Charter Communications Operating Capital | | | | | | | | |
3.90% due 06/01/52 | | | 21,690,000 | | | | 13,794,103 | |
Altice France S.A. | | | | | | | | |
5.13% due 07/15/293 | | | 17,800,000 | | | | 12,033,398 | |
5.13% due 01/15/293 | | | 2,290,000 | | | | 1,568,203 | |
Go Daddy Operating Company LLC / GD Finance Co., Inc. | | | | | | | | |
3.50% due 03/01/293 | | | 8,203,000 | | | | 7,398,281 | |
CSC Holdings LLC | | | | | | | | |
4.13% due 12/01/303 | | | 5,772,000 | | | | 4,127,269 | |
Outfront Media Capital LLC / Outfront Media Capital Corp. | | | | | | | | |
7.38% due 02/15/313 | | | 1,450,000 | | | | 1,518,765 | |
McGraw-Hill Education, Inc. | | | | | | | | |
5.75% due 08/01/283 | | | 1,549,000 | | | | 1,459,092 | |
Interpublic Group of Companies, Inc. | | | | | | | | |
3.38% due 03/01/41 | | | 1,950,000 | | | | 1,455,343 | |
Koninklijke KPN N.V. | | | | | | | | |
8.38% due 10/01/30 | | | 1,140,000 | | | | 1,336,370 | |
Match Group Holdings II LLC | | | | | | | | |
4.13% due 08/01/303 | | | 1,250,000 | | | | 1,112,179 | |
Virgin Media Finance plc | | | | | | | | |
5.00% due 07/15/303 | | | 1,050,000 | | | | 888,466 | |
Motorola Solutions, Inc. | | | | | | | | |
5.50% due 09/01/44 | | | 360,000 | | | | 354,804 | |
Sunrise FinCo I BV | | | | | | | | |
4.88% due 07/15/313 | | | 200,000 | | | | 178,495 | |
CCO Holdings LLC / CCO Holdings Capital Corp. | | | | | | | | |
4.25% due 02/01/313 | | | 20,000 | | | | 16,333 | |
Total Communications | | | 394,406,239 | |
| | | | | | | | | |
Energy - 1.5% |
BP Capital Markets plc | | | | | | | | |
4.88% 5,6 | | | 75,020,000 | | | | 71,570,618 | |
Venture Global LNG, Inc. | | | | | | | | |
9.50% due 02/01/293 | | | 29,800,000 | | | | 32,120,317 | |
9.88% due 02/01/323 | | | 10,300,000 | | | | 11,100,763 | |
ITT Holdings LLC | | | | | | | | |
6.50% due 08/01/293 | | | 38,518,000 | | | | 35,151,504 | |
Galaxy Pipeline Assets Bidco Ltd. | | | | | | | | |
3.25% due 09/30/403 | | | 43,921,000 | | | | 33,422,756 | |
Targa Resources Corp. | | | | | | | | |
6.50% due 03/30/34 | | | 15,800,000 | | | | 16,976,693 | |
6.50% due 02/15/53 | | | 1,000,000 | | | | 1,071,583 | |
Midwest Connector Capital Company LLC | | | | | | | | |
4.63% due 04/01/293 | | | 16,048,000 | | | | 15,492,499 | |
ONEOK, Inc. | | | | | | | | |
6.05% due 09/01/33 | | | 11,350,000 | | | | 11,837,527 | |
3.95% due 03/01/50 | | | 1,600,000 | | | | 1,179,925 | |
5.15% due 10/15/43 | | | 1,100,000 | | | | 1,001,962 | |
24 | THE GUGGENHEIM FUNDS SEMI-ANNUAL REPORT | SEE NOTES TO FINANCIAL STATEMENTS. |
SCHEDULE OF INVESTMENTS (Unaudited)(continued) | March 31, 2024 |
TOTAL RETURN BOND FUND | |
| | Face
Amount~ | | | Value | |
4.50% due 03/15/50 | | | 850,000 | | | $ | 693,107 | |
Energy Transfer, LP | | | | | | | | |
7.38% due 02/01/313 | | | 7,610,000 | | | | 7,960,212 | |
5.50% due 06/01/27 | | | 3,175,000 | | | | 3,194,653 | |
6.13% due 12/15/45 | | | 1,190,000 | | | | 1,196,123 | |
5.55% due 05/15/34 | | | 500,000 | | | | 501,523 | |
NuStar Logistics, LP | | | | | | | | |
6.38% due 10/01/30 | | | 10,560,000 | | | | 10,628,281 | |
5.63% due 04/28/27 | | | 1,880,000 | | | | 1,860,674 | |
Greensaif Pipelines Bidco SARL | | | | | | | | |
6.51% due 02/23/423 | | | 6,500,000 | | | | 6,755,032 | |
6.13% due 02/23/383 | | | 5,550,000 | | | | 5,643,331 | |
TransCanada PipeLines Ltd. | | | | | | | | |
6.20% due 03/09/26 | | | 10,900,000 | | | | 10,902,038 | |
4.88% due 05/15/48 | | | 1,200,000 | | | | 1,067,137 | |
Viper Energy, Inc. | | | | | | | | |
7.38% due 11/01/313 | | | 11,300,000 | | | | 11,747,212 | |
Cheniere Energy, Inc. | | | | | | | | |
5.65% due 04/15/343 | | | 11,550,000 | | | | 11,632,476 | |
Kinetik Holdings, LP | | | | | | | | |
6.63% due 12/15/283 | | | 9,625,000 | | | | 9,795,882 | |
Cheniere Energy Partners, LP | | | | | | | | |
5.95% due 06/30/33 | | | 8,845,000 | | | | 9,042,889 | |
Parkland Corp. | | | | | | | | |
4.63% due 05/01/303 | | | 8,000,000 | | | | 7,375,186 | |
Boardwalk Pipelines, LP | | | | | | | | |
5.63% due 08/01/34 | | | 6,675,000 | | | | 6,677,967 | |
CQP Holdco Limited Partnership / BIP-V Chinook Holdco LLC | | | | | | | | |
7.50% due 12/15/333 | | | 5,000,000 | | | | 5,146,085 | |
Kinder Morgan, Inc. | | | | | | | | |
5.20% due 06/01/33 | | | 4,700,000 | | | | 4,628,662 | |
Buckeye Partners, LP | | | | | | | | |
3.95% due 12/01/26 | | | 4,250,000 | | | | 4,063,113 | |
DT Midstream, Inc. | | | | | | | | |
4.30% due 04/15/323 | | | 3,250,000 | | | | 2,947,014 | |
4.13% due 06/15/293 | | | 550,000 | | | | 505,633 | |
Marathon Petroleum Corp. | | | | | | | | |
6.50% due 03/01/41 | | | 1,650,000 | | | | 1,794,026 | |
Valero Energy Corp. | | | | | | | | |
7.50% due 04/15/32 | | | 1,350,000 | | | | 1,549,778 | |
Enbridge Energy Partners, LP | | | | | | | | |
7.38% due 10/15/45 | | | 1,040,000 | | | | 1,220,039 | |
MPLX, LP | | | | | | | | |
5.50% due 02/15/49 | | | 1,100,000 | | | | 1,047,155 | |
DCP Midstream Operating, LP | | | | | | | | |
6.45% due 11/03/363 | | | 1,000,000 | | | | 1,046,998 | |
Eastern Gas Transmission & Storage, Inc. | | | | | | | | |
4.60% due 12/15/44 | | | 500,000 | | | | 429,567 | |
Total Energy | | | 361,977,940 | |
| | | | | | | | | |
Technology - 1.0% |
Broadcom, Inc. | | | | | | | | |
4.93% due 05/15/373 | | | 33,182,000 | | | | 31,491,915 | |
3.19% due 11/15/363 | | | 3,135,000 | | | | 2,494,995 | |
2.60% due 02/15/333 | | | 1,660,000 | | | | 1,348,187 | |
Fiserv, Inc. | | | | | | | | |
5.35% due 03/15/31 | | | 20,920,000 | | | | 21,163,900 | |
2.65% due 06/01/30 | | | 7,920,000 | | | | 6,895,723 | |
5.60% due 03/02/33 | | | 3,523,000 | | | | 3,591,760 | |
5.63% due 08/21/33 | | | 2,300,000 | | | | 2,349,642 | |
Leidos, Inc. | | | | | | | | |
2.30% due 02/15/31 | | | 20,050,000 | | | | 16,572,647 | |
5.75% due 03/15/33 | | | 9,550,000 | | | | 9,790,253 | |
4.38% due 05/15/30 | | | 2,650,000 | | | | 2,511,001 | |
Oracle Corp. | | | | | | | | |
3.95% due 03/25/51 | | | 33,794,000 | | | | 25,748,864 | |
Qorvo, Inc. | | | | | | | | |
4.38% due 10/15/29 | | | 14,751,000 | | | | 13,826,161 | |
3.38% due 04/01/313 | | | 8,675,000 | | | | 7,460,620 | |
MSCI, Inc. | | | | | | | | |
3.63% due 09/01/303 | | | 17,718,000 | | | | 15,726,155 | |
3.88% due 02/15/313 | | | 1,769,000 | | | | 1,577,748 | |
3.63% due 11/01/313 | | | 1,780,000 | | | | 1,544,817 | |
Booz Allen Hamilton, Inc. | | | | | | | | |
5.95% due 08/04/33 | | | 10,470,000 | | | | 10,831,288 | |
3.88% due 09/01/283 | | | 4,550,000 | | | | 4,262,178 | |
Fair Isaac Corp. | | | | | | | | |
5.25% due 05/15/263 | | | 13,640,000 | | | | 13,487,835 | |
SEE NOTES TO FINANCIAL STATEMENTS. | THE GUGGENHEIM FUNDS SEMI-ANNUAL REPORT | 25 |
SCHEDULE OF INVESTMENTS (Unaudited)(continued) | March 31, 2024 |
TOTAL RETURN BOND FUND | |
| | Face
Amount~ | | | Value | |
CGI, Inc. | | | | | | | | |
2.30% due 09/14/31 | | | 16,050,000 | | | $ | 12,920,786 | |
Constellation Software, Inc. | | | | | | | | |
5.16% due 02/16/293 | | | 8,250,000 | | | | 8,241,232 | |
5.46% due 02/16/343 | | | 4,425,000 | | | | 4,453,884 | |
Foundry JV Holdco LLC | | | | | | | | |
5.88% due 01/25/343 | | | 11,525,000 | | | | 11,542,374 | |
ACI Worldwide, Inc. | | | | | | | | |
5.75% due 08/15/263 | | | 6,973,000 | | | | 6,855,981 | |
Cloud Software Group, Inc. | | | | | | | | |
6.50% due 03/31/293 | | | 7,200,000 | | | | 6,832,523 | |
Broadridge Financial Solutions, Inc. | | | | | | | | |
2.90% due 12/01/29 | | | 1,200,000 | | | | 1,062,613 | |
NXP BV / NXP Funding LLC / NXP USA, Inc. | | | | | | | | |
3.13% due 02/15/42 | | | 1,400,000 | | | | 1,009,508 | |
CDW LLC / CDW Finance Corp. | | | | | | | | |
3.25% due 02/15/29 | | | 1,100,000 | | | | 995,953 | |
Total Technology | | | 246,590,543 | |
| | | | | | | | | |
Utilities - 0.6% |
AES Corp. | | | | | | | | |
3.95% due 07/15/303 | | | 28,124,000 | | | | 25,578,502 | |
3.30% due 07/15/253 | | | 3,750,000 | | | | 3,632,742 | |
NRG Energy, Inc. | | | | | | | | |
2.45% due 12/02/273 | | | 26,000,000 | | | | 23,370,425 | |
Liberty Utilities Co. | | | | | | | | |
5.58% due 01/31/293 | | | 16,600,000 | | | | 16,689,560 | |
5.87% due 01/31/343 | | | 6,450,000 | | | | 6,515,779 | |
AmeriGas Partners Limited Partnership / AmeriGas Finance Corp. | | | | | | | | |
5.50% due 05/20/25 | | | 7,482,000 | | | | 7,484,955 | |
5.88% due 08/20/26 | | | 6,975,000 | | | | 6,963,447 | |
Enel Finance International N.V. | | | | | | | | |
5.00% due 06/15/323 | | | 13,690,000 | | | | 13,268,014 | |
Brooklyn Union Gas Co. | | | | | | | | |
6.39% due 09/15/333 | | | 10,800,000 | | | | 11,156,674 | |
4.27% due 03/15/483 | | | 1,300,000 | | | | 995,596 | |
Alexander Funding Trust II | | | | | | | | |
7.47% due 07/31/283 | | | 6,560,000 | | | | 6,935,891 | |
Black Hills Corp. | | | | | | | | |
5.95% due 03/15/28 | | | 5,050,000 | | | | 5,213,182 | |
4.20% due 09/15/46 | | | 1,200,000 | | | | 941,808 | |
Appalachian Power Co. | | | | | | | | |
5.80% due 10/01/35 | | | 4,150,000 | | | | 4,158,994 | |
Terraform Global Operating, LP | | | | | | | | |
6.13% due 03/01/263 | | | 3,000,000 | | | | 2,958,008 | |
Constellation Energy Generation LLC | | | | | | | | |
5.75% due 10/01/41 | | | 1,800,000 | | | | 1,791,709 | |
Entergy Texas, Inc. | | | | | | | | |
1.50% due 09/01/26 | | | 1,650,000 | | | | 1,499,426 | |
Nevada Power Co. | | | | | | | | |
6.65% due 04/01/36 | | | 1,180,000 | | | | 1,280,409 | |
Southern Power Co. | | | | | | | | |
5.25% due 07/15/43 | | | 1,350,000 | | | | 1,271,541 | |
Consolidated Edison Company of New York, Inc. | | | | | | | | |
5.10% due 06/15/33 | | | 1,080,000 | | | | 1,051,843 | |
Tampa Electric Co. | | | | | | | | |
4.45% due 06/15/49 | | | 1,200,000 | | | | 1,027,723 | |
Duke Energy Ohio, Inc. | | | | | | | | |
4.30% due 02/01/49 | | | 1,200,000 | | | | 999,940 | |
Arizona Public Service Co. | | | | | | | | |
3.75% due 05/15/46 | | | 1,300,000 | | | | 981,304 | |
Washington Gas Light Co. | | | | | | | | |
3.80% due 09/15/46 | | | 1,300,000 | | | | 981,133 | |
Louisville Gas and Electric Co. | | | | | | | | |
4.25% due 04/01/49 | | | 1,100,000 | | | | 921,980 | |
Total Utilities | | | 147,670,585 | |
| | | | | | | | | |
Basic Materials - 0.6% |
Anglo American Capital plc | | | | | | | | |
5.63% due 04/01/303 | | | 21,300,000 | | | | 21,583,977 | |
2.63% due 09/10/303 | | | 18,000,000 | | | | 15,323,040 | |
26 | THE GUGGENHEIM FUNDS SEMI-ANNUAL REPORT | SEE NOTES TO FINANCIAL STATEMENTS. |
SCHEDULE OF INVESTMENTS (Unaudited)(continued) | March 31, 2024 |
TOTAL RETURN BOND FUND | |
| | Face
Amount~ | | | Value | |
3.95% due 09/10/503 | | | 14,140,000 | | | $ | 10,631,207 | |
Alcoa Nederland Holding BV | | | | | | | | |
4.13% due 03/31/293 | | | 8,600,000 | | | | 7,895,601 | |
5.50% due 12/15/273 | | | 6,525,000 | | | | 6,460,697 | |
7.13% due 03/15/313 | | | 3,200,000 | | | | 3,259,693 | |
6.13% due 05/15/283 | | | 2,800,000 | | | | 2,804,183 | |
International Flavors & Fragrances, Inc. | | | | | | | | |
1.23% due 10/01/253 | | | 21,520,000 | | | | 20,142,711 | |
Minerals Technologies, Inc. | | | | | | | | |
5.00% due 07/01/283 | | | 18,748,000 | | | | 17,925,900 | |
Yamana Gold, Inc. | | | | | | | | |
2.63% due 08/15/31 | | | 14,431,000 | | | | 12,027,448 | |
4.63% due 12/15/27 | | | 3,000,000 | | | | 2,868,503 | |
Steel Dynamics, Inc. | | | | | | | | |
2.40% due 06/15/25 | | | 5,950,000 | | | | 5,729,431 | |
Novelis Corp. | | | | | | | | |
3.25% due 11/15/263 | | | 5,923,000 | | | | 5,518,934 | |
Axalta Coating Systems Dutch Holding B BV | | | | | | | | |
7.25% due 02/15/313 | | | 2,000,000 | | | | 2,080,416 | |
Southern Copper Corp. | | | | | | | | |
7.50% due 07/27/35 | | | 1,250,000 | | | | 1,445,509 | |
Carpenter Technology Corp. | | | | | | | | |
6.38% due 07/15/28 | | | 178,000 | | | | 177,700 | |
Total Basic Materials | | | 135,874,950 | |
| | | | | | | | | |
Total Corporate Bonds |
(Cost $6,413,598,732) | | | 5,738,453,582 | |
| | | | | | | | | |
COLLATERALIZED MORTGAGE OBLIGATIONS†† - 21.9% |
Government Agency - 11.6% |
Fannie Mae | | | | | | | | |
5.00% due 06/01/53 | | | 315,973,918 | | | | 308,285,865 | |
5.00% due 05/01/53 | | | 288,234,335 | | | | 281,600,891 | |
5.50% due 05/01/53 | | | 186,358,104 | | | | 185,504,587 | |
5.00% due 04/01/53 | | | 178,804,154 | | | | 174,621,582 | |
5.50% due 06/01/53 | | | 154,716,264 | | | | 154,205,184 | |
4.00% due 06/01/52 | | | 102,939,153 | | | | 96,147,780 | |
5.00% due 08/01/53 | | | 81,356,781 | | | | 79,454,737 | |
5.00% due 12/01/53 | | | 77,729,290 | | | | 75,834,500 | |
4.00% due 07/01/52 | | | 81,106,010 | | | | 75,498,632 | |
5.00% due 09/01/52 | | | 29,476,818 | | | | 28,803,857 | |
5.00% due 01/01/54 | | | 23,832,171 | | | | 23,251,208 | |
due 12/25/4310 | | | 9,928,269 | | | | 7,456,486 | |
3.05% due 03/01/50 | | | 5,821,518 | | | | 4,579,411 | |
2.51% due 10/01/46 | | | 5,446,524 | | | | 4,175,843 | |
4.07% due 05/01/49 | | | 4,560,794 | | | | 4,107,345 | |
due 10/25/4310 | | | 5,016,550 | | | | 3,796,018 | |
2.49% due 12/01/39 | | | 4,107,245 | | | | 3,199,860 | |
3.50% due 02/01/48 | | | 3,584,996 | | | | 3,062,216 | |
4.24% due 08/01/48 | | | 3,371,865 | | | | 3,016,896 | |
3.42% due 09/01/47 | | | 3,459,794 | | | | 2,914,322 | |
2.54% due 12/01/39 | | | 3,582,632 | | | | 2,804,489 | |
3.00% due 01/01/52 | | | 2,916,873 | | | | 2,513,767 | |
2.42% due 10/01/51 | | | 3,344,727 | | | | 2,426,518 | |
3.42% due 10/01/47 | | | 2,656,083 | | | | 2,256,943 | |
3.26% due 11/01/46 | | | 2,276,981 | | | | 1,900,779 | |
2.17% due 10/01/50 | | | 2,628,945 | | | | 1,858,113 | |
2.69% due 02/01/52 | | | 2,417,524 | | | | 1,799,128 | |
2.92% due 03/01/50 | | | 2,281,766 | | | | 1,784,325 | |
2.49% due 09/01/51 | | | 2,450,569 | | | | 1,756,835 | |
2.17% due 09/01/50 | | | 2,361,844 | | | | 1,670,923 | |
2.62% due 12/01/51 | | | 2,261,742 | | | | 1,666,531 | |
2.93% due 03/01/52 | | | 2,025,820 | | | | 1,568,257 | |
2.68% due 04/01/50 | | | 1,845,457 | | | | 1,413,552 | |
3.46% due 08/01/49 | | | 1,618,177 | | | | 1,361,682 | |
2.51% due 07/01/50 | | | 1,730,821 | | | | 1,280,829 | |
2.43% due 12/01/51 | | | 1,900,000 | | | | 1,202,383 | |
3.74% due 02/01/48 | | | 1,203,973 | | | | 1,052,437 | |
4.05% due 09/01/48 | | | 1,114,902 | | | | 1,004,626 | |
2.32% due 07/01/50 | | | 1,325,163 | | | | 953,923 | |
2.34% due 09/01/39 | | | 1,235,841 | | | | 921,847 | |
2.25% due 10/01/50 | | | 1,219,710 | | | | 865,418 | |
3.00% due 05/01/52 | | | 952,480 | | | | 827,494 | |
3.96% due 06/01/49 | | | 927,037 | | | | 810,763 | |
3.60% due 10/01/47 | | | 889,782 | | | | 764,284 | |
2.65% due 12/01/51 | | | 967,797 | | | | 712,750 | |
3.63% due 01/01/37 | | | 690,811 | | | | 624,993 | |
2.34% due 03/01/51 | | | 851,035 | | | | 613,694 | |
3.50% due 12/01/46 | | | 641,158 | | | | 584,628 | |
3.91% due 07/01/49 | | | 650,608 | | | | 568,205 | |
5.32% due 06/01/33 | | | 530,000 | | | | 544,238 | |
2.50% due 01/25/52 | | | 846,240 | | | | 528,862 | |
2.75% due 11/01/31 | | | 592,752 | | | | 526,801 | |
3.18% due 09/01/42 | | | 627,704 | | | | 524,623 | |
2.56% due 05/01/39 | | | 584,889 | | | | 448,020 | |
SEE NOTES TO FINANCIAL STATEMENTS. | THE GUGGENHEIM FUNDS SEMI-ANNUAL REPORT | 27 |
SCHEDULE OF INVESTMENTS (Unaudited)(continued) | March 31, 2024 |
TOTAL RETURN BOND FUND | |
| | Face
Amount~ | | | Value | |
3.50% due 11/01/47 | | | 486,913 | | | $ | 443,976 | |
2.51% due 02/01/48 | | | 563,404 | | | | 426,174 | |
3.00% due 07/01/46 | | | 445,476 | | | | 389,747 | |
4.00% due 01/01/46 | | | 386,265 | | | | 365,850 | |
4.00% due 12/01/38 | | | 358,643 | | | | 343,200 | |
3.50% due 10/01/45 | | | 338,818 | | | | 310,760 | |
3.51% due 11/01/47 | | | 358,079 | | | | 307,041 | |
4.33% due 09/01/48 | | | 320,851 | | | | 298,321 | |
4.00% due 11/01/38 | | | 301,934 | | | | 288,956 | |
4.22% due 04/01/49 | | | 315,000 | | | | 280,740 | |
4.50% due 02/01/45 | | | 282,612 | | | | 275,765 | |
2.50% due 11/01/51 | | | 329,627 | | | | 274,245 | |
2.50% due 11/25/50 | | | 460,569 | | | | 270,032 | |
4.50% due 03/01/48 | | | 270,877 | | | | 262,518 | |
3.77% due 08/01/45 | | | 282,889 | | | | 241,253 | |
4.23% due 07/01/39 | | | 265,813 | | | | 241,168 | |
4.50% due 04/01/48 | | | 231,080 | | | | 222,878 | |
5.00% due 12/01/44 | | | 222,219 | | | | 221,197 | |
3.00% due 03/01/52 | | | 237,115 | | | | 205,505 | |
3.50% due 12/01/45 | | | 204,452 | | | | 186,431 | |
3.50% due 08/01/43 | | | 195,978 | | | | 179,907 | |
2.00% due 10/25/51 | | | 336,393 | | | | 171,890 | |
3.95% due 06/01/49 | | | 187,805 | | | | 164,662 | |
3.18% due 08/01/42 | | | 179,768 | | | | 150,217 | |
4.50% due 05/01/47 | | | 153,730 | | | | 150,003 | |
4.00% due 10/01/45 | | | 123,532 | | | | 117,041 | |
5.00% due 05/01/44 | | | 110,963 | | | | 110,453 | |
2.06% due 09/01/36 | | | 140,000 | | | | 102,408 | |
3.50% due 04/01/48 | | | 109,186 | | | | 99,558 | |
5.00% due 04/01/44 | | | 70,160 | | | | 69,179 | |
2.28% due 01/01/51 | | | 67,591 | | | | 48,629 | |
3.50% due 06/01/46 | | | 12,693 | | | | 11,574 | |
Freddie Mac | | | | | | | | |
5.50% due 09/01/53 | | | 202,433,197 | | | | 203,818,777 | |
5.00% due 04/01/53 | | | 195,489,629 | | | | 190,858,644 | |
5.00% due 06/01/53 | | | 175,020,374 | | | | 170,749,593 | |
5.50% due 06/01/53 | | | 170,498,068 | | | | 170,049,782 | |
4.00% due 02/01/53 | | | 122,274,488 | | | | 114,440,565 | |
5.00% due 09/01/52 | | | 79,325,553 | | | | 77,519,871 | |
5.00% due 03/01/53 | | | 68,631,253 | | | | 67,033,326 | |
4.00% due 10/01/52 | | | 45,942,968 | | | | 42,801,159 | |
4.00% due 04/01/52 | | | 30,460,632 | | | | 28,508,844 | |
5.00% due 01/01/54 | | | 24,696,961 | | | | 24,093,882 | |
5.50% due 02/01/53 | | | 12,808,529 | | | | 12,820,589 | |
5.00% due 08/01/53 | | | 9,677,184 | | | | 9,519,046 | |
3.26% due 09/01/45 | | | 2,089,665 | | | | 1,762,367 | |
4.50% due 08/01/52 | | | 1,102,574 | | | | 1,059,237 | |
1.96% due 05/01/50 | | | 1,514,493 | | | | 1,029,158 | |
3.50% due 01/01/44 | | | 577,619 | | | | 531,769 | |
2.00% due 10/25/51 | | | 840,982 | | | | 438,699 | |
3.00% due 08/01/46 | | | 474,725 | | | | 418,463 | |
4.00% due 02/01/46 | | | 284,062 | | | | 266,396 | |
4.00% due 01/01/46 | | | 263,665 | | | | 250,040 | |
4.00% due 05/25/52 | | | 270,000 | | | | 222,499 | |
4.50% due 06/01/48 | | | 211,429 | | | | 204,989 | |
3.50% due 12/01/45 | | | 179,695 | | | | 164,049 | |
4.00% due 11/01/45 | | | 159,790 | | | | 151,532 | |
4.00% due 08/01/45 | | | 144,695 | | | | 137,217 | |
4.00% due 09/01/45 | | | 137,215 | | | | 130,124 | |
2.50% due 02/25/52 | | | 137,228 | | | | 82,112 | |
Uniform MBS 15 Year | | | | | | | | |
due 05/02/2417 | | | 23,050,000 | | | | 23,018,998 | |
Fannie Mae-Aces | | | | | | | | |
1.49% (WAC) due 03/25/35◊,11 | | | 201,004,601 | | | | 19,246,472 | |
Ginnie Mae | | | | | | | | |
6.00% due 06/20/47 | | | 15,630,279 | | | | 15,648,114 | |
Freddie Mac Seasoned Credit Risk Transfer Trust | | | | | | | | |
2.00% due 11/25/59 | | | 10,777,650 | | | | 8,471,440 | |
2.00% due 05/25/60 | | | 8,825,543 | | | | 6,947,758 | |
FARM Mortgage Trust | | | | | | | | |
2.18% (WAC) due 01/25/51◊,3 | | | 10,162,028 | | | | 7,942,013 | |
Freddie Mac Multifamily Structured Pass Through Certificates | | | | | | | | |
0.50% (WAC) due 12/25/24◊,11 | | | 40,223,466 | | | | 104,734 | |
Total Government Agency | | | 2,769,333,416 | |
| | | | | | | | | |
Residential Mortgage-Backed Securities - 8.2% |
BRAVO Residential Funding Trust | | | | | | | | |
2022-R1, 3.13% due 01/29/703,12 | | | 79,114,452 | | | | 74,078,042 | |
2021-C, 1.62% due 03/01/613,12 | | | 58,808,603 | | | | 55,600,611 | |
28 | THE GUGGENHEIM FUNDS SEMI-ANNUAL REPORT | SEE NOTES TO FINANCIAL STATEMENTS. |
SCHEDULE OF INVESTMENTS (Unaudited)(continued) | March 31, 2024 |
TOTAL RETURN BOND FUND | |
| | Face
Amount~ | | | Value | |
2023-NQM2, 4.50% due 05/25/623,12 | | | 29,814,377 | | | $ | 28,924,739 | |
2024-NQM3, 6.19% due 03/25/643,12 | | | 14,400,000 | | | | 14,394,917 | |
2024-NQM1, 6.40% due 12/01/633,12 | | | 7,577,399 | | | | 7,579,287 | |
2021-HE1, 6.82% (30 Day Average SOFR + 1.50%, Rate Floor: 0.00%) due 01/25/70◊,3 | | | 7,500,000 | | | | 7,465,696 | |
2024-NQM3, 6.50% due 03/25/643,12 | | | 6,650,000 | | | | 6,643,510 | |
2023-NQM6, 7.06% due 09/25/633,12 | | | 6,195,796 | | | | 6,228,768 | |
2023-NQM5, 7.01% due 06/25/633,12 | | | 4,132,375 | | | | 4,156,334 | |
2024-NQM3, 6.39% due 03/25/643,12 | | | 2,439,000 | | | | 2,436,773 | |
CSMC Trust | | | | | | | | |
2020-RPL5, 4.68% (WAC) due 08/25/60◊,3 | | | 59,931,689 | | | | 59,363,537 | |
2021-RPL4, 1.80% (WAC) due 12/27/60◊,3 | | | 58,354,050 | | | | 56,578,657 | |
2021-RPL7, 1.93% (WAC) due 07/27/61◊,3 | | | 52,165,632 | | | | 49,921,733 | |
2021-RPL1, 4.04% (WAC) due 09/27/60◊,3 | | | 24,148,165 | | | | 23,319,238 | |
OBX Trust | | | | | | | | |
2024-NQM5, due 03/25/283,12,17 | | | 22,550,000 | | | | 22,549,617 | |
2024-NQM5, due 03/25/283,12,17 | | | 18,250,000 | | | | 18,249,884 | |
2024-NQM4, 6.07% due 01/25/643,12 | | | 16,700,000 | | | | 16,707,206 | |
2024-NQM5, due 03/25/283,12,17 | | | 11,250,000 | | | | 11,249,881 | |
2022-NQM9, 6.45% due 09/25/623,12 | | | 10,814,094 | | | | 10,838,110 | |
2024-NQM4, 6.32% due 01/25/643,12 | | | 9,100,000 | | | | 9,095,453 | |
2024-NQM3, 6.13% due 12/25/633,12 | | | 7,300,000 | | | | 7,303,989 | |
2024-NQM3, 6.33% due 12/25/633,12 | | | 6,050,000 | | | | 6,053,327 | |
2023-NQM9, 7.66% due 10/25/633,12 | | | 5,834,518 | | | | 5,937,116 | |
2023-NQM2, 6.32% due 01/25/623,12 | | | 5,692,703 | | | | 5,695,654 | |
2024-NQM4, 6.22% due 01/25/643,12 | | | 4,200,000 | | | | 4,197,924 | |
2024-NQM2, 6.18% due 12/25/633,12 | | | 3,897,044 | | | | 3,879,962 | |
2022-NQM8, 6.10% due 09/25/623,12 | | | 3,573,994 | | | | 3,528,430 | |
2023-NQM2, 6.72% due 01/25/623,12 | | | 3,311,402 | | | | 3,322,141 | |
2024-NQM3, 6.43% due 12/25/633,12 | | | 1,900,000 | | | | 1,901,032 | |
PRPM LLC | | | | | | | | |
2021-5, 1.79% due 06/25/263,12 | | | 53,748,977 | | | | 52,555,729 | |
2021-8, 1.74% (WAC) due 09/25/26◊,3 | | | 28,622,524 | | | | 27,483,940 | |
2023-1, 6.88% (WAC) due 02/25/28◊,3 | | | 18,805,424 | | | | 18,904,626 | |
2022-1, 3.72% due 02/25/273,12 | | | 10,048,406 | | | | 9,759,846 | |
2023-RCF1, 4.00% due 06/25/533,12 | | | 4,416,414 | | | | 4,244,230 | |
Legacy Mortgage Asset Trust | | | | | | | | |
2021-GS2, 1.75% due 04/25/613,12 | | | 35,326,581 | | | | 34,234,774 | |
2021-GS3, 1.75% due 07/25/613,12 | | | 32,245,763 | | | | 31,179,009 | |
2021-GS5, 2.25% due 07/25/673,12 | | | 20,387,563 | | | | 19,671,116 | |
2021-GS4, 1.65% due 11/25/603,12 | | | 4,913,348 | | | | 4,752,106 | |
Angel Oak Mortgage Trust | | | | | | | | |
2023-2, 4.65% due 10/25/673,12 | | | 21,813,240 | | | | 21,267,843 | |
SEE NOTES TO FINANCIAL STATEMENTS. | THE GUGGENHEIM FUNDS SEMI-ANNUAL REPORT | 29 |
SCHEDULE OF INVESTMENTS (Unaudited)(continued) | March 31, 2024 |
TOTAL RETURN BOND FUND | |
| | Face
Amount~ | | | Value | |
2023-1, 4.75% due 09/26/673,12 | | | 21,983,052 | | | $ | 21,053,620 | |
2024-2, 5.99% due 01/25/693,12 | | | 19,815,805 | | | | 19,746,067 | |
2024-2, 6.19% due 01/25/693,12 | | | 9,709,744 | | | | 9,664,361 | |
2024-2, 6.25% due 01/25/693,12 | | | 8,955,753 | | | | 8,885,697 | |
2024-3, 4.80% due 11/26/683,12 | | | 8,150,000 | | | | 7,838,974 | |
Towd Point Revolving Trust | | | | | | | | |
4.83% due 09/25/647 | | | 81,500,000 | | | | 81,051,750 | |
Morgan Stanley ABS Capital I Incorporated Trust | | | | | | | | |
2006-NC5, 5.59% (1 Month Term SOFR + 0.26%, Rate Floor: 0.15%) due 10/25/36◊ | | | 25,038,347 | | | | 13,152,283 | |
2007-HE5, 5.78% (1 Month Term SOFR + 0.45%, Rate Floor: 0.34%) due 03/25/37◊ | | | 26,138,543 | | | | 11,084,781 | |
2006-HE6, 5.92% (1 Month Term SOFR + 0.59%, Rate Floor: 0.48%) due 09/25/36◊ | | | 22,813,166 | | | | 7,897,576 | |
2006-HE5, 5.72% (1 Month Term SOFR + 0.39%, Rate Floor: 0.28%) due 08/25/36◊ | | | 12,789,234 | | | | 6,397,392 | |
2007-HE3, 5.55% (1 Month Term SOFR + 0.22%, Rate Floor: 0.11%) due 12/25/36◊ | | | 10,717,388 | | | | 5,314,817 | |
2006-HE4, 5.92% (1 Month Term SOFR + 0.59%, Rate Floor: 0.48%) due 06/25/36◊ | | | 7,986,091 | | | | 4,151,368 | |
2006-HE5, 5.94% (1 Month Term SOFR + 0.61%, Rate Floor: 0.50%) due 08/25/36◊ | | | 7,663,214 | | | | 3,833,131 | |
2007-HE2, 5.53% (1 Month Term SOFR + 0.20%, Rate Floor: 0.09%) due 01/25/37◊ | | | 8,232,331 | | | | 3,794,118 | |
2007-HE2, 5.57% (1 Month Term SOFR + 0.24%, Rate Floor: 0.13%) due 01/25/37◊ | | | 7,822,358 | | | | 3,605,143 | |
2007-HE2, 5.65% (1 Month Term SOFR + 0.32%, Rate Floor: 0.21%) due 01/25/37◊ | | | 6,159,337 | | | | 2,838,654 | |
2007-NC3, 5.63% (1 Month Term SOFR + 0.30%, Rate Floor: 0.19%) due 05/25/37◊ | | | 3,148,171 | | | | 2,332,293 | |
2007-HE6, 5.50% (1 Month Term SOFR + 0.17%, Rate Floor: 0.06%) due 05/25/37◊ | | | 2,289,563 | | | | 2,000,304 | |
2007-HE3, 5.57% (1 Month Term SOFR + 0.24%, Rate Floor: 0.13%) due 12/25/36◊,7 | | | 1,965,677 | | | | 1,191,311 | |
2006-HE6, 5.74% (1 Month Term SOFR + 0.41%, Rate Floor: 0.30%) due 09/25/36◊ | | | 2,891,810 | | | | 1,001,039 | |
30 | THE GUGGENHEIM FUNDS SEMI-ANNUAL REPORT | SEE NOTES TO FINANCIAL STATEMENTS. |
SCHEDULE OF INVESTMENTS (Unaudited)(continued) | March 31, 2024 |
TOTAL RETURN BOND FUND | |
| | Face
Amount~ | | | Value | |
COLT Mortgage Loan Trust | | | | | | | | |
2023-3, 7.18% due 09/25/683,12 | | | 41,306,293 | | | $ | 42,081,641 | |
2023-3, 7.58% due 09/25/683,12 | | | 9,297,548 | | | | 9,416,612 | |
2023-4, 7.62% due 10/25/683,12 | | | 5,739,023 | | | | 5,819,245 | |
2021-2, 2.38% (WAC) due 08/25/66◊,3 | | | 7,108,000 | | | | 4,661,056 | |
2024-1, 6.14% due 02/25/693,12 | | | 4,664,422 | | | | 4,630,329 | |
NYMT Loan Trust | | | | | | | | |
2022-SP1, 5.25% due 07/25/623,12 | | | 61,136,742 | | | | 59,656,566 | |
GCAT Trust | | | | | | | | |
2022-NQM5, 5.71% due 08/25/673,12 | | | 21,499,293 | | | | 21,270,455 | |
2023-NQM3, 6.89% due 08/25/683,12 | | | 18,823,184 | | | | 19,097,445 | |
2022-NQM3, 4.35% (WAC) due 04/25/67◊,3 | | | 11,048,642 | | | | 10,201,201 | |
2023-NQM3, 7.34% due 08/25/683,12 | | | 4,787,131 | | | | 4,829,646 | |
2023-NQM2, 6.24% due 11/25/673,12 | | | 2,779,175 | | | | 2,774,833 | |
OSAT Trust | | | | | | | | |
2021-RPL1, 2.12% due 05/25/653,12 | | | 56,708,659 | | | | 55,213,093 | |
JP Morgan Mortgage Acquisition Trust | | | | | | | | |
2006-WMC4, 5.57% (1 Month Term SOFR + 0.24%, Rate Floor: 0.13%) due 12/25/36◊ | | | 59,589,055 | | | | 36,023,032 | |
2006-WMC4, 5.56% (1 Month Term SOFR + 0.23%, Rate Floor: 0.12%) due 12/25/36◊ | | | 12,291,361 | | | | 6,449,194 | |
2006-WMC3, 5.92% (1 Month Term SOFR + 0.59%, Rate Floor: 0.48%) due 08/25/36◊ | | | 1,751,173 | | | | 1,252,097 | |
Home Equity Loan Trust | | | | | | | | |
2007-FRE1, 5.63% (1 Month Term SOFR + 0.30%, Rate Floor: 0.19%) due 04/25/37◊ | | | 46,341,911 | | | | 43,196,375 | |
Verus Securitization Trust | | | | | | | | |
2023-7, 7.42% due 10/25/683,12 | | | 18,956,132 | | | | 19,201,574 | |
2022-8, 6.13% due 09/25/673,7,12 | | | 14,069,221 | | | | 13,942,575 | |
2024-1, 6.12% due 01/25/693,12 | | | 3,929,613 | | | | 3,911,912 | |
2023-2, 6.85% due 03/25/683,12 | | | 3,525,957 | | | | 3,543,385 | |
GSAMP Trust | | | | | | | | |
2007-NC1, 5.57% (1 Month Term SOFR + 0.24%, Rate Floor: 0.13%) due 12/25/46◊ | | | 24,593,896 | | | | 12,670,377 | |
2006-HE8, 5.67% (1 Month Term SOFR + 0.34%, Rate Floor: 0.23%) due 01/25/37◊ | | | 10,107,000 | | | | 8,215,667 | |
2006-NC2, 5.74% (1 Month Term SOFR + 0.41%, Rate Floor: 0.30%) due 06/25/36◊ | | | 11,548,152 | | | | 6,486,122 | |
2007-NC1, 5.59% (1 Month Term SOFR + 0.26%, Rate Floor: 0.15%) due 12/25/46◊ | | | 7,035,303 | | | | 3,434,540 | |
SEE NOTES TO FINANCIAL STATEMENTS. | THE GUGGENHEIM FUNDS SEMI-ANNUAL REPORT | 31 |
SCHEDULE OF INVESTMENTS (Unaudited)(continued) | March 31, 2024 |
TOTAL RETURN BOND FUND | |
| | Face
Amount~ | | | Value | |
LSTAR Securities Investment Ltd. | | | | | | | | |
2024-1, 8.42% (30 Day Average SOFR + 3.10%, Rate Floor: 3.10%) due 01/01/29◊,†††,3 | | | 26,434,331 | | | $ | 26,472,607 | |
Soundview Home Loan Trust | | | | | | | | |
2006-OPT5, 5.72% (1 Month Term SOFR + 0.39%, Rate Floor: 0.28%) due 07/25/36◊ | | | 25,532,774 | | | | 24,143,607 | |
Alternative Loan Trust | | | | | | | | |
2007-OA4, 5.78% (1 Month Term SOFR + 0.45%, Rate Floor: 0.34%) due 05/25/47◊ | | | 14,180,485 | | | | 11,901,273 | |
2007-OH3, 6.02% (1 Month Term SOFR + 0.69%, Rate Cap/Floor: 10.00%/0.58%) due 09/25/47◊ | | | 6,083,538 | | | | 5,420,692 | |
2006-43CB, 6.00% (1 Month Term SOFR + 0.61%, Rate Cap/Floor: 6.00%/6.00%) due 02/25/37◊ | | | 5,896,143 | | | | 3,229,777 | |
2007-OA7, 5.80% (1 Month Term SOFR + 0.47%, Rate Floor: 0.36%) due 05/25/47◊ | | | 2,170,374 | | | | 1,973,970 | |
2007-OH3, 5.88% (1 Month Term SOFR + 0.55%, Rate Cap/Floor: 10.00%/0.44%) due 09/25/47◊ | | | 604,725 | | | | 553,908 | |
Imperial Fund Mortgage Trust | | | | | | | | |
2022-NQM2, 4.02% (WAC) due 03/25/67◊,3 | | | 12,333,918 | | | | 11,307,385 | |
2022-NQM2, 4.20% (WAC) due 03/25/67◊,3 | | | 12,124,334 | | | | 11,159,671 | |
Citigroup Mortgage Loan Trust, Inc. | | | | | | | | |
2007-AMC1, 5.76% (1 Month Term SOFR + 0.43%, Rate Floor: 0.32%) due 12/25/36◊,3 | | | 20,086,792 | | | | 10,850,244 | |
2006-WF1, 4.98% due 03/25/36 | | | 13,522,384 | | | | 6,624,524 | |
2007-AMC3, 5.62% (1 Month Term SOFR + 0.29%, Rate Floor: 0.18%) due 03/25/37◊ | | | 5,702,715 | | | | 4,687,178 | |
Saluda Grade Alternative Mortgage Trust | | | | | | | | |
2023-FIG4, 6.72% (WAC) due 11/25/53◊,3 | | | 21,130,188 | | | | 21,542,664 | |
NovaStar Mortgage Funding Trust Series | | | | | | | | |
2007-2, 5.64% (1 Month Term SOFR + 0.31%, Rate Cap/Floor: 11.00%/0.20%) due 09/25/37◊ | | | 19,456,862 | | | | 18,684,459 | |
2007-1, 5.70% (1 Month Term SOFR + 0.37%, Rate Cap/Floor: 11.00%/0.26%) due 03/25/37◊ | | | 2,665,401 | | | | 1,622,919 | |
32 | THE GUGGENHEIM FUNDS SEMI-ANNUAL REPORT | SEE NOTES TO FINANCIAL STATEMENTS. |
SCHEDULE OF INVESTMENTS (Unaudited)(continued) | March 31, 2024 |
TOTAL RETURN BOND FUND | |
| | Face
Amount~ | | | Value | |
ACE Securities Corporation Home Equity Loan Trust Series | | | | | | | | |
2006-NC1, 6.06% (1 Month Term SOFR + 0.73%, Rate Floor: 0.62%) due 12/25/35◊ | | | 15,151,779 | | | $ | 13,939,442 | |
2007-ASP1, 5.84% (1 Month Term SOFR + 0.51%, Rate Floor: 0.40%) due 03/25/37◊ | | | 8,057,972 | | | | 3,288,761 | |
2007-WM2, 5.65% (1 Month Term SOFR + 0.32%, Rate Floor: 0.21%) due 02/25/37◊ | | | 6,085,897 | | | | 2,532,034 | |
SPS Servicer Advance Receivables Trust | | | | | | | | |
2020-T2, 1.83% due 11/15/553 | | | 20,000,000 | | | | 18,738,550 | |
FIGRE Trust | | | | | | | | |
2024-HE1, 6.17% (WAC) due 03/25/54◊,3 | | | 17,800,000 | | | | 17,807,476 | |
American Home Mortgage Investment Trust | | | | | | | | |
2007-1, 2.08% due 05/25/4711 | | | 123,146,355 | | | | 17,665,886 | |
Structured Asset Securities Corporation Mortgage Loan Trust | | | | | | | | |
2008-BC4, 6.07% (1 Month Term SOFR + 0.74%, Rate Floor: 0.63%) due 11/25/37◊ | | | 16,602,026 | | | | 15,735,350 | |
2006-BC4, 5.78% (1 Month Term SOFR + 0.45%, Rate Floor: 0.34%) due 12/25/36◊ | | | 1,612,830 | | | | 1,539,401 | |
2006-BC6, 5.61% (1 Month Term SOFR + 0.28%, Rate Floor: 0.17%) due 01/25/37◊ | | | 95,949 | | | | 93,767 | |
IXIS Real Estate Capital Trust | | | | | | | | |
2007-HE1, 5.55% (1 Month Term SOFR + 0.22%, Rate Floor: 0.11%) due 05/25/37◊ | | | 31,844,420 | | | | 7,463,284 | |
2006-HE1, 6.04% (1 Month Term SOFR + 0.71%, Rate Floor: 0.60%) due 03/25/36◊ | | | 11,151,263 | | | | 5,770,781 | |
2007-HE1, 5.67% (1 Month Term SOFR + 0.34%, Rate Floor: 0.23%) due 05/25/37◊ | | | 6,043,616 | | | | 1,416,372 | |
2007-HE1, 5.60% (1 Month Term SOFR + 0.27%, Rate Floor: 0.16%) due 05/25/37◊ | | | 5,676,058 | | | | 1,330,262 | |
2007-HE1, 5.50% (1 Month Term SOFR + 0.17%, Rate Floor: 0.06%) due 05/25/37◊ | | | 4,722,218 | | | | 1,106,748 | |
Securitized Asset-Backed Receivables LLC Trust | | | | | | | | |
2006-WM4, 5.60% (1 Month Term SOFR + 0.27%, Rate Floor: 0.16%) due 11/25/36◊ | | | 29,679,962 | | | | 7,815,883 | |
2007-BR2, 5.80% (1 Month Term SOFR + 0.47%, Rate Floor: 0.36%) due 02/25/37◊,3 | | | 9,531,878 | | | | 7,814,151 | |
SEE NOTES TO FINANCIAL STATEMENTS. | THE GUGGENHEIM FUNDS SEMI-ANNUAL REPORT | 33 |
SCHEDULE OF INVESTMENTS (Unaudited)(continued) | March 31, 2024 |
TOTAL RETURN BOND FUND | |
| | Face
Amount~ | | | Value | |
2006-HE2, 5.74% (1 Month Term SOFR + 0.41%, Rate Floor: 0.30%) due 07/25/36◊ | | | 3,211,090 | | | $ | 1,274,194 | |
Washington Mutual Mortgage Pass-Through Certificates WMALT Series Trust | | | | | | | | |
2006-AR9, 5.92% (1 Year CMT Rate + 0.83%, Rate Floor: 0.83%) due 11/25/46◊ | | | 8,394,045 | | | | 6,799,597 | |
2006-AR10, 5.78% (1 Month Term SOFR + 0.45%, Rate Floor: 0.34%) due 12/25/36◊ | | | 7,195,054 | | | | 5,605,715 | |
2006-AR9, 5.93% (1 Year CMT Rate + 0.84%, Rate Floor: 0.84%) due 11/25/46◊ | | | 3,611,957 | | | | 2,879,135 | |
2006-7, 4.05% due 09/25/36 | | | 5,232,112 | | | | 1,444,275 | |
2006-8, 4.15% due 10/25/36 | | | 333,759 | | | | 111,114 | |
Citigroup Mortgage Loan Trust | | | | | | | | |
2022-A, 6.17% due 09/25/623,12 | | | 16,645,337 | | | | 16,639,456 | |
Credit Suisse Mortgage Capital Certificates | | | | | | | | |
2021-RPL9, 2.44% (WAC) due 02/25/61◊,3 | | | 16,803,230 | | | | 16,229,637 | |
WaMu Asset-Backed Certificates WaMu Series Trust | | | | | | | | |
2007-HE1, 5.59% (1 Month Term SOFR + 0.26%, Rate Floor: 0.26%) due 01/25/37◊ | | | 32,634,196 | | | | 15,009,521 | |
Starwood Mortgage Residential Trust | | | | | | | | |
2020-1, 2.56% (WAC) due 02/25/50◊,3 | | | 8,965,227 | | | | 8,362,484 | |
2020-1, 2.41% (WAC) due 02/25/50◊,3 | | | 6,896,328 | | | | 6,437,525 | |
American Home Mortgage Assets Trust | | | | | | | | |
2007-5, 5.82% (1 Month Term SOFR + 0.49%, Rate Cap/Floor: 99.00%/0.19%) due 06/25/47◊ | | | 9,016,451 | | | | 7,801,201 | |
2006-4, 5.63% (1 Month Term SOFR + 0.30%, Rate Floor: 0.30%) due 10/25/46◊ | | | 6,542,149 | | | | 3,407,865 | |
2006-6, 5.63% (1 Month Term SOFR + 0.30%, Rate Floor: 0.19%) due 12/25/46◊ | | | 2,016,712 | | | | 1,673,645 | |
Merrill Lynch Mortgage Investors Trust Series | | | | | | | | |
2007-HE2, 5.96% (1 Month Term SOFR + 0.63%, Rate Floor: 0.52%) due 02/25/37◊ | | | 31,053,826 | | | | 8,878,699 | |
2006-HE6, 4.48% (1 Month Term SOFR + 0.39%, Rate Floor: 0.28%) due 11/25/37◊ | | | 7,707,217 | | | | 3,669,834 | |
RALI Series Trust | | | | | | | | |
2007-QO4, 5.82% (1 Month Term SOFR + 0.49%, Rate Floor: 0.38%) due 05/25/47◊ | | | 3,911,528 | | | | 3,388,671 | |
34 | THE GUGGENHEIM FUNDS SEMI-ANNUAL REPORT | SEE NOTES TO FINANCIAL STATEMENTS. |
SCHEDULE OF INVESTMENTS (Unaudited)(continued) | March 31, 2024 |
TOTAL RETURN BOND FUND | |
| | Face
Amount~ | | | Value | |
2006-QO2, 5.88% (1 Month Term SOFR + 0.55%, Rate Floor: 0.44%) due 02/25/46◊ | | | 16,536,210 | | | $ | 2,934,547 | |
2007-QO2, 5.59% (1 Month Term SOFR + 0.26%, Rate Floor: 0.15%) due 02/25/47◊ | | | 7,409,529 | | | | 2,529,733 | |
2006-QO6, 5.62% (1 Month Term SOFR + 0.47%, Rate Floor: 0.36%) due 06/25/46◊ | | | 4,715,292 | | | | 1,085,832 | |
2006-QO2, 5.98% (1 Month Term SOFR + 0.65%, Rate Floor: 0.54%) due 02/25/46◊ | | | 5,362,610 | | | | 971,659 | |
2007-QO3, 5.76% (1 Month Term SOFR + 0.43%, Rate Floor: 0.32%) due 03/25/47◊ | | | 773,515 | | | | 657,455 | |
2006-QO2, 6.12% (1 Month Term SOFR + 0.79%, Rate Floor: 0.68%) due 02/25/46◊ | | | 1,105,132 | | | | 205,699 | |
Ameriquest Mortgage Securities Trust | | | | | | | | |
2006-M3, 5.60% (1 Month Term SOFR + 0.27%, Rate Floor: 0.16%) due 10/25/36◊ | | | 26,222,717 | | | | 7,622,564 | |
2006-M3, 5.54% (1 Month Term SOFR + 0.21%, Rate Floor: 0.10%) due 10/25/36◊ | | | 11,015,302 | | | | 3,202,044 | |
RCKT Mortgage Trust | | | | | | | | |
2023-CES1, 6.52% (WAC) due 06/25/43◊,3 | | | 5,513,575 | | | | 5,526,051 | |
2023-CES2, 6.81% (WAC) due 09/25/43◊,3 | | | 4,614,104 | | | | 4,668,797 | |
Master Asset-Backed Securities Trust | | | | | | | | |
2006-WMC4, 5.59% (1 Month Term SOFR + 0.26%, Rate Floor: 0.15%) due 10/25/36◊ | | | 10,467,532 | | | | 3,421,732 | |
2006-NC2, 5.92% (1 Month Term SOFR + 0.59%, Rate Floor: 0.48%) due 08/25/36◊ | | | 7,500,725 | | | | 2,860,116 | |
2006-WMC3, 5.76% (1 Month Term SOFR + 0.43%, Rate Floor: 0.32%) due 08/25/36◊ | | | 5,593,797 | | | | 1,942,226 | |
2007-WMC1, 5.76% (1 Month Term SOFR + 0.43%, Rate Floor: 0.32%) due 01/25/37◊ | | | 5,748,450 | | | | 1,626,403 | |
ABFC Trust | | | | | | | | |
2007-WMC1, 6.69% (1 Month Term SOFR + 1.36%, Rate Floor: 1.25%) due 06/25/37◊ | | | 14,506,321 | | | | 9,821,648 | |
HarborView Mortgage Loan Trust | | | | | | | | |
2006-14, 5.74% (1 Month Term SOFR + 0.41%, Rate Floor: 0.30%) due 01/25/47◊ | | | 5,973,125 | | | | 5,274,140 | |
2006-12, 5.82% (1 Month Term SOFR + 0.49%, Rate Floor: 0.38%) due 01/19/38◊ | | | 4,510,887 | | | | 3,907,129 | |
SEE NOTES TO FINANCIAL STATEMENTS. | THE GUGGENHEIM FUNDS SEMI-ANNUAL REPORT | 35 |
SCHEDULE OF INVESTMENTS (Unaudited)(continued) | March 31, 2024 |
TOTAL RETURN BOND FUND | |
| | Face
Amount~ | | | Value | |
First NLC Trust | | | | | | | | |
2005-4, 6.22% (1 Month Term SOFR + 0.89%, Rate Cap/Floor: 14.00%/0.78%) due 02/25/36◊ | | | 7,137,967 | | | $ | 6,899,200 | |
2005-1, 3.70% (1 Month Term SOFR + 0.57%, Rate Cap/Floor: 14.00%/0.46%) due 05/25/35◊ | | | 2,037,753 | | | | 1,773,573 | |
Fremont Home Loan Trust | | | | | | | | |
2006-E, 5.56% (1 Month Term SOFR + 0.23%, Rate Floor: 0.12%) due 01/25/37◊ | | | 11,331,064 | | | | 5,066,899 | |
2006-D, 5.59% (1 Month Term SOFR + 0.26%, Rate Floor: 0.15%) due 11/25/36◊ | | | 10,213,531 | | | | 3,538,962 | |
First Franklin Mortgage Loan Trust | | | | | | | | |
2006-FF16, 5.72% (1 Month Term SOFR + 0.39%, Rate Floor: 0.28%) due 12/25/36◊ | | | 19,626,360 | | | | 8,028,092 | |
Bear Stearns Asset-Backed Securities I Trust | | | | | | | | |
2006-HE9, 5.72% (1 Month Term SOFR + 0.39%, Rate Floor: 0.28%) due 11/25/36◊ | | | 7,978,036 | | | | 7,791,305 | |
Cascade Funding Mortgage Trust | | | | | | | | |
2018-RM2, 4.00% (WAC) due 10/25/68◊,7 | | | 6,258,941 | | | | 6,184,871 | |
2019-RM3, 2.80% (WAC) due 06/25/69◊,7 | | | 1,625,661 | | | | 1,589,259 | |
CFMT LLC | | | | | | | | |
2022-HB9, 3.25% (WAC) due 09/25/37◊,7 | | | 8,091,733 | | | | 7,739,784 | |
Merrill Lynch Alternative Note Asset Trust Series | | | | | | | | |
2007-A1, 5.90% (1 Month Term SOFR + 0.57%, Rate Floor: 0.46%) due 01/25/37◊ | | | 18,814,732 | | | | 5,315,218 | |
2007-A1, 5.74% (1 Month Term SOFR + 0.41%, Rate Floor: 0.30%) due 01/25/37◊ | | | 7,134,860 | | | | 2,006,266 | |
Argent Securities Incorporated Asset-Backed Pass-Through Certificates Series | | | | | | | | |
2005-W4, 6.20% (1 Month Term SOFR + 0.87%, Rate Floor: 0.76%) due 02/25/36◊ | | | 9,288,611 | | | | 7,105,833 | |
Asset-Backed Securities Corporation Home Equity Loan Trust Series AEG | | | | | | | | |
2006-HE1, 4.20% (1 Month Term SOFR + 0.71%, Rate Floor: 0.60%) due 01/25/36◊ | | | 7,294,223 | | | | 6,984,384 | |
36 | THE GUGGENHEIM FUNDS SEMI-ANNUAL REPORT | SEE NOTES TO FINANCIAL STATEMENTS. |
SCHEDULE OF INVESTMENTS (Unaudited)(continued) | March 31, 2024 |
TOTAL RETURN BOND FUND | |
| | Face
Amount~ | | | Value | |
Long Beach Mortgage Loan Trust | | | | | | | | |
2006-8, 5.76% (1 Month Term SOFR + 0.43%, Rate Floor: 0.32%) due 09/25/36◊ | | | 14,369,544 | | | $ | 3,886,480 | |
2006-6, 5.94% (1 Month Term SOFR + 0.61%, Rate Floor: 0.50%) due 07/25/36◊ | | | 4,491,124 | | | | 1,716,414 | |
2006-8, 5.62% (1 Month Term SOFR + 0.29%, Rate Floor: 0.18%) due 09/25/36◊ | | | 3,834,963 | | | | 1,034,689 | |
Towd Point Mortgage Trust | | | | | | | | |
2023-CES1, 6.75% (WAC) due 07/25/63◊,3 | | | 6,537,554 | | | | 6,586,916 | |
Option One Mortgage Loan Trust | | | | | | | | |
2007-5, 5.66% (1 Month Term SOFR + 0.33%, Rate Floor: 0.22%) due 05/25/37◊ | | | 6,739,442 | | | | 3,976,777 | |
2007-2, 5.69% (1 Month Term SOFR + 0.36%, Rate Floor: 0.25%) due 03/25/37◊ | | | 4,767,983 | | | | 2,337,629 | |
Lehman XS Trust Series | | | | | | | | |
2007-2N, 5.62% (1 Month Term SOFR + 0.29%, Rate Floor: 0.18%) due 02/25/37◊ | | | 4,518,513 | | | | 4,070,799 | |
2007-15N, 5.94% (1 Month Term SOFR + 0.61%, Rate Floor: 0.00%) due 08/25/37◊ | | | 1,184,712 | | | | 1,088,566 | |
2006-10N, 5.86% (1 Month Term SOFR + 0.53%, Rate Floor: 0.42%) due 07/25/46◊ | | | 282,514 | | | | 253,315 | |
WaMu Asset-Backed Certificates WaMu Series | | | | | | | | |
2007-HE4, 5.61% (1 Month Term SOFR + 0.28%, Rate Floor: 0.28%) due 07/25/47◊ | | | 4,739,593 | | | | 3,361,616 | |
2007-HE4, 5.69% (1 Month Term SOFR + 0.36%, Rate Floor: 0.36%) due 07/25/47◊ | | | 3,263,405 | | | | 1,916,103 | |
CWABS Asset-Backed Certificates Trust | | | | | | | | |
2006-12, 5.70% (1 Month Term SOFR + 0.37%, Rate Floor: 0.26%) due 12/25/36◊ | | | 5,757,446 | | | | 5,198,650 | |
WaMu Mortgage Pass-Through Certificates Series Trust | | | | | | | | |
2007-OA6, 5.90% (1 Year CMT Rate + 0.81%, Rate Floor: 0.81%) due 07/25/47◊ | | | 4,336,776 | | | | 3,421,551 | |
2006-AR13, 5.97% (1 Year CMT Rate + 0.88%, Rate Floor: 0.88%) due 10/25/46◊ | | | 1,339,971 | | | | 1,105,274 | |
2006-AR11, 6.01% (1 Year CMT Rate + 0.92%, Rate Floor: 0.92%) due 09/25/46◊ | | | 595,257 | | | | 501,061 | |
SEE NOTES TO FINANCIAL STATEMENTS. | THE GUGGENHEIM FUNDS SEMI-ANNUAL REPORT | 37 |
SCHEDULE OF INVESTMENTS (Unaudited)(continued) | March 31, 2024 |
TOTAL RETURN BOND FUND | |
| | Face
Amount~ | | | Value | |
Credit-Based Asset Servicing and Securitization LLC | | | | | | | | |
2006-CB2, 3.64% (1 Month Term SOFR + 0.49%, Rate Floor: 0.38%) due 12/25/36◊ | | | 5,366,129 | | | $ | 5,016,326 | |
Deutsche Alt-A Securities Mortgage Loan Trust Series | | | | | | | | |
2006-AR4, 5.70% (1 Month Term SOFR + 0.37%, Rate Floor: 0.26%) due 12/25/36◊ | | | 9,324,886 | | | | 3,059,149 | |
2007-OA2, 5.86% (1 Year CMT Rate + 0.77%, Rate Floor: 0.77%) due 04/25/47◊ | | | 2,001,235 | | | | 1,694,741 | |
Morgan Stanley IXIS Real Estate Capital Trust | | | | | | | | |
2006-2, 5.59% (1 Month Term SOFR + 0.26%, Rate Floor: 0.15%) due 11/25/36◊ | | | 14,916,631 | | | | 4,747,958 | |
GSAA Home Equity Trust | | | | | | | | |
2006-5, 5.80% (1 Month Term SOFR + 0.47%, Rate Floor: 0.36%) due 03/25/36◊ | | | 12,175,560 | | | | 4,041,223 | |
2007-7, 5.98% (1 Month Term SOFR + 0.65%, Rate Floor: 0.54%) due 07/25/37◊ | | | 123,728 | | | | 114,346 | |
Impac Secured Assets CMN Owner Trust | | | | | | | | |
2005-2, 5.94% (1 Month Term SOFR + 0.61%, Rate Floor: 0.50%) due 03/25/36◊ | | | 4,398,287 | | | | 3,958,163 | |
GSAA Trust | | | | | | | | |
2007-3, 5.78% (1 Month Term SOFR + 0.45%, Rate Floor: 0.34%) due 03/25/47◊ | | | 10,668,003 | | | | 2,900,121 | |
ASG Resecuritization Trust | | | | | | | | |
2010-3, 4.91% (1 Month Term SOFR + 0.40%, Rate Cap/Floor: 10.50%/0.29%) due 12/28/45◊,3 | | | 2,177,557 | | | | 1,992,566 | |
C-BASS Mortgage Loan Trust | | | | | | | | |
2007-CB2, 3.57% due 02/25/37 | | | 2,551,112 | | | | 1,526,235 | |
Morgan Stanley Capital I Incorporated Trust | | | | | | | | |
2006-HE1, 6.02% (1 Month Term SOFR + 0.69%, Rate Floor: 0.58%) due 01/25/36◊ | | | 1,561,044 | | | | 1,485,591 | |
Securitized Asset Backed Receivables LLC Trust | | | | | | | | |
2006-WM4, 5.76% (1 Month Term SOFR + 0.43%, Rate Floor: 0.32%) due 11/25/36◊ | | | 5,208,794 | | | | 1,371,607 | |
38 | THE GUGGENHEIM FUNDS SEMI-ANNUAL REPORT | SEE NOTES TO FINANCIAL STATEMENTS. |
SCHEDULE OF INVESTMENTS (Unaudited)(continued) | March 31, 2024 |
TOTAL RETURN BOND FUND | |
| | Face
Amount~ | | | Value | |
Countrywide Asset-Backed Certificates | | | | | | | | |
2005-15, 3.64% (1 Month Term SOFR + 0.79%, Rate Floor: 0.68%) due 03/25/36◊ | | | 779,207 | | | $ | 752,913 | |
Residential Mortgage Loan Trust | | | | | | | | |
2020-1, 2.68% (WAC) due 01/26/60◊,7 | | | 601,574 | | | | 569,068 | |
Structured Asset Investment Loan Trust | | | | | | | | |
2004-BNC2, 6.64% (1 Month Term SOFR + 1.31%, Rate Floor: 1.20%) due 12/25/34◊ | | | 320,241 | | | | 316,349 | |
2006-3, 5.74% (1 Month Term SOFR + 0.41%, Rate Floor: 0.30%) due 06/25/36◊ | | | 235,300 | | | | 218,470 | |
Impac Secured Assets Trust | | | | | | | | |
2006-2, 5.78% (1 Month Term SOFR + 0.45%, Rate Cap/Floor: 11.50%/0.34%) due 08/25/36◊ | | | 474,637 | | | | 460,046 | |
Nomura Resecuritization Trust | | | | | | | | |
2015-4R, 3.04% (1 Month Term SOFR + 0.54%, Rate Floor: 0.43%) due 03/26/36◊,7 | | | 478,455 | | | | 449,660 | |
Alliance Bancorp Trust | | | | | | | | |
2007-OA1, 5.92% (1 Month Term SOFR + 0.59%, Rate Floor: 0.48%) due 07/25/37◊ | | | 513,704 | | | | 429,157 | |
Morgan Stanley Re-REMIC Trust | | | | | | | | |
2010-R5, 4.12% due 06/26/367 | | | 100,147 | | | | 86,920 | |
GreenPoint Mortgage Funding Trust | | | | | | | | |
2006-AR1, 6.02% (1 Month Term SOFR + 0.69%, Rate Cap/Floor: 10.50%/0.58%) due 02/25/36◊ | | | 88,691 | | | | 74,651 | |
UCFC Manufactured Housing Contract | | | | | | | | |
1997-2, 7.38% due 10/15/28 | | | 56,867 | | | | 56,484 | |
Irwin Home Equity Loan Trust | | | | | | | | |
2007-1, 6.35% due 08/25/377 | | | 94 | | | | 93 | |
Total Residential Mortgage-Backed Securities | | | 1,963,973,124 | |
| | | | | | | | | |
Commercial Mortgage-Backed Securities - 1.3% |
BX Commercial Mortgage Trust | | | | | | | | |
2021-VOLT, 7.44% (1 Month Term SOFR + 2.11%, Rate Floor: 2.00%) due 09/15/36◊,3 | | | 60,050,000 | | | | 59,186,781 | |
SEE NOTES TO FINANCIAL STATEMENTS. | THE GUGGENHEIM FUNDS SEMI-ANNUAL REPORT | 39 |
SCHEDULE OF INVESTMENTS (Unaudited)(continued) | March 31, 2024 |
TOTAL RETURN BOND FUND | |
| | Face
Amount~ | | | Value | |
2021-VOLT, 7.09% (1 Month Term SOFR + 1.76%, Rate Floor: 1.65%) due 09/15/36◊,3 | | | 52,000,000 | | | $ | 51,238,585 | |
2022-LP2, 7.29% (1 Month Term SOFR + 1.96%, Rate Floor: 1.96%) due 02/15/39◊,3 | | | 5,072,017 | | | | 5,002,277 | |
SMRT | | | | | | | | |
2022-MINI, 7.28% (1 Month Term SOFR + 1.95%, Rate Floor: 1.95%) due 01/15/39◊,3 | | | 32,500,000 | | | | 31,928,799 | |
JP Morgan Chase Commercial Mortgage Securities Trust | | | | | | | | |
2021-NYAH, 7.27% (1 Month Term SOFR + 1.95%, Rate Floor: 1.84%) due 06/15/38◊,3 | | | 14,350,000 | | | | 12,336,171 | |
2016-JP3, 3.42% (WAC) due 08/15/49◊ | | | 10,290,000 | | | | 8,531,324 | |
2021-NYAH, 7.62% (1 Month Term SOFR + 2.30%, Rate Floor: 2.19%) due 06/15/38◊,3 | | | 8,000,000 | | | | 6,604,060 | |
2016-JP3, 1.33% (WAC) due 08/15/49◊,11 | | | 51,698,585 | | | | 1,287,476 | |
Life Mortgage Trust | | | | | | | | |
2021-BMR, 7.79% (1 Month Term SOFR + 2.46%, Rate Floor: 2.35%) due 03/15/38◊,3 | | | 19,167,918 | | | | 18,544,961 | |
2021-BMR, 7.19% (1 Month Term SOFR + 1.86%, Rate Floor: 1.75%) due 03/15/38◊,3 | | | 5,160,593 | | | | 5,044,480 | |
Extended Stay America Trust | | | | | | | | |
2021-ESH, 7.69% (1 Month Term SOFR + 2.36%, Rate Floor: 2.25%) due 07/15/38◊,3 | | | 11,428,197 | | | | 11,413,911 | |
2021-ESH, 7.14% (1 Month Term SOFR + 1.81%, Rate Floor: 1.70%) due 07/15/38◊,3 | | | 5,896,950 | | | | 5,891,421 | |
Citigroup Commercial Mortgage Trust | | | | | | | | |
2019-GC43, 0.62% (WAC) due 11/10/52◊,11 | | | 217,614,461 | | | | 5,780,254 | |
2019-GC41, 1.04% (WAC) due 08/10/56◊,11 | | | 102,931,162 | | | | 3,761,310 | |
2016-P4, 1.88% (WAC) due 07/10/49◊,11 | | | 27,725,696 | | | | 859,350 | |
2016-C2, 1.66% (WAC) due 08/10/49◊,11 | | | 30,054,890 | | | | 837,107 | |
2015-GC35, 4.35% (WAC) due 11/10/48◊ | | | 810,679 | | | | 695,504 | |
2016-P5, 1.38% (WAC) due 10/10/49◊,11 | | | 24,713,412 | | | | 623,050 | |
2016-GC37, 1.65% (WAC) due 04/10/49◊,11 | | | 19,004,084 | | | | 443,029 | |
2015-GC35, 0.71% (WAC) due 11/10/48◊,11 | | | 27,630,829 | | | | 226,092 | |
40 | THE GUGGENHEIM FUNDS SEMI-ANNUAL REPORT | SEE NOTES TO FINANCIAL STATEMENTS. |
SCHEDULE OF INVESTMENTS (Unaudited)(continued) | March 31, 2024 |
TOTAL RETURN BOND FUND | |
| | Face
Amount~ | | | Value | |
2016-C3, 0.98% (WAC) due 11/15/49◊,11 | | | 9,780,596 | | | $ | 195,778 | |
2015-GC29, 1.01% (WAC) due 04/10/48◊,11 | | | 17,939,218 | | | | 123,657 | |
GS Mortgage Securities Corporation Trust | | | | | | | | |
2020-UPTN, 3.25% (WAC) due 02/10/37◊,3 | | | 5,350,000 | | | | 4,978,972 | |
2020-DUNE, 6.95% (1 Month Term SOFR + 1.61%, Rate Floor: 1.35%) due 12/15/36◊,3 | | | 3,750,000 | | | | 3,701,294 | |
2020-DUNE, 7.50% (1 Month Term SOFR + 2.16%, Rate Floor: 1.90%) due 12/15/36◊,3 | | | 1,000,000 | | | | 972,874 | |
BENCHMARK Mortgage Trust | | | | | | | | |
2020-IG3, 3.13% (WAC) due 09/15/48◊,3 | | | 5,232,000 | | | | 2,962,507 | |
2019-B14, 0.77% (WAC) due 12/15/62◊,11 | | | 107,831,557 | | | | 2,702,345 | |
2018-B2, 0.45% (WAC) due 02/15/51◊,11 | | | 98,319,873 | | | | 1,215,499 | |
2018-B6, 4.59% (WAC) due 10/10/51◊ | | | 750,000 | | | | 682,630 | |
2018-B6, 0.40% (WAC) due 10/10/51◊,11 | | | 58,753,916 | | | | 682,544 | |
GS Mortgage Securities Trust | | | | | | | | |
2020-GC45, 0.66% (WAC) due 02/13/53◊,11 | | | 151,644,404 | | | | 4,217,610 | |
2019-GC42, 0.82% (WAC) due 09/10/52◊,11 | | | 64,932,117 | | | | 2,210,088 | |
2017-GS6, 1.01% (WAC) due 05/10/50◊,11 | | | 40,671,060 | | | | 1,020,063 | |
2017-GS6, 3.87% due 05/10/50 | | | 521,000 | | | | 454,585 | |
2015-GC28, 0.96% (WAC) due 02/10/48◊,11 | | | 14,333,582 | | | | 54,620 | |
Wells Fargo Commercial Mortgage Trust | | | | | | | | |
2017-C38, 0.93% (WAC) due 07/15/50◊,11 | | | 63,236,640 | | | | 1,434,504 | |
2016-BNK1, 1.71% (WAC) due 08/15/49◊,11 | | | 34,005,464 | | | | 973,553 | |
2017-RB1, 1.19% (WAC) due 03/15/50◊,11 | | | 32,613,018 | | | | 895,550 | |
2017-C42, 0.86% (WAC) due 12/15/50◊,11 | | | 33,614,727 | | | | 875,502 | |
2016-C35, 1.88% (WAC) due 07/15/48◊,11 | | | 21,457,647 | | | | 675,783 | |
2017-RC1, 1.38% (WAC) due 01/15/60◊,11 | | | 16,205,973 | | | | 531,271 | |
2015-NXS4, 1.01% (WAC) due 12/15/48◊,11 | | | 36,540,923 | | | | 450,396 | |
2016-NXS5, 1.40% (WAC) due 01/15/59◊,11 | | | 19,876,173 | | | | 397,150 | |
2015-P2, 0.92% (WAC) due 12/15/48◊,11 | | | 21,592,131 | | | | 262,148 | |
2015-C30, 0.87% (WAC) due 09/15/58◊,11 | | | 27,779,176 | | | | 244,798 | |
SEE NOTES TO FINANCIAL STATEMENTS. | THE GUGGENHEIM FUNDS SEMI-ANNUAL REPORT | 41 |
SCHEDULE OF INVESTMENTS (Unaudited)(continued) | March 31, 2024 |
TOTAL RETURN BOND FUND | |
| | Face
Amount~ | | | Value | |
2016-C37, 0.78% (WAC) due 12/15/49◊,11 | | | 10,305,714 | | | $ | 160,531 | |
2015-NXS1, 1.06% (WAC) due 05/15/48◊,11 | | | 7,337,271 | | | | 39,154 | |
DBGS Mortgage Trust | | | | | | | | |
2018-C1, 4.65% (WAC) due 10/15/51◊ | | | 7,588,000 | | | | 6,890,772 | |
JPMDB Commercial Mortgage Securities Trust | | | | | | | | |
2017-C7, 0.83% (WAC) due 10/15/50◊,11 | | | 123,357,904 | | | | 2,677,286 | |
2016-C4, 3.64% (WAC) due 12/15/49◊ | | | 2,650,000 | | | | 2,307,389 | |
2016-C4, 0.70% (WAC) due 12/15/49◊,11 | | | 72,312,893 | | | | 1,061,163 | |
2016-C2, 1.48% (WAC) due 06/15/49◊,11 | | | 22,869,964 | | | | 512,399 | |
2017-C5, 0.87% (WAC) due 03/15/50◊,11 | | | 7,286,548 | | | | 133,182 | |
COMM Mortgage Trust | | | | | | | | |
2018-COR3, 0.43% (WAC) due 05/10/51◊,11 | | | 195,010,606 | | | | 2,996,143 | |
2015-CR26, 0.89% (WAC) due 10/10/48◊,11 | | | 74,402,900 | | | | 652,365 | |
2015-CR27, 0.90% (WAC) due 10/10/48◊,11 | | | 24,719,238 | | | | 246,883 | |
2015-CR24, 0.69% (WAC) due 08/10/48◊,11 | | | 38,123,265 | | | | 245,369 | |
2015-CR23, 0.84% (WAC) due 05/10/48◊,11 | | | 34,540,284 | | | | 222,236 | |
BANK | | | | | | | | |
2020-BN25, 0.44% (WAC) due 01/15/63◊,11 | | | 140,000,000 | | | | 3,086,384 | |
2017-BNK6, 0.77% (WAC) due 07/15/60◊,11 | | | 37,919,783 | | | | 714,727 | |
2017-BNK4, 1.34% (WAC) due 05/15/50◊,11 | | | 10,558,893 | | | | 333,362 | |
CSAIL Commercial Mortgage Trust | | | | | | | | |
2019-C15, 0.99% (WAC) due 03/15/52◊,11 | | | 85,989,532 | | | | 3,287,689 | |
2016-C6, 1.86% (WAC) due 01/15/49◊,11 | | | 4,749,664 | | | | 127,917 | |
2015-C1, 0.80% (WAC) due 04/15/50◊,11 | | | 48,400,794 | | | | 127,299 | |
UBS Commercial Mortgage Trust | | | | | | | | |
2017-C2, 1.07% (WAC) due 08/15/50◊,11 | | | 38,075,312 | | | | 1,062,214 | |
2017-C5, 1.07% (WAC) due 11/15/50◊,11 | | | 41,494,828 | | | | 1,040,001 | |
CD Mortgage Trust | | | | | | | | |
2017-CD6, 0.87% (WAC) due 11/13/50◊,11 | | | 40,117,803 | | | | 854,028 | |
2016-CD1, 1.37% (WAC) due 08/10/49◊,11 | | | 28,721,082 | | | | 616,392 | |
2016-CD2, 0.56% (WAC) due 11/10/49◊,11 | | | 29,393,717 | | | | 296,541 | |
BBCMS Mortgage Trust | | | | | | | | |
2018-C2, 0.75% (WAC) due 12/15/51◊,11 | | | 56,839,098 | | | | 1,576,620 | |
42 | THE GUGGENHEIM FUNDS SEMI-ANNUAL REPORT | SEE NOTES TO FINANCIAL STATEMENTS. |
SCHEDULE OF INVESTMENTS (Unaudited)(continued) | March 31, 2024 |
TOTAL RETURN BOND FUND | |
| | Face
Amount~ | | | Value | |
CD Commercial Mortgage Trust | | | | | | | | |
2017-CD4, 1.22% (WAC) due 05/10/50◊,11 | | | 25,180,472 | | | $ | 711,044 | |
2017-CD3, 0.95% (WAC) due 02/10/50◊,11 | | | 31,154,343 | | | | 626,872 | |
CGMS Commercial Mortgage Trust | | | | | | | | |
2017-B1, 0.73% (WAC) due 08/15/50◊,11 | | | 58,219,897 | | | | 1,171,751 | |
JPMCC Commercial Mortgage Securities Trust | | | | | | | | |
2017-JP6, 1.02% (WAC) due 07/15/50◊,11 | | | 47,066,092 | | | | 1,053,603 | |
Morgan Stanley Bank of America Merrill Lynch Trust | | | | | | | | |
2015-C27, 0.85% (WAC) due 12/15/47◊,11 | | | 60,678,635 | | | | 486,388 | |
2014-C18, 4.00% due 08/15/31 | | | 525,365 | | | | 395,415 | |
CFCRE Commercial Mortgage Trust | | | | | | | | |
2016-C3, 0.98% (WAC) due 01/10/48◊,11 | | | 42,487,628 | | | | 561,712 | |
Bank of America Merrill Lynch Commercial Mortgage Trust | | | | | | | | |
2017-BNK3, 1.01% (WAC) due 02/15/50◊,11 | | | 20,922,419 | | | | 473,805 | |
2016-UB10, 1.73% (WAC) due 07/15/49◊,11 | | | 1,533,378 | | | | 37,880 | |
DBJPM Mortgage Trust | | | | | | | | |
2017-C6, 0.91% (WAC) due 06/10/50◊,11 | | | 20,015,232 | | | | 415,640 | |
JPMBB Commercial Mortgage Securities Trust | | | | | | | | |
2015-C27, 1.14% (WAC) due 02/15/48◊,11 | | | 63,532,096 | | | | 323,956 | |
Morgan Stanley Capital I Trust | | | | | | | | |
2016-UBS9, 4.59% (WAC) due 03/15/49◊ | | | 275,000 | | | | 253,462 | |
SG Commercial Mortgage Securities Trust | | | | | | | | |
2016-C5, 1.86% (WAC) due 10/10/48◊,11 | | | 4,851,070 | | | | 136,923 | |
Total Commercial Mortgage-Backed Securities | | | 301,068,160 | |
| | | | | | | | | |
Military Housing - 0.8% |
Freddie Mac Military Housing Bonds Resecuritization Trust Certificates | | | | | | | | |
2015-R1, 5.00% (WAC) due 11/25/55◊,†††,3 | | | 68,661,981 | | | | 60,401,285 | |
2015-R1, 4.44% (WAC) due 11/25/52◊,†††,3 | | | 8,785,489 | | | | 7,962,854 | |
2015-R1, 4.31% (WAC) due 10/25/52◊,†††,3 | | | 2,538,365 | | | | 2,170,513 | |
Freddie Mac Military Housing Bonds Resecuritization Trust Certificates | | | | | | | | |
2015-R1, 5.00% (WAC) due 11/25/55◊,3 | | | 41,664,865 | | | | 33,081,595 | |
2015-R1, 0.70% (WAC) due 11/25/55◊,3,11 | | | 165,786,983 | | | | 10,491,730 | |
SEE NOTES TO FINANCIAL STATEMENTS. | THE GUGGENHEIM FUNDS SEMI-ANNUAL REPORT | 43 |
SCHEDULE OF INVESTMENTS (Unaudited)(continued) | March 31, 2024 |
TOTAL RETURN BOND FUND | |
| | Face
Amount~ | | | Value | |
2015-R1, 4.44% (WAC) due 11/25/52◊,3 | | | 11,926,763 | | | $ | 9,830,028 | |
2015-R1, 4.31% (WAC) due 10/25/52◊,3 | | | 10,614,981 | | | | 7,947,803 | |
Capmark Military Housing Trust | | | | | | | | |
2006-RILY, 6.15% due 07/10/51†††,3 | | | 12,450,917 | | | | 11,247,914 | |
2007-AETC, 5.75% due 02/10/52†††,3 | | | 7,080,383 | | | | 6,236,059 | |
2006-RILY, 5.81% (1 Month Term SOFR + 0.37%, Rate Floor: 0.37%) due 07/10/51◊,†††,3 | | | 6,703,434 | | | | 4,424,229 | |
2007-ROBS, 6.06% due 10/10/52†††,3 | | | 4,484,275 | | | | 4,042,496 | |
2007-AET2, 6.06% due 10/10/52†††,3 | | | 2,945,901 | | | | 2,845,951 | |
GMAC Commercial Mortgage Asset Corp. | | | | | | | | |
2007-HCKM, 6.11% due 08/10/52†††,3 | | | 21,282,139 | | | | 20,658,226 | |
2005-DRUM, 5.47% due 05/10/50†††,3 | | | 4,307,329 | | | | 3,836,637 | |
2005-BLIS, 5.25% due 07/10/50†††,3 | | | 2,500,000 | | | | 2,066,280 | |
Total Military Housing | | | 187,243,600 | |
| | | | | | | | | |
Total Collateralized Mortgage Obligations |
(Cost $5,549,371,220) | | | 5,221,618,306 | |
| | | | | | | | | |
ASSET-BACKED SECURITIES†† - 21.4% |
Collateralized Loan Obligations - 13.1% |
LCCM Trust | | | | | | | | |
2021-FL3 A, 6.89% (1 Month Term SOFR + 1.56%, Rate Floor: 1.56%) due 11/15/38◊,3 | | | 97,429,966 | | | | 96,063,316 | |
2021-FL3 AS, 7.24% (1 Month Term SOFR + 1.91%, Rate Floor: 1.91%) due 11/15/38◊,3 | | | 37,152,000 | | | | 35,734,948 | |
2021-FL3 B, 7.64% (1 Month Term SOFR + 2.31%, Rate Floor: 2.31%) due 11/15/38◊,3 | | | 21,450,000 | | | | 20,661,071 | |
2021-FL2 B, 7.34% (1 Month Term SOFR + 2.01%, Rate Floor: 2.01%) due 12/13/38◊,3 | | | 400,000 | | | | 382,115 | |
Palmer Square Loan Funding Ltd. | | | | | | | | |
2022-1A A2, 6.92% (3 Month Term SOFR + 1.60%, Rate Floor: 1.60%) due 04/15/30◊,3 | | | 23,000,000 | | | | 22,974,647 | |
2021-3A B, 7.33% (3 Month Term SOFR + 2.01%, Rate Floor: 2.01%) due 07/20/29◊,3 | | | 22,500,000 | | | | 22,524,172 | |
2023-2A A2, 7.65% (3 Month Term SOFR + 2.30%, Rate Floor: 2.30%) due 01/25/32◊,3 | | | 19,500,000 | | | | 19,500,739 | |
2024-3A BR, 7.32% (3 Month Term SOFR + 2.00%, Rate Floor: 2.00%) due 04/15/31◊,3 | | | 16,050,000 | | | | 16,033,773 | |
2023-1A B, 8.12% (3 Month Term SOFR + 2.80%, Rate Floor: 2.80%) due 07/20/31◊,3 | | | 15,250,000 | | | | 15,260,673 | |
44 | THE GUGGENHEIM FUNDS SEMI-ANNUAL REPORT | SEE NOTES TO FINANCIAL STATEMENTS. |
SCHEDULE OF INVESTMENTS (Unaudited)(continued) | March 31, 2024 |
TOTAL RETURN BOND FUND | |
| | Face
Amount~ | | | Value | |
2023-2A B, 8.05% (3 Month Term SOFR + 2.70%, Rate Floor: 2.70%) due 01/25/32◊,3 | | | 11,750,000 | | | $ | 11,742,984 | |
2021-2A B, 6.98% (3 Month Term SOFR + 1.66%, Rate Floor: 1.66%) due 05/20/29◊,3 | | | 10,500,000 | | | | 10,499,805 | |
2021-1A B, 7.38% (3 Month Term SOFR + 2.06%, Rate Floor: 2.06%) due 04/20/29◊,3 | | | 7,100,000 | | | | 7,105,537 | |
2023-4A B, 8.07% (3 Month Term SOFR + 2.75%, Rate Floor: 2.75%) due 07/24/31◊,3 | | | 7,050,000 | | | | 7,056,490 | |
2021-2A C, 7.98% (3 Month Term SOFR + 2.66%, Rate Floor: 2.66%) due 05/20/29◊,3 | | | 7,000,000 | | | | 6,935,940 | |
BXMT Ltd. | | | | | | | | |
2020-FL2 A, 6.34% (1 Month Term SOFR + 1.01%, Rate Floor: 1.01%) due 02/15/38◊,3 | | | 38,620,164 | | | | 37,075,357 | |
2020-FL3 AS, 7.19% (1 Month Term SOFR + 1.86%, Rate Floor: 1.86%) due 11/15/37◊,3 | | | 23,550,000 | | | | 22,206,423 | |
2020-FL2 B, 6.84% (1 Month Term SOFR + 1.51%, Rate Floor: 1.51%) due 02/15/38◊,3 | | | 16,000,000 | | | | 14,587,490 | |
2020-FL3 C, 7.99% (1 Month Term SOFR + 2.66%, Rate Floor: 2.66%) due 11/15/37◊,3 | | | 16,327,000 | | | | 14,166,014 | |
2020-FL3 B, 7.59% (1 Month Term SOFR + 2.26%, Rate Floor: 2.26%) due 11/15/37◊,3 | | | 10,600,000 | | | | 9,766,910 | |
2020-FL2 AS, 6.59% (1 Month Term SOFR + 1.26%, Rate Floor: 1.26%) due 02/15/38◊,3 | | | 6,008,500 | | | | 5,664,966 | |
2020-FL2 C, 7.09% (1 Month Term SOFR + 1.76%, Rate Floor: 1.76%) due 02/15/38◊,3 | | | 5,360,000 | | | | 4,718,537 | |
Cerberus Loan Funding XXXII, LP | | | | | | | | |
2021-2A A, 7.20% (3 Month Term SOFR + 1.88%, Rate Floor: 1.88%) due 04/22/33◊,3 | | | 65,000,000 | | | | 64,772,637 | |
2021-2A C, 8.43% (3 Month Term SOFR + 3.11%, Rate Floor: 3.11%) due 04/22/33◊,3 | | | 20,925,000 | | | | 20,614,517 | |
2021-2A B, 7.48% (3 Month Term SOFR + 2.16%, Rate Floor: 2.16%) due 04/22/33◊,3 | | | 19,200,000 | | | | 19,086,117 | |
Golub Capital Partners CLO 33M Ltd. | | | | | | | | |
2021-33A AR2, 7.45% (3 Month Term SOFR + 2.12%, Rate Floor: 1.86%) due 08/25/33◊,3 | | | 105,004,127 | | | | 104,380,150 | |
SEE NOTES TO FINANCIAL STATEMENTS. | THE GUGGENHEIM FUNDS SEMI-ANNUAL REPORT | 45 |
SCHEDULE OF INVESTMENTS (Unaudited)(continued) | March 31, 2024 |
TOTAL RETURN BOND FUND | |
| | Face
Amount~ | | | Value | |
Woodmont Trust | | | | | | | | |
2020-7A A1A, 7.48% (3 Month Term SOFR + 2.16%, Rate Floor: 1.90%) due 01/15/32◊,3 | | | 83,000,000 | | | $ | 83,297,746 | |
2020-7A B, 8.18% (3 Month Term SOFR + 2.86%, Rate Floor: 2.60%) due 01/15/32◊,3 | | | 13,500,000 | | | | 13,626,239 | |
2020-7A A2, 7.83% (3 Month Term SOFR + 2.51%, Rate Floor: 2.25%) due 01/15/32◊,3 | | | 7,000,000 | | | | 7,075,860 | |
HERA Commercial Mortgage Ltd. | | | | | | | | |
2021-FL1 B, 7.03% (1 Month Term SOFR + 1.71%, Rate Floor: 1.60%) due 02/18/38◊,3 | | | 49,562,000 | | | | 47,741,419 | |
2021-FL1 AS, 6.73% (1 Month Term SOFR + 1.41%, Rate Floor: 1.30%) due 02/18/38◊,3 | | | 28,000,000 | | | | 27,071,912 | |
2021-FL1 C, 7.38% (1 Month Term SOFR + 2.06%, Rate Floor: 1.95%) due 02/18/38◊,3 | | | 19,200,000 | | | | 18,203,672 | |
2021-FL1 A, 6.48% (1 Month Term SOFR + 1.16%, Rate Floor: 1.05%) due 02/18/38◊,3 | | | 7,422,099 | | | | 7,205,691 | |
LoanCore Issuer Ltd. | | | | | | | | |
2021-CRE6 B, 7.34% (1 Month Term SOFR + 2.01%, Rate Floor: 1.90%) due 11/15/38◊,3 | | | 44,000,000 | | | | 42,305,239 | |
2021-CRE6 C, 7.74% (1 Month Term SOFR + 2.41%, Rate Floor: 2.30%) due 11/15/38◊,3 | | | 22,825,000 | | | | 21,952,558 | |
2021-CRE5 D, 8.44% (1 Month Term SOFR + 3.11%, Rate Floor: 3.11%) due 07/15/36◊,3 | | | 14,350,000 | | | | 13,501,492 | |
2021-CRE5 A, 6.74% (1 Month Term SOFR + 1.41%, Rate Floor: 1.41%) due 07/15/36◊,3 | | | 10,644,219 | | | | 10,591,408 | |
GoldenTree Loan Management US CLO 1 Ltd. | | | | | | | | |
2024-9A BR, due 04/20/37◊,3 | | | 47,450,000 | | | | 47,450,000 | |
2021-9A B, 7.08% (3 Month Term SOFR + 1.76%, Rate Floor: 1.50%) due 01/20/33◊,3 | | | 35,900,000 | | | | 35,900,000 | |
2021-9A C, 7.38% (3 Month Term SOFR + 2.06%, Rate Floor: 1.80%) due 01/20/33◊,3 | | | 4,900,000 | | | | 4,854,737 | |
Cerberus Loan Funding XLV LLC | | | | | | | | |
2024-1A A, 7.29% (3 Month Term SOFR + 1.90%, Rate Floor: 1.90%) due 04/15/36◊,3 | | | 75,250,000 | | | | 75,262,394 | |
2024-1A B, 7.72% (3 Month Term SOFR + 2.40%, Rate Floor: 2.40%) due 04/15/36◊,3 | | | 12,000,000 | | | | 11,999,963 | |
46 | THE GUGGENHEIM FUNDS SEMI-ANNUAL REPORT | SEE NOTES TO FINANCIAL STATEMENTS. |
SCHEDULE OF INVESTMENTS (Unaudited)(continued) | March 31, 2024 |
TOTAL RETURN BOND FUND | |
| | Face
Amount~ | | | Value | |
ABPCI Direct Lending Fund CLO II LLC | | | | | | | | |
2021-1A A1R, 7.18% (3 Month Term SOFR + 1.86%, Rate Floor: 1.60%) due 04/20/32◊,3 | | | 84,258,254 | | | $ | 84,356,019 | |
Cerberus Loan Funding XLIV LLC | | | | | | | | |
2024-5A A, 7.45% (3 Month Term SOFR + 2.35%, Rate Floor: 2.35%) due 01/15/36◊,3 | | | 50,000,000 | | | | 50,520,240 | |
2024-5A B, 8.30% (3 Month Term SOFR + 3.20%, Rate Floor: 3.20%) due 01/15/36◊,3 | | | 24,950,000 | | | | 24,963,747 | |
Cerberus Loan Funding XLII LLC | | | | | | | | |
2023-3A A1, 7.79% (3 Month Term SOFR + 2.48%, Rate Floor: 2.48%) due 09/13/35◊,3 | | | 54,450,000 | | | | 54,977,621 | |
2023-3A B, 8.66% (3 Month Term SOFR + 3.35%, Rate Floor: 3.35%) due 09/13/35◊,3 | | | 15,700,000 | | | | 15,700,096 | |
Owl Rock CLO XVI | | | | | | | | |
2024-16A A, 7.32% (3 Month Term SOFR + 2.00%, Rate Floor: 2.00%) due 04/20/36◊,3 | | | 57,300,000 | | | | 57,619,539 | |
2024-16A B, 7.82% (3 Month Term SOFR + 2.50%, Rate Floor: 2.50%) due 04/20/36◊,3 | | | 9,550,000 | | | | 9,646,141 | |
THL Credit Lake Shore MM CLO I Ltd. | | | | | | | | |
2021-1A A1R, 7.28% (3 Month Term SOFR + 1.96%, Rate Floor: 1.70%) due 04/15/33◊,3 | | | 33,500,000 | | | | 33,491,059 | |
2021-1A BR, 7.58% (3 Month Term SOFR + 2.26%, Rate Floor: 2.00%) due 04/15/33◊,3 | | | 30,400,000 | | | | 30,215,797 | |
ABPCI Direct Lending Fund CLO I LLC | | | | | | | | |
2021-1A A1A2, 7.28% (3 Month Term SOFR + 1.96%, Rate Floor: 1.96%) due 07/20/33◊,3 | | | 59,500,000 | | | | 59,506,432 | |
2021-1A B12, 7.58% (3 Month Term SOFR + 2.26%, Rate Floor: 2.26%) due 07/20/33◊,3 | | | 2,500,000 | | | | 2,503,148 | |
Cerberus Loan Funding XL LLC | | | | | | | | |
2023-1A A, 7.71% (3 Month Term SOFR + 2.40%, Rate Floor: 2.40%) due 03/22/35◊,3 | | | 55,500,000 | | | | 56,065,234 | |
2023-1A B, 8.91% (3 Month Term SOFR + 3.60%, Rate Floor: 3.60%) due 03/22/35◊,3 | | | 4,600,000 | | | | 4,600,019 | |
Golub Capital Partners CLO 36M Ltd. | | | | | | | | |
2018-36A A, 6.83% (3 Month Term SOFR + 1.56%, Rate Floor: 0.00%) due 02/05/31◊,3 | | | 59,962,156 | | | | 59,898,788 | |
SEE NOTES TO FINANCIAL STATEMENTS. | THE GUGGENHEIM FUNDS SEMI-ANNUAL REPORT | 47 |
SCHEDULE OF INVESTMENTS (Unaudited)(continued) | March 31, 2024 |
TOTAL RETURN BOND FUND | |
| | Face
Amount~ | | | Value | |
FS Rialto | | | | | | | | |
2021-FL3 C, 7.49% (1 Month Term SOFR + 2.16%, Rate Floor: 2.16%) due 11/16/36◊,3 | | | 31,150,000 | | | $ | 29,627,759 | |
2021-FL2 C, 7.49% (1 Month Term SOFR + 2.16%, Rate Floor: 2.16%) due 05/16/38◊,3 | | | 15,665,000 | | | | 14,886,348 | |
2021-FL3 B, 7.24% (1 Month Term SOFR + 1.91%, Rate Floor: 1.91%) due 11/16/36◊,3 | | | 8,420,000 | | | | 8,309,738 | |
2021-FL2 A, 6.66% (1 Month Term SOFR + 1.33%, Rate Floor: 1.33%) due 05/16/38◊,3 | | | 6,260,761 | | | | 6,192,984 | |
ABPCI Direct Lending Fund IX LLC | | | | | | | | |
2021-9A A1R, 6.98% (3 Month Term SOFR + 1.66%, Rate Floor: 1.40%) due 11/18/31◊,3 | | | 32,167,210 | | | | 32,149,271 | |
2021-9A A2R, 7.38% (3 Month Term SOFR + 2.06%, Rate Floor: 1.80%) due 11/18/31◊,3 | | | 26,000,000 | | | | 25,948,780 | |
Owl Rock CLO IV Ltd. | | | | | | | | |
2021-4A A1R, 7.18% (3 Month Term SOFR + 1.86%, Rate Floor: 1.60%) due 08/20/33◊,3 | | | 40,750,000 | | | | 40,737,225 | |
2021-4A A2R, 7.48% (3 Month Term SOFR + 2.16%, Rate Floor: 1.90%) due 08/20/33◊,3 | | | 16,750,000 | | | | 16,633,038 | |
Cerberus Loan Funding XXXIII, LP | | | | | | | | |
2021-3A A, 7.14% (3 Month Term SOFR + 1.82%, Rate Floor: 1.56%) due 07/23/33◊,3 | | | 47,750,000 | | | | 47,853,073 | |
2021-3A B, 7.43% (3 Month Term SOFR + 2.11%, Rate Floor: 1.85%) due 07/23/33◊,3 | | | 9,500,000 | | | | 9,497,388 | |
Fortress Credit Opportunities IX CLO Ltd. | | | | | | | | |
2021-9A A2TR, 7.38% (3 Month Term SOFR + 2.06%, Rate Floor: 1.80%) due 10/15/33◊,3 | | | 46,200,000 | | | | 46,675,481 | |
2021-9A BR, 7.53% (3 Month Term SOFR + 2.21%, Rate Floor: 1.95%) due 10/15/33◊,3 | | | 6,700,000 | | | | 6,701,637 | |
2021-9A A1TR, 7.13% (3 Month Term SOFR + 1.81%, Rate Floor: 1.55%) due 10/15/33◊,3 | | | 3,450,000 | | | | 3,458,954 | |
Owl Rock CLO III Ltd. | | | | | | | | |
2024-3A AR, due 04/20/36◊,3 | | | 54,750,000 | | | | 54,750,000 | |
Cerberus Loan Funding XXXV, LP | | | | | | | | |
2021-5A A, 7.08% (3 Month Term SOFR + 1.76%, Rate Floor: 1.50%) due 09/22/33◊,3 | | | 41,500,000 | | | | 41,610,058 | |
2021-5A B, 7.43% (3 Month Term SOFR + 2.11%, Rate Floor: 1.85%) due 09/22/33◊,3 | | | 8,000,000 | | | | 8,002,266 | |
48 | THE GUGGENHEIM FUNDS SEMI-ANNUAL REPORT | SEE NOTES TO FINANCIAL STATEMENTS. |
SCHEDULE OF INVESTMENTS (Unaudited)(continued) | March 31, 2024 |
TOTAL RETURN BOND FUND | |
| | Face
Amount~ | | | Value | |
Cerberus Loan Funding XXXI, LP | | | | | | | | |
2021-1A A, 7.08% (3 Month Term SOFR + 1.76%, Rate Floor: 1.50%) due 04/15/32◊,3 | | | 35,462,879 | | | $ | 35,500,495 | |
2021-1A C, 8.18% (3 Month Term SOFR + 2.86%, Rate Floor: 2.60%) due 04/15/32◊,3 | | | 12,000,000 | | | | 11,916,157 | |
ACRES Commercial Realty Ltd. | | | | | | | | |
2021-FL1 C, 7.44% (1 Month Term SOFR + 2.11%, Rate Floor: 2.11%) due 06/15/36◊,3 | | | 13,092,000 | | | | 12,479,296 | |
2021-FL1 D, 8.09% (1 Month Term SOFR + 2.76%, Rate Floor: 2.76%) due 06/15/36◊,3 | | | 11,750,000 | | | | 10,354,311 | |
2021-FL2 B, 7.69% (1 Month Term SOFR + 2.36%, Rate Floor: 2.36%) due 01/15/37◊,3 | | | 10,100,000 | | | | 9,844,901 | |
2021-FL1 AS, 7.04% (1 Month Term SOFR + 1.71%, Rate Floor: 1.71%) due 06/15/36◊,3 | | | 6,425,000 | | | | 6,318,323 | |
2021-FL2 AS, 7.19% (1 Month Term SOFR + 1.86%, Rate Floor: 1.86%) due 01/15/37◊,3 | | | 3,500,000 | | | | 3,458,139 | |
Golub Capital Partners CLO 54M LP | | | | | | | | |
2021-54A B, 7.38% (3 Month Term SOFR + 2.11%, Rate Floor: 1.85%) due 08/05/33◊,3 | | | 21,000,000 | | | | 20,958,827 | |
2021-54A A, 7.06% (3 Month Term SOFR + 1.79%, Rate Floor: 1.53%) due 08/05/33◊,3 | | | 16,700,000 | | | | 16,731,152 | |
LCM XXIV Ltd. | | | | | | | | |
2021-24A BR, 6.98% (3 Month Term SOFR + 1.66%, Rate Floor: 0.00%) due 03/20/30◊,3 | | | 24,200,000 | | | | 24,192,987 | |
2021-24A CR, 7.48% (3 Month Term SOFR + 2.16%, Rate Floor: 0.00%) due 03/20/30◊,3 | | | 13,050,000 | | | | 12,962,108 | |
Golub Capital Partners CLO 16 Ltd. | | | | | | | | |
2021-16A A1R2, 7.20% (3 Month Term SOFR + 1.87%, Rate Floor: 1.61%) due 07/25/33◊,3 | | | 26,750,000 | | | | 26,891,205 | |
2021-16A A2R2, 7.39% (3 Month Term SOFR + 2.06%, Rate Floor: 1.80%) due 07/25/33◊,3 | | | 9,750,000 | | | | 9,779,784 | |
SEE NOTES TO FINANCIAL STATEMENTS. | THE GUGGENHEIM FUNDS SEMI-ANNUAL REPORT | 49 |
SCHEDULE OF INVESTMENTS (Unaudited)(continued) | March 31, 2024 |
TOTAL RETURN BOND FUND | |
| | Face
Amount~ | | | Value | |
CHCP Ltd. | | | | | | | | |
2021-FL1 AS, 6.74% (1 Month Term SOFR + 1.41%, Rate Floor: 1.30%) due 02/15/38◊,3 | | | 22,250,000 | | | $ | 22,043,353 | |
2021-FL1 B, 7.09% (1 Month Term SOFR + 1.76%, Rate Floor: 1.65%) due 02/15/38◊,3 | | | 6,600,000 | | | | 6,506,743 | |
2021-FL1 A, 6.49% (1 Month Term SOFR + 1.16%, Rate Floor: 1.05%) due 02/15/38◊,3 | | | 4,825,824 | | | | 4,812,367 | |
2021-FL1 C, 7.54% (1 Month Term SOFR + 2.21%, Rate Floor: 2.10%) due 02/15/38◊,3 | | | 2,950,000 | | | | 2,888,503 | |
Golub Capital Partners CLO 49M Ltd. | | | | | | | | |
2021-49A BR, 7.48% (3 Month Term SOFR + 2.16%, Rate Floor: 2.16%) due 08/26/33◊,3 | | | 21,695,000 | | | | 21,695,961 | |
2021-49A CR, 8.18% (3 Month Term SOFR + 2.86%, Rate Floor: 2.86%) due 08/26/33◊,3 | | | 12,600,000 | | | | 12,467,852 | |
Fortress Credit Opportunities XI CLO Ltd. | | | | | | | | |
2018-11A A1T, 6.88% (3 Month Term SOFR + 1.56%, Rate Floor: 0.00%) due 04/15/31◊,3 | | | 31,983,993 | | | | 31,894,844 | |
2018-11A C, 8.08% (3 Month Term SOFR + 2.76%, Rate Floor: 0.00%) due 04/15/31◊,3 | | | 2,300,000 | | | | 2,251,928 | |
Madison Park Funding XLVIII Ltd. | | | | | | | | |
2021-48A B, 7.02% (3 Month Term SOFR + 1.71%, Rate Floor: 1.71%) due 04/19/33◊,3 | | | 27,500,000 | | | | 27,456,602 | |
2021-48A C, 7.57% (3 Month Term SOFR + 2.26%, Rate Floor: 2.26%) due 04/19/33◊,3 | | | 6,650,000 | | | | 6,653,122 | |
KREF Ltd. | | | | | | | | |
2021-FL2 AS, 6.74% (1 Month Term SOFR + 1.41%, Rate Floor: 1.30%) due 02/15/39◊,3 | | | 19,300,000 | | | | 18,564,004 | |
2021-FL2 C, 7.44% (1 Month Term SOFR + 2.11%, Rate Floor: 2.00%) due 02/15/39◊,3 | | | 16,600,000 | | | | 15,447,040 | |
Palmer Square CLO Ltd. | | | | | | | | |
2023-4A C, 8.01% (3 Month Term SOFR + 2.60%, Rate Floor: 2.60%) due 10/20/33◊,3 | | | 16,250,000 | | | | 16,289,369 | |
2023-4A B, 7.56% (3 Month Term SOFR + 2.15%, Rate Floor: 2.15%) due 10/20/33◊,3 | | | 14,200,000 | | | | 14,268,749 | |
50 | THE GUGGENHEIM FUNDS SEMI-ANNUAL REPORT | SEE NOTES TO FINANCIAL STATEMENTS. |
SCHEDULE OF INVESTMENTS (Unaudited)(continued) | March 31, 2024 |
TOTAL RETURN BOND FUND | |
| | Face
Amount~ | | | Value | |
BCC Middle Market CLO LLC | | | | | | | | |
2021-1A A1R, 7.08% (3 Month Term SOFR + 1.76%, Rate Floor: 1.50%) due 10/15/33◊,3 | | | 30,450,000 | | | $ | 30,453,742 | |
Owl Rock CLO II Ltd. | | | | | | | | |
2021-2A ALR, 7.13% (3 Month Term SOFR + 1.81%, Rate Floor: 1.55%) due 04/20/33◊,3 | | | 30,350,000 | | | | 30,379,446 | |
Neuberger Berman Loan Advisers CLO 40 Ltd. | | | | | | | | |
2021-40A B, 6.98% (3 Month Term SOFR + 1.66%, Rate Floor: 1.40%) due 04/16/33◊,3 | | | 26,700,000 | | | | 26,607,428 | |
2021-40A C, 7.33% (3 Month Term SOFR + 2.01%, Rate Floor: 1.75%) due 04/16/33◊,3 | | | 2,500,000 | | | | 2,474,997 | |
STWD Ltd. | | | | | | | | |
2019-FL1 B, 7.04% (1 Month Term SOFR + 1.71%, Rate Floor: 1.71%) due 07/15/38◊,3 | | | 11,210,000 | | | | 10,982,839 | |
2019-FL1 C, 7.39% (1 Month Term SOFR + 2.06%, Rate Floor: 2.06%) due 07/15/38◊,3 | | | 8,800,000 | | | | 8,342,567 | |
2021-FL2 A, 6.64% (1 Month Term SOFR + 1.31%, Rate Floor: 1.20%) due 04/18/38◊,3 | | | 4,442,265 | | | | 4,343,133 | |
2021-FL2 C, 7.54% (1 Month Term SOFR + 2.21%, Rate Floor: 2.10%) due 04/18/38◊,3 | | | 2,820,000 | | | | 2,519,218 | |
2019-FL1 AS, 6.84% (1 Month Term SOFR + 1.51%, Rate Floor: 1.51%) due 07/15/38◊,3 | | | 2,200,000 | | | | 2,178,651 | |
MidOcean Credit CLO VII | | | | | | | | |
2020-7A BR, 7.18% (3 Month Term SOFR + 1.86%, Rate Floor: 0.00%) due 07/15/29◊,3 | | | 27,500,000 | | | | 27,415,798 | |
Fontainbleau Vegas | | | | | | | | |
10.97% (1 Month Term SOFR + 5.65%, Rate Floor: 5.65%) due 01/31/26◊,††† | | | 26,250,000 | | | | 26,250,000 | |
BDS Ltd. | | | | | | | | |
2021-FL9 C, 7.34% (1 Month Term SOFR + 2.01%, Rate Floor: 1.90%) due 11/16/38◊,3 | | | 19,500,000 | | | | 18,755,266 | |
2021-FL9 D, 7.69% (1 Month Term SOFR + 2.36%, Rate Floor: 2.25%) due 11/16/38◊,3 | | | 4,400,000 | | | | 4,156,635 | |
2020-FL5 B, 7.24% (1 Month Term SOFR + 1.91%, Rate Floor: 1.80%) due 02/16/37◊,3 | | | 2,828,717 | | | | 2,800,757 | |
SEE NOTES TO FINANCIAL STATEMENTS. | THE GUGGENHEIM FUNDS SEMI-ANNUAL REPORT | 51 |
SCHEDULE OF INVESTMENTS (Unaudited)(continued) | March 31, 2024 |
TOTAL RETURN BOND FUND | |
| | Face
Amount~ | | | Value | |
Madison Park Funding LIII Ltd. | | | | | | | | |
2022-53A B, 7.07% (3 Month Term SOFR + 1.75%, Rate Floor: 1.75%) due 04/21/35◊,3 | | | 24,000,000 | | | $ | 23,898,823 | |
BSPDF Issuer Ltd. | | | | | | | | |
2021-FL1 C, 7.69% (1 Month Term SOFR + 2.36%, Rate Floor: 2.25%) due 10/15/36◊,3 | | | 15,300,000 | | | | 14,033,386 | |
2021-FL1 B, 7.24% (1 Month Term SOFR + 1.91%, Rate Floor: 1.80%) due 10/15/36◊,3 | | | 6,500,000 | | | | 6,079,421 | |
2021-FL1 D, 8.19% (1 Month Term SOFR + 2.86%, Rate Floor: 2.75%) due 10/15/36◊,3 | | | 3,500,000 | | | | 3,209,003 | |
Magnetite XXIX Ltd. | | | | | | | | |
2021-29A B, 6.98% (3 Month Term SOFR + 1.66%, Rate Floor: 1.40%) due 01/15/34◊,3 | | | 15,100,000 | | | | 15,072,757 | |
2021-29A C, 7.23% (3 Month Term SOFR + 1.91%, Rate Floor: 1.65%) due 01/15/34◊,3 | | | 7,700,000 | | | | 7,710,490 | |
Venture XIV CLO Ltd. | | | | | | | | |
2020-14A CRR, 7.85% (3 Month Term SOFR + 2.51%, Rate Floor: 2.25%) due 08/28/29◊,3 | | | 22,725,000 | | | | 22,703,913 | |
KREF Funding V LLC | | | | | | | | |
7.18% (1 Month Term SOFR + 1.86%, Rate Floor: 1.86%) due 06/25/26◊,††† | | | 22,081,647 | | | | 21,940,881 | |
0.15% due 06/25/26†††,11 | | | 313,636,364 | | | | 263,455 | |
Madison Park Funding LVIII Ltd. | | | | | | | | |
2024-58A B, due 04/25/37◊,3 | | | 19,950,000 | | | | 19,950,000 | |
Golub Capital Partners CLO 17 Ltd. | | | | | | | | |
2017-17A A1R, 7.24% (3 Month Term SOFR + 1.91%, Rate Floor: 0.00%) due 10/25/30◊,3 | | | 19,377,818 | | | | 19,555,109 | |
Recette CLO Ltd. | | | | | | | | |
2021-1A BRR, 6.98% (3 Month Term SOFR + 1.66%, Rate Floor: 0.00%) due 04/20/34◊,3 | | | 9,800,000 | | | | 9,710,092 | |
2021-1A CRR, 7.33% (3 Month Term SOFR + 2.01%, Rate Floor: 0.00%) due 04/20/34◊,3 | | | 9,200,000 | | | | 9,081,130 | |
Anchorage Capital CLO 6 Ltd. | | | | | | | | |
2021-6A CRR, 7.78% (3 Month Term SOFR + 2.46%, Rate Floor: 2.20%) due 07/15/30◊,3 | | | 18,585,000 | | | | 18,604,405 | |
Neuberger Berman Loan Advisers CLO 32 Ltd. | | | | | | | | |
2021-32A BR, 6.97% (3 Month Term SOFR + 1.66%, Rate Floor: 1.40%) due 01/20/32◊,3 | | | 14,100,000 | | | | 14,051,196 | |
52 | THE GUGGENHEIM FUNDS SEMI-ANNUAL REPORT | SEE NOTES TO FINANCIAL STATEMENTS. |
SCHEDULE OF INVESTMENTS (Unaudited)(continued) | March 31, 2024 |
TOTAL RETURN BOND FUND | |
| | Face
Amount~ | | | Value | |
2021-32A CR, 7.27% (3 Month Term SOFR + 1.96%, Rate Floor: 1.70%) due 01/20/32◊,3 | | | 4,200,000 | | | $ | 4,174,173 | |
BSPRT Issuer Ltd. | | | | | | | | |
2021-FL7 C, 7.74% (1 Month Term SOFR + 2.41%, Rate Floor: 2.41%) due 12/15/38◊,3 | | | 7,250,000 | | | | 6,975,991 | |
2021-FL6 C, 7.49% (1 Month Term SOFR + 2.16%, Rate Floor: 2.05%) due 03/15/36◊,3 | | | 5,550,000 | | | | 5,184,286 | |
2021-FL7 B, 7.49% (1 Month Term SOFR + 2.16%, Rate Floor: 2.16%) due 12/15/38◊,3 | | | 4,875,000 | | | | 4,750,997 | |
Cerberus Loan Funding XXXVIII, LP | | | | | | | | |
2022-2A A1, 8.06% (3 Month Term SOFR + 2.75%, Rate Floor: 2.75%) due 10/15/34◊,3 | | | 16,570,000 | | | | 16,742,169 | |
Owl Rock CLO I LLC | | | | | | | | |
2024-1A ANR, 7.74% (3 Month Term SOFR + 2.40%, Rate Floor: 2.40%) due 02/20/36◊,3 | | | 14,400,000 | | | | 14,547,531 | |
2024-1A BR, 8.59% (3 Month Term SOFR + 3.25%, Rate Floor: 3.25%) due 02/20/36◊,3 | | | 1,100,000 | | | | 1,116,873 | |
Dryden 36 Senior Loan Fund | | | | | | | | |
2020-36A CR3, 7.63% (3 Month Term SOFR + 2.31%, Rate Floor: 2.05%) due 04/15/29◊,3 | | | 15,200,000 | | | | 15,218,444 | |
Owl Rock CLO XIII LLC | | | | | | | | |
2023-13A B, 8.68% (3 Month Term SOFR + 3.35%, Rate Floor: 3.35%) due 09/20/35◊,3 | | | 14,750,000 | | | | 14,976,638 | |
NewStar Fairfield Fund CLO Ltd. | | | | | | | | |
2018-2A A1N, 6.85% (3 Month Term SOFR + 1.53%, Rate Floor: 1.27%) due 04/20/30◊,3 | | | 13,474,420 | | | | 13,496,951 | |
Octagon Investment Partners 49 Ltd. | | | | | | | | |
2024-5A BR, 7.24% (3 Month Term SOFR + 1.95%, Rate Floor: 1.95%) due 04/15/37◊,3 | | | 12,800,000 | | | | 12,813,085 | |
Greystone Commercial Real Estate Notes | | | | | | | | |
2021-FL3 C, 7.44% (1 Month Term SOFR + 2.11%, Rate Floor: 2.00%) due 07/15/39◊,3 | | | 12,000,000 | | | | 11,351,952 | |
Golub Capital Partners CLO 46 Ltd. | | | | | | | | |
2019-46A , due 04/20/3717 | | | 10,300,000 | | | | 10,300,000 | |
Neuberger Berman CLO XVI-S Ltd. | | | | | | | | |
2021-16SA BR, 6.98% (3 Month Term SOFR + 1.66%, Rate Floor: 1.40%) due 04/15/34◊,3 | | | 10,200,000 | | | | 10,152,761 | |
SEE NOTES TO FINANCIAL STATEMENTS. | THE GUGGENHEIM FUNDS SEMI-ANNUAL REPORT | 53 |
SCHEDULE OF INVESTMENTS (Unaudited)(continued) | March 31, 2024 |
TOTAL RETURN BOND FUND | |
| | Face
Amount~ | | | Value | |
HPS Loan Management Ltd. | | | | | | | | |
2018-2016 BR, 7.18% (3 Month Term SOFR + 1.86%, Rate Floor: 1.60%) due 07/20/30◊,3 | | | 9,500,000 | | | $ | 9,497,521 | |
Lake Shore MM CLO III LLC | | | | | | | | |
2021-2A A1R, 7.06% (3 Month Term SOFR + 1.74%, Rate Floor: 1.48%) due 10/17/31◊,3 | | | 9,117,132 | | | | 9,043,042 | |
Neuberger Berman Loan Advisers CLO 47 Ltd. | | | | | | | | |
2022-47A B, 7.12% (3 Month Term SOFR + 1.80%, Rate Floor: 1.80%) due 04/14/35◊,3 | | | 9,000,000 | | | | 9,015,246 | |
Boyce Park CLO Ltd. | | | | | | | | |
2022-1A B1, 7.07% (3 Month Term SOFR + 1.75%, Rate Floor: 1.75%) due 04/21/35◊,3 | | | 8,800,000 | | | | 8,756,892 | |
Dryden 37 Senior Loan Fund | | | | | | | | |
2015-37A Q, due 01/15/313,13 | | | 10,000,000 | | | | 7,083,134 | |
Golub Capital Partners CLO 25M Ltd. | | | | | | | | |
2018-25A AR, 6.91% (3 Month Term SOFR + 1.64%, Rate Floor: 1.38%) due 05/05/30◊,3 | | | 6,963,788 | | | | 6,968,969 | |
ACRE Commercial Mortgage Ltd. | | | | | | | | |
2021-FL4 B, 6.84% (1 Month Term SOFR + 1.51%, Rate Floor: 1.40%) due 12/18/37◊,3 | | | 3,100,000 | | | | 3,074,054 | |
2021-FL4 C, 7.19% (1 Month Term SOFR + 1.86%, Rate Floor: 1.75%) due 12/18/37◊,3 | | | 3,100,000 | | | | 2,969,446 | |
HGI CRE CLO Ltd. | | | | | | | | |
2021-FL2 B, 6.94% (1 Month Term SOFR + 1.61%, Rate Floor: 1.61%) due 09/17/36◊,3 | | | 5,000,000 | | | | 4,812,872 | |
2021-FL2 C, 7.24% (1 Month Term SOFR + 1.91%, Rate Floor: 1.91%) due 09/17/36◊,3 | | | 1,000,000 | | | | 953,661 | |
VOYA CLO | | | | | | | | |
2021-2A BR, 7.73% (3 Month Term SOFR + 2.41%, Rate Floor: 2.15%) due 06/07/30◊,3 | | | 4,950,000 | | | | 4,950,161 | |
Northwoods Capital XII-B Ltd. | | | | | | | | |
2018-12BA B, 7.44% (3 Month Term SOFR + 2.11%, Rate Floor: 1.85%) due 06/15/31◊,3 | | | 4,000,000 | | | | 4,006,666 | |
Shackleton CLO Ltd. | | | | | | | | |
2021-16A B, 7.33% (3 Month Term SOFR + 2.01%, Rate Floor: 1.75%) due 10/20/34◊,3 | | | 3,900,000 | | | | 3,911,294 | |
54 | THE GUGGENHEIM FUNDS SEMI-ANNUAL REPORT | SEE NOTES TO FINANCIAL STATEMENTS. |
SCHEDULE OF INVESTMENTS (Unaudited)(continued) | March 31, 2024 |
TOTAL RETURN BOND FUND | |
| | Face
Amount~ | | | Value | |
BRSP Ltd. | | | | | | | | |
2021-FL1 D, 8.14% (1 Month Term SOFR + 2.81%, Rate Floor: 2.70%) due 08/19/38◊,3 | | | 4,200,000 | | | $ | 3,789,634 | |
MF1 Multifamily Housing Mortgage Loan Trust | | | | | | | | |
2021-FL6 D, 7.99% (1 Month Term SOFR + 2.66%, Rate Floor: 2.55%) due 07/16/36◊,3 | | | 3,800,000 | | | | 3,644,099 | |
Dryden XXVI Senior Loan Fund | | | | | | | | |
2018-26A CR, 7.43% (3 Month Term SOFR + 2.11%, Rate Floor: 0.00%) due 04/15/29◊,3 | | | 3,500,000 | | | | 3,493,006 | |
Carlyle Global Market Strategies CLO Ltd. | | | | | | | | |
2012-3A SUB, due 01/14/323,13 | | | 8,920,000 | | | | 2,740,224 | |
Wellfleet CLO Ltd. | | | | | | | | |
2018-2A A2R, 7.16% (3 Month Term SOFR + 1.84%, Rate Floor: 1.58%) due 10/20/28◊,3 | | | 2,500,000 | | | | 2,500,002 | |
Allegro CLO VII Ltd. | | | | | | | | |
2018-1A C, 7.48% (3 Month Term SOFR + 2.16%, Rate Floor: 1.90%) due 06/13/31◊,3 | | | 2,500,000 | | | | 2,480,262 | |
Sound Point CLO XXXI Ltd. | | | | | | | | |
2021-3A B, 7.24% (3 Month Term SOFR + 1.91%, Rate Floor: 1.65%) due 10/25/34◊,3 | | | 2,200,000 | | | | 2,186,842 | |
Cerberus Loan Funding XXXVI, LP | | | | | | | | |
2021-6A A, 6.98% (3 Month Term SOFR + 1.66%, Rate Floor: 1.40%) due 11/22/33◊,3 | | | 984,613 | | | | 985,705 | |
Voya CLO Ltd. | | | | | | | | |
2013-1A INC, due 10/15/303,13 | | | 10,575,071 | | | | 405,871 | |
Great Lakes CLO Ltd. | | | | | | | | |
2014-1A SUB, due 10/15/293,13 | | | 461,538 | | | | 179,827 | |
Venture XIII CLO Ltd. | | | | | | | | |
2013-13A SUB, due 09/10/293,13 | | | 3,700,000 | | | | 111,081 | |
Babson CLO Ltd. | | | | | | | | |
2014-IA SUB, due 07/20/253,13 | | | 1,266,687 | | | | 37,532 | |
Treman Park CLO Ltd. | | | | | | | | |
2015-1A SUB, due 10/20/283,13 | | | 6,859,005 | | | | 23,869 | |
Atlas Senior Loan Fund IX Ltd. | | | | | | | | |
2018-9A SUB, due 04/20/283,13 | | | 1,200,000 | | | | 22,333 | |
Copper River CLO Ltd. | | | | | | | | |
2007-1A INC, due 01/20/217,13 | | | 1,500,000 | | | | 150 | |
Total Collateralized Loan Obligations | | | 3,062,251,444 | |
| | | | | | | | | |
Financial - 2.2% |
Project Onyx I | | | | | | | | |
8.48% (3 Month Term SOFR + 3.15%, Rate Floor: 3.15%) due 01/26/27◊,††† | | | 75,022,206 | | | | 75,008,177 | |
KKR Core Holding Company LLC | | | | | | | | |
4.00% due 08/12/31††† | | | 80,664,650 | | | | 71,700,771 | |
SEE NOTES TO FINANCIAL STATEMENTS. | THE GUGGENHEIM FUNDS SEMI-ANNUAL REPORT | 55 |
SCHEDULE OF INVESTMENTS (Unaudited)(continued) | March 31, 2024 |
TOTAL RETURN BOND FUND | |
| | Face
Amount~ | | | Value | |
Strategic Partners Fund VIII, LP | | | | | | | | |
7.93% (1 Month Term SOFR + 2.60%, Rate Floor: 2.60%) due 03/10/26◊,††† | | | 63,715,956 | | | $ | 63,360,302 | |
HV Eight LLC | | | | | | | | |
7.48% (3 Month EURIBOR + 3.50%, Rate Floor: 3.50%) due 12/31/27◊,††† | | EUR | 55,583,426 | | | | 60,203,184 | |
LVNV Funding LLC | | | | | | | | |
7.80% due 11/05/28††† | | | 39,400,000 | | | | 40,423,220 | |
Thunderbird A | | | | | | | | |
5.50% due 03/01/37††† | | | 37,505,000 | | | | 34,588,259 | |
Lightning A | | | | | | | | |
5.50% due 03/01/37††† | | | 37,505,000 | | | | 34,588,259 | |
HarbourVest Structured Solutions IV Holdings, LP | | | | | | | | |
8.11% (3 Month USD LIBOR + 2.45%, Rate Floor: 2.45%) due 09/15/26◊,††† | | | 17,837,421 | | | | 17,834,511 | |
6.05% (3 Month EURIBOR + 2.45%, Rate Floor: 2.45%) due 09/15/26◊,††† | | EUR | 11,100,000 | | | | 11,977,977 | |
Madison Avenue Secured Funding Trust | | | | | | | | |
2023-2, 7.17% (1 Month Term SOFR + 1.85%, Rate Floor: 1.85%) due 10/15/24◊,†††,3 | | | 25,350,000 | | | | 25,350,000 | |
Ceamer Finance LLC | | | | | | | | |
3.69% due 03/24/31††† | | | 19,291,311 | | | | 18,148,677 | |
6.92% due 11/15/37††† | | | 7,249,765 | | | | 7,054,609 | |
Project Onyx II | | | | | | | | |
8.48% (3 Month Term SOFR + 3.15%, Rate Floor: 3.15%) due 01/26/27◊,††† | | | 20,926,560 | | | | 20,923,449 | |
Bib Merchant Voucher Receivables Ltd. | | | | | | | | |
4.18% due 04/07/28††† | | | 14,636,927 | | | | 14,152,678 | |
Station Place Securitization Trust | | | | | | | | |
2023-SP1, 7.17% (1 Month Term SOFR + 1.85%, Rate Floor: 1.85%) due 10/15/24◊,†††,3 | | | 12,650,000 | | | | 12,650,000 | |
Nassau LLC | | | | | | | | |
2019-1, 3.98% due 08/15/343 | | | 10,280,434 | | | | 9,826,652 | |
Aesf Vi Verdi, LP | | | | | | | | |
7.63% (3 Month Term SOFR + 2.30%, Rate Floor: 2.30%) due 11/25/24◊,††† | | | 5,702,405 | | | | 5,702,405 | |
Oxford Finance Funding | | | | | | | | |
2020-1A, 3.10% due 02/15/283 | | | 4,544,682 | | | | 4,414,639 | |
Industrial DPR Funding Ltd. | | | | | | | | |
2016-1A, 5.24% due 04/15/263 | | | 1,447,580 | | | | 1,424,464 | |
Total Financial | | | 529,332,233 | |
| | | | | | | | | |
Whole Business - 1.4% |
Arbys Funding LLC | | | | | | | | |
2020-1A, 3.24% due 07/30/503 | | | 94,408,845 | | | | 87,290,069 | |
SERVPRO Master Issuer LLC | | | | | | | | |
2021-1A, 2.39% due 04/25/513 | | | 39,296,780 | | | | 34,498,348 | |
56 | THE GUGGENHEIM FUNDS SEMI-ANNUAL REPORT | SEE NOTES TO FINANCIAL STATEMENTS. |
SCHEDULE OF INVESTMENTS (Unaudited)(continued) | March 31, 2024 |
TOTAL RETURN BOND FUND | |
| | Face
Amount~ | | | Value | |
2022-1A, 3.13% due 01/25/523 | | | 23,030,000 | | | $ | 20,522,604 | |
2024-1A, 6.17% due 01/25/543 | | | 16,620,000 | | | | 16,801,163 | |
2019-1A, 3.88% due 10/25/493 | | | 4,649,620 | | | | 4,409,812 | |
Sonic Capital LLC | | | | | | | | |
2021-1A, 2.64% due 08/20/513 | | | 23,513,100 | | | | 19,030,466 | |
2020-1A, 3.85% due 01/20/503 | | | 12,012,552 | | | | 11,372,554 | |
2021-1A, 2.19% due 08/20/513 | | | 10,036,650 | | | | 8,688,608 | |
2020-1A, 4.34% due 01/20/503 | | | 7,023,954 | | | | 6,536,788 | |
ServiceMaster Funding LLC | | | | | | | | |
2020-1, 3.34% due 01/30/513 | | | 27,853,139 | | | | 23,789,458 | |
2020-1, 2.84% due 01/30/513 | | | 9,265,507 | | | | 8,272,960 | |
Wingstop Funding LLC | | | | | | | | |
2020-1A, 2.84% due 12/05/503 | | | 25,117,500 | | | | 22,795,103 | |
2022-1A, 3.73% due 03/05/523 | | | 1,191,000 | | | | 1,089,074 | |
Applebee’s Funding LLC / IHOP Funding LLC | | | | | | | | |
2019-1A, 4.72% due 06/05/493 | | | 22,918,500 | | | | 22,045,656 | |
Taco Bell Funding LLC | | | | | | | | |
2016-1A, 4.97% due 05/25/463 | | | 17,392,559 | | | | 17,131,010 | |
Wendy’s Funding LLC | | | | | | | | |
2019-1A, 3.78% due 06/15/493 | | | 12,142,736 | | | | 11,647,288 | |
Domino’s Pizza Master Issuer LLC | | | | | | | | |
2017-1A, 4.12% due 07/25/473 | | | 7,802,000 | | | | 7,467,913 | |
Total Whole Business | | | 323,388,874 | |
| | | | | | | | | |
Transport-Aircraft - 1.3% |
AASET Trust | | | | | | | | |
2021-1A, 2.95% due 11/16/413 | | | 55,585,671 | | | | 50,393,969 | |
2021-2A, 2.80% due 01/15/473 | | | 32,986,050 | | | | 28,878,297 | |
2020-1A, 3.35% due 01/16/403 | | | 13,547,980 | | | | 12,103,831 | |
2019-1, 3.84% due 05/15/393 | | | 2,294,157 | | | | 1,972,975 | |
2019-2, 3.38% due 10/16/393 | | | 1,452,413 | | | | 1,310,923 | |
Navigator Aircraft ABS Ltd. | | | | | | | | |
2021-1, 2.77% due 11/15/463 | | | 45,787,945 | | | | 40,857,888 | |
Castlelake Aircraft Structured Trust | | | | | | | | |
2021-1A, 3.47% due 01/15/463 | | | 31,311,094 | | | | 29,443,513 | |
Lunar Structured Aircraft Portfolio Notes | | | | | | | | |
2021-1, 2.64% due 10/15/463 | | | 32,950,472 | | | | 29,223,774 | |
Sprite Ltd. | | | | | | | | |
2021-1, 3.75% due 11/15/463 | | | 26,514,033 | | | | 24,630,993 | |
Sapphire Aviation Finance II Ltd. | | | | | | | | |
2020-1A, 3.23% due 03/15/403 | | | 23,642,559 | | | | 21,515,438 | |
AASET US Ltd. | | | | | | | | |
2018-2A, 4.45% due 11/18/383 | | | 19,113,143 | | | | 16,880,306 | |
KDAC Aviation Finance Ltd. | | | | | | | | |
2017-1A, 4.21% due 12/15/423 | | | 18,718,896 | | | | 16,100,845 | |
WAVE LLC | | | | | | | | |
2019-1, 3.60% due 09/15/443 | | | 16,330,076 | | | | 14,534,258 | |
SEE NOTES TO FINANCIAL STATEMENTS. | THE GUGGENHEIM FUNDS SEMI-ANNUAL REPORT | 57 |
SCHEDULE OF INVESTMENTS (Unaudited)(continued) | March 31, 2024 |
TOTAL RETURN BOND FUND | |
| | Face
Amount~ | | | Value | |
Sapphire Aviation Finance I Ltd. | | | | | | | | |
2018-1A, 4.25% due 03/15/403 | | | 11,267,570 | | | $ | 10,343,854 | |
Falcon Aerospace Ltd. | | | | | | | | |
2019-1, 3.60% due 09/15/393 | | | 7,634,388 | | | | 6,947,294 | |
2017-1, 4.58% due 02/15/423 | | | 2,260,703 | | | | 2,135,978 | |
Castlelake Aircraft Securitization Trust | | | | | | | | |
2018-1, 4.13% due 06/15/433 | | | 6,122,381 | | | | 5,581,660 | |
MAPS Ltd. | | | | | | | | |
2018-1A, 4.21% due 05/15/433 | | | 5,334,948 | | | | 4,921,554 | |
Slam Ltd. | | | | | | | | |
2021-1A, 2.43% due 06/15/463 | | | 1,656,200 | | | | 1,446,501 | |
2021-1A, 3.42% due 06/15/463 | | | 1,242,150 | | | | 1,055,206 | |
Total Transport-Aircraft | | | 320,279,057 | |
| | | | | | | | | |
Net Lease - 0.8% |
STORE Master Funding I-VII | | | | | | | | |
2016-1A, 3.96% due 10/20/463 | | | 27,239,135 | | | | 25,637,915 | |
2016-1A, 4.32% due 10/20/463 | | | 10,781,174 | | | | 10,090,580 | |
CF Hippolyta Issuer LLC | | | | | | | | |
2022-1A, 6.11% due 08/15/623 | | | 20,275,457 | | | | 19,678,012 | |
2020-1, 2.28% due 07/15/603 | | | 10,075,718 | | | | 9,268,651 | |
Capital Automotive REIT | | | | | | | | |
2020-1A, 3.48% due 02/15/503 | | | 21,935,483 | | | | 20,076,528 | |
2021-1A, 2.76% due 08/15/513 | | | 6,560,125 | | | | 4,846,321 | |
CARS-DB4, LP | | | | | | | | |
2020-1A, 3.81% due 02/15/503 | | | 19,989,099 | | | | 17,119,362 | |
2020-1A, 3.25% due 02/15/503 | | | 3,389,154 | | | | 2,968,836 | |
2020-1A, 2.69% due 02/15/503 | | | 1,863,147 | | | | 1,809,074 | |
SVC ABS LLC | | | | | | | | |
2023-1A, 5.15% due 02/20/533 | | | 15,266,854 | | | | 14,567,455 | |
2023-1A, 5.55% due 02/20/533 | | | 3,490,521 | | | | 3,266,914 | |
CMFT Net Lease Master Issuer LLC | | | | | | | | |
2021-1, 2.91% due 07/20/513 | | | 10,050,000 | | | | 8,456,163 | |
2021-1, 3.04% due 07/20/513 | | | 5,050,000 | | | | 3,928,987 | |
2021-1, 2.51% due 07/20/513 | | | 3,000,000 | | | | 2,519,090 | |
2021-1, 3.44% due 07/20/513 | | | 3,215,000 | | | | 2,505,043 | |
Oak Street Investment Grade Net Lease Fund Series | | | | | | | | |
2020-1A, 2.26% due 11/20/503 | | | 14,975,000 | | | | 13,568,015 | |
STORE Master Funding LLC | | | | | | | | |
2021-1A, 2.96% due 06/20/513 | | | 12,624,000 | | | | 9,577,758 | |
2021-1A, 3.70% due 06/20/513 | | | 3,533,734 | | | | 2,680,055 | |
STORE Master Funding I LLC | | | | | | | | |
2015-1A, 4.17% due 04/20/453 | | | 9,930,161 | | | | 9,544,904 | |
New Economy Assets Phase 1 Sponsor LLC | | | | | | | | |
2021-1, 2.41% due 10/20/613 | | | 10,000,000 | | | | 8,397,645 | |
CARS-DB7, LP | | | | | | | | |
2023-1A, 5.75% due 09/15/533 | | | 4,459,000 | | | | 4,430,697 | |
CF Hippolyta LLC | | | | | | | | |
2020-1, 2.60% due 07/15/603 | | | 4,312,872 | | | | 3,544,074 | |
Total Net Lease | | | 198,482,079 | |
58 | THE GUGGENHEIM FUNDS SEMI-ANNUAL REPORT | SEE NOTES TO FINANCIAL STATEMENTS. |
SCHEDULE OF INVESTMENTS (Unaudited)(continued) | March 31, 2024 |
TOTAL RETURN BOND FUND | |
| | Face
Amount~ | | | Value | |
| | | | | | | | | |
Infrastructure - 0.8% |
Stack Infrastructure Issuer LLC | | | | | | | | |
2023-3A, 5.90% due 10/25/483 | | | 31,313,000 | | | $ | 31,420,983 | |
2024-1A, 5.90% due 03/25/493 | | | 16,250,000 | | | | 16,288,155 | |
2020-1A, 1.89% due 08/25/453 | | | 11,624,000 | | | | 10,953,612 | |
2023-1A, 5.90% due 03/25/483 | | | 6,000,000 | | | | 5,979,922 | |
2023-2A, 5.90% due 07/25/483 | | | 6,000,000 | | | | 5,978,963 | |
Hotwire Funding LLC | | | | | | | | |
2023-1A, 8.84% due 05/20/533 | | | 31,200,000 | | | | 30,880,821 | |
2021-1, 2.31% due 11/20/513 | | | 5,350,000 | | | | 4,836,720 | |
2021-1, 2.66% due 11/20/513 | | | 4,025,000 | | | | 3,556,156 | |
VB-S1 Issuer LLC - VBTEL | | | | | | | | |
2022-1A, 4.29% due 02/15/523 | | | 40,900,000 | | | | 36,362,980 | |
Aligned Data Centers Issuer LLC | | | | | | | | |
2021-1A, 1.94% due 08/15/463 | | | 28,913,000 | | | | 26,279,879 | |
2023-1A, 6.00% due 08/17/483 | | | 2,600,000 | | | | 2,599,357 | |
Blue Stream Issuer LLC | | | | | | | | |
2023-1A, 5.40% due 05/20/533 | | | 6,625,000 | | | | 6,391,236 | |
Switch ABS Issuer LLC | | | | | | | | |
2024-1A, 6.28% due 03/25/543 | | | 3,100,000 | | | | 3,076,877 | |
Vantage Data Centers Issuer LLC | | | | | | | | |
2020-1A, 1.65% due 09/15/453 | | | 3,100,000 | | | | 2,904,194 | |
Total Infrastructure | | | 187,509,855 | |
| | | | | | | | | |
Single Family Residence - 0.7% |
FirstKey Homes Trust | | | | | | | | |
2020-SFR2, 4.50% due 10/19/373 | | | 21,640,000 | | | | 20,610,860 | |
2020-SFR2, 4.00% due 10/19/373 | | | 20,340,000 | | | | 19,324,314 | |
2020-SFR2, 3.37% due 10/19/373 | | | 13,010,000 | | | | 12,284,199 | |
2021-SFR1, 2.19% due 08/17/383 | | | 13,174,000 | | | | 11,959,887 | |
Home Partners of America Trust | | | | | | | | |
2021-2, 2.65% due 12/17/263 | | | 46,389,454 | | | | 42,117,315 | |
2021-3, 2.80% due 01/17/413 | | | 15,250,896 | | | | 13,337,950 | |
Tricon Residential Trust | | | | | | | | |
2023-SFR2, 5.00% due 12/17/403 | | | 31,239,000 | | | | 30,421,625 | |
2021-SFR1, 2.59% due 07/17/383 | | | 7,000,000 | | | | 6,439,421 | |
2024-SFR1, due 04/17/293,17 | | | 3,600,000 | | | | 3,462,006 | |
Total Single Family Residence | | | 159,957,577 | |
| | | | | | | | | |
Transport-Container - 0.5% |
Textainer Marine Containers VII Ltd. | | | | | | | | |
2020-1A, 2.73% due 08/21/453 | | | 41,858,813 | | | | 39,130,338 | |
2021-2A, 2.23% due 04/20/463 | | | 2,491,667 | | | | 2,232,142 | |
TIF Funding III LLC | | | | | | | | |
2024-1A, due 05/22/343,17 | | | 33,300,000 | | | | 33,315,898 | |
Textainer Marine Containers Ltd. | | | | | | | | |
2021-3A, 1.94% due 08/20/463 | | | 24,585,400 | | | | 21,167,189 | |
MC Ltd. | | | | | | | | |
2021-1, 2.63% due 11/05/353 | | | 9,375,014 | | | | 8,439,459 | |
CLI Funding VIII LLC | | | | | | | | |
2021-1A, 1.64% due 02/18/463 | | | 2,751,204 | | | | 2,440,403 | |
Total Transport-Container | | | 106,725,429 | |
| | | | | | | | | |
SEE NOTES TO FINANCIAL STATEMENTS. | THE GUGGENHEIM FUNDS SEMI-ANNUAL REPORT | 59 |
SCHEDULE OF INVESTMENTS (Unaudited)(continued) | March 31, 2024 |
TOTAL RETURN BOND FUND | |
| | Face
Amount~ | | | Value | |
Collateralized Debt Obligations - 0.4% |
Anchorage Credit Funding 4 Ltd. | | | | | | | | |
2021-4A AR, 2.72% due 04/27/393 | | | 108,854,127 | | | $ | 98,372,966 | |
Anchorage Credit Funding 13 Ltd. | | | | | | | | |
2021-13A A2, 2.80% due 07/27/393 | | | 2,700,000 | | | | 2,410,560 | |
2021-13A C2, 3.65% due 07/27/393 | | | 1,950,000 | | | | 1,628,397 | |
Total Collateralized Debt Obligations | | | 102,411,923 | |
| | | | | | | | | |
Automotive - 0.1% |
Avis Budget Rental Car Funding AESOP LLC | | | | | | | | |
2023-8A, 6.66% due 02/20/303 | | | 12,750,000 | | | | 13,234,578 | |
2023-8A, 6.02% due 02/20/303 | | | 11,000,000 | | | | 11,344,047 | |
2024-3A, 5.58% due 12/20/303 | | | 8,250,000 | | | | 8,228,843 | |
Total Automotive | | | 32,807,468 | |
| | | | | | | | | |
Insurance - 0.1% |
CHEST | | | | | | | | |
7.13% due 03/15/43††† | | | 18,145,000 | | | | 18,374,152 | |
JGWPT XXIII LLC | | | | | | | | |
2011-1A, 4.70% due 10/15/563 | | | 2,076,309 | | | | 2,015,047 | |
JGWPT XXIV LLC | | | | | | | | |
2011-2A, 4.94% due 09/15/563 | | | 1,539,401 | | | | 1,500,759 | |
VICOF 2 | | | | | | | | |
4.00% due 02/22/30††† | | | 601,905 | | | | 578,078 | |
321 Henderson Receivables VI LLC | | | | | | | | |
2010-1A, 5.56% due 07/15/593 | | | 556,762 | | | | 554,098 | |
SPSS | | | | | | | | |
5.14% due 11/15/52†††,7 | | | 141,512 | | | | 129,552 | |
Total Insurance | | | 23,151,686 | |
| | | | | | | | | |
Total Asset-Backed Securities |
(Cost $5,187,525,435) | | | 5,046,297,625 | |
| | | | | | | | | |
U.S. GOVERNMENT SECURITIES†† - 21.2% |
U.S. Treasury Notes |
4.13% due 03/31/31 | | | 1,210,930,000 | | | | 1,204,118,519 | |
3.50% due 01/31/28 | | | 742,300,000 | | | | 720,581,928 | |
4.13% due 06/15/26 | | | 477,680,000 | | | | 472,977,837 | |
3.75% due 12/31/30 | | | 350,000,000 | | | | 340,306,641 | |
4.25% due 02/28/31 | | | 210,000,000 | | | | 210,360,938 | |
4.63% due 03/15/26 | | | 4,900,000 | | | | 4,895,789 | |
3.63% due 03/31/28 | | | 2,770,000 | | | | 2,700,317 | |
2.63% due 05/31/27 | | | 1,550,000 | | | | 1,468,807 | |
1.50% due 01/31/27 | | | 1,200,000 | | | | 1,106,625 | |
4.50% due 11/15/33 | | | 1,046,400 | | | | 1,069,617 | |
2.13% due 05/15/25 | | | 1,100,000 | | | | 1,066,012 | |
4.63% due 09/30/28 | | | 800,000 | | | | 811,531 | |
4.00% due 01/31/29 | | | 700,000 | | | | 692,781 | |
4.00% due 02/15/34 | | | 650,000 | | | | 639,234 | |
4.00% due 01/31/31 | | | 420,000 | | | | 414,487 | |
U.S. Treasury Bonds |
due 05/15/5310,14 | | | 2,171,040,000 | | | | 636,439,812 | |
4.38% due 11/15/39 | | | 480,370,000 | | | | 484,610,764 | |
due 02/15/4611,14 | | | 371,000,000 | | | | 135,238,749 | |
due 05/15/4411,14 | | | 318,000,000 | | | | 125,303,244 | |
due 11/15/5110,14 | | | 275,000,000 | | | | 83,866,978 | |
due 11/15/4411,14 | | | 75,000,000 | | | | 28,844,230 | |
2.88% due 08/15/45 | | | 3,000,000 | | | | 2,335,195 | |
United States Treasury Inflation Indexed Bonds |
0.13% due 10/15/2516 | | | 212,966,656 | | | | 206,694,765 | |
0.13% due 04/15/2516 | | | 206,588,821 | | | | 201,470,060 | |
1.25% due 04/15/2816 | | | 57,673,605 | | | | 56,024,209 | |
1.38% due 07/15/3316 | | | 28,398,780 | | | | 27,253,710 | |
U.S. Treasury Strip Principal |
due 02/15/5110,14 | | | 280,000,000 | | | | 87,484,225 | |
Total U.S. Government Securities |
(Cost $5,241,086,806) | | | | | | | 5,038,777,004 | |
| | | | | | | | | |
60 | THE GUGGENHEIM FUNDS SEMI-ANNUAL REPORT | SEE NOTES TO FINANCIAL STATEMENTS. |
SCHEDULE OF INVESTMENTS (Unaudited)(continued) | March 31, 2024 |
TOTAL RETURN BOND FUND | |
| | Face
Amount~ | | | Value | |
SENIOR FLOATING RATE INTERESTS††,◊ - 2.8% |
Financial - 0.6% |
Higginbotham Insurance Agency, Inc. | | | | | | | | |
10.93% (1 Month Term SOFR + 5.50%, Rate Floor: 6.50%) due 11/24/28††† | | | 50,227,123 | | | $ | 49,783,007 | |
Jane Street Group LLC | | | | | | | | |
7.94% (1 Month Term SOFR + 2.50%, Rate Floor: 2.50%) due 01/26/28 | | | 35,477,740 | | | | 35,486,609 | |
Citadel Securities, LP | | | | | | | | |
7.58% (1 Month Term SOFR + 2.25%, Rate Floor: 2.25%) due 07/29/30 | | | 24,896,335 | | | | 24,863,721 | |
HighTower Holding LLC | | | | | | | | |
9.59% (3 Month Term SOFR + 4.00%, Rate Floor: 4.75%) due 04/21/28 | | | 17,374,108 | | | | 17,374,109 | |
Eisner Advisory Group | | | | | | | | |
9.33% (1 Month Term SOFR + 4.00%, Rate Floor: 4.50%) due 02/22/31 | | | 16,150,000 | | | | 16,190,375 | |
Osaic Holdings, Inc. | | | | | | | | |
due 08/17/28 | | | 4,500,000 | | | | 4,514,895 | |
Total Financial | | | 148,212,716 | |
| | | | | | | | | |
Industrial - 0.6% |
Quikrete Holdings, Inc. | | | | | | | | |
due 03/19/29 | | | 16,500,000 | | | | 16,500,000 | |
due 03/18/31 | | | 11,800,000 | | | | 11,804,956 | |
Mileage Plus Holdings LLC | | | | | | | | |
10.73% (3 Month Term SOFR + 5.25%, Rate Floor: 6.25%) due 06/21/27 | | | 20,166,487 | | | | 20,741,636 | |
EMRLD Borrower, LP | | | | | | | | |
7.79% (3 Month Term SOFR + 2.50%, Rate Floor: 2.50%) due 05/31/30 | | | 18,473,700 | | | | 18,455,226 | |
Clean Harbors, Inc. | | | | | | | | |
due 10/08/28 | | | 18,400,000 | | | | 18,417,296 | |
United Rentals, Inc. | | | | | | | | |
7.08% (1 Month Term SOFR + 1.75%, Rate Floor: 1.75%) due 02/14/31 | | | 17,875,000 | | | | 17,908,605 | |
United Airlines Inc. | | | | | | | | |
8.08% (3 Month Term SOFR + 2.75%, Rate Floor: 2.75%) due 02/15/31 | | | 16,300,000 | | | | 16,297,392 | |
CapStone Acquisition Holdings, Inc. | | | | | | | | |
10.18% (1 Month Term SOFR + 4.75%, Rate Floor: 5.75%) due 11/12/27††† | | | 8,530,543 | | | | 8,486,528 | |
Installed Building Products, Inc. | | | | | | | | |
due 03/21/31 | | | 3,600,000 | | | | 3,597,768 | |
Dispatch Terra Acquisition LLC | | | | | | | | |
9.70% (3 Month Term SOFR + 4.25%, Rate Floor: 5.00%) due 03/27/28 | | | 3,796,305 | | | | 3,516,328 | |
SEE NOTES TO FINANCIAL STATEMENTS. | THE GUGGENHEIM FUNDS SEMI-ANNUAL REPORT | 61 |
SCHEDULE OF INVESTMENTS (Unaudited)(continued) | March 31, 2024 |
TOTAL RETURN BOND FUND | |
| | Face
Amount~ | | | Value | |
Air Canada | | | | | | | | |
7.83% (3 Month Term SOFR + 2.50%, Rate Floor: 2.50%) due 03/14/31 | | | 3,325,000 | | | $ | 3,327,095 | |
Beacon Roofing Supply, Inc. | | | | | | | | |
due 05/19/28 | | | 2,250,000 | | | | 2,250,855 | |
Hillman Group, Inc. | | | | | | | | |
due 07/14/28 | | | 1,800,000 | | | | 1,800,648 | |
Merlin Buyer, Inc. | | | | | | | | |
9.33% (1 Month Term SOFR + 4.00%, Rate Floor: 4.50%) due 12/14/28 | | | 615,913 | | | | 612,833 | |
API Heat Transfer Thermasys Corp. | | | | | | | | |
13.58% (3 Month Term SOFR + 8.00%, Rate Floor: 10.00%) due 11/10/27††† | | | 20,317 | | | | 20,317 | |
10.58% (3 Month Term SOFR + 5.00%, Rate Floor: 7.00%) due 11/10/27††† | | | 11,759 | | | | 11,759 | |
Total Industrial | | | 143,749,242 | |
| | | | | | | | | |
Consumer, Non-cyclical - 0.6% |
Quirch Foods Holdings LLC | | | | | | | | |
10.32% (3 Month Term SOFR + 4.75%, Rate Floor: 5.75%) due 10/27/27 | | | 28,523,160 | | | | 28,558,814 | |
PetIQ LLC | | | | | | | | |
10.17% (6 Month Term SOFR + 4.25%, Rate Floor: 4.75%) due 04/13/28 | | | 27,554,849 | | | | 27,279,300 | |
Mission Veterinary Partners | | | | | | | | |
9.44% (1 Month Term SOFR + 4.00%, Rate Floor: 4.75%) due 04/27/28 | | | 18,817,500 | | | | 18,782,499 | |
Southern Veterinary Partners LLC | | | | | | | | |
9.44% (1 Month Term SOFR + 4.00%, Rate Floor: 5.00%) due 10/05/27 | | | 15,601,376 | | | | 15,601,376 | |
Women’s Care Holdings, Inc. | | | | | | | | |
9.91% (3 Month Term SOFR + 4.50%, Rate Floor: 5.25%) due 01/17/28 | | | 15,635,328 | | | | 13,944,836 | |
Nidda Healthcare Holding GmbH | | | | | | | | |
7.45% (3 Month EURIBOR + 3.50%, Rate Floor: 3.50%) due 08/21/26 | | EUR | 12,766,306 | | | | 13,663,997 | |
Blue Ribbon LLC | | | | | | | | |
11.44% (1 Month Term SOFR + 6.00%, Rate Floor: 6.75%) due 05/08/28 | | | 12,993,750 | | | | 11,298,066 | |
HAH Group Holding Co. LLC | | | | | | | | |
10.44% (1 Month Term SOFR + 5.00%, Rate Floor: 6.00%) due 10/29/27 | | | 4,465,530 | | | | 4,437,620 | |
62 | THE GUGGENHEIM FUNDS SEMI-ANNUAL REPORT | SEE NOTES TO FINANCIAL STATEMENTS. |
SCHEDULE OF INVESTMENTS (Unaudited)(continued) | March 31, 2024 |
TOTAL RETURN BOND FUND | |
| | Face
Amount~ | | | Value | |
Elanco Animal Health, Inc. | | | | | | | | |
7.18% (1 Month Term SOFR + 1.75%, Rate Floor: 1.75%) due 08/02/27 | | | 1,696,643 | | | $ | 1,689,670 | |
Total Consumer, Non-cyclical | | | 135,256,178 | |
| | | | | | | | | |
Technology - 0.4% |
Datix Bidco Ltd. | | | | | | | | |
9.69% (6 Month GBP SONIA + 4.50%, Rate Floor: 5.19%) due 04/28/25††† | | GBP | 45,800,000 | | | | 57,805,657 | |
RLDatix | | | | | | | | |
9.94% (6 Month Term SOFR + 4.50%, Rate Floor: 4.50%) due 04/28/25††† | | | 19,781,561 | | | | 19,781,560 | |
Aston FinCo SARL | | | | | | | | |
9.96% (1 Month GBP SONIA + 4.75%, Rate Floor: 4.75%) due 10/09/26 | | GBP | 5,641,153 | | | | 6,621,489 | |
9.69% (1 Month Term SOFR + 4.25%, Rate Floor: 5.25%) due 10/09/26 | | | 739,718 | | | | 658,216 | |
Iron Mountain Information Management Services, Inc. | | | | | | | | |
7.58% (1 Month Term SOFR + 2.25%, Rate Floor: 2.25%) due 01/31/31 | | | 5,511,188 | | | | 5,460,650 | |
Dun & Bradstreet | | | | | | | | |
8.08% (1 Month Term SOFR + 2.75%, Rate Floor: 2.75%) due 01/18/29 | | | 3,752,070 | | | | 3,750,306 | |
Emerald TopCo, Inc. (Press Ganey) | | | | | | | | |
8.94% (1 Month Term SOFR + 3.50%, Rate Floor: 4.50%) due 07/24/26 | | | 955,686 | | | | 949,512 | |
Total Technology | | | 95,027,390 | |
| | | | | | | | | |
Consumer, Cyclical - 0.4% |
First Brands Group LLC | | | | | | | | |
10.57% (3 Month Term SOFR + 5.00%, Rate Floor: 6.00%) due 03/30/27 | | | 24,050,754 | | | | 24,040,652 | |
MB2 Dental Solutions, LLC | | | | | | | | |
11.32% (1 Month Term SOFR + 6.00%, Rate Floor: 6.75%) due 01/29/31††† | | | 19,922,786 | | | | 19,882,223 | |
Pacific Bells LLC | | | | | | | | |
10.06% (3 Month Term SOFR + 4.50%, Rate Floor: 5.00%) due 11/10/28 | | | 13,895,487 | | | | 13,787,797 | |
BCP V Modular Services Holdings IV Ltd. | | | | | | | | |
8.33% (3 Month EURIBOR + 4.43%, Rate Floor: 4.43%) due 12/15/28 | | EUR | 11,600,000 | | | | 12,392,274 | |
Packers Holdings LLC | | | | | | | | |
8.68% (1 Month Term SOFR + 3.25%, Rate Floor: 4.00%) due 03/09/28 | | | 14,471,042 | | | | 9,171,023 | |
SEE NOTES TO FINANCIAL STATEMENTS. | THE GUGGENHEIM FUNDS SEMI-ANNUAL REPORT | 63 |
SCHEDULE OF INVESTMENTS (Unaudited)(continued) | March 31, 2024 |
TOTAL RETURN BOND FUND | |
| | Face
Amount~ | | | Value | |
Adevinta ASA | | | | | | | | |
6.33% (1 Month EURIBOR + 2.50%, Rate Floor: 2.50%) due 06/26/28 | | EUR | 6,538,889 | | | $ | 7,046,521 | |
Station Casinos LLC | | | | | | | | |
7.58% (1 Month Term SOFR + 2.25%, Rate Floor: 2.25%) due 03/07/31 | | | 2,200,000 | | | | 2,195,754 | |
WW International, Inc. | | | | | | | | |
8.94% (1 Month Term SOFR + 3.50%, Rate Floor: 4.00%) due 04/13/28 | | | 1,395,000 | | | | 609,155 | |
Rent-A-Center, Inc. | | | | | | | | |
9.12% (6 Month Term SOFR + 3.25%, Rate Floor: 3.75%) due 02/17/28 | | | 462,423 | | | | 461,651 | |
Total Consumer, Cyclical | | | 89,587,050 | |
| | | | | | | | | |
Basic Materials - 0.1% |
INEOS Ltd. | | | | | | | | |
6.63% (1 Month EURIBOR + 2.75%, Rate Floor: 2.75%) due 01/29/26 | | EUR | 17,822,962 | | | | 19,143,531 | |
Trinseo Materials Operating S.C.A. | | | | | | | | |
8.10% (3 Month Term SOFR + 2.50%, Rate Floor: 3.50%) due 05/03/28 | | | 10,822,500 | | | | 7,989,494 | |
Arsenal AIC Parent LLC | | | | | | | | |
9.08% (1 Month Term SOFR + 3.75%, Rate Floor: 3.75%) due 08/19/30 | | | 1,880,288 | | | | 1,884,518 | |
Total Basic Materials | | | 29,017,543 | |
| | | | | | | | | |
Energy - 0.1% |
ITT Holdings LLC | | | | | | | | |
8.68% (1 Month Term SOFR + 3.25%, Rate Floor: 3.75%) due 10/11/30 | | | 8,379,000 | | | | 8,383,189 | |
Venture Global Calcasieu Pass LLC | | | | | | | | |
8.05% (1 Month Term SOFR + 2.63%, Rate Floor: 3.63%) due 08/19/26 | | | 6,146,504 | | | | 6,123,455 | |
WhiteWater DBR HoldCo LLC | | | | | | | | |
8.06% (1 Month Term SOFR + 2.75%, Rate Floor: 2.75%) due 02/16/31 | | | 4,600,000 | | | | 4,605,750 | |
Total Energy | | | 19,112,394 | |
| | | | | | | | | |
Communications - 0.0% |
Xplornet Communications, Inc. | | | | | | | | |
9.57% (3 Month Term SOFR + 4.00%, Rate Floor: 4.50%) due 10/02/28 | | | 5,936,493 | | | | 2,687,213 | |
64 | THE GUGGENHEIM FUNDS SEMI-ANNUAL REPORT | SEE NOTES TO FINANCIAL STATEMENTS. |
SCHEDULE OF INVESTMENTS (Unaudited)(continued) | March 31, 2024 |
TOTAL RETURN BOND FUND | |
| | Face
Amount~ | | | Value | |
Zayo Group Holdings, Inc. | | | | | | | | |
8.44% (1 Month Term SOFR + 3.00%, Rate Floor: 3.00%) due 03/09/27 | | | 1,652,094 | | | $ | 1,445,896 | |
Total Communications | | | 4,133,109 | |
| | | | | | | | | |
Utilities - 0.0% |
NRG Energy, Inc. | | | | | | | | |
due 03/26/31 | | | 2,500,000 | | | | 2,495,325 | |
TerraForm Power Operating LLC | | | | | | | | |
7.90% (3 Month Term SOFR + 2.50%, Rate Floor: 3.00%) due 05/21/29 | | | 200,000 | | | | 198,500 | |
Total Utilities | | | 2,693,825 | |
| | | | | | | | | |
Total Senior Floating Rate Interests |
(Cost $690,664,253) | | | 666,789,447 | |
| | | | | | | | | |
FEDERAL AGENCY BONDS†† - 0.9% |
Tennessee Valley Authority |
4.25% due 09/15/65 | | | 138,205,000 | | | | 121,247,385 | |
4.63% due 09/15/60 | | | 42,436,000 | | | | 40,190,584 | |
5.38% due 04/01/56 | | | 9,283,000 | | | | 9,945,648 | |
due 09/15/5311,14 | | | 1,612,000 | | | | 359,529 | |
due 09/15/5511,14 | | | 1,612,000 | | | | 324,705 | |
due 09/15/5611,14 | | | 1,612,000 | | | | 307,605 | |
due 03/15/5711,14 | | | 1,612,000 | | | | 299,855 | |
due 09/15/5711,14 | | | 1,612,000 | | | | 292,301 | |
due 09/15/5811,14 | | | 1,612,000 | | | | 276,826 | |
due 03/15/5911,14 | | | 1,612,000 | | | | 269,838 | |
due 09/15/5911,14 | | | 1,612,000 | | | | 263,025 | |
due 09/15/6011,14 | | | 1,612,000 | | | | 249,028 | |
due 09/15/5411,14 | | | 1,020,000 | | | | 216,196 | |
due 03/15/6111,14 | | | 1,020,000 | | | | 153,589 | |
due 09/15/6111,14 | | | 1,020,000 | | | | 149,704 | |
due 09/15/6211,14 | | | 1,020,000 | | | | 142,228 | |
due 03/15/6311,14 | | | 1,020,000 | | | | 138,630 | |
due 09/15/6311,14 | | | 1,020,000 | | | | 135,124 | |
due 09/15/6411,14 | | | 1,020,000 | | | | 128,376 | |
due 03/15/6511,14 | | | 1,020,000 | | | | 125,130 | |
due 09/15/6511,14 | | | 1,020,000 | | | | 121,965 | |
Tennessee Valley Authority Principal Strips |
due 01/15/4810,14 | | | 38,804,000 | | | | 11,604,375 | |
due 12/15/4210,14 | | | 23,785,000 | | | | 9,222,872 | |
due 01/15/3814 | | | 15,800,000 | | | | 7,954,636 | |
due 09/15/6510,14 | | | 3,500,000 | | | | 418,509 | |
due 09/15/3910,14 | | | 570,000 | | | | 261,750 | |
due 04/01/5610,14 | | | 540,000 | | | | 105,797 | |
Federal Farm Credit Bank |
3.00% due 03/08/32 | | | 4,100,000 | | | | 3,630,214 | |
2.04% due 12/22/45 | | | 2,170,000 | | | | 1,280,044 | |
3.11% due 08/05/48 | | | 1,500,000 | | | | 1,100,034 | |
2.43% due 01/29/37 | | | 720,000 | | | | 568,272 | |
2.90% due 12/09/41 | | | 720,000 | | | | 537,770 | |
2.84% due 06/01/46 | | | 720,000 | | | | 488,107 | |
1.99% due 07/30/40 | | | 300,000 | | | | 197,692 | |
2.60% due 09/06/39 | | | 250,000 | | | | 185,085 | |
2.59% due 12/30/41 | | | 180,000 | | | | 127,453 | |
2.74% due 11/01/39 | | | 144,000 | | | | 108,682 | |
2.59% due 08/24/46 | | | 140,000 | | | | 90,476 | |
3.67% due 02/26/44 | | | 70,000 | | | | 58,351 | |
Freddie Mac |
2.05% due 08/19/50 | | | 2,010,000 | | | | 1,082,518 | |
2.02% due 10/05/45 | | | 720,000 | | | | 421,704 | |
2.25% due 09/15/50 | | | 360,000 | | | | 202,797 | |
Federal Home Loan Bank |
2.45% due 08/16/41 | | | 540,000 | | | | 377,790 | |
3.63% due 06/22/43 | | | 350,000 | | | | 292,148 | |
Total Federal Agency Bonds |
(Cost $326,572,649) | | | | | | | 215,654,347 | |
| | | | | | | | | |
MUNICIPAL BONDS†† - 0.2% |
California - 0.1% |
California Statewide Communities Development Authority Revenue Bonds | | | | | | | | |
7.14% due 08/15/47 | | | 10,500,000 | | | | 11,299,127 | |
California Public Finance Authority Revenue Bonds | | | | | | | | |
3.07% due 10/15/40 | | | 8,000,000 | | | | 6,193,481 | |
2.55% due 01/01/40 | | | 3,600,000 | | | | 2,541,065 | |
SEE NOTES TO FINANCIAL STATEMENTS. | THE GUGGENHEIM FUNDS SEMI-ANNUAL REPORT | 65 |
SCHEDULE OF INVESTMENTS (Unaudited)(continued) | March 31, 2024 |
TOTAL RETURN BOND FUND | |
| | Face
Amount~ | | | Value | |
Oakland Redevelopment Agency Successor Agency Tax Allocation | | | | | | | | |
4.00% due 09/01/39 | | | 1,100,000 | | | $ | 955,606 | |
Hillsborough City School District General Obligation Unlimited | | | | | | | | |
due 09/01/3714 | | | 1,000,000 | | | | 497,050 | |
due 09/01/3914 | | | 1,000,000 | | | | 441,572 | |
Total California | | | 21,927,901 | |
| | | | | | | | | |
Illinois - 0.0% |
State of Illinois General Obligation Unlimited | | | | | | | | |
5.65% due 12/01/38 | | | 4,875,000 | | | | 4,947,833 | |
6.63% due 02/01/35 | | | 1,540,000 | | | | 1,642,340 | |
City of Chicago Illinois General Obligation Unlimited | | | | | | | | |
6.31% due 01/01/44 | | | 4,500,000 | | | | 4,766,232 | |
Total Illinois | | | 11,356,405 | |
| | | | | | | | | |
Mississippi - 0.1% |
Medical Center Educational Building Corp. Revenue Bonds | | | | | | | | |
2.92% due 06/01/41 | | | 11,800,000 | | | | 9,048,010 | |
| | | | | | | | | |
Texas - 0.0% |
Central Texas Turnpike System Revenue Bonds | | | | | | | | |
3.03% due 08/15/41 | | | 3,150,000 | | | | 2,395,849 | |
Central Texas Regional Mobility Authority Revenue Bonds | | | | | | | | |
3.17% due 01/01/41 | | | 3,000,000 | | | | 2,325,441 | |
Tarrant County Cultural Education Facilities Finance Corp. Revenue Bonds | | | | | | | | |
3.42% due 09/01/50 | | | 2,500,000 | | | | 1,771,304 | |
Harris County Cultural Education Facilities Finance Corp. Revenue Bonds | | | | | | | | |
23,0183.34% due 11/15/37 | | | 1,500,000 | | | | 1,226,348 | |
Grand Parkway Transportation Corp. Revenue Bonds | | | | | | | | |
3.31% due 10/01/49 | | | 1,000,000 | | | | 746,772 | |
Total Texas | | | 8,465,714 | |
| | | | | | | | | |
Ohio - 0.0% |
County of Franklin Ohio Revenue Bonds | | | | | | | | |
2.88% due 11/01/50 | | | 4,000,000 | | | | 2,689,653 | |
| | | | | | | | | |
Washington - 0.0% |
Central Washington University Revenue Bonds | | | | | | | | |
6.95% due 05/01/40 | | | 1,750,000 | | | | 1,954,474 | |
| | | | | | | | | |
Oklahoma - 0.0% |
Tulsa Airports Improvement Trust Revenue Bonds | | | | | | | | |
3.10% due 06/01/45 | | | 1,000,000 | | | | 722,730 | |
Oklahoma Development Finance Authority Revenue Bonds | | | | | | | | |
4.65% due 08/15/30 | | | 450,000 | | | | 422,782 | |
Total Oklahoma | | | 1,145,512 | |
| | | | | | | | | |
Total Municipal Bonds |
(Cost $67,115,207) | | | 56,587,669 | |
| | | | | | | | | |
FOREIGN GOVERNMENT DEBT†† - 0.1% |
Panama Government International Bond |
4.50% due 04/16/50 | | | 22,700,000 | | | | 15,294,359 | |
Israel Government International Bond |
5.38% due 03/12/29 | | | 9,800,000 | | | | 9,822,050 | |
Total Foreign Government Debt |
(Cost $35,097,484) | | | | | | | 25,116,409 | |
| | | | | | | | | |
66 | THE GUGGENHEIM FUNDS SEMI-ANNUAL REPORT | SEE NOTES TO FINANCIAL STATEMENTS. |
SCHEDULE OF INVESTMENTS (Unaudited)(continued) | March 31, 2024 |
TOTAL RETURN BOND FUND | |
| | Face
Amount~ | | | Value | |
U.S. TREASURY BILLS†† - 0.0% |
U.S. Treasury Bills |
5.14% due 04/11/2415 | | | 3,200,000 | | | $ | 3,195,343 | |
4.98% due 04/11/2415 | | | 1,800,000 | | | | 1,797,381 | |
5.15% due 04/11/2415 | | | 700,000 | | | | 698,981 | |
Total U.S. Treasury Bills |
(Cost $5,691,750) | | | | | | | 5,691,705 | |
| | | | | | | | | |
SENIOR FIXED RATE INTERESTS††† - 0.0% |
Industrial - 0.0% |
CTL Logistics | | | | | | | | |
2.65% due 10/10/42 | | | 6,719,968 | | | | 5,291,086 | |
Total Senior Fixed Rate Interests |
(Cost $6,719,968) | | | 5,291,086 | |
| | | Notional
Value | | | | | |
OTC OPTIONS PURCHASED†† - 0.0% |
Call Options on: |
Interest Rate Options |
Morgan Stanley Capital Services LLC 10Y-2Y SOFR CMS CAP Expiring June 2024 with strike price of $0.10 | | | USD 510,300,000 | | | | 30,536 | |
Barclays Bank plc 10Y-2Y SOFR CMS CAP Expiring June 2024 with strike price of $0.10 | | | USD 506,250,000 | | | | 30,294 | |
Bank of America, N.A. 10Y-2Y SOFR CMS CAP Expiring June 2024 with strike price of $0.10 | | | USD 253,750,000 | | | | 15,185 | |
Goldman Sachs International 10Y-2Y SOFR CMS CAP Expiring June 2024 with strike price of $0.10 | | | USD 207,200,000 | | | | 12,399 | |
Total Interest Rate Options | | | 88,414 | |
| | | | | | | | | |
Total OTC Options Purchased |
(Cost $6,668,548) | | | | | | | 88,414 | |
| | | | | | | | | |
Total Investments - 97.6% |
(Cost $24,791,803,155) | | $ | 23,177,513,117 | |
Other Assets & Liabilities, net - 2.4% | | | 632,322,134 | |
Total Net Assets - 100.0% | | $ | 23,809,835,251 | |
SEE NOTES TO FINANCIAL STATEMENTS. | THE GUGGENHEIM FUNDS SEMI-ANNUAL REPORT | 67 |
SCHEDULE OF INVESTMENTS (Unaudited)(continued) | March 31, 2024 |
TOTAL RETURN BOND FUND | |
Futures Contracts |
Description | | Number of
Contracts | | | Expiration
Date | | | Notional
Amount | | | Value and
Unrealized
Depreciation** | |
Interest Rate Futures Contracts Purchased† |
3-Month SOFR Futures Contracts | | | 8,747 | | | | Jun 2025 | | | $ | 2,092,391,738 | | | $ | (3,371,924 | ) |
Centrally Cleared Credit Default Swap Agreements Protection Purchased†† |
Counterparty | Exchange | Index | | Protection
Premium
Rate | | | Payment
Frequency | | | Maturity
Date | |
BofA Securities, Inc. | ICE | ITRAXX.EUR.41.V1 | | | 1.00 | % | | | Quarterly | | | | 06/20/29 | |
BofA Securities, Inc. | ICE | CDX.NA.HY.41.V2 | | | 5.00 | % | | | Quarterly | | | | 12/20/28 | |
| | Notional
Amount~ | | | Value | | | Upfront
Premiums
Paid(Received) | | | Unrealized
Appreciation
(Depreciation)** | |
EUR | | | 82,880,000 | | | $ | (1,972,337 | ) | | $ | (2,003,034 | ) | | $ | 30,697 | |
| | | | 140,481,000 | | | | (10,342,284 | ) | | | 491,885 | | | | (10,834,169 | ) |
| | | | | | | $ | (12,314,621 | ) | | $ | (1,511,149 | ) | | $ | (10,803,472 | ) |
Centrally Cleared Interest Rate Swap Agreements†† |
Counterparty | Exchange | Floating
Rate Type | Floating Rate Index | | Fixed Rate | | | Payment
Frequency | | | Maturity
Date | |
BofA Securities, Inc. | CME | Pay | U.S. Secured Overnight Financing Rate | | | 4.48 | % | | | Annually | | | | 11/02/33 | |
BofA Securities, Inc. | CME | Pay | U.S. Secured Overnight Financing Rate | | | 4.51 | % | | | Annually | | | | 10/11/28 | |
BofA Securities, Inc. | CME | Pay | U.S. Secured Overnight Financing Rate | | | 4.35 | % | | | Annually | | | | 10/03/28 | |
BofA Securities, Inc. | CME | Pay | U.S. Secured Overnight Financing Rate | | | 4.50 | % | | | Annually | | | | 11/02/30 | |
BofA Securities, Inc. | CME | Pay | U.S. Secured Overnight Financing Rate | | | 4.99 | % | | | Annually | | | | 10/11/25 | |
BofA Securities, Inc. | CME | Pay | U.S. Secured Overnight Financing Rate | | | 3.55 | % | | | Annually | | | | 02/05/29 | |
BofA Securities, Inc. | CME | Pay | U.S. Secured Overnight Financing Rate | | | 3.75 | % | | | Annually | | | | 02/05/27 | |
68 | THE GUGGENHEIM FUNDS SEMI-ANNUAL REPORT | SEE NOTES TO FINANCIAL STATEMENTS. |
SCHEDULE OF INVESTMENTS (Unaudited)(continued) | March 31, 2024 |
TOTAL RETURN BOND FUND | |
Centrally Cleared Interest Rate Swap Agreements†† (continued) |
Counterparty | Exchange | Floating
Rate Type | Floating Rate Index | | Fixed Rate | | | Payment
Frequency | | | Maturity
Date | |
BofA Securities, Inc. | CME | Pay | U.S. Secured Overnight Financing Rate | | | 3.66 | % | | | Annually | | | | 01/16/29 | |
BofA Securities, Inc. | CME | Pay | U.S. Secured Overnight Financing Rate | | | 3.76 | % | | | Annually | | | | 02/06/29 | |
BofA Securities, Inc. | CME | Pay | U.S. Secured Overnight Financing Rate | | | 3.59 | % | | | Annually | | | | 01/02/28 | |
BofA Securities, Inc. | CME | Pay | U.S. Secured Overnight Financing Rate | | | 3.40 | % | | | Annually | | | | 04/04/28 | |
BofA Securities, Inc. | CME | Pay | U.S. Secured Overnight Financing Rate | | | 2.78 | % | | | Annually | | | | 07/18/27 | |
| | Notional
Amount | | | Value | | | Upfront
Premiums Paid
(Received) | | | Unrealized
Appreciation
(Depreciation)** | |
| | | $ | 1,096,000,000 | | | $ | 55,841,825 | | | $ | 8,667 | | | $ | 55,833,158 | |
| | | | 566,740,000 | | | | 11,243,901 | | | | 2,578 | | | | 11,241,323 | |
| | | | 800,000,000 | | | | 10,583,792 | | | | 3,512 | | | | 10,580,280 | |
| | | | 250,000,000 | | | | 8,488,427 | | | | 1,693 | | | | 8,486,734 | |
| | | | 1,337,210,000 | | | | 4,412,111 | | | | 2,773 | | | | 4,409,338 | |
| | | | 3,000,000 | | | | (58,432 | ) | | | 303 | | | | (58,735 | ) |
| | | | 6,000,000 | | | | (86,071 | ) | | | 298 | | | | (86,369 | ) |
| | | | 240,000,000 | | | | (3,552,871 | ) | | | 1,320 | | | | (3,554,191 | ) |
| | | | 650,000,000 | | | | (6,854,439 | ) | | | 3,126 | | | | (6,857,565 | ) |
| | | | 660,000,000 | | | | (12,189,929 | ) | | | 3,060 | | | | (12,192,989 | ) |
| | | | 900,000,000 | | | | (22,286,097 | ) | | | 3,478 | | | | (22,289,575 | ) |
| | | | 1,803,000,000 | | | | (76,424,086 | ) | | | 5,497 | | | | (76,429,583 | ) |
| | | | | | | $ | (30,881,869 | ) | | $ | 36,305 | | | $ | (30,918,174 | ) |
Forward Foreign Currency Exchange Contracts†† |
Counterparty | | Currency | | | Type | | | Quantity | | | Contract Amount | | | Settlement
Date | | | Unrealized
Appreciation
(Depreciation) | |
Barclays Bank plc | EUR | Sell | | | 134,325,000 | | | | 146,913,174 USD | | | | 04/15/24 | | | $ | 1,902,595 | |
Bank of America, N.A. | GBP | Sell | | | 57,550,000 | | | | 73,620,550 USD | | | | 04/15/24 | | | | 979,475 | |
UBS AG | EUR | Buy | | | 3,411,000 | | | | 3,705,059 USD | | | | 04/15/24 | | | | (22,713 | ) |
Barclays Bank plc | EUR | Buy | | | 16,700,000 | | | | 18,078,572 USD | | | | 04/15/24 | | | | (50,084 | ) |
| | | | | | | | | | | | | | | | | | | | | | | $ | 2,809,273 | |
SEE NOTES TO FINANCIAL STATEMENTS. | THE GUGGENHEIM FUNDS SEMI-ANNUAL REPORT | 69 |
SCHEDULE OF INVESTMENTS (Unaudited)(continued) | March 31, 2024 |
TOTAL RETURN BOND FUND | |
~ | The face amount is denominated in U.S. dollars unless otherwise indicated. |
* | Non-income producing security. |
** | Includes cumulative appreciation (depreciation). Variation margin is reported within the Statement of Assets and Liabilities. |
† | Value determined based on Level 1 inputs, unless otherwise noted — See Note 4. |
†† | Value determined based on Level 2 inputs, unless otherwise noted — See Note 4. |
††† | Value determined based on Level 3 inputs — See Note 4. |
◊ | Variable rate security. Rate indicated is the rate effective at March 31, 2024. In some instances, the effective rate is limited by a minimum rate floor or a maximum rate cap established by the issuer. The settlement status of a position may also impact the effective rate indicated. In some cases, a position may be unsettled at period end and may not have a stated effective rate. In instances where multiple underlying reference rates and spread amounts are shown, the effective rate is based on a weighted average. |
1 | Affiliated issuer. |
2 | Special Purpose Acquisition Company (SPAC). |
3 | Security is a 144A or Section 4(a)(2) security. These securities have been determined to be liquid under guidelines established by the Board of Trustees. The total market value of 144A or Section 4(a)(2) securities is $9,251,599,719 (cost $9,823,754,829), or 38.9% of total net assets. |
4 | Rate indicated is the 7-day yield as of March 31, 2024. |
5 | Perpetual maturity. |
6 | Security has a fixed rate coupon which will convert to a floating or variable rate coupon on a future date. |
7 | Security is a 144A or Section 4(a)(2) security. These securities have been determined to be illiquid and restricted under guidelines established by the Board of Trustees. The total market value of 144A or Section 4(a)(2) illiquid and restricted securities is $115,054,581 (cost $120,065,729), or 0.5% of total net assets — See Note 10. |
8 | Security is in default of interest and/or principal obligations. |
9 | All or a portion of this security has been physically segregated or earmarked in connection with reverse repurchase agreements. At March 31, 2024, the total market value of segregated or earmarked securities was $10,923,750. — see Note 6. |
10 | Security is a principal-only strip. |
11 | Security is an interest-only strip. |
12 | Security is a step up/down bond. The coupon increases or decreases at regular intervals until the bond reaches full maturity. Rate indicated is the rate at March 31, 2024. See table below for additional step information for each security. |
13 | Security has no stated coupon. However, it is expected to receive residual cash flow payments on defined deal dates. |
14 | Zero coupon rate security. |
15 | Rate indicated is the effective yield at the time of purchase. |
16 | Face amount of security is adjusted for inflation. |
17 | Security is unsettled at period end and does not have a stated effective rate. |
| | BofA — Bank of America |
| | CDX.NA.HY.41.V2 — Credit Default Swap North American High Yield Series 41 Index Version 2 |
| | CME — Chicago Mercantile Exchange |
| | CMS — Constant Maturity Swap |
| | CMT — Constant Maturity Treasury |
| | EUR — Euro |
| | EURIBOR — European Interbank Offered Rate |
| | GBP — British Pound |
| | ICE — Intercontinental Exchange |
| | ITRAXX.EUR.41.V1 — iTraxx Europe Series 41 Index Version 2 |
70 | THE GUGGENHEIM FUNDS SEMI-ANNUAL REPORT | SEE NOTES TO FINANCIAL STATEMENTS. |
SCHEDULE OF INVESTMENTS (Unaudited)(continued) | March 31, 2024 |
TOTAL RETURN BOND FUND | |
| | LIBOR — London Interbank Offered Rate |
| | plc — Public Limited Company |
| | REMIC — Real Estate Mortgage Investment Conduit |
| | REIT — Real Estate Investment Trust |
| | SARL — Société à Responsabilité Limitée |
| | SOFR — Secured Overnight Financing Rate |
| | SONIA — Sterling Overnight Index Average |
| | WAC — Weighted Average Coupon |
| | |
| | See Sector Classification in Other Information section. |
SEE NOTES TO FINANCIAL STATEMENTS. | THE GUGGENHEIM FUNDS SEMI-ANNUAL REPORT | 71 |
SCHEDULE OF INVESTMENTS (Unaudited)(continued) | March 31, 2024 |
TOTAL RETURN BOND FUND | |
The following table summarizes the inputs used to value the Fund’s investments at March 31, 2024 (See Note 4 in the Notes to Financial Statements):
Investments in Securities (Assets) | | Level 1
Quoted
Prices | | | Level 2
Significant
Observable
Inputs | | | Level 3
Significant
Unobservable
Inputs | | | Total | |
Common Stocks | | $ | 124,254 | | | $ | — | | | $ | 219,034 | | | $ | 343,288 | |
Preferred Stocks | | | — | | | | 638,807,210 | | | | 49,543,433 | | | | 688,350,643 | |
Warrants | | | 9,134 | | | | — | | | | 104 | | | | 9,238 | |
Mutual Funds | | | 200,573,339 | | | | — | | | | — | | | | 200,573,339 | |
Money Market Funds | | | 267,871,015 | | | | — | | | | — | | | | 267,871,015 | |
Corporate Bonds | | | — | | | | 5,381,681,800 | | | | 356,771,782 | | | | 5,738,453,582 | |
Collateralized Mortgage Obligations | | | — | | | | 5,069,253,255 | | | | 152,365,051 | | | | 5,221,618,306 | |
Asset-Backed Securities | | | — | | | | 4,465,095,029 | | | | 581,202,596 | | | | 5,046,297,625 | |
U.S. Government Securities | | | — | | | | 5,038,777,004 | | | | — | | | | 5,038,777,004 | |
Senior Floating Rate Interests | | | — | | | | 511,018,396 | | | | 155,771,051 | | | | 666,789,447 | |
Federal Agency Bonds | | | — | | | | 215,654,347 | | | | — | | | | 215,654,347 | |
Municipal Bonds | | | — | | | | 56,587,669 | | | | — | | | | 56,587,669 | |
Foreign Government Debt | | | — | | | | 25,116,409 | | | | — | | | | 25,116,409 | |
U.S. Treasury Bills | | | — | | | | 5,691,705 | | | | — | | | | 5,691,705 | |
Senior Fixed Rate Interests | | | — | | | | — | | | | 5,291,086 | | | | 5,291,086 | |
Options Purchased | | | — | | | | 88,414 | | | | — | | | | 88,414 | |
Credit Default Swap Agreements** | | | — | | | | 30,697 | | | | — | | | | 30,697 | |
Interest Rate Swap Agreements** | | | — | | | | 90,550,833 | | | | — | | | | 90,550,833 | |
Forward Foreign Currency Exchange Contracts** | | | — | | | | 2,882,070 | | | | — | | | | 2,882,070 | |
Total Assets | | $ | 468,577,742 | | | $ | 21,501,234,838 | | | $ | 1,301,164,137 | | | $ | 23,270,976,717 | |
Investments in Securities (Liabilities) | | Level 1
Quoted
Prices | | | Level 2
Significant
Observable
Inputs | | | Level 3
Significant
Unobservable
Inputs | | | Total | |
Interest Rate Futures Contracts** | | $ | 3,371,924 | | | $ | — | | | $ | — | | | $ | 3,371,924 | |
Credit Default Swap Agreements** | | | — | | | | 10,834,169 | | | | — | | | | 10,834,169 | |
Interest Rate Swap Agreements** | | | — | | | | 121,469,007 | | | | — | | | | 121,469,007 | |
Forward Foreign Currency Exchange Contracts** | | | — | | | | 72,797 | | | | — | | | | 72,797 | |
Unfunded Loan Commitments (Note 9) | | | — | | | | — | | | | 393,660 | | | | 393,660 | |
Total Liabilities | | $ | 3,371,924 | | | $ | 132,375,973 | | | $ | 393,660 | | | $ | 136,141,557 | |
** | This derivative is reported as unrealized appreciation/depreciation at period end. |
The Fund may hold assets and/or liabilities in which the fair value approximates the carrying amount for financial statement purposes. As of the period end, reverse repurchase agreements of $3,622,770 are categorized as Level 2 within the disclosure hierarchy — See Note 6.
72 | THE GUGGENHEIM FUNDS SEMI-ANNUAL REPORT | SEE NOTES TO FINANCIAL STATEMENTS. |
SCHEDULE OF INVESTMENTS (Unaudited)(continued) | March 31, 2024 |
TOTAL RETURN BOND FUND | |
The following is a summary of significant unobservable inputs used in the fair valuation of assets and liabilities categorized within Level 3 of the fair value hierarchy:
Category | | Ending
Balance at
March 31,
2024 | | | Valuation
Technique | | | Unobservable
Inputs | | | Input
Range | | | Weighted
Average* | |
Assets: | | | | | | | | | | | | | | | | | | | | |
Asset-Backed Securities | | $ | 296,451,767 | | Option adjusted spread off prior month end broker quote | Broker Quote | — | — |
Asset-Backed Securities | | | 200,361,749 | | Yield Analysis | Yield | 3.0%-8.2% | 6.4% |
Asset-Backed Securities | | | 40,423,220 | | Yield Analysis | Yield | 7.2% | — |
Asset-Backed Securities | | | 38,263,455 | | Third Party Pricing | Broker Quote | — | — |
Asset-Backed Securities | | | 5,702,405 | | Model Price | Purchase Price | — | — |
Collateralized Mortgage Obligations | | | 70,534,652 | | Yield Analysis | Yield | 5.6%-5.8% | 6.4% |
Collateralized Mortgage Obligations | | | 55,357,792 | | Option adjusted spread off prior month end broker quote | Broker Quote | — | — |
Collateralized Mortgage Obligations | | | 26,472,607 | | Third Party Pricing | Trade Price | — | — |
Common Stocks | | | 218,103 | | Enterprise Value | Valuation Multiple | 2.9x-8.2x | 5.0x |
Common Stocks | | | 931 | | Model Price | Liquidation Value | — | — |
Corporate Bonds | | | 253,753,299 | | Option adjusted spread off prior month end broker quote | Broker Quote | — | — |
Corporate Bonds | | | 75,817,243 | | Yield Analysis | Yield | 6.2%-6.7% | 6.7% |
Corporate Bonds | | | 16,714,282 | | Third Party Pricing | Broker Quote | — | — |
Corporate Bonds | | | 10,432,609 | | Third Party Pricing | Trade Price | — | — |
Corporate Bonds | | | 54,349 | | Model Price | Purchase Price | — | — |
Preferred Stocks | | | 47,154,160 | | Yield Analysis | Yield | 6.8% | — |
Preferred Stocks | | | 2,389,273 | | Enterprise Value | Valuation Multiple | 5.0x | — |
Senior Fixed Rate Interests | | | 5,291,086 | | Option adjusted spread off prior month end broker quote | Broker Quote | — | — |
Senior Floating Rate Interests | | | 155,738,975 | | Yield Analysis | Yield | 10.3%-11.3% | 10.7% |
Senior Floating Rate Interests | | | 32,076 | | Model Price | Purchase Price | — | — |
Warrants | | | 104 | | Model Price | Liquidation Value | — | — |
Total Assets | | $ | 1,301,164,137 | | | | | |
Liabilities: | | | | | | | | | | | | | | | | | | | | |
Unfunded Loan Commitments | | $ | 393,660 | | Model Price | Purchase Price | — | — |
* | Inputs are weighted by the fair value of the instruments. |
Significant changes in quote, yield, liquidation value or valuation multiple would generally result in significant changes in the fair value of the security.
SEE NOTES TO FINANCIAL STATEMENTS. | THE GUGGENHEIM FUNDS SEMI-ANNUAL REPORT | 73 |
SCHEDULE OF INVESTMENTS (Unaudited)(continued) | March 31, 2024 |
TOTAL RETURN BOND FUND | |
The Fund’s fair valuation leveling guidelines classify a single daily broker quote, or a vendor price based on a single daily or monthly broker quote, as Level 3, if such a quote or price cannot be supported with other available market information.
Transfers between Level 2 and Level 3 may occur as markets fluctuate and/or the availability of data used in an investment’s valuation changes. For the period ended March 31, 2024, the Fund had securities with a total value of $70,534,652 transfer into Level 3 from Level 2 due to a lack of observable inputs and had securities with a total value of $80,089,083 transfer out of Level 3 into Level 2 due to the availability of current and reliable market-based data provided by a third-party pricing service which utilizes significant observable inputs.
Summary of Fair Value Level 3 Activity
Following is a reconciliation of Level 3 assets for which significant unobservable inputs were used to determine fair value for the year ended March 31, 2024:
| | | Assets | |
| | Asset-Backed
Securities | | | Collateralized
Mortgage
Obligations | | | Corporate
Bonds | | | Senior
Floating Rate
Interests | | | Warrants | |
Beginning Balance | | $ | 567,198,526 | | | $ | 94,495,909 | | | $ | 316,972,375 | | | $ | 216,787,942 | | | $ | 104 | |
Purchases/(Receipts) | | | 99,412,232 | | | | 26,900,000 | | | | 26,980,000 | | | | 35,241,417 | | | | — | |
(Sales, maturities and paydowns)/Fundings | | | (79,048,402 | ) | | | (3,141,600 | ) | | | (5,232,692 | ) | | | (73,607,403 | ) | | | — | |
Amortization of premiums/discounts | | | 539,176 | | | | 9,344 | | | | 185,811 | | | | 1,152,320 | | | | — | |
Corporate actions | | | — | | | | — | | | | — | | | | (42,623 | ) | | | — | |
Total realized gains (losses) included in earnings | | | 238,096 | | | | (33,544 | ) | | | (602,100 | ) | | | 260,314 | | | | — | |
Total change in unrealized appreciation (depreciation) included in earnings | | | 6,097,546 | | | | 3,175,495 | | | | 18,468,388 | | | | 3,258,384 | | | | — | |
Transfers into Level 3 | | | — | | | | 70,534,652 | | | | — | | | | — | | | | — | |
Transfers out of Level 3 | | | (13,234,578 | ) | | | (39,575,205 | ) | | | — | | | | (27,279,300 | ) | | | — | |
Ending Balance | | $ | 581,202,596 | | | $ | 152,365,051 | | | $ | 356,771,782 | | | $ | 155,771,051 | | | $ | 104 | |
Net change in unrealized appreciation (depreciation) for investments in Level 3 securities still held at March 31, 2024 | | $ | 5,502,021 | | | $ | 2,759,132 | | | $ | 18,468,388 | | | $ | 3,250,675 | | | $ | — | |
74 | THE GUGGENHEIM FUNDS SEMI-ANNUAL REPORT | SEE NOTES TO FINANCIAL STATEMENTS. |
SCHEDULE OF INVESTMENTS (Unaudited)(continued) | March 31, 2024 |
TOTAL RETURN BOND FUND | |
| | | Assets | | | | | | | Liabilities | |
| | Common
Stocks | | | Preferred
Stocks | | | Senior Fixed
Rate Interests | | | Total Assets | | | Unfunded Loan
Commitments | |
Beginning Balance | | $ | 2,503 | | | $ | 47,610,124 | | | $ | 4,997,084 | | | $ | 1,248,064,567 | | | $ | (151,690 | ) |
Purchases/(Receipts) | | | — | | | | — | | | | — | | | | 188,533,649 | | | | (248,173 | ) |
(Sales, maturities and paydowns)/Fundings | | | — | | | | — | | | | (129,992 | ) | | | (161,160,089 | ) | | | — | |
Amortization of premiums/discounts | | | — | | | | — | | | | — | | | | 1,886,651 | | | | 57,820 | |
Corporate actions | | | 49,860 | | | | (7,237 | ) | | | — | | | | — | | | | — | |
Total realized gains (losses) included in earnings | | | (20,873 | ) | | | — | | | | — | | | | (158,107 | ) | | | 27 | |
Total change in unrealized appreciation (depreciation) included in earnings | | | 187,544 | | | | 1,940,546 | | | | 423,994 | | | | 33,551,897 | | | | (51,644 | ) |
Transfers into Level 3 | | | — | | | | — | | | | — | | | | 70,534,652 | | | | — | |
Transfers out of Level 3 | | | — | | | | — | | | | — | | | | (80,089,083 | ) | | | — | |
Ending Balance | | $ | 219,034 | | | $ | 49,543,433 | | | $ | 5,291,086 | | | $ | 1,301,164,137 | | | $ | (393,660 | ) |
Net change in unrealized appreciation (depreciation) for investments in Level 3 securities still held at March 31, 2024 | | $ | 166,679 | | | $ | 1,937,418 | | | $ | 423,994 | | | $ | 32,508,307 | | | $ | (48,660 | ) |
Step Coupon Bonds
The following table discloses additional information related to step coupon bonds held by the Fund. Certain securities are subject to multiple rate changes prior to maturity. For those securities, a range of rates and corresponding dates have been provided. Rates for all step coupon bonds held by the Fund are scheduled to increase, none are scheduled to decrease.
Name | | Coupon Rate at
Next Reset Date | | | Next Rate
Reset Date | | | Future Reset Rate | | | Future Reset Date | |
Angel Oak Mortgage Trust 2023-2, 4.65% due 10/25/67 | | | 5.65 | % | | | 02/01/27 | | | | — | | | | — | |
Angel Oak Mortgage Trust 2023-2, 4.65% due 10/25/67 | | | 5.65 | % | | | 02/01/27 | | | | — | | | | — | |
Angel Oak Mortgage Trust 2023-1, 4.75% due 09/26/67 | | | 5.75 | % | | | 01/01/27 | | | | — | | | | — | |
Angel Oak Mortgage Trust 2023-1, 4.75% due 09/26/67 | | | 5.75 | % | | | 01/01/27 | | | | — | | | | — | |
Angel Oak Mortgage Trust 2024-3, 4.80% due 11/26/68 | | | 5.80 | % | | | 02/01/28 | | | | — | | | | — | |
Angel Oak Mortgage Trust 2024-3, 4.80% due 11/26/68 | | | 5.80 | % | | | 02/01/28 | | | | — | | | | — | |
Angel Oak Mortgage Trust 2024-2, 5.99% due 01/25/69 | | | 6.93 | % | | | 01/01/28 | | | | — | | | | — | |
Angel Oak Mortgage Trust 2024-2, 6.19% due 01/25/69 | | | 7.13 | % | | | 01/01/28 | | | | — | | | | — | |
Angel Oak Mortgage Trust 2024-2, 6.25% due 01/25/69 | | | 7.25 | % | | | 01/01/28 | | | | — | | | | — | |
SEE NOTES TO FINANCIAL STATEMENTS. | THE GUGGENHEIM FUNDS SEMI-ANNUAL REPORT | 75 |
SCHEDULE OF INVESTMENTS (Unaudited)(continued) | March 31, 2024 |
TOTAL RETURN BOND FUND | |
Name | | Coupon Rate at
Next Reset Date | | | Next Rate
Reset Date | | | Future Reset Rate | | | Future Reset Date | |
BRAVO Residential Funding Trust 2023-NQM2, 4.50% due 05/25/62 | | | 5.50 | % | | | 02/01/27 | | | | — | | | | — | |
BRAVO Residential Funding Trust 2023-NQM2, 4.50% due 05/25/62 | | | 5.50 | % | | | 02/01/27 | | | | — | | | | — | |
BRAVO Residential Funding Trust 2023-NQM2, 4.50% due 05/25/62 | | | 5.50 | % | | | 02/01/27 | | | | — | | | | — | |
BRAVO Residential Funding Trust 2024-NQM1, 6.40% due 12/01/63 | | | 7.40 | % | | | 01/01/28 | | | | — | | | | — | |
BRAVO Residential Funding Trust 2023-NQM5, 7.01% due 06/25/63 | | | 8.01 | % | | | 07/01/27 | | | | — | | | | — | |
BRAVO Residential Funding Trust 2024-NQM3, 6.39% due 03/25/64 | | | 7.39 | % | | | 03/01/28 | | | | — | | | | — | |
BRAVO Residential Funding Trust 2024-NQM3, 6.19% due 03/25/64 | | | 7.19 | % | | | 03/01/28 | | | | — | | | | — | |
BRAVO Residential Funding Trust 2023-NQM6, 7.06% due 09/25/63 | | | 8.06 | % | | | 08/01/27 | | | | — | | | | — | |
BRAVO Residential Funding Trust 2021-C, 1.62% due 03/01/61 | | | 4.62 | % | | | 09/25/24 | | | | 5.62 | % | | | 09/25/25 | |
BRAVO Residential Funding Trust 2022-R1, 3.13% due 01/29/70 | | | 6.13 | % | | | 01/30/25 | | | | — | | | | — | |
BRAVO Residential Funding Trust 2024-NQM3, 6.50% due 03/25/64 | | | 7.50 | % | | | 03/01/28 | | | | — | | | | — | |
Citigroup Mortgage Loan Trust 2022-A, 6.17% due 09/25/62 | | | 9.17 | % | | | 09/25/25 | | | | 10 17 | % | | | 09/25/26 | |
COLT Mortgage Loan Trust 2023-4, 7.62% due 10/25/68 | | | 8.62 | % | | | 10/01/27 | | | | — | | | | — | |
COLT Mortgage Loan Trust 2023-3, 7.18% due 09/25/68 | | | 8.18 | % | | | 09/01/27 | | | | — | | | | — | |
COLT Mortgage Loan Trust 2023-3, 7.58% due 09/25/68 | | | 8.58 | % | | | 09/01/27 | | | | — | | | | — | |
COLT Mortgage Loan Trust 2024-1, 6.14% due 02/25/69 | | | 7.14 | % | | | 01/01/28 | | | | — | | | | — | |
GCAT Trust 2023-NQM3, 6.89% due 08/25/68 | | | 7.89 | % | | | 09/01/27 | | | | — | | | | — | |
GCAT Trust 2023-NQM2, 6.24% due 11/25/67 | | | 7.24 | % | | | 01/01/27 | | | | — | | | | — | |
GCAT Trust 2023-NQM3, 7.34% due 08/25/68 | | | 8.34 | % | | | 09/01/27 | | | | — | | | | — | |
GCAT Trust 2022-NQM5, 5.71% due 08/25/67 | | | 6.71 | % | | | 10/01/26 | | | | — | | | | — | |
GCAT Trust 2022-NQM5, 5.71% due 08/25/67 | | | 6.71 | % | | | 10/01/26 | | | | — | | | | — | |
Legacy Mortgage Asset Trust 2021-GS3, 1.75% due 07/25/61 | | | 4.75 | % | | | 05/25/24 | | | | 5.75 | % | | | 05/25/25 | |
Legacy Mortgage Asset Trust 2021-GS4, 1.65% due 11/25/60 | | | 4.65 | % | | | 08/25/24 | | | | 5.65 | % | | | 08/25/25 | |
76 | THE GUGGENHEIM FUNDS SEMI-ANNUAL REPORT | SEE NOTES TO FINANCIAL STATEMENTS. |
SCHEDULE OF INVESTMENTS (Unaudited)(continued) | March 31, 2024 |
TOTAL RETURN BOND FUND | |
Name | | Coupon Rate at
Next Reset Date | | | Next Rate
Reset Date | | | Future Reset Rate | | | Future Reset Date | |
Legacy Mortgage Asset Trust 2021-GS5, 2.25% due 07/25/67 | | | 5.25 | % | | | 11/25/24 | | | | 6.25 | % | | | 11/25/25 | |
Legacy Mortgage Asset Trust 2021-GS2, 1.75% due 04/25/61 | | | 4.75 | % | | | 04/25/24 | | | | 5.75 | % | | | 04/25/25 | |
NYMT Loan Trust 2022-SP1, 5.25% due 07/25/62 | | | 8.25 | % | | | 07/01/25 | | | | 9.25 | % | | | 07/01/26 | |
OBX Trust 2024-NQM5, due 03/25/28 | | | 7.39 | % | | | 03/01/28 | | | | — | | | | — | |
OBX Trust 2024-NQM5, due 03/25/28 | | | 7.29 | % | | | 03/01/28 | | | | — | | | | — | |
OBX Trust 2024-NQM5, due 03/25/28 | | | 6.99 | % | | | 03/01/28 | | | | — | | | | — | |
OBX Trust 2023-NQM9, 7.66% due 10/25/63 | | | 8.66 | % | | | 10/01/27 | | | | — | | | | — | |
OBX Trust 2024-NQM4, 6.32% due 01/25/64 | | | 7.32 | % | | | 02/01/28 | | | | — | | | | — | |
OBX Trust 2024-NQM4, 6.22% due 01/25/64 | | | 7.22 | % | | | 02/01/28 | | | | — | | | | — | |
OBX Trust 2024-NQM4, 6.07% due 01/25/64 | | | 7.07 | % | | | 02/01/28 | | | | — | | | | — | |
OBX Trust 2022-NQM9, 6.45% due 09/25/62 | | | 7.45 | % | | | 11/01/26 | | | | — | | | | — | |
OBX Trust 2022-NQM9, 6.45% due 09/25/62 | | | 7.45 | % | | | 11/01/26 | | | | — | | | | — | |
OBX Trust 2024-NQM3, 6.33% due 12/25/63 | | | 7.33 | % | | | 02/01/28 | | | | — | | | | — | |
OBX Trust 2024-NQM3, 6.13% due 12/25/63 | | | 7.13 | % | | | 02/01/28 | | | | — | | | | — | |
OBX Trust 2024-NQM2, 6.18% due 12/25/63 | | | 7.18 | % | | | 01/01/28 | | | | — | | | | — | |
OBX Trust 2022-NQM8, 6.10% due 09/25/62 | | | 7.10 | % | | | 10/01/26 | | | | — | | | | — | |
OBX Trust 2023-NQM2, 6.72% due 01/25/62 | | | 7.72 | % | | | 02/01/27 | | | | — | | | | — | |
OBX Trust 2023-NQM2, 6.32% due 01/25/62 | | | 7.32 | % | | | 02/01/27 | | | | — | | | | — | |
OBX Trust 2024-NQM3, 6.43% due 12/25/63 | | | 7.43 | % | | | 02/01/28 | | | | — | | | | — | |
OSAT Trust 2021-RPL1, 2.12% due 05/25/65 | | | 5.12 | % | | | 06/25/24 | | | | 6.12 | % | | | 06/25/25 | |
PRPM LLC 2022-1, 3.72% due 02/25/27 | | | 6.72 | % | | | 02/25/25 | | | | 7.72 | % | | | 02/25/26 | |
PRPM LLC 2021-5, 1.79% due 06/25/26 | | | 4.79 | % | | | 06/25/24 | | | | 5.79 | % | | | 06/25/25 | |
PRPM LLC 2023-RCF1, 4.00% due 06/25/53 | | | 5.00 | % | | | 06/25/27 | | | | — | | | | — | |
SEE NOTES TO FINANCIAL STATEMENTS. | THE GUGGENHEIM FUNDS SEMI-ANNUAL REPORT | 77 |
SCHEDULE OF INVESTMENTS (Unaudited)(continued) | March 31, 2024 |
TOTAL RETURN BOND FUND | |
Name | | Coupon Rate at
Next Reset Date | | | Next Rate
Reset Date | | | Future Reset Rate | | | Future Reset Date | |
Verus Securitization Trust 2023-7, 7.42% due 10/25/68 | | | 8.42 | % | | | 10/01/27 | | | | — | | | | — | |
Verus Securitization Trust 2022-8, 6.13% due 09/25/67 | | | 7.13 | % | | | 10/01/26 | | | | — | | | | — | |
Verus Securitization Trust 2022-8, 6.13% due 09/25/67 | | | 7.13 | % | | | 10/01/26 | | | | — | | | | — | |
Verus Securitization Trust 2023-2, 6.85% due 03/25/68 | | | 7.85 | % | | | 03/01/27 | | | | — | | | | — | |
Verus Securitization Trust 2024-1, 6.12% due 01/25/69 | | | 7.12 | % | | | 01/01/28 | | | | — | | | | — | |
Affiliated Transactions
Investments representing 5% or more of the outstanding voting shares of a company, or control of or by, or common control under Guggenheim Investments (“GI”), result in that company being considered an affiliated issuer, as defined in the 1940 Act.
The Fund may invest in certain of the underlying series of Guggenheim Strategy Funds Trust, including Guggenheim Strategy Fund II and Guggenheim Strategy Fund III (collectively, the “Guggenheim Strategy Funds”), each of which are open-end management investment companies managed by GI. The Guggenheim Strategy Funds, which launched on March 11, 2014, are offered as short term investment options only to mutual funds, trusts, and other accounts managed by GI and/or its affiliates, and are not available to the public. The Guggenheim Strategy Funds pay no investment management fees. The Guggenheim Strategy Funds’ annual report on Form N-CSR dated September 30, 2023 is available publicly or upon request. This information is available from the EDGAR database on the SEC’s website at https://www.sec.gov/Archives/edgar/data/1601445/000182126823000217/gug86449-ncsr.htm. The Fund may invest in certain of the underlying series of Guggenheim Funds Trust, which are open-end management investment companies managed by GI, are available to the public and whose most recent annual report on Form N-CSR is available publicly or upon request.
Transactions during the period ended March 31, 2024, in which the company is an affiliated issuer, were as follows:
Security Name | | Value
09/30/23 | | | Additions | | | Reductions | | | Realized
Gain (Loss) | |
Common Stocks | | | | | | | | | | | | | | | | |
BP Holdco LLC * | | $ | 683 | | | $ | — | | | $ | — | | | $ | — | |
Mutual Funds | | | | | | | | | | | | | | | | |
Guggenheim Limited Duration Fund — Class R6 | | | 120,393,598 | | | | 2,984,864 | | | | — | | | | — | |
Guggenheim Strategy Fund II | | | 28,409,135 | | | | 668,573 | | | | — | | | | — | |
Guggenheim Strategy Fund III | | | 15,326,528 | | | | 418,661 | | | | — | | | | — | |
Guggenheim Ultra Short Duration Fund — Institutional Class | | | 27,908,179 | | | | 793,292 | | | | — | | | | — | |
| | | $ | 192,038,123 | | | $ | 4,865,390 | | | $ | — | | | $ | — | |
78 | THE GUGGENHEIM FUNDS SEMI-ANNUAL REPORT | SEE NOTES TO FINANCIAL STATEMENTS. |
SCHEDULE OF INVESTMENTS (Unaudited)(concluded) | March 31, 2024 |
TOTAL RETURN BOND FUND | |
Security Name | | Change in
Unrealized
Appreciation
(Depreciation) | | | Value
03/31/24 | | | Shares
03/31/24 | | | Investment
Income | |
Common Stocks | | | | | | | | | | | | | | | | |
BP Holdco LLC * | | $ | (38 | ) | | $ | 645 | | | | 532 | | | $ | — | |
Mutual Funds | | | | | | | | | | | | | | | | |
Guggenheim Limited Duration Fund — Class R6 | | | 2,573,868 | | | | 125,952,330 | | | | 5,228,407 | | | | 3,003,473 | |
Guggenheim Strategy Fund II | | | 390,730 | | | | 29,468,438 | | | | 1,197,904 | | | | 814,850 | |
Guggenheim Strategy Fund III | | | 242,308 | | | | 15,987,497 | | | | 648,054 | | | | 420,899 | |
Guggenheim Ultra Short Duration Fund — Institutional Class | | | 463,603 | | | | 29,165,074 | | | | 2,942,994 | | | | 797,878 | |
| | | $ | 3,670,471 | | | $ | 200,573,984 | | | | | | | $ | 5,037,100 | |
* | Non-income producing security. |
SEE NOTES TO FINANCIAL STATEMENTS. | THE GUGGENHEIM FUNDS SEMI-ANNUAL REPORT | 79 |
STATEMENT OF ASSETS AND LIABILITIES (Unaudited) | |
TOTAL RETURN BOND FUND | |
March 31, 2024
Assets: |
Investments in unaffiliated issuers, at value (cost $24,592,817,428) | | $ | 22,976,939,133 | |
Investments in affiliated issuers, at value (cost $198,985,727) | | | 200,573,984 | |
Cash | | | 31,359,300 | |
Segregated cash with broker | | | 78,382,503 | |
Foreign currency, at value (cost $1,808,357) | | | 1,808,369 | |
Unamortized upfront premiums paid on credit default swap agreements | | | 491,885 | |
Unamortized upfront premiums paid on interest rate swap agreements | | | 36,305 | |
Unrealized appreciation on forward foreign currency exchange contracts | | | 2,882,070 | |
Prepaid expenses | | | 370,199 | |
Receivables: |
Securities sold | | | 2,492,766,206 | |
Interest | | | 191,274,039 | |
Fund shares sold | | | 54,099,333 | |
Dividends | | | 1,240,228 | |
Foreign tax reclaims | | | 5,009 | |
Variation margin on credit default swap agreements | | | 3,523 | |
Total assets | | | 26,032,232,086 | |
| | | | | |
Liabilities: |
Unfunded loan commitments, at value (Note 9) (commitment fees received $345,154) | | | 393,660 | |
Reverse repurchase agreements | | | 3,622,770 | |
Segregated cash due to broker | | | 156,000 | |
Unamortized upfront premiums received on credit default swap agreements | | | 2,003,034 | |
Unrealized depreciation on forward foreign currency exchange contracts | | | 72,797 | |
Payable for: |
Securities purchased | | | 2,048,856,046 | |
Variation margin on interest rate swap agreements | | | 76,341,955 | |
Fund shares redeemed | | $ | 52,640,400 | |
Distributions to shareholders | | | 9,037,422 | |
Management fees | | | 5,380,784 | |
Variation margin on futures contracts | | | 1,640,062 | |
Transfer agent fees | | | 645,344 | |
Distribution and service fees | | | 307,530 | |
Protection fees on credit default swap agreements | | | 263,944 | |
Fund accounting/ administration fees | | | 142,698 | |
Swap settlement | | | 104,219 | |
Due to Investment Adviser | | | 24,831 | |
Trustees’ fees* | | | 14,311 | |
Miscellaneous | | | 20,749,028 | |
Total liabilities | | | 2,222,396,835 | |
Net assets | | $ | 23,809,835,251 | |
| | | | | |
Net assets consist of: |
Paid in capital | | $ | 27,940,487,946 | |
Total distributable earnings (loss) | | | (4,130,652,695 | ) |
Net assets | | $ | 23,809,835,251 | |
Class A: |
Net assets | | $ | 456,423,654 | |
Capital shares outstanding | | | 19,401,330 | |
Net asset value per share | | $ | 23.53 | |
Maximum offering price per share (Net asset value divided by 96.00%) | | $ | 24.51 | |
Class C: |
Net assets | | $ | 155,330,990 | |
Capital shares outstanding | | | 6,602,049 | |
Net asset value per share | | $ | 23.53 | |
Class P: |
Net assets | | $ | 374,828,162 | |
Capital shares outstanding | | | 15,937,750 | |
Net asset value per share | | $ | 23.52 | |
Institutional Class: |
Net assets | | $ | 22,549,000,549 | |
Capital shares outstanding | | | 957,680,661 | |
Net asset value per share | | $ | 23.55 | |
Class R6: |
Net assets | | $ | 274,251,896 | |
Capital shares outstanding | | | 11,640,819 | |
Net asset value per share | | $ | 23.56 | |
* | Relates to Trustees not deemed “interested persons” within the meaning of Section 2(a)(19) of the 1940 Act. |
80 | THE GUGGENHEIM FUNDS SEMI-ANNUAL REPORT | SEE NOTES TO FINANCIAL STATEMENTS. |
STATEMENT OF OPERATIONS (Unaudited) |
TOTAL RETURN BOND FUND |
Six Months Ended March 31, 2024
Investment Income: |
Dividends from securities of unaffiliated issuers | | $ | 3,088,079 | |
Dividends from securities of affiliated issuers | | | 5,037,100 | |
Interest | | | 627,746,387 | |
Total investment income | | | 635,871,566 | |
| | | | | |
Expenses: |
Management fees | | | 42,949,055 | |
Distribution and service fees: |
Class A | | | 571,015 | |
Class C | | | 779,922 | |
Class P | | | 480,972 | |
Transfer agent fees: |
Class A | | | 221,287 | |
Class C | | | 25,658 | |
Class P | | | 97,489 | |
Institutional Class | | | 5,541,743 | |
Class R6 | | | 14,284 | |
Interest expense | | | 17,948,765 | |
Fund accounting /administration fees | | | 4,330,161 | |
Professional fees | | | 712,179 | |
Line of credit fees | | | 637,587 | |
Trustees’ fees* | | | 160,125 | |
Custodian fees | | | 42,368 | |
Miscellaneous | | | 931,008 | |
Recoupment of previously waived fees: |
Class A | | | 8,163 | |
Class C | | | 49,565 | |
Class P | | | 84,611 | |
Institutional Class | | | 2,719,879 | |
Class R6 | | | 2,399 | |
Total expenses | | | 78,308,235 | |
Less: |
Expenses reimbursed by Adviser: |
Class A | | | (13,067 | ) |
Class C | | | (143 | ) |
Institutional Class | | | (2,559,383 | ) |
Class R6 | | | (226 | ) |
Expenses waived by Adviser | | $ | (3,696,049 | ) |
Total waived/reimbursed expenses | | | (6,268,868 | ) |
Net expenses | | | 72,039,367 | |
Net investment income | | | 563,832,199 | |
| | | | | |
Net Realized and Unrealized Gain (Loss): |
Net realized gain (loss) on: |
Investments in unaffiliated issuers | | | (405,394,989 | ) |
Investments sold short | | | (154,774 | ) |
Swap agreements | | | (53,225,933 | ) |
Futures contracts | | | (2,582 | ) |
Options purchased | | | (5,938,161 | ) |
Options written | | | (5,798,744 | ) |
Forward foreign currency exchange contracts | | | (2,414,633 | ) |
Foreign currency transactions | | | (271,128 | ) |
Net realized loss | | | (473,200,944 | ) |
Net change in unrealized appreciation (depreciation) on: |
Investments in unaffiliated issuers | | | 1,250,543,318 | |
Investments in affiliated issuers | | | 3,670,471 | |
Swap agreements | | | 107,386,586 | |
Futures contracts | | | (3,371,924 | ) |
Options purchased | | | 2,142,420 | |
Options written | | | 4,635,100 | |
Forward foreign currency exchange contracts | | | (2,641,236 | ) |
Foreign currency translations | | | 173,427 | |
Net change in unrealized appreciation (depreciation) | | | 1,362,538,162 | |
Net realized and unrealized gain | | | 889,337,218 | |
Net increase in net assets resulting from operations | | $ | 1,453,169,417 | |
* | Relates to Trustees not deemed “interested persons” within the meaning of Section 2(a)(19) of the 1940 Act. |
SEE NOTES TO FINANCIAL STATEMENTS. | THE GUGGENHEIM FUNDS SEMI-ANNUAL REPORT | 81 |
STATEMENTS OF CHANGES IN NET ASSETS | |
TOTAL RETURN BOND FUND | |
| | Six Months Ended
March 31, 2024
(Unaudited) | | | Year Ended
September 30,
2023 | |
Increase (Decrease) in Net Assets from Operations: | | | | | | | | |
Net investment income | | $ | 563,832,199 | | | $ | 918,952,851 | |
Net realized loss on investments | | | (473,200,944 | ) | | | (1,472,550,068 | ) |
Net change in unrealized appreciation (depreciation) on investments | | | 1,362,538,162 | | | | 756,084,184 | |
Net increase in net assets resulting from operations | | | 1,453,169,417 | | | | 202,486,967 | |
| | | | | | | | | |
Distributions to shareholders: | | | | | | | | |
Class A | | | (10,327,924 | ) | | | (19,019,129 | ) |
Class C | | | (2,943,113 | ) | | | (6,072,905 | ) |
Class P | | | (8,716,466 | ) | | | (18,625,018 | ) |
Institutional Class | | | (498,156,305 | ) | | | (818,465,001 | ) |
Class R6 | | | (6,170,236 | ) | | | (10,162,965 | ) |
Total distributions to shareholders | | | (526,314,044 | ) | | | (872,345,018 | ) |
| | | | | | | | | |
Capital share transactions: | | | | | | | | |
Proceeds from sale of shares | | | | | | | | |
Class A | | | 87,892,441 | | | | 190,008,832 | |
Class C | | | 19,258,311 | | | | 32,292,309 | |
Class P | | | 45,788,289 | | | | 143,216,250 | |
Institutional Class | | | 5,390,744,951 | | | | 9,905,246,248 | |
Class R6 | | | 60,636,411 | | | | 140,809,681 | |
Distributions reinvested | | | | | | | | |
Class A | | | 8,947,137 | | | | 16,394,524 | |
Class C | | | 2,562,554 | | | | 5,230,841 | |
Class P | | | 8,632,673 | | | | 18,492,403 | |
Institutional Class | | | 443,402,370 | | | | 725,020,898 | |
Class R6 | | | 5,975,902 | | | | 9,871,684 | |
Cost of shares redeemed | | | | | | | | |
Class A | | | (104,923,714 | ) | | | (176,845,859 | ) |
Class C | | | (31,743,187 | ) | | | (72,847,845 | ) |
Class P | | | (90,228,707 | ) | | | (327,848,764 | ) |
Institutional Class | | | (3,959,910,620 | ) | | | (7,698,063,900 | ) |
Class R6 | | | (64,395,277 | ) | | | (90,056,671 | ) |
Net increase from capital share transactions | | | 1,822,639,534 | | | | 2,820,920,631 | |
Net increase in net assets | | | 2,749,494,907 | | | | 2,151,062,580 | |
| | | | | | | | | |
Net assets: | | | | | | | | |
Beginning of period | | | 21,060,340,344 | | | | 18,909,277,764 | |
End of period | | $ | 23,809,835,251 | | | $ | 21,060,340,344 | |
| | | | | | | | | |
82 | THE GUGGENHEIM FUNDS SEMI-ANNUAL REPORT | SEE NOTES TO FINANCIAL STATEMENTS. |
STATEMENTS OF CHANGES IN NET ASSETS (concluded) | |
TOTAL RETURN BOND FUND | |
| | Six Months Ended
March 31, 2024
(Unaudited) | | | Year Ended
September 30,
2023 | |
Capital share activity: | | | | | | | | |
Shares sold | | | | | | | | |
Class A | | | 3,799,218 | | | | 8,094,504 | |
Class C | | | 826,920 | | | | 1,375,517 | |
Class P | | | 1,975,519 | | | | 6,070,940 | |
Institutional Class | | | 232,486,901 | | | | 421,456,679 | |
Class R6 | | | 2,607,148 | | | | 5,994,350 | |
Shares issued from reinvestment of distributions | | | | | | | | |
Class A | | | 385,273 | | | | 702,293 | |
Class C | | | 110,430 | | | | 224,186 | |
Class P | | | 372,117 | | | | 793,085 | |
Institutional Class | | | 19,071,044 | | | | 31,049,191 | |
Class R6 | | | 256,981 | | | | 422,497 | |
Shares redeemed | | | | | | | | |
Class A | | | (4,518,768 | ) | | | (7,564,633 | ) |
Class C | | | (1,371,210 | ) | | | (3,122,803 | ) |
Class P | | | (3,899,673 | ) | | | (14,121,799 | ) |
Institutional Class | | | (172,399,137 | ) | | | (330,170,194 | ) |
Class R6 | | | (2,819,163 | ) | | | (3,874,827 | ) |
Net increase in shares | | | 76,883,600 | | | | 117,328,986 | |
SEE NOTES TO FINANCIAL STATEMENTS. | THE GUGGENHEIM FUNDS SEMI-ANNUAL REPORT | 83 |
FINANCIAL HIGHLIGHTS |
TOTAL RETURN BOND FUND |
This table is presented to show selected data for a share outstanding throughout each period and to assist shareholders in evaluating a Fund’s performance for the periods presented.
Class A | | Six Months Ended
March 31, 2024a | | | Year
Ended
Sept. 30,
2023 | | | Year
Ended
Sept. 30,
2022 | | | Year
Ended
Sept. 30,
2021 | | | Year
Ended
Sept. 30,
2020 | | | Year
Ended
Sept. 30,
2019 | |
Per Share Data |
Net asset value, beginning of period | | $ | 22.52 | | | $ | 23.12 | | | $ | 28.94 | | | $ | 29.76 | | | $ | 27.42 | | | $ | 26.69 | |
Income (loss) from investment operations: |
Net investment income (loss)b | | | .56 | | | | 1.03 | | | | .78 | | | | .72 | | | | .56 | | | | .64 | |
Net gain (loss) on investments (realized and unrealized) | | | .97 | | | | (.65 | ) | | | (5.53 | ) | | | (.05 | ) | | | 2.41 | | | | .85 | |
Total from investment operations | | | 1.53 | | | | .38 | | | | (4.75 | ) | | | .67 | | | | 2.97 | | | | 1.49 | |
Less distributions from: |
Net investment income | | | (.52 | ) | | | (.98 | ) | | | (.80 | ) | | | (.76 | ) | | | (.63 | ) | | | (.65 | ) |
Net realized gains | | | — | | | | — | | | | (.27 | ) | | | (.73 | ) | | | — | | | | (.11 | ) |
Total distributions | | | (.52 | ) | | | (.98 | ) | | | (1.07 | ) | | | (1.49 | ) | | | (.63 | ) | | | (.76 | ) |
Net asset value, end of period | | $ | 23.53 | | | $ | 22.52 | | | $ | 23.12 | | | $ | 28.94 | | | $ | 29.76 | | | $ | 27.42 | |
|
Total Returnc | | | 6.80 | % | | | 1.55 | % | | | (16.82 | %) | | | 2.27 | % | | | 10.96 | % | | | 5.70 | % |
Ratios/Supplemental Data |
Net assets, end of period (in thousands) | | $ | 456,424 | | | $ | 444,454 | | | $ | 427,870 | | | $ | 677,172 | | | $ | 804,750 | | | $ | 609,602 | |
Ratios to average net assets: |
Net investment income (loss) | | | 4.85 | % | | | 4.40 | % | | | 2.94 | % | | | 2.47 | % | | | 1.99 | % | | | 2.37 | % |
Total expensesd | | | 0.97 | % | | | 0.96 | % | | | 0.85 | % | | | 0.84 | % | | | 0.87 | % | | | 0.96 | % |
Net expensese,f,g | | | 0.93 | % | | | 0.91 | % | | | 0.81 | % | | | 0.79 | % | | | 0.80 | % | | | 0.80 | % |
Portfolio turnover rate | | | 39 | % | | | 90 | % | | | 55 | % | | | 92 | % | | | 116 | % | | | 68 | % |
84 | THE GUGGENHEIM FUNDS SEMI-ANNUAL REPORT | SEE NOTES TO FINANCIAL STATEMENTS. |
FINANCIAL HIGHLIGHTS (continued) |
TOTAL RETURN BOND FUND |
This table is presented to show selected data for a share outstanding throughout each period and to assist shareholders in evaluating a Fund’s performance for the periods presented.
Class C | | Six Months Ended
March 31, 2024a | | | Year
Ended
Sept. 30,
2023 | | | Year
Ended
Sept. 30,
2022 | | | Year
Ended
Sept. 30,
2021 | | | Year
Ended
Sept. 30,
2020 | | | Year
Ended
Sept. 30,
2019 | |
Per Share Data |
Net asset value, beginning of period | | $ | 22.52 | | | $ | 23.13 | | | $ | 28.94 | | | $ | 29.76 | | | $ | 27.43 | | | $ | 26.69 | |
Income (loss) from investment operations: |
Net investment income (loss)b | | | .47 | | | | .86 | | | | .58 | | | | .50 | | | | .35 | | | | .43 | |
Net gain (loss) on investments (realized and unrealized) | | | .98 | | | | (.67 | ) | | | (5.52 | ) | | | (.05 | ) | | | 2.40 | | | | .87 | |
Total from investment operations | | | 1.45 | | | | .19 | | | | (4.94 | ) | | | .45 | | | | 2.75 | | | | 1.30 | |
Less distributions from: |
Net investment income | | | (.44 | ) | | | (.80 | ) | | | (.60 | ) | | | (.54 | ) | | | (.42 | ) | | | (.45 | ) |
Net realized gains | | | — | | | | — | | | | (.27 | ) | | | (.73 | ) | | | — | | | | (.11 | ) |
Total distributions | | | (.44 | ) | | | (.80 | ) | | | (.87 | ) | | | (1.27 | ) | | | (.42 | ) | | | (.56 | ) |
Net asset value, end of period | | $ | 23.53 | | | $ | 22.52 | | | $ | 23.13 | | | $ | 28.94 | | | $ | 29.76 | | | $ | 27.43 | |
|
Total Returnc | | | 6.40 | % | | | 0.74 | % | | | (17.41 | %) | | | 1.50 | % | | | 10.10 | % | | | 4.95 | % |
Ratios/Supplemental Data |
Net assets, end of period (in thousands) | | $ | 155,331 | | | $ | 158,466 | | | $ | 197,933 | | | $ | 327,712 | | | $ | 338,656 | | | $ | 286,050 | |
Ratios to average net assets: |
Net investment income (loss) | | | 4.10 | % | | | 3.65 | % | | | 2.18 | % | | | 1.72 | % | | | 1.24 | % | | | 1.62 | % |
Total expensesd | | | 1.72 | % | | | 1.72 | % | | | 1.63 | % | | | 1.59 | % | | | 1.59 | % | | | 1.60 | % |
Net expensese,f,g | | | 1.69 | % | | | 1.66 | % | | | 1.56 | % | | | 1.53 | % | | | 1.55 | % | | | 1.55 | % |
Portfolio turnover rate | | | 39 | % | | | 90 | % | | | 55 | % | | | 92 | % | | | 116 | % | | | 68 | % |
SEE NOTES TO FINANCIAL STATEMENTS. | THE GUGGENHEIM FUNDS SEMI-ANNUAL REPORT | 85 |
FINANCIAL HIGHLIGHTS (continued) |
TOTAL RETURN BOND FUND |
This table is presented to show selected data for a share outstanding throughout each period and to assist shareholders in evaluating a Fund’s performance for the periods presented.
Class P | | Six Months Ended
March 31, 2024a | | | Year
Ended
Sept. 30,
2023 | | | Year
Ended
Sept. 30,
2022 | | | Year
Ended
Sept. 30,
2021 | | | Year
Ended
Sept. 30,
2020 | | | Year
Ended
Sept. 30,
2019 | |
Per Share Data |
Net asset value, beginning of period | | $ | 22.51 | | | $ | 23.12 | | | $ | 28.93 | | | $ | 29.75 | | | $ | 27.42 | | | $ | 26.69 | |
Income (loss) from investment operations: |
Net investment income (loss)b | | | .56 | | | | 1.03 | | | | .77 | | | | .72 | | | | .56 | | | | .63 | |
Net gain (loss) on investments (realized and unrealized) | | | .97 | | | | (.66 | ) | | | (5.51 | ) | | | (.05 | ) | | | 2.40 | | | | .86 | |
Total from investment operations | | | 1.53 | | | | .37 | | | | (4.74 | ) | | | .67 | | | | 2.96 | | | | 1.49 | |
Less distributions from: |
Net investment income | | | (.52 | ) | | | (.98 | ) | | | (.80 | ) | | | (.76 | ) | | | (.63 | ) | | | (.65 | ) |
Net realized gains | | | — | | | | — | | | | (.27 | ) | | | (.73 | ) | | | — | | | | (.11 | ) |
Total distributions | | | (.52 | ) | | | (.98 | ) | | | (1.07 | ) | | | (1.49 | ) | | | (.63 | ) | | | (.76 | ) |
Net asset value, end of period | | $ | 23.52 | | | $ | 22.51 | | | $ | 23.12 | | | $ | 28.93 | | | $ | 29.75 | | | $ | 27.42 | |
|
Total Return | | | 6.80 | % | | | 1.51 | % | | | (16.79 | %) | | | 2.27 | % | | | 10.92 | % | | | 5.70 | % |
Ratios/Supplemental Data |
Net assets, end of period (in thousands) | | $ | 374,828 | | | $ | 393,752 | | | $ | 572,113 | | | $ | 1,043,507 | | | $ | 926,745 | | | $ | 819,770 | |
Ratios to average net assets: |
Net investment income (loss) | | | 4.85 | % | | | 4.41 | % | | | 2.90 | % | | | 2.47 | % | | | 1.98 | % | | | 2.37 | % |
Total expensesd | | | 0.97 | % | | | 1.06 | % | | | 0.93 | % | | | 0.87 | % | | | 0.88 | % | | | 0.87 | % |
Net expensese,f,g | | | 0.93 | % | | | 0.91 | % | | | 0.81 | % | | | 0.79 | % | | | 0.80 | % | | | 0.80 | % |
Portfolio turnover rate | | | 39 | % | | | 90 | % | | | 55 | % | | | 92 | % | | | 116 | % | | | 68 | % |
86 | THE GUGGENHEIM FUNDS SEMI-ANNUAL REPORT | SEE NOTES TO FINANCIAL STATEMENTS. |
FINANCIAL HIGHLIGHTS (continued) |
TOTAL RETURN BOND FUND | |
This table is presented to show selected data for a share outstanding throughout each period and to assist shareholders in evaluating a Fund’s performance for the periods presented.
Institutional Class | | Six Months Ended
March 31, 2024a | | | Year
Ended
Sept. 30,
2023 | | | Year
Ended
Sept. 30,
2022 | | | Year
Ended
Sept. 30,
2021 | | | Year
Ended
Sept. 30,
2020 | | | Year
Ended
Sept. 30,
2019 | |
Per Share Data |
Net asset value, beginning of period | | $ | 22.54 | | | $ | 23.14 | | | $ | 28.97 | | | $ | 29.78 | | | $ | 27.45 | | | $ | 26.71 | |
Income (loss) from investment operations: |
Net investment income (loss)b | | | .60 | | | | 1.10 | | | | .86 | | | | .81 | | | | .65 | | | | .71 | |
Net gain (loss) on investments (realized and unrealized) | | | .97 | | | | (.66 | ) | | | (5.54 | ) | | | (.05 | ) | | | 2.39 | | | | .87 | |
Total from investment operations | | | 1.57 | | | | .44 | | | | (4.68 | ) | | | .76 | | | | 3.04 | | | | 1.58 | |
Less distributions from: |
Net investment income | | | (.56 | ) | | | (1.04 | ) | | | (.88 | ) | | | (.84 | ) | | | (.71 | ) | | | (.73 | ) |
Net realized gains | | | — | | | | — | | | | (.27 | ) | | | (.73 | ) | | | — | | | | (.11 | ) |
Total distributions | | | (.56 | ) | | | (1.04 | ) | | | (1.15 | ) | | | (1.57 | ) | | | (.71 | ) | | | (.84 | ) |
Net asset value, end of period | | $ | 23.55 | | | $ | 22.54 | | | $ | 23.14 | | | $ | 28.97 | | | $ | 29.78 | | | $ | 27.45 | |
|
Total Return | | | 6.95 | % | | | 1.84 | % | | | (16.59 | %) | | | 2.59 | % | | | 11.23 | % | | | 6.03 | % |
Ratios/Supplemental Data |
Net assets, end of period (in thousands) | | $ | 22,549,001 | | | $ | 19,802,142 | | | $ | 17,501,690 | | | $ | 24,912,049 | | | $ | 19,152,857 | | | $ | 12,138,270 | |
Ratios to average net assets: |
Net investment income (loss) | | | 5.14 | % | | | 4.69 | % | | | 3.23 | % | | | 2.76 | % | | | 2.29 | % | | | 2.64 | % |
Total expensesd | | | 0.69 | % | | | 0.71 | % | | | 0.62 | % | | | 0.57 | % | | | 0.57 | % | | | 0.58 | % |
Net expensese,f,g | | | 0.64 | % | | | 0.62 | % | | | 0.52 | % | | | 0.50 | % | | | 0.51 | % | | | 0.51 | % |
Portfolio turnover rate | | | 39 | % | | | 90 | % | | | 55 | % | | | 92 | % | | | 116 | % | | | 68 | % |
SEE NOTES TO FINANCIAL STATEMENTS. | THE GUGGENHEIM FUNDS SEMI-ANNUAL REPORT | 87 |
FINANCIAL HIGHLIGHTS (continued) |
TOTAL RETURN BOND FUND | |
This table is presented to show selected data for a share outstanding throughout each period and to assist shareholders in evaluating a Fund’s performance for the periods presented.
Class R6 | | Six Months Ended
March 31, 2024a | | | Year
Ended
Sept. 30,
2023 | | | Year
Ended
Sept. 30,
2022 | | | Year
Ended
Sept. 30,
2021 | | | Year
Ended
Sept. 30,
2020 | | | Year
Ended
Sept. 30,
2019 | |
Per Share Data |
Net asset value, beginning of period | | $ | 22.55 | | | $ | 23.16 | | | $ | 28.98 | | | $ | 29.80 | | | $ | 27.46 | | | $ | 26.73 | |
Income (loss) from investment operations: |
Net investment income (loss)b | | | .60 | | | | 1.11 | | | | .87 | | | | .81 | | | | .65 | | | | .71 | |
Net gain (loss) on investments (realized and unrealized) | | | .97 | | | | (.67 | ) | | | (5.54 | ) | | | (.06 | ) | | | 2.40 | | | | .86 | |
Total from investment operations | | | 1.57 | | | | .44 | | | | (4.67 | ) | | | .75 | | | | 3.05 | | | | 1.57 | |
Less distributions from: |
Net investment income | | | (.56 | ) | | | (1.05 | ) | | | (.88 | ) | | | (.84 | ) | | | (.71 | ) | | | (.73 | ) |
Net realized gains | | | — | | | | — | | | | (.27 | ) | | | (.73 | ) | | | — | | | | (.11 | ) |
Total distributions | | | (.56 | ) | | | (1.05 | ) | | | (1.15 | ) | | | (1.57 | ) | | | (.71 | ) | | | (.84 | ) |
Net asset value, end of period | | $ | 23.56 | | | $ | 22.55 | | | $ | 23.16 | | | $ | 28.98 | | | $ | 29.80 | | | $ | 27.46 | |
|
Total Return | | | 6.96 | % | | | 1.84 | % | | | (16.55 | %) | | | 2.56 | % | | | 11.26 | % | | | 5.99 | % |
Ratios/Supplemental Data |
Net assets, end of period (in thousands) | | $ | 274,252 | | | $ | 261,527 | | | $ | 209,671 | | | $ | 247,051 | | | $ | 167,409 | | | $ | 55,441 | |
Ratios to average net assets: |
Net investment income (loss) | | | 5.18 | % | | | 4.73 | % | | | 3.26 | % | | | 2.76 | % | | | 2.28 | % | | | 2.64 | % |
Total expensesd | | | 0.63 | % | | | 0.62 | % | | | 0.53 | % | | | 0.50 | % | | | 0.52 | % | | | 0.52 | % |
Net expensese,f,g | | | 0.60 | % | | | 0.58 | % | | | 0.52 | % | | | 0.50 | % | | | 0.51 | % | | | 0.51 | % |
Portfolio turnover rate | | | 39 | % | | | 90 | % | | | 55 | % | | | 92 | % | | | 116 | % | | | 68 | % |
88 | THE GUGGENHEIM FUNDS SEMI-ANNUAL REPORT | SEE NOTES TO FINANCIAL STATEMENTS. |
FINANCIAL HIGHLIGHTS (concluded) |
TOTAL RETURN BOND FUND | |
a | Unaudited figures for the period ended March 31, 2024. Percentage amounts for the period, except total return and portfolio turnover rate, have been annualized. |
b | Net investment income (loss) per share was computed using average shares outstanding throughout the period. |
c | Total return does not reflect the impact of any applicable sales charges. |
d | Does not include expenses of the underlying funds in which the Fund invests. |
e | Net expense information reflects the expense ratios after expense waivers and reimbursements, as applicable. |
f | The portion of the ratios of net expenses to average net assets attributable to recoupments of prior fee reductions or expense reimbursements for the years presented was as follows: |
| | | 03/31/24a | 09/30/23 | 09/30/22 | 09/30/21 | 09/30/20 | 09/30/19 |
| | Class A | 0.00%* | 0.01% | 0.01% | 0.00%* | 0.00%* | — |
| | Class C | 0.06% | 0.02% | — | 0.00%* | 0.00%* | — |
| | Class P | 0.04% | 0.00%* | — | — | 0.00%* | 0.00%* |
| | Institutional Class | 0.03% | 0.00%* | — | — | 0.00%* | — |
| | Class R6 | 0.00%* | 0.00%* | 0.01% | 0.01% | 0.00%* | 0.00%* |
g | Net expenses may include expenses that are excluded from the expense limitation agreement. Excluding these expenses, the net expense ratios for the years presented would be: |
| | | 03/31/24a | 09/30/23 | 09/30/22 | 09/30/21 | 09/30/20 | 09/30/19 |
| | Class A | 0.76% | 0.76% | 0.77% | 0.78% | 0.79% | 0.79% |
| | Class C | 1.51% | 1.52% | 1.52% | 1.53% | 1.54% | 1.54% |
| | Class P | 0.76% | 0.76% | 0.77% | 0.78% | 0.79% | 0.79% |
| | Institutional Class | 0.47% | 0.47% | 0.48% | 0.49% | 0.50% | 0.50% |
| | Class R6 | 0.43% | 0.43% | 0.48% | 0.49% | 0.50% | 0.50% |
SEE NOTES TO FINANCIAL STATEMENTS. | THE GUGGENHEIM FUNDS SEMI-ANNUAL REPORT | 89 |
NOTES TO FINANCIAL STATEMENTS (Unaudited) |
Note 1 – Organization and Significant Accounting Policies
Organization
Guggenheim Funds Trust (the “Trust”), a Delaware statutory trust, is registered with the U.S. Securities and Exchange Commission (the “SEC”) under the Investment Company Act of 1940 (the “1940 Act”), as an open-ended investment company of the series type. Each series, in effect, is representing a separate fund. The Trust may issue an unlimited number of authorized shares. The Trust accounts for the assets of each fund separately.
The Trust offers a combination of five separate classes of shares: Class A shares, Class C shares, Class P shares, Class R6 shares and Institutional Class shares. Sales of shares of each Class are made without a front-end sales charge at the net asset value per share (“NAV”), with the exception of Class A shares. Class A shares are sold at the NAV, plus the applicable front-end sales charge. The sales charge varies depending on the amount purchased. Class A share purchases of $1 million or more are exempt from the front-end sales charge but have a 1% contingent deferred sales charge (“CDSC”), if shares are redeemed within 12 months of purchase. Class C shares have a 1% CDSC if shares are redeemed within 12 months of purchase. Class C shares automatically convert to Class A shares on or about the 10th day of the month following the 8-year anniversary of the purchase of the Class C shares. This conversion will be executed without any sales charge, fee or other charge. After the conversion is completed, the shares will be subject to all features and expenses of Class A shares. Institutional Class shares are offered primarily for direct investment by institutions such as pension and profit sharing plans, endowments, foundations and corporations. Institutional Class shares require a minimum initial investment of $2 million and a minimum account balance of $1 million. Class R6 shares are offered primarily through qualified retirement and benefit plans. Class R6 shares are also offered through certain other plans and platforms sponsored by financial intermediaries. Certain institutional investors and others deemed appropriate by Guggenheim Investments (“GI” or the “Adviser”) may also be eligible to purchase Class R6 shares subject to a $2 million minimum initial investment. At March 31, 2024, the Trust consisted of eighteen funds (the “Funds”).
This report covers the Total Return Bond Fund (the “Fund”), a Diversified investment company. At September 30, 2023, Class A, Class C, Class P, Institutional Class and Class R6 shares have been issued by the Fund.
Guggenheim Partners Investment Mangagement, LLC (“GPIM” or “the Adviser”), which operates under the name Guggenheim Investments (“GI”), provides advisory services. Guggenheim Funds Distributors, LLC (“GFD”) serves as distributor for the Trust. GI and GFD are affiliated entities.
Significant Accounting Policies
The Fund operates as an investment company and, accordingly, follows the investment company accounting and reporting guidance of the Financial Accounting Standards Board (“FASB”) Accounting Standards Codification Topic 946 Financial Services – Investment Companies.
90 | THE GUGGENHEIM FUNDS SEMI-ANNUAL REPORT | |
NOTES TO FINANCIAL STATEMENTS (Unaudited)(continued) |
The following significant accounting policies are in conformity with U.S. generally accepted accounting principles (“U.S. GAAP”) and are consistently followed by the Trust. This requires management to make estimates and assumptions that affect the reported amount of assets and liabilities, contingent assets and liabilities at the date of the financial statements, and the reported amounts of revenues and expenses during the reporting period. Actual results could differ from these estimates. All time references are based on Eastern Time.
The NAV of each share class of the Fund is calculated by dividing the market value of the Fund’s securities and other assets, less all liabilities attributable to the share class by the number of outstanding shares of the share class on the specified date.
(a) Valuation of Investments
The Board of Trustees of the Fund (the “Board”) adopted policies and procedures for the valuation of the Fund’s investments (the “Fund Valuation Procedures”). The SEC adopted Rule 2a-5 under the 1940 Act (“Rule 2a-5”) which establishes requirements for determining fair value in good faith. Rule 2a-5 also defines “readily available market quotations” for purposes of the 1940 Act and establishes requirements for determining whether a fund must fair value a security in good faith.
Pursuant to Rule 2a-5, the Board has designated the Adviser as the valuation designee to perform fair valuation determinations for the Fund with respect to all Fund investments and other assets. As the Fund’s valuation designee pursuant to Rule 2a-5, the Adviser has adopted separate procedures (the “Valuation Designee Procedures” and collectively with the Fund Valuation Procedures, the “Valuation Procedures”) reasonably designed to prevent violations of the requirements of Rule 2a-5 and Rule 31a-4. The Adviser, in its role as valuation designee, utilizes the assistance of a valuation committee, consisting of representatives from Guggenheim’s investment management, fund administration, legal and compliance departments (the “Valuation Committee”), in determining the fair value of the Fund’s securities and other assets.
Valuations of the Fund’s securities and other assets are supplied primarily by pricing service providers appointed pursuant to the processes set forth in the Valuation Procedures. The Adviser, with the assistance of the Valuation Committee, convenes monthly, or more frequently as needed, to review the valuation of all assets which have been fair valued. The Adviser, consistent with the monitoring and review responsibilities set forth in the Valuation Procedures, regularly reviews the appropriateness of the inputs, methods, models and assumptions employed by the pricing service provider.
If the pricing service provider cannot or does not provide a valuation for a particular investment or such valuation is deemed unreliable, such investment is fair valued by the Adviser.
| | THE GUGGENHEIM FUNDS SEMI-ANNUAL REPORT | 91 |
NOTES TO FINANCIAL STATEMENTS (Unaudited)(continued) |
Equity securities listed or traded on a recognized U.S. securities exchange or the Nasdaq Stock Market (“NASDAQ”) will generally be valued on the basis of the last sale price on the primary U.S. exchange or market on which the security is listed or traded; provided, however, that securities listed on NASDAQ will be valued at the NASDAQ official closing price, which may not necessarily represent the last sale price.
Generally, trading in foreign securities markets is substantially completed each day at various times prior to the close of the New York Stock Exchange (“NYSE”). The values of foreign securities are determined as of the close of such foreign markets or the close of the NYSE, if earlier. All investments quoted in foreign currencies are valued in U.S. dollars on the basis of the foreign currency exchange rates prevailing at the close of U.S. business at 4:00 p.m. Investments in foreign securities may involve risks not present in domestic investments. The Adviser will determine the current value of such foreign securities by taking into consideration certain factors which may include the following factors, among others: the value of the securities traded on other foreign markets, American Depositary Receipts (“ADR”) trading, closed-end fund trading, foreign currency exchange activity, and the trading prices of financial products that are tied to foreign securities. In addition, under the Valuation Procedures, the Adviser is authorized to use prices and other information supplied by a pricing service provider in valuing foreign securities.
Open-end investment companies are valued at their NAV as of the close of business, on the valuation date. Exchange-traded funds and closed-end investment companies are generally valued at the last quoted sale price.
U.S. Government securities are valued by pricing service providers, using the last traded fill price, or at the reported bid price at the close of business on the valuation date.
CLOs, CDOs, MBS, ABS, and other structured finance securities are generally valued using a pricing service provider.
Commercial paper and discount notes with a maturity of greater than 60 days at acquisition are valued at prices that reflect broker-dealer supplied valuations or are obtained from pricing service providers, which may consider the trade activity, treasury spreads, yields or price of bonds of comparable quality, coupon, maturity, and type, as well as prices quoted by dealers who make markets in such securities. Commercial paper and discount notes with a maturity of 60 days or less at acquisition are valued at amortized cost, unless the Adviser concludes that amortized cost does not represent the fair value of the applicable asset in which case it will be valued using an independent pricing service provider.
Typically, loans are valued using information provided by pricing service provider which uses broker quotes, among other inputs. If the pricing service cannot or does not provide a valuation for a particular loan, or such valuation is deemed unreliable, such investment is valued based on a quote from a broker-dealer or is fair valued by the Adviser.
92 | THE GUGGENHEIM FUNDS SEMI-ANNUAL REPORT | |
NOTES TO FINANCIAL STATEMENTS (Unaudited)(continued) |
Exchange-traded options are valued at the mean of the bid and ask prices on the principal exchange on which they are traded. Over-the-counter (“OTC”) options and options on swaps (“swaptions”) are valued using a price provided by a pricing service.
Futures contracts are valued on the basis of the last sale price as of 4:00 p.m. on the valuation date. In the event that the exchange for a specific futures contract closes earlier than 4:00 p.m., the futures contract is valued at the official settlement price of the exchange. However, the underlying securities from which the futures contract value is derived are monitored until 4:00 p.m. to determine if fair valuation of the underlying securities would provide a more accurate valuation of the futures contract.
Interest rate swap agreements entered into by the Fund is valued on the basis of the last sale price on the primary exchange on which the swap is traded.
Swap agreements entered into by the Fund are generally valued using an evaluated price provided by a pricing service provider.
Forward foreign currency exchange contracts are valued daily based on the applicable exchange rate of the underlying currency.
Investments for which market quotations are not readily available are fair valued as determined in good faith by the Adviser. Valuations in accordance with these methods are intended to reflect each security’s (or asset’s or liability’s) “fair value”. Each such determination is based on a consideration of all relevant factors, which are likely to vary from one pricing context to another. Examples of such factors may include, but are not limited to market prices; sale prices; broker quotes; and models which derive prices based on inputs such as prices of securities with comparable maturities and characteristics, or based on inputs such as anticipated cash flows or collateral, spread over U.S. Treasury securities, and other information analysis. In connection with futures contracts and other derivative investments, such factors may include obtaining information as to how (a) these contracts and other derivative investments trade in the futures or other derivative markets, respectively, and (b) the securities underlying these contracts and other derivative investments trade in the cash market.
(b) U.S. Government and Agency Obligations
Certain U.S. Government and Agency Obligations are traded on a discount basis; the interest rates shown on the Schedule of Investments reflect the effective rates paid at the time of purchase by the Fund. Other securities bear interest at the rates shown, payable at fixed dates through maturity.
Inflation-Indexed bonds are fixed-income securities whose principal value is periodically adjusted to the rate of inflation. The interest rate on these securities is generally fixed at issuance at a rate lower thanbonds which are not inflation-indexed. Over the life of an inflation-indexed bond however, interest will be paid based on a principal value which is adjusted for inflation. Any
| | THE GUGGENHEIM FUNDS SEMI-ANNUAL REPORT | 93 |
NOTES TO FINANCIAL STATEMENTS (Unaudited)(continued) |
increase in the principal amount of an inflation-indexed bond is recognized as a component of Interest on the Fund’s Statement of Operations, even though principal is not received until maturity.
(c) Senior Floating Rate Interests and Loan Investments
Senior floating rate interests in which the Fund invests generally pay interest rates which are periodically adjusted by reference to a base short-term floating rate, plus a premium. These base lending rates are generally (i) the lending rate offered by one or moremajor European banks, (ii) the prime rate offered by one or more major United States banks, or (iii) the bank’s certificate of deposit rate. Senior floating rate interests often require prepayments from excess cash flows or permit the borrower to repay at its election. The rate at which the borrower repays cannot be predicted with accuracy. As a result, the actual remaining maturity may be substantially less than the stated maturities disclosed in the Fund’s Schedule of Investments.
The Fund invests in loans and other similar debt obligations (“obligations”). A portion of the Fund’s investments in these obligations is sometimes referred to as “covenant lite” loans or obligations (“covenant lite obligations”), which are obligations that lack covenants or possess fewer or less restrictive covenants or constraints on borrowers than certain other types of obligations. The Fund may also obtain exposure to covenant lite obligations through investment in securitization vehicles and other structured products. Recently, many new or reissued obligations have not featured traditional covenants, which are intended to protect lenders and investors by (i) imposing certain restrictions or other limitations on a borrower’s operations or assets or (ii) providing certain rights to lenders. The Fund may have fewer rights with respect to covenant lite obligations, including fewer protections against the possibility of default and fewer remedies in the event of default. As a result, investments in (or exposure to) covenant lite obligations are subject to more risk than investments in (or exposure to) certain other types of obligations. The Fund is subject to other risks associated with investments in (or exposure to) obligations, including that obligations may not be considered “securities” and, as a result, the Fund may not be entitled to rely on the anti-fraud protections under the federal securities laws and instead may have to resort to state law and direct claims.
(d) Interest on When-Issued Securities
The Fund may purchase and sell interests in securities on a when-issued and delayed delivery basis, with payment and delivery scheduled for a future date. No income accrues to the Fund on such interests or securities in connection with such transactions prior to the date the Fund actually takes delivery of such interests or securities. These transactions are subject to market fluctuations and are subject to the risk that the value at delivery may be more or less than the trade date purchase price. Although the Fund will generally purchase these securities with the intention of acquiring such securities, it may sell such securities before the settlement date.
94 | THE GUGGENHEIM FUNDS SEMI-ANNUAL REPORT | |
NOTES TO FINANCIAL STATEMENTS (Unaudited)(continued) |
(e) Options
Upon the purchase of an option, the premium paid is recorded as an investment, the value of which is marked-to-market daily. If a purchased option expires, the Fund realizes a loss in the amount of the cost of the option. When the Fund enters into a closing sale transaction, it realizes a gain or loss depending on whether the proceeds from the closing sale transaction are greater or less than the cost of the option. If the Fund exercises a put option, it realizes a gain or loss from the sale of the underlying security and the proceeds from such sale will be decreased by the premium originally paid. When the Fund exercises a call option, the cost of the security purchased by the Fund upon exercise increases by the premium originally paid.
When the Fund writes (sells) an option, an amount equal to the premium received is entered in that Fund’s accounting records as an asset and equivalent liability. The amount of the liability is subsequently marked-to-market to reflect the current value of the option written. When a written option expires, or if the Fund enters into a closing purchase transaction, it realizes a gain (or loss if the cost of a closing purchase transaction exceeds the premium received when the option was sold).
The Fund may purchase and write swaptions primarily to preserve a return or spread on a particular investment or portion of the Fund’s holdings, as a duration management technique or to protect against an increase in the price of securities it anticipates purchasing at a later date. The purchaser and writer of a swaption is buying or granting the right to enter into a previously agreed upon interest rate swap agreement at any time before the expiration of the options. The swaptions are forward premium swaptions which have extended settlement dates.
(f) Futures Contracts
Upon entering into a futures contract, a Fund deposits and maintains as collateral such initial margin as required by the exchange on which the transaction is affected. Pursuant to the contract, the Fund agrees to receive from or pay to the broker an amount of cash equal to the daily fluctuation in value of the contract. Such receipts or payments are known as variation margin and are recorded by the Fund as unrealized appreciation or depreciation. When the contract is closed, the Fund records a realized gain or loss equal to the difference between the value of the contract at the time it was opened and the value at the time it was closed.
(g) Swap Agreements
Swap agreements are marked-to-market daily and the change, if any, is recorded as unrealized appreciation or depreciation. Payments received or made as a result of an agreement or termination of an agreement are recognized as realized gains or losses.
Upon entering into certain centrally-cleared swap transactions, a Fund is required to deposit with its clearing broker an amount of cash or securities as an initial margin. Subsequent variation margin receipts or payments are received or made by the Fund depending on fluctuations in the fair value of the reference entity and are recorded by the Fund as unrealized appreciation or
| | THE GUGGENHEIM FUNDS SEMI-ANNUAL REPORT | 95 |
NOTES TO FINANCIAL STATEMENTS (Unaudited)(continued) |
depreciation. When the contract is closed, the Fund records a realized gain or loss equal to the difference between the value of the contract at the time it was opened and the value at the time it was closed.
Upfront payments received or made by a Fund on credit default swap agreements and interest rate swap agreements are amortized over the expected life of the agreement. Periodic payments received or paid by a Fund are recorded as realized gains or losses. Payments received or made as a result of a credit event or termination of the contract are recognized, net of a proportional amount of the upfront payment, as realized gains or losses.
(h) Forward Foreign Currency Exchange Contracts
The change in value of a forward foreign currency exchange contract is recorded as unrealized appreciation or depreciation until the contract is closed. When the contract is closed, the Fund records a realized gain or loss equal to the difference between the value at the time the contract was opened and the value at the time it was closed.
(i) Currency Translations
The accounting records of the Fund are maintained in U.S. dollars. All assets and liabilities initially expressed in foreign currencies are converted into U.S. dollars at prevailing exchange rates. Purchases and sales of investment securities, dividend and interest income, and certain expenses are translated at the rates of exchange prevailing on the respective dates of such transactions. Changes in the relationship of these foreign currencies to the U.S. dollar can significantly affect the value of the investments and earnings of the Fund. Foreign investments may also subject the Fund to foreign government exchange restrictions, expropriation, taxation, or other political, social, geopolitical or economic developments, all of which could affect the market and/or credit risk of the investments.
The Fund does not isolate that portion of the results of operations resulting from changes in the foreign exchange rates on investments from the fluctuations arising from changes in the market prices of securities held. Such fluctuations are included with the net realized gain or loss and unrealized appreciation or depreciation on investments.
Reported net realized foreign exchange gains and losses arise from sales of foreign currencies and currency gains or losses realized between the trade and settlement dates on investment transactions. Net unrealized appreciation and depreciation arise from changes in the fair values of assets and liabilities other than investments in securities at the fiscal period end, resulting from changes in exchange rates.
(j) Foreign Taxes
The Fund may be subject to foreign taxes (a portion of which may be reclaimable) on income, stock dividends, capital gains on investments or certain foreign currency transactions. All foreign taxes are recorded in accordance with the applicable foreign tax regulations and rates that exist
96 | THE GUGGENHEIM FUNDS SEMI-ANNUAL REPORT | |
NOTES TO FINANCIAL STATEMENTS (Unaudited)(continued) |
in the foreign jurisdictions in which the Fund invests. These foreign taxes, if any, are paid by the Fund and reflected in its Statement of Operations as follows: foreign taxes withheld at source are presented as a reduction of income and foreign taxes on capital gains from sales of investments are included with the net realized gain (loss) on investments. Foreign taxes payable or deferred as of March 31, 2024, if any, are disclosed in the Fund’s Statement of Assets and Liabilities.
(k) Security Transactions
Security transactions are recorded on the trade date for financial reporting purposes. Realized gains and losses from securities transactions are recorded using the identified cost basis. Proceeds from lawsuits related to investment holdings are recorded as a reduction to cost if the securities are still held and as realized gains if no longer held in the Fund. Dividend income is recorded on the ex-dividend date, net of applicable taxes withheld by foreign countries, if any. Taxable non-cash dividends are recorded as dividend income. Interest income, including amortization of premiums and accretion of discounts, is accrued on a daily basis. Interest income also includes paydown gains and losses on mortgage-backed and asset-backed securities and senior and subordinated loans. Amendment fees are earned as compensation for evaluating and accepting changes to the original loan agreement and are recognized when received. Dividend income from Real Estate Investment Trusts (“REITs”) is recorded based on the income included in the distributions received from the REIT investments using published REIT classifications, including some management estimates when actual amounts are not available. Distributions received in excess of this estimated amount are recorded as a reduction of the cost of investments or reclassified to realized gains. The actual amounts of income, return of capital, and realized gains are only determined by each REIT after its fiscal year-end, and may differ from the estimated amounts.
Income from residual collateralized loan obligations is recognized using the effective interest method. At the time of purchase, management estimates the future expected cash flows and determines the effective yield and estimated maturity date based on the estimated cash flows. Subsequent to the purchase, the estimated cash flows are updated periodically and a revised yield is calculated prospectively.
The Fund may receive other income from investments in senior loan interests including amendment fees, consent fees and commitment fees. For funded loans, these fees are recorded as income when received by the Fund and included in interest income on the Fund’s Statement of Operations. For unfunded loans, commitment fees are included in realized gain on investments on the Fund’s Statement of Operations at the end of the commitment period.
(l) Distributions
The Fund declares dividends from investment income daily. The Fund pays its shareholders from its net investment income monthly and distributes any net capital gains that it has realized, at least annually. Distributions to shareholders are recorded on the ex-dividend date. Dividends are
| | THE GUGGENHEIM FUNDS SEMI-ANNUAL REPORT | 97 |
NOTES TO FINANCIAL STATEMENTS (Unaudited)(continued) |
reinvested in additional shares, unless shareholders request payment in cash. The character of distributions made during the year from net investment income or net realized gains may differ from their ultimate characterization for U.S. federal income tax purposes.
(m) Class Allocations
Interest and dividend income, most expenses, all realized gains and losses, and all unrealized appreciation and depreciation are allocated to the share classes based upon the value of the outstanding shares in each share class. Certain costs, such as distribution and service fees are charged directly to specific share classes. In addition, certain expenses have been allocated to the individual Funds in the Trust based on the respective net assets of each Fund included in the Trust.
(n) Earnings Credits
Under the fee arrangement with the custodian, the Fund may earn credits based on overnight custody cash balances. These credits are utilized to reduce related custodial expenses. The custodian fees disclosed in the Fund’s Statement of Operations are before the reduction in expense from the related earnings credits, if any. Earnings credits for the period ended March 31, 2024, are disclosed in the Fund’s Statement of Operations.
(o) Cash
The Fund may leave cash overnight in its cash account with the custodian. Periodically, the Fund may have cash due to the custodian bank as an overdraft balance. A fee is incurred on this overdraft, calculated by multiplying the overdraft by a rate based on the federal funds rate, which was 5.33% at March 31, 2024.
(p) Indemnifications
Under the Fund’s organizational documents, its Trustees and Officers are indemnified against certain liabilities arising out of the performance of their duties to the Trust. In addition, throughout the normal course of business, the Fund enters into contracts that contain a variety of representations and warranties which provide general indemnifications. The Fund’s maximum exposure under these arrangements is unknown, as this would involve future claims that may be made against the Fund and/or its affiliates that have not yet occurred. However, based on experience, the Fund expects the risk of loss to be remote.
(q) Special Purpose Acquisition Companies
The Fund may acquire an interest in a special purpose acquisition company (“SPAC”) in an initial public offering or a secondary market transaction. SPAC investments carry many of the same risks as investments in initial public offering securities, such as erratic price movements, greater risk of loss, lack of information about the issuer, limited operating and little public or no trading history, and higher transaction costs. An investment in a SPAC is typically subject to a higher risk of dilution by additional later offerings of interests in the SPAC or by other investors exercising existing rights to purchase shares of the SPAC and interests in SPACs may be illiquid and/or
98 | THE GUGGENHEIM FUNDS SEMI-ANNUAL REPORT | |
NOTES TO FINANCIAL STATEMENTS (Unaudited)(continued) |
be subject to restrictions on resale. A SPAC is a publicly traded company that raises investment capital for the purpose of acquiring the equity securities of one or more existing companies (or interests therein) via merger, combination, acquisition or other similar transactions. Unless and until an acquisition is completed, a SPAC generally invests its assets (less a portion retained to cover expenses) in U.S. government securities, money market securities and cash and does not typically pay dividends in respect of its common stock. SPAC investments are also subject to the risk that a significant portion of the funds raised by the SPAC may be expended during the search for a target acquisition or merger and that the SPAC may have limited time in which to conduct due diligence on potential business combination targets. Because SPACs are in essence blank check companies without operating history or ongoing business other than seeking acquisitions, the value of their securities is particularly dependent on the ability of the entity’s management to identify and complete a profitable acquisition. Among other conflicts of interest, the economic interests of the management, directors, officers and related parties of a SPAC can differ from the economic interests of public shareholders, which may lead to conflicts as they evaluate, negotiate and recommend business combination transactions to shareholders. This risk may become more acute as the deadline for the completion of a business combination nears. There is no guarantee that the SPACs in which the Fund invests will complete an acquisition or that any acquisitions that are completed will be profitable.
Note 2 – Financial Instruments and Derivatives
As part of its investment strategy, the Fund utilizes a variety of derivative instruments. These investments involve, to varying degrees, elements of market risk and risks in excess of amounts recognized on the Fund’s Statement of Assets and Liabilities. Valuation and accounting treatment of these instruments can be found under Significant Accounting Policies in Note 1 of these Notes to Financial Statements.
Short Sales
A short sale is a transaction in which the Fund sells a security it does not own. If the security sold short decreases in price between the time the Fund sells the security and closes its short position, the Fund will realize a gain on the transaction. Conversely, if the security increases in price during the period, the Fund will realize a loss on the transaction. The risk of such price increases is the principal risk of engaging in short sales.
Derivatives
Derivatives are instruments whose values depend on, or are derived from, in whole or in part, the value of one or more other assets, such as securities, currencies, commodities or indices. Derivative instruments may be used for investment purposes (including to maintain cash reserves while maintaining exposure to certain other assets), for risk management (hedging) purposes, to facilitate trading, to reduce transaction costs and to pursue higher investment returns. Derivative instruments may also be used to seek to mitigate certain investment risks, such as foreign currency exchange rate risk, interest rate risk and credit risk. U.S. GAAP requires disclosures to
| | THE GUGGENHEIM FUNDS SEMI-ANNUAL REPORT | 99 |
NOTES TO FINANCIAL STATEMENTS (Unaudited)(continued) |
enable investors to better understand how and why a Fund uses derivative instruments, how these derivative instruments are accounted for and their effects on the Fund’s financial position and results of operations.
The Fund utilized derivatives for the following purposes:
Duration: the use of an instrument to manage the interest rate risk of a portfolio.
Hedge: an investment made in order to reduce the risk of adverse price movements in a security, by taking an offsetting position to protect against broad market moves.
Income: the use of any instrument that distributes cash flows typically based upon some rate of interest.
Index Exposure: the use of an instrument to obtain exposure to a listed or other type of index.
Options Purchased and Written
A call option on a security gives the purchaser of the option the right to buy, and the writer of a call option the obligation to sell, the underlying security. The purchaser of a put option has the right to sell, and the writer of the put option the obligation to buy, the underlying security at any time during the option period. The risk associated with purchasing options is limited to the premium originally paid.
The following table represents the Fund’s use and volume of call/put options purchased on a monthly basis:
| | | Average Notional Amount | |
Use | | Call | | | Put | |
Duration, Hedge, Income | | $ | 1,970,000,000 | | | $ | — | |
The Fund held written call options for 17 days during the period. The average notional amount of call options written during the days held was $354,750,000.
Futures Contracts
A futures contract is an agreement to purchase (long) or sell (short) an agreed amount of securities or other instruments at a set price for delivery at a future date. There are significant risks associated with a Fund’s use of futures contracts, including (i) there may be an imperfect or no correlation between the changes in market value of the underlying asset and the prices of futures contracts; (ii) there may not be a liquid secondary market for a futures contract; (iii) trading restrictions or limitations may be imposed by an exchange; and (iv) government regulations may restrict trading in futures contracts. When investing in futures, there is minimal counterparty credit risk to a Fund because futures are exchange-traded and the exchange’s
100 | THE GUGGENHEIM FUNDS SEMI-ANNUAL REPORT | |
NOTES TO FINANCIAL STATEMENTS (Unaudited)(continued) |
clearinghouse, as counterparty to all exchange-traded futures, guarantees against default. Cash deposits are shown as segregated cash with broker on the Fund’s Statement of Assets and Liabilities; securities held as collateral are noted on the Fund’s Schedule of Investments.
The following table represents the Fund’s use and volume of futures on a monthly basis:
| | | Average Notional Amount | |
Use | | Long | | | Short | |
Duration, Hedge | | $ | 1,751,714,310 | | | $ | — | |
Swap Agreements
A swap is an agreement that obligates two parties to exchange a series of cash flows at specified intervals based upon or calculated by reference to changes in specified prices or rates for a specified amount of an underlying asset. When utilizing OTC swaps, the Fund bears the risk of loss of the amount expected to be received under a swap agreement in the event of the default or bankruptcy of a swap agreement counterparty or if the underlying asset declines in value. Certain standardized swaps are subject to mandatory central clearing and are executed on a multi-lateral or other trade facility platform, such as a registered exchange. There is limited counterparty credit risk with respect to centrally-cleared swaps as the transaction is facilitated through a central clearinghouse, much like exchange-traded futures contracts. For a Fund utilizing centrally-cleared swaps, the exchange bears the risk of loss resulting from a counterparty not being able to pay. There is no guarantee that a Fund or an underlying fund could eliminate its exposure under an outstanding swap agreement by entering into an offsetting swap agreement with the same or another party.
Total return swaps involve commitments where single or multiple cash flows are exchanged based on the price of an underlying reference asset (such as an index) for a fixed or variable interest rate. Total return swaps will usually be computed based on the current value of the reference asset as of the close of regular trading on the NYSE or other exchange, with the swap value being adjusted to include dividends accrued, financing charges and/or interest associated with the swap agreement. When utilizing total return swaps, a Fund bears the risk of loss of the amount expected to be received under a swap agreement in the event of the default or bankruptcy of a swap agreement counterparty or if the underlying reference asset declines in value.
The following table represents the Fund’s use and volume of total return swaps on a monthly basis:
| | | Average Notional Amount | |
Use | | Long | | | Short | |
Index exposure, Hedge | | $ | 46,431,678 | | | $ | 25,781,331 | |
| | THE GUGGENHEIM FUNDS SEMI-ANNUAL REPORT | 101 |
NOTES TO FINANCIAL STATEMENTS (Unaudited)(continued) |
Interest rate swaps involve the exchange by the Fund with another party for its respective commitment to pay or receive a fixed or variable interest rate on a notional amount of principal. Interest rate swaps are generally centrally-cleared, but central clearing does not make interest rate swap transactions risk free.
The following table represents the Fund’s use and volume of interest rate swaps on a monthly basis:
| | | Average Notional Amount | |
Use | | Pay Floating Rate | | | Receive Floating Rate | |
Duration, Income | | $ | 7,324,950,000 | | | $ | — | |
Credit default swaps are instruments which allow for the full or partial transfer of third party credit risk, with respect to a particular entity or entities, from one counterparty to the other. The Fund enters into credit default swaps as a “seller” or “buyer” of protection primarily to gain or reduce exposure to the investment grade and/or high yield bond market. A seller of credit default swaps is selling credit protection or assuming credit risk with respect to the underlying entity or entities. The buyer in a credit default swap is obligated to pay the seller a periodic stream of payments over the term of the contract provided that no event of default on an underlying reference obligation has occurred. If a credit event occurs, as defined under the terms of the swap agreement, the seller will either (i) pay to the buyer of protection an amount equal to the notional amount of the swap and take delivery of the referenced obligation or underlying securities comprising the referenced index or (ii) pay a net settlement amount in the form of cash or securities equal to the notional amount of the swap less the recovery value of the referenced obligation or underlying securities comprising the referenced index. The notional amount reflects the maximum potential amount the seller of credit protection could be required to pay to the buyer if a credit event occurs. The seller of protection receives periodic premium payments from the buyer and may also receive or pay an upfront premium adjustment to the stated periodic payments. In the event a credit default occurs on a credit default swap referencing an index, a factor adjustment will take place and the buyer of protection will receive a payment reflecting the par less the default recovery rate of the defaulted index component based on its weighting in the index. If no default occurs, the counterparty will pay the stream of payments and have no further obligations to the fund selling the credit protection. For a fund utilizing centrally cleared credit default swaps, the exchange bears the risk of loss resulting from a counterparty not being able to pay. For OTC credit default swaps, a fund bears the risk of loss of the amount expected to be received under a swap agreement in the event of the default or bankruptcy of a swap agreement counterparty, or in the case of a credit default swap in which a fund is selling credit protection, the default of a third party issuer.
The quoted market prices and resulting market values for credit default swap agreements on securities and credit indices serve as an indicator of the current status of the payment/performance risk and represent the likelihood of an expected liability (or profit) for the credit
102 | THE GUGGENHEIM FUNDS SEMI-ANNUAL REPORT | |
NOTES TO FINANCIAL STATEMENTS (Unaudited)(continued) |
derivative had the notional amount of the swap agreement been closed/sold as of the period end. Increasing market values, in absolute terms when compared to the notional amount of the swap, represent a deterioration of the referenced entity’s credit soundness and a greater likelihood or risk of default or other credit event occurring as defined under the terms of the agreement.
The following table represents the Fund’s use and volume of credit default swaps on a monthly basis:
| | | Average Notional Amount | |
Use | | Protection Sold | | | Protection Purchased | |
Hedge, Index exposure | | $ | — | | | $ | 343,680,833 | |
Forward Foreign Currency Exchange Contracts
A forward foreign currency exchange contract is an agreement between two parties to exchange two designated currencies at a specific time in the future. Certain types of contracts may be cash settled, in an amount equal to the change in exchange rates during the term of the contract. The contracts can be used to hedge or manage exposure to foreign currency risks with portfolio investments or to gain exposure to foreign currencies.
The market value of a forward foreign currency exchange contract changes with fluctuations in foreign currency exchange rates. Furthermore, the Fund may be exposed to risk if the counterparties cannot meet the contract terms or if the currency value changes unfavorably as compared to the U.S. dollar.
The following table represents the Fund’s use and volume of forward foreign currency exchange contracts on a monthly basis:
| | | Average Value | |
Use | | Purchased | | | Sold | |
Hedge | | $ | 5,064,983 | | | $ | 246,060,524 | |
| | THE GUGGENHEIM FUNDS SEMI-ANNUAL REPORT | 103 |
NOTES TO FINANCIAL STATEMENTS (Unaudited)(continued) |
Derivative Investment Holdings Categorized by Risk Exposure
The following is a summary of the location of derivative investments on the Fund’s Statement of Assets and Liabilities as of March 31, 2024:
Derivative Investment Type | Asset Derivatives | Liability Derivatives |
Interest rate futures contracts | — | Variation margin on futures contacts |
Currency forward contracts | Unrealized appreciation on forward foreign currency exchange contracts | Unrealized depreciation on forward foreign currency exchange contracts |
Interest rate swap agreements | Unamortized upfront premiums paid on interest rate swap agreements | Variation margin on interest rate swap agreements |
Credit swap agreements | Unamortized upfront premiums paid on credit default swap agreements Variation margin on credit default swap agreements | Unamortized upfront premiums received on credit default swap agreements |
Interest rate option contracts | Investments in unaffiliated issuers, at value | |
The following tables set forth the fair value of the Fund’s derivative investments categorized by primary risk exposure at March 31, 2024:
| | Asset Derivative Investments Value | |
| | | | | Futures
Interest
Rate
Risk* | | | Swaps
Interest
Rate
Risk* | | | Swaps
Credit
Risk* | | | Forward
Foreign
Currency
Exchange
Risk | | | Options
Purchased
Interest
Rate
Risk | | | Total Value at
March 31,
2024 | |
| | | | | | $ | — | | | $ | 90,550,833 | | | $ | 30,697 | | | | 2,882,070 | | | $ | 88,414 | | | $ | 93,552,014 | |
| | Liability Derivative Investments Value |
| | | | | | Futures
Interest
Rate
Risk* | | | Swaps
Interest
Rate
Risk* | | | Swaps
Credit
Risk* | | | Forward
Foreign
Currency
Exchange
Risk | | | Options
Purchased
Interest
Rate
Risk | | | Total Value at
March 31,
2024 | |
| | | | | | $ | 3,371,924 | | | $ | 121,469,007 | | | $ | 10,834,169 | | | | 72,797 | | | $ | — | | | $ | 135,747,897 | |
* | Includes cumulative appreciation (depreciation) of exchange-traded, OTC and centrally-cleared derivatives contracts as reported on the Fund’s Schedules of Investments. For exchange-traded and centrally-cleared derivatives, variation margin is reported within the Fund’s Statement of Assets and Liabilities. |
104 | THE GUGGENHEIM FUNDS SEMI-ANNUAL REPORT | |
NOTES TO FINANCIAL STATEMENTS (Unaudited)(continued) |
The following is a summary of the location of derivative investments on the Fund’s Statement of Operations for the period ended March 31, 2024:
Derivative Investment Type | Location of Gain (Loss) on Derivatives |
Currency forward contracts | Net realized gain (loss) on forward foreign currency exchange contracts |
| Net change in unrealized appreciation (depreciation) on forward foreign currency exchange contracts |
Interest rate futures contracts | Net realized gain (loss) on futures contracts |
| Net change in unrealized appreciation (depreciation) on futures contracts |
Interest rate options contracts | Net realized gain (loss) on options purchased |
| | Net realized gain (loss) on options written |
| | Net change in unrealized appreciation (depreciation) on options purchased |
| Net change in unrealized appreciation (depreciation) on options written |
Interest rate/Credit swap agreements | Net realized gain (loss) on swap agreements |
| Net change in unrealized appreciation (depreciation) on swap agreements |
The following is a summary of the Fund’s realized gain (loss) and change in unrealized appreciation (depreciation) on derivative investments recognized on the Fund’s Statement of Operations categorized by primary risk exposure for the period ended March 31, 2024:
Realized Gain (Loss) on Derivative Investments Recognized on the Statement of Operations |
| | | | | | | | Futures
Interest
Rate
Risk | | | Swaps
Interest
Rate
Risk | | | Swaps
Credit
Risk | | | Forward
Foreign
Currency
Exchange
Risk | | | Options
Purchased
Interest
Rate
Risk | | | Options
Written
Interest
Rate
Risk | | | Total | |
| | | | | | | | | | | $ | (2,582 | ) | | $ | (41,993,694 | ) | | $ | (11,232,239 | ) | | $ | (2,414,633 | ) | | $ | (5,938,161 | ) | | $ | (5,798,744 | ) | | $ | (67,380,053 | ) |
Change in Unrealized Appreciation (Depreciation) on Derivative Investments Recognized on the Statement of Operations |
| | | | | | | | Futures
Interest
Rate
Risk | | | Swaps
Interest
Rate
Risk | | | Swaps
Credit
Risk | | | Forward
Foreign
Currency
Exchange
Risk | | | Options
Purchased
Interest
Rate
Risk | | | Options
Written
Interest
Rate
Risk | | | Total | |
| | | | | | | | | | | $ | (3,371,924 | ) | | $ | 112,978,668 | | | $ | (5,592,082 | ) | | $ | (2,641,236 | ) | | $ | 2,142,420 | | | $ | 4,635,100 | | | $ | 108,150,946 | |
| | THE GUGGENHEIM FUNDS SEMI-ANNUAL REPORT | 105 |
NOTES TO FINANCIAL STATEMENTS (Unaudited)(continued) |
In conjunction with short sales and the use of derivative instruments, the Fund is required to maintain collateral in various forms. Depending on the financial instrument utilized and the broker involved, the Fund uses margin deposits at the broker, cash and/or securities segregated at the custodian bank, discount notes or repurchase agreements allocated to the Fund as collateral.
Foreign Investments
There are several risks associated with exposure to foreign currencies, foreign issuers and emerging markets. The Fund’s indirect and direct exposure to foreign currencies subjects the Fund to the risk that those currencies will decline in value relative to the U.S. dollar, or in the case of short positions, that the U.S. dollar will decline in value relative to the currency being hedged.
Currency rates in foreign countries may fluctuate significantly over short periods of time for a number of reasons, including changes in interest rates and the imposition of currency controls or other political developments in the U.S. or abroad. In addition, the Fund may incur transaction costs in connection with conversions between various currencies. The Fund may, but is not obligated to, engage in currency hedging transactions, which generally involve buying currency forward, options or futures contracts. However, not all currency risks may be effectively hedged, and in some cases the costs of hedging techniques may outweigh expected benefits. In such instances, the value of securities denominated in foreign currencies can change significantly when foreign currencies strengthen or weaken relative to the U.S. dollar.
The Fund may invest in securities of foreign companies directly, or in financial instruments, such as ADRs and exchange-traded funds, which are indirectly linked to the performance of foreign issuers. Foreign markets can be more volatile than the U.S. market due to increased risks of adverse issuer, political, regulatory, market, or economic developments and can perform differently from the U.S. market. Investing in securities of foreign companies directly, or in financial instruments that are indirectly linked to the performance of foreign issuers, may involve risks not typically associated with investing in U.S. issuers. The value of securities denominated in foreign currencies, and of dividends from such securities, can change significantly when foreign currencies strengthen or weaken relative to the U.S. dollar. Foreign securities markets generally have less trading volume and less liquidity than U.S. markets, and prices in some foreign markets may fluctuate more than those of securities traded on U.S. markets. Many foreign countries lack accounting and disclosure standards comparable to those that apply to U.S. companies, and it may be more difficult to obtain reliable information regarding a foreign issuer’s financial condition and operations. Transaction costs and costs associated with custody services are generally higher for foreign securities than they are for U.S. securities. Some foreign governments levy withholding taxes against dividend and interest income. Although in some countries portions of these taxes are recoverable, the non-recovered portion will reduce the income received by the Fund.
The Trust has established counterparty credit guidelines and enters into transactions only with financial institutions rated/identified as investment grade or better. The Trust monitors the counterparty credit risk associated with each such financial institution.
106 | THE GUGGENHEIM FUNDS SEMI-ANNUAL REPORT | |
NOTES TO FINANCIAL STATEMENTS (Unaudited)(continued) |
Note 3 – Offsetting
In the normal course of business, the Fund enters into transactions subject to enforceable master netting arrangements or other similar arrangements. Generally, the right to offset in those agreements allows the Fund to counteract the exposure to a specific counterparty with collateral received from or delivered to that counterparty based on the terms of the arrangements. These arrangements provide for the right to liquidate upon the occurrence of an event of default, credit event upon merger or additional termination event.
In order to better define its contractual rights and to secure rights that will help the Fund mitigate its counterparty risk, the Fund may enter into an International Swaps and Derivatives Association, Inc. Master Agreement (“ISDA Master Agreement”) or similar agreement with its derivative contract counterparties. An ISDA Master Agreement is a bilateral agreement between a fund and a counterparty that governs OTC derivatives, including foreign exchange contracts, and typically contains, among other things, collateral posting terms and netting provisions in the event of a default and/or termination event. The provisions of the ISDA Master Agreement typically permit a single net payment in the event of a default (close-out netting) or similar event, including the bankruptcy or insolvency of the counterparty.
For derivatives traded under an ISDA Master Agreement, the collateral requirements are typically calculated by netting the mark-to-market amount for each transaction under such agreement and comparing that amount to the value of any collateral currently pledged by the Fund and the counterparty. For financial reporting purposes, cash collateral that has been pledged to cover obligations of the Fund and cash collateral received from the counterparty, if any, are reported separately on the Fund’s Statement of Assets and Liabilities as segregated cash with broker/receivable for variation margin, or payable for swap settlement/variation margin. Cash and/or securities pledged or received as collateral by the Fund in connection with an OTC derivative subject to an ISDA Master Agreement generally may not be invested, sold or rehypothecated by the counterparty or the Fund, as applicable, absent an event of default under such agreement, in which case such collateral generally may be applied towards obligations due to and payable by such counterparty or the Fund, as applicable. Generally, the amount of collateral due from or to a counterparty must exceed a minimum transfer amount threshold (e.g., $300,000) before a transfer is required to be made. To the extent amounts due to the Fund from its counterparties are not fully collateralized, contractually or otherwise, the Fund bears the risk of loss from counterparty nonperformance. The Fund attempts to mitigate counterparty risk by only entering into agreements with counterparties that it believes to be of good standing and by monitoring the financial stability of those counterparties.
For financial reporting purposes, the Fund does not offset derivative assets and derivative liabilities that are subject to netting arrangements in the Fund’s Statement of Assets and Liabilities.
| | THE GUGGENHEIM FUNDS SEMI-ANNUAL REPORT | 107 |
NOTES TO FINANCIAL STATEMENTS (Unaudited)(continued) |
The following tables present derivative financial instruments and secured financing transactions that are subject to enforceable netting arrangements:
| | | | | | | | | | | | | | | Gross Amounts Not Offset
in the Statement of
Assets and Liabilities | | | | | |
Instrument | | Gross
Amounts of
Recognized
Assets1 | | | Gross
Amounts
Offset in the
Statement of
Assets and
Liabilities | | | Net Amount
of Assets
Presented on
the Statement
of Assets and
Liabilities | | | Financial
Instruments | | | Cash
Collateral
Received | | | Net
Amount | |
Options purchased | | $ | 88,414 | | | $ | — | | | $ | 88,414 | | | $ | — | | | $ | (42,935 | ) | | $ | 45,479 | |
Forward foreign currency exchange contracts | | | 2,882,070 | | | | — | | | | 2,882,070 | | | | (50,084 | ) | | | — | | | | 2,831,986 | |
| | | | | | | | | | | | | | | Gross Amounts Not Offset
in the Statement of
Assets and Liabilities | | | | | |
Instrument | | Gross
Amounts of
Recognized
Liabilities1 | | | Gross
Amounts
Offset in the
Statement of
Assets and
Liabilities | | | Net Amounts
of Assets
Presented on
the Statement
of Assets and
Liabilities | | | Financial
Instruments | | | Cash
Collateral
Pledged | | | Net
Amount | |
Forward foreign currency exchange contracts | | $ | 72,797 | | | $ | — | | | $ | 72,797 | | | $ | (50,084 | ) | | $ | — | | | $ | 22,713 | |
1 | Exchange-traded or centrally-cleared derivatives are excluded from these reported amounts |
The Fund has the right to offset deposits against any related derivative liabilities outstanding with each counterparty with the exception of exchange-traded or centrally-cleared derivatives. The following table presents deposits held by others in connection with derivative investments as of March 31, 2024.
Counterparty | Asset Type | | Cash Pledged | | | Cash Received | |
BofA Securities, Inc. | Credit default swap agreements | | $ | 12,386,070 | | | $ | — | |
BofA Securities, Inc. | Interest rate swap agreements | | | 57,817,433 | | | | — | |
Goldman Sachs International | Options | | | — | | | | 30,000 | |
JP Morgan Chase and Co. | Futures contracts | | | 8,179,000 | | | | — | |
Morgan Stanley Capital Services LLC | Options | | | — | | | | 126,000 | |
| | | $ | 78,382,503 | | | $ | 156,000 | |
108 | THE GUGGENHEIM FUNDS SEMI-ANNUAL REPORT | |
NOTES TO FINANCIAL STATEMENTS (Unaudited)(continued) |
Note 4 – Fair Value Measurement
In accordance with U.S. GAAP, fair value is defined as the price that the Fund would receive to sell an investment or pay to transfer a liability in an orderly transaction between market participants at the measurement date. U.S. GAAP establishes a three-tier fair value hierarchy based on the types of inputs used to value assets and liabilities and requires corresponding disclosure. The hierarchy and the corresponding inputs are summarized below:
Level 1 — | unadjusted quoted prices in active markets for identical assets or liabilities. |
Level 2 — | significant other observable inputs (for example quoted prices for securities that are similar based on characteristics such as interest rates, prepayment speeds, credit risk, etc.). |
Level 3 — | significant unobservable inputs based on the best information available under the circumstances, to the extent observable inputs are not available, which may include assumptions. |
Rule 2a-5 sets forth a definition of “readily available market quotations,” which is consistent with the definition of a Level 1 input under U.S. GAAP. Rule 2a-5 provides that “a market quotation is readily available only when that quotation is a quoted price (unadjusted) in active markets for identical investments that the fund can access at the measurement date, provided that a quotation will not be readily available if it is not reliable.”
Securities for which market quotations are not readily available must be valued at fair value as determined in good faith. Accordingly, any security priced using inputs other than Level 1 inputs will be subject to fair value requirements. The types of inputs available depend on a variety of factors, such as the type of security and the characteristics of the markets in which it trades, if any. Fair valuation determinations that rely on fewer or no observable inputs require greater judgment. Accordingly, fair value determinations for Level 3 securities require the greatest amount of judgment.
Pricing service providers are used to value a majority of the Fund’s investments. When values are not available from a pricing service provider, they will be determined using a variety of sources and techniques, including: market prices; broker quotes; and models which derive prices based on inputs such as prices of securities with comparable maturities and characteristics or based on inputs such as anticipated cash flows or collateral, spread over U.S. Treasury securities, and other information and analysis. A significant portion of the Fund’s assets and liabilities are categorized as Level 2, as indicated in this report.
Quotes from broker-dealers, adjusted for fluctuations in criteria such as credit spreads and interest rates, may also be used to value the Fund’s assets and liabilities, i.e. prices provided by a broker-dealer or other market participant who has not committed to trade at that price. Although
| | THE GUGGENHEIM FUNDS SEMI-ANNUAL REPORT | 109 |
NOTES TO FINANCIAL STATEMENTS (Unaudited)(continued) |
quotes are typically received from established market participants, the Fund may not have the transparency to view the underlying inputs which support the market quotations. Significant changes in a quote would generally result in significant changes in the fair value of the security.
Certain fixed income securities are valued by obtaining a monthly quote from a broker-dealer, adjusted for fluctuations in criteria such as credit spreads and interest rates.
Certain loans and other securities are valued using a single daily broker quote or a price from a pricing service provider based on a single daily or monthly broker quote.
The inputs or methodologies selected and applied for valuing securities or other assets are not necessarily an indication of the risk associated with investing in those securities. The suitability, appropriateness and accuracy of the techniques, methodologies and sources employed to determine fair valuation are periodically reviewed and subject to change.
Note 5 – Investment Advisory Agreement and Other Agreements
Under the terms of an investment advisory contract, the Fund pays GI investment advisory fees on a monthly basis calculated daily at an annualized rate of 0.39% of the average daily net assets of the Fund.
GI pays operating expenses on behalf of the Trust, such as audit and accounting related services, legal services, custody, printing and mailing, among others, on a pass-through basis. Such expenses are allocated to various Funds within the complex based on relative net assets.
The Board has adopted Distribution Plans related to the offering of Class A, Class C and Class P shares pursuant to Rule 12b-1 under the 1940 Act. The plans provide for payments at an annual rate of 0.25% of the average daily net assets of the Fund’s Class A and Class P shares, and 1.00% of the average daily net assets of the Fund’s Class C shares.
The investment advisory contract for the Fund provides that the total expenses be limited to a percentage of average net assets for each class of shares, exclusive of brokerage costs, dividends or interest on securities sold short, expenses of other investment companies in which the Fund invests, interest, taxes, litigation, indemnification and extraordinary expenses. The limits are listed below:
| | Limit | | | Effective
Date | | | Contract
End Date | |
Class A | | | 0.79 | % | | | 11/20/17 | | | | 02/01/25 | |
Class C | | | 1.54 | % | | | 11/20/17 | | | | 02/01/25 | |
Class P | | | 0.79 | % | | | 11/20/17 | | | | 02/01/25 | |
Institutional Class | | | 0.50 | % | | | 11/30/12 | | | | 02/01/25 | |
Class R6 | | | 0.50 | % | | | 10/19/16 | | | | 02/01/25 | |
110 | THE GUGGENHEIM FUNDS SEMI-ANNUAL REPORT | |
NOTES TO FINANCIAL STATEMENTS (Unaudited)(continued) |
GI is entitled to reimbursement by the Fund for fees waived or expenses reimbursed during any of the previous 36 months, beginning on the date of the expense limitation agreement, if on any day the estimated operating expenses are less than the indicated percentages. For purposes of this arrangement, GI is entitled to recoupment of previously waived fees or reimbursed expenses for 36 months from the date of the waiver or reimbursement by GI. At March 31, 2024, the amount of fees waived or expenses reimbursed that are subject to recoupment and will expire during the years ended September 30, are presented in the following table:
| | 2024 | | | 2025 | | | 2026 | | | 2027 | | | Total | |
Class A | | $ | 413,648 | | | $ | 196,304 | | | $ | 56,238 | | | $ | 13,067 | | | $ | 679,257 | |
Class C | | | 124,554 | | | | 167,978 | | | | 42,447 | | | | 143 | | | | 335,122 | |
Class P | | | 698,639 | | | | 1,002,868 | | | | 499,250 | | | | — | | | | 2,200,757 | |
Institutional Class | | | 13,350,335 | | | | 19,248,693 | | | | 10,006,046 | | | | 2,559,383 | | | | 45,164,457 | |
Class R6 | | | — | | | | — | | | | — | | | | — | | | | — | |
For the period ended March 31, 2024, GI recouped $2,864,617 from the Fund.
If the Fund invests in a fund that is advised by the same adviser or an affiliated adviser, the investing Fund’s adviser has agreed to waive fees at the investing fund level to the extent necessary to offset the proportionate share of any management fee paid by the Fund with respect to its investment in such affiliated fund. Fee waivers will be calculated at the investing fund level without regard to any expense cap, if any, in effect for the investing fund. Fees waived under this arrangement are not subject to reimbursement to GI. For the period ended March 31, 2024, the Fund waived $275,680 related to investments in affiliated funds.
For the period ended March 31, 2023, GFD retained sales charges of $77,213 relating to sales of Class A shares of the Trust.
Certain trustees and officers of the Trust are also officers of GI and/or GFD. The Trust does not compensate its officers or trustees who are officers, directors and/or employees of GI or GFD.
MUFG Investor Services (US), LLC (“MUIS”) acts as the Fund’s administrator, transfer agent and accounting agent. As administrator, transfer agent and accounting agent, MUIS maintains the books and records of the Fund’s securities and cash. The Bank of New York Mellon Corp. (“BNY”) acts as the Fund’s custodian. As custodian, BNY is responsible for the custody of the Fund’s assets. For providing the aforementioned administrative and accounting services, MUIS is entitled to receive a monthly fee equal to a percentage of the Fund’s average daily net assets and out of pocket expenses. For providing the aforementioned transfer agent and custodian services, MUIS and BNY are entitled to receive a monthly fee based on the number of transactions during the month and the number of accounts under management, subject to certain minimum monthly fees, and out of pocket expenses.
| | THE GUGGENHEIM FUNDS SEMI-ANNUAL REPORT | 111 |
NOTES TO FINANCIAL STATEMENTS (Unaudited)(continued) |
Note 6 – Reverse Repurchase Agreements
The Fund may enter into reverse repurchase agreements. Under a reverse repurchase agreement, the Fund sells securities and agrees to repurchase them at a particular price at a future date. In the event the buyer of securities under a reverse repurchase agreement files for bankruptcy or becomes insolvent, such buyer or its trustee or receiver may receive an extension of time to determine whether to enforce the Fund’s obligation to repurchase the securities, and the Fund’s use of the proceeds of the reverse repurchase agreement may effectively be restricted pending such decision.
For the period ended March 31, 2024, the Fund entered into reverse repurchase agreements as follows:
Number of Days
Outstanding | | Balance at
March 31, 2024 | | | Average Balance
Outstanding | | | Average
Interest Rate | |
183 | | $ | 3,622,770 | | | $ | 644,969,572 | | | | 5.57 | % |
The following table presents reverse repurchase agreements that are subject to netting arrangements and offset in the Fund’s Statement of Assets of Liabilities in conformity with U.S.GAAP:
| | | | | | | | | | | | | | | Gross Amounts Not Offset
in the Statement of
Assets and Liabilities | | | | | |
Instrument | | Gross
Amounts of
Recognized
Liabilities | | | Gross
Amounts
Offset in the
Statement of
Assets and
Liabilities | | | Net Amount
of Liabilities
Presented on
the Statement
of Assets and
Liabilities | | | Financial
Instruments | | | Cash Collateral
Pledged | | | Net Amount | |
Reverse repurchase agreements | | $ | 3,622,770 | | | $ | — | | | $ | 3,622,770 | | | $ | (3,622,770 | ) | | $ | — | | | $ | — | |
As of March 31, 2024, the Fund had outstanding reverse repurchase agreements with one counterparty. Details of the reverse repurchase agreements by counterparty are as follows:
Counterparty | | Interest Rate | | | Maturity Date | | | Face Value | |
Goldman Sachs & Co. LLC | (0.25%)* | Open Maturity | | $ | 3,622,770 | |
| | | | | | | | 3,622,770 | |
* | The rate is adjusted periodically by the counterparty, subject to approval by the Adviser, and is not based upon a set reference rate and spread. Rate indicated is the rate effective as of March 31, 2024 |
112 | THE GUGGENHEIM FUNDS SEMI-ANNUAL REPORT | |
NOTES TO FINANCIAL STATEMENTS (Unaudited)(continued) |
The following is a summary of the remaining contractual maturities of the reverse repurchase agreements outstanding as of period end, aggregated by asset class of the related collateral pledged by the Fund:
Asset Type | | Overnight and
continuous | | | Total | |
Corporate Bonds | | $ | 3,622,770 | | | $ | 3,622,770 | |
Gross amount of recognized liabilities for reverse repurchase agreements | | $ | 3,622,770 | | | $ | 3,622,770 | |
Note 7 – Federal Income Tax Information
The Fund intends to comply with the provisions of Subchapter M of the Internal Revenue Code of 1986, as amended (the “Internal Revenue Code”), applicable to regulated investment companies and will distribute substantially all taxable net investment income and capital gains sufficient to relieve the Fund from all, or substantially all, federal income, excise and state income taxes. Therefore, no provision for federal or state income tax or federal excise tax is required.
Tax positions taken or expected to be taken in the course of preparing the Fund’s tax returns are evaluated to determine whether the tax positions are “more-likely-than-not” of being sustained by the applicable tax authority. Tax positions not deemed to meet the “more-likely-than-not” threshold would be recorded as a tax benefit or expense in the current year. Management has analyzed the Fund’s tax positions taken, or to be taken, on U.S. federal income tax returns for all open tax years, and has concluded that no provision for income tax is required in the Fund’s financial statements. The Fund’s U.S. federal income tax returns are subject to examination by the Internal Revenue Service (“IRS”) for a period of three years after they are filed.
At March 31, 2024, the cost of investments for U.S. federal income tax purposes, the aggregate gross unrealized appreciation for all investments for which there was an excess of value over tax cost, and the aggregate gross unrealized depreciation for all investments for which there was an excess of tax cost over value, were as follows:
| | Tax
Cost | | | Tax
Unrealized
Appreciation | | | Tax
Unrealized
Depreciation | | | Net Unrealized
Appreciation
(Depreciation) | |
| | | $ | 24,792,694,520 | | | $ | 175,083,772 | | | $ | (1,832,549,472 | ) | | $ | (1,657,465,700 | ) |
Note 8 – Securities Transactions
For the period ended March 31, 2024, the cost of purchases and proceeds from sales of investment securities, excluding government securities, short-term investments and derivatives, were as follows:
| | Purchases | | | Sales | |
| | | $ | 2,539,248,923 | | | $ | 2,501,646,032 | |
| | THE GUGGENHEIM FUNDS SEMI-ANNUAL REPORT | 113 |
NOTES TO FINANCIAL STATEMENTS (Unaudited)(continued) |
For the period ended March 31, 2024, the cost of purchases and proceeds from sales of government securities were as follows:
| | Purchases | | | Sales | |
| | | $ | 6,860,384,958 | | | $ | 6,101,187,217 | |
The Fund is permitted to purchase or sell securities from or to certain affiliated funds under specified conditions outlined in procedures adopted by the Board. The procedures have been designed to ensure that any purchase or sale of securities by the Fund from or to another fund or portfolio that is or could be considered an affiliate by virtue of having a common investment adviser (or affiliated investment advisers), common trustees and/or common officers complies with Rule 17a-7 of the 1940 Act. Further, as defined under these procedures, each transaction is effected at the current market price. For the period ended March 31, 2024, the Fund did not engage in purchases and sales of securities, pursuant to Rule 17a-7 of the 1940 Act.
Note 9 – Unfunded Loan Commitments
Pursuant to the terms of certain loan agreements, the Fund held unfunded loan commitments as of March 31, 2024. The Fund is obligated to fund these loan commitments at the borrower’s discretion.
The unfunded loan commitments as of March 31, 2024, were as follows:
Borrower | Maturity Date | | Face Amount | | | Value | |
Datix Bidco Ltd. | 05/16/24 | | $ | 50,694,794 | | | $ | — | |
Higginbotham Insurance Agency, Inc. | 11/25/28 | | | 8,000,000 | | | | 70,737 | |
Lightning A | 03/01/37 | | | 20,195,000 | | | | — | |
MB2 Dental Solutions, LLC | 01/29/31 | | | 12,407,214 | | | | 322,923 | |
Thunderbird A | 03/01/37 | | | 20,195,000 | | | | — | |
| | | | $ | 111,492,008 | | | $ | 393,660 | |
114 | THE GUGGENHEIM FUNDS SEMI-ANNUAL REPORT | |
NOTES TO FINANCIAL STATEMENTS (Unaudited)(continued) |
Note 10 – Restricted Securities
The securities below are considered illiquid and restricted under guidelines established by the Board:
Restricted Securities | | Acquisition
Date | | | Cost | | | Value | |
Atlas Mara Ltd. | | | | | | | | | | | | |
due 12/31/211 | | | 10/01/15 | | | $ | 1,549,002 | | | $ | 54,349 | |
Cascade Funding Mortgage Trust | | | | | | | | | | | | |
2018-RM2 4.00% (WAC ) due 10/25/682 | | | 11/02/18 | | | | 6,236,679 | | | | 6,184,871 | |
Cascade Funding Mortgage Trust | | | | | | | | | | | | |
2019-RM3 2.80% (WAC) due 06/25/692 | | | 06/25/19 | | | | 1,625,656 | | | | 1,589,259 | |
Central Storage Safety Project Trust | | | | | | | | | | | | |
4.82% due 02/01/38 | | | 02/02/18 | | | | 17,369,384 | | | | 14,572,095 | |
CFMT LLC | | | | | | | | | | | | |
2022-HB9 3.25% (WAC) due 09/25/372 | | | 09/23/22 | | | | 7,567,659 | | | | 7,739,784 | |
Copper River CLO Ltd. | | | | | | | | | | | | |
2007-1A INC, (WAC) due 01/20/213 | | | 05/09/14 | | | | — | | | | 150 | |
Irwin Home Equity Loan Trust | | | | | | | | | | | | |
2007-1 6.35% due 08/25/37 | | | 02/27/15 | | | | 95 | | | | 93 | |
Morgan Stanley ABS Capital I Incorporated Trust | | | | | | | | | | | | |
2007-HE3 5.57% (1 Month Term SOFR + 0.24%, Rate Floor: 0.13%) due 12/25/362 | | | 03/10/21 | | | | 1,520,683 | | | | 1,191,311 | |
Morgan Stanley Re-REMIC Trust | | | | | | | | | | | | |
2010-R5 4.12% due 06/26/36 | | | 07/18/14 | | | | 85,017 | | | | 86,920 | |
Nomura Resecuritization Trust | | | | | | | | | | | | |
2015-4R 3.04% (1 Month Term SOFR + 0.54%, Rate Floor: 0.43%) due 03/26/362 | | | 03/20/15 | | | | 469,470 | | | | 449,660 | |
Residential Mortgage Loan Trust | | | | | | | | | | | | |
2020-1 2.68% (WAC ) due 01/26/602 | | | 02/06/20 | | | | 601,573 | | | | 569,068 | |
SPSS | | | | | | | | | | | | |
5.14% due 11/15/52 | | | 03/30/23 | | | | 128,224 | | | | 129,552 | |
Towd Point Revolving Trust | | | | | | | | | | | | |
4.83% due 09/25/64 | | | 03/17/22 | | | | 81,499,998 | | | | 81,051,750 | |
Verus Securitization Trust | | | | | | | | | | | | |
2022-8 6.13% due 09/25/674 | | | 10/06/22 | | | | 1,412,289 | | | | 1,435,719 | |
| | | | | | | $ | 120,065,729 | | | $ | 115,054,581 | |
1 | Security is in default of interest and/or principal obligations. |
2 | Variable rate security. Rate indicated is the rate effective at March 31, 2024. In some instances, the effective rate is limited by a minimum rate floor or a maximum rate cap established by the issuer. The settlement status of a position may also impact the effective rate indicated. In some cases, a position may be unsettled at period end and may not have a stated effective rate. In instances where multiple underlying reference rates and spread amounts are shown, the effective rate is based on a weighted average. |
3 | Security has no stated coupon. However, it is expected to receive residual cash flow payments on defined deal dates. |
4 | Security is a step up/down bond. The coupon increases or decreases at regular intervals until the bond reaches full maturity. Rate indicated is the rate at March 31, 2024. |
| | THE GUGGENHEIM FUNDS SEMI-ANNUAL REPORT | 115 |
NOTES TO FINANCIAL STATEMENTS (Unaudited)(continued) |
Note 11 – Line of Credit
The Trust, along with other affiliated trusts, secured a 364-day committed, $1,150,000,000 line of credit from Citibank, N.A., which was in place through September 29, 2023, at which time a new line of credit was entered into in the amount of $1,165,000,000. The Fund may draw (borrow) from the line of credit as a temporary measure for emergency purposes, to facilitate redemption requests, or for other short-term liquidity purposes consistent with the Fund’s investment objective and program. For example, it may be advantageous for the Fund to borrow money rather than sell existing portfolio positions to meet redemption requests. Fees related to borrowings, if any, vary under this arrangement between the greater of Citibank’s “base rate”, SOFR plus 1%, or the federal funds rate plus 1/2 of 1%.
The commitment fee that may be paid by the Fund is at an annualized rate of 0.15% of the average daily amount of its allocated unused commitment amount. The commitment fee amount is allocated to the individual Funds based on the respective net assets of each participating Fund and is referenced in the Fund’s Statement of Operations under “Line of credit fees”. The Fund did not have any borrowings under this agreement as of and for the period ended March 31, 2024.
Note 12 – Market Risks
The value of, or income generated by, the investments held by the Fund are subject to the possibility of rapid and unpredictable fluctuation, and loss that may result from various factors. These factors include, among others, developments affecting individual companies, or from broader influences, including real or perceived changes in prevailing interest rates (which may change at any time based on changes in monetary policies and various market and other economic conditions), changes in inflation rates or expectations about inflation rates, adverse investor confidence or sentiment, changing economic, political (including geopolitical), social or financial market conditions, increased instability or general uncertainty, environmental disasters, governmental actions, public health emergencies (such as the spread of infectious diseases, pandemics and epidemics), debt crises, actual or threatened wars or other armed conflicts (such as the ongoing Russia-Ukraine conflict and its collateral economic and other effects, including, but not limited to, sanctions and other international trade barriers) or ratings downgrades, and other similar events, each of which may be temporary or last for extended periods. Moreover, changing economic, political, geopolitical, social, financial market or other conditions in one country, geographic region or industry could adversely affect the value, yield and return of the investments held by the Fund in a different country, geographic region, economy, industry or market because of the increasingly interconnected global economies and financial markets. The duration and extent of the foregoing types of factors or conditions are highly uncertain and difficult to predict and have in the past, and may in the future, cause volatility and distress in economies and financial markets or other adverse circumstances, which may negatively affect the value of the Fund’s investments and performance of the Fund.
116 | THE GUGGENHEIM FUNDS SEMI-ANNUAL REPORT | |
NOTES TO FINANCIAL STATEMENTS (Unaudited)(concluded) |
Note 13 – Subsequent Events
The Fund evaluated subsequent events through the date the financial statements are issued and determined there were no material events that would require adjustment to or disclosure in the Fund’s financial statements.
| | THE GUGGENHEIM FUNDS SEMI-ANNUAL REPORT | 117 |
OTHER INFORMATION (Unaudited) |
Delivery of Shareholder Reports
Paper copies of the Fund’s annual and semi-annual shareholder reports are not sent by mail, unless you specifically request paper copies of the reports from a fund or from your financial intermediary. Instead, the reports are made available on a website, and you are notified by mail each time a report is posted and provided with a website link to access the report.
You may elect to receive all future shareholder reports in paper free of charge. If you hold shares of a fund directly, you can inform the Fund that you wish to receive paper copies of reports by calling 800.820.0888. If you hold shares of a fund through a financial intermediary, please contact the financial intermediary to make this election. Your election to receive reports in paper may apply to all Guggenheim Funds in which you are invested and may apply to all Guggenheim funds held with your financial intermediary.
Tailored Shareholder Reports for Open-End Mutual Funds and Exchange-Traded Funds
Effective January 24, 2023, the SEC adopted rule and form amendments to require open-end mutual funds and exchange-traded funds registered on Form N-1A to transmit concise and visually engaging streamlined annual and semi-annual reports to shareholders that highlight key information. Other information, including financial statements, will no longer appear in a streamlined shareholder report but must be available online, delivered free of charge upon request, and filed on a semi-annual basis on Form N-CSR. The rule and form amendments have a compliance date of July 24, 2024. At this time, management is evaluating the impact of these amendments on the shareholder reports for the Fund.
Proxy Voting Information
A description of the policies and procedures that the Trust uses to determine how to vote proxies relating to securities held in the Fund’s portfolio is available, without charge and upon request, by calling 800.820.0888. This information is also available from the EDGAR database on the SEC’s website at https://www.sec.gov.
Information regarding how the Fund voted proxies relating to portfolio securities during the most recent 12-month period ended June 30 is available without charge, upon request, by calling 800.820.0888. This information is also available from the EDGAR database on the SEC’s website at https://www.sec.gov.
Sector Classification
Information in the Schedule of Investments is categorized by sectors using sector-level Classifications defined by the Bloomberg Industry Classification System, a widely recognized industry classification system provider. The Fund’s registration statement has investment policies relating to concentration in specific sectors/industries. For purposes of these investment policies, the Fund usually classifies sectors/industries based on industry-level Classifications
118 | THE GUGGENHEIM FUNDS SEMI-ANNUAL REPORT | |
OTHER INFORMATION (Unaudited)(concluded) |
used by widely recognized industry classification system providers such as Bloomberg Industry Classification System, Global Industry Classification Standards and Barclays Global Classification Scheme.
Quarterly Portfolio Schedules Information
The Trust files its complete schedule of portfolio holdings with the SEC for the first and third quarters of each fiscal year as an exhibit to its reports on Form N-PORT. The Fund’s Form N-PORT is available on the SEC’s website at https://www.sec.gov. The Fund’s complete schedule of securities holdings as of the end of each fiscal quarter will be made available to the public on the SEC’s website at www.sec.gov and on our website at www.guggenheiminvestments.com, and will be made available, upon request and without charge, by calling 800.820.0888.
| | THE GUGGENHEIM FUNDS SEMI-ANNUAL REPORT | 119 |
INFORMATION ON BOARD OF TRUSTEES AND OFFICERS (Unaudited) |
A Board of Trustees oversees the Trust, as well as other trusts of GI, in which its members have no stated term of service, and continue to serve after election until resignation. The Fund’s Statement of Additional Information includes further information about Fund Trustees and Officers, and can be obtained without charge by visiting guggenheiminvestments.com or by calling 800.820.0888.
Name, Address*
and Year of Birth | Position(s)
Held with
Trust | Term of Office
and Length of
Time Served** | Principal Occupation(s)
During Past Five Years | Number of
Portfolios
in Fund
Complex
Overseen | Other
Directorships Held
by Trustees*** |
INDEPENDENT TRUSTEES: | | | |
Randall C. Barnes (1951) | Trustee and Chair of the Valuation Oversight Committee | Since 2014 (Trustee) Since 2020 (Chair of the Valuation Oversight Committee) | Current: Private Investor (2001-present). Former: Senior Vice President and Treasurer, PepsiCo, Inc. (1993-1997); President, Pizza Hut International (1991-1993); Senior Vice President, Strategic Planning and New Business Development, PepsiCo, Inc. (1987-1990). | 153 | Current: Advent Convertible and Income Fund (2005-present); Purpose Investments Funds (2013-present). Former: Guggenheim Energy & Income Fund (2015-2023); Fiduciary/Claymore Energy Infrastructure Fund (2004-2022); Guggenheim Enhanced Equity Income Fund (2005-2021); Guggenheim Credit Allocation Fund (2013-2021). |
120 | THE GUGGENHEIM FUNDS SEMI-ANNUAL REPORT | |
INFORMATION ON BOARD OF TRUSTEES AND OFFICERS (Unaudited)(continued) |
Name, Address*
and Year of Birth | Position(s)
Held with
Trust | Term of Office
and Length of
Time Served** | Principal Occupation(s)
During Past Five Years | Number of
Portfolios
in Fund
Complex
Overseen | Other
Directorships Held
by Trustees*** |
INDEPENDENT TRUSTEES - continued | | |
Angela Brock-Kyle (1959) | Trustee | Since 2019 | Current: Founder and Chief Executive Officer, B.O.A.R.D.S. (consulting firm) (2013-present); Director, Mutual Fund Directors Forum (2022-present). Former: Senior Leader, TIAA (financial services firm) (1987-2012). | 152 | Current: Bowhead Insurance GP, LLC (2020-present); Hunt Companies, Inc. (2019-present). Former: Guggenheim Energy & Income Fund (2019-2023); Fiduciary/Claymore Energy Infrastructure Fund (2019-2022); Guggenheim Enhanced Equity Income Fund (2019-2021); Guggenheim Credit Allocation Fund (2019-2021); Infinity Property & Casualty Corp. (2014-2018). |
Thomas F. Lydon, Jr. (1960) | Trustee and Chair of the Contracts Review Committee | Since 2019 (Trustee) Since 2020 (Chair of the Contracts Review Committee) | Current: President, Global Trends Investments (registered investment adviser) (1996-present); Chief Executive Officer, Lydon Media (2016-present); Vice Chairman, VettaFi, a wholly owned subsidiary of The TMX Group (financial advisor content, research and digital distribution provider) (2022-present). Former: Chief Executive Officer, ETF Flows, LLC (financial advisor education and research provider) (2019-2023); Director, GDX Index Partners, LLC (index provider) (2021-2023). | 152 | Current: US Global Investors, Inc. (GROW) (1995-present); The 2023 ETF Series Trust (4) (2023-present); The 2023 ETF Series II (1) (2023-present). Former: Guggenheim Energy & Income Fund (2019-2023); Fiduciary/Claymore Energy Infrastructure Fund (2019-2022); Guggenheim Enhanced Equity Income Fund (2019-2021); Guggenheim Credit Allocation Fund (2019-2021); Harvest Volatility Edge Trust (3) (2017-2019). |
| | THE GUGGENHEIM FUNDS SEMI-ANNUAL REPORT | 121 |
INFORMATION ON BOARD OF TRUSTEES AND OFFICERS (Unaudited)(continued) |
Name, Address*
and Year of Birth | Position(s)
Held with
Trust | Term of Office
and Length of
Time Served** | Principal Occupation(s)
During Past Five Years | Number of
Portfolios
in Fund
Complex
Overseen | Other
Directorships Held
by Trustees*** |
INDEPENDENT TRUSTEES - continued | | |
Ronald A. Nyberg (1953) | Trustee and Chair of the Nominating and Governance Committee | Since 2014 | Current: Of Counsel (formerly Partner), Momkus LLP (law firm) (2016-present). Former: Partner, Nyberg & Cassioppi, LLC (law firm) (2000-2016); Executive Vice President, General Counsel, and Corporate Secretary, Van Kampen Investments (1982-1999). | 153 | Current: Advent Convertible and Income Fund (2003-present); PPM Funds (2) (2018-present); Endeavor Health (2012-present). Former: Guggenheim Energy & Income Fund (2015-2023); Fiduciary/Claymore Energy Infrastructure Fund (2004-2022); Guggenheim Enhanced Equity Income Fund (2005-2021); Guggenheim Credit Allocation Fund (2013-2021); Western Asset Inflation-Linked Opportunities & Income Fund (2004-2020); Western Asset Inflation-Linked Income Fund (2003-2020). |
122 | THE GUGGENHEIM FUNDS SEMI-ANNUAL REPORT | |
INFORMATION ON BOARD OF TRUSTEES AND OFFICERS (Unaudited)(continued) |
Name, Address*
and Year of Birth | Position(s)
Held with
Trust | Term of Office
and Length of
Time Served** | Principal Occupation(s)
During Past Five Years | Number of
Portfolios
in Fund
Complex
Overseen | Other
Directorships Held
by Trustees*** |
INDEPENDENT TRUSTEES - continued | | |
Sandra G. Sponem (1958) | Trustee and Chair of the Audit Committee | Since 2019 (Trustee) Since 2020 (Chair of the Audit Committee) | Current: Retired. Former: Senior Vice President and Chief Financial Officer, M.A. Mortenson-Companies, Inc. (construction and real estate development company) (2007-2017). | 152 | Current: SPDR Series Trust (81) (2018-present); SPDR Index Shares Funds (30) (2018-present); SSGA Active Trust (14) (2018-present). Former: Guggenheim Energy & Income Fund (2019-2023); Fiduciary/Claymore Energy Infrastructure Fund (2019-2022); Guggenheim Enhanced Equity Income Fund (2019-2021); Guggenheim Credit Allocation Fund (2019-2021); SSGA Master Trust (1) (2018-2020). |
| | THE GUGGENHEIM FUNDS SEMI-ANNUAL REPORT | 123 |
INFORMATION ON BOARD OF TRUSTEES AND OFFICERS (Unaudited)(continued) |
Name, Address*
and Year of Birth | Position(s)
Held with
Trust | Term of Office
and Length of
Time Served** | Principal Occupation(s)
During Past Five Years | Number of
Portfolios
in Fund
Complex
Overseen | Other
Directorships Held
by Trustees*** |
INDEPENDENT TRUSTEES - concluded | | |
Ronald E. Toupin, Jr. (1958) | Trustee, Chair of the Board and Chair of the Executive Committee | Since 2014 | Current: Portfolio Consultant (2010-present); Member, Governing Council, Independent Directors Council (2013-present); Governor, Board of Governors, Investment Company Institute (2018-present). Former: Member, Executive Committee, Independent Directors Council (2016-2018); Vice President, Manager and Portfolio Manager, Nuveen Asset Management (1998-1999); Vice President, Nuveen Investment Advisory Corp. (1992-1999); Vice President and Manager, Nuveen Unit Investment Trusts (1991-1999); and Assistant Vice President and Portfolio Manager, Nuveen Unit Investment Trusts (1988-1999), each of John Nuveen & Co., Inc. (registered broker dealer) (1982-1999). | 152 | Former: Guggenheim Energy & Income Fund (2015-2023); Fiduciary/Claymore Energy Infrastructure Fund (2004-2022); Guggenheim Enhanced Equity Income Fund (2005-2021); Guggenheim Credit Allocation Fund (2013-2021); Western Asset Inflation-Linked Opportunities & Income Fund (2004-2020); Western Asset Inflation-Linked Income Fund (2003-2020). |
124 | THE GUGGENHEIM FUNDS SEMI-ANNUAL REPORT | |
INFORMATION ON BOARD OF TRUSTEES AND OFFICERS (Unaudited)(continued) |
Name, Address*
and Year of Birth | Position(s)
Held with
Trust | Term of Office
and Length of
Time Served** | Principal Occupation(s)
During Past Five Years | Number of
Portfolios
in Fund
Complex
Overseen | Other
Directorships Held
by Trustees*** |
INTERESTED TRUSTEE: | |
Amy J. Lee**** (1961) | Trustee, Vice President and Chief Legal Officer | Since 2018 (Trustee) Since 2014 (Chief Legal Officer) Since 2007 (Vice President) | Current: Interested Trustee, certain other funds in the Fund Complex (2018-present); Chief Legal Officer, certain other funds in the Fund Complex (2014-present); Vice President, certain other funds in the Fund Complex (2007-present); Senior Managing Director, Guggenheim Investments (2012-present). Former: President and/or Chief Executive Officer, certain other funds in the Fund Complex (2017-2019); Vice President, Associate General Counsel and Assistant Secretary, Security Benefit Life Insurance Company and Security Benefit Corporation (2004-2012). | 152 | Former: Guggenheim Energy & Income Fund (2018-2023); Fiduciary/Claymore Energy Infrastructure Fund (2018-2022); Guggenheim Enhanced Equity Income Fund (2018-2021); Guggenheim Credit Allocation Fund (2018-2021). |
* | The business address of each Trustee is c/o Guggenheim Investments, 227 West Monroe Street, Chicago, Illinois 60606. |
** | Each Trustee serves an indefinite term, until his or her successor is elected and qualified. Time served includes time served in the respective position for the Predecessor Corporation. |
*** | Each Trustee also serves on the Boards of Trustees of Guggenheim Funds Trust, Guggenheim Variable Funds Trust, Guggenheim Strategy Funds Trust, Guggenheim Taxable Municipal Bond & Investment Grade Debt Trust, Guggenheim Strategic Opportunities Fund, Guggenheim Active Allocation Fund, Rydex Series Funds, Rydex Dynamic Funds, Rydex Variable Trust and Transparent Value Trust. Messrs. Barnes and Nyberg also serve on the Board of Trustees of Advent Convertible & Income Fund. |
**** | This Trustee is deemed to be an “interested person” of the Fund under the 1940 Act by reason of her position with the Fund’s Adviser and/or the parent of the Adviser. |
| | THE GUGGENHEIM FUNDS SEMI-ANNUAL REPORT | 125 |
INFORMATION ON BOARD OF TRUSTEES AND OFFICERS (Unaudited)(continued) |
Name, Address*
and Year of Birth | Position(s)
Held with
Trust | Term of Office
and Length of
Time Served** | Principal Occupation(s)
During Past Five Years |
OFFICERS | | | |
Brian E. Binder (1972) | President and Chief Executive Officer | Since 2018 | Current: President, Mutual Fund Boards, Guggenheim Investments (2022-present); President and Chief Executive Officer, certain other funds in the Fund Complex (2018-present); President, Mutual Funds Boards, Guggenheim Funds Investment Advisors, LLC and Security Investors, LLC (2018-present); Board Member, Guggenheim Partners Investment Funds plc (2022-present); Board Member, Guggenheim Global Investments plc (2022-present); Board Member, Guggenheim Partners Fund Management (Europe) Limited (2018-present). Former: Senior Managing Director and Chief Administrative Officer, Guggenheim Investments (2018-2022); Managing Director and President, Deutsche Funds, and Head of US Product, Trading and Fund Administration, Deutsche Asset Management (2013-2018); Managing Director, Chairman of North American Executive Committee and Head of Business Management and Consulting, Invesco Ltd. (2010-2012). |
James Howley (1972) | Chief Financial Officer, Chief Accounting Officer and Treasurer | Since 2022 | Current: Managing Director, Guggenheim Investments (2004-present); Chief Financial Officer, Chief Accounting Officer, and Treasurer, certain other funds in the Fund Complex (2022-present). Former: Assistant Treasurer, certain other funds in the Fund Complex (2006-2022); Manager, Mutual Fund Administration of Van Kampen Investments, Inc. (1996-2004). |
Mark E. Mathiasen (1978) | Secretary | Since 2014 | Current: Secretary, certain other funds in the Fund Complex (2007-present); Managing Director, Guggenheim Investments (2007-present). |
Glenn McWhinnie (1969) | Assistant Treasurer | Since 2016 | Current: Vice President, Guggenheim Investments (2009-present); Assistant Treasurer, certain other funds in the Fund Complex (2016-present). |
Michael P. Megaris (1984) | Assistant Secretary | Since 2014 | Current: Assistant Secretary, certain other funds in the Fund Complex (2014-present); Managing Director, Guggenheim Investments (2012-present). |
126 | THE GUGGENHEIM FUNDS SEMI-ANNUAL REPORT | |
INFORMATION ON BOARD OF TRUSTEES AND OFFICERS (Unaudited)(continued) |
Name, Address*
and Year of Birth | Position(s)
Held with
Trust | Term of Office
and Length of
Time Served** | Principal Occupation(s)
During Past Five Years |
OFFICERS - continued | |
Elisabeth Miller (1968) | Chief Compliance Officer | Since 2012 | Current: Chief Compliance Officer, certain other funds in the Fund Complex (2012-present); Senior Managing Director, Guggenheim Investments (2012-present); Senior Managing Director, Guggenheim Funds Distributors, LLC (2014-present). Former: Chief Compliance Officer, Security Investors, LLC and Guggenheim Funds Investment Advisors, LLC (2012-2018); Chief Compliance Officer, Guggenheim Distributors, LLC (2009-2014); Senior Manager, Security Investors, LLC (2004-2014); Senior Manager, Guggenheim Distributors, LLC (2004-2014). |
Margaux Misantone (1978) | AML Officer | Since 2017 | Current: Chief Compliance Officer, Security Investors, LLC and Guggenheim Funds Investment Advisors, LLC (2018-present); AML Officer, Security Investors, LLC and certain other funds in the Fund Complex (2017-present); Managing Director, Guggenheim Investments (2015-present). Former: Assistant Chief Compliance Officer, Security Investors, LLC and Guggenheim Funds Investments Advisors, LLC (2015-2018). |
Kimberly J. Scott (1974) | Assistant Treasurer | Since 2014 | Current: Director, Guggenheim Investments (2012-present); Assistant Treasurer, certain other funds in the Fund Complex (2012-present). Former: Financial Reporting Manager, Invesco, Ltd. (2010-2011); Vice President/Assistant Treasurer, Mutual Fund Administration for Van Kampen Investments, Inc./Morgan Stanley Investment Management (2009-2010); Manager of Mutual Fund Administration, Van Kampen Investments, Inc./Morgan Stanley Investment Management (2005-2009). |
| | THE GUGGENHEIM FUNDS SEMI-ANNUAL REPORT | 127 |
INFORMATION ON BOARD OF TRUSTEES AND OFFICERS (Unaudited)(concluded) |
Name, Address*
and Year of Birth | Position(s)
Held with
Trust | Term of Office
and Length of
Time Served** | Principal Occupation(s)
During Past Five Years |
OFFICERS - concluded | |
Jon Szafran (1989) | Assistant Treasurer | Since 2017 | Current: Director, Guggenheim Investments (2017-present); Assistant Treasurer, certain other funds in the Fund Complex (2017-present). Former: Assistant Treasurer of Henderson Global Funds and Manager of US Fund Administration, Henderson Global Investors (North America) Inc. (“HGINA”), (2017); Senior Analyst of US Fund Administration, HGINA (2014–2017); Senior Associate of Fund Administration, Cortland Capital Market Services, LLC (2013-2014); Experienced Associate, PricewaterhouseCoopers LLP (2012-2013). |
* | The business address of each officer is c/o Guggenheim Investments, 227 West Monroe Street, Chicago, Illinois 60606. |
** | Each officer serves an indefinite term, until his or her successor is duly elected and qualified. |
128 | THE GUGGENHEIM FUNDS SEMI-ANNUAL REPORT | |
GUGGENHEIM INVESTMENTS PRIVACY NOTICE (Unaudited) |
Who We Are
This Privacy Notice describes the data protection practices of Guggenheim Investments. Guggenheim Investments as used herein refers to the affiliated investment management businesses of Guggenheim Partners, LLC: Guggenheim Funds Investment Advisors, LLC, Guggenheim Partners Investment Management, LLC, Guggenheim Funds Distributors, LLC, Security Investors, LLC, Guggenheim Investment Advisors (Europe) Limited, Guggenheim Real Estate, LLC, GS Gamma Advisors, LLC, Guggenheim Partners India Management, LLC, Guggenheim Partners Europe Limited, as well as the funds in the Guggenheim Funds complex (the “Funds”) (“Guggenheim Investments,” “we,” “us,” or “our”).
Guggenheim Partners Investment Management Holdings, LLC, located at 330 Madison Avenue, New York, New York, 10017 is the data controller for your information. The affiliates who are also controllers of certain of your information are: Guggenheim Investment Advisors (Europe) Limited, Guggenheim Partners Europe Limited, Guggenheim Partners, LLC, Guggenheim Funds Investment Advisors, LLC, Guggenheim Partners Investment Management, LLC, Guggenheim Funds Distributors, LLC and Security Investors, LLC, as well as the Funds.
Our Commitment to You
Guggenheim Investments considers your privacy our utmost concern. When you become our client or investor, you entrust us with not only your hard-earned money but also with your personal and financial information. Because we have access to your private information, we hold ourselves to the highest standards in its safekeeping and use. We strictly limit how we share your information with others, whether you are a current or former Guggenheim Investments client or investor.
The Information We Collect About You
We collect certain nonpublic personal information about you from information you provide on applications, other forms, our website, and/or from third parties including investment advisors. This information includes Social Security or other tax identification number, assets, income, tax information, retirement and estate plan information, transaction history, account balance, payment history, bank account information, marital status, family relationships, information that we collect on our website through the use of “cookies,” and other personal information that you or others provide to us. We may also collect such information through your inquiries by mail, e-mail or telephone. We may also collect customer due diligence information, as required by applicable law and regulation, through third party service providers.
How We Handle Your Personal Information
The legal basis for using your information as set out in this Privacy Notice is as follows: (a) use of your personal data is necessary to perform our obligations under any contract with you (such as a contract for us to provide financial services to you); or (b) where use of your personal data is not necessary for performance of a contract, use of your personal data is necessary for our
| | THE GUGGENHEIM FUNDS SEMI-ANNUAL REPORT | 129 |
GUGGENHEIM INVESTMENTS PRIVACY NOTICE (Unaudited)(continued) |
legitimate interests or the legitimate interests of others (for example, to enforce the legal terms governing our services, operate and market our website and other services we offer, ensure safe environments for our personnel and others, make and receive payments, prevent fraud and to know the customer to whom we are providing the services). Some processing is done to comply with applicable law.
In addition to the specific uses described above, we also use your information in the following manner:
| | ● | We use your information in connection with servicing your accounts. |
| | ● | We use information to respond to your requests or questions. For example, we might use your information to respond to your customer feedback. |
| | ● | We use information to improve our products and services. We may use your information to make our website and products better. We may use your information to customize your experience with us. |
| | ● | We use information for security purposes. We may use your information to protect our company and our customers. |
| | ● | We use information to communicate with you. For example, we will communicate with you about your account or our relationship. We may contact you about your feedback. We might also contact you about this Privacy Notice. We may also enroll you in our email newsletter. |
| | ● | We use information as otherwise permitted by law, as we may notify you. |
| | ● | Aggregate/Anonymous Data. We may aggregate and/or anonymize any information collected through the website so that such information can no longer be linked to you or your device (“Aggregate/Anonymous Information”). We may use Aggregate/Anonymous Information for any purpose, including without limitation for research and marketing purposes, and may also share such data with any third parties, including advertisers, promotional partners, and sponsors. We do not sell information about current or former clients or their accounts to third parties. Nor do we share this information, except when necessary to complete transactions at your request, to make you aware of investment products and services that we or our affiliates offer, or as permitted or required by law. |
We provide information about you to companies and individuals not affiliated with Guggenheim Investments to complete certain transactions or account changes, or to perform services for us related to your account. For example, if you ask to transfer assets from another financial institution to Guggenheim Investments, we must provide certain information about you to that company to complete the transaction. We provide the third party with only the information necessary to carry out its responsibilities and only for that purpose. And we require these third parties to treat your private information with the same high degree of confidentiality that we do.
130 | THE GUGGENHEIM FUNDS SEMI-ANNUAL REPORT | |
GUGGENHEIM INVESTMENTS PRIVACY NOTICE (Unaudited)(continued) |
To alert you to other Guggenheim Investments products and services, we share your information within our family of affiliated companies. You may limit our sharing with affiliated companies as set out below. We may also share information with any successor to all or part of our business, or in connection with steps leading up to a merger or acquisition. For example, if part of our business was sold we may give customer information as part of that transaction. We may also share information about you with your consent.
We will release information about you if you direct us to do so, if we are compelled by law to do so, or in other circumstances as permitted by law (for example, to protect your account from fraud).
If you close your account(s) or become an inactive client or investor, we will continue to adhere to the privacy policies and practices described in this notice.
Opt-Out Provisions and Your Data Choices
The law allows you to “opt out” of certain kinds of information sharing with third parties. We do not share personal information about you with any third parties that triggers this opt-out right. This means YOU ARE ALREADY OPTED OUT.
When you are no longer our client or investor, we continue to share your information as described in this notice, and you may contact us at any time to limit our sharing by sending an email to CorporateDataPrivacy@GuggenheimPartners.com.
European Union Data Subjects and certain others: In addition to the choices set forth above, residents of the European Union and certain other jurisdictions have certain rights to (1) request access to or rectification or deletion of information we collect about them, (2) request a restriction on the processing of their information, (3) object to the processing of their information, or (4) request the portability of certain information. To exercise these or other rights, please contact us using the contact information below. We will consider all requests and provide our response within the time period stated by applicable law. Please note, however, that certain information may be exempt from such requests in some circumstances, which may include if we need to keep processing your information for our legitimate interests or to comply with a legal obligation. We may request you provide us with information necessary to confirm your identity before responding to your request.
Residents of France and certain other jurisdictions may also provide us with instructions regarding the manner in which we may continue to store, erase and share your information after your death, and where applicable, the person you have designated to exercise these rights after your death.
How We Protect Privacy Online
We take steps to protect your privacy when you use our web site – www.guggenheiminvestments.com – by using secure forms of online communication, including encryption technology, Secure Socket Layer (SSL) protocol, firewalls and user names and
| | THE GUGGENHEIM FUNDS SEMI-ANNUAL REPORT | 131 |
GUGGENHEIM INVESTMENTS PRIVACY NOTICE (Unaudited)(concluded) |
passwords. These safeguards vary based on the sensitivity of the information that we collect and store. However, we cannot and do not guarantee that these measures will prevent every unauthorized attempt to access, use, or disclose your information since despite our efforts, no Internet and/or other electronic transmissions can be completely secure. Our web site uses “http cookies”—tiny pieces of information that we ask your browser to store. We use cookies for session management and security features on the Guggenheim Investments web site. We do not use them to pull data from your hard drive, to learn your e-mail address, or to view data in cookies created by other web sites. We will not share the information in our cookies or give others access to it. See the legal information area on our web site for more details about web site security and privacy features.
How We Safeguard Your Personal Information and Data Retention
We restrict access to nonpublic personal information about you to our employees and in some cases to third parties (for example, the service providers described above) as permitted by law. We maintain strict physical, electronic and procedural safeguards that comply with federal standards to guard your nonpublic personal information.
We keep your information for no longer than necessary for the purposes for which it is processed. The length of time for which we retain information depends on the purposes for which we collected and use it and/or as required to comply with applicable laws. Information may persist in copies made for backup and business continuity purposes for additional time.
International Visitors
If you are not a resident of the United States, please be aware that your information may be transferred to, stored and processed in the United States where our servers are located and our databases are operated. The data protection and other laws of the United States and other countries might not be as comprehensive as those in your country.
In such cases, we ensure that a legal basis for such a transfer exists and that adequate protection is provided as required by applicable law, for example, by using standard contractual clauses or by transferring your data to a jurisdiction that has obtained an adequacy finding. Individuals whose data may be transferred on the basis of standard contractual clauses may contact us as described below.
We’ll Keep You Informed
If you have any questions or concerns about how we treat your personal data, we encourage you to consult with us first. You may also contact the relevant supervisory authority.
We reserve the right to modify this policy at any time and will inform you promptly of material changes. You may access our privacy policy from our web site at www.guggenheiminvestments.com. Should you have any questions regarding our privacy policy, contact us by email at CorporateDataPrivacy@GuggenheimPartners.com.
132 | THE GUGGENHEIM FUNDS SEMI-ANNUAL REPORT | |
This page intentionally left blank.
This page intentionally left blank.
This page intentionally left blank.
This page intentionally left blank.
This page intentionally left blank.
Not required at this time.
| Item 3. | Audit Committee Financial Expert. |
Not required at this time.
| Item 4. | Principal Accountant Fees and Services. |
Not required at this time.
| Item 5. | Audit Committee of Listed Registrants. |
Not applicable.
(a) The Schedule of Investments is included under Item 1 of this Form.
(b) Not applicable.
| Item 7. | Disclosure of Proxy Voting Policies and Procedures for Closed-End Management Investment Companies. |
Not applicable.
| Item 8. | Portfolio Managers of Closed-end Management Investment Companies |
Not applicable.
| Item 9. | Purchases of Equity Securities by Closed-End Management Investment Company and Affiliated Purchasers. |
Not applicable.
| Item 10. | Submission of Matters to a Vote of Security Holders. |
The registrant does not currently have in place procedures by which shareholders may recommend nominees to the registrant’s board.
There have been no changes to the procedures by which shareholders may recommend nominees to the registrant’s board.
| Item 11. | Controls and Procedures. |
| (a) | The registrant’s President (principal executive officer) and Treasurer (principal financial officer) have evaluated the registrant’s disclosure controls and procedures (as defined in Rule 30a-3(c) under the Investment Company Act) as of a date within 90 days of this filing and have concluded that based on such evaluation as required by Rule 30a-3(b) under the Investment Company Act, that the registrant’s disclosure controls and procedures were effective as of that date in ensuring that information required to be disclosed by the registrant in this Form N-CSR was recorded, processed, summarized, and reported within the time periods specified in the Securities and Exchange Commission’s rules and forms.. |
| (b) | There were no changes in the registrant’s internal control over financial reporting (as defined in Rule 30a-3(d) under the Investment Company Act) that occurred during the period covered by this report that have materially affected, or are reasonably likely to materially affect, the registrant’s internal control over financial reporting. |
| Item 12. | Disclosure of Securities Lending Activities for Closed-End Management Investment Companies. |
Not applicable.
| Item 13. | Recovery of Erroneously Awarded Compensation. |
(a) Not applicable.
(b) Not applicable.
SIGNATURES
Pursuant to the requirements of the Securities Exchange Act of 1934 and the Investment Company Act of 1940, the registrant has duly caused this report to be signed on its behalf by the undersigned, thereunto duly authorized.
| (Registrant) | Guggenheim Funds Trust | |
| | | |
| By (Signature and Title)* | /s/ Brian E. Binder | |
| | Brian E. Binder, President and Chief Executive Officer | |
| | | |
| Date | May 31, 2024 | |
Pursuant to the requirements of the Securities Exchange Act of 1934 and the Investment Company Act of 1940, this report has been signed below by the following persons on behalf of the registrant and in the capacities and on the dates indicated.
| By (Signature and Title)* | /s/ Brian E. Binder | |
| | Brian E. Binder, President and Chief Executive Officer | |
| | | |
| Date | May 31, 2024 | |
| | | |
| By (Signature and Title)* | /s/ James Howley | |
| | James Howley, Chief Financial Officer, Chief Accounting Officer and Treasurer | |
| | | |
| Date | May 31, 2024 | |
| * | Print the name and title of each signing officer under his or her signature. |


