0000088525 equity:GuggenheimLargeCapValueFundClassPRussell1000ValueIndexMember 2015-05-01 0000088525 equity:C000165921Member 2024-06-30 0000088525 equity:C000138554Member equity:RealtyIncomeCorpMember 2024-09-30 0000088525 equity:C000023972Member 2017-06-30 0000088525 equity:C000136534Member 2024-09-30 0000088525 equity:C000100456Member equity:StrongTotalInvestmentsstrongMember 2024-09-30 0000088525 equity:C000155966Member 2016-12-31 0000088525 equity:GuggenheimLimitedDurationFundClassR6BloombergUSAggregateBond13YearTotalReturnIndexMember 2021-03-31 0000088525 equity:C000136524Member 2023-10-01 2024-09-30 0000088525 equity:C000136529Member equity:UnitedStatesTreasuryInflationIndexedBonds213due041529Member 2024-09-30
UNITED STATES
SECURITIES AND EXCHANGE COMMISSION
Washington, D.C. 20549
FORM N-CSR
CERTIFIED SHAREHOLDER REPORT OF REGISTERED MANAGEMENT INVESTMENT COMPANIES
Investment Company Act file number 811- 01136
Guggenheim Funds Trust
(Exact name of registrant as specified in charter)
702 King Farm Boulevard, Suite 200
Rockville, Maryland 20850
(Address of principal executive offices) (Zip code)
Amy J. Lee
Guggenheim Funds Trust
702 King Farm Boulevard, Suite 200
Rockville, Maryland 20850
(Name and address of agent for service)
Registrant's telephone number, including area code: (301) 296-5100
Date of fiscal year end: September 30
Date of reporting period: October 1, 2023 - September 30, 2024
| Item 1. | Reports to Stockholders. |
| (a) | The registrant’s annual report transmitted to shareholders pursuant to Rule 30e-1 under the Investment Company Act of 1940, as amended (the “Investment Company Act”), is as follows: |

Annual Shareholder Report | 9.30.24
This annual shareholder report contains important information about the Guggenheim Alpha Opportunity Fund for the period of October 1, 2023 to September 30, 2024. You can find additional information about the fund at GuggenheimInvestments.com/mutual-funds/literature. You can also request this information by contacting 800 820 0888 or GuggenheimClientServices@mufg-is.com.
This report describes changes to the fund that occurred during the reporting period.
For the period of October 1, 2023 to September 30, 2024, the fund (Class A shares) returned 14.64%, underperforming the fund's benchmark, the S&P 500 Index, which returned 36.35% for the same period and outperforming the fund's secondary index, the ICE BofA 3-Month U.S. Treasury Bill Index, which returned 5.49% for the same period.
The fund's broad-based securities market index was changed from the ICE BofA 3-Month U.S. Treasury Bill Index to the S&P 500 Index to comply with the regulation that requires the fund's broad-based securities market index to represent the overall applicable market.
What factors materially affected the fund's performance over the last year?
The global growth outlook remained modestly bullish and steady during the reporting period, while inflation seemed to be finally tamed, resulting in a 50 basis point rate cut by the U.S. Federal Reserve in September and potentially up to two more by the end of 2024. This optimism helped the S&P 500 Index gain more than 36% during the reporting period. The fund significantly outperformed the ICE BofA 3-Month U.S. Treasury Bill Index. Among the fundamental factors, the fund's exposure in higher profitability, lower volatility, and higher momentum names paid off well. The overall contribution of the industry tilts (overweights/underweights) was moderate, whereas security selection was quite strong.
Cumulative performance* for the fund's most recently completed 10 years (as of 9.30.24), assuming a $10,000 initial investment.
| 09/30/2014 | 9523 | 10000 | 10000 |
| 12/31/2014 | 10114 | 10493 | 10000 |
| 03/31/2015 | 9907 | 10593 | 10001 |
| 06/30/2015 | 9764 | 10622 | 10001 |
| 09/30/2015 | 9753 | 9939 | 10002 |
| 12/31/2015 | 9647 | 10638 | 10006 |
| 03/31/2016 | 10321 | 10782 | 10013 |
| 06/30/2016 | 10002 | 11047 | 10020 |
| 09/30/2016 | 10114 | 11472 | 10030 |
| 12/31/2016 | 10886 | 11911 | 10038 |
| 03/31/2017 | 11183 | 12633 | 10049 |
| 06/30/2017 | 10939 | 13023 | 10069 |
| 09/30/2017 | 11196 | 13607 | 10096 |
| 12/31/2017 | 11701 | 14511 | 10124 |
| 03/31/2018 | 11162 | 14401 | 10160 |
| 06/30/2018 | 10656 | 14896 | 10206 |
| 09/30/2018 | 10872 | 16044 | 10256 |
| 12/31/2018 | 10385 | 13875 | 10314 |
| 03/31/2019 | 10391 | 15769 | 10376 |
| 06/30/2019 | 10017 | 16447 | 10442 |
| 09/30/2019 | 10006 | 16727 | 10501 |
| 12/31/2019 | 10151 | 18244 | 10549 |
| 03/31/2020 | 9293 | 14668 | 10610 |
| 06/30/2020 | 9698 | 17682 | 10612 |
| 09/30/2020 | 9791 | 19260 | 10616 |
| 12/31/2020 | 10168 | 21600 | 10620 |
| 03/31/2021 | 11019 | 22934 | 10622 |
| 06/30/2021 | 10837 | 24895 | 10622 |
| 09/30/2021 | 10591 | 25040 | 10624 |
| 12/31/2021 | 11631 | 27801 | 10625 |
| 03/31/2022 | 10738 | 26522 | 10629 |
| 06/30/2022 | 10738 | 22252 | 10640 |
| 09/30/2022 | 9897 | 21165 | 10690 |
| 12/31/2022 | 10625 | 22766 | 10781 |
| 03/31/2023 | 10959 | 24473 | 10898 |
| 06/30/2023 | 11149 | 26612 | 11026 |
| 09/30/2023 | 11543 | 25741 | 11171 |
| 12/31/2023 | 11560 | 28750 | 11325 |
| 03/31/2024 | 12945 | 31785 | 11472 |
| 06/30/2024 | 12621 | 33147 | 11625 |
| 09/30/2024 | 13233 | 35098 | 11784 |
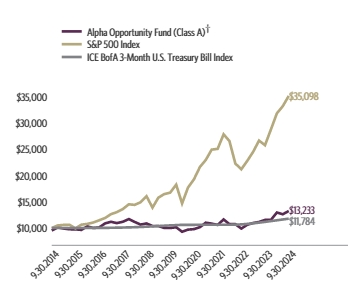
| Class A (without sales charge) | 14.64% | 5.75% | 3.34% |
| Class A (with sales charge)† | 9.18% | 4.72% | 2.84% |
| S&P 500 Index | 36.35% | 15.98% | 13.38% |
| ICE BofA 3-Month U.S. Treasury Bill Index | 5.49% | 2.33% | 1.66% |
The fund's past performance is not a good predictor of the fund's future performance. Visit GuggenheimInvestments.com/mutual-funds/performance for more recent performance information.
| Net Assets | $37,989,207 |
| Total Number of Portfolio Holdings | 156 |
| Portfolio Turnover Rate | 306% |
| Total Advisory Fees Paid | $288,033 |
| Guggenheim Alpha Opportunity Fund | Class A | SAOAX | Annual Shareholder Report | September 30, 2024 |
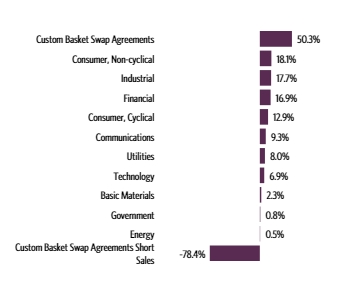
| Custom Basket Swap Agreements | 50.3% |
| Consumer, Non-cyclical | 18.1% |
| Industrial | 17.7% |
| Financial | 16.9% |
| Consumer, Cyclical | 12.9% |
| Communications | 9.3% |
| Utilities | 8.0% |
| Technology | 6.9% |
| Basic Materials | 2.3% |
| Government | 0.8% |
| Energy | 0.5% |
| Custom Basket Swap Agreements Short Sales | -78.4% |

| UFP Industries, Inc. | 1.1% |
| Acuity Brands, Inc. | 1.1% |
| Allison Transmission Holdings, Inc. | 1.1% |
| Boise Cascade Co. | 1.1% |
| Mueller Industries, Inc. | 1.1% |
| Apogee Enterprises, Inc. | 1.0% |
| Teekay Tankers Ltd. — Class A | 1.0% |
| Entergy Corp. | 1.0% |
| Incyte Corp. | 1.0% |
| Gilead Sciences, Inc. | 1.0% |
| Top 10 Total | 10.5% |
| |
1 | "Holdings Diversification (Market Exposure as a % of Net Assets)" excludes any temporary cash investments, investments in Guggenheim Strategy Funds Trust mutual funds, or investments in Guggenheim Ultra Short Duration Fund. |
| |
2 | "10 Largest Holdings (as a % of Net Assets)" excludes any temporary cash investments. |
| UFP Industries, Inc. | 1.1% |
| Acuity Brands, Inc. | 1.1% |
| Allison Transmission Holdings, Inc. | 1.1% |
| Boise Cascade Co. | 1.1% |
| Mueller Industries, Inc. | 1.1% |
| Apogee Enterprises, Inc. | 1.0% |
| Teekay Tankers Ltd. — Class A | 1.0% |
| Entergy Corp. | 1.0% |
| Incyte Corp. | 1.0% |
| Gilead Sciences, Inc. | 1.0% |
| Top 10 Total | 10.5% |
| |
2 | "10 Largest Holdings (as a % of Net Assets)" excludes any temporary cash investments. |
There were no changes in or disagreements with fund accountants for the period.
This is a summary of certain changes to the fund since September 30, 2023.
Subsequent to the September 30, 2024 year-end, on October 25, 2024, the fund was reorganized into New Age Alpha Opportunity Fund, a series of New Age Alpha Funds Trust, pursuant to an Agreement and Plan of Reorganization approved by the Board of Trustees and shareholders of the fund.
| |  | Availability of Additional Information. For additional information, including financial information, holdings and proxy voting information, go to GuggenheimInvestments.com/mutual-funds/literature or, call 800 820 0888. |
AR-SAOAX-093024
Annual Shareholder Report | 9.30.24
This annual shareholder report contains important information about the Guggenheim Alpha Opportunity Fund for the period of October 1, 2023 to September 30, 2024. You can find additional information about the fund at GuggenheimInvestments.com/mutual-funds/literature. You can also request this information by contacting 800 820 0888 or GuggenheimClientServices@mufg-is.com.
This report describes changes to the fund that occurred during the reporting period.
For the period of October 1, 2023 to September 30, 2024, the fund (Class C shares) returned 13.86%, underperforming the fund's benchmark, the S&P 500 Index, which returned 36.35% for the same period and outperforming the fund's secondary index, the ICE BofA 3-Month U.S. Treasury Bill Index, which returned 5.49% for the same period.
The fund's broad-based securities market index was changed from the ICE BofA 3-Month U.S. Treasury Bill Index to the S&P 500 Index to comply with the regulation that requires the fund's broad-based securities market index to represent the overall applicable market.
What factors materially affected the fund's performance over the last year?
The global growth outlook remained modestly bullish and steady during the reporting period, while inflation seemed to be finally tamed, resulting in a 50 basis point rate cut by the U.S. Federal Reserve in September and potentially up to two more by the end of 2024. This optimism helped the S&P 500 Index gain more than 36% during the reporting period. The fund significantly outperformed the ICE BofA 3-Month U.S. Treasury Bill Index. Among the fundamental factors, the fund's exposure in higher profitability, lower volatility, and higher momentum names paid off well. The overall contribution of the industry tilts (overweights/underweights) was moderate, whereas security selection was quite strong.
Cumulative performance* for the fund's most recently completed 10 years (as of 9.30.24), assuming a $10,000 initial investment.
| 09/30/2014 | 10000 | 10000 | 10000 |
| 12/31/2014 | 10602 | 10493 | 10000 |
| 03/31/2015 | 10367 | 10593 | 10001 |
| 06/30/2015 | 10200 | 10622 | 10001 |
| 09/30/2015 | 10169 | 9939 | 10002 |
| 12/31/2015 | 10040 | 10638 | 10006 |
| 03/31/2016 | 10719 | 10782 | 10013 |
| 06/30/2016 | 10373 | 11047 | 10020 |
| 09/30/2016 | 10466 | 11472 | 10030 |
| 12/31/2016 | 11242 | 11911 | 10038 |
| 03/31/2017 | 11532 | 12633 | 10049 |
| 06/30/2017 | 11254 | 13023 | 10069 |
| 09/30/2017 | 11504 | 13607 | 10096 |
| 12/31/2017 | 11992 | 14511 | 10124 |
| 03/31/2018 | 11425 | 14401 | 10160 |
| 06/30/2018 | 10884 | 14896 | 10206 |
| 09/30/2018 | 11084 | 16044 | 10256 |
| 12/31/2018 | 10564 | 13875 | 10314 |
| 03/31/2019 | 10544 | 15769 | 10376 |
| 06/30/2019 | 10150 | 16447 | 10442 |
| 09/30/2019 | 10117 | 16727 | 10501 |
| 12/31/2019 | 10243 | 18244 | 10549 |
| 03/31/2020 | 9349 | 14668 | 10610 |
| 06/30/2020 | 9743 | 17682 | 10612 |
| 09/30/2020 | 9816 | 19260 | 10616 |
| 12/31/2020 | 10178 | 21600 | 10620 |
| 03/31/2021 | 11008 | 22934 | 10622 |
| 06/30/2021 | 10800 | 24895 | 10622 |
| 09/30/2021 | 10540 | 25040 | 10624 |
| 12/31/2021 | 11551 | 27801 | 10625 |
| 03/31/2022 | 10647 | 26522 | 10629 |
| 06/30/2022 | 10627 | 22252 | 10640 |
| 09/30/2022 | 9776 | 21165 | 10690 |
| 12/31/2022 | 10473 | 22766 | 10781 |
| 03/31/2023 | 10781 | 24473 | 10898 |
| 06/30/2023 | 10948 | 26612 | 11026 |
| 09/30/2023 | 11310 | 25741 | 11171 |
| 12/31/2023 | 11310 | 28750 | 11325 |
| 03/31/2024 | 12637 | 31785 | 11472 |
| 06/30/2024 | 12302 | 33147 | 11625 |
| 09/30/2024 | 12878 | 35098 | 11784 |

| Class C (without CDSC) | 13.86% | 4.95% | 2.56% |
| Class C (with CDSC)‡ | 12.86% | 4.95% | 2.56% |
| S&P 500 Index | 36.35% | 15.98% | 13.38% |
| ICE BofA 3-Month U.S. Treasury Bill Index | 5.49% | 2.33% | 1.66% |
The fund's past performance is not a good predictor of the fund's future performance. Visit GuggenheimInvestments.com/mutual-funds/performance for more recent performance information.
| Net Assets | $37,989,207 |
| Total Number of Portfolio Holdings | 156 |
| Portfolio Turnover Rate | 306% |
| Total Advisory Fees Paid | $288,033 |
| Guggenheim Alpha Opportunity Fund | Class C | SAOCX | Annual Shareholder Report | September 30, 2024 |
| Custom Basket Swap Agreements | 50.3% |
| Consumer, Non-cyclical | 18.1% |
| Industrial | 17.7% |
| Financial | 16.9% |
| Consumer, Cyclical | 12.9% |
| Communications | 9.3% |
| Utilities | 8.0% |
| Technology | 6.9% |
| Basic Materials | 2.3% |
| Government | 0.8% |
| Energy | 0.5% |
| Custom Basket Swap Agreements Short Sales | -78.4% |

| UFP Industries, Inc. | 1.1% |
| Acuity Brands, Inc. | 1.1% |
| Allison Transmission Holdings, Inc. | 1.1% |
| Boise Cascade Co. | 1.1% |
| Mueller Industries, Inc. | 1.1% |
| Apogee Enterprises, Inc. | 1.0% |
| Teekay Tankers Ltd. — Class A | 1.0% |
| Entergy Corp. | 1.0% |
| Incyte Corp. | 1.0% |
| Gilead Sciences, Inc. | 1.0% |
| Top 10 Total | 10.5% |
| |
1 | "Holdings Diversification (Market Exposure as a % of Net Assets)" excludes any temporary cash investments, investments in Guggenheim Strategy Funds Trust mutual funds, or investments in Guggenheim Ultra Short Duration Fund. |
| |
2 | "10 Largest Holdings (as a % of Net Assets)" excludes any temporary cash investments. |
| UFP Industries, Inc. | 1.1% |
| Acuity Brands, Inc. | 1.1% |
| Allison Transmission Holdings, Inc. | 1.1% |
| Boise Cascade Co. | 1.1% |
| Mueller Industries, Inc. | 1.1% |
| Apogee Enterprises, Inc. | 1.0% |
| Teekay Tankers Ltd. — Class A | 1.0% |
| Entergy Corp. | 1.0% |
| Incyte Corp. | 1.0% |
| Gilead Sciences, Inc. | 1.0% |
| Top 10 Total | 10.5% |
| |
2 | "10 Largest Holdings (as a % of Net Assets)" excludes any temporary cash investments. |
There were no changes in or disagreements with fund accountants for the period.
This is a summary of certain changes to the fund since September 30, 2023.
Subsequent to the September 30, 2024 year-end, on October 25, 2024, the fund was reorganized into New Age Alpha Opportunity Fund, a series of New Age Alpha Funds Trust, pursuant to an Agreement and Plan of Reorganization approved by the Board of Trustees and shareholders of the fund.
| |  | Availability of Additional Information. For additional information, including financial information, holdings and proxy voting information, go to GuggenheimInvestments.com/mutual-funds/literature or, call 800 820 0888. |
AR-SAOCX-093024
Annual Shareholder Report | 9.30.24
This annual shareholder report contains important information about the Guggenheim Alpha Opportunity Fund for the period of October 1, 2023 to September 30, 2024. You can find additional information about the fund at GuggenheimInvestments.com/mutual-funds/literature. You can also request this information by contacting 800 820 0888 or GuggenheimClientServices@mufg-is.com.
This report describes changes to the fund that occurred during the reporting period.
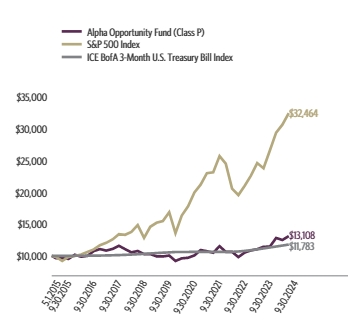
For the period of October 1, 2023 to September 30, 2024, the fund (Class P shares) returned 14.65%, underperforming the fund's benchmark, the S&P 500 Index, which returned 36.35% for the same period and outperforming the fund's secondary index, the ICE BofA 3-Month U.S. Treasury Bill Index, which returned 5.49% for the same period.
The fund's broad-based securities market index was changed from the ICE BofA 3-Month U.S. Treasury Bill Index to the S&P 500 Index to comply with the regulation that requires the fund's broad-based securities market index to represent the overall applicable market.
What factors materially affected the fund's performance over the last year?
The global growth outlook remained modestly bullish and steady during the reporting period, while inflation seemed to be finally tamed, resulting in a 50 basis point rate cut by the U.S. Federal Reserve in September and potentially up to two more by the end of 2024. This optimism helped the S&P 500 Index gain more than 36% during the reporting period. The fund significantly outperformed the ICE BofA 3-Month U.S. Treasury Bill Index. Among the fundamental factors, the fund's exposure in higher profitability, lower volatility, and higher momentum names paid off well. The overall contribution of the industry tilts (overweights/underweights) was moderate, whereas security selection was quite strong.
Cumulative performance* for the fund since inception (as of 9.30.24), assuming a $10,000 initial investment.
| 05/01/2015 | 10000 | 10000 | 10000 |
| 06/30/2015 | 9634 | 9825 | 10000 |
| 09/30/2015 | 9623 | 9193 | 10002 |
| 12/31/2015 | 9524 | 9840 | 10005 |
| 03/31/2016 | 10183 | 9973 | 10012 |
| 06/30/2016 | 9869 | 10217 | 10019 |
| 09/30/2016 | 9995 | 10611 | 10029 |
| 12/31/2016 | 10757 | 11017 | 10037 |
| 03/31/2017 | 11066 | 11685 | 10048 |
| 06/30/2017 | 10830 | 12046 | 10068 |
| 09/30/2017 | 11094 | 12586 | 10095 |
| 12/31/2017 | 11587 | 13422 | 10123 |
| 03/31/2018 | 11060 | 13320 | 10159 |
| 06/30/2018 | 10551 | 13777 | 10205 |
| 09/30/2018 | 10769 | 14840 | 10255 |
| 12/31/2018 | 10282 | 12834 | 10313 |
| 03/31/2019 | 10287 | 14585 | 10375 |
| 06/30/2019 | 9921 | 15213 | 10441 |
| 09/30/2019 | 9909 | 15471 | 10500 |
| 12/31/2019 | 10052 | 16874 | 10548 |
| 03/31/2020 | 9199 | 13567 | 10609 |
| 06/30/2020 | 9609 | 16354 | 10611 |
| 09/30/2020 | 9700 | 17815 | 10615 |
| 12/31/2020 | 10072 | 19979 | 10619 |
| 03/31/2021 | 10919 | 21213 | 10621 |
| 06/30/2021 | 10734 | 23026 | 10621 |
| 09/30/2021 | 10492 | 23160 | 10623 |
| 12/31/2021 | 11520 | 25714 | 10624 |
| 03/31/2022 | 10637 | 24532 | 10628 |
| 06/30/2022 | 10637 | 20582 | 10639 |
| 09/30/2022 | 9806 | 19577 | 10689 |
| 12/31/2022 | 10526 | 21057 | 10780 |
| 03/31/2023 | 10854 | 22636 | 10897 |
| 06/30/2023 | 11047 | 24615 | 11025 |
| 09/30/2023 | 11434 | 23809 | 11170 |
| 12/31/2023 | 11453 | 26592 | 11324 |
| 03/31/2024 | 12820 | 29400 | 11471 |
| 06/30/2024 | 12502 | 30659 | 11624 |
| 09/30/2024 | 13108 | 32464 | 11783 |
| Class P | 14.65% | 5.76% | 2.92% |
| S&P 500 Index | 36.35% | 15.98% | 13.32% |
| ICE BofA 3-Month U.S. Treasury Bill Index | 5.49% | 2.33% | 1.76% |
The fund's past performance is not a good predictor of the fund's future performance. Visit GuggenheimInvestments.com/mutual-funds/performance for more recent performance information.
| Net Assets | $37,989,207 |
| Total Number of Portfolio Holdings | 156 |
| Portfolio Turnover Rate | 306% |
| Total Advisory Fees Paid | $288,033 |
| Guggenheim Alpha Opportunity Fund | Class P | SAOSX | Annual Shareholder Report | September 30, 2024 |
| Custom Basket Swap Agreements | 50.3% |
| Consumer, Non-cyclical | 18.1% |
| Industrial | 17.7% |
| Financial | 16.9% |
| Consumer, Cyclical | 12.9% |
| Communications | 9.3% |
| Utilities | 8.0% |
| Technology | 6.9% |
| Basic Materials | 2.3% |
| Government | 0.8% |
| Energy | 0.5% |
| Custom Basket Swap Agreements Short Sales | -78.4% |
| UFP Industries, Inc. | 1.1% |
| Acuity Brands, Inc. | 1.1% |
| Allison Transmission Holdings, Inc. | 1.1% |
| Boise Cascade Co. | 1.1% |
| Mueller Industries, Inc. | 1.1% |
| Apogee Enterprises, Inc. | 1.0% |
| Teekay Tankers Ltd. — Class A | 1.0% |
| Entergy Corp. | 1.0% |
| Incyte Corp. | 1.0% |
| Gilead Sciences, Inc. | 1.0% |
| Top 10 Total | 10.5% |
| |
1 | "Holdings Diversification (Market Exposure as a % of Net Assets)" excludes any temporary cash investments, investments in Guggenheim Strategy Funds Trust mutual funds, or investments in Guggenheim Ultra Short Duration Fund. |
| |
2 | "10 Largest Holdings (as a % of Net Assets)" excludes any temporary cash investments. |
| UFP Industries, Inc. | 1.1% |
| Acuity Brands, Inc. | 1.1% |
| Allison Transmission Holdings, Inc. | 1.1% |
| Boise Cascade Co. | 1.1% |
| Mueller Industries, Inc. | 1.1% |
| Apogee Enterprises, Inc. | 1.0% |
| Teekay Tankers Ltd. — Class A | 1.0% |
| Entergy Corp. | 1.0% |
| Incyte Corp. | 1.0% |
| Gilead Sciences, Inc. | 1.0% |
| Top 10 Total | 10.5% |
| |
2 | "10 Largest Holdings (as a % of Net Assets)" excludes any temporary cash investments. |
There were no changes in or disagreements with fund accountants for the period.
This is a summary of certain changes to the fund since September 30, 2023.
Subsequent to the September 30, 2024 year-end, on October 25, 2024, the fund was reorganized into New Age Alpha Opportunity Fund, a series of New Age Alpha Funds Trust, pursuant to an Agreement and Plan of Reorganization approved by the Board of Trustees and shareholders of the fund.
| |  | Availability of Additional Information. For additional information, including financial information, holdings and proxy voting information, go to GuggenheimInvestments.com/mutual-funds/literature or, call 800 820 0888. |
AR-SAOSX-093024
Annual Shareholder Report | 9.30.24
This annual shareholder report contains important information about the Guggenheim Alpha Opportunity Fund for the period of October 1, 2023 to September 30, 2024. You can find additional information about the fund at GuggenheimInvestments.com/mutual-funds/literature. You can also request this information by contacting 800 820 0888 or GuggenheimClientServices@mufg-is.com.
This report describes changes to the fund that occurred during the reporting period.
| Institutional Class | $153 | 1.42% |
For the period of October 1, 2023 to September 30, 2024, the fund (Institutional Class shares) returned 15.04%, underperforming the fund's benchmark, the S&P 500 Index, which returned 36.35% for the same period and outperforming the fund's secondary index, the ICE BofA 3-Month U.S. Treasury Bill Index, which returned 5.49% for the same period.
The fund's broad-based securities market index was changed from the ICE BofA 3-Month U.S. Treasury Bill Index to the S&P 500 Index to comply with the regulation that requires the fund's broad-based securities market index to represent the overall applicable market.
What factors materially affected the fund's performance over the last year?
The global growth outlook remained modestly bullish and steady during the reporting period, while inflation seemed to be finally tamed, resulting in a 50 basis point rate cut by the U.S. Federal Reserve in September and potentially up to two more by the end of 2024. This optimism helped the S&P 500 Index gain more than 36% during the reporting period. The fund significantly outperformed the ICE BofA 3-Month U.S. Treasury Bill Index. Among the fundamental factors, the fund's exposure in higher profitability, lower volatility, and higher momentum names paid off well. The overall contribution of the industry tilts (overweights/underweights) was moderate, whereas security selection was quite strong.
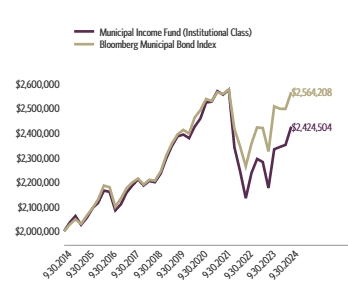
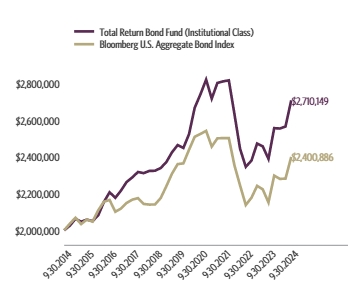
Cumulative performance* for the fund's most recently completed 10 years (as of 9.30.24), assuming a $2,000,000 initial investment.
| 09/30/2014 | 2000000 | 2000000 | 2000000 |
| 12/31/2014 | 2125665 | 2098653 | 2000070 |
| 03/31/2015 | 2083359 | 2118603 | 2000136 |
| 06/30/2015 | 2054623 | 2124494 | 2000244 |
| 09/30/2015 | 2053825 | 1987710 | 2000499 |
| 12/31/2015 | 2033071 | 2127695 | 2001131 |
| 03/31/2016 | 2175953 | 2156373 | 2002596 |
| 06/30/2016 | 2110499 | 2209317 | 2004046 |
| 09/30/2016 | 2140033 | 2294422 | 2005971 |
| 12/31/2016 | 2307378 | 2382166 | 2007676 |
| 03/31/2017 | 2373645 | 2526671 | 2009744 |
| 06/30/2017 | 2325741 | 2604699 | 2013801 |
| 09/30/2017 | 2384381 | 2721399 | 2019132 |
| 12/31/2017 | 2495489 | 2902230 | 2024862 |
| 03/31/2018 | 2382476 | 2880198 | 2032043 |
| 06/30/2018 | 2276161 | 2979101 | 2041233 |
| 09/30/2018 | 2324714 | 3208812 | 2051264 |
| 12/31/2018 | 2223373 | 2774986 | 2062818 |
| 03/31/2019 | 2226761 | 3153716 | 2075187 |
| 06/30/2019 | 2148837 | 3289447 | 2088446 |
| 09/30/2019 | 2148837 | 3345311 | 2100188 |
| 12/31/2019 | 2182123 | 3648730 | 2109860 |
| 03/31/2020 | 1997357 | 2933652 | 2121982 |
| 06/30/2020 | 2088029 | 3536320 | 2122455 |
| 09/30/2020 | 2108559 | 3852094 | 2123290 |
| 12/31/2020 | 2191748 | 4320052 | 2123934 |
| 03/31/2021 | 2375979 | 4586814 | 2124468 |
| 06/30/2021 | 2337922 | 4978933 | 2124465 |
| 09/30/2021 | 2286891 | 5007913 | 2124772 |
| 12/31/2021 | 2511989 | 5560141 | 2124978 |
| 03/31/2022 | 2321172 | 5304457 | 2125810 |
| 06/30/2022 | 2322914 | 4450380 | 2128038 |
| 09/30/2022 | 2142553 | 4233086 | 2138028 |
| 12/31/2022 | 2300974 | 4553151 | 2156220 |
| 03/31/2023 | 2375510 | 4894505 | 2179522 |
| 06/30/2023 | 2418478 | 5322389 | 2205147 |
| 09/30/2023 | 2504413 | 5148165 | 2234281 |
| 12/31/2023 | 2510759 | 5750067 | 2265013 |
| 03/31/2024 | 2813249 | 6357039 | 2294431 |
| 06/30/2024 | 2745343 | 6629362 | 2324946 |
| 09/30/2024 | 2881155 | 7019604 | 2356881 |
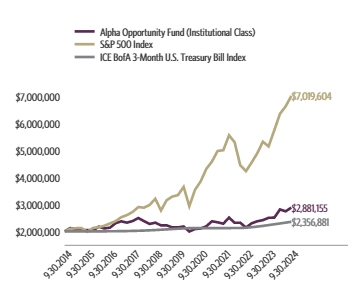
| Institutional Class | 15.04% | 6.04% | 3.72% |
| S&P 500 Index | 36.35% | 15.98% | 13.38% |
| ICE BofA 3-Month U.S. Treasury Bill Index | 5.49% | 2.33% | 1.66% |
The fund's past performance is not a good predictor of the fund's future performance. Visit GuggenheimInvestments.com/mutual-funds/performance for more recent performance information.
| Net Assets | $37,989,207 |
| Total Number of Portfolio Holdings | 156 |
| Portfolio Turnover Rate | 306% |
| Total Advisory Fees Paid | $288,033 |
| Guggenheim Alpha Opportunity Fund | Institutional Class | SAOIX | Annual Shareholder Report | September 30, 2024 |
| Custom Basket Swap Agreements | 50.3% |
| Consumer, Non-cyclical | 18.1% |
| Industrial | 17.7% |
| Financial | 16.9% |
| Consumer, Cyclical | 12.9% |
| Communications | 9.3% |
| Utilities | 8.0% |
| Technology | 6.9% |
| Basic Materials | 2.3% |
| Government | 0.8% |
| Energy | 0.5% |
| Custom Basket Swap Agreements Short Sales | -78.4% |

| UFP Industries, Inc. | 1.1% |
| Acuity Brands, Inc. | 1.1% |
| Allison Transmission Holdings, Inc. | 1.1% |
| Boise Cascade Co. | 1.1% |
| Mueller Industries, Inc. | 1.1% |
| Apogee Enterprises, Inc. | 1.0% |
| Teekay Tankers Ltd. — Class A | 1.0% |
| Entergy Corp. | 1.0% |
| Incyte Corp. | 1.0% |
| Gilead Sciences, Inc. | 1.0% |
| Top 10 Total | 10.5% |
| |
1 | "Holdings Diversification (Market Exposure as a % of Net Assets)" excludes any temporary cash investments, investments in Guggenheim Strategy Funds Trust mutual funds, or investments in Guggenheim Ultra Short Duration Fund. |
| |
2 | "10 Largest Holdings (as a % of Net Assets)" excludes any temporary cash investments. |
| UFP Industries, Inc. | 1.1% |
| Acuity Brands, Inc. | 1.1% |
| Allison Transmission Holdings, Inc. | 1.1% |
| Boise Cascade Co. | 1.1% |
| Mueller Industries, Inc. | 1.1% |
| Apogee Enterprises, Inc. | 1.0% |
| Teekay Tankers Ltd. — Class A | 1.0% |
| Entergy Corp. | 1.0% |
| Incyte Corp. | 1.0% |
| Gilead Sciences, Inc. | 1.0% |
| Top 10 Total | 10.5% |
| |
2 | "10 Largest Holdings (as a % of Net Assets)" excludes any temporary cash investments. |
There were no changes in or disagreements with fund accountants for the period.
This is a summary of certain changes to the fund since September 30, 2023.
Subsequent to the September 30, 2024 year-end, on October 25, 2024, the fund was reorganized into New Age Alpha Opportunity Fund, a series of New Age Alpha Funds Trust, pursuant to an Agreement and Plan of Reorganization approved by the Board of Trustees and shareholders of the fund.
| |  | Availability of Additional Information. For additional information, including financial information, holdings and proxy voting information, go to GuggenheimInvestments.com/mutual-funds/literature or, call 800 820 0888. |
AR-SAOIX-093024
Annual Shareholder Report | 9.30.24
This annual shareholder report contains important information about the Guggenheim Large Cap Value Fund for the period of October 1, 2023 to September 30, 2024. You can find additional information about the fund at GuggenheimInvestments.com/mutual-funds/literature. You can also request this information by contacting 800 820 0888 or GuggenheimClientServices@mufg-is.com.
This report describes changes to the fund that occurred during the reporting period.
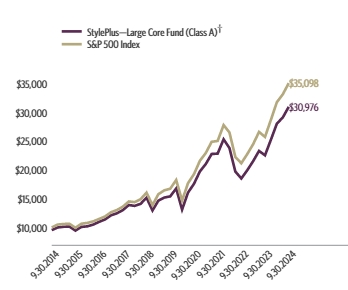
For the period of October 1, 2023 to September 30, 2024, the fund (Class A shares) returned 23.55%, underperforming the fund's benchmark, the S&P 500 Index, which returned 36.35% for the same period and underperforming the fund's secondary index, the Russell 1000 Value Index, which returned 27.76% for the same period.
The fund's broad-based securities market index was changed from the Russell 1000 Value Index to the S&P 500 Index to comply with the regulation that requires the fund's broad-based securities market index to represent the overall applicable market.
What factors materially affected the fund's performance over the last year?
The fund lagged the Russell 1000 Value Index (the fund's ancillary index) due to sector allocation, as an overweight to the Energy sector, the worst performing sector, and an underweight to the Industrials sector, hurt results. An overweight to the Utilities sector, which was one of the best performing sectors during the reporting period, benefited performance. The largest individual detractor for the fund was Humana, Inc., a health insurance provider whose profitability suffered as industry competition increased along with patients' claims. Positive selection within the Technology sector, which benefited from AI-driven investment, contributed to performance.
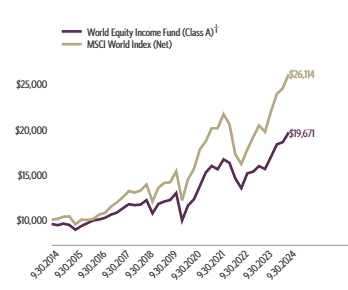
Cumulative performance* for the fund's most recently completed 10 years (as of 9.30.24), assuming a $10,000 initial investment.
| 09/30/2014 | 9526 | 10000 | 10000 |
| 12/31/2014 | 9713 | 10493 | 10498 |
| 03/31/2015 | 9734 | 10593 | 10422 |
| 06/30/2015 | 9670 | 10622 | 10434 |
| 09/30/2015 | 8841 | 9939 | 9558 |
| 12/31/2015 | 9202 | 10638 | 10096 |
| 03/31/2016 | 9366 | 10782 | 10262 |
| 06/30/2016 | 9805 | 11047 | 10732 |
| 09/30/2016 | 10228 | 11472 | 11105 |
| 12/31/2016 | 11145 | 11911 | 11847 |
| 03/31/2017 | 11532 | 12633 | 12234 |
| 06/30/2017 | 11591 | 13023 | 12399 |
| 09/30/2017 | 12037 | | 12785 |
| 12/31/2017 | 12848 | 14511 | 13466 |
| 03/31/2018 | 12460 | 14401 | 13084 |
| 06/30/2018 | 12679 | 14896 | 13238 |
| 09/30/2018 | 13339 | 16044 | 13993 |
| 12/31/2018 | 11567 | 13875 | 12353 |
| 03/31/2019 | 12837 | 15769 | 13827 |
| 06/30/2019 | 12949 | 16447 | 14358 |
| 09/30/2019 | 12860 | 16727 | 14553 |
| 12/31/2019 | 14045 | 18244 | 15631 |
| 03/31/2020 | 10119 | 14668 | 11453 |
| 06/30/2020 | 11580 | 17682 | 13090 |
| 09/30/2020 | 12143 | 19260 | 13822 |
| 12/31/2020 | 14406 | 21600 | 16068 |
| 03/31/2021 | 16458 | 22934 | 17877 |
| 06/30/2021 | 17082 | 24895 | 18808 |
| 09/30/2021 | 17072 | 25040 | 18661 |
| 12/31/2021 | 18311 | 27801 | 20111 |
| 03/31/2022 | 19023 | 26522 | 19962 |
| 06/30/2022 | 16931 | 22252 | 17525 |
| 09/30/2022 | 15975 | 21165 | 16540 |
| 12/31/2022 | 18054 | 22766 | 18595 |
| 03/31/2023 | 18050 | 24473 | 18782 |
| 06/30/2023 | 18805 | 26612 | 19547 |
| 09/30/2023 | 18242 | 25741 | 18929 |
| 12/31/2023 | 19648 | 28750 | 20726 |
| 03/31/2024 | 21431 | 31785 | 22589 |
| 06/30/2024 | 21315 | 33147 | 22099 |
| 09/30/2024 | 22538 | 35098 | 24183 |

| Class A (without sales charge) | 23.55% | 11.87% | 8.99% |
| Class A (with sales charge)† | 17.67% | 10.79% | 8.47% |
| S&P 500 Index | 36.35% | 15.98% | 13.38% |
| Russell 1000 Value Index | 27.76% | 10.69% | 9.23% |
The fund's past performance is not a good predictor of the fund's future performance. Visit GuggenheimInvestments.com/mutual-funds/performance for more recent performance information.
| Net Assets | $40,156,538 |
| Total Number of Portfolio Holdings | 83 |
| Portfolio Turnover Rate | 13% |
| Total Advisory Fees Paid | $92,634 |
| Guggenheim Large Cap Value Fund | Class A | SECIX | Annual Shareholder Report | September 30, 2024 |
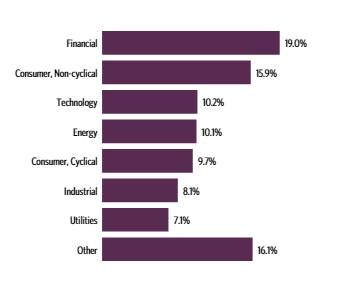
| Financial | 19.0% |
| Consumer, Non-cyclical | 15.9% |
| Technology | 10.2% |
| Energy | 10.1% |
| Consumer, Cyclical | 9.7% |
| Industrial | 8.1% |
| Utilities | 7.1% |
| Other | 16.1% |

| iShares Russell 1000 Value ETF | 3.8% |
| Berkshire Hathaway, Inc. — Class B | 2.8% |
| Verizon Communications, Inc. | 2.7% |
| Bank of America Corp. | 2.6% |
| Walmart, Inc. | 2.6% |
| Chevron Corp. | 2.3% |
| OGE Energy Corp. | 1.9% |
| Curtiss-Wright Corp. | 1.9% |
| JPMorgan Chase & Co. | 1.9% |
| Jefferies Financial Group, Inc. | 1.9% |
| Top 10 Total | 24.4% |
| |
1 | "Holdings Diversification (Market Exposure as a % of Net Assets)" excludes any temporary cash investments, investments in Guggenheim Strategy Funds Trust mutual funds, or investments in Guggenheim Ultra Short Duration Fund. |
| |
2 | "10 Largest Holdings (as a % of Net Assets)" excludes any temporary cash investments. |
| iShares Russell 1000 Value ETF | 3.8% |
| Berkshire Hathaway, Inc. — Class B | 2.8% |
| Verizon Communications, Inc. | 2.7% |
| Bank of America Corp. | 2.6% |
| Walmart, Inc. | 2.6% |
| Chevron Corp. | 2.3% |
| OGE Energy Corp. | 1.9% |
| Curtiss-Wright Corp. | 1.9% |
| JPMorgan Chase & Co. | 1.9% |
| Jefferies Financial Group, Inc. | 1.9% |
| Top 10 Total | 24.4% |
| |
2 | "10 Largest Holdings (as a % of Net Assets)" excludes any temporary cash investments. |
There were no changes in or disagreements with fund accountants for the period.
This is a summary of certain changes to the fund since September 30, 2023.
Subsequent to the September 30, 2024 year-end, on October 25, 2024, the fund was reorganized into New Age Alpha Large Cap Value Fund, a series of New Age Alpha Funds Trust, pursuant to an Agreement and Plan of Reorganization approved by the Board of Trustees and shareholders of the fund.
| |  | Availability of Additional Information. For additional information, including financial information, holdings and proxy voting information, go to GuggenheimInvestments.com/mutual-funds/literature or, call 800 820 0888. |
AR-SECIX-093024
Annual Shareholder Report | 9.30.24
This annual shareholder report contains important information about the Guggenheim Large Cap Value Fund for the period of October 1, 2023 to September 30, 2024. You can find additional information about the fund at GuggenheimInvestments.com/mutual-funds/literature. You can also request this information by contacting 800 820 0888 or GuggenheimClientServices@mufg-is.com.
This report describes changes to the fund that occurred during the reporting period.
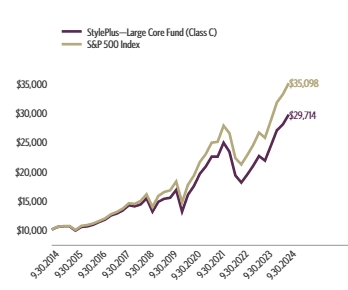
For the period of October 1, 2023 to September 30, 2024, the fund (Class C shares) returned 22.63%, underperforming the fund's benchmark, the S&P 500 Index, which returned 36.35% for the same period and underperforming the fund's secondary index, the Russell 1000 Value Index, which returned 27.76% for the same period.
The fund's broad-based securities market index was changed from the Russell 1000 Value Index to the S&P 500 Index to comply with the regulation that requires the fund's broad-based securities market index to represent the overall applicable market.
What factors materially affected the fund's performance over the last year?
The fund lagged the Russell 1000 Value Index (the fund's ancillary index) due to sector allocation, as an overweight to the Energy sector, the worst performing sector, and an underweight to the Industrials sector, hurt results. An overweight to the Utilities sector, which was one of the best performing sectors during the reporting period, benefited performance. The largest individual detractor for the fund was Humana, Inc., a health insurance provider whose profitability suffered as industry competition increased along with patients' claims. Positive selection within the Technology sector, which benefited from AI-driven investment, contributed to performance.
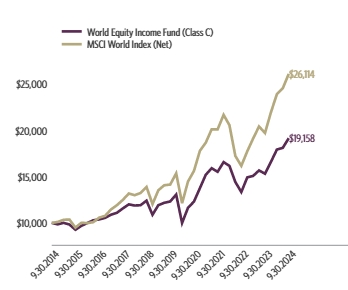
Cumulative performance* for the fund's most recently completed 10 years (as of 9.30.24), assuming a $10,000 initial investment.
| 09/30/2014 | 10000 | 10000 | 10000 |
| 12/31/2014 | 10179 | 10493 | 10498 |
| 03/31/2015 | 10184 | 10593 | 10422 |
| 06/30/2015 | 10098 | 10622 | 10434 |
| 09/30/2015 | 9212 | 9939 | 9558 |
| 12/31/2015 | 9572 | 10638 | 10096 |
| 03/31/2016 | 9725 | 10782 | 10262 |
| 06/30/2016 | 10163 | 11047 | 10732 |
| 09/30/2016 | 10581 | 11472 | 11105 |
| 12/31/2016 | 11505 | 11911 | 11847 |
| 03/31/2017 | 11879 | 12633 | 12234 |
| 06/30/2017 | 11916 | 13023 | 12399 |
| 09/30/2017 | 12353 | 13607 | 12785 |
| 12/31/2017 | 13159 | 14511 | 13466 |
| 03/31/2018 | 12740 | 14401 | 13084 |
| 06/30/2018 | 12937 | 14896 | 13238 |
| 09/30/2018 | 13585 | 16044 | 13993 |
| 12/31/2018 | 11761 | 13875 | 12353 |
| 03/31/2019 | 13026 | 15769 | 13827 |
| 06/30/2019 | 13117 | 16447 | 14358 |
| 09/30/2019 | 13003 | 16727 | 14553 |
| 12/31/2019 | 14170 | 18244 | 15631 |
| 03/31/2020 | 10192 | 14668 | 11453 |
| 06/30/2020 | 11641 | 17682 | 13090 |
| 09/30/2020 | 12184 | 19260 | 13822 |
| 12/31/2020 | 14428 | 21600 | 16068 |
| 03/31/2021 | 16453 | 22934 | 17877 |
| 06/30/2021 | 17044 | 24895 | 18808 |
| 09/30/2021 | 17003 | 25040 | 18661 |
| 12/31/2021 | 18202 | 27801 | 20111 |
| 03/31/2022 | 18874 | 26522 | 19962 |
| 06/30/2022 | 16768 | 22252 | 17525 |
| 09/30/2022 | 15791 | 21165 | 16540 |
| 12/31/2022 | 17813 | 22766 | 18595 |
| 03/31/2023 | 17778 | 24473 | 18782 |
| 06/30/2023 | 18482 | 26612 | 19547 |
| 09/30/2023 | 17897 | 25741 | 18929 |
| 12/31/2023 | 19239 | 28750 | 20726 |
| 03/31/2024 | 20947 | 31785 | 22589 |
| 06/30/2024 | 20798 | 33147 | 22099 |
| 09/30/2024 | 21947 | 35098 | 24183 |
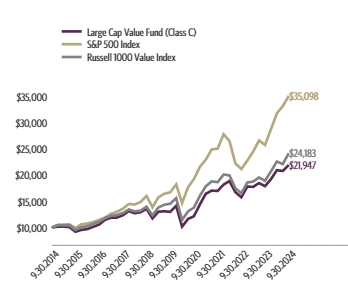
| Class C (without CDSC) | 22.63% | 11.04% | 8.18% |
| Class C (with CDSC)‡ | 21.63% | 11.04% | 8.18% |
| S&P 500 Index | 36.35% | 15.98% | 13.38% |
| Russell 1000 Value Index | 27.76% | 10.69% | 9.23% |
The fund's past performance is not a good predictor of the fund's future performance. Visit GuggenheimInvestments.com/mutual-funds/performance for more recent performance information.
| Net Assets | $40,156,538 |
| Total Number of Portfolio Holdings | 83 |
| Portfolio Turnover Rate | 13% |
| Total Advisory Fees Paid | $92,634 |
| Guggenheim Large Cap Value Fund | Class C | SEGIX | Annual Shareholder Report | September 30, 2024 |
| Financial | 19.0% |
| Consumer, Non-cyclical | 15.9% |
| Technology | 10.2% |
| Energy | 10.1% |
| Consumer, Cyclical | 9.7% |
| Industrial | 8.1% |
| Utilities | 7.1% |
| Other | 16.1% |

| iShares Russell 1000 Value ETF | 3.8% |
| Berkshire Hathaway, Inc. — Class B | 2.8% |
| Verizon Communications, Inc. | 2.7% |
| Bank of America Corp. | 2.6% |
| Walmart, Inc. | 2.6% |
| Chevron Corp. | 2.3% |
| OGE Energy Corp. | 1.9% |
| Curtiss-Wright Corp. | 1.9% |
| JPMorgan Chase & Co. | 1.9% |
| Jefferies Financial Group, Inc. | 1.9% |
| Top 10 Total | 24.4% |
| |
1 | "Holdings Diversification (Market Exposure as a % of Net Assets)" excludes any temporary cash investments, investments in Guggenheim Strategy Funds Trust mutual funds, or investments in Guggenheim Ultra Short Duration Fund. |
| |
2 | "10 Largest Holdings (as a % of Net Assets)" excludes any temporary cash investments. |
| iShares Russell 1000 Value ETF | 3.8% |
| Berkshire Hathaway, Inc. — Class B | 2.8% |
| Verizon Communications, Inc. | 2.7% |
| Bank of America Corp. | 2.6% |
| Walmart, Inc. | 2.6% |
| Chevron Corp. | 2.3% |
| OGE Energy Corp. | 1.9% |
| Curtiss-Wright Corp. | 1.9% |
| JPMorgan Chase & Co. | 1.9% |
| Jefferies Financial Group, Inc. | 1.9% |
| Top 10 Total | 24.4% |
| |
2 | "10 Largest Holdings (as a % of Net Assets)" excludes any temporary cash investments. |
There were no changes in or disagreements with fund accountants for the period.
This is a summary of certain changes to the fund since September 30, 2023.
Subsequent to the September 30, 2024 year-end, on October 25, 2024, the fund was reorganized into New Age Alpha Large Cap Value Fund, a series of New Age Alpha Funds Trust, pursuant to an Agreement and Plan of Reorganization approved by the Board of Trustees and shareholders of the fund.
| |  | Availability of Additional Information. For additional information, including financial information, holdings and proxy voting information, go to GuggenheimInvestments.com/mutual-funds/literature or, call 800 820 0888. |
AR-SEGIX-093024
Annual Shareholder Report | 9.30.24
This annual shareholder report contains important information about the Guggenheim Large Cap Value Fund for the period of October 1, 2023 to September 30, 2024. You can find additional information about the fund at GuggenheimInvestments.com/mutual-funds/literature. You can also request this information by contacting 800 820 0888 or GuggenheimClientServices@mufg-is.com.
This report describes changes to the fund that occurred during the reporting period.
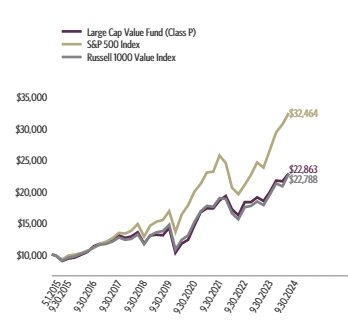
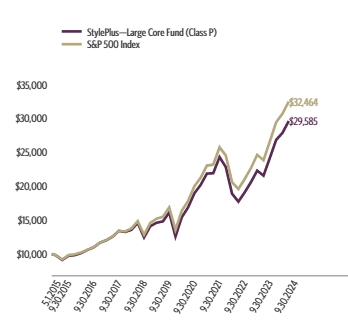
For the period of October 1, 2023 to September 30, 2024, the fund (Class P shares) returned 23.56%, underperforming the fund's benchmark, the S&P 500 Index, which returned 36.35% for the same period and underperforming the fund's secondary index, the Russell 1000 Value Index, which returned 27.76% for the same period.
The fund's broad-based securities market index was changed from the Russell 1000 Value Index to the S&P 500 Index to comply with the regulation that requires the fund's broad-based securities market index to represent the overall applicable market.
What factors materially affected the fund's performance over the last year?
The fund lagged the Russell 1000 Value Index (the fund's ancillary index) due to sector allocation, as an overweight to the Energy sector, the worst performing sector, and an underweight to the Industrials sector, hurt results. An overweight to the Utilities sector, which was one of the best performing sectors during the reporting period, benefited performance. The largest individual detractor for the fund was Humana, Inc., a health insurance provider whose profitability suffered as industry competition increased along with patients' claims. Positive selection within the Technology sector, which benefited from AI-driven investment, contributed to performance.
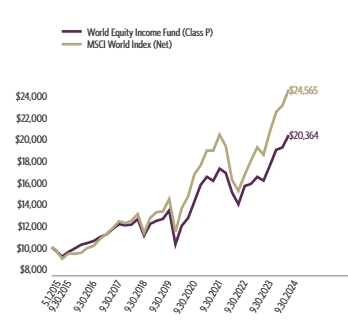
Cumulative performance* for the fund since inception (as of 9.30.24), assuming a $10,000 initial investment.
| 05/01/2015 | 10000 | 10000 | 10000 |
| 06/30/2015 | 9805 | 9825 | 9831 |
| 09/30/2015 | 8962 | 9193 | 9006 |
| 12/31/2015 | 9339 | 9840 | 9514 |
| 03/31/2016 | 9503 | 9973 | 9669 |
| 06/30/2016 | 9950 | 10217 | 10113 |
| 09/30/2016 | 10381 | 10611 | 10465 |
| 12/31/2016 | 11310 | 11017 | 11163 |
| 03/31/2017 | 11698 | 11685 | 11528 |
| 06/30/2017 | 11758 | 12046 | 11683 |
| 09/30/2017 | 12211 | 12586 | 12047 |
| 12/31/2017 | 13034 | 13422 | 12689 |
| 03/31/2018 | 12639 | 13320 | 12329 |
| 06/30/2018 | 12859 | 13777 | 12474 |
| 09/30/2018 | 13530 | 14840 | 13186 |
| 12/31/2018 | 11734 | 12834 | 11640 |
| 03/31/2019 | 13021 | 14585 | 13029 |
| 06/30/2019 | 13136 | 15213 | 13530 |
| 09/30/2019 | 13045 | 15471 | 13713 |
| 12/31/2019 | 14247 | 16874 | 14729 |
| 03/31/2020 | 10266 | 13567 | 10792 |
| 06/30/2020 | 11748 | 16354 | 12334 |
| 09/30/2020 | 12318 | 17815 | 13024 |
| 12/31/2020 | 14613 | 19979 | 15141 |
| 03/31/2021 | 16694 | 21213 | 16845 |
| 06/30/2021 | 17329 | 23026 | 17722 |
| 09/30/2021 | 17319 | 23160 | 17584 |
| 12/31/2021 | 18576 | 25714 | 18950 |
| 03/31/2022 | 19297 | 24532 | 18810 |
| 06/30/2022 | 17174 | 20582 | 16514 |
| 09/30/2022 | 16204 | 19577 | 15586 |
| 12/31/2022 | 18312 | 21057 | 17522 |
| 03/31/2023 | 18312 | 22636 | 17698 |
| 06/30/2023 | 19073 | 24615 | 18419 |
| 09/30/2023 | 18503 | 23809 | 17836 |
| 12/31/2023 | 19932 | 26592 | 19530 |
| 03/31/2024 | 21737 | 29400 | 21285 |
| 06/30/2024 | 21623 | 30659 | 20824 |
| 09/30/2024 | 22863 | 32464 | 22788 |
| Class P | 23.56% | 11.88% | 9.18% |
| S&P 500 Index | 36.35% | 15.98% | 13.32% |
| Russell 1000 Value Index | 27.76% | 10.69% | 9.14% |
The fund's past performance is not a good predictor of the fund's future performance. Visit GuggenheimInvestments.com/mutual-funds/performance for more recent performance information.
| Net Assets | $40,156,538 |
| Total Number of Portfolio Holdings | 83 |
| Portfolio Turnover Rate | 13% |
| Total Advisory Fees Paid | $92,634 |
| Guggenheim Large Cap Value Fund | Class P | SEGPX | Annual Shareholder Report | September 30, 2024 |
| Financial | 19.0% |
| Consumer, Non-cyclical | 15.9% |
| Technology | 10.2% |
| Energy | 10.1% |
| Consumer, Cyclical | 9.7% |
| Industrial | 8.1% |
| Utilities | 7.1% |
| Other | 16.1% |

| iShares Russell 1000 Value ETF | 3.8% |
| Berkshire Hathaway, Inc. — Class B | 2.8% |
| Verizon Communications, Inc. | 2.7% |
| Bank of America Corp. | 2.6% |
| Walmart, Inc. | 2.6% |
| Chevron Corp. | 2.3% |
| OGE Energy Corp. | 1.9% |
| Curtiss-Wright Corp. | 1.9% |
| JPMorgan Chase & Co. | 1.9% |
| Jefferies Financial Group, Inc. | 1.9% |
| Top 10 Total | 24.4% |
| |
1 | "Holdings Diversification (Market Exposure as a % of Net Assets)" excludes any temporary cash investments, investments in Guggenheim Strategy Funds Trust mutual funds, or investments in Guggenheim Ultra Short Duration Fund. |
| |
2 | "10 Largest Holdings (as a % of Net Assets)" excludes any temporary cash investments. |
| iShares Russell 1000 Value ETF | 3.8% |
| Berkshire Hathaway, Inc. — Class B | 2.8% |
| Verizon Communications, Inc. | 2.7% |
| Bank of America Corp. | 2.6% |
| Walmart, Inc. | 2.6% |
| Chevron Corp. | 2.3% |
| OGE Energy Corp. | 1.9% |
| Curtiss-Wright Corp. | 1.9% |
| JPMorgan Chase & Co. | 1.9% |
| Jefferies Financial Group, Inc. | 1.9% |
| Top 10 Total | 24.4% |
| |
2 | "10 Largest Holdings (as a % of Net Assets)" excludes any temporary cash investments. |
There were no changes in or disagreements with fund accountants for the period.
This is a summary of certain changes to the fund since September 30, 2023.
Subsequent to the September 30, 2024 year-end, on October 25, 2024, the fund was reorganized into New Age Alpha Large Cap Value Fund, a series of New Age Alpha Funds Trust, pursuant to an Agreement and Plan of Reorganization approved by the Board of Trustees and shareholders of the fund.
| |  | Availability of Additional Information. For additional information, including financial information, holdings and proxy voting information, go to GuggenheimInvestments.com/mutual-funds/literature or, call 800 820 0888. |
AR-SEGPX-093024
Annual Shareholder Report | 9.30.24
This annual shareholder report contains important information about the Guggenheim Large Cap Value Fund for the period of October 1, 2023 to September 30, 2024. You can find additional information about the fund at GuggenheimInvestments.com/mutual-funds/literature. You can also request this information by contacting 800 820 0888 or GuggenheimClientServices@mufg-is.com.
This report describes changes to the fund that occurred during the reporting period.
| Institutional Class | $97 | 0.87% |
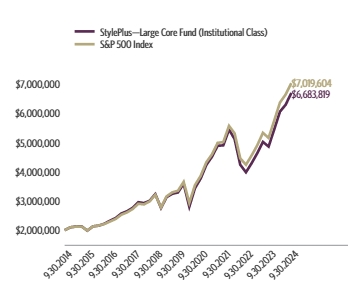
For the period of October 1, 2023 to September 30, 2024, the fund (Institutional Class shares) returned 23.89%, underperforming the fund's benchmark, the S&P 500 Index, which returned 36.35% for the same period and underperforming the fund's secondary index, the Russell 1000 Value Index, which returned 27.76% for the same period.
The fund's broad-based securities market index was changed from the Russell 1000 Value Index to the S&P 500 Index to comply with the regulation that requires the fund's broad-based securities market index to represent the overall applicable market.
What factors materially affected the fund's performance over the last year?
The fund lagged the Russell 1000 Value Index (the fund's ancillary index) due to sector allocation, as an overweight to the Energy sector, the worst performing sector, and an underweight to the Industrials sector, hurt results. An overweight to the Utilities sector, which was one of the best performing sectors during the reporting period, benefited performance. The largest individual detractor for the fund was Humana, Inc., a health insurance provider whose profitability suffered as industry competition increased along with patients' claims. Positive selection within the Technology sector, which benefited from AI-driven investment, contributed to performance.
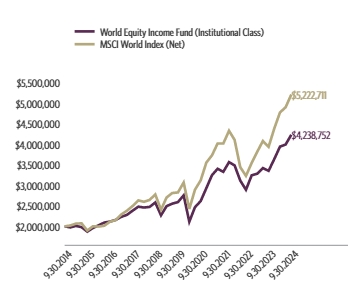
Cumulative performance* for the fund's most recently completed 10 years (as of 9.30.24), assuming a $2,000,000 initial investment.
| 09/30/2014 | 2000000 | 2000000 | 2000000 |
| 12/31/2014 | 2041156 | 2098653 | 2099603 |
| 03/31/2015 | 2046856 | 2118603 | 2084445 |
| 06/30/2015 | 2034506 | 2124494 | 2086704 |
| 09/30/2015 | 1860649 | 1987710 | 1911526 |
| 12/31/2015 | 1938166 | 2127695 | 2019244 |
| 03/31/2016 | 1973761 | 2156373 | 2052327 |
| 06/30/2016 | 2067652 | 2209317 | 2146387 |
| 09/30/2016 | 2157931 | 2294422 | 2221100 |
| 12/31/2016 | 2353040 | 2382166 | 2369391 |
| 03/31/2017 | 2435047 | 2526671 | 2446836 |
| 06/30/2017 | 2449261 | 2604699 | 2479736 |
| 09/30/2017 | 2545482 | 2721399 | 2556977 |
| 12/31/2017 | 2718469 | 2902230 | 2693157 |
| 03/31/2018 | 2637117 | 2880198 | 2616848 |
| 06/30/2018 | 2685216 | 2979101 | 2647613 |
| 09/30/2018 | 2826543 | 3208812 | 2798625 |
| 12/31/2018 | 2453327 | 2774986 | 2470505 |
| 03/31/2019 | 2724157 | 3153716 | 2765346 |
| 06/30/2019 | 2749528 | 3289447 | 2871660 |
| 09/30/2019 | 2732403 | 3345311 | 2910587 |
| 12/31/2019 | 2985458 | 3648730 | 3126210 |
| 03/31/2020 | 2152163 | 2933652 | 2290576 |
| 06/30/2020 | 2464906 | 3536320 | 2617912 |
| 09/30/2020 | 2586299 | 3852094 | 2764327 |
| 12/31/2020 | 3070014 | 4320052 | 3213608 |
| 03/31/2021 | 3509853 | 4586814 | 3575300 |
| 06/30/2021 | 3644904 | 4978933 | 3761508 |
| 09/30/2021 | 3644904 | 5007913 | 3732169 |
| 12/31/2021 | 3912220 | 5560141 | 4022165 |
| 03/31/2022 | 4066107 | 5304457 | 3992496 |
| 06/30/2022 | 3621897 | | 3504984 |
| 09/30/2022 | 3418829 | 4233086 | 3308093 |
| 12/31/2022 | 3866725 | 4553151 | 3718980 |
| 03/31/2023 | 3868468 | 4894505 | 3756397 |
| 06/30/2023 | 4032342 | 5322389 | 3909453 |
| 09/30/2023 | 3913795 | 5148165 | 3785723 |
| 12/31/2023 | 4218213 | 5750067 | 4145276 |
| 03/31/2024 | 4604187 | 6357039 | 4517754 |
| 06/30/2024 | 4582580 | 6629362 | 4419900 |
| 09/30/2024 | 4848735 | 7019604 | 4836692 |
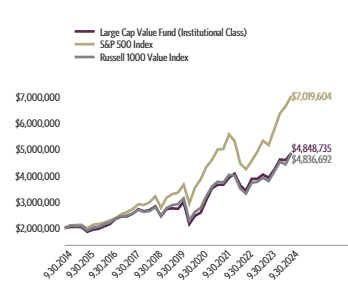
| Institutional Class | 23.89% | 12.15% | 9.26% |
| S&P 500 Index | 36.35% | 15.98% | 13.38% |
| Russell 1000 Value Index | 27.76% | 10.69% | 9.23% |
The fund's past performance is not a good predictor of the fund's future performance. Visit GuggenheimInvestments.com/mutual-funds/performance for more recent performance information.
| Net Assets | $40,156,538 |
| Total Number of Portfolio Holdings | 83 |
| Portfolio Turnover Rate | 13% |
| Total Advisory Fees Paid | $92,634 |
| Guggenheim Large Cap Value Fund | Institutional Class | GILCX | Annual Shareholder Report | September 30, 2024 |
| Financial | 19.0% |
| Consumer, Non-cyclical | 15.9% |
| Technology | 10.2% |
| Energy | 10.1% |
| Consumer, Cyclical | 9.7% |
| Industrial | 8.1% |
| Utilities | 7.1% |
| Other | 16.1% |
| iShares Russell 1000 Value ETF | 3.8% |
| Berkshire Hathaway, Inc. — Class B | 2.8% |
| Verizon Communications, Inc. | 2.7% |
| Bank of America Corp. | 2.6% |
| Walmart, Inc. | 2.6% |
| Chevron Corp. | 2.3% |
| OGE Energy Corp. | 1.9% |
| Curtiss-Wright Corp. | 1.9% |
| JPMorgan Chase & Co. | 1.9% |
| Jefferies Financial Group, Inc. | 1.9% |
| Top 10 Total | 24.4% |
| |
1 | "Holdings Diversification (Market Exposure as a % of Net Assets)" excludes any temporary cash investments, investments in Guggenheim Strategy Funds Trust mutual funds, or investments in Guggenheim Ultra Short Duration Fund. |
| |
2 | "10 Largest Holdings (as a % of Net Assets)" excludes any temporary cash investments. |
| iShares Russell 1000 Value ETF | 3.8% |
| Berkshire Hathaway, Inc. — Class B | 2.8% |
| Verizon Communications, Inc. | 2.7% |
| Bank of America Corp. | 2.6% |
| Walmart, Inc. | 2.6% |
| Chevron Corp. | 2.3% |
| OGE Energy Corp. | 1.9% |
| Curtiss-Wright Corp. | 1.9% |
| JPMorgan Chase & Co. | 1.9% |
| Jefferies Financial Group, Inc. | 1.9% |
| Top 10 Total | 24.4% |
| |
2 | "10 Largest Holdings (as a % of Net Assets)" excludes any temporary cash investments. |
There were no changes in or disagreements with fund accountants for the period.
This is a summary of certain changes to the fund since September 30, 2023.
Subsequent to the September 30, 2024 year-end, on October 25, 2024, the fund was reorganized into New Age Alpha Large Cap Value Fund, a series of New Age Alpha Funds Trust, pursuant to an Agreement and Plan of Reorganization approved by the Board of Trustees and shareholders of the fund.
| |  | Availability of Additional Information. For additional information, including financial information, holdings and proxy voting information, go to GuggenheimInvestments.com/mutual-funds/literature or, call 800 820 0888. |
AR-GILCX-093024
Annual Shareholder Report | 9.30.24
This annual shareholder report contains important information about the Guggenheim Market Neutral Real Estate Fund for the period of October 1, 2023 to September 30, 2024. You can find additional information about the fund at GuggenheimInvestments.com/mutual-funds/literature. You can also request this information by contacting 800 820 0888 or GuggenheimClientServices@mufg-is.com.
This report describes changes to the fund that occurred during the reporting period.
For the period of October 1, 2023 to September 30, 2024, the fund (Class A shares) returned 1.47%, underperforming the fund's benchmark, the S&P 500 Index, which returned 36.35% for the same period and underperforming the fund's secondary index, the ICE BofA 3-Month U.S. Treasury Bill Index, which returned 5.49% for the same period.
The fund's broad-based securities market index was changed from the ICE BofA 3-Month U.S. Treasury Bill Index to the S&P 500 Index to comply with the regulation that requires the fund's broad-based securities market index to represent the overall applicable market.
What factors materially affected the fund's performance over the last year?
The global growth outlook remained modestly bullish and steady during the reporting period, while inflation seemed to be finally tamed, resulting in a 50 basis point rate cut by the U.S. Federal Reserve in September and potentially up to two more by the end of 2024. The fund underperformed the ICE BofA 3-Month U.S. Treasury Bill Index. Among REITs Sectors, the fund had negative contribution from Residential, Net Lease, and Industrial. This was slightly offset by positive contribution in Lodging, Data Center, and Strip Retail.
Cumulative performance* for the fund since inception (as of 9.30.24), assuming a $10,000 initial investment.
| 02/26/2016 | 9524 | 10000 | 10000 |
| 02/29/2016 | 9524 | 9920 | 10000 |
| 03/31/2016 | 9371 | 10593 | 10004 |
| 04/30/2016 | 9288 | 10634 | 10007 |
| 05/31/2016 | 9463 | 10825 | 10008 |
| 06/30/2016 | 9284 | 10853 | 10012 |
| 07/31/2016 | 9280 | 11253 | 10015 |
| 08/31/2016 | 9269 | 11269 | 10016 |
| 09/30/2016 | 9314 | 11271 | 10021 |
| 10/31/2016 | 9455 | 11065 | 10024 |
| 11/30/2016 | 9676 | 11475 | 10025 |
| 12/31/2016 | 9695 | 11702 | 10030 |
| 01/31/2017 | 9672 | 11924 | 10034 |
| 02/28/2017 | 9684 | 12397 | 10038 |
| 03/31/2017 | 9752 | 12412 | 10040 |
| 04/30/2017 | 9840 | 12539 | 10047 |
| 05/31/2017 | 10042 | 12716 | 10052 |
| 06/30/2017 | 10080 | 12795 | 10060 |
| 07/31/2017 | 10080 | 13058 | 10069 |
| 08/31/2017 | 10278 | 13098 | 10078 |
| 09/30/2017 | 10095 | 13368 | 10087 |
| 10/31/2017 | 10278 | 13680 | 10096 |
| 11/30/2017 | 10248 | 14100 | 10104 |
| 12/31/2017 | 10329 | 14256 | 10116 |
| 01/31/2018 | 10606 | 15073 | 10128 |
| 02/28/2018 | 10731 | 14517 | 10137 |
| 03/31/2018 | 10506 | 14148 | 10151 |
| 04/30/2018 | 10562 | 14203 | 10165 |
| 05/31/2018 | 10269 | 14545 | 10180 |
| 06/30/2018 | 10156 | 14634 | 10197 |
| 07/31/2018 | 10052 | 15179 | 10213 |
| 08/31/2018 | 9907 | 15673 | 10232 |
| 09/30/2018 | 10108 | 15762 | 10247 |
| 10/31/2018 | 10188 | 14685 | 10265 |
| 11/30/2018 | 10225 | 14984 | 10286 |
| 12/31/2018 | 10304 | 13631 | 10305 |
| 01/31/2019 | 10300 | 14724 | 10326 |
| 02/28/2019 | 10337 | 15197 | 10344 |
| 03/31/2019 | 10519 | 15492 | 10367 |
| 04/30/2019 | 10694 | 16119 | 10387 |
| 05/31/2019 | 10848 | 15095 | 10410 |
| 06/30/2019 | 10937 | 16159 | 10433 |
| 07/31/2019 | 10864 | 16391 | 10452 |
| 08/31/2019 | 11322 | 16131 | 10474 |
| 09/30/2019 | 10929 | 16433 | 10492 |
| 10/31/2019 | 10974 | 16789 | 10512 |
| 11/30/2019 | 10965 | 17398 | 10525 |
| 12/31/2019 | 10921 | 17923 | 10540 |
| 01/31/2020 | 11216 | 17916 | 10554 |
| 02/29/2020 | 11432 | 16442 | 10570 |
| 03/31/2020 | 12191 | 14411 | 10601 |
| 04/30/2020 | 11968 | 16258 | 10602 |
| 05/31/2020 | 12044 | 17033 | 10602 |
| 06/30/2020 | 11605 | 17371 | 10603 |
| 07/31/2020 | 12014 | 18351 | 10605 |
| 08/31/2020 | 11883 | 19670 | 10606 |
| 09/30/2020 | 11892 | 18922 | 10607 |
| 10/31/2020 | 12052 | 18419 | 10608 |
| 11/30/2020 | 11541 | 20435 | 10609 |
| 12/31/2020 | 11625 | 21221 | 10611 |
| 01/31/2021 | 11532 | 21007 | 10612 |
| 02/28/2021 | 11692 | 21586 | 10612 |
| 03/31/2021 | 11726 | 22532 | 10613 |
| 04/30/2021 | 11654 | 23734 | 10613 |
| 05/31/2021 | 11747 | 23900 | 10614 |
| 06/30/2021 | 11735 | 24458 | 10613 |
| 07/31/2021 | 11620 | 25039 | 10614 |
| 08/31/2021 | 11730 | 25800 | 10614 |
| 09/30/2021 | 11756 | 24600 | 10615 |
| 10/31/2021 | 11701 | 26324 | 10614 |
| 11/30/2021 | 11654 | 26141 | 10615 |
| 12/31/2021 | 11887 | 27313 | 10616 |
| 01/31/2022 | 11765 | 25899 | 10615 |
| 02/28/2022 | 11798 | 25124 | 10617 |
| 03/31/2022 | 11722 | 26057 | 10620 |
| 04/30/2022 | 11866 | 23785 | 10621 |
| 05/31/2022 | 11595 | 23828 | 10629 |
| 06/30/2022 | 11430 | 21861 | 10631 |
| 07/31/2022 | 11536 | 23877 | 10637 |
| 08/31/2022 | 11477 | 22903 | 10654 |
| 09/30/2022 | 11426 | 20794 | 10681 |
| 10/31/2022 | 11295 | 22477 | 10698 |
| 11/30/2022 | 11354 | 23734 | 10733 |
| 12/31/2022 | 11396 | 22366 | 10772 |
| 01/31/2023 | 11367 | 23772 | 10806 |
| 02/28/2023 | 11396 | 23192 | 10841 |
| 03/31/2023 | 11532 | 24043 | 10888 |
| 04/30/2023 | 11616 | 24418 | 10923 |
| 05/31/2023 | 11570 | 24524 | 10966 |
| 06/30/2023 | 11532 | 26145 | 11016 |
| 07/31/2023 | 11464 | 26985 | 11060 |
| 08/31/2023 | 11456 | 26555 | 11111 |
| 09/30/2023 | 11536 | 25289 | 11162 |
| 10/31/2023 | 11633 | 24757 | 11212 |
| 11/30/2023 | 11811 | 27018 | 11263 |
| 12/31/2023 | 11736 | 28246 | 11315 |
| 01/31/2024 | 11766 | 28720 | 11364 |
| 02/29/2024 | 11792 | 30254 | 11411 |
| 03/31/2024 | 11801 | 31227 | 11462 |
| 04/30/2024 | 11684 | 29952 | 11512 |
| 05/31/2024 | 11801 | 31437 | 11567 |
| 06/30/2024 | 11740 | 32565 | 11615 |
| 07/31/2024 | 11671 | 32961 | 11667 |
| 08/31/2024 | 11697 | 33761 | 11723 |
| 09/30/2024 | 11705 | 34482 | 11774 |
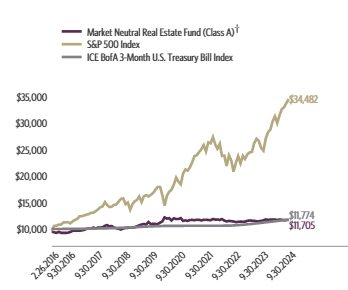
| Class A (without sales charge) | 1.47% | 1.38% | 2.43% |
| Class A (with sales charge)† | -3.35% | 0.40% | 1.85% |
| S&P 500 Index | 36.35% | 15.98% | 15.49% |
| ICE BofA 3-Month U.S. Treasury Bill Index | 5.49% | 2.33% | 1.92% |
The fund's past performance is not a good predictor of the fund's future performance. Visit GuggenheimInvestments.com/mutual-funds/performance for more recent performance information.
| Net Assets | $40,826,908 |
| Total Number of Portfolio Holdings | 36 |
| Portfolio Turnover Rate | 136% |
| Total Advisory Fees Paid | $322,604 |
| Guggenheim Market Neutral Real Estate Fund | Class A | GUMAX | Annual Shareholder Report | September 30, 2024 |
| REITs-Diversified | 11.5% |
| REITs-Apartments | 9.7% |
| REITs-Office Property | 7.8% |
| REITs-Hotels | 5.9% |
| REITs-Shopping Centers | 5.6% |
| REITs-Health Care | 4.5% |
| REITs-Warehouse/Industries | 4.0% |
| Other | 5.5% |
| Custom Basket Swap Agreements | -54.7% |

| Kilroy Realty Corp. | 3.6% |
| Invitation Homes, Inc. | 3.4% |
| Essex Property Trust, Inc. | 3.0% |
| VICI Properties, Inc. | 3.0% |
| Park Hotels & Resorts, Inc. | 2.4% |
| Kite Realty Group Trust | 2.4% |
| Alexandria Real Estate Equities, Inc. | 2.3% |
| Kimco Realty Corp. | 2.2% |
| Prologis, Inc. | 2.0% |
| Healthcare Realty Trust, Inc. | 2.0% |
| Top 10 Total | 26.3% |
| |
1 | "Holdings Diversification (Market Exposure as a % of Net Assets)" excludes any temporary cash investments, investments in Guggenheim Strategy Funds Trust mutual funds, or investments in Guggenheim Ultra Short Duration Fund. |
| |
2 | "10 Largest Holdings (as a % of Net Assets)" excludes any temporary cash investments. |
| Kilroy Realty Corp. | 3.6% |
| Invitation Homes, Inc. | 3.4% |
| Essex Property Trust, Inc. | 3.0% |
| VICI Properties, Inc. | 3.0% |
| Park Hotels & Resorts, Inc. | 2.4% |
| Kite Realty Group Trust | 2.4% |
| Alexandria Real Estate Equities, Inc. | 2.3% |
| Kimco Realty Corp. | 2.2% |
| Prologis, Inc. | 2.0% |
| Healthcare Realty Trust, Inc. | 2.0% |
| Top 10 Total | 26.3% |
| |
2 | "10 Largest Holdings (as a % of Net Assets)" excludes any temporary cash investments. |
There were no changes in or disagreements with fund accountants for the period.
This is a summary of certain changes to the fund since September 30, 2023.
Subsequent to the September 30, 2024 year-end, on October 25, 2024, the fund was reorganized into New Age Alpha Market Neutral Real Estate Fund, a series of New Age Alpha Funds Trust, pursuant to an Agreement and Plan of Reorganization approved by the Board of Trustees and shareholders of the fund.
| |  | Availability of Additional Information. For additional information, including financial information, holdings and proxy voting information, go to GuggenheimInvestments.com/mutual-funds/literature or, call 800 820 0888. |
AR-GUMAX-093024
Annual Shareholder Report | 9.30.24
This annual shareholder report contains important information about the Guggenheim Market Neutral Real Estate Fund for the period of October 1, 2023 to September 30, 2024. You can find additional information about the fund at GuggenheimInvestments.com/mutual-funds/literature. You can also request this information by contacting 800 820 0888 or GuggenheimClientServices@mufg-is.com.
This report describes changes to the fund that occurred during the reporting period.
For the period of October 1, 2023 to September 30, 2024, the fund (Class C shares) returned 0.70%, underperforming the fund's benchmark, the S&P 500 Index, which returned 36.35% for the same period and underperforming the fund's secondary index, the ICE BofA 3-Month U.S. Treasury Bill Index, which returned 5.49% for the same period.
The fund's broad-based securities market index was changed from the ICE BofA 3-Month U.S. Treasury Bill Index to the S&P 500 Index to comply with the regulation that requires the fund's broad-based securities market index to represent the overall applicable market.
What factors materially affected the fund's performance over the last year?
The global growth outlook remained modestly bullish and steady during the reporting period, while inflation seemed to be finally tamed, resulting in a 50 basis point rate cut by the U.S. Federal Reserve in September and potentially up to two more by the end of 2024. The fund underperformed the ICE BofA 3-Month U.S. Treasury Bill Index. Among REITs Sectors, the fund had negative contribution from Residential, Net Lease, and Industrial. This was slightly offset by positive contribution in Lodging, Data Center, and Strip Retail.
Cumulative performance* for the fund since inception (as of 9.30.24), assuming a $10,000 initial investment.
| 02/26/2016 | 10000 | 10000 | 10000 |
| 02/29/2016 | 10000 | 9920 | 10000 |
| 03/31/2016 | 9832 | 10593 | 10004 |
| 04/30/2016 | 9740 | 10634 | 10007 |
| 05/31/2016 | 9916 | 10825 | 10008 |
| 06/30/2016 | 9724 | 10853 | 10012 |
| 07/31/2016 | 9712 | 11253 | 10015 |
| 08/31/2016 | 9696 | 11269 | 10016 |
| 09/30/2016 | 9740 | 11271 | 10021 |
| 10/31/2016 | 9880 | 11065 | 10024 |
| 11/30/2016 | 10100 | 11475 | 10025 |
| 12/31/2016 | 10116 | 11702 | 10030 |
| 01/31/2017 | 10088 | 11924 | 10034 |
| 02/28/2017 | 10092 | 12397 | 10038 |
| 03/31/2017 | 10160 | 12412 | 10040 |
| 04/30/2017 | 10248 | 12539 | 10047 |
| 05/31/2017 | 10448 | 12716 | 10052 |
| 06/30/2017 | 10480 | 12795 | 10060 |
| 07/31/2017 | 10476 | 13058 | 10069 |
| 08/31/2017 | 10676 | 13098 | 10078 |
| 09/30/2017 | 10476 | 13368 | 10087 |
| 10/31/2017 | 10664 | 13680 | 10096 |
| 11/30/2017 | 10624 | 14100 | 10104 |
| 12/31/2017 | 10705 | 14256 | 10116 |
| 01/31/2018 | 10984 | 15073 | 10128 |
| 02/28/2018 | 11107 | 14517 | 10137 |
| 03/31/2018 | 10866 | 14148 | 10151 |
| 04/30/2018 | 10921 | 14203 | 10165 |
| 05/31/2018 | 10608 | 14545 | 10180 |
| 06/30/2018 | 10486 | 14634 | 10197 |
| 07/31/2018 | 10368 | 15179 | 10213 |
| 08/31/2018 | 10216 | 15673 | 10232 |
| 09/30/2018 | 10414 | 15762 | 10247 |
| 10/31/2018 | 10494 | 14685 | 10265 |
| 11/30/2018 | 10507 | 14984 | 10286 |
| 12/31/2018 | 10585 | 13631 | 10305 |
| 01/31/2019 | 10568 | 14724 | 10326 |
| 02/28/2019 | 10602 | 15197 | 10344 |
| 03/31/2019 | 10782 | 15492 | 10367 |
| 04/30/2019 | 10953 | 16119 | 10387 |
| 05/31/2019 | 11103 | 15095 | 10410 |
| 06/30/2019 | 11189 | 16159 | 10433 |
| 07/31/2019 | 11108 | 16391 | 10452 |
| 08/31/2019 | 11570 | 16131 | 10474 |
| 09/30/2019 | 11159 | 16433 | 10492 |
| 10/31/2019 | 11197 | 16789 | 10512 |
| 11/30/2019 | 11185 | 17398 | 10525 |
| 12/31/2019 | 11129 | 17923 | 10540 |
| 01/31/2020 | 11426 | 17916 | 10554 |
| 02/29/2020 | 11638 | 16442 | 10570 |
| 03/31/2020 | 12405 | 14411 | 10601 |
| 04/30/2020 | 12170 | 16258 | 10602 |
| 05/31/2020 | 12241 | 17033 | 10602 |
| 06/30/2020 | 11780 | 17371 | 10603 |
| 07/31/2020 | 12192 | 18351 | 10605 |
| 08/31/2020 | 12055 | 19670 | 10606 |
| 09/30/2020 | 12050 | 18922 | 10607 |
| 10/31/2020 | 12205 | 18419 | 10608 |
| 11/30/2020 | 11683 | 20435 | 10609 |
| 12/31/2020 | 11757 | 21221 | 10611 |
| 01/31/2021 | 11659 | 21007 | 10612 |
| 02/28/2021 | 11810 | 21586 | 10612 |
| 03/31/2021 | 11841 | 22532 | 10613 |
| 04/30/2021 | 11757 | 23734 | 10613 |
| 05/31/2021 | 11850 | 23900 | 10614 |
| 06/30/2021 | 11828 | 24458 | 10613 |
| 07/31/2021 | 11703 | 25039 | 10614 |
| 08/31/2021 | 11810 | 25800 | 10614 |
| 09/30/2021 | 11824 | 24600 | 10615 |
| 10/31/2021 | 11762 | 26324 | 10614 |
| 11/30/2021 | 11713 | 26141 | 10615 |
| 12/31/2021 | 11935 | 27313 | 10616 |
| 01/31/2022 | 11806 | 25899 | 10615 |
| 02/28/2022 | 11828 | 25124 | 10617 |
| 03/31/2022 | 11744 | 26057 | 10620 |
| 04/30/2022 | 11877 | 23785 | 10621 |
| 05/31/2022 | 11602 | 23828 | 10629 |
| 06/30/2022 | 11433 | 21861 | 10631 |
| 07/31/2022 | 11530 | 23877 | 10637 |
| 08/31/2022 | 11464 | 22903 | 10654 |
| 09/30/2022 | 11406 | 20794 | 10681 |
| 10/31/2022 | 11268 | 22477 | 10698 |
| 11/30/2022 | 11317 | 23734 | 10733 |
| 12/31/2022 | 11353 | 22366 | 10772 |
| 01/31/2023 | 11317 | 23772 | 10806 |
| 02/28/2023 | 11339 | 23192 | 10841 |
| 03/31/2023 | 11468 | 24043 | 10888 |
| 04/30/2023 | 11544 | 24418 | 10923 |
| 05/31/2023 | 11495 | 24524 | 10966 |
| 06/30/2023 | 11442 | 26145 | 11016 |
| 07/31/2023 | 11371 | 26985 | 11060 |
| 08/31/2023 | 11357 | 26555 | 11111 |
| 09/30/2023 | 11428 | 25289 | 11162 |
| 10/31/2023 | 11517 | 24757 | 11212 |
| 11/30/2023 | 11686 | 27018 | 11263 |
| 12/31/2023 | 11602 | 28246 | 11315 |
| 01/31/2024 | 11625 | 28720 | 11364 |
| 02/29/2024 | 11643 | 30254 | 11411 |
| 03/31/2024 | 11647 | 31227 | 11462 |
| 04/30/2024 | 11522 | 29952 | 11512 |
| 05/31/2024 | 11629 | 31437 | 11567 |
| 06/30/2024 | 11567 | 32565 | 11615 |
| 07/31/2024 | 11491 | 32961 | 11667 |
| 08/31/2024 | 11508 | 33761 | 11723 |
| 09/30/2024 | 11508 | 34482 | 11774 |
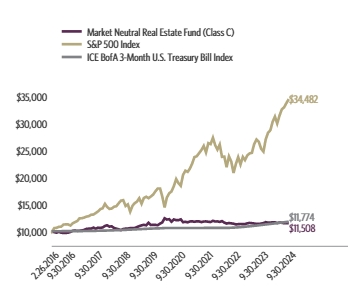
| Class C (without CDSC) | 0.70% | 0.62% | 1.65% |
| Class C (with CDSC)‡ | -0.30% | 0.62% | 1.65% |
| S&P 500 Index | 36.35% | 15.98% | 15.49% |
| ICE BofA 3-Month U.S. Treasury Bill Index | 5.49% | 2.33% | 1.92% |
The fund's past performance is not a good predictor of the fund's future performance. Visit GuggenheimInvestments.com/mutual-funds/performance for more recent performance information.
| Net Assets | $40,826,908 |
| Total Number of Portfolio Holdings | 36 |
| Portfolio Turnover Rate | 136% |
| Total Advisory Fees Paid | $322,604 |
| Guggenheim Market Neutral Real Estate Fund | Class C | GUMCX | Annual Shareholder Report | September 30, 2024 |
| REITs-Diversified | 11.5% |
| REITs-Apartments | 9.7% |
| REITs-Office Property | 7.8% |
| REITs-Hotels | 5.9% |
| REITs-Shopping Centers | 5.6% |
| REITs-Health Care | 4.5% |
| REITs-Warehouse/Industries | 4.0% |
| Other | 5.5% |
| Custom Basket Swap Agreements | -54.7% |

| Kilroy Realty Corp. | 3.6% |
| Invitation Homes, Inc. | 3.4% |
| Essex Property Trust, Inc. | 3.0% |
| VICI Properties, Inc. | 3.0% |
| Park Hotels & Resorts, Inc. | 2.4% |
| Kite Realty Group Trust | 2.4% |
| Alexandria Real Estate Equities, Inc. | 2.3% |
| Kimco Realty Corp. | 2.2% |
| Prologis, Inc. | 2.0% |
| Healthcare Realty Trust, Inc. | 2.0% |
| Top 10 Total | 26.3% |
| |
1 | "Holdings Diversification (Market Exposure as a % of Net Assets)" excludes any temporary cash investments, investments in Guggenheim Strategy Funds Trust mutual funds, or investments in Guggenheim Ultra Short Duration Fund. |
| |
2 | "10 Largest Holdings (as a % of Net Assets)" excludes any temporary cash investments. |
| Kilroy Realty Corp. | 3.6% |
| Invitation Homes, Inc. | 3.4% |
| Essex Property Trust, Inc. | 3.0% |
| VICI Properties, Inc. | 3.0% |
| Park Hotels & Resorts, Inc. | 2.4% |
| Kite Realty Group Trust | 2.4% |
| Alexandria Real Estate Equities, Inc. | 2.3% |
| Kimco Realty Corp. | 2.2% |
| Prologis, Inc. | 2.0% |
| Healthcare Realty Trust, Inc. | 2.0% |
| Top 10 Total | 26.3% |
| |
2 | "10 Largest Holdings (as a % of Net Assets)" excludes any temporary cash investments. |
There were no changes in or disagreements with fund accountants for the period.
This is a summary of certain changes to the fund since September 30, 2023.
Subsequent to the September 30, 2024 year-end, on October 25, 2024, the fund was reorganized into New Age Alpha Market Neutral Real Estate Fund, a series of New Age Alpha Funds Trust, pursuant to an Agreement and Plan of Reorganization approved by the Board of Trustees and shareholders of the fund.
| |  | Availability of Additional Information. For additional information, including financial information, holdings and proxy voting information, go to GuggenheimInvestments.com/mutual-funds/literature or, call 800 820 0888. |
AR-GUMCX-093024
Annual Shareholder Report | 9.30.24
This annual shareholder report contains important information about the Guggenheim Market Neutral Real Estate Fund for the period of October 1, 2023 to September 30, 2024. You can find additional information about the fund at GuggenheimInvestments.com/mutual-funds/literature. You can also request this information by contacting 800 820 0888 or GuggenheimClientServices@mufg-is.com.
This report describes changes to the fund that occurred during the reporting period.
For the period of October 1, 2023 to September 30, 2024, the fund (Class P shares) returned 1.42%, underperforming the fund's benchmark, the S&P 500 Index, which returned 36.35% for the same period and underperforming the fund's secondary index, the ICE BofA 3-Month U.S. Treasury Bill Index, which returned 5.49% for the same period.
The fund's broad-based securities market index was changed from the ICE BofA 3-Month U.S. Treasury Bill Index to the S&P 500 Index to comply with the regulation that requires the fund's broad-based securities market index to represent the overall applicable market.
What factors materially affected the fund's performance over the last year?
The global growth outlook remained modestly bullish and steady during the reporting period, while inflation seemed to be finally tamed, resulting in a 50 basis point rate cut by the U.S. Federal Reserve in September and potentially up to two more by the end of 2024. The fund underperformed the ICE BofA 3-Month U.S. Treasury Bill Index. Among REITs Sectors, the fund had negative contribution from Residential, Net Lease, and Industrial. This was slightly offset by positive contribution in Lodging, Data Center, and Strip Retail.
Cumulative performance* for the fund since inception (as of 9.30.24), assuming a $10,000 initial investment.
| 02/26/2016 | 10000 | 10000 | 10000 |
| 02/29/2016 | 10000 | 9920 | 10000 |
| 03/31/2016 | 9840 | 10593 | 10004 |
| 04/30/2016 | 9752 | 10634 | 10007 |
| 05/31/2016 | 9936 | 10825 | 10008 |
| 06/30/2016 | 9748 | 10853 | 10012 |
| 07/31/2016 | 9744 | 11253 | 10015 |
| 08/31/2016 | 9732 | 11269 | 10016 |
| 09/30/2016 | 9780 | 11271 | 10021 |
| 10/31/2016 | 9928 | 11065 | 10024 |
| 11/30/2016 | 10156 | 11475 | 10025 |
| 12/31/2016 | 10176 | 11702 | 10030 |
| 01/31/2017 | 10152 | 11924 | 10034 |
| 02/28/2017 | 10168 | 12397 | 10038 |
| 03/31/2017 | 10240 | 12412 | 10040 |
| 04/30/2017 | 10332 | 12539 | 10047 |
| 05/31/2017 | 10540 | 12716 | 10052 |
| 06/30/2017 | 10580 | 12795 | 10060 |
| 07/31/2017 | 10580 | 13058 | 10069 |
| 08/31/2017 | 10792 | 13098 | 10078 |
| 09/30/2017 | 10596 | 13368 | 10087 |
| 10/31/2017 | 10792 | 13680 | 10096 |
| 11/30/2017 | 10756 | 14100 | 10104 |
| 12/31/2017 | 10841 | 14256 | 10116 |
| 01/31/2018 | 11128 | 15073 | 10128 |
| 02/28/2018 | 11259 | 14517 | 10137 |
| 03/31/2018 | 11023 | 14148 | 10151 |
| 04/30/2018 | 11086 | 14203 | 10165 |
| 05/31/2018 | 10774 | 14545 | 10180 |
| 06/30/2018 | 10656 | 14634 | 10197 |
| 07/31/2018 | 10546 | 15179 | 10213 |
| 08/31/2018 | 10399 | 15673 | 10232 |
| 09/30/2018 | 10605 | 15762 | 10247 |
| 10/31/2018 | 10690 | 14685 | 10265 |
| 11/30/2018 | 10698 | 14984 | 10286 |
| 12/31/2018 | 10780 | 13631 | 10305 |
| 01/31/2019 | 10771 | 14724 | 10326 |
| 02/28/2019 | 10810 | 15197 | 10344 |
| 03/31/2019 | 11003 | 15492 | 10367 |
| 04/30/2019 | 11183 | 16119 | 10387 |
| 05/31/2019 | 11345 | 15095 | 10410 |
| 06/30/2019 | 11441 | 16159 | 10433 |
| 07/31/2019 | 11362 | 16391 | 10452 |
| 08/31/2019 | 11844 | 16131 | 10474 |
| 09/30/2019 | 11432 | 16433 | 10492 |
| 10/31/2019 | 11480 | 16789 | 10512 |
| 11/30/2019 | 11467 | 17398 | 10525 |
| 12/31/2019 | 11424 | 17923 | 10540 |
| 01/31/2020 | 11734 | 17916 | 10554 |
| 02/29/2020 | 11958 | 16442 | 10570 |
| 03/31/2020 | 12753 | 14411 | 10601 |
| 04/30/2020 | 12520 | 16258 | 10602 |
| 05/31/2020 | 12598 | 17033 | 10602 |
| 06/30/2020 | 12136 | 17371 | 10603 |
| 07/31/2020 | 12566 | 18351 | 10605 |
| 08/31/2020 | 12429 | 19670 | 10606 |
| 09/30/2020 | 12438 | 18922 | 10607 |
| 10/31/2020 | 12607 | 18419 | 10608 |
| 11/30/2020 | 12072 | 20435 | 10609 |
| 12/31/2020 | 12155 | 21221 | 10611 |
| 01/31/2021 | 12059 | 21007 | 10612 |
| 02/28/2021 | 12228 | 21586 | 10612 |
| 03/31/2021 | 12260 | 22532 | 10613 |
| 04/30/2021 | 12187 | 23734 | 10613 |
| 05/31/2021 | 12288 | 23900 | 10614 |
| 06/30/2021 | 12269 | 24458 | 10613 |
| 07/31/2021 | 12150 | 25039 | 10614 |
| 08/31/2021 | 12269 | 25800 | 10614 |
| 09/30/2021 | 12293 | 24600 | 10615 |
| 10/31/2021 | 12238 | 26324 | 10614 |
| 11/30/2021 | 12192 | 26141 | 10615 |
| 12/31/2021 | 12435 | 27313 | 10616 |
| 01/31/2022 | 12302 | 25899 | 10615 |
| 02/28/2022 | 12334 | 25124 | 10617 |
| 03/31/2022 | 12256 | 26057 | 10620 |
| 04/30/2022 | 12403 | 23785 | 10621 |
| 05/31/2022 | 12123 | 23828 | 10629 |
| 06/30/2022 | 11949 | 21861 | 10631 |
| 07/31/2022 | 12059 | 23877 | 10637 |
| 08/31/2022 | 11999 | 22903 | 10654 |
| 09/30/2022 | 11944 | 20794 | 10681 |
| 10/31/2022 | 11807 | 22477 | 10698 |
| 11/30/2022 | 11871 | 23734 | 10733 |
| 12/31/2022 | 11912 | 22366 | 10772 |
| 01/31/2023 | 11885 | 23772 | 10806 |
| 02/28/2023 | 11912 | 23192 | 10841 |
| 03/31/2023 | 12059 | 24043 | 10888 |
| 04/30/2023 | 12141 | 24418 | 10923 |
| 05/31/2023 | 12096 | 24524 | 10966 |
| 06/30/2023 | 12054 | 26145 | 11016 |
| 07/31/2023 | 11986 | 26985 | 11060 |
| 08/31/2023 | 11976 | 26555 | 11111 |
| 09/30/2023 | 12059 | 25289 | 11162 |
| 10/31/2023 | 12160 | 24757 | 11212 |
| 11/30/2023 | 12348 | 27018 | 11263 |
| 12/31/2023 | 12268 | 28246 | 11315 |
| 01/31/2024 | 12301 | 28720 | 11364 |
| 02/29/2024 | 12324 | 30254 | 11411 |
| 03/31/2024 | 12338 | 31227 | 11462 |
| 04/30/2024 | 12216 | 29952 | 11512 |
| 05/31/2024 | 12334 | 31437 | 11567 |
| 06/30/2024 | 12273 | 32565 | 11615 |
| 07/31/2024 | 12198 | 32961 | 11667 |
| 08/31/2024 | 12226 | 33761 | 11723 |
| 09/30/2024 | 12230 | 34482 | 11774 |
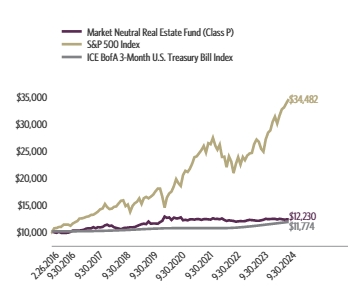
| Class P | 1.42% | 1.36% | 2.37% |
| S&P 500 Index | 36.35% | 15.98% | 15.49% |
| ICE BofA 3-Month U.S. Treasury Bill Index | 5.49% | 2.33% | 1.92% |
The fund's past performance is not a good predictor of the fund's future performance. Visit GuggenheimInvestments.com/mutual-funds/performance for more recent performance information.
| Net Assets | $40,826,908 |
| Total Number of Portfolio Holdings | 36 |
| Portfolio Turnover Rate | 136% |
| Total Advisory Fees Paid | $322,604 |
| Guggenheim Market Neutral Real Estate Fund | Class P | GUMPX | Annual Shareholder Report | September 30, 2024 |
| REITs-Diversified | 11.5% |
| REITs-Apartments | 9.7% |
| REITs-Office Property | 7.8% |
| REITs-Hotels | 5.9% |
| REITs-Shopping Centers | 5.6% |
| REITs-Health Care | 4.5% |
| REITs-Warehouse/Industries | 4.0% |
| Other | 5.5% |
| Custom Basket Swap Agreements | -54.7% |

| Kilroy Realty Corp. | 3.6% |
| Invitation Homes, Inc. | 3.4% |
| Essex Property Trust, Inc. | 3.0% |
| VICI Properties, Inc. | 3.0% |
| Park Hotels & Resorts, Inc. | 2.4% |
| Kite Realty Group Trust | 2.4% |
| Alexandria Real Estate Equities, Inc. | 2.3% |
| Kimco Realty Corp. | 2.2% |
| Prologis, Inc. | 2.0% |
| Healthcare Realty Trust, Inc. | 2.0% |
| Top 10 Total | 26.3% |
| |
1 | "Holdings Diversification (Market Exposure as a % of Net Assets)" excludes any temporary cash investments, investments in Guggenheim Strategy Funds Trust mutual funds, or investments in Guggenheim Ultra Short Duration Fund. |
| |
2 | "10 Largest Holdings (as a % of Net Assets)" excludes any temporary cash investments. |
| Kilroy Realty Corp. | 3.6% |
| Invitation Homes, Inc. | 3.4% |
| Essex Property Trust, Inc. | 3.0% |
| VICI Properties, Inc. | 3.0% |
| Park Hotels & Resorts, Inc. | 2.4% |
| Kite Realty Group Trust | 2.4% |
| Alexandria Real Estate Equities, Inc. | 2.3% |
| Kimco Realty Corp. | 2.2% |
| Prologis, Inc. | 2.0% |
| Healthcare Realty Trust, Inc. | 2.0% |
| Top 10 Total | 26.3% |
| |
2 | "10 Largest Holdings (as a % of Net Assets)" excludes any temporary cash investments. |
There were no changes in or disagreements with fund accountants for the period.
This is a summary of certain changes to the fund since September 30, 2023.
Subsequent to the September 30, 2024 year-end, on October 25, 2024, the fund was reorganized into New Age Alpha Market Neutral Real Estate Fund, a series of New Age Alpha Funds Trust, pursuant to an Agreement and Plan of Reorganization approved by the Board of Trustees and shareholders of the fund.
| |  | Availability of Additional Information. For additional information, including financial information, holdings and proxy voting information, go to GuggenheimInvestments.com/mutual-funds/literature or, call 800 820 0888. |
AR-GUMPX-093024
Annual Shareholder Report | 9.30.24
This annual shareholder report contains important information about the Guggenheim Market Neutral Real Estate Fund for the period of October 1, 2023 to September 30, 2024. You can find additional information about the fund at GuggenheimInvestments.com/mutual-funds/literature. You can also request this information by contacting 800 820 0888 or GuggenheimClientServices@mufg-is.com.
This report describes changes to the fund that occurred during the reporting period.
| Institutional Class | $139 | 1.38% |
For the period of October 1, 2023 to September 30, 2024, the fund (Institutional Class shares) returned 1.69%, underperforming the fund's benchmark, the S&P 500 Index, which returned 36.35% for the same period and underperforming the fund's secondary index, the ICE BofA 3-Month U.S. Treasury Bill Index, which returned 5.49% for the same period.
The fund's broad-based securities market index was changed from the ICE BofA 3-Month U.S. Treasury Bill Index to the S&P 500 Index to comply with the regulation that requires the fund's broad-based securities market index to represent the overall applicable market.
What factors materially affected the fund's performance over the last year?
The global growth outlook remained modestly bullish and steady during the reporting period, while inflation seemed to be finally tamed, resulting in a 50 basis point rate cut by the U.S. Federal Reserve in September and potentially up to two more by the end of 2024. The fund underperformed the ICE BofA 3-Month U.S. Treasury Bill Index. Among REITs Sectors, the fund had negative contribution from Residential, Net Lease, and Industrial. This was slightly offset by positive contribution in Lodging, Data Center, and Strip Retail.
Cumulative performance* for the fund since inception (as of 9.30.24), assuming a $2,000,000 initial investment.
| 02/26/2016 | 2000000 | 2000000 | 2000000 |
| 03/31/2016 | 1968000 | 2118529 | 2000872 |
| 06/30/2016 | 1951200 | 2170544 | 2002321 |
| 09/30/2016 | 1959200 | 2254155 | 2004245 |
| 12/31/2016 | 2040000 | 2340359 | 2005949 |
| 03/31/2017 | 2053600 | 2482328 | 2008015 |
| 06/30/2017 | 2124000 | 2558987 | 2012068 |
| 09/30/2017 | 2128000 | 2673638 | 2017394 |
| 12/31/2017 | 2178698 | 2851296 | 2023120 |
| 03/31/2018 | 2216655 | 2829651 | 2030294 |
| 06/30/2018 | 2144116 | 2926818 | 2039476 |
| 09/30/2018 | 2135681 | 3152498 | 2049499 |
| 12/31/2018 | 2174975 | 2726285 | 2061043 |
| 03/31/2019 | 2221638 | 3098369 | 2073401 |
| 06/30/2019 | 2311505 | 3231717 | 2086649 |
| 09/30/2019 | 2310641 | 3286601 | 2098381 |
| 12/31/2019 | 2310610 | 3584695 | 2108044 |
| 03/31/2020 | 2580482 | 2882167 | 2120156 |
| 06/30/2020 | 2457731 | 3474258 | 2120628 |
| 09/30/2020 | 2520009 | 3784490 | 2121463 |
| 12/31/2020 | 2465332 | 4244235 | 2122106 |
| 03/31/2021 | 2487967 | 4506316 | 2122639 |
| 06/30/2021 | 2491588 | 4891553 | 2122636 |
| 09/30/2021 | 2498005 | 4920024 | 2122944 |
| 12/31/2021 | 2528287 | 5462561 | 2123149 |
| 03/31/2022 | 2492844 | 5211364 | 2123981 |
| 06/30/2022 | 2432863 | 4372276 | 2126206 |
| 09/30/2022 | 2433772 | 4158796 | 2136188 |
| 12/31/2022 | 2428948 | 4473244 | 2154365 |
| 03/31/2023 | 2459002 | 4808607 | 2177647 |
| 06/30/2023 | 2460550 | 5228981 | 2203250 |
| 09/30/2023 | 2463283 | 5057815 | 2232359 |
| 12/31/2023 | 2506833 | 5649153 | 2263064 |
| 03/31/2024 | 2522740 | 6245474 | 2292457 |
| 06/30/2024 | 2511511 | 6513017 | 2322945 |
| 09/30/2024 | 2504961 | 6896411 | 2354853 |
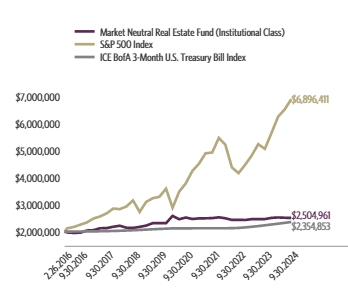
| Institutional Class | 1.69% | 1.63% | 2.65% |
| S&P 500 Index | 36.35% | 15.98% | 15.49% |
| ICE BofA 3-Month U.S. Treasury Bill Index | 5.49% | 2.33% | 1.92% |
The fund's past performance is not a good predictor of the fund's future performance. Visit GuggenheimInvestments.com/mutual-funds/performance for more recent performance information.
| Net Assets | $40,826,908 |
| Total Number of Portfolio Holdings | 36 |
| Portfolio Turnover Rate | 136% |
| Total Advisory Fees Paid | $322,604 |
| Guggenheim Market Neutral Real Estate Fund | Institutional Class | GUMNX | Annual Shareholder Report | September 30, 2024 |
| REITs-Diversified | 11.5% |
| REITs-Apartments | 9.7% |
| REITs-Office Property | 7.8% |
| REITs-Hotels | 5.9% |
| REITs-Shopping Centers | 5.6% |
| REITs-Health Care | 4.5% |
| REITs-Warehouse/Industries | 4.0% |
| Other | 5.5% |
| Custom Basket Swap Agreements | -54.7% |

| Kilroy Realty Corp. | 3.6% |
| Invitation Homes, Inc. | 3.4% |
| Essex Property Trust, Inc. | 3.0% |
| VICI Properties, Inc. | 3.0% |
| Park Hotels & Resorts, Inc. | 2.4% |
| Kite Realty Group Trust | 2.4% |
| Alexandria Real Estate Equities, Inc. | 2.3% |
| Kimco Realty Corp. | 2.2% |
| Prologis, Inc. | 2.0% |
| Healthcare Realty Trust, Inc. | 2.0% |
| Top 10 Total | 26.3% |
| |
1 | "Holdings Diversification (Market Exposure as a % of Net Assets)" excludes any temporary cash investments, investments in Guggenheim Strategy Funds Trust mutual funds, or investments in Guggenheim Ultra Short Duration Fund. |
| |
2 | "10 Largest Holdings (as a % of Net Assets)" excludes any temporary cash investments. |
| Kilroy Realty Corp. | 3.6% |
| Invitation Homes, Inc. | 3.4% |
| Essex Property Trust, Inc. | 3.0% |
| VICI Properties, Inc. | 3.0% |
| Park Hotels & Resorts, Inc. | 2.4% |
| Kite Realty Group Trust | 2.4% |
| Alexandria Real Estate Equities, Inc. | 2.3% |
| Kimco Realty Corp. | 2.2% |
| Prologis, Inc. | 2.0% |
| Healthcare Realty Trust, Inc. | 2.0% |
| Top 10 Total | 26.3% |
| |
2 | "10 Largest Holdings (as a % of Net Assets)" excludes any temporary cash investments. |
There were no changes in or disagreements with fund accountants for the period.
This is a summary of certain changes to the fund since September 30, 2023.
Subsequent to the September 30, 2024 year-end, on October 25, 2024, the fund was reorganized into New Age Alpha Market Neutral Real Estate Fund, a series of New Age Alpha Funds Trust, pursuant to an Agreement and Plan of Reorganization approved by the Board of Trustees and shareholders of the fund.
| |  | Availability of Additional Information. For additional information, including financial information, holdings and proxy voting information, go to GuggenheimInvestments.com/mutual-funds/literature or, call 800 820 0888. |
AR-GUMNX-093024
Annual Shareholder Report | 9.30.24
This annual shareholder report contains important information about the Guggenheim Risk Managed Real Estate Fund for the period of October 1, 2023 to September 30, 2024. You can find additional information about the fund at GuggenheimInvestments.com/mutual-funds/literature. You can also request this information by contacting 800 820 0888 or GuggenheimClientServices@mufg-is.com.
This report describes changes to the fund that occurred during the reporting period.
For the period of October 1, 2023 to September 30, 2024, the fund (Class A shares) returned 28.31%, underperforming the fund's benchmark, the S&P 500 Index, which returned 36.35% for the same period and underperforming the fund's secondary index, the FTSE NAREIT Equity REITs Total Return Index, which returned 34.74% for the same period.
The fund's broad-based securities market index was changed from the FTSE NAREIT Equity REITs Index to the S&P 500 Index to comply with the regulation that requires the fund's broad-based securities market index to represent the overall applicable market.
What factors materially affected the fund's performance over the last year?
The global growth outlook remained modestly bullish and steady during the reporting period, while inflation seemed to be finally tamed, resulting in a 50 basis point rate cut by the U.S. Federal Reserve in September and potentially up to two more by the end of 2024. This optimism helped the FTSE Nareit Equity REITS Index (the Fund's ancillary index) to gain more than 34%. The fund underperformed the FTSE Nareit Equity REITS Index. Of the fund's three potential alpha sources (long-only portfolio, long/short portfolio, REIT risk allocation model), two of the three contributed negatively to performance. The long sleeve underperformed the index, while the long/short sleeve contributed to the fund's return. The risk allocation model detracted from return as the index performed strongly during the last quarter of the year versus the roughly 91% beta exposure of the fund (which is typical neutral positioning for the fund).
Cumulative performance* for the fund's most recently completed 10 years (as of 9.30.24), assuming a $10,000 initial investment.
| 09/30/2014 | 9524 | 10000 | 10000 |
| 10/31/2014 | 10335 | 10244 | 10994 |
| 11/30/2014 | 10614 | 10520 | 11210 |
| 12/31/2014 | 10799 | 10493 | 11420 |
| 01/31/2015 | 11335 | 10178 | 12186 |
| 02/28/2015 | 11218 | 10763 | 11762 |
| 03/31/2015 | 11367 | 10593 | 11963 |
| 04/30/2015 | 10870 | 10695 | 11306 |
| 05/31/2015 | 10920 | 10832 | 11292 |
| 06/30/2015 | 10384 | 10622 | 10772 |
| 07/31/2015 | 10955 | 10845 | 11380 |
| 08/31/2015 | 10440 | 10191 | 10675 |
| 09/30/2015 | 10568 | 9939 | 10988 |
| 10/31/2015 | 11058 | 10777 | 11633 |
| 11/30/2015 | 10980 | 10809 | 11572 |
| 12/31/2015 | 11186 | 10638 | 11785 |
| 01/31/2016 | 10716 | 10111 | 11390 |
| 02/29/2016 | 10707 | 10097 | 11342 |
| 03/31/2016 | 11631 | 10782 | 12493 |
| 04/30/2016 | 11338 | 10824 | 12195 |
| 05/31/2016 | 11694 | 11018 | 12491 |
| 06/30/2016 | 12292 | 11047 | 13362 |
| 07/31/2016 | 12657 | 11454 | 13917 |
| 08/31/2016 | 12263 | 11470 | 13406 |
| 09/30/2016 | 12140 | 11472 | 13170 |
| 10/31/2016 | 11720 | 11263 | 12425 |
| 11/30/2016 | 11758 | 11680 | 12216 |
| 12/31/2016 | 12223 | 11911 | 12789 |
| 01/31/2017 | 12180 | 12137 | 12804 |
| 02/28/2017 | 12580 | 12619 | 13240 |
| 03/31/2017 | 12386 | 12633 | 12938 |
| 04/30/2017 | 12495 | 12763 | 12954 |
| 05/31/2017 | 12665 | 12943 | 12854 |
| 06/30/2017 | 12904 | 13023 | 13135 |
| 07/31/2017 | 13062 | 13291 | 13295 |
| 08/31/2017 | 13263 | 13332 | 13261 |
| 09/30/2017 | 13056 | 13607 | 13258 |
| 10/31/2017 | 13139 | 13925 | 13130 |
| 11/30/2017 | 13398 | 14352 | 13486 |
| 12/31/2017 | 13432 | 14511 | 13457 |
| 01/31/2018 | 13249 | 15342 | 12895 |
| 02/28/2018 | 12509 | 14777 | 11901 |
| 03/31/2018 | 12731 | 14401 | 12354 |
| 04/30/2018 | 12841 | 14456 | 12531 |
| 05/31/2018 | 12979 | 14804 | 13026 |
| 06/30/2018 | 13346 | 14896 | 13594 |
| 07/31/2018 | 13355 | 15450 | 13703 |
| 08/31/2018 | 13622 | 15953 | 14120 |
| 09/30/2018 | 13408 | 16044 | 13761 |
| 10/31/2018 | 13167 | 14947 | 13353 |
| 11/30/2018 | 13718 | 15252 | 13986 |
| 12/31/2018 | 12861 | 13875 | 12835 |
| 01/31/2019 | 14022 | 14987 | 14343 |
| 02/28/2019 | 14154 | 15468 | 14448 |
| 03/31/2019 | 14724 | 15769 | 14932 |
| 04/30/2019 | 14833 | 16407 | 14897 |
| 05/31/2019 | 15055 | 15364 | 14929 |
| 06/30/2019 | 15260 | 16447 | 15117 |
| 07/31/2019 | 15341 | 16684 | 15311 |
| 08/31/2019 | 16305 | 16419 | 15831 |
| 09/30/2019 | 16240 | 16727 | 16296 |
| 10/31/2019 | 16501 | 17089 | 16518 |
| 11/30/2019 | 16316 | 17709 | 16270 |
| 12/31/2019 | 16098 | 18244 | 16172 |
| 01/31/2020 | 16622 | 18236 | 16368 |
| 02/29/2020 | 15829 | 16735 | 15057 |
| 03/31/2020 | 14023 | 14668 | 11757 |
| 04/30/2020 | 14479 | 16549 | 12733 |
| 05/31/2020 | 14699 | 17337 | 12757 |
| 06/30/2020 | 14510 | 17682 | 13147 |
| 07/31/2020 | 15450 | 18679 | 13679 |
| 08/31/2020 | 15500 | 20021 | 13786 |
| 09/30/2020 | 15147 | 19260 | 13336 |
| 10/31/2020 | 14970 | 18748 | 12987 |
| 11/30/2020 | 15748 | 20801 | 14405 |
| 12/31/2020 | 16324 | 21600 | 14878 |
| 01/31/2021 | 16276 | 21382 | 14894 |
| 02/28/2021 | 17098 | 21972 | 15491 |
| 03/31/2021 | 17819 | 22934 | 16199 |
| 04/30/2021 | 19146 | 24158 | 17504 |
| 05/31/2021 | 19378 | 24327 | 17683 |
| 06/30/2021 | 19876 | 24895 | 18145 |
| 07/31/2021 | 20634 | 25486 | 19018 |
| 08/31/2021 | 21046 | 26261 | 19368 |
| 09/30/2021 | 20013 | 25040 | 18322 |
| 10/31/2021 | 21354 | 26794 | 19715 |
| 11/30/2021 | 21158 | 26608 | 19582 |
| 12/31/2021 | 23130 | 27801 | 21311 |
| 01/31/2022 | 21519 | 26362 | 19852 |
| 02/28/2022 | 20861 | 25573 | 19231 |
| 03/31/2022 | 21962 | 26522 | 20490 |
| 04/30/2022 | 21330 | 24209 | 19590 |
| 05/31/2022 | 19925 | 24254 | 18368 |
| 06/30/2022 | 18522 | 22252 | 17007 |
| 07/31/2022 | 20052 | 24304 | 18547 |
| 08/31/2022 | 19013 | 23312 | 17439 |
| 09/30/2022 | 16950 | 21165 | 15316 |
| 10/31/2022 | 17438 | 22879 | 16066 |
| 11/30/2022 | 18358 | 24158 | 16992 |
| 12/31/2022 | 17574 | 22766 | 16119 |
| 01/31/2023 | 19140 | 24196 | 17839 |
| 02/28/2023 | 18342 | 23606 | 16983 |
| 03/31/2023 | 18019 | 24473 | 16551 |
| 04/30/2023 | 18196 | 24855 | 16689 |
| 05/31/2023 | 17575 | 24963 | 16152 |
| 06/30/2023 | 18279 | 26612 | 16984 |
| 07/31/2023 | 18647 | 27467 | 17468 |
| 08/31/2023 | 18095 | 27030 | 16925 |
| 09/30/2023 | 17048 | 25741 | 15773 |
| 10/31/2023 | 16406 | 25200 | 15085 |
| 11/30/2023 | 18147 | 27501 | 16678 |
| 12/31/2023 | 19786 | 28750 | 18332 |
| 01/31/2024 | 19002 | 29233 | 17571 |
| 02/29/2024 | 19344 | 30794 | 17927 |
| 03/31/2024 | 19612 | 31785 | 18296 |
| 04/30/2024 | 18186 | 30487 | 17013 |
| 05/31/2024 | 18987 | 31999 | 17794 |
| 06/30/2024 | 19385 | 33147 | 18308 |
| 07/31/2024 | 20332 | 33550 | 19448 |
| 08/31/2024 | 21424 | 34364 | 20694 |
| 09/30/2024 | 21874 | 35098 | 21253 |
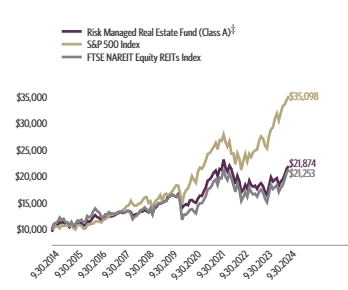
| Class A (without sales charge) | 28.31% | 6.14% | 8.67% |
| Class A (with sales charge)† | 22.20% | 5.11% | 8.14% |
| S&P 500 Index | 36.35% | 15.98% | 13.38% |
| FTSE NAREIT Equity REITs Total Return Index | 34.74% | 5.46% | 7.83% |
The fund's past performance is not a good predictor of the fund's future performance. Visit GuggenheimInvestments.com/mutual-funds/performance for more recent performance information.
| Net Assets | $338,231,464 |
| Total Number of Portfolio Holdings | 111 |
| Portfolio Turnover Rate | 72% |
| Total Advisory Fees Paid | $2,430,467 |
| Guggenheim Risk Managed Real Estate Fund | Class A | GURAX | Annual Shareholder Report | September 30, 2024 |
| REITs-Diversified | 19.8% |
| REITs-Apartments | 14.5% |
| REITs-Health Care | 14.4% |
| Custom Basket Swap Agreements | 13.6% |
| REITs-Warehouse/Industries | 13.5% |
| REITs-Storage | 10.4% |
| REITs-Shopping Centers | 5.9% |
| REITs-Regional Malls | 4.8% |
| REITs-Single Tenant | 4.7% |
| REITs-Office Property | 4.4% |
| REITs-Hotels | 3.8% |
| REITs-Manufactured Homes | 1.6% |
| Exchange Traded Funds Short Sales | -0.3% |
| REITs-Manufactured Homes Short Sales | -0.2% |
| REITs-Storage Short Sales | -0.2% |
| REITs-Regional Malls Short Sales | -0.3% |
| REITs-Health Care Short Sales | -0.6% |
| REITs-Warehouse/Industries Short Sales | -0.7% |
| REITs-Diversified Short Sales | -0.7% |
| REITs-Shopping Centers Short Sales | |
| REITs-Hotels Short Sales | -0.9% |
| REITs-Single Tenant Short Sales | -0.9% |
| REITs-Apartments Short Sales | -1.0% |
| REITs-Office Property Short Sales | -1.2% |
| Custom Basket Swap Agreements Short Sales | -13.6% |

| Prologis, Inc. | 9.2% |
| Equinix, Inc. | 5.7% |
| Welltower, Inc. | 5.3% |
| Digital Realty Trust, Inc. | 4.3% |
| Simon Property Group, Inc. | 4.2% |
| VICI Properties, Inc. | 3.9% |
| Public Storage | 3.7% |
| Realty Income Corp. | 3.4% |
| Extra Space Storage, Inc. | |
| Invitation Homes, Inc. | 3.0% |
| Top 10 Total | 46.0% |
| |
1 | "Holdings Diversification (Market Exposure as a % of Net Assets)" excludes any temporary cash investments, investments in Guggenheim Strategy Funds Trust mutual funds, or investments in Guggenheim Ultra Short Duration Fund. |
| |
2 | "10 Largest Holdings (as a % of Net Assets)" excludes any temporary cash investments. |
| Prologis, Inc. | 9.2% |
| Equinix, Inc. | 5.7% |
| Welltower, Inc. | 5.3% |
| Digital Realty Trust, Inc. | 4.3% |
| Simon Property Group, Inc. | 4.2% |
| VICI Properties, Inc. | 3.9% |
| Public Storage | 3.7% |
| Realty Income Corp. | 3.4% |
| Extra Space Storage, Inc. | |
| Invitation Homes, Inc. | 3.0% |
| Top 10 Total | 46.0% |
| |
2 | "10 Largest Holdings (as a % of Net Assets)" excludes any temporary cash investments. |
There were no changes in or disagreements with fund accountants for the period.
This is a summary of certain changes to the fund since September 30, 2023.
Subsequent to the September 30, 2024 year-end, on October 25, 2024, the fund was reorganized into New Age Alpha Risk Managed Real Estate Fund, a series of New Age Alpha Funds Trust, pursuant to an Agreement and Plan of Reorganization approved by the Board of Trustees and shareholders of the fund.
| |  | Availability of Additional Information. For additional information, including financial information, holdings and proxy voting information, go to GuggenheimInvestments.com/mutual-funds/literature or, call 800 820 0888. |
AR-GURAX-093024
Annual Shareholder Report | 9.30.24
This annual shareholder report contains important information about the Guggenheim Risk Managed Real Estate Fund for the period of October 1, 2023 to September 30, 2024. You can find additional information about the fund at GuggenheimInvestments.com/mutual-funds/literature. You can also request this information by contacting 800 820 0888 or GuggenheimClientServices@mufg-is.com.
This report describes changes to the fund that occurred during the reporting period.
For the period of October 1, 2023 to September 30, 2024, the fund (Class C shares) returned 27.44%, underperforming the fund's benchmark, the S&P 500 Index, which returned 36.35% for the same period and underperforming the fund's secondary index, the FTSE NAREIT Equity REITs Total Return Index, which returned 34.74% for the same period.
The fund's broad-based securities market index was changed from the FTSE NAREIT Equity REITs Index to the S&P 500 Index to comply with the regulation that requires the fund's broad-based securities market index to represent the overall applicable market.
What factors materially affected the fund's performance over the last year?
The global growth outlook remained modestly bullish and steady during the reporting period, while inflation seemed to be finally tamed, resulting in a 50 basis point rate cut by the U.S. Federal Reserve in September and potentially up to two more by the end of 2024. This optimism helped the FTSE Nareit Equity REITS Index (the Fund's ancillary index) to gain more than 34%. The fund underperformed the FTSE Nareit Equity REITS Index. Of the fund's three potential alpha sources (long-only portfolio, long/short portfolio, REIT risk allocation model), two of the three contributed negatively to performance. The long sleeve underperformed the index, while the long/short sleeve contributed to the fund's return. The risk allocation model detracted from return as the index performed strongly during the last quarter of the year versus the roughly 91% beta exposure of the fund (which is typical neutral positioning for the fund).
Cumulative performance* for the fund's most recently completed 10 years (as of 9.30.24), assuming a $10,000 initial investment.
| 09/30/2014 | 10000 | 10000 | 10000 |
| 10/31/2014 | 10850 | 10244 | 10994 |
| 11/30/2014 | 11135 | 10520 | 11210 |
| 12/31/2014 | 11322 | 10493 | 11420 |
| 01/31/2015 | 11877 | 10178 | 12186 |
| 02/28/2015 | 11747 | 10763 | 11762 |
| 03/31/2015 | 11896 | 10593 | 11963 |
| 04/30/2015 | 11370 | 10695 | 11306 |
| 05/31/2015 | 11411 | 10832 | 11292 |
| 06/30/2015 | 10848 | 10622 | 10772 |
| 07/31/2015 | 11437 | 10845 | 11380 |
| 08/31/2015 | 10893 | 10191 | 10675 |
| 09/30/2015 | 11020 | 9939 | 10988 |
| 10/31/2015 | 11523 | 10777 | 11633 |
| 11/30/2015 | 11434 | 10809 | 11572 |
| 12/31/2015 | 11643 | 10638 | 11785 |
| 01/31/2016 | 11143 | 10111 | 11390 |
| 02/29/2016 | 11130 | 10097 | 11342 |
| 03/31/2016 | 12081 | 10782 | 12493 |
| 04/30/2016 | 11771 | 10824 | 12195 |
| 05/31/2016 | 12137 | 11018 | 12491 |
| 06/30/2016 | 12743 | 11047 | 13362 |
| 07/31/2016 | 13122 | 11454 | 13917 |
| 08/31/2016 | 12699 | 11470 | 13406 |
| 09/30/2016 | 12563 | 11472 | 13170 |
| 10/31/2016 | 12121 | 11263 | 12425 |
| 11/30/2016 | 12148 | 11680 | 12216 |
| 12/31/2016 | 12622 | 11911 | 12789 |
| 01/31/2017 | 12572 | 12137 | 12804 |
| 02/28/2017 | 12979 | 12619 | 13240 |
| 03/31/2017 | 12769 | 12633 | 12938 |
| 04/30/2017 | 12878 | 12763 | 12954 |
| 05/31/2017 | 13045 | 12943 | 12854 |
| 06/30/2017 | 13285 | 13023 | 13135 |
| 07/31/2017 | 13430 | 13291 | 13295 |
| 08/31/2017 | 13629 | 13332 | 13261 |
| 09/30/2017 | 13406 | 13607 | 13258 |
| 10/31/2017 | 13488 | 13925 | 13130 |
| 11/30/2017 | 13747 | 14352 | 13486 |
| 12/31/2017 | 13774 | 14511 | 13457 |
| 01/31/2018 | 13575 | 15342 | 12895 |
| 02/28/2018 | 12811 | 14777 | 11901 |
| 03/31/2018 | 13030 | 14401 | 12354 |
| 04/30/2018 | 13138 | 14456 | 12531 |
| 05/31/2018 | 13266 | 14804 | 13026 |
| 06/30/2018 | 13632 | 14896 | 13594 |
| 07/31/2018 | 13632 | 15450 | 13703 |
| 08/31/2018 | 13897 | 15953 | 14120 |
| 09/30/2018 | 13665 | 16044 | 13761 |
| 10/31/2018 | 13413 | 14947 | 13353 |
| 11/30/2018 | 13965 | 15252 | 13986 |
| 12/31/2018 | 13085 | 13875 | 12835 |
| 01/31/2019 | 14259 | 14987 | 14343 |
| 02/28/2019 | 14384 | 15468 | 14448 |
| 03/31/2019 | 14956 | 15769 | 14932 |
| 04/30/2019 | 15053 | 16407 | 14897 |
| 05/31/2019 | 15266 | 15364 | 14929 |
| 06/30/2019 | 15472 | 16447 | 15117 |
| 07/31/2019 | 15540 | 16684 | 15311 |
| 08/31/2019 | 16504 | 16419 | 15831 |
| 09/30/2019 | 16430 | 16727 | 16296 |
| 10/31/2019 | 16682 | 17089 | 16518 |
| 11/30/2019 | 16484 | 17709 | 16270 |
| 12/31/2019 | 16255 | 18244 | 16172 |
| 01/31/2020 | 16772 | 18236 | 16368 |
| 02/29/2020 | 15961 | 16735 | 15057 |
| 03/31/2020 | 14131 | 14668 | 11757 |
| 04/30/2020 | 14584 | 16549 | 12733 |
| 05/31/2020 | 14793 | 17337 | 12757 |
| 06/30/2020 | 14587 | 17682 | 13147 |
| 07/31/2020 | 15524 | 18679 | 13679 |
| 08/31/2020 | 15559 | 20021 | 13786 |
| 09/30/2020 | 15201 | 19260 | 13336 |
| 10/31/2020 | 15007 | 18748 | 12987 |
| 11/30/2020 | 15783 | 20801 | 14405 |
| 12/31/2020 | 16346 | 21600 | 14878 |
| 01/31/2021 | 16287 | 21382 | 14894 |
| 02/28/2021 | 17100 | 21972 | 15491 |
| 03/31/2021 | 17811 | 22934 | 16199 |
| 04/30/2021 | 19121 | 24158 | 17504 |
| 05/31/2021 | 19338 | 24327 | 17683 |
| 06/30/2021 | 19826 | 24895 | 18145 |
| 07/31/2021 | 20561 | 25486 | 19018 |
| 08/31/2021 | 20958 | 26261 | 19368 |
| 09/30/2021 | 19920 | 25040 | 18322 |
| 10/31/2021 | 21239 | 26794 | 19715 |
| 11/30/2021 | 21032 | 26608 | 19582 |
| 12/31/2021 | 22978 | 27801 | 21311 |
| 01/31/2022 | 21368 | 26362 | 19852 |
| 02/28/2022 | 20697 | 25573 | 19231 |
| 03/31/2022 | 21776 | 26522 | 20490 |
| 04/30/2022 | 21138 | 24209 | 19590 |
| 05/31/2022 | 19738 | 24254 | 18368 |
| 06/30/2022 | 18331 | 22252 | 17007 |
| 07/31/2022 | 19836 | 24304 | 18547 |
| 08/31/2022 | 18792 | 23312 | 17439 |
| 09/30/2022 | 16747 | 21165 | 15316 |
| 10/31/2022 | 17217 | 22879 | 16066 |
| 11/30/2022 | 18117 | 24158 | 16992 |
| 12/31/2022 | 17336 | 22766 | 16119 |
| 01/31/2023 | 18869 | 24196 | 17839 |
| 02/28/2023 | 18075 | 23606 | 16983 |
| 03/31/2023 | 17744 | 24473 | 16551 |
| 04/30/2023 | 17907 | 24855 | 16689 |
| 05/31/2023 | 17284 | 24963 | 16152 |
| 06/30/2023 | 17973 | 26612 | 16984 |
| 07/31/2023 | 18325 | 27467 | 17468 |
| 08/31/2023 | 17772 | 27030 | 16925 |
| 09/30/2023 | 16731 | 25741 | 15773 |
| 10/31/2023 | 16095 | 25200 | 15085 |
| 11/30/2023 | 17789 | 27501 | 16678 |
| 12/31/2023 | 19387 | 28750 | 18332 |
| 01/31/2024 | 18613 | 29233 | 17571 |
| 02/29/2024 | 18939 | 30794 | 17927 |
| 03/31/2024 | 19184 | 31785 | 18296 |
| 04/30/2024 | 17784 | 30487 | 17013 |
| 05/31/2024 | 18548 | 31999 | 17794 |
| 06/30/2024 | 18925 | 33147 | 18308 |
| 07/31/2024 | 19838 | 33550 | 19448 |
| 08/31/2024 | 20888 | 34364 | 20694 |
| 09/30/2024 | 21322 | 35098 | 21253 |
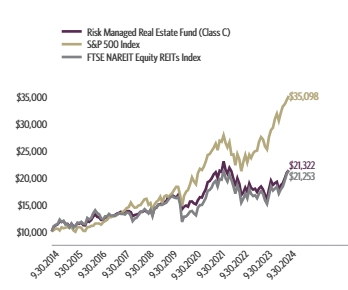
| Class C (without CDSC) | 27.44% | 5.35% | 7.87% |
| Class C (with CDSC)‡ | 26.44% | 5.35% | 7.87% |
| S&P 500 Index | 36.35% | 15.98% | 13.38% |
| FTSE NAREIT Equity REITs Total Return Index | 34.74% | 5.46% | 7.83% |
The fund's past performance is not a good predictor of the fund's future performance. Visit GuggenheimInvestments.com/mutual-funds/performance for more recent performance information.
| Net Assets | $338,231,464 |
| Total Number of Portfolio Holdings | 111 |
| Portfolio Turnover Rate | 72% |
| Total Advisory Fees Paid | $2,430,467 |
| Guggenheim Risk Managed Real Estate Fund | Class C | GURCX | Annual Shareholder Report | September 30, 2024 |
| REITs-Diversified | 19.8% |
| REITs-Apartments | 14.5% |
| REITs-Health Care | 14.4% |
| Custom Basket Swap Agreements | 13.6% |
| REITs-Warehouse/Industries | 13.5% |
| REITs-Storage | 10.4% |
| REITs-Shopping Centers | 5.9% |
| REITs-Regional Malls | 4.8% |
| REITs-Single Tenant | 4.7% |
| REITs-Office Property | 4.4% |
| REITs-Hotels | 3.8% |
| REITs-Manufactured Homes | 1.6% |
| Exchange Traded Funds Short Sales | -0.3% |
| REITs-Manufactured Homes Short Sales | -0.2% |
| REITs-Storage Short Sales | -0.2% |
| REITs-Regional Malls Short Sales | -0.3% |
| REITs-Health Care Short Sales | -0.6% |
| REITs-Warehouse/Industries Short Sales | -0.7% |
| REITs-Diversified Short Sales | -0.7% |
| REITs-Shopping Centers Short Sales | |
| REITs-Hotels Short Sales | -0.9% |
| REITs-Single Tenant Short Sales | -0.9% |
| REITs-Apartments Short Sales | -1.0% |
| REITs-Office Property Short Sales | -1.2% |
| Custom Basket Swap Agreements Short Sales | -13.6% |

| Prologis, Inc. | 9.2% |
| Equinix, Inc. | 5.7% |
| Welltower, Inc. | 5.3% |
| Digital Realty Trust, Inc. | 4.3% |
| Simon Property Group, Inc. | 4.2% |
| VICI Properties, Inc. | 3.9% |
| Public Storage | 3.7% |
| Realty Income Corp. | 3.4% |
| Extra Space Storage, Inc. | |
| Invitation Homes, Inc. | 3.0% |
| Top 10 Total | 46.0% |
| |
1 | "Holdings Diversification (Market Exposure as a % of Net Assets)" excludes any temporary cash investments, investments in Guggenheim Strategy Funds Trust mutual funds, or investments in Guggenheim Ultra Short Duration Fund. |
| |
2 | "10 Largest Holdings (as a % of Net Assets)" excludes any temporary cash investments. |
| Prologis, Inc. | 9.2% |
| Equinix, Inc. | 5.7% |
| Welltower, Inc. | 5.3% |
| Digital Realty Trust, Inc. | 4.3% |
| Simon Property Group, Inc. | 4.2% |
| VICI Properties, Inc. | 3.9% |
| Public Storage | 3.7% |
| Realty Income Corp. | 3.4% |
| Extra Space Storage, Inc. | |
| Invitation Homes, Inc. | 3.0% |
| Top 10 Total | 46.0% |
| |
2 | "10 Largest Holdings (as a % of Net Assets)" excludes any temporary cash investments. |
There were no changes in or disagreements with fund accountants for the period.
This is a summary of certain changes to the fund since September 30, 2023.
Subsequent to the September 30, 2024 year-end, on October 25, 2024, the fund was reorganized into New Age Alpha Risk Managed Real Estate Fund, a series of New Age Alpha Funds Trust, pursuant to an Agreement and Plan of Reorganization approved by the Board of Trustees and shareholders of the fund.
| |  | Availability of Additional Information. For additional information, including financial information, holdings and proxy voting information, go to GuggenheimInvestments.com/mutual-funds/literature or, call 800 820 0888. |
AR-GURCX-093024
Annual Shareholder Report | 9.30.24
This annual shareholder report contains important information about the Guggenheim Risk Managed Real Estate Fund for the period of October 1, 2023 to September 30, 2024. You can find additional information about the fund at GuggenheimInvestments.com/mutual-funds/literature. You can also request this information by contacting 800 820 0888 or GuggenheimClientServices@mufg-is.com.
This report describes changes to the fund that occurred during the reporting period.
For the period of October 1, 2023 to September 30, 2024, the fund (Class P shares) returned 28.30%, underperforming the fund's benchmark, the S&P 500 Index, which returned 36.35% for the same period and underperforming the fund's secondary index, the FTSE NAREIT Equity REITs Total Return Index, which returned 34.74% for the same period.
The fund's broad-based securities market index was changed from the FTSE NAREIT Equity REITs Index to the S&P 500 Index to comply with the regulation that requires the fund's broad-based securities market index to represent the overall applicable market.
What factors materially affected the fund's performance over the last year?
The global growth outlook remained modestly bullish and steady during the reporting period, while inflation seemed to be finally tamed, resulting in a 50 basis point rate cut by the U.S. Federal Reserve in September and potentially up to two more by the end of 2024. This optimism helped the FTSE Nareit Equity REITS Index (the Fund's ancillary index) to gain more than 34%. The fund underperformed the FTSE Nareit Equity REITS Index. Of the fund's three potential alpha sources (long-only portfolio, long/short portfolio, REIT risk allocation model), two of the three contributed negatively to performance. The long sleeve underperformed the index, while the long/short sleeve contributed to the fund's return. The risk allocation model detracted from return as the index performed strongly during the last quarter of the year versus the roughly 91% beta exposure of the fund (which is typical neutral positioning for the fund).
Cumulative performance* for the fund since inception (as of 9.30.24), assuming a $10,000 initial investment.
| 05/01/2015 | 10000 | 10000 | 10000 |
| 06/30/2015 | 9469 | 9825 | 9452 |
| 09/30/2015 | 9637 | 9193 | 9641 |
| 12/31/2015 | 10202 | 9840 | 10341 |
| 03/31/2016 | 10606 | 9973 | 10962 |
| 06/30/2016 | 11208 | 10217 | 11724 |
| 09/30/2016 | 11070 | 10611 | 11556 |
| 12/31/2016 | 11147 | 11017 | 11222 |
| 03/31/2017 | 11297 | 11685 | 11352 |
| 06/30/2017 | 11774 | 12046 | 11525 |
| 09/30/2017 | 11904 | 12586 | 11633 |
| 12/31/2017 | 12248 | 13422 | 11808 |
| 03/31/2018 | 11608 | 13320 | 10840 |
| 06/30/2018 | 12169 | 13777 | 11928 |
| 09/30/2018 | 12223 | 14840 | 12075 |
| 12/31/2018 | 11725 | 12834 | 11262 |
| 03/31/2019 | 13422 | 14585 | 13102 |
| 06/30/2019 | 13915 | 15213 | 13265 |
| 09/30/2019 | 14805 | 15471 | 14299 |
| 12/31/2019 | 14670 | 16874 | 14190 |
| 03/31/2020 | 12778 | 13567 | 10316 |
| 06/30/2020 | 13220 | 16354 | 11536 |
| 09/30/2020 | 13797 | 17815 | 11701 |
| 12/31/2020 | 14865 | 19979 | 13055 |
| 03/31/2021 | 16224 | 21213 | 14213 |
| 06/30/2021 | 18095 | 23026 | 15921 |
| 09/30/2021 | 18216 | 23160 | 16077 |
| 12/31/2021 | 21051 | 25714 | 18700 |
| 03/31/2022 | 19981 | 24532 | 17978 |
| 06/30/2022 | 16849 | 20582 | 14922 |
| 09/30/2022 | 15420 | 19577 | 13439 |
| 12/31/2022 | 15989 | 21057 | 14143 |
| 03/31/2023 | 16388 | 22636 | 14523 |
| 06/30/2023 | 16630 | 24615 | 14903 |
| 09/30/2023 | 15505 | 23809 | 13840 |
| 12/31/2023 | 17995 | 26592 | 16085 |
| 03/31/2024 | 17842 | 29400 | 16054 |
| 06/30/2024 | 17629 | 30659 | 16064 |
| 09/30/2024 | 19894 | 32464 | 18648 |
| Class P | 28.30% | 6.09% | 7.58% |
| S&P 500 Index | 36.35% | 15.98% | 13.32% |
| FTSE NAREIT Equity REITs Total Return Index | 34.74% | 5.46% | 6.84% |
The fund's past performance is not a good predictor of the fund's future performance. Visit GuggenheimInvestments.com/mutual-funds/performance for more recent performance information.
| Net Assets | $338,231,464 |
| Total Number of Portfolio Holdings | 111 |
| Portfolio Turnover Rate | 72% |
| Total Advisory Fees Paid | $2,430,467 |
| Guggenheim Risk Managed Real Estate Fund | Class P | GURPX | Annual Shareholder Report | September 30, 2024 |
| REITs-Diversified | 19.8% |
| REITs-Apartments | 14.5% |
| REITs-Health Care | 14.4% |
| Custom Basket Swap Agreements | 13.6% |
| REITs-Warehouse/Industries | 13.5% |
| REITs-Storage | 10.4% |
| REITs-Shopping Centers | 5.9% |
| REITs-Regional Malls | 4.8% |
| REITs-Single Tenant | 4.7% |
| REITs-Office Property | 4.4% |
| REITs-Hotels | 3.8% |
| REITs-Manufactured Homes | 1.6% |
| Exchange Traded Funds Short Sales | -0.3% |
| REITs-Manufactured Homes Short Sales | -0.2% |
| REITs-Storage Short Sales | -0.2% |
| REITs-Regional Malls Short Sales | -0.3% |
| REITs-Health Care Short Sales | -0.6% |
| REITs-Warehouse/Industries Short Sales | -0.7% |
| REITs-Diversified Short Sales | -0.7% |
| REITs-Shopping Centers Short Sales | |
| REITs-Hotels Short Sales | -0.9% |
| REITs-Single Tenant Short Sales | -0.9% |
| REITs-Apartments Short Sales | -1.0% |
| REITs-Office Property Short Sales | -1.2% |
| Custom Basket Swap Agreements Short Sales | -13.6% |

| Prologis, Inc. | 9.2% |
| Equinix, Inc. | 5.7% |
| Welltower, Inc. | 5.3% |
| Digital Realty Trust, Inc. | 4.3% |
| Simon Property Group, Inc. | 4.2% |
| VICI Properties, Inc. | 3.9% |
| Public Storage | 3.7% |
| Realty Income Corp. | 3.4% |
| Extra Space Storage, Inc. | |
| Invitation Homes, Inc. | 3.0% |
| Top 10 Total | 46.0% |
| |
1 | "Holdings Diversification (Market Exposure as a % of Net Assets)" excludes any temporary cash investments, investments in Guggenheim Strategy Funds Trust mutual funds, or investments in Guggenheim Ultra Short Duration Fund. |
| |
2 | "10 Largest Holdings (as a % of Net Assets)" excludes any temporary cash investments. |
| Prologis, Inc. | 9.2% |
| Equinix, Inc. | 5.7% |
| Welltower, Inc. | 5.3% |
| Digital Realty Trust, Inc. | 4.3% |
| Simon Property Group, Inc. | 4.2% |
| VICI Properties, Inc. | 3.9% |
| Public Storage | 3.7% |
| Realty Income Corp. | 3.4% |
| Extra Space Storage, Inc. | |
| Invitation Homes, Inc. | 3.0% |
| Top 10 Total | 46.0% |
| |
2 | "10 Largest Holdings (as a % of Net Assets)" excludes any temporary cash investments. |
There were no changes in or disagreements with fund accountants for the period.
This is a summary of certain changes to the fund since September 30, 2023.
Subsequent to the September 30, 2024 year-end, on October 25, 2024, the fund was reorganized into New Age Alpha Risk Managed Real Estate Fund, a series of New Age Alpha Funds Trust, pursuant to an Agreement and Plan of Reorganization approved by the Board of Trustees and shareholders of the fund.
| |  | Availability of Additional Information. For additional information, including financial information, holdings and proxy voting information, go to GuggenheimInvestments.com/mutual-funds/literature or, call 800 820 0888. |
AR-GURPX-093024
Annual Shareholder Report | 9.30.24
This annual shareholder report contains important information about the Guggenheim Risk Managed Real Estate Fund for the period of October 1, 2023 to September 30, 2024. You can find additional information about the fund at GuggenheimInvestments.com/mutual-funds/literature. You can also request this information by contacting 800 820 0888 or GuggenheimClientServices@mufg-is.com.
This report describes changes to the fund that occurred during the reporting period.
| Institutional Class | $160 | 1.40% |
For the period of October 1, 2023 to September 30, 2024, the fund (Institutional Class shares) returned 28.74%, underperforming the fund's benchmark, the S&P 500 Index, which returned 36.35% for the same period and underperforming the fund's secondary index, the FTSE NAREIT Equity REITs Total Return Index, which returned 34.74% for the same period.
The fund's broad-based securities market index was changed from the FTSE NAREIT Equity REITs Index to the S&P 500 Index to comply with the regulation that requires the fund's broad-based securities market index to represent the overall applicable market.
What factors materially affected the fund's performance over the last year?
The global growth outlook remained modestly bullish and steady during the reporting period, while inflation seemed to be finally tamed, resulting in a 50 basis point rate cut by the U.S. Federal Reserve in September and potentially up to two more by the end of 2024. This optimism helped the FTSE Nareit Equity REITS Index (the Fund's ancillary index) to gain more than 34%. The fund underperformed the FTSE Nareit Equity REITS Index. Of the fund's three potential alpha sources (long-only portfolio, long/short portfolio, REIT risk allocation model), two of the three contributed negatively to performance. The long sleeve underperformed the index, while the long/short sleeve contributed to the fund's return. The risk allocation model detracted from return as the index performed strongly during the last quarter of the year versus the roughly 91% beta exposure of the fund (which is typical neutral positioning for the fund).
Cumulative performance* for the fund's most recently completed 10 years (as of 9.30.24), assuming a $2,000,000 initial investment.
| 09/30/2014 | 2000000 | 2000000 | 2000000 |
| 12/31/2014 | 2270473 | 2098653 | 2284027 |
| 03/31/2015 | 2391148 | 2118603 | 2392564 |
| 06/30/2015 | 2187044 | 2124494 | 2154448 |
| 09/30/2015 | 2227269 | 1987710 | 2197570 |
| 12/31/2015 | 2359834 | 2127695 | 2357031 |
| 03/31/2016 | 2454561 | 2156373 | 2498506 |
| 06/30/2016 | 2595620 | 2209317 | 2672363 |
| 09/30/2016 | 2565795 | 2294422 | 2634025 |
| 12/31/2016 | 2585414 | 2382166 | 2557818 |
| 03/31/2017 | 2623000 | 2526671 | 2587546 |
| 06/30/2017 | 2735465 | 2604699 | 2626972 |
| 09/30/2017 | 2767629 | 2721399 | 2651574 |
| 12/31/2017 | 2849499 | 2902230 | 2691490 |
| 03/31/2018 | 2702962 | 2880198 | 2470854 |
| 06/30/2018 | 2835932 | 2979101 | 2718839 |
| 09/30/2018 | 2850029 | 3208812 | 2752267 |
| 12/31/2018 | 2735833 | 2774986 | 2567071 |
| 03/31/2019 | 3133902 | 3153716 | 2986338 |
| 06/30/2019 | 3251094 | 3289447 | 3023499 |
| 09/30/2019 | 3461649 | 3345311 | 3259186 |
| 12/31/2019 | 3433388 | 3648730 | 3234479 |
| 03/31/2020 | 2993353 | 2933652 | 2351329 |
| 06/30/2020 | 3099284 | 3536320 | 2629365 |
| 09/30/2020 | 3237203 | 3852094 | 2667161 |
| 12/31/2020 | 3492316 | 4320052 | 2975699 |
| 03/31/2021 | 3813881 | 4586814 | 3239719 |
| 06/30/2021 | 4256856 | 4978933 | 3629019 |
| 09/30/2021 | 4290030 | 5007913 | 3664448 |
| 12/31/2021 | 4961461 | 5560141 | 4262276 |
| 03/31/2022 | 4713667 | 5304457 | 4097917 |
| 06/30/2022 | 3977877 | 4450380 | 3401335 |
| 09/30/2022 | 3644347 | 4233086 | 3063198 |
| 12/31/2022 | 3781057 | 4553151 | 3223763 |
| 03/31/2023 | 3879745 | 4894505 | 3310291 |
| 06/30/2023 | 3940342 | 5322389 | 3396866 |
| 09/30/2023 | 3677654 | 5148165 | 3154688 |
| 12/31/2023 | 4272436 | 5750067 | 3666424 |
| 03/31/2024 | 4239215 | 6357039 | 3659239 |
| 06/30/2024 | 4192476 | 6629362 | 3661552 |
| 09/30/2024 | 4734653 | 7019604 | 4250585 |
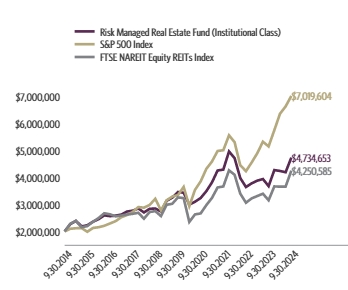
| Institutional Class | 28.74% | 6.46% | 9.00% |
| S&P 500 Index | 36.35% | 15.98% | 13.38% |
| FTSE NAREIT Equity REITs Total Return Index | 34.74% | 5.46% | 7.83% |
The fund's past performance is not a good predictor of the fund's future performance. Visit GuggenheimInvestments.com/mutual-funds/performance for more recent performance information.
| Net Assets | $338,231,464 |
| Total Number of Portfolio Holdings | 111 |
| Portfolio Turnover Rate | 72% |
| Total Advisory Fees Paid | $2,430,467 |
| Guggenheim Risk Managed Real Estate Fund | Institutional Class | GURIX | Annual Shareholder Report | September 30, 2024 |
| REITs-Diversified | 19.8% |
| REITs-Apartments | 14.5% |
| REITs-Health Care | 14.4% |
| Custom Basket Swap Agreements | 13.6% |
| REITs-Warehouse/Industries | 13.5% |
| REITs-Storage | 10.4% |
| REITs-Shopping Centers | 5.9% |
| REITs-Regional Malls | 4.8% |
| REITs-Single Tenant | 4.7% |
| REITs-Office Property | 4.4% |
| REITs-Hotels | 3.8% |
| REITs-Manufactured Homes | 1.6% |
| Exchange Traded Funds Short Sales | -0.3% |
| REITs-Manufactured Homes Short Sales | -0.2% |
| REITs-Storage Short Sales | -0.2% |
| REITs-Regional Malls Short Sales | -0.3% |
| REITs-Health Care Short Sales | -0.6% |
| REITs-Warehouse/Industries Short Sales | -0.7% |
| REITs-Diversified Short Sales | -0.7% |
| REITs-Shopping Centers Short Sales | |
| REITs-Hotels Short Sales | -0.9% |
| REITs-Single Tenant Short Sales | -0.9% |
| REITs-Apartments Short Sales | -1.0% |
| REITs-Office Property Short Sales | -1.2% |
| Custom Basket Swap Agreements Short Sales | -13.6% |
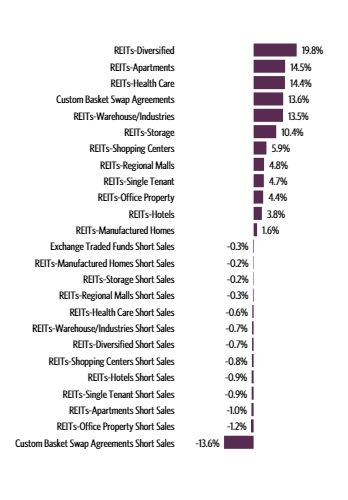
| Prologis, Inc. | 9.2% |
| Equinix, Inc. | 5.7% |
| Welltower, Inc. | 5.3% |
| Digital Realty Trust, Inc. | 4.3% |
| Simon Property Group, Inc. | 4.2% |
| VICI Properties, Inc. | 3.9% |
| Public Storage | 3.7% |
| Realty Income Corp. | 3.4% |
| Extra Space Storage, Inc. | |
| Invitation Homes, Inc. | 3.0% |
| Top 10 Total | 46.0% |
| |
1 | "Holdings Diversification (Market Exposure as a % of Net Assets)" excludes any temporary cash investments, investments in Guggenheim Strategy Funds Trust mutual funds, or investments in Guggenheim Ultra Short Duration Fund. |
| |
2 | "10 Largest Holdings (as a % of Net Assets)" excludes any temporary cash investments. |
| Prologis, Inc. | 9.2% |
| Equinix, Inc. | 5.7% |
| Welltower, Inc. | 5.3% |
| Digital Realty Trust, Inc. | 4.3% |
| Simon Property Group, Inc. | 4.2% |
| VICI Properties, Inc. | 3.9% |
| Public Storage | 3.7% |
| Realty Income Corp. | 3.4% |
| Extra Space Storage, Inc. | |
| Invitation Homes, Inc. | 3.0% |
| Top 10 Total | 46.0% |
| |
2 | "10 Largest Holdings (as a % of Net Assets)" excludes any temporary cash investments. |
There were no changes in or disagreements with fund accountants for the period.
This is a summary of certain changes to the fund since September 30, 2023.
Subsequent to the September 30, 2024 year-end, on October 25, 2024, the fund was reorganized into New Age Alpha Risk Managed Real Estate Fund, a series of New Age Alpha Funds Trust, pursuant to an Agreement and Plan of Reorganization approved by the Board of Trustees and shareholders of the fund.
| |  | Availability of Additional Information. For additional information, including financial information, holdings and proxy voting information, go to GuggenheimInvestments.com/mutual-funds/literature or, call 800 820 0888. |
AR-GURIX-093024
Annual Shareholder Report | 9.30.24
This annual shareholder report contains important information about the Guggenheim SMid Cap Value Fund for the period of October 1, 2023 to September 30, 2024. You can find additional information about the fund at GuggenheimInvestments.com/mutual-funds/literature. You can also request this information by contacting 800 820 0888 or GuggenheimClientServices@mufg-is.com.
This report describes changes to the fund that occurred during the reporting period.
For the period of October 1, 2023 to September 30, 2024, the fund (Class A shares) returned 21.25%, underperforming the fund's benchmark, the S&P 500 Index, which returned 36.35% for the same period and underperforming the fund's secondary index, the Russell 2500 Value Index, which returned 26.59% for the same period.
The fund's broad-based securities market index was changed from the Russell 2500 Value Index to the S&P 500 Index to comply with the regulation that requires the fund's broad-based securities market index to represent the overall applicable market.
What factors materially affected the fund's performance over the last year?
The fund lagged the Russell 2500 Value Index (the fund's ancillary index). While poor performance from smaller positions such as LivePerson, Inc., Luna Innovations, and Ginkgo Bioworks were the largest negative contributors, none detracted from performance by more than 45 basis points. Sector allocation was a larger detractor from performance, especially an overweighting in the Energy sector. Positive contributors included selection in Financials and Industrials as Jeffries Financial, Stifel Financial, PGTI, and Leidos all gained more than 50% during the period. Performance was subdued relative to equity indexes such as the S&P 500 Index which benefited from AI-driven large cap technology growth stocks.
Cumulative performance* for the fund's most recently completed 10 years (as of 9.30.24), assuming a $10,000 initial investment.
| 09/30/2014 | 9525 | 10000 | 10000 |
| 12/31/2014 | 9726 | 10493 | 10609 |
| 03/31/2015 | 9890 | 10593 | 10929 |
| 06/30/2015 | 9665 | 10622 | 10790 |
| 09/30/2015 | 8874 | 9939 | 9756 |
| 12/31/2015 | 8994 | 10638 | 10027 |
| 03/31/2016 | 9455 | 10782 | 10361 |
| 06/30/2016 | 9749 | 11047 | 10813 |
| 09/30/2016 | 10251 | 11472 | 11481 |
| 12/31/2016 | 11407 | 11911 | 12554 |
| 03/31/2017 | 11673 | 12633 | 12757 |
| 06/30/2017 | 11732 | 13023 | 12799 |
| 09/30/2017 | 12365 | 13607 | 13289 |
| 12/31/2017 | 12927 | 14511 | 13854 |
| 03/31/2018 | 12683 | 14401 | 13487 |
| 06/30/2018 | 13461 | 14896 | 14269 |
| 09/30/2018 | 13607 | 16044 | 14651 |
| 12/31/2018 | 11236 | 13875 | 12142 |
| 03/31/2019 | 12570 | 15769 | 13735 |
| 06/30/2019 | 12896 | 16447 | 13995 |
| 09/30/2019 | 13266 | 16727 | 14013 |
| 12/31/2019 | 14249 | 18244 | 15003 |
| 03/31/2020 | 9771 | 14668 | 9806 |
| 06/30/2020 | 11602 | 17682 | 11826 |
| 09/30/2020 | 11906 | 19260 | 12244 |
| 12/31/2020 | 14756 | 21600 | 15735 |
| 03/31/2021 | 17340 | 22934 | 18383 |
| 06/30/2021 | 17720 | 24895 | 19303 |
| 09/30/2021 | 17222 | 25040 | 18904 |
| 12/31/2021 | 18249 | 27801 | 20106 |
| 03/31/2022 | 18657 | 26522 | 19804 |
| 06/30/2022 | 16461 | 22252 | 16756 |
| 09/30/2022 | 15829 | 21165 | 16002 |
| 12/31/2022 | 17894 | 22766 | 17475 |
| 03/31/2023 | 18027 | 24473 | 17719 |
| 06/30/2023 | 18530 | 26612 | 18494 |
| 09/30/2023 | 17832 | 25741 | 17817 |
| 12/31/2023 | 19560 | 28750 | 20268 |
| 03/31/2024 | 20862 | 31785 | 21499 |
| 06/30/2024 | 20117 | 33147 | 20573 |
| 09/30/2024 | 21622 | 35098 | 22554 |
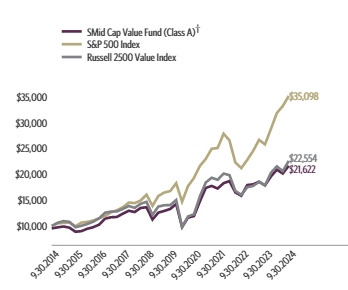
| Class A (without sales charge) | 21.25% | 10.26% | 8.54% |
| Class A (with sales charge)† | 15.51% | 9.20% | 8.02% |
| S&P 500 Index | 36.35% | 15.98% | 13.38% |
| Russell 2500 Value Index | 26.59% | 9.99% | 8.47% |
The fund's past performance is not a good predictor of the fund's future performance. Visit GuggenheimInvestments.com/mutual-funds/performance for more recent performance information.
| Net Assets | $371,566,045 |
| Total Number of Portfolio Holdings | 87 |
| Portfolio Turnover Rate | 25% |
| Total Advisory Fees Paid | $2,631,997 |
| Guggenheim SMid Cap Value Fund | Class A | SEVAX | Annual Shareholder Report | September 30, 2024 |
| Industrial | 22.9% |
| Financial | 18.7% |
| Consumer, Non-cyclical | 16.0% |
| Technology | 8.2% |
| Basic Materials | 8.0% |
| Consumer, Cyclical | 7.5% |
| Utilities | 7.4% |
| Other | 7.4% |

| OGE Energy Corp. | 2.6% |
| Ingredion, Inc. | 2.5% |
| Evergy, Inc. | 2.3% |
| Unum Group | 2.2% |
| Teledyne Technologies, Inc. | 2.2% |
| Stifel Financial Corp. | 2.1% |
| Curtiss-Wright Corp. | 2.1% |
| Teradyne, Inc. | 2.1% |
| Encompass Health Corp. | 2.0% |
| Jefferies Financial Group, Inc. | 2.0% |
| Top 10 Total | 22.1% |
| |
1 | "Holdings Diversification (Market Exposure as a % of Net Assets)" excludes any temporary cash investments, investments in Guggenheim Strategy Funds Trust mutual funds, or investments in Guggenheim Ultra Short Duration Fund. |
| |
2 | "10 Largest Holdings (as a % of Net Assets)" excludes any temporary cash investments. |
| OGE Energy Corp. | 2.6% |
| Ingredion, Inc. | 2.5% |
| Evergy, Inc. | 2.3% |
| Unum Group | 2.2% |
| Teledyne Technologies, Inc. | 2.2% |
| Stifel Financial Corp. | 2.1% |
| Curtiss-Wright Corp. | 2.1% |
| Teradyne, Inc. | 2.1% |
| Encompass Health Corp. | 2.0% |
| Jefferies Financial Group, Inc. | 2.0% |
| Top 10 Total | 22.1% |
| |
2 | "10 Largest Holdings (as a % of Net Assets)" excludes any temporary cash investments. |
There were no changes in or disagreements with fund accountants for the period.
This is a summary of certain changes to the fund since September 30, 2023.
Subsequent to the September 30, 2024 year-end, on October 25, 2024, the fund was reorganized into New Age Alpha SMid Cap Value Fund, a series of New Age Alpha Funds Trust, pursuant to an Agreement and Plan of Reorganization approved by the Board of Trustees and shareholders of the fund.
| |  | Availability of Additional Information. For additional information, including financial information, holdings and proxy voting information, go to GuggenheimInvestments.com/mutual-funds/literature or, call 800 820 0888. |
AR-SEVAX-093024
Annual Shareholder Report | 9.30.24
This annual shareholder report contains important information about the Guggenheim SMid Cap Value Fund for the period of October 1, 2023 to September 30, 2024. You can find additional information about the fund at GuggenheimInvestments.com/mutual-funds/literature. You can also request this information by contacting 800 820 0888 or GuggenheimClientServices@mufg-is.com.
This report describes changes to the fund that occurred during the reporting period.
For the period of October 1, 2023 to September 30, 2024, the fund (Class C shares) returned 20.27%, underperforming the fund's benchmark, the S&P 500 Index, which returned 36.35% for the same period and underperforming the fund's secondary index, the Russell 2500 Value Index, which returned 26.59% for the same period.
The fund's broad-based securities market index was changed from the Russell 2500 Value Index to the S&P 500 Index to comply with the regulation that requires the fund's broad-based securities market index to represent the overall applicable market.
What factors materially affected the fund's performance over the last year?
The fund lagged the Russell 2500 Value Index (the fund's ancillary index). While poor performance from smaller positions such as LivePerson, Inc., Luna Innovations, and Ginkgo Bioworks were the largest negative contributors, none detracted from performance by more than 45 basis points. Sector allocation was a larger detractor from performance, especially an overweighting in the Energy sector. Positive contributors included selection in Financials and Industrials as Jeffries Financial, Stifel Financial, PGTI, and Leidos all gained more than 50% during the period. Performance was subdued relative to equity indexes such as the S&P 500 Index which benefited from AI-driven large cap technology growth stocks.
Cumulative performance* for the fund's most recently completed 10 years (as of 9.30.24), assuming a $10,000 initial investment.
| 09/30/2014 | 10000 | 10000 | 10000 |
| 12/31/2014 | 10193 | 10493 | 10609 |
| 03/31/2015 | 10348 | 10593 | 10929 |
| 06/30/2015 | 10095 | 10622 | 10790 |
| 09/30/2015 | 9251 | 9939 | 9756 |
| 12/31/2015 | 9357 | 10638 | 10027 |
| 03/31/2016 | 9818 | 10782 | 10361 |
| 06/30/2016 | 10106 | 11047 | 10813 |
| 09/30/2016 | 10605 | 11472 | 11481 |
| 12/31/2016 | 11771 | 11911 | 12554 |
| 03/31/2017 | 12026 | 12633 | 12757 |
| 06/30/2017 | 12065 | 13023 | 12799 |
| 09/30/2017 | 12686 | 13607 | 13289 |
| 12/31/2017 | 13239 | 14511 | 13854 |
| 03/31/2018 | 12968 | 14401 | 13487 |
| 06/30/2018 | 13734 | 14896 | 14269 |
| 09/30/2018 | 13856 | 16044 | 14651 |
| 12/31/2018 | 11418 | 13875 | 12142 |
| 03/31/2019 | 12745 | 15769 | 13735 |
| 06/30/2019 | 13052 | 16447 | 13995 |
| 09/30/2019 | 13393 | 16727 | 14013 |
| 12/31/2019 | 14358 | 18244 | 15003 |
| 03/31/2020 | 9826 | 14668 | 9806 |
| 06/30/2020 | 11644 | 17682 | 11826 |
| 09/30/2020 | 11927 | 19260 | 12244 |
| 12/31/2020 | 14750 | 21600 | 15735 |
| 03/31/2021 | 17298 | 22934 | 18383 |
| 06/30/2021 | 17642 | 24895 | 19303 |
| 09/30/2021 | 17112 | 25040 | 18904 |
| 12/31/2021 | 18097 | 27801 | 20106 |
| 03/31/2022 | 18456 | 26522 | 19804 |
| 06/30/2022 | 16248 | 22252 | 16756 |
| 09/30/2022 | 15598 | 21165 | 16002 |
| 12/31/2022 | 17591 | 22766 | 17475 |
| 03/31/2023 | 17682 | 24473 | 17719 |
| 06/30/2023 | 18136 | 26612 | 18494 |
| 09/30/2023 | 17418 | 25741 | 17817 |
| 12/31/2023 | 19057 | 28750 | 20268 |
| 03/31/2024 | 20290 | 31785 | 21499 |
| 06/30/2024 | 19522 | 33147 | 20573 |
| 09/30/2024 | 20948 | 35098 | 22554 |
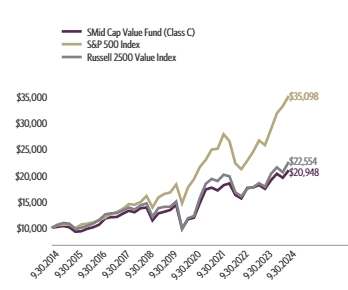
| Class C (without CDSC) | 20.27% | 9.36% | 7.67% |
| Class C (with CDSC)‡ | 19.27% | 9.36% | 7.67% |
| S&P 500 Index | 36.35% | 15.98% | 13.38% |
| Russell 2500 Value Index | 26.59% | 9.99% | 8.47% |
The fund's past performance is not a good predictor of the fund's future performance. Visit GuggenheimInvestments.com/mutual-funds/performance for more recent performance information.
| Net Assets | $371,566,045 |
| Total Number of Portfolio Holdings | 87 |
| Portfolio Turnover Rate | 25% |
| Total Advisory Fees Paid | $2,631,997 |
| Guggenheim SMid Cap Value Fund | Class C | SEVSX | Annual Shareholder Report | September 30, 2024 |
| Industrial | 22.9% |
| Financial | 18.7% |
| Consumer, Non-cyclical | 16.0% |
| Technology | 8.2% |
| Basic Materials | 8.0% |
| Consumer, Cyclical | 7.5% |
| Utilities | 7.4% |
| Other | 7.4% |

| OGE Energy Corp. | 2.6% |
| Ingredion, Inc. | 2.5% |
| Evergy, Inc. | 2.3% |
| Unum Group | 2.2% |
| Teledyne Technologies, Inc. | 2.2% |
| Stifel Financial Corp. | 2.1% |
| Curtiss-Wright Corp. | 2.1% |
| Teradyne, Inc. | 2.1% |
| Encompass Health Corp. | 2.0% |
| Jefferies Financial Group, Inc. | 2.0% |
| Top 10 Total | 22.1% |
| |
1 | "Holdings Diversification (Market Exposure as a % of Net Assets)" excludes any temporary cash investments, investments in Guggenheim Strategy Funds Trust mutual funds, or investments in Guggenheim Ultra Short Duration Fund. |
| |
2 | "10 Largest Holdings (as a % of Net Assets)" excludes any temporary cash investments. |
| OGE Energy Corp. | 2.6% |
| Ingredion, Inc. | 2.5% |
| Evergy, Inc. | 2.3% |
| Unum Group | 2.2% |
| Teledyne Technologies, Inc. | 2.2% |
| Stifel Financial Corp. | 2.1% |
| Curtiss-Wright Corp. | 2.1% |
| Teradyne, Inc. | 2.1% |
| Encompass Health Corp. | 2.0% |
| Jefferies Financial Group, Inc. | 2.0% |
| Top 10 Total | 22.1% |
| |
2 | "10 Largest Holdings (as a % of Net Assets)" excludes any temporary cash investments. |
There were no changes in or disagreements with fund accountants for the period.
This is a summary of certain changes to the fund since September 30, 2023.
Subsequent to the September 30, 2024 year-end, on October 25, 2024, the fund was reorganized into New Age Alpha SMid Cap Value Fund, a series of New Age Alpha Funds Trust, pursuant to an Agreement and Plan of Reorganization approved by the Board of Trustees and shareholders of the fund.
| |  | Availability of Additional Information. For additional information, including financial information, holdings and proxy voting information, go to GuggenheimInvestments.com/mutual-funds/literature or, call 800 820 0888. |
AR-SEVSX-093024
Annual Shareholder Report | 9.30.24
This annual shareholder report contains important information about the Guggenheim SMid Cap Value Fund for the period of October 1, 2023 to September 30, 2024. You can find additional information about the fund at GuggenheimInvestments.com/mutual-funds/literature. You can also request this information by contacting 800 820 0888 or GuggenheimClientServices@mufg-is.com.
This report describes changes to the fund that occurred during the reporting period.
For the period of October 1, 2023 to September 30, 2024, the fund (Class P shares) returned 21.24%, underperforming the fund's benchmark, the S&P 500 Index, which returned 36.35% for the same period and underperforming the fund's secondary index, the Russell 2500 Value Index, which returned 26.59% for the same period.
The fund's broad-based securities market index was changed from the Russell 2500 Value Index to the S&P 500 Index to comply with the regulation that requires the fund's broad-based securities market index to represent the overall applicable market.
What factors materially affected the fund's performance over the last year?
The fund lagged the Russell 2500 Value Index (the fund's ancillary index). While poor performance from smaller positions such as LivePerson, Inc., Luna Innovations, and Ginkgo Bioworks were the largest negative contributors, none detracted from performance by more than 45 basis points. Sector allocation was a larger detractor from performance, especially an overweighting in the Energy sector. Positive contributors included selection in Financials and Industrials as Jeffries Financial, Stifel Financial, PGTI, and Leidos all gained more than 50% during the period. Performance was subdued relative to equity indexes such as the S&P 500 Index which benefited from AI-driven large cap technology growth stocks.
Cumulative performance* for the fund since inception (as of 9.30.24), assuming a $10,000 initial investment.
| 05/01/2015 | 10000 | 10000 | 10000 |
| 06/30/2015 | 9912 | 9825 | 9960 |
| 09/30/2015 | 9074 | 9193 | 9005 |
| 12/31/2015 | 9194 | 9840 | 9255 |
| 03/31/2016 | 9667 | 9973 | 9563 |
| 06/30/2016 | 9973 | 10217 | 9981 |
| 09/30/2016 | 10491 | 10611 | 10597 |
| 12/31/2016 | 11669 | 11017 | 11587 |
| 03/31/2017 | 11943 | 11685 | 11776 |
| 06/30/2017 | 12004 | 12046 | 11814 |
| 09/30/2017 | 12649 | 12586 | 12266 |
| 12/31/2017 | 13227 | 13422 | 12788 |
| 03/31/2018 | 12980 | 13320 | 12449 |
| 06/30/2018 | 13770 | 13777 | 13171 |
| 09/30/2018 | 13917 | 14840 | 13523 |
| 12/31/2018 | 11493 | 12834 | 11207 |
| 03/31/2019 | 12850 | 14585 | 12678 |
| 06/30/2019 | 13182 | 15213 | 12917 |
| 09/30/2019 | 13554 | 15471 | 12934 |
| 12/31/2019 | 14561 | 16874 | 13848 |
| 03/31/2020 | 9984 | 13567 | 9051 |
| 06/30/2020 | 11855 | 16354 | 10915 |
| 09/30/2020 | 12158 | 17815 | 11302 |
| 12/31/2020 | 15069 | 19979 | 14524 |
| 03/31/2021 | 17705 | 21213 | 16968 |
| 06/30/2021 | 18087 | 23026 | 17817 |
| 09/30/2021 | 17574 | 23160 | 17449 |
| 12/31/2021 | 18620 | 25714 | 18559 |
| 03/31/2022 | 19030 | 24532 | 18280 |
| 06/30/2022 | 16786 | 20582 | 15467 |
| 09/30/2022 | 16141 | 19577 | 14770 |
| 12/31/2022 | 18244 | 21057 | 16130 |
| 03/31/2023 | 18376 | 22636 | 16355 |
| 06/30/2023 | 18882 | 24615 | 17071 |
| 09/30/2023 | 18170 | 23809 | 16446 |
| 12/31/2023 | 19927 | 26592 | 18708 |
| 03/31/2024 | 21254 | 29400 | 19844 |
| 06/30/2024 | 20494 | 30659 | 18990 |
| 09/30/2024 | 22030 | 32464 | 20818 |
| Class P | 21.24% | 10.20% | 8.75% |
| S&P 500 Index | 36.35% | 15.98% | 13.32% |
| Russell 2500 Value Index | 26.59% | 9.99% | 8.10% |
The fund's past performance is not a good predictor of the fund's future performance. Visit GuggenheimInvestments.com/mutual-funds/performance for more recent performance information.
| Net Assets | $371,566,045 |
| Total Number of Portfolio Holdings | 87 |
| Portfolio Turnover Rate | 25% |
| Total Advisory Fees Paid | $2,631,997 |
| Guggenheim SMid Cap Value Fund | Class P | SEVPX | Annual Shareholder Report | September 30, 2024 |
| Industrial | 22.9% |
| Financial | 18.7% |
| Consumer, Non-cyclical | 16.0% |
| Technology | 8.2% |
| Basic Materials | 8.0% |
| Consumer, Cyclical | 7.5% |
| Utilities | 7.4% |
| Other | 7.4% |

| OGE Energy Corp. | 2.6% |
| Ingredion, Inc. | 2.5% |
| Evergy, Inc. | 2.3% |
| Unum Group | 2.2% |
| Teledyne Technologies, Inc. | 2.2% |
| Stifel Financial Corp. | 2.1% |
| Curtiss-Wright Corp. | 2.1% |
| Teradyne, Inc. | 2.1% |
| Encompass Health Corp. | 2.0% |
| Jefferies Financial Group, Inc. | 2.0% |
| Top 10 Total | 22.1% |
| |
1 | "Holdings Diversification (Market Exposure as a % of Net Assets)" excludes any temporary cash investments, investments in Guggenheim Strategy Funds Trust mutual funds, or investments in Guggenheim Ultra Short Duration Fund. |
| |
2 | "10 Largest Holdings (as a % of Net Assets)" excludes any temporary cash investments. |
| OGE Energy Corp. | 2.6% |
| Ingredion, Inc. | 2.5% |
| Evergy, Inc. | 2.3% |
| Unum Group | 2.2% |
| Teledyne Technologies, Inc. | 2.2% |
| Stifel Financial Corp. | 2.1% |
| Curtiss-Wright Corp. | 2.1% |
| Teradyne, Inc. | 2.1% |
| Encompass Health Corp. | 2.0% |
| Jefferies Financial Group, Inc. | 2.0% |
| Top 10 Total | 22.1% |
| |
2 | "10 Largest Holdings (as a % of Net Assets)" excludes any temporary cash investments. |
There were no changes in or disagreements with fund accountants for the period.
This is a summary of certain changes to the fund since September 30, 2023.
Subsequent to the September 30, 2024 year-end, on October 25, 2024, the fund was reorganized into New Age Alpha SMid Cap Value Fund, a series of New Age Alpha Funds Trust, pursuant to an Agreement and Plan of Reorganization approved by the Board of Trustees and shareholders of the fund.
| |  | Availability of Additional Information. For additional information, including financial information, holdings and proxy voting information, go to GuggenheimInvestments.com/mutual-funds/literature or, call 800 820 0888. |
AR-SEVPX-093024
Annual Shareholder Report | 9.30.24
This annual shareholder report contains important information about the Guggenheim SMid Cap Value Fund for the period of October 1, 2023 to September 30, 2024. You can find additional information about the fund at GuggenheimInvestments.com/mutual-funds/literature. You can also request this information by contacting 800 820 0888 or GuggenheimClientServices@mufg-is.com.
This report describes changes to the fund that occurred during the reporting period.
| Institutional Class | $104 | 0.94% |
For the period of October 1, 2023 to September 30, 2024, the fund (Institutional Class shares) returned 21.52%, underperforming the fund's benchmark, the S&P 500 Index, which returned 36.35% for the same period and underperforming the fund's secondary index, the Russell 2500 Value Index, which returned 26.59% for the same period.
The fund's broad-based securities market index was changed from the Russell 2500 Value Index to the S&P 500 Index to comply with the regulation that requires the fund's broad-based securities market index to represent the overall applicable market.
What factors materially affected the fund's performance over the last year?
The fund lagged the Russell 2500 Value Index (the fund's ancillary index). While poor performance from smaller positions such as LivePerson, Inc., Luna Innovations, and Ginkgo Bioworks were the largest negative contributors, none detracted from performance by more than 45 basis points. Sector allocation was a larger detractor from performance, especially an overweighting in the Energy sector. Positive contributors included selection in Financials and Industrials as Jeffries Financial, Stifel Financial, PGTI, and Leidos all gained more than 50% during the period. Performance was subdued relative to equity indexes such as the S&P 500 Index which benefited from AI-driven large cap technology growth stocks.
Cumulative performance* for the fund's most recently completed 10 years, assuming a $2,000,000 initial investment.
| 09/30/2014 | 2000000 | 2000000 | 2000000 |
| 12/31/2014 | 2049490 | 2098653 | 2121725 |
| 03/31/2015 | 2085668 | 2118603 | 2185737 |
| 06/30/2015 | 2042254 | 2124494 | 2158013 |
| 09/30/2015 | 1883071 | 1987710 | 1951186 |
| 12/31/2015 | 1912171 | 2127695 | 2005342 |
| 03/31/2016 | 2014716 | 2156373 | 2072172 |
| 06/30/2016 | 2075037 | 2209317 | 2162653 |
| 09/30/2016 | 2189647 | 2294422 | 2296223 |
| 12/31/2016 | 2430861 | 2382166 | 2510712 |
| 03/31/2017 | 2489112 | 2526671 | 2551477 |
| 06/30/2017 | 2502555 | 2604699 | 2559730 |
| 09/30/2017 | 2632500 | 2721399 | 2657818 |
| 12/31/2017 | 2752530 | 2902230 | 2770800 |
| 03/31/2018 | 2702025 | 2880198 | 2697331 |
| 06/30/2018 | 2871217 | 2979101 | 2853815 |
| 09/30/2018 | 2904045 | 3208812 | 2930101 |
| 12/31/2018 | 2397388 | 2774986 | 2428396 |
| 03/31/2019 | 2684032 | 3153716 | 2746919 |
| 06/30/2019 | 2753522 | 3289447 | 2798905 |
| 09/30/2019 | 2857756 | 3345311 | 2802554 |
| 12/31/2019 | 3064073 | 3648730 | 3000645 |
| 03/31/2020 | 2103558 | 2933652 | 1961180 |
| 06/30/2020 | 2498536 | 3536320 | 2365114 |
| 09/30/2020 | 2564366 | 3852094 | 2448892 |
| 12/31/2020 | 3180771 | 4320052 | 3146993 |
| 03/31/2021 | 3737331 | 4586814 | 3676608 |
| 06/30/2021 | 3821114 | 4978933 | 3860593 |
| 09/30/2021 | 3716385 | 5007913 | 3780719 |
| 12/31/2021 | 3939747 | 5560141 | 4021256 |
| 03/31/2022 | 4031191 | 5304457 | 3960898 |
| 06/30/2022 | 3554916 | 4450380 | 3351250 |
| 09/30/2022 | 3421559 | 4233086 | 3200324 |
| 12/31/2022 | 3868044 | 4553151 | 3495088 |
| 03/31/2023 | 3901430 | 4894505 | 3543846 |
| 06/30/2023 | 4011128 | 5322389 | 3698791 |
| 09/30/2023 | 3863274 | 5148165 | 3563373 |
| 12/31/2023 | 4238248 | 5750067 | 4053645 |
| 03/31/2024 | 4523565 | 6357039 | 4299717 |
| 06/30/2024 | 4367937 | 6629362 | 4114599 |
| 09/30/2024 | 4694755 | 7019604 | 4510723 |
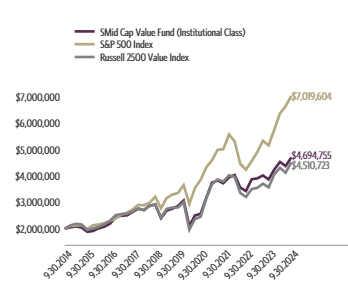
| Institutional Class1 | 21.52% | 10.44% | 8.91% |
| S&P 500 Index | 36.35% | 15.98% | 13.38% |
| Russell 2500 Value Index | 26.59% | 9.99% | 8.47% |
The fund's past performance is not a good predictor of the fund's future performance. Visit GuggenheimInvestments.com/mutual-funds/performance for more recent performance information.
| Net Assets | $371,566,045 |
| Total Number of Portfolio Holdings | 87 |
| Portfolio Turnover Rate | 25% |
| Total Advisory Fees Paid | $2,631,997 |
| Guggenheim SMid Cap Value Fund | Institutional Class | SVUIX | Annual Shareholder Report | September 30, 2024 |
| Industrial | 22.9% |
| Financial | 18.7% |
| Consumer, Non-cyclical | 16.0% |
| Technology | 8.2% |
| Basic Materials | 8.0% |
| Consumer, Cyclical | 7.5% |
| Utilities | 7.4% |
| Other | 7.4% |
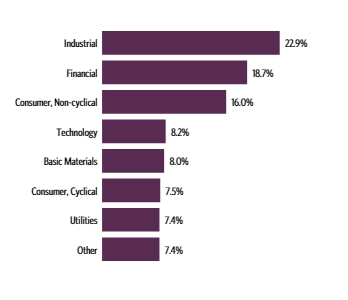
| OGE Energy Corp. | 2.6% |
| Ingredion, Inc. | 2.5% |
| Evergy, Inc. | 2.3% |
| Unum Group | 2.2% |
| Teledyne Technologies, Inc. | 2.2% |
| Stifel Financial Corp. | 2.1% |
| Curtiss-Wright Corp. | 2.1% |
| Teradyne, Inc. | 2.1% |
| Encompass Health Corp. | 2.0% |
| Jefferies Financial Group, Inc. | 2.0% |
| Top 10 Total | 22.1% |
| |
1 | "Holdings Diversification (Market Exposure as a % of Net Assets)" excludes any temporary cash investments, investments in Guggenheim Strategy Funds Trust mutual funds, or investments in Guggenheim Ultra Short Duration Fund. |
| |
2 | "10 Largest Holdings (as a % of Net Assets)" excludes any temporary cash investments. |
| OGE Energy Corp. | 2.6% |
| Ingredion, Inc. | 2.5% |
| Evergy, Inc. | 2.3% |
| Unum Group | 2.2% |
| Teledyne Technologies, Inc. | 2.2% |
| Stifel Financial Corp. | 2.1% |
| Curtiss-Wright Corp. | 2.1% |
| Teradyne, Inc. | 2.1% |
| Encompass Health Corp. | 2.0% |
| Jefferies Financial Group, Inc. | 2.0% |
| Top 10 Total | 22.1% |
| |
2 | "10 Largest Holdings (as a % of Net Assets)" excludes any temporary cash investments. |
There were no changes in or disagreements with fund accountants for the period.
This is a summary of certain changes to the fund since September 30, 2023.
Subsequent to the September 30, 2024 year-end, on October 25, 2024, the fund was reorganized into New Age Alpha SMid Cap Value Fund, a series of New Age Alpha Funds Trust, pursuant to an Agreement and Plan of Reorganization approved by the Board of Trustees and shareholders of the fund.
| |  | Availability of Additional Information. For additional information, including financial information, holdings and proxy voting information, go to GuggenheimInvestments.com/mutual-funds/literature or, call 800 820 0888. |
AR-SVUIX-093024
Annual Shareholder Report | 9.30.24
This annual shareholder report contains important information about the Guggenheim StylePlus—Large Core Fund for the period of October 1, 2023 to September 30, 2024. You can find additional information about the fund at GuggenheimInvestments.com/mutual-funds/literature. You can also request this information by contacting 800 820 0888 or GuggenheimClientServices@mufg-is.com.
This report describes changes to the fund that occurred during the reporting period.
For the period of October 1, 2023 to September 30, 2024, the fund (Class A shares) returned 37.38%, outperforming the fund's benchmark, the S&P 500 Index, which returned 36.35% for the same period.
What factors materially affected the fund's performance over the last year?
The equity sleeve was allocated 15%-25% to actively managed equity and 75%-85% to passive equity. Relative to the fund's benchmark, the active equity sleeve contributed to performance. The passive equity component, which accounted for most of the fund's exposure to the broad equity market, consisted of equity index swaps and equity index futures, and generated performance roughly in line with fund's benchmark (before costs associated with derivatives); the active fixed income sleeve generated excess returns over the costs of equity index derivatives.
Cumulative performance* for the fund's most recently completed 10 years (as of 9.30.24), assuming a $10,000 initial investment.
| 09/30/2014 | 9526 | 10000 |
| 12/31/2014 | 9987 | 10493 |
| 03/31/2015 | 10112 | 10593 |
| 06/30/2015 | 10139 | 10622 |
| 09/30/2015 | 9446 | 9939 |
| 12/31/2015 | 10086 | 10638 |
| 03/31/2016 | 10187 | 10782 |
| 06/30/2016 | 10488 | 11047 |
| 09/30/2016 | 10970 | 11472 |
| 12/31/2016 | 11394 | 11911 |
| 03/31/2017 | 12100 | 12633 |
| 06/30/2017 | 12456 | 13023 |
| 09/30/2017 | 13008 | 13607 |
| 12/31/2017 | 13894 | 14511 |
| 03/31/2018 | 13747 | 14401 |
| 06/30/2018 | 14096 | 14896 |
| 09/30/2018 | 15168 | 16044 |
| 12/31/2018 | 12943 | 13875 |
| 03/31/2019 | 14650 | 15769 |
| 06/30/2019 | 15192 | 16447 |
| 09/30/2019 | 15395 | 16727 |
| 12/31/2019 | 16776 | 18244 |
| 03/31/2020 | 13094 | 14668 |
| 06/30/2020 | 16050 | 17682 |
| 09/30/2020 | 17578 | 19260 |
| 12/31/2020 | 19746 | 21600 |
| 03/31/2021 | 21024 | 22934 |
| 06/30/2021 | 22777 | 24895 |
| 09/30/2021 | 22836 | 25040 |
| 12/31/2021 | 25327 | 27801 |
| 03/31/2022 | 23806 | 26522 |
| 06/30/2022 | 19716 | 22252 |
| 09/30/2022 | 18510 | 21165 |
| 12/31/2022 | 19955 | 22766 |
| 03/31/2023 | 21520 | 24473 |
| 06/30/2023 | 23305 | 26612 |
| 09/30/2023 | 22547 | 25741 |
| 12/31/2023 | 25285 | 28750 |
| 03/31/2024 | 28055 | 31785 |
| 06/30/2024 | 29121 | 33147 |
| 09/30/2024 | 30976 | 35098 |
| Class A (without sales charge) | 37.38% | 15.01% | 12.51% |
| Class A (with sales charge)† | 30.86% | 13.90% | 11.97% |
| S&P 500 Index | 36.35% | 15.98% | 13.38% |
The fund's past performance is not a good predictor of the fund's future performance. Visit GuggenheimInvestments.com/mutual-funds/performance for more recent performance information.
| Net Assets | $264,090,628 |
| Total Number of Portfolio Holdings | 84 |
| Portfolio Turnover Rate | 56% |
| Total Advisory Fees Paid | $1,714,349 |
| Guggenheim StylePlus—Large Core Fund | Class A | SECEX | Annual Shareholder Report | September 30, 2024 |
| S&P 500 Index Equity Swap Agreements | 76.8% |
| Technology | 7.6% |
| Communications | 3.8% |
| Consumer, Non-cyclical | 3.7% |
| Industrial | 3.0% |
| Financial | 3.0% |
| Consumer, Cyclical | 1.4% |
| S&P 500 Index Futures | 1.1% |
| Other | 0.2% |
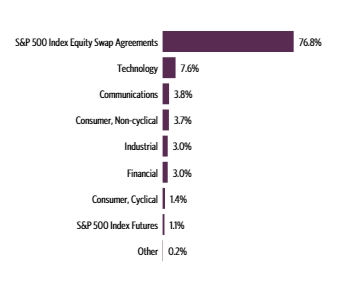
| Guggenheim Strategy Fund III | 31.6% |
| Guggenheim Strategy Fund II | 27.5% |
| Guggenheim Ultra Short Duration Fund — Institutional Class | 12.9% |
| Microsoft Corp. | 1.6% |
| Apple, Inc. | 1.4% |
| NVIDIA Corp. | 1.3% |
| Amazon.com, Inc. | 0.8% |
| Alphabet, Inc. — Class C | 0.7% |
| Johnson & Johnson | 0.4% |
| AbbVie, Inc. | 0.4% |
| Top 10 Total | 78.6% |
| |
1 | "Holdings Diversification (Market Exposure as a % of Net Assets)" excludes any temporary cash investments, investments in Guggenheim Strategy Funds Trust mutual funds, or investments in Guggenheim Ultra Short Duration Fund. |
| |
2 | "10 Largest Holdings (as a % of Net Assets)" excludes any temporary cash investments. |
| Guggenheim Strategy Fund III | 31.6% |
| Guggenheim Strategy Fund II | 27.5% |
| Guggenheim Ultra Short Duration Fund — Institutional Class | 12.9% |
| Microsoft Corp. | 1.6% |
| Apple, Inc. | 1.4% |
| NVIDIA Corp. | 1.3% |
| Amazon.com, Inc. | 0.8% |
| Alphabet, Inc. — Class C | 0.7% |
| Johnson & Johnson | 0.4% |
| AbbVie, Inc. | 0.4% |
| Top 10 Total | 78.6% |
| |
2 | "10 Largest Holdings (as a % of Net Assets)" excludes any temporary cash investments. |
There were no changes in or disagreements with fund accountants for the period.
This is a summary of certain changes to the fund since September 30, 2023.
The fund's (Class A shares) net expense ratio, which reflects expense waivers and reimbursements, was 1.59% for the year ended September 30, 2024, an increase of 0.15% compared to the prior year. The primary driver of the increase was an increase in interest expense on cash collateral received.
Subsequent to the September 30, 2024 year-end, on October 25, 2024, the fund was reorganized into New Age Alpha Large Core Fund, a series of New Age Alpha Funds Trust, pursuant to an Agreement and Plan of Reorganization approved by the Board of Trustees and shareholders of the fund.
| |  | Availability of Additional Information. For additional information, including financial information, holdings and proxy voting information, go to GuggenheimInvestments.com/mutual-funds/literature or, call 800 820 0888. |
AR-SECEX-093024
Annual Shareholder Report | 9.30.24
This annual shareholder report contains important information about the Guggenheim StylePlus—Large Core Fund for the period of October 1, 2023 to September 30, 2024. You can find additional information about the fund at GuggenheimInvestments.com/mutual-funds/literature. You can also request this information by contacting 800 820 0888 or GuggenheimClientServices@mufg-is.com.
This report describes changes to the fund that occurred during the reporting period.
For the period of October 1, 2023 to September 30, 2024, the fund (Class C shares) returned 36.17%, underperforming the fund's benchmark, the S&P 500 Index, which returned 36.35% for the same period.
What factors materially affected the fund's performance over the last year?
The equity sleeve was allocated 15%-25% to actively managed equity and 75%-85% to passive equity. Relative to the fund's benchmark, the active equity sleeve contributed to performance. The passive equity component, which accounted for most of the fund's exposure to the broad equity market, consisted of equity index swaps and equity index futures, and generated performance roughly in line with fund's benchmark (before costs associated with derivatives); the active fixed income sleeve generated excess returns over the costs of equity index derivatives.
Cumulative performance* for the fund's most recently completed 10 years (as of 9.30.24), assuming a $10,000 initial investment.
| 09/30/2014 | 10000 | 10000 |
| 12/31/2014 | 10457 | 10493 |
| 03/31/2015 | 10566 | 10593 |
| 06/30/2015 | 10572 | 10622 |
| 09/30/2015 | 9828 | 9939 |
| 12/31/2015 | 10461 | 10638 |
| 03/31/2016 | 10546 | 10782 |
| 06/30/2016 | 10829 | 11047 |
| 09/30/2016 | 11302 | 11472 |
| 12/31/2016 | 11714 | 11911 |
| 03/31/2017 | 12414 | 12633 |
| 06/30/2017 | 12751 | 13023 |
| 09/30/2017 | 13290 | 13607 |
| 12/31/2017 | 14165 | 14511 |
| 03/31/2018 | 13981 | 14401 |
| 06/30/2018 | 14307 | 14896 |
| 09/30/2018 | 15358 | 16044 |
| 12/31/2018 | 13071 | 13875 |
| 03/31/2019 | 14766 | 15769 |
| 06/30/2019 | 15277 | 16447 |
| 09/30/2019 | 15451 | 16727 |
| 12/31/2019 | 16794 | 18244 |
| 03/31/2020 | 13072 | 14668 |
| 06/30/2020 | 15979 | 17682 |
| 09/30/2020 | 17477 | 19260 |
| 12/31/2020 | 19584 | 21600 |
| 03/31/2021 | 20806 | 22934 |
| 06/30/2021 | 22490 | 24895 |
| 09/30/2021 | 22490 | 25040 |
| 12/31/2021 | 24881 | 27801 |
| 03/31/2022 | 23336 | 26522 |
| 06/30/2022 | 19287 | 22252 |
| 09/30/2022 | 18061 | 21165 |
| 12/31/2022 | 19439 | 22766 |
| 03/31/2023 | 20916 | 24473 |
| 06/30/2023 | 22607 | 26612 |
| 09/30/2023 | 21821 | 25741 |
| 12/31/2023 | 24409 | 28750 |
| 03/31/2024 | 27024 | 31785 |
| 06/30/2024 | 27995 | 33147 |
| 09/30/2024 | 29714 | 35098 |
| Class C (without CDSC) | 36.17% | 13.97% | 11.51% |
| Class C (with CDSC)‡ | 35.17% | 13.97% | 11.51% |
| S&P 500 Index | 36.35% | 15.98% | 13.38% |
The fund's past performance is not a good predictor of the fund's future performance. Visit GuggenheimInvestments.com/mutual-funds/performance for more recent performance information.
| Net Assets | $264,090,628 |
| Total Number of Portfolio Holdings | 84 |
| Portfolio Turnover Rate | 56% |
| Total Advisory Fees Paid | $1,714,349 |
| Guggenheim StylePlus—Large Core Fund | Class C | SFECX | Annual Shareholder Report | September 30, 2024 |
| S&P 500 Index Equity Swap Agreements | 76.8% |
| Technology | 7.6% |
| Communications | 3.8% |
| Consumer, Non-cyclical | 3.7% |
| Industrial | 3.0% |
| Financial | 3.0% |
| Consumer, Cyclical | 1.4% |
| S&P 500 Index Futures | 1.1% |
| Other | 0.2% |

| Guggenheim Strategy Fund III | 31.6% |
| Guggenheim Strategy Fund II | 27.5% |
| Guggenheim Ultra Short Duration Fund — Institutional Class | 12.9% |
| Microsoft Corp. | 1.6% |
| Apple, Inc. | 1.4% |
| NVIDIA Corp. | 1.3% |
| Amazon.com, Inc. | 0.8% |
| Alphabet, Inc. — Class C | 0.7% |
| Johnson & Johnson | 0.4% |
| AbbVie, Inc. | 0.4% |
| Top 10 Total | 78.6% |
| |
1 | "Holdings Diversification (Market Exposure as a % of Net Assets)" excludes any temporary cash investments, investments in Guggenheim Strategy Funds Trust mutual funds, or investments in Guggenheim Ultra Short Duration Fund. |
| |
2 | "10 Largest Holdings (as a % of Net Assets)" excludes any temporary cash investments. |
| Guggenheim Strategy Fund III | 31.6% |
| Guggenheim Strategy Fund II | 27.5% |
| Guggenheim Ultra Short Duration Fund — Institutional Class | 12.9% |
| Microsoft Corp. | 1.6% |
| Apple, Inc. | 1.4% |
| NVIDIA Corp. | 1.3% |
| Amazon.com, Inc. | 0.8% |
| Alphabet, Inc. — Class C | 0.7% |
| Johnson & Johnson | 0.4% |
| AbbVie, Inc. | 0.4% |
| Top 10 Total | 78.6% |
| |
2 | "10 Largest Holdings (as a % of Net Assets)" excludes any temporary cash investments. |
There were no changes in or disagreements with fund accountants for the period.
This is a summary of certain changes to the fund since September 30, 2023.
Subsequent to the September 30, 2024 year-end, on October 25, 2024, the fund was reorganized into New Age Alpha Large Core Fund, a series of New Age Alpha Funds Trust, pursuant to an Agreement and Plan of Reorganization approved by the Board of Trustees and shareholders of the fund.
| |  | Availability of Additional Information. For additional information, including financial information, holdings and proxy voting information, go to GuggenheimInvestments.com/mutual-funds/literature or, call 800 820 0888. |
AR-SFECX-093024
Annual Shareholder Report | 9.30.24
This annual shareholder report contains important information about the Guggenheim StylePlus—Large Core Fund for the period of October 1, 2023 to September 30, 2024. You can find additional information about the fund at GuggenheimInvestments.com/mutual-funds/literature. You can also request this information by contacting 800 820 0888 or GuggenheimClientServices@mufg-is.com.
This report describes changes to the fund that occurred during the reporting period.
For the period of October 1, 2023 to September 30, 2024, the fund (Class P shares) returned 37.29%, outperforming the fund's benchmark, the S&P 500 Index, which returned 36.35% for the same period.
What factors materially affected the fund's performance over the last year?
The equity sleeve was allocated 15%-25% to actively managed equity and 75%-85% to passive equity. Relative to the fund's benchmark, the active equity sleeve contributed to performance. The passive equity component, which accounted for most of the fund's exposure to the broad equity market, consisted of equity index swaps and equity index futures, and generated performance roughly in line with fund's benchmark (before costs associated with derivatives); the active fixed income sleeve generated excess returns over the costs of equity index derivatives.
Cumulative performance* for the fund since inception (as of 9.30.24), assuming a $10,000 initial investment.
| 05/01/2015 | 10000 | 10000 |
| 06/30/2015 | 9814 | 9825 |
| 09/30/2015 | 9131 | 9193 |
| 12/31/2015 | 9736 | 9840 |
| 03/31/2016 | 9838 | 9973 |
| 06/30/2016 | 10131 | 10217 |
| 09/30/2016 | 10599 | 10611 |
| 12/31/2016 | 10992 | 11017 |
| 03/31/2017 | 11675 | 11685 |
| 06/30/2017 | 12021 | 12046 |
| 09/30/2017 | 12552 | 12586 |
| 12/31/2017 | 13403 | 13422 |
| 03/31/2018 | 13248 | 13320 |
| 06/30/2018 | 13564 | 13777 |
| 09/30/2018 | 14589 | 14840 |
| 12/31/2018 | 12444 | 12834 |
| 03/31/2019 | 14092 | 14585 |
| 06/30/2019 | 14605 | 15213 |
| 09/30/2019 | 14802 | 15471 |
| 12/31/2019 | 16121 | 16874 |
| 03/31/2020 | 12581 | 13567 |
| 06/30/2020 | 15407 | 16354 |
| 09/30/2020 | 16872 | 17815 |
| 12/31/2020 | 18955 | 19979 |
| 03/31/2021 | 20175 | 21213 |
| 06/30/2021 | 21842 | 23026 |
| 09/30/2021 | 21899 | 23160 |
| 12/31/2021 | 24277 | 25714 |
| 03/31/2022 | 22814 | 24532 |
| 06/30/2022 | 18884 | 20582 |
| 09/30/2022 | 17718 | 19577 |
| 12/31/2022 | 19086 | 21057 |
| 03/31/2023 | 20580 | 22636 |
| 06/30/2023 | 22277 | 24615 |
| 09/30/2023 | 21548 | 23809 |
| 12/31/2023 | 24162 | 26592 |
| 03/31/2024 | 26806 | 29400 |
| 06/30/2024 | 27822 | 30659 |
| 09/30/2024 | 29585 | 32464 |
| Class P | 37.29% | 14.85% | 12.21% |
| S&P 500 Index | 36.35% | 15.98% | 13.32% |
The fund's past performance is not a good predictor of the fund's future performance. Visit GuggenheimInvestments.com/mutual-funds/performance for more recent performance information.
| Net Assets | $264,090,628 |
| Total Number of Portfolio Holdings | 84 |
| Portfolio Turnover Rate | 56% |
| Total Advisory Fees Paid | $1,714,349 |
| Guggenheim StylePlus—Large Core Fund | Class P | SFEPX | Annual Shareholder Report | September 30, 2024 |
| S&P 500 Index Equity Swap Agreements | 76.8% |
| Technology | 7.6% |
| Communications | 3.8% |
| Consumer, Non-cyclical | 3.7% |
| Industrial | 3.0% |
| Financial | 3.0% |
| Consumer, Cyclical | 1.4% |
| S&P 500 Index Futures | 1.1% |
| Other | 0.2% |

| Guggenheim Strategy Fund III | 31.6% |
| Guggenheim Strategy Fund II | 27.5% |
| Guggenheim Ultra Short Duration Fund — Institutional Class | 12.9% |
| Microsoft Corp. | 1.6% |
| Apple, Inc. | 1.4% |
| NVIDIA Corp. | 1.3% |
| Amazon.com, Inc. | 0.8% |
| Alphabet, Inc. — Class C | 0.7% |
| Johnson & Johnson | 0.4% |
| AbbVie, Inc. | 0.4% |
| Top 10 Total | 78.6% |
| |
1 | "Holdings Diversification (Market Exposure as a % of Net Assets)" excludes any temporary cash investments, investments in Guggenheim Strategy Funds Trust mutual funds, or investments in Guggenheim Ultra Short Duration Fund. |
| |
2 | "10 Largest Holdings (as a % of Net Assets)" excludes any temporary cash investments. |
| Guggenheim Strategy Fund III | 31.6% |
| Guggenheim Strategy Fund II | 27.5% |
| Guggenheim Ultra Short Duration Fund — Institutional Class | 12.9% |
| Microsoft Corp. | 1.6% |
| Apple, Inc. | 1.4% |
| NVIDIA Corp. | 1.3% |
| Amazon.com, Inc. | 0.8% |
| Alphabet, Inc. — Class C | 0.7% |
| Johnson & Johnson | 0.4% |
| AbbVie, Inc. | 0.4% |
| Top 10 Total | 78.6% |
| |
2 | "10 Largest Holdings (as a % of Net Assets)" excludes any temporary cash investments. |
There were no changes in or disagreements with fund accountants for the period.
This is a summary of certain changes to the fund since September 30, 2023.
Subsequent to the September 30, 2024 year-end, on October 25, 2024, the fund was reorganized into New Age Alpha Large Core Fund, a series of New Age Alpha Funds Trust, pursuant to an Agreement and Plan of Reorganization approved by the Board of Trustees and shareholders of the fund.
| |  | Availability of Additional Information. For additional information, including financial information, holdings and proxy voting information, go to GuggenheimInvestments.com/mutual-funds/literature or, call 800 820 0888. |
AR-SFEPX-093024
Annual Shareholder Report | 9.30.24
This annual shareholder report contains important information about the Guggenheim StylePlus—Large Core Fund for the period of October 1, 2023 to September 30, 2024. You can find additional information about the fund at GuggenheimInvestments.com/mutual-funds/literature. You can also request this information by contacting 800 820 0888 or GuggenheimClientServices@mufg-is.com.
This report describes changes to the fund that occurred during the reporting period.
| Institutional Class | $164 | 1.38% |
For the period of October 1, 2023 to September 30, 2024, the fund (Institutional Class shares) returned 37.71%, outperforming the fund's benchmark, the S&P 500 Index, which returned 36.35% for the same period.
What factors materially affected the fund's performance over the last year?
The equity sleeve was allocated 15%-25% to actively managed equity and 75%-85% to passive equity. Relative to the fund's benchmark, the active equity sleeve contributed to performance. The passive equity component, which accounted for most of the fund's exposure to the broad equity market, consisted of equity index swaps and equity index futures, and generated performance roughly in line with fund's benchmark (before costs associated with derivatives); the active fixed income sleeve generated excess returns over the costs of equity index derivatives.
Cumulative performance* for the fund's most recently completed 10 years (as of 9.30.24), assuming a $2,000,000 initial investment.
| 09/30/2014 | 2000000 | 2000000 |
| 12/31/2014 | 2097596 | 2098653 |
| 03/31/2015 | 2125010 | 2118603 |
| 06/30/2015 | 2129736 | 2124494 |
| 09/30/2015 | 1985107 | 1987710 |
| 12/31/2015 | 2130713 | 2127695 |
| 03/31/2016 | 2153108 | 2156373 |
| 06/30/2016 | 2219226 | 2209317 |
| 09/30/2016 | 2322669 | 2294422 |
| 12/31/2016 | 2415487 | 2382166 |
| 03/31/2017 | 2567211 | 2526671 |
| 06/30/2017 | 2644172 | 2604699 |
| 09/30/2017 | 2762912 | 2721399 |
| 12/31/2017 | 2954834 | 2902230 |
| 03/31/2018 | 2924682 | 2880198 |
| 06/30/2018 | 3002027 | 2979101 |
| 09/30/2018 | 3231440 | 3208812 |
| 12/31/2018 | 2758379 | 2774986 |
| 03/31/2019 | 3125839 | 3153716 |
| 06/30/2019 | 3240772 | 3289447 |
| 09/30/2019 | 3287716 | 3345311 |
| 12/31/2019 | 3584518 | 3648730 |
| 03/31/2020 | 2800044 | 2933652 |
| 06/30/2020 | 3432897 | 3536320 |
| 09/30/2020 | 3762508 | 3852094 |
| 12/31/2020 | 4229244 | 4320052 |
| 03/31/2021 | 4503847 | 4586814 |
| 06/30/2021 | 4879619 | 4978933 |
| 09/30/2021 | 4895878 | 5007913 |
| 12/31/2021 | 5433847 | 5560141 |
| 03/31/2022 | 5109750 | 5304457 |
| 06/30/2022 | 4234118 | 4450380 |
| 09/30/2022 | 3976356 | 4233086 |
| 12/31/2022 | 4287626 | 4553151 |
| 03/31/2023 | 4626685 | 4894505 |
| 06/30/2023 | 5013799 | 5322389 |
| 09/30/2023 | 4853614 | 5148165 |
| 12/31/2023 | 5448616 | 5750067 |
| 03/31/2024 | 6047003 | 6357039 |
| 06/30/2024 | 6280319 | 6629362 |
| 09/30/2024 | 6683819 | 7019604 |
| Institutional Class | 37.71% | 15.25% | 12.82% |
| S&P 500 Index | 36.35% | 15.98% | 13.38% |
The fund's past performance is not a good predictor of the fund's future performance. Visit GuggenheimInvestments.com/mutual-funds/performance for more recent performance information.
| Net Assets | $264,090,628 |
| Total Number of Portfolio Holdings | 84 |
| Portfolio Turnover Rate | 56% |
| Total Advisory Fees Paid | $1,714,349 |
| Guggenheim StylePlus—Large Core Fund | Institutional Class | GILIX | Annual Shareholder Report | September 30, 2024 |
| S&P 500 Index Equity Swap Agreements | 76.8% |
| Technology | 7.6% |
| Communications | 3.8% |
| Consumer, Non-cyclical | 3.7% |
| Industrial | 3.0% |
| Financial | 3.0% |
| Consumer, Cyclical | 1.4% |
| S&P 500 Index Futures | 1.1% |
| Other | 0.2% |

| Guggenheim Strategy Fund III | 31.6% |
| Guggenheim Strategy Fund II | 27.5% |
| Guggenheim Ultra Short Duration Fund — Institutional Class | 12.9% |
| Microsoft Corp. | 1.6% |
| Apple, Inc. | 1.4% |
| NVIDIA Corp. | 1.3% |
| Amazon.com, Inc. | 0.8% |
| Alphabet, Inc. — Class C | 0.7% |
| Johnson & Johnson | 0.4% |
| AbbVie, Inc. | 0.4% |
| Top 10 Total | 78.6% |
| |
1 | "Holdings Diversification (Market Exposure as a % of Net Assets)" excludes any temporary cash investments, investments in Guggenheim Strategy Funds Trust mutual funds, or investments in Guggenheim Ultra Short Duration Fund. |
| |
2 | "10 Largest Holdings (as a % of Net Assets)" excludes any temporary cash investments. |
| Guggenheim Strategy Fund III | 31.6% |
| Guggenheim Strategy Fund II | 27.5% |
| Guggenheim Ultra Short Duration Fund — Institutional Class | 12.9% |
| Microsoft Corp. | 1.6% |
| Apple, Inc. | 1.4% |
| NVIDIA Corp. | 1.3% |
| Amazon.com, Inc. | 0.8% |
| Alphabet, Inc. — Class C | 0.7% |
| Johnson & Johnson | 0.4% |
| AbbVie, Inc. | 0.4% |
| Top 10 Total | 78.6% |
| |
2 | "10 Largest Holdings (as a % of Net Assets)" excludes any temporary cash investments. |
There were no changes in or disagreements with fund accountants for the period.
This is a summary of certain changes to the fund since September 30, 2023.
The fund's (Institutional Class shares) net expense ratio, which reflects expense waivers and reimbursements, was 1.38% for the year ended September 30, 2024, an increase of 0.15% compared to the prior year. The primary driver of the increase was an increase in interest expense on cash collateral received.
Subsequent to the September 30, 2024 year-end, on October 25, 2024, the fund was reorganized into New Age Alpha Large Core Fund, a series of New Age Alpha Funds Trust, pursuant to an Agreement and Plan of Reorganization approved by the Board of Trustees and shareholders of the fund.
| |  | Availability of Additional Information. For additional information, including financial information, holdings and proxy voting information, go to GuggenheimInvestments.com/mutual-funds/literature or, call 800 820 0888. |
AR-GILIX-093024
Annual Shareholder Report | 9.30.24
This annual shareholder report contains important information about the Guggenheim StylePlus—Mid Growth Fund for the period of October 1, 2023 to September 30, 2024. You can find additional information about the fund at GuggenheimInvestments.com/mutual-funds/literature. You can also request this information by contacting 800 820 0888 or GuggenheimClientServices@mufg-is.com.
This report describes changes to the fund that occurred during the reporting period.
For the period of October 1, 2023 to September 30, 2024, the fund (Class A shares) returned 31.52%, underperforming the fund's benchmark, the S&P 500 Index, which returned 36.35% for the same period and outperforming the fund's secondary index, the Russell Midcap Growth Index, which returned 29.33% for the same period.
The fund's broad-based securities market index was changed from the Russell Midcap Growth Index to the S&P 500 Index to comply with the regulation that requires the fund's broad-based securities market index to represent the overall applicable market.
What factors materially affected the fund's performance over the last year?
The fund outperformed the Russell Midcap Growth Index (the "Index") for the reporting period. The equity sleeve was allocated 15%-25% to actively managed equity and 75%-85% to passive equity. Relative to the Index, the active equity sleeve contributed to performance. The passive equity component, which accounted for most of the fund's exposure to the broad equity market, consisted of equity index swaps and equity index futures, and generated performance roughly in line with the Index (before costs associated with derivatives); the active fixed income sleeve generated excess returns over the costs of equity index derivatives.
Cumulative performance* for the fund's most recently completed 10 years (as of 9.30.24), assuming a $10,000 initial investment.
| 09/30/2014 | 9526 | 10000 | 10000 |
| 12/31/2014 | 10082 | 10493 | 10584 |
| 03/31/2015 | 10625 | 10593 | 11153 |
| 06/30/2015 | 10493 | 10622 | 11026 |
| 09/30/2015 | 9625 | 9939 | 10145 |
| 12/31/2015 | 10003 | 10638 | 10563 |
| 03/31/2016 | 10022 | 10782 | 10624 |
| 06/30/2016 | 10218 | 11047 | 10790 |
| 09/30/2016 | 10737 | 11472 | 11285 |
| 12/31/2016 | 10821 | 11911 | 11337 |
| 03/31/2017 | 11586 | 12633 | 12118 |
| 06/30/2017 | 12028 | 13023 | 12629 |
| 09/30/2017 | 12620 | 13607 | 13296 |
| 12/31/2017 | 13433 | 14511 | 14201 |
| 03/31/2018 | 13656 | 14401 | 14510 |
| 06/30/2018 | 13984 | 14896 | 14968 |
| 09/30/2018 | 14965 | 16044 | 16102 |
| 12/31/2018 | 12455 | 13875 | 13527 |
| 03/31/2019 | 14768 | 15769 | 16181 |
| 06/30/2019 | 15456 | 16447 | 17055 |
| 09/30/2019 | 15305 | 16727 | 16940 |
| 12/31/2019 | 16493 | 18244 | 18324 |
| 03/31/2020 | 12566 | 14668 | 14652 |
| 06/30/2020 | 16565 | 17682 | 19086 |
| 09/30/2020 | 18147 | 19260 | 20875 |
| 12/31/2020 | 21715 | 21600 | 24845 |
| 03/31/2021 | 21999 | 22934 | 24705 |
| 06/30/2021 | 24087 | 24895 | 27440 |
| 09/30/2021 | 23785 | 25040 | 27232 |
| 12/31/2021 | 24653 | 27801 | 28008 |
| 03/31/2022 | 21445 | 26522 | 24484 |
| 06/30/2022 | 16921 | 22252 | 19325 |
| 09/30/2022 | 16487 | 21165 | 19199 |
| 12/31/2022 | 17866 | 22766 | 20524 |
| 03/31/2023 | 19480 | 24473 | 22399 |
| 06/30/2023 | 20728 | 26612 | 23795 |
| 09/30/2023 | 19758 | 25741 | 22552 |
| 12/31/2023 | 22579 | 28750 | 25833 |
| 03/31/2024 | 25189 | 31785 | 28286 |
| 06/30/2024 | 24286 | 33147 | 27377 |
| 09/30/2024 | 25987 | 35098 | 29168 |
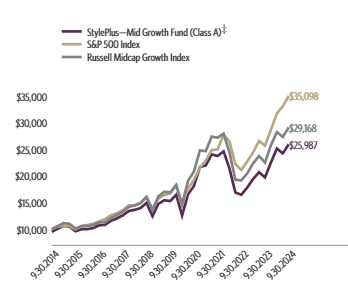
| Class A (without sales charge) | 31.52% | 11.17% | 10.56% |
| Class A (with sales charge)‡ | 25.29% | 10.09% | 10.02% |
| S&P 500 Index | 36.35% | 15.98% | 13.38% |
| Russell Midcap Growth Index | 29.33% | 11.48% | 11.30% |
The fund's past performance is not a good predictor of the fund's future performance. Visit GuggenheimInvestments.com/mutual-funds/performance for more recent performance information.
| Net Assets | $77,712,974 |
| Total Number of Portfolio Holdings | 113 |
| Portfolio Turnover Rate | 80% |
| Total Advisory Fees Paid | $538,718 |
| Guggenheim StylePlus—Mid Growth Fund | Class A | SECUX | Annual Shareholder Report | September 30, 2024 |
| Russell Midcap Growth Index Swap Agreements | 76.0% |
| Industrial | 8.4% |
| Consumer, Cyclical | 5.0% |
| Technology | 3.5% |
| Consumer, Non-cyclical | 3.5% |
| Financial | 2.2% |
| Energy | 1.2% |
| Other | 1.0% |

| Guggenheim Strategy Fund II | 34.6% |
| Guggenheim Strategy Fund III | 29.6% |
| Guggenheim Ultra Short Duration Fund — Institutional Class | 3.0% |
| Carlisle Companies, Inc. | 0.6% |
| EMCOR Group, Inc. | 0.6% |
| Lennox International, Inc. | 0.5% |
| Owens Corning | 0.5% |
| Toll Brothers, Inc. | 0.5% |
| Williams-Sonoma, Inc. | 0.4% |
| Advanced Drainage Systems, Inc. | 0.4% |
| Top 10 Total | 70.7% |
| |
1 | "Holdings Diversification (Market Exposure as a % of Net Assets)" excludes any temporary cash investments, investments in Guggenheim Strategy Funds Trust mutual funds, or investments in Guggenheim Ultra Short Duration Fund. |
| |
2 | "10 Largest Holdings (as a % of Net Assets)" excludes any temporary cash investments. |
| Guggenheim Strategy Fund II | 34.6% |
| Guggenheim Strategy Fund III | 29.6% |
| Guggenheim Ultra Short Duration Fund — Institutional Class | 3.0% |
| Carlisle Companies, Inc. | 0.6% |
| EMCOR Group, Inc. | 0.6% |
| Lennox International, Inc. | 0.5% |
| Owens Corning | 0.5% |
| Toll Brothers, Inc. | 0.5% |
| Williams-Sonoma, Inc. | 0.4% |
| Advanced Drainage Systems, Inc. | 0.4% |
| Top 10 Total | 70.7% |
| |
2 | "10 Largest Holdings (as a % of Net Assets)" excludes any temporary cash investments. |
There were no changes in or disagreements with fund accountants for the period.
This is a summary of certain changes to the fund since September 30, 2023.
Subsequent to the September 30, 2024 year-end, on October 25, 2024, the fund was reorganized into New Age Alpha Mid Growth Fund, a series of New Age Alpha Funds Trust, pursuant to an Agreement and Plan of Reorganization approved by the Board of Trustees and shareholders of the fund.
| |  | Availability of Additional Information. For additional information, including financial information, holdings and proxy voting information, go to GuggenheimInvestments.com/mutual-funds/literature or, call 800 820 0888. |
AR-SECUX-093024
Annual Shareholder Report | 9.30.24
This annual shareholder report contains important information about the Guggenheim StylePlus—Mid Growth Fund for the period of October 1, 2023 to September 30, 2024. You can find additional information about the fund at GuggenheimInvestments.com/mutual-funds/literature. You can also request this information by contacting 800 820 0888 or GuggenheimClientServices@mufg-is.com.
This report describes changes to the fund that occurred during the reporting period.
For the period of October 1, 2023 to September 30, 2024, the fund (Class C shares) returned 30.26%, underperforming the fund's benchmark, the S&P 500 Index, which returned 36.35% for the same period and outperforming the fund's secondary index, the Russell Midcap Growth Index, which returned 29.33% for the same period.
The fund's broad-based securities market index was changed from the Russell Midcap Growth Index to the S&P 500 Index to comply with the regulation that requires the fund's broad-based securities market index to represent the overall applicable market.
What factors materially affected the fund's performance over the last year?
The fund outperformed the Russell Midcap Growth Index (the "Index") for the reporting period. The equity sleeve was allocated 15%-25% to actively managed equity and 75%-85% to passive equity. Relative to the Index, the active equity sleeve contributed to performance. The passive equity component, which accounted for most of the fund's exposure to the broad equity market, consisted of equity index swaps and equity index futures, and generated performance roughly in line with the Index (before costs associated with derivatives); the active fixed income sleeve generated excess returns over the costs of equity index derivatives.
Cumulative performance* for the fund's most recently completed 10 years (as of 9.30.24), assuming a $10,000 initial investment.
| 09/30/2014 | 10000 | 10000 | 10000 |
| 12/31/2014 | 10558 | 10493 | 10584 |
| 03/31/2015 | 11105 | 10593 | 11153 |
| 06/30/2015 | 10946 | 10622 | 11026 |
| 09/30/2015 | 10020 | 9939 | 10145 |
| 12/31/2015 | 10388 | 10638 | 10563 |
| 03/31/2016 | 10388 | 10782 | 10624 |
| 06/30/2016 | 10566 | 11047 | 10790 |
| 09/30/2016 | 11077 | 11472 | 11285 |
| 12/31/2016 | 11142 | 11911 | 11337 |
| 03/31/2017 | 11903 | 12633 | 12118 |
| 06/30/2017 | 12330 | 13023 | 12629 |
| 09/30/2017 | 12910 | 13607 | 13296 |
| 12/31/2017 | 13716 | 14511 | 14201 |
| 03/31/2018 | 13919 | 14401 | 14510 |
| 06/30/2018 | 14225 | 14896 | 14968 |
| 09/30/2018 | 15187 | 16044 | 16102 |
| 12/31/2018 | 12609 | 13875 | 13527 |
| 03/31/2019 | 14918 | 15769 | 16181 |
| 06/30/2019 | 15578 | 16447 | 17055 |
| 09/30/2019 | 15392 | 16727 | 16940 |
| 12/31/2019 | 16552 | 18244 | 18324 |
| 03/31/2020 | 12583 | 14668 | 14652 |
| 06/30/2020 | 16552 | 17682 | 19086 |
| 09/30/2020 | 18090 | 19260 | 20875 |
| 12/31/2020 | 21597 | 21600 | 24845 |
| 03/31/2021 | 21832 | 22934 | 24705 |
| 06/30/2021 | 23846 | 24895 | 27440 |
| 09/30/2021 | 23497 | 25040 | 27232 |
| 12/31/2021 | 24289 | 27801 | 28008 |
| 03/31/2022 | 21083 | 26522 | 24484 |
| 06/30/2022 | 16597 | 22252 | 19325 |
| 09/30/2022 | 16136 | 21165 | 19199 |
| 12/31/2022 | 17453 | 22766 | 20524 |
| 03/31/2023 | 18985 | 24473 | 22399 |
| 06/30/2023 | 20165 | 26612 | 23795 |
| 09/30/2023 | 19178 | 25741 | 22552 |
| 12/31/2023 | 21860 | 28750 | 25833 |
| 03/31/2024 | 24328 | 31785 | 28286 |
| 06/30/2024 | 23412 | 33147 | 27377 |
| 09/30/2024 | 24982 | 35098 | 29168 |
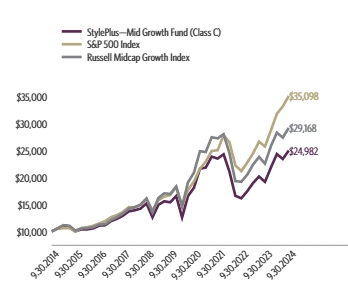
| Class C (without CDSC) | 30.26% | 10.17% | 9.59% |
| Class C (with CDSC)‡ | 29.26% | 10.17% | 9.59% |
| S&P 500 Index | 36.35% | 15.98% | 13.38% |
| Russell Midcap Growth Index | 29.33% | 11.48% | 11.30% |
The fund's past performance is not a good predictor of the fund's future performance. Visit GuggenheimInvestments.com/mutual-funds/performance for more recent performance information.
| Net Assets | $77,712,974 |
| Total Number of Portfolio Holdings | 113 |
| Portfolio Turnover Rate | 80% |
| Total Advisory Fees Paid | $538,718 |
| Guggenheim StylePlus—Mid Growth Fund | Class C | SUFCX | Annual Shareholder Report | September 30, 2024 |
| Russell Midcap Growth Index Swap Agreements | 76.0% |
| Industrial | 8.4% |
| Consumer, Cyclical | 5.0% |
| Technology | 3.5% |
| Consumer, Non-cyclical | 3.5% |
| Financial | 2.2% |
| Energy | 1.2% |
| Other | 1.0% |
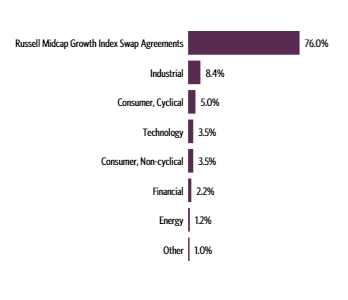
| Guggenheim Strategy Fund II | 34.6% |
| Guggenheim Strategy Fund III | 29.6% |
| Guggenheim Ultra Short Duration Fund — Institutional Class | 3.0% |
| Carlisle Companies, Inc. | 0.6% |
| EMCOR Group, Inc. | 0.6% |
| Lennox International, Inc. | 0.5% |
| Owens Corning | 0.5% |
| Toll Brothers, Inc. | 0.5% |
| Williams-Sonoma, Inc. | 0.4% |
| Advanced Drainage Systems, Inc. | 0.4% |
| Top 10 Total | 70.7% |
| |
1 | "Holdings Diversification (Market Exposure as a % of Net Assets)" excludes any temporary cash investments, investments in Guggenheim Strategy Funds Trust mutual funds, or investments in Guggenheim Ultra Short Duration Fund. |
| |
2 | "10 Largest Holdings (as a % of Net Assets)" excludes any temporary cash investments. |
| Guggenheim Strategy Fund II | 34.6% |
| Guggenheim Strategy Fund III | 29.6% |
| Guggenheim Ultra Short Duration Fund — Institutional Class | 3.0% |
| Carlisle Companies, Inc. | 0.6% |
| EMCOR Group, Inc. | 0.6% |
| Lennox International, Inc. | 0.5% |
| Owens Corning | 0.5% |
| Toll Brothers, Inc. | 0.5% |
| Williams-Sonoma, Inc. | 0.4% |
| Advanced Drainage Systems, Inc. | 0.4% |
| Top 10 Total | 70.7% |
| |
2 | "10 Largest Holdings (as a % of Net Assets)" excludes any temporary cash investments. |
There were no changes in or disagreements with fund accountants for the period.
This is a summary of certain changes to the fund since September 30, 2023.
Subsequent to the September 30, 2024 year-end, on October 25, 2024, the fund was reorganized into New Age Alpha Mid Growth Fund, a series of New Age Alpha Funds Trust, pursuant to an Agreement and Plan of Reorganization approved by the Board of Trustees and shareholders of the fund.
| |  | Availability of Additional Information. For additional information, including financial information, holdings and proxy voting information, go to GuggenheimInvestments.com/mutual-funds/literature or, call 800 820 0888. |
AR-SUFCX-093024
Annual Shareholder Report | 9.30.24
This annual shareholder report contains important information about the Guggenheim StylePlus—Mid Growth Fund for the period of October 1, 2023 to September 30, 2024. You can find additional information about the fund at GuggenheimInvestments.com/mutual-funds/literature. You can also request this information by contacting 800 820 0888 or GuggenheimClientServices@mufg-is.com.
This report describes changes to the fund that occurred during the reporting period.
For the period of October 1, 2023 to September 30, 2024, the fund (Class P shares) returned 31.28%, underperforming the fund's benchmark, the S&P 500 Index, which returned 36.35% for the same period and outperforming the fund's secondary index, the Russell Midcap Growth Index, which returned 29.33% for the same period.
The fund's broad-based securities market index was changed from the Russell Midcap Growth Index to the S&P 500 Index to comply with the regulation that requires the fund's broad-based securities market index to represent the overall applicable market.
What factors materially affected the fund's performance over the last year?
The fund outperformed the Russell Midcap Growth Index (the "Index") for the reporting period. The equity sleeve was allocated 15%-25% to actively managed equity and 75%-85% to passive equity. Relative to the Index, the active equity sleeve contributed to performance. The passive equity component, which accounted for most of the fund's exposure to the broad equity market, consisted of equity index swaps and equity index futures, and generated performance roughly in line with the Index (before costs associated with derivatives); the active fixed income sleeve generated excess returns over the costs of equity index derivatives.
Cumulative performance* for the fund since inception (as of 9.30.24), assuming a $10,000 initial investment.
| 05/01/2015 | 10000 | 10000 | 10000 |
| 06/30/2015 | 9843 | 9825 | 9852 |
| 09/30/2015 | 9025 | 9193 | 9065 |
| 12/31/2015 | 9361 | 9840 | 9439 |
| 03/31/2016 | 9379 | 9973 | 9493 |
| 06/30/2016 | 9564 | 10217 | 9642 |
| 09/30/2016 | 10050 | 10611 | 10084 |
| 12/31/2016 | 10112 | 11017 | 10130 |
| 03/31/2017 | 10824 | 11685 | 10829 |
| 06/30/2017 | 11237 | 12046 | 11285 |
| 09/30/2017 | 11786 | 12586 | 11881 |
| 12/31/2017 | 12542 | 13422 | 12690 |
| 03/31/2018 | 12743 | 13320 | 12966 |
| 06/30/2018 | 13038 | 13777 | 13375 |
| 09/30/2018 | 13946 | 14840 | 14388 |
| 12/31/2018 | 11606 | 12834 | 12087 |
| 03/31/2019 | 13756 | 14585 | 14459 |
| 06/30/2019 | 14392 | 15213 | 15240 |
| 09/30/2019 | 14247 | 15471 | 15137 |
| 12/31/2019 | 15346 | 16874 | 16374 |
| 03/31/2020 | 11692 | 13567 | 13093 |
| 06/30/2020 | 15413 | 16354 | 17055 |
| 09/30/2020 | 16879 | 17815 | 18654 |
| 12/31/2020 | 20193 | 19979 | 22201 |
| 03/31/2021 | 20453 | 21213 | 22076 |
| 06/30/2021 | 22388 | 23026 | 24520 |
| 09/30/2021 | 22098 | 23160 | 24334 |
| 12/31/2021 | 22900 | 25714 | 25027 |
| 03/31/2022 | 19912 | 24532 | 21879 |
| 06/30/2022 | 15693 | 20582 | 17269 |
| 09/30/2022 | 15270 | 19577 | 17156 |
| 12/31/2022 | 16536 | 21057 | 18340 |
| 03/31/2023 | 18007 | 22636 | 20015 |
| 06/30/2023 | 19137 | 24615 | 21263 |
| 09/30/2023 | 18231 | 23809 | 20152 |
| 12/31/2023 | 20834 | 26592 | 23084 |
| 03/31/2024 | 23227 | 29400 | 25276 |
| 06/30/2024 | 22371 | 30659 | 24464 |
| 09/30/2024 | 23933 | 32464 | 26064 |
| Class P | 31.28% | 10.93% | 9.71% |
| S&P 500 Index | 36.35% | 15.98% | 13.32% |
| Russell Midcap Growth Index | 29.33% | 11.48% | 10.71% |
The fund's past performance is not a good predictor of the fund's future performance. Visit GuggenheimInvestments.com/mutual-funds/performance for more recent performance information.
| Net Assets | $77,712,974 |
| Total Number of Portfolio Holdings | 113 |
| Portfolio Turnover Rate | 80% |
| Total Advisory Fees Paid | $538,718 |
| Guggenheim StylePlus—Mid Growth Fund | Class P | SEUPX | Annual Shareholder Report | September 30, 2024 |
| Russell Midcap Growth Index Swap Agreements | 76.0% |
| Industrial | 8.4% |
| Consumer, Cyclical | 5.0% |
| Technology | 3.5% |
| Consumer, Non-cyclical | 3.5% |
| Financial | 2.2% |
| Energy | 1.2% |
| Other | 1.0% |

| Guggenheim Strategy Fund II | 34.6% |
| Guggenheim Strategy Fund III | 29.6% |
| Guggenheim Ultra Short Duration Fund — Institutional Class | 3.0% |
| Carlisle Companies, Inc. | 0.6% |
| EMCOR Group, Inc. | 0.6% |
| Lennox International, Inc. | 0.5% |
| Owens Corning | 0.5% |
| Toll Brothers, Inc. | 0.5% |
| Williams-Sonoma, Inc. | 0.4% |
| Advanced Drainage Systems, Inc. | 0.4% |
| Top 10 Total | 70.7% |
| |
1 | "Holdings Diversification (Market Exposure as a % of Net Assets)" excludes any temporary cash investments, investments in Guggenheim Strategy Funds Trust mutual funds, or investments in Guggenheim Ultra Short Duration Fund. |
| |
2 | "10 Largest Holdings (as a % of Net Assets)" excludes any temporary cash investments. |
| Guggenheim Strategy Fund II | 34.6% |
| Guggenheim Strategy Fund III | 29.6% |
| Guggenheim Ultra Short Duration Fund — Institutional Class | 3.0% |
| Carlisle Companies, Inc. | 0.6% |
| EMCOR Group, Inc. | 0.6% |
| Lennox International, Inc. | 0.5% |
| Owens Corning | 0.5% |
| Toll Brothers, Inc. | 0.5% |
| Williams-Sonoma, Inc. | 0.4% |
| Advanced Drainage Systems, Inc. | 0.4% |
| Top 10 Total | 70.7% |
| |
2 | "10 Largest Holdings (as a % of Net Assets)" excludes any temporary cash investments. |
There were no changes in or disagreements with fund accountants for the period.
This is a summary of certain changes to the fund since September 30, 2023.
Subsequent to the September 30, 2024 year-end, on October 25, 2024, the fund was reorganized into New Age Alpha Mid Growth Fund, a series of New Age Alpha Funds Trust, pursuant to an Agreement and Plan of Reorganization approved by the Board of Trustees and shareholders of the fund.
| |  | Availability of Additional Information. For additional information, including financial information, holdings and proxy voting information, go to GuggenheimInvestments.com/mutual-funds/literature or, call 800 820 0888. |
AR-SEUPX-093024
Annual Shareholder Report | 9.30.24
This annual shareholder report contains important information about the Guggenheim StylePlus—Mid Growth Fund for the period of October 1, 2023 to September 30, 2024. You can find additional information about the fund at GuggenheimInvestments.com/mutual-funds/literature. You can also request this information by contacting 800 820 0888 or GuggenheimClientServices@mufg-is.com.
This report describes changes to the fund that occurred during the reporting period.
| Institutional Class | $169 | 1.46% |
For the period of October 1, 2023 to September 30, 2024, the fund (Institutional Class shares) returned 31.84%, underperforming the fund's benchmark, the S&P 500 Index, which returned 36.35% for the same period and outperforming the fund's secondary index, the Russell Midcap Growth Index, which returned 29.33% for the same period.
The fund's broad-based securities market index was changed from the Russell Midcap Growth Index to the S&P 500 Index to comply with the regulation that requires the fund's broad-based securities market index to represent the overall applicable market.
What factors materially affected the fund's performance over the last year?
The fund outperformed the Russell Midcap Growth Index (the "Index") for the reporting period. The equity sleeve was allocated 15%-25% to actively managed equity and 75%-85% to passive equity. Relative to the Index, the active equity sleeve contributed to performance. The passive equity component, which accounted for most of the fund's exposure to the broad equity market, consisted of equity index swaps and equity index futures, and generated performance roughly in line with the Index (before costs associated with derivatives); the active fixed income sleeve generated excess returns over the costs of equity index derivatives.
Cumulative performance* for the fund's most recently completed 10 years (as of 9.30.24), assuming a $2,000,000 initial investment.
| 09/30/2014 | 2000000 | 2000000 | 2000000 |
| 12/31/2014 | 2117363 | 2098653 | 2116756 |
| 03/31/2015 | 2231946 | 2118603 | 2230597 |
| 06/30/2015 | 2203786 | 2124494 | 2205145 |
| 09/30/2015 | 2021715 | 1987710 | 2028966 |
| 12/31/2015 | 2101487 | 2127695 | 2112521 |
| 03/31/2016 | 2105374 | 2156373 | 2124755 |
| 06/30/2016 | 2144805 | 2209317 | 2157958 |
| 09/30/2016 | 2254211 | 2294422 | 2257050 |
| 12/31/2016 | 2274001 | 2382166 | 2267338 |
| 03/31/2017 | 2436310 | 2526671 | 2423659 |
| 06/30/2017 | 2530896 | 2604699 | 2525814 |
| 09/30/2017 | 2657385 | 2721399 | 2659254 |
| 12/31/2017 | 2831579 | 2902230 | 2840249 |
| 03/31/2018 | 2880377 | 2880198 | 2902006 |
| 06/30/2018 | 2950089 | 2979101 | 2993636 |
| 09/30/2018 | 3158592 | 3208812 | 3220390 |
| 12/31/2018 | 2631313 | 2774986 | 2705319 |
| 03/31/2019 | 3118261 | 3153716 | 3236130 |
| 06/30/2019 | 3263448 | 3289447 | 3410940 |
| 09/30/2019 | 3232453 | 3345311 | 3387967 |
| 12/31/2019 | 3484904 | 3648730 | 3664888 |
| 03/31/2020 | 2656477 | 2933652 | 2930445 |
| 06/30/2020 | 3503276 | 3536320 | 3817225 |
| 09/30/2020 | 3839824 | 3852094 | 4175035 |
| 12/31/2020 | 4597289 | 4320052 | 4969092 |
| 03/31/2021 | 4659440 | 4586814 | 4941004 |
| 06/30/2021 | 5103106 | 4978933 | 5488078 |
| 09/30/2021 | 5039998 | 5007913 | 5446372 |
| 12/31/2021 | 5226952 | 5560141 | 5601569 |
| 03/31/2022 | 4548817 | 5304457 | 4896873 |
| 06/30/2022 | 3589827 | 4450380 | 3865016 |
| 09/30/2022 | 3497911 | 4233086 | 3839778 |
| 12/31/2022 | 3788759 | 4553151 | 4104777 |
| 03/31/2023 | 4134633 | 4894505 | 4479785 |
| 06/30/2023 | 4401244 | 5322389 | 4759067 |
| 09/30/2023 | 4198043 | 5148165 | 4510456 |
| 12/31/2023 | 4800627 | 5750067 | 5166553 |
| 03/31/2024 | 5358976 | 6357039 | 5657197 |
| 06/30/2024 | 5169906 | 6629362 | 5475412 |
| 09/30/2024 | 5534753 | 7019604 | 5833576 |
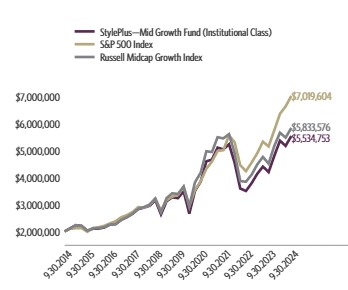
| Institutional Class | 31.84% | 11.36% | 10.72% |
| S&P 500 Index | 36.35% | 15.98% | 13.38% |
| Russell Midcap Growth Index | 29.33% | 11.48% | 11.30% |
The fund's past performance is not a good predictor of the fund's future performance. Visit GuggenheimInvestments.com/mutual-funds/performance for more recent performance information.
| Net Assets | $77,712,974 |
| Total Number of Portfolio Holdings | 113 |
| Portfolio Turnover Rate | 80% |
| Total Advisory Fees Paid | $538,718 |
| Guggenheim StylePlus—Mid Growth Fund | Institutional Class | GIUIX | Annual Shareholder Report | September 30, 2024 |
| Russell Midcap Growth Index Swap Agreements | 76.0% |
| Industrial | 8.4% |
| Consumer, Cyclical | 5.0% |
| Technology | 3.5% |
| Consumer, Non-cyclical | 3.5% |
| Financial | 2.2% |
| Energy | 1.2% |
| Other | 1.0% |

| Guggenheim Strategy Fund II | 34.6% |
| Guggenheim Strategy Fund III | 29.6% |
| Guggenheim Ultra Short Duration Fund — Institutional Class | 3.0% |
| Carlisle Companies, Inc. | 0.6% |
| EMCOR Group, Inc. | 0.6% |
| Lennox International, Inc. | 0.5% |
| Owens Corning | 0.5% |
| Toll Brothers, Inc. | 0.5% |
| Williams-Sonoma, Inc. | 0.4% |
| Advanced Drainage Systems, Inc. | 0.4% |
| Top 10 Total | 70.7% |
| |
1 | "Holdings Diversification (Market Exposure as a % of Net Assets)" excludes any temporary cash investments, investments in Guggenheim Strategy Funds Trust mutual funds, or investments in Guggenheim Ultra Short Duration Fund. |
| |
2 | "10 Largest Holdings (as a % of Net Assets)" excludes any temporary cash investments. |
| Guggenheim Strategy Fund II | 34.6% |
| Guggenheim Strategy Fund III | 29.6% |
| Guggenheim Ultra Short Duration Fund — Institutional Class | 3.0% |
| Carlisle Companies, Inc. | 0.6% |
| EMCOR Group, Inc. | 0.6% |
| Lennox International, Inc. | 0.5% |
| Owens Corning | 0.5% |
| Toll Brothers, Inc. | 0.5% |
| Williams-Sonoma, Inc. | 0.4% |
| Advanced Drainage Systems, Inc. | 0.4% |
| Top 10 Total | 70.7% |
| |
2 | "10 Largest Holdings (as a % of Net Assets)" excludes any temporary cash investments. |
There were no changes in or disagreements with fund accountants for the period.
This is a summary of certain changes to the fund since September 30, 2023.
Subsequent to the September 30, 2024 year-end, on October 25, 2024, the fund was reorganized into New Age Alpha Mid Growth Fund, a series of New Age Alpha Funds Trust, pursuant to an Agreement and Plan of Reorganization approved by the Board of Trustees and shareholders of the fund.
| |  | Availability of Additional Information. For additional information, including financial information, holdings and proxy voting information, go to GuggenheimInvestments.com/mutual-funds/literature or, call 800 820 0888. |
AR-GIUIX-093024
Annual Shareholder Report | 9.30.24
This annual shareholder report contains important information about the Guggenheim World Equity Income Fund for the period of October 1, 2023 to September 30, 2024. You can find additional information about the fund at GuggenheimInvestments.com/mutual-funds/literature. You can also request this information by contacting 800 820 0888 or GuggenheimClientServices@mufg-is.com.
This report describes changes to the fund that occurred during the reporting period.
For the period of October 1, 2023 to September 30, 2024, the fund (Class A shares) returned 26.03%, underperforming the fund's benchmark, the MSCI World Index (Net), which returned 32.43% for the same period.
What factors materially affected the fund's performance over the last year?
An underweight in the Health Care sector and good selection in Consumer Staples were the largest positive contributors to the fund's return. The leading overall detractor from return was security selection, with the Industrials and Health Care sectors responsible for most of the relative underperformance. The fund was also most underweight relative to the MSCI World Index (Net) (the fund's benchmark) in the Information Technology sector, which exacerbated the underperformance. From a country perspective, security selection in Italy, France and China were the largest relative contributors to return. The U.S. was the single largest relative detractor from return. Denmark and Germany were the other leading detractors from return on a relative basis. The top relative individual contributor to the fund was Dell Technologies, Inc. The biggest individual detractor was an underweight in Nvidia Corp.
Cumulative performance* for the fund's most recently completed 10 years (as of 9.30.24), assuming a $10,000 initial investment.
| 09/30/2014 | 9528 | 10000 |
| 12/31/2014 | 9401 | 10101 |
| 03/31/2015 | 9569 | 10335 |
| 06/30/2015 | 9415 | 10367 |
| 09/30/2015 | 8890 | 9491 |
| 12/31/2015 | 9309 | 10013 |
| 03/31/2016 | 9615 | 9978 |
| 06/30/2016 | 9922 | 10078 |
| 09/30/2016 | 10033 | 10569 |
| 12/31/2016 | 10217 | 10765 |
| 03/31/2017 | 10561 | 11451 |
| 06/30/2017 | 10787 | 11912 |
| 09/30/2017 | 11268 | 12489 |
| 12/31/2017 | 11719 | 13176 |
| 03/31/2018 | 11615 | 12999 |
| 06/30/2018 | 11673 | 13233 |
| 09/30/2018 | 12170 | 13892 |
| 12/31/2018 | 10701 | 12028 |
| 03/31/2019 | 11740 | 13529 |
| 06/30/2019 | 12019 | 14071 |
| 09/30/2019 | 12187 | 14146 |
| 12/31/2019 | 12949 | 15357 |
| 03/31/2020 | 9920 | 12124 |
| 06/30/2020 | 11573 | 14471 |
| 09/30/2020 | 12261 | 15618 |
| 12/31/2020 | 13744 | 17799 |
| 03/31/2021 | 15217 | 18675 |
| 06/30/2021 | 15944 | 20121 |
| 09/30/2021 | 15587 | 20119 |
| 12/31/2021 | 16675 | 21682 |
| 03/31/2022 | 16292 | 20565 |
| 06/30/2022 | 14560 | 17236 |
| 09/30/2022 | 13491 | 16169 |
| 12/31/2022 | 15128 | 17748 |
| 03/31/2023 | 15318 | 19121 |
| 06/30/2023 | 15934 | 20426 |
| 09/30/2023 | 15608 | 19719 |
| 12/31/2023 | 16957 | 21970 |
| 03/31/2024 | 18342 | 23915 |
| 06/30/2024 | 18580 | 24551 |
| 09/30/2024 | 19671 | 26114 |
| Class A (without sales charge) | 26.03% | 10.05% | 7.52% |
| Class A (with sales charge)† | 20.02% | 8.98% | 7.00% |
| MSCI World Index (Net) | 32.43% | 13.04% | 10.07% |
The fund's past performance is not a good predictor of the fund's future performance. Visit GuggenheimInvestments.com/mutual-funds/performance for more recent performance information.
| Net Assets | $52,025,269 |
| Total Number of Portfolio Holdings | 152 |
| Portfolio Turnover Rate | 122% |
| Total Advisory Fees Paid | $158,563 |
| Guggenheim World Equity Income Fund | Class A | SEQAX | Annual Shareholder Report | September 30, 2024 |
| Financial | 24.0% |
| Technology | 18.5% |
| Consumer, Non-cyclical | 13.6% |
| Communications | 11.8% |
| Industrial | 7.4% |
| Utilities | 6.8% |
| Consumer, Cyclical | 6.2% |
| Other | 11.1% |

| United States | 67.8% |
| Canada | 3.9% |
| Japan | 3.4% |
| Sweden | 3.1% |
| Italy | 3.0% |
| Ireland | 2.4% |
| Australia | 2.3% |
| Other | 14.1% |
| Total Investments | 100.0% |
| NVIDIA Corp. | 3.2% |
| Apple, Inc. | 3.2% |
| Microsoft Corp. | 3.0% |
| Alphabet, Inc. — Class C | 2.1% |
| Amazon.com, Inc. | 1.7% |
| iShares MSCI EAFE ETF | 1.5% |
| SPDR S&P 500 ETF Trust | 1.4% |
| Home Depot, Inc. | 1.3% |
| Johnson & Johnson | 1.2% |
| Novo Nordisk A/S — Class B | 1.1% |
| Top 10 Total | 19.7% |
| |
1 | "Holdings Diversification (Market Exposure as a % of Net Assets)" excludes any temporary cash investments, investments in Guggenheim Strategy Funds Trust mutual funds, or investments in Guggenheim Ultra Short Duration Fund. |
| |
2 | "10 Largest Holdings (as a % of Net Assets)" excludes any temporary cash investments. |
| NVIDIA Corp. | 3.2% |
| Apple, Inc. | 3.2% |
| Microsoft Corp. | 3.0% |
| Alphabet, Inc. — Class C | 2.1% |
| Amazon.com, Inc. | 1.7% |
| iShares MSCI EAFE ETF | 1.5% |
| SPDR S&P 500 ETF Trust | 1.4% |
| Home Depot, Inc. | 1.3% |
| Johnson & Johnson | 1.2% |
| Novo Nordisk A/S — Class B | 1.1% |
| Top 10 Total | 19.7% |
| |
2 | "10 Largest Holdings (as a % of Net Assets)" excludes any temporary cash investments. |
There were no changes in or disagreements with fund accountants for the period.
This is a summary of certain changes to the fund since September 30, 2023.
Subsequent to the September 30, 2024 year-end, on November 8, 2024, the fund was reorganized into New Age Alpha World Equity Income Fund, a series of New Age Alpha Funds Trust, pursuant to an Agreement and Plan of Reorganization approved by the Board of Trustees and shareholders of the fund.
| |  | Availability of Additional Information. For additional information, including financial information, holdings and proxy voting information, go to GuggenheimInvestments.com/mutual-funds/literature or, call 800 820 0888. |
AR-SEQAX-093024
Annual Shareholder Report | 9.30.24
This annual shareholder report contains important information about the Guggenheim World Equity Income Fund for the period of October 1, 2023 to September 30, 2024. You can find additional information about the fund at GuggenheimInvestments.com/mutual-funds/literature. You can also request this information by contacting 800 820 0888 or GuggenheimClientServices@mufg-is.com.
This report describes changes to the fund that occurred during the reporting period.
For the period of October 1, 2023 to September 30, 2024, the fund (Class C shares) returned 25.05%, underperforming the fund's benchmark, the MSCI World Index (Net), which returned 32.43% for the same period.
What factors materially affected the fund's performance over the last year?
An underweight in the Health Care sector and good selection in Consumer Staples were the largest positive contributors to the fund's return. The leading overall detractor from return was security selection, with the Industrials and Health Care sectors responsible for most of the relative underperformance. The fund was also most underweight relative to the MSCI World Index (Net) (the fund's benchmark) in the Information Technology sector, which exacerbated the underperformance. From a country perspective, security selection in Italy, France and China were the largest relative contributors to return. The U.S. was the single largest relative detractor from return. Denmark and Germany were the other leading detractors from return on a relative basis. The top relative individual contributor to the fund was Dell Technologies, Inc. The biggest individual detractor was an underweight in Nvidia Corp.
Cumulative performance* for the fund's most recently completed 10 years (as of 9.30.24), assuming a $10,000 initial investment.
| 09/30/2014 | 10000 | 10000 |
| 12/31/2014 | 9847 | 10101 |
| 03/31/2015 | 10004 | 10335 |
| 06/30/2015 | 9828 | 10367 |
| 09/30/2015 | 9260 | 9491 |
| 12/31/2015 | 9684 | 10013 |
| 03/31/2016 | 9984 | 9978 |
| 06/30/2016 | 10280 | 10078 |
| 09/30/2016 | 10376 | 10569 |
| 12/31/2016 | 10546 | 10765 |
| 03/31/2017 | 10883 | 11451 |
| 06/30/2017 | 11093 | 11912 |
| 09/30/2017 | 11565 | 12489 |
| 12/31/2017 | 12006 | 13176 |
| 03/31/2018 | 11878 | 12999 |
| 06/30/2018 | 11917 | 13233 |
| 09/30/2018 | 12405 | 13892 |
| 12/31/2018 | 10881 | 12028 |
| 03/31/2019 | 11915 | 13529 |
| 06/30/2019 | 12173 | 14071 |
| 09/30/2019 | 12319 | 14146 |
| 12/31/2019 | 13066 | 15357 |
| 03/31/2020 | 9991 | 12124 |
| 06/30/2020 | 11632 | 14471 |
| 09/30/2020 | 12303 | 15618 |
| 12/31/2020 | 13763 | 17799 |
| 03/31/2021 | 15204 | 18675 |
| 06/30/2021 | 15911 | 20121 |
| 09/30/2021 | 15528 | 20119 |
| 12/31/2021 | 16572 | 21682 |
| 03/31/2022 | 16165 | 20565 |
| 06/30/2022 | 14421 | 17236 |
| 09/30/2022 | 13337 | 16169 |
| 12/31/2022 | 14924 | 17748 |
| 03/31/2023 | 15083 | 19121 |
| 06/30/2023 | 15673 | 20426 |
| 09/30/2023 | 15320 | 19719 |
| 12/31/2023 | 16602 | 21970 |
| 03/31/2024 | 17929 | 23915 |
| 06/30/2024 | 18115 | 24551 |
| 09/30/2024 | 19158 | 26114 |
| Class C (without CDSC) | 25.05% | 9.23% | 6.72% |
| Class C (with CDSC)‡ | 24.05% | 9.23% | 6.72% |
| MSCI World Index (Net) | 32.43% | 13.04% | 10.07% |
The fund's past performance is not a good predictor of the fund's future performance. Visit GuggenheimInvestments.com/mutual-funds/performance for more recent performance information.
| Net Assets | $52,025,269 |
| Total Number of Portfolio Holdings | 152 |
| Portfolio Turnover Rate | 122% |
| Total Advisory Fees Paid | $158,563 |
| Guggenheim World Equity Income Fund | Class C | SFGCX | Annual Shareholder Report | September 30, 2024 |
| Financial | 24.0% |
| Technology | 18.5% |
| Consumer, Non-cyclical | 13.6% |
| Communications | 11.8% |
| Industrial | 7.4% |
| Utilities | 6.8% |
| Consumer, Cyclical | 6.2% |
| Other | 11.1% |
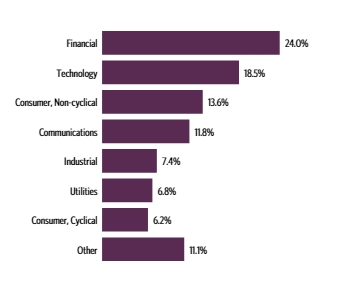
| United States | 67.8% |
| Canada | 3.9% |
| Japan | 3.4% |
| Sweden | 3.1% |
| Italy | 3.0% |
| Ireland | 2.4% |
| Australia | 2.3% |
| Other | 14.1% |
| Total Investments | 100.0% |
| NVIDIA Corp. | 3.2% |
| Apple, Inc. | 3.2% |
| Microsoft Corp. | 3.0% |
| Alphabet, Inc. — Class C | 2.1% |
| Amazon.com, Inc. | 1.7% |
| iShares MSCI EAFE ETF | 1.5% |
| SPDR S&P 500 ETF Trust | 1.4% |
| Home Depot, Inc. | 1.3% |
| Johnson & Johnson | 1.2% |
| Novo Nordisk A/S — Class B | 1.1% |
| Top 10 Total | 19.7% |
| |
1 | "Holdings Diversification (Market Exposure as a % of Net Assets)" excludes any temporary cash investments, investments in Guggenheim Strategy Funds Trust mutual funds, or investments in Guggenheim Ultra Short Duration Fund. |
| |
2 | "10 Largest Holdings (as a % of Net Assets)" excludes any temporary cash investments. |
| NVIDIA Corp. | 3.2% |
| Apple, Inc. | 3.2% |
| Microsoft Corp. | 3.0% |
| Alphabet, Inc. — Class C | 2.1% |
| Amazon.com, Inc. | 1.7% |
| iShares MSCI EAFE ETF | 1.5% |
| SPDR S&P 500 ETF Trust | 1.4% |
| Home Depot, Inc. | 1.3% |
| Johnson & Johnson | 1.2% |
| Novo Nordisk A/S — Class B | 1.1% |
| Top 10 Total | 19.7% |
| |
2 | "10 Largest Holdings (as a % of Net Assets)" excludes any temporary cash investments. |
There were no changes in or disagreements with fund accountants for the period.
This is a summary of certain changes to the fund since September 30, 2023.
Subsequent to the September 30, 2024 year-end, on November 8, 2024, the fund was reorganized into New Age Alpha World Equity Income Fund, a series of New Age Alpha Funds Trust, pursuant to an Agreement and Plan of Reorganization approved by the Board of Trustees and shareholders of the fund.
| |  | Availability of Additional Information. For additional information, including financial information, holdings and proxy voting information, go to GuggenheimInvestments.com/mutual-funds/literature or, call 800 820 0888. |
AR-SFGCX-093024
Annual Shareholder Report | 9.30.24
This annual shareholder report contains important information about the Guggenheim World Equity Income Fund for the period of October 1, 2023 to September 30, 2024. You can find additional information about the fund at GuggenheimInvestments.com/mutual-funds/literature. You can also request this information by contacting 800 820 0888 or GuggenheimClientServices@mufg-is.com.
This report describes changes to the fund that occurred during the reporting period.
For the period of October 1, 2023 to September 30, 2024, the fund (Class P shares) returned 26.06%, underperforming the fund's benchmark, the MSCI World Index (Net), which returned 32.43% for the same period.
What factors materially affected the fund's performance over the last year?
An underweight in the Health Care sector and good selection in Consumer Staples were the largest positive contributors to the fund's return. The leading overall detractor from return was security selection, with the Industrials and Health Care sectors responsible for most of the relative underperformance. The fund was also most underweight relative to the MSCI World Index (Net) (the fund's benchmark) in the Information Technology sector, which exacerbated the underperformance. From a country perspective, security selection in Italy, France and China were the largest relative contributors to return. The U.S. was the single largest relative detractor from return. Denmark and Germany were the other leading detractors from return on a relative basis. The top relative individual contributor to the fund was Dell Technologies, Inc. The biggest individual detractor was an underweight in Nvidia Corp.
Cumulative performance* for the fund since inception (as of 9.30.24), assuming a $10,000 initial investment.
| 05/01/2015 | 10000 | 10000 |
| 06/30/2015 | 9676 | 9752 |
| 09/30/2015 | 9137 | 8928 |
| 12/31/2015 | 9575 | 9419 |
| 03/31/2016 | 9887 | 9386 |
| 06/30/2016 | 10231 | 9481 |
| 09/30/2016 | 10391 | 9942 |
| 12/31/2016 | 10579 | 10126 |
| 03/31/2017 | 10933 | 10772 |
| 06/30/2017 | 11169 | 11206 |
| 09/30/2017 | 11672 | 11748 |
| 12/31/2017 | 12130 | 12395 |
| 03/31/2018 | 12028 | 12228 |
| 06/30/2018 | 12087 | 12448 |
| 09/30/2018 | 12605 | 13068 |
| 12/31/2018 | 11076 | 11315 |
| 03/31/2019 | 12156 | 12727 |
| 06/30/2019 | 12440 | 13236 |
| 09/30/2019 | 12612 | 13307 |
| 12/31/2019 | 13403 | 14446 |
| 03/31/2020 | 10270 | 11405 |
| 06/30/2020 | 11983 | 13613 |
| 09/30/2020 | 12696 | 14692 |
| 12/31/2020 | 14226 | 16743 |
| 03/31/2021 | 15751 | 17567 |
| 06/30/2021 | 16504 | 18928 |
| 09/30/2021 | 16137 | 18926 |
| 12/31/2021 | 17262 | 20396 |
| 03/31/2022 | 16860 | 19345 |
| 06/30/2022 | 15064 | 16214 |
| 09/30/2022 | 13968 | 15210 |
| 12/31/2022 | 15657 | 16696 |
| 03/31/2023 | 15852 | 17986 |
| 06/30/2023 | 16499 | 19215 |
| 09/30/2023 | 16154 | 18550 |
| 12/31/2023 | 17547 | 20667 |
| 03/31/2024 | 18990 | 22496 |
| 06/30/2024 | 19223 | 23095 |
| 09/30/2024 | 20364 | 24565 |
| Class P | 26.06% | 10.06% | 7.84% |
| MSCI World Index (Net) | 32.43% | 13.04% | 10.01% |
The fund's past performance is not a good predictor of the fund's future performance. Visit GuggenheimInvestments.com/mutual-funds/performance for more recent performance information.
| Net Assets | $52,025,269 |
| Total Number of Portfolio Holdings | 152 |
| Portfolio Turnover Rate | 122% |
| Total Advisory Fees Paid | $158,563 |
| Guggenheim World Equity Income Fund | Class P | SEQPX | Annual Shareholder Report | September 30, 2024 |
| Financial | 24.0% |
| Technology | 18.5% |
| Consumer, Non-cyclical | 13.6% |
| Communications | 11.8% |
| Industrial | 7.4% |
| Utilities | 6.8% |
| Consumer, Cyclical | 6.2% |
| Other | 11.1% |

| United States | 67.8% |
| Canada | 3.9% |
| Japan | 3.4% |
| Sweden | 3.1% |
| Italy | 3.0% |
| Ireland | 2.4% |
| Australia | 2.3% |
| Other | 14.1% |
| Total Investments | 100.0% |
| NVIDIA Corp. | 3.2% |
| Apple, Inc. | 3.2% |
| Microsoft Corp. | 3.0% |
| Alphabet, Inc. — Class C | 2.1% |
| Amazon.com, Inc. | 1.7% |
| iShares MSCI EAFE ETF | 1.5% |
| SPDR S&P 500 ETF Trust | 1.4% |
| Home Depot, Inc. | 1.3% |
| Johnson & Johnson | 1.2% |
| Novo Nordisk A/S — Class B | 1.1% |
| Top 10 Total | 19.7% |
| |
1 | "Holdings Diversification (Market Exposure as a % of Net Assets)" excludes any temporary cash investments, investments in Guggenheim Strategy Funds Trust mutual funds, or investments in Guggenheim Ultra Short Duration Fund. |
| |
2 | "10 Largest Holdings (as a % of Net Assets)" excludes any temporary cash investments. |
| NVIDIA Corp. | 3.2% |
| Apple, Inc. | 3.2% |
| Microsoft Corp. | 3.0% |
| Alphabet, Inc. — Class C | 2.1% |
| Amazon.com, Inc. | 1.7% |
| iShares MSCI EAFE ETF | 1.5% |
| SPDR S&P 500 ETF Trust | 1.4% |
| Home Depot, Inc. | 1.3% |
| Johnson & Johnson | 1.2% |
| Novo Nordisk A/S — Class B | 1.1% |
| Top 10 Total | 19.7% |
| |
2 | "10 Largest Holdings (as a % of Net Assets)" excludes any temporary cash investments. |
There were no changes in or disagreements with fund accountants for the period.
This is a summary of certain changes to the fund since September 30, 2023.
Subsequent to the September 30, 2024 year-end, on November 8, 2024, the fund was reorganized into New Age Alpha World Equity Income Fund, a series of New Age Alpha Funds Trust, pursuant to an Agreement and Plan of Reorganization approved by the Board of Trustees and shareholders of the fund.
| |  | Availability of Additional Information. For additional information, including financial information, holdings and proxy voting information, go to GuggenheimInvestments.com/mutual-funds/literature or, call 800 820 0888. |
AR-SEQPX-093024
Annual Shareholder Report | 9.30.24
This annual shareholder report contains important information about the Guggenheim World Equity Income Fund for the period of October 1, 2023 to September 30, 2024. You can find additional information about the fund at GuggenheimInvestments.com/mutual-funds/literature. You can also request this information by contacting 800 820 0888 or GuggenheimClientServices@mufg-is.com.
This report describes changes to the fund that occurred during the reporting period.
| Institutional Class | $106 | 0.94% |
For the period of October 1, 2023 to September 30, 2024, the fund (Institutional Class shares) returned 26.28%, underperforming the fund's benchmark, the MSCI World Index (Net), which returned 32.43% for the same period.
What factors materially affected the fund's performance over the last year?
An underweight in the Health Care sector and good selection in Consumer Staples were the largest positive contributors to the fund's return. The leading overall detractor from return was security selection, with the Industrials and Health Care sectors responsible for most of the relative underperformance. The fund was also most underweight relative to the MSCI World Index (Net) (the fund's benchmark) in the Information Technology sector, which exacerbated the underperformance. From a country perspective, security selection in Italy, France and China were the largest relative contributors to return. The U.S. was the single largest relative detractor from return. Denmark and Germany were the other leading detractors from return on a relative basis. The top relative individual contributor to the fund was Dell Technologies, Inc. The biggest individual detractor was an underweight in Nvidia Corp.
Cumulative performance* for the fund's most recently completed 10 years (as of 9.30.24), assuming a $2,000,000 initial investment.
| 09/30/2014 | 2000000 | 2000000 |
| 12/31/2014 | 1975023 | 2020171 |
| 03/31/2015 | 2011089 | 2066910 |
| 06/30/2015 | 1981049 | 2073315 |
| 09/30/2015 | 1871482 | 1898174 |
| 12/31/2015 | 1961063 | 2002569 |
| 03/31/2016 | 2026714 | 1995568 |
| 06/30/2016 | 2092474 | 2015686 |
| 09/30/2016 | 2116933 | 2113760 |
| 12/31/2016 | 2157776 | 2152974 |
| 03/31/2017 | 2232533 | 2290248 |
| 06/30/2017 | 2281073 | 2382455 |
| 09/30/2017 | 2383938 | 2497735 |
| 12/31/2017 | 2481067 | 2635245 |
| 03/31/2018 | 2460425 | 2599828 |
| 06/30/2018 | 2475265 | 2646606 |
| 09/30/2018 | 2582812 | 2778422 |
| 12/31/2018 | 2271121 | 2405675 |
| 03/31/2019 | 2494453 | 2705898 |
| 06/30/2019 | 2554607 | 2814151 |
| 09/30/2019 | 2593221 | 2829197 |
| 12/31/2019 | 2757654 | 3071329 |
| 03/31/2020 | 2113225 | 2424762 |
| 06/30/2020 | 2467825 | 2894170 |
| 09/30/2020 | 2617005 | 3123637 |
| 12/31/2020 | 2935407 | 3559747 |
| 03/31/2021 | 3250147 | 3734946 |
| 06/30/2021 | 3406824 | 4024185 |
| 09/30/2021 | 3333636 | 4023896 |
| 12/31/2021 | 3569715 | 4336383 |
| 03/31/2022 | 3489537 | 4112929 |
| 06/30/2022 | 3118927 | 3447191 |
| 09/30/2022 | 2894364 | 3233890 |
| 12/31/2022 | 3246772 | 3549697 |
| 03/31/2023 | 3287722 | 3824112 |
| 06/30/2023 | 3424960 | 4085281 |
| 09/30/2023 | 3356535 | 3943855 |
| 12/31/2023 | 3647401 | 4394065 |
| 03/31/2024 | 3947687 | 4782925 |
| 06/30/2024 | 4000234 | 4910189 |
| 09/30/2024 | 4238752 | 5222711 |
| Institutional Class | 26.28% | 10.33% | 7.80% |
| MSCI World Index (Net) | 32.43% | 13.04% | 10.07% |
The fund's past performance is not a good predictor of the fund's future performance. Visit GuggenheimInvestments.com/mutual-funds/performance for more recent performance information.
| Net Assets | $52,025,269 |
| Total Number of Portfolio Holdings | 152 |
| Portfolio Turnover Rate | 122% |
| Total Advisory Fees Paid | $158,563 |
| Guggenheim World Equity Income Fund | Institutional Class | SEWIX | Annual Shareholder Report | September 30, 2024 |
| Financial | 24.0% |
| Technology | 18.5% |
| Consumer, Non-cyclical | 13.6% |
| Communications | 11.8% |
| Industrial | 7.4% |
| Utilities | 6.8% |
| Consumer, Cyclical | 6.2% |
| Other | 11.1% |

| United States | 67.8% |
| Canada | 3.9% |
| Japan | 3.4% |
| Sweden | 3.1% |
| Italy | 3.0% |
| Ireland | 2.4% |
| Australia | 2.3% |
| Other | 14.1% |
| Total Investments | 100.0% |
| NVIDIA Corp. | 3.2% |
| Apple, Inc. | 3.2% |
| Microsoft Corp. | 3.0% |
| Alphabet, Inc. — Class C | 2.1% |
| Amazon.com, Inc. | 1.7% |
| iShares MSCI EAFE ETF | 1.5% |
| SPDR S&P 500 ETF Trust | 1.4% |
| Home Depot, Inc. | 1.3% |
| Johnson & Johnson | 1.2% |
| Novo Nordisk A/S — Class B | 1.1% |
| Top 10 Total | 19.7% |
| |
1 | "Holdings Diversification (Market Exposure as a % of Net Assets)" excludes any temporary cash investments, investments in Guggenheim Strategy Funds Trust mutual funds, or investments in Guggenheim Ultra Short Duration Fund. |
| |
2 | "10 Largest Holdings (as a % of Net Assets)" excludes any temporary cash investments. |
| NVIDIA Corp. | 3.2% |
| Apple, Inc. | 3.2% |
| Microsoft Corp. | 3.0% |
| Alphabet, Inc. — Class C | 2.1% |
| Amazon.com, Inc. | 1.7% |
| iShares MSCI EAFE ETF | 1.5% |
| SPDR S&P 500 ETF Trust | 1.4% |
| Home Depot, Inc. | 1.3% |
| Johnson & Johnson | 1.2% |
| Novo Nordisk A/S — Class B | 1.1% |
| Top 10 Total | 19.7% |
| |
2 | "10 Largest Holdings (as a % of Net Assets)" excludes any temporary cash investments. |
There were no changes in or disagreements with fund accountants for the period.
This is a summary of certain changes to the fund since September 30, 2023.
Subsequent to the September 30, 2024 year-end, on November 8, 2024, the fund was reorganized into New Age Alpha World Equity Income Fund, a series of New Age Alpha Funds Trust, pursuant to an Agreement and Plan of Reorganization approved by the Board of Trustees and shareholders of the fund.
| |  | Availability of Additional Information. For additional information, including financial information, holdings and proxy voting information, go to GuggenheimInvestments.com/mutual-funds/literature or, call 800 820 0888. |
AR-SEWIX-093024
Annual Shareholder Report | 9.30.24
This annual shareholder report contains important information about the Guggenheim Active INvestment Series (GAINS)-Core Plus Fund for the period of August 14, 2024 (the commencement of operations) to September 30, 2024. You can find additional information about the fund at GuggenheimInvestments.com/mutual-funds/literature. You can also request this information by contacting 800 820 0888 or GuggenheimClientServices@mufg-is.com.
This report describes changes to the fund that occurred during the reporting period.
For the period of August 14, 2024 (the commencement of operations) to September 30, 2024, the fund (SMA Class shares) returned 0.92%, underperforming the fund's benchmark, the Bloomberg U.S. Aggregate Bond Index, which returned 1.28% for the same period.
What factors materially affected the fund's performance over the last year?
The fund's positive performance was driven by carry (or earned income), while duration and credit were minor contributors. The fund benefited from its allocation to high yield corporates as spreads in the Bloomberg U.S. Corporate High Yield Bond Index tightened by 50 basis points since the inception of the fund. The allocation is concentrated towards shorter maturity debt of higher credit quality issuers, which we believe offers attractive total return opportunities as issuers take advantage of an accommodating capital markets environment and refinance debt early.
Cumulative performance* for the fund since inception (as of 9.30.24), assuming a $10,000 initial investment.
| 08/14/2024 | 10000 | 10000 |
| 08/19/2024 | 10002 | 9993 |
| 08/26/2024 | 10023 | 10039 |
| 09/02/2024 | 10025 | 9994 |
| 09/09/2024 | 10061 | 10138 |
| 09/16/2024 | 10088 | 10206 |
| 09/23/2024 | 10089 | 10148 |
| 09/30/2024 | 10092 | 10128 |
| Active INvestment Series (GAINS) - Core Plus Fund | 0.92% |
| Bloomberg U.S. Aggregate Bond Index | 1.28% |
The fund's past performance is not a good predictor of the fund's future performance. Visit GuggenheimInvestments.com/mutual-funds/performance for more recent performance information.
| Net Assets | $8,530,894 |
| Total Number of Portfolio Holdings | 75 |
| Portfolio Turnover Rate | 0% |
| Total Advisory Fees Paid | $0 |
The fund does not pay an advisory fee. The fund is a part of "wrap fee" programs, including those sponsored by investment advisers and broker/dealers unaffiliated with the fund or Guggenheim Partners Investment Management, LLC, also known as Guggenheim Investments (the "Investment Manager"). Participants in these programs pay a "wrap" fee to the sponsor of the program. The Investment Manager is compensated directly or indirectly by wrap fee program sponsors or participants for separately managed account advisory services.
| Guggenheim Active INvestment Series (GAINS)-Core Plus Fund | SMA Class | GUCPX | Annual Shareholder Report | September 30, 2024 |
| Asset-Backed Securities | 29.5% |
| Collateralized Mortgage Obligations | 14.0% |
| Corporate Bonds | 5.7% |
| Senior Floating Rate Interests | 3.4% |
| Preferred Stocks | 0.8% |
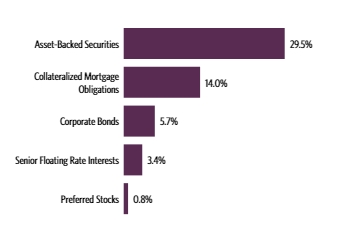
| AAA | 12.5% |
| AA | 7.3% |
| A | 10.1% |
| BBB | 8.6% |
| BB | 4.0% |
| B | 1.9% |
| NR3 | 2.5% |
| Other Instruments | 53.1% |
| Navigator Aviation Ltd., 5.40% | 2.9% |
| Cerberus Loan Funding XLVIII LLC | 2.3% |
| PRPM LLC | 1.8% |
| Golub Capital Partners CLO 36M Ltd., 6.80% | 1.4% |
| Five Guys Holdings, Inc., 7.55% | 1.2% |
| SERVPRO Master Issuer LLC, 6.17% | 1.2% |
| Mill City Mortgage Loan Trust, 2.50% | 1.2% |
| ABPCI Direct Lending Fund CLO V Ltd., 7.48% | 1.2% |
| Owl Rock CLO XIII LLC, 7.36% | 1.2% |
| Owl Rock CLO X LLC, 7.73% | 1.2% |
| Top 10 Total | 15.6% |
| |
1 | "Holdings Diversification (Market Exposure as a % of Net Assets)" excludes any temporary cash investments, investments in Guggenheim Strategy Funds Trust mutual funds, or investments in Guggenheim Ultra Short Duration Fund. |
| |
2 | Source: BlackRock Solutions. Credit quality ratings are measured on a scale that generally ranges from AAA (highest) to D (lowest). All securities except for those labeled "NR" have been rated by Moody's, Standard & Poor's ("S&P"), or Fitch, each of which is a Nationally Recognized Statistical Rating Organization ("NRSRO"). For purposes of this presentation, when ratings are available from more than one agency, the highest rating is used. Guggenheim Investments has converted ratings to the equivalent S&P rating. |
3 | NR (not rated) securities do not necessarily indicate low credit quality. |
| |
4 | "10 Largest Holdings (as a % of Net Assets)" excludes any temporary cash or derivative investments. |
| Navigator Aviation Ltd., 5.40% | 2.9% |
| Cerberus Loan Funding XLVIII LLC | 2.3% |
| PRPM LLC | 1.8% |
| Golub Capital Partners CLO 36M Ltd., 6.80% | 1.4% |
| Five Guys Holdings, Inc., 7.55% | 1.2% |
| SERVPRO Master Issuer LLC, 6.17% | 1.2% |
| Mill City Mortgage Loan Trust, 2.50% | 1.2% |
| ABPCI Direct Lending Fund CLO V Ltd., 7.48% | 1.2% |
| Owl Rock CLO XIII LLC, 7.36% | 1.2% |
| Owl Rock CLO X LLC, 7.73% | 1.2% |
| Top 10 Total | 15.6% |
| |
4 | "10 Largest Holdings (as a % of Net Assets)" excludes any temporary cash or derivative investments. |
There were no changes in or disagreements with fund accountants for the period.
There were no material changes for the period.
| |  | Availability of Additional Information. For additional information, including the fund's prospectus, financial information, holdings and proxy voting information, go to GuggenheimInvestments.com/mutual-funds/literature or, call 800 820 0888. |
AR-GUCPX-093024
Annual Shareholder Report | 9.30.24
This annual shareholder report contains important information about the Guggenheim Active INvestment Series (GAINS)-Limited Duration Fund for the period of August 14, 2024 (the commencement of operations) to September 30, 2024. You can find additional information about the fund at GuggenheimInvestments.com/mutual-funds/literature. You can also request this information by contacting 800 820 0888 or GuggenheimClientServices@mufg-is.com.
This report describes changes to the fund that occurred during the reporting period.
For the period of August 14, 2024 (the commencement of operations) to September 30, 2024, the fund (SMA Class shares) returned 0.90%, underperforming the fund's benchmark, the Bloomberg U.S. Aggregate Bond Index, which returned 1.28% for the same period.
What factors materially affected the fund's performance over the last year?
The fund's positive performance was driven by carry (or earned income), while duration was a minor contributor. The fund benefitted from its allocation to high yield corporates as spreads in the Bloomberg U.S. Corporate High Yield Bond Index tightened by 50 basis points since the inception of the fund. The allocation is concentrated towards shorter maturity debt of higher credit quality issuers, which we believe offers attractive total return opportunities as issuers take advantage of an accommodating capital markets environment and refinance debt early.
Cumulative performance* for the fund since inception (as of 9.30.24), assuming a $10,000 initial investment.
| 08/14/2024 | 10000 | 10000 |
| 08/19/2024 | 10002 | 9993 |
| 08/26/2024 | 10023 | 10039 |
| 09/02/2024 | 10030 | 9994 |
| 09/09/2024 | 10056 | 10138 |
| 09/16/2024 | 10077 | 10206 |
| 09/23/2024 | 10084 | 10148 |
| 09/30/2024 | 10090 | 10128 |
| Active INvestment Series (GAINS) - Limited Duration Fund | 0.90% |
| Bloomberg U.S. Aggregate Bond Index | 1.28% |
The fund's past performance is not a good predictor of the fund's future performance. Visit GuggenheimInvestments.com/mutual-funds/performance for more recent performance information.
| Net Assets | $3,526,974 |
| Total Number of Portfolio Holdings | 54 |
| Portfolio Turnover Rate | 0% |
| Total Advisory Fees Paid | $0 |
The fund does not pay an advisory fee. The fund is a part of "wrap fee" programs, including those sponsored by investment advisers and broker/dealers unaffiliated with the fund or Guggenheim Partners Investment Management, LLC, also known as Guggenheim Investments (the "Investment Manager"). Participants in these programs pay a "wrap" fee to the sponsor of the program. The Investment Manager is compensated directly or indirectly by wrap fee program sponsors or participants for separately managed account advisory services.
| Guggenheim Active INvestment Series (GAINS)-Limited Duration Fund | SMA Class | GULDX | Annual Shareholder Report | September 30, 2024 |
| Asset-Backed Securities | 56.4% |
| Collateralized Mortgage Obligations | 28.0% |
| Corporate Bonds | 7.5% |
| Senior Floating Rate Interests | 6.6% |
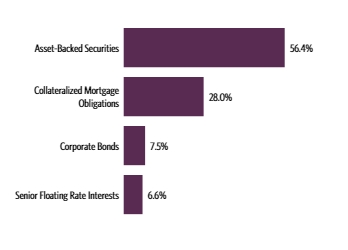
| AAA | 26.5% |
| AA | 18.0% |
| A | 16.0% |
| BBB | 16.6% |
| BB | 7.7% |
| B | 2.5% |
| NR3 | 2.4% |
| Other Instruments | 10.3% |
| Navigator Aviation Ltd., 5.40% | 7.1% |
| Fortress Credit Opportunities XI CLO Ltd., 6.86% | 4.1% |
| Five Guys Holdings, Inc., 7.55% | 3.0% |
| SERVPRO Master Issuer LLC, 6.17% | 2.9% |
| Mill City Mortgage Loan Trust, 2.50% | 2.9% |
| ABPCI Direct Lending Fund CLO V Ltd., 7.48% | 2.9% |
| Owl Rock CLO XIII LLC, 7.36% | 2.9% |
| Owl Rock CLO X LLC, 7.73% | 2.9% |
| FIGRE Trust, 5.06% | 2.9% |
| BRAVO, 5.66% | 2.9% |
| Top 10 Total | 34.5% |
| |
1 | "Holdings Diversification (Market Exposure as a % of Net Assets)" excludes any temporary cash investments, investments in Guggenheim Strategy Funds Trust mutual funds, or investments in Guggenheim Ultra Short Duration Fund. |
| |
2 | Source: BlackRock Solutions. Credit quality ratings are measured on a scale that generally ranges from AAA (highest) to D (lowest). All securities except for those labeled "NR" have been rated by Moody's, Standard & Poor's ("S&P"), or Fitch, each of which is a Nationally Recognized Statistical Rating Organization ("NRSRO"). For purposes of this presentation, when ratings are available from more than one agency, the highest rating is used. Guggenheim Investments has converted ratings to the equivalent S&P rating. |
3 | NR (not rated) securities do not necessarily indicate low credit quality. |
| |
4 | "10 Largest Holdings (as a % of Net Assets)" excludes any temporary cash or derivative investments. |
| Navigator Aviation Ltd., 5.40% | 7.1% |
| Fortress Credit Opportunities XI CLO Ltd., 6.86% | 4.1% |
| Five Guys Holdings, Inc., 7.55% | 3.0% |
| SERVPRO Master Issuer LLC, 6.17% | 2.9% |
| Mill City Mortgage Loan Trust, 2.50% | 2.9% |
| ABPCI Direct Lending Fund CLO V Ltd., 7.48% | 2.9% |
| Owl Rock CLO XIII LLC, 7.36% | 2.9% |
| Owl Rock CLO X LLC, 7.73% | 2.9% |
| FIGRE Trust, 5.06% | 2.9% |
| BRAVO, 5.66% | 2.9% |
| Top 10 Total | 34.5% |
| |
4 | "10 Largest Holdings (as a % of Net Assets)" excludes any temporary cash or derivative investments. |
There were no changes in or disagreements with fund accountants for the period.
There were no material changes for the period.
| |  | Availability of Additional Information. For additional information, including the fund's prospectus, financial information, holdings and proxy voting information, go to GuggenheimInvestments.com/mutual-funds/literature or, call 800 820 0888. |
AR-GULDX-093024
Annual Shareholder Report | 9.30.24
This annual shareholder report contains important information about the Guggenheim Core Bond Fund for the period of October 1, 2023 to September 30, 2024. You can find additional information about the fund at GuggenheimInvestments.com/mutual-funds/literature. You can also request this information by contacting 800 820 0888 or GuggenheimClientServices@mufg-is.com.
This report describes changes to the fund that occurred during the reporting period.
For the period of October 1, 2023 to September 30, 2024, the fund (Class A shares) returned 12.27%, outperforming the fund's benchmark, the Bloomberg U.S. Aggregate Bond Index, which returned 11.57% for the same period.
What factors materially affected the fund's performance over the last year?
The fund's relative outperformance against the benchmark was primarily driven by sector allocation, security selection, and the fund's carry (or earned income) advantage. The fund benefited from an overweight allocation to credit, as spreads tightened materially across the broader category. Performance from credit spread tightening in agency residential mortgage-backed securities and investment grade corporates were large drivers of absolute performance, while out-of-benchmark allocations like structured credit drove most of the relative outperformance. Duration was a large driver of absolute performance given the bull steepening move in U.S. yields.
Cumulative performance* for the fund's most recently completed 10 years (as of 9.30.24), assuming a $10,000 initial investment.
| 09/30/2014 | 9526 | 10000 |
| 12/31/2014 | 9618 | 10179 |
| 03/31/2015 | 9755 | 10343 |
| 06/30/2015 | 9711 | 10169 |
| 09/30/2015 | 9728 | 10294 |
| 12/31/2015 | 9715 | 10235 |
| 03/31/2016 | 9850 | 10546 |
| 06/30/2016 | 10146 | 10779 |
| 09/30/2016 | 10360 | 10829 |
| 12/31/2016 | 10202 | 10506 |
| 03/31/2017 | 10383 | 10592 |
| 06/30/2017 | 10595 | 10745 |
| 09/30/2017 | 10711 | 10836 |
| 12/31/2017 | 10847 | 10879 |
| 03/31/2018 | 10811 | 10720 |
| 06/30/2018 | 10865 | 10703 |
| 09/30/2018 | 10867 | 10705 |
| 12/31/2018 | 10937 | 10880 |
| 03/31/2019 | 11077 | 11200 |
| 06/30/2019 | 11307 | 11545 |
| 09/30/2019 | 11489 | 11807 |
| 12/31/2019 | 11408 | 11828 |
| 03/31/2020 | 11761 | 12200 |
| 06/30/2020 | 12403 | 12554 |
| 09/30/2020 | 12716 | 12632 |
| 12/31/2020 | 13069 | 12716 |
| 03/31/2021 | 12591 | 12287 |
| 06/30/2021 | 12979 | 12512 |
| 09/30/2021 | 12983 | 12518 |
| 12/31/2021 | 12963 | 12520 |
| 03/31/2022 | 12064 | 11777 |
| 06/30/2022 | 11213 | 11224 |
| 09/30/2022 | 10736 | 10691 |
| 12/31/2022 | 10875 | 10891 |
| 03/31/2023 | 11295 | 11214 |
| 06/30/2023 | 11241 | 11119 |
| 09/30/2023 | 10893 | 10760 |
| 12/31/2023 | 11606 | 11493 |
| 03/31/2024 | 11573 | 11404 |
| 06/30/2024 | 11611 | 11411 |
| 09/30/2024 | 12229 | 12004 |
| Class A (without sales charge) | 12.27% | 1.21% | 2.50% |
| Class A (with sales charge)† | 7.76% | 0.38% | 2.01% |
| Bloomberg U.S. Aggregate Bond Index | 11.57% | 0.33% | 1.84% |
The fund's past performance is not a good predictor of the fund's future performance. Visit GuggenheimInvestments.com/mutual-funds/performance for more recent performance information.
| Net Assets | $2,093,399,727 |
| Total Number of Portfolio Holdings | 771 |
| Portfolio Turnover Rate | 89% |
| Total Advisory Fees Paid | $6,266,296 |
| Guggenheim Core Bond Fund | Class A | SIUSX | Annual Shareholder Report | September 30, 2024 |
| Collateralized Mortgage Obligations | 30.4% |
| Interest Rate Swap Agreements | 27.3% |
| U.S. Government Securities | 24.8% |
| Corporate Bonds | 24.0% |
| Asset-Backed Securities | 22.0% |
| Interest Rate Futures Contracts | 7.1% |
| Preferred Stocks | 1.5% |
| Senior Floating Rate Interests | 1.0% |
| Federal Agency Bonds | 0.9% |
| Other | 0.4% |
| Credit Default Swaps Agreements Protection Purchased | -2.6% |
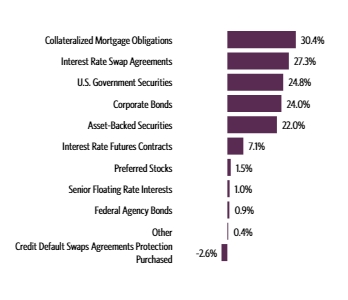
| AAA | 51.4% |
| AA | 6.8% |
| A | 16.7% |
| BBB | 16.8% |
| BB | 1.0% |
| B | 0.2% |
| CCC* | 0.0% |
| CC* | 0.0% |
| C* | 0.0% |
| NR3 | 0.3% |
| Other Instruments | 6.8% |
| U.S. Treasury Notes, 4.13% | 4.2% |
| U.S. Treasury Notes, 4.63% | 3.0% |
| U.S. Treasury Notes, 3.75% | 2.7% |
| U.S. Treasury Bonds due 05/15/51 | 2.6% |
| Uniform MBS 30 Year due 12/01/24 | 2.6% |
| U.S. Treasury Notes, 3.38% | 2.4% |
| Uniform MBS 30 Year due 12/01/24 | 1.8% |
| Uniform MBS 30 Year due 01/01/25 | 1.4% |
| GNMA II 30Year TBA due 10/21/24 | 1.4% |
| Fannie Mae, 5.50% due 05/01/53 | 1.3% |
| Top 10 Total | 23.4% |
| |
* | Less than 0.10% of Total Investments. |
1 | "Holdings Diversification (Market Exposure as a % of Net Assets)" excludes any temporary cash investments, investments in Guggenheim Strategy Funds Trust mutual funds, or investments in Guggenheim Ultra Short Duration Fund. |
| |
2 | Source: BlackRock Solutions. Credit quality ratings are measured on a scale that generally ranges from AAA (highest) to D (lowest). All securities except for those labeled "NR" have been rated by Moody's, Standard & Poor's ("S&P"), or Fitch, each of which is a Nationally Recognized Statistical Rating Organization ("NRSRO"). For purposes of this presentation, when ratings are available from more than one agency, the highest rating is used. Guggenheim Investments has converted ratings to the equivalent S&P rating. |
3 | NR (not rated) securities do not necessarily indicate low credit quality. |
| |
4 | "10 Largest Holdings (as a % of Net Assets)" excludes any temporary cash or derivative investments. |
| U.S. Treasury Notes, 4.13% | 4.2% |
| U.S. Treasury Notes, 4.63% | 3.0% |
| U.S. Treasury Notes, 3.75% | 2.7% |
| U.S. Treasury Bonds due 05/15/51 | 2.6% |
| Uniform MBS 30 Year due 12/01/24 | 2.6% |
| U.S. Treasury Notes, 3.38% | 2.4% |
| Uniform MBS 30 Year due 12/01/24 | 1.8% |
| Uniform MBS 30 Year due 01/01/25 | 1.4% |
| GNMA II 30Year TBA due 10/21/24 | 1.4% |
| Fannie Mae, 5.50% due 05/01/53 | 1.3% |
| Top 10 Total | 23.4% |
| |
4 | "10 Largest Holdings (as a % of Net Assets)" excludes any temporary cash or derivative investments. |
There were no changes in or disagreements with fund accountants for the period.
This is a summary of certain changes to the fund since September 30, 2023. For more complete information, you may review the fund's next prospectus, which we expect to be available by January 31, 2025 at GuggenheimInvestments.com/mutual-funds/literature or, by calling 800 820 0888.
Subsequent to the September 30, 2024 year-end, effective November 29, 2024, Guggenheim Partners Investment Management, LLC replaced Securities Investors, LLC as the fund's Investment Adviser in connection with an internal realignment of Guggenheim Investment's lines of business.
| |  | Availability of Additional Information. For additional information, including the fund's prospectus, financial information, holdings and proxy voting information, go to GuggenheimInvestments.com/mutual-funds/literature or, call 800 820 0888. |
AR-SIUSX-093024
Annual Shareholder Report | 9.30.24
This annual shareholder report contains important information about the Guggenheim Core Bond Fund for the period of October 1, 2023 to September 30, 2024. You can find additional information about the fund at GuggenheimInvestments.com/mutual-funds/literature. You can also request this information by contacting 800 820 0888 or GuggenheimClientServices@mufg-is.com.
This report describes changes to the fund that occurred during the reporting period.
For the period of October 1, 2023 to September 30, 2024, the fund (Class C shares) returned 11.49%, outperforming the fund's benchmark, the Bloomberg U.S. Aggregate Bond Index, which returned 11.57% for the same period.
What factors materially affected the fund's performance over the last year?
The fund's relative outperformance against the benchmark was primarily driven by sector allocation, security selection, and the fund's carry (or earned income) advantage. The fund benefited from an overweight allocation to credit, as spreads tightened materially across the broader category. Performance from credit spread tightening in agency residential mortgage-backed securities and investment grade corporates were large drivers of absolute performance, while out-of-benchmark allocations like structured credit drove most of the relative outperformance. Duration was a large driver of absolute performance given the bull steepening move in U.S. yields.
Cumulative performance* for the fund's most recently completed 10 years (as of 9.30.24), assuming a $10,000 initial investment.
| 09/30/2014 | 10000 | 10000 |
| 12/31/2014 | 10077 | 10179 |
| 03/31/2015 | 10203 | 10343 |
| 06/30/2015 | 10137 | 10169 |
| 09/30/2015 | 10137 | 10294 |
| 12/31/2015 | 10103 | 10235 |
| 03/31/2016 | 10226 | 10546 |
| 06/30/2016 | 10515 | 10779 |
| 09/30/2016 | 10722 | 10829 |
| 12/31/2016 | 10538 | 10506 |
| 03/31/2017 | 10700 | 10592 |
| 06/30/2017 | 10899 | 10745 |
| 09/30/2017 | 11000 | 10836 |
| 12/31/2017 | 11119 | 10879 |
| 03/31/2018 | 11062 | 10720 |
| 06/30/2018 | 11103 | 10703 |
| 09/30/2018 | 11078 | 10705 |
| 12/31/2018 | 11134 | 10880 |
| 03/31/2019 | 11251 | 11200 |
| 06/30/2019 | 11465 | 11545 |
| 09/30/2019 | 11628 | 11807 |
| 12/31/2019 | 11523 | 11828 |
| 03/31/2020 | 11860 | 12200 |
| 06/30/2020 | 12481 | 12554 |
| 09/30/2020 | 12774 | 12632 |
| 12/31/2020 | 13104 | 12716 |
| 03/31/2021 | 12600 | 12287 |
| 06/30/2021 | 12973 | 12512 |
| 09/30/2021 | 12945 | 12518 |
| 12/31/2021 | 12907 | 12520 |
| 03/31/2022 | 11986 | 11777 |
| 06/30/2022 | 11123 | 11224 |
| 09/30/2022 | 10628 | 10691 |
| 12/31/2022 | 10742 | 10891 |
| 03/31/2023 | 11139 | 11214 |
| 06/30/2023 | 11064 | 11119 |
| 09/30/2023 | 10700 | 10760 |
| 12/31/2023 | 11383 | 11493 |
| 03/31/2024 | 11336 | 11404 |
| 06/30/2024 | 11346 | 11411 |
| 09/30/2024 | 11930 | 12004 |
| Class C (without CDSC) | 11.49% | 0.48% | 1.76% |
| Class C (with CDSC) ‡ | 10.49% | 0.48% | 1.76% |
| Bloomberg U.S. Aggregate Bond Index | 11.57% | 0.33% | 1.84% |
The fund's past performance is not a good predictor of the fund's future performance. Visit GuggenheimInvestments.com/mutual-funds/performance for more recent performance information.
| Net Assets | $2,093,399,727 |
| Total Number of Portfolio Holdings | 771 |
| Portfolio Turnover Rate | 89% |
| Total Advisory Fees Paid | $6,266,296 |
| Guggenheim Core Bond Fund | Class C | SDICX | Annual Shareholder Report | September 30, 2024 |
| Collateralized Mortgage Obligations | 30.4% |
| Interest Rate Swap Agreements | 27.3% |
| U.S. Government Securities | 24.8% |
| Corporate Bonds | 24.0% |
| Asset-Backed Securities | 22.0% |
| Interest Rate Futures Contracts | 7.1% |
| Preferred Stocks | 1.5% |
| Senior Floating Rate Interests | 1.0% |
| Federal Agency Bonds | 0.9% |
| Other | 0.4% |
| Credit Default Swaps Agreements Protection Purchased | -2.6% |

| AAA | 51.4% |
| AA | 6.8% |
| A | 16.7% |
| BBB | 16.8% |
| BB | 1.0% |
| B | 0.2% |
| CCC* | 0.0% |
| CC* | 0.0% |
| C* | 0.0% |
| NR3 | 0.3% |
| Other Instruments | 6.8% |
| U.S. Treasury Notes, 4.13% | 4.2% |
| U.S. Treasury Notes, 4.63% | 3.0% |
| U.S. Treasury Notes, 3.75% | 2.7% |
| U.S. Treasury Bonds due 05/15/51 | 2.6% |
| Uniform MBS 30 Year due 12/01/24 | 2.6% |
| U.S. Treasury Notes, 3.38% | 2.4% |
| Uniform MBS 30 Year due 12/01/24 | 1.8% |
| Uniform MBS 30 Year due 01/01/25 | 1.4% |
| GNMA II 30Year TBA due 10/21/24 | 1.4% |
| Fannie Mae, 5.50% due 05/01/53 | 1.3% |
| Top 10 Total | 23.4% |
| |
* | Less than 0.10% of Total Investments. |
1 | "Holdings Diversification (Market Exposure as a % of Net Assets)" excludes any temporary cash investments, investments in Guggenheim Strategy Funds Trust mutual funds, or investments in Guggenheim Ultra Short Duration Fund. |
| |
2 | Source: BlackRock Solutions. Credit quality ratings are measured on a scale that generally ranges from AAA (highest) to D (lowest). All securities except for those labeled "NR" have been rated by Moody's, Standard & Poor's ("S&P"), or Fitch, each of which is a Nationally Recognized Statistical Rating Organization ("NRSRO"). For purposes of this presentation, when ratings are available from more than one agency, the highest rating is used. Guggenheim Investments has converted ratings to the equivalent S&P rating. |
3 | NR (not rated) securities do not necessarily indicate low credit quality. |
| |
4 | "10 Largest Holdings (as a % of Net Assets)" excludes any temporary cash or derivative investments. |
| U.S. Treasury Notes, 4.13% | 4.2% |
| U.S. Treasury Notes, 4.63% | 3.0% |
| U.S. Treasury Notes, 3.75% | 2.7% |
| U.S. Treasury Bonds due 05/15/51 | 2.6% |
| Uniform MBS 30 Year due 12/01/24 | 2.6% |
| U.S. Treasury Notes, 3.38% | 2.4% |
| Uniform MBS 30 Year due 12/01/24 | 1.8% |
| Uniform MBS 30 Year due 01/01/25 | 1.4% |
| GNMA II 30Year TBA due 10/21/24 | 1.4% |
| Fannie Mae, 5.50% due 05/01/53 | 1.3% |
| Top 10 Total | 23.4% |
| |
4 | "10 Largest Holdings (as a % of Net Assets)" excludes any temporary cash or derivative investments. |
There were no changes in or disagreements with fund accountants for the period.
This is a summary of certain changes to the fund since September 30, 2023. For more complete information, you may review the fund's next prospectus, which we expect to be available by January 31, 2025 at GuggenheimInvestments.com/mutual-funds/literature or, by calling 800 820 0888.
Subsequent to the September 30, 2024 year-end, effective November 29, 2024, Guggenheim Partners Investment Management, LLC replaced Securities Investors, LLC as the fund's Investment Adviser in connection with an internal realignment of Guggenheim Investment's lines of business.
| |  | Availability of Additional Information. For additional information, including the fund's prospectus, financial information, holdings and proxy voting information, go to GuggenheimInvestments.com/mutual-funds/literature or, call 800 820 0888. |
AR-SDICX-093024
Annual Shareholder Report | 9.30.24
This annual shareholder report contains important information about the Guggenheim Core Bond Fund for the period of October 1, 2023 to September 30, 2024. You can find additional information about the fund at GuggenheimInvestments.com/mutual-funds/literature. You can also request this information by contacting 800 820 0888 or GuggenheimClientServices@mufg-is.com.
This report describes changes to the fund that occurred during the reporting period.
For the period of October 1, 2023 to September 30, 2024, the fund (Class P shares) returned 12.25%, outperforming the fund's benchmark, the Bloomberg U.S. Aggregate Bond Index, which returned 11.57% for the same period.
What factors materially affected the fund's performance over the last year?
The fund's relative outperformance against the benchmark was primarily driven by sector allocation, security selection, and the fund's carry (or earned income) advantage. The fund benefited from an overweight allocation to credit, as spreads tightened materially across the broader category. Performance from credit spread tightening in agency residential mortgage-backed securities and investment grade corporates were large drivers of absolute performance, while out-of-benchmark allocations like structured credit drove most of the relative outperformance. Duration was a large driver of absolute performance given the bull steepening move in U.S. yields.
Cumulative performance* for the fund since inception (as of 9.30.24), assuming a $10,000 initial investment.
| 05/01/2015 | 10000 | 10000 |
| 06/30/2015 | 9961 | 9899 |
| 09/30/2015 | 9989 | 10021 |
| 12/31/2015 | 9974 | 9964 |
| 03/31/2016 | 10111 | 10266 |
| 06/30/2016 | 10414 | 10493 |
| 09/30/2016 | 10640 | 10542 |
| 12/31/2016 | 10478 | 10228 |
| 03/31/2017 | 10659 | 10311 |
| 06/30/2017 | 10876 | 10460 |
| 09/30/2017 | 10994 | 10549 |
| 12/31/2017 | 11140 | 10590 |
| 03/31/2018 | 11103 | 10435 |
| 06/30/2018 | 11158 | 10419 |
| 09/30/2018 | 11154 | 10421 |
| 12/31/2018 | 11232 | 10591 |
| 03/31/2019 | 11375 | 10903 |
| 06/30/2019 | 11611 | 11239 |
| 09/30/2019 | 11797 | 11494 |
| 12/31/2019 | 11714 | 11515 |
| 03/31/2020 | 12076 | 11877 |
| 06/30/2020 | 12728 | 12221 |
| 09/30/2020 | 13056 | 12297 |
| 12/31/2020 | 13418 | 12379 |
| 03/31/2021 | 12921 | 11961 |
| 06/30/2021 | 13325 | 12180 |
| 09/30/2021 | 13322 | 12187 |
| 12/31/2021 | 13309 | 12188 |
| 03/31/2022 | 12386 | 11465 |
| 06/30/2022 | 11507 | 10927 |
| 09/30/2022 | 11018 | 10407 |
| 12/31/2022 | 11158 | 10602 |
| 03/31/2023 | 11596 | 10916 |
| 06/30/2023 | 11540 | 10824 |
| 09/30/2023 | 11183 | 10474 |
| 12/31/2023 | 11915 | 11189 |
| 03/31/2024 | 11880 | 11102 |
| 06/30/2024 | 11920 | 11109 |
| 09/30/2024 | 12554 | 11686 |
| Class P | 12.25% | 1.20% | 2.42% |
| Bloomberg U.S. Aggregate Bond Index | 11.57% | 0.33% | 1.67% |
The fund's past performance is not a good predictor of the fund's future performance. Visit GuggenheimInvestments.com/mutual-funds/performance for more recent performance information.
| Net Assets | $2,093,399,727 |
| Total Number of Portfolio Holdings | 771 |
| Portfolio Turnover Rate | 89% |
| Total Advisory Fees Paid | $6,266,296 |
| Guggenheim Core Bond Fund | Class P | SIUPX | Annual Shareholder Report | September 30, 2024 |
| Collateralized Mortgage Obligations | 30.4% |
| Interest Rate Swap Agreements | 27.3% |
| U.S. Government Securities | 24.8% |
| Corporate Bonds | 24.0% |
| Asset-Backed Securities | 22.0% |
| Interest Rate Futures Contracts | 7.1% |
| Preferred Stocks | 1.5% |
| Senior Floating Rate Interests | 1.0% |
| Federal Agency Bonds | 0.9% |
| Other | 0.4% |
| Credit Default Swaps Agreements Protection Purchased | -2.6% |

| AAA | 51.4% |
| AA | 6.8% |
| A | 16.7% |
| BBB | 16.8% |
| BB | 1.0% |
| B | 0.2% |
| CCC* | 0.0% |
| CC* | 0.0% |
| C* | 0.0% |
| NR3 | 0.3% |
| Other Instruments | 6.8% |
| U.S. Treasury Notes, 4.13% | 4.2% |
| U.S. Treasury Notes, 4.63% | 3.0% |
| U.S. Treasury Notes, 3.75% | 2.7% |
| U.S. Treasury Bonds due 05/15/51 | 2.6% |
| Uniform MBS 30 Year due 12/01/24 | 2.6% |
| U.S. Treasury Notes, 3.38% | 2.4% |
| Uniform MBS 30 Year due 12/01/24 | 1.8% |
| Uniform MBS 30 Year due 01/01/25 | 1.4% |
| GNMA II 30Year TBA due 10/21/24 | 1.4% |
| Fannie Mae, 5.50% due 05/01/53 | 1.3% |
| Top 10 Total | 23.4% |
| |
* | Less than 0.10% of Total Investments. |
1 | "Holdings Diversification (Market Exposure as a % of Net Assets)" excludes any temporary cash investments, investments in Guggenheim Strategy Funds Trust mutual funds, or investments in Guggenheim Ultra Short Duration Fund. |
| |
2 | Source: BlackRock Solutions. Credit quality ratings are measured on a scale that generally ranges from AAA (highest) to D (lowest). All securities except for those labeled "NR" have been rated by Moody's, Standard & Poor's ("S&P"), or Fitch, each of which is a Nationally Recognized Statistical Rating Organization ("NRSRO"). For purposes of this presentation, when ratings are available from more than one agency, the highest rating is used. Guggenheim Investments has converted ratings to the equivalent S&P rating. |
3 | NR (not rated) securities do not necessarily indicate low credit quality. |
| |
4 | "10 Largest Holdings (as a % of Net Assets)" excludes any temporary cash or derivative investments. |
| U.S. Treasury Notes, 4.13% | 4.2% |
| U.S. Treasury Notes, 4.63% | 3.0% |
| U.S. Treasury Notes, 3.75% | 2.7% |
| U.S. Treasury Bonds due 05/15/51 | 2.6% |
| Uniform MBS 30 Year due 12/01/24 | 2.6% |
| U.S. Treasury Notes, 3.38% | 2.4% |
| Uniform MBS 30 Year due 12/01/24 | 1.8% |
| Uniform MBS 30 Year due 01/01/25 | 1.4% |
| GNMA II 30Year TBA due 10/21/24 | 1.4% |
| Fannie Mae, 5.50% due 05/01/53 | 1.3% |
| Top 10 Total | 23.4% |
| |
4 | "10 Largest Holdings (as a % of Net Assets)" excludes any temporary cash or derivative investments. |
There were no changes in or disagreements with fund accountants for the period.
This is a summary of certain changes to the fund since September 30, 2023. For more complete information, you may review the fund's next prospectus, which we expect to be available by January 31, 2025 at GuggenheimInvestments.com/mutual-funds/literature or, by calling 800 820 0888.
Subsequent to the September 30, 2024 year-end, effective November 29, 2024, Guggenheim Partners Investment Management, LLC replaced Securities Investors, LLC as the fund's Investment Adviser in connection with an internal realignment of Guggenheim Investment's lines of business.
| |  | Availability of Additional Information. For additional information, including the fund's prospectus, financial information, holdings and proxy voting information, go to GuggenheimInvestments.com/mutual-funds/literature or, call 800 820 0888. |
AR-SIUPX-093024
Annual Shareholder Report | 9.30.24
This annual shareholder report contains important information about the Guggenheim Core Bond Fund for the period of October 1, 2023 to September 30, 2024. You can find additional information about the fund at GuggenheimInvestments.com/mutual-funds/literature. You can also request this information by contacting 800 820 0888 or GuggenheimClientServices@mufg-is.com.
This report describes changes to the fund that occurred during the reporting period.
| Institutional Class | $56 | 0.53% |
For the period of October 1, 2023 to September 30, 2024, the fund (Institutional Class shares) returned 12.61%, outperforming the fund's benchmark, the Bloomberg U.S. Aggregate Bond Index, which returned 11.57% for the same period.
What factors materially affected the fund's performance over the last year?
The fund's relative outperformance against the benchmark was primarily driven by sector allocation, security selection, and the fund's carry (or earned income) advantage. The fund benefited from an overweight allocation to credit, as spreads tightened materially across the broader category. Performance from credit spread tightening in agency residential mortgage-backed securities and investment grade corporates were large drivers of absolute performance, while out-of-benchmark allocations like structured credit drove most of the relative outperformance. Duration was a large driver of absolute performance given the bull steepening move in U.S. yields.
Cumulative performance* for the fund's most recently completed 10 years (as of 9.30.24), assuming a $2,000,000 initial investment.
| 09/30/2014 | 2000000 | 2000000 |
| 12/31/2014 | 2020440 | 2035885 |
| 03/31/2015 | 2051664 | 2068593 |
| 06/30/2015 | 2043571 | 2033787 |
| 09/30/2015 | 2047403 | 2058816 |
| 12/31/2015 | 2045965 | 2047081 |
| 03/31/2016 | 2076760 | 2109149 |
| 06/30/2016 | 2139295 | 2155839 |
| 09/30/2016 | 2187185 | 2165719 |
| 12/31/2016 | 2155610 | 2101277 |
| 03/31/2017 | 2194743 | 2118439 |
| 06/30/2017 | 2241501 | 2149054 |
| 09/30/2017 | 2267386 | 2167289 |
| 12/31/2017 | 2297818 | 2175701 |
| 03/31/2018 | 2293127 | 2143918 |
| 06/30/2018 | 2306175 | 2140524 |
| 09/30/2018 | 2307009 | 2140934 |
| 12/31/2018 | 2324904 | 2175948 |
| 03/31/2019 | 2356165 | 2239983 |
| 06/30/2019 | 2407007 | 2308967 |
| 09/30/2019 | 2446194 | 2361362 |
| 12/31/2019 | 2430708 | 2365619 |
| 03/31/2020 | 2509158 | 2440097 |
| 06/30/2020 | 2646788 | 2510752 |
| 09/30/2020 | 2717046 | 2526300 |
| 12/31/2020 | 2793228 | 2543198 |
| 03/31/2021 | 2692756 | 2457428 |
| 06/30/2021 | 2779394 | 2502393 |
| 09/30/2021 | 2780731 | 2503689 |
| 12/31/2021 | 2780043 | 2503980 |
| 03/31/2022 | 2588744 | 2355394 |
| 06/30/2022 | 2407692 | 2244843 |
| 09/30/2022 | 2305498 | 2138160 |
| 12/31/2022 | 2337886 | 2178209 |
| 03/31/2023 | 2430233 | 2242728 |
| 06/30/2023 | 2420287 | 2223793 |
| 09/30/2023 | 2346954 | 2151938 |
| 12/31/2023 | 2502629 | 2298638 |
| 03/31/2024 | 2498705 | 2280808 |
| 06/30/2024 | 2507359 | 2282297 |
| 09/30/2024 | 2642869 | 2400886 |
| Institutional Class | 12.61% | 1.52% | 2.81% |
| Bloomberg U.S. Aggregate Bond Index | 11.57% | 0.33% | 1.84% |
The fund's past performance is not a good predictor of the fund's future performance. Visit GuggenheimInvestments.com/mutual-funds/performance for more recent performance information.
| Net Assets | $2,093,399,727 |
| Total Number of Portfolio Holdings | 771 |
| Portfolio Turnover Rate | 89% |
| Total Advisory Fees Paid | $6,266,296 |
| Guggenheim Core Bond Fund | Institutional Class | GIUSX | Annual Shareholder Report | September 30, 2024 |
| Collateralized Mortgage Obligations | 30.4% |
| Interest Rate Swap Agreements | 27.3% |
| U.S. Government Securities | 24.8% |
| Corporate Bonds | 24.0% |
| Asset-Backed Securities | 22.0% |
| Interest Rate Futures Contracts | 7.1% |
| Preferred Stocks | 1.5% |
| Senior Floating Rate Interests | 1.0% |
| Federal Agency Bonds | 0.9% |
| Other | 0.4% |
| Credit Default Swaps Agreements Protection Purchased | -2.6% |

| AAA | 51.4% |
| AA | 6.8% |
| A | 16.7% |
| BBB | 16.8% |
| BB | 1.0% |
| B | 0.2% |
| CCC* | 0.0% |
| CC* | 0.0% |
| C* | 0.0% |
| NR3 | 0.3% |
| Other Instruments | 6.8% |
| U.S. Treasury Notes, 4.13% | 4.2% |
| U.S. Treasury Notes, 4.63% | 3.0% |
| U.S. Treasury Notes, 3.75% | 2.7% |
| U.S. Treasury Bonds due 05/15/51 | 2.6% |
| Uniform MBS 30 Year due 12/01/24 | 2.6% |
| U.S. Treasury Notes, 3.38% | 2.4% |
| Uniform MBS 30 Year due 12/01/24 | 1.8% |
| Uniform MBS 30 Year due 01/01/25 | 1.4% |
| GNMA II 30Year TBA due 10/21/24 | 1.4% |
| Fannie Mae, 5.50% due 05/01/53 | 1.3% |
| Top 10 Total | 23.4% |
| |
* | Less than 0.10% of Total Investments. |
1 | "Holdings Diversification (Market Exposure as a % of Net Assets)" excludes any temporary cash investments, investments in Guggenheim Strategy Funds Trust mutual funds, or investments in Guggenheim Ultra Short Duration Fund. |
| |
2 | Source: BlackRock Solutions. Credit quality ratings are measured on a scale that generally ranges from AAA (highest) to D (lowest). All securities except for those labeled "NR" have been rated by Moody's, Standard & Poor's ("S&P"), or Fitch, each of which is a Nationally Recognized Statistical Rating Organization ("NRSRO"). For purposes of this presentation, when ratings are available from more than one agency, the highest rating is used. Guggenheim Investments has converted ratings to the equivalent S&P rating. |
3 | NR (not rated) securities do not necessarily indicate low credit quality. |
| |
4 | "10 Largest Holdings (as a % of Net Assets)" excludes any temporary cash or derivative investments. |
| U.S. Treasury Notes, 4.13% | 4.2% |
| U.S. Treasury Notes, 4.63% | 3.0% |
| U.S. Treasury Notes, 3.75% | 2.7% |
| U.S. Treasury Bonds due 05/15/51 | 2.6% |
| Uniform MBS 30 Year due 12/01/24 | 2.6% |
| U.S. Treasury Notes, 3.38% | 2.4% |
| Uniform MBS 30 Year due 12/01/24 | 1.8% |
| Uniform MBS 30 Year due 01/01/25 | 1.4% |
| GNMA II 30Year TBA due 10/21/24 | 1.4% |
| Fannie Mae, 5.50% due 05/01/53 | 1.3% |
| Top 10 Total | 23.4% |
| |
4 | "10 Largest Holdings (as a % of Net Assets)" excludes any temporary cash or derivative investments. |
There were no changes in or disagreements with fund accountants for the period.
This is a summary of certain changes to the fund since September 30, 2023. For more complete information, you may review the fund's next prospectus, which we expect to be available by January 31, 2025 at GuggenheimInvestments.com/mutual-funds/literature or, by calling 800 820 0888.
Subsequent to the September 30, 2024 year-end, effective November 29, 2024, Guggenheim Partners Investment Management, LLC replaced Securities Investors, LLC as the fund's Investment Adviser in connection with an internal realignment of Guggenheim Investment's lines of business.
| |  | Availability of Additional Information. For additional information, including the fund's prospectus, financial information, holdings and proxy voting information, go to GuggenheimInvestments.com/mutual-funds/literature or, call 800 820 0888. |
AR-GIUSX-093024
Annual Shareholder Report | 9.30.24
This annual shareholder report contains important information about the Guggenheim Floating Rate Strategies Fund for the period of October 1, 2023 to September 30, 2024. You can find additional information about the fund at GuggenheimInvestments.com/mutual-funds/literature. You can also request this information by contacting 800 820 0888 or GuggenheimClientServices@mufg-is.com.
This report describes changes to the fund that occurred during the reporting period.
For the period of October 1, 2023 to September 30, 2024, the fund (Class A shares) returned 7.41%, underperforming the fund's benchmark, the Bloomberg U.S. Aggregate Bond Index, which returned 11.57% for the same period and underperforming the fund's secondary index, the Credit Suisse Leveraged Loan Index, which returned 9.65% for the same period.
The fund's broad-based securities market index was changed from the Credit Suisse Leveraged Loan Index to the Bloomberg U.S. Aggregate Bond Index to comply with the regulation that requires the fund's broad-based securities market index to represent the overall applicable market.
What factors materially affected the fund's performance over the last year?
Above-average returns for both the fund and the Credit Suisse Leveraged Loan Index (the "Index") continued to be driven by high all-in coupon rates. Loan demand, driven by record collateralized loan obligation issuance, continued to outpace net new loan issuance. Loan issuance has increased during 2024, but remains predominantly opportunistic (refinancings/repricings); new money M&A volume remains lackluster. Loan issuer fundamentals have remained in-line with historical averages given strong starting levels and resilient earnings growth, although we have continued to see tail-risk in the market. Loans spreads have tightened this year but all-in yields have remained above historical averages. Comparing the fund to the Index, idiosyncratic credit issues in the Communications and Consumer sectors were the primary detractors to relative performance during the reporting period. Credit selection in the Technology sector and the fund's high-yield bond allocation were contributors to performance during the period.
Cumulative performance* for the fund's most recently completed 10 years (as of 9.30.24), assuming a $10,000 initial investment.
| 09/30/2014 | 9526 | 10000 | 10000 |
| 12/31/2014 | 9522 | 10179 | 9963 |
| 03/31/2015 | 9704 | 10343 | 10169 |
| 06/30/2015 | 9796 | 10169 | 10249 |
| 09/30/2015 | 9750 | 10294 | 10123 |
| 12/31/2015 | 9625 | 10235 | 9925 |
| 03/31/2016 | 9738 | 10546 | 10057 |
| 06/30/2016 | 9930 | 10779 | 10344 |
| 09/30/2016 | 10187 | 10829 | 10665 |
| 12/31/2016 | 10341 | 10506 | 10905 |
| 03/31/2017 | 10424 | 10592 | 11036 |
| 06/30/2017 | 10497 | 10745 | 11119 |
| 09/30/2017 | 10597 | 10836 | 11237 |
| 12/31/2017 | 10689 | 10879 | 11368 |
| 03/31/2018 | 10789 | 10720 | 11548 |
| 06/30/2018 | 10811 | 10703 | 11638 |
| 09/30/2018 | 11000 | 10705 | 11863 |
| 12/31/2018 | 10655 | 10880 | 11498 |
| 03/31/2019 | 10974 | 11200 | 11932 |
| 06/30/2019 | 11118 | 11545 | 12121 |
| 09/30/2019 | 11221 | 11807 | 12233 |
| 12/31/2019 | 11388 | 11828 | 12438 |
| 03/31/2020 | 9831 | 12200 | 10797 |
| 06/30/2020 | 10632 | 12554 | 11846 |
| 09/30/2020 | 11165 | 12632 | 12335 |
| 12/31/2020 | 11548 | 12716 | 12783 |
| 03/31/2021 | 11734 | 12287 | 13040 |
| 06/30/2021 | 11915 | 12512 | 13228 |
| 09/30/2021 | 12039 | 12518 | 13378 |
| 12/31/2021 | 12108 | 12520 | 13474 |
| 03/31/2022 | 12045 | 11777 | 13460 |
| 06/30/2022 | 11471 | 11224 | 12874 |
| 09/30/2022 | 11621 | 10691 | 13027 |
| 12/31/2022 | 11984 | 10891 | 13331 |
| 03/31/2023 | 12393 | 11214 | 13746 |
| 06/30/2023 | 12766 | 11119 | 14175 |
| 09/30/2023 | 13187 | 10760 | 14652 |
| 12/31/2023 | 13507 | 11493 | 15070 |
| 03/31/2024 | 13780 | 11404 | 15451 |
| 06/30/2024 | 13910 | 11411 | 15740 |
| 09/30/2024 | 14164 | 12004 | 16067 |
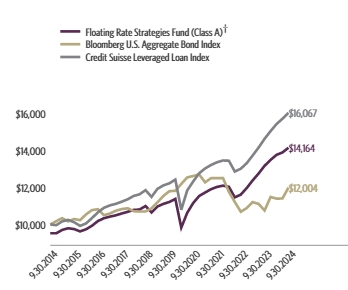
| Class A (without sales charge) | 7.41% | 4.77% | 4.05% |
| Class A (with sales charge)† | 4.18% | 4.13% | 3.54% |
| Bloomberg U.S. Aggregate Bond Index | 11.57% | 0.33% | 1.84% |
| Credit Suisse Leveraged Loan Index | 9.65% | 5.60% | 4.86% |
The fund's past performance is not a good predictor of the fund's future performance. Visit GuggenheimInvestments.com/mutual-funds/performance for more recent performance information.
| Net Assets | $949,597,913 |
| Total Number of Portfolio Holdings | 327 |
| Portfolio Turnover Rate | 37% |
| Total Advisory Fees Paid | $5,600,859 |
| Guggenheim Floating Rate Strategies Fund | Class A | GIFAX | Annual Shareholder Report | September 30, 2024 |
| Senior Floating Rate Interests | 89.7% |
| Corporate Bonds | 4.0% |
| Exchange-Traded Funds | 2.7% |
| Collateralized Mortgage Obligations | 0.9% |
| Common Stocks | 0.4% |
| Asset-Backed Securities | 0.0% |

| A | 0.3% |
| BBB | 6.0% |
| BB | 27.3% |
| B | 53.7% |
| CCC | 4.4% |
| CC | 0.7% |
| NR3 | 1.1% |
| Other Instruments | 6.5% |
| SPDR Blackstone Senior Loan ETF | 2.7% |
| Arcline FM Holdings, LLC, 9.65% | 1.0% |
| American Bath Group LLC, 8.70% | 0.9% |
| CoreLogic, Inc., 8.46% | 0.9% |
| CTEC III GmbH, 7.01% | 0.9% |
| Pelican Products, Inc., 9.12% | 0.9% |
| Virgin Media Bristol LLC, 7.71% | 0.8% |
| Hayward Industries, Inc., 7.46% | 0.8% |
| VC GB Holdings I Corp., 8.37% | 0.8% |
| Medical Solutions Parent Holdings, Inc., 8.85% | 0.7% |
| Top 10 Total | 10.4% |
| |
1 | "Holdings Diversification (Market Exposure as a % of Net Assets)" excludes any temporary cash investments, investments in Guggenheim Strategy Funds Trust mutual funds, or investments in Guggenheim Ultra Short Duration Fund. |
| |
2 | Source: BlackRock Solutions. Credit quality ratings are measured on a scale that generally ranges from AAA (highest) to D (lowest). All securities except for those labeled "NR" have been rated by Moody's, Standard & Poor's ("S&P"), or Fitch, each of which is a Nationally Recognized Statistical Rating Organization ("NRSRO"). For purposes of this presentation, when ratings are available from more than one agency, the highest rating is used. Guggenheim Investments has converted ratings to the equivalent S&P rating. |
3 | NR (not rated) securities do not necessarily indicate low credit quality. |
| |
4 | "10 Largest Holdings (as a % of Net Assets)" excludes any temporary cash or derivative investments. |
| SPDR Blackstone Senior Loan ETF | 2.7% |
| Arcline FM Holdings, LLC, 9.65% | 1.0% |
| American Bath Group LLC, 8.70% | 0.9% |
| CoreLogic, Inc., 8.46% | 0.9% |
| CTEC III GmbH, 7.01% | 0.9% |
| Pelican Products, Inc., 9.12% | 0.9% |
| Virgin Media Bristol LLC, 7.71% | 0.8% |
| Hayward Industries, Inc., 7.46% | 0.8% |
| VC GB Holdings I Corp., 8.37% | 0.8% |
| Medical Solutions Parent Holdings, Inc., 8.85% | 0.7% |
| Top 10 Total | 10.4% |
| |
4 | "10 Largest Holdings (as a % of Net Assets)" excludes any temporary cash or derivative investments. |
There were no changes in or disagreements with fund accountants for the period.
There were no material changes for the period.
| |  | Availability of Additional Information. For additional information, including the fund's prospectus, financial information, holdings and proxy voting information, go to GuggenheimInvestments.com/mutual-funds/literature or, call 800 820 0888. |
AR-GIFAX-093024
Annual Shareholder Report | 9.30.24
This annual shareholder report contains important information about the Guggenheim Floating Rate Strategies Fund for the period of October 1, 2023 to September 30, 2024. You can find additional information about the fund at GuggenheimInvestments.com/mutual-funds/literature. You can also request this information by contacting 800 820 0888 or GuggenheimClientServices@mufg-is.com.
This report describes changes to the fund that occurred during the reporting period.
For the period of October 1, 2023 to September 30, 2024, the fund (Class C shares) returned 6.62%, underperforming the fund's benchmark, the Bloomberg U.S. Aggregate Bond Index, which returned 11.57% for the same period and underperforming the fund's secondary index, the Credit Suisse Leveraged Loan Index, which returned 9.65% for the same period.
The fund's broad-based securities market index was changed from the Credit Suisse Leveraged Loan Index to the Bloomberg U.S. Aggregate Bond Index to comply with the regulation that requires the fund's broad-based securities market index to represent the overall applicable market.
What factors materially affected the fund's performance over the last year?
Above-average returns for both the fund and the Credit Suisse Leveraged Loan Index (the "Index") continued to be driven by high all-in coupon rates. Loan demand, driven by record collateralized loan obligation issuance, continued to outpace net new loan issuance. Loan issuance has increased during 2024, but remains predominantly opportunistic (refinancings/repricings); new money M&A volume remains lackluster. Loan issuer fundamentals have remained in-line with historical averages given strong starting levels and resilient earnings growth, although we have continued to see tail-risk in the market. Loans spreads have tightened this year but all-in yields have remained above historical averages. Comparing the fund to the Index, idiosyncratic credit issues in the Communications and Consumer sectors were the primary detractors to relative performance during the reporting period. Credit selection in the Technology sector and the fund's high-yield bond allocation were contributors to performance during the period.
Cumulative performance* for the fund's most recently completed 10 years (as of 9.30.24), assuming a $10,000 initial investment.
| 09/30/2014 | 10000 | 10000 | 10000 |
| 12/31/2014 | 9981 | 10179 | 9963 |
| 03/31/2015 | 10153 | 10343 | 10169 |
| 06/30/2015 | 10230 | 10169 | 10249 |
| 09/30/2015 | 10163 | 10294 | 10123 |
| 12/31/2015 | 10013 | 10235 | 9925 |
| 03/31/2016 | 10108 | 10546 | 10057 |
| 06/30/2016 | 10292 | 10779 | 10344 |
| 09/30/2016 | 10537 | 10829 | 10665 |
| 12/31/2016 | 10677 | 10506 | 10905 |
| 03/31/2017 | 10742 | 10592 | 11036 |
| 06/30/2017 | 10798 | 10745 | 11119 |
| 09/30/2017 | 10881 | 10836 | 11237 |
| 12/31/2017 | 10954 | 10879 | 11368 |
| 03/31/2018 | 11037 | 10720 | 11548 |
| 06/30/2018 | 11039 | 10703 | 11638 |
| 09/30/2018 | 11210 | 10705 | 11863 |
| 12/31/2018 | 10839 | 10880 | 11498 |
| 03/31/2019 | 11143 | 11200 | 11932 |
| 06/30/2019 | 11268 | 11545 | 12121 |
| 09/30/2019 | 11351 | 11807 | 12233 |
| 12/31/2019 | 11498 | 11828 | 12438 |
| 03/31/2020 | 9906 | 12200 | 10797 |
| 06/30/2020 | 10695 | 12554 | 11846 |
| 09/30/2020 | 11210 | 12632 | 12335 |
| 12/31/2020 | 11573 | 12716 | 12783 |
| 03/31/2021 | 11738 | 12287 | 13040 |
| 06/30/2021 | 11898 | 12512 | 13228 |
| 09/30/2021 | 11999 | 12518 | 13378 |
| 12/31/2021 | 12044 | 12520 | 13474 |
| 03/31/2022 | 11960 | 11777 | 13460 |
| 06/30/2022 | 11368 | 11224 | 12874 |
| 09/30/2022 | 11500 | 10691 | 13027 |
| 12/31/2022 | 11832 | 10891 | 13331 |
| 03/31/2023 | 12214 | 11214 | 13746 |
| 06/30/2023 | 12563 | 11119 | 14175 |
| 09/30/2023 | 12948 | 10760 | 14652 |
| 12/31/2023 | 13237 | 11493 | 15070 |
| 03/31/2024 | 13480 | 11404 | 15451 |
| 06/30/2024 | 13582 | 11411 | 15740 |
| 09/30/2024 | 13804 | 12004 | 16067 |
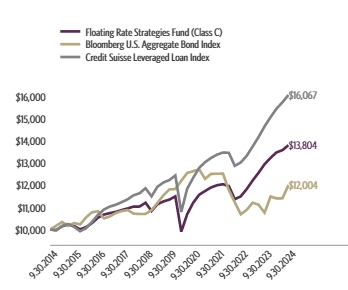
| Class C (without CDSC) | 6.62% | 3.99% | 3.28% |
| Class C (with CDSC)‡ | 5.63% | 3.99% | 3.28% |
| Bloomberg U.S. Aggregate Bond Index | 11.57% | 0.33% | 1.84% |
| Credit Suisse Leveraged Loan Index | 9.65% | 5.60% | 4.86% |
The fund's past performance is not a good predictor of the fund's future performance. Visit GuggenheimInvestments.com/mutual-funds/performance for more recent performance information.
| Net Assets | $949,597,913 |
| Total Number of Portfolio Holdings | 327 |
| Portfolio Turnover Rate | 37% |
| Total Advisory Fees Paid | $5,600,859 |
| Guggenheim Floating Rate Strategies Fund | Class C | GIFCX | Annual Shareholder Report | September 30, 2024 |
| Senior Floating Rate Interests | 89.7% |
| Corporate Bonds | 4.0% |
| Exchange-Traded Funds | 2.7% |
| Collateralized Mortgage Obligations | 0.9% |
| Common Stocks | 0.4% |
| Asset-Backed Securities | 0.0% |
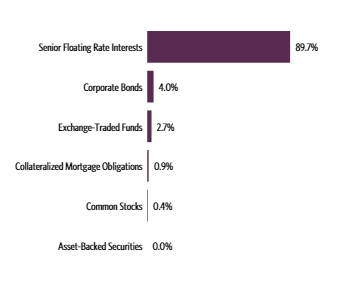
| A | 0.3% |
| BBB | 6.0% |
| BB | 27.3% |
| B | 53.7% |
| CCC | 4.4% |
| CC | 0.7% |
| NR3 | 1.1% |
| Other Instruments | 6.5% |
| SPDR Blackstone Senior Loan ETF | 2.7% |
| Arcline FM Holdings, LLC, 9.65% | 1.0% |
| American Bath Group LLC, 8.70% | 0.9% |
| CoreLogic, Inc., 8.46% | 0.9% |
| CTEC III GmbH, 7.01% | 0.9% |
| Pelican Products, Inc., 9.12% | 0.9% |
| Virgin Media Bristol LLC, 7.71% | 0.8% |
| Hayward Industries, Inc., 7.46% | 0.8% |
| VC GB Holdings I Corp., 8.37% | 0.8% |
| Medical Solutions Parent Holdings, Inc., 8.85% | 0.7% |
| Top 10 Total | 10.4% |
| |
1 | "Holdings Diversification (Market Exposure as a % of Net Assets)" excludes any temporary cash investments, investments in Guggenheim Strategy Funds Trust mutual funds, or investments in Guggenheim Ultra Short Duration Fund. |
| |
2 | Source: BlackRock Solutions. Credit quality ratings are measured on a scale that generally ranges from AAA (highest) to D (lowest). All securities except for those labeled "NR" have been rated by Moody's, Standard & Poor's ("S&P"), or Fitch, each of which is a Nationally Recognized Statistical Rating Organization ("NRSRO"). For purposes of this presentation, when ratings are available from more than one agency, the highest rating is used. Guggenheim Investments has converted ratings to the equivalent S&P rating. |
3 | NR (not rated) securities do not necessarily indicate low credit quality. |
| |
4 | "10 Largest Holdings (as a % of Net Assets)" excludes any temporary cash or derivative investments. |
| SPDR Blackstone Senior Loan ETF | 2.7% |
| Arcline FM Holdings, LLC, 9.65% | 1.0% |
| American Bath Group LLC, 8.70% | 0.9% |
| CoreLogic, Inc., 8.46% | 0.9% |
| CTEC III GmbH, 7.01% | 0.9% |
| Pelican Products, Inc., 9.12% | 0.9% |
| Virgin Media Bristol LLC, 7.71% | 0.8% |
| Hayward Industries, Inc., 7.46% | 0.8% |
| VC GB Holdings I Corp., 8.37% | 0.8% |
| Medical Solutions Parent Holdings, Inc., 8.85% | 0.7% |
| Top 10 Total | 10.4% |
| |
4 | "10 Largest Holdings (as a % of Net Assets)" excludes any temporary cash or derivative investments. |
There were no changes in or disagreements with fund accountants for the period.
There were no material changes for the period.
| |  | Availability of Additional Information. For additional information, including the fund's prospectus, financial information, holdings and proxy voting information, go to GuggenheimInvestments.com/mutual-funds/literature or, call 800 820 0888. |
AR-GIFCX-093024
Annual Shareholder Report | 9.30.24
This annual shareholder report contains important information about the Guggenheim Floating Rate Strategies Fund for the period of October 1, 2023 to September 30, 2024. You can find additional information about the fund at GuggenheimInvestments.com/mutual-funds/literature. You can also request this information by contacting 800 820 0888 or GuggenheimClientServices@mufg-is.com.
This report describes changes to the fund that occurred during the reporting period.
For the period of October 1, 2023 to September 30, 2024, the fund (Class P shares) returned 7.41%, underperforming the fund's benchmark, the Bloomberg U.S. Aggregate Bond Index, which returned 11.57% for the same period and underperforming the fund's secondary index, the Credit Suisse Leveraged Loan Index, which returned 9.65% for the same period.
The fund's broad-based securities market index was changed from the Credit Suisse Leveraged Loan Index to the Bloomberg U.S. Aggregate Bond Index to comply with the regulation that requires the fund's broad-based securities market index to represent the overall applicable market.
What factors materially affected the fund's performance over the last year?
Above-average returns for both the fund and the Credit Suisse Leveraged Loan Index (the "Index") continued to be driven by high all-in coupon rates. Loan demand, driven by record collateralized loan obligation issuance, continued to outpace net new loan issuance. Loan issuance has increased during 2024, but remains predominantly opportunistic (refinancings/repricings); new money M&A volume remains lackluster. Loan issuer fundamentals have remained in-line with historical averages given strong starting levels and resilient earnings growth, although we have continued to see tail-risk in the market. Loans spreads have tightened this year but all-in yields have remained above historical averages. Comparing the fund to the Index, idiosyncratic credit issues in the Communications and Consumer sectors were the primary detractors to relative performance during the reporting period. Credit selection in the Technology sector and the fund's high-yield bond allocation were contributors to performance during the period.
Cumulative performance* for the fund since inception (as of 9.30.24), assuming a $10,000 initial investment.
| 05/01/2015 | 10000 | 10000 | 10000 |
| 06/30/2015 | 10023 | 9899 | 9988 |
| 09/30/2015 | 9976 | 10021 | 9866 |
| 12/31/2015 | 9847 | 9964 | 9672 |
| 03/31/2016 | 9963 | 10266 | 9801 |
| 06/30/2016 | 10158 | 10493 | 10081 |
| 09/30/2016 | 10420 | 10542 | 10394 |
| 12/31/2016 | 10579 | 10228 | 10628 |
| 03/31/2017 | 10663 | 10311 | 10755 |
| 06/30/2017 | 10738 | 10460 | 10836 |
| 09/30/2017 | 10841 | 10549 | 10951 |
| 12/31/2017 | 10935 | 10590 | 11079 |
| 03/31/2018 | 11037 | 10435 | 11254 |
| 06/30/2018 | 11059 | 10419 | 11342 |
| 09/30/2018 | 11252 | 10421 | 11562 |
| 12/31/2018 | 10900 | 10591 | 11206 |
| 03/31/2019 | 11226 | 10903 | 11629 |
| 06/30/2019 | 11373 | 11239 | 11813 |
| 09/30/2019 | 11478 | 11494 | 11922 |
| 12/31/2019 | 11649 | 11515 | 12122 |
| 03/31/2020 | 10057 | 11877 | 10523 |
| 06/30/2020 | 10876 | 12221 | 11545 |
| 09/30/2020 | 11421 | 12297 | 12021 |
| 12/31/2020 | 11814 | 12379 | 12458 |
| 03/31/2021 | 12003 | 11961 | 12709 |
| 06/30/2021 | 12189 | 12180 | 12892 |
| 09/30/2021 | 12315 | 12187 | 13038 |
| 12/31/2021 | 12385 | 12188 | 13131 |
| 03/31/2022 | 12321 | 11465 | 13118 |
| 06/30/2022 | 11734 | 10927 | 12547 |
| 09/30/2022 | 11888 | 10407 | 12696 |
| 12/31/2022 | 12259 | 10602 | 12992 |
| 03/31/2023 | 12677 | 10916 | 13396 |
| 06/30/2023 | 13063 | 10824 | 13814 |
| 09/30/2023 | 13488 | 10474 | 14280 |
| 12/31/2023 | 13815 | 11189 | 14687 |
| 03/31/2024 | 14095 | 11102 | 15058 |
| 06/30/2024 | 14228 | 11109 | 15339 |
| 09/30/2024 | 14487 | 11686 | 15658 |
| Class P | 7.41% | 4.77% | 4.02% |
| Bloomberg U.S. Aggregate Bond Index | 11.57% | 0.33% | 1.67% |
| Credit Suisse Leveraged Loan Index | 9.65% | 5.60% | 4.88% |
The fund's past performance is not a good predictor of the fund's future performance. Visit GuggenheimInvestments.com/mutual-funds/performance for more recent performance information.
| Net Assets | $949,597,913 |
| Total Number of Portfolio Holdings | 327 |
| Portfolio Turnover Rate | 37% |
| Total Advisory Fees Paid | $5,600,859 |
| Guggenheim Floating Rate Strategies Fund | Class P | GIFPX | Annual Shareholder Report | September 30, 2024 |
| Senior Floating Rate Interests | 89.7% |
| Corporate Bonds | 4.0% |
| Exchange-Traded Funds | 2.7% |
| Collateralized Mortgage Obligations | 0.9% |
| Common Stocks | 0.4% |
| Asset-Backed Securities | 0.0% |

| A | 0.3% |
| BBB | 6.0% |
| BB | 27.3% |
| B | 53.7% |
| CCC | 4.4% |
| CC | 0.7% |
| NR3 | 1.1% |
| Other Instruments | 6.5% |
| SPDR Blackstone Senior Loan ETF | 2.7% |
| Arcline FM Holdings, LLC, 9.65% | 1.0% |
| American Bath Group LLC, 8.70% | 0.9% |
| CoreLogic, Inc., 8.46% | 0.9% |
| CTEC III GmbH, 7.01% | 0.9% |
| Pelican Products, Inc., 9.12% | 0.9% |
| Virgin Media Bristol LLC, 7.71% | 0.8% |
| Hayward Industries, Inc., 7.46% | 0.8% |
| VC GB Holdings I Corp., 8.37% | 0.8% |
| Medical Solutions Parent Holdings, Inc., 8.85% | 0.7% |
| Top 10 Total | 10.4% |
| |
1 | "Holdings Diversification (Market Exposure as a % of Net Assets)" excludes any temporary cash investments, investments in Guggenheim Strategy Funds Trust mutual funds, or investments in Guggenheim Ultra Short Duration Fund. |
| |
2 | Source: BlackRock Solutions. Credit quality ratings are measured on a scale that generally ranges from AAA (highest) to D (lowest). All securities except for those labeled "NR" have been rated by Moody's, Standard & Poor's ("S&P"), or Fitch, each of which is a Nationally Recognized Statistical Rating Organization ("NRSRO"). For purposes of this presentation, when ratings are available from more than one agency, the highest rating is used. Guggenheim Investments has converted ratings to the equivalent S&P rating. |
3 | NR (not rated) securities do not necessarily indicate low credit quality. |
| |
4 | "10 Largest Holdings (as a % of Net Assets)" excludes any temporary cash or derivative investments. |
| SPDR Blackstone Senior Loan ETF | 2.7% |
| Arcline FM Holdings, LLC, 9.65% | 1.0% |
| American Bath Group LLC, 8.70% | 0.9% |
| CoreLogic, Inc., 8.46% | 0.9% |
| CTEC III GmbH, 7.01% | 0.9% |
| Pelican Products, Inc., 9.12% | 0.9% |
| Virgin Media Bristol LLC, 7.71% | 0.8% |
| Hayward Industries, Inc., 7.46% | 0.8% |
| VC GB Holdings I Corp., 8.37% | 0.8% |
| Medical Solutions Parent Holdings, Inc., 8.85% | 0.7% |
| Top 10 Total | 10.4% |
| |
4 | "10 Largest Holdings (as a % of Net Assets)" excludes any temporary cash or derivative investments. |
There were no changes in or disagreements with fund accountants for the period.
There were no material changes for the period.
| |  | Availability of Additional Information. For additional information, including the fund's prospectus, financial information, holdings and proxy voting information, go to GuggenheimInvestments.com/mutual-funds/literature or, call 800 820 0888. |
AR-GIFPX-093024
Annual Shareholder Report | 9.30.24
This annual shareholder report contains important information about the Guggenheim Floating Rate Strategies Fund for the period of October 1, 2023 to September 30, 2024. You can find additional information about the fund at GuggenheimInvestments.com/mutual-funds/literature. You can also request this information by contacting 800 820 0888 or GuggenheimClientServices@mufg-is.com.
This report describes changes to the fund that occurred during the reporting period.
| Institutional Class | $81 | 0.78% |
For the period of October 1, 2023 to September 30, 2024, the fund (Institutional Class shares) returned 7.66%, underperforming the fund's benchmark, the Bloomberg U.S. Aggregate Bond Index, which returned 11.57% for the same period and underperforming the fund's secondary index, the Credit Suisse Leveraged Loan Index, which returned 9.65% for the same period.
The fund's broad-based securities market index was changed from the Credit Suisse Leveraged Loan Index to the Bloomberg U.S. Aggregate Bond Index to comply with the regulation that requires the fund's broad-based securities market index to represent the overall applicable market.
What factors materially affected the fund's performance over the last year?
Above-average returns for both the fund and the Credit Suisse Leveraged Loan Index (the "Index") continued to be driven by high all-in coupon rates. Loan demand, driven by record collateralized loan obligation issuance, continued to outpace net new loan issuance. Loan issuance has increased during 2024, but remains predominantly opportunistic (refinancings/repricings); new money M&A volume remains lackluster. Loan issuer fundamentals have remained in-line with historical averages given strong starting levels and resilient earnings growth, although we have continued to see tail-risk in the market. Loans spreads have tightened this year but all-in yields have remained above historical averages. Comparing the fund to the Index, idiosyncratic credit issues in the Communications and Consumer sectors were the primary detractors to relative performance during the reporting period. Credit selection in the Technology sector and the fund's high-yield bond allocation were contributors to performance during the period.
Cumulative performance* for the fund's most recently completed 10 years (as of 9.30.24), assuming a $2,000,000 initial investment.
| 09/30/2014 | 2000000 | 2000000 | 2000000 |
| 12/31/2014 | 2000413 | 2035885 | 1992594 |
| 03/31/2015 | 2039663 | 2068593 | 2033797 |
| 06/30/2015 | 2060286 | 2033787 | 2049775 |
| 09/30/2015 | 2051877 | 2058816 | 2024668 |
| 12/31/2015 | 2026833 | 2047081 | 1984927 |
| 03/31/2016 | 2051799 | 2109149 | 2011305 |
| 06/30/2016 | 2093277 | 2155839 | 2068849 |
| 09/30/2016 | 2148572 | 2165719 | 2132944 |
| 12/31/2016 | 2182490 | 2101277 | 2180990 |
| 03/31/2017 | 2201278 | 2118439 | 2207195 |
| 06/30/2017 | 2218092 | 2149054 | 2223820 |
| 09/30/2017 | 2240630 | 2167289 | 2247307 |
| 12/31/2017 | 2261376 | 2175701 | 2273622 |
| 03/31/2018 | 2283789 | 2143918 | 2309590 |
| 06/30/2018 | 2289873 | 2140524 | 2327686 |
| 09/30/2018 | 2332120 | 2140934 | 2372676 |
| 12/31/2018 | 2259632 | 2175948 | 2299576 |
| 03/31/2019 | 2328479 | 2239983 | 2386472 |
| 06/30/2019 | 2360423 | 2308967 | 2424185 |
| 09/30/2019 | 2383711 | 2361362 | 2446544 |
| 12/31/2019 | 2420551 | 2365619 | 2487563 |
| 03/31/2020 | 2091052 | 2440097 | 2159499 |
| 06/30/2020 | 2262732 | 2510752 | 2369233 |
| 09/30/2020 | 2377488 | 2526300 | 2466973 |
| 12/31/2020 | 2460625 | 2543198 | 2556682 |
| 03/31/2021 | 2501513 | 2457428 | 2608029 |
| 06/30/2021 | 2541570 | 2502393 | 2645669 |
| 09/30/2021 | 2569521 | 2503689 | 2675657 |
| 12/31/2021 | 2586688 | 2503980 | 2694727 |
| 03/31/2022 | 2574828 | 2355394 | 2692032 |
| 06/30/2022 | 2452644 | 2244843 | 2574865 |
| 09/30/2022 | 2487364 | 2138160 | 2605480 |
| 12/31/2022 | 2565493 | 2178209 | 2666252 |
| 03/31/2023 | 2654457 | 2242728 | 2749199 |
| 06/30/2023 | 2737021 | 2223793 | 2834929 |
| 09/30/2023 | 2827698 | 2151938 | 2930473 |
| 12/31/2023 | 2897893 | 2298638 | 3014019 |
| 03/31/2024 | 2958304 | 2280808 | 3090123 |
| 06/30/2024 | 2987953 | 2282297 | 3147906 |
| 09/30/2024 | 3044283 | 2400886 | 3213317 |
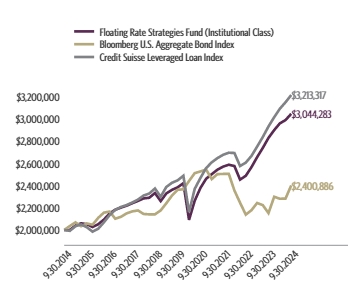
| Institutional Class | 7.66% | 5.01% | 4.29% |
| Bloomberg U.S. Aggregate Bond Index | 11.57% | 0.33% | 1.84% |
| Credit Suisse Leveraged Loan Index | 9.65% | 5.60% | 4.86% |
The fund's past performance is not a good predictor of the fund's future performance. Visit GuggenheimInvestments.com/mutual-funds/performance for more recent performance information.
| Net Assets | $949,597,913 |
| Total Number of Portfolio Holdings | 327 |
| Portfolio Turnover Rate | 37% |
| Total Advisory Fees Paid | $5,600,859 |
| Guggenheim Floating Rate Strategies Fund | Institutional Class | GIFIX | Annual Shareholder Report | September 30, 2024 |
| Senior Floating Rate Interests | 89.7% |
| Corporate Bonds | 4.0% |
| Exchange-Traded Funds | 2.7% |
| Collateralized Mortgage Obligations | 0.9% |
| Common Stocks | 0.4% |
| Asset-Backed Securities | 0.0% |

| A | 0.3% |
| BBB | 6.0% |
| BB | 27.3% |
| B | 53.7% |
| CCC | 4.4% |
| CC | 0.7% |
| NR3 | 1.1% |
| Other Instruments | 6.5% |
| SPDR Blackstone Senior Loan ETF | 2.7% |
| Arcline FM Holdings, LLC, 9.65% | 1.0% |
| American Bath Group LLC, 8.70% | 0.9% |
| CoreLogic, Inc., 8.46% | 0.9% |
| CTEC III GmbH, 7.01% | 0.9% |
| Pelican Products, Inc., 9.12% | 0.9% |
| Virgin Media Bristol LLC, 7.71% | 0.8% |
| Hayward Industries, Inc., 7.46% | 0.8% |
| VC GB Holdings I Corp., 8.37% | 0.8% |
| Medical Solutions Parent Holdings, Inc., 8.85% | 0.7% |
| Top 10 Total | 10.4% |
| |
1 | "Holdings Diversification (Market Exposure as a % of Net Assets)" excludes any temporary cash investments, investments in Guggenheim Strategy Funds Trust mutual funds, or investments in Guggenheim Ultra Short Duration Fund. |
| |
2 | Source: BlackRock Solutions. Credit quality ratings are measured on a scale that generally ranges from AAA (highest) to D (lowest). All securities except for those labeled "NR" have been rated by Moody's, Standard & Poor's ("S&P"), or Fitch, each of which is a Nationally Recognized Statistical Rating Organization ("NRSRO"). For purposes of this presentation, when ratings are available from more than one agency, the highest rating is used. Guggenheim Investments has converted ratings to the equivalent S&P rating. |
3 | NR (not rated) securities do not necessarily indicate low credit quality. |
| |
4 | "10 Largest Holdings (as a % of Net Assets)" excludes any temporary cash or derivative investments. |
| SPDR Blackstone Senior Loan ETF | 2.7% |
| Arcline FM Holdings, LLC, 9.65% | 1.0% |
| American Bath Group LLC, 8.70% | 0.9% |
| CoreLogic, Inc., 8.46% | 0.9% |
| CTEC III GmbH, 7.01% | 0.9% |
| Pelican Products, Inc., 9.12% | 0.9% |
| Virgin Media Bristol LLC, 7.71% | 0.8% |
| Hayward Industries, Inc., 7.46% | 0.8% |
| VC GB Holdings I Corp., 8.37% | 0.8% |
| Medical Solutions Parent Holdings, Inc., 8.85% | 0.7% |
| Top 10 Total | 10.4% |
| |
4 | "10 Largest Holdings (as a % of Net Assets)" excludes any temporary cash or derivative investments. |
There were no changes in or disagreements with fund accountants for the period.
There were no material changes for the period.
| |  | Availability of Additional Information. For additional information, including the fund's prospectus, financial information, holdings and proxy voting information, go to GuggenheimInvestments.com/mutual-funds/literature or, call 800 820 0888. |
AR-GIFIX-093024
Annual Shareholder Report | 9.30.24
This annual shareholder report contains important information about the Guggenheim Floating Rate Strategies Fund for the period of October 1, 2023 to September 30, 2024. You can find additional information about the fund at GuggenheimInvestments.com/mutual-funds/literature. You can also request this information by contacting 800 820 0888 or GuggenheimClientServices@mufg-is.com.
This report describes changes to the fund that occurred during the reporting period.
For the period of October 1, 2023 to September 30, 2024, the fund (Class R6 shares) returned 7.67%, underperforming the fund's benchmark, the Bloomberg U.S. Aggregate Bond Index, which returned 11.57% for the same period and underperforming the fund's secondary index, the Credit Suisse Leveraged Loan Index, which returned 9.65% for the same period.
The fund's broad-based securities market index was changed from the Credit Suisse Leveraged Loan Index to the Bloomberg U.S. Aggregate Bond Index to comply with the regulation that requires the fund's broad-based securities market index to represent the overall applicable market.
What factors materially affected the fund's performance over the last year?
Above-average returns for both the fund and the Credit Suisse Leveraged Loan Index (the "Index") continued to be driven by high all-in coupon rates. Loan demand, driven by record collateralized loan obligation issuance, continued to outpace net new loan issuance. Loan issuance has increased during 2024, but remains predominantly opportunistic (refinancings/repricings); new money M&A volume remains lackluster. Loan issuer fundamentals have remained in-line with historical averages given strong starting levels and resilient earnings growth, although we have continued to see tail-risk in the market. Loans spreads have tightened this year but all-in yields have remained above historical averages. Comparing the fund to the Index, idiosyncratic credit issues in the Communications and Consumer sectors were the primary detractors to relative performance during the reporting period. Credit selection in the Technology sector and the fund's high-yield bond allocation were contributors to performance during the period.
Cumulative performance* for the fund since inception (as of 9.30.24), assuming a $10,000 initial investment.
| 03/13/2019 | 10000 | 10000 | 10000 |
| 03/31/2019 | 9983 | 10126 | 9987 |
| 06/30/2019 | 10120 | 10438 | 10145 |
| 09/30/2019 | 10220 | 10675 | 10239 |
| 12/31/2019 | 10378 | 10694 | 10410 |
| 03/31/2020 | 8966 | 11031 | 9037 |
| 06/30/2020 | 9702 | 11350 | 9915 |
| 09/30/2020 | 10198 | 11420 | 10324 |
| 12/31/2020 | 10554 | 11497 | 10700 |
| 03/31/2021 | 10725 | 11109 | 10915 |
| 06/30/2021 | 10900 | 11312 | 11072 |
| 09/30/2021 | 11020 | 11318 | 11198 |
| 12/31/2021 | 11094 | 11319 | 11277 |
| 03/31/2022 | 11038 | 10648 | 11266 |
| 06/30/2022 | 10518 | 10148 | 10776 |
| 09/30/2022 | 10662 | 9666 | 10904 |
| 12/31/2022 | 11006 | 9847 | 11158 |
| 03/31/2023 | 11397 | 10138 | 11505 |
| 06/30/2023 | 11752 | 10053 | 11864 |
| 09/30/2023 | 12141 | 9728 | 12264 |
| 12/31/2023 | 12443 | 10391 | 12614 |
| 03/31/2024 | 12704 | 10311 | 12932 |
| 06/30/2024 | 12831 | 10317 | 13174 |
| 09/30/2024 | 13072 | 10853 | 13448 |
| Class R6 | 7.67% | 5.05% | 4.94% |
| Bloomberg U.S. Aggregate Bond Index | 11.57% | 0.33% | 1.49% |
| Credit Suisse Leveraged Loan Index | 9.65% | 5.60% | 5.48% |
The fund's past performance is not a good predictor of the fund's future performance. Visit GuggenheimInvestments.com/mutual-funds/performance for more recent performance information.
| Net Assets | $949,597,913 |
| Total Number of Portfolio Holdings | 327 |
| Portfolio Turnover Rate | 37% |
| Total Advisory Fees Paid | $5,600,859 |
| Guggenheim Floating Rate Strategies Fund | Class R6 | GIFSX | Annual Shareholder Report | September 30, 2024 |
| Senior Floating Rate Interests | 89.7% |
| Corporate Bonds | 4.0% |
| Exchange-Traded Funds | 2.7% |
| Collateralized Mortgage Obligations | 0.9% |
| Common Stocks | 0.4% |
| Asset-Backed Securities | 0.0% |
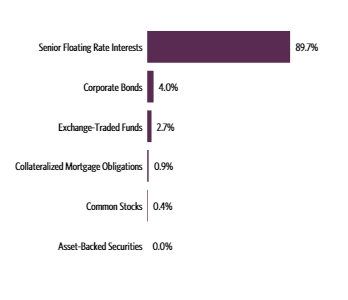
| A | 0.3% |
| BBB | 6.0% |
| BB | 27.3% |
| B | 53.7% |
| CCC | 4.4% |
| CC | 0.7% |
| NR3 | 1.1% |
| Other Instruments | 6.5% |
| SPDR Blackstone Senior Loan ETF | 2.7% |
| Arcline FM Holdings, LLC, 9.65% | 1.0% |
| American Bath Group LLC, 8.70% | 0.9% |
| CoreLogic, Inc., 8.46% | 0.9% |
| CTEC III GmbH, 7.01% | 0.9% |
| Pelican Products, Inc., 9.12% | 0.9% |
| Virgin Media Bristol LLC, 7.71% | 0.8% |
| Hayward Industries, Inc., 7.46% | 0.8% |
| VC GB Holdings I Corp., 8.37% | 0.8% |
| Medical Solutions Parent Holdings, Inc., 8.85% | 0.7% |
| Top 10 Total | 10.4% |
| |
1 | "Holdings Diversification (Market Exposure as a % of Net Assets)" excludes any temporary cash investments, investments in Guggenheim Strategy Funds Trust mutual funds, or investments in Guggenheim Ultra Short Duration Fund. |
| |
2 | Source: BlackRock Solutions. Credit quality ratings are measured on a scale that generally ranges from AAA (highest) to D (lowest). All securities except for those labeled "NR" have been rated by Moody's, Standard & Poor's ("S&P"), or Fitch, each of which is a Nationally Recognized Statistical Rating Organization ("NRSRO"). For purposes of this presentation, when ratings are available from more than one agency, the highest rating is used. Guggenheim Investments has converted ratings to the equivalent S&P rating. |
3 | NR (not rated) securities do not necessarily indicate low credit quality. |
| |
4 | "10 Largest Holdings (as a % of Net Assets)" excludes any temporary cash or derivative investments. |
| SPDR Blackstone Senior Loan ETF | 2.7% |
| Arcline FM Holdings, LLC, 9.65% | 1.0% |
| American Bath Group LLC, 8.70% | 0.9% |
| CoreLogic, Inc., 8.46% | 0.9% |
| CTEC III GmbH, 7.01% | 0.9% |
| Pelican Products, Inc., 9.12% | 0.9% |
| Virgin Media Bristol LLC, 7.71% | 0.8% |
| Hayward Industries, Inc., 7.46% | 0.8% |
| VC GB Holdings I Corp., 8.37% | 0.8% |
| Medical Solutions Parent Holdings, Inc., 8.85% | 0.7% |
| Top 10 Total | 10.4% |
| |
4 | "10 Largest Holdings (as a % of Net Assets)" excludes any temporary cash or derivative investments. |
There were no changes in or disagreements with fund accountants for the period.
There were no material changes for the period.
| |  | Availability of Additional Information. For additional information, including the fund's prospectus, financial information, holdings and proxy voting information, go to GuggenheimInvestments.com/mutual-funds/literature or, call 800 820 0888. |
AR-GIFSX-093024
Annual Shareholder Report | 9.30.24
This annual shareholder report contains important information about the Guggenheim High Yield Fund for the period of October 1, 2023 to September 30, 2024. You can find additional information about the fund at GuggenheimInvestments.com/mutual-funds/literature. You can also request this information by contacting 800 820 0888 or GuggenheimClientServices@mufg-is.com.
This report describes changes to the fund that occurred during the reporting period.
For the period of October 1, 2023 to September 30, 2024, the fund (Class A shares) returned 14.08%, outperforming the fund's benchmark, the Bloomberg U.S. Aggregate Bond Index, which returned 11.57% for the same period and underperforming the fund's secondary index, the Bloomberg U.S. Corporate High Yield Index, which returned 15.74% for the same period.
The fund's broad-based securities market index was changed from the Bloomberg U.S. Corporate High Yield Index to the Bloomberg U.S. Aggregate Bond Index to comply with the regulation that requires the fund's broad-based securities market index to represent the overall applicable market.
What factors materially affected the fund's performance over the last year?
Overall, lower financing costs spurred heavy new issuance volume while strong market conditions resulted in tightening credit spreads. The primary contributors to the fund's performance were exposure to higher quality BB-credit and solid credit selection in the Communications sector. The primary detractor was the fund's exposure to bank loans, which significantly underperformed high yield for the period.
Cumulative performance* for the fund's most recently completed 10 years (as of 9.30.24), assuming a $10,000 initial investment.
| 09/30/2014 | 9525 | 10000 | 10000 |
| 12/31/2014 | 9324 | 10179 | 9900 |
| 03/31/2015 | 9550 | 10343 | 10149 |
| 06/30/2015 | 9663 | 10169 | 10150 |
| 09/30/2015 | 9296 | 10294 | 9657 |
| 12/31/2015 | 9107 | 10235 | 9457 |
| 03/31/2016 | 9247 | 10546 | 9775 |
| 06/30/2016 | 9752 | 10779 | 10314 |
| 09/30/2016 | 10291 | 10829 | 10887 |
| 12/31/2016 | 10606 | 10506 | 11077 |
| 03/31/2017 | 10828 | 10592 | 11377 |
| 06/30/2017 | 11039 | 10745 | 11624 |
| 09/30/2017 | 11229 | 10836 | 11853 |
| 12/31/2017 | 11336 | 10879 | 11909 |
| 03/31/2018 | 11198 | 10720 | 11807 |
| 06/30/2018 | 11246 | 10703 | 11928 |
| 09/30/2018 | 11454 | 10705 | 12215 |
| 12/31/2018 | 10971 | 10880 | 11661 |
| 03/31/2019 | 11523 | 11200 | 12507 |
| 06/30/2019 | 11877 | 11545 | 12820 |
| 09/30/2019 | 12025 | 11807 | 12991 |
| 12/31/2019 | 12263 | 11828 | 13331 |
| 03/31/2020 | 10550 | 12200 | 11640 |
| 06/30/2020 | 11567 | 12554 | 12824 |
| 09/30/2020 | 12126 | 12632 | 13414 |
| 12/31/2020 | 12875 | 12716 | 14279 |
| 03/31/2021 | 12918 | 12287 | 14400 |
| 06/30/2021 | 13286 | 12512 | 14795 |
| 09/30/2021 | 13462 | 12518 | 14926 |
| 12/31/2021 | 13529 | 12520 | 15032 |
| 03/31/2022 | 12995 | 11777 | 14305 |
| 06/30/2022 | 11896 | 11224 | 12899 |
| 09/30/2022 | 11833 | 10691 | 12816 |
| 12/31/2022 | 12277 | 10891 | 13351 |
| 03/31/2023 | 12658 | 11214 | 13827 |
| 06/30/2023 | 12822 | 11119 | 14068 |
| 09/30/2023 | 12969 | 10760 | 14133 |
| 12/31/2023 | 13742 | 11493 | 15146 |
| 03/31/2024 | 13984 | 11404 | 15369 |
| 06/30/2024 | 14139 | 11411 | 15537 |
| 09/30/2024 | 14796 | 12004 | 16358 |
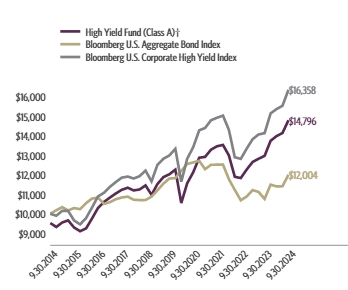
| Class A (without sales charge) | 14.08% | 4.23% | 4.50% |
| Class A (with sales charge)† | 9.55% | 3.39% | 4.00% |
| Bloomberg U.S. Aggregate Bond Index | 11.57% | 0.33% | 1.84% |
| Bloomberg U.S. Corporate High Yield Index | 15.74% | 4.72% | 5.04% |
The fund's past performance is not a good predictor of the fund's future performance. Visit GuggenheimInvestments.com/mutual-funds/performance for more recent performance information.
| Net Assets | $204,093,994 |
| Total Number of Portfolio Holdings | 340 |
| Portfolio Turnover Rate | 45% |
| Total Advisory Fees Paid | $905,708 |
| Guggenheim High Yield Fund | Class A | SIHAX | Annual Shareholder Report | September 30, 2024 |
| Corporate Bonds | 82.3% |
| Senior Floating Rate Interests | 11.5% |
| Preferred Stocks | 1.8% |
| Common Stocks | 0.3% |
| Asset-Backed Securities | 0.3% |

| A | 0.1% |
| BBB | 4.4% |
| BB | 46.2% |
| B | 36.7% |
| CCC | 7.1% |
| NR3 | 0.1% |
| Other Instruments | 5.4% |
| Terraform Global Operating, LP, 6.13% | 1.0% |
| CCO Holdings LLC / CCO Holdings Capital Corp., 4.50% | 1.0% |
| Trinity Industries, Inc., 7.75% | 0.9% |
| ITT Holdings LLC, 6.50% | 0.9% |
| CPI CG, Inc., 10.00% | 0.8% |
| GrafTech Finance, Inc., 4.63% | 0.8% |
| Enviri Corp., 5.75% | 0.8% |
| CD&R Smokey Buyer, Inc., 6.75% | 0.7% |
| Focus Financial Partners LLC, 6.75% | 0.7% |
| TransMontaigne Partners Limited Partnership / TLP Finance Corp., 6.13% | 0.7% |
| Top 10 Total | 8.3% |
| |
1 | "Holdings Diversification (Market Exposure as a % of Net Assets)" excludes any temporary cash investments, investments in Guggenheim Strategy Funds Trust mutual funds, or investments in Guggenheim Ultra Short Duration Fund. |
| |
2 | Source: BlackRock Solutions. Credit quality ratings are measured on a scale that generally ranges from AAA (highest) to D (lowest). All securities except for those labeled "NR" have been rated by Moody's, Standard & Poor's ("S&P"), or Fitch, each of which is a Nationally Recognized Statistical Rating Organization ("NRSRO"). For purposes of this presentation, when ratings are available from more than one agency, the highest rating is used. Guggenheim Investments has converted ratings to the equivalent S&P rating. |
3 | NR (not rated) securities do not necessarily indicate low credit quality. |
| |
4 | "10 Largest Holdings (as a % of Net Assets)" excludes any temporary cash or derivative investments. |
| Terraform Global Operating, LP, 6.13% | 1.0% |
| CCO Holdings LLC / CCO Holdings Capital Corp., 4.50% | 1.0% |
| Trinity Industries, Inc., 7.75% | 0.9% |
| ITT Holdings LLC, 6.50% | 0.9% |
| CPI CG, Inc., 10.00% | 0.8% |
| GrafTech Finance, Inc., 4.63% | 0.8% |
| Enviri Corp., 5.75% | 0.8% |
| CD&R Smokey Buyer, Inc., 6.75% | 0.7% |
| Focus Financial Partners LLC, 6.75% | 0.7% |
| TransMontaigne Partners Limited Partnership / TLP Finance Corp., 6.13% | 0.7% |
| Top 10 Total | 8.3% |
| |
4 | "10 Largest Holdings (as a % of Net Assets)" excludes any temporary cash or derivative investments. |
There were no changes in or disagreements with fund accountants for the period.
This is a summary of certain changes to the fund since September 30, 2023. For more complete information, you may review the fund's next prospectus, which we expect to be available by January 31, 2025 at GuggenheimInvestments.com/mutual-funds/literature or, by calling 800 820 0888.
Effective February 21, 2024, the fund's (Class A shares) annual expense limit was contractually reduced to 0.94% from 1.16%.
The fund's (Class A shares) net expense ratio, which reflects expense waivers and reimbursements and includes certain expenses that are outside of the contractual expense limit, was 1.02% for the year ended September 30, 2024, a reduction of 0.14% compared to the prior year. The primary driver of the reduction was the reduction of the fund's annual expense limit.
Subsequent to the September 30, 2024 year-end, effective November 29, 2024, Guggenheim Partners Investment Management, LLC replaced Security Investors, LLC as the fund's investment adviser in connection with an internal realignment of Guggenheim Investment's lines of business.
| |  | Availability of Additional Information. For additional information, including the fund's prospectus, financial information, holdings and proxy voting information, go to GuggenheimInvestments.com/mutual-funds/literature or, call 800 820 0888. |
AR-SIHAX-093024
Annual Shareholder Report | 9.30.24
This annual shareholder report contains important information about the Guggenheim High Yield Fund for the period of October 1, 2023 to September 30, 2024. You can find additional information about the fund at GuggenheimInvestments.com/mutual-funds/literature. You can also request this information by contacting 800 820 0888 or GuggenheimClientServices@mufg-is.com.
This report describes changes to the fund that occurred during the reporting period.
For the period of October 1, 2023 to September 30, 2024, the fund (Class C shares) returned 13.19%, outperforming the fund's benchmark, the Bloomberg U.S. Aggregate Bond Index, which returned 11.57% for the same period and underperforming the fund's secondary index, the Bloomberg U.S. Corporate High Yield Index, which returned 15.74% for the same period.
The fund's broad-based securities market index was changed from the Bloomberg U.S. Corporate High Yield Index to the Bloomberg U.S. Aggregate Bond Index to comply with the regulation that requires the fund's broad-based securities market index to represent the overall applicable market.
What factors materially affected the fund's performance over the last year?
Overall, lower financing costs spurred heavy new issuance volume while strong market conditions resulted in tightening credit spreads. The primary contributors to the fund's performance were exposure to higher quality BB-credit and solid credit selection in the Communications sector. The primary detractor was the fund's exposure to bank loans, which significantly underperformed high yield for the period.
Cumulative performance* for the fund's most recently completed 10 years (as of 9.30.24), assuming a $10,000 initial investment.
| 09/30/2014 | 10000 | 10000 | 10000 |
| 12/31/2014 | 9766 | 10179 | 9900 |
| 03/31/2015 | 9983 | 10343 | 10149 |
| 06/30/2015 | 10083 | 10169 | 10150 |
| 09/30/2015 | 9686 | 10294 | 9657 |
| 12/31/2015 | 9464 | 10235 | 9457 |
| 03/31/2016 | 9592 | 10546 | 9775 |
| 06/30/2016 | 10095 | 10779 | 10314 |
| 09/30/2016 | 10636 | 10829 | 10887 |
| 12/31/2016 | 10940 | 10506 | 11077 |
| 03/31/2017 | 11147 | 10592 | 11377 |
| 06/30/2017 | 11353 | 10745 | 11624 |
| 09/30/2017 | 11527 | 10836 | 11853 |
| 12/31/2017 | 11615 | 10879 | 11909 |
| 03/31/2018 | 11455 | 10720 | 11807 |
| 06/30/2018 | 11473 | 10703 | 11928 |
| 09/30/2018 | 11673 | 10705 | 12215 |
| 12/31/2018 | 11156 | 10880 | 11661 |
| 03/31/2019 | 11692 | 11200 | 12507 |
| 06/30/2019 | 12027 | 11545 | 12820 |
| 09/30/2019 | 12155 | 11807 | 12991 |
| 12/31/2019 | 12371 | 11828 | 13331 |
| 03/31/2020 | 10628 | 12200 | 11640 |
| 06/30/2020 | 11621 | 12554 | 12824 |
| 09/30/2020 | 12165 | 12632 | 13414 |
| 12/31/2020 | 12884 | 12716 | 14279 |
| 03/31/2021 | 12905 | 12287 | 14400 |
| 06/30/2021 | 13251 | 12512 | 14795 |
| 09/30/2021 | 13387 | 12518 | 14926 |
| 12/31/2021 | 13440 | 12520 | 15032 |
| 03/31/2022 | 12876 | 11777 | 14305 |
| 06/30/2022 | 11762 | 11224 | 12899 |
| 09/30/2022 | 11679 | 10691 | 12816 |
| 12/31/2022 | 12092 | 10891 | 13351 |
| 03/31/2023 | 12442 | 11214 | 13827 |
| 06/30/2023 | 12593 | 11119 | 14068 |
| 09/30/2023 | 12700 | 10760 | 14133 |
| 12/31/2023 | 13441 | 11493 | 15146 |
| 03/31/2024 | 13641 | 11404 | 15369 |
| 06/30/2024 | 13767 | 11411 | 15537 |
| 09/30/2024 | 14376 | 12004 | 16358 |
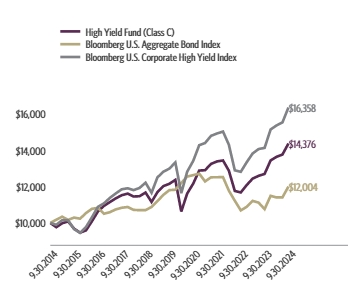
| Class C (without CDSC) | 13.19% | 3.41% | 3.70% |
| Class C (with CDSC)‡ | 12.19% | 3.41% | 3.70% |
| Bloomberg U.S. Aggregate Bond Index | 11.57% | 0.33% | 1.84% |
| Bloomberg U.S. Corporate High Yield Index | 15.74% | 4.72% | 5.04% |
The fund's past performance is not a good predictor of the fund's future performance. Visit GuggenheimInvestments.com/mutual-funds/performance for more recent performance information.
| Net Assets | $204,093,994 |
| Total Number of Portfolio Holdings | 340 |
| Portfolio Turnover Rate | 45% |
| Total Advisory Fees Paid | $905,708 |
| Guggenheim High Yield Fund | Class C | SIHSX | Annual Shareholder Report | September 30, 2024 |
| Corporate Bonds | 82.3% |
| Senior Floating Rate Interests | 11.5% |
| Preferred Stocks | 1.8% |
| Common Stocks | 0.3% |
| Asset-Backed Securities | 0.3% |

| A | 0.1% |
| BBB | 4.4% |
| BB | 46.2% |
| B | 36.7% |
| CCC | 7.1% |
| NR3 | 0.1% |
| Other Instruments | 5.4% |
| Terraform Global Operating, LP, 6.13% | 1.0% |
| CCO Holdings LLC / CCO Holdings Capital Corp., 4.50% | 1.0% |
| Trinity Industries, Inc., 7.75% | 0.9% |
| ITT Holdings LLC, 6.50% | 0.9% |
| CPI CG, Inc., 10.00% | 0.8% |
| GrafTech Finance, Inc., 4.63% | 0.8% |
| Enviri Corp., 5.75% | 0.8% |
| CD&R Smokey Buyer, Inc., 6.75% | 0.7% |
| Focus Financial Partners LLC, 6.75% | 0.7% |
| TransMontaigne Partners Limited Partnership / TLP Finance Corp., 6.13% | 0.7% |
| Top 10 Total | 8.3% |
| |
1 | "Holdings Diversification (Market Exposure as a % of Net Assets)" excludes any temporary cash investments, investments in Guggenheim Strategy Funds Trust mutual funds, or investments in Guggenheim Ultra Short Duration Fund. |
| |
2 | Source: BlackRock Solutions. Credit quality ratings are measured on a scale that generally ranges from AAA (highest) to D (lowest). All securities except for those labeled "NR" have been rated by Moody's, Standard & Poor's ("S&P"), or Fitch, each of which is a Nationally Recognized Statistical Rating Organization ("NRSRO"). For purposes of this presentation, when ratings are available from more than one agency, the highest rating is used. Guggenheim Investments has converted ratings to the equivalent S&P rating. |
3 | NR (not rated) securities do not necessarily indicate low credit quality. |
| |
4 | "10 Largest Holdings (as a % of Net Assets)" excludes any temporary cash or derivative investments. |
| Terraform Global Operating, LP, 6.13% | 1.0% |
| CCO Holdings LLC / CCO Holdings Capital Corp., 4.50% | 1.0% |
| Trinity Industries, Inc., 7.75% | 0.9% |
| ITT Holdings LLC, 6.50% | 0.9% |
| CPI CG, Inc., 10.00% | 0.8% |
| GrafTech Finance, Inc., 4.63% | 0.8% |
| Enviri Corp., 5.75% | 0.8% |
| CD&R Smokey Buyer, Inc., 6.75% | 0.7% |
| Focus Financial Partners LLC, 6.75% | 0.7% |
| TransMontaigne Partners Limited Partnership / TLP Finance Corp., 6.13% | 0.7% |
| Top 10 Total | 8.3% |
| |
4 | "10 Largest Holdings (as a % of Net Assets)" excludes any temporary cash or derivative investments. |
There were no changes in or disagreements with fund accountants for the period.
This is a summary of certain changes to the fund since September 30, 2023. For more complete information, you may review the fund's next prospectus, which we expect to be available by January 31, 2025 at GuggenheimInvestments.com/mutual-funds/literature or, by calling 800 820 0888.
Effective February 21, 2024, the fund's (Class C shares) annual expense limit was contractually reduced to 1.69% from 1.91%.
The fund's (Class C shares) net expense ratio, which reflects expense waivers and reimbursements and includes certain expenses that are outside of the contractual expense limit, was 1.78% for the year ended September 30, 2024, a reduction of 0.14% compared to the prior year. The primary driver of the reduction was the contractual reduction of the fund's annual expense limit.
Subsequent to the September 30, 2024 year-end, effective November 29, 2024, Guggenheim Partners Investment Management, LLC replaced Securities Investors, LLC as the fund's Investment Adviser in connection with an internal realignment of Guggenheim Investment's lines of business.
| |  | Availability of Additional Information. For additional information, including the fund's prospectus, financial information, holdings and proxy voting information, go to GuggenheimInvestments.com/mutual-funds/literature or, call 800 820 0888. |
AR-SIHSX-093024
Annual Shareholder Report | 9.30.24
This annual shareholder report contains important information about the Guggenheim High Yield Fund for the period of October 1, 2023 to September 30, 2024. You can find additional information about the fund at GuggenheimInvestments.com/mutual-funds/literature. You can also request this information by contacting 800 820 0888 or GuggenheimClientServices@mufg-is.com.
This report describes changes to the fund that occurred during the reporting period.
For the period of October 1, 2023 to September 30, 2024, the fund (Class P shares) returned 14.00%, outperforming the fund's benchmark, the Bloomberg U.S. Aggregate Bond Index, which returned 11.57% for the same period and underperforming the fund's secondary index, the Bloomberg U.S. Corporate High Yield Index, which returned 15.74% for the same period.
The fund's broad-based securities market index was changed from the Bloomberg U.S. Corporate High Yield Index to the Bloomberg U.S. Aggregate Bond Index to comply with the regulation that requires the fund's broad-based securities market index to represent the overall applicable market.
hat factors materially affected the fund's performance over the last year?
Overall, lower financing costs spurred heavy new issuance volume while strong market conditions resulted in tightening credit spreads. The primary contributors to the fund's performance were exposure to higher quality BB-credit and solid credit selection in the Communications sector. The primary detractor was the fund's exposure to bank loans, which significantly underperformed high yield for the period.
Cumulative performance* for the fund since inception, assuming a $10,000 initial investment.
| 05/01/2015 | 10000 | 10000 | 10000 |
| 06/30/2015 | 9964 | 9899 | 9879 |
| 09/30/2015 | 9594 | 10021 | 9399 |
| 12/31/2015 | 9393 | 9964 | 9205 |
| 03/31/2016 | 9538 | 10266 | 9514 |
| 06/30/2016 | 10058 | 10493 | 10039 |
| 09/30/2016 | 10624 | 10542 | 10596 |
| 12/31/2016 | 10943 | 10228 | 10782 |
| 03/31/2017 | 11188 | 10311 | 11073 |
| 06/30/2017 | 11410 | 10460 | 11314 |
| 09/30/2017 | 11606 | 10549 | 11537 |
| 12/31/2017 | 11714 | 10590 | 11591 |
| 03/31/2018 | 11571 | 10435 | 11492 |
| 06/30/2018 | 11618 | 10419 | 11610 |
| 09/30/2018 | 11832 | 10421 | 11889 |
| 12/31/2018 | 11332 | 10591 | 11350 |
| 03/31/2019 | 11891 | 10903 | 12174 |
| 06/30/2019 | 12256 | 11239 | 12478 |
| 09/30/2019 | 12421 | 11494 | 12645 |
| 12/31/2019 | 12666 | 11515 | 12975 |
| 03/31/2020 | 10899 | 11877 | 11329 |
| 06/30/2020 | 11935 | 12221 | 12482 |
| 09/30/2020 | 12520 | 12297 | 13056 |
| 12/31/2020 | 13277 | 12379 | 13898 |
| 03/31/2021 | 13322 | 11961 | 14016 |
| 06/30/2021 | 13705 | 12180 | 14401 |
| 09/30/2021 | 13871 | 12187 | 14528 |
| 12/31/2021 | 13952 | 12188 | 14632 |
| 03/31/2022 | 13384 | 11465 | 13924 |
| 06/30/2022 | 12266 | 10927 | 12555 |
| 09/30/2022 | 12188 | 10407 | 12474 |
| 12/31/2022 | 12646 | 10602 | 12995 |
| 03/31/2023 | 13038 | 10916 | 13458 |
| 06/30/2023 | 13220 | 10824 | 13693 |
| 09/30/2023 | 13372 | 10474 | 13756 |
| 12/31/2023 | 14168 | 11189 | 14742 |
| 03/31/2024 | 14407 | 11102 | 14959 |
| 06/30/2024 | 14567 | 11109 | 15123 |
| 09/30/2024 | 15244 | 11686 | 15922 |
| Class P | 14.00% | 4.18% | 4.58% |
| Bloomberg U.S. Aggregate Bond Index | 11.57% | 0.33% | 1.67% |
| Bloomberg U.S. Corporate High Yield Index | 15.74% | 4.72% | 5.06% |
The fund's past performance is not a good predictor of the fund's future performance. Visit GuggenheimInvestments.com/mutual-funds/performance for more recent performance information.
| Net Assets | $204,093,994 |
| Total Number of Portfolio Holdings | 340 |
| Portfolio Turnover Rate | 45% |
| Total Advisory Fees Paid | $905,708 |
| Guggenheim High Yield Fund | Class P | SIHPX | Annual Shareholder Report | September 30, 2024 |
| Corporate Bonds | 82.3% |
| Senior Floating Rate Interests | 11.5% |
| Preferred Stocks | 1.8% |
| Common Stocks | 0.3% |
| Asset-Backed Securities | 0.3% |

| A | 0.1% |
| BBB | 4.4% |
| BB | 46.2% |
| B | 36.7% |
| CCC | 7.1% |
| NR3 | 0.1% |
| Other Instruments | 5.4% |
| Terraform Global Operating, LP, 6.13% | 1.0% |
| CCO Holdings LLC / CCO Holdings Capital Corp., 4.50% | 1.0% |
| Trinity Industries, Inc., 7.75% | 0.9% |
| ITT Holdings LLC, 6.50% | 0.9% |
| CPI CG, Inc., 10.00% | 0.8% |
| GrafTech Finance, Inc., 4.63% | 0.8% |
| Enviri Corp., 5.75% | 0.8% |
| CD&R Smokey Buyer, Inc., 6.75% | 0.7% |
| Focus Financial Partners LLC, 6.75% | 0.7% |
| TransMontaigne Partners Limited Partnership / TLP Finance Corp., 6.13% | 0.7% |
| Top 10 Total | 8.3% |
| |
1 | "Holdings Diversification (Market Exposure as a % of Net Assets)" excludes any temporary cash investments, investments in Guggenheim Strategy Funds Trust mutual funds, or investments in Guggenheim Ultra Short Duration Fund. |
| |
2 | Source: BlackRock Solutions. Credit quality ratings are measured on a scale that generally ranges from AAA (highest) to D (lowest). All securities except for those labeled "NR" have been rated by Moody's, Standard & Poor's ("S&P"), or Fitch, each of which is a Nationally Recognized Statistical Rating Organization ("NRSRO"). For purposes of this presentation, when ratings are available from more than one agency, the highest rating is used. Guggenheim Investments has converted ratings to the equivalent S&P rating. |
3 | NR (not rated) securities do not necessarily indicate low credit quality. |
| |
4 | "10 Largest Holdings (as a % of Net Assets)" excludes any temporary cash or derivative investments. |
| Terraform Global Operating, LP, 6.13% | 1.0% |
| CCO Holdings LLC / CCO Holdings Capital Corp., 4.50% | 1.0% |
| Trinity Industries, Inc., 7.75% | 0.9% |
| ITT Holdings LLC, 6.50% | 0.9% |
| CPI CG, Inc., 10.00% | 0.8% |
| GrafTech Finance, Inc., 4.63% | 0.8% |
| Enviri Corp., 5.75% | 0.8% |
| CD&R Smokey Buyer, Inc., 6.75% | 0.7% |
| Focus Financial Partners LLC, 6.75% | 0.7% |
| TransMontaigne Partners Limited Partnership / TLP Finance Corp., 6.13% | 0.7% |
| Top 10 Total | 8.3% |
| |
4 | "10 Largest Holdings (as a % of Net Assets)" excludes any temporary cash or derivative investments. |
There were no changes in or disagreements with fund accountants for the period.
This is a summary of certain changes to the fund since September 30, 2023. For more complete information, you may review the fund's next prospectus, which we expect to be available by January 31, 2025 at GuggenheimInvestments.com/mutual-funds/literature or, by calling 800 820 0888.
Effective February 21, 2024, the fund's (Class P shares) annual expense limit was contractually reduced to 0.94% from 1.16%.
The fund's (Class P shares) net expense ratio, which reflects expense waivers and reimbursements and includes certain expenses that are outside of the contractual expense limit, was 1.03% for the year ended September 30, 2024, a reduction of 0.13% compared to the prior year. The primary driver of the reduction was the reduction of the fund's annual expense limit.
Subsequent to the September 30, 2024 year-end, effective November 29, 2024, Guggenheim Partners Investment Management, LLC replaced Securities Investors, LLC as the fund's Investment Adviser in connection with an internal realignment of Guggenheim Investment's lines of business.
| |  | Availability of Additional Information. For additional information, including the fund's prospectus, financial information, holdings and proxy voting information, go to GuggenheimInvestments.com/mutual-funds/literature or, call 800 820 0888. |
AR-SIHPX-093024
Annual Shareholder Report | 9.30.24
This annual shareholder report contains important information about the Guggenheim High Yield Fund for the period of October 1, 2023 to September 30, 2024. You can find additional information about the fund at GuggenheimInvestments.com/mutual-funds/literature. You can also request this information by contacting 800 820 0888 or GuggenheimClientServices@mufg-is.com.
This report describes changes to the fund that occurred during the reporting period.
| Institutional Class | $83 | 0.77% |
For the period of October 1, 2023 to September 30, 2024, the fund (Institutional Class shares) returned 14.40%, outperforming the fund's benchmark, the Bloomberg U.S. Aggregate Bond Index, which returned 11.57% for the same period and underperforming the fund's secondary index, the Bloomberg U.S. Corporate High Yield Index, which returned 15.74% for the same period.
The fund's broad-based securities market index was changed from the Bloomberg U.S. Corporate High Yield Index to the Bloomberg U.S. Aggregate Bond Index to comply with the regulation that requires the fund's broad-based securities market index to represent the overall applicable market.
What factors materially affected the fund's performance over the last year?
Overall, lower financing costs spurred heavy new issuance volume while strong market conditions resulted in tightening credit spreads. The primary contributors to the fund's performance were exposure to higher quality BB-credit and solid credit selection in the Communications sector. The primary detractor was the fund's exposure to bank loans, which significantly underperformed high yield for the period.
Cumulative performance* for the fund's most recently completed 10 years (as of 9.30.24), assuming a $2,000,000 initial investment.
| 09/30/2014 | 2000000 | 2000000 | 2000000 |
| 12/31/2014 | 1957711 | 2035885 | 1979955 |
| 03/31/2015 | 2005956 | 2068593 | 2029898 |
| 06/30/2015 | 2031551 | 2033787 | 2029953 |
| 09/30/2015 | 1955792 | 2058816 | 1931378 |
| 12/31/2015 | 1916699 | 2047081 | 1891491 |
| 03/31/2016 | 1946572 | 2109149 | 1954916 |
| 06/30/2016 | 2054556 | 2155839 | 2062809 |
| 09/30/2016 | 2170047 | 2165719 | 2177320 |
| 12/31/2016 | 2238669 | 2101277 | 2215499 |
| 03/31/2017 | 2288919 | 2118439 | 2275301 |
| 06/30/2017 | 2335875 | 2149054 | 2324729 |
| 09/30/2017 | 2377591 | 2167289 | 2370651 |
| 12/31/2017 | 2401440 | 2175701 | 2381762 |
| 03/31/2018 | 2374991 | 2143918 | 2361334 |
| 06/30/2018 | 2384961 | 2140524 | 2385576 |
| 09/30/2018 | 2431524 | 2140934 | 2442925 |
| 12/31/2018 | 2328890 | 2175948 | 2332165 |
| 03/31/2019 | 2447192 | 2239983 | 2501429 |
| 06/30/2019 | 2524450 | 2308967 | 2563977 |
| 09/30/2019 | 2556811 | 2361362 | 2598176 |
| 12/31/2019 | 2608812 | 2365619 | 2666115 |
| 03/31/2020 | 2249405 | 2440097 | 2327921 |
| 06/30/2020 | 2464805 | 2510752 | 2564840 |
| 09/30/2020 | 2585981 | 2526300 | 2682729 |
| 12/31/2020 | 2744192 | 2543198 | 2855776 |
| 03/31/2021 | 2756678 | 2457428 | 2880049 |
| 06/30/2021 | 2836428 | 2502393 | 2959058 |
| 09/30/2021 | 2873982 | 2503689 | 2985262 |
| 12/31/2021 | 2892979 | 2503980 | 3006484 |
| 03/31/2022 | 2779250 | 2355394 | 2861072 |
| 06/30/2022 | 2544338 | 2244843 | 2579860 |
| 09/30/2022 | 2534712 | 2138160 | 2563180 |
| 12/31/2022 | 2630560 | 2178209 | 2670102 |
| 03/31/2023 | 2712965 | 2242728 | 2765374 |
| 06/30/2023 | 2751979 | 2223793 | 2813700 |
| 09/30/2023 | 2782602 | 2151938 | 2826582 |
| 12/31/2023 | 2951806 | 2298638 | 3029103 |
| 03/31/2024 | 3007213 | 2280808 | 3073771 |
| 06/30/2024 | 3038787 | 2282297 | 3107397 |
| 09/30/2024 | 3183386 | 2400886 | 3271570 |
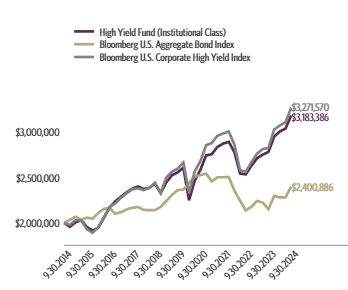
| Institutional Class | 14.40% | 4.48% | 4.76% |
| Bloomberg U.S. Aggregate Bond Index | 11.57% | 0.33% | 1.84% |
| Bloomberg U.S. Corporate High Yield Index | 15.74% | 4.72% | 5.04% |
The fund's past performance is not a good predictor of the fund's future performance. Visit GuggenheimInvestments.com/mutual-funds/performance for more recent performance information.
| Net Assets | $204,093,994 |
| Total Number of Portfolio Holdings | 340 |
| Portfolio Turnover Rate | 45% |
| Total Advisory Fees Paid | $905,708 |
| Guggenheim High Yield Fund | Institutional Class | SHYIX | Annual Shareholder Report | September 30, 2024 |
| Corporate Bonds | 82.3% |
| Senior Floating Rate Interests | 11.5% |
| Preferred Stocks | 1.8% |
| Common Stocks | 0.3% |
| Asset-Backed Securities | 0.3% |
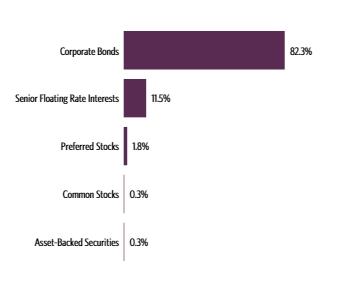
| A | 0.1% |
| BBB | 4.4% |
| BB | 46.2% |
| B | 36.7% |
| CCC | 7.1% |
| NR3 | 0.1% |
| Other Instruments | 5.4% |
| Terraform Global Operating, LP, 6.13% | 1.0% |
| CCO Holdings LLC / CCO Holdings Capital Corp., 4.50% | 1.0% |
| Trinity Industries, Inc., 7.75% | 0.9% |
| ITT Holdings LLC, 6.50% | 0.9% |
| CPI CG, Inc., 10.00% | 0.8% |
| GrafTech Finance, Inc., 4.63% | 0.8% |
| Enviri Corp., 5.75% | 0.8% |
| CD&R Smokey Buyer, Inc., 6.75% | 0.7% |
| Focus Financial Partners LLC, 6.75% | 0.7% |
| TransMontaigne Partners Limited Partnership / TLP Finance Corp., 6.13% | 0.7% |
| Top 10 Total | 8.3% |
| |
1 | "Holdings Diversification (Market Exposure as a % of Net Assets)" excludes any temporary cash investments, investments in Guggenheim Strategy Funds Trust mutual funds, or investments in Guggenheim Ultra Short Duration Fund. |
| |
2 | Source: BlackRock Solutions. Credit quality ratings are measured on a scale that generally ranges from AAA (highest) to D (lowest). All securities except for those labeled "NR" have been rated by Moody's, Standard & Poor's ("S&P"), or Fitch, each of which is a Nationally Recognized Statistical Rating Organization ("NRSRO"). For purposes of this presentation, when ratings are available from more than one agency, the highest rating is used. Guggenheim Investments has converted ratings to the equivalent S&P rating. |
3 | NR (not rated) securities do not necessarily indicate low credit quality. |
| |
4 | "10 Largest Holdings (as a % of Net Assets)" excludes any temporary cash or derivative investments. |
| Terraform Global Operating, LP, 6.13% | 1.0% |
| CCO Holdings LLC / CCO Holdings Capital Corp., 4.50% | 1.0% |
| Trinity Industries, Inc., 7.75% | 0.9% |
| ITT Holdings LLC, 6.50% | 0.9% |
| CPI CG, Inc., 10.00% | 0.8% |
| GrafTech Finance, Inc., 4.63% | 0.8% |
| Enviri Corp., 5.75% | 0.8% |
| CD&R Smokey Buyer, Inc., 6.75% | 0.7% |
| Focus Financial Partners LLC, 6.75% | 0.7% |
| TransMontaigne Partners Limited Partnership / TLP Finance Corp., 6.13% | 0.7% |
| Top 10 Total | 8.3% |
| |
4 | "10 Largest Holdings (as a % of Net Assets)" excludes any temporary cash or derivative investments. |
There were no changes in or disagreements with fund accountants for the period.
This is a summary of certain changes to the fund since September 30, 2023. For more complete information, you may review the fund's next prospectus, which we expect to be available by January 31, 2025 at GuggenheimInvestments.com/mutual-funds/literature or, by calling 800 820 0888.
Effective February 21, 2024, the fund's (Institutional Class shares) annual expense limit was contractually reduced to 0.69% from 0.91%.
The fund's (Institutional Class shares) net expense ratio, which reflects expense waivers and reimbursements and includes certain expenses that are outside of the contractual expense limit, was 0.77% for the year ended September 30, 2024, a reduction of 0.14% compared to the prior year. The primary driver of the reduction was the reduction of the fund's annual expense limit.
Subsequent to the September 30, 2024 year-end, effective November 29, 2024, Guggenheim Partners Investment Management, LLC replaced Securities Investors, LLC as the fund's Investment Adviser in connection with an internal realignment of Guggenheim Investment's lines of business.
| |  | Availability of Additional Information. For additional information, including the fund's prospectus, financial information, holdings and proxy voting information, go to GuggenheimInvestments.com/mutual-funds/literature or, call 800 820 0888. |
AR-SHYIX-093024
Annual Shareholder Report | 9.30.24
This annual shareholder report contains important information about the Guggenheim High Yield Fund for the period of October 1, 2023 to September 30, 2024. You can find additional information about the fund at GuggenheimInvestments.com/mutual-funds/literature. You can also request this information by contacting 800 820 0888 or GuggenheimClientServices@mufg-is.com.
This report describes changes to the fund that occurred during the reporting period.
For the period of October 1, 2023 to September 30, 2024, the fund (Class R6 shares) returned 14.42%, outperforming the fund's benchmark, the Bloomberg U.S. Aggregate Bond Index, which returned 11.57% for the same period and underperforming the fund's secondary index, the Bloomberg U.S. Corporate High Yield Index, which returned 15.74% for the same period.
The fund's broad-based securities market index was changed from the Bloomberg U.S. Corporate High Yield Index to the Bloomberg U.S. Aggregate Bond Index to comply with the regulation that requires the fund's broad-based securities market index to represent the overall applicable market.
What factors materially affected the fund's performance over the last year?
Overall, lower financing costs spurred heavy new issuance volume while strong market conditions resulted in tightening credit spreads. The primary contributors to the fund's performance were exposure to higher quality BB-credit and solid credit selection in the Communications sector. The primary detractor was the fund's exposure to bank loans, which significantly underperformed high yield for the period.
Cumulative performance* for the fund since inception, assuming a $10,000 initial investment.
| 05/15/2017 | 10000 | 10000 | 10000 |
| 06/30/2017 | 10067 | 10069 | 10066 |
| 09/30/2017 | 10249 | 10154 | 10265 |
| 12/31/2017 | 10355 | 10194 | 10313 |
| 03/31/2018 | 10238 | 10045 | 10224 |
| 06/30/2018 | 10290 | 10029 | 10329 |
| 09/30/2018 | 10489 | 10031 | 10578 |
| 12/31/2018 | 10056 | 10195 | 10098 |
| 03/31/2019 | 10562 | 10495 | 10831 |
| 06/30/2019 | 10898 | 10818 | 11102 |
| 09/30/2019 | 11055 | 11064 | 11250 |
| 12/31/2019 | 11284 | 11084 | 11544 |
| 03/31/2020 | 9717 | 11433 | 10080 |
| 06/30/2020 | 10663 | 11764 | 11106 |
| 09/30/2020 | 11186 | 11836 | 11616 |
| 12/31/2020 | 11875 | 11916 | 12365 |
| 03/31/2021 | 11926 | 11514 | 12470 |
| 06/30/2021 | 12283 | 11724 | 12812 |
| 09/30/2021 | 12456 | 11731 | 12926 |
| 12/31/2021 | 12529 | 11732 | 13018 |
| 03/31/2022 | 12038 | 11036 | 12388 |
| 06/30/2022 | 11024 | 10518 | 11171 |
| 09/30/2022 | 10972 | 10018 | 11098 |
| 12/31/2022 | 11396 | 10206 | 11561 |
| 03/31/2023 | 11759 | 10508 | 11974 |
| 06/30/2023 | 11935 | 10419 | 12183 |
| 09/30/2023 | 12069 | 10082 | 12239 |
| 12/31/2023 | 12815 | 10770 | 13116 |
| 03/31/2024 | 13034 | 10686 | 13309 |
| 06/30/2024 | 13189 | 10693 | 13455 |
| 09/30/2024 | 13810 | 11249 | 14166 |
| Class R6 | 14.42% | 4.55% | 4.47% |
| Bloomberg U.S. Aggregate Bond Index | 11.57% | 0.33% | 1.61% |
| Bloomberg U.S. Corporate High Yield Index | 15.74% | 4.72% | 4.83% |
The fund's past performance is not a good predictor of the fund's future performance. Visit GuggenheimInvestments.com/mutual-funds/performance for more recent performance information.
| Net Assets | $204,093,994 |
| Total Number of Portfolio Holdings | 340 |
| Portfolio Turnover Rate | 45% |
| Total Advisory Fees Paid | $905,708 |
| Guggenheim High Yield Fund | Class R6 | SHYSX | Annual Shareholder Report | September 30, 2024 |
| Corporate Bonds | 82.3% |
| Senior Floating Rate Interests | 11.5% |
| Preferred Stocks | 1.8% |
| Common Stocks | 0.3% |
| Asset-Backed Securities | 0.3% |

| A | 0.1% |
| BBB | 4.4% |
| BB | 46.2% |
| B | 36.7% |
| CCC | 7.1% |
| NR3 | 0.1% |
| Other Instruments | 5.4% |
| Terraform Global Operating, LP, 6.13% | 1.0% |
| CCO Holdings LLC / CCO Holdings Capital Corp., 4.50% | 1.0% |
| Trinity Industries, Inc., 7.75% | 0.9% |
| ITT Holdings LLC, 6.50% | 0.9% |
| CPI CG, Inc., 10.00% | 0.8% |
| GrafTech Finance, Inc., 4.63% | 0.8% |
| Enviri Corp., 5.75% | 0.8% |
| CD&R Smokey Buyer, Inc., 6.75% | 0.7% |
| Focus Financial Partners LLC, 6.75% | 0.7% |
| TransMontaigne Partners Limited Partnership / TLP Finance Corp., 6.13% | 0.7% |
| Top 10 Total | 8.3% |
| |
1 | "Holdings Diversification (Market Exposure as a % of Net Assets)" excludes any temporary cash investments, investments in Guggenheim Strategy Funds Trust mutual funds, or investments in Guggenheim Ultra Short Duration Fund. |
| |
2 | Source: BlackRock Solutions. Credit quality ratings are measured on a scale that generally ranges from AAA (highest) to D (lowest). All securities except for those labeled "NR" have been rated by Moody's, Standard & Poor's ("S&P"), or Fitch, each of which is a Nationally Recognized Statistical Rating Organization ("NRSRO"). For purposes of this presentation, when ratings are available from more than one agency, the highest rating is used. Guggenheim Investments has converted ratings to the equivalent S&P rating. |
3 | NR (not rated) securities do not necessarily indicate low credit quality. |
| |
4 | "10 Largest Holdings (as a % of Net Assets)" excludes any temporary cash or derivative investments. |
| Terraform Global Operating, LP, 6.13% | 1.0% |
| CCO Holdings LLC / CCO Holdings Capital Corp., 4.50% | 1.0% |
| Trinity Industries, Inc., 7.75% | 0.9% |
| ITT Holdings LLC, 6.50% | 0.9% |
| CPI CG, Inc., 10.00% | 0.8% |
| GrafTech Finance, Inc., 4.63% | 0.8% |
| Enviri Corp., 5.75% | 0.8% |
| CD&R Smokey Buyer, Inc., 6.75% | 0.7% |
| Focus Financial Partners LLC, 6.75% | 0.7% |
| TransMontaigne Partners Limited Partnership / TLP Finance Corp., 6.13% | 0.7% |
| Top 10 Total | 8.3% |
| |
4 | "10 Largest Holdings (as a % of Net Assets)" excludes any temporary cash or derivative investments. |
There were no changes in or disagreements with fund accountants for the period.
This is a summary of certain changes to the fund since September 30, 2023. For more complete information, you may review the fund's next prospectus, which we expect to be available by January 31, 2025 at GuggenheimInvestments.com/mutual-funds/literature or, by calling 800 820 0888.
Effective February 21, 2024, the fund's (Class R6 shares) annual expense limit was contractually reduced to 0.69% from 0.91%.
The fund's (Class R6 shares) net expense ratio, which reflects expense waivers and reimbursements and includes certain expenses that are outside of the contractual expense limit, was 0.76% for the year ended September 30, 2024, a reduction of 0.04% compared to the prior year. The primary driver of the reduction was the reduction of the fund's annual expense limit.
Subsequent to the September 30, 2024 year-end, effective November 29, 2024, Guggenheim Partners Investment Management, LLC replaced Securities Investors, LLC as the fund's Investment Adviser in connection with an internal realignment of Guggenheim Investment's lines of business.
| |  | Availability of Additional Information. For additional information, including the fund's prospectus, financial information, holdings and proxy voting information, go to GuggenheimInvestments.com/mutual-funds/literature or, call 800 820 0888. |
AR-SHYSX-093024
Annual Shareholder Report | 9.30.24
This annual shareholder report contains important information about the Guggenheim Limited Duration Fund for the period of October 1, 2023 to September 30, 2024. You can find additional information about the fund at GuggenheimInvestments.com/mutual-funds/literature. You can also request this information by contacting 800 820 0888 or GuggenheimClientServices@mufg-is.com.
This report describes changes to the fund that occurred during the reporting period.
For the period of October 1, 2023 to September 30, 2024, the fund (Class A shares) returned 8.96%, underperforming the fund's benchmark, the Bloomberg U.S. Aggregate Bond Index, which returned 11.57% for the same period and outperforming the fund's secondary index, the Bloomberg U.S. Aggregate Bond 1-3 Year Total Return Index, which returned 7.23% for the same period.
The fund's broad-based securities market index was changed from the Bloomberg U.S. Aggregate Bond 1-3 Year Total Return Index to the Bloomberg U.S. Aggregate Bond Index to comply with the regulation that requires the fund's broad-based securities market index to represent the overall applicable market.
What factors materially affected the fund's performance over the last year?
The fund's relative outperformance against the Bloomberg U.S. Aggregate Bond 1-3 Year Total Return Index (the fund's ancillary index) was primarily driven by sector allocation, security selection, and the fund's carry (or earned income) advantage. The fund benefited from its structured credit allocation, which includes various subsectors of asset-backed securities, collateralized loan obligations, non-agency commercial mortgage-backed securities and non-agency residential mortgage-backed securities, as prices moved higher on both lower interest rates and tighter credit spreads. This followed increased market optimism on the potential for a soft landing given disinflationary trends and resilient economic data. Security selection within investment grade corporates was a key contributor to performance as the fund's investment grade corporate holdings outperformed the Index by 1.2%.
Cumulative performance* for the fund's most recently completed 10 years (as of 9.30.24), assuming a $10,000 initial investment.
| 09/30/2014 | 9777 | 10000 | 10000 |
| 12/31/2014 | 9801 | 10179 | 10018 |
| 03/31/2015 | 9924 | 10343 | 10077 |
| 06/30/2015 | 9985 | 10169 | 10091 |
| 09/30/2015 | 9987 | 10294 | 10121 |
| 12/31/2015 | 9972 | 10235 | 10085 |
| 03/31/2016 | 9968 | 10546 | 10183 |
| 06/30/2016 | 10125 | 10779 | 10252 |
| 09/30/2016 | 10303 | 10829 | 10255 |
| 12/31/2016 | 10352 | 10506 | 10217 |
| 03/31/2017 | 10455 | 10592 | 10258 |
| 06/30/2017 | 10542 | 10745 | 10291 |
| 09/30/2017 | 10606 | 10836 | 10326 |
| 12/31/2017 | 10649 | 10879 | 10305 |
| 03/31/2018 | 10682 | 10720 | 10284 |
| 06/30/2018 | 10719 | 10703 | 10313 |
| 09/30/2018 | 10786 | 10705 | 10348 |
| 12/31/2018 | 10811 | 10880 | 10470 |
| 03/31/2019 | 10869 | 11200 | 10597 |
| 06/30/2019 | 10963 | 11545 | 10755 |
| 09/30/2019 | 11030 | 11807 | 10831 |
| 12/31/2019 | 11039 | 11828 | 10893 |
| 03/31/2020 | 10989 | 12200 | 11088 |
| 06/30/2020 | 11453 | 12554 | 11185 |
| 09/30/2020 | 11638 | 12632 | 11203 |
| 12/31/2020 | 11749 | 12716 | 11228 |
| 03/31/2021 | 11690 | 12287 | 11220 |
| 06/30/2021 | 11780 | 12512 | 11226 |
| 09/30/2021 | 11799 | 12518 | 11236 |
| 12/31/2021 | 11751 | 12520 | 11173 |
| 03/31/2022 | 11470 | 11777 | 10893 |
| 06/30/2022 | 11197 | 11224 | 10824 |
| 09/30/2022 | 11041 | 10691 | 10661 |
| 12/31/2022 | 11220 | 10891 | 10757 |
| 03/31/2023 | 11474 | 11214 | 10920 |
| 06/30/2023 | 11523 | 11119 | 10880 |
| 09/30/2023 | 11627 | 10760 | 10960 |
| 12/31/2023 | 12005 | 11493 | 11257 |
| 03/31/2024 | 12141 | 11404 | 11308 |
| 06/30/2024 | 12299 | 11411 | 11416 |
| 09/30/2024 | 12669 | 12004 | 11753 |
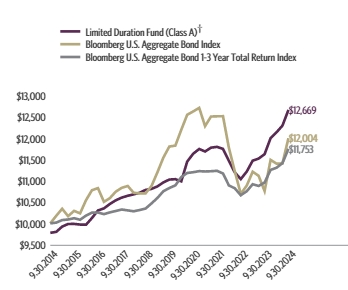
| Class A (without sales charge) | 8.96% | 2.79% | 2.62% |
| Class A (with sales charge)† | 6.52% | 2.32% | 2.39% |
| Bloomberg U.S. Aggregate Bond Index | 11.57% | 0.33% | 1.84% |
| Bloomberg U.S. Aggregate Bond 1-3 Year Total Return Index | 7.23% | 1.65% | 1.63% |
The fund's past performance is not a good predictor of the fund's future performance. Visit GuggenheimInvestments.com/mutual-funds/performance for more recent performance information.
| Net Assets | $4,472,650,204 |
| Total Number of Portfolio Holdings | 593 |
| Portfolio Turnover Rate | 42% |
| Total Advisory Fees Paid | $14,155,779 |
| Guggenheim Limited Duration Fund | Class A | GILDX | Annual Shareholder Report | September 30, 2024 |
| Corporate Bonds | 33.1% |
| Collateralized Mortgage Obligations | 28.3% |
| Asset-Backed Securities | 26.3% |
| U.S. Government Securities | 18.0% |
| Interest Rate Futures Contracts | 7.3% |
| Senior Floating Rate Interests | 1.9% |
| Preferred Stocks | 0.5% |
| Municipal Bonds | 0.2% |
| Interest Rate Swap Agreements | 24.6% |
| Common Stocks | 0.0% |
| Warrants | 0.0% |
| Credit Default Swap Agreements Protection Purchased | -2.6% |

| AAA | 43.2% |
| AA | 7.1% |
| A | 18.1% |
| BBB | 17.3% |
| BB | 3.7% |
| B | 0.7% |
| CCC | 0.4% |
| CC | 0.2% |
| NR3 | 5.4% |
| Other Instruments | 3.9% |
| Uniform MBS 15 Year | 6.2% |
| U.S. Treasury Notes, 4.75% | 4.5% |
| U.S. Treasury Notes, 4.38% | 3.6% |
| Uniform MBS 15 Year | 3.4% |
| Uniform MBS 15 Year | 2.6% |
| U.S. Treasury Notes, 4.63% | 2.2% |
| U.S. Treasury Notes, 3.75% | 1.5% |
| U.S. Treasury Inflation Indexed Bonds, 2.13% | 1.3% |
| THL Credit Lake Shore MM CLO I Ltd., 7.26% | 1.1% |
| U.S. Treasury Notes, 3.38% | 1.1% |
| Top 10 Total | 27.5% |
| |
1 | "Holdings Diversification (Market Exposure as a % of Net Assets)" excludes any temporary cash investments, investments in Guggenheim Strategy Funds Trust mutual funds, or investments in Guggenheim Ultra Short Duration Fund. |
| |
2 | Source: BlackRock Solutions. Credit quality ratings are measured on a scale that generally ranges from AAA (highest) to D (lowest). All securities except for those labeled "NR" have been rated by Moody's, Standard & Poor's ("S&P"), or Fitch, each of which is a Nationally Recognized Statistical Rating Organization ("NRSRO"). For purposes of this presentation, when ratings are available from more than one agency, the highest rating is used. Guggenheim Investments has converted ratings to the equivalent S&P rating. |
3 | NR (not rated) securities do not necessarily indicate low credit quality. |
| |
4 | "10 Largest Holdings (as a % of Net Assets)" excludes any temporary cash or derivative investments. |
| Uniform MBS 15 Year | 6.2% |
| U.S. Treasury Notes, 4.75% | 4.5% |
| U.S. Treasury Notes, 4.38% | 3.6% |
| Uniform MBS 15 Year | 3.4% |
| Uniform MBS 15 Year | 2.6% |
| U.S. Treasury Notes, 4.63% | 2.2% |
| U.S. Treasury Notes, 3.75% | 1.5% |
| U.S. Treasury Inflation Indexed Bonds, 2.13% | 1.3% |
| THL Credit Lake Shore MM CLO I Ltd., 7.26% | 1.1% |
| U.S. Treasury Notes, 3.38% | 1.1% |
| Top 10 Total | 27.5% |
| |
4 | "10 Largest Holdings (as a % of Net Assets)" excludes any temporary cash or derivative investments. |
There were no changes in or disagreements with fund accountants for the period.
There were no material changes for the period.
| |  | Availability of Additional Information. For additional information, including the fund's prospectus, financial information, holdings and proxy voting information, go to GuggenheimInvestments.com/mutual-funds/literature or, call 800 820 0888. |
AR-GILDX-093024
Annual Shareholder Report | 9.30.24
This annual shareholder report contains important information about the Guggenheim Limited Duration Fund for the period of October 1, 2023 to September 30, 2024. You can find additional information about the fund at GuggenheimInvestments.com/mutual-funds/literature. You can also request this information by contacting 800 820 0888 or GuggenheimClientServices@mufg-is.com.
This report describes changes to the fund that occurred during the reporting period.
For the period of October 1, 2023 to September 30, 2024, the fund (Class C shares) returned 8.20%, underperforming the fund's benchmark, the Bloomberg U.S. Aggregate Bond Index, which returned 11.57% for the same period and outperforming the fund's secondary index, the Bloomberg U.S. Aggregate Bond 1-3 Year Total Return Index, which returned 7.23% for the same period.
The fund's broad-based securities market index was changed from the Bloomberg U.S. Aggregate Bond 1-3 Year Total Return Index to the Bloomberg U.S. Aggregate Bond Index to comply with the regulation that requires the fund's broad-based securities market index to represent the overall applicable market.
What factors materially affected the fund's performance over the last year?
The fund's relative outperformance against the Bloomberg U.S. Aggregate Bond 1-3 Year Total Return Index (the fund's ancillary index) was primarily driven by sector allocation, security selection, and the fund's carry (or earned income) advantage. The fund benefited from its structured credit allocation, which includes various subsectors of asset-backed securities, collateralized loan obligations, non-agency commercial mortgage-backed securities and non-agency residential mortgage-backed securities, as prices moved higher on both lower interest rates and tighter credit spreads. This followed increased market optimism on the potential for a soft landing given disinflationary trends and resilient economic data. Security selection within investment grade corporates was a key contributor to performance as the fund's investment grade corporate holdings outperformed the Index by 1.2%.
Cumulative performance* for the fund's most recently completed 10 years (as of 9.30.24), assuming a $10,000 initial investment.
| 09/30/2014 | 10000 | 10000 | 10000 |
| 12/31/2014 | 10010 | 10179 | 10018 |
| 03/31/2015 | 10112 | 10343 | 10077 |
| 06/30/2015 | 10154 | 10169 | 10091 |
| 09/30/2015 | 10137 | 10294 | 10121 |
| 12/31/2015 | 10102 | 10235 | 10085 |
| 03/31/2016 | 10080 | 10546 | 10183 |
| 06/30/2016 | 10219 | 10779 | 10252 |
| 09/30/2016 | 10379 | 10829 | 10255 |
| 12/31/2016 | 10413 | 10506 | 10217 |
| 03/31/2017 | 10494 | 10592 | 10258 |
| 06/30/2017 | 10561 | 10745 | 10291 |
| 09/30/2017 | 10606 | 10836 | 10326 |
| 12/31/2017 | 10631 | 10879 | 10305 |
| 03/31/2018 | 10646 | 10720 | 10284 |
| 06/30/2018 | 10659 | 10703 | 10313 |
| 09/30/2018 | 10705 | 10705 | 10348 |
| 12/31/2018 | 10710 | 10880 | 10470 |
| 03/31/2019 | 10749 | 11200 | 10597 |
| 06/30/2019 | 10820 | 11545 | 10755 |
| 09/30/2019 | 10867 | 11807 | 10831 |
| 12/31/2019 | 10855 | 11828 | 10893 |
| 03/31/2020 | 10790 | 12200 | 11088 |
| 06/30/2020 | 11220 | 12554 | 11185 |
| 09/30/2020 | 11380 | 12632 | 11203 |
| 12/31/2020 | 11471 | 12716 | 11228 |
| 03/31/2021 | 11389 | 12287 | 11220 |
| 06/30/2021 | 11455 | 12512 | 11226 |
| 09/30/2021 | 11456 | 12518 | 11236 |
| 12/31/2021 | 11384 | 12520 | 11173 |
| 03/31/2022 | 11096 | 11777 | 10893 |
| 06/30/2022 | 10811 | 11224 | 10824 |
| 09/30/2022 | 10640 | 10691 | 10661 |
| 12/31/2022 | 10787 | 10891 | 10757 |
| 03/31/2023 | 11012 | 11214 | 10920 |
| 06/30/2023 | 11038 | 11119 | 10880 |
| 09/30/2023 | 11116 | 10760 | 10960 |
| 12/31/2023 | 11457 | 11493 | 11257 |
| 03/31/2024 | 11565 | 11404 | 11308 |
| 06/30/2024 | 11699 | 11411 | 11416 |
| 09/30/2024 | 12028 | 12004 | 11753 |
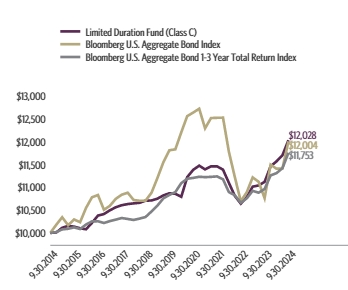
| Class C (without CDSC) | 8.20% | 2.03% | 1.85% |
| Class C (with CDSC)‡ | 7.20% | 2.03% | 1.85% |
| Bloomberg U.S. Aggregate Bond Index | 11.57% | 0.33% | 1.84% |
| Bloomberg U.S. Aggregate Bond 1-3 Year Total Return Index | 7.23% | 1.65% | 1.63% |
The fund's past performance is not a good predictor of the fund's future performance. Visit GuggenheimInvestments.com/mutual-funds/performance for more recent performance information.
| Net Assets | $4,472,650,204 |
| Total Number of Portfolio Holdings | 593 |
| Portfolio Turnover Rate | 42% |
| Total Advisory Fees Paid | $14,155,779 |
| Guggenheim Limited Duration Fund | Class C | GILFX | Annual Shareholder Report | September 30, 2024 |
| Corporate Bonds | 33.1% |
| Collateralized Mortgage Obligations | 28.3% |
| Asset-Backed Securities | 26.3% |
| U.S. Government Securities | 18.0% |
| Interest Rate Futures Contracts | 7.3% |
| Senior Floating Rate Interests | 1.9% |
| Preferred Stocks | 0.5% |
| Municipal Bonds | 0.2% |
| Interest Rate Swap Agreements | 24.6% |
| Common Stocks | 0.0% |
| Warrants | 0.0% |
| Credit Default Swap Agreements Protection Purchased | -2.6% |

| AAA | 43.2% |
| AA | 7.1% |
| A | 18.1% |
| BBB | 17.3% |
| BB | 3.7% |
| B | 0.7% |
| CCC | 0.4% |
| CC | 0.2% |
| NR3 | 5.4% |
| Other Instruments | 3.9% |
| Uniform MBS 15 Year | 6.2% |
| U.S. Treasury Notes, 4.75% | 4.5% |
| U.S. Treasury Notes, 4.38% | 3.6% |
| Uniform MBS 15 Year | 3.4% |
| Uniform MBS 15 Year | 2.6% |
| U.S. Treasury Notes, 4.63% | 2.2% |
| U.S. Treasury Notes, 3.75% | 1.5% |
| U.S. Treasury Inflation Indexed Bonds, 2.13% | 1.3% |
| THL Credit Lake Shore MM CLO I Ltd., 7.26% | 1.1% |
| U.S. Treasury Notes, 3.38% | 1.1% |
| Top 10 Total | 27.5% |
| |
1 | "Holdings Diversification (Market Exposure as a % of Net Assets)" excludes any temporary cash investments, investments in Guggenheim Strategy Funds Trust mutual funds, or investments in Guggenheim Ultra Short Duration Fund. |
| |
2 | Source: BlackRock Solutions. Credit quality ratings are measured on a scale that generally ranges from AAA (highest) to D (lowest). All securities except for those labeled "NR" have been rated by Moody's, Standard & Poor's ("S&P"), or Fitch, each of which is a Nationally Recognized Statistical Rating Organization ("NRSRO"). For purposes of this presentation, when ratings are available from more than one agency, the highest rating is used. Guggenheim Investments has converted ratings to the equivalent S&P rating. |
3 | NR (not rated) securities do not necessarily indicate low credit quality. |
| |
4 | "10 Largest Holdings (as a % of Net Assets)" excludes any temporary cash or derivative investments. |
| Uniform MBS 15 Year | 6.2% |
| U.S. Treasury Notes, 4.75% | 4.5% |
| U.S. Treasury Notes, 4.38% | 3.6% |
| Uniform MBS 15 Year | 3.4% |
| Uniform MBS 15 Year | 2.6% |
| U.S. Treasury Notes, 4.63% | 2.2% |
| U.S. Treasury Notes, 3.75% | 1.5% |
| U.S. Treasury Inflation Indexed Bonds, 2.13% | 1.3% |
| THL Credit Lake Shore MM CLO I Ltd., 7.26% | 1.1% |
| U.S. Treasury Notes, 3.38% | 1.1% |
| Top 10 Total | 27.5% |
| |
4 | "10 Largest Holdings (as a % of Net Assets)" excludes any temporary cash or derivative investments. |
There were no changes in or disagreements with fund accountants for the period.
There were no material changes for the period.
| |  | Availability of Additional Information. For additional information, including the fund's prospectus, financial information, holdings and proxy voting information, go to GuggenheimInvestments.com/mutual-funds/literature or, call 800 820 0888. |
AR-GILFX-093024
Annual Shareholder Report | 9.30.24
This annual shareholder report contains important information about the Guggenheim Limited Duration Fund for the period of October 1, 2023 to September 30, 2024. You can find additional information about the fund at GuggenheimInvestments.com/mutual-funds/literature. You can also request this information by contacting 800 820 0888 or GuggenheimClientServices@mufg-is.com.
This report describes changes to the fund that occurred during the reporting period.
For the period of October 1, 2023 to September 30, 2024, the fund (Class P shares) returned 8.96%, underperforming the fund's benchmark, the Bloomberg U.S. Aggregate Bond Index, which returned 11.57% for the same period and outperforming the fund's secondary index, the Bloomberg U.S. Aggregate Bond 1-3 Year Total Return Index, which returned 7.23% for the same period.
The fund's broad-based securities market index was changed from the Bloomberg U.S. Aggregate Bond 1-3 Year Total Return Index to the Bloomberg U.S. Aggregate Bond Index to comply with the regulation that requires the fund's broad-based securities market index to represent the overall applicable market.
What factors materially affected the fund's performance over the last year?
The fund's relative outperformance against the Bloomberg U.S. Aggregate Bond 1-3 Year Total Return Index (the fund's ancillary index) was primarily driven by sector allocation, security selection, and the fund's carry (or earned income) advantage. The fund benefited from its structured credit allocation, which includes various subsectors of asset-backed securities, collateralized loan obligations, non-agency commercial mortgage-backed securities and non-agency residential mortgage-backed securities, as prices moved higher on both lower interest rates and tighter credit spreads. This followed increased market optimism on the potential for a soft landing given disinflationary trends and resilient economic data. Security selection within investment grade corporates was a key contributor to performance as the fund's investment grade corporate holdings outperformed the Index by 1.2%.
Cumulative performance* for the fund since inception (as of 9.30.24), assuming a $10,000 initial investment.
| 05/01/2015 | 10000 | 10000 | 10000 |
| 06/30/2015 | 10031 | 9899 | 10011 |
| 09/30/2015 | 10032 | 10021 | 10040 |
| 12/31/2015 | 10018 | 9964 | 10004 |
| 03/31/2016 | 10013 | 10266 | 10102 |
| 06/30/2016 | 10171 | 10493 | 10170 |
| 09/30/2016 | 10350 | 10542 | 10174 |
| 12/31/2016 | 10399 | 10228 | 10135 |
| 03/31/2017 | 10502 | 10311 | 10177 |
| 06/30/2017 | 10589 | 10460 | 10209 |
| 09/30/2017 | 10653 | 10549 | 10244 |
| 12/31/2017 | 10697 | 10590 | 10223 |
| 03/31/2018 | 10730 | 10435 | 10202 |
| 06/30/2018 | 10762 | 10419 | 10231 |
| 09/30/2018 | 10834 | 10421 | 10266 |
| 12/31/2018 | 10859 | 10591 | 10387 |
| 03/31/2019 | 10918 | 10903 | 10513 |
| 06/30/2019 | 11011 | 11239 | 10669 |
| 09/30/2019 | 11079 | 11494 | 10745 |
| 12/31/2019 | 11088 | 11515 | 10806 |
| 03/31/2020 | 11038 | 11877 | 11000 |
| 06/30/2020 | 11504 | 12221 | 11096 |
| 09/30/2020 | 11689 | 12297 | 11114 |
| 12/31/2020 | 11801 | 12379 | 11139 |
| 03/31/2021 | 11742 | 11961 | 11131 |
| 06/30/2021 | 11832 | 12180 | 11136 |
| 09/30/2021 | 11851 | 12187 | 11146 |
| 12/31/2021 | 11804 | 12188 | 11084 |
| 03/31/2022 | 11521 | 11465 | 10806 |
| 06/30/2022 | 11247 | 10927 | 10738 |
| 09/30/2022 | 11090 | 10407 | 10576 |
| 12/31/2022 | 11270 | 10602 | 10671 |
| 03/31/2023 | 11525 | 10916 | 10833 |
| 06/30/2023 | 11575 | 10824 | 10794 |
| 09/30/2023 | 11679 | 10474 | 10873 |
| 12/31/2023 | 12059 | 11189 | 11167 |
| 03/31/2024 | 12195 | 11102 | 11218 |
| 06/30/2024 | 12354 | 11109 | 11325 |
| 09/30/2024 | 12725 | 11686 | 11659 |
| Class P | 8.96% | 2.79% | 2.58% |
| Bloomberg U.S. Aggregate Bond Index | 11.57% | 0.33% | 1.67% |
| Bloomberg U.S. Aggregate Bond 1-3 Year Total Return Index | 7.23% | 1.65% | 1.64% |
The fund's past performance is not a good predictor of the fund's future performance. Visit GuggenheimInvestments.com/mutual-funds/performance for more recent performance information.
| Net Assets | $4,472,650,204 |
| Total Number of Portfolio Holdings | 593 |
| Portfolio Turnover Rate | 42% |
| Total Advisory Fees Paid | $14,155,779 |
| Guggenheim Limited Duration Fund | Class P | GILPX | Annual Shareholder Report | September 30, 2024 |
| Corporate Bonds | 33.1% |
| Collateralized Mortgage Obligations | 28.3% |
| Asset-Backed Securities | 26.3% |
| U.S. Government Securities | 18.0% |
| Interest Rate Futures Contracts | 7.3% |
| Senior Floating Rate Interests | 1.9% |
| Preferred Stocks | 0.5% |
| Municipal Bonds | 0.2% |
| Interest Rate Swap Agreements | 24.6% |
| Common Stocks | 0.0% |
| Warrants | 0.0% |
| Credit Default Swap Agreements Protection Purchased | -2.6% |

| AAA | 43.2% |
| AA | 7.1% |
| A | 18.1% |
| BBB | 17.3% |
| BB | 3.7% |
| B | 0.7% |
| CCC | 0.4% |
| CC | 0.2% |
| NR3 | 5.4% |
| Other Instruments | 3.9% |
| Uniform MBS 15 Year | 6.2% |
| U.S. Treasury Notes, 4.75% | 4.5% |
| U.S. Treasury Notes, 4.38% | 3.6% |
| Uniform MBS 15 Year | 3.4% |
| Uniform MBS 15 Year | 2.6% |
| U.S. Treasury Notes, 4.63% | 2.2% |
| U.S. Treasury Notes, 3.75% | 1.5% |
| U.S. Treasury Inflation Indexed Bonds, 2.13% | 1.3% |
| THL Credit Lake Shore MM CLO I Ltd., 7.26% | 1.1% |
| U.S. Treasury Notes, 3.38% | 1.1% |
| Top 10 Total | 27.5% |
| |
1 | "Holdings Diversification (Market Exposure as a % of Net Assets)" excludes any temporary cash investments, investments in Guggenheim Strategy Funds Trust mutual funds, or investments in Guggenheim Ultra Short Duration Fund. |
| |
2 | Source: BlackRock Solutions. Credit quality ratings are measured on a scale that generally ranges from AAA (highest) to D (lowest). All securities except for those labeled "NR" have been rated by Moody's, Standard & Poor's ("S&P"), or Fitch, each of which is a Nationally Recognized Statistical Rating Organization ("NRSRO"). For purposes of this presentation, when ratings are available from more than one agency, the highest rating is used. Guggenheim Investments has converted ratings to the equivalent S&P rating. |
3 | NR (not rated) securities do not necessarily indicate low credit quality. |
| |
4 | "10 Largest Holdings (as a % of Net Assets)" excludes any temporary cash or derivative investments. |
| Uniform MBS 15 Year | 6.2% |
| U.S. Treasury Notes, 4.75% | 4.5% |
| U.S. Treasury Notes, 4.38% | 3.6% |
| Uniform MBS 15 Year | 3.4% |
| Uniform MBS 15 Year | 2.6% |
| U.S. Treasury Notes, 4.63% | 2.2% |
| U.S. Treasury Notes, 3.75% | 1.5% |
| U.S. Treasury Inflation Indexed Bonds, 2.13% | 1.3% |
| THL Credit Lake Shore MM CLO I Ltd., 7.26% | 1.1% |
| U.S. Treasury Notes, 3.38% | 1.1% |
| Top 10 Total | 27.5% |
| |
4 | "10 Largest Holdings (as a % of Net Assets)" excludes any temporary cash or derivative investments. |
There were no changes in or disagreements with fund accountants for the period.
There were no material changes for the period.
| |  | Availability of Additional Information. For additional information, including the fund's prospectus, financial information, holdings and proxy voting information, go to GuggenheimInvestments.com/mutual-funds/literature or, call 800 820 0888. |
AR-GILPX-093024
Annual Shareholder Report | 9.30.24
This annual shareholder report contains important information about the Guggenheim Limited Duration Fund for the period of October 1, 2023 to September 30, 2024. You can find additional information about the fund at GuggenheimInvestments.com/mutual-funds/literature. You can also request this information by contacting 800 820 0888 or GuggenheimClientServices@mufg-is.com.
This report describes changes to the fund that occurred during the reporting period.
| Institutional Class | $52 | 0.50% |
For the period of October 1, 2023 to September 30, 2024, the fund (Institutional Class shares) returned 9.28%, underperforming the fund's benchmark, the Bloomberg U.S. Aggregate Bond Index, which returned 11.57% for the same period and outperforming the fund's secondary index, the Bloomberg U.S. Aggregate Bond 1-3 Year Total Return Index, which returned 7.23% for the same period.
The fund's broad-based securities market index was changed from the Bloomberg U.S. Aggregate Bond 1-3 Year Total Return Index to the Bloomberg U.S. Aggregate Bond Index to comply with the regulation that requires the fund's broad-based securities market index to represent the overall applicable market.
What factors materially affected the fund's performance over the last year?
The fund's relative outperformance against the Bloomberg U.S. Aggregate Bond 1-3 Year Total Return Index (the fund's ancillary index) was primarily driven by sector allocation, security selection, and the fund's carry (or earned income) advantage. The fund benefited from its structured credit allocation, which includes various subsectors of asset-backed securities, collateralized loan obligations, non-agency commercial mortgage-backed securities and non-agency residential mortgage-backed securities, as prices moved higher on both lower interest rates and tighter credit spreads. This followed increased market optimism on the potential for a soft landing given disinflationary trends and resilient economic data. Security selection within investment grade corporates was a key contributor to performance as the fund's investment grade corporate holdings outperformed the Index by 1.2%.
Cumulative performance* for the fund's most recently completed 10 years (as of 9.30.24), assuming a $2,000,000 initial investment.
| 09/30/2014 | 2000000 | 2000000 | 2000000 |
| 12/31/2014 | 2007056 | 2035885 | 2003624 |
| 03/31/2015 | 2032619 | 2068593 | 2015435 |
| 06/30/2015 | 2046498 | 2033787 | 2018190 |
| 09/30/2015 | 2048235 | 2058816 | 2024189 |
| 12/31/2015 | 2046625 | 2047081 | 2016942 |
| 03/31/2016 | 2046964 | 2109149 | 2036589 |
| 06/30/2016 | 2080432 | 2155839 | 2050395 |
| 09/30/2016 | 2118426 | 2165719 | 2051029 |
| 12/31/2016 | 2130697 | 2101277 | 2043312 |
| 03/31/2017 | 2152593 | 2118439 | 2051675 |
| 06/30/2017 | 2171850 | 2149054 | 2058137 |
| 09/30/2017 | 2186476 | 2167289 | 2065150 |
| 12/31/2017 | 2197673 | 2175701 | 2060984 |
| 03/31/2018 | 2205781 | 2143918 | 2056770 |
| 06/30/2018 | 2213825 | 2140524 | 2062630 |
| 09/30/2018 | 2229071 | 2140934 | 2069606 |
| 12/31/2018 | 2235663 | 2175948 | 2094031 |
| 03/31/2019 | 2249089 | 2239983 | 2119500 |
| 06/30/2019 | 2269725 | 2308967 | 2151001 |
| 09/30/2019 | 2285177 | 2361362 | 2166177 |
| 12/31/2019 | 2289387 | 2365619 | 2178577 |
| 03/31/2020 | 2280317 | 2440097 | 2217567 |
| 06/30/2020 | 2377123 | 2510752 | 2237064 |
| 09/30/2020 | 2417070 | 2526300 | 2240622 |
| 12/31/2020 | 2442632 | 2543198 | 2245663 |
| 03/31/2021 | 2430920 | 2457428 | 2243983 |
| 06/30/2021 | 2452167 | 2502393 | 2245120 |
| 09/30/2021 | 2457541 | 2503689 | 2247158 |
| 12/31/2021 | 2449286 | 2503980 | 2234584 |
| 03/31/2022 | 2392147 | 2355394 | 2178632 |
| 06/30/2022 | 2336563 | 2244843 | 2164747 |
| 09/30/2022 | 2305458 | 2138160 | 2132260 |
| 12/31/2022 | 2343364 | 2178209 | 2151377 |
| 03/31/2023 | 2397942 | 2242728 | 2183903 |
| 06/30/2023 | 2409779 | 2223793 | 2176031 |
| 09/30/2023 | 2432913 | 2151938 | 2192051 |
| 12/31/2023 | 2513655 | 2298638 | 2251390 |
| 03/31/2024 | 2544656 | 2280808 | 2261626 |
| 06/30/2024 | 2579452 | 2282297 | 2283101 |
| 09/30/2024 | 2658649 | 2400886 | 2350583 |
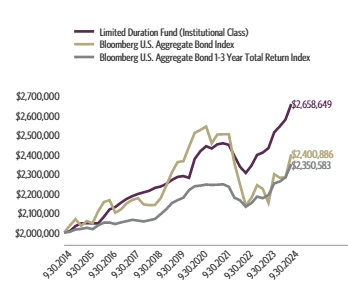
| Institutional Class | 9.28% | 3.06% | 2.88% |
| Bloomberg U.S. Aggregate Bond Index | 11.57% | 0.33% | 1.84% |
| Bloomberg U.S. Aggregate Bond 1-3 Year Total Return Index | 7.23% | 1.65% | 1.63% |
The fund's past performance is not a good predictor of the fund's future performance. Visit GuggenheimInvestments.com/mutual-funds/performance for more recent performance information.
| Net Assets | $4,472,650,204 |
| Total Number of Portfolio Holdings | 593 |
| Portfolio Turnover Rate | 42% |
| Total Advisory Fees Paid | $14,155,779 |
| Guggenheim Limited Duration Fund | Institutional Class | GILHX | Annual Shareholder Report | September 30, 2024 |
| Corporate Bonds | 33.1% |
| Collateralized Mortgage Obligations | 28.3% |
| Asset-Backed Securities | 26.3% |
| U.S. Government Securities | 18.0% |
| Interest Rate Futures Contracts | 7.3% |
| Senior Floating Rate Interests | 1.9% |
| Preferred Stocks | 0.5% |
| Municipal Bonds | 0.2% |
| Interest Rate Swap Agreements | 24.6% |
| Common Stocks | 0.0% |
| Warrants | 0.0% |
| Credit Default Swap Agreements Protection Purchased | -2.6% |
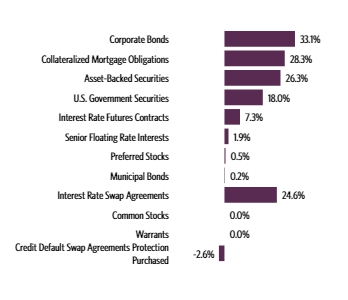
| AAA | 43.2% |
| AA | 7.1% |
| A | 18.1% |
| BBB | 17.3% |
| BB | 3.7% |
| B | 0.7% |
| CCC | 0.4% |
| CC | 0.2% |
| NR3 | 5.4% |
| Other Instruments | 3.9% |
| Uniform MBS 15 Year | 6.2% |
| U.S. Treasury Notes, 4.75% | 4.5% |
| U.S. Treasury Notes, 4.38% | 3.6% |
| Uniform MBS 15 Year | 3.4% |
| Uniform MBS 15 Year | 2.6% |
| U.S. Treasury Notes, 4.63% | 2.2% |
| U.S. Treasury Notes, 3.75% | 1.5% |
| U.S. Treasury Inflation Indexed Bonds, 2.13% | 1.3% |
| THL Credit Lake Shore MM CLO I Ltd., 7.26% | 1.1% |
| U.S. Treasury Notes, 3.38% | 1.1% |
| Top 10 Total | 27.5% |
| |
1 | "Holdings Diversification (Market Exposure as a % of Net Assets)" excludes any temporary cash investments, investments in Guggenheim Strategy Funds Trust mutual funds, or investments in Guggenheim Ultra Short Duration Fund. |
| |
2 | Source: BlackRock Solutions. Credit quality ratings are measured on a scale that generally ranges from AAA (highest) to D (lowest). All securities except for those labeled "NR" have been rated by Moody's, Standard & Poor's ("S&P"), or Fitch, each of which is a Nationally Recognized Statistical Rating Organization ("NRSRO"). For purposes of this presentation, when ratings are available from more than one agency, the highest rating is used. Guggenheim Investments has converted ratings to the equivalent S&P rating. |
3 | NR (not rated) securities do not necessarily indicate low credit quality. |
| |
4 | "10 Largest Holdings (as a % of Net Assets)" excludes any temporary cash or derivative investments. |
| Uniform MBS 15 Year | 6.2% |
| U.S. Treasury Notes, 4.75% | 4.5% |
| U.S. Treasury Notes, 4.38% | 3.6% |
| Uniform MBS 15 Year | 3.4% |
| Uniform MBS 15 Year | 2.6% |
| U.S. Treasury Notes, 4.63% | 2.2% |
| U.S. Treasury Notes, 3.75% | 1.5% |
| U.S. Treasury Inflation Indexed Bonds, 2.13% | 1.3% |
| THL Credit Lake Shore MM CLO I Ltd., 7.26% | 1.1% |
| U.S. Treasury Notes, 3.38% | 1.1% |
| Top 10 Total | 27.5% |
| |
4 | "10 Largest Holdings (as a % of Net Assets)" excludes any temporary cash or derivative investments. |
There were no changes in or disagreements with fund accountants for the period.
There were no material changes for the period.
| |  | Availability of Additional Information. For additional information, including the fund's prospectus, financial information, holdings and proxy voting information, go to GuggenheimInvestments.com/mutual-funds/literature or, call 800 820 0888. |
AR-GILHX-093024
Annual Shareholder Report | 9.30.24
This annual shareholder report contains important information about the Guggenheim Limited Duration Fund for the period of October 1, 2023 to September 30, 2024. You can find additional information about the fund at GuggenheimInvestments.com/mutual-funds/literature. You can also request this information by contacting 800 820 0888 or GuggenheimClientServices@mufg-is.com.
This report describes changes to the fund that occurred during the reporting period.
For the period of October 1, 2023 to September 30, 2024, the fund (Class R6 shares) returned 9.33%, underperforming the fund's benchmark, the Bloomberg U.S. Aggregate Bond Index, which returned 11.57% for the same period and outperforming the fund's secondary index, the Bloomberg U.S. Aggregate Bond 1-3 Year Total Return Index, which returned 7.23% for the same period.
The fund's broad-based securities market index was changed from the Bloomberg U.S. Aggregate Bond 1-3 Year Total Return Index to the Bloomberg U.S. Aggregate Bond Index to comply with the regulation that requires the fund's broad-based securities market index to represent the overall applicable market.
What factors materially affected the fund's performance over the last year?
The fund's relative outperformance against the Bloomberg U.S. Aggregate Bond 1-3 Year Total Return Index (the fund's ancillary index) was primarily driven by sector allocation, security selection, and the fund's carry (or earned income) advantage. The fund benefited from its structured credit allocation, which includes various subsectors of asset-backed securities, collateralized loan obligations, non-agency commercial mortgage-backed securities and non-agency residential mortgage-backed securities, as prices moved higher on both lower interest rates and tighter credit spreads. This followed increased market optimism on the potential for a soft landing given disinflationary trends and resilient economic data. Security selection within investment grade corporates was a key contributor to performance as the fund's investment grade corporate holdings outperformed the Index by 1.2%.
Cumulative performance* for the fund since inception, assuming a $10,000 initial investment.
| 03/13/2019 | 10000 | 10000 | 10000 |
| 03/31/2019 | 10019 | 10126 | 10044 |
| 06/30/2019 | 10113 | 10438 | 10193 |
| 09/30/2019 | 10183 | 10675 | 10265 |
| 12/31/2019 | 10197 | 10694 | 10323 |
| 03/31/2020 | 10157 | 11031 | 10508 |
| 06/30/2020 | 10593 | 11350 | 10601 |
| 09/30/2020 | 10771 | 11420 | 10617 |
| 12/31/2020 | 10885 | 11497 | 10641 |
| 03/31/2021 | 10833 | 11109 | 10633 |
| 06/30/2021 | 10923 | 11312 | 10639 |
| 09/30/2021 | 10947 | 11318 | 10648 |
| 12/31/2021 | 10911 | 11319 | 10589 |
| 03/31/2022 | 10656 | 10648 | 10324 |
| 06/30/2022 | 10412 | 10148 | 10258 |
| 09/30/2022 | 10269 | 9666 | 10104 |
| 12/31/2022 | 10443 | 9847 | 10195 |
| 03/31/2023 | 10686 | 10138 | 10349 |
| 06/30/2023 | 10740 | 10053 | 10311 |
| 09/30/2023 | 10844 | 9728 | 10387 |
| 12/31/2023 | 11206 | 10391 | 10669 |
| 03/31/2024 | 11345 | 10311 | 10717 |
| 06/30/2024 | 11502 | 10317 | 10819 |
| 09/30/2024 | 11856 | 10853 | 11139 |
| Class R6 | 9.33% | 3.07% | 3.10% |
| Bloomberg U.S. Aggregate Bond Index | 11.57% | 0.33% | 1.49% |
| Bloomberg U.S. Aggregate Bond 1-3 Year Total Return Index | 7.23% | 1.65% | 1.96% |
The fund's past performance is not a good predictor of the fund's future performance. Visit GuggenheimInvestments.com/mutual-funds/performance for more recent performance information.
| Net Assets | $4,472,650,204 |
| Total Number of Portfolio Holdings | 593 |
| Portfolio Turnover Rate | 42% |
| Total Advisory Fees Paid | $14,155,779 |
| Guggenheim Limited Duration Fund | Class R6 | GIKRX | Annual Shareholder Report | September 30, 2024 |
| Corporate Bonds | 33.1% |
| Collateralized Mortgage Obligations | 28.3% |
| Asset-Backed Securities | 26.3% |
| U.S. Government Securities | 18.0% |
| Interest Rate Futures Contracts | 7.3% |
| Senior Floating Rate Interests | 1.9% |
| Preferred Stocks | 0.5% |
| Municipal Bonds | 0.2% |
| Interest Rate Swap Agreements | 24.6% |
| Common Stocks | 0.0% |
| Warrants | 0.0% |
| Credit Default Swap Agreements Protection Purchased | -2.6% |

| AAA | 43.2% |
| AA | 7.1% |
| A | 18.1% |
| BBB | 17.3% |
| BB | 3.7% |
| B | 0.7% |
| CCC | 0.4% |
| CC | 0.2% |
| NR3 | 5.4% |
| Other Instruments | 3.9% |
| Uniform MBS 15 Year | 6.2% |
| U.S. Treasury Notes, 4.75% | 4.5% |
| U.S. Treasury Notes, 4.38% | 3.6% |
| Uniform MBS 15 Year | 3.4% |
| Uniform MBS 15 Year | 2.6% |
| U.S. Treasury Notes, 4.63% | 2.2% |
| U.S. Treasury Notes, 3.75% | 1.5% |
| U.S. Treasury Inflation Indexed Bonds, 2.13% | 1.3% |
| THL Credit Lake Shore MM CLO I Ltd., 7.26% | 1.1% |
| U.S. Treasury Notes, 3.38% | 1.1% |
| Top 10 Total | 27.5% |
| |
1 | "Holdings Diversification (Market Exposure as a % of Net Assets)" excludes any temporary cash investments, investments in Guggenheim Strategy Funds Trust mutual funds, or investments in Guggenheim Ultra Short Duration Fund. |
| |
2 | Source: BlackRock Solutions. Credit quality ratings are measured on a scale that generally ranges from AAA (highest) to D (lowest). All securities except for those labeled "NR" have been rated by Moody's, Standard & Poor's ("S&P"), or Fitch, each of which is a Nationally Recognized Statistical Rating Organization ("NRSRO"). For purposes of this presentation, when ratings are available from more than one agency, the highest rating is used. Guggenheim Investments has converted ratings to the equivalent S&P rating. |
3 | NR (not rated) securities do not necessarily indicate low credit quality. |
| |
4 | "10 Largest Holdings (as a % of Net Assets)" excludes any temporary cash or derivative investments. |
| Uniform MBS 15 Year | 6.2% |
| U.S. Treasury Notes, 4.75% | 4.5% |
| U.S. Treasury Notes, 4.38% | 3.6% |
| Uniform MBS 15 Year | 3.4% |
| Uniform MBS 15 Year | 2.6% |
| U.S. Treasury Notes, 4.63% | 2.2% |
| U.S. Treasury Notes, 3.75% | 1.5% |
| U.S. Treasury Inflation Indexed Bonds, 2.13% | 1.3% |
| THL Credit Lake Shore MM CLO I Ltd., 7.26% | 1.1% |
| U.S. Treasury Notes, 3.38% | 1.1% |
| Top 10 Total | 27.5% |
| |
4 | "10 Largest Holdings (as a % of Net Assets)" excludes any temporary cash or derivative investments. |
There were no changes in or disagreements with fund accountants for the period.
There were no material changes for the period.
| |  | Availability of Additional Information. For additional information, including the fund's prospectus, financial information, holdings and proxy voting information, go to GuggenheimInvestments.com/mutual-funds/literature or, call 800 820 0888. |
AR-GIKRX-093024
Annual Shareholder Report | 9.30.24
This annual shareholder report contains important information about the Guggenheim Macro Opportunities Fund for the period of October 1, 2023 to September 30, 2024. You can find additional information about the fund at GuggenheimInvestments.com/mutual-funds/literature. You can also request this information by contacting 800 820 0888 or GuggenheimClientServices@mufg-is.com.
This report describes changes to the fund that occurred during the reporting period.
For the period of October 1, 2023 to September 30, 2024, the fund (Class A shares) returned 11.92%, outperforming the fund's benchmark, the Bloomberg U.S. Aggregate Bond Index, which returned 11.57% for the same period and outperforming the fund's secondary index, the ICE BofA 3-Month U.S. Treasury Bill Index, which returned 5.49% for the same period.
The fund's broad-based securities market index was changed from the ICE BofA 3-Month U.S. Treasury Bill Index to the Bloomberg U.S. Aggregate Bond Index to comply with the regulation that requires the fund's broad-based securities market index to represent the overall applicable market.
What factors materially affected the fund's performance over the last year?
The fund's positive performance was driven by credit positioning, duration, and carry (or earned income). The fund benefited from its allocation to high yield corporates as spreads in the Bloomberg U.S. Corporate High Yield Bond Index tightened by 99 basis points amid increased market optimism on the potential for a soft landing given disinflationary trends and resilient economic data. Security selection within high yield corporates, collateralized loan obligations, and asset-backed securities was a key contributor to performance as the fund's holdings outperformed representative indices for each of these sectors by 2.0%, 2.6%, and 3.9%, respectively.
Cumulative performance* for the fund's most recently completed 10 years (as of 9.30.24), assuming a $10,000 initial investment.
| 09/30/2014 | 9524 | 10000 | 10000 |
| 12/31/2014 | 9635 | 10179 | 10000 |
| 03/31/2015 | 9807 | 10343 | 10001 |
| 06/30/2015 | 9766 | 10169 | 10001 |
| 09/30/2015 | 9675 | 10294 | 10002 |
| 12/31/2015 | 9490 | 10235 | 10006 |
| 03/31/2016 | 9511 | 10546 | 10013 |
| 06/30/2016 | 9828 | 10779 | 10020 |
| 09/30/2016 | 10215 | 10829 | 10030 |
| 12/31/2016 | 10458 | 10506 | 10038 |
| 03/31/2017 | 10659 | 10592 | 10049 |
| 06/30/2017 | 10753 | 10745 | 10069 |
| 09/30/2017 | 10862 | 10836 | 10096 |
| 12/31/2017 | 10975 | 10879 | 10124 |
| 03/31/2018 | 11006 | 10720 | 10160 |
| 06/30/2018 | 11021 | 10703 | 10206 |
| 09/30/2018 | 11124 | 10705 | 10256 |
| 12/31/2018 | 10993 | 10880 | 10314 |
| 03/31/2019 | 11052 | 11200 | 10376 |
| 06/30/2019 | 11126 | 11545 | 10442 |
| 09/30/2019 | 11169 | 11807 | 10501 |
| 12/31/2019 | 11195 | 11828 | 10549 |
| 03/31/2020 | 10515 | 12200 | 10610 |
| 06/30/2020 | 11102 | 12554 | 10612 |
| 09/30/2020 | 11771 | 12632 | 10616 |
| 12/31/2020 | 12436 | 12716 | 10620 |
| 03/31/2021 | 12459 | 12287 | 10622 |
| 06/30/2021 | 12632 | 12512 | 10622 |
| 09/30/2021 | 12652 | 12518 | 10624 |
| 12/31/2021 | 12695 | 12520 | 10625 |
| 03/31/2022 | 12280 | 11777 | 10629 |
| 06/30/2022 | 11469 | 11224 | 10640 |
| 09/30/2022 | 11289 | 10691 | 10690 |
| 12/31/2022 | 11587 | 10891 | 10781 |
| 03/31/2023 | 11920 | 11214 | 10898 |
| 06/30/2023 | 11990 | 11119 | 11026 |
| 09/30/2023 | 12090 | 10760 | 11171 |
| 12/31/2023 | 12649 | 11493 | 11325 |
| 03/31/2024 | 12863 | 11404 | 11472 |
| 06/30/2024 | 13049 | 11411 | 11625 |
| 09/30/2024 | 13530 | 12004 | 11784 |
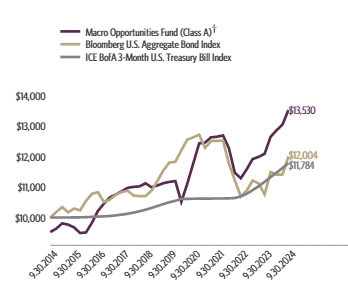
| Class A (without sales charge) | 11.92% | 3.91% | 3.57% |
| Class A (with sales charge)† | 7.42% | 3.06% | 3.07% |
| Bloomberg U.S. Aggregate Bond Index | 11.57% | 0.33% | 1.84% |
| ICE BofA 3-Month U.S. Treasury Bill Index | 5.49% | 2.33% | 1.66% |
The fund's past performance is not a good predictor of the fund's future performance. Visit GuggenheimInvestments.com/mutual-funds/performance for more recent performance information.
| Net Assets | $7,464,947,935 |
| Total Number of Portfolio Holdings | 858 |
| Portfolio Turnover Rate | 24% |
| Total Advisory Fees Paid | $49,999,504 |
| Guggenheim Macro Opportunities Fund | Class A | GIOAX | Annual Shareholder Report | September 30, 2024 |
| Corporate Bonds | 29.9% |
| Asset-Backed Securities | 18.5% |
| Senior Floating Rate Interests | 15.9% |
| Collateralized Mortgage Obligations | 12.2% |
| Interest Rate Futures Contracts | 6.6% |
| U.S. Government Securities | 5.2% |
| Preferred Stocks | 4.3% |
| Mutual Funds | 2.8% |
| Interest Rate Swap Agreements | 2.1% |
| Commodity Futures Contracts | 1.0% |
| Exchange-Traded Funds | 1.0% |
| Total Return Interest Rate Swap Agreements | 0.8% |
| Equity Index Swap Agreements | 0.6% |
| Convertible Bonds | 0.4% |
| Common Stocks | 0.1% |
| Options Purchased* | 0.0% |
| Senior Fixed Rate Interests* | 0.0% |
| Warrants* | 0.0% |
| Forward Foreign Currency Exchange Contracts* | 0.0% |
| Credit Default Swap Agreements Protection Purchased | -3.4% |

| AAA | 10.5% |
| AA | 0.7% |
| A | 12.6% |
| BBB | 15.5% |
| BB | 16.6% |
| B | 17.2% |
| CCC | 2.5% |
| CC | 2.4% |
| C* | 0.0% |
| NR3 | 3.8% |
| Other Instruments | 18.2% |
| U.S. Treasury Notes, 4.25% | 4.9% |
| Guggenheim Limited Duration Fund — Class R6 | 1.8% |
| Fannie Mae, 5.50% | 1.4% |
| SPDR S&P 500 ETF Trust | 1.0% |
| Freddie Mac, 5.50% | 0.7% |
| Guggenheim Ultra Short Duration Fund — Institutional Class | 0.7% |
| AP Grange Holdings, 6.50% | 0.6% |
| BP Capital Markets plc, 4.88% | 0.5% |
| Guggenheim Risk Managed Real Estate Fund — Institutional Class | 0.5% |
| VB-S1 Issuer LLC - VBTEL, 5.27% | 0.5% |
| Top 10 Total | 12.6% |
| |
* | Less than 0.1%. |
1 | "Consolidated Holdings Diversification (Market Exposure as a % of Net Assets)" excludes any temporary cash investments, investments in Guggenheim Strategy Funds Trust mutual funds, or investments in Guggenheim Ultra Short Duration Fund. |
| |
2 | Source: BlackRock Solutions. Credit quality ratings are measured on a scale that generally ranges from AAA (highest) to D (lowest). All securities except for those labeled "NR" have been rated by Moody's, Standard & Poor's ("S&P"), or Fitch, each of which is a Nationally Recognized Statistical Rating Organization ("NRSRO"). For purposes of this presentation, when ratings are available from more than one agency, the highest rating is used. Guggenheim Investments has converted ratings to the equivalent S&P rating. |
3 | NR (not rated) securities do not necessarily indicate low credit quality. |
| |
4 | "10 Largest Holdings (as a % of Net Assets)" excludes any temporary cash or derivative investments. |
| U.S. Treasury Notes, 4.25% | 4.9% |
| Guggenheim Limited Duration Fund — Class R6 | 1.8% |
| Fannie Mae, 5.50% | 1.4% |
| SPDR S&P 500 ETF Trust | 1.0% |
| Freddie Mac, 5.50% | 0.7% |
| Guggenheim Ultra Short Duration Fund — Institutional Class | 0.7% |
| AP Grange Holdings, 6.50% | 0.6% |
| BP Capital Markets plc, 4.88% | 0.5% |
| Guggenheim Risk Managed Real Estate Fund — Institutional Class | 0.5% |
| VB-S1 Issuer LLC - VBTEL, 5.27% | 0.5% |
| Top 10 Total | 12.6% |
| |
4 | "10 Largest Holdings (as a % of Net Assets)" excludes any temporary cash or derivative investments. |
There were no changes in or disagreements with fund accountants for the period.
This is a summary of certain changes to the fund since September 30, 2023. For more complete information, you may review the fund's next prospectus, which we expect to be available by January 31, 2025 at GuggenheimInvestments.com/mutual-funds/literature or, by calling 800 820 0888.
The fund's (Class A shares) net expense ratio, which reflects expense waivers and reimbursements and includes certain expenses that are outside of the contractual expense limit, was 1.25% for the year ended September 30, 2024, a decrease of 0.19% compared to the prior year. The primary driver of the decrease was a decrease in interest expense as the fund did not utilize reverse repurchase agreements during the reporting period.
| |  | Availability of Additional Information. For additional information, including the fund's prospectus, financial information, holdings and proxy voting information, go to GuggenheimInvestments.com/mutual-funds/literature or, call 800 820 0888. |
AR-GIOAX-093024
Annual Shareholder Report | 9.30.24
This annual shareholder report contains important information about the Guggenheim Macro Opportunities Fund for the period of October 1, 2023 to September 30, 2024. You can find additional information about the fund at GuggenheimInvestments.com/mutual-funds/literature. You can also request this information by contacting 800 820 0888 or GuggenheimClientServices@mufg-is.com.
This report describes changes to the fund that occurred during the reporting period.
For the period of October 1, 2023 to September 30, 2024, the fund (Class C shares) returned 11.13%, underperforming the fund's benchmark, the Bloomberg U.S. Aggregate Bond Index, which returned 11.57% for the same period and outperforming the fund's secondary index, the ICE BofA 3-Month U.S. Treasury Bill Index, which returned 5.49% for the same period.
The fund's broad-based securities market index was changed from the ICE BofA 3-Month U.S. Treasury Bill Index to the Bloomberg U.S. Aggregate Bond Index to comply with the regulation that requires the fund's broad-based securities market index to represent the overall applicable market.
What factors materially affected the fund's performance over the last year?
The fund's positive performance was driven by credit positioning, duration, and carry (or earned income). The fund benefited from its allocation to high yield corporates as spreads in the Bloomberg U.S. Corporate High Yield Bond Index tightened by 99 basis points amid increased market optimism on the potential for a soft landing given disinflationary trends and resilient economic data. Security selection within high yield corporates, collateralized loan obligations, and asset-backed securities was a key contributor to performance as the fund's holdings outperformed representative indices for each of these sectors by 2.0%, 2.6%, and 3.9%, respectively.
Cumulative performance* for the fund's most recently completed 10 years (as of 9.30.24), assuming a $10,000 initial investment.
| 09/30/2014 | 10000 | 10000 | 10000 |
| 12/31/2014 | 10099 | 10179 | 10000 |
| 03/31/2015 | 10260 | 10343 | 10001 |
| 06/30/2015 | 10198 | 10169 | 10001 |
| 09/30/2015 | 10084 | 10294 | 10002 |
| 12/31/2015 | 9871 | 10235 | 10006 |
| 03/31/2016 | 9876 | 10546 | 10013 |
| 06/30/2016 | 10187 | 10779 | 10020 |
| 09/30/2016 | 10567 | 10829 | 10030 |
| 12/31/2016 | 10802 | 10506 | 10038 |
| 03/31/2017 | 10989 | 10592 | 10049 |
| 06/30/2017 | 11061 | 10745 | 10069 |
| 09/30/2017 | 11153 | 10836 | 10096 |
| 12/31/2017 | 11252 | 10879 | 10124 |
| 03/31/2018 | 11259 | 10720 | 10160 |
| 06/30/2018 | 11258 | 10703 | 10206 |
| 09/30/2018 | 11341 | 10705 | 10256 |
| 12/31/2018 | 11183 | 10880 | 10314 |
| 03/31/2019 | 11227 | 11200 | 10376 |
| 06/30/2019 | 11277 | 11545 | 10442 |
| 09/30/2019 | 11299 | 11807 | 10501 |
| 12/31/2019 | 11303 | 11828 | 10549 |
| 03/31/2020 | 10601 | 12200 | 10610 |
| 06/30/2020 | 11172 | 12554 | 10612 |
| 09/30/2020 | 11819 | 12632 | 10616 |
| 12/31/2020 | 12468 | 12716 | 10620 |
| 03/31/2021 | 12465 | 12287 | 10622 |
| 06/30/2021 | 12615 | 12512 | 10622 |
| 09/30/2021 | 12611 | 12518 | 10624 |
| 12/31/2021 | 12630 | 12520 | 10625 |
| 03/31/2022 | 12194 | 11777 | 10629 |
| 06/30/2022 | 11372 | 11224 | 10640 |
| 09/30/2022 | 11172 | 10691 | 10690 |
| 12/31/2022 | 11440 | 10891 | 10781 |
| 03/31/2023 | 11748 | 11214 | 10898 |
| 06/30/2023 | 11795 | 11119 | 11026 |
| 09/30/2023 | 11871 | 10760 | 11171 |
| 12/31/2023 | 12403 | 11493 | 11325 |
| 03/31/2024 | 12585 | 11404 | 11472 |
| 06/30/2024 | 12744 | 11411 | 11625 |
| 09/30/2024 | 13192 | 12004 | 11784 |
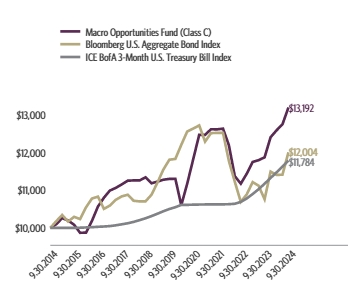
| Class C (without CDSC) | 11.13% | 3.15% | 2.81% |
| Class C (with CDSC)‡ | 10.13% | 3.15% | 2.81% |
| Bloomberg U.S. Aggregate Bond Index | 11.57% | 0.33% | 1.84% |
| ICE BofA 3-Month U.S. Treasury Bill Index | 5.49% | 2.33% | 1.66% |
The fund's past performance is not a good predictor of the fund's future performance. Visit GuggenheimInvestments.com/mutual-funds/performance for more recent performance information.
| Net Assets | $7,464,947,935 |
| Total Number of Portfolio Holdings | 858 |
| Portfolio Turnover Rate | 24% |
| Total Advisory Fees Paid | $49,999,504 |
| Guggenheim Macro Opportunities Fund | Class C | GIOCX | Annual Shareholder Report | September 30, 2024 |
| Corporate Bonds | 29.9% |
| Asset-Backed Securities | 18.5% |
| Senior Floating Rate Interests | 15.9% |
| Collateralized Mortgage Obligations | 12.2% |
| Interest Rate Futures Contracts | 6.6% |
| U.S. Government Securities | 5.2% |
| Preferred Stocks | 4.3% |
| Mutual Funds | 2.8% |
| Interest Rate Swap Agreements | 2.1% |
| Commodity Futures Contracts | 1.0% |
| Exchange-Traded Funds | 1.0% |
| Total Return Interest Rate Swap Agreements | 0.8% |
| Equity Index Swap Agreements | 0.6% |
| Convertible Bonds | 0.4% |
| Common Stocks | 0.1% |
| Options Purchased* | 0.0% |
| Senior Fixed Rate Interests* | 0.0% |
| Warrants* | 0.0% |
| Forward Foreign Currency Exchange Contracts* | 0.0% |
| Credit Default Swap Agreements Protection Purchased | -3.4% |

| AAA | 10.5% |
| AA | 0.7% |
| A | 12.6% |
| BBB | 15.5% |
| BB | 16.6% |
| B | 17.2% |
| CCC | 2.5% |
| CC | 2.4% |
| C* | 0.0% |
| NR3 | 3.8% |
| Other Instruments | 18.2% |
| U.S. Treasury Notes, 4.25% | 4.9% |
| Guggenheim Limited Duration Fund — Class R6 | 1.8% |
| Fannie Mae, 5.50% | 1.4% |
| SPDR S&P 500 ETF Trust | 1.0% |
| Freddie Mac, 5.50% | 0.7% |
| Guggenheim Ultra Short Duration Fund — Institutional Class | 0.7% |
| AP Grange Holdings, 6.50% | 0.6% |
| BP Capital Markets plc, 4.88% | 0.5% |
| Guggenheim Risk Managed Real Estate Fund — Institutional Class | 0.5% |
| VB-S1 Issuer LLC - VBTEL, 5.27% | 0.5% |
| Top 10 Total | 12.6% |
| |
* | Less than 0.1%. |
1 | "Consolidated Holdings Diversification (Market Exposure as a % of Net Assets)" excludes any temporary cash investments, investments in Guggenheim Strategy Funds Trust mutual funds, or investments in Guggenheim Ultra Short Duration Fund. |
| |
2 | Source: BlackRock Solutions. Credit quality ratings are measured on a scale that generally ranges from AAA (highest) to D (lowest). All securities except for those labeled "NR" have been rated by Moody's, Standard & Poor's ("S&P"), or Fitch, each of which is a Nationally Recognized Statistical Rating Organization ("NRSRO"). For purposes of this presentation, when ratings are available from more than one agency, the highest rating is used. Guggenheim Investments has converted ratings to the equivalent S&P rating. |
3 | NR (not rated) securities do not necessarily indicate low credit quality. |
| |
4 | "10 Largest Holdings (as a % of Net Assets)" excludes any temporary cash or derivative investments. |
| U.S. Treasury Notes, 4.25% | 4.9% |
| Guggenheim Limited Duration Fund — Class R6 | 1.8% |
| Fannie Mae, 5.50% | 1.4% |
| SPDR S&P 500 ETF Trust | 1.0% |
| Freddie Mac, 5.50% | 0.7% |
| Guggenheim Ultra Short Duration Fund — Institutional Class | 0.7% |
| AP Grange Holdings, 6.50% | 0.6% |
| BP Capital Markets plc, 4.88% | 0.5% |
| Guggenheim Risk Managed Real Estate Fund — Institutional Class | 0.5% |
| VB-S1 Issuer LLC - VBTEL, 5.27% | 0.5% |
| Top 10 Total | 12.6% |
| |
4 | "10 Largest Holdings (as a % of Net Assets)" excludes any temporary cash or derivative investments. |
There were no changes in or disagreements with fund accountants for the period.
This is a summary of certain changes to the fund since September 30, 2023. For more complete information, you may review the fund's next prospectus, which we expect to be available by January 31, 2025 at GuggenheimInvestments.com/mutual-funds/literature or, by calling 800 820 0888.
The fund's (Class C shares) net expense ratio, which reflects expense waivers and reimbursements and includes certain expenses that are outside of the contractual expense limit, was 1.97% for the year ended September 30, 2024, a decrease of 0.24% compared to the prior year. The primary driver of the decrease was a decrease in interest expense as the fund did not utilize reverse repurchase agreements during the reporting period.
| |  | Availability of Additional Information. For additional information, including the fund's prospectus, financial information, holdings and proxy voting information, go to GuggenheimInvestments.com/mutual-funds/literature or, call 800 820 0888. |
AR-GIOCX-093024
Annual Shareholder Report | 9.30.24
This annual shareholder report contains important information about the Guggenheim Macro Opportunities Fund for the period of October 1, 2023 to September 30, 2024. You can find additional information about the fund at GuggenheimInvestments.com/mutual-funds/literature. You can also request this information by contacting 800 820 0888 or GuggenheimClientServices@mufg-is.com.
This report describes changes to the fund that occurred during the reporting period.
For the period of October 1, 2023 to September 30, 2024, the fund (Class P shares) returned 11.84%, outperforming the fund's benchmark, the Bloomberg U.S. Aggregate Bond Index, which returned 11.57% for the same period and outperforming the fund's secondary index, the ICE BofA 3-Month U.S. Treasury Bill Index, which returned 5.49% for the same period.
The fund's broad-based securities market index was changed from the ICE BofA 3-Month U.S. Treasury Bill Index to the Bloomberg U.S. Aggregate Bond Index to comply with the regulation that requires the fund's broad-based securities market index to represent the overall applicable market.
What factors materially affected the fund's performance over the last year?
The fund's positive performance was driven by credit positioning, duration, and carry (or earned income). The fund benefited from its allocation to high yield corporates as spreads in the Bloomberg U.S. Corporate High Yield Bond Index tightened by 99 basis points amid increased market optimism on the potential for a soft landing given disinflationary trends and resilient economic data. Security selection within high yield corporates, collateralized loan obligations, and asset-backed securities was a key contributor to performance as the fund's holdings outperformed representative indices for each of these sectors by 2.0%, 2.6%, and 3.9%, respectively.
Cumulative performance* for the fund since inception (as of 9.30.24), assuming a $10,000 initial investment.
| 05/01/2015 | 10000 | 10000 | 10000 |
| 06/30/2015 | 9997 | 9899 | 10000 |
| 09/30/2015 | 9905 | 10021 | 10002 |
| 12/31/2015 | 9717 | 9964 | 10005 |
| 03/31/2016 | 9741 | 10266 | 10012 |
| 06/30/2016 | 10070 | 10493 | 10019 |
| 09/30/2016 | 10473 | 10542 | 10029 |
| 12/31/2016 | 10724 | 10228 | 10037 |
| 03/31/2017 | 10929 | 10311 | 10048 |
| 06/30/2017 | 11026 | 10460 | 10068 |
| 09/30/2017 | 11137 | 10549 | 10095 |
| 12/31/2017 | 11253 | 10590 | 10123 |
| 03/31/2018 | 11285 | 10435 | 10159 |
| 06/30/2018 | 11300 | 10419 | 10205 |
| 09/30/2018 | 11406 | 10421 | 10255 |
| 12/31/2018 | 11271 | 10591 | 10313 |
| 03/31/2019 | 11331 | 10903 | 10375 |
| 06/30/2019 | 11408 | 11239 | 10441 |
| 09/30/2019 | 11448 | 11494 | 10500 |
| 12/31/2019 | 11478 | 11515 | 10548 |
| 03/31/2020 | 10782 | 11877 | 10609 |
| 06/30/2020 | 11383 | 12221 | 10611 |
| 09/30/2020 | 12068 | 12297 | 10615 |
| 12/31/2020 | 12750 | 12379 | 10619 |
| 03/31/2021 | 12772 | 11961 | 10621 |
| 06/30/2021 | 12950 | 12180 | 10621 |
| 09/30/2021 | 12970 | 12187 | 10623 |
| 12/31/2021 | 13014 | 12188 | 10624 |
| 03/31/2022 | 12588 | 11465 | 10628 |
| 06/30/2022 | 11758 | 10927 | 10639 |
| 09/30/2022 | 11573 | 10407 | 10689 |
| 12/31/2022 | 11873 | 10602 | 10780 |
| 03/31/2023 | 12220 | 10916 | 10897 |
| 06/30/2023 | 12292 | 10824 | 11025 |
| 09/30/2023 | 12394 | 10474 | 11170 |
| 12/31/2023 | 12967 | 11189 | 11324 |
| 03/31/2024 | 13184 | 11102 | 11471 |
| 06/30/2024 | 13371 | 11109 | 11624 |
| 09/30/2024 | 13861 | 11686 | 11783 |
| Class P | 11.84% | 3.90% | 3.53% |
| Bloomberg U.S. Aggregate Bond Index | 11.57% | 0.33% | 1.67% |
| ICE BofA 3-Month U.S. Treasury Bill Index | 5.49% | 2.33% | 1.76% |
The fund's past performance is not a good predictor of the fund's future performance. Visit GuggenheimInvestments.com/mutual-funds/performance for more recent performance information.
| Net Assets | $7,464,947,935 |
| Total Number of Portfolio Holdings | 858 |
| Portfolio Turnover Rate | 24% |
| Total Advisory Fees Paid | $49,999,504 |
| Guggenheim Macro Opportunities Fund | Class P | GIOPX | Annual Shareholder Report | September 30, 2024 |
| Corporate Bonds | 29.9% |
| Asset-Backed Securities | 18.5% |
| Senior Floating Rate Interests | 15.9% |
| Collateralized Mortgage Obligations | 12.2% |
| Interest Rate Futures Contracts | 6.6% |
| U.S. Government Securities | 5.2% |
| Preferred Stocks | 4.3% |
| Mutual Funds | 2.8% |
| Interest Rate Swap Agreements | 2.1% |
| Commodity Futures Contracts | 1.0% |
| Exchange-Traded Funds | 1.0% |
| Total Return Interest Rate Swap Agreements | 0.8% |
| Equity Index Swap Agreements | 0.6% |
| Convertible Bonds | 0.4% |
| Common Stocks | 0.1% |
| Options Purchased* | 0.0% |
| Senior Fixed Rate Interests* | 0.0% |
| Warrants* | 0.0% |
| Forward Foreign Currency Exchange Contracts* | 0.0% |
| Credit Default Swap Agreements Protection Purchased | -3.4% |

| AAA | 10.5% |
| AA | 0.7% |
| A | 12.6% |
| BBB | 15.5% |
| BB | 16.6% |
| B | 17.2% |
| CCC | 2.5% |
| CC | 2.4% |
| C* | 0.0% |
| NR3 | 3.8% |
| Other Instruments | 18.2% |
| U.S. Treasury Notes, 4.25% | 4.9% |
| Guggenheim Limited Duration Fund — Class R6 | 1.8% |
| Fannie Mae, 5.50% | 1.4% |
| SPDR S&P 500 ETF Trust | 1.0% |
| Freddie Mac, 5.50% | 0.7% |
| Guggenheim Ultra Short Duration Fund — Institutional Class | 0.7% |
| AP Grange Holdings, 6.50% | 0.6% |
| BP Capital Markets plc, 4.88% | 0.5% |
| Guggenheim Risk Managed Real Estate Fund — Institutional Class | 0.5% |
| VB-S1 Issuer LLC - VBTEL, 5.27% | 0.5% |
| Top 10 Total | 12.6% |
| |
* | Less than 0.1%. |
1 | "Consolidated Holdings Diversification (Market Exposure as a % of Net Assets)" excludes any temporary cash investments, investments in Guggenheim Strategy Funds Trust mutual funds, or investments in Guggenheim Ultra Short Duration Fund. |
| |
2 | Source: BlackRock Solutions. Credit quality ratings are measured on a scale that generally ranges from AAA (highest) to D (lowest). All securities except for those labeled "NR" have been rated by Moody's, Standard & Poor's ("S&P"), or Fitch, each of which is a Nationally Recognized Statistical Rating Organization ("NRSRO"). For purposes of this presentation, when ratings are available from more than one agency, the highest rating is used. Guggenheim Investments has converted ratings to the equivalent S&P rating. |
3 | NR (not rated) securities do not necessarily indicate low credit quality. |
| |
4 | "10 Largest Holdings (as a % of Net Assets)" excludes any temporary cash or derivative investments. |
| U.S. Treasury Notes, 4.25% | 4.9% |
| Guggenheim Limited Duration Fund — Class R6 | 1.8% |
| Fannie Mae, 5.50% | 1.4% |
| SPDR S&P 500 ETF Trust | 1.0% |
| Freddie Mac, 5.50% | 0.7% |
| Guggenheim Ultra Short Duration Fund — Institutional Class | 0.7% |
| AP Grange Holdings, 6.50% | 0.6% |
| BP Capital Markets plc, 4.88% | 0.5% |
| Guggenheim Risk Managed Real Estate Fund — Institutional Class | 0.5% |
| VB-S1 Issuer LLC - VBTEL, 5.27% | 0.5% |
| Top 10 Total | 12.6% |
| |
4 | "10 Largest Holdings (as a % of Net Assets)" excludes any temporary cash or derivative investments. |
There were no changes in or disagreements with fund accountants for the period.
This is a summary of certain changes to the fund since September 30, 2023. For more complete information, you may review the fund's next prospectus, which we expect to be available by January 31, 2025 at GuggenheimInvestments.com/mutual-funds/literature or, by calling 800 820 0888.
The fund's (Class P shares) net expense ratio, which reflects expense waivers and reimbursements and includes certain expenses that are outside of the contractual expense limit, was 1.32% for the year ended September 30, 2024, a decrease of 0.17% compared to the prior year. The primary driver of the decrease was a decrease in interest expense as the fund did not utilize reverse repurchase agreements during the reporting period.
| |  | Availability of Additional Information. For additional information, including the fund's prospectus, financial information, holdings and proxy voting information, go to GuggenheimInvestments.com/mutual-funds/literature or, call 800 820 0888. |
AR-GIOPX-093024
Annual Shareholder Report | 9.30.24
This annual shareholder report contains important information about the Guggenheim Macro Opportunities Fund for the period of October 1, 2023 to September 30, 2024. You can find additional information about the fund at GuggenheimInvestments.com/mutual-funds/literature. You can also request this information by contacting 800 820 0888 or GuggenheimClientServices@mufg-is.com.
This report describes changes to the fund that occurred during the reporting period.
| Institutional Class | $97 | 0.91% |
For the period of October 1, 2023 to September 30, 2024, the fund (Institutional Class shares) returned 12.28%, outperforming the fund's benchmark, the Bloomberg U.S. Aggregate Bond Index, which returned 11.57% for the same period and outperforming the fund's secondary index, the ICE BofA 3-Month U.S. Treasury Bill Index, which returned 5.49% for the same period.
The fund's broad-based securities market index was changed from the ICE BofA 3-Month U.S. Treasury Bill Index to the Bloomberg U.S. Aggregate Bond Index to comply with the regulation that requires the fund's broad-based securities market index to represent the overall applicable market.
What factors materially affected the fund's performance over the last year?
The fund's positive performance was driven by credit positioning, duration, and carry (or earned income). The fund benefited from its allocation to high yield corporates as spreads in the Bloomberg U.S. Corporate High Yield Bond Index tightened by 99 basis points amid increased market optimism on the potential for a soft landing given disinflationary trends and resilient economic data. Security selection within high yield corporates, collateralized loan obligations, and asset-backed securities was a key contributor to performance as the fund's holdings outperformed representative indices for each of these sectors by 2.0%, 2.6%, and 3.9%, respectively.
Cumulative performance* for the fund's most recently completed 10 years (as of 9.30.24), assuming a $2,000,000 initial investment.
| 09/30/2014 | 2000000 | 2000000 | 2000000 |
| 12/31/2014 | 2025009 | 2035885 | 2000070 |
| 03/31/2015 | 2062714 | 2068593 | 2000136 |
| 06/30/2015 | 2055820 | 2033787 | 2000244 |
| 09/30/2015 | 2038384 | 2058816 | 2000499 |
| 12/31/2015 | 2001125 | 2047081 | 2001131 |
| 03/31/2016 | 2007278 | 2109149 | 2002596 |
| 06/30/2016 | 2076320 | 2155839 | 2004046 |
| 09/30/2016 | 2160014 | 2165719 | 2005971 |
| 12/31/2016 | 2214450 | 2101277 | 2007676 |
| 03/31/2017 | 2258464 | 2118439 | 2009744 |
| 06/30/2017 | 2280375 | 2149054 | 2013801 |
| 09/30/2017 | 2305478 | 2167289 | 2019132 |
| 12/31/2017 | 2331855 | 2175701 | 2024862 |
| 03/31/2018 | 2340791 | 2143918 | 2032043 |
| 06/30/2018 | 2346356 | 2140524 | 2041233 |
| 09/30/2018 | 2370681 | 2140934 | 2051264 |
| 12/31/2018 | 2344292 | 2175948 | 2062818 |
| 03/31/2019 | 2360020 | 2239983 | 2075187 |
| 06/30/2019 | 2377417 | 2308967 | 2088446 |
| 09/30/2019 | 2389020 | 2361362 | 2100188 |
| 12/31/2019 | 2396896 | 2365619 | 2109860 |
| 03/31/2020 | 2254796 | 2440097 | 2121982 |
| 06/30/2020 | 2382684 | 2510752 | 2122455 |
| 09/30/2020 | 2528491 | 2526300 | 2123290 |
| 12/31/2020 | 2673881 | 2543198 | 2123934 |
| 03/31/2021 | 2681344 | 2457428 | 2124468 |
| 06/30/2021 | 2721347 | 2502393 | 2124465 |
| 09/30/2021 | 2728408 | 2503689 | 2124772 |
| 12/31/2021 | 2740602 | 2503980 | 2124978 |
| 03/31/2022 | 2653617 | 2355394 | 2125810 |
| 06/30/2022 | 2481380 | 2244843 | 2128038 |
| 09/30/2022 | 2445035 | 2138160 | 2138028 |
| 12/31/2022 | 2510888 | 2178209 | 2156220 |
| 03/31/2023 | 2585553 | 2242728 | 2179522 |
| 06/30/2023 | 2603519 | 2223793 | 2205147 |
| 09/30/2023 | 2627675 | 2151938 | 2234281 |
| 12/31/2023 | 2753075 | 2298638 | 2265013 |
| 03/31/2024 | 2800738 | 2280808 | 2294431 |
| 06/30/2024 | 2843249 | 2282297 | 2324946 |
| 09/30/2024 | 2951417 | 2400886 | 2356881 |
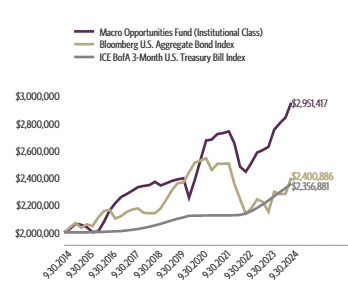
| Institutional Class | 12.28% | 4.32% | 3.97% |
| Bloomberg U.S. Aggregate Bond Index | 11.57% | 0.33% | 1.84% |
| ICE BofA 3-Month U.S. Treasury Bill Index | 5.49% | 2.33% | 1.66% |
The fund's past performance is not a good predictor of the fund's future performance. Visit GuggenheimInvestments.com/mutual-funds/performance for more recent performance information.
| Net Assets | $7,464,947,935 |
| Total Number of Portfolio Holdings | 858 |
| Portfolio Turnover Rate | 24% |
| Total Advisory Fees Paid | $49,999,504 |
| Guggenheim Macro Opportunities Fund | Institutional Class | GIOIX | Annual Shareholder Report | September 30, 2024 |
| Corporate Bonds | 29.9% |
| Asset-Backed Securities | 18.5% |
| Senior Floating Rate Interests | 15.9% |
| Collateralized Mortgage Obligations | 12.2% |
| Interest Rate Futures Contracts | 6.6% |
| U.S. Government Securities | 5.2% |
| Preferred Stocks | 4.3% |
| Mutual Funds | 2.8% |
| Interest Rate Swap Agreements | 2.1% |
| Commodity Futures Contracts | 1.0% |
| Exchange-Traded Funds | 1.0% |
| Total Return Interest Rate Swap Agreements | 0.8% |
| Equity Index Swap Agreements | 0.6% |
| Convertible Bonds | 0.4% |
| Common Stocks | 0.1% |
| Options Purchased* | 0.0% |
| Senior Fixed Rate Interests* | 0.0% |
| Warrants* | 0.0% |
| Forward Foreign Currency Exchange Contracts* | 0.0% |
| Credit Default Swap Agreements Protection Purchased | -3.4% |

| AAA | 10.5% |
| AA | 0.7% |
| A | 12.6% |
| BBB | 15.5% |
| BB | 16.6% |
| B | 17.2% |
| CCC | 2.5% |
| CC | 2.4% |
| C* | 0.0% |
| NR3 | 3.8% |
| Other Instruments | 18.2% |
| U.S. Treasury Notes, 4.25% | 4.9% |
| Guggenheim Limited Duration Fund — Class R6 | 1.8% |
| Fannie Mae, 5.50% | 1.4% |
| SPDR S&P 500 ETF Trust | 1.0% |
| Freddie Mac, 5.50% | 0.7% |
| Guggenheim Ultra Short Duration Fund — Institutional Class | 0.7% |
| AP Grange Holdings, 6.50% | 0.6% |
| BP Capital Markets plc, 4.88% | 0.5% |
| Guggenheim Risk Managed Real Estate Fund — Institutional Class | 0.5% |
| VB-S1 Issuer LLC - VBTEL, 5.27% | 0.5% |
| Top 10 Total | 12.6% |
| |
* | Less than 0.1%. |
1 | "Consolidated Holdings Diversification (Market Exposure as a % of Net Assets)" excludes any temporary cash investments, investments in Guggenheim Strategy Funds Trust mutual funds, or investments in Guggenheim Ultra Short Duration Fund. |
| |
2 | Source: BlackRock Solutions. Credit quality ratings are measured on a scale that generally ranges from AAA (highest) to D (lowest). All securities except for those labeled "NR" have been rated by Moody's, Standard & Poor's ("S&P"), or Fitch, each of which is a Nationally Recognized Statistical Rating Organization ("NRSRO"). For purposes of this presentation, when ratings are available from more than one agency, the highest rating is used. Guggenheim Investments has converted ratings to the equivalent S&P rating. |
3 | NR (not rated) securities do not necessarily indicate low credit quality. |
| |
4 | "10 Largest Holdings (as a % of Net Assets)" excludes any temporary cash or derivative investments. |
| U.S. Treasury Notes, 4.25% | 4.9% |
| Guggenheim Limited Duration Fund — Class R6 | 1.8% |
| Fannie Mae, 5.50% | 1.4% |
| SPDR S&P 500 ETF Trust | 1.0% |
| Freddie Mac, 5.50% | 0.7% |
| Guggenheim Ultra Short Duration Fund — Institutional Class | 0.7% |
| AP Grange Holdings, 6.50% | 0.6% |
| BP Capital Markets plc, 4.88% | 0.5% |
| Guggenheim Risk Managed Real Estate Fund — Institutional Class | 0.5% |
| VB-S1 Issuer LLC - VBTEL, 5.27% | 0.5% |
| Top 10 Total | 12.6% |
| |
4 | "10 Largest Holdings (as a % of Net Assets)" excludes any temporary cash or derivative investments. |
There were no changes in or disagreements with fund accountants for the period.
This is a summary of certain changes to the fund since September 30, 2023. For more complete information, you may review the fund's next prospectus, which we expect to be available by January 31, 2025 at GuggenheimInvestments.com/mutual-funds/literature or, by calling 800 820 0888.
The fund's (Institutional Class shares) net expense ratio, which reflects expense waivers and reimbursements and includes certain expenses that are outside of the contractual expense limit, was 0.91% for the year ended September 30, 2024, a decrease of 0.12% compared to the prior year. The primary driver of the decrease was a decrease in interest expense as the fund did not utilize reverse repurchase agreements during the reporting period.
| |  | Availability of Additional Information. For additional information, including the fund's prospectus, financial information, holdings and proxy voting information, go to GuggenheimInvestments.com/mutual-funds/literature or, call 800 820 0888. |
AR-GIOIX-093024
Annual Shareholder Report | 9.30.24
This annual shareholder report contains important information about the Guggenheim Macro Opportunities Fund for the period of October 1, 2023 to September 30, 2024. You can find additional information about the fund at GuggenheimInvestments.com/mutual-funds/literature. You can also request this information by contacting 800 820 0888 or GuggenheimClientServices@mufg-is.com.
This report describes changes to the fund that occurred during the reporting period.
For the period of October 1, 2023 to September 30, 2024, the fund (Class R6 shares) returned 12.28%, outperforming the fund's benchmark, the Bloomberg U.S. Aggregate Bond Index, which returned 11.57% for the same period and outperforming the fund's secondary index, the ICE BofA 3-Month U.S. Treasury Bill Index, which returned 5.49% for the same period.
The fund's broad-based securities market index was changed from the ICE BofA 3-Month U.S. Treasury Bill Index to the Bloomberg U.S. Aggregate Bond Index to comply with the regulation that requires the fund's broad-based securities market index to represent the overall applicable market.
What factors materially affected the fund's performance over the last year?
The fund's positive performance was driven by credit positioning, duration, and carry (or earned income). The fund benefited from its allocation to high yield corporates as spreads in the Bloomberg U.S. Corporate High Yield Bond Index tightened by 99 basis points amid increased market optimism on the potential for a soft landing given disinflationary trends and resilient economic data. Security selection within high yield corporates, collateralized loan obligations, and asset-backed securities was a key contributor to performance as the fund's holdings outperformed representative indices for each of these sectors by 2.0%, 2.6%, and 3.9%, respectively.
Cumulative performance* for the fund since inception (as of 9.30.24), assuming a $10,000 initial investment.
| 03/13/2019 | 10000 | 10000 | 10000 |
| 03/31/2019 | 10005 | 10126 | 10013 |
| 06/30/2019 | 10080 | 10438 | 10077 |
| 09/30/2019 | 10130 | 10675 | 10134 |
| 12/31/2019 | 10163 | 10694 | 10181 |
| 03/31/2020 | 9556 | 11031 | 10239 |
| 06/30/2020 | 10099 | 11350 | 10241 |
| 09/30/2020 | 10719 | 11420 | 10245 |
| 12/31/2020 | 11335 | 11497 | 10249 |
| 03/31/2021 | 11368 | 11109 | 10251 |
| 06/30/2021 | 11537 | 11312 | 10251 |
| 09/30/2021 | 11567 | 11318 | 10253 |
| 12/31/2021 | 11618 | 11319 | 10254 |
| 03/31/2022 | 11249 | 10648 | 10258 |
| 06/30/2022 | 10519 | 10148 | 10268 |
| 09/30/2022 | 10365 | 9666 | 10317 |
| 12/31/2022 | 10644 | 9847 | 10404 |
| 03/31/2023 | 10965 | 10138 | 10517 |
| 06/30/2023 | 11037 | 10053 | 10640 |
| 09/30/2023 | 11144 | 9728 | 10781 |
| 12/31/2023 | 11676 | 10391 | 10929 |
| 03/31/2024 | 11878 | 10311 | 11071 |
| 06/30/2024 | 12058 | 10317 | 11219 |
| 09/30/2024 | 12512 | 10853 | 11373 |
| Class R6 | 12.28% | 4.31% | 4.12% |
| Bloomberg U.S. Aggregate Bond Index | 11.57% | 0.33% | 1.49% |
| ICE BofA 3-Month U.S. Treasury Bill Index | 5.49% | 2.33% | 2.34% |
The fund's past performance is not a good predictor of the fund's future performance. Visit GuggenheimInvestments.com/mutual-funds/performance for more recent performance information.
| Net Assets | $7,464,947,935 |
| Total Number of Portfolio Holdings | 858 |
| Portfolio Turnover Rate | 24% |
| Total Advisory Fees Paid | $49,999,504 |
| Guggenheim Macro Opportunities Fund | Class R6 | GIOSX | Annual Shareholder Report | September 30, 2024 |
| Corporate Bonds | 29.9% |
| Asset-Backed Securities | 18.5% |
| Senior Floating Rate Interests | 15.9% |
| Collateralized Mortgage Obligations | 12.2% |
| Interest Rate Futures Contracts | 6.6% |
| U.S. Government Securities | 5.2% |
| Preferred Stocks | |
| Mutual Funds | 2.8% |
| Interest Rate Swap Agreements | 2.1% |
| Commodity Futures Contracts | 1.0% |
| Exchange-Traded Funds | 1.0% |
| Total Return Interest Rate Swap Agreements | 0.8% |
| Equity Index Swap Agreements | 0.6% |
| Convertible Bonds | 0.4% |
| Common Stocks | 0.1% |
| Options Purchased* | 0.0% |
| Senior Fixed Rate Interests* | 0.0% |
| Warrants* | 0.0% |
| Forward Foreign Currency Exchange Contracts* | 0.0% |
| Credit Default Swap Agreements Protection Purchased | -3.4% |
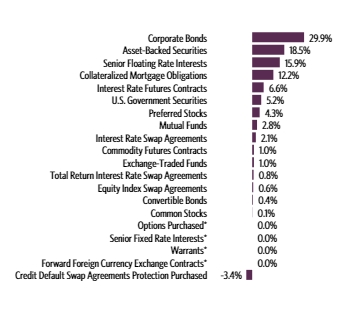
| AAA | 10.5% |
| AA | 0.7% |
| A | 12.6% |
| BBB | 15.5% |
| BB | 16.6% |
| B | 17.2% |
| CCC | 2.5% |
| CC | 2.4% |
| C* | 0.0% |
| NR3 | 3.8% |
| Other Instruments | 18.2% |
| U.S. Treasury Notes, 4.25% | 4.9% |
| Guggenheim Limited Duration Fund — Class R6 | 1.8% |
| Fannie Mae, 5.50% | 1.4% |
| SPDR S&P 500 ETF Trust | 1.0% |
| Freddie Mac, 5.50% | 0.7% |
| Guggenheim Ultra Short Duration Fund — Institutional Class | 0.7% |
| AP Grange Holdings, 6.50% | 0.6% |
| BP Capital Markets plc, 4.88% | 0.5% |
| Guggenheim Risk Managed Real Estate Fund — Institutional Class | 0.5% |
| VB-S1 Issuer LLC - VBTEL, 5.27% | 0.5% |
| Top 10 Total | 12.6% |
| |
* | Less than 0.1%. |
1 | "Consolidated Holdings Diversification (Market Exposure as a % of Net Assets)" excludes any temporary cash investments, investments in Guggenheim Strategy Funds Trust mutual funds, or investments in Guggenheim Ultra Short Duration Fund. |
| |
2 | Source: BlackRock Solutions. Credit quality ratings are measured on a scale that generally ranges from AAA (highest) to D (lowest). All securities except for those labeled "NR" have been rated by Moody's, Standard & Poor's ("S&P"), or Fitch, each of which is a Nationally Recognized Statistical Rating Organization ("NRSRO"). For purposes of this presentation, when ratings are available from more than one agency, the highest rating is used. Guggenheim Investments has converted ratings to the equivalent S&P rating. |
3 | NR (not rated) securities do not necessarily indicate low credit quality. |
| |
4 | "10 Largest Holdings (as a % of Net Assets)" excludes any temporary cash or derivative investments. |
| U.S. Treasury Notes, 4.25% | 4.9% |
| Guggenheim Limited Duration Fund — Class R6 | 1.8% |
| Fannie Mae, 5.50% | 1.4% |
| SPDR S&P 500 ETF Trust | 1.0% |
| Freddie Mac, 5.50% | 0.7% |
| Guggenheim Ultra Short Duration Fund — Institutional Class | 0.7% |
| AP Grange Holdings, 6.50% | 0.6% |
| BP Capital Markets plc, 4.88% | 0.5% |
| Guggenheim Risk Managed Real Estate Fund — Institutional Class | 0.5% |
| VB-S1 Issuer LLC - VBTEL, 5.27% | 0.5% |
| Top 10 Total | 12.6% |
| |
4 | "10 Largest Holdings (as a % of Net Assets)" excludes any temporary cash or derivative investments. |
There were no changes in or disagreements with fund accountants for the period.
This is a summary of certain changes to the fund since September 30, 2023. For more complete information, you may review the fund's next prospectus, which we expect to be available by January 31, 2025 at GuggenheimInvestments.com/mutual-funds/literature or, by calling 800 820 0888.
The fund's (Class R6 shares) net expense ratio, which reflects expense waivers and reimbursements and includes certain expenses that are outside of the contractual expense limit, was 0.91% for the year ended September 30, 2024, a decrease of 0.10% compared to the prior year. The primary driver of the decrease was a decrease in interest expense as the fund did not utilize reverse repurchase agreements during the reporting period.
| |  | Availability of Additional Information. For additional information, including the fund's prospectus, financial information, holdings and proxy voting information, go to GuggenheimInvestments.com/mutual-funds/literature or, call 800 820 0888. |
AR-GIOSX-093024
Annual Shareholder Report | 9.30.24
This annual shareholder report contains important information about the Guggenheim Municipal Income Fund for the period of October 1, 2023 to September 30, 2024. You can find additional information about the fund at GuggenheimInvestments.com/mutual-funds/literature. You can also request this information by contacting 800 820 0888 or GuggenheimClientServices@mufg-is.com.
This report describes changes to the fund that occurred during the reporting period.
For the period of October 1, 2023 to September 30, 2024, the fund (Class A shares) returned 11.10%, outperforming the fund's benchmark, the Bloomberg Municipal Bond Index, which returned 10.37% for the same period.
What factors materially affected the fund's performance over the last year?
The fund's relative outperformance was driven by duration positioning and tighter spreads. School districts and healthcare were the two largest sector allocations and the top two contributors to total return during the year. Security selection in most sectors helped relative returns. Tax exempt agency mortgage-backed securities modestly contributed to performance, a welcome reversal from prior periods.
Cumulative performance* for the fund's most recently completed 10 years (as of 9.30.24), assuming a $10,000 initial investment.
| 09/30/2014 | 9528 | 10000 |
| 12/31/2014 | 9684 | 10137 |
| 03/31/2015 | 9801 | 10240 |
| 06/30/2015 | 9625 | 10148 |
| 09/30/2015 | 9756 | 10316 |
| 12/31/2015 | 9932 | 10472 |
| 03/31/2016 | 10042 | 10647 |
| 06/30/2016 | 10260 | 10925 |
| 09/30/2016 | 10229 | 10892 |
| 12/31/2016 | 9875 | 10497 |
| 03/31/2017 | 9986 | 10663 |
| 06/30/2017 | 10195 | 10872 |
| 09/30/2017 | 10326 | 10987 |
| 12/31/2017 | 10443 | 11069 |
| 03/31/2018 | 10321 | 10947 |
| 06/30/2018 | 10400 | 11042 |
| 09/30/2018 | 10371 | 11025 |
| 12/31/2018 | 10529 | 11211 |
| 03/31/2019 | 10813 | 11536 |
| 06/30/2019 | 11046 | 11782 |
| 09/30/2019 | 11214 | 11968 |
| 12/31/2019 | 11248 | 12056 |
| 03/31/2020 | 11174 | 11980 |
| 06/30/2020 | 11385 | 12307 |
| 09/30/2020 | 11533 | 12458 |
| 12/31/2020 | 11831 | 12685 |
| 03/31/2021 | 11839 | 12640 |
| 06/30/2021 | 12031 | 12819 |
| 09/30/2021 | 11957 | 12785 |
| 12/31/2021 | 12045 | 12877 |
| 03/31/2022 | 10942 | 12075 |
| 06/30/2022 | 10485 | 11720 |
| 09/30/2022 | 9964 | 11315 |
| 12/31/2022 | 10436 | 11779 |
| 03/31/2023 | 10695 | 12106 |
| 06/30/2023 | 10630 | 12094 |
| 09/30/2023 | 10130 | 11616 |
| 12/31/2023 | 10857 | 12533 |
| 03/31/2024 | 10894 | 12485 |
| 06/30/2024 | 10927 | 12482 |
| 09/30/2024 | 11255 | 12821 |
| Class A (without sales charge) | 11.10% | 0.07% | 1.68% |
| Class A (with sales charge)† | 6.65% | -0.75% | 1.19% |
| Bloomberg Municipal Bond Index | 10.37% | 1.39% | 2.52% |
The fund's past performance is not a good predictor of the fund's future performance. Visit GuggenheimInvestments.com/mutual-funds/performance for more recent performance information.
| Net Assets | $20,893,995 |
| Total Number of Portfolio Holdings | 65 |
| Portfolio Turnover Rate | 59% |
| Total Advisory Fees Paid | $0 |
The fund incurred $135,565 of advisory fees which were fully waived/reimbursed by the Adviser to ensure each Share Class of the fund operated at its applicable operating expense cap.
| Guggenheim Municipal Income Fund | Class A | GIJAX | Annual Shareholder Report | September 30, 2024 |
| Interest Rate Swap Agreements | 49.5% |
| California | 14.8% |
| Pennsylvania | 8.3% |
| Oregon | 7.1% |
| Michigan | 6.7% |
| Virginia | 6.3% |
| Nebraska | 6.2% |
| Tennessee | 5.6% |
| Other | 41.8% |
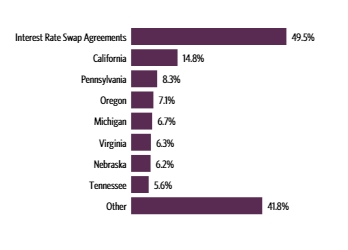
| AAA | 29.7% |
| AA | 49.1% |
| A | 15.1% |
| BBB | 4.2% |
| BB | 1.8% |
| NR3 | 0.1% |
| Freddie Mac Multifamily Variable Rate Certificate Revenue Bonds, 3.15% | 5.5% |
| Michigan Technological University Revenue Bonds, 5.25% | 5.3% |
| Maine Health & Higher Educational Facilities Authority Revenue Bonds, 5.25% | 5.3% |
| Pennsylvania Housing Finance Agency Revenue Bonds, 4.95% | 5.2% |
| Nebraska Investment Finance Authority Revenue Bonds, 4.95% | 5.2% |
| Metropolitan Government Nashville & Davidson County Health & Educational Facilities Board Revenue Bonds, 2.25% | 4.8% |
| Westchester County Local Development Corp. Revenue Bonds, 5.75% | 4.1% |
| Newport Mesa Unified School District General Obligation Unlimited | 3.5% |
| Inlivian Revenue Bonds, 2.02% | 3.3% |
| Clackamas & Washington Counties School District No. 3 General Obligation Unlimited | 3.1% |
| Top 10 Total | 45.3% |
| |
1 | "Holdings Diversification (Market Exposure as a % of Net Assets)" excludes any temporary cash investments, investments in Guggenheim Strategy Funds Trust mutual funds, or investments in Guggenheim Ultra Short Duration Fund. |
| |
2 | Source: BlackRock Solutions. Credit quality ratings are measured on a scale that generally ranges from AAA (highest) to D (lowest). All securities except for those labeled "NR" have been rated by Moody's, Standard & Poor's ("S&P"), or Fitch, each of which is a Nationally Recognized Statistical Rating Organization ("NRSRO"). For purposes of this presentation, when ratings are available from more than one agency, the highest rating is used. Guggenheim Investments has converted ratings to the equivalent S&P rating. |
3 | NR (not rated) securities do not necessarily indicate low credit quality. |
| |
4 | "10 Largest Holdings (as a % of Net Assets)" excludes any temporary cash or derivative investments. |
| Freddie Mac Multifamily Variable Rate Certificate Revenue Bonds, 3.15% | 5.5% |
| Michigan Technological University Revenue Bonds, 5.25% | 5.3% |
| Maine Health & Higher Educational Facilities Authority Revenue Bonds, 5.25% | 5.3% |
| Pennsylvania Housing Finance Agency Revenue Bonds, 4.95% | 5.2% |
| Nebraska Investment Finance Authority Revenue Bonds, 4.95% | 5.2% |
| Metropolitan Government Nashville & Davidson County Health & Educational Facilities Board Revenue Bonds, 2.25% | 4.8% |
| Westchester County Local Development Corp. Revenue Bonds, 5.75% | 4.1% |
| Newport Mesa Unified School District General Obligation Unlimited | 3.5% |
| Inlivian Revenue Bonds, 2.02% | 3.3% |
| Clackamas & Washington Counties School District No. 3 General Obligation Unlimited | 3.1% |
| Top 10 Total | 45.3% |
| |
4 | "10 Largest Holdings (as a % of Net Assets)" excludes any temporary cash or derivative investments. |
There were no changes in or disagreements with fund accountants for the period.
This is a summary of certain changes to the fund since September 30, 2023. For more complete information, you may review the fund's next prospectus, which we expect to be available by January 31, 2025 at GuggenheimInvestments.com/mutual-funds/literature or, by calling 800 820 0888.
Subsequent to the September 30, 2024 year-end, effective November 29, 2024, Guggenheim Partners Investment Management, LLC replaced Securities Investors, LLC as the fund's Investment Adviser in connection with an internal realignment of Guggenheim Investment's lines of business.
| |  | Availability of Additional Information. For additional information, including the fund's prospectus, financial information, holdings and proxy voting information, go to GuggenheimInvestments.com/mutual-funds/literature or, call 800 820 0888. |
AR-GIJAX-093024
Annual Shareholder Report | 9.30.24
This annual shareholder report contains important information about the Guggenheim Municipal Income Fund for the period of October 1, 2023 to September 30, 2024. You can find additional information about the fund at GuggenheimInvestments.com/mutual-funds/literature. You can also request this information by contacting 800 820 0888 or GuggenheimClientServices@mufg-is.com.
This report describes changes to the fund that occurred during the reporting period.
For the period of October 1, 2023 to September 30, 2024, the fund (Class C shares) returned 10.38%, outperforming the fund's benchmark, the Bloomberg Municipal Bond Index, which returned 10.37% for the same period.
What factors materially affected the fund's performance over the last year?
The fund's relative outperformance was driven by duration positioning and tighter spreads. School districts and healthcare were the two largest sector allocations and the top two contributors to total return during the year. Security selection in most sectors helped relative returns. Tax exempt agency mortgage-backed securities modestly contributed to performance, a welcome reversal from prior periods.
Cumulative performance* for the fund's most recently completed 10 years (as of 9.30.24), assuming a $10,000 initial investment.
| 09/30/2014 | 10000 | 10000 |
| 12/31/2014 | 10153 | 10137 |
| 03/31/2015 | 10257 | 10240 |
| 06/30/2015 | 10054 | 10148 |
| 09/30/2015 | 10171 | 10316 |
| 12/31/2015 | 10334 | 10472 |
| 03/31/2016 | 10421 | 10647 |
| 06/30/2016 | 10628 | 10925 |
| 09/30/2016 | 10584 | 10892 |
| 12/31/2016 | 10190 | 10497 |
| 03/31/2017 | 10285 | 10663 |
| 06/30/2017 | 10481 | 10872 |
| 09/30/2017 | 10596 | 10987 |
| 12/31/2017 | 10696 | 11069 |
| 03/31/2018 | 10552 | 10947 |
| 06/30/2018 | 10613 | 11042 |
| 09/30/2018 | 10564 | 11025 |
| 12/31/2018 | 10705 | 11211 |
| 03/31/2019 | 10973 | 11536 |
| 06/30/2019 | 11189 | 11782 |
| 09/30/2019 | 11339 | 11968 |
| 12/31/2019 | 11351 | 12056 |
| 03/31/2020 | 11256 | 11980 |
| 06/30/2020 | 11448 | 12307 |
| 09/30/2020 | 11575 | 12458 |
| 12/31/2020 | 11851 | 12685 |
| 03/31/2021 | 11839 | 12640 |
| 06/30/2021 | 12000 | 12819 |
| 09/30/2021 | 11911 | 12785 |
| 12/31/2021 | 11976 | 12877 |
| 03/31/2022 | 10859 | 12075 |
| 06/30/2022 | 10386 | 11720 |
| 09/30/2022 | 9859 | 11315 |
| 12/31/2022 | 10298 | 11779 |
| 03/31/2023 | 10534 | 12106 |
| 06/30/2023 | 10450 | 12094 |
| 09/30/2023 | 9939 | 11616 |
| 12/31/2023 | 10633 | 12533 |
| 03/31/2024 | 10649 | 12485 |
| 06/30/2024 | 10661 | 12482 |
| 09/30/2024 | 10971 | 12821 |
| Class C (without CDSC) | 10.38% | -0.66% | 0.93% |
| Class C (with CDSC)‡ | 9.38% | -0.66% | 0.93% |
| Bloomberg Municipal Bond Index | 10.37% | 1.39% | 2.52% |
The fund's past performance is not a good predictor of the fund's future performance. Visit GuggenheimInvestments.com/mutual-funds/performance for more recent performance information.
| Net Assets | $20,893,995 |
| Total Number of Portfolio Holdings | 65 |
| Portfolio Turnover Rate | 59% |
| Total Advisory Fees Paid | $0 |
The fund incurred $135,565 of advisory fees which were fully waived/reimbursed by the Adviser to ensure each Share Class of the fund operated at its applicable operating expense cap.
| Guggenheim Municipal Income Fund | Class C | GIJCX | Annual Shareholder Report | September 30, 2024 |
| Interest Rate Swap Agreements | 49.5% |
| California | 14.8% |
| Pennsylvania | 8.3% |
| Oregon | 7.1% |
| Michigan | 6.7% |
| Virginia | 6.3% |
| Nebraska | 6.2% |
| Tennessee | 5.6% |
| Other | 41.8% |

| AAA | 29.7% |
| AA | 49.1% |
| A | 15.1% |
| BBB | 4.2% |
| BB | 1.8% |
| NR3 | 0.1% |
| Freddie Mac Multifamily Variable Rate Certificate Revenue Bonds, 3.15% | 5.5% |
| Michigan Technological University Revenue Bonds, 5.25% | 5.3% |
| Maine Health & Higher Educational Facilities Authority Revenue Bonds, 5.25% | 5.3% |
| Pennsylvania Housing Finance Agency Revenue Bonds, 4.95% | 5.2% |
| Nebraska Investment Finance Authority Revenue Bonds, 4.95% | 5.2% |
| Metropolitan Government Nashville & Davidson County Health & Educational Facilities Board Revenue Bonds, 2.25% | 4.8% |
| Westchester County Local Development Corp. Revenue Bonds, 5.75% | 4.1% |
| Newport Mesa Unified School District General Obligation Unlimited | 3.5% |
| Inlivian Revenue Bonds, 2.02% | 3.3% |
| Clackamas & Washington Counties School District No. 3 General Obligation Unlimited | 3.1% |
| Top 10 Total | 45.3% |
| |
1 | "Holdings Diversification (Market Exposure as a % of Net Assets)" excludes any temporary cash investments, investments in Guggenheim Strategy Funds Trust mutual funds, or investments in Guggenheim Ultra Short Duration Fund. |
| |
2 | Source: BlackRock Solutions. Credit quality ratings are measured on a scale that generally ranges from AAA (highest) to D (lowest). All securities except for those labeled "NR" have been rated by Moody's, Standard & Poor's ("S&P"), or Fitch, each of which is a Nationally Recognized Statistical Rating Organization ("NRSRO"). For purposes of this presentation, when ratings are available from more than one agency, the highest rating is used. Guggenheim Investments has converted ratings to the equivalent S&P rating. |
3 | NR (not rated) securities do not necessarily indicate low credit quality. |
| |
4 | "10 Largest Holdings (as a % of Net Assets)" excludes any temporary cash or derivative investments. |
| Freddie Mac Multifamily Variable Rate Certificate Revenue Bonds, 3.15% | 5.5% |
| Michigan Technological University Revenue Bonds, 5.25% | 5.3% |
| Maine Health & Higher Educational Facilities Authority Revenue Bonds, 5.25% | 5.3% |
| Pennsylvania Housing Finance Agency Revenue Bonds, 4.95% | 5.2% |
| Nebraska Investment Finance Authority Revenue Bonds, 4.95% | 5.2% |
| Metropolitan Government Nashville & Davidson County Health & Educational Facilities Board Revenue Bonds, 2.25% | 4.8% |
| Westchester County Local Development Corp. Revenue Bonds, 5.75% | 4.1% |
| Newport Mesa Unified School District General Obligation Unlimited | 3.5% |
| Inlivian Revenue Bonds, 2.02% | 3.3% |
| Clackamas & Washington Counties School District No. 3 General Obligation Unlimited | 3.1% |
| Top 10 Total | 45.3% |
| |
4 | "10 Largest Holdings (as a % of Net Assets)" excludes any temporary cash or derivative investments. |
There were no changes in or disagreements with fund accountants for the period.
This is a summary of certain changes to the fund since September 30, 2023. For more complete information, you may review the fund's next prospectus, which we expect to be available by January 31, 2025 at GuggenheimInvestments.com/mutual-funds/literature or, by calling 800 820 0888.
Subsequent to the September 30, 2024 year-end, effective November 29, 2024, Guggenheim Partners Investment Management, LLC replaced Securities Investors, LLC as the fund's Investment Adviser in connection with an internal realignment of Guggenheim Investment's lines of business.
| |  | Availability of Additional Information. For additional information, including the fund's prospectus, financial information, holdings and proxy voting information, go to GuggenheimInvestments.com/mutual-funds/literature or, call 800 820 0888. |
AR-GIJCX-093024
Annual Shareholder Report | 9.30.24
This annual shareholder report contains important information about the Guggenheim Municipal Income Fund for the period of October 1, 2023 to September 30, 2024. You can find additional information about the fund at GuggenheimInvestments.com/mutual-funds/literature. You can also request this information by contacting 800 820 0888 or GuggenheimClientServices@mufg-is.com.
This report describes changes to the fund that occurred during the reporting period.
For the period of October 1, 2023 to September 30, 2024, the fund (Class P shares) returned 11.20%, outperforming the fund's benchmark, the Bloomberg Municipal Bond Index, which returned 10.37% for the same period.
What factors materially affected the fund's performance over the last year?
The fund's relative outperformance was driven by duration positioning and tighter spreads. School districts and healthcare were the two largest sector allocations and the top two contributors to total return during the year. Security selection in most sectors helped relative returns. Tax exempt agency mortgage-backed securities modestly contributed to performance, a welcome reversal from prior periods.
Cumulative performance* for the fund since inception (as of 9.30.24), assuming a $10,000 initial investment.
| 05/01/2015 | 10000 | 10000 |
| 06/30/2015 | 9872 | 9974 |
| 09/30/2015 | 10006 | 10139 |
| 12/31/2015 | 10186 | 10292 |
| 03/31/2016 | 10290 | 10464 |
| 06/30/2016 | 10522 | 10737 |
| 09/30/2016 | 10492 | 10705 |
| 12/31/2016 | 10129 | 10317 |
| 03/31/2017 | 10232 | 10480 |
| 06/30/2017 | 10452 | 10685 |
| 09/30/2017 | 10586 | 10798 |
| 12/31/2017 | 10706 | 10879 |
| 03/31/2018 | 10582 | 10759 |
| 06/30/2018 | 10662 | 10852 |
| 09/30/2018 | 10633 | 10836 |
| 12/31/2018 | 10794 | 11019 |
| 03/31/2019 | 11085 | 11338 |
| 06/30/2019 | 11324 | 11580 |
| 09/30/2019 | 11505 | 11762 |
| 12/31/2019 | 11531 | 11849 |
| 03/31/2020 | 11446 | 11774 |
| 06/30/2020 | 11663 | 12095 |
| 09/30/2020 | 11815 | 12244 |
| 12/31/2020 | 12120 | 12467 |
| 03/31/2021 | 12137 | 12423 |
| 06/30/2021 | 12325 | 12599 |
| 09/30/2021 | 12249 | 12566 |
| 12/31/2021 | 12339 | 12656 |
| 03/31/2022 | 11208 | 11868 |
| 06/30/2022 | 10740 | 11519 |
| 09/30/2022 | 10214 | 11120 |
| 12/31/2022 | 10690 | 11577 |
| 03/31/2023 | 10955 | 11898 |
| 06/30/2023 | 10888 | 11886 |
| 09/30/2023 | 10376 | 11417 |
| 12/31/2023 | 11131 | 12318 |
| 03/31/2024 | 11168 | 12270 |
| 06/30/2024 | 11192 | 12268 |
| 09/30/2024 | 11538 | 12601 |
| Class P | 11.20% | 0.06% | 1.53% |
| Bloomberg Municipal Bond Index | 10.37% | 1.39% | 2.49% |
The fund's past performance is not a good predictor of the fund's future performance. Visit GuggenheimInvestments.com/mutual-funds/performance for more recent performance information.
| Net Assets | $20,893,995 |
| Total Number of Portfolio Holdings | 65 |
| Portfolio Turnover Rate | 59% |
| Total Advisory Fees Paid | $0 |
The fund incurred $135,565 of advisory fees which were fully waived/reimbursed by the Adviser to ensure each Share Class of the fund operated at its applicable operating expense cap.
| Guggenheim Municipal Income Fund | Class P | GIJPX | Annual Shareholder Report | September 30, 2024 |
| Interest Rate Swap Agreements | 49.5% |
| California | 14.8% |
| Pennsylvania | 8.3% |
| Oregon | 7.1% |
| Michigan | 6.7% |
| Virginia | 6.3% |
| Nebraska | 6.2% |
| Tennessee | 5.6% |
| Other | 41.8% |

| AAA | 29.7% |
| AA | 49.1% |
| A | 15.1% |
| BBB | 4.2% |
| BB | 1.8% |
| NR3 | 0.1% |
| Freddie Mac Multifamily Variable Rate Certificate Revenue Bonds, 3.15% | 5.5% |
| Michigan Technological University Revenue Bonds, 5.25% | 5.3% |
| Maine Health & Higher Educational Facilities Authority Revenue Bonds, 5.25% | 5.3% |
| Pennsylvania Housing Finance Agency Revenue Bonds, 4.95% | 5.2% |
| Nebraska Investment Finance Authority Revenue Bonds, 4.95% | 5.2% |
| Metropolitan Government Nashville & Davidson County Health & Educational Facilities Board Revenue Bonds, 2.25% | 4.8% |
| Westchester County Local Development Corp. Revenue Bonds, 5.75% | 4.1% |
| Newport Mesa Unified School District General Obligation Unlimited | 3.5% |
| Inlivian Revenue Bonds, 2.02% | 3.3% |
| Clackamas & Washington Counties School District No. 3 General Obligation Unlimited | 3.1% |
| Top 10 Total | 45.3% |
| |
1 | "Holdings Diversification (Market Exposure as a % of Net Assets)" excludes any temporary cash investments, investments in Guggenheim Strategy Funds Trust mutual funds, or investments in Guggenheim Ultra Short Duration Fund. |
| |
2 | Source: BlackRock Solutions. Credit quality ratings are measured on a scale that generally ranges from AAA (highest) to D (lowest). All securities except for those labeled "NR" have been rated by Moody's, Standard & Poor's ("S&P"), or Fitch, each of which is a Nationally Recognized Statistical Rating Organization ("NRSRO"). For purposes of this presentation, when ratings are available from more than one agency, the highest rating is used. Guggenheim Investments has converted ratings to the equivalent S&P rating. |
3 | NR (not rated) securities do not necessarily indicate low credit quality. |
| |
4 | "10 Largest Holdings (as a % of Net Assets)" excludes any temporary cash or derivative investments. |
| Freddie Mac Multifamily Variable Rate Certificate Revenue Bonds, 3.15% | 5.5% |
| Michigan Technological University Revenue Bonds, 5.25% | 5.3% |
| Maine Health & Higher Educational Facilities Authority Revenue Bonds, 5.25% | 5.3% |
| Pennsylvania Housing Finance Agency Revenue Bonds, 4.95% | 5.2% |
| Nebraska Investment Finance Authority Revenue Bonds, 4.95% | 5.2% |
| Metropolitan Government Nashville & Davidson County Health & Educational Facilities Board Revenue Bonds, 2.25% | 4.8% |
| Westchester County Local Development Corp. Revenue Bonds, 5.75% | 4.1% |
| Newport Mesa Unified School District General Obligation Unlimited | 3.5% |
| Inlivian Revenue Bonds, 2.02% | 3.3% |
| Clackamas & Washington Counties School District No. 3 General Obligation Unlimited | 3.1% |
| Top 10 Total | 45.3% |
| |
4 | "10 Largest Holdings (as a % of Net Assets)" excludes any temporary cash or derivative investments. |
There were no changes in or disagreements with fund accountants for the period.
This is a summary of certain changes to the fund since September 30, 2023. For more complete information, you may review the fund's next prospectus, which we expect to be available by January 31, 2025 at GuggenheimInvestments.com/mutual-funds/literature or, by calling 800 820 0888.
Subsequent to the September 30, 2024 year-end, effective November 29, 2024, Guggenheim Partners Investment Management, LLC replaced Securities Investors, LLC as the fund's Investment Adviser in connection with an internal realignment of Guggenheim Investment's lines of business.
| |  | Availability of Additional Information. For additional information, including the fund's prospectus, financial information, holdings and proxy voting information, go to GuggenheimInvestments.com/mutual-funds/literature or, call 800 820 0888. |
AR-GIJPX-093024
Annual Shareholder Report | 9.30.24
This annual shareholder report contains important information about the Guggenheim Municipal Income Fund for the period of October 1, 2023 to September 30, 2024. You can find additional information about the fund at GuggenheimInvestments.com/mutual-funds/literature. You can also request this information by contacting 800 820 0888 or GuggenheimClientServices@mufg-is.com.
This report describes changes to the fund that occurred during the reporting period.
| Institutional Class | $57 | 0.54% |
For the period of October 1, 2023 to September 30, 2024, the fund (Institutional Class shares) returned 11.48%, outperforming the fund's benchmark, the Bloomberg Municipal Bond Index, which returned 10.37% for the same period.
What factors materially affected the fund's performance over the last year?
The fund's relative outperformance was driven by duration positioning and tighter spreads. School districts and healthcare were the two largest sector allocations and the top two contributors to total return during the year. Security selection in most sectors helped relative returns. Tax exempt agency mortgage-backed securities modestly contributed to performance, a welcome reversal from prior periods.
Cumulative performance* for the fund's most recently completed 10 years (as of 9.30.24), assuming a $2,000,000 initial investment.
| 09/30/2014 | 2000000 | 2000000 |
| 12/31/2014 | 2035789 | 2027375 |
| 03/31/2015 | 2061558 | 2047921 |
| 06/30/2015 | 2025881 | 2029697 |
| 09/30/2015 | 2054588 | 2063252 |
| 12/31/2015 | 2092919 | 2094302 |
| 03/31/2016 | 2115695 | 2129347 |
| 06/30/2016 | 2164711 | 2185023 |
| 09/30/2016 | 2159598 | 2178380 |
| 12/31/2016 | 2084469 | 2099497 |
| 03/31/2017 | 2109167 | 2132633 |
| 06/30/2017 | 2156403 | 2174373 |
| 09/30/2017 | 2185402 | 2197417 |
| 12/31/2017 | 2209865 | 2213886 |
| 03/31/2018 | 2185536 | 2189336 |
| 06/30/2018 | 2203552 | 2208387 |
| 09/30/2018 | 2198807 | 2205062 |
| 12/31/2018 | 2233720 | 2242269 |
| 03/31/2019 | 2295194 | 2307220 |
| 06/30/2019 | 2346217 | 2356488 |
| 09/30/2019 | 2385249 | 2393606 |
| 12/31/2019 | 2392181 | 2411232 |
| 03/31/2020 | 2377819 | 2396025 |
| 06/30/2020 | 2424373 | 2461310 |
| 09/30/2020 | 2457467 | 2491550 |
| 12/31/2020 | 2522498 | 2536913 |
| 03/31/2021 | 2525806 | 2528009 |
| 06/30/2021 | 2568407 | 2563840 |
| 09/30/2021 | 2554122 | 2557029 |
| 12/31/2021 | 2574552 | 2575405 |
| 03/31/2022 | 2340269 | 2415023 |
| 06/30/2022 | 2243933 | 2344076 |
| 09/30/2022 | 2133777 | 2262959 |
| 12/31/2022 | 2236498 | 2355831 |
| 03/31/2023 | 2293321 | 2421258 |
| 06/30/2023 | 2280831 | 2418782 |
| 09/30/2023 | 2174912 | 2323245 |
| 12/31/2023 | 2332471 | 2506637 |
| 03/31/2024 | 2341852 | 2496960 |
| 06/30/2024 | 2350297 | 2496490 |
| 09/30/2024 | 2424504 | 2564208 |
| Institutional Class | 11.48% | 0.33% | 1.94% |
| Bloomberg Municipal Bond Index | 10.37% | 1.39% | 2.52% |
The fund's past performance is not a good predictor of the fund's future performance. Visit GuggenheimInvestments.com/mutual-funds/performance for more recent performance information.
| Net Assets | $20,893,995 |
| Total Number of Portfolio Holdings | 65 |
| Portfolio Turnover Rate | 59% |
| Total Advisory Fees Paid | $0 |
The fund incurred $135,565 of advisory fees which were fully waived/reimbursed by the Adviser to ensure each Share Class of the fund operated at its applicable operating expense cap.
| Guggenheim Municipal Income Fund | Institutional Class | GIJIX | Annual Shareholder Report | September 30, 2024 |
| Interest Rate Swap Agreements | 49.5% |
| California | 14.8% |
| Pennsylvania | 8.3% |
| Oregon | 7.1% |
| Michigan | 6.7% |
| Virginia | 6.3% |
| Nebraska | 6.2% |
| Tennessee | 5.6% |
| Other | 41.8% |
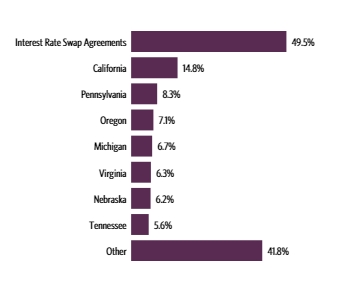
| AAA | 29.7% |
| AA | 49.1% |
| A | 15.1% |
| BBB | 4.2% |
| BB | 1.8% |
| NR3 | 0.1% |
| Freddie Mac Multifamily Variable Rate Certificate Revenue Bonds, 3.15% | 5.5% |
| Michigan Technological University Revenue Bonds, 5.25% | 5.3% |
| Maine Health & Higher Educational Facilities Authority Revenue Bonds, 5.25% | 5.3% |
| Pennsylvania Housing Finance Agency Revenue Bonds, 4.95% | 5.2% |
| Nebraska Investment Finance Authority Revenue Bonds, 4.95% | 5.2% |
| Metropolitan Government Nashville & Davidson County Health & Educational Facilities Board Revenue Bonds, 2.25% | 4.8% |
| Westchester County Local Development Corp. Revenue Bonds, 5.75% | 4.1% |
| Newport Mesa Unified School District General Obligation Unlimited | 3.5% |
| Inlivian Revenue Bonds, 2.02% | 3.3% |
| Clackamas & Washington Counties School District No. 3 General Obligation Unlimited | 3.1% |
| Top 10 Total | 45.3% |
| |
1 | "Holdings Diversification (Market Exposure as a % of Net Assets)" excludes any temporary cash investments, investments in Guggenheim Strategy Funds Trust mutual funds, or investments in Guggenheim Ultra Short Duration Fund. |
| |
2 | Source: BlackRock Solutions. Credit quality ratings are measured on a scale that generally ranges from AAA (highest) to D (lowest). All securities except for those labeled "NR" have been rated by Moody's, Standard & Poor's ("S&P"), or Fitch, each of which is a Nationally Recognized Statistical Rating Organization ("NRSRO"). For purposes of this presentation, when ratings are available from more than one agency, the highest rating is used. Guggenheim Investments has converted ratings to the equivalent S&P rating. |
3 | NR (not rated) securities do not necessarily indicate low credit quality. |
| |
4 | "10 Largest Holdings (as a % of Net Assets)" excludes any temporary cash or derivative investments. |
| Freddie Mac Multifamily Variable Rate Certificate Revenue Bonds, 3.15% | 5.5% |
| Michigan Technological University Revenue Bonds, 5.25% | 5.3% |
| Maine Health & Higher Educational Facilities Authority Revenue Bonds, 5.25% | 5.3% |
| Pennsylvania Housing Finance Agency Revenue Bonds, 4.95% | 5.2% |
| Nebraska Investment Finance Authority Revenue Bonds, 4.95% | 5.2% |
| Metropolitan Government Nashville & Davidson County Health & Educational Facilities Board Revenue Bonds, 2.25% | 4.8% |
| Westchester County Local Development Corp. Revenue Bonds, 5.75% | 4.1% |
| Newport Mesa Unified School District General Obligation Unlimited | 3.5% |
| Inlivian Revenue Bonds, 2.02% | 3.3% |
| Clackamas & Washington Counties School District No. 3 General Obligation Unlimited | 3.1% |
| Top 10 Total | 45.3% |
| |
4 | "10 Largest Holdings (as a % of Net Assets)" excludes any temporary cash or derivative investments. |
There were no changes in or disagreements with fund accountants for the period.
This is a summary of certain changes to the fund since September 30, 2023. For more complete information, you may review the fund's next prospectus, which we expect to be available by January 31, 2025 at GuggenheimInvestments.com/mutual-funds/literature or, by calling 800 820 0888.
Subsequent to the September 30, 2024 year-end, effective November 29, 2024, Guggenheim Partners Investment Management, LLC replaced Securities Investors, LLC as the fund's Investment Adviser in connection with an internal realignment of Guggenheim Investment's lines of business.
| |  | Availability of Additional Information. For additional information, including the fund's prospectus, financial information, holdings and proxy voting information, go to GuggenheimInvestments.com/mutual-funds/literature or, call 800 820 0888. |
AR-GIJIX-093024
Annual Shareholder Report | 9.30.24
This annual shareholder report contains important information about the Guggenheim Total Return Bond Fund for the period of October 1, 2023 to September 30, 2024. You can find additional information about the fund at GuggenheimInvestments.com/mutual-funds/literature. You can also request this information by contacting 800 820 0888 or GuggenheimClientServices@mufg-is.com.
This report describes changes to the fund that occurred during the reporting period.
For the period of October 1, 2023 to September 30, 2024, the fund (Class A shares) returned 13.04%, outperforming the fund's benchmark, the Bloomberg U.S. Aggregate Bond Index, which returned 11.57% for the same period.
What factors materially affected the fund's performance over the last year?
The fund's relative outperformance was primarily driven by sector allocation, security selection, and the fund's carry (or earned income) advantage over the benchmark. The fund benefited from an overweight allocation to credit, as spreads tightened materially across the broader category. Performance from credit spread tightening in agency residential mortgage-backed securities and investment grade corporates were large drivers of absolute performance, while out-of-benchmark allocations like high yield corporates and structured credit drove most of the relative outperformance. Duration was a large driver of absolute performance given the bull steepening move in U.S. yields.
Cumulative performance* for the fund's most recently completed 10 years (as of 9.30.24), assuming a $10,000 initial investment.
| 09/30/2014 | 9526 | 10000 |
| 12/31/2014 | 9637 | 10179 |
| 03/31/2015 | 9808 | 10343 |
| 06/30/2015 | 9724 | 10169 |
| 09/30/2015 | 9770 | 10294 |
| 12/31/2015 | 9723 | 10235 |
| 03/31/2016 | 9864 | 10546 |
| 06/30/2016 | 10198 | 10779 |
| 09/30/2016 | 10442 | 10829 |
| 12/31/2016 | 10284 | 10506 |
| 03/31/2017 | 10464 | 10592 |
| 06/30/2017 | 10680 | 10745 |
| 09/30/2017 | 10789 | 10836 |
| 12/31/2017 | 10919 | 10879 |
| 03/31/2018 | 10882 | 10720 |
| 06/30/2018 | 10930 | 10703 |
| 09/30/2018 | 10928 | 10705 |
| 12/31/2018 | 10989 | 10880 |
| 03/31/2019 | 11132 | 11200 |
| 06/30/2019 | 11375 | 11545 |
| 09/30/2019 | 11550 | 11807 |
| 12/31/2019 | 11472 | 11828 |
| 03/31/2020 | 11813 | 12200 |
| 06/30/2020 | 12479 | 12554 |
| 09/30/2020 | 12816 | 12632 |
| 12/31/2020 | 13184 | 12716 |
| 03/31/2021 | 12689 | 12287 |
| 06/30/2021 | 13076 | 12512 |
| 09/30/2021 | 13107 | 12518 |
| 12/31/2021 | 13128 | 12520 |
| 03/31/2022 | 12265 | 11777 |
| 06/30/2022 | 11368 | 11224 |
| 09/30/2022 | 10902 | 10691 |
| 12/31/2022 | 11054 | 10891 |
| 03/31/2023 | 11477 | 11214 |
| 06/30/2023 | 11397 | 11119 |
| 09/30/2023 | 11071 | 10760 |
| 12/31/2023 | 11842 | 11493 |
| 03/31/2024 | 11824 | 11404 |
| 06/30/2024 | 11867 | 11411 |
| 09/30/2024 | 12515 | 12004 |
| Class A (without sales charge) | 13.04% | 1.57% | 2.75% |
| Class A (with sales charge)† | 8.51% | 0.75% | 2.25% |
| Bloomberg U.S. Aggregate Bond Index | 11.57% | 0.33% | 1.84% |
The fund's past performance is not a good predictor of the fund's future performance. Visit GuggenheimInvestments.com/mutual-funds/performance for more recent performance information.
| Net Assets | $26,777,806,246 |
| Total Number of Portfolio Holdings | 1,620 |
| Portfolio Turnover Rate | 70% |
| Total Advisory Fees Paid | $77,121,880 |
| Guggenheim Total Return Bond Fund | Class A | GIBAX | Annual Shareholder Report | September 30, 2024 |
| Collateralized Mortgage Obligations | 32.6% |
| Interest Rate Swap Agreements | 32.5% |
| Corporate Bonds | 26.2% |
| Asset-Backed Securities | 21.9% |
| U.S. Government Securities | 19.3% |
| Interest Rate Futures Contracts | 6.6% |
| Senior Floating Rate Interests | 3.2% |
| Preferred Stocks | 2.6% |
| Other | 2.3% |
| Credit Default Swaps Agreements Protection Purchased | -2.6% |

| AAA | 46.2% |
| AA | 6.1% |
| A | 14.3% |
| BBB | 15.2% |
| BB | 5.3% |
| B | 2.1% |
| CCC | 0.5% |
| CC | 0.9% |
| C | 0.1% |
| NR3 | 2.8% |
| Other Instruments | 6.5% |
| U.S. Treasury Bonds due 05/15/51 | 2.7% |
| U.S. Treasury Notes, 4.00% due 02/15/34 | 2.3% |
| Uniform MBS 30 Year due 12/01/24 | 2.3% |
| U.S. Treasury Bonds, 4.38% due 11/15/39 | 1.9% |
| U.S. Treasury Notes, 4.13% due 06/15/26 | 1.7% |
| Uniform MBS 30 Year due 12/01/24 | 1.6% |
| Uniform MBS 30 Year due 01/01/25 | 1.6% |
| GNMA II 30Year TBA due 10/21/24 | 1.4% |
| United States Treasury Inflation Indexed Bonds, 2.13% due 04/15/29 | 1.2% |
| Uniform MBS 30 Year due 12/01/24 | 0.9% |
| Top 10 Total | 17.6% |
| |
1 | "Holdings Diversification (Market Exposure as a % of Net Assets)" excludes any temporary cash investments, investments in Guggenheim Strategy Funds Trust mutual funds, or investments in Guggenheim Ultra Short Duration Fund. |
| |
2 | Source: BlackRock Solutions. Credit quality ratings are measured on a scale that generally ranges from AAA (highest) to D (lowest). All securities except for those labeled "NR" have been rated by Moody's, Standard & Poor's ("S&P"), or Fitch, each of which is a Nationally Recognized Statistical Rating Organization ("NRSRO"). For purposes of this presentation, when ratings are available from more than one agency, the highest rating is used. Guggenheim Investments has converted ratings to the equivalent S&P rating. |
3 | NR (not rated) securities do not necessarily indicate low credit quality. |
| |
4 | "10 Largest Holdings (as a % of Net Assets)" excludes any temporary cash or derivative investments. |
| U.S. Treasury Bonds due 05/15/51 | 2.7% |
| U.S. Treasury Notes, 4.00% due 02/15/34 | 2.3% |
| Uniform MBS 30 Year due 12/01/24 | 2.3% |
| U.S. Treasury Bonds, 4.38% due 11/15/39 | 1.9% |
| U.S. Treasury Notes, 4.13% due 06/15/26 | 1.7% |
| Uniform MBS 30 Year due 12/01/24 | 1.6% |
| Uniform MBS 30 Year due 01/01/25 | 1.6% |
| GNMA II 30Year TBA due 10/21/24 | 1.4% |
| United States Treasury Inflation Indexed Bonds, 2.13% due 04/15/29 | 1.2% |
| Uniform MBS 30 Year due 12/01/24 | 0.9% |
| Top 10 Total | 17.6% |
| |
4 | "10 Largest Holdings (as a % of Net Assets)" excludes any temporary cash or derivative investments. |
There were no changes in or disagreements with fund accountants for the period.
This is a summary of certain changes to the fund since September 30, 2023. For more complete information, you may review the fund's next prospectus, which we expect to be available by January 31, 2025 at GuggenheimInvestments.com/mutual-funds/literature or, by calling 800 820 0888.
The fund's (Class A shares) net expense ratio, which reflects expense waivers and reimbursements and includes certain expenses that are outside of the contractual expense limit, was 0.84% for the year ended September 30, 2024, a decrease of 0.07% compared to the prior year. The primary driver of the decrease was a decrease in interest expense as the fund utilized fewer reverse repurchase agreements during the reporting period.
| |  | Availability of Additional Information. For additional information, including the fund's prospectus, financial information, holdings and proxy voting information, go to GuggenheimInvestments.com/mutual-funds/literature or, call 800 820 0888. |
AR-GIBAX-093024
Annual Shareholder Report | 9.30.24
This annual shareholder report contains important information about the Guggenheim Total Return Bond Fund for the period of October 1, 2023 to September 30, 2024. You can find additional information about the fund at GuggenheimInvestments.com/mutual-funds/literature. You can also request this information by contacting 800 820 0888 or GuggenheimClientServices@mufg-is.com.
This report describes changes to the fund that occurred during the reporting period.
For the period of October 1, 2023 to September 30, 2024, the fund (Class C shares) returned 12.25%, outperforming the fund's benchmark, the Bloomberg U.S. Aggregate Bond Index, which returned 11.57% for the same period.
What factors materially affected the fund's performance over the last year?
The fund's relative outperformance was primarily driven by sector allocation, security selection, and the fund's carry (or earned income) advantage over the benchmark. The fund benefited from an overweight allocation to credit, as spreads tightened materially across the broader category. Performance from credit spread tightening in agency residential mortgage-backed securities and investment grade corporates were large drivers of absolute performance, while out-of-benchmark allocations like high yield corporates and structured credit drove most of the relative outperformance. Duration was a large driver of absolute performance given the bull steepening move in U.S. yields.
Cumulative performance* for the fund's most recently completed 10 years (as of 9.30.24), assuming a $10,000 initial investment.
| 09/30/2014 | 10000 | 10000 |
| 12/31/2014 | 10099 | 10179 |
| 03/31/2015 | 10259 | 10343 |
| 06/30/2015 | 10153 | 10169 |
| 09/30/2015 | 10182 | 10294 |
| 12/31/2015 | 10114 | 10235 |
| 03/31/2016 | 10242 | 10546 |
| 06/30/2016 | 10570 | 10779 |
| 09/30/2016 | 10801 | 10829 |
| 12/31/2016 | 10624 | 10506 |
| 03/31/2017 | 10786 | 10592 |
| 06/30/2017 | 10987 | 10745 |
| 09/30/2017 | 11080 | 10836 |
| 12/31/2017 | 11193 | 10879 |
| 03/31/2018 | 11133 | 10720 |
| 06/30/2018 | 11162 | 10703 |
| 09/30/2018 | 11139 | 10705 |
| 12/31/2018 | 11180 | 10880 |
| 03/31/2019 | 11305 | 11200 |
| 06/30/2019 | 11530 | 11545 |
| 09/30/2019 | 11690 | 11807 |
| 12/31/2019 | 11584 | 11828 |
| 03/31/2020 | 11907 | 12200 |
| 06/30/2020 | 12559 | 12554 |
| 09/30/2020 | 12870 | 12632 |
| 12/31/2020 | 13214 | 12716 |
| 03/31/2021 | 12694 | 12287 |
| 06/30/2021 | 13057 | 12512 |
| 09/30/2021 | 13063 | 12518 |
| 12/31/2021 | 13059 | 12520 |
| 03/31/2022 | 12179 | 11777 |
| 06/30/2022 | 11267 | 11224 |
| 09/30/2022 | 10789 | 10691 |
| 12/31/2022 | 10914 | 10891 |
| 03/31/2023 | 11311 | 11214 |
| 06/30/2023 | 11211 | 11119 |
| 09/30/2023 | 10869 | 10760 |
| 12/31/2023 | 11604 | 11493 |
| 03/31/2024 | 11565 | 11404 |
| 06/30/2024 | 11586 | 11411 |
| 09/30/2024 | 12200 | 12004 |
| Class C (without CDSC) | 12.25% | 0.81% | 1.98% |
| Class C (with CDSC)‡ | 11.25% | 0.81% | 1.98% |
| Bloomberg U.S. Aggregate Bond Index | 11.57% | 0.33% | 1.84% |
The fund's past performance is not a good predictor of the fund's future performance. Visit GuggenheimInvestments.com/mutual-funds/performance for more recent performance information.
| Net Assets | $26,777,806,246 |
| Total Number of Portfolio Holdings | 1,620 |
| Portfolio Turnover Rate | 70% |
| Total Advisory Fees Paid | $77,121,880 |
| Guggenheim Total Return Bond Fund | Class C | GIBCX | Annual Shareholder Report | September 30, 2024 |
| Collateralized Mortgage Obligations | 32.6% |
| Interest Rate Swap Agreements | 32.5% |
| Corporate Bonds | 26.2% |
| Asset-Backed Securities | 21.9% |
| U.S. Government Securities | 19.3% |
| Interest Rate Futures Contracts | 6.6% |
| Senior Floating Rate Interests | 3.2% |
| Preferred Stocks | 2.6% |
| Other | 2.3% |
| Credit Default Swaps Agreements Protection Purchased | -2.6% |

| AAA | 46.2% |
| AA | 6.1% |
| A | 14.3% |
| BBB | 15.2% |
| BB | 5.3% |
| B | 2.1% |
| CCC | 0.5% |
| CC | 0.9% |
| C | 0.1% |
| NR3 | 2.8% |
| Other Instruments | 6.5% |
| U.S. Treasury Bonds due 05/15/51 | 2.7% |
| U.S. Treasury Notes, 4.00% due 02/15/34 | 2.3% |
| Uniform MBS 30 Year due 12/01/24 | 2.3% |
| U.S. Treasury Bonds, 4.38% due 11/15/39 | 1.9% |
| U.S. Treasury Notes, 4.13% due 06/15/26 | 1.7% |
| Uniform MBS 30 Year due 12/01/24 | 1.6% |
| Uniform MBS 30 Year due 01/01/25 | 1.6% |
| GNMA II 30Year TBA due 10/21/24 | 1.4% |
| United States Treasury Inflation Indexed Bonds, 2.13% due 04/15/29 | 1.2% |
| Uniform MBS 30 Year due 12/01/24 | 0.9% |
| Top 10 Total | 17.6% |
| |
1 | "Holdings Diversification (Market Exposure as a % of Net Assets)" excludes any temporary cash investments, investments in Guggenheim Strategy Funds Trust mutual funds, or investments in Guggenheim Ultra Short Duration Fund. |
| |
2 | Source: BlackRock Solutions. Credit quality ratings are measured on a scale that generally ranges from AAA (highest) to D (lowest). All securities except for those labeled "NR" have been rated by Moody's, Standard & Poor's ("S&P"), or Fitch, each of which is a Nationally Recognized Statistical Rating Organization ("NRSRO"). For purposes of this presentation, when ratings are available from more than one agency, the highest rating is used. Guggenheim Investments has converted ratings to the equivalent S&P rating. |
3 | NR (not rated) securities do not necessarily indicate low credit quality. |
| |
4 | "10 Largest Holdings (as a % of Net Assets)" excludes any temporary cash or derivative investments. |
| U.S. Treasury Bonds due 05/15/51 | 2.7% |
| U.S. Treasury Notes, 4.00% due 02/15/34 | 2.3% |
| Uniform MBS 30 Year due 12/01/24 | 2.3% |
| U.S. Treasury Bonds, 4.38% due 11/15/39 | 1.9% |
| U.S. Treasury Notes, 4.13% due 06/15/26 | 1.7% |
| Uniform MBS 30 Year due 12/01/24 | 1.6% |
| Uniform MBS 30 Year due 01/01/25 | 1.6% |
| GNMA II 30Year TBA due 10/21/24 | 1.4% |
| United States Treasury Inflation Indexed Bonds, 2.13% due 04/15/29 | 1.2% |
| Uniform MBS 30 Year due 12/01/24 | 0.9% |
| Top 10 Total | 17.6% |
| |
4 | "10 Largest Holdings (as a % of Net Assets)" excludes any temporary cash or derivative investments. |
There were no changes in or disagreements with fund accountants for the period.
This is a summary of certain changes to the fund since September 30, 2023. For more complete information, you may review the fund's next prospectus, which we expect to be available by January 31, 2025 at GuggenheimInvestments.com/mutual-funds/literature or, by calling 800 820 0888.
The fund's (Class C shares) net expense ratio, which reflects expense waivers and reimbursements and includes certain expenses that are outside of the contractual expense limit, was 1.60% for the year ended September 30, 2024, a decrease of 0.06% compared to the prior year. The primary driver of the decrease was a decrease in interest expense as the fund utilized fewer reverse repurchase agreements during the reporting period.
| |  | Availability of Additional Information. For additional information, including the fund's prospectus, financial information, holdings and proxy voting information, go to GuggenheimInvestments.com/mutual-funds/literature or, call 800 820 0888. |
AR-GIBCX-093024
Annual Shareholder Report | 9.30.24
This annual shareholder report contains important information about the Guggenheim Total Return Bond Fund for the period of October 1, 2023 to September 30, 2024. You can find additional information about the fund at GuggenheimInvestments.com/mutual-funds/literature. You can also request this information by contacting 800 820 0888 or GuggenheimClientServices@mufg-is.com.
This report describes changes to the fund that occurred during the reporting period.
For the period of October 1, 2023 to September 30, 2024, the fund (Class P shares) returned 13.09%, outperforming the fund's benchmark, the Bloomberg U.S. Aggregate Bond Index, which returned 11.57% for the same period.
What factors materially affected the fund's performance over the last year?
The fund's relative outperformance was primarily driven by sector allocation, security selection, and the fund's carry (or earned income) advantage over the benchmark. The fund benefited from an overweight allocation to credit, as spreads tightened materially across the broader category. Performance from credit spread tightening in agency residential mortgage-backed securities and investment grade corporates were large drivers of absolute performance, while out-of-benchmark allocations like high yield corporates and structured credit drove most of the relative outperformance. Duration was a large driver of absolute performance given the bull steepening move in U.S. yields.
Cumulative performance* for the fund since inception (as of 9.30.24), assuming a $10,000 initial investment.
| 05/01/2015 | 10000 | 10000 |
| 06/30/2015 | 9931 | 9899 |
| 09/30/2015 | 9979 | 10021 |
| 12/31/2015 | 9933 | 9964 |
| 03/31/2016 | 10079 | 10266 |
| 06/30/2016 | 10424 | 10493 |
| 09/30/2016 | 10675 | 10542 |
| 12/31/2016 | 10519 | 10228 |
| 03/31/2017 | 10700 | 10311 |
| 06/30/2017 | 10919 | 10460 |
| 09/30/2017 | 11031 | 10549 |
| 12/31/2017 | 11165 | 10590 |
| 03/31/2018 | 11126 | 10435 |
| 06/30/2018 | 11175 | 10419 |
| 09/30/2018 | 11177 | 10421 |
| 12/31/2018 | 11236 | 10591 |
| 03/31/2019 | 11382 | 10903 |
| 06/30/2019 | 11630 | 11239 |
| 09/30/2019 | 11814 | 11494 |
| 12/31/2019 | 11730 | 11515 |
| 03/31/2020 | 12079 | 11877 |
| 06/30/2020 | 12759 | 12221 |
| 09/30/2020 | 13104 | 12297 |
| 12/31/2020 | 13481 | 12379 |
| 03/31/2021 | 12974 | 11961 |
| 06/30/2021 | 13370 | 12180 |
| 09/30/2021 | 13402 | 12187 |
| 12/31/2021 | 13423 | 12188 |
| 03/31/2022 | 12541 | 11465 |
| 06/30/2022 | 11628 | 10927 |
| 09/30/2022 | 11151 | 10407 |
| 12/31/2022 | 11302 | 10602 |
| 03/31/2023 | 11735 | 10916 |
| 06/30/2023 | 11653 | 10824 |
| 09/30/2023 | 11319 | 10474 |
| 12/31/2023 | 12108 | 11189 |
| 03/31/2024 | 12089 | 11102 |
| 06/30/2024 | 12134 | 11109 |
| 09/30/2024 | 12801 | 11686 |
| Class P | 13.09% | 1.57% | 2.63% |
| Bloomberg U.S. Aggregate Bond Index | 11.57% | 0.33% | 1.67% |
The fund's past performance is not a good predictor of the fund's future performance. Visit GuggenheimInvestments.com/mutual-funds/performance for more recent performance information.
| Net Assets | $26,777,806,246 |
| Total Number of Portfolio Holdings | 1,620 |
| Portfolio Turnover Rate | 70% |
| Total Advisory Fees Paid | $77,121,880 |
| Guggenheim Total Return Bond Fund | Class P | GIBLX | Annual Shareholder Report | September 30, 2024 |
| Collateralized Mortgage Obligations | 32.6% |
| Interest Rate Swap Agreements | 32.5% |
| Corporate Bonds | 26.2% |
| Asset-Backed Securities | 21.9% |
| U.S. Government Securities | 19.3% |
| Interest Rate Futures Contracts | 6.6% |
| Senior Floating Rate Interests | 3.2% |
| Preferred Stocks | 2.6% |
| Other | 2.3% |
| Credit Default Swaps Agreements Protection Purchased | -2.6% |

| AAA | 46.2% |
| AA | 6.1% |
| A | 14.3% |
| BBB | 15.2% |
| BB | 5.3% |
| B | 2.1% |
| CCC | 0.5% |
| CC | 0.9% |
| C | 0.1% |
| NR3 | 2.8% |
| Other Instruments | 6.5% |
| U.S. Treasury Bonds due 05/15/51 | 2.7% |
| U.S. Treasury Notes, 4.00% due 02/15/34 | 2.3% |
| Uniform MBS 30 Year due 12/01/24 | 2.3% |
| U.S. Treasury Bonds, 4.38% due 11/15/39 | 1.9% |
| U.S. Treasury Notes, 4.13% due 06/15/26 | 1.7% |
| Uniform MBS 30 Year due 12/01/24 | 1.6% |
| Uniform MBS 30 Year due 01/01/25 | 1.6% |
| GNMA II 30Year TBA due 10/21/24 | 1.4% |
| United States Treasury Inflation Indexed Bonds, 2.13% due 04/15/29 | 1.2% |
| Uniform MBS 30 Year due 12/01/24 | 0.9% |
| Top 10 Total | 17.6% |
| |
1 | "Holdings Diversification (Market Exposure as a % of Net Assets)" excludes any temporary cash investments, investments in Guggenheim Strategy Funds Trust mutual funds, or investments in Guggenheim Ultra Short Duration Fund. |
| |
2 | Source: BlackRock Solutions. Credit quality ratings are measured on a scale that generally ranges from AAA (highest) to D (lowest). All securities except for those labeled "NR" have been rated by Moody's, Standard & Poor's ("S&P"), or Fitch, each of which is a Nationally Recognized Statistical Rating Organization ("NRSRO"). For purposes of this presentation, when ratings are available from more than one agency, the highest rating is used. Guggenheim Investments has converted ratings to the equivalent S&P rating. |
3 | NR (not rated) securities do not necessarily indicate low credit quality. |
| |
4 | "10 Largest Holdings (as a % of Net Assets)" excludes any temporary cash or derivative investments. |
| U.S. Treasury Bonds due 05/15/51 | 2.7% |
| U.S. Treasury Notes, 4.00% due 02/15/34 | 2.3% |
| Uniform MBS 30 Year due 12/01/24 | 2.3% |
| U.S. Treasury Bonds, 4.38% due 11/15/39 | 1.9% |
| U.S. Treasury Notes, 4.13% due 06/15/26 | 1.7% |
| Uniform MBS 30 Year due 12/01/24 | 1.6% |
| Uniform MBS 30 Year due 01/01/25 | 1.6% |
| GNMA II 30Year TBA due 10/21/24 | 1.4% |
| United States Treasury Inflation Indexed Bonds, 2.13% due 04/15/29 | 1.2% |
| Uniform MBS 30 Year due 12/01/24 | 0.9% |
| Top 10 Total | 17.6% |
| |
4 | "10 Largest Holdings (as a % of Net Assets)" excludes any temporary cash or derivative investments. |
There were no changes in or disagreements with fund accountants for the period.
This is a summary of certain changes to the fund since September 30, 2023. For more complete information, you may review the fund's next prospectus, which we expect to be available by January 31, 2025 at GuggenheimInvestments.com/mutual-funds/literature or, by calling 800 820 0888.
The fund's (Class P shares) net expense ratio, which reflects expense waivers and reimbursements and includes certain expenses that are outside of the contractual expense limit, was 0.85% for the year ended September 30, 2024, a decrease of 0.06% compared to the prior year. The primary driver of the decrease was a decrease in interest expense as the fund utilized fewer reverse repurchase agreements during the reporting period.
| |  | Availability of Additional Information. For additional information, including the fund's prospectus, financial information, holdings and proxy voting information, go to GuggenheimInvestments.com/mutual-funds/literature or, call 800 820 0888. |
AR-GIBLX-093024
Annual Shareholder Report | 9.30.24
This annual shareholder report contains important information about the Guggenheim Total Return Bond Fund for the period of October 1, 2023 to September 30, 2024. You can find additional information about the fund at GuggenheimInvestments.com/mutual-funds/literature. You can also request this information by contacting 800 820 0888 or GuggenheimClientServices@mufg-is.com.
This report describes changes to the fund that occurred during the reporting period.
| Institutional Class | $58 | 0.54% |
For the period of October 1, 2023 to September 30, 2024, the fund (Institutional Class shares) returned 13.40%, outperforming the fund's benchmark, the Bloomberg U.S. Aggregate Bond Index, which returned 11.57% for the same period.
What factors materially affected the fund's performance over the last year?
The fund's relative outperformance was primarily driven by sector allocation, security selection, and the fund's carry (or earned income) advantage over the benchmark. The fund benefited from an overweight allocation to credit, as spreads tightened materially across the broader category. Performance from credit spread tightening in agency residential mortgage-backed securities and investment grade corporates were large drivers of absolute performance, while out-of-benchmark allocations like high yield corporates and structured credit drove most of the relative outperformance. Duration was a large driver of absolute performance given the bull steepening move in U.S. yields.
Cumulative performance* for the fund's most recently completed 10 years (as of 9.30.24), assuming a $2,000,000 initial investment.
| 09/30/2014 | 2000000 | 2000000 |
| 12/31/2014 | 2025248 | 2035885 |
| 03/31/2015 | 2062727 | 2068593 |
| 06/30/2015 | 2046812 | 2033787 |
| 09/30/2015 | 2058243 | 2058816 |
| 12/31/2015 | 2050206 | 2047081 |
| 03/31/2016 | 2081610 | 2109149 |
| 06/30/2016 | 2154241 | 2155839 |
| 09/30/2016 | 2207694 | 2165719 |
| 12/31/2016 | 2177370 | 2101277 |
| 03/31/2017 | 2216235 | 2118439 |
| 06/30/2017 | 2263502 | 2149054 |
| 09/30/2017 | 2288967 | 2167289 |
| 12/31/2017 | 2318576 | 2175701 |
| 03/31/2018 | 2312237 | 2143918 |
| 06/30/2018 | 2324134 | 2140524 |
| 09/30/2018 | 2325329 | 2140934 |
| 12/31/2018 | 2340162 | 2175948 |
| 03/31/2019 | 2372112 | 2239983 |
| 06/30/2019 | 2425595 | 2308967 |
| 09/30/2019 | 2465645 | 2361362 |
| 12/31/2019 | 2449917 | 2365619 |
| 03/31/2020 | 2525385 | 2440097 |
| 06/30/2020 | 2669350 | 2510752 |
| 09/30/2020 | 2742521 | 2526300 |
| 12/31/2020 | 2823296 | 2543198 |
| 03/31/2021 | 2719151 | 2457428 |
| 06/30/2021 | 2804988 | 2502393 |
| 09/30/2021 | 2813655 | 2503689 |
| 12/31/2021 | 2819218 | 2503980 |
| 03/31/2022 | 2636015 | 2355394 |
| 06/30/2022 | 2445112 | 2244843 |
| 09/30/2022 | 2346736 | 2138160 |
| 12/31/2022 | 2381181 | 2178209 |
| 03/31/2023 | 2474035 | 2242728 |
| 06/30/2023 | 2458606 | 2223793 |
| 09/30/2023 | 2389956 | 2151938 |
| 12/31/2023 | 2558133 | 2298638 |
| 03/31/2024 | 2555958 | 2280808 |
| 06/30/2024 | 2567072 | 2282297 |
| 09/30/2024 | 2710149 | 2400886 |
| Institutional Class | 13.40% | 1.86% | 3.06% |
| Bloomberg U.S. Aggregate Bond Index | 11.57% | 0.33% | 1.84% |
The fund's past performance is not a good predictor of the fund's future performance. Visit GuggenheimInvestments.com/mutual-funds/performance for more recent performance information.
| Net Assets | $26,777,806,246 |
| Total Number of Portfolio Holdings | 1,620 |
| Portfolio Turnover Rate | 70% |
| Total Advisory Fees Paid | $77,121,880 |
| Guggenheim Total Return Bond Fund | Institutional Class | GIBIX | Annual Shareholder Report | September 30, 2024 |
| Collateralized Mortgage Obligations | 32.6% |
| Interest Rate Swap Agreements | 32.5% |
| Corporate Bonds | 26.2% |
| Asset-Backed Securities | 21.9% |
| U.S. Government Securities | 19.3% |
| Interest Rate Futures Contracts | 6.6% |
| Senior Floating Rate Interests | 3.2% |
| Preferred Stocks | 2.6% |
| Other | 2.3% |
| Credit Default Swaps Agreements Protection Purchased | -2.6% |
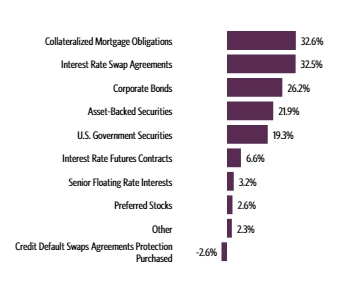
| AAA | 46.2% |
| AA | 6.1% |
| A | 14.3% |
| BBB | 15.2% |
| BB | 5.3% |
| B | 2.1% |
| CCC | 0.5% |
| CC | 0.9% |
| C | 0.1% |
| NR3 | 2.8% |
| Other Instruments | 6.5% |
| U.S. Treasury Bonds due 05/15/51 | 2.7% |
| U.S. Treasury Notes, 4.00% due 02/15/34 | 2.3% |
| Uniform MBS 30 Year due 12/01/24 | 2.3% |
| U.S. Treasury Bonds, 4.38% due 11/15/39 | 1.9% |
| U.S. Treasury Notes, 4.13% due 06/15/26 | 1.7% |
| Uniform MBS 30 Year due 12/01/24 | 1.6% |
| Uniform MBS 30 Year due 01/01/25 | 1.6% |
| GNMA II 30Year TBA due 10/21/24 | 1.4% |
| United States Treasury Inflation Indexed Bonds, 2.13% due 04/15/29 | 1.2% |
| Uniform MBS 30 Year due 12/01/24 | 0.9% |
| Top 10 Total | 17.6% |
| |
1 | "Holdings Diversification (Market Exposure as a % of Net Assets)" excludes any temporary cash investments, investments in Guggenheim Strategy Funds Trust mutual funds, or investments in Guggenheim Ultra Short Duration Fund. |
| |
2 | Source: BlackRock Solutions. Credit quality ratings are measured on a scale that generally ranges from AAA (highest) to D (lowest). All securities except for those labeled "NR" have been rated by Moody's, Standard & Poor's ("S&P"), or Fitch, each of which is a Nationally Recognized Statistical Rating Organization ("NRSRO"). For purposes of this presentation, when ratings are available from more than one agency, the highest rating is used. Guggenheim Investments has converted ratings to the equivalent S&P rating. |
3 | NR (not rated) securities do not necessarily indicate low credit quality. |
| |
4 | "10 Largest Holdings (as a % of Net Assets)" excludes any temporary cash or derivative investments. |
| U.S. Treasury Bonds due 05/15/51 | 2.7% |
| U.S. Treasury Notes, 4.00% due 02/15/34 | 2.3% |
| Uniform MBS 30 Year due 12/01/24 | 2.3% |
| U.S. Treasury Bonds, 4.38% due 11/15/39 | 1.9% |
| U.S. Treasury Notes, 4.13% due 06/15/26 | 1.7% |
| Uniform MBS 30 Year due 12/01/24 | 1.6% |
| Uniform MBS 30 Year due 01/01/25 | 1.6% |
| GNMA II 30Year TBA due 10/21/24 | 1.4% |
| United States Treasury Inflation Indexed Bonds, 2.13% due 04/15/29 | 1.2% |
| Uniform MBS 30 Year due 12/01/24 | 0.9% |
| Top 10 Total | 17.6% |
| |
4 | "10 Largest Holdings (as a % of Net Assets)" excludes any temporary cash or derivative investments. |
There were no changes in or disagreements with fund accountants for the period.
This is a summary of certain changes to the fund since September 30, 2023. For more complete information, you may review the fund's next prospectus, which we expect to be available by January 31, 2025 at GuggenheimInvestments.com/mutual-funds/literature or, by calling 800 820 0888.
The fund's (Institutional Class shares) net expense ratio, which reflects expense waivers and reimbursements and includes certain expenses that are outside of the contractual expense limit, was 0.54% for the year ended September 30, 2024, a decrease of 0.08% compared to the prior year. The primary driver of the decrease was a decrease in interest expense as the fund utilized fewer reverse repurchase agreements during the reporting period.
| |  | Availability of Additional Information. For additional information, including the fund's prospectus, financial information, holdings and proxy voting information, go to GuggenheimInvestments.com/mutual-funds/literature or, call 800 820 0888. |
AR-GIBIX-093024
Annual Shareholder Report | 9.30.24
This annual shareholder report contains important information about the Guggenheim Total Return Bond Fund for the period of October 1, 2023 to September 30, 2024. You can find additional information about the fund at GuggenheimInvestments.com/mutual-funds/literature. You can also request this information by contacting 800 820 0888 or GuggenheimClientServices@mufg-is.com.
This report describes changes to the fund that occurred during the reporting period.
For the period of October 1, 2023 to September 30, 2024, the fund (Class R6 shares) returned 13.44%, underperforming the fund's benchmark, the Bloomberg U.S. Aggregate Bond Index, which returned 11.57% for the same period.
What factors materially affected the fund's performance over the last year?
The fund's relative outperformance was primarily driven by sector allocation, security selection, and the fund's carry (or earned income) advantage over the benchmark. The fund benefited from an overweight allocation to credit, as spreads tightened materially across the broader category. Performance from credit spread tightening in agency residential mortgage-backed securities and investment grade corporates were large drivers of absolute performance, while out-of-benchmark allocations like high yield corporates and structured credit drove most of the relative outperformance. Duration was a large driver of absolute performance given the bull steepening move in U.S. yields.
Cumulative performance* for the fund since inception (as of 9.30.24), assuming a $10,000 initial investment.
| 10/19/2016 | 10000 | 10000 |
| 12/31/2016 | 9882 | 9741 |
| 03/31/2017 | 10063 | 9820 |
| 06/30/2017 | 10278 | 9962 |
| 09/30/2017 | 10397 | 10047 |
| 12/31/2017 | 10527 | 10086 |
| 03/31/2018 | 10502 | 9938 |
| 06/30/2018 | 10552 | 9923 |
| 09/30/2018 | 10561 | 9924 |
| 12/31/2018 | 10629 | 10087 |
| 03/31/2019 | 10774 | 10384 |
| 06/30/2019 | 11013 | 10703 |
| 09/30/2019 | 11194 | 10946 |
| 12/31/2019 | 11127 | 10966 |
| 03/31/2020 | 11465 | 11311 |
| 06/30/2020 | 12119 | 11639 |
| 09/30/2020 | 12455 | 11711 |
| 12/31/2020 | 12822 | 11789 |
| 03/31/2021 | 12349 | 11392 |
| 06/30/2021 | 12734 | 11600 |
| 09/30/2021 | 12774 | 11606 |
| 12/31/2021 | 12803 | 11607 |
| 03/31/2022 | 11972 | 10919 |
| 06/30/2022 | 11106 | 10406 |
| 09/30/2022 | 10660 | 9912 |
| 12/31/2022 | 10812 | 10097 |
| 03/31/2023 | 11234 | 10396 |
| 06/30/2023 | 11166 | 10309 |
| 09/30/2023 | 10856 | 9975 |
| 12/31/2023 | 11620 | 10656 |
| 03/31/2024 | 11612 | 10573 |
| 06/30/2024 | 11663 | 10580 |
| 09/30/2024 | 12314 | 11130 |
| Class R6 | 13.44% | 1.88% | 2.63% |
| Bloomberg U.S. Aggregate Bond Index | 11.57% | 0.33% | 1.36% |
The fund's past performance is not a good predictor of the fund's future performance. Visit GuggenheimInvestments.com/mutual-funds/performance for more recent performance information.
| Net Assets | $26,777,806,246 |
| Total Number of Portfolio Holdings | 1,620 |
| Portfolio Turnover Rate | 70% |
| Total Advisory Fees Paid | $77,121,880 |
| Guggenheim Total Return Bond Fund | Class R6 | GIBRX | Annual Shareholder Report | September 30, 2024 |
| Collateralized Mortgage Obligations | 32.6% |
| Interest Rate Swap Agreements | 32.5% |
| Corporate Bonds | 26.2% |
| Asset-Backed Securities | 21.9% |
| U.S. Government Securities | 19.3% |
| Interest Rate Futures Contracts | 6.6% |
| Senior Floating Rate Interests | 3.2% |
| Preferred Stocks | 2.6% |
| Other | 2.3% |
| Credit Default Swaps Agreements Protection Purchased | -2.6% |

| AAA | 46.2% |
| AA | 6.1% |
| A | 14.3% |
| BBB | 15.2% |
| BB | 5.3% |
| B | 2.1% |
| CCC | 0.5% |
| CC | 0.9% |
| C | 0.1% |
| NR3 | 2.8% |
| Other Instruments | 6.5% |
| U.S. Treasury Bonds due 05/15/51 | 2.7% |
| U.S. Treasury Notes, 4.00% due 02/15/34 | 2.3% |
| Uniform MBS 30 Year due 12/01/24 | 2.3% |
| U.S. Treasury Bonds, 4.38% due 11/15/39 | 1.9% |
| U.S. Treasury Notes, 4.13% due 06/15/26 | 1.7% |
| Uniform MBS 30 Year due 12/01/24 | 1.6% |
| Uniform MBS 30 Year due 01/01/25 | 1.6% |
| GNMA II 30Year TBA due 10/21/24 | 1.4% |
| United States Treasury Inflation Indexed Bonds, 2.13% due 04/15/29 | 1.2% |
| Uniform MBS 30 Year due 12/01/24 | 0.9% |
| Top 10 Total | 17.6% |
| |
1 | "Holdings Diversification (Market Exposure as a % of Net Assets)" excludes any temporary cash investments, investments in Guggenheim Strategy Funds Trust mutual funds, or investments in Guggenheim Ultra Short Duration Fund. |
| |
2 | Source: BlackRock Solutions. Credit quality ratings are measured on a scale that generally ranges from AAA (highest) to D (lowest). All securities except for those labeled "NR" have been rated by Moody's, Standard & Poor's ("S&P"), or Fitch, each of which is a Nationally Recognized Statistical Rating Organization ("NRSRO"). For purposes of this presentation, when ratings are available from more than one agency, the highest rating is used. Guggenheim Investments has converted ratings to the equivalent S&P rating. |
3 | NR (not rated) securities do not necessarily indicate low credit quality. |
| |
4 | "10 Largest Holdings (as a % of Net Assets)" excludes any temporary cash or derivative investments. |
| U.S. Treasury Bonds due 05/15/51 | 2.7% |
| U.S. Treasury Notes, 4.00% due 02/15/34 | 2.3% |
| Uniform MBS 30 Year due 12/01/24 | 2.3% |
| U.S. Treasury Bonds, 4.38% due 11/15/39 | 1.9% |
| U.S. Treasury Notes, 4.13% due 06/15/26 | 1.7% |
| Uniform MBS 30 Year due 12/01/24 | 1.6% |
| Uniform MBS 30 Year due 01/01/25 | 1.6% |
| GNMA II 30Year TBA due 10/21/24 | 1.4% |
| United States Treasury Inflation Indexed Bonds, 2.13% due 04/15/29 | 1.2% |
| Uniform MBS 30 Year due 12/01/24 | 0.9% |
| Top 10 Total | 17.6% |
| |
4 | "10 Largest Holdings (as a % of Net Assets)" excludes any temporary cash or derivative investments. |
There were no changes in or disagreements with fund accountants for the period.
This is a summary of certain changes to the fund since September 30, 2023. For more complete information, you may review the fund's next prospectus, which we expect to be available by January 31, 2025 at GuggenheimInvestments.com/mutual-funds/literature or, by calling 800 820 0888.
The fund's (Class R6 shares) net expense ratio, which reflects expense waivers and reimbursements and includes certain expenses that are outside of the contractual expense limit, was 0.49% for the year ended September 30, 2024, a decrease of 0.09% compared to the prior year. The primary driver of the decrease was a decrease in interest expense as the fund utilized fewer reverse repurchase agreements during the reporting period.
| |  | Availability of Additional Information. For additional information, including the fund's prospectus, financial information, holdings and proxy voting information, go to GuggenheimInvestments.com/mutual-funds/literature or, call 800 820 0888. |
AR-GIBRX-093024
Annual Shareholder Report | 9.30.24
This annual shareholder report contains important information about the Guggenheim Ultra Short Duration Fund for the period of October 1, 2023 to September 30, 2024. You can find additional information about the fund at GuggenheimInvestments.com/mutual-funds/literature. You can also request this information by contacting 800 820 0888 or GuggenheimClientServices@mufg-is.com.
This report describes changes to the fund that occurred during the reporting period.
For the period of October 1, 2023 to September 30, 2024, the fund (Class A shares) returned 8.16%, underperforming the fund's benchmark, the Bloomberg U.S. Aggregate Bond Index, which returned 11.57% for the same period and outperforming the fund's secondary index, the Bloomberg 1-3 Month U.S. Treasury Bill Index, which returned 5.52% for the same period.
The fund's broad-based securities market index was changed from the Bloomberg 1-3 Month U.S. Treasury Bill Index to the Bloomberg U.S. Aggregate Bond Index to comply with the regulation that requires the fund's broad-based securities market index to represent the overall applicable market.
What factors materially affected the fund's performance over the last year?
The fund's positive performance was driven by credit positioning, duration, and carry (or earned income). The fund benefited from its diverse structured credit allocation, which includes asset-backed securities, collateralized loan obligations, non-agency commercial mortgage-backed securities and non-agency residential mortgage-backed securities, as prices moved higher following increased market optimism on the potential for a soft landing given disinflationary trends and resilient economic data. Duration was a considerable contributor to performance as 2-year and 3-year Treasury yields fell 140 basis points and 125 basis points, respectively, following softer Consumer Price Index ("CPI") reports.
Cumulative performance* for the fund since inception (as of 9.30.24), assuming a $10,000 initial investment.
| 11/30/2018 | 10000 | 10000 | 10000 |
| 12/31/2018 | 9998 | 10184 | 10019 |
| 03/31/2019 | 10062 | 10483 | 10079 |
| 06/30/2019 | 10126 | 10806 | 10141 |
| 09/30/2019 | 10189 | 11051 | 10196 |
| 12/31/2019 | 10226 | 11071 | 10240 |
| 03/31/2020 | 10086 | 11420 | 10288 |
| 06/30/2020 | 10269 | 11751 | 10291 |
| 09/30/2020 | 10344 | 11823 | 10294 |
| 12/31/2020 | 10368 | 11902 | 10296 |
| 03/31/2021 | 10375 | 11501 | 10298 |
| 06/30/2021 | 10393 | 11712 | 10298 |
| 09/30/2021 | 10408 | 11718 | 10299 |
| 12/31/2021 | 10384 | 11719 | 10300 |
| 03/31/2022 | 10256 | 11024 | 10304 |
| 06/30/2022 | 10138 | 10506 | 10316 |
| 09/30/2022 | 10149 | 10007 | 10365 |
| 12/31/2022 | 10287 | 10194 | 10457 |
| 03/31/2023 | 10481 | 10496 | 10571 |
| 06/30/2023 | 10637 | 10408 | 10701 |
| 09/30/2023 | 10791 | 10071 | 10844 |
| 12/31/2023 | 11059 | 10758 | 10994 |
| 03/31/2024 | 11263 | 10674 | 11140 |
| 06/30/2024 | 11436 | 10681 | 11289 |
| 09/30/2024 | 11671 | 11236 | 11443 |
| Class A Shares | 8.16% | 2.75% | 2.68% |
| Bloomberg U.S. Aggregate Bond Index | 11.57% | 0.33% | 2.02% |
| Bloomberg 1-3 Month U.S. Treasury Bill Index | 5.52% | 2.33% | 2.31% |
The fund's past performance is not a good predictor of the fund's future performance. Visit GuggenheimInvestments.com/mutual-funds/performance for more recent performance information.
| Net Assets | $516,502,806 |
| Total Number of Portfolio Holdings | 169 |
| Portfolio Turnover Rate | 10% |
| Total Advisory Fees Paid | $1,144,830 |
| Guggenheim Ultra Short Duration Fund | Class A | GIYAX | Annual Shareholder Report | September 30, 2024 |
| Corporate Bonds | 24.0% |
| Asset-Backed Securities | 23.4% |
| Collateralized Mortgage Obligations | 16.9% |
| Interest Rate Swap Agreements | 11.8% |

| AAA | 16.9% |
| AA | 10.1% |
| A | 12.6% |
| BBB | 15.7% |
| BB | 1.4% |
| NR3 | 7.7% |
| Other Instruments | 35.6% |
| BX Commercial Mortgage Trust, 6.86% | 2.0% |
| NYMT Loan Trust, 4.67% | 1.3% |
| Golub Capital Partners CLO 49M Ltd., 7.07% | 1.2% |
| Oak Street Investment Grade Net Lease Fund Series, 1.85% | 1.2% |
| OSAT Trust, 5.12% | 1.1% |
| Global Payments, Inc., 1.50% | 1.1% |
| Warnermedia Holdings, Inc., 3.64% | 1.1% |
| FS Rialto, 7.01% | 1.1% |
| Macquarie Group Ltd., 1.20% | 1.0% |
| Corebridge Financial, Inc., 3.50% | 1.0% |
| Top 10 Total | 12.1% |
| |
1 | "Holdings Diversification (Market Exposure as a % of Net Assets)" excludes any temporary cash investments. |
| |
2 | Source: BlackRock Solutions. Credit quality ratings are measured on a scale that generally ranges from AAA (highest) to D (lowest). All securities except for those labeled "NR" have been rated by Moody's, Standard & Poor's ("S&P"), or Fitch, each of which is a Nationally Recognized Statistical Rating Organization ("NRSRO"). For purposes of this presentation, when ratings are available from more than one agency, the highest rating is used. Guggenheim Investments has converted ratings to the equivalent S&P rating. |
3 | NR (not rated) securities do not necessarily indicate low credit quality. |
| |
4 | "10 Largest Holdings (as a % of Net Assets)" excludes any temporary cash or derivative investments. |
| BX Commercial Mortgage Trust, 6.86% | 2.0% |
| NYMT Loan Trust, 4.67% | 1.3% |
| Golub Capital Partners CLO 49M Ltd., 7.07% | 1.2% |
| Oak Street Investment Grade Net Lease Fund Series, 1.85% | 1.2% |
| OSAT Trust, 5.12% | 1.1% |
| Global Payments, Inc., 1.50% | 1.1% |
| Warnermedia Holdings, Inc., 3.64% | 1.1% |
| FS Rialto, 7.01% | 1.1% |
| Macquarie Group Ltd., 1.20% | 1.0% |
| Corebridge Financial, Inc., 3.50% | 1.0% |
| Top 10 Total | 12.1% |
| |
4 | "10 Largest Holdings (as a % of Net Assets)" excludes any temporary cash or derivative investments. |
There were no changes in or disagreements with fund accountants for the period.
There were no material changes for the period.
| |  | Availability of Additional Information. For additional information, including the fund's prospectus, financial information, holdings and proxy voting information, go to GuggenheimInvestments.com/mutual-funds/literature or, call 800 820 0888. |
AR-GIYAX-093024
Annual Shareholder Report | 9.30.24
This annual shareholder report contains important information about the Guggenheim Ultra Short Duration Fund for the period of October 1, 2023 to September 30, 2024. You can find additional information about the fund at GuggenheimInvestments.com/mutual-funds/literature. You can also request this information by contacting 800 820 0888 or GuggenheimClientServices@mufg-is.com.
This report describes changes to the fund that occurred during the reporting period.
| Institutional Class | $34 | 0.33% |
For the period of October 1, 2023 to September 30, 2024, the fund (Institutional Class shares) returned 8.43%, underperforming the fund's benchmark, the Bloomberg U.S. Aggregate Bond Index, which returned 11.57% for the same period and outperforming the fund's secondary index, the Bloomberg 1-3 Month U.S. Treasury Bill Index, which returned 5.52% for the same period.
The fund's broad-based securities market index was changed from the Bloomberg 1-3 Month U.S. Treasury Bill Index to the Bloomberg U.S. Aggregate Bond Index to comply with the regulation that requires the fund's broad-based securities market index to represent the overall applicable market.
What factors materially affected the fund's performance over the last year?
The fund's positive performance was driven by credit positioning, duration, and carry (or earned income). The fund benefited from its diverse structured credit allocation, which includes asset-backed securities, collateralized loan obligations, non-agency commercial mortgage-backed securities and non-agency residential mortgage-backed securities, as prices moved higher following increased market optimism on the potential for a soft landing given disinflationary trends and resilient economic data. Duration was a considerable contributor to performance as 2-year and 3-year Treasury yields fell 140 basis points and 125 basis points, respectively, following softer Consumer Price Index ("CPI") reports.
Cumulative performance* for the fund's most recently completed 10 years (as of 9.30.24), assuming a $2,000,000 initial investment.
| 09/30/2014 | 2000000 | 2000000 | 2000000 |
| 12/31/2014 | 2001336 | 2035885 | 2000049 |
| 03/31/2015 | 2013594 | 2068593 | 2000113 |
| 06/30/2015 | 2020257 | 2033787 | 2000179 |
| 09/30/2015 | 2021275 | 2058816 | 2000318 |
| 12/31/2015 | 2025559 | 2047081 | 2000603 |
| 03/31/2016 | 2028267 | 2109149 | 2001898 |
| 06/30/2016 | 2044718 | 2155839 | 2002929 |
| 09/30/2016 | 2060755 | 2165719 | 2004429 |
| 12/31/2016 | 2070013 | 2101277 | 2005808 |
| 03/31/2017 | 2083345 | 2118439 | 2007906 |
| 06/30/2017 | 2094142 | 2149054 | 2011842 |
| 09/30/2017 | 2107002 | 2167289 | 2016960 |
| 12/31/2017 | 2118279 | 2175701 | 2022192 |
| 03/31/2018 | 2129598 | 2143918 | 2028908 |
| 06/30/2018 | 2142783 | 2140524 | 2037837 |
| 09/30/2018 | 2159208 | 2140934 | 2047685 |
| 12/31/2018 | 2166760 | 2175948 | 2059067 |
| 03/31/2019 | 2182028 | 2239983 | 2071300 |
| 06/30/2019 | 2195123 | 2308967 | 2084105 |
| 09/30/2019 | 2210303 | 2361362 | 2095357 |
| 12/31/2019 | 2219759 | 2365619 | 2104532 |
| 03/31/2020 | 2190751 | 2440097 | 2114405 |
| 06/30/2020 | 2231822 | 2510752 | 2114826 |
| 09/30/2020 | 2251950 | 2526300 | 2115467 |
| 12/31/2020 | 2258564 | 2543198 | 2115972 |
| 03/31/2021 | 2259233 | 2457428 | 2116341 |
| 06/30/2021 | 2266757 | 2502393 | 2116344 |
| 09/30/2021 | 2271582 | 2503689 | 2116592 |
| 12/31/2021 | 2265388 | 2503980 | 2116843 |
| 03/31/2022 | 2241226 | 2355394 | 2117518 |
| 06/30/2022 | 2216825 | 2244843 | 2120127 |
| 09/30/2022 | 2218449 | 2138160 | 2130131 |
| 12/31/2022 | 2252307 | 2178209 | 2149030 |
| 03/31/2023 | 2296261 | 2242728 | 2172496 |
| 06/30/2023 | 2331954 | 2223793 | 2199100 |
| 09/30/2023 | 2366992 | 2151938 | 2228657 |
| 12/31/2023 | 2427339 | 2298638 | 2259441 |
| 03/31/2024 | 2473594 | 2280808 | 2289310 |
| 06/30/2024 | 2513342 | 2282297 | 2320011 |
| 09/30/2024 | 2566528 | 2400886 | 2351650 |
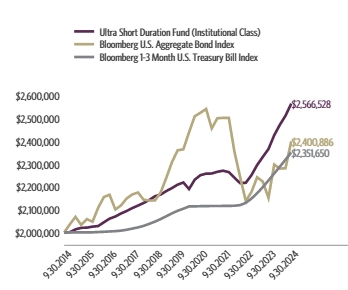
| Institutional Class Shares | 8.43% | 3.03% | 2.37% |
| Bloomberg U.S. Aggregate Bond Index | 11.57% | 0.33% | 1.84% |
| Bloomberg 1-3 Month U.S. Treasury Bill Index | 5.52% | 2.33% | 1.63% |
The fund's past performance is not a good predictor of the fund's future performance. Visit GuggenheimInvestments.com/mutual-funds/performance for more recent performance information.
| Net Assets | $516,502,806 |
| Total Number of Portfolio Holdings | 169 |
| Portfolio Turnover Rate | 10% |
| Total Advisory Fees Paid | $1,144,830 |
| Guggenheim Ultra Short Duration Fund | Institutional Class | GIYIX | Annual Shareholder Report | September 30, 2024 |
| Corporate Bonds | 24.0% |
| Asset-Backed Securities | 23.4% |
| Collateralized Mortgage Obligations | 16.9% |
| Interest Rate Swap Agreements | 11.8% |
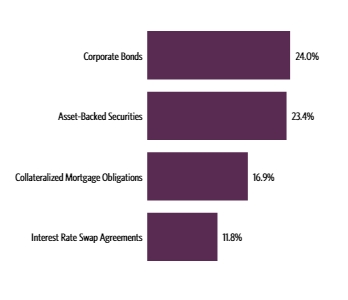
| AAA | 16.9% |
| AA | 10.1% |
| A | 12.6% |
| BBB | 15.7% |
| BB | 1.4% |
| NR3 | 7.7% |
| Other Instruments | 35.6% |
| BX Commercial Mortgage Trust, 6.86% | 2.0% |
| NYMT Loan Trust, 4.67% | 1.3% |
| Golub Capital Partners CLO 49M Ltd., 7.07% | 1.2% |
| Oak Street Investment Grade Net Lease Fund Series, 1.85% | 1.2% |
| OSAT Trust, 5.12% | 1.1% |
| Global Payments, Inc., 1.50% | 1.1% |
| Warnermedia Holdings, Inc., 3.64% | 1.1% |
| FS Rialto, 7.01% | 1.1% |
| Macquarie Group Ltd., 1.20% | 1.0% |
| Corebridge Financial, Inc., 3.50% | 1.0% |
| Top 10 Total | 12.1% |
| |
1 | "Holdings Diversification (Market Exposure as a % of Net Assets)" excludes any temporary cash investments. |
| |
2 | Source: BlackRock Solutions. Credit quality ratings are measured on a scale that generally ranges from AAA (highest) to D (lowest). All securities except for those labeled "NR" have been rated by Moody's, Standard & Poor's ("S&P"), or Fitch, each of which is a Nationally Recognized Statistical Rating Organization ("NRSRO"). For purposes of this presentation, when ratings are available from more than one agency, the highest rating is used. Guggenheim Investments has converted ratings to the equivalent S&P rating. |
3 | NR (not rated) securities do not necessarily indicate low credit quality. |
| |
4 | "10 Largest Holdings (as a % of Net Assets)" excludes any temporary cash or derivative investments. |
| BX Commercial Mortgage Trust, 6.86% | 2.0% |
| NYMT Loan Trust, 4.67% | 1.3% |
| Golub Capital Partners CLO 49M Ltd., 7.07% | 1.2% |
| Oak Street Investment Grade Net Lease Fund Series, 1.85% | 1.2% |
| OSAT Trust, 5.12% | 1.1% |
| Global Payments, Inc., 1.50% | 1.1% |
| Warnermedia Holdings, Inc., 3.64% | 1.1% |
| FS Rialto, 7.01% | 1.1% |
| Macquarie Group Ltd., 1.20% | 1.0% |
| Corebridge Financial, Inc., 3.50% | 1.0% |
| Top 10 Total | 12.1% |
| |
4 | "10 Largest Holdings (as a % of Net Assets)" excludes any temporary cash or derivative investments. |
There were no changes in or disagreements with fund accountants for the period.
There were no material changes for the period.
| |  | Availability of Additional Information. For additional information, including the fund's prospectus, financial information, holdings and proxy voting information, go to GuggenheimInvestments.com/mutual-funds/literature or, call 800 820 0888. |
AR-GIYIX-093024
The registrant’s Board of Trustees has adopted a code of ethics that applies to the registrant’s principal executive officer and principal financial officer. No substantive amendments were approved or waivers were granted to the code of ethics during the period covered by this report. The code of ethics is filed as an exhibit to this Form N-CSR.
| Item 3. | Audit Committee Financial Expert. |
The registrant's Board of Trustees has determined that it has at least one audit committee financial expert serving on its audit committee (the “Audit Committee”), Sandra G. Sponem. Ms. Sponem is “independent,” meaning that she is not an “interested person” of the registrant (as that term is defined in Section 2(a)(19) of the Investment Company Act) and she does not accept any consulting, advisory, or other compensatory fee from the registrant (except in her capacity as a Board or committee member).
(Under applicable securities laws, a person who is determined to be an audit committee financial expert will not be deemed an "expert" for any purpose, including without limitation for the purposes of Section 11 of the Securities Act of 1933, as amended, as a result of being designated or identified as an audit committee financial expert. The designation or identification of a person as an audit committee financial expert does not impose on such person any duties, obligations, or liabilities that are greater than the duties, obligations, and liabilities imposed on such person as a member of the Audit Committee and Board of Trustees in the absence of such designation or identification. The designation or identification of a person as an audit committee financial expert does not affect the duties, obligations or liability of any other member of the audit committee or Board of Trustees.)
| Item 4. | Principal Accountant Fees and Services. |
| (a) | Audit Fees: the aggregate Audit Fees billed by the registrant’s principal accountant for professional services rendered for the audit of the annual financial statements, or services that are normally provided by the accountant in connection with statutory and regulatory filings or engagements were $706,919 and $705,059 for the fiscal years ended September 30, 2024 and September 30, 2023, respectively. |
| (b) | Audit-Related Fees: the aggregate Audit-Related Fees billed by the registrant’s principal accountant for assurance and related services that are reasonably related to the performance of the audit of the registrant’s financial statements and are not reported under paragraph (a) of this Item 4 were $14,906 and $0 for fiscal years ended September 30, 2024 and September 30, 2023, respectively. |
| (c) | Tax Fees: the aggregate Tax Fees billed by the registrant’s principal accountant for professional services rendered for tax compliance, tax advice and tax planning including preparation of tax returns and distribution assistance were 226,776 and $260,077 for the fiscal years ended September 30, 2024 and September 30, 2023, respectively. These services consisted of (i) preparation of U.S. federal, state and excise tax returns; (ii) U.S. federal and state tax planning, advice and assistance regarding statutory, regulatory or administrative developments, (iii) tax advice regarding tax qualification matters and/or treatment of various financial instruments held or proposed to be acquired and (iv) review of U.S. federal excise distribution calculations. |
| (d) | All Other Fees: the aggregate All Other Fees billed by the registrant’s principal accountant for products and services provided by the principal accountant, other than the services reported in paragraphs (a) through (c) of this Item 4, were $0 and $0 for the fiscal years ended September 30, 2024 and September 30, 2023, respectively. |
| (e) | Audit Committee Pre-Approval Policies and Procedures. |
(1) The registrant’s pre-approval policy requires the Audit Committee to pre-approve any engagement of the registrant’s independent auditors to provide any services, other than “prohibited non-audit services,” to the registrant, including the fees and other compensation to be paid to the independent auditors (unless an exception is available under Rule 2-01 of Regulation S-X). The independent auditors or the Chief Accounting Officer of the registrant (or an officer of the registrant who reports to the Chief Accounting Officer) report to the Audit Committee at each of its regular scheduled meetings all audit, audit-related and permissible non-audit services initiated since the last such report (unless the services were contained in the initial audit plan, as previously presented to, and approved by, the Audit Committee). The report includes a general description of the services and projected fees, and the means by which such services were approved by the Audit Committee. The Audit Committee is also required to pre-approve any engagement of the registrant’s independent auditors, including the fees and other compensation to be paid to the independent auditors, to provide any non-audit services to the registrant’s investment adviser (or any “control affiliate” of the investment adviser providing ongoing services to the registrant), if the engagement relates directly to the operations or financial reporting of the registrant (unless an exception is available under Rule 2-01 of Regulation S-X).
(2) None of the services described in each of Items 4(b) through (d) were approved by the Audit Committee pursuant to paragraph (c)(7)(i)(C) of Rule 2-01 of Regulation S-X.
| (g) | Non-Audit Fees. The aggregate non-audit fees billed by the registrant's accountant for the most recent fiscal year and the preceding years for services rendered to the registrant, the investment adviser and any entity controlling, controlled by, or under common control with the adviser that provides ongoing services to the registrant were $241,682 and $260,077, respectively. These aggregate fees were less than the aggregate fees billed for the same periods by the registrant’s principal accountant for audit services rendered to the registrant, the investment advisor, and any entity controlling, controlled by, or under common control with the advisor that provides ongoing services to the registrant. |
| (h) | Auditor Independence. The registrant’s Audit Committee was provided with information relating to the provision of non-audit services by Ernst & Young, LLP to the registrant’s investment adviser (not including any sub adviser whose role is primarily portfolio management and is subcontracted with or overseen by another investment adviser), and any entity controlling, controlled by, or under common control with the investment adviser that provides ongoing services to the registrant that were not pre-approved by the Audit Committee so that a determination could be made whether the provision of such services is compatible with maintaining Ernst & Young, LLP’s independence. |
| Item 5. | Audit Committee of Listed Registrants. |
| (a) | Not applicable to this registrant. |
| (b) | Not applicable to this registrant |
| (a) | The Schedule of Investments is included under Item 7 of this Form. |
| Item 7. | Financial Statements and Financial Highlights for Open-End Management Investment Companies |
9.30.2024
Guggenheim Funds Annual Financial Report
Guggenheim Funds Trust-Equity |
Guggenheim Alpha Opportunity Fund |
Guggenheim Large Cap Value Fund |
Guggenheim Market Neutral Real Estate Fund |
Guggenheim Risk Managed Real Estate Fund |
Guggenheim SMid Cap Value Fund |
Guggenheim StylePlus—Large Core Fund |
Guggenheim StylePlus—Mid Growth Fund |
Guggenheim World Equity Income Fund |
| |
Guggenheim Funds Trust-Fixed Income |
Guggenheim Active INvestment Series (GAINS) – Core Plus Fund |
Guggenheim Active INvestment Series (GAINS) – Limited Duration Fund |
Guggenheim Core Bond Fund |
Guggenheim Floating Rate Strategies Fund |
Guggenheim High Yield Fund |
Guggenheim Limited Duration Fund |
Guggenheim Macro Opportunities Fund |
Guggenheim Municipal Income Fund |
Guggenheim Total Return Bond Fund |
Guggenheim Ultra Short Duration Fund |
GuggenheimInvestments.com | |
This report and the financial statements contained herein are submitted for the general information of our shareholders. The report is not authorized for distribution to prospective investors unless preceded or accompanied by an effective prospectus.
Distributed by Guggenheim Funds Distributors, LLC.
| | |
ITEM 7: FINANCIAL STATEMENTS AND FINANCIAL HIGHLIGHTS FOR OPEN-END MANAGEMENT INVESTMENT COMPANIES (ANNUAL FINANCIAL REPORT) | |
ALPHA OPPORTUNITY FUND | 2 |
LARGE CAP VALUE FUND | 17 |
MARKET NEUTRAL REAL ESTATE FUND | 24 |
RISK MANAGED REAL ESTATE FUND | 32 |
SMID CAP VALUE FUND | 44 |
STYLEPLUS—LARGE CORE FUND | 51 |
STYLEPLUS—MID GROWTH FUND | 59 |
WORLD EQUITY INCOME FUND | 66 |
ACTIVE INVESTMENT SERIES (GAINS) – CORE PLUS FUND | 74 |
ACTIVE INVESTMENT SERIES (GAINS) – LIMITED DURATION FUND | 81 |
CORE BOND FUND | 88 |
FLOATING RATE STRATEGIES FUND | 114 |
HIGH YIELD FUND | 133 |
LIMITED DURATION FUND | 150 |
MACRO OPPORTUNITIES FUND | 176 |
MUNICIPAL INCOME FUND | 210 |
TOTAL RETURN BOND FUND | 219 |
ULTRA SHORT DURATION FUND | 267 |
NOTES TO FINANCIAL STATEMENTS | 279 |
REPORT OF INDEPENDENT REGISTERED PUBLIC ACCOUNTING FIRM | 315 |
OTHER INFORMATION | 317 |
ITEM 8: CHANGES IN AND DISAGREEMENTS WITH ACCOUNTANTS FOR OPEN-END MANAGEMENT INVESTMENT COMPANIES | 319 |
ITEM 9: PROXY DISCLOSURES FOR OPEN-END MANAGEMENT INVESTMENT COMPANIES | 320 |
ITEM 10: RENUMERATION PAID TO DIRECTORS, OFFICERS, AND OTHERS OF OPEN-END MANAGEMENT INVESTMENT COMPANIES | 321 |
ITEM 11: STATEMENT REGARDING BASIS FOR APPROVAL OF INVESTMENT ADVISORY CONTRACT | 322 |
| | THE GUGGENHEIM FUNDS ANNUAL REPORT | 1 |
SCHEDULE OF INVESTMENTS | September 30, 2024 |
ALPHA OPPORTUNITY FUND | |
| | Shares | | | Value | |
COMMON STOCKS† - 93.4% |
| | | | | | | | | |
Consumer, Non-cyclical - 18.1% |
Incyte Corp.*,1 | | | 5,885 | | | $ | 388,998 | |
Gilead Sciences, Inc.1 | | | 4,636 | | | | 388,682 | |
Cal-Maine Foods, Inc. | | | 4,994 | | | | 373,751 | |
Ingredion, Inc. | | | 2,679 | | | | 368,175 | |
Hologic, Inc.* | | | 4,512 | | | | 367,547 | |
Innoviva, Inc.* | | | 18,392 | | | | 355,149 | |
Johnson & Johnson | | | 2,185 | | | | 354,101 | |
Royalty Pharma plc — Class A | | | 12,440 | | | | 351,928 | |
Merck & Company, Inc. | | | 3,057 | | | | 347,153 | |
United Therapeutics Corp.* | | | 968 | | | | 346,883 | |
Regeneron Pharmaceuticals, Inc.* | | | 312 | | | | 327,987 | |
Alarm.com Holdings, Inc.* | | | 5,878 | | | | 321,350 | |
Bristol-Myers Squibb Co.1 | | | 5,742 | | | | 297,091 | |
Medtronic plc | | | 2,559 | | | | 230,387 | |
Catalyst Pharmaceuticals, Inc.* | | | 10,015 | | | | 199,098 | |
Perdoceo Education Corp.1 | | | 8,784 | | | | 195,356 | |
Premier, Inc. — Class A | | | 8,578 | | | | 171,560 | |
Zimmer Biomet Holdings, Inc. | | | 1,549 | | | | 167,214 | |
Protagonist Therapeutics, Inc.* | | | 3,700 | | | | 166,500 | |
Alkermes plc* | | | 5,406 | | | | 151,314 | |
Inmode Ltd.* | | | 8,869 | | | | 150,330 | |
Neurocrine Biosciences, Inc.* | | | 1,252 | | | | 144,256 | |
Laureate Education, Inc. — Class A | | | 8,464 | | | | 140,587 | |
Stride, Inc.* | | | 1,496 | | | | 127,624 | |
Jazz Pharmaceuticals plc* | | | 1,101 | | | | 122,662 | |
Biogen, Inc.* | | | 434 | | | | 84,127 | |
ADT, Inc. | | | 11,606 | | | | 83,912 | |
Centene Corp.* | | | 1,018 | | | | 76,635 | |
USANA Health Sciences, Inc.* | | | 1,843 | | | | 69,887 | |
Total Consumer, Non-cyclical | | | | | | | 6,870,244 | |
| | | | | | | | | |
Industrial - 17.7% |
UFP Industries, Inc. | | | 3,147 | | | | 412,918 | |
Acuity Brands, Inc. | | | 1,481 | | | | 407,853 | |
Boise Cascade Co.1 | | | 2,886 | | | | 406,868 | |
Mueller Industries, Inc.1 | | | 5,399 | | | | 400,066 | |
Apogee Enterprises, Inc. | | | 5,701 | | | | 399,155 | |
Teekay Tankers Ltd. — Class A | | | 6,744 | | | | 392,838 | |
Snap-on, Inc. | | | 1,323 | | | | 383,286 | |
Avnet, Inc. | | | 6,944 | | | | 377,129 | |
Teekay Corp.* | | | 38,935 | | | | 358,202 | |
Scorpio Tankers, Inc. | | | 4,613 | | | | 328,907 | |
International Seaways, Inc. | | | 6,325 | | | | 326,117 | |
Owens Corning | | | 1,804 | | | | 318,442 | |
Tennant Co. | | | 2,888 | | | | 277,364 | |
Donaldson Company, Inc. | | | 3,730 | | | | 274,901 | |
Ardmore Shipping Corp. | | | 13,336 | | | | 241,381 | |
Caterpillar, Inc. | | | 581 | | | | 227,241 | |
Dorian LPG Ltd. | | | 5,492 | | | | 189,035 | |
Gates Industrial Corporation plc* | | | 9,402 | | | | 165,005 | |
Mueller Water Products, Inc. — Class A | | | 6,866 | | | | 148,992 | |
Masterbrand, Inc.* | | | 7,919 | | | | 146,818 | |
Textron, Inc. | | | 1,627 | | | | 144,120 | |
Griffon Corp. | | | 1,734 | | | | 121,380 | |
Gibraltar Industries, Inc.* | | | 1,592 | | | | 111,329 | |
Benchmark Electronics, Inc. | | | 1,881 | | | | 83,366 | |
Vishay Intertechnology, Inc. | | | 4,004 | | | | 75,715 | |
Total Industrial | | | | | | | 6,718,428 | |
| | | | | | | | | |
Financial - 16.9% |
Fidelity National Financial, Inc. | | | 6,155 | | | | 381,978 | |
Hartford Financial Services Group, Inc.1 | | | 3,167 | | | | 372,471 | |
Enact Holdings, Inc.1 | | | 10,232 | | | | 371,729 | |
MGIC Investment Corp. | | | 14,311 | | | | 366,362 | |
OFG Bancorp | | | 8,153 | | | | 366,233 | |
Essent Group Ltd. | | | 5,681 | | | | 365,231 | |
Reinsurance Group of America, Inc. — Class A | | | 1,672 | | | | 364,279 | |
Axis Capital Holdings Ltd. | | | 4,250 | | | | 338,342 | |
NMI Holdings, Inc. — Class A*,1 | | | 8,180 | | | | 336,934 | |
Preferred Bank/Los Angeles CA | | | 3,968 | | | | 318,432 | |
Affiliated Managers Group, Inc. | | | 1,679 | | | | 298,526 | |
Synchrony Financial1 | | | 5,873 | | | | 292,945 | |
American International Group, Inc. | | | 3,926 | | | | 287,501 | |
Janus Henderson Group plc | | | 6,583 | | | | 250,615 | |
Enova International, Inc.* | | | 2,645 | | | | 221,625 | |
American Express Co. | | | 706 | | | | 191,467 | |
Everest Group Ltd. | | | 485 | | | | 190,038 | |
Travelers Companies, Inc. | | | 717 | | | | 167,864 | |
RenaissanceRe Holdings Ltd. | | | 581 | | | | 158,264 | |
International Bancshares Corp. | | | 2,386 | | | | 142,659 | |
Arch Capital Group Ltd.* | | | 1,210 | | | | 135,375 | |
Highwoods Properties, Inc. REIT | | | 3,763 | | | | 126,098 | |
OneMain Holdings, Inc. | | | 2,634 | | | | 123,982 | |
Park Hotels & Resorts, Inc. REIT | | | 8,391 | | | | 118,313 | |
Kilroy Realty Corp. REIT | | | 2,025 | | | | 78,368 | |
WP Carey, Inc. REIT | | | 1,180 | | | | 73,514 | |
Total Financial | | | | | | | 6,439,145 | |
| | | | | | | | | |
Consumer, Cyclical - 12.9% |
Allison Transmission Holdings, Inc.1 | | | 4,238 | | | | 407,145 | |
PACCAR, Inc. | | | 3,920 | | | | 386,826 | |
Monarch Casino & Resort, Inc. | | | 4,781 | | | | 378,990 | |
Lear Corp. | | | 3,196 | | | | 348,843 | |
Columbia Sportswear Co. | | | 3,579 | | | | 297,737 | |
PC Connection, Inc. | | | 3,165 | | | | 238,736 | |
Visteon Corp.* | | | 2,400 | | | | 228,576 | |
Phinia, Inc. | | | 4,805 | | | | 221,174 | |
Toll Brothers, Inc. | | | 1,370 | | | | 211,651 | |
Buckle, Inc.1 | | | 4,350 | | | | 191,269 | |
ScanSource, Inc.* | | | 3,948 | | | | 189,622 | |
Autoliv, Inc. | | | 2,011 | | | | 187,767 | |
Cummins, Inc. | | | 536 | | | | 173,551 | |
Movado Group, Inc. | | | 8,732 | | | | 162,415 | |
M/I Homes, Inc.* | | | 946 | | | | 162,107 | |
Lennar Corp. — Class A1 | | | 786 | | | | 147,359 | |
Gentex Corp. | | | 4,743 | | | | 140,820 | |
MasterCraft Boat Holdings, Inc.* | | | 6,686 | | | | 121,752 | |
Patrick Industries, Inc. | | | 775 | | | | 110,337 | |
BorgWarner, Inc. | | | 3,030 | | | | 109,959 | |
Carter’s, Inc. | | | 1,492 | | | | 96,950 | |
2 | THE GUGGENHEIM FUNDS ANNUAL REPORT | SEE NOTES TO FINANCIAL STATEMENTS. |
SCHEDULE OF INVESTMENTS (continued) | September 30, 2024 |
ALPHA OPPORTUNITY FUND | |
| | Shares | | | Value | |
Sonos, Inc.* | | | 7,788 | | | $ | 95,714 | |
Core & Main, Inc. — Class A* | | | 2,134 | | | | 94,750 | |
KB Home | | | 1,076 | | | | 92,203 | |
MRC Global, Inc.* | | | 6,866 | | | | 87,473 | |
Total Consumer, Cyclical | | | | | | | 4,883,726 | |
| | | | | | | | | |
Communications - 9.3% |
InterDigital, Inc. | | | 2,700 | | | | 382,401 | |
AT&T, Inc.1 | | | 16,430 | | | | 361,460 | |
F5, Inc.* | | | 1,541 | | | | 339,328 | |
IDT Corp. — Class B1 | | | 8,738 | | | | 333,529 | |
Verizon Communications, Inc.1 | | | 7,037 | | | | 316,032 | |
T-Mobile US, Inc. | | | 1,465 | | | | 302,317 | |
ePlus, Inc.* | | | 2,712 | | | | 266,698 | |
Yelp, Inc. — Class A* | | | 6,810 | | | | 238,895 | |
Gen Digital, Inc. | | | 6,712 | | | | 184,110 | |
eBay, Inc.1 | | | 2,742 | | | | 178,532 | |
Spok Holdings, Inc. | | | 11,628 | | | | 175,118 | |
Anterix, Inc.* | | | 3,857 | | | | 145,255 | |
Gogo, Inc.* | | | 17,245 | | | | 123,819 | |
HealthStream, Inc. | | | 3,730 | | | | 107,573 | |
Expedia Group, Inc.* | | | 531 | | | | 78,599 | |
Total Communications | | | | | | | 3,533,666 | |
| | | | | | | | | |
Utilities - 8.0% |
Entergy Corp. | | | 2,971 | | | | 391,013 | |
OGE Energy Corp.1 | | | 9,058 | | | | 371,559 | |
Spire, Inc. | | | 5,488 | | | | 369,288 | |
Black Hills Corp. | | | 6,036 | | | | 368,920 | |
National Fuel Gas Co. | | | 6,065 | | | | 367,600 | |
Duke Energy Corp.1 | | | 3,109 | | | | 358,468 | |
Otter Tail Corp. | | | 3,581 | | | | 279,891 | |
Avista Corp. | | | 5,930 | | | | 229,788 | |
Southwest Gas Holdings, Inc. | | | 2,594 | | | | 191,333 | |
PPL Corp. | | | 3,892 | | | | 128,747 | |
Total Utilities | | | | | | | 3,056,607 | |
| | | | | | | | | |
Technology - 6.9% |
Zoom Video Communications, Inc. — Class A* | | | 4,566 | | | | 318,433 | |
QUALCOMM, Inc. | | | 1,841 | | | | 313,062 | |
Cirrus Logic, Inc.* | | | 2,331 | | | | 289,534 | |
Amdocs Ltd. | | | 3,226 | | | | 282,211 | |
Skyworks Solutions, Inc. | | | 2,375 | | | | 234,579 | |
TE Connectivity plc | | | 1,544 | | | | 233,129 | |
IPG Photonics Corp.* | | | 3,028 | | | | 225,041 | |
NetApp, Inc.1 | | | 1,326 | | | | 163,774 | |
Photronics, Inc.* | | | 6,195 | | | | 153,388 | |
International Business Machines Corp. | | | 677 | | | | 149,671 | |
HP, Inc. | | | 2,828 | | | | 101,440 | |
Qorvo, Inc.* | | | 725 | | | | 74,892 | |
Adeia, Inc. | | | 6,060 | | | | 72,174 | |
Total Technology | | | | | | | 2,611,328 | |
| | | | | | | | | |
Basic Materials - 2.3% |
CF Industries Holdings, Inc. | | | 2,863 | | | | 245,645 | |
Cabot Corp. | | | 1,717 | | | | 191,909 | |
NewMarket Corp. | | | 291 | | | | 160,600 | |
Sylvamo Corp. | | | 1,586 | | | | 136,158 | |
Minerals Technologies, Inc. | | | 1,734 | | | | 133,917 | |
Total Basic Materials | | | | | | | 868,229 | |
| | | | | | | | | |
Government - 0.8% |
Banco Latinoamericano de Comercio Exterior S.A. — Class E | | | 9,213 | | | | 299,330 | |
| | | | | | | | | |
Energy - 0.5% |
HF Sinclair Corp. | | | 2,397 | | | | 106,835 | |
DNOW, Inc.* | | | 7,169 | | | | 92,695 | |
Total Energy | | | | | | | 199,530 | |
| | | | | | | | | |
Total Common Stocks | | | | |
(Cost $32,129,076) | | | | | | | 35,480,233 | |
| | | | | | | | | |
MONEY MARKET FUND***,† - 5.3% |
Goldman Sachs Financial Square Treasury Instruments Fund — Institutional Shares, 4.90%2 | | | 2,011,791 | | | | 2,011,791 | |
Total Money Market Fund | | | | |
(Cost $2,011,791) | | | | | | | 2,011,791 | |
| | | | | | | | | |
Total Investments - 98.7% | | | | |
(Cost $34,140,867) | | $ | 37,492,024 | |
Other Assets & Liabilities, net - 1.3% | | | 497,183 | |
Total Net Assets - 100.0% | | $ | 37,989,207 | |
SEE NOTES TO FINANCIAL STATEMENTS. | THE GUGGENHEIM FUNDS ANNUAL REPORT | 3 |
SCHEDULE OF INVESTMENTS (continued) | September 30, 2024 |
ALPHA OPPORTUNITY FUND | |
Custom Basket Swap Agreements |
Counterparty | Reference Obligation | Type | Financing
Rate | | Payment
Frequency | | | Maturity
Date | | | Notional
Amount | | | Value and
Unrealized
Appreciation
(Depreciation) | |
OTC Custom Basket Swap Agreements†† |
Morgan Stanley Capital Services LLC | MS Equity Custom Basket | Pay | 5.23% (Federal Funds Rate + 0.40%) | | | At Maturity | | | | 02/03/25 | | | $ | 9,552,167 | | | $ | 1,165,201 | |
Goldman Sachs International | GS Equity Custom Basket | Pay | 5.28% (Federal Funds Rate + 0.45%) | | | At Maturity | | | | 05/16/28 | | | | 9,552,167 | | | | 1,029,989 | |
| | | | | | | | | | | | | | $ | 19,104,334 | | | $ | 2,195,190 | |
OTC Custom Basket Swap Agreements Sold Short†† |
Morgan Stanley Capital Services LLC | MS Equity Custom Basket | Receive | 4.48% (Federal Funds Rate - 0.35%) | | | At Maturity | | | | 02/03/25 | | | $ | 14,888,931 | | | $ | (682,049 | ) |
Goldman Sachs International | GS Equity Custom Basket | Receive | 4.55% (Federal Funds Rate - 0.28%) | | | At Maturity | | | | 05/16/28 | | | | 14,905,323 | | | | (784,416 | ) |
| | | | | | | | | | | | | | $ | 29,794,254 | | | $ | (1,466,465 | ) |
| | Shares | | | Percentage
Notional
Amount | | | Value and
Unrealized
Appreciation
(Depreciation) | |
MS EQUITY LONG CUSTOM BASKET | | | | | | | | |
Communications | | | | | | | | | | | | |
InterDigital, Inc. | | | 727 | | | | 1.06 | % | | $ | 35,484 | |
AT&T, Inc. | | | 4,423 | | | | 1.02 | % | | | 31,304 | |
IDT Corp. — Class B | | | 2,353 | | | | 0.94 | % | | | 25,218 | |
T-Mobile US, Inc. | | | 395 | | | | 0.85 | % | | | 23,746 | |
Verizon Communications, Inc. | | | 1,895 | | | | 0.89 | % | | | 19,617 | |
eBay, Inc. | | | 738 | | | | 0.50 | % | | | 19,258 | |
F5, Inc. | | | 415 | | | | 0.96 | % | | | 16,565 | |
ePlus, Inc. | | | 730 | | | | 0.75 | % | | | 10,545 | |
Gen Digital, Inc. | | | 1,807 | | | | 0.52 | % | | | 4,633 | |
Expedia Group, Inc. | | | 143 | | | | 0.22 | % | | | 1,782 | |
HealthStream, Inc. | | | 1,004 | | | | 0.30 | % | | | 510 | |
Spok Holdings, Inc. | | | 3,131 | | | | 0.49 | % | | | (115 | ) |
Anterix, Inc. | | | 1,038 | | | | 0.41 | % | | | (1,270 | ) |
Yelp, Inc. — Class A | | | 1,833 | | | | 0.67 | % | | | (2,021 | ) |
Gogo, Inc. | | | 4,643 | | | | 0.35 | % | | | (6,695 | ) |
Total Communications | | | | | | | | | | | 178,561 | |
| | | | | | | | | | | | | |
Utilities | | | | | | | | | | | | |
OGE Energy Corp. | | | 2,439 | | | | 1.05 | % | | | 17,463 | |
National Fuel Gas Co. | | | 1,633 | | | | 1.04 | % | | | 17,075 | |
Black Hills Corp. | | | 1,625 | | | | 1.04 | % | | | 14,039 | |
Duke Energy Corp. | | | 837 | | | | 1.01 | % | | | 8,703 | |
Entergy Corp. | | | 800 | | | | 1.10 | % | | | 7,522 | |
Spire, Inc. | | | 1,477 | | | | 1.04 | % | | | 2,601 | |
Southwest Gas Holdings, Inc. | | | 698 | | | | 0.54 | % | | | 2,278 | |
PPL Corp. | | | 1,048 | | | | 0.36 | % | | | 903 | |
Avista Corp. | | | 1,596 | | | | 0.65 | % | | | (677 | ) |
Otter Tail Corp. | | | 964 | | | | 0.79 | % | | | (7,294 | ) |
Total Utilities | | | | | | | | | | | 62,613 | |
| | | | | | | | | | | | | |
Consumer, Cyclical | | | | | | | | | | | | |
Allison Transmission Holdings, Inc. | | | 1,141 | | | | 1.15 | % | | | 63,918 | |
M/I Homes, Inc. | | | 255 | | | | 0.46 | % | | | 22,840 | |
Monarch Casino & Resort, Inc. | | | 1,287 | | | | 1.07 | % | | | 17,110 | |
Lennar Corp. — Class A | | | 212 | | | | 0.42 | % | | | 15,068 | |
Toll Brothers, Inc. | | | 369 | | | | 0.60 | % | | | 14,038 | |
PC Connection, Inc. | | | 852 | | | | 0.67 | % | | | 8,734 | |
Buckle, Inc. | | | 1,171 | | | | 0.54 | % | | | 7,237 | |
Cummins, Inc. | | | 144 | | | | 0.49 | % | | | 6,461 | |
Patrick Industries, Inc. | | | 209 | | | | 0.31 | % | | | 4,167 | |
Columbia Sportswear Co. | | | 964 | | | | 0.84 | % | | | 3,839 | |
BorgWarner, Inc. | | | 816 | | | | 0.31 | % | | | 3,298 | |
KB Home | | | 290 | | | | 0.26 | % | | | 1,980 | |
Phinia, Inc. | | | 1,294 | | | | 0.62 | % | | | 1,915 | |
MRC Global, Inc. | | | 1,848 | | | | 0.25 | % | | | 743 | |
ScanSource, Inc. | | | 1,063 | | | | 0.53 | % | | | 202 | |
Sonos, Inc. | | | 2,097 | | | | 0.27 | % | | | 155 | |
Carter’s, Inc. | | | 402 | | | | 0.27 | % | | | (799 | ) |
Core & Main, Inc. — Class A | | | 574 | | | | 0.27 | % | | | (1,780 | ) |
Gentex Corp. | | | 1,277 | | | | 0.40 | % | | | (4,796 | ) |
MasterCraft Boat Holdings, Inc. | | | 1,800 | | | | 0.34 | % | | | (4,826 | ) |
PACCAR, Inc. | | | 1,055 | | | | 1.09 | % | | | (5,156 | ) |
Visteon Corp. | | | 646 | | | | 0.64 | % | | | (5,391 | ) |
Autoliv, Inc. | | | 541 | | | | 0.53 | % | | | (7,216 | ) |
4 | THE GUGGENHEIM FUNDS ANNUAL REPORT | SEE NOTES TO FINANCIAL STATEMENTS. |
SCHEDULE OF INVESTMENTS (continued) | September 30, 2024 |
ALPHA OPPORTUNITY FUND | |
| | Shares | | | Percentage
Notional
Amount | | | Value and
Unrealized
Appreciation
(Depreciation) | |
Lear Corp. | | | 860 | | | | 0.98 | % | | $ | (14,342 | ) |
Movado Group, Inc. | | | 2,351 | | | | 0.46 | % | | | (16,655 | ) |
Total Consumer, Cyclical | | | | | | | | | | | 110,744 | |
| | | | | | | | | | | | | |
Consumer, Non-cyclical | | | | | | | | | | | | |
United Therapeutics Corp. | | | 261 | | | | 0.98 | % | | | 36,073 | |
Innoviva, Inc. | | | 4,952 | | | | 1.00 | % | | | 31,509 | |
Perdoceo Education Corp. | | | 2,365 | | | | 0.55 | % | | | 21,695 | |
Gilead Sciences, Inc. | | | 1,248 | | | | 1.10 | % | | | 20,136 | |
Cal-Maine Foods, Inc. | | | 1,344 | | | | 1.05 | % | | | 16,352 | |
Ingredion, Inc. | | | 721 | | | | 1.04 | % | | | 15,106 | |
Catalyst Pharmaceuticals, Inc. | | | 2,696 | | | | 0.56 | % | | | 12,054 | |
Incyte Corp. | | | 1,585 | | | | 1.10 | % | | | 11,796 | |
Medtronic plc | | | 689 | | | | 0.65 | % | | | 6,319 | |
Merck & Company, Inc. | | | 823 | | | | 0.98 | % | | | 5,704 | |
Johnson & Johnson | | | 588 | | | | 1.00 | % | | | 5,698 | |
Bristol-Myers Squibb Co. | | | 1,546 | | | | 0.84 | % | | | 5,552 | |
Laureate Education, Inc. — Class A | | | 2,279 | | | | 0.40 | % | | | 4,220 | |
Protagonist Therapeutics, Inc. | | | 996 | | | | 0.47 | % | | | 3,193 | |
Alkermes plc | | | 1,455 | | | | 0.43 | % | | | 2,765 | |
Stride, Inc. | | | 403 | | | | 0.36 | % | | | 1,749 | |
Zimmer Biomet Holdings, Inc. | | | 417 | | | | 0.47 | % | | | 1,021 | |
Centene Corp. | | | 274 | | | | 0.22 | % | | | 953 | |
Royalty Pharma plc — Class A | | | 3,349 | | | | 0.99 | % | | | 757 | |
Jazz Pharmaceuticals plc | | | 296 | | | | 0.35 | % | | | 708 | |
ADT, Inc. | | | 3,125 | | | | 0.24 | % | | | 318 | |
Premier, Inc. — Class A | | | 2,310 | | | | 0.48 | % | | | 179 | |
Hologic, Inc. | | | 1,215 | | | | 1.04 | % | | | (519 | ) |
Biogen, Inc. | | | 117 | | | | 0.24 | % | | | (826 | ) |
Regeneron Pharmaceuticals, Inc. | | | 84 | | | | 0.92 | % | | | (1,116 | ) |
Inmode Ltd. | | | 2,388 | | | | 0.42 | % | | | (5,029 | ) |
USANA Health Sciences, Inc. | | | 496 | | | | 0.20 | % | | | (5,351 | ) |
Alarm.com Holdings, Inc. | | | 1,582 | | | | 0.91 | % | | | (5,642 | ) |
Neurocrine Biosciences, Inc. | | | 337 | | | | 0.41 | % | | | (6,142 | ) |
Total Consumer, Non-cyclical | | | | | | | | | | | 179,232 | |
| | | | | | | | | | | | | |
Industrial | | | | | | | | | | | | |
Mueller Industries, Inc. | | | 1,454 | | | | 1.13 | % | | | 58,863 | |
Boise Cascade Co. | | | 777 | | | | 1.15 | % | | | 36,963 | |
Apogee Enterprises, Inc. | | | 1,535 | | | | 1.13 | % | | | 34,403 | |
Teekay Corp. | | | 10,482 | | | | 1.01 | % | | | 25,856 | |
UFP Industries, Inc. | | | 847 | | | | 1.16 | % | | | 20,968 | |
Owens Corning | | | 486 | | | | 0.90 | % | | | 20,421 | |
Snap-on, Inc. | | | 356 | | | | 1.08 | % | | | 15,587 | |
International Seaways, Inc. | | | 1,703 | | | | 0.92 | % | | | 15,357 | |
Scorpio Tankers, Inc. | | | 1,242 | | | | 0.93 | % | | | 13,035 | |
Teekay Tankers Ltd. — Class A | | | 1,816 | | | | 1.11 | % | | | 11,354 | |
Acuity Brands, Inc. | | | 399 | | | | 1.15 | % | | | 10,108 | |
Caterpillar, Inc. | | | 156 | | | | 0.64 | % | | | 9,750 | |
Ardmore Shipping Corp. | | | 3,591 | | | | 0.68 | % | | | 5,245 | |
Masterbrand, Inc. | | | 2,132 | | | | 0.41 | % | | | 3,913 | |
Mueller Water Products, Inc. — Class A | | | 1,848 | | | | 0.42 | % | | | 3,172 | |
Donaldson Company, Inc. | | | 1,004 | | | | 0.77 | % | | | 2,994 | |
Gates Industrial Corporation plc | | | 2,531 | | | | 0.47 | % | | | 2,019 | |
Benchmark Electronics, Inc. | | | 506 | | | | 0.23 | % | | | 1,677 | |
Gibraltar Industries, Inc. | | | 429 | | | | 0.31 | % | | | 1,126 | |
Avnet, Inc. | | | 1,870 | | | | 1.06 | % | | | 900 | |
Textron, Inc. | | | 438 | | | | 0.41 | % | | | 641 | |
Griffon Corp. | | | 467 | | | | 0.34 | % | | | 541 | |
Tennant Co. | | | 777 | | | | 0.78 | % | | | (137 | ) |
Vishay Intertechnology, Inc. | | | 1,078 | | | | 0.21 | % | | | (3,156 | ) |
Dorian LPG Ltd. | | | 1,479 | | | | 0.53 | % | | | (14,754 | ) |
Total Industrial | | | | | | | | | | | 276,846 | |
| | | | | | | | | | | | | |
Financial | | | | | | | | | | | | |
MGIC Investment Corp. | | | 3,854 | | | | 1.03 | % | | | 44,702 | |
Essent Group Ltd. | | | 1,530 | | | | 1.03 | % | | | 32,389 | |
Enact Holdings, Inc. | | | 2,755 | | | | 1.05 | % | | | 23,365 | |
NMI Holdings, Inc. — Class A | | | 2,202 | | | | 0.95 | % | | | 23,226 | |
Fidelity National Financial, Inc. | | | 1,657 | | | | 1.08 | % | | | 22,852 | |
Synchrony Financial | | | 1,581 | | | | 0.83 | % | | | 18,454 | |
Hartford Financial Services Group, Inc. | | | 853 | | | | 1.05 | % | | | 15,493 | |
Preferred Bank/Los Angeles CA | | | 1,068 | | | | 0.90 | % | | | 15,067 | |
OFG Bancorp | | | 2,195 | | | | 1.03 | % | | | 13,425 | |
Enova International, Inc. | | | 712 | | | | 0.62 | % | | | 9,771 | |
International Bancshares Corp. | | | 642 | | | | 0.40 | % | | | 9,604 | |
Axis Capital Holdings Ltd. | | | 1,144 | | | | 0.95 | % | | | 8,056 | |
Janus Henderson Group plc | | | 1,772 | | | | 0.71 | % | | | 7,729 | |
American Express Co. | | | 190 | | | | 0.54 | % | | | 6,920 | |
RenaissanceRe Holdings Ltd. | | | 156 | | | | 0.44 | % | | | 6,744 | |
Reinsurance Group of America, Inc. — Class A | | | 450 | | | | 1.03 | % | | | 4,975 | |
Arch Capital Group Ltd. | | | 326 | | | | 0.38 | % | | | 4,455 | |
Affiliated Managers Group, Inc. | | | 452 | | | | 0.84 | % | | | 4,401 | |
Travelers Companies, Inc. | | | 193 | | | | 0.47 | % | | | 3,384 | |
Everest Group Ltd. | | | 131 | | | | 0.54 | % | | | 3,033 | |
Kilroy Realty Corp. | | | 545 | | | | 0.22 | % | | | 1,850 | |
SEE NOTES TO FINANCIAL STATEMENTS. | THE GUGGENHEIM FUNDS ANNUAL REPORT | 5 |
SCHEDULE OF INVESTMENTS (continued) | September 30, 2024 |
ALPHA OPPORTUNITY FUND | |
| | Shares | | | Percentage
Notional
Amount | | | Value and
Unrealized
Appreciation
(Depreciation) | |
Highwoods Properties, Inc. | | | 1,013 | | | | 0.36 | % | | $ | 1,675 | |
WP Carey, Inc. | | | 318 | | | | 0.21 | % | | | 361 | |
OneMain Holdings, Inc. | | | 709 | | | | 0.35 | % | | | (441 | ) |
Park Hotels & Resorts, Inc. | | | 2,259 | | | | 0.33 | % | | | (500 | ) |
American International Group, Inc. | | | 1,057 | | | | 0.81 | % | | | (519 | ) |
Total Financial | | | | | | | | | | | 280,471 | |
| | | | | | | | | | | | | |
Energy | | | | | | | | | | | | |
DNOW, Inc. | | | 1,930 | | | | 0.26 | % | | | 1,424 | |
HF Sinclair Corp. | | | 645 | | | | 0.30 | % | | | (5,888 | ) |
Total Energy | | | | | | | | | | | (4,464 | ) |
| | | | | | | | | | | | | |
Technology | | | | | | | | | | | | |
Cirrus Logic, Inc. | | | 628 | | | | 0.82 | % | | | 14,063 | |
Zoom Video Communications, Inc. — Class A | | | 1,229 | | | | 0.90 | % | | | 8,026 | |
NetApp, Inc. | | | 357 | | | | 0.46 | % | | | 6,038 | |
Amdocs Ltd. | | | 869 | | | | 0.80 | % | | | 5,901 | |
International Business Machines Corp. | | | 182 | | | | 0.42 | % | | | 3,571 | |
Adeia, Inc. | | | 1,632 | | | | 0.20 | % | | | 2,251 | |
TE Connectivity plc | | | 416 | | | | 0.66 | % | | | 1,957 | |
HP, Inc. | | | 762 | | | | 0.29 | % | | | 1,018 | |
IPG Photonics Corp. | | | 815 | | | | 0.63 | % | | | 361 | |
Qorvo, Inc. | | | 195 | | | | 0.21 | % | | | (918 | ) |
Photronics, Inc. | | | 1,668 | | | | 0.43 | % | | | (2,247 | ) |
Skyworks Solutions, Inc. | | | 639 | | | | 0.66 | % | | | (3,296 | ) |
QUALCOMM, Inc. | | | 496 | | | | 0.88 | % | | | (6,808 | ) |
Total Technology | | | | | | | | | | | 29,917 | |
| | | | | | | | | | | | | |
Basic Materials | | | | | | | | | | | | |
Cabot Corp. | | | 462 | | | | 0.54 | % | | | 10,250 | |
CF Industries Holdings, Inc. | | | 771 | | | | 0.69 | % | | | 7,260 | |
Sylvamo Corp. | | | 427 | | | | 0.38 | % | | | 4,185 | |
NewMarket Corp. | | | 78 | | | | 0.45 | % | | | 3,030 | |
Minerals Technologies, Inc. | | | 467 | | | | 0.38 | % | | | 2,276 | |
Total Basic Materials | | | | | | | | | | | 27,001 | |
| | | | | | | | | | | | | |
Government | | | | | | | | | | | | |
Banco Latinoamericano de Comercio Exterior S.A. — Class E | | | 2,480 | | | | 0.84 | % | | | 24,280 | |
Total MS Equity Long Custom Basket | | | | | | | 1,165,201 | |
| | | | | | | | | |
MS EQUITY SHORT CUSTOM BASKET | | | | | | | | |
Consumer, Non-cyclical | | | | | | | | | | | | |
Avis Budget Group, Inc. | | | 806 | | | | (0.51 | )% | | | 18,674 | |
Patterson Companies, Inc. | | | 7,859 | | | | (1.15 | )% | | | 8,932 | |
NeoGenomics, Inc. | | | 6,557 | | | | (0.65 | )% | | | 2,869 | |
Verisk Analytics, Inc. — Class A | | | 558 | | | | (1.00 | )% | | | (3,057 | ) |
Amicus Therapeutics, Inc. | | | 7,145 | | | | (0.51 | )% | | | (3,767 | ) |
Spectrum Brands Holdings, Inc. | | | 885 | | | | (0.57 | )% | | | (10,235 | ) |
Booz Allen Hamilton Holding Corp. | | | 1,276 | | | | (1.39 | )% | | | (11,795 | ) |
Equifax, Inc. | | | 289 | | | | (0.57 | )% | | | (15,554 | ) |
GXO Logistics, Inc. | | | 5,822 | | | | (2.04 | )% | | | (20,177 | ) |
TransUnion | | | 1,137 | | | | (0.80 | )% | | | (35,128 | ) |
Total Consumer, Non-cyclical | | | | | | | | | | | (69,238 | ) |
| | | | | | | | | | | | | |
Financial | | | | | | | | | | | | |
Sun Communities, Inc. | | | 1,757 | | | | (1.59 | )% | | | 57,151 | |
New York Mortgage Trust, Inc. | | | 40,459 | | | | (1.72 | )% | | | 52,751 | |
Americold Realty Trust, Inc. | | | 9,592 | | | | (1.82 | )% | | | 40,050 | |
Cannae Holdings, Inc. | | | 8,504 | | | | (1.09 | )% | | | 17,309 | |
PotlatchDeltic Corp. | | | 5,161 | | | | (1.56 | )% | | | 6,635 | |
TFS Financial Corp. | | | 15,455 | | | | (1.33 | )% | | | 5,462 | |
Triumph Financial, Inc. | | | 1,700 | | | | (0.91 | )% | | | 3,309 | |
UDR, Inc. | | | 2,051 | | | | (0.62 | )% | | | (2,116 | ) |
St. Joe Co. | | | 4,831 | | | | (1.89 | )% | | | (4,722 | ) |
CoStar Group, Inc. | | | 2,309 | | | | (1.17 | )% | | | (4,892 | ) |
Brighthouse Financial, Inc. | | | 6,174 | | | | (1.87 | )% | | | (8,465 | ) |
Safehold, Inc. | | | 7,053 | | | | (1.24 | )% | | | (9,560 | ) |
Digital Realty Trust, Inc. | | | 831 | | | | (0.90 | )% | | | (10,922 | ) |
Burford Capital Ltd. | | | 16,870 | | | | (1.50 | )% | | | (11,182 | ) |
Equity LifeStyle Properties, Inc. | | | 3,303 | | | | (1.58 | )% | | | (11,464 | ) |
Capitol Federal Financial, Inc. | | | 39,000 | | | | (1.53 | )% | | | (15,855 | ) |
Marcus & Millichap, Inc. | | | 6,388 | | | | (1.70 | )% | | | (18,501 | ) |
Apartment Investment and Management Co. — Class A | | | 22,579 | | | | (1.37 | )% | | | (25,433 | ) |
Banc of California, Inc. | | | 16,057 | | | | (1.59 | )% | | | (26,504 | ) |
Equinix, Inc. | | | 337 | | | | (2.01 | )% | | | (28,579 | ) |
Crown Castle, Inc. | | | 2,074 | | | | (1.65 | )% | | | (31,778 | ) |
SBA Communications Corp. | | | 944 | | | | (1.53 | )% | | | (38,506 | ) |
Veris Residential, Inc. | | | 12,737 | | | | (1.53 | )% | | | (38,725 | ) |
State Street Corp. | | | 3,242 | | | | (1.93 | )% | | | (45,021 | ) |
Redwood Trust, Inc. | | | 37,328 | | | | (1.94 | )% | | | (55,450 | ) |
FTAI Infrastructure, Inc. | | | 23,761 | | | | (1.49 | )% | | | (60,142 | ) |
Iron Mountain, Inc. | | | 2,411 | | | | (1.92 | )% | | | (80,511 | ) |
CBRE Group, Inc. — Class A | | | 2,428 | | | | (2.03 | )% | | | (89,564 | ) |
Total Financial | | | | | | | | | | | (435,225 | ) |
| | | | | | | | | | | | | |
Energy | | | | | | | | | | | | |
Valaris Ltd. | | | 3,702 | | | | (1.39 | )% | | | 47,753 | |
Transocean Ltd. | | | 62,912 | | | | (1.80 | )% | | | 37,704 | |
Core Laboratories, Inc. | | | 13,685 | | | | (1.70 | )% | | | 25,598 | |
Expro Group Holdings N.V. | | | 4,360 | | | | (0.50 | )% | | | 4,782 | |
Antero Resources Corp. | | | 6,911 | | | | (1.33 | )% | | | (5,620 | ) |
Bristow Group, Inc. | | | 5,156 | | | | (1.20 | )% | | | (9,904 | ) |
6 | THE GUGGENHEIM FUNDS ANNUAL REPORT | SEE NOTES TO FINANCIAL STATEMENTS. |
SCHEDULE OF INVESTMENTS (continued) | September 30, 2024 |
ALPHA OPPORTUNITY FUND | |
| | Shares | | | Percentage
Notional
Amount | | | Value and
Unrealized
Appreciation
(Depreciation) | |
Oceaneering International, Inc. | | | 5,698 | | | | (0.95 | )% | | $ | (10,834 | ) |
Total Energy | | | | | | | | | | | 89,479 | |
| | | | | | | | | | | | | |
Industrial | | | | | | | | | | | | |
Boeing Co. | | | 889 | | | | (0.91 | )% | | | 35,053 | |
Montrose Environmental Group, Inc. | | | 2,209 | | | | (0.39 | )% | | | 34,691 | |
XPO, Inc. | | | 1,794 | | | | (1.30 | )% | | | 15,356 | |
Saia, Inc. | | | 233 | | | | (0.68 | )% | | | 14,952 | |
Old Dominion Freight Line, Inc. | | | 1,047 | | | | (1.40 | )% | | | 11,180 | |
Knight-Swift Transportation Holdings, Inc. | | | 2,296 | | | | (0.83 | )% | | | 5,334 | |
Norfolk Southern Corp. | | | 631 | | | | (1.05 | )% | | | 1,722 | |
Union Pacific Corp. | | | 325 | | | | (0.54 | )% | | | (1,960 | ) |
Covenant Logistics Group, Inc. — Class A | | | 2,008 | | | | (0.71 | )% | | | (2,403 | ) |
Materion Corp. | | | 731 | | | | (0.55 | )% | | | (3,956 | ) |
Forward Air Corp. | | | 2,286 | | | | (0.54 | )% | | | (6,175 | ) |
Perma-Fix Environmental Services, Inc. | | | 5,675 | | | | (0.47 | )% | | | (9,645 | ) |
United Parcel Service, Inc. — Class B | | | 1,181 | | | | (1.08 | )% | | | (11,045 | ) |
Casella Waste Systems, Inc. — Class A | | | 1,249 | | | | (0.83 | )% | | | (15,344 | ) |
J.B. Hunt Transport Services, Inc. | | | 1,266 | | | | (1.47 | )% | | | (16,258 | ) |
CH Robinson Worldwide, Inc. | | | 2,715 | | | | (2.01 | )% | | | (61,874 | ) |
Total Industrial | | | | | | | | | | | (10,372 | ) |
| | | | | | | | | | | | | |
Technology | | | | | | | | | | | | |
Dayforce, Inc. | | | 4,887 | | | | (2.01 | )% | | | 9,495 | |
Take-Two Interactive Software, Inc. | | | 1,195 | | | | (1.23 | )% | | | 4,208 | |
Appian Corp. — Class A | | | 2,663 | | | | (0.61 | )% | | | (7,889 | ) |
KBR, Inc. | | | 3,357 | | | | (1.47 | )% | | | (9,790 | ) |
Total Technology | | | | | | | | | | | (3,976 | ) |
| | | | | | | | | | | | | |
Basic Materials | | | | | | | | | | | | |
Compass Minerals International, Inc. | | | 17,094 | | | | (1.38 | )% | | | 30,657 | |
Novagold Resources, Inc. | | | 41,564 | | | | (1.14 | )% | | | 987 | |
Ivanhoe Electric Incorporated / US | | | 18,742 | | | | (1.06 | )% | | | (8,001 | ) |
Coeur Mining, Inc. | | | 10,055 | | | | (0.46 | )% | | | (13,073 | ) |
Radius Recycling, Inc. — Class A | | | 5,114 | | | | (0.64 | )% | | | (20,251 | ) |
Hecla Mining Co. | | | 25,217 | | | | (1.13 | )% | | | (26,226 | ) |
MP Materials Corp. | | | 14,326 | | | | (1.70 | )% | | | (49,390 | ) |
Total Basic Materials | | | | | | | | | | | (85,297 | ) |
Utilities | | | | | | | | | | | | |
Middlesex Water Co. | | | 2,166 | | | | (0.95 | )% | | | (8,964 | ) |
TXNM Energy, Inc. | | | 4,105 | | | | (1.21 | )% | | | (21,515 | ) |
Eversource Energy | | | 3,933 | | | | (1.80 | )% | | | (42,355 | ) |
Total Utilities | | | | | | | | | | | (72,834 | ) |
| | | | | | | | | | | | | |
Consumer, Cyclical | | | | | | | | | | | | |
VSE Corp. | | | 2,473 | | | | (1.37 | )% | | | 6,551 | |
Walgreens Boots Alliance, Inc. | | | 6,570 | | | | (0.40 | )% | | | (3,042 | ) |
Madison Square Garden Sports Corp. — Class A | | | 641 | | | | (0.90 | )% | | | (11,441 | ) |
JetBlue Airways Corp. | | | 23,120 | | | | (1.02 | )% | | | (20,654 | ) |
American Airlines Group, Inc. | | | 25,297 | | | | (1.91 | )% | | | (23,322 | ) |
LGI Homes, Inc. | | | 1,131 | | | | (0.90 | )% | | | (33,518 | ) |
Total Consumer, Cyclical | | | | | | | | | | | (85,426 | ) |
| | | | | | | | | | | | | |
Communications | | | | | | | | | | | | |
Sphere Entertainment Co. | | | 1,414 | | | | (0.42 | )% | | | (806 | ) |
Uber Technologies, Inc. | | | 918 | | | | (0.46 | )% | | | (8,352 | ) |
Total Communications | | | | | | | | | | | (9,158 | ) |
Total MS Equity Short Custom Basket | | | | | | | (682,049 | ) |
| | | | | | | | | |
GS EQUITY LONG CUSTOM BASKET | | | | | | | | |
Consumer, Non-cyclical | | | | | | | | | | | | |
United Therapeutics Corp. | | | 261 | | | | 0.96 | % | | | 36,150 | |
Innoviva, Inc. | | | 4,952 | | | | 1.00 | % | | | 31,107 | |
Gilead Sciences, Inc. | | | 1,248 | | | | 1.10 | % | | | 20,167 | |
Cal-Maine Foods, Inc. | | | 1,344 | | | | 1.05 | % | | | 15,757 | |
Ingredion, Inc. | | | 721 | | | | 1.04 | % | | | 14,981 | |
Bristol-Myers Squibb Co. | | | 1,546 | | | | 0.84 | % | | | 12,899 | |
Catalyst Pharmaceuticals, Inc. | | | 2,696 | | | | 0.56 | % | | | 11,984 | |
Incyte Corp. | | | 1,585 | | | | 1.10 | % | | | 11,610 | |
Medtronic plc | | | 689 | | | | 0.65 | % | | | 6,397 | |
Merck & Company, Inc. | | | 823 | | | | 0.98 | % | | | 5,737 | |
Johnson & Johnson | | | 588 | | | | 1.00 | % | | | 5,619 | |
Laureate Education, Inc. — Class A | | | 2,279 | | | | 0.40 | % | | | 4,154 | |
Protagonist Therapeutics, Inc. | | | 996 | | | | 0.47 | % | | | 3,248 | |
Alkermes plc | | | 1,455 | | | | 0.43 | % | | | 2,745 | |
Perdoceo Education Corp. | | | 2,365 | | | | 0.55 | % | | | 2,364 | |
Stride, Inc. | | | 403 | | | | 0.36 | % | | | 1,854 | |
Zimmer Biomet Holdings, Inc. | | | 417 | | | | 0.47 | % | | | 998 | |
Centene Corp. | | | 274 | | | | 0.22 | % | | | 930 | |
Royalty Pharma plc — Class A | | | 3,349 | | | | 0.99 | % | | | 803 | |
Jazz Pharmaceuticals plc | | | 296 | | | | 0.35 | % | | | 712 | |
ADT, Inc. | | | 3,125 | | | | 0.24 | % | | | 324 | |
Premier, Inc. — Class A | | | 2,310 | | | | 0.48 | % | | | 100 | |
Hologic, Inc. | | | 1,215 | | | | 1.04 | % | | | (373 | ) |
SEE NOTES TO FINANCIAL STATEMENTS. | THE GUGGENHEIM FUNDS ANNUAL REPORT | 7 |
SCHEDULE OF INVESTMENTS (continued) | September 30, 2024 |
ALPHA OPPORTUNITY FUND | |
| | Shares | | | Percentage
Notional
Amount | | | Value and
Unrealized
Appreciation
(Depreciation) | |
Biogen, Inc. | | | 117 | | | | 0.24 | % | | $ | (853 | ) |
Regeneron Pharmaceuticals, Inc. | | | 84 | | | | 0.92 | % | | | (1,064 | ) |
Inmode Ltd. | | | 2,388 | | | | 0.42 | % | | | (5,053 | ) |
USANA Health Sciences, Inc. | | | 496 | | | | 0.20 | % | | | (5,405 | ) |
Alarm.com Holdings, Inc. | | | 1,582 | | | | 0.91 | % | | | (5,826 | ) |
Neurocrine Biosciences, Inc. | | | 337 | | | | 0.41 | % | | | (6,321 | ) |
Total Consumer, Non-cyclical | | | | | | | | | | | 165,745 | |
| | | | | | | | | | | | | |
Financial | | | | | | | | | | | | |
Essent Group Ltd. | | | 1,531 | | | | 1.03 | % | | | 28,744 | |
Enact Holdings, Inc. | | | 2,755 | | | | 1.05 | % | | | 23,402 | |
Fidelity National Financial, Inc. | | | 1,657 | | | | 1.08 | % | | | 23,051 | |
NMI Holdings, Inc. — Class A | | | 2,202 | | | | 0.95 | % | | | 23,010 | |
MGIC Investment Corp. | | | 3,853 | | | | 1.03 | % | | | 22,983 | |
Synchrony Financial | | | 1,581 | | | | 0.83 | % | | | 18,558 | |
Hartford Financial Services Group, Inc. | | | 853 | | | | 1.05 | % | | | 15,468 | |
Preferred Bank/Los Angeles CA | | | 1,068 | | | | 0.90 | % | | | 14,499 | |
OFG Bancorp | | | 2,195 | | | | 1.03 | % | | | 13,543 | |
Enova International, Inc. | | | 712 | | | | 0.62 | % | | | 9,748 | |
Axis Capital Holdings Ltd. | | | 1,144 | | | | 0.95 | % | | | 7,975 | |
Janus Henderson Group plc | | | 1,772 | | | | 0.71 | % | | | 7,736 | |
International Bancshares Corp. | | | 642 | | | | 0.40 | % | | | 7,000 | |
American Express Co. | | | 190 | | | | 0.54 | % | | | 6,865 | |
RenaissanceRe Holdings Ltd. | | | 156 | | | | 0.44 | % | | | 6,738 | |
Reinsurance Group of America, Inc. — Class A | | | 450 | | | | 1.03 | % | | | 5,073 | |
Affiliated Managers Group, Inc. | | | 452 | | | | 0.84 | % | | | 4,579 | |
Arch Capital Group Ltd. | | | 326 | | | | 0.38 | % | | | 4,398 | |
Travelers Companies, Inc. | | | 193 | | | | 0.47 | % | | | 3,382 | |
Everest Group Ltd. | | | 131 | | | | 0.54 | % | | | 3,015 | |
Kilroy Realty Corp. | | | 545 | | | | 0.22 | % | | | 1,896 | |
Highwoods Properties, Inc. | | | 1,013 | | | | 0.36 | % | | | 1,654 | |
WP Carey, Inc. | | | 318 | | | | 0.21 | % | | | 372 | |
Park Hotels & Resorts, Inc. | | | 2,259 | | | | 0.33 | % | | | (478 | ) |
OneMain Holdings, Inc. | | | 709 | | | | 0.35 | % | | | (485 | ) |
American International Group, Inc. | | | 1,057 | | | | 0.81 | % | | | (544 | ) |
Total Financial | | | | | | | | | | | 252,182 | |
| | | | | | | | | | | | | |
Industrial | | | | | | | | | | | | |
Mueller Industries, Inc. | | | 1,454 | | | | 1.13 | % | | | 41,859 | |
Apogee Enterprises, Inc. | | | 1,535 | | | | 1.13 | % | | | 34,388 | |
Teekay Corp. | | | 10,482 | | | | 1.01 | % | | | 25,776 | |
UFP Industries, Inc. | | | 847 | | | | 1.16 | % | | | 20,713 | |
Owens Corning | | | 486 | | | | 0.90 | % | | | 20,490 | |
Teekay Tankers Ltd. — Class A | | | 1,816 | | | | 1.11 | % | | | 11,267 | |
International Seaways, Inc. | | | 1,703 | | | | 0.92 | % | | | 10,697 | |
Acuity Brands, Inc. | | | 399 | | | | 1.15 | % | | | 10,130 | |
Caterpillar, Inc. | | | 156 | | | | 0.64 | % | | | 9,754 | |
Snap-on, Inc. | | | 356 | | | | 1.08 | % | | | 8,195 | |
Boise Cascade Co. | | | 777 | | | | 1.15 | % | | | 8,056 | |
Ardmore Shipping Corp. | | | 3,591 | | | | 0.68 | % | | | 5,218 | |
Masterbrand, Inc. | | | 2,132 | | | | 0.41 | % | | | 3,900 | |
Mueller Water Products, Inc. — Class A | | | 1,848 | | | | 0.42 | % | | | 3,199 | |
Donaldson Company, Inc. | | | 1,004 | | | | 0.77 | % | | | 2,910 | |
Gates Industrial Corporation plc | | | 2,531 | | | | 0.47 | % | | | 2,209 | |
Benchmark Electronics, Inc. | | | 506 | | | | 0.23 | % | | | 1,730 | |
Scorpio Tankers, Inc. | | | 1,242 | | | | 0.93 | % | | | 1,470 | |
Gibraltar Industries, Inc. | | | 429 | | | | 0.31 | % | | | 1,135 | |
Avnet, Inc. | | | 1,870 | | | | 1.06 | % | | | 1,083 | |
Griffon Corp. | | | 467 | | | | 0.34 | % | | | 714 | |
Textron, Inc. | | | 438 | | | | 0.41 | % | | | 698 | |
Tennant Co. | | | 777 | | | | 0.78 | % | | | (96 | ) |
Vishay Intertechnology, Inc. | | | 1,078 | | | | 0.21 | % | | | (3,183 | ) |
Dorian LPG Ltd. | | | 1,479 | | | | 0.53 | % | | | (14,622 | ) |
Total Industrial | | | | | | | | | | | 207,690 | |
| | | | | | | | | | | | | |
Utilities | | | | | | | | | | | | |
OGE Energy Corp. | | | 2,439 | | | | 1.05 | % | | | 17,228 | |
National Fuel Gas Co. | | | 1,633 | | | | 1.04 | % | | | 17,027 | |
Black Hills Corp. | | | 1,625 | | | | 1.04 | % | | | 13,718 | |
Duke Energy Corp. | | | 837 | | | | 1.01 | % | | | 8,638 | |
Entergy Corp. | | | 800 | | | | 1.10 | % | | | 7,644 | |
Spire, Inc. | | | 1,477 | | | | 1.04 | % | | | 2,602 | |
Southwest Gas Holdings, Inc. | | | 698 | | | | 0.54 | % | | | 2,210 | |
PPL Corp. | | | 1,048 | | | | 0.36 | % | | | 905 | |
Avista Corp. | | | 1,596 | | | | 0.65 | % | | | (885 | ) |
Otter Tail Corp. | | | 964 | | | | 0.79 | % | | | (7,354 | ) |
Total Utilities | | | | | | | | | | | 61,733 | |
| | | | | | | | | | | | | |
Basic Materials | | | | | | | | | | | | |
Cabot Corp. | | | 462 | | | | 0.54 | % | | | 10,310 | |
CF Industries Holdings, Inc. | | | 771 | | | | 0.69 | % | | | 7,274 | |
Sylvamo Corp. | | | 427 | | | | 0.38 | % | | | 4,404 | |
NewMarket Corp. | | | 78 | | | | 0.45 | % | | | 2,937 | |
Minerals Technologies, Inc. | | | 467 | | | | 0.38 | % | | | 2,202 | |
Total Basic Materials | | | | | | | | | | | 27,127 | |
| | | | | | | | | | | | | |
Consumer, Cyclical | | | | | | | | | | | | |
Allison Transmission Holdings, Inc. | | | 1,141 | | | | 1.15 | % | | | 40,398 | |
M/I Homes, Inc. | | | 255 | | | | 0.46 | % | | | 22,861 | |
8 | THE GUGGENHEIM FUNDS ANNUAL REPORT | SEE NOTES TO FINANCIAL STATEMENTS. |
SCHEDULE OF INVESTMENTS (continued) | September 30, 2024 |
ALPHA OPPORTUNITY FUND | |
| | Shares | | | Percentage
Notional
Amount | | | Value and
Unrealized
Appreciation
(Depreciation) | |
Monarch Casino & Resort, Inc. | | | 1,287 | | | | 1.07 | % | | $ | 16,980 | |
Lennar Corp. — Class A | | | 212 | | | | 0.42 | % | | | 15,162 | |
Toll Brothers, Inc. | | | 369 | | | | 0.60 | % | | | 14,031 | |
PC Connection, Inc. | | | 852 | | | | 0.67 | % | | | 8,712 | |
Buckle, Inc. | | | 1,171 | | | | 0.54 | % | | | 7,306 | |
Cummins, Inc. | | | 144 | | | | 0.49 | % | | | 6,485 | |
Patrick Industries, Inc. | | | 209 | | | | 0.31 | % | | | 4,240 | |
Columbia Sportswear Co. | | | 964 | | | | 0.84 | % | | | 3,837 | |
BorgWarner, Inc. | | | 816 | | | | 0.31 | % | | | 3,225 | |
Phinia, Inc. | | | 1,294 | | | | 0.62 | % | | | 2,155 | |
KB Home | | | 290 | | | | 0.26 | % | | | 1,982 | |
MRC Global, Inc. | | | 1,848 | | | | 0.25 | % | | | 707 | |
ScanSource, Inc. | | | 1,063 | | | | 0.53 | % | | | 320 | |
Sonos, Inc. | | | 2,097 | | | | 0.27 | % | | | 194 | |
Carter’s, Inc. | | | 402 | | | | 0.27 | % | | | (821 | ) |
Core & Main, Inc. — Class A | | | 574 | | | | 0.27 | % | | | (1,774 | ) |
Gentex Corp. | | | 1,277 | | | | 0.40 | % | | | (4,760 | ) |
MasterCraft Boat Holdings, Inc. | | | 1,800 | | | | 0.34 | % | | | (4,888 | ) |
PACCAR, Inc. | | | 1,055 | | | | 1.09 | % | | | (5,135 | ) |
Visteon Corp. | | | 646 | | | | 0.64 | % | | | (5,311 | ) |
Autoliv, Inc. | | | 541 | | | | 0.53 | % | | | (7,260 | ) |
Lear Corp. | | | 860 | | | | 0.98 | % | | | (14,265 | ) |
Movado Group, Inc. | | | 2,351 | | | | 0.46 | % | | | (16,348 | ) |
Total Consumer, Cyclical | | | | | | | | | | | 88,033 | |
| | | | | | | | | | | | | |
Technology | | | | | | | | | | | | |
Cirrus Logic, Inc. | | | 628 | | | | 0.82 | % | | | 14,041 | |
Zoom Video Communications, Inc. — Class A | | | 1,229 | | | | 0.90 | % | | | 7,932 | |
NetApp, Inc. | | | 357 | | | | 0.46 | % | | | 6,075 | |
Amdocs Ltd. | | | 869 | | | | 0.80 | % | | | 5,806 | |
International Business Machines Corp. | | | 182 | | | | 0.42 | % | | | 3,553 | |
Adeia, Inc. | | | 1,632 | | | | 0.20 | % | | | 2,262 | |
TE Connectivity plc | | | 416 | | | | 0.66 | % | | | 2,075 | |
HP, Inc. | | | 762 | | | | 0.29 | % | | | 1,014 | |
IPG Photonics Corp. | | | 815 | | | | 0.63 | % | | | 296 | |
Qorvo, Inc. | | | 195 | | | | 0.21 | % | | | (911 | ) |
Photronics, Inc. | | | 1,668 | | | | 0.43 | % | | | (2,117 | ) |
Skyworks Solutions, Inc. | | | 639 | | | | 0.66 | % | | | (3,337 | ) |
QUALCOMM, Inc. | | | 496 | | | | 0.88 | % | | | (6,774 | ) |
Total Technology | | | | | | | | | | | 29,915 | |
| | | | | | | | | | | | | |
Communications | | | | | | | | | | | | |
InterDigital, Inc. | | | 727 | | | | 1.08 | % | | | 35,486 | |
AT&T, Inc. | | | 4,423 | | | | 1.02 | % | | | 31,266 | |
IDT Corp. — Class B | | | 2,353 | | | | 0.94 | % | | | 25,207 | |
T-Mobile US, Inc. | | | 395 | | | | 0.85 | % | | | 23,719 | |
Verizon Communications, Inc. | | | 1,895 | | | | 0.89 | % | | | 19,491 | |
eBay, Inc. | | | 738 | | | | 0.50 | % | | | 19,208 | |
F5, Inc. | | | 415 | | | | 0.96 | % | | | 16,585 | |
ePlus, Inc. | | | 730 | | | | 0.75 | % | | | 10,486 | |
Gen Digital, Inc. | | | 1,807 | | | | 0.52 | % | | | 4,765 | |
Expedia Group, Inc. | | | 143 | | | | 0.22 | % | | | 1,770 | |
HealthStream, Inc. | | | 1,004 | | | | 0.30 | % | | | 478 | |
Spok Holdings, Inc. | | | 3,131 | | | | 0.49 | % | | | (58 | ) |
Anterix, Inc. | | | 1,038 | | | | 0.41 | % | | | (1,257 | ) |
Yelp, Inc. — Class A | | | 1,833 | | | | 0.67 | % | | | (2,014 | ) |
Gogo, Inc. | | | 4,643 | | | | 0.35 | % | | | (7,185 | ) |
Total Communications | | | | | | | | | | | 177,947 | |
| | | | | | | | | | | | | |
Energy | | | | | | | | | | | | |
DNOW, Inc. | | | 1,930 | | | | 0.26 | % | | | 1,345 | |
HF Sinclair Corp. | | | 645 | | | | 0.30 | % | | | (5,825 | ) |
Total Energy | | | | | | | | | | | (4,480 | ) |
| | | | | | | | | | | | | |
Government | | | | | | | | | | | | |
Banco Latinoamericano de Comercio Exterior S.A. — Class E | | | 2,480 | | | | 0.84 | % | | | 24,097 | |
Total GS Equity Long Custom Basket | | | | | | | 1,029,989 | |
| | | | | | | | | |
GS EQUITY SHORT CUSTOM BASKET | | | | | | | | |
Consumer, Cyclical | | | | | | | | | | | | |
VSE Corp. | | | 2,473 | | | | (1.39 | )% | | | 6,477 | |
Walgreens Boots Alliance, Inc. | | | 6,570 | | | | (0.39 | )% | | | (3,050 | ) |
Madison Square Garden Sports Corp. — Class A | | | 641 | | | | (0.90 | )% | | | (11,187 | ) |
JetBlue Airways Corp. | | | 23,120 | | | | (1.02 | )% | | | (20,847 | ) |
American Airlines Group, Inc. | | | 25,297 | | | | (1.91 | )% | | | (22,845 | ) |
LGI Homes, Inc. | | | 1,131 | | | | (0.90 | )% | | | (33,611 | ) |
Total Consumer, Cyclical | | | | | | | | | | | (85,063 | ) |
| | | | | | | | | |
Consumer, Non-cyclical | | | | | | | | | | | | |
Avis Budget Group, Inc. | | | 806 | | | | (0.47 | )% | | | 18,577 | |
Patterson Companies, Inc. | | | 7,859 | | | | (1.15 | )% | | | 8,530 | |
NeoGenomics, Inc. | | | 6,557 | | | | (0.65 | )% | | | 2,545 | |
Verisk Analytics, Inc. — Class A | | | 558 | | | | (1.00 | )% | | | (3,268 | ) |
Amicus Therapeutics, Inc. | | | 7,145 | | | | (0.51 | )% | | | (3,676 | ) |
Spectrum Brands Holdings, Inc. | | | 885 | | | | (0.56 | )% | | | (10,204 | ) |
Booz Allen Hamilton Holding Corp. | | | 1,276 | | | | (1.39 | )% | | | (11,740 | ) |
Equifax, Inc. | | | 289 | | | | (0.57 | )% | | | (15,706 | ) |
GXO Logistics, Inc. | | | 5,822 | | | | (2.03 | )% | | | (18,808 | ) |
TransUnion | | | 1,137 | | | | (0.80 | )% | | | (35,214 | ) |
Total Consumer, Non-cyclical | | | | | | | | | | | (68,964 | ) |
| | | | | | | | | | | | | |
Financial | | | | | | | | | | | | |
New York Mortgage Trust, Inc. | | | 40,459 | | | | (1.72 | )% | | | 52,504 | |
Americold Realty Trust, Inc. | | | 9,592 | | | | (1.82 | )% | | | 25,102 | |
SEE NOTES TO FINANCIAL STATEMENTS. | THE GUGGENHEIM FUNDS ANNUAL REPORT | 9 |
SCHEDULE OF INVESTMENTS (continued) | September 30, 2024 |
ALPHA OPPORTUNITY FUND | |
| | Shares | | | Percentage
Notional
Amount | | | Value and
Unrealized
Appreciation
(Depreciation) | |
Cannae Holdings, Inc. | | | 8,504 | | | | (1.09 | )% | | $ | 17,174 | |
TFS Financial Corp. | | | 15,455 | | | | (1.33 | )% | | | 7,656 | |
PotlatchDeltic Corp. | | | 5,161 | | | | (1.56 | )% | | | 6,808 | |
Triumph Financial, Inc. | | | 1,700 | | | | (0.91 | )% | | | 3,283 | |
Sun Communities, Inc. | | | 1,757 | | | | (1.59 | )% | | | 362 | |
UDR, Inc. | | | 2,051 | | | | (0.62 | )% | | | (2,305 | ) |
St. Joe Co. | | | 4,831 | | | | (1.89 | )% | | | (4,928 | ) |
CoStar Group, Inc. | | | 2,309 | | | | (1.17 | )% | | | (4,936 | ) |
Brighthouse Financial, Inc. | | | 6,174 | | | | (1.87 | )% | | | (8,879 | ) |
Safehold, Inc. | | | 7,053 | | | | (1.24 | )% | | | (9,765 | ) |
Burford Capital Ltd. | | | 16,870 | | | | (1.50 | )% | | | (10,964 | ) |
Digital Realty Trust, Inc. | | | 831 | | | | (0.90 | )% | | | (11,035 | ) |
Equity LifeStyle Properties, Inc. | | | 3,303 | | | | (1.58 | )% | | | (11,414 | ) |
Capitol Federal Financial, Inc. | | | 39,000 | | | | (1.53 | )% | | | (15,431 | ) |
Marcus & Millichap, Inc. | | | 6,388 | | | | (1.70 | )% | | | (18,700 | ) |
Apartment Investment and Management Co. — Class A | | | 22,579 | | | | (1.37 | )% | | | (25,514 | ) |
Banc of California, Inc. | | | 16,057 | | | | (1.59 | )% | | | (26,986 | ) |
Crown Castle, Inc. | | | 2,074 | | | | (1.65 | )% | | | (31,914 | ) |
SBA Communications Corp. | | | 944 | | | | (1.52 | )% | | | (38,685 | ) |
Veris Residential, Inc. | | | 12,737 | | | | (1.53 | )% | | | (38,762 | ) |
State Street Corp. | | | 3,242 | | | | (1.92 | )% | | | (44,863 | ) |
Equinix, Inc. | | | 337 | | | | (2.01 | )% | | | (48,415 | ) |
Redwood Trust, Inc. | | | 37,328 | | | | (1.94 | )% | | | (55,478 | ) |
FTAI Infrastructure, Inc. | | | 23,761 | | | | (1.49 | )% | | | (60,416 | ) |
Iron Mountain, Inc. | | | 2,411 | | | | (1.92 | )% | | | (80,532 | ) |
CBRE Group, Inc. — Class A | | | 2,428 | | | | (2.03 | )% | | | (89,966 | ) |
Total Financial | | | | | | | | | | | (526,999 | ) |
| | | | | | | | | | | | | |
Basic Materials | | | | | | | | | | | | |
Compass Minerals International, Inc. | | | 17,094 | | | | (1.38 | )% | | | 29,311 | |
Novagold Resources, Inc. | | | 41,564 | | | | (1.14 | )% | | | 800 | |
Ivanhoe Electric Incorporated / US | | | 18,742 | | | | (1.06 | )% | | | (7,126 | ) |
Coeur Mining, Inc. | | | 10,055 | | | | (0.46 | )% | | | (13,260 | ) |
Radius Recycling, Inc. — Class A | | | 5,114 | | | | (0.64 | )% | | | (20,907 | ) |
Hecla Mining Co. | | | 25,217 | | | | (1.13 | )% | | | (38,460 | ) |
MP Materials Corp. | | | 14,326 | | | | (1.70 | )% | | | (48,744 | ) |
Total Basic Materials | | | | | | | | | | | (98,386 | ) |
| | | | | | | | | | | | | |
Industrial | | | | | | | | | | | | |
Boeing Co. | | | 889 | | | | (0.91 | )% | | | 35,111 | |
Montrose Environmental Group, Inc. | | | 2,209 | | | | (0.39 | )% | | | 34,222 | |
XPO, Inc. | | | 1,794 | | | | (1.29 | )% | | | 16,413 | |
Saia, Inc. | | | 233 | | | | (0.68 | )% | | | 14,894 | |
Old Dominion Freight Line, Inc. | | | 1,047 | | | | (1.40 | )% | | | 10,946 | |
Knight-Swift Transportation Holdings, Inc. | | | 2,296 | | | | (0.83 | )% | | | 5,319 | |
Norfolk Southern Corp. | | | 631 | | | | (1.05 | )% | | | 1,822 | |
Union Pacific Corp. | | | 325 | | | | (0.54 | )% | | | (1,982 | ) |
Covenant Logistics Group, Inc. — Class A | | | 2,008 | | | | (0.71 | )% | | | (2,233 | ) |
Materion Corp. | | | 731 | | | | (0.55 | )% | | | (3,910 | ) |
Forward Air Corp. | | | 2,286 | | | | (0.54 | )% | | | (6,987 | ) |
Casella Waste Systems, Inc. — Class A | | | 1,249 | | | | (0.83 | )% | | | (7,198 | ) |
United Parcel Service, Inc. — Class B | | | 1,181 | | | | (1.08 | )% | | | (11,116 | ) |
Perma-Fix Environmental Services, Inc. | | | 7,011 | | | | (0.58 | )% | | | (11,945 | ) |
J.B. Hunt Transport Services, Inc. | | | 1,266 | | | | (1.46 | )% | | | (16,811 | ) |
CH Robinson Worldwide, Inc. | | | 2,715 | | | | (2.01 | )% | | | (62,849 | ) |
Total Industrial | | | | | | | | | | | (6,304 | ) |
| | | | | | | | | | | | | |
Utilities | | | | | | | | | | | | |
Middlesex Water Co. | | | 2,166 | | | | (0.95 | )% | | | (9,130 | ) |
TXNM Energy, Inc. | | | 4,105 | | | | (1.21 | )% | | | (21,481 | ) |
Eversource Energy | | | 3,933 | | | | (1.80 | )% | | | (42,142 | ) |
Total Utilities | | | | | | | | | | | (72,753 | ) |
| | | | | | | | | | | | | |
Technology | | | | | | | | | | | | |
Dayforce, Inc. | | | 4,887 | | | | (2.01 | )% | | | 8,930 | |
Take-Two Interactive Software, Inc. | | | 1,195 | | | | (1.23 | )% | | | 4,633 | |
Appian Corp. — Class A | | | 2,663 | | | | (0.61 | )% | | | (8,518 | ) |
KBR, Inc. | | | 3,357 | | | | (1.47 | )% | | | (9,841 | ) |
Total Technology | | | | | | | | | | | (4,796 | ) |
| | | | | | | | | | | | | |
Energy | | | | | | | | | | | | |
Valaris Ltd. | | | 3,702 | | | | (1.38 | )% | | | 48,755 | |
Transocean Ltd. | | | 62,912 | | | | (1.79 | )% | | | 37,086 | |
Core Laboratories, Inc. | | | 13,685 | | | | (1.70 | )% | | | 24,867 | |
Expro Group Holdings N.V. | | | 4,360 | | | | (0.50 | )% | | | 4,235 | |
Antero Resources Corp. | | | 6,911 | | | | (1.33 | )% | | | (5,932 | ) |
Bristow Group, Inc. | | | 5,156 | | | | (1.20 | )% | | | (9,993 | ) |
Oceaneering International, Inc. | | | 5,698 | | | | (0.95 | )% | | | (10,909 | ) |
Total Energy | | | | | | | | | | | 88,109 | |
| | | | | | | | | | | | | |
Communications | | | | | | | | | | | | |
Sphere Entertainment Co. | | | 1,414 | | | | (0.42 | )% | | | (959 | ) |
Uber Technologies, Inc. | | | 918 | | | | (0.46 | )% | | | (8,301 | ) |
Total Communications | | | | | | | | | | | (9,260 | ) |
Total GS Equity Short Custom Basket | | | | | | $ | (784,416 | ) |
10 | THE GUGGENHEIM FUNDS ANNUAL REPORT | SEE NOTES TO FINANCIAL STATEMENTS. |
SCHEDULE OF INVESTMENTS (concluded) | September 30, 2024 |
ALPHA OPPORTUNITY FUND | |
* | Non-income producing security. |
*** | A copy of each underlying unaffiliated fund’s financial statements is available at the SEC’s website at www.sec.gov. |
† | Value determined based on Level 1 inputs — See Note 4. |
†† | Value determined based on Level 2 inputs — See Note 4. |
1 | All or a portion of this security is pledged as equity custom basket swap collateral at September 30, 2024. |
2 | Rate indicated is the 7-day yield as of September 30, 2024. |
| | GS — Goldman Sachs International |
| | MS — Morgan Stanley Capital Services LLC |
| | plc — Public Limited Company |
| | REIT — Real Estate Investment Trust |
| | |
| | See Sector Classification in Other Information section. |
The following table summarizes the inputs used to value the Fund’s investments at September 30, 2024 (See Note 4 in the Notes to Financial Statements):
Investments in Securities (Assets) | | Level 1
Quoted
Prices | | | Level 2
Significant
Observable
Inputs | | | Level 3
Significant
Unobservable
Inputs | | | Total | |
Common Stocks | | $ | 35,480,233 | | | $ | — | | | $ | — | | | $ | 35,480,233 | |
Money Market Fund | | | 2,011,791 | | | | — | | | | — | | | | 2,011,791 | |
Equity Custom Basket Swap Agreements** | | | — | | | | 2,195,190 | | | | — | | | | 2,195,190 | |
Total Assets | | $ | 37,492,024 | | | $ | 2,195,190 | | | $ | — | | | $ | 39,687,214 | |
Investments in Securities (Liabilities) | | Level 1
Quoted
Prices | | | Level 2
Significant
Observable
Inputs | | | Level 3
Significant
Unobservable
Inputs | | | Total | |
Equity Custom Basket Swap Agreements** | | $ | — | | | $ | 1,466,465 | | | $ | — | | | $ | 1,466,465 | |
** | This derivative is reported as unrealized appreciation/depreciation at period end. |
SEE NOTES TO FINANCIAL STATEMENTS. | THE GUGGENHEIM FUNDS ANNUAL REPORT | 11 |
STATEMENT OF ASSETS AND LIABILITIES |
September 30, 2024 |
Assets: |
Investments, at value (cost $34,140,867) | | $ | 37,492,024 | |
Cash | | | 3,398 | |
Unrealized appreciation on OTC swap agreements | | | 2,195,190 | |
Prepaid expenses | | | 23,557 | |
Receivables: |
Dividends | | | 27,472 | |
Interest | | | 6,091 | |
Fund shares sold | | | 892 | |
Total assets | | | 39,748,624 | |
| | | | | |
Liabilities: |
Unrealized depreciation on OTC swap agreements | | | 1,466,465 | |
Payable for: |
Swap settlement | | | 225,385 | |
Management fees | | | 11,105 | |
Fund accounting/administration fees | | | 3,946 | |
Transfer agent/maintenance fees | | | 3,164 | |
Distribution and service fees | | | 881 | |
Trustees’ fees* | | | 135 | |
Fund shares redeemed | | | 7 | |
Miscellaneous | | | 48,329 | |
Total liabilities | | | 1,759,417 | |
Net assets | | $ | 37,989,207 | |
| | | | | |
Net assets consist of: |
Paid in capital | | $ | 57,866,366 | |
Total distributable earnings (loss) | | | (19,877,159 | ) |
Net assets | | $ | 37,989,207 | |
Class A: |
Net assets | | $ | 3,054,333 | |
Capital shares outstanding | | | 138,373 | |
Net asset value per share | | $ | 22.07 | |
Maximum offering price per share (Net asset value divided by 95.25%) | | $ | 23.17 | |
Class C: |
Net assets | | $ | 191,372 | |
Capital shares outstanding | | | 9,959 | |
Net asset value per share | | $ | 19.22 | |
Class P: |
Net assets | | $ | 840,766 | |
Capital shares outstanding | | | 37,784 | |
Net asset value per share | | $ | 22.25 | |
| | | | | |
Institutional Class: |
Net assets | | $ | 33,902,736 | |
Capital shares outstanding | | | 1,037,850 | |
Net asset value per share | | $ | 32.67 | |
STATEMENT OF OPERATIONS |
Year Ended September 30, 2024 |
Investment Income: |
Dividends (net of foreign withholding tax of $306) | | $ | 759,581 | |
Interest | | | 66,117 | |
Total investment income | | | 825,698 | |
| | | | | |
Expenses: |
Management fees | | | 334,606 | |
Distribution and service fees: |
Class A | | | 7,411 | |
Class C | | | 1,938 | |
Class P | | | 4,528 | |
Transfer agent/maintenance fees: |
Class A | | | 7,468 | |
Class C | | | 632 | |
Class P | | | 1,825 | |
Institutional Class | | | 21,246 | |
Registration fees | | | 70,303 | |
Professional fees | | | 50,570 | |
Fund accounting/administration fees | | | 23,320 | |
Custodian fees | | | 18,571 | |
Trustees’ fees* | | | 13,810 | |
Line of credit fees | | | 957 | |
Miscellaneous | | | 20,328 | |
Recoupment of previously waived fees: |
Class A | | | 577 | |
Class C | | | 29 | |
Class P | | | 1,642 | |
Institutional Class | | | 12,210 | |
Total expenses | | | 591,971 | |
Less: |
Expenses reimbursed by Adviser: |
Class A | | | (4,253 | ) |
Class C | | | (407 | ) |
Class P | | | (822 | ) |
Institutional Class | | | (12,693 | ) |
Expenses waived by Adviser | | | (28,398 | ) |
Total waived/reimbursed expenses | | | (46,573 | ) |
Net expenses | | | 545,398 | |
Net investment income | | | 280,300 | |
| | | | | |
Net Realized and Unrealized Gain (Loss): |
Net realized gain (loss) on: |
Investments | | | 4,074,460 | |
Swap agreements | | | (1,340,707 | ) |
Net realized gain | | | 2,733,753 | |
Net change in unrealized appreciation (depreciation) on: |
Investments | | | 3,587,535 | |
Swap agreements | | | (1,452,064 | ) |
Net change in unrealized appreciation (depreciation) | | | 2,135,471 | |
Net realized and unrealized gain | | | 4,869,224 | |
Net increase in net assets resulting from operations | | $ | 5,149,524 | |
* | Relates to Trustees not deemed “interested persons” within the meaning of Section 2(a)(19) of the 1940 Act. |
12 | THE GUGGENHEIM FUNDS ANNUAL REPORT | SEE NOTES TO FINANCIAL STATEMENTS. |
STATEMENTS OF CHANGES IN NET ASSETS |
| | Year Ended
September 30,
2024 | | | Year Ended
September 30,
2023 | |
Increase (Decrease) in Net Assets from Operations: | | | | | | | | |
Net investment income | | $ | 280,300 | | | $ | 199,681 | |
Net realized gain on investments | | | 2,733,753 | | | | 2,370,224 | |
Net change in unrealized appreciation (depreciation) on investments | | | 2,135,471 | | | | 2,491,104 | |
Net increase in net assets resulting from operations | | | 5,149,524 | | | | 5,061,009 | |
| | | | | | | | | |
Distributions to shareholders: | | | | | | | | |
Class A | | | (17,013 | ) | | | (19,964 | ) |
Class P | | | (11,717 | ) | | | (12,413 | ) |
Institutional Class | | | (170,951 | ) | | | (173,553 | ) |
Total distributions to shareholders | | | (199,681 | ) | | | (205,930 | ) |
| | | | | | | | | |
Capital share transactions: | | | | | | | | |
Proceeds from sale of shares | | | | | | | | |
Class A | | | 521,179 | | | | 143,300 | |
Class C | | | 28,394 | | | | 2,880 | |
Class P | | | 93,001 | | | | 51,362 | |
Institutional Class | | | 162,832 | | | | 779,910 | |
Distributions reinvested | | | | | | | | |
Class A | | | 14,054 | | | | 17,789 | |
Class P | | | 11,717 | | | | 12,413 | |
Institutional Class | | | 170,951 | | | | 173,553 | |
Cost of shares redeemed | | | | | | | | |
Class A | | | (706,294 | ) | | | (329,547 | ) |
Class C | | | (55,553 | ) | | | (34,599 | ) |
Class P | | | (1,355,753 | ) | | | (89,028 | ) |
Institutional Class | | | (1,056,198 | ) | | | (459,238 | ) |
Net increase (decrease) from capital share transactions | | | (2,171,670 | ) | | | 268,795 | |
Net increase in net assets | | | 2,778,173 | | | | 5,123,874 | |
| | | | | | | | | |
Net assets: | | | | | | | | |
Beginning of year | | | 35,211,034 | | | | 30,087,160 | |
End of year | | $ | 37,989,207 | | | $ | 35,211,034 | |
| | | | | | | | | |
Capital share activity: | | | | | | | | |
Shares sold | | | | | | | | |
Class A | | | 24,797 | | | | 7,772 | |
Class C | | | 1,567 | | | | 179 | |
Class P | | | 4,366 | | | | 2,642 | |
Institutional Class | | | 5,415 | | | | 28,646 | |
Shares issued from reinvestment of distributions | | | | | | | | |
Class A | | | 732 | | | | 1,004 | |
Class P | | | 605 | | | | 695 | |
Institutional Class | | | 6,030 | | | | 6,660 | |
Shares redeemed | | | | | | | | |
Class A | | | (33,883 | ) | | | (18,034 | ) |
Class C | | | (3,081 | ) | | | (2,086 | ) |
Class P | | | (63,484 | ) | | | (4,858 | ) |
Institutional Class | | | (34,432 | ) | | | (16,727 | ) |
Net increase (decrease) in shares | | | (91,368 | ) | | | 5,893 | |
SEE NOTES TO FINANCIAL STATEMENTS. | THE GUGGENHEIM FUNDS ANNUAL REPORT | 13 |
This table is presented to show selected data for a share outstanding throughout each period and to assist shareholders in evaluating a Fund’s performance for the periods presented.
Class A | | Year Ended
September 30,
2024 | | | Year Ended
September 30,
2023 | | | Year Ended
September 30,
2022 | | | Year Ended
September 30,
2021 | | | Year Ended
September 30,
2020 | |
Per Share Data |
Net asset value, beginning of period | | $ | 19.37 | | | $ | 16.73 | | | $ | 18.05 | | | $ | 16.89 | | | $ | 17.42 | |
Income (loss) from investment operations: |
Net investment income (loss)a | | | .10 | | | | .07 | | | | .07 | | | | .10 | | | | .11 | |
Net gain (loss) on investments (realized and unrealized) | | | 2.72 | | | | 2.70 | | | | (1.23 | ) | | | 1.27 | | | | (.48 | ) |
Total from investment operations | | | 2.82 | | | | 2.77 | | | | (1.16 | ) | | | 1.37 | | | | (.37 | ) |
Less distributions from: |
Net investment income | | | (.12 | ) | | | (.13 | ) | | | (.16 | ) | | | (.21 | ) | | | (.16 | ) |
Total distributions | | | (.12 | ) | | | (.13 | ) | | | (.16 | ) | | | (.21 | ) | | | (.16 | ) |
Net asset value, end of period | | $ | 22.07 | | | $ | 19.37 | | | $ | 16.73 | | | $ | 18.05 | | | $ | 16.89 | |
|
Total Returnb | | | 14.64 | % | | | 16.62 | % | | | (6.55 | %) | | | 8.17 | % | | | (2.15 | %) |
Ratios/Supplemental Data |
Net assets, end of period (in thousands) | | $ | 3,054 | | | $ | 2,842 | | | $ | 2,610 | | | $ | 3,042 | | | $ | 3,429 | |
Ratios to average net assets: |
Net investment income (loss) | | | 0.49 | % | | | 0.39 | % | | | 0.39 | % | | | 0.56 | % | | | 0.65 | % |
Total expensesc | | | 1.95 | % | | | 1.94 | % | | | 1.91 | % | | | 1.94 | % | | | 1.73 | % |
Net expensesd,e,f | | | 1.73 | % | | | 1.74 | % | | | 1.76 | % | | | 1.76 | % | | | 1.69 | % |
Portfolio turnover rate | | | 306 | % | | | 309 | % | | | 283 | % | | | 169 | % | | | 209 | % |
Class C | | Year Ended
September 30,
2024 | | | Year Ended
September 30,
2023 | | | Year Ended
September 30,
2022 | | | Year Ended
September 30,
2021 | | | Year Ended
September 30,
2020 | |
Per Share Data |
Net asset value, beginning of period | | $ | 16.88 | | | $ | 14.59 | | | $ | 15.76 | | | $ | 14.71 | | | $ | 15.16 | |
Income (loss) from investment operations: |
Net investment income (loss)a | | | (.05 | ) | | | (.06 | ) | | | (.06 | ) | | | (.03 | ) | | | (.02 | ) |
Net gain (loss) on investments (realized and unrealized) | | | 2.39 | | | | 2.35 | | | | (1.08 | ) | | | 1.11 | | | | (.43 | ) |
Total from investment operations | | | 2.34 | | | | 2.29 | | | | (1.14 | ) | | | 1.08 | | | | (.45 | ) |
Less distributions from: |
Net investment income | | | — | | | | — | | | | (.03 | ) | | | (.03 | ) | | | — | |
Total distributions | | | — | | | | — | | | | (.03 | ) | | | (.03 | ) | | | — | |
Net asset value, end of period | | $ | 19.22 | | | $ | 16.88 | | | $ | 14.59 | | | $ | 15.76 | | | $ | 14.71 | |
|
Total Returnb | | | 13.86 | % | | | 15.70 | % | | | (7.25 | %) | | | 7.37 | % | | | (2.97 | %) |
Ratios/Supplemental Data |
Net assets, end of period (in thousands) | | $ | 191 | | | $ | 194 | | | $ | 195 | | | $ | 277 | | | $ | 354 | |
Ratios to average net assets: |
Net investment income (loss) | | | (0.27 | %) | | | (0.36 | %) | | | (0.37 | %) | | | (0.19 | %) | | | (0.15 | %) |
Total expensesc | | | 2.77 | % | | | 2.77 | % | | | 2.75 | % | | | 2.75 | % | | | 2.72 | % |
Net expensesd,e,f | | | 2.48 | % | | | 2.50 | % | | | 2.51 | % | | | 2.51 | % | | | 2.51 | % |
Portfolio turnover rate | | | 306 | % | | | 309 | % | | | 283 | % | | | 169 | % | | | 209 | % |
14 | THE GUGGENHEIM FUNDS ANNUAL REPORT | SEE NOTES TO FINANCIAL STATEMENTS. |
FINANCIAL HIGHLIGHTS (continued) |
This table is presented to show selected data for a share outstanding throughout each period and to assist shareholders in evaluating a Fund’s performance for the periods presented.
Class P | | Year Ended
September 30,
2024 | | | Year Ended
September 30,
2023 | | | Year Ended
September 30,
2022 | | | Year Ended
September 30,
2021 | | | Year Ended
September 30,
2020 | |
Per Share Data |
Net asset value, beginning of period | | $ | 19.52 | | | $ | 16.87 | | | $ | 18.21 | | | $ | 17.06 | | | $ | 17.56 | |
Income (loss) from investment operations: |
Net investment income (loss)a | | | .09 | | | | .07 | | | | .07 | | | | .10 | | | | .12 | |
Net gain (loss) on investments (realized and unrealized) | | | 2.76 | | | | 2.71 | | | | (1.24 | ) | | | 1.28 | | | | (.49 | ) |
Total from investment operations | | | 2.85 | | | | 2.78 | | | | (1.17 | ) | | | 1.38 | | | | (.37 | ) |
Less distributions from: |
Net investment income | | | (.12 | ) | | | (.13 | ) | | | (.17 | ) | | | (.23 | ) | | | (.13 | ) |
Total distributions | | | (.12 | ) | | | (.13 | ) | | | (.17 | ) | | | (.23 | ) | | | (.13 | ) |
Net asset value, end of period | | $ | 22.25 | | | $ | 19.52 | | | $ | 16.87 | | | $ | 18.21 | | | $ | 17.06 | |
|
Total Return | | | 14.65 | % | | | 16.60 | % | | | (6.54 | %) | | | 8.17 | % | | | (2.11 | %) |
Ratios/Supplemental Data |
Net assets, end of period (in thousands) | | $ | 841 | | | $ | 1,880 | | | $ | 1,650 | | | $ | 1,855 | | | $ | 1,161 | |
Ratios to average net assets: |
Net investment income (loss) | | | 0.45 | % | | | 0.39 | % | | | 0.39 | % | | | 0.54 | % | | | 0.70 | % |
Total expensesc | | | 1.84 | % | | | 1.87 | % | | | 1.82 | % | | | 1.96 | % | | | 1.67 | % |
Net expensesd,e,f | | | 1.73 | % | | | 1.74 | % | | | 1.76 | % | | | 1.76 | % | | | 1.64 | % |
Portfolio turnover rate | | | 306 | % | | | 309 | % | | | 283 | % | | | 169 | % | | | 209 | % |
SEE NOTES TO FINANCIAL STATEMENTS. | THE GUGGENHEIM FUNDS ANNUAL REPORT | 15 |
FINANCIAL HIGHLIGHTS (concluded) |
This table is presented to show selected data for a share outstanding throughout each period and to assist shareholders in evaluating a Fund’s performance for the periods presented.
Institutional Class | | Year Ended
September 30,
2024 | | | Year Ended
September 30,
2023 | | | Year Ended
September 30,
2022 | | | Year Ended
September 30,
2021 | | | Year Ended
September 30,
2020 | |
Per Share Data |
Net asset value, beginning of period | | $ | 28.56 | | | $ | 24.59 | | | $ | 26.44 | | | $ | 24.65 | | | $ | 25.37 | |
Income (loss) from investment operations: |
Net investment income (loss)a | | | .24 | | | | .17 | | | | .17 | | | | .22 | | | | .25 | |
Net gain (loss) on investments (realized and unrealized) | | | 4.03 | | | | 3.97 | | | | (1.81 | ) | | | 1.85 | | | | (.72 | ) |
Total from investment operations | | | 4.27 | | | | 4.14 | | | | (1.64 | ) | | | 2.07 | | | | (.47 | ) |
Less distributions from: |
Net investment income | | | (.16 | ) | | | (.17 | ) | | | (.21 | ) | | | (.28 | ) | | | (.25 | ) |
Total distributions | | | (.16 | ) | | | (.17 | ) | | | (.21 | ) | | | (.28 | ) | | | (.25 | ) |
Net asset value, end of period | | $ | 32.67 | | | $ | 28.56 | | | $ | 24.59 | | | $ | 26.44 | | | $ | 24.65 | |
|
Total Return | | | 15.04 | % | | | 16.89 | % | | | (6.31 | %) | | | 8.46 | % | | | (1.87 | %) |
Ratios/Supplemental Data |
Net assets, end of period (in thousands) | | $ | 33,903 | | | $ | 30,296 | | | $ | 25,632 | | | $ | 29,778 | | | $ | 32,260 | |
Ratios to average net assets: |
Net investment income (loss) | | | 0.80 | % | | | 0.64 | % | | | 0.64 | % | | | 0.82 | % | | | 1.00 | % |
Total expensesc | | | 1.54 | % | | | 1.56 | % | | | 1.54 | % | | | 1.58 | % | | | 1.36 | % |
Net expensesd,e,f | | | 1.42 | % | | | 1.49 | % | | | 1.51 | % | | | 1.50 | % | | | 1.36 | % |
Portfolio turnover rate | | | 306 | % | | | 309 | % | | | 283 | % | | | 169 | % | | | 209 | % |
a | Net investment income (loss) per share was computed using average shares outstanding throughout the period. |
b | Total return does not reflect the impact of any applicable sales charges. |
c | Does not include expenses of the underlying funds in which the Fund invests. |
d | Net expense information reflects the expense ratios after expense waivers and reimbursements, as applicable. |
e | The portion of the ratios of net expenses to average net assets attributable to recoupments of prior fee reductions or expense reimbursements for the years presented was as follows: |
| | | 09/30/24 | 09/30/23 | 09/30/22 | 09/30/21 | 09/30/20 |
| | Class A | 0.02% | 0.02% | 0.02% | 0.01% | 0.02% |
| | Class C | 0.01% | 0.02% | 0.03% | 0.01% | 0.01% |
| | Class P | 0.09% | 0.02% | 0.03% | 0.01% | 0.01% |
| | Institutional Class | 0.04% | 0.04% | 0.06% | 0.02% | 0.00%* |
f | Net expenses may include expenses that are excluded from the expense limitation agreement. Excluding these expenses, the net expense ratios for the years presented would be:. |
| | | 09/30/24 | 09/30/23 | 09/30/22 | 09/30/21 | 09/30/20 |
| | Class A | 1.73% | 1.74% | 1.76% | 1.76% | 1.69% |
| | Class C | 2.48% | 2.49% | 2.51% | 2.51% | 2.51% |
| | Class P | 1.73% | 1.74% | 1.76% | 1.76% | 1.64% |
| | Institutional Class | 1.42% | 1.48% | 1.50% | 1.50% | 1.36%* |
16 | THE GUGGENHEIM FUNDS ANNUAL REPORT | SEE NOTES TO FINANCIAL STATEMENTS. |
SCHEDULE OF INVESTMENTS | September 30, 2024 |
LARGE CAP VALUE FUND | |
| | Shares | | | Value | |
COMMON STOCKS† - 92.4% |
| | | | | | | | | |
Financial - 19.0% |
Berkshire Hathaway, Inc. — Class B* | | | 2,471 | | | $ | 1,137,302 | |
Bank of America Corp. | | | 26,532 | | | | 1,052,790 | |
JPMorgan Chase & Co. | | | 3,590 | | | | 756,988 | |
Jefferies Financial Group, Inc. | | | 12,178 | | | | 749,556 | |
First Horizon Corp. | | | 42,332 | | | | 657,416 | |
American Tower Corp. — Class A REIT | | | 2,660 | | | | 618,610 | |
Unum Group | | | 7,213 | | | | 428,741 | |
Charles Schwab Corp. | | | 6,546 | | | | 424,246 | |
Synovus Financial Corp. | | | 9,411 | | | | 418,507 | |
Wells Fargo & Co. | | | 7,241 | | | | 409,044 | |
Mastercard, Inc. — Class A | | | 789 | | | | 389,608 | |
Goldman Sachs Group, Inc. | | | 640 | | | | 316,870 | |
STAG Industrial, Inc. REIT | | | 6,837 | | | | 267,258 | |
Total Financial | | | | | | | 7,626,936 | |
| | | | | | | | | |
Consumer, Non-cyclical - 15.9% |
Johnson & Johnson | | | 4,170 | | | | 675,790 | |
Tyson Foods, Inc. — Class A | | | 11,064 | | | | 658,972 | |
Medtronic plc | | | 6,416 | | | | 577,633 | |
PayPal Holdings, Inc.* | | | 7,205 | | | | 562,206 | |
Encompass Health Corp. | | | 5,404 | | | | 522,243 | |
HCA Healthcare, Inc. | | | 1,156 | | | | 469,833 | |
Ingredion, Inc. | | | 3,299 | | | | 453,381 | |
Coca-Cola Co. | | | 6,081 | | | | 436,981 | |
Humana, Inc. | | | 1,306 | | | | 413,662 | |
Merck & Company, Inc. | | | 3,339 | | | | 379,177 | |
Archer-Daniels-Midland Co. | | | 6,265 | | | | 374,271 | |
Bunge Global S.A. | | | 3,038 | | | | 293,592 | |
Euronet Worldwide, Inc.* | | | 2,372 | | | | 235,374 | |
MGP Ingredients, Inc. | | | 2,368 | | | | 197,136 | |
Pfizer, Inc. | | | 4,745 | | | | 137,320 | |
Total Consumer, Non-cyclical | | | | | | | 6,387,571 | |
| | | | | | | | | |
Technology - 10.2% |
Leidos Holdings, Inc. | | | 4,014 | | | | 654,282 | |
Microsoft Corp. | | | 1,371 | | | | 589,941 | |
Fortinet, Inc.* | | | 7,101 | | | | 550,683 | |
Fiserv, Inc.* | | | 2,949 | | | | 529,788 | |
Teradyne, Inc. | | | 2,764 | | | | 370,182 | |
KLA Corp. | | | 456 | | | | 353,131 | |
Applied Materials, Inc. | | | 1,742 | | | | 351,971 | |
QUALCOMM, Inc. | | | 1,984 | | | | 337,379 | |
NXP Semiconductor N.V. | | | 1,295 | | | | 310,813 | |
Intel Corp.* | | | 2,399 | | | | 56,281 | |
Total Technology | | | | | | | 4,104,451 | |
| | | | | | | | | |
Energy - 10.1% |
Chevron Corp. | | | 6,300 | | | | 927,801 | |
ConocoPhillips | | | 7,001 | | | | 737,065 | |
Diamondback Energy, Inc. | | | 3,541 | | | | 610,468 | |
Coterra Energy, Inc. — Class A | | | 15,804 | | | | 378,506 | |
Kinder Morgan, Inc. | | | 16,847 | | | | 372,150 | |
Equities Corp. | | | 9,397 | | | | 344,306 | |
Marathon Oil Corp. | | | 12,079 | | | | 321,664 | |
Exxon Mobil Corp. | | | 1,676 | | | | 196,461 | |
Range Resources Corp. | | | 5,505 | | | | 169,334 | |
Total Energy | | | | | | | 4,057,755 | |
| | | | | | | | | |
Consumer, Cyclical - 9.7% |
Walmart, Inc. | | | 12,996 | | | | 1,049,427 | |
Levi Strauss & Co. — Class A | | | 21,539 | | | | 469,550 | |
Las Vegas Sands Corp. | | | 8,325 | | | | 419,080 | |
Ferguson Enterprises, Inc. | | | 1,981 | | | | 393,367 | |
Delta Air Lines, Inc. | | | 6,868 | | | | 348,826 | |
Lear Corp. | | | 2,877 | | | | 314,025 | |
Southwest Airlines Co. | | | 9,056 | | | | 268,329 | |
H&E Equipment Services, Inc. | | | 4,041 | | | | 196,716 | |
BorgWarner, Inc. | | | 5,190 | | | | 188,345 | |
Crocs, Inc.* | | | 1,076 | | | | 155,816 | |
Advance Auto Parts, Inc. | | | 2,570 | | | | 100,204 | |
Total Consumer, Cyclical | | | | | | | 3,903,685 | |
| | | | | | | | | |
Industrial - 8.1% |
Curtiss-Wright Corp. | | | 2,347 | | | | 771,436 | |
Knight-Swift Transportation Holdings, Inc. | | | 9,555 | | | | 515,492 | |
L3Harris Technologies, Inc. | | | 2,153 | | | | 512,134 | |
Advanced Energy Industries, Inc. | | | 4,251 | | | | 447,375 | |
Eagle Materials, Inc. | | | 1,440 | | | | 414,216 | |
Teledyne Technologies, Inc.* | | | 840 | | | | 367,635 | |
Johnson Controls International plc | | | 2,984 | | | | 231,588 | |
Total Industrial | | | | | | | 3,259,876 | |
| | | | | | | | | |
Utilities - 7.1% |
OGE Energy Corp. | | | 18,873 | | | | 774,170 | |
Edison International | | | 7,613 | | | | 663,016 | |
Pinnacle West Capital Corp. | | | 6,179 | | | | 547,398 | |
Exelon Corp. | | | 11,169 | | | | 452,903 | |
Duke Energy Corp. | | | 3,475 | | | | 400,668 | |
Total Utilities | | | | | | | 2,838,155 | |
| | | | | | | | | |
Communications - 7.0% |
Verizon Communications, Inc. | | | 24,434 | | | | 1,097,331 | |
Alphabet, Inc. — Class A | | | 4,480 | | | | 743,008 | |
AT&T, Inc. | | | 22,158 | | | | 487,476 | |
T-Mobile US, Inc. | | | 1,466 | | | | 302,524 | |
Walt Disney Co. | | | 1,666 | | | | 160,252 | |
Total Communications | | | | | | | 2,790,591 | |
| | | | | | | | | |
Basic Materials - 5.3% |
Freeport-McMoRan, Inc. | | | 9,272 | | | | 462,858 | |
Westlake Corp. | | | 2,839 | | | | 426,674 | |
Nucor Corp. | | | 2,541 | | | | 382,014 | |
DuPont de Nemours, Inc. | | | 4,043 | | | | 360,272 | |
Reliance, Inc. | | | 1,014 | | | | 293,259 | |
Huntsman Corp. | | | 8,911 | | | | 215,646 | |
Total Basic Materials | | | | | | | 2,140,723 | |
| | | | | | | | | |
Total Common Stocks | | | | |
(Cost $27,558,746) | | | | | | | 37,109,743 | |
| | | | | | | | | |
SEE NOTES TO FINANCIAL STATEMENTS. | THE GUGGENHEIM FUNDS ANNUAL REPORT | 17 |
SCHEDULE OF INVESTMENTS (concluded) | September 30, 2024 |
LARGE CAP VALUE FUND | |
| | Shares | | | Value | |
EXCHANGE-TRADED FUNDS***,† - 3.8% |
iShares Russell 1000 Value ETF | | | 7,953 | | | $ | 1,509,479 | |
Total Exchange-Traded Funds | | | | |
(Cost $1,121,233) | | | | | | | 1,509,479 | |
| | | | | | | | | |
MONEY MARKET FUND***,† - 3.8% |
Dreyfus Treasury Securities Cash Management Fund — Institutional Shares, 4.88%1 | | | 1,519,168 | | | | 1,519,168 | |
Total Money Market Fund | | | | |
(Cost $1,519,168) | | | | | | | 1,519,168 | |
| | | | | | | | | |
Total Investments - 100.0% | | | | |
(Cost $30,199,147) | | $ | 40,138,390 | |
Other Assets & Liabilities, net - 0.0% | | | 18,148 | |
Total Net Assets - 100.0% | | $ | 40,156,538 | |
* | Non-income producing security. |
*** | A copy of each underlying unaffiliated fund’s financial statements is available at the SEC’s website at www.sec.gov. |
† | Value determined based on Level 1 inputs — See Note 4. |
1 | Rate indicated is the 7-day yield as of September 30, 2024. |
| | plc — Public Limited Company |
| | REIT — Real Estate Investment Trust |
| | |
| | See Sector Classification in Other Information section. |
The following table summarizes the inputs used to value the Fund’s investments at September 30, 2024 (See Note 4 in the Notes to Financial Statements):
Investments in Securities (Assets) | | Level 1
Quoted
Prices | | | Level 2
Significant
Observable
Inputs | | | Level 3
Significant
Unobservable
Inputs | | | Total | |
Common Stocks | | $ | 37,109,743 | | | $ | — | | | $ | — | | | $ | 37,109,743 | |
Exchange-Traded Funds | | | 1,509,479 | | | | — | | | | — | | | | 1,509,479 | |
Money Market Fund | | | 1,519,168 | | | | — | | | | — | | | | 1,519,168 | |
Total Assets | | $ | 40,138,390 | | | $ | — | | | $ | — | | | $ | 40,138,390 | |
18 | THE GUGGENHEIM FUNDS ANNUAL REPORT | SEE NOTES TO FINANCIAL STATEMENTS. |
STATEMENT OF ASSETS AND LIABILITIES |
September 30, 2024 |
Assets: |
Investments, at value (cost $30,199,147) | | $ | 40,138,390 | |
Prepaid expenses | | | 31,921 | |
Receivables: |
Dividends | | | 27,947 | |
Investment Adviser | | | 8,265 | |
Interest | | | 6,332 | |
Fund shares sold | | | 2,225 | |
Total assets | | | 40,215,080 | |
| | | | | |
Liabilities: |
Payable for: |
Professional fees | | | 27,507 | |
Distribution and service fees | | | 7,620 | |
Printing fees | | | 7,309 | |
Transfer agent/maintenance fees | | | 6,297 | |
Fund accounting /administration fees | | | 3,867 | |
Fund shares redeemed | | | 1,914 | |
Trustees’ fees* | | | 1,634 | |
Due to Investment Adviser | | | 95 | |
Miscellaneous | | | 2,299 | |
Total liabilities | | | 58,542 | |
Net assets | | $ | 40,156,538 | |
| | | | | |
Net assets consist of: |
Paid in capital | | $ | 28,911,971 | |
Total distributable earnings (loss) | | | 11,244,567 | |
Net assets | | $ | 40,156,538 | |
Class A: |
Net assets | | $ | 35,887,886 | |
Capital shares outstanding | | | 713,291 | |
Net asset value per share | | $ | 50.31 | |
Maximum offering price per share (Net asset value divided by 95.25%) | | $ | 52.82 | |
Class C: |
Net assets | | $ | 1,168,171 | |
Capital shares outstanding | | | 26,349 | |
Net asset value per share | | $ | 44.33 | |
Class P: |
Net assets | | $ | 79,098 | |
Capital shares outstanding | | | 1,577 | |
Net asset value per share | | $ | 50.16 | |
| | | | | |
Institutional Class: |
Net assets | | $ | 3,021,383 | |
Capital shares outstanding | | | 61,205 | |
Net asset value per share | | $ | 49.36 | |
STATEMENT OF OPERATIONS |
Year Ended September 30, 2024 |
Investment Income: |
Dividends (net of foreign withholding tax of $949) | | $ | 835,170 | |
Interest | | | 53,317 | |
Total investment income | | | 888,487 | |
| | | | | |
Expenses: |
Management fees | | | 243,424 | |
Distribution and service fees: |
Class A | | | 84,429 | |
Class C | | | 11,577 | |
Class P | | | 206 | |
Transfer agent/maintenance fees: |
Class A | | | 55,358 | |
Class C | | | 2,980 | |
Class P | | | 294 | |
Institutional Class | | | 4,219 | |
Registration fees | | | 61,547 | |
Professional fees | | | 40,053 | |
Fund accounting/administration fees | | | 23,416 | |
Trustees’ fees* | | | 15,214 | |
Custodian fees | | | 3,579 | |
Line of credit fees | | | 1,024 | |
Miscellaneous | | | 26,456 | |
Recoupment of previously waived fees: |
Class A | | | 290 | |
Class C | | | 16 | |
Class P | | | 1 | |
Institutional Class | | | 18 | |
Total expenses | | | 574,101 | |
Less: |
Expenses reimbursed by Adviser: |
Class A | | | (58,851 | ) |
Class C | | | (3,086 | ) |
Class P | | | (301 | ) |
Institutional Class | | | (4,519 | ) |
Expenses waived by Adviser | | | (84,033 | ) |
Total waived/reimbursed expenses | | | (150,790 | ) |
Net expenses | | | 423,311 | |
Net investment income | | | 465,176 | |
| | | | | |
Net Realized and Unrealized Gain (Loss): |
Net realized gain (loss) on: |
Investments | | | 1,125,722 | |
Net realized gain | | | 1,125,722 | |
Net change in unrealized appreciation (depreciation) on: |
Investments | | | 6,300,481 | |
Net change in unrealized appreciation (depreciation) | | | 6,300,481 | |
Net realized and unrealized gain | | | 7,426,203 | |
Net increase in net assets resulting from operations | | $ | 7,891,379 | |
* | Relates to Trustees not deemed “interested persons” within the meaning of Section 2(a)(19) of the 1940 Act. |
SEE NOTES TO FINANCIAL STATEMENTS. | THE GUGGENHEIM FUNDS ANNUAL REPORT | 19 |
STATEMENTS OF CHANGES IN NET ASSETS |
| | Year Ended
September 30,
2024 | | | Year Ended
September 30,
2023 | |
Increase (Decrease) in Net Assets from Operations: | | | | | | | | |
Net investment income | | $ | 465,176 | | | $ | 513,399 | |
Net realized gain on investments | | | 1,125,722 | | | | 4,048,731 | |
Net change in unrealized appreciation (depreciation) on investments | | | 6,300,481 | | | | 863,434 | |
Net increase in net assets resulting from operations | | | 7,891,379 | | | | 5,425,564 | |
| | | | | | | | | |
Distributions to shareholders: | | | | | | | | |
Class A | | | (3,614,984 | ) | | | (2,952,899 | ) |
Class C | | | (133,562 | ) | | | (151,235 | ) |
Class P | | | (9,665 | ) | | | (8,525 | ) |
Institutional Class | | | (215,928 | ) | | | (518,877 | ) |
Total distributions to shareholders | | | (3,974,139 | ) | | | (3,631,536 | ) |
| | | | | | | | | |
Capital share transactions: | | | | | | | | |
Proceeds from sale of shares | | | | | | | | |
Class A | | | 822,724 | | | | 1,050,924 | |
Class C | | | 96,923 | | | | 236,441 | |
Class P | | | 645 | | | | 5,872 | |
Institutional Class | | | 1,637,823 | | | | 1,317,443 | |
Distributions reinvested | | | | | | | | |
Class A | | | 3,537,482 | | | | 2,884,298 | |
Class C | | | 133,562 | | | | 137,939 | |
Class P | | | 9,665 | | | | 8,525 | |
Institutional Class | | | 215,928 | | | | 518,877 | |
Cost of shares redeemed | | | | | | | | |
Class A | | | (3,861,275 | ) | | | (4,238,196 | ) |
Class C | | | (388,459 | ) | | | (876,269 | ) |
Class P | | | (23,068 | ) | | | (33,478 | ) |
Institutional Class | | | (1,141,930 | ) | | | (5,335,058 | ) |
Net increase (decrease) from capital share transactions | | | 1,040,020 | | | | (4,322,682 | ) |
Net increase (decrease) in net assets | | | 4,957,260 | | | | (2,528,654 | ) |
| | | | | | | | | |
Net assets: | | | | | | | | |
Beginning of year | | | 35,199,278 | | | | 37,727,932 | |
End of year | | $ | 40,156,538 | | | $ | 35,199,278 | |
| | | | | | | | | |
Capital share activity: | | | | | | | | |
Shares sold | | | | | | | | |
Class A | | | 17,707 | | | | 22,456 | |
Class C | | | 2,411 | | | | 5,650 | |
Class P | | | 13 | | | | 129 | |
Institutional Class | | | 36,005 | | | | 29,033 | |
Shares issued from reinvestment of distributions | | | | | | | | |
Class A | | | 80,968 | | | | 63,832 | |
Class C | | | 3,449 | | | | 3,405 | |
Class P | | | 222 | | | | 189 | |
Institutional Class | | | 5,048 | | | | 11,697 | |
Shares redeemed | | | | | | | | |
Class A | | | (83,236 | ) | | | (90,872 | ) |
Class C | | | (9,626 | ) | | | (20,843 | ) |
Class P | | | (495 | ) | | | (706 | ) |
Institutional Class | | | (25,018 | ) | | | (117,251 | ) |
Net increase (decrease) in shares | | | 27,448 | | | | (93,281 | ) |
20 | THE GUGGENHEIM FUNDS ANNUAL REPORT | SEE NOTES TO FINANCIAL STATEMENTS. |
This table is presented to show selected data for a share outstanding throughout each period and to assist shareholders in evaluating a Fund’s performance for the periods presented.
Class A | | Year Ended
September 30,
2024 | | | Year Ended
September 30,
2023 | | | Year Ended
September 30,
2022 | | | Year Ended
September 30,
2021 | | | Year Ended
September 30,
2020 | |
Per Share Data |
Net asset value, beginning of period | | $ | 45.66 | | | $ | 43.75 | | | $ | 50.08 | | | $ | 38.17 | | | $ | 43.56 | |
Income (loss) from investment operations: |
Net investment income (loss)a | | | .58 | | | | .61 | | | | .56 | | | | .41 | | | | .97 | |
Net gain (loss) on investments (realized and unrealized) | | | 9.37 | | | | 5.55 | | | | (3.40 | ) | | | 14.51 | | | | (2.97 | ) |
Total from investment operations | | | 9.95 | | | | 6.16 | | | | (2.84 | ) | | | 14.92 | | | | (2.00 | ) |
Less distributions from: |
Net investment income | | | (.70 | ) | | | (.52 | ) | | | (.43 | ) | | | (1.30 | ) | | | (.70 | ) |
Net realized gains | | | (4.60 | ) | | | (3.73 | ) | | | (3.06 | ) | | | (1.71 | ) | | | (2.69 | ) |
Total distributions | | | (5.30 | ) | | | (4.25 | ) | | | (3.49 | ) | | | (3.01 | ) | | | (3.39 | ) |
Net asset value, end of period | | $ | 50.31 | | | $ | 45.66 | | | $ | 43.75 | | | $ | 50.08 | | | $ | 38.17 | |
|
Total Returnb | | | 23.55 | % | | | 14.19 | % | | | (6.43 | %) | | | 40.59 | % | | | (5.58 | %) |
Ratios/Supplemental Data |
Net assets, end of period (in thousands) | | $ | 35,888 | | | $ | 31,862 | | | $ | 30,733 | | | $ | 36,678 | | | $ | 28,548 | |
Ratios to average net assets: |
Net investment income (loss) | | | 1.25 | % | | | 1.32 | % | | | 1.11 | % | | | 0.88 | % | | | 2.40 | % |
Total expensesc | | | 1.52 | % | | | 1.47 | % | | | 1.41 | % | | | 1.47 | % | | | 1.46 | % |
Net expensesd,e,f | | | 1.12 | % | | | 1.12 | % | | | 1.13 | % | | | 1.15 | % | | | 1.15 | % |
Portfolio turnover rate | | | 13 | % | | | 19 | % | | | 33 | % | | | 19 | % | | | 25 | % |
Class C | | Year Ended
September 30,
2024 | | | Year Ended
September 30,
2023 | | | Year Ended
September 30,
2022 | | | Year Ended
September 30,
2021 | | | Year Ended
September 30,
2020 | |
Per Share Data |
Net asset value, beginning of period | | $ | 40.68 | | | $ | 39.44 | | | $ | 45.43 | | | $ | 34.79 | | | $ | 39.77 | |
Income (loss) from investment operations: |
Net investment income (loss)a | | | .21 | | | | .24 | | | | .18 | | | | .05 | | | | .62 | |
Net gain (loss) on investments (realized and unrealized) | | | 8.30 | | | | 5.00 | | | | (3.07 | ) | | | 13.23 | | | | (2.74 | ) |
Total from investment operations | | | 8.51 | | | | 5.24 | | | | (2.89 | ) | | | 13.28 | | | | (2.12 | ) |
Less distributions from: |
Net investment income | | | (.26 | ) | | | (.27 | ) | | | (.04 | ) | | | (.93 | ) | | | (.17 | ) |
Net realized gains | | | (4.60 | ) | | | (3.73 | ) | | | (3.06 | ) | | | (1.71 | ) | | | (2.69 | ) |
Total distributions | | | (4.86 | ) | | | (4.00 | ) | | | (3.10 | ) | | | (2.64 | ) | | | (2.86 | ) |
Net asset value, end of period | | $ | 44.33 | | | $ | 40.68 | | | $ | 39.44 | | | $ | 45.43 | | | $ | 34.79 | |
|
Total Returnb | | | 22.63 | % | | | 13.33 | % | | | (7.13 | %) | | | 39.55 | % | | | (6.30 | %) |
Ratios/Supplemental Data |
Net assets, end of period (in thousands) | | $ | 1,168 | | | $ | 1,225 | | | $ | 1,653 | | | $ | 1,191 | | | $ | 911 | |
Ratios to average net assets: |
Net investment income (loss) | | | 0.50 | % | | | 0.57 | % | | | 0.39 | % | | | 0.12 | % | | | 1.69 | % |
Total expensesc | | | 2.36 | % | | | 2.28 | % | | | 2.29 | % | | | 2.36 | % | | | 2.43 | % |
Net expensesd,e,f | | | 1.87 | % | | | 1.87 | % | | | 1.88 | % | | | 1.89 | % | | | 1.90 | % |
Portfolio turnover rate | | | 13 | % | | | 19 | % | | | 33 | % | | | 19 | % | | | 25 | % |
SEE NOTES TO FINANCIAL STATEMENTS. | THE GUGGENHEIM FUNDS ANNUAL REPORT | 21 |
FINANCIAL HIGHLIGHTS (continued) |
This table is presented to show selected data for a share outstanding throughout each period and to assist shareholders in evaluating a Fund’s performance for the periods presented.
Class P | | Year Ended
September 30,
2024 | | | Year Ended
September 30,
2023 | | | Year Ended
September 30,
2022 | | | Year Ended
September 30,
2021 | | | Year Ended
September 30,
2020 | |
Per Share Data |
Net asset value, beginning of period | | $ | 45.53 | | | $ | 43.59 | | | $ | 49.91 | | | $ | 38.06 | | | $ | 43.46 | |
Income (loss) from investment operations: |
Net investment income (loss)a | | | .58 | | | | .62 | | | | .53 | | | | .41 | | | | .83 | |
Net gain (loss) on investments (realized and unrealized) | | | 9.35 | | | | 5.52 | | | | (3.34 | ) | | | 14.46 | | | | (2.82 | ) |
Total from investment operations | | | 9.93 | | | | 6.14 | | | | (2.81 | ) | | | 14.87 | | | | (1.99 | ) |
Less distributions from: |
Net investment income | | | (.70 | ) | | | (.47 | ) | | | (.45 | ) | | | (1.31 | ) | | | (.72 | ) |
Net realized gains | | | (4.60 | ) | | | (3.73 | ) | | | (3.06 | ) | | | (1.71 | ) | | | (2.69 | ) |
Total distributions | | | (5.30 | ) | | | (4.20 | ) | | | (3.51 | ) | | | (3.02 | ) | | | (3.41 | ) |
Net asset value, end of period | | $ | 50.16 | | | $ | 45.53 | | | $ | 43.59 | | | $ | 49.91 | | | $ | 38.06 | |
|
Total Return | | | 23.56 | % | | | 14.19 | % | | | (6.44 | %) | | | 40.60 | % | | | (5.58 | %) |
Ratios/Supplemental Data |
Net assets, end of period (in thousands) | | $ | 79 | | | $ | 84 | | | $ | 97 | | | $ | 194 | | | $ | 170 | |
Ratios to average net assets: |
Net investment income (loss) | | | 1.26 | % | | | 1.33 | % | | | 1.05 | % | | | 0.87 | % | | | 2.12 | % |
Total expensesc | | | 1.71 | % | | | 1.70 | % | | | 1.67 | % | | | 1.71 | % | | | 1.72 | % |
Net expensesd,e,f | | | 1.12 | % | | | 1.12 | % | | | 1.14 | % | | | 1.15 | % | | | 1.15 | % |
Portfolio turnover rate | | | 13 | % | | | 19 | % | | | 33 | % | | | 19 | % | | | 25 | % |
22 | THE GUGGENHEIM FUNDS ANNUAL REPORT | SEE NOTES TO FINANCIAL STATEMENTS. |
FINANCIAL HIGHLIGHTS (concluded) |
This table is presented to show selected data for a share outstanding throughout each period and to assist shareholders in evaluating a Fund’s performance for the periods presented.
Institutional Class | | Year Ended
September 30,
2024 | | | Year Ended
September 30,
2023 | | | Year Ended
September 30,
2022 | | | Year Ended
September 30,
2021 | | | Year Ended
September 30,
2020 | |
Per Share Data |
Net asset value, beginning of period | | $ | 44.90 | | | $ | 43.11 | | | $ | 49.39 | | | $ | 37.71 | | | $ | 43.08 | |
Income (loss) from investment operations: |
Net investment income (loss)a | | | .68 | | | | .74 | | | | .71 | | | | .52 | | | | .98 | |
Net gain (loss) on investments (realized and unrealized) | | | 9.21 | | | | 5.43 | | | | (3.38 | ) | | | 14.31 | | | | (2.84 | ) |
Total from investment operations | | | 9.89 | | | | 6.17 | | | | (2.67 | ) | | | 14.83 | | | | (1.86 | ) |
Less distributions from: |
Net investment income | | | (.83 | ) | | | (.65 | ) | | | (.55 | ) | | | (1.44 | ) | | | (.82 | ) |
Net realized gains | | | (4.60 | ) | | | (3.73 | ) | | | (3.06 | ) | | | (1.71 | ) | | | (2.69 | ) |
Total distributions | | | (5.43 | ) | | | (4.38 | ) | | | (3.61 | ) | | | (3.15 | ) | | | (3.51 | ) |
Net asset value, end of period | | $ | 49.36 | | | $ | 44.90 | | | $ | 43.11 | | | $ | 49.39 | | | $ | 37.71 | |
|
Total Return | | | 23.89 | % | | | 14.48 | % | | | (6.20 | %) | | | 40.93 | % | | | (5.35 | %) |
Ratios/Supplemental Data |
Net assets, end of period (in thousands) | | $ | 3,021 | | | $ | 2,028 | | | $ | 5,246 | | | $ | 1,364 | | | $ | 477 | |
Ratios to average net assets: |
Net investment income (loss) | | | 1.48 | % | | | 1.61 | % | | | 1.46 | % | | | 1.10 | % | | | 2.50 | % |
Total expensesc | | | 1.29 | % | | | 1.21 | % | | | 1.15 | % | | | 1.24 | % | | | 1.35 | % |
Net expensesd,e,f | | | 0.87 | % | | | 0.87 | % | | | 0.88 | % | | | 0.89 | % | | | 0.90 | % |
Portfolio turnover rate | | | 13 | % | | | 19 | % | | | 33 | % | | | 19 | % | | | 25 | % |
a | Net investment income (loss) per share was computed using average shares outstanding throughout the period. |
b | Total return does not reflect the impact of any applicable sales charges. |
c | Does not include expenses of the underlying funds in which the Fund invests. |
d | Net expense information reflects the expense ratios after expense waivers and reimbursements, as applicable. |
e | The portion of the ratios of net expenses to average net assets attributable to recoupments of prior fee reductions or expense reimbursements for the years presented was as follows: |
| | | 09/30/24 | 09/30/23 | 09/30/22 | 09/30/21 | 09/30/20 |
| | Class A | 0.00%* | — | — | 0.00%* | 0.00%* |
| | Class C | 0.00%* | — | — | 0.00%* | — |
| | Class P | 0.00%* | — | — | — | — |
| | Institutional Class | 0.00%* | — | — | — | — |
f | Net expenses may include expenses that are excluded from the expense limitation agreement. Excluding these expenses, the net expense ratios for the years presented would be: |
| | | 09/30/24 | 09/30/23 | 09/30/22 | 09/30/21 | 09/30/20 |
| | Class A | 1.12% | 1.12% | 1.13% | 1.14% | 1.15% |
| | Class C | 1.87% | 1.87% | 1.88% | 1.89% | 1.90% |
| | Class P | 1.12% | 1.12% | 1.13% | 1.14% | 1.15% |
| | Institutional Class | 0.87% | 0.87% | 0.88% | 0.89% | 0.90% |
SEE NOTES TO FINANCIAL STATEMENTS. | THE GUGGENHEIM FUNDS ANNUAL REPORT | 23 |
SCHEDULE OF INVESTMENTS | September 30, 2024 |
MARKET NEUTRAL REAL ESTATE FUND | |
| | Shares | | | Value | |
COMMON STOCKS† - 54.5% |
| | | | | | | | | |
REITs - 54.5% |
REITs-Diversified - 11.5% |
VICI Properties, Inc. | | | 37,177 | | | $ | 1,238,366 | |
Gaming and Leisure Properties, Inc. | | | 12,043 | | | | 619,612 | |
InvenTrust Properties Corp. | | | 16,761 | | | | 475,510 | |
EPR Properties | | | 9,555 | | | | 468,577 | |
WP Carey, Inc. | | | 7,242 | | | | 451,177 | |
Digital Realty Trust, Inc. | | | 2,704 | | | | 437,588 | |
SBA Communications Corp. | | | 1,719 | | | | 413,763 | |
American Tower Corp. — Class A | | | 1,752 | | | | 407,445 | |
Alexander & Baldwin, Inc. | | | 10,441 | | | | 200,467 | |
Total REITs-Diversified | | | | | | | 4,712,505 | |
| | | | | | | | | |
REITs-Apartments - 9.7% |
Invitation Homes, Inc. | | | 39,351 | | | | 1,387,516 | |
Essex Property Trust, Inc. | | | 4,192 | | | | 1,238,401 | |
American Homes 4 Rent — Class A | | | 18,262 | | | | 701,078 | |
UDR, Inc. | | | 13,999 | | | | 634,715 | |
Total REITs-Apartments | | | | | | | 3,961,710 | |
| | | | | | | | | |
REITs-Office Property - 7.8% |
Kilroy Realty Corp. | | | 37,472 | | | | 1,450,166 | |
Alexandria Real Estate Equities, Inc. | | | 7,854 | | | | 932,663 | |
Vornado Realty Trust | | | 20,212 | | | | 796,353 | |
Total REITs-Office Property | | | | | | | 3,179,182 | |
| | | | | | | | | |
REITs-Hotels - 5.9% |
Park Hotels & Resorts, Inc. | | | 69,857 | | | | 984,984 | |
Apple Hospitality REIT, Inc. | | | 54,323 | | | | 806,697 | |
Ryman Hospitality Properties, Inc. | | | 3,663 | | | | 392,820 | |
RLJ Lodging Trust | | | 23,008 | | | | 211,213 | |
Total REITs-Hotels | | | | | | | 2,395,714 | |
| | | | | | | | | |
REITs-Shopping Centers - 5.6% |
Kite Realty Group Trust | | | 36,170 | | | | 960,675 | |
Kimco Realty Corp. | | | 38,713 | | | | 898,916 | |
NETSTREIT Corp. | | | 25,103 | | | | 414,953 | |
Total REITs-Shopping Centers | | | | | | | 2,274,544 | |
| | | | | | | | | |
REITs-Health Care - 4.5% |
Healthcare Realty Trust, Inc. | | | 44,844 | | | | 813,919 | |
Sabra Health Care REIT, Inc. | | | 32,812 | | | | 610,631 | |
CareTrust REIT, Inc. | | | 13,233 | | | | 408,370 | |
Total REITs-Health Care | | | | | | | 1,832,920 | |
| | | | | | | | | |
REITs-Warehouse/Industries - 4.0% |
Prologis, Inc. | | | 6,511 | | | | 822,209 | |
STAG Industrial, Inc. | | | 20,820 | | | | 813,854 | |
Total REITs-Warehouse/Industries | | | | | | | 1,636,063 | |
| | | | | | | | | |
REITs-Regional Malls - 2.0% |
Tanger, Inc. | | | 12,536 | | | | 415,944 | |
Simon Property Group, Inc. | | | 2,423 | | | | 409,535 | |
Total REITs-Regional Malls | | | | | | | 825,479 | |
| | | | | | | | | |
REITs-Storage - 2.0% |
National Storage Affiliates Trust | | | 8,523 | | | | 410,809 | |
Extra Space Storage, Inc. | | | 2,271 | | | | 409,211 | |
Total REITs-Storage | | | | | | | 820,020 | |
| | | | | | | | | |
REITs-Single Tenant - 1.5% |
NNN REIT, Inc. | | | 12,795 | | | | 620,430 | |
Total REITs | | | | | | | 22,258,567 | |
| | | | | | | | | |
Total Common Stocks | | | | |
(Cost $20,158,172) | | | | | | | 22,258,567 | |
| | | | | | | | | |
MONEY MARKET FUND***,† - 43.5% |
Goldman Sachs Financial Square Treasury Instruments Fund — Institutional Shares, 4.90%1 | | | 17,765,843 | | | | 17,765,843 | |
Total Money Market Fund | | | | |
(Cost $17,765,843) | | | | | | | 17,765,843 | |
| | | | | | | | | |
Total Investments - 98.0% | | | | |
(Cost $37,924,015) | | $ | 40,024,410 | |
Other Assets & Liabilities, net - 2.0% | | | 802,498 | |
Total Net Assets - 100.0% | | $ | 40,826,908 | |
Custom Basket Swap Agreements |
Counterparty | Reference Obligation | Type | Financing
Rate | | Payment
Frequency | | | Maturity
Date | | | Notional
Amount | | | Value and
Unrealized
Depreciation | |
OTC Custom Basket Swap Agreements Sold Short†† |
Morgan Stanley Capital Services LLC | MS Equity Custom Basket | Receive | 4.52% (Federal Funds Rate - 0.31%) | | | At Maturity | | | | 11/22/24 | | | $ | 11,159,930 | | | $ | (389,630 | ) |
Goldman Sachs International | GS Equity Custom Basket | Receive | 4.63% (Federal Funds Rate - 0.20%) | | | At Maturity | | | | 05/16/28 | | | | 11,162,012 | | | | (783,179 | ) |
| | | | | | | | | | | | | | $ | 22,321,942 | | | $ | (1,172,809 | ) |
24 | THE GUGGENHEIM FUNDS ANNUAL REPORT | SEE NOTES TO FINANCIAL STATEMENTS. |
SCHEDULE OF INVESTMENTS (continued) | September 30, 2024 |
MARKET NEUTRAL REAL ESTATE FUND | |
| | Shares | | | Percentage
Notional
Amount | | | Value and
Unrealized
Appreciation
(Depreciation) | |
MS EQUITY SHORT CUSTOM BASKET | | | | | | | | |
Financial | | | | | | | | | | | | |
Douglas Emmett, Inc. | | | 21,869 | | | | (3.45 | )% | | $ | 334,884 | |
Service Properties Trust | | | 19,903 | | | | (0.81 | )% | | | 90,954 | |
Realty Income Corp. | | | 6,642 | | | | (3.77 | )% | | | 37,910 | |
Pebblebrook Hotel Trust | | | 22,515 | | | | (2.67 | )% | | | 28,761 | |
JBG SMITH Properties | | | 4,602 | | | | (0.72 | )% | | | 10,127 | |
Host Hotels & Resorts, Inc. | | | 11,123 | | | | (1.75 | )% | | | 6,179 | |
LXP Industrial Trust | | | 15,028 | | | | (1.35 | )% | | | 3,758 | |
Camden Property Trust | | | 5,369 | | | | (5.95 | )% | | | 2,919 | |
Americold Realty Trust, Inc. | | | 4,650 | | | | (1.18 | )% | | | 1,122 | |
Rexford Industrial Realty, Inc. | | | 2,603 | | | | (1.17 | )% | | | 1,029 | |
Equity LifeStyle Properties, Inc. | | | 2,849 | | | | (1.82 | )% | | | 986 | |
EastGroup Properties, Inc. | | | 713 | | | | (1.19 | )% | | | 639 | |
Cousins Properties, Inc. | | | 6,852 | | | | (1.81 | )% | | | (40 | ) |
Independence Realty Trust, Inc. | | | 2,942 | | | | (0.54 | )% | | | (197 | ) |
Getty Realty Corp. | | | 4,576 | | | | (1.30 | )% | | | (1,322 | ) |
Global Net Lease, Inc. | | | 13,223 | | | | (1.00 | )% | | | (2,315 | ) |
Sun Communities, Inc. | | | 1,500 | | | | (1.82 | )% | | | (2,555 | ) |
Sunstone Hotel Investors, Inc. | | | 38,199 | | | | (3.53 | )% | | | (5,375 | ) |
Regency Centers Corp. | | | 2,900 | | | | (1.88 | )% | | | (5,959 | ) |
CubeSmart | | | 3,822 | | | | (1.84 | )% | | | (10,048 | ) |
DiamondRock Hospitality Co. | | | 25,495 | | | | (1.99 | )% | | | (13,978 | ) |
Veris Residential, Inc. | | | 6,242 | | | | (1.00 | )% | | | (14,147 | ) |
Public Storage | | | 572 | | | | (1.87 | )% | | | (16,042 | ) |
Safehold, Inc. | | | 5,152 | | | | (1.21 | )% | | | (19,588 | ) |
Four Corners Property Trust, Inc. | | | 10,376 | | | | (2.73 | )% | | | (19,759 | ) |
Equinix, Inc. | | | 255 | | | | (2.03 | )% | | | (27,367 | ) |
Crown Castle, Inc. | | | 3,509 | | | | (3.73 | )% | | | (29,794 | ) |
Phillips Edison & Company, Inc. | | | 8,766 | | | | (2.96 | )% | | | (36,530 | ) |
Acadia Realty Trust | | | 8,773 | | | | (1.85 | )% | | | (38,001 | ) |
Federal Realty Investment Trust | | | 3,560 | | | | (3.67 | )% | | | (42,561 | ) |
SL Green Realty Corp. | | | 3,887 | | | | (2.42 | )% | | | (48,685 | ) |
Terreno Realty Corp. | | | 6,021 | | | | (3.61 | )% | | | (50,735 | ) |
Mid-America Apartment Communities, Inc. | | | 4,729 | | | | (6.73 | )% | | | (60,670 | ) |
BXP, Inc. | | | 7,965 | | | | (5.75 | )% | | | (67,266 | ) |
Agree Realty Corp. | | | 6,357 | | | | (4.29 | )% | | | (67,422 | ) |
Omega Healthcare Investors, Inc. | | | 7,503 | | | | (2.74 | )% | | | (87,117 | ) |
Macerich Co. | | | 23,272 | | | | (3.80 | )% | | | (97,200 | ) |
National Health Investors, Inc. | | | 6,285 | | | | (4.73 | )% | | | (193,931 | ) |
Total Financial | | | | | | | | | | | (439,333 | ) |
| | | | | | | | | | | | | |
Exchange-Traded Funds | | | | | | | | | | | | |
Vanguard Real Estate ETF | | | 3,828 | | | | (3.34 | )% | | | 49,703 | |
Total MS Equity Short Custom Basket | | | | | | | (389,630 | ) |
| | | | | | | | | |
GS EQUITY SHORT CUSTOM BASKET | | | | | | | | |
Financial | | | | | | | | | | | | |
Douglas Emmett, Inc. | | | 22,142 | | | | (3.50 | )% | | | 57,936 | |
Service Properties Trust | | | 19,903 | | | | (0.81 | )% | | | 43,712 | |
Pebblebrook Hotel Trust | | | 22,515 | | | | (2.67 | )% | | | 22,999 | |
JBG SMITH Properties | | | 4,602 | | | | (0.72 | )% | | | 10,181 | |
Host Hotels & Resorts, Inc. | | | 11,123 | | | | (1.75 | )% | | | 6,322 | |
LXP Industrial Trust | | | 15,028 | | | | (1.35 | )% | | | 4,049 | |
Camden Property Trust | | | 5,369 | | | | (5.95 | )% | | | 3,560 | |
Rexford Industrial Realty, Inc. | | | 2,603 | | | | (1.17 | )% | | | 1,740 | |
Sunstone Hotel Investors, Inc. | | | 38,199 | | | | (3.53 | )% | | | 1,157 | |
Equity LifeStyle Properties, Inc. | | | 2,849 | | | | (1.82 | )% | | | 1,014 | |
Americold Realty Trust, Inc. | | | 4,650 | | | | (1.18 | )% | | | 905 | |
EastGroup Properties, Inc. | | | 713 | | | | (1.19 | )% | | | 772 | |
Cousins Properties, Inc. | | | 6,852 | | | | (1.81 | )% | | | (146 | ) |
Independence Realty Trust, Inc. | | | 2,942 | | | | (0.54 | )% | | | (263 | ) |
Getty Realty Corp. | | | 4,576 | | | | (1.30 | )% | | | (1,347 | ) |
Sun Communities, Inc. | | | 1,500 | | | | (1.82 | )% | | | (2,512 | ) |
Global Net Lease, Inc. | | | 13,223 | | | | (1.00 | )% | | | (2,571 | ) |
Regency Centers Corp. | | | 2,900 | | | | (1.88 | )% | | | (7,782 | ) |
CubeSmart | | | 3,822 | | | | (1.84 | )% | | | (10,882 | ) |
DiamondRock Hospitality Co. | | | 25,495 | | | | (1.99 | )% | | | (11,931 | ) |
Veris Residential, Inc. | | | 6,242 | | | | (1.00 | )% | | | (13,954 | ) |
Public Storage | | | 572 | | | | (1.86 | )% | | | (17,350 | ) |
Four Corners Property Trust, Inc. | | | 10,376 | | | | (2.72 | )% | | | (21,791 | ) |
Safehold, Inc. | | | 5,152 | | | | (1.21 | )% | | | (22,210 | ) |
Equinix, Inc. | | | 255 | | | | (2.03 | )% | | | (27,243 | ) |
Crown Castle, Inc. | | | 3,509 | | | | (3.73 | )% | | | (28,158 | ) |
Federal Realty Investment Trust | | | 3,560 | | | | (3.67 | )% | | | (32,914 | ) |
Acadia Realty Trust | | | 8,773 | | | | (1.85 | )% | | | (38,358 | ) |
Phillips Edison & Company, Inc. | | | 8,766 | | | | (2.96 | )% | | | (40,014 | ) |
Terreno Realty Corp. | | | 6,021 | | | | (3.60 | )% | | | (51,379 | ) |
Realty Income Corp. | | | 6,642 | | | | (3.77 | )% | | | (56,018 | ) |
SL Green Realty Corp. | | | 3,848 | | | | (2.40 | )% | | | (57,588 | ) |
Macerich Co. | | | 23,272 | | | | (3.80 | )% | | | (62,348 | ) |
BXP, Inc. | | | 7,965 | | | | (5.74 | )% | | | (66,774 | ) |
Agree Realty Corp. | | | 6,357 | | | | (4.29 | )% | | | (69,265 | ) |
Omega Healthcare Investors, Inc. | | | 7,503 | | | | (2.74 | )% | | | (70,753 | ) |
Mid-America Apartment Communities, Inc. | | | 4,729 | | | | (6.74 | )% | | | (78,935 | ) |
SEE NOTES TO FINANCIAL STATEMENTS. | THE GUGGENHEIM FUNDS ANNUAL REPORT | 25 |
SCHEDULE OF INVESTMENTS (concluded) | September 30, 2024 |
MARKET NEUTRAL REAL ESTATE FUND | |
| | Shares | | | Percentage
Notional
Amount | | | Value and
Unrealized
Appreciation
(Depreciation) | |
National Health Investors, Inc. | | | 6,285 | | | | (4.73 | )% | | $ | (195,015 | ) |
Total Financial | | | | | | | | | | | (833,155 | ) |
| | | | | | | | | | | | | |
Exchange-Traded Funds | | | | | | | | | | | | |
Vanguard Real Estate ETF | | | 3,828 | | | | (3.34 | )% | | | 49,975 | |
Total GS Equity Short Custom Basket | | | | | | $ | (783,179 | ) |
*** | A copy of each underlying unaffiliated fund’s financial statements is available at the SEC’s website at www.sec.gov. |
† | Value determined based on Level 1 inputs — See Note 4. |
†† | Value determined based on Level 2 inputs — See Note 4. |
1 | Rate indicated is the 7-day yield as of September 30, 2024. |
| | GS — Goldman Sachs International |
| | MS — Morgan Stanley Capital Services LLC |
| | REIT — Real Estate Investment Trust |
| | |
| | See Sector Classification in Other Information section. |
The following table summarizes the inputs used to value the Fund’s investments at September 30, 2024 (See Note 4 in the Notes to Financial Statements):
Investments in Securities (Assets) | | Level 1
Quoted
Prices | | | Level 2
Significant
Observable
Inputs | | | Level 3
Significant
Unobservable
Inputs | | | Total | |
Common Stocks | | $ | 22,258,567 | | | $ | — | | | $ | — | | | $ | 22,258,567 | |
Money Market Fund | | | 17,765,843 | | | | — | | | | — | | | | 17,765,843 | |
Total Assets | | $ | 40,024,410 | | | $ | — | | | $ | — | | | $ | 40,024,410 | |
Investments in Securities (Liabilities) | | Level 1
Quoted
Prices | | | Level 2
Significant
Observable
Inputs | | | Level 3
Significant
Unobservable
Inputs | | | Total | |
Equity Custom Basket Swap Agreements** | | $ | — | | | $ | 1,172,809 | | | $ | — | | | $ | 1,172,809 | |
** | This derivative is reported as unrealized appreciation/depreciation at period end. |
26 | THE GUGGENHEIM FUNDS ANNUAL REPORT | SEE NOTES TO FINANCIAL STATEMENTS. |
MARKET NEUTRAL REAL ESTATE FUND | |
STATEMENT OF ASSETS AND LIABILITIES |
September 30, 2024 |
Assets: |
Investments, at value (cost $37,924,015) | | $ | 40,024,410 | |
Cash | | | 629,911 | |
Segregated cash with broker | | | 2,270,000 | |
Prepaid expenses | | | 28,024 | |
Receivables: |
Dividends | | | 118,284 | |
Interest | | | 61,863 | |
Fund shares sold | | | 46,299 | |
Total assets | | | 43,178,791 | |
| | | | | |
Liabilities: |
Unrealized depreciation on OTC swap agreements | | | 1,172,809 | |
Payable for: |
Swap settlement | | | 1,111,602 | |
Fund shares redeemed | | | 5,828 | |
Management fees | | | 5,297 | |
Fund accounting/administration fees | | | 3,858 | |
Transfer agent/maintenance fees | | | 3,533 | |
Trustees’ fees* | | | 481 | |
Distribution and service fees | | | 128 | |
Miscellaneous | | | 48,347 | |
Total liabilities | | | 2,351,883 | |
Net assets | | $ | 40,826,908 | |
| | | | | |
Net assets consist of: |
Paid in capital | | $ | 41,999,380 | |
Total distributable earnings (loss) | | | (1,172,472 | ) |
Net assets | | $ | 40,826,908 | |
Class A: |
Net assets | | $ | 313,398 | |
Capital shares outstanding | | | 11,596 | |
Net asset value per share | | $ | 27.03 | |
Maximum offering price per share (Net asset value divided by 95.25%) | | $ | 28.38 | |
Class C: |
Net assets | | $ | 22,322 | |
Capital shares outstanding | | | 867 | |
Net asset value per share | | $ | 25.75 | |
Class P |
Net assets | | $ | 255,555 | |
Capital shares outstanding | | | 9,801 | |
Net asset value per share | | $ | 26.07 | |
| | | | | |
Institutional Class: |
Net assets | | $ | 40,235,633 | |
Capital shares outstanding | | | 1,503,036 | |
Net asset value per share | | $ | 26.77 | |
STATEMENT OF OPERATIONS |
Year Ended September 30, 2024 |
Investment Income: |
Dividends | | $ | 1,079,244 | |
Interest | | | 682,787 | |
Total investment income | | | 1,762,031 | |
| | | | | |
Expenses: |
Management fees | | | 473,988 | |
Distribution and service fees: |
Class A | | | 841 | |
Class C | | | 756 | |
Class P | | | 1,700 | |
Transfer agent/maintenance fees: |
Class A | | | 914 | |
Class C | | | 335 | |
Class P | | | 1,052 | |
Institutional Class | | | 64,174 | |
Registration fees | | | 77,638 | |
Professional fees | | | 54,131 | |
Fund accounting/administration fees | | | 25,628 | |
Trustees’ fees* | | | 14,229 | |
Custodian fees | | | 7,796 | |
Line of credit fees | | | 1,333 | |
Miscellaneous | | | 22,795 | |
Total expenses | | | 747,310 | |
Less: |
Expenses reimbursed by Adviser: |
Class A | | | (953 | ) |
Class C | | | (334 | ) |
Class P | | | (1,067 | ) |
Institutional Class | | | (69,393 | ) |
Expenses waived by Adviser | | | (79,637 | ) |
Earnings credits applied | | | (575 | ) |
Total waived/reimbursed expenses | | | (151,959 | ) |
Net expenses | | | 595,351 | |
Net investment income | | | 1,166,680 | |
| | | | | |
Net Realized and Unrealized Gain (Loss): |
Net realized gain (loss) on: |
Investments | | | 2,217,407 | |
Swap agreements | | | (1,822,758 | ) |
Net realized gain | | | 394,649 | |
Net change in unrealized appreciation (depreciation) on: |
Investments | | | 4,374,089 | |
Swap agreements | | | (5,072,996 | ) |
Net change in unrealized appreciation (depreciation) | | | (698,907 | ) |
Net realized and unrealized loss | | | (304,258 | ) |
Net increase in net assets resulting from operations | | $ | 862,422 | |
* | Relates to Trustees not deemed “interested persons” within the meaning of Section 2(a)(19) of the 1940 Act. |
SEE NOTES TO FINANCIAL STATEMENTS. | THE GUGGENHEIM FUNDS ANNUAL REPORT | 27 |
MARKET NEUTRAL REAL ESTATE FUND | |
STATEMENTS OF CHANGES IN NET ASSETS |
| | Year Ended
September 30,
2024 | | | Year Ended
September 30,
2023 | |
Increase (Decrease) in Net Assets from Operations: | | | | | | | | |
Net investment income | | $ | 1,166,680 | | | $ | 1,127,209 | |
Net realized gain on investments | | | 394,649 | | | | 272,163 | |
Net change in unrealized appreciation (depreciation) on investments | | | (698,907 | ) | | | (836,795 | ) |
Net increase in net assets resulting from operations | | | 862,422 | | | | 562,577 | |
| | | | | | | | | |
Distributions to shareholders: | | | | | | | | |
Class A | | | (7,322 | ) | | | — | |
Class C | | | (614 | ) | | | — | |
Class P | | | (22,159 | ) | | | — | |
Institutional Class | | | (1,109,073 | ) | | | (111,384 | ) |
Total distributions to shareholders | | | (1,139,168 | ) | | | (111,384 | ) |
| | | | | | | | | |
Capital share transactions: | | | | | | | | |
Proceeds from sale of shares | | | | | | | | |
Class A | | | — | | | | 9,606 | |
Class C | | | 360 | | | | 360 | |
Class P | | | 3,070 | | | | 9,676 | |
Institutional Class | | | 7,987,936 | | | | 14,559,299 | |
Distributions reinvested | | | | | | | | |
Class A | | | 7,322 | | | | — | |
Class C | | | 614 | | | | — | |
Class P | | | 22,159 | | | | — | |
Institutional Class | | | 1,108,788 | | | | 111,379 | |
Cost of shares redeemed | | | | | | | | |
Class A | | | (133,099 | ) | | | (15,667 | ) |
Class C | | | (193,809 | ) | | | (19,120 | ) |
Class P | | | (847,256 | ) | | | (636,059 | ) |
Institutional Class | | | (15,842,835 | ) | | | (11,897,103 | ) |
Net increase (decrease) from capital share transactions | | | (7,886,750 | ) | | | 2,122,371 | |
Net increase (decrease) in net assets | | | (8,163,496 | ) | | | 2,573,564 | |
| | | | | | | | | |
Net assets: | | | | | | | | |
Beginning of year | | | 48,990,404 | | | | 46,416,840 | |
End of year | | $ | 40,826,908 | | | $ | 48,990,404 | |
| | | | | | | | | |
Capital share activity: | | | | | | | | |
Shares sold | | | | | | | | |
Class A | | | — | | | | 359 | |
Class C | | | 14 | | | | 14 | |
Class P | | | 117 | | | | 368 | |
Institutional Class | | | 297,465 | | | | 543,333 | |
Shares issued from reinvestment of distributions | | | | | | | | |
Class A | | | 271 | | | | — | |
Class C | | | 24 | | | | — | |
Class P | | | 850 | | | | — | |
Institutional Class | | | 41,543 | | | | 4,185 | |
Shares redeemed | | | | | | | | |
Class A | | | (4,793 | ) | | | (579 | ) |
Class C | | | (7,420 | ) | | | (753 | ) |
Class P | | | (32,285 | ) | | | (24,402 | ) |
Institutional Class | | | (584,115 | ) | | | (444,521 | ) |
Net increase (decrease) in shares | | | (288,329 | ) | | | 78,004 | |
28 | THE GUGGENHEIM FUNDS ANNUAL REPORT | SEE NOTES TO FINANCIAL STATEMENTS. |
MARKET NEUTRAL REAL ESTATE FUND | |
This table is presented to show selected data for a share outstanding throughout each period and to assist shareholders in evaluating a Fund’s performance for the periods presented.
Class A | | Year Ended
September 30,
2024 | | | Year Ended
September 30,
2023 | | | Year Ended
September 30,
2022 | | | Year Ended
September 30,
2021 | | | Year Ended
September 30,
2020 | |
Per Share Data |
Net asset value, beginning of period | | $ | 27.26 | | | $ | 27.00 | | | $ | 27.78 | | | $ | 28.18 | | | $ | 26.95 | |
Income (loss) from investment operations: |
Net investment income (loss)a | | | .66 | | | | .57 | | | | (.07 | ) | | | (.08 | ) | | | (.02 | ) |
Net gain (loss) on investments (realized and unrealized) | | | (.26 | ) | | | (.31 | ) | | | (.71 | ) | | | (.24 | ) | | | 2.30 | |
Total from investment operations | | | .40 | | | | .26 | | | | (.78 | ) | | | (.32 | ) | | | 2.28 | |
Less distributions from: |
Net investment income | | | (.63 | ) | | | — | | | | — | | | | (.02 | ) | | | (.25 | ) |
Net realized gains | | | — | | | | — | | | | — | | | | (.06 | ) | | | (.80 | ) |
Total distributions | | | (.63 | ) | | | — | | | | — | | | | (.08 | ) | | | (1.05 | ) |
Net asset value, end of period | | $ | 27.03 | | | $ | 27.26 | | | $ | 27.00 | | | $ | 27.78 | | | $ | 28.18 | |
|
Total Returnb | | | 1.47 | % | | | 0.96 | % | | | (2.81 | %) | | | (1.14 | %) | | | 8.81 | % |
Ratios/Supplemental Data |
Net assets, end of period (in thousands) | | $ | 313 | | | $ | 439 | | | $ | 441 | | | $ | 1,867 | | | $ | 11,723 | |
Ratios to average net assets: |
Net investment income (loss) | | | 2.43 | % | | | 2.11 | % | | | (0.25 | %) | | | (0.29 | %) | | | (0.06 | %) |
Total expensesc | | | 2.09 | % | | | 2.20 | % | | | 2.42 | % | | | 2.08 | % | | | 2.38 | % |
Net expensesd,e,f | | | 1.63 | % | | | 1.63 | % | | | 1.64 | % | | | 1.64 | % | | | 1.65 | % |
Portfolio turnover rate | | | 136 | % | | | 55 | % | | | 49 | % | | | 264 | % | | | 355 | % |
Class C | | Year Ended
September 30,
2024 | | | Year Ended
September 30,
2023 | | | Year Ended
September 30,
2022 | | | Year Ended
September 30,
2021 | | | Year Ended
September 30,
2020 | |
Per Share Data |
Net asset value, beginning of period | | $ | 25.72 | | | $ | 25.67 | | | $ | 26.61 | | | $ | 27.20 | | | $ | 26.07 | |
Income (loss) from investment operations: |
Net investment income (loss)a | | | .34 | | | | .34 | | | | (.19 | ) | | | (.22 | ) | | | (.15 | ) |
Net gain (loss) on investments (realized and unrealized) | | | (.15 | ) | | | (.29 | ) | | | (.75 | ) | | | (.29 | ) | | | 2.16 | |
Total from investment operations | | | .19 | | | | .05 | | | | (.94 | ) | | | (.51 | ) | | | 2.01 | |
Less distributions from: |
Net investment income | | | (.16 | ) | | | — | | | | — | | | | (.02 | ) | | | (.08 | ) |
Net realized gains | | | — | | | | — | | | | — | | | | (.06 | ) | | | (.80 | ) |
Total distributions | | | (.16 | ) | | | — | | | | — | | | | (.08 | ) | | | (.88 | ) |
Net asset value, end of period | | $ | 25.75 | | | $ | 25.72 | | | $ | 25.67 | | | $ | 26.61 | | | $ | 27.20 | |
|
Total Returnb | | | 0.70 | % | | | 0.19 | % | | | (3.53 | %) | | | (1.88 | %) | | | 7.99 | % |
Ratios/Supplemental Data |
Net assets, end of period (in thousands) | | $ | 22 | | | $ | 212 | | | $ | 231 | | | $ | 242 | | | $ | 333 | |
Ratios to average net assets: |
Net investment income (loss) | | | 1.31 | % | | | 1.33 | % | | | (0.72 | %) | | | (0.83 | %) | | | (0.56 | %) |
Total expensesc | | | 2.98 | % | | | 2.66 | % | | | 2.72 | % | | | 2.71 | % | | | 3.17 | % |
Net expensesd,e,f | | | 2.38 | % | | | 2.38 | % | | | 2.39 | % | | | 2.39 | % | | | 2.40 | % |
Portfolio turnover rate | | | 136 | % | | | 55 | % | | | 49 | % | | | 264 | % | | | 355 | % |
SEE NOTES TO FINANCIAL STATEMENTS. | THE GUGGENHEIM FUNDS ANNUAL REPORT | 29 |
MARKET NEUTRAL REAL ESTATE FUND | |
FINANCIAL HIGHLIGHTS (continued) |
This table is presented to show selected data for a share outstanding throughout each period and to assist shareholders in evaluating a Fund’s performance for the periods presented.
Class P | | Year Ended
September 30,
2024 | | | Year Ended
September 30,
2023 | | | Year Ended
September 30,
2022 | | | Year Ended
September 30,
2021 | | | Year Ended
September 30,
2020 | |
Per Share Data |
Net asset value, beginning of period | | $ | 26.32 | | | $ | 26.07 | | | $ | 26.83 | | | $ | 27.23 | | | $ | 26.10 | |
Income (loss) from investment operations: |
Net investment income (loss)a | | | .62 | | | | .52 | | | | (.03 | ) | | | (.04 | ) | | | — | |
Net gain (loss) on investments (realized and unrealized) | | | (.25 | ) | | | (.27 | ) | | | (.73 | ) | | | (.28 | ) | | | 2.20 | |
Total from investment operations | | | .37 | | | | .25 | | | | (.76 | ) | | | (.32 | ) | | | 2.20 | |
Less distributions from: |
Net investment income | | | (.62 | ) | | | — | | | | — | | | | (.02 | ) | | | (.27 | ) |
Net realized gains | | | — | | | | — | | | | — | | | | (.06 | ) | | | (.80 | ) |
Total distributions | | | (.62 | ) | | | — | | | | — | | | | (.08 | ) | | | (1.07 | ) |
Net asset value, end of period | | $ | 26.07 | | | $ | 26.32 | | | $ | 26.07 | | | $ | 26.83 | | | $ | 27.23 | |
|
Total Return | | | 1.42 | % | | | 0.96 | % | | | (2.83 | %) | | | (1.17 | %) | | | 8.79 | % |
Ratios/Supplemental Data |
Net assets, end of period (in thousands) | | $ | 256 | | | $ | 1,082 | | | $ | 1,699 | | | $ | 2,727 | | | $ | 8,360 | |
Ratios to average net assets: |
Net investment income (loss) | | | 2.36 | % | | | 1.99 | % | | | (0.11 | %) | | | (0.16 | %) | | | 0.00 | % |
Total expensesc | | | 1.93 | % | | | 1.94 | % | | | 1.95 | % | | | 1.91 | % | | | 2.00 | % |
Net expensesd,e,f | | | 1.63 | % | | | 1.63 | % | | | 1.64 | % | | | 1.64 | % | | | 1.65 | % |
Portfolio turnover rate | | | 136 | % | | | 55 | % | | | 49 | % | | | 264 | % | | | 355 | % |
30 | THE GUGGENHEIM FUNDS ANNUAL REPORT | SEE NOTES TO FINANCIAL STATEMENTS. |
MARKET NEUTRAL REAL ESTATE FUND | |
FINANCIAL HIGHLIGHTS (concluded) |
This table is presented to show selected data for a share outstanding throughout each period and to assist shareholders in evaluating a Fund’s performance for the periods presented.
Institutional Class | | Year Ended
September 30,
2024 | | | Year Ended
September 30,
2023 | | | Year Ended
September 30,
2022 | | | Year Ended
September 30,
2021 | | | Year Ended
September 30,
2020 | |
Per Share Data |
Net asset value, beginning of period | | $ | 27.03 | | | $ | 26.77 | | | $ | 27.57 | | | $ | 27.92 | | | $ | 26.74 | |
Income (loss) from investment operations: |
Net investment income (loss)a | | | .73 | | | | .63 | | | | .06 | | | | .07 | | | | .09 | |
Net gain (loss) on investments (realized and unrealized) | | | (.26 | ) | | | (.31 | ) | | | (.78 | ) | | | (.31 | ) | | | 2.23 | |
Total from investment operations | | | .47 | | | | .32 | | | | (.72 | ) | | | (.24 | ) | | | 2.32 | |
Less distributions from: |
Net investment income | | | (.73 | ) | | | (.06 | ) | | | (.08 | ) | | | (.05 | ) | | | (.34 | ) |
Net realized gains | | | — | | | | — | | | | — | | | | (.06 | ) | | | (.80 | ) |
Total distributions | | | (.73 | ) | | | (.06 | ) | | | (.08 | ) | | | (.11 | ) | | | (1.14 | ) |
Net asset value, end of period | | $ | 26.77 | | | $ | 27.03 | | | $ | 26.77 | | | $ | 27.57 | | | $ | 27.92 | |
|
Total Return | | | 1.69 | % | | | 1.21 | % | | | (2.57 | %) | | | (0.87 | %) | | | 9.06 | % |
Ratios/Supplemental Data |
Net assets, end of period (in thousands) | | $ | 40,236 | | | $ | 47,257 | | | $ | 44,047 | | | $ | 53,609 | | | $ | 37,399 | |
Ratios to average net assets: |
Net investment income (loss) | | | 2.72 | % | | | 2.36 | % | | | 0.21 | % | | | 0.27 | % | | | 0.32 | % |
Total expensesc | | | 1.73 | % | | | 1.62 | % | | | 1.64 | % | | | 1.58 | % | | | 1.85 | % |
Net expensesd,e,f | | | 1.38 | % | | | 1.38 | % | | | 1.39 | % | | | 1.39 | % | | | 1.40 | % |
Portfolio turnover rate | | | 136 | % | | | 55 | % | | | 49 | % | | | 264 | % | | | 355 | % |
a | Net investment income (loss) per share was computed using average shares outstanding throughout the period. |
b | Total return does not reflect the impact of any applicable sales charges. |
c | Does not include expenses of the underlying funds in which the Fund invests. |
d | Net expense information reflects the expense ratios after expense waivers and reimbursements, as applicable. |
e | The portion of the ratios of net expenses to average net assets attributable to recoupments of prior fee reductions or expense reimbursements for the years presented was as follows: |
| | | 09/30/24 | 09/30/23 | 09/30/22 | 09/30/21 | 09/30/20 |
| | Class A | — | 0.00%* | — | — | 0.00%* |
| | Class C | — | 0.00%* | 0.00%* | — | 0.00%* |
| | Class P | — | 0.00%* | 0.01% | — | 0.00%* |
| | Institutional Class | — | 0.00%* | 0.01% | — | 0.00%* |
f | Net expenses may include expenses that are excluded from the expense limitation agreement. Excluding these expenses, the net expense ratios for the years presented would be: |
| | | 09/30/24 | 09/30/23 | 09/30/22 | 09/30/21 | 09/30/20 |
| | Class A | 1.62% | 1.62% | 1.63% | 1.63% | 1.65% |
| | Class C | 2.38% | 2.37% | 2.38% | 2.38% | 2.40% |
| | Class P | 1.62% | 1.62% | 1.63% | 1.63% | 1.64% |
| | Institutional Class | 1.37% | 1.37% | 1.38% | 1.39% | 1.40% |
SEE NOTES TO FINANCIAL STATEMENTS. | THE GUGGENHEIM FUNDS ANNUAL REPORT | 31 |
SCHEDULE OF INVESTMENTS | September 30, 2024 |
RISK MANAGED REAL ESTATE FUND | |
| | Shares | | | Value | |
COMMON STOCKS† - 97.8% |
| | | | | | | | | |
REITs - 97.8% |
REITs-Diversified - 19.8% |
Equinix, Inc. | | | 21,886 | | | $ | 19,426,670 | |
Digital Realty Trust, Inc. | | | 89,387 | | | | 14,465,498 | |
VICI Properties, Inc. | | | 391,801 | | | | 13,050,891 | |
WP Carey, Inc. | | | 78,542 | | | | 4,893,167 | |
Gaming and Leisure Properties, Inc. | | | 86,823 | | | | 4,467,043 | |
EPR Properties | | | 56,349 | | | | 2,763,355 | |
InvenTrust Properties Corp. | | | 61,379 | | | | 1,741,322 | |
Lamar Advertising Co. — Class A | | | 11,457 | | | | 1,530,655 | |
SBA Communications Corp. | | | 6,211 | | | | 1,494,988 | |
American Tower Corp. — Class A | | | 6,040 | | | | 1,404,662 | |
Alexander & Baldwin, Inc. | | | 60,551 | | | | 1,162,579 | |
Outfront Media, Inc. | | | 55,989 | | | | 1,029,078 | |
Total REITs-Diversified | | | | | | | 67,429,908 | |
| | | | | | | | | |
REITs-Apartments - 14.5% |
Invitation Homes, Inc. | | | 284,741 | | | | 10,039,968 | |
Essex Property Trust, Inc. | | | 29,833 | | | | 8,813,265 | |
AvalonBay Communities, Inc. | | | 35,120 | | | | 7,910,780 | |
Equity Residential1 | | | 93,097 | | | | 6,932,003 | |
American Homes 4 Rent — Class A | | | 168,351 | | | | 6,462,995 | |
UDR, Inc. | | | 117,730 | | | | 5,337,878 | |
Mid-America Apartment Communities, Inc. | | | 15,002 | | | | 2,383,818 | |
Camden Property Trust | | | 10,422 | | | | 1,287,430 | |
Total REITs-Apartments | | | | | | | 49,168,137 | |
| | | | | | | | | |
REITs-Health Care - 14.4% |
Welltower, Inc. | | | 139,037 | | | | 17,800,907 | |
Alexandria Real Estate Equities, Inc. | | | 63,537 | | | | 7,545,019 | |
Ventas, Inc. | | | 100,233 | | | | 6,427,942 | |
Healthpeak Properties, Inc. | | | 172,426 | | | | 3,943,383 | |
CareTrust REIT, Inc. | | | 118,762 | | | | 3,664,995 | |
Healthcare Realty Trust, Inc. | | | 181,086 | | | | 3,286,711 | |
Omega Healthcare Investors, Inc. | | | 60,858 | | | | 2,476,921 | |
LTC Properties, Inc. | | | 39,577 | | | | 1,452,080 | |
Sabra Health Care REIT, Inc. | | | 38,959 | | | | 725,027 | |
Global Medical REIT, Inc. | | | 59,950 | | | | 594,104 | |
Community Healthcare Trust, Inc. | | | 32,706 | | | | 593,614 | |
Total REITs-Health Care | | | | | | | 48,510,703 | |
| | | | | | | | | |
REITs-Warehouse/Industries - 13.5% |
Prologis, Inc.1 | | | 246,108 | | | | 31,078,519 | |
STAG Industrial, Inc. | | | 143,464 | | | | 5,608,008 | |
Rexford Industrial Realty, Inc. | | | 58,347 | | | | 2,935,438 | |
First Industrial Realty Trust, Inc. | | | 27,303 | | | | 1,528,422 | |
EastGroup Properties, Inc. | | | 8,118 | | | | 1,516,605 | |
LXP Industrial Trust | | | 150,489 | | | | 1,512,414 | |
Americold Realty Trust, Inc.1 | | | 49,056 | | | | 1,386,813 | |
Total REITs-Warehouse/Industries | | | | | | | 45,566,219 | |
| | | | | | | | | |
REITs-Storage - 10.4% |
Public Storage | | | 34,372 | | | | 12,506,940 | |
Extra Space Storage, Inc. | | | 62,471 | | | | 11,256,649 | |
Iron Mountain, Inc. | | | 66,510 | | | | 7,903,383 | |
National Storage Affiliates Trust | | | 59,265 | | | | 2,856,573 | |
CubeSmart | | | 17,222 | | | | 927,060 | |
Total REITs-Storage | | | | | | | 35,450,605 | |
| | | | | | | | | |
REITs-Shopping Centers - 5.9% |
Kimco Realty Corp. | | | 271,515 | | | | 6,304,578 | |
Kite Realty Group Trust | | | 154,457 | | | | 4,102,378 | |
Regency Centers Corp. | | | 45,540 | | | | 3,289,354 | |
Brixmor Property Group, Inc. | | | 107,981 | | | | 3,008,351 | |
NETSTREIT Corp. | | | 109,895 | | | | 1,816,564 | |
Federal Realty Investment Trust | | | 10,378 | | | | 1,193,159 | |
Total REITs-Shopping Centers | | | | | | | 19,714,384 | |
| | | | | | | | | |
REITs-Regional Malls - 4.8% |
Simon Property Group, Inc. | | | 84,751 | | | | 14,324,614 | |
Tanger, Inc. | | | 64,856 | | | | 2,151,922 | |
Total REITs-Regional Malls | | | | | | | 16,476,536 | |
| | | | | | | | | |
REITs-Single Tenant - 4.7% |
Realty Income Corp. | | | 182,310 | | | | 11,562,100 | |
NNN REIT, Inc. | | | 94,151 | | | | 4,565,382 | |
Total REITs-Single Tenant | | | | | | | 16,127,482 | |
| | | | | | | | | |
REITs-Office Property - 4.4% |
Kilroy Realty Corp. | | | 136,410 | | | | 5,279,067 | |
Vornado Realty Trust | | | 114,764 | | | | 4,521,702 | |
Douglas Emmett, Inc. | | | 92,589 | | | | 1,626,789 | |
JBG SMITH Properties | | | 85,369 | | | | 1,492,250 | |
Cousins Properties, Inc. | | | 37,874 | | | | 1,116,525 | |
COPT Defense Properties | | | 30,878 | | | | 936,530 | |
Total REITs-Office Property | | | | | | | 14,972,863 | |
| | | | | | | | | |
REITs-Hotels - 3.8% |
Park Hotels & Resorts, Inc. | | | 240,338 | | | | 3,388,766 | |
Apple Hospitality REIT, Inc. | | | 217,494 | | | | 3,229,786 | |
Host Hotels & Resorts, Inc. | | | 125,230 | | | | 2,204,048 | |
Ryman Hospitality Properties, Inc. | | | 18,848 | | | | 2,021,260 | |
RLJ Lodging Trust | | | 186,897 | | | | 1,715,714 | |
Total REITs-Hotels | | | | | | | 12,559,574 | |
| | | | | | | | | |
REITs-Manufactured Homes - 1.6% |
Sun Communities, Inc. | | | 22,081 | | | | 2,984,247 | |
Equity LifeStyle Properties, Inc. | | | 31,817 | | | | 2,269,825 | |
Total REITs-Manufactured Homes | | | | | | | 5,254,072 | |
| | | | | | | | | |
Total REITS | | | | | | | 331,230,483 | |
| | | | | | | | | |
Total Common Stocks | | | | |
(Cost $293,773,712) | | | | | | | 331,230,483 | |
| | | | | | | | | |
MONEY MARKET FUND***,† - 3.5% |
Dreyfus Treasury Securities Cash Management Fund — Institutional Shares, 4.88%2 | | | 11,710,414 | | | | 11,710,414 | |
Total Money Market Fund | | | | |
(Cost $11,710,414) | | | | | | | 11,710,414 | |
| | | | | | | | | |
Total Investments - 101.3% | | | | |
(Cost $305,484,126) | | | 342,940,897 | |
32 | THE GUGGENHEIM FUNDS ANNUAL REPORT | SEE NOTES TO FINANCIAL STATEMENTS. |
SCHEDULE OF INVESTMENTS (continued) | September 30, 2024 |
RISK MANAGED REAL ESTATE FUND | |
| | Shares | | | Value | |
COMMON STOCKS SOLD SHORT† - (7.5)% |
REITs - (7.5)% |
REITs-Manufactured Homes - (0.2)% |
Sun Communities, Inc. | | | 3,562 | | | $ | (481,404 | ) |
Equity LifeStyle Properties, Inc. | | | 6,766 | | | | (482,687 | ) |
Total REITs-Manufactured Homes | | | | | | | (964,091 | ) |
| | | | | | | | | |
REITs-Storage - (0.2)% |
CubeSmart | | | 9,076 | | | | (488,561 | ) |
Public Storage | | | 1,359 | | | | (494,499 | ) |
Total REITs-Storage | | | | | | | (983,060 | ) |
| | | | | | | | | |
REITs-Regional Malls - (0.3)% |
Macerich Co. | | | 55,264 | | | | (1,008,015 | ) |
REITs-Health Care - (0.6)% |
Omega Healthcare Investors, Inc. | | | 17,817 | | | | (725,152 | ) |
National Health Investors, Inc. | | | 14,924 | | | | (1,254,512 | ) |
Total REITs-Health Care | | | | | | | (1,979,664 | ) |
| | | | | | | | | |
REITs-Warehouse/Industries - (0.7)% |
Rexford Industrial Realty, Inc. | | | 6,181 | | | | (310,966 | ) |
Americold Realty Trust, Inc. | | | 11,043 | | | | (312,186 | ) |
EastGroup Properties, Inc. | | | 1,693 | | | | (316,286 | ) |
LXP Industrial Trust | | | 35,687 | | | | (358,654 | ) |
Terreno Realty Corp. | | | 14,298 | | | | (955,535 | ) |
Total REITs-Warehouse/Industries | | | | | | | (2,253,627 | ) |
| | | | | | | | | |
REITs-Diversified - (0.7)% |
WP Carey, Inc. | | | 2,288 | | | | (142,542 | ) |
Global Net Lease, Inc. | | | 31,401 | | | | (264,396 | ) |
Veris Residential, Inc. | | | 14,822 | | | | (264,721 | ) |
Safehold, Inc. | | | 12,233 | | | | (320,872 | ) |
Equinix, Inc. | | | 606 | | | | (537,904 | ) |
Crown Castle, Inc. | | | 8,332 | | | | (988,425 | ) |
Total REITs-Diversified | | | | | | | (2,518,860 | ) |
| | | | | | | | | |
REITs-Shopping Centers - (0.8)% |
Acadia Realty Trust | | | 20,834 | | | | (489,182 | ) |
Regency Centers Corp. | | | 6,887 | | | | (497,448 | ) |
Phillips Edison & Company, Inc. | | | 20,817 | | | | (785,009 | ) |
Federal Realty Investment Trust | | | 8,454 | | | | (971,956 | ) |
Total REITs-Shopping Centers | | | | | | | (2,743,595 | ) |
| | | | | | | | | |
REITs-Hotels - (0.9)% |
Service Properties Trust | | | 47,261 | | | | (215,510 | ) |
Host Hotels & Resorts, Inc. | | | 26,412 | | | | (464,851 | ) |
DiamondRock Hospitality Co. | | | 60,541 | | | | (528,523 | ) |
Pebblebrook Hotel Trust | | | 53,464 | | | | (707,329 | ) |
Sunstone Hotel Investors, Inc. | | | 90,709 | | | | (936,117 | ) |
Total REITs-Hotels | | | | | | | (2,852,330 | ) |
| | | | | | | | | |
REITs-Single Tenant - (0.9)% |
Getty Realty Corp. | | | 10,866 | | | | (345,648 | ) |
Four Corners Property Trust, Inc. | | | 24,638 | | | | (722,140 | ) |
Realty Income Corp. | | | 15,772 | | | | (1,000,260 | ) |
Agree Realty Corp. | | | 15,095 | | | | (1,137,106 | ) |
Total REITs-Single Tenant | | | | | | | (3,205,154 | ) |
| | | | | | | | | |
REITs-Apartments - (1.0)% |
Independence Realty Trust, Inc. | | | 6,986 | | | | (143,213 | ) |
Camden Property Trust | | | 12,750 | | | | (1,575,008 | ) |
Mid-America Apartment Communities, Inc. | | | 11,230 | | | | (1,784,447 | ) |
Total REITs-Apartments | | | | | | | (3,502,668 | ) |
| | | | | | | | | |
REITs-Office Property - (1.2)% |
JBG SMITH Properties | | | 10,928 | | | | (191,021 | ) |
Cousins Properties, Inc. | | | 16,271 | | | | (479,669 | ) |
SL Green Realty Corp. | | | 9,280 | | | | (645,981 | ) |
Douglas Emmett, Inc. | | | 52,329 | | | | (919,421 | ) |
BXP, Inc. | | | 18,913 | | | | (1,521,740 | ) |
Total REITs-Office Property | | | | | | | (3,757,832 | ) |
| | | | | | | | | |
Total REITS | | | | | | | (25,768,896 | ) |
| | | | | | | | | |
Total Common Stocks Sold Short | | | | |
(Proceeds $23,202,305) | | | | | | | (25,768,896 | ) |
| | | | | | | | | |
EXCHANGE-TRADED FUNDS SOLD SHORT***,† - (0.3)% |
Vanguard Real Estate ETF | | | 9,090 | | | | (885,548 | ) |
Total Exchange-Traded Funds Sold Short | | | | |
(Proceeds $786,756) | | | | | | | (885,548 | ) |
| | | | | | | | | |
Total Securities Sold Short - (7.8)% | | | | |
(Proceeds $23,989,061) | | $ | (26,654,444 | ) |
Other Assets & Liabilities, net - 6.5% | | | 21,945,011 | |
Total Net Assets - 100.0% | | $ | 338,231,464 | |
SEE NOTES TO FINANCIAL STATEMENTS. | THE GUGGENHEIM FUNDS ANNUAL REPORT | 33 |
SCHEDULE OF INVESTMENTS (continued) | September 30, 2024 |
RISK MANAGED REAL ESTATE FUND | |
Custom Basket Swap Agreements |
Counterparty | Reference Obligation | Type | Financing
Rate | | Payment
Frequency | | | Maturity
Date | | | Notional
Amount | | | Value and
Unrealized
Appreciation
(Depreciation) | |
OTC Custom Basket Swap Agreements†† |
Morgan Stanley Capital Services LLC | MS Equity Custom Basket | Pay | 5.23% (Federal Funds Rate + 0.40%) | | | At Maturity | | | | 11/12/24 | | | $ | 22,941,655 | | | $ | 2,285,364 | |
Goldman Sachs International | GS Equity Custom Basket | Pay | 5.28% (Federal Funds Rate + 0.45%) | | | At Maturity | | | | 05/16/28 | | | | 22,941,655 | | | | 2,099,407 | |
| | | | | | | | | | | | | | $ | 45,883,310 | | | $ | 4,384,771 | |
OTC Custom Basket Swap Agreements Sold Short†† |
Morgan Stanley Capital Services LLC | MS Equity Custom Basket | Receive | 4.52% (Federal Funds Rate - 0.31%) | | | At Maturity | | | | 11/12/24 | | | $ | 23,016,539 | | | $ | (428,909 | ) |
Goldman Sachs International | GS Equity Custom Basket | Receive | 4.63% (Federal Funds Rate - 0.20%) | | | At Maturity | | | | 05/16/28 | | | | 23,021,161 | | | | (1,507,147 | ) |
| | | | | | | | | | | | | | $ | 46,037,700 | | | $ | (1,936,056 | ) |
34 | THE GUGGENHEIM FUNDS ANNUAL REPORT | SEE NOTES TO FINANCIAL STATEMENTS. |
SCHEDULE OF INVESTMENTS (continued) | September 30, 2024 |
RISK MANAGED REAL ESTATE FUND | |
| | Shares | | | Percentage
Notional
Amount | | | Value and
Unrealized
Appreciation
(Depreciation) | |
MS EQUITY LONG CUSTOM BASKET | | | | | | | | |
Financial | | | | | | | | | | | | |
Vornado Realty Trust | | | 20,832 | | | | 3.56 | % | | $ | 310,508 | |
Kimco Realty Corp. | | | 39,901 | | | | 4.04 | % | | | 230,898 | |
Kilroy Realty Corp. | | | 38,622 | | | | 6.52 | % | | | 206,616 | |
Kite Realty Group Trust | | | 37,280 | | | | 4.32 | % | | | 203,372 | |
VICI Properties, Inc. | | | 38,319 | | | | 5.56 | % | | | 189,893 | |
CareTrust REIT, Inc. | | | 13,639 | | | | 1.83 | % | | | 186,063 | |
Sabra Health Care REIT, Inc. | | | 33,819 | | | | 2.74 | % | | | 161,388 | |
Invitation Homes, Inc. | | | 40,559 | | | | 6.23 | % | | | 138,020 | |
Digital Realty Trust, Inc. | | | 2,787 | | | | 1.97 | % | | | 123,049 | |
Ryman Hospitality Properties, Inc. | | | 3,776 | | | | 1.77 | % | | | 114,435 | |
InvenTrust Properties Corp. | | | 17,276 | | | | 2.14 | % | | | 114,321 | |
American Homes 4 Rent — Class A | | | 18,822 | | | | 3.15 | % | | | 82,619 | |
Tanger, Inc. | | | 12,920 | | | | 1.87 | % | | | 74,025 | |
EPR Properties | | | 9,848 | | | | 2.11 | % | | | 56,687 | |
SBA Communications Corp. | | | 1,772 | | | | 1.86 | % | | | 50,332 | |
National Storage Affiliates Trust | | | 8,785 | | | | 1.85 | % | | | 43,705 | |
WP Carey, Inc. | | | 7,464 | | | | 2.03 | % | | | 41,552 | |
NNN REIT, Inc. | | | 13,188 | | | | 2.79 | % | | | 19,679 | |
UDR, Inc. | | | 14,428 | | | | 2.85 | % | | | 18,124 | |
Apple Hospitality REIT, Inc. | | | 55,990 | | | | 3.62 | % | | | 15,976 | |
STAG Industrial, Inc. | | | 21,459 | | | | 3.66 | % | | | 10,798 | |
Extra Space Storage, Inc. | | | 2,341 | | | | 1.84 | % | | | 10,230 | |
Simon Property Group, Inc. | | | 2,497 | | | | 1.84 | % | | | 6,129 | |
Prologis, Inc. | | | 6,711 | | | | 3.69 | % | | | 5,820 | |
RLJ Lodging Trust | | | 23,714 | | | | 0.95 | % | | | 2,883 | |
American Tower Corp. — Class A | | | 1,805 | | | | 1.83 | % | | | 2,618 | |
Gaming and Leisure Properties, Inc. | | | 12,412 | | | | 2.78 | % | | | 1,991 | |
Healthcare Realty Trust, Inc. | | | 46,220 | | | | 3.66 | % | | | (277 | ) |
Alexander & Baldwin, Inc. | | | 10,761 | | | | 0.90 | % | | | (5,119 | ) |
NETSTREIT Corp. | | | 25,873 | | | | 1.86 | % | | | (9,379 | ) |
Essex Property Trust, Inc. | | | 4,321 | | | | 5.56 | % | | | (11,340 | ) |
Park Hotels & Resorts, Inc. | | | 72,001 | | | | 4.43 | % | | | (27,923 | ) |
Alexandria Real Estate Equities, Inc. | | | 8,095 | | | | 4.19 | % | | | (82,329 | ) |
Total Financial | | | | | | | | | | | 2,285,364 | |
Total MS Equity Long Custom Basket | | | | | | | 2,285,364 | |
| | | | | | | | | |
MS EQUITY SHORT CUSTOM BASKET | | | | | | | | |
Financial | | | | | | | | | | | | |
Douglas Emmett, Inc. | | | 45,513 | | | | (3.49 | )% | | | 719,833 | |
Service Properties Trust | | | 41,027 | | | | (0.81 | )% | | | 168,732 | |
Realty Income Corp. | | | 13,691 | | | | (3.77 | )% | | | 122,642 | |
Mid-America Apartment Communities, Inc. | | | 9,749 | | | | (6.73 | )% | | | 93,295 | |
Pebblebrook Hotel Trust | | | 46,411 | | | | (2.67 | )% | | | 58,430 | |
Camden Property Trust | | | 11,068 | | | | (5.94 | )% | | | 54,054 | |
JBG SMITH Properties | | | 9,486 | | | | (0.72 | )% | | | 20,875 | |
Host Hotels & Resorts, Inc. | | | 22,928 | | | | (1.75 | )% | | | 12,737 | |
LXP Industrial Trust | | | 30,979 | | | | (1.35 | )% | | | 7,694 | |
Americold Realty Trust, Inc. | | | 9,586 | | | | (1.18 | )% | | | 2,313 | |
Rexford Industrial Realty, Inc. | | | 5,366 | | | | (1.17 | )% | | | 2,121 | |
Equity LifeStyle Properties, Inc. | | | 5,873 | | | | (1.82 | )% | | | 2,081 | |
EastGroup Properties, Inc. | | | 1,469 | | | | (1.19 | )% | | | 1,316 | |
Cousins Properties, Inc. | | | 14,124 | | | | (1.81 | )% | | | (82 | ) |
Independence Realty Trust, Inc. | | | 6,065 | | | | (0.54 | )% | | | (405 | ) |
Getty Realty Corp. | | | 9,433 | | | | (1.30 | )% | | | (2,723 | ) |
Global Net Lease, Inc. | | | 27,259 | | | | (1.00 | )% | | | (4,449 | ) |
Sun Communities, Inc. | | | 3,092 | | | | (1.82 | )% | | | (5,335 | ) |
Regency Centers Corp. | | | 5,979 | | | | (1.88 | )% | | | (12,331 | ) |
CubeSmart | | | 7,879 | | | | (1.84 | )% | | | (19,146 | ) |
Sunstone Hotel Investors, Inc. | | | 78,743 | | | | (3.53 | )% | | | (21,578 | ) |
Veris Residential, Inc. | | | 12,867 | | | | (1.00 | )% | | | (29,046 | ) |
DiamondRock Hospitality Co. | | | 52,555 | | | | (1.99 | )% | | | (30,108 | ) |
Public Storage | | | 1,179 | | | | (1.86 | )% | | | (30,703 | ) |
Safehold, Inc. | | | 10,620 | | | | (1.21 | )% | | | (41,009 | ) |
Four Corners Property Trust, Inc. | | | 21,388 | | | | (2.72 | )% | | | (41,488 | ) |
Equinix, Inc. | | | 526 | | | | (2.03 | )% | | | (56,372 | ) |
Phillips Edison & Company, Inc. | | | 18,071 | | | | (2.96 | )% | | | (56,471 | ) |
Federal Realty Investment Trust | | | 7,339 | | | | (3.67 | )% | | | (60,696 | ) |
Crown Castle, Inc. | | | 7,233 | | | | (3.73 | )% | | | (61,808 | ) |
Acadia Realty Trust | | | 18,085 | | | | (1.84 | )% | | | (74,505 | ) |
Terreno Realty Corp. | | | 12,412 | | | | (3.60 | )% | | | (99,855 | ) |
SL Green Realty Corp. | | | 8,067 | | | | (2.44 | )% | | | (103,185 | ) |
Agree Realty Corp. | | | 13,104 | | | | (4.29 | )% | | | (132,654 | ) |
BXP, Inc. | | | 16,418 | | | | (5.74 | )% | | | (138,050 | ) |
Omega Healthcare Investors, Inc. | | | 15,467 | | | | (2.74 | )% | | | (178,489 | ) |
Macerich Co. | | | 47,973 | | | | (3.80 | )% | | | (202,605 | ) |
National Health Investors, Inc. | | | 12,955 | | | | (4.73 | )% | | | (400,444 | ) |
Total Financial | | | | | | | | | | | (537,414 | ) |
| | | | | | | | | | | | | |
Exchange Traded Funds | | | | | | | | | | | | |
Vanguard Real Estate ETF | | | 7,891 | | | | (3.34 | )% | | | 108,505 | |
Total MS Equity Short Custom Basket | | | | | | | (428,909 | ) |
SEE NOTES TO FINANCIAL STATEMENTS. | THE GUGGENHEIM FUNDS ANNUAL REPORT | 35 |
SCHEDULE OF INVESTMENTS (continued) | September 30, 2024 |
RISK MANAGED REAL ESTATE FUND | |
| | Shares | | | Percentage
Notional
Amount | | | Value and
Unrealized
Appreciation
(Depreciation) | |
GS EQUITY LONG CUSTOM BASKET | | | | | | | | |
Financial | | | | | | | | | | | | |
Vornado Realty Trust | | | 20,832 | | | | 3.56 | % | | $ | 305,340 | |
Kimco Realty Corp. | | | 39,901 | | | | 4.04 | % | | | 232,461 | |
Kilroy Realty Corp. | | | 38,622 | | | | 6.52 | % | | | 203,792 | |
Kite Realty Group Trust | | | 37,280 | | | | 4.32 | % | | | 191,103 | |
VICI Properties, Inc. | | | 38,319 | | | | 5.56 | % | | | 188,973 | |
Sabra Health Care REIT, Inc. | | | 33,819 | | | | 2.74 | % | | | 160,099 | |
Invitation Homes, Inc. | | | 40,559 | | | | 6.23 | % | | | 135,673 | |
Digital Realty Trust, Inc. | | | 2,787 | | | | 1.97 | % | | | 123,228 | |
American Homes 4 Rent — Class A | | | 18,822 | | | | 3.15 | % | | | 82,655 | |
CareTrust REIT, Inc. | | | 13,639 | | | | 1.83 | % | | | 75,696 | |
Tanger, Inc. | | | 12,920 | | | | 1.87 | % | | | 75,051 | |
EPR Properties | | | 9,848 | | | | 2.11 | % | | | 57,285 | |
InvenTrust Properties Corp. | | | 17,276 | | | | 2.14 | % | | | 50,219 | |
SBA Communications Corp. | | | 1,772 | | | | 1.86 | % | | | 46,613 | |
National Storage Affiliates Trust | | | 8,785 | | | | 1.85 | % | | | 43,445 | |
Alexandria Real Estate Equities, Inc. | | | 8,095 | | | | 4.19 | % | | | 40,237 | |
WP Carey, Inc. | | | 7,464 | | | | 2.03 | % | | | 40,022 | |
NNN REIT, Inc. | | | 13,188 | | | | 2.79 | % | | | 18,690 | |
UDR, Inc. | | | 14,428 | | | | 2.85 | % | | | 16,871 | |
Apple Hospitality REIT, Inc. | | | 55,990 | | | | 3.62 | % | | | 16,779 | |
STAG Industrial, Inc. | | | 21,459 | | | | 3.66 | % | | | 12,224 | |
Extra Space Storage, Inc. | | | 2,341 | | | | 1.84 | % | | | 10,843 | |
Ryman Hospitality Properties, Inc. | | | 3,776 | | | | 1.77 | % | | | 9,520 | |
Simon Property Group, Inc. | | | 2,497 | | | | 1.84 | % | | | 5,171 | |
American Tower Corp. — Class A | | | 1,805 | | | | 1.83 | % | | | 2,975 | |
RLJ Lodging Trust | | | 23,714 | | | | 0.95 | % | | | 2,642 | |
Prologis, Inc. | | | 6,711 | | | | 3.69 | % | | | 2,575 | |
Gaming and Leisure Properties, Inc. | | | 12,412 | | | | 2.78 | % | | | 2,498 | |
Healthcare Realty Trust, Inc. | | | 46,220 | | | | 3.66 | % | | | (1,756 | ) |
NETSTREIT Corp. | | | 25,873 | | | | 1.86 | % | | | (5,115 | ) |
Alexander & Baldwin, Inc. | | | 10,761 | | | | 0.90 | % | | | (5,161 | ) |
Essex Property Trust, Inc. | | | 4,321 | | | | 5.56 | % | | | (12,384 | ) |
Park Hotels & Resorts, Inc. | | | 72,001 | | | | 4.43 | % | | | (28,857 | ) |
Total Financial | | | | | | | | | | | 2,099,407 | |
Total GS Equity Long Custom Basket | | | | | | | 2,099,407 | |
| | | | | | | | | |
GS EQUITY SHORT CUSTOM BASKET | | | | | | | | |
Financial | | | | | | | | | | | | |
Service Properties Trust | | | 41,027 | | | | (0.81 | )% | | | 80,875 | |
Camden Property Trust | | | 11,068 | | | | (5.94 | )% | | | 59,264 | |
Pebblebrook Hotel Trust | | | 46,411 | | | | (2.67 | )% | | | 47,956 | |
JBG SMITH Properties | | | 9,486 | | | | (0.72 | )% | | | 20,987 | |
Host Hotels & Resorts, Inc. | | | 22,928 | | | | (1.75 | )% | | | 13,032 | |
LXP Industrial Trust | | | 30,979 | | | | (1.35 | )% | | | 8,343 | |
Rexford Industrial Realty, Inc. | | | 5,366 | | | | (1.17 | )% | | | 3,588 | |
Equity LifeStyle Properties, Inc. | | | 5,873 | | | | (1.82 | )% | | | 2,134 | |
Americold Realty Trust, Inc. | | | 9,586 | | | | (1.18 | )% | | | 1,866 | |
EastGroup Properties, Inc. | | | 1,469 | | | | (1.19 | )% | | | 1,590 | |
Cousins Properties, Inc. | | | 14,124 | | | | (1.81 | )% | | | (300 | ) |
Independence Realty Trust, Inc. | | | 6,065 | | | | (0.54 | )% | | | (542 | ) |
Getty Realty Corp. | | | 9,433 | | | | (1.30 | )% | | | (2,785 | ) |
Sunstone Hotel Investors, Inc. | | | 78,743 | | | | (3.53 | )% | | | (4,286 | ) |
Global Net Lease, Inc. | | | 27,259 | | | | (1.00 | )% | | | (4,948 | ) |
Sun Communities, Inc. | | | 3,092 | | | | (1.82 | )% | | | (5,249 | ) |
Douglas Emmett, Inc. | | | 46,089 | | | | (3.52 | )% | | | (6,630 | ) |
Regency Centers Corp. | | | 5,979 | | | | (1.88 | )% | | | (16,182 | ) |
CubeSmart | | | 7,879 | | | | (1.84 | )% | | | (19,698 | ) |
DiamondRock Hospitality Co. | | | 52,555 | | | | (1.99 | )% | | | (26,330 | ) |
Veris Residential, Inc. | | | 12,867 | | | | (1.00 | )% | | | (28,757 | ) |
Public Storage | | | 1,179 | | | | (1.86 | )% | | | (31,536 | ) |
Mid-America Apartment Communities, Inc. | | | 9,749 | | | | (6.73 | )% | | | (36,166 | ) |
Four Corners Property Trust, Inc. | | | 21,388 | | | | (2.72 | )% | | | (45,165 | ) |
Safehold, Inc. | | | 10,620 | | | | (1.21 | )% | | | (45,586 | ) |
Federal Realty Investment Trust | | | 7,339 | | | | (3.67 | )% | | | (51,101 | ) |
Equinix, Inc. | | | 526 | | | | (2.03 | )% | | | (56,119 | ) |
Crown Castle, Inc. | | | 7,233 | | | | (3.73 | )% | | | (58,414 | ) |
Phillips Edison & Company, Inc. | | | 18,071 | | | | (2.96 | )% | | | (73,088 | ) |
Acadia Realty Trust | | | 18,085 | | | | (1.84 | )% | | | (75,066 | ) |
Realty Income Corp. | | | 13,691 | | | | (3.77 | )% | | | (93,999 | ) |
Terreno Realty Corp. | | | 12,412 | | | | (3.60 | )% | | | (100,783 | ) |
SL Green Realty Corp. | | | 7,988 | | | | (2.42 | )% | | | (122,910 | ) |
Macerich Co. | | | 47,973 | | | | (3.80 | )% | | | (129,674 | ) |
Agree Realty Corp. | | | 13,104 | | | | (4.29 | )% | | | (135,852 | ) |
BXP, Inc. | | | 16,418 | | | | (5.74 | )% | | | (137,105 | ) |
Omega Healthcare Investors, Inc. | | | 15,467 | | | | (2.73 | )% | | | (145,049 | ) |
National Health Investors, Inc. | | | 12,955 | | | | (4.73 | )% | | | (402,422 | ) |
Total Financial | | | | | | | | | | | (1,616,107 | ) |
| | | | | | | | | | | | | |
Exchange Traded Funds | | | | | | | | | | | | |
Vanguard Real Estate ETF | | | 7,891 | | | | (3.34 | )% | | | 108,960 | |
Total GS Equity Short Custom Basket | | | | | | $ | (1,507,147 | ) |
36 | THE GUGGENHEIM FUNDS ANNUAL REPORT | SEE NOTES TO FINANCIAL STATEMENTS. |
SCHEDULE OF INVESTMENTS (concluded) | September 30, 2024 |
RISK MANAGED REAL ESTATE FUND | |
*** | A copy of each underlying unaffiliated fund’s financial statements is available at the SEC’s website at www.sec.gov. |
† | Value determined based on Level 1 inputs — See Note 4. |
†† | Value determined based on Level 2 inputs — See Note 4. |
1 | All or a portion of this security is pledged as short security collateral at September 30, 2024 |
2 | Rate indicated is the 7-day yield as of September 30, 2024. |
| | GS — Goldman Sachs International |
| | MS — Morgan Stanley Capital Services LLC |
| | REIT — Real Estate Investment Trust |
| | |
| | See Sector Classification in Other Information section. |
The following table summarizes the inputs used to value the Fund’s investments at September 30, 2024 (See Note 4 in the Notes to Financial Statements):
Investments in Securities (Assets) | | Level 1
Quoted
Prices | | | Level 2
Significant
Observable
Inputs | | | Level 3
Significant
Unobservable
Inputs | | | Total | |
Common Stocks | | $ | 331,230,483 | | | $ | — | | | $ | — | | | $ | 331,230,483 | |
Money Market Fund | | | 11,710,414 | | | | — | | | | — | | | | 11,710,414 | |
Equity Custom Basket Swap Agreements** | | | — | | | | 4,384,771 | | | | — | | | | 4,384,771 | |
Total Assets | | $ | 342,940,897 | | | $ | 4,384,771 | | | $ | — | | | $ | 347,325,668 | |
Investments in Securities (Liabilities) | | Level 1
Quoted
Prices | | | Level 2
Significant
Observable
Inputs | | | Level 3
Significant
Unobservable
Inputs | | | Total | |
Common Stocks | | $ | 25,768,896 | | | $ | — | | | $ | — | | | $ | 25,768,896 | |
Exchange-Traded Funds | | | 885,548 | | | | — | | | | — | | | | 885,548 | |
Equity Custom Basket Swap Agreements** | | | — | | | | 1,936,056 | | | | — | | | | 1,936,056 | |
Total Liabilities | | $ | 26,654,444 | | | $ | 1,936,056 | | | $ | — | | | $ | 28,590,500 | |
** | This derivative is reported as unrealized appreciation/depreciation at period end. |
SEE NOTES TO FINANCIAL STATEMENTS. | THE GUGGENHEIM FUNDS ANNUAL REPORT | 37 |
RISK MANAGED REAL ESTATE FUND | |
STATEMENT OF ASSETS AND LIABILITIES |
September 30, 2024 |
Assets: |
Investments, at value (cost $305,484,126) | | $ | 342,940,897 | |
Cash | | | 22,272,633 | |
Segregated cash with broker | | | 2,309,456 | |
Unrealized appreciation on OTC swap agreements | | | 4,384,771 | |
Prepaid expenses | | | 31,557 | |
Receivables: |
Dividends | | | 1,037,413 | |
Fund shares sold | | | 278,990 | |
Interest | | | 42,665 | |
Other assets | | | 10,701 | |
Total assets | | | 373,309,083 | |
| | | | | |
Liabilities: |
Securities sold short, at value (proceeds $23,989,061) | | | 26,654,444 | |
Segregated cash due to broker | | | 4,043,030 | |
Unrealized depreciation on OTC swap agreements | | | 1,936,056 | |
Payable for: |
Fund shares redeemed | | | 1,098,972 | |
Swap settlement | | | 862,590 | |
Management fees | | | 193,655 | |
Distributions to shareholders | | | 87,894 | |
Transfer agent/maintenance fees | | | 56,558 | |
Distribution and service fees | | | 6,728 | |
Fund accounting/administration fees | | | 4,308 | |
Trustees’ fees* | | | 3,043 | |
Due to Investment Adviser | | | 53 | |
Miscellaneous | | | 130,288 | |
Total liabilities | | | 35,077,619 | |
Net assets | | $ | 338,231,464 | |
| | | | | |
Net assets consist of: |
Paid in capital | | $ | 309,300,864 | |
Total distributable earnings (loss) | | | 28,930,600 | |
Net assets | | $ | 338,231,464 | |
Class A: |
Net assets | | $ | 4,836,934 | |
Capital shares outstanding | | | 140,344 | |
Net asset value per share | | $ | 34.46 | |
Maximum offering price per share (Net asset value divided by 95.25%) | | $ | 36.18 | |
Class C: |
Net assets | | $ | 5,007,103 | |
Capital shares outstanding | | | 146,509 | |
Net asset value per share | | $ | 34.18 | |
Class P: |
Net assets | | $ | 10,074,496 | |
Capital shares outstanding | | | 290,529 | |
Net asset value per share | | $ | 34.68 | |
| | | | | |
Institutional Class: |
Net assets | | $ | 318,312,931 | |
Capital shares outstanding | | | 9,102,244 | |
Net asset value per share | | $ | 34.97 | |
* | Relates to Trustees not deemed “interested persons” within the meaning of Section 2(a)(19) of the 1940 Act. |
38 | THE GUGGENHEIM FUNDS ANNUAL REPORT | SEE NOTES TO FINANCIAL STATEMENTS. |
RISK MANAGED REAL ESTATE FUND | |
STATEMENT OF OPERATIONS |
Year Ended September 30, 2024 |
Investment Income: |
Dividends (net of foreign withholding tax of $19,888) | | $ | 11,456,510 | |
Interest | | | 1,952,014 | |
Total investment income | | | 13,408,524 | |
| | | | | |
Expenses: |
Management fees | | | 2,538,398 | |
Distribution and service fees: |
Class A | | | 11,068 | |
Class C | | | 48,656 | |
Class P | | | 23,644 | |
Transfer agent/maintenance fees: |
Class A | | | 5,150 | |
Class C | | | 5,003 | |
Class P | | | 14,311 | |
Institutional Class | | | 272,901 | |
Short sales dividend expense | | | 1,309,648 | |
Interest expense | | | 316,941 | |
Fund accounting/administration fees | | | 139,273 | |
Professional fees | | | 87,211 | |
Trustees’ fees* | | | 20,130 | |
Custodian fees | | | 19,801 | |
Line of credit fees | | | 9,181 | |
Miscellaneous | | | 126,576 | |
Recoupment of previously waived fees: |
Class A | | | 854 | |
Class C | | | 645 | |
Class P | | | 3,370 | |
Total expenses | | | 4,952,761 | |
Less: |
Expense reimbursed by Adviser: |
Class A | | | (180 | ) |
Class C | | | (84 | ) |
Class P | | | (96 | ) |
Institutional Class | | | (868 | ) |
Expenses waived by Adviser | | | (106,703 | ) |
Total waived/reimbursed expenses | | | (107,931 | ) |
Net expenses | | | 4,844,830 | |
Net investment income | | | 8,563,694 | |
| | | | | |
Net Realized and Unrealized Gain (Loss): |
Net realized gain (loss) on: |
Investments | | $ | (3,368,738 | ) |
Investments sold short | | | 2,776,429 | |
Swap agreements | | | 8,058,851 | |
Net realized gain | | | 7,466,542 | |
Net change in unrealized appreciation (depreciation) on: |
Investments | | | 80,460,006 | |
Investments sold short | | | (7,391,582 | ) |
Swap agreements | | | (4,631,112 | ) |
Net change in unrealized appreciation (depreciation) | | | 68,437,312 | |
Net realized and unrealized gain | | | 75,903,854 | |
Net increase in net assets resulting from operations | | $ | 84,467,548 | |
* | Relates to Trustees not deemed “interested persons” within the meaning of Section 2(a)(19) of the 1940 Act. |
SEE NOTES TO FINANCIAL STATEMENTS. | THE GUGGENHEIM FUNDS ANNUAL REPORT | 39 |
RISK MANAGED REAL ESTATE FUND | |
STATEMENTS OF CHANGES IN NET ASSETS |
| | Year Ended
September 30,
2024 | | | Year Ended
September 30,
2023 | |
Increase (Decrease) in Net Assets from Operations: | | | | | | | | |
Net investment income | | $ | 8,563,694 | | | $ | 9,991,453 | |
Net realized gain on investments | | | 7,466,542 | | | | 1,677,521 | |
Net change in unrealized appreciation (depreciation) on investments | | | 68,437,312 | | | | (4,167,625 | ) |
Net increase in net assets resulting from operations | | | 84,467,548 | | | | 7,501,349 | |
| | | | | | | | | |
Distributions to shareholders: | | | | | | | | |
Class A | | | (124,087 | ) | | | (347,557 | ) |
Class C | | | (100,127 | ) | | | (302,170 | ) |
Class P | | | (258,942 | ) | | | (683,918 | ) |
Institutional Class | | | (9,703,511 | ) | | | (26,554,622 | ) |
Return of Capital | | | | | | | | |
Class A | | | — | | | | (34,317 | ) |
Class C | | | — | | | | (34,101 | ) |
Class P | | | — | | | | (67,335 | ) |
Institutional Class | | | — | | | | (2,503,050 | ) |
Total distributions to shareholders | | | (10,186,667 | ) | | | (30,527,070 | ) |
| | | | | | | | | |
Capital share transactions: | | | | | | | | |
Proceeds from sale of shares | | | | | | | | |
Class A | | | 975,223 | | | | 1,251,126 | |
Class C | | | 449,159 | | | | 693,027 | |
Class P | | | 1,668,346 | | | | 1,230,119 | |
Institutional Class | | | 56,496,605 | | | | 89,132,585 | |
Distributions reinvested | | | | | | | | |
Class A | | | 113,706 | | | | 353,469 | |
Class C | | | 96,964 | | | | 322,373 | |
Class P | | | 258,942 | | | | 751,253 | |
Institutional Class | | | 9,267,091 | | | | 25,711,484 | |
Cost of shares redeemed | | | | | | | | |
Class A | | | (1,535,282 | ) | | | (6,232,246 | ) |
Class C | | | (1,316,770 | ) | | | (1,422,158 | ) |
Class P | | | (2,686,041 | ) | | | (5,440,837 | ) |
Institutional Class | | | (152,743,720 | ) | | | (167,277,680 | ) |
Net decrease from capital share transactions | | | (88,955,777 | ) | | | (60,927,485 | ) |
Net decrease in net assets | | | (14,674,896 | ) | | | (83,953,206 | ) |
| | | | | | | | | |
Net assets: | | | | | | | | |
Beginning of year | | | 352,906,360 | | | | 436,859,566 | |
End of year | | $ | 338,231,464 | | | $ | 352,906,360 | |
| | | | | | | | | |
Capital share activity: | | | | | | | | |
Shares sold | | | | | | | | |
Class A | | | 31,903 | | | | 42,057 | |
Class C | | | 15,361 | | | | 23,748 | |
Class P | | | 53,565 | | | | 40,388 | |
Institutional Class | | | 1,826,925 | | | | 2,917,549 | |
Shares issued from reinvestment of distributions | | | | | | | | |
Class A | | | 3,567 | | | | 12,164 | |
Class C | | | 3,077 | | | | 11,190 | |
Class P | | | 8,075 | | | | 25,698 | |
Institutional Class | | | 286,640 | | | | 872,328 | |
Shares redeemed | | | | | | | | |
Class A | | | (50,152 | ) | | | (205,886 | ) |
Class C | | | (42,364 | ) | | | (48,660 | ) |
Class P | | | (85,912 | ) | | | (180,387 | ) |
Institutional Class | | | (4,977,917 | ) | | | (5,535,082 | ) |
Net decrease in shares | | | (2,927,232 | ) | | | (2,024,893 | ) |
40 | THE GUGGENHEIM FUNDS ANNUAL REPORT | SEE NOTES TO FINANCIAL STATEMENTS. |
RISK MANAGED REAL ESTATE FUND | |
This table is presented to show selected data for a share outstanding throughout each period and to assist shareholders in evaluating a Fund’s performance for the periods presented.
Class A | | Year Ended
September 30,
2024 | | | Year Ended
September 30,
2023 | | | Year Ended
September 30,
2022 | | | Year Ended
September 30,
2021 | | | Year Ended
September 30,
2020 | |
Per Share Data |
Net asset value, beginning of period | | $ | 27.61 | | | $ | 29.48 | | | $ | 36.87 | | | $ | 29.97 | | | $ | 34.11 | |
Income (loss) from investment operations: |
Net investment income (loss)a | | | .71 | | | | .56 | | | | .23 | | | | .32 | | | | .31 | |
Net gain (loss) on investments (realized and unrealized) | | | 7.01 | | | | (.31 | ) | | | (5.35 | ) | | | 8.86 | | | | (2.53 | ) |
Total from investment operations | | | 7.72 | | | | .25 | | | | (5.12 | ) | | | 9.18 | | | | (2.22 | ) |
Less distributions from: |
Net investment income | | | (.87 | ) | | | (.63 | ) | | | (.55 | ) | | | (.54 | ) | | | (.63 | ) |
Return of capital | | | — | | | | (.20 | ) | | | — | | | | — | | | | — | |
Net realized gains | | | — | | | | (1.29 | ) | | | (1.72 | ) | | | (1.74 | ) | | | (1.29 | ) |
Total distributions | | | (.87 | ) | | | (2.12 | ) | | | (2.27 | ) | | | (2.28 | ) | | | (1.92 | ) |
Net asset value, end of period | | $ | 34.46 | | | $ | 27.61 | | | $ | 29.48 | | | $ | 36.87 | | | $ | 29.97 | |
|
Total Returnb | | | 28.31 | % | | | 0.58 | % | | | (15.31 | %) | | | 32.13 | % | | | (6.73 | %) |
Ratios/Supplemental Data |
Net assets, end of period (in thousands) | | $ | 4,837 | | | $ | 4,280 | | | $ | 9,043 | | | $ | 10,098 | | | $ | 15,857 | |
Ratios to average net assets: |
Net investment income (loss) | | | 2.31 | % | | | 1.86 | % | | | 0.62 | % | | | 0.95 | % | | | 0.99 | % |
Total expensesc | | | 1.73 | % | | | 1.72 | % | | | 1.62 | % | | | 1.39 | % | | | 1.71 | % |
Net expensesd,e,f | | | 1.70 | % | | | 1.66 | % | | | 1.58 | % | | | 1.38 | % | | | 1.70 | % |
Portfolio turnover rate | | | 72 | % | | | 21 | % | | | 47 | % | | | 80 | % | | | 180 | % |
Class C | | Year Ended
September 30,
2024 | | | Year Ended
September 30,
2023 | | | Year Ended
September 30,
2022 | | | Year Ended
September 30,
2021 | | | Year Ended
September 30,
2020 | |
Per Share Data |
Net asset value, beginning of period | | $ | 27.38 | | | $ | 29.23 | | | $ | 36.55 | | | $ | 29.76 | | | $ | 33.88 | |
Income (loss) from investment operations: |
Net investment income (loss)a | | | .47 | | | | .42 | | | | (.01 | ) | | | .05 | | | | .08 | |
Net gain (loss) on investments (realized and unrealized) | | | 6.97 | | | | (.38 | ) | | | (5.30 | ) | | | 8.76 | | | | (2.53 | ) |
Total from investment operations | | | 7.44 | | | | .04 | | | | (5.31 | ) | | | 8.81 | | | | (2.45 | ) |
Less distributions from: |
Net investment income | | | (.64 | ) | | | (.40 | ) | | | (.29 | ) | | | (.28 | ) | | | (.38 | ) |
Return of capital | | | — | | | | (.20 | ) | | | — | | | | — | | | | — | |
Net realized gains | | | — | | | | (1.29 | ) | | | (1.72 | ) | | | (1.74 | ) | | | (1.29 | ) |
Total distributions | | | (.64 | ) | | | (1.89 | ) | | | (2.01 | ) | | | (2.02 | ) | | | (1.67 | ) |
Net asset value, end of period | | $ | 34.18 | | | $ | 27.38 | | | $ | 29.23 | | | $ | 36.55 | | | $ | 29.76 | |
|
Total Returnb | | | 27.44 | % | | | (0.10 | %) | | | (15.93 | %) | | | 31.05 | % | | | (7.48 | %) |
Ratios/Supplemental Data |
Net assets, end of period (in thousands) | | $ | 5,007 | | | $ | 4,667 | | | $ | 5,382 | | | $ | 5,029 | | | $ | 2,446 | |
Ratios to average net assets: |
Net investment income (loss) | | | 1.56 | % | | | 1.40 | % | | | (0.03 | %) | | | 0.16 | % | | | 0.26 | % |
Total expensesc | | | 2.47 | % | | | 2.36 | % | | | 2.34 | % | | | 2.21 | % | | | 2.54 | % |
Net expensesd,e,f | | | 2.43 | % | | | 2.32 | % | | | 2.31 | % | | | 2.20 | % | | | 2.51 | % |
Portfolio turnover rate | | | 72 | % | | | 21 | % | | | 47 | % | | | 80 | % | | | 180 | % |
SEE NOTES TO FINANCIAL STATEMENTS. | THE GUGGENHEIM FUNDS ANNUAL REPORT | 41 |
RISK MANAGED REAL ESTATE FUND | |
FINANCIAL HIGHLIGHTS (continued) |
This table is presented to show selected data for a share outstanding throughout each period and to assist shareholders in evaluating a Fund’s performance for the periods presented.
Class P | | Year Ended
September 30,
2024 | | | Year Ended
September 30,
2023 | | | Year Ended
September 30,
2022 | | | Year Ended
September 30,
2021 | | | Year Ended
September 30,
2020 | |
Per Share Data |
Net asset value, beginning of period | | $ | 27.77 | | | $ | 29.63 | | | $ | 37.04 | | | $ | 30.12 | | | $ | 34.30 | |
Income (loss) from investment operations: |
Net investment income (loss)a | | | .70 | | | | .60 | | | | .18 | | | | .29 | | | | .22 | |
Net gain (loss) on investments (realized and unrealized) | | | 7.07 | | | | (.36 | ) | | | (5.35 | ) | | | 8.91 | | | | (2.48 | ) |
Total from investment operations | | | 7.77 | | | | .24 | | | | (5.17 | ) | | | 9.20 | | | | (2.26 | ) |
Less distributions from: |
Net investment income | | | (.86 | ) | | | (.61 | ) | | | (.52 | ) | | | (.54 | ) | | | (.63 | ) |
Return of capital | | | — | | | | (.20 | ) | | | — | | | | — | | | | — | |
Net realized gains | | | — | | | | (1.29 | ) | | | (1.72 | ) | | | (1.74 | ) | | | (1.29 | ) |
Total distributions | | | (.86 | ) | | | (2.10 | ) | | | (2.24 | ) | | | (2.28 | ) | | | (1.92 | ) |
Net asset value, end of period | | $ | 34.68 | | | $ | 27.77 | | | $ | 29.63 | | | $ | 37.04 | | | $ | 30.12 | |
|
Total Return | | | 28.30 | % | | | 0.55 | % | | | (15.35 | %) | | | 32.03 | % | | | (6.81 | %) |
Ratios/Supplemental Data |
Net assets, end of period (in thousands) | | $ | 10,074 | | | $ | 8,743 | | | $ | 12,716 | | | $ | 14,830 | | | $ | 12,152 | |
Ratios to average net assets: |
Net investment income (loss) | | | 2.26 | % | | | 1.99 | % | | | 0.48 | % | | | 0.86 | % | | | 0.70 | % |
Total expensesc | | | 1.79 | % | | | 1.73 | % | | | 1.69 | % | | | 1.47 | % | | | 1.84 | % |
Net expensesd,e,f | | | 1.75 | % | | | 1.66 | % | | | 1.64 | % | | | 1.45 | % | | | 1.78 | % |
Portfolio turnover rate | | | 72 | % | | | 21 | % | | | 47 | % | | | 80 | % | | | 180 | % |
42 | THE GUGGENHEIM FUNDS ANNUAL REPORT | SEE NOTES TO FINANCIAL STATEMENTS. |
RISK MANAGED REAL ESTATE FUND | |
FINANCIAL HIGHLIGHTS (concluded) |
This table is presented to show selected data for a share outstanding throughout each period and to assist shareholders in evaluating a Fund’s performance for the periods presented.
Institutional Class | | Year Ended
September 30,
2024 | | | Year Ended
September 30,
2023 | | | Year Ended
September 30,
2022 | | | Year Ended
September 30,
2021 | | | Year Ended
September 30,
2020 | |
Per Share Data |
Net asset value, beginning of period | | $ | 28.01 | | | $ | 29.88 | | | $ | 37.34 | | | $ | 30.34 | | | $ | 34.51 | |
Income (loss) from investment operations: |
Net investment income (loss)a | | | .79 | | | | .74 | | | | .34 | | | | .41 | | | | .41 | |
Net gain (loss) on investments (realized and unrealized) | | | 7.16 | | | | (.39 | ) | | | (5.42 | ) | | | 8.98 | | | | (2.58 | ) |
Total from investment operations | | | 7.95 | | | | .35 | | | | (5.08 | ) | | | 9.39 | | | | (2.17 | ) |
Less distributions from: |
Net investment income | | | (.99 | ) | | | (.73 | ) | | | (.66 | ) | | | (.65 | ) | | | (.71 | ) |
Return of capital | | | -— | | | | (.20 | ) | | | — | | | | — | | | | — | |
Net realized gains | | | — | | | | (1.29 | ) | | | (1.72 | ) | | | (1.74 | ) | | | (1.29 | ) |
Total distributions | | | (.99 | ) | | | (2.22 | ) | | | (2.38 | ) | | | (2.39 | ) | | | (2.00 | ) |
Net asset value, end of period | | $ | 34.97 | | | $ | 28.01 | | | $ | 29.88 | | | $ | 37.34 | | | $ | 30.34 | |
|
Total Return | | | 28.74 | % | | | 0.91 | % | | | (15.05 | %) | | | 32.52 | % | | | (6.48 | %) |
Ratios/Supplemental Data |
Net assets, end of period (in thousands) | | $ | 318,313 | | | $ | 335,217 | | | $ | 409,719 | | | $ | 465,267 | | | $ | 290,551 | |
Ratios to average net assets: |
Net investment income (loss) | | | 2.56 | % | | | 2.43 | % | | | 0.92 | % | | | 1.18 | % | | | 1.31 | % |
Total expensesc | | | 1.43 | % | | | 1.34 | % | | | 1.30 | % | | | 1.10 | % | | | 1.43 | % |
Net expensesd,e,f | | | 1.40 | % | | | 1.29 | % | | | 1.28 | % | | | 1.10 | % | | | 1.43 | % |
Portfolio turnover rate | | | 72 | % | | | 21 | % | | | 47 | % | | | 80 | % | | | 180 | % |
a | Net investment income (loss) per share was computed using average shares outstanding throughout the period. |
b | Total return does not reflect the impact of any applicable sales charges. |
c | Does not include expenses of the underlying funds in which the Fund invests. |
d | Net expense information reflects the expense ratios after expense waivers and reimbursements, as applicable. |
e | The portion of the ratios of net expenses to average net assets attributable to recoupments of prior fee reductions or expense reimbursements for the years presented was as follows: |
| | | 09/30/24 | 09/30/23 | 09/30/22 | 09/30/21 | 09/30/20 |
| | Class A | 0.02% | 0.03% | 0.02% | 0.01% | 0.02% |
| | Class C | 0.01% | 0.01% | 0.03% | 0.06% | 0.04% |
| | Class P | 0.04% | 0.01% | 0.05% | 0.06% | 0.02% |
| | Institutional Class | — | 0.02% | 0.01% | 0.00%* | 0.01% |
f | Net expenses may include expenses that are excluded from the expense limitation agreement. Excluding these expenses, the net expense ratios for the years presented would be: |
| | | 09/30/24 | 09/30/23 | 09/30/22 | 09/30/21 | 09/30/20 |
| | Class A | 1.22% | 1.27% | 1.22% | 1.21% | 1.23% |
| | Class C | 1.95% | 1.93% | 1.95% | 2.04% | 2.05% |
| | Class P | 1.27% | 1.27% | 1.28% | 1.29% | 1.30% |
| | Institutional Class | 0.92% | 0.90% | 0.92% | 0.94% | 0.96% |
SEE NOTES TO FINANCIAL STATEMENTS. | THE GUGGENHEIM FUNDS ANNUAL REPORT | 43 |
SCHEDULE OF INVESTMENTS | September 30, 2024 |
SMID CAP VALUE FUND | |
| | Shares | | | Value | |
COMMON STOCKS† - 96.1% |
| | | | | | | | | |
Industrial - 22.9% |
Teledyne Technologies, Inc.* | | | 18,440 | | | $ | 8,070,450 | |
Curtiss-Wright Corp. | | | 23,413 | | | | 7,695,619 | |
Kirby Corp.* | | | 59,036 | | | | 7,227,777 | |
Graphic Packaging Holding Co. | | | 240,516 | | | | 7,116,869 | |
Coherent Corp.* | | | 66,386 | | | | 5,902,379 | |
Summit Materials, Inc. — Class A* | | | 141,380 | | | | 5,518,061 | |
Knight-Swift Transportation Holdings, Inc. | | | 99,408 | | | | 5,363,062 | |
Arcosa, Inc. | | | 55,422 | | | | 5,251,789 | |
Advanced Energy Industries, Inc. | | | 42,919 | | | | 4,516,796 | |
Johnson Controls International plc | | | 56,979 | | | | 4,422,140 | |
Esab Corp. | | | 41,571 | | | | 4,419,413 | |
MDU Resources Group, Inc. | | | 160,895 | | | | 4,410,132 | |
A O Smith Corp. | | | 33,178 | | | | 2,980,380 | |
Littelfuse, Inc. | | | 9,911 | | | | 2,628,893 | |
Park Aerospace Corp. | | | 174,887 | | | | 2,278,778 | |
Timken Co. | | | 24,565 | | | | 2,070,584 | |
Gates Industrial Corporation plc* | | | 111,817 | | | | 1,962,388 | |
Sonoco Products Co. | | | 34,129 | | | | 1,864,467 | |
Regal Rexnord Corp. | | | 5,480 | | | | 909,022 | |
Stoneridge, Inc.* | | | 41,338 | | | | 462,572 | |
Total Industrial | | | | | | | 85,071,571 | |
| | | | | | | | | |
Financial - 18.7% |
Unum Group | | | 140,291 | | | | 8,338,897 | |
Stifel Financial Corp. | | | 82,394 | | | | 7,736,797 | |
Jefferies Financial Group, Inc. | | | 122,576 | | | | 7,544,553 | |
Old Republic International Corp. | | | 206,205 | | | | 7,303,781 | |
First Horizon Corp. | | | 369,776 | | | | 5,742,621 | |
Jones Lang LaSalle, Inc.* | | | 21,074 | | | | 5,685,976 | |
Alexandria Real Estate Equities, Inc. REIT | | | 45,826 | | | | 5,441,838 | |
Prosperity Bancshares, Inc. | | | 74,846 | | | | 5,394,151 | |
First Merchants Corp. | | | 114,112 | | | | 4,244,967 | |
Stewart Information Services Corp. | | | 49,893 | | | | 3,729,003 | |
WisdomTree, Inc. | | | 285,549 | | | | 2,852,634 | |
Apple Hospitality REIT, Inc. REIT | | | 191,498 | | | | 2,843,745 | |
Axos Financial, Inc.* | | | 42,006 | | | | 2,641,337 | |
Total Financial | | | | | | | 69,500,300 | |
| | | | | | | | | |
Consumer, Non-cyclical - 16.0% |
Ingredion, Inc. | | | 66,822 | | | | 9,183,347 | |
Encompass Health Corp. | | | 78,117 | | | | 7,549,227 | |
MGP Ingredients, Inc. | | | 85,998 | | | | 7,159,334 | |
Integer Holdings Corp.* | | | 53,596 | | | | 6,967,480 | |
Euronet Worldwide, Inc.* | | | 66,598 | | | | 6,608,520 | |
Enovis Corp.* | | | 108,056 | | | | 4,651,811 | |
RadNet, Inc.* | | | 66,669 | | | | 4,626,162 | |
Central Garden & Pet Co. — Class A* | | | 110,835 | | | | 3,480,219 | |
ICF International, Inc. | | | 19,374 | | | | 3,231,389 | |
LivaNova plc* | | | 39,390 | | | | 2,069,551 | |
Azenta, Inc.* | | | 33,889 | | | | 1,641,583 | |
Certara, Inc.* | | | 109,254 | | | | 1,279,364 | |
Conagra Brands, Inc. | | | 29,950 | | | | 973,974 | |
Total Consumer, Non-cyclical | | | | | | | 59,421,961 | |
Technology - 8.2% |
Teradyne, Inc. | | | 57,150 | | | | 7,654,099 | |
Leidos Holdings, Inc. | | | 45,214 | | | | 7,369,882 | |
Science Applications International Corp. | | | 43,533 | | | | 6,062,841 | |
MACOM Technology Solutions Holdings, Inc.* | | | 50,130 | | | | 5,577,464 | |
Amkor Technology, Inc. | | | 118,412 | | | | 3,623,407 | |
Total Technology | | | | | | | 30,287,693 | |
| | | | | | | | | |
Basic Materials - 8.0% |
Reliance, Inc. | | | 20,537 | | | | 5,939,506 | |
Avient Corp. | | | 109,330 | | | | 5,501,486 | |
Westlake Corp. | | | 30,968 | | | | 4,654,181 | |
Huntsman Corp. | | | 152,929 | | | | 3,700,882 | |
Ashland, Inc. | | | 41,548 | | | | 3,613,429 | |
Nucor Corp. | | | 21,263 | | | | 3,196,679 | |
MP Materials Corp.* | | | 169,089 | | | | 2,984,421 | |
Total Basic Materials | | | | | | | 29,590,584 | |
| | | | | | | | | |
Consumer, Cyclical - 7.5% |
H&E Equipment Services, Inc. | | | 115,711 | | | | 5,632,811 | |
MSC Industrial Direct Company, Inc. — Class A | | | 53,460 | | | | 4,600,768 | |
Sonic Automotive, Inc. — Class A | | | 56,308 | | | | 3,292,892 | |
Ralph Lauren Corp. — Class A | | | 13,201 | | | | 2,559,278 | |
AutoNation, Inc.* | | | 13,370 | | | | 2,392,160 | |
Crocs, Inc.* | | | 14,885 | | | | 2,155,497 | |
Lakeland Industries, Inc. | | | 82,219 | | | | 1,652,602 | |
Lear Corp. | | | 14,734 | | | | 1,608,216 | |
Century Communities, Inc. | | | 11,018 | | | | 1,134,634 | |
Advance Auto Parts, Inc. | | | 28,844 | | | | 1,124,627 | |
Newell Brands, Inc. | | | 141,095 | | | | 1,083,610 | |
Methode Electronics, Inc. | | | 68,189 | | | | 815,540 | |
Total Consumer, Cyclical | | | | | | | 28,052,635 | |
| | | | | | | | | |
Utilities - 7.4% |
OGE Energy Corp. | | | 233,750 | | | | 9,588,425 | |
Evergy, Inc. | | | 135,657 | | | | 8,412,091 | |
Pinnacle West Capital Corp. | | | 81,991 | | | | 7,263,583 | |
Black Hills Corp. | | | 35,919 | | | | 2,195,369 | |
Total Utilities | | | | | | | 27,459,468 | |
| | | | | | | | | |
Energy - 5.8% |
Diamondback Energy, Inc. | | | 40,485 | | | | 6,979,614 | |
Murphy Oil Corp. | | | 98,302 | | | | 3,316,710 | |
Liberty Energy, Inc. — Class A | | | 165,250 | | | | 3,154,622 | |
Equities Corp. | | | 73,308 | | | | 2,686,005 | |
Kinder Morgan, Inc. | | | 112,598 | | | | 2,487,290 | |
Talos Energy, Inc.* | | | 188,175 | | | | 1,947,611 | |
Patterson-UTI Energy, Inc. | | | 116,563 | | | | 891,707 | |
HydroGen Corp.*,†††,1 | | | 1,265,700 | | | | 2 | |
Total Energy | | | | | | | 21,463,561 | |
| | | | | | | | | |
Communications - 1.6% |
Ciena Corp.* | | | 47,396 | | | | 2,919,120 | |
Calix, Inc.* | | | 65,690 | | | | 2,548,115 | |
44 | THE GUGGENHEIM FUNDS ANNUAL REPORT | SEE NOTES TO FINANCIAL STATEMENTS. |
SCHEDULE OF INVESTMENTS (concluded) | September 30, 2024 |
SMID CAP VALUE FUND | |
| | Shares | | | Value | |
Luna Innovations, Inc.* | | | 278,235 | | | $ | 653,852 | |
Total Communications | | | | | | | 6,121,087 | |
| | | | | | | | | |
Total Common Stocks | | | | |
(Cost $271,713,867) | | | | | | | 356,968,860 | |
| | | | | | | | | |
CONVERTIBLE PREFERRED STOCKS††† - 0.0% |
Industrial - 0.0% |
Thermoenergy Corp.*,2 | | | 1,652,084 | | | | 482 | |
Total Convertible Preferred Stocks | | | | |
(Cost $1,577,634) | | | | | | | 482 | |
| | | | | | | | | |
MONEY MARKET FUND***,† - 3.9% |
Dreyfus Treasury Securities Cash Management Fund — Institutional Shares, 4.88%3 | | | 14,502,863 | | | | 14,502,863 | |
Total Money Market Fund | | | | |
(Cost $14,502,863) | | | | | | | 14,502,863 | |
| | | | | | | | | |
Total Investments - 100.0% | | | | |
(Cost $287,794,364) | | $ | 371,472,205 | |
Other Assets & Liabilities, net - 0.0% | | | 93,840 | |
Total Net Assets - 100.0% | | $ | 371,566,045 | |
* | Non-income producing security. |
*** | A copy of each underlying unaffiliated fund’s financial statements is available at the SEC’s website at www.sec.gov. |
† | Value determined based on Level 1 inputs, unless otherwise noted — See Note 4. |
††† | Value determined based on Level 3 inputs — See Note 4. |
1 | Affiliated issuer. |
2 | PIPE (Private Investment in Public Equity) — Stock issued by a company in the secondary market as a means of raising capital more quickly and less expensively than through registration of a secondary public offering. |
3 | Rate indicated is the 7-day yield as of September 30, 2024. |
| | plc — Public Limited Company |
| | REIT — Real Estate Investment Trust |
| | |
| | See Sector Classification in Other Information section. |
The following table summarizes the inputs used to value the Fund’s investments at September 30, 2024 (See Note 4 in the Notes to Financial Statements):
Investments in Securities (Assets) | | Level 1
Quoted
Prices | | | Level 2
Significant
Observable
Inputs | | | Level 3
Significant
Unobservable
Inputs | | | Total | |
Common Stocks | | $ | 356,968,858 | | | $ | — | | | $ | 2 | | | $ | 356,968,860 | |
Convertible Preferred Stocks | | | — | | | | — | | | | 482 | | | | 482 | |
Money Market Fund | | | 14,502,863 | | | | — | | | | — | | | | 14,502,863 | |
Total Assets | | $ | 371,471,721 | | | $ | — | | | $ | 484 | | | $ | 371,472,205 | |
Affiliated Transactions
Investments representing 5% or more of the outstanding voting shares of a company, or control of or by, or common control under Guggenheim Investments, result in that company being considered an affiliated issuer, as defined in the 1940 Act.
Transactions during the year ended September 30, 2024, in which the company is an affiliated issuer, were as follows:
Security Name | | Value
09/30/23 | | | Additions | | | Reductions | | | Realized
Gain (Loss) | | | Change in
Unrealized
Appreciation
(Depreciation) | | | Value
09/30/24 | | | Shares
09/30/24 | |
Common Stocks | | | | | | | | | | | | | | | | | | | | | | | | | | | | |
HydroGen Corp. * | | $ | 2 | | | $ | — | | | $ | — | | | $ | — | | | $ | — | | | $ | 2 | | | | 1,265,700 | |
* | Non-income producing security. |
SEE NOTES TO FINANCIAL STATEMENTS. | THE GUGGENHEIM FUNDS ANNUAL REPORT | 45 |
STATEMENT OF ASSETS AND LIABILITIES |
September 30, 2024 |
Assets: |
Investments in unaffiliated issuers, at value (cost $287,791,833) | | $ | 371,472,203 | |
Investments in affiliated issuers, at value (cost $2,531) | | | 2 | |
Prepaid expenses | | | 29,882 | |
Receivables: |
Dividends | | | 322,535 | |
Fund shares sold | | | 195,846 | |
Interest | | | 43,434 | |
Foreign tax reclaims | | | 302 | |
Total assets | | | 372,064,204 | |
| | | | | |
Liabilities: |
Payable for: |
Management fees | | | 199,207 | |
Fund shares redeemed | | | 126,472 | |
Transfer agent fees | | | 59,085 | |
Distribution and service fees | | | 58,169 | |
Professional fees | | | 40,919 | |
Fund accounting and administration fees | | | 4,316 | |
Trustees’ fees* | | | 1,072 | |
Miscellaneous | | | 8,919 | |
Total liabilities | | | 498,159 | |
Net assets | | $ | 371,566,045 | |
| | | | | |
Net assets consist of: |
Paid in capital | | $ | 263,237,680 | |
Total distributable earnings (loss) | | | 108,328,365 | |
Net assets | | $ | 371,566,045 | |
Class A: |
Net assets | | $ | 291,071,338 | |
Capital shares outstanding | | | 7,012,345 | |
Net asset value per share | | $ | 41.51 | |
Maximum offering price per share (Net asset value divided by 95.25%) | | $ | 43.58 | |
Class C: |
Net assets | | $ | 3,570,042 | |
Capital shares outstanding | | | 143,862 | |
Net asset value per share | | $ | 24.82 | |
Class P: |
Net assets | | $ | 4,880,998 | |
Capital shares outstanding | | | 118,574 | |
Net asset value per share | | $ | 41.16 | |
| | | | | |
Institutional Class: |
Net assets | | $ | 72,043,667 | |
Capital shares outstanding | | | 7,959,397 | |
Net asset value per share | | $ | 9.05 | |
STATEMENT OF OPERATIONS |
Year Ended September 30, 2024 |
Investment Income: |
Dividends from securities of unaffiliated issuers | | $ | 6,696,895 | |
Interest from securities of unaffiliated issuers | | | 293,453 | |
Total investment income | | | 6,990,348 | |
| | | | | |
Expenses: |
Management fees | | | 2,782,782 | |
Distribution and service fees: |
Class A | | | 706,207 | |
Class C | | | 38,726 | |
Class P | | | 12,508 | |
Transfer agent fees: |
Class A | | | 376,088 | |
Class C | | | 7,456 | |
Class P | | | 5,925 | |
Institutional Class | | | 101,516 | |
Fund accounting and administration fees | | | 151,741 | |
Professional fees | | | 69,829 | |
Trustees’ fees* | | | 18,893 | |
Line of credit fees | | | 10,226 | |
Custodian fees | | | 9,471 | |
Miscellaneous | | | 145,411 | |
Recoupment of previously waived fees: |
Class C | | | 1,768 | |
Total expenses | | | 4,438,547 | |
Less: |
Expenses reimbursed by Adviser: |
Class A | | | (16,428 | ) |
Class C | | | (1,531 | ) |
Class P | | | (144 | ) |
Institutional Class | | | (5,164 | ) |
Expenses waived by Adviser | | | (127,518 | ) |
Total waived/reimbursed expenses | | | (150,785 | ) |
Net expenses | | | 4,287,762 | |
Net investment income | | | 2,702,586 | |
| | | | | |
Net Realized and Unrealized Gain (Loss): |
Net realized gain (loss) on: |
Investments in unaffiliated issuers | | | 26,188,659 | |
Net realized gain | | | 26,188,659 | |
Net change in unrealized appreciation (depreciation) on: |
Investments in unaffiliated issuers | | | 42,714,503 | |
Net change in unrealized appreciation (depreciation) | | | 42,714,503 | |
Net realized and unrealized gain | | | 68,903,162 | |
Net increase in net assets resulting from operations | | $ | 71,605,748 | |
* | Relates to Trustees not deemed “interested persons” within the meaning of Section 2(a)(19) of the 1940 Act. |
46 | THE GUGGENHEIM FUNDS ANNUAL REPORT | SEE NOTES TO FINANCIAL STATEMENTS. |
STATEMENTS OF CHANGES IN NET ASSETS |
| | Year Ended
September 30,
2024 | | | Year Ended
September 30,
2023 | |
Increase (Decrease) in Net Assets from Operations: | | | | | | | | |
Net investment income | | $ | 2,702,586 | | | $ | 4,203,907 | |
Net realized gain on investments | | | 26,188,659 | | | | 12,000,716 | |
Net change in unrealized appreciation (depreciation) on investments | | | 42,714,503 | | | | 29,280,726 | |
Net increase in net assets resulting from operations | | | 71,605,748 | | | | 45,485,349 | |
| | | | | | | | | |
Distributions to shareholders: | | | | | | | | |
Class A | | | (4,519,035 | ) | | | (15,287,730 | ) |
Class C | | | (90,028 | ) | | | (400,511 | ) |
Class P | | | (83,545 | ) | | | (319,757 | ) |
Institutional Class | | | (6,882,413 | ) | | | (17,898,014 | ) |
Total distributions to shareholders | | | (11,575,021 | ) | | | (33,906,012 | ) |
| | | | | | | | | |
Capital share transactions: | | | | | | | | |
Proceeds from sale of shares | | | | | | | | |
Class A | | | 5,756,207 | | | | 9,197,883 | |
Class C | | | 209,657 | | | | 485,848 | |
Class P | | | 79,097 | | | | 151,281 | |
Institutional Class | | | 14,895,834 | | | | 21,824,839 | |
Distributions reinvested | | | | | | | | |
Class A | | | 4,392,317 | | | | 14,853,499 | |
Class C | | | 83,920 | | | | 379,175 | |
Class P | | | 83,545 | | | | 319,757 | |
Institutional Class | | | 5,463,438 | | | | 13,919,483 | |
Cost of shares redeemed | | | | | | | | |
Class A | | | (42,061,906 | ) | | | (32,127,530 | ) |
Class C | | | (1,536,349 | ) | | | (2,161,822 | ) |
Class P | | | (1,466,108 | ) | | | (1,145,194 | ) |
Institutional Class | | | (37,727,972 | ) | | | (29,487,889 | ) |
Net decrease from capital share transactions | | | (51,828,320 | ) | | | (3,790,670 | ) |
Net increase in net assets | | | 8,202,407 | | | | 7,788,667 | |
| | | | | | | | | |
Net assets: | | | | | | | | |
Beginning of year | | | 363,363,638 | | | | 355,574,971 | |
End of year | | $ | 371,566,045 | | | $ | 363,363,638 | |
| | | | | | | | | |
Capital share activity: | | | | | | | | |
Shares sold | | | | | | | | |
Class A | | | 152,442 | | | | 253,740 | |
Class C | | | 9,107 | | | | 22,243 | |
Class P | | | 2,074 | | | | 4,170 | |
Institutional Class | | | 1,804,887 | | | | 2,544,475 | |
Shares issued from reinvestment of distributions | | | | | | | | |
Class A | | | 118,391 | | | | 428,425 | |
Class C | | | 3,758 | | | | 17,903 | |
Class P | | | 2,271 | | | | 9,303 | |
Institutional Class | | | 677,006 | | | | 1,726,983 | |
Shares redeemed | | | | | | | | |
Class A | | | (1,112,216 | ) | | | (898,347 | ) |
Class C | | | (68,315 | ) | | | (98,361 | ) |
Class P | | | (39,748 | ) | | | (32,403 | ) |
Institutional Class | | | (4,483,828 | ) | | | (3,417,401 | ) |
Net increase (decrease) in shares | | | (2,934,171 | ) | | | 560,730 | |
SEE NOTES TO FINANCIAL STATEMENTS. | THE GUGGENHEIM FUNDS ANNUAL REPORT | 47 |
This table is presented to show selected data for a share outstanding throughout each period and to assist shareholders in evaluating a Fund’s performance for the periods presented.
Class A | | Year Ended
September 30,
2024 | | | Year Ended
September 30,
2023 | | | Year Ended
September 30,
2022 | | | Year Ended
September 30,
2021 | | | Year Ended
September 30,
2020 | |
Per Share Data |
Net asset value, beginning of period | | $ | 34.78 | | | $ | 32.58 | | | $ | 38.00 | | | $ | 26.27 | | | $ | 30.52 | |
Income (loss) from investment operations: |
Net investment income (loss)a | | | .26 | | | | .37 | | | | .36 | | | | .19 | | | | .46 | |
Net gain (loss) on investments (realized and unrealized) | | | 7.06 | | | | 3.75 | | | | (3.16 | ) | | | 11.54 | | | | (3.37 | ) |
Total from investment operations | | | 7.32 | | | | 4.12 | | | | (2.80 | ) | | | 11.73 | | | | (2.91 | ) |
Less distributions from: |
Net investment income | | | (.09 | ) | | | (.22 | ) | | | (.10 | ) | | | — | | | | (.26 | ) |
Net realized gains | | | (.50 | ) | | | (1.70 | ) | | | (2.52 | ) | | | — | | | | (1.04 | ) |
Return of capital | | | — | | | | — | | | | — | | | | — | | | | (.04 | ) |
Total distributions | | | (.59 | ) | | | (1.92 | ) | | | (2.62 | ) | | | — | | | | (1.34 | ) |
Net asset value, end of period | | $ | 41.51 | | | $ | 34.78 | | | $ | 32.58 | | | $ | 38.00 | | | $ | 26.27 | |
|
Total Returnb | | | 21.25 | % | | | 12.65 | % | | | (8.08 | %) | | | 44.65 | % | | | (10.25 | %) |
Ratios/Supplemental Data |
Net assets, end of period (in thousands) | | $ | 291,071 | | | $ | 273,173 | | | $ | 262,943 | | | $ | 315,323 | | | $ | 243,072 | |
Ratios to average net assets: |
Net investment income (loss) | | | 0.68 | % | | | 1.05 | % | | | 0.96 | % | | | 0.53 | % | | | 1.64 | % |
Total expensesc | | | 1.24 | % | | | 1.20 | % | | | 1.19 | % | | | 1.20 | % | | | 1.25 | % |
Net expensesd,e,f | | | 1.20 | % | | | 1.15 | % | | | 1.18 | % | | | 1.19 | % | | | 1.24 | % |
Portfolio turnover rate | | | 25 | % | | | 28 | % | | | 39 | % | | | 34 | % | | | 41 | % |
Class C | | Year Ended
September 30,
2024 | | | Year Ended
September 30,
2023 | | | Year Ended
September 30,
2022 | | | Year Ended
September 30,
2021 | | | Year Ended
September 30,
2020 | |
Per Share Data |
Net asset value, beginning of period | | $ | 21.10 | | | $ | 20.41 | | | $ | 24.85 | | | $ | 17.32 | | | $ | 20.48 | |
Income (loss) from investment operations: |
Net investment income (loss)a | | | (.03 | ) | | | .04 | | | | .01 | | | | (.06 | ) | | | .16 | |
Net gain (loss) on investments (realized and unrealized) | | | 4.25 | | | | 2.35 | | | | (1.93 | ) | | | 7.59 | | | | (2.22 | ) |
Total from investment operations | | | 4.22 | | | | 2.39 | | | | (1.92 | ) | | | 7.53 | | | | (2.06 | ) |
Less distributions from: |
Net investment income | | | — | | | | — | | | | — | | | | — | | | | (.03 | ) |
Net realized gains | | | (.50 | ) | | | (1.70 | ) | | | (2.52 | ) | | | — | | | | (1.04 | ) |
Return of capital | | | — | | | | — | | | | — | | | | — | | | | (.03 | ) |
Total distributions | | | (.50 | ) | | | (1.70 | ) | | | (2.52 | ) | | | — | | | | (1.10 | ) |
Net asset value, end of period | | $ | 24.82 | | | $ | 21.10 | | | $ | 20.41 | | | $ | 24.85 | | | $ | 17.32 | |
|
Total Returnb | | | 20.27 | % | | | 11.67 | % | | | (8.85 | %) | | | 43.48 | % | | | (10.95 | %) |
Ratios/Supplemental Data |
Net assets, end of period (in thousands) | | $ | 3,570 | | | $ | 4,205 | | | $ | 5,256 | | | $ | 10,015 | | | $ | 14,276 | |
Ratios to average net assets: |
Net investment income (loss) | | | (0.15 | %) | | | 0.18 | % | | | 0.04 | % | | | (0.27 | %) | | | 0.86 | % |
Total expensesc | | | 2.10 | % | | | 2.10 | % | | | 2.09 | % | | | 2.05 | % | | | 2.14 | % |
Net expensesd,e,f | | | 2.02 | % | | | 2.02 | % | | | 2.02 | % | | | 2.02 | % | | | 2.07 | % |
Portfolio turnover rate | | | 25 | % | | | 28 | % | | | 39 | % | | | 34 | % | | | 41 | % |
48 | THE GUGGENHEIM FUNDS ANNUAL REPORT | SEE NOTES TO FINANCIAL STATEMENTS. |
FINANCIAL HIGHLIGHTS (continued) |
This table is presented to show selected data for a share outstanding throughout each period and to assist shareholders in evaluating a Fund’s performance for the periods presented.
Class P | | Year Ended
September 30,
2024 | | | Year Ended
September 30,
2023 | | | Year Ended
September 30,
2022 | | | Year Ended
September 30,
2021 | | | Year Ended
September 30,
2020 | |
Per Share Data |
Net asset value, beginning of period | | $ | 34.46 | | | $ | 32.30 | | | $ | 37.67 | | | $ | 26.06 | | | $ | 30.25 | |
Income (loss) from investment operations: |
Net investment income (loss)a | | | .26 | | | | .34 | | | | .33 | | | | .15 | | | | .46 | |
Net gain (loss) on investments (realized and unrealized) | | | 6.99 | | | | 3.71 | | | | (3.12 | ) | | | 11.46 | | | | (3.37 | ) |
Total from investment operations | | | 7.25 | | | | 4.05 | | | | (2.79 | ) | | | 11.61 | | | | (2.91 | ) |
Less distributions from: |
Net investment income | | | (.05 | ) | | | (.19 | ) | | | (.06 | ) | | | — | | | | (.20 | ) |
Net realized gains | | | (.50 | ) | | | (1.70 | ) | | | (2.52 | ) | | | — | | | | (1.04 | ) |
Return of capital | | | — | | | | — | | | | — | | | | — | | | | (.04 | ) |
Total distributions | | | (.55 | ) | | | (1.89 | ) | | | (2.58 | ) | | | — | | | | (1.28 | ) |
Net asset value, end of period | | $ | 41.16 | | | $ | 34.46 | | | $ | 32.30 | | | $ | 37.67 | | | $ | 26.06 | |
|
Total Return | | | 21.24 | % | | | 12.57 | % | | | (8.16 | %) | | | 44.55 | % | | | (10.30 | %) |
Ratios/Supplemental Data |
Net assets, end of period (in thousands) | | $ | 4,881 | | | $ | 5,306 | | | $ | 5,584 | | | $ | 6,907 | | | $ | 7,662 | |
Ratios to average net assets: |
Net investment income (loss) | | | 0.69 | % | | | 0.96 | % | | | 0.90 | % | | | 0.43 | % | | | 1.64 | % |
Total expensesc | | | 1.23 | % | | | 1.27 | % | | | 1.30 | % | | | 1.32 | % | | | 1.33 | % |
Net expensesd,e,f | | | 1.19 | % | | | 1.24 | % | | | 1.26 | % | | | 1.28 | % | | | 1.31 | % |
Portfolio turnover rate | | | 25 | % | | | 28 | % | | | 39 | % | | | 34 | % | | | 41 | % |
SEE NOTES TO FINANCIAL STATEMENTS. | THE GUGGENHEIM FUNDS ANNUAL REPORT | 49 |
FINANCIAL HIGHLIGHTS (concluded) |
This table is presented to show selected data for a share outstanding throughout each period and to assist shareholders in evaluating a Fund’s performance for the periods presented.
Institutional Class | | Year Ended
September 30,
2024 | | | Year Ended
September 30,
2023 | | | Year Ended
September 30,
2022 | | | Year Ended
September 30,
2021 | | | Period Ended
September 30,
2020g | |
Per Share Data |
Net asset value, beginning of period | | $ | 8.10 | | | $ | 8.98 | | | $ | 12.42 | | | $ | 8.57 | | | $ | 10.20 | |
Income (loss) from investment operations: |
Net investment income (loss)a | | | .08 | | | | .11 | | | | .12 | | | | .08 | | | | .11 | |
Net gain (loss) on investments (realized and unrealized) | | | 1.58 | | | | 1.04 | | | | (.82 | ) | | | 3.77 | | | | (1.74 | ) |
Total from investment operations | | | 1.66 | | | | 1.15 | | | | (.70 | ) | | | 3.85 | | | | (1.63 | ) |
Less distributions from: |
Net investment income | | | (.21 | ) | | | (.33 | ) | | | (.22 | ) | | | — | | | | — | |
Net realized gains | | | (.50 | ) | | | (1.70 | ) | | | (2.52 | ) | | | — | | | | — | |
Total distributions | | | (.71 | ) | | | (2.03 | ) | | | (2.74 | ) | | | — | | | | — | |
Net asset value, end of period | | $ | 9.05 | | | $ | 8.10 | | | $ | 8.98 | | | $ | 12.42 | | | $ | 8.57 | |
|
Total Return | | | 21.52 | % | | | 12.91 | % | | | (7.93 | %) | | | 44.92 | % | | | (15.98 | %) |
Ratios/Supplemental Data |
Net assets, end of period (in thousands) | | $ | 72,044 | | | $ | 80,679 | | | $ | 81,792 | | | $ | 96,973 | | | $ | 60,783 | |
Ratios to average net assets: |
Net investment income (loss) | | | 0.94 | % | | | 1.26 | % | | | 1.14 | % | | | 0.70 | % | | | 1.87 | % |
Total expensesc | | | 0.99 | % | | | 0.98 | % | | | 1.03 | % | | | 1.06 | % | | | 1.09 | % |
Net expensesd,e,f | | | 0.94 | % | | | 0.94 | % | | | 1.01 | % | | | 1.02 | % | | | 1.03 | % |
Portfolio turnover rate | | | 25 | % | | | 28 | % | | | 39 | % | | | 34 | % | | | 41 | % |
a | Net investment income (loss) per share was computed using average shares outstanding throughout the period. |
b | Total return does not reflect the impact of any applicable sales charges. |
c | Does not include expenses of the underlying funds in which the Fund invests, if any. |
d | Net expense information reflects the expense ratios after expense waivers and reimbursements, as applicable. |
e | The portion of the ratios of net expenses to average net assets attributable to recoupments of prior fee reductions or expense reimbursements for the years presented was as follows: |
| | | 09/30/24 | 09/30/23 | 09/30/22 | 09/30/21 | 09/30/20 |
| | Class A | — | 0.00%* | 0.01% | 0.00% | 0.00%* |
| | Class C | 0.05% | 0.04% | 0.00%* | 0.00%* | 0.00%* |
| | Class P | — | 0.01% | 0.02% | 0.07% | 0.01% |
| | Institutional Class | — | 0.04% | 0.00%* | 0.00%* | 0.00%*,g |
f | Net expenses may include expenses that are excluded from the expense limitation agreement. Excluding these expenses, the net expense ratios for the years presented would be: |
| | | 09/30/24 | 09/30/23 | 09/30/22 | 09/30/21 | 09/30/20 |
| | Class A | 1.20% | 1.15% | 1.18% | 1.19% | 1.24% |
| | Class C | 2.02% | 2.02% | 2.02% | 2.01% | 2.07% |
| | Class P | 1.19% | 1.23% | 1.25% | 1.28% | 1.30% |
| | Institutional Class | 0.94% | 0.94% | 1.01% | 1.02% | 1.03%g |
g | Since commencement of operations: January 3, 2020. Percentage amounts for the period, except total return and portfolio turnover rate, have been annualized. |
50 | THE GUGGENHEIM FUNDS ANNUAL REPORT | SEE NOTES TO FINANCIAL STATEMENTS. |
SCHEDULE OF INVESTMENTS | September 30, 2024 |
STYLEPLUS—LARGE CORE FUND | |
| | Shares | | | Value | |
COMMON STOCKS† - 22.7% |
| | | | | | | | | |
Technology - 7.6% |
Microsoft Corp. | | | 9,830 | | | $ | 4,229,849 | |
Apple, Inc. | | | 15,825 | | | | 3,687,225 | |
NVIDIA Corp. | | | 29,113 | | | | 3,535,483 | |
Broadcom, Inc. | | | 5,850 | | | | 1,009,125 | |
International Business Machines Corp. | | | 3,948 | | | | 872,824 | |
QUALCOMM, Inc. | | | 4,927 | | | | 837,836 | |
Applied Materials, Inc. | | | 3,704 | | | | 748,393 | |
NXP Semiconductor N.V. | | | 2,741 | | | | 657,867 | |
TE Connectivity plc | | | 4,293 | | | | 648,200 | |
HP, Inc. | | | 17,647 | | | | 632,998 | |
Akamai Technologies, Inc.* | | | 5,957 | | | | 601,359 | |
NetApp, Inc. | | | 4,663 | | | | 575,927 | |
Fair Isaac Corp.* | | | 267 | | | | 518,920 | |
Skyworks Solutions, Inc. | | | 5,228 | | | | 516,370 | |
Qorvo, Inc.* | | | 4,534 | | | | 468,362 | |
KLA Corp. | | | 567 | | | | 439,091 | |
Total Technology | | | | | | | 19,979,829 | |
| | | | | | | | | |
Communications - 3.8% |
Amazon.com, Inc.* | | | 11,251 | | | | 2,096,399 | |
Alphabet, Inc. — Class C | | | 11,608 | | | | 1,940,741 | |
Meta Platforms, Inc. — Class A | | | 1,560 | | | | 893,006 | |
Cisco Systems, Inc. | | | 15,622 | | | | 831,403 | |
AT&T, Inc. | | | 34,845 | | | | 766,590 | |
Motorola Solutions, Inc. | | | 1,531 | | | | 688,384 | |
eBay, Inc. | | | 10,353 | | | | 674,084 | |
F5, Inc.* | | | 2,942 | | | | 647,828 | |
Gen Digital, Inc. | | | 22,585 | | | | 619,507 | |
GoDaddy, Inc. — Class A* | | | 3,874 | | | | 607,366 | |
Arista Networks, Inc.* | | | 1,004 | | | | 385,355 | |
Total Communications | | | | | | | 10,150,663 | |
| | | | | | | | | |
Consumer, Non-cyclical - 3.7% |
Johnson & Johnson | | | 6,390 | | | | 1,035,563 | |
AbbVie, Inc. | | | 5,128 | | | | 1,012,677 | |
Merck & Company, Inc. | | | 7,928 | | | | 900,304 | |
Gilead Sciences, Inc. | | | 8,892 | | | | 745,505 | |
United Rentals, Inc. | | | 920 | | | | 744,952 | |
Bristol-Myers Squibb Co. | | | 14,101 | | | | 729,586 | |
HCA Healthcare, Inc. | | | 1,705 | | | | 692,963 | |
Regeneron Pharmaceuticals, Inc.* | | | 626 | | | | 658,076 | |
Incyte Corp.* | | | 9,556 | | | | 631,652 | |
Hologic, Inc.* | | | 7,453 | | | | 607,121 | |
Eli Lilly & Co. | | | 680 | | | | 602,439 | |
Universal Health Services, Inc. — Class B | | | 2,510 | | | | 574,815 | |
Amgen, Inc. | | | 1,691 | | | | 544,857 | |
DaVita, Inc.* | | | 1,571 | | | | 257,534 | |
UnitedHealth Group, Inc. | | | 290 | | | | 169,558 | |
Total Consumer, Non-cyclical | | | | | | | 9,907,602 | |
| | | | | | | | | |
Industrial - 3.0% |
Caterpillar, Inc. | | | 2,363 | | | | 924,216 | |
RTX Corp. | | | 6,362 | | | | 770,820 | |
Lockheed Martin Corp. | | | 1,277 | | | | 746,483 | |
Amphenol Corp. — Class A | | | 10,888 | | | | 709,462 | |
Westinghouse Air Brake Technologies Corp. | | | 3,757 | | | | 682,910 | |
Masco Corp. | | | 7,704 | | | | 646,674 | |
Allegion plc | | | 4,341 | | | | 632,657 | |
Dover Corp. | | | 3,157 | | | | 605,323 | |
TransDigm Group, Inc. | | | 414 | | | | 590,832 | |
Snap-on, Inc. | | | 1,958 | | | | 567,252 | |
Garmin Ltd. | | | 3,051 | | | | 537,068 | |
Honeywell International, Inc. | | | 1,828 | | | | 377,866 | |
A O Smith Corp. | | | 2,220 | | | | 199,423 | |
Total Industrial | | | | | | | 7,990,986 | |
| | | | | | | | | |
Financial - 3.0% |
Bank of America Corp. | | | 22,515 | | | | 893,417 | |
American Express Co. | | | 2,994 | | | | 811,973 | |
Wells Fargo & Co. | | | 13,684 | | | | 773,009 | |
Chubb Ltd. | | | 2,501 | | | | 721,264 | |
Ameriprise Financial, Inc. | | | 1,433 | | | | 673,237 | |
Hartford Financial Services Group, Inc. | | | 5,394 | | | | 634,388 | |
Arch Capital Group Ltd.* | | | 5,607 | | | | 627,311 | |
Fifth Third Bancorp | | | 14,520 | | | | 622,037 | |
Everest Group Ltd. | | | 1,536 | | | | 601,851 | |
Berkshire Hathaway, Inc. — Class B* | | | 1,218 | | | | 560,597 | |
Synchrony Financial | | | 9,826 | | | | 490,121 | |
Citizens Financial Group, Inc. | | | 6,698 | | | | 275,087 | |
JPMorgan Chase & Co. | | | 947 | | | | 199,684 | |
Total Financial | | | | | | | 7,883,976 | |
| | | | | | | | | |
Consumer, Cyclical - 1.4% |
WW Grainger, Inc. | | | 668 | | | | 693,925 | |
Cummins, Inc. | | | 2,117 | | | | 685,464 | |
PACCAR, Inc. | | | 6,888 | | | | 679,708 | |
PulteGroup, Inc. | | | 3,786 | | | | 543,405 | |
Lennar Corp. — Class A | | | 1,928 | | | | 361,461 | |
Ralph Lauren Corp. — Class A | | | 1,268 | | | | 245,827 | |
General Motors Co. | | | 5,144 | | | | 230,657 | |
Tesla, Inc.* | | | 737 | | | | 192,821 | |
Total Consumer, Cyclical | | | | | | | 3,633,268 | |
| | | | | | | | | |
Utilities - 0.1% |
Duke Energy Corp. | | | 3,502 | | | | 403,780 | |
| | | | | | | | | |
Energy - 0.1% |
Exxon Mobil Corp. | | | 1,517 | | | | 177,823 | |
| | | | | | | | | |
Total Common Stocks | | | | |
(Cost $49,133,220) | | | | | | | 60,127,927 | |
| | | | | | | | | |
MUTUAL FUNDS† - 72.0% |
Guggenheim Strategy Fund III1 | | | 3,355,050 | | | | 83,507,185 | |
Guggenheim Strategy Fund II1 | | | 2,922,707 | | | | 72,483,129 | |
Guggenheim Ultra Short Duration Fund — Institutional Class1 | | | 3,400,126 | | | | 34,069,259 | |
Total Mutual Funds | | | | |
(Cost $188,265,777) | | | | | | | 190,059,573 | |
| | | | | | | | | |
SEE NOTES TO FINANCIAL STATEMENTS. | THE GUGGENHEIM FUNDS ANNUAL REPORT | 51 |
SCHEDULE OF INVESTMENTS (continued) | September 30, 2024 |
STYLEPLUS—LARGE CORE FUND | |
| | Shares | | | Value | |
MONEY MARKET FUND***,† - 5.0% |
Dreyfus Treasury Securities Cash Management Fund — Institutional Shares, 4.88%2 | | | 13,177,443 | | | $ | 13,177,443 | |
Total Money Market Fund | | | | |
(Cost $13,177,443) | | | | | | | 13,177,443 | |
| | | | | | | | | |
Total Investments - 99.7% | | | | |
(Cost $250,576,440) | | $ | 263,364,943 | |
Other Assets & Liabilities, net - 0.3% | | | 725,685 | |
Total Net Assets - 100.0% | | $ | 264,090,628 | |
Futures Contracts |
Description | | Number of
Contracts | | | Expiration
Date | | | Notional
Amount | | | Value and
Unrealized
Appreciation** | |
Equity Futures Contracts Purchased† |
S&P 500 Index Mini Futures Contracts | | | 10 | | | | Dec 2024 | | | $ | 2,908,000 | | | $ | 62,524 | |
Total Return Swap Agreements |
Counterparty | Index | Type | Financing
Rate | | Payment
Frequency | | | Maturity
Date | | | Units | | | Notional
Amount | | | Value and
Unrealized
Appreciation | |
OTC Equity Index Swap Agreements†† |
Wells Fargo Bank, N.A. | S&P 500 Index | Pay | 5.39% (Federal Funds Rate + 0.56%) | | | At Maturity | | | | 03/03/25 | | | | 16,086 | | | $ | 202,788,320 | | | $ | 33,863,475 | |
* | Non-income producing security. |
** | Includes cumulative appreciation (depreciation). Variation margin is reported within the Statement of Assets and Liabilities. |
*** | A copy of each underlying unaffiliated fund’s financial statements is available at the SEC’s website at www.sec.gov. |
† | Value determined based on Level 1 inputs — See Note 4. |
†† | Value determined based on Level 2 inputs — See Note 4. |
1 | Affiliated issuer. |
2 | Rate indicated is the 7-day yield as of September 30, 2024. |
| | plc — Public Limited Company |
| | |
| | See Sector Classification in Other Information section. |
52 | THE GUGGENHEIM FUNDS ANNUAL REPORT | SEE NOTES TO FINANCIAL STATEMENTS. |
SCHEDULE OF INVESTMENTS (concluded) | September 30, 2024 |
STYLEPLUS—LARGE CORE FUND | |
The following table summarizes the inputs used to value the Fund’s investments at September 30, 2024 (See Note 4 in the Notes to Financial Statements):
Investments in Securities (Assets) | | Level 1
Quoted
Prices | | | Level 2
Significant
Observable
Inputs | | | Level 3
Significant
Unobservable
Inputs | | | Total | |
Common Stocks | | $ | 60,127,927 | | | $ | — | | | $ | — | | | $ | 60,127,927 | |
Mutual Funds | | | 190,059,573 | | | | — | | | | — | | | | 190,059,573 | |
Money Market Fund | | | 13,177,443 | | | | — | | | | — | | | | 13,177,443 | |
Equity Futures Contracts** | | | 62,524 | | | | — | | | | — | | | | 62,524 | |
Equity Index Swap Agreements** | | | — | | | | 33,863,475 | | | | — | | | | 33,863,475 | |
Total Assets | | $ | 263,427,467 | | | $ | 33,863,475 | | | $ | — | | | $ | 297,290,942 | |
** | This derivative is reported as unrealized appreciation/depreciation at period end. |
Affiliated Transactions
Investments representing 5% or more of the outstanding voting shares of a company, or control of or by, or common control under Guggenheim Investments (“GI”), result in that company being considered an affiliated issuer, as defined in the 1940 Act.
The Fund may invest in certain of the underlying series of Guggenheim Strategy Funds Trust, including Guggenheim Strategy Fund II and Guggenheim Strategy Fund III (collectively, the “Guggenheim Strategy Funds”), each of which are open-end management investment companies managed by GI. The Guggenheim Strategy Funds, which launched on March 11, 2014, are offered as short term investment options only to mutual funds, trusts, and other accounts managed by GI and/or its affiliates, and are not available to the public. The Guggenheim Strategy Funds pay no investment management fees. The Guggenheim Strategy Funds’ annual report on Form N-CSR dated September 30, 2023 is available publicly or upon request. This information is available from the EDGAR database on the SEC’s website at https://www.sec.gov/Archives/edgar/data/1601445/000182126823000217/gug86449-ncsr.htm. The Fund may invest in certain of the underlying series of Guggenheim Funds Trust, which are open-end management investment companies managed by GI, are available to the public and whose most recent annual report on Form N-CSR is available publicly or upon request.
Transactions during the year ended September 30, 2024, in which the company is an affiliated issuer, were as follows:
Security Name | | Value
09/30/23 | | | Additions | | | Reductions | | | Realized
Gain (Loss) | | | Change in
Unrealized
Appreciation
(Depreciation) | | | Value
09/30/24 | | | Shares
09/30/24 | | | Investment
Income | |
Mutual Funds | | | | | | | | | | | | | | | | | | | | | | | | | | | | | | | | |
Guggenheim Strategy Fund II | | $ | 59,650,586 | | | $ | 28,883,994 | | | $ | (17,498,700 | ) | | $ | (152,064 | ) | | $ | 1,599,313 | | | $ | 72,483,129 | | | | 2,922,707 | | | $ | 3,848,577 | |
Guggenheim Strategy Fund III | | | 72,469,308 | | | | 20,145,422 | | | | (10,904,674 | ) | | | (212,232 | ) | | | 2,009,361 | | | | 83,507,185 | | | | 3,355,050 | | | | 4,172,004 | |
Guggenheim Ultra Short Duration Fund — Institutional Class | | | 31,420,533 | | | | 1,756,937 | | | | — | | | | — | | | | 891,789 | | | | 34,069,259 | | | | 3,400,126 | | | | 1,762,097 | |
| | | $ | 163,540,427 | | | $ | 50,786,353 | | | $ | (28,403,374 | ) | | $ | (364,296 | ) | | $ | 4,500,463 | | | $ | 190,059,573 | | | | | | | $ | 9,782,678 | |
SEE NOTES TO FINANCIAL STATEMENTS. | THE GUGGENHEIM FUNDS ANNUAL REPORT | 53 |
STYLEPLUS—LARGE CORE FUND | |
STATEMENT OF ASSETS AND LIABILITIES |
September 30, 2024 |
Assets: |
Investments in unaffiliated issuers, at value (cost $62,310,663) | | $ | 73,305,370 | |
Investments in affiliated issuers, at value (cost $188,265,777) | | | 190,059,573 | |
Segregated cash with broker | | | 330,000 | |
Unrealized appreciation on OTC swap agreements | | | 33,863,475 | |
Prepaid expenses | | | 44,659 | |
Receivables: |
Dividends | | | 834,947 | |
Interest | | | 40,284 | |
Variation margin on futures contracts | | | 12,375 | |
Fund shares sold | | | 1,306 | |
Investment Adviser | | | 467 | |
Total assets | | | 298,492,456 | |
| | | | | |
Liabilities: |
Overdraft due to custodian bank | | | 8,030 | |
Segregated cash due to broker | | | 26,450,000 | |
Payable for: |
Swap settlement | | | 6,669,622 | |
Securities purchased | | | 806,214 | |
Management fees | | | 141,875 | |
Fund shares redeemed | | | 92,906 | |
Distribution and service fees | | | 48,402 | |
Transfer agent/maintenance fees | | | 13,833 | |
Fund accounting/administration fees | | | 10,269 | |
Trustees’ fees* | | | 1,007 | |
Miscellaneous | | | 159,670 | |
Total liabilities | | | 34,401,828 | |
Net assets | | $ | 264,090,628 | |
| | | | | |
Net assets consist of: |
Paid in capital | | $ | 209,732,853 | |
Total distributable earnings (loss) | | | 54,357,775 | |
Net assets | | $ | 264,090,628 | |
Class A: |
Net assets | | $ | 254,992,346 | |
Capital shares outstanding | | | 10,319,894 | |
Net asset value per share | | $ | 24.71 | |
Maximum offering price per share (Net asset value divided by 95.25%) | | $ | 25.94 | |
Class C: |
Net assets | | $ | 841,581 | |
Capital shares outstanding | | | 70,557 | |
Net asset value per share | | $ | 11.93 | |
Class P: |
Net assets | | $ | 87,088 | |
Capital shares outstanding | | | 3,604 | |
Net asset value per share | | $ | 24.16 | |
| | | | | |
Institutional Class: |
Net assets | | $ | 8,169,613 | |
Capital shares outstanding | | | 335,539 | |
Net asset value per share | | $ | 24.35 | |
STATEMENT OF OPERATIONS |
Year Ended September 30, 2024 |
Investment Income: |
Dividends from securities of unaffiliated issuers (net of foreign withholding tax of $1,525) | | $ | 801,861 | |
Dividends from securities of affiliated issuers | | | 9,782,678 | |
Interest | | | 506,639 | |
Total investment income | | | 11,091,178 | |
| | | | | |
Expenses: |
Management fees | | | 1,796,074 | |
Distribution and service fees: |
Class A | | | 578,387 | |
Class C | | | 8,548 | |
Class P | | | 599 | |
Transfer agent/maintenance fees: |
Class A | | | 192,478 | |
Class C | | | 1,916 | |
Class P | | | 343 | |
Institutional Class | | | 8,512 | |
Interest expense | | | 969,504 | |
Fund accounting/administration fees | | | 100,989 | |
Professional fees | | | 57,560 | |
Trustees’ fees* | | | 16,630 | |
Custodian fees | | | 13,524 | |
Line of credit fees | | | 4,623 | |
Miscellaneous | | | 128,536 | |
Total expenses | | | 3,878,223 | |
Less: |
Expenses waived by Adviser | | | (81,725 | ) |
Net expenses | | | 3,796,498 | |
Net investment income | | | 7,294,680 | |
| | | | | |
Net Realized and Unrealized Gain (Loss): |
Net realized gain (loss) on: |
Investments in unaffiliated issuers | | | 7,215,823 | |
Investments in affiliated issuers | | | (364,296 | ) |
Swap agreements | | | 33,338,204 | |
Futures contracts | | | 1,596,960 | |
Net realized gain | | | 41,786,691 | |
Net change in unrealized appreciation (depreciation) on: |
Investments in unaffiliated issuers | | | 8,665,289 | |
Investments in affiliated issuers | | | 4,500,463 | |
Swap agreements | | | 12,774,700 | |
Futures contracts | | | 118,865 | |
Net change in unrealized appreciation (depreciation) | | | 26,059,317 | |
Net realized and unrealized gain | | | 67,846,008 | |
Net increase in net assets resulting from operations | | $ | 75,140,688 | |
* | Relates to Trustees not deemed “interested persons” within the meaning of Section 2(a)(19) of the 1940 Act. |
54 | THE GUGGENHEIM FUNDS ANNUAL REPORT | SEE NOTES TO FINANCIAL STATEMENTS. |
STYLEPLUS—LARGE CORE FUND | |
STATEMENTS OF CHANGES IN NET ASSETS |
| | Year Ended
September 30,
2024 | | | Year Ended
September 30,
2023 | |
Increase (Decrease) in Net Assets from Operations: | | | | | | | | |
Net investment income | | $ | 7,294,680 | | | $ | 6,276,519 | |
Net realized gain (loss) on investments | | | 41,786,691 | | | | (36,981,624 | ) |
Net change in unrealized appreciation (depreciation) on investments | | | 26,059,317 | | | | 71,070,811 | |
Net increase in net assets resulting from operations | | | 75,140,688 | | | | 40,365,706 | |
| | | | | | | | | |
Distributions to shareholders: | | | | | | | | |
Class A | | | (5,405,491 | ) | | | (57,362,413 | ) |
Class C | | | (36,849 | ) | | | (480,274 | ) |
Class P | | | (5,396 | ) | | | (80,505 | ) |
Institutional Class | | | (182,850 | ) | | | (1,403,582 | ) |
Total distributions to shareholders | | | (5,630,586 | ) | | | (59,326,774 | ) |
| | | | | | | | | |
Capital share transactions: | | | | | | | | |
Proceeds from sale of shares | | | | | | | | |
Class A | | | 6,210,855 | | | | 2,166,582 | |
Class C | | | 69,462 | | | | 125,050 | |
Class P | | | 1,460 | | | | 7,830 | |
Institutional Class | | | 1,830,970 | | | | 1,924,452 | |
Distributions reinvested | | | | | | | | |
Class A | | | 5,134,767 | | | | 54,015,082 | |
Class C | | | 36,186 | | | | 480,152 | |
Class P | | | 5,396 | | | | 80,505 | |
Institutional Class | | | 181,876 | | | | 1,391,827 | |
Cost of shares redeemed | | | | | | | | |
Class A | | | (25,109,528 | ) | | | (23,234,130 | ) |
Class C | | | (283,343 | ) | | | (520,369 | ) |
Class P | | | (195,305 | ) | | | (102,107 | ) |
Institutional Class | | | (2,050,837 | ) | | | (1,714,715 | ) |
Net increase (decrease) from capital share transactions | | | (14,168,041 | ) | | | 34,620,159 | |
Net increase in net assets | | | 55,342,061 | | | | 15,659,091 | |
| | | | | | | | | |
Net assets: | | | | | | | | |
Beginning of year | | | 208,748,567 | | | | 193,089,476 | |
End of year | | $ | 264,090,628 | | | $ | 208,748,567 | |
| | | | | | | | | |
Capital share activity: | | | | | | | | |
Shares sold | | | | | | | | |
Class A | | | 291,700 | | | | 118,847 | |
Class C | | | 6,735 | | | | 13,926 | |
Class P | | | 65 | | | | 451 | |
Institutional Class | | | 87,396 | | | | 110,833 | |
Shares issued from reinvestment of distributions | | | | | | | | |
Class A | | | 257,382 | | | | 3,255,882 | |
Class C | | | 3,730 | | | | 57,850 | |
Class P | | | 276 | | | | 4,957 | |
Institutional Class | | | 9,265 | | | | 85,231 | |
Shares redeemed | | | | | | | | |
Class A | | | (1,161,333 | ) | | | (1,271,366 | ) |
Class C | | | (26,945 | ) | | | (58,377 | ) |
Class P | | | (8,169 | ) | | | (6,243 | ) |
Institutional Class | | | (99,766 | ) | | | (89,973 | ) |
Net increase (decrease) in shares | | | (639,664 | ) | | | 2,222,018 | |
SEE NOTES TO FINANCIAL STATEMENTS. | THE GUGGENHEIM FUNDS ANNUAL REPORT | 55 |
STYLEPLUS—LARGE CORE FUND | |
This table is presented to show selected data for a share outstanding throughout each period and to assist shareholders in evaluating a Fund’s performance for the periods presented.
Class A | | Year Ended
September 30,
2024 | | | Year Ended
September 30,
2023 | | | Year Ended
September 30,
2022 | | | Year Ended
September 30,
2021 | | | Year Ended
September 30,
2020 | |
Per Share Data |
Net asset value, beginning of period | | $ | 18.44 | | | $ | 21.18 | | | $ | 27.35 | | | $ | 23.01 | | | $ | 20.48 | |
Income (loss) from investment operations: |
Net investment income (loss)a | | | .66 | | | | .56 | | | | .18 | | | | .06 | | | | .17 | |
Net gain (loss) on investments (realized and unrealized) | | | 6.11 | | | | 3.32 | | | | (5.02 | ) | | | 6.46 | | | | 2.70 | |
Total from investment operations | | | 6.77 | | | | 3.88 | | | | (4.84 | ) | | | 6.52 | | | | 2.87 | |
Less distributions from: |
Net investment income | | | (.50 | ) | | | (.22 | ) | | | (.08 | ) | | | (.19 | ) | | | (.31 | ) |
Net realized gains | | | — | | | | (6.40 | ) | | | (1.25 | ) | | | (1.99 | ) | | | (.03 | ) |
Total distributions | | | (.50 | ) | | | (6.62 | ) | | | (1.33 | ) | | | (2.18 | ) | | | (.34 | ) |
Net asset value, end of period | | $ | 24.71 | | | $ | 18.44 | | | $ | 21.18 | | | $ | 27.35 | | | $ | 23.01 | |
|
Total Returnb | | | 37.38 | % | | | 21.81 | % | | | (18.94 | %) | | | 29.91 | % | | | 14.18 | % |
Ratios/Supplemental Data |
Net assets, end of period (in thousands) | | $ | 254,992 | | | $ | 201,587 | | | $ | 186,957 | | | $ | 247,243 | | | $ | 204,428 | |
Ratios to average net assets: |
Net investment income (loss) | | | 3.04 | % | | | 3.01 | % | | | 0.68 | % | | | 0.23 | % | | | 0.79 | % |
Total expensesc | | | 1.62 | % | | | 1.48 | % | | | 1.20 | % | | | 1.23 | % | | | 1.32 | % |
Net expensesd | | | 1.59 | % | | | 1.44 | % | | | 1.15 | % | | | 1.17 | % | | | 1.28 | % |
Portfolio turnover rate | | | 56 | % | | | 56 | % | | | 62 | % | | | 25 | % | | | 69 | % |
Class C | | Year Ended
September 30,
2024 | | | Year Ended
September 30,
2023 | | | Year Ended
September 30,
2022 | | | Year Ended
September 30,
2021 | | | Year Ended
September 30,
2020 | |
Per Share Data |
Net asset value, beginning of period | | $ | 9.16 | | | $ | 13.57 | | | $ | 18.03 | | | $ | 15.87 | | | $ | 14.22 | |
Income (loss) from investment operations: |
Net investment income (loss)a | | | .23 | | | | .21 | | | | (.02 | ) | | | (.11 | ) | | | (.02 | ) |
Net gain (loss) on investments (realized and unrealized) | | | 2.98 | | | | 1.93 | | | | (3.20 | ) | | | 4.34 | | | | 1.87 | |
Total from investment operations | | | 3.21 | | | | 2.14 | | | | (3.22 | ) | | | 4.23 | | | | 1.85 | |
Less distributions from: |
Net investment income | | | (.44 | ) | | | (.15 | ) | | | — | | | | (.08 | ) | | | (.17 | ) |
Net realized gains | | | — | | | | (6.40 | ) | | | (1.24 | ) | | | (1.99 | ) | | | (.03 | ) |
Total distributions | | | (.44 | ) | | | (6.55 | ) | | | (1.24 | ) | | | (2.07 | ) | | | (.20 | ) |
Net asset value, end of period | | $ | 11.93 | | | $ | 9.16 | | | $ | 13.57 | | | $ | 18.03 | | | $ | 15.87 | |
|
Total Returnb | | | 36.17 | % | | | 20.81 | % | | | (19.69 | %) | | | 28.69 | % | | | 13.11 | % |
Ratios/Supplemental Data |
Net assets, end of period (in thousands) | | $ | 842 | | | $ | 797 | | | $ | 999 | | | $ | 869 | | | $ | 1,019 | |
Ratios to average net assets: |
Net investment income (loss) | | | 2.15 | % | | | 2.14 | % | | | (0.10 | %) | | | (0.67 | %) | | | (0.15 | %) |
Total expensesc | | | 2.51 | % | | | 2.32 | % | | | 2.10 | % | | | 2.15 | % | | | 2.24 | % |
Net expensesd | | | 2.48 | % | | | 2.28 | % | | | 2.04 | % | | | 2.09 | % | | | 2.20 | % |
Portfolio turnover rate | | | 56 | % | | | 56 | % | | | 62 | % | | | 25 | % | | | 69 | % |
56 | THE GUGGENHEIM FUNDS ANNUAL REPORT | SEE NOTES TO FINANCIAL STATEMENTS. |
STYLEPLUS—LARGE CORE FUND | |
FINANCIAL HIGHLIGHTS (continued) |
This table is presented to show selected data for a share outstanding throughout each period and to assist shareholders in evaluating a Fund’s performance for the periods presented.
Class P | | Year Ended
September 30,
2024 | | | Year Ended
September 30,
2023 | | | Year Ended
September 30,
2022 | | | Year Ended
September 30,
2021 | | | Year Ended
September 30,
2020 | |
Per Share Data |
Net asset value, beginning of period | | $ | 18.03 | | | $ | 20.83 | | | $ | 26.93 | | | $ | 22.69 | | | $ | 20.21 | |
Income (loss) from investment operations: |
Net investment income (loss)a | | | .63 | | | | .53 | | | | .13 | | | | .02 | | | | .14 | |
Net gain (loss) on investments (realized and unrealized) | | | 5.97 | | | | 3.25 | | | | (4.94 | ) | | | 6.38 | | | | 2.67 | |
Total from investment operations | | | 6.60 | | | | 3.78 | | | | (4.81 | ) | | | 6.40 | | | | 2.81 | |
Less distributions from: |
Net investment income | | | (.47 | ) | | | (.18 | ) | | | (.05 | ) | | | (.17 | ) | | | (.30 | ) |
Net realized gains | | | — | | | | (6.40 | ) | | | (1.24 | ) | | | (1.99 | ) | | | (.03 | ) |
Total distributions | | | (.47 | ) | | | (6.58 | ) | | | (1.29 | ) | | | (2.16 | ) | | | (.33 | ) |
Net asset value, end of period | | $ | 24.16 | | | $ | 18.03 | | | $ | 20.83 | | | $ | 26.93 | | | $ | 22.69 | |
|
Total Return | | | 37.29 | % | | | 21.62 | % | | | (19.09 | %) | | | 29.79 | % | | | 13.98 | % |
Ratios/Supplemental Data |
Net assets, end of period (in thousands) | | $ | 87 | | | $ | 206 | | | $ | 255 | | | $ | 347 | | | $ | 224 | |
Ratios to average net assets: |
Net investment income (loss) | | | 2.99 | % | | | 2.83 | % | | | 0.53 | % | | | 0.09 | % | | | 0.67 | % |
Total expensesc | | | 1.68 | % | | | 1.64 | % | | | 1.36 | % | | | 1.36 | % | | | 1.46 | % |
Net expensesd | | | 1.65 | % | | | 1.59 | % | | | 1.31 | % | | | 1.30 | % | | | 1.42 | % |
Portfolio turnover rate | | | 56 | % | | | 56 | % | | | 62 | % | | | 25 | % | | | 69 | % |
SEE NOTES TO FINANCIAL STATEMENTS. | THE GUGGENHEIM FUNDS ANNUAL REPORT | 57 |
STYLEPLUS—LARGE CORE FUND | |
FINANCIAL HIGHLIGHTS (concluded) |
This table is presented to show selected data for a share outstanding throughout each period and to assist shareholders in evaluating a Fund’s performance for the periods presented.
Institutional Class | | Year Ended
September 30,
2024 | | | Year Ended
September 30,
2023 | | | Year Ended
September 30,
2022 | | | Year Ended
September 30,
2021 | | | Year Ended
September 30,
2020 | |
Per Share Data |
Net asset value, beginning of period | | $ | 18.18 | | | $ | 20.98 | | | $ | 27.10 | | | $ | 22.83 | | | $ | 20.31 | |
Income (loss) from investment operations: |
Net investment income (loss)a | | | .69 | | | | .60 | | | | .23 | | | | .10 | | | | .21 | |
Net gain (loss) on investments (realized and unrealized) | | | 6.03 | | | | 3.27 | | | | (4.97 | ) | | | 6.40 | | | | 2.70 | |
Total from investment operations | | | 6.72 | | | | 3.87 | | | | (4.74 | ) | | | 6.50 | | | | 2.91 | |
Less distributions from: |
Net investment income | | | (.55 | ) | | | (.27 | ) | | | (.14 | ) | | | (.24 | ) | | | (.36 | ) |
Net realized gains | | | — | | | | (6.40 | ) | | | (1.24 | ) | | | (1.99 | ) | | | (.03 | ) |
Total distributions | | | (.55 | ) | | | (6.67 | ) | | | (1.38 | ) | | | (2.23 | ) | | | (.39 | ) |
Net asset value, end of period | | $ | 24.35 | | | $ | 18.18 | | | $ | 20.98 | | | $ | 27.10 | | | $ | 22.83 | |
|
Total Return | | | 37.71 | % | | | 22.06 | % | | | (18.78 | %) | | | 30.12 | % | | | 14.44 | % |
Ratios/Supplemental Data |
Net assets, end of period (in thousands) | | $ | 8,170 | | | $ | 6,158 | | | $ | 4,878 | | | $ | 6,260 | | | $ | 3,344 | |
Ratios to average net assets: |
Net investment income (loss) | | | 3.25 | % | | | 3.23 | % | | | 0.88 | % | | | 0.38 | % | | | 1.01 | % |
Total expensesc | | | 1.41 | % | | | 1.27 | % | | | 1.00 | % | | | 1.06 | % | | | 1.08 | % |
Net expensesd | | | 1.38 | % | | | 1.23 | % | | | 0.95 | % | | | 0.99 | % | | | 1.04 | % |
Portfolio turnover rate | | | 56 | % | | | 56 | % | | | 62 | % | | | 25 | % | | | 69 | % |
a | Net investment income (loss) per share was computed using average shares outstanding throughout the period. |
b | Total return does not reflect the impact of any applicable sales charges. |
c | Does not include expenses of the underlying funds in which the Fund invests. |
d | Net expense information reflects the expense ratios after expense waivers and reimbursements, as applicable. |
58 | THE GUGGENHEIM FUNDS ANNUAL REPORT | SEE NOTES TO FINANCIAL STATEMENTS. |
SCHEDULE OF INVESTMENTS | September 30, 2024 |
STYLEPLUS—MID GROWTH FUND | |
| | Shares | | | Value | |
COMMON STOCKS† - 24.8% |
| | | | | | | | | |
Industrial - 8.4% |
Carlisle Companies, Inc. | | | 1,083 | | | $ | 487,079 | |
EMCOR Group, Inc. | | | 1,027 | | | | 442,154 | |
Lennox International, Inc. | | | 690 | | | | 416,960 | |
Owens Corning | | | 2,286 | | | | 403,525 | |
Advanced Drainage Systems, Inc. | | | 2,064 | | | | 324,378 | |
Applied Industrial Technologies, Inc. | | | 1,432 | | | | 319,522 | |
UFP Industries, Inc. | | | 2,401 | | | | 315,035 | |
Acuity Brands, Inc. | | | 948 | | | | 261,070 | |
Donaldson Company, Inc. | | | 3,495 | | | | 257,582 | |
Vontier Corp. | | | 7,470 | | | | 252,038 | |
Comfort Systems USA, Inc. | | | 549 | | | | 214,302 | |
Boise Cascade Co. | | | 1,452 | | | | 204,703 | |
Mueller Industries, Inc. | | | 2,717 | | | | 201,330 | |
Masco Corp. | | | 2,354 | | | | 197,595 | |
Allegion plc | | | 1,341 | | | | 195,437 | |
Armstrong World Industries, Inc. | | | 1,475 | | | | 193,859 | |
Watts Water Technologies, Inc. — Class A | | | 932 | | | | 193,101 | |
Snap-on, Inc. | | | 666 | | | | 192,947 | |
TopBuild Corp.* | | | 456 | | | | 185,506 | |
Curtiss-Wright Corp. | | | 559 | | | | 183,738 | |
Esab Corp. | | | 1,724 | | | | 183,278 | |
Lincoln Electric Holdings, Inc. | | | 954 | | | | 183,187 | |
Universal Display Corp. | | | 837 | | | | 175,686 | |
Simpson Manufacturing Company, Inc. | | | 762 | | | | 145,748 | |
Amphenol Corp. — Class A | | | 1,975 | | | | 128,691 | |
Louisiana-Pacific Corp. | | | 992 | | | | 106,600 | |
NEXTracker, Inc. — Class A* | | | 2,167 | | | | 81,219 | |
Garmin Ltd. | | | 439 | | | | 77,277 | |
Total Industrial | | | | | | | 6,523,547 | |
| | | | | | | | | |
Consumer, Cyclical - 5.0% |
Toll Brothers, Inc. | | | 2,488 | | | | 384,371 | |
Williams-Sonoma, Inc. | | | 2,120 | | | | 328,431 | |
Core & Main, Inc. — Class A* | | | 6,081 | | | | 269,996 | |
Travel + Leisure Co. | | | 4,501 | | | | 207,406 | |
PACCAR, Inc. | | | 1,973 | | | | 194,696 | |
Wingstop, Inc. | | | 464 | | | | 193,061 | |
Crocs, Inc.* | | | 1,326 | | | | 192,018 | |
KB Home | | | 2,094 | | | | 179,435 | |
Skechers USA, Inc. — Class A* | | | 2,429 | | | | 162,548 | |
Columbia Sportswear Co. | | | 1,778 | | | | 147,912 | |
Light & Wonder, Inc. — Class A* | | | 1,620 | | | | 146,983 | |
Visteon Corp.* | | | 1,515 | | | | 144,289 | |
Gentex Corp. | | | 4,657 | | | | 138,266 | |
Autoliv, Inc. | | | 1,441 | | | | 134,546 | |
Boyd Gaming Corp. | | | 1,945 | | | | 125,744 | |
Tempur Sealy International, Inc. | | | 2,257 | | | | 123,232 | |
Dick’s Sporting Goods, Inc. | | | 574 | | | | 119,794 | |
Abercrombie & Fitch Co. — Class A* | | | 819 | | | | 114,578 | |
PulteGroup, Inc. | | | 719 | | | | 103,198 | |
Ralph Lauren Corp. — Class A | | | 510 | | | | 98,874 | |
Scotts Miracle-Gro Co. — Class A | | | 1,124 | | | | 97,451 | |
Mattel, Inc.* | | | 3,501 | | | | 66,694 | |
Royal Caribbean Cruises Ltd. | | | 342 | | | | 60,657 | |
Watsco, Inc. | | | 121 | | | | 59,518 | |
Lennar Corp. — Class A | | | 307 | | | | 57,556 | |
Total Consumer, Cyclical | | | | | | | 3,851,254 | |
| | | | | | | | | |
Technology - 3.5% |
Pure Storage, Inc. — Class A* | | | 5,482 | | | | 275,381 | |
Manhattan Associates, Inc.* | | | 803 | | | | 225,948 | |
Cirrus Logic, Inc.* | | | 1,719 | | | | 213,517 | |
Dropbox, Inc. — Class A* | | | 8,350 | | | | 212,340 | |
NetApp, Inc. | | | 1,551 | | | | 191,564 | |
Insight Enterprises, Inc.* | | | 878 | | | | 189,112 | |
TE Connectivity plc | | | 1,237 | | | | 186,775 | |
NXP Semiconductor N.V. | | | 744 | | | | 178,567 | |
ACI Worldwide, Inc.* | | | 2,894 | | | | 147,305 | |
CommVault Systems, Inc.* | | | 869 | | | | 133,696 | |
Akamai Technologies, Inc.* | | | 1,269 | | | | 128,106 | |
Teradata Corp.* | | | 4,102 | | | | 124,455 | |
Qualys, Inc.* | | | 952 | | | | 122,294 | |
Fair Isaac Corp.* | | | 62 | | | | 120,498 | |
KLA Corp. | | | 153 | | | | 118,485 | |
Duolingo, Inc.* | | | 408 | | | | 115,064 | |
Paycom Software, Inc. | | | 343 | | | | 57,133 | |
Total Technology | | | | | | | 2,740,240 | |
| | | | | | | | | |
Consumer, Non-cyclical - 3.5% |
United Therapeutics Corp.* | | | 782 | | | | 280,230 | |
Neurocrine Biosciences, Inc.* | | | 2,396 | | | | 276,067 | |
Halozyme Therapeutics, Inc.* | | | 4,610 | | | | 263,876 | |
H&R Block, Inc. | | | 4,044 | | | | 256,996 | |
Encompass Health Corp. | | | 2,514 | | | | 242,953 | |
United Rentals, Inc. | | | 264 | | | | 213,769 | |
Jazz Pharmaceuticals plc* | | | 1,830 | | | | 203,881 | |
Exelixis, Inc.* | | | 6,721 | | | | 174,410 | |
Medpace Holdings, Inc.* | | | 484 | | | | 161,559 | |
Grand Canyon Education, Inc.* | | | 937 | | | | 132,913 | |
Lantheus Holdings, Inc.* | | | 1,035 | | | | 113,591 | |
Sarepta Therapeutics, Inc.* | | | 865 | | | | 108,030 | |
HCA Healthcare, Inc. | | | 247 | | | | 100,388 | |
DaVita, Inc.* | | | 544 | | | | 89,178 | |
RB Global, Inc. | | | 654 | | | | 52,641 | |
Total Consumer, Non-cyclical | | | | | | | 2,670,482 | |
| | | | | | | | | |
Financial - 2.2% |
Equitable Holdings, Inc. | | | 5,837 | | | | 245,329 | |
RenaissanceRe Holdings Ltd. | | | 878 | | | | 239,167 | |
MGIC Investment Corp. | | | 8,477 | | | | 217,011 | |
Ameriprise Financial, Inc. | | | 415 | | | | 194,971 | |
International Bancshares Corp. | | | 3,258 | | | | 194,796 | |
Cullen/Frost Bankers, Inc. | | | 1,386 | | | | 155,038 | |
Kinsale Capital Group, Inc. | | | 255 | | | | 118,721 | |
Evercore, Inc. — Class A | | | 456 | | | | 115,523 | |
Arch Capital Group Ltd.* | | | 1,027 | | | | 114,901 | |
East West Bancorp, Inc. | | | 973 | | | | 80,506 | |
American Homes 4 Rent — Class A REIT | | | 1,367 | | | | 52,479 | |
Total Financial | | | | | | | 1,728,442 | |
| | | | | | | | | |
SEE NOTES TO FINANCIAL STATEMENTS. | THE GUGGENHEIM FUNDS ANNUAL REPORT | 59 |
SCHEDULE OF INVESTMENTS (continued) | September 30, 2024 |
STYLEPLUS—MID GROWTH FUND | |
| | Shares | | | Value | |
Energy - 1.2% |
Permian Resources Corp. | | | 14,541 | | | $ | 197,903 | |
Civitas Resources, Inc. | | | 3,601 | | | | 182,462 | |
Matador Resources Co. | | | 3,469 | | | | 171,438 | |
DT Midstream, Inc. | | | 1,708 | | | | 134,352 | |
Texas Pacific Land Corp. | | | 147 | | | | 130,057 | |
Chord Energy Corp. | | | 834 | | | | 108,612 | |
Total Energy | | | | | | | 924,824 | |
| | | | | | | | | |
Communications - 0.5% |
GoDaddy, Inc. — Class A* | | | 1,169 | | | | 183,276 | |
Motorola Solutions, Inc. | | | 283 | | | | 127,245 | |
Ciena Corp.* | | | 1,724 | | | | 106,181 | |
Total Communications | | | | | | | 416,702 | |
| | | | | | | | | |
Basic Materials - 0.5% |
NewMarket Corp. | | | 365 | | | | 201,440 | |
Cabot Corp. | | | 1,378 | | | | 154,019 | |
Reliance, Inc. | | | 201 | | | | 58,131 | |
Total Basic Materials | | | | | | | 413,590 | |
| | | | | | | | | |
Total Common Stocks | | | | |
(Cost $17,067,121) | | | | | | | 19,269,081 | |
MUTUAL FUNDS† - 67.2% |
Guggenheim Strategy Fund II1 | | | 1,084,974 | | | | 26,907,363 | |
Guggenheim Strategy Fund III1 | | | 923,061 | | | | 22,974,985 | |
Guggenheim Ultra Short Duration Fund — Institutional Class1 | | | 230,095 | | | | 2,305,552 | |
Total Mutual Funds | | | | |
(Cost $51,311,216) | | | | | | | 52,187,900 | |
| | | | | | | | | |
MONEY MARKET FUND***,† - 6.3% |
Dreyfus Treasury Securities Cash Management Fund — Institutional Shares, 4.88%2 | | | 4,904,107 | | | | 4,904,107 | |
Total Money Market Fund | | | | |
(Cost $4,904,107) | | | | | | | 4,904,107 | |
| | | | | | | | | |
Total Investments - 98.3% | | | | |
(Cost $73,282,444) | | $ | 76,361,088 | |
Other Assets & Liabilities, net - 1.7% | | | 1,351,886 | |
Total Net Assets - 100.0% | | $ | 77,712,974 | |
Total Return Swap Agreements |
Counterparty | Index | Type | Financing
Rate | | Payment
Frequency | | | Maturity
Date | | | Units | | | Notional
Amount | | | Value and
Unrealized
Appreciation | |
OTC Equity Index Swap Agreements†† |
Wells Fargo Bank, N.A. | Russell MidCap Growth Index | Pay | 5.38% (Federal Funds Rate + 0.55%) | | | At Maturity | | | | 03/03/25 | | | | 10,144 | | | $ | 59,028,037 | | | $ | 7,028,514 | |
* | Non-income producing security. |
*** | A copy of each underlying unaffiliated fund’s financial statements is available at the SEC’s website at www.sec.gov. |
† | Value determined based on Level 1 inputs — See Note 4. |
†† | Value determined based on Level 2 inputs — See Note 4. |
1 | Affiliated issuer. |
2 | Rate indicated is the 7-day yield as of September 30, 2024. |
| | plc — Public Limited Company |
| | REIT — Real Estate Investment Trust |
| | |
| | See Sector Classification in Other Information section. |
60 | THE GUGGENHEIM FUNDS ANNUAL REPORT | SEE NOTES TO FINANCIAL STATEMENTS. |
SCHEDULE OF INVESTMENTS (concluded) | September 30, 2024 |
STYLEPLUS—MID GROWTH FUND | |
The following table summarizes the inputs used to value the Fund’s investments at September 30, 2024 (See Note 4 in the Notes to Financial Statements):
Investments in Securities (Assets) | | Level 1
Quoted
Prices | | | Level 2
Significant
Observable
Inputs | | | Level 3
Significant
Unobservable
Inputs | | | Total | |
Common Stocks | | $ | 19,269,081 | | | $ | — | | | $ | — | | | $ | 19,269,081 | |
Mutual Funds | | | 52,187,900 | | | | — | | | | — | | | | 52,187,900 | |
Money Market Fund | | | 4,904,107 | | | | — | | | | — | | | | 4,904,107 | |
Equity Index Swap Agreements** | | | — | | | | 7,028,514 | | | | — | | | | 7,028,514 | |
Total Assets | | $ | 76,361,088 | | | $ | 7,028,514 | | | $ | — | | | $ | 83,389,602 | |
** | This derivative is reported as unrealized appreciation/depreciation at period end. |
Affiliated Transactions
Investments representing 5% or more of the outstanding voting shares of a company, or control of or by, or common control under Guggenheim Investments (“GI”), result in that company being considered an affiliated issuer, as defined in the 1940 Act.
The Fund may invest in certain of the underlying series of Guggenheim Strategy Funds Trust, including Guggenheim Strategy Fund II and Guggenheim Strategy Fund III (collectively, the “Guggenheim Strategy Funds”), each of which are open-end management investment companies managed by GI. The Guggenheim Strategy Funds, which launched on March 11, 2014, are offered as short term investment options only to mutual funds, trusts, and other accounts managed by GI and/or its affiliates, and are not available to the public. The Guggenheim Strategy Funds pay no investment management fees. The Guggenheim Strategy Funds’ annual report on Form N-CSR dated September 30, 2023 is available publicly or upon request. This information is available from the EDGAR database on the SEC’s website at https://www.sec.gov/Archives/edgar/data/1601445/000182126823000217/gug86449-ncsr.htm. The Fund may invest in certain of the underlying series of Guggenheim Funds Trust, which are open-end management investment companies managed by GI, are available to the public and whose most recent annual report on Form N-CSR is available publicly or upon request.
Transactions during the year ended September 30, 2024, in which the company is an affiliated issuer, were as follows:
Security Name | | Value
09/30/23 | | | Additions | | | Reductions | | | Realized
Gain (Loss) | | | Change in
Unrealized
Appreciation
(Depreciation) | | | Value
09/30/24 | | | Shares
09/30/24 | | | Investment
Income | |
Mutual Funds | | | | | | | | | | | | | | | | | | | | | | | | | | | | | | | | |
Guggenheim Strategy Fund II | | $ | 22,166,962 | | | $ | 8,378,066 | | | $ | (4,158,478 | ) | | $ | (19,446 | ) | | $ | 540,259 | | | $ | 26,907,363 | | | | 1,084,974 | | | $ | 1,403,481 | |
Guggenheim Strategy Fund III | | | 23,628,764 | | | | 4,554,480 | | | | (5,790,840 | ) | | | (123,802 | ) | | | 706,383 | | | | 22,974,985 | | | | 923,061 | | | | 1,322,180 | |
Guggenheim Ultra Short Duration Fund — Institutional Class | | | 2,126,306 | | | | 118,896 | | | | — | | | | — | | | | 60,350 | | | | 2,305,552 | | | | 230,095 | | | | 119,245 | |
| | | $ | 47,922,032 | | | $ | 13,051,442 | | | $ | (9,949,318 | ) | | $ | (143,248 | ) | | $ | 1,306,992 | | | $ | 52,187,900 | | | | | | | $ | 2,844,906 | |
SEE NOTES TO FINANCIAL STATEMENTS. | THE GUGGENHEIM FUNDS ANNUAL REPORT | 61 |
STYLEPLUS—MID GROWTH FUND | |
STATEMENT OF ASSETS AND LIABILITIES |
September 30, 2024 |
Assets: |
Investments in unaffiliated issuers, at value (cost $21,971,228) | | $ | 24,173,188 | |
Investments in affiliated issuers, at value (cost $51,311,216) | | | 52,187,900 | |
Cash | | | 4 | |
Unrealized appreciation on OTC swap agreements | | | 7,028,514 | |
Prepaid expenses | | | 45,348 | |
Receivables: |
Securities sold | | | 1,400,277 | |
Dividends | | | 233,473 | |
Fund shares sold | | | 125,880 | |
Interest | | | 12,776 | |
Total assets | | | 85,207,360 | |
| | | | | |
Liabilities: |
Segregated cash due to broker | | | 5,080,000 | |
Payable for: |
Swap settlement | | | 2,049,590 | |
Securities purchased | | | 224,285 | |
Management fees | | | 42,812 | |
Distribution and service fees | | | 14,549 | |
Transfer agent/maintenance fees | | | 8,316 | |
Fund accounting/administration fees | | | 5,799 | |
Fund shares redeemed | | | 4,094 | |
Trustees’ fees* | | | 389 | |
Miscellaneous | | | 64,552 | |
Total liabilities | | | 7,494,386 | |
Net assets | | $ | 77,712,974 | |
| | | | | |
Net assets consist of: |
Paid in capital | | $ | 80,142,302 | |
Total distributable earnings (loss) | | | (2,429,328 | ) |
Net assets | | $ | 77,712,974 | |
Class A: |
Net assets | | $ | 75,898,570 | |
Capital shares outstanding | | | 2,027,147 | |
Net asset value per share | | $ | 37.44 | |
Maximum offering price per share (Net asset value divided by 95.25%) | | $ | 39.31 | |
Class C: |
Net assets | | $ | 612,259 | |
Capital shares outstanding | | | 45,827 | |
Net asset value per share | | $ | 13.36 | |
Class P: |
Net assets | | $ | 71,703 | |
Capital shares outstanding | | | 1,959 | |
Net asset value per share | | $ | 36.60 | |
| | | | | |
Institutional Class: |
Net assets | | $ | 1,130,442 | |
Capital shares outstanding | | | 30,169 | |
Net asset value per share | | $ | 37.47 | |
STATEMENT OF OPERATIONS |
Year Ended September 30, 2024 |
Investment Income: |
Dividends from securities of unaffiliated issuers (net of foreign withholding tax of $453) | | $ | 205,675 | |
Dividends from securities of affiliated issuers | | | 2,844,906 | |
Interest | | | 146,345 | |
Total investment income | | | 3,196,926 | |
| | | | | |
Expenses: |
Management fees | | | 544,249 | |
Distribution and service fees: |
Class A | | | 177,199 | |
Class C | | | 6,017 | |
Class P | | | 150 | |
Transfer agent/maintenance fees: |
Class A | | | 77,037 | |
Class C | | | 1,870 | |
Class P | | | 191 | |
Institutional Class | | | 1,331 | |
Interest expense | | | 219,649 | |
Registration fees | | | 62,630 | |
Professional fees | | | 46,742 | |
Fund accounting/administration fees | | | 36,906 | |
Custodian fees | | | 15,807 | |
Trustees’ fees* | | | 14,750 | |
Line of credit fees | | | 1,756 | |
Miscellaneous | | | 24,010 | |
Total expenses | | | 1,230,294 | |
Less: |
Expenses waived by Adviser | | | (5,531 | ) |
Net expenses | | | 1,224,763 | |
Net investment income | | | 1,972,163 | |
| | | | | |
Net Realized and Unrealized Gain (Loss): |
Net realized gain (loss) on: |
Investments in unaffiliated issuers | | | 3,569,621 | |
Investments in affiliated issuers | | | (143,248 | ) |
Swap agreements | | | 8,984,678 | |
Futures contracts | | | 401,522 | |
Net realized gain | | | 12,812,573 | |
Net change in unrealized appreciation (depreciation) on: |
Investments in unaffiliated issuers | | | 1,506,584 | |
Investments in affiliated issuers | | | 1,306,992 | |
Swap agreements | | | 1,879,162 | |
Futures contracts | | | 109,411 | |
Net change in unrealized appreciation (depreciation) | | | 4,802,149 | |
Net realized and unrealized gain | | | 17,614,722 | |
Net increase in net assets resulting from operations | | $ | 19,586,885 | |
* | Relates to Trustees not deemed “interested persons” within the meaning of Section 2(a)(19) of the 1940 Act. |
62 | THE GUGGENHEIM FUNDS ANNUAL REPORT | SEE NOTES TO FINANCIAL STATEMENTS. |
STYLEPLUS—MID GROWTH FUND | |
STATEMENTS OF CHANGES IN NET ASSETS |
| | Year Ended
September 30,
2024 | | | Year Ended
September 30,
2023 | |
Increase (Decrease) in Net Assets from Operations: | | | | | | | | |
Net investment income | | $ | 1,972,163 | | | $ | 1,660,859 | |
Net realized gain (loss) on investments | | | 12,812,573 | | | | (22,978,263 | ) |
Net change in unrealized appreciation (depreciation) on investments | | | 4,802,149 | | | | 33,116,667 | |
Net increase in net assets resulting from operations | | | 19,586,885 | | | | 11,799,263 | |
| | | | | | | | | |
Distributions to shareholders: | | | | | | | | |
Class A | | | (1,599,572 | ) | | | (18,424,696 | ) |
Class C | | | (35,883 | ) | | | (356,411 | ) |
Class P | | | (1,001 | ) | | | (34,001 | ) |
Institutional Class | | | (25,329 | ) | | | (258,969 | ) |
Total distributions to shareholders | | | (1,661,785 | ) | | | (19,074,077 | ) |
| | | | | | | | | |
Capital share transactions: | | | | | | | | |
Proceeds from sale of shares | | | | | | | | |
Class A | | | 1,127,898 | | | | 1,044,582 | |
Class C | | | 54,595 | | | | 26,052 | |
Class P | | | 8,666 | | | | 5,957 | |
Institutional Class | | | 242,286 | | | | 374,605 | |
Distributions reinvested | | | | | | | | |
Class A | | | 1,520,104 | | | | 17,671,252 | |
Class C | | | 35,883 | | | | 298,799 | |
Class P | | | 1,001 | | | | 34,001 | |
Institutional Class | | | 25,262 | | | | 250,941 | |
Cost of shares redeemed | | | | | | | | |
Class A | | | (7,500,936 | ) | | | (15,576,440 | ) |
Class C | | | (155,959 | ) | | | (213,354 | ) |
Class P | | | (2,851 | ) | | | (80,078 | ) |
Institutional Class | | | (316,333 | ) | | | (508,296 | ) |
Net increase (decrease) from capital share transactions | | | (4,960,384 | ) | | | 3,328,021 | |
Net increase (decrease) in net assets | | | 12,964,716 | | | | (3,946,793 | ) |
| | | | | | | | | |
Net assets: | | | | | | | | |
Beginning of year | | | 64,748,258 | | | | 68,695,051 | |
End of year | | $ | 77,712,974 | | | $ | 64,748,258 | |
| | | | | | | | | |
Capital share activity: | | | | | | | | |
Shares sold | | | | | | | | |
Class A | | | 33,254 | | | | 34,720 | |
Class C | | | 4,488 | | | | 2,227 | |
Class P | | | 258 | | | | 203 | |
Institutional Class | | | 7,128 | | | | 13,235 | |
Shares issued from reinvestment of distributions | | | | | | | | |
Class A | | | 47,135 | | | | 659,621 | |
Class C | | | 3,096 | | | | 29,643 | |
Class P | | | 32 | | | | 1,299 | |
Institutional Class | | | 784 | | | | 9,384 | |
Shares redeemed | | | | | | | | |
Class A | | | (223,835 | ) | | | (481,994 | ) |
Class C | | | (12,835 | ) | | | (17,169 | ) |
Class P | | | (87 | ) | | | (2,987 | ) |
Institutional Class | | | (9,222 | ) | | | (16,939 | ) |
Net increase (decrease) in shares | | | (149,804 | ) | | | 231,243 | |
SEE NOTES TO FINANCIAL STATEMENTS. | THE GUGGENHEIM FUNDS ANNUAL REPORT | 63 |
STYLEPLUS—MID GROWTH FUND | |
This table is presented to show selected data for a share outstanding throughout each period and to assist shareholders in evaluating a Fund’s performance for the periods presented.
Class A | | Year Ended
September 30,
2024 | | | Year Ended
September 30,
2023 | | | Year Ended
September 30,
2022 | | | Year Ended
September 30,
2021 | | | Year Ended
September 30,
2020 | |
Per Share Data |
Net asset value, beginning of period | | $ | 29.13 | | | $ | 34.22 | | | $ | 52.73 | | | $ | 45.98 | | | $ | 39.64 | |
Income (loss) from investment operations: |
Net investment income (loss)a | | | .91 | | | | .76 | | | | .16 | | | | (.02 | ) | | | .19 | |
Net gain (loss) on investments (realized and unrealized) | | | 8.15 | | | | 5.07 | | | | (15.32 | ) | | | 13.67 | | | | 7.06 | |
Total from investment operations | | | 9.06 | | | | 5.83 | | | | (15.16 | ) | | | 13.65 | | | | 7.25 | |
Less distributions from: |
Net investment income | | | (.75 | ) | | | (.19 | ) | | | — | | | | (.20 | ) | | | (.45 | ) |
Net realized gains | | | — | | | | (10.73 | ) | | | (3.35 | ) | | | (6.70 | ) | | | (.46 | ) |
Total distributions | | | (.75 | ) | | | (10.92 | ) | | | (3.35 | ) | | | (6.90 | ) | | | (.91 | ) |
Net asset value, end of period | | $ | 37.44 | | | $ | 29.13 | | | $ | 34.22 | | | $ | 52.73 | | | $ | 45.98 | |
|
Total Returnb | | | 31.52 | % | | | 19.84 | % | | | (30.68 | %) | | | 31.07 | % | | | 18.57 | % |
Ratios/Supplemental Data |
Net assets, end of period (in thousands) | | $ | 75,899 | | | $ | 63,225 | | | $ | 67,014 | | | $ | 107,983 | | | $ | 89,469 | |
Ratios to average net assets: |
Net investment income (loss) | | | 2.72 | % | | | 2.52 | % | | | 0.36 | % | | | (0.04 | %) | | | 0.46 | % |
Total expensesc | | | 1.69 | % | | | 1.66 | % | | | 1.32 | % | | | 1.34 | % | | | 1.45 | % |
Net expensesd | | | 1.68 | % | | | 1.65 | % | | | 1.30 | % | | | 1.28 | % | | | 1.40 | % |
Portfolio turnover rate | | | 80 | % | | | 82 | % | | | 72 | % | | | 44 | % | | | 82 | % |
Class C | | Year Ended
September 30,
2024 | | | Year Ended
September 30,
2023 | | | Year Ended
September 30,
2022 | | | Year Ended
September 30,
2021 | | | Year Ended
September 30,
2020 | |
Per Share Data |
Net asset value, beginning of period | | $ | 10.89 | | | $ | 18.92 | | | $ | 30.92 | | | $ | 29.40 | | | $ | 25.66 | |
Income (loss) from investment operations: |
Net investment income (loss)a | | | .21 | | | | .20 | | | | (.15 | ) | | | (.29 | ) | | | (.10 | ) |
Net gain (loss) on investments (realized and unrealized) | | | 2.98 | | | | 2.50 | | | | (8.50 | ) | | | 8.51 | | | | 4.53 | |
Total from investment operations | | | 3.19 | | | | 2.70 | | | | (8.65 | ) | | | 8.22 | | | | 4.43 | |
Less distributions from: |
Net investment income | | | (.72 | ) | | | — | | | | — | | | | — | | | | (.23 | ) |
Net realized gains | | | — | | | | (10.73 | ) | | | (3.35 | ) | | | (6.70 | ) | | | (.46 | ) |
Total distributions | | | (.72 | ) | | | (10.73 | ) | | | (3.35 | ) | | | (6.70 | ) | | | (.69 | ) |
Net asset value, end of period | | $ | 13.36 | | | $ | 10.89 | | | $ | 18.92 | | | $ | 30.92 | | | $ | 29.40 | |
|
Total Returnb | | | 30.26 | % | | | 18.85 | % | | | (31.33 | %) | | | 29.88 | % | | | 17.53 | % |
Ratios/Supplemental Data |
Net assets, end of period (in thousands) | | $ | 612 | | | $ | 556 | | | $ | 688 | | | $ | 1,327 | | | $ | 1,510 | |
Ratios to average net assets: |
Net investment income (loss) | | | 1.77 | % | | | 1.66 | % | | | (0.59 | %) | | | (0.94 | %) | | | (0.39 | %) |
Total expensesc | | | 2.64 | % | | | 2.49 | % | | | 2.25 | % | | | 2.26 | % | | | 2.32 | % |
Net expensesd | | | 2.63 | % | | | 2.48 | % | | | 2.23 | % | | | 2.20 | % | | | 2.28 | % |
Portfolio turnover rate | | | 80 | % | | | 82 | % | | | 72 | % | | | 44 | % | | | 82 | % |
64 | THE GUGGENHEIM FUNDS ANNUAL REPORT | SEE NOTES TO FINANCIAL STATEMENTS. |
STYLEPLUS—MID GROWTH FUND | |
FINANCIAL HIGHLIGHTS (concluded) |
This table is presented to show selected data for a share outstanding throughout each period and to assist shareholders in evaluating a Fund’s performance for the periods presented.
Class P | | Year Ended
September 30,
2024 | | | Year Ended
September 30,
2023 | | | Year Ended
September 30,
2022 | | | Year Ended
September 30,
2021 | | | Year Ended
September 30,
2020 | |
Per Share Data |
Net asset value, beginning of period | | $ | 28.38 | | | $ | 33.58 | | | $ | 51.96 | | | $ | 45.45 | | | $ | 39.17 | |
Income (loss) from investment operations: |
Net investment income (loss)a | | | .83 | | | | .64 | | | | — | | | | (.07 | ) | | | .15 | |
Net gain (loss) on investments (realized and unrealized) | | | 7.96 | | | | 4.96 | | | | (15.03 | ) | | | 13.51 | | | | 6.99 | |
Total from investment operations | | | 8.79 | | | | 5.60 | | | | (15.03 | ) | | | 13.44 | | | | 7.14 | |
Less distributions from: |
Net investment income | | | (.57 | ) | | | (.07 | ) | | | — | | | | (.23 | ) | | | (.40 | ) |
Net realized gains | | | — | | | | (10.73 | ) | | | (3.35 | ) | | | (6.70 | ) | | | (.46 | ) |
Total distributions | | | (.57 | ) | | | (10.80 | ) | | | (3.35 | ) | | | (6.93 | ) | | | (.86 | ) |
Net asset value, end of period | | $ | 36.60 | | | $ | 28.38 | | | $ | 33.58 | | | $ | 51.96 | | | $ | 45.45 | |
|
Total Return | | | 31.28 | % | | | 19.40 | % | | | (30.90 | %) | | | 30.92 | % | | | 18.48 | % |
Ratios/Supplemental Data |
Net assets, end of period (in thousands) | | $ | 72 | | | $ | 50 | | | $ | 109 | | | $ | 237 | | | $ | 116 | |
Ratios to average net assets: |
Net investment income (loss) | | | 2.51 | % | | | 2.09 | % | | | 0.01 | % | | | (0.14 | %) | | | 0.36 | % |
Total expensesc | | | 1.90 | % | | | 1.97 | % | | | 1.56 | % | | | 1.43 | % | | | 1.54 | % |
Net expensesd | | | 1.89 | % | | | 1.96 | % | | | 1.54 | % | | | 1.37 | % | | | 1.50 | % |
Portfolio turnover rate | | | 80 | % | | | 82 | % | | | 72 | % | | | 44 | % | | | 82 | % |
Institutional Class | | Year Ended
September 30,
2024 | | | Year Ended
September 30,
2023 | | | Year Ended
September 30,
2022 | | | Year Ended
September 30,
2021 | | | Year Ended
September 30,
2020 | |
Per Share Data |
Net asset value, beginning of period | | $ | 29.13 | | | $ | 34.25 | | | $ | 52.71 | | | $ | 45.98 | | | $ | 39.64 | |
Income (loss) from investment operations: |
Net investment income (loss)a | | | .99 | | | | .82 | | | | .22 | | | | .07 | | | | .24 | |
Net gain (loss) on investments (realized and unrealized) | | | 8.15 | | | | 5.05 | | | | (15.33 | ) | | | 13.65 | | | | 7.09 | |
Total from investment operations | | | 9.14 | | | | 5.87 | | | | (15.11 | ) | | | 13.72 | | | | 7.33 | |
Less distributions from: |
Net investment income | | | (.80 | ) | | | (.26 | ) | | | — | | | | (.29 | ) | | | (.53 | ) |
Net realized gains | | | — | | | | (10.73 | ) | | | (3.35 | ) | | | (6.70 | ) | | | (.46 | ) |
Total distributions | | | (.80 | ) | | | (10.99 | ) | | | (3.35 | ) | | | (6.99 | ) | | | (.99 | ) |
Net asset value, end of period | | $ | 37.47 | | | $ | 29.13 | | | $ | 34.25 | | | $ | 52.71 | | | $ | 45.98 | |
|
Total Return | | | 31.84 | % | | | 20.02 | % | | | (30.60 | %) | | | 31.26 | % | | | 18.79 | % |
Ratios/Supplemental Data |
Net assets, end of period (in thousands) | | $ | 1,130 | | | $ | 917 | | | $ | 884 | | | $ | 1,390 | | | $ | 1,311 | |
Ratios to average net assets: |
Net investment income (loss) | | | 2.95 | % | | | 2.72 | % | | | 0.50 | % | | | 0.14 | % | | | 0.58 | % |
Total expensesc | | | 1.46 | % | | | 1.49 | % | | | 1.20 | % | | | 1.17 | % | | | 1.26 | % |
Net expensesd | | | 1.46 | % | | | 1.49 | % | | | 1.18 | % | | | 1.11 | % | | | 1.22 | % |
Portfolio turnover rate | | | 80 | % | | | 82 | % | | | 72 | % | | | 44 | % | | | 82 | % |
a | Net investment income (loss) per share was computed using average shares outstanding throughout the period. |
b | Total return does not reflect the impact of any applicable sales charges. |
c | Does not include expenses of the underlying funds in which the Fund invests. |
d | Net expense information reflects the expense ratios after expense waivers and reimbursements, as applicable. |
SEE NOTES TO FINANCIAL STATEMENTS. | THE GUGGENHEIM FUNDS ANNUAL REPORT | 65 |
SCHEDULE OF INVESTMENTS | September 30, 2024 |
WORLD EQUITY INCOME FUND | |
| | Shares | | | Value | |
COMMON STOCKS† - 96.5% |
| | | | | | | | | |
Financial - 24.0% |
Goldman Sachs Group, Inc. | | | 1,100 | | | $ | 544,621 | |
AXA S.A. | | | 12,000 | | | | 461,477 | |
Simon Property Group, Inc. REIT | | | 2,690 | | | | 454,664 | |
AvalonBay Communities, Inc. REIT | | | 1,971 | | | | 443,967 | |
Intesa Sanpaolo SpA | | | 101,700 | | | | 434,652 | |
Generali | | | 15,000 | | | | 433,512 | |
Westpac Banking Corp. | | | 19,660 | | | | 431,239 | |
Bank of New York Mellon Corp. | | | 6,000 | | | | 431,160 | |
United Overseas Bank Ltd. | | | 17,000 | | | | 425,665 | |
National Australia Bank Ltd. | | | 16,450 | | | | 424,872 | |
Berkshire Hathaway, Inc. — Class B* | | | 890 | | | | 409,631 | |
VICI Properties, Inc. REIT | | | 12,000 | | | | 399,720 | |
UniCredit SpA | | | 9,000 | | | | 394,571 | |
Essex Property Trust, Inc. REIT | | | 1,200 | | | | 354,504 | |
Skandinaviska Enskilda Banken AB — Class A | | | 23,000 | | | | 351,703 | |
Public Storage REIT | | | 963 | | | | 350,407 | |
Svenska Handelsbanken AB — Class A | | | 34,000 | | | | 349,117 | |
Swedbank AB — Class A | | | 16,000 | | | | 339,297 | |
Nordea Bank Abp | | | 27,000 | | | | 318,443 | |
WP Carey, Inc. REIT | | | 5,000 | | | | 311,500 | |
Gaming and Leisure Properties, Inc. REIT | | | 6,000 | | | | 308,700 | |
Danske Bank A/S | | | 10,000 | | | | 300,955 | |
Allianz AG | | | 900 | | | | 295,690 | |
Tryg A/S | | | 12,000 | | | | 284,615 | |
Northern Trust Corp. | | | 3,100 | | | | 279,093 | |
Banco Santander S.A. | | | 54,000 | | | | 276,676 | |
ING Groep N.V. | | | 15,000 | | | | 271,868 | |
Mitsubishi HC Capital, Inc. | | | 36,000 | | | | 253,112 | |
BNP Paribas S.A. | | | 3,600 | | | | 246,776 | |
Banco Bilbao Vizcaya Argentaria S.A. | | | 22,570 | | | | 244,024 | |
Zurich Insurance Group AG | | | 400 | | | | 241,000 | |
Swiss Life Holding AG | | | 250 | | | | 208,594 | |
Mediobanca Banca di Credito Finanziario SpA | | | 12,070 | | | | 206,006 | |
NN Group N.V. | | | 4,000 | | | | 199,488 | |
FirstService Corp. | | | 800 | | | | 146,229 | |
Synchrony Financial | | | 2,800 | | | | 139,664 | |
Equity Residential REIT | | | 1,800 | | | | 134,028 | |
Citigroup, Inc. | | | 1,700 | | | | 106,420 | |
JPMorgan Chase & Co. | | | 500 | | | | 105,430 | |
Sampo Oyj — Class A | | | 2,000 | | | | 93,329 | |
American International Group, Inc. | | | 1,200 | | | | 87,876 | |
Total Financial | | | | | | | 12,494,295 | |
| | | | | | | | | |
Technology - 18.5% |
NVIDIA Corp. | | | 13,700 | | | | 1,663,728 | |
Apple, Inc. | | | 7,074 | | | | 1,648,242 | |
Microsoft Corp. | | | 3,659 | | | | 1,574,467 | |
International Business Machines Corp. | | | 2,700 | | | | 596,916 | |
Texas Instruments, Inc. | | | 2,262 | | | | 467,261 | |
TE Connectivity plc | | | 2,700 | | | | 407,673 | |
Cognizant Technology Solutions Corp. — Class A | | | 5,100 | | | | 393,618 | |
CGI, Inc.* | | | 3,100 | | | | 356,845 | |
Constellation Software, Inc. | | | 110 | | | | 356,825 | |
Skyworks Solutions, Inc. | | | 3,600 | | | | 355,572 | |
Dell Technologies, Inc. — Class C | | | 2,900 | | | | 343,766 | |
Pro Medicus Ltd. | | | 2,700 | | | | 332,809 | |
Descartes Systems Group, Inc.* | | | 2,700 | | | | 277,947 | |
QUALCOMM, Inc. | | | 1,300 | | | | 221,065 | |
Broadcom, Inc. | | | 1,020 | | | | 175,950 | |
SCSK Corp. | | | 8,000 | | | | 164,734 | |
Paychex, Inc. | | | 800 | | | | 107,352 | |
Otsuka Corp. | | | 4,000 | | | | 98,634 | |
Ricoh Company Ltd. | | | 9,000 | | | | 96,592 | |
Total Technology | | | | | | | 9,639,996 | |
| | | | | | | | | |
Consumer, Non-cyclical - 13.6% |
Johnson & Johnson | | | 3,992 | | | | 646,944 | |
Novo Nordisk A/S — Class B | | | 5,100 | | | | 599,323 | |
PepsiCo, Inc. | | | 3,124 | | | | 531,236 | |
Colgate-Palmolive Co. | | | 4,465 | | | | 463,512 | |
Altria Group, Inc. | | | 9,000 | | | | 459,360 | |
Elevance Health, Inc. | | | 800 | | | | 416,000 | |
CVS Health Corp. | | | 6,300 | | | | 396,144 | |
UnitedHealth Group, Inc. | | | 677 | | | | 395,829 | |
Kraft Heinz Co. | | | 11,000 | | | | 386,210 | |
McKesson Corp. | | | 730 | | | | 360,927 | |
CK Hutchison Holdings Ltd. | | | 62,468 | | | | 359,223 | |
Kimberly-Clark Corp. | | | 2,400 | | | | 341,472 | |
Shionogi & Company Ltd. | | | 18,000 | | | | 257,182 | |
Essity AB — Class B | | | 7,000 | | | | 218,492 | |
Medtronic plc | | | 2,400 | | | | 216,072 | |
Royalty Pharma plc — Class A | | | 7,000 | | | | 198,030 | |
Eli Lilly & Co. | | | 200 | | | | 177,188 | |
Philip Morris International, Inc. | | | 1,100 | | | | 133,540 | |
Coca-Cola Co. | | | 1,800 | | | | 129,348 | |
Regeneron Pharmaceuticals, Inc.* | | | 100 | | | | 105,124 | |
Constellation Brands, Inc. — Class A | | | 400 | | | | 103,076 | |
Merck & Company, Inc. | | | 900 | | | | 102,204 | |
Sysco Corp. | | | 1,160 | | | | 90,550 | |
Total Consumer, Non-cyclical | | | | | | | 7,086,986 | |
| | | | | | | | | |
Communications - 11.8% |
Alphabet, Inc. — Class C | | | 6,435 | | | | 1,075,868 | |
Amazon.com, Inc.* | | | 4,838 | | | | 901,464 | |
Verizon Communications, Inc. | | | 12,381 | | | | 556,031 | |
Cisco Systems, Inc. | | | 9,700 | | | | 516,234 | |
Meta Platforms, Inc. — Class A | | | 900 | | | | 515,196 | |
Arista Networks, Inc.* | | | 1,100 | | | | 422,202 | |
Motorola Solutions, Inc. | | | 800 | | | | 359,704 | |
Thomson Reuters Corp. | | | 2,100 | | | | 358,344 | |
SoftBank Corp. | | | 220,000 | | | | 286,551 | |
HKT Trust & HKT Ltd. | | | 210,000 | | | | 268,808 | |
T-Mobile US, Inc. | | | 1,200 | | | | 247,632 | |
Tele2 AB — Class B | | | 20,000 | | | | 226,343 | |
KDDI Corp. | | | 7,000 | | | | 223,750 | |
66 | THE GUGGENHEIM FUNDS ANNUAL REPORT | SEE NOTES TO FINANCIAL STATEMENTS. |
SCHEDULE OF INVESTMENTS (continued) | September 30, 2024 |
WORLD EQUITY INCOME FUND | |
| | Shares | | | Value | |
Comcast Corp. — Class A | | | 4,000 | | | $ | 167,080 | |
Total Communications | | | | | | | 6,125,207 | |
| | | | | | | | | |
Industrial - 7.4% |
Lockheed Martin Corp. | | | 789 | | | | 461,218 | |
Smurfit WestRock plc | | | 8,900 | | | | 439,838 | |
Waste Connections, Inc. | | | 2,200 | | | | 393,404 | |
Garmin Ltd. | | | 2,200 | | | | 387,266 | |
Martin Marietta Materials, Inc. | | | 700 | | | | 376,775 | |
General Dynamics Corp. | | | 1,200 | | | | 362,640 | |
Snap-on, Inc. | | | 1,090 | | | | 315,784 | |
Amphenol Corp. — Class A | | | 2,760 | | | | 179,841 | |
CRH plc* | | | 1,900 | | | | 176,206 | |
Aena SME S.A.1 | | | 800 | | | | 176,055 | |
Illinois Tool Works, Inc. | | | 600 | | | | 157,242 | |
United Parcel Service, Inc. — Class B | | | 1,000 | | | | 136,340 | |
Poste Italiane SpA1 | | | 8,000 | | | | 112,173 | |
Packaging Corporation of America | | | 500 | | | | 107,700 | |
Hexagon AB — Class B | | | 10,000 | | | | 107,557 | |
Total Industrial | | | | | | | 3,890,039 | |
| | | | | | | | | |
Utilities - 6.8% |
Southern Co. | | | 5,875 | | | | 529,807 | |
Duke Energy Corp. | | | 4,175 | | | | 481,377 | |
Entergy Corp. | | | 3,500 | | | | 460,635 | |
Consolidated Edison, Inc. | | | 4,112 | | | | 428,183 | |
DTE Energy Co. | | | 2,980 | | | | 382,662 | |
Exelon Corp. | | | 9,010 | | | | 365,356 | |
American Electric Power Company, Inc. | | | 3,200 | | | | 328,320 | |
Iberdrola S.A. | | | 21,000 | | | | 324,858 | |
FirstEnergy Corp. | | | 3,000 | | | | 133,050 | |
Atmos Energy Corp. | | | 800 | | | | 110,968 | |
Total Utilities | | | | | | | 3,545,216 | |
| | | | | | | | | |
Consumer, Cyclical - 6.2% |
Home Depot, Inc. | | | 1,609 | | | | 651,967 | |
Walmart, Inc. | | | 7,000 | | | | 565,250 | |
McDonald’s Corp. | | | 1,400 | | | | 426,314 | |
PACCAR, Inc. | | | 3,700 | | | | 365,116 | |
Sekisui House Ltd. | | | 12,930 | | | | 357,520 | |
General Motors Co. | | | 6,000 | | | | 269,040 | |
Singapore Airlines Ltd. | | | 50,000 | | | | 264,634 | |
Tesla, Inc.* | | | 600 | | | | 156,978 | |
Lennar Corp. — Class A | | | 800 | | | | 149,984 | |
Total Consumer, Cyclical | | | | | | | 3,206,803 | |
| | | | | | | | | |
Basic Materials - 4.1% |
Dow, Inc. | | | 6,500 | | | | 355,095 | |
Reliance, Inc. | | | 1,200 | | | | 347,052 | |
LyondellBasell Industries N.V. — Class A | | | 3,362 | | | | 322,416 | |
Rio Tinto plc | | | 4,300 | | | | 304,593 | |
Eastman Chemical Co. | | | 2,500 | | | | 279,875 | |
Celanese Corp. — Class A | | | 1,100 | | | | 149,556 | |
Nucor Corp. | | | 900 | | | | 135,306 | |
Wheaton Precious Metals Corp. | | | 2,200 | | | | 134,417 | |
Air Products and Chemicals, Inc. | | | 400 | | | | 119,096 | |
Total Basic Materials | | | | | | | 2,147,406 | |
| | | | | | | | | |
Energy - 3.7% |
Phillips 66 | | | 3,040 | | | | 399,608 | |
Marathon Petroleum Corp. | | | 2,451 | | | | 399,293 | |
Valero Energy Corp. | | | 2,640 | | | | 356,479 | |
Chord Energy Corp. | | | 1,600 | | | | 208,368 | |
Kinder Morgan, Inc. | | | 9,000 | | | | 198,810 | |
DCC plc | | | 2,400 | | | | 163,491 | |
Chevron Corp. | | | 600 | | | | 88,362 | |
Aker BP ASA | | | 4,000 | | | | 85,751 | |
Total Energy | | | | | | | 1,900,162 | |
| | | | | | | | | |
Diversified - 0.4% |
Jardine Matheson Holdings Ltd. | | | 5,000 | | | | 195,300 | |
| | | | | | | | | |
Total Common Stocks | | | | |
(Cost $42,066,699) | | | | | | | 50,231,410 | |
| | | | | | | | | |
EXCHANGE-TRADED FUNDS***,† - 2.9% |
iShares MSCI EAFE ETF | | | 8,927 | | | | 746,565 | |
SPDR S&P 500 ETF Trust | | | 1,296 | | | | 743,593 | |
Total Exchange-Traded Funds | | | | |
(Cost $1,422,921) | | | | | | | 1,490,158 | |
| | | | | | | | | |
MONEY MARKET FUND***,† - 0.5% |
Goldman Sachs Financial Square Treasury Instruments Fund Institutional Shares, 4.90%2 | | | 234,530 | | | | 234,530 | |
Total Money Market Fund | | | | |
(Cost $234,530) | | | | | | | 234,530 | |
| | | | | | | | | |
Total Investments - 99.9% | | | | |
(Cost $43,724,150) | | $ | 51,956,098 | |
Other Assets & Liabilities, net - 0.1% | | | 69,171 | |
Total Net Assets - 100.0% | | $ | 52,025,269 | |
* | Non-income producing security. |
*** | A copy of each underlying unaffiliated fund’s financial statements is available at the SEC’s website at www.sec.gov. |
† | Value determined based on Level 1 inputs — See Note 4. |
1 | Security is a 144A or Section 4(a)(2) security. These securities have been determined to be liquid under guidelines established by the Board of Trustees. The total market value of 144A or Section 4(a)(2) securities is $288,228 (cost $262,001), or 0.6% of total net assets. |
2 | Rate indicated is the 7-day yield as of September 30, 2024. |
SEE NOTES TO FINANCIAL STATEMENTS. | THE GUGGENHEIM FUNDS ANNUAL REPORT | 67 |
SCHEDULE OF INVESTMENTS (concluded) | September 30, 2024 |
WORLD EQUITY INCOME FUND | |
The following table summarizes the inputs used to value the Fund’s investments at September 30, 2024 (See Note 4 in the Notes to Financial Statements):
Investments in Securities (Assets) | | Level 1
Quoted
Prices | | | Level 2
Significant
Observable
Inputs | | | Level 3
Significant
Unobservable
Inputs | | | Total | |
Common Stocks | | $ | 50,231,410 | | | $ | — | | | $ | — | | | $ | 50,231,410 | |
Exchange-Traded Funds | | | 1,490,158 | | | | — | | | | — | | | | 1,490,158 | |
Money Market Fund | | | 234,530 | | | | — | | | | — | | | | 234,530 | |
Total Assets | | $ | 51,956,098 | | | $ | — | | | $ | — | | | $ | 51,956,098 | |
68 | THE GUGGENHEIM FUNDS ANNUAL REPORT | SEE NOTES TO FINANCIAL STATEMENTS. |
STATEMENT OF ASSETS AND LIABILITIES |
September 30, 2024 |
Assets: |
Investments, at value (cost $43,724,150) | | $ | 51,956,098 | |
Foreign currency, at value (cost $9,424) | | | 9,438 | |
Cash | | | 2,608 | |
Prepaid expenses | | | 32,560 | |
Receivables: |
Foreign tax reclaims | | | 83,698 | |
Dividends | | | 68,882 | |
Investment Adviser | | | 1,615 | |
Interest | | | 992 | |
Fund shares sold | | | 347 | |
Securities sold | | | 17 | |
Total assets | | | 52,156,255 | |
| | | | | |
Liabilities: |
Payable for: |
Fund shares redeemed | | | 51,737 | |
Professional fees | | | 38,757 | |
Distribution and service fees | | | 10,694 | |
Transfer agent/maintenance fees | | | 7,450 | |
Distributions to shareholders | | | 4,671 | |
Fund accounting/administration fees | | | 4,560 | |
Trustees’ fees* | | | 186 | |
Due to Investment Adviser | | | 134 | |
Miscellaneous | | | 12,797 | |
Total liabilities | | | 130,986 | |
Net assets | | $ | 52,025,269 | |
| | | | | |
Net assets consist of: |
Paid in capital | | $ | 41,498,950 | |
Total distributable earnings (loss) | | | 10,526,319 | |
Net assets | | $ | 52,025,269 | |
Class A: |
Net assets | | $ | 45,968,922 | |
Capital shares outstanding | | | 2,616,097 | |
Net asset value per share | | $ | 17.57 | |
Maximum offering price per share (Net asset value divided by 95.25%) | | $ | 18.45 | |
Class C: |
Net assets | | $ | 2,599,880 | |
Capital shares outstanding | | | 181,328 | |
Net asset value per share | | $ | 14.34 | |
Class P: |
Net assets | | $ | 98,988 | |
Capital shares outstanding | | | 5,578 | |
Net asset value per share | | $ | 17.75 | |
| | | | | |
Institutional Class: |
Net assets | | $ | 3,357,479 | |
Capital shares outstanding | | | 192,377 | |
Net asset value per share | | $ | 17.45 | |
STATEMENT OF OPERATIONS |
Year Ended September 30, 2024 |
Investment Income: |
Dividends (net of foreign withholding tax of $114,274) | | $ | 1,413,359 | |
Interest | | | 15,873 | |
Total investment income | | | 1,429,232 | |
| | | | | |
Expenses: |
Management fees | | | 337,179 | |
Distribution and service fees: |
Class A | | | 106,343 | |
Class C | | | 27,791 | |
Class P | | | 239 | |
Transfer agent/maintenance fees: |
Class A | | | 68,890 | |
Class C | | | 3,319 | |
Class P | | | 250 | |
Institutional Class | | | 3,559 | |
Registration fees | | | 72,033 | |
Professional fees | | | 49,172 | |
Fund accounting/administration fees | | | 27,536 | |
Custodian fees | | | 16,814 | |
Trustees’ fees* | | | 13,515 | |
Line of credit fees | | | 1,197 | |
Miscellaneous | | | 39,084 | |
Recoupment of previously waived fees: |
Class A | | | 411 | |
Class C | | | 43 | |
Class P | | | 1 | |
Institutional Class | | | 73 | |
Total expenses | | | 767,449 | |
Less: Expenses reimbursed by Adviser: |
Class A | | | (71,148 | ) |
Class C | | | (3,389 | ) |
Class P | | | (255 | ) |
Institutional Class | | | (3,850 | ) |
Expenses waived by Adviser | | | (99,974 | ) |
Total waived/reimbursed expenses | | | (178,616 | ) |
Net expenses | | | 588,833 | |
Net investment income | | | 840,399 | |
| | | | | |
Net Realized and Unrealized Gain (Loss): |
Net realized gain (loss) on: |
Investments | | | 2,615,973 | |
Futures contracts | | | 99,668 | |
Foreign currency transactions | | | 28,132 | |
Net realized gain | | | 2,743,773 | |
Net change in unrealized appreciation (depreciation) on: |
Investments | | | 7,685,717 | |
Futures contracts | | | (183,425 | ) |
Foreign currency translations | | | 6,138 | |
Net change in unrealized appreciation (depreciation) | | | 7,508,430 | |
Net realized and unrealized gain | | | 10,252,203 | |
Net increase in net assets resulting from operations | | $ | 11,092,602 | |
* | Relates to Trustees not deemed “interested persons” within the meaning of Section 2(a)(19) of the 1940 Act. |
SEE NOTES TO FINANCIAL STATEMENTS. | THE GUGGENHEIM FUNDS ANNUAL REPORT | 69 |
STATEMENTS OF CHANGES IN NET ASSETS |
| | Year Ended
September 30,
2024 | | | Year Ended
September 30,
2023 | |
Increase (Decrease) in Net Assets from Operations: | | | | | | | | |
Net investment income | | $ | 840,399 | | | $ | 827,459 | |
Net realized gain on investments | | | 2,743,773 | | | | 196,753 | |
Net change in unrealized appreciation (depreciation) on investments | | | 7,508,430 | | | | 5,558,023 | |
Net increase in net assets resulting from operations | | | 11,092,602 | | | | 6,582,235 | |
| | | | | | | | | |
Distributions to shareholders: | | | | | | | | |
Class A | | | (768,591 | ) | | | (722,703 | ) |
Class C | | | (29,760 | ) | | | (29,606 | ) |
Class P | | | (1,703 | ) | | | (1,387 | ) |
Institutional Class | | | (54,773 | ) | | | (62,449 | ) |
Total distributions to shareholders | | | (854,827 | ) | | | (816,145 | ) |
| | | | | | | | | |
Capital share transactions: | | | | | | | | |
Proceeds from sale of shares | | | | | | | | |
Class A | | | 1,607,596 | | | | 1,839,546 | |
Class C | | | 203,517 | | | | 303,253 | |
Class P | | | 1,064 | | | | 23,194 | |
Institutional Class | | | 1,388,085 | | | | 359,897 | |
Distributions reinvested | | | | | | | | |
Class A | | | 739,598 | | | | 695,071 | |
Class C | | | 29,760 | | | | 29,606 | |
Class P | | | 1,299 | | | | 1,233 | |
Institutional Class | | | 54,443 | | | | 62,113 | |
Cost of shares redeemed | | | | | | | | |
Class A | | | (4,592,926 | ) | | | (4,132,861 | ) |
Class C | | | (875,233 | ) | | | (536,800 | ) |
Class P | | | (18,515 | ) | | | (275 | ) |
Institutional Class | | | (1,475,557 | ) | | | (3,906,719 | ) |
Net decrease from capital share transactions | | | (2,936,869 | ) | | | (5,262,742 | ) |
Net increase in net assets | | | 7,300,906 | | | | 503,348 | |
| | | | | | | | | |
Net assets: | | | | | | | | |
Beginning of year | | | 44,724,363 | | | | 44,221,015 | |
End of year | | $ | 52,025,269 | | | $ | 44,724,363 | |
| | | | | | | | | |
Capital share activity: | | | | | | | | |
Shares sold | | | | | | | | |
Class A | | | 101,178 | | | | 130,111 | |
Class C | | | 17,189 | | | | 26,132 | |
Class P | | | 67 | | | | 1,612 | |
Institutional Class | | | 85,631 | | | | 25,667 | |
Shares issued from reinvestment of distributions | | | | | | | | |
Class A | | | 45,106 | | | | 48,930 | |
Class C | | | 2,243 | | | | 2,549 | |
Class P | | | 78 | | | | 86 | |
Institutional Class | | | 3,346 | | | | 4,415 | |
Shares redeemed | | | | | | | | |
Class A | | | (291,196 | ) | | | (292,035 | ) |
Class C | | | (66,359 | ) | | | (47,251 | ) |
Class P | | | (1,157 | ) | | | (18 | ) |
Institutional Class | | | (95,637 | ) | | | (293,795 | ) |
Net decrease in shares | | | (199,511 | ) | | | (393,597 | ) |
70 | THE GUGGENHEIM FUNDS ANNUAL REPORT | SEE NOTES TO FINANCIAL STATEMENTS. |
This table is presented to show selected data for a share outstanding throughout each period and to assist shareholders in evaluating a Fund’s performance for the periods presented.
Class A | | Year Ended
September 30,
2024 | | | Year Ended
September 30,
2023 | | | Year Ended
September 30,
2022 | | | Year Ended
September 30,
2021 | | | Year Ended
September 30,
2020 | |
Per Share Data |
Net asset value, beginning of period | | $ | 14.19 | | | $ | 12.49 | | | $ | 18.73 | | | $ | 15.03 | | | $ | 15.26 | |
Income (loss) from investment operations: |
Net investment income (loss)a | | | .28 | | | | .26 | | | | .29 | | | | .28 | | | | .20 | |
Net gain (loss) on investments (realized and unrealized) | | | 3.39 | | | | 1.70 | | | | (1.97 | ) | | | 3.79 | | | | (.12 | )g |
Total from investment operations | | | 3.67 | | | | 1.96 | | | | (1.68 | ) | | | 4.07 | | | | .08 | |
Less distributions from: |
Net investment income | | | (.29 | ) | | | (.25 | ) | | | (.34 | ) | | | (.34 | ) | | | (.27 | ) |
Net realized gains | | | — | | | | (.01 | ) | | | (4.22 | ) | | | (.03 | ) | | | (.04 | ) |
Total distributions | | | (.29 | ) | | | (.26 | ) | | | (4.56 | ) | | | (.37 | ) | | | (.31 | ) |
Net asset value, end of period | | $ | 17.57 | | | $ | 14.19 | | | $ | 12.49 | | | $ | 18.73 | | | $ | 15.03 | |
|
Total Returnb | | | 26.03 | % | | | 15.69 | % | | | (13.44 | %) | | | 27.13 | % | | | 0.60 | % |
Ratios/Supplemental Data |
Net assets, end of period (in thousands) | | $ | 45,969 | | | $ | 39,183 | | | $ | 35,905 | | | $ | 44,337 | | | $ | 37,911 | |
Ratios to average net assets: |
Net investment income (loss) | | | 1.78 | % | | | 1.84 | % | | | 1.87 | % | | | 1.55 | % | | | 1.36 | % |
Total expensesc | | | 1.57 | % | | | 1.50 | % | | | 1.39 | % | | | 1.45 | % | | | 1.48 | % |
Net expensesd,e,f | | | 1.19 | % | | | 1.19 | % | | | 1.20 | % | | | 1.21 | % | | | 1.22 | % |
Portfolio turnover rate | | | 122 | % | | | 156 | % | | | 162 | % | | | 191 | % | | | 192 | % |
Class C | | Year Ended
September 30,
2024 | | | Year Ended
September 30,
2023 | | | Year Ended
September 30,
2022 | | | Year Ended
September 30,
2021 | | | Year Ended
September 30,
2020 | |
Per Share Data |
Net asset value, beginning of period | | $ | 11.59 | | | $ | 10.20 | | | $ | 16.03 | | | $ | 12.87 | | | $ | 13.06 | |
Income (loss) from investment operations: |
Net investment income (loss)a | | | .13 | | | | .13 | | | | .14 | | | | .13 | | | | .08 | |
Net gain (loss) on investments (realized and unrealized) | | | 2.76 | | | | 1.39 | | | | (1.56 | ) | | | 3.24 | | | | (.10 | )g |
Total from investment operations | | | 2.89 | | | | 1.52 | | | | (1.42 | ) | | | 3.37 | | | | (.02 | ) |
Less distributions from: |
Net investment income | | | (.14 | ) | | | (.12 | ) | | | (.19 | ) | | | (.18 | ) | | | (.13 | ) |
Net realized gains | | | — | | | | (.01 | ) | | | (4.22 | ) | | | (.03 | ) | | | (.04 | ) |
Total distributions | | | (.14 | ) | | | (.13 | ) | | | (4.41 | ) | | | (.21 | ) | | | (.17 | ) |
Net asset value, end of period | | $ | 14.34 | | | $ | 11.59 | | | $ | 10.20 | | | $ | 16.03 | | | $ | 12.87 | |
|
Total Returnb | | | 25.05 | % | | | 14.87 | % | | | (14.11 | %) | | | 26.22 | % | | | (0.13 | %) |
Ratios/Supplemental Data |
Net assets, end of period (in thousands) | | $ | 2,600 | | | $ | 2,645 | | | $ | 2,518 | | | $ | 3,230 | | | $ | 2,893 | |
Ratios to average net assets: |
Net investment income (loss) | | | 1.03 | % | | | 1.10 | % | | | 1.12 | % | | | 0.81 | % | | | 0.67 | % |
Total expensesc | | | 2.28 | % | | | 2.25 | % | | | 2.20 | % | | | 2.28 | % | | | 2.40 | % |
Net expensesd,e,f | | | 1.94 | % | | | 1.94 | % | | | 1.95 | % | | | 1.96 | % | | | 1.97 | % |
Portfolio turnover rate | | | 122 | % | | | 156 | % | | | 162 | % | | | 191 | % | | | 192 | % |
SEE NOTES TO FINANCIAL STATEMENTS. | THE GUGGENHEIM FUNDS ANNUAL REPORT | 71 |
FINANCIAL HIGHLIGHTS (continued) |
This table is presented to show selected data for a share outstanding throughout each period and to assist shareholders in evaluating a Fund’s performance for the periods presented.
Class P | | Year Ended
September 30,
2024 | | | Year Ended
September 30,
2023 | | | Year Ended
September 30,
2022 | | | Year Ended
September 30,
2021 | | | Year Ended
September 30,
2020 | |
Per Share Data |
Net asset value, beginning of period | | $ | 14.33 | | | $ | 12.60 | | | $ | 18.91 | | | $ | 15.17 | | | $ | 15.38 | |
Income (loss) from investment operations: |
Net investment income (loss)a | | | .28 | | | | .26 | | | | .29 | | | | .30 | | | | .20 | |
Net gain (loss) on investments (realized and unrealized) | | | 3.43 | | | | 1.71 | | | | (1.99 | ) | | | 3.80 | | | | (.11 | )g |
Total from investment operations | | | 3.71 | | | | 1.97 | | | | (1.70 | ) | | | 4.10 | | | | .09 | |
Less distributions from: |
Net investment income | | | (.29 | ) | | | (.23 | ) | | | (.39 | ) | | | (.33 | ) | | | (.26 | ) |
Net realized gains | | | — | | | | (.01 | ) | | | (4.22 | ) | | | (.03 | ) | | | (.04 | ) |
Total distributions | | | (.29 | ) | | | (.24 | ) | | | (4.61 | ) | | | (.36 | ) | | | (.30 | ) |
Net asset value, end of period | | $ | 17.75 | | | $ | 14.33 | | | $ | 12.60 | | | $ | 18.91 | | | $ | 15.17 | |
|
Total Return | | | 26.06 | % | | | 15.65 | % | | | (13.44 | %) | | | 27.10 | % | | | 0.66 | % |
Ratios/Supplemental Data |
Net assets, end of period (in thousands) | | $ | 99 | | | $ | 94 | | | $ | 62 | | | $ | 118 | | | $ | 94 | |
Ratios to average net assets: |
Net investment income (loss) | | | 1.75 | % | | | 1.80 | % | | | 1.82 | % | | | 1.61 | % | | | 1.36 | % |
Total expensesc | | | 1.67 | % | | | 1.74 | % | | | 1.62 | % | | | 1.53 | % | | | 1.56 | % |
Net expensesd,e,f | | | 1.19 | % | | | 1.19 | % | | | 1.20 | % | | | 1.21 | % | | | 1.22 | % |
Portfolio turnover rate | | | 122 | % | | | 156 | % | | | 162 | % | | | 191 | % | | | 192 | % |
72 | THE GUGGENHEIM FUNDS ANNUAL REPORT | SEE NOTES TO FINANCIAL STATEMENTS. |
FINANCIAL HIGHLIGHTS (concluded) |
This table is presented to show selected data for a share outstanding throughout each period and to assist shareholders in evaluating a Fund’s performance for the periods presented.
Institutional Class | | Year Ended
September 30,
2024 | | | Year Ended
September 30,
2023 | | | Year Ended
September 30,
2022 | | | Year Ended
September 30,
2021 | | | Year Ended
September 30,
2020 | |
Per Share Data |
Net asset value, beginning of period | | $ | 14.08 | | | $ | 12.40 | | | $ | 18.61 | | | $ | 14.94 | | | $ | 15.16 | |
Income (loss) from investment operations: |
Net investment income (loss)a | | | .31 | | | | .28 | | | | .36 | | | | .33 | | | | .25 | |
Net gain (loss) on investments (realized and unrealized) | | | 3.37 | | | | 1.70 | | | | (1.98 | ) | | | 3.75 | | | | (.13 | )g |
Total from investment operations | | | 3.68 | | | | 1.98 | | | | (1.62 | ) | | | 4.08 | | | | .12 | |
Less distributions from: |
Net investment income | | | (.31 | ) | | | (.29 | ) | | | (.37 | ) | | | (.38 | ) | | | (.30 | ) |
Net realized gains | | | — | | | | (.01 | ) | | | (4.22 | ) | | | (.03 | ) | | | (.04 | ) |
Total distributions | | | (.31 | ) | | | (.30 | ) | | | (4.59 | ) | | | (.41 | ) | | | (.34 | ) |
Net asset value, end of period | | $ | 17.45 | | | $ | 14.08 | | | $ | 12.40 | | | $ | 18.61 | | | $ | 14.94 | |
|
Total Return | | | 26.28 | % | | | 15.97 | % | | | (13.18 | %) | | | 27.38 | % | | | 0.92 | % |
Ratios/Supplemental Data |
Net assets, end of period (in thousands) | | $ | 3,357 | | | $ | 2,802 | | | $ | 5,736 | | | $ | 2,985 | | | $ | 2,513 | |
Ratios to average net assets: |
Net investment income (loss) | | | 1.95 | % | | | 1.99 | % | | | 2.36 | % | | | 1.82 | % | | | 1.66 | % |
Total expensesc | | | 1.30 | % | | | 1.24 | % | | | 1.13 | % | | | 1.21 | % | | | 1.50 | % |
Net expensesd,e,f | | | 0.94 | % | | | 0.94 | % | | | 0.95 | % | | | 0.96 | % | | | 0.97 | % |
Portfolio turnover rate | | | 122 | % | | | 156 | % | | | 162 | % | | | 191 | % | | | 192 | % |
a | Net investment income (loss) per share was computed using average shares outstanding throughout the period. |
b | Total return does not reflect the impact of any applicable sales charges. |
c | Does not include expenses of the underlying funds in which the Fund invests. |
d | Net expense information reflects the expense ratios after expense waivers and reimbursements, as applicable. |
e | The portion of the ratios of net expenses to average net assets attributable to recoupments of prior fee reductions or expense reimbursements for the years presented was as follows: |
| | | 09/30/24 | 09/30/23 | 09/30/22 | 09/30/21 | 09/30/20 |
| | Class A | 0.00%* | — | 0.01% | — | — |
| | Class C | 0.00%* | — | 0.00%* | — | — |
| | Class P | 0.00%* | — | 0.00%* | — | — |
| | Institutional Class | 0.00%* | 0.00% | 0.01% | 0.02% | — |
f | Net expenses may include expenses that are excluded from the expense limitation agreement. Excluding these expenses, the net expense ratios for the years presented would be: |
| | | 09/30/24 | 09/30/23 | 09/30/22 | 09/30/21 | 09/30/20 |
| | Class A | 1.19% | 1.18% | 1.20% | 1.21% | 1.22% |
| | Class C | 1.94% | 1.93% | 1.95% | 1.96% | 1.97% |
| | Class P | 1.19% | 1.18% | 1.20% | 1.21% | 1.22% |
| | Institutional Class | 0.94% | 0.93% | 0.95% | 0.96% | 0.97% |
g | The amount shown for a share outstanding throughout the year does not agree with the aggregate net gain on investments for the year because of the sales and repurchases of fund shares in relation to the fluctuating market value of the investments of the Fund. |
SEE NOTES TO FINANCIAL STATEMENTS. | THE GUGGENHEIM FUNDS ANNUAL REPORT | 73 |
SCHEDULE OF INVESTMENTS | September 30, 2024 |
ACTIVE INVESTMENT SERIES (GAINS) – CORE PLUS FUND | |
| | Shares | | | Value | |
PREFERRED STOCKS†† - 0.8% |
| | | | | | | | | |
Energy - 0.8% |
Venture Global LNG, Inc. |
9.00%1 | | | 70,000 | | | $ | 70,954 | |
Total Preferred Stocks | | | | |
(Cost $70,000) | | | | | | | 70,954 | |
| | | | | | | | | |
MONEY MARKET FUNDS***,† - 58.8% |
Dreyfus Treasury Securities Cash Management Fund — Institutional Shares, 4.88%2 | | | 5,012,263 | | | | 5,012,263 | |
Dreyfus Treasury Obligations Cash Management Fund — Institutional Shares, 4.81%2 | | | 51 | | | | 51 | |
Total Money Market Funds | | | | |
(Cost $5,012,314) | | | | | | | 5,012,314 | |
| | | | | | | | | |
| | | Face
Amount | | | | | |
ASSET-BACKED SECURITIES†† - 29.5% |
Collateralized Loan Obligations - 13.5% | | | | | | | | |
Cerberus Loan Funding XLVIII LLC | | | | | | | | |
2024-4A AN, due 10/15/36◊,1 | | | 200,000 | | | | 200,327 | |
Golub Capital Partners CLO 36M Ltd. | | | | | | | | |
2018-36A A, 6.80% (3 Month Term SOFR + 1.56%, Rate Floor: 0.00%) due 02/05/31◊,1 | | | 116,984 | | | | 116,963 | |
ABPCI Direct Lending Fund CLO V Ltd. | | | | | | | | |
2024-5A A1RR, 7.48% (3 Month Term SOFR + 2.20%, Rate Floor: 2.20%) due 01/20/36◊,1 | | | 100,000 | | | | 101,152 | |
Owl Rock CLO XIII LLC | | | | | | | | |
2023-13A A, 7.36% (3 Month Term SOFR + 2.55%, Rate Floor: 2.55%) due 09/20/35◊,1 | | | 100,000 | | | | 100,593 | |
Owl Rock CLO X LLC | | | | | | | | |
2023-10A A, 7.73% (3 Month Term SOFR + 2.45%, Rate Floor: 2.45%) due 04/20/35◊,1 | | | 100,000 | | | | 100,489 | |
BCRED MML CLO 2022-1 LLC | | | | | | | | |
2022-1A A1, 6.93% (3 Month Term SOFR + 1.65%, Rate Floor: 1.65%) due 04/20/35◊,1 | | | 100,000 | | | | 100,100 | |
Barings CLO Limited 2022-III | | | | | | | | |
2024-3A BR, due 10/20/37◊,1 | | | 100,000 | | | | 100,000 | |
Ares Direct Lending CLO 2 LLC | | | | | | | | |
2024-2A B, due 10/20/36◊,1 | | | 100,000 | | | | 100,000 | |
BSPRT Issuer LLC | | | | | | | | |
2024-FL11 B, 7.46% (1 Month Term SOFR + 2.29%, Rate Floor: 2.29%) due 07/15/39◊,1 | | | 100,000 | | | | 99,813 | |
BDS LLC | | | | | | | | |
2024-FL13 AS, 7.19% (1 Month Term SOFR + 1.99%, Rate Floor: 1.99%) due 09/19/39◊,1 | | | 100,000 | | | | 99,748 | |
Fortress Credit Opportunities XI CLO Ltd. | | | | | | | | |
2018-11A A1T, 6.86% (3 Month Term SOFR + 1.56%, Rate Floor: 0.00%) due 04/15/31◊,1 | | | 36,156 | | | | 36,163 | |
Total Collateralized Loan Obligations | | | | | | | 1,155,348 | |
| | | | | | | | | |
Whole Business - 5.2% | | | | | | | | |
Five Guys Holdings, Inc. | | | | | | | | |
2023-1A, 7.55% due 01/26/541 | | | 100,000 | | | | 105,709 | |
SERVPRO Master Issuer LLC | | | | | | | | |
2024-1A, 6.17% due 01/25/541 | | | 99,500 | | | | 102,273 | |
Applebee’s Funding LLC / IHOP Funding LLC | | | | | | | | |
2019-1A, 4.72% due 06/05/491 | | | 99,000 | | | | 97,379 | |
Arbys Funding LLC | | | | | | | | |
2020-1A, 3.24% due 07/30/501 | | | 96,000 | | | | 91,655 | |
Subway Funding LLC | | | | | | | | |
2024-3A, 5.91% due 07/30/541 | | | 50,000 | | | | 50,039 | |
Total Whole Business | | | | | | | 447,055 | |
| | | | | | | | | |
Transport-Aircraft - 4.1% | | | | | | | | |
Navigator Aviation Ltd. | | | | | | | | |
2024-1, 5.40% due 08/15/491 | | | 250,000 | | | | 249,644 | |
Slam Ltd. | | | | | | | | |
2024-1A, 5.34% due 09/15/491 | | | 100,000 | | | | 99,731 | |
Total Transport-Aircraft | | | | | | | 349,375 | |
| | | | | | | | | |
Infrastructure - 1.8% | | | | | | | | |
Vantage Data Centers Issuer LLC | | | | | | | | |
2024-1A, due 09/15/541,5 | | | 100,000 | | | | 100,000 | |
SBA Tower Trust | | | | | | | | |
4.83% due 10/15/291 | | | 50,000 | | | | 49,710 | |
Total Infrastructure | | | | | | | 149,710 | |
| | | | | | | | | |
Financial - 1.5% | | | | | | | | |
ST Group Food Industries Holdings Ltd. | | | | | | | | |
due 11/10/255 | | | 75,000 | | | | 75,000 | |
due 11/10/255 | | | 50,000 | | | | 50,000 | |
Total Financial | | | | | | | 125,000 | |
| | | | | | | | | |
Unsecured Consumer Loans - 1.2% | | | | | | | | |
Foundation Finance Trust | | | | | | | | |
2024-2A, 4.93% due 03/15/501 | | | 100,000 | | | | 100,179 | |
| | | | | | | | | |
Net Lease - 1.1% | | | | | | | | |
Capital Automotive REIT | | | | | | | | |
2024-3A, due 10/15/541,5 | | | 100,000 | | | | 96,516 | |
| | | | | | | | | |
Single Family Residence - 1.1% | | | | | | | | |
Invitation Homes Trust | | | | | | | | |
2024-SFR1, 4.00% due 09/17/411 | | | 100,000 | | | | 95,590 | |
Total Asset-Backed Securities | | | | |
(Cost $2,517,485) | | | 2,518,773 | |
74 | THE GUGGENHEIM FUNDS ANNUAL REPORT | SEE NOTES TO FINANCIAL STATEMENTS. |
SCHEDULE OF INVESTMENTS (continued) | September 30, 2024 |
ACTIVE INVESTMENT SERIES (GAINS) – CORE PLUS FUND | |
| | Face
Amount | | | Value | |
COLLATERALIZED MORTGAGE OBLIGATIONS†† - 14.0% |
Residential Mortgage-Backed Securities - 13.1% | | | | | | | | |
OBX Trust | | | | | | | | |
2024-NQM13, 5.37% due 06/25/641,3 | | | 99,466 | | | $ | 99,786 | |
2024-NQM12, 5.83% due 07/25/641,3 | | | 98,611 | | | | 99,237 | |
PRPM LLC | | | | | | | | |
2024-5, due 09/25/291,3,5 | | | 150,000 | | | | 150,039 | |
Mill City Mortgage Loan Trust | | | | | | | | |
2021-NMR1, 2.50% (WAC) due 11/25/60◊,1 | | | 120,000 | | | | 101,227 | |
FIGRE Trust | | | | | | | | |
2024-HE4, 5.06% (WAC) due 09/25/54◊,1 | | | 100,000 | | | | 100,405 | |
BRAVO | | | | | | | | |
2024-NQM6, 5.66% due 08/01/641,3 | | | 99,863 | | | | 100,395 | |
New Residential Mortgage Loan Trust | | | | | | | | |
2024-NQM2, 5.42% due 09/25/641 | | | 100,000 | | | | 99,915 | |
ATLX Trust | | | | | | | | |
2024-RPL1, 3.85% due 04/25/641,3 | | | 99,458 | | | | 96,369 | |
BRAVO Residential Funding Trust | | | | | | | | |
2022-R1, 3.13% due 01/29/701,3 | | | 93,241 | | | | 92,537 | |
Mill City Securities Ltd. | | | | | | | | |
2024-RS1, 3.00% due 11/01/691,3 | | | 100,000 | | | | 92,322 | |
Towd Point Mortgage Trust | | | | | | | | |
2023-CES2, 7.29% (WAC) due 10/25/63◊,1 | | | 82,395 | | | | 84,377 | |
Total Residential Mortgage-Backed Securities | | | | | | | 1,116,609 | |
| | | | | | | | | |
Military Housing - 0.6% | | | | | | | | |
Freddie Mac Military Housing Bonds Resecuritization Trust Certificates | | | | | | | | |
2015-R1, 0.70% (WAC) due 10/25/52◊,1,4 | | | 917,092 | | | | 54,608 | |
| | | | | | | | | |
Commercial Mortgage-Backed Securities - 0.3% | | | | | | | | |
BXHPP Trust | | | | | | | | |
2021-FILM, 6.31% (1 Month Term SOFR + 1.21%, Rate Floor: 1.10%) due 08/15/36◊,1 | | | 25,000 | | | | 23,451 | |
Total Collateralized Mortgage Obligations | | | | |
(Cost $1,192,351) | | | 1,194,668 | |
| | | | | |
CORPORATE BONDS†† - 5.7% |
Consumer, Non-cyclical - 2.1% | | | | | | | | |
Health Care Service Corporation A Mutual Legal Reserve Co. | | | | | | | | |
5.88% due 06/15/541 | | | 50,000 | | | | 52,850 | |
Performance Food Group, Inc. | | | | | | | | |
6.13% due 09/15/321 | | | 25,000 | | | | 25,546 | |
Prime Security Services Borrower LLC / Prime Finance, Inc. | | | | | | | | |
5.75% due 04/15/261 | | | 25,000 | | | | 25,114 | |
Graham Holdings Co. | | | | | | | | |
5.75% due 06/01/261 | | | 25,000 | | | | 24,989 | |
Williams Scotsman, Inc. | | | | | | | | |
6.13% due 06/15/251 | | | 25,000 | | | | 24,975 | |
AMN Healthcare, Inc. | | | | | | | | |
4.63% due 10/01/271 | | | 25,000 | | | | 24,437 | |
Total Consumer, Non-cyclical | | | | | | | 177,911 | |
| | | | | | | | | |
Financial - 1.3% | | | | | | | | |
American National Group, Inc. | | | | | | | | |
5.75% due 10/01/29 | | | 60,000 | | | | 60,347 | |
Ryan Specialty LLC | | | | | | | | |
5.88% due 08/01/321 | | | 25,000 | | | | 25,416 | |
Focus Financial Partners LLC | | | | | | | | |
6.75% due 09/15/311 | | | 25,000 | | | | 25,239 | |
Total Financial | | | | | | | 111,002 | |
| | | | | | | | | |
Consumer, Cyclical - 1.2% | | | | | | | | |
Six Flags Entertainment Corporation / Six Flags Theme Parks, Inc. | | | | | | | | |
6.63% due 05/01/321 | | | 25,000 | | | | 25,890 | |
Hilton Domestic Operating Company, Inc. | | | | | | | | |
5.88% due 03/15/331 | | | 25,000 | | | | 25,474 | |
1011778 BC ULC / New Red Finance, Inc. | | | | | | | | |
5.63% due 09/15/291 | | | 25,000 | | | | 25,361 | |
Wynn Resorts Finance LLC / Wynn Resorts Capital Corp. | | | | | | | | |
6.25% due 03/15/331 | | | 25,000 | | | | 25,326 | |
Total Consumer, Cyclical | | | | | | | 102,051 | |
| | | | | | | | | |
Energy - 0.6% | | | | | | | | |
Viper Energy, Inc. | | | | | | | | |
5.38% due 11/01/271 | | | 25,000 | | | | 24,898 | |
Buckeye Partners, LP | | | | | | | | |
4.13% due 03/01/251 | | | 25,000 | | | | 24,792 | |
Total Energy | | | | | | | 49,690 | |
| | | | | | | | | |
Technology - 0.3% | | | | | | | | |
ACI Worldwide, Inc. | | | | | | | | |
5.75% due 08/15/261 | | | 25,000 | | | | 24,993 | |
| | | | | | | | | |
Industrial - 0.2% | | | | | | | | |
Atkore, Inc. | | | | | | | | |
4.25% due 06/01/311 | | | 25,000 | | | | 22,855 | |
Total Corporate Bonds | | | | |
(Cost $483,842) | | | 488,502 | |
| | | | | |
SENIOR FLOATING RATE INTERESTS††,◊ - 3.4% |
Industrial - 1.3% | | | | | | | | |
Artera Services LLC | | | | | | | | |
due 02/15/31 | | | 30,000 | | | | 29,170 | |
StandardAero | | | | | | | | |
due 08/24/28 | | | 25,000 | | | | 25,005 | |
Service Logic Acquisition, Inc. | | | | | | | | |
8.31% (3 Month Term SOFR + 3.50%, Rate Floor: 4.25%) due 10/29/27 | | | 24,938 | | | | 24,984 | |
TransDigm, Inc. | | | | | | | | |
7.32% (3 Month Term SOFR + 2.50%, Rate Floor: 2.50%) due 01/09/32 | | | 25,000 | | | | 24,896 | |
Capstone Acquisition Holdings, Inc. | | | | | | | | |
9.45% (1 Month Term SOFR + 4.50%, Rate Floor: 5.50%) due 11/12/29††† | | | 9,195 | | | | 9,143 | |
Total Industrial | | | | | | | 113,198 | |
| | | | | | | | | |
SEE NOTES TO FINANCIAL STATEMENTS. | THE GUGGENHEIM FUNDS ANNUAL REPORT | 75 |
SCHEDULE OF INVESTMENTS (continued) | September 30, 2024 |
ACTIVE INVESTMENT SERIES (GAINS) – CORE PLUS FUND | |
| | Face
Amount | | | Value | |
Financial - 0.7% | | | | | | | | |
Alliant Holdings Intermediate LLC | | | | | | | | |
due 09/19/31 | | | 25,000 | | | $ | 24,851 | |
Duff & Phelps | | | | | | | | |
8.35% (3 Month Term SOFR + 3.75%, Rate Floor: 4.75%) due 04/09/27 | | | 24,935 | | | | 24,400 | |
Asurion LLC | | | | | | | | |
9.10% (1 Month Term SOFR + 4.25%, Rate Floor: 4.25%) due 09/19/30 | | | 10,000 | | | | 9,813 | |
Total Financial | | | | | | | 59,064 | |
| | | | | | | | | |
Consumer, Cyclical - 0.6% | | | | | | | | |
PCI Gaming Authority, Inc. | | | | | | | | |
due 07/18/31 | | | 30,000 | | | | 29,802 | |
Truck Hero, Inc. | | | | | | | | |
due 01/31/28 | | | 10,000 | | | | 9,822 | |
Crash Champions Inc. | | | | | | | | |
9.85% (3 Month Term SOFR + 4.75%, Rate Floor: 4.75%) due 02/23/29 | | | 10,000 | | | | 9,600 | |
Total Consumer, Cyclical | | | | | | | 49,224 | |
| | | | | | | | | |
Consumer, Non-cyclical - 0.4% | | | | | | | | |
Froneri US, Inc. | | | | | | | | |
due 09/16/31 | | | 25,000 | | | | 24,892 | |
HAH Group Holding Co. LLC | | | | | | | | |
due 09/17/31 | | | 10,000 | | | | 9,857 | |
Total Consumer, Non-cyclical | | | | | | | 34,749 | |
| | | | | | | | | |
Utilities — 0.3% | | | | | | | | |
Calpine Construction Finance Company, LP | | | | | | | | |
6.85% (1 Month Term SOFR + 2.00%, Rate Floor: 2.00%) due 07/31/30 | | | 25,000 | | | | 24,827 | |
| | | | | | | | | |
Technology - 0.1% | | | | | | | | |
DS Admiral Bidco LLC | | | | | | | | |
due 06/26/31 | | | 10,000 | | | | 9,600 | |
Total Senior Floating Rate Interests | | | | |
(Cost $292,273) | | | 290,662 | |
| | | | | | | | | |
Total Investments - 112.2% | | | | |
(Cost $9,568,265) | | $ | 9,575,873 | |
Other Assets & Liabilities, net - (12.2)% | | | (1,044,979 | ) |
Total Net Assets - 100.0% | | $ | 8,530,894 | |
*** | A copy of each underlying unaffiliated fund’s financial statements is available at the SEC’s website at www.sec.gov. |
† | Value determined based on Level 1 inputs — See Note 4. |
†† | Value determined based on Level 2 inputs, unless otherwise noted — See Note 4. |
††† | Value determined based on Level 3 inputs — See Note 4. |
◊ | Variable rate security. Rate indicated is the rate effective at September 30, 2024. In some instances, the effective rate is limited by a minimum rate floor or a maximum rate cap established by the issuer. The settlement status of a position may also impact the effective rate indicated. In some cases, a position may be unsettled at period end and may not have a stated effective rate. In instances where multiple underlying reference rates and spread amounts are shown, the effective rate is based on a weighted average. |
1 | Security is a 144A or Section 4(a)(2) security. These securities have been determined to be liquid under guidelines established by the Board of Trustees. The total market value of 144A or Section 4(a)(2) securities is $4,087,550 (cost $4,078,707), or 47.9% of total net assets. |
2 | Rate indicated is the 7-day yield as of September 30, 2024. |
3 | Security is a step up/down bond. The coupon increases or decreases at regular intervals until the bond reaches full maturity. Rate indicated is the rate at September 30, 2024. See table below for additional step information for each security. |
4 | Security is an interest-only strip. |
5 | Security is unsettled at period end and does not have a stated effective rate. |
| | REIT — Real Estate Investment Trust |
| | SOFR — Secured Overnight Financing Rate |
| | WAC — Weighted Average Coupon |
| | |
| | See Sector Classification in Other Information section. |
76 | THE GUGGENHEIM FUNDS ANNUAL REPORT | SEE NOTES TO FINANCIAL STATEMENTS. |
SCHEDULE OF INVESTMENTS (concluded) | September 30, 2024 |
ACTIVE INVESTMENT SERIES (GAINS) – CORE PLUS FUND | |
The following table summarizes the inputs used to value the Fund’s investments at September 30, 2024 (See Note 4 in the Notes to Financial Statements):
Investments in Securities (Assets) | | Level 1
Quoted
Prices | | | Level 2
Significant
Observable
Inputs | | | Level 3
Significant
Unobservable
Inputs | | | Total | |
Preferred Stocks | | $ | — | | | $ | 70,954 | | | $ | — | | | $ | 70,954 | |
Money Market Funds | | | 5,012,314 | | | | — | | | | — | | | | 5,012,314 | |
Asset-Backed Securities | | | — | | | | 2,518,773 | | | | — | | | | 2,518,773 | |
Collateralized Mortgage Obligations | | | — | | | | 1,194,668 | | | | — | | | | 1,194,668 | |
Corporate Bonds | | | — | | | | 488,502 | | | | — | | | | 488,502 | |
Senior Floating Rate Interests | | | — | | | | 281,519 | | | | 9,143 | | | | 290,662 | |
Total Assets | | $ | 5,012,314 | | | $ | 4,554,416 | | | $ | 9,143 | | | $ | 9,575,873 | |
Investments in Securities (Liabilities) | | Level 1
Quoted
Prices | | | Level 2
Significant
Observable
Inputs | | | Level 3
Significant
Unobservable
Inputs | | | Total | |
Unfunded Loan Commitments (Note 9) | | $ | — | | | $ | — | | | $ | 5 | | | $ | 5 | |
Step Coupon Bonds
The following table discloses additional information related to step coupon bonds held by the Fund. Certain securities are subject to multiple rate changes prior to maturity. For those securities, a range of rates and corresponding dates have been provided. Rates for all step coupon bonds held by the Fund are scheduled to increase, none are scheduled to decrease.
Name | | Coupon Rate at
Next Reset Date | | | Next Rate Reset Date | | | Future Reset Rate(s) | | | Future Reset Date(s) | |
ATLX Trust 2024-RPL1, 3.85% due 04/25/64 | | | 4.85 | % | | | 08/01/28 | | | | — | | | | — | |
BRAVO 2024-NQM6, 5.66% due 08/01/64 | | | 6.66 | % | | | 08/01/28 | | | | — | | | | — | |
BRAVO Residential Funding Trust 2022-R1, 3.13% due 01/29/70 | | | 6.13 | % | | | 01/30/25 | | | | — | | | | — | |
Mill City Securities Ltd. 2024-RS1, 3.00% due 11/01/69 | | | 6.00 | % | | | 10/01/27 | | | | — | | | | — | |
OBX Trust 2024-NQM13, 5.37% due 06/25/64 | | | 6.37 | % | | | 08/01/28 | | | | — | | | | — | |
OBX Trust 2024-NQM12, 5.83% due 07/25/64 | | | 6.83 | % | | | 08/01/28 | | | | — | | | | — | |
PRPM LLC 2024-5, 5.69% due 09/25/29 | | | 8.69 | % | | | 09/25/27 | | | | 9.69 | % | | | 09/25/28 | |
SEE NOTES TO FINANCIAL STATEMENTS. | THE GUGGENHEIM FUNDS ANNUAL REPORT | 77 |
ACTIVE INVESTMENT SERIES (GAINS) – CORE PLUS FUND | |
STATEMENT OF ASSETS AND LIABILITIES |
September 30, 2024 |
Assets: |
Investments, at value (cost $9,568,265) | | $ | 9,575,873 | |
Cash | | | 69,989 | |
Receivables: |
Investment Adviser | | | 29,693 | |
Interest | | | 20,688 | |
Total assets | | | 9,696,243 | |
| | | | | |
Liabilities: |
Unfunded loan commitments, at value (Note 9) (commitment fees received $-) | | | 5 | |
Payable for: |
Securities purchased | | | 1,135,713 | |
Fund accounting/administration fees | | | 3,219 | |
Transfer agent fees | | | 1,545 | |
Trustees’ fees* | | | 564 | |
Miscellaneous | | | 24,303 | |
Total liabilities | | | 1,165,349 | |
Net assets | | $ | 8,530,894 | |
| | | | | |
Net assets consist of: |
Paid in capital | | $ | 8,523,432 | |
Total distributable earnings (loss) | | | 7,462 | |
Net assets | | $ | 8,530,894 | |
Capital shares outstanding | | | 425,621 | |
Net asset value per share | | $ | 20.04 | |
STATEMENT OF OPERATIONS |
Period Ended September 30, 2024** |
Investment Income: |
Interest | | $ | 23,277 | |
Total investment income | | | 23,277 | |
| | | | | |
Expenses: |
Transfer agent fees | | | 1,545 | |
Professional fees | | | 23,070 | |
Fund accounting/administration fees | | | 3,219 | |
Trustees’ fees* | | | 564 | |
Custodian fees | | | 481 | |
Line of credit fees | | | 15 | |
Interest expense | | | 8 | |
Miscellaneous | | | 814 | |
Total expenses | | | 29,716 | |
Less: |
Expenses reimbursed by Adviser | | | (29,693 | ) |
Net expenses | | | 23 | |
Net investment income | | | 23,254 | |
| | | | | |
Net Realized and Unrealized Gain (Loss): |
Net realized gain (loss) on: |
Investments | | | 37 | |
Net realized gain | | | 37 | |
Net change in unrealized appreciation (depreciation) on: |
Investments | | | 7,603 | |
Net change in unrealized appreciation (depreciation) | | | 7,603 | |
Net realized and unrealized gain | | | 7,640 | |
Net increase in net assets resulting from operations | | $ | 30,894 | |
* | Relates to Trustees not deemed “interested persons” within the meaning of Section 2(a)(19) of the 1940 Act. |
** | Since commencement of operations: August 14, 2024. |
78 | THE GUGGENHEIM FUNDS ANNUAL REPORT | SEE NOTES TO FINANCIAL STATEMENTS. |
ACTIVE INVESTMENT SERIES (GAINS) – CORE PLUS FUND | |
STATEMENTS OF CHANGES IN NET ASSETS |
| | Period Ended
September 30,
2024a | |
Increase (Decrease) in Net Assets from Operations: | | | | |
Net investment income | | $ | 23,254 | |
Net realized gain on investments | | | 37 | |
Net change in unrealized appreciation (depreciation) on investments | | | 7,603 | |
Net increase in net assets resulting from operations | | | 30,894 | |
| | | | | |
Distributions to shareholders | | | (23,432 | ) |
| | | | | |
Capital share transactions: | | | | |
Proceeds from sale of shares | | | 8,500,000 | |
Distributions reinvested | | | 23,432 | |
Cost of shares redeemed | | | — | |
Net increase from capital share transactions | | | 8,523,432 | |
Net increase in net assets | | | 8,530,894 | |
| | | | | |
Net assets: | | | | |
Beginning of period | | | — | |
End of period | | $ | 8,530,894 | |
| | | | | |
Capital share activity: | | | | |
Shares sold | | | 424,451 | |
Shares issued from reinvestment of distributions | | | 1,170 | |
Shares redeemed | | | — | |
Net increase in shares | | | 425,621 | |
a | Since commencement of operations: August 14, 2024. |
SEE NOTES TO FINANCIAL STATEMENTS. | THE GUGGENHEIM FUNDS ANNUAL REPORT | 79 |
ACTIVE INVESTMENT SERIES (GAINS) – CORE PLUS FUND | |
This table is presented to show selected data for a share outstanding throughout each period and to assist shareholders in evaluating a Fund’s performance for the period presented.
SMA Class | | Period Ended
September 30,
2024a | |
Per Share Data |
Net asset value, beginning of period | | $ | 20.00 | |
Income (loss) from investment operations: |
Net investment income (loss)b | | | .14 | |
Net gain (loss) on investments (realized and unrealized) | | | .04 | |
Total from investment operations | | | .18 | |
Less distributions from: |
Net investment income | | | (.14 | ) |
Total distributions | | | (.14 | ) |
Net asset value, end of period | | $ | 20.04 | |
|
Total Return | | | 0.92 | % |
Ratios/Supplemental Data |
Net assets, end of period (in thousands) | | $ | 8,531 | |
Ratios to average net assets: |
Net investment income (loss) | | | 0.67 | % |
Total expenses | | | 0.85 | % |
Net expensesc | | | — | d |
Portfolio turnover rate | | | — | e |
a | Since commencement of operations: August 14, 2024. |
b | Net investment income (loss) per share was computed using average shares outstanding throughout the period. |
c | Net expense information reflects the expense ratios after expense waivers and reimbursements, as applicable. |
d | Less than 0.01% |
e | Less than 1.0%. |
80 | THE GUGGENHEIM FUNDS ANNUAL REPORT | SEE NOTES TO FINANCIAL STATEMENTS. |
SCHEDULE OF INVESTMENTS | September 30, 2024 |
ACTIVE INVESTMENT SERIES (GAINS) – LIMITED DURATION FUND | |
| | Shares | | | Value | |
MONEY MARKET FUNDS***,† - 11.4% |
Dreyfus Treasury Securities Cash Management Fund — Institutional Shares, 4.88%1 | | | 400,903 | | | $ | 400,903 | |
Dreyfus Treasury Obligations Cash Management Fund — Institutional Shares, 4.81%1 | | | 50 | | | | 50 | |
Total Money Market Funds | | | | |
(Cost $400,953) | | | | | | | 400,953 | |
| | | | | | | | | |
| | | Face
Amount | | | | | |
ASSET-BACKED SECURITIES†† - 56.4% |
Collateralized Loan Obligations - 26.8% | | | | | | | | |
Fortress Credit Opportunities XI CLO Ltd. | | | | | | | | |
2018-11A A1T, 6.86% (3 Month Term SOFR + 1.56%, Rate Floor: 0.00%) due 04/15/31◊,2 | | $ | 144,625 | | | | 144,653 | |
ABPCI Direct Lending Fund CLO V Ltd. | | | | | | | | |
2024-5A A1RR, 7.48% (3 Month Term SOFR + 2.20%, Rate Floor: 2.20%) due 01/20/36◊,2 | | | 100,000 | | | | 101,152 | |
Owl Rock CLO XIII LLC | | | | | | | | |
2023-13A A, 7.36% (3 Month Term SOFR + 2.55%, Rate Floor: 2.55%) due 09/20/35◊,2 | | | 100,000 | | | | 100,593 | |
Owl Rock CLO X LLC | | | | | | | | |
2023-10A A, 7.73% (3 Month Term SOFR + 2.45%, Rate Floor: 2.45%) due 04/20/35◊,2 | | | 100,000 | | | | 100,489 | |
BCRED MML CLO 2022-1 LLC | | | | | | | | |
2022-1A A1, 6.93% (3 Month Term SOFR + 1.65%, Rate Floor: 1.65%) due 04/20/35◊,2 | | | 100,000 | | | | 100,100 | |
Ares Direct Lending CLO 2 LLC | | | | | | | | |
2024-2A B, due 10/20/36◊,2 | | | 100,000 | | | | 100,000 | |
Barings CLO Limited 2022-III | | | | | | | | |
2024-3A BR, due 10/20/37◊,2 | | | 100,000 | | | | 100,000 | |
BSPRT Issuer LLC | | | | | | | | |
2024-FL11 B, 7.46% (1 Month Term SOFR + 2.29%, Rate Floor: 2.29%) due 07/15/39◊,2 | | | 100,000 | | | | 99,813 | |
BDS LLC | | | | | | | | |
2024-FL13 AS, 7.19% (1 Month Term SOFR + 1.99%, Rate Floor: 1.99%) due 09/19/39◊,2 | | | 100,000 | | | | 99,748 | |
Total Collateralized Loan Obligations | | | | | | | 946,548 | |
| | | | | | | | | |
Whole Business - 12.7% | | | | | | | | |
Five Guys Holdings, Inc. | | | | | | | | |
2023-1A, 7.55% due 01/26/542 | | | 100,000 | | | | 105,709 | |
SERVPRO Master Issuer LLC | | | | | | | | |
2024-1A, 6.17% due 01/25/542 | | | 99,500 | | | | 102,273 | |
Applebee’s Funding LLC / IHOP Funding LLC | | | | | | | | |
2019-1A, 4.72% due 06/05/492 | | | 99,000 | | | | 97,379 | |
Arbys Funding LLC | | | | | | | | |
2020-1A, 3.24% due 07/30/502 | | | 96,000 | | | | 91,655 | |
Subway Funding LLC | | | | | | | | |
2024-3A, 5.25% due 07/30/542 | | | 50,000 | | | | 49,990 | |
Total Whole Business | | | | | | | 447,006 | |
| | | | | | | | | |
Transport-Aircraft - 9.9% | | | | | | | | |
Navigator Aviation Ltd. | | | | | | | | |
2024-1, 5.40% due 08/15/492 | | | 250,000 | | | | 249,644 | |
Slam Ltd. | | | | | | | | |
2024-1A, 5.34% due 09/15/492 | | | 100,000 | | | | 99,731 | |
Total Transport-Aircraft | | | | | | | 349,375 | |
| | | | | | | | | |
Unsecured Consumer Loans - 2.9% | | | | | | | | |
Foundation Finance Trust | | | | | | | | |
2024-2A, 4.93% due 03/15/502 | | | 100,000 | | | | 100,179 | |
| | | | | | | | | |
Single Family Residence - 2.7% | | | | | | | | |
Invitation Homes Trust | | | | | | | | |
2024-SFR1, 4.00% due 09/17/412 | | | 100,000 | | | | 95,590 | |
| | | | | | | | | |
Infrastructure - 1.4% | | | | | | | | |
SBA Tower Trust | | | | | | | | |
4.83% due 10/15/292 | | | 50,000 | | | | 49,710 | |
Total Asset-Backed Securities | | | | |
(Cost $1,987,453) | | | 1,988,408 | |
| | | | | |
COLLATERALIZED MORTGAGE OBLIGATIONS†† - 28.0% |
Residential Mortgage-Backed Securities - 27.4% | | | | | | | | |
OBX Trust | | | | | | | | |
2024-NQM13, 5.37% due 06/25/642,3 | | | 99,466 | | | | 99,786 | |
2024-NQM12, 5.83% due 07/25/643 | | | 98,611 | | | | 99,237 | |
Mill City Mortgage Loan Trust | | | | | | | | |
2021-NMR1, 2.50% (WAC) due 11/25/60◊,2 | | | 120,000 | | | | 101,227 | |
FIGRE Trust | | | | | | | | |
2024-HE4, 5.06% (WAC) due 09/25/54◊,2 | | | 100,000 | | | | 100,405 | |
BRAVO | | | | | | | | |
2024-NQM6, 5.66% due 08/01/642,3 | | | 99,863 | | | | 100,395 | |
New Residential Mortgage Loan Trust | | | | | | | | |
2024-NQM2, 5.42% due 09/25/642 | | | 100,000 | | | | 99,915 | |
ATLX Trust | | | | | | | | |
2024-RPL1, 3.85% due 04/25/642,3 | | | 99,458 | | | | 96,369 | |
BRAVO Residential Funding Trust | | | | | | | | |
2022-R1, 3.13% due 01/29/702,3 | | | 93,241 | | | | 92,537 | |
Mill City Securities Ltd. | | | | | | | | |
2024-RS1, 3.00% due 11/01/692,3 | | | 100,000 | | | | 92,322 | |
Towd Point Mortgage Trust | | | | | | | | |
2023-CES2, 7.29% (WAC) due 10/25/63◊,2 | | | 82,395 | | | | 84,377 | |
Total Residential Mortgage-Backed Securities | | | | | | | 966,570 | |
| | | | | | | | | |
SEE NOTES TO FINANCIAL STATEMENTS. | THE GUGGENHEIM FUNDS ANNUAL REPORT | 81 |
SCHEDULE OF INVESTMENTS (continued) | September 30, 2024 |
ACTIVE INVESTMENT SERIES (GAINS) – LIMITED DURATION FUND | |
| | Face
Amount | | | Value | |
Commercial Mortgage-Backed Securities - 0.6% | | | | | | | | |
BXHPP Trust | | | | | | | | |
2021-FILM, 6.31% (1 Month Term SOFR + 1.21%, Rate Floor: 1.10%) due 08/15/36◊,2 | | | 25,000 | | | $ | 23,451 | |
Total Collateralized Mortgage Obligations | | | | |
(Cost $987,469) | | | 990,021 | |
| |
CORPORATE BONDS†† - 7.5% |
Consumer, Non-cyclical - 2.8% | | | | | | | | |
Prime Security Services Borrower LLC / Prime Finance, Inc. | | | | | | | | |
5.75% due 04/15/262 | | | 25,000 | | | | 25,114 | |
Graham Holdings Co. | | | | | | | | |
5.75% due 06/01/262 | | | 25,000 | | | | 24,989 | |
Williams Scotsman, Inc. | | | | | | | | |
6.13% due 06/15/252 | | | 25,000 | | | | 24,975 | |
AMN Healthcare, Inc. | | | | | | | | |
4.63% due 10/01/272 | | | 25,000 | | | | 24,437 | |
Total Consumer, Non-cyclical | | | | | | | 99,515 | |
| | | | | | | | | |
Consumer, Cyclical - 1.5% | | | | | | | | |
Six Flags Entertainment Corporation / Six Flags Theme Parks, Inc. | | | | | | | | |
6.63% due 05/01/322 | | | 25,000 | | | | 25,890 | |
1011778 BC ULC / New Red Finance, Inc. | | | | | | | | |
5.63% due 09/15/292 | | | 25,000 | | | | 25,361 | |
Total Consumer, Cyclical | | | | | | | 51,251 | |
| | | | | | | | | |
Energy - 1.4% | | | | | | | | |
Viper Energy, Inc. | | | | | | | | |
5.38% due 11/01/272 | | | 25,000 | | | | 24,898 | |
Buckeye Partners, LP | | | | | | | | |
4.13% due 03/01/252 | | | 25,000 | | | | 24,792 | |
Total Energy | | | | | | | 49,690 | |
| | | | | | | | | |
Financial - 1.1% | | | | | | | | |
American National Group, Inc. | | | | | | | | |
5.75% due 10/01/29 | | | 30,000 | | | | 30,173 | |
Focus Financial Partners LLC | | | | | | | | |
6.75% due 09/15/312 | | | 10,000 | | | | 10,096 | |
Total Financial | | | | | | | 40,269 | |
| | | | | | | | | |
Technology - 0.7% | | | | | | | | |
ACI Worldwide, Inc. | | | | | | | | |
5.75% due 08/15/262 | | | 25,000 | | | | 24,993 | |
Total Corporate Bonds | | | | |
(Cost $264,306) | | | 265,718 | |
| |
SENIOR FLOATING RATE INTERESTS††,◊ - 6.6% |
Industrial - 2.4% | | | | | | | | |
StandardAero | | | | | | | | |
due 08/24/28 | | | 25,000 | | | | 25,005 | |
Service Logic Acquisition, Inc. | | | | | | | | |
8.31% (3 Month Term SOFR + 3.50%, Rate Floor: 4.25%) due 10/29/27 | | | 24,938 | | | | 24,984 | |
TransDigm, Inc. | | | | | | | | |
7.32% (3 Month Term SOFR + 2.50%, Rate Floor: 2.50%) due 01/19/32 | | | 25,000 | | | | 24,896 | |
Capstone Acquisition Holdings, Inc. | | | | | | | | |
9.45% (1 Month Term SOFR + 4.50%, Rate Floor: 5.50%) due 11/12/29††† | | | 9,195 | | | | 9,143 | |
Total Industrial | | | | | | | 84,028 | |
| | | | | | | | | |
Financial - 1.4% | | | | | | | | |
Ryan Specialty LLC | | | | | | | | |
7.35% (1 Month Term SOFR + 2.25%, Rate Floor: 3.00%) due 09/15/31 | | | 25,000 | | | | 24,945 | |
Duff & Phelps | | | | | | | | |
8.35% (3 Month Term SOFR + 3.75%, Rate Floor: 4.75%) due 04/09/27 | | | 24,935 | | | | 24,401 | |
Total Financial | | | | | | | 49,346 | |
| | | | | | | | | |
Consumer, Cyclical - 1.1% | | | | | | | | |
PCI Gaming Authority, Inc. | | | | | | | | |
due 07/18/31 | | | 30,000 | | | | 29,802 | |
Truck Hero, Inc. | | | | | | | | |
due 01/31/28 | | | 10,000 | | | | 9,822 | |
Total Consumer, Cyclical | | | | | | | 39,624 | |
| | | | | | | | | |
Consumer, Non-cyclical - 1.0% | | | | | | | | |
Froneri US, Inc. | | | | | | | | |
due 09/16/31 | | | 25,000 | | | | 24,892 | |
HAH Group Holding Co. LLC | | | | | | | | |
due 09/17/31 | | | 10,000 | | | | 9,857 | |
Total Consumer, Non-cyclical | | | | | | | 34,749 | |
| | | | | | | | | |
Utilities - 0.7% | | | | | | | | |
Calpine Construction Finance Company, LP | | | | | | | | |
6.85% (1 Month Term SOFR + 2.00%, Rate Floor: 2.00%) due 07/31/30 | | | 25,000 | | | | 24,826 | |
Total Senior Floating Rate Interests | | | | |
(Cost $233,183) | | | 232,573 | |
| | | | | | | | | |
Total Investments - 109.9% | | | | |
(Cost $3,873,364) | | $ | 3,877,673 | |
Other Assets & Liabilities, net - (9.9)% | | | (350,699 | ) |
Total Net Assets - 100.0% | | $ | 3,526,974 | |
82 | THE GUGGENHEIM FUNDS ANNUAL REPORT | SEE NOTES TO FINANCIAL STATEMENTS. |
SCHEDULE OF INVESTMENTS (continued) | September 30, 2024 |
ACTIVE INVESTMENT SERIES (GAINS) – LIMITED DURATION FUND | |
*** | A copy of each underlying unaffiliated fund’s financial statements is available at the SEC’s website at www.sec.gov. |
† | Value determined based on Level 1 inputs — See Note 4. |
†† | Value determined based on Level 2 inputs, unless otherwise noted — See Note 4. |
††† | Value determined based on Level 3 inputs — See Note 4. |
◊ | Variable rate security. Rate indicated is the rate effective at September 30, 2024. In some instances, the effective rate is limited by a minimum rate floor or a maximum rate cap established by the issuer. The settlement status of a position may also impact the effective rate indicated. In some cases, a position may be unsettled at period end and may not have a stated effective rate. In instances where multiple underlying reference rates and spread amounts are shown, the effective rate is based on a weighted average. |
1 | Rate indicated is the 7-day yield as of September 30, 2024. |
2 | Security is a 144A or Section 4(a)(2) security. These securities have been determined to be liquid under guidelines established by the Board of Trustees. The total market value of 144A or Section 4(a)(2) securities is $3,213,974 (cost $3,209,243), or 91.1% of total net assets. |
3 | Security is a step up/down bond. The coupon increases or decreases at regular intervals until the bond reaches full maturity. Rate indicated is the rate at September 30, 2024. See table below for additional step information for each security. |
| | SOFR — Secured Overnight Financing Rate |
| | WAC — Weighted Average Coupon |
| | |
| | See Sector Classification in Other Information section. |
The following table summarizes the inputs used to value the Fund’s investments at September 30, 2024 (See Note 4 in the Notes to Financial Statements):
Investments in Securities (Assets) | | Level 1
Quoted
Prices | | | Level 2
Significant
Observable
Inputs | | | Level 3
Significant
Unobservable
Inputs | | | Total | |
Money Market Funds | | $ | 400,953 | | | $ | — | | | $ | — | | | $ | 400,953 | |
Asset-Backed Securities | | | — | | | | 1,988,408 | | | | — | | | | 1,988,408 | |
Collateralized Mortgage Obligations | | | — | | | | 990,021 | | | | — | | | | 990,021 | |
Corporate Bonds | | | — | | | | 265,718 | | | | — | | | | 265,718 | |
Senior Floating Rate Interests | | | — | | | | 223,430 | | | | 9,143 | | | | 232,573 | |
Total Assets | | $ | 400,953 | | | $ | 3,467,577 | | | $ | 9,143 | | | $ | 3,877,673 | |
Investments in Securities (Liabilities) | | Level 1
Quoted
Prices | | | Level 2
Significant
Observable
Inputs | | | Level 3
Significant
Unobservable
Inputs | | | Total | |
Unfunded Loan Commitments (Note 9) | | $ | — | | | $ | — | | | $ | 5 | | | $ | 5 | |
SEE NOTES TO FINANCIAL STATEMENTS. | THE GUGGENHEIM FUNDS ANNUAL REPORT | 83 |
SCHEDULE OF INVESTMENTS (concluded) | September 30, 2024 |
ACTIVE INVESTMENT SERIES (GAINS) – LIMITED DURATION FUND | |
Step Coupon Bonds
The following table discloses additional information related to step coupon bonds held by the Fund. Certain securities are subject to multiple rate changes prior to maturity. For those securities, a range of rates and corresponding dates have been provided. Rates for all step coupon bonds held by the Fund are scheduled to increase, none are scheduled to decrease.
Name | | Coupon Rate at
Next Reset Date | | | Next Rate Reset Date | |
ATLX Trust 2024-RPL1, 3.85% due 04/25/64 | | | 4.85 | % | | | 08/01/28 | |
BRAVO 2024-NQM6, 5.66% due 08/01/64 | | | 6.66 | % | | | 08/01/28 | |
BRAVO Residential Funding Trust 2022-R1, 3.13% due 01/29/70 | | | 6.13 | % | | | 01/30/25 | |
Mill City Securities Ltd. 2024-RS1, 3.00% due 11/01/69 | | | 6.00 | % | | | 10/01/27 | |
OBX Trust 2024-NQM12, 5.83% due 07/25/64 | | | 6.83 | % | | | 08/01/28 | |
OBX Trust 2024-NQM13, 5.37% due 06/25/64 | | | 6.37 | % | | | 08/01/28 | |
84 | THE GUGGENHEIM FUNDS ANNUAL REPORT | SEE NOTES TO FINANCIAL STATEMENTS. |
ACTIVE INVESTMENT SERIES (GAINS) – LIMITED DURATION FUND | |
STATEMENT OF ASSETS AND LIABILITIES |
September 30, 2024 |
Assets: |
Investments, at value (cost $3,873,364) | | $ | 3,877,673 | |
Receivables: |
Investment Adviser | | | 29,697 | |
Interest | | | 19,415 | |
Total assets | | | 3,926,785 | |
| | | | | |
Liabilities: |
Unfunded loan commitments, at value (Note 9) (commitment fees received $–) | | | 5 | |
Overdraft due to custodian bank | | | 517 | |
Payable for: |
Securities purchased | | | 369,661 | |
Professional fees | | | 23,070 | |
Fund accounting /administration fees | | | 3,219 | |
Transfer agent fees | | | 1,545 | |
Trustees’ fees* | | | 564 | |
Miscellaneous | | | 1,230 | |
Total liabilities | | | 399,811 | |
Net assets | | $ | 3,526,974 | |
| | | | | |
Net assets consist of: |
Paid in capital | | $ | 3,522,813 | |
Total distributable earnings (loss) | | | 4,161 | |
Net assets | | $ | 3,526,974 | |
Capital shares outstanding | | | 176,102 | |
Net asset value per share | | $ | 20.03 | |
STATEMENT OF OPERATIONS |
Period Ended September 30, 2024** |
Investment Income: |
Interest | | $ | 22,650 | |
Total investment income | | | 22,650 | |
| | | | | |
Expenses: |
Transfer agent fees | | | 1,545 | |
Professional fees | | | 23,070 | |
Fund accounting / administration fees | | | 3,219 | |
Trustees’ fees* | | | 564 | |
Custodian fees | | | 480 | |
Line of credit fees | | | 12 | |
Miscellaneous | | | 819 | |
Total expenses | | | 29,709 | |
Less: |
Expenses reimbursed by Adviser | | | (29,697 | ) |
Net expenses | | | 12 | |
Net investment income | | | 22,638 | |
| | | | | |
Net Realized and Unrealized Gain (Loss): |
Net realized gain (loss) on: |
Investments | | | 30 | |
Net realized gain | | | 30 | |
Net change in unrealized appreciation (depreciation) on: |
Investments | | | 4,304 | |
Net change in unrealized appreciation (depreciation) | | | 4,304 | |
Net realized and unrealized gain | | | 4,334 | |
Net increase in net assets resulting from operations | | $ | 26,972 | |
* | Relates to Trustees not deemed “interested persons” within the meaning of Section 2(a)(19) of the 1940 Act. |
** | Since commencement of operations: August 14, 2024. |
SEE NOTES TO FINANCIAL STATEMENTS. | THE GUGGENHEIM FUNDS ANNUAL REPORT | 85 |
ACTIVE INVESTMENT SERIES (GAINS) – LIMITED DURATION FUND | |
STATEMENT OF CHANGES IN NET ASSETS |
| | Period Ended
September 30,
2024a | |
Increase (Decrease) in Net Assets from Operations: | | | | |
Net investment income | | $ | 22,638 | |
Net realized gain on investments | | | 30 | |
Net change in unrealized appreciation (depreciation) on investments | | | 4,304 | |
Net increase in net assets resulting from operations | | | 26,972 | |
| | | | | |
Distributions to shareholders | | | (22,811 | ) |
| | | | | |
Capital share transactions: | | | | |
Proceeds from sale of shares | | | 3,500,002 | |
Distributions reinvested | | | 22,811 | |
Cost of shares redeemed | | | — | |
Net increase from capital share transactions | | | 3,522,813 | |
Net increase in net assets | | | 3,526,974 | |
| | | | | |
Net assets: | | | | |
Beginning of period | | | — | |
End of period | | $ | 3,526,974 | |
| | | | | |
Capital share activity: | | | | |
Shares sold | | | 174,962 | |
Shares issued from reinvestment of distributions | | | 1,140 | |
Shares redeemed | | | — | |
Net increase in shares | | | 176,102 | |
a | Since commencement of operations: August 14, 2024. |
86 | THE GUGGENHEIM FUNDS ANNUAL REPORT | SEE NOTES TO FINANCIAL STATEMENTS. |
ACTIVE INVESTMENT SERIES (GAINS) – LIMITED DURATION FUND | |
This table is presented to show selected data for a share outstanding throughout each period and to assist shareholders in evaluating a Fund’s performance for the period presented.
SMA Class | | Period Ended
September 30,
2024a | |
Per Share Data |
Net asset value, beginning of period | | $ | 20.00 | |
Income (loss) from investment operations: |
Net investment income (loss)b | | | .15 | |
Net gain (loss) on investments (realized and unrealized) | | | .03 | |
Total from investment operations | | | .18 | |
Less distributions from: |
Net investment income | | | (.15 | ) |
Total distributions | | | (.15 | ) |
Net asset value, end of period | | $ | 20.03 | |
|
Total Return | | | 0.90 | % |
Ratios/Supplemental Data |
Net assets, end of period (in thousands) | | $ | 3,527 | |
Ratios to average net assets: |
Net investment income (loss) | | | 0.74 | % |
Total expenses | | | 0.97 | % |
Net expensesc | | | — | d |
Portfolio turnover rate | | | — | e |
a | Since commencement of operations: August 14, 2024. |
b | Net investment income (loss) per share was computed using average shares outstanding throughout the period. |
c | Net expense information reflects the expense ratios after expense waivers and reimbursements, as applicable. |
d | Less than 0.01%. |
e | Less than 1.0%. |
SEE NOTES TO FINANCIAL STATEMENTS. | THE GUGGENHEIM FUNDS ANNUAL REPORT | 87 |
SCHEDULE OF INVESTMENTS | September 30, 2024 |
CORE BOND FUND | |
| | Shares | | | Value | |
COMMON STOCKS† - 0.0% |
| | | | | | | | | |
Communications - 0.0% |
Vacasa, Inc. — Class A* | | | 1,596 | | | $ | 4,485 | |
| | | | | | | | | |
Financial - 0.0% |
Pershing Square Tontine Holdings, Ltd. — Class A*,†††,1 | | | 622,890 | | | | 62 | |
| | | | | | | | | |
Industrial - 0.0% |
Constar International Holdings LLC*,††† | | | 68 | | | | — | |
| | | | | | | | | |
Total Common Stocks | | | | |
(Cost $318,203) | | | | | | | 4,547 | |
| | | | | | | | | |
PREFERRED STOCKS†† - 1.5% |
Financial - 1.5% |
Charles Schwab Corp. |
4.00% | | | 8,500,000 | | | | 7,601,482 | |
Wells Fargo & Co. |
3.90% | | | 5,550,000 | | | | 5,394,077 | |
State Street Corp. |
6.70% | | | 4,870,000 | | | | 5,045,257 | |
Bank of New York Mellon Corp. |
3.75% | | | 3,900,000 | | | | 3,680,942 | |
MetLife, Inc. |
3.85% | | | 3,520,000 | | | | 3,463,174 | |
JPMorgan Chase & Co. |
3.65% | | | 2,350,000 | | | | 2,273,488 | |
Markel Group, Inc. |
6.00% | | | 1,360,000 | | | | 1,358,531 | |
CNO Financial Group, Inc. |
5.13% due 11/25/60 | | | 47,950 | | | | 1,032,843 | |
Kuvare US Holdings, Inc. |
7.00% due 02/17/513 | | | 1,000,000 | | | | 1,005,000 | |
Depository Trust & Clearing Corp. |
3.38%3 | | | 1,000,000 | | | | 955,617 | |
First Republic Bank |
4.25%* | | | 77,975 | | | | 31 | |
Total Financial | | | | | | | 31,810,442 | |
| | | | | | | | | |
Industrial - 0.0% |
Constar International Holdings LLC*,††† | | | 7 | | | | — | |
Total Preferred Stocks | | | | |
(Cost $34,906,865) | | | | | | | 31,810,442 | |
| | | | | | | | | |
WARRANTS† - 0.0% |
Ginkgo Bioworks Holdings, Inc. | | | | | | | | |
Expiring 09/16/26 | | | 6,510 | | | | 29 | |
Pershing Square SPARC Holdings, Ltd. | | | | | | | | |
Expiring 12/31/49*,†††,1 | | | 190,327 | | | | 19 | |
Pershing Square Tontine Holdings, Ltd. | | | | | | | | |
Expiring 07/24/25*,†††,1 | | | 69,210 | | | | 7 | |
Total Warrants | | | | |
(Cost $15,075) | | | | | | | 55 | |
| | | | | | | | | |
MONEY MARKET FUNDS***,† - 6.1% |
Dreyfus Treasury Securities Cash Management Fund — Institutional Shares, 4.88%4 | | | 127,494,124 | | | | 127,494,124 | |
Dreyfus Treasury Obligations Cash Management Fund — Institutional Shares, 4.81%4 | | | 123,739 | | | | 123,739 | |
Total Money Market Funds | | | | |
(Cost $127,617,863) | | | | | | | 127,617,863 | |
| | | | | | | | | |
| | | Face
Amount~ | | | | | |
COLLATERALIZED MORTGAGE OBLIGATIONS†† - 30.4% |
Government Agency - 21.2% | | | | | | | | |
Uniform MBS 30 Year TBA | | | | | | | | |
due 12/01/2412 | | $ | 53,462,754 | | | | 53,439,979 | |
due 12/01/2412 | | | 42,250,000 | | | | 37,947,260 | |
due 01/01/2512 | | | 29,737,500 | | | | 29,232,706 | |
due 11/01/2412 | | | 16,091,246 | | | | 16,081,446 | |
due 12/01/2412 | | | 18,405,000 | | | | 15,895,497 | |
due 12/01/2412 | | | 16,012,500 | | | | 15,744,211 | |
due 12/01/2412 | | | 15,965,000 | | | | 13,235,359 | |
due 11/01/2412 | | | 10,095,792 | | | | 10,214,720 | |
Fannie Mae | | | | | | | | |
5.50% due 05/01/53 | | | 27,410,507 | | | | 27,761,236 | |
3.00% due 05/01/52 | | | 18,046,227 | | | | 16,198,681 | |
5.00% due 05/01/53 | | | 12,796,114 | | | | 12,802,509 | |
5.50% due 06/01/54 | | | 10,626,192 | | | | 10,750,501 | |
6.00% due 07/01/54 | | | 9,487,909 | | | | 9,796,561 | |
5.50% due 07/01/54 | | | 9,589,543 | | | | 9,763,345 | |
5.00% due 04/01/53 | | | 7,633,461 | | | | 7,637,829 | |
5.00% due 06/01/53 | | | 7,095,505 | | | | 7,140,514 | |
5.00% due 08/01/53 | | | 5,557,874 | | | | 5,560,769 | |
6.00% due 09/01/54 | | | 3,323,617 | | | | 3,426,633 | |
5.50% due 09/01/54 | | | 3,322,678 | | | | 3,378,345 | |
6.50% due 04/25/49 | | | 3,169,080 | | | | 3,223,614 | |
2.78% due 05/01/51 | | | 2,608,428 | | | | 2,085,680 | |
2.32% due 02/01/51 | | | 1,971,158 | | | | 1,508,412 | |
2.00% due 09/01/50 | | | 1,988,804 | | | | 1,471,275 | |
2.11% due 10/01/50 | | | 1,757,244 | | | | 1,320,966 | |
2.27% due 02/01/51 | | | 1,641,102 | | | | 1,248,247 | |
2.39% due 02/01/51 | | | 1,366,335 | | | | 1,056,620 | |
4.24% due 08/01/48 | | | 984,630 | | | | 939,327 | |
2.58% due 10/01/51 | | | 1,144,647 | | | | 898,217 | |
3.46% due 08/01/49 | | | 913,696 | | | | 816,637 | |
4.37% due 10/01/48 | | | 687,987 | | | | 678,981 | |
4.25% due 05/01/48 | | | 603,053 | | | | 582,487 | |
due 12/25/435 | | | 627,216 | | | | 481,449 | |
Freddie Mac | | | | | | | | |
6.00% due 08/01/54 | | | 19,149,466 | | | | 19,763,820 | |
5.50% due 09/01/53 | | | 14,922,356 | | | | 15,303,684 | |
5.50% due 06/01/53 | | | 12,141,094 | | | | 12,318,558 | |
5.50% due 06/01/54 | | | 11,886,875 | | | | 12,025,320 | |
5.00% due 04/01/53 | | | 7,613,478 | | | | 7,617,443 | |
5.00% due 03/01/53 | | | 4,183,090 | | | | 4,186,252 | |
88 | THE GUGGENHEIM FUNDS ANNUAL REPORT | SEE NOTES TO FINANCIAL STATEMENTS. |
SCHEDULE OF INVESTMENTS (continued) | September 30, 2024 |
CORE BOND FUND | |
| | Face
Amount~ | | | Value | |
6.00% due 09/01/54 | | $ | 2,085,000 | | | $ | 2,148,233 | |
5.50% due 09/01/54 | | | 2,060,000 | | | | 2,100,516 | |
1.98% due 05/01/50 | | | 1,312,625 | | | | 958,195 | |
GNMA II 30Year TBA | | | | | | | | |
due 10/21/2412 | | | 28,336,548 | | | | 28,607,162 | |
Ginnie Mae | | | | | | | | |
due 12/01/2412 | | | 9,470,000 | | | | 9,477,765 | |
6.00% due 06/20/47 | | | 896,700 | | | | 906,078 | |
Freddie Mac Seasoned Credit Risk Transfer Trust | | | | | | | | |
2.00% due 05/25/60 | | | 3,013,644 | | | | 2,474,862 | |
2.00% due 11/25/59 | | | 1,140,484 | | | | 934,586 | |
Fannie Mae-Aces | | | | | | | | |
1.59% (WAC) due 03/25/35◊,6 | | | 17,352,474 | | | | 1,549,609 | |
FARM Mortgage Trust | | | | | | | | |
2.18% (WAC) due 01/25/51◊,3 | | | 816,356 | | | | 669,266 | |
Total Government Agency | | | | | | | 443,361,362 | |
| | | | | | | | | |
Residential Mortgage-Backed Securities - 6.6% | | | | | | | | |
OBX Trust | | | | | | | | |
2023-NQM9, 7.66% due 10/25/633,7 | | | 3,296,031 | | | | 3,382,965 | |
2024-NQM4, 6.22% due 01/25/643,7 | | | 2,749,539 | | | | 2,780,575 | |
2024-NQM5, 6.29% due 01/25/643,7 | | | 1,573,948 | | | | 1,593,710 | |
2024-NQM6, 6.85% due 02/25/643,7 | | | 1,439,238 | | | | 1,468,314 | |
2024-NQM5, 5.99% due 01/25/643,7 | | | 1,349,098 | | | | 1,366,673 | |
2024-NQM6, 6.45% due 02/25/643,7 | | | 1,114,249 | | | | 1,138,661 | |
2024-NQM7, 6.24% due 03/25/643,7 | | | 939,580 | | | | 955,804 | |
2024-NQM7, 6.60% due 03/25/643,7 | | | 939,580 | | | | 954,964 | |
2024-NQM6, 6.70% due 02/25/643,7 | | | 928,541 | | | | 946,557 | |
2024-NQM8, 6.59% due 05/25/643,7 | | | 896,854 | | | | 911,973 | |
2024-NQM5, 6.39% due 01/25/643,7 | | | 899,399 | | | | 910,008 | |
2024-NQM3, 6.13% due 12/25/633,7 | | | 857,983 | | | | 871,603 | |
2024-NQM3, 6.33% due 12/25/633,7 | | | 857,983 | | | | 868,768 | |
2024-NQM3, 6.43% due 12/25/637 | | | 857,983 | | | | 867,892 | |
2022-NQM8, 6.10% due 09/25/627 | | | 796,440 | | | | 797,475 | |
2024-NQM8, 6.23% due 05/25/643,7 | | | 755,245 | | | | 768,254 | |
2024-NQM7, 6.45% due 03/25/643,7 | | | 563,748 | | | | 572,528 | |
2022-NQM9, 6.45% due 09/25/623,7 | | | 536,107 | | | | 540,711 | |
2024-NQM2, 6.18% due 12/25/637 | | | 447,850 | | | | 451,806 | |
COLT Mortgage Loan Trust | | | | | | | | |
2023-4, 7.62% due 10/25/683,7 | | | 3,398,864 | | | | 3,489,675 | |
2021-2, 2.38% (WAC) due 08/25/66◊,3 | | | 4,000,000 | | | | 2,894,323 | |
2023-3, 7.18% due 09/25/683,7 | | | 2,611,602 | | | | 2,672,013 | |
2024-1, 6.14% due 02/25/693,7 | | | 1,288,530 | | | | 1,301,878 | |
2024-2, 6.13% due 04/25/693,7 | | | 985,340 | | | | 997,686 | |
2023-3, 7.58% due 09/25/683,7 | | | 842,452 | | | | 863,529 | |
2024-2, 6.33% due 04/25/693,7 | | | 447,882 | | | | 453,482 | |
2024-2, 6.43% due 04/25/693,7 | | | 447,882 | | | | 453,481 | |
Angel Oak Mortgage Trust | | | | | | | | |
2024-2, 6.25% due 01/25/693,7 | | | 4,527,644 | | | | 4,585,435 | |
2024-4, 6.20% due 01/25/693,7 | | | 2,518,694 | | | | 2,565,154 | |
2024-3, 4.80% due 11/26/683,7 | | | 1,856,943 | | | | 1,851,091 | |
2023-1, 4.75% due 09/26/673,7 | | | 1,392,571 | | | | 1,380,303 | |
2024-4, 6.50% due 01/25/693,7 | | | 764,604 | | | | 774,560 | |
2024-4, 6.40% due 01/25/693,7 | | | 359,813 | | | | 365,169 | |
2020-1, 2.77% (WAC) due 12/25/59◊,3 | | | 235,019 | | | | 224,910 | |
JP Morgan Mortgage Trust | | | | | | | | |
2021-12, 2.50% (WAC) due 02/25/52◊,3 | | | 7,741,134 | | | | 7,193,880 | |
2021-13, 2.50% (WAC) due 04/25/52◊,3 | | | 3,462,862 | | | | 3,218,450 | |
FIGRE Trust | | | | | | | | |
2024-HE2, 6.38% (WAC) due 05/25/54◊,3 | | | 3,034,982 | | | | 3,107,282 | |
2024-HE1, 6.17% (WAC) due 03/25/54◊,3 | | | 2,669,038 | | | | 2,717,346 | |
2024-HE4, 5.06% (WAC) due 09/25/54◊,3 | | | 1,650,000 | | | | 1,656,683 | |
2024-HE3, 6.13% (WAC) due 07/25/54◊,3 | | | 1,238,166 | | | | 1,258,953 | |
GCAT Trust | | | | | | | | |
2022-NQM3, 4.35% (WAC) due 04/25/67◊,3 | | | 2,973,968 | | | | 2,840,322 | |
2023-NQM3, 7.34% due 08/25/683,7 | | | 1,674,524 | | | | 1,710,624 | |
2023-NQM3, 6.89% due 08/25/683,7 | | | 1,674,520 | | | | 1,706,282 | |
2024-NQM2, 6.54% due 06/25/597 | | | 890,559 | | | | 903,918 | |
2024-NQM2, 6.09% due 06/25/597 | | | 445,280 | | | | 451,684 | |
Verus Securitization Trust | | | | | | | | |
2024-1, 6.12% due 01/25/697 | | | 4,195,046 | | | | 4,225,035 | |
2023-2, 6.85% due 03/25/687 | | | 1,470,604 | | | | 1,487,157 | |
2023-7, 7.42% due 10/25/683,7 | | | 1,231,308 | | | | 1,260,291 | |
2019-4, 3.85% due 11/25/593 | | | 360,626 | | | | 354,855 | |
BRAVO Residential Funding Trust | | | | | | | | |
2023-NQM2, 4.50% due 05/25/627 | | | 1,728,769 | | | | 1,710,944 | |
2024-NQM3, 6.39% due 03/25/647 | | | 1,529,216 | | | | 1,550,800 | |
2023-NQM8, 7.10% due 10/25/633,7 | | | 1,324,996 | | | | 1,352,173 | |
2021-HE1, 6.78% (30 Day Average SOFR + 1.50%, Rate Floor: 0.00%) due 01/25/70◊,3 | | | 1,000,000 | | | | 998,608 | |
2024-CES1, 6.38% due 04/25/543,7 | | | 926,557 | | | | 940,289 | |
RCKT Mortgage Trust | | | | | | | | |
2023-CES2, 6.81% (WAC) due 09/25/43◊,3 | | | 3,208,858 | | | | 3,260,411 | |
2024-CES4, 6.15% due 06/25/443,7 | | | 2,652,643 | | | | 2,695,121 | |
Mill City Mortgage Loan Trust | | | | | | | | |
2021-NMR1, 2.50% (WAC) due 11/25/60◊,3 | | | 5,810,000 | | | | 5,004,237 | |
PRPM LLC | | | | | | | | |
2021-RPL2, 2.93% (WAC) due 10/25/51◊,3 | | | 2,472,000 | | | | 2,175,896 | |
2024-RPL2, 3.50% due 05/25/543 | | | 2,025,714 | | | | 1,958,711 | |
2023-RCF1, 4.00% due 06/25/533,7 | | | 821,395 | | | | 807,908 | |
GS Mortgage-Backed Securities Trust | | | | | | | | |
2021-PJ10, 2.50% (WAC) due 03/25/52◊,3 | | | 4,835,709 | | | | 4,454,318 | |
2020-NQM1, 1.79% (WAC) due 09/27/60◊,3 | | | 147,044 | | | | 138,211 | |
New Residential Mortgage Loan Trust | | | | | | | | |
2024-NQM2, 5.37% due 09/25/643 | | | 1,800,000 | | | | 1,798,650 | |
2024-NQM2, 5.42% due 09/25/643 | | | 1,800,000 | | | | 1,798,470 | |
2019-6A, 3.50% (WAC) due 09/25/59◊,3 | | | 375,465 | | | | 358,568 | |
Mill City Securities Ltd. | | | | | | | | |
2024-RS1, 3.00% due 11/01/693,7 | | | 4,050,000 | | | | 3,739,025 | |
Vista Point Securitization Trust | | | | | | | | |
2024-CES2, 5.25% due 10/25/543,7 | | | 3,300,000 | | | | 3,302,297 | |
Towd Point Mortgage Trust | | | | | | | | |
2023-CES2, 7.29% (WAC) due 10/25/63◊,3 | | | 1,730,287 | | | | 1,771,920 | |
2023-CES1, 6.75% (WAC) due 07/25/63◊,3 | | | 729,580 | | | | 739,223 | |
CFMT LLC | | | | | | | | |
2022-HB9, 3.25% (WAC) due 09/25/37◊,3 | | | 2,446,594 | | | | 2,345,224 | |
Morgan Stanley Residential Mortgage Loan Trust | | | | | | | | |
2024-NQM3, 5.04% (WAC) due 07/25/69◊,3 | | | 1,000,000 | | | | 997,620 | |
2024-NQM3, 5.35% due 07/25/693,7 | | | 1,000,000 | | | | 997,560 | |
SEE NOTES TO FINANCIAL STATEMENTS. | THE GUGGENHEIM FUNDS ANNUAL REPORT | 89 |
SCHEDULE OF INVESTMENTS (continued) | September 30, 2024 |
CORE BOND FUND | |
| | Face
Amount~ | | | Value | |
Sequoia Mortgage Trust | | | | | | | | |
2024-5, 6.00% (WAC) due 06/25/54◊,3 | | $ | 1,764,332 | | | $ | 1,782,764 | |
Saluda Grade Alternative Mortgage Trust | | | | | | | | |
2023-FIG4, 6.72% (WAC) due 11/25/53◊,3 | | | 1,594,520 | | | | 1,640,613 | |
Imperial Fund Mortgage Trust | | | | | | | | |
2022-NQM2, 4.20% (WAC) due 03/25/67◊,3 | | | 807,355 | | | | 761,856 | |
2022-NQM2, 4.02% (WAC) due 03/25/67◊,3 | | | 807,355 | | | | 756,556 | |
Starwood Mortgage Residential Trust | | | | | | | | |
2020-1, 2.41% (WAC) due 02/25/50◊,3 | | | 650,275 | | | | 621,524 | |
2020-1, 2.56% (WAC) due 02/25/50◊,3 | | | 650,275 | | | | 621,029 | |
SPS Servicer Advance Receivables Trust | | | | | | | | |
2020-T2, 1.83% due 11/15/553 | | | 1,250,000 | | | | 1,207,200 | |
American Home Mortgage Investment Trust | | | | | | | | |
2007-1, 2.08% due 05/25/476 | | | 5,830,924 | | | | 841,661 | |
CSMC Trust | | | | | | | | |
2018-RPL9, 3.85% (WAC) due 09/25/57◊,3 | | | 629,411 | | | | 620,285 | |
2020-NQM1, 2.72% due 05/25/653,7 | | | 167,352 | | | | 155,864 | |
MFRA Trust | | | | | | | | |
2021-INV1, 2.29% (WAC) due 01/25/56◊,3 | | | 700,000 | | | | 640,919 | |
Securitized Asset-Backed Receivables LLC Trust | | | | | | | | |
2006-HE2, 5.27% (1 Month Term SOFR + 0.41%, Rate Floor: 0.30%) due 07/25/36◊ | | | 1,343,484 | | | | 532,978 | |
RALI Series Trust | | | | | | | | |
2006-QO2, 5.41% (1 Month Term SOFR + 0.55%, Rate Floor: 0.44%) due 02/25/46◊ | | | 1,487,218 | | | | 263,486 | |
Washington Mutual Mortgage Pass-Through Certificates WMALT Series Trust | | | | | | | | |
2006-AR9, 5.96% (1 Year CMT Rate + 0.84%, Rate Floor: 0.84%) due 11/25/46◊ | | | 220,202 | | | | 180,976 | |
MASTR Adjustable Rate Mortgages Trust | | | | | | | | |
2003-5, 3.30% (WAC) due 11/25/33◊ | | | 199,061 | | | | 174,381 | |
Residential Mortgage Loan Trust | | | | | | | | |
2020-1, 2.68% (WAC) due 01/26/60◊ | | | 73,058 | | | | 71,170 | |
UCFC Manufactured Housing Contract | | | | | | | | |
1997-2, 7.38% due 10/15/28 | | | 2,810 | | | | 2,801 | |
Total Residential Mortgage-Backed Securities | | | | | | | 136,886,939 | |
| | | | | | | | | |
Commercial Mortgage-Backed Securities - 2.0% | | | | | | | | |
BX Commercial Mortgage Trust | | | | | | | | |
2021-VOLT, 6.31% (1 Month Term SOFR + 1.21%, Rate Floor: 1.10%) due 09/15/36◊,3 | | | 3,490,000 | | | | 3,452,919 | |
2021-VOLT, 7.21% (1 Month Term SOFR + 2.11%, Rate Floor: 2.00%) due 09/15/36◊,3 | | | 3,450,000 | | | | 3,424,125 | |
2024-AIRC, 6.79% (1 Month Term SOFR + 1.69%, Rate Floor: 1.69%) due 08/15/39◊,3 | | | 1,050,000 | | | | 1,051,312 | |
2024-AIRC, 7.24% (1 Month Term SOFR + 2.14%, Rate Floor: 2.14%) due 08/15/39◊,3 | | | 1,000,000 | | | | 1,001,250 | |
GS Mortgage Securities Trust | | | | | | | | |
2020-GSA2, 2.34% due 12/12/53 | | | 8,000,000 | | | | 6,301,818 | |
2020-GC45, 0.77% (WAC) due 02/13/53◊,6 | | | 18,628,235 | | | | 483,736 | |
2019-GC42, 0.93% (WAC) due 09/10/52◊,6 | | | 13,886,531 | | | | 436,715 | |
JP Morgan Chase Commercial Mortgage Securities Trust | | | | | | | | |
2021-NYAH, 7.30% (1 Month Term SOFR + 2.20%, Rate Floor: 1.84%) due 06/15/38◊,3 | | | 4,000,000 | | | | 3,518,280 | |
2016-JP3, 3.56% (WAC) due 08/15/49◊ | | | 4,000,000 | | | | 3,305,145 | |
DBGS Mortgage Trust | | | | | | | | |
2018-C1, 4.80% (WAC) due 10/15/51◊ | | | 7,000,000 | | | | 6,565,982 | |
BX Trust | | | | | | | | |
2024-VLT4, 7.24% (1 Month Term SOFR + 2.14%, Rate Floor: 2.14%) due 07/15/29◊,3 | | | 1,700,000 | | | | 1,695,750 | |
2024-VLT4, 7.04% (1 Month Term SOFR + 1.94%, Rate Floor: 1.94%) due 07/15/29◊,3 | | | 1,450,000 | | | | 1,450,000 | |
SMRT | | | | | | | | |
2022-MINI, 7.05% (1 Month Term SOFR + 1.95%, Rate Floor: 1.95%) due 01/15/39◊,3 | | | 2,000,000 | | | | 1,963,916 | |
GS Mortgage Securities Corporation Trust | | | | | | | | |
2020-DUNE, 6.72% (1 Month Term SOFR + 1.61%, Rate Floor: 1.35%) due 12/15/36◊,3 | | | 1,000,000 | | | | 993,977 | |
2020-UPTN, 3.35% (WAC) due 02/10/37◊,3 | | | 1,000,000 | | | | 955,032 | |
Life Mortgage Trust | | | | | | | | |
2021-BMR, 6.61% (1 Month Term SOFR + 1.51%, Rate Floor: 1.40%) due 03/15/38◊,3 | | | 1,586,268 | | | | 1,554,754 | |
BMP Trust | | | | | | | | |
2024-MF23, 6.74% (1 Month Term SOFR + 1.64%, Rate Floor: 1.64%) due 06/15/41◊,3 | | | 1,000,000 | | | | 996,875 | |
Extended Stay America Trust | | | | | | | | |
2021-ESH, 7.46% (1 Month Term SOFR + 2.36%, Rate Floor: 2.25%) due 07/15/38◊,3 | | | 980,139 | | | | 982,033 | |
BENCHMARK Mortgage Trust | | | | | | | | |
2019-B14, 0.89% (WAC) due 12/15/62◊,6 | | | 19,550,246 | | | | 442,557 | |
2018-B6, 0.55% (WAC) due 10/10/51◊,6 | | | 28,307,505 | | | | 294,625 | |
Citigroup Commercial Mortgage Trust | | | | | | | | |
2019-GC43, 0.74% (WAC) due 11/10/52◊,6 | | | 19,592,684 | | | | 487,748 | |
2016-C2, 1.80% (WAC) due 08/10/49◊,6 | | | 2,151,471 | | | | 44,453 | |
2016-GC37, 1.81% (WAC) due 04/10/49◊,6 | | | 2,745,030 | | | | 42,693 | |
2016-P5, 1.52% (WAC) due 10/10/49◊,6 | | | 1,529,288 | | | | 28,987 | |
CSAIL Commercial Mortgage Trust | | | | | | | | |
2019-C15, 1.16% (WAC) due 03/15/52◊,6 | | | 10,958,592 | | | | 378,980 | |
UBS Commercial Mortgage Trust | | | | | | | | |
2017-C2, 1.21% (WAC) due 08/15/50◊,6 | | | 7,740,263 | | | | 181,808 | |
SG Commercial Mortgage Securities Trust | | | | | | | | |
2016-C5, 1.98% (WAC) due 10/10/48◊,6 | | | 6,992,223 | | | | 155,897 | |
90 | THE GUGGENHEIM FUNDS ANNUAL REPORT | SEE NOTES TO FINANCIAL STATEMENTS. |
SCHEDULE OF INVESTMENTS (continued) | September 30, 2024 |
CORE BOND FUND | |
| | Face
Amount~ | | | Value | |
COMM Mortgage Trust | | | | | | | | |
2015-CR24, 0.83% (WAC) due 08/10/48◊,6 | | $ | 35,130,568 | | | $ | 103,010 | |
2015-CR26, 1.04% (WAC) due 10/10/48◊,6 | | | 7,967,717 | | | | 33,451 | |
Morgan Stanley Capital I Trust | | | | | | | | |
2016-UB11, 1.57% (WAC) due 08/15/49◊,6 | | | 5,578,450 | | | | 111,534 | |
JPMDB Commercial Mortgage Securities Trust | | | | | | | | |
2016-C2, 1.63% (WAC) due 06/15/49◊,6 | | | 6,110,768 | | | | 97,521 | |
Wells Fargo Commercial Mortgage Trust | | | | | | | | |
2016-NXS5, 1.56% (WAC) due 01/15/59◊,6 | | | 3,160,688 | | | | 42,320 | |
2016-C37, 0.92% (WAC) due 12/15/49◊,6 | | | 2,354,378 | | | | 30,132 | |
CFCRE Commercial Mortgage Trust | | | | | | | | |
2016-C3, 1.11% (WAC) due 01/10/48◊,6 | | | 4,730,800 | | | | 38,113 | |
CD Mortgage Trust | | | | | | | | |
2016-CD1, 1.48% (WAC) due 08/10/49◊,6 | | | 2,007,856 | | | | 29,837 | |
Total Commercial Mortgage-Backed Securities | | | | | | | 42,677,285 | |
| | | | | | | | | |
Military Housing - 0.6% | | | | | | | | |
Freddie Mac Military Housing Bonds Resecuritization Trust Certificates | | | | | | | | |
2015-R1, 4.66% (WAC) due 11/25/55◊,3 | | | 6,730,869 | | | | 6,229,239 | |
2015-R1, 4.45% (WAC) due 11/25/52◊,3 | | | 2,691,878 | | | | 2,531,751 | |
2015-R1, 0.70% (WAC) due 11/25/55◊,3,6 | | | 9,851,139 | | | | 616,807 | |
Capmark Military Housing Trust | | | | | | | | |
2006-RILY, 6.15% due 07/10/51†††,3 | | | 2,207,981 | | | | 2,048,918 | |
2007-ROBS, 6.06% due 10/10/52†††,3 | | | 445,548 | | | | 398,761 | |
2007-AETC, 5.75% due 02/10/52†††,3 | | | 261,746 | | | | 237,921 | |
GMAC Commercial Mortgage Asset Corp. | | | | | | | | |
2007-HCKM, 6.11% due 08/10/52†††,3 | | | 1,400,530 | | | | 1,278,642 | |
Total Military Housing | | | | | | | 13,342,039 | |
| | | | | | | | | |
Total Collateralized Mortgage Obligations | | | | |
(Cost $648,876,065) | | | 636,267,625 | |
| | | | | |
U.S. GOVERNMENT SECURITIES†† - 24.8% |
U.S. Treasury Notes |
4.13% due 03/31/31 | | | 85,832,400 | | | | 88,165,968 | |
4.63% due 04/30/31 | | | 60,000,000 | | | | 63,386,719 | |
3.75% due 08/31/31 | | | 56,220,000 | | | | 56,518,669 | |
3.38% due 09/15/27 | | | 50,000,000 | | | | 49,746,094 | |
4.63% due 04/30/29 | | | 22,800,000 | | | | 23,808,188 | |
4.13% due 06/15/26 | | | 260,000 | | | | 261,757 | |
U.S. Treasury Bonds |
due 05/15/515,8 | | | 167,110,000 | | | | 54,894,425 | |
due 11/15/535,8 | | | 46,000,000 | | | | 14,391,653 | |
due 08/15/535,8 | | | 35,000,000 | | | | 10,918,288 | |
due 02/15/525,8 | | | 29,980,000 | | | | 9,572,869 | |
4.38% due 11/15/39 | | | 8,880,000 | | | | 9,288,966 | |
due 02/15/466,8 | | | 23,500,000 | | | | 9,112,052 | |
due 02/15/545,8 | | | 28,290,000 | | | | 8,710,241 | |
due 05/15/446,8 | | | 20,000,000 | | | | 8,385,151 | |
due 08/15/545,8 | | | 14,290,000 | | | | 4,334,874 | |
due 11/15/446,8 | | | 4,600,000 | | | | 1,885,043 | |
4.25% due 08/15/54 | | | 1,200,000 | | | | 1,225,500 | |
United States Treasury Inflation Indexed Bonds |
2.13% due 04/15/2913 | | | 23,713,642 | | | | 24,371,031 | |
0.13% due 10/15/2513 | | | 16,970,660 | | | | 16,640,943 | |
0.38% due 01/15/2713 | | | 16,890,183 | | | | 16,409,425 | |
0.13% due 04/15/2513 | | | 16,475,210 | | | | 16,181,649 | |
1.25% due 04/15/2813 | | | 10,873,982 | | | | 10,770,796 | |
0.50% due 01/15/2813 | | | 9,920,356 | | | | 9,605,004 | |
0.13% due 04/15/2713 | | | 9,078,937 | | | | 8,739,878 | |
1.38% due 07/15/3313 | | | 1,998,766 | | | | 1,970,107 | |
Total U.S. Government Securities | | | | |
(Cost $510,002,053) | | | | | | | 519,295,290 | |
| | | | | | | | | |
CORPORATE BONDS†† - 24.0% |
Financial - 12.7% | | | | | | | | |
Pershing Square Holdings Ltd. | | | | | | | | |
3.25% due 10/01/313 | | | 6,200,000 | | | | 5,314,764 | |
3.25% due 11/15/30 | | | 4,000,000 | | | | 3,517,680 | |
Nippon Life Insurance Co. | | | | | | | | |
2.75% due 01/21/512,3 | | | 8,150,000 | | | | 7,115,754 | |
BPCE S.A. | | | | | | | | |
2.28% due 01/20/322,3 | | | 8,200,000 | | | | 6,987,278 | |
Societe Generale S.A. | | | | | | | | |
5.52% due 01/19/282,3 | | | 5,500,000 | | | | 5,576,470 | |
3.34% due 01/21/332,3 | | | 1,300,000 | | | | 1,142,667 | |
Morgan Stanley | | | | | | | | |
6.63% due 11/01/342 | | | 4,000,000 | | | | 4,524,182 | |
5.94% due 02/07/392 | | | 1,950,000 | | | | 2,047,408 | |
American National Group, Inc. | | | | | | | | |
5.00% due 06/15/27 | | | 5,036,000 | | | | 5,067,772 | |
5.75% due 10/01/29 | | | 1,000,000 | | | | 1,005,779 | |
Host Hotels & Resorts, LP | | | | | | | | |
3.50% due 09/15/30 | | | 3,385,000 | | | | 3,139,266 | |
5.70% due 07/01/34 | | | 2,750,000 | | | | 2,839,446 | |
Wilton RE Ltd. | | | | | | | | |
6.00%2,3,9 | | | 6,237,000 | | | | 5,762,388 | |
Liberty Mutual Group, Inc. | | | | | | | | |
4.13% due 12/15/512,3 | | | 5,800,000 | | | | 5,486,827 | |
Blue Owl Capital GP LLC | | | | | | | | |
7.21% due 08/22/43††† | | | 5,000,000 | | | | 5,486,400 | |
Jefferies Financial Group, Inc. | | | | | | | | |
2.75% due 10/15/32 | | | 2,720,000 | | | | 2,320,373 | |
6.20% due 04/14/34 | | | 1,650,000 | | | | 1,766,311 | |
2.63% due 10/15/31 | | | 1,400,000 | | | | 1,214,343 | |
GLP Capital Limited Partnership / GLP Financing II, Inc. | | | | | | | | |
4.00% due 01/15/31 | | | 4,650,000 | | | | 4,359,034 | |
5.30% due 01/15/29 | | | 900,000 | | | | 915,289 | |
Safehold GL Holdings LLC | | | | | | | | |
2.85% due 01/15/32 | | | 2,428,000 | | | | 2,098,418 | |
2.80% due 06/15/31 | | | 1,931,000 | | | | 1,695,168 | |
6.10% due 04/01/34 | | | 1,400,000 | | | | 1,479,540 | |
GA Global Funding Trust | | | | | | | | |
1.63% due 01/15/263 | | | 5,450,000 | | | | 5,246,437 | |
Brighthouse Financial Global Funding | | | | | | | | |
5.65% due 06/10/293 | | | 4,975,000 | | | | 5,138,901 | |
Citigroup, Inc. | | | | | | | | |
5.83% due 02/13/352 | | | 4,900,000 | | | | 5,117,298 | |
Global Atlantic Finance Co. | | | | | | | | |
7.95% due 06/15/333 | | | 3,841,000 | | | | 4,384,281 | |
6.75% due 03/15/543 | | | 639,000 | | | | 679,905 | |
SEE NOTES TO FINANCIAL STATEMENTS. | THE GUGGENHEIM FUNDS ANNUAL REPORT | 91 |
SCHEDULE OF INVESTMENTS (continued) | September 30, 2024 |
CORE BOND FUND | |
| | Face
Amount~ | | | Value | |
CNA Financial Corp. | | | | | | | | |
5.13% due 02/15/34 | | $ | 4,950,000 | | | $ | 5,061,840 | |
LPL Holdings, Inc. | | | | | | | | |
4.38% due 05/15/313 | | | 3,060,000 | | | | 2,883,817 | |
6.00% due 05/20/34 | | | 1,490,000 | | | | 1,557,447 | |
Demeter Investments BV | | | | | | | | |
5.63% due 08/15/52 | | | 4,350,000 | | | | 4,412,205 | |
Allianz SE | | | | | | | | |
3.20% 2,3,9 | | | 5,000,000 | | | | 4,281,613 | |
Iron Mountain, Inc. | | | | | | | | |
4.50% due 02/15/313 | | | 1,917,000 | | | | 1,818,460 | |
5.25% due 07/15/303 | | | 1,283,000 | | | | 1,266,801 | |
5.63% due 07/15/323 | | | 1,000,000 | | | | 997,434 | |
Reliance Standard Life Global Funding II | | | | | | | | |
5.24% due 02/02/263 | | | 4,016,000 | | | | 4,035,139 | |
First American Financial Corp. | | | | | | | | |
4.00% due 05/15/30 | | | 3,180,000 | | | | 3,020,502 | |
5.45% due 09/30/34 | | | 1,000,000 | | | | 995,399 | |
PartnerRe Finance B LLC | | | | | | | | |
4.50% due 10/01/502 | | | 4,040,000 | | | | 3,736,515 | |
FS KKR Capital Corp. | | | | | | | | |
2.63% due 01/15/27 | | | 2,150,000 | | | | 2,022,116 | |
3.25% due 07/15/27 | | | 1,800,000 | | | | 1,704,754 | |
CoStar Group, Inc. | | | | | | | | |
2.80% due 07/15/303 | | | 4,130,000 | | | | 3,720,762 | |
Macquarie Group Ltd. | | | | | | | | |
2.87% due 01/14/332,3 | | | 2,150,000 | | | | 1,867,474 | |
2.69% due 06/23/322,3 | | | 2,000,000 | | | | 1,740,865 | |
Maple Grove Funding Trust I | | | | | | | | |
4.16% due 08/15/513 | | | 4,750,000 | | | | 3,425,609 | |
Lazard Group LLC | | | | | | | | |
6.00% due 03/15/31 | | | 3,230,000 | | | | 3,406,025 | |
Macquarie Bank Ltd. | | | | | | | | |
3.62% due 06/03/303 | | | 3,570,000 | | | | 3,335,209 | |
Fairfax Financial Holdings Ltd. | | | | | | | | |
3.38% due 03/03/31 | | | 2,500,000 | | | | 2,284,454 | |
5.63% due 08/16/32 | | | 1,000,000 | | | | 1,036,079 | |
Brookfield Finance, Inc. | | | | | | | | |
5.97% due 03/04/54 | | | 1,300,000 | | | | 1,411,919 | |
4.70% due 09/20/47 | | | 650,000 | | | | 600,892 | |
3.50% due 03/30/51 | | | 630,000 | | | | 475,047 | |
3.63% due 02/15/52 | | | 620,000 | | | | 467,858 | |
5.68% due 01/15/35 | | | 300,000 | | | | 314,877 | |
CNO Financial Group, Inc. | | | | | | | | |
6.45% due 06/15/34 | | | 2,410,000 | | | | 2,547,652 | |
5.25% due 05/30/29 | | | 700,000 | | | | 708,467 | |
Nuveen LLC | | | | | | | | |
5.85% due 04/15/343 | | | 2,150,000 | | | | 2,276,902 | |
5.55% due 01/15/303 | | | 700,000 | | | | 732,993 | |
Old Republic International Corp. | | | | | | | | |
5.75% due 03/28/34 | | | 2,850,000 | | | | 2,989,454 | |
Nationwide Mutual Insurance Co. | | | | | | | | |
4.35% due 04/30/503 | | | 3,687,000 | | | | 2,985,603 | |
Rocket Mortgage LLC / Rocket Mortgage Company-Issuer, Inc. | | | | | | | | |
3.88% due 03/01/313 | | | 3,150,000 | | | | 2,900,332 | |
Pacific Beacon LLC | | | | | | | | |
5.51% due 07/15/363 | | | 2,900,000 | | | | 2,858,112 | |
OneAmerica Financial Partners, Inc. | | | | | | | | |
4.25% due 10/15/503 | | | 3,620,000 | | | | 2,687,330 | |
UBS Group AG | | | | | | | | |
3.09% due 05/14/322,3 | | | 2,950,000 | | | | 2,660,172 | |
Ares Finance Company II LLC | | | | | | | | |
3.25% due 06/15/303 | | | 2,760,000 | | | | 2,575,876 | |
Accident Fund Insurance Company of America | | | | | | | | |
8.50% due 08/01/323 | | | 2,450,000 | | | | 2,492,004 | |
TPG Operating Group II, LP | | | | | | | | |
5.88% due 03/05/34 | | | 2,300,000 | | | | 2,452,168 | |
Jefferies Finance LLC / JFIN Company-Issuer Corp. | | | | | | | | |
5.00% due 08/15/283 | | | 2,450,000 | | | | 2,329,486 | |
Voya Financial, Inc. | | | | | | | | |
4.80% due 06/15/46 | | | 2,500,000 | | | | 2,268,448 | |
Sumitomo Life Insurance Co. | | | | | | | | |
3.38% due 04/15/812,3 | | | 2,500,000 | | | | 2,256,742 | |
Fidelity National Financial, Inc. | | | | | | | | |
3.40% due 06/15/30 | | | 2,350,000 | | | | 2,188,528 | |
2.45% due 03/15/31 | | | 70,000 | | | | 60,672 | |
Standard Chartered plc | | | | | | | | |
4.64% due 04/01/312,3 | | | 2,250,000 | | | | 2,241,963 | |
Capital One Financial Corp. | | | | | | | | |
6.05% due 02/01/352 | | | 2,000,000 | | | | 2,117,684 | |
Aon North America, Inc. | | | | | | | | |
5.45% due 03/01/34 | | | 1,900,000 | | | | 1,994,850 | |
Stewart Information Services Corp. | | | | | | | | |
3.60% due 11/15/31 | | | 2,250,000 | | | | 1,975,455 | |
AmFam Holdings, Inc. | | | | | | | | |
2.81% due 03/11/313 | | | 1,800,000 | | | | 1,430,161 | |
3.83% due 03/11/513 | | | 850,000 | | | | 539,759 | |
Mid-Atlantic Military Family Communities LLC | | | | | | | | |
5.30% due 08/01/503 | | | 2,127,979 | | | | 1,921,413 | |
Westpac Banking Corp. | | | | | | | | |
3.02% due 11/18/362 | | | 1,200,000 | | | | 1,041,474 | |
2.96% due 11/16/40 | | | 805,000 | | | | 609,087 | |
2.67% due 11/15/352 | | | 295,000 | | | | 257,386 | |
Equinix Europe 2 Financing Corporation LLC | | | | | | | | |
5.50% due 06/15/34 | | | 1,800,000 | | | | 1,888,797 | |
Reinsurance Group of America, Inc. | | | | | | | | |
5.75% due 09/15/34 | | | 1,750,000 | | | | 1,843,469 | |
Americo Life, Inc. | | | | | | | | |
3.45% due 04/15/313 | | | 2,060,000 | | | | 1,753,962 | |
QBE Insurance Group Ltd. | | | | | | | | |
5.88% 2,3,9 | | | 1,750,000 | | | | 1,740,240 | |
KKR Group Finance Company VIII LLC | | | | | | | | |
3.50% due 08/25/503 | | | 2,360,000 | | | | 1,729,136 | |
Corebridge Life Holdings, Inc. | | | | | | | | |
8.13% due 03/15/463 | | | 1,400,000 | | | | 1,686,146 | |
Markel Group, Inc. | | | | | | | | |
6.00% due 05/16/54 | | | 1,550,000 | | | | 1,648,078 | |
Bank of America Corp. | | | | | | | | |
2.59% due 04/29/312 | | | 1,800,000 | | | | 1,632,316 | |
92 | THE GUGGENHEIM FUNDS ANNUAL REPORT | SEE NOTES TO FINANCIAL STATEMENTS. |
SCHEDULE OF INVESTMENTS (continued) | September 30, 2024 |
CORE BOND FUND | |
| | Face
Amount~ | | | Value | |
Dyal Capital Partners III | | | | | | | | |
4.40% due 06/15/40††† | | $ | 1,750,000 | | | $ | 1,632,102 | |
Trustage Financial Group, Inc. | | | | | | | | |
4.63% due 04/15/323 | | | 1,750,000 | | | | 1,613,333 | |
Australia & New Zealand Banking Group Ltd. | | | | | | | | |
2.57% due 11/25/352,3 | | | 1,800,000 | | | | 1,561,858 | |
Lloyds Banking Group plc | | | | | | | | |
5.46% due 01/05/282 | | | 1,500,000 | | | | 1,533,610 | |
HS Wildcat LLC | | | | | | | | |
3.83% due 12/31/50††† | | | 1,982,347 | | | | 1,493,976 | |
BNP Paribas S.A. | | | | | | | | |
5.50% due 05/20/302,3 | | | 1,400,000 | | | | 1,450,763 | |
Muenchener Rueckversicherungs-Gesellschaft AG in Muenchen | | | | | | | | |
5.88% due 05/23/422,3 | | | 1,350,000 | | | | 1,414,233 | |
National Australia Bank Ltd. | | | | | | | | |
2.99% due 05/21/313 | | | 975,000 | | | | 867,215 | |
2.33% due 08/21/303 | | | 502,000 | | | | 437,354 | |
ABN AMRO Bank N.V. | | | | | | | | |
2.47% due 12/13/292,3 | | | 1,400,000 | | | | 1,287,230 | |
Globe Life, Inc. | | | | | | | | |
5.85% due 09/15/34 | | | 1,160,000 | | | | 1,198,657 | |
Brookfield Capital Finance LLC | | | | | | | | |
6.09% due 06/14/33 | | | 1,100,000 | | | | 1,190,387 | |
Assurant, Inc. | | | | | | | | |
2.65% due 01/15/32 | | | 1,377,000 | | | | 1,186,979 | |
Prudential Financial, Inc. | | | | | | | | |
3.70% due 10/01/502 | | | 1,160,000 | | | | 1,071,110 | |
RGA Global Funding | | | | | | | | |
5.50% due 01/11/313 | | | 1,000,000 | | | | 1,045,199 | |
JPMorgan Chase & Co. | | | | | | | | |
2.96% due 05/13/312 | | | 1,093,000 | | | | 1,005,285 | |
Belvoir Land LLC | | | | | | | | |
5.60% due 12/15/353 | | | 1,000,000 | | | | 988,414 | |
VICI Properties Limited Partnership / VICI Note Company, Inc. | | | | | | | | |
4.13% due 08/15/303 | | | 1,000,000 | | | | 949,631 | |
Mutual of Omaha Insurance Co. | | | | | | | | |
6.14% due 01/16/642,3 | | | 850,000 | | | | 907,218 | |
Sumitomo Mitsui Financial Group, Inc. | | | | | | | | |
2.22% due 09/17/31 | | | 1,050,000 | | | | 904,371 | |
Wells Fargo & Co. | | | | | | | | |
6.85% 2,9 | | | 850,000 | | | | 887,148 | |
Apollo Management Holdings, LP | | | | | | | | |
2.65% due 06/05/303 | | | 930,000 | | | | 843,096 | |
Fort Moore Family Communities LLC | | | | | | | | |
6.09% due 01/15/513 | | | 861,787 | | | | 819,780 | |
Dyal Capital Partners III (B) LP | | | | | | | | |
6.55% due 06/15/44††† | | | 770,000 | | | | 794,625 | |
Central Storage Safety Project Trust | | | | | | | | |
4.82% due 02/01/3810 | | | 793,920 | | | | 749,577 | |
Protective Life Corp. | | | | | | | | |
3.40% due 01/15/303 | | | 740,000 | | | | 700,559 | |
Brown & Brown, Inc. | | | | | | | | |
2.38% due 03/15/31 | | | 800,000 | | | | 692,560 | |
Penn Mutual Life Insurance Co. | | | | | | | | |
3.80% due 04/29/613 | | | 950,000 | | | | 656,524 | |
Western & Southern Life Insurance Co. | | | | | | | | |
3.75% due 04/28/613 | | | 850,000 | | | | 618,657 | |
Assured Guaranty US Holdings, Inc. | | | | | | | | |
3.60% due 09/15/51 | | | 800,000 | | | | 586,330 | |
Kemper Corp. | | | | | | | | |
2.40% due 09/30/30 | | | 675,000 | | | | 585,129 | |
Horace Mann Educators Corp. | | | | | | | | |
7.25% due 09/15/28 | | | 517,000 | | | | 561,556 | |
Credit Agricole S.A. | | | | | | | | |
5.34% due 01/10/302,3 | | | 500,000 | | | | 514,510 | |
Hanover Insurance Group, Inc. | | | | | | | | |
2.50% due 09/01/30 | | | 480,000 | | | | 420,785 | |
Cooperatieve Rabobank UA | | | | | | | | |
4.66% due 08/22/282,3 | | | 400,000 | | | | 403,103 | |
Brookfield Finance LLC / Brookfield Finance, Inc. | | | | | | | | |
3.45% due 04/15/50 | | | 470,000 | | | | 349,737 | |
Cushman & Wakefield US Borrower LLC | | | | | | | | |
6.75% due 05/15/283 | | | 296,000 | | | | 298,685 | |
Swiss Re Finance Luxembourg S.A. | | | | | | | | |
5.00% due 04/02/492,3 | | | 200,000 | | | | 203,027 | |
Fidelity & Guaranty Life Holdings, Inc. | | | | | | | | |
5.50% due 05/01/253 | | | 127,000 | | | | 126,993 | |
KKR Group Finance Company III LLC | | | | | | | | |
5.13% due 06/01/443 | | | 100,000 | | | | 96,792 | |
Total Financial | | | | | | | 265,980,906 | |
| | | | | | | | | |
Industrial - 2.8% | | | | | | | | |
AP Grange Holdings | | | | | | | | |
6.50% due 03/20/45††† | | | 12,900,000 | | | | 13,006,948 | |
5.00% due 03/20/45††† | | | 1,400,000 | | | | 1,436,083 | |
TD SYNNEX Corp. | | | | | | | | |
6.10% due 04/12/34 | | | 1,750,000 | | | | 1,851,878 | |
2.65% due 08/09/31 | | | 2,142,000 | | | | 1,835,291 | |
2.38% due 08/09/28 | | | 1,600,000 | | | | 1,475,124 | |
Berry Global, Inc. | | | | | | | | |
5.80% due 06/15/313 | | | 2,350,000 | | | | 2,445,199 | |
4.88% due 07/15/263 | | | 2,156,000 | | | | 2,152,555 | |
Howmet Aerospace, Inc. | | | | | | | | |
3.00% due 01/15/29 | | | 3,800,000 | | | | 3,602,854 | |
FLNG Liquefaction 3 LLC | | | | | | | | |
3.08% due 06/30/39††† | | | 3,918,460 | | | | 3,183,827 | |
Vontier Corp. | | | | | | | | |
2.95% due 04/01/31 | | | 3,450,000 | | | | 3,001,509 | |
Amazon.com, Inc. | | | | | | | | |
2.65% due 10/10/42††† | | | 3,419,585 | | | | 2,835,007 | |
Flowserve Corp. | | | | | | | | |
3.50% due 10/01/30 | | | 1,810,000 | | | | 1,685,069 | |
2.80% due 01/15/32 | | | 1,150,000 | | | | 996,044 | |
Boeing Co. | | | | | | | | |
6.86% due 05/01/543 | | | 1,150,000 | | | | 1,262,252 | |
6.53% due 05/01/343 | | | 950,000 | | | | 1,019,602 | |
SEE NOTES TO FINANCIAL STATEMENTS. | THE GUGGENHEIM FUNDS ANNUAL REPORT | 93 |
SCHEDULE OF INVESTMENTS (continued) | September 30, 2024 |
CORE BOND FUND | |
| | Face
Amount~ | | | Value | |
Penske Truck Leasing Company Lp / PTL Finance Corp. | | $ | | | | | | |
5.25% due 07/01/293 | | | 2,100,000 | | | $ | 2,162,581 | |
Fortune Brands Innovations, Inc. | | | | | | | | |
4.00% due 03/25/32 | | | 2,050,000 | | | | 1,951,799 | |
Smurfit Kappa Treasury ULC | | | | | | | | |
5.44% due 04/03/343 | | | 1,850,000 | | | | 1,928,078 | |
Cliffwater Corporate Lending Fund | | | | | | | | |
6.77% due 08/04/28††† | | | 1,550,000 | | | | 1,613,953 | |
Owens Corning | | | | | | | | |
5.95% due 06/15/54 | | | 1,380,000 | | | | 1,464,638 | |
Stadco LA LLC | | | | | | | | |
3.75% due 05/15/56††† | | | 2,000,000 | | | | 1,423,940 | |
GATX Corp. | | | | | | | | |
6.05% due 06/05/54 | | | 1,258,000 | | | | 1,360,175 | |
Cellnex Finance Company S.A. | | | | | | | | |
3.88% due 07/07/413 | | | 1,372,000 | | | | 1,121,419 | |
Amcor Flexibles North America, Inc. | | | | | | | | |
2.63% due 06/19/30 | | | 1,230,000 | | | | 1,106,254 | |
Dyal Capital Partners III (A) LP | | | | | | | | |
6.55% due 06/15/44††† | | | 980,000 | | | | 1,011,340 | |
Sonoco Products Co. | | | | | | | | |
5.00% due 09/01/34 | | | 700,000 | | | | 690,233 | |
Westinghouse Air Brake Technologies Corp. | | | | | | | | |
5.61% due 03/11/34 | | | 500,000 | | | | 528,516 | |
Norfolk Southern Corp. | | | | | | | | |
4.10% due 05/15/21 | | | 600,000 | | | | 453,972 | |
Total Industrial | | | | | | | 58,606,140 | |
| | | | | | | | | |
Consumer, Cyclical - 2.2% | | | | | | | | |
Hyatt Hotels Corp. | | | | | | | | |
5.38% due 04/23/25 | | | 3,950,000 | | | | 3,956,425 | |
5.75% due 04/23/30 | | | 3,010,000 | | | | 3,150,447 | |
Choice Hotels International, Inc. | | | | | | | | |
3.70% due 01/15/31 | | | 7,340,000 | | | | 6,789,145 | |
Advance Auto Parts, Inc. | | | | | | | | |
5.90% due 03/09/26 | | | 4,972,000 | | | | 5,023,295 | |
Whirlpool Corp. | | | | | | | | |
4.60% due 05/15/50 | | | 4,840,000 | | | | 4,053,470 | |
Delta Air Lines, Inc. | | | | | | | | |
7.00% due 05/01/253 | | | 3,014,000 | | | | 3,045,749 | |
Smithsonian Institution | | | | | | | | |
2.70% due 09/01/44 | | | 4,000,000 | | | | 2,900,612 | |
Alt-2 Structured Trust | | | | | | | | |
2.95% due 05/14/31◊,††† | | | 2,826,547 | | | | 2,601,724 | |
British Airways Class A Pass Through Trust | | | | | | | | |
4.25% due 11/15/323 | | | 1,836,510 | | | | 1,758,702 | |
2.90% due 03/15/353 | | | 746,966 | | | | 662,563 | |
Warnermedia Holdings, Inc. | | | | | | | | |
5.14% due 03/15/52 | | | 1,640,000 | | | | 1,264,890 | |
6.41% due 03/15/26 | | | 600,000 | | | | 600,355 | |
Ferguson Finance plc | | | | | | | | |
3.25% due 06/02/303 | | | 1,204,000 | | | | 1,121,744 | |
4.65% due 04/20/323 | | | 600,000 | | | | 588,401 | |
LG Energy Solution Ltd. | | | | | | | | |
5.50% due 07/02/343 | | | 1,600,000 | | | | 1,645,152 | |
United Airlines 2023-1 Class A Pass Through Trust | | | | | | | | |
5.80% due 01/15/36 | | | 1,417,603 | | | | 1,487,785 | |
Mileage Plus Holdings LLC / Mileage Plus Intellectual Property Assets Ltd. | | | | | | | | |
6.50% due 06/20/273 | | | 1,402,500 | | | | 1,419,939 | |
Delta Air Lines, Inc. / SkyMiles IP Ltd. | | | | | | | | |
4.50% due 10/20/253 | | | 1,311,250 | | | | 1,303,270 | |
Polaris, Inc. | | | | | | | | |
6.95% due 03/15/29 | | | 1,050,000 | | | | 1,139,627 | |
Flutter Treasury Designated Activity Co. | | | | | | | | |
6.38% due 04/29/293 | | | 1,050,000 | | | | 1,087,195 | |
American Airlines Class AA Pass Through Trust | | | | | | | | |
3.20% due 06/15/28 | | | 652,000 | | | | 617,579 | |
LKQ Corp. | | | | | | | | |
6.25% due 06/15/33 | | | 300,000 | | | | 318,114 | |
Total Consumer, Cyclical | | | | | | | 46,536,183 | |
| | | | | | | | | |
Consumer, Non-cyclical - 2.0% | | | | | | | | |
Philip Morris International, Inc. | | | | | | | | |
5.13% due 02/13/31 | | | 4,900,000 | | | | 5,093,058 | |
5.25% due 02/13/34 | | | 750,000 | | | | 778,885 | |
JBS USA Holding Lux SARL/ JBS USA Food Company/ JBS Lux Co SARL | | | | | | | | |
5.50% due 01/15/30 | | | 2,200,000 | | | | 2,228,389 | |
3.00% due 05/15/32 | | | 1,750,000 | | | | 1,517,565 | |
4.38% due 02/02/52 | | | 600,000 | | | | 476,544 | |
Smithfield Foods, Inc. | | | | | | | | |
2.63% due 09/13/313 | | | 2,500,000 | | | | 2,118,428 | |
5.20% due 04/01/293 | | | 1,200,000 | | | | 1,203,966 | |
3.00% due 10/15/303 | | | 970,000 | | | | 869,402 | |
BAT Capital Corp. | | | | | | | | |
6.00% due 02/20/34 | | | 3,000,000 | | | | 3,206,384 | |
Global Payments, Inc. | | | | | | | | |
2.90% due 11/15/31 | | | 1,650,000 | | | | 1,452,300 | |
2.90% due 05/15/30 | | | 1,506,000 | | | | 1,371,696 | |
3.20% due 08/15/29 | | | 114,000 | | | | 106,803 | |
GXO Logistics, Inc. | | | | | | | | |
6.50% due 05/06/34 | | | 1,250,000 | | | | 1,329,818 | |
6.25% due 05/06/29 | | | 1,250,000 | | | | 1,315,557 | |
Universal Health Services, Inc. | | | | | | | | |
2.65% due 10/15/30 | | | 1,320,000 | | | | 1,177,308 | |
5.05% due 10/15/34 | | | 1,000,000 | | | | 981,616 | |
Altria Group, Inc. | | | | | | | | |
4.45% due 05/06/50 | | | 1,365,000 | | | | 1,143,738 | |
3.70% due 02/04/51 | | | 1,280,000 | | | | 944,617 | |
CVS Health Corp. | | | | | | | | |
5.70% due 06/01/34 | | | 2,000,000 | | | | 2,086,452 | |
Royalty Pharma plc | | | | | | | | |
3.55% due 09/02/50 | | | 2,690,000 | | | | 1,949,232 | |
Triton Container International Ltd. | | | | | | | | |
3.15% due 06/15/313 | | | 2,100,000 | | | | 1,830,102 | |
Element Fleet Management Corp. | | | | | | | | |
6.32% due 12/04/283 | | | 1,500,000 | | | | 1,598,436 | |
94 | THE GUGGENHEIM FUNDS ANNUAL REPORT | SEE NOTES TO FINANCIAL STATEMENTS. |
SCHEDULE OF INVESTMENTS (continued) | September 30, 2024 |
CORE BOND FUND | |
| | Face
Amount~ | | | Value | |
AZ Battery Property LLC | | | | | | | | |
6.73% due 02/20/46††† | | | 1,420,000 | | | $ | 1,490,105 | |
Yale-New Haven Health Services Corp. | | | | | | | | |
2.50% due 07/01/50 | | | 2,250,000 | | | | 1,429,440 | |
Highmark, Inc. | | | | | | | | |
2.55% due 05/10/313 | | | 1,500,000 | | | | 1,270,758 | |
Transurban Finance Company Pty Ltd. | | | | | | | | |
2.45% due 03/16/313 | | | 1,300,000 | | | | 1,129,656 | |
Kroger Co. | | | | | | | | |
5.50% due 09/15/54 | | | 850,000 | | | | 855,444 | |
Kraft Heinz Foods Co. | | | | | | | | |
7.13% due 08/01/393 | | | 650,000 | | | | 776,468 | |
Tyson Foods, Inc. | | | | | | | | |
5.70% due 03/15/34 | | | 400,000 | | | | 421,470 | |
Catalent Pharma Solutions, Inc. | | | | | | | | |
3.13% due 02/15/293 | | | 250,000 | | | | 245,575 | |
Triton Container International Limited / TAL International Container Corp. | | | | | | | | |
3.25% due 03/15/32 | | | 200,000 | | | | 172,883 | |
Total Consumer, Non-cyclical | | | | | | | 42,572,095 | |
| | | | | | | | | |
Energy - 1.6% | | | | | | | | |
BP Capital Markets plc | | | | | | | | |
4.88% 2,9 | | | 6,348,000 | | | | 6,279,142 | |
ONEOK, Inc. | | | | | | | | |
6.05% due 09/01/33 | | | 3,800,000 | | | | 4,060,167 | |
3.95% due 03/01/50 | | | 2,000,000 | | | | 1,536,884 | |
Greensaif Pipelines Bidco SARL | | | | | | | | |
5.85% due 02/23/363 | | | 1,500,000 | | | | 1,551,473 | |
6.10% due 08/23/423 | | | 800,000 | | | | 828,470 | |
6.51% due 02/23/423 | | | 400,000 | | | | 430,566 | |
6.13% due 02/23/383 | | | 350,000 | | | | 370,622 | |
Plains All American Pipeline Limited Partnership / PAA Finance Corp. | | | | | | | | |
5.70% due 09/15/34 | | | 2,850,000 | | | | 2,961,630 | |
Galaxy Pipeline Assets Bidco Ltd. | | | | | | | | |
3.25% due 09/30/403 | | | 2,986,000 | | | | 2,417,219 | |
Boardwalk Pipelines, LP | | | | | | | | |
5.63% due 08/01/34 | | | 2,000,000 | | | | 2,063,026 | |
Enbridge, Inc. | | | | | | | | |
5.63% due 04/05/34 | | | 1,900,000 | | | | 1,992,750 | |
Targa Resources Partners Limited Partnership / Targa Resources Partners Finance Corp. | | | | | | | | |
6.88% due 01/15/29 | | | 1,734,000 | | | | 1,777,891 | |
Midwest Connector Capital Company LLC | | | | | | | | |
4.63% due 04/01/293 | | | 1,050,000 | | | | 1,043,690 | |
Cheniere Energy, Inc. | | | | | | | | |
5.65% due 04/15/343 | | | 1,000,000 | | | | 1,034,610 | |
Cheniere Energy Partners, LP | | | | | | | | |
5.95% due 06/30/33 | | | 750,000 | | | | 793,610 | |
5.75% due 08/15/343 | | | 150,000 | | | | 156,262 | |
Viper Energy, Inc. | | | | | | | | |
7.38% due 11/01/313 | | | 850,000 | | | | 896,473 | |
Kinder Morgan Energy Partners, LP | | | | | | | | |
5.80% due 03/15/35 | | | 725,000 | | | | 761,726 | |
Energy Transfer, LP | | | | | | | | |
7.38% due 02/01/313 | | | 710,000 | | | | 755,333 | |
NuStar Logistics, LP | | | | | | | | |
6.38% due 10/01/30 | | | 534,000 | | | | 554,090 | |
6.00% due 06/01/26 | | | 200,000 | | | | 201,189 | |
TransCanada PipeLines Ltd. | | | | | | | | |
6.20% due 03/09/26 | | | 700,000 | | | | 700,682 | |
Total Energy | | | | | | | 33,167,505 | |
| | | | | | | | | |
Technology - 1.0% | | | | | | | | |
Entegris, Inc. | | | | | | | | |
4.75% due 04/15/293 | | | 3,700,000 | | | | 3,646,166 | |
Foundry JV Holdco LLC | | | | | | | | |
5.88% due 01/25/343 | | | 1,900,000 | | | | 1,935,671 | |
6.15% due 01/25/323 | | | 600,000 | | | | 623,971 | |
6.40% due 01/25/383 | | | 550,000 | | | | 579,147 | |
Fiserv, Inc. | | | | | | | | |
5.35% due 03/15/31 | | | 1,850,000 | | | | 1,935,119 | |
5.63% due 08/21/33 | | | 1,000,000 | | | | 1,059,259 | |
Broadcom, Inc. | | | | | | | | |
4.93% due 05/15/373 | | | 2,306,000 | | | | 2,304,005 | |
3.19% due 11/15/363 | | | 217,000 | | | | 183,915 | |
Leidos, Inc. | | | | | | | | |
2.30% due 02/15/31 | | | 1,750,000 | | | | 1,520,315 | |
5.75% due 03/15/33 | | | 500,000 | | | | 525,968 | |
4.38% due 05/15/30 | | | 200,000 | | | | 196,798 | |
Oracle Corp. | | | | | | | | |
3.95% due 03/25/51 | | | 2,128,000 | | | | 1,712,621 | |
Atlassian Corp. | | | | | | | | |
5.50% due 05/15/34 | | | 1,450,000 | | | | 1,517,363 | |
MSCI, Inc. | | | | | | | | |
3.63% due 11/01/313 | | | 1,300,000 | | | | 1,196,412 | |
CGI, Inc. | | | | | | | | |
2.30% due 09/14/31 | | | 1,300,000 | | | | 1,114,225 | |
Constellation Software, Inc. | | | | | | | | |
5.16% due 02/16/293 | | | 700,000 | | | | 721,573 | |
5.46% due 02/16/343 | | | 350,000 | | | | 365,862 | |
Booz Allen Hamilton, Inc. | | | | | | | | |
5.95% due 08/04/33 | | | 700,000 | | | | 747,142 | |
Total Technology | | | | | | | 21,885,532 | |
| | | | | | | | | |
Communications - 0.8% | | | | | | | | |
British Telecommunications plc | | | | | | | | |
4.88% due 11/23/812,3 | | | 2,900,000 | | | | 2,677,125 | |
4.25% due 11/23/812,3 | | | 500,000 | | | | 485,237 | |
9.63% due 12/15/30 | | | 150,000 | | | | 189,422 | |
Vodafone Group plc | | | | | | | | |
4.13% due 06/04/812 | | | 2,550,000 | | | | 2,311,508 | |
Paramount Global | | | | | | | | |
4.90% due 08/15/44 | | | 1,035,000 | | | | 795,442 | |
5.90% due 10/15/40 | | | 666,000 | | | | 589,282 | |
5.25% due 04/01/44 | | | 358,000 | | | | 285,198 | |
2.90% due 01/15/27 | | | 236,000 | | | | 225,838 | |
4.85% due 07/01/42 | | | 281,000 | | | | 224,133 | |
4.60% due 01/15/45 | | | 150,000 | | | | 110,706 | |
SEE NOTES TO FINANCIAL STATEMENTS. | THE GUGGENHEIM FUNDS ANNUAL REPORT | 95 |
SCHEDULE OF INVESTMENTS (continued) | September 30, 2024 |
CORE BOND FUND | |
| | Face
Amount~ | | | Value | |
Charter Communications Operating LLC / Charter Communications Operating Capital | | | | | | | | |
3.90% due 06/01/52 | | | 3,350,000 | | | $ | 2,196,409 | |
Level 3 Financing, Inc. | | | | | | | | |
4.50% due 04/01/303 | | | 2,175,000 | | | | 1,684,552 | |
11.00% due 11/15/293 | | | 359,563 | | | | 398,243 | |
Fox Corp. | | | | | | | | |
6.50% due 10/13/33 | | | 1,650,000 | | | | 1,805,477 | |
Rogers Communications, Inc. | | | | | | | | |
4.55% due 03/15/52 | | | 2,000,000 | | | | 1,731,874 | |
CSC Holdings LLC | | | | | | | | |
4.13% due 12/01/303 | | | 600,000 | | | | 437,253 | |
Telenet Finance Luxembourg Notes SARL | | | | | | | | |
5.50% due 03/01/28 | | | 200,000 | | | | 195,547 | |
Altice France S.A. | | | | | | | | |
5.13% due 01/15/293 | | | 250,000 | | | | 175,582 | |
Total Communications | | | | | | | 16,518,828 | |
| | | | | | | | | |
Utilities - 0.5% | | | | | | | | |
Liberty Utilities Co. | | | | | | | | |
5.58% due 01/31/293 | | | 1,400,000 | | | | 1,447,284 | |
5.87% due 01/31/343 | | | 550,000 | | | | 576,432 | |
AES Corp. | | | | | | | | |
3.95% due 07/15/303 | | | 1,760,000 | | | | 1,678,450 | |
NRG Energy, Inc. | | | | | | | | |
2.45% due 12/02/273 | | | 1,750,000 | | | | 1,639,534 | |
Public Service Company of Colorado | | | | | | | | |
5.35% due 05/15/34 | | | 1,100,000 | | | | 1,153,687 | |
Brooklyn Union Gas Co. | | | | | | | | |
6.39% due 09/15/333 | | | 800,000 | | | | 871,115 | |
Enel Finance International N.V. | | | | | | | | |
5.00% due 06/15/323 | | | 850,000 | | | | 859,845 | |
Black Hills Corp. | | | | | | | | |
6.00% due 01/15/35 | | | 800,000 | | | | 851,856 | |
Alexander Funding Trust II | | | | | | | | |
7.47% due 07/31/283 | | | 450,000 | | | | 486,208 | |
Total Utilities | | | | | | | 9,564,411 | |
| | | | | | | | | |
Basic Materials - 0.3% | | | | | | | | |
Anglo American Capital plc | | | | | | | | |
5.63% due 04/01/303 | | | 1,800,000 | | | | 1,870,814 | |
5.75% due 04/05/343 | | | 1,650,000 | | | | 1,722,472 | |
3.95% due 09/10/503 | | | 970,000 | | | | 761,255 | |
2.63% due 09/10/303 | | | 250,000 | | | | 222,509 | |
Yamana Gold, Inc. | | | | | | | | |
2.63% due 08/15/31 | | | 1,200,000 | | | | 1,038,892 | |
Total Basic Materials | | | | | | | 5,615,942 | |
| | | | | | | | | |
Transporation - 0.1% | | | | | | | | |
Stolthaven Houston, Inc. | | | | | | | | |
5.98% due 07/17/34††† | | | 2,000,000 | | | | 2,060,120 | |
Total Corporate Bonds | | | | |
(Cost $528,610,555) | | | 502,507,662 | |
ASSET-BACKED SECURITIES†† - 22.0% |
Collateralized Loan Obligations - 11.0% | | | | | | | | |
Cerberus Loan Funding XLIV LLC | | | | | | | | |
2024-5A A, 7.65% (3 Month Term SOFR + 2.35%, Rate Floor: 2.35%) due 01/15/36◊,3 | | | 8,900,000 | | | | 8,931,008 | |
2024-5A B, 8.50% (3 Month Term SOFR + 3.20%, Rate Floor: 3.20%) due 01/15/36◊,3 | | | 3,000,000 | | | | 3,003,426 | |
Palmer Square Loan Funding Ltd. | | | | | | | | |
2021-3A C, 8.04% (3 Month Term SOFR + 2.76%, Rate Floor: 2.76%) due 07/20/29◊,3 | | | 2,000,000 | | | | 2,003,909 | |
2021-1A B, 7.34% (3 Month Term SOFR + 2.06%, Rate Floor: 2.06%) due 04/20/29◊,3 | | | 2,000,000 | | | | 1,999,994 | |
2021-1A A2, 6.79% (3 Month Term SOFR + 1.51%, Rate Floor: 1.51%) due 04/20/29◊,3 | | | 1,528,175 | | | | 1,528,152 | |
2023-2A A2, 7.59% (3 Month Term SOFR + 2.30%, Rate Floor: 2.30%) due 01/25/32◊,3 | | | 1,500,000 | | | | 1,504,928 | |
2024-3A BR, 7.30% (3 Month Term SOFR + 2.00%, Rate Floor: 2.00%) due 04/15/31◊,3 | | | 1,500,000 | | | | 1,503,595 | |
2023-4A B, 8.03% (3 Month Term SOFR + 2.75%, Rate Floor: 2.75%) due 07/24/31◊,3 | | | 1,000,000 | | | | 1,004,651 | |
2023-2A B, 7.99% (3 Month Term SOFR + 2.70%, Rate Floor: 2.70%) due 01/25/32◊,3 | | | 1,000,000 | | | | 1,004,238 | |
2021-2A C, 7.79% (3 Month Term SOFR + 2.66%, Rate Floor: 2.66%) due 05/20/29◊,3 | | | 1,000,000 | | | | 1,000,941 | |
LoanCore Issuer Ltd. | | | | | | | | |
2021-CRE5 C, 7.56% (1 Month Term SOFR + 2.46%, Rate Floor: 2.46%) due 07/15/36◊,3 | | | 7,500,000 | | | | 7,372,799 | |
2021-CRE6 C, 7.51% (1 Month Term SOFR + 2.41%, Rate Floor: 2.30%) due 11/15/38◊,3 | | | 4,000,000 | | | | 3,902,748 | |
LCCM Trust | | | | | | | | |
2021-FL3 A, 6.66% (1 Month Term SOFR + 1.56%, Rate Floor: 1.56%) due 11/15/38◊,3 | | | 4,465,705 | | | | 4,435,978 | |
2021-FL3 AS, 7.01% (1 Month Term SOFR + 1.91%, Rate Floor: 1.91%) due 11/15/38◊,3 | | | 3,950,000 | | | | 3,842,411 | |
2021-FL2 C, 7.36% (1 Month Term SOFR + 2.26%, Rate Floor: 2.26%) due 12/13/38◊,3 | | | 3,100,000 | | | | 2,982,339 | |
Octagon Investment Partners 49 Ltd. | | | | | | | | |
2024-5A BR, 7.25% (3 Month Term SOFR + 1.95%, Rate Floor: 1.95%) due 04/15/37◊,3 | | | 8,500,000 | | | | 8,549,065 | |
96 | THE GUGGENHEIM FUNDS ANNUAL REPORT | SEE NOTES TO FINANCIAL STATEMENTS. |
SCHEDULE OF INVESTMENTS (continued) | September 30, 2024 |
CORE BOND FUND | |
| | Face
Amount~ | | | Value | |
Dryden 36 Senior Loan Fund | | | | | | | | |
2020-36A CR3, 7.61% (3 Month Term SOFR + 2.31%, Rate Floor: 2.05%) due 04/15/29◊,3 | | | 8,000,000 | | | $ | 8,023,977 | |
Madison Park Funding XLVIII Ltd. | | | | | | | | |
2021-48A C, 7.54% (3 Month Term SOFR + 2.26%, Rate Floor: 2.26%) due 04/19/33◊,3 | | | 4,000,000 | | | | 4,011,338 | |
2021-48A B, 6.99% (3 Month Term SOFR + 1.71%, Rate Floor: 1.71%) due 04/19/33◊,3 | | | 4,000,000 | | | | 4,004,667 | |
Cerberus Loan Funding XLV LLC | | | | | | | | |
2024-1A A, 7.20% (3 Month Term SOFR + 1.90%, Rate Floor: 1.90%) due 04/15/36◊,3 | | | 6,500,000 | | | | 6,516,674 | |
2024-1A B, 7.70% (3 Month Term SOFR + 2.40%, Rate Floor: 2.40%) due 04/15/36◊,3 | | | 1,000,000 | | | | 1,010,850 | |
MF1 Multifamily Housing Mortgage Loan Trust | | | | | | | | |
2021-FL6 D, 7.68% (1 Month Term SOFR + 2.66%, Rate Floor: 2.55%) due 07/16/36◊,3 | | | 4,000,000 | | | | 3,858,151 | |
2021-FL6 C, 6.98% (1 Month Term SOFR + 1.96%, Rate Floor: 1.85%) due 07/16/36◊,3 | | | 3,400,000 | | | | 3,324,605 | |
Owl Rock CLO III Ltd. | | | | | | | | |
2024-3A AR, 7.23% (3 Month Term SOFR + 1.85%, Rate Floor: 1.85%) due 04/20/36◊,3 | | | 5,500,000 | | | | 5,524,179 | |
2024-3A BR, 7.65% (3 Month Term SOFR + 2.35%, Rate Floor: 2.35%) due 04/20/36◊,3 | | | 1,250,000 | | | | 1,249,922 | |
Golub Capital Partners CLO 33M Ltd. | | | | | | | | |
2021-33A AR2, 7.19% (3 Month Term SOFR + 2.12%, Rate Floor: 1.86%) due 08/25/33◊,3 | | | 6,500,000 | | | | 6,483,977 | |
Owl Rock CLO XVI LLC | | | | | | | | |
2024-16A A, 7.28% (3 Month Term SOFR + 2.00%, Rate Floor: 2.00%) due 04/20/36◊,3 | | | 5,000,000 | | | | 5,034,889 | |
2024-16A B, 7.78% (3 Month Term SOFR + 2.50%, Rate Floor: 2.50%) due 04/20/36◊,3 | | | 1,000,000 | | | | 1,002,320 | |
Golub Capital Partners CLO 16 Ltd. | | | | | | | | |
2021-16A A1R2, 7.16% (3 Month Term SOFR + 1.87%, Rate Floor: 1.61%) due 07/25/33◊,3 | | | 4,000,000 | | | | 4,002,916 | |
2021-16A A2R2, 7.35% (3 Month Term SOFR + 2.06%, Rate Floor: 1.80%) due 07/25/33◊,3 | | | 2,000,000 | | | | 2,001,153 | |
Cerberus Loan Funding XXXII, LP | | | | | | | | |
2021-2A A, 7.18% (3 Month Term SOFR + 1.88%, Rate Floor: 1.88%) due 04/22/33◊,3 | | | 4,250,000 | | | | 4,251,024 | |
2021-2A C, 8.41% (3 Month Term SOFR + 3.11%, Rate Floor: 3.11%) due 04/22/33◊,3 | | | 1,250,000 | | | | 1,255,341 | |
GoldenTree Loan Management US CLO 1 Ltd. | | | | | | | | |
2024-9A BR, 7.23% (3 Month Term SOFR + 1.95%, Rate Floor: 1.95%) due 04/20/37◊,3 | | | 3,000,000 | | | | 3,021,347 | |
2024-9A CR, 7.68% (3 Month Term SOFR + 2.40%, Rate Floor: 2.40%) due 04/20/37◊,3 | | | 2,000,000 | | | | 2,029,135 | |
Cerberus Loan Funding XLII LLC | | | | | | | | |
2023-3A A1, 7.77% (3 Month Term SOFR + 2.48%, Rate Floor: 2.48%) due 09/13/35◊,3 | | | 3,750,000 | | | | 3,776,732 | |
2023-3A B, 8.64% (3 Month Term SOFR + 3.35%, Rate Floor: 3.35%) due 09/13/35◊,3 | | | 1,250,000 | | | | 1,249,955 | |
Palmer Square CLO Ltd. | | | | | | | | |
2024-4A BR, due 10/20/37◊,3 | | | 2,700,000 | | | | 2,700,986 | |
2023-4A C, 7.88% (3 Month Term SOFR + 2.60%, Rate Floor: 2.60%) due 10/20/33◊,3 | | | 1,250,000 | | | | 1,252,621 | |
2023-4A B, 7.43% (3 Month Term SOFR + 2.15%, Rate Floor: 2.15%) due 10/20/33◊,3 | | | 1,000,000 | | | | 1,001,905 | |
Cerberus Loan Funding XL LLC | | | | | | | | |
2023-1A A, 7.70% (3 Month Term SOFR + 2.40%, Rate Floor: 2.40%) due 03/22/35◊,3 | | | 4,500,000 | | | | 4,532,921 | |
Fortress Credit Opportunities IX CLO Ltd. | | | | | | | | |
2021-9A A2TR, 7.36% (3 Month Term SOFR + 2.06%, Rate Floor: 1.80%) due 10/15/33◊,3 | | | 3,250,000 | | | | 3,264,099 | |
2021-9A A1TR, 7.11% (3 Month Term SOFR + 1.81%, Rate Floor: 1.55%) due 10/15/33◊,3 | | | 1,000,000 | | | | 1,002,212 | |
THL Credit Lake Shore MM CLO I Ltd. | | | | | | | | |
2021-1A A1R, 7.26% (3 Month Term SOFR + 1.96%, Rate Floor: 1.70%) due 04/15/33◊,3 | | | 4,250,000 | | | | 4,249,975 | |
Cerberus Loan Funding XLVII LLC | | | | | | | | |
2024-3A B, 7.35% (3 Month Term SOFR + 1.95%, Rate Floor: 1.95%) due 07/15/36◊,3 | | | 3,000,000 | | | | 3,002,664 | |
2024-3A A, 7.08% (3 Month Term SOFR + 1.75%, Rate Floor: 1.75%) due 07/15/36◊,3 | | | 1,000,000 | | | | 1,001,519 | |
ACRES Commercial Realty Ltd. | | | | | | | | |
2021-FL2 AS, 6.95% (1 Month Term SOFR + 1.86%, Rate Floor: 1.86%) due 01/15/37◊,3 | | | 2,000,000 | | | | 1,980,621 | |
2021-FL1 AS, 6.80% (1 Month Term SOFR + 1.71%, Rate Floor: 1.71%) due 06/15/36◊,3 | | | 2,000,000 | | | | 1,962,000 | |
SEE NOTES TO FINANCIAL STATEMENTS. | THE GUGGENHEIM FUNDS ANNUAL REPORT | 97 |
SCHEDULE OF INVESTMENTS (continued) | September 30, 2024 |
CORE BOND FUND | |
| | Face
Amount~ | | | Value | |
BSPDF Issuer Ltd. | | | | | | | | |
2021-FL1 C, 7.46% (1 Month Term SOFR + 2.36%, Rate Floor: 2.25%) due 10/15/36◊,3 | | | 4,000,000 | | | $ | 3,843,411 | |
Owl Rock CLO IV Ltd. | | | | | | | | |
2021-4A A1R, 6.99% (3 Month Term SOFR + 1.86%, Rate Floor: 1.60%) due 08/20/33◊,3 | | | 3,750,000 | | | | 3,768,928 | |
ABPCI Direct Lending Fund CLO I LLC | | | | | | | | |
2021-1A A1A2, 7.24% (3 Month Term SOFR + 1.96%, Rate Floor: 1.96%) due 07/20/33◊,3 | | | 3,750,000 | | | | 3,756,699 | |
FS RIALTO | | | | | | | | |
2021-FL2 A, 6.43% (1 Month Term SOFR + 1.33%, Rate Floor: 1.33%) due 05/16/38◊,3 | | | 3,734,374 | | | | 3,726,168 | |
VOYA CLO | | | | | | | | |
2021-2A A2AR, 7.21% (3 Month Term SOFR + 1.91%, Rate Floor: 1.65%) due 06/07/30◊,3 | | | 2,550,000 | | | | 2,553,468 | |
2024-2A B, 7.12% (3 Month Term SOFR + 1.80%, Rate Floor: 1.80%) due 07/20/37◊,3 | | | 1,000,000 | | | | 1,002,281 | |
Cerberus Loan Funding XLVIII LLC | | | | | | | | |
2024-4A B, due 10/15/36◊,3 | | | 3,500,000 | | | | 3,505,100 | |
Cerberus Loan Funding XXXIII, LP | | | | | | | | |
2021-3A B, 7.41% (3 Month Term SOFR + 2.11%, Rate Floor: 1.85%) due 07/23/33◊,3 | | | 2,000,000 | | | | 2,004,209 | |
2021-3A A, 7.12% (3 Month Term SOFR + 1.82%, Rate Floor: 1.56%) due 07/23/33◊,3 | | | 1,250,000 | | | | 1,251,258 | |
Owl Rock CLO II Ltd. | | | | | | | | |
2021-2A ALR, 7.09% (3 Month Term SOFR + 1.81%, Rate Floor: 1.55%) due 04/20/33◊,3 | | | 3,000,000 | | | | 3,001,093 | |
Golub Capital Partners CLO 54M LP | | | | | | | | |
2021-54A A, 7.03% (3 Month Term SOFR + 1.79%, Rate Floor: 1.53%) due 08/05/33◊,3 | | | 1,500,000 | | | | 1,500,631 | |
2021-54A B, 7.35% (3 Month Term SOFR + 2.11%, Rate Floor: 1.85%) due 08/05/33◊,3 | | | 1,500,000 | | | | 1,497,947 | |
Golub Capital Partners CLO 31M Ltd. | | | | | | | | |
2024-31A A1RR, due 11/05/37◊,3 | | | 2,750,000 | | | | 2,751,478 | |
KREF Ltd. | | | | | | | | |
2021-FL2 AS, 6.50% (1 Month Term SOFR + 1.41%, Rate Floor: 1.30%) due 02/15/39◊,3 | | | 1,500,000 | | | | 1,467,850 | |
2021-FL2 C, 7.20% (1 Month Term SOFR + 2.11%, Rate Floor: 2.00%) due 02/15/39◊,3 | | | 1,000,000 | | | | 955,957 | |
Carlyle Direct Lending CLO LLC | | | | | | | | |
2024-1A A11A, 7.12% (3 Month Term SOFR + 1.80%, Rate Floor: 1.80%) due 07/15/36◊,3 | | | 2,400,000 | | | | 2,415,536 | |
Owl Rock CLO I LLC | | | | | | | | |
2024-1A ANR, 7.53% (3 Month Term SOFR + 2.40%, Rate Floor: 2.40%) due 02/20/36◊,3 | | | 2,000,000 | | | | 2,022,484 | |
Madison Park Funding LVIII Ltd. | | | | | | | | |
2024-58A C, 7.77% (3 Month Term SOFR + 2.45%, Rate Floor: 2.45%) due 04/25/37◊,3 | | | 1,000,000 | | | | 1,012,649 | |
2024-58A B, 7.27% (3 Month Term SOFR + 1.95%, Rate Floor: 1.95%) due 04/25/37◊,3 | | | 1,000,000 | | | | 1,008,369 | |
MidOcean Credit CLO VII | | | | | | | | |
2020-7A BR, 7.16% (3 Month Term SOFR + 1.86%, Rate Floor: 0.00%) due 07/15/29◊,3 | | | 2,000,000 | | | | 2,006,643 | |
Neuberger Berman Loan Advisers CLO 40 Ltd. | | | | | | | | |
2021-40A C, 7.30% (3 Month Term SOFR + 2.01%, Rate Floor: 1.75%) due 04/16/33◊,3 | | | 2,000,000 | | | | 2,003,929 | |
Cerberus Loan Funding XLVI, LP | | | | | | | | |
2024-2A A, 7.16% (3 Month Term SOFR + 1.85%, Rate Floor: 1.85%) due 07/15/36◊,3 | | | 1,500,000 | | | | 1,503,728 | |
2024-2A B, 7.61% (3 Month Term SOFR + 2.30%, Rate Floor: 2.30%) due 07/15/36◊,3 | | | 500,000 | | | | 499,927 | |
HPS Loan Management Ltd. | | | | | | | | |
2018-2016 BR, 7.14% (3 Month Term SOFR + 1.86%, Rate Floor: 1.60%) due 07/20/30◊,3 | | | 2,000,000 | | | | 2,003,474 | |
Sound Point CLO XXXI Ltd. | | | | | | | | |
2021-3A B, 7.20% (3 Month Term SOFR + 1.91%, Rate Floor: 1.65%) due 10/25/34◊,3 | | | 2,000,000 | | | | 2,003,242 | |
BRSP Ltd. | | | | | | | | |
2021-FL1 C, 7.23% (1 Month Term SOFR + 2.26%, Rate Floor: 2.15%) due 08/19/38◊,3 | | | 2,000,000 | | | | 1,941,917 | |
FS Rialto | | | | | | | | |
2021-FL3 C, 7.26% (1 Month Term SOFR + 2.16%, Rate Floor: 2.16%) due 11/16/36◊,3 | | | 2,000,000 | | | | 1,920,208 | |
Golub Capital Partners CLO 36M Ltd. | | | | | | | | |
2018-36A A, 6.80% (3 Month Term SOFR + 1.56%, Rate Floor: 0.00%) due 02/05/31◊,3 | | | 1,918,541 | | | | 1,918,187 | |
Canyon Capital CLO Ltd. | | | | | | | | |
2018-1A A2R, 7.02% (3 Month Term SOFR + 1.76%, Rate Floor: 1.50%) due 01/30/31◊,3 | | | 1,900,000 | | | | 1,898,622 | |
BXMT Ltd. | | | | | | | | |
2020-FL2 A, 6.10% (1 Month Term SOFR + 1.01%, Rate Floor: 1.01%) due 02/15/38◊,3 | | | 1,877,336 | | | | 1,804,248 | |
98 | THE GUGGENHEIM FUNDS ANNUAL REPORT | SEE NOTES TO FINANCIAL STATEMENTS. |
SCHEDULE OF INVESTMENTS (continued) | September 30, 2024 |
CORE BOND FUND | |
| | Face
Amount~ | | | Value | |
KREF Funding V LLC | | | | | | | | |
6.96% (1 Month Term SOFR + 1.86%, Rate Floor: 1.86%) due 06/25/26◊,††† | | | 1,536,115 | | | $ | 1,526,283 | |
0.15% due 06/25/26†††,6 | | | 21,818,182 | | | | 23,345 | |
STWD Ltd. | | | | | | | | |
2019-FL1 D, 7.56% (1 Month Term SOFR + 2.46%, Rate Floor: 2.46%) due 07/15/38◊,3 | | | 1,459,000 | | | | 1,421,703 | |
Madison Park Funding Ltd. | | | | | | | | |
2024-69A B, 7.28% (3 Month Term SOFR + 1.95%, Rate Floor: 1.95%) due 07/25/37◊,3 | | | 1,250,000 | | | | 1,257,386 | |
Cerberus Loan Funding XXXVIII, LP | | | | | | | | |
2022-2A A1, 8.05% (3 Month Term SOFR + 2.75%, Rate Floor: 2.75%) due 10/15/34◊,3 | | | 1,000,000 | | | | 1,008,887 | |
Owl Rock CLO XIII LLC | | | | | | | | |
2023-13A B, 8.16% (3 Month Term SOFR + 3.35%, Rate Floor: 3.35%) due 09/20/35◊,3 | | | 1,000,000 | | | | 1,003,841 | |
Cerberus Loan Funding XXXV, LP | | | | | | | | |
2021-5A A, 7.06% (3 Month Term SOFR + 1.76%, Rate Floor: 1.50%) due 09/22/33◊,3 | | | 1,000,000 | | | | 1,000,080 | |
Golub Capital Partners CLO 46 Ltd. | | | | | | | | |
2024-46A BR, 7.58% (3 Month Term SOFR + 2.30%, Rate Floor: 2.30%) due 04/20/37◊,3 | | | 1,000,000 | | | | 999,915 | |
BSPRT Issuer LLC | | | | | | | | |
2024-FL11 B, 7.46% (1 Month Term SOFR + 2.29%, Rate Floor: 2.29%) due 07/15/39◊,3 | | | 1,000,000 | | | | 998,125 | |
BSPRT Issuer Ltd. | | | | | | | | |
2021-FL7 C, 7.51% (1 Month Term SOFR + 2.41%, Rate Floor: 2.41%) due 12/15/38◊,3 | | | 1,000,000 | | | | 983,137 | |
Cerberus Loan Funding XXXI, LP | | | | | | | | |
2021-1A A, 7.06% (3 Month Term SOFR + 1.76%, Rate Floor: 1.50%) due 04/15/32◊,3 | | | 816,093 | | | | 816,742 | |
ACRE Commercial Mortgage Ltd. | | | | | | | | |
2021-FL4 D, 7.73% (1 Month Term SOFR + 2.71%, Rate Floor: 2.60%) due 12/18/37◊,3 | | | 773,000 | | | | 758,753 | |
Ares Direct Lending CLO 1 LLC | | | | | | | | |
2024-1A B, 7.59% (3 Month Term SOFR + 2.20%, Rate Floor: 2.20%) due 04/25/36◊,3 | | | 750,000 | | | | 750,832 | |
Fortress Credit Opportunities XI CLO Ltd. | | | | | | | | |
2018-11A A1T, 6.86% (3 Month Term SOFR + 1.56%, Rate Floor: 0.00%) due 04/15/31◊,3 | | | 723,126 | | | | 723,265 | |
Dryden 37 Senior Loan Fund | | | | | | | | |
2015-37A Q, due 01/15/313,11 | | | 1,000,000 | | | | 691,261 | |
Sound Point CLO XXIV | | | | | | | | |
2021-3A B1R, 7.25% (3 Month Term SOFR + 1.96%, Rate Floor: 1.96%) due 10/25/34◊,3 | | | 500,000 | | | | 500,252 | |
NewStar Fairfield Fund CLO Ltd. | | | | | | | | |
2018-2A A1N, 6.81% (3 Month Term SOFR + 1.53%, Rate Floor: 1.27%) due 04/20/30◊,3 | | | 481,741 | | | | 481,857 | |
Golub Capital Partners CLO 17 Ltd. | | | | | | | | |
2017-17A A1R, 7.20% (3 Month Term SOFR + 1.91%, Rate Floor: 0.00%) due 10/25/30◊,3 | | | 270,228 | | | | 270,393 | |
Babson CLO Ltd. | | | | | | | | |
2014-IA SUB, due 07/20/253,11 | | | 650,000 | | | | 15,542 | |
Treman Park CLO Ltd. | | | | | | | | |
2015-1A COM, due 10/20/283,11 | | | 162,950 | | | | 1,449 | |
Copper River CLO Ltd. | | | | | | | | |
2007-1A INC, due 01/20/2110,11 | | | 700,000 | | | | 70 | |
Total Collateralized Loan Obligations | | | | | | | 229,937,616 | |
| | | | | | | | | |
Financial - 2.2% | | | | | | | | |
Station Place Securitization Trust | | | | | | | | |
2024-SP1, 6.51% (1 Month Term SOFR + 1.40%, Rate Floor: 1.40%) due 08/12/25◊,†††,3 | | | 3,800,000 | | | | 3,800,000 | |
2024-SP2, 6.81% (1 Month Term SOFR + 1.70%, Rate Floor: 1.70%) due 07/12/26◊,†††,3 | | | 3,800,000 | | | | 3,800,000 | |
2023-SP1, 6.96% (1 Month Term SOFR + 1.85%, Rate Floor: 1.85%) due 10/15/24◊,†††,3 | | | 575,000 | | | | 575,000 | |
Project Onyx I | | | | | | | | |
8.47% (3 Month Term SOFR + 3.15%, Rate Floor: 3.15%) due 01/26/27◊,††† | | | 5,000,761 | | | | 4,989,059 | |
ST Group Food Industries Holdings Ltd. | | | | | | | | |
due 11/10/2512 | | | 3,000,000 | | | | 3,000,000 | |
due 11/10/2512 | | | 1,500,000 | | | | 1,500,000 | |
KKR Core Holding Company LLC | | | | | | | | |
4.00% due 08/12/31††† | | | 4,620,675 | | | | 4,309,888 | |
HV Eight LLC | | | | | | | | |
7.48% (3 Month EURIBOR + 3.50%, Rate Floor: 3.50%) due 12/31/27◊,††† | | | EUR 3,739,527 | | | | 4,166,289 | |
Strategic Partners Fund VIII, LP | | | | | | | | |
7.85% (1 Month Term SOFR + 2.60%, Rate Floor: 2.60%) due 03/10/26◊,††† | | | 3,598,331 | | | | 3,564,615 | |
LVNV Funding LLC | | | | | | | | |
7.80% due 11/05/28††† | | | 2,900,000 | | | | 3,093,923 | |
Lightning A | | | | | | | | |
5.50% due 03/01/37††† | | | 2,521,111 | | | | 2,364,802 | |
Thunderbird A | | | | | | | | |
5.50% due 03/01/37††† | | | 2,503,333 | | | | 2,348,127 | |
HarbourVest Structured Solutions IV Holdings, LP | | | | | | | | |
8.28% (3 Month Term SOFR + 2.95%, Rate Floor: 2.45%) due 09/15/26◊,††† | | | 1,490,277 | | | | 1,483,943 | |
SEE NOTES TO FINANCIAL STATEMENTS. | THE GUGGENHEIM FUNDS ANNUAL REPORT | 99 |
SCHEDULE OF INVESTMENTS (continued) | September 30, 2024 |
CORE BOND FUND | |
| | Face
Amount~ | | | Value | |
6.38% (3 Month EURIBOR + 2.45%, Rate Floor: 2.45%) due 09/15/26◊,††† | | | EUR 728,947 | | | $ | 802,573 | |
Ceamer Finance LLC | | | | | | | | |
6.92% due 11/15/37††† | | | 1,787,008 | | | | 1,798,749 | |
Project Onyx II | | | | | | | | |
8.47% (3 Month Term SOFR + 3.15%, Rate Floor: 3.15%) due 01/26/27◊,††† | | | 1,428,028 | | | | 1,418,103 | |
Madison Avenue Secured Funding Trust | | | | | | | | |
2023-2, 6.96% (1 Month Term SOFR + 1.85%, Rate Floor: 1.85%) due 10/15/24◊,†††,3 | | | 1,175,000 | | | | 1,175,000 | |
Bib Merchant Voucher Receivables Ltd. | | | | | | | | |
4.18% due 04/07/28††† | | | 609,633 | | | | 601,293 | |
Nassau LLC | | | | | | | | |
2019-1, 3.98% due 08/15/3410 | | | 538,721 | | | | 493,135 | |
Total Financial | | | | | | | 45,284,499 | |
| | | | | | | | | |
Whole Business - 2.1% | | | | | | | | |
Subway Funding LLC | | | | | | | | |
2024-3A, 5.91% due 07/30/543 | | | 2,750,000 | | | | 2,752,159 | |
2024-1A, 6.51% due 07/30/543 | | | 2,050,000 | | | | 2,125,835 | |
2024-1A, 6.27% due 07/30/543 | | | 1,600,000 | | | | 1,652,354 | |
2024-1A, 6.03% due 07/30/543 | | | 800,000 | | | | 825,385 | |
SERVPRO Master Issuer LLC | | | | | | | | |
2021-1A, 2.39% due 04/25/513 | | | 4,208,625 | | | | 3,833,947 | |
2019-1A, 3.88% due 10/25/493 | | | 1,524,000 | | | | 1,486,821 | |
2024-1A, 6.17% due 01/25/543 | | | 1,393,000 | | | | 1,431,816 | |
Arbys Funding LLC | | | | | | | | |
2020-1A, 3.24% due 07/30/503 | | | 6,480,000 | | | | 6,186,676 | |
Sonic Capital LLC | | | | | | | | |
2020-1A, 3.85% due 01/20/503 | | | 2,182,104 | | | | 2,118,084 | |
2021-1A, 2.19% due 08/20/513 | | | 2,226,150 | | | | 1,996,675 | |
2020-1A, 4.34% due 01/20/503 | | | 959,167 | | | | 917,612 | |
Domino’s Pizza Master Issuer LLC | | | | | | | | |
2017-1A, 4.12% due 07/25/473 | | | 5,076,000 | | | | 4,984,617 | |
Taco Bell Funding LLC | | | | | | | | |
2016-1A, 4.97% due 05/25/463 | | | 3,515,625 | | | | 3,520,664 | |
ServiceMaster Funding LLC | | | | | | | | |
2020-1, 2.84% due 01/30/513 | | | 3,771,840 | | | | 3,483,282 | |
Five Guys Holdings, Inc. | | | | | | | | |
2023-1A, 7.55% due 01/26/543 | | | 2,050,000 | | | | 2,167,038 | |
Applebee’s Funding LLC / IHOP Funding LLC | | | | | | | | |
2019-1A, 4.72% due 06/05/493 | | | 1,732,500 | | | | 1,704,137 | |
Wingstop Funding LLC | | | | | | | | |
2020-1A, 2.84% due 12/05/503 | | | 1,231,250 | | | | 1,157,732 | |
2022-1A, 3.73% due 03/05/523 | | | 248,125 | | | | 234,951 | |
Wendy’s Funding LLC | | | | | | | | |
2019-1A, 3.78% due 06/15/493 | | | 1,306,525 | | | | 1,282,180 | |
DB Master Finance LLC | | | | | | | | |
2019-1A, 4.02% due 05/20/493 | | | 1,187,500 | | | | 1,172,648 | |
Total Whole Business | | | | | | | 45,034,613 | |
| | | | | | | | | |
Transport-Aircraft - 1.5% | | | | | | | | |
AASET Trust | | | | | | | | |
2024-1A, 6.26% due 05/16/493 | | | 2,901,108 | | | | 3,012,970 | |
2021-1A, 2.95% due 11/16/413 | | | 3,018,117 | | | | 2,808,895 | |
2021-2A, 2.80% due 01/15/473 | | | 2,871,099 | | | | 2,628,159 | |
2020-1A, 3.35% due 01/16/403 | | | 743,335 | | | | 706,230 | |
Slam Ltd. | | | | | | | | |
2024-1A, 5.34% due 09/15/493 | | | 2,500,000 | | | | 2,493,267 | |
2021-1A, 2.43% due 06/15/463 | | | 1,633,645 | | | | 1,505,824 | |
Navigator Aircraft ABS Ltd. | | | | | | | | |
2021-1, 2.77% due 11/15/463 | | | 4,275,373 | | | | 3,953,366 | |
Navigator Aviation Ltd. | | | | | | | | |
2024-1, 5.40% due 08/15/493 | | | 3,200,000 | | | | 3,195,443 | |
Castlelake Aircraft Structured Trust | | | | | | | | |
2021-1A, 3.47% due 01/15/463 | | | 1,835,875 | | | | 1,774,747 | |
Lunar Structured Aircraft Portfolio Notes | | | | | | | | |
2021-1, 2.64% due 10/15/463 | | | 1,902,791 | | | | 1,742,252 | |
MACH 1 Cayman Ltd. | | | | | | | | |
2019-1, 3.47% due 10/15/393 | | | 1,423,168 | | | | 1,323,731 | |
Sprite Ltd. | | | | | | | | |
2021-1, 3.75% due 11/15/463 | | | 1,373,555 | | | | 1,314,978 | |
Sapphire Aviation Finance II Ltd. | | | | | | | | |
2020-1A, 3.23% due 03/15/403 | | | 1,417,333 | | | | 1,300,956 | |
AASET US Ltd. | | | | | | | | |
2018-2A, 4.45% due 11/18/383 | | | 1,137,348 | | | | 1,094,704 | |
Falcon Aerospace Ltd. | | | | | | | | |
2019-1, 3.60% due 09/15/393 | | | 842,408 | | | | 789,409 | |
2017-1, 4.58% due 02/15/423 | | | 88,143 | | | | 86,381 | |
WAVE LLC | | | | | | | | |
2019-1, 3.60% due 09/15/443 | | | 642,423 | | | | 594,267 | |
Sapphire Aviation Finance I Ltd. | | | | | | | | |
2018-1A, 4.25% due 03/15/403 | | | 481,670 | | | | 459,566 | |
MAPS Ltd. | | | | | | | | |
2018-1A, 4.21% due 05/15/433 | | | 361,677 | | | | 357,174 | |
Castlelake Aircraft Securitization Trust | | | | | | | | |
2018-1, 4.13% due 06/15/433 | | | 261,173 | | | | 243,565 | |
Total Transport-Aircraft | | | | | | | 31,385,884 | |
| | | | | | | | | |
Infrastructure - 1.5% | | | | | | | | |
Stack Infrastructure Issuer LLC | | | | | | | | |
2023-3A, 5.90% due 10/25/483 | | | 3,000,000 | | | | 3,053,408 | |
2024-1A, 5.90% due 03/25/493 | | | 1,250,000 | | | | 1,283,012 | |
2023-1A, 5.90% due 03/25/483 | | | 1,000,000 | | | | 1,010,984 | |
2020-1A, 1.89% due 08/25/453 | | | 1,000,000 | | | | 970,598 | |
VB-S1 Issuer LLC - VBTEL | | | | | | | | |
2022-1A, 4.29% due 02/15/523 | | | 2,500,000 | | | | 2,396,922 | |
2024-1A, 5.59% due 05/15/543 | | | 2,350,000 | | | | 2,388,128 | |
2024-1A, 6.64% due 05/15/543 | | | 1,250,000 | | | | 1,288,019 | |
Hotwire Funding LLC | | | | | | | | |
2024-1A, 5.89% due 06/20/543 | | | 1,950,000 | | | | 2,000,556 | |
2021-1, 2.31% due 11/20/513 | | | 2,000,000 | | | | 1,891,151 | |
2023-1A, 5.69% due 05/20/533 | | | 1,005,000 | | | | 1,029,334 | |
Switch ABS Issuer LLC | | | | | | | | |
2024-2A, 5.44% due 06/25/543 | | | 4,000,000 | | | | 4,041,694 | |
2024-1A, 6.28% due 03/25/543 | | | 800,000 | | | | 817,422 | |
100 | THE GUGGENHEIM FUNDS ANNUAL REPORT | SEE NOTES TO FINANCIAL STATEMENTS. |
SCHEDULE OF INVESTMENTS (continued) | September 30, 2024 |
CORE BOND FUND | |
| | Face
Amount~ | | | Value | |
Aligned Data Centers Issuer LLC | | | | | | | | |
2021-1A, 1.94% due 08/15/463 | | | 3,350,000 | | | $ | 3,175,076 | |
SBA Tower Trust | | | | | | | | |
1.84% due 04/15/273 | | | 3,000,000 | | | | 2,790,737 | |
Vantage Data Centers Issuer LLC | | | | | | | | |
2020-1A, 1.65% due 09/15/453 | | | 1,366,000 | | | | 1,321,163 | |
2024-1A, due 09/15/543,12 | | | 1,100,000 | | | | 1,100,000 | |
Total Infrastructure | | | | | | | 30,558,204 | |
| | | | | | | | | |
Net Lease - 1.3% | | | | | | | | |
CARS-DB4, LP | | | | | | | | |
2020-1A, 3.81% due 02/15/503 | | | 2,212,969 | | | | 2,007,128 | |
2020-1A, 2.69% due 02/15/503 | | | 1,769,680 | | | | 1,767,361 | |
2020-1A, 4.95% due 02/15/503 | | | 1,500,000 | | | | 1,342,364 | |
CF Hippolyta Issuer LLC | | | | | | | | |
2022-1A, 6.11% due 08/15/623 | | | 2,687,109 | | | | 2,705,664 | |
2020-1, 2.28% due 07/15/603 | | | 674,589 | | | | 645,842 | |
SVC ABS LLC | | | | | | | | |
2023-1A, 5.15% due 02/20/533 | | | 3,224,271 | | | | 3,192,020 | |
CMFT Net Lease Master Issuer LLC | | | | | | | | |
2021-1, 3.44% due 07/20/513 | | | 3,570,000 | | | | 3,112,740 | |
STORE Master Funding I-VII | | | | | | | | |
2016-1A, 3.96% due 10/20/463 | | | 2,433,916 | | | | 2,361,416 | |
Oak Street Investment Grade Net Lease Fund Series | | | | | | | | |
2020-1A, 2.26% due 11/20/503 | | | 2,489,583 | | | | 2,350,588 | |
CF Hippolyta LLC | | | | | | | | |
2020-1, 2.60% due 07/15/603 | | | 2,479,789 | | | | 2,165,753 | |
Capital Automotive REIT | | | | | | | | |
2020-1A, 3.48% due 02/15/503 | | | 1,229,427 | | | | 1,174,629 | |
2024-3A, due 10/15/543,12 | | | 700,000 | | | | 675,613 | |
STORE Master Funding LLC | | | | | | | | |
2021-1A, 2.96% due 06/20/513 | | | 1,967,500 | | | | 1,645,400 | |
AFN ABSPROP001 LLC | | | | | | | | |
2021-1A, 2.21% due 05/20/513 | | | 1,525,736 | | | | 1,367,655 | |
CARS-DB5, LP | | | | | | | | |
2021-1A, 2.76% due 08/15/513 | | | 991,458 | | | | 840,164 | |
Store Master Funding I-VII XIV XIX XX XXIV XXII | | | | | | | | |
2024-1A, 5.69% due 05/20/543 | | | 498,958 | | | | 506,618 | |
Total Net Lease | | | | | | | 27,860,955 | |
| | | | | | | | | |
Single Family Residence - 0.8% | | | | | | | | |
Tricon Residential Trust | | | | | | | | |
2021-SFR1, 2.34% due 07/17/383 | | | 2,850,000 | | | | 2,716,334 | |
2023-SFR1, 5.10% due 07/17/403 | | | 2,722,000 | | | | 2,706,122 | |
2023-SFR2, 5.00% due 12/17/403 | | | 2,550,000 | | | | 2,536,745 | |
2024-SFR2, 5.70% due 06/17/403 | | | 1,500,000 | | | | 1,526,310 | |
2024-SFR1, 4.75% due 04/17/413 | | | 1,000,000 | | | | 990,466 | |
FirstKey Homes Trust | | | | | | | | |
2020-SFR2, 2.67% due 10/19/373 | | | 2,250,000 | | | | 2,179,902 | |
2020-SFR2, 4.00% due 10/19/373 | | | 1,400,000 | | | | 1,361,956 | |
2020-SFR2, 4.50% due 10/19/373 | | | 1,350,000 | | | | 1,315,420 | |
2020-SFR2, 3.37% due 10/19/373 | | | 900,000 | | | | 871,935 | |
Home Partners of America Trust | | | | | | | | |
2021-3, 2.80% due 01/17/413 | | | 910,553 | | | | 825,727 | |
2021-2, 2.40% due 12/17/263 | | | 480,445 | | | | 453,740 | |
Total Single Family Residence | | | | | | | 17,484,657 | |
| | | | | | | | | |
Transport-Container - 0.6% | | | | | | | | |
Textainer Marine Containers VII Ltd. | | | | | | | | |
2020-1A, 2.73% due 08/21/453 | | | 2,561,631 | | | | 2,444,981 | |
2021-2A, 2.23% due 04/20/463 | | | 1,431,533 | | | | 1,319,447 | |
MC Ltd. | | | | | | | | |
2021-1, 2.63% due 11/05/353 | | | 2,900,271 | | | | 2,706,766 | |
TIF Funding III LLC | | | | | | | | |
2024-1A, 5.48% due 04/20/493 | | | 2,646,875 | | | | 2,683,695 | |
Textainer Marine Containers Ltd. | | | | | | | | |
2021-3A, 1.94% due 08/20/463 | | | 1,506,667 | | | | 1,338,799 | |
CLI Funding VI LLC | | | | | | | | |
2020-1A, 2.08% due 09/18/453 | | | 1,009,210 | | | | 933,251 | |
TIF Funding II LLC | | | | | | | | |
2021-1A, 1.65% due 02/20/463 | | | 672,125 | | | | 602,858 | |
Total Transport-Container | | | | | | | 12,029,797 | |
| | | | | | | | | |
Collateralized Debt Obligations - 0.4% | | | | | | | | |
Anchorage Credit Funding 4 Ltd. | | | | | | | | |
2021-4A AR, 2.72% due 04/27/393 | | | 7,250,000 | | | | 6,887,718 | |
Anchorage Credit Funding 13 Ltd. | | | | | | | | |
2021-13A A2, 2.80% due 07/27/393 | | | 1,000,000 | | | | 915,505 | |
Total Collateralized Debt Obligations | | | | | | | 7,803,223 | |
| | | | | | | | | |
Unsecured Consumer Loans - 0.2% | | | | | | | | |
Foundation Finance Trust | | | | | | | | |
2024-1A, 5.95% due 12/15/493 | | | 2,220,000 | | | | 2,283,611 | |
Service Experts Issuer LLC | | | | | | | | |
2024-1A, 6.39% due 11/20/353 | | | 1,825,094 | | | | 1,881,538 | |
Total Unsecured Consumer Loans | | | | | | | 4,165,149 | |
| | | | | | | | | |
Insurance - 0.2% | | | | | | | | |
Obra Longevity | | | | | | | | |
8.48% due 06/30/39††† | | | 3,060,000 | | | | 3,114,162 | |
CHEST | | | | | | | | |
7.13% due 03/15/43††† | | | 950,000 | | | | 997,167 | |
Total Insurance | | | | | | | 4,111,329 | |
| | | | | | | | | |
Automotive - 0.1% | | | | | | | | |
Avis Budget Rental Car Funding AESOP LLC | | | | | | | | |
2023-8A, 6.66% due 02/20/303 | | | 1,800,000 | | | | 1,904,986 | |
2024-1A, 5.85% due 06/20/303 | | | 1,300,000 | | | | 1,338,768 | |
Total Automotive | | | | | | | 3,243,754 | |
| | | | | | | | | |
Consumer, Non-cyclical - 0.1% | | | | | | | | |
Endo Luxembourg Finance Co I SARL / Endo US, Inc. | | | | | | | | |
7.40% due 09/30/45††† | | | 1,300,000 | | | | 1,367,249 | |
Total Asset-Backed Securities | | | | |
(Cost $462,587,612) | | | 460,266,929 | |
SEE NOTES TO FINANCIAL STATEMENTS. | THE GUGGENHEIM FUNDS ANNUAL REPORT | 101 |
SCHEDULE OF INVESTMENTS (continued) | September 30, 2024 |
CORE BOND FUND | |
| | Face
Amount~ | | | Value | |
SENIOR FLOATING RATE INTERESTS††,◊ - 1.0% |
Industrial - 0.4% | | | | | | | | |
Summit Materials LLC | | | | | | | | |
7.05% (3 Month Term SOFR + 1.75%, Rate Floor: 1.75%) due 01/12/29 | | | 2,743,108 | | | $ | 2,752,243 | |
XPO, Inc. | | | | | | | | |
7.11% (1 Month Term SOFR + 2.00%, Rate Floor: 2.00%) due 02/03/31 | | | 2,475,000 | | | | 2,476,559 | |
United Rentals, Inc. | | | | | | | | |
6.60% (1 Month Term SOFR + 1.75%, Rate Floor: 1.75%) due 02/14/31 | | | 1,492,500 | | | | 1,501,455 | |
Standard Industries, Inc. | | | | | | | | |
6.92% (1 Month Term SOFR + 2.00%, Rate Floor: 2.50%) due 09/22/28 | | | 945,182 | | | | 946,761 | |
SkyMiles IP Ltd. | | | | | | | | |
9.03% (3 Month Term SOFR + 3.75%, Rate Floor: 4.75%) due 10/20/27 | | | 677,642 | | | | 689,670 | |
Total Industrial | | | | | | | 8,366,688 | |
| | | | | | | | | |
Consumer, Cyclical - 0.2% | | | | | | | | |
Wyndham Hotels & Resorts, Inc. | | | | | | | | |
6.60% (1 Month Term SOFR + 1.75%, Rate Floor: 1.75%) due 05/24/30 | | | 4,987,500 | | | | 4,981,266 | |
Utilities - 0.2% | | | | | | | | |
NRG Energy, Inc. | | | | | | | | |
7.26% (3 Month Term SOFR + 2.00%, Rate Floor: 2.00%) due 04/16/31 | | | 2,985,000 | | | | 2,987,239 | |
| | | | | | | | | |
Financial - 0.1% | | | | | | | | |
Citadel Securities, LP | | | | | | | | |
7.10% (1 Month Term SOFR + 2.25%, Rate Floor: 2.25%) due 07/29/30 | | | 2,027,543 | | | | 2,025,698 | |
Eagle Point Holdings Borrower LLC | | | | | | | | |
9.06% (3 Month Term SOFR + 3.75%, Rate Floor: 4.75%) due 03/31/28††† | | | 766,667 | | | | 766,667 | |
Total Financial | | | | | | | 2,792,365 | |
| | | | | | | | | |
Consumer, Non-cyclical - 0.1% | | | | | | | | |
Southern Veterinary Partners LLC | | | | | | | | |
8.00% (3 Month Term SOFR + 3.75%, Rate Floor: 4.75%) due 10/05/27 | | | 1,049,149 | | | | 1,049,589 | |
HAH Group Holding Co. LLC | | | | | | | | |
10.26% (3 Month Term SOFR + 5.00%, Rate Floor: 6.00%) due 09/17/31 | | | 230,177 | | | | 230,080 | |
10.35% (3 Month Term SOFR + 5.00%, Rate Floor: 6.00%) due 09/17/31 | | | 29,126 | | | | 29,114 | |
Total Consumer, Non-cyclical | | | | | | | 1,308,783 | |
| | | | | | | | | |
Energy - 0.0% | | | | | | | | |
Venture Global Calcasieu Pass LLC | | | | | | | | |
7.82% (1 Month Term SOFR + 2.88%, Rate Floor: 3.88%) due 08/19/26 | | | 380,616 | | | | 380,300 | |
Total Senior Floating Rate Interests | | | | |
(Cost $20,764,156) | | | 20,816,641 | |
| | | | | |
FEDERAL AGENCY BONDS†† - 0.9% |
Tennessee Valley Authority Principal Strips |
due 06/15/385,8 | | | 9,400,000 | | | | 5,144,864 | |
due 01/15/485,8 | | | 9,700,000 | | | | 3,238,587 | |
due 01/15/388 | | | 4,000,000 | | | | 2,226,892 | |
due 06/15/355,8 | | | 1,583,000 | | | | 1,011,214 | |
due 12/15/425,8 | | | 1,600,000 | | | | 683,568 | |
Federal Farm Credit Bank |
3.51% due 06/11/40 | | | 3,300,000 | | | | 2,960,361 | |
Tennessee Valley Authority |
4.25% due 09/15/65 | | | 2,450,000 | | | | 2,239,511 | |
5.38% due 04/01/56 | | | 600,000 | | | | 668,750 | |
U.S. International Development Finance Corp. |
due 01/17/268 | | | 800,000 | | | | 870,198 | |
Total Federal Agency Bonds | | | | |
(Cost $25,017,607) | | | | | | | 19,043,945 | |
| | | | | | | | | |
MUNICIPAL BONDS†† - 0.3% |
Texas - 0.1% | | | | | | | | |
Tarrant County Cultural Education Facilities Finance Corp. Revenue Bonds | | | | | | | | |
3.29% due 09/01/40 | | | 2,100,000 | | | | 1,728,036 | |
2.78% due 09/01/34 | | | 700,000 | | | | 601,952 | |
2.69% due 09/01/33 | | | 500,000 | | | | 435,694 | |
2.41% due 09/01/31 | | | 450,000 | | | | 400,045 | |
Total Texas | | | | | | | 3,165,727 | |
| | | | | | | | | |
California - 0.2% | | | | | | | | |
California Statewide Communities Development Authority Revenue Bonds | | | | | | | | |
7.14% due 08/15/47 | | | 1,180,000 | | | | 1,289,833 | |
2.68% due 02/01/39 | | | 1,200,000 | | | | 941,149 | |
Total California | | | | | | | 2,230,982 | |
| | | | | | | | | |
Illinois - 0.0% | | | | | | | | |
State of Illinois General Obligation Unlimited | | | | | | | | |
5.65% due 12/01/38 | | | 416,667 | | | | 431,471 | |
Total Municipal Bonds | | | | |
(Cost $6,553,183) | | | 5,828,180 | |
| | | | | |
FOREIGN GOVERNMENT DEBT†† - 0.1% |
Panama Government International Bond |
4.50% due 01/19/63 | | | 2,600,000 | | | | 1,813,919 | |
4.50% due 04/16/50 | | | 1,450,000 | | | | 1,064,011 | |
Total Foreign Government Debt | | | | |
(Cost $4,201,362) | | | | | | | 2,877,930 | |
| | | | | | | | | |
Total Investments - 111.1% | | | | |
(Cost $2,369,470,599) | | $ | 2,326,337,109 | |
Other Assets & Liabilities, net - (11.1)% | | | (232,937,382 | ) |
Total Net Assets - 100.0% | | $ | 2,093,399,727 | |
102 | THE GUGGENHEIM FUNDS ANNUAL REPORT | SEE NOTES TO FINANCIAL STATEMENTS. |
SCHEDULE OF INVESTMENTS (continued) | September 30, 2024 |
CORE BOND FUND | |
Futures Contracts |
Description | | Number of
Contracts | | | Expiration
Date | | | Notional
Amount | | | Value and
Unrealized
Appreciation** | |
Interest Rate Futures Contracts Purchased† |
3-Month SOFR Futures Contracts | | | 205 | | | | Sep 2025 | | | $ | 49,607,438 | | | $ | 558,296 | |
3-Month SOFR Futures Contracts | | | 205 | | | | Dec 2025 | | | | 49,681,750 | | | | 555,730 | |
3-Month SOFR Futures Contracts | | | 205 | | | | Mar 2026 | | | | 49,717,625 | | | | 537,793 | |
| | | | | | | | | | | $ | 149,006,813 | | | $ | 1,651,819 | |
Centrally Cleared Credit Default Swap Agreements Protection Purchased†† |
Counterparty | | Exchange | | | Index | | | Protection
Premium
Rate | | | Payment
Frequency | | | Maturity
Date | | | Notional
Amount~ | | | Value | | | Upfront
Premiums
(Received) | | | Unrealized
Appreciation
(Depreciation)** | |
BofA Securities, Inc. | ICE | ITRAXX.EUR.42.V1 | | | 1.00% | | | | Quarterly | | | | 12/20/29 | | EUR 4,750,000 | | $ | (106,174 | ) | | $ | (105,553 | ) | | $ | (621 | ) |
BofA Securities, Inc. | ICE | CDX.NA.IG.43.V1 | | | 1.00% | | | | Quarterly | | | | 12/20/29 | | | | 49,214,557 | | | | (1,100,305 | ) | | | (1,101,580 | ) | | | 1,275 | |
| | | | | | | | | | | | | | | | | | | | | | | | | | | $ | (1,206,479 | ) | | $ | (1,207,133 | ) | | $ | 654 | |
Centrally Cleared Interest Rate Swap Agreements†† |
Counterparty | | Exchange | | | Floating
Rate
Type | | | Floating
Rate
Index | | | Fixed
Rate | | | Payment
Frequency | | | Maturity
Date | | | Notional
Amount | | | Value | | | Upfront
Premiums
Paid | | | Unrealized
Appreciation** | |
BofA Securities, Inc. | CME | Pay | U.S. Secured Overnight Financing Rate | 3.94% | Annually | 06/05/30 | | $ | 153,100,000 | | | $ | 1,872,471 | | | $ | 17,192 | | | $ | 1,855,279 | |
BofA Securities, Inc. | CME | Pay | U.S. Secured Overnight Financing Rate | 4.32% | Annually | 07/02/27 | | | 65,000,000 | | | | 1,645,047 | | | | 424 | | | | 1,644,623 | |
BofA Securities, Inc. | CME | Pay | U.S. Secured Overnight Financing Rate | 4.99% | Annually | 10/11/25 | | | 98,748,000 | | | | 1,143,416 | | | | 280 | | | | 1,143,136 | |
BofA Securities, Inc. | CME | Pay | U.S. Secured Overnight Financing Rate | 4.96% | Annually | 10/16/25 | | | 95,000,000 | | | | 1,083,792 | | | | 278 | | | | 1,083,514 | |
BofA Securities, Inc. | CME | Pay | U.S. Secured Overnight Financing Rate | 3.75% | Annually | 08/01/29 | | | 45,560,000 | | | | 968,179 | | | | 488 | | | | 967,691 | |
BofA Securities, Inc. | CME | Pay | U.S. Secured Overnight Financing Rate | 3.98% | Annually | 02/06/27 | | | 70,000,000 | | | | 902,665 | | | | 371 | | | | 902,294 | |
BofA Securities, Inc. | CME | Pay | U.S. Secured Overnight Financing Rate | 3.39% | Annually | 08/02/29 | | | 43,670,000 | | | | 174,712 | | | | 395 | | | | 174,317 | |
| | | | | | | | | | | | | | | | | | | | | | | | | | | | | | | $ | 7,790,282 | | | $ | 19,428 | | | $ | 7,770,854 | |
SEE NOTES TO FINANCIAL STATEMENTS. | THE GUGGENHEIM FUNDS ANNUAL REPORT | 103 |
SCHEDULE OF INVESTMENTS (continued) | September 30, 2024 |
CORE BOND FUND | |
Forward Foreign Currency Exchange Contracts†† |
Counterparty | | Currency | | | Type | | | Quantity | | | Contract
Amount | | | Settlement
Date | | | Unrealized
Appreciation
(Depreciation) | |
Bank of America, N.A. | | | EUR | | | | Buy | | | | 190,000 | | | | 211,413 USD | | | | 10/18/24 | | | $ | 349 | |
Citibank, N.A. | | | EUR | | | | Buy | | | | 49,000 | | | | 54,550 USD | | | | 10/18/24 | | | | 62 | |
Bank of America, N.A. | | | EUR | | | | Sell | | | | 4,390,000 | | | | 4,862,852 USD | | | | 10/18/24 | | | | (29,955 | ) |
| | | | | | | | | | | | | | | | | | | | | | | $ | (29,544 | ) |
~ | The face amount is denominated in U.S. dollars unless otherwise indicated. |
* | Non-income producing security. |
** | Includes cumulative appreciation (depreciation). Variation margin is reported within the Statement of Assets and Liabilities. |
*** | A copy of each underlying unaffiliated fund’s financial statements is available at the SEC’s website at www.sec.gov. |
† | Value determined based on Level 1 inputs, unless otherwise noted — See Note 4. |
†† | Value determined based on Level 2 inputs, unless otherwise noted — See Note 4. |
††† | Value determined based on Level 3 inputs — See Note 4. |
◊ | Variable rate security. Rate indicated is the rate effective at September 30, 2024. In some instances, the effective rate is limited by a minimum rate floor or a maximum rate cap established by the issuer. The settlement status of a position may also impact the effective rate indicated. In some cases, a position may be unsettled at period end and may not have a stated effective rate. In instances where multiple underlying reference rates and spread amounts are shown, the effective rate is based on a weighted average. |
1 | Special Purpose Acquisition Company (SPAC). |
2 | Security has a fixed rate coupon which will convert to a floating or variable rate coupon on a future date. |
3 | Security is a 144A or Section 4(a)(2) security. These securities have been determined to be liquid under guidelines established by the Board of Trustees. The total market value of 144A or Section 4(a)(2) securities is $793,302,977 (cost $813,236,809), or 37.9% of total net assets. |
4 | Rate indicated is the 7-day yield as of September 30, 2024. |
5 | Security is a principal-only strip. |
6 | Security is an interest-only strip. |
7 | Security is a step up/down bond. The coupon increases or decreases at regular intervals until the bond reaches full maturity. Rate indicated is the rate at September 30, 2024. See table below for additional step information for each security. |
8 | Zero coupon rate security. |
9 | Perpetual maturity. |
10 | Security is a 144A or Section 4(a)(2) security. These securities have been determined to be illiquid and restricted under guidelines established by the Board of Trustees. The total market value of 144A or Section 4(a)(2) illiquid and restricted securities is $1,242,782 (cost $1,348,900), or 0.1% of total net assets — See Note 10. |
11 | Security has no stated coupon. However, it is expected to receive residual cash flow payments on defined deal dates. |
12 | Security is unsettled at period end and does not have a stated effective rate. |
13 | Face amount of security is adjusted for inflation. |
| | BofA — Bank of America |
| | CDX.NA.IG.43.V1 — Credit Default Swap North American Investment Grade Series 43 Index Version 1 |
| | CME — Chicago Mercantile Exchange |
| | CMT — Constant Maturity Treasury |
| | EUR — Euro |
| | EURIBOR — European Interbank Offered Rate |
| | ICE — Intercontinental Exchange |
| | ITRAXX.EUR.42.V1 — iTraxx Europe Series 42 Index Version 1 |
| | plc — Public Limited Company |
| | REIT — Real Estate Investment Trust |
| | SARL — Société à Responsabilité Limitée |
| | SOFR — Secured Overnight Financing Rate |
| | WAC — Weighted Average Coupon |
| | |
| | See Sector Classification in Other Information section. |
104 | THE GUGGENHEIM FUNDS ANNUAL REPORT | SEE NOTES TO FINANCIAL STATEMENTS. |
SCHEDULE OF INVESTMENTS (continued) | September 30, 2024 |
CORE BOND FUND | |
The following table summarizes the inputs used to value the Fund’s investments at September 30, 2024 (See Note 4 in the Notes to Financial Statements):
Investments in Securities (Assets) | | Level 1
Quoted
Prices | | | Level 2
Significant
Observable
Inputs | | | Level 3
Significant
Unobservable
Inputs | | | Total | |
Common Stocks | | $ | 4,485 | | | $ | — | | | $ | 62 | | | $ | 4,547 | |
Preferred Stocks | | | — | | | | 31,810,442 | | | | — | * | | | 31,810,442 | |
Warrants | | | 29 | | | | — | | | | 26 | | | | 55 | |
Money Market Funds | | | 127,617,863 | | | | — | | | | — | | | | 127,617,863 | |
Collateralized Mortgage Obligations | | | — | | | | 632,303,383 | | | | 3,964,242 | | | | 636,267,625 | |
U.S. Government Securities | | | — | | | | 519,295,290 | | | | — | | | | 519,295,290 | |
Corporate Bonds | | | — | | | | 462,437,512 | | | | 40,070,150 | | | | 502,507,662 | |
Asset-Backed Securities | | | — | | | | 412,947,359 | | | | 47,319,570 | | | | 460,266,929 | |
Senior Floating Rate Interests | | | — | | | | 20,049,974 | | | | 766,667 | | | | 20,816,641 | |
Federal Agency Bonds | | | — | | | | 19,043,945 | | | | — | | | | 19,043,945 | |
Municipal Bonds | | | — | | | | 5,828,180 | | | | — | | | | 5,828,180 | |
Foreign Government Debt | | | — | | | | 2,877,930 | | | | — | | | | 2,877,930 | |
Interest Rate Futures Contracts** | | | 1,651,819 | | | | — | | | | — | | | | 1,651,819 | |
Credit Default Swap Agreements** | | | — | | | | 1,275 | | | | — | | | | 1,275 | |
Interest Rate Swap Agreements** | | | — | | | | 7,770,854 | | | | — | | | | 7,770,854 | |
Forward Foreign Currency Exchange Contracts** | | | — | | | | 411 | | | | — | | | | 411 | |
Total Assets | | $ | 129,274,196 | | | $ | 2,114,366,555 | | | $ | 92,120,717 | | | $ | 2,335,761,468 | |
Investments in Securities (Liabilities) | | Level 1
Quoted
Prices | | | Level 2
Significant
Observable
Inputs | | | Level 3
Significant
Unobservable
Inputs | | | Total | |
Unfunded Loan Commitments | | $ | — | | | $ | — | | | $ | — | * | | $ | — | |
Credit Default Swap Agreements** | | | — | | | | 621 | | | | — | | | | 621 | |
Forward Foreign Currency Exchange Contracts** | | | — | | | | 29,955 | | | | — | | | | 29,955 | |
Total Liabilities | | $ | — | | | $ | 30,576 | | | $ | — | | | $ | 30,576 | |
* | Security has a market value of $0. |
** | This derivative is reported as unrealized appreciation/depreciation at period end. |
The following is a summary of significant unobservable inputs used in the fair valuation of assets and liabilities categorized within Level 3 of the fair value hierarchy:
Category | | Ending
Balance at
September 30,
2024 | | Valuation
Technique | Unobservable
Inputs | | Input Range | | | Weighted
Average* | |
Assets: | | | | | | | | | | | | | | |
Asset-Backed Securities | | $ | 22,863,776 | | Option adjusted spread off prior month end broker quote | Broker Quote | — | — |
Asset-Backed Securities | | | 15,082,449 | | Yield Analysis | Yield | 4.8%-7.0% | 6.3% |
Asset-Backed Securities | | | 9,373,345 | | Third Party Pricing | Broker Quote | — | — |
Collateralized Mortgage Obligations | | | 3,964,242 | | Option adjusted spread off prior month end broker quote | Broker Quote | — | — |
Common Stocks | | | 62 | | Model Price | Liquidation Value | — | — |
Corporate Bonds | | | 23,025,395 | | Option adjusted spread off prior month end broker quote | Broker Quote | — | — |
Corporate Bonds | | | 17,044,755 | | Yield Analysis | Yield | 5.6%-9.6% | 6.7% |
SEE NOTES TO FINANCIAL STATEMENTS. | THE GUGGENHEIM FUNDS ANNUAL REPORT | 105 |
SCHEDULE OF INVESTMENTS (continued) | September 30, 2024 |
CORE BOND FUND | |
Category | | Ending
Balance at
September 30,
2024 | | Valuation
Technique | Unobservable
Inputs | | Input Range | | | Weighted
Average* | |
Senior Floating Rate Interests | | $ | 766,667 | | Yield Analysis | Yield | 8.0% | —% |
Warrants | | | 26 | | Model Price | Liquidation Value | — | — |
Total Assets | | $ | 92,120,717 | | | | | |
* | Inputs are weighted by the fair value of the instruments. |
Significant changes in a quote, yield, or liquidation value would generally result in significant changes in the fair value of the security. Any remaining Level 3 securities held by the Fund and excluded from the table above, were not considered material to the Fund.
The Fund’s fair valuation leveling guidelines classify a single daily broker quote, or a vendor price based on a single daily or monthly broker quote, as Level 3, if such a quote or price cannot be supported with other available market information.
Transfers between Level 2 and Level 3 may occur as markets fluctuate and/or the availability of data used in an investment’s valuation changes. For the year ended September 30, 2024, the Fund had securities with a total value of $6,227,970 transfer out of Level 3 into Level 2 due to the availability of current and reliable market-based data provided by a third-party pricing service which utilizes significant observable inputs.
Summary of Fair Value Level 3 Activity
Following is a reconciliation of Level 3 assets for which significant unobservable inputs were used to determine fair value for the year ended September 30, 2024:
| | | Assets | | | | | | | Liabilities | |
| | Asset
Backed
Securities | | | Collateralized
Mortgage
Obligations | | | Corporate
Bonds | | | Senior
Floating
Rate
Interests | | | Warrants | | | Common
Stocks | | | Senior
Fixed
Rate
Interests | | | Total
Assets | | | Unfunded
Loan
Commitments | |
Beginning Balance | | $ | 38,332,615 | | | $ | 8,981,359 | | | $ | 17,372,298 | | | $ | 4,701,097 | | | $ | 7 | | | $ | 62 | | | $ | 2,572,239 | | | $ | 71,959,677 | | | $ | — | |
Purchases/(Receipts) | | | 18,409,969 | | | | — | | | | 19,470,000 | | | | 766,667 | | | | — | | | | — | | | | — | | | | 38,646,636 | | | | — | |
(Sales, maturities and paydowns)/Fundings | | | (8,799,548 | ) | | | (962,112 | ) | | | (1,730,634 | ) | | | (4,875,779 | ) | | | — | | | | — | | | | — | | | | (16,368,073 | ) | | | — | |
Amortization of premiums/discounts | | | 38,021 | | | | (14,264 | ) | | | 3,469 | | | | 51,642 | | | | — | | | | — | | | | — | | | | 78,868 | | | | — | |
Corporate actions | | | — | | | | — | | | | 3,526,004 | | | | — | | | | — | | | | — | | | | (3,526,004 | ) | | | — | | | | — | |
Total realized gains (losses) included in earnings | | | 7,178 | | | | — | | | | — | | | | (372,431 | ) | | | — | | | | — | | | | — | | | | (365,253 | ) | | | — | |
Total change in unrealized appreciation (depreciation) included in earnings | | | 1,236,321 | | | | 282,243 | | | | 1,429,013 | | | | 495,471 | | | | 19 | | | | — | | | | 953,765 | | | | 4,396,832 | | | | — | |
Transfers into Level 3 | | | — | | | | — | | | | — | | | | — | | | | — | | | | — | | | | — | | | | — | | | | — | |
Transfers out of Level 3 | | | (1,904,986 | ) | | | (4,322,984 | ) | | | — | | | | — | | | | — | | | | — | | | | — | | | | (6,227,970 | ) | | | — | |
Ending Balance | | $ | 47,319,570 | | | $ | 3,964,242 | | | $ | 40,070,150 | | | $ | 766,667 | | | $ | 26 | | | $ | 62 | | | $ | — | | | $ | 92,120,717 | | | $ | — | |
Net change in unrealized appreciation (depreciation) for investments in Level 3 securities still held at September 30, 2024 | | $ | 1,122,939 | | | $ | 191,379 | | | $ | 1,355,513 | | | $ | — | | | $ | 19 | | | $ | — | | | $ | — | | | $ | 2,669,850 | | | $ | — | |
106 | THE GUGGENHEIM FUNDS ANNUAL REPORT | SEE NOTES TO FINANCIAL STATEMENTS. |
SCHEDULE OF INVESTMENTS (concluded) | September 30, 2024 |
CORE BOND FUND | |
Step Coupon Bonds
The following table discloses additional information related to step coupon bonds held by the Fund. Certain securities are subject to multiple rate changes prior to maturity. For those securities, a range of rates and corresponding dates have been provided. Rates for all step coupon bonds held by the Fund are scheduled to increase, none are scheduled to decrease.
Name | | Coupon Rate at
Next Reset Date | | | Next Rate Reset Date | |
Angel Oak Mortgage Trust 2024-4, 6.20% due 01/25/69 | | | 7.20 | % | | | 03/01/28 | |
Angel Oak Mortgage Trust 2024-4, 6.50% due 01/25/69 | | | 7.50 | % | | | 03/01/28 | |
Angel Oak Mortgage Trust 2024-4, 6.40% due 01/25/69 | | | 7.40 | % | | | 03/01/28 | |
Angel Oak Mortgage Trust 2023-1, 4.75% due 09/26/67 | | | 5.75 | % | | | 01/01/27 | |
Angel Oak Mortgage Trust 2024-3, 4.80% due 11/26/68 | | | 5.80 | % | | | 02/01/28 | |
Angel Oak Mortgage Trust 2024-2, 6.25% due 01/25/69 | | | 7.25 | % | | | 01/01/28 | |
BRAVO Residential Funding Trust 2024-NQM3, 6.39% due 03/25/64 | | | 7.39 | % | | | 03/01/28 | |
BRAVO Residential Funding Trust 2024-CES1, 6.38% due 04/25/54 | | | 7.38 | % | | | 04/01/28 | |
BRAVO Residential Funding Trust 2023-NQM2, 4.50% due 05/25/62 | | | 5.50 | % | | | 02/01/27 | |
BRAVO Residential Funding Trust 2023-NQM8, 7.10% due 10/25/63 | | | 8.10 | % | | | 11/01/27 | |
COLT Mortgage Loan Trust 2023-3, 7.58% due 09/25/68 | | | 8.58 | % | | | 09/01/27 | |
COLT Mortgage Loan Trust 2024-2, 6.43% due 04/25/69 | | | 7.43 | % | | | 03/01/28 | |
COLT Mortgage Loan Trust 2024-2, 6.33% due 04/25/69 | | | 7.33 | % | | | 03/01/28 | |
COLT Mortgage Loan Trust 2024-2, 6.13% due 04/25/69 | | | 7.13 | % | | | 03/01/28 | |
COLT Mortgage Loan Trust 2023-3, 7.18% due 09/25/68 | | | 8.18 | % | | | 09/01/27 | |
COLT Mortgage Loan Trust 2023-4, 7.62% due 10/25/68 | | | 8.62 | % | | | 10/01/27 | |
COLT Mortgage Loan Trust 2024-1, 6.14% due 02/25/69 | | | 7.14 | % | | | 01/01/28 | |
GCAT Trust 2024-NQM2, 6.09% due 06/25/59 | | | 7.36 | % | | | 05/01/28 | |
GCAT Trust 2023-NQM3, 6.89% due 08/25/68 | | | 7.89 | % | | | 09/01/27 | |
GCAT Trust 2024-NQM2, 6.54% due 06/25/59 | | | 7.71 | % | | | 05/01/28 | |
GCAT Trust 2023-NQM3, 7.34% due 08/25/68 | | | 8.34 | % | | | 09/01/27 | |
Mill City Securities Ltd. 2024-RS1, 3.00% due 11/01/69 | | | 6.00 | % | | | 10/01/27 | |
Morgan Stanley Residential Mortgage Loan Trust 2024-NQM3, 5.35% due 07/25/69 | | | 6.35 | % | | | 09/01/28 | |
OBX Trust 2024-NQM3, 6.33% due 12/25/63 | | | 7.33 | % | | | 02/01/28 | |
OBX Trust 2024-NQM8, 6.59% due 05/25/64 | | | 7.59 | % | | | 05/01/28 | |
OBX Trust 2024-NQM7, 6.24% due 03/25/64 | | | 7.24 | % | | | 04/01/28 | |
OBX Trust 2022-NQM8, 6.10% due 09/25/62 | | | 7.10 | % | | | 10/01/26 | |
OBX Trust 2024-NQM8, 6.23% due 05/25/64 | | | 7.23 | % | | | 05/01/28 | |
OBX Trust 2023-NQM9, 7.66% due 10/25/63 | | | 8.66 | % | | | 10/01/27 | |
OBX Trust 2022-NQM9, 6.45% due 09/25/62 | | | 7.45 | % | | | 11/01/26 | |
OBX Trust 2024-NQM3, 6.43% due 12/25/63 | | | 7.43 | % | | | 02/01/28 | |
OBX Trust 2024-NQM4, 6.22% due 01/25/64 | | | 7.22 | % | | | 02/01/28 | |
OBX Trust 2024-NQM6, 6.70% due 02/25/64 | | | 7.70 | % | | | 04/01/28 | |
OBX Trust 2024-NQM7, 6.45% due 03/25/64 | | | 7.45 | % | | | 04/01/28 | |
OBX Trust 2024-NQM5, 5.99% due 01/25/64 | | | 6.99 | % | | | 03/01/28 | |
OBX Trust 2024-NQM5, 6.39% due 01/25/64 | | | 7.39 | % | | | 03/01/28 | |
OBX Trust 2024-NQM2, 6.18% due 12/25/63 | | | 7.18 | % | | | 01/01/28 | |
OBX Trust 2024-NQM3, 6.13% due 12/25/63 | | | 7.13 | % | | | 02/01/28 | |
OBX Trust 2024-NQM6, 6.45% due 02/25/64 | | | 7.45 | % | | | 04/01/28 | |
OBX Trust 2024-NQM7, 6.60% due 03/25/64 | | | 7.60 | % | | | 04/01/28 | |
OBX Trust 2024-NQM5, 6.29% due 01/25/64 | | | 7.29 | % | | | 03/01/28 | |
OBX Trust 2024-NQM6, 6.85% due 02/25/64 | | | 7.85 | % | | | 04/01/28 | |
PRPM LLC 2023-RCF1, 4.00% due 06/25/53 | | | 5.00 | % | | | 06/25/27 | |
RCKT Mortgage Trust 2024-CES4, 6.15% due 06/25/44 | | | 7.15 | % | | | 05/01/28 | |
Verus Securitization Trust 2023-7, 7.42% due 10/25/68 | | | 8.42 | % | | | 10/01/27 | |
Verus Securitization Trust 2023-2, 6.85% due 03/25/68 | | | 7.85 | % | | | 03/01/27 | |
Verus Securitization Trust 2024-1, 6.12% due 01/25/69 | | | 7.12 | % | | | 01/01/28 | |
Vista Point Securitization Trust 2024-CES2, 5.25% due 10/25/54 | | | 6.25 | % | | | 09/01/28 | |
SEE NOTES TO FINANCIAL STATEMENTS. | THE GUGGENHEIM FUNDS ANNUAL REPORT | 107 |
STATEMENT OF ASSETS AND LIABILITIES |
September 30, 2024 |
Assets: |
Investments, at value (cost $2,369,470,599) | | $ | 2,326,337,109 | |
Foreign currency, at value (cost 132,021) | | | 131,735 | |
Cash | | | 337,371 | |
Segregated cash with broker | | | 3,321,622 | |
Unamortized upfront premiums paid on interest rate swap agreements | | | 19,428 | |
Unrealized appreciation on forward foreign currency exchange contracts | | | 411 | |
Prepaid expenses | | | 58,919 | |
Receivables: |
Securities sold | | | 237,988,587 | |
Interest | | | 15,676,476 | |
Fund shares sold | | | 4,125,689 | |
Dividends | | | 12,255 | |
Variation margin on credit default swap agreements | | | 9,993 | |
Foreign tax reclaims | | | 2,236 | |
Total assets | | | 2,588,021,831 | |
| | | | | |
Liabilities: |
Unfunded loan commitments, at value (Note 9) (commitment fees received $—) | | | — | |
Unamortized upfront premiums received on credit default swap agreements | | | 1,207,133 | |
Unrealized depreciation on forward foreign currency exchange contracts | | | 29,955 | |
Payable for: |
Securities purchased | | | 484,633,131 | |
Fund shares redeemed | | | 3,790,075 | |
Variation margin on interest rate swap agreements | | | 2,417,193 | |
Distributions to shareholders | | | 430,984 | |
Management fees | | | 378,696 | |
Variation margin on futures contracts | | | 158,875 | |
Transfer agent/maintenance fees | | | 89,836 | |
Distribution and service fees | | | 48,075 | |
Protection fees on credit default swap agreements | | | 16,654 | |
Fund accounting/administration fees | | | 7,341 | |
Trustees’ fees* | | | 2,648 | |
Due to Investment Adviser | | | 1,579 | |
Swap settlement | | | 894 | |
Miscellaneous | | | 1,409,035 | |
Total liabilities | | | 494,622,104 | |
Net assets | | $ | 2,093,399,727 | |
| | | | | |
Net assets consist of: |
Paid in capital | | $ | 2,289,400,833 | |
Total distributable earnings (loss) | | | (196,001,106 | ) |
Net assets | | $ | 2,093,399,727 | |
| | | | | |
Class A: |
Net assets | | $ | 137,882,563 | |
Capital shares outstanding | | | 8,255,536 | |
Net asset value per share | | $ | 16.70 | |
Maximum offering price per share (Net asset value divided by 96.00%) | | $ | 17.40 | |
| | | | | |
Class C: |
Net assets | | $ | 22,759,365 | |
Capital shares outstanding | | | 1,368,333 | |
Net asset value per share | | $ | 16.63 | |
| | | | | |
Class P: |
Net assets | | $ | 24,777,819 | |
Capital shares outstanding | | | 1,481,861 | |
Net asset value per share | | $ | 16.72 | |
| | | | | |
Institutional Class: |
Net assets | | $ | 1,907,979,980 | |
Capital shares outstanding | | | 114,360,960 | |
Net asset value per share | | $ | 16.68 | |
* | Relates to Trustees not deemed “interested persons” within the meaning of Section 2(a)(19) of the 1940 Act. |
108 | THE GUGGENHEIM FUNDS ANNUAL REPORT | SEE NOTES TO FINANCIAL STATEMENTS. |
STATEMENT OF OPERATIONS |
Year Ended September 30, 2024 |
Investment Income: |
Dividends | | $ | 104,984 | |
Interest | | | 100,842,959 | |
Total investment income | | | 100,947,943 | |
| | | | | |
Expenses: |
Management fees | | | 7,370,510 | |
Distribution and service fees: |
Class A | | | 312,195 | |
Class C | | | 217,844 | |
Class P | | | 63,394 | |
Transfer agent/maintenance fees: |
Class A | | | 189,041 | |
Class C | | | 11,576 | |
Class P | | | 9,951 | |
Institutional Class | | | 1,100,857 | |
Interest expense | | | 1,041,744 | |
Fund accounting/administration fees | | | 735,084 | |
Professional fees | | | 137,698 | |
Line of credit fees | | | 86,752 | |
Trustees’ fees* | | | 39,489 | |
Custodian fees | | | 31,354 | |
Miscellaneous | | | 271,573 | |
Recoupment of previously waived fees: |
Class C | | | 8,677 | |
Class P | | | 12,675 | |
Institutional Class | | | 128,147 | |
Total expenses | | | 11,768,561 | |
Less: |
Expense reimbursed by adviser: |
Class A | | | (79,123 | ) |
Class C | | | (1,262 | ) |
Class P | | | (301 | ) |
Institutional Class | | | (412,327 | ) |
Expenses waived by Adviser | | | (611,201 | ) |
Total waived/reimbursed expenses | | | (1,104,214 | ) |
Net expenses | | | 10,664,347 | |
Net investment income | | | 90,283,596 | |
| | | | | |
Net Realized and Unrealized Gain (Loss): |
Net realized gain (loss) on: |
Investments | | $ | (41,671,523 | ) |
Swap agreements | | | (3,333,283 | ) |
Futures contracts | | | (632,569 | ) |
Options purchased | | | 524,620 | |
Options written | | | (1,372,342 | ) |
Forward foreign currency exchange contracts | | | 7,393 | |
Foreign currency transactions | | | (16,852 | ) |
Net realized loss | | | (46,494,556 | ) |
Net change in unrealized appreciation (depreciation) on: |
Investments | | | 162,029,233 | |
Swap agreements | | | 14,045,561 | |
Futures contracts | | | 1,651,819 | |
Options purchased | | | 585,689 | |
Options written | | | 318,806 | |
Forward foreign currency exchange contracts | | | (280,288 | ) |
Foreign currency translations | | | (3,365 | ) |
Net change in unrealized appreciation (depreciation) | | | 178,347,455 | |
Net realized and unrealized gain | | | 131,852,899 | |
Net increase in net assets resulting from operations | | $ | 222,136,495 | |
* | Relates to Trustees not deemed “interested persons” within the meaning of Section 2(a)(19) of the 1940 Act. |
SEE NOTES TO FINANCIAL STATEMENTS. | THE GUGGENHEIM FUNDS ANNUAL REPORT | 109 |
STATEMENTS OF CHANGES IN NET ASSETS |
| | Year Ended
September 30,
2024 | | | Year Ended
September 30,
2023 | |
Increase (Decrease) in Net Assets from Operations: | | | | | | | | |
Net investment income | | $ | 90,283,596 | | | $ | 58,090,969 | |
Net realized loss on investments | | | (46,494,556 | ) | | | (83,396,652 | ) |
Net change in unrealized appreciation (depreciation) on investments | | | 178,347,455 | | | | 34,192,240 | |
Net increase in net assets resulting from operations | | | 222,136,495 | | | | 8,886,557 | |
| | | | | | | | | |
Distributions to shareholders: | | | | | | | | |
Class A | | | (5,572,388 | ) | | | (4,628,669 | ) |
Class C | | | (813,243 | ) | | | (690,054 | ) |
Class P | | | (1,134,659 | ) | | | (1,494,786 | ) |
Institutional Class | | | (81,533,571 | ) | | | (49,253,737 | ) |
Total distributions to shareholders | | | (89,053,861 | ) | | | (56,067,246 | ) |
| | | | | | | | | |
Capital share transactions: | | | | | | | | |
Proceeds from sale of shares | | | | | | | | |
Class A | | | 36,111,802 | | | | 27,585,227 | |
Class C | | | 6,006,562 | | | | 9,484,399 | |
Class P | | | 5,823,351 | | | | 6,643,720 | |
Institutional Class | | | 1,248,197,694 | | | | 875,193,068 | |
Distributions reinvested | | | | | | | | |
Class A | | | 5,100,462 | | | | 4,189,176 | |
Class C | | | 724,884 | | | | 610,361 | |
Class P | | | 1,130,342 | | | | 1,488,895 | |
Institutional Class | | | 77,395,407 | | | | 46,738,789 | |
Cost of shares redeemed | | | | | | | | |
Class A | | | (29,449,474 | ) | | | (23,834,759 | ) |
Class C | | | (7,509,799 | ) | | | (8,402,408 | ) |
Class P | | | (12,856,110 | ) | | | (32,056,257 | ) |
Institutional Class | | | (917,116,326 | ) | | | (582,763,645 | ) |
Net increase from capital share transactions | | | 413,558,795 | | | | 324,876,566 | |
Net increase in net assets | | | 546,641,429 | | | | 277,695,877 | |
| | | | | | | | | |
Net assets: | | | | | | | | |
Beginning of year | | | 1,546,758,298 | | | | 1,269,062,421 | |
End of year | | $ | 2,093,399,727 | | | $ | 1,546,758,298 | |
| | | | | | | | | |
Capital share activity: | | | | | | | | |
Shares sold | | | | | | | | |
Class A | | | 2,242,770 | | | | 1,708,895 | |
Class C | | | 372,815 | | | | 586,868 | |
Class P | | | 359,191 | | | | 410,906 | |
Institutional Class | | | 78,174,273 | | | | 54,190,672 | |
Shares issued from reinvestment of distributions | | | | | | | | |
Class A | | | 317,202 | | | | 259,787 | |
Class C | | | 45,306 | | | | 38,033 | |
Class P | | | 70,321 | | | | 92,259 | |
Institutional Class | | | 4,816,891 | | | | 2,904,961 | |
Shares redeemed | | | | | | | | |
Class A | | | (1,831,649 | ) | | | (1,470,307 | ) |
Class C | | | (471,900 | ) | | | (523,605 | ) |
Class P | | | (802,798 | ) | | | (1,981,473 | ) |
Institutional Class | | | (57,378,056 | ) | | | (36,342,037 | ) |
Net increase in shares | | | 25,914,366 | | | | 19,874,959 | |
110 | THE GUGGENHEIM FUNDS ANNUAL REPORT | SEE NOTES TO FINANCIAL STATEMENTS. |
This table is presented to show selected data for a share outstanding throughout each period and to assist shareholders in evaluating a Fund’s performance for the periods presented.
Class A | | Year Ended
September 30,
2024 | | | Year Ended
September 30,
2023 | | | Year Ended
September 30,
2022 | | | Year Ended
September 30,
2021 | | | Year Ended
September 30,
2020 | |
Per Share Data |
Net asset value, beginning of period | | $ | 15.56 | | | $ | 15.95 | | | $ | 20.06 | | | $ | 20.53 | | | $ | 18.94 | |
Income (loss) from investment operations: |
Net investment income (loss)a | | | .73 | | | | .67 | | | | .46 | | | | .44 | | | | .37 | |
Net gain (loss) on investments (realized and unrealized) | | | 1.13 | | | | (.41 | ) | | | (3.84 | ) | | | (.01 | ) | | | 1.63 | |
Total from investment operations | | | 1.86 | | | | .26 | | | | (3.38 | ) | | | .43 | | | | 2.00 | |
Less distributions from: |
Net investment income | | | (.72 | ) | | | (.65 | ) | | | (.47 | ) | | | (.47 | ) | | | (.41 | ) |
Net realized gains | | | — | | | | — | | | | (.26 | ) | | | (.43 | ) | | | — | |
Total distributions | | | (.72 | ) | | | (.65 | ) | | | (.73 | ) | | | (.90 | ) | | | (.41 | ) |
Net asset value, end of period | | $ | 16.70 | | | $ | 15.56 | | | $ | 15.95 | | | $ | 20.06 | | | $ | 20.53 | |
|
Total Returnb | | | 12.27 | % | | | 1.46 | % | | | (17.30 | %) | | | 2.09 | % | | | 10.68 | % |
Ratios/Supplemental Data |
Net assets, end of period (in thousands) | | $ | 137,883 | | | $ | 117,100 | | | $ | 112,084 | | | $ | 151,026 | | | $ | 218,856 | |
Ratios to average net assets: |
Net investment income (loss) | | | 4.54 | % | | | 4.12 | % | | | 2.53 | % | | | 2.20 | % | | | 1.87 | % |
Total expensesc | | | 0.93 | % | | | 0.92 | % | | | 0.82 | % | | | 0.85 | % | | | 0.85 | % |
Net expensesd,e,f | | | 0.83 | % | | | 0.83 | % | | | 0.78 | % | | | 0.79 | % | | | 0.79 | % |
Portfolio turnover rate | | | 89 | % | | | 88 | % | | | 49 | % | | | 103 | % | | | 126 | % |
Class C | | Year Ended
September 30,
2024 | | | Year Ended
September 30,
2023 | | | Year Ended
September 30,
2022 | | | Year Ended
September 30,
2021 | | | Year Ended
September 30,
2020 | |
Per Share Data |
Net asset value, beginning of period | | $ | 15.49 | | | $ | 15.88 | | | $ | 19.97 | | | $ | 20.45 | | | $ | 18.86 | |
Income (loss) from investment operations: |
Net investment income (loss)a | | | .60 | | | | .55 | | | | .33 | | | | .29 | | | | .22 | |
Net gain (loss) on investments (realized and unrealized) | | | 1.14 | | | | (.42 | ) | | | (3.83 | ) | | | (.03 | ) | | | 1.64 | |
Total from investment operations | | | 1.74 | | | | .13 | | | | (3.50 | ) | | | .26 | | | | 1.86 | |
Less distributions from: |
Net investment income | | | (.60 | ) | | | (.52 | ) | | | (.33 | ) | | | (.31 | ) | | | (.27 | ) |
Net realized gains | | | — | | | | — | | | | (.26 | ) | | | (.43 | ) | | | — | |
Total distributions | | | (.60 | ) | | | (.52 | ) | | | (.59 | ) | | | (.74 | ) | | | (.27 | ) |
Net asset value, end of period | | $ | 16.63 | | | $ | 15.49 | | | $ | 15.88 | | | $ | 19.97 | | | $ | 20.45 | |
|
Total Returnb | | | 11.49 | % | | | 0.68 | % | | | (17.90 | %) | | | 1.34 | % | | | 9.86 | % |
Ratios/Supplemental Data |
Net assets, end of period (in thousands) | | $ | 22,759 | | | $ | 22,027 | | | $ | 20,970 | | | $ | 33,407 | | | $ | 33,163 | |
Ratios to average net assets: |
Net investment income (loss) | | | 3.80 | % | | | 3.39 | % | | | 1.78 | % | | | 1.46 | % | | | 1.13 | % |
Total expensesc | | | 1.63 | % | | | 1.66 | % | | | 1.61 | % | | | 1.61 | % | | | 1.62 | % |
Net expensesd,e,f | | | 1.59 | % | | | 1.59 | % | | | 1.53 | % | | | 1.54 | % | | | 1.54 | % |
Portfolio turnover rate | | | 89 | % | | | 88 | % | | | 49 | % | | | 103 | % | | | 126 | % |
SEE NOTES TO FINANCIAL STATEMENTS. | THE GUGGENHEIM FUNDS ANNUAL REPORT | 111 |
FINANCIAL HIGHLIGHTS (continued) |
This table is presented to show selected data for a share outstanding throughout each period and to assist shareholders in evaluating a Fund’s performance for the periods presented.
Class P | | Year Ended
September 30,
2024 | | | Year Ended
September 30,
2023 | | | Year Ended
September 30,
2022 | | | Year Ended
September 30,
2021 | | | Year Ended
September 30,
2020 | |
Per Share Data |
Net asset value, beginning of period | | $ | 15.57 | | | $ | 15.96 | | | $ | 20.07 | | | $ | 20.55 | | | $ | 18.96 | |
Income (loss) from investment operations: |
Net investment income (loss)a | | | .72 | | | | .66 | | | | .46 | | | | .44 | | | | .36 | |
Net gain (loss) on investments (realized and unrealized) | | | 1.15 | | | | (.41 | ) | | | (3.84 | ) | | | (.02 | ) | | | 1.64 | |
Total from investment operations | | | 1.87 | | | | .25 | | | | (3.38 | ) | | | .42 | | | | 2.00 | |
Less distributions from: |
Net investment income | | | (.72 | ) | | | (.64 | ) | | | (.47 | ) | | | (.47 | ) | | | (.41 | ) |
Net realized gains | | | — | | | | — | | | | (.26 | ) | | | (.43 | ) | | | — | |
Total distributions | | | (.72 | ) | | | (.64 | ) | | | (.73 | ) | | | (.90 | ) | | | (.41 | ) |
Net asset value, end of period | | $ | 16.72 | | | $ | 15.57 | | | $ | 15.96 | | | $ | 20.07 | | | $ | 20.55 | |
|
Total Return | | | 12.25 | % | | | 1.50 | % | | | (17.30 | %) | | | 2.04 | % | | | 10.67 | % |
Ratios/Supplemental Data |
Net assets, end of period (in thousands) | | $ | 24,778 | | | $ | 28,885 | | | $ | 53,203 | | | $ | 89,223 | | | $ | 60,534 | |
Ratios to average net assets: |
Net investment income (loss) | | | 4.53 | % | | | 4.10 | % | | | 2.49 | % | | | 2.17 | % | | | 1.86 | % |
Total expensesc | | | 0.87 | % | | | 1.01 | % | | | 0.94 | % | | | 0.90 | % | | | 0.91 | % |
Net expensesd,e,f | | | 0.84 | % | | | 0.82 | % | | | 0.78 | % | | | 0.79 | % | | | 0.79 | % |
Portfolio turnover rate | | | 89 | % | | | 88 | % | | | 49 | % | | | 103 | % | | | 126 | % |
112 | THE GUGGENHEIM FUNDS ANNUAL REPORT | SEE NOTES TO FINANCIAL STATEMENTS. |
FINANCIAL HIGHLIGHTS (concluded) |
This table is presented to show selected data for a share outstanding throughout each period and to assist shareholders in evaluating a Fund’s performance for the periods presented.
Institutional Class | | Year Ended
September 30,
2024 | | | Year Ended
September 30,
2023 | | | Year Ended
September 30,
2022 | | | Year Ended
September 30,
2021 | | | Year Ended
September 30,
2020 | |
Per Share Data |
Net asset value, beginning of period | | $ | 15.54 | | | $ | 15.92 | | | $ | 20.03 | | | $ | 20.51 | | | $ | 18.91 | |
Income (loss) from investment operations: |
Net investment income (loss)a | | | .77 | | | | .71 | | | | .52 | | | | .50 | | | | .42 | |
Net gain (loss) on investments (realized and unrealized) | | | 1.13 | | | | (.40 | ) | | | (3.85 | ) | | | (.03 | ) | | | 1.65 | |
Total from investment operations | | | 1.90 | | | | .31 | | | | (3.33 | ) | | | .47 | | | | 2.07 | |
Less distributions from: |
Net investment income | | | (.76 | ) | | | (.69 | ) | | | (.52 | ) | | | (.52 | ) | | | (.47 | ) |
Net realized gains | | | — | | | | — | | | | (.26 | ) | | | (.43 | ) | | | — | |
Total distributions | | | (.76 | ) | | | (.69 | ) | | | (.78 | ) | | | (.95 | ) | | | (.47 | ) |
Net asset value, end of period | | $ | 16.68 | | | $ | 15.54 | | | $ | 15.92 | | | $ | 20.03 | | | $ | 20.51 | |
|
Total Return | | | 12.61 | % | | | 1.80 | % | | | (17.09 | %) | | | 2.34 | % | | | 11.07 | % |
Ratios/Supplemental Data |
Net assets, end of period (in thousands) | | $ | 1,907,980 | | | $ | 1,378,747 | | | $ | 1,082,805 | | | $ | 1,382,711 | | | $ | 1,139,109 | |
Ratios to average net assets: |
Net investment income (loss) | | | 4.84 | % | | | 4.43 | % | | | 2.84 | % | | | 2.49 | % | | | 2.17 | % |
Total expensesc | | | 0.59 | % | | | 0.65 | % | | | 0.60 | % | | | 0.60 | % | | | 0.58 | % |
Net expensesd,e,f | | | 0.53 | % | | | 0.55 | % | | | 0.49 | % | | | 0.50 | % | | | 0.50 | % |
Portfolio turnover rate | | | 89 | % | | | 88 | % | | | 49 | % | | | 103 | % | | | 126 | % |
a | Net investment income (loss) per share was computed using average shares outstanding throughout the period. |
b | Total return does not reflect the impact of any applicable sales charges. |
c | Does not include expenses of the underlying funds in which the Fund invests. |
d | Net expense information reflects the expense ratios after expense waivers and reimbursements, as applicable. |
e | The portion of the ratios of net expenses to average net assets attributable to recoupments of prior fee reductions or expense reimbursements for the years presented was as follows: |
| | | 09/30/24 | 09/30/23 | 09/30/22 | 09/30/21 | 09/30/20 |
| | Class A | — | 0.01% | 0.01% | 0.01% | 0.00%* |
| | Class C | 0.04% | 0.01% | 0.00%* | — | 0.00%* |
| | Class P | 0.05% | 0.00%* | — | — | 0.00%* |
| | Institutional Class | 0.01% | 0.00%* | — | — | 0.00%* |
f | Net expenses may include expenses that are excluded from the expense limitation agreement. Excluding these expenses, the net expense ratios for the years presented would be: |
| | | 09/30/24 | 09/30/23 | 09/30/22 | 09/30/21 | 09/30/20 |
| | Class A | 0.76% | 0.76% | 0.77% | 0.78% | 0.78% |
| | Class C | 1.51% | 1.52% | 1.52% | 1.53% | 1.53% |
| | Class P | 0.76% | 0.76% | 0.77% | 0.78% | 0.78% |
| | Institutional Class | 0.47% | 0.47% | 0.48% | 0.49% | 0.49% |
SEE NOTES TO FINANCIAL STATEMENTS. | THE GUGGENHEIM FUNDS ANNUAL REPORT | 113 |
SCHEDULE OF INVESTMENTS | September 30, 2024 |
FLOATING RATE STRATEGIES FUND | |
| | Shares | | | Value | |
COMMON STOCKS† - 0.4% |
| | | | | | | | | |
Industrial - 0.4% |
API Heat Transfer Intermediate*,††† | | | 2,105 | | | $ | 3,016,118 | |
BP Holdco LLC*,†††,1 | | | 244,278 | | | | 296,099 | |
YAK BLOCKER 2 LLC*,††† | | | 15,530 | | | | 31,216 | |
YAK BLOCKER 2 LLC*,††† | | | 14,354 | | | | 28,852 | |
Vector Phoenix Holdings, LP*,††† | | | 244,278 | | | | 5,169 | |
Targus, Inc.*,††† | | | 12,773 | | | | 542 | |
Targus, Inc.*,††† | | | 12,773 | | | | 73 | |
Targus, Inc.*,††† | | | 12,773 | | | | 1 | |
Total Industrial | | | | | | | 3,378,070 | |
| | | | | | | | | |
Consumer, Non-cyclical - 0.0% |
Endo, Inc.* | | | 20,157 | | | | 519,043 | |
| | | | | | | | | |
Consumer, Cyclical - 0.0% |
SHO Holding I Corp.*,††† | | | 178 | | | | 140,023 | |
| | | | | | | | | |
Energy - 0.0% |
Permian Production Partners LLC*,††† | | | 401,481 | | | | 7,215 | |
| | | | | | | | | |
Total Common Stocks | | | | |
(Cost $4,114,914) | | | | | | | 4,044,351 | |
| | | | | | | | | |
EXCHANGE-TRADED FUNDS***,† - 2.7% |
SPDR Blackstone Senior Loan ETF | | | 602,210 | | | | 25,148,290 | |
Total Exchange-Traded Funds | | | | |
(Cost $24,937,026) | | | | | | | 25,148,290 | |
| | | | | | | | | |
MONEY MARKET FUND***,† - 3.5% |
Federated Hermes U.S. Treasury Cash Reserves Fund — Institutional Shares, 4.85%2 | | | 33,224,225 | | | | 33,224,225 | |
Total Money Market Fund | | | | |
(Cost $33,224,225) | | | | | | | 33,224,225 | |
| | | | | | | | | |
| | | Face
Amount~ | | | | | |
SENIOR FLOATING RATE INTERESTS††,◊ - 89.7% |
Consumer, Cyclical - 17.6% | | | | | | | | |
PetSmart LLC | | | | | | | | |
8.70% (1 Month Term SOFR + 3.75%, Rate Floor: 4.50%) due 02/11/28 | | | 6,159,500 | | | | 6,099,014 | |
Eagle Parent Corp. | | | | | | | | |
8.85% (3 Month Term SOFR + 4.25%, Rate Floor: 4.75%) due 04/02/29 | | | 6,215,625 | | | | 5,880,416 | |
Truck Hero, Inc. | | | | | | | | |
8.46% (1 Month Term SOFR + 3.50%, Rate Floor: 4.25%) due 01/31/28 | | | 5,800,073 | | | | 5,696,889 | |
Da Vinci Purchaser Corp. | | | | | | | | |
8.35% (1 Month Term SOFR + 3.50%, Rate Floor: 4.50%) due 01/08/27 | | | 5,491,010 | | | | 5,487,606 | |
Congruex Group LLC | | | | | | | | |
11.15% (3 Month Term SOFR + 5.75%, Rate Floor: 6.50%) due 05/03/29 | | | 6,842,500 | | | | 5,277,278 | |
Restaurant Brands | | | | | | | | |
6.60% (1 Month Term SOFR + 1.75%, Rate Floor: 1.75%) due 09/20/30 | | | 5,315,673 | | | | 5,256,829 | |
Fertitta Entertainment LLC | | | | | | | | |
8.85% (1 Month Term SOFR + 3.75%, Rate Floor: 4.25%) due 01/27/29 | | | 5,208,759 | | | | 5,191,778 | |
Flutter Financing B.V. | | | | | | | | |
6.60% (3 Month Term SOFR + 2.00%, Rate Floor: 2.50%) due 11/29/30 | | | 4,972,425 | | | | 4,970,635 | |
Petco Health And Wellness Company, Inc. | | | | | | | | |
8.12% (3 Month Term SOFR + 3.25%, Rate Floor: 4.00%) due 03/03/28 | | | 5,179,248 | | | | 4,917,800 | |
Peer Holding III BV | | | | | | | | |
7.85% (3 Month Term SOFR + 3.25%, Rate Floor: 3.25%) due 10/28/30 | | | 3,751,150 | | | | 3,758,202 | |
7.60% (3 Month Term SOFR + 3.00%, Rate Floor: 3.00%) due 07/01/31 | | | 990,000 | | | | 991,653 | |
Alterra Mountain Co. | | | | | | | | |
8.10% (1 Month Term SOFR + 3.25%, Rate Floor: 3.25%) due 08/17/28 | | | 4,649,672 | | | | 4,653,531 | |
Cedar Fair LP | | | | | | | | |
6.85% (1 Month Term SOFR + 2.00%, Rate Floor: 2.00%) due 05/01/31 | | | 4,488,750 | | | | 4,476,406 | |
Entain Holdings (Gibraltar) Ltd. | | | | | | | | |
7.86% (6 Month Term SOFR + 2.50%, Rate Floor: 3.00%) due 03/29/27 | | | 2,640,078 | | | | 2,647,497 | |
8.01% (6 Month Term SOFR + 2.75%, Rate Floor: 3.25%) due 10/31/29 | | | 1,596,000 | | | | 1,595,330 | |
American Tire Distributors, Inc. | | | | | | | | |
11.80% (3 Month Term SOFR + 6.25%, Rate Floor: 7.00%) due 10/20/28 | | | 6,825,000 | | | | 4,038,148 | |
Belron Finance US LLC | | | | | | | | |
7.63% (3 Month Term SOFR + 2.25%, Rate Floor: 2.75%) due 04/18/29 | | | 3,950,000 | | | | 3,948,341 | |
Ontario Gaming GTA, LP | | | | | | | | |
8.89% (3 Month Term SOFR + 4.25%, Rate Floor: 4.75%) due 08/01/30 | | | 3,948,071 | | | | 3,941,478 | |
Thevelia US LLC | | | | | | | | |
7.85% (3 Month Term SOFR + 3.25%, Rate Floor: 3.75%) due 06/18/29 | | | 3,905,653 | | | | 3,905,653 | |
CCRR Parent, Inc. | | | | | | | | |
9.21% (1 Month Term SOFR + 4.25%, Rate Floor: 5.00%) due 03/06/28 | | | 4,623,176 | | | | 3,825,678 | |
Grant Thornton Advisors LLC | | | | | | | | |
8.10% (1 Month Term SOFR + 3.25%, Rate Floor: 3.25%) due 06/02/31 | | | 3,807,642 | | | | 3,811,906 | |
BCPE Empire Holdings, Inc. | | | | | | | | |
8.85% (1 Month Term SOFR + 4.00%, Rate Floor: 4.50%) due 12/11/28 | | | 3,700,756 | | | | 3,700,312 | |
Scientific Games Corp. | | | | | | | | |
8.32% (3 Month Term SOFR + 3.00%, Rate Floor: 3.50%) due 04/04/29 | | | 3,696,857 | | | | 3,672,495 | |
114 | THE GUGGENHEIM FUNDS ANNUAL REPORT | SEE NOTES TO FINANCIAL STATEMENTS. |
SCHEDULE OF INVESTMENTS (continued) | September 30, 2024 |
FLOATING RATE STRATEGIES FUND | |
| | Face
Amount~ | | | Value | |
Caesars Entertainment, Inc. | | | | | | | | |
7.60% (1 Month Term SOFR + 2.75%, Rate Floor: 3.25%) due 02/06/31 | | | 2,064,625 | | | $ | 2,062,044 | |
7.60% (1 Month Term SOFR + 2.75%, Rate Floor: 3.25%) due 02/06/30 | | | 1,606,500 | | | | 1,604,990 | |
Galaxy US Opco, Inc. | | | | | | | | |
10.00% (3 Month Term SOFR + 4.75%, Rate Floor: 5.25%) due 04/29/29 | | | 4,057,635 | | | | 3,391,939 | |
Mavis Tire Express Services TopCo Corp. | | | | | | | | |
8.35% (1 Month Term SOFR + 3.50%, Rate Floor: 4.25%) due 05/04/28 | | | 3,297,675 | | | | 3,293,553 | |
BIFM CA Buyer, Inc. | | | | | | | | |
9.10% (1 Month Term SOFR + 4.25%, Rate Floor: 4.75%) due 05/31/28 | | | 3,182,196 | | | | 3,192,156 | |
Paint Intermediate III LLC | | | | | | | | |
due 09/11/31 | | | 3,200,000 | | | | 3,192,000 | |
Rent-A-Center, Inc. | | | | | | | | |
8.00% (3 Month Term SOFR + 2.75%, Rate Floor: 3.25%) due 02/17/28 | | | 3,028,436 | | | | 3,017,412 | |
Guardian US HoldCo LLC | | | | | | | | |
8.10% (3 Month Term SOFR + 3.50%, Rate Floor: 4.00%) due 01/31/30 | | | 2,822,160 | | | | 2,803,336 | |
Apro LLC | | | | | | | | |
8.87% (1 Month Term SOFR + 3.75%, Rate Floor: 3.75%) due 07/09/31 | | | 2,650,000 | | | | 2,656,625 | |
First Brands Group LLC | | | | | | | | |
10.51% (3 Month Term SOFR + 5.00%, Rate Floor: 6.00%) due 03/30/27 | | | 2,613,154 | | | | 2,582,136 | |
Michaels Stores, Inc. | | | | | | | | |
9.12% (3 Month Term SOFR + 4.25%, Rate Floor: 5.00%) due 04/15/28 | | | 3,170,728 | | | | 2,493,778 | |
AlixPartners, LLP | | | | | | | | |
7.46% (1 Month Term SOFR + 2.50%, Rate Floor: 3.00%) due 02/04/28 | | | 2,461,874 | | | | 2,463,105 | |
Hanesbrands, Inc. | | | | | | | | |
8.60% (1 Month Term SOFR + 3.75%, Rate Floor: 4.25%) due 03/08/30 | | | 2,413,250 | | | | 2,407,217 | |
EG Finco Ltd. | | | | | | | | |
8.88% (3 Month EURIBOR + 5.50%, Rate Floor: 5.50%) due 02/07/28 | | | EUR 1,939,014 | | | | 2,161,227 | |
10.44% (6 Month Term SOFR + 5.76%, Rate Floor: 5.76%) due 02/07/28 | | | 157,672 | | | | 157,345 | |
Crash Champions Inc. | | | | | | | | |
9.85% (3 Month Term SOFR + 4.75%, Rate Floor: 4.75%) due 02/23/29 | | | 2,388,000 | | | | 2,292,480 | |
Packers Holdings LLC | | | | | | | | |
8.20% (1 Month Term SOFR + 3.25%, Rate Floor: 4.00%) due 03/09/28 | | | 4,406,194 | | | | 2,288,489 | |
Prime Security Services Borrower LLC | | | | | | | | |
7.45% (1 Month Term SOFR + 2.25%, Rate Floor: 2.25%) due 10/13/30 | | | 2,271,806 | | | | 2,268,489 | |
Seren BidCo AB | | | | | | | | |
8.48% (3 Month SOFR + 3.15%, Rate Floor: 3.65%) due 11/16/28 | | | 2,139,500 | | | | 2,135,927 | |
Clarios Global, LP | | | | | | | | |
7.35% (1 Month Term SOFR + 2.50%, Rate Floor: 2.50%) due 05/06/30 | | | 2,036,296 | | | | 2,034,178 | |
TransNetwork LLC | | | | | | | | |
10.10% (3 Month Term SOFR + 5.50%, Rate Floor: 6.00%) due 12/30/30††† | | | 1,994,959 | | | | 2,014,908 | |
Match Group, Inc. | | | | | | | | |
6.71% (3 Month Term SOFR + 1.75%, Rate Floor: 1.75%) due 02/13/27 | | | 2,000,000 | | | | 1,992,500 | |
Alexander Mann | | | | | | | | |
11.44% (1 Month SOFR + 6.00%, Rate Floor: 6.00%) due 06/29/27 | | | 1,951,488 | | | | 1,900,261 | |
Sweetwater Sound | | | | | | | | |
9.21% (1 Month Term SOFR + 4.25%, Rate Floor: 5.00%) due 08/07/28 | | | 1,901,453 | | | | 1,899,076 | |
TMF Sapphire Bidco BV | | | | | | | | |
8.81% (3 Month Term SOFR + 3.50%, Rate Floor: 3.50%) due 05/03/28 | | | 1,844,655 | | | | 1,848,492 | |
PCI Gaming Authority, Inc. | | | | | | | | |
due 07/18/31 | | | 1,578,492 | | | | 1,568,074 | |
Go Daddy Operating Company LLC | | | | | | | | |
6.85% (1 Month Term SOFR + 2.00%, Rate Floor: 2.00%) due 11/09/29 | | | 1,432,470 | | | | 1,430,378 | |
AAL Delaware Holdco, Inc. | | | | | | | | |
8.35% (1 Month Term SOFR + 3.50%, Rate Floor: 3.50%) due 07/30/31 | | | 1,390,000 | | | | 1,394,782 | |
ImageFIRST Holdings LLC | | | | | | | | |
8.85% (3 Month Term SOFR + 4.25%, Rate Floor: 5.00%) due 04/27/28††† | | | 1,230,700 | | | | 1,221,470 | |
Bulldog Purchaser, Inc. | | | | | | | | |
8.85% (3 Month Term SOFR + 4.25%, Rate Floor: 4.75%) due 06/30/31 | | | 1,188,796 | | | | 1,193,254 | |
American Trailer World Corp. | | | | | | | | |
8.70% (1 Month Term SOFR + 3.75%, Rate Floor: 4.50%) due 03/03/28 | | | 1,085,951 | | | | 978,713 | |
Station Casinos LLC | | | | | | | | |
7.10% (1 Month Term SOFR + 2.25%, Rate Floor: 2.25%) due 03/14/31 | | | 830,825 | | | | 826,820 | |
Dealer Tire LLC | | | | | | | | |
8.35% (1 Month Term SOFR + 3.50%, Rate Floor: 4.00%) due 07/02/31 | | | 560,000 | | | | 560,700 | |
CHG Healthcare Services, Inc. | | | | | | | | |
8.46% (1 Month Term SOFR + 3.50%, Rate Floor: 4.00%) due 09/29/28 | | | 511,711 | | | | 512,207 | |
American Tire Distributors, Inc. | | | | | | | | |
11.28% (3 Month Term SOFR + 6.00%, Rate Floor: 6.00%) due 10/22/26††† | | | 545,238 | | | | 507,071 | |
WW International, Inc. | | | | | | | | |
8.46% (1 Month Term SOFR + 3.50%, Rate Floor: 4.00%) due 04/13/28 | | | 1,653,750 | | | | 439,286 | |
Hilton Worldwide Finance LLC | | | | | | | | |
6.60% (1 Month Term SOFR + 1.75%, Rate Floor: 1.75%) due 11/08/30 | | | 427,249 | | | | 427,006 | |
SEE NOTES TO FINANCIAL STATEMENTS. | THE GUGGENHEIM FUNDS ANNUAL REPORT | 115 |
SCHEDULE OF INVESTMENTS (continued) | September 30, 2024 |
FLOATING RATE STRATEGIES FUND | |
| | Face
Amount~ | | | Value | |
SHO Holding I Corp. | | | | | | | | |
11.82% (1 Month Term SOFR + 6.50%, Rate Floor: 7.50%) due 06/30/29††† | | | 263,276 | | | $ | 261,291 | |
12.32% (1 Month Term SOFR + 2.00%, Rate Floor: 3.00%) (in-kind rate was 5.00%) due 06/30/29†††,3 | | | 94,034 | | | | 82,750 | |
Total Consumer, Cyclical | | | | | | | 167,302,340 | |
| | | | | | | | | |
Industrial - 16.8% | | | | | | | | |
Arcline FM Holdings, LLC | | | | | | | | |
9.65% ((3 Month Term SOFR + 4.50%) and (6 Month Term SOFR + 4.50%), Rate Floor: 5.25%) due 06/23/28 | | | 9,350,588 | | | | 9,360,593 | |
American Bath Group LLC | | | | | | | | |
8.70% (1 Month Term SOFR + 3.75%, Rate Floor: 4.25%) due 11/23/27 | | | 8,693,840 | | | | 8,568,909 | |
Pelican Products, Inc. | | | | | | | | |
9.12% (3 Month Term SOFR + 4.25%, Rate Floor: 4.75%) due 12/29/28 | | | 8,913,472 | | | | 8,159,036 | |
Hunter Douglas, Inc. | | | | | | | | |
8.57% (3 Month Term SOFR + 3.50%, Rate Floor: 4.00%) due 02/26/29 | | | 6,528,524 | | | | 6,463,239 | |
Park River Holdings, Inc. | | | | | | | | |
8.84% (3 Month Term SOFR + 3.25%, Rate Floor: 4.00%) due 12/28/27 | | | 5,923,420 | | | | 5,820,352 | |
White Cap Supply Holdings LLC | | | | | | | | |
8.10% (1 Month Term SOFR + 3.25%, Rate Floor: 3.25%) due 10/19/29 | | | 4,924,433 | | | | 4,886,269 | |
Duran Group Holding GmbH | | | | | | | | |
9.21% (3 Month EURIBOR + 5.50%, Rate Floor: 5.50%) due 05/31/26††† | | | EUR 4,527,760 | | | | 4,740,054 | |
TransDigm, Inc. | | | | | | | | |
7.10% (3 Month Term SOFR + 2.50%, Rate Floor: 2.50%) due 01/19/32 | | | 3,199,187 | | | | 3,185,750 | |
7.32% (3 Month Term SOFR + 2.50%, Rate Floor: 2.50%) due 01/19/32 | | | 1,530,000 | | | | 1,523,620 | |
TricorBraun Holdings, Inc. | | | | | | | | |
8.21% (1 Month Term SOFR + 3.25%, Rate Floor: 3.75%) due 03/03/28 | | | 4,766,523 | | | | 4,669,429 | |
Michael Baker International LLC | | | | | | | | |
9.60% (1 Month Term SOFR + 4.75%, Rate Floor: 5.50%) due 12/01/28 | | | 4,641,236 | | | | 4,658,640 | |
DXP Enterprises, Inc. | | | | | | | | |
10.16% (6 Month Term SOFR + 4.75%, Rate Floor: 5.75%) due 10/11/30 | | | 3,757,050 | | | | 3,758,929 | |
due 10/11/30 | | | 695,000 | | | | 695,347 | |
DG Investment Intermediate Holdings 2, Inc. | | | | | | | | |
8.71% (1 Month Term SOFR + 3.86%, Rate Floor: 4.61%) due 03/31/28 | | | 4,461,215 | | | | 4,441,719 | |
Berlin Packaging LLC | | | | | | | | |
8.89% ((1 Month Term SOFR + 3.75%) and (3 Month Term SOFR + 3.75%), Rate Floor: 3.75%) due 06/07/31 | | | 4,116,557 | | | | 4,112,152 | |
United Airlines Inc. | | | | | | | | |
8.03% (3 Month Term SOFR + 2.75%, Rate Floor: 2.75%) due 02/22/31 | | | 4,009,950 | | | | 4,011,193 | |
Fugue Finance LLC | | | | | | | | |
9.06% (3 Month Term SOFR + 4.00%, Rate Floor: 4.50%) due 01/31/28 | | | 2,098,886 | | | | 2,108,247 | |
8.81% (3 Month Term SOFR + 3.75%, Rate Floor: 4.25%) due 02/26/31 | | | 1,725,675 | | | | 1,733,872 | |
Mauser Packaging Solutions Holding Co. | | | | | | | | |
8.70% (1 Month Term SOFR + 3.50%, Rate Floor: 3.50%) due 04/15/27 | | | 3,645,770 | | | | 3,650,838 | |
Engineered Machinery Holdings, Inc. | | | | | | | | |
8.62% (3 Month Term SOFR + 3.75%, Rate Floor: 4.50%) due 05/19/28 | | | 3,467,127 | | | | 3,475,794 | |
LBM Acquisition LLC | | | | | | | | |
8.97% (1 Month Term SOFR + 3.75%, Rate Floor: 4.50%) due 06/06/31 | | | 3,483,924 | | | | 3,412,086 | |
Aegion Corp. | | | | | | | | |
8.60% (1 Month Term SOFR + 3.75%, Rate Floor: 4.50%) due 05/17/28 | | | 3,297,761 | | | | 3,303,960 | |
Mirion Technologies, Inc. | | | | | | | | |
6.85% (3 Month Term SOFR + 2.25%, Rate Floor: 2.75%) due 10/20/28 | | | 3,065,287 | | | | 3,059,555 | |
FCG Acquisitions, Inc | | | | | | | | |
8.71% (1 Month Term SOFR + 3.75%, Rate Floor: 4.25%) due 03/31/28 | | | 3,026,360 | | | | 3,023,334 | |
Hobbs & Associates LLC | | | | | | | | |
8.10% (1 Month Term SOFR + 3.25%, Rate Floor: 3.25%) due 07/23/31 | | | 2,955,547 | | | | 2,948,158 | |
Merlin Buyer, Inc. | | | | | | | | |
9.35% (3 Month Term SOFR + 4.75%, Rate Floor: 5.25%) due 12/14/28††† | | | 2,940,151 | | | | 2,918,100 | |
Quikrete Holdings, Inc. | | | | | | | | |
7.10% (1 Month Term SOFR + 2.25%, Rate Floor: 2.25%) due 03/19/29 | | | 2,900,800 | | | | 2,900,133 | |
Protective Industrial Products, Inc. | | | | | | | | |
8.96% (1 Month Term SOFR + 4.00%, Rate Floor: 4.75%) due 12/29/27 | | | 2,911,804 | | | | 2,899,080 | |
Service Logic Acquisition, Inc. | | | | | | | | |
8.31% (3 Month Term SOFR + 3.50%, Rate Floor: 4.25%) due 10/29/27 | | | 2,708,136 | | | | 2,713,227 | |
Genesee & Wyoming, Inc. | | | | | | | | |
6.60% (3 Month Term SOFR + 2.00%, Rate Floor: 2.00%) due 04/10/31 | | | 2,690,000 | | | | 2,683,275 | |
Engineering Research And Consulting LLC | | | | | | | | |
10.06% (3 Month Term SOFR + 5.00%, Rate Floor: 5.00%) due 08/29/31††† | | | 2,550,000 | | | | 2,511,750 | |
Amentum Holdings, Inc. | | | | | | | | |
due 07/29/31 | | | 2,470,118 | | | | 2,460,855 | |
EMRLD Borrower, LP | | | | | | | | |
7.56% (3 Month Term SOFR + 2.50%, Rate Floor: 2.50%) due 05/31/30 | | | 2,455,150 | | | | 2,449,012 | |
Anchor Packaging LLC | | | | | | | | |
8.60% (3 Month Term SOFR + 3.75%, Rate Floor: 3.75%) due 07/18/29 | | | 2,230,000 | | | | 2,234,192 | |
Foundation Building Materials Holding Company LLC | | | | | | | | |
9.25% (1 Month Term SOFR + 4.00%, Rate Floor: 4.00%) due 01/29/31 | | | 2,288,500 | | | | 2,225,040 | |
116 | THE GUGGENHEIM FUNDS ANNUAL REPORT | SEE NOTES TO FINANCIAL STATEMENTS. |
SCHEDULE OF INVESTMENTS (continued) | September 30, 2024 |
FLOATING RATE STRATEGIES FUND | |
| | Face
Amount~ | | | Value | |
Brown Group Holding LLC | | | | | | | | |
7.60% (1 Month Term SOFR + 2.75%, Rate Floor: 3.25%) due 07/01/31 | | | 2,006,475 | | | $ | 2,000,335 | |
7.84% ((1 Month Term SOFR + 2.75%) and (3 Month Term SOFR + 2.75%), Rate Floor: 3.25%) due 07/01/31 | | | 187,031 | | | | 186,511 | |
API Heat Transfer | | | | | | | | |
13.19% (3 Month Term SOFR + 8.00%, Rate Floor: 11.00%) due 11/12/27††† | | | 1,376,260 | | | | 1,376,260 | |
10.19% (3 Month Term SOFR + 5.00%, Rate Floor: 8.00%) due 11/10/27††† | | | 796,558 | | | | 796,558 | |
STS Operating, Inc. | | | | | | | | |
8.95% (1 Month Term SOFR + 4.00%, Rate Floor: 4.00%) due 03/25/31 | | | 2,005,920 | | | | 1,990,876 | |
Sundyne (Star US Bidco) | | | | | | | | |
9.60% (3 Month Term SOFR + 4.35%, Rate Floor: 5.35%) due 03/17/27††† | | | 1,935,444 | | | | 1,951,169 | |
Artera Services LLC | | | | | | | | |
9.10% (3 Month Term SOFR + 4.50%, Rate Floor: 4.50%) due 02/15/31 | | | 1,940,325 | | | | 1,886,656 | |
ASP Dream Acquisiton Co. LLC | | | | | | | | |
9.20% (1 Month Term SOFR + 4.25%, Rate Floor: 5.00%) due 12/15/28††† | | | 1,694,504 | | | | 1,694,504 | |
Standard Industries, Inc. | | | | | | | | |
6.92% (1 Month Term SOFR + 2.00%, Rate Floor: 2.50%) due 09/22/28 | | | 1,658,233 | | | | 1,661,002 | |
Air Canada | | | | | | | | |
7.25% (3 Month Term SOFR + 2.50%, Rate Floor: 2.50%) due 03/21/31 | | | 1,651,700 | | | | 1,653,765 | |
Albion Financing 3 SARL | | | | | | | | |
9.83% (3 Month Term SOFR + 4.25%, Rate Floor: 4.75%) due 08/16/29 | | | 1,608,476 | | | | 1,614,507 | |
CPM Holdings, Inc. | | | | | | | | |
9.70% (1 Month Term SOFR + 4.50%, Rate Floor: 5.00%) due 09/28/28 | | | 1,564,205 | | | | 1,481,240 | |
Madison Safety & Flow LLC | | | | | | | | |
due 09/19/31 | | | 1,368,786 | | | | 1,367,075 | |
Bleriot US Bidco LLC | | | | | | | | |
7.85% (3 Month Term SOFR + 3.25%, Rate Floor: 3.25%) due 10/31/30 | | | 1,310,439 | | | | 1,310,714 | |
GFL Environmental, Inc. | | | | | | | | |
7.32% (3 Month Term SOFR + 2.00%, Rate Floor: 2.50%) due 07/03/31 | | | 1,240,000 | | | | 1,238,227 | |
ProAmpac PG Borrower LLC | | | | | | | | |
9.23% (3 Month Term SOFR + 4.00%, Rate Floor: 4.75%) due 09/15/28 | | | 1,218,722 | | | | 1,219,636 | |
Charter Next Generation Inc. | | | | | | | | |
8.10% (1 Month Term SOFR + 3.25%, Rate Floor: 4.00%) due 12/01/27 | | | 981,951 | | | | 981,852 | |
Savage Enterprises LLC | | | | | | | | |
7.85% (1 Month Term SOFR + 3.00%, Rate Floor: 3.50%) due 09/15/28 | | | 771,171 | | | | 773,168 | |
MI Windows And Doors LLC | | | | | | | | |
8.35% (1 Month Term SOFR + 3.50%, Rate Floor: 3.50%) due 03/28/31 | | | 728,175 | | | | 728,779 | |
SiteOne Landscaping Supply Holding LLC | | | | | | | | |
6.95% (1 Month Term SOFR + 1.75%, Rate Floor: 2.25%) due 03/23/30††† | | | 700,000 | | | | 701,750 | |
American Residential Services LLC | | | | | | | | |
8.37% (3 Month Term SOFR + 3.50%, Rate Floor: 4.25%) due 10/15/27 | | | 563,536 | | | | 563,891 | |
Osmose Utility Services, Inc. | | | | | | | | |
8.21% (1 Month Term SOFR + 3.25%, Rate Floor: 3.75%) due 06/23/28 | | | 480,138 | | | | 475,337 | |
StandardAero | | | | | | | | |
due 08/24/28 | | | 300,000 | | | | 300,063 | |
Total Industrial | | | | | | | 159,719,614 | |
| | | | | | | | | |
Consumer, Non-cyclical - 15.1% | | | | | | | | |
Hayward Industries, Inc. | | | | | | | | |
7.46% (1 Month Term SOFR + 2.50%, Rate Floor: 3.00%) due 05/30/28 | | | 7,546,500 | | | | 7,529,747 | |
VC GB Holdings I Corp. | | | | | | | | |
8.37% (3 Month Term SOFR + 3.50%, Rate Floor: 4.00%) due 07/21/28 | | | 7,214,350 | | | | 7,190,687 | |
Medical Solutions Parent Holdings, Inc. | | | | | | | | |
8.85% (3 Month Term SOFR + 3.50%, Rate Floor: 4.00%) due 11/01/28 | | | 9,075,268 | | | | 6,851,827 | |
Bombardier Recreational Products, Inc. | | | | | | | | |
7.60% (1 Month Term SOFR + 2.75%, Rate Floor: 2.75%) due 01/22/31 | | | 6,370,013 | | | | 6,354,088 | |
National Mentor Holdings, Inc. | | | | | | | | |
8.65% ((1 Month Term SOFR + 3.75%) and (3 Month Term SOFR + 3.75%), Rate Floor: 4.50%) due 03/02/28 | | | 6,392,435 | | | | 6,131,048 | |
8.45% (3 Month Term SOFR + 3.75%, Rate Floor: 4.50%) due 03/02/28 | | | 211,372 | | | | 202,729 | |
Quirch Foods Holdings LLC | | | | | | | | |
9.89% (3 Month Term SOFR + 5.00%, Rate Floor: 6.00%) due 10/27/27 | | | 6,549,873 | | | | 6,156,881 | |
Weber-Stephen Products LLC | | | | | | | | |
8.21% (1 Month Term SOFR + 3.25%, Rate Floor: 4.00%) due 10/30/27 | | | 6,299,760 | | | | 5,923,538 | |
Dermatology Intermediate Holdings III, Inc. | | | | | | | | |
9.10% (1 Month Term SOFR + 4.25%, Rate Floor: 4.75%) due 03/30/29 | | | 5,123,658 | | | | 4,872,035 | |
PlayCore | | | | | | | | |
9.75% (3 Month Term SOFR + 4.50%, Rate Floor: 5.50%) due 02/20/30 | | | 4,821,860 | | | | 4,835,120 | |
Agiliti | | | | | | | | |
8.33% (3 Month Term SOFR + 3.00%, Rate Floor: 3.00%) due 05/01/30 | | | 4,974,874 | | | | 4,825,628 | |
HAH Group Holding Co. LLC | | | | | | | | |
due 09/17/31 | | | 4,755,388 | | | | 4,687,053 | |
Midwest Veterinary Partners LLC | | | | | | | | |
8.87% (1 Month Term SOFR + 3.75%, Rate Floor: 4.50%) due 04/27/28 | | | 4,333,987 | | | | 4,329,913 | |
TGP Holdings LLC | | | | | | | | |
8.20% (1 Month Term SOFR + 3.25%, Rate Floor: 4.00%) due 06/29/28 | | | 4,535,099 | | | | 4,262,993 | |
SEE NOTES TO FINANCIAL STATEMENTS. | THE GUGGENHEIM FUNDS ANNUAL REPORT | 117 |
SCHEDULE OF INVESTMENTS (continued) | September 30, 2024 |
FLOATING RATE STRATEGIES FUND | |
| | Face
Amount~ | | | Value | |
Chefs’ Warehouse, Inc. | | | | | | | | |
8.85% (1 Month Term SOFR + 4.00%, Rate Floor: 4.50%) due 08/23/29 | | | 4,235,667 | | | $ | 4,235,667 | |
Endo Finance Holdings, Inc. | | | | | | | | |
9.78% (3 Month Term SOFR + 4.50%, Rate Floor: 5.00%) due 04/23/31 | | | 4,221,074 | | | | 4,214,911 | |
Resonetics LLC | | | | | | | | |
8.71% (1 Month Term SOFR + 3.75%, Rate Floor: 4.50%) due 06/18/31 | | | 4,055,082 | | | | 4,056,988 | |
Grifols Worldwide Operations USA, Inc. | | | | | | | | |
7.40% (3 Month Term SOFR + 2.00%, Rate Floor: 3.00%) due 11/15/27 | | | 4,105,658 | | | | 3,984,418 | |
Outcomes Group Holdings, Inc. | | | | | | | | |
9.10% (1 Month Term SOFR + 4.25%, Rate Floor: 4.25%) due 05/06/31 | | | 3,878,510 | | | | 3,898,717 | |
Osmosis Holdings Australia II Pty Ltd. | | | | | | | | |
8.70% (1 Month Term SOFR + 3.50%, Rate Floor: 4.00%) due 07/31/28 | | | 3,900,771 | | | | 3,894,881 | |
US Foods, Inc. | | | | | | | | |
due 11/26/31 | | | 3,800,000 | | | | 3,804,750 | |
Del Monte Foods, Inc. | | | | | | | | |
13.17% (3 Month Term SOFR + 8.00%, Rate Floor: 8.00%) due 08/02/28 | | | 2,071,472 | | | | 1,943,724 | |
9.41% (3 Month Term SOFR + 4.25%, Rate Floor: 4.75%) due 08/01/28 | | | 3,354,820 | | | | 1,794,828 | |
Froneri US, Inc. | | | | | | | | |
7.20% (1 Month Term SOFR + 2.25%, Rate Floor: 2.25%) due 01/29/27 | | | 3,396,130 | | | | 3,386,790 | |
Perrigo Investments LLC | | | | | | | | |
7.20% (1 Month Term SOFR + 2.25%, Rate Floor: 2.75%) due 04/20/29 | | | 3,149,564 | | | | 3,137,753 | |
CHG PPC Parent LLC | | | | | | | | |
7.71% (1 Month Term SOFR + 2.75%, Rate Floor: 3.25%) due 12/08/28 | | | 2,888,299 | | | | 2,875,677 | |
Topgolf Callaway Brands Corp. | | | | | | | | |
7.85% (1 Month Term SOFR + 3.00%, Rate Floor: 3.00%) due 03/15/30 | | | 2,728,800 | | | | 2,686,176 | |
Balrog Acquisition, Inc. | | | | | | | | |
9.46% (1 Month Term SOFR + 4.50%, Rate Floor: 5.25%) due 09/05/28††† | | | 2,569,305 | | | | 2,556,459 | |
Elanco Animal Health, Inc. | | | | | | | | |
7.05% (1 Month Term SOFR + 1.75%, Rate Floor: 1.75%) due 08/01/27 | | | 2,515,167 | | | | 2,508,703 | |
Summit Behavioral Healthcare LLC | | | | | | | | |
9.31% (3 Month Term SOFR + 4.25%, Rate Floor: 5.00%) due 11/24/28††† | | | 2,671,472 | | | | 2,484,469 | |
Heritage Grocers Group LLC | | | | | | | | |
11.45% (3 Month Term SOFR + 6.75%, Rate Floor: 7.50%) due 08/01/29 | | | 2,459,155 | | | | 2,422,268 | |
Midwest Physician Administrative Services | | | | | | | | |
7.87% (3 Month Term SOFR + 3.00%, Rate Floor: 3.75%) due 03/12/28 | | | 2,470,320 | | | | 2,225,041 | |
Cambrex Corp. | | | | | | | | |
8.45% (1 Month Term SOFR + 3.50%, Rate Floor: 4.25%) due 12/04/26 | | | 2,088,337 | | | | 2,074,158 | |
Pacific Dental Services LLC | | | | | | | | |
7.85% (1 Month Term SOFR + 2.75%, Rate Floor: 2.75%) due 03/15/31 | | | 1,895,475 | | | | 1,892,802 | |
Energizer Holdings, Inc. | | | | | | | | |
6.92% (1 Month Term SOFR + 2.00%, Rate Floor: 2.00%) due 12/22/27 | | | 1,857,250 | | | | 1,856,470 | |
Blue Ribbon LLC | | | | | | | | |
11.58% (3 Month Term SOFR + 6.00%, Rate Floor: 6.75%) due 05/08/28 | | | 2,369,231 | | | | 1,648,582 | |
IVI America LLC | | | | | | | | |
9.10% (3 Month Term SOFR + 4.50%, Rate Floor: 4.50%) due 04/09/31 | | | 1,502,030 | | | | 1,510,081 | |
Nomad Foods Limited | | | | | | | | |
7.81% (3 Month Term SOFR + 2.50%, Rate Floor: 3.00%) due 11/12/29 | | | 1,050,000 | | | | 1,048,246 | |
Aramark Services, Inc. | | | | | | | | |
6.85% (1 Month Term SOFR + 2.00%, Rate Floor: 2.00%) due 06/22/30 | | | 1,000,000 | | | | 1,001,500 | |
Amer Sports, Inc. | | | | | | | | |
8.35% (3 Month Term SOFR + 3.50%, Rate Floor: 3.50%) due 02/17/31 | | | 748,125 | | | | 749,060 | |
Upstream Newco, Inc. | | | | | | | | |
9.76% (3 Month Term SOFR + 4.25%, Rate Floor: 4.25%) due 11/20/26 | | | 725,625 | | | | 626,657 | |
Mamba Purchaser, Inc. | | | | | | | | |
8.35% (1 Month Term SOFR + 3.25%, Rate Floor: 3.75%) due 10/16/28 | | | 309,837 | | | | 308,985 | |
Total Consumer, Non-cyclical | | | | | | | 142,982,048 | |
| | | | | | | | | |
Technology - 13.4% | | | | | | | | |
CoreLogic, Inc. | | | | | | | | |
8.46% (1 Month Term SOFR + 3.50%, Rate Floor: 4.00%) due 06/02/28 | | | 8,456,747 | | | | 8,360,086 | |
Athenahealth Group, Inc. | | | | | | | | |
8.10% (3 Month Term SOFR + 3.25%, Rate Floor: 3.75%) due 02/15/29 | | | 6,020,229 | | | | 5,976,341 | |
Polaris Newco LLC | | | | | | | | |
9.51% (3 Month Term SOFR + 4.00%, Rate Floor: 4.50%) due 06/02/28 | | | 5,908,629 | | | | 5,804,638 | |
Ascend Learning LLC | | | | | | | | |
8.45% (1 Month Term SOFR + 3.50%, Rate Floor: 4.00%) due 12/11/28 | | | 5,578,879 | | | | 5,550,594 | |
Peraton Corp. | | | | | | | | |
8.70% (1 Month Term SOFR + 3.75%, Rate Floor: 4.50%) due 02/01/28 | | | 5,769,239 | | | | 5,539,681 | |
Instructure Holdings, Inc. | | | | | | | | |
8.07% (3 Month Term SOFR + 2.75%, Rate Floor: 3.25%) due 10/30/28 | | | 2,886,277 | | | | 2,886,884 | |
due 09/12/31 | | | 2,531,602 | | | | 2,511,552 | |
Wrench Group LLC | | | | | | | | |
8.87% (3 Month Term SOFR + 4.00%, Rate Floor: 5.00%) due 10/30/28 | | | 5,356,807 | | | | 5,352,361 | |
Atlas CC Acquisition Corp. | | | | | | | | |
9.57% (3 Month Term SOFR + 4.25%, Rate Floor: 5.00%) due 05/25/28 | | | 6,683,640 | | | | 5,148,275 | |
118 | THE GUGGENHEIM FUNDS ANNUAL REPORT | SEE NOTES TO FINANCIAL STATEMENTS. |
SCHEDULE OF INVESTMENTS (continued) | September 30, 2024 |
FLOATING RATE STRATEGIES FUND | |
| | Face
Amount~ | | | Value | |
Planview Parent, Inc. | | | | | | | | |
8.35% (3 Month Term SOFR + 3.75%, Rate Floor: 3.75%) due 12/17/27 | | | 5,113,486 | | | $ | 5,113,537 | |
Boxer Parent Co., Inc. | | | | | | | | |
9.01% (3 Month Term SOFR + 3.75%, Rate Floor: 3.75%) due 07/30/31 | | | 5,119,864 | | | | 5,106,194 | |
DCert Buyer, Inc. | | | | | | | | |
8.85% (3 Month Term SOFR + 4.00%, Rate Floor: 4.00%) due 10/16/26 | | | 5,161,162 | | | | 5,000,701 | |
Cloud Software Group, Inc. | | | | | | | | |
8.60% (3 Month Term SOFR + 4.00%, Rate Floor: 4.50%) due 03/30/29 | | | 4,898,448 | | | | 4,874,445 | |
Xerox Corp. | | | | | | | | |
8.71% ((1 Month Term SOFR + 4.00%) and (3 Month Term SOFR + 4.00%), Rate Floor: 4.50%) due 11/17/29 | | | 4,708,695 | | | | 4,683,974 | |
Azalea TopCo | | | | | | | | |
8.35% (1 Month Term SOFR + 3.50%, Rate Floor: 3.50%) due 04/30/31 | | | 4,515,546 | | | | 4,504,258 | |
Conair Holdings LLC | | | | | | | | |
8.71% (1 Month Term SOFR + 3.75%, Rate Floor: 4.25%) due 05/17/28 | | | 4,903,967 | | | | 4,477,518 | |
Sabre GLBL, Inc. | | | | | | | | |
9.95% (1 Month Term SOFR + 5.00%, Rate Floor: 5.50%) due 06/30/28 | | | 3,296,299 | | | | 3,123,244 | |
8.46% (1 Month Term SOFR + 3.50%, Rate Floor: 4.00%) due 12/17/27 | | | 1,348,992 | | | | 1,255,682 | |
Iron Mountain Information Management Services, Inc. | | | | | | | | |
6.85% (1 Month Term SOFR + 2.00%, Rate Floor: 2.00%) due 01/31/31 | | | 4,337,465 | | | | 4,304,934 | |
Project Ruby Ultimate Parent Corp. | | | | | | | | |
8.21% (1 Month Term SOFR + 3.25%, Rate Floor: 4.00%) due 03/10/28 | | | 3,377,500 | | | | 3,370,103 | |
8.46% (1 Month Term SOFR + 3.50%, Rate Floor: 3.50%) due 03/10/28 | | | 905,450 | | | | 904,771 | |
CCC Intelligent Solutions, Inc. | | | | | | | | |
7.21% (1 Month Term SOFR + 2.25%, Rate Floor: 2.75%) due 09/21/28 | | | 3,880,226 | | | | 3,877,316 | |
Taxware Holdings (Sovos Compliance LLC) | | | | | | | | |
9.46% (3 Month Term SOFR + 4.61%, Rate Floor: 5.11%) due 08/11/28 | | | 3,698,298 | | | | 3,693,268 | |
Pushpay USA, Inc. | | | | | | | | |
9.10% (3 Month Term SOFR + 4.50%, Rate Floor: 4.50%) due 08/15/31††† | | | 3,224,175 | | | | 3,216,114 | |
Indicor LLC | | | | | | | | |
7.85% (3 Month Term SOFR + 3.25%, Rate Floor: 3.75%) due 11/22/29 | | | 3,024,208 | | | | 3,028,533 | |
RealPage, Inc. | | | | | | | | |
7.96% (1 Month Term SOFR + 3.00%, Rate Floor: 3.50%) due 04/24/28 | | | 2,947,914 | | | | 2,859,476 | |
Modena Buyer LLC | | | | | | | | |
9.10% (3 Month Term SOFR + 4.50%, Rate Floor: 4.50%) due 07/01/31 | | | 2,644,415 | | | | 2,525,971 | |
Blackhawk Network Holdings, Inc. | | | | | | | | |
9.85% (1 Month Term SOFR + 5.00%, Rate Floor: 6.00%) due 03/12/29 | | | 2,483,775 | | | | 2,492,866 | |
DS Admiral Bidco LLC | | | | | | | | |
9.10% (1 Month Term SOFR + 4.25%, Rate Floor: 4.25%) due 06/26/31 | | | 2,424,177 | | | | 2,327,210 | |
Central Parent LLC | | | | | | | | |
7.85% (3 Month Term SOFR + 3.25%, Rate Floor: 3.25%) due 07/06/29 | | | 2,101,775 | | | | 2,077,962 | |
Epicor Software | | | | | | | | |
8.10% (1 Month Term SOFR + 3.25%, Rate Floor: 3.25%) due 05/30/31 | | | 1,700,564 | | | | 1,701,142 | |
Dye & Durham Corp. | | | | | | | | |
8.95% (3 Month Term SOFR + 4.25%, Rate Floor: 5.25%) due 04/11/31 | | | 1,435,714 | | | | 1,441,098 | |
World Wide Technology Holding Co. LLC | | | | | | | | |
7.81% (1 Month Term SOFR + 2.75%, Rate Floor: 3.25%) due 03/01/30 | | | 1,390,716 | | | | 1,390,716 | |
VS Buyer LLC | | | | | | | | |
8.35% (1 Month Term SOFR + 3.25%, Rate Floor: 3.25%) due 04/12/31 | | | 1,346,625 | | | | 1,346,059 | |
Leia Finco US LLC | | | | | | | | |
due 07/02/31 | | | 1,088,047 | | | | 1,070,061 | |
Imprivata, Inc. | | | | | | | | |
8.75% (3 Month Term SOFR + 3.50%, Rate Floor: 4.00%) due 12/01/27 | | | 635,428 | | | | 637,105 | |
Total Technology | | | | | | | 127,534,670 | |
| | | | | | | | | |
Financial - 11.3% | | | | | | | | |
USI, Inc. | | | | | | | | |
7.35% (3 Month Term SOFR + 2.75%, Rate Floor: 2.75%) due 11/22/29 | | | 5,452,996 | | | | 5,434,837 | |
7.35% (3 Month Term SOFR + 2.75%, Rate Floor: 2.75%) due 09/27/30 | | | 1,482,591 | | | | 1,477,432 | |
Citadel Securities, LP | | | | | | | | |
7.10% (1 Month Term SOFR + 2.25%, Rate Floor: 2.25%) due 07/29/30 | | | 6,380,856 | | | | 6,375,049 | |
Apex Group Treasury LLC | | | | | | | | |
8.96% (6 Month Term SOFR + 3.75%, Rate Floor: 4.25%) due 07/27/28 | | | 3,395,000 | | | | 3,395,000 | |
9.08% (6 Month Term SOFR + 4.00%, Rate Floor: 4.00%) due 07/27/28 | | | 2,063,329 | | | | 2,065,908 | |
Nexus Buyer LLC | | | | | | | | |
8.85% (3 Month Term SOFR + 4.00%, Rate Floor: 4.00%) due 07/31/31 | | | 5,140,723 | | | | 5,093,326 | |
AmWINS Group, Inc. | | | | | | | | |
7.21% (1 Month Term SOFR + 2.25%, Rate Floor: 3.00%) due 02/19/28 | | | 5,022,595 | | | | 5,012,600 | |
Worldpay | | | | | | | | |
7.10% (3 Month Term SOFR + 2.50%, Rate Floor: 2.50%) due 01/31/31 | | | 4,930,000 | | | | 4,927,929 | |
Jane Street Group LLC | | | | | | | | |
7.46% (3 Month Term SOFR + 2.61%, Rate Floor: 2.61%) due 01/26/28 | | | 4,802,880 | | | | 4,797,405 | |
SEE NOTES TO FINANCIAL STATEMENTS. | THE GUGGENHEIM FUNDS ANNUAL REPORT | 119 |
SCHEDULE OF INVESTMENTS (continued) | September 30, 2024 |
FLOATING RATE STRATEGIES FUND | |
| | Face
Amount~ | | | Value | |
Ardonagh Midco 3 plc | | | | | | | | |
8.52% ((3 Month Term SOFR + 3.75%) and (6 Month Term SOFR + 3.75%), Rate Floor: 3.75%) due 02/17/31 | | | 4,136,750 | | | $ | 4,139,356 | |
Duff & Phelps | | | | | | | | |
8.35% (3 Month Term SOFR + 3.75%, Rate Floor: 4.75%) due 04/09/27 | | | 4,016,419 | | | | 3,930,307 | |
Asurion LLC | | | | | | | | |
9.20% (1 Month Term SOFR + 4.25%, Rate Floor: 4.25%) due 08/19/28 | | | 3,948,059 | | | | 3,885,324 | |
HighTower Holding LLC | | | | | | | | |
8.75% (3 Month Term SOFR + 3.50%, Rate Floor: 3.50%) due 04/21/28 | | | 3,845,250 | | | | 3,842,866 | |
Corpay, Inc. | | | | | | | | |
due 04/28/28 | | | 3,650,000 | | | | 3,640,875 | |
Cobham Ultra SeniorCo SARL | | | | | | | | |
9.24% (6 Month Term SOFR + 3.75%, Rate Floor: 4.25%) due 08/03/29 | | | 3,684,134 | | | | 3,521,406 | |
Focus Financial Partners LLC | | | | | | | | |
due 09/11/31 | | | 3,214,348 | | | | 3,203,709 | |
Virtu Financial | | | | | | | | |
7.60% (1 Month Term SOFR + 2.75%, Rate Floor: 3.25%) due 06/21/31 | | | 3,085,000 | | | | 3,085,000 | |
Zodiac Pool Solutions LLC | | | | | | | | |
6.87% (1 Month Term SOFR + 1.93%, Rate Floor: 2.43%) due 01/29/29 | | | 2,984,085 | | | | 2,982,235 | |
Orion Advisor Solutions, Inc. | | | | | | | | |
9.26% (3 Month Term SOFR + 3.75%, Rate Floor: 4.50%) due 09/24/27 | | | 2,865,939 | | | | 2,858,373 | |
Franklin Square Holdings LP | | | | | | | | |
7.10% (1 Month Term SOFR + 2.25%, Rate Floor: 2.25%) due 04/25/31††† | | | 2,713,938 | | | | 2,710,545 | |
Tegra118 Wealth Solutions, Inc. | | | | | | | | |
9.13% (3 Month Term SOFR + 4.00%, Rate Floor: 4.00%) due 02/18/27 | | | 2,784,114 | | | | 2,654,485 | |
Eisner Advisory Group | | | | | | | | |
8.85% (1 Month Term SOFR + 4.00%, Rate Floor: 4.50%) due 02/28/31 | | | 2,527,105 | | | | 2,532,083 | |
Franchise Group, Inc. | | | | | | | | |
10.39% (3 Month Term SOFR + 4.75%, Rate Floor: 5.50%) due 03/10/26 | | | 3,965,453 | | | | 2,525,993 | |
Delos Aircraft Leasing | | | | | | | | |
6.35% (3 Month Term SOFR + 1.75%, Rate Floor: 1.75%) due 10/31/27 | | | 2,508,571 | | | | 2,519,760 | |
Alliant Holdings Intermediate LLC | | | | | | | | |
7.96% (1 Month Term SOFR + 3.00%, Rate Floor: 3.00%) due 09/19/31 | | | 2,492,159 | | | | 2,477,356 | |
Ryan Specialty LLC | | | | | | | | |
7.35% (1 Month Term SOFR + 2.25%, Rate Floor: 3.00%) due 09/15/31 | | | 2,472,732 | | | | 2,467,317 | |
Harbourvest Partners LP | | | | | | | | |
6.85% (3 Month Term SOFR + 2.25%, Rate Floor: 2.25%) due 04/18/30††† | | | 2,459,404 | | | | 2,453,256 | |
Assetmark Financial Holdings, Inc. | | | | | | | | |
7.60% (3 Month Term SOFR + 3.00%, Rate Floor: 3.00%) due 06/03/31 | | | 1,800,000 | | | | 1,778,058 | |
Alter Domus | | | | | | | | |
due 07/17/31 | | | 1,758,919 | | | | 1,764,970 | |
Trans Union LLC | | | | | | | | |
6.60% (1 Month Term SOFR + 1.75%, Rate Floor: 1.75%) due 06/24/31 | | | 1,695,750 | | | | 1,691,901 | |
CPI Holdco B LLC | | | | | | | | |
6.85% (1 Month Term SOFR + 2.00%, Rate Floor: 2.00%) due 05/17/31 | | | 1,615,000 | | | | 1,606,634 | |
GIP Pilot Acquisition Partners, LP | | | | | | | | |
7.82% (3 Month Term SOFR + 2.50%, Rate Floor: 2.50%) due 10/04/30 | | | 1,601,580 | | | | 1,602,909 | |
HUB International Ltd. | | | | | | | | |
8.26% (3 Month Term SOFR + 3.00%, Rate Floor: 3.75%) due 06/20/30 | | | 1,594,620 | | | | 1,592,068 | |
Aretec Group, Inc. | | | | | | | | |
8.85% (1 Month Term SOFR + 4.00%, Rate Floor: 4.00%) due 08/09/30 | | | 1,596,817 | | | | 1,562,437 | |
FleetCor Technologies Operating Company LLC | | | | | | | | |
6.60% (1 Month Term SOFR + 1.85%, Rate Floor: 1.85%) due 04/28/28 | | | 1,500,000 | | | | 1,497,420 | |
Total Financial | | | | | | | 107,106,129 | |
| | | | | | | | | |
Communications - 7.8% | | | | | | | | |
Virgin Media Bristol LLC | | | | | | | | |
7.71% (1 Month Term SOFR + 2.50%, Rate Floor: 2.50%) due 01/31/28 | | | 7,916,233 | | | | 7,566,573 | |
Ziggo Financing Partnership | | | | | | | | |
7.71% (1 Month Term SOFR + 2.50%, Rate Floor: 2.50%) due 04/30/28 | | | 6,685,000 | | | | 6,523,223 | |
CSC Holdings LLC | | | | | | | | |
9.60% (1 Month Term SOFR + 4.50%, Rate Floor: 4.50%) due 01/18/28 | | | 6,660,644 | | | | 6,462,024 | |
Titan AcquisitionCo New Zealand Ltd. (Trade Me) | | | | | | | | |
8.87% (3 Month Term SOFR + 4.00%, Rate Floor: 4.50%) due 10/18/28 | | | 5,913,889 | | | | 5,925,008 | |
McGraw Hill LLC | | | | | | | | |
8.60% (3 Month Term SOFR + 4.00%, Rate Floor: 4.50%) due 08/06/31 | | | 5,877,124 | | | | 5,899,164 | |
SBA Senior Finance II LLC | | | | | | | | |
due 01/27/31 | | | 3,699,724 | | | | 3,700,574 | |
6.85% (1 Month Term SOFR + 2.00%, Rate Floor: 2.00%) due 01/25/31 | | | 1,343,250 | | | | 1,343,559 | |
Zayo Group Holdings, Inc. | | | | | | | | |
9.10% (1 Month Term SOFR + 4.25%, Rate Floor: 4.75%) due 03/09/27 | | | 3,900,000 | | | | 3,587,025 | |
7.96% (1 Month Term SOFR + 3.00%, Rate Floor: 3.00%) due 03/09/27 | | | 1,148,468 | | | | 1,047,265 | |
Cengage Learning, Inc. | | | | | | | | |
9.54% (6 Month Term SOFR + 4.25%, Rate Floor: 5.25%) due 03/24/31 | | | 4,079,775 | | | | 4,086,221 | |
Telenet Financing USD LLC | | | | | | | | |
7.21% (1 Month Term SOFR + 2.00%, Rate Floor: 2.00%) due 04/30/28 | | | 4,000,000 | | | | 3,850,000 | |
120 | THE GUGGENHEIM FUNDS ANNUAL REPORT | SEE NOTES TO FINANCIAL STATEMENTS. |
SCHEDULE OF INVESTMENTS (continued) | September 30, 2024 |
FLOATING RATE STRATEGIES FUND | |
| | Face
Amount~ | | | Value | |
Altice France SA | | | | | | | | |
10.80% (3 Month Term SOFR + 5.50%, Rate Floor: 5.50%) due 08/15/28 | | | 4,880,561 | | | $ | 3,646,169 | |
Charter Communications Operating LLC | | | | | | | | |
7.33% (3 Month Term SOFR + 2.00%, Rate Floor: 2.00%) due 12/07/30 | | | 3,225,625 | | | | 3,196,498 | |
LCPR Loan Financing LLC | | | | | | | | |
8.96% (1 Month Term SOFR + 3.75%, Rate Floor: 4.75%) due 10/16/28 | | | 3,162,794 | | | | 2,899,492 | |
Level 3 Financing, Inc. | | | | | | | | |
11.41% (1 Month Term SOFR + 6.56%, Rate Floor: 6.56%) due 04/15/30 | | | 1,298,730 | | | | 1,319,834 | |
11.41% (1 Month Term SOFR + 6.56%, Rate Floor: 6.56%) due 04/15/29 | | | 1,289,271 | | | | 1,314,734 | |
Playtika Holding Corp. | | | | | | | | |
7.71% (1 Month Term SOFR + 2.75%, Rate Floor: 3.75%) due 03/13/28 | | | 2,597,739 | | | | 2,577,762 | |
Midcontinent Communications | | | | | | | | |
7.60% (1 Month Term SOFR + 2.50%, Rate Floor: 2.50%) due 08/16/31 | | | 2,500,000 | | | | 2,509,375 | |
Simon & Schuster | | | | | | | | |
9.26% (3 Month Term SOFR + 4.00%, Rate Floor: 4.00%) due 10/30/30 | | | 2,056,068 | | | | 2,050,064 | |
UPC Broadband Holding BV | | | | | | | | |
8.14% (1 Month Term SOFR + 2.93%, Rate Floor: 2.93%) due 01/31/29 | | | 1,999,703 | | | | 1,987,764 | |
Xplornet Communications, Inc. | | | | | | | | |
9.57% (3 Month Term SOFR + 4.26%, Rate Floor: 4.76%) due 10/02/28 | | | 8,441,151 | | | | 1,403,341 | |
Planet US Buyer LLC | | | | | | | | |
8.60% (3 Month Term SOFR + 3.50%, Rate Floor: 3.50%) due 02/07/31 | | | 1,396,500 | | | | 1,397,896 | |
Total Communications | | | | | | | 74,293,565 | |
| | | | | | | | | |
Basic Materials - 3.8% | | | | | | | | |
CTEC III GmbH | | | | | | | | |
7.01% (3 Month EURIBOR + 3.50%, Rate Floor: 3.50%) due 03/16/29 | | | EUR 7,500,000 | | | | 8,317,741 | |
Arsenal AIC Parent LLC | | | | | | | | |
8.10% (1 Month Term SOFR + 3.25%, Rate Floor: 3.25%) due 08/18/30 | | | 4,974,403 | | | | 4,964,455 | |
Illuminate Buyer LLC | | | | | | | | |
8.46% (1 Month Term SOFR + 3.50%, Rate Floor: 3.50%) due 12/31/29 | | | 4,364,231 | | | | 4,372,043 | |
Discovery Purchaser Corp. | | | | | | | | |
due 10/04/29 | | | 3,730,844 | | | | 3,711,145 | |
Nouryon USA LLC | | | | | | | | |
8.63% (3 Month Term SOFR + 3.50%, Rate Floor: 3.50%) due 04/03/28 | | | 1,799,654 | | | | 1,799,654 | |
8.82% (3 Month Term SOFR + 3.50%, Rate Floor: 3.50%) due 04/03/28 | | | 1,341,475 | | | | 1,342,589 | |
NIC Acquisition Corp. | | | | | | | | |
8.62% (3 Month Term SOFR + 3.75%, Rate Floor: 4.50%) due 12/29/27 | | | 3,528,762 | | | | 3,063,424 | |
LSF11 A5 HoldCo LLC | | | | | | | | |
8.46% (1 Month Term SOFR + 3.50%, Rate Floor: 4.00%) due 10/15/28 | | | 2,521,145 | | | | 2,514,388 | |
Platform Specialty Products | | | | | | | | |
6.85% (1 Month Term SOFR + 2.00%, Rate Floor: 2.00%) due 12/18/30 | | | 2,342,300 | | | | 2,342,300 | |
Vantage Specialty Chemicals, Inc. | | | | | | | | |
9.87% (3 Month Term SOFR + 4.75%, Rate Floor: 5.25%) due 10/26/26 | | | 2,235,188 | | | | 2,210,042 | |
Trinseo Materials Operating S.C.A. | | | | | | | | |
7.82% (3 Month Term SOFR + 2.50%, Rate Floor: 3.50%) due 05/03/28 | | | 1,548,000 | | | | 1,220,459 | |
A-AP Buyer, Inc. | | | | | | | | |
7.85% (3 Month Term SOFR + 3.25%, Rate Floor: 3.25%) due 09/09/31††† | | | 650,000 | | | | 652,438 | |
Total Basic Materials | | | | | | | 36,510,678 | |
| | | | | | | | | |
Energy - 2.4% | | | | | | | | |
BANGL LLC | | | | | | | | |
9.82% (3 Month Term SOFR + 4.50%, Rate Floor: 4.50%) due 02/01/29 | | | 4,140,239 | | | | 4,140,239 | |
AL GCX Holdings LLC | | | | | | | | |
7.87% (1 Month Term SOFR + 2.75%, Rate Floor: 3.25%) due 05/17/29 | | | 3,486,860 | | | | 3,487,697 | |
Par Petroleum LLC | | | | | | | | |
9.06% (3 Month Term SOFR + 3.75%, Rate Floor: 4.25%) due 02/28/30 | | | 3,171,700 | | | | 3,172,366 | |
TransMontaigne Operating Company, LP | | | | | | | | |
8.46% (1 Month Term SOFR + 3.50%, Rate Floor: 4.00%) due 11/17/28 | | | 2,534,230 | | | | 2,535,143 | |
Buckeye Partners, LP | | | | | | | | |
6.60% (1 Month Term SOFR + 1.75%, Rate Floor: 1.75%) due 11/01/26 | | | 1,123,946 | | | | 1,123,474 | |
6.85% (1 Month Term SOFR + 2.00%, Rate Floor: 2.00%) due 11/22/30 | | | 823,442 | | | | 822,108 | |
WhiteWater DBR HoldCo LLC | | | | | | | | |
7.35% (3 Month Term SOFR + 2.75%, Rate Floor: 2.75%) due 03/03/31 | | | 1,865,000 | | | | 1,860,915 | |
ITT Holdings LLC | | | | | | | | |
7.95% (1 Month Term SOFR + 3.00%, Rate Floor: 3.50%) due 10/11/30 | | | 1,786,995 | | | | 1,788,478 | |
Traverse Midstream Partners LLC | | | | | | | | |
8.75% (3 Month Term SOFR + 3.50%, Rate Floor: 4.00%) due 02/16/28 | | | 1,626,172 | | | | 1,626,676 | |
Bip PipeCo Holdings LLC | | | | | | | | |
7.82% (3 Month Term SOFR + 2.50%, Rate Floor: 2.50%) due 12/06/30 | | | 1,326,675 | | | | 1,325,017 | |
Permian Production Partners LLC | | | | | | | | |
14.96% (1 Month Term SOFR + 6.11%, Rate Floor: 7.11%) (in-kind rate was 2.00%) due 11/24/25†††,3 | | | 489,365 | | | | 484,471 | |
Total Energy | | | | | | | 22,366,584 | |
| | | | | | | | | |
Utilities - 1.5% | | | | | | | | |
Calpine Construction Finance Company, LP | | | | | | | | |
6.85% (1 Month Term SOFR + 2.00%, Rate Floor: 2.00%) due 07/31/30 | | | 4,965,050 | | | | 4,930,593 | |
SEE NOTES TO FINANCIAL STATEMENTS. | THE GUGGENHEIM FUNDS ANNUAL REPORT | 121 |
SCHEDULE OF INVESTMENTS (continued) | September 30, 2024 |
FLOATING RATE STRATEGIES FUND | |
| | Face
Amount~ | | | Value | |
UGI Energy Services LLC | | | | | | | | |
7.35% (1 Month Term SOFR + 2.50%, Rate Floor: 2.50%) due 02/22/30 | | | 4,099,393 | | | $ | 4,098,655 | |
NRG Energy, Inc. | | | | | | | | |
7.26% (3 Month Term SOFR + 2.00%, Rate Floor: 2.00%) due 04/16/31 | | | 2,699,612 | | | | 2,701,637 | |
TerraForm Power Operating LLC | | | | | | | | |
7.20% (3 Month Term SOFR + 2.50%, Rate Floor: 3.00%) due 05/21/29 | | | 2,540,659 | | | | 2,539,872 | |
Total Utilities | | | | | | | 14,270,757 | |
| | | | | | | | | |
Total Senior Floating Rate Interests | | | | |
(Cost $880,219,573) | | | 852,086,385 | |
| | | | | |
CORPORATE BONDS†† - 4.0% |
Consumer, Non-cyclical - 1.4% | | | | | | | | |
Cheplapharm Arzneimittel GmbH | | | | | | | | |
5.50% due 01/15/284 | | | 2,975,000 | | | | 2,885,383 | |
Sotheby’s | | | | | | | | |
7.38% due 10/15/274 | | | 2,875,000 | | | | 2,767,029 | |
ADT Security Corp. | | | | | | | | |
4.13% due 08/01/294 | | | 2,875,000 | | | | 2,746,034 | |
Tenet Healthcare Corp. | | | | | | | | |
4.38% due 01/15/30 | | | 2,800,000 | | | | 2,686,411 | |
HCA, Inc. | | | | | | | | |
4.50% due 02/15/27 | | | 1,500,000 | | | | 1,501,908 | |
WW International, Inc. | | | | | | | | |
4.50% due 04/15/294 | | | 2,875,000 | | | | 634,827 | |
Total Consumer, Non-cyclical | | | | | | | 13,221,592 | |
| | | | | | | | | |
Communications - 1.1% | | | | | | | | |
VZ Secured Financing B.V. | | | | | | | | |
5.00% due 01/15/324 | | | 3,500,000 | | | | 3,220,852 | |
LCPR Senior Secured Financing DAC | | | | | | | | |
6.75% due 10/15/274 | | | 2,875,000 | | | | 2,630,706 | |
Altice France S.A. | | | | | | | | |
5.50% due 10/15/294 | | | 2,850,000 | | | | 1,995,968 | |
McGraw-Hill Education, Inc. | | | | | | | | |
5.75% due 08/01/284 | | | 1,575,000 | | | | 1,556,476 | |
Level 3 Financing, Inc. | | | | | | | | |
11.00% due 11/15/294 | | | 899,070 | | | | 995,788 | |
Total Communications | | | | | | | 10,399,790 | |
| | | | | | | | | |
Industrial - 0.6% | | | | | | | | |
New Enterprise Stone & Lime Company, Inc. | | | | | | | | |
5.25% due 07/15/284 | | | 2,875,000 | | | | 2,807,436 | |
GrafTech Global Enterprises, Inc. | | | | | | | | |
9.88% due 12/15/284 | | | 2,120,000 | | | | 1,698,094 | |
Brundage-Bone Concrete Pumping Holdings, Inc. | | | | | | | | |
6.00% due 02/01/264 | | | 1,412,000 | | | | 1,406,363 | |
Total Industrial | | | | | | | 5,911,893 | |
| | | | | | | | | |
Consumer, Cyclical - 0.5% | | | | | | | | |
Fertitta Entertainment LLC / Fertitta Entertainment Finance Company, Inc. | | | | | | | | |
4.63% due 01/15/294 | | | 5,000,000 | | | | 4,774,141 | |
| | | | | | | | | |
Basic Materials - 0.2% | | | | | | | | |
WR Grace Holdings LLC | | | | | | | | |
4.88% due 06/15/274 | | | 1,975,000 | | | | 1,946,153 | |
Mirabela Nickel Ltd. | | | | | | | | |
due 06/24/19†††,5,6 | | | 1,279,819 | | | | 6,399 | |
Total Basic Materials | | | | | | | 1,952,552 | |
| | | | | | | | | |
Financial - 0.2% | | | | | | | | |
Hunt Companies, Inc. | | | | | | | | |
5.25% due 04/15/294 | | | 1,850,000 | | | | 1,789,902 | |
Total Corporate Bonds | | | | |
(Cost $43,263,154) | | | 38,049,870 | |
| | | | | |
COLLATERALIZED MORTGAGE OBLIGATIONS†† - 0.9% |
Residential Mortgage-Backed Securities - 0.9% | | | | | | | | |
RALI Series Trust | | | | | | | | |
2006-QO6, 5.33% (1 Month Term SOFR + 0.47%, Rate Floor: 0.36%) due 06/25/46◊ | | | 10,472,375 | | | | 2,441,463 | |
2006-QO2, 5.41% (1 Month Term SOFR + 0.55%, Rate Floor: 0.44%) due 02/25/46◊ | | | 416,751 | | | | 73,835 | |
Washington Mutual Mortgage Pass-Through Certificates Trust | | | | | | | | |
2007-OA6, 5.93% (1 Year CMT Rate + 0.81%, Rate Floor: 0.81%) due 07/25/47◊ | | | 2,049,832 | | | | 1,684,632 | |
Washington Mutual Mortgage Pass-Through Certificates WMALT Series Trust | | | | | | | | |
2006-AR9, 5.96% (1 Year CMT Rate + 0.84%, Rate Floor: 0.84%) due 11/25/46◊ | | | 1,420,301 | | | | 1,167,297 | |
American Home Mortgage Assets Trust | | | | | | | | |
2006-4, 5.18% (1 Month Term SOFR + 0.32%, Rate Floor: 0.32%) due 10/25/46◊ | | | 2,109,403 | | | | 1,139,078 | |
Lehman XS Trust Series | | | | | | | | |
2006-16N, 5.35% (1 Month Term SOFR + 0.49%, Rate Floor: 0.38%) due 11/25/46◊ | | | 1,133,125 | | | | 1,001,719 | |
Nomura Resecuritization Trust | | | | | | | | |
2015-4R, 2.71% (1 Month Term SOFR + 0.54%, Rate Floor: 0.43%) due 03/26/36◊ ,4 | | | 370,488 | | | | 356,673 | |
Alliance Bancorp Trust | | | | | | | | |
2007-OA1, 5.45% (1 Month Term SOFR + 0.59%, Rate Floor: 0.48%) due 07/25/37◊ | | | 323,542 | | | | 278,121 | |
Morgan Stanley Re-REMIC Trust | | | | | | | | |
2010-R5, 5.31% due 06/26/36 4 | | | 201,721 | | | | 188,227 | |
GSAA Home Equity Trust | | | | | | | | |
2007-7, 5.51% (1 Month Term SOFR + 0.65%, Rate Floor: 0.54%) due 07/25/37◊ | | | 79,127 | | | | 74,463 | |
122 | THE GUGGENHEIM FUNDS ANNUAL REPORT | SEE NOTES TO FINANCIAL STATEMENTS. |
SCHEDULE OF INVESTMENTS (continued) | September 30, 2024 |
FLOATING RATE STRATEGIES FUND | |
| | Face
Amount~ | | | Value | |
New Century Home Equity Loan Trust | | | | | | | | |
2004-4, 5.76% (1 Month Term SOFR + 0.91%, Rate Cap/Floor: 12.50%/0.80%) due 02/25/35◊ | | | 47,529 | | | $ | 50,022 | |
Total Residential Mortgage-Backed Securities | | | | | | | 8,455,530 | |
| | | | | | | | | |
Total Collateralized Mortgage Obligations | | | | |
(Cost $11,702,350) | | | 8,455,530 | |
ASSET-BACKED SECURITIES†† - 0.0% |
Collateralized Loan Obligations - 0.0% | | | | | | | | |
Octagon Loan Funding Ltd. | | | | | | | | |
2014-1A SUB, due 11/18/314,7 | | | 2,071,948 | | | | 207,024 | |
Treman Park CLO Ltd. | | | | | | | | |
2015-1A COM, due 10/20/284,7 | | | 977,702 | | | | 8,692 | |
Total Collateralized Loan Obligations | | | | | | | 215,716 | |
| | | | | | | | | |
Total Asset-Backed Securities | | | | |
(Cost $4,371) | | | 215,716 | |
| | | | | | | | | |
Total Investments - 101.2% | | | | |
(Cost $997,465,613) | | $ | 961,224,367 | |
Other Assets & Liabilities, net - (1.2)% | | | (11,626,454 | ) |
Total Net Assets - 100.0% | | $ | 949,597,913 | |
Forward Foreign Currency Exchange Contracts†† |
Counterparty | | Currency | | | Type | | | Quantity | | | Contract
Amount | | | Settlement
Date | | | Unrealized
Depreciation | |
Bank of America, N.A. | | | EUR | | | | Sell | | | | 13,945,000 | | | | 15,447,030 USD | | | | 10/18/24 | | | $ | (95,154 | ) |
~ | The face amount is denominated in U.S. dollars unless otherwise indicated. |
* | Non-income producing security. |
*** | A copy of each underlying unaffiliated fund’s financial statements is available at the SEC’s website at www.sec.gov. |
† | Value determined based on Level 1 inputs, unless otherwise noted — See Note 4. |
†† | Value determined based on Level 2 inputs, unless otherwise noted — See Note 4. |
††† | Value determined based on Level 3 inputs — See Note 4. |
◊ | Variable rate security. Rate indicated is the rate effective at September 30, 2024. In some instances, the effective rate is limited by a minimum rate floor or a maximum rate cap established by the issuer. The settlement status of a position may also impact the effective rate indicated. In some cases, a position may be unsettled at period end and may not have a stated effective rate. In instances where multiple underlying reference rates and spread amounts are shown, the effective rate is based on a weighted average. |
1 | Affiliated issuer. |
2 | Rate indicated is the 7-day yield as of September 30, 2024. |
3 | Payment-in-kind security. |
4 | Security is a 144A or Section 4(a)(2) security. These securities have been determined to be liquid under guidelines established by the Board of Trustees. The total market value of 144A or Section 4(a)(2) securities is $34,615,768 (cost $38,412,439), or 3.7% of total net assets. |
5 | Security is a 144A or Section 4(a)(2) security. These securities have been determined to be illiquid and restricted under guidelines established by the Board of Trustees. The total market value of 144A or Section 4(a)(2) illiquid and restricted securities is $6,399 (cost $1,160,811), or less than 0.1% of total net assets — See Note 10. |
6 | Security is in default of interest and/or principal obligations. |
7 | Security has no stated coupon. However, it is expected to receive residual cash flow payments on defined deal dates. |
| | CMT — Constant Maturity Treasury |
| | EUR — Euro |
| | EURIBOR — European Interbank Offered Rate |
| | plc — Public Limited Company |
| | REMIC — Real Estate Mortgage Investment Conduit |
| | SARL — Société à Responsabilité Limitée |
| | SOFR — Secured Overnight Financing Rate |
| | |
| | See Sector Classification in Other Information section. |
SEE NOTES TO FINANCIAL STATEMENTS. | THE GUGGENHEIM FUNDS ANNUAL REPORT | 123 |
SCHEDULE OF INVESTMENTS (continued) | September 30, 2024 |
FLOATING RATE STRATEGIES FUND | |
The following table summarizes the inputs used to value the Fund’s investments at September 30, 2024 (See Note 4 in the Notes to Financial Statements):
Investments in Securities (Assets) | | Level 1
Quoted
Prices | | | Level 2
Significant
Observable
Inputs | | | Level 3
Significant
Unobservable
Inputs | | | Total | |
Common Stocks | | $ | 519,043 | | | $ | — | | | $ | 3,525,308 | | | $ | 4,044,351 | |
Exchange-Traded Funds | | | 25,148,290 | | | | — | | | | — | | | | 25,148,290 | |
Money Market Fund | | | 33,224,225 | | | | — | | | | — | | | | 33,224,225 | |
Senior Floating Rate Interests | | | — | | | | 816,750,998 | | | | 35,335,387 | | | | 852,086,385 | |
Corporate Bonds | | | — | | | | 38,043,471 | | | | 6,399 | | | | 38,049,870 | |
Collateralized Mortgage Obligations | | | — | | | | 8,455,530 | | | | — | | | | 8,455,530 | |
Asset-Backed Securities | | | — | | | | 215,716 | | | | — | | | | 215,716 | |
Total Assets | | $ | 58,891,558 | | | $ | 863,465,715 | | | $ | 38,867,094 | | | $ | 961,224,367 | |
Investments in Securities (Liabilities) | | Level 1
Quoted
Prices | | | Level 2
Significant
Observable
Inputs | | | Level 3
Significant
Unobservable
Inputs | | | Total | |
Forward Foreign Currency Exchange Contracts** | | $ | — | | | $ | 95,154 | | | $ | — | | | $ | 95,154 | |
Unfunded Loan Commitments (Note 9) | | | — | | | | — | | | | 20,064 | | | | 20,064 | |
Total Liabilities | | $ | — | | | $ | 95,154 | | | $ | 20,064 | | | $ | 115,218 | |
** | This derivative is reported as unrealized appreciation/depreciation at period end. |
The following is a summary of significant unobservable inputs used in the fair valuation of assets and liabilities categorized within Level 3 of the fair value hierarchy:
Category | | Ending
Balance at
September 30,
2024 | | Valuation
Technique | Unobservable
Inputs | | Input Range | | | Weighted
Average* | |
Assets: | | | | | | | | | | | | | | |
Common Stocks | | $ | 3,524,692 | | Enterprise Value | Valuation Multiple | 2.9x-8.6x | 4.9x |
Common Stocks | | | 616 | | Model Price | Liquidation Value | — | — |
Corporate Bonds | | | 6,399 | | Third Party Pricing | Trade Price | — | — |
Senior Floating Rate Interests | | | 30,360,288 | | Third Party Pricing | Broker Quote | — | — |
Senior Floating Rate Interests | | | 2,172,818 | | Model Price | Purchase Price | — | — |
Senior Floating Rate Interests | | | 1,951,169 | | Third Party Pricing | Vendor Price | — | — |
Senior Floating Rate Interests | | | 507,071 | | Third Party Pricing | Trade Price | — | — |
Senior Floating Rate Interests | | | 344,041 | | Yield Analysis | Yield | 11.1%-15.8% | 12.4% |
Total Assets | | $ | 38,867,094 | | | | | |
Liabilities: | | | | | | | | | | | | | | |
Unfunded Loan Commitments | | $ | 20,064 | | Model Price | Purchase Price | — | — |
* | Inputs are weighted by the fair value of the instruments. |
Significant changes in a quote, yield, liquidation value or valuation multiple would generally result in significant changes in the fair value of the security.
124 | THE GUGGENHEIM FUNDS ANNUAL REPORT | SEE NOTES TO FINANCIAL STATEMENTS. |
SCHEDULE OF INVESTMENTS (concluded) | September 30, 2024 |
FLOATING RATE STRATEGIES FUND | |
The Fund’s fair valuation leveling guidelines classify a single daily broker quote, or a vendor price based on a single daily or monthly broker quote, as Level 3, if such a quote or price cannot be supported with other available market information.
Transfers between Level 2 and Level 3 may occur as markets fluctuate and/or the availability of data used in an investment’s valuation changes. For the year ended September 30, 2024, the Fund had securities with a total value of $1,951,169 transfer into Level 3 from Level 2 due to a lack of observable inputs and had securities with a total value of $2,056,421 transfer out of Level 3 into Level 2 due to the availability of current and reliable market-based data provided by a third-party pricing service which utilizes significant observable inputs.
Summary of Fair Value Level 3 Activity
Following is a reconciliation of Level 3 assets for which significant unobservable inputs were used to determine fair value for the year ended September 30, 2024:
| | | Assets | | | | | | | Liabilities | |
| | Corporate
Bonds | | | Senior
Floating Rate
Interests | | | Common
Stocks | | | Preferred
Stocks | | | Total Assets | | | Unfunded
Loan
Commitments | |
Beginning Balance | | $ | 60,792 | | | $ | 16,360,394 | | | $ | 346,762 | | | $ | 493,907 | | | $ | 17,261,855 | | | $ | (249 | ) |
Purchases/(Receipts) | | | — | | | | 23,962,141 | | | | — | | | | — | | | | 23,962,141 | | | | (10,552 | ) |
(Sales, maturities and paydowns)/Fundings | | | — | | | | (2,926,553 | ) | | | (3,295 | ) | | | (543,063 | ) | | | (3,472,911 | ) | | | — | |
Amortization of premiums/discounts | | | — | | | | 131,605 | | | | — | | | | — | | | | 131,605 | | | | — | |
Corporate actions | | | — | | | | (2,026,277 | ) | | | 3,579,592 | | | | (493,920 | ) | | | 1,059,395 | | | | — | |
Total realized gains (losses) included in earnings | | | — | | | | 18,161 | | | | (1,424,838 | ) | | | (1,824,923 | ) | | | (3,231,600 | ) | | | 6,019 | |
Total change in unrealized appreciation (depreciation) included in earnings | | | (54,393 | ) | | | (78,832 | ) | | | 1,027,087 | | | | 2,367,999 | | | | 3,261,861 | | | | (15,282 | ) |
Transfers into Level 3 | | | — | | | | 1,951,169 | | | | — | | | | — | | | | 1,951,169 | | | | — | |
Transfers out of Level 3 | | | — | | | | (2,056,421 | ) | | | — | | | | — | | | | (2,056,421 | ) | | | — | |
Ending Balance | | $ | 6,399 | | | $ | 35,335,387 | | | $ | 3,525,308 | | | $ | — | | | $ | 38,867,094 | | | $ | (20,064 | ) |
Net change in unrealized appreciation (depreciation) for investments in Level 3 securities still held at September 30, 2024 | | $ | (54,393 | ) | | $ | (356,656 | ) | | $ | (397,405 | ) | | $ | — | | | $ | (808,454 | ) | | $ | (9,512 | ) |
Affiliated Transactions
Investments representing 5% or more of the outstanding voting shares of a company, or control of or by, or common control under Guggenheim Investments, result in that company being considered an affiliated issuer, as defined in the 1940 Act.
Transactions during the year ended September 30, 2024, in which the company is an affiliated issuer, were as follows:
Security Name | | Value
09/30/23 | | | Additions | | | Reductions | | | Realized
Gain (Loss) | | | Change in
Unrealized
Appreciation
(Depreciation) | | | Value
09/30/24 | | | Shares
09/30/24 | |
Common Stocks | | | | | | | | | | | | | | | | | | | | | | | | | | | | |
BP Holdco LLC * | | $ | 313,770 | | | $ | — | | | $ | — | | | $ | — | | | $ | (17,671 | ) | | $ | 296,099 | | | | 244,278 | |
* | Non-income producing security. |
SEE NOTES TO FINANCIAL STATEMENTS. | THE GUGGENHEIM FUNDS ANNUAL REPORT | 125 |
FLOATING RATE STRATEGIES FUND | |
STATEMENT OF ASSETS AND LIABILITIES |
September 30, 2024 |
Assets: |
Investments in unaffiliated issuers, at value (cost $997,379,357) | | $ | 960,928,268 | |
Investments in affiliated issuers, at value (cost $86,256) | | | 296,099 | |
Cash | | | 3,330,487 | |
Prepaid expenses | | | 131,999 | |
Receivables: |
Securities sold | | | 21,338,536 | |
Interest | | | 7,091,306 | |
Fund shares sold | | | 1,360,151 | |
Total assets | | | 994,476,846 | |
| | | | | |
Liabilities: |
Unfunded loan commitments, at value (Note 9) (commitment fees received $11,415) | | | 20,064 | |
Unrealized depreciation on forward foreign currency exchange contracts | | | 95,154 | |
Payable for: |
Securities purchased | | | 40,047,180 | |
Fund shares redeemed | | | 3,036,760 | |
Distributions to shareholders | | | 884,053 | |
Management fees | | | 406,430 | |
Transfer agent/maintenance fees | | | 145,752 | |
Distribution and service fees | | | 56,575 | |
Fund accounting/administration fees | | | 5,233 | |
Trustees’ fees* | | | 2,045 | |
Miscellaneous | | | 179,687 | |
Total liabilities | | | 44,878,933 | |
Net assets | | $ | 949,597,913 | |
| | | | | |
Net assets consist of: |
Paid in capital | | $ | 1,166,841,582 | |
Total distributable earnings (loss) | | | (217,243,669 | ) |
Net assets | | $ | 949,597,913 | |
| | | | | |
Class A: |
Net assets | | $ | 141,421,955 | |
Capital shares outstanding | | | 5,839,595 | |
Net asset value per share | | $ | 24.22 | |
Maximum offering price per share (Net asset value divided by 97.00%) | | $ | 24.97 | |
| | | | | |
Class C: |
Net assets | | $ | 27,738,522 | |
Capital shares outstanding | | | 1,145,811 | |
Net asset value per share | | $ | 24.21 | |
| | | | | |
Class P: |
Net assets | | $ | 42,808,272 | |
Capital shares outstanding | | | 1,766,858 | |
Net asset value per share | | $ | 24.23 | |
| | | | | |
Institutional Class: |
Net assets | | $ | 735,606,168 | |
Capital shares outstanding | | | 30,348,478 | |
Net asset value per share | | $ | 24.24 | |
| | | | | |
Class R6: |
Net assets | | $ | 2,022,996 | |
Capital shares outstanding | | | 83,424 | |
Net asset value per share | | $ | 24.25 | |
* | Relates to Trustees not deemed “interested persons” within the meaning of Section 2(a)(19) of the 1940 Act. |
126 | THE GUGGENHEIM FUNDS ANNUAL REPORT | SEE NOTES TO FINANCIAL STATEMENTS. |
FLOATING RATE STRATEGIES FUND | |
STATEMENT OF OPERATIONS |
Year Ended September 30, 2024 |
Investment Income: |
Dividends from securities of unaffiliated issuers | | $ | 2,471,244 | |
Interest from securities of unaffiliated issuers | | | 92,619,384 | |
Total investment income | | | 95,090,628 | |
| | | | | |
Expenses: |
Management fees | | | 6,571,231 | |
Distribution and service fees: |
Class A | | | 345,797 | |
Class C | | | 311,340 | |
Class P | | | 109,749 | |
Transfer agent/maintenance fees: |
Class A | | | 175,014 | |
Class C | | | 34,139 | |
Class P | | | 70,278 | |
Institutional Class | | | 814,560 | |
Class R6 | | | 540 | |
Fund accounting/administration fees | | | 397,997 | |
Line of credit fees | | | 311,122 | |
Professional fees | | | 158,520 | |
Trustees’ fees* | | | 23,524 | |
Custodian fees | | | 20,396 | |
Interest expense | | | 1,891 | |
Miscellaneous | | | 270,124 | |
Recoupment of previously waived fees: |
Class C | | | 23 | |
Class R6 | | | 383 | |
Total expenses | | | 9,616,628 | |
Less: |
Expenses reimbursed by Adviser: |
Class A | | $ | (125,612 | ) |
Class C | | | (23,007 | ) |
Class P | | | (54,498 | ) |
Institutional Class | | | (444,669 | ) |
Class R6 | | | (322 | ) |
Expenses waived by Adviser | | | (322,264 | ) |
Total waived/reimbursed expenses | | | (970,372 | ) |
Net expenses | | | 8,646,256 | |
Net investment income | | | 86,444,372 | |
| | | | | |
Net Realized and Unrealized Gain (Loss): |
Net realized gain (loss) on: |
Investments in unaffiliated issuers | | | (9,758,221 | ) |
Forward foreign currency exchange contracts | | | (117,693 | ) |
Foreign currency transactions | | | (6,319 | ) |
Net realized loss | | | (9,882,233 | ) |
Net change in unrealized appreciation (depreciation) on: |
Investments in unaffiliated issuers | | | (2,413,152 | ) |
Investments in affiliated issuers | | | (17,671 | ) |
Forward foreign currency exchange contracts | | | (555,754 | ) |
Foreign currency translations | | | 13,765 | |
Net change in unrealized appreciation (depreciation) | | | (2,972,812 | ) |
Net realized and unrealized loss | | | (12,855,045 | ) |
Net increase in net assets resulting from operations | | $ | 73,589,327 | |
* | Relates to Trustees not deemed “interested persons” within the meaning of Section 2(a)(19) of the 1940 Act. |
SEE NOTES TO FINANCIAL STATEMENTS. | THE GUGGENHEIM FUNDS ANNUAL REPORT | 127 |
FLOATING RATE STRATEGIES FUND | |
STATEMENTS OF CHANGES IN NET ASSETS |
| | Year Ended
September 30,
2024 | | | Year Ended
September 30,
2023 | |
Increase (Decrease) in Net Assets from Operations: | | | | | | | | |
Net investment income | | $ | 86,444,372 | | | $ | 85,185,982 | |
Net realized loss on investments | | | (9,882,233 | ) | | | (15,113,133 | ) |
Net change in unrealized appreciation (depreciation) on investments | | | (2,972,812 | ) | | | 66,855,926 | |
Net increase in net assets resulting from operations | | | 73,589,327 | | | | 136,928,775 | |
| | | | | | | | | |
Distributions to shareholders: | | | | | | | | |
Class A | | | (11,647,241 | ) | | | (11,434,737 | ) |
Class C | | | (2,392,488 | ) | | | (2,844,666 | ) |
Class P | | | (3,696,006 | ) | | | (3,555,101 | ) |
Institutional Class | | | (68,865,154 | ) | | | (66,543,982 | ) |
Class R6 | | | (111,604 | ) | | | (903,249 | ) |
Total distributions to shareholders | | | (86,712,493 | ) | | | (85,281,735 | ) |
| | | | | | | | | |
Capital share transactions: | | | | | | | | |
Proceeds from sale of shares | | | | | | | | |
Class A | | | 32,935,433 | | | | 37,817,506 | |
Class C | | | 4,255,461 | | | | 4,906,993 | |
Class P | | | 8,843,585 | | | | 26,809,190 | |
Institutional Class | | | 363,619,911 | | | | 419,167,716 | |
Class R6 | | | 1,698,695 | | | | 30,694,165 | |
Distributions reinvested | | | | | | | | |
Class A | | | 10,200,966 | | | | 9,830,459 | |
Class C | | | 2,062,297 | | | | 2,422,173 | |
Class P | | | 3,686,772 | | | | 3,544,719 | |
Institutional Class | | | 57,864,332 | | | | 55,637,014 | |
Class R6 | | | 110,482 | | | | 898,525 | |
Cost of shares redeemed | | | | | | | | |
Class A | | | (38,989,840 | ) | | | (69,825,528 | ) |
Class C | | | (14,028,271 | ) | | | (20,716,384 | ) |
Class P | | | (13,476,997 | ) | | | (31,805,294 | ) |
Institutional Class | | | (469,201,327 | ) | | | (700,163,252 | ) |
Class R6 | | | (1,212,290 | ) | | | (32,266,778 | ) |
Net decrease from capital share transactions | | | (51,630,791 | ) | | | (263,048,776 | ) |
Net decrease in net assets | | | (64,753,957 | ) | | | (211,401,736 | ) |
| | | | | | | | | |
Net assets: | | | | | | | | |
Beginning of year | | | 1,014,351,870 | | | | 1,225,753,606 | |
End of year | | $ | 949,597,913 | | | $ | 1,014,351,870 | |
| | | | | | | | | |
128 | THE GUGGENHEIM FUNDS ANNUAL REPORT | SEE NOTES TO FINANCIAL STATEMENTS. |
FLOATING RATE STRATEGIES FUND | |
STATEMENTS OF CHANGES IN NET ASSETS (concluded) |
| | Year Ended
September 30,
2024 | | | Year Ended
September 30,
2023 | |
Capital share activity: | | | | | | | | |
Shares sold | | | | | | | | |
Class A | | | 1,348,314 | | | | 1,569,726 | |
Class C | | | 174,243 | | | | 204,188 | |
Class P | | | 361,398 | | | | 1,116,540 | |
Institutional Class | | | 14,865,436 | | | | 17,415,091 | |
Class R6 | | | 69,319 | | | | 1,288,449 | |
Shares issued from reinvestment of distributions | | | | | | | | |
Class A | | | 418,133 | | | | 408,128 | |
Class C | | | 84,541 | | | | 100,670 | |
Class P | | | 151,019 | | | | 147,100 | |
Institutional Class | | | 2,369,521 | | | | 2,308,872 | |
Class R6 | | | 4,529 | | | | 37,421 | |
Shares redeemed | | | | | | | | |
Class A | | | (1,596,637 | ) | | | (2,905,865 | ) |
Class C | | | (574,443 | ) | | | (863,523 | ) |
Class P | | | (551,414 | ) | | | (1,323,129 | ) |
Institutional Class | | | (19,234,875 | ) | | | (29,241,651 | ) |
Class R6 | | | (49,303 | ) | | | (1,340,629 | ) |
Net decrease in shares | | | (2,160,219 | ) | | | (11,078,612 | ) |
SEE NOTES TO FINANCIAL STATEMENTS. | THE GUGGENHEIM FUNDS ANNUAL REPORT | 129 |
FLOATING RATE STRATEGIES FUND | |
This table is presented to show selected data for a share outstanding throughout each period and to assist shareholders in evaluating a Fund’s performance for the periods presented.
Class A | | Year Ended
September 30,
2024 | | | Year Ended
September 30,
2023 | | | Year Ended
September 30,
2022 | | | Year Ended
September 30,
2021 | | | Year Ended
September 30,
2020 | |
Per Share Data |
Net asset value, beginning of period | | $ | 24.52 | | | $ | 23.37 | | | $ | 25.09 | | | $ | 24.08 | | | $ | 25.23 | |
Income (loss) from investment operations: |
Net investment income (loss)a | | | 2.05 | | | | 1.88 | | | | .87 | | | | .83 | | | | 1.02 | |
Net gain (loss) on investments (realized and unrealized) | | | (.29 | ) | | | 1.16 | | | | (1.72 | ) | | | 1.02 | | | | (1.16 | ) |
Total from investment operations | | | 1.76 | | | | 3.04 | | | | (.85 | ) | | | 1.85 | | | | (.14 | ) |
Less distributions from: |
Net investment income | | | (2.06 | ) | | | (1.89 | ) | | | (.87 | ) | | | (.83 | ) | | | (.83 | ) |
Return of capital | | | — | | | | — | | | | — | | | | (.01 | ) | | | (.18 | ) |
Total distributions | | | (2.06 | ) | | | (1.89 | ) | | | (.87 | ) | | | (.84 | ) | | | (1.01 | ) |
Net asset value, end of period | | $ | 24.22 | | | $ | 24.52 | | | $ | 23.37 | | | $ | 25.09 | | | $ | 24.08 | |
|
Total Returnb | | | 7.41 | % | | | 13.47 | % | | | (3.47 | %) | | | 7.83 | % | | | (0.50 | %) |
Ratios/Supplemental Data |
Net assets, end of period (in thousands) | | $ | 141,422 | | | $ | 139,008 | | | $ | 154,160 | | | $ | 123,392 | | | $ | 139,857 | |
Ratios to average net assets: |
Net investment income (loss) | | | 8.39 | % | | | 7.82 | % | | | 3.57 | % | | | 3.36 | % | | | 4.23 | % |
Total expensesc | | | 1.15 | % | | | 1.15 | % | | | 1.11 | % | | | 1.09 | % | | | 1.25 | % |
Net expensesd,e,f | | | 1.02 | % | | | 1.02 | % | | | 1.02 | % | | | 1.05 | % | | | 1.10 | % |
Portfolio turnover rate | | | 37 | % | | | 23 | % | | | 30 | % | | | 57 | % | | | 20 | % |
Class C | | Year Ended
September 30,
2024 | | | Year Ended
September 30,
2023 | | | Year Ended
September 30,
2022 | | | Year Ended
September 30,
2021 | | | Year Ended
September 30,
2020 | |
Per Share Data |
Net asset value, beginning of period | | $ | 24.51 | | | $ | 23.36 | | | $ | 25.08 | | | $ | 24.07 | | | $ | 25.22 | |
Income (loss) from investment operations: |
Net investment income (loss)a | | | 1.87 | | | | 1.69 | | | | .68 | | | | .65 | | | | .84 | |
Net gain (loss) on investments (realized and unrealized) | | | (.30 | ) | | | 1.16 | | | | (1.71 | ) | | | 1.02 | | | | (1.16 | ) |
Total from investment operations | | | 1.57 | | | | 2.85 | | | | (1.03 | ) | | | 1.67 | | | | (.32 | ) |
Less distributions from: |
Net investment income | | | (1.87 | ) | | | (1.70 | ) | | | (.69 | ) | | | (.65 | ) | | | (.68 | ) |
Return of capital | | | — | | | | — | | | | — | | | | (.01 | ) | | | (.15 | ) |
Total distributions | | | (1.87 | ) | | | (1.70 | ) | | | (.69 | ) | | | (.66 | ) | | | (.83 | ) |
Net asset value, end of period | | $ | 24.21 | | | $ | 24.51 | | | $ | 23.36 | | | $ | 25.08 | | | $ | 24.07 | |
|
Total Returnb | | | 6.62 | % | | | 12.58 | % | | | (4.15 | %) | | | 7.03 | % | | | (1.24 | %) |
Ratios/Supplemental Data |
Net assets, end of period (in thousands) | | $ | 27,739 | | | $ | 35,818 | | | $ | 47,183 | | | $ | 52,308 | | | $ | 63,891 | |
Ratios to average net assets: |
Net investment income (loss) | | | 7.66 | % | | | 7.02 | % | | | 2.78 | % | | | 2.61 | % | | | 3.47 | % |
Total expensesc | | | 1.88 | % | | | 1.89 | % | | | 1.91 | % | | | 1.86 | % | | | 1.96 | % |
Net expensesd,e,f | | | 1.77 | % | | | 1.78 | % | | | 1.77 | % | | | 1.80 | % | | | 1.85 | % |
Portfolio turnover rate | | | 37 | % | | | 23 | % | | | 30 | % | | | 57 | % | | | 20 | % |
130 | THE GUGGENHEIM FUNDS ANNUAL REPORT | SEE NOTES TO FINANCIAL STATEMENTS. |
FLOATING RATE STRATEGIES FUND | |
FINANCIAL HIGHLIGHTS (continued) |
This table is presented to show selected data for a share outstanding throughout each period and to assist shareholders in evaluating a Fund’s performance for the periods presented.
Class P | | Year Ended
September 30,
2024 | | | Year Ended
September 30,
2023 | | | Year Ended
September 30,
2022 | | | Year Ended
September 30,
2021 | | | Year Ended
September 30,
2020 | |
Per Share Data |
Net asset value, beginning of period | | $ | 24.53 | | | $ | 23.38 | | | $ | 25.10 | | | $ | 24.09 | | | $ | 25.24 | |
Income (loss) from investment operations: |
Net investment income (loss)a | | | 2.05 | | | | 1.88 | | | | .88 | | | | .83 | | | | 1.04 | |
Net gain (loss) on investments (realized and unrealized) | | | (.29 | ) | | | 1.16 | | | | (1.73 | ) | | | 1.02 | | | | (1.18 | ) |
Total from investment operations | | | 1.76 | | | | 3.04 | | | | (.85 | ) | | | 1.85 | | | | (.14 | ) |
Less distributions from: |
Net investment income | | | (2.06 | ) | | | (1.89 | ) | | | (.87 | ) | | | (.83 | ) | | | (.83 | ) |
Return of capital | | | — | | | | — | | | | — | | | | (.01 | ) | | | (.18 | ) |
Total distributions | | | (2.06 | ) | | | (1.89 | ) | | | (.87 | ) | | | (.84 | ) | | | (1.01 | ) |
Net asset value, end of period | | $ | 24.23 | | | $ | 24.53 | | | $ | 23.38 | | | $ | 25.10 | | | $ | 24.09 | |
|
Total Return | | | 7.41 | % | | | 13.46 | % | | | (3.47 | %) | | | 7.83 | % | | | (0.50 | %) |
Ratios/Supplemental Data |
Net assets, end of period (in thousands) | | $ | 42,808 | | | $ | 44,295 | | | $ | 43,603 | | | $ | 35,430 | | | $ | 33,251 | |
Ratios to average net assets: |
Net investment income (loss) | | | 8.39 | % | | | 7.81 | % | | | 3.58 | % | | | 3.36 | % | | | 4.26 | % |
Total expensesc | | | 1.18 | % | | | 1.18 | % | | | 1.14 | % | | | 1.06 | % | | | 1.37 | % |
Net expensesd,e,f | | | 1.02 | % | | | 1.02 | % | | | 1.02 | % | | | 1.05 | % | | | 1.10 | % |
Portfolio turnover rate | | | 37 | % | | | 23 | % | | | 30 | % | | | 57 | % | | | 20 | % |
Institutional Class | | Year Ended
September 30,
2024 | | | Year Ended
September 30,
2023 | | | Year Ended
September 30,
2022 | | | Year Ended
September 30,
2021 | | | Year Ended
September 30,
2020 | |
Per Share Data |
Net asset value, beginning of period | | $ | 24.54 | | | $ | 23.39 | | | $ | 25.11 | | | $ | 24.10 | | | $ | 25.25 | |
Income (loss) from investment operations: |
Net investment income (loss)a | | | 2.11 | | | | 1.93 | | | | .94 | | | | .89 | | | | 1.09 | |
Net gain (loss) on investments (realized and unrealized) | | | (.30 | ) | | | 1.16 | | | | (1.73 | ) | | | 1.02 | | | | (1.17 | ) |
Total from investment operations | | | 1.81 | | | | 3.09 | | | | (.79 | ) | | | 1.91 | | | | (.08 | ) |
Less distributions from: |
Net investment income | | | (2.11 | ) | | | (1.94 | ) | | | (.93 | ) | | | (.89 | ) | | | (.88 | ) |
Return of capital | | | — | | | | — | | | | — | | | | (.01 | ) | | | (.19 | ) |
Total distributions | | | (2.11 | ) | | | (1.94 | ) | | | (.93 | ) | | | (.90 | ) | | | (1.07 | ) |
Net asset value, end of period | | $ | 24.24 | | | $ | 24.54 | | | $ | 23.39 | | | $ | 25.11 | | | $ | 24.10 | |
|
Total Return | | | 7.66 | % | | | 13.68 | % | | | (3.20 | %) | | | 8.08 | % | | | (0.26 | %) |
Ratios/Supplemental Data |
Net assets, end of period (in thousands) | | $ | 735,606 | | | $ | 793,785 | | | $ | 979,086 | | | $ | 711,583 | | | $ | 504,449 | |
Ratios to average net assets: |
Net investment income (loss) | | | 8.62 | % | | | 8.02 | % | | | 3.84 | % | | | 3.59 | % | | | 4.48 | % |
Total expensesc | | | 0.87 | % | | | 0.88 | % | | | 0.87 | % | | | 0.85 | % | | | 0.97 | % |
Net expensesd,e,f | | | 0.78 | % | | | 0.78 | % | | | 0.78 | % | | | 0.81 | % | | | 0.85 | % |
Portfolio turnover rate | | | 37 | % | | | 23 | % | | | 30 | % | | | 57 | % | | | 20 | % |
SEE NOTES TO FINANCIAL STATEMENTS. | THE GUGGENHEIM FUNDS ANNUAL REPORT | 131 |
FLOATING RATE STRATEGIES FUND | |
FINANCIAL HIGHLIGHTS (concluded) |
This table is presented to show selected data for a share outstanding throughout each period and to assist shareholders in evaluating a Fund’s performance for the periods presented.
Class R6 | | Year Ended
September 30,
2024 | | | Year Ended
September 30,
2023 | | | Year Ended
September 30,
2022 | | | Year Ended
September 30,
2021 | | | Year Ended
September 30,
2020 | |
Per Share Data |
Net asset value, beginning of period | | $ | 24.55 | | | $ | 23.38 | | | $ | 25.11 | | | $ | 24.10 | | | $ | 25.25 | |
Income (loss) from investment operations: |
Net investment income (loss)a | | | 2.09 | | | | 1.87 | | | | .82 | | | | .91 | | | | 1.13 | |
Net gain (loss) on investments (realized and unrealized) | | | (.27 | ) | | | 1.27 | | | | (1.62 | ) | | | 1.01 | | | | (1.21 | ) |
Total from investment operations | | | 1.82 | | | | 3.14 | | | | (.80 | ) | | | 1.92 | | | | (.08 | ) |
Less distributions from: |
Net investment income | | | (2.12 | ) | | | (1.97 | ) | | | (.93 | ) | | | (.90 | ) | | | (.88 | ) |
Return of capital | | | — | | | | — | | | | — | | | | (.01 | ) | | | (.19 | ) |
Total distributions | | | (2.12 | ) | | | (1.97 | ) | | | (.93 | ) | | | (.91 | ) | | | (1.07 | ) |
Net asset value, end of period | | $ | 24.25 | | | $ | 24.55 | | | $ | 23.38 | | | $ | 25.11 | | | $ | 24.10 | |
|
Total Return | | | 7.67 | % | | | 13.87 | % | | | (3.25 | %) | | | 8.06 | % | | | (0.22 | %) |
Ratios/Supplemental Data |
Net assets, end of period (in thousands) | | $ | 2,023 | | | $ | 1,445 | | | $ | 1,722 | | | $ | 1,257 | | | $ | 1,625 | |
Ratios to average net assets: |
Net investment income (loss) | | | 8.58 | % | | | 7.79 | % | | | 3.31 | % | | | 3.66 | % | | | 4.56 | % |
Total expensesc | | | 0.84 | % | | | 0.78 | % | | | 0.82 | % | | | 0.83 | % | | | 0.86 | % |
Net expensesd,e,f | | | 0.79 | % | | | 0.74 | % | | | 0.79 | % | | | 0.82 | % | | | 0.84 | % |
Portfolio turnover rate | | | 37 | % | | | 23 | % | | | 30 | % | | | 57 | % | | | 20 | % |
a | Net investment income (loss) per share was computed using average shares outstanding throughout the period. |
b | Total return does not reflect the impact of any applicable sales charges. |
c | Does not include expenses of the underlying funds in which the Fund invests. |
d | Net expense information reflects the expense ratios after expense waivers and reimbursements, as applicable. |
e | The portion of the ratios of net expenses to average net assets attributable to recoupments of prior fee reductions or expense reimbursements for the years presented was as follows: |
| | | 09/30/24 | 09/30/23 | 09/30/22 | 09/30/21 | 09/30/20 |
| | Class A | — | 0.03% | 0.03% | — | 0.00%* |
| | Class C | 0.00%* | 0.04% | 0.04% | — | 0.00%* |
| | Class P | — | 0.03% | 0.04% | 0.00%* | 0.00%* |
| | Institutional Class | — | 0.02% | 0.04% | 0.00%* | 0.00%* |
| | Class R6 | 0.03% | 0.02% | 0.03% | 0.01% | 0.00%* |
f | Net expenses may include expenses that are excluded from the expense limitation agreement. Excluding these expenses, the net expense ratios for the years presented would be: |
| | | 09/30/24 | 09/30/23 | 09/30/22 | 09/30/21 | 09/30/20 |
| | Class A | 0.99% | 0.99% | 1.00% | 1.01% | 1.02% |
| | Class C | 1.74% | 1.75% | 1.75% | 1.76% | 1.77% |
| | Class P | 0.99% | 0.99% | 1.00% | 1.01% | 1.02% |
| | Institutional Class | 0.75% | 0.75% | 0.76% | 0.77% | 0.78% |
| | Class R6 | 0.75% | 0.71% | 0.76% | 0.77% | 0.78% |
132 | THE GUGGENHEIM FUNDS ANNUAL REPORT | SEE NOTES TO FINANCIAL STATEMENTS. |
SCHEDULE OF INVESTMENTS | September 30, 2024 |
HIGH YIELD FUND | |
| | Shares | | | Value | |
COMMON STOCKS† - 0.3% |
| | | | | | | | | |
Consumer, Non-cyclical - 0.3% |
Endo, Inc.* | | | 22,743 | | | $ | 585,632 | |
Save-A-Lot*,††† | | | 797,632 | | | | 5,863 | |
Total Consumer, Non-cyclical | | | | | | | 591,495 | |
| | | | | | | | | |
Industrial - 0.0% |
BP Holdco LLC*,†††,1 | | | 23,711 | | | | 28,741 | |
YAK BLOCKER 2 LLC*,††† | | | 6,243 | | | | 12,547 | |
YAK BLOCKER 2 LLC*,††† | | | 5,770 | | | | 11,597 | |
Targus, Inc.*,††† | | | 12,825 | | | | 545 | |
Vector Phoenix Holdings, LP*,††† | | | 23,711 | | | | 502 | |
Targus, Inc.*,††† | | | 12,825 | | | | 73 | |
Targus, Inc.*,††† | | | 12,825 | | | | 1 | |
Total Industrial | | | | | | | 54,006 | |
| | | | | | | | | |
Energy - 0.0% |
Legacy Reserves, Inc.*,††† | | | 3,452 | | | | 13,808 | |
Permian Production Partners LLC*,††† | | | 57,028 | | | | 1,025 | |
Total Energy | | | | | | | 14,833 | |
| | | | | | | | | |
Utilities - 0.0% |
Mountain Creek Power LLC*,††† | | | 26,665 | | | | 2,667 | |
| | | | | | | | | |
Financial - 0.0% |
Endo Luxembourg Finance Co I SARL / Endo US, Inc.*,†††,2 | | | 1,210,000 | | | | 121 | |
Endo Luxembourg Finance Co I SARL / Endo US, Inc.*,†††,2 | | | 950,000 | | | | 95 | |
Avison Young (Canada), Inc.*,†† | | | 132 | | | | 37 | |
Endo Luxembourg Finance Co I SARL / Endo US, Inc.*,††† | | | 171,000 | | | | 17 | |
Total Financial | | | | | | | 270 | |
| | | | | | | | | |
Total Common Stocks | | | | |
(Cost $528,014) | | | | | | | 663,271 | |
| | | | | | | | | |
PREFERRED STOCKS†† - 1.8% |
Financial - 1.5% |
Charles Schwab Corp. |
4.00% | | | 1,325,000 | | | | 1,184,937 | |
Citigroup, Inc. |
7.63%3 | | | 775,000 | | | | 827,990 | |
American National Group, Inc. |
5.95% | | | 21,500 | | | | 531,695 | |
Goldman Sachs Group, Inc. |
7.50%3 | | | 475,000 | | | | 510,596 | |
Avison Young (Canada), Inc. | | | 185,779 | | | | 38,456 | |
Total Financial | | | | | | | 3,093,674 | |
| | | | | | | | | |
Energy - 0.3% |
Venture Global LNG, Inc. |
9.00%4 | | | 475,000 | | | | 481,474 | |
| | | | | | | | | |
Industrial - 0.0% |
U.S. Shipping Corp.*,††† | | | 14,718 | | | | 2 | |
Total Preferred Stocks | | | | |
(Cost $4,112,805) | | | | | | | 3,575,150 | |
| | | | | | | | | |
WARRANTS† - 0.0% |
Ginkgo Bioworks Holdings, Inc. | | | | | | | | |
Expiring 09/16/26* | | | 4 | | | | — | |
Total Warrants | | | | |
(Cost $9) | | | | | | | — | |
| | | | | | | | | |
MONEY MARKET FUND***,† - 3.3% |
Dreyfus Treasury Securities Cash Management Fund — Institutional Shares, 4.88%5 | | | 6,831,221 | | | | 6,831,221 | |
Total Money Market Fund | | | | |
(Cost $6,831,221) | | | | | | | 6,831,221 | |
| | | | | | | | | |
| | | Face
Amount~ | | | | | |
CORPORATE BONDS†† - 82.3% |
Consumer, Cyclical - 16.1% | | | | | | | | |
CD&R Smokey Buyer, Inc. | | | | | | | | |
6.75% due 07/15/254 | | | 1,525,000 | | | | 1,524,499 | |
Hilton Domestic Operating Company, Inc. | | | | | | | | |
5.88% due 03/15/334 | | | 1,000,000 | | | | 1,018,952 | |
6.13% due 04/01/324 | | | 425,000 | | | | 437,610 | |
Ferrellgas Limited Partnership / Ferrellgas Finance Corp. | | | | | | | | |
5.38% due 04/01/264 | | | 1,225,000 | | | | 1,222,154 | |
Clarios Global Limited Partnership / Clarios US Finance Co. | | | | | | | | |
8.50% due 05/15/274 | | | 475,000 | | | | 476,547 | |
6.75% due 05/15/284 | | | 350,000 | | | | 360,764 | |
6.25% due 05/15/264 | | | 325,000 | | | | 324,883 | |
PetSmart, Inc. / PetSmart Finance Corp. | | | | | | | | |
4.75% due 02/15/284 | | | 1,150,000 | | | | 1,102,526 | |
Scientific Games Holdings Limited Partnership/Scientific Games US FinCo, Inc. | | | | | | | | |
6.63% due 03/01/304 | | | 1,100,000 | | | | 1,091,695 | |
Caesars Entertainment, Inc. | | | | | | | | |
8.13% due 07/01/274 | | | 900,000 | | | | 918,532 | |
6.50% due 02/15/324 | | | 150,000 | | | | 155,162 | |
Wolverine World Wide, Inc. | | | | | | | | |
4.00% due 08/15/294 | | | 1,200,000 | | | | 1,058,872 | |
Allwyn Entertainment Financing UK plc | | | | | | | | |
7.88% due 04/30/294 | | | 1,000,000 | | | | 1,051,448 | |
Fertitta Entertainment LLC / Fertitta Entertainment Finance Company, Inc. | | | | | | | | |
4.63% due 01/15/294 | | | 1,100,000 | | | | 1,050,311 | |
Vail Resorts, Inc. | | | | | | | | |
6.50% due 05/15/324 | | | 1,000,000 | | | | 1,044,919 | |
SEE NOTES TO FINANCIAL STATEMENTS. | THE GUGGENHEIM FUNDS ANNUAL REPORT | 133 |
SCHEDULE OF INVESTMENTS (continued) | September 30, 2024 |
HIGH YIELD FUND | |
| | Face
Amount~ | | | Value | |
Hanesbrands, Inc. | | | | | | | | |
4.88% due 05/15/264 | | | 1,050,000 | | | $ | 1,040,794 | |
Crocs, Inc. | | | | | | | | |
4.25% due 03/15/294 | | | 1,094,000 | | | | 1,034,262 | |
Scotts Miracle-Gro Co. | | | | | | | | |
4.38% due 02/01/32 | | | 1,050,000 | | | | 973,054 | |
Newell Brands, Inc. | | | | | | | | |
6.38% due 09/15/27 | | | 500,000 | | | | 505,703 | |
5.70% due 04/01/26 | | | 450,000 | | | | 451,104 | |
United Airlines, Inc. | | | | | | | | |
4.63% due 04/15/294 | | | 650,000 | | | | 627,938 | |
4.38% due 04/15/264 | | | 325,000 | | | | 319,783 | |
Wabash National Corp. | | | | | | | | |
4.50% due 10/15/284 | | | 1,025,000 | | | | 939,017 | |
Ontario Gaming GTA Limited Partnership/OTG Company-Issuer, Inc. | | | | | | | | |
8.00% due 08/01/304 | | | 875,000 | | | | 909,323 | |
Velocity Vehicle Group LLC | | | | | | | | |
8.00% due 06/01/294 | | | 850,000 | | | | 885,025 | |
Tempur Sealy International, Inc. | | | | | | | | |
3.88% due 10/15/314 | | | 875,000 | | | | 779,946 | |
Aramark Services, Inc. | | | | | | | | |
5.00% due 02/01/284 | | | 750,000 | | | | 747,588 | |
Suburban Propane Partners Limited Partnership/Suburban Energy Finance Corp. | | | | | | | | |
5.00% due 06/01/314 | | | 800,000 | | | | 745,874 | |
Ritchie Bros Holdings, Inc. | | | | | | | | |
7.75% due 03/15/314 | | | 450,000 | | | | 479,255 | |
6.75% due 03/15/284 | | | 250,000 | | | | 258,459 | |
Hawaiian Brand Intellectual Property Ltd. / HawaiianMiles Loyalty Ltd. | | | | | | | | |
11.00% due 04/15/294 | | | 721,875 | | | | 724,763 | |
Amer Sports Co. | | | | | | | | |
6.75% due 02/16/314 | | | 675,000 | | | | 691,925 | |
ONE Hotels GmbH | | | | | | | | |
7.75% due 04/02/314 | | | EUR 575,000 | | | | 674,804 | |
Station Casinos LLC | | | | | | | | |
4.63% due 12/01/314 | | | 700,000 | | | | 649,118 | |
Park River Holdings, Inc. | | | | | | | | |
5.63% due 02/01/294 | | | 675,000 | | | | 579,452 | |
Wynn Resorts Finance LLC / Wynn Resorts Capital Corp. | | | | | | | | |
6.25% due 03/15/334 | | | 550,000 | | | | 557,176 | |
Advance Auto Parts, Inc. | | | | | | | | |
5.90% due 03/09/26 | | | 550,000 | | | | 555,674 | |
Penn Entertainment, Inc. | | | | | | | | |
4.13% due 07/01/294 | | | 579,000 | | | | 527,531 | |
Asbury Automotive Group, Inc. | | | | | | | | |
5.00% due 02/15/324 | | | 550,000 | | | | 521,554 | |
JB Poindexter & Company, Inc. | | | | | | | | |
8.75% due 12/15/314 | | | 475,000 | | | | 502,201 | |
AccorInvest Group S.A. | | | | | | | | |
6.38% due 10/15/294 | | | EUR 425,000 | | | | 489,984 | |
Air Canada | | | | | | | | |
3.88% due 08/15/264 | | | 500,000 | | | | 486,893 | |
Evergreen Acqco 1 Limited Partnership / TVI, Inc. | | | | | | | | |
9.75% due 04/26/284 | | | 458,000 | | | | 482,946 | |
Michaels Companies, Inc. | | | | | | | | |
5.25% due 05/01/284 | | | 600,000 | | | | 442,865 | |
Superior Plus, LP | | | | | | | | |
4.25% due 05/18/284 | | | CAD 550,000 | | | | 383,439 | |
Sabre GLBL, Inc. | | | | | | | | |
7.38% due 09/01/252 | | | 320,000 | | | | 316,800 | |
9.25% due 04/15/252 | | | 31,000 | | | | 30,884 | |
Papa John’s International, Inc. | | | | | | | | |
3.88% due 09/15/294 | | | 275,000 | | | | 254,508 | |
1011778 BC ULC / New Red Finance, Inc. | | | | | | | | |
5.63% due 09/15/294 | | | 200,000 | | | | 202,890 | |
Allison Transmission, Inc. | | | | | | | | |
4.75% due 10/01/274 | | | 200,000 | | | | 196,782 | |
Six Flags Theme Parks, Inc. | | | | | | | | |
7.00% due 07/01/254 | | | 117,000 | | | | 117,092 | |
Total Consumer, Cyclical | | | | | | | 32,925,280 | |
| | | | | | | | | |
Consumer, Non-cyclical - 13.1% | | | | | | | | |
CPI CG, Inc. | | | | | | | | |
10.00% due 07/15/294 | | | 1,650,000 | | | | 1,736,625 | |
Tenet Healthcare Corp. | | | | | | | | |
6.75% due 05/15/31 | | | 675,000 | | | | 703,601 | |
4.38% due 01/15/30 | | | 625,000 | | | | 599,645 | |
6.13% due 06/15/30 | | | 275,000 | | | | 279,494 | |
Post Holdings, Inc. | | | | | | | | |
4.63% due 04/15/304 | | | 600,000 | | | | 574,116 | |
5.50% due 12/15/294 | | | 500,000 | | | | 496,372 | |
6.25% due 10/15/344 | | | 350,000 | | | | 352,206 | |
Cheplapharm Arzneimittel GmbH | | | | | | | | |
5.50% due 01/15/284 | | | 1,303,000 | | | | 1,263,749 | |
HAH Group Holding Company LLC | | | | | | | | |
9.75% due 10/01/314 | | | 1,075,000 | | | | 1,083,949 | |
Sotheby’s/Bidfair Holdings, Inc. | | | | | | | | |
5.88% due 06/01/294 | | | 1,200,000 | | | | 1,051,778 | |
Champions Financing, Inc. | | | | | | | | |
8.75% due 02/15/294 | | | 1,025,000 | | | | 1,044,018 | |
ADT Security Corp. | | | | | | | | |
4.13% due 08/01/294 | | | 1,050,000 | | | | 1,002,899 | |
Carriage Services, Inc. | | | | | | | | |
4.25% due 05/15/294 | | | 1,075,000 | | | | 995,876 | |
TriNet Group, Inc. | | | | | | | | |
7.13% due 08/15/314 | | | 950,000 | | | | 989,743 | |
Upbound Group, Inc. | | | | | | | | |
6.38% due 02/15/294 | | | 989,000 | | | | 957,484 | |
Bausch Health Companies, Inc. | | | | | | | | |
4.88% due 06/01/28†††,4 | | | 1,200,000 | | | | 936,000 | |
Boost Newco Borrower LLC | | | | | | | | |
7.50% due 01/15/314 | | | 850,000 | | | | 912,090 | |
Medline Borrower, LP | | | | | | | | |
5.25% due 10/01/294 | | | 850,000 | | | | 834,005 | |
BCP V Modular Services Finance II plc | | | | | | | | |
4.75% due 10/30/284 | | | EUR 736,000 | | | | 797,149 | |
Williams Scotsman, Inc. | | | | | | | | |
7.38% due 10/01/314 | | | 725,000 | | | | 766,298 | |
134 | THE GUGGENHEIM FUNDS ANNUAL REPORT | SEE NOTES TO FINANCIAL STATEMENTS. |
SCHEDULE OF INVESTMENTS (continued) | September 30, 2024 |
HIGH YIELD FUND | |
| | Face
Amount~ | | | Value | |
AMN Healthcare, Inc. | | | | | | | | |
4.63% due 10/01/274 | | | 775,000 | | | $ | 757,551 | |
Service Corporation International | | | | | | | | |
5.75% due 10/15/32 | | | 425,000 | | | | 427,783 | |
3.38% due 08/15/30 | | | 325,000 | | | | 294,543 | |
Performance Food Group, Inc. | | | | | | | | |
6.13% due 09/15/324 | | | 700,000 | | | | 715,299 | |
Central Garden & Pet Co. | | | | | | | | |
4.13% due 10/15/30 | | | 711,000 | | | | 660,981 | |
Albertsons Companies Incorporated / Safeway Inc / New Albertsons Limited Partnership / Albertsons LLC | | | | | | | | |
5.88% due 02/15/284 | | | 475,000 | | | | 477,121 | |
6.50% due 02/15/284 | | | 175,000 | | | | 178,185 | |
DaVita, Inc. | | | | | | | | |
3.75% due 02/15/314 | | | 625,000 | | | | 563,750 | |
Grifols S.A. | | | | | | | | |
4.75% due 10/15/284 | | | 600,000 | | | | 562,002 | |
Valvoline, Inc. | | | | | | | | |
3.63% due 06/15/314 | | | 600,000 | | | | 536,933 | |
US Foods, Inc. | | | | | | | | |
7.25% due 01/15/324 | | | 500,000 | | | | 529,173 | |
Darling Ingredients, Inc. | | | | | | | | |
5.25% due 04/15/274 | | | 500,000 | | | | 497,351 | |
Brink’s Co. | | | | | | | | |
6.75% due 06/15/324 | | | 475,000 | | | | 495,465 | |
Prime Security Services Borrower LLC / Prime Finance, Inc. | | | | | | | | |
5.75% due 04/15/264 | | | 450,000 | | | | 452,054 | |
Graham Holdings Co. | | | | | | | | |
5.75% due 06/01/264 | | | 400,000 | | | | 399,827 | |
IQVIA, Inc. | | | | | | | | |
5.00% due 05/15/274 | | | 395,000 | | | | 392,594 | |
Neogen Food Safety Corp. | | | | | | | | |
8.63% due 07/20/304 | | | 300,000 | | | | 332,049 | |
Block, Inc. | | | | | | | | |
6.50% due 05/15/324 | | | 250,000 | | | | 260,330 | |
Medline Borrower Limited Partnership/Medline Company-Issuer, Inc. | | | | | | | | |
6.25% due 04/01/294 | | | 225,000 | | | | 231,825 | |
Perrigo Finance Unlimited Co. | | | | | | | | |
6.13% due 09/30/32 | | | 225,000 | | | | 226,737 | |
Endo Finance Holdings, Inc. | | | | | | | | |
8.50% due 04/15/314 | | | 200,000 | | | | 214,306 | |
WW International, Inc. | | | | | | | | |
4.50% due 04/15/294 | | | 690,000 | | | | 152,358 | |
Ingles Markets, Inc. | | | | | | | | |
4.00% due 06/15/314 | | | 75,000 | | | | 68,582 | |
Total Consumer, Non-cyclical | | | | | | | 26,803,896 | |
| | | | | | | | | |
Industrial - 12.6% | | | | | | | | |
TransDigm, Inc. | | | | | | | | |
6.88% due 12/15/304 | | | 925,000 | | | | 968,638 | |
6.00% due 01/15/334 | | | 900,000 | | | | 912,748 | |
6.38% due 03/01/294 | | | 250,000 | | | | 257,930 | |
New Enterprise Stone & Lime Company, Inc. | | | | | | | | |
9.75% due 07/15/284 | | | 1,225,000 | | | | 1,251,341 | |
5.25% due 07/15/284 | | | 675,000 | | | | 659,137 | |
Trinity Industries, Inc. | | | | | | | | |
7.75% due 07/15/284 | | | 1,725,000 | | | | 1,810,541 | |
GrafTech Finance, Inc. | | | | | | | | |
4.63% due 12/15/284 | | | 2,500,000 | | | | 1,669,914 | |
Mauser Packaging Solutions Holding Co. | | | | | | | | |
7.88% due 04/15/274 | | | 1,025,000 | | | | 1,059,007 | |
9.25% due 04/15/274 | | | 500,000 | | | | 512,687 | |
Enviri Corp. | | | | | | | | |
5.75% due 07/31/274 | | | 1,575,000 | | | | 1,545,952 | |
Great Lakes Dredge & Dock Corp. | | | | | | | | |
5.25% due 06/01/294 | | | 1,525,000 | | | | 1,417,571 | |
Amsted Industries, Inc. | | | | | | | | |
4.63% due 05/15/304 | | | 900,000 | | | | 859,623 | |
5.63% due 07/01/274 | | | 250,000 | | | | 249,331 | |
Builders FirstSource, Inc. | | | | | | | | |
6.38% due 06/15/324 | | | 750,000 | | | | 777,466 | |
6.38% due 03/01/344 | | | 200,000 | | | | 207,669 | |
4.25% due 02/01/324 | | | 100,000 | | | | 92,432 | |
Brundage-Bone Concrete Pumping Holdings, Inc. | | | | | | | | |
6.00% due 02/01/264 | | | 1,076,000 | | | | 1,071,704 | |
EMRLD Borrower Limited Partnership / Emerald Company-Issuer, Inc. | | | | | | | | |
6.63% due 12/15/304 | | | 825,000 | | | | 850,654 | |
MIWD Holdco II LLC / MIWD Finance Corp. | | | | | | | | |
5.50% due 02/01/304 | | | 800,000 | | | | 777,063 | |
Artera Services LLC | | | | | | | | |
8.50% due 02/15/314 | | | 725,000 | | | | 717,912 | |
Clearwater Paper Corp. | | | | | | | | |
4.75% due 08/15/284 | | | 750,000 | | | | 705,937 | |
Pactiv Evergreen Group Issuer Incorporated/Pactiv Evergreen Group Issuer LLC | | | | | | | | |
4.00% due 10/15/274 | | | 700,000 | | | | 673,094 | |
Arcosa, Inc. | | | | | | | | |
4.38% due 04/15/294 | | | 700,000 | | | | 670,984 | |
Sealed Air Corporation/Sealed Air Corp US | | | | | | | | |
7.25% due 02/15/314 | | | 350,000 | | | | 370,436 | |
6.13% due 02/01/284 | | | 250,000 | | | | 254,185 | |
Summit Materials LLC / Summit Materials Finance Corp. | | | | | | | | |
6.50% due 03/15/274 | | | 425,000 | | | | 425,468 | |
7.25% due 01/15/314 | | | 175,000 | | | | 185,377 | |
Advanced Drainage Systems, Inc. | | | | | | | | |
6.38% due 06/15/304 | | | 575,000 | | | | 587,347 | |
Standard Industries, Inc. | | | | | | | | |
4.38% due 07/15/304 | | | 550,000 | | | | 520,577 | |
Howmet Aerospace, Inc. | | | | | | | | |
5.95% due 02/01/37 | | | 475,000 | | | | 519,430 | |
Ardagh Metal Packaging Finance USA LLC / Ardagh Metal Packaging Finance plc | | | | | | | | |
6.00% due 06/15/274 | | | 500,000 | | | | 503,594 | |
Calderys Financing LLC | | | | | | | | |
11.25% due 06/01/284 | | | 425,000 | | | | 456,882 | |
SEE NOTES TO FINANCIAL STATEMENTS. | THE GUGGENHEIM FUNDS ANNUAL REPORT | 135 |
SCHEDULE OF INVESTMENTS (continued) | September 30, 2024 |
HIGH YIELD FUND | |
| | Face
Amount~ | | | Value | |
Ball Corp. | | | | | | | | |
6.00% due 06/15/29 | | | 425,000 | | | $ | 439,835 | |
Hillenbrand, Inc. | | | | | | | | |
6.25% due 02/15/29 | | | 425,000 | | | | 432,487 | |
Standard Building Solutions, Inc. | | | | | | | | |
6.50% due 08/15/324 | | | 350,000 | | | | 362,409 | |
AmeriTex HoldCo Intermediate LLC | | | | | | | | |
10.25% due 10/15/284 | | | 300,000 | | | | 313,825 | |
Clean Harbors, Inc. | | | | | | | | |
6.38% due 02/01/314 | | | 225,000 | | | | 230,494 | |
Miter Brands Acquisition Holdco Incorporated / MIWD Borrower LLC | | | | | | | | |
6.75% due 04/01/324 | | | 175,000 | | | | 181,410 | |
EnerSys | | | | | | | | |
6.63% due 01/15/324 | | | 175,000 | | | | 181,004 | |
Total Industrial | | | | | | | 25,684,095 | |
| | | | | | | | | |
Communications - 11.8% | | | | | | | | |
CCO Holdings LLC / CCO Holdings Capital Corp. | | | | | | | | |
4.50% due 05/01/32 | | | 2,250,000 | | | | 1,945,470 | |
6.38% due 09/01/294 | | | 1,275,000 | | | | 1,276,511 | |
4.25% due 01/15/344 | | | 975,000 | | | | 799,754 | |
Altice France S.A. | | | | | | | | |
5.13% due 07/15/294 | | | 1,450,000 | | | | 1,019,666 | |
5.50% due 10/15/294 | | | 1,250,000 | | | | 875,424 | |
8.13% due 02/01/274 | | | 900,000 | | | | 735,960 | |
Vmed O2 UK Financing I plc | | | | | | | | |
4.25% due 01/31/314 | | | 1,125,000 | | | | 995,897 | |
4.75% due 07/15/314 | | | 850,000 | | | | 756,523 | |
7.75% due 04/15/324 | | | 350,000 | | | | 359,268 | |
CSC Holdings LLC | | | | | | | | |
3.38% due 02/15/314 | | | 1,025,000 | | | | 726,776 | |
4.13% due 12/01/304 | | | 975,000 | | | | 710,536 | |
4.63% due 12/01/304 | | | 950,000 | | | | 482,118 | |
McGraw-Hill Education, Inc. | | | | | | | | |
8.00% due 08/01/294 | | | 775,000 | | | | 777,780 | |
5.75% due 08/01/284 | | | 625,000 | | | | 617,649 | |
7.38% due 09/01/314 | | | 100,000 | | | | 103,757 | |
Level 3 Financing, Inc. | | | | | | | | |
3.88% due 10/15/304 | | | 1,250,000 | | | | 915,964 | |
11.00% due 11/15/294 | | | 520,747 | | | | 576,767 | |
VZ Secured Financing B.V. | | | | | | | | |
5.00% due 01/15/324 | | | 1,600,000 | | | | 1,472,390 | |
Cogent Communications Group Incorporated / Cogent Communications Finance, Inc. | | | | | | | | |
7.00% due 06/15/274 | | | 1,350,000 | | | | 1,371,987 | |
Telenet Finance Luxembourg Notes SARL | | | | | | | | |
5.50% due 03/01/28 | | | 1,400,000 | | | | 1,368,830 | |
LCPR Senior Secured Financing DAC | | | | | | | | |
6.75% due 10/15/274 | | | 1,417,000 | | | | 1,296,595 | |
Sunrise FinCo I B.V. | | | | | | | | |
4.88% due 07/15/314 | | | 1,200,000 | | | | 1,135,416 | |
AMC Networks, Inc. | | | | | | | | |
4.25% due 02/15/29 | | | 1,550,000 | | | | 1,121,022 | |
Sirius XM Radio, Inc. | | | | | | | | |
4.13% due 07/01/304 | | | 800,000 | | | | 725,502 | |
5.50% due 07/01/294 | | | 325,000 | | | | 317,501 | |
3.88% due 09/01/314 | | | 50,000 | | | | 43,563 | |
Match Group Holdings II LLC | | | | | | | | |
4.63% due 06/01/284 | | | 600,000 | | | | 583,368 | |
Outfront Media Capital LLC / Outfront Media Capital Corp. | | | | | | | | |
4.25% due 01/15/294 | | | 550,000 | | | | 523,682 | |
Zayo Group Holdings, Inc. | | | | | | | | |
4.00% due 03/01/274 | | | 300,000 | | | | 268,333 | |
Cogent Communications Group LLC | | | | | | | | |
7.00% due 06/15/274 | | | 100,000 | | | | 101,758 | |
Total Communications | | | | | | | 24,005,767 | |
| | | | | | | | | |
Financial - 10.1% | | | | | | | | |
Jones Deslauriers Insurance Management, Inc. | | | | | | | | |
10.50% due 12/15/304 | | | 1,300,000 | | | | 1,413,725 | |
8.50% due 03/15/304 | | | 200,000 | | | | 213,981 | |
Alliant Holdings Intermediate LLC / Alliant Holdings Company-Issuer | | | | | | | | |
6.50% due 10/01/314 | | | 1,100,000 | | | | 1,111,535 | |
4.25% due 10/15/274 | | | 475,000 | | | | 454,724 | |
Focus Financial Partners LLC | | | | | | | | |
6.75% due 09/15/314 | | | 1,500,000 | | | | 1,514,319 | |
Jefferies Finance LLC / JFIN Company-Issuer Corp. | | | | | | | | |
5.00% due 08/15/284 | | | 1,550,000 | | | | 1,473,756 | |
Hunt Companies, Inc. | | | | | | | | |
5.25% due 04/15/294 | | | 1,225,000 | | | | 1,185,205 | |
United Wholesale Mortgage LLC | | | | | | | | |
5.75% due 06/15/274 | | | 675,000 | | | | 670,610 | |
5.50% due 04/15/294 | | | 475,000 | | | | 462,650 | |
Rocket Mortgage LLC / Rocket Mortgage Company-Issuer, Inc. | | | | | | | | |
3.88% due 03/01/314 | | | 875,000 | | | | 805,648 | |
4.00% due 10/15/334 | | | 350,000 | | | | 312,650 | |
OneMain Finance Corp. | | | | | | | | |
4.00% due 09/15/30 | | | 750,000 | | | | 668,008 | |
3.88% due 09/15/28 | | | 375,000 | | | | 347,820 | |
Starwood Property Trust, Inc. | | | | | | | | |
4.38% due 01/15/274 | | | 550,000 | | | | 535,966 | |
7.25% due 04/01/294 | | | 425,000 | | | | 445,639 | |
Iron Mountain Information Management Services, Inc. | | | | | | | | |
5.00% due 07/15/324 | | | 1,000,000 | | | | 963,871 | |
SLM Corp. | | | | | | | | |
3.13% due 11/02/26 | | | 1,000,000 | | | | 961,346 | |
Ardonagh Finco Ltd. | | | | | | | | |
7.75% due 02/15/314 | | | 900,000 | | | | 930,351 | |
VFH Parent LLC / Valor Company-Issuer, Inc. | | | | | | | | |
7.50% due 06/15/314 | | | 850,000 | | | | 891,438 | |
Encore Capital Group, Inc. | | | | | | | | |
9.25% due 04/01/294 | | | 600,000 | | | | 645,570 | |
Aretec Group, Inc. | | | | | | | | |
10.00% due 08/15/304 | | | 575,000 | | | | 611,924 | |
136 | THE GUGGENHEIM FUNDS ANNUAL REPORT | SEE NOTES TO FINANCIAL STATEMENTS. |
SCHEDULE OF INVESTMENTS (continued) | September 30, 2024 |
HIGH YIELD FUND | |
| | Face
Amount~ | | | Value | |
HUB International Ltd. | | | | | | | | |
5.63% due 12/01/294 | | | 375,000 | | | $ | 367,797 | |
7.38% due 01/31/324 | | | 225,000 | | | | 232,334 | |
Kennedy-Wilson, Inc. | | | | | | | | |
4.75% due 02/01/30 | | | 450,000 | | | | 408,093 | |
4.75% due 03/01/29 | | | 150,000 | | | | 138,853 | |
PennyMac Financial Services, Inc. | | | | | | | | |
7.88% due 12/15/294 | | | 325,000 | | | | 346,553 | |
7.13% due 11/15/304 | | | 175,000 | | | | 181,202 | |
Jane Street Group / JSG Finance, Inc. | | | | | | | | |
7.13% due 04/30/314 | | | 475,000 | | | | 503,291 | |
Liberty Mutual Group, Inc. | | | | | | | | |
4.30% due 02/01/614 | | | 750,000 | | | | 503,176 | |
Hightower Holding LLC | | | | | | | | |
9.13% due 01/31/304 | | | 475,000 | | | | 495,721 | |
USI, Inc. | | | | | | | | |
7.50% due 01/15/324 | | | 300,000 | | | | 310,785 | |
American National Group, Inc. | | | | | | | | |
5.75% due 10/01/29 | | | 250,000 | | | | 251,445 | |
Ryan Specialty LLC | | | | | | | | |
5.88% due 08/01/324 | | | 175,000 | | | | 177,916 | |
Total Financial | | | | | | | 20,537,902 | |
| | | | | | | | | |
Energy - 7.4% | | | | | | | | |
ITT Holdings LLC | | | | | | | | |
6.50% due 08/01/294 | | | 1,875,000 | | | | 1,776,286 | |
TransMontaigne Partners Limited Partnership / TLP Finance Corp. | | | | | | | | |
6.13% due 02/15/26 | | | 1,500,000 | | | | 1,474,161 | |
CVR Energy, Inc. | | | | | | | | |
5.75% due 02/15/284 | | | 1,179,000 | | | | 1,107,200 | |
8.50% due 01/15/294 | | | 350,000 | | | | 353,797 | |
Global Partners Limited Partnership / GLP Finance Corp. | | | | | | | | |
7.00% due 08/01/27 | | | 1,200,000 | | | | 1,208,101 | |
6.88% due 01/15/29 | | | 250,000 | | | | 250,770 | |
Buckeye Partners, LP | | | | | | | | |
6.88% due 07/01/294 | | | 775,000 | | | | 794,042 | |
3.95% due 12/01/26 | | | 550,000 | | | | 534,027 | |
Viper Energy, Inc. | | | | | | | | |
7.38% due 11/01/314 | | | 1,015,000 | | | | 1,070,494 | |
Venture Global LNG, Inc. | | | | | | | | |
9.50% due 02/01/294 | | | 525,000 | | | | 591,415 | |
7.00% due 01/15/304 | | | 400,000 | | | | 408,647 | |
EnLink Midstream LLC | | | | | | | | |
5.38% due 06/01/29 | | | 925,000 | | | | 948,313 | |
Sunoco Limited Partnership / Sunoco Finance Corp. | | | | | | | | |
6.00% due 04/15/27 | | | 800,000 | | | | 802,661 | |
Parkland Corp. | | | | | | | | |
4.50% due 10/01/294 | | | 750,000 | | | | 710,087 | |
CQP Holdco Limited Partnership / BIP-V Chinook Holdco LLC | | | | | | | | |
7.50% due 12/15/334 | | | 600,000 | | | | 650,985 | |
NuStar Logistics, LP | | | | | | | | |
5.63% due 04/28/27 | | | 610,000 | | | | 612,782 | |
Sunoco, LP | | | | | | | | |
7.25% due 05/01/324 | | | 500,000 | | | | 530,009 | |
Venture Global Calcasieu Pass LLC | | | | | | | | |
6.25% due 01/15/304 | | | 500,000 | | | | 524,130 | |
Southwestern Energy Co. | | | | | | | | |
5.38% due 02/01/29 | | | 425,000 | | | | 423,567 | |
Kinetik Holdings, LP | | | | | | | | |
5.88% due 06/15/304 | | | 350,000 | | | | 352,384 | |
Basic Energy Services, Inc. | | | | | | | | |
due 10/15/237 | | | 1,175,000 | | | | 11,750 | |
Total Energy | | | | | | | 15,135,608 | |
| | | | | | | | | |
Basic Materials - 6.4% | | | | | | | | |
Carpenter Technology Corp. | | | | | | | | |
6.38% due 07/15/28 | | | 825,000 | | | | 830,659 | |
7.63% due 03/15/30 | | | 650,000 | | | | 680,597 | |
SK Invictus Intermediate II SARL | | | | | | | | |
5.00% due 10/30/294 | | | 1,350,000 | | | | 1,296,016 | |
INEOS Finance plc | | | | | | | | |
6.75% due 05/15/284 | | | 1,100,000 | | | | 1,110,918 | |
Ingevity Corp. | | | | | | | | |
3.88% due 11/01/284 | | | 1,150,000 | | | | 1,079,900 | |
Minerals Technologies, Inc. | | | | | | | | |
5.00% due 07/01/284 | | | 1,022,000 | | | | 994,457 | |
Novelis Corp. | | | | | | | | |
4.75% due 01/30/304 | | | 1,025,000 | | | | 993,744 | |
WR Grace Holdings LLC | | | | | | | | |
4.88% due 06/15/274 | | | 1,000,000 | | | | 985,394 | |
SCIL IV LLC / SCIL USA Holdings LLC | | | | | | | | |
5.38% due 11/01/264 | | | 950,000 | | | | 938,202 | |
Illuminate Buyer LLC / Illuminate Holdings IV, Inc. | | | | | | | | |
9.00% due 07/01/284 | | | 900,000 | | | | 909,902 | |
Compass Minerals International, Inc. | | | | | | | | |
6.75% due 12/01/274 | | | 875,000 | | | | 870,788 | |
Alcoa Nederland Holding B.V. | | | | | | | | |
6.13% due 05/15/284 | | | 450,000 | | | | 456,238 | |
7.13% due 03/15/314 | | | 275,000 | | | | 293,157 | |
Arsenal AIC Parent LLC | | | | | | | | |
8.00% due 10/01/304 | | | 675,000 | | | | 724,331 | |
Kaiser Aluminum Corp. | | | | | | | | |
4.50% due 06/01/314 | | | 725,000 | | | | 663,311 | |
Axalta Coating Systems Dutch Holding B B.V. | | | | | | | | |
7.25% due 02/15/314 | | | 250,000 | | | | 266,973 | |
Mirabela Nickel Ltd. | | | | | | | | |
due 06/24/19†††,2,7 | | | 278,115 | | | | 1,391 | |
Total Basic Materials | | | | | | | 13,095,978 | |
| | | | | | | | | |
Technology - 3.8% | | | | | | | | |
Dye & Durham Ltd. | | | | | | | | |
8.63% due 04/15/294 | | | 1,200,000 | | | | 1,269,455 | |
Capstone Borrower, Inc. | | | | | | | | |
8.00% due 06/15/304 | | | 950,000 | | | | 1,006,580 | |
ACI Worldwide, Inc. | | | | | | | | |
5.75% due 08/15/264 | | | 1,000,000 | | | | 999,725 | |
Dun & Bradstreet Corp. | | | | | | | | |
5.00% due 12/15/294 | | | 925,000 | | | | 921,078 | |
SEE NOTES TO FINANCIAL STATEMENTS. | THE GUGGENHEIM FUNDS ANNUAL REPORT | 137 |
SCHEDULE OF INVESTMENTS (continued) | September 30, 2024 |
HIGH YIELD FUND | |
| | Face
Amount~ | | | Value | |
TeamSystem S.p.A. | | | | | | | | |
7.19% due 07/31/31 | | | EUR 700,000 | | | $ | 782,979 | |
SS&C Technologies, Inc. | | | | | | | | |
5.50% due 09/30/274 | | | 600,000 | | | | 599,740 | |
Qorvo, Inc. | | | | | | | | |
3.38% due 04/01/314 | | | 600,000 | | | | 537,206 | |
Cloud Software Group, Inc. | | | | | | | | |
6.50% due 03/31/294 | | | 525,000 | | | | 522,358 | |
Playtika Holding Corp. | | | | | | | | |
4.25% due 03/15/294 | | | 500,000 | | | | 458,878 | |
NCR Voyix Corp. | | | | | | | | |
5.13% due 04/15/294 | | | 292,000 | | | | 285,733 | |
Amentum Holdings, Inc. | | | | | | | | |
7.25% due 08/01/324 | | | 200,000 | | | | 208,727 | |
Central Parent LLC / CDK Global II LLC / CDK Financing Company, Inc. | | | | | | | | |
8.00% due 06/15/294 | | | 200,000 | | | | 208,017 | |
Total Technology | | | | | | | 7,800,476 | |
| | | | | | | | | |
Utilities - 1.0% | | | | | | | | |
Terraform Global Operating, LP | | | | | | | | |
6.13% due 03/01/264 | | | 1,955,000 | | | | 1,955,962 | |
Total Corporate Bonds | | | | |
(Cost $172,658,437) | | | 167,944,964 | |
| | | | | |
SENIOR FLOATING RATE INTERESTS††,◊ - 11.5% |
Consumer, Non-cyclical - 2.8% | | | | | | | | |
Gibson Brands, Inc. | | | | | | | | |
10.58% (6 Month Term SOFR + 5.00%, Rate Floor: 5.75%) due 08/11/28 | | | 846,075 | | | | 803,771 | |
Blue Ribbon LLC | | | | | | | | |
11.58% (3 Month Term SOFR + 6.00%, Rate Floor: 6.75%) due 05/08/28 | | | 952,927 | | | | 663,075 | |
Women’s Care Holdings, Inc. | | | | | | | | |
9.85% (3 Month Term SOFR + 4.50%, Rate Floor: 5.25%) due 01/15/28 | | | 648,276 | | | | 622,883 | |
PlayCore | | | | | | | | |
9.75% (3 Month Term SOFR + 4.50%, Rate Floor: 5.50%) due 02/20/30 | | | 597,249 | | | | 598,892 | |
Outcomes Group Holdings, Inc. | | | | | | | | |
9.10% (1 Month Term SOFR + 4.25%, Rate Floor: 4.25%) due 05/06/31 | | | 498,750 | | | | 501,348 | |
Midwest Physician Administrative Services | | | | | | | | |
7.87% (3 Month Term SOFR + 3.00%, Rate Floor: 3.75%) due 03/12/28 | | | 498,839 | | | | 449,309 | |
Moran Foods LLC | | | | | | | | |
11.95% (3 Month Term SOFR + 7.25%, Rate Floor: 8.25%) due 06/30/26††† | | | 782,422 | | | | 431,873 | |
IVI America LLC | | | | | | | | |
9.10% (3 Month Term SOFR + 4.50%, Rate Floor: 4.50%) due 04/09/31 | | | 425,000 | | | | 427,278 | |
Endo Finance Holdings, Inc. | | | | | | | | |
9.78% (3 Month Term SOFR + 4.50%, Rate Floor: 5.00%) due 04/23/31 | | | 380,000 | | | | 379,445 | |
Balrog Acquisition, Inc. | | | | | | | | |
9.46% (1 Month Term SOFR + 4.50%, Rate Floor: 5.25%) due 09/05/28††† | | | 346,500 | | | | 344,767 | |
TGP Holdings LLC | | | | | | | | |
8.20% (1 Month Term SOFR + 3.25%, Rate Floor: 4.00%) due 06/29/28 | | | 360,270 | | | | 338,653 | |
Florida Food Products LLC | | | | | | | | |
9.96% (1 Month Term SOFR + 5.00%, Rate Floor: 5.75%) due 10/18/28 | | | 219,375 | | | | 191,405 | |
Total Consumer, Non-cyclical | | | | | | | 5,752,699 | |
| | | | | | | | | |
Industrial - 2.4% | | | | | | | | |
Dispatch Terra Acquisition LLC | | | | | | | | |
9.00% (3 Month Term SOFR + 4.25%, Rate Floor: 5.00%) due 03/27/28 | | | 1,161,606 | | | | 1,052,078 | |
Aegion Corp. | | | | | | | | |
8.60% (1 Month Term SOFR + 3.75%, Rate Floor: 4.50%) due 05/17/28 | | | 679,531 | | | | 680,808 | |
Pelican Products, Inc. | | | | | | | | |
9.12% (3 Month Term SOFR + 4.25%, Rate Floor: 4.75%) due 12/29/28 | | | 641,011 | | | | 586,756 | |
Engineering Research And Consulting LLC | | | | | | | | |
10.06% (3 Month Term SOFR + 5.00%, Rate Floor: 5.00%) due 08/29/31††† | | | 475,000 | | | | 467,875 | |
Michael Baker International LLC | | | | | | | | |
9.60% (1 Month Term SOFR + 4.75%, Rate Floor: 5.50%) due 12/01/28 | | | 453,863 | | | | 455,565 | |
STS Operating, Inc. | | | | | | | | |
8.95% (1 Month Term SOFR + 4.00%, Rate Floor: 4.00%) due 03/25/31 | | | 398,000 | | | | 395,015 | |
FCG Acquisitions, Inc | | | | | | | | |
8.71% (1 Month Term SOFR + 3.75%, Rate Floor: 4.25%) due 03/31/28 | | | 328,303 | | | | 327,975 | |
Arcline FM Holdings, LLC | | | | | | | | |
9.65% ((3 Month Term SOFR + 4.50%) and (6 Month Term SOFR + 4.50%), Rate Floor: 5.25%) due 06/23/28 | | | 272,909 | | | | 273,201 | |
Protective Industrial Products, Inc. | | | | | | | | |
8.96% (1 Month Term SOFR + 4.00%, Rate Floor: 4.75%) due 12/29/27 | | | 250,000 | | | | 248,908 | |
Osmose Utility Services, Inc. | | | | | | | | |
8.21% (1 Month Term SOFR + 3.25%, Rate Floor: 3.75%) due 06/23/28 | | | 199,486 | | | | 197,491 | |
MI Windows And Doors LLC | | | | | | | | |
8.35% (1 Month Term SOFR + 3.50%, Rate Floor: 3.50%) due 03/28/31 | | | 174,563 | | | | 174,707 | |
Total Industrial | | | | | | | 4,860,379 | |
| | | | | | | | | |
Technology - 2.3% | | | | | | | | |
Pushpay USA, Inc. | | | | | | | | |
9.10% (3 Month Term SOFR + 4.50%, Rate Floor: 4.50%) due 08/15/31††† | | | 625,000 | | | | 623,438 | |
Blackhawk Network Holdings, Inc. | | | | | | | | |
9.85% (1 Month Term SOFR + 5.00%, Rate Floor: 6.00%) due 03/12/29 | | | 498,750 | | | | 500,575 | |
Cloud Software Group, Inc. | | | | | | | | |
8.60% (3 Month Term SOFR + 4.00%, Rate Floor: 4.50%) due 03/30/29 | | | 493,156 | | | | 490,739 | |
138 | THE GUGGENHEIM FUNDS ANNUAL REPORT | SEE NOTES TO FINANCIAL STATEMENTS. |
SCHEDULE OF INVESTMENTS (continued) | September 30, 2024 |
HIGH YIELD FUND | |
| | Face
Amount~ | | | Value | |
DS Admiral Bidco LLC | | | | | | | | |
9.10% (1 Month Term SOFR + 4.25%, Rate Floor: 4.25%) due 06/26/31 | | | 500,000 | | | $ | 480,000 | |
Modena Buyer LLC | | | | | | | | |
9.10% (3 Month Term SOFR + 4.50%, Rate Floor: 4.50%) due 07/01/31 | | | 500,000 | | | | 477,605 | |
Boxer Parent Co., Inc. | | | | | | | | |
9.01% (3 Month Term SOFR + 3.75%, Rate Floor: 3.75%) due 07/30/31 | | | 475,000 | | | | 473,732 | |
Xerox Corp. | | | | | | | | |
8.71% ((1 Month Term SOFR + 4.00%) and (3 Month Term SOFR + 4.00%), Rate Floor: 4.50%) due 11/17/29 | | | 444,231 | | | | 441,899 | |
Atlas CC Acquisition Corp. | | | | | | | | |
9.57% (3 Month Term SOFR + 4.25%, Rate Floor: 5.00%) due 05/25/28 | | | 556,313 | | | | 428,516 | |
Dye & Durham Corp. | | | | | | | | |
8.95% (3 Month Term SOFR + 4.25%, Rate Floor: 5.25%) due 04/11/31 | | | 335,000 | | | | 336,256 | |
Central Parent LLC | | | | | | | | |
7.85% (3 Month Term SOFR + 3.25%, Rate Floor: 3.25%) due 07/06/29 | | | 275,000 | | | | 271,884 | |
Leia Finco US LLC | | | | | | | | |
due 07/02/31 | | | 200,000 | | | | 196,694 | |
Total Technology | | | | | | | 4,721,338 | |
| | | | | | | | | |
Consumer, Cyclical - 1.9% | | | | | | | | |
Alexander Mann | | | | | | | | |
11.44% (1 Month SOFR + 6.00%, Rate Floor: 6.00%) due 06/29/27 | | | 949,260 | | | | 924,341 | |
Holding SOCOTEC | | | | | | | | |
6.85% (6 Month Term SOFR + 3.50%, Rate Floor: 4.25%) due 06/30/28 | | | 591,700 | | | | 590,221 | |
American Tire Distributors, Inc. | | | | | | | | |
11.80% (3 Month Term SOFR + 6.25%, Rate Floor: 7.00%) due 10/20/28 | | | 902,367 | | | | 533,904 | |
ScribeAmerica Intermediate Holdco LLC (Healthchannels) | | | | | | | | |
9.67% (6 Month Term SOFR + 4.50%, Rate Floor: 5.50%) due 04/03/25 | | | 733,082 | | | | 486,891 | |
Accuride Corp. | | | | | | | | |
11.93% (1 Month Term SOFR + 1.00%, Rate Floor: 6.06%) (in-kind rate was 5.87%) due 05/18/266 | | | 505,081 | | | | 335,248 | |
First Brands Group LLC | | | | | | | | |
10.51% (3 Month Term SOFR + 5.00%, Rate Floor: 6.00%) due 03/30/27 | | | 297,895 | | | | 294,321 | |
CCRR Parent, Inc. | | | | | | | | |
9.21% (1 Month Term SOFR + 4.25%, Rate Floor: 5.00%) due 03/06/28 | | | 296,923 | | | | 245,704 | |
Galaxy US Opco, Inc. | | | | | | | | |
10.00% (3 Month Term SOFR + 4.75%, Rate Floor: 5.25%) due 04/29/29 | | | 249,364 | | | | 208,453 | |
Accuride Corp. | | | | | | | | |
14.85% (1 Month Term SOFR ) (in-kind rate was 14.85%) due 10/07/24†††,6 | | | 155,329 | | | | 147,933 | |
WW International, Inc. | | | | | | | | |
8.46% (1 Month Term SOFR + 3.50%, Rate Floor: 4.00%) due 04/13/28 | | | 491,625 | | | | 130,590 | |
American Tire Distributors, Inc. | | | | | | | | |
11.28% (3 Month Term SOFR + 6.00%, Rate Floor: 6.00%) due 10/22/26††† | | | 72,089 | | | | 67,042 | |
Total Consumer, Cyclical | | | | | | | 3,964,648 | |
| | | | | | | | | |
Financial - 1.2% | | | | | | | | |
Franchise Group, Inc. | | | | | | | | |
10.39% (3 Month Term SOFR + 4.75%, Rate Floor: 5.50%) due 03/10/26 | | | 941,294 | | | | 599,605 | |
Cobham Ultra SeniorCo SARL | | | | | | | | |
9.24% (6 Month Term SOFR + 3.75%, Rate Floor: 4.25%) due 08/03/29 | | | 593,039 | | | | 566,844 | |
Asurion LLC | | | | | | | | |
9.20% (1 Month Term SOFR + 4.25%, Rate Floor: 4.25%) due 08/19/28 | | | 427,828 | | | | 421,030 | |
Avison Young (Canada), Inc. | | | | | | | | |
13.21% (3 Month Term SOFR + 8.00%, Rate Floor: 10.00%) due 03/12/29 | | | 251,660 | | | | 186,066 | |
11.20% (3 Month Term SOFR + 6.25%, Rate Floor: 8.25%) due 03/13/28 | | | 83,540 | | | | 83,609 | |
Ardonagh Midco 3 plc | | | | | | | | |
8.52% ((3 Month Term SOFR + 3.75%) and (6 Month Term SOFR + 3.75%), Rate Floor: 3.75%) due 02/17/31 | | | 250,000 | | | | 250,157 | |
Saphilux SARL | | | | | | | | |
8.56% (3 Month Term SOFR + 3.50%, Rate Floor: 4.00%) due 07/18/28 | | | 152,500 | | | | 152,691 | |
Aretec Group, Inc. | | | | | | | | |
8.85% (1 Month Term SOFR + 4.00%, Rate Floor: 4.00%) due 08/09/30 | | | 119,400 | | | | 116,829 | |
Total Financial | | | | | | | 2,376,831 | |
| | | | | | | | | |
Basic Materials - 0.7% | | | | | | | | |
Discovery Purchaser Corp. | | | | | | | | |
4.88% (3 Month Term SOFR + 4.38%, Rate Floor: 4.88%) due 10/04/29 | | | 775,000 | | | | 770,908 | |
NIC Acquisition Corp. | | | | | | | | |
8.62% (3 Month Term SOFR + 3.75%, Rate Floor: 4.50%) due 12/29/27 | | | 653,766 | | | | 567,554 | |
Total Basic Materials | | | | | | | 1,338,462 | |
| | | | | | | | | |
Energy - 0.2% | | | | | | | | |
BANGL LLC | | | | | | | | |
9.82% (3 Month Term SOFR + 4.50%, Rate Floor: 4.50%) due 02/01/29 | | | 374,060 | | | | 374,060 | |
Permian Production Partners LLC | | | | | | | | |
14.96% (1 Month Term SOFR + 6.11%, Rate Floor: 12.96%) (in-kind rate was 2.00%) due 11/24/25†††,6 | | | 69,512 | | | | 68,817 | |
Total Energy | | | | | | | 442,877 | |
| | | | | | | | | |
Total Senior Floating Rate Interests | | | | |
(Cost $25,934,503) | | | 23,457,234 | |
SEE NOTES TO FINANCIAL STATEMENTS. | THE GUGGENHEIM FUNDS ANNUAL REPORT | 139 |
SCHEDULE OF INVESTMENTS (continued) | September 30, 2024 |
HIGH YIELD FUND | |
| | Face
Amount~ | | | Value | |
ASSET-BACKED SECURITIES†† - 0.3% |
Infrastructure - 0.2% | | | | | | | | |
Hotwire Funding LLC | | | | | | | | |
2021-1, 4.46% due 11/20/514 | | | 400,000 | | | $ | 374,451 | |
| | | | | | | | | |
Collateralized Loan Obligations - 0.1% | | | | | | | | |
WhiteHorse X Ltd. | | | | | | | | |
2015-10A E, 10.85% (3 Month Term SOFR + 5.56%, Rate Floor: 5.30%) due 04/17/27◊,4 | | | 157,546 | | | | 157,541 | |
Total Asset-Backed Securities | | | | |
(Cost $546,831) | | | 531,992 | |
| | | | | | | | | |
Total Investments - 99.5% | | | | |
(Cost $210,611,820) | | $ | 203,003,832 | |
Other Assets & Liabilities, net - 0.5% | | | 1,090,162 | |
Total Net Assets - 100.0% | | $ | 204,093,994 | |
Forward Foreign Currency Exchange Contracts†† |
Counterparty | | Currency | | | Type | | | Quantity | | | Contract
Amount | | | Settlement
Date | | | Unrealized
Depreciation | |
Barclays Bank plc | | | EUR | | | | Sell | | | | 450,000 | | | | 500,736 USD | | | | 10/18/24 | | | $ | (805 | ) |
Barclays Bank plc | | | CAD | | | | Sell | | | | 527,000 | | | | 388,272 USD | | | | 10/18/24 | | | | (1,704 | ) |
Bank of America, N.A. | | | EUR | | | | Sell | | | | 2,052,000 | | | | 2,273,023 USD | | | | 10/18/24 | | | | (14,002 | ) |
| | | | | | | | | | | | | | | | | | | | | | | $ | (16,511 | ) |
~ | The face amount is denominated in U.S. dollars unless otherwise indicated. |
* | Non-income producing security. |
*** | A copy of each underlying unaffiliated fund’s financial statements is available at the SEC’s website at www.sec.gov. |
† | Value determined based on Level 1 inputs, unless otherwise noted — See Note 4. |
†† | Value determined based on Level 2 inputs, unless otherwise noted — See Note 4. |
††† | Value determined based on Level 3 inputs — See Note 4. |
◊ | Variable rate security. Rate indicated is the rate effective at September 30, 2024. In some instances, the effective rate is limited by a minimum rate floor or a maximum rate cap established by the issuer. The settlement status of a position may also impact the effective rate indicated. In some cases, a position may be unsettled at period end and may not have a stated effective rate. In instances where multiple underlying reference rates and spread amounts are shown, the effective rate is based on a weighted average. |
1 | Affiliated issuer. |
2 | Security is a 144A or Section 4(a)(2) security. These securities have been determined to be illiquid and restricted under guidelines established by the Board of Trustees. The total market value of 144A or Section 4(a)(2) illiquid and restricted securities is $349,291 (cost $616,920), or 0.2% of total net assets — See Note 10. |
3 | Security has a fixed rate coupon which will convert to a floating or variable rate coupon on a future date. |
4 | Security is a 144A or Section 4(a)(2) security. These securities have been determined to be liquid under guidelines established by the Board of Trustees. The total market value of 144A or Section 4(a)(2) securities is $145,768,030 (cost $148,590,130), or 71.4% of total net assets. |
5 | Rate indicated is the 7-day yield as of September 30, 2024. |
6 | Payment-in-kind security. |
7 | Security is in default of interest and/or principal obligations. |
| | CAD — Canadian Dollar |
| | EUR — Euro |
| | plc — Public Limited Company |
| | SARL — Société à Responsabilité Limitée |
| | SOFR — Secured Overnight Financing Rate |
| | |
| | See Sector Classification in Other Information section. |
140 | THE GUGGENHEIM FUNDS ANNUAL REPORT | SEE NOTES TO FINANCIAL STATEMENTS. |
SCHEDULE OF INVESTMENTS (continued) | September 30, 2024 |
HIGH YIELD FUND | |
The following table summarizes the inputs used to value the Fund’s investments at September 30, 2024 (See Note 4 in the Notes to Financial Statements):
Investments in Securities (Assets) | | Level 1
Quoted
Prices | | | Level 2
Significant
Observable
Inputs | | | Level 3
Significant
Unobservable
Inputs | | | Total | |
Common Stocks | | $ | 585,632 | | | $ | 37 | | | $ | 77,602 | | | $ | 663,271 | |
Preferred Stocks | | | — | | | | 3,575,148 | | | | 2 | | | | 3,575,150 | |
Warrants | | | — | * | | | — | | | | — | | | | — | |
Money Market Fund | | | 6,831,221 | | | | — | | | | — | | | | 6,831,221 | |
Corporate Bonds | | | — | | | | 167,007,573 | | | | 937,391 | | | | 167,944,964 | |
Senior Floating Rate Interests | | | — | | | | 21,305,489 | | | | 2,151,745 | | | | 23,457,234 | |
Asset-Backed Securities | | | — | | | | 531,992 | | | | — | | | | 531,992 | |
Total Assets | | $ | 7,416,853 | | | $ | 192,420,239 | | | $ | 3,166,740 | | | $ | 203,003,832 | |
Investments in Securities (Liabilities) | | Level 1
Quoted
Prices | | | Level 2
Significant
Observable
Inputs | | | Level 3
Significant
Unobservable
Inputs | | | Total | |
Forward Foreign Currency Exchange Contracts** | | $ | — | | | $ | 16,511 | | | $ | — | | | $ | 16,511 | |
Unfunded Loan Commitments (Note 9) | | | — | | | | — | | | | 6,186 | | | | 6,186 | |
Total Liabilities | | $ | — | | | $ | 16,511 | | | $ | 6,186 | | | $ | 22,697 | |
* | Security has a market value of $0. |
** | This derivative is reported as unrealized appreciation/depreciation at period end. |
The following is a summary of significant unobservable inputs used in the fair valuation of assets and liabilities categorized within Level 3 of the fair value hierarchy:
Category | | Ending
Balance at
September 30,
2024 | | Valuation
Technique | Unobservable
Inputs | | Input Range | | | Weighted
Average* | |
Assets: | | | | | | | | | | | | | | |
Common Stocks | | $ | 68,220 | | Enterprise Value | Valuation Multiple | 2.9x-8.6x | 3.9x |
Common Stocks | | | 9,382 | | Model Price | Liquidation Value | — | — |
Corporate Bonds | | | 936,000 | | Third Party Pricing | Broker Quote | — | — |
Corporate Bonds | | | 1,391 | | Third Party Pricing | Trade Price | — | — |
Preferred Stocks | | | 2 | | Model Price | Liquidation Value | — | — |
Senior Floating Rate Interests | | | 1,504,897 | | Third Party Pricing | Broker Quote | — | — |
Senior Floating Rate Interests | | | 431,872 | | Model Price | Liquidation Value | — | — |
Senior Floating Rate Interests | | | 214,976 | | Third Party Pricing | Trade Price | — | — |
Total Assets | | $ | 3,166,740 | | | | | |
Liabilities: | | | | | | | | | | | | | | |
Unfunded Loan Commitments | | $ | 6,186 | | Model Price | Purchase Price | — | — |
* | Inputs are weighted by the fair value of the instruments. |
Significant changes in a quote, liquidation value or valuation multiple would generally result in significant changes in the fair value of the security. Any remaining Level 3 securities held by the Fund and excluded from the table above, were not considered material to the Fund.
SEE NOTES TO FINANCIAL STATEMENTS. | THE GUGGENHEIM FUNDS ANNUAL REPORT | 141 |
SCHEDULE OF INVESTMENTS (concluded) | September 30, 2024 |
HIGH YIELD FUND | |
The Fund’s fair valuation leveling guidelines classify a single daily broker quote, or a vendor price based on a single daily or monthly broker quote, as Level 3, if such a quote or price cannot be supported with other available market information.
Transfers between Level 2 and Level 3 may occur as markets fluctuate and/or the availability of data used in an investment’s valuation changes. For the year ended September 30, 2024, the Fund had securities with a total value of $941,863 transfer into Level 3 from Level 2 due to a lack of observable inputs and did not have any securities to transfer out of Level 3 into Level 2.
Summary of Fair Value Level 3 Activity
Following is a reconciliation of Level 3 assets for which significant unobservable inputs were used to determine fair value for the year ended September 30, 2024:
| | | Assets | | | | | | | Liabilities | |
| | Corporate
Bonds | | | Senior
Floating Rate
Interests | | | Common
Stocks | | | Preferred
Stocks | | | Total Assets | | | Unfunded
Loan
Commitments | |
Beginning Balance | | $ | 13,211 | | | $ | 3,744,601 | | | $ | 64,125 | | | $ | 85,798 | | | | 3,907,735 | | | $ | — | |
Purchases/(Receipts) | | | — | | | | 1,330,774 | | | | 17,272 | | | | — | | | | 1,348,046 | | | | (4,924 | ) |
(Sales, maturities and paydowns)/Fundings | | | — | | | | (2,835,511 | ) | | | (2,174 | ) | | | (218,290 | ) | | | (3,055,975 | ) | | | — | |
Amortization of premiums/discounts | | | — | | | | 116,306 | | | | — | | | | — | | | | 116,306 | | | | — | |
Total realized gains (losses) included in earnings | | | — | | | | (225,801 | ) | | | (24,988 | ) | | | (704,965 | ) | | | (955,754 | ) | | | — | |
Total change in unrealized appreciation (depreciation) included in earnings | | | (11,820 | ) | | | 21,376 | | | | 17,504 | | | | 837,459 | | | | 864,519 | | | | (1,262 | ) |
Transfers into Level 3 | | | 936,000 | | | | — | | | | 5,863 | | | | — | | | | 941,863 | | | | — | |
Transfers out of Level 3 | | | — | | | | — | | | | — | | | | — | | | | — | | | | — | |
Ending Balance | | $ | 937,391 | | | $ | 2,151,745 | | | $ | 77,602 | | | $ | 2 | | | $ | 3,166,740 | | | $ | (6,186 | ) |
Net change in unrealized appreciation (depreciation) for investments in Level 3 securities still held at September 30 , 2024 | | $ | (11,820 | ) | | $ | (285,369 | ) | | $ | (7,089 | ) | | $ | — | | | $ | (304,278 | ) | | $ | (1,262 | ) |
Affiliated Transactions
Investments representing 5% or more of the outstanding voting shares of a company, or control of or by, or common control under Guggenheim Investments, result in that company being considered an affiliated issuer, as defined in the 1940 Act.
Transactions during the year ended September 30, 2024, in which the company is an affiliated issuer, were as follows:
Security Name | | Value
09/30/23 | | | Additions | | | Reductions | | | Realized
Gain (Loss) | | | Change in
Unrealized
Appreciation
(Depreciation) | | | Value
09/30/24 | | | Shares
09/30/24 | |
Common Stocks | | | | | | | | | | | | | | | | | | | | | | | | | | | | |
BP Holdco LLC * | | $ | 30,456 | | | $ | — | | | $ | — | | | $ | — | | | $ | (1,715 | ) | | $ | 28,741 | | | | 23,711 | |
* | Non-income producing security. |
142 | THE GUGGENHEIM FUNDS ANNUAL REPORT | SEE NOTES TO FINANCIAL STATEMENTS. |
STATEMENT OF ASSETS AND LIABILITIES |
September 30, 2024 |
Assets: |
Investments in unaffiliated issuers, at value (cost $210,603,447) | | $ | 202,975,091 | |
Investments in affiliated issuers, at value (cost $8,373) | | | 28,741 | |
Foreign currency, at value (cost 965) | | | 967 | |
Cash | | | 1,180,639 | |
Prepaid expenses | | | 53,920 | |
Receivables: |
Interest | | | 2,993,821 | |
Securities sold | | | 633,051 | |
Fund shares sold | | | 199,213 | |
Foreign tax reclaims | | | 4,934 | |
Total assets | | | 208,070,377 | |
| | | | | |
Liabilities: |
Unfunded loan commitments, at value (Note 9) (commitment fees received $4,924) | | | 6,186 | |
Unrealized depreciation on forward foreign currency exchange contracts | | | 16,511 | |
Payable for: |
Securities purchased | | | 3,138,286 | |
Fund shares redeemed | | | 539,094 | |
Distributions to shareholders | | | 106,088 | |
Management fees | | | 42,942 | |
Distribution and service fees | | | 16,450 | |
Transfer agent/maintenance fees | | | 12,576 | |
Fund accounting/administration fees | | | 4,166 | |
Trustees’ fees* | | | 2,972 | |
Miscellaneous | | | 91,112 | |
Total liabilities | | | 3,976,383 | |
Net assets | | $ | 204,093,994 | |
| | | | | |
Net assets consist of: |
Paid in capital | | $ | 245,842,093 | |
Total distributable earnings (loss) | | | (41,748,099 | ) |
Net assets | | $ | 204,093,994 | |
| | | | | |
Class A: |
Net assets | | $ | 50,331,747 | |
Capital shares outstanding | | | 4,989,986 | |
Net asset value per share | | $ | 10.09 | |
Maximum offering price per share (Net asset value divided by 96.00%) | | $ | 10.51 | |
| | | | | |
Class C: |
Net assets | | $ | 8,260,201 | |
Capital shares outstanding | | | 812,163 | |
Net asset value per share | | $ | 10.17 | |
| | | | | |
Class P: |
Net assets | | $ | 3,976,103 | |
Capital shares outstanding | | | 394,187 | |
Net asset value per share | | $ | 10.09 | |
| | | | | |
Institutional Class: |
Net assets | | $ | 141,285,382 | |
Capital shares outstanding | | | 17,196,156 | |
Net asset value per share | | $ | 8.22 | |
| | | | | |
Class R6: |
Net assets | | $ | 240,561 | |
Capital shares outstanding | | | 23,873 | |
Net asset value per share | | $ | 10.08 | |
* | Relates to Trustees not deemed “interested persons” within the meaning of Section 2(a)(19) of the 1940 Act. |
SEE NOTES TO FINANCIAL STATEMENTS. | THE GUGGENHEIM FUNDS ANNUAL REPORT | 143 |
STATEMENT OF OPERATIONS |
Year Ended September 30, 2024 |
Investment Income: |
Dividends from securities of unaffiliated issuers | | $ | 107,803 | |
Interest from securities of unaffiliated issuers | | | 14,287,660 | |
Total investment income | | | 14,395,463 | |
| | | | | |
Expenses: |
Management fees | | | 1,163,127 | |
Distribution and service fees: |
Class A | | | 116,997 | |
Class C | | | 86,938 | |
Class P | | | 11,993 | |
Transfer agent fees: |
Class A | | | 56,059 | |
Class C | | | 14,040 | |
Class P | | | 6,946 | |
Institutional Class | | | 104,010 | |
Class R6 | | | 630 | |
Fund accounting/administration fees | | | 83,591 | |
Professional fees | | | 53,300 | |
Interest expense | | | 36,821 | |
Custodian fees | | | 19,436 | |
Trustees’ fees* | | | 16,113 | |
Line of credit fees | | | 11,239 | |
Miscellaneous | | | 129,852 | |
Recoupment of previously waived fees: |
Class A | | | 9,256 | |
Class C | | | 1,125 | |
Class P | | | 953 | |
Institutional Class | | | 42,954 | |
Total expenses | | | 1,965,380 | |
Less: |
Expenses reimbursed by Adviser: |
Class A | | | (37,185 | ) |
Class C | | | (9,353 | ) |
Class P | | | (4,559 | ) |
Institutional Class | | | (66,148 | ) |
Class R6 | | | (480 | ) |
Expenses waived by Adviser | | | (139,694 | ) |
Total waived/reimbursed expenses | | | (257,419 | ) |
Net expenses | | | 1,707,961 | |
Net investment income | | | 12,687,502 | |
| | | | | |
Net Realized and Unrealized Gain (Loss): |
Net realized gain (loss) on: |
Investments in unaffiliated issuers | | $ | (2,268,538 | ) |
Forward foreign currency exchange contracts | | | (35,284 | ) |
Foreign currency transactions | | | 4,623 | |
Net realized loss | | | (2,299,199 | ) |
Net change in unrealized appreciation (depreciation) on: |
Investments in unaffiliated issuers | | | 15,541,331 | |
Investments in affiliated issuers | | | (1,715 | ) |
Forward foreign currency exchange contracts | | | (86,050 | ) |
Foreign currency translations | | | 4,324 | |
Net change in unrealized appreciation (depreciation) | | | 15,457,890 | |
Net realized and unrealized gain | | | 13,158,691 | |
Net increase in net assets resulting from operations | | $ | 25,846,193 | |
* | Relates to Trustees not deemed “interested persons” within the meaning of Section 2(a)(19) of the 1940 Act. |
144 | THE GUGGENHEIM FUNDS ANNUAL REPORT | SEE NOTES TO FINANCIAL STATEMENTS. |
STATEMENTS OF CHANGES IN NET ASSETS |
| | Year Ended
September 30,
2024 | | | Year Ended
September 30,
2023 | |
Increase (Decrease) in Net Assets from Operations: | | | | | | | | |
Net investment income | | $ | 12,687,502 | | | $ | 11,429,443 | |
Net realized loss on investments | | | (2,299,199 | ) | | | (4,445,420 | ) |
Net change in unrealized appreciation (depreciation) on investments | | | 15,457,890 | | | | 9,908,149 | |
Net increase in net assets resulting from operations | | | 25,846,193 | | | | 16,892,172 | |
| | | | | | | | | |
Distributions to shareholders: | | | | | | | | |
Class A | | | (2,951,701 | ) | | | (2,681,360 | ) |
Class C | | | (485,898 | ) | | | (531,795 | ) |
Class P | | | (304,126 | ) | | | (302,555 | ) |
Institutional Class | | | (8,705,844 | ) | | | (7,690,867 | ) |
Class R6 | | | (48,082 | ) | | | (126,227 | ) |
Return of capital | | | | | | | | |
Class A | | | (72,997 | ) | | | (27,032 | ) |
Class C | | | (12,016 | ) | | | (5,361 | ) |
Class P | | | (7,521 | ) | | | (3,050 | ) |
Institutional Class | | | (215,300 | ) | | | (77,534 | ) |
Class R6 | | | (1,189 | ) | | | (1,273 | ) |
Total distributions to shareholders | | | (12,804,674 | ) | | | (11,447,054 | ) |
| | | | | | | | | |
Capital share transactions: | | | | | | | | |
Proceeds from sale of shares | | | | | | | | |
Class A | | | 6,794,252 | | | | 4,413,398 | |
Class C | | | 493,931 | | | | 1,181,267 | |
Class P | | | 180,785 | | | | 1,437,731 | |
Institutional Class | | | 52,099,287 | | | | 39,343,841 | |
Class R6 | | | 209,532 | | | | 2,663 | |
Redemption fees collected | | | | | | | | |
Class A | | | 2,150 | | | | 133 | |
Class C | | | 359 | | | | 29 | |
Class P | | | 187 | | | | 15 | |
Institutional Class | | | 5,924 | | | | 387 | |
Class R6 | | | 9 | | | | 6 | |
Distributions reinvested | | | | | | | | |
Class A | | | 2,716,066 | | | | 2,472,792 | |
Class C | | | 488,260 | | | | 524,910 | |
Class P | | | 310,713 | | | | 305,110 | |
Institutional Class | | | 7,483,748 | | | | 6,336,875 | |
Class R6 | | | 48,915 | | | | 127,232 | |
Cost of shares redeemed | | | | | | | | |
Class A | | | (7,158,221 | ) | | | (7,261,678 | ) |
Class C | | | (2,714,375 | ) | | | (2,518,867 | ) |
Class P | | | (2,036,439 | ) | | | (1,100,898 | ) |
Institutional Class | | | (54,895,756 | ) | | | (35,208,501 | ) |
Class R6 | | | (2,075,976 | ) | | | (113,880 | ) |
Net increase from capital share transactions | | | 1,953,351 | | | | 9,942,565 | |
Net increase in net assets | | | 14,994,870 | | | | 15,387,683 | |
| | | | | | | | | |
Net assets: | | | | | | | | |
Beginning of year | | | 189,099,124 | | | | 173,711,441 | |
End of year | | $ | 204,093,994 | | | $ | 189,099,124 | |
| | | | | | | | | |
SEE NOTES TO FINANCIAL STATEMENTS. | THE GUGGENHEIM FUNDS ANNUAL REPORT | 145 |
STATEMENTS OF CHANGES IN NET ASSETS (concluded)
| | Year Ended
September 30,
2024 | | | Year Ended
September 30,
2023 | |
Capital share activity: | | | | | | | | |
Shares sold | | | | | | | | |
Class A | | | 695,071 | | | | 466,658 | |
Class C | | | 49,214 | | | | 123,430 | |
Class P | | | 18,530 | | | | 152,312 | |
Institutional Class | | | 6,538,845 | | | | 5,099,917 | |
Class R6 | | | 21,520 | | | | 283 | |
Shares issued from reinvestment of distributions | | | | | | | | |
Class A | | | 277,694 | | | | 261,165 | |
Class C | | | 49,575 | | | | 54,963 | |
Class P | | | 31,816 | | | | 32,203 | |
Institutional Class | | | 938,964 | | | | 821,359 | |
Class R6 | | | 5,091 | | | | 13,463 | |
Shares redeemed | | | | | | | | |
Class A | | | (737,355 | ) | | | (767,705 | ) |
Class C | | | (276,628 | ) | | | (264,048 | ) |
Class P | | | (207,810 | ) | | | (116,881 | ) |
Institutional Class | | | (6,894,574 | ) | | | (4,570,555 | ) |
Class R6 | | | (213,252 | ) | | | (12,038 | ) |
Net increase in shares | | | 296,701 | | | | 1,294,526 | |
146 | THE GUGGENHEIM FUNDS ANNUAL REPORT | SEE NOTES TO FINANCIAL STATEMENTS. |
This table is presented to show selected data for a share outstanding throughout each period and to assist shareholders in evaluating a Fund’s performance for the periods presented.
Class A | | Year Ended
September 30,
2024 | | | Year Ended
September 30,
2023 | | | Year Ended
September 30,
2022 | | | Year Ended
September 30,
2021 | | | Year Ended
September 30,
2020 | |
Per Share Data |
Net asset value, beginning of period | | $ | 9.43 | | | $ | 9.14 | | | $ | 10.98 | | | $ | 10.37 | | | $ | 10.90 | |
Income (loss) from investment operations: |
Net investment income (loss)a | | | .63 | | | | .57 | | | | .56 | | | | .49 | | | | .57 | |
Net gain (loss) on investments (realized and unrealized) | | | .66 | | | | .30 | | | | (1.86 | ) | | | .63 | | | | (.50 | ) |
Total from investment operations | | | 1.29 | | | | .87 | | | | (1.30 | ) | | | 1.12 | | | | .07 | |
Less distributions from: |
Net investment income | | | (.62 | ) | | | (.57 | ) | | | (.52 | ) | | | (.48 | ) | | | (.60 | ) |
Return of capital | | | (.01 | ) | | | (.01 | ) | | | (.02 | ) | | | (.03 | ) | | | — | |
Total distributions | | | (.63 | ) | | | (.58 | ) | | | (.54 | ) | | | (.51 | ) | | | (.60 | ) |
Redemption fees collected | | | — | b | | | — | b | | | — | b | | | — | b | | | — | b |
Net asset value, end of period | | $ | 10.09 | | | $ | 9.43 | | | $ | 9.14 | | | $ | 10.98 | | | $ | 10.37 | |
|
Total Returnc | | | 14.08 | % | | | 9.60 | % | | | (12.10 | %) | | | 11.02 | % | | | 0.84 | % |
Ratios/Supplemental Data |
Net assets, end of period (in thousands) | | $ | 50,332 | | | $ | 44,846 | | | $ | 43,822 | | | $ | 55,550 | | | $ | 53,997 | |
Ratios to average net assets: |
Net investment income (loss) | | | 6.40 | % | | | 6.07 | % | | | 5.46 | % | | | 4.51 | % | | | 5.44 | % |
Total expensesd | | | 1.17 | % | | | 1.22 | % | | | 1.14 | % | | | 1.07 | % | | | 1.21 | % |
Net expensese,f,g | | | 1.02 | % | | | 1.16 | % | | | 1.10 | % | | | 1.05 | % | | | 1.20 | % |
Portfolio turnover rate | | | 45 | % | | | 31 | % | | | 42 | % | | | 86 | % | | | 81 | % |
Class C | | Year Ended
September 30,
2024 | | | Year Ended
September 30,
2023 | | | Year Ended
September 30,
2022 | | | Year Ended
September 30,
2021 | | | Year Ended
September 30,
2020 | |
Per Share Data |
Net asset value, beginning of period | | $ | 9.51 | | | $ | 9.22 | | | $ | 11.07 | | | $ | 10.46 | | | $ | 10.99 | |
Income (loss) from investment operations: |
Net investment income (loss)a | | | .56 | | | | .51 | | | | .47 | | | | .40 | | | | .49 | |
Net gain (loss) on investments (realized and unrealized) | | | .66 | | | | .29 | | | | (1.85 | ) | | | .64 | | | | (.49 | ) |
Total from investment operations | | | 1.22 | | | | .80 | | | | (1.38 | ) | | | 1.04 | | | | — | |
Less distributions from: |
Net investment income | | | (.55 | ) | | | (.50 | ) | | | (.45 | ) | | | (.40 | ) | | | (.53 | ) |
Return of capital | | | (.01 | ) | | | (.01 | ) | | | (.02 | ) | | | (.03 | ) | | | — | |
Total distributions | | | (.56 | ) | | | (.51 | ) | | | (.47 | ) | | | (.43 | ) | | | (.53 | ) |
Redemption fees collected | | | — | b | | | — | b | | | — | b | | | — | b | | | — | b |
Net asset value, end of period | | $ | 10.17 | | | $ | 9.51 | | | $ | 9.22 | | | $ | 11.07 | | | $ | 10.46 | |
|
Total Returnc | | | 13.19 | % | | | 8.75 | % | | | (12.76 | %) | | | 10.04 | % | | | 0.09 | % |
Ratios/Supplemental Data |
Net assets, end of period (in thousands) | | $ | 8,260 | | | $ | 9,417 | | | $ | 9,915 | | | $ | 16,242 | | | $ | 16,437 | |
Ratios to average net assets: |
Net investment income (loss) | | | 5.67 | % | | | 5.30 | % | | | 4.55 | % | | | 3.67 | % | | | 4.68 | % |
Total expensesd | | | 1.95 | % | | | 1.97 | % | | | 1.94 | % | | | 1.91 | % | | | 2.00 | % |
Net expensese,f,g | | | 1.78 | % | | | 1.92 | % | | | 1.90 | % | | | 1.89 | % | | | 1.99 | % |
Portfolio turnover rate | | | 45 | % | | | 31 | % | | | 42 | % | | | 86 | % | | | 81 | % |
SEE NOTES TO FINANCIAL STATEMENTS. | THE GUGGENHEIM FUNDS ANNUAL REPORT | 147 |
FINANCIAL HIGHLIGHTS (continued) |
This table is presented to show selected data for a share outstanding throughout each period and to assist shareholders in evaluating a Fund’s performance for the periods presented.
Class P | | Year Ended
September 30,
2024 | | | Year Ended
September 30,
2023 | | | Year Ended
September 30,
2022 | | | Year Ended
September 30,
2021 | | | Year Ended
September 30,
2020 | |
Per Share Data |
Net asset value, beginning of period | | $ | 9.44 | | | $ | 9.14 | | | $ | 10.98 | | | $ | 10.38 | | | $ | 10.91 | |
Income (loss) from investment operations: |
Net investment income (loss)a | | | .63 | | | | .57 | | | | .55 | | | | .48 | | | | .57 | |
Net gain (loss) on investments (realized and unrealized) | | | .65 | | | | .30 | | | | (1.85 | ) | | | .62 | | | | (.50 | ) |
Total from investment operations | | | 1.28 | | | | .87 | | | | (1.30 | ) | | | 1.10 | | | | .07 | |
Less distributions from: |
Net investment income | | | (.62 | ) | | | (.56 | ) | | | (.52 | ) | | | (.47 | ) | | | (.60 | ) |
Return of capital | | | (.01 | ) | | | (.01 | ) | | | (.02 | ) | | | (.03 | ) | | | — | |
Total distributions | | | (.63 | ) | | | (.57 | ) | | | (.54 | ) | | | (.50 | ) | | | (.60 | ) |
Redemption fees collected | | | — | b | | | — | b | | | — | b | | | — | b | | | — | b |
Net asset value, end of period | | $ | 10.09 | | | $ | 9.44 | | | $ | 9.14 | | | $ | 10.98 | | | $ | 10.38 | |
|
Total Return | | | 14.00 | % | | | 9.71 | % | | | (12.13 | %) | | | 10.80 | % | | | 0.80 | % |
Ratios/Supplemental Data |
Net assets, end of period (in thousands) | | $ | 3,976 | | | $ | 5,205 | | | $ | 4,426 | | | $ | 5,660 | | | $ | 5,837 | |
Ratios to average net assets: |
Net investment income (loss) | | | 6.44 | % | | | 6.07 | % | | | 5.37 | % | | | 4.40 | % | | | 5.42 | % |
Total expensesd | | | 1.19 | % | | | 1.22 | % | | | 1.28 | % | | | 1.20 | % | | | 1.26 | % |
Net expensee,f,g | | | 1.03 | % | | | 1.16 | % | | | 1.15 | % | | | 1.16 | % | | | 1.25 | % |
Portfolio turnover rate | | | 45 | % | | | 31 | % | | | 42 | % | | | 86 | % | | | 81 | % |
Institutional Class | | Year Ended
September 30,
2024 | | | Year Ended
September 30,
2023 | | | Year Ended
September 30,
2022 | | | Year Ended
September 30,
2021 | | | Year Ended
September 30,
2020 | |
Per Share Data |
Net asset value, beginning of period | | $ | 7.68 | | | $ | 7.45 | | | $ | 8.94 | | | $ | 8.45 | | | $ | 8.88 | |
Income (loss) from investment operations: |
Net investment income (loss)a | | | .53 | | | | .49 | | | | .47 | | | | .41 | | | | .48 | |
Net gain (loss) on investments (realized and unrealized) | | | .54 | | | | .23 | | | | (1.50 | ) | | | .51 | | | | (.39 | ) |
Total from investment operations | | | 1.07 | | | | .72 | | | | (1.03 | ) | | | .92 | | | | .09 | |
Less distributions from: |
Net investment income | | | (.52 | ) | | | (.48 | ) | | | (.44 | ) | | | (.40 | ) | | | (.52 | ) |
Return of capital | | | (.01 | ) | | | (.01 | ) | | | (.02 | ) | | | (.03 | ) | | | — | |
Total distributions | | | (.53 | ) | | | (.49 | ) | | | (.46 | ) | | | (.43 | ) | | | (.52 | ) |
Redemption fees collected | | | — | b | | | — | b | | | — | b | | | — | b | | | — | b |
Net asset value, end of period | | $ | 8.22 | | | $ | 7.68 | | | $ | 7.45 | | | $ | 8.94 | | | $ | 8.45 | |
|
Total Return | | | 14.40 | % | | | 9.78 | % | | | (11.80 | %) | | | 11.14 | % | | | 1.14 | % |
Ratios/Supplemental Data |
Net assets, end of period (in thousands) | | $ | 141,285 | | | $ | 127,649 | | | $ | 113,644 | | | $ | 167,486 | | | $ | 171,641 | |
Ratios to average net assets: |
Net investment income (loss) | | | 6.66 | % | | | 6.32 | % | | | 5.63 | % | | | 4.71 | % | | | 5.67 | % |
Total expensesd | | | 0.89 | % | | | 0.95 | % | | | 0.95 | % | | | 0.88 | % | | | 0.98 | % |
Net expensese,f,g | | | 0.77 | % | | | 0.91 | % | | | 0.88 | % | | | 0.85 | % | | | 0.96 | % |
Portfolio turnover rate | | | 45 | % | | | 31 | % | | | 42 | % | | | 86 | % | | | 81 | % |
148 | THE GUGGENHEIM FUNDS ANNUAL REPORT | SEE NOTES TO FINANCIAL STATEMENTS. |
FINANCIAL HIGHLIGHTS (concluded) |
This table is presented to show selected data for a share outstanding throughout each period and to assist shareholders in evaluating a Fund’s performance for the periods presented.
Class R6 | | Year Ended
September 30,
2024 | | | Year Ended
September 30,
2023 | | | Year Ended
September 30,
2022 | | | Year Ended
September 30,
2021 | | | Year Ended
September 30,
2020 | |
Per Share Data |
Net asset value, beginning of period | | $ | 9.41 | | | $ | 9.12 | | | $ | 10.97 | | | $ | 10.36 | | | $ | 10.89 | |
Income (loss) from investment operations: |
Net investment income (loss)a | | | .66 | | | | .61 | | | | .50 | | | | .52 | | | | .60 | |
Net gain (loss) on investments (realized and unrealized) | | | .66 | | | | .29 | | | | (1.77 | ) | | | .63 | | | | (.49 | ) |
Total from investment operations | | | 1.32 | | | | .90 | | | | (1.27 | ) | | | 1.15 | | | | .11 | |
Less distributions from: |
Net investment income | | | (.64 | ) | | | (.60 | ) | | | (.56 | ) | | | (.51 | ) | | | (.64 | ) |
Return of capital | | | (.01 | ) | | | (.01 | ) | | | (.02 | ) | | | (.03 | ) | | | — | |
Total distributions | | | (.65 | ) | | | (.61 | ) | | | (.58 | ) | | | (.54 | ) | | | (.64 | ) |
Redemption fees collected | | | — | b | | | — | b | | | — | b | | | — | b | | | — | b |
Net asset value, end of period | | $ | 10.08 | | | $ | 9.41 | | | $ | 9.12 | | | $ | 10.97 | | | $ | 10.36 | |
|
Total Return | | | 14.42 | % | | | 10.00 | % | | | (11.91 | %) | | | 11.35 | % | | | 1.19 | % |
Ratios/Supplemental Data |
Net assets, end of period (in thousands) | | $ | 241 | | | $ | 1,982 | | | $ | 1,905 | | | $ | 126,683 | | | $ | 127,037 | |
Ratios to average net assets: |
Net investment income (loss) | | | 6.80 | % | | | 6.43 | % | | | 4.70 | % | | | 4.80 | % | | | 5.79 | % |
Total expensesd | | | 0.87 | % | | | 0.84 | % | | | 0.75 | % | | | 0.77 | % | | | 0.85 | % |
Net expensese,f,g | | | 0.76 | % | | | 0.80 | % | | | 0.75 | % | | | 0.76 | % | | | 0.85 | % |
Portfolio turnover rate | | | 45 | % | | | 31 | % | | | 42 | % | | | 86 | % | | | 81 | % |
a | Net investment income (loss) per share was computed using average shares outstanding throughout the period. |
b | Redemption fees collected are less than $0.01 per share. |
c | Total return does not reflect the impact of any applicable sales charges. |
d | Does not include expenses of the underlying funds in which the Fund invests. |
e | Net expense information reflects the expense ratios after expense waivers and reimbursements, as applicable. |
f | The portion of the ratios of net expenses to average net assets attributable to recoupments of prior fee reductions or expense reimbursements for the years presented was as follows: |
| | | 09/30/24 | 09/30/23 | 09/30/22 | 09/30/21 | 09/30/20 |
| | Class A | 0.02% | 0.04% | 0.01% | 0.00%* | 0.05% |
| | Class C | 0.01% | 0.04% | 0.00%* | 0.01% | 0.04% |
| | Class P | 0.02% | 0.01% | 0.04% | 0.04% | 0.02% |
| | Institutional Class | 0.03% | 0.03% | 0.02% | 0.01% | 0.02% |
| | Class R6 | — | — | — | — | 0.00%* |
g | Net expenses may include expenses that are excluded from the expense limitation agreement. Excluding these expenses, the net expense ratios for the years presented would be: |
| | | 09/30/24 | 09/30/23 | 09/30/22 | 09/30/21 | 09/30/20 |
| | Class A | 0.99% | 1.13% | 1.09% | 1.03% | 1.12% |
| | Class C | 1.75% | 1.89% | 1.89% | 1.87% | 1.90% |
| | Class P | 1.00% | 1.13% | 1.14% | 1.14% | 1.16% |
| | Institutional Class | 0.74% | 0.88% | 0.87% | 0.83% | 0.87% |
| | Class R6 | 0.74% | 0.77% | 0.75% | 0.74% | 0.77% |
SEE NOTES TO FINANCIAL STATEMENTS. | THE GUGGENHEIM FUNDS ANNUAL REPORT | 149 |
SCHEDULE OF INVESTMENTS | September 30, 2024 |
LIMITED DURATION FUND | |
| | Shares | | | Value | |
COMMON STOCKS† - 0.0% |
| | | | | | | | | |
Communications - 0.0% |
Vacasa, Inc. — Class A* | | | 4,070 | | | $ | 11,437 | |
| | | | | | | | | |
Total Common Stocks | | | | |
(Cost $813,037) | | | | | | | 11,437 | |
| | | | | | | | | |
PREFERRED STOCKS†† - 0.5% |
Financial - 0.5% |
Wells Fargo & Co. |
3.90% | | | 12,100,000 | | | | 11,760,060 | |
MetLife, Inc. |
3.85% | | | 4,620,000 | | | | 4,545,415 | |
Markel Group, Inc. |
6.00% | | | 4,085,000 | | | | 4,080,588 | |
American National Group, Inc. |
5.95% | | | 8,000 | | | | 197,840 | |
Total Financial | | | | | | | 20,583,903 | |
| | | | | | | | | |
Total Preferred Stocks | | | | |
(Cost $20,988,758) | | | | | | | 20,583,903 | |
| | | | | | | | | |
WARRANTS† - 0.0% |
Ginkgo Bioworks Holdings, Inc. | | | | | | | | |
Expiring 09/16/26 | | | 19,663 | | | | 89 | |
Total Warrants | | | | |
(Cost $45,531) | | | | | | | 89 | |
| | | | | | | | | |
MUTUAL FUNDS† - 2.2% |
Guggenheim Strategy Fund III1 | | | 1,358,668 | | | | 33,817,254 | |
Guggenheim Strategy Fund II1 | | | 1,359,476 | | | | 33,714,995 | |
Guggenheim Ultra Short Duration Fund — Institutional Class1 | | | 3,296,586 | | | | 33,031,793 | |
Total Mutual Funds | | | | |
(Cost $99,168,203) | | | | | | | 100,564,042 | |
| | | | | | | | | |
MONEY MARKET FUNDS***,† - 1.7% |
Dreyfus Treasury Securities Cash Management Fund — Institutional Shares, 4.88%2 | | | 63,916,187 | | | | 63,916,187 | |
Dreyfus Treasury Obligations Cash Management Fund — Institutional Shares, 4.81%2 | | | 11,643,974 | | | | 11,643,974 | |
Federated Hermes U.S. Treasury Cash Reserves Fund — Institutional Shares, 4.85%2 | | | 855,107 | | | | 855,107 | |
Total Money Market Funds | | | | |
(Cost $76,415,268) | | | | | | | 76,415,268 | |
| | | | | | | | | |
| | | Face
Amount~ | | | | | |
CORPORATE BONDS†† - 33.1% |
Financial - 18.8% | | | | | | | | |
Athene Global Funding | | | | | | | | |
6.09% (SOFR Compounded Index + 0.72%) due 01/07/25◊,3 | | | 30,000,000 | | | | 30,007,520 | |
1.99% due 08/19/283 | | | 15,850,000 | | | | 14,382,335 | |
1.73% due 10/02/263 | | | 14,700,000 | | | | 13,932,584 | |
5.68% due 02/23/263 | | | 4,750,000 | | | | 4,819,187 | |
Goldman Sachs Group, Inc. | | | | | | | | |
3.50% due 04/01/25 | | | 42,900,000 | | | | 42,634,444 | |
Societe Generale S.A. | | | | | | | | |
1.79% due 06/09/273,4 | | | 28,000,000 | | | | 26,600,619 | |
1.49% due 12/14/263,4 | | | 10,500,000 | | | | 10,057,208 | |
Bank of America Corp. | | | | | | | | |
3.95% due 04/21/25 | | | 36,390,000 | | | | 36,209,086 | |
AEGON Funding Company LLC | | | | | | | | |
5.50% due 04/16/273 | | | 35,000,000 | | | | 35,772,552 | |
Brighthouse Financial Global Funding | | | | | | | | |
5.55% due 04/09/273 | | | 34,500,000 | | | | 35,219,852 | |
Macquarie Group Ltd. | | | | | | | | |
1.63% due 09/23/273,4 | | | 16,750,000 | | | | 15,840,868 | |
1.20% due 10/14/253,4 | | | 13,550,000 | | | | 13,530,212 | |
Corebridge Financial, Inc. | | | | | | | | |
3.50% due 04/04/25 | | | 26,460,000 | | | | 26,262,275 | |
Equitable Financial Life Global Funding | | | | | | | | |
1.40% due 07/07/253 | | | 15,000,000 | | | | 14,626,444 | |
1.80% due 03/08/283 | | | 12,000,000 | | | | 10,982,682 | |
UBS AG/Stamford CT | | | | | | | | |
2.95% due 04/09/25 | | | 24,565,000 | | | | 24,321,047 | |
Cooperatieve Rabobank UA | | | | | | | | |
1.34% due 06/24/263,4 | | | 15,000,000 | | | | 14,618,734 | |
1.98% due 12/15/273,4 | | | 10,000,000 | | | | 9,490,454 | |
Pershing Square Holdings Ltd. | | | | | | | | |
3.25% due 10/01/313 | | | 25,600,000 | | | | 21,944,832 | |
JPMorgan Chase & Co. | | | | | | | | |
1.47% due 09/22/274 | | | 15,000,000 | | | | 14,207,784 | |
5.04% due 01/23/284 | | | 7,600,000 | | | | 7,727,119 | |
Jackson National Life Global Funding | | | | | | | | |
1.75% due 01/12/253 | | | 15,000,000 | | | | 14,851,483 | |
5.60% due 04/10/263 | | | 6,750,000 | | | | 6,846,861 | |
GA Global Funding Trust | | | | | | | | |
4.40% due 09/23/273 | | | 14,650,000 | | | | 14,616,363 | |
1.63% due 01/15/263 | | | 7,300,000 | | | | 7,027,337 | |
LPL Holdings, Inc. | | | | | | | | |
5.70% due 05/20/27 | | | 14,700,000 | | | | 15,024,695 | |
4.00% due 03/15/293 | | | 4,450,000 | | | | 4,259,179 | |
4.63% due 11/15/273 | | | 2,000,000 | | | | 1,984,897 | |
Reliance Standard Life Global Funding II | | | | | | | | |
5.24% due 02/02/263 | | | 20,850,000 | | | | 20,949,363 | |
BNP Paribas S.A. | | | | | | | | |
1.32% due 01/13/273,4 | | | 21,350,000 | | | | 20,453,743 | |
2.22% due 06/09/263,4 | | | 400,000 | | | | 392,310 | |
Credit Agricole S.A. | | | | | | | | |
1.25% due 01/26/273,4 | | | 17,950,000 | | | | 17,157,091 | |
1.91% due 06/16/263,4 | | | 400,000 | | | | 391,462 | |
Corebridge Global Funding | | | | | | | | |
4.65% due 08/20/273 | | | 9,500,000 | | | | 9,613,400 | |
5.75% due 07/02/263 | | | 7,250,000 | | | | 7,434,106 | |
Ares Finance Company LLC | | | | | | | | |
4.00% due 10/08/243 | | | 14,617,000 | | | | 14,611,494 | |
150 | THE GUGGENHEIM FUNDS ANNUAL REPORT | SEE NOTES TO FINANCIAL STATEMENTS. |
SCHEDULE OF INVESTMENTS (continued) | September 30, 2024 |
LIMITED DURATION FUND | |
| | Face
Amount~ | | | Value | |
FS KKR Capital Corp. | | | | | | | | |
4.25% due 02/14/253 | | | 7,600,000 | | | $ | 7,554,810 | |
2.63% due 01/15/27 | | | 7,400,000 | | | | 6,959,841 | |
Rocket Mortgage LLC / Rocket Mortgage Company-Issuer, Inc. | | | | | | | | |
2.88% due 10/15/263 | | | 10,800,000 | | | | 10,368,834 | |
3.88% due 03/01/313 | | | 4,100,000 | | | | 3,775,035 | |
Alexandria Real Estate Equities, Inc. | | | | | | | | |
3.45% due 04/30/25 | | | 14,200,000 | | | | 14,088,742 | |
CoStar Group, Inc. | | | | | | | | |
2.80% due 07/15/303 | | | 15,280,000 | | | | 13,765,918 | |
F&G Global Funding | | | | | | | | |
1.75% due 06/30/263 | | | 14,250,000 | | | | 13,503,249 | |
CNO Global Funding | | | | | | | | |
5.88% due 06/04/273 | | | 13,100,000 | | | | 13,494,178 | |
ABN AMRO Bank N.V. | | | | | | | | |
1.54% due 06/16/273,4 | | | 14,000,000 | | | | 13,303,451 | |
American National Group, Inc. | | | | | | | | |
5.00% due 06/15/27 | | | 13,075,000 | | | | 13,157,490 | |
Nationwide Building Society | | | | | | | | |
2.97% due 02/16/283,4 | | | 11,300,000 | | | | 10,896,783 | |
Standard Chartered plc | | | | | | | | |
5.69% due 05/14/283,4 | | | 10,600,000 | | | | 10,885,322 | |
Iron Mountain, Inc. | | | | | | | | |
4.88% due 09/15/273 | | | 7,360,000 | | | | 7,304,566 | |
5.00% due 07/15/283 | | | 3,085,000 | | | | 3,044,422 | |
CBS Studio Center | | | | | | | | |
8.10% (1 Month Term SOFR + 3.00%, Rate Floor: 3.00%) due 01/09/25◊,††† | | | 10,000,000 | | | | 10,000,000 | |
ING Groep N.V. | | | | | | | | |
1.73% due 04/01/274 | | | 9,800,000 | | | | 9,404,915 | |
SLM Corp. | | | | | | | | |
3.13% due 11/02/26 | | | 9,596,000 | | | | 9,225,072 | |
BPCE S.A. | | | | | | | | |
1.65% due 10/06/263,4 | | | 9,500,000 | | | | 9,200,121 | |
First American Financial Corp. | | | | | | | | |
4.00% due 05/15/30 | | | 7,860,000 | | | | 7,465,770 | |
United Wholesale Mortgage LLC | | | | | | | | |
5.50% due 11/15/253 | | | 7,120,000 | | | | 7,106,722 | |
5.50% due 04/15/293 | | | 275,000 | | | | 267,850 | |
Macquarie Bank Ltd. | | | | | | | | |
5.27% due 07/02/273 | | | 7,100,000 | | | | 7,325,967 | |
Apollo Management Holdings, LP | | | | | | | | |
4.40% due 05/27/263 | | | 7,115,000 | | | | 7,112,192 | |
OneMain Finance Corp. | | | | | | | | |
3.50% due 01/15/27 | | | 7,050,000 | | | | 6,738,539 | |
7.13% due 03/15/26 | | | 50,000 | | | | 51,046 | |
SBA Communications Corp. | | | | | | | | |
3.13% due 02/01/29 | | | 6,500,000 | | | | 6,007,916 | |
RenaissanceRe Finance, Inc. | | | | | | | | |
3.70% due 04/01/25 | | | 5,662,000 | | | | 5,618,083 | |
National Bank of Canada | | | | | | | | |
5.60% due 07/02/274 | | | 4,650,000 | | | | 4,744,693 | |
Horace Mann Educators Corp. | | | | | | | | |
4.50% due 12/01/25 | | | 4,420,000 | | | | 4,396,448 | |
Deloitte LLP | | | | | | | | |
3.46% due 05/07/27††† | | | 4,500,000 | | | | 4,323,465 | |
Jefferies Finance LLC / JFIN Company-Issuer Corp. | | | | | | | | |
5.00% due 08/15/283 | | | 4,300,000 | | | | 4,088,485 | |
Fidelity & Guaranty Life Holdings, Inc. | | | | | | | | |
5.50% due 05/01/253 | | | 3,613,000 | | | | 3,612,808 | |
Peachtree Corners Funding Trust | | | | | | | | |
3.98% due 02/15/253 | | | 3,450,000 | | | | 3,432,361 | |
Hunt Companies, Inc. | | | | | | | | |
5.25% due 04/15/293 | | | 3,250,000 | | | | 3,144,422 | |
AMC East Communities LLC | | | | | | | | |
5.74% due 01/15/283 | | | 1,484,927 | | | | 1,504,102 | |
Brookfield Finance, Inc. | | | | | | | | |
3.90% due 01/25/28 | | | 1,400,000 | | | | 1,380,763 | |
CNO Financial Group, Inc. | | | | | | | | |
5.25% due 05/30/25 | | | 1,200,000 | | | | 1,200,645 | |
Trinity Acquisition plc | | | | | | | | |
4.40% due 03/15/26 | | | 881,000 | | | | 878,757 | |
Old Republic International Corp. | | | | | | | | |
3.88% due 08/26/26 | | | 700,000 | | | | 692,892 | |
Equinix, Inc. | | | | | | | | |
1.55% due 03/15/28 | | | 700,000 | | | | 638,541 | |
Belvoir Land LLC | | | | | | | | |
5.03% due 12/15/253 | | | 440,360 | | | | 439,199 | |
Morgan Stanley | | | | | | | | |
3.77% due 01/24/294 | | | 361,000 | | | | 355,055 | |
Assurant, Inc. | | | | | | | | |
4.90% due 03/27/28 | | | 350,000 | | | | 352,942 | |
Total Financial | | | | | | | 841,614,034 | |
| | | | | | | | | |
Consumer, Non-cyclical - 3.1% | | | | | | | | |
Global Payments, Inc. | | | | | | | | |
2.90% due 05/15/30 | | | 28,801,000 | | | | 26,232,551 | |
3.20% due 08/15/29 | | | 2,199,000 | | | | 2,060,172 | |
Humana, Inc. | | | | | | | | |
4.50% due 04/01/25 | | | 16,650,000 | | | | 16,616,113 | |
GXO Logistics, Inc. | | | | | | | | |
6.25% due 05/06/29 | | | 15,000,000 | | | | 15,786,683 | |
Element Fleet Management Corp. | | | | | | | | |
5.64% due 03/13/273 | | | 9,925,000 | | | | 10,177,913 | |
6.27% due 06/26/263 | | | 4,400,000 | | | | 4,518,100 | |
Laboratory Corporation of America Holdings | | | | | | | | |
1.55% due 06/01/26 | | | 10,571,000 | | | | 10,094,214 | |
PRA Health Sciences, Inc. | | | | | | | | |
2.88% due 07/15/263 | | | 10,280,000 | | | | 9,964,507 | |
Block, Inc. | | | | | | | | |
2.75% due 06/01/26 | | | 7,600,000 | | | | 7,368,243 | |
Danone S.A. | | | | | | | | |
2.95% due 11/02/263 | | | 6,952,000 | | | | 6,773,394 | |
Valvoline, Inc. | | | | | | | | |
3.63% due 06/15/313 | | | 7,434,000 | | | | 6,652,599 | |
Royalty Pharma plc | | | | | | | | |
1.75% due 09/02/27 | | | 5,150,000 | | | | 4,799,000 | |
BAT Capital Corp. | | | | | | | | |
4.70% due 04/02/27 | | | 4,220,000 | | | | 4,257,606 | |
3.56% due 08/15/27 | | | 527,000 | | | | 516,224 | |
SEE NOTES TO FINANCIAL STATEMENTS. | THE GUGGENHEIM FUNDS ANNUAL REPORT | 151 |
SCHEDULE OF INVESTMENTS (continued) | September 30, 2024 |
LIMITED DURATION FUND | |
| | Face
Amount~ | | | Value | |
JBS USA Holding Lux SARL/ JBS USA Food Company/ JBS Lux Co SARL | | | | | | | | |
5.13% due 02/01/28 | | | 4,306,000 | | | $ | 4,363,722 | |
IQVIA, Inc. | | | | | | | | |
5.00% due 05/15/273 | | | 2,300,000 | | | | 2,285,990 | |
HAH Group Holding Company LLC | | | | | | | | |
9.75% due 10/01/313 | | | 1,780,000 | | | | 1,794,819 | |
Triton Container International Ltd. | | | | | | | | |
2.05% due 04/15/263 | | | 1,800,000 | | | | 1,721,647 | |
Molina Healthcare, Inc. | | | | | | | | |
4.38% due 06/15/283 | | | 1,115,000 | | | | 1,083,973 | |
Catalent Pharma Solutions, Inc. | | | | | | | | |
3.13% due 02/15/293 | | | 1,050,000 | | | | 1,031,416 | |
Avantor Funding, Inc. | | | | | | | | |
4.63% due 07/15/283 | | | 1,050,000 | | | | 1,026,262 | |
Smithfield Foods, Inc. | | | | | | | | |
4.25% due 02/01/273 | | | 350,000 | | | | 344,190 | |
Performance Food Group, Inc. | | | | | | | | |
5.50% due 10/15/273 | | | 100,000 | | | | 99,716 | |
Total Consumer, Non-cyclical | | | | | | | 139,569,054 | |
| | | | | | | | | |
Industrial - 2.6% | | | | | | | | |
Berry Global, Inc. | | | | | | | | |
1.57% due 01/15/26 | | | 11,750,000 | | | | 11,306,662 | |
4.88% due 07/15/263 | | | 5,165,000 | | | | 5,156,746 | |
5.80% due 06/15/313 | | | 2,500,000 | | | | 2,601,275 | |
Sealed Air Corp. | | | | | | | | |
1.57% due 10/15/263 | | | 16,450,000 | | | | 15,443,359 | |
Amcor Flexibles North America, Inc. | | | | | | | | |
4.00% due 05/17/25 | | | 13,690,000 | | | | 13,608,863 | |
Silgan Holdings, Inc. | | | | | | | | |
1.40% due 04/01/263 | | | 12,600,000 | | | | 11,950,709 | |
Vontier Corp. | | | | | | | | |
1.80% due 04/01/26 | | | 7,050,000 | | | | 6,749,725 | |
2.40% due 04/01/28 | | | 3,900,000 | | | | 3,583,725 | |
3M Co. | | | | | | | | |
2.65% due 04/15/25 | | | 8,263,000 | | | | 8,171,185 | |
Graphic Packaging International LLC | | | | | | | | |
1.51% due 04/15/263 | | | 6,500,000 | | | | 6,149,070 | |
Penske Truck Leasing Company LP / PTL Finance Corp. | | | | | | | | |
4.45% due 01/29/263 | | | 5,475,000 | | | | 5,463,871 | |
4.20% due 04/01/273 | | | 500,000 | | | | 497,501 | |
Weir Group plc | | | | | | | | |
2.20% due 05/13/263 | | | 5,410,000 | | | | 5,203,434 | |
Penske Truck Leasing Company Lp / PTL Finance Corp. | | | | | | | | |
5.25% due 07/01/293 | | | 4,750,000 | | | | 4,891,553 | |
Jabil, Inc. | | | | | | | | |
1.70% due 04/15/26 | | | 3,800,000 | | | | 3,639,642 | |
GATX Corp. | | | | | | | | |
3.85% due 03/30/27 | | | 2,900,000 | | | | 2,859,148 | |
3.50% due 03/15/28 | | | 200,000 | | | | 193,367 | |
Standard Industries, Inc. | | | | | | | | |
4.75% due 01/15/283 | | | 2,671,000 | | | | 2,616,218 | |
Crown Americas LLC / Crown Americas Capital Corporation VI | | | | | | | | |
4.75% due 02/01/26 | | | 1,038,000 | | | | 1,034,347 | |
Brundage-Bone Concrete Pumping Holdings, Inc. | | | | | | | | |
6.00% due 02/01/263 | | | 800,000 | | | | 796,806 | |
Amsted Industries, Inc. | | | | | | | | |
5.63% due 07/01/273 | | | 425,000 | | | | 423,863 | |
4.63% due 05/15/303 | | | 350,000 | | | | 334,298 | |
Summit Materials LLC / Summit Materials Finance Corp. | | | | | | | | |
5.25% due 01/15/293 | | | 275,000 | | | | 271,967 | |
6.50% due 03/15/273 | | | 75,000 | | | | 75,083 | |
Enviri Corp. | | | | | | | | |
5.75% due 07/31/273 | | | 125,000 | | | | 122,695 | |
Total Industrial | | | | | | | 113,145,112 | |
| | | | | | | | | |
Consumer, Cyclical - 2.5% | | | | | | | | |
VF Corp. | | | | | | | | |
2.40% due 04/23/25 | | | 23,000,000 | | | | 22,614,328 | |
LG Electronics, Inc. | | | | | | | | |
5.63% due 04/24/273 | | | 11,000,000 | | | | 11,303,600 | |
LG Energy Solution Ltd. | | | | | | | | |
5.38% due 07/02/273 | | | 9,650,000 | | | | 9,803,918 | |
Alt-2 Structured Trust | | | | | | | | |
2.95% due 05/14/31◊,††† | | | 8,832,960 | | | | 8,130,387 | |
Warnermedia Holdings, Inc. | | | | | | | | |
6.41% due 03/15/26 | | | 8,050,000 | | | | 8,054,756 | |
United Airlines, Inc. | | | | | | | | |
4.38% due 04/15/263 | | | 8,125,000 | | | | 7,994,583 | |
Choice Hotels International, Inc. | | | | | | | | |
3.70% due 01/15/31 | | | 7,350,000 | | | | 6,798,394 | |
CD&R Smokey Buyer, Inc. | | | | | | | | |
6.75% due 07/15/253 | | | 4,654,000 | | | | 4,652,471 | |
Hyatt Hotels Corp. | | | | | | | | |
5.75% due 04/23/30 | | | 4,320,000 | | | | 4,521,572 | |
Air Canada | | | | | | | | |
3.88% due 08/15/263 | | | 4,550,000 | | | | 4,430,726 | |
Delta Air Lines, Inc. | | | | | | | | |
7.00% due 05/01/253 | | | 4,300,000 | | | | 4,345,295 | |
Delta Air Lines, Inc. / SkyMiles IP Ltd. | | | | | | | | |
4.50% due 10/20/253 | | | 4,167,500 | | | | 4,142,139 | |
American Airlines Class AA Pass Through Trust | | | | | | | | |
3.35% due 10/15/29 | | | 2,363,433 | | | | 2,230,405 | |
3.00% due 10/15/28 | | | 1,457,053 | | | | 1,371,137 | |
Newell Brands, Inc. | | | | | | | | |
6.38% due 09/15/27 | | | 1,548,000 | | | | 1,565,655 | |
5.70% due 04/01/26 | | | 1,552,000 | | | | 1,555,809 | |
Beacon Roofing Supply, Inc. | | | | | | | | |
4.50% due 11/15/263 | | | 2,404,000 | | | | 2,366,768 | |
Suburban Propane Partners Limited Partnership/Suburban Energy Finance Corp. | | | | | | | | |
5.88% due 03/01/27 | | | 2,300,000 | | | | 2,296,091 | |
152 | THE GUGGENHEIM FUNDS ANNUAL REPORT | SEE NOTES TO FINANCIAL STATEMENTS. |
SCHEDULE OF INVESTMENTS (continued) | September 30, 2024 |
LIMITED DURATION FUND | |
| | Face
Amount~ | | | Value | |
Mileage Plus Holdings LLC / Mileage Plus Intellectual Property Assets Ltd. | | | | | | | | |
6.50% due 06/20/273 | | | 1,842,500 | | | $ | 1,865,410 | |
Walgreens Boots Alliance, Inc. | | | | | | | | |
3.45% due 06/01/26 | | | 1,650,000 | | | | 1,587,319 | |
Advance Auto Parts, Inc. | | | | | | | | |
5.90% due 03/09/26 | | | 514,000 | | | | 519,303 | |
Tempur Sealy International, Inc. | | | | | | | | |
4.00% due 04/15/293 | | | 375,000 | | | | 349,722 | |
Hilton Domestic Operating Company, Inc. | | | | | | | | |
5.38% due 05/01/253 | | | 300,000 | | | | 299,074 | |
Total Consumer, Cyclical | | | | | | | 112,798,862 | |
| | | | | | | | | |
Technology - 2.0% | | | | | | | | |
CDW LLC / CDW Finance Corp. | | | | | | | | |
2.67% due 12/01/26 | | | 22,350,000 | | | | 21,503,775 | |
3.25% due 02/15/29 | | | 810,000 | | | | 763,662 | |
Oracle Corp. | | | | | | | | |
2.50% due 04/01/25 | | | 22,221,000 | | | | 21,964,684 | |
NetApp, Inc. | | | | | | | | |
1.88% due 06/22/25 | | | 18,082,000 | | | | 17,706,037 | |
Infor, Inc. | | | | | | | | |
1.75% due 07/15/253 | | | 13,800,000 | | | | 13,398,435 | |
Qorvo, Inc. | | | | | | | | |
1.75% due 12/15/24 | | | 10,600,000 | | | | 10,515,821 | |
3.38% due 04/01/313 | | | 1,200,000 | | | | 1,074,413 | |
4.38% due 10/15/29 | | | 963,000 | | | | 933,012 | |
Twilio, Inc. | | | | | | | | |
3.63% due 03/15/29 | | | 994,000 | | | | 924,852 | |
NCR Voyix Corp. | | | | | | | | |
5.13% due 04/15/293 | | | 636,000 | | | | 622,351 | |
MSCI, Inc. | | | | | | | | |
3.88% due 02/15/313 | | | 379,000 | | | | 358,631 | |
Total Technology | | | | | | | 89,765,673 | |
| | | | | | | | | |
Communications - 1.5% | | | | | | | | |
Fox Corp. | | | | | | | | |
3.05% due 04/07/25 | | | 45,864,000 | | | | 45,416,812 | |
Level 3 Financing, Inc. | | | | | | | | |
3.88% due 10/15/303 | | | 5,070,000 | | | | 3,715,149 | |
4.50% due 04/01/303 | | | 2,277,000 | | | | 1,763,552 | |
11.00% due 11/15/293 | | | 1,570,009 | | | | 1,738,904 | |
4.00% due 04/15/313 | | | 2,150,000 | | | | 1,564,125 | |
NTT Finance Corp. | | | | | | | | |
1.16% due 04/03/263 | | | 7,598,000 | | | | 7,256,720 | |
Charter Communications Operating LLC / Charter Communications Operating Capital | | | | | | | | |
2.80% due 04/01/31 | | | 3,250,000 | | | | 2,781,192 | |
Cogent Communications Group LLC | | | | | | | | |
3.50% due 05/01/263 | | | 2,680,000 | | | | 2,612,595 | |
CSC Holdings LLC | | | | | | | | |
4.13% due 12/01/303 | | | 250,000 | | | | 182,189 | |
AMC Networks, Inc. | | | | | | | | |
4.25% due 02/15/29 | | | 225,000 | | | | 162,729 | |
Match Group Holdings II LLC | | | | | | | | |
4.63% due 06/01/283 | | | 75,000 | | | | 72,921 | |
Sirius XM Radio, Inc. | | | | | | | | |
3.88% due 09/01/313 | | | 75,000 | | | | 65,345 | |
Total Communications | | | | | | | 67,332,233 | |
| | | | | | | | | |
Utilities - 0.9% | | | | | | | | |
Avangrid, Inc. | | | | | | | | |
3.20% due 04/15/25 | | | 19,179,000 | | | | 18,983,283 | |
Terraform Global Operating, LP | | | | | | | | |
6.13% due 03/01/263 | | | 9,020,000 | | | | 9,024,438 | |
Algonquin Power & Utilities Corp. | | | | | | | | |
5.37% due 06/15/26 | | | 8,200,000 | | | | 8,299,103 | |
AES Corp. | | | | | | | | |
3.30% due 07/15/253 | | | 4,250,000 | | | | 4,188,091 | |
Total Utilities | | | | | | | 40,494,915 | |
| | | | | | | | | |
Energy - 0.8% | | | | | | | | |
Occidental Petroleum Corp. | | | | | | | | |
5.00% due 08/01/27 | | | 6,100,000 | | | | 6,183,948 | |
5.50% due 12/01/25 | | | 5,000,000 | | | | 5,020,960 | |
HF Sinclair Corp. | | | | | | | | |
6.38% due 04/15/27 | | | 8,593,000 | | | | 8,711,483 | |
BP Capital Markets plc | | | | | | | | |
4.88% 4,5 | | | 7,500,000 | | | | 7,418,646 | |
Venture Global LNG, Inc. | | | | | | | | |
9.50% due 02/01/293 | | | 4,600,000 | | | | 5,181,921 | |
Buckeye Partners, LP | | | | | | | | |
4.13% due 03/01/253 | | | 1,600,000 | | | | 1,586,706 | |
Targa Resources Partners Limited Partnership / Targa Resources Partners Finance Corp. | | | | | | | | |
6.88% due 01/15/29 | | | 1,003,000 | | | | 1,028,388 | |
Gulfstream Natural Gas System LLC | | | | | | | | |
4.60% due 09/15/253 | | | 400,000 | | | | 398,810 | |
Sabine Pass Liquefaction LLC | | | | | | | | |
5.00% due 03/15/27 | | | 300,000 | | | | 303,894 | |
Parkland Corp. | | | | | | | | |
5.88% due 07/15/273 | | | 80,000 | | | | 79,794 | |
Total Energy | | | | | | | 35,914,550 | |
| | | | | | | | | |
Basic Materials - 0.8% | | | | | | | | |
Anglo American Capital plc | | | | | | | | |
2.25% due 03/17/283 | | | 14,000,000 | | | | 12,965,260 | |
4.00% due 09/11/273 | | | 750,000 | | | | 738,397 | |
5.38% due 04/01/253 | | | 600,000 | | | | 600,488 | |
Kaiser Aluminum Corp. | | | | | | | | |
4.63% due 03/01/283 | | | 9,643,000 | | | | 9,326,176 | |
International Flavors & Fragrances, Inc. | | | | | | | | |
1.23% due 10/01/253 | | | 4,130,000 | | | | 3,986,006 | |
Alcoa Nederland Holding B.V. | | | | | | | | |
5.50% due 12/15/273 | | | 3,675,000 | | | | 3,688,823 | |
Carpenter Technology Corp. | | | | | | | | |
6.38% due 07/15/28 | | | 1,145,000 | | | | 1,152,853 | |
Minerals Technologies, Inc. | | | | | | | | |
5.00% due 07/01/283 | | | 140,000 | | | | 136,227 | |
Total Basic Materials | | | | | | | 32,594,230 | |
| | | | | | | | | |
SEE NOTES TO FINANCIAL STATEMENTS. | THE GUGGENHEIM FUNDS ANNUAL REPORT | 153 |
SCHEDULE OF INVESTMENTS (continued) | September 30, 2024 |
LIMITED DURATION FUND | |
| | Face
Amount~ | | | Value | |
Transporation - 0.1% | | | | | | | | |
Stolthaven Houston, Inc. | | | | | | | | |
5.88% due 07/17/31††† | | | 4,800,000 | | | $ | 4,945,920 | |
Total Corporate Bonds | | | | |
(Cost $1,504,607,600) | | | 1,478,174,583 | |
| | | | | |
COLLATERALIZED MORTGAGE OBLIGATIONS†† - 28.3% |
Government Agency - 15.4% | | | | | | | | |
Uniform MBS 15 Year | | | | | | | | |
due 11/01/2411 | | | 274,950,000 | | | | 275,983,812 | |
due 12/01/2411 | | | 150,000,000 | | | | 150,625,500 | |
due 11/01/2411 | | | 113,550,000 | | | | 115,090,874 | |
Freddie Mac | | | | | | | | |
5.50% due 02/01/53 | | | 36,363,473 | | | | 37,048,150 | |
6.00% due 08/01/54 | | | 21,721,890 | | | | 22,418,826 | |
5.00% due 06/01/53 | | | 19,163,391 | | | | 19,267,519 | |
5.00% due 02/01/53 | | | 16,733,773 | | | | 16,824,216 | |
Ginnie Mae | | | | | | | | |
6.00% due 09/20/45 | | | 15,630,050 | | | | 15,786,073 | |
6.00% due 06/20/47 | | | 2,417,192 | | | | 2,442,470 | |
Fannie Mae | | | | | | | | |
6.50% due 04/25/49 | | | 7,922,701 | | | | 8,059,035 | |
5.00% due 08/01/53 | | | 7,534,008 | | | | 7,537,932 | |
5.00% due 06/01/53 | | | 2,565,810 | | | | 2,565,940 | |
Uniform MBS 30 Year | | | | | | | | |
due 12/01/2411 | | | 10,286,000 | | | | 10,281,618 | |
Freddie Mac Seasoned Credit Risk Transfer Trust | | | | | | | | |
2.00% due 05/25/60 | | | 3,013,644 | | | | 2,474,862 | |
2.00% due 11/25/59 | | | 1,710,725 | | | | 1,401,879 | |
Fannie Mae-Aces | | | | | | | | |
1.59% (WAC) due 03/25/35◊,6 | | | 5,960,773 | | | | 532,308 | |
Total Government Agency | | | | | | | 688,341,014 | |
| | | | | | | | | |
Residential Mortgage-Backed Securities - 10.9% | | | | | | | | |
CSMC Trust | | | | | | | | |
2021-RPL1, 4.07% (WAC) due 09/27/60◊,3 | | | 23,964,778 | | | | 23,880,267 | |
2021-RPL7, 1.93% (WAC) due 07/27/61◊,3 | | | 10,767,364 | | | | 10,732,744 | |
2021-RPL4, 4.06% (WAC) due 12/27/60◊,3 | | | 10,170,170 | | | | 10,134,338 | |
2021-NQM8, 2.41% (WAC) due 10/25/66◊,3 | | | 7,229,774 | | | | 6,370,635 | |
2018-RPL9, 3.85% (WAC) due 09/25/57◊,3 | | | 3,776,463 | | | | 3,721,712 | |
2020-NQM1, 2.41% due 05/25/653,7 | | | 1,600,417 | | | | 1,501,480 | |
PRPM LLC | | | | | | | | |
2021-5, 4.79% due 06/25/263,7 | | | 17,754,922 | | | | 17,676,443 | |
2022-1, 3.72% due 02/25/273,7 | | | 16,867,020 | | | | 16,722,939 | |
2021-8, 4.74% (WAC) due 09/25/26◊,3 | | | 7,795,902 | | | | 7,751,641 | |
2024-RPL2, 3.50% due 05/25/543 | | | 4,437,277 | | | | 4,290,510 | |
2024-4, 6.41% due 08/25/293,7 | | | 2,452,172 | | | | 2,466,857 | |
2021-RPL2, 2.49% (WAC) due 10/25/51◊,3 | | | 2,500,000 | | | | 2,165,886 | |
Legacy Mortgage Asset Trust | | | | | | | | |
2021-GS3, 4.75% due 07/25/613,7 | | | 18,562,945 | | | | 18,423,069 | |
2021-GS4, 4.65% due 11/25/603,7 | | | 15,566,994 | | | | 15,564,566 | |
2021-GS2, 4.75% due 04/25/613,7 | | | 6,715,022 | | | | 6,762,815 | |
2021-GS5, 2.25% due 07/25/673,7 | | | 4,302,030 | | | | 4,269,153 | |
NYMT Loan Trust | | | | | | | | |
2021-SP1, 4.67% due 08/25/613,7 | | | 30,450,176 | | | | 30,197,132 | |
2022-SP1, 5.25% due 07/25/623,7 | | | 8,790,837 | | | | 8,627,062 | |
OSAT Trust | | | | | | | | |
2021-RPL1, 5.12% due 05/25/653,7 | | | 36,276,619 | | | | 36,210,549 | |
OBX Trust | | | | | | | | |
2024-NQM5, 5.99% due 01/25/643,7 | | | 19,786,774 | | | | 20,044,544 | |
2024-NQM8, 6.23% due 05/25/643,7 | | | 3,256,994 | | | | 3,313,097 | |
2024-NQM9, 6.28% due 01/25/647 | | | 2,715,113 | | | | 2,753,381 | |
2022-NQM9, 6.45% due 09/25/623,7 | | | 1,979,470 | | | | 1,996,470 | |
BRAVO Residential Funding Trust | | | | | | | | |
2022-R1, 3.13% due 01/29/703,7 | | | 17,808,977 | | | | 17,674,590 | |
2021-HE2, 6.13% (30 Day Average SOFR + 0.85%, Rate Floor: 0.00%) due 11/25/69◊,3 | | | 1,381,575 | | | | 1,376,365 | |
2021-HE2, 6.33% (30 Day Average SOFR + 1.05%, Rate Floor: 0.00%) due 11/25/69◊,3 | | | 1,268,664 | | | | 1,265,190 | |
2021-HE1, 6.23% (30 Day Average SOFR + 0.95%, Rate Floor: 0.00%) due 01/25/70◊,3 | | | 1,069,645 | | | | 1,066,321 | |
2021-HE1, 6.13% (30 Day Average SOFR + 0.85%, Rate Floor: 0.00%) due 01/25/70◊,3 | | | 803,141 | | | | 800,644 | |
Verus Securitization Trust | | | | | | | | |
2021-4, 1.35% (WAC) due 07/25/66◊,3 | | | 5,492,177 | | | | 4,676,258 | |
2021-5, 1.37% (WAC) due 09/25/66◊,3 | | | 5,275,841 | | | | 4,552,346 | |
2020-5, 1.58% due 05/25/653,7 | | | 3,596,267 | | | | 3,454,595 | |
2024-5, 6.45% due 06/25/697 | | | 2,974,999 | | | | 3,023,478 | |
2021-3, 1.44% (WAC) due 06/25/66◊,3 | | | 3,217,589 | | | | 2,791,785 | |
2021-6, 1.89% (WAC) due 10/25/66◊,3 | | | 2,531,723 | | | | 2,189,701 | |
2019-4, 3.64% due 11/25/593 | | | 922,295 | | | | 907,616 | |
2020-1, 3.42% due 01/25/603 | | | 518,053 | | | | 506,335 | |
JP Morgan Mortgage Trust | | | | | | | | |
2021-12, 2.50% (WAC) due 02/25/52◊,3 | | | 16,953,966 | | | | 15,755,419 | |
Citigroup Mortgage Loan Trust, Inc. | | | | | | | | |
2022-A, 6.17% due 09/25/623,7 | | | 10,552,462 | | | | 10,551,918 | |
2006-WF1, 4.93% due 03/25/36 | | | 3,325,478 | | | | 1,649,210 | |
GS Mortgage-Backed Securities Trust | | | | | | | | |
2021-PJ10, 2.50% (WAC) due 03/25/52◊,3 | | | 10,518,551 | | | | 9,688,955 | |
2020-NQM1, 1.38% (WAC) due 09/27/60◊,3 | | | 1,614,272 | | | | 1,517,985 | |
Imperial Fund Mortgage Trust | | | | | | | | |
2022-NQM2, 4.02% (WAC) due 03/25/67◊,3 | | | 10,899,295 | | | | 10,213,502 | |
Towd Point Mortgage Trust | | | | | | | | |
2017-6, 2.75% (WAC) due 10/25/57◊,3 | | | 4,818,113 | | | | 4,688,972 | |
2018-2, 3.25% (WAC) due 03/25/58◊,3 | | | 2,341,552 | | | | 2,293,104 | |
2023-CES1, 6.75% (WAC) due 07/25/63◊,3 | | | 1,094,370 | | | | 1,108,834 | |
2017-5, 5.57% (1 Month Term SOFR + 0.71%, Rate Floor: 0.00%) due 02/25/57◊,3 | | | 849,011 | | | | 874,170 | |
2018-1, 3.00% (WAC) due 01/25/58◊,3 | | | 271,028 | | | | 264,621 | |
Home Equity Loan Trust | | | | | | | | |
2007-FRE1, 5.16% (1 Month Term SOFR + 0.30%, Rate Floor: 0.19%) due 04/25/37◊ | | | 9,156,011 | | | | 8,719,414 | |
154 | THE GUGGENHEIM FUNDS ANNUAL REPORT | SEE NOTES TO FINANCIAL STATEMENTS. |
SCHEDULE OF INVESTMENTS (continued) | September 30, 2024 |
LIMITED DURATION FUND | |
| | Face
Amount~ | | | Value | |
Structured Asset Securities Corporation Mortgage Loan Trust | | | | | | | | |
2008-BC4, 5.60% (1 Month Term SOFR + 0.74%, Rate Floor: 0.63%) due 11/25/37◊ | | | 8,490,750 | | | $ | 8,192,014 | |
2006-BC4, 5.31% (1 Month Term SOFR + 0.45%, Rate Floor: 0.34%) due 12/25/36◊ | | | 373,510 | | | | 362,719 | |
Angel Oak Mortgage Trust | | | | | | | | |
2024-4, 6.20% due 01/25/693,7 | | | 5,532,131 | | | | 5,634,178 | |
2021-6, 1.71% (WAC) due 09/25/66◊,3 | | | 2,359,186 | | | | 1,986,993 | |
New Residential Mortgage Loan Trust | | | | | | | | |
2018-2A, 3.50% (WAC) due 02/25/58◊,3 | | | 4,494,743 | | | | 4,287,496 | |
2018-1A, 4.00% (WAC) due 12/25/57◊,3 | | | 1,450,672 | | | | 1,415,915 | |
2019-6A, 3.50% (WAC) due 09/25/59◊,3 | | | 1,126,395 | | | | 1,075,704 | |
2017-5A, 6.47% (1 Month Term SOFR + 1.61%, Rate Floor: 1.50%) due 06/25/57◊,3 | | | 418,020 | | | | 423,382 | |
Soundview Home Loan Trust | | | | | | | | |
2006-OPT5, 5.25% (1 Month Term SOFR + 0.39%, Rate Floor: 0.28%) due 07/25/36◊ | | | 6,135,320 | | | | 5,895,980 | |
2005-OPT3, 5.67% (1 Month Term SOFR + 0.82%, Rate Floor: 0.71%) due 11/25/35◊ | | | 647,904 | | | | 635,772 | |
RCKT Mortgage Trust | | | | | | | | |
2024-CES4, 6.15% due 06/25/443,7 | | | 5,691,125 | | | | 5,782,260 | |
Alternative Loan Trust | | | | | | | | |
2007-OA7, 5.25% (1 Month Term SOFR + 0.39%, Rate Floor: 0.28%) due 05/25/47◊ | | | 4,074,416 | | | | 3,826,884 | |
2007-OH3, 5.55% (1 Month Term SOFR + 0.69%, Rate Cap/Floor: 10.00%/0.58%) due 09/25/47◊ | | | 1,998,212 | | | | 1,819,051 | |
FIGRE Trust | | | | | | | | |
2024-HE2, 6.38% (WAC) due 05/25/54◊,3 | | | 3,356,874 | | | | 3,436,842 | |
2024-HE3, 5.94% (WAC) due 07/25/54◊,3 | | | 1,666,762 | | | | 1,702,232 | |
NovaStar Mortgage Funding Trust Series | | | | | | | | |
2007-2, 5.17% (1 Month Term SOFR + 0.31%, Rate Cap/Floor: 11.00%/0.20%) due 09/25/37◊ | | | 4,990,956 | | | | 4,864,649 | |
Morgan Stanley ABS Capital I Incorporated Trust | | | | | | | | |
2007-HE3, 5.22% (1 Month Term SOFR + 0.36%, Rate Floor: 0.25%) due 12/25/36◊ | | | 4,306,925 | | | | 2,166,540 | |
2007-HE3, 5.12% (1 Month Term SOFR + 0.26%, Rate Floor: 0.15%) due 12/25/36◊ | | | 3,085,481 | | | | 1,552,114 | |
2007-HE5, 5.57% (1 Month Term SOFR + 0.29%, Rate Floor: 0.18%) due 03/25/37◊ | | | 1,526,870 | | | | 653,086 | |
2006-NC1, 5.54% (1 Month Term SOFR + 0.68%, Rate Floor: 0.57%) due 12/25/35◊ | | | 135,188 | | | | 133,671 | |
American Home Mortgage Investment Trust | | | | | | | | |
2006-3, 5.75% (1 Month Term SOFR + 0.47%, Rate Cap/Floor: 10.50%/0.36%) due 12/25/46◊ | | | 5,096,622 | | | | 4,200,810 | |
Mill City Securities Ltd. | | | | | | | | |
2024-RS1, 3.00% due 11/01/693,7 | | | 4,300,000 | | | | 3,969,829 | |
BRAVO | | | | | | | | |
2024-NQM6, 5.66% due 08/01/643,7 | | | 3,794,786 | | | | 3,815,021 | |
Sequoia Mortgage Trust | | | | | | | | |
2024-5, 6.00% (WAC) due 06/25/54◊,3 | | | 3,650,108 | | | | 3,678,857 | |
Credit Suisse Mortgage Capital Certificates | | | | | | | | |
2021-RPL9, 2.44% (WAC) due 02/25/61◊,3 | | | 3,691,540 | | | | 3,670,297 | |
SPS Servicer Advance Receivables Trust | | | | | | | | |
2020-T2, 1.83% due 11/15/553 | | | 3,750,000 | | | | 3,621,600 | |
COLT Mortgage Loan Trust | | | | | | | | |
2024-2, 6.13% due 04/25/693,7 | | | 2,194,620 | | | | 2,222,119 | |
2021-2, 2.38% (WAC) due 08/25/66◊,3 | | | 1,500,000 | | | | 1,085,371 | |
GCAT Trust | | | | | | | | |
2024-NQM2, 6.09% due 06/25/597 | | | 3,116,957 | | | | 3,161,791 | |
Cascade Funding Mortgage Trust | | | | | | | | |
2018-RM2, 4.00% (WAC) due 10/25/68◊,3 | | | 3,015,235 | | | | 2,986,562 | |
2019-RM3, 2.80% (WAC) due 06/25/69◊,9 | | | 65,856 | | | | 65,619 | |
Securitized Asset Backed Receivables LLC Trust | | | | | | | | |
2007-HE1, 5.19% (1 Month Term SOFR + 0.33%, Rate Floor: 0.22%) due 12/25/36◊ | | | 12,763,391 | | | | 2,872,690 | |
HarborView Mortgage Loan Trust | | | | | | | | |
2006-14, 5.38% (1 Month Term SOFR + 0.41%, Rate Floor: 0.30%) due 01/25/47◊ | | | 1,738,543 | | | | 1,606,839 | |
2006-12, 5.46% (1 Month Term SOFR + 0.49%, Rate Floor: 0.38%) due 01/19/38◊ | | | 1,414,307 | | | | 1,251,482 | |
IXIS Real Estate Capital Trust | | | | | | | | |
2006-HE1, 5.57% (1 Month Term SOFR + 0.71%, Rate Floor: 0.60%) due 03/25/36◊ | | | 4,518,231 | | | | 2,367,393 | |
Ellington Financial Mortgage Trust | | | | | | | | |
2021-2, 1.29% (WAC) due 06/25/66◊,3 | | | 1,866,521 | | | | 1,558,307 | |
2020-2, 1.64% (WAC) due 10/25/65◊,3 | | | 769,292 | | | | 709,830 | |
Bear Stearns Asset-Backed Securities I Trust | | | | | | | | |
2006-HE9, 5.25% (1 Month Term SOFR + 0.39%, Rate Floor: 0.28%) due 11/25/36◊ | | | 2,233,585 | | | | 2,204,313 | |
Asset-Backed Securities Corporation Home Equity Loan Trust Series AEG | | | | | | | | |
2006-HE1, 3.93% (1 Month Term SOFR + 0.71%, Rate Floor: 0.60%) due 01/25/36◊ | | | 2,126,020 | | | | 2,075,001 | |
Banc of America Funding Trust | | | | | | | | |
2015-R2, 5.23% (1 Month Term SOFR + 0.37%, Rate Floor: 0.26%) due 04/29/37◊,3 | | | 2,055,587 | | | | 2,042,928 | |
CFMT LLC | | | | | | | | |
2022-HB9, 3.25% (WAC) due 09/25/37◊,3 | | | 1,834,946 | | | | 1,758,918 | |
SEE NOTES TO FINANCIAL STATEMENTS. | THE GUGGENHEIM FUNDS ANNUAL REPORT | 155 |
SCHEDULE OF INVESTMENTS (continued) | September 30, 2024 |
LIMITED DURATION FUND | |
| | Face
Amount~ | | | Value | |
First NLC Trust | | | | | | | | |
2005-4, 5.75% (1 Month Term SOFR + 0.89%, Rate Cap/Floor: 14.00%/0.78%) due 02/25/36◊ | | | 1,689,588 | | | $ | 1,653,611 | |
SG Residential Mortgage Trust | | | | | | | | |
2022-1, 3.68% (WAC) due 03/27/62◊,3 | | | 1,714,075 | | | | 1,585,258 | |
Argent Securities Incorporated Asset-Backed Pass-Through Certificates Series | | | | | | | | |
2005-W2, 5.70% (1 Month Term SOFR + 0.85%, Rate Floor: 0.74%) due 10/25/35◊ | | | 1,433,633 | | | | 1,408,118 | |
Morgan Stanley IXIS Real Estate Capital Trust | | | | | | | | |
2006-2, 5.12% (1 Month Term SOFR + 0.26%, Rate Floor: 0.15%) due 11/25/36◊ | | | 3,704,126 | | | | 1,203,283 | |
GSAA Home Equity Trust | | | | | | | | |
2006-3, 5.57% (1 Month Term SOFR + 0.71%, Rate Floor: 0.60%) due 03/25/36◊ | | | 2,153,480 | | | | 1,064,806 | |
Credit-Based Asset Servicing and Securitization LLC | | | | | | | | |
2006-CB2, 3.34% (1 Month Term SOFR + 0.49%, Rate Floor: 0.38%) due 12/25/36◊ | | | 1,083,168 | | | | 1,030,238 | |
Lehman XS Trust Series | | | | | | | | |
2006-16N, 5.35% (1 Month Term SOFR + 0.49%, Rate Floor: 0.38%) due 11/25/46◊ | | | 1,140,857 | | | | 1,008,555 | |
Structured Asset Investment Loan Trust | | | | | | | | |
2006-3, 5.27% (1 Month Term SOFR + 0.41%, Rate Floor: 0.30%) due 06/25/36◊ | | | 902,236 | | | | 854,680 | |
Long Beach Mortgage Loan Trust | | | | | | | | |
2006-8, 5.29% (1 Month Term SOFR + 0.43%, Rate Floor: 0.32%) due 09/25/36◊ | | | 2,265,209 | | | | 626,368 | |
ACE Securities Corporation Home Equity Loan Trust Series | | | | | | | | |
2005-HE2, 5.99% (1 Month Term SOFR + 1.13%, Rate Floor: 1.02%) due 04/25/35◊ | | | 617,830 | | | | 594,935 | |
Morgan Stanley Capital I Incorporated Trust | | | | | | | | |
2006-HE1, 5.55% (1 Month Term SOFR + 0.69%, Rate Floor: 0.58%) due 01/25/36◊ | | | 574,833 | | | | 555,979 | |
MFRA Trust | | | | | | | | |
2021-INV1, 1.26% (WAC) due 01/25/56◊,3 | | | 509,061 | | | | 484,116 | |
Residential Mortgage Loan Trust | | | | | | | | |
2020-1, 2.38% (WAC) due 01/26/60◊,3 | | | 436,517 | | | | 427,076 | |
Morgan Stanley Home Equity Loan Trust | | | | | | | | |
2006-2, 5.53% (1 Month Term SOFR + 0.67%, Rate Floor: 0.56%) due 02/25/36◊ | | | 289,726 | | | | 287,852 | |
Starwood Mortgage Residential Trust | | | | | | | | |
2020-1, 2.28% (WAC) due 02/25/50◊,3 | | | 263,162 | | | | 249,272 | |
Nomura Resecuritization Trust | | | | | | | | |
2015-4R, 2.71% (1 Month Term SOFR + 0.54%, Rate Floor: 0.43%) due 03/26/36◊,3 | | | 246,992 | | | | 237,782 | |
First Franklin Mortgage Loan Trust | | | | | | | | |
2004-FF10, 6.24% (1 Month Term SOFR + 1.39%, Rate Floor: 1.28%) due 07/25/34◊ | | | 195,129 | | | | 192,162 | |
Nationstar Home Equity Loan Trust | | | | | | | | |
2007-B, 5.19% (1 Month Term SOFR + 0.33%, Rate Floor: 0.22%) due 04/25/37◊ | | | 119,837 | | | | 119,698 | |
Morgan Stanley Re-REMIC Trust | | | | | | | | |
2010-R5, 5.31% due 06/26/363 | | | 35,862 | | | | 33,463 | |
UCFC Manufactured Housing Contract | | | | | | | | |
1997-2, 7.38% due 10/15/28 | | | 7,193 | | | | 7,171 | |
Total Residential Mortgage-Backed Securities | | | | | | | 487,586,100 | |
| | | | | | | | | |
Commercial Mortgage-Backed Securities - 2.0% | | | | | | | | |
BX Commercial Mortgage Trust | | | | | | | | |
2021-VOLT, 6.86% (1 Month Term SOFR + 1.76%, Rate Floor: 1.65%) due 09/15/36◊,3 | | | 25,000,000 | | | | 24,734,375 | |
2022-LP2, 6.66% (1 Month Term SOFR + 1.56%, Rate Floor: 1.56%) due 02/15/39◊,3 | | | 12,375,540 | | | | 12,282,724 | |
2024-AIRC, 6.79% (1 Month Term SOFR + 1.69%, Rate Floor: 1.69%) due 08/15/39◊,3 | | | 2,350,000 | | | | 2,352,937 | |
JP Morgan Chase Commercial Mortgage Securities Trust | | | | | | | | |
2021-NYAH, 7.00% (1 Month Term SOFR + 1.90%, Rate Floor: 1.54%) due 06/15/38◊,3 | | | 10,200,000 | | | | 9,471,490 | |
2016-JP2, 1.94% (WAC) due 08/15/49◊,6 | | | 28,663,805 | | | | 598,188 | |
BX Trust | | | | | | | | |
2024-VLT4, 7.04% (1 Month Term SOFR + 1.94%, Rate Floor: 1.94%) due 07/15/29◊,3 | | | 7,800,000 | | | | 7,800,000 | |
BXHPP Trust | | | | | | | | |
2021-FILM, 6.31% (1 Month Term SOFR + 1.21%, Rate Floor: 1.10%) due 08/15/36◊,3 | | | 8,250,000 | | | | 7,738,916 | |
MHP | | | | | | | | |
2022-MHIL, 6.36% (1 Month Term SOFR + 1.26%, Rate Floor: 1.26%) due 01/15/27◊,3 | | | 7,292,911 | | | | 7,188,076 | |
Life Mortgage Trust | | | | | | | | |
2021-BMR, 6.61% (1 Month Term SOFR + 1.51%, Rate Floor: 1.40%) due 03/15/38◊,3 | | | 5,551,940 | | | | 5,441,639 | |
Extended Stay America Trust | | | | | | | | |
2021-ESH, 6.91% (1 Month Term SOFR + 1.81%, Rate Floor: 1.70%) due 07/15/38◊,3 | | | 3,564,141 | | | | 3,556,345 | |
156 | THE GUGGENHEIM FUNDS ANNUAL REPORT | SEE NOTES TO FINANCIAL STATEMENTS. |
SCHEDULE OF INVESTMENTS (continued) | September 30, 2024 |
LIMITED DURATION FUND | |
| | Face
Amount~ | | | Value | |
Wells Fargo Commercial Mortgage Trust | | | | | | | | |
2017-C38, 1.06% (WAC) due 07/15/50◊,6 | | | 21,495,893 | | | $ | 410,516 | |
2017-C42, 1.00% (WAC) due 12/15/50◊,6 | | | 13,928,898 | | | | 316,552 | |
2016-C37, 0.92% (WAC) due 12/15/49◊,6 | | | 23,453,231 | | | | 300,164 | |
2017-RB1, 1.35% (WAC) due 03/15/50◊,6 | | | 7,840,963 | | | | 175,741 | |
2015-LC22, 0.88% (WAC) due 09/15/58◊,6 | | | 17,640,439 | | | | 80,167 | |
2016-NXS5, 1.56% (WAC) due 01/15/59◊,6 | | | 4,424,963 | | | | 59,248 | |
JPMDB Commercial Mortgage Securities Trust | | | | | | | | |
2018-C8, 0.76% (WAC) due 06/15/51◊,6 | | | 29,832,570 | | | | 515,850 | |
2016-C4, 0.83% (WAC) due 12/15/49◊,6 | | | 32,590,860 | | | | 371,956 | |
2016-C2, 1.63% (WAC) due 06/15/49◊,6 | | | 6,110,768 | | | | 97,521 | |
2017-C5, 1.02% (WAC) due 03/15/50◊,6 | | | 2,968,047 | | | | 42,393 | |
BENCHMARK Mortgage Trust | | | | | | | | |
2018-B2, 0.59% (WAC) due 02/15/51◊,6 | | | 85,012,183 | | | | 974,163 | |
DBJPM Mortgage Trust | | | | | | | | |
2017-C6, 1.05% (WAC) due 06/10/50◊,6 | | | 43,231,124 | | | | 851,926 | |
UBS Commercial Mortgage Trust | | | | | | | | |
2017-C2, 1.21% (WAC) due 08/15/50◊,6 | | | 21,414,727 | | | | 503,002 | |
2017-C5, 1.21% (WAC) due 11/15/50◊,6 | | | 10,561,324 | | | | 227,971 | |
BBCMS Mortgage Trust | | | | | | | | |
2018-C2, 0.91% (WAC) due 12/15/51◊,6 | | | 28,865,087 | | | | 714,642 | |
CSAIL Commercial Mortgage Trust | | | | | | | | |
2019-C15, 1.16% (WAC) due 03/15/52◊,6 | | | 17,533,747 | | | | 606,368 | |
2016-C6, 2.02% (WAC) due 01/15/49◊,6 | | | 5,873,293 | | | | 106,940 | |
Bank of America Merrill Lynch Commercial Mortgage Trust | | | | | | | | |
2017-BNK3, 1.16% (WAC) due 02/15/50◊,6 | | | 28,635,118 | | | | 518,516 | |
2016-UB10, 1.88% (WAC) due 07/15/49◊,6 | | | 9,820,080 | | | | 163,755 | |
COMM Mortgage Trust | | | | | | | | |
2018-COR3, 0.58% (WAC) due 05/10/51◊,6 | | | 35,000,899 | | | | 476,380 | |
2015-CR24, 0.83% (WAC) due 08/10/48◊,6 | | | 48,931,862 | | | | 143,478 | |
Morgan Stanley Bank of America Merrill Lynch Trust | | | | | | | | |
2017-C34, 0.91% (WAC) due 11/15/52◊,6 | | | 22,509,156 | | | | 386,786 | |
2015-C27, 1.00% (WAC) due 12/15/47◊,6 | | | 27,250,589 | | | | 110,888 | |
CGMS Commercial Mortgage Trust | | | | | | | | |
2017-B1, 0.86% (WAC) due 08/15/50◊,6 | | | 19,471,337 | | | | 329,790 | |
CD Commercial Mortgage Trust | | | | | | | | |
2017-CD4, 1.38% (WAC) due 05/10/50◊,6 | | | 13,183,012 | | | | 322,234 | |
CD Mortgage Trust | | | | | | | | |
2017-CD6, 1.01% (WAC) due 11/13/50◊,6 | | | 12,425,989 | | | | 223,875 | |
2016-CD1, 1.48% (WAC) due 08/10/49◊,6 | | | 5,482,992 | | | | 81,477 | |
GS Mortgage Securities Trust | | | | | | | | |
2017-GS6, 1.15% (WAC) due 05/10/50◊,6 | | | 10,817,229 | | | | 220,485 | |
BANK | | | | | | | | |
2017-BNK6, 0.90% (WAC) due 07/15/60◊,6 | | | 11,852,071 | | | | 207,160 | |
Citigroup Commercial Mortgage Trust | | | | | | | | |
2016-C2, 1.80% (WAC) due 08/10/49◊,6 | | | 5,852,001 | | | | 120,912 | |
2016-GC37, 1.81% (WAC) due 04/10/49◊,6 | | | 2,745,030 | | | | 42,693 | |
Total Commercial Mortgage-Backed Securities | | | | | | | 90,868,239 | |
| | | | | | | | | |
Total Collateralized Mortgage Obligations | | | | |
(Cost $1,286,734,216) | | | 1,266,795,353 | |
ASSET-BACKED SECURITIES†† - 26.3% |
Collateralized Loan Obligations - 14.8% | | | | | | | | |
THL Credit Lake Shore MM CLO I Ltd. | | | | | | | | |
2021-1A A1R, 7.26% (3 Month Term SOFR + 1.96%, Rate Floor: 1.70%) due 04/15/33◊,3 | | | 48,500,000 | | | | 48,499,719 | |
2021-1A A2R, 7.41% (3 Month Term SOFR + 2.11%, Rate Floor: 1.85%) due 04/15/33◊,3 | | | 6,250,000 | | | | 6,248,821 | |
Golub Capital Partners CLO 49M Ltd. | | | | | | | | |
2021-49A AR, 7.07% (3 Month Term SOFR + 1.79%, Rate Floor: 1.79%) due 08/26/33◊,3 | | | 36,500,000 | | | | 36,446,834 | |
BXMT Ltd. | | | | | | | | |
2020-FL2 AS, 6.35% (1 Month Term SOFR + 1.26%, Rate Floor: 1.26%) due 02/15/38◊,3 | | | 14,310,000 | | | | 13,791,321 | |
2020-FL2 A, 6.10% (1 Month Term SOFR + 1.01%, Rate Floor: 1.01%) due 02/15/38◊,3 | | | 11,097,042 | | | | 10,665,018 | |
2020-FL3 AS, 6.95% (1 Month Term SOFR + 1.86%, Rate Floor: 1.86%) due 11/15/37◊,3 | | | 4,500,000 | | | | 4,393,322 | |
2020-FL3 B, 7.35% (1 Month Term SOFR + 2.26%, Rate Floor: 2.26%) due 11/15/37◊,3 | | | 2,000,000 | | | | 1,916,095 | |
2020-FL2 B, 6.60% (1 Month Term SOFR + 1.51%, Rate Floor: 1.51%) due 02/15/38◊,3 | | | 2,000,000 | | | | 1,807,170 | |
Golub Capital Partners CLO 54M LP | | | | | | | | |
2021-54A A, 7.03% (3 Month Term SOFR + 1.79%, Rate Floor: 1.53%) due 08/05/33◊,3 | | | 29,000,000 | | | | 29,012,200 | |
Owl Rock CLO IV Ltd. | | | | | | | | |
2021-4A A1R, 6.99% (3 Month Term SOFR + 1.86%, Rate Floor: 1.60%) due 08/20/33◊,3 | | | 24,250,000 | | | | 24,372,402 | |
2021-4A A2R, 7.29% (3 Month Term SOFR + 2.16%, Rate Floor: 1.90%) due 08/20/33◊,3 | | | 3,650,000 | | | | 3,652,689 | |
Golub Capital Partners CLO 16 Ltd. | | | | | | | | |
2021-16A A1R2, 7.16% (3 Month Term SOFR + 1.87%, Rate Floor: 1.61%) due 07/25/33◊,3 | | | 27,650,000 | | | | 27,670,154 | |
Parliament CLO II Ltd. | | | | | | | | |
2021-2A B, 7.09% (3 Month Term SOFR + 1.96%, Rate Floor: 1.70%) due 08/20/32◊,3 | | | 22,250,000 | | | | 22,205,883 | |
2021-2A A, 6.74% (3 Month Term SOFR + 1.61%, Rate Floor: 1.35%) due 08/20/32◊,3 | | | 2,536,986 | | | | 2,529,822 | |
2021-2A C, 7.94% (3 Month Term SOFR + 2.81%, Rate Floor: 2.55%) due 08/20/32◊,3 | | | 500,000 | | | | 482,361 | |
SEE NOTES TO FINANCIAL STATEMENTS. | THE GUGGENHEIM FUNDS ANNUAL REPORT | 157 |
SCHEDULE OF INVESTMENTS (continued) | September 30, 2024 |
LIMITED DURATION FUND | |
| | Face
Amount~ | | | Value | |
Golub Capital Partners CLO 33M Ltd. | | | | | | | | |
2021-33A AR2, 7.19% (3 Month Term SOFR + 2.12%, Rate Floor: 1.86%) due 08/25/33◊,3 | | | 23,000,000 | | | $ | 22,943,305 | |
LCCM Trust | | | | | | | | |
2021-FL3 A, 6.66% (1 Month Term SOFR + 1.56%, Rate Floor: 1.56%) due 11/15/38◊,3 | | | 16,560,324 | | | | 16,450,085 | |
2021-FL2 B, 7.11% (1 Month Term SOFR + 2.01%, Rate Floor: 2.01%) due 12/13/38◊,3 | | | 6,000,000 | | | | 5,918,667 | |
Madison Park Funding XLVIII Ltd. | | | | | | | | |
2021-48A B, 6.99% (3 Month Term SOFR + 1.71%, Rate Floor: 1.71%) due 04/19/33◊,3 | | | 22,000,000 | | | | 22,025,667 | |
Cerberus Loan Funding XLIV LLC | | | | | | | | |
2024-5A A, 7.65% (3 Month Term SOFR + 2.35%, Rate Floor: 2.35%) due 01/15/36◊,3 | | | 20,000,000 | | | | 20,069,682 | |
Cerberus Loan Funding XL LLC | | | | | | | | |
2023-1A A, 7.70% (3 Month Term SOFR + 2.40%, Rate Floor: 2.40%) due 03/22/35◊,3 | | | 16,500,000 | | | | 16,620,709 | |
2023-1A B, 8.90% (3 Month Term SOFR + 3.60%, Rate Floor: 3.60%) due 03/22/35◊,3 | | | 3,250,000 | | | | 3,255,272 | |
Cerberus Loan Funding XXXII, LP | | | | | | | | |
2021-2A A, 7.18% (3 Month Term SOFR + 1.88%, Rate Floor: 1.88%) due 04/22/33◊,3 | | | 14,250,000 | | | | 14,253,434 | |
2021-2A B, 7.46% (3 Month Term SOFR + 2.16%, Rate Floor: 2.16%) due 04/22/33◊,3 | | | 4,000,000 | | | | 4,006,377 | |
Palmer Square Loan Funding Ltd. | | | | | | | | |
2021-3A B, 7.29% (3 Month Term SOFR + 2.01%, Rate Floor: 2.01%) due 07/20/29◊,3 | | | 5,000,000 | | | | 5,011,635 | |
2022-1A A2, 6.90% (3 Month Term SOFR + 1.60%, Rate Floor: 1.60%) due 04/15/30◊,3 | | | 5,000,000 | | | | 4,994,856 | |
2021-2A B, 6.79% (3 Month Term SOFR + 1.66%, Rate Floor: 1.66%) due 05/20/29◊,3 | | | 4,000,000 | | | | 4,003,095 | |
2023-2A A2, 7.59% (3 Month Term SOFR + 2.30%, Rate Floor: 2.30%) due 01/25/32◊,3 | | | 2,000,000 | | | | 2,006,570 | |
BRSP Ltd. | | | | | | | | |
2021-FL1 C, 7.23% (1 Month Term SOFR + 2.26%, Rate Floor: 2.15%) due 08/19/38◊,3 | | | 10,000,000 | | | | 9,709,585 | |
2021-FL1 B, 6.98% (1 Month Term SOFR + 2.01%, Rate Floor: 1.90%) due 08/19/38◊,3 | | | 6,400,000 | | | | 6,209,711 | |
ACRES Commercial Realty Ltd. | | | | | | | | |
2021-FL1 B, 7.00% (1 Month Term SOFR + 1.91%, Rate Floor: 1.91%) due 06/15/36◊,3 | | | 11,200,000 | | | $ | 10,873,583 | |
2021-FL1 C, 7.20% (1 Month Term SOFR + 2.11%, Rate Floor: 2.11%) due 06/15/36◊,3 | | | 4,800,000 | | | | 4,614,772 | |
Fortress Credit BSL XV Ltd. | | | | | | | | |
2024-2A AR, 6.68% (3 Month Term SOFR + 1.40%, Rate Floor: 1.40%) due 10/18/33◊,3 | | | 15,000,000 | | | | 15,028,253 | |
HERA Commercial Mortgage Ltd. | | | | | | | | |
2021-FL1 A, 6.18% (1 Month Term SOFR + 1.16%, Rate Floor: 1.05%) due 02/18/38◊,3 | | | 10,945,202 | | | | 10,786,453 | |
2021-FL1 B, 6.73% (1 Month Term SOFR + 1.71%, Rate Floor: 1.60%) due 02/18/38◊,3 | | | 3,750,000 | | | | 3,657,929 | |
Cerberus Loan Funding XXXIII, LP | | | | | | | | |
2021-3A A, 7.12% (3 Month Term SOFR + 1.82%, Rate Floor: 1.56%) due 07/23/33◊,3 | | | 11,500,000 | | | | 11,511,570 | |
2021-3A B, 7.41% (3 Month Term SOFR + 2.11%, Rate Floor: 1.85%) due 07/23/33◊,3 | | | 2,250,000 | | | | 2,254,735 | |
Golub Capital Partners CLO 36M Ltd. | | | | | | | | |
2018-36A A, 6.80% (3 Month Term SOFR + 1.56%, Rate Floor: 0.00%) due 02/05/31◊,3 | | | 12,868,260 | | | | 12,865,889 | |
ABPCI Direct Lending Fund CLO I LLC | | | | | | | | |
2021-1A A1A2, 7.24% (3 Month Term SOFR + 1.96%, Rate Floor: 1.96%) due 07/20/33◊,3 | | | 12,250,000 | | | | 12,271,885 | |
Cerberus Loan Funding XXXI, LP | | | | | | | | |
2021-1A B, 7.46% (3 Month Term SOFR + 2.16%, Rate Floor: 1.90%) due 04/15/32◊,3 | | | 9,600,000 | | | | 9,605,784 | |
2021-1A A, 7.06% (3 Month Term SOFR + 1.76%, Rate Floor: 1.50%) due 04/15/32◊,3 | | | 2,012,284 | | | | 2,013,885 | |
Fortress Credit Opportunities IX CLO Ltd. | | | | | | | | |
2021-9A A2TR, 7.36% (3 Month Term SOFR + 2.06%, Rate Floor: 1.80%) due 10/15/33◊,3 | | | 11,500,000 | | | | 11,549,887 | |
Owl Rock CLO II Ltd. | | | | | | | | |
2021-2A ALR, 7.09% (3 Month Term SOFR + 1.81%, Rate Floor: 1.55%) due 04/20/33◊,3 | | | 10,500,000 | | | | 10,503,824 | |
KREF | | | | | | | | |
2021-FL2 B, 6.85% (1 Month Term SOFR + 1.76%, Rate Floor: 1.65%) due 02/15/39◊,3 | | | 10,700,000 | | | | 10,357,438 | |
GoldenTree Loan Management US CLO 1 Ltd. | | | | | | | | |
2024-9A BR, 7.23% (3 Month Term SOFR + 1.95%, Rate Floor: 1.95%) due 04/20/37◊,3 | | | 8,250,000 | | | | 8,308,705 | |
158 | THE GUGGENHEIM FUNDS ANNUAL REPORT | SEE NOTES TO FINANCIAL STATEMENTS. |
SCHEDULE OF INVESTMENTS (continued) | September 30, 2024 |
LIMITED DURATION FUND | |
| | Face
Amount~ | | | Value | |
Cerberus Loan Funding XXXV, LP | | | | | | | | |
2021-5A A, 7.06% (3 Month Term SOFR + 1.76%, Rate Floor: 1.50%) due 09/22/33◊,3 | | | 8,000,000 | | | $ | 8,000,641 | |
LoanCore Issuer Ltd. | | | | | | | | |
2021-CRE5 B, 7.21% (1 Month Term SOFR + 2.11%, Rate Floor: 2.11%) due 07/15/36◊,3 | | | 7,900,000 | | | | 7,788,338 | |
LCM XXIV Ltd. | | | | | | | | |
2021-24A AR, 6.52% (3 Month Term SOFR + 1.24%, Rate Floor: 0.98%) due 03/20/30◊,3 | | | 7,670,128 | | | | 7,670,354 | |
Cerberus Loan Funding XLVIII LLC | | | | | | | | |
2024-4A B, due 10/15/36◊,3 | | | 7,500,000 | | | | 7,510,987 | |
FS Rialto | | | | | | | | |
2021-FL3 B, 7.01% (1 Month Term SOFR + 1.91%, Rate Floor: 1.91%) due 11/16/36◊,3 | | | 7,500,000 | | | | 7,418,220 | |
BCC Middle Market CLO LLC | | | | | | | | |
2021-1A A1R, 7.06% (3 Month Term SOFR + 1.76%, Rate Floor: 1.50%) due 10/15/33◊,3 | | | 6,750,000 | | | | 6,757,358 | |
Neuberger Berman Loan Advisers CLO 40 Ltd. | | | | | | | | |
2021-40A B, 6.95% (3 Month Term SOFR + 1.66%, Rate Floor: 1.40%) due 04/16/33◊,3 | | | 6,000,000 | | | | 6,011,789 | |
Fontainbleau Vegas | | | | | | | | |
10.77% (1 Month Term SOFR + 5.65%, Rate Floor: 5.65%) due 01/31/26◊,††† | | | 6,000,000 | | | | 6,000,000 | |
MF1 Multifamily Housing Mortgage Loan Trust | | | | | | | | |
2021-FL6 B, 6.78% (1 Month Term SOFR + 1.76%, Rate Floor: 1.65%) due 07/16/36◊,3 | | | 6,000,000 | | | | 5,881,301 | |
Cerberus Loan Funding XLII LLC | | | | | | | | |
2023-3A A1, 7.77% (3 Month Term SOFR + 2.48%, Rate Floor: 2.48%) due 09/13/35◊,3 | | | 5,750,000 | | | | 5,790,989 | |
HGI CRE CLO Ltd. | | | | | | | | |
2021-FL2 A, 6.21% (1 Month Term SOFR + 1.11%, Rate Floor: 1.11%) due 09/17/36◊,3 | | | 3,647,187 | | | | 3,621,550 | |
2021-FL2 B, 6.71% (1 Month Term SOFR + 1.61%, Rate Floor: 1.61%) due 09/17/36◊,3 | | | 2,000,000 | | | | 1,938,036 | |
STWD Ltd. | | | | | | | | |
2019-FL1 C, 7.16% (1 Month Term SOFR + 2.06%, Rate Floor: 2.06%) due 07/15/38◊,3 | | | 3,200,000 | | | | 3,146,435 | |
2021-FL2 B, 6.93% (1 Month Term SOFR + 1.91%, Rate Floor: 1.80%) due 04/18/38◊,3 | | | 2,187,000 | | | | 2,097,433 | |
Carlyle Direct Lending CLO LLC | | | | | | | | |
2024-1A A11A, 7.12% (3 Month Term SOFR + 1.80%, Rate Floor: 1.80%) due 07/15/36◊,3 | | | 5,150,000 | | | | 5,183,337 | |
Cerberus Loan Funding XLVII LLC | | | | | | | | |
2024-3A A, 7.08% (3 Month Term SOFR + 1.75%, Rate Floor: 1.75%) due 07/15/36◊,3 | | | 5,000,000 | | | | 5,007,595 | |
CIFC Funding Ltd. | | | | | | | | |
2021-4A A1B2, 6.79% (3 Month Term SOFR + 1.51%, Rate Floor: 1.51%) due 04/20/34◊,3 | | | 5,000,000 | | | | 4,988,454 | |
Fortress Credit Opportunities XI CLO Ltd. | | | | | | | | |
2018-11A A1T, 6.86% (3 Month Term SOFR + 1.56%, Rate Floor: 0.00%) due 04/15/31◊,3 | | | 4,863,025 | | | | 4,863,956 | |
BDS Ltd. | | | | | | | | |
2021-FL9 C, 7.03% (1 Month Term SOFR + 2.01%, Rate Floor: 1.90%) due 11/16/38◊,3 | | | 5,000,000 | | | | 4,843,882 | |
BSPRT Issuer Ltd. | | | | | | | | |
2021-FL6 C, 7.26% (1 Month Term SOFR + 2.16%, Rate Floor: 2.05%) due 03/15/36◊,3 | | | 5,000,000 | | | | 4,716,693 | |
VOYA CLO | | | | | | | | |
2021-2A BR, 7.71% (3 Month Term SOFR + 2.41%, Rate Floor: 2.15%) due 06/07/30◊,3 | | | 4,500,000 | | | | 4,515,383 | |
Neuberger Berman Loan Advisers CLO 32 Ltd. | | | | | | | | |
2021-32A BR, 6.94% (3 Month Term SOFR + 1.66%, Rate Floor: 1.40%) due 01/20/32◊,3 | | | 4,000,000 | | | | 4,000,597 | |
ACRE Commercial Mortgage Ltd. | | | | | | | | |
2021-FL4 AS, 6.23% (1 Month Term SOFR + 1.21%, Rate Floor: 1.10%) due 12/18/37◊,3 | | | 3,437,052 | | | | 3,421,769 | |
NewStar Fairfield Fund CLO Ltd. | | | | | | | | |
2018-2A A1N, 6.81% (3 Month Term SOFR + 1.53%, Rate Floor: 1.27%) due 04/20/30◊,3 | | | 3,179,491 | | | | 3,180,258 | |
FS RIALTO | | | | | | | | |
2021-FL2 C, 7.26% (1 Month Term SOFR + 2.16%, Rate Floor: 2.16%) due 05/16/38◊,3 | | | 3,250,000 | | | | 3,128,946 | |
Carlyle Global Market Strategies CLO Ltd. | | | | | | | | |
2018-4A A1RR, 6.56% (3 Month Term SOFR + 1.26%, Rate Floor: 1.00%) due 01/15/31◊,3 | | | 2,195,606 | | | | 2,199,339 | |
Greystone Commercial Real Estate Notes | | | | | | | | |
2021-FL3 B, 6.86% (1 Month Term SOFR + 1.76%, Rate Floor: 1.65%) due 07/15/39◊,3 | | | 2,200,000 | | | | 2,179,927 | |
KREF Funding V LLC | | | | | | | | |
6.96% (1 Month Term SOFR + 1.86%, Rate Floor: 1.86%) due 06/25/26◊,††† | | | 1,920,143 | | | | 1,907,854 | |
0.15% due 06/25/26†††,6 | | | 27,272,727 | | | | 29,182 | |
Dryden 37 Senior Loan Fund | | | | | | | | |
2015-37A Q, due 01/15/313,8 | | | 1,500,000 | | | | 1,036,891 | |
SEE NOTES TO FINANCIAL STATEMENTS. | THE GUGGENHEIM FUNDS ANNUAL REPORT | 159 |
SCHEDULE OF INVESTMENTS (continued) | September 30, 2024 |
LIMITED DURATION FUND | |
| | Face
Amount~ | | | Value | |
Golub Capital Partners CLO 17 Ltd. | | | | | | | | |
2017-17A A1R, 7.20% (3 Month Term SOFR + 1.91%, Rate Floor: 0.00%) due 10/25/30◊,3 | | | 900,761 | | | $ | 901,312 | |
Treman Park CLO Ltd. | | | | | | | | |
2015-1A COM, due 10/20/283,8 | | | 325,901 | | | | 2,897 | |
Copper River CLO Ltd. | | | | | | | | |
2007-1A INC, due 01/20/218,9 | | | 500,000 | | | | 50 | |
Total Collateralized Loan Obligations | | | | | | | 663,118,806 | |
| | | | | | | | | |
Financial - 2.8% | | | | | | | | |
Station Place Securitization Trust | | | | | | | | |
2024-SP1, 6.51% (1 Month Term SOFR + 1.40%, Rate Floor: 1.40%) due 08/12/25◊,†††,3 | | | 8,775,000 | | | | 8,775,000 | |
2024-SP2, 6.81% (1 Month Term SOFR + 1.70%, Rate Floor: 1.70%) due 07/12/26◊,†††,3 | | | 8,775,000 | | | | 8,775,000 | |
2023-SP1, 6.96% (1 Month Term SOFR + 1.85%, Rate Floor: 1.85%) due 10/15/24◊,†††,3 | | | 7,525,000 | | | | 7,525,000 | |
Strategic Partners Fund VIII, LP | | | | | | | | |
7.85% (1 Month Term SOFR + 2.60%, Rate Floor: 2.60%) due 03/10/26◊,††† | | | 20,615,440 | | | | 20,422,274 | |
Madison Avenue Secured Funding Trust | | | | | | | | |
2023-2, 6.96% (1 Month Term SOFR + 1.85%, Rate Floor: 1.85%) due 10/15/24◊,†††,3 | | | 15,025,000 | | | | 15,025,000 | |
KKR Core Holding Company LLC | | | | | | | | |
4.00% due 08/12/31††† | | | 16,062,346 | | | | 14,981,993 | |
HV Eight LLC | | | | | | | | |
7.48% (3 Month EURIBOR + 3.50%, Rate Floor: 3.50%) due 12/31/27◊,††† | | | EUR 10,538,668 | | | | 11,741,361 | |
Project Onyx I | | | | | | | | |
8.47% (3 Month Term SOFR + 3.15%, Rate Floor: 3.15%) due 01/26/27◊,††† | | | 8,553,933 | | | | 8,533,917 | |
ST Group Food Industries Holdings Ltd. | | | | | | | | |
due 11/10/2511 | | | 5,675,000 | | | | 5,675,000 | |
due 11/10/2511 | | | 2,825,000 | | | | 2,825,000 | |
Project Onyx | | | | | | | | |
8.07% (3 Month Term SOFR + 2.75%, Rate Floor: 3.15%) due 01/26/27◊,††† | | | 6,015,552 | | | | 5,998,003 | |
Lightning A | | | | | | | | |
5.50% due 03/01/37††† | | | 4,745,621 | | | | 4,451,392 | |
Thunderbird A | | | | | | | | |
5.50% due 03/01/37††† | | | 4,712,157 | | | | 4,420,003 | |
Ceamer Finance LLC | | | | | | | | |
3.69% due 03/24/31††† | | | 3,288,713 | | | | 3,118,719 | |
Project Onyx II | | | | | | | | |
8.47% (3 Month Term SOFR + 3.15%, Rate Floor: 3.15%) due 01/26/27◊,††† | | | 2,442,679 | | | | 2,425,702 | |
Total Financial | | | | | | | 124,693,364 | |
| | | | | | | | | |
Whole Business - 1.7% | | | | | | | | |
Taco Bell Funding LLC | | | | | | | | |
2021-1A, 1.95% due 08/25/513 | | | 18,421,875 | | | | 17,264,344 | |
SERVPRO Master Issuer LLC | | | | | | | | |
2021-1A, 2.39% due 04/25/513 | | | 11,706,750 | | | | 10,664,541 | |
2019-1A, 3.88% due 10/25/493 | | | 6,334,125 | | | | 6,179,600 | |
Subway Funding LLC | | | | | | | | |
2024-1A, 6.03% due 07/30/543 | | | 8,900,000 | | | | 9,182,407 | |
2024-3A, 5.25% due 07/30/543 | | | 7,200,000 | | | | 7,198,614 | |
ServiceMaster Funding LLC | | | | | | | | |
2020-1, 2.84% due 01/30/513 | | | 8,722,379 | | | | 8,055,090 | |
Wingstop Funding LLC | | | | | | | | |
2020-1A, 2.84% due 12/05/503 | | | 7,742,100 | | | | 7,279,818 | |
Arbys Funding LLC | | | | | | | | |
2020-1A, 3.24% due 07/30/503 | | | 6,960,000 | | | | 6,644,949 | |
DB Master Finance LLC | | | | | | | | |
2019-1A, 4.02% due 05/20/493 | | | 2,850,000 | | | | 2,814,355 | |
Domino’s Pizza Master Issuer LLC | | | | | | | | |
2017-1A, 4.12% due 07/25/473 | | | 1,692,000 | | | | 1,661,539 | |
2018-1A, 4.12% due 07/25/483 | | | 947,500 | | | | 939,819 | |
Total Whole Business | | | | | | | 77,885,076 | |
| | | | | | | | | |
Net Lease - 1.7% | | | | | | | | |
Oak Street Investment Grade Net Lease Fund Series | | | | | | | | |
2020-1A, 1.85% due 11/20/503 | | | 37,483,006 | | | | 35,929,882 | |
STORE Master Funding I LLC | | | | | | | | |
2015-1A, 4.17% due 04/20/453 | | | 10,196,208 | | | | 10,101,294 | |
Capital Automotive REIT | | | | | | | | |
2024-2A, 4.90% due 05/15/543 | | | 5,426,667 | | | | 5,451,426 | |
2020-1A, 3.48% due 02/15/503 | | | 1,967,083 | | | | 1,879,407 | |
STORE Master Funding LLC | | | | | | | | |
2021-1A, 2.86% due 06/20/513 | | | 6,837,062 | | | | 6,226,415 | |
CF Hippolyta Issuer LLC | | | | | | | | |
2021-1A, 1.98% due 03/15/613 | | | 5,748,930 | | | | 5,291,587 | |
CMFT Net Lease Master Issuer LLC | | | | | | | | |
2021-1, 2.91% due 07/20/513 | | | 3,000,000 | | | | 2,734,033 | |
2021-1, 2.51% due 07/20/513 | | | 2,500,000 | | | | 2,255,989 | |
CARS-DB4, LP | | | | | | | | |
2020-1A, 3.19% due 02/15/503 | | | 3,934,167 | | | | 3,891,528 | |
2020-1A, 3.25% due 02/15/503 | | | 884,840 | | | | 804,323 | |
New Economy Assets Phase 1 Sponsor LLC | | | | | | | | |
2021-1, 1.91% due 10/20/613 | | | 2,500,000 | | | | 2,304,273 | |
Total Net Lease | | | | | | | 76,870,157 | |
| | | | | | | | | |
Transport-Container - 1.7% | | | | | | | | |
Triton Container Finance VIII LLC | | | | | | | | |
2021-1A, 1.86% due 03/20/463 | | | 28,451,250 | | | | 25,711,332 | |
Textainer Marine Containers VII Ltd. | | | | | | | | |
2021-1A, 1.68% due 02/20/463 | | | 8,060,666 | | | | 7,362,576 | |
2020-1A, 2.73% due 08/21/453 | | | 3,525,685 | | | | 3,365,135 | |
2020-2A, 2.10% due 09/20/453 | | | 3,061,198 | | | | 2,856,341 | |
TIF Funding II LLC | | | | | | | | |
2021-1A, 1.65% due 02/20/463 | | | 12,947,250 | | | | 11,612,953 | |
CLI Funding VI LLC | | | | | | | | |
2020-3A, 2.07% due 10/18/453 | | | 10,735,000 | | | | 9,969,008 | |
2020-1A, 2.08% due 09/18/453 | | | 1,187,306 | | | | 1,097,943 | |
CLI Funding VIII LLC | | | | | | | | |
2021-1A, 1.64% due 02/18/463 | | | 11,644,197 | | | | 10,615,665 | |
160 | THE GUGGENHEIM FUNDS ANNUAL REPORT | SEE NOTES TO FINANCIAL STATEMENTS. |
SCHEDULE OF INVESTMENTS (continued) | September 30, 2024 |
LIMITED DURATION FUND | |
| | Face
Amount~ | | | Value | |
CAL Funding IV Ltd. | | | | | | | | |
2020-1A, 2.22% due 09/25/453 | | | 2,475,000 | | | $ | 2,307,510 | |
Total Transport-Container | | | | | | | 74,898,463 | |
| | | | | | | | | |
Infrastructure - 1.2% | | | | | | | | |
VB-S1 Issuer LLC - VBTEL | | | | | | | | |
2022-1A, 4.29% due 02/15/523 | | | 9,250,000 | | | | 8,868,611 | |
2024-1A, 5.59% due 05/15/543 | | | 4,000,000 | | | | 4,064,899 | |
Aligned Data Centers Issuer LLC | | | | | | | | |
2021-1A, 1.94% due 08/15/463 | | | 11,150,000 | | | | 10,567,792 | |
SBA Tower Trust | | | | | | | | |
1.63% due 11/15/263 | | | 5,723,000 | | | | 5,358,412 | |
2.84% due 01/15/253 | | | 3,550,000 | | | | 3,524,503 | |
1.84% due 04/15/273 | | | 1,200,000 | | | | 1,116,295 | |
Stack Infrastructure Issuer LLC | | | | | | | | |
2020-1A, 1.89% due 08/25/453 | | | 5,169,000 | | | | 5,017,019 | |
2021-1A, 1.88% due 03/26/463 | | | 2,750,000 | | | | 2,627,587 | |
Crown Castle Towers LLC | | | | | | | | |
3.66% due 05/15/253 | | | 5,850,000 | | | | 5,804,540 | |
Switch ABS Issuer LLC | | | | | | | | |
2024-2A, 5.44% due 06/25/543 | | | 5,450,000 | | | | 5,506,809 | |
Total Infrastructure | | | | | | | 52,456,467 | |
| | | | | | | | | |
Transport-Aircraft - 1.0% | | | | | | | | |
AASET Trust | | | | | | | | |
2021-1A, 2.95% due 11/16/413 | | | 11,278,226 | | | | 10,496,395 | |
2024-1A, 6.26% due 05/16/493 | | | 6,588,957 | | | | 6,843,016 | |
AASET US Ltd. | | | | | | | | |
2018-2A, 4.45% due 11/18/383 | | | 5,276,764 | | | | 5,078,915 | |
Sapphire Aviation Finance II Ltd. | | | | | | | | |
2020-1A, 3.23% due 03/15/403 | | | 4,975,743 | | | | 4,567,184 | |
KDAC Aviation Finance Ltd. | | | | | | | | |
2017-1A, 4.21% due 12/15/423 | | | 4,726,689 | | | | 4,353,888 | |
Sapphire Aviation Finance I Ltd. | | | | | | | | |
2018-1A, 4.25% due 03/15/403 | | | 2,942,567 | | | | 2,807,533 | |
Navigator Aircraft ABS Ltd. | | | | | | | | |
2021-1, 2.77% due 11/15/463 | | | 2,597,189 | | | | 2,401,578 | |
Castlelake Aircraft Structured Trust | | | | | | | | |
2021-1A, 3.47% due 01/15/463 | | | 2,447,834 | | | | 2,366,330 | |
Falcon Aerospace Ltd. | | | | | | | | |
2019-1, 3.60% due 09/15/393 | | | 1,404,013 | | | | 1,315,681 | |
2017-1, 4.58% due 02/15/423 | | | 300,488 | | | | 294,480 | |
Castlelake Aircraft Securitization Trust | | | | | | | | |
2018-1, 4.13% due 06/15/433 | | | 1,719,392 | | | | 1,603,471 | |
MAPS Ltd. | | | | | | | | |
2018-1A, 4.21% due 05/15/433 | | | 1,519,045 | | | | 1,500,130 | |
Total Transport-Aircraft | | | | | | | 43,628,601 | |
| | | | | | | | | |
Single Family Residence - 0.6% | | | | | | | | |
FirstKey Homes Trust | | | | | | | | |
2020-SFR2, 4.00% due 10/19/373 | | | 5,050,000 | | | | 4,912,769 | |
2020-SFR2, 4.50% due 10/19/373 | | | 4,900,000 | | | | 4,774,486 | |
2020-SFR2, 1.67% due 10/19/373 | | | 3,950,000 | | | | 3,808,256 | |
2021-SFR1, 2.19% due 08/17/383 | | | 4,000,000 | | | | 3,778,545 | |
2020-SFR2, 3.37% due 10/19/373 | | | 3,200,000 | | | | 3,100,212 | |
Tricon Residential Trust | | | | | | | | |
2024-SFR2, 4.75% due 06/17/403 | | | 4,996,892 | | | | 5,004,223 | |
Total Single Family Residence | | | | | | | 25,378,491 | |
| | | | | | | | | |
Collateralized Debt Obligations - 0.5% | | | | | | | | |
Anchorage Credit Funding 4 Ltd. | | | | | | | | |
2021-4A AR, 2.72% due 04/27/393 | | | 24,650,000 | | | | 23,418,242 | |
| | | | | | | | | |
Automotive - 0.2% | | | | | | | | |
Avis Budget Rental Car Funding AESOP LLC | | | | | | | | |
2021-1A, 1.38% due 08/20/273 | | | 5,675,000 | | | | 5,380,617 | |
2020-2A, 2.02% due 02/20/273 | | | 4,550,000 | | | | 4,409,167 | |
Total Automotive | | | | | | | 9,789,784 | |
| | | | | | | | | |
Insurance - 0.1% | | | | | | | | |
Obra Longevity | | | | | | | | |
8.48% due 06/30/39††† | | | 3,510,000 | | | | 3,572,127 | |
Total Asset-Backed Securities | | | | |
(Cost $1,196,897,404) | | | 1,175,709,578 | |
| | | | | |
U.S. GOVERNMENT SECURITIES†† - 18.0% |
U.S. Treasury Notes |
4.75% due 07/31/25 | | | 200,000,000 | | | | 201,070,312 | |
4.38% due 07/31/26 | | | 160,700,000 | | | | 162,633,422 | |
4.63% due 06/30/25 | | | 100,000,000 | | | | 100,349,609 | |
3.75% due 08/31/26 | | | 68,690,000 | | | | 68,789,278 | |
3.38% due 09/15/27 | | | 47,000,000 | | | | 46,761,328 | |
4.25% due 01/31/26 | | | 15,700,000 | | | | 15,784,633 | |
3.50% due 09/30/26 | | | 800,000 | | | | 797,781 | |
United States Treasury Inflation Indexed Bonds |
2.13% due 04/15/2912 | | | 54,575,950 | | | | 56,088,904 | |
0.13% due 10/15/2512 | | | 42,608,479 | | | | 41,780,655 | |
0.13% due 04/15/2512 | | | 41,340,236 | | | | 40,603,620 | |
1.25% due 04/15/2812 | | | 25,030,082 | | | | 24,792,564 | |
0.50% due 01/15/2812 | | | 22,837,220 | | | | 22,111,262 | |
0.38% due 01/15/2712 | | | 19,390,503 | | | | 18,838,577 | |
1.38% due 07/15/3312 | | | 5,354,207 | | | | 5,277,437 | |
Total U.S. Government Securities | | | | |
(Cost $799,957,077) | | | | | | | 805,679,382 | |
| | | | | | | | | |
SENIOR FLOATING RATE INTERESTS††,◊ - 1.9% |
Financial - 0.3% | | | | | | | | |
Jane Street Group LLC | | | | | | | | |
7.46% (3 Month Term SOFR + 2.61%, Rate Floor: 2.61%) due 01/26/28 | | | 7,009,305 | | | | 7,001,315 | |
Citadel Securities, LP | | | | | | | | |
7.10% (1 Month Term SOFR + 2.25%, Rate Floor: 2.25%) due 07/29/30 | | | 4,218,125 | | | | 4,214,287 | |
Eagle Point Holdings Borrower LLC | | | | | | | | |
9.06% (3 Month Term SOFR + 3.75%, Rate Floor: 4.75%) due 03/31/28††† | | | 1,733,333 | | | | 1,733,333 | |
Total Financial | | | | | | | 12,948,935 | |
| | | | | | | | | |
Communications - 0.3% | | | | | | | | |
Playtika Holding Corp. | | | | | | | | |
7.71% (1 Month Term SOFR + 2.75%, Rate Floor: 3.75%) due 03/13/28 | | | 10,229,000 | | | | 10,150,339 | |
SEE NOTES TO FINANCIAL STATEMENTS. | THE GUGGENHEIM FUNDS ANNUAL REPORT | 161 |
SCHEDULE OF INVESTMENTS (continued) | September 30, 2024 |
LIMITED DURATION FUND | |
| | Face
Amount~ | | | Value | |
Zayo Group Holdings, Inc. | | | | | | | | |
7.96% (1 Month Term SOFR + 3.00%, Rate Floor: 3.00%) due 03/09/27 | | | 1,500,000 | | | $ | 1,367,820 | |
SBA Senior Finance II LLC | | | | | | | | |
6.85% (1 Month Term SOFR + 2.00%, Rate Floor: 2.00%) due 01/25/31 | | | 746,250 | | | | 746,422 | |
Virgin Media Bristol LLC | | | | | | | | |
7.71% (1 Month Term SOFR + 2.50%, Rate Floor: 2.50%) due 01/31/28 | | | 600,000 | | | | 573,498 | |
Total Communications | | | | | | | 12,838,079 | |
| | | | | | | | | |
Consumer, Non-cyclical - 0.3% | | | | | | | | |
Women’s Care Holdings, Inc. | | | | | | | | |
9.85% (3 Month Term SOFR + 4.50%, Rate Floor: 5.25%) due 01/15/28 | | | 4,502,029 | | | | 4,325,684 | |
Bombardier Recreational Products, Inc. | | | | | | | | |
7.60% (1 Month Term SOFR + 2.75%, Rate Floor: 2.75%) due 01/22/31 | | | 4,052,222 | | | | 4,042,092 | |
Froneri US, Inc. | | | | | | | | |
due 09/16/31 | | | 1,880,000 | | | | 1,871,897 | |
7.20% (1 Month Term SOFR + 2.25%, Rate Floor: 2.25%) due 01/29/27 | | | 430,875 | | | | 429,690 | |
Eyecare Partners LLC | | | | | | | | |
9.99% (3 Month Term SOFR + 1.00%, Rate Floor: 1.00%) (in-kind rate was 3.61%) due 11/30/2810 | | | 422,262 | | | | 299,806 | |
11.03% (3 Month Term SOFR + 5.75%, Rate Floor: 5.75%) due 08/31/28 | | | 100,810 | | | | 101,146 | |
Total Consumer, Non-cyclical | | | | | | | 11,070,315 | |
| | | | | | | | | |
Energy - 0.2% | | | | | | | | |
ITT Holdings LLC | | | | | | | | |
7.95% (1 Month Term SOFR + 3.00%, Rate Floor: 3.50%) due 10/11/30 | | | 10,246,759 | | | | 10,255,264 | |
Venture Global Calcasieu Pass LLC | | | | | | | | |
7.82% (1 Month Term SOFR + 2.88%, Rate Floor: 3.88%) due 08/19/26 | | | 380,616 | | | | 380,300 | |
Total Energy | | | | | | | 10,635,564 | |
| | | | | | | | | |
Technology - 0.2% | | | | | | | | |
Dun & Bradstreet | | | | | | | | |
7.61% (1 Month Term SOFR + 2.75%, Rate Floor: 2.75%) due 01/18/29 | | | 8,407,253 | | | | 8,397,332 | |
Datix Bidco Ltd. | | | | | | | | |
10.70% (1 Month GBP SONIA + 5.50%, Rate Floor: 5.50%) due 04/25/31††† | | | GBP 968,800 | | | | 1,285,445 | |
10.82% (1 Month Term SOFR + 5.50%, Rate Floor: 6.00%) due 04/30/31††† | | | 275,000 | | | | 272,906 | |
Upland Software, Inc. | | | | | | | | |
8.70% (1 Month Term SOFR + 3.75%, Rate Floor: 4.75%) due 08/06/26 | | | 311,476 | | | | 301,873 | |
Total Technology | | | | | | | 10,257,556 | |
| | | | | | | | | |
Industrial - 0.2% | | | | | | | | |
Harsco Corporation | | | | | | | | |
7.21% (1 Month Term SOFR + 2.25%, Rate Floor: 2.75%) due 06/09/28 | | | 3,994,357 | | | | 3,982,694 | |
United Rentals, Inc. | | | | | | | | |
6.60% (1 Month Term SOFR + 1.75%, Rate Floor: 1.75%) due 02/14/31 | | | 3,333,250 | | | | 3,353,249 | |
CPM Holdings, Inc. | | | | | | | | |
9.70% (1 Month Term SOFR + 4.50%, Rate Floor: 5.00%) due 09/28/28 | | | 1,479,421 | | | | 1,400,952 | |
Total Industrial | | | | | | | 8,736,895 | |
| | | | | | | | | |
Consumer, Cyclical - 0.2% | | | | | | | | |
Samsonite IP Holdings SARL | | | | | | | | |
6.85% (1 Month Term SOFR + 2.00%, Rate Floor: 2.50%) due 06/21/30 | | | 2,598,136 | | | | 2,602,475 | |
Rent-A-Center, Inc. | | | | | | | | |
8.00% (3 Month Term SOFR + 2.75%, Rate Floor: 3.25%) due 02/17/28 | | | 2,087,000 | | | | 2,079,403 | |
Pacific Bells LLC | | | | | | | | |
9.37% (1 Month Term SOFR + 4.50%, Rate Floor: 9.50%) due 11/10/28 | | | 1,552,655 | | | | 1,552,655 | |
Entain Holdings (Gibraltar) Ltd. | | | | | | | | |
7.86% (6 Month Term SOFR + 2.50%, Rate Floor: 3.00%) due 03/29/27 | | | 1,451,250 | | | | 1,455,328 | |
Packers Holdings LLC | | | | | | | | |
8.20% (1 Month Term SOFR + 3.25%, Rate Floor: 4.00%) due 03/09/28 | | | 1,672,907 | | | | 868,875 | |
Cushman & Wakefield US Borrower LLC | | | | | | | | |
7.71% (1 Month Term SOFR + 2.75%, Rate Floor: 3.75%) due 08/21/25 | | | 17,619 | | | | 17,608 | |
Total Consumer, Cyclical | | | | | | | 8,576,344 | |
| | | | | | | | | |
Basic Materials - 0.2% | | | | | | | | |
Trinseo Materials Operating S.C.A. | | | | | | | | |
7.82% (3 Month Term SOFR + 2.50%, Rate Floor: 3.50%) due 05/03/28 | | | 10,739,250 | | | | 8,466,932 | |
Total Senior Floating Rate Interests | | | | |
(Cost $86,655,180) | | | 83,530,620 | |
| | | | | |
MUNICIPAL BONDS†† - 0.2% |
Colorado - 0.1% | | | | | | | | |
Fort Carson Family Housing LLC Revenue Bonds | | | | | | | | |
7.86% due 11/15/29 | | | 6,985,000 | | | | 7,269,639 | |
| | | | | | | | | |
California - 0.1% | | | | | | | | |
California Public Finance Authority Revenue Bonds | | | | | | | | |
1.55% due 10/15/26 | | | 3,145,000 | | | | 2,985,099 | |
Total Municipal Bonds | | | | |
(Cost $10,555,624) | | | 10,254,738 | |
| | | | | | | | | |
Total Investments - 112.2% | | | | |
(Cost $5,082,837,898) | | $ | 5,017,718,993 | |
Other Assets & Liabilities, net - (12.2)% | | | (545,068,789 | ) |
Total Net Assets - 100.0% | | $ | 4,472,650,204 | |
162 | THE GUGGENHEIM FUNDS ANNUAL REPORT | SEE NOTES TO FINANCIAL STATEMENTS. |
SCHEDULE OF INVESTMENTS (continued) | September 30, 2024 |
LIMITED DURATION FUND | |
Futures Contracts |
Description | | Number of
Contracts | | | Expiration
Date | | | Notional
Amount | | | Value and
Unrealized
Appreciation** | |
Interest Rate Futures Contracts Purchased† |
3-Month SOFR Futures Contracts | | | 451 | | | | Sep 2025 | | | $ | 109,136,363 | | | $ | 1,228,251 | |
3-Month SOFR Futures Contracts | | | 451 | | | | Dec 2025 | | | | 109,299,850 | | | | 1,222,607 | |
3-Month SOFR Futures Contracts | | | 451 | | | | Mar 2026 | | | | 109,378,775 | | | | 1,183,144 | |
| | | | | | | | | | | $ | 327,814,988 | | | $ | 3,634,002 | |
Centrally Cleared Credit Default Swap Agreements Protection Purchased†† |
Counterparty | | Exchange | | | Index | | | Protection
Premium
Rate | | | Payment
Frequency | | | Maturity
Date | | | Notional
Amount | | | Value | | | Upfront
Premiums
Paid(Received) | | | Unrealized
Appreciation
(Depreciation)** | |
BofA Securities, Inc. | ICE | ITRAXX.EUR.42.V1 | | | 1.00% | | | | Quarterly | | | | 12/20/29 | | EUR 5,190,000 | | $ | (116,009 | ) | | $ | (115,361 | ) | | $ | (648 | ) |
BofA Securities, Inc. | ICE | CDX.NA.IG.43.V1 | | | 1.00% | | | | Quarterly | | | | 12/20/29 | | | | 111,950,914 | | | | (2,502,921 | ) | | | (2,506,204 | ) | | | 3,283 | |
| | | | | | | | | | | | | | | | | | | | | | | | | | | $ | (2,618,930 | ) | | $ | (2,621,565 | ) | | $ | 2,635 | |
Centrally Cleared Interest Rate Swap Agreements†† |
Counterparty | | Exchange | | | Floating
Rate
Type | | | Floating
Rate
Index | | | Fixed
Rate | | | Payment
Frequency | | | Maturity
Date | | | Notional
Amount | | | Value | | | Upfront
Premiums
Paid
(Received) | | | Unrealized
Appreciation
(Depreciation)** | |
BofA Securities, Inc. | CME | Pay | U.S. Secured Overnight Financing Rate | 4.37% | | | Annually | | | | 07/03/27 | | | $ | 165,000,000 | | | $ | 4,400,487 | | | $ | 535 | | | $ | 4,399,952 | |
BofA Securities, Inc. | CME | Pay | U.S. Secured Overnight Financing Rate | 3.85% | | | Annually | | | | 08/12/26 | | | | 532,000,000 | | | | 3,469,981 | | | | 1,480 | | | | 3,468,501 | |
BofA Securities, Inc. | CME | Pay | U.S. Secured Overnight Financing Rate | 3.40% | | | Annually | | | | 04/04/28 | | | | 28,000,000 | | | | 89,934 | | | | 201 | | | | 89,733 | |
BofA Securities, Inc. | CME | Pay | U.S. Secured Overnight Financing Rate | 4.62% | | | Annually | | | | 07/03/26 | | | | 1,200,000 | | | | 22,282 | | | | 228 | | | | 22,054 | |
BofA Securities, Inc. | CME | Pay | U.S. Secured Overnight Financing Rate | 3.85% | | | Annually | | | | 08/14/26 | | | | 900,000 | | | | 5,799 | | | | 282 | | | | 5,517 | |
BofA Securities, Inc. | CME | Pay | U.S. Secured Overnight Financing Rate | 3.45% | | | Annually | | | | 10/01/26 | | | | 185,800,000 | | | | 765 | | | | 765 | | | | — | |
BofA Securities, Inc. | CME | Receive | U.S. Secured Overnight Financing Rate | 3.60% | | | Annually | | | | 08/12/39 | | | | 270,000 | | | | (5,610 | ) | | | (2,810 | ) | | | (2,800 | ) |
BofA Securities, Inc. | CME | Receive | U.S. Secured Overnight Financing Rate | 3.55% | | | Annually | | | | 08/13/39 | | | | 5,000,000 | | | | (72,932 | ) | | | 298 | | | | (73,230 | ) |
SEE NOTES TO FINANCIAL STATEMENTS. | THE GUGGENHEIM FUNDS ANNUAL REPORT | 163 |
SCHEDULE OF INVESTMENTS (continued) | September 30, 2024 |
LIMITED DURATION FUND | |
Centrally Cleared Interest Rate Swap Agreements†† (continued) |
Counterparty | | Exchange | | | Floating
Rate
Type | | | Floating
Rate
Index | | | Fixed
Rate | | | Payment
Frequency | | | Maturity
Date | | | Notional
Amount | | | Value | | | Upfront
Premiums
Paid
(Received) | | | Unrealized
Appreciation
(Depreciation)** | |
BofA Securities, Inc. | CME | Pay | U.S. Secured Overnight Financing Rate | 3.55% | Annually | 08/12/34 | | $ | 15,300,000 | | | $ | (274,616 | ) | | $ | 614 | | | $ | (275,230 | ) |
BofA Securities, Inc. | CME | Receive | U.S. Secured Overnight Financing Rate | 3.49% | Annually | 08/13/34 | | | 45,550,000 | | | | (612,994 | ) | | | 951 | | | | (613,945 | ) |
BofA Securities, Inc. | CME | Receive | U.S. Secured Overnight Financing Rate | 4.36% | Annually | 10/16/30 | | | 121,000,000 | | | | (7,219,469 | ) | | | 812 | | | | (7,220,281 | ) |
| | | | | | | | | | | | | | | | | | | | | | | | | | | | | | | $ | (196,373 | ) | | $ | 3,356 | | | $ | (199,729 | ) |
Forward Foreign Currency Exchange Contracts†† |
Counterparty | | Currency | | | Type | | | Quantity | | | Contract
Amount | | | Settlement
Date | | | Unrealized
Depreciation | |
Bank of America, N.A. | | | GBP | | | | Sell | | | | 1,005,000 | | | | 1,317,688 USD | | | | 10/18/24 | | | $ | (26,014 | ) |
Bank of America, N.A. | | | EUR | | | | Sell | | | | 10,090,000 | | | | 11,176,804 USD | | | | 10/18/24 | | | | (68,849 | ) |
| | | | | | | | | | | | | | | | | | | | | | | $ | (94,863 | ) |
164 | THE GUGGENHEIM FUNDS ANNUAL REPORT | SEE NOTES TO FINANCIAL STATEMENTS. |
SCHEDULE OF INVESTMENTS (continued) | September 30, 2024 |
LIMITED DURATION FUND | |
~ | The face amount is denominated in U.S. dollars unless otherwise indicated. |
* | Non-income producing security. |
** | Includes cumulative appreciation (depreciation). Variation margin is reported within the Statement of Assets and Liabilities. |
*** | A copy of each underlying unaffiliated fund’s financial statements is available at the SEC’s website at www.sec.gov. |
† | Value determined based on Level 1 inputs — See Note 4. |
†† | Value determined based on Level 2 inputs, unless otherwise noted. — See Note 4. |
††† | Value determined based on Level 3 inputs — See Note 4. |
◊ | Variable rate security. Rate indicated is the rate effective at September 30, 2024. In some instances, the effective rate is limited by a minimum rate floor or a maximum rate cap established by the issuer. The settlement status of a position may also impact the effective rate indicated. In some cases, a position may be unsettled at period end and may not have a stated effective rate. In instances where multiple underlying reference rates and spread amounts are shown, the effective rate is based on a weighted average. |
1 | Affiliated issuer. |
2 | Rate indicated is the 7-day yield as of September 30, 2024. |
3 | Security is a 144A or Section 4(a)(2) security. These securities have been determined to be liquid under guidelines established by the Board of Trustees. The total market value of 144A or Section 4(a)(2) securities is $2,385,997,362 (cost $2,436,091,944), or 53.3% of total net assets. |
4 | Security has a fixed rate coupon which will convert to a floating or variable rate coupon on a future date. |
5 | Perpetual maturity. |
6 | Security is an interest-only strip. |
7 | Security is a step up/down bond. The coupon increases or decreases at regular intervals until the bond reaches full maturity. Rate indicated is the rate at September 30, 2024. See table below for additional step information for each security. |
8 | Security has no stated coupon. However, it is expected to receive residual cash flow payments on defined deal dates. |
9 | Security is a 144A or Section 4(a)(2) security. These securities have been determined to be illiquid and restricted under guidelines established by the Board of Trustees. The total market value of 144A or Section 4(a)(2) illiquid and restricted securities is $65,669 (cost $650,854), or 0.0% of total net assets — See Note 10. |
10 | Payment-in-kind security. |
11 | Security is unsettled at period end and does not have a stated effective rate. |
12 | Face amount of security is adjusted for inflation. |
| | BofA — Bank of America |
| | CDX.NA.IG.43.V1 — Credit Default Swap North American Investment Grade Series 43 Index Version 1 |
| | CME — Chicago Mercantile Exchange |
| | EUR — Euro |
| | EURIBOR — European Interbank Offered Rate |
| | GBP — British Pound |
| | ICE — Intercontinental Exchange |
| | ITRAXX.EUR.42.V1 — iTraxx Europe Series 42 Index Version 1 |
| | plc — Public Limited Company |
| | REMIC — Real Estate Mortgage Investment Conduit |
| | REIT — Real Estate Investment Trust |
| | SARL — Société à Responsabilité Limitée |
| | SOFR — Secured Overnight Financing Rate |
| | SONIA — Sterling Overnight Index Average |
| | WAC — Weighted Average Coupon |
| | |
| | See Sector Classification in Other Information section. |
SEE NOTES TO FINANCIAL STATEMENTS. | THE GUGGENHEIM FUNDS ANNUAL REPORT | 165 |
SCHEDULE OF INVESTMENTS (continued) | September 30, 2024 |
LIMITED DURATION FUND | |
The following table summarizes the inputs used to value the Fund’s investments at September 30, 2024 (See Note 4 in the Notes to Financial Statements):
Investments in Securities (Assets) | | Level 1
Quoted
Prices | | | Level 2
Significant
Observable
Inputs | | | Level 3
Significant
Unobservable
Inputs | | | Total | |
Common Stocks | | $ | 11,437 | | | $ | — | | | $ | — | | | $ | 11,437 | |
Preferred Stocks | | | — | | | | 20,583,903 | | | | — | | | | 20,583,903 | |
Warrants | | | 89 | | | | — | | | | — | | | | 89 | |
Mutual Funds | | | 100,564,042 | | | | — | | | | — | | | | 100,564,042 | |
Money Market Funds | | | 76,415,268 | | | | — | | | | — | | | | 76,415,268 | |
Corporate Bonds | | | — | | | | 1,450,774,811 | | | | 27,399,772 | | | | 1,478,174,583 | |
Collateralized Mortgage Obligations | | | — | | | | 1,266,795,353 | | | | — | | | | 1,266,795,353 | |
Asset-Backed Securities | | | — | | | | 1,048,007,051 | | | | 127,702,527 | | | | 1,175,709,578 | |
U.S. Government Securities | | | — | | | | 805,679,382 | | | | — | | | | 805,679,382 | |
Senior Floating Rate Interests | | | — | | | | 80,238,936 | | | | 3,291,684 | | | | 83,530,620 | |
Municipal Bonds | | | — | | | | 10,254,738 | | | | — | | | | 10,254,738 | |
Interest Rate Futures Contracts** | | | 3,634,002 | | | | — | | | | — | | | | 3,634,002 | |
Credit Default Swap Agreements** | | | — | | | | 3,283 | | | | — | | | | 3,283 | |
Interest Rate Swap Agreements** | | | — | | | | 7,985,757 | | | | — | | | | 7,985,757 | |
Total Assets | | $ | 180,624,838 | | | $ | 4,690,323,214 | | | $ | 158,393,983 | | | $ | 5,029,342,035 | |
Investments in Securities (Liabilities) | | Level 1
Quoted
Prices | | | Level 2
Significant
Observable
Inputs | | | Level 3
Significant
Unobservable
Inputs | | | Total | |
Credit Default Swap Agreements** | | $ | — | | | $ | 648 | | | $ | — | | | $ | 648 | |
Interest Rate Swap Agreements** | | | — | | | | 8,185,486 | | | | — | | | | 8,185,486 | |
Forward Foreign Currency Exchange Contracts** | | | — | | | | 94,863 | | | | — | | | | 94,863 | |
Unfunded Loan Commitments (Note 9) | | | — | | | | — | | | | 4,105 | | | | 4,105 | |
Total Liabilities | | $ | — | | | $ | 8,280,997 | | | $ | 4,105 | | | $ | 8,285,102 | |
** | This derivative is reported as unrealized appreciation/depreciation at period end. |
The following is a summary of significant unobservable inputs used in the fair valuation of assets and liabilities categorized within Level 3 of the fair value hierarchy:
Category | | Ending
Balance at
September 30,
2024 | | Valuation
Technique | Unobservable
Inputs | | Input Range | | | Weighted
Average* | |
Assets: | | | | | | | | | | | | | | |
Asset-Backed Securities | | $ | 57,719,957 | | Option adjusted spread off prior month end broker quote | Broker Quote | — | — |
Asset-Backed Securities | | | 40,129,182 | | Third Party Pricing | Broker Quote | — | — |
Asset-Backed Securities | | | 29,853,388 | | Yield Analysis | Yield | 5.7%-7.0% | 6.2% |
Corporate Bonds | | | 18,130,387 | | Yield Analysis | Yield | 5.6%-6.7% | 6.2% |
Corporate Bonds | | | 9,269,385 | | Option adjusted spread off prior month end broker quote | Broker Quote | — | — |
Senior Floating Rate Interests | | | 3,291,684 | | Yield Analysis | Yield | 8.0%-10.3% | 9.4% |
Total Assets | | $ | 158,393,983 | | | | | |
Liabilities: | | | | | | | | | | | | | | |
Unfunded Loan Commitments | | $ | 4,105 | | Model Price | Purchase Price | — | — |
* | Inputs are weighted by the fair value of the instruments. |
166 | THE GUGGENHEIM FUNDS ANNUAL REPORT | SEE NOTES TO FINANCIAL STATEMENTS. |
SCHEDULE OF INVESTMENTS (continued) | September 30, 2024 |
LIMITED DURATION FUND | |
Significant changes in a quote, yield, market comparable yields, liquidation value or valuation multiple would generally result in significant changes in the fair value of the security. Any remaining Level 3 securities held by the Fund and excluded from the table above, were not considered material to the Fund.
The Fund’s fair valuation leveling guidelines classify a single daily broker quote, or a vendor price based on a single daily or monthly broker quote, as Level 3, if such a quote or price cannot be supported with other available market information.
Transfers between Level 2 and Level 3 may occur as markets fluctuate and/or the availability of data used in an investment’s valuation changes. For the year ended September 30, 2024, the Fund had securities with a total value of $18,228,543 transfer out of Level 3 into Level 2 due to the availability of current and reliable market-based data provided by a third-party pricing service which utilizes significant observable inputs.
Summary of Fair Value Level 3 Activity
Following is a reconciliation of Level 3 assets for which significant unobservable inputs were used to determine fair value for the year ended September 30, 2024:
| | | Assets | | | | | | | Liabilities | |
| | Asset-Backed
Securities | | | Collateralized
Mortgage
Obligations | | | Corporate
Bonds | | | Senior
Floating Rate
Interests | | | Total Assets | | | Unfunded
Loan
Commitments | |
Beginning Balance | | $ | 143,391,739 | | | $ | 23,897,802 | | | $ | 33,706,418 | | | $ | 13,540,818 | | | $ | 214,536,777 | | | $ | — | |
Purchases/(Receipts) | | | 55,117,230 | | | | — | | | | 4,800,000 | | | | 3,203,890 | | | | 63,121,120 | | | | (32,116 | ) |
(Sales, maturities and paydowns)/Fundings | | | (72,887,884 | ) | | | (5,952,757 | ) | | | (12,365,851 | ) | | | (13,798,856 | ) | | | (105,005,348 | ) | | | — | |
Amortization of premiums/discounts | | | 73,030 | | | | 24,170 | | | | (10,116 | ) | | | 89,722 | | | | 176,806 | | | | (4,913 | ) |
Total realized gains (losses) included in earnings | | | 74,627 | | | | — | | | | — | | | | — | | | | 74,627 | | | | — | |
Total change in unrealized appreciation (depreciation) included in earnings | | | 1,933,785 | | | | 259,328 | | | | 1,269,321 | | | | 256,110 | | | | 3,718,544 | | | | 32,924 | |
Transfers into Level 3 | | | — | | | | — | | | | — | | | | — | | | | — | | | | — | |
Transfers out of Level 3 | | | — | | | | (18,228,543 | ) | | | — | | | | — | | | | (18,228,543 | ) | | | — | |
Ending Balance | | $ | 127,702,527 | | | $ | — | | | $ | 27,399,772 | | | $ | 3,291,684 | | | $ | 158,393,983 | | | $ | (4,105 | ) |
Net change in unrealized appreciation (depreciation) for investments in Level 3 securities still held at September 30, 2024 | | $ | 1,932,964 | | | $ | — | | | $ | 946,988 | | | $ | 87,038 | | | $ | 2,966,990 | | | $ | 32,924 | |
Step Coupon Bonds
The following table discloses additional information related to step coupon bonds held by the Fund. Certain securities are subject to multiple rate changes prior to maturity. For those securities, a range of rates and corresponding dates have been provided. Rates for all step coupon bonds held by the Fund are scheduled to increase, none are scheduled to decrease.
Name | | Coupon Rate at
Next Reset Date | | | Next Rate Reset Date | | | Future Reset Rate(s) | | | Future Reset Date(s) | |
Angel Oak Mortgage Trust 2024-4, 6.20% due 01/25/69 | | | 7.20 | % | | | 03/01/28 | | | | — | | | | — | |
BRAVO 2024-NQM6, 5.66% due 08/01/64 | | | 6.66 | % | | | 08/01/28 | | | | — | | | | — | |
BRAVO Residential Funding Trust 2022-R1, 3.13% due 01/29/70 | | | 6.13 | % | | | 01/30/25 | | | | — | | | | — | |
Citigroup Mortgage Loan Trust, Inc. 2022-A, 6.17% due 09/25/62 | | | 9.17 | % | | | 09/25/25 | | | | 10.17 | % | | | 09/25/26 | |
COLT Mortgage Loan Trust 2024-2, 6.13% due 04/25/69 | | | 7.13 | % | | | 03/01/28 | | | | — | | | | — | |
GCAT Trust 2024-NQM2, 6.09% due 06/25/59 | | | 7.36 | % | | | 05/01/28 | | | | — | | | | — | |
Legacy Mortgage Asset Trust 2021-GS5, 2.25% due 07/25/67 | | | 5.25 | % | | | 11/25/24 | | | | 6.25 | % | | | 11/25/25 | |
Legacy Mortgage Asset Trust 2021-GS2, 4.75% due 04/25/61 | | | 5.75 | % | | | 04/25/25 | | | | — | | | | — | |
SEE NOTES TO FINANCIAL STATEMENTS. | THE GUGGENHEIM FUNDS ANNUAL REPORT | 167 |
SCHEDULE OF INVESTMENTS (concluded) | September 30, 2024 |
LIMITED DURATION FUND | |
Name | | Coupon Rate at
Next Reset Date | | | Next Rate Reset Date | | | Future Reset Rate(s) | | | Future Reset Date(s) | |
Legacy Mortgage Asset Trust 2021-GS4, 4.65% due 11/25/60 | | | 5.65 | % | | | 08/25/25 | | | | — | | | | — | |
Legacy Mortgage Asset Trust 2021-GS3, 4.75% due 07/25/61 | | | 5.75 | % | | | 05/25/25 | | | | — | | | | — | |
Mill City Securities Ltd. 2024-RS1, 3.00% due 11/01/69 | | | 6.00 | % | | | 10/01/27 | | | | — | | | | — | |
NYMT Loan Trust 2021-SP1, 4.67% due 08/25/61 | | | 5.67 | % | | | 08/01/25 | | | | — | | | | — | |
NYMT Loan Trust 2022-SP1, 5.25% due 07/25/62 | | | 8.25 | % | | | 07/01/25 | | | | 9.25 | % | | | 07/01/26 | |
OBX Trust 2022-NQM9, 6.45% due 09/25/62 | | | 7.45 | % | | | 11/01/26 | | | | — | | | | — | |
OBX Trust 2024-NQM9, 6.28% due 01/25/64 | | | 7.46 | % | | | 06/01/28 | | | | — | | | | — | |
OBX Trust 2024-NQM8, 6.23% due 05/25/64 | | | 7.23 | % | | | 05/01/28 | | | | — | | | | — | |
OBX Trust 2024-NQM5, 5.99% due 01/25/64 | | | 6.99 | % | | | 03/01/28 | | | | — | | | | — | |
OSAT Trust 2021-RPL1, 5.12% due 05/25/65 | | | 6.12 | % | | | 06/25/25 | | | | — | | | | — | |
PRPM LLC 2021-5, 4.79% due 06/25/26 | | | 5.79 | % | | | 06/25/25 | | | | — | | | | — | |
PRPM LLC 2024-4, 6.41% due 08/25/29 | | | 9.41 | % | | | 08/25/27 | | | | 10.41 | % | | | 08/25/28 | |
PRPM LLC 2022-1, 3.72% due 02/25/27 | | | 6.72 | % | | | 02/25/25 | | | | 7.72 | % | | | 02/25/26 | |
RCKT Mortgage Trust 2024-CES4, 6.15% due 06/25/44 | | | 7.15 | % | | | 05/01/28 | | | | — | | | | — | |
Verus Securitization Trust 2020-5, 1.58% due 05/25/65 | | | 2.58 | % | | | 10/26/24 | | | | — | | | | — | |
Verus Securitization Trust 2024-5, 6.45% due 06/25/69 | | | 7.45 | % | | | 06/01/28 | | | | — | | | | — | |
Affiliated Transactions
Investments representing 5% or more of the outstanding voting shares of a company, or control of or by, or common control under Guggenheim Investments (“GI”), result in that company being considered an affiliated issuer, as defined in the 1940 Act.
The Fund may invest in certain of the underlying series of Guggenheim Strategy Funds Trust, including Guggenheim Strategy Fund II and Guggenheim Strategy Fund III (collectively, the “Guggenheim Strategy Funds”), each of which are open-end management investment companies managed by GI. The Guggenheim Strategy Funds, which launched on March 11, 2014, are offered as short term investment options only to mutual funds, trusts, and other accounts managed by GI and/or its affiliates, and are not available to the public. The Guggenheim Strategy Funds pay no investment management fees. The Guggenheim Strategy Funds’ annual report on Form N-CSR dated September 30, 2023 is available publicly or upon request. This information is available from the EDGAR database on the SEC’s website at https://www.sec.gov/Archives/edgar/data/1601445/000182126823000217/gug86449-ncsr.htm. The Fund may invest in certain of the underlying series of Guggenheim Funds Trust, which are open-end management investment companies managed by GI, are available to the public and whose most recent annual report on Form N-CSR is available publicly or upon request.
Transactions during the year ended September 30, 2024, in which the company is an affiliated issuer, were as follows:
Security Name | | Value
09/30/23 | | | Additions | | | Reductions | | | Realized
Gain (Loss) | | | Change in
Unrealized
Appreciation
(Depreciation) | | | Value
09/30/24 | | | Shares
09/30/24 | | | Investment
Income | |
Mutual Funds | | | | | | | | | | | | | | | | | | | | | | | | | | | | | | | | |
Guggenheim Strategy Fund II | | $ | 31,186,426 | | | $ | 1,830,797 | | | $ | — | | | $ | — | | | $ | 697,772 | | | $ | 33,714,995 | | | | 1,359,476 | | | $ | 1,836,314 | |
Guggenheim Strategy Fund III | | | 31,270,271 | | | | 1,757,099 | | | | — | | | | — | | | | 789,884 | | | | 33,817,254 | | | | 1,358,668 | | | | 1,761,665 | |
Guggenheim Ultra Short Duration Fund — Institutional Class | | | 30,463,724 | | | | 1,703,435 | | | | — | | | | — | | | | 864,634 | | | | 33,031,793 | | | | 3,296,586 | | | | 1,708,441 | |
| | | $ | 92,920,421 | | | $ | 5,291,331 | | | $ | — | | | $ | — | | | $ | 2,352,290 | | | $ | 100,564,042 | | | | | | | $ | 5,306,420 | |
168 | THE GUGGENHEIM FUNDS ANNUAL REPORT | SEE NOTES TO FINANCIAL STATEMENTS. |
STATEMENT OF ASSETS AND LIABILITIES |
September 30, 2024 |
Assets: |
Investments in unaffiliated issuers, at value (cost $4,983,669,695) | | $ | 4,917,154,951 | |
Investments in affiliated issuers, at value (cost $99,168,203) | | | 100,564,042 | |
Foreign currency, at value (cost 2,653) | | | 2,646 | |
Cash | | | 1,755,020 | |
Segregated cash with broker | | | 5,055,881 | |
Unamortized upfront premiums paid on interest rate swap agreements | | | 6,166 | |
Prepaid expenses | | | 104,588 | |
Receivables: |
Securities sold | | | 161,168,528 | |
Interest | | | 34,060,053 | |
Fund shares sold | | | 7,382,688 | |
Dividends | | | 422,966 | |
Variation margin on credit default swap agreements | | | 17,444 | |
Due from Investment Adviser | | | 284 | |
Total assets | | | 5,227,695,257 | |
| | | | | |
Liabilities: |
Unfunded loan commitments, at value (Note 9) (commitment fees received $37,029) | | | 4,105 | |
Segregated cash due to broker | | | 1,405,838 | |
Unamortized upfront premiums received on credit default swap agreements | | | 2,621,565 | |
Unamortized upfront premiums received on interest rate swap agreements | | | 2,810 | |
Unrealized depreciation on forward foreign currency exchange contracts | | | 94,863 | |
Payable for: |
Securities purchased | | | 734,050,839 | |
Fund shares redeemed | | | 11,545,694 | |
Distributions to shareholders | | | 1,593,531 | |
Variation margin on interest rate swap agreements | | | 1,237,628 | |
Management fees | | | 1,220,128 | |
Variation margin on futures contracts | | | 349,525 | |
Transfer agent fees | | | 274,959 | |
Distribution and service fees | | | 131,209 | |
Protection fees on credit default swap agreements | | | 35,973 | |
Swap settlement | | | 764 | |
Fund accounting/administration fees | | | 16,037 | |
Trustees’ fees* | | | 10,015 | |
Due to Investment Adviser | | | 4,932 | |
Miscellaneous | | | 444,638 | |
Total liabilities | | | 755,045,053 | |
Net assets | | $ | 4,472,650,204 | |
| | | | | |
Net assets consist of: |
Paid in capital | | $ | 4,643,927,051 | |
Total distributable earnings (loss) | | | (171,276,847 | ) |
Net assets | | $ | 4,472,650,204 | |
| | | | | |
Class A: |
Net assets | | $ | 454,151,669 | |
Capital shares outstanding | | | 18,443,080 | |
Net asset value per share | | $ | 24.62 | |
Maximum offering price per share (Net asset value divided by 97.75%) | | $ | 25.19 | |
| | | | | |
Class C: |
Net assets | | $ | 51,214,140 | |
Capital shares outstanding | | | 2,081,193 | |
Net asset value per share | | $ | 24.61 | |
| | | | | |
Class P: |
Net assets | | $ | 29,560,901 | |
Capital shares outstanding | | | 1,200,560 | |
Net asset value per share | | $ | 24.62 | |
| | | | | |
Institutional Class: |
Net assets | | $ | 3,567,952,176 | |
Capital shares outstanding | | | 144,924,269 | |
Net asset value per share | | $ | 24.62 | |
| | | | | |
Class R6: |
Net assets | | $ | 369,771,318 | |
Capital shares outstanding | | | 15,025,163 | |
Net asset value per share | | $ | 24.61 | |
* | Relates to Trustees not deemed “interested persons” within the meaning of Section 2(a)(19) of the 1940 Act. |
SEE NOTES TO FINANCIAL STATEMENTS. | THE GUGGENHEIM FUNDS ANNUAL REPORT | 169 |
STATEMENT OF OPERATIONS |
Year Ended September 30, 2024 |
Investment Income: |
Dividends from securities of unaffiliated issuers | | $ | 11,903 | |
Dividends from securities of affiliated issuers | | | 5,306,420 | |
Interest | | | 211,371,831 | |
Total investment income | | | 216,690,154 | |
| | | | | |
Expenses: |
Management fees | | | 16,628,051 | |
Distribution and service fees: |
Class A | | | 1,008,797 | |
Class C | | | 508,089 | |
Class P | | | 114,175 | |
Transfer agent/maintenance fees: |
Class A | | | 170,897 | |
Class C | | | 23,492 | |
Class P | | | 57,448 | |
Institutional Class | | | 2,262,727 | |
Class R6 | | | 6,296 | |
Fund accounting/administration fees | | | 1,653,572 | |
Interest expense | | | 1,390,726 | |
Professional fees | | | 364,925 | |
Line of credit fees | | | 164,079 | |
Trustees’ fees* | | | 76,897 | |
Custodian fees | | | 25,100 | |
Miscellaneous | | | 435,791 | |
Recoupment of previously waived fees: |
Class A | | | 39,874 | |
Class C | | | 6,705 | |
Institutional Class | | | 496,384 | |
Class R6 | | | 2,061 | |
Total expenses | | | 25,436,086 | |
Less: |
Expenses reimbursed by Adviser: |
Class A | | | (4,277 | ) |
Class C | | | (3,998 | ) |
Class P | | | (34,279 | ) |
Institutional Class | | | (1,020,934 | ) |
Class R6 | | | (886 | ) |
Expenses waived by Adviser | | | (1,407,898 | ) |
Total waived/reimbursed expenses | | | (2,472,272 | ) |
Net expenses | | | 22,963,814 | |
Net investment income | | | 193,726,340 | |
| | | | | |
Net Realized and Unrealized Gain (Loss): |
Net realized gain (loss) on: |
Investments in unaffiliated issuers | | $ | (10,793,213 | ) |
Swap agreements | | | (7,444,415 | ) |
Futures contracts | | | (1,519,309 | ) |
Options purchased | | | (2,968,935 | ) |
Options written | | | (1,055,134 | ) |
Forward foreign currency exchange contracts | | | 4,608 | |
Foreign currency transactions | | | (138,946 | ) |
Net realized loss | | | (23,915,344 | ) |
Net change in unrealized appreciation (depreciation) on: |
Investments in unaffiliated issuers | | | 192,260,428 | |
Investments in affiliated issuers | | | 2,352,290 | |
Swap agreements | | | 6,917,120 | |
Futures contracts | | | 3,634,002 | |
Options purchased | | | 2,054,220 | |
Options written | | | 843,399 | |
Forward foreign currency exchange contracts | | | (606,731 | ) |
Foreign currency translations | | | 1,889 | |
Net change in unrealized appreciation (depreciation) | | | 207,456,617 | |
Net realized and unrealized gain | | | 183,541,273 | |
Net increase in net assets resulting from operations | | $ | 377,267,613 | |
* | Relates to Trustees not deemed “interested persons” within the meaning of Section 2(a)(19) of the 1940 Act. |
170 | THE GUGGENHEIM FUNDS ANNUAL REPORT | SEE NOTES TO FINANCIAL STATEMENTS. |
STATEMENTS OF CHANGES IN NET ASSETS |
| | Year Ended
September 30,
2024 | | | Year Ended
September 30,
2023 | |
Increase (Decrease) in Net Assets from Operations: | | | | | | | | |
Net investment income | | $ | 193,726,340 | | | $ | 161,809,974 | |
Net realized loss on investments | | | (23,915,344 | ) | | | (76,942,694 | ) |
Net change in unrealized appreciation (depreciation) on investments | | | 207,456,617 | | | | 137,680,504 | |
Net increase in net assets resulting from operations | | | 377,267,613 | | | | 222,547,784 | |
| | | | | | | | | |
Distributions to shareholders: | | | | | | | | |
Class A | | | (17,826,264 | ) | | | (16,755,868 | ) |
Class C | | | (1,871,628 | ) | | | (1,778,619 | ) |
Class P | | | (2,034,505 | ) | | | (2,575,520 | ) |
Institutional Class | | | (159,841,168 | ) | | | (136,965,962 | ) |
Class R6 | | | (15,937,115 | ) | | | (5,921,753 | ) |
Total distributions to shareholders | | | (197,510,680 | ) | | | (163,997,722 | ) |
| | | | | | | | | |
Capital share transactions: | | | | | | | | |
Proceeds from sale of shares | | | | | | | | |
Class A | | | 225,507,616 | | | | 134,134,218 | |
Class C | | | 13,709,872 | | | | 14,149,452 | |
Class P | | | 4,428,844 | | | | 9,238,532 | |
Institutional Class | | | 1,742,700,293 | | | | 1,552,067,621 | |
Class R6 | | | 46,625,759 | | | | 339,029,073 | |
Distributions reinvested | | | | | | | | |
Class A | | | 15,271,634 | | | | 13,736,751 | |
Class C | | | 1,661,112 | | | | 1,490,112 | |
Class P | | | 2,024,993 | | | | 2,558,616 | |
Institutional Class | | | 138,561,310 | | | | 113,710,269 | |
Class R6 | | | 15,745,321 | | | | 5,772,795 | |
Cost of shares redeemed | | | | | | | | |
Class A | | | (196,894,765 | ) | | | (311,444,561 | ) |
Class C | | | (19,766,923 | ) | | | (25,891,808 | ) |
Class P | | | (33,513,727 | ) | | | (39,029,342 | ) |
Institutional Class | | | (1,702,738,590 | ) | | | (2,378,071,191 | ) |
Class R6 | | | (15,117,148 | ) | | | (63,202,366 | ) |
Net increase (decrease) from capital share transactions | | | 238,205,601 | | | | (631,751,829 | ) |
Net increase (decrease) in net assets | | | 417,962,534 | | | | (573,201,767 | ) |
| | | | | | | | | |
Net assets: | | | | | | | | |
Beginning of year | | | 4,054,687,670 | | | | 4,627,889,437 | |
End of year | | $ | 4,472,650,204 | | | $ | 4,054,687,670 | |
| | | | | | | | | |
SEE NOTES TO FINANCIAL STATEMENTS. | THE GUGGENHEIM FUNDS ANNUAL REPORT | 171 |
STATEMENTS OF CHANGES IN NET ASSETS (concluded) |
| | Year Ended
September 30,
2024 | | | Year Ended
September 30,
2023 | |
Capital share activity: | | | | | | | | |
Shares sold | | | | | | | | |
Class A | | | 9,346,342 | | | | 5,673,976 | |
Class C | | | 568,277 | | | | 601,182 | |
Class P | | | 183,397 | | | | 393,536 | |
Institutional Class | | | 72,480,726 | | | | 65,761,074 | |
Class R6 | | | 1,937,664 | | | | 14,311,441 | |
Shares issued from reinvestment of distributions | | | | | | | | |
Class A | | | 633,797 | | | | 582,051 | |
Class C | | | 69,026 | | | | 63,143 | |
Class P | | | 84,178 | | | | 108,402 | |
Institutional Class | | | 5,751,736 | | | | 4,817,987 | |
Class R6 | | | 653,719 | | | | 243,986 | |
Shares redeemed | | | | | | | | |
Class A | | | (8,181,737 | ) | | | (13,221,104 | ) |
Class C | | | (822,359 | ) | | | (1,100,053 | ) |
Class P | | | (1,382,825 | ) | | | (1,654,015 | ) |
Institutional Class | | | (70,810,858 | ) | | | (100,931,627 | ) |
Class R6 | | | (628,235 | ) | | | (2,675,457 | ) |
Net increase (decrease) in shares | | | 9,882,848 | | | | (27,025,478 | ) |
172 | THE GUGGENHEIM FUNDS ANNUAL REPORT | SEE NOTES TO FINANCIAL STATEMENTS. |
This table is presented to show selected data for a share outstanding throughout each period and to assist shareholders in evaluating a Fund’s performance for the periods presented.
Class A | | Year Ended
September 30,
2024 | | | Year Ended
September 30,
2023 | | | Year Ended
September 30,
2022 | | | Year Ended
September 30,
2021 | | | Year Ended
September 30,
2020 | |
Per Share Data |
Net asset value, beginning of period | | $ | 23.61 | | | $ | 23.28 | | | $ | 25.42 | | | $ | 25.57 | | | $ | 24.68 | |
Income (loss) from investment operations: |
Net investment income (loss)a | | | 1.04 | | | | .87 | | | | .42 | | | | .34 | | | | .40 | |
Net gain (loss) on investments (realized and unrealized) | | | 1.03 | | | | .35 | | | | (2.04 | ) | | | .01 | g | | | .94 | |
Total from investment operations | | | 2.07 | | | | 1.22 | | | | (1.62 | ) | | | .35 | | | | 1.34 | |
Less distributions from: |
Net investment income | | | (1.06 | ) | | | (.89 | ) | | | (.43 | ) | | | (.38 | ) | | | (.45 | ) |
Net realized gains | | | — | | | | — | | | | (.09 | ) | | | (.12 | ) | | | — | |
Total distributions | | | (1.06 | ) | | | (.89 | ) | | | (.52 | ) | | | (.50 | ) | | | (.45 | ) |
Net asset value, end of period | | $ | 24.62 | | | $ | 23.61 | | | $ | 23.28 | | | $ | 25.42 | | | $ | 25.57 | |
|
Total Returnb | | | 8.96 | % | | | 5.31 | % | | | (6.42 | %) | | | 1.38 | % | | | 5.51 | % |
Ratios/Supplemental Data |
Net assets, end of period (in thousands) | | $ | 454,152 | | | $ | 392,937 | | | $ | 549,667 | | | $ | 855,473 | | | $ | 625,386 | |
Ratios to average net assets: |
Net investment income (loss) | | | 4.33 | % | | | 3.70 | % | | | 1.69 | % | | | 1.32 | % | | | 1.60 | % |
Total expensesc | | | 0.79 | % | | | 0.80 | % | | | 0.80 | % | | | 0.79 | % | | | 0.84 | % |
Net expensesd,e,f | | | 0.75 | % | | | 0.75 | % | | | 0.74 | % | | | 0.74 | % | | | 0.77 | % |
Portfolio turnover rate | | | 42 | % | | | 28 | % | | | 23 | % | | | 80 | % | | | 123 | % |
Class C | | Year Ended
September 30,
2024 | | | Year Ended
September 30,
2023 | | | Year Ended
September 30,
2022 | | | Year Ended
September 30,
2021 | | | Year Ended
September 30,
2020 | |
Per Share Data |
Net asset value, beginning of period | | $ | 23.59 | | | $ | 23.27 | | | $ | 25.41 | | | $ | 25.55 | | | $ | 24.66 | |
Income (loss) from investment operations: |
Net investment income (loss)a | | | .86 | | | | .70 | | | | .24 | | | | .15 | | | | .21 | |
Net gain (loss) on investments (realized and unrealized) | | | 1.04 | | | | .33 | | | | (2.04 | ) | | | .02 | g | | | .95 | |
Total from investment operations | | | 1.90 | | | | 1.03 | | | | (1.80 | ) | | | .17 | | | | 1.16 | |
Less distributions from: |
Net investment income | | | (.88 | ) | | | (.71 | ) | | | (.25 | ) | | | (.19 | ) | | | (.27 | ) |
Net realized gains | | | — | | | | — | | | | (.09 | ) | | | (.12 | ) | | | — | |
Total distributions | | | (.88 | ) | | | (.71 | ) | | | (.34 | ) | | | (.31 | ) | | | (.27 | ) |
Net asset value, end of period | | $ | 24.61 | | | $ | 23.59 | | | $ | 23.27 | | | $ | 25.41 | | | $ | 25.55 | |
|
Total Returnb | | | 8.20 | % | | | 4.48 | % | | | (7.13 | %) | | | 0.67 | % | | | 4.72 | % |
Ratios/Supplemental Data |
Net assets, end of period (in thousands) | | $ | 51,214 | | | $ | 53,465 | | | $ | 62,864 | | | $ | 90,205 | | | $ | 86,143 | |
Ratios to average net assets: |
Net investment income (loss) | | | 3.58 | % | | | 2.96 | % | | | 0.96 | % | | | 0.58 | % | | | 0.85 | % |
Total expensesc | | | 1.55 | % | | | 1.60 | % | | | 1.58 | % | | | 1.58 | % | | | 1.61 | % |
Net expensesd,e,f | | | 1.50 | % | | | 1.50 | % | | | 1.49 | % | | | 1.49 | % | | | 1.52 | % |
Portfolio turnover rate | | | 42 | % | | | 28 | % | | | 23 | % | | | 80 | % | | | 123 | % |
SEE NOTES TO FINANCIAL STATEMENTS. | THE GUGGENHEIM FUNDS ANNUAL REPORT | 173 |
FINANCIAL HIGHLIGHTS (continued) |
This table is presented to show selected data for a share outstanding throughout each period and to assist shareholders in evaluating a Fund’s performance for the periods presented.
Class P | | Year Ended
September 30,
2024 | | | Year Ended
September 30,
2023 | | | Year Ended
September 30,
2022 | | | Year Ended
September 30,
2021 | | | Year Ended
September 30,
2020 | |
Per Share Data |
Net asset value, beginning of period | | $ | 23.61 | | | $ | 23.28 | | | $ | 25.42 | | | $ | 25.57 | | | $ | 24.68 | |
Income (loss) from investment operations: |
Net investment income (loss)a | | | 1.04 | | | | .87 | | | | .42 | | | | .34 | | | | .40 | |
Net gain (loss) on investments (realized and unrealized) | | | 1.03 | | | | .35 | | | | (2.04 | ) | | | .01 | g | | | .94 | |
Total from investment operations | | | 2.07 | | | | 1.22 | | | | (1.62 | ) | | | .35 | | | | 1.34 | |
Less distributions from: |
Net investment income | | | (1.06 | ) | | | (.89 | ) | | | (.43 | ) | | | (.38 | ) | | | (.45 | ) |
Net realized gains | | | — | | | | — | | | | (.09 | ) | | | (.12 | ) | | | — | |
Total distributions | | | (1.06 | ) | | | (.89 | ) | | | (.52 | ) | | | (.50 | ) | | | (.45 | ) |
Net asset value, end of period | | $ | 24.62 | | | $ | 23.61 | | | $ | 23.28 | | | $ | 25.42 | | | $ | 25.57 | |
|
Total Return | | | 8.96 | % | | | 5.31 | % | | | (6.42 | %) | | | 1.38 | % | | | 5.50 | % |
Ratios/Supplemental Data |
Net assets, end of period (in thousands) | | $ | 29,561 | | | $ | 54,668 | | | $ | 80,735 | | | $ | 155,465 | | | $ | 150,623 | |
Ratios to average net assets: |
Net investment income (loss) | | | 4.32 | % | | | 3.69 | % | | | 1.67 | % | | | 1.33 | % | | | 1.60 | % |
Total expensesc | | | 0.86 | % | | | 0.82 | % | | | 0.95 | % | | | 0.83 | % | | | 0.90 | % |
Net expensesd,e,f | | | 0.75 | % | | | 0.75 | % | | | 0.74 | % | | | 0.74 | % | | | 0.77 | % |
Portfolio turnover rate | | | 42 | % | | | 28 | % | | | 23 | % | | | 80 | % | | | 123 | % |
Institutional Class | | Year Ended
September 30,
2024 | | | Year Ended
September 30,
2023 | | | Year Ended
September 30,
2022 | | | Year Ended
September 30,
2021 | | | Year Ended
September 30,
2020 | |
Per Share Data |
Net asset value, beginning of period | | $ | 23.60 | | | $ | 23.28 | | | $ | 25.42 | | | $ | 25.56 | | | $ | 24.67 | |
Income (loss) from investment operations: |
Net investment income (loss)a | | | 1.10 | | | | .93 | | | | .49 | | | | .40 | | | | .46 | |
Net gain (loss) on investments (realized and unrealized) | | | 1.04 | | | | .34 | | | | (2.05 | ) | | | .03 | g | | | .95 | |
Total from investment operations | | | 2.14 | | | | 1.27 | | | | (1.56 | ) | | | .43 | | | | 1.41 | |
Less distributions from: |
Net investment income | | | (1.12 | ) | | | (.95 | ) | | | (.49 | ) | | | (.45 | ) | | | (.52 | ) |
Net realized gains | | | — | | | | — | | | | (.09 | ) | | | (.12 | ) | | | — | |
Total distributions | | | (1.12 | ) | | | (.95 | ) | | | (.58 | ) | | | (.57 | ) | | | (.52 | ) |
Net asset value, end of period | | $ | 24.62 | | | $ | 23.60 | | | $ | 23.28 | | | $ | 25.42 | | | $ | 25.56 | |
|
Total Return | | | 9.28 | % | | | 5.53 | % | | | (6.19 | %) | | | 1.67 | % | | | 5.77 | % |
Ratios/Supplemental Data |
Net assets, end of period (in thousands) | | $ | 3,567,952 | | | $ | 3,245,439 | | | $ | 3,907,125 | | | $ | 4,960,578 | | | $ | 2,911,309 | |
Ratios to average net assets: |
Net investment income (loss) | | | 4.58 | % | | | 3.96 | % | | | 1.97 | % | | | 1.58 | % | | | 1.85 | % |
Total expensesc | | | 0.57 | % | | | 0.59 | % | | | 0.56 | % | | | 0.56 | % | | | 0.59 | % |
Net expensesd,e,f | | | 0.50 | % | | | 0.50 | % | | | 0.49 | % | | | 0.49 | % | | | 0.52 | % |
Portfolio turnover rate | | | 42 | % | | | 28 | % | | | 23 | % | | | 80 | % | | | 123 | % |
174 | THE GUGGENHEIM FUNDS ANNUAL REPORT | SEE NOTES TO FINANCIAL STATEMENTS. |
FINANCIAL HIGHLIGHTS (concluded) |
This table is presented to show selected data for a share outstanding throughout each period and to assist shareholders in evaluating a Fund’s performance for the periods presented.
Class R6 | | Year Ended
September 30,
2024 | | | Year Ended
September 30,
2023 | | | Year Ended
September 30,
2022 | | | Year Ended
September 30,
2021 | | | Year Ended
September 30,
2020 | |
Per Share Data |
Net asset value, beginning of period | | $ | 23.59 | | | $ | 23.26 | | | $ | 25.40 | | | $ | 25.55 | | | $ | 24.66 | |
Income (loss) from investment operations: |
Net investment income (loss)a | | | 1.11 | | | | 1.00 | | | | .48 | | | | .40 | | | | .48 | |
Net gain (loss) on investments (realized and unrealized) | | | 1.05 | | | | .29 | | | | (2.04 | ) | | | .02 | g | | | .93 | |
Total from investment operations | | | 2.16 | | | | 1.29 | | | | (1.56 | ) | | | .42 | | | | 1.41 | |
Less distributions from: |
Net investment income | | | (1.14 | ) | | | (.96 | ) | | | (.49 | ) | | | (.45 | ) | | | (.52 | ) |
Net realized gains | | | — | | | | — | | | | (.09 | ) | | | (.12 | ) | | | — | |
Total distributions | | | (1.14 | ) | | | (.96 | ) | | | (.58 | ) | | | (.57 | ) | | | (.52 | ) |
Net asset value, end of period | | $ | 24.61 | | | $ | 23.59 | | | $ | 23.26 | | | $ | 25.40 | | | $ | 25.55 | |
|
Total Return | | | 9.33 | % | | | 5.60 | % | | | (6.19 | %) | | | 1.64 | % | | | 5.78 | % |
Ratios/Supplemental Data |
Net assets, end of period (in thousands) | | $ | 369,771 | | | $ | 308,179 | | | $ | 27,499 | | | $ | 44,232 | | | $ | 31,315 | |
Ratios to average net assets: |
Net investment income (loss) | | | 4.63 | % | | | 4.22 | % | | | 1.94 | % | | | 1.58 | % | | | 1.96 | % |
Total expensesc | | | 0.49 | % | | | 0.49 | % | | | 0.49 | % | | | 0.49 | % | | | 0.53 | % |
Net expensesd,e,f | | | 0.46 | % | | | 0.46 | % | | | 0.49 | % | | | 0.49 | % | | | 0.52 | % |
Portfolio turnover rate | | | 42 | % | | | 28 | % | | | 23 | % | | | 80 | % | | | 123 | % |
a | Net investment income (loss) per share was computed using average shares outstanding throughout the period. |
b | Total return does not reflect the impact of any applicable sales charges. |
c | Does not include expenses of the underlying funds in which the Fund invests. |
d | Net expense information reflects the expense ratios after expense waivers and reimbursements, as applicable. |
e | The portion of the ratios of net expenses to average net assets attributable to recoupments of prior fee reductions or expense reimbursements for the years presented was as follows: |
| | | 09/30/24 | 09/30/23 | 09/30/22 | 09/30/21 | 09/30/20 |
| | Class A | 0.01% | 0.01% | 0.00%* | — | 0.00%* |
| | Class C | 0.01% | 0.01% | — | — | 0.00%* |
| | Class P | — | 0.00%* | — | — | 0.00%* |
| | Institutional Class | 0.01% | 0.00%* | — | — | 0.00%* |
| | Class R6 | 0.00%* | 0.02% | 0.02% | 0.01% | 0.00%* |
f | Net expenses may include expenses that are excluded from the expense limitation agreement. Excluding these expenses, the net expense ratios for the years presented would be: |
| | | 09/30/24 | 09/30/23 | 09/30/22 | 09/30/21 | 09/30/20 |
| | Class A | 0.72% | 0.72% | 0.73% | 0.73% | 0.75% |
| | Class C | 1.47% | 1.48% | 1.48% | 1.48% | 1.50% |
| | Class P | 0.72% | 0.72% | 0.73% | 0.73% | 0.75% |
| | Institutional Class | 0.47% | 0.47% | 0.48% | 0.48% | 0.50% |
| | Class R6 | 0.42% | 0.44% | 0.48% | 0.48% | 0.50% |
g | The amount shown for a share outstanding throughout the year does not agree with the aggregate net loss on investments for the year because of the sales and purchases of fund shares in relation to fluctuating market value of the investments of the Fund. |
SEE NOTES TO FINANCIAL STATEMENTS. | THE GUGGENHEIM FUNDS ANNUAL REPORT | 175 |
CONSOLIDATED SCHEDULE OF INVESTMENTS | September 30, 2024 |
MACRO OPPORTUNITIES FUND | |
| | Shares | | | Value | |
COMMON STOCKS† - 0.1% |
| | | | | | | | | |
Consumer, Non-cyclical - 0.1% |
Endo, Inc.* | | | 146,283 | | | $ | 3,766,787 | |
Cengage Learning Holdings II, Inc.*,†† | | | 21,660 | | | | 373,635 | |
Save-A-Lot*,††† | | | 1,053,728 | | | | 7,745 | |
Total Consumer, Non-cyclical | | | | | | | 4,148,167 | |
| | | | | | | | | |
Industrial - 0.0% |
API Heat Transfer Intermediate*,††† | | | 743 | | | | 1,064,597 | |
Schur Flexibles GesmbH*,†† | | | 1,661 | | | | 216,126 | |
YAK BLOCKER 2 LLC*,††† | | | 74,424 | | | | 149,593 | |
YAK BLOCKER 2 LLC*,††† | | | 68,788 | | | | 138,264 | |
BP Holdco LLC*,†††,1 | | | 37,539 | | | | 45,503 | |
Vector Phoenix Holdings, LP*,††† | | | 37,539 | | | | 794 | |
Targus, Inc.*,††† | | | 12,773 | | | | 542 | |
Targus, Inc.*,††† | | | 12,773 | | | | 73 | |
Targus, Inc.*,††† | | | 12,773 | | | | 1 | |
Total Industrial | | | | | | | 1,615,493 | |
| | | | | | | | | |
Consumer, Cyclical - 0.0% |
SHO Holding I Corp.*,††† | | | 1,150 | | | | 903,398 | |
ATD New Holdings, Inc.*,†† | | | 42,478 | | | | 297,346 | |
Total Consumer, Cyclical | | | | | | | 1,200,744 | |
| | | | | | | | | |
Financial - 0.0% |
Checkers Holdings, Inc.*,††† | | | 158,620 | | | | 631,308 | |
Pershing Square Tontine Holdings, Ltd. — Class A*,†††,2 | | | 6,864,930 | | | | 686 | |
Endo Luxembourg Finance Co. I SARL / Endo US, Inc.*,†††,3 | | | 4,400,000 | | | | 440 | |
Endo Luxembourg Finance Co. I SARL / Endo US, Inc.*,†††,3 | | | 1,825,000 | | | | 183 | |
Total Financial | | | | | | | 632,617 | |
| | | | | | | | | |
Communications - 0.0% |
Vacasa, Inc. — Class A* | | | 25,191 | | | | 70,786 | |
| | | | | | | | | |
Utilities - 0.0% |
Mountain Creek Power LLC*,††† | | | 180,169 | | | | 18,017 | |
| | | | | | | | | |
Energy - 0.0% |
Permian Production Partners LLC*,††† | | | 573,522 | | | | 10,306 | |
| | | | | | | | | |
Total Common Stocks | | | | |
(Cost $14,098,745) | | | | | | | 7,696,130 | |
| | | | | | | | | |
PREFERRED STOCKS†† - 4.3% |
Financial - 3.3% |
Citigroup, Inc. |
3.88% | | | 30,600,000 | | | | 29,451,787 | |
4.00% | | | 13,100,000 | | | | 12,825,611 | |
7.38% | | | 1,400,000 | | | | 1,469,668 | |
Goldman Sachs Group, Inc. |
4.13% | | | 20,500,000 | | | | 19,637,184 | |
7.50% | | | 10,750,000 | | | | 11,394,678 | |
Markel Group, Inc. |
6.00% | | | 29,050,000 | | | | 29,018,623 | |
Wells Fargo & Co. |
3.90% | | | 25,750,000 | | | | 25,026,574 | |
Equitable Holdings, Inc. |
4.95% | | | 22,819,000 | | | | 22,602,329 | |
Bank of New York Mellon Corp. |
3.75% | | | 20,550,000 | | | | 19,395,731 | |
Charles Schwab Corp. |
4.00% | | | 18,700,000 | | | | 16,723,260 | |
Kuvare US Holdings, Inc. |
7.00% due 02/17/514 | | | 16,130,000 | | | | 16,210,652 | |
Bank of America Corp. |
4.38% | | | 13,850,000 | | | | 13,407,163 | |
MetLife, Inc. |
3.85% | | | 12,200,000 | | | | 12,003,045 | |
Jackson Financial, Inc. |
8.00% | | | 284,000 | | | | 7,588,480 | |
CNO Financial Group, Inc. |
5.13% due 11/25/60 | | | 323,600 | | | | 6,970,344 | |
Selective Insurance Group, Inc. |
4.60% | | | 246,000 | | | | 4,860,960 | |
American National Group, Inc. |
5.95% | | | 9,800 | | | | 242,354 | |
First Republic Bank |
4.25%* | | | 803,675 | | | | 322 | |
4.50%* | | | 238,300 | | | | 95 | |
Total Financial | | | | | | | 248,828,860 | |
| | | | | | | | | |
Communications - 0.4% |
AT&T Mobility II LLC |
6.80%*,††† | | | 27,000 | | | | 27,633,690 | |
| | | | | | | | | |
Government - 0.4% |
CoBank ACB |
4.25% | | | 20,000,000 | | | | 19,214,974 | |
Farmer Mac |
5.75% | | | 308,805 | | | | 7,534,811 | |
Total Government | | | | | | | 26,749,785 | |
| | | | | | | | | |
Energy - 0.2% |
Venture Global LNG, Inc. |
9.00%4 | | | 18,150,000 | | | | 18,397,365 | |
Total Preferred Stocks | | | | |
(Cost $355,701,212) | | | | | | | 321,609,700 | |
| | | | | | | | | |
WARRANTS† - 0.0% |
Ginkgo Bioworks Holdings, Inc. | | | | | | | | |
Expiring 09/16/26* | | | 128,004 | | | | 576 | |
Pershing Square SPARC Holdings, Ltd*,†††,2 | | | 2,097,618 | | | | 210 | |
Pershing Square Tontine Holdings, Ltd. — Class A | | | | | | | | |
Expiring 07/24/25*,†††,2 | | | 762,770 | | | | 76 | |
Total Warrants | | | | |
(Cost $296,403) | | | | | | | 862 | |
| | | | | | | | | |
EXCHANGE-TRADED FUNDS***,† - 1.0% |
SPDR S&P 500 ETF Trust | | | 125,000 | | | | 71,720,000 | |
Total Exchange-Traded Funds | | | | |
(Cost $65,397,500) | | | | | | | 71,720,000 | |
| | | | | | | | | |
176 | THE GUGGENHEIM FUNDS ANNUAL REPORT | SEE NOTES TO FINANCIAL STATEMENTS. |
CONSOLIDATED SCHEDULE OF INVESTMENTS (continued) | September 30, 2024 |
MACRO OPPORTUNITIES FUND | |
| | Shares | | | Value | |
MUTUAL FUNDS† - 4.2% |
Guggenheim Limited Duration Fund — Class R61 | | | 5,457,388 | | | $ | 134,197,181 | |
Guggenheim Ultra Short Duration Fund — Institutional Class1 | | | 5,286,176 | | | | 52,967,485 | |
Guggenheim Risk Managed Real Estate Fund — Institutional Class1 | | | 1,093,826 | | | | 38,251,104 | |
Guggenheim Strategy Fund III1 | | | 1,448,221 | | | | 36,046,213 | |
Guggenheim Alpha Opportunity Fund — Institutional Class1 | | | 1,022,808 | | | | 33,415,126 | |
Guggenheim Strategy Fund II1 | | | 837,301 | | | | 20,765,053 | |
Total Mutual Funds | | | | |
(Cost $305,063,386) | | | | | | | 315,642,162 | |
| | | | | | | | | |
MONEY MARKET FUNDS***,† - 7.4% |
Federated Hermes U.S. Treasury Cash Reserves Fund — Institutional Shares, 4.85%5 | | | 467,527,779 | | | | 467,527,779 | |
Dreyfus Treasury Obligations Cash Management Fund — Institutional Shares, 4.81%5 | | | 74,700,216 | | | | 74,700,216 | |
Western Asset Institutional U.S. Treasury Reserves — Institutional Shares, 4.89%5 | | | 10,730,307 | | | | 10,730,307 | |
Total Money Market Funds | | | | |
(Cost $552,958,302) | | | | | | | 552,958,302 | |
| | | | | | | | | |
| | | Face
Amount~ | | | | | |
CORPORATE BONDS†† - 29.9% |
Financial - 9.2% | | | | | | | | |
Pershing Square Holdings Ltd. | | | | | | | | |
3.25% due 10/01/314 | | | 31,500,000 | | | | 27,002,430 | |
3.25% due 11/15/30 | | | 12,620,000 | | | | 11,098,281 | |
Jane Street Group / JSG Finance, Inc. | | | | | | | | |
7.13% due 04/30/314 | | | 23,725,000 | | | | 25,138,061 | |
4.50% due 11/15/294 | | | 9,650,000 | | | | 9,288,312 | |
Wilton RE Ltd. | | | | | | | | |
6.00%4,6,7 | | | 31,350,000 | | | | 28,964,385 | |
Rocket Mortgage LLC / Rocket Mortgage Company-Issuer, Inc. | | | | | | | | |
3.88% due 03/01/314 | | | 21,650,000 | | | | 19,934,025 | |
2.88% due 10/15/264 | | | 9,250,000 | | | | 8,880,714 | |
GLP Capital Limited Partnership / GLP Financing II, Inc. | | | | | | | | |
4.00% due 01/15/31 | | | 22,640,000 | | | | 21,223,341 | |
5.30% due 01/15/29 | | | 6,950,000 | | | | 7,068,064 | |
Liberty Mutual Group, Inc. | | | | | | | | |
4.30% due 02/01/614 | | | 36,940,000 | | | | 24,783,098 | |
Host Hotels & Resorts, LP | | | | | | | | |
3.50% due 09/15/30 | | | 24,000,000 | | | | 22,257,719 | |
CBS Studio Center | | | | | | | | |
8.10% (1 Month Term SOFR + 3.00%, Rate Floor: 3.00%) due 01/09/25◊,††† | | | 22,000,000 | | | | 22,000,000 | |
Jefferies Finance LLC / JFIN Company-Issuer Corp. | | | | | | | | |
5.00% due 08/15/284 | | | 23,000,000 | | | | 21,868,642 | |
Iron Mountain, Inc. | | | | | | | | |
5.63% due 07/15/324 | | | 20,000,000 | | | | 19,948,670 | |
4.50% due 02/15/314 | | | 925,000 | | | | 877,452 | |
FS KKR Capital Corp. | | | | | | | | |
3.25% due 07/15/27 | | | 21,000,000 | | | | 19,888,791 | |
LPL Holdings, Inc. | | | | | | | | |
4.00% due 03/15/294 | | | 14,788,000 | | | | 14,153,875 | |
4.38% due 05/15/314 | | | 5,500,000 | | | | 5,183,331 | |
Mitsubishi UFJ Financial Group, Inc. | | | | | | | | |
5.42% due 02/22/297 | | | 18,050,000 | | | | 18,663,662 | |
Starwood Property Trust, Inc. | | | | | | | | |
4.38% due 01/15/274 | | | 19,000,000 | | | | 18,515,212 | |
Alliant Holdings Intermediate LLC / Alliant Holdings Company-Issuer | | | | | | | | |
6.50% due 10/01/314 | | | 14,770,000 | | | | 14,924,888 | |
7.00% due 01/15/314 | | | 3,475,000 | | | | 3,570,886 | |
OneMain Finance Corp. | | | | | | | | |
9.00% due 01/15/29 | | | 7,150,000 | | | | 7,576,619 | |
4.00% due 09/15/30 | | | 7,250,000 | | | | 6,457,415 | |
7.88% due 03/15/30 | | | 2,225,000 | | | | 2,325,986 | |
7.13% due 03/15/26 | | | 2,000,000 | | | | 2,041,830 | |
United Wholesale Mortgage LLC | | | | | | | | |
5.50% due 04/15/294 | | | 7,150,000 | | | | 6,964,106 | |
5.50% due 11/15/254 | | | 6,300,000 | | | | 6,288,251 | |
5.75% due 06/15/274 | | | 4,550,000 | | | | 4,520,409 | |
Encore Capital Group, Inc. | | | | | | | | |
8.50% due 05/15/304 | | | 12,100,000 | | | | 12,752,517 | |
9.25% due 04/01/294 | | | 4,450,000 | | | | 4,787,980 | |
Global Atlantic Finance Co. | | | | | | | | |
4.70% due 10/15/514,7 | | | 11,350,000 | | | | 10,866,147 | |
7.95% due 06/15/334 | | | 2,289,000 | | | | 2,612,762 | |
6.75% due 03/15/544 | | | 2,091,000 | | | | 2,224,852 | |
PennyMac Financial Services, Inc. | | | | | | | | |
7.13% due 11/15/304 | | | 9,275,000 | | | | 9,603,678 | |
7.88% due 12/15/294 | | | 3,675,000 | | | | 3,918,719 | |
5.38% due 10/15/254 | | | 1,819,000 | | | | 1,815,894 | |
Sherwood Financing plc | | | | | | | | |
4.50% due 11/15/264 | | | EUR 12,050,000 | | | | 12,715,642 | |
8.17% (3 Month EURIBOR + 4.63%, Rate Floor: 0.00%) due 11/15/27◊ | | | EUR 1,550,000 | | | | 1,637,996 | |
Focus Financial Partners LLC | | | | | | | | |
6.75% due 09/15/314 | | | 14,035,000 | | | | 14,168,978 | |
Hampton Roads PPV LLC | | | | | | | | |
6.62% due 06/15/53†††,4 | | | 16,560,000 | | | | 14,144,890 | |
Kennedy-Wilson, Inc. | | | | | | | | |
5.00% due 03/01/31 | | | 14,669,000 | | | | 13,168,900 | |
4.75% due 02/01/30 | | | 250,000 | | | | 226,718 | |
4.75% due 03/01/29 | | | 25,000 | | | | 23,142 | |
Hunt Companies, Inc. | | | | | | | | |
5.25% due 04/15/294 | | | 13,700,000 | | | | 13,254,947 | |
Lloyds Banking Group plc | | | | | | | | |
5.87% due 03/06/297 | | | 12,100,000 | | | | 12,620,817 | |
SEE NOTES TO FINANCIAL STATEMENTS. | THE GUGGENHEIM FUNDS ANNUAL REPORT | 177 |
CONSOLIDATED SCHEDULE OF INVESTMENTS (continued) | September 30, 2024 |
MACRO OPPORTUNITIES FUND | |
| | Face
Amount~ | | | Value | |
MidCap Funding XLVI Trust | | | | | | | | |
8.58% (1 Month Term SOFR + 3.50%, Rate Floor: 3.50%) due 04/15/27◊,††† | | | 12,440,000 | | | $ | 12,440,000 | |
First American Financial Corp. | | | | | | | | |
4.00% due 05/15/30 | | | 11,760,000 | | | | 11,170,160 | |
State Street Corp. | | | | | | | | |
6.70%6,7 | | | 9,590,000 | | | | 9,928,546 | |
Nationstar Mortgage Holdings, Inc. | | | | | | | | |
5.00% due 02/01/264 | | | 9,810,000 | | | | 9,762,401 | |
SLM Corp. | | | | | | | | |
3.13% due 11/02/26 | | | 8,914,000 | | | | 8,569,435 | |
4.20% due 10/29/25 | | | 1,000,000 | | | | 988,585 | |
Wells Fargo & Co. | | | | | | | | |
6.85%6,7 | | | 8,250,000 | | | | 8,610,550 | |
OneAmerica Financial Partners, Inc. | | | | | | | | |
4.25% due 10/15/504 | | | 11,550,000 | | | | 8,574,216 | |
QBE Insurance Group Ltd. | | | | | | | | |
5.88%4,6,7 | | | 7,550,000 | | | | 7,507,894 | |
VFH Parent LLC / Valor Company-Issuer, Inc. | | | | | | | | |
7.50% due 06/15/314 | | | 7,150,000 | | | | 7,498,562 | |
Stewart Information Services Corp. | | | | | | | | |
3.60% due 11/15/31 | | | 7,788,000 | | | | 6,837,710 | |
Toronto-Dominion Bank | | | | | | | | |
8.13% due 10/31/827 | | | 6,300,000 | | | | 6,758,716 | |
PartnerRe Finance B LLC | | | | | | | | |
4.50% due 10/01/507 | | | 6,460,000 | | | | 5,974,725 | |
CNO Financial Group, Inc. | | | | | | | | |
6.45% due 06/15/34 | | | 5,200,000 | | | | 5,497,008 | |
Cushman & Wakefield US Borrower LLC | | | | | | | | |
6.75% due 05/15/284 | | | 5,303,000 | | | | 5,351,104 | |
Blue Owl Capital GP LLC | | | | | | | | |
7.11% due 08/22/43††† | | | 5,000,000 | | | | 5,302,150 | |
Bank of Nova Scotia | | | | | | | | |
8.63% due 10/27/827 | | | 4,650,000 | | | | 5,029,640 | |
American National Group, Inc. | | | | | | | | |
5.00% due 06/15/27 | | | 4,813,000 | | | | 4,843,365 | |
Globe Life, Inc. | | | | | | | | |
5.85% due 09/15/34 | | | 4,340,000 | | | | 4,484,631 | |
Goldman Sachs Group, Inc. | | | | | | | | |
6.13%6,7 | | | 4,250,000 | | | | 4,268,424 | |
Accident Fund Insurance Company of America | | | | | | | | |
8.50% due 08/01/324 | | | 3,000,000 | | | | 3,051,433 | |
SBA Communications Corp. | | | | | | | | |
3.13% due 02/01/29 | | | 3,100,000 | | | | 2,865,314 | |
Prudential Financial, Inc. | | | | | | | | |
5.13% due 03/01/527 | | | 2,750,000 | | | | 2,728,901 | |
Horace Mann Educators Corp. | | | | | | | | |
7.25% due 09/15/28 | | | 1,962,000 | | | | 2,131,088 | |
Jones Deslauriers Insurance Management, Inc. | | | | | | | | |
10.50% due 12/15/304 | | | 1,700,000 | | | | 1,848,718 | |
Iron Mountain Information Management Services, Inc. | | | | | | | | |
5.00% due 07/15/324 | | | 1,726,000 | | | | 1,663,641 | |
Atlas Mara Ltd. | | | | | | | | |
due 12/31/21†††,15 | | | 1,183,303 | | | | 1 | |
Total Financial | | | | | | | 685,639,952 | |
| | | | | | | | | |
Energy - 3.7% | | | | | | | | |
BP Capital Markets plc | | | | | | | | |
4.88%6,7 | | | 39,360,000 | | | | 38,933,054 | |
NuStar Logistics, LP | | | | | | | | |
6.38% due 10/01/30 | | | 14,506,000 | | | | 15,051,751 | |
5.75% due 10/01/25 | | | 5,095,000 | | | | 5,102,826 | |
5.63% due 04/28/27 | | | 450,000 | | | | 452,052 | |
Parkland Corp. | | | | | | | | |
4.63% due 05/01/304 | | | 20,000,000 | | | | 18,861,022 | |
Midwest Connector Capital Company LLC | | | | | | | | |
4.63% due 04/01/294 | | | 18,763,000 | | | | 18,650,236 | |
ITT Holdings LLC | | | | | | | | |
6.50% due 08/01/294 | | | 19,477,000 | | | | 18,451,583 | |
Occidental Petroleum Corp. | | | | | | | | |
7.95% due 06/15/39 | | | 12,735,000 | | | | 15,274,830 | |
4.50% due 07/15/44 | | | 2,850,000 | | | | 2,316,876 | |
Cheniere Energy Partners, LP | | | | | | | | |
5.75% due 08/15/344 | | | 16,340,000 | | | | 17,022,190 | |
CVR Energy, Inc. | | | | | | | | |
8.50% due 01/15/294 | | | 15,975,000 | | | | 16,148,281 | |
Targa Resources Partners Limited Partnership / Targa Resources Partners Finance Corp. | | | | | | | | |
6.88% due 01/15/29 | | | 10,145,000 | | | | 10,401,790 | |
4.88% due 02/01/31 | | | 5,000,000 | | | | 4,963,191 | |
Venture Global LNG, Inc. | | | | | | | | |
9.50% due 02/01/294 | | | 8,700,000 | | | | 9,800,591 | |
9.88% due 02/01/324 | | | 3,000,000 | | | | 3,333,575 | |
Hess Midstream Operations, LP | | | | | | | | |
5.63% due 02/15/264 | | | 12,456,000 | | | | 12,457,021 | |
Buckeye Partners, LP | | | | | | | | |
6.88% due 07/01/294 | | | 7,970,000 | | | | 8,165,823 | |
4.13% due 03/01/254 | | | 4,318,000 | | | | 4,282,123 | |
Global Partners Limited Partnership / GLP Finance Corp. | | | | | | | | |
6.88% due 01/15/29 | | | 7,750,000 | | | | 7,773,886 | |
8.25% due 01/15/324 | | | 2,200,000 | | | | 2,282,036 | |
7.00% due 08/01/27 | | | 2,200,000 | | | | 2,214,853 | |
Viper Energy, Inc. | | | | | | | | |
7.38% due 11/01/314 | | | 6,100,000 | | | | 6,433,511 | |
5.38% due 11/01/274 | | | 4,286,000 | | | | 4,268,435 | |
CQP Holdco Limited Partnership / BIP-V Chinook Holdco LLC | | | | | | | | |
7.50% due 12/15/334 | | | 6,550,000 | | | | 7,106,593 | |
Kinetik Holdings, LP | | | | | | | | |
5.88% due 06/15/304 | | | 6,100,000 | | | | 6,141,547 | |
DT Midstream, Inc. | | | | | | | | |
4.13% due 06/15/294 | | | 5,250,000 | | | | 5,021,842 | |
TransCanada PipeLines Ltd. | | | | | | | | |
6.20% due 03/09/26 | | | 3,300,000 | | | | 3,303,217 | |
Venture Global Calcasieu Pass LLC | | | | | | | | |
3.88% due 11/01/334 | | | 2,198,000 | | | | 1,971,307 | |
178 | THE GUGGENHEIM FUNDS ANNUAL REPORT | SEE NOTES TO FINANCIAL STATEMENTS. |
CONSOLIDATED SCHEDULE OF INVESTMENTS (continued) | September 30, 2024 |
MACRO OPPORTUNITIES FUND | |
| | Face
Amount~ | | | Value | |
4.13% due 08/15/314 | | | 760,000 | | | $ | 706,595 | |
3.88% due 08/15/294 | | | 510,000 | | | | 481,966 | |
HF Sinclair Corp. | | | | | | | | |
6.38% due 04/15/27 | | | 2,689,000 | | | | 2,726,077 | |
Sunoco, LP | | | | | | | | |
7.25% due 05/01/324 | | | 1,500,000 | | | | 1,590,026 | |
TransMontaigne Partners Limited Partnership / TLP Finance Corp. | | | | | | | | |
6.13% due 02/15/26 | | | 950,000 | | | | 933,635 | |
Basic Energy Services, Inc. | | | | | | | | |
due 10/15/2315 | | | 1,438,000 | | | | 14,380 | |
Total Energy | | | | | | | 272,638,721 | |
| | | | | | | | | |
Communications - 3.6% | | | | | | | | |
British Telecommunications plc | | | | | | | | |
4.88% due 11/23/814,7 | | | 28,200,000 | | | | 26,032,734 | |
4.25% due 11/23/814,7 | | | 5,250,000 | | | | 5,094,991 | |
Level 3 Financing, Inc. | | | | | | | | |
4.50% due 04/01/304 | | | 19,794,000 | | | | 15,330,588 | |
11.00% due 11/15/294 | | | 5,431,914 | | | | 6,016,256 | |
4.00% due 04/15/314 | | | 7,600,000 | | | | 5,529,000 | |
10.75% due 12/15/304 | | | 2,600,000 | | | | 2,853,387 | |
McGraw-Hill Education, Inc. | | | | | | | | |
8.00% due 08/01/294 | | | 22,634,000 | | | | 22,715,188 | |
5.75% due 08/01/284 | | | 4,600,000 | | | | 4,545,899 | |
Sunrise FinCo I B.V. | | | | | | | | |
4.88% due 07/15/314 | | | 20,200,000 | | | | 19,112,836 | |
Altice France S.A. | | | | | | | | |
5.13% due 07/15/294 | | | 13,250,000 | | | | 9,317,637 | |
5.50% due 10/15/294 | | | 11,760,000 | | | | 8,235,992 | |
CSC Holdings LLC | | | | | | | | |
4.13% due 12/01/304 | | | 20,672,000 | | | | 15,064,829 | |
4.63% due 12/01/304 | | | 2,715,000 | | | | 1,377,844 | |
Vodafone Group plc | | | | | | | | |
5.13% due 06/04/817 | | | 16,875,000 | | | | 13,900,074 | |
LCPR Senior Secured Financing DAC | | | | | | | | |
5.13% due 07/15/294 | | | 16,250,000 | | | | 13,167,820 | |
CCO Holdings LLC / CCO Holdings Capital Corp. | | | | | | | | |
4.50% due 06/01/334 | | | 14,265,000 | | | | 12,114,329 | |
Virgin Media Finance plc | | | | | | | | |
5.00% due 07/15/304 | | | 11,400,000 | | | | 10,026,579 | |
Cable One, Inc. | | | | | | | | |
4.00% due 11/15/304 | | | 12,575,000 | | | | 10,023,843 | |
Sirius XM Radio, Inc. | | | | | | | | |
4.13% due 07/01/304 | | | 8,900,000 | | | | 8,071,209 | |
3.13% due 09/01/264 | | | 1,550,000 | | | | 1,497,546 | |
AMC Networks, Inc. | | | | | | | | |
4.25% due 02/15/29 | | | 10,200,000 | | | | 7,377,045 | |
10.25% due 01/15/294 | | | 2,125,000 | | | | 2,183,756 | |
Cogent Communications Group Incorporated / Cogent Communications Finance, Inc. | | | | | | | | |
7.00% due 06/15/274 | | | 8,550,000 | | | | 8,689,254 | |
Paramount Global | | | | | | | | |
4.85% due 07/01/42 | | | 3,667,000 | | | | 2,924,891 | |
5.90% due 10/15/40 | | | 2,765,000 | | | | 2,446,493 | |
4.90% due 08/15/44 | | | 1,797,000 | | | | 1,381,072 | |
5.25% due 04/01/44 | | | 1,488,000 | | | | 1,185,404 | |
4.60% due 01/15/45 | | | 624,000 | | | | 460,538 | |
Match Group Holdings II LLC | | | | | | | | |
4.63% due 06/01/284 | | | 7,700,000 | | | | 7,486,550 | |
Cogent Communications Group LLC | | | | | | | | |
7.00% due 06/15/274 | | | 7,250,000 | | | | 7,377,448 | |
Telenet Finance Luxembourg Notes SARL | | | | | | | | |
5.50% due 03/01/28 | | | 7,000,000 | | | | 6,844,152 | |
Virgin Media Vendor Financing Notes IV DAC | | | | | | | | |
5.00% due 07/15/284 | | | 3,650,000 | | | | 3,517,732 | |
Charter Communications Operating LLC / Charter Communications Operating Capital | | | | | | | | |
3.90% due 06/01/52 | | | 3,500,000 | | | | 2,294,756 | |
Ziggo B.V. | | | | | | | | |
4.88% due 01/15/304 | | | 1,685,000 | | | | 1,601,118 | |
Zayo Group Holdings, Inc. | | | | | | | | |
4.00% due 03/01/274 | | | 700,000 | | | | 626,110 | |
Total Communications | | | | | | | 266,424,900 | |
| | | | | | | | | |
Industrial - 3.4% | | | | | | | | |
AP Grange Holdings | | | | | | | | |
6.50% due 03/20/45††† | | | 43,700,000 | | | | 44,062,297 | |
5.00% due 03/20/45††† | | | 4,900,000 | | | | 5,026,289 | |
Great Lakes Dredge & Dock Corp. | | | | | | | | |
5.25% due 06/01/294 | | | 17,160,000 | | | | 15,951,152 | |
XPO, Inc. | | | | | | | | |
6.25% due 06/01/284 | | | 14,085,000 | | | | 14,405,349 | |
New Enterprise Stone & Lime Company, Inc. | | | | | | | | |
5.25% due 07/15/284 | | | 9,081,000 | | | | 8,867,594 | |
9.75% due 07/15/284 | | | 5,350,000 | | | | 5,465,041 | |
Standard Industries, Inc. | | | | | | | | |
4.38% due 07/15/304 | | | 6,200,000 | | | | 5,868,316 | |
3.38% due 01/15/314 | | | 6,552,000 | | | | 5,836,778 | |
TransDigm, Inc. | | | | | | | | |
6.75% due 08/15/284 | | | 7,000,000 | | | | 7,205,016 | |
6.88% due 12/15/304 | | | 4,050,000 | | | | 4,241,063 | |
Sealed Air Corporation/Sealed Air Corp US | | | | | | | | |
6.13% due 02/01/284 | | | 11,105,000 | | | | 11,290,920 | |
IP Lending X Ltd. | | | | | | | | |
7.75% due 07/02/294 | | | 10,457,121 | | | | 10,483,264 | |
Arcosa, Inc. | | | | | | | | |
4.38% due 04/15/294 | | | 9,400,000 | | | | 9,010,356 | |
6.88% due 08/15/324 | | | 1,300,000 | | | | 1,360,501 | |
Dyal Capital Partners IV | | | | | | | | |
3.65% due 02/22/41††† | | | 10,950,000 | | | | 9,702,357 | |
Flowserve Corp. | | | | | | | | |
3.50% due 10/01/30 | | | 10,270,000 | | | | 9,561,138 | |
Miter Brands Acquisition Holdco Incorporated / MIWD Borrower LLC | | | | | | | | |
6.75% due 04/01/324 | | | 7,455,000 | | | | 7,728,047 | |
Pactiv Evergreen Group Issuer Incorporated/Pactiv Evergreen Group Issuer LLC | | | | | | | | |
4.00% due 10/15/274 | | | 7,943,000 | | | | 7,637,692 | |
SEE NOTES TO FINANCIAL STATEMENTS. | THE GUGGENHEIM FUNDS ANNUAL REPORT | 179 |
CONSOLIDATED SCHEDULE OF INVESTMENTS (continued) | September 30, 2024 |
MACRO OPPORTUNITIES FUND | |
| | Face
Amount~ | | | Value | |
Deuce FinCo plc | | | | | | | | |
5.50% due 06/15/274 | | | GBP 5,350,000 | | | $ | 7,019,850 | |
Atkore, Inc. | | | | | | | | |
4.25% due 06/01/314 | | | 7,500,000 | | | | 6,856,318 | |
GrafTech Finance, Inc. | | | | | | | | |
4.63% due 12/15/284 | | | 10,000,000 | | | | 6,679,656 | |
GrafTech Global Enterprises, Inc. | | | | | | | | |
9.88% due 12/15/284 | | | 6,520,000 | | | | 5,222,440 | |
TopBuild Corp. | | | | | | | | |
3.63% due 03/15/294 | | | 5,550,000 | | | | 5,175,111 | |
Sealed Air Corp. | | | | | | | | |
6.50% due 07/15/324 | | | 5,000,000 | | | | 5,155,830 | |
Artera Services LLC | | | | | | | | |
8.50% due 02/15/314 | | | 4,525,000 | | | | 4,480,763 | |
SCIL IV LLC / SCIL USA Holdings LLC | | | | | | | | |
9.50% due 07/15/28 | | | EUR 3,500,000 | | | | 4,206,997 | |
Enviri Corp. | | | | | | | | |
5.75% due 07/31/274 | | | 4,125,000 | | | | 4,048,922 | |
Boeing Co. | | | | | | | | |
6.53% due 05/01/344 | | | 3,250,000 | | | | 3,488,111 | |
Wrangler Holdco Corp. | | | | | | | | |
6.63% due 04/01/324 | | | 3,350,000 | | | | 3,482,073 | |
Ball Corp. | | | | | | | | |
6.88% due 03/15/28 | | | 3,270,000 | | | | 3,386,239 | |
Summit Materials LLC / Summit Materials Finance Corp. | | | | | | | | |
7.25% due 01/15/314 | | | 3,150,000 | | | | 3,336,792 | |
TK Elevator US Newco, Inc. | | | | | | | | |
5.25% due 07/15/274 | | | 3,000,000 | | | | 2,967,620 | |
AmeriTex HoldCo Intermediate LLC | | | | | | | | |
10.25% due 10/15/284 | | | 2,450,000 | | | | 2,562,903 | |
Enpro, Inc. | | | | | | | | |
5.75% due 10/15/26 | | | 2,510,000 | | | | 2,491,419 | |
Builders FirstSource, Inc. | | | | | | | | |
6.38% due 06/15/324 | | | 800,000 | | | | 829,297 | |
Brundage-Bone Concrete Pumping Holdings, Inc. | | | | | | | | |
6.00% due 02/01/264 | | | 525,000 | | | | 522,904 | |
Total Industrial | | | | | | | 255,616,415 | |
| | | | | | | | | |
Consumer, Cyclical - 3.3% | | | | | | | | |
Hilton Domestic Operating Company, Inc. | | | | | | | | |
4.00% due 05/01/314 | | | 15,900,000 | | | | 14,867,424 | |
3.63% due 02/15/324 | | | 4,150,000 | | | | 3,749,207 | |
5.75% due 05/01/284 | | | 525,000 | | | | 527,303 | |
Ferrellgas Limited Partnership / Ferrellgas Finance Corp. | | | | | | | | |
5.38% due 04/01/264 | | | 16,778,000 | | | | 16,739,015 | |
Walgreens Boots Alliance, Inc. | | | | | | | | |
3.45% due 06/01/26 | | | 15,450,000 | | | | 14,863,076 | |
Suburban Propane Partners Limited Partnership/Suburban Energy Finance Corp. | | | | | | | | |
5.00% due 06/01/314 | | | 11,350,000 | | | | 10,582,090 | |
5.88% due 03/01/27 | | | 660,000 | | | | 658,878 | |
Mileage Plus Holdings LLC / Mileage Plus Intellectual Property Assets Ltd. | | | | | | | | |
6.50% due 06/20/274 | | | 10,835,000 | | | | 10,969,722 | |
Delta Air Lines, Inc. | | | | | | | | |
7.00% due 05/01/254 | | | 10,536,000 | | | | 10,646,984 | |
1011778 BC ULC / New Red Finance, Inc. | | | | | | | | |
4.00% due 10/15/304 | | | 9,333,000 | | | | 8,606,339 | |
Clarios Global Limited Partnership / Clarios US Finance Co. | | | | | | | | |
6.25% due 05/15/264 | | | 8,299,000 | | | | 8,296,020 | |
Beacon Roofing Supply, Inc. | | | | | | | | |
4.13% due 05/15/294 | | | 4,117,000 | | | | 3,878,761 | |
4.50% due 11/15/264 | | | 3,730,000 | | | | 3,672,232 | |
Wynn Resorts Finance LLC / Wynn Resorts Capital Corp. | | | | | | | | |
6.25% due 03/15/334 | | | 7,425,000 | | | | 7,521,869 | |
CD&R Smokey Buyer, Inc. | | | | | | | | |
6.75% due 07/15/254 | | | 7,250,000 | | | | 7,247,619 | |
Warnermedia Holdings, Inc. | | | | | | | | |
6.41% due 03/15/26 | | | 7,200,000 | | | | 7,204,254 | |
Hyatt Hotels Corp. | | | | | | | | |
5.75% due 04/23/30 | | | 6,530,000 | | | | 6,834,691 | |
British Airways Class A Pass Through Trust | | | | | | | | |
4.25% due 11/15/324 | | | 6,894,827 | | | | 6,602,711 | |
Hanesbrands, Inc. | | | | | | | | |
9.00% due 02/15/314 | | | 6,100,000 | | | | 6,584,334 | |
Papa John’s International, Inc. | | | | | | | | |
3.88% due 09/15/294 | | | 7,025,000 | | | | 6,501,523 | |
Penn Entertainment, Inc. | | | | | | | | |
4.13% due 07/01/294 | | | 6,975,000 | | | | 6,354,967 | |
ONE Hotels GmbH | | | | | | | | |
7.75% due 04/02/314 | | | EUR 5,150,000 | | | | 6,043,894 | |
Six Flags Entertainment Corporation / Six Flags Theme Parks, Inc. | | | | | | | | |
6.63% due 05/01/324 | | | 5,450,000 | | | | 5,644,036 | |
Hawaiian Brand Intellectual Property Ltd. / HawaiianMiles Loyalty Ltd. | | | | | | | | |
11.00% due 04/15/294 | | | 5,482,125 | | | | 5,504,054 | |
JB Poindexter & Company, Inc. | | | | | | | | |
8.75% due 12/15/314 | | | 5,100,000 | | | | 5,392,046 | |
Boyne USA, Inc. | | | | | | | | |
4.75% due 05/15/294 | | | 5,484,000 | | | | 5,271,939 | |
Air Canada | | | | | | | | |
4.63% due 08/15/294 | | | CAD 5,550,000 | | | | 4,033,460 | |
3.88% due 08/15/264 | | | 1,264,000 | | | | 1,230,866 | |
American Airlines Class AA Pass Through Trust | | | | | | | | |
3.58% due 01/15/28 | | | 2,017,419 | | | | 1,945,159 | |
3.35% due 10/15/29 | | | 1,080,426 | | | | 1,019,614 | |
3.65% due 02/15/29 | | | 946,628 | | | | 903,276 | |
3.15% due 02/15/32 | | | 907,026 | | | | 843,758 | |
Ontario Gaming GTA Limited Partnership/OTG Company-Issuer, Inc. | | | | | | | | |
8.00% due 08/01/304 | | | 4,525,000 | | | | 4,702,501 | |
180 | THE GUGGENHEIM FUNDS ANNUAL REPORT | SEE NOTES TO FINANCIAL STATEMENTS. |
CONSOLIDATED SCHEDULE OF INVESTMENTS (continued) | September 30, 2024 |
MACRO OPPORTUNITIES FUND | |
| | Face
Amount~ | | | Value | |
Superior Plus Limited Partnership / Superior General Partner, Inc. | | | | | | | | |
4.50% due 03/15/294 | | | 4,800,000 | | | $ | 4,551,098 | |
Asbury Automotive Group, Inc. | | | | | | | | |
4.63% due 11/15/294 | | | 4,472,000 | | | | 4,264,932 | |
Allwyn Entertainment Financing UK plc | | | | | | | | |
7.88% due 04/30/294 | | | 3,450,000 | | | | 3,627,496 | |
Station Casinos LLC | | | | | | | | |
4.63% due 12/01/314 | | | 3,800,000 | | | | 3,523,787 | |
Scientific Games Holdings Limited Partnership/Scientific Games US FinCo, Inc. | | | | | | | | |
6.63% due 03/01/304 | | | 3,500,000 | | | | 3,473,576 | |
Ritchie Bros Holdings, Inc. | | | | | | | | |
6.75% due 03/15/284 | | | 2,950,000 | | | | 3,049,819 | |
PetSmart, Inc. / PetSmart Finance Corp. | | | | | | | | |
4.75% due 02/15/284 | | | 2,800,000 | | | | 2,684,411 | |
AccorInvest Group S.A. | | | | | | | | |
6.38% due 10/15/294 | | | EUR 2,325,000 | | | | 2,680,500 | |
Gates Corp. | | | | | | | | |
6.88% due 07/01/294 | | | 2,425,000 | | | | 2,511,946 | |
William Carter Co. | | | | | | | | |
5.63% due 03/15/274 | | | 2,300,000 | | | | 2,295,180 | |
Air Canada Class A Pass Through Trust | | | | | | | | |
5.25% due 04/01/294 | | | 2,138,677 | | | | 2,141,169 | |
United Airlines, Inc. | | | | | | | | |
4.63% due 04/15/294 | | | 1,700,000 | | | | 1,642,300 | |
Acushnet Co. | | | | | | | | |
7.38% due 10/15/284 | | | 1,500,000 | | | | 1,581,229 | |
Six Flags Theme Parks, Inc. | | | | | | | | |
7.00% due 07/01/254 | | | 1,511,000 | | | | 1,512,188 | |
United Airlines Class AA Pass Through Trust | | | | | | | | |
4.15% due 08/25/31 | | | 884,921 | | | | 849,116 | |
Wyndham Hotels & Resorts, Inc. | | | | | | | | |
4.38% due 08/15/284 | | | 700,000 | | | | 675,232 | |
International Game Technology plc | | | | | | | | |
4.13% due 04/15/264 | | | 624,000 | | | | 615,855 | |
Live Nation Entertainment, Inc. | | | | | | | | |
6.50% due 05/15/274 | | | 571,000 | | | | 582,416 | |
Newell Brands, Inc. | | | | | | | | |
5.70% due 04/01/26 | | | 450,000 | | | | 451,104 | |
Caesars Entertainment, Inc. | | | | | | | | |
6.50% due 02/15/324 | | | 400,000 | | | | 413,766 | |
Aramark Services, Inc. | | | | | | | | |
5.00% due 04/01/254 | | | 311,000 | | | | 310,305 | |
Total Consumer, Cyclical | | | | | | | 248,881,047 | |
| | | | | | | | | |
Consumer, Non-cyclical - 3.0% | | | | | | | | |
Medline Borrower, LP | | | | | | | | |
3.88% due 04/01/294 | | | 18,246,000 | | | | 17,274,665 | |
Williams Scotsman, Inc. | | | | | | | | |
6.13% due 06/15/254 | | | 11,108,000 | | | | 11,096,670 | |
7.38% due 10/01/314 | | | 1,950,000 | | | | 2,061,076 | |
JBS USA Holding Lux SARL/ JBS USA Food Company/ JBS Lux Co SARL | | | | | | | | |
4.38% due 02/02/52 | | | 6,500,000 | | | | 5,162,556 | |
5.50% due 01/15/30 | | | 4,500,000 | | | | 4,558,068 | |
3.75% due 12/01/31 | | | 3,400,000 | | | | 3,127,070 | |
DaVita, Inc. | | | | | | | | |
4.63% due 06/01/304 | | | 8,678,000 | | | | 8,272,695 | |
3.75% due 02/15/314 | | | 4,892,000 | | | | 4,412,584 | |
AZ Battery Property LLC | | | | | | | | |
6.73% due 02/20/46††† | | | 11,600,000 | | | | 12,172,692 | |
Bausch Health Companies, Inc. | | | | | | | | |
4.88% due 06/01/28†††,4 | | | 15,600,000 | | | | 12,168,000 | |
US Foods, Inc. | | | | | | | | |
4.75% due 02/15/294 | | | 6,550,000 | | | | 6,385,829 | |
6.88% due 09/15/284 | | | 3,875,000 | | | | 4,038,823 | |
Prime Security Services Borrower LLC / Prime Finance, Inc. | | | | | | | | |
3.38% due 08/31/274 | | | 6,861,000 | | | | 6,519,163 | |
5.75% due 04/15/264 | | | 3,020,000 | | | | 3,033,783 | |
Verisure Holding AB | | | | | | | | |
5.50% due 05/15/304 | | | EUR 7,450,000 | | | | 8,546,052 | |
Sotheby’s/Bidfair Holdings, Inc. | | | | | | | | |
5.88% due 06/01/294 | | | 9,400,000 | | | | 8,238,927 | |
Cheplapharm Arzneimittel GmbH | | | | | | | | |
5.50% due 01/15/284 | | | 8,085,000 | | | | 7,841,451 | |
BCP V Modular Services Finance II plc | | | | | | | | |
4.75% due 10/30/284 | | | EUR 7,000,000 | | | | 7,581,579 | |
Nobel Bidco B.V. | | | | | | | | |
3.13% due 06/15/28 | | | EUR 7,050,000 | | | | 7,452,476 | |
Option Care Health, Inc. | | | | | | | | |
4.38% due 10/31/294 | | | 7,736,000 | | | | 7,350,078 | |
HealthEquity, Inc. | | | | | | | | |
4.50% due 10/01/294 | | | 6,555,000 | | | | 6,334,999 | |
Smithfield Foods, Inc. | | | | | | | | |
3.00% due 10/15/304 | | | 7,000,000 | | | | 6,274,037 | |
Boost Newco Borrower LLC | | | | | | | | |
7.50% due 01/15/314 | | | 5,275,000 | | | | 5,660,323 | |
CPI CG, Inc. | | | | | | | | |
10.00% due 07/15/294 | | | 4,685,000 | | | | 4,930,962 | |
ADT Security Corp. | | | | | | | | |
4.88% due 07/15/324 | | | 5,150,000 | | | | 4,919,023 | |
Central Garden & Pet Co. | | | | | | | | |
4.13% due 04/30/314 | | | 5,300,000 | | | | 4,854,419 | |
TriNet Group, Inc. | | | | | | | | |
7.13% due 08/15/314 | | | 4,465,000 | | | | 4,651,793 | |
Graham Holdings Co. | | | | | | | | |
5.75% due 06/01/264 | | | 4,561,000 | | | | 4,559,031 | |
Chrome Bidco | | | | | | | | |
3.50% due 05/31/284 | | | EUR 4,800,000 | | | | 4,520,414 | |
Carriage Services, Inc. | | | | | | | | |
4.25% due 05/15/294 | | | 4,575,000 | | | | 4,238,262 | |
CAB SELAS | | | | | | | | |
3.38% due 02/01/284 | | | EUR 4,100,000 | | | | 4,221,735 | |
Perrigo Finance Unlimited Co. | | | | | | | | |
5.38% due 09/30/32 | | | EUR 3,550,000 | | | | 4,022,859 | |
Catalent Pharma Solutions, Inc. | | | | | | | | |
3.13% due 02/15/294 | | | 2,825,000 | | | | 2,775,002 | |
Darling Ingredients, Inc. | | | | | | | | |
6.00% due 06/15/304 | | | 2,350,000 | | | | 2,372,358 | |
5.25% due 04/15/274 | | | 200,000 | | | | 198,940 | |
SEE NOTES TO FINANCIAL STATEMENTS. | THE GUGGENHEIM FUNDS ANNUAL REPORT | 181 |
CONSOLIDATED SCHEDULE OF INVESTMENTS (continued) | September 30, 2024 |
MACRO OPPORTUNITIES FUND | |
| | Face
Amount~ | | | Value | |
Molina Healthcare, Inc. | | | | | | | | |
4.38% due 06/15/284 | | | 1,770,000 | | | $ | 1,720,746 | |
Tenet Healthcare Corp. | | | | | | | | |
4.63% due 06/15/28 | | | 975,000 | | | | 956,915 | |
5.13% due 11/01/27 | | | 550,000 | | | | 547,921 | |
Upbound Group, Inc. | | | | | | | | |
6.38% due 02/15/294 | | | 1,450,000 | | | | 1,403,793 | |
Altria Group, Inc. | | | | | | | | |
4.45% due 05/06/50 | | | 1,670,000 | | | | 1,399,299 | |
WW International, Inc. | | | | | | | | |
4.50% due 04/15/294 | | | 6,335,000 | | | | 1,398,827 | |
Concentra Escrow Issuer Corp. | | | | | | | | |
6.88% due 07/15/324 | | | 1,120,000 | | | | 1,177,695 | |
AMN Healthcare, Inc. | | | | | | | | |
4.63% due 10/01/274 | | | 620,000 | | | | 606,041 | |
Champions Financing, Inc. | | | | | | | | |
8.75% due 02/15/294 | | | 250,000 | | | | 254,638 | |
Total Consumer, Non-cyclical | | | | | | | 221,294,269 | |
| | | | | | | | | |
Basic Materials - 1.5% | | | | | | | | |
Alcoa Nederland Holding B.V. | | | | | | | | |
5.50% due 12/15/274 | | | 15,125,000 | | | | 15,181,892 | |
6.13% due 05/15/284 | | | 7,450,000 | | | | 7,553,279 | |
4.13% due 03/31/294 | | | 4,900,000 | | | | 4,699,222 | |
Kaiser Aluminum Corp. | | | | | | | | |
4.50% due 06/01/314 | | | 13,250,000 | | | | 12,122,573 | |
4.63% due 03/01/284 | | | 650,000 | | | | 628,644 | |
International Flavors & Fragrances, Inc. | | | | | | | | |
1.23% due 10/01/254 | | | 11,950,000 | | | | 11,533,358 | |
SK Invictus Intermediate II SARL | | | | | | | | |
5.00% due 10/30/294 | | | 11,525,000 | | | | 11,064,139 | |
Minerals Technologies, Inc. | | | | | | | | |
5.00% due 07/01/284 | | | 11,280,000 | | | | 10,976,004 | |
SCIL IV LLC / SCIL USA Holdings LLC | | | | | | | | |
5.38% due 11/01/264 | | | 10,375,000 | | | | 10,246,150 | |
Carpenter Technology Corp. | | | | | | | | |
6.38% due 07/15/28 | | | 8,315,000 | | | | 8,372,033 | |
Novelis Corp. | | | | | | | | |
3.25% due 11/15/264 | | | 5,670,000 | | | | 5,471,397 | |
HB Fuller Co. | | | | | | | | |
4.25% due 10/15/28 | | | 5,250,000 | | | | 5,034,586 | |
Novelis Sheet Ingot GmbH | | | | | | | | |
3.38% due 04/15/29 | | | EUR 4,500,000 | | | | 4,784,955 | |
Arsenal AIC Parent LLC | | | | | | | | |
8.00% due 10/01/304 | | | 3,800,000 | | | | 4,077,716 | |
Ingevity Corp. | | | | | | | | |
3.88% due 11/01/284 | | | 1,000,000 | | | | 939,043 | |
Mirabela Nickel Ltd. | | | | | | | | |
due 06/24/19†††,3,15 | | | 1,885,418 | | | | 9,427 | |
Total Basic Materials | | | | | | | 112,694,418 | |
| | | | | | | | | |
Utilities - 1.1% | | | | | | | | |
AmeriGas Partners Limited Partnership / AmeriGas Finance Corp. | | | | | | | | |
5.88% due 08/20/26 | | | 17,145,000 | | | | 17,026,508 | |
Terraform Global Operating, LP | | | | | | | | |
6.13% due 03/01/264 | | | 16,660,000 | | | | 16,668,197 | |
Algonquin Power & Utilities Corp. | | | | | | | | |
5.37% due 06/15/26 | | | 12,300,000 | | | | 12,448,654 | |
AES Corp. | | | | | | | | |
3.95% due 07/15/304 | | | 9,760,000 | | | | 9,307,770 | |
Clearway Energy Operating LLC | | | | | | | | |
3.75% due 02/15/314 | | | 9,409,000 | | | | 8,615,539 | |
Alexander Funding Trust II | | | | | | | | |
7.47% due 07/31/284 | | | 7,750,000 | | | | 8,373,577 | |
NRG Energy, Inc. | | | | | | | | |
7.00% due 03/15/334 | | | 6,950,000 | | | | 7,720,477 | |
DPL, Inc. | | | | | | | | |
4.13% due 07/01/25 | | | 2,334,000 | | | | 2,310,716 | |
Atlantica Sustainable Infrastructure plc | | | | | | | | |
4.13% due 06/15/284 | | | 1,550,000 | | | | 1,534,902 | |
Total Utilities | | | | | | | 84,006,340 | |
| | | | | | | | | |
Technology - 1.1% | | | | | | | | |
Qorvo, Inc. | | | | | | | | |
3.38% due 04/01/314 | | | 9,225,000 | | | | 8,259,549 | |
4.38% due 10/15/29 | | | 7,833,000 | | | | 7,589,083 | |
TeamSystem SpA | | | | | | | | |
7.44% (3 Month EURIBOR + 3.75%, Rate Floor: 3.75%) due 02/15/28◊ | | | EUR 11,750,000 | | | | 13,149,361 | |
Booz Allen Hamilton, Inc. | | | | | | | | |
3.88% due 09/01/284 | | | 11,800,000 | | | | 11,442,807 | |
Dye & Durham Ltd. | | | | | | | | |
8.63% due 04/15/294 | | | 7,338,000 | | | | 7,762,716 | |
Playtika Holding Corp. | | | | | | | | |
4.25% due 03/15/294 | | | 5,850,000 | | | | 5,368,875 | |
Cloud Software Group, Inc. | | | | | | | | |
6.50% due 03/31/294 | | | 5,300,000 | | | | 5,273,322 | |
Capstone Borrower, Inc. | | | | | | | | |
8.00% due 06/15/304 | | | 3,525,000 | | | | 3,734,942 | |
Twilio, Inc. | | | | | | | | |
3.88% due 03/15/31 | | | 4,000,000 | | | | 3,695,320 | |
Central Parent LLC / CDK Global II LLC / CDK Financing Company, Inc. | | | | | | | | |
8.00% due 06/15/294 | | | 3,050,000 | | | | 3,172,259 | |
Amentum Holdings, Inc. | | | | | | | | |
7.25% due 08/01/324 | | | 2,845,000 | | | | 2,969,136 | |
ACI Worldwide, Inc. | | | | | | | | |
5.75% due 08/15/264 | | | 2,348,000 | | | | 2,347,355 | |
PTC, Inc. | | | | | | | | |
3.63% due 02/15/254 | | | 1,830,000 | | | | 1,823,647 | |
SS&C Technologies, Inc. | | | | | | | | |
5.50% due 09/30/274 | | | 1,570,000 | | | | 1,569,320 | |
Fair Isaac Corp. | | | | | | | | |
5.25% due 05/15/264 | | | 1,375,000 | | | | 1,374,790 | |
NCR Voyix Corp. | | | | | | | | |
5.13% due 04/15/294 | | | 1,122,000 | | | | 1,097,920 | |
MSCI, Inc. | | | | | | | | |
3.88% due 02/15/314 | | | 883,000 | | | | 835,545 | |
TeamSystem S.p.A. | | | | | | | | |
7.19% due 07/31/31 | | | EUR 350,000 | | | | 391,489 | |
Total Technology | | | | | | | 81,857,436 | |
| | | | | | | | | |
Total Corporate Bonds | | | | |
(Cost $2,334,247,702) | | | 2,229,053,498 | |
182 | THE GUGGENHEIM FUNDS ANNUAL REPORT | SEE NOTES TO FINANCIAL STATEMENTS. |
CONSOLIDATED SCHEDULE OF INVESTMENTS (continued) | September 30, 2024 |
MACRO OPPORTUNITIES FUND | |
| | Face
Amount~ | | | Value | |
ASSET-BACKED SECURITIES†† - 18.5% |
Collateralized Loan Obligations - 10.0% | | | | | | | | |
Fortress Credit Opportunities IX CLO Ltd. | | | | | | | | |
2021-9A CR, 8.36% (3 Month Term SOFR + 3.06%, Rate Floor: 2.80%) due 10/15/33◊,4 | | | 35,000,000 | | | $ | 35,000,000 | |
2021-9A DR, 9.51% (3 Month Term SOFR + 4.21%, Rate Floor: 3.95%) due 10/15/33◊,4 | | | 7,750,000 | | | | 7,775,004 | |
2021-9A A2TR, 7.36% (3 Month Term SOFR + 2.06%, Rate Floor: 1.80%) due 10/15/33◊,4 | | | 2,950,000 | | | | 2,962,797 | |
FS Rialto | | | | | | | | |
2021-FL3 D, 7.71% (1 Month Term SOFR + 2.61%, Rate Floor: 2.61%) due 11/16/36◊,4 | | | 36,500,000 | | | | 35,056,180 | |
2021-FL2 D, 8.01% (1 Month Term SOFR + 2.91%, Rate Floor: 2.91%) due 05/16/38◊,4 | | | 8,850,000 | | | | 8,402,819 | |
Palmer Square Loan Funding Ltd. | | | | | | | | |
2022-1A B, 7.30% (3 Month Term SOFR + 2.00%, Rate Floor: 2.00%) due 04/15/30◊,4 | | | 26,200,000 | | | | 26,254,082 | |
2021-3A C, 8.04% (3 Month Term SOFR + 2.76%, Rate Floor: 2.76%) due 07/20/29◊,4 | | | 8,300,000 | | | | 8,316,222 | |
2022-1A C, 7.90% (3 Month Term SOFR + 2.60%, Rate Floor: 2.60%) due 04/15/30◊,4 | | | 3,400,000 | | | | 3,405,222 | |
LCCM Trust | | | | | | | | |
2021-FL3 C, 7.81% (1 Month Term SOFR + 2.71%, Rate Floor: 2.71%) due 11/15/38◊,4 | | | 28,865,000 | | | | 27,468,713 | |
2021-FL2 D, 8.11% (1 Month Term SOFR + 3.01%, Rate Floor: 3.01%) due 12/13/38◊,4 | | | 5,750,000 | | | | 5,359,551 | |
Fontainbleau Vegas | | | | | | | | |
10.77% (1 Month Term SOFR + 5.65%, Rate Floor: 5.65%) due 01/31/26◊,††† | | | 26,499,999 | | | | 26,499,999 | |
BXMT Ltd. | | | | | | | | |
2020-FL2 C, 6.85% (1 Month Term SOFR + 1.76%, Rate Floor: 1.76%) due 02/15/38◊,4 | | | 15,640,000 | | | | 13,646,458 | |
2020-FL2 D, 7.15% (1 Month Term SOFR + 2.06%, Rate Floor: 2.06%) due 02/15/38◊,4 | | | 8,000,000 | | | | 6,372,169 | |
2020-FL3 D, 8.00% (1 Month Term SOFR + 2.91%, Rate Floor: 2.91%) due 11/15/37◊,4 | | | 7,350,000 | | | | 5,550,615 | |
LoanCore Issuer Ltd. | | | | | | | | |
2021-CRE6 D, 8.06% (1 Month Term SOFR + 2.96%, Rate Floor: 2.85%) due 11/15/38◊,4 | | | 11,300,000 | | | | 10,916,374 | |
2021-CRE5 D, 8.21% (1 Month Term SOFR + 3.11%, Rate Floor: 3.11%) due 07/15/36◊,4 | | | 8,250,000 | | | | 8,070,537 | |
2022-CRE7 D, 8.44% (30 Day Average SOFR + 3.10%, Rate Floor: 3.10%) due 01/17/37◊,4 | | | 6,400,000 | | | | 6,227,453 | |
ACRES Commercial Realty Ltd. | | | | | | | | |
2021-FL2 D, 8.30% (1 Month Term SOFR + 3.21%, Rate Floor: 3.21%) due 01/15/37◊,4 | | | 8,350,000 | | | | 7,939,684 | |
2021-FL1 D, 7.85% (1 Month Term SOFR + 2.76%, Rate Floor: 2.76%) due 06/15/36◊,4 | | | 7,250,000 | | | | 6,930,952 | |
2021-FL2 C, 7.85% (1 Month Term SOFR + 2.76%, Rate Floor: 2.76%) due 01/15/37◊,4 | | | 6,500,000 | | | | 6,342,200 | |
2021-FL2 B, 7.45% (1 Month Term SOFR + 2.36%, Rate Floor: 2.36%) due 01/15/37◊,4 | | | 3,500,000 | | | | 3,429,567 | |
Cerberus Loan Funding XLVII LLC | | | | | | | | |
2024-3A C, 7.95% (3 Month Term SOFR + 2.55%, Rate Floor: 2.55%) due 07/15/36◊,4 | | | 20,150,000 | | | | 20,221,929 | |
2024-3A D, 9.68% (3 Month Term SOFR + 4.35%, Rate Floor: 4.35%) due 07/15/36◊,4 | | | 3,900,000 | | | | 3,926,281 | |
Cerberus Loan Funding XLIV LLC | | | | | | | | |
2024-5A C, 9.50% (3 Month Term SOFR + 4.20%, Rate Floor: 4.20%) due 01/15/36◊,4 | | | 22,800,000 | | | | 22,929,490 | |
Cerberus Loan Funding XLII LLC | | | | | | | | |
2023-3A C, 9.44% (3 Month Term SOFR + 4.15%, Rate Floor: 4.15%) due 09/13/35◊,4 | | | 21,550,000 | | | | 21,574,457 | |
MidOcean Credit CLO VII | | | | | | | | |
2020-7A CR, 7.76% (3 Month Term SOFR + 2.46%, Rate Floor: 0.00%) due 07/15/29◊,4 | | | 21,000,000 | | | | 21,021,798 | |
Golub Capital Partners CLO Ltd. | | | | | | | | |
2018-36A C, 7.60% (3 Month Term SOFR + 2.36%, Rate Floor: 0.00%) due 02/05/31◊,4 | | | 20,000,000 | | | | 20,092,446 | |
BSPDF Issuer Ltd. | | | | | | | | |
2021-FL1 D, 7.96% (1 Month Term SOFR + 2.86%, Rate Floor: 2.75%) due 10/15/36◊,4 | | | 19,975,000 | | | | 19,219,426 | |
BSPRT Issuer Ltd. | | | | | | | | |
2021-FL6 D, 8.21% (1 Month Term SOFR + 3.11%, Rate Floor: 3.00%) due 03/15/36◊,4 | | | 18,425,000 | | | | 16,832,715 | |
2021-FL7 D, 7.96% (1 Month Term SOFR + 2.86%, Rate Floor: 2.86%) due 12/15/38◊,4 | | | 1,600,000 | | | | 1,549,066 | |
Golub Capital Partners CLO 49M Ltd. | | | | | | | | |
2021-49A D, 9.39% (3 Month Term SOFR + 4.11%, Rate Floor: 4.11%) due 08/26/33◊,4 | | | 18,100,000 | | | | 18,155,010 | |
SEE NOTES TO FINANCIAL STATEMENTS. | THE GUGGENHEIM FUNDS ANNUAL REPORT | 183 |
CONSOLIDATED SCHEDULE OF INVESTMENTS (continued) | September 30, 2024 |
MACRO OPPORTUNITIES FUND | |
| | Face
Amount~ | | | Value | |
Voya CLO Ltd. | | | | | | | | |
2021-2A CR, 9.16% (3 Month Term SOFR + 3.86%, Rate Floor: 3.60%) due 06/07/30◊,4 | | | 16,500,000 | | | $ | 16,695,890 | |
2013-1A INC, due 10/15/304,8 | | | 28,970,307 | | | | 775,825 | |
Owl Rock CLO I LLC | | | | | | | | |
2024-1A C, 9.38% (3 Month Term SOFR + 4.25%, Rate Floor: 4.25%) due 02/20/36◊,4 | | | 17,250,000 | | | | 17,309,732 | |
Cerberus Loan Funding XLV LLC | | | | | | | | |
2024-1A C, 8.45% (3 Month Term SOFR + 3.15%, Rate Floor: 3.15%) due 04/15/36◊,4 | | | 17,150,000 | | | | 17,205,557 | |
STWD Ltd. | | | | | | | | |
2022-FL3 D, 8.09% (30 Day Average SOFR + 2.75%, Rate Floor: 2.75%) due 11/15/38◊,4 | | | 11,900,000 | | | | 10,925,833 | |
2021-FL2 D, 7.93% (1 Month Term SOFR + 2.91%, Rate Floor: 2.80%) due 04/18/38◊,4 | | | 3,750,000 | | | | 3,506,331 | |
Carlyle Direct Lending CLO LLC | | | | | | | | |
2024-1A BR, 8.07% (3 Month Term SOFR + 2.75%, Rate Floor: 2.75%) due 07/15/36◊,4 | | | 14,200,000 | | | | 14,199,061 | |
GoldenTree Loan Management US CLO 1 Ltd. | | | | | | | | |
2024-9A DR, 8.63% (3 Month Term SOFR + 3.35%, Rate Floor: 3.35%) due 04/20/37◊,4 | | | 13,500,000 | | | | 13,693,698 | |
Ares Direct Lending CLO 2 LLC | | | | | | | | |
2024-2A D, due 10/20/36◊,†††,4 | | | 13,050,000 | | | | 13,142,655 | |
Cerberus Loan Funding XL LLC | | | | | | | | |
2023-1A C, 9.70% (3 Month Term SOFR + 4.40%, Rate Floor: 4.40%) due 03/22/35◊,4 | | | 12,750,000 | | | | 12,824,891 | |
Neuberger Berman Loan Advisers CLO 32 Ltd. | | | | | | | | |
2021-32A DR, 8.24% (3 Month Term SOFR + 2.96%, Rate Floor: 2.70%) due 01/20/32◊,4 | | | 11,500,000 | | | | 11,530,255 | |
Fortress Credit BSL XV Ltd. | | | | | | | | |
2024-2A CR, 7.88% (3 Month Term SOFR + 2.60%, Rate Floor: 2.60%) due 10/18/33◊,4 | | | 11,150,000 | | | | 11,254,341 | |
KREF Ltd. | | | | | | | | |
2021-FL2 AS, 6.50% (1 Month Term SOFR + 1.41%, Rate Floor: 1.30%) due 02/15/39◊,4 | | | 11,000,000 | | | | 10,764,233 | |
Owl Rock CLO XVI LLC | | | | | | | | |
2024-16A C, 8.58% (3 Month Term SOFR + 3.30%, Rate Floor: 3.30%) due 04/20/36◊,4 | | | 10,150,000 | | | | 10,228,504 | |
THL Credit Lake Shore MM CLO I Ltd. | | | | | | | | |
2021-1A CR, 8.56% (3 Month Term SOFR + 3.26%, Rate Floor: 3.00%) due 04/15/33◊,4 | | | 9,900,000 | | | | 9,749,183 | |
Golub Capital Partners CLO 16 Ltd. | | | | | | | | |
2021-16A CR2, 8.45% (3 Month Term SOFR + 3.16%, Rate Floor: 2.90%) due 07/25/33◊,4 | | | 9,300,000 | | | | 9,268,936 | |
Cerberus Loan Funding XLVI, LP | | | | | | | | |
2024-2A C, 8.36% (3 Month Term SOFR + 3.05%, Rate Floor: 3.05%) due 07/15/36◊,4 | | | 8,000,000 | | | | 7,998,658 | |
2024-2A D, 10.26% (3 Month Term SOFR + 4.95%, Rate Floor: 4.95%) due 07/15/36◊,4 | | | 1,000,000 | | | | 1,022,470 | |
BCC Middle Market CLO LLC | | | | | | | | |
2021-1A A1R, 7.06% (3 Month Term SOFR + 1.76%, Rate Floor: 1.50%) due 10/15/33◊,4 | | | 9,000,000 | | | | 9,009,810 | |
CIFC Funding Ltd. | | | | | | | | |
2021-2A DR, 8.64% (3 Month Term SOFR + 3.36%, Rate Floor: 3.10%) due 04/20/30◊,4 | | | 8,100,000 | | | | 8,155,597 | |
BSPRT Issuer LLC | | | | | | | | |
2024-FL11 C, 7.81% (1 Month Term SOFR + 2.64%, Rate Floor: 2.64%) due 07/15/39◊,4 | | | 7,825,000 | | | | 7,810,328 | |
Madison Park Funding XLVIII Ltd. | | | | | | | | |
2021-48A D, 8.54% (3 Month Term SOFR + 3.26%, Rate Floor: 3.26%) due 04/19/33◊,4 | | | 7,500,000 | | | | 7,542,356 | |
ACRE Commercial Mortgage Ltd. | | | | | | | | |
2021-FL4 D, 7.73% (1 Month Term SOFR + 2.71%, Rate Floor: 2.60%) due 12/18/37◊,4 | | | 7,350,000 | | | | 7,214,537 | |
FS Rialto Issuer LLC | | | | | | | | |
2022-FL5 C, 8.89% (1 Month Term SOFR + 3.92%, Rate Floor: 3.92%) due 06/19/37◊,4 | | | 6,950,000 | | | | 6,837,477 | |
Madison Park Funding LVIII Ltd. | | | | | | | | |
2024-58A D, 8.97% (3 Month Term SOFR + 3.65%, Rate Floor: 3.65%) due 04/25/37◊,4 | | | 6,600,000 | | | | 6,674,197 | |
Dryden 37 Senior Loan Fund | | | | | | | | |
2015-37A Q, due 01/15/314,8 | | | 9,500,000 | | | | 6,566,978 | |
Cerberus Loan Funding XXXIII, LP | | | | | | | | |
2021-3A C, 8.36% (3 Month Term SOFR + 3.06%, Rate Floor: 2.80%) due 07/23/33◊,4 | | | 5,900,000 | | | | 5,909,131 | |
ABPCI Direct Lending Fund CLO I LLC | | | | | | | | |
2021-1A C2, 8.54% (3 Month Term SOFR + 3.26%, Rate Floor: 3.26%) due 07/20/33◊,4 | | | 5,550,000 | | | | 5,599,978 | |
Venture XIV CLO Ltd. | | | | | | | | |
2020-14A CRR, 7.57% (3 Month Term SOFR + 2.51%, Rate Floor: 2.25%) due 08/28/29◊,4 | | | 5,518,631 | | | | 5,524,267 | |
Cerberus Loan Funding XLVIII LLC | | | | | | | | |
2024-4A D, due 10/15/36◊,4 | | | 5,350,000 | | | | 5,353,210 | |
184 | THE GUGGENHEIM FUNDS ANNUAL REPORT | SEE NOTES TO FINANCIAL STATEMENTS. |
CONSOLIDATED SCHEDULE OF INVESTMENTS (continued) | September 30, 2024 |
MACRO OPPORTUNITIES FUND | |
| | Face
Amount~ | | | Value | |
KREF Funding V LLC | | | | | | | | |
6.96% (1 Month Term SOFR + 1.86%, Rate Floor: 1.86%) due 06/25/26◊,††† | | | 5,184,387 | | | $ | 5,151,207 | |
0.15% due 06/25/26†††,9 | | | 73,636,363 | | | | 78,791 | |
Cerberus Loan Funding XXXV, LP | | | | | | | | |
2021-5A C, 8.16% (3 Month Term SOFR + 2.86%, Rate Floor: 2.60%) due 09/22/33◊,4 | | | 5,150,000 | | | | 5,141,839 | |
Neuberger Berman Loan Advisers CLO 40 Ltd. | | | | | | | | |
2021-40A D, 8.30% (3 Month Term SOFR + 3.01%, Rate Floor: 2.75%) due 04/16/33◊,4 | | | 4,050,000 | | | | 4,061,578 | |
Neuberger Berman Loan Advisers CLO 57 Ltd. | | | | | | | | |
2024-57A SUB, due 10/24/38◊,4 | | | 4,250,000 | | | | 3,705,023 | |
Wellfleet CLO Ltd. | | | | | | | | |
2021-3A C, 7.81% (3 Month Term SOFR + 2.51%, Rate Floor: 2.25%) due 01/15/35◊,4 | | | 3,400,000 | | | | 3,405,557 | |
Ares Direct Lending CLO 1 LLC | | | | | | | | |
2024-1A B, 7.59% (3 Month Term SOFR + 2.20%, Rate Floor: 2.20%) due 04/25/36◊,4 | | | 2,750,000 | | | | 2,753,051 | |
HGI CRE CLO Ltd. | | | | | | | | |
2021-FL2 D, 7.36% (1 Month Term SOFR + 2.26%, Rate Floor: 2.26%) due 09/17/36◊,4 | | | 1,600,000 | | | | 1,523,193 | |
2021-FL2 E, 7.66% (1 Month Term SOFR + 2.56%, Rate Floor: 2.56%) due 09/17/36◊,4 | | | 1,200,000 | | | | 1,143,880 | |
BDS Ltd. | | | | | | | | |
2021-FL9 E, 7.73% (1 Month Term SOFR + 2.71%, Rate Floor: 2.60%) due 11/16/38◊,4 | | | 2,700,000 | | | | 2,550,866 | |
PFP Ltd. | | | | | | | | |
2024-11 B, 7.57% (1 Month Term SOFR + 2.49%, Rate Floor: 2.49%) due 09/17/39◊,4 | | | 2,250,000 | | | | 2,244,430 | |
BNPP IP CLO Ltd. | | | | | | | | |
2014-2A E, 10.77% (3 Month Term SOFR + 5.51%, Rate Floor: 0.00%) due 10/30/25◊,4 | | | 6,337,836 | | | | 2,114,175 | |
GoldenTree Loan Management US CLO 4 Ltd. | | | | | | | | |
2021-4A DR, 8.70% (3 Month Term SOFR + 3.41%, Rate Floor: 3.15%) due 04/24/31◊,4 | | | 2,000,000 | | | | 2,013,894 | |
Octagon Loan Funding Ltd. | | | | | | | | |
2014-1A SUB, due 11/18/314,8 | | | 19,435,737 | | | | 1,941,974 | |
Wind River CLO Ltd. | | | | | | | | |
2018-1A ARR, 6.59% (3 Month Term SOFR + 1.31%, Rate Floor: 1.05%) due 07/18/31◊,4 | | | 1,799,386 | | | | 1,800,869 | |
Dryden 50 Senior Loan Fund | | | | | | | | |
2017-50A SUB, due 07/15/304,8 | | | 7,895,000 | | | | 1,501,787 | |
Carlyle Global Market Strategies CLO Ltd. | | | | | | | | |
2012-3A SUB, due 01/14/324,8 | | | 6,400,000 | | | | 1,319,587 | |
2013-3X SUB, due 10/15/308 | | | 4,938,326 | | | | 106,964 | |
WhiteHorse X Ltd. | | | | | | | | |
2015-10A E, 10.85% (3 Month Term SOFR + 5.56%, Rate Floor: 5.30%) due 04/17/27◊,4 | | | 1,046,102 | | | | 1,046,071 | |
AMMC CLO XI Ltd. | | | | | | | | |
2012-11A SUB, due 04/30/314,8 | | | 5,650,000 | | | | 674,756 | |
Great Lakes CLO Ltd. | | | | | | | | |
2014-1A SUB, due 10/15/294,8 | | | 1,500,000 | | | | 566,467 | |
Babson CLO Ltd. | | | | | | | | |
2014-IA SUB, due 07/20/254,8 | | | 11,900,000 | | | | 284,529 | |
KVK CLO Ltd. | | | | | | | | |
2013-1A SUB, due 01/14/284,8 | | | 11,900,000 | | | | 224,910 | |
Dryden 41 Senior Loan Fund | | | | | | | | |
2015-41A SUB, due 04/15/314,8 | | | 11,700,000 | | | | 199,129 | |
Treman Park CLO Ltd. | | | | | | | | |
2015-1A SUB, due 10/20/284,8 | | | 18,918,010 | | | | 168,181 | |
Marathon CLO V Ltd. | | | | | | | | |
2013-5A SUB, due 11/21/274,8 | | | 5,500,000 | | | | 42,350 | |
Dryden Senior Loan Fund | | | | | | | | |
2015-37X, due 01/15/318 | | | 1,897,598 | | | | 39,165 | |
Venture XIII CLO Ltd. | | | | | | | | |
2013-13A SUB, due 09/10/294,8 | | | 13,790,000 | | | | 1,379 | |
Copper River CLO Ltd. | | | | | | | | |
2007-1A INC, due 01/20/213,8 | | | 8,150,000 | | | | 815 | |
West CLO Ltd. | | | | | | | | |
2013-1A SUB, due 11/07/254,8 | | | 5,300,000 | | | | 530 | |
Total Collateralized Loan Obligations | | | | | | | 747,550,082 | |
| | | | | | | | | |
Transport-Aircraft - 2.6% | | | | | | | | |
AASET Trust | | | | | | | | |
2024-1A, 6.26% due 05/16/494 | | | 14,112,170 | | | | 14,656,309 | |
2021-1A, 2.95% due 11/16/414 | | | 14,772,887 | | | | 13,748,799 | |
2020-1A, 3.35% due 01/16/404 | | | 4,461,497 | | | | 4,238,792 | |
2020-1A, 4.34% due 01/16/404 | | | 3,751,347 | | | | 3,104,343 | |
2021-2A, 3.54% due 01/15/474 | | | 2,882,479 | | | | 2,589,580 | |
2019-2, 3.38% due 10/16/394 | | | 2,072,609 | | | | 1,990,948 | |
2019-1, 3.84% due 05/15/394 | | | 935,132 | | | | 902,616 | |
KDAC Aviation Finance Ltd. | | | | | | | | |
2017-1A, 4.21% due 12/15/424 | | | 24,994,729 | | | | 23,023,362 | |
Navigator Aviation Ltd. | | | | | | | | |
2024-1, 6.09% due 08/15/494 | | | 15,000,000 | | | | 15,042,600 | |
GAIA Aviation Ltd. | | | | | | | | |
2019-1, 3.97% due 12/15/444,10 | | | 10,344,032 | | | | 9,700,685 | |
2019-1, 5.19% due 12/15/444,10 | | | 4,716,821 | | | | 4,245,946 | |
Sprite Ltd. | | | | | | | | |
2021-1, 3.75% due 11/15/464 | | | 12,209,382 | | | | 11,688,697 | |
Slam Ltd. | | | | | | | | |
2024-1A, 5.34% due 09/15/494 | | | 8,900,000 | | | | 8,876,031 | |
2021-1A, 3.42% due 06/15/464 | | | 2,868,840 | | | | 2,594,548 | |
Castlelake Aircraft Securitization Trust | | | | | | | | |
2019-1A, 3.97% due 04/15/394 | | | 4,886,436 | | | | 4,471,621 | |
2018-1, 4.13% due 06/15/434 | | | 4,512,497 | | | | 4,208,264 | |
Falcon Aerospace Ltd. | | | | | | | | |
2017-1, 4.58% due 02/15/424 | | | 4,342,648 | | | | 4,255,824 | |
2019-1, 3.60% due 09/15/394 | | | 3,448,256 | | | | 3,231,314 | |
2017-1, 6.30% due 02/15/424 | | | 1,240,740 | | | | 1,191,119 | |
SEE NOTES TO FINANCIAL STATEMENTS. | THE GUGGENHEIM FUNDS ANNUAL REPORT | 185 |
CONSOLIDATED SCHEDULE OF INVESTMENTS (continued) | September 30, 2024 |
MACRO OPPORTUNITIES FUND | |
| | Face
Amount~ | | | Value | |
JOL Air Ltd. | | | | | | | | |
2019-1, 3.97% due 04/15/444 | | | 8,587,056 | | | $ | 8,287,540 | |
Sapphire Aviation Finance I Ltd. | | | | | | | | |
2018-1A, 4.25% due 03/15/404 | | | 7,873,119 | | | | 7,511,822 | |
Labrador Aviation Finance Ltd. | | | | | | | | |
2016-1A, 4.30% due 01/15/424 | | | 7,346,518 | | | | 6,795,847 | |
Navigator Aircraft ABS Ltd. | | | | | | | | |
2021-1, 3.57% due 11/15/464 | | | 7,007,361 | | | | 6,417,153 | |
Sapphire Aviation Finance II Ltd. | | | | | | | | |
2020-1A, 4.34% due 03/15/404 | | | 7,188,572 | | | | 5,681,329 | |
2020-1A, 3.23% due 03/15/404 | | | 452,340 | | | | 415,199 | |
AASET US Ltd. | | | | | | | | |
2018-2A, 4.45% due 11/18/384 | | | 5,951,238 | | | | 5,728,100 | |
WAVE LLC | | | | | | | | |
2019-1, 3.60% due 09/15/444 | | | 5,743,260 | | | | 5,312,745 | |
Project Silver | | | | | | | | |
2019-1, 3.97% due 07/15/444 | | | 5,099,497 | | | | 4,692,047 | |
Lunar Structured Aircraft Portfolio Notes | | | | | | | | |
2021-1, 3.43% due 10/15/464 | | | 4,703,324 | | | | 4,256,429 | |
MACH 1 Cayman Ltd. | | | | | | | | |
2019-1, 3.47% due 10/15/394 | | | 2,802,432 | | | | 2,606,626 | |
MAPS Ltd. | | | | | | | | |
2018-1A, 4.21% due 05/15/434 | | | 1,150,279 | | | | 1,135,955 | |
Castlelake Aircraft Structured Trust | | | | | | | | |
2021-1A, 6.66% due 01/15/464 | | | 889,536 | | | | 859,768 | |
MAPS Trust | | | | | | | | |
2021-1A, 2.52% due 06/15/464 | | | 681,042 | | | | 634,710 | |
Total Transport-Aircraft | | | | | | | 194,096,668 | |
| | | | | | | | | |
Financial - 2.1% | | | | | | | | |
HarbourVest Structured Solutions IV Holdings, LP | | | | | | | | |
8.28% (3 Month Term SOFR + 2.95%, Rate Floor: 2.45%) due 09/15/26◊,††† | | | 18,902,986 | | | | 18,822,648 | |
6.38% (3 Month EURIBOR + 2.45%, Rate Floor: 2.45%) due 09/15/26◊,††† | | | EUR 9,403,421 | | | | 10,353,189 | |
Lightning A | | | | | | | | |
5.50% due 03/01/37††† | | | 25,804,314 | | | | 24,204,446 | |
Thunderbird A | | | | | | | | |
5.50% due 03/01/37††† | | | 25,622,353 | | | | 24,033,767 | |
KKR Core Holding Company LLC | | | | | | | | |
4.00% due 08/12/31††† | | | 21,475,137 | | | | 20,030,719 | |
Project Onyx I | | | | | | | | |
8.47% (3 Month Term SOFR + 3.15%, Rate Floor: 3.15%) due 01/26/27◊,††† | | | 15,133,882 | | | | 15,098,468 | |
Ceamer Finance LLC | | | | | | | | |
6.92% due 11/15/37††† | | | 9,873,219 | | | | 9,938,086 | |
3.69% due 03/24/31††† | | | 4,384,950 | | | | 4,158,292 | |
Bib Merchant Voucher Receivables Ltd. | | | | | | | | |
4.18% due 04/07/28††† | | | 9,327,379 | | | | 9,199,781 | |
Nassau LLC | | | | | | | | |
2019-1, 3.98% due 08/15/343 | | | 8,942,768 | | | | 8,186,044 | |
Lightning B | | | | | | | | |
7.50% due 03/01/37††† | | | 5,190,523 | | | | 4,870,475 | |
Thunderbird B | | | | | | | | |
7.50% due 03/01/37††† | | | 5,153,922 | | | | 4,836,131 | |
Project Onyx II | | | | | | | | |
8.47% (3 Month Term SOFR + 3.15%, Rate Floor: 3.15%) due 01/26/27◊,††† | | | 4,321,663 | | | | 4,291,627 | |
Total Financial | | | | | | | 158,023,673 | |
| | | | | | | | | |
Infrastructure - 1.5% | | | | | | | | |
VB-S1 Issuer LLC - VBTEL | | | | | | | | |
2022-1A, 5.27% due 02/15/524 | | | 39,650,000 | | | | 37,181,605 | |
2024-1A, 8.87% due 05/15/544 | | | 5,950,000 | | | | 6,154,444 | |
Hotwire Funding LLC | | | | | | | | |
2023-1A, 8.84% due 05/20/534 | | | 20,000,000 | | | | 20,665,698 | |
2021-1, 4.46% due 11/20/514 | | | 11,750,000 | | | | 10,999,508 | |
2024-1A, 9.19% due 06/20/544 | | | 7,250,000 | | | | 7,650,015 | |
Switch ABS Issuer LLC | | | | | | | | |
2024-2A, 5.44% due 06/25/544 | | | 17,550,000 | | | | 17,732,934 | |
Vault DI Issuer LLC | | | | | | | | |
2021-1A, 2.80% due 07/15/464 | | | 7,150,000 | | | | 6,558,031 | |
Aligned Data Centers Issuer LLC | | | | | | | | |
2021-1A, 2.48% due 08/15/464 | | | 4,925,000 | | | | 4,608,940 | |
Blue Stream Issuer LLC | | | | | | | | |
2023-1A, 6.90% due 05/20/534 | | | 3,400,000 | | | | 3,446,841 | |
Total Infrastructure | | | | | | | 114,998,016 | |
| | | | | | | | | |
Net Lease - 0.6% | | | | | | | | |
CARS-DB4, LP | | | | | | | | |
2020-1A, 4.95% due 02/15/504 | | | 27,799,000 | | | | 24,877,587 | |
CARS-DB7, LP | | | | | | | | |
2023-1A, 6.50% due 09/15/534 | | | 11,158,750 | | | | 11,434,224 | |
SVC ABS LLC | | | | | | | | |
2023-1A, 5.55% due 02/20/534 | | | 5,926,448 | | | | 5,762,391 | |
Total Net Lease | | | | | | | 42,074,202 | |
| | | | | | | | | |
Whole Business - 0.5% | | | | | | | | |
Subway Funding LLC | | | | | | | | |
2024-1A, 6.51% due 07/30/544 | | | 17,750,000 | | | | 18,406,620 | |
2024-3A, 5.91% due 07/30/544 | | | 9,050,000 | | | | 9,057,106 | |
Applebee’s Funding LLC / IHOP Funding LLC | | | | | | | | |
2019-1A, 4.72% due 06/05/494 | | | 9,742,590 | | | | 9,583,091 | |
Taco Bell Funding LLC | | | | | | | | |
2016-1A, 4.97% due 05/25/464 | | | 2,648,438 | | | | 2,652,234 | |
Wendy’s Funding LLC | | | | | | | | |
2018-1A, 3.88% due 03/15/484 | | | 372,951 | | | | 361,886 | |
Total Whole Business | | | | | | | 40,060,937 | |
| | | | | | | | | |
Single Family Residence - 0.5% | | | | | | | | |
FirstKey Homes Trust | | | | | | | | |
2020-SFR2, 4.00% due 10/19/374 | | | 13,550,000 | | | | 13,181,786 | |
2020-SFR2, 4.50% due 10/19/374 | | | 13,250,000 | | | | 12,910,600 | |
2020-SFR2, 3.37% due 10/19/374 | | | 8,550,000 | | | | 8,283,379 | |
Total Single Family Residence | | | | | | | 34,375,765 | |
| | | | | | | | | |
Insurance - 0.4% | | | | | | | | |
Obra Longevity | | | | | | | | |
8.48% due 06/30/39††† | | | 20,580,000 | | | | 20,944,266 | |
CHEST | | | | | | | | |
7.13% due 03/15/43††† | | | 5,700,000 | | | | 5,983,005 | |
Total Insurance | | | | | | | 26,927,271 | |
186 | THE GUGGENHEIM FUNDS ANNUAL REPORT | SEE NOTES TO FINANCIAL STATEMENTS. |
CONSOLIDATED SCHEDULE OF INVESTMENTS (continued) | September 30, 2024 |
MACRO OPPORTUNITIES FUND | |
| | Face
Amount~ | | | Value | |
Asset-Backed Securities - 0.2% | | | | | | | | |
Endo Luxembourg Finance Co. I SARL / Endo US, Inc. | | | | | | | | |
7.40% due 09/30/45††† | | | 17,000,000 | | | $ | 17,879,410 | |
| | | | | | | | | |
Collateralized Debt Obligations - 0.1% | | | | | | | | |
Anchorage Credit Funding 4 Ltd. | | | | | | | | |
2021-4A CR, 3.52% due 04/27/394 | | | 4,250,000 | | | | 3,842,472 | |
Total Asset-Backed Securities | | | | |
(Cost $1,404,003,511) | | | 1,379,828,496 | |
| | | | | |
SENIOR FLOATING RATE INTERESTS††,◊ - 15.9% |
Consumer, Cyclical - 4.2% | | | | | | | | |
Zephyr Bidco Ltd. | | | | | | | | |
10.45% (1 Month GBP SONIA + 5.50%, Rate Floor: 5.50%) due 07/20/28 | | | GBP 20,850,000 | | | | 27,971,443 | |
FR Refuel LLC | | | | | | | | |
9.71% (1 Month Term SOFR + 4.75%, Rate Floor: 5.50%) due 11/08/28††† | | | 20,698,329 | | | | 20,284,362 | |
Crash Champions Inc. | | | | | | | | |
9.85% (3 Month Term SOFR + 4.75%, Rate Floor: 4.75%) due 02/23/29 | | | 18,565,000 | | | | 17,822,400 | |
MB2 Dental Solutions LLC | | | | | | | | |
10.85% (1 Month Term SOFR + 6.00%, Rate Floor: 6.75%) due 02/13/31††† | | | 15,305,530 | | | | 15,270,626 | |
6.75% (1 Month Term SOFR + 6.00%, Rate Floor: 6.75%) due 02/13/31††† | | | 606,000 | | | | 537,083 | |
Alexander Mann | | | | | | | | |
11.44% (1 Month SOFR + 6.00%, Rate Floor: 6.00%) due 06/29/27 | | | 15,905,292 | | | | 15,487,779 | |
First Brands Group LLC | | | | | | | | |
10.51% (3 Month Term SOFR + 5.00%, Rate Floor: 6.00%) due 03/30/27 | | | 12,870,653 | | | | 12,716,801 | |
Fertitta Entertainment LLC | | | | | | | | |
8.85% (1 Month Term SOFR + 3.75%, Rate Floor: 4.25%) due 01/27/29 | | | 12,479,008 | | | | 12,438,326 | |
Pacific Bells LLC | | | | | | | | |
9.37% (1 Month Term SOFR + 4.50%, Rate Floor: 9.50%) due 11/10/28 | | | 11,943,491 | | | | 11,943,491 | |
Casper Bidco SAS (B&B Hotels) | | | | | | | | |
7.63% (1 Month EURIBOR + 4.25%, Rate Floor: 4.25%) due 03/21/31 | | | EUR 10,496,376 | | | | 11,711,192 | |
One Hotels GmbH | | | | | | | | |
8.21% (3 Month EURIBOR + 4.50%, Rate Floor: 4.50%) due 04/02/31 | | | EUR 10,400,000 | | | | 11,590,805 | |
Drive Bidco B.V. | | | | | | | | |
8.13% (3 Month EURIBOR + 4.50%, Rate Floor: 4.50%) due 05/09/31††† | | | EUR 8,800,000 | | | | 9,776,144 | |
Rent-A-Center, Inc. | | | | | | | | |
8.00% (3 Month Term SOFR + 2.75%, Rate Floor: 3.25%) due 02/17/28 | | | 9,730,735 | | | | 9,695,315 | |
QSRP Finco B.V. | | | | | | | | |
8.96% (3 Month EURIBOR + 5.25%, Rate Floor: 5.25%) due 06/19/31 | | | EUR 8,600,000 | | | | 9,588,440 | |
Caesars Entertainment, Inc. | | | | | | | | |
7.60% (1 Month Term SOFR + 2.75%, Rate Floor: 3.25%) due 02/06/31 | | | 9,303,250 | | | | 9,291,621 | |
Peer Holding III BV | | | | | | | | |
7.60% (3 Month Term SOFR + 3.00%, Rate Floor: 3.00%) due 07/01/31 | | | 5,120,000 | | | | 5,128,550 | |
7.85% (3 Month Term SOFR + 3.25%, Rate Floor: 3.25%) due 10/28/30 | | | 3,482,500 | | | | 3,489,047 | |
The Facilities Group | | | | | | | | |
10.64% ((3 Month Term SOFR + 5.75%) and (6 Month Term SOFR + 5.75%), Rate Floor: 6.75%) due 11/30/27††† | | | 8,329,720 | | | | 8,191,164 | |
NFM & J LLC | | | | | | | | |
11.10% (3 Month Term SOFR + 5.75%, Rate Floor: 6.75%) due 11/30/27††† | | | 8,194,570 | | | | 8,058,262 | |
PCI Gaming Authority, Inc. | | | | | | | | |
6.85% (1 Month Term SOFR + 2.00%, Rate Floor: 2.00%) due 07/18/31 | | | 7,182,000 | | | | 7,134,599 | |
Holding SOCOTEC | | | | | | | | |
6.85% (6 Month Term SOFR + 3.50%, Rate Floor: 4.25%) due 06/30/28 | | | 6,935,500 | | | | 6,918,161 | |
Scientific Games Corp. | | | | | | | | |
8.32% (3 Month Term SOFR + 3.00%, Rate Floor: 3.50%) due 04/04/29 | | | 6,955,000 | | | | 6,909,167 | |
Clarios Global, LP | | | | | | | | |
6.38% (1 Month EURIBOR + 3.00%, Rate Floor: 3.00%) due 07/16/31 | | | EUR 4,810,000 | | | | 5,341,891 | |
7.35% (1 Month Term SOFR + 2.50%, Rate Floor: 2.50%) due 05/06/30 | | | 1,170,000 | | | | 1,168,783 | |
Apro LLC | | | | | | | | |
8.87% (1 Month Term SOFR + 3.75%, Rate Floor: 3.75%) due 07/09/31 | | | 6,350,000 | | | | 6,365,875 | |
Entain Holdings (Gibraltar) Ltd. | | | | | | | | |
6.92% (6 Month EURIBOR + 3.25%, Rate Floor: 3.25%) due 06/30/28 | | | EUR 5,450,000 | | | | 6,095,211 | |
Shaw Development LLC | | | | | | | | |
11.25% (3 Month Term SOFR + 6.00%, Rate Floor: 6.00%) due 10/30/29††† | | | 6,135,128 | | | | 6,031,234 | |
Grant Thornton Advisors LLC | | | | | | | | |
8.10% (1 Month Term SOFR + 3.25%, Rate Floor: 3.25%) due 06/02/31 | | | 5,670,000 | | | | 5,676,350 | |
Packers Holdings LLC | | | | | | | | |
8.20% (1 Month Term SOFR + 3.25%, Rate Floor: 4.00%) due 03/09/28 | | | 9,103,678 | | | | 4,728,268 | |
Accuride Corp. | | | | | | | | |
11.93% (1 Month Term SOFR + 1.00%, Rate Floor: 6.06%) (in-kind rate was 5.87%) due 05/18/2611 | | | 6,067,545 | | | | 4,027,333 | |
ImageFIRST Holdings LLC | | | | | | | | |
8.85% (3 Month Term SOFR + 4.25%, Rate Floor: 5.00%) due 04/27/28††† | | | 3,843,908 | | | | 3,815,079 | |
Da Vinci Purchaser Corp. | | | | | | | | |
8.35% (1 Month Term SOFR + 3.50%, Rate Floor: 4.50%) due 01/08/27 | | | 3,791,263 | | | | 3,788,913 | |
Tacala Investment Corp. | | | | | | | | |
8.35% (3 Month Term SOFR + 4.00%, Rate Floor: 4.75%) due 01/31/31 | | | 2,985,000 | | | | 2,985,746 | |
due 01/31/31 | | | 600,000 | | | | 600,150 | |
SEE NOTES TO FINANCIAL STATEMENTS. | THE GUGGENHEIM FUNDS ANNUAL REPORT | 187 |
CONSOLIDATED SCHEDULE OF INVESTMENTS (continued) | September 30, 2024 |
MACRO OPPORTUNITIES FUND | |
| | Face
Amount~ | | | Value | |
Orion Group | | | | | | | | |
10.87% (1 Month Term SOFR + 6.51%, Rate Floor: 7.51%) due 03/19/27††† | | | 3,572,479 | | | $ | 3,500,397 | |
ScribeAmerica Intermediate Holdco LLC (Healthchannels) | | | | | | | | |
9.67% (6 Month Term SOFR + 4.50%, Rate Floor: 5.50%) due 04/03/25 | | | 4,603,917 | | | | 3,057,784 | |
Albion Financing 3 SARL | | | | | | | | |
7.96% (3 Month EURIBOR + 4.25%, Rate Floor: 4.25%) due 08/16/29 | | | EUR 2,300,000 | | | | 2,570,037 | |
SHO Holding I Corp. | | | | | | | | |
11.82% (1 Month Term SOFR + 6.50%, Rate Floor: 7.50%) due 06/30/29††† | | | 1,698,653 | | | | 1,685,849 | |
12.32% (1 Month Term SOFR + 2.00%, Rate Floor: 7.32%) (in-kind rate was 5.00%) due 06/30/29†††,11 | | | 606,701 | | | | 533,897 | |
Congruex Group LLC | | | | | | | | |
11.15% (3 Month Term SOFR + 5.75%, Rate Floor: 6.50%) due 05/03/29 | | | 2,738,642 | | | | 2,112,177 | |
Allwyn Entertainment Financing US LLC | | | | | | | | |
7.55% (3 Month Term SOFR + 2.25%, Rate Floor: 2.25%) due 06/02/31 | | | 1,970,000 | | | | 1,966,316 | |
Dealer Tire LLC | | | | | | | | |
8.35% (1 Month Term SOFR + 3.50%, Rate Floor: 4.00%) due 07/02/31 | | | 1,805,000 | | | | 1,807,256 | |
Accuride Corp. | | | | | | | | |
14.85% (1 Month Term SOFR) (in-kind rate was 14.85%) due 10/07/24†††,11 | | | 1,865,969 | | | | 1,777,113 | |
Checkers Holdings, Inc. | | | | | | | | |
14.70% (6 Month Term SOFR + 3.00%, Rate Floor: 8.70%) (in-kind rate was 6.00%) due 06/16/28†††,11 | | | 1,293,192 | | | | 1,293,192 | |
12.70% (6 Month Term SOFR + 3.00%, Rate Floor: 8.70%) (in-kind rate was 4.00%) due 06/16/27†††,11 | | | 180,443 | | | | 180,443 | |
Alterra Mountain Co. | | | | | | | | |
8.10% (1 Month Term SOFR + 3.25%, Rate Floor: 3.25%) due 08/17/28 | | | 1,436,400 | | | | 1,437,592 | |
EG Finco Ltd. | | | | | | | | |
11.45% (1 Month GBP SONIA + 6.62%, Rate Floor: 6.62%) due 02/07/28††† | | | GBP 561,394 | | | | 735,585 | |
Verisure Holding AB | | | | | | | | |
6.35% (3 Month EURIBOR + 3.00%, Rate Floor: 3.00%) due 03/27/28 | | | EUR 370,000 | | | | 412,213 | |
WW International, Inc. | | | | | | | | |
8.46% (1 Month Term SOFR + 3.50%, Rate Floor: 4.00%) due 04/13/28 | | | 750,000 | | | | 199,222 | |
Total Consumer, Cyclical | | | | | | | 315,848,684 | |
| | | | | | | | | |
Consumer, Non-cyclical - 3.1% | | | | | | | | |
Women’s Care Holdings, Inc. | | | | | | | | |
9.85% (3 Month Term SOFR + 4.50%, Rate Floor: 5.25%) due 01/15/28 | | | 30,362,519 | | | | 29,173,219 | |
Midwest Veterinary Partners LLC | | | | | | | | |
8.87% (1 Month Term SOFR + 3.75%, Rate Floor: 4.50%) due 04/27/28 | | | 20,861,466 | | | | 20,841,856 | |
Nidda Healthcare Holding GmbH | | | | | | | | |
due 02/21/30 | | | EUR 8,250,000 | | | | 9,183,328 | |
7.10% (1 Month EURIBOR + 3.50%, Rate Floor: 3.50%) due 08/21/26 | | | EUR 7,897,239 | | | | 8,784,766 | |
HAH Group Holding Co. LLC | | | | | | | | |
10.35% (3 Month Term SOFR + 5.00%, Rate Floor: 6.00%) due 09/17/31 | | | 8,140,601 | | | | 8,137,181 | |
due 09/17/31 | | | 6,680,000 | | | | 6,584,008 | |
10.26% (3 Month Term SOFR + 5.00%, Rate Floor: 6.00%) due 09/17/31 | | | 2,471,885 | | | | 2,470,847 | |
PlayCore | | | | | | | | |
9.75% (3 Month Term SOFR + 4.50%, Rate Floor: 5.50%) due 02/20/30 | | | 16,592,498 | | | | 16,638,127 | |
Southern Veterinary Partners LLC | | | | | | | | |
8.00% (3 Month Term SOFR + 3.75%, Rate Floor: 4.75%) due 10/05/27 | | | 14,651,705 | | | | 14,657,858 | |
Quirch Foods Holdings LLC | | | | | | | | |
9.89% (3 Month Term SOFR + 5.00%, Rate Floor: 6.00%) due 10/27/27 | | | 15,021,640 | | | | 14,120,342 | |
PetIQ LLC | | | | | | | | |
9.22% (1 Month Term SOFR + 4.25%, Rate Floor: 4.75%) due 04/13/28 | | | 14,029,001 | | | | 14,011,465 | |
LaserAway Intermediate Holdings II LLC | | | | | | | | |
11.30% (3 Month Term SOFR + 5.75%, Rate Floor: 6.50%) due 10/14/27 | | | 12,189,834 | | | | 12,098,411 | |
Blue Ribbon LLC | | | | | | | | |
11.58% (3 Month Term SOFR + 6.00%, Rate Floor: 6.75%) due 05/08/28 | | | 14,689,231 | | | | 10,221,208 | |
Rainbow Finco SARL | | | | | | | | |
9.70% (3 Month GBP SONIA + 4.75%, Rate Floor: 4.75%) due 02/26/29 | | | GBP 7,250,000 | | | | 9,654,065 | |
CHG PPC Parent LLC | | | | | | | | |
7.71% (1 Month Term SOFR + 2.75%, Rate Floor: 3.25%) due 12/08/28 | | | 9,076,418 | | | | 9,036,754 | |
Eyecare Partners LLC | | | | | | | | |
9.99% (3 Month Term SOFR + 1.00%, Rate Floor: 6.38%) (in-kind rate was 3.61%) due 11/30/2811 | | | 8,798,944 | | | | 6,247,251 | |
11.03% (3 Month Term SOFR + 5.75%, Rate Floor: 5.75%) due 08/31/28 | | | 2,100,649 | | | | 2,107,644 | |
Gibson Brands, Inc. | | | | | | | | |
10.58% (6 Month Term SOFR + 5.00%, Rate Floor: 5.75%) due 08/11/28 | | | 8,071,750 | | | | 7,668,163 | |
Florida Food Products LLC | | | | | | | | |
9.96% (1 Month Term SOFR + 5.00%, Rate Floor: 5.75%) due 10/18/28 | | | 8,667,549 | | | | 7,562,437 | |
Outcomes Group Holdings, Inc. | | | | | | | | |
9.10% (1 Month Term SOFR + 4.25%, Rate Floor: 4.25%) due 05/06/31 | | | 4,339,125 | | | | 4,361,732 | |
IVI America LLC | | | | | | | | |
9.10% (3 Month Term SOFR + 4.50%, Rate Floor: 4.50%) due 04/09/31 | | | 4,300,000 | | | | 4,323,048 | |
VC GB Holdings I Corp. | | | | | | | | |
8.37% (3 Month Term SOFR + 3.50%, Rate Floor: 4.00%) due 07/21/28 | | | 4,128,772 | | | | 4,115,230 | |
188 | THE GUGGENHEIM FUNDS ANNUAL REPORT | SEE NOTES TO FINANCIAL STATEMENTS. |
CONSOLIDATED SCHEDULE OF INVESTMENTS (continued) | September 30, 2024 |
MACRO OPPORTUNITIES FUND | |
| | Face
Amount~ | | | Value | |
Froneri US, Inc. | | | | | | | | |
due 09/16/31 | | | 3,200,000 | | | $ | 3,186,208 | |
Resonetics LLC | | | | | | | | |
8.71% (1 Month Term SOFR + 3.75%, Rate Floor: 4.50%) due 06/18/31 | | | 2,820,000 | | | | 2,821,325 | |
Endo Finance Holdings, Inc. | | | | | | | | |
9.78% (3 Month Term SOFR + 4.50%, Rate Floor: 5.00%) due 04/23/31 | | | 1,700,000 | | | | 1,697,518 | |
Medical Solutions Parent Holdings, Inc. | | | | | | | | |
8.85% (3 Month Term SOFR + 3.50%, Rate Floor: 4.00%) due 11/01/28 | | | 2,217,732 | | | | 1,674,388 | |
Heritage Grocers Group LLC | | | | | | | | |
11.45% (3 Month Term SOFR + 6.75%, Rate Floor: 7.50%) due 08/01/29 | | | 1,674,372 | | | | 1,649,256 | |
Osmosis Holdings Australia II Pty Ltd. | | | | | | | | |
8.70% (1 Month Term SOFR + 3.50%, Rate Floor: 4.00%) due 07/31/28 | | | 1,640,826 | | | | 1,638,349 | |
Moran Foods LLC | | | | | | | | |
11.95% (3 Month Term SOFR + 7.25%, Rate Floor: 8.25%) due 06/30/26††† | | | 1,033,634 | | | | 570,533 | |
Weber-Stephen Products LLC | | | | | | | | |
9.20% (1 Month Term SOFR + 4.25%, Rate Floor: 5.00%) due 10/30/27 | | | 414,375 | | | | 389,687 | |
TGP Holdings LLC | | | | | | | | |
8.20% (1 Month Term SOFR + 3.25%, Rate Floor: 4.00%) due 06/29/28 | | | 211,599 | | | | 198,903 | |
Total Consumer, Non-cyclical | | | | | | | 235,825,107 | |
| | | | | | | | | |
Technology - 3.0% | | | | | | | | |
Sitecore Holding III A/S | | | | | | | | |
13.30% (6 Month Term SOFR + 7.00%, Rate Floor: 12.55%) (in-kind rate was 0.75%) due 03/12/29†††,11 | | | 13,884,621 | | | | 13,769,026 | |
11.55% (6 Month EURIBOR + 7.00%, Rate Floor: 10.80%) (in-kind rate was 0.75%) due 03/12/29†††,11 | | | EUR 9,764,781 | | | | 10,784,592 | |
Datix Bidco Ltd. | | | | | | | | |
10.70% (1 Month GBP SONIA + 5.50%, Rate Floor: 5.50%) due 04/25/31††† | | | GBP 12,072,000 | | | | 16,017,635 | |
10.82% (1 Month Term SOFR + 5.50%, Rate Floor: 6.00%) due 04/30/31††† | | | 3,430,000 | | | | 3,403,880 | |
Visma AS | | | | | | | | |
7.38% (6 Month EURIBOR + 4.00%, Rate Floor: 4.00%) due 12/05/28††† | | | EUR 16,296,596 | | | | 17,968,182 | |
Avalara, Inc. | | | | | | | | |
10.85% (3 Month Term SOFR + 6.25%, Rate Floor: 7.00%) due 10/19/28††† | | | 16,000,000 | | | | 15,845,401 | |
Aston FinCo SARL | | | | | | | | |
9.72% (1 Month GBP SONIA + 4.75%, Rate Floor: 4.75%) due 10/09/26 | | | GBP 12,579,288 | | | | 15,578,417 | |
Team.Blue Finco SARL | | | | | | | | |
due 09/30/29 | | | EUR 7,500,000 | | | | 8,271,049 | |
7.05% (3 Month EURIBOR + 3.70%, Rate Floor: 3.70%) due 03/30/28 | | | EUR 6,506,144 | | | | 7,114,690 | |
DS Admiral Bidco LLC | | | | | | | | |
9.10% (1 Month Term SOFR + 4.25%, Rate Floor: 4.25%) due 06/26/31 | | | 15,720,000 | | | | 15,091,200 | |
Polaris Newco LLC | | | | | | | | |
8.62% (3 Month Term SOFR + 3.50%, Rate Floor: 3.50%) due 06/04/26††† | | | 15,053,504 | | | | 14,422,839 | |
Wrench Group LLC | | | | | | | | |
8.87% (3 Month Term SOFR + 4.00%, Rate Floor: 5.00%) due 10/30/28 | | | 12,935,000 | | | | 12,924,264 | |
Concorde Lux | | | | | | | | |
7.85% (6 Month EURIBOR + 4.00%, Rate Floor: 4.00%) due 03/01/28 | | | EUR 10,525,431 | | | | 11,697,893 | |
Modena Buyer LLC | | | | | | | | |
9.10% (3 Month Term SOFR + 4.50%, Rate Floor: 4.50%) due 07/01/31 | | | 10,420,000 | | | | 9,953,288 | |
Leia Finco US LLC | | | | | | | | |
due 07/02/31 | | | 10,065,000 | | | | 9,898,626 | |
Boxer Parent Co., Inc. | | | | | | | | |
9.01% (3 Month Term SOFR + 3.75%, Rate Floor: 3.75%) due 07/30/31 | | | 8,670,000 | | | | 8,646,851 | |
Pushpay USA, Inc. | | | | | | | | |
9.10% (3 Month Term SOFR + 4.50%, Rate Floor: 4.50%) due 08/15/31††† | | | 7,645,000 | | | | 7,625,888 | |
Finastra | | | | | | | | |
12.18% (3 Month Term SOFR + 7.25%, Rate Floor: 8.25%) due 09/13/29††† | | | 7,630,655 | | | | 7,573,997 | |
Planview Parent, Inc. | | | | | | | | |
8.35% (3 Month Term SOFR + 3.75%, Rate Floor: 3.75%) due 12/17/27 | | | 4,109,700 | | | | 4,109,741 | |
Blackhawk Network Holdings, Inc. | | | | | | | | |
9.85% (1 Month Term SOFR + 5.00%, Rate Floor: 6.00%) due 03/12/29 | | | 3,930,150 | | | | 3,944,534 | |
Azalea TopCo | | | | | | | | |
8.35% (1 Month Term SOFR + 3.50%, Rate Floor: 3.50%) due 04/30/31 | | | 3,930,000 | | | | 3,920,175 | |
Atlas CC Acquisition Corp. | | | | | | | | |
9.57% (3 Month Term SOFR + 4.25%, Rate Floor: 5.00%) due 05/25/28 | | | 3,022,363 | | | | 2,328,066 | |
Central Parent LLC | | | | | | | | |
7.85% (3 Month Term SOFR + 3.25%, Rate Floor: 3.25%) due 07/06/29 | | | 1,470,000 | | | | 1,453,345 | |
Precise Midco B.V. | | | | | | | | |
7.47% (3 Month EURIBOR + 4.00%, Rate Floor: 4.00%) due 11/15/30 | | | EUR 1,000,000 | | | | 1,114,924 | |
Cloud Software Group, Inc. | | | | | | | | |
8.60% (3 Month Term SOFR + 4.00%, Rate Floor: 4.50%) due 03/30/29 | | | 989,706 | | | | 984,856 | |
Xerox Corp. | | | | | | | | |
8.71% ((1 Month Term SOFR + 4.00%) and (3 Month Term SOFR + 4.00%), Rate Floor: 4.50%) due 11/17/29 | | | 444,231 | | | | 441,899 | |
Finastra USA, Inc. | | | | | | | | |
12.18% (3 Month Term SOFR + 7.25%, Rate Floor: 8.25%) due 09/13/29††† | | | 447,436 | | | | 401,840 | |
Total Technology | | | | | | | 225,287,098 | |
| | | | | | | | | |
SEE NOTES TO FINANCIAL STATEMENTS. | THE GUGGENHEIM FUNDS ANNUAL REPORT | 189 |
CONSOLIDATED SCHEDULE OF INVESTMENTS (continued) | September 30, 2024 |
MACRO OPPORTUNITIES FUND | |
| | Face
Amount~ | | | Value | |
Industrial - 2.5% | | | | | | | | |
Capstone Acquisition Holdings, Inc. | | | | | | | | |
9.45% (1 Month Term SOFR + 4.50%, Rate Floor: 5.50%) due 11/12/29††† | | | 17,817,209 | | | $ | 17,716,207 | |
Arcline FM Holdings, LLC | | | | | | | | |
9.65% ((3 Month Term SOFR + 4.50%) and (6 Month Term SOFR + 4.50%), Rate Floor: 5.25%) due 06/23/28 | | | 14,046,407 | | | | 14,061,436 | |
Dispatch Terra Acquisition LLC | | | | | | | | |
9.00% (3 Month Term SOFR + 4.25%, Rate Floor: 5.00%) due 03/27/28 | | | 10,059,270 | | | | 9,110,782 | |
Hobbs & Associates LLC | | | | | | | | |
8.10% (1 Month Term SOFR + 3.25%, Rate Floor: 3.25%) due 07/23/31 | | | 9,063,636 | | | | 9,040,977 | |
Merlin Buyer, Inc. | | | | | | | | |
9.35% (3 Month Term SOFR + 4.75%, Rate Floor: 5.25%) due 12/14/28††† | | | 8,266,080 | | | | 8,204,085 | |
Fugue Finance LLC | | | | | | | | |
8.81% (3 Month Term SOFR + 3.75%, Rate Floor: 4.25%) due 02/26/31 | | | 8,029,875 | | | | 8,068,017 | |
Boluda Towage S.L. | | | | | | | | |
7.26% (3 Month EURIBOR + 3.75%, Rate Floor: 3.75%) due 06/01/30 | | | EUR 7,215,385 | | | | 8,057,783 | |
Foundation Building Materials Holding Company LLC | | | | | | | | |
9.25% (1 Month Term SOFR + 4.00%, Rate Floor: 4.00%) due 01/29/31 | | | 8,159,000 | | | | 7,932,751 | |
DXP Enterprises, Inc. | | | | | | | | |
10.16% (6 Month Term SOFR + 4.75%, Rate Floor: 5.75%) due 10/11/30 | | | 5,890,500 | | | | 5,893,445 | |
due 10/11/30 | | | 2,000,000 | | | | 2,001,000 | |
Quikrete Holdings, Inc. | | | | | | | | |
7.35% (1 Month Term SOFR + 2.50%, Rate Floor: 2.50%) due 04/14/31 | | | 7,860,500 | | | | 7,860,500 | |
Valcour Packaging LLC | | | | | | | | |
9.33% (3 Month Term SOFR + 1.50%, Rate Floor: 7.08%) (in-kind rate was 2.25%) due 10/04/2811 | | | 4,153,784 | | | | 3,590,448 | |
10.56% (3 Month Term SOFR + 5.25%, Rate Floor: 5.25%) due 10/04/28 | | | 3,454,560 | | | | 3,489,106 | |
Michael Baker International LLC | | | | | | | | |
9.60% (1 Month Term SOFR + 4.75%, Rate Floor: 5.50%) due 12/01/28 | | | 7,052,325 | | | | 7,078,771 | |
DG Investment Intermediate Holdings 2, Inc. | | | | | | | | |
due 03/31/28 | | | 7,080,804 | | | | 7,049,861 | |
Merlin Buyer, Inc. | | | | | | | | |
8.60% (3 Month Term SOFR + 4.00%, Rate Floor: 4.50%) due 12/14/28 | | | 6,880,579 | | | | 6,828,975 | |
Geo Parent Corp. | | | | | | | | |
10.60% (3 Month Term SOFR + 5.25%, Rate Floor: 5.25%) due 12/19/28††† | | | 5,870,500 | | | | 5,870,500 | |
Inspired Finco Holdings Ltd. | | | | | | | | |
7.38% (1 Month EURIBOR + 4.00%, Rate Floor: 4.00%) due 02/28/31 | | | EUR 5,200,000 | | | | 5,800,325 | |
United Airlines Inc. | | | | | | | | |
8.03% (3 Month Term SOFR + 2.75%, Rate Floor: 2.75%) due 02/22/31 | | | 5,236,875 | | | | 5,238,499 | |
Integrated Power Services Holdings, Inc. | | | | | | | | |
9.46% (1 Month Term SOFR + 4.50%, Rate Floor: 5.25%) due 11/22/28††† | | | 4,800,061 | | | | 4,785,850 | |
Anchor Packaging LLC | | | | | | | | |
8.60% (3 Month Term SOFR + 3.75%, Rate Floor: 3.75%) due 07/18/29 | | | 4,690,000 | | | | 4,698,817 | |
MI Windows And Doors LLC | | | | | | | | |
8.35% (1 Month Term SOFR + 3.50%, Rate Floor: 3.50%) due 03/28/31 | | | 3,592,188 | | | | 3,595,169 | |
Artera Services LLC | | | | | | | | |
9.10% (3 Month Term SOFR + 4.50%, Rate Floor: 4.50%) due 02/15/31 | | | 3,594,833 | | | | 3,495,400 | |
FCG Acquisitions, Inc | | | | | | | | |
8.71% (1 Month Term SOFR + 3.75%, Rate Floor: 4.25%) due 03/31/28 | | | 3,432,262 | | | | 3,428,830 | |
TK Elevator Midco GmbH | | | | | | | | |
6.38% (1 Month EURIBOR + 3.00%, Rate Floor: 3.00%) due 01/29/27††† | | | EUR 3,067,766 | | | | 3,280,862 | |
Aegion Corp. | | | | | | | | |
8.60% (1 Month Term SOFR + 3.75%, Rate Floor: 4.50%) due 05/17/28 | | | 3,116,489 | | | | 3,122,348 | |
Mauser Packaging Solutions Holding Co. | | | | | | | | |
8.70% (1 Month Term SOFR + 3.50%, Rate Floor: 3.50%) due 04/15/27 | | | 2,992,424 | | | | 2,996,584 | |
Brown Group Holding LLC | | | | | | | | |
7.60% (1 Month Term SOFR + 2.75%, Rate Floor: 3.25%) due 07/01/31 | | | 1,396,151 | | | | 1,391,879 | |
7.84% ((1 Month Term SOFR + 2.75%) and (3 Month Term SOFR + 2.75%), Rate Floor: 3.25%) due 07/01/31 | | | 1,246,875 | | | | 1,243,409 | |
ILPEA Parent, Inc. | | | | | | | | |
8.85% (1 Month Term SOFR + 4.00%, Rate Floor: 4.75%) due 06/22/28††† | | | 2,076,681 | | | | 2,079,277 | |
NA Rail Hold Co. LLC | | | | | | | | |
8.87% (3 Month Term SOFR + 4.00%, Rate Floor: 4.25%) due 10/19/26 | | | 1,929,790 | | | | 1,939,439 | |
Madison Safety & Flow LLC | | | | | | | | |
due 09/19/31 | | | 1,400,000 | | | | 1,398,250 | |
EMRLD Borrower, LP | | | | | | | | |
7.56% (3 Month Term SOFR + 2.50%, Rate Floor: 2.50%) due 05/31/30 | | | 1,261,671 | | | | 1,258,516 | |
Air Canada | | | | | | | | |
7.25% (3 Month Term SOFR + 2.50%, Rate Floor: 2.50%) due 03/21/31 | | | 995,000 | | | | 996,244 | |
Albion Financing 3 SARL | | | | | | | | |
9.83% (3 Month Term SOFR + 4.25%, Rate Floor: 4.75%) due 08/16/29 | | | 768,075 | | | | 770,955 | |
API Heat Transfer Thermasys Corp. | | | | | | | | |
13.19% (3 Month Term SOFR + 8.00%, Rate Floor: 11.00%) due 11/12/27††† | | | 485,976 | | | | 485,976 | |
10.19% (3 Month Term SOFR + 5.00%, Rate Floor: 8.00%) due 11/10/27††† | | | 281,275 | | | | 281,275 | |
Gulfside Supply, Inc. | | | | | | | | |
8.29% (3 Month Term SOFR + 3.00%, Rate Floor: 3.00%) due 06/17/31 | | | 387,111 | | | | 386,627 | |
Total Industrial | | | | | | | 184,529,175 | |
| | | | | | | | | |
190 | THE GUGGENHEIM FUNDS ANNUAL REPORT | SEE NOTES TO FINANCIAL STATEMENTS. |
CONSOLIDATED SCHEDULE OF INVESTMENTS (continued) | September 30, 2024 |
MACRO OPPORTUNITIES FUND | |
| | Face
Amount~ | | | Value | |
Financial - 2.0% | | | | | | | | |
Higginbotham Insurance Agency, Inc. | | | | | | | | |
9.35% (1 Month Term SOFR + 4.50%, Rate Floor: 4.50%) due 11/24/28††† | | | 20,828,171 | | | $ | 20,664,119 | |
Asurion LLC | | | | | | | | |
9.10% (1 Month Term SOFR + 4.25%, Rate Floor: 4.25%) due 09/19/30 | | | 15,350,000 | | | | 15,062,188 | |
9.20% (1 Month Term SOFR + 4.25%, Rate Floor: 4.25%) due 08/19/28 | | | 3,088,533 | | | | 3,039,456 | |
Eisner Advisory Group | | | | | | | | |
8.85% (1 Month Term SOFR + 4.00%, Rate Floor: 4.50%) due 02/28/31 | | | 16,078,703 | | | | 16,110,378 | |
HighTower Holding LLC | | | | | | | | |
8.75% (3 Month Term SOFR + 3.50%, Rate Floor: 3.50%) due 04/21/28 | | | 12,306,060 | | | | 12,298,431 | |
Aretec Group, Inc. | | | | | | | | |
8.85% (1 Month Term SOFR + 4.00%, Rate Floor: 4.00%) due 08/09/30 | | | 12,251,405 | | | | 11,987,632 | |
Claudius Finance Parent SARL | | | | | | | | |
7.20% (3 Month EURIBOR + 3.50%, Rate Floor: 3.50%) due 07/10/28 | | | EUR 9,225,000 | | | | 10,270,377 | |
AqGen Island Holdings, Inc. | | | | | | | | |
8.46% (1 Month Term SOFR + 3.50%, Rate Floor: 4.00%) due 08/02/28 | | | 9,078,174 | | | | 9,061,198 | |
Duff & Phelps | | | | | | | | |
8.35% (3 Month Term SOFR + 3.75%, Rate Floor: 4.75%) due 04/09/27 | | | 5,837,703 | | | | 5,712,543 | |
due 04/09/27 | | | EUR 3,000,000 | | | | 3,208,887 | |
Osaic Holdings, Inc. | | | | | | | | |
8.85% (1 Month Term SOFR + 4.00%, Rate Floor: 4.00%) due 08/17/28 | | | 5,446,350 | | | | 5,382,791 | |
Tegra118 Wealth Solutions, Inc. | | | | | | | | |
9.13% (3 Month Term SOFR + 4.00%, Rate Floor: 4.00%) due 02/18/27 | | | 5,594,443 | | | | 5,333,966 | |
HUB International Ltd. | | | | | | | | |
8.26% (3 Month Term SOFR + 3.00%, Rate Floor: 3.75%) due 06/20/30 | | | 4,316,207 | | | | 4,309,301 | |
Apleona Holding GmbH | | | | | | | | |
7.39% (3 Month EURIBOR + 3.75%, Rate Floor: 3.75%) due 04/28/28 | | | EUR 3,200,000 | | | | 3,574,456 | |
OEG Borrower LLC | | | | | | | | |
8.36% (3 Month Term SOFR + 3.50%, Rate Floor: 3.50%) due 06/30/31 | | | 3,430,000 | | | | 3,421,425 | |
Alter Domus | | | | | | | | |
due 07/17/31 | | | 3,137,934 | | | | 3,148,729 | |
Cervantes Bidco S.L.U. | | | | | | | | |
due 06/13/31 | | | EUR 2,800,000 | | | | 3,126,838 | |
Ardonagh Midco 3 plc | | | | | | | | |
9.90% (6 Month Term SOFR + 4.75%, Rate Floor: 4.75%) due 02/16/31††† | | | 3,086,747 | | | | 3,044,324 | |
Worldpay | | | | | | | | |
7.10% (3 Month Term SOFR + 2.50%, Rate Floor: 2.50%) due 01/31/31 | | | 3,000,000 | | | | 2,998,740 | |
Assetmark Financial Holdings, Inc. | | | | | | | | |
7.60% (3 Month Term SOFR + 3.00%, Rate Floor: 3.00%) due 06/03/31 | | | 2,200,000 | | | | 2,173,182 | |
Ardonagh Midco 3 plc | | | | | | | | |
8.52% ((3 Month Term SOFR + 3.75%) and (6 Month Term SOFR + 3.75%), Rate Floor: 3.75%) due 02/17/31 | | | 2,070,000 | | | | 2,071,304 | |
Virtu Financial | | | | | | | | |
7.60% (1 Month Term SOFR + 2.75%, Rate Floor: 3.25%) due 06/21/31 | | | 1,250,000 | | | | 1,250,000 | |
Capstone Borrower, Inc. | | | | | | | | |
7.85% (3 Month Term SOFR + 3.25%, Rate Floor: 3.25%) due 06/17/30 | | | 328,075 | | | | 328,075 | |
Total Financial | | | | | | | 147,578,340 | |
| | | | | | | | | |
Communications - 0.7% | | | | | | | | |
Syndigo LLC | | | | | | | | |
9.46% (1 Month Term SOFR + 4.50%, Rate Floor: 5.25%) due 12/15/27 | | | 22,041,343 | | | | 21,931,136 | |
FirstDigital Communications LLC | | | | | | | | |
11.25% (3 Month Term SOFR + 3.25%, Rate Floor: 4.00%) due 12/17/26††† | | | 10,470,875 | | | | 10,234,487 | |
Simon & Schuster | | | | | | | | |
9.26% (3 Month Term SOFR + 4.00%, Rate Floor: 4.00%) due 10/30/30 | | | 9,850,500 | | | | 9,821,737 | |
Zayo Group Holdings, Inc. | | | | | | | | |
7.96% (1 Month Term SOFR + 3.00%, Rate Floor: 3.00%) due 03/09/27 | | | 6,146,447 | | | | 5,604,822 | |
Cengage Learning, Inc. | | | | | | | | |
9.54% (6 Month Term SOFR + 4.25%, Rate Floor: 5.25%) due 03/24/31 | | | 5,361,563 | | | | 5,370,034 | |
Xplornet Communications, Inc. | | | | | | | | |
9.57% (3 Month Term SOFR + 4.26%, Rate Floor: 4.76%) due 10/02/28 | | | 15,095,771 | | | | 2,509,672 | |
Total Communications | | | | | | | 55,471,888 | |
| | | | | | | | | |
Energy - 0.3% | | | | | | | | |
BANGL LLC | | | | | | | | |
9.82% (3 Month Term SOFR + 4.50%, Rate Floor: 4.50%) due 02/01/29 | | | 13,685,346 | | | | 13,685,346 | |
Bip PipeCo Holdings LLC | | | | | | | | |
7.82% (3 Month Term SOFR + 2.50%, Rate Floor: 2.50%) due 12/06/30 | | | 3,067,313 | | | | 3,063,478 | |
Venture Global Calcasieu Pass LLC | | | | | | | | |
7.82% (1 Month Term SOFR + 2.88%, Rate Floor: 3.88%) due 08/19/26 | | | 2,474,007 | | | | 2,471,953 | |
Permian Production Partners LLC | | | | | | | | |
14.96% (1 Month Term SOFR + 6.11%, Rate Floor: 12.96%) (in-kind rate was 2.00%) due 11/24/25†††,11 | | | 686,779 | | | | 679,912 | |
Total Energy | | | | | | | 19,900,689 | |
| | | | | | | | | |
Basic Materials - 0.1% | | | | | | | | |
Arsenal AIC Parent LLC | | | | | | | | |
8.10% (1 Month Term SOFR + 3.25%, Rate Floor: 3.25%) due 08/18/30 | | | 3,934,681 | | | | 3,926,812 | |
Discovery Purchaser Corp. | | | | | | | | |
due 10/04/29 | | | 1,000,000 | | | | 994,720 | |
SEE NOTES TO FINANCIAL STATEMENTS. | THE GUGGENHEIM FUNDS ANNUAL REPORT | 191 |
CONSOLIDATED SCHEDULE OF INVESTMENTS (continued) | September 30, 2024 |
MACRO OPPORTUNITIES FUND | |
| | Face
Amount~ | | | Value | |
Schur Flexibles GmbH | | | | | | | | |
8.66% (6 Month EURIBOR + 5.50%, Rate Floor: 5.50%) due 09/28/27 | | | EUR 787,500 | | | $ | 513,072 | |
Total Basic Materials | | | | | | | 5,434,604 | |
| | | | | | | | | |
Total Senior Floating Rate Interests | | | | |
(Cost $1,213,539,685) | | | 1,189,875,585 | |
| | | | | |
COLLATERALIZED MORTGAGE OBLIGATIONS†† - 12.2% |
Residential Mortgage-Backed Securities - 5.8% | | | | | | | | |
OBX Trust | | | | | | | | |
2024-NQM5, 6.51% due 01/25/644 | | | 12,495,000 | | | | 12,723,590 | |
2024-NQM6, 6.92% (WAC) due 02/25/64◊,4 | | | 6,901,000 | | | | 7,107,486 | |
2022-NQM9, 6.45% due 09/25/624,10 | | | 6,928,155 | | | | 6,956,187 | |
2023-NQM2, 6.80% due 01/25/624,10 | | | 5,673,288 | | | | 5,726,187 | |
2024-NQM4, 6.62% (WAC) due 01/25/64◊,4 | | | 5,250,000 | | | | 5,359,730 | |
2022-NQM8, 6.10% due 09/25/624,10 | | | 3,902,555 | | | | 3,904,523 | |
JP Morgan Mortgage Acquisition Trust | | | | | | | | |
2006-WMC4, 5.12% (1 Month Term SOFR + 0.26%, Rate Floor: 0.15%) due 12/25/36◊ | | | 19,906,408 | | | | 10,595,293 | |
2006-WMC3, 5.27% (1 Month Term SOFR + 0.41%, Rate Floor: 0.30%) due 08/25/36◊ | | | 7,742,711 | | | | 5,681,467 | |
2006-HE3, 4.25% (1 Month Term SOFR + 0.43%, Rate Floor: 0.32%) due 11/25/36◊ | | | 4,586,567 | | | | 4,149,251 | |
2006-WMC4, 5.09% (1 Month Term SOFR + 0.23%, Rate Floor: 0.12%) due 12/25/36◊ | | | 6,851,961 | | | | 3,644,792 | |
2006-WMC4, 5.05% (1 Month Term SOFR + 0.19%, Rate Floor: 0.08%) due 12/25/36◊ | | | 2,897,249 | | | | 1,538,690 | |
Top Pressure Recovery Turbines | | | | | | | | |
7.51% due 11/01/69 | | | 24,862,593 | | | | 25,086,356 | |
BRAVO Residential Funding Trust | | | | | | | | |
2022-R1, 3.13% due 01/29/704,10 | | | 24,475,688 | | | | 24,290,994 | |
Ameriquest Mortgage Securities Trust | | | | | | | | |
2006-M3, 5.14% (1 Month Term SOFR + 0.29%, Rate Floor: 0.18%) due 10/25/36◊ | | | 18,382,291 | | | | 10,276,252 | |
2006-M3, 5.21% (1 Month Term SOFR + 0.35%, Rate Floor: 0.24%) due 10/25/36◊ | | | 30,697,714 | | | | 9,045,014 | |
2006-M3, 5.07% (1 Month Term SOFR + 0.21%, Rate Floor: 0.10%) due 10/25/36◊ | | | 12,761,606 | | | | 3,760,354 | |
Mill City Securities Ltd. | | | | | | | | |
2024-RS1, 4.00% due 11/01/694,10 | | | 23,164,000 | | | | 20,762,356 | |
WaMu Asset-Backed Certificates WaMu Series | | | | | | | | |
2007-HE2, 5.33% (1 Month Term SOFR + 0.47%, Rate Floor: 0.47%) due 04/25/37◊ | | | 22,843,928 | | | | 8,629,947 | |
2007-HE2, 5.16% (1 Month Term SOFR + 0.30%, Rate Floor: 0.30%) due 04/25/37◊ | | | 17,406,871 | | | | 6,567,066 | |
2007-HE4, 5.14% (1 Month Term SOFR + 0.28%, Rate Floor: 0.28%) due 07/25/47◊ | | | 6,009,990 | | | | 4,418,234 | |
2007-HE4, 5.22% (1 Month Term SOFR + 0.36%, Rate Floor: 0.36%) due 07/25/47◊ | | | 1,883,458 | | | | 1,125,568 | |
Long Beach Mortgage Loan Trust | | | | | | | | |
2006-6, 5.47% (1 Month Term SOFR + 0.61%, Rate Floor: 0.50%) due 07/25/36◊ | | | 13,313,579 | | | | 5,248,147 | |
2006-8, 5.29% (1 Month Term SOFR + 0.43%, Rate Floor: 0.32%) due 09/25/36◊ | | | 15,856,466 | | | | 4,384,576 | |
2006-1, 5.35% (1 Month Term SOFR + 0.49%, Rate Floor: 0.38%) due 02/25/36◊ | | | 3,558,340 | | | | 3,031,483 | |
2006-4, 5.29% (1 Month Term SOFR + 0.43%, Rate Floor: 0.32%) due 05/25/36◊ | | | 9,647,952 | | | | 2,862,237 | |
2006-6, 5.27% (1 Month Term SOFR + 0.41%, Rate Floor: 0.30%) due 07/25/36◊ | | | 4,145,687 | | | | 1,629,963 | |
2006-8, 5.15% (1 Month Term SOFR + 0.29%, Rate Floor: 0.18%) due 09/25/36◊ | | | 4,296,804 | | | | 1,181,815 | |
2006-6, 5.17% (1 Month Term SOFR + 0.31%, Rate Floor: 0.20%) due 07/25/36◊ | | | 2,399,851 | | | | 941,361 | |
RALI Series Trust | | | | | | | | |
2006-QO6, 5.33% (1 Month Term SOFR + 0.47%, Rate Floor: 0.36%) due 06/25/46◊ | | | 30,674,404 | | | | 7,151,237 | |
2007-QO2, 5.12% (1 Month Term SOFR + 0.26%, Rate Floor: 0.15%) due 02/25/47◊ | | | 12,852,328 | | | | 4,399,933 | |
2006-QO8, 5.37% (1 Month Term SOFR + 0.51%, Rate Floor: 0.40%) due 10/25/46◊ | | | 2,678,389 | | | | 2,538,499 | |
2006-QO6, 5.43% (1 Month Term SOFR + 0.57%, Rate Floor: 0.46%) due 06/25/46◊ | | | 7,981,062 | | | | 1,904,525 | |
2006-QO6, 5.49% (1 Month Term SOFR + 0.63%, Rate Floor: 0.52%) due 06/25/46◊ | | | 5,035,370 | | | | 1,218,442 | |
2006-QO2, 5.51% (1 Month Term SOFR + 0.65%, Rate Floor: 0.54%) due 02/25/46◊ | | | 5,947,913 | | | | 1,071,413 | |
2006-QO2, 5.65% (1 Month Term SOFR + 0.79%, Rate Floor: 0.68%) due 02/25/46◊ | | | 3,182,638 | | | | 586,675 | |
2006-QO2, 5.41% (1 Month Term SOFR + 0.55%, Rate Floor: 0.44%) due 02/25/46◊ | | | 213,333 | | | | 37,796 | |
American Home Mortgage Assets Trust | | | | | | | | |
2006-6, 5.18% (1 Month Term SOFR + 0.32%, Rate Floor: 0.21%) due 12/25/46◊ | | | 6,775,495 | | | | 5,744,327 | |
192 | THE GUGGENHEIM FUNDS ANNUAL REPORT | SEE NOTES TO FINANCIAL STATEMENTS. |
CONSOLIDATED SCHEDULE OF INVESTMENTS (continued) | September 30, 2024 |
MACRO OPPORTUNITIES FUND | |
| | Face
Amount~ | | | Value | |
2006-1, 5.58% (1 Month Term SOFR + 0.30%, Rate Floor: 0.19%) due 05/25/46◊ | | | 5,735,377 | | | $ | 5,143,134 | |
2006-3, 6.06% (1 Year CMT Rate + 0.94%, Rate Floor: 0.94%) due 10/25/46◊ | | | 4,662,358 | | | | 3,094,376 | |
LSTAR Securities Investment Ltd. | | | | | | | | |
2024-1, 8.45% (30 Day Average SOFR + 3.10%, Rate Floor: 3.10%) due 01/01/29◊,4 | | | 13,170,848 | | | | 13,124,640 | |
Morgan Stanley IXIS Real Estate Capital Trust | | | | | | | | |
2006-2, 5.19% (1 Month Term SOFR + 0.33%, Rate Floor: 0.22%) due 11/25/36◊ | | | 21,054,471 | | | | 6,839,467 | |
2006-2, 5.12% (1 Month Term SOFR + 0.26%, Rate Floor: 0.15%) due 11/25/36◊ | | | 18,514,368 | | | | 6,014,383 | |
Citigroup Mortgage Loan Trust, Inc. | | | | | | | | |
2007-AMC3, 5.22% (1 Month Term SOFR + 0.36%, Rate Floor: 0.25%) due 03/25/37◊ | | | 9,091,299 | | | | 7,681,709 | |
2022-A, 6.17% due 09/25/624,10 | | | 4,226,288 | | | | 4,226,071 | |
NYMT Loan Trust | | | | | | | | |
2022-SP1, 5.25% due 07/25/624,10 | | | 12,025,201 | | | | 11,801,170 | |
GCAT Trust | | | | | | | | |
2022-NQM5, 5.71% due 08/25/674,10 | | | 8,230,142 | | | | 8,201,299 | |
2023-NQM2, 6.60% due 11/25/674,10 | | | 2,692,563 | | | | 2,706,283 | |
Morgan Stanley ABS Capital I Incorporated Trust | | | | | | | | |
2006-HE8, 5.61% (1 Month Term SOFR + 0.33%, Rate Floor: 0.22%) due 10/25/36◊ | | | 18,380,998 | | | | 8,116,284 | |
2006-HE6, 5.17% (1 Month Term SOFR + 0.31%, Rate Floor: 0.20%) due 09/25/36◊ | | | 4,165,628 | | | | 1,428,077 | |
2007-HE4, 5.20% (1 Month Term SOFR + 0.34%, Rate Floor: 0.23%) due 02/25/37◊ | | | 3,657,246 | | | | 1,190,757 | |
IXIS Real Estate Capital Trust | | | | | | | | |
2007-HE1, 5.55% (1 Month Term SOFR + 0.27%, Rate Floor: 0.16%) due 05/25/37◊ | | | 23,074,997 | | | | 5,439,974 | |
2007-HE1, 5.62% (1 Month Term SOFR + 0.34%, Rate Floor: 0.23%) due 05/25/37◊ | | | 16,348,311 | | | | 3,854,033 | |
GSAMP Trust | | | | | | | | |
2007-NC1, 5.65% (1 Month Term SOFR + 0.37%, Rate Floor: 0.26%) due 12/25/46◊ | | | 17,154,929 | | | | 8,955,324 | |
Master Asset-Backed Securities Trust | | | | | | | | |
2006-WMC3, 5.29% (1 Month Term SOFR + 0.43%, Rate Floor: 0.32%) due 08/25/36◊ | | | 9,715,874 | | | | 3,445,851 | |
2006-HE3, 5.17% (1 Month Term SOFR + 0.31%, Rate Floor: 0.20%) due 08/25/36◊ | | | 9,104,486 | | | | 2,770,682 | |
2006-HE3, 5.27% (1 Month Term SOFR + 0.41%, Rate Floor: 0.30%) due 08/25/36◊ | | | 7,654,698 | | | | 2,329,570 | |
PRPM LLC | | | | | | | | |
2024-4, 6.41% due 08/25/294,10 | | | 7,994,080 | | | | 8,041,954 | |
CFMT LLC | | | | | | | | |
2022-HB9, 3.25% (WAC) due 09/25/37◊,4 | | | 8,650,000 | | | | 7,986,240 | |
FIGRE Trust | | | | | | | | |
2024-HE4, 5.25% (WAC) due 09/25/54◊,4 | | | 3,778,000 | | | | 3,793,356 | |
2024-HE4, 5.30% (WAC) due 09/25/54◊,4 | | | 3,250,000 | | | | 3,259,021 | |
GSAA Home Equity Trust | | | | | | | | |
2006-3, 5.57% (1 Month Term SOFR + 0.71%, Rate Floor: 0.60%) due 03/25/36◊ | | | 9,617,484 | | | | 4,755,444 | |
2006-9, 5.45% (1 Month Term SOFR + 0.59%, Rate Floor: 0.48%) due 06/25/36◊ | | | 6,968,767 | | | | 1,851,766 | |
2007-7, 5.51% (1 Month Term SOFR + 0.65%, Rate Floor: 0.54%) due 07/25/37◊ | | | 298,703 | | | | 281,096 | |
OSAT Trust | | | | | | | | |
2021-RPL1, 5.12% due 05/25/654,10 | | | 6,477,968 | | | | 6,466,169 | |
First NLC Trust | | | | | | | | |
2007-1, 5.67% (1 Month Term SOFR + 0.39%, Rate Floor: 0.28%) due 08/25/37◊,4 | | | 6,156,014 | | | | 3,108,374 | |
2007-1, 5.46% (1 Month Term SOFR + 0.18%, Rate Floor: 0.07%) due 08/25/37◊,4 | | | 4,668,303 | | | | 2,356,722 | |
Home Equity Loan Trust | | | | | | | | |
2007-FRE1, 5.16% (1 Month Term SOFR + 0.30%, Rate Floor: 0.19%) due 04/25/37◊ | | | 5,700,695 | | | | 5,428,862 | |
Alternative Loan Trust | | | | | | | | |
2007-OA7, 5.33% (1 Month Term SOFR + 0.47%, Rate Floor: 0.36%) due 05/25/47◊ | | | 5,693,735 | | | | 5,378,480 | |
Argent Securities Trust | | | | | | | | |
2006-W5, 5.27% (1 Month Term SOFR + 0.41%, Rate Floor: 0.30%) due 06/25/36◊ | | | 8,243,402 | | | | 5,378,105 | |
Lehman XS Trust Series | | | | | | | | |
2006-18N, 5.33% (1 Month Term SOFR + 0.47%, Rate Floor: 0.36%) due 12/25/36◊ | | | 3,257,332 | | | | 3,096,979 | |
2006-10N, 5.39% (1 Month Term SOFR + 0.53%, Rate Floor: 0.42%) due 07/25/46◊ | | | 2,140,569 | | | | 1,914,241 | |
Merrill Lynch Mortgage Investors Trust Series | | | | | | | | |
2007-HE2, 5.39% (1 Month Term SOFR + 0.53%, Rate Floor: 0.42%) due 02/25/37◊ | | | 6,686,562 | | | | 1,948,353 | |
2007-HE2, 5.49% (1 Month Term SOFR + 0.63%, Rate Floor: 0.52%) due 02/25/37◊ | | | 4,840,113 | | | | 1,410,285 | |
SEE NOTES TO FINANCIAL STATEMENTS. | THE GUGGENHEIM FUNDS ANNUAL REPORT | 193 |
CONSOLIDATED SCHEDULE OF INVESTMENTS (continued) | September 30, 2024 |
MACRO OPPORTUNITIES FUND | |
| | Face
Amount~ | | | Value | |
2007-HE2, 5.21% (1 Month Term SOFR + 0.35%, Rate Floor: 0.24%) due 02/25/37◊ | | | 3,848,386 | | | $ | 1,121,379 | |
2007-HE2, 5.81% (1 Month Term SOFR + 0.95%, Rate Floor: 0.84%) due 02/25/37◊ | | | 1,566,045 | | | | 456,249 | |
WaMu Asset-Backed Certificates WaMu Series Trust | | | | | | | | |
2007-HE1, 5.43% (1 Month Term SOFR + 0.57%, Rate Floor: 0.57%) due 01/25/37◊ | | | 6,832,526 | | | | 3,176,460 | |
2007-HE4, 5.14% (1 Month Term SOFR + 0.28%, Rate Floor: 0.28%) due 07/25/47◊ | | | 2,637,897 | | | | 1,576,423 | |
Saluda Grade Alternative Mortgage Trust | | | | | | | | |
2023-FIG4, 7.12% (WAC) due 11/25/53◊,4 | | | 4,374,157 | | | | 4,487,293 | |
ACE Securities Corporation Home Equity Loan Trust Series | | | | | | | | |
2007-ASP1, 5.73% (1 Month Term SOFR + 0.87%, Rate Floor: 0.76%) due 03/25/37◊ | | | 10,174,326 | | | | 4,141,993 | |
Verus Securitization Trust | | | | | | | | |
2022-8, 6.13% due 09/25/674,10 | | | 4,108,721 | | | | 4,108,947 | |
HSI Asset Securitization Corporation Trust | | | | | | | | |
2007-HE1, 5.16% (1 Month Term SOFR + 0.30%, Rate Floor: 0.19%) due 01/25/37◊ | | | 5,479,962 | | | | 3,923,241 | |
Finance of America HECM Buyout | | | | | | | | |
2022-HB2, 6.00% (WAC) due 08/01/32◊,4 | | | 3,850,000 | | | | 3,830,618 | |
First Franklin Mortgage Loan Trust | | | | | | | | |
2006-FF16, 5.39% (1 Month Term SOFR + 0.53%, Rate Floor: 0.42%) due 12/25/36◊ | | | 7,031,211 | | | | 2,906,306 | |
Washington Mutual Mortgage Pass-Through Certificates WMALT Series Trust | | | | | | | | |
2006-AR9, 5.96% (1 Year CMT Rate + 0.84%, Rate Floor: 0.84%) due 11/25/46◊ | | | 3,457,166 | | | | 2,841,327 | |
Morgan Stanley Mortgage Loan Trust | | | | | | | | |
2006-9AR, 5.69% (1 Month Term SOFR + 0.41%, Rate Floor: 0.30%) due 08/25/36◊ | | | 7,774,088 | | | | 1,853,793 | |
Alliance Bancorp Trust | | | | | | | | |
2007-OA1, 5.45% (1 Month Term SOFR + 0.59%, Rate Floor: 0.48%) due 07/25/37◊ | | | 1,779,483 | | | | 1,529,664 | |
Nomura Resecuritization Trust | | | | | | | | |
2015-4R, 2.71% (1 Month Term SOFR + 0.54%, Rate Floor: 0.43%) due 03/26/36◊,4 | | | 953,838 | | | | 918,270 | |
Morgan Stanley Re-REMIC Trust | | | | | | | | |
2010-R5, 5.31% due 06/26/364 | | | 389,994 | | | | 363,906 | |
Total Residential Mortgage-Backed Securities | | | | | | | 435,336,166 | |
| | | | | | | | | |
Government Agency - 4.3% | | | | | | | | |
Fannie Mae | | | | | | | | |
5.50% due 05/01/53 | | | 104,614,638 | | | | 105,967,564 | |
5.00% due 05/01/53 | | | 34,158,776 | | | | 34,176,567 | |
5.00% due 08/01/53 | | | 21,772,755 | | | | 21,784,096 | |
5.00% due 06/01/53 | | | 7,415,009 | | | | 7,415,386 | |
Freddie Mac | | | | | | | | |
5.50% due 02/01/53 | | | 53,300,450 | | | | 54,304,027 | |
5.00% due 06/01/53 | | | 27,798,461 | | | | 27,949,510 | |
5.00% due 02/01/53 | | | 23,971,182 | | | | 24,100,743 | |
5.00% due 03/01/53 | | | 18,897,439 | | | | 18,911,722 | |
Uniform MBS 30 Year | | | | | | | | |
due 12/01/2416 | | | 29,725,000 | | | | 29,712,337 | |
Total Government Agency | | | | | | | 324,321,952 | |
| | | | | | | | | |
Commercial Mortgage-Backed Securities - 1.7% | | | | | | | | |
BX Trust | | | | | | | | |
2024-VLT4, 7.54% (1 Month Term SOFR + 2.44%, Rate Floor: 2.44%) due 07/15/29◊,4 | | | 20,650,000 | | | | 20,598,375 | |
2023-DELC, 8.44% (1 Month Term SOFR + 3.34%, Rate Floor: 3.34%) due 05/15/38◊,4 | | | 10,650,000 | | | | 10,743,188 | |
BX Commercial Mortgage Trust | | | | | | | | |
2021-VOLT, 7.21% (1 Month Term SOFR + 2.11%, Rate Floor: 2.00%) due 09/15/36◊,4 | | | 20,650,000 | | | | 20,495,125 | |
2024-AIRC, 7.69% (1 Month Term SOFR + 2.59%, Rate Floor: 2.59%) due 08/15/39◊,4 | | | 6,500,000 | | | | 6,516,250 | |
BXHPP Trust | | | | | | | | |
2021-FILM, 6.31% (1 Month Term SOFR + 1.21%, Rate Floor: 1.10%) due 08/15/36◊,4 | | | 21,644,000 | | | | 20,303,163 | |
GS Mortgage Securities Corporation Trust | | | | | | | | |
2020-UPTN, 3.35% (WAC) due 02/10/37◊,4 | | | 8,256,000 | | | | 7,853,295 | |
2020-DUNE, 7.87% (1 Month Term SOFR + 2.76%, Rate Floor: 2.65%) due 12/15/36◊,4 | | | 7,340,000 | | | | 7,236,820 | |
2020-DUNE, 7.27% (1 Month Term SOFR + 2.16%, Rate Floor: 1.90%) due 12/15/36◊,4 | | | 2,750,000 | | | | 2,721,215 | |
JP Morgan Chase Commercial Mortgage Securities Trust | | | | | | | | |
2021-NYAH, 8.10% (1 Month Term SOFR + 3.00%, Rate Floor: 2.64%) due 06/15/38◊,4 | | | 15,000,000 | | | | 11,996,676 | |
SMRT | | | | | | | | |
2022-MINI, 7.05% (1 Month Term SOFR + 1.95%, Rate Floor: 1.95%) due 01/15/39◊,4 | | | 10,000,000 | | | | 9,819,581 | |
194 | THE GUGGENHEIM FUNDS ANNUAL REPORT | SEE NOTES TO FINANCIAL STATEMENTS. |
CONSOLIDATED SCHEDULE OF INVESTMENTS (continued) | September 30, 2024 |
MACRO OPPORTUNITIES FUND | |
| | Face
Amount~ | | | Value | |
MHP | | | | | | | | |
2022-MHIL, 7.71% (1 Month Term SOFR + 2.61%, Rate Floor: 2.61%) due 01/15/27◊,4 | | | 8,204,525 | | | $ | 8,117,352 | |
Total Commercial Mortgage-Backed Securities | | | | | | | 126,401,040 | |
| | | | | | | | | |
Military Housing - 0.4% | | | | | | | | |
Freddie Mac Military Housing Bonds Resecuritization Trust Certificates | | | | | | | | |
2015-R1, 0.70% (WAC) due 10/25/52◊,4,9 | | | 155,676,358 | | | | 9,259,441 | |
2015-R1, 0.70% (WAC) due 11/25/52◊,4,9 | | | 149,088,601 | | | | 8,261,148 | |
2015-R1, 0.70% (WAC) due 11/25/55◊,4,9 | | | 62,717,432 | | | | 3,926,914 | |
Capmark Military Housing Trust | | | | | | | | |
2007-AET2, 6.06% due 10/10/52†††,4 | | | 5,403,692 | | | | 5,406,232 | |
Total Military Housing | | | | | | | 26,853,735 | |
| | | | | | | | | |
Total Collateralized Mortgage Obligations | | | | |
(Cost $1,041,239,749) | | | 912,912,893 | |
| | | | | |
U.S. GOVERNMENT SECURITIES†† - 5.2% |
U.S. Treasury Notes |
4.25% due 03/15/2717 | | | 360,000,000 | | | | 365,554,688 | |
4.63% due 02/28/25 | | | 21,000,000 | | | | 21,014,766 | |
Total U.S. Government Securities | | | | |
(Cost $380,458,898) | | | | | | | 386,569,454 | |
| | | | | | | | | |
U.S. TREASURY BILLS†† - 0.8% |
U.S. Treasury Bills |
5.14% due 10/01/2412 | | | 63,310,000 | | | | 63,310,000 | |
Total U.S. Treasury Bills | | | | |
(Cost $63,310,000) | | | | | | | 63,310,000 | |
| | | | | | | | | |
CONVERTIBLE BONDS†† - 0.4% |
Consumer, Non-cyclical - 0.3% | | | | | | | | |
Block, Inc. | | | | | | | | |
due 05/01/2613 | | | 21,951,000 | | | | 20,227,846 | |
| | | | | | | | | |
Communications - 0.1% | | | | | | | | |
Cable One, Inc. | | | | | | | | |
due 03/15/2613 | | | 5,750,000 | | | | 5,261,250 | |
Total Convertible Bonds | | | | |
(Cost $25,429,053) | | | 25,489,096 | |
| | | | | |
SENIOR FIXED RATE INTERESTS†† - 0.0% |
Industrial - 0.0% | | | | | | | | |
Schur Flexibles GmbH | | | | | | | | |
13.17% due 09/30/26 | | | EUR 722,396 | | | | 712,017 | |
8.66% due 09/30/26 | | | EUR 292,063 | | | | 287,867 | |
Total Industrial | | | | | | | 999,884 | |
| | | | | | | | | |
Total Senior Fixed Rate Interests | | | | |
(Cost $1,049,733) | | | 999,884 | |
| | | | | |
REPURCHASE AGREEMENTS††,14 - 0.4% |
BNP Paribas |
issued 09/30/24 at 4.86% due 10/01/24 | | | 29,510,000 | | | | 29,510,000 | |
Total Repurchase Agreements | | | | |
(Cost $29,510,000) | | | | | | | 29,510,000 | |
| | | | | | | | | |
| | | Contracts | | | | | |
LISTED OPTIONS PURCHASED† - 0.0% |
Put Options on: | | | | | | | | |
Equity Options | | | | | | | | |
SPDR S&P Regional Banking ETF Expiring January 2025 with strike price of $43.00 (Notional Value $48,817,500) | | | 8,625 | | | | 345,000 | |
SPDR S&P Regional Banking ETF Expiring December 2024 with strike price of $42.00 (Notional Value $60,409,180) | | | 10,673 | | | | 234,806 | |
Total Listed Options Purchased | | | | |
(Cost $5,910,564) | | | | | | | 579,806 | |
| | | | | | | | | |
OTC OPTIONS PURCHASED†† - 0.0% |
Put Options on: | | | | | | | | |
Equity Options | | | | | | | | |
Goldman Sachs International Gaotu Techedu, Inc. Expiring January 2025 with strike price of $110.00 (Notional Value $105,776,252) | | | 810,981 | | | | 1,430,003 | |
Goldman Sachs International SPDR S&P Regional Banking ETF Expiring December 2024 with strike price of $42.00 (Notional Value $19,781,700) | | | 3,495 | | | | 76,890 | |
Total OTC Options Purchased | | | | |
(Cost $4,715,319) | | | | | | | 1,506,893 | |
| | | | | | | | | |
Total Investments - 100.3% | | | | |
(Cost $7,796,929,762) | | $ | 7,489,262,761 | |
Other Assets & Liabilities, net - (0.3)% | | | (24,314,826 | ) |
Total Net Assets - 100.0% | | $ | 7,464,947,935 | |
SEE NOTES TO FINANCIAL STATEMENTS. | THE GUGGENHEIM FUNDS ANNUAL REPORT | 195 |
CONSOLIDATED SCHEDULE OF INVESTMENTS (continued) | September 30, 2024 |
MACRO OPPORTUNITIES FUND | |
Futures Contracts |
Description | | Number of
Contracts | | | Expiration
Date | | | Notional
Amount | | | Value and
Unrealized
Appreciation** | |
Commodity Futures Contracts Purchased† |
Gold 100 oz. Futures Contracts | | | 293 | | | | Dec 2024 | | | $ | 77,729,970 | | | $ | 6,681,528 | |
Interest Rate Futures Contracts Purchased† |
3-Month SOFR Futures Contracts | | | 675 | | | | Sep 2025 | | | | 163,341,563 | | | | 1,838,190 | |
3-Month SOFR Futures Contracts | | | 675 | | | | Dec 2025 | | | | 163,586,250 | | | | 1,829,743 | |
3-Month SOFR Futures Contracts | | | 675 | | | | Mar 2026 | | | | 163,704,375 | | | | 1,770,680 | |
| | | | | | | | | | | $ | 490,632,188 | | | $ | 5,438,613 | |
Centrally Cleared Credit Default Swap Agreements Protection Purchased†† |
Counterparty | | Exchange | | | Index | | | Protection
Premium
Rate | | | Payment
Frequency | | | Maturity
Date | | | Notional
Amount~ | | | Value | | | Upfront
Premiums
Paid
(Received) | | | Unrealized
Appreciation
(Depreciation)** | |
J.P. Morgan Securities LLC | ICE | ITRAXX.EUR.42.V1 | | | 1.00% | | | | Quarterly | | | | 12/20/29 | | EUR 62,590,000 | | $ | (1,399,032 | ) | | $ | (1,395,662 | ) | | $ | (3,370 | ) |
J.P. Morgan Securities LLC | ICE | CDX.NA.IG.43.V1 | | | 1.00% | | | | Quarterly | | | | 12/20/29 | | 183,422,063 | | | (4,100,824 | ) | | | (4,107,541 | ) | | | 6,717 | |
| | | | | | | | | | | | | | | | | | | | | | | | | | | $ | (5,499,856 | ) | | $ | (5,503,203 | ) | | $ | 3,347 | |
Centrally Cleared Interest Rate Swap Agreements†† |
Counterparty | | Exchange | | | Floating
Rate
Type | | | Floating
Rate
Index | | | Fixed
Rate | | | Payment
Frequency | | | Maturity
Date | | | Notional
Amount | | | Value | | | Upfront
Premiums
Paid | | | Unrealized
Appreciation
(Depreciation)** | |
J.P. Morgan Securities LLC | CME | Pay | U.S. Secured Overnight Financing Rate | 3.75% | Annually | 08/01/29 | | $ | 152,530,000 | | | $ | 3,241,360 | | | $ | 905 | | | $ | 3,240,455 | |
J.P. Morgan Securities LLC | CME | Receive | U.S. Secured Overnight Financing Rate | 3.55% | Annually | 03/14/54 | | | 3,060,000 | | | | (126,983 | ) | | | 298 | | | | (127,281 | ) |
| | | | | | | | | | | | | | | | | | | | | | | | | | | | | | | $ | 3,114,377 | | | $ | 1,203 | | | $ | 3,113,174 | |
Total Return Swap Agreements |
Counterparty | Reference
Obligation | Type | Financing
Rate | | Payment
Frequency | | | Maturity
Date | | | Units | | | Notional
Amount | | | Value and
Unrealized
Appreciation | |
OTC Equity Index Swap Agreements†† |
Bank of America, N.A. | SPDR S&P 500 ETF Trust | Pay | 5.47% (Federal Funds Rate + 0.64%) | | | At Maturity | | | | 06/02/25 | | | | 74,100 | | | $ | 42,515,616 | | | $ | 5,412,353 | |
OTC Total Return Interest Rate Swap Agreements†† |
Goldman Sachs International | Goldman Sachs Swaption Forward Volatility Index | Pay | 5.83% (Federal Funds Rate + 1.00%) | | | At Maturity | | | | 04/11/25 | | | | 37,000,000 | | | | 58,004,900 | | | | 3,774,999 | |
196 | THE GUGGENHEIM FUNDS ANNUAL REPORT | SEE NOTES TO FINANCIAL STATEMENTS. |
CONSOLIDATED SCHEDULE OF INVESTMENTS (continued) | September 30, 2024 |
MACRO OPPORTUNITIES FUND | |
Forward Foreign Currency Exchange Contracts†† |
Counterparty | | Currency | | | Type | | | Quantity | | | Contract
Amount | | | Settlement
Date | | | Unrealized
Appreciation
(Depreciation) | |
Morgan Stanley Capital Services LLC | | | EUR | | | | Sell | | | | 1,710,000 | | | | 1,908,349 USD | | | | 10/18/24 | | | $ | 2,495 | |
Bank of America, N.A. | | | EUR | | | | Buy | | | | 1,295,000 | | | | 1,447,254 USD | | | | 10/18/24 | | | | (3,932 | ) |
Barclays Bank plc | | | EUR | | | | Sell | | | | 2,325,000 | | | | 2,587,133 USD | | | | 10/18/24 | | | | (4,160 | ) |
Barclays Bank plc | | | CAD | | | | Sell | | | | 5,455,000 | | | | 4,019,022 USD | | | | 10/18/24 | | | | (17,641 | ) |
Bank of America, N.A. | | | EUR | | | | Sell | | | | 210,010,000 | | | | 232,638,281 USD | | | | 10/18/24 | | | | (1,425,110 | ) |
Bank of America, N.A. | | | GBP | | | | Sell | | | | 58,825,000 | | | | 77,127,340 USD | | | | 10/18/24 | | | | (1,522,676 | ) |
| | | | | | | | | | | | | | | | | | | | | | | $ | (2,971,024 | ) |
~ | The face amount is denominated in U.S. dollars unless otherwise indicated. |
* | Non-income producing security. |
** | Includes cumulative appreciation (depreciation). Variation margin is reported within the Consolidated Statement of Assets and Liabilities. |
*** | A copy of each underlying unaffiliated fund’s financial statements is available at the SEC’s website at www.sec.gov. |
† | Value determined based on Level 1 inputs, unless otherwise noted — See Note 4. |
†† | Value determined based on Level 2 inputs, unless otherwise noted — See Note 4. |
††† | Value determined based on Level 3 inputs — See Note 4. |
◊ | Variable rate security. Rate indicated is the rate effective at September 30, 2024. In some instances, the effective rate is limited by a minimum rate floor or a maximum rate cap established by the issuer. The settlement status of a position may also impact the effective rate indicated. In some cases, a position may be unsettled at period end and may not have a stated effective rate. In instances where multiple underlying reference rates and spread amounts are shown, the effective rate is based on a weighted average. |
1 | Affiliated issuer. |
2 | Special Purpose Acquisition Company (SPAC). |
3 | Security is a 144A or Section 4(a)(2) security. These securities have been determined to be illiquid and restricted under guidelines established by the Board of Trustees. The total market value of 144A or Section 4(a)(2) illiquid and restricted securities is $8,196,909 (cost $10,690,333), or 0.1% of total net assets — See Note 10. |
4 | Security is a 144A or Section 4(a)(2) security. These securities have been determined to be liquid under guidelines established by the Board of Trustees. The total market value of 144A or Section 4(a)(2) securities is $3,084,442,154 (cost $3,195,826,315), or 41.3% of total net assets. |
5 | Rate indicated is the 7-day yield as of September 30, 2024. |
6 | Perpetual maturity. |
7 | Security has a fixed rate coupon which will convert to a floating or variable rate coupon on a future date. |
8 | Security has no stated coupon. However, it is expected to receive residual cash flow payments on defined deal dates. |
9 | Security is an interest-only strip. |
10 | Security is a step up/down bond. The coupon increases or decreases at regular intervals until the bond reaches full maturity. Rate indicated is the rate at September 30, 2024. See table below for additional step information for each security. |
11 | Payment-in-kind security. |
12 | Rate indicated is the effective yield at the time of purchase. |
13 | Zero coupon rate security. |
14 | Repurchase Agreements - The interest rate on repurchase agreements is market driven and based on the underlying collateral obtained. See additional disclosure in the repurchase agreements table below for more information on repurchase agreements. |
15 | Security is in default of interest and/or principal obligations. |
16 | Security is unsettled at period end and does not have a stated effective rate. |
17 | All or a portion of this security is pledged as collateral for options and total return swap agreements at September 30, 2024. |
| | CAD — Canadian Dollar |
| | CDX.NA.IG.43.V1 — Credit Default Swap North American Investment Grade Series 43 Index Version 1 |
| | CME — Chicago Mercantile Exchange |
| | CMT — Constant Maturity Treasury |
| | EUR — Euro |
| | EURIBOR — European Interbank Offered Rate |
| | GBP — British Pound |
| | ICE — Intercontinental Exchange |
| | ITRAXX.EUR.42.V1 — iTraxx Europe Series 42 Index Version 1 |
| | plc — Public Limited Company |
| | PPV — Public-Private Venture |
| | REMIC — Real Estate Mortgage Investment Conduit |
| | SARL — Société à Responsabilité Limitée |
| | SOFR — Secured Overnight Financing Rate |
| | SONIA — Sterling Overnight Index Average |
| | WAC — Weighted Average Coupon |
| | |
| | See Sector Classification in Other Information section. |
SEE NOTES TO FINANCIAL STATEMENTS. | THE GUGGENHEIM FUNDS ANNUAL REPORT | 197 |
CONSOLIDATED SCHEDULE OF INVESTMENTS (continued) | September 30, 2024 |
MACRO OPPORTUNITIES FUND | |
The following table summarizes the inputs used to value the Fund’s investments at September 30, 2024 (See Note 4 in the Notes to Financial Statements):
Investments in Securities (Assets) | | Level 1
Quoted
Prices | | | Level 2
Significant
Observable
Inputs | | | Level 3
Significant
Unobservable
Inputs | | | Total | |
Common Stocks | | $ | 3,837,573 | | | $ | 887,107 | | | $ | 2,971,450 | | | $ | 7,696,130 | |
Preferred Stocks | | | — | | | | 293,976,010 | | | | 27,633,690 | | | | 321,609,700 | |
Warrants | | | 576 | | | | — | | | | 286 | | | | 862 | |
Exchange-Traded Funds | | | 71,720,000 | | | | — | | | | — | | | | 71,720,000 | |
Mutual Funds | | | 315,642,162 | | | | — | | | | — | | | | 315,642,162 | |
Money Market Funds | | | 552,958,302 | | | | — | | | | — | | | | 552,958,302 | |
Corporate Bonds | | | — | | | | 2,092,025,395 | | | | 137,028,103 | | | | 2,229,053,498 | |
Asset-Backed Securities | | | — | | | | 1,140,311,534 | | | | 239,516,962 | | | | 1,379,828,496 | |
Senior Floating Rate Interests | | | — | | | | 922,494,468 | | | | 267,381,117 | | | | 1,189,875,585 | |
Collateralized Mortgage Obligations | | | — | | | | 907,506,661 | | | | 5,406,232 | | | | 912,912,893 | |
U.S. Government Securities | | | — | | | | 386,569,454 | | | | — | | | | 386,569,454 | |
U.S. Treasury Bills | | | — | | | | 63,310,000 | | | | — | | | | 63,310,000 | |
Convertible Bonds | | | — | | | | 25,489,096 | | | | — | | | | 25,489,096 | |
Senior Fixed Rate Interests | | | — | | | | 999,884 | | | | — | | | | 999,884 | |
Repurchase Agreements | | | — | | | | 29,510,000 | | | | — | | | | 29,510,000 | |
Options Purchased | | | 579,806 | | | | 1,506,893 | | | | — | | | | 2,086,699 | |
Commodity Futures Contracts** | | | 6,681,528 | | | | — | | | | — | | | | 6,681,528 | |
Interest Rate Futures Contracts** | | | 5,438,613 | | | | — | | | | — | | | | 5,438,613 | |
Credit Default Swap Agreements** | | | — | | | | 6,717 | | | | — | | | | 6,717 | |
Interest Rate Swap Agreements** | | | — | | | | 3,240,455 | | | | — | | | | 3,240,455 | |
Equity Index Swap Agreements** | | | — | | | | 5,412,353 | | | | — | | | | 5,412,353 | |
Total Return Interest Rate Swap Agreements** | | | — | | | | 3,774,999 | | | | — | | | | 3,774,999 | |
Forward Foreign Currency Exchange Contracts** | | | — | | | | 2,495 | | | | — | | | | 2,495 | |
Total Assets | | $ | 956,858,560 | | | $ | 5,877,023,521 | | | $ | 679,937,840 | | | $ | 7,513,819,921 | |
Investments in Securities (Liabilities) | | Level 1
Quoted
Prices | | | Level 2
Significant
Observable
Inputs | | | Level 3
Significant
Unobservable
Inputs | | | Total | |
Credit Default Swap Agreements** | | $ | — | | | $ | 3,370 | | | $ | — | | | $ | 3,370 | |
Interest Rate Swap Agreements** | | | — | | | | 127,281 | | | | — | | | | 127,281 | |
Forward Foreign Currency Exchange Contracts** | | | — | | | | 2,973,519 | | | | — | | | | 2,973,519 | |
Unfunded Loan Commitments (Note 9) | | | — | | | | — | | | | 1,325,732 | | | | 1,325,732 | |
Total Liabilities | | $ | — | | | $ | 3,104,170 | | | $ | 1,325,732 | | | $ | 4,429,902 | |
** | This derivative is reported as unrealized appreciation/depreciation at period end. |
The following is a summary of significant unobservable inputs used in the fair valuation of assets and liabilities categorized within Level 3 of the fair value hierarchy:
Category | | Ending
Balance at
September 30,
2024 | | Valuation
Technique | Unobservable
Inputs | | Input Range | | | Weighted
Average* | |
Assets: | | | | | | | | | | | | | | |
Asset-Backed Securities | | $ | 137,537,733 | | Yield Analysis | Yield | 4.8%-8.6% | 6.6% |
Asset-Backed Securities | | | 88,757,783 | | Option adjusted spread off prior month end broker quote | Broker Quote | — | — |
Asset-Backed Securities | | | 13,142,655 | | Third Party Pricing | Trade Price | — | — |
198 | THE GUGGENHEIM FUNDS ANNUAL REPORT | SEE NOTES TO FINANCIAL STATEMENTS. |
CONSOLIDATED SCHEDULE OF INVESTMENTS (continued) | September 30, 2024 |
MACRO OPPORTUNITIES FUND | |
Category | | Ending
Balance at
September 30,
2024 | | Valuation
Technique | Unobservable
Inputs | | Input Range | | | Weighted
Average* | |
Asset-Backed Securities | | $ | 78,791 | | Third Party Pricing | Broker Quote | — | — |
Collateralized Mortgage Obligations | | | 5,406,232 | | Option adjusted spread off prior month end broker quote | Broker Quote | — | — |
Common Stocks | | | 2,943,763 | | Enterprise Value | Valuation Multiple | 2.9x-8.6x | 5.6x |
Common Stocks | | | 27,687 | | Model Price | Liquidation Value | — | — |
Corporate Bonds | | | 71,088,586 | | Yield Analysis | Yield | 6.6%-9.6% | 6.8% |
Corporate Bonds | | | 41,322,089 | | Option adjusted spread off prior month end broker quote | Broker Quote | — | — |
Corporate Bonds | | | 24,608,000 | | Third Party Pricing | Broker Quote | — | — |
Corporate Bonds | | | 9,427 | | Third Party Pricing | Trade Price | — | — |
Corporate Bonds | | | 1 | | Model Price | Liquidation Value | — | — |
Preferred Stocks | | | 27,633,690 | | Yield Analysis | Yield | 5.8% | — |
Senior Floating Rate Interests | | | 138,395,648 | | Model Price | Purchase Price | — | — |
Senior Floating Rate Interests | | | 77,039,014 | | Third Party Pricing | Broker Quote | — | — |
Senior Floating Rate Interests | | | 49,598,809 | | Yield Analysis | Yield | 10.3%-15.8% | 10.8% |
Senior Floating Rate Interests | | | 1,777,113 | | Third Party Pricing | Trade Price | — | — |
Senior Floating Rate Interests | | | 570,533 | | Model Price | Liquidation Value | — | — |
Warrants | | | 286 | | Model Price | Liquidation Value | — | — |
Total Assets | | $ | 679,937,840 | | | | | |
Liabilities: | | | | | | | | | | | | | | |
Unfunded Loan Commitments | | $ | 1,325,732 | | Model Price | Purchase Price | — | — |
* | Inputs are weighted by the fair value of the instruments. |
Significant changes in a quote, yield, liquidation value or valuation multiple would generally result in significant changes in the fair value of the security.
The Fund’s fair valuation leveling guidelines classify a single daily broker quote, or a vendor price based on a single daily or monthly broker quote, as Level 3, if such a quote or price cannot be supported with other available market information.
Transfers between Level 2 and Level 3 may occur as markets fluctuate and/or the availability of data used in an investment’s valuation changes. For the year ended September 30, 2024, the Fund had securities with a total value of $30,337,082 transfer into Level 3 from Level 2 due to a lack of observable inputs and had securities with a total value of $35,928,953 transfer out of Level 3 into Level 2 due to the availability of current and reliable market-based data provided by a third-party pricing service which utilizes significant observable inputs.
SEE NOTES TO FINANCIAL STATEMENTS. | THE GUGGENHEIM FUNDS ANNUAL REPORT | 199 |
CONSOLIDATED SCHEDULE OF INVESTMENTS (continued) | September 30, 2024 |
MACRO OPPORTUNITIES FUND | |
Summary of Fair Value Level 3 Activity
Following is a reconciliation of Level 3 assets for which significant unobservable inputs were used to determine fair value for the year ended September 30, 2024:
| | | Assets | | | | | | | Liabilities | |
| | Asset-
Backed
Securities | | | Collateralized
Mortgage
Obligations | | | Corporate
Bonds | | | Senior
Floating
Rate
Interests | | | Warrants | | | Common
Stocks | | | Preferred
Stocks | | | Total
Assets | | | Unfunded
Loan
Commitments | |
Beginning Balance | | $ | 223,348,932 | | | $ | 4,986,289 | | | $ | 59,850,234 | | | $ | 243,686,805 | | | $ | 76 | | | $ | 995,145 | | | $ | 28,121,912 | | | $ | 560,989,393 | | | $ | (1,990,229 | ) |
Purchases/(Receipts) | | | 75,415,636 | | | | — | | | | 74,678,462 | | | | 144,994,392 | | | | — | | | | 55,180 | | | | — | | | | 295,143,670 | | | | (1,674,800 | ) |
(Sales, maturities and paydowns)/Fundings | | | (60,773,341 | ) | | | (68,718 | ) | | | (17,493,055 | ) | | | (120,126,311 | ) | | | — | | | | (397,790 | ) | | | (2,602,482 | ) | | | (201,461,697 | ) | | | 1,209,833 | |
Amortization of premiums/discounts | | | 226,839 | | | | (127 | ) | | | 601,703 | | | | 1,581,698 | | | | — | | | | — | | | | — | | | | 2,410,113 | | | | (34,876 | ) |
Corporate actions | | | — | | | | — | | | | — | | | | 3,456,752 | | | | — | | | | 2,361,618 | | | | (174,412 | ) | | | 5,643,958 | | | | — | |
Total realized gains (losses) included in earnings | | | (175,395 | ) | | | (104 | ) | | | (1,313,672 | ) | | | (883,545 | ) | | | — | | | | (297,261 | ) | | | (7,062,917 | ) | | | (9,732,894 | ) | | | 659,155 | |
Total change in unrealized appreciation (depreciation) included in earnings | | | 12,908,515 | | | | 488,892 | | | | 4,874,805 | | | | 4,666,344 | | | | 210 | | | | 246,813 | | | | 9,351,589 | | | | 32,537,168 | | | | 505,185 | |
Transfers into Level 3 | | | — | | | | — | | | | 26,312,890 | | | | 4,016,447 | | | | — | | | | 7,745 | | | | — | | | | 30,337,082 | | | | — | |
Transfers out of Level 3 | | | (11,434,224 | ) | | | — | | | | (10,483,264 | ) | | | (14,011,465 | ) | | | — | | | | — | | | | — | | | | (35,928,953 | ) | | | — | |
Ending Balance | | $ | 239,516,962 | | | $ | 5,406,232 | | | $ | 137,028,103 | | | $ | 267,381,117 | | | $ | 286 | | | $ | 2,971,450 | | | $ | 27,633,690 | | | $ | 679,937,840 | | | $ | (1,325,732 | ) |
Net change in unrealized appreciation (depreciation) for investments in Level 3 securities still held at September 30, 2024 | | $ | 5,486,801 | | | $ | 488,892 | | | $ | 3,524,334 | | | $ | 1,378,918 | | | $ | 210 | | | $ | (148,045 | ) | | $ | 633,690 | | | $ | 11,364,800 | | | $ | 364,131 | |
Step Coupon Bonds
The following table discloses additional information related to step coupon bonds held by the Fund. Certain securities are subject to multiple rate changes prior to maturity. For those securities, a range of rates and corresponding dates have been provided. Rates for all step coupon bonds held by the Fund are scheduled to increase, except GAIA Aviation Ltd. which are scheduled to decrease.
Name | | Coupon Rate at
Next Reset Date | | | Next Rate Reset Date | | | Future Reset Rate | | | Future Reset Date | |
BRAVO Residential Funding Trust 2022-R1, 3.13% due 01/29/70 | | | 6.13 | % | | | 01/30/25 | | | | — | | | | — | |
Citigroup Mortgage Loan Trust, Inc. 2022-A, 6.17% due 09/25/62 | | | 9.17 | % | | | 09/25/25 | | | | 10.17 | % | | | 09/25/26 | |
GAIA Aviation Ltd. 2019-1, 3.97% due 12/15/44 | | | 2.00 | % | | | 10/15/26 | | | | — | | | | — | |
GAIA Aviation Ltd. 2019-1, 5.19% due 12/15/44 | | | 2.00 | % | | | 10/15/26 | | | | — | | | | — | |
GCAT Trust 2022-NQM5, 5.71% due 08/25/67 | | | 6.71 | % | | | 10/01/26 | | | | — | | | | — | |
GCAT Trust 2023-NQM2, 6.60% due 11/25/67 | | | 7.60 | % | | | 01/01/27 | | | | — | | | | — | |
Mill City Securities Ltd. 2024-RS1, 4.00% due 11/01/69 | | | 7.00 | % | | | 10/01/27 | | | | — | | | | — | |
NYMT Loan Trust 2022-SP1, 5.25% due 07/25/62 | | | 8.25 | % | | | 07/01/25 | | | | 9.25 | % | | | 07/01/26 | |
OBX Trust 2022-NQM8, 6.10% due 09/25/62 | | | 7.10 | % | | | 10/01/26 | | | | — | | | | — | |
OBX Trust 2022-NQM9, 6.45% due 09/25/62 | | | 7.45 | % | | | 11/01/26 | | | | — | | | | — | |
OBX Trust 2023-NQM2, 6.80% due 01/25/62 | | | 7.80 | % | | | 02/01/27 | | | | — | | | | — | |
OSAT Trust 2021-RPL1, 5.12% due 05/25/65 | | | 6.12 | % | | | 06/25/25 | | | | — | | | | — | |
PRPM LLC 2024-4, 6.41% due 08/25/29 | | | 9.41 | % | | | 08/25/27 | | | | 10.41 | % | | | 08/25/28 | |
Verus Securitization Trust 2022-8, 6.13% due 09/25/67 | | | 7.13 | % | | | 10/01/26 | | | | — | | | | — | |
200 | THE GUGGENHEIM FUNDS ANNUAL REPORT | SEE NOTES TO FINANCIAL STATEMENTS. |
CONSOLIDATED SCHEDULE OF INVESTMENTS (continued) | September 30, 2024 |
MACRO OPPORTUNITIES FUND | |
Repurchase Agreements
The Fund may engage in repurchase agreements. Repurchase agreements are fixed income securities in the form of agreements backed by collateral. These agreements typically involve the acquisition by the Fund of securities from the selling institution coupled with the agreement that the selling institution will repurchase the underlying securities at a specified price and at a fixed time in the future. The Fund may accept a wide variety of underlying securities as collateral for the repurchase agreements entered into by the Fund. Any such securities serving as collateral are marked-to-market daily in order to maintain full collateralization. Securities purchased under repurchase agreements are reflected as an asset on the Fund’s Consolidated Statement of Assets and Liabilities. Interest earned is recorded as a component of interest income on the Fund’s Consolidated Statement of Operations.
In connection with transactions in repurchase agreements, it is the Fund’s policy that its custodian take possession of the underlying collateral. The collateral is in the possession of the Fund’s custodian and is evaluated to ensure that its market value exceeds, at a minimum, 102% of the original face amount of the repurchase agreements, subject to minimum amounts to initiate a margin call, with the exception of where securities are being sold short. The interest rate on repurchase agreements is market driven and based on the underlying collateral obtained.
The use of repurchase agreements involves certain risks. For example, if the selling institution defaults on its obligation to repurchase the underlying securities at a time when the value of securities has declined, the Fund may incur a loss upon disposition of them. In the event of an insolvency or bankruptcy by the selling institution, the Fund’s right to control the collateral could be affected and result in certain costs and delays. In addition, the Fund could incur a loss if the value of the underlying collateral falls below the agreed upon repurchase price.
At September 30, 2024, the repurchase agreements in the account were as follows:
Counterparty and
Terms of Agreement | | Face Value | | | Repurchase Price | | | Collateral | | Par Value | | | Fair Value | |
BNP Paribas | | | | | | | | | | U.S. Treasury Bond | | | | | | | | |
4.86% | | | | | | | | | | 3.63% | | | | | | | | |
Due 10/01/24 | | $ | 29,510,000 | | | $ | 29,513,984 | | | Due 02/15/53 | | $ | 12,298,900 | | | $ | 11,244,789 | |
| | | | | | | | | | | | | | | | | | | |
| | | | | | | | | | | U.S. Treasury Strips | | | | | | | | |
| | | | | | | | | | | 0.00% | | | | | | | | |
| | | | | | | | | | | Due 11/15/34 - 08/15/47 | | | 14,293,720 | | | | 9,881,235 | |
| | | | | | | | | | | | | | | | | | | |
| | | | | | | | | | | U.S. Treasury Notes | | | | | | | | |
| | | | | | | | | | | 1.25% - 4.50% | | | | | | | | |
| | | | | | | | | | | Due 12/31/24 - 11/30/26 | | | 8,675,000 | | | | 8,322,336 | |
| | | | | | | | | | | | | | | | | | | |
| | | | | | | | | | | U.S Treasury Inflation Indexed Bonds | | | | | | | | |
| | | | | | | | | | | 0.13% - 3.63% | | | | | | | | |
| | | | | | | | | | | Due 04/15/28 - 01/15/31 | | | 699,870 | | | | 655,909 | |
| | | | | | | | | | | | | $ | 35,967,490 | | | $ | 30,104,269 | |
Affiliated Transactions
Investments representing 5% or more of the outstanding voting shares of a company, or control of or by, or common control under Guggenheim Investments (“GI”), result in that company being considered an affiliated issuer, as defined in the 1940 Act.
The Fund may invest in certain of the underlying series of Guggenheim Strategy Funds Trust, including Guggenheim Strategy Fund II and Guggenheim Strategy Fund III (collectively, the “Guggenheim Strategy Funds”), each of which are open-end management investment companies managed by GI. The Guggenheim Strategy Funds, which launched on March 11, 2014, are offered as short term investment options only to mutual funds, trusts, and other accounts managed by GI and/or its affiliates, and are not available to the public. The Guggenheim Strategy Funds pay no investment management fees. The Guggenheim Strategy Funds’ annual report on Form N-CSR dated September 30, 2023 is available publicly or upon request. This information is available from the EDGAR database on the SEC’s website at https://www.sec.gov/
SEE NOTES TO FINANCIAL STATEMENTS. | THE GUGGENHEIM FUNDS ANNUAL REPORT | 201 |
CONSOLIDATED SCHEDULE OF INVESTMENTS (concluded) | September 30, 2024 |
MACRO OPPORTUNITIES FUND | |
Archives/edgar/data/1601445/000182126823000217/gug86449-ncsr.htm. The Fund may invest in certain of the underlying series of Guggenheim Funds Trust, which are open-end management investment companies managed by GI, are available to the public and whose most recent annual report on Form N-CSR is available publicly or upon request.
Transactions during the year ended September 30, 2024, in which the company is an affiliated issuer, were as follows:
Security Name | | Value
09/30/23 | | | Additions | | | Reductions | | | Realized
Gain (Loss) | | | Change in
Unrealized
Appreciation
(Depreciation) | | | Value
09/30/24 | | | Shares
09/30/24 | | | Investment
Income | |
Common Stocks | | | | | | | | | | | | | | | | | | | | | | | | | | | | | | | | |
BP Holdco LLC* | | $ | 48,218 | | | $ | — | | | $ | — | | | $ | — | | | $ | (2,715 | ) | | $ | 45,503 | | | | 37,539 | | | $ | — | |
Mutual Funds | | | | | | | | | | | | | | | | | | | | | | | | | | | | | | | | |
Guggenheim Alpha Opportunity Fund — Institutional Class | | | 29,045,744 | | | | 164,424 | | | | — | | | | — | | | | 4,204,958 | | | | 33,415,126 | | | | 1,022,808 | | | | 164,424 | |
Guggenheim Limited Duration Fund — Class R6 | | | 122,839,898 | | | | 6,021,946 | | | | — | | | | — | | | | 5,335,337 | | | | 134,197,181 | | | | 5,457,388 | | | | 6,040,934 | |
Guggenheim Risk Managed Real Estate Fund — Institutional Class | | | 29,711,644 | | | | 1,058,513 | | | | — | | | | — | | | | 7,480,947 | | | | 38,251,104 | | | | 1,093,826 | | | | 1,058,513 | |
Guggenheim Strategy Fund II | | | 19,207,708 | | | | 1,127,587 | | | | — | | | | — | | | | 429,758 | | | | 20,765,053 | | | | 837,301 | | | | 1,130,985 | |
Guggenheim Strategy Fund III | | | 33,331,353 | | | | 1,872,913 | | | | — | | | | — | | | | 841,947 | | | | 36,046,213 | | | | 1,448,221 | | | | 1,877,780 | |
Guggenheim Ultra Short Duration Fund — Institutional Class | | | 48,849,509 | | | | 2,731,511 | | | | — | | | | — | | | | 1,386,465 | | | | 52,967,485 | | | | 5,286,176 | | | | 2,739,537 | |
| | | $ | 283,034,074 | | | $ | 12,976,894 | | | $ | — | | | $ | — | | | $ | 19,676,697 | | | $ | 315,687,665 | | | | | | | $ | 13,012,173 | |
* | Non-income producing security. |
202 | THE GUGGENHEIM FUNDS ANNUAL REPORT | SEE NOTES TO FINANCIAL STATEMENTS. |
CONSOLIDATED STATEMENT OF ASSETS AND LIABILITIES |
September 30, 2024 |
Assets: |
Investments in unaffiliated issuers, at value (cost $7,462,343,121) | | $ | 7,144,065,096 | |
Investments in affiliated issuers, at value (cost $305,076,641) | | | 315,687,665 | |
Repurchase agreements, at value (cost $29,510,000) | | | 29,510,000 | |
Foreign currency, at value (cost $2,680,249) | | | 2,692,009 | |
Cash | | | 22,577,802 | |
Segregated cash with broker | | | 14,435,996 | |
Unamortized upfront premiums paid on interest rate swap agreements | | | 1,203 | |
Unrealized appreciation on OTC swap agreements | | | 9,187,352 | |
Unrealized appreciation on forward foreign currency exchange contracts | | | 2,495 | |
Prepaid expenses | | | 240,986 | |
Receivables: |
Interest | | | 65,548,234 | |
Securities sold | | | 29,774,120 | |
Fund shares sold | | | 11,181,836 | |
Dividends | | | 1,382,077 | |
Variation margin on credit default swap agreements | | | 79,488 | |
Investment Adviser | | | 3,467 | |
Total assets | | | 7,646,369,826 | |
| | | | | |
Liabilities: |
Unfunded loan commitments, at value (Note 9) (commitment fees received $2,483,370) | | | 1,325,732 | |
Segregated cash due to broker | | | 1,778,403 | |
Unamortized upfront premiums received on credit default swap agreements | | | 5,503,203 | |
Unrealized depreciation on forward foreign currency exchange contracts | | | 2,973,519 | |
Payable for: |
Securities purchased | | | 140,926,997 | |
Fund shares redeemed | | | 14,264,209 | |
Management fees | | | 4,515,516 | |
Distributions to shareholders | | | 4,013,355 | |
Swap settlement | | | 1,808,108 | |
Variation margin on futures contracts | | | 968,485 | |
Variation margin on interest rate swap agreements | | | 851,954 | |
Transfer agent/maintenance fees | | | 342,314 | |
Distribution and service fees | | | 148,809 | |
Protection fees on credit default swap agreements | | | 77,345 | |
Fund accounting/administration fees | | | 24,657 | |
Trustees’ fees* | | | 6,637 | |
Due to Investment Adviser | | | 4,997 | |
Miscellaneous | | | 1,887,651 | |
Total liabilities | | | 181,421,891 | |
Net assets | | $ | 7,464,947,935 | |
| | | | | |
Net assets consist of: |
Paid in capital | | $ | 8,216,624,553 | |
Total distributable earnings (loss) | | | (751,676,618 | ) |
Net assets | | $ | 7,464,947,935 | |
| | | | | |
Class A: |
Net assets | | $ | 330,519,464 | |
Capital shares outstanding | | | 13,296,167 | |
Net asset value per share | | $ | 24.86 | |
Maximum offering price per share (Net asset value divided by 96.00%) | | $ | 25.90 | |
| | | | | |
Class C: |
Net assets | | $ | 107,377,259 | |
Capital shares outstanding | | | 4,322,712 | |
Net asset value per share | | $ | 24.84 | |
| | | | | |
Class P: |
Net assets | | $ | 27,134,675 | |
Capital shares outstanding | | | 1,091,085 | |
Net asset value per share | | $ | 24.87 | |
| | | | | |
Institutional Class: |
Net assets | | $ | 6,846,334,313 | |
Capital shares outstanding | | | 275,008,488 | |
Net asset value per share | | $ | 24.89 | |
| | | | | |
Class R6: |
Net assets | | $ | 153,582,224 | |
Capital shares outstanding | | | 6,170,376 | |
Net asset value per share | | $ | 24.89 | |
* | Relates to Trustees not deemed “interested persons” within the meaning of Section 2(a)(19) of the 1940 Act. |
SEE NOTES TO FINANCIAL STATEMENTS. | THE GUGGENHEIM FUNDS ANNUAL REPORT | 203 |
CONSOLIDATED STATEMENT OF OPERATIONS |
Year Ended September 30, 2024 |
Investment Income: |
Dividends from securities of unaffiliated issuers | | $ | 4,845,309 | |
Dividends from securities of affiliated issuers | | | 13,012,173 | |
Interest from securities of unaffiliated issuers | | | 439,154,106 | |
Total investment income | | | 457,011,588 | |
| | | | | |
Expenses: |
Management fees | | | 57,449,778 | |
Distribution and service fees: |
Class A | | | 727,863 | |
Class C | | | 1,023,761 | |
Class P | | | 117,816 | |
Transfer agent/maintenance fees: |
Class A | | | 212,162 | |
Class C | | | 33,836 | |
Class P | | | 29,959 | |
Institutional Class | | | 4,788,068 | |
Class R6 | | | 6,510 | |
Fund accounting/administration fees | | | 2,526,543 | |
Professional fees | | | 544,574 | |
Line of credit fees | | | 490,451 | |
Trustees’ fees* | | | 102,220 | |
Custodian fees | | | 96,844 | |
Miscellaneous | | | 695,223 | |
Recoupment of previously waived fees: |
Class A | | | 96,132 | |
Class C | | | 43,926 | |
Class P | | | 51,304 | |
Institutional Class | | | 14,563 | |
Class R6 | | | 14,422 | |
Total expenses | | | 69,065,955 | |
Less: |
Expenses reimbursed by Adviser: |
Class A | | | (295 | ) |
Class C | | | (265 | ) |
Institutional Class | | | (3,997,671 | ) |
Class R6 | | | (1,958 | ) |
Expenses waived by Adviser | | | (3,450,085 | ) |
Earnings credits applied | | | (3,114 | ) |
Total waived/reimbursed expenses | | | (7,453,388 | ) |
Net expenses | | | 61,612,567 | |
Net investment income | | | 395,399,021 | |
| | | | | |
Net Realized and Unrealized Gain (Loss): |
Net realized gain (loss) on: |
Investments in unaffiliated issuers | | $ | (48,018,260 | ) |
Swap agreements | | | (29,287,900 | ) |
Futures contracts | | | (3,215,125 | ) |
Options purchased | | | 1,064,695 | |
Options written | | | (3,640,905 | ) |
Forward foreign currency exchange contracts | | | (6,740,405 | ) |
Foreign currency transactions | | | (3,255,680 | ) |
Net realized loss | | | (93,093,580 | ) |
Net change in unrealized appreciation (depreciation) on: |
Investments in unaffiliated issuers | | | 400,472,496 | |
Investments in affiliated issuers | | | 19,676,697 | |
Swap agreements | | | 35,319,379 | |
Futures contracts | | | 12,120,141 | |
Options purchased | | | (5,729,526 | ) |
Forward foreign currency exchange contracts | | | (6,674,079 | ) |
Foreign currency translations | | | (794,153 | ) |
Net change in unrealized appreciation (depreciation) | | | 454,390,955 | |
Net realized and unrealized gain | | | 361,297,375 | |
Net increase in net assets resulting from operations | | $ | 756,696,396 | |
* | Relates to Trustees not deemed “interested persons” within the meaning of Section 2(a)(19) of the 1940 Act. |
204 | THE GUGGENHEIM FUNDS ANNUAL REPORT | SEE NOTES TO FINANCIAL STATEMENTS. |
CONSOLIDATED STATEMENTS OF CHANGES IN NET ASSETS |
| | Year Ended
September 30,
2024 | | | Year Ended
September 30,
2023 | |
Increase (Decrease) in Net Assets from Operations: | | | | | | | | |
Net investment income | | $ | 395,399,021 | | | $ | 339,429,107 | |
Net realized loss on investments | | | (93,093,580 | ) | | | (210,856,113 | ) |
Net change in unrealized appreciation (depreciation) on investments | | | 454,390,955 | | | | 292,518,294 | |
Net increase in net assets resulting from operations | | | 756,696,396 | | | | 421,091,288 | |
| | | | | | | | | |
Distributions to shareholders: | | | | | | | | |
Class A | | | (18,434,390 | ) | | | (16,952,857 | ) |
Class C | | | (5,780,507 | ) | | | (5,928,309 | ) |
Class P | | | (2,980,359 | ) | | | (4,987,662 | ) |
Institutional Class | | | (393,918,652 | ) | | | (310,664,175 | ) |
Class R6 | | | (9,856,861 | ) | | | (8,818,791 | ) |
Total distributions to shareholders | | | (430,970,769 | ) | | | (347,351,794 | ) |
| | | | | | | | | |
Capital share transactions: | | | | | | | | |
Proceeds from sale of shares | | | | | | | | |
Class A | | | 122,660,844 | | | | 88,917,715 | |
Class C | | | 30,464,616 | | | | 12,403,253 | |
Class P | | | 9,692,840 | | | | 16,822,252 | |
Institutional Class | | | 2,655,046,775 | | | | 2,128,695,437 | |
Class R6 | | | 66,002,762 | | | | 83,550,238 | |
Distributions reinvested | | | | | | | | |
Class A | | | 15,596,676 | | | | 14,302,558 | |
Class C | | | 5,231,832 | | | | 5,285,062 | |
Class P | | | 2,953,184 | | | | 4,948,543 | |
Institutional Class | | | 342,864,582 | | | | 268,719,399 | |
Class R6 | | | 9,703,987 | | | | 8,818,791 | |
Cost of shares redeemed | | | | | | | | |
Class A | | | (102,590,665 | ) | | | (154,649,331 | ) |
Class C | | | (36,716,557 | ) | | | (61,940,389 | ) |
Class P | | | (42,732,573 | ) | | | (130,394,089 | ) |
Institutional Class | | | (1,676,736,544 | ) | | | (2,629,895,397 | ) |
Class R6 | | | (117,211,214 | ) | | | (30,444,262 | ) |
Net increase (decrease) from capital share transactions | | | 1,284,230,545 | | | | (374,860,220 | ) |
Net increase (decrease) in net assets | | | 1,609,956,172 | | | | (301,120,726 | ) |
| | | | | | | | | |
Net assets: | | | | | | | | |
Beginning of year | | | 5,854,991,763 | | | | 6,156,112,489 | |
End of year | | $ | 7,464,947,935 | | | $ | 5,854,991,763 | |
| | | | | | | | | |
SEE NOTES TO FINANCIAL STATEMENTS. | THE GUGGENHEIM FUNDS ANNUAL REPORT | 205 |
CONSOLIDATED STATEMENTS OF CHANGES IN NET ASSETS (concluded) |
| | Year Ended
September 30,
2024 | | | Year Ended
September 30,
2023 | |
Capital share activity: | | | | | | | | |
Shares sold | | | | | | | | |
Class A | | | 5,055,388 | | | | 3,734,087 | |
Class C | | | 1,258,346 | | | | 521,851 | |
Class P | | | 400,331 | | | | 707,632 | |
Institutional Class | | | 109,467,399 | | | | 89,245,962 | |
Class R6 | | | 2,727,890 | | | | 3,495,646 | |
Shares issued from reinvestment of distributions | | | | | | | | |
Class A | | | 644,458 | | | | 600,755 | |
Class C | | | 216,488 | | | | 222,238 | |
Class P | | | 122,198 | | | | 208,213 | |
Institutional Class | | | 14,136,969 | | | | 11,271,078 | |
Class R6 | | | 401,374 | | | | 370,155 | |
Shares redeemed | | | | | | | | |
Class A | | | (4,249,244 | ) | | | (6,501,599 | ) |
Class C | | | (1,522,468 | ) | | | (2,604,191 | ) |
Class P | | | (1,754,486 | ) | | | (5,490,413 | ) |
Institutional Class | | | (69,266,077 | ) | | | (110,513,346 | ) |
Class R6 | | | (4,883,357 | ) | | | (1,280,546 | ) |
Net increase (decrease) in shares | | | 52,755,209 | | | | (16,012,478 | ) |
206 | THE GUGGENHEIM FUNDS ANNUAL REPORT | SEE NOTES TO FINANCIAL STATEMENTS. |
CONSOLIDATED FINANCIAL HIGHLIGHTS |
This table is presented to show selected data for a share outstanding throughout each period and to assist shareholders in evaluating a Fund’s performance for the periods presented.
Class A | | Year Ended
September 30,
2024 | | | Year Ended
September 30,
2023 | | | Year Ended
September 30,
2022 | | | Year Ended
September 30,
2021 | | | Year Ended
September 30,
2020 | |
Per Share Data |
Net asset value, beginning of period | | $ | 23.66 | | | $ | 23.36 | | | $ | 27.19 | | | $ | 26.31 | | | $ | 25.82 | |
Income (loss) from investment operations: |
Net investment income (loss)a | | | 1.39 | | | | 1.30 | | | | .89 | | | | .91 | | | | .74 | |
Net gain (loss) on investments (realized and unrealized) | | | 1.34 | | | | .33 | | | | (3.77 | ) | | | 1.04 | | | | .61 | |
Total from investment operations | | | 2.73 | | | | 1.63 | | | | (2.88 | ) | | | 1.95 | | | | 1.35 | |
Less distributions from: |
Net investment income | | | (1.53 | ) | | | (1.33 | ) | | | (.95 | ) | | | (1.07 | ) | | | (.86 | ) |
Total distributions | | | (1.53 | ) | | | (1.33 | ) | | | (.95 | ) | | | (1.07 | ) | | | (.86 | ) |
Net asset value, end of period | | $ | 24.86 | | | $ | 23.66 | | | $ | 23.36 | | | $ | 27.19 | | | $ | 26.31 | |
|
Total Returnb | | | 11.92 | % | | | 7.09 | % | | | (10.77 | %) | | | 7.49 | % | | | 5.39 | % |
Ratios/Supplemental Data |
Net assets, end of period (in thousands) | | $ | 330,519 | | | $ | 280,275 | | | $ | 327,393 | | | $ | 435,293 | | | $ | 312,986 | |
Ratios to average net assets: |
Net investment income (loss) | | | 5.76 | % | | | 5.46 | % | | | 3.46 | % | | | 3.35 | % | | | 2.90 | % |
Total expensesc | | | 1.30 | % | | | 1.50 | % | | | 1.42 | % | | | 1.43 | % | | | 1.51 | % |
Net expensesd,e,f | | | 1.25 | % | | | 1.44 | % | | | 1.37 | % | | | 1.37 | % | | | 1.39 | % |
Portfolio turnover rate | | | 24 | % | | | 32 | % | | | 25 | % | | | 84 | % | | | 130 | % |
Class C | | Year Ended
September 30,
2024 | | | Year Ended
September 30,
2023 | | | Year Ended
September 30,
2022 | | | Year Ended
September 30,
2021 | | | Year Ended
September 30,
2020 | |
Per Share Data |
Net asset value, beginning of period | | $ | 23.64 | | | $ | 23.35 | | | $ | 27.17 | | | $ | 26.29 | | | $ | 25.80 | |
Income (loss) from investment operations: |
Net investment income (loss)a | | | 1.22 | | | | 1.12 | | | | .70 | | | | .72 | | | | .55 | |
Net gain (loss) on investments (realized and unrealized) | | | 1.34 | | | | .32 | | | | (3.76 | ) | | | 1.03 | | | | .61 | |
Total from investment operations | | | 2.56 | | | | 1.44 | | | | (3.06 | ) | | | 1.75 | | | | 1.16 | |
Less distributions from: |
Net investment income | | | (1.36 | ) | | | (1.15 | ) | | | (.76 | ) | | | (.87 | ) | | | (.67 | ) |
Total distributions | | | (1.36 | ) | | | (1.15 | ) | | | (.76 | ) | | | (.87 | ) | | | (.67 | ) |
Net asset value, end of period | | $ | 24.84 | | | $ | 23.64 | | | $ | 23.35 | | | $ | 27.17 | | | $ | 26.29 | |
|
Total Returnb | | | 11.13 | % | | | 6.25 | % | | | (11.41 | %) | | | 6.70 | % | | | 4.60 | % |
Ratios/Supplemental Data |
Net assets, end of period (in thousands) | | $ | 107,377 | | | $ | 103,332 | | | $ | 145,469 | | | $ | 207,739 | | | $ | 219,866 | |
Ratios to average net assets: |
Net investment income (loss) | | | 5.05 | % | | | 4.72 | % | | | 2.70 | % | | | 2.64 | % | | | 2.15 | % |
Total expensesc | | | 2.03 | % | | | 2.27 | % | | | 2.17 | % | | | 2.18 | % | | | 2.25 | % |
Net expensesd,e,f | | | 1.97 | % | | | 2.21 | % | | | 2.12 | % | | | 2.12 | % | | | 2.15 | % |
Portfolio turnover rate | | | 24 | % | | | 32 | % | | | 25 | % | | | 84 | % | | | 130 | % |
SEE NOTES TO FINANCIAL STATEMENTS. | THE GUGGENHEIM FUNDS ANNUAL REPORT | 207 |
CONSOLIDATED FINANCIAL HIGHLIGHTS (continued) |
This table is presented to show selected data for a share outstanding throughout each period and to assist shareholders in evaluating a Fund’s performance for the periods presented.
Class P | | Year Ended
September 30,
2024 | | | Year Ended
September 30,
2023 | | | Year Ended
September 30,
2022 | | | Year Ended
September 30,
2021 | | | Year Ended
September 30,
2020 | |
Per Share Data |
Net asset value, beginning of period | | $ | 23.67 | | | $ | 23.38 | | | $ | 27.20 | | | $ | 26.32 | | | $ | 25.82 | |
Income (loss) from investment operations: |
Net investment income (loss)a | | | 1.38 | | | | 1.30 | | | | .90 | | | | .91 | | | | .74 | |
Net gain (loss) on investments (realized and unrealized) | | | 1.34 | | | | .32 | | | | (3.77 | ) | | | 1.04 | | | | .62 | |
Total from investment operations | | | 2.72 | | | | 1.62 | | | | (2.87 | ) | | | 1.95 | | | | 1.36 | |
Less distributions from: |
Net investment income | | | (1.52 | ) | | | (1.33 | ) | | | (.95 | ) | | | (1.07 | ) | | | (.86 | ) |
Total distributions | | | (1.52 | ) | | | (1.33 | ) | | | (.95 | ) | | | (1.07 | ) | | | (.86 | ) |
Net asset value, end of period | | $ | 24.87 | | | $ | 23.67 | | | $ | 23.38 | | | $ | 27.20 | | | $ | 26.32 | |
|
Total Return | | | 11.84 | % | | | 7.09 | % | | | (10.77 | %) | | | 7.48 | % | | | 5.42 | % |
Ratios/Supplemental Data |
Net assets, end of period (in thousands) | | $ | 27,135 | | | $ | 54,987 | | | $ | 161,232 | | | $ | 162,928 | | | $ | 99,575 | |
Ratios to average net assets: |
Net investment income (loss) | | | 5.70 | % | | | 5.49 | % | | | 3.51 | % | | | 3.33 | % | | | 2.91 | % |
Total expensesc | | | 1.37 | % | | | 1.66 | % | | | 1.45 | % | | | 1.45 | % | | | 1.50 | % |
Net expensesd,e,f | | | 1.32 | % | | | 1.49 | % | | | 1.37 | % | | | 1.37 | % | | | 1.40 | % |
Portfolio turnover rate | | | 24 | % | | | 32 | % | | | 25 | % | | | 84 | % | | | 130 | % |
Institutional Class | | Year Ended
September 30,
2024 | | | Year Ended
September 30,
2023 | | | Year Ended
September 30,
2022 | | | Year Ended
September 30,
2021 | | | Year Ended
September 30,
2020 | |
Per Share Data |
Net asset value, beginning of period | | $ | 23.69 | | | $ | 23.40 | | | $ | 27.23 | | | $ | 26.34 | | | $ | 25.85 | |
Income (loss) from investment operations: |
Net investment income (loss)a | | | 1.47 | | | | 1.40 | | | | .99 | | | | 1.02 | | | | .85 | |
Net gain (loss) on investments (realized and unrealized) | | | 1.35 | | | | .32 | | | | (3.76 | ) | | | 1.05 | | | | .60 | |
Total from investment operations | | | 2.82 | | | | 1.72 | | | | (2.77 | ) | | | 2.07 | | | | 1.45 | |
Less distributions from: |
Net investment income | | | (1.62 | ) | | | (1.43 | ) | | | (1.06 | ) | | | (1.18 | ) | | | (.96 | ) |
Total distributions | | | (1.62 | ) | | | (1.43 | ) | | | (1.06 | ) | | | (1.18 | ) | | | (.96 | ) |
Net asset value, end of period | | $ | 24.89 | | | $ | 23.69 | | | $ | 23.40 | | | $ | 27.23 | | | $ | 26.34 | |
|
Total Return | | | 12.28 | % | | | 7.47 | % | | | (10.39 | %) | | | 7.91 | % | | | 5.84 | % |
Ratios/Supplemental Data |
Net assets, end of period (in thousands) | | | $6,846,334 | | | $ | 5,228,680 | | | $ | 5,397,131 | | | $ | 6,906,534 | | | $ | 4,097,303 | |
Ratios to average net assets: |
Net investment income (loss) | | | 6.08 | % | | | 5.86 | % | | | 3.85 | % | | | 3.74 | % | | | 3.32 | % |
Total expensesc | | | 1.03 | % | | | 1.18 | % | | | 1.09 | % | | | 1.08 | % | | | 1.17 | % |
Net expensesd,e,f | | | 0.91 | % | | | 1.03 | % | | | 0.96 | % | | | 0.96 | % | | | 0.99 | % |
Portfolio turnover rate | | | 24 | % | | | 32 | % | | | 25 | % | | | 84 | % | | | 130 | % |
208 | THE GUGGENHEIM FUNDS ANNUAL REPORT | SEE NOTES TO FINANCIAL STATEMENTS. |
CONSOLIDATED FINANCIAL HIGHLIGHTS (concluded) |
This table is presented to show selected data for a share outstanding throughout each period and to assist shareholders in evaluating a Fund’s performance for the periods presented.
Class R6 | | Year Ended
September 30,
2024 | | | Year Ended
September 30,
2023 | | | Year Ended
September 30,
2022 | | | Year Ended
September 30,
2021 | | | Year Ended
September 30,
2020 | |
Per Share Data |
Net asset value, beginning of period | | $ | 23.69 | | | $ | 23.39 | | | $ | 27.22 | | | $ | 26.34 | | | $ | 25.84 | |
Income (loss) from investment operations: |
Net investment income (loss)a | | | 1.48 | | | | 1.40 | | | | .98 | | | | 1.02 | | | | .87 | |
Net gain (loss) on investments (realized and unrealized) | | | 1.34 | | | | .33 | | | | (3.75 | ) | | | 1.04 | | | | .58 | |
Total from investment operations | | | 2.82 | | | | 1.73 | | | | (2.77 | ) | | | 2.06 | | | | 1.45 | |
Less distributions from: |
Net investment income | | | (1.62 | ) | | | (1.43 | ) | | | (1.06 | ) | | | (1.18 | ) | | | (.95 | ) |
Total distributions | | | (1.62 | ) | | | (1.43 | ) | | | (1.06 | ) | | | (1.18 | ) | | | (.95 | ) |
Net asset value, end of period | | $ | 24.89 | | | $ | 23.69 | | | $ | 23.39 | | | $ | 27.22 | | | $ | 26.34 | |
|
Total Return | | | 12.28 | % | | | 7.51 | % | | | (10.39 | %) | | | 7.91 | % | | | 5.81 | % |
Ratios/Supplemental Data |
Net assets, end of period (in thousands) | | $ | 153,582 | | | $ | 187,717 | | | $ | 124,888 | | | $ | 197,067 | | | $ | 136,669 | |
Ratios to average net assets: |
Net investment income (loss) | | | 6.10 | % | | | 5.85 | % | | | 3.79 | % | | | 3.74 | % | | | 3.41 | % |
Total expensesc | | | 0.96 | % | | | 1.07 | % | | | 1.00 | % | | | 1.01 | % | | | 1.09 | % |
Net expensesd,e,f | | | 0.91 | % | | | 1.01 | % | | | 0.96 | % | | | 0.96 | % | | | 0.99 | % |
Portfolio turnover rate | | | 24 | % | | | 32 | % | | | 25 | % | | | 84 | % | | | 130 | % |
a | Net investment income (loss) per share was computed using average shares outstanding throughout the period. |
b | Total return does not reflect the impact of any applicable sales charges. |
c | Does not include expenses of the underlying funds in which the Fund invests. |
d | Net expense information reflects the expense ratios after expense waivers and reimbursements, as applicable. |
e | The portion of the ratios of net expenses to average net assets attributable to recoupments of prior fee reductions or expense reimbursements for the years presented was as follows: |
| | | 09/30/24 | 09/30/23 | 09/30/22 | 09/30/21 | 09/30/20 |
| | Class A | 0.03% | 0.05% | 0.06% | 0.10% | 0.03% |
| | Class C | 0.04% | 0.04% | 0.06% | 0.08% | 0.05% |
| | Class P | 0.11% | 0.01% | 0.05% | 0.09% | 0.03% |
| | Institutional Class | 0.00%* | 0.00%* | — | — | 0.00%* |
| | Class R6 | 0.01% | 0.01% | 0.00%* | 0.00%* | 0.00%* |
f | Net expenses may include expenses that are excluded from the expense limitation agreement. Excluding these expenses, the net expense ratios for the years presented would be: |
| | | 09/30/24 | 09/30/23 | 09/30/22 | 09/30/21 | 09/30/20 |
| | Class A | 1.24% | 1.32% | 1.33% | 1.33% | 1.33% |
| | Class C | 1.96% | 2.07% | 2.08% | 2.08% | 2.08% |
| | Class P | 1.31% | 1.32% | 1.33% | 1.33% | 1.33% |
| | Institutional Class | 0.90% | 0.91% | 0.92% | 0.92% | 0.92% |
| | Class R6 | 0.90% | 0.91% | 0.92% | 0.92% | 0.92% |
SEE NOTES TO FINANCIAL STATEMENTS. | THE GUGGENHEIM FUNDS ANNUAL REPORT | 209 |
SCHEDULE OF INVESTMENTS | September 30, 2024 |
MUNICIPAL INCOME FUND | |
| | Face
Amount | | | Value | |
MUNICIPAL BONDS†† - 96.8% |
| | | | | | | | | |
California - 14.8% | | | | | | | | |
Newport Mesa Unified School District General Obligation Unlimited | | | | | | | | |
due 08/01/391 | | $ | 1,300,000 | | | $ | 736,076 | |
Compton Unified School District General Obligation Unlimited | | | | | | | | |
due 06/01/401 | | | 1,000,000 | | | | 546,175 | |
California Statewide Communities Development Authority Revenue Bonds | | | | | | | | |
5.25% due 08/15/52 | | | 500,000 | | | | 544,773 | |
Alameda Corridor Transportation Authority Revenue Bonds | | | | | | | | |
5.20% due 10/01/372 | | | 500,000 | | | | 292,772 | |
El Monte Union High School District General Obligation Unlimited | | | | | | | | |
due 06/01/431 | | | 500,000 | | | | 245,553 | |
M-S-R Energy Authority Revenue Bonds | | | | | | | | |
6.13% due 11/01/29 | | | 160,000 | | | | 171,668 | |
Westside Elementary School District General Obligation Unlimited | | | | | | | | |
5.00% due 08/01/48 | | | 155,000 | | | | 162,692 | |
Freddie Mac Multifamily VRD Certificates Revenue Bonds | | | | | | | | |
2.40% due 10/15/29 | | | 150,000 | | | | 144,232 | |
Coast Community College District General Obligation Unlimited | | | | | | | | |
due 08/01/401 | | | 250,000 | | | | 139,457 | |
Department of Veterans Affairs Veteran’s Farm & Home Purchase Program Revenue Bonds | | | | | | | | |
3.45% due 12/01/39 | | | 110,000 | | | | 109,279 | |
Total California | | | | | | | 3,092,677 | |
| | | | | | | | | |
Pennsylvania - 8.3% | | | | | | | | |
Pennsylvania Housing Finance Agency Revenue Bonds | | | | | | | | |
4.95% due 10/01/38 | | | 1,000,000 | | | | 1,080,867 | |
School District of Philadelphia General Obligation Limited | | | | | | | | |
5.25% due 09/01/43 | | | 575,000 | | | | 645,182 | |
Total Pennsylvania | | | | | | | 1,726,049 | |
| | | | | | | | | |
Oregon - 7.1% | | | | | | | | |
Clackamas & Washington Counties School District No. 3 General Obligation Unlimited | | | | | | | | |
due 06/15/481 | | | 2,000,000 | | | | 656,583 | |
due 06/15/501 | | | 400,000 | | | | 118,234 | |
due 06/15/491 | | | 350,000 | | | | 108,958 | |
Salem-Keizer School District No. 24J General Obligation Unlimited | | | | | | | | |
due 06/15/401 | | | 1,250,000 | | | | 610,802 | |
Total Oregon | | | | | | | 1,494,577 | |
| | | | | | | | | |
Michigan - 6.7% | | | | | | | | |
Michigan Technological University Revenue Bonds | | | | | | | | |
5.25% due 10/01/53 | | | 1,000,000 | | | | 1,112,553 | |
Michigan State Housing Development Authority Revenue Bonds | | | | | | | | |
3.35% due 12/01/34 | | | 200,000 | | | | 197,218 | |
Flint Hospital Building Authority Revenue Bonds | | | | | | | | |
5.00% due 07/01/25 | | | 100,000 | | | | 100,390 | |
Total Michigan | | | | | | | 1,410,161 | |
| | | | | | | | | |
Virginia - 6.3% | | | | | | | | |
Freddie Mac Multifamily Variable Rate Certificate Revenue Bonds | | | | | | | | |
3.15% due 10/15/36 | | | 1,260,000 | | | | 1,153,923 | |
Loudoun County Economic Development Authority Revenue Bonds | | | | | | | | |
due 07/01/491 | | | 500,000 | | | | 173,197 | |
Total Virginia | | | | | | | 1,327,120 | |
| | | | | | | | | |
Nebraska - 6.2% | | | | | | | | |
Nebraska Investment Finance Authority Revenue Bonds | | | | | | | | |
4.95% due 09/01/38 | | | 1,000,000 | | | | 1,080,721 | |
Central Plains Energy Project Revenue Bonds | | | | | | | | |
5.00% due 09/01/29 | | | 200,000 | | | | 214,176 | |
Total Nebraska | | | | | | | 1,294,897 | |
| | | | | | | | | |
Tennessee - 5.6% | | | | | | | | |
Metropolitan Government Nashville & Davidson County Health & Educational Facilities Board Revenue Bonds | | | | | | | | |
2.25% due 07/01/45 | | | 1,500,000 | | | | 1,002,930 | |
2.48% due 12/01/37 | | | 200,000 | | | | 163,815 | |
Total Tennessee | | | | | | | 1,166,745 | |
| | | | | | | | | |
New York - 5.5% | | | | | | | | |
Westchester County Local Development Corp. Revenue Bonds | | | | | | | | |
5.75% due 11/01/53 | | | 750,000 | | | | 850,509 | |
New York Power Authority Revenue Bonds | | | | | | | | |
5.25% due 11/15/41 | | | 250,000 | | | | 294,979 | |
Total New York | | | | | | | 1,145,488 | |
| | | | | | | | | |
Maine - 5.3% | | | | | | | | |
Maine Health & Higher Educational Facilities Authority Revenue Bonds | | | | | | | | |
5.25% due 07/01/48 | | | 1,000,000 | | | | 1,106,818 | |
| | | | | | | | | |
Arizona - 3.6% | | | | | | | | |
Arizona Industrial Development Authority Revenue Bonds | | | | | | | | |
5.25% due 11/01/48 | | | 500,000 | | | | 541,171 | |
Salt Verde Financial Corp. Revenue Bonds | | | | | | | | |
5.00% due 12/01/32 | | | 200,000 | | | | 219,007 | |
Total Arizona | | | | | | | 760,178 | |
| | | | | | | | | |
210 | THE GUGGENHEIM FUNDS ANNUAL REPORT | SEE NOTES TO FINANCIAL STATEMENTS. |
SCHEDULE OF INVESTMENTS (continued) | September 30, 2024 |
MUNICIPAL INCOME FUND | |
| | Face
Amount | | | Value | |
North Carolina - 3.3% | | | | | | | | |
Inlivian Revenue Bonds | | | | | | | | |
2.02% due 04/01/42 | | $ | 1,000,000 | | | $ | 684,024 | |
| | | | | | | | | |
Texas - 3.0% | | | | | | | | |
Harris County-Houston Sports Authority Revenue Bonds | | | | | | | | |
due 11/15/531 | | | 1,000,000 | | | | 245,066 | |
Arlington Higher Education Finance Corp. Revenue Bonds | | | | | | | | |
5.00% due 12/01/46 | | | 200,000 | | | | 201,146 | |
Hutto Independent School District General Obligation Unlimited | | | | | | | | |
5.00% due 08/01/49 | | | 100,000 | | | | 103,972 | |
Texas Municipal Gas Acquisition and Supply Corporation I Revenue Bonds | | | | | | | | |
6.25% due 12/15/26 | | | 90,000 | | | | 93,073 | |
Total Texas | | | | | | | 643,257 | |
| | | | | | | | | |
Oklahoma - 2.8% | | | | | | | | |
Oklahoma Development Finance Authority Revenue Bonds | | | | | | | | |
5.00% due 08/15/28 | | | 350,000 | | | | 368,356 | |
Oklahoma City Airport Trust Revenue Bonds | | | | | | | | |
5.00% due 07/01/30 | | | 200,000 | | | | 211,470 | |
Total Oklahoma | | | | | | | 579,826 | |
| | | | | | | | | |
Georgia - 2.6% | | | | | | | | |
Columbia County Hospital Authority Revenue Bonds | | | | | | | | |
5.00% due 04/01/48 | | | 500,000 | | | | 539,570 | |
| | | | | | | | | |
Colorado - 2.3% | | | | | | | | |
City & County of Denver Colorado Airport System Revenue Bonds | | | | | | | | |
5.00% due 12/01/28 | | | 200,000 | | | | 214,236 | |
City & County of Denver Colorado Pledged Excise Tax Revenue Bonds | | | | | | | | |
due 08/01/301 | | | 200,000 | | | | 160,817 | |
Colorado School of Mines Revenue Bonds | | | | | | | | |
5.00% due 12/01/47 | | | 100,000 | | | | 103,137 | |
Total Colorado | | | | | | | 478,190 | |
| | | | | | | | | |
Washington - 2.0% | | | | | | | | |
Central Puget Sound Regional Transit Authority Revenue Bonds | | | | | | | | |
5.00% due 11/01/41 | | | 200,000 | | | | 206,719 | |
Washington State Convention Center Public Facilities District Revenue Bonds | | | | | | | | |
4.00% due 07/01/48 | | | 210,000 | | | | 201,933 | |
Total Washington | | | | | | | 408,652 | |
| | | | | | | | | |
Arkansas - 1.6% | | | | | | | | |
County of Baxter Arkansas Revenue Bonds | | | | | | | | |
5.00% due 09/01/26 | | | 330,000 | | | | 335,106 | |
| | | | | | | | | |
West Virginia - 1.5% | | | | | | | | |
West Virginia Hospital Finance Authority Revenue Bonds | | | | | | | | |
5.00% due 06/01/42 | | | 300,000 | | | | 307,343 | |
| | | | | | | | | |
New Mexico - 1.3% | | | | | | | | |
New Mexico Mortgage Finance Authority Revenue Bonds | | | | | | | | |
4.95% due 09/01/38 | | | 245,000 | | | | 264,760 | |
City of Albuquerque New Mexico Gross Receipts Tax Revenue Bonds | | | | | | | | |
5.00% due 07/01/25 | | | 10,000 | | | | 10,002 | |
Total New Mexico | | | | | | | 274,762 | |
| | | | | | | | | |
Alaska - 1.3% | | | | | | | | |
University of Alaska Revenue Bonds | | | | | | | | |
5.00% due 10/01/40 | | | 260,000 | | | | 264,971 | |
| | | | | | | | | |
South Carolina - 1.0% | | | | | | | | |
Charleston County Airport District Revenue Bonds | | | | | | | | |
5.00% due 07/01/43 | | | 200,000 | | | | 212,238 | |
| | | | | | | | | |
Ohio - 1.0% | | | | | | | | |
American Municipal Power, Inc. Revenue Bonds | | | | | | | | |
5.00% due 02/15/41 | | | 200,000 | | | | 203,984 | |
| | | | | | | | | |
Vermont - 1.0% | | | | | | | | |
Vermont Educational & Health Buildings Financing Agency Revenue Bonds | | | | | | | | |
5.00% due 12/01/46 | | | 200,000 | | | | 201,706 | |
| | | | | | | | | |
Connecticut - 0.9% | | | | | | | | |
New Haven Housing Authority Revenue Bonds | | | | | | | | |
2.26% due 05/01/38 | | | 240,706 | | | | 186,325 | |
| | | | | | | | | |
Massachusetts - 0.8% | | | | | | | | |
Massachusetts Development Finance Agency Revenue Bonds | | | | | | | | |
5.00% due 10/01/34 | | | 150,000 | | | | 163,428 | |
| | | | | | | | | |
Kansas - 0.5% | | | | | | | | |
University of Kansas Hospital Authority Revenue Bonds | | | | | | | | |
5.00% due 09/01/48 | | | 100,000 | | | | 103,449 | |
| | | | | | | | | |
Iowa - 0.5% | | | | | | | | |
PEFA, Inc. Revenue Bonds | | | | | | | | |
5.00% due 09/01/263 | | | 100,000 | | | | 102,847 | |
| | | | | | | | | |
Louisiana - 0.0% | | | | | | | | |
Louisiana Public Facilities Authority Revenue Bonds | | | | | | | | |
5.00% due 05/15/26 | | | 5,000 | | | | 5,128 | |
| | | | | | | | | |
SEE NOTES TO FINANCIAL STATEMENTS. | THE GUGGENHEIM FUNDS ANNUAL REPORT | 211 |
SCHEDULE OF INVESTMENTS (continued) | September 30, 2024 |
MUNICIPAL INCOME FUND | |
| | Face
Amount | | | Value | |
Maryland - 0.0% | | | | | | | | |
Maryland Health & Higher Educational Facilities Authority Revenue Bonds | | | | | | | | |
5.00% due 07/01/27 | | $ | 5,000 | | | $ | 5,114 | |
Total Municipal Bonds | | | | |
(Cost $21,583,878) | | | 20,224,630 | |
| | | | | | | | | |
Total Investments - 96.8% | | | | |
(Cost $21,583,878) | | $ | 20,224,630 | |
Other Assets & Liabilities, net - 3.2% | | | 669,365 | |
Total Net Assets - 100.0% | | $ | 20,893,995 | |
Centrally Cleared Interest Rate Swap Agreements†† |
Counterparty | | Exchange | | | Floating
Rate
Type | | | Floating
Rate
Index | | | Fixed
Rate | | | Payment
Frequency | | | Maturity
Date | | | Notional
Amount | | | Value | | | Upfront
Premiums
Paid
(Received) | | | Unrealized
Appreciation
(Depreciation)** | |
BofA Securities, Inc. | CME | Receive | U.S. Secured Overnight Financing Rate + 0.26% | 1.67% | Quarterly | 09/27/51 | | $ | 2,550,000 | | | $ | 880,159 | | | $ | (725 | ) | | $ | 880,884 | |
BofA Securities, Inc. | CME | Pay | U.S. Secured Overnight Financing Rate | 4.68% | Annually | 10/20/28 | | | 2,600,000 | | | | 137,744 | | | | 252 | | | | 137,492 | |
BofA Securities, Inc. | CME | Pay | U.S. Secured Overnight Financing Rate | 4.98% | Annually | 10/11/25 | | | 2,700,000 | | | | 31,060 | | | | 50 | | | | 31,010 | |
BofA Securities, Inc. | CME | Receive | U.S. Secured Overnight Financing Rate | 3.26% | Annually | 05/24/53 | | | 400,000 | | | | 4,506 | | | | 106 | | | | 4,400 | |
BofA Securities, Inc. | CME | Receive | U.S. Secured Overnight Financing Rate | 3.28% | Annually | 09/23/34 | | | 400,000 | | | | 1,811 | | | | 303 | | | | 1,508 | |
BofA Securities, Inc. | CME | Receive | U.S. Secured Overnight Financing Rate | 4.31% | Annually | 11/06/33 | | | 200,000 | | | | (15,613 | ) | | | 56 | | | | (15,669 | ) |
BofA Securities, Inc. | CME | Receive | U.S. Secured Overnight Financing Rate | 4.11% | Annually | 11/20/33 | | | 1,500,000 | | | | (93,467 | ) | | | 285 | | | | (93,752 | ) |
| | | | | | | | | | | | | | | | | | | | | | | | | | | | | | | $ | 946,200 | | | $ | 327 | | | $ | 945,873 | |
** | Includes cumulative appreciation (depreciation). Variation margin is reported within the Statement of Assets and Liabilities. |
†† | Value determined based on Level 2 inputs — See Note 4. |
1 | Zero coupon rate security. |
2 | Security is a step up/down bond with a 5.20% coupon rate until 10/01/2037. |
3 | The rate is adjusted periodically by the issuer, allows the holder to tender the security upon a rate reset, and is not based upon a set reference rate and spread. |
| | BofA — Bank of America |
| | CME — Chicago Mercantile Exchange |
| | |
| | See Sector Classification in Other Information section. |
212 | THE GUGGENHEIM FUNDS ANNUAL REPORT | SEE NOTES TO FINANCIAL STATEMENTS. |
SCHEDULE OF INVESTMENTS (concluded) | September 30, 2024 |
MUNICIPAL INCOME FUND | |
The following table summarizes the inputs used to value the Fund’s investments at September 30, 2024 (See Note 4 in the Notes to Financial Statements):
Investments in Securities (Assets) | | Level 1
Quoted
Prices | | | Level 2
Significant
Observable
Inputs | | | Level 3
Significant
Unobservable
Inputs | | | Total | |
Municipal Bonds | | $ | — | | | $ | 20,224,630 | | | $ | — | | | $ | 20,224,630 | |
Interest Rate Swap Agreements** | | | — | | | | 1,055,294 | | | | — | | | | 1,055,294 | |
Total Assets | | $ | — | | | $ | 21,279,924 | | | $ | — | | | $ | 21,279,924 | |
Investments in Securities (Liabilities) | | Level 1
Quoted
Prices | | | Level 2
Significant
Observable
Inputs | | | Level 3
Significant
Unobservable
Inputs | | | Total | |
Interest Rate Swap Agreements** | | $ | — | | | $ | 109,421 | | | $ | — | | | $ | 109,421 | |
** | This derivative is reported as unrealized appreciation/depreciation at period end. |
SEE NOTES TO FINANCIAL STATEMENTS. | THE GUGGENHEIM FUNDS ANNUAL REPORT | 213 |
STATEMENT OF ASSETS AND LIABILITIES |
September 30, 2024 |
Assets: |
Investments, at value (cost $21,583,878) | | $ | 20,224,630 | |
Cash | | | 223,332 | |
Segregated cash with broker | | | 289,174 | |
Unamortized upfront premiums paid on interest rate swap agreements | | | 1,052 | |
Prepaid expenses | | | 29,507 | |
Receivables: |
Interest | | | 190,841 | |
Investment Adviser | | | 37,564 | |
Swap settlement | | | 13,431 | |
Securities sold | | | 11,234 | |
Fund shares sold | | | 2,907 | |
Total assets | | | 21,023,672 | |
Liabilities: |
Unamortized upfront premiums received on interest rate swap agreements | | | 725 | |
Payable for: |
Professional fees | | | 40,276 | |
Fund shares redeemed | | | 24,139 | |
Securities purchased | | | 15,180 | |
Printing fees | | | 12,452 | |
Transfer agent/maintenance fees | | | 9,332 | |
Pricing fees | | | 8,628 | |
Distributions to shareholders | | | 6,085 | |
Fund accounting/administration fees | | | 3,857 | |
Distribution and service fees | | | 3,741 | |
Variation margin on interest rate swap agreements | | | 820 | |
Trustees’ fees* | | | 685 | |
Miscellaneous | | | 3,757 | |
Total liabilities | | | 129,677 | |
Net assets | | $ | 20,893,995 | |
Net assets consist of: |
Paid in capital | | $ | 27,408,851 | |
Total distributable earnings (loss) | | | (6,514,856 | ) |
Net assets | | $ | 20,893,995 | |
Class A: |
Net assets | | $ | 16,540,951 | |
Capital shares outstanding | | | 1,429,288 | |
Net asset value per share | | $ | 11.57 | |
Maximum offering price per share (Net asset value divided by 96.00%) | | $ | 12.05 | |
Class C: |
Net assets | | $ | 621,091 | |
Capital shares outstanding | | | 53,705 | |
Net asset value per share | | $ | 11.56 | |
Class P: |
Net assets | | $ | 125,496 | |
Capital shares outstanding | | | 10,849 | |
Net asset value per share | | $ | 11.57 | |
Institutional Class: |
Net assets | | $ | 3,606,457 | |
Capital shares outstanding | | | 311,553 | |
Net asset value per share | | $ | 11.58 | |
STATEMENT OF OPERATIONS |
Year Ended September 30, 2024 |
Investment Income: |
Interest | | $ | 977,291 | |
Total investment income | | | 977,291 | |
| | | | | |
Expenses: |
Management fees | | | 135,565 | |
Distribution and service fees: |
Class A | | | 51,081 | |
Class C | | | 8,175 | |
Class P | | | 309 | |
Transfer agent/maintenance fees: |
Class A | | | 25,695 | |
Class C | | | 1,565 | |
Class P | | | 408 | |
Institutional Class | | | 13,626 | |
Registration fees | | | 75,721 | |
Professional fees | | | 50,243 | |
Fund accounting/administration fees | | | 19,532 | |
Trustees’ fees* | | | 13,390 | |
Custodian fees | | | 6,707 | |
Line of credit fees | | | 2,537 | |
Interest expense | | | 575 | |
Miscellaneous | | | 22,823 | |
Total expenses | | | 427,952 | |
Less: Expenses reimbursed by Adviser: |
Class A | | | (67,301 | ) |
Class C | | | (3,330 | ) |
Class P | | | (705 | ) |
Institutional Class | | | (23,392 | ) |
Expenses waived by Adviser | | | (128,376 | ) |
Earnings credits applied | | | (1,120 | ) |
Total waived/reimbursed expenses | | | (224,224 | ) |
Net expenses | | | 203,728 | |
Net investment income | | | 773,563 | |
| | | | | |
Net Realized and Unrealized Gain (Loss): |
Net realized gain (loss) on: |
Investments | | | (4,847,521 | ) |
Swap agreements | | | (210,660 | ) |
Net realized loss | | | (5,058,181 | ) |
Net change in unrealized appreciation (depreciation) on: |
Investments | | | 8,307,605 | |
Swap agreements | | | (457,977 | ) |
Net change in unrealized appreciation (depreciation) | | | 7,849,628 | |
Net realized and unrealized gain | | | 2,791,447 | |
Net increase in net assets resulting from operations | | $ | 3,565,010 | |
* | Relates to Trustees not deemed “interested persons” within the meaning of Section 2(a)(19) of the 1940 Act. |
214 | THE GUGGENHEIM FUNDS ANNUAL REPORT | SEE NOTES TO FINANCIAL STATEMENTS. |
STATEMENTS OF CHANGES IN NET ASSETS |
| | Year Ended
September 30,
2024 | | | Year Ended
September 30,
2023 | |
Increase (Decrease) in Net Assets from Operations: | | | | | | | | |
Net investment income | | $ | 773,563 | | | $ | 1,080,466 | |
Net realized loss on investments | | | (5,058,181 | ) | | | (788,039 | ) |
Net change in unrealized appreciation (depreciation) on investments | | | 7,849,628 | | | | 804,518 | |
Net increase in net assets resulting from operations | | | 3,565,010 | | | | 1,096,945 | |
| | | | | | | | | |
Distributions to shareholders: | | | | | | | | |
Class A | | | (679,675 | ) | | | (1,453,969 | ) |
Class C | | | (21,144 | ) | | | (31,189 | ) |
Class P | | | (4,067 | ) | | | (4,574 | ) |
Institutional Class | | | (205,499 | ) | | | (364,176 | ) |
Return of capital | | | | | | | | |
Class A | | | (17,975 | ) | | | — | |
Class C | | | (559 | ) | | | — | |
Class P | | | (108 | ) | | | — | |
Institutional Class | | | (5,435 | ) | | | — | |
Total distributions to shareholders | | | (934,462 | ) | | | (1,853,908 | ) |
| | | | | | | | | |
Capital share transactions: | | | | | | | | |
Proceeds from sale of shares | | | | | | | | |
Class A | | | 1,462,458 | | | | 3,606,381 | |
Class C | | | 149,213 | | | | 346,333 | |
Class P | | | 22,902 | | | | 846,126 | |
Institutional Class | | | 2,197,008 | | | | 12,725,440 | |
Distributions reinvested | | | | | | | | |
Class A | | | 604,053 | | | | 1,328,775 | |
Class C | | | 20,639 | | | | 30,159 | |
Class P | | | 4,160 | | | | 4,569 | |
Institutional Class | | | 207,496 | | | | 359,627 | |
Cost of shares redeemed | | | | | | | | |
Class A | | | (16,349,357 | ) | | | (19,006,404 | ) |
Class C | | | (457,748 | ) | | | (581,224 | ) |
Class P | | | (24,620 | ) | | | (867,839 | ) |
Institutional Class | | | (10,268,568 | ) | | | (6,514,995 | ) |
Net decrease from capital share transactions | | | (22,432,364 | ) | | | (7,723,052 | ) |
Net decrease in net assets | | | (19,801,816 | ) | | | (8,480,015 | ) |
| | | | | | | | | |
Net assets: | | | | | | | | |
Beginning of year | | | 40,695,811 | | | | 49,175,826 | |
End of year | | $ | 20,893,995 | | | $ | 40,695,811 | |
| | | | | | | | | |
Capital share activity: | | | | | | | | |
Shares sold | | | | | | | | |
Class A | | | 129,161 | | | | 316,903 | |
Class C | | | 13,502 | | | | 30,364 | |
Class P | | | 2,007 | | | | 75,140 | |
Institutional Class | | | 195,626 | | | | 1,120,796 | |
Shares issued from reinvestment of distributions | | | | | | | | |
Class A | | | 53,576 | | | | 117,206 | |
Class C | | | 1,828 | | | | 2,659 | |
Class P | | | 368 | | | | 404 | |
Institutional Class | | | 18,440 | | | | 31,729 | |
Shares redeemed | | | | | | | | |
Class A | | | (1,437,356 | ) | | | (1,700,924 | ) |
Class C | | | (40,338 | ) | | | (51,290 | ) |
Class P | | | (2,156 | ) | | | (76,692 | ) |
Institutional Class | | | (907,439 | ) | | | (569,408 | ) |
Net decrease in shares | | | (1,972,781 | ) | | | (703,113 | ) |
SEE NOTES TO FINANCIAL STATEMENTS. | THE GUGGENHEIM FUNDS ANNUAL REPORT | 215 |
This table is presented to show selected data for a share outstanding throughout each period and to assist shareholders in evaluating a Fund’s performance for the periods presented.
Class A | | Year Ended
September 30,
2024 | | | Year Ended
September 30,
2023 | | | Year Ended
September 30,
2022 | | | Year Ended
September 30,
2021 | | | Year Ended
September 30,
2020 | |
Per Share Data |
Net asset value, beginning of period | | $ | 10.77 | | | $ | 10.97 | | | $ | 13.46 | | | $ | 13.23 | | | $ | 13.12 | |
Income (loss) from investment operations: |
Net investment income (loss)a | | | .32 | | | | .23 | | | | .23 | | | | .25 | | | | .26 | |
Net gain (loss) on investments (realized and unrealized) | | | .86 | | | | (.04 | ) | | | (2.44 | ) | | | .23 | | | | .11 | |
Total from investment operations | | | 1.18 | | | | .19 | | | | (2.21 | ) | | | .48 | | | | .37 | |
Less distributions from: |
Net investment income | | | (.36 | ) | | | (.25 | ) | | | (.22 | ) | | | (.23 | ) | | | (.26 | ) |
Net realized gains | | | — | | | | (.14 | ) | | | (.06 | ) | | | (.02 | ) | | | — | |
Return of capital | | | (.02 | ) | | | — | | | | — | | | | — | | | | — | |
Total distributions | | | (.38 | ) | | | (.39 | ) | | | (.28 | ) | | | (.25 | ) | | | (.26 | ) |
Net asset value, end of period | | $ | 11.57 | | | $ | 10.77 | | | $ | 10.97 | | | $ | 13.46 | | | $ | 13.23 | |
|
Total Returnb | | | 11.10 | % | | | 1.67 | % | | | (16.67 | %) | | | 3.67 | % | | | 2.85 | % |
Ratios/Supplemental Data |
Net assets, end of period (in thousands) | | $ | 16,541 | | | $ | 28,909 | | | $ | 43,354 | | | $ | 63,359 | | | $ | 62,583 | |
Ratios to average net assets: |
Net investment income (loss) | | | 2.83 | % | | | 2.06 | % | | | 1.84 | % | | | 1.82 | % | | | 1.95 | % |
Total expensesc | | | 1.59 | % | | | 1.20 | % | | | 1.18 | % | | | 1.17 | % | | | 1.21 | % |
Net expensesd,e,f | | | 0.79 | % | | | 0.78 | % | | | 0.79 | % | | | 0.80 | % | | | 0.81 | % |
Portfolio turnover rate | | | 59 | % | | | 11 | % | | | 14 | % | | | 22 | % | | | 58 | % |
Class C | | Year Ended
September 30,
2024 | | | Year Ended
September 30,
2023 | | | Year Ended
September 30,
2022 | | | Year Ended
September 30,
2021 | | | Year Ended
September 30,
2020 | |
Per Share Data |
Net asset value, beginning of period | | $ | 10.76 | | | $ | 10.96 | | | $ | 13.45 | | | $ | 13.22 | | | $ | 13.11 | |
Income (loss) from investment operations: |
Net investment income (loss)a | | | .24 | | | | .15 | | | | .14 | | | | .15 | | | | .16 | |
Net gain (loss) on investments (realized and unrealized) | | | .86 | | | | (.04 | ) | | | (2.45 | ) | | | .23 | | | | .11 | |
Total from investment operations | | | 1.10 | | | | .11 | | | | (2.31 | ) | | | .38 | | | | .27 | |
Less distributions from: |
Net investment income | | | (.28 | ) | | | (.17 | ) | | | (.12 | ) | | | (.13 | ) | | | (.16 | ) |
Net realized gains | | | — | | | | (.14 | ) | | | (.06 | ) | | | (.02 | ) | | | — | |
Return of capital | | | (.02 | ) | | | — | | | | — | | | | — | | | | — | |
Total distributions | | | (.30 | ) | | | (.31 | ) | | | (.18 | ) | | | (.15 | ) | | | (.16 | ) |
Net asset value, end of period | | $ | 11.56 | | | $ | 10.76 | | | $ | 10.96 | | | $ | 13.45 | | | $ | 13.22 | |
|
Total Returnb | | | 10.38 | % | | | 0.91 | % | | | (17.23 | %) | | | 2.91 | % | | | 2.09 | % |
Ratios/Supplemental Data |
Net assets, end of period (in thousands) | | $ | 621 | | | $ | 847 | | | $ | 1,063 | | | $ | 1,769 | | | $ | 2,177 | |
Ratios to average net assets: |
Net investment income (loss) | | | 2.10 | % | | | 1.30 | % | | | 1.08 | % | | | 1.08 | % | | | 1.23 | % |
Total expensesc | | | 2.42 | % | | | 2.00 | % | | | 1.97 | % | | | 1.97 | % | | | 1.97 | % |
Net expensesd,e,f | | | 1.54 | % | | | 1.54 | % | | | 1.54 | % | | | 1.55 | % | | | 1.56 | % |
Portfolio turnover rate | | | 59 | % | | | 11 | % | | | 14 | % | | | 22 | % | | | 58 | % |
216 | THE GUGGENHEIM FUNDS ANNUAL REPORT | SEE NOTES TO FINANCIAL STATEMENTS. |
FINANCIAL HIGHLIGHTS (continued) |
This table is presented to show selected data for a share outstanding throughout each period and to assist shareholders in evaluating a Fund’s performance for the periods presented.
Class P | | Year Ended
September 30,
2024 | | | Year Ended
September 30,
2023 | | | Year Ended
September 30,
2022 | | | Year Ended
September 30,
2021 | | | Year Ended
September 30,
2020 | |
Per Share Data |
Net asset value, beginning of period | | $ | 10.76 | | | $ | 10.97 | | | $ | 13.45 | | | $ | 13.22 | | | $ | 13.13 | |
Income (loss) from investment operations: |
Net investment income (loss)a | | | .32 | | | | .23 | | | | .23 | | | | .25 | | | | .26 | |
Net gain (loss) on investments (realized and unrealized) | | | .87 | | | | (.05 | ) | | | (2.43 | ) | | | .23 | | | | .09 | |
Total from investment operations | | | 1.19 | | | | .18 | | | | (2.20 | ) | | | .48 | | | | .35 | |
Less distributions from: |
Net investment income | | | (.36 | ) | | | (.25 | ) | | | (.22 | ) | | | (.23 | ) | | | (.26 | ) |
Net realized gains | | | — | | | | (.14 | ) | | | (.06 | ) | | | (.02 | ) | | | — | |
Return of capital | | | (.02 | ) | | | — | | | | — | | | | — | | | | — | |
Total distributions | | | (.38 | ) | | | (.39 | ) | | | (.28 | ) | | | (.25 | ) | | | (.26 | ) |
Net asset value, end of period | | $ | 11.57 | | | $ | 10.76 | | | $ | 10.97 | | | $ | 13.45 | | | $ | 13.22 | |
|
Total Return | | | 11.20 | % | | | 1.58 | % | | | (16.61 | %) | | | 3.67 | % | | | 2.69 | % |
Ratios/Supplemental Data |
Net assets, end of period (in thousands) | | $ | 125 | | | $ | 114 | | | $ | 129 | | | $ | 220 | | | $ | 202 | |
Ratios to average net assets: |
Net investment income (loss) | | | 2.84 | % | | | 2.04 | % | | | 1.81 | % | | | 1.83 | % | | | 1.96 | % |
Total expensesc | | | 1.84 | % | | | 1.51 | % | | | 1.47 | % | | | 1.38 | % | | | 1.40 | % |
Net expensesd,e,f | | | 0.78 | % | | | 0.78 | % | | | 0.79 | % | | | 0.80 | % | | | 0.81 | % |
Portfolio turnover rate | | | 59 | % | | | 11 | % | | | 14 | % | | | 22 | % | | | 58 | % |
SEE NOTES TO FINANCIAL STATEMENTS. | THE GUGGENHEIM FUNDS ANNUAL REPORT | 217 |
FINANCIAL HIGHLIGHTS (concluded) |
This table is presented to show selected data for a share outstanding throughout each period and to assist shareholders in evaluating a Fund’s performance for the periods presented.
Institutional Class | | Year Ended
September 30,
2024 | | | Year Ended
September 30,
2023 | | | Year Ended
September 30,
2022 | | | Year Ended
September 30,
2021 | | | Year Ended
September 30,
2020 | |
Per Share Data |
Net asset value, beginning of period | | $ | 10.77 | | | $ | 10.97 | | | $ | 13.46 | | | $ | 13.23 | | | $ | 13.13 | |
Income (loss) from investment operations: |
Net investment income (loss)a | | | .34 | | | | .26 | | | | .26 | | | | .28 | | | | .29 | |
Net gain (loss) on investments (realized and unrealized) | | | .88 | | | | (.03 | ) | | | (2.44 | ) | | | .24 | | | | .10 | |
Total from investment operations | | | 1.22 | | | | .23 | | | | (2.18 | ) | | | .52 | | | | .39 | |
Less distributions from: |
Net investment income | | | (.39 | ) | | | (.29 | ) | | | (.25 | ) | | | (.27 | ) | | | (.29 | ) |
Net realized gains | | | — | | | | (.14 | ) | | | (.06 | ) | | | (.02 | ) | | | — | |
Return of capital | | | (.02 | ) | | | — | | | | — | | | | — | | | | — | |
Total distributions | | | (.41 | ) | | | (.43 | ) | | | (.31 | ) | | | (.29 | ) | | | (.29 | ) |
Net asset value, end of period | | $ | 11.58 | | | $ | 10.77 | | | $ | 10.97 | | | $ | 13.46 | | | $ | 13.23 | |
|
Total Return | | | 11.48 | % | | | 1.93 | % | | | (16.46 | %) | | | 3.93 | % | | | 3.03 | % |
Ratios/Supplemental Data |
Net assets, end of period (in thousands) | | $ | 3,606 | | | $ | 10,826 | | | $ | 4,629 | | | $ | 12,772 | | | $ | 13,406 | |
Ratios to average net assets: |
Net investment income (loss) | | | 3.06 | % | | | 2.30 | % | | | 2.04 | % | | | 2.08 | % | | | 2.23 | % |
Total expensesc | | | 1.41 | % | | | 0.96 | % | | | 0.98 | % | | | 0.96 | % | | | 1.00 | % |
Net expensesd,e,f | | | 0.54 | % | | | 0.53 | % | | | 0.54 | % | | | 0.55 | % | | | 0.56 | % |
Portfolio turnover rate | | | 59 | % | | | 11 | % | | | 14 | % | | | 22 | % | | | 58 | % |
a | Net investment income (loss) per share was computed using average shares outstanding throughout the period. |
b | Total return does not reflect the impact of any applicable sales charges. |
c | Does not include expenses of the underlying funds in which the Fund invests. |
d | Net expense information reflects the expense ratios after expense waivers and reimbursements, as applicable. |
e | The portion of the ratios of net expenses to average net assets attributable to recoupments of prior fee reductions or expense reimbursements for the years presented was as follows: |
| | | 09/30/24 | 09/30/23 | 09/30/22 | 09/30/21 | 09/30/20 |
| | Class A | — | 0.00%* | 0.02% | — | 0.00%* |
| | Class C | — | 0.01% | 0.01% | — | 0.00%* |
| | Class P | — | 0.00%* | 0.01% | — | 0.00%* |
| | Institutional Class | — | 0.00%* | 0.01% | — | 0.00%* |
f | Net expenses may include expenses that are excluded from the expense limitation agreement. Excluding these expenses, the net expense ratios for the years presented would be: |
| | | 09/30/24 | 09/30/23 | 09/30/22 | 09/30/21 | 09/30/20 |
| | Class A | 0.77% | 0.77% | 0.78% | 0.79% | 0.80% |
| | Class C | 1.52% | 1.53% | 1.53% | 1.54% | 1.55% |
| | Class P | 0.77% | 0.77% | 0.78% | 0.79% | 0.80% |
| | Institutional Class | 0.52% | 0.52% | 0.53% | 0.54% | 0.55% |
218 | THE GUGGENHEIM FUNDS ANNUAL REPORT | SEE NOTES TO FINANCIAL STATEMENTS. |
SCHEDULE OF INVESTMENTS | September 30, 2024 |
TOTAL RETURN BOND FUND | |
| | Shares | | | Value | |
COMMON STOCKS† - 0.0% |
| | | | | | | | | |
Industrial - 0.0% |
YAK BLOCKER 2 LLC*,††† | | | 44,094 | | | $ | 88,628 | |
YAK BLOCKER 2 LLC*,††† | | | 40,754 | | | | 81,916 | |
API Heat Transfer Intermediate*,††† | | | 31 | | | | 44,404 | |
BP Holdco LLC*,†††,1 | | | 532 | | | | 645 | |
Vector Phoenix Holdings, LP*,††† | | | 532 | | | | 11 | |
Total Industrial | | | | | | | 215,604 | |
| | | | | | | | | |
Communications - 0.0% |
Vacasa, Inc. — Class A* | | | 18,219 | | | | 51,195 | |
| | | | | | | | | |
Financial - 0.0% |
Pershing Square Tontine Holdings, Ltd. — Class A*,†††,2 | | | 9,315,080 | | | | 932 | |
| | | | | | | | | |
Total Common Stocks | | | | |
(Cost $3,668,341) | | | | | | | 267,731 | |
| | | | | | | | | |
PREFERRED STOCKS†† - 2.6% |
Financial - 2.4% |
Markel Group, Inc. |
6.00% | | | 72,131,000 | | | | 72,053,091 | |
Citigroup, Inc. |
3.88% | | | 31,175,000 | | | | 30,005,211 | |
4.00% | | | 26,571,000 | | | | 26,014,452 | |
7.63% | | | 14,300,000 | | | | 15,277,748 | |
Wells Fargo & Co. |
3.90% | | | 66,688,000 | | | | 64,814,454 | |
7.63% | | | 4,100,000 | | | | 4,465,039 | |
Equitable Holdings, Inc. |
4.95% | | | 68,525,000 | | | | 67,874,341 | |
Charles Schwab Corp. |
4.00% | | | 73,673,000 | | | | 65,885,175 | |
Bank of New York Mellon Corp. |
3.75% | | | 65,200,000 | | | | 61,537,794 | |
Goldman Sachs Group, Inc. |
7.50% | | | 25,300,000 | | | | 26,817,241 | |
3.80% | | | 25,830,000 | | | | 24,857,953 | |
3.65% | | | 2,450,000 | | | | 2,322,434 | |
MetLife, Inc. |
3.85% | | | 53,467,000 | | | | 52,603,834 | |
JPMorgan Chase & Co. |
3.65% | | | 37,412,000 | | | | 36,193,933 | |
Bank of America Corp. |
4.38% | | | 27,700,000 | | | | 26,814,326 | |
Kuvare US Holdings, Inc. |
7.00% due 02/17/514 | | | 15,731,000 | | | | 15,809,657 | |
CNO Financial Group, Inc. |
5.13% due 11/25/60 | | | 714,375 | | | | 15,387,638 | |
Jackson Financial, Inc. |
8.00% | | | 472,000 | | | | 12,611,840 | |
Selective Insurance Group, Inc. |
4.60% | | | 541,225 | | | | 10,694,606 | |
Depository Trust & Clearing Corp. |
3.38%4 | | | 4,750,000 | | | | 4,539,181 | |
State Street Corp. |
6.70% | | | 2,645,000 | | | | 2,740,186 | |
First Republic Bank |
4.25%* | | | 2,368,525 | | | | 947 | |
4.50%* | | | 276,775 | | | | 111 | |
Total Financial | | | | | | | 639,321,192 | |
| | | | | | | | | |
Communications - 0.1% |
AT&T Mobility II LLC |
6.80%*,††† | | | 47,000 | | | | 48,103,090 | |
| | | | | | | | | |
Energy - 0.1% |
Venture Global LNG, Inc. |
9.00%*,4 | | | 21,555,000 | | | | 21,848,771 | |
| | | | | | | | | |
Government - 0.0% |
CoBank ACB |
4.25% | | | 3,300,000 | | | | 3,170,471 | |
Total Preferred Stocks | | | | |
(Cost $796,008,213) | | | | | | | 712,443,524 | |
| | | | | | | | | |
WARRANTS† - 0.0% |
Ginkgo Bioworks Holdings, Inc. | | | | | | | | |
Expiring 09/16/26* | | | 101,490 | | | | 457 | |
Pershing Square SPARC Holdings, Ltd.*,†††,2 | | | 2,846,274 | | | | 285 | |
Pershing Square Tontine Holdings, Ltd. | | | | | | | | |
Expiring 07/24/25*,†††,2 | | | 1,035,008 | | | | 103 | |
Total Warrants | | | | |
(Cost $233,835) | | | | | | | 845 | |
| | | | | | | | | |
EXCHANGE-TRADED FUNDS***,† - 0.7% |
Vanguard Intermediate-Term Corporate Bond ETF | | | 2,240,000 | | | | 187,600,000 | |
Total Exchange-Traded Funds | | | | |
(Cost $184,990,400) | | | | | | | 187,600,000 | |
| | | | | | | | | |
MUTUAL FUNDS† - 0.8% |
Guggenheim Limited Duration Fund — Class R61 | | | 5,348,707 | | | | 131,524,706 | |
Guggenheim Strategy Fund II1 | | | 1,238,408 | | | | 30,712,524 | |
Guggenheim Ultra Short Duration Fund — Institutional Class1 | | | 3,020,042 | | | | 30,260,817 | |
Guggenheim Strategy Fund III1 | | | 665,925 | | | | 16,574,884 | |
Total Mutual Funds | | | | |
(Cost $204,111,673) | | | | | | | 209,072,931 | |
| | | | | | | | | |
MONEY MARKET FUNDS***,† - 3.0% |
Dreyfus Treasury Securities Cash Management Fund — Institutional Shares, 4.88%5 | | | 717,742,897 | | | | 717,742,897 | |
Dreyfus Treasury Obligations Cash Management Fund — Institutional Shares, 4.81%5 | | | 59,338,504 | | | | 59,338,504 | |
Federated Hermes U.S. Treasury Cash Reserves Fund — Institutional Shares, 4.85%5 | | | 24,478,723 | | | | 24,478,723 | |
Total Money Market Funds | | | | |
(Cost $801,560,124) | | | | | | | 801,560,124 | |
SEE NOTES TO FINANCIAL STATEMENTS. | THE GUGGENHEIM FUNDS ANNUAL REPORT | 219 |
SCHEDULE OF INVESTMENTS (continued) | September 30, 2024 |
TOTAL RETURN BOND FUND | |
| | Face
Amount~ | | | Value | |
COLLATERALIZED MORTGAGE OBLIGATIONS†† - 32.6% |
Government Agency - 21.1% | | | | | | | | |
Uniform MBS 30 Year | | | | | | | | |
due 12/01/2415 | | | 614,506,081 | | | $ | 614,244,301 | |
due 12/01/2415 | | | 486,030,000 | | | | 436,532,705 | |
due 01/01/2515 | | | 420,939,550 | | | | 413,794,101 | |
due 12/01/2415 | | | 254,365,450 | | | | 250,103,557 | |
due 12/01/2415 | | | 199,940,000 | | | | 172,678,381 | |
due 11/01/2415 | | | 164,090,919 | | | | 163,990,988 | |
due 12/01/2415 | | | 192,250,000 | | | | 159,379,756 | |
due 11/01/2415 | | | 121,258,969 | | | | 122,687,400 | |
Fannie Mae | | | | | | | | |
5.00% due 05/01/53 | | | 216,181,755 | | | | 216,456,066 | |
6.00% due 09/01/54 | | | 190,764,615 | | | | 196,677,401 | |
3.00% due 05/01/52 | | | 216,897,643 | | | | 194,691,990 | |
5.50% due 05/01/53 | | | 178,506,152 | | | | 180,664,568 | |
5.50% due 09/01/54 | | | 164,592,773 | | | | 167,350,338 | |
5.50% due 06/01/54 | | | 155,624,346 | | | | 157,444,886 | |
5.50% due 06/01/53 | | | 149,910,065 | | | | 151,915,929 | |
5.00% due 04/01/53 | | | 111,570,357 | | | | 111,634,208 | |
5.00% due 08/01/53 | | | 78,586,590 | | | | 78,627,523 | |
5.00% due 06/01/53 | | | 26,839,413 | | | | 26,841,427 | |
due 12/25/436,12 | | | 9,226,582 | | | | 7,082,295 | |
3.05% due 03/01/50 | | | 5,762,276 | | | | 4,846,848 | |
2.51% due 10/01/46 | | | 5,369,290 | | | | 4,321,991 | |
2.49% due 12/01/39 | | | 4,065,878 | | | | 3,326,835 | |
4.24% due 08/01/48 | | | 3,347,742 | | | | 3,193,711 | |
2.54% due 12/01/39 | | | 3,547,642 | | | | 2,908,041 | |
3.00% due 01/01/52 | | | 2,761,109 | | | | 2,485,286 | |
3.42% due 10/01/47 | | | 2,619,326 | | | | 2,364,672 | |
3.26% due 11/01/46 | | | 2,247,004 | | | | 1,996,529 | |
2.69% due 02/01/52 | | | 2,397,097 | | | | 1,897,892 | |
2.49% due 09/01/51 | | | 2,429,242 | | | | 1,854,359 | |
2.62% due 12/01/51 | | | 2,240,043 | | | | 1,752,373 | |
2.93% due 03/01/52 | | | 2,006,611 | | | | 1,655,092 | |
3.46% due 08/01/49 | | | 1,598,967 | | | | 1,429,115 | |
2.51% due 07/01/50 | | | 1,714,062 | | | | 1,353,678 | |
2.43% due 12/01/51 | | | 1,900,000 | | | | 1,304,705 | |
3.74% due 02/01/48 | | | 1,190,004 | | | | 1,103,174 | |
4.05% due 09/01/48 | | | 1,102,842 | | | | 1,053,360 | |
2.32% due 07/01/50 | | | 1,312,412 | | | | 1,009,319 | |
3.96% due 06/01/49 | | | 916,606 | | | | 850,529 | |
3.00% due 05/01/52 | | | 893,278 | | | | 810,233 | |
3.60% due 10/01/47 | | | 877,840 | | | | 799,752 | |
2.65% due 12/01/51 | | | 960,335 | | | | 753,009 | |
2.34% due 03/01/51 | | | 842,420 | | | | 648,711 | |
3.91% due 07/01/49 | | | 643,432 | | | | 590,540 | |
3.18% due 09/01/42 | | | 618,030 | | | | 538,302 | |
2.56% due 05/01/39 | | | 581,386 | | | | 469,549 | |
2.51% due 02/01/48 | | | 556,954 | | | | 444,610 | |
3.00% due 07/01/46 | | | 425,037 | | | | 387,784 | |
3.51% due 11/01/47 | | | 353,931 | | | | 321,742 | |
4.33% due 09/01/48 | | | 317,189 | | | | 312,206 | |
3.50% due 10/01/45 | | | 320,765 | | | | 304,567 | |
4.22% due 04/01/49 | | | 313,237 | | | | 294,747 | |
3.77% due 08/01/45 | | | 282,889 | | | | 256,425 | |
4.23% due 07/01/39 | | | 264,598 | | | | 252,375 | |
2.00% due 02/25/52 | | | 379,704 | | | | 237,205 | |
5.00% due 12/01/44 | | | 217,484 | | | | 221,638 | |
4.50% due 04/01/48 | | | 217,981 | | | | 216,255 | |
3.50% due 11/01/47 | | | 226,205 | | | | 213,461 | |
3.00% due 03/01/52 | | | 223,411 | | | | 201,867 | |
3.50% due 12/01/45 | | | 187,676 | | | | 177,260 | |
3.50% due 08/01/43 | | | 183,453 | | | | 175,158 | |
3.95% due 06/01/49 | | | 186,123 | | | | 172,367 | |
2.50% due 01/25/52 | | | 257,062 | | | | 171,386 | |
3.18% due 08/01/42 | | | 177,049 | | | | 154,193 | |
4.00% due 10/01/45 | | | 121,043 | | | | 118,224 | |
2.06% due 09/01/36 | | | 140,000 | | | | 109,666 | |
5.00% due 05/01/44 | | | 103,673 | | | | 105,653 | |
2.34% due 09/01/39 | | | 122,670 | | | | 97,057 | |
2.50% due 11/25/50 | | | 139,907 | | | | 86,608 | |
5.00% due 04/01/44 | | | 68,857 | | | | 69,527 | |
2.00% due 10/25/51 | | | 101,931 | | | | 55,723 | |
2.28% due 01/01/51 | | | 66,859 | | | | 51,351 | |
3.50% due 06/01/46 | | | 12,299 | | | | 11,606 | |
Freddie Mac | | | | | | | | |
6.00% due 08/01/54 | | | 255,010,823 | | | | 263,191,856 | |
5.50% due 09/01/53 | | | 192,924,093 | | | | 197,854,106 | |
5.50% due 06/01/54 | | | 184,582,748 | | | | 186,732,559 | |
5.50% due 06/01/53 | | | 164,408,909 | | | | 166,796,417 | |
5.00% due 04/01/53 | | | 111,272,878 | | | | 111,330,834 | |
6.00% due 09/01/54 | | | 103,289,475 | | | | 106,422,016 | |
5.50% due 09/01/54 | | | 102,158,168 | | | | 104,167,394 | |
5.00% due 03/01/53 | | | 66,930,223 | | | | 66,980,811 | |
5.50% due 02/01/53 | | | 12,345,624 | | | | 12,578,076 | |
5.00% due 08/01/53 | | | 8,737,236 | | | | 8,810,473 | |
1.96% due 05/01/50 | | | 1,500,541 | | | | 1,092,262 | |
5.00% due 09/01/52 | | | 961,327 | | | | 979,611 | |
3.00% due 08/01/46 | | | 452,924 | | | | 414,773 | |
4.50% due 06/01/48 | | | 193,927 | | | | 193,404 | |
3.50% due 12/01/45 | | | 170,901 | | | | 161,450 | |
4.00% due 11/01/45 | | | 152,439 | | | | 149,007 | |
2.00% due 10/25/51 | | | 254,828 | | | | 139,432 | |
4.00% due 08/01/45 | | | 137,602 | | | | 134,503 | |
4.00% due 09/01/45 | | | 128,563 | | | | 125,668 | |
2.00% due 09/25/51 | | | 169,105 | | | | 88,761 | |
2.50% due 02/25/52 | | | 138,952 | | | | 87,633 | |
4.00% due 05/25/52 | | | 81,000 | | | | 69,129 | |
GNMA II 30Year TBA | | | | | | | | |
due 10/21/2415 | | | 363,358,901 | | | | 366,828,978 | |
Ginnie Mae | | | | | | | | |
due 12/01/2415 | | | 123,300,000 | | | | 123,401,106 | |
6.00% due 06/20/47 | | | 12,573,296 | | | | 12,704,784 | |
Fannie Mae-Aces | | | | | | | | |
1.59% (WAC) due 03/25/35◊,7 | | | 199,429,369 | | | | 17,809,421 | |
Freddie Mac Seasoned Credit Risk Transfer Trust | | | | | | | | |
2.00% due 11/25/59 | | | 10,264,352 | | | | 8,411,277 | |
2.00% due 05/25/60 | | | 8,438,202 | | | | 6,929,613 | |
FARM Mortgage Trust | | | | | | | | |
2.18% (WAC) due 01/25/51◊,4 | | | 9,947,302 | | | | 8,155,012 | |
220 | THE GUGGENHEIM FUNDS ANNUAL REPORT | SEE NOTES TO FINANCIAL STATEMENTS. |
SCHEDULE OF INVESTMENTS (continued) | September 30, 2024 |
TOTAL RETURN BOND FUND | |
| | Face
Amount~ | | | Value | |
Freddie Mac Multifamily Structured Pass Through Certificates | | | | | | | | |
0.63% (WAC) due 12/25/24◊,7 | | | 36,598,080 | | | $ | 9,827 | |
Total Government Agency | | | | | | | 5,646,086,279 | |
| | | | | | | | | |
Residential Mortgage-Backed Securities - 9.4% | | | | | | | | |
OBX Trust | | | | | | | | |
2024-NQM5, 6.39% due 01/25/644,8 | | | 20,281,443 | | | | 20,520,679 | |
2024-NQM6, 6.85% due 02/25/644,8 | | | 17,260,640 | | | | 17,609,348 | |
2024-NQM5, 5.99% due 01/25/644,8 | | | 16,414,029 | | | | 16,627,861 | |
2024-NQM4, 6.07% due 01/25/644,8 | | | 15,305,769 | | | | 15,536,415 | |
2024-NQM7, 6.24% due 03/25/644,8 | | | 13,435,998 | | | | 13,667,992 | |
2024-NQM6, 6.45% due 02/25/644,8 | | | 13,185,275 | | | | 13,474,152 | |
2024-NQM9, 6.44% due 01/25/644,8 | | | 12,248,493 | | | | 12,430,973 | |
2024-NQM8, 6.59% due 05/25/644,8 | | | 10,483,746 | | | | 10,660,489 | |
2024-NQM6, 6.70% due 02/25/644,8 | | | 10,306,800 | | | | 10,506,786 | |
2022-NQM9, 6.45% due 09/25/624,8,9 | | | 10,186,027 | | | | 10,264,138 | |
2024-NQM5, 6.29% due 01/25/644,8 | | | 10,118,237 | | | | 10,245,280 | |
2024-NQM7, 6.60% due 03/25/644,8 | | | 9,724,656 | | | | 9,883,880 | |
2024-NQM8, 6.23% due 05/25/644,8 | | | 9,204,549 | | | | 9,363,100 | |
2024-NQM11, 6.23% due 06/25/644,8 | | | 8,922,525 | | | | 9,018,784 | |
2024-NQM10, 6.33% due 05/25/644,8 | | | 8,322,276 | | | | 8,448,895 | |
2024-NQM4, 6.32% due 01/25/644,8 | | | 8,340,269 | | | | 8,434,125 | |
2024-NQM8, 6.44% due 05/25/644,8 | | | 7,835,668 | | | | 7,961,499 | |
2024-NQM11, 6.13% due 06/25/644,8 | | | 6,837,370 | | | | 6,922,741 | |
2024-NQM7, 6.45% due 03/25/644,8 | | | 6,764,978 | | | | 6,870,340 | |
2024-NQM3, 6.13% due 12/25/634,8 | | | 6,263,277 | | | | 6,362,700 | |
2024-NQM11, 5.88% due 06/25/644,8 | | | 5,819,038 | | | | 5,886,542 | |
2024-NQM13, 5.37% due 06/25/644,8 | | | 5,769,056 | | | | 5,787,585 | |
2023-NQM2, 6.32% due 01/25/624,8 | | | 5,268,053 | | | | 5,321,214 | |
2023-NQM9, 7.66% due 10/25/634,8 | | | 5,136,040 | | | | 5,271,505 | |
2024-NQM3, 6.33% due 12/25/634,8 | | | 5,190,798 | | | | 5,256,046 | |
2024-NQM4, 6.22% due 01/25/644,8 | | | 3,849,355 | | | | 3,892,806 | |
2024-NQM2, 6.18% due 12/25/638,9 | | | 3,560,407 | | | | 3,591,858 | |
2024-NQM9, 6.28% due 01/25/648,9 | | | 3,429,616 | | | | 3,477,955 | |
2022-NQM8, 6.10% due 09/25/628,9 | | | 3,384,869 | | | | 3,389,267 | |
2023-NQM2, 6.72% due 01/25/628,9 | | | 3,064,386 | | | | 3,093,873 | |
2024-NQM12, 5.83% due 07/25/648,9 | | | 3,056,931 | | | | 3,076,339 | |
2024-NQM3, 6.43% due 12/25/638,9 | | | 1,630,168 | | | | 1,648,994 | |
BRAVO Residential Funding Trust | | | | | | | | |
2022-R1, 3.13% due 01/29/704,8 | | | 78,322,201 | | | | 77,731,182 | |
2023-NQM2, 4.50% due 05/25/624,8,9 | | | 28,382,934 | | | | 28,119,460 | |
2024-NQM3, 6.19% due 03/25/644,8 | | | 12,953,363 | | | | 13,148,543 | |
2021-HE1, 6.78% (30 Day Average SOFR + 1.50%, Rate Floor: 0.00%) due 01/25/70◊,4 | | | 7,500,000 | | | | 7,489,562 | |
2024-NQM1, 6.40% due 12/01/634,8 | | | 6,665,149 | | | | 6,737,274 | |
2024-NQM3, 6.50% due 03/25/644,8 | | | 5,981,935 | | | | 6,066,356 | |
2023-NQM6, 7.06% due 09/25/634,8 | | | 5,701,458 | | | | 5,801,788 | |
2023-NQM5, 7.01% due 06/25/638,9 | | | 3,608,168 | | | | 3,664,891 | |
2024-NQM3, 6.39% due 03/25/648,9 | | | 2,193,976 | | | | 2,224,942 | |
PRPM LLC | | | | | | | | |
2021-5, 4.79% due 06/25/264,8 | | | 49,365,023 | | | | 49,146,825 | |
2021-8, 4.74% (WAC) due 09/25/26◊,4 | | | 25,438,029 | | | | 25,293,604 | |
2024-RPL2, 3.50% due 05/25/544 | | | 24,527,532 | | | | 23,716,262 | |
2024-4, 6.41% due 08/25/294,8 | | | 14,112,739 | | | | 14,197,256 | |
2022-1, 3.72% due 02/25/274,8 | | | 9,553,312 | | | | 9,471,706 | |
2024-5, due 09/25/294,8 | | | 7,750,000 | | | | 7,752,015 | |
2023-RCF1, 4.00% due 06/25/534,8 | | | 4,106,975 | | | | 4,039,542 | |
Angel Oak Mortgage Trust | | | | | | | | |
2024-4, 6.20% due 01/25/694,8 | | | 29,639,630 | | | | 30,186,366 | |
2023-1, 4.75% due 09/26/674,8 | | | 20,850,263 | | | | 20,679,854 | |
2023-2, 4.65% due 10/25/674,8 | | | 20,297,391 | | | | 20,127,748 | |
2024-2, 5.99% due 01/25/694,8 | | | 18,110,575 | | | | 18,365,822 | |
2024-4, 6.50% due 01/25/694,8 | | | 9,130,265 | | | | 9,249,156 | |
2024-2, 6.19% due 01/25/694,8 | | | 8,874,182 | | | | 9,017,684 | |
2024-2, 6.25% due 01/25/694,8 | | | 8,185,075 | | | | 8,289,549 | |
2024-3, 4.80% due 11/26/684,8,9 | | | 7,567,044 | | | | 7,522,215 | |
2024-4, 6.40% due 01/25/694,8 | | | 4,497,668 | | | | 4,564,610 | |
CSMC Trust | | | | | | | | |
2021-RPL4, 4.06% (WAC) due 12/27/60◊,4 | | | 57,663,720 | | | | 57,460,553 | |
2021-RPL7, 1.93% (WAC) due 07/27/61◊,4 | | | 48,421,090 | | | | 48,265,407 | |
2021-RPL1, 4.07% (WAC) due 09/27/60◊,4 | | | 22,224,320 | | | | 22,145,946 | |
JP Morgan Mortgage Trust | | | | | | | | |
2021-12, 2.50% (WAC) due 02/25/52◊,4 | | | 94,105,599 | | | | 87,452,878 | |
2021-13, 2.50% (WAC) due 04/25/52◊,4 | | | 41,997,490 | | | | 39,033,274 | |
FIGRE Trust | | | | | | | | |
2024-HE2, 6.38% (WAC) due 05/25/54◊,4 | | | 41,202,174 | | | | 42,183,704 | |
2024-HE4, 5.06% (WAC) due 09/25/54◊,4 | | | 21,546,000 | | | | 21,633,263 | |
2024-HE1, 6.17% (WAC) due 03/25/54◊,4 | | | 15,836,293 | | | | 16,122,921 | |
2024-HE3, 5.94% (WAC) due 07/25/54◊,4 | | | 12,381,660 | | | | 12,645,152 | |
2024-HE3, 6.13% (WAC) due 07/25/54◊,4 | | | 5,143,151 | | | | 5,229,497 | |
2024-HE3, 6.23% (WAC) due 07/25/54◊,9 | | | 2,666,819 | | | | 2,707,287 | |
Legacy Mortgage Asset Trust | | | | | | | | |
2021-GS2, 4.75% due 04/25/614,8 | | | 33,044,153 | | | | 33,279,342 | |
2021-GS3, 4.75% due 07/25/614,8 | | | 31,196,527 | | | | 30,961,455 | |
2021-GS5, 2.25% due 07/25/674,8 | | | 20,742,403 | | | | 20,583,885 | |
2021-GS4, 4.65% due 11/25/604,8 | | | 4,540,373 | | | | 4,539,665 | |
COLT Mortgage Loan Trust | | | | | | | | |
2023-3, 7.18% due 09/25/684,8 | | | 35,930,585 | | | | 36,761,731 | |
2024-2, 6.13% due 04/25/694,8 | | | 11,958,439 | | | | 12,108,283 | |
2023-3, 7.58% due 09/25/684,8 | | | 8,087,541 | | | | 8,289,883 | |
2023-4, 7.62% due 10/25/684,8 | | | 5,019,273 | | | | 5,153,377 | |
2021-2, 2.38% (WAC) due 08/25/66◊,4 | | | 7,108,000 | | | | 5,143,212 | |
2024-2, 6.33% due 04/25/694,8 | | | 4,926,698 | | | | 4,988,299 | |
2024-2, 6.43% due 04/25/694,8 | | | 4,568,392 | | | | 4,625,507 | |
2024-1, 6.14% due 02/25/694,8 | | | 4,123,295 | | | | 4,166,009 | |
GCAT Trust | | | | | | | | |
2022-NQM5, 5.71% due 08/25/674,8 | | | 20,624,644 | | | | 20,606,977 | |
2023-NQM3, 6.89% due 08/25/684,8 | | | 16,954,519 | | | | 17,276,101 | |
2024-NQM2, 6.44% due 06/25/594,8 | | | 12,468,719 | | | | 12,656,210 | |
2022-NQM3, 4.35% (WAC) due 04/25/67◊,4 | | | 10,545,692 | | | | 10,071,780 | |
2023-NQM3, 7.34% due 08/25/684,8 | | | 4,311,900 | | | | 4,404,856 | |
2024-NQM2, 6.09% due 06/25/598,9 | | | 3,632,591 | | | | 3,684,841 | |
2024-NQM2, 6.54% due 06/25/598,9 | | | 2,760,733 | | | | 2,802,146 | |
2023-NQM2, 6.24% due 11/25/678,9 | | | 2,573,774 | | | | 2,580,820 | |
Morgan Stanley ABS Capital I Incorporated Trust | | | | | | | | |
2006-NC5, 5.12% (1 Month Term SOFR + 0.26%, Rate Floor: 0.15%) due 10/25/36◊ | | | 24,533,968 | | | | 13,236,966 | |
SEE NOTES TO FINANCIAL STATEMENTS. | THE GUGGENHEIM FUNDS ANNUAL REPORT | 221 |
SCHEDULE OF INVESTMENTS (continued) | September 30, 2024 |
TOTAL RETURN BOND FUND | |
| | Face
Amount~ | | | Value | |
2007-HE5, 5.73% (1 Month Term SOFR + 0.45%, Rate Floor: 0.34%) due 03/25/37◊ | | | 25,667,108 | | | $ | 10,978,548 | |
2006-HE6, 5.45% (1 Month Term SOFR + 0.59%, Rate Floor: 0.48%) due 09/25/36◊ | | | 22,455,783 | | | | 7,688,653 | |
2006-HE5, 5.25% (1 Month Term SOFR + 0.39%, Rate Floor: 0.28%) due 08/25/36◊ | | | 12,559,238 | | | | 6,359,378 | |
2007-HE3, 5.08% (1 Month Term SOFR + 0.22%, Rate Floor: 0.11%) due 12/25/36◊ | | | 10,403,807 | | | | 5,233,484 | |
2006-HE4, 5.45% (1 Month Term SOFR + 0.59%, Rate Floor: 0.48%) due 06/25/36◊ | | | 7,802,275 | | | | 4,043,993 | |
2006-HE5, 5.47% (1 Month Term SOFR + 0.61%, Rate Floor: 0.50%) due 08/25/36◊ | | | 7,525,402 | | | | 3,809,743 | |
2007-HE2, 5.06% (1 Month Term SOFR + 0.20%, Rate Floor: 0.09%) due 01/25/37◊ | | | 8,072,324 | | | | 3,629,394 | |
2007-HE2, 5.10% (1 Month Term SOFR + 0.24%, Rate Floor: 0.13%) due 01/25/37◊ | | | 7,670,320 | | | | 3,448,759 | |
2007-HE2, 5.18% (1 Month Term SOFR + 0.32%, Rate Floor: 0.21%) due 01/25/37◊ | | | 6,039,622 | | | | 2,715,217 | |
2007-NC3, 5.58% (1 Month Term SOFR + 0.30%, Rate Floor: 0.19%) due 05/25/37◊ | | | 3,029,960 | | | | 2,325,310 | |
2007-HE6, 5.45% (1 Month Term SOFR + 0.17%, Rate Floor: 0.06%) due 05/25/37◊ | | | 2,214,130 | | | | 1,987,778 | |
2007-HE3, 5.10% (1 Month Term SOFR + 0.24%, Rate Floor: 0.13%) due 12/25/36◊,9 | | | 1,912,509 | | | | 1,192,937 | |
2006-HE6, 5.27% (1 Month Term SOFR + 0.41%, Rate Floor: 0.30%) due 09/25/36◊ | | | 2,846,508 | | | | 975,583 | |
NYMT Loan Trust | | | | | | | | |
2022-SP1, 5.25% due 07/25/624,8 | | | 58,658,101 | | | | 57,565,295 | |
GS Mortgage-Backed Securities Trust | | | | | | | | |
2021-PJ10, 2.50% (WAC) due 03/25/52◊,4 | | | 58,769,754 | | | | 54,134,595 | |
Verus Securitization Trust | | | | | | | | |
2023-7, 7.42% due 10/25/684,8 | | | 16,417,439 | | | | 16,803,880 | |
2024-5, 6.65% due 06/25/694,8 | | | 14,203,222 | | | | 14,456,017 | |
2022-8, 6.13% due 09/25/674,8,9 | | | 13,209,539 | | | | 13,211,389 | |
2024-1, 6.12% due 01/25/698,9 | | | 3,459,832 | | | | 3,484,565 | |
2023-2, 6.85% due 03/25/688,9 | | | 3,166,945 | | | | 3,202,592 | |
2024-5, 6.45% due 06/25/698,9 | | | 2,399,193 | | | | 2,438,289 | |
OSAT Trust | | | | | | | | |
2021-RPL1, 5.12% due 05/25/654,8 | | | 53,199,210 | | | | 53,102,319 | |
Vista Point Securitization Trust | | | | | | | | |
2024-CES2, 5.25% due 10/25/544,8 | | | 42,400,000 | | | | 42,429,510 | |
2024-CES1, 6.68% due 05/25/544,8 | | | 8,291,777 | | | | 8,433,561 | |
Mill City Securities Ltd. | | | | | | | | |
2024-RS1, 3.00% due 11/01/694,8 | | | 52,050,000 | | | | 48,053,393 | |
RCKT Mortgage Trust | | | | | | | | |
2024-CES4, 6.15% due 06/25/444,8 | | | 31,397,648 | | | | 31,900,434 | |
2024-CES4, 6.30% due 06/25/444,8 | | | 6,527,431 | | | | 6,638,954 | |
2023-CES1, 6.52% (WAC) due 06/25/43◊,4 | | | 4,628,163 | | | | 4,662,498 | |
2023-CES2, 6.81% (WAC) due 09/25/43◊,4 | | | 4,011,073 | | | | 4,075,514 | |
New Residential Mortgage Loan Trust | | | | | | | | |
2024-NQM2, 5.37% due 09/25/644 | | | 26,600,000 | | | | 26,580,050 | |
2024-NQM2, 5.42% due 09/25/644 | | | 19,201,000 | | | | 19,184,679 | |
Top Pressure Recovery Turbines | | | | | | | | |
7.51% due 11/01/69 | | | 44,427,157 | | | | 44,827,001 | |
JP Morgan Mortgage Acquisition Trust | | | | | | | | |
2006-WMC4, 5.10% (1 Month Term SOFR + 0.24%, Rate Floor: 0.13%) due 12/25/36◊ | | | 57,585,283 | | | | 35,923,007 | |
2006-WMC4, 5.09% (1 Month Term SOFR + 0.23%, Rate Floor: 0.12%) due 12/25/36◊ | | | 12,015,287 | | | | 6,391,341 | |
2006-WMC3, 5.45% (1 Month Term SOFR + 0.59%, Rate Floor: 0.48%) due 08/25/36◊ | | | 1,689,680 | | | | 1,240,192 | |
Home Equity Loan Trust | | | | | | | | |
2007-FRE1, 5.16% (1 Month Term SOFR + 0.30%, Rate Floor: 0.19%) due 04/25/37◊ | | | 43,041,110 | | | | 40,988,734 | |
Citigroup Mortgage Loan Trust, Inc. | | | | | | | | |
2022-A, 6.17% due 09/25/624,8 | | | 15,604,119 | | | | 15,603,316 | |
2007-AMC1, 5.29% (1 Month Term SOFR + 0.43%, Rate Floor: 0.32%) due 12/25/36◊,4 | | | 19,684,132 | | | | 10,738,263 | |
2006-WF1, 4.93% due 03/25/36 | | | 13,147,056 | | | | 6,520,041 | |
2007-AMC3, 5.15% (1 Month Term SOFR + 0.29%, Rate Floor: 0.18%) due 03/25/37◊ | | | 5,550,088 | | | | 4,689,608 | |
GSAMP Trust | | | | | | | | |
2007-NC1, 5.65% (1 Month Term SOFR + 0.37%, Rate Floor: 0.26%) due 12/25/46◊ | | | 23,926,868 | | | | 12,490,454 | |
2006-HE8, 5.43% (1 Month Term SOFR + 0.57%, Rate Floor: 0.46%) due 01/25/37◊ | | | 10,107,000 | | | | 8,575,416 | |
2006-NC2, 5.27% (1 Month Term SOFR + 0.41%, Rate Floor: 0.30%) due 06/25/36◊ | | | 11,194,698 | | | | 6,390,837 | |
2007-NC1, 5.69% (1 Month Term SOFR + 0.41%, Rate Floor: 0.30%) due 12/25/46◊ | | | 6,844,493 | | | | 3,380,611 | |
Alternative Loan Trust | | | | | | | | |
2007-OA4, 5.31% (1 Month Term SOFR + 0.45%, Rate Floor: 0.34%) due 05/25/47◊ | | | 13,556,683 | | | | 11,812,841 | |
2007-OH3, 5.55% (1 Month Term SOFR + 0.69%, Rate Cap/Floor: 10.00%/0.58%) due 09/25/47◊ | | | 5,912,356 | | | | 5,382,251 | |
222 | THE GUGGENHEIM FUNDS ANNUAL REPORT | SEE NOTES TO FINANCIAL STATEMENTS. |
SCHEDULE OF INVESTMENTS (continued) | September 30, 2024 |
TOTAL RETURN BOND FUND | |
| | Face
Amount~ | | | Value | |
2006-43CB, 6.00% (1 Month Term SOFR + 0.61%, Rate Cap/Floor: 6.00%/6.00%) due 02/25/37◊ | | | 5,796,129 | | | $ | 3,183,473 | |
2007-OA7, 5.33% (1 Month Term SOFR + 0.47%, Rate Floor: 0.36%) due 05/25/47◊ | | | 2,112,428 | | | | 1,995,466 | |
2007-OH3, 5.41% (1 Month Term SOFR + 0.55%, Rate Cap/Floor: 10.00%/0.44%) due 09/25/47◊ | | | 587,709 | | | | 555,545 | |
Imperial Fund Mortgage Trust | | | | | | | | |
2022-NQM2, 4.02% (WAC) due 03/25/67◊,4 | | | 11,688,081 | | | | 10,952,657 | |
2022-NQM2, 4.20% (WAC) due 03/25/67◊,4 | | | 11,489,471 | | | | 10,841,976 | |
Sequoia Mortgage Trust | | | | | | | | |
2024-5, 6.00% (WAC) due 06/25/54◊,4 | | | 21,294,500 | | | | 21,519,035 | |
Soundview Home Loan Trust | | | | | | | | |
2006-OPT5, 5.25% (1 Month Term SOFR + 0.39%, Rate Floor: 0.28%) due 07/25/36◊ | | | 21,864,966 | | | | 21,012,012 | |
Saluda Grade Alternative Mortgage Trust | | | | | | | | |
2023-FIG4, 6.72% (WAC) due 11/25/53◊,4 | | | 19,091,149 | | | | 19,643,017 | |
SPS Servicer Advance Receivables Trust | | | | | | | | |
2020-T2, 1.83% due 11/15/554 | | | 20,000,000 | | | | 19,315,202 | |
ACE Securities Corporation Home Equity Loan Trust Series | | | | | | | | |
2006-NC1, 5.58% (1 Month Term SOFR + 0.73%, Rate Floor: 0.62%) due 12/25/35◊ | | | 14,117,180 | | | | 13,241,429 | |
2007-ASP1, 5.37% (1 Month Term SOFR + 0.51%, Rate Floor: 0.40%) due 03/25/37◊ | | | 7,890,424 | | | | 3,212,605 | |
2007-WM2, 5.18% (1 Month Term SOFR + 0.32%, Rate Floor: 0.21%) due 02/25/37◊ | | | 5,964,687 | | | | 2,535,393 | |
NovaStar Mortgage Funding Trust Series | | | | | | | | |
2007-2, 5.17% (1 Month Term SOFR + 0.31%, Rate Cap/Floor: 11.00%/0.20%) due 09/25/37◊ | | | 17,471,968 | | | | 17,029,800 | |
2007-1, 5.23% (1 Month Term SOFR + 0.37%, Rate Cap/Floor: 11.00%/0.26%) due 03/25/37◊ | | | 2,540,466 | | | | 1,622,935 | |
Morgan Stanley Residential Mortgage Loan Trust | | | | | | | | |
2024-NQM3, 5.35% due 07/25/694,8 | | | 9,650,000 | | | | 9,626,454 | |
2024-NQM3, 5.04% (WAC) due 07/25/69◊,4 | | | 9,000,000 | | | | 8,978,580 | |
American Home Mortgage Investment Trust | | | | | | | | |
2007-1, 2.08% due 05/25/477 | | | 121,208,469 | | | | 17,495,764 | |
IXIS Real Estate Capital Trust | | | | | | | | |
2007-HE1, 5.50% (1 Month Term SOFR + 0.22%, Rate Floor: 0.11%) due 05/25/37◊ | | | 31,454,536 | | | | 7,412,450 | |
2006-HE1, 5.57% (1 Month Term SOFR + 0.71%, Rate Floor: 0.60%) due 03/25/36◊ | | | 10,850,441 | | | | 5,685,246 | |
2007-HE1, 5.62% (1 Month Term SOFR + 0.34%, Rate Floor: 0.23%) due 05/25/37◊ | | | 5,969,621 | | | | 1,407,308 | |
2007-HE1, 5.55% (1 Month Term SOFR + 0.27%, Rate Floor: 0.16%) due 05/25/37◊ | | | 5,606,564 | | | | 1,321,758 | |
2007-HE1, 5.45% (1 Month Term SOFR + 0.17%, Rate Floor: 0.06%) due 05/25/37◊ | | | 4,664,402 | | | | 1,099,295 | |
Securitized Asset-Backed Receivables LLC Trust | | | | | | | | |
2006-WM4, 5.13% (1 Month Term SOFR + 0.27%, Rate Floor: 0.16%) due 11/25/36◊ | | | 29,387,531 | | | | 8,024,680 | |
2007-BR2, 5.33% (1 Month Term SOFR + 0.47%, Rate Floor: 0.36%) due 02/25/37◊,4 | | | 8,920,178 | | | | 7,598,722 | |
2006-HE2, 5.27% (1 Month Term SOFR + 0.41%, Rate Floor: 0.30%) due 07/25/36◊ | | | 3,134,796 | | | | 1,243,616 | |
Washington Mutual Mortgage Pass-Through Certificates WMALT Series Trust | | | | | | | | |
2006-AR9, 5.95% (1 Year CMT Rate + 0.83%, Rate Floor: 0.83%) due 11/25/46◊ | | | 7,988,208 | | | | 6,639,029 | |
2006-AR10, 5.31% (1 Month Term SOFR + 0.45%, Rate Floor: 0.34%) due 12/25/36◊ | | | 6,892,027 | | | | 5,539,165 | |
2006-AR9, 5.96% (1 Year CMT Rate + 0.84%, Rate Floor: 0.84%) due 11/25/46◊ | | | 3,540,842 | | | | 2,910,098 | |
2006-7, 4.02% due 09/25/36 | | | 5,123,813 | | | | 1,396,969 | |
2006-8, 4.13% due 10/25/36 | | | 326,930 | | | | 110,401 | |
Credit Suisse Mortgage Capital Certificates | | | | | | | | |
2021-RPL9, 2.44% (WAC) due 02/25/61◊,4 | | | 15,873,623 | | | | 15,782,275 | |
Structured Asset Securities Corporation Mortgage Loan Trust | | | | | | | | |
2008-BC4, 5.60% (1 Month Term SOFR + 0.74%, Rate Floor: 0.63%) due 11/25/37◊ | | | 14,142,703 | | | | 13,645,111 | |
2006-BC4, 5.31% (1 Month Term SOFR + 0.45%, Rate Floor: 0.34%) due 12/25/36◊ | | | 1,320,950 | | | | 1,282,786 | |
2006-BC6, 5.14% (1 Month Term SOFR + 0.28%, Rate Floor: 0.17%) due 01/25/37◊ | | | 63,707 | | | | 62,835 | |
WaMu Asset-Backed Certificates WaMu Series Trust | | | | | | | | |
2007-HE1, 5.27% (1 Month Term SOFR + 0.41%, Rate Floor: 0.41%) due 01/25/37◊ | | | 31,726,568 | | | | 14,736,870 | |
Starwood Mortgage Residential Trust | | | | | | | | |
2020-1, 2.56% (WAC) due 02/25/50◊,4 | | | 8,453,580 | | | | 8,073,373 | |
2020-1, 2.41% (WAC) due 02/25/50◊,4 | | | 6,502,754 | | | | 6,215,236 | |
Merrill Lynch Mortgage Investors Trust Series | | | | | | | | |
2007-HE2, 5.49% (1 Month Term SOFR + 0.63%, Rate Floor: 0.52%) due 02/25/37◊ | | | 30,714,279 | | | | 8,949,355 | |
SEE NOTES TO FINANCIAL STATEMENTS. | THE GUGGENHEIM FUNDS ANNUAL REPORT | 223 |
SCHEDULE OF INVESTMENTS (continued) | September 30, 2024 |
TOTAL RETURN BOND FUND | |
| | Face
Amount~ | | | Value | |
2006-HE6, 4.14% (1 Month Term SOFR + 0.39%, Rate Floor: 0.28%) due 11/25/37◊ | | | 7,435,526 | | | $ | 3,644,479 | |
American Home Mortgage Assets Trust | | | | | | | | |
2007-5, 5.35% (1 Month Term SOFR + 0.49%, Rate Cap/Floor: 99.00%/0.19%) due 06/25/47◊ | | | 8,366,419 | | | | 7,424,179 | |
2006-4, 5.16% (1 Month Term SOFR + 0.30%, Rate Floor: 0.30%) due 10/25/46◊ | | | 6,494,968 | | | | 3,510,467 | |
2006-6, 5.16% (1 Month Term SOFR + 0.30%, Rate Floor: 0.19%) due 12/25/46◊ | | | 1,922,784 | | | | 1,626,566 | |
LSTAR Securities Investment Ltd. | | | | | | | | |
2024-1, 8.45% (30 Day Average SOFR + 3.10%, Rate Floor: 3.10%) due 01/01/29◊,4 | | | 11,782,368 | | | | 11,741,031 | |
RALI Series Trust | | | | | | | | |
2007-QO4, 5.35% (1 Month Term SOFR + 0.49%, Rate Floor: 0.38%) due 05/25/47◊ | | | 3,622,473 | | | | 3,260,142 | |
2006-QO2, 5.41% (1 Month Term SOFR + 0.55%, Rate Floor: 0.44%) due 02/25/46◊ | | | 16,536,210 | | | | 2,929,676 | |
2007-QO2, 5.12% (1 Month Term SOFR + 0.26%, Rate Floor: 0.15%) due 02/25/47◊ | | | 7,409,529 | | | | 2,536,617 | |
2006-QO6, 5.33% (1 Month Term SOFR + 0.47%, Rate Floor: 0.36%) due 06/25/46◊ | | | 4,715,292 | | | | 1,099,293 | |
2006-QO2, 5.51% (1 Month Term SOFR + 0.65%, Rate Floor: 0.54%) due 02/25/46◊ | | | 5,362,610 | | | | 965,980 | |
2007-QO3, 5.29% (1 Month Term SOFR + 0.43%, Rate Floor: 0.32%) due 03/25/47◊ | | | 760,844 | | | | 671,484 | |
2006-QO2, 5.65% (1 Month Term SOFR + 0.79%, Rate Floor: 0.68%) due 02/25/46◊ | | | 1,105,132 | | | | 203,716 | |
Ameriquest Mortgage Securities Trust | | | | | | | | |
2006-M3, 5.13% (1 Month Term SOFR + 0.27%, Rate Floor: 0.16%) due 10/25/36◊ | | | 26,025,058 | | | | 7,668,565 | |
2006-M3, 5.07% (1 Month Term SOFR + 0.21%, Rate Floor: 0.10%) due 10/25/36◊ | | | 10,932,272 | | | | 3,221,320 | |
ABFC Trust | | | | | | | | |
2007-WMC1, 6.64% (1 Month Term SOFR + 1.36%, Rate Floor: 1.25%) due 06/25/37◊ | | | 14,034,999 | | | | 10,129,396 | |
Master Asset-Backed Securities Trust | | | | | | | | |
2006-WMC4, 5.27% (1 Month Term SOFR + 0.41%, Rate Floor: 0.30%) due 10/25/36◊ | | | 10,293,196 | | | | 3,367,923 | |
2006-NC2, 5.45% (1 Month Term SOFR + 0.59%, Rate Floor: 0.48%) due 08/25/36◊ | | | 7,329,395 | | | | 2,774,350 | |
2006-WMC3, 5.29% (1 Month Term SOFR + 0.43%, Rate Floor: 0.32%) due 08/25/36◊ | | | 5,526,551 | | | | 1,960,058 | |
2007-WMC1, 5.29% (1 Month Term SOFR + 0.43%, Rate Floor: 0.32%) due 01/25/37◊ | | | 5,685,254 | | | | 1,626,045 | |
HarborView Mortgage Loan Trust | | | | | | | | |
2006-14, 5.38% (1 Month Term SOFR + 0.41%, Rate Floor: 0.30%) due 01/25/47◊ | | | 5,753,426 | | | | 5,317,574 | |
2006-12, 5.46% (1 Month Term SOFR + 0.49%, Rate Floor: 0.38%) due 01/19/38◊ | | | 4,230,991 | | | | 3,743,888 | |
Fremont Home Loan Trust | | | | | | | | |
2006-E, 5.51% (1 Month Term SOFR + 0.23%, Rate Floor: 0.12%) due 01/25/37◊ | | | 11,140,808 | | | | 5,071,851 | |
2006-D, 5.12% (1 Month Term SOFR + 0.26%, Rate Floor: 0.15%) due 11/25/36◊ | | | 10,003,529 | | | | 3,510,292 | |
First Franklin Mortgage Loan Trust | | | | | | | | |
2006-FF16, 5.25% (1 Month Term SOFR + 0.39%, Rate Floor: 0.28%) due 12/25/36◊ | | | 19,278,673 | | | | 7,947,856 | |
First NLC Trust | | | | | | | | |
2005-4, 5.75% (1 Month Term SOFR + 0.89%, Rate Cap/Floor: 14.00%/0.78%) due 02/25/36◊ | | | 6,174,271 | | | | 6,042,799 | |
2005-1, 2.78% (1 Month Term SOFR + 0.57%, Rate Cap/Floor: 14.00%/0.46%) due 05/25/35◊ | | | 1,960,367 | | | | 1,734,679 | |
ATLX Trust | | | | | | | | |
2024-RPL1, 3.85% due 04/25/644,8 | | | 7,757,735 | | | | 7,516,745 | |
Merrill Lynch Alternative Note Asset Trust Series | | | | | | | | |
2007-A1, 5.85% (1 Month Term SOFR + 0.57%, Rate Floor: 0.46%) due 01/25/37◊ | | | 18,619,731 | | | | 5,388,673 | |
2007-A1, 5.69% (1 Month Term SOFR + 0.41%, Rate Floor: 0.30%) due 01/25/37◊ | | | 7,060,913 | | | | 2,042,555 | |
Argent Securities Incorporated Asset-Backed Pass-Through Certificates Series | | | | | | | | |
2005-W4, 5.73% (1 Month Term SOFR + 0.87%, Rate Floor: 0.76%) due 02/25/36◊ | | | 9,106,855 | | | | 7,252,310 | |
CFMT LLC | | | | | | | | |
2022-HB9, 3.25% (WAC) due 09/25/37◊,4 | | | 7,543,666 | | | | 7,231,108 | |
Bear Stearns Asset-Backed Securities I Trust | | | | | | | | |
2006-HE9, 5.25% (1 Month Term SOFR + 0.39%, Rate Floor: 0.28%) due 11/25/36◊ | | | 6,990,108 | | | | 6,898,331 | |
224 | THE GUGGENHEIM FUNDS ANNUAL REPORT | SEE NOTES TO FINANCIAL STATEMENTS. |
SCHEDULE OF INVESTMENTS (continued) | September 30, 2024 |
TOTAL RETURN BOND FUND | |
| | Face
Amount~ | | | Value | |
Long Beach Mortgage Loan Trust | | | | | | | | |
2006-8, 5.29% (1 Month Term SOFR + 0.43%, Rate Floor: 0.32%) due 09/25/36◊ | | | 14,122,856 | | | $ | 3,905,204 | |
2006-6, 5.47% (1 Month Term SOFR + 0.61%, Rate Floor: 0.50%) due 07/25/36◊ | | | 4,406,273 | | | | 1,736,931 | |
2006-8, 5.15% (1 Month Term SOFR + 0.29%, Rate Floor: 0.18%) due 09/25/36◊ | | | 3,769,127 | | | | 1,036,680 | |
Option One Mortgage Loan Trust | | | | | | | | |
2007-5, 5.19% (1 Month Term SOFR + 0.33%, Rate Floor: 0.22%) due 05/25/37◊ | | | 6,547,035 | | | | 3,948,298 | |
2007-2, 5.22% (1 Month Term SOFR + 0.36%, Rate Floor: 0.25%) due 03/25/37◊ | | | 4,665,640 | | | | 2,331,992 | |
Asset-Backed Securities Corporation Home Equity Loan Trust Series AEG | | | | | | | | |
2006-HE1, 3.93% (1 Month Term SOFR + 0.71%, Rate Floor: 0.60%) due 01/25/36◊ | | | 6,392,023 | | | | 6,238,631 | |
Cross Mortgage Trust | | | | | | | | |
2024-H5, 6.16% due 08/26/694,8 | | | 5,856,960 | | | | 5,894,521 | |
Towd Point Mortgage Trust | | | | | | | | |
2023-CES1, 6.75% (WAC) due 07/25/63◊,4 | | | 5,471,851 | | | | 5,544,171 | |
Lehman XS Trust Series | | | | | | | | |
2007-2N, 5.15% (1 Month Term SOFR + 0.29%, Rate Floor: 0.18%) due 02/25/37◊ | | | 4,305,645 | | | | 3,919,519 | |
2007-15N, 5.47% (1 Month Term SOFR + 0.61%, Rate Floor: 0.00%) due 08/25/37◊ | | | 1,108,921 | | | | 1,066,641 | |
2006-10N, 5.39% (1 Month Term SOFR + 0.53%, Rate Floor: 0.42%) due 07/25/46◊ | | | 270,388 | | | | 241,799 | |
Morgan Stanley IXIS Real Estate Capital Trust | | | | | | | | |
2006-2, 5.12% (1 Month Term SOFR + 0.26%, Rate Floor: 0.15%) due 11/25/36◊ | | | 16,065,057 | | | | 5,218,726 | |
WaMu Asset-Backed Certificates WaMu Series | | | | | | | | |
2007-HE4, 5.14% (1 Month Term SOFR + 0.28%, Rate Floor: 0.28%) due 07/25/47◊ | | | 4,507,493 | | | | 3,313,676 | |
2007-HE4, 5.22% (1 Month Term SOFR + 0.36%, Rate Floor: 0.36%) due 07/25/47◊ | | | 3,187,458 | | | | 1,904,847 | |
CWABS Asset-Backed Certificates Trust | | | | | | | | |
2006-12, 5.23% (1 Month Term SOFR + 0.37%, Rate Floor: 0.26%) due 12/25/36◊ | | | 5,503,849 | | | | 5,092,447 | |
WaMu Mortgage Pass-Through Certificates Series Trust | | | | | | | | |
2007-OA6, 5.93% (1 Year CMT Rate + 0.81%, Rate Floor: 0.81%) due 07/25/47◊ | | | 4,093,357 | | | | 3,364,082 | |
2006-AR13, 6.00% (1 Year CMT Rate + 0.88%, Rate Floor: 0.88%) due 10/25/46◊ | | | 1,303,010 | | | | 1,108,145 | |
2006-AR11, 6.04% (1 Year CMT Rate + 0.92%, Rate Floor: 0.92%) due 09/25/46◊ | | | 566,932 | | | | 494,676 | |
Deutsche Alt-A Securities Mortgage Loan Trust Series | | | | | | | | |
2006-AR4, 5.23% (1 Month Term SOFR + 0.37%, Rate Floor: 0.26%) due 12/25/36◊ | | | 9,172,215 | | | | 3,163,000 | |
2007-OA2, 5.89% (1 Year CMT Rate + 0.77%, Rate Floor: 0.77%) due 04/25/47◊ | | | 1,967,135 | | | | 1,731,952 | |
Credit-Based Asset Servicing and Securitization LLC | | | | | | | | |
2006-CB2, 3.34% (1 Month Term SOFR + 0.49%, Rate Floor: 0.38%) due 12/25/36◊ | | | 4,835,570 | | | | 4,599,276 | |
Cascade Funding Mortgage Trust | | | | | | | | |
2018-RM2, 4.00% (WAC) due 10/25/68◊,4 | | | 4,372,091 | | | | 4,330,515 | |
2019-RM3, 2.80% (WAC) due 06/25/69◊,9 | | | 238,728 | | | | 237,868 | |
GSAA Home Equity Trust | | | | | | | | |
2006-5, 5.33% (1 Month Term SOFR + 0.47%, Rate Floor: 0.36%) due 03/25/36◊ | | | 11,972,408 | | | | 3,951,989 | |
2007-7, 5.51% (1 Month Term SOFR + 0.65%, Rate Floor: 0.54%) due 07/25/37◊ | | | 110,777 | | | | 104,247 | |
Impac Secured Assets CMN Owner Trust | | | | | | | | |
2005-2, 5.89% (1 Month Term SOFR + 0.61%, Rate Floor: 0.50%) due 03/25/36◊ | | | 3,907,841 | | | | 3,542,341 | |
GSAA Trust | | | | | | | | |
2007-3, 5.31% (1 Month Term SOFR + 0.45%, Rate Floor: 0.34%) due 03/25/47◊ | | | 10,480,341 | | | | 2,872,167 | |
ASG Resecuritization Trust | | | | | | | | |
2010-3, 4.91% (1 Month Term SOFR + 0.40%, Rate Cap/Floor: 10.50%/0.29%) due 12/28/45◊,9 | | | 1,915,429 | | | | 1,812,712 | |
C-BASS Mortgage Loan Trust | | | | | | | | |
2007-CB2, 3.55% due 02/25/37 | | | 2,456,513 | | | | 1,489,756 | |
Securitized Asset Backed Receivables LLC Trust | | | | | | | | |
2006-WM4, 5.29% (1 Month Term SOFR + 0.43%, Rate Floor: 0.32%) due 11/25/36◊ | | | 5,157,473 | | | | 1,408,206 | |
Morgan Stanley Capital I Incorporated Trust | | | | | | | | |
2006-HE1, 5.55% (1 Month Term SOFR + 0.69%, Rate Floor: 0.58%) due 01/25/36◊ | | | 1,447,727 | | | | 1,400,244 | |
Countrywide Asset-Backed Certificates | | | | | | | | |
2005-15, 3.39% (1 Month Term SOFR + 0.79%, Rate Floor: 0.68%) due 03/25/36◊ | | | 628,621 | | | | 614,436 | |
SEE NOTES TO FINANCIAL STATEMENTS. | THE GUGGENHEIM FUNDS ANNUAL REPORT | 225 |
SCHEDULE OF INVESTMENTS (continued) | September 30, 2024 |
TOTAL RETURN BOND FUND | |
| | Face
Amount~ | | | Value | |
Structured Asset Investment Loan Trust | | | | | | | | |
2004-BNC2, 6.17% (1 Month Term SOFR + 1.31%, Rate Floor: 1.20%) due 12/25/34◊ | | | 254,921 | | | $ | 252,414 | |
2006-3, 5.27% (1 Month Term SOFR + 0.41%, Rate Floor: 0.30%) due 06/25/36◊ | | | 184,075 | | | | 174,372 | |
Alliance Bancorp Trust | | | | | | | | |
2007-OA1, 5.45% (1 Month Term SOFR + 0.59%, Rate Floor: 0.48%) due 07/25/37◊ | | | 485,314 | | | | 417,181 | |
Impac Secured Assets Trust | | | | | | | | |
2006-2, 5.31% (1 Month Term SOFR + 0.45%, Rate Cap/Floor: 11.50%/0.34%) due 08/25/36◊ | | | 437,048 | | | | 405,626 | |
Residential Mortgage Loan Trust | | | | | | | | |
2020-1, 2.68% (WAC) due 01/26/60◊,9 | | | 390,860 | | | | 380,758 | |
Nomura Resecuritization Trust | | | | | | | | |
2015-4R, 2.71% (1 Month Term SOFR + 0.54%, Rate Floor: 0.43%) due 03/26/36◊,9 | | | 370,488 | | | | 356,673 | |
Morgan Stanley Re-REMIC Trust | | | | | | | | |
2010-R5, 5.31% due 06/26/369 | | | 89,654 | | | | 83,657 | |
GreenPoint Mortgage Funding Trust | | | | | | | | |
2006-AR1, 5.55% (1 Month Term SOFR + 0.69%, Rate Cap/Floor: 10.50%/0.58%) due 02/25/36◊ | | | 85,044 | | | | 73,728 | |
UCFC Manufactured Housing Contract | | | | | | | | |
1997-2, 7.38% due 10/15/28 | | | 12,138 | | | | 12,100 | |
Irwin Home Equity Loan Trust | | | | | | | | |
2007-1, 6.35% due 08/25/379 | | | 34 | | | | 33 | |
Total Residential Mortgage-Backed Securities | | | | | | | 2,511,343,930 | |
| | | | | | | | | |
Commercial Mortgage-Backed Securities - 1.4% | | | | | | | | |
BX Commercial Mortgage Trust | | | | | | | | |
2021-VOLT, 7.21% (1 Month Term SOFR + 2.11%, Rate Floor: 2.00%) due 09/15/36◊,4 | | | 60,050,000 | | | | 59,599,625 | |
2021-VOLT, 6.86% (1 Month Term SOFR + 1.76%, Rate Floor: 1.65%) due 09/15/36◊,4 | | | 52,000,000 | | | | 51,447,500 | |
2024-AIRC, 6.79% (1 Month Term SOFR + 1.69%, Rate Floor: 1.69%) due 08/15/39◊,4 | | | 15,850,000 | | | | 15,869,813 | |
2024-AIRC, 7.24% (1 Month Term SOFR + 2.14%, Rate Floor: 2.14%) due 08/15/39◊,4 | | | 11,400,000 | | | | 11,414,250 | |
2024-AIR2, 6.59% (1 Month Term SOFR + 1.49%, Rate Floor: 1.49%) due 10/15/41◊,4 | | | 10,000,000 | | | | 10,000,000 | |
2022-LP2, 7.06% (1 Month Term SOFR + 1.96%, Rate Floor: 1.96%) due 02/15/39◊,4 | | | 4,783,184 | | | | 4,744,321 | |
2024-AIR2, 6.89% (1 Month Term SOFR + 1.79%, Rate Floor: 1.79%) due 10/15/41◊,4 | | | 3,800,000 | | | | 3,797,625 | |
BX Trust | | | | | | | | |
2024-VLT4, 7.24% (1 Month Term SOFR + 2.14%, Rate Floor: 2.14%) due 07/15/29◊,4 | | | 20,650,000 | | | | 20,598,375 | |
2024-VLT4, 7.04% (1 Month Term SOFR + 1.94%, Rate Floor: 1.94%) due 07/15/29◊,4 | | | 17,150,000 | | | | 17,150,000 | |
SMRT | | | | | | | | |
2022-MINI, 7.05% (1 Month Term SOFR + 1.95%, Rate Floor: 1.95%) due 01/15/39◊,4 | | | 32,500,000 | | | | 31,913,638 | |
JP Morgan Chase Commercial Mortgage Securities Trust | | | | | | | | |
2021-NYAH, 7.30% (1 Month Term SOFR + 2.20%, Rate Floor: 1.84%) due 06/15/38◊,4 | | | 14,350,000 | | | | 12,621,829 | |
2016-JP3, 3.56% (WAC) due 08/15/49◊ | | | 10,290,000 | | | | 8,502,485 | |
2021-NYAH, 7.65% (1 Month Term SOFR + 2.55%, Rate Floor: 2.19%) due 06/15/38◊,4 | | | 8,000,000 | | | | 6,783,072 | |
2016-JP3, 1.46% (WAC) due 08/15/49◊,7 | | | 51,370,402 | | | | 965,805 | |
Life Mortgage Trust | | | | | | | | |
2021-BMR, 7.56% (1 Month Term SOFR + 2.46%, Rate Floor: 2.35%) due 03/15/38◊,4 | | | 15,466,117 | | | | 14,889,933 | |
2021-BMR, 6.96% (1 Month Term SOFR + 1.86%, Rate Floor: 1.75%) due 03/15/38◊,4 | | | 4,163,955 | | | | 4,039,861 | |
Extended Stay America Trust | | | | | | | | |
2021-ESH, 7.46% (1 Month Term SOFR + 2.36%, Rate Floor: 2.25%) due 07/15/38◊,4 | | | 11,137,942 | | | | 11,159,463 | |
2021-ESH, 6.91% (1 Month Term SOFR + 1.81%, Rate Floor: 1.70%) due 07/15/38◊,4 | | | 5,747,178 | | | | 5,734,606 | |
Citigroup Commercial Mortgage Trust | | | | | | | | |
2019-GC43, 0.74% (WAC) due 11/10/52◊,7 | | | 215,519,527 | | | | 5,365,229 | |
2019-GC41, 1.16% (WAC) due 08/10/56◊,7 | | | 96,297,570 | | | | 3,505,443 | |
2015-GC35, 4.35% (WAC) due 11/10/48◊ | | | 810,679 | | | | 693,213 | |
2016-P4, 2.05% (WAC) due 07/10/49◊,7 | | | 27,693,953 | | | | 637,479 | |
2016-C2, 1.80% (WAC) due 08/10/49◊,7 | | | 29,776,360 | | | | 615,230 | |
2016-P5, 1.52% (WAC) due 10/10/49◊,7 | | | 24,468,605 | | | | 463,790 | |
2016-GC37, 1.81% (WAC) due 04/10/49◊,7 | | | 18,785,828 | | | | 292,172 | |
2016-C3, 1.05% (WAC) due 11/15/49◊,7 | | | 8,935,889 | | | | 131,191 | |
2015-GC35, 0.86% (WAC) due 11/10/48◊,7 | | | 27,465,058 | | | | 130,058 | |
2015-GC29, 1.15% (WAC) due 04/10/48◊,7 | | | 17,514,908 | | | | 32,303 | |
GS Mortgage Securities Corporation Trust | | | | | | | | |
2020-UPTN, 3.35% (WAC) due 02/10/37◊,4 | | | 5,350,000 | | | | 5,109,423 | |
2020-DUNE, 6.72% (1 Month Term SOFR + 1.61%, Rate Floor: 1.35%) due 12/15/36◊,4 | | | 3,750,000 | | | | 3,727,412 | |
226 | THE GUGGENHEIM FUNDS ANNUAL REPORT | SEE NOTES TO FINANCIAL STATEMENTS. |
SCHEDULE OF INVESTMENTS (continued) | September 30, 2024 |
TOTAL RETURN BOND FUND | |
| | Face
Amount~ | | | Value | |
2020-DUNE, 7.27% (1 Month Term SOFR + 2.16%, Rate Floor: 1.90%) due 12/15/36◊,4 | | | 1,000,000 | | | $ | 989,533 | |
BENCHMARK Mortgage Trust | | | | | | | | |
2020-IG3, 3.23% (WAC) due 09/15/48◊,4 | | | 5,232,000 | | | | 3,219,059 | |
2019-B14, 0.89% (WAC) due 12/15/62◊,7 | | | 107,526,356 | | | | 2,434,063 | |
2018-B2, 0.59% (WAC) due 02/15/51◊,7 | | | 91,099,138 | | | | 1,043,914 | |
2018-B6, 4.74% (WAC) due 10/10/51◊ | | | 750,000 | | | | 705,823 | |
2018-B6, 0.55% (WAC) due 10/10/51◊,7 | | | 58,412,311 | | | | 607,955 | |
GS Mortgage Securities Trust | | | | | | | | |
2020-GC45, 0.77% (WAC) due 02/13/53◊,7 | | | 151,116,168 | | | | 3,924,170 | |
2019-GC42, 0.93% (WAC) due 09/10/52◊,7 | | | 64,803,810 | | | | 2,038,002 | |
2017-GS6, 1.15% (WAC) due 05/10/50◊,7 | | | 40,051,724 | | | | 816,366 | |
2017-GS6, 3.87% due 05/10/50 | | | 521,000 | | | | 456,048 | |
2015-GC28, 1.06% (WAC) due 02/10/48◊,7 | | | 6,854,063 | | | | 1,843 | |
DBGS Mortgage Trust | | | | | | | | |
2018-C1, 4.80% (WAC) due 10/15/51◊ | | | 7,588,000 | | | | 7,117,525 | |
JPMDB Commercial Mortgage Securities Trust | | | | | | | | |
2016-C4, 3.64% (WAC) due 12/15/49◊ | | | 2,650,000 | | | | 2,404,684 | |
2017-C7, 0.96% (WAC) due 10/15/50◊,7 | | | 112,780,037 | | | | 2,242,924 | |
2016-C4, 0.83% (WAC) due 12/15/49◊,7 | | | 71,699,891 | | | | 818,304 | |
2016-C2, 1.63% (WAC) due 06/15/49◊,7 | | | 22,633,738 | | | | 361,210 | |
2017-C5, 1.02% (WAC) due 03/15/50◊,7 | | | 7,226,173 | | | | 103,211 | |
Wells Fargo Commercial Mortgage Trust | | | | | | | | |
2017-C38, 1.06% (WAC) due 07/15/50◊,7 | | | 62,007,384 | | | | 1,184,180 | |
2017-C42, 1.00% (WAC) due 12/15/50◊,7 | | | 32,965,058 | | | | 749,174 | |
2017-RB1, 1.35% (WAC) due 03/15/50◊,7 | | | 32,403,181 | | | | 726,259 | |
2016-BNK1, 1.85% (WAC) due 08/15/49◊,7 | | | 33,635,464 | | | | 709,950 | |
2016-C35, 2.03% (WAC) due 07/15/48◊,7 | | | 20,771,306 | | | | 484,518 | |
2017-RC1, 1.54% (WAC) due 01/15/60◊,7 | | | 16,011,483 | | | | 424,336 | |
2016-NXS5, 1.56% (WAC) due 01/15/59◊,7 | | | 19,596,266 | | | | 262,382 | |
2015-NXS4, 1.15% (WAC) due 12/15/48◊,7 | | | 35,523,729 | | | | 256,037 | |
2015-P2, 1.08% (WAC) due 12/15/48◊,7 | | | 21,304,926 | | | | 160,739 | |
2016-C37, 0.92% (WAC) due 12/15/49◊,7 | | | 10,141,938 | | | | 129,801 | |
2015-C30, 1.01% (WAC) due 09/15/58◊,7 | | | 27,122,112 | | | | 119,568 | |
2015-NXS1, 1.12% (WAC) due 05/15/48◊,7 | | | 6,776,995 | | | | 4,361 | |
BMP Trust | | | | | | | | |
2024-MF23, 6.74% (1 Month Term SOFR + 1.64%, Rate Floor: 1.64%) due 06/15/41◊,4 | | | 4,900,000 | | | | 4,884,687 | |
BANK | | | | | | | | |
2020-BN25, 0.53% (WAC) due 01/15/63◊,7 | | | 140,000,000 | | | | 2,872,884 | |
2017-BNK6, 0.90% (WAC) due 07/15/60◊,7 | | | 33,732,816 | | | | 589,609 | |
2017-BNK4, 1.49% (WAC) due 05/15/50◊,7 | | | 10,462,750 | | | | 286,307 | |
COMM Mortgage Trust | | | | | | | | |
2018-COR3, 0.58% (WAC) due 05/10/51◊,7 | | | 194,936,377 | | | | 2,653,182 | |
2015-CR26, 1.04% (WAC) due 10/10/48◊,7 | | | 73,271,754 | | | | 307,617 | |
2015-CR27, 1.05% (WAC) due 10/10/48◊,7 | | | 24,411,268 | | | | 134,394 | |
2015-CR24, 0.83% (WAC) due 08/10/48◊,7 | | | 36,803,452 | | | | 107,915 | |
2015-CR23, 0.96% (WAC) due 05/10/48◊,7 | | | 29,017,676 | | | | 68,784 | |
CSAIL Commercial Mortgage Trust | | | | | | | | |
2019-C15, 1.16% (WAC) due 03/15/52◊,7 | | | 85,477,015 | | | | 2,956,043 | |
2016-C6, 2.02% (WAC) due 01/15/49◊,7 | | | 4,698,634 | | | | 85,552 | |
2015-C1, 0.87% (WAC) due 04/15/50◊,7 | | | 32,759,301 | | | | 17,277 | |
UBS Commercial Mortgage Trust | | | | | | | | |
2017-C5, 1.21% (WAC) due 11/15/50◊,7 | | | 41,009,397 | | | | 885,208 | |
2017-C2, 1.21% (WAC) due 08/15/50◊,7 | | | 37,604,777 | | | | 883,284 | |
BBCMS Mortgage Trust | | | | | | | | |
2018-C2, 0.91% (WAC) due 12/15/51◊,7 | | | 56,286,920 | | | | 1,393,552 | |
CD Mortgage Trust | | | | | | | | |
2017-CD6, 1.01% (WAC) due 11/13/50◊,7 | | | 39,763,164 | | | | 716,401 | |
2016-CD1, 1.48% (WAC) due 08/10/49◊,7 | | | 27,878,311 | | | | 414,272 | |
2016-CD2, 0.69% (WAC) due 11/10/49◊,7 | | | 29,254,417 | | | | 214,060 | |
CD Commercial Mortgage Trust | | | | | | | | |
2017-CD4, 1.38% (WAC) due 05/10/50◊,7 | | | 24,918,179 | | | | 609,078 | |
2017-CD3, 1.10% (WAC) due 02/10/50◊,7 | | | 30,975,240 | | | | 562,929 | |
CGMS Commercial Mortgage Trust | | | | | | | | |
2017-B1, 0.86% (WAC) due 08/15/50◊,7 | | | 57,894,775 | | | | 980,575 | |
JPMCC Commercial Mortgage Securities Trust | | | | | | | | |
2017-JP6, 1.16% (WAC) due 07/15/50◊,7 | | | 46,645,548 | | | | 862,854 | |
Bank of America Merrill Lynch Commercial Mortgage Trust | | | | | | | | |
2017-BNK3, 1.16% (WAC) due 02/15/50◊,7 | | | 20,779,466 | | | | 376,268 | |
2016-UB10, 1.88% (WAC) due 07/15/49◊,7 | | | 1,510,782 | | | | 25,193 | |
DBJPM Mortgage Trust | | | | | | | | |
2017-C6, 1.05% (WAC) due 06/10/50◊,7 | | | 17,196,533 | | | | 338,880 | |
CFCRE Commercial Mortgage Trust | | | | | | | | |
2016-C3, 1.11% (WAC) due 01/10/48◊,7 | | | 38,381,304 | | | | 309,215 | |
Morgan Stanley Bank of America Merrill Lynch Trust | | | | | | | | |
2015-C27, 1.00% (WAC) due 12/15/47◊,7 | | | 59,509,626 | | | | 242,157 | |
Morgan Stanley Capital I Trust | | | | | | | | |
2016-UBS9, 4.76% (WAC) due 03/15/49◊ | | | 275,000 | | | | 237,798 | |
SG Commercial Mortgage Securities Trust | | | | | | | | |
2016-C5, 1.98% (WAC) due 10/10/48◊,7 | | | 4,454,046 | | | | 99,307 | |
JPMBB Commercial Mortgage Securities Trust | | | | | | | | |
2015-C27, 1.23% (WAC) due 02/15/48◊,7 | | | 56,599,510 | | | | 1,585 | |
Total Commercial Mortgage-Backed Securities | | | | | | | 370,547,950 | |
| | | | | | | | | |
Military Housing - 0.7% | | | | | | | | |
Freddie Mac Military Housing Bonds Resecuritization Trust Certificates | | | | | | | | |
2015-R1, 4.66% (WAC) due 11/25/55◊,4 | | | 109,369,968 | | | | 101,204,590 | |
2015-R1, 4.45% (WAC) due 11/25/52◊,4 | | | 20,425,138 | | | | 19,210,147 | |
2015-R1, 4.31% (WAC) due 10/25/52◊,4 | | | 13,068,560 | | | | 11,608,564 | |
2015-R1, 0.70% (WAC) due 11/25/55◊,4,7 | | | 164,349,092 | | | | 10,290,357 | |
Capmark Military Housing Trust | | | | | | | | |
2006-RILY, 6.15% due 07/10/51†††,4 | | | 12,364,692 | | | | 11,473,940 | |
2007-AETC, 5.75% due 02/10/52†††,4 | | | 7,029,738 | | | | 6,389,891 | |
2006-RILY, 5.82% (1 Month Term SOFR + 0.48%, Rate Floor: 0.37%) due 07/10/51◊,†††,4 | | | 6,658,600 | | | | 4,456,002 | |
2007-ROBS, 6.06% due 10/10/52†††,4 | | | 4,455,483 | | | | 3,987,612 | |
2007-AET2, 6.06% due 10/10/52†††,4 | | | 2,927,000 | | | | 2,928,375 | |
GMAC Commercial Mortgage Asset Corp. | | | | | | | | |
2007-HCKM, 6.11% due 08/10/52†††,4 | | | 21,143,479 | | | | 19,303,362 | |
2005-DRUM, 5.47% due 05/10/50†††,4 | | | 4,271,975 | | | | 3,931,798 | |
2005-BLIS, 5.25% due 07/10/50†††,4 | | | 2,500,000 | | | | 2,133,050 | |
Total Military Housing | | | | | | | 196,917,688 | |
| | | | | | | | | |
Total Collateralized Mortgage Obligations | | | | |
(Cost $8,927,067,187) | | | 8,724,895,847 | |
SEE NOTES TO FINANCIAL STATEMENTS. | THE GUGGENHEIM FUNDS ANNUAL REPORT | 227 |
SCHEDULE OF INVESTMENTS (continued) | September 30, 2024 |
TOTAL RETURN BOND FUND | |
| | Face
Amount~ | | | Value | |
CORPORATE BONDS†† - 26.2% |
Financial - 12.1% | | | | | | | | |
Pershing Square Holdings Ltd. | | | | | | | | |
3.25% due 10/01/314 | | | 101,800,000 | | | $ | 87,264,996 | |
3.25% due 11/15/30 | | | 55,930,000 | | | | 49,185,961 | |
Wilton RE Ltd. | | | | | | | | |
6.00%3,4,10 | | | 92,239,000 | | | | 85,219,965 | |
CoStar Group, Inc. | | | | | | | | |
2.80% due 07/15/304 | | | 90,310,000 | | | | 81,361,263 | |
Host Hotels & Resorts, LP | | | | | | | | |
3.50% due 09/15/30 | | | 44,753,000 | | | | 41,504,154 | |
2.90% due 12/15/31 | | | 20,200,000 | | | | 17,762,957 | |
5.70% due 07/01/34 | | | 12,075,000 | | | | 12,467,751 | |
GLP Capital Limited Partnership / GLP Financing II, Inc. | | | | | | | | |
4.00% due 01/15/31 | | | 54,748,000 | | | | 51,322,237 | |
5.30% due 01/15/29 | | | 15,867,000 | | | | 16,136,544 | |
3.25% due 01/15/32 | | | 4,150,000 | | | | 3,671,295 | |
4.00% due 01/15/30 | | | 475,000 | | | | 453,555 | |
Jefferies Financial Group, Inc. | | | | | | | | |
2.75% due 10/15/32 | | | 40,642,000 | | | | 34,670,812 | |
2.63% due 10/15/31 | | | 27,400,000 | | | | 23,766,429 | |
6.20% due 04/14/34 | | | 7,970,000 | | | | 8,531,819 | |
6.25% due 01/15/36 | | | 1,000,000 | | | | 1,081,420 | |
Nippon Life Insurance Co. | | | | | | | | |
2.75% due 01/21/513,4 | | | 45,350,000 | | | | 39,595,026 | |
5.95% due 04/16/543,4 | | | 13,950,000 | | | | 14,568,296 | |
2.90% due 09/16/513,4 | | | 10,380,000 | | | | 9,003,677 | |
Reliance Standard Life Global Funding II | | | | | | | | |
5.24% due 02/02/264 | | | 62,487,000 | | | | 62,784,789 | |
Morgan Stanley | | | | | | | | |
6.63% due 11/01/343 | | | 31,480,000 | | | | 35,605,312 | |
5.94% due 02/07/393 | | | 23,310,000 | | | | 24,474,398 | |
2.51% due 10/20/323 | | | 1,200,000 | | | | 1,047,476 | |
Safehold GL Holdings LLC | | | | | | | | |
2.80% due 06/15/31 | | | 30,247,000 | | | | 26,552,957 | |
2.85% due 01/15/32 | | | 27,008,000 | | | | 23,341,876 | |
6.10% due 04/01/34 | | | 10,480,000 | | | | 11,075,412 | |
FS KKR Capital Corp. | | | | | | | | |
2.63% due 01/15/27 | | | 33,971,000 | | | | 31,950,376 | |
3.25% due 07/15/27 | | | 30,100,000 | | | | 28,507,267 | |
First American Financial Corp. | | | | | | | | |
4.00% due 05/15/30 | | | 40,891,000 | | | | 38,840,053 | |
2.40% due 08/15/31 | | | 11,875,000 | | | | 9,971,736 | |
5.45% due 09/30/34 | | | 8,270,000 | | | | 8,231,950 | |
Liberty Mutual Group, Inc. | | | | | | | | |
4.30% due 02/01/614 | | | 74,981,000 | | | | 50,304,858 | |
4.13% due 12/15/513,4 | | | 3,600,000 | | | | 3,405,617 | |
3.95% due 05/15/604 | | | 4,064,000 | | | | 2,993,352 | |
Maple Grove Funding Trust I | | | | | | | | |
4.16% due 08/15/514 | | | 77,700,000 | | | | 56,035,743 | |
United Wholesale Mortgage LLC | | | | | | | | |
5.50% due 04/15/294 | | | 32,712,000 | | | | 31,861,517 | |
5.50% due 11/15/254 | | | 23,739,000 | | | | 23,694,729 | |
Macquarie Bank Ltd. | | | | | | | | |
3.62% due 06/03/304 | | | 59,035,000 | | | | 55,152,400 | |
Rocket Mortgage LLC / Rocket Mortgage Company-Issuer, Inc. | | | | | | | | |
3.88% due 03/01/314 | | | 46,892,000 | | | | 43,175,350 | |
2.88% due 10/15/264 | | | 11,869,000 | | | | 11,395,156 | |
Global Atlantic Finance Co. | | | | | | | | |
4.70% due 10/15/513,4 | | | 35,662,000 | | | | 34,141,719 | |
7.95% due 06/15/334 | | | 12,224,000 | | | | 13,952,996 | |
6.75% due 03/15/544 | | | 4,956,000 | | | | 5,273,250 | |
Fairfax Financial Holdings Ltd. | | | | | | | | |
3.38% due 03/03/31 | | | 41,708,000 | | | | 38,112,007 | |
5.63% due 08/16/32 | | | 13,100,000 | | | | 13,572,631 | |
Macquarie Group Ltd. | | | | | | | | |
2.69% due 06/23/323,4 | | | 31,550,000 | | | | 27,462,149 | |
2.87% due 01/14/333,4 | | | 19,981,000 | | | | 17,355,352 | |
1.63% due 09/23/273,4 | | | 4,125,000 | | | | 3,901,109 | |
LPL Holdings, Inc. | | | | | | | | |
6.00% due 05/20/34 | | | 22,970,000 | | | | 24,009,771 | |
4.00% due 03/15/294 | | | 15,257,000 | | | | 14,602,764 | |
4.38% due 05/15/314 | | | 9,541,000 | | | | 8,991,666 | |
Blue Owl Capital GP LLC | | | | | | | | |
7.21% due 08/22/43††† | | | 28,550,000 | | | | 31,327,344 | |
7.11% due 08/22/43††† | | | 15,200,000 | | | | 16,118,536 | |
Nationwide Mutual Insurance Co. | | | | | | | | |
4.35% due 04/30/504 | | | 57,736,000 | | | | 46,752,590 | |
Lazard Group LLC | | | | | | | | |
6.00% due 03/15/31 | | | 42,290,000 | | | | 44,594,674 | |
Bain Capital, LP | | | | | | | | |
3.41% due 04/15/41††† | | | 36,000,000 | | | | 26,721,000 | |
3.72% due 04/15/42††† | | | 20,300,000 | | | | 15,499,659 | |
OneAmerica Financial Partners, Inc. | | | | | | | | |
4.25% due 10/15/504 | | | 54,705,000 | | | | 40,610,606 | |
Brookfield Finance, Inc. | | | | | | | | |
5.68% due 01/15/35 | | | 9,400,000 | | | | 9,866,151 | |
4.70% due 09/20/47 | | | 9,790,000 | | | | 9,050,367 | |
3.50% due 03/30/51 | | | 9,526,000 | | | | 7,183,006 | |
3.63% due 02/15/52 | | | 9,380,000 | | | | 7,078,236 | |
5.97% due 03/04/54 | | | 4,425,000 | | | | 4,805,956 | |
6.35% due 01/05/34 | | | 1,640,000 | | | | 1,804,289 | |
American National Group, Inc. | | | | | | | | |
5.75% due 10/01/29 | | | 28,780,000 | | | | 28,946,314 | |
5.00% due 06/15/27 | | | 8,142,000 | | | | 8,193,368 | |
6.14% due 06/13/324 | | | 2,000,000 | | | | 1,989,383 | |
Jefferies Finance LLC / JFIN Company-Issuer Corp. | | | | | | | | |
5.00% due 08/15/284 | | | 39,650,000 | | | | 37,699,636 | |
Sumitomo Life Insurance Co. | | | | | | | | |
3.38% due 04/15/813,4 | | | 39,900,000 | | | | 36,017,602 | |
CNO Financial Group, Inc. | | | | | | | | |
6.45% due 06/15/34 | | | 23,390,000 | | | | 24,725,962 | |
5.25% due 05/30/29 | | | 11,125,000 | | | | 11,259,567 | |
Old Republic International Corp. | | | | | | | | |
5.75% due 03/28/34 | | | 33,750,000 | | | | 35,401,433 | |
Nuveen LLC | | | | | | | | |
5.85% due 04/15/344 | | | 25,425,000 | | | | 26,925,688 | |
5.55% due 01/15/304 | | | 8,075,000 | | | | 8,455,599 | |
228 | THE GUGGENHEIM FUNDS ANNUAL REPORT | SEE NOTES TO FINANCIAL STATEMENTS. |
SCHEDULE OF INVESTMENTS (continued) | September 30, 2024 |
TOTAL RETURN BOND FUND | |
| | Face
Amount~ | | | Value | |
Ares Finance Company II LLC | | | | | | | | |
3.25% due 06/15/304 | | | 37,075,000 | | | $ | 34,601,669 | |
Stewart Information Services Corp. | | | | | | | | |
3.60% due 11/15/31 | | | 39,359,000 | | | | 34,556,423 | |
CBS Studio Center | | | | | | | | |
8.10% (1 Month Term SOFR + 3.00%, Rate Floor: 3.00%) due 01/09/25◊,††† | | | 34,100,000 | | | | 34,100,000 | |
Fidelity National Financial, Inc. | | | | | | | | |
3.40% due 06/15/30 | | | 33,216,000 | | | | 30,933,684 | |
2.45% due 03/15/31 | | | 2,540,000 | | | | 2,201,538 | |
National Australia Bank Ltd. | | | | | | | | |
3.35% due 01/12/373,4 | | | 14,550,000 | | | | 12,967,384 | |
2.99% due 05/21/314 | | | 14,525,000 | | | | 12,919,283 | |
2.33% due 08/21/304 | | | 7,498,000 | | | | 6,532,430 | |
OneMain Finance Corp. | | | | | | | | |
7.13% due 03/15/26 | | | 18,872,000 | | | | 19,266,710 | |
7.50% due 05/15/31 | | | 8,250,000 | | | | 8,492,319 | |
3.88% due 09/15/28 | | | 2,270,000 | | | | 2,105,469 | |
7.13% due 11/15/31 | | | 1,125,000 | | | | 1,138,516 | |
TPG Operating Group II, LP | | | | | | | | |
5.88% due 03/05/34 | | | 28,630,000 | | | | 30,524,161 | |
UBS Group AG | | | | | | | | |
3.09% due 05/14/323,4 | | | 33,400,000 | | | | 30,118,559 | |
Societe Generale S.A. | | | | | | | | |
3.34% due 01/21/333,4 | | | 21,150,000 | | | | 18,590,314 | |
6.07% due 01/19/353,4 | | | 8,750,000 | | | | 9,127,220 | |
1.79% due 06/09/273,4 | | | 1,630,000 | | | | 1,548,536 | |
Standard Chartered plc | | | | | | | | |
4.64% due 04/01/313,4 | | | 28,908,000 | | | | 28,804,736 | |
5.69% due 05/14/283,4 | | | 420,000 | | | | 431,305 | |
Iron Mountain, Inc. | | | | | | | | |
4.50% due 02/15/314 | | | 18,937,000 | | | | 17,963,580 | |
5.63% due 07/15/324 | | | 8,431,000 | | | | 8,409,362 | |
4.88% due 09/15/274 | | | 1,938,000 | | | | 1,923,403 | |
5.25% due 07/15/304 | | | 74,000 | | | | 73,066 | |
Capital One Financial Corp. | | | | | | | | |
6.38% due 06/08/343 | | | 22,450,000 | | | | 24,253,612 | |
6.05% due 02/01/353 | | | 2,570,000 | | | | 2,721,224 | |
5.88% due 07/26/353 | | | 1,130,000 | | | | 1,182,589 | |
Americo Life, Inc. | | | | | | | | |
3.45% due 04/15/314 | | | 32,364,000 | | | | 27,555,928 | |
Westpac Banking Corp. | | | | | | | | |
3.02% due 11/18/363 | | | 15,650,000 | | | | 13,582,557 | |
2.96% due 11/16/40 | | | 12,214,000 | | | | 9,241,471 | |
2.67% due 11/15/353 | | | 4,467,000 | | | | 3,897,433 | |
Jane Street Group / JSG Finance, Inc. | | | | | | | | |
7.13% due 04/30/314 | | | 24,480,000 | | | | 25,938,029 | |
Bank of America Corp. | | | | | | | | |
2.59% due 04/29/313 | | | 28,440,000 | | | | 25,790,593 | |
Dyal Capital Partners III | | | | | | | | |
4.40% due 06/15/40††† | | | 26,750,000 | | | | 24,947,852 | |
Trustage Financial Group, Inc. | | | | | | | | |
4.63% due 04/15/324 | | | 26,450,000 | | | | 24,384,373 | |
Hunt Companies, Inc. | | | | | | | | |
5.25% due 04/15/294 | | | 25,121,000 | | | | 24,304,929 | |
Meiji Yasuda Life Insurance Co. | | | | | | | | |
5.80% due 09/11/543,4 | | | 23,600,000 | | | | 24,242,722 | |
Aon North America, Inc. | | | | | | | | |
5.45% due 03/01/34 | | | 22,300,000 | | | | 23,413,237 | |
AmFam Holdings, Inc. | | | | | | | | |
2.81% due 03/11/314 | | | 19,350,000 | | | | 15,374,232 | |
3.83% due 03/11/514 | | | 12,438,000 | | | | 7,898,261 | |
Brown & Brown, Inc. | | | | | | | | |
5.65% due 06/11/34 | | | 21,200,000 | | | | 22,242,344 | |
2.38% due 03/15/31 | | | 57,000 | | | | 49,345 | |
Reinsurance Group of America, Inc. | | | | | | | | |
5.75% due 09/15/34 | | | 20,050,000 | | | | 21,120,884 | |
Assurant, Inc. | | | | | | | | |
2.65% due 01/15/32 | | | 22,105,000 | | | | 19,054,593 | |
6.75% due 02/15/34 | | | 1,450,000 | | | | 1,603,305 | |
Corebridge Life Holdings, Inc. | | | | | | | | |
8.13% due 03/15/464 | | | 17,100,000 | | | | 20,595,064 | |
Markel Group, Inc. | | | | | | | | |
6.00% due 05/16/54 | | | 18,900,000 | | | | 20,095,917 | |
PartnerRe Finance B LLC | | | | | | | | |
4.50% due 10/01/503 | | | 21,056,000 | | | | 19,474,273 | |
BPCE S.A. | | | | | | | | |
7.00% due 10/19/343,4 | | | 10,000,000 | | | | 11,197,735 | |
5.94% due 05/30/353,4 | | | 7,750,000 | | | | 8,115,383 | |
Lloyds Banking Group plc | | | | | | | | |
5.46% due 01/05/283 | | | 17,200,000 | | | | 17,585,391 | |
3.51% due 03/18/263 | | | 1,580,000 | | | | 1,568,943 | |
JPMorgan Chase & Co. | | | | | | | | |
2.96% due 05/13/313 | | | 17,276,000 | | | | 15,889,580 | |
6.40% (SOFR + 1.20%) due 01/23/28◊ | | | 1,850,000 | | | | 1,866,500 | |
2.07% due 06/01/293 | | | 900,000 | | | | 832,666 | |
Swiss Re Finance Luxembourg S.A. | | | | | | | | |
5.00% due 04/02/493,4 | | | 18,300,000 | | | | 18,576,970 | |
Brookfield Capital Finance LLC | | | | | | | | |
6.09% due 06/14/33 | | | 16,800,000 | | | | 18,180,453 | |
BNP Paribas S.A. | | | | | | | | |
5.50% due 05/20/303,4 | | | 15,990,000 | | | | 16,569,788 | |
1.32% due 01/13/273,4 | | | 1,640,000 | | | | 1,571,154 | |
Equinix Europe 2 Financing Corporation LLC | | | | | | | | |
5.50% due 06/15/34 | | | 16,600,000 | | | | 17,418,902 | |
ABN AMRO Bank N.V. | | | | | | | | |
2.47% due 12/13/293,4 | | | 18,000,000 | | | | 16,550,097 | |
KKR Group Finance Company VIII LLC | | | | | | | | |
3.50% due 08/25/504 | | | 22,210,000 | | | | 16,272,931 | |
Globe Life, Inc. | | | | | | | | |
5.85% due 09/15/34 | | | 15,320,000 | | | | 15,830,542 | |
Prudential Financial, Inc. | | | | | | | | |
3.70% due 10/01/503 | | | 17,139,000 | | | | 15,825,647 | |
QBE Insurance Group Ltd. | | | | | | | | |
5.88% 3,4,10 | | | 15,700,000 | | | | 15,612,441 | |
Central Storage Safety Project Trust | | | | | | | | |
4.82% due 02/01/389 | | | 16,275,360 | | | | 15,366,320 | |
GA Global Funding Trust | | | | | | | | |
2.90% due 01/06/324 | | | 17,480,000 | | | | 15,187,509 | |
Kennedy-Wilson, Inc. | | | | | | | | |
4.75% due 03/01/29 | | | 15,662,000 | | | | 14,498,086 | |
4.75% due 02/01/30 | | | 81,000 | | | | 73,457 | |
SEE NOTES TO FINANCIAL STATEMENTS. | THE GUGGENHEIM FUNDS ANNUAL REPORT | 229 |
SCHEDULE OF INVESTMENTS (continued) | September 30, 2024 |
TOTAL RETURN BOND FUND | |
| | Face
Amount~ | | | Value | |
Wells Fargo & Co. | | | | | | | | |
6.85% 3,10 | | | 12,840,000 | | | $ | 13,401,147 | |
2.41% due 10/30/253 | | | 600,000 | | | | 598,360 | |
RGA Global Funding | | | | | | | | |
5.50% due 01/11/314 | | | 12,750,000 | | | | 13,326,283 | |
VFH Parent LLC / Valor Company-Issuer, Inc. | | | | | | | | |
7.50% due 06/15/314 | | | 12,675,000 | | | | 13,292,906 | |
SLM Corp. | | | | | | | | |
4.20% due 10/29/25 | | | 6,900,000 | | | | 6,821,237 | |
3.13% due 11/02/26 | | | 6,632,000 | | | | 6,375,644 | |
NatWest Group plc | | | | | | | | |
6.02% due 03/02/343 | | | 10,130,000 | | | | 10,950,120 | |
4.45% due 05/08/303 | | | 1,100,000 | | | | 1,092,331 | |
PennyMac Financial Services, Inc. | | | | | | | | |
5.38% due 10/15/254 | | | 11,933,000 | | | | 11,912,622 | |
Horace Mann Educators Corp. | | | | | | | | |
7.25% due 09/15/28 | | | 6,513,000 | | | | 7,074,300 | |
4.50% due 12/01/25 | | | 4,560,000 | | | | 4,535,702 | |
Australia & New Zealand Banking Group Ltd. | | | | | | | | |
5.20% due 09/30/353,4 | | | 10,000,000 | | | | 9,958,771 | |
2.57% due 11/25/353,4 | | | 1,600,000 | | | | 1,388,318 | |
HSBC Holdings plc | | | | | | | | |
6.16% due 03/09/293 | | | 8,700,000 | | | | 9,159,751 | |
6.33% due 03/09/443 | | | 1,520,000 | | | | 1,716,949 | |
Atlantic Marine Corporations Communities LLC | | | | | | | | |
5.34% due 12/01/504 | | | 10,771,915 | | | | 10,188,832 | |
5.37% due 12/01/509 | | | 731,395 | | | | 662,747 | |
Mutual of Omaha Insurance Co. | | | | | | | | |
6.14% due 01/16/643,4 | | | 10,150,000 | | | | 10,833,252 | |
KKR Group Finance Company X LLC | | | | | | | | |
3.25% due 12/15/514 | | | 15,150,000 | | | | 10,690,171 | |
Encore Capital Group, Inc. | | | | | | | | |
8.50% due 05/15/304 | | | 9,950,000 | | | | 10,486,574 | |
Penn Mutual Life Insurance Co. | | | | | | | | |
3.80% due 04/29/614 | | | 14,970,000 | | | | 10,345,433 | |
Sumitomo Mitsui Financial Group, Inc. | | | | | | | | |
2.22% due 09/17/31 | | | 11,900,000 | | | | 10,249,535 | |
Western & Southern Life Insurance Co. | | | | | | | | |
3.75% due 04/28/614 | | | 13,360,000 | | | | 9,723,838 | |
Assured Guaranty US Holdings, Inc. | | | | | | | | |
3.60% due 09/15/51 | | | 13,031,000 | | | | 9,550,587 | |
Goldman Sachs Group, Inc. | | | | | | | | |
6.13% 3,10 | | | 9,350,000 | | | | 9,390,532 | |
Blue Owl Finance LLC | | | | | | | | |
6.25% due 04/18/344 | | | 8,820,000 | | | | 9,237,029 | |
Accident Fund Insurance Company of America | | | | | | | | |
8.50% due 08/01/324 | | | 9,000,000 | | | | 9,154,300 | |
Aretec Group, Inc. | | | | | | | | |
10.00% due 08/15/304 | | | 8,275,000 | | | | 8,806,386 | |
Alliant Holdings Intermediate LLC / Alliant Holdings Company-Issuer | | | | | | | | |
6.50% due 10/01/314 | | | 8,600,000 | | | | 8,690,185 | |
Kemper Corp. | | | | | | | | |
2.40% due 09/30/30 | | | 10,006,000 | | | | 8,673,773 | |
Credit Agricole S.A. | | | | | | | | |
5.34% due 01/10/303,4 | | | 6,050,000 | | | | 6,225,577 | |
6.58% (SOFR + 1.21%) due 09/11/28◊,4 | | | 2,208,000 | | | | 2,217,870 | |
Five Corners Funding Trust III | | | | | | | | |
5.79% due 02/15/334 | | | 7,550,000 | | | | 8,101,472 | |
CNO Global Funding | | | | | | | | |
1.75% due 10/07/264 | | | 7,400,000 | | | | 7,010,925 | |
Cooperatieve Rabobank UA | | | | | | | | |
4.66% due 08/22/283,4 | | | 6,200,000 | | | | 6,248,098 | |
Ohana Military Communities LLC | | | | | | | | |
5.56% due 10/01/364 | | | 3,820,000 | | | | 3,933,916 | |
5.78% due 10/01/364 | | | 2,200,000 | | | | 2,304,742 | |
Mid-Atlantic Military Family Communities LLC | | | | | | | | |
5.30% due 08/01/504 | | | 5,788,104 | | | | 5,226,244 | |
5.24% due 08/01/504 | | | 1,060,568 | | | | 999,112 | |
Belvoir Land LLC | | | | | | | | |
5.60% due 12/15/354 | | | 5,600,000 | | | | 5,535,118 | |
Brookfield Finance LLC / Brookfield Finance, Inc. | | | | | | | | |
3.45% due 04/15/50 | | | 6,852,000 | | | | 5,098,716 | |
Deloitte LLP | | | | | | | | |
7.33% due 11/20/26††† | | | 4,800,000 | | | | 5,016,384 | |
Demeter Investments BV | | | | | | | | |
5.63% due 08/15/52 | | | 4,900,000 | | | | 4,970,070 | |
Dyal Capital Partners III (B) LP | | | | | | | | |
6.55% due 06/15/44††† | | | 4,620,000 | | | | 4,767,748 | |
Cushman & Wakefield US Borrower LLC | | | | | | | | |
6.75% due 05/15/284 | | | 4,710,000 | | | | 4,752,725 | |
Manulife Financial Corp. | | | | | | | | |
4.06% due 02/24/323 | | | 4,815,000 | | | | 4,743,975 | |
CBRE Services, Inc. | | | | | | | | |
5.95% due 08/15/34 | | | 3,500,000 | | | | 3,758,896 | |
HS Wildcat LLC | | | | | | | | |
3.83% due 12/31/50††† | | | 4,955,868 | | | | 3,734,940 | |
VICI Properties Limited Partnership / VICI Note Company, Inc. | | | | | | | | |
4.13% due 08/15/304 | | | 3,600,000 | | | | 3,418,673 | |
Commonwealth Bank of Australia | | | | | | | | |
3.61% due 09/12/343,4 | | | 3,550,000 | | | | 3,339,222 | |
Nationstar Mortgage Holdings, Inc. | | | | | | | | |
5.00% due 02/01/264 | | | 2,780,000 | | | | 2,766,511 | |
Enstar Group Ltd. | | | | | | | | |
3.10% due 09/01/31 | | | 1,670,000 | | | | 1,442,686 | |
4.95% due 06/01/29 | | | 1,250,000 | | | | 1,256,913 | |
KKR Group Finance Company III LLC | | | | | | | | |
5.13% due 06/01/444 | | | 2,710,000 | | | | 2,623,061 | |
Fidelity & Guaranty Life Holdings, Inc. | | | | | | | | |
5.50% due 05/01/254 | | | 2,540,000 | | | | 2,539,865 | |
Ryan Specialty LLC | | | | | | | | |
5.88% due 08/01/324 | | | 2,475,000 | | | | 2,516,236 | |
Pine Street Trust III | | | | | | | | |
6.22% due 05/15/544 | | | 2,140,000 | | | | 2,319,861 | |
Apollo Global Management, Inc. | | | | | | | | |
5.80% due 05/21/54 | | | 2,130,000 | | | | 2,270,781 | |
230 | THE GUGGENHEIM FUNDS ANNUAL REPORT | SEE NOTES TO FINANCIAL STATEMENTS. |
SCHEDULE OF INVESTMENTS (continued) | September 30, 2024 |
TOTAL RETURN BOND FUND | |
| | Face
Amount~ | | | Value | |
Nordea Bank Abp | | | | | | | | |
6.39% (SOFR + 1.02%) due 09/10/29◊,4 | | | 2,190,000 | | | $ | 2,194,533 | |
Athene Global Funding | | | | | | | | |
2.67% due 06/07/314 | | | 1,550,000 | | | | 1,340,805 | |
6.58% (SOFR Compounded Index + 1.21%) due 03/25/27◊,4 | | | 500,000 | | | | 502,966 | |
2.65% due 10/04/314 | | | 400,000 | | | | 343,238 | |
Aurora Military Housing LLC | | | | | | | | |
5.82% due 07/15/344 | | | 2,159,161 | | | | 2,136,379 | |
Sumitomo Mitsui Trust Bank Ltd. | | | | | | | | |
6.35% (SOFR + 0.98%) due 09/10/27◊,4 | | | 2,060,000 | | | | 2,071,886 | |
Jackson Financial, Inc. | | | | | | | | |
4.00% due 11/23/51 | | | 2,610,000 | | | | 1,908,045 | |
Deutsche Bank AG NY | | | | | | | | |
3.55% due 09/18/313 | | | 1,990,000 | | | | 1,855,061 | |
Ares Finance Company IV LLC | | | | | | | | |
3.65% due 02/01/524 | | | 2,450,000 | | | | 1,838,110 | |
Skandinaviska Enskilda Banken AB | | | | | | | | |
6.26% (SOFR + 0.89%) due 03/05/27◊,4 | | | 1,730,000 | | | | 1,741,502 | |
Mizuho Financial Group, Inc. | | | | | | | | |
5.59% due 07/10/353 | | | 1,630,000 | | | | 1,719,397 | |
ING Groep N.V. | | | | | | | | |
5.55% due 03/19/353 | | | 1,620,000 | | | | 1,698,051 | |
Jackson National Life Global Funding | | | | | | | | |
1.75% due 01/12/254 | | | 1,650,000 | | | | 1,633,663 | |
GMAC, Inc. | | | | | | | | |
8.00% due 11/01/31 | | | 1,390,000 | | | | 1,573,644 | |
Iron Mountain Information Management Services, Inc. | | | | | | | | |
5.00% due 07/15/324 | | | 1,617,000 | | | | 1,558,579 | |
Blackstone Holdings Finance Company LLC | | | | | | | | |
3.20% due 01/30/524 | | | 2,150,000 | | | | 1,535,717 | |
BGC Group, Inc. | | | | | | | | |
8.00% due 05/25/28 | | | 1,410,000 | | | | 1,517,135 | |
F&G Global Funding | | | | | | | | |
2.30% due 04/11/274 | | | 790,000 | | | | 739,115 | |
2.00% due 09/20/284 | | | 800,000 | | | | 711,500 | |
Fort Moore Family Communities LLC | | | | | | | | |
6.09% due 01/15/514 | | | 1,542,145 | | | | 1,422,812 | |
Fort Knox Military Housing Privatization Project | | | | | | | | |
5.55% (1 Month Term SOFR + 0.45%) due 02/15/52◊,4 | | | 1,625,118 | | | | 1,260,336 | |
Banco Santander S.A. | | | | | | | | |
6.94% due 11/07/33 | | | 1,000,000 | | | | 1,157,956 | |
Midwest Family Housing LLC | | | | | | | | |
5.58% due 01/01/514 | | | 1,260,087 | | | | 1,122,936 | |
Belrose Funding Trust | | | | | | | | |
2.33% due 08/15/304 | | | 1,230,000 | | | | 1,055,429 | |
Regions Financial Corp. | | | | | | | | |
5.50% due 09/06/353 | | | 1,030,000 | | | | 1,048,160 | |
KKR Group Finance Company II LLC | | | | | | | | |
5.50% due 02/01/434 | | | 1,000,000 | | | | 1,010,456 | |
Barclays plc | | | | | | | | |
6.40% (SOFR + 1.49%) due 03/12/28◊ | | | 1,000,000 | | | | 1,007,690 | |
Citizens Financial Group, Inc. | | | | | | | | |
6.65% due 04/25/353 | | | 900,000 | | | | 988,104 | |
Mitsubishi UFJ Financial Group, Inc. | | | | | | | | |
5.72% due 02/20/263 | | | 500,000 | | | | 501,281 | |
Pacific Beacon LLC | | | | | | | | |
5.51% due 07/15/364 | | | 500,000 | | | | 492,778 | |
Peachtree Corners Funding Trust | | | | | | | | |
3.98% due 02/15/254 | | | 215,000 | | | | 213,901 | |
Equitable Holdings, Inc. | | | | | | | | |
4.57% due 02/15/294 | | | 65,000 | | | | 64,751 | |
Atlas Mara Ltd. | | | | | | | | |
due 12/31/21†††,16 | | | 542,348 | | | | 1 | |
Total Financial | | | | | | | 3,242,651,659 | |
| | | | | | | | | |
Industrial - 3.1% | | | | | | | | |
AP Grange Holdings | | | | | | | | |
6.50% due 03/20/45††† | | | 155,100,000 | | | | 156,385,864 | |
5.00% due 03/20/45††† | | | 16,400,000 | | | | 16,822,682 | |
TD SYNNEX Corp. | | | | | | | | |
2.65% due 08/09/31 | | | 34,240,000 | | | | 29,337,246 | |
2.38% due 08/09/28 | | | 15,581,000 | | | | 14,364,940 | |
6.10% due 04/12/34 | | | 11,960,000 | | | | 12,656,260 | |
Builders FirstSource, Inc. | | | | | | | | |
6.38% due 03/01/344 | | | 52,000,000 | | | | 53,993,992 | |
FLNG Liquefaction 3 LLC | | | | | | | | |
3.08% due 06/30/39††† | | | 60,671,540 | | | | 49,296,840 | |
Vontier Corp. | | | | | | | | |
2.95% due 04/01/31 | | | 36,612,000 | | | | 31,852,539 | |
2.40% due 04/01/28 | | | 14,150,000 | | | | 13,002,491 | |
Dyal Capital Partners IV | | | | | | | | |
3.65% due 02/22/41††† | | | 41,800,000 | | | | 37,037,308 | |
Flowserve Corp. | | | | | | | | |
2.80% due 01/15/32 | | | 19,800,000 | | | | 17,149,286 | |
3.50% due 10/01/30 | | | 17,421,000 | | | | 16,218,557 | |
Berry Global, Inc. | | | | | | | | |
5.80% due 06/15/314 | | | 20,700,000 | | | | 21,538,559 | |
5.65% due 01/15/344 | | | 11,050,000 | | | | 11,344,205 | |
TransDigm, Inc. | | | | | | | | |
6.00% due 01/15/334 | | | 16,200,000 | | | | 16,429,470 | |
6.63% due 03/01/324 | | | 7,300,000 | | | | 7,601,797 | |
6.88% due 12/15/304 | | | 5,375,000 | | | | 5,628,571 | |
Boeing Co. | | | | | | | | |
6.86% due 05/01/544 | | | 14,350,000 | | | | 15,750,705 | |
6.53% due 05/01/344 | | | 11,625,000 | | | | 12,476,707 | |
Mauser Packaging Solutions Holding Co. | | | | | | | | |
7.88% due 04/15/274 | | | 23,759,000 | | | | 24,547,264 | |
Cliffwater Corporate Lending Fund | | | | | | | | |
6.77% due 08/04/28††† | | | 22,700,000 | | | | 23,636,602 | |
Smurfit Kappa Treasury ULC | | | | | | | | |
5.44% due 04/03/344 | | | 22,000,000 | | | | 22,928,492 | |
Stadco LA LLC | | | | | | | | |
3.75% due 05/15/56††† | | | 31,000,000 | | | | 22,071,070 | |
Trinity Industries, Inc. | | | | | | | | |
7.75% due 07/15/284 | | | 13,225,000 | | | | 13,880,815 | |
Graphic Packaging International LLC | | | | | | | | |
6.38% due 07/15/324 | | | 12,525,000 | | | | 12,922,118 | |
Weir Group plc | | | | | | | | |
2.20% due 05/13/264 | | | 13,015,000 | | | | 12,518,057 | |
TFI International, Inc. | | | | | | | | |
3.35% due 01/05/33††† | | | 14,000,000 | | | | 11,898,740 | |
SEE NOTES TO FINANCIAL STATEMENTS. | THE GUGGENHEIM FUNDS ANNUAL REPORT | 231 |
SCHEDULE OF INVESTMENTS (continued) | September 30, 2024 |
TOTAL RETURN BOND FUND | |
| | Face
Amount~ | | | Value | |
Hillenbrand, Inc. | | | | | | | | |
3.75% due 03/01/31 | | | 7,650,000 | | | $ | 6,843,368 | |
6.25% due 02/15/29 | | | 4,500,000 | | | | 4,579,267 | |
Crown Americas LLC / Crown Americas Capital Corporation VI | | | | | | | | |
4.75% due 02/01/26 | | | 11,379,000 | | | | 11,338,958 | |
Sealed Air Corporation/Sealed Air Corp US | | | | | | | | |
6.13% due 02/01/284 | | | 11,046,000 | | | | 11,230,932 | |
Textron, Inc. | | | | | | | | |
6.10% due 11/15/33 | | | 10,000,000 | | | | 10,832,941 | |
Owens Corning | | | | | | | | |
5.95% due 06/15/54 | | | 6,310,000 | | | | 6,697,004 | |
3.50% due 02/15/30 | | | 3,760,000 | | | | 3,571,132 | |
Sonoco Products Co. | | | | | | | | |
5.00% due 09/01/34 | | | 9,000,000 | | | | 8,874,421 | |
Sealed Air Corp. | | | | | | | | |
6.50% due 07/15/324 | | | 8,500,000 | | | | 8,764,911 | |
QTS Irving DC3 LLC | | | | | | | | |
5.96% due 07/09/29††† | | | 7,000,000 | | | | 7,241,990 | |
Norfolk Southern Corp. | | | | | | | | |
4.10% due 05/15/21 | | | 9,100,000 | | | | 6,885,235 | |
GATX Corp. | | | | | | | | |
6.05% due 06/05/54 | | | 5,328,000 | | | | 5,760,739 | |
3.50% due 06/01/32 | | | 480,000 | | | | 439,930 | |
4.70% due 04/01/29 | | | 125,000 | | | | 126,134 | |
Virgin Media Vendor Financing Notes III DAC | | | | | | | | |
4.88% due 07/15/28 | | | GBP 5,000,000 | | | | 6,176,046 | |
Wrangler Holdco Corp. | | | | | | | | |
6.63% due 04/01/324 | | | 5,900,000 | | | | 6,132,608 | |
Dyal Capital Partners III (A) LP | | | | | | | | |
6.55% due 06/15/44††† | | | 5,880,000 | | | | 6,068,042 | |
Amazon.com, Inc. | | | | | | | | |
2.65% due 10/10/42††† | | | 6,606,102 | | | | 5,476,789 | |
Mueller Water Products, Inc. | | | | | | | | |
4.00% due 06/15/294 | | | 5,216,000 | | | | 4,975,363 | |
Enpro, Inc. | | | | | | | | |
5.75% due 10/15/26 | | | 5,007,000 | | | | 4,969,933 | |
EnerSys | | | | | | | | |
6.63% due 01/15/324 | | | 4,725,000 | | | | 4,887,105 | |
Ball Corp. | | | | | | | | |
6.88% due 03/15/28 | | | 4,350,000 | | | | 4,504,629 | |
Genesee & Wyoming, Inc. | | | | | | | | |
6.25% due 04/15/324 | | | 3,925,000 | | | | 4,036,270 | |
Hope Gas Holdings LLC | | | | | | | | |
5.99% due 09/01/33††† | | | 3,000,000 | | | | 2,997,960 | |
GrafTech Global Enterprises, Inc. | | | | | | | | |
9.88% due 12/15/284 | | | 3,100,000 | | | | 2,483,062 | |
Avnet, Inc. | | | | | | | | |
5.50% due 06/01/32 | | | 1,550,000 | | | | 1,569,758 | |
nVent Finance SARL | | | | | | | | |
2.75% due 11/15/31 | | | 1,300,000 | | | | 1,130,494 | |
Penske Truck Leasing Company Lp / PTL Finance Corp. | | | | | | | | |
5.25% due 07/01/294 | | | 1,000,000 | | | | 1,029,800 | |
Westinghouse Air Brake Technologies Corp. | | | | | | | | |
5.61% due 03/11/34 | | | 650,000 | | | | 687,070 | |
Fortune Brands Innovations, Inc. | | | | | | | | |
4.50% due 03/25/52 | | | 300,000 | | | | 252,699 | |
5.88% due 06/01/33 | | | 119,000 | | | | 127,714 | |
MIWD Holdco II LLC / MIWD Finance Corp. | | | | | | | | |
5.50% due 02/01/304 | | | 250,000 | | | | 242,832 | |
Virgin Media Inc. | | | | | | | | |
4.00% due 01/31/29 | | | GBP 150,000 | | | | 179,495 | |
Standard Industries, Inc. | | | | | | | | |
4.38% due 07/15/304 | | | 101,000 | | | | 95,597 | |
3.38% due 01/15/314 | | | 81,000 | | | | 72,158 | |
Total Industrial | | | | | | | 834,573,563 | |
| | | | | | | | | |
Consumer, Non-cyclical - 2.6% | | | | | | | | |
Smithfield Foods, Inc. | | | | | | | | |
2.63% due 09/13/314 | | | 45,782,000 | | | | 38,794,343 | |
3.00% due 10/15/304 | | | 15,528,000 | | | | 13,917,605 | |
JBS USA Holding Lux SARL/ JBS USA Food Company/ JBS Lux Co SARL | | | | | | | | |
3.00% due 05/15/32 | | | 29,206,000 | | | | 25,326,865 | |
4.38% due 02/02/52 | | | 12,630,000 | | | | 10,031,244 | |
5.50% due 01/15/30 | | | 7,550,000 | | | | 7,647,425 | |
5.13% due 02/01/28 | | | 2,250,000 | | | | 2,280,161 | |
Global Payments, Inc. | | | | | | | | |
2.90% due 11/15/31 | | | 30,265,000 | | | | 26,638,706 | |
2.90% due 05/15/30 | | | 18,405,000 | | | | 16,763,658 | |
3.20% due 08/15/29 | | | 1,405,000 | | | | 1,316,299 | |
Altria Group, Inc. | | | | | | | | |
4.45% due 05/06/50 | | | 25,185,000 | | | | 21,102,594 | |
3.70% due 02/04/51 | | | 25,038,000 | | | | 18,477,604 | |
Brink’s Co. | | | | | | | | |
6.75% due 06/15/324 | | | 22,420,000 | | | | 23,385,966 | |
6.50% due 06/15/294 | | | 13,500,000 | | | | 13,985,217 | |
Royalty Pharma plc | | | | | | | | |
3.55% due 09/02/50 | | | 39,920,000 | | | | 28,926,886 | |
1.20% due 09/02/25 | | | 1,875,000 | | | | 1,816,160 | |
Triton Container International Ltd. | | | | | | | | |
3.15% due 06/15/314 | | | 34,821,000 | | | | 30,345,710 | |
GXO Logistics, Inc. | | | | | | | | |
6.25% due 05/06/29 | | | 13,120,000 | | | | 13,808,085 | |
6.50% due 05/06/34 | | | 11,975,000 | | | | 12,739,658 | |
Kroger Co. | | | | | | | | |
4.90% due 09/15/31 | | | 13,500,000 | | | | 13,587,286 | |
5.50% due 09/15/54 | | | 12,360,000 | | | | 12,439,157 | |
Universal Health Services, Inc. | | | | | | | | |
5.05% due 10/15/34 | | | 13,850,000 | | | | 13,595,386 | |
2.65% due 10/15/30 | | | 13,757,000 | | | | 12,269,871 | |
CVS Health Corp. | | | | | | | | |
5.70% due 06/01/34 | | | 24,150,000 | | | | 25,193,903 | |
Icon Investments Six DAC | | | | | | | | |
6.00% due 05/08/34 | | | 10,700,000 | | | | 11,383,232 | |
5.85% due 05/08/29 | | | 9,400,000 | | | | 9,879,532 | |
Yale-New Haven Health Services Corp. | | | | | | | | |
2.50% due 07/01/50 | | | 32,350,000 | | | | 20,552,164 | |
IQVIA, Inc. | | | | | | | | |
5.00% due 05/15/274 | | | 10,699,000 | | | | 10,633,827 | |
5.00% due 10/15/264 | | | 8,700,000 | | | | 8,676,057 | |
232 | THE GUGGENHEIM FUNDS ANNUAL REPORT | SEE NOTES TO FINANCIAL STATEMENTS. |
SCHEDULE OF INVESTMENTS (continued) | September 30, 2024 |
TOTAL RETURN BOND FUND | |
| | Face
Amount~ | | | Value | |
HAH Group Holding Company LLC | | | | | | | | |
9.75% due 10/01/314 | | | 17,915,000 | | | $ | 18,064,143 | |
Element Fleet Management Corp. | | | | | | | | |
6.32% due 12/04/284 | | | 16,730,000 | | | | 17,827,883 | |
Prime Security Services Borrower LLC / Prime Finance, Inc. | | | | | | | | |
5.75% due 04/15/264 | | | 17,352,000 | | | | 17,431,195 | |
AZ Battery Property LLC | | | | | | | | |
6.73% due 02/20/46††† | | | 16,480,000 | | | | 17,293,618 | |
Valvoline, Inc. | | | | | | | | |
3.63% due 06/15/314 | | | 18,300,000 | | | | 16,376,454 | |
Catalent Pharma Solutions, Inc. | | | | | | | | |
3.50% due 04/01/304 | | | 9,500,000 | | | | 9,344,719 | |
3.13% due 02/15/294 | | | 6,654,000 | | | | 6,536,234 | |
Highmark, Inc. | | | | | | | | |
2.55% due 05/10/314 | | | 17,850,000 | | | | 15,122,019 | |
Williams Scotsman, Inc. | | | | | | | | |
6.13% due 06/15/254 | | | 14,625,000 | | | | 14,610,082 | |
Transurban Finance Company Pty Ltd. | | | | | | | | |
2.45% due 03/16/314 | | | 14,400,000 | | | | 12,513,114 | |
HCA, Inc. | | | | | | | | |
6.00% due 04/01/54 | | | 8,960,000 | | | | 9,467,125 | |
5.88% due 02/15/26 | | | 2,775,000 | | | | 2,804,116 | |
3.50% due 09/01/30 | | | 68,000 | | | | 64,081 | |
Medline Borrower Limited Partnership/Medline Company-Issuer, Inc. | | | | | | | | |
6.25% due 04/01/294 | | | 10,350,000 | | | | 10,663,927 | |
Performance Food Group, Inc. | | | | | | | | |
6.13% due 09/15/324 | | | 9,025,000 | | | | 9,222,245 | |
BAT Capital Corp. | | | | | | | | |
6.00% due 02/20/34 | | | 5,925,000 | | | | 6,332,608 | |
4.76% due 09/06/49 | | | 2,300,000 | | | | 1,984,796 | |
Block, Inc. | | | | | | | | |
6.50% due 05/15/324 | | | 7,875,000 | | | | 8,200,379 | |
TriNet Group, Inc. | | | | | | | | |
7.13% due 08/15/314 | | | 5,450,000 | | | | 5,678,001 | |
Albertsons Companies Incorporated / Safeway Inc / New Albertsons Limited Partnership / Albertsons LLC | | | | | | | | |
3.25% due 03/15/264 | | | 5,690,000 | | | | 5,502,042 | |
Health Care Service Corporation A Mutual Legal Reserve Co. | | | | | | | | |
5.88% due 06/15/544 | | | 4,800,000 | | | | 5,073,568 | |
Graham Holdings Co. | | | | | | | | |
5.75% due 06/01/264 | | | 4,767,000 | | | | 4,764,942 | |
Medline Borrower, LP | | | | | | | | |
3.88% due 04/01/294 | | | 4,345,000 | | | | 4,113,692 | |
APi Group DE, Inc. | | | | | | | | |
4.13% due 07/15/294 | | | 4,150,000 | | | | 3,902,050 | |
Central Garden & Pet Co. | | | | | | | | |
4.13% due 04/30/314 | | | 3,854,000 | | | | 3,529,987 | |
Darling Ingredients, Inc. | | | | | | | | |
6.00% due 06/15/304 | | | 3,394,000 | | | | 3,426,290 | |
Sotheby’s/Bidfair Holdings, Inc. | | | | | | | | |
5.88% due 06/01/294 | | | 3,900,000 | | | | 3,418,278 | |
Boost Newco Borrower LLC | | | | | | | | |
7.50% due 01/15/314 | | | 2,600,000 | | | | 2,789,922 | |
Providence St. Joseph Health Obligated Group | | | | | | | | |
2.70% due 10/01/51 | | | 4,250,000 | | | | 2,699,690 | |
WW International, Inc. | | | | | | | | |
4.50% due 04/15/294 | | | 11,651,000 | | | | 2,572,649 | |
Laboratory Corporation of America Holdings | | | | | | | | |
4.80% due 10/01/34 | | | 2,230,000 | | | | 2,204,054 | |
Tenet Healthcare Corp. | | | | | | | | |
4.63% due 06/15/28 | | | 2,096,000 | | | | 2,057,123 | |
Beth Israel Lahey Health, Inc. | | | | | | | | |
3.08% due 07/01/51 | | | 2,700,000 | | | | 1,825,526 | |
Quanta Services, Inc. | | | | | | | | |
0.95% due 10/01/24 | | | 1,660,000 | | | | 1,660,000 | |
Pilgrim’s Pride Corp. | | | | | | | | |
3.50% due 03/01/32 | | | 1,810,000 | | | | 1,607,097 | �� |
Triton Container International Limited / TAL International Container Corp. | | | | | | | | |
3.25% due 03/15/32 | | | 1,850,000 | | | | 1,599,170 | |
Molina Healthcare, Inc. | | | | | | | | |
4.38% due 06/15/284 | | | 1,290,000 | | | | 1,254,103 | |
DaVita, Inc. | | | | | | | | |
3.75% due 02/15/314 | | | 149,000 | | | | 134,398 | |
4.63% due 06/01/304 | | | 76,000 | | | | 72,450 | |
Total Consumer, Non-cyclical | | | | | | | 699,258,371 | |
| | | | | | | | | |
Consumer, Cyclical - 2.4% | | | | | | | | |
Choice Hotels International, Inc. | | | | | | | | |
3.70% due 01/15/31 | | | 49,207,000 | | | | 45,514,092 | |
5.85% due 08/01/34 | | | 11,150,000 | | | | 11,498,512 | |
Delta Air Lines, Inc. | | | | | | | | |
7.00% due 05/01/254 | | | 46,883,000 | | | | 47,376,857 | |
Alt-2 Structured Trust | | | | | | | | |
2.95% due 05/14/31◊,††† | | | 43,458,166 | | | | 40,001,503 | |
Hyatt Hotels Corp. | | | | | | | | |
5.75% due 04/23/30 | | | 19,039,000 | | | | 19,927,362 | |
5.38% due 04/23/25 | | | 18,928,000 | | | | 18,958,791 | |
Warnermedia Holdings, Inc. | | | | | | | | |
5.14% due 03/15/52 | | | 27,327,000 | | | | 21,076,622 | |
6.41% due 03/15/26 | | | 9,250,000 | | | | 9,255,465 | |
Flutter Treasury Designated Activity Co. | | | | | | | | |
6.38% due 04/29/294 | | | 25,950,000 | | | | 26,869,253 | |
Hilton Domestic Operating Company, Inc. | | | | | | | | |
6.13% due 04/01/324 | | | 12,925,000 | | | | 13,308,485 | |
5.88% due 03/15/334 | | | 11,665,000 | | | | 11,886,072 | |
Hasbro, Inc. | | | | | | | | |
6.05% due 05/14/34 | | | 22,871,000 | | | | 24,071,455 | |
LG Energy Solution Ltd. | | | | | | | | |
5.38% due 07/02/294 | | | 15,000,000 | | | | 15,359,576 | |
5.50% due 07/02/344 | | | 7,100,000 | | | | 7,300,362 | |
Air Canada | | | | | | | | |
3.88% due 08/15/264 | | | 23,129,000 | | | | 22,522,696 | |
Delta Air Lines, Inc. / SkyMiles IP Ltd. | | | | | | | | |
4.50% due 10/20/254 | | | 18,838,750 | | | | 18,724,108 | |
4.75% due 10/20/284 | | | 3,800,000 | | | | 3,795,500 | |
SEE NOTES TO FINANCIAL STATEMENTS. | THE GUGGENHEIM FUNDS ANNUAL REPORT | 233 |
SCHEDULE OF INVESTMENTS (continued) | September 30, 2024 |
TOTAL RETURN BOND FUND | |
| | Face
Amount~ | | | Value | |
Mileage Plus Holdings LLC / Mileage Plus Intellectual Property Assets Ltd. | | | | | | | | |
6.50% due 06/20/274 | | | 21,555,862 | | | $ | 21,823,887 | |
Walgreens Boots Alliance, Inc. | | | | | | | | |
3.45% due 06/01/26 | | | 11,825,000 | | | | 11,375,785 | |
4.10% due 04/15/50 | | | 15,203,000 | | | | 9,992,637 | |
Whirlpool Corp. | | | | | | | | |
4.60% due 05/15/50 | | | 13,326,000 | | | | 11,160,442 | |
5.75% due 03/01/34 | | | 8,070,000 | | | | 8,266,199 | |
CD&R Smokey Buyer, Inc. | | | | | | | | |
6.75% due 07/15/254 | | | 17,620,000 | | | | 17,614,212 | |
International Game Technology plc | | | | | | | | |
4.13% due 04/15/264 | | | 17,834,000 | | | | 17,601,207 | |
Ferguson Finance plc | | | | | | | | |
3.25% due 06/02/304 | | | 12,904,000 | | | | 12,022,407 | |
4.65% due 04/20/324 | | | 5,200,000 | | | | 5,099,477 | |
Clarios Global Limited Partnership / Clarios US Finance Co. | | | | | | | | |
6.25% due 05/15/264 | | | 17,027,000 | | | | 17,020,886 | |
British Airways Class A Pass Through Trust | | | | | | | | |
2.90% due 03/15/354 | | | 13,533,261 | | | | 12,004,094 | |
4.25% due 11/15/324 | | | 4,747,901 | | | | 4,546,745 | |
IGT Lottery Holdings B.V. | | | | | | | | |
4.25% due 03/15/30 | | | EUR 14,500,000 | | | | 16,290,094 | |
American Airlines Class AA Pass Through Trust | | | | | | | | |
3.35% due 10/15/29 | | | 7,586,620 | | | | 7,159,601 | |
3.20% due 06/15/28 | | | 4,824,800 | | | | 4,570,084 | |
3.00% due 10/15/28 | | | 3,454,835 | | | | 3,251,118 | |
3.15% due 02/15/32 | | | 139,833 | | | | 130,079 | |
Polaris, Inc. | | | | | | | | |
6.95% due 03/15/29 | | | 13,000,000 | | | | 14,109,666 | |
United Airlines, Inc. | | | | | | | | |
4.38% due 04/15/264 | | | 12,700,000 | | | | 12,496,148 | |
Vail Resorts, Inc. | | | | | | | | |
6.50% due 05/15/324 | | | 11,650,000 | | | | 12,173,306 | |
Beacon Roofing Supply, Inc. | | | | | | | | |
4.50% due 11/15/264 | | | 6,120,000 | | | | 6,025,216 | |
6.50% due 08/01/304 | | | 1,925,000 | | | | 1,992,356 | |
1011778 BC ULC / New Red Finance, Inc. | | | | | | | | |
6.13% due 06/15/294 | | | 4,800,000 | | | | 4,938,043 | |
5.63% due 09/15/294 | | | 2,950,000 | | | | 2,992,626 | |
United Airlines 2023-1 Class A Pass Through Trust | | | | | | | | |
5.80% due 01/15/36 | | | 7,283,545 | | | | 7,644,137 | |
Marriott International, Inc. | | | | | | | | |
5.35% due 03/15/35 | | | 7,100,000 | | | | 7,276,681 | |
Flutter Entertainment plc | | | | | | | | |
5.00% due 04/29/29 | | | EUR 4,900,000 | | | | 5,622,781 | |
Live Nation Entertainment, Inc. | | | | | | | | |
6.50% due 05/15/274 | | | 4,635,000 | | | | 4,727,668 | |
Wynn Resorts Finance LLC / Wynn Resorts Capital Corp. | | | | | | | | |
6.25% due 03/15/334 | | | 4,150,000 | | | | 4,204,143 | |
LKQ Corp. | | | | | | | | |
6.25% due 06/15/33 | | | 3,412,000 | | | | 3,618,016 | |
William Carter Co. | | | | | | | | |
5.63% due 03/15/274 | | | 3,450,000 | | | | 3,442,770 | |
Brunswick Corp. | | | | | | | | |
5.10% due 04/01/52 | | | 2,030,000 | | | | 1,713,009 | |
PulteGroup, Inc. | | | | | | | | |
6.38% due 05/15/33 | | | 1,400,000 | | | | 1,539,944 | |
JB Poindexter & Company, Inc. | | | | | | | | |
8.75% due 12/15/314 | | | 1,230,000 | | | | 1,300,435 | |
JetBlue Class A Pass Through Trust | | | | | | | | |
4.00% due 11/15/32 | | | 115,646 | | | | 110,966 | |
Total Consumer, Cyclical | | | | | | | 633,303,576 | |
| | | | | | | | | |
Energy - 2.1% | | | | | | | | |
BP Capital Markets plc | | | | | | | | |
4.88% 3,10 | | | 75,020,000 | | | | 74,206,243 | |
Venture Global LNG, Inc. | | | | | | | | |
9.50% due 02/01/294 | | | 29,800,000 | | | | 33,569,839 | |
9.88% due 02/01/324 | | | 10,300,000 | | | | 11,445,276 | |
Greensaif Pipelines Bidco SARL | | | | | | | | |
6.10% due 08/23/424 | | | 17,000,000 | | | | 17,604,996 | |
5.85% due 02/23/364 | | | 11,900,000 | | | | 12,308,348 | |
6.51% due 02/23/424 | | | 6,500,000 | | | | 6,996,696 | |
6.13% due 02/23/384 | | | 5,550,000 | | | | 5,877,013 | |
Plains All American Pipeline Limited Partnership / PAA Finance Corp. | | | | | | | | |
5.70% due 09/15/34 | | | 37,730,000 | | | | 39,207,828 | |
ITT Holdings LLC | | | | | | | | |
6.50% due 08/01/294 | | | 38,518,000 | | | | 36,490,120 | |
Galaxy Pipeline Assets Bidco Ltd. | | | | | | | | |
3.25% due 09/30/404 | | | 43,921,000 | | | | 35,554,809 | |
Energy Transfer, LP | | | | | | | | |
6.00% due 02/01/294 | | | 11,400,000 | | | | 11,677,601 | |
7.38% due 02/01/314 | | | 7,610,000 | | | | 8,095,891 | |
5.50% due 06/01/27 | | | 3,175,000 | | | | 3,256,188 | |
6.13% due 12/15/45 | | | 1,190,000 | | | | 1,241,918 | |
6.05% due 09/01/54 | | | 500,000 | | | | 517,974 | |
Enbridge, Inc. | | | | | | | | |
5.63% due 04/05/34 | | | 22,300,000 | | | | 23,388,586 | |
Targa Resources Corp. | | | | | | | | |
6.50% due 03/30/34 | | | 9,937,000 | | | | 10,982,747 | |
5.50% due 02/15/35 | | | 8,800,000 | | | | 9,062,959 | |
6.50% due 02/15/53 | | | 1,000,000 | | | | 1,109,768 | |
Occidental Petroleum Corp. | | | | | | | | |
5.38% due 01/01/32 | | | 18,470,000 | | | | 18,723,649 | |
Sunoco, LP | | | | | | | | |
7.25% due 05/01/324 | | | 17,125,000 | | | | 18,152,791 | |
Viper Energy, Inc. | | | | | | | | |
7.38% due 11/01/314 | | | 11,300,000 | | | | 11,917,816 | |
5.38% due 11/01/274 | | | 6,141,000 | | | | 6,115,832 | |
Midwest Connector Capital Company LLC | | | | | | | | |
4.63% due 04/01/294 | | | 14,608,000 | | | | 14,520,208 | |
Whistler Pipeline LLC | | | | | | | | |
5.70% due 09/30/314 | | | 13,350,000 | | | | 13,820,940 | |
Venture Global Calcasieu Pass LLC | | | | | | | | |
3.88% due 11/01/334 | | | 10,672,000 | | | | 9,571,333 | |
4.13% due 08/15/314 | | | 2,667,000 | | | | 2,479,589 | |
6.25% due 01/15/304 | | | 1,500,000 | | | | 1,572,391 | |
234 | THE GUGGENHEIM FUNDS ANNUAL REPORT | SEE NOTES TO FINANCIAL STATEMENTS. |
SCHEDULE OF INVESTMENTS (continued) | September 30, 2024 |
TOTAL RETURN BOND FUND | |
| | Face
Amount~ | | | Value | |
NuStar Logistics, LP | | | | | | | | |
6.38% due 10/01/30 | | | 10,560,000 | | | $ | 10,957,293 | |
5.63% due 04/28/27 | | | 1,880,000 | | | | 1,888,573 | |
Cheniere Energy Partners, LP | | | | | | | | |
5.95% due 06/30/33 | | | 8,845,000 | | | | 9,359,301 | |
5.75% due 08/15/344 | | | 2,950,000 | | | | 3,073,162 | |
TransCanada PipeLines Ltd. | | | | | | | | |
6.20% due 03/09/26 | | | 10,900,000 | | | | 10,910,627 | |
4.88% due 05/15/48 | | | 1,200,000 | | | | 1,123,088 | |
Cheniere Energy, Inc. | | | | | | | | |
5.65% due 04/15/344 | | | 11,550,000 | | | | 11,949,745 | |
Parkland Corp. | | | | | | | | |
4.63% due 05/01/304 | | | 8,000,000 | | | | 7,544,409 | |
6.63% due 08/15/324 | | | 4,200,000 | | | | 4,263,756 | |
Kinetik Holdings, LP | | | | | | | | |
6.63% due 12/15/284 | | | 9,625,000 | | | | 9,989,306 | |
ONEOK, Inc. | | | | | | | | |
6.05% due 09/01/33 | | | 6,350,000 | | | | 6,784,752 | |
3.95% due 03/01/50 | | | 1,600,000 | | | | 1,229,507 | |
5.15% due 10/15/43 | | | 1,100,000 | | | | 1,046,664 | |
4.50% due 03/15/50 | | | 850,000 | | | | 707,497 | |
Buckeye Partners, LP | | | | | | | | |
4.13% due 03/01/254 | | | 5,201,000 | | | | 5,157,786 | |
3.95% due 12/01/26 | | | 4,250,000 | | | | 4,126,569 | |
Boardwalk Pipelines, LP | | | | | | | | |
5.63% due 08/01/34 | | | 6,675,000 | | | | 6,885,351 | |
Targa Resources Partners Limited Partnership / Targa Resources Partners Finance Corp. | | | | | | | | |
5.50% due 03/01/30 | | | 5,863,000 | | | | 5,970,284 | |
CQP Holdco Limited Partnership / BIP-V Chinook Holdco LLC | | | | | | | | |
7.50% due 12/15/334 | | | 5,000,000 | | | | 5,424,880 | |
EnLink Midstream LLC | | | | | | | | |
5.65% due 09/01/34 | | | 5,050,000 | | | | 5,218,029 | |
DT Midstream, Inc. | | | | | | | | |
4.30% due 04/15/324 | | | 3,250,000 | | | | 3,041,107 | |
4.13% due 06/15/294 | | | 550,000 | | | | 526,098 | |
Marathon Petroleum Corp. | | | | | | | | |
6.50% due 03/01/41 | | | 1,650,000 | | | | 1,796,864 | |
Kinder Morgan Energy Partners, LP | | | | | | | | |
7.50% due 11/15/40 | | | 1,380,000 | | | | 1,633,715 | |
EnLink Midstream Partners, LP | | | | | | | | |
5.60% due 04/01/44 | | | 1,680,000 | | | | 1,605,643 | |
Western Midstream Operating, LP | | | | | | | | |
5.30% due 03/01/48 | | | 1,690,000 | | | | 1,534,727 | |
DCP Midstream Operating, LP | | | | | | | | |
6.45% due 11/03/364 | | | 1,000,000 | | | | 1,078,471 | |
MPLX, LP | | | | | | | | |
5.50% due 02/15/49 | | | 1,100,000 | | | | 1,071,010 | |
Eastern Gas Transmission & Storage, Inc. | | | | | | | | |
4.60% due 12/15/44 | | | 500,000 | | | | 453,063 | |
Kinder Morgan, Inc. | | | | | | | | |
5.20% due 06/01/33 | | | 126,000 | | | | 127,551 | |
Total Energy | | | | | | | 565,948,177 | |
| | | | | | | | | |
Communications - 1.5% | | | | | | | | |
Level 3 Financing, Inc. | | | | | | | | |
3.88% due 10/15/304 | | | 34,939,000 | | | | 25,602,289 | |
10.75% due 12/15/304 | | | 20,300,000 | | | | 22,278,367 | |
11.00% due 11/15/294 | | | 19,567,314 | | | | 21,672,282 | |
4.50% due 04/01/304 | | | 26,815,000 | | | | 20,768,400 | |
4.00% due 04/15/314 | | | 13,950,000 | | | | 10,148,625 | |
British Telecommunications plc | | | | | | | | |
4.88% due 11/23/813,4 | | | 47,450,000 | | | | 43,803,306 | |
4.25% due 11/23/813,4 | | | 8,250,000 | | | | 8,006,415 | |
9.63% due 12/15/30 | | | 2,391,000 | | | | 3,019,386 | |
Sirius XM Radio, Inc. | | | | | | | | |
3.13% due 09/01/264 | | | 26,975,000 | | | | 26,062,137 | |
4.13% due 07/01/304 | | | 12,010,000 | | | | 10,891,598 | |
Vodafone Group plc | | | | | | | | |
4.13% due 06/04/813 | | | 40,537,000 | | | | 36,745,716 | |
Paramount Global | | | | | | | | |
5.90% due 10/15/40 | | | 20,648,000 | | | | 18,269,505 | |
5.25% due 04/01/44 | | | 7,691,000 | | | | 6,126,977 | |
4.90% due 08/15/44 | | | 6,518,000 | | | | 5,009,365 | |
4.85% due 07/01/42 | | | 4,496,000 | | | | 3,586,122 | |
4.60% due 01/15/45 | | | 2,403,000 | | | | 1,773,514 | |
Rogers Communications, Inc. | | | | | | | | |
4.55% due 03/15/52 | | | 29,725,000 | | | | 25,739,968 | |
Cogent Communications Group LLC | | | | | | | | |
3.50% due 05/01/264 | | | 16,765,000 | | | | 16,343,342 | |
7.00% due 06/15/274 | | | 8,285,000 | | | | 8,430,642 | |
Fox Corp. | | | | | | | | |
6.50% due 10/13/33 | | | 19,400,000 | | | | 21,228,037 | |
Charter Communications Operating LLC / Charter Communications Operating Capital | | | | | | | | |
3.90% due 06/01/52 | | | 21,690,000 | | | | 14,220,928 | |
Altice France S.A. | | | | | | | | |
5.13% due 07/15/294 | | | 17,800,000 | | | | 12,517,279 | |
5.13% due 01/15/294 | | | 2,290,000 | | | | 1,608,331 | |
Go Daddy Operating Company LLC / GD Finance Co., Inc. | | | | | | | | |
3.50% due 03/01/294 | | | 8,203,000 | | | | 7,696,633 | |
CSC Holdings LLC | | | | | | | | |
4.13% due 12/01/304 | | | 5,772,000 | | | | 4,206,375 | |
AT&T, Inc. | | | | | | | | |
6.38% due 03/01/41 | | | 1,800,000 | | | | 1,997,881 | |
Corning, Inc. | | | | | | | | |
5.75% due 08/15/40 | | | 1,900,000 | | | | 1,993,126 | |
Outfront Media Capital LLC / Outfront Media Capital Corp. | | | | | | | | |
7.38% due 02/15/314 | | | 1,450,000 | | | | 1,547,861 | |
McGraw-Hill Education, Inc. | | | | | | | | |
5.75% due 08/01/284 | | | 1,549,000 | | | | 1,530,782 | |
Interpublic Group of Companies, Inc. | | | | | | | | |
3.38% due 03/01/41 | | | 1,950,000 | | | | 1,516,834 | |
Match Group Holdings II LLC | | | | | | | | |
4.13% due 08/01/304 | | | 1,250,000 | | | | 1,170,951 | |
Virgin Media Finance plc | | | | | | | | |
5.00% due 07/15/304 | | | 1,050,000 | | | | 923,501 | |
SEE NOTES TO FINANCIAL STATEMENTS. | THE GUGGENHEIM FUNDS ANNUAL REPORT | 235 |
SCHEDULE OF INVESTMENTS (continued) | September 30, 2024 |
TOTAL RETURN BOND FUND | |
| | Face
Amount~ | | | Value | |
Sunrise FinCo I B.V. | | | | | | | | |
4.88% due 07/15/314 | | | 200,000 | | | $ | 189,236 | |
Total Communications | | | | | | | 386,625,711 | |
| | | | | | | | | |
Technology - 1.0% | | | | | | | | |
Fiserv, Inc. | | | | | | | | |
5.35% due 03/15/31 | | | 20,920,000 | | | | 21,882,537 | |
2.65% due 06/01/30 | | | 7,920,000 | | | | 7,216,269 | |
5.60% due 03/02/33 | | | 3,523,000 | | | | 3,730,943 | |
5.63% due 08/21/33 | | | 2,300,000 | | | | 2,436,296 | |
Broadcom, Inc. | | | | | | | | |
4.93% due 05/15/374 | | | 33,182,000 | | | | 33,153,289 | |
Foundry JV Holdco LLC | | | | | | | | |
5.88% due 01/25/344 | | | 13,506,000 | | | | 13,759,565 | |
6.40% due 01/25/384 | | | 10,950,000 | | | | 11,530,291 | |
6.15% due 01/25/324 | | | 6,550,000 | | | | 6,811,687 | |
Oracle Corp. | | | | | | | | |
3.95% due 03/25/51 | | | 33,794,000 | | | | 27,197,512 | |
Leidos, Inc. | | | | | | | | |
2.30% due 02/15/31 | | | 15,050,000 | | | | 13,074,712 | |
5.75% due 03/15/33 | | | 9,431,000 | | | | 9,920,812 | |
4.38% due 05/15/30 | | | 2,650,000 | | | | 2,607,567 | |
Qorvo, Inc. | | | | | | | | |
3.38% due 04/01/314 | | | 10,809,000 | | | | 9,677,773 | |
4.38% due 10/15/29 | | | 9,751,000 | | | | 9,447,357 | |
Atlassian Corp. | | | | | | | | |
5.50% due 05/15/34 | | | 17,500,000 | | | | 18,313,005 | |
Fair Isaac Corp. | | | | | | | | |
5.25% due 05/15/264 | | | 15,640,000 | | | | 15,637,618 | |
MSCI, Inc. | | | | | | | | |
3.63% due 09/01/304 | | | 12,718,000 | | | | 11,949,697 | |
3.88% due 02/15/314 | | | 1,769,000 | | | | 1,673,928 | |
3.63% due 11/01/314 | | | 1,780,000 | | | | 1,638,164 | |
CGI, Inc. | | | | | | | | |
2.30% due 09/14/31 | | | 16,050,000 | | | | 13,756,391 | |
Booz Allen Hamilton, Inc. | | | | | | | | |
5.95% due 08/04/33 | | | 10,470,000 | | | | 11,175,113 | |
Constellation Software, Inc. | | | | | | | | |
5.46% due 02/16/344 | | | 4,425,000 | | | | 4,625,542 | |
5.16% due 02/16/294 | | | 3,250,000 | | | | 3,350,158 | |
Cloud Software Group, Inc. | | | | | | | | |
6.50% due 03/31/294 | | | 7,200,000 | | | | 7,163,758 | |
ACI Worldwide, Inc. | | | | | | | | |
5.75% due 08/15/264 | | | 6,973,000 | | | | 6,971,084 | |
NXP BV / NXP Funding LLC / NXP USA, Inc. | | | | | | | | |
3.13% due 02/15/42 | | | 1,400,000 | | | | 1,050,301 | |
Total Technology | | | | | | | 269,751,369 | |
| | | | | | | | | |
Utilities - 0.7% | | | | | | | | |
NRG Energy, Inc. | | | | | | | | |
2.45% due 12/02/274 | | | 26,000,000 | | | | 24,358,791 | |
7.00% due 03/15/334 | | | 9,490,000 | | | | 10,542,061 | |
AES Corp. | | | | | | | | |
3.95% due 07/15/304 | | | 23,124,000 | | | | 22,052,549 | |
3.30% due 07/15/254 | | | 3,750,000 | | | | 3,695,374 | |
Liberty Utilities Co. | | | | | | | | |
5.58% due 01/31/294 | | | 11,600,000 | | | | 11,991,780 | |
5.87% due 01/31/344 | | | 6,450,000 | | | | 6,759,974 | |
Brooklyn Union Gas Co. | | | | | | | | |
6.39% due 09/15/334 | | | 12,675,000 | | | | 13,801,735 | |
4.27% due 03/15/484 | | | 1,300,000 | | | | 1,054,700 | |
6.42% due 07/18/544 | | | 125,000 | | | | 136,284 | |
Public Service Company of Colorado | | | | | | | | |
5.35% due 05/15/34 | | | 13,400,000 | | | | 14,054,004 | |
Alexander Funding Trust II | | | | | | | | |
7.47% due 07/31/284 | | | 12,360,000 | | | | 13,354,505 | |
AmeriGas Partners Limited Partnership / AmeriGas Finance Corp. | | | | | | | | |
5.88% due 08/20/26 | | | 10,945,000 | | | | 10,869,357 | |
5.50% due 05/20/25 | | | 1,859,000 | | | | 1,852,301 | |
Black Hills Corp. | | | | | | | | |
6.00% due 01/15/35 | | | 9,020,000 | | | | 9,604,675 | |
4.20% due 09/15/46 | | | 1,200,000 | | | | 1,005,179 | |
5.95% due 03/15/28 | | | 50,000 | | | | 52,468 | |
Enel Finance International N.V. | | | | | | | | |
5.00% due 06/15/324 | | | 8,690,000 | | | | 8,790,650 | |
Appalachian Power Co. | | | | | | | | |
5.80% due 10/01/35 | | | 4,150,000 | | | | 4,345,072 | |
4.40% due 05/15/44 | | | 2,400,000 | | | | 2,092,972 | |
Interstate Power and Light Co. | | | | | | | | |
4.95% due 09/30/34 | | | 6,300,000 | | | | 6,395,303 | |
Southern Company Gas Capital Corp. | | | | | | | | |
4.95% due 09/15/34 | | | 5,900,000 | | | | 5,961,607 | |
Terraform Global Operating, LP | | | | | | | | |
6.13% due 03/01/264 | | | 5,235,000 | | | | 5,237,576 | |
Idaho Power Co. | | | | | | | | |
4.20% due 03/01/48 | | | 2,660,000 | | | | 2,251,002 | |
Indianapolis Power & Light Co. | | | | | | | | |
5.70% due 04/01/544 | | | 2,000,000 | | | | 2,129,995 | |
Arizona Public Service Co. | | | | | | | | |
5.55% due 08/01/33 | | | 1,900,000 | | | | 1,980,879 | |
Constellation Energy Generation LLC | | | | | | | | |
5.75% due 10/01/41 | | | 1,800,000 | | | | 1,898,950 | |
Entergy Texas, Inc. | | | | | | | | |
1.50% due 09/01/26 | | | 1,650,000 | | | | 1,559,941 | |
Southern Power Co. | | | | | | | | |
5.25% due 07/15/43 | | | 1,350,000 | | | | 1,341,616 | |
Nevada Power Co. | | | | | | | | |
6.65% due 04/01/36 | | | 1,180,000 | | | | 1,338,982 | |
Washington Gas Light Co. | | | | | | | | |
3.80% due 09/15/46 | | | 1,300,000 | | | | 1,053,974 | |
Duke Energy Ohio, Inc. | | | | | | | | |
4.30% due 02/01/49 | | | 1,200,000 | | | | 1,038,083 | |
Louisville Gas and Electric Co. | | | | | | | | |
4.25% due 04/01/49 | | | 1,100,000 | | | | 939,755 | |
Total Utilities | | | | | | | 193,542,094 | |
| | | | | | | | | |
Basic Materials - 0.6% | | | | | | | | |
Anglo American Capital plc | | | | | | | | |
5.63% due 04/01/304 | | | 21,300,000 | | | | 22,137,963 | |
2.63% due 09/10/304 | | | 18,000,000 | | | | 16,020,639 | |
3.95% due 09/10/504 | | | 14,140,000 | | | | 11,097,059 | |
5.75% due 04/05/344 | | | 5,550,000 | | | | 5,793,769 | |
6.00% due 04/05/54 | | | 1,000,000 | | | | 1,047,055 | |
236 | THE GUGGENHEIM FUNDS ANNUAL REPORT | SEE NOTES TO FINANCIAL STATEMENTS. |
SCHEDULE OF INVESTMENTS (continued) | September 30, 2024 |
TOTAL RETURN BOND FUND | |
| | Face
Amount~ | | | Value | |
Alcoa Nederland Holding B.V. | | | | | | | | |
5.50% due 12/15/274 | | | 14,325,000 | | | $ | 14,378,883 | |
4.13% due 03/31/294 | | | 8,600,000 | | | | 8,247,614 | |
7.13% due 03/15/314 | | | 3,200,000 | | | | 3,411,280 | |
6.13% due 05/15/284 | | | 2,800,000 | | | | 2,838,816 | |
International Flavors & Fragrances, Inc. | | | | | | | | |
1.23% due 10/01/254 | | | 21,520,000 | | | | 20,769,695 | |
5.00% due 09/26/48 | | | 1,100,000 | | | | 1,012,667 | |
Minerals Technologies, Inc. | | | | | | | | |
5.00% due 07/01/284 | | | 18,748,000 | | | | 18,242,742 | |
Yamana Gold, Inc. | | | | | | | | |
2.63% due 08/15/31 | | | 9,431,000 | | | | 8,164,826 | |
4.63% due 12/15/27 | | | 3,000,000 | | | | 3,004,562 | |
Steel Dynamics, Inc. | | | | | | | | |
2.40% due 06/15/25 | | | 5,950,000 | | | | 5,853,680 | |
Novelis Corp. | | | | | | | | |
3.25% due 11/15/264 | | | 5,923,000 | | | | 5,715,535 | |
Axalta Coating Systems Dutch Holding B B.V. | | | | | | | | |
7.25% due 02/15/314 | | | 2,000,000 | | | | 2,135,784 | |
International Paper Co. | | | | | | | | |
4.40% due 08/15/47 | | | 2,400,000 | | | | 2,115,235 | |
FMC Corp. | | | | | | | | |
6.38% due 05/18/53 | | | 1,530,000 | | | | 1,638,718 | |
Southern Copper Corp. | | | | | | | | |
7.50% due 07/27/35 | | | 1,080,000 | | | | 1,284,831 | |
Carpenter Technology Corp. | | | | | | | | |
6.38% due 07/15/28 | | | 178,000 | | | | 179,221 | |
Total Basic Materials | | | | | | | 155,090,574 | |
| | | | | | | | | |
Transporation - 0.1% | | | | | | | | |
Stolthaven Houston, Inc. | | | | | | | | |
5.88% due 07/17/31††† | | | 14,200,000 | | | | 14,631,680 | |
5.98% due 07/17/34††† | | | 12,800,000 | | | | 13,184,768 | |
Total Transporation | | | | | | | 27,816,448 | |
| | | | | | | | | |
Total Corporate Bonds | | | | |
(Cost $7,363,953,412) | | | 7,008,561,542 | |
| | | | | |
ASSET-BACKED SECURITIES†† - 21.9% |
Collateralized Loan Obligations - 11.2% | | | | | | | | |
LCCM Trust | | | | | | | | |
2021-FL3 A, 6.66% (1 Month Term SOFR + 1.56%, Rate Floor: 1.56%) due 11/15/38◊,4 | | | 73,311,997 | | | | 72,823,973 | |
2021-FL3 AS, 7.01% (1 Month Term SOFR + 1.91%, Rate Floor: 1.91%) due 11/15/38◊,4 | | | 37,152,000 | | | | 36,140,069 | |
2021-FL3 B, 7.41% (1 Month Term SOFR + 2.31%, Rate Floor: 2.31%) due 11/15/38◊,4 | | | 21,450,000 | | | | 20,740,949 | |
2021-FL2 B, 7.11% (1 Month Term SOFR + 2.01%, Rate Floor: 2.01%) due 12/13/38◊,4 | | | 400,000 | | | | 394,578 | |
Palmer Square Loan Funding Ltd. | | | | | | | | |
2022-1A A2, 6.90% (3 Month Term SOFR + 1.60%, Rate Floor: 1.60%) due 04/15/30◊,4 | | | 23,000,000 | | | | 22,976,335 | |
2021-3A B, 7.29% (3 Month Term SOFR + 2.01%, Rate Floor: 2.01%) due 07/20/29◊,4 | | | 22,500,000 | | | | 22,552,357 | |
2023-2A A2, 7.59% (3 Month Term SOFR + 2.30%, Rate Floor: 2.30%) due 01/25/32◊,4 | | | 19,500,000 | | | | 19,564,061 | |
2024-3A BR, 7.30% (3 Month Term SOFR + 2.00%, Rate Floor: 2.00%) due 04/15/31◊,4 | | | 16,050,000 | | | | 16,088,467 | |
2023-2A B, 7.99% (3 Month Term SOFR + 2.70%, Rate Floor: 2.70%) due 01/25/32◊,4 | | | 11,750,000 | | | | 11,799,801 | |
2021-2A B, 6.79% (3 Month Term SOFR + 1.66%, Rate Floor: 1.66%) due 05/20/29◊,4 | | | 10,500,000 | | | | 10,508,124 | |
2021-1A B, 7.34% (3 Month Term SOFR + 2.06%, Rate Floor: 2.06%) due 04/20/29◊,4 | | | 7,100,000 | | | | 7,099,978 | |
2023-4A B, 8.03% (3 Month Term SOFR + 2.75%, Rate Floor: 2.75%) due 07/24/31◊,4 | | | 7,050,000 | | | | 7,082,787 | |
2021-2A C, 7.79% (3 Month Term SOFR + 2.66%, Rate Floor: 2.66%) due 05/20/29◊,4 | | | 7,000,000 | | | | 7,006,590 | |
Cerberus Loan Funding XXXII, LP | | | | | | | | |
2021-2A A, 7.18% (3 Month Term SOFR + 1.88%, Rate Floor: 1.88%) due 04/22/33◊,4 | | | 65,000,000 | | | | 65,015,665 | |
2021-2A C, 8.41% (3 Month Term SOFR + 3.11%, Rate Floor: 3.11%) due 04/22/33◊,4 | | | 20,925,000 | | | | 21,014,404 | |
2021-2A B, 7.46% (3 Month Term SOFR + 2.16%, Rate Floor: 2.16%) due 04/22/33◊,4 | | | 19,200,000 | | | | 19,230,609 | |
BXMT Ltd. | | | | | | | | |
2020-FL2 A, 6.10% (1 Month Term SOFR + 1.01%, Rate Floor: 1.01%) due 02/15/38◊,4 | | | 33,670,569 | | | | 32,359,723 | |
2020-FL3 AS, 6.95% (1 Month Term SOFR + 1.86%, Rate Floor: 1.86%) due 11/15/37◊,4 | | | 23,550,000 | | | | 22,991,719 | |
2020-FL3 C, 7.75% (1 Month Term SOFR + 2.66%, Rate Floor: 2.66%) due 11/15/37◊,4 | | | 16,327,000 | | | | 14,466,476 | |
2020-FL2 B, 6.60% (1 Month Term SOFR + 1.51%, Rate Floor: 1.51%) due 02/15/38◊,4 | | | 16,000,000 | | | | 14,457,363 | |
2020-FL3 B, 7.35% (1 Month Term SOFR + 2.26%, Rate Floor: 2.26%) due 11/15/37◊,4 | | | 10,600,000 | | | | 10,155,306 | |
SEE NOTES TO FINANCIAL STATEMENTS. | THE GUGGENHEIM FUNDS ANNUAL REPORT | 237 |
SCHEDULE OF INVESTMENTS (continued) | September 30, 2024 |
TOTAL RETURN BOND FUND | |
| | Face
Amount~ | | | Value | |
2020-FL2 AS, 6.35% (1 Month Term SOFR + 1.26%, Rate Floor: 1.26%) due 02/15/38◊,4 | | | 6,008,500 | | | $ | 5,790,717 | |
2020-FL2 C, 6.85% (1 Month Term SOFR + 1.76%, Rate Floor: 1.76%) due 02/15/38◊,4 | | | 5,360,000 | | | | 4,676,791 | |
Golub Capital Partners CLO 33M Ltd. | | | | | | | | |
2021-33A AR2, 7.19% (3 Month Term SOFR + 2.12%, Rate Floor: 1.86%) due 08/25/33◊,4 | | | 105,004,127 | | | | 104,745,292 | |
HERA Commercial Mortgage Ltd. | | | | | | | | |
2021-FL1 B, 6.73% (1 Month Term SOFR + 1.71%, Rate Floor: 1.60%) due 02/18/38◊,4 | | | 49,562,000 | | | | 48,345,139 | |
2021-FL1 AS, 6.43% (1 Month Term SOFR + 1.41%, Rate Floor: 1.30%) due 02/18/38◊,4 | | | 28,000,000 | | | | 27,309,985 | |
2021-FL1 C, 7.08% (1 Month Term SOFR + 2.06%, Rate Floor: 1.95%) due 02/18/38◊,4 | | | 19,200,000 | | | | 18,535,212 | |
2021-FL1 A, 6.18% (1 Month Term SOFR + 1.16%, Rate Floor: 1.05%) due 02/18/38◊,4 | | | 4,811,078 | | | | 4,741,298 | |
LoanCore Issuer Ltd. | | | | | | | | |
2021-CRE6 B, 7.11% (1 Month Term SOFR + 2.01%, Rate Floor: 1.90%) due 11/15/38◊,4 | | | 44,000,000 | | | | 42,807,186 | |
2021-CRE6 C, 7.51% (1 Month Term SOFR + 2.41%, Rate Floor: 2.30%) due 11/15/38◊,4 | | | 22,825,000 | | | | 22,270,053 | |
2021-CRE5 D, 8.21% (1 Month Term SOFR + 3.11%, Rate Floor: 3.11%) due 07/15/36◊,4 | | | 14,350,000 | | | | 14,037,843 | |
2021-CRE5 A, 6.51% (1 Month Term SOFR + 1.41%, Rate Floor: 1.41%) due 07/15/36◊,4 | | | 9,797,782 | | | | 9,764,262 | |
Cerberus Loan Funding XLV LLC | | | | | | | | |
2024-1A A, 7.20% (3 Month Term SOFR + 1.90%, Rate Floor: 1.90%) due 04/15/36◊,4 | | | 75,250,000 | | | | 75,443,031 | |
2024-1A B, 7.70% (3 Month Term SOFR + 2.40%, Rate Floor: 2.40%) due 04/15/36◊,4 | | | 12,000,000 | | | | 12,130,205 | |
Cerberus Loan Funding XLIV LLC | | | | | | | | |
2024-5A A, 7.65% (3 Month Term SOFR + 2.35%, Rate Floor: 2.35%) due 01/15/36◊,4 | | | 50,000,000 | | | | 50,174,205 | |
2024-5A B, 8.50% (3 Month Term SOFR + 3.20%, Rate Floor: 3.20%) due 01/15/36◊,4 | | | 24,950,000 | | | | 24,978,490 | |
Cerberus Loan Funding XLII LLC | | | | | | | | |
2023-3A A1, 7.77% (3 Month Term SOFR + 2.48%, Rate Floor: 2.48%) due 09/13/35◊,4 | | | 54,450,000 | | | | 54,838,152 | |
2023-3A B, 8.64% (3 Month Term SOFR + 3.35%, Rate Floor: 3.35%) due 09/13/35◊,4 | | | 15,700,000 | | | | 15,699,436 | |
Cerberus Loan Funding XL LLC | | | | | | | | |
2023-1A A, 7.70% (3 Month Term SOFR + 2.40%, Rate Floor: 2.40%) due 03/22/35◊,4 | | | 64,859,750 | | | | 65,334,244 | |
2023-1A B, 8.90% (3 Month Term SOFR + 3.60%, Rate Floor: 3.60%) due 03/22/35◊,4 | | | 4,600,000 | | | | 4,607,462 | |
Owl Rock CLO XVI LLC | | | | | | | | |
2024-16A A, 7.28% (3 Month Term SOFR + 2.00%, Rate Floor: 2.00%) due 04/20/36◊,4 | | | 57,300,000 | | | | 57,699,828 | |
2024-16A B, 7.78% (3 Month Term SOFR + 2.50%, Rate Floor: 2.50%) due 04/20/36◊,4 | | | 9,550,000 | | | | 9,572,153 | |
Palmer Square CLO Ltd. | | | | | | | | |
2024-4A BR, due 10/20/37◊,4 | | | 36,200,000 | | | | 36,213,566 | |
2023-4A C, 7.88% (3 Month Term SOFR + 2.60%, Rate Floor: 2.60%) due 10/20/33◊,4 | | | 16,250,000 | | | | 16,284,071 | |
2023-4A B, 7.43% (3 Month Term SOFR + 2.15%, Rate Floor: 2.15%) due 10/20/33◊,4 | | | 14,200,000 | | | | 14,227,051 | |
THL Credit Lake Shore MM CLO I Ltd. | | | | | | | | |
2021-1A A1R, 7.26% (3 Month Term SOFR + 1.96%, Rate Floor: 1.70%) due 04/15/33◊,4 | | | 33,500,000 | | | | 33,499,806 | |
2021-1A BR, 7.56% (3 Month Term SOFR + 2.26%, Rate Floor: 2.00%) due 04/15/33◊,4 | | | 30,400,000 | | | | 30,228,465 | |
ABPCI Direct Lending Fund CLO I LLC | | | | | | | | |
2021-1A A1A2, 7.24% (3 Month Term SOFR + 1.96%, Rate Floor: 1.96%) due 07/20/33◊,4 | | | 59,500,000 | | | | 59,606,297 | |
2021-1A B12, 7.54% (3 Month Term SOFR + 2.26%, Rate Floor: 2.26%) due 07/20/33◊,4 | | | 2,500,000 | | | | 2,490,113 | |
Ares Direct Lending CLO 1 LLC | | | | | | | | |
2024-1A A, 7.18% (3 Month Term SOFR + 1.80%, Rate Floor: 1.80%) due 04/25/36◊,4 | | | 49,000,000 | | | | 49,017,714 | |
2024-1A B, 7.59% (3 Month Term SOFR + 2.20%, Rate Floor: 2.20%) due 04/25/36◊,4 | | | 9,750,000 | | | | 9,760,818 | |
Owl Rock CLO IV Ltd. | | | | | | | | |
2021-4A A1R, 6.99% (3 Month Term SOFR + 1.86%, Rate Floor: 1.60%) due 08/20/33◊,4 | | | 40,750,000 | | | | 40,955,686 | |
2021-4A A2R, 7.29% (3 Month Term SOFR + 2.16%, Rate Floor: 1.90%) due 08/20/33◊,4 | | | 16,750,000 | | | | 16,762,338 | |
238 | THE GUGGENHEIM FUNDS ANNUAL REPORT | SEE NOTES TO FINANCIAL STATEMENTS. |
SCHEDULE OF INVESTMENTS (continued) | September 30, 2024 |
TOTAL RETURN BOND FUND | |
| | Face
Amount~ | | | Value | |
Cerberus Loan Funding XXXIII, LP | | | | | | | | |
2021-3A A, 7.12% (3 Month Term SOFR + 1.82%, Rate Floor: 1.56%) due 07/23/33◊,4 | | | 47,750,000 | | | $ | 47,798,041 | |
2021-3A B, 7.41% (3 Month Term SOFR + 2.11%, Rate Floor: 1.85%) due 07/23/33◊,4 | | | 9,500,000 | | | | 9,519,993 | |
Fortress Credit Opportunities IX CLO Ltd. | | | | | | | | |
2021-9A A2TR, 7.36% (3 Month Term SOFR + 2.06%, Rate Floor: 1.80%) due 10/15/33◊,4 | | | 46,200,000 | | | | 46,400,416 | |
2021-9A BR, 7.51% (3 Month Term SOFR + 2.21%, Rate Floor: 1.95%) due 10/15/33◊,4 | | | 6,700,000 | | | | 6,678,934 | |
2021-9A A1TR, 7.11% (3 Month Term SOFR + 1.81%, Rate Floor: 1.55%) due 10/15/33◊,4 | | | 3,450,000 | | | | 3,457,633 | |
Owl Rock CLO III Ltd. | | | | | | | | |
2024-3A AR, 7.23% (3 Month Term SOFR + 1.85%, Rate Floor: 1.85%) due 04/20/36◊,4 | | | 41,250,000 | | | | 41,431,339 | |
2024-3A BR, 7.65% (3 Month Term SOFR + 2.35%, Rate Floor: 2.35%) due 04/20/36◊,4 | | | 13,500,000 | | | | 13,499,158 | |
Cerberus Loan Funding XXXV, LP | | | | | | | | |
2021-5A A, 7.06% (3 Month Term SOFR + 1.76%, Rate Floor: 1.50%) due 09/22/33◊,4 | | | 41,500,000 | | | | 41,503,324 | |
2021-5A B, 7.41% (3 Month Term SOFR + 2.11%, Rate Floor: 1.85%) due 09/22/33◊,4 | | | 8,000,000 | | | | 8,014,131 | |
Cerberus Loan Funding XLVII LLC | | | | | | | | |
2024-3A A, 7.08% (3 Month Term SOFR + 1.75%, Rate Floor: 1.75%) due 07/15/36◊,4 | | | 44,000,000 | | | | 44,066,832 | |
2024-3A B, 7.35% (3 Month Term SOFR + 1.95%, Rate Floor: 1.95%) due 07/15/36◊,4 | | | 5,250,000 | | | | 5,254,662 | |
GoldenTree Loan Management US CLO 1 Ltd. | | | | | | | | |
2024-9A BR, 7.23% (3 Month Term SOFR + 1.95%, Rate Floor: 1.95%) due 04/20/37◊,4 | | | 28,900,000 | | | | 29,105,644 | |
2024-9A CR, 7.68% (3 Month Term SOFR + 2.40%, Rate Floor: 2.40%) due 04/20/37◊,4 | | | 18,550,000 | | | | 18,820,231 | |
Cerberus Loan Funding XLVIII LLC | | | | | | | | |
2024-4A AN, due 10/15/36◊,4 | | | 45,550,000 | | | | 45,618,694 | |
ACRES Commercial Realty Ltd. | | | | | | | | |
2021-FL1 C, 7.20% (1 Month Term SOFR + 2.11%, Rate Floor: 2.11%) due 06/15/36◊,4 | | | 13,092,000 | | | | 12,586,790 | |
2021-FL1 D, 7.85% (1 Month Term SOFR + 2.76%, Rate Floor: 2.76%) due 06/15/36◊,4 | | | 11,750,000 | | | | 11,232,922 | |
2021-FL2 B, 7.45% (1 Month Term SOFR + 2.36%, Rate Floor: 2.36%) due 01/15/37◊,4 | | | 10,100,000 | | | | 9,896,751 | |
2021-FL1 AS, 6.80% (1 Month Term SOFR + 1.71%, Rate Floor: 1.71%) due 06/15/36◊,4 | | | 6,425,000 | | | | 6,302,926 | |
2021-FL2 AS, 6.95% (1 Month Term SOFR + 1.86%, Rate Floor: 1.86%) due 01/15/37◊,4 | | | 3,500,000 | | | | 3,466,087 | |
FS Rialto | | | | | | | | |
2021-FL3 C, 7.26% (1 Month Term SOFR + 2.16%, Rate Floor: 2.16%) due 11/16/36◊,4 | | | 31,150,000 | | | | 29,907,240 | |
2021-FL3 B, 7.01% (1 Month Term SOFR + 1.91%, Rate Floor: 1.91%) due 11/16/36◊,4 | | | 8,420,000 | | | | 8,328,188 | |
Golub Capital Partners CLO 54M LP | | | | | | | | |
2021-54A B, 7.35% (3 Month Term SOFR + 2.11%, Rate Floor: 1.85%) due 08/05/33◊,4 | | | 21,000,000 | | | | 20,971,253 | |
2021-54A A, 7.03% (3 Month Term SOFR + 1.79%, Rate Floor: 1.53%) due 08/05/33◊,4 | | | 16,700,000 | | | | 16,707,026 | |
LCM XXIV Ltd. | | | | | | | | |
2021-24A BR, 6.94% (3 Month Term SOFR + 1.66%, Rate Floor: 0.00%) due 03/20/30◊,4 | | | 24,200,000 | | | | 24,186,876 | |
2021-24A CR, 7.44% (3 Month Term SOFR + 2.16%, Rate Floor: 0.00%) due 03/20/30◊,4 | | | 13,050,000 | | | | 13,092,624 | |
Carlyle Direct Lending CLO LLC | | | | | | | | |
2024-1A A11A, 7.12% (3 Month Term SOFR + 1.80%, Rate Floor: 1.80%) due 07/15/36◊,4 | | | 28,850,000 | | | | 29,036,752 | |
2024-1A A12B, 7.32% (3 Month Term SOFR + 2.00%, Rate Floor: 2.00%) due 07/15/36◊,4 | | | 7,500,000 | | | | 7,563,242 | |
Golub Capital Partners CLO 16 Ltd. | | | | | | | | |
2021-16A A1R2, 7.16% (3 Month Term SOFR + 1.87%, Rate Floor: 1.61%) due 07/25/33◊,4 | | | 26,750,000 | | | | 26,769,498 | |
2021-16A A2R2, 7.35% (3 Month Term SOFR + 2.06%, Rate Floor: 1.80%) due 07/25/33◊,4 | | | 9,750,000 | | | | 9,755,621 | |
Golub Capital Partners CLO 36M Ltd. | | | | | | | | |
2018-36A A, 6.80% (3 Month Term SOFR + 1.56%, Rate Floor: 0.00%) due 02/05/31◊,4 | | | 35,703,571 | | | | 35,696,995 | |
Fortress Credit BSL XV Ltd. | | | | | | | | |
2024-2A AR, 6.68% (3 Month Term SOFR + 1.40%, Rate Floor: 1.40%) due 10/18/33◊,4 | | | 35,000,000 | | | | 35,065,923 | |
Golub Capital Partners CLO 31M Ltd. | | | | | | | | |
2024-31A A1RR, due 11/05/37◊,4 | | | 35,000,000 | | | | 35,018,323 | |
SEE NOTES TO FINANCIAL STATEMENTS. | THE GUGGENHEIM FUNDS ANNUAL REPORT | 239 |
SCHEDULE OF INVESTMENTS (continued) | September 30, 2024 |
TOTAL RETURN BOND FUND | |
| | Face
Amount~ | | | Value | |
KREF Ltd. | | | | | | | | |
2021-FL2 AS, 6.50% (1 Month Term SOFR + 1.41%, Rate Floor: 1.30%) due 02/15/39◊,4 | | | 19,300,000 | | | $ | 18,886,335 | |
2021-FL2 C, 7.20% (1 Month Term SOFR + 2.11%, Rate Floor: 2.00%) due 02/15/39◊,4 | | | 16,600,000 | | | | 15,868,883 | |
Golub Capital Partners CLO 49M Ltd. | | | | | | | | |
2021-49A BR, 7.44% (3 Month Term SOFR + 2.16%, Rate Floor: 2.16%) due 08/26/33◊,4 | | | 21,695,000 | | | | 21,614,438 | |
2021-49A CR, 8.14% (3 Month Term SOFR + 2.86%, Rate Floor: 2.86%) due 08/26/33◊,4 | | | 12,600,000 | | | | 12,854,538 | |
Madison Park Funding XLVIII Ltd. | | | | | | | | |
2021-48A B, 6.99% (3 Month Term SOFR + 1.71%, Rate Floor: 1.71%) due 04/19/33◊,4 | | | 27,500,000 | | | | 27,532,084 | |
2021-48A C, 7.54% (3 Month Term SOFR + 2.26%, Rate Floor: 2.26%) due 04/19/33◊,4 | | | 6,650,000 | | | | 6,668,849 | |
BCC Middle Market CLO LLC | | | | | | | | |
2021-1A A1R, 7.06% (3 Month Term SOFR + 1.76%, Rate Floor: 1.50%) due 10/15/33◊,4 | | | 30,450,000 | | | | 30,483,191 | |
Owl Rock CLO II Ltd. | | | | | | | | |
2021-2A ALR, 7.09% (3 Month Term SOFR + 1.81%, Rate Floor: 1.55%) due 04/20/33◊,4 | | | 30,350,000 | | | | 30,361,053 | |
Neuberger Berman Loan Advisers CLO 40 Ltd. | | | | | | | | |
2021-40A B, 6.95% (3 Month Term SOFR + 1.66%, Rate Floor: 1.40%) due 04/16/33◊,4 | | | 26,700,000 | | | | 26,752,463 | |
2021-40A C, 7.30% (3 Month Term SOFR + 2.01%, Rate Floor: 1.75%) due 04/16/33◊,4 | | | 2,500,000 | | | | 2,504,911 | |
MidOcean Credit CLO VII | | | | | | | | |
2020-7A BR, 7.16% (3 Month Term SOFR + 1.86%, Rate Floor: 0.00%) due 07/15/29◊,4 | | | 27,500,000 | | | | 27,591,336 | |
STWD Ltd. | | | | | | | | |
2019-FL1 B, 6.81% (1 Month Term SOFR + 1.71%, Rate Floor: 1.71%) due 07/15/38◊,4 | | | 11,210,000 | | | | 11,164,817 | |
2019-FL1 C, 7.16% (1 Month Term SOFR + 2.06%, Rate Floor: 2.06%) due 07/15/38◊,4 | | | 8,800,000 | | | | 8,652,697 | |
2021-FL2 A, 6.33% (1 Month Term SOFR + 1.31%, Rate Floor: 1.20%) due 04/18/38◊,4 | | | 3,946,335 | | | | 3,889,644 | |
2021-FL2 C, 7.23% (1 Month Term SOFR + 2.21%, Rate Floor: 2.10%) due 04/18/38◊,4 | | | 2,820,000 | | | | 2,711,092 | |
2019-FL1 AS, 6.61% (1 Month Term SOFR + 1.51%, Rate Floor: 1.51%) due 07/15/38◊,4 | | | 310,327 | | | | 309,994 | |
Fontainbleau Vegas | | | | | | | | |
10.77% (1 Month Term SOFR + 5.65%, Rate Floor: 5.65%) due 01/31/26◊,††† | | | 26,250,000 | | | | 26,250,000 | |
BSPDF Issuer Ltd. | | | | | | | | |
2021-FL1 C, 7.46% (1 Month Term SOFR + 2.36%, Rate Floor: 2.25%) due 10/15/36◊,4 | | | 15,300,000 | | | | 14,701,046 | |
2021-FL1 B, 7.01% (1 Month Term SOFR + 1.91%, Rate Floor: 1.80%) due 10/15/36◊,4 | | | 6,500,000 | | | | 6,253,883 | |
2021-FL1 D, 7.96% (1 Month Term SOFR + 2.86%, Rate Floor: 2.75%) due 10/15/36◊,4 | | | 3,500,000 | | | | 3,367,609 | |
Madison Park Funding LIII Ltd. | | | | | | | | |
2022-53A B, 7.03% (3 Month Term SOFR + 1.75%, Rate Floor: 1.75%) due 04/21/35◊,4 | | | 24,000,000 | | | | 24,051,418 | |
BDS Ltd. | | | | | | | | |
2021-FL9 C, 7.03% (1 Month Term SOFR + 2.01%, Rate Floor: 1.90%) due 11/16/38◊,4 | | | 19,500,000 | | | | 18,891,138 | |
2021-FL9 D, 7.38% (1 Month Term SOFR + 2.36%, Rate Floor: 2.25%) due 11/16/38◊,4 | | | 4,400,000 | | | | 4,199,259 | |
Cerberus Loan Funding XXXI, LP | | | | | | | | |
2021-1A C, 8.16% (3 Month Term SOFR + 2.86%, Rate Floor: 2.60%) due 04/15/32◊,4 | | | 12,000,000 | | | | 12,023,467 | |
2021-1A A, 7.06% (3 Month Term SOFR + 1.76%, Rate Floor: 1.50%) due 04/15/32◊,4 | | | 10,471,328 | | | | 10,479,663 | |
ABPCI Direct Lending Fund CLO II LLC | | | | | | | | |
2024-1A A1RR, 6.58% (3 Month Term SOFR + 1.65%, Rate Floor: 1.65%) due 07/20/37◊,4 | | | 22,500,000 | | | | 22,498,184 | |
Cerberus Loan Funding XLVI, LP | | | | | | | | |
2024-2A A, 7.16% (3 Month Term SOFR + 1.85%, Rate Floor: 1.85%) due 07/15/36◊,4 | | | 16,500,000 | | | | 16,541,012 | |
2024-2A B, 7.61% (3 Month Term SOFR + 2.30%, Rate Floor: 2.30%) due 07/15/36◊,4 | | | 5,900,000 | | | | 5,899,137 | |
KREF Funding V LLC | | | | | | | | |
6.96% (1 Month Term SOFR + 1.86%, Rate Floor: 1.86%) due 06/25/26◊,††† | | | 22,081,647 | | | | 21,940,325 | |
0.15% due 06/25/26†††,7 | | | 313,636,364 | | | | 335,591 | |
FS RIALTO | | | | | | | | |
2021-FL2 C, 7.26% (1 Month Term SOFR + 2.16%, Rate Floor: 2.16%) due 05/16/38◊,4 | | | 15,665,000 | | | | 15,081,521 | |
2021-FL2 A, 6.43% (1 Month Term SOFR + 1.33%, Rate Floor: 1.33%) due 05/16/38◊,4 | | | 5,087,409 | | | | 5,076,230 | |
240 | THE GUGGENHEIM FUNDS ANNUAL REPORT | SEE NOTES TO FINANCIAL STATEMENTS. |
SCHEDULE OF INVESTMENTS (continued) | September 30, 2024 |
TOTAL RETURN BOND FUND | |
| | Face
Amount~ | | | Value | |
Madison Park Funding LVIII Ltd. | | | | | | | | |
2024-58A B, 7.27% (3 Month Term SOFR + 1.95%, Rate Floor: 1.95%) due 04/25/37◊,4 | | | 11,700,000 | | | $ | 11,797,917 | |
2024-58A C, 7.77% (3 Month Term SOFR + 2.45%, Rate Floor: 2.45%) due 04/25/37◊,4 | | | 8,250,000 | | | | 8,354,358 | |
VOYA CLO | | | | | | | | |
2024-2A B, 7.12% (3 Month Term SOFR + 1.80%, Rate Floor: 1.80%) due 07/20/37◊,4 | | | 14,750,000 | | | | 14,783,649 | |
2021-2A BR, 7.71% (3 Month Term SOFR + 2.41%, Rate Floor: 2.15%) due 06/07/30◊,4 | | | 4,950,000 | | | | 4,966,921 | |
Recette CLO Ltd. | | | | | | | | |
2021-1A BRR, 6.94% (3 Month Term SOFR + 1.66%, Rate Floor: 0.00%) due 04/20/34◊,4 | | | 9,800,000 | | | | 9,800,000 | |
2021-1A CRR, 7.29% (3 Month Term SOFR + 2.01%, Rate Floor: 0.00%) due 04/20/34◊,4 | | | 9,200,000 | | | | 9,214,474 | |
Fortress Credit Opportunities XI CLO Ltd. | | | | | | | | |
2018-11A A1T, 6.86% (3 Month Term SOFR + 1.56%, Rate Floor: 0.00%) due 04/15/31◊,4 | | | 16,236,426 | | | | 16,239,534 | |
2018-11A C, 8.06% (3 Month Term SOFR + 2.76%, Rate Floor: 0.00%) due 04/15/31◊,4 | | | 2,300,000 | | | | 2,287,108 | |
Neuberger Berman Loan Advisers CLO 32 Ltd. | | | | | | | | |
2021-32A BR, 6.94% (3 Month Term SOFR + 1.66%, Rate Floor: 1.40%) due 01/20/32◊,4 | | | 14,100,000 | | | | 14,102,105 | |
2021-32A CR, 7.24% (3 Month Term SOFR + 1.96%, Rate Floor: 1.70%) due 01/20/32◊,4 | | | 4,200,000 | | | | 4,209,410 | |
BSPRT Issuer Ltd. | | | | | | | | |
2021-FL7 C, 7.51% (1 Month Term SOFR + 2.41%, Rate Floor: 2.41%) due 12/15/38◊,4 | | | 7,250,000 | | | | 7,127,740 | |
2021-FL6 C, 7.26% (1 Month Term SOFR + 2.16%, Rate Floor: 2.05%) due 03/15/36◊,4 | | | 5,550,000 | | | | 5,235,529 | |
2021-FL7 B, 7.26% (1 Month Term SOFR + 2.16%, Rate Floor: 2.16%) due 12/15/38◊,4 | | | 4,875,000 | | | | 4,790,926 | |
Cerberus Loan Funding XXXVIII, LP | | | | | | | | |
2022-2A A1, 8.05% (3 Month Term SOFR + 2.75%, Rate Floor: 2.75%) due 10/15/34◊,4 | | | 16,570,000 | | | | 16,717,254 | |
Venture XIV CLO Ltd. | | | | | | | | |
2020-14A CRR, 7.57% (3 Month Term SOFR + 2.51%, Rate Floor: 2.25%) due 08/28/29◊,4 | | | 15,676,361 | | | | 15,692,372 | |
Owl Rock CLO I LLC | | | | | | | | |
2024-1A ANR, 7.53% (3 Month Term SOFR + 2.40%, Rate Floor: 2.40%) due 02/20/36◊,4 | | | 14,400,000 | | | | 14,561,885 | |
2024-1A BR, 8.38% (3 Month Term SOFR + 3.25%, Rate Floor: 3.25%) due 02/20/36◊,4 | | | 1,100,000 | | | | 1,103,663 | |
Dryden 36 Senior Loan Fund | | | | | | | | |
2020-36A CR3, 7.61% (3 Month Term SOFR + 2.31%, Rate Floor: 2.05%) due 04/15/29◊,4 | | | 15,200,000 | | | | 15,245,556 | |
Owl Rock CLO XIII LLC | | | | | | | | |
2023-13A B, 8.16% (3 Month Term SOFR + 3.35%, Rate Floor: 3.35%) due 09/20/35◊,4 | | | 14,750,000 | | | | 14,806,652 | |
Madison Park Funding Ltd. | | | | | | | | |
2024-69A B, 7.28% (3 Month Term SOFR + 1.95%, Rate Floor: 1.95%) due 07/25/37◊,4 | | | 14,500,000 | | | | 14,585,682 | |
Ares Direct Lending CLO 2 LLC | | | | | | | | |
2024-2A C, due 10/20/36◊,†††,4 | | | 13,600,000 | | | | 13,675,344 | |
Octagon Investment Partners 49 Ltd. | | | | | | | | |
2024-5A BR, 7.25% (3 Month Term SOFR + 1.95%, Rate Floor: 1.95%) due 04/15/37◊,4 | | | 12,800,000 | | | | 12,873,887 | |
BDS LLC | | | | | | | | |
2024-FL13 A, 6.78% (1 Month Term SOFR + 1.58%, Rate Floor: 1.58%) due 09/19/39◊,4 | | | 5,000,000 | | | | 4,987,434 | |
2024-FL13 AS, 7.19% (1 Month Term SOFR + 1.99%, Rate Floor: 1.99%) due 09/19/39◊,4 | | | 4,000,000 | | | | 3,989,927 | |
2024-FL13 B, 7.44% (1 Month Term SOFR + 2.24%, Rate Floor: 2.24%) due 09/19/39◊,4 | | | 3,900,000 | | | | 3,890,174 | |
BSPRT Issuer LLC | | | | | | | | |
2024-FL11 AS, 7.26% (1 Month Term SOFR + 2.10%, Rate Floor: 2.10%) due 07/15/39◊,4 | | | 8,900,000 | | | | 8,883,313 | |
2024-FL11 B, 7.46% (1 Month Term SOFR + 2.29%, Rate Floor: 2.29%) due 07/15/39◊,4 | | | 3,800,000 | | | | 3,792,875 | |
PFP Ltd. | | | | | | | | |
2024-11 A, 6.92% (1 Month Term SOFR + 1.83%, Rate Floor: 1.83%) due 09/17/39◊,4 | | | 7,000,000 | | | | 6,982,816 | |
2024-11 AS, 7.27% (1 Month Term SOFR + 2.19%, Rate Floor: 2.19%) due 09/17/39◊,4 | | | 5,300,000 | | | | 5,286,899 | |
Greystone Commercial Real Estate Notes | | | | | | | | |
2021-FL3 C, 7.21% (1 Month Term SOFR + 2.11%, Rate Floor: 2.00%) due 07/15/39◊,4 | | | 12,000,000 | | | | 11,890,175 | |
BRSP Ltd. | | | | | | | | |
2024-FL2 A, 6.91% (1 Month Term SOFR + 1.95%, Rate Floor: 1.95%) due 08/19/37◊,4 | | | 5,650,000 | | | | 5,636,373 | |
SEE NOTES TO FINANCIAL STATEMENTS. | THE GUGGENHEIM FUNDS ANNUAL REPORT | 241 |
SCHEDULE OF INVESTMENTS (continued) | September 30, 2024 |
TOTAL RETURN BOND FUND | |
| | Face
Amount~ | | | Value | |
2021-FL1 D, 7.78% (1 Month Term SOFR + 2.81%, Rate Floor: 2.70%) due 08/19/38◊,4 | | | 4,200,000 | | | $ | 4,036,365 | |
2024-FL2 AS, 7.35% (1 Month Term SOFR + 2.38%, Rate Floor: 2.38%) due 08/19/37◊,4 | | | 1,850,000 | | | | 1,845,435 | |
Golub Capital Partners CLO 17 Ltd. | | | | | | | | |
2017-17A A1R, 7.20% (3 Month Term SOFR + 1.91%, Rate Floor: 0.00%) due 10/25/30◊,4 | | | 10,863,176 | | | | 10,869,818 | |
NewStar Fairfield Fund CLO Ltd. | | | | | | | | |
2018-2A A1N, 6.81% (3 Month Term SOFR + 1.53%, Rate Floor: 1.27%) due 04/20/30◊,4 | | | 10,309,260 | | | | 10,311,746 | |
Golub Capital Partners CLO 46 Ltd. | | | | | | | | |
2024-46A BR, 7.58% (3 Month Term SOFR + 2.30%, Rate Floor: 2.30%) due 04/20/37◊,4 | | | 10,300,000 | | | | 10,299,119 | |
Neuberger Berman CLO XVI-S Ltd. | | | | | | | | |
2021-16SA BR, 6.96% (3 Month Term SOFR + 1.66%, Rate Floor: 1.40%) due 04/15/34◊,4 | | | 10,200,000 | | | | 10,201,757 | |
HPS Loan Management Ltd. | | | | | | | | |
2018-2016 BR, 7.14% (3 Month Term SOFR + 1.86%, Rate Floor: 1.60%) due 07/20/30◊,4 | | | 9,500,000 | | | | 9,516,502 | |
Neuberger Berman Loan Advisers CLO 47 Ltd. | | | | | | | | |
2022-47A B, 7.10% (3 Month Term SOFR + 1.80%, Rate Floor: 1.80%) due 04/14/35◊,4 | | | 9,000,000 | | | | 9,033,940 | |
Boyce Park CLO Ltd. | | | | | | | | |
2022-1A B1, 7.03% (3 Month Term SOFR + 1.75%, Rate Floor: 1.75%) due 04/21/35◊,4 | | | 8,800,000 | | | | 8,814,362 | |
Dryden 37 Senior Loan Fund | | | | | | | | |
2015-37A Q, due 01/15/314,11 | | | 10,000,000 | | | | 6,912,608 | |
ACRE Commercial Mortgage Ltd. | | | | | | | | |
2021-FL4 B, 6.53% (1 Month Term SOFR + 1.51%, Rate Floor: 1.40%) due 12/18/37◊,4 | | | 3,100,000 | | | | 3,086,572 | |
2021-FL4 C, 6.88% (1 Month Term SOFR + 1.86%, Rate Floor: 1.75%) due 12/18/37◊,4 | | | 3,100,000 | | | | 3,079,121 | |
Barings CLO Limited 2022-III | | | | | | | | |
2024-3A BR, due 10/20/37◊,4 | | | 5,950,000 | | | | 5,950,000 | |
HGI CRE CLO Ltd. | | | | | | | | |
2021-FL2 B, 6.71% (1 Month Term SOFR + 1.61%, Rate Floor: 1.61%) due 09/17/36◊,4 | | | 5,000,000 | | | | 4,845,090 | |
2021-FL2 C, 7.01% (1 Month Term SOFR + 1.91%, Rate Floor: 1.91%) due 09/17/36◊,4 | | | 1,000,000 | | | | 961,166 | |
Sound Point CLO XXIV | | | | | | | | |
2021-3A B1R, 7.25% (3 Month Term SOFR + 1.96%, Rate Floor: 1.96%) due 10/25/34◊,4 | | | 5,150,000 | | | | 5,152,596 | |
Owl Rock CLO XVII LLC | | | | | | | | |
2024-17A B, 7.23% (3 Month Term SOFR + 1.95%, Rate Floor: 1.95%) due 07/15/36◊,4 | | | 4,300,000 | | | | 4,304,101 | |
Shackleton CLO Ltd. | | | | | | | | |
2021-16A B, 7.29% (3 Month Term SOFR + 2.01%, Rate Floor: 1.75%) due 10/20/34◊,4 | | | 3,900,000 | | | | 3,896,527 | |
MF1 Multifamily Housing Mortgage Loan Trust | | | | | | | | |
2021-FL6 D, 7.68% (1 Month Term SOFR + 2.66%, Rate Floor: 2.55%) due 07/16/36◊,4 | | | 3,800,000 | | | | 3,665,243 | |
Dryden XXVI Senior Loan Fund | | | | | | | | |
2018-26A CR, 7.41% (3 Month Term SOFR + 2.11%, Rate Floor: 0.00%) due 04/15/29◊,4 | | | 3,500,000 | | | | 3,508,393 | |
Golub Capital Partners CLO 25M Ltd. | | | | | | | | |
2018-25A AR, 6.88% (3 Month Term SOFR + 1.64%, Rate Floor: 1.38%) due 05/05/30◊,4 | | | 2,647,946 | | | | 2,650,027 | |
Allegro CLO VII Ltd. | | | | | | | | |
2024-1A CR, 7.30% (3 Month Term SOFR + 2.00%, Rate Floor: 2.00%) due 06/13/31◊,4 | | | 2,500,000 | | | | 2,506,220 | |
Sound Point CLO XXXI Ltd. | | | | | | | | |
2021-3A B, 7.20% (3 Month Term SOFR + 1.91%, Rate Floor: 1.65%) due 10/25/34◊,4 | | | 2,200,000 | | | | 2,203,566 | |
Carlyle Global Market Strategies CLO Ltd. | | | | | | | | |
2012-3A SUB, due 01/14/324,11 | | | 8,920,000 | | | | 1,839,174 | |
Voya CLO Ltd. | | | | | | | | |
2013-1A INC, due 10/15/304,11 | | | 10,575,071 | | | | 283,200 | |
Wellfleet CLO Ltd. | | | | | | | | |
2018-2A A2R, 7.12% (3 Month Term SOFR + 1.84%, Rate Floor: 1.58%) due 10/20/28◊,4 | | | 181,742 | | | | 181,729 | |
Great Lakes CLO Ltd. | | | | | | | | |
2014-1A SUB, due 10/15/294,11 | | | 461,538 | | | | 174,297 | |
Treman Park CLO Ltd. | | | | | | | | |
2015-1A SUB, due 10/20/284,11 | | | 6,859,005 | | | | 60,977 | |
Babson CLO Ltd. | | | | | | | | |
2014-IA SUB, due 07/20/254,11 | | | 1,300,000 | | | | 31,083 | |
Venture XIII CLO Ltd. | | | | | | | | |
2013-13A SUB, due 09/10/294,11 | | | 3,700,000 | | | | 370 | |
Copper River CLO Ltd. | | | | | | | | |
2007-1A INC, due 01/20/219,11 | | | 1,500,000 | | | | 150 | |
Total Collateralized Loan Obligations | | | | | | | 3,006,939,326 | |
| | | | | | | | | |
Financial - 2.5% | | | | | | | | |
Station Place Securitization Trust | | | | | | | | |
2024-SP2, 6.81% (1 Month Term SOFR + 1.70%, Rate Floor: 1.70%) due 07/12/26◊,†††,4 | | | 50,500,000 | | | | 50,500,000 | |
242 | THE GUGGENHEIM FUNDS ANNUAL REPORT | SEE NOTES TO FINANCIAL STATEMENTS. |
SCHEDULE OF INVESTMENTS (continued) | September 30, 2024 |
TOTAL RETURN BOND FUND | |
| | Face
Amount~ | | | Value | |
2024-SP1, 6.51% (1 Month Term SOFR + 1.40%, Rate Floor: 1.40%) due 08/12/25◊,†††,4 | | | 50,500,000 | | | $ | 50,500,000 | |
2023-SP1, 6.96% (1 Month Term SOFR + 1.85%, Rate Floor: 1.85%) due 10/15/24◊,†††,4 | | | 12,650,000 | | | | 12,650,000 | |
KKR Core Holding Company LLC | | | | | | | | |
4.00% due 08/12/31††† | | | 73,754,774 | | | | 68,794,028 | |
HV Eight LLC | | | | | | | | |
7.48% (3 Month EURIBOR + 3.50%, Rate Floor: 3.50%) due 12/31/27◊,††† | | | EUR 51,954,306 | | | | 58,008,609 | |
Strategic Partners Fund VIII, LP | | | | | | | | |
7.85% (1 Month Term SOFR + 2.60%, Rate Floor: 2.60%) due 03/10/26◊,††† | | | 55,324,343 | | | | 54,805,953 | |
LVNV Funding LLC | | | | | | | | |
7.80% due 11/05/28††† | | | 39,400,000 | | | | 42,034,678 | |
6.84% due 06/12/29††† | | | 11,400,000 | | | | 11,815,758 | |
ST Group Food Industries Holdings Ltd. | | | | | | | | |
due 11/10/25 | | | 34,275,000 | | | | 34,275,000 | |
due 11/10/25 | | | 17,125,000 | | | | 17,125,000 | |
Project Onyx I | | | | | | | | |
8.47% (3 Month Term SOFR + 3.15%, Rate Floor: 3.15%) due 01/26/27◊,††† | | | 48,296,822 | | | | 48,183,808 | |
Lightning A | | | | | | | | |
5.50% due 03/01/37††† | | | 42,784,739 | | | | 40,132,085 | |
Thunderbird A | | | | | | | | |
5.50% due 03/01/37††† | | | 42,483,039 | | | | 39,849,091 | |
Project Onyx | | | | | | | | |
8.07% (3 Month Term SOFR + 2.75%, Rate Floor: 3.15%) due 01/26/27◊,††† | | | 26,568,456 | | | | 26,488,924 | |
Madison Avenue Secured Funding Trust | | | | | | | | |
2023-2, 6.96% (1 Month Term SOFR + 1.85%, Rate Floor: 1.85%) due 10/15/24◊,†††,4 | | | 25,350,000 | | | | 25,350,000 | |
HarbourVest Structured Solutions IV Holdings, LP | | | | | | | | |
8.28% (3 Month Term SOFR + 2.95%, Rate Floor: 2.45%) due 09/15/26◊,††† | | | 16,236,174 | | | | 16,167,171 | |
6.38% (3 Month EURIBOR + 2.45%, Rate Floor: 2.45%) due 09/15/26◊,††† | | | EUR 8,091,316 | | | | 8,908,557 | |
Ceamer Finance LLC | | | | | | | | |
3.69% due 03/24/31††† | | | 17,009,952 | | | | 16,130,708 | |
6.92% due 11/15/37††† | | | 6,701,280 | | | | 6,745,307 | |
Project Onyx II | | | | | | | | |
8.47% (3 Month Term SOFR + 3.15%, Rate Floor: 3.15%) due 01/26/27◊,††† | | | 13,791,741 | | | | 13,695,888 | |
Bib Merchant Voucher Receivables Ltd. | | | | | | | | |
4.18% due 04/07/28††† | | | 13,046,138 | | | | 12,867,667 | |
Nassau LLC | | | | | | | | |
2019-1, 3.98% due 08/15/349 | | | 9,373,745 | | | | 8,580,553 | |
Aesf Vi Verdi, LP | | | | | | | | |
7.63% (3 Month Term SOFR + 2.30%, Rate Floor: 2.30%) due 11/25/24◊,††† | | | 3,888,126 | | | | 3,888,126 | |
Industrial DPR Funding Ltd. | | | | | | | | |
2016-1A, 5.24% due 04/15/264 | | | 1,140,373 | | | | 1,134,403 | |
Total Financial | | | | | | | 668,631,314 | |
Transport-Aircraft - 1.9% | | | | | | | | |
AASET Trust | | | | | | | | |
2024-1A, 6.26% due 05/16/494 | | | 50,007,235 | | | | 51,935,424 | |
2021-1A, 2.95% due 11/16/414 | | | 50,196,046 | | | | 46,716,351 | |
2021-2A, 2.80% due 01/15/474 | | | 29,726,637 | | | | 27,211,302 | |
2020-1A, 3.35% due 01/16/404 | | | 12,199,987 | | | | 11,590,998 | |
2019-2, 3.38% due 10/16/394 | | | 1,290,636 | | | | 1,239,785 | |
2019-1, 3.84% due 05/15/394 | | | 930,628 | | | | 898,268 | |
Navigator Aircraft ABS Ltd. | | | | | | | | |
2021-1, 2.77% due 11/15/464 | | | 56,658,681 | | | | 52,391,342 | |
Next10, Inc. | | | | | | | | |
6.73% due 12/15/30††† | | | 48,047,006 | | | | 49,577,303 | |
Slam Ltd. | | | | | | | | |
2024-1A, 5.34% due 09/15/494 | | | 32,400,000 | | | | 32,312,744 | |
2021-1A, 2.43% due 06/15/464 | | | 14,483,658 | | | | 13,350,413 | |
2021-1A, 3.42% due 06/15/464 | | | 1,195,350 | | | | 1,081,061 | |
Navigator Aviation Ltd. | | | | | | | | |
2024-1, 5.40% due 08/15/494 | | | 41,800,000 | | | | 41,740,477 | |
Lunar Structured Aircraft Portfolio Notes | | | | | | | | |
2021-1, 2.64% due 10/15/464 | | | 31,586,334 | | | | 28,921,389 | |
Castlelake Aircraft Structured Trust | | | | | | | | |
2021-1A, 3.47% due 01/15/464 | | | 28,295,429 | | | | 27,353,293 | |
Sprite Ltd. | | | | | | | | |
2021-1, 3.75% due 11/15/464 | | | 23,075,731 | | | | 22,091,637 | |
Sapphire Aviation Finance II Ltd. | | | | | | | | |
2020-1A, 3.23% due 03/15/404 | | | 22,466,232 | | | | 20,621,529 | |
KDAC Aviation Finance Ltd. | | | | | | | | |
2017-1A, 4.21% due 12/15/424 | | | 17,016,079 | | | | 15,673,998 | |
AASET US Ltd. | | | | | | | | |
2018-2A, 4.45% due 11/18/384 | | | 15,750,943 | | | | 15,160,371 | |
WAVE LLC | | | | | | | | |
2019-1, 3.60% due 09/15/444 | | | 15,233,131 | | | | 14,091,255 | |
Sapphire Aviation Finance I Ltd. | | | | | | | | |
2018-1A, 4.25% due 03/15/404 | | | 8,889,005 | | | | 8,481,089 | |
Falcon Aerospace Ltd. | | | | | | | | |
2019-1, 3.60% due 09/15/394 | | | 6,770,852 | | | | 6,344,874 | |
2017-1, 4.58% due 02/15/424 | | | 1,426,315 | | | | 1,397,798 | |
Castlelake Aircraft Securitization Trust | | | | | | | | |
2018-1, 4.13% due 06/15/434 | | | 5,259,744 | | | | 4,905,131 | |
MAPS Ltd. | | | | | | | | |
2018-1A, 4.21% due 05/15/434 | | | 4,492,033 | | | | 4,436,098 | |
Total Transport-Aircraft | | | | | | | 499,523,930 | |
| | | | | | | | | |
Whole Business - 1.8% | | | | | | | | |
Subway Funding LLC | | | | | | | | |
2024-3A, 5.91% due 07/30/544 | | | 36,200,000 | | | | 36,228,424 | |
2024-1A, 6.51% due 07/30/544 | | | 28,550,000 | | | | 29,606,142 | |
2024-1A, 6.27% due 07/30/544 | | | 18,900,000 | | | | 19,518,436 | |
2024-1A, 6.03% due 07/30/544 | | | 9,500,000 | | | | 9,801,445 | |
Arbys Funding LLC | | | | | | | | |
2020-1A, 3.24% due 07/30/504 | | | 94,399,680 | | | | 90,126,584 | |
SERVPRO Master Issuer LLC | | | | | | | | |
2021-1A, 2.39% due 04/25/514 | | | 43,738,740 | | | | 39,844,842 | |
2022-1A, 3.13% due 01/25/524 | | | 22,912,500 | | | | 21,169,003 | |
2024-1A, 6.17% due 01/25/544 | | | 16,536,900 | | | | 16,997,697 | |
2019-1A, 3.88% due 10/25/494 | | | 6,530,340 | | | | 6,371,028 | |
SEE NOTES TO FINANCIAL STATEMENTS. | THE GUGGENHEIM FUNDS ANNUAL REPORT | 243 |
SCHEDULE OF INVESTMENTS (continued) | September 30, 2024 |
TOTAL RETURN BOND FUND | |
| | Face
Amount~ | | | Value | |
Sonic Capital LLC | | | | | | | | |
2021-1A, 2.64% due 08/20/514 | | | 23,392,520 | | | $ | 19,597,774 | |
2020-1A, 3.85% due 01/20/504 | | | 12,170,866 | | | | 11,813,786 | |
2021-1A, 2.19% due 08/20/514 | | | 9,985,180 | | | | 8,955,895 | |
2020-1A, 4.34% due 01/20/504 | | | 6,987,529 | | | | 6,684,806 | |
ServiceMaster Funding LLC | | | | | | | | |
2020-1, 3.34% due 01/30/514 | | | 27,779,485 | | | | 24,544,667 | |
2020-1, 2.84% due 01/30/514 | | | 9,241,007 | | | | 8,534,041 | |
Five Guys Holdings, Inc. | | | | | | | | |
2023-1A, 7.55% due 01/26/544 | | | 25,445,000 | | | | 26,897,693 | |
Wingstop Funding LLC | | | | | | | | |
2020-1A, 2.84% due 12/05/504 | | | 25,117,500 | | | | 23,617,731 | |
2022-1A, 3.73% due 03/05/524 | | | 1,191,000 | | | | 1,127,764 | |
Applebee’s Funding LLC / IHOP Funding LLC | | | | | | | | |
2019-1A, 4.72% due 06/05/494 | | | 22,918,500 | | | | 22,543,294 | |
Taco Bell Funding LLC | | | | | | | | |
2016-1A, 4.97% due 05/25/464 | | | 17,392,559 | | | | 17,417,489 | |
DB Master Finance LLC | | | | | | | | |
2019-1A, 4.02% due 05/20/494 | | | 15,912,500 | | | | 15,713,484 | |
Wendy’s Funding LLC | | | | | | | | |
2019-1A, 3.78% due 06/15/494 | | | 12,074,647 | | | | 11,849,656 | |
Domino’s Pizza Master Issuer LLC | | | | | | | | |
2017-1A, 4.12% due 07/25/474 | | | 7,802,000 | | | | 7,661,541 | |
Total Whole Business | | | | | | | 476,623,222 | |
| | | | | | | | | |
Infrastructure - 1.5% | | | | | | | | |
VB-S1 Issuer LLC - VBTEL | | | | | | | | |
2022-1A, 4.29% due 02/15/524 | | | 40,900,000 | | | | 39,213,644 | |
2024-1A, 5.59% due 05/15/544 | | | 28,950,000 | | | | 29,419,705 | |
2024-1A, 6.64% due 05/15/544 | | | 3,950,000 | | | | 4,070,140 | |
Stack Infrastructure Issuer LLC | | | | | | | | |
2023-3A, 5.90% due 10/25/484 | | | 31,313,000 | | | | 31,870,453 | |
2024-1A, 5.90% due 03/25/494 | | | 16,250,000 | | | | 16,679,156 | |
2020-1A, 1.89% due 08/25/454 | | | 11,624,000 | | | | 11,282,227 | |
2023-2A, 5.90% due 07/25/484 | | | 6,000,000 | | | | 6,092,865 | |
2023-1A, 5.90% due 03/25/484 | | | 6,000,000 | | | | 6,065,902 | |
Hotwire Funding LLC | | | | | | | | |
2023-1A, 8.84% due 05/20/534 | | | 31,200,000 | | | | 32,238,489 | |
2024-1A, 5.89% due 06/20/544 | | | 22,750,000 | | | | 23,339,823 | |
2021-1, 2.31% due 11/20/514 | | | 5,350,000 | | | | 5,058,828 | |
2021-1, 2.66% due 11/20/514 | | | 4,025,000 | | | | 3,759,100 | |
2024-1A, 6.67% due 06/20/544 | | | 3,150,000 | | | | 3,241,919 | |
Switch ABS Issuer LLC | | | | | | | | |
2024-2A, 5.44% due 06/25/544 | | | 52,900,000 | | | | 53,451,408 | |
2024-1A, 6.28% due 03/25/544 | | | 9,550,000 | | | | 9,757,978 | |
Aligned Data Centers Issuer LLC | | | | | | | | |
2021-1A, 1.94% due 08/15/464 | | | 47,980,000 | | | | 45,474,676 | |
2023-1A, 6.00% due 08/17/484 | | | 2,600,000 | | | | 2,652,603 | |
2023-2A, 6.50% due 11/16/484 | | | 1,345,000 | | | | 1,382,045 | |
Vantage Data Centers Issuer LLC | | | | | | | | |
2024-1A, due 09/15/544 | | | 30,250,000 | | | | 30,250,000 | |
2020-1A, 1.65% due 09/15/454 | | | 3,100,000 | | | | 2,998,246 | |
SBA Tower Trust | | | | | | | | |
4.83% due 10/15/294 | | | 22,150,000 | | | | 22,021,530 | |
6.60% due 01/15/284 | | | 3,800,000 | | | | 3,954,557 | |
Blue Stream Issuer LLC | | | | | | | | |
2023-1A, 5.40% due 05/20/534 | | | 6,625,000 | | | | 6,656,951 | |
ALLO Issuer LLC | | | | | | | | |
2024-1A, 5.94% due 07/20/544 | | | 1,000,000 | | | | 1,016,333 | |
Total Infrastructure | | | | | | | 391,948,578 | |
| | | | | | | | | |
Net Lease - 0.9% | | | | | | | | |
Capital Automotive REIT | | | | | | | | |
2020-1A, 3.48% due 02/15/504 | | | 21,879,868 | | | | 20,904,641 | |
2024-2A, 5.25% due 05/15/544 | | | 14,140,833 | | | | 14,129,082 | |
2024-3A, due 10/15/544 | | | 9,850,000 | | | | 9,506,840 | |
2024-2A, 4.90% due 05/15/544 | | | 3,453,333 | | | | 3,469,089 | |
STORE Master Funding I-VII | | | | | | | | |
2016-1A, 3.96% due 10/20/464 | | | 26,863,929 | | | | 26,063,723 | |
2016-1A, 4.32% due 10/20/464 | | | 10,637,543 | | | | 10,282,374 | |
CF Hippolyta Issuer LLC | | | | | | | | |
2022-1A, 6.11% due 08/15/624 | | | 20,275,457 | | | | 20,415,465 | |
2020-1, 2.28% due 07/15/604 | | | 10,075,718 | | | | 9,646,347 | |
CARS-DB4, LP | | | | | | | | |
2020-1A, 3.81% due 02/15/504 | | | 19,938,419 | | | | 18,083,835 | |
2020-1A, 3.25% due 02/15/504 | | | 3,380,089 | | | | 3,072,514 | |
2020-1A, 2.69% due 02/15/504 | | | 1,858,164 | | | | 1,855,729 | |
CMFT Net Lease Master Issuer LLC | | | | | | | | |
2021-1, 2.91% due 07/20/514 | | | 10,050,000 | | | | 9,159,010 | |
2021-1, 3.04% due 07/20/514 | | | 5,050,000 | | | | 4,350,346 | |
2021-1, 3.44% due 07/20/514 | | | 3,215,000 | | | | 2,803,210 | |
2021-1, 2.51% due 07/20/514 | | | 3,000,000 | | | | 2,707,186 | |
SVC ABS LLC | | | | | | | | |
2023-1A, 5.15% due 02/20/534 | | | 15,228,479 | | | | 15,076,156 | |
2023-1A, 5.55% due 02/20/534 | | | 3,486,146 | | | | 3,389,642 | |
Oak Street Investment Grade Net Lease Fund Series | | | | | | | | |
2020-1A, 2.26% due 11/20/504 | | | 14,937,500 | | | | 14,103,526 | |
STORE Master Funding LLC | | | | | | | | |
2021-1A, 2.96% due 06/20/514 | | | 12,592,000 | | | | 10,530,560 | |
2021-1A, 3.70% due 06/20/514 | | | 3,524,776 | | | | 2,955,869 | |
STORE Master Funding I LLC | | | | | | | | |
2015-1A, 4.17% due 04/20/454 | | | 9,904,177 | | | | 9,811,981 | |
New Economy Assets Phase 1 Sponsor LLC | | | | | | | | |
2021-1, 2.41% due 10/20/614 | | | 10,000,000 | | | | 8,997,815 | |
Store Master Funding I-VII XIV XIX XX XXIV XXII | | | | | | | | |
2024-1A, 5.69% due 05/20/544 | | | 5,987,500 | | | | 6,079,421 | |
CARS-DB5, LP | | | | | | | | |
2021-1A, 2.76% due 08/15/514 | | | 6,543,625 | | | | 5,545,082 | |
CARS-DB7, LP | | | | | | | | |
2023-1A, 5.75% due 09/15/534 | | | 4,368,000 | | | | 4,421,946 | |
CF Hippolyta LLC | | | | | | | | |
2020-1, 2.60% due 07/15/604 | | | 4,312,872 | | | | 3,766,697 | |
Store Master Funding I-VII | | | | | | | | |
2018-1A, 4.74% due 10/20/484 | | | 2,809,713 | | | | 2,797,023 | |
Total Net Lease | | | | | | | 243,925,109 | |
| | | | | | | | | |
Single Family Residence - 0.8% | | | | | | | | |
Tricon Residential Trust | | | | | | | | |
2023-SFR2, 5.00% due 12/17/404 | | | 31,239,000 | | | | 31,075,984 | |
2024-SFR3, 5.00% due 08/17/414 | | | 10,500,000 | | | | 10,493,332 | |
2024-SFR2, 4.75% due 06/17/404 | | | 9,993,784 | | | | 10,008,447 | |
2024-SFR3, 5.25% due 08/17/414 | | | 9,550,000 | | | | 9,585,275 | |
244 | THE GUGGENHEIM FUNDS ANNUAL REPORT | SEE NOTES TO FINANCIAL STATEMENTS. |
SCHEDULE OF INVESTMENTS (continued) | September 30, 2024 |
TOTAL RETURN BOND FUND | |
| | Face
Amount~ | | | Value | |
2024-SFR2, 5.90% due 06/17/404 | | | 9,215,000 | | | $ | 9,376,475 | |
2024-SFR2, 5.70% due 06/17/404 | | | 7,950,000 | | | | 8,089,443 | |
2021-SFR1, 2.59% due 07/17/384 | | | 7,000,000 | | | | 6,677,996 | |
2024-SFR1, 4.75% due 04/17/414 | | | 3,600,000 | | | | 3,565,676 | |
FirstKey Homes Trust | | | | | | | | |
2020-SFR2, 4.50% due 10/19/374 | | | 21,640,000 | | | | 21,085,689 | |
2020-SFR2, 4.00% due 10/19/374 | | | 20,340,000 | | | | 19,787,271 | |
2020-SFR2, 3.37% due 10/19/374 | | | 13,010,000 | | | | 12,604,300 | |
2021-SFR1, 2.19% due 08/17/384 | | | 13,174,000 | | | | 12,444,637 | |
Home Partners of America Trust | | | | | | | | |
2021-2, 2.65% due 12/17/264 | | | 46,362,940 | | | | 43,792,672 | |
2021-3, 2.80% due 01/17/414 | | | 15,170,727 | | | | 13,757,434 | |
Invitation Homes Trust | | | | | | | | |
2024-SFR1, 4.00% due 09/17/414 | | | 13,100,000 | | | | 12,522,337 | |
Total Single Family Residence | | | | | | | 224,866,968 | |
| | | | | | | | | |
Collateralized Debt Obligations - 0.4% | | | | | | | | |
Anchorage Credit Funding 4 Ltd. | | | | | | | | |
2021-4A AR, 2.72% due 04/27/394 | | | 111,754,127 | | | | 106,169,785 | |
Anchorage Credit Funding 13 Ltd. | | | | | | | | |
2021-13A A2, 2.80% due 07/27/394 | | | 2,700,000 | | | | 2,471,864 | |
2021-13A C2, 3.65% due 07/27/394 | | | 1,950,000 | | | | 1,689,063 | |
Oxford Finance Funding | | | | | | | | |
2020-1A A2, 3.10% due 02/15/284 | | | 4,188,431 | | | | 4,158,093 | |
Total Collateralized Debt Obligations | | | | | | | 114,488,805 | |
| | | | | | | | | |
Transport-Container - 0.4% | | | | | | | | |
Textainer Marine Containers VII Ltd. | | | | | | | | |
2020-1A, 2.73% due 08/21/454 | | | 38,341,278 | | | | 36,595,316 | |
2021-2A, 2.23% due 04/20/464 | | | 2,361,667 | | | | 2,176,752 | |
TIF Funding III LLC | | | | | | | | |
2024-1A, 5.48% due 04/20/494 | | | 32,051,250 | | | | 32,497,102 | |
Textainer Marine Containers Ltd. | | | | | | | | |
2021-3A, 1.94% due 08/20/464 | | | 23,345,800 | | | | 20,744,695 | |
MC Ltd. | | | | | | | | |
2021-1, 2.63% due 11/05/354 | | | 8,773,320 | | | | 8,187,967 | |
CLI Funding VIII LLC | | | | | | | | |
2021-1A, 1.64% due 02/18/464 | | | 2,515,147 | | | | 2,292,984 | |
Total Transport-Container | | | | | | | 102,494,816 | |
| | | | | | | | | |
Insurance - 0.2% | | | | | | | | |
Obra Longevity | | | | | | | | |
8.48% due 06/30/39††† | | | 40,200,000 | | | | 40,911,540 | |
CHEST | | | | | | | | |
7.13% due 03/15/43††† | | | 18,145,000 | | | | 19,045,899 | |
JGWPT XXIII LLC | | | | | | | | |
2011-1A, 4.70% due 10/15/564 | | | 1,964,339 | | | | 1,955,770 | |
JGWPT XXIV LLC | | | | | | | | |
2011-2A, 4.94% due 09/15/564 | | | 1,452,532 | | | | 1,456,552 | |
321 Henderson Receivables VI LLC | | | | | | | | |
2010-1A, 5.56% due 07/15/594 | | | 462,549 | | | | 462,773 | |
VICOF 2 | | | | | | | | |
4.00% due 02/22/30††† | | | 388,336 | | | | 379,043 | |
SPSS | | | | | | | | |
5.14% due 11/15/52†††,9 | | | 136,046 | | | | 127,445 | |
Total Insurance | | | | | | | 64,339,022 | |
Automotive - 0.1% | | | | | | | | |
Avis Budget Rental Car Funding AESOP LLC | | | | | | | | |
2023-8A, 6.66% due 02/20/304 | | | 15,350,000 | | | | 16,245,303 | |
2023-8A, 6.02% due 02/20/304 | | | 11,000,000 | | | | 11,575,070 | |
2024-3A, 5.58% due 12/20/304 | | | 8,250,000 | | | | 8,433,638 | |
Total Automotive | | | | | | | 36,254,011 | |
| | | | | | | | | |
Unsecured Consumer Loans - 0.1% | | | | | | | | |
Service Experts Issuer LLC | | | | | | | | |
2024-1A, 6.39% due 11/20/354 | | | 21,667,147 | | | | 22,337,231 | |
Foundation Finance Trust | | | | | | | | |
2024-2A, 4.93% due 03/15/504 | | | 8,200,000 | | | | 8,214,687 | |
Total Unsecured Consumer Loans | | | | | | | 30,551,918 | |
| | | | | | | | | |
Asset Backed Securities - 0.1% | | | | | | | | |
Endo Luxembourg Finance Co I SARL / Endo US, Inc. | | | | | | | | |
7.40% due 09/30/45††† | | | 15,650,000 | | | | 16,459,574 | |
Total Asset-Backed Securities | | | | |
(Cost $5,929,308,543) | | | 5,877,046,593 | |
| | | | | |
U.S. GOVERNMENT SECURITIES†† - 19.3% |
U.S. Treasury Bonds |
due 05/15/516,12 | | | 2,204,980,000 | | | | 724,319,966 | |
4.38% due 11/15/39 | | | 481,570,000 | | | | 503,748,557 | |
due 02/15/467,12 | | | 371,000,000 | | | | 143,854,093 | |
due 05/15/447,12 | | | 318,000,000 | | | | 133,323,901 | |
due 02/15/546,12 | | | 428,770,000 | | | | 132,014,501 | |
due 08/15/546,12 | | | 428,760,000 | | | | 130,064,410 | |
due 11/15/516,12 | | | 275,000,000 | | | | 88,644,867 | |
due 11/15/447,12 | | | 75,000,000 | | | | 30,734,402 | |
U.S. Treasury Notes |
4.00% due 02/15/34 | | | 612,000,000 | | | | 622,518,750 | |
4.13% due 06/15/26 | | | 453,680,000 | | | | 456,745,883 | |
3.75% due 08/31/31 | | | 214,220,000 | | | | 215,358,044 | |
4.25% due 02/28/31 | | | 197,000,000 | | | | 203,733,399 | |
4.13% due 07/31/31 | | | 170,000,000 | | | | 174,754,688 | |
3.75% due 12/31/30 | | | 157,200,000 | | | | 158,127,235 | |
4.63% due 03/15/26 | | | 4,900,000 | | | | 4,958,953 | |
3.63% due 03/31/28 | | | 2,570,000 | | | | 2,575,220 | |
3.63% due 08/31/29 | | | 1,800,000 | | | | 1,805,344 | |
2.13% due 05/15/25 | | | 1,100,000 | | | | 1,085,670 | |
4.63% due 04/30/29 | | | 840,000 | | | | 877,144 | |
4.38% due 05/15/34 | | | 50,000 | | | | 52,367 | |
3.88% due 11/30/27 | | | 4,000 | | | | 4,035 | |
United States Treasury Inflation Indexed Bonds |
2.13% due 04/15/29 | | | 310,168,738 | | | | 318,767,235 | |
0.13% due 10/15/25 | | | 217,224,448 | | | | 213,004,077 | |
0.13% due 04/15/25 | | | 210,719,524 | | | | 206,964,843 | |
0.38% due 01/15/27 | | | 210,144,083 | | | | 204,162,604 | |
1.25% due 04/15/28 | | | 142,137,730 | | | | 140,788,945 | |
0.50% due 01/15/28 | | | 129,614,932 | | | | 125,494,683 | |
0.13% due 04/15/27 | | | 106,563,327 | | | | 102,583,647 | |
1.38% due 07/15/33 | | | 28,966,571 | | | | 28,551,239 | |
U.S. Treasury Strip Principal |
due 02/15/516,12 | | | 280,000,000 | | | | 92,512,837 | |
Total U.S. Government Securities | | | | |
(Cost $5,137,358,349) | | | | | | | 5,162,131,539 | |
SEE NOTES TO FINANCIAL STATEMENTS. | THE GUGGENHEIM FUNDS ANNUAL REPORT | 245 |
SCHEDULE OF INVESTMENTS (continued) | September 30, 2024 |
TOTAL RETURN BOND FUND | |
| | Face
Amount~ | | | Value | |
SENIOR FLOATING RATE INTERESTS††,◊ - 3.2% |
Financial - 0.8% | | | | | | | | |
Higginbotham Insurance Agency, Inc. | | | | | | | | |
9.35% (1 Month Term SOFR + 4.50%, Rate Floor: 4.50%) due 11/24/28††† | | | 49,847,888 | | | $ | 49,455,265 | |
9.60% (1 Month Term SOFR + 4.75%, Rate Floor: 5.75%) due 11/24/28††† | | | 1,392,168 | | | | 1,381,203 | |
Jane Street Group LLC | | | | | | | | |
7.46% (3 Month Term SOFR + 2.61%, Rate Floor: 2.61%) due 01/26/28 | | | 35,294,865 | | | | 35,254,629 | |
Citadel Securities, LP | | | | | | | | |
7.10% (1 Month Term SOFR + 2.25%, Rate Floor: 2.25%) due 07/29/30 | | | 24,709,613 | | | | 24,687,127 | |
Asurion LLC | | | | | | | | |
9.10% (1 Month Term SOFR + 4.25%, Rate Floor: 4.25%) due 09/19/30 | | | 23,690,000 | | | | 23,245,812 | |
Alliant Holdings Intermediate LLC | | | | | | | | |
due 09/19/31 | | | 19,665,000 | | | | 19,548,190 | |
HighTower Holding LLC | | | | | | | | |
8.75% (3 Month Term SOFR + 3.50%, Rate Floor: 3.50%) due 04/21/28 | | | 17,329,559 | | | | 17,318,815 | |
Eisner Advisory Group | | | | | | | | |
8.85% (1 Month Term SOFR + 4.00%, Rate Floor: 4.50%) due 02/28/31 | | | 16,822,089 | | | | 16,855,229 | |
Eagle Point Holdings Borrower LLC | | | | | | | | |
9.06% (3 Month Term SOFR + 3.75%, Rate Floor: 4.75%) due 03/31/28††† | | | 9,918,462 | | | | 9,918,462 | |
Osaic Holdings, Inc. | | | | | | | | |
8.85% (1 Month Term SOFR + 4.00%, Rate Floor: 4.00%) due 08/17/28 | | | 4,488,750 | | | | 4,436,366 | |
Worldpay | | | | | | | | |
7.10% (3 Month Term SOFR + 2.50%, Rate Floor: 2.50%) due 01/31/31 | | | 2,895,000 | | | | 2,893,784 | |
Virtu Financial | | | | | | | | |
7.60% (1 Month Term SOFR + 2.75%, Rate Floor: 3.25%) due 06/21/31 | | | 2,070,000 | | | | 2,070,000 | |
CPI Holdco B LLC | | | | | | | | |
6.85% (1 Month Term SOFR + 2.00%, Rate Floor: 2.00%) due 05/17/31 | | | 1,150,000 | | | | 1,144,043 | |
Total Financial | | | | | | | 208,208,925 | |
| | | | | | | | | |
Consumer, Non-cyclical - 0.7% | | | | | | | | |
PetIQ LLC | | | | | | | | |
9.22% (1 Month Term SOFR + 4.25%, Rate Floor: 4.75%) due 04/13/28 | | | 27,413,178 | | | | 27,378,912 | |
Nidda Healthcare Holding GmbH | | | | | | | | |
7.10% (1 Month EURIBOR + 3.50%, Rate Floor: 3.50%) due 08/21/26 | | | EUR 12,766,306 | | | | 14,201,040 | |
due 02/21/30 | | | EUR 11,400,000 | | | | 12,689,689 | |
Quirch Foods Holdings LLC | | | | | | | | |
9.89% (3 Month Term SOFR + 5.00%, Rate Floor: 6.00%) due 10/27/27 | | | 28,375,749 | | | | 26,673,204 | |
Froneri US, Inc. | | | | | | | | |
due 09/16/31 | | | 23,215,000 | | | | 23,114,943 | |
Southern Veterinary Partners LLC | | | | | | | | |
8.00% (3 Month Term SOFR + 3.75%, Rate Floor: 4.75%) due 10/05/27 | | | 19,327,935 | | | | 19,336,052 | |
Midwest Veterinary Partners LLC | | | | | | | | |
8.87% (1 Month Term SOFR + 3.75%, Rate Floor: 4.50%) due 04/27/28 | | | 18,770,456 | | | | 18,752,812 | |
Women’s Care Holdings, Inc. | | | | | | | | |
9.85% (3 Month Term SOFR + 4.50%, Rate Floor: 5.25%) due 01/15/28 | | | 15,554,940 | | | | 14,945,653 | |
US Foods, Inc. | | | | | | | | |
due 11/26/31 | | | 10,200,000 | | | | 10,212,750 | |
Blue Ribbon LLC | | | | | | | | |
11.58% (3 Month Term SOFR + 6.00%, Rate Floor: 6.75%) due 05/08/28 | | | 12,251,250 | | | | 8,524,787 | |
HAH Group Holding Co. LLC | | | | | | | | |
10.26% (3 Month Term SOFR + 5.00%, Rate Floor: 6.00%) due 09/17/31 | | | 3,953,721 | | | | 3,952,061 | |
10.35% (3 Month Term SOFR + 5.00%, Rate Floor: 6.00%) due 09/17/31 | | | 500,303 | | | | 500,093 | |
CHG PPC Parent LLC | | | | | | | | |
7.71% (1 Month Term SOFR + 2.75%, Rate Floor: 3.25%) due 12/08/28 | | | 1,536,009 | | | | 1,529,297 | |
Elanco Animal Health, Inc. | | | | | | | | |
7.05% (1 Month Term SOFR + 1.75%, Rate Floor: 1.75%) due 08/01/27 | | | 1,149,255 | | | | 1,146,302 | |
Medline Borrower LP | | | | | | | | |
7.10% (1 Month Term SOFR + 2.25%, Rate Floor: 2.75%) due 10/23/28 | | | 850,000 | | | | 848,785 | |
Energizer Holdings, Inc. | | | | | | | | |
6.92% (1 Month Term SOFR + 2.00%, Rate Floor: 2.00%) due 12/22/27 | | | 419,928 | | | | 419,752 | |
Total Consumer, Non-cyclical | | | | | | | 184,226,132 | |
| | | | | | | | | |
Industrial - 0.6% | | | | | | | | |
Quikrete Holdings, Inc. | | | | | | | | |
7.10% (1 Month Term SOFR + 2.25%, Rate Floor: 2.25%) due 03/19/29 | | | 16,417,500 | | | | 16,413,724 | |
7.35% (1 Month Term SOFR + 2.50%, Rate Floor: 2.50%) due 04/14/31 | | | 11,741,000 | | | | 11,741,000 | |
EMRLD Borrower, LP | | | | | | | | |
7.56% (3 Month Term SOFR + 2.50%, Rate Floor: 2.50%) due 05/31/30 | | | 18,381,100 | | | | 18,335,147 | |
7.56% (3 Month Term SOFR + 2.50%, Rate Floor: 2.50%) due 08/04/31 | | | 7,770,000 | | | | 7,749,176 | |
Capstone Acquisition Holdings, Inc. | | | | | | | | |
9.45% (1 Month Term SOFR + 4.50%, Rate Floor: 5.50%) due 11/12/29††† | | | 21,037,715 | | | | 20,918,456 | |
Clean Harbors, Inc. | | | | | | | | |
6.71% (1 Month Term SOFR + 1.75%, Rate Floor: 1.75%) due 10/08/28 | | | 18,259,184 | | | | 18,286,573 | |
United Rentals, Inc. | | | | | | | | |
6.60% (1 Month Term SOFR + 1.75%, Rate Floor: 1.75%) due 02/14/31 | | | 17,785,625 | | | | 17,892,339 | |
United Airlines Inc. | | | | | | | | |
8.03% (3 Month Term SOFR + 2.75%, Rate Floor: 2.75%) due 02/22/31 | | | 16,259,250 | | | | 16,264,290 | |
246 | THE GUGGENHEIM FUNDS ANNUAL REPORT | SEE NOTES TO FINANCIAL STATEMENTS. |
SCHEDULE OF INVESTMENTS (continued) | September 30, 2024 |
TOTAL RETURN BOND FUND | |
| | Face
Amount~ | | | Value | |
Brown Group Holding LLC | | | | | | | | |
7.60% (1 Month Term SOFR + 2.75%, Rate Floor: 3.25%) due 07/01/31 | | | 4,957,964 | | | $ | 4,942,792 | |
7.84% ((1 Month Term SOFR + 2.75%) and (3 Month Term SOFR + 2.75%), Rate Floor: 3.25%) due 07/01/31 | | | 4,467,173 | | | | 4,454,754 | |
Amentum Holdings, Inc. | | | | | | | | |
due 07/29/31 | | | 7,100,000 | | | | 7,073,375 | |
TransDigm, Inc. | | | | | | | | |
7.32% (3 Month Term SOFR + 2.50%, Rate Floor: 2.50%) due 01/19/32 | | | 4,850,000 | | | | 4,829,776 | |
Installed Building Products, Inc. | | | | | | | | |
6.85% (1 Month Term SOFR + 2.00%, Rate Floor: 2.00%) due 03/28/31 | | | 3,582,000 | | | | 3,590,955 | |
Dispatch Terra Acquisition LLC | | | | | | | | |
9.00% (3 Month Term SOFR + 4.25%, Rate Floor: 5.00%) due 03/27/28 | | | 3,767,103 | | | | 3,411,903 | |
Air Canada | | | | | | | | |
7.25% (3 Month Term SOFR + 2.50%, Rate Floor: 2.50%) due 03/21/31 | | | 3,308,375 | | | | 3,312,511 | |
CPG International LLC | | | | | | | | |
due 09/23/31 | | | 3,075,000 | | | | 3,075,000 | |
Arcosa, Inc. | | | | | | | | |
due 08/12/31††† | | | 2,770,000 | | | | 2,763,075 | |
Genesee & Wyoming, Inc. | | | | | | | | |
6.60% (3 Month Term SOFR + 2.00%, Rate Floor: 2.00%) due 04/10/31 | | | 2,500,000 | | | | 2,493,750 | |
Beacon Roofing Supply, Inc. | | | | | | | | |
6.85% (1 Month Term SOFR + 2.00%, Rate Floor: 2.00%) due 05/19/28 | | | 2,233,125 | | | | 2,232,433 | |
Hillman Group, Inc. | | | | | | | | |
7.10% (1 Month Term SOFR + 2.25%, Rate Floor: 2.75%) due 07/14/28 | | | 1,784,720 | | | | 1,781,989 | |
Merlin Buyer, Inc. | | | | | | | | |
8.60% (3 Month Term SOFR + 4.00%, Rate Floor: 4.50%) due 12/14/28 | | | 611,211 | | | | 606,627 | |
API Heat Transfer Thermasys Corp. | | | | | | | | |
13.19% (3 Month Term SOFR + 8.00%, Rate Floor: 11.00%) due 11/12/27††† | | | 20,165 | | | | 20,165 | |
10.19% (3 Month Term SOFR + 5.00%, Rate Floor: 8.00%) due 11/10/27††† | | | 11,671 | | | | 11,671 | |
Total Industrial | | | | | | | 172,201,481 | |
| | | | | | | | | |
Consumer, Cyclical - 0.5% | | | | | | | | |
MB2 Dental Solutions LLC | | | | | | | | |
10.85%(1 Month Term SOFR + 6.00%, Rate Floor: 6.75%) Due 02/13/31††† | | | 20,976,735 | | | | 20,928,897 | |
6.75%(3 Month Term SOFR + 6.00%, Rate Floor:6.75%) due 02/13/31††† | | | 821,795 | | | | 728,337 | |
First Brands Group LLC | | | | | | | | |
10.51% (3 Month Term SOFR + 5.00%, Rate Floor: 6.00%) due 03/30/27 | | | 21,437,780 | | | | 21,180,527 | |
Restaurant Brands | | | | | | | | |
6.60% (1 Month Term SOFR + 1.75%, Rate Floor: 1.75%) due 09/20/30 | | | 14,912,625 | | | | 14,747,542 | |
Pacific Bells LLC | | | | | | | | |
9.37% (1 Month Term SOFR + 4.50%, Rate Floor: 9.50%) due 11/10/28 | | | 13,824,593 | | | | 13,824,593 | |
PCI Gaming Authority, Inc. | | | | | | | | |
6.85% (1 Month Term SOFR + 2.00%, Rate Floor: 2.00%) due 07/18/31 | | | 11,164,983 | | | | 11,091,294 | |
Entain Holdings (Gibraltar) Ltd. | | | | | | | | |
6.92% (6 Month EURIBOR + 3.25%, Rate Floor: 3.25%) due 06/30/28 | | | EUR 7,800,000 | | | | 8,723,421 | |
Peer Holding III BV | | | | | | | | |
7.60% (3 Month Term SOFR + 3.00%, Rate Floor: 3.00%) due 07/01/31 | | | 8,475,000 | | | | 8,489,153 | |
Wyndham Hotels & Resorts, Inc. | | | | | | | | |
6.60% (1 Month Term SOFR + 1.75%, Rate Floor: 1.75%) due 05/24/30 | | | 7,600,950 | | | | 7,591,449 | |
Packers Holdings LLC | | | | | | | | |
8.20% (1 Month Term SOFR + 3.25%, Rate Floor: 4.00%) due 03/09/28 | | | 14,397,688 | | | | 7,477,871 | |
Scientific Games Corp. | | | | | | | | |
8.32% (3 Month Term SOFR + 3.00%, Rate Floor: 3.50%) due 04/04/29 | | | 5,000,000 | | | | 4,967,050 | |
Go Daddy Operating Company LLC | | | | | | | | |
6.60% (1 Month Term SOFR + 1.75%, Rate Floor: 1.75%) due 05/30/31 | | | 4,259,325 | | | | 4,246,888 | |
Tripadvisor, Inc. | | | | | | | | |
7.60% (1 Month Term SOFR + 2.75%, Rate Floor: 2.75%) due 07/08/31 | | | 4,100,000 | | | | 4,085,896 | |
Prime Security Services Borrower LLC | | | | | | | | |
7.45% (1 Month Term SOFR + 2.25%, Rate Floor: 2.25%) due 10/13/30 | | | 3,492,000 | | | | 3,486,902 | |
Clarios Global, LP | | | | | | | | |
6.38% (1 Month EURIBOR + 3.00%, Rate Floor: 3.00%) due 07/16/31 | | | EUR 2,850,870 | | | | 3,166,119 | |
Station Casinos LLC | | | | | | | | |
7.10% (1 Month Term SOFR + 2.25%, Rate Floor: 2.25%) due 03/14/31 | | | 2,189,000 | | | | 2,178,449 | |
Rent-A-Center, Inc. | | | | | | | | |
8.00% (3 Month Term SOFR + 2.75%, Rate Floor: 3.25%) due 02/17/28 | | | 458,681 | | | | 457,012 | |
WW International, Inc. | | | | | | | | |
8.46% (1 Month Term SOFR + 3.50%, Rate Floor: 4.00%) due 04/13/28 | | | 1,395,000 | | | | 370,554 | |
Total Consumer, Cyclical | | | | | | | 137,741,954 | |
| | | | | | | | | |
Technology - 0.3% | | | | | | | | |
Visma AS | | | | | | | | |
due 12/05/28 | | | EUR 23,750,000 | | | | 26,186,101 | |
Polaris Newco LLC | | | | | | | | |
10.20% (1 Month GBP SONIA + 5.25%, Rate Floor: 5.25%) due 06/02/28 | | | GBP 15,159,170 | | | | 19,335,831 | |
Datix Bidco Ltd. | | | | | | | | |
10.70% (1 Month GBP SONIA + 5.50%, Rate Floor: 5.50%) due 04/25/31††† | | | GBP 10,570,675 | | | | 14,025,614 | |
10.82% (1 Month Term SOFR + 5.50%, Rate Floor: 6.00%) due 04/30/31††† | | | 2,613,869 | | | | 2,593,964 | |
SEE NOTES TO FINANCIAL STATEMENTS. | THE GUGGENHEIM FUNDS ANNUAL REPORT | 247 |
SCHEDULE OF INVESTMENTS (continued) | September 30, 2024 |
TOTAL RETURN BOND FUND | |
| | Face
Amount~ | | | Value | |
Modena Buyer LLC | | | | | | | | |
9.10% (3 Month Term SOFR + 4.50%, Rate Floor: 4.50%) due 07/01/31 | | | 11,400,000 | | | $ | 10,889,394 | |
Aston FinCo SARL | | | | | | | | |
9.72% (1 Month GBP SONIA + 4.75%, Rate Floor: 4.75%) due 10/09/26 | | | GBP 5,612,298 | | | | 6,950,371 | |
9.21% (1 Month Term SOFR + 4.25%, Rate Floor: 5.25%) due 10/09/26 | | | 735,865 | | | | 696,467 | |
Dun & Bradstreet | | | | | | | | |
7.61% (1 Month Term SOFR + 2.75%, Rate Floor: 2.75%) due 01/18/29 | | | 3,733,309 | | | | 3,728,904 | |
Total Technology | | | | | | | 84,406,646 | |
| | | | | | | | | |
Energy - 0.1% | | | | | | | | |
ITT Holdings LLC | | | | | | | | |
7.95% (1 Month Term SOFR + 3.00%, Rate Floor: 3.50%) due 10/11/30 | | | 8,316,210 | | | | 8,323,112 | |
Venture Global Calcasieu Pass LLC | | | | | | | | |
7.82% (1 Month Term SOFR + 2.88%, Rate Floor: 3.88%) due 08/19/26 | | | 5,456,372 | | | | 5,451,844 | |
WhiteWater DBR HoldCo LLC | | | | | | | | |
7.35% (3 Month Term SOFR + 2.75%, Rate Floor: 2.75%) due 03/03/31 | | | 4,600,000 | | | | 4,589,926 | |
Total Energy | | | | | | | 18,364,882 | |
| | | | | | | | | |
Utilities - 0.1% | | | | | | | | |
Calpine Construction Finance Company, LP | | | | | | | | |
6.85% (1 Month Term SOFR + 2.00%, Rate Floor: 2.00%) due 07/31/30 | | | 10,350,000 | | | | 10,278,171 | |
UGI Energy Services LLC | | | | | | | | |
7.35% (1 Month Term SOFR + 2.50%, Rate Floor: 2.50%) due 02/22/30 | | | 3,792,281 | | | | 3,791,598 | |
NRG Energy, Inc. | | | | | | | | |
7.26% (3 Month Term SOFR + 2.00%, Rate Floor: 2.00%) due 04/16/31 | | | 2,487,500 | | | | 2,489,366 | |
TerraForm Power Operating LLC | | | | | | | | |
7.20% (3 Month Term SOFR + 2.50%, Rate Floor: 3.00%) due 05/21/29 | | | 198,343 | | | | 198,281 | |
Total Utilities | | | | | | | 16,757,416 | |
| | | | | | | | | |
Communications - 0.1% | | | | | | | | |
SBA Senior Finance II LLC | | | | | | | | |
due 01/27/31 | | | 13,500,000 | | | | 13,503,105 | |
Zayo Group Holdings, Inc. | | | | | | | | |
7.96% (1 Month Term SOFR + 3.00%, Rate Floor: 3.00%) due 03/09/27 | | | 1,652,094 | | | | 1,506,511 | |
Xplornet Communications, Inc. | | | | | | | | |
9.57% (3 Month Term SOFR + 4.26%, Rate Floor: 4.76%) due 10/02/28 | | | 5,936,493 | | | | 986,942 | |
Total Communications | | | | | | | 15,996,558 | |
| | | | | | | | | |
Basic Materials - 0.0% | | | | | | | | |
Trinseo Materials Operating S.C.A. | | | | | | | | |
7.82% (3 Month Term SOFR + 2.50%, Rate Floor: 3.50%) due 05/03/28 | | | 10,739,250 | | | | 8,466,932 | |
Arsenal AIC Parent LLC | | | | | | | | |
8.10% (1 Month Term SOFR + 3.25%, Rate Floor: 3.25%) due 08/18/30 | | | 1,870,886 | | | | 1,867,144 | |
Total Basic Materials | | | | | | | 10,334,076 | |
| | | | | | | | | |
Total Senior Floating Rate Interests | | | | |
(Cost $867,649,593) | | | 848,238,070 | |
| | | | | |
FEDERAL AGENCY BONDS†† - 0.8% |
Tennessee Valley Authority |
4.25% due 09/15/65 | | | 138,205,000 | | | | 126,331,256 | |
4.63% due 09/15/60 | | | 42,436,000 | | | | 41,912,467 | |
5.38% due 04/01/56 | | | 9,283,000 | | | | 10,346,683 | |
due 09/15/537,12 | | | 1,612,000 | | | | 398,375 | |
due 09/15/557,12 | | | 1,612,000 | | | | 358,446 | |
due 09/15/567,12 | | | 1,612,000 | | | | 340,390 | |
due 03/15/577,12 | | | 1,612,000 | | | | 332,207 | |
due 09/15/577,12 | | | 1,612,000 | | | | 324,222 | |
due 09/15/587,12 | | | 1,612,000 | | | | 308,821 | |
due 03/15/597,12 | | | 1,612,000 | | | | 301,397 | |
due 09/15/597,12 | | | 1,612,000 | | | | 294,151 | |
due 09/15/607,12 | | | 1,612,000 | | | | 280,179 | |
due 09/15/547,12 | | | 1,020,000 | | | | 239,492 | |
due 03/15/617,12 | | | 1,020,000 | | | | 173,023 | |
due 09/15/617,12 | | | 1,020,000 | | | | 168,255 | |
due 09/15/627,12 | | | 1,020,000 | | | | 159,655 | |
due 03/15/637,12 | | | 1,020,000 | | | | 155,802 | |
due 09/15/637,12 | | | 1,020,000 | | | | 151,465 | |
due 09/15/647,12 | | | 1,020,000 | | | | 144,228 | |
due 03/15/657,12 | | | 1,020,000 | | | | 140,186 | |
due 09/15/657,12 | | | 1,020,000 | | | | 136,789 | |
Tennessee Valley Authority Principal Strips |
due 01/15/486,12 | | | 38,804,000 | | | | 12,955,686 | |
due 12/15/426,12 | | | 23,785,000 | | | | 10,161,666 | |
due 01/15/386,12 | | | 15,800,000 | | | | 8,796,223 | |
due 04/01/566,12 | | | 11,415,000 | | | | 2,464,430 | |
due 09/15/656,12 | | | 3,500,000 | | | | 469,375 | |
due 09/15/396,12 | | | 170,000 | | | | 86,537 | |
Federal Farm Credit Bank |
3.11% due 08/05/48 | | | 1,500,000 | | | | 1,195,780 | |
1.99% due 07/30/40 | | | 300,000 | | | | 210,529 | |
2.60% due 09/06/39 | | | 250,000 | | | | 194,527 | |
2.90% due 12/09/41 | | | 220,000 | | | | 172,064 | |
2.59% due 12/30/41 | | | 180,000 | | | | 134,721 | |
2.74% due 11/01/39 | | | 144,000 | | | | 114,137 | |
2.84% due 06/01/46 | | | 140,000 | | | | 101,876 | |
2.59% due 08/24/46 | | | 140,000 | | | | 97,318 | |
3.67% due 02/26/44 | | | 70,000 | | | | 62,730 | |
Federal Home Loan Bank |
2.45% due 08/16/41 | | | 270,000 | | | | 199,054 | |
3.63% due 06/22/43 | | | 100,000 | | | | 89,396 | |
Freddie Mac |
2.25% due 09/15/50 | | | 360,000 | | | | 222,123 | |
Total Federal Agency Bonds | | | | |
(Cost $317,259,498) | | | | | | | 220,725,661 | |
| | | | | | | | | |
248 | THE GUGGENHEIM FUNDS ANNUAL REPORT | SEE NOTES TO FINANCIAL STATEMENTS. |
SCHEDULE OF INVESTMENTS (continued) | September 30, 2024 |
TOTAL RETURN BOND FUND | |
| | Face
Amount~ | | | Value | |
MUNICIPAL BONDS†† - 0.2% |
California - 0.2% | | | | | | | | |
California Statewide Communities Development Authority Revenue Bonds | | | | | | | | |
7.14% due 08/15/47 | | | 10,335,000 | | | $ | 11,296,969 | |
California Public Finance Authority Revenue Bonds | | | | | | | | |
3.07% due 10/15/40 | | | 8,000,000 | | | | 6,466,600 | |
2.55% due 01/01/40 | | | 3,600,000 | | | | 2,659,617 | |
Hillsborough City School District General Obligation Unlimited | | | | | | | | |
due 09/01/3712 | | | 1,000,000 | | | | 534,044 | |
due 09/01/3912 | | | 1,000,000 | | | | 475,518 | |
Oakland Redevelopment Agency Successor Agency Tax Allocation | | | | | | | | |
4.00% due 09/01/39 | | | 1,100,000 | | | | 991,428 | |
Total California | | | | | | | 22,424,176 | |
| | | | | | | | | |
Illinois - 0.0% | | | | | | | | |
State of Illinois General Obligation Unlimited | | | | | | | | |
5.65% due 12/01/38 | | | 4,875,000 | | | | 5,048,217 | |
6.63% due 02/01/35 | | | 1,540,000 | | | | 1,673,021 | |
City of Chicago Illinois General Obligation Unlimited | | | | | | | | |
6.31% due 01/01/44 | | | 4,500,000 | | | | 4,989,840 | |
Total Illinois | | | | | | | 11,711,078 | |
| | | | | | | | | |
Texas - 0.0% | | | | | | | | |
Central Texas Turnpike System Revenue Bonds | | | | | | | | |
3.03% due 08/15/41 | | | 3,150,000 | | | | 2,488,992 | |
Tarrant County Cultural Education Facilities Finance Corp. Revenue Bonds | | | | | | | | |
3.42% due 09/01/50 | | | 2,500,000 | | | | 1,885,808 | |
Harris County Cultural Education Facilities Finance Corp. Revenue Bonds | | | | | | | | |
3.34% due 11/15/37 | | | 1,500,000 | | | | 1,298,584 | |
Total Texas | | | | | | | 5,673,384 | |
| | | | | | | | | |
Washington - 0.0% | | | | | | | | |
Central Washington University Revenue Bonds | | | | | | | | |
6.95% due 05/01/40 | | | 1,750,000 | | | | 2,009,921 | |
| | | | | | | | | |
Oklahoma - 0.0% | | | | | | | | |
Tulsa Airports Improvement Trust Revenue Bonds | | | | | | | | |
3.10% due 06/01/45 | | | 1,000,000 | | | | 749,150 | |
Oklahoma Development Finance Authority Revenue Bonds | | | | | | | | |
4.65% due 08/15/30 | | | 450,000 | | | | 444,629 | |
Total Oklahoma | | | | | | | 1,193,779 | |
| | | | | | | | | |
Total Municipal Bonds | | | | |
(Cost $47,143,113) | | | 43,012,338 | |
| | | | | |
FOREIGN GOVERNMENT DEBT†† - 0.1% |
Panama Government International Bond |
4.50% due 04/16/50 | | | 22,700,000 | | | | 16,657,272 | |
Israel Government International Bond |
5.38% due 03/12/29 | | | 9,800,000 | | | | 9,958,074 | |
Total Foreign Government Debt | | | | |
(Cost $35,070,843) | | | | | | | 26,615,346 | |
| | | | | | | | | |
U.S. TREASURY BILLS†† - 0.0% |
U.S. Treasury Bills |
5.12% due 10/17/2413 | | | 1,650,000 | | | | 1,646,552 | |
5.03% due 10/10/2413 | | | 1,400,000 | | | | 1,398,374 | |
4.87% due 10/10/2413 | | | 1,400,000 | | | | 1,398,374 | |
5.11% due 10/24/2413 | | | 800,000 | | | | 797,586 | |
4.88% due 04/17/2513 | | | 550,000 | | | | 538,067 | |
Total U.S. Treasury Bills | | | | |
(Cost $5,775,186) | | | | | | | 5,778,953 | |
| | | | | | | | | |
REPURCHASE AGREEMENTS††,14 - 0.1% |
BNP Paribas |
issued 09/30/24 at 4.86% due 10/01/24 | | | 17,510,000 | | | | 17,510,000 | |
Total Repurchase Agreements | | | | |
(Cost $17,510,000) | | | | | | | 17,510,000 | |
| | | | | | | | | |
Total Investments - 111.5% | | | | |
(Cost $30,638,668,310) | | $ | 29,845,461,044 | |
Other Assets & Liabilities, net - (11.5)% | | | (3,067,654,798 | ) |
Total Net Assets - 100.0% | | $ | 26,777,806,246 | |
SEE NOTES TO FINANCIAL STATEMENTS. | THE GUGGENHEIM FUNDS ANNUAL REPORT | 249 |
SCHEDULE OF INVESTMENTS (continued) | September 30, 2024 |
TOTAL RETURN BOND FUND | |
Futures Contracts |
Description | | Number of
Contracts | | | Expiration Date | | | Notional
Amount | | | Value and
Unrealized
Appreciation** | |
Interest Rate Futures Contracts Purchased† |
3-Month SOFR Futures Contracts | | | 2,426 | | | | Sep 2025 | | | $ | 587,061,675 | | | $ | 6,606,591 | |
3-Month SOFR Futures Contracts | | | 2,426 | | | | Dec 2025 | | | | 587,941,100 | | | | 6,576,231 | |
3-Month SOFR Futures Contracts | | | 2,426 | | | | Mar 2026 | | | | 588,365,650 | | | | 6,363,956 | |
| | | | | | | | | | | $ | 1,763,368,425 | | | $ | 19,546,778 | |
Centrally Cleared Credit Default Swap Agreements Protection Purchased†† |
Counterparty | | Exchange | | | Index | | | Protection
Premium
Rate | | | Payment
Frequency | | | Maturity
Date | | | Notional
Amount~ | | | Value | | | Upfront
Premiums
Received | | | Unrealized
Appreciation
(Depreciation)** | |
BofA Securities, Inc. | ICE | ITRAXX.EUR.42.V1 | 1.00% | | | Quarterly | | | | 12/20/29 | | EUR 56,240,000 | | $ | (1,257,095 | ) | | $ | (1,253,359 | ) | | $ | (3,736 | ) |
BofA Securities, Inc. | ICE | CDX.NA.IG.43.V1 | 1.00% | | | Quarterly | | | | 12/20/29 | | 644,242,019 | | | (14,403,518 | ) | | | (14,423,831 | ) | | | 20,313 | |
| | | | | | | | | | | | | | | | | | | | | | | | | | | $ | (15,660,613 | ) | | $ | (15,677,190 | ) | | $ | 16,577 | |
Centrally Cleared Interest Rate Swap Agreements†† |
Counterparty | | Exchange | | | Floating
Rate
Type | | | Floating
Rate Index | | | Fixed
Rate | | | Payment
Frequency | | | Maturity
Date | | | Notional
Amount | | | Value | | | Upfront
Premiums
Paid | | | Unrealized
Appreciation
(Depreciation)** | |
BofA Securities, Inc. | CME | Pay | U.S. Secured Overnight Financing Rate | 4.48% | Annually | 11/02/33 | | $ | 389,640,000 | | | $ | 35,608,023 | | | $ | 2,920 | | | $ | 35,605,103 | |
BofA Securities, Inc. | CME | Pay | U.S. Secured Overnight Financing Rate | 3.94% | Annually | 06/05/30 | | | 1,958,500,000 | | | | 23,953,199 | | | | 221,422 | | | | 23,731,777 | |
BofA Securities, Inc. | CME | Pay | U.S. Secured Overnight Financing Rate | 4.99% | Annually | 10/11/25 | | | 1,337,210,000 | | | | 15,443,184 | | | | 1,864 | | | | 15,441,320 | |
BofA Securities, Inc. | CME | Pay | U.S. Secured Overnight Financing Rate | 3.76% | Annually | 02/06/29 | | | 650,000,000 | | | | 12,571,917 | | | | 2,803 | | | | 12,569,114 | |
BofA Securities, Inc. | CME | Pay | U.S. Secured Overnight Financing Rate | 3.59% | Annually | 01/02/28 | | | 660,000,000 | | | | 5,484,758 | | | | 2,652 | | | | 5,482,106 | |
BofA Securities, Inc. | CME | Pay | U.S. Secured Overnight Financing Rate | 3.66% | Annually | 01/16/29 | | | 240,000,000 | | | | 3,666,211 | | | | 1,182 | | | | 3,665,029 | |
BofA Securities, Inc. | CME | Pay | U.S. Secured Overnight Financing Rate | 3.40% | Annually | 04/04/28 | | | 900,000,000 | | | | 2,890,737 | | | | 3,043 | | | | 2,887,694 | |
BofA Securities, Inc. | CME | Pay | U.S. Secured Overnight Financing Rate | 3.39% | Annually | 08/02/29 | | | 707,990,000 | | | | 2,832,477 | | | | 2,291 | | | | 2,830,186 | |
250 | THE GUGGENHEIM FUNDS ANNUAL REPORT | SEE NOTES TO FINANCIAL STATEMENTS. |
SCHEDULE OF INVESTMENTS (continued) | September 30, 2024 |
TOTAL RETURN BOND FUND | |
Centrally Cleared Interest Rate Swap Agreements†† (continued) |
Counterparty | | Exchange | | | Floating
Rate
Type | | | Floating
Rate Index | | | Fixed
Rate | | | Payment
Frequency | | | Maturity
Date | | | Notional
Amount | | | Value | | | Upfront
Premiums
Paid | | | Unrealized
Appreciation
(Depreciation)** | |
BofA Securities, Inc. | CME | Pay | U.S. Secured Overnight Financing Rate | 3.96% | Annually | 04/03/34 | | $ | 53,740,000 | | | $ | 2,749,022 | | | $ | 498 | | | $ | 2,748,524 | |
BofA Securities, Inc. | CME | Pay | U.S. Secured Overnight Financing Rate | 3.75% | Annually | 02/05/27 | | | 4,960,000 | | | | 38,954 | | | | 203 | | | | 38,751 | |
BofA Securities, Inc. | CME | Pay | U.S. Secured Overnight Financing Rate | 3.55% | Annually | 02/05/29 | | | 1,960,000 | | | | 21,725 | | | | 178 | | | | 21,547 | |
BofA Securities, Inc. | CME | Pay | U.S. Secured Overnight Financing Rate | 3.72% | Annually | 07/19/34 | | | 340,000 | | | | 11,094 | | | | 297 | | | | 10,797 | |
BofA Securities, Inc. | CME | Pay | U.S. Secured Overnight Financing Rate | 2.78% | Annually | 07/18/27 | 1,803,000,000 | | | (27,106,554 | ) | | | 4,661 | | | | (27,111,215 | ) |
| | | | | | | | | | | | | | | | | | | | | | | | | | | | | | | $ | 78,164,747 | | | $ | 244,014 | | | $ | 77,920,733 | |
Forward Foreign Currency Exchange Contracts†† |
Counterparty | | Currency | | | Type | | | Quantity | | | Contract
Amount | | | Settlement
Date | | | Unrealized
Depreciation | |
Bank of America, N.A. | | | EUR | | | | Buy | | | | 2,500,000 | | 2,792,082 USD | | | 10/18/24 | | | $ | (5,746 | ) |
Bank of America, N.A. | | | GBP | | | | Sell | | | | 22,875,000 | | 29,992,145 USD | | | 10/18/24 | | | | (592,116 | ) |
Bank of America, N.A. | | | EUR | | | | Sell | | | | 104,470,000 | | 115,753,264 USD | | | 10/18/24 | | | | (682,154 | ) |
| | | | | | | | | | | | | | | | | | | | | | | $ | (1,280,016 | ) |
SEE NOTES TO FINANCIAL STATEMENTS. | THE GUGGENHEIM FUNDS ANNUAL REPORT | 251 |
SCHEDULE OF INVESTMENTS (continued) | September 30, 2024 |
TOTAL RETURN BOND FUND | |
~ | The face amount is denominated in U.S. dollars unless otherwise indicated. |
* | Non-income producing security. |
** | Includes cumulative appreciation (depreciation). Variation margin is reported within the Statement of Assets and Liabilities. |
*** | A copy of each underlying unaffiliated fund’s financial statements is available at the SEC’s website at www.sec.gov. |
† | Value determined based on Level 1 inputs, unless otherwise noted — See Note 4. |
†† | Value determined based on Level 2 inputs, unless otherwise noted — See Note 4. |
††† | Value determined based on Level 3 inputs — See Note 4. |
◊ | Variable rate security. Rate indicated is the rate effective at September 30, 2024. In some instances, the effective rate is limited by a minimum rate floor or a maximum rate cap established by the issuer. The settlement status of a position may also impact the effective rate indicated. In some cases, a position may be unsettled at period end and may not have a stated effective rate. In instances where multiple underlying reference rates and spread amounts are shown, the effective rate is based on a weighted average. |
1 | Affiliated issuer. |
2 | Special Purpose Acquisition Company (SPAC). |
3 | Security has a fixed rate coupon which will convert to a floating or variable rate coupon on a future date. |
4 | Security is a 144A or Section 4(a)(2) security. These securities have been determined to be liquid under guidelines established by the Board of Trustees. The total market value of 144A or Section 4(a)(2) securities is $11,156,913,781 (cost $11,440,747,012), or 41.7% of total net assets. |
5 | Rate indicated is the 7-day yield as of September 30, 2024. |
6 | Security is a principal-only strip. |
7 | Security is an interest-only strip. |
8 | Security is a step up/down bond. The coupon increases or decreases at regular intervals until the bond reaches full maturity. Rate indicated is the rate at September 30, 2024. See table below for additional step information for each security. |
9 | Security is a 144A or Section 4(a)(2) security. These securities have been determined to be illiquid and restricted under guidelines established by the Board of Trustees. The total market value of 144A or Section 4(a)(2) illiquid and restricted securities is $81,984,623 (cost $83,697,587), or 0.3% of total net assets — See Note 10. |
10 | Perpetual maturity. |
11 | Security has no stated coupon. However, it is expected to receive residual cash flow payments on defined deal dates. |
12 | Zero coupon rate security. |
13 | Rate indicated is the effective yield at the time of purchase. |
14 | Repurchase Agreements - The interest rate on repurchase agreements is market driven and based on the underlying collateral obtained. See additional disclosure in the repurchase agreements table below for more information on repurchase agreements. |
15 | Security is unsettled at period end and does not have a stated effective rate. |
16 | Security is in default of interest and/or principal obligations. |
| | BofA — Bank of America |
| | CDX.NA.IG.43.V1 — Credit Default Swap North American Investment Grade Series 43 Index Version 1 |
| | CME — Chicago Mercantile Exchange |
| | CMT — Constant Maturity Treasury |
| | EUR — Euro |
| | EURIBOR — European Interbank Offered Rate |
| | GBP — British Pound |
| | ICE — Intercontinental Exchange |
| | ITRAXX.EUR.42.V1 — iTraxx Europe Series 42 Index Version 1 |
| | plc — Public Limited Company |
| | REMIC — Real Estate Mortgage Investment Conduit |
| | REIT — Real Estate Investment Trust |
| | SARL — Société à Responsabilité Limitée |
| | SOFR — Secured Overnight Financing Rate |
| | SONIA — Sterling Overnight Index Average |
| | WAC — Weighted Average Coupon |
| | |
| | See Sector Classification in Other Information section. |
252 | THE GUGGENHEIM FUNDS ANNUAL REPORT | SEE NOTES TO FINANCIAL STATEMENTS. |
SCHEDULE OF INVESTMENTS (continued) | September 30, 2024 |
TOTAL RETURN BOND FUND | |
The following table summarizes the inputs used to value the Fund’s investments at September 30, 2024 (See Note 4 in the Notes to Financial Statements):
Investments in Securities (Assets) | | Level 1
Quoted
Prices | | | Level 2
Significant
Observable
Inputs | | | Level 3
Significant
Unobservable
Inputs | | | Total | |
Common Stocks | | $ | 51,195 | | | $ | — | | | $ | 216,536 | | | $ | 267,731 | |
Preferred Stocks | | | — | | | | 664,340,434 | | | | 48,103,090 | | | | 712,443,524 | |
Warrants | | | 457 | | | | — | | | | 388 | | | | 845 | |
Exchange-Traded Funds | | | 187,600,000 | | | | — | | | | — | | | | 187,600,000 | |
Mutual Funds | | | 209,072,931 | | | | — | | | | — | | | | 209,072,931 | |
Money Market Fund | | | 801,560,124 | | | | — | | | | — | | | | 801,560,124 | |
Collateralized Mortgage Obligations | | | — | | | | 8,670,291,817 | | | | 54,604,030 | | | | 8,724,895,847 | |
Corporate Bonds | | | — | | | | 6,422,282,622 | | | | 586,278,920 | | | | 7,008,561,542 | |
Asset-Backed Securities | | | — | | | | 5,080,828,171 | | | | 796,218,422 | | | | 5,877,046,593 | |
U.S. Government Securities | | | — | | | | 5,162,131,539 | | | | — | | | | 5,162,131,539 | |
Senior Floating Rate Interests | | | — | | | | 725,492,961 | | | | 122,745,109 | | | | 848,238,070 | |
Federal Agency Bonds | | | — | | | | 220,725,661 | | | | — | | | | 220,725,661 | |
Municipal Bonds | | | — | | | | 43,012,338 | | | | — | | | | 43,012,338 | |
Foreign Government Debt | | | — | | | | 26,615,346 | | | | — | | | | 26,615,346 | |
U.S. Treasury Bills | | | — | | | | 5,778,953 | | | | — | | | | 5,778,953 | |
Repurchase Agreements | | | — | | | | 17,510,000 | | | | — | | | | 17,510,000 | |
Interest Rate Futures Contracts** | | | 19,546,778 | | | | — | | | | — | | | | 19,546,778 | |
Credit Default Swap Agreements** | | | — | | | | 20,313 | | | | — | | | | 20,313 | |
Interest Rate Swap Agreements** | | | — | | | | 105,031,948 | | | | — | | | | 105,031,948 | |
Total Assets | | $ | 1,217,831,485 | | | $ | 27,144,062,103 | | | $ | 1,608,166,495 | | | $ | 29,970,060,083 | |
Investments in Securities (Liabilities) | | Level 1
Quoted
Prices | | | Level 2
Significant
Observable
Inputs | | | Level 3
Significant
Unobservable
Inputs | | | Total | |
Credit Default Swap Agreements** | | $ | — | | | $ | 3,736 | | | $ | — | | | $ | 3,736 | |
Interest Rate Swap Agreements** | | | — | | | | 27,111,215 | | | | — | | | | 27,111,215 | |
Forward Foreign Currency Exchange Contracts** | | | — | | | | 1,280,016 | | | | — | | | | 1,280,016 | |
Unfunded Loan Commitments (Note 9) | | | — | | | | — | | | | 121,352 | | | | 121,352 | |
Total Liabilities | | $ | — | | | $ | 28,394,967 | | | $ | 121,352 | | | $ | 28,516,319 | |
** | This derivative is reported as unrealized appreciation/depreciation at period end. |
The following is a summary of significant unobservable inputs used in the fair valuation of assets and liabilities categorized within Level 3 of the fair value hierarchy:
Category | | Ending
Balance at
September 30,
2024 | | Valuation
Technique | Unobservable
Inputs | | Input Range | | | Weighted
Average* | |
Assets: | | | | | | | | | | | | | | |
Asset-Backed Securities | | $ | 361,564,093 | | Option adjusted spread off prior month end broker quote | Broker Quote | — | — |
Asset-Backed Securities | | | 277,755,268 | | Yield Analysis | Yield | 3.2%-7.3% | 6.3% |
Asset-Backed Securities | | | 143,223,717 | | Third Party Pricing | Broker Quote | — | — |
Asset-Backed Securities | | | 13,675,344 | | Third Party Pricing | Trade Price | — | — |
Collateralized Mortgage Obligations | | | 54,604,030 | | Option adjusted spread off prior month end broker quote | Broker Quote | — | — |
SEE NOTES TO FINANCIAL STATEMENTS. | THE GUGGENHEIM FUNDS ANNUAL REPORT | 253 |
SCHEDULE OF INVESTMENTS (continued) | September 30, 2024 |
TOTAL RETURN BOND FUND | |
Category | | Ending
Balance at
September 30,
2024 | | Valuation
Technique | Unobservable
Inputs | | Input Range | | | Weighted
Average* | |
Common Stocks | | $ | 215,604 | | Enterprise Value | Valuation Multiple | 2.9x-8.6x | 5.0x |
Common Stocks | | | 932 | | Model Price | Liquidation Value | — | — |
Corporate Bonds | | | 338,968,870 | | Option adjusted spread off prior month end broker quote | Broker Quote | — | — |
Corporate Bonds | | | 247,310,049 | | Yield Analysis | Yield | 5.6%-9.6% | 6.6% |
Corporate Bonds | | | 1 | | Model Price | Liquidation Value | — | — |
Preferred Stocks | | | 48,103,090 | | Yield Analysis | Yield | 5.8% | — |
Senior Floating Rate Interests | | | 93,443,994 | | Model Price | Purchase Price | — | — |
Senior Floating Rate Interests | | | 26,538,040 | | Yield Analysis | Yield | 8.0%-10.3% | 9.40% |
Senior Floating Rate Interests | | | 2,763,075 | | Third Party Pricing | Broker Quote | — | — |
Warrants | | | 388 | | Model Price | Liquidation Value | — | — |
Total Assets | | $ | 1,608,166,495 | | | | | |
Liabilities: | | | | | | | | | | | | | | |
Unfunded Loan Commitments | | $ | 121,352 | | Model Price | Purchase Price | — | — |
* | Inputs are weighted by the fair value of the instruments. |
Significant changes in a quote, yield, liquidation value or valuation multiple would generally result in significant changes in the fair value of the security.
The Fund’s fair valuation leveling guidelines classify a single daily broker quote, or a vendor price based on a single daily or monthly broker quote, as Level 3, if such a quote or price cannot be supported with other available market information.
Transfers between Level 2 and Level 3 may occur as markets fluctuate and/or the availability of data used in an investment’s valuation changes. For the year ended September 30, 2024, the Fund did not have any securities transfer into Level 3 from Level 2 and had securities with a total value of $78,009,956 transfer out of Level 3 into Level 2 due to the availability of current and reliable market-based data provided by a third-party pricing service which utilizes significant observable inputs.
254 | THE GUGGENHEIM FUNDS ANNUAL REPORT | SEE NOTES TO FINANCIAL STATEMENTS. |
SCHEDULE OF INVESTMENTS (continued) | September 30, 2024 |
TOTAL RETURN BOND FUND | |
Summary of Fair Value Level 3 Activity
Following is a reconciliation of Level 3 assets for which significant unobservable inputs were used to determine fair value for the year ended September 30, 2024:
| | | Assets | | | | | | | Liabilities | |
| | Asset-
Backed
Securities | | | Collateralized
Mortgage
Obligations | | | Corporate
Bonds | | | Senior
Floating
Rate
Interests | | | Warrants | | | Common
Stocks | | | Preferred
Stocks | | | Senior
Fixed Rate
Interests | | | Total Assets | | | Unfunded
Loan
Commitments | |
Beginning Balance | | $ | 567,198,526 | | | $ | 94,495,909 | | | $ | 316,972,375 | | | $ | 216,787,942 | | | $ | 104 | | | $ | 2,503 | | | $ | 47,610,124 | | | $ | 4,997,084 | | | $ | 1,248,064,567 | | | $ | (151,690 | ) |
Purchases/(Receipts) | | | 373,881,340 | | | | — | | | | 235,480,000 | | | | 79,442,008 | | | | — | | | | — | | | | — | | | | — | | | | 688,803,348 | | | | (644,185 | ) |
(Sales, maturities and paydowns)/Fundings | | | (148,581,103 | ) | | | (8,480,220 | ) | | | (9,941,315 | ) | | | (151,392,184 | ) | | | — | | | | (7,402 | ) | | | (1,541,871 | ) | | | — | | | | (319,944,095 | ) | | | 154,889 | |
Amortization of premiums/discounts | | | 681,795 | | | | 19,397 | | | | 167,713 | | | | 1,809,855 | | | | — | | | | — | | | | — | | | | — | | | | 2,678,760 | | | | 43,505 | |
Corporate actions | | | — | | | | — | | | | 6,849,961 | | | | (42,623 | ) | | | — | | | | 49,860 | | | | (7,237 | ) | | | (6,849,961 | ) | | | — | | | | — | |
Total realized gains (losses) included in earnings | | | 186,875 | | | | (64,058 | ) | | | (602,100 | ) | | | (5,621,613 | ) | | | — | | | | (20,873 | ) | | | (3,627,058 | ) | | | — | | | | (9,748,827 | ) | | | 2,779 | |
Total change in unrealized appreciation (depreciation) included in earnings | | | 19,096,292 | | | | 3,018,743 | | | | 37,352,286 | | | | 9,140,636 | | | | 284 | | | | 192,448 | | | | 5,669,132 | | | | 1,852,877 | | | | 76,322,698 | | | | 473,350 | |
Transfers into Level 3 | | | — | | | | — | | | | — | | | | — | | | | — | | | | — | | | | — | | | | — | | | | — | | | | — | |
Transfers out of Level 3 | | | (16,245,303 | ) | | | (34,385,741 | ) | | | — | | | | (27,378,912 | ) | | | — | | | | — | | | | — | | | | — | | | | (78,009,956 | ) | | | — | |
Ending Balance | | $ | 796,218,422 | | | $ | 54,604,030 | | | $ | 586,278,920 | | | $ | 122,745,109 | | | $ | 388 | | | $ | 216,536 | | | $ | 48,103,090 | | | $ | — | | | $ | 1,608,166,495 | | | $ | (121,352 | ) |
Net change in unrealized appreciation (depreciation) for investments in Level 3 securities still held at September 30, 2024 | | $ | 18,159,201 | | | $ | 2,401,417 | | | $ | 37,352,286 | | | $ | 971,060 | | | $ | 284 | | | $ | 171,582 | | | $ | 1,103,090 | | | $ | — | | | $ | 60,158,920 | | | $ | 476,488 | |
Step Coupon Bonds
The following table discloses additional information related to step coupon bonds held by the Fund. Certain securities are subject to multiple rate changes prior to maturity. For those securities, a range of rates and corresponding dates have been provided. Rates for all step coupon bonds held by the Fund are scheduled to increase, none are scheduled to decrease.
Name | | Coupon Rate at
Next Reset Date | | | Next Rate Reset Date | | | Future Reset Rate | | | Future Reset Date | |
Angel Oak Mortgage Trust 2023-1, 4.75% due 09/26/67 | | | 5.75 | % | | | 01/01/27 | | | | — | | | | — | |
Angel Oak Mortgage Trust 2023-1, 4.75% due 09/26/67 | | | 5.75 | % | | | 01/01/27 | | | | — | | | | — | |
Angel Oak Mortgage Trust 2024-3, 4.80% due 11/26/68 | | | 5.80 | % | | | 02/01/28 | | | | — | | | | — | |
Angel Oak Mortgage Trust 2024-2, 5.99% due 01/25/69 | | | 6.93 | % | | | 01/01/28 | | | | — | | | | — | |
Angel Oak Mortgage Trust 2024-2, 6.25% due 01/25/69 | | | 7.25 | % | | | 01/01/28 | | | | — | | | | — | |
Angel Oak Mortgage Trust 2024-4, 6.20% due 01/25/69 | | | 7.20 | % | | | 03/01/28 | | | | — | | | | — | |
Angel Oak Mortgage Trust 2024-4, 6.40% due 01/25/69 | | | 7.40 | % | | | 03/01/28 | | | | — | | | | — | |
Angel Oak Mortgage Trust 2024-4, 6.50% due 01/25/69 | | | 7.50 | % | | | 03/01/28 | | | | — | | | | — | |
SEE NOTES TO FINANCIAL STATEMENTS. | THE GUGGENHEIM FUNDS ANNUAL REPORT | 255 |
SCHEDULE OF INVESTMENTS (continued) | September 30, 2024 |
TOTAL RETURN BOND FUND | |
Name | | Coupon Rate at
Next Reset Date | | | Next Rate Reset Date | | | Future Reset Rate | | | Future Reset Date | |
Angel Oak Mortgage Trust 2023-2, 4.65% due 10/25/67 | | | 5.65 | % | | | 02/01/27 | | | | — | | | | — | |
Angel Oak Mortgage Trust 2024-2, 6.19% due 01/25/69 | | | 7.13 | % | | | 01/01/28 | | | | — | | | | — | |
Angel Oak Mortgage Trust 2023-2, 4.65% due 10/25/67 | | | 5.65 | % | | | 02/01/27 | | | | — | | | | — | |
Angel Oak Mortgage Trust 2024-3, 4.80% due 11/26/68 | | | 5.80 | % | | | 02/01/28 | | | | — | | | | — | |
ATLX Trust 2024-RPL1, 3.85% due 04/25/64 | | | 4.85 | % | | | 08/01/28 | | | | — | | | | — | |
BRAVO Residential Funding Trust 2024-NQM3, 6.39% due 03/25/64 | | | 7.39 | % | | | 03/01/28 | | | | — | | | | — | |
BRAVO Residential Funding Trust 2024-NQM3, 6.50% due 03/25/64 | | | 7.50 | % | | | 03/01/28 | | | | — | | | | — | |
BRAVO Residential Funding Trust 2024-NQM1, 6.40% due 12/01/63 | | | 7.40 | % | | | 01/01/28 | | | | — | | | | — | |
BRAVO Residential Funding Trust 2023-NQM5, 7.01% due 06/25/63 | | | 8.01 | % | | | 07/01/27 | | | | — | | | | — | |
BRAVO Residential Funding Trust 2023-NQM2, 4.50% due 05/25/62 | | | 5.50 | % | | | 02/01/27 | | | | — | | | | — | |
BRAVO Residential Funding Trust 2023-NQM2, 4.50% due 05/25/62 | | | 5.50 | % | | | 02/01/27 | | | | — | | | | — | |
BRAVO Residential Funding Trust 2022-R1, 3.13% due 01/29/70 | | | 6.13 | % | | | 01/30/25 | | | | — | | | | — | |
BRAVO Residential Funding Trust 2024-NQM3, 6.19% due 03/25/64 | | | 7.19 | % | | | 03/01/28 | | | | — | | | | — | |
BRAVO Residential Funding Trust 2023-NQM6, 7.06% due 09/25/63 | | | 8.06 | % | | | 08/01/27 | | | | — | | | | — | |
BRAVO Residential Funding Trust 2023-NQM2, 4.50% due 05/25/62 | | | 5.50 | % | | | 02/01/27 | | | | — | | | | — | |
Citigroup Mortgage Loan Trust, Inc. 2022-A, 6.17% due 09/25/62 | | | 9.17 | % | | | 09/25/25 | | | | 10.17 | % | | | 09/25/26 | |
COLT Mortgage Loan Trust 2023-3, 7.18% due 09/25/68 | | | 8.18 | % | | | 09/01/27 | | | | — | | | | — | |
COLT Mortgage Loan Trust 2024-2, 6.33% due 04/25/69 | | | 7.33 | % | | | 03/01/28 | | | | — | | | | — | |
COLT Mortgage Loan Trust 2024-2, 6.43% due 04/25/69 | | | 7.43 | % | | | 03/01/28 | | | | — | | | | — | |
COLT Mortgage Loan Trust 2024-1, 6.14% due 02/25/69 | | | 7.14 | % | | | 01/01/28 | | | | — | | | | — | |
COLT Mortgage Loan Trust 2024-2, 6.13% due 04/25/69 | | | 7.13 | % | | | 03/01/28 | | | | — | | | | — | |
COLT Mortgage Loan Trust 2023-4, 7.62% due 10/25/68 | | | 8.62 | % | | | 10/01/27 | | | | — | | | | — | |
COLT Mortgage Loan Trust 2023-3, 7.58% due 09/25/68 | | | 8.58 | % | | | 09/01/27 | | | | — | | | | — | |
Cross Mortgage Trust 2024-H5, 6.16% due 08/26/69 | | | 7.16 | % | | | 07/01/28 | | | | — | | | | — | |
GCAT Trust 2023-NQM3, 6.89% due 08/25/68 | | | 7.89 | % | | | 09/01/27 | | | | — | | | | — | |
GCAT Trust 2023-NQM2, 6.24% due 11/25/67 | | | 7.24 | % | | | 01/01/27 | | | | — | | | | — | |
GCAT Trust 2024-NQM2, 6.44% due 06/25/59 | | | 7.56 | % | | | 05/01/28 | | | | — | | | | — | |
GCAT Trust 2023-NQM3, 7.34% due 08/25/68 | | | 8.34 | % | | | 09/01/27 | | | | — | | | | — | |
GCAT Trust 2022-NQM5, 5.71% due 08/25/67 | | | 6.71 | % | | | 10/01/26 | | | | — | | | | — | |
GCAT Trust 2022-NQM5, 5.71% due 08/25/67 | | | 6.71 | % | | | 10/01/26 | | | | — | | | | — | |
GCAT Trust 2024-NQM2, 6.54% due 06/25/59 | | | 7.71 | % | | | 05/01/28 | | | | — | | | | — | |
GCAT Trust 2024-NQM2, 6.09% due 06/25/59 | | | 7.36 | % | | | 05/01/28 | | | | — | | | | — | |
Legacy Mortgage Asset Trust 2021-GS3, 4.75% due 07/25/61 | | | 5.75 | % | | | 05/25/25 | | | | — | | | | — | |
Legacy Mortgage Asset Trust 2021-GS4, 4.65% due 11/25/60 | | | 5.65 | % | | | 08/25/25 | | | | — | | | | — | |
Legacy Mortgage Asset Trust 2021-GS5, 2.25% due 07/25/67 | | | 5.25 | % | | | 11/25/24 | | | | 6.25 | % | | | 11/25/25 | |
256 | THE GUGGENHEIM FUNDS ANNUAL REPORT | SEE NOTES TO FINANCIAL STATEMENTS. |
SCHEDULE OF INVESTMENTS (continued) | September 30, 2024 |
TOTAL RETURN BOND FUND | |
Name | | Coupon Rate at
Next Reset Date | | | Next Rate Reset Date | | | Future Reset Rate | | | Future Reset Date | |
Legacy Mortgage Asset Trust 2021-GS2, 4.75% due 04/25/61 | | | 5.75 | % | | | 04/25/25 | | | | — | | | | — | |
Mill City Securities Ltd. 2024-RS1, 3.00% due 11/01/69 | | | 6.00 | % | | | 10/01/27 | | | | — | | | | — | |
Morgan Stanley Residential Mortgage Loan Trust 2024-NQM3, 5.35% due 07/25/69 | | | 6.35 | % | | | 09/01/28 | | | | — | | | | — | |
NYMT Loan Trust 2022-SP1, 5.25% due 07/25/62 | | | 8.25 | % | | | 07/01/25 | | | | 9.25 | % | | | 07/01/26 | |
OBX Trust 2022-NQM8, 6.10% due 09/25/62 | | | 7.10 | % | | | 10/01/26 | | | | — | | | | — | |
OBX Trust 2024-NQM3, 6.33% due 12/25/63 | | | 7.33 | % | | | 02/01/28 | | | | — | | | | — | |
OBX Trust 2022-NQM9, 6.45% due 09/25/62 | | | 7.45 | % | | | 11/01/26 | | | | — | | | | — | |
OBX Trust 2024-NQM4, 6.07% due 01/25/64 | | | 7.07 | % | | | 02/01/28 | | | | — | | | | — | |
OBX Trust 2024-NQM6, 6.45% due 02/25/64 | | | 7.45 | % | | | 04/01/28 | | | | — | | | | — | |
OBX Trust 2024-NQM8, 6.44% due 05/25/64 | | | 7.44 | % | | | 05/01/28 | | | | — | | | | — | |
OBX Trust 2024-NQM9, 6.28% due 01/25/64 | | | 7.46 | % | | | 06/01/28 | | | | — | | | | — | |
OBX Trust 2024-NQM11, 5.88% due 06/25/64 | | | 6.83 | % | | | 07/01/28 | | | | — | | | | — | |
OBX Trust 2024-NQM5, 5.99% due 01/25/64 | | | 6.99 | % | | | 03/01/28 | | | | — | | | | — | |
OBX Trust 2024-NQM5, 6.29% due 01/25/64 | | | 7.29 | % | | | 03/01/28 | | | | — | | | | — | |
OBX Trust 2024-NQM5, 6.39% due 01/25/64 | | | 7.39 | % | | | 03/01/28 | | | | — | | | | — | |
OBX Trust 2024-NQM12, 5.83% due 07/25/64 | | | 6.83 | % | | | 08/01/28 | | | | — | | | | — | |
OBX Trust 2024-NQM13, 5.37% due 06/25/64 | | | 6.37 | % | | | 08/01/28 | | | | — | | | | — | |
OBX Trust 2024-NQM4, 6.22% due 01/25/64 | | | 7.22 | % | | | 02/01/28 | | | | — | | | | — | |
OBX Trust 2024-NQM6, 6.70% due 02/25/64 | | | 7.70 | % | | | 04/01/28 | | | | — | | | | — | |
OBX Trust 2023-NQM2, 6.32% due 01/25/62 | | | 7.32 | % | | | 02/01/27 | | | | — | | | | — | |
OBX Trust 2024-NQM3, 6.43% due 12/25/63 | | | 7.43 | % | | | 02/01/28 | | | | — | | | | — | |
OBX Trust 2022-NQM9, 6.45% due 09/25/62 | | | 7.45 | % | | | 11/01/26 | | | | — | | | | — | |
OBX Trust 2024-NQM4, 6.32% due 01/25/64 | | | 7.32 | % | | | 02/01/28 | | | | — | | | | — | |
OBX Trust 2024-NQM7, 6.45% due 03/25/64 | | | 7.45 | % | | | 04/01/28 | | | | — | | | | — | |
OBX Trust 2023-NQM2, 6.72% due 01/25/62 | | | 7.72 | % | | | 02/01/27 | | | | — | | | | — | |
OBX Trust 2024-NQM6, 6.85% due 02/25/64 | | | 7.85 | % | | | 04/01/28 | | | | — | | | | — | |
OBX Trust 2024-NQM8, 6.23% due 05/25/64 | | | 7.23 | % | | | 05/01/28 | | | | — | | | | — | |
OBX Trust 2024-NQM8, 6.59% due 05/25/64 | | | 7.59 | % | | | 05/01/28 | | | | — | | | | — | |
OBX Trust 2024-NQM11, 6.13% due 06/25/64 | | | 7.08 | % | | | 07/01/28 | | | | — | | | | — | |
OBX Trust 2024-NQM9, 6.44% due 01/25/64 | | | 7.66 | % | | | 06/01/28 | | | | — | | | | — | |
OBX Trust 2024-NQM7, 6.24% due 03/25/64 | | | 7.24 | % | | | 04/01/28 | | | | — | | | | — | |
OBX Trust 2024-NQM7, 6.60% due 03/25/64 | | | 7.60 | % | | | 04/01/28 | | | | — | | | | — | |
OBX Trust 2024-NQM11, 6.23% due 06/25/64 | | | 7.18 | % | | | 07/01/28 | | | | — | | | | — | |
OBX Trust 2023-NQM9, 7.66% due 10/25/63 | | | 8.66 | % | | | 10/01/27 | | | | — | | | | — | |
OBX Trust 2024-NQM3, 6.13% due 12/25/63 | | | 7.13 | % | | | 02/01/28 | | | | — | | | | — | |
OBX Trust 2024-NQM2, 6.18% due 12/25/63 | | | 7.18 | % | | | 01/01/28 | | | | — | | | | — | |
OBX Trust 2024-NQM10, 6.33% due 05/25/64 | | | 7.33 | % | | | 06/01/28 | | | | — | | | | — | |
OSAT Trust 2021-RPL1, 5.12% due 05/25/65 | | | 6.12 | % | | | 06/25/25 | | | | — | | | | — | |
PRPM LLC 2021-5, 4.79% due 06/25/26 | | | 5.79 | % | | | 06/25/25 | | | | — | | | | — | |
PRPM LLC 2022-1, 3.72% due 02/25/27 | | | 6.72 | % | | | 02/25/25 | | | | 7.72 | % | | | 02/25/26 | |
PRPM LLC 2024-5, 5.69% due 09/25/29 | | | 8.69 | % | | | 09/25/27 | | | | 9.69 | % | | | 09/25/28 | |
PRPM LLC 2024-4, 6.41% due 08/25/29 | | | 9.41 | % | | | 08/25/27 | | | | 10.41 | % | | | 08/25/28 | |
PRPM LLC 2023-RCF1, 4.00% due 06/25/53 | | | 5.00 | % | | | 06/25/27 | | | | — | | | | — | |
RCKT Mortgage Trust 2024-CES4, 6.30% due 06/25/44 | | | 7.30 | % | | | 05/01/28 | | | | — | | | | — | |
RCKT Mortgage Trust 2024-CES4, 6.15% due 06/25/44 | | | 7.15 | % | | | 05/01/28 | | | | — | | | | — | |
Verus Securitization Trust 2024-5, 6.65% due 06/25/69 | | | 7.65 | % | | | 06/01/28 | | | | — | | | | — | |
Verus Securitization Trust 2023-7, 7.42% due 10/25/68 | | | 8.42 | % | | | 10/01/27 | | | | — | | | | — | |
Verus Securitization Trust 2022-8, 6.13% due 09/25/67 | | | 7.13 | % | | | 10/01/26 | | | | — | | | | — | |
Verus Securitization Trust 2023-2, 6.85% due 03/25/68 | | | 7.85 | % | | | 03/01/27 | | | | — | | | | — | |
Verus Securitization Trust 2024-1, 6.12% due 01/25/69 | | | 7.12 | % | | | 01/01/28 | | | | — | | | | — | |
Verus Securitization Trust 2024-5, 6.45% due 06/25/69 | | | 7.45 | % | | | 06/01/28 | | | | — | | | | — | |
SEE NOTES TO FINANCIAL STATEMENTS. | THE GUGGENHEIM FUNDS ANNUAL REPORT | 257 |
SCHEDULE OF INVESTMENTS (continued) | September 30, 2024 |
TOTAL RETURN BOND FUND | |
Name | | Coupon Rate at
Next Reset Date | | | Next Rate Reset Date | | | Future Reset Rate | | | Future Reset Date | |
Verus Securitization Trust 2022-8, 6.13% due 09/25/67 | | | 7.13 | % | | | 10/01/26 | | | | — | | | | — | |
Vista Point Securitization Trust 2024-CES2, 5.25% due 10/25/54 | | | 6.25 | % | | | 09/01/28 | | | | — | | | | — | |
Vista Point Securitization Trust 2024-CES1, 6.68% due 05/25/54 | | | 7.67 | % | | | 04/01/28 | | | | — | | | | — | |
Repurchase Agreements
The Fund may engage in repurchase agreements. Repurchase agreements are fixed income securities in the form of agreements backed by collateral. These agreements typically involve the acquisition by the Fund of securities from the selling institution coupled with the agreement that the selling institution will repurchase the underlying securities at a specified price and at a fixed time in the future. The Fund may accept a wide variety of underlying securities as collateral for the repurchase agreements entered into by the Fund. Any such securities serving as collateral are marked-to-market daily in order to maintain full collateralization. Securities purchased under repurchase agreements are reflected as an asset on the Statement of Assets and Liabilities. Interest earned is recorded as a component of interest income on the Statement of Operations.
In connection with transactions in repurchase agreements, it is the Fund’s policy that its custodian take possession of the underlying collateral. The collateral is in the possession of the Fund’s custodian and is evaluated to ensure that its market value exceeds, at a minimum, 102% of the original face amount of the repurchase agreements.
The use of repurchase agreements involves certain risks. For example, if the selling institution defaults on its obligation to repurchase the underlying securities at a time when the value of securities has declined, the Fund may incur a loss upon disposition of them. In the event of an insolvency or bankruptcy by the selling institution, the Fund’s right to control the collateral could be affected and result in certain costs and delays. In addition, the Fund could incur a loss if the value of the underlying collateral falls below the agreed upon repurchase price.
At September 30, 2024, the repurchase agreements in the account were as follows:
Counterparty and
Terms of Agreement | | Face Value | | | Repurchase Price | | | Collateral | | Par Value | | | Fair Value | |
BNP Paribas | | | | | | | | | | U.S. Treasury Strips | | | | | | | | |
4.86% | | | | | | | | | | 0.00% | | | | | | | | |
Due 10/01/24 | | $ | 17,510,000 | | | $ | 17,512,364 | | | Due 08/15/41 - 11/15/45 | | $ | 38,623,716 | | | $ | 15,823,674 | |
| | | | | | | | | | | | | | | | | | | |
| | | | | | | | | | | U.S. Treasury Notes | | | | | | | | |
| | | | | | | | | | | 1.75% - 3.50% | | | | | | | | |
| | | | | | | | | | | Due 12/31/24 - 09/30/26 | | | 1,970,100 | | | | 1,964,338 | |
| | | | | | | | | | | | | | | | | | | |
| | | | | | | | | | | U.S. Treasury Inflation Indexed Bond | | | | | | | | |
| | | | | | | | | | | 2.38% | | | | | | | | |
| | | | | | | | | | | Due 10/15/28 | | | 71,060 | | | | 74,601 | |
| | | | | | | | | | | | | $ | 40,664,876 | | | $ | 17,862,613 | |
Affiliated Transactions
Investments representing 5% or more of the outstanding voting shares of a company, or control of or by, or common control under Guggenheim Investments (“GI”), result in that company being considered an affiliated issuer, as defined in the 1940 Act.
The Fund may invest in certain of the underlying series of Guggenheim Strategy Funds Trust, including Guggenheim Strategy Fund II and Guggenheim Strategy Fund III (collectively, the “Guggenheim Strategy Funds”), each of which are open-end management investment companies managed by GI. The Guggenheim Strategy Funds, which launched on March 11, 2014, are offered as short term investment options only to mutual funds, trusts, and other accounts managed by GI and/or its affiliates, and are not available to the public. The Guggenheim Strategy
258 | THE GUGGENHEIM FUNDS ANNUAL REPORT | SEE NOTES TO FINANCIAL STATEMENTS. |
SCHEDULE OF INVESTMENTS (concluded) | September 30, 2024 |
TOTAL RETURN BOND FUND | |
Funds pay no investment management fees. The Guggenheim Strategy Funds’ annual report on Form N-CSR dated September 30, 2023 is available publicly or upon request. This information is available from the EDGAR database on the SEC’s website at https://www.sec.gov/Archives/edgar/data/1601445/000182126823000217/gug86449-ncsr.htm. The Fund may invest in certain of the underlying series of Guggenheim Funds Trust, which are open-end management investment companies managed by GI, are available to the public and whose most recent annual report on Form N-CSR is available publicly or upon request.
Transactions during the year ended September 30, 2024, in which the company is an affiliated issuer, were as follows:
Security Name | | Value
09/30/23 | | | Additions | | | Reductions | | | Realized
Gain (Loss) | | | Change in
Unrealized
Appreciation
(Depreciation) | | | Value
09/30/24 | | | Shares
09/30/24 | | | Investment
Income | |
Common Stocks | | | | | | | | | | | | | | | | | | | | | | | | | | | | | | | | |
BP Holdco LLC * | | $ | 683 | | | $ | — | | | $ | — | | | $ | — | | | $ | (38 | ) | | $ | 645 | | | | 532 | | | $ | — | |
Mutual Funds | | | | | | | | | | | | | | | | | | | | | | | | | | | | | | | | |
Guggenheim Limited Duration Fund — Class R6 | | | 120,393,598 | | | | 5,902,022 | | | | — | | | | — | | | | 5,229,086 | | | | 131,524,706 | | | | 5,348,707 | | | | 5,920,631 | |
Guggenheim Strategy Fund II | | | 28,409,135 | | | | 1,667,756 | | | | — | | | | — | | | | 635,633 | | | | 30,712,524 | | | | 1,238,408 | | | | 1,672,782 | |
Guggenheim Strategy Fund III | | | 15,326,528 | | | | 861,209 | | | | — | | | | — | | | | 387,147 | | | | 16,574,884 | | | | 665,925 | | | | 863,447 | |
Guggenheim Ultra Short Duration Fund — Institutional Class | | | 27,908,179 | | | | 1,560,537 | | | | — | | | | — | | | | 792,101 | | | | 30,260,817 | | | | 3,020,042 | | | | 1,565,123 | |
| | | $ | 192,038,123 | | | $ | 9,991,524 | | | $ | — | | | $ | — | | | $ | 7,043,929 | | | $ | 209,073,576 | | | | | | | $ | 10,021,983 | |
* | Non-income producing security. |
SEE NOTES TO FINANCIAL STATEMENTS. | THE GUGGENHEIM FUNDS ANNUAL REPORT | 259 |
STATEMENT OF ASSETS AND LIABILITIES |
September 30, 2024 |
Assets: |
Investments in unaffiliated issuers, at value (cost $30,417,046,449) | | $ | 29,618,877,468 | |
Investments in affiliated issuers, at value (cost $204,111,861) | | | 209,073,576 | |
Repurchase agreements, at value (cost $17,510,000) | | | 17,510,000 | |
Foreign currency, at value (cost 5,326,010) | | | 5,180,113 | |
Cash | | | 21,986,145 | |
Segregated cash with broker | | | 56,838,919 | |
Unamortized upfront premiums paid on interest rate swap agreements | | | 244,014 | |
Prepaid expenses | | | 521,478 | |
Receivables: |
Securities sold | | | 3,018,531,555 | |
Interest | | | 213,920,841 | |
Fund shares sold | | | 39,016,970 | |
Dividends | | | 943,651 | |
Variation margin on credit default swap agreements | | | 125,204 | |
Foreign tax reclaims | | | 11,233 | |
Investment Adviser | | | 3,045 | |
Total assets | | | 33,202,784,212 | |
| | | | | |
Liabilities: |
Unfunded loan commitments, at value (Note 9) (commitment fees received $597,840) | | | 121,352 | |
Segregated cash due to broker | | | 9,212,786 | |
Unamortized upfront premiums received on credit default swap agreements | | | 15,677,190 | |
Unrealized depreciation on forward foreign currency exchange contracts | | | 1,280,016 | |
Payable for: |
Securities purchased | | | 6,258,749,274 | |
Variation margin on interest rate swap agreements | | | 57,192,530 | |
Fund shares redeemed | | | 47,789,058 | |
Distributions to shareholders | | | 8,140,753 | |
Management fees | | | 6,608,841 | |
Variation margin on futures contracts | | | 1,880,150 | |
Transfer agent fees | | | 1,117,386 | |
Distribution and service fees | | | 268,849 | |
Protection fees on credit default swap agreements | | | 215,990 | |
Fund accounting/administration fees | | | 89,295 | |
Trustees’ fees* | | | 33,887 | |
Due to Investment Adviser | | | 3,175 | |
Miscellaneous | | | 16,597,434 | |
Total liabilities | | | 6,424,977,966 | |
Net assets | | $ | 26,777,806,246 | |
| | | | | |
Net assets consist of: |
Paid in capital | | $ | 30,019,691,050 | |
Total distributable earnings (loss) | | | (3,241,884,804 | ) |
Net assets | | $ | 26,777,806,246 | |
Class A: |
Net assets | | $ | 487,539,022 | |
Capital shares outstanding | | | 20,019,419 | |
Net asset value per share | | $ | 24.35 | |
Maximum offering price per share (Net asset value divided by 96.00%) | | $ | 25.36 | |
| | | | | |
Class C: |
Net assets | | $ | 149,405,154 | |
Capital shares outstanding | | | 6,134,308 | |
Net asset value per share | | $ | 24.36 | |
| | | | | |
Class P: |
Net assets | | $ | 321,930,738 | |
Capital shares outstanding | | | 13,223,573 | |
Net asset value per share | | $ | 24.35 | |
| | | | | |
Institutional Class: |
Net assets | | $ | 25,476,353,247 | |
Capital shares outstanding | | | 1,045,165,662 | |
Net asset value per share | | $ | 24.38 | |
| | | | | |
Class R6: |
Net assets | | $ | 342,578,085 | |
Capital shares outstanding | | | 14,045,870 | |
Net asset value per share | | $ | 24.39 | |
* | Relates to Trustees not deemed “interested persons” within the meaning of Section 2(a)(19) of the 1940 Act. |
260 | THE GUGGENHEIM FUNDS ANNUAL REPORT | SEE NOTES TO FINANCIAL STATEMENTS. |
STATEMENT OF OPERATIONS |
Year Ended September 30, 2024 |
Investment Income: |
Dividends from securities of unaffiliated issuers | | $ | 7,005,543 | |
Dividends from securities of affiliated issuers | | | 10,021,983 | |
Interest | | | 1,311,885,154 | |
Total investment income | | | 1,328,912,680 | |
| | | | | |
Expenses: |
Management fees | | | 90,987,861 | |
Distribution and service fees: |
Class A | | | 1,136,036 | |
Class C | | | 1,509,815 | |
Class P | | | 897,683 | |
Transfer agent fees: |
Class A | | | 437,559 | |
Class C | | | 123,347 | |
Class P | | | 306,457 | |
Institutional Class | | | 15,632,448 | |
Class R6 | | | 30,354 | |
Interest expense | | | 16,368,175 | |
Fund accounting/administration fees | | | 9,004,962 | |
Professional fees | | | 1,364,935 | |
Line of credit fees | | | 1,223,118 | |
Trustees’ fees* | | | 344,729 | |
Custodian fees | | | 120,568 | |
Miscellaneous | | | 1,817,248 | |
Recoupment of previously waived fees: |
Class A | | | 22,525 | |
Class C | | | 73,613 | |
Class P | | | 120,252 | |
Institutional Class | | | 2,719,879 | |
Class R6 | | | 226 | |
Total expenses | | | 144,241,790 | |
Less: Expenses reimbursed by Adviser |
Class A | | | (19,859 | ) |
Class C | | | (48,988 | ) |
Class P | | | (79,420 | ) |
Institutional Class | | | (5,713,035 | ) |
Class R6 | | | (813 | ) |
Expenses waived by Adviser | | | (8,003,866 | ) |
Total waived/reimbursed expenses | | | (13,865,981 | ) |
Net expenses | | | 130,375,809 | |
Net investment income | | | 1,198,536,871 | |
Net Realized and Unrealized Gain (Loss): |
Net realized gain (loss) on: |
Investments in unaffiliated issuers | | $ | (501,084,437 | ) |
Swap agreements | | | (75,428,375 | ) |
Futures contracts | | | (7,619,388 | ) |
Options purchased | | | 5,379,060 | |
Options written | | | (18,549,319 | ) |
Forward foreign currency exchange contracts | | | (1,731,846 | ) |
Foreign currency transactions | | | (668,100 | ) |
Net realized loss | | | (599,702,405 | ) |
Net change in unrealized appreciation (depreciation) on: |
Investments in unaffiliated issuers | | | 2,062,197,492 | |
Investments in affiliated issuers | | | 7,043,929 | |
Swap agreements | | | 227,045,542 | |
Futures contracts | | | 19,546,778 | |
Options purchased | | | 8,722,554 | |
Options written | | | 4,635,100 | |
Forward foreign currency exchange contracts | | | (6,730,525 | ) |
Foreign currency translations | | | (979,849 | ) |
Net change in unrealized appreciation (depreciation) | | | 2,321,481,021 | |
Net realized and unrealized gain | | | 1,721,778,616 | |
Net increase in net assets resulting from operations | | $ | 2,920,315,487 | |
* | Relates to Trustees not deemed “interested persons” within the meaning of Section 2(a)(19) of the 1940 Act. |
SEE NOTES TO FINANCIAL STATEMENTS. | THE GUGGENHEIM FUNDS ANNUAL REPORT | 261 |
STATEMENTS OF CHANGES IN NET ASSETS |
| | Year Ended
September 30,
2024 | | | Year Ended
September 30,
2023 | |
Increase (Decrease) in Net Assets from Operations: | | | | | | | | |
Net investment income | | $ | 1,198,536,871 | | | $ | 918,952,851 | |
Net realized loss on investments | | | (599,702,405 | ) | | | (1,472,550,068 | ) |
Net change in unrealized appreciation (depreciation) on investments | | | 2,321,481,021 | | | | 756,084,184 | |
Net increase in net assets resulting from operations | | | 2,920,315,487 | | | | 202,486,967 | |
| | | | | | | | | |
Distributions to shareholders: | | | | | | | | |
Class A | | | (20,333,503 | ) | | | (19,019,129 | ) |
Class C | | | (5,628,329 | ) | | | (6,072,905 | ) |
Class P | | | (16,104,326 | ) | | | (18,625,018 | ) |
Institutional Class | | | (1,049,271,732 | ) | | | (818,465,001 | ) |
Class R6 | | | (13,354,333 | ) | | | (10,162,965 | ) |
Total distributions to shareholders | | | (1,104,692,223 | ) | | | (872,345,018 | ) |
| | | | | | | | | |
Capital share transactions: | | | | | | | | |
Proceeds from sale of shares | | | | | | | | |
Class A | | | 198,179,248 | | | | 190,008,832 | |
Class C | | | 35,001,713 | | | | 32,292,309 | |
Class P | | | 81,643,859 | | | | 143,216,250 | |
Institutional Class | | | 9,959,347,215 | | | | 9,905,246,248 | |
Class R6 | | | 162,553,005 | | | | 140,809,681 | |
Distributions reinvested | | | | | | | | |
Class A | | | 17,538,129 | | | | 16,394,524 | |
Class C | | | 4,935,617 | | | | 5,230,841 | |
Class P | | | 15,995,894 | | | | 18,492,403 | |
Institutional Class | | | 946,531,735 | | | | 725,020,898 | |
Class R6 | | | 12,988,662 | | | | 9,871,684 | |
Cost of shares redeemed | | | | | | | | |
Class A | | | (208,810,751 | ) | | | (176,845,859 | ) |
Class C | | | (60,616,986 | ) | | | (72,847,845 | ) |
Class P | | | (197,068,145 | ) | | | (327,848,764 | ) |
Institutional Class | | | (6,950,231,500 | ) | | | (7,698,063,900 | ) |
Class R6 | | | (116,145,057 | ) | | | (90,056,671 | ) |
Net increase from capital share transactions | | | 3,901,842,638 | | | | 2,820,920,631 | |
Net increase in net assets | | | 5,717,465,902 | | | | 2,151,062,580 | |
| | | | | | | | | |
Net assets: | | | | | | | | |
Beginning of year | | | 21,060,340,344 | | | | 18,909,277,764 | |
End of year | | $ | 26,777,806,246 | | | $ | 21,060,340,344 | |
| | | | | | | | | |
262 | THE GUGGENHEIM FUNDS ANNUAL REPORT | SEE NOTES TO FINANCIAL STATEMENTS. |
STATEMENTS OF CHANGES IN NET ASSETS (concluded)
| | Year Ended
September 30,
2024 | | | Year Ended
September 30,
2023 | |
Capital share activity: | | | | | | | | |
Shares sold | | | | | | | | |
Class A | | | 8,481,505 | | | | 8,094,504 | |
Class C | | | 1,485,557 | | | | 1,375,517 | |
Class P | | | 3,498,570 | | | | 6,070,940 | |
Institutional Class | | | 425,314,648 | | | | 421,456,679 | |
Class R6 | | | 6,929,297 | | | | 5,994,350 | |
Shares issued from reinvestment of distributions | | | | | | | | |
Class A | | | 749,822 | | | | 702,293 | |
Class C | | | 211,171 | | | | 224,186 | |
Class P | | | 684,908 | | | | 793,085 | |
Institutional Class | | | 40,391,299 | | | | 31,049,191 | |
Class R6 | | | 553,807 | | | | 422,497 | |
Shares redeemed | | | | | | | | |
Class A | | | (8,947,515 | ) | | | (7,564,633 | ) |
Class C | | | (2,598,329 | ) | | | (3,122,803 | ) |
Class P | | | (8,449,692 | ) | | | (14,121,799 | ) |
Institutional Class | | | (299,062,138 | ) | | | (330,170,194 | ) |
Class R6 | | | (5,033,087 | ) | | | (3,874,827 | ) |
Net increase in shares | | | 164,209,823 | | | | 117,328,986 | |
SEE NOTES TO FINANCIAL STATEMENTS. | THE GUGGENHEIM FUNDS ANNUAL REPORT | 263 |
This table is presented to show selected data for a share outstanding throughout each period and to assist shareholders in evaluating a Fund’s performance for the periods presented.
Class A | | Year Ended
September 30,
2024 | | | Year Ended
September 30,
2023 | | | Year Ended
September 30,
2022 | | | Year Ended
September 30,
2021 | | | Year Ended
September 30,
2020 | |
Per Share Data |
Net asset value, beginning of period | | $ | 22.52 | | | $ | 23.12 | | | $ | 28.94 | | | $ | 29.76 | | | $ | 27.42 | |
Income (loss) from investment operations: |
Net investment income (loss)a | | | 1.14 | | | | 1.03 | | | | .78 | | | | .72 | | | | .56 | |
Net gain (loss) on investments (realized and unrealized) | | | 1.73 | | | | (.65 | ) | | | (5.53 | ) | | | (.05 | ) | | | 2.41 | |
Total from investment operations | | | 2.87 | | | | .38 | | | | (4.75 | ) | | | .67 | | | | 2.97 | |
Less distributions from: |
Net investment income | | | (1.04 | ) | | | (.98 | ) | | | (.80 | ) | | | (.76 | ) | | | (.63 | ) |
Net realized gains | | | — | | | | — | | | | (.27 | ) | | | (.73 | ) | | | — | |
Total distributions | | | (1.04 | ) | | | (.98 | ) | | | (1.07 | ) | | | (1.49 | ) | | | (.63 | ) |
Net asset value, end of period | | $ | 24.35 | | | $ | 22.52 | | | $ | 23.12 | | | $ | 28.94 | | | $ | 29.76 | |
|
Total Returnb | | | 13.04 | % | | | 1.55 | % | | | (16.82 | %) | | | 2.27 | % | | | 10.96 | % |
Ratios/Supplemental Data |
Net assets, end of period (in thousands) | | $ | 487,539 | | | $ | 444,454 | | | $ | 427,870 | | | $ | 677,172 | | | $ | 804,750 | |
Ratios to average net assets: |
Net investment income (loss) | | | 4.87 | % | | | 4.40 | % | | | 2.94 | % | | | 2.47 | % | | | 1.99 | % |
Total expensesc | | | 0.88 | % | | | 0.96 | % | | | 0.85 | % | | | 0.84 | % | | | 0.87 | % |
Net expensesd,e,f | | | 0.84 | % | | | 0.91 | % | | | 0.81 | % | | | 0.79 | % | | | 0.80 | % |
Portfolio turnover rate | | | 70 | % | | | 90 | % | | | 55 | % | | | 92 | % | | | 116 | % |
Class C | | Year Ended
September 30,
2024 | | | Year Ended
September 30,
2023 | | | Year Ended
September 30,
2022 | | | Year Ended
September 30,
2021 | | | Year Ended
September 30,
2020 | |
Per Share Data |
Net asset value, beginning of period | | $ | 22.52 | | | $ | 23.13 | | | $ | 28.94 | | | $ | 29.76 | | | $ | 27.43 | |
Income (loss) from investment operations: |
Net investment income (loss)a | | | .96 | | | | .86 | | | | .58 | | | | .50 | | | | .35 | |
Net gain (loss) on investments (realized and unrealized) | | | 1.75 | | | | (.67 | ) | | | (5.52 | ) | | | (.05 | ) | | | 2.40 | |
Total from investment operations | | | 2.71 | | | | .19 | | | | (4.94 | ) | | | .45 | | | | 2.75 | |
Less distributions from: |
Net investment income | | | (.87 | ) | | | (.80 | ) | | | (.60 | ) | | | (.54 | ) | | | (.42 | ) |
Net realized gains | | | — | | | | — | | | | (.27 | ) | | | (.73 | ) | | | — | |
Total distributions | | | (.87 | ) | | | (.80 | ) | | | (.87 | ) | | | (1.27 | ) | | | (.42 | ) |
Net asset value, end of period | | $ | 24.36 | | | $ | 22.52 | | | $ | 23.13 | | | $ | 28.94 | | | $ | 29.76 | |
|
Total Returnb | | | 12.25 | % | | | 0.74 | % | | | (17.41 | %) | | | 1.50 | % | | | 10.10 | % |
Ratios/Supplemental Data |
Net assets, end of period (in thousands) | | $ | 149,405 | | | $ | 158,466 | | | $ | 197,933 | | | $ | 327,712 | | | $ | 338,656 | |
Ratios to average net assets: |
Net investment income (loss) | | | 4.12 | % | | | 3.65 | % | | | 2.18 | % | | | 1.72 | % | | | 1.24 | % |
Total expensesc | | | 1.66 | % | | | 1.72 | % | | | 1.63 | % | | | 1.59 | % | | | 1.59 | % |
Net expensesd,e,f | | | 1.60 | % | | | 1.66 | % | | | 1.56 | % | | | 1.53 | % | | | 1.55 | % |
Portfolio turnover rate | | | 70 | % | | | 90 | % | | | 55 | % | | | 92 | % | | | 116 | % |
264 | THE GUGGENHEIM FUNDS ANNUAL REPORT | SEE NOTES TO FINANCIAL STATEMENTS. |
This table is presented to show selected data for a share outstanding throughout each period and to assist shareholders in evaluating a Fund’s performance for the periods presented.
Class P | | Year Ended
September 30,
2024 | | | Year Ended
September 30,
2023 | | | Year Ended
September 30,
2022 | | | Year Ended
September 30,
2021 | | | Year Ended
September 30,
2020 | |
Per Share Data |
Net asset value, beginning of period | | $ | 22.51 | | | $ | 23.12 | | | $ | 28.93 | | | $ | 29.75 | | | $ | 27.42 | |
Income (loss) from investment operations: |
Net investment income (loss)a | | | 1.14 | | | | 1.03 | | | | .77 | | | | .72 | | | | .56 | |
Net gain (loss) on investments (realized and unrealized) | | | 1.74 | | | | (.66 | ) | | | (5.51 | ) | | | (.05 | ) | | | 2.40 | |
Total from investment operations | | | 2.88 | | | | .37 | | | | (4.74 | ) | | | .67 | | | | 2.96 | |
Less distributions from: |
Net investment income | | | (1.04 | ) | | | (.98 | ) | | | (.80 | ) | | | (.76 | ) | | | (.63 | ) |
Net realized gains | | | — | | | | — | | | | (.27 | ) | | | (.73 | ) | | | — | |
Total distributions | | | (1.04 | ) | | | (.98 | ) | | | (1.07 | ) | | | (1.49 | ) | | | (.63 | ) |
Net asset value, end of period | | $ | 24.35 | | | $ | 22.51 | | | $ | 23.12 | | | $ | 28.93 | | | $ | 29.75 | |
|
Total Return | | | 13.09 | % | | | 1.51 | % | | | (16.79 | %) | | | 2.27 | % | | | 10.92 | % |
Ratios/Supplemental Data |
Net assets, end of period (in thousands) | | $ | 321,931 | | | $ | 393,752 | | | $ | 572,113 | | | $ | 1,043,507 | | | $ | 926,745 | |
Ratios to average net assets: |
Net investment income (loss) | | | 4.87 | % | | | 4.41 | % | | | 2.90 | % | | | 2.47 | % | | | 1.98 | % |
Total expensesc | | | 0.91 | % | | | 1.06 | % | | | 0.93 | % | | | 0.87 | % | | | 0.88 | % |
Net expensesd,e,f | | | 0.85 | % | | | 0.91 | % | | | 0.81 | % | | | 0.79 | % | | | 0.80 | % |
Portfolio turnover rate | | | 70 | % | | | 90 | % | | | 55 | % | | | 92 | % | | | 116 | % |
Institutional Class | | Year Ended
September 30,
2024 | | | Year Ended
September 30,
2023 | | | Year Ended
September 30,
2022 | | | Year Ended
September 30,
2021 | | | Year Ended
September 30,
2020 | |
Per Share Data |
Net asset value, beginning of period | | $ | 22.54 | | | $ | 23.14 | | | $ | 28.97 | | | $ | 29.78 | | | $ | 27.45 | |
Income (loss) from investment operations: |
Net investment income (loss)a | | | 1.21 | | | | 1.10 | | | | .86 | | | | .81 | | | | .65 | |
Net gain (loss) on investments (realized and unrealized) | | | 1.74 | | | | (.66 | ) | | | (5.54 | ) | | | (.05 | ) | | | 2.39 | |
Total from investment operations | | | 2.95 | | | | .44 | | | | (4.68 | ) | | | .76 | | | | 3.04 | |
Less distributions from: |
Net investment income | | | (1.11 | ) | | | (1.04 | ) | | | (.88 | ) | | | (.84 | ) | | | (.71 | ) |
Net realized gains | | | — | | | | — | | | | (.27 | ) | | | (.73 | ) | | | — | |
Total distributions | | | (1.11 | ) | | | (1.04 | ) | | | (1.15 | ) | | | (1.57 | ) | | | (.71 | ) |
Net asset value, end of period | | $ | 24.38 | | | $ | 22.54 | | | $ | 23.14 | | | $ | 28.97 | | | $ | 29.78 | |
|
Total Return | | | 13.40 | % | | | 1.84 | % | | | (16.59 | %) | | | 2.59 | % | | | 11.23 | % |
Ratios/Supplemental Data |
Net assets, end of period (in thousands) | | $ | 25,476,353 | | | $ | 19,802,142 | | | $ | 17,501,690 | | | $ | 24,912,049 | | | $ | 19,152,857 | |
Ratios to average net assets: |
Net investment income (loss) | | | 5.16 | % | | | 4.69 | % | | | 3.23 | % | | | 2.76 | % | | | 2.29 | % |
Total expensesc | | | 0.60 | % | | | 0.71 | % | | | 0.62 | % | | | 0.57 | % | | | 0.57 | % |
Net expensesd,e,f | | | 0.54 | % | | | 0.62 | % | | | 0.52 | % | | | 0.50 | % | | | 0.51 | % |
Portfolio turnover rate | | | 70 | % | | | 90 | % | | | 55 | % | | | 92 | % | | | 116 | % |
SEE NOTES TO FINANCIAL STATEMENTS. | THE GUGGENHEIM FUNDS ANNUAL REPORT | 265 |
This table is presented to show selected data for a share outstanding throughout each period and to assist shareholders in evaluating a Fund’s performance for the periods presented.
Class R6 | | Year Ended
September 30,
2024 | | | Year Ended
September 30,
2023 | | | Year Ended
September 30,
2022 | | | Year Ended
September 30,
2021 | | | Year Ended
September 30,
2020 | |
Per Share Data |
Net asset value, beginning of period | | $ | 22.55 | | | $ | 23.16 | | | $ | 28.98 | | | $ | 29.80 | | | $ | 27.46 | |
Income (loss) from investment operations: |
Net investment income (loss)a | | | 1.22 | | | | 1.11 | | | | .87 | | | | .81 | | | | .65 | |
Net gain (loss) on investments (realized and unrealized) | | | 1.74 | | | | (.67 | ) | | | (5.54 | ) | | | (.06 | ) | | | 2.40 | |
Total from investment operations | | | 2.96 | | | | .44 | | | | (4.67 | ) | | | .75 | | | | 3.05 | |
Less distributions from: |
Net investment income | | | (1.12 | ) | | | (1.05 | ) | | | (.88 | ) | | | (.84 | ) | | | (.71 | ) |
Net realized gains | | | — | | | | — | | | | (.27 | ) | | | (.73 | ) | | | — | |
Total distributions | | | (1.12 | ) | | | (1.05 | ) | | | (1.15 | ) | | | (1.57 | ) | | | (.71 | ) |
Net asset value, end of period | | $ | 24.39 | | | $ | 22.55 | | | $ | 23.16 | | | $ | 28.98 | | | $ | 29.80 | |
|
Total Return | | | 13.44 | % | | | 1.84 | % | | | (16.55 | %) | | | 2.56 | % | | | 11.26 | % |
Ratios/Supplemental Data |
Net assets, end of period (in thousands) | | $ | 342,578 | | | $ | 261,527 | | | $ | 209,671 | | | $ | 247,051 | | | $ | 167,409 | |
Ratios to average net assets: |
Net investment income (loss) | | | 5.19 | % | | | 4.73 | % | | | 3.26 | % | | | 2.76 | % | | | 2.28 | % |
Total expensesc | | | 0.53 | % | | | 0.62 | % | | | 0.53 | % | | | 0.50 | % | | | 0.52 | % |
Net expensesd,e,f | | | 0.49 | % | | | 0.58 | % | | | 0.52 | % | | | 0.50 | % | | | 0.51 | % |
Portfolio turnover rate | | | 70 | % | | | 90 | % | | | 55 | % | | | 92 | % | | | 116 | % |
a | Net investment income (loss) per share was computed using average shares outstanding throughout the period. |
b | Total return does not reflect the impact of any applicable sales charges. |
c | Does not include expenses of the underlying funds in which the Fund invests. |
d | Net expense information reflects the expense ratios after expense waivers and reimbursements, as applicable. |
e | The portion of the ratios of net expenses to average net assets attributable to recoupments of prior fee reductions or expense reimbursements for the years presented was as follows: |
| | | 09/30/24 | 09/30/23 | 09/30/22 | 09/30/21 | 09/30/20 |
| | Class A | 0.00%* | 0.01% | 0.01% | 0.00%* | 0.00%* |
| | Class C | 0.05% | 0.02% | — | 0.00%* | 0.00%* |
| | Class P | 0.03% | 0.00%* | — | — | 0.00%* |
| | Institutional Class | 0.01% | 0.00%* | — | — | 0.00%* |
| | Class R6 | 0.00%* | 0.00%* | 0.01% | 0.01% | 0.00%* |
f | Net expenses may include expenses that are excluded from the expense limitation agreement. Excluding these expenses, the net expense ratios for the years presented would be: |
| | | 09/30/24 | 09/30/23 | 09/30/22 | 09/30/21 | 09/30/20 |
| | Class A | 0.76% | 0.76% | 0.77% | 0.78% | 0.79% |
| | Class C | 1.51% | 1.52% | 1.52% | 1.53% | 1.54% |
| | Class P | 0.76% | 0.76% | 0.77% | 0.78% | 0.79% |
| | Institutional Class | 0.47% | 0.47% | 0.48% | 0.49% | 0.50% |
| | Class R6 | 0.42% | 0.43% | 0.48% | 0.49% | 0.50% |
266 | THE GUGGENHEIM FUNDS ANNUAL REPORT | SEE NOTES TO FINANCIAL STATEMENTS. |
SCHEDULE OF INVESTMENTS | September 30, 2024 |
ULTRA SHORT DURATION FUND | |
| | Shares | | | Value | |
MONEY MARKET FUNDS***,† - 33.2% |
Dreyfus Treasury Securities Cash Management Fund — Institutional Shares, 4.88%1 | | | 135,821,987 | | | $ | 135,821,987 | |
Dreyfus Treasury Obligations Cash Management Fund — Institutional Shares, 4.81%1 | | | 35,748,030 | | | | 35,748,030 | |
Total Money Market Funds | | | | |
(Cost $171,570,017) | | | | | | | 171,570,017 | |
| | | | | | | | | |
| | | Face
Amount | | | | | |
CORPORATE BONDS†† - 24.0% |
Financial - 12.6% | | | | | | | | |
Macquarie Group Ltd. | | | | | | | | |
1.20% due 10/14/252,3 | | $ | 5,250,000 | | | | 5,242,333 | |
Corebridge Financial, Inc. | | | | | | | | |
3.50% due 04/04/25 | | | 5,150,000 | | | | 5,111,516 | |
Goldman Sachs Group, Inc. | | | | | | | | |
3.50% due 04/01/25 | | | 5,050,000 | | | | 5,018,740 | |
Bank of America Corp. | | | | | | | | |
3.95% due 04/21/25 | | | 4,100,000 | | | | 4,079,617 | |
Brighthouse Financial Global Funding | | | | | | | | |
5.55% due 04/09/272 | | | 3,900,000 | | | | 3,981,375 | |
AEGON Funding Company LLC | | | | | | | | |
5.50% due 04/16/272 | | | 3,750,000 | | | | 3,832,773 | |
UBS AG/Stamford CT | | | | | | | | |
2.95% due 04/09/25 | | | 3,800,000 | | | | 3,762,263 | |
Essex Portfolio, LP | | | | | | | | |
3.50% due 04/01/25 | | | 3,181,000 | | | | 3,158,739 | |
Macquarie Bank Ltd. | | | | | | | | |
5.27% due 07/02/272 | | | 2,600,000 | | | | 2,682,748 | |
Alexandria Real Estate Equities, Inc. | | | | | | | | |
3.45% due 04/30/25 | | | 2,600,000 | | | | 2,579,629 | |
Jackson National Life Global Funding | | | | | | | | |
1.75% due 01/12/252 | | | 2,600,000 | | | | 2,574,257 | |
Citigroup, Inc. | | | | | | | | |
6.00% (SOFR + 0.69%) due 01/25/26◊ | | | 2,550,000 | | | | 2,555,017 | |
Rocket Mortgage LLC / Rocket Mortgage Company-Issuer, Inc. | | | | | | | | |
2.88% due 10/15/262 | | | 2,650,000 | | | | 2,544,205 | |
Starwood Property Trust, Inc. | | | | | | | | |
3.75% due 12/31/242 | | | 2,550,000 | | | | 2,535,549 | |
Morgan Stanley Bank North America | | | | | | | | |
5.88% due 10/30/26 | | | 2,400,000 | | | | 2,486,477 | |
FS KKR Capital Corp. | | | | | | | | |
4.25% due 02/14/252 | | | 2,450,000 | | | | 2,435,432 | |
American National Group, Inc. | | | | | | | | |
5.00% due 06/15/27 | | | 2,150,000 | | | | 2,163,564 | |
CNO Global Funding | | | | | | | | |
5.88% due 06/04/272 | | | 1,660,000 | | | | 1,709,949 | |
Societe Generale S.A. | | | | | | | | |
5.52% due 01/19/282,3 | | | 1,300,000 | | | | 1,318,075 | |
GA Global Funding Trust | | | | | | | | |
1.63% due 01/15/262 | | | 1,300,000 | | | | 1,251,444 | |
LPL Holdings, Inc. | | | | | | | | |
5.70% due 05/20/27 | | | 1,200,000 | | | | 1,226,506 | |
OneMain Finance Corp. | | | | | | | | |
3.50% due 01/15/27 | | | 1,150,000 | | | | 1,099,194 | |
RenaissanceRe Finance, Inc. | | | | | | | | |
3.70% due 04/01/25 | | | 700,000 | | | | 694,570 | |
Peachtree Corners Funding Trust | | | | | | | | |
3.98% due 02/15/252 | | | 650,000 | | | | 646,677 | |
First American Financial Corp. | | | | | | | | |
4.60% due 11/15/24 | | | 500,000 | | | | 498,525 | |
Fidelity & Guaranty Life Holdings, Inc. | | | | | | | | |
5.50% due 05/01/252 | | | 127,000 | | | | 126,993 | |
Total Financial | | | | | | | 65,316,167 | |
| | | | | | | | | |
Consumer, Non-cyclical - 2.7% | | | | | | | | |
Global Payments, Inc. | | | | | | | | |
1.50% due 11/15/24 | | | 5,700,000 | | | | 5,672,548 | |
Humana, Inc. | | | | | | | | |
4.50% due 04/01/25 | | | 5,000,000 | | | | 4,989,824 | |
Triton Container International Ltd. | | | | | | | | |
2.05% due 04/15/262 | | | 2,200,000 | | | | 2,104,236 | |
Element Fleet Management Corp. | | | | | | | | |
6.27% due 06/26/262 | | | 1,200,000 | | | | 1,232,209 | |
Total Consumer, Non-cyclical | | | | | | | 13,998,817 | |
| | | | | | | | | |
Industrial - 2.6% | | | | | | | | |
Ryder System, Inc. | | | | | | | | |
3.35% due 09/01/25 | | | 4,820,000 | | | | 4,763,991 | |
Silgan Holdings, Inc. | | | | | | | | |
1.40% due 04/01/262 | | | 2,350,000 | | | | 2,228,902 | |
Vontier Corp. | | | | | | | | |
1.80% due 04/01/26 | | | 2,150,000 | | | | 2,058,427 | |
Jabil, Inc. | | | | | | | | |
1.70% due 04/15/26 | | | 650,000 | | | | 622,570 | |
4.25% due 05/15/27 | | | 600,000 | | | | 595,840 | |
Berry Global, Inc. | | | | | | | | |
1.65% due 01/15/27 | | | 1,100,000 | | | | 1,032,653 | |
3M Co. | | | | | | | | |
2.65% due 04/15/25 | | | 1,000,000 | | | | 988,888 | |
Penske Truck Leasing Company LP / PTL Finance Corp. | | | | | | | | |
2.70% due 11/01/242 | | | 900,000 | | | | 897,903 | |
Weir Group plc | | | | | | | | |
2.20% due 05/13/262 | | | 440,000 | | | | 423,200 | |
Total Industrial | | | | | | | 13,612,374 | |
| | | | | | | | | |
Communications - 2.0% | | | | | | | | |
Fox Corp. | | | | | | | | |
3.05% due 04/07/25 | | | 5,100,000 | | | | 5,050,273 | |
Rogers Communications, Inc. | | | | | | | | |
2.95% due 03/15/25 | | | 2,400,000 | | | | 2,377,778 | |
T-Mobile USA, Inc. | | | | | | | | |
2.63% due 04/15/26 | | | 1,600,000 | | | | 1,559,240 | |
2.25% due 02/15/26 | | | 600,000 | | | | 583,360 | |
Cogent Communications Group LLC | | | | | | | | |
3.50% due 05/01/262 | | | 434,000 | | | | 423,085 | |
SEE NOTES TO FINANCIAL STATEMENTS. | THE GUGGENHEIM FUNDS ANNUAL REPORT | 267 |
SCHEDULE OF INVESTMENTS (continued) | September 30, 2024 |
ULTRA SHORT DURATION FUND | |
| | Face
Amount | | | Value | |
Sprint Spectrum Company LLC / Sprint Spectrum Co II LLC / Sprint Spectrum Co III LLC | | | | | | | | |
4.74% due 03/20/252 | | $ | 112,500 | | | $ | 112,206 | |
Total Communications | | | | | | | 10,105,942 | |
| | | | | | | | | |
Technology - 1.7% | | | | | | | | |
CDW LLC / CDW Finance Corp. | | | | | | | | |
2.67% due 12/01/26 | | | 4,300,000 | | | | 4,137,192 | |
Oracle Corp. | | | | | | | | |
2.50% due 04/01/25 | | | 2,650,000 | | | | 2,619,432 | |
Qorvo, Inc. | | | | | | | | |
1.75% due 12/15/24 | | | 2,050,000 | | | | 2,033,720 | |
Total Technology | | | | | | | 8,790,344 | |
| | | | | | | | | |
Consumer, Cyclical - 1.6% | | | | | | | | |
Warnermedia Holdings, Inc. | | | | | | | | |
3.64% due 03/15/25 | | | 5,700,000 | | | | 5,659,994 | |
VF Corp. | | | | | | | | |
2.40% due 04/23/25 | | | 2,700,000 | | | | 2,654,725 | |
Total Consumer, Cyclical | | | | | | | 8,314,719 | |
| | | | | | | | | |
Utilities - 0.5% | | | | | | | | |
Avangrid, Inc. | | | | | | | | |
3.20% due 04/15/25 | | | 2,250,000 | | | | 2,227,039 | |
AES Corp. | | | | | | | | |
3.30% due 07/15/252 | | | 300,000 | | | | 295,630 | |
Total Utilities | | | | | | | 2,522,669 | |
| | | | | | | | | |
Basic Materials - 0.2% | | | | | | | | |
International Flavors & Fragrances, Inc. | | | | | | | | |
1.23% due 10/01/252 | | | 540,000 | | | | 521,173 | |
Anglo American Capital plc | | | | | | | | |
5.38% due 04/01/252 | | | 450,000 | | | | 450,366 | |
Total Basic Materials | | | | | | | 971,539 | |
| | | | | | | | | |
Energy - 0.1% | | | | | | | | |
Buckeye Partners, LP | | | | | | | | |
4.13% due 03/01/252 | | | 450,000 | | | | 446,261 | |
Total Corporate Bonds | | | | |
(Cost $124,758,590) | | | 124,078,832 | |
| | | | | |
ASSET-BACKED SECURITIES†† - 23.4% |
Collateralized Loan Obligations - 17.3% | | | | | | | | |
BXMT Ltd. | | | | | | | | |
2020-FL2 AS, 6.35% (1 Month Term SOFR + 1.26%, Rate Floor: 1.26%) due 02/15/38◊,2 | | | 2,550,000 | | | | 2,457,573 | |
2020-FL3 AS, 6.95% (1 Month Term SOFR + 1.86%, Rate Floor: 1.86%) due 11/15/37◊,2 | | | 2,500,000 | | | | 2,440,734 | |
2020-FL2 A, 6.10% (1 Month Term SOFR + 1.01%, Rate Floor: 1.01%) due 02/15/38◊,2 | | | 2,208,630 | | | | 2,122,645 | |
HERA Commercial Mortgage Ltd. | | | | | | | | |
2021-FL1 AS, 6.43% (1 Month Term SOFR + 1.41%, Rate Floor: 1.30%) due 02/18/38◊,2 | | | 5,000,000 | | | | 4,876,783 | |
2021-FL1 A, 6.18% (1 Month Term SOFR + 1.16%, Rate Floor: 1.05%) due 02/18/38◊,2 | | | 2,044,708 | | | | 2,015,052 | |
Golub Capital Partners CLO 49M Ltd. | | | | | | | | |
2021-49A AR, 7.07% (3 Month Term SOFR + 1.79%, Rate Floor: 1.79%) due 08/26/33◊,2 | | | 6,250,000 | | | | 6,240,896 | |
Palmer Square Loan Funding Ltd. | | | | | | | | |
2021-2A B, 6.79% (3 Month Term SOFR + 1.66%, Rate Floor: 1.66%) due 05/20/29◊,2 | | | 4,500,000 | | | | 4,503,482 | |
2022-1A A2, 6.90% (3 Month Term SOFR + 1.60%, Rate Floor: 1.60%) due 04/15/30◊,2 | | | 1,000,000 | | | | 998,971 | |
FS Rialto | | | | | | | | |
2021-FL3 B, 7.01% (1 Month Term SOFR + 1.91%, Rate Floor: 1.91%) due 11/16/36◊,2 | | | 5,500,000 | | | | 5,440,028 | |
Cerberus Loan Funding XXXV, LP | | | | | | | | |
2021-5A A, 7.06% (3 Month Term SOFR + 1.76%, Rate Floor: 1.50%) due 09/22/33◊,2 | | | 5,000,000 | | | | 5,000,400 | |
Golub Capital Partners CLO 54M LP | | | | | | | | |
2021-54A A, 7.03% (3 Month Term SOFR + 1.79%, Rate Floor: 1.53%) due 08/05/33◊,2 | | | 4,750,000 | | | | 4,751,998 | |
Owl Rock CLO IV Ltd. | | | | | | | | |
2021-4A A1R, 6.99% (3 Month Term SOFR + 1.86%, Rate Floor: 1.60%) due 08/20/33◊,2 | | | 4,500,000 | | | | 4,522,714 | |
Golub Capital Partners CLO 16 Ltd. | | | | | | | | |
2021-16A A1R2, 7.16% (3 Month Term SOFR + 1.87%, Rate Floor: 1.61%) due 07/25/33◊,2 | | | 4,250,000 | | | | 4,253,098 | |
BRSP Ltd. | | | | | | | | |
2021-FL1 B, 6.98% (1 Month Term SOFR + 2.01%, Rate Floor: 1.90%) due 08/19/38◊,2 | | | 4,250,000 | | | | 4,123,636 | |
LCCM Trust | | | | | | | | |
2021-FL3 A, 6.66% (1 Month Term SOFR + 1.56%, Rate Floor: 1.56%) due 11/15/38◊,2 | | | 3,051,565 | | | | 3,031,252 | |
2021-FL2 B, 7.11% (1 Month Term SOFR + 2.01%, Rate Floor: 2.01%) due 12/13/38◊,2 | | | 1,000,000 | | | | 986,445 | |
Madison Park Funding XLVIII Ltd. | | | | | | | | |
2021-48A B, 6.99% (3 Month Term SOFR + 1.71%, Rate Floor: 1.71%) due 04/19/33◊,2 | | | 4,000,000 | | | | 4,004,667 | |
268 | THE GUGGENHEIM FUNDS ANNUAL REPORT | SEE NOTES TO FINANCIAL STATEMENTS. |
SCHEDULE OF INVESTMENTS (continued) | September 30, 2024 |
ULTRA SHORT DURATION FUND | |
| | Face
Amount | | | Value | |
Golub Capital Partners CLO 33M Ltd. | | | | | | | | |
2021-33A AR2, 7.19% (3 Month Term SOFR + 2.12%, Rate Floor: 1.86%) due 08/25/33◊,2 | | $ | 3,750,000 | | | $ | 3,740,756 | |
Cerberus Loan Funding XXXII, LP | | | | | | | | |
2021-2A A, 7.18% (3 Month Term SOFR + 1.88%, Rate Floor: 1.88%) due 04/22/33◊,2 | | | 2,500,000 | | | | 2,500,602 | |
Carlyle Global Market Strategies CLO Ltd. | | | | | | | | |
2018-4A A1RR, 6.56% (3 Month Term SOFR + 1.26%, Rate Floor: 1.00%) due 01/15/31◊,2 | | | 2,311,165 | | | | 2,315,094 | |
ABPCI Direct Lending Fund CLO I LLC | | | | | | | | |
2021-1A A1A2, 7.24% (3 Month Term SOFR + 1.96%, Rate Floor: 1.96%) due 07/20/33◊,2 | | | 2,250,000 | | | | 2,254,020 | |
Cerberus Loan Funding XXXIII, LP | | | | | | | | |
2021-3A A, 7.12% (3 Month Term SOFR + 1.82%, Rate Floor: 1.56%) due 07/23/33◊,2 | | | 2,250,000 | | | | 2,252,264 | |
THL Credit Lake Shore MM CLO I Ltd. | | | | | | | | |
2021-1A A1R, 7.26% (3 Month Term SOFR + 1.96%, Rate Floor: 1.70%) due 04/15/33◊,2 | | | 2,250,000 | | | | 2,249,987 | |
Parliament CLO II Ltd. | | | | | | | | |
2021-2A A, 6.74% (3 Month Term SOFR + 1.61%, Rate Floor: 1.35%) due 08/20/32◊,2 | | | 2,174,559 | | | | 2,168,419 | |
CIFC Funding Ltd. | | | | | | | | |
2018-3A AR, 6.41% (3 Month Term SOFR + 1.13%, Rate Floor: 0.00%) due 04/19/29◊,2 | | | 2,025,822 | | | | 2,028,456 | |
Madison Park Funding LIII Ltd. | | | | | | | | |
2022-53A B, 7.03% (3 Month Term SOFR + 1.75%, Rate Floor: 1.75%) due 04/21/35◊,2 | | | 1,750,000 | | | | 1,753,749 | |
LCM XXIV Ltd. | | | | | | | | |
2021-24A AR, 6.52% (3 Month Term SOFR + 1.24%, Rate Floor: 0.98%) due 03/20/30◊,2 | | | 1,411,304 | | | | 1,411,345 | |
BCC Middle Market CLO LLC | | | | | | | | |
2021-1A A1R, 7.06% (3 Month Term SOFR + 1.76%, Rate Floor: 1.50%) due 10/15/33◊,2 | | | 1,250,000 | | | | 1,251,363 | |
Greystone Commercial Real Estate Notes | | | | | | | | |
2021-FL3 B, 6.86% (1 Month Term SOFR + 1.76%, Rate Floor: 1.65%) due 07/15/39◊,2 | | | 1,000,000 | | | | 990,876 | |
STWD Ltd. | | | | | | | | |
2021-FL2 B, 6.93% (1 Month Term SOFR + 1.91%, Rate Floor: 1.80%) due 04/18/38◊,2 | | | 1,000,000 | | | | 959,046 | |
Fortress Credit Opportunities XI CLO Ltd. | | | | | | | | |
2018-11A A1T, 6.86% (3 Month Term SOFR + 1.56%, Rate Floor: 0.00%) due 04/15/31◊,2 | | | 650,814 | | | | 650,938 | |
ACRE Commercial Mortgage Ltd. | | | | | | | | |
2021-FL4 AS, 6.23% (1 Month Term SOFR + 1.21%, Rate Floor: 1.10%) due 12/18/37◊,2 | | | 649,221 | | | | 646,334 | |
Cerberus Loan Funding XXXI, LP | | | | | | | | |
2021-1A A, 7.06% (3 Month Term SOFR + 1.76%, Rate Floor: 1.50%) due 04/15/32◊,2 | | | 372,645 | | | | 372,942 | |
Golub Capital Partners CLO 17 Ltd. | | | | | | | | |
2017-17A A1R, 7.20% (3 Month Term SOFR + 1.91%, Rate Floor: 0.00%) due 10/25/30◊,2 | | | 126,107 | | | | 126,184 | |
MidOcean Credit CLO VII | | | | | | | | |
2020-7A A1R, 6.60% (3 Month Term SOFR + 1.30%, Rate Floor: 0.00%) due 07/15/29◊,2 | | | 30,732 | | | | 30,736 | |
Total Collateralized Loan Obligations | | | | | | | 89,473,485 | |
| | | | | | | | | |
Whole Business - 1.8% | | | | | | | | |
Domino’s Pizza Master Issuer LLC | | | | | | | | |
2018-1A, 4.33% due 07/25/482 | | | 4,254,275 | | | | 4,201,370 | |
Taco Bell Funding LLC | | | | | | | | |
2021-1A, 1.95% due 08/25/512 | | | 3,193,125 | | | | 2,992,486 | |
Wingstop Funding LLC | | | | | | | | |
2020-1A, 2.84% due 12/05/502 | | | 1,329,750 | | | | 1,250,351 | |
SERVPRO Master Issuer LLC | | | | | | | | |
2019-1A, 3.88% due 10/25/492 | | | 952,500 | | | | 929,263 | |
Total Whole Business | | | | | | | 9,373,470 | |
| | | | | | | | | |
Transport-Container - 1.6% | | | | | | | | |
Triton Container Finance VIII LLC | | | | | | | | |
2021-1A, 1.86% due 03/20/462 | | | 5,093,125 | | | | 4,602,646 | |
Textainer Marine Containers VII Ltd. | | | | | | | | |
2021-1A, 1.68% due 02/20/462 | | | 1,498,000 | | | | 1,368,266 | |
2020-1A, 2.73% due 08/21/452 | | | 495,800 | | | | 473,222 | |
CLI Funding VIII LLC | | | | | | | | |
2021-1A, 1.64% due 02/18/462 | | | 2,018,327 | | | | 1,840,049 | |
Total Transport-Container | | | | | | | 8,284,183 | |
| | | | | | | | | |
Net Lease - 1.6% | | | | | | | | |
Oak Street Investment Grade Net Lease Fund Series | | | | | | | | |
2020-1A, 1.85% due 11/20/502 | | | 6,208,841 | | | | 5,951,575 | |
CF Hippolyta Issuer LLC | | | | | | | | |
2021-1A, 1.98% due 03/15/612 | | | 2,120,507 | | | | 1,951,815 | |
Total Net Lease | | | | | | | 7,903,390 | |
| | | | | | | | | |
Financial - 1.1% | | | | | | | | |
Station Place Securitization Trust | | | | | | | | |
2024-SP2, 6.81% (1 Month Term SOFR + 1.70%, Rate Floor: 1.70%) due 07/12/26◊,†††,2 | | | 900,000 | | | | 900,000 | |
2023-SP1, 6.96% (1 Month Term SOFR + 1.85%, Rate Floor: 1.85%) due 10/15/24◊,†††,2 | | | 900,000 | | | | 900,000 | |
SEE NOTES TO FINANCIAL STATEMENTS. | THE GUGGENHEIM FUNDS ANNUAL REPORT | 269 |
SCHEDULE OF INVESTMENTS (continued) | September 30, 2024 |
ULTRA SHORT DURATION FUND | |
| | Face
Amount | | | Value | |
2024-SP1, 6.51% (1 Month Term SOFR + 1.40%, Rate Floor: 1.40%) due 08/12/25◊,†††,2 | | $ | 900,000 | | | $ | 900,000 | |
Madison Avenue Secured Funding Trust | | | | | | | | |
2023-2, 6.96% (1 Month Term SOFR + 1.85%, Rate Floor: 1.85%) due 10/15/24◊,†††,2 | | | 1,800,000 | | | | 1,800,000 | |
ST Group Food Industries Holdings Ltd. | | | | | | | | |
due 11/10/257 | | | 675,000 | | | | 675,000 | |
due 11/10/257 | | | 325,000 | | | | 325,000 | |
Total Financial | | | | | | | 5,500,000 | |
| | | | | | | | | |
Total Asset-Backed Securities | | | | |
(Cost $122,944,176) | | | 120,534,528 | |
| | | | | |
COLLATERALIZED MORTGAGE OBLIGATIONS†† - 16.9% |
Residential Mortgage-Backed Securities - 12.2% | | | | | | | | |
CSMC Trust | | | | | | | | |
2021-RPL1, 4.07% (WAC) due 09/27/60◊,2 | | | 4,418,088 | | | | 4,402,507 | |
2021-RPL7, 1.93% (WAC) due 07/27/61◊,2 | | | 1,922,743 | | | | 1,916,562 | |
2021-NQM8, 2.41% (WAC) due 10/25/66◊,2 | | | 1,445,666 | | | | 1,273,873 | |
2021-RPL4, 4.06% (WAC) due 12/27/60◊,2 | | | 1,146,396 | | | | 1,142,357 | |
2020-NQM1, 2.21% due 05/25/652 | | | 853,380 | | | | 797,245 | |
PRPM LLC | | | | | | | | |
2021-5, 4.79% due 06/25/262,4 | | | 2,853,470 | | | | 2,840,857 | |
2022-1, 3.72% due 02/25/272,4 | | | 2,834,499 | | | | 2,810,286 | |
2021-RPL2, 2.24% (WAC) due 10/25/51◊,2 | | | 2,000,000 | | | | 1,738,581 | |
2021-8, 4.74% (WAC) due 09/25/26◊,2 | | | 1,377,276 | | | | 1,369,457 | |
NYMT Loan Trust | | | | | | | | |
2021-SP1, 4.67% due 08/25/612,4 | | | 6,548,425 | | | | 6,494,007 | |
2022-SP1, 5.25% due 07/25/622,4 | | | 1,658,648 | | | | 1,627,748 | |
Legacy Mortgage Asset Trust | | | | | | | | |
2021-GS4, 4.65% due 11/25/602,4 | | | 2,756,655 | | | | 2,756,225 | |
2021-GS3, 4.75% due 07/25/612,4 | | | 2,728,854 | | | | 2,708,291 | |
2021-GS2, 4.75% due 04/25/612,4 | | | 1,249,306 | | | | 1,258,198 | |
2021-GS5, 2.25% due 07/25/672,4 | | | 827,313 | | | | 820,991 | |
Verus Securitization Trust | | | | | | | | |
2021-5, 1.37% (WAC) due 09/25/66◊,2 | | | 1,819,256 | | | | 1,569,775 | |
2021-6, 1.89% (WAC) due 10/25/66◊,2 | | | 1,609,904 | | | | 1,392,415 | |
2020-5, 1.22% due 05/25/652,4 | | | 1,188,845 | | | | 1,138,832 | |
2021-4, 1.35% (WAC) due 07/25/66◊,2 | | | 862,646 | | | | 734,491 | |
2021-3, 1.44% (WAC) due 06/25/66◊,2 | | | 528,604 | | | | 458,650 | |
2019-4, 3.85% due 11/25/592 | | | 278,197 | | | | 273,745 | |
2020-1, 3.42% due 01/25/602 | | | 213,316 | | | | 208,491 | |
2019-4, 3.64% due 11/25/592 | | | 133,666 | | | | 131,539 | |
OSAT Trust | | | | | | | | |
2021-RPL1, 5.12% due 05/25/652,4 | | | 5,830,171 | | | | 5,819,553 | |
Imperial Fund Mortgage Trust | | | | | | | | |
2022-NQM2, 4.02% (WAC) due 03/25/67◊,2 | | | 3,834,937 | | | | 3,593,640 | |
BRAVO Residential Funding Trust | | | | | | | | |
2022-R1, 3.13% due 01/29/702,4 | | | 2,797,221 | | | | 2,776,114 | |
2021-HE1, 6.13% (30 Day Average SOFR + 0.85%, Rate Floor: 0.00%) due 01/25/70◊,2 | | | 480,475 | | | | 478,981 | |
2021-HE2, 6.13% (30 Day Average SOFR + 0.85%, Rate Floor: 0.00%) due 11/25/69◊,2 | | | 228,360 | | | | 227,498 | |
CFMT LLC | | | | | | | | |
2022-HB9, 3.25% (WAC) due 09/25/37◊,2 | | | 2,038,829 | | | | 1,954,354 | |
Structured Asset Securities Corporation Mortgage Loan Trust | | | | | | | | |
2008-BC4, 5.60% (1 Month Term SOFR + 0.74%, Rate Floor: 0.63%) due 11/25/37◊ | | | 1,475,600 | | | | 1,423,684 | |
New Residential Mortgage Loan Trust | | | | | | | | |
2019-1A, 3.50% (WAC) due 10/25/59◊,2 | | | 919,085 | | | | 869,329 | |
2018-2A, 3.50% (WAC) due 02/25/58◊,2 | | | 519,393 | | | | 495,444 | |
Angel Oak Mortgage Trust | | | | | | | | |
2022-1, 3.29% (WAC) due 12/25/66◊,2 | | | 1,308,684 | | | | 1,183,304 | |
Soundview Home Loan Trust | | | | | | | | |
2006-OPT5, 5.25% (1 Month Term SOFR + 0.39%, Rate Floor: 0.28%) due 07/25/36◊ | | | 895,667 | | | | 860,727 | |
Credit Suisse Mortgage Capital Certificates | | | | | | | | |
2021-RPL9, 2.44% (WAC) due 02/25/61◊,2 | | | 738,308 | | | | 734,059 | |
Towd Point Mortgage Trust | | | | | | | | |
2018-2, 3.25% (WAC) due 03/25/58◊,2 | | | 263,096 | | | | 257,652 | |
2017-6, 2.75% (WAC) due 10/25/57◊,2 | | | 243,241 | | | | 236,721 | |
2017-5, 5.57% (1 Month Term SOFR + 0.71%, Rate Floor: 0.00%) due 02/25/57◊,2 | | | 48,302 | | | | 49,733 | |
Ellington Financial Mortgage Trust | | | | | | | | |
2020-2, 1.49% (WAC) due 10/25/65◊,2 | | | 296,776 | | | | 275,309 | |
2020-2, 1.64% (WAC) due 10/25/65◊,2 | | | 170,954 | | | | 157,740 | |
SG Residential Mortgage Trust | | | | | | | | |
2022-1, 3.68% (WAC) due 03/27/62◊,2 | | | 418,067 | | | | 386,648 | |
Argent Securities Incorporated Asset-Backed Pass-Through Certificates Series | | | | | | | | |
2005-W2, 5.70% (1 Month Term SOFR + 0.85%, Rate Floor: 0.74%) due 10/25/35◊ | | | 306,501 | | | | 301,046 | |
Banc of America Funding Trust | | | | | | | | |
2015-R2, 5.23% (1 Month Term SOFR + 0.37%, Rate Floor: 0.26%) due 04/29/37◊,2 | | | 239,999 | | | | 238,521 | |
GS Mortgage-Backed Securities Trust | | | | | | | | |
2020-NQM1, 1.38% (WAC) due 09/27/60◊,2 | | | 249,887 | | | | 234,982 | |
Morgan Stanley ABS Capital I Incorporated Trust | | | | | | | | |
2006-NC1, 5.54% (1 Month Term SOFR + 0.68%, Rate Floor: 0.57%) due 12/25/35◊ | | | 229,819 | | | | 227,241 | |
Residential Mortgage Loan Trust | | | | | | | | |
2020-1, 2.38% (WAC) due 01/26/60◊,2 | | | 200,071 | | | | 195,743 | |
Starwood Mortgage Residential Trust | | | | | | | | |
2020-1, 2.28% (WAC) due 02/25/50◊,2 | | | 43,860 | | | | 41,545 | |
Cascade Funding Mortgage Trust | | | | | | | | |
2019-RM3, 2.80% (WAC) due 06/25/69◊ | | | 8,232 | | | | 8,202 | |
Total Residential Mortgage-Backed Securities | | | | | | | 62,892,893 | |
| | | | | | | | | |
270 | THE GUGGENHEIM FUNDS ANNUAL REPORT | SEE NOTES TO FINANCIAL STATEMENTS. |
SCHEDULE OF INVESTMENTS (continued) | September 30, 2024 |
ULTRA SHORT DURATION FUND | |
| | Face
Amount | | | Value | |
Commercial Mortgage-Backed Securities - 4.7% | | | | | | | | |
BX Commercial Mortgage Trust | | | | | | | | |
2021-VOLT, 6.86% (1 Month Term SOFR + 1.76%, Rate Floor: 1.65%) due 09/15/36◊,2 | | $ | 10,250,000 | | | $ | 10,141,094 | |
2022-LP2, 6.66% (1 Month Term SOFR + 1.56%, Rate Floor: 1.56%) due 02/15/39◊,2 | | | 2,011,974 | | | | 1,996,885 | |
JP Morgan Chase Commercial Mortgage Securities Trust | | | | | | | | |
2021-NYAH, 7.00% (1 Month Term SOFR + 1.90%, Rate Floor: 1.54%) due 06/15/38◊,2 | | | 2,700,000 | | | | 2,507,159 | |
WMRK Commercial Mortgage Trust | | | | | | | | |
2022-WMRK, 8.53% (1 Month Term SOFR + 3.44%, Rate Floor: 3.44%) due 11/15/27◊,2 | | | 2,100,000 | | | | 2,105,906 | |
Life Mortgage Trust | | | | | | | | |
2021-BMR, 6.31% (1 Month Term SOFR + 1.21%, Rate Floor: 1.10%) due 03/15/38◊,2 | | | 1,943,179 | | | | 1,906,987 | |
BXHPP Trust | | | | | | | | |
2021-FILM, 6.31% (1 Month Term SOFR + 1.21%, Rate Floor: 1.10%) due 08/15/36◊,2 | | | 1,500,000 | | | | 1,407,076 | |
MHP | | | | | | | | |
2022-MHIL, 6.36% (1 Month Term SOFR + 1.26%, Rate Floor: 1.26%) due 01/15/27◊,2 | | | 1,367,421 | | | | 1,347,764 | |
Morgan Stanley Capital I Trust | | | | | | | | |
2018-H3, 0.96% (WAC) due 07/15/51◊,5 | | | 38,306,079 | | | | 888,996 | |
Citigroup Commercial Mortgage Trust | | | | | | | | |
2019-GC41, 1.16% (WAC) due 08/10/56◊,5 | | | 22,927,993 | | | | 834,629 | |
BENCHMARK Mortgage Trust | | | | | | | | |
2019-B14, 0.89% (WAC) due 12/15/62◊,5 | | | 34,212,931 | | | | 774,475 | |
JPMDB Commercial Mortgage Securities Trust | | | | | | | | |
2018-C8, 0.76% (WAC) due 06/15/51◊,5 | | | 20,774,770 | | | | 359,227 | |
Total Commercial Mortgage-Backed Securities | | | | | | | 24,270,198 | |
| | | | | | | | | |
Total Collateralized Mortgage Obligations | | | | |
(Cost $90,129,361) | | | 87,163,091 | |
| | | | | | | | | |
REPURCHASE AGREEMENTS††,6 - 2.3% |
BNP Paribas |
issued 09/30/24 at 4.86% due 10/01/24 | | | 12,035,000 | | | | 12,035,000 | |
Total Repurchase Agreements | | | | |
(Cost $12,035,000) | | | | | | | 12,035,000 | |
| | | | | | | | | |
Total Investments - 99.8% | | | | |
(Cost $521,437,144) | | $ | 515,381,468 | |
Other Assets & Liabilities, net - 0.2% | | | 1,121,338 | |
Total Net Assets - 100.0% | | $ | 516,502,806 | |
Centrally Cleared Interest Rate Swap Agreements†† |
Counterparty | | Exchange | | | Floating
Rate
Type | | | Floating
Rate
Index | | | Fixed
Rate | | | Payment
Frequency | | | Maturity
Date | | | Notional
Amount | | | Value | | | Upfront
Premiums
Paid | | | Unrealized
Appreciation** | |
BofA Securities, Inc. | CME | Receive | U.S. Secured Overnight Financing Rate | 1.10% | Annually | 01/10/25 | | $ | 61,000,000 | | | $ | 604,696 | | | $ | 26 | | | $ | 604,670 | |
SEE NOTES TO FINANCIAL STATEMENTS. | THE GUGGENHEIM FUNDS ANNUAL REPORT | 271 |
SCHEDULE OF INVESTMENTS (continued) | September 30, 2024 |
ULTRA SHORT DURATION FUND | |
** | Includes cumulative appreciation (depreciation). Variation margin is reported within the Statement of Assets and Liabilities. |
*** | A copy of each underlying unaffiliated fund’s financial statements is available at the SEC’s website at www.sec.gov. |
† | Value determined based on Level 1 inputs — See Note 4. |
†† | Value determined based on Level 2 inputs, unless otherwise noted — See Note 4. |
††† | Value determined based on Level 3 inputs — See Note 4. |
◊ | Variable rate security. Rate indicated is the rate effective at September 30, 2024. In some instances, the effective rate is limited by a minimum rate floor or a maximum rate cap established by the issuer. The settlement status of a position may also impact the effective rate indicated. In some cases, a position may be unsettled at period end and may not have a stated effective rate. In instances where multiple underlying reference rates and spread amounts are shown, the effective rate is based on a weighted average. |
1 | Rate indicated is the 7-day yield as of September 30, 2024. |
2 | Security is a 144A or Section 4(a)(2) security. These securities have been determined to be liquid under guidelines established by the Board of Trustees. The total market value of 144A or Section 4(a)(2) securities is $241,044,575 (cost $245,985,054), or 46.7% of total net assets. |
3 | Security has a fixed rate coupon which will convert to a floating or variable rate coupon on a future date. |
4 | Security is a step up/down bond. The coupon increases or decreases at regular intervals until the bond reaches full maturity. Rate indicated is the rate at September 30, 2024. See table below for additional step information for each security. |
5 | Security is an interest-only strip. |
6 | Repurchase Agreements - The interest rate on repurchase agreements is market driven and based on the underlying collateral obtained. See additional disclosure in the repurchase agreements table below for more information on repurchase agreements. |
7 | Security is unsettled at period end and does not have at stated effective rate. |
| | BofA — Bank of America |
| | CME — Chicago Mercantile Exchange |
| | plc — Public Limited Company |
| | SOFR — Secured Overnight Financing Rate |
| | WAC — Weighted Average Coupon |
| | |
| | See Sector Classification in Other Information section. |
The following table summarizes the inputs used to value the Fund’s investments at September 30, 2024 (See Note 4 in the Notes to Financial Statements):
Investments in Securities (Assets) | | Level 1
Quoted
Prices | | | Level 2
Significant
Observable
Inputs | | | Level 3
Significant
Unobservable
Inputs | | | Total | |
Money Market Funds | | $ | 171,570,017 | | | $ | — | | | $ | — | | | $ | 171,570,017 | |
Corporate Bonds | | | — | | | | 124,078,832 | | | | — | | | | 124,078,832 | |
Asset-Backed Securities | | | — | | | | 116,034,528 | | | | 4,500,000 | | | | 120,534,528 | |
Collateralized Mortgage Obligations | | | — | | | | 87,163,091 | | | | — | | | | 87,163,091 | |
Repurchase Agreements | | | — | | | | 12,035,000 | | | | — | | | | 12,035,000 | |
Interest Rate Swap Agreements** | | | — | | | | 604,670 | | | | — | | | | 604,670 | |
Total Assets | | $ | 171,570,017 | | | $ | 339,916,121 | | | $ | 4,500,000 | | | $ | 515,986,138 | |
** | This derivative is reported as unrealized appreciation/depreciation at period end. |
272 | THE GUGGENHEIM FUNDS ANNUAL REPORT | SEE NOTES TO FINANCIAL STATEMENTS. |
SCHEDULE OF INVESTMENTS (continued) | September 30, 2024 |
ULTRA SHORT DURATION FUND | |
Step Coupon Bonds
The following table discloses additional information related to step coupon bonds held by the Fund. Certain securities are subject to multiple rate changes prior to maturity. For those securities, a range of rates and corresponding dates have been provided. Rates for all step coupon bonds held by the Fund are scheduled to increase, none are scheduled to decrease.
Name | | Coupon Rate at
Next Reset Date | | | Next Rate Reset Date | | | Future Reset Rate(s) | | | Future Reset Date(s) | |
BRAVO Residential Funding Trust 2022-R1, 3.13% due 01/29/70 | | | 6.13 | % | | | 01/30/25 | | | | — | | | | — | |
Legacy Mortgage Asset Trust 2021-GS4, 4.65% due 11/25/60 | | | 5.65 | % | | | 08/25/25 | | | | — | | | | — | |
Legacy Mortgage Asset Trust 2021-GS3, 4.75% due 07/25/61 | | | 5.75 | % | | | 05/25/25 | | | | — | | | | — | |
Legacy Mortgage Asset Trust 2021-GS5, 2.25% due 07/25/67 | | | 5.25 | % | | | 11/25/24 | | | | 6.25 | % | | | 11/25/25 | |
Legacy Mortgage Asset Trust 2021-GS2, 4.75% due 04/25/61 | | | 5.75 | % | | | 04/25/25 | | | | — | | | | — | |
NYMT Loan Trust 2022-SP1, 5.25% due 07/25/62 | | | 8.25 | % | | | 07/01/25 | | | | 9.25 | % | | | 07/01/26 | |
NYMT Loan Trust 2021-SP1, 4.67% due 08/25/61 | | | 5.67 | % | | | 08/01/25 | | | | — | | | | — | |
OSAT Trust 2021-RPL1, 5.12% due 05/25/65 | | | 6.12 | % | | | 06/25/25 | | | | — | | | | — | |
PRPM LLC 2022-1, 3.72% due 02/25/27 | | | 6.72 | % | | | 02/25/25 | | | | 7.72 | % | | | 02/25/26 | |
PRPM LLC 2021-5, 4.79% due 06/25/26 | | | 5.79 | % | | | 06/25/25 | | | | — | | | | — | |
Verus Securitization Trust 2020-5, 1.22% due 05/25/65 | | | 2.22 | % | | | 10/26/24 | | | | — | | | | — | |
Repurchase Agreements
The Fund may engage in repurchase agreements. Repurchase agreements are fixed income securities in the form of agreements backed by collateral. These agreements typically involve the acquisition by the Fund of securities from the selling institution coupled with the agreement that the selling institution will repurchase the underlying securities at a specified price and at a fixed time in the future. The Fund may accept a wide variety of underlying securities as collateral for the repurchase agreements entered into by the Fund. Any such securities serving as collateral are marked-to-market daily in order to maintain full collateralization. Securities purchased under repurchase agreements are reflected as an asset on the Statement of Assets and Liabilities. Interest earned is recorded as a component of interest income on the Statement of Operations.
In connection with transactions in repurchase agreements, it is the Fund’s policy that its custodian take possession of the underlying collateral. The collateral is in the possession of the Fund’s custodian and is evaluated to ensure that its market value exceeds, at a minimum, 102% of the original face amount of the repurchase agreements.
The use of repurchase agreements involves certain risks. For example, if the selling institution defaults on its obligation to repurchase the underlying securities at a time when the value of securities has declined, the Fund may incur a loss upon disposition of them. In the event of an insolvency or bankruptcy by the selling institution, the Fund’s right to control the collateral could be affected and result in certain costs and delays. In addition, the Fund could incur a loss if the value of the underlying collateral falls below the agreed upon repurchase price.
SEE NOTES TO FINANCIAL STATEMENTS. | THE GUGGENHEIM FUNDS ANNUAL REPORT | 273 |
SCHEDULE OF INVESTMENTS (concluded) | September 30, 2024 |
ULTRA SHORT DURATION FUND | |
At September 30, 2024, the repurchase agreements in the account were as follows:
Counterparty and
Terms of Agreement | | Face Value | | | Repurchase Price | | | Collateral | | Par Value | | | Fair Value | |
BNP Paribas | | | | | | | | | | U.S. Treasury Strips | | | | | | | | |
4.86% | | | | | | | | | | 0.00% | | | | | | | | |
Due 10/01/24 | | $ | 12,035,000 | | | $ | 12,036,625 | | | Due 05/15/35 - 11/15/45 | | $ | 19,676,542 | | | $ | 12,005,399 | |
| | | | | | | | | | | | | | | | | | | |
| | | | | | | | | | | U.S. Treasury Inflation Indexed Bonds | | | | | | | | |
| | | | | | | | | | | 1.75% - 3.63% | | | | | | | | |
| | | | | | | | | | | Due 04/15/28 - 01/15/34 | | | 260,672 | | | | 271,198 | |
| | | | | | | | | | | | | | | | | | | |
| | | | | | | | | | | U.S. Treasury Notes | | | | | | | | |
| | | | | | | | | | | 0.38% - 4.13% | | | | | | | | |
| | | | | | | | | | | Due 09/30/27 - 07/31/31 | | | 800 | | | | 816 | |
| | | | | | | | | | | | | $ | 19,938,014 | | | $ | 12,277,413 | |
274 | THE GUGGENHEIM FUNDS ANNUAL REPORT | SEE NOTES TO FINANCIAL STATEMENTS. |
ULTRA SHORT DURATION FUND | |
STATEMENT OF ASSETS AND LIABILITIES |
September 30, 2024 |
Assets: |
Investments, at value (cost $509,402,144) | | $ | 503,346,468 | |
Repurchase agreements, at value (cost $12,035,000) | | | 12,035,000 | |
Cash | | | 28,157 | |
Unamortized upfront premiums paid on interest rate swap agreements | | | 26 | |
Prepaid expenses | | | 49,373 | |
Receivables: |
Interest | | | 2,939,239 | |
Variation margin on interest rate swap agreements | | | 1,878,574 | |
Fund shares sold | | | 37,943 | |
Securities sold | | | 7,094 | |
Total assets | | | 520,321,874 | |
| | | | | |
Liabilities: |
Segregated cash due to broker | | | 1,798,848 | |
Payable for: |
Securities purchased | | | 1,000,000 | |
Fund shares redeemed | | | 446,670 | |
Distributions to shareholders | | | 312,080 | |
Management fees | | | 79,756 | |
Transfer agent/maintenance fees | | | 23,013 | |
Fund accounting/administration fees | | | 16,826 | |
Distribution and service fees | | | 15,002 | |
Trustees’ fees* | | | 4,319 | |
Due to Investment Adviser | | | 114 | |
Miscellaneous | | | 122,440 | |
Total liabilities | | | 3,819,068 | |
Net assets | | $ | 516,502,806 | |
| | | | | |
Net assets consist of: |
Paid in capital | | $ | 527,592,754 | |
Total distributable earnings (loss) | | | (11,089,948 | ) |
Net assets | | $ | 516,502,806 | |
Class A: |
Net assets | | $ | 78,903,529 | |
Capital shares outstanding | | | 7,876,624 | |
Net asset value per share | | $ | 10.02 | |
| | | | | |
Institutional Class: |
Net assets | | $ | 437,599,277 | |
Capital shares outstanding | | | 43,689,843 | |
Net asset value per share | | $ | 10.02 | |
STATEMENT OF OPERATIONS |
Year Ended September 30, 2024 |
Investment Income: |
Interest | | $ | 25,349,151 | |
Total investment income | | | 25,349,151 | |
| | | | | |
Expenses: |
Management fees | | | 1,263,605 | |
Distribution and service fees: |
Class A | | | 205,846 | |
Transfer agent fees and administrative fees | | | 12,001 | |
Transfer agent fees/maintenance fees: |
Class A | | | 38,532 | |
Institutional Class | | | 91,129 | |
Fund accounting/administration fees | | | 160,642 | |
Professional fees | | | 96,881 | |
Custodian fees | | | 32,965 | |
Trustees’ fees* | | | 23,132 | |
Line of credit fees | | | 18,377 | |
Miscellaneous | | | 73,645 | |
Recoupment of previously waived fees: |
Class A | | | 346 | |
Institutional Class | | | 915 | |
Total expenses | | | 2,018,016 | |
Less: |
Expenses reimbursed by Adviser: |
Class A | | | (32,765 | ) |
Institutional Class | | | (63,640 | ) |
Expenses waived by Adviser | | | (22,370 | ) |
Earnings credits applied | | | (3,033 | ) |
Total waived/reimbursed expenses | | | (121,808 | ) |
Net expenses | | | 1,896,208 | |
Net investment income | | | 23,452,943 | |
| | | | | |
Net Realized and Unrealized Gain (Loss): |
Net realized gain (loss) on: |
Investments | | | (68,111 | ) |
Swap agreements | | | 2,694,935 | |
Net realized gain | | | 2,626,824 | |
Net change in unrealized appreciation (depreciation) on: |
Investments | | | 17,097,378 | |
Swap agreements | | | (2,563,335 | ) |
Net change in unrealized appreciation (depreciation) | | | 14,534,043 | |
Net realized and unrealized gain | | | 17,160,867 | |
Net increase in net assets resulting from operations | | $ | 40,613,810 | |
* | Relates to Trustees not deemed “interested persons” within the meaning of Section 2(a)(19) of the 1940 Act. |
SEE NOTES TO FINANCIAL STATEMENTS. | THE GUGGENHEIM FUNDS ANNUAL REPORT | 275 |
ULTRA SHORT DURATION FUND | |
STATEMENTS OF CHANGES IN NET ASSETS |
| | Year Ended
September 30,
2024 | | | Year Ended
September 30,
2023 | |
Increase (Decrease) in Net Assets from Operations: | | | | | | | | |
Net investment income | | $ | 23,452,943 | | | $ | 22,666,036 | |
Net realized gain on investments | | | 2,626,824 | | | | 1,202,006 | |
Net change in unrealized appreciation (depreciation) on investments | | | 14,534,043 | | | | 12,420,237 | |
Net increase in net assets resulting from operations | | | 40,613,810 | | | | 36,288,279 | |
| | | | | | | | | |
Distributions to shareholders: | | | | | | | | |
Class A | | | (4,254,223 | ) | | | (4,918,176 | ) |
Institutional Class | | | (22,827,310 | ) | | | (21,914,210 | ) |
Total distributions to shareholders | | | (27,081,533 | ) | | | (26,832,386 | ) |
| | | | | | | | | |
Capital share transactions: | | | | | | | | |
Proceeds from sale of shares | | | | | | | | |
Class A | | | 9,023,891 | | | | 10,686,656 | |
Institutional Class | | | 119,245,603 | | | | 119,682,982 | |
Distributions reinvested | | | | | | | | |
Class A | | | 4,193,730 | | | | 4,830,340 | |
Institutional Class | | | 18,382,654 | | | | 17,231,019 | |
Cost of shares redeemed | | | | | | | | |
Class A | | | (32,872,998 | ) | | | (53,521,575 | ) |
Institutional Class | | | (130,583,325 | ) | | | (342,903,679 | ) |
Net decrease from capital share transactions | | | (12,610,445 | ) | | | (243,994,257 | ) |
Net increase (decrease) in net assets | | | 921,832 | | | | (234,538,364 | ) |
| | | | | | | | | |
Net assets: | | | | | | | | |
Beginning of year | | | 515,580,974 | | | | 750,119,338 | |
End of year | | $ | 516,502,806 | | | $ | 515,580,974 | |
| | | | | | | | | |
Capital share activity: | | | | | | | | |
Shares sold | | | | | | | | |
Class A | | | 909,121 | | | | 1,102,052 | |
Institutional Class | | | 12,052,468 | | | | 12,352,609 | |
Shares issued from reinvestment of distributions | | | | | | | | |
Class A | | | 423,959 | | | | 497,546 | |
Institutional Class | | | 1,857,271 | | | | 1,775,408 | |
Shares redeemed | | | | | | | | |
Class A | | | (3,334,055 | ) | | | (5,533,062 | ) |
Institutional Class | | | (13,207,350 | ) | | | (35,519,480 | ) |
Net decrease in shares | | | (1,298,586 | ) | | | (25,324,927 | ) |
276 | THE GUGGENHEIM FUNDS ANNUAL REPORT | SEE NOTES TO FINANCIAL STATEMENTS. |
ULTRA SHORT DURATION FUND | |
This table is presented to show selected data for a share outstanding throughout each period and to assist shareholders in evaluating a Fund’s performance for the periods presented.
Class A | | Year Ended
September 30,
2024 | | | Year Ended
September 30,
2023 | | | Year Ended
September 30,
2022 | | | Year Ended
September 30,
2021 | | | Year Ended
September 30,
2020 | |
Per Share Data |
Net asset value, beginning of period | | $ | 9.75 | | | $ | 9.60 | | | $ | 9.97 | | | $ | 9.98 | | | $ | 9.97 | |
Income (loss) from investment operations: |
Net investment income (loss)a | | | .44 | | | | .37 | | | | .12 | | | | .06 | | | | .12 | |
Net gain (loss) on investments (realized and unrealized) | | | .34 | | | | .23 | | | | (.37 | ) | | | — | | | | .03 | |
Total from investment operations | | | .78 | | | | .60 | | | | (.25 | ) | | | .06 | | | | .15 | |
Less distributions from: |
Net investment income | | | (.51 | ) | | | (.45 | ) | | | (.12 | ) | | | (.07 | ) | | | (.14 | ) |
Total distributions | | | (.51 | ) | | | (.45 | ) | | | (.12 | ) | | | (.07 | ) | | | (.14 | ) |
Net asset value, end of period | | $ | 10.02 | | | $ | 9.75 | | | $ | 9.60 | | | $ | 9.97 | | | $ | 9.98 | |
|
Total Returnb | | | 8.16 | % | | | 6.32 | % | | | (2.49 | %) | | | 0.62 | % | | | 1.52 | % |
Ratios/Supplemental Data |
Net assets, end of period (in thousands) | | $ | 78,904 | | | $ | 96,348 | | | $ | 132,518 | | | $ | 188,416 | | | $ | 62,956 | |
Ratios to average net assets: |
Net investment income (loss) | | | 4.43 | % | | | 3.80 | % | | | 1.18 | % | | | 0.63 | % | | | 1.20 | % |
Total expensesb | | | 0.63 | % | | | 0.68 | % | | | 0.65 | % | | | 0.63 | % | | | 0.65 | % |
Net expensesc,d,e | | | 0.59 | % | | | 0.59 | % | | | 0.59 | % | | | 0.59 | % | | | 0.61 | % |
Portfolio turnover rate | | | 10 | % | | | 2 | % | | | 24 | % | | | 122 | % | | | 129 | % |
SEE NOTES TO FINANCIAL STATEMENTS. | THE GUGGENHEIM FUNDS ANNUAL REPORT | 277 |
ULTRA SHORT DURATION FUND | |
FINANCIAL HIGHLIGHTS (concluded) |
This table is presented to show selected data for a share outstanding throughout each period and to assist shareholders in evaluating a Fund’s performance for the periods presented.
Institutional Class | | Year Ended
September 30,
2024 | | | Year Ended
September 30,
2023 | | | Year Ended
September 30,
2022 | | | Year Ended
September 30,
2021 | | | Year Ended
September 30,
2020 | |
Per Share Data |
Net asset value, beginning of period | | $ | 9.75 | | | $ | 9.59 | | | $ | 9.97 | | | $ | 9.98 | | | $ | 9.96 | |
Income (loss) from investment operations: |
Net investment income (loss)a | | | .46 | | | | .39 | | | | .14 | | | | .09 | | | | .15 | |
Net gain (loss) on investments (realized and unrealized) | | | .34 | | | | .24 | | | | (.37 | ) | | | — | | | | .04 | |
Total from investment operations | | | .80 | | | | .63 | | | | (.23 | ) | | | .09 | | | | .19 | |
Less distributions from: |
Net investment income | | | (.53 | ) | | | (.47 | ) | | | (.15 | ) | | | (.10 | ) | | | (.17 | ) |
Total distributions | | | (.53 | ) | | | (.47 | ) | | | (.15 | ) | | | (.10 | ) | | | (.17 | ) |
Net asset value, end of period | | $ | 10.02 | | | $ | 9.75 | | | $ | 9.59 | | | $ | 9.97 | | | $ | 9.98 | |
|
Total Return | | | 8.43 | % | | | 6.70 | % | | | (2.34 | %) | | | 0.87 | % | | | 1.88 | % |
Ratios/Supplemental Data |
Net assets, end of period (in thousands) | | $ | 437,599 | | | $ | 419,233 | | | $ | 617,601 | | | $ | 882,047 | | | $ | 440,356 | |
Ratios to average net assets: |
Net investment income (loss) | | | 4.68 | % | | | 4.03 | % | | | 1.44 | % | | | 0.88 | % | | | 1.47 | % |
Total expensesb | | | 0.35 | % | | | 0.39 | % | | | 0.36 | % | | | 0.34 | % | | | 0.38 | % |
Net expensesc,d,e | | | 0.33 | % | | | 0.34 | % | | | 0.34 | % | | | 0.34 | % | | | 0.36 | % |
Portfolio turnover rate | | | 10 | % | | | 2 | % | | | 24 | % | | | 122 | % | | | 129 | % |
a | Net investment income (loss) per share was computed using average shares outstanding throughout the period. |
b | Does not include expenses of the underlying funds in which the Fund invests. |
c | Net expense information reflects the expense ratios after expense waivers and reimbursements, as applicable. |
d | The portion of the ratios of net expenses to average net assets attributable to recoupments of prior fee reductions or expense reimbursements for the years presented was as follows: |
| | | | | | 09/30/24 | | | 09/30/23 | | | 09/30/22 | | | 09/30/21 | | | 09/30/20 | |
| | Class A | | | 0.00 | %* | | | 0.00 | %* | | | 0.01 | % | | | 0.00 | %* | | | 0.00 | %* |
| | Institutional Class | | | 0.00 | %* | | | 0.00 | %* | | | 0.01 | % | | | 0.01 | % | | | 0.00 | %* |
e | Net expenses may include expenses that are excluded from the expense limitation agreement. Excluding these expenses, the net expense ratios for the years presented would be: |
| | | | | | 09/30/24 | | | 09/30/23 | | | 09/30/22 | | | 09/30/21 | | | 09/30/20 | |
| | Class A | | | 0.58 | % | | | 0.58 | % | | | 0.58 | % | | | 0.58 | % | | | 0.58 | % |
| | Institutional Class | | | 0.33 | % | | | 0.33 | % | | | 0.33 | % | | | 0.33 | % | | | 0.33 | % |
278 | THE GUGGENHEIM FUNDS ANNUAL REPORT | SEE NOTES TO FINANCIAL STATEMENTS. |
NOTES TO FINANCIAL STATEMENTS |
Note 1 – Organization and Significant Accounting Policies
Organization
Guggenheim Funds Trust (the “Trust”), a Delaware statutory trust, is registered with the U.S. Securities and Exchange Commission (the “SEC”) under the Investment Company Act of 1940 (the “1940 Act”), as an open-ended investment company of the series type. Each series, in effect, is representing a separate fund (each, a “Fund”). The Trust may issue an unlimited number of authorized shares. The Trust accounts for the assets of each Fund separately.
The Trust offers a combination of six separate classes of shares: Class A shares, Class C shares, Class P shares, Class R6 shares, SMA Class shares and Institutional Class shares. Sales of shares of each Class are made without a front-end sales charge at the net asset value per share (“NAV”), with the exception of Class A shares. Class A shares are sold at the NAV, plus the applicable front-end sales charge. The sales charge varies depending on the amount purchased. Class A share purchases of $1 million or more are exempt from the front-end sales charge but have a 1% contingent deferred sales charge (“CDSC”), if shares are redeemed within 12 months of purchase. Class C shares have a 1% CDSC if shares are redeemed within 12 months of purchase. Class C shares of each Fund automatically convert to Class A shares of the same Fund on or about the 10th day of the month following the 8-year anniversary of the purchase of the Class C shares. This conversion will be executed without any sales charge, fee or other charge. After the conversion is completed, the shares will be subject to all features and expenses of Class A shares. Institutional Class shares are offered primarily for direct investment by institutions such as pension and profit sharing plans, endowments, foundations and corporations. Institutional Class shares require a minimum initial investment of $2 million and a minimum account balance of $1 million. Class R6 shares are offered primarily through qualified retirement and benefit plans. Class R6 shares are also offered through certain other plans and platforms sponsored by financial intermediaries. Certain institutional investors and others deemed appropriate by Guggenheim Investments (“GI” or the “Adviser”) may also be eligible to purchase Class R6 shares subject to a $2 million minimum initial investment. SMA Class shares may be purchased only by or on behalf of “wrap” account clients where Guggenheim Investments or an affiliate thereof has an agreement to serve as investment adviser or sub-adviser to the account with the wrap program sponsor (typically a registered investment adviser, bank or broker-dealer) or directly with the client. Certain other funds in the Guggenheim complex may also be eligible to purchase SMA Class shares. At September 30, 2024, SMA Class shares were only offered for Active INvestment Series (GAINS) - Core Plus Fund and Active INvestment Series (GAINS) - Limited Duration Fund. At September 30, 2024, the Trust consisted of eighteen funds.
Class A, Class C, Class P, Institutional Class and Class R6 shares of High Yield Fund are subject to a 2% redemption fee when shares are redeemed or exchanged within 90 days of purchase.
This report covers the following funds (collectively, the “Funds” and additionally grouped as the “Equity Funds” and the “Fixed Income Funds”):
Equity Funds | | Investment
Company Type | |
Alpha Opportunity Fund | Diversified |
Large Cap Value Fund | Diversified |
Market Neutral Real Estate Fund | Diversified |
Risk Managed Real Estate Fund | Diversified |
SMid Cap Value Fund | Diversified |
StylePlus—Large Core Fund | Diversified |
StylePlus—Mid Growth Fund | Diversified |
World Equity Income Fund | Diversified |
Fixed Income Funds | | Investment
Company Type | |
Active INvestment Series (GAINS) - Core Plus Fund | Diversified |
Active INvestment Series (GAINS) - Limited Duration Fund | Diversified |
Core Bond Fund | Diversified |
Floating Rate Strategies Fund | Diversified |
High Yield Fund | Diversified |
Limited Duration Fund | Diversified |
Macro Opportunities Fund | Diversified |
Municipal Income Fund | Diversified |
Total Return Bond Fund | Diversified |
Ultra Short Duration Fund | Diversified |
At September 30, 2024, Class A, Class C, Class P, Institutional Class, Class R6 and SMA Class shares have been issued by the Funds.
Security Investors, LLC (“SI” or the “Adviser”) and Guggenheim Partners Investment Management, LLC (“GPIM” or the “Adviser”), which operate under the name Guggenheim Investments (“GI”), provide advisory services. Guggenheim Funds Distributors, LLC (“GFD”) serves as the distributor for the Trust. GI and GFD are affiliated entities.
SI provides advisory services to Alpha Opportunity Fund, Large Cap Value Fund, SMid Cap Value Fund, StylePlus-Large Core Fund, StylePlus-Mid Growth Fund, World Equity Income Fund, Core Bond Fund, High Yield Fund and Municipal Income Fund.
GPIM provides advisory services to Market Neutral Real Estate Fund, Risk Managed Real Estate Fund, Active INvestment Series (GAINS) - Core Plus Fund, Active INvestment Series (GAINS) - Limited Duration Fund, Floating Rate Strategies Fund, Limited Duration Fund, Macro Opportunities Fund, Total Return Bond Fund and Ultra Short Duration Fund. GPIM also serves as investment sub-advisor (the “Sub-Advisor”) to the Municipal Income Fund and is responsible for the day-to-day management of the Fund’s portfolio.
| | THE GUGGENHEIM FUNDS ANNUAL REPORT | 279 |
NOTES TO FINANCIAL STATEMENTS (continued) |
Consolidation of Subsidiary
The consolidated financial statements of the Macro Opportunities Fund include the accounts of a wholly-owned and controlled Cayman Islands subsidiary (the “Subsidiary”). Significant inter-company accounts and transactions have been eliminated in consolidation for the Macro Opportunities Fund. The Notes to Financial Statements presented herein are consolidated with respect to Macro Opportunities Fund and include the accounts of the Subsidiary.
The Macro Opportunities Fund may invest up to 25% of its total assets in its Subsidiary, which acts as an investment vehicle in order to effect certain investments consistent with the Fund’s investment objectives and policies.
A summary of each Fund’s investment in its respective Subsidiary is as follows:
Fund | | Inception Date
of Subsidiary | | | Subsidiary
Net Assets at
September 30, 2024 | | | % of Net Assets
of the Fund at
September 30, 2024 | |
Macro Opportunities Fund | | | 01/08/15 | | | $ | 13,149,877 | | | | 0.18 | % |
Significant Accounting Policies
The Funds operate as investment companies and, accordingly, follow the investment company accounting and reporting guidance of the Financial Accounting Standards Board (“FASB”) Accounting Standards Codification Topic 946 Financial Services – Investment Companies.
The following significant accounting policies are in conformity with U.S. generally accepted accounting principles (“U.S. GAAP”) and are consistently followed by the Trust. This requires management to make estimates and assumptions that affect the reported amount of assets and liabilities, contingent assets and liabilities at the date of the financial statements, and the reported amounts of revenues and expenses during the reporting period. Actual results could differ from these estimates. All time references are based on Eastern Time.
The NAV of each share class of each Fund is calculated by dividing the market value of a fund’s securities and other assets, less all liabilities attributable to the share class by the number of outstanding shares of the share class on the specified date.
(a) Valuation of Investments
The Board of Trustees of the Funds (the “Board”) adopted policies and procedures for the valuation of the Funds’ investments (the “Fund Valuation Procedures”).
Pursuant to Rule 2a-5, the Board designated the Adviser as the valuation designee to perform fair valuation determinations for the Funds with respect to all Fund investments and/or other assets. As the Funds’ valuation designee pursuant to Rule 2a-5, the Adviser has adopted separate procedures (the “Valuation Designee Procedures” and collectively with the Fund Valuation Procedures, the “Valuation Procedures”) reasonably designed to prevent violations of the requirements of Rule 2a-5 and Rule 31a-4 under the 1940 act. The Adviser, in its role as valuation designee, utilizes the assistance of a valuation committee, consisting of representatives from Guggenheim’s investment management, fund administration, legal and compliance departments (the “Valuation Committee”), in determining the fair value of the Funds’ securities and/or other assets. The Valuation Procedures may be amended and potentially adversely affected as the Funds seek to comply with regulations that apply to the valuation practices of registered investment companies.
Valuations of the Funds’ securities and other assets are supplied primarily by independent third-party pricing service appointed pursuant to the processes set forth in the Valuation Procedures. The Adviser, with the assistance of the Valuation Committee, convenes monthly, or more frequently as needed, to review the valuation of all assets which have been fair valued. The Adviser, consistent with the monitoring and review responsibilities set forth in the Valuation Procedures, regularly reviews the appropriateness of the inputs, methods, models and assumptions employed by the independent third-party pricing services.
If the independent third-party pricing service cannot or does not provide a valuation for a particular investment or such valuation is deemed unreliable, such investment is fair valued by the Adviser.
280 | THE GUGGENHEIM FUNDS ANNUAL REPORT | |
NOTES TO FINANCIAL STATEMENTS (continued) |
Equity securities listed or traded on a recognized U.S. securities exchange or the Nasdaq Stock Market (“NASDAQ”) will generally be valued on the basis of the last sale price on the primary U.S. exchange or market on which the security is listed or traded; provided, however, that securities listed on NASDAQ will be valued at the NASDAQ official closing price, which may not necessarily represent the last sale price.
Generally, trading in foreign securities markets is substantially completed each day at various times prior to the close of the New York Stock Exchange (“NYSE”). The values of foreign securities are determined as of the close of such foreign markets or the close of the NYSE, if earlier. All investments quoted in foreign currencies are valued in U.S. dollars on the basis of the foreign currency exchange rates prevailing at the close of U.S. business at 4:00 p.m. Investments in foreign securities may involve risks not present in domestic investments. The Adviser will determine the current value of such foreign securities by taking into consideration certain factors which may include the following factors, among others: the value of the securities traded on other foreign markets, American Depositary Receipts (“ADR”) trading, closed-end fund trading, foreign currency exchange activity, and the trading prices of financial products that are tied to foreign securities. In addition, under the Valuation Procedures, the Adviser is authorized to use prices and other information supplied by an independent third-party pricing service in valuing foreign securities.
Open-end investment companies are valued at their NAV as of the close of business, on the valuation date. Exchange-traded funds and closed-end investment companies are generally valued at the last quoted sale price.
U.S. Government securities are valued by independent third-party pricing services, using the last traded fill price, or at the reported bid price at the close of business on the valuation date.
CLOs, CDOs, MBS, ABS, and other structured finance securities are generally valued using an independent third party pricing service.
Repurchase agreements are generally valued at amortized cost, provided such amounts approximate market value.
Commercial paper and discount notes with a maturity of greater than 60 days at acquisition are valued at prices that reflect broker-dealer supplied valuations or are obtained from independent third-party pricing services, which may consider the trade activity, treasury spreads, yields or price of bonds of comparable quality, coupon, maturity, and type, as well as prices quoted by dealers who make markets in such securities. Commercial paper and discount notes with a maturity of 60 days or less at acquisition are valued at amortized cost, unless the Adviser concludes that amortized cost does not represent the fair value of the applicable asset in which case it will be valued using an independent third-party pricing service provider.
Typically, loans are valued using information provided by independent third-party pricing services which uses broker quotes, among other inputs. If the pricing service cannot or does not provide a valuation for a particular loan, or such valuation is deemed unreliable, such investment is valued based on a quote from a broker-dealer or is fair valued by the Adviser.
Exchange-traded options are valued at the mean of the bid and ask prices on the principal exchange on which they are traded. Over-the-counter (“OTC”) options and options on swaps (“swaptions”) are valued using a price provided by a pricing service.
Futures contracts are valued on the basis of the last sale price as of 4:00 p.m. on the valuation date. In the event that the exchange for a specific futures contract closes earlier than 4:00 p.m., the futures contract is valued at the official settlement price of the exchange. However, the underlying securities from which the futures contract value is derived are monitored until 4:00 p.m. to determine if fair valuation of the underlying securities would provide a more accurate valuation of the futures contract.
Interest rate swap agreements entered into by a Fund is valued on the basis of the last sale price on the primary exchange on which the swap is traded.
Other swap agreements entered into by a Fund are generally valued using an evaluated price provided by an independent third-party pricing service.
Forward foreign currency exchange contracts are valued daily based on the applicable exchange rate of the underlying currency.
| | THE GUGGENHEIM FUNDS ANNUAL REPORT | 281 |
NOTES TO FINANCIAL STATEMENTS (continued) |
Investments for which market quotations are not readily available are fair valued as determined in good faith by the Adviser. Valuations in accordance with these methods are intended to reflect each security’s (or asset’s or liability’s) “fair value”. Each such determination is based on a consideration of all relevant factors, which are likely to vary from one pricing context to another. Examples of such factors may include, but are not limited to market prices; sale prices; broker quotes; and models which derive prices based on inputs such as prices of securities with comparable maturities and characteristics, or on inputs such as anticipated cash flows or collateral, spread over U.S. Treasury securities, and other information analysis. In connection with futures contracts and other derivative investments, such factors may include obtaining information as to how (a) these contracts and other derivative investments trade in the futures or other derivative markets, respectively, and (b) the securities underlying these contracts and other derivative investments trade in the cash market.
(b) U.S. Government and Agency Obligations
Certain U.S. Government and Agency Obligations are traded on a discount basis; the interest rates shown on the Funds’ Schedules of Investments reflect the effective rates paid at the time of purchase by the Funds. Other securities bear interest at the rates shown, payable at fixed dates through maturity.
Inflation-Indexed bonds are fixed-income securities whose principal value is periodically adjusted to the rate of inflation. The interest rate on these securities is generally fixed at issuance at a rate lower than typical bonds. Over the life of an inflation indexed bond however, interest will be paid based on a principal value which is adjusted for inflation. Any increase in the principal amount of an inflation-indexed bond is recognized as a component of Interest on the Funds’ Statements of Operations, even though principal is not received until maturity.
(c) Senior Floating Rate Interests and Loan Investments
Senior floating rate interests in which the Trust invests generally pay interest rates which are periodically adjusted by reference to a base short-term floating rate, plus a premium. These base lending rates are generally (i) the lending rate offered by one or more major European banks, (ii) the prime rate offered by one or more major United States banks, or (iii) the bank’s certificate of deposit rate. Senior floating rate interests often require prepayments from excess cash flows or permit the borrower to repay at its election. The rate at which the borrower repays cannot be predicted with accuracy. As a result, the actual remaining maturity may be substantially less than the stated maturities disclosed in the Funds’ Schedules of Investments.
The Funds invest in loans and other similar debt obligations (“obligations”). A portion of the Funds’ investments in these obligations is sometimes referred to as “covenant lite” loans or obligations (“covenant lite obligations”), which are obligations that lack financial maintenance covenants or possess fewer or contingent financial maintenance covenants and other financial protections for lenders and investors. The Funds may also obtain exposure to covenant lite obligations through investment in securitization vehicles and other structured products. Many new, restructured or reissued obligations have not featured traditional covenants, which are intended to protect lenders and investors by (i) imposing certain restrictions or other limitations on a borrower’s operations or assets or (ii) providing certain rights to lenders. The Funds may have fewer rights with respect to covenant lite obligations, including fewer protections against the possibility of default and fewer remedies in the event of default. As a result, investments in (or exposure to) covenant lite obligations are subject to more risk than investments in (or exposure to) certain other types of obligations. The Funds are subject to other risks associated with investments in (or exposure to) obligations, including that obligations may not be considered “securities” and, as a result, the Funds may not be entitled to rely on the anti-fraud protections under the federal securities laws and instead may have to resort to state law and direct claims.
(d) Interest on When-Issued Securities
The Funds may purchase and sell interests in securities on a when-issued and delayed delivery basis, with payment and delivery scheduled for a future date. No income accrues to the Funds on such interests or securities in connection with such transactions prior to the date the Funds actually take delivery of such interests or securities. These transactions are subject to market fluctuations and are subject to the risk that the value at delivery may be more or less than the trade date purchase price. Although the Funds will generally purchase these securities with the intention of acquiring such securities, they may sell such securities before the settlement date.
(e) Short Sales
When a Fund engages in a short sale of a security, an amount equal to the proceeds is reflected as an asset and an equivalent liability. The amount of the liability is subsequently marked-to-market to reflect the market value of the short sale.
282 | THE GUGGENHEIM FUNDS ANNUAL REPORT | |
NOTES TO FINANCIAL STATEMENTS (continued) |
Fees, if any, paid to brokers to borrow securities in connection with short sales are recorded as interest expense. In addition, the Fund must pay out the dividend rate of the equity or coupon rate of the obligation to the lender and record this as an expense. Short dividend or interest expense is a cost associated with the investment objective of short sales transactions, rather than an operational cost associated with the day-to-day management of any mutual fund. The Fund may also receive rebate income from the broker resulting from the investment of the proceeds from securities sold short.
(f) Options
Upon the purchase of an option, the premium paid is recorded as an investment, the value of which is marked-to-market daily. If a purchased option expires, the Fund realizes a loss in the amount of the cost of the option. When the Fund enters into a closing sale transaction, it realizes a gain or loss depending on whether the proceeds from the closing sale transaction are greater or less than the cost of the option. If the Fund exercises a put option, it realizes a gain or loss from the sale of the underlying security and the proceeds from such sale will be decreased by the premium originally paid. When the Fund exercises a call option, the cost of the security purchased by the Fund upon exercise increases by the premium originally paid.
When the Fund writes (sells) an option, an amount equal to the premium received is entered in that Fund’s accounting records as an asset and equivalent liability. The amount of the liability is subsequently marked-to-market to reflect the current value of the option written. When a written option expires, or if the Fund enters into a closing purchase transaction, it realizes a gain (or loss if the cost of a closing purchase transaction exceeds the premium received when the option was sold).
The Fund may purchase and write swaptions primarily to preserve a return or spread on a particular investment or portion of the Funds’ holdings, as a duration management technique or to protect against an increase in the price of securities it anticipates purchasing at a later date. The purchaser and writer of a swaption is buying or granting the right to enter into a previously agreed upon interest rate swap agreement at any time before the expiration of the options. The swaptions are forward premium swaptions which have extended settlement dates.
(g) Futures Contracts
Upon entering into a futures contract, a Fund deposits and maintains as collateral such initial margin as required by the exchange on which the transaction is affected. Pursuant to the contract, the Fund agrees to receive from or pay to the broker an amount of cash equal to the daily fluctuation in value of the contract. Such receipts or payments are known as variation margin and are recorded by the Fund as unrealized appreciation or depreciation. When the contract is closed, the Fund records a realized gain or loss equal to the difference between the value of the contract at the time it was opened and the value at the time it was closed.
(h) Swap Agreements
Swap agreements are marked-to-market daily and the change, if any, is recorded as unrealized appreciation or depreciation. Payments received or made as a result of an agreement or termination of an agreement are recognized as realized gains or losses.
Upon entering into certain centrally-cleared swap transactions, a Fund is required to deposit with its clearing broker an amount of cash or securities as an initial margin. Subsequent variation margin receipts or payments are received or made by the Fund depending on fluctuations in the fair value of the reference entity and are recorded by the Fund as unrealized appreciation or depreciation. When the contract is closed, the Fund records a realized gain or loss equal to the difference between the value of the contract at the time it was opened and the value at the time it was closed.
Upfront payments received or made by a Fund on credit default swap agreements and interest rate swap agreements are amortized over the expected life of the agreement. Periodic payments received or paid by a Fund are recorded as realized gains or losses. Payments received or made as a result of a credit event or termination of the contract are recognized, net of a proportional amount of the upfront payment, as realized gains or losses.
(i) Forward Foreign Currency Exchange Contracts
The change in value of a forward foreign currency exchange contract is recorded as unrealized appreciation or depreciation until the contract is closed. When the contract is closed, the Funds record a realized gain or loss equal to the difference between the value at the time the contract was opened and the value at the time it was closed.
| | THE GUGGENHEIM FUNDS ANNUAL REPORT | 283 |
NOTES TO FINANCIAL STATEMENTS (continued) |
(j) Currency Translations
The accounting records of the Funds are maintained in U.S. dollars. All assets and liabilities initially expressed in foreign currencies are converted into U.S. dollars at prevailing exchange rates. Purchases and sales of investment securities, dividend and interest income, and certain expenses are translated at the rates of exchange prevailing on the respective dates of such transactions. Changes in the relationship of these foreign currencies to the U.S. dollar can significantly affect the value of the investments and earnings of the Funds. Foreign investments may also subject the Funds to foreign government exchange restrictions, expropriation, taxation, or other political, social, geopolitical or economic developments, all of which could affect the market and/or credit risk of the investments.
The Funds do not isolate that portion of the results of operations resulting from changes in the foreign exchange rates on investments from the fluctuations arising from changes in the market prices of securities held. Such fluctuations are included with the net realized gain or loss and unrealized appreciation or depreciation on investments.
Reported net realized foreign exchange gains and losses arise from sales of foreign currencies and currency gains or losses realized between the trade and settlement dates on investment transactions. Net unrealized appreciation and depreciation arise from changes in the fair values of assets and liabilities other than investments in securities at the fiscal period end, resulting from changes in exchange rates.
(k) Foreign Taxes
The Funds may be subject to foreign taxes (a portion of which may be reclaimable) on income, stock dividends, capital gains on investments or certain foreign currency transactions. All foreign taxes are recorded in accordance with the applicable foreign tax regulations and rates that exist in the foreign jurisdictions in which the Funds invest. These foreign taxes, if any, are paid by the Funds and reflected in their Statements of Operations as follows: foreign taxes withheld at source are presented as a reduction of income and foreign taxes on capital gains from sales of investments are included with the net realized gain (loss) on investments. Foreign taxes payable or deferred as of September 30, 2024, if any, are disclosed in the Funds’ Statements of Assets and Liabilities.
(l) Security Transactions
Security transactions are recorded on the trade date for financial reporting purposes. Realized gains and losses from securities transactions are recorded using the identified cost basis. Proceeds from lawsuits related to investment holdings are recorded as a reduction to cost if the securities are still held and as realized gains if no longer held in the respective Fund. Dividend income is recorded on the ex-dividend date, net of applicable taxes withheld by foreign countries, if any. Taxable non-cash dividends are recorded as dividend income. Interest income, including amortization of premiums and accretion of discounts, is accrued on a daily basis. Interest income also includes paydown gains and losses on mortgage-backed and asset-backed securities and senior and subordinated loans. Amendment fees are earned as compensation for evaluating and accepting changes to the original loan agreement and are recognized when received. Dividend income from Real Estate Investment Trusts (“REITs”) is recorded based on the income included in the distributions received from the REIT investments using published REIT classifications, including some management estimates when actual amounts are not available. Distributions received in excess of this estimated amount are recorded as a reduction of the cost of investments or reclassified to realized gains. The actual amounts of income, return of capital, and realized gains are only determined by each REIT after its fiscal year-end, and may differ from the estimated amounts.
Income from residual collateralized loan obligations is recognized using the effective interest method. At the time of purchase, management estimates the future expected cash flows and determines the effective yield and estimated maturity date based on the estimated cash flows. Subsequent to the purchase, the estimated cash flows are updated periodically and a revised yield is calculated prospectively.
Certain Funds may receive other income from investments in senior loan interests including amendment fees, consent fees and commitment fees. For funded loans, these fees are recorded as income when received by the Funds and included in interest income on the Funds’ Statements of Operations. For unfunded loans, commitment fees are included in realized gain on investments on the Funds’ Statements of Operations at the end of the commitment period.
284 | THE GUGGENHEIM FUNDS ANNUAL REPORT | |
NOTES TO FINANCIAL STATEMENTS (continued) |
(m) Distributions
The Fixed Income Funds declare dividends from investment income daily. Each of the Fixed Income Funds pays its shareholders from its net investment income monthly and distributes any net capital gains that it has realized, at least annually. Distributions to shareholders are recorded on the ex-dividend date. Dividends are reinvested in additional shares, unless shareholders request payment in cash. The character of distributions made during the year from net investment income or net realized gains may differ from their ultimate characterization for U.S. federal income tax purposes.
Dividends from net investment income are declared quarterly in the World Equity Income Fund and Risk Managed Real Estate Fund. Dividends are reinvested in additional shares, unless shareholders request payment in cash. Distributions of net investment income in the remaining Equity Funds and distributions of net realized gains, if any, in all Funds are declared at least annually and recorded on the ex-dividend date and are determined in accordance with U.S. federal income tax regulations which may differ from U.S. GAAP.
(n) Class Allocations
Interest and dividend income, most expenses, all realized gains and losses, and all unrealized appreciation and depreciation are allocated to the share classes based upon the value of the outstanding shares in each share class. Certain costs, such as distribution and service fees are charged directly to specific share classes. In addition, certain expenses have been allocated to the individual Funds in the Trust based on the respective net assets of each Fund included in the Trust.
(o) Earnings Credits
Under the fee arrangement with the custodian, the Funds may earn credits based on overnight custody cash balances. These credits are utilized to reduce related custodial expenses. The custodian fees disclosed in the Funds’ Statements of Operations are before the reduction in expense from the related earnings credits, if any. Earnings credits for the year ended September 30, 2024, are disclosed in the Funds’ Statements of Operations.
(p) Cash
The Funds may leave cash overnight in their cash account with the custodian. Periodically, a Fund may have cash due to the custodian bank as an overdraft balance. A fee is incurred on this overdraft, calculated by multiplying the overdraft by a rate based on the federal funds rate, which was 4.83% at September 30, 2024.
(q) Indemnifications
Under the Funds’ organizational documents, the Trustees and Officers are indemnified against certain liabilities arising out of the performance of their duties to the Trust. In addition, throughout the normal course of business, the Funds enter into contracts that contain a variety of representations and warranties which provide general indemnifications. The Funds’ maximum exposure under these arrangements is unknown, as this would involve future claims that may be made against the Funds and/or their affiliates that have not yet occurred. However, based on experience, the Funds expect the risk of loss to be remote.
(r) Special Purpose Acquisition Companies
The Funds may acquire an interest in a special purpose acquisition company (“SPAC”) in an initial public offering or a secondary market transaction. SPAC investments carry many of the same risks as investments in initial public offering securities, such as erratic price movements, greater risk of loss, lack of information about the issuer, limited operating and little public or no trading history, and higher transaction costs. An investment in a SPAC is typically subject to a higher risk of dilution by additional later offerings of interests in the SPAC or by other investors exercising existing rights to purchase shares of the SPAC and interests in SPACs may be illiquid and/or be subject to restrictions on resale. A SPAC is a publicly traded company that raises investment capital for the purpose of acquiring the equity securities of one or more existing companies (or interests therein) via merger, combination, acquisition or other similar transactions. Unless and until an acquisition is completed, a SPAC generally invests its assets (less a portion retained to cover expenses) in U.S. government securities, money market securities and cash and does not typically pay dividends in respect of its common stock. SPAC investments are also subject to the risk that a significant portion of the funds raised by the SPAC may be expended during the search for a target acquisition or merger and that the SPAC may have limited time in which to conduct due diligence on potential business combination targets. Because SPACs are in essence blank check companies without operating history or ongoing business other than seeking acquisitions, the value of their securities is particularly dependent on the ability of the entity’s management to identify and complete a profitable acquisition. Among other conflicts of interest, the economic interests of the management, directors, officers and related parties of a SPAC can differ from the economic interests of public shareholders, which may lead to
| | THE GUGGENHEIM FUNDS ANNUAL REPORT | 285 |
NOTES TO FINANCIAL STATEMENTS (continued) |
conflicts as they evaluate, negotiate and recommend business combination transactions to shareholders. This risk may become more acute as the deadline for the completion of a business combination nears. There is no guarantee that the SPACs in which the Funds invest will complete an acquisition or that any acquisitions that are completed will be profitable.
Note 2 – Financial Instruments and Derivatives
As part of their investment strategies, the Funds may utilize short sales and a variety of derivative instruments. These investments involve, to varying degrees, elements of market risk and risks in excess of amounts recognized on the Funds’ Statements of Assets and Liabilities. Valuation and accounting treatment of these instruments can be found under Significant Accounting Policies in Note 1 of these Notes to Financial Statements.
Short Sales
A short sale is a transaction in which a Fund sells a security it does not own. If the security sold short decreases in price between the time the Fund sells the security and closes its short position, the Fund will realize a gain on the transaction. Conversely, if the security increases in price during the period, the Fund will realize a loss on the transaction. The risk of such price increases is the principal risk of engaging in short sales.
Derivatives
Derivatives are instruments whose values depend on, or are derived from, in whole or in part, the value of one or more other assets, such as securities, currencies, commodities or indices. Derivative instruments may be used for investment purposes (including to maintain cash reserves while maintaining exposure to certain other assets), for risk management (hedging) purposes, to facilitate trading, to reduce transaction costs and to pursue higher investment returns. Derivative instruments may also be used to seek to mitigate certain investment risks, such as foreign currency exchange rate risk, interest rate risk and credit risk. U.S. GAAP requires disclosures to enable investors to better understand how and why a Fund uses derivative instruments, how these derivative instruments are accounted for and their effects on the Fund’s financial position and results of operations.
The Funds may utilize derivatives for the following purposes:
Duration: the use of an instrument to manage the interest rate risk of a portfolio.
Hedge: an investment made in order to reduce the risk of adverse price movements in a security, by taking an offsetting position to protect against broad market moves.
Income: the use of any instrument that distributes cash flows typically based upon some rate of interest.
Index Exposure: the use of an instrument to obtain exposure to a listed or other type of index.
Leverage: gaining total exposure to equities or other assets on the long and short sides at greater than 100% of invested capital.
If a Fund’s investment strategy consistently involves applying leverage, the value of the Fund’s shares will tend to increase or decrease more than the value of any increase or decrease in the underlying index or other asset. In addition, because an investment in derivative instruments generally requires a small investment relative to the amount of investment exposure assumed, an opportunity for increased net income is created; but, at the same time, leverage risk will increase. The Fund’s use of leverage, through borrowings or instruments such as derivatives, may cause an investment in the Fund to be more volatile and riskier than if the Fund had not been leveraged.
Options Purchased and Written
A call option on a security gives the purchaser of the option the right to buy, and the writer of a call option the obligation to sell, the underlying security. The purchaser of a put option has the right to sell, and the writer of the put option the obligation to buy, the underlying security at any time during the option period. The risk associated with purchasing options is limited to the premium originally paid.
286 | THE GUGGENHEIM FUNDS ANNUAL REPORT | |
NOTES TO FINANCIAL STATEMENTS (continued) |
The following table represents the Funds’ use and volume of call/put options purchased on a monthly basis:
| | | | Average Notional Amount | |
Fund | Use | | Call | | | Put | |
Core Bond Fund | Duration, Hedge | | $ | 124,601,913 | | | $ | — | |
Limited Duration Fund | Duration, Hedge | | | 289,958,333 | | | | — | |
Macro Opportunities Fund | Duration, Hedge | | | 553,117,762 | | | | 198,256,949 | |
Total Return Bond Fund | Duration, Hedge | | | 1,783,417,444 | | | | — | |
The risk in writing a call option is that a Fund may incur a loss if the market price of the underlying security increases and the option is exercised. The risk in writing a put option is that a Fund may incur a loss if the market price of the underlying security decreases and the option is exercised. In addition, there may be an imperfect correlation between the movement in prices of options and the underlying securities where a Fund may not be able to enter into a closing transaction because of an illiquid secondary market; or, for OTC options, a Fund may be at risk because of the counterparty’s inability to perform.
The following table represents the Funds’ use and volume of call/put options written on a monthly basis:
| | | | Average Notional Amount | |
Fund | Use | | Call | | | Put | |
Core Bond Fund | Duration, Hedge, Income | | $ | 41,935,246 | | | $ | — | |
Macro Opportunities Fund | Duration, Hedge, Income | | | 156,534,429 | | | | — | |
Total Return Bond Fund | Duration, Hedge, Income | | | 552,167,444 | | | | — | |
Futures Contracts
A futures contract is an agreement to purchase (long) or sell (short) an agreed upon amount of securities or other instruments at a set price for delivery at a future date. There are significant risks associated with a Fund’s use of futures contracts, including (i) there may be an imperfect or no correlation between the changes in market value of the underlying asset and the prices of futures contracts; (ii) there may not be a liquid secondary market for a futures contract; (iii) trading restrictions or limitations may be imposed by an exchange; and (iv) government regulations may restrict trading in futures contracts. When investing in futures, there is minimal counterparty credit risk to a Fund because futures are exchange-traded and the exchange’s clearinghouse, as counterparty to all exchange-traded futures, guarantees against default. Cash deposits are shown as segregated cash with broker on the Funds’ Statements of Assets and Liabilities; securities held as collateral are noted on the Funds’ Schedules of Investments.
The following table represents the Funds’ use and volume of futures on a monthly basis:
| | | | Average Notional Amount | |
Fund | Use | | Long | | | Short | |
StylePlus—Large Core Fund | Index Exposure | | $ | 7,235,308 | | | $ | — | |
StylePlus—Mid Growth Fund | Index Exposure | | | 1,924,386 | | | | — | |
World Equity Income Fund | Hedge | | | — | | | | 2,053,107 | |
| | | | Average Notional Amount | |
Fund | Use | | Long | | | Short | |
Core Bond Fund | Duration, Hedge | | $ | 150,682,742 | | | $ | — | |
Limited Duration Fund | Index exposure, Income | | | 347,182,958 | | | | — | |
Macro Opportunities Fund | Duration, Hedge | | | 536,266,575 | | | | — | |
Total Return Bond Fund | Duration, Hedge | | | 1,798,763,151 | | | | — | |
Swap Agreements
A swap is an agreement that obligates two parties to exchange a series of cash flows at specified intervals based upon or calculated by reference to changes in specified prices or rates for a specified amount of an underlying asset. When utilizing OTC swaps, a Fund bears the risk of loss of the amount expected to be received under a swap agreement in the event of the default or bankruptcy of a swap agreement counterparty or if
| | THE GUGGENHEIM FUNDS ANNUAL REPORT | 287 |
NOTES TO FINANCIAL STATEMENTS (continued) |
the underlying asset declines in value. Certain standardized swaps are subject to mandatory central clearing and are executed on a multi-lateral or other trade facility platform, such as a registered exchange. There is limited counterparty credit risk with respect to centrally-cleared swaps as the transaction is facilitated through a central clearinghouse, much like exchange-traded futures contracts. For a Fund utilizing centrally-cleared swaps, the exchange bears the risk of loss resulting from a counterparty not being able to pay. There is no guarantee that a Fund or an underlying fund could eliminate its exposure under an outstanding swap agreement by entering into an offsetting swap agreement with the same or another party.
Total return and custom basket swaps involve commitments where single or multiple cash flows are exchanged based on the price of an underlying reference asset (such as an index or custom basket of securities) for a fixed or variable interest rate. Total return and custom basket swaps will usually be computed based on the current value of the reference asset as of the close of regular trading on the NYSE or other exchange, with the swap value being adjusted to include dividends accrued, financing charges and/or interest associated with the swap agreement. When utilizing total return or custom basket swaps, a Fund bears the risk of loss of the amount expected to be received under a swap agreement in the event of the default or bankruptcy of a swap agreement counterparty or if the underlying reference asset declines in value.
The following table represents the Funds’ use and volume of total return swaps on a monthly basis:
| | | | Average Notional Amount | |
Fund | Use | | Long | | | Short | |
StylePlus—Large Core Fund | Index Exposure | | $ | 182,480,371 | | | $ | — | |
StylePlus—Mid Growth Fund | Index Exposure | | | 54,671,616 | | | | — | |
| | | | Average Notional Amount | |
Fund | Use | | Long | | | Short | |
Core Bond Fund | Hedge, Index exposure | | $ | 1,704,335 | | | $ | 946,337 | |
Macro Opportunities Fund | Hedge, Index exposure, Income | | | 76,393,628 | | | | 40,652,746 | |
Total Return Bond Fund | Hedge, Index exposure | | | 23,215,839 | | | | 12,890,665 | |
The following table represents the Funds’ use and volume of custom basket swaps on a monthly basis:
| | | | Average Notional Amount | |
Fund | Use | | Long | | | Short | |
Alpha Opportunity Fund | Hedge, Leverage | | $ | 20,252,558 | | | $ | 37,364,305 | |
Market Neutral Real Estate Fund | Hedge | | | — | | | | 27,424,050 | |
Risk Managed Real Estate Fund | Hedge, Leverage | | | 68,945,172 | | | | 51,634,142 | |
Interest rate swaps involve the exchange by the Funds with another party for their respective commitment to pay or receive a fixed or variable interest rate on a notional amount of principal. Interest rate swaps are generally centrally-cleared, but central clearing does not make interest rate swap transactions risk free.
The following table represents the Funds’ use and volume of interest rate swaps on a monthly basis:
| | | | Average Notional Amount | |
Fund | Use | | Pay Floating Rate | | | Receive Floating Rate | |
Core Bond Fund | Duration, Income | | $ | 507,396,083 | | | $ | — | |
Limited Duration Fund | Duration, Hedge | | | 1,126,641,667 | | | | 173,112,500 | |
Macro Opportunities Fund | Duration | | | 176,528,333 | | | | 1,785,000 | |
Municipal Income Fund | Duration | | | 10,175,000 | | | | 7,140,000 | |
Total Return Bond Fund | Duration, Income | | | 7,936,133,333 | | | | — | |
Ultra Short Duration Fund | Hedge, Income | | | — | | | | 61,000,000 | |
Credit default swaps are instruments which allow for the full or partial transfer of third-party credit risk, with respect to a particular entity or entities, from one counterparty to the other. A fund enters into credit default swaps as a “seller” or “buyer” of protection primarily to gain or reduce exposure to the investment grade and/or high yield bond market. A seller of credit default swaps is selling credit protection or assuming
288 | THE GUGGENHEIM FUNDS ANNUAL REPORT | |
NOTES TO FINANCIAL STATEMENTS (continued) |
credit risk with respect to the underlying entity or entities. The buyer in a credit default swap is obligated to pay the seller a periodic stream of payments over the term of the contract provided that no event of default on an underlying reference obligation has occurred. If a credit event occurs, as defined under the terms of the swap agreement, the seller will either (i) pay to the buyer of protection an amount equal to the notional amount of the swap and take delivery of the referenced obligation or underlying securities comprising the referenced index or (ii) pay a net settlement amount in the form of cash or securities equal to the notional amount of the swap less the recovery value of the referenced obligation or underlying securities comprising the referenced index. The notional amount reflects the maximum potential amount the seller of credit protection could be required to pay to the buyer if a credit event occurs. The seller of protection receives periodic premium payments from the buyer and may also receive or pay an upfront premium adjustment to the stated periodic payments. In the event a credit default occurs on a credit default swap referencing an index, a factor adjustment will take place and the buyer of protection will receive a payment reflecting the par less the default recovery rate of the defaulted index component based on its weighting in the index. If no default occurs, the counterparty will pay the stream of payments and have no further obligations to the fund selling the credit protection. For a fund utilizing centrally cleared credit default swaps, the exchange bears the risk of loss resulting from a counterparty not being able to pay. For OTC credit default swaps, a fund bears the risk of loss of the amount expected to be received under a swap agreement in the event of the default or bankruptcy of a swap agreement counterparty, or in the case of a credit default swap in which a fund is selling credit protection, the default of a third party issuer.
The quoted market prices and resulting market values for credit default swap agreements on securities and credit indices serve as an indicator of the current status of the payment/performance risk and represent the likelihood of an expected liability (or profit) for the credit derivative had the notional amount of the swap agreement been closed/sold as of the period end. Increasing market values, in absolute terms when compared to the notional amount of the swap, represent a deterioration of the referenced entity’s credit soundness and a greater likelihood or risk of default or other credit event occurring as defined under the terms of the agreement.
The following table represents the Funds’ use and volume of credit default swaps on a monthly basis:
| | | | Average Notional Amount | |
Fund | Use | | Protection Sold | | | Protection Purchased | |
Core Bond Fund | Hedge, Index exposure | | $ | — | | | $ | 22,058,260 | |
Limited Duration Fund | Index exposure, Income | | | — | | | | 47,671,402 | |
Macro Opportunities Fund | Hedge, Index exposure | | | — | | | | 197,286,594 | |
Total Return Bond Fund | Hedge, Index exposure | | | — | | | | 307,334,107 | |
Forward Foreign Currency Exchange Contracts
A forward foreign currency exchange contract is an agreement between two parties to exchange two designated currencies at a specific time in the future. Certain types of contracts may be cash settled, in an amount equal to the change in exchange rates during the term of the contract. The contracts can be used to hedge or manage exposure to foreign currency risks with portfolio investments or to gain exposure to foreign currencies.
The market value of a forward foreign currency exchange contract changes with fluctuations in foreign currency exchange rates. Furthermore, the Funds may be exposed to risk if the counterparties cannot meet the contract terms or if the currency value changes unfavorably as compared to the U.S. dollar.
The following table represents the Funds’ use and volume of forward foreign currency exchange contracts on a monthly basis:
| | | | Average Value | |
Fund | Use | | Purchased | | | Sold | |
Core Bond Fund | Hedge | | $ | 49,747 | | | $ | 9,795,422 | |
Floating Rate Strategies Fund | Hedge | | | 59,728 | | | | 16,493,361 | |
High Yield Fund | Hedge | | | — | | | | 3,106,435 | |
Limited Duration Fund | Index exposure, Income | | | 805,829 | | | | 20,616,505 | |
Macro Opportunities Fund | Hedge, Income | | | 2,160,570 | | | | 235,748,411 | |
Total Return Bond Fund | Hedge | | | 3,597,535 | | | | 194,782,283 | |
| | THE GUGGENHEIM FUNDS ANNUAL REPORT | 289 |
NOTES TO FINANCIAL STATEMENTS (continued) |
Derivative Investment Holdings Categorized by Risk Exposure
The following is a summary of the location of derivative investments on the Funds’ Statements of Assets and Liabilities as of September 30, 2024:
Derivative Investment Type | Asset Derivatives | Liability Derivatives |
Commodity/Currency/Equity/Interest rate futures contracts | Variation margin on futures contracts | Variation margin on futures contracts |
Currency forward contracts | Unrealized appreciation on forward foreign currency exchange contracts | Unrealized depreciation on forward foreign currency exchange contracts |
Credit/Equity/Interest rate swap agreements | Unrealized appreciation on OTC swap agreements | Unrealized depreciation on OTC swap agreements |
| | Unamortized upfront premiums paid on interest rate swap agreements | Unamortized upfront premiums received on interest rate swap agreements |
| | Variation margin on credit default swap agreements | Unamortized upfront premiums received on credit default swap agreements |
| | Variation margin on interest rate swap agreements | Variation margin on interest rate swap agreements |
Currency/Equity/Interest rate option contracts | Investments in unaffiliated issuers, at value | — |
The following tables set forth the fair value of the Funds’ derivative investments categorized by primary risk exposure at September 30, 2024:
Asset Derivative Investments Value |
Fund | | Futures
Equity
Risk* | | | Swaps
Equity
Risk | | | Total Value at
September 30,
2024 | |
Alpha Opportunity Fund | | $ | — | | | $ | 2,195,190 | | | $ | 2,195,190 | |
Risk Managed Real Estate Fund | | | — | | | | 4,384,771 | | | | 4,384,771 | |
StylePlus—Large Core Fund | | | 62,524 | | | | 33,863,475 | | | | 33,925,999 | |
StylePlus—Mid Growth Fund | | | — | | | | 7,028,514 | | | | 7,028,514 | |
Liability Derivative Investments Value |
Fund | | Futures
Equity
Risk* | | | Swaps
Equity
Risk | | | Total Value at
September 30,
2024 | |
Alpha Opportunity Fund | | $ | — | | | $ | 1,466,465 | | | $ | 1,466,465 | |
Market Neutral Real Estate Fund | | | — | | | | 1,172,809 | | | | 1,172,809 | |
Risk Managed Real Estate Fund | | | — | | | | 1,936,056 | | | | 1,936,056 | |
* | Includes cumulative appreciation (depreciation) of exchange-traded, OTC and centrally-cleared derivatives contracts as reported on the Schedules of Investments. For exchange-traded and centrally-cleared derivatives, variation margin is reported within the Funds’ Statements of Assets and Liabilities. |
290 | THE GUGGENHEIM FUNDS ANNUAL REPORT | |
NOTES TO FINANCIAL STATEMENTS (continued) |
Asset Derivative Investments Value |
Fund | | Swaps
Equity
Risk | | | Futures
Interest
Rate
Risk* | | | Swaps
Interest
Rate
Risk* | | | Futures
Commodity
Risk* | | | Swaps
Credit
Risk* | | | Options
Purchased
Equity
Risk | | | Forward
Foreign
Currency
Exchange
Risk | | | Total Value at
September 30,
2024 | |
Core Bond Fund | | $ | — | | | $ | 1,651,819 | | | $ | 7,770,854 | | | $ | — | | | $ | 1,275 | | | $ | — | | | | 411 | | | $ | 9,424,359 | |
Limited Duration Fund | | | — | | | | 3,634,002 | | | | 7,985,757 | | | | — | | | | 3,283 | | | | — | | | | — | | | | 11,623,042 | |
Macro Opportunities Fund | | | 5,412,353 | | | | 5,438,613 | | | | 7,015,454 | | | | 6,681,528 | | | | 6,717 | | | | 2,086,699 | | | | 2,495 | | | | 26,643,859 | |
Municipal Income Fund | | | — | | | | — | | | | 1,055,294 | | | | — | | | | — | | | | — | | | | — | | | | 1,055,294 | |
Total Return Bond Fund | | | — | | | | 19,546,778 | | | | 105,031,948 | | | | — | | | | 20,313 | | | | — | | | | — | | | | 124,599,039 | |
Ultra Short Duration Fund | | | — | | | | — | | | | 604,670 | | | | — | | | | — | | | | — | | | | — | | | | 604,670 | |
Liability Derivative Investments Value |
Fund | | Swaps
Equity
Risk | | | Futures
Interest
Rate
Risk* | | | Swaps
Interest
Rate
Risk* | | | Futures
Commodity
Risk* | | | Swaps
Credit
Risk* | | | Options
Written
Equity
Risk | | | Forward
Foreign
Currency
Exchange
Risk | | | Total Value at
September 30,
2024 | |
Core Bond Fund | | $ | — | | | $ | — | | | $ | — | | | $ | — | | | $ | 621 | | | $ | — | | | | 29,955 | | | $ | 30,576 | |
Floating Rate Strategies Fund | | | — | | | | — | | | | — | | | | — | | | | — | | | | — | | | | 95,154 | | | | 95,154 | |
High Yield Fund | | | — | | | | — | | | | — | | | | — | | | | — | | | | — | | | | 16,511 | | | | 16,511 | |
Limited Duration Fund | | | — | | | | — | | | | 8,185,486 | | | | — | | | | 648 | | | | — | | | | 94,863 | | | | 8,280,997 | |
Macro Opportunities Fund | | | — | | | | — | | | | 127,281 | | | | — | | | | 3,370 | | | | — | | | | 2,973,519 | | | | 3,104,170 | |
Municipal Income Fund | | | — | | | | — | | | | 109,420 | | | | — | | | | — | | | | — | | | | — | | | | 109,420 | |
Total Return Bond Fund | | | — | | | | — | | | | 27,111,215 | | | | — | | | | 3,736 | | | | — | | | | 1,280,016 | | | | 28,394,967 | |
* | Includes cumulative appreciation (depreciation) of exchange-traded, OTC and centrally-cleared derivatives contracts as reported on the Schedules of Investments. For exchange-traded and centrally-cleared derivatives, variation margin is reported within the Funds’ Statements of Assets and Liabilities. |
The following is a summary of the location of derivative investments on the Funds’ Statements of Operations for the year ended September 30, 2024:
Derivative Investment Type | Location of Gain (Loss) on Derivatives |
Commodity/Currency/Equity/Interest rate futures contracts | Net realized gain (loss) on futures contracts |
| | Net change in unrealized appreciation (depreciation) on futures contracts |
Currency forward contracts | Net realized gain (loss) on forward foreign currency exchange contracts |
| | Net change in unrealized appreciation (depreciation) on forward foreign currency exchange contracts |
Equity/Foreign currency/Interest rate option contracts | Net realized gain (loss) on options purchased |
| | Net change in unrealized appreciation (depreciation) on options purchased |
| | Net realized gain (loss) on options written Net change in unrealized appreciation (depreciation) on options written |
Credit/Equity/Interest rate swap agreements | Net realized gain (loss) on swap agreements |
| | Net change in unrealized appreciation (depreciation) on swap agreements |
| | THE GUGGENHEIM FUNDS ANNUAL REPORT | 291 |
NOTES TO FINANCIAL STATEMENTS (continued) |
The following is a summary of the Funds’ realized gain (loss) and change in unrealized appreciation (depreciation) on derivative investments recognized on the Funds’ Statements of Operations categorized by primary risk exposure for the year ended September 30, 2024:
Realized Gain (Loss) on Derivative Investments Recognized on the Statements of Operations |
Fund | | Futures
Equity
Risk | | | Swaps
Equity
Risk | | | Futures
Foreign
Currency
Exchange
Risk | | | Futures
Commodity
Risk | | | Total | |
Alpha Opportunity Fund | | $ | — | | | $ | (1,340,707 | ) | | $ | — | | | $ | — | | | $ | (1,340,707 | ) |
Market Neutral Real Estate Fund | | | — | | | | (1,822,758 | ) | | | — | | | | — | | | | (1,822,758 | ) |
Risk Managed Real Estate Fund | | | — | | | | 8,058,851 | | | | — | | | | — | | | | 8,058,851 | |
StylePlus—Large Core Fund | | | 1,596,960 | | | | 33,338,204 | | | | — | | | | — | | | | 34,935,164 | |
StylePlus—Mid Growth Fund | | | 401,522 | | | | 8,984,678 | | | | — | | | | — | | | | 9,386,200 | |
World Equity Income Fund | | | — | | | | — | | | | 99,668 | | | | — | | | | 99,668 | |
Change in Unrealized Appreciation (Depreciation) on Derivative Investments Recognized on the Statements of Operations |
Fund | | Futures
Equity
Risk | | | Swaps
Equity
Risk | | | Futures
Foreign
Currency
Exchange
Risk | | | Futures
Commodity
Risk | | | Total | |
Alpha Opportunity Fund | | $ | — | | | $ | (1,452,064 | ) | | $ | — | | | $ | — | | | $ | (1,452,064 | ) |
Market Neutral Real Estate Fund | | | — | | | | (5,072,996 | ) | | | — | | | | — | | | | (5,072,996 | ) |
Risk Managed Real Estate Fund | | | — | | | | (4,631,112 | ) | | | — | | | | — | | | | (4,631,112 | ) |
StylePlus—Large Core Fund | | | 118,865 | | | | 12,774,700 | | | | — | | | | — | | | | 12,893,565 | |
StylePlus—Mid Growth Fund | | | 109,411 | | | | 1,879,162 | | | | — | | | | — | | | | 1,988,573 | |
World Equity Income Fund | | | — | | | | — | | | | (183,425 | ) | | | —— | | | | (183,425 | ) |
Realized Gain (Loss) on Derivative Investments Recognized on the Statements of Operations |
Fund | | Swaps
Equity
Risk | | | Futures
Interest
Rate
Risk | | | Swaps
Interest
Rate
Risk | | | Futures
Commodity
Risk | | | Swaps
Credit
Risk | | | Options
Purchased
Equity
Risk | | | Forward
Foreign
Currency
Exchange
Risk | | | Options
Purchased
Interest
Rate Risk | | | Options
Written
Interest
Rate Risk | | | Total | |
Core Bond Fund | | $ | — | | | $ | (632,569 | ) | | $ | (1,856,367 | ) | | $ | — | | | $ | (1,476,916 | ) | | $ | — | | | $ | 7,393 | | | $ | 524,620 | | | $ | (1,372,342 | ) | | $ | (4,806,181 | ) |
Floating Rate Strategies Fund | | | — | | | | — | | | | — | | | | — | | | | — | | | | — | | | | (117,693 | ) | | | — | | | | — | | | | (117,693 | ) |
High Yield Fund | | | — | | | | — | | | | — | | | | — | | | | — | | | | — | | | | (35,284 | ) | | | — | | | | — | | | | (35,284 | ) |
Limited Duration Fund | | | — | | | | (1,519,309 | ) | | | (3,750,143 | ) | | | — | | | | (3,694,272 | ) | | | — | | | | 4,608 | | | | (2,968,935 | ) | | | (1,055,134 | ) | | | (12,983,185 | ) |
Macro Opportunities Fund | | | 1,078,385 | | | | (2,124,423 | ) | | | (18,621,886 | ) | | | (1,090,702 | ) | | | (11,744,399 | ) | | | — | | | | (6,740,405 | ) | | | 1,064,695 | | | | (3,640,905 | ) | | | (41,819,640 | ) |
Municipal Income Fund | | | — | | | | — | | | | (210,660 | ) | | | — | | | | — | | | | — | | | | — | | | | — | | | | — | | | | (210,660 | ) |
Total Return Bond Fund | | | — | | | | (7,619,388 | ) | | | (20,160,958 | ) | | | — | | | | (55,267,417 | ) | | | — | | | | (1,731,846 | ) | | | 5,379,060 | | | | (18,549,319 | ) | | | (97,949,868 | ) |
Ultra Short Duration Fund | | | — | | | | — | | | | 2,694,935 | | | | — | | | | — | | | | — | | | | — | | | | — | | | | — | | | | 2,694,935 | |
292 | THE GUGGENHEIM FUNDS ANNUAL REPORT | |
NOTES TO FINANCIAL STATEMENTS (continued) |
Change in Unrealized Appreciation (Depreciation) on Derivative Investments Recognized on the Statements of Operations |
Fund | | Swaps
Equity
Risk | | | Futures
Interest
Rate
Risk | | | Swaps
Interest
Rate
Risk | | | Futures
Commodity
Risk | | | Swaps
Credit
Risk | | | Options
Purchased
Equity
Risk | | | Forward
Foreign
Currency
Exchange
Risk | | | Options
Purchased
Interest
Rate Risk | | | Options
Written
Interest
Rate Risk | | | Total | |
Core Bond Fund | | $ | — | | | $ | 1,651,819 | | | $ | 13,703,589 | | | $ | — | | | $ | 341,972 | | | $ | — | | | $ | (280,288 | ) | | $ | 585,689 | | | $ | 318,806 | | | $ | 16,321,587 | |
Floating Rate Strategies Fund | | | — | | | | — | | | | — | | | | — | | | | — | | | | — | | | | (555,754 | ) | | | — | | | | — | | | | (555,754 | ) |
High Yield Fund | | | — | | | | — | | | | — | | | | — | | | | — | | | | — | | | | (86,050 | ) | | | — | | | | — | | | | (86,050 | ) |
Limited Duration Fund | | | — | | | | 3,634,002 | | | | 5,955,298 | | | | — | | | | 961,822 | | | | — | | | | (606,731 | ) | | | 2,054,220 | | | | 843,399 | | | | 12,842,010 | |
Macro Opportunities Fund | | | 5,412,353 | | | | 5,438,613 | | | | 26,583,760 | | | | 6,681,528 | | | | 3,323,266 | | | | (8,539,184 | ) | | | (6,674,079 | ) | | | 2,809,658 | | | | — | | | | 35,035,915 | |
Municipal Income Fund | | | — | | | | — | | | | (457,977 | ) | | | — | | | | — | | | | — | | | | — | | | | — | | | | — | | | | (457,977 | ) |
Total Return Bond Fund | | | — | | | | 19,546,778 | | | | 221,817,575 | | | | — | | | | 5,227,967 | | | | — | | | | (6,730,525 | ) | | | 8,722,554 | | | | 4,635,100 | | | | 253,219,449 | |
Ultra Short Duration Fund | | | — | | | | — | | | | (2,563,335 | ) | | | — | | | | — | | | | — | | | | — | | | | — | | | | — | | | | (2,563,335 | ) |
In conjunction with short sales and the use of derivative instruments, the Funds are required to maintain collateral in various forms. Depending on the financial instrument utilized and the broker involved, the Funds use margin deposits at the broker, cash and/or securities segregated at the custodian bank, discount notes or repurchase agreements allocated to the Funds as collateral.
The Trust has established counterparty credit guidelines and enters into transactions only with financial institutions rated/identified as investment grade or better. The Trust monitors the counterparty credit risk associated with each such financial institution.
Foreign Investments
There are several risks associated with exposure to foreign currencies, foreign issuers and emerging markets. A fund’s indirect and direct exposure to foreign currencies subjects the Fund to the risk that those currencies will decline in value relative to the U.S. dollar, or in the case of short positions, that the U.S. dollar will decline in value relative to the currency being hedged. Currency rates in foreign countries may fluctuate significantly over short periods of time for a number of reasons, including changes in interest rates and the imposition of currency controls or other political developments in the U.S. or abroad. In addition, the Funds may incur transaction costs in connection with conversions between various currencies. The Funds may, but is not obligated to, engage in currency hedging transactions, which generally involve buying currency forward, options or futures contracts. However, not all currency risks may be effectively hedged, and in some cases the costs of hedging techniques may outweigh expected benefits. In such instances, the value of securities denominated in foreign currencies can change significantly when foreign currencies strengthen or weaken relative to the U.S. dollar.
The Funds may invest in securities of foreign companies directly, or in financial instruments, such as ADRs and exchange-traded funds, which are indirectly linked to the performance of foreign issuers. Foreign markets can be more volatile than the U.S. market due to increased risks of adverse issuer, political, regulatory, market, or economic developments and can perform differently from the U.S. market. Investing in securities of foreign companies directly, or in financial instruments that are indirectly linked to the performance of foreign issuers, may involve risks not typically associated with investing in U.S. issuers. The value of securities denominated in foreign currencies, and of dividends from such securities, can change significantly when foreign currencies strengthen or weaken relative to the U.S. dollar. Foreign securities markets generally have less trading volume and less liquidity than U.S. markets, and prices in some foreign markets may fluctuate more than those of securities traded on U.S. markets. Many foreign countries lack accounting and disclosure standards comparable to those that apply to U.S. companies, and it may be more difficult to obtain reliable information regarding a foreign issuer’s financial condition and operations. Transaction costs and costs associated with custody services are generally higher for foreign securities than they are for U.S. securities. Some foreign governments levy withholding taxes against dividend and interest income. Although in some countries portions of these taxes are recoverable, the non-recovered portion will reduce the income received by the Funds.
| | THE GUGGENHEIM FUNDS ANNUAL REPORT | 293 |
NOTES TO FINANCIAL STATEMENTS (continued) |
Note 3 – Offsetting
In the normal course of business, the Funds enter into transactions subject to enforceable master netting arrangements or other similar arrangements. Generally, the right to offset in those agreements allows the Funds to counteract the exposure to a specific counterparty with collateral received from or delivered to that counterparty based on the terms of the arrangements. These arrangements provide for the right to liquidate upon the occurrence of an event of default, credit event upon merger or additional termination event.
In order to better define their contractual rights and to secure rights that will help the Funds mitigate their counterparty risk, the Funds may enter into an International Swaps and Derivatives Association, Inc. Master Agreement (“ISDA Master Agreement”) or similar agreement with their derivative contract counterparties. An ISDA Master Agreement is a bilateral agreement between a fund and a counterparty that governs OTC derivatives, including foreign exchange contracts, and typically contains, among other things, collateral posting terms and netting provisions in the event of a default and/or termination event. The provisions of the ISDA Master Agreement typically permit a single net payment in the event of a default (close-out netting) or similar event, including the bankruptcy or insolvency of the counterparty.
For derivatives traded under an ISDA Master Agreement, the collateral requirements are typically calculated by netting the mark-to-market amount for each transaction under such agreement and comparing that amount to the value of any collateral currently pledged by the Funds and the counterparty. For financial reporting purposes, cash collateral that has been pledged to cover obligations of the Funds and cash collateral received from the counterparty, if any, are reported separately on the Funds’ Statements of Assets and Liabilities as segregated cash with broker/receivable for variation margin, or payable for swap settlement/variation margin. Cash and/or securities pledged or received as collateral by the Funds in connection with an OTC derivative subject to an ISDA Master Agreement generally may not be invested, sold or rehypothecated by the counterparty or the Funds, as applicable, absent an event of default under such agreement, in which case such collateral generally may be applied towards obligations due to and payable by such counterparty or the Funds, as applicable. Generally, the amount of collateral due from or to a counterparty must exceed a minimum transfer amount threshold (e.g., $300,000) before a transfer is required to be made. To the extent amounts due to the Funds from their counterparties are not fully collateralized, contractually or otherwise, the Funds bear the risk of loss from counterparty nonperformance. The Funds attempt to mitigate counterparty risk by only entering into agreements with counterparties that they believe to be of good standing and by monitoring the financial stability of those counterparties.
For financial reporting purposes, the Funds do not offset derivative assets and derivative liabilities that are subject to netting arrangements in the Funds’ Statements of Assets and Liabilities.
The following tables present derivative financial instruments and secured financing transactions that are subject to enforceable netting arrangements:
| | | | | | | | | | | | | | | | Gross Amounts Not Offset
in the Statements of
Assets and Liabilities | | | | | |
Fund | Instrument | | Gross
Amounts of
Recognized
Assets1 | | | Gross
Amounts
Offset in the
Statements
of Assets and
Liabilities | | | Net Amount
of Assets
Presented on
the Statements
of Assets and
Liabilities | | | Financial
Instruments | | | Cash
Collateral
Received | | | Net
Amount | |
Alpha Opportunity Fund | Custom basket swap agreements | | $ | 2,195,190 | | | $ | — | | | $ | 2,195,190 | | | $ | (1,466,465 | ) | | $ | — | | | $ | 728,725 | |
Risk Managed Real Estate Fund | Custom basket swap agreements | | | 4,384,771 | | | | — | | | | 4,384,771 | | | | (1,936,056 | ) | | | (1,856,455 | ) | | | 592,260 | |
StylePlus—Large Core Fund | Swap equity agreements | | | 33,863,475 | | | | — | | | | 33,863,475 | | | | — | | | | (26,450,000 | ) | | | 7,413,475 | |
StylePlus—Mid Growth Fund | Swap equity agreements | | | 7,028,514 | | | | — | | | | 7,028,514 | | | | — | | | | (5,080,000 | ) | | | 1,948,514 | |
294 | THE GUGGENHEIM FUNDS ANNUAL REPORT | |
NOTES TO FINANCIAL STATEMENTS (continued) |
| | | | | | | | | | | | | | | | Gross Amounts Not Offset
in the Statements of
Assets and Liabilities | | | | | |
Fund | Instrument | | Gross
Amounts of
Recognized
Liabilities1 | | | Gross
Amounts
Offset in the
Statements
of Assets and
Liabilities | | | Net Amounts
of Liabilities
Presented on
the Statements
of Assets and
Liabilities | | | Financial
Instruments | | | Cash
Collateral
Pledged | | | Net
Amount | |
Alpha Opportunity Fund | Custom basket swap agreements | | $ | 1,466,465 | | | $ | — | | | $ | 1,466,465 | | | $ | (1,466,465 | ) | | $ | — | | | $ | — | |
Market Neutral Real Estate Fund | Custom basket swap agreements | | | 1,172,809 | | | | — | | | | 1,172,809 | | | | — | | | | (1,172,809 | ) | | | — | |
Risk Managed Real Estate Fund | Custom basket swap agreements | | | 1,936,056 | | | | — | | | | 1,936,056 | | | | (1,936,056 | ) | | | — | | | | — | |
| | | | | | | | | | | | | | | | Gross Amounts Not Offset
in the Statements of
Assets and Liabilities | | | | | |
Fund | Instrument | | Gross
Amounts of
Recognized
Assets1 | | | Gross
Amounts
Offset in the
Statements
of Assets and
Liabilities | | | Net Amount
of Assets
Presented on
the Statements
of Assets and
Liabilities | | | Financial
Instruments | | | Cash
Collateral
Received | | | Net
Amount | |
Core Bond Fund | Forward foreign currency exchange contracts | | $ | 411 | | | $ | — | | | $ | 411 | | | $ | (349 | ) | | $ | — | | | $ | 62 | |
Macro Opportunities Fund | Forward foreign currency exchange contracts | | | 2,495 | | | | — | | | | 2,495 | | | | — | | | | — | | | | 2,495 | |
Macro Opportunities Fund | Equity index swap agreements | | | 5,412,353 | | | | — | | | | 5,412,353 | | | | (2,951,718 | ) | | | — | | | | 2,460,635 | |
Macro Opportunities Fund | Total return interest rate swap agreements | | | 3,774,999 | | | | — | | | | 3,774,999 | | | | — | | | | — | | | | 3,774,999 | |
Macro Opportunities Fund | Options purchased | | | 1,506,893 | | | | — | | | | 1,506,893 | | | | — | | | | — | | | | 1,506,893 | |
| | THE GUGGENHEIM FUNDS ANNUAL REPORT | 295 |
NOTES TO FINANCIAL STATEMENTS (continued) |
| | | | | | | | | | | | | | | | Gross Amounts Not Offset
in the Statements of
Assets and Liabilities | | | | | |
Fund | Instrument | | Gross
Amounts of
Recognized
Liabilities1 | | | Gross
Amounts
Offset in the
Statements
of Assets and
Liabilities | | | Net Amounts
of Liabilities
Presented on
the Statements
of Assets and
Liabilities | | | Financial
Instruments | | | Cash
Collateral
Pledged | | | Net Amount | |
Core Bond Fund | Forward foreign currency exchange contracts | | $ | 29,955 | | | $ | — | | | $ | 29,955 | | | $ | (349 | ) | | $ | — | | | $ | 29,606 | |
Floating Rate Strategies Fund | Forward foreign currency exchange contracts | | | 95,154 | | | | — | | | | 95,154 | | | | — | | | | — | | | | 95,154 | |
High Yield Fund | Forward foreign currency exchange contracts | | | 16,511 | | | | — | | | | 16,511 | | | | — | | | | — | | | | 16,511 | |
Limited Duration Fund | Forward foreign currency exchange contracts | | | 94,863 | | | | — | | | | 94,863 | | | | — | | | | — | | | | 94,863 | |
Macro Opportunities Fund | Forward foreign currency exchange contracts | | | 2,973,519 | | | | — | | | | 2,973,519 | | | | (2,951,718 | ) | | | — | | | | 21,801 | |
Total Return Bond Fund | Forward foreign currency exchange contracts | | | 1,280,016 | | | | — | | | | 1,280,016 | | | | — | | | | — | | | | 1,280,016 | |
1 | Exchange-traded or centrally-cleared derivatives are excluded from these reported amounts. |
The Funds have the right to offset deposits against any related derivative liabilities outstanding with each counterparty with the exception of exchange-traded or centrally-cleared derivatives. The following table presents deposits held by others in connection with derivative investments and other investments as of September 30, 2024.
Fund | Counterparty | Asset Type | | Cash Pledged | | | Cash Received | |
Market Neutral Real Estate Fund | Goldman Sachs International | Custom basket swap agreements | | $ | 2,270,000 | | | $ | — | |
Risk Managed Real Estate Fund | Goldman Sachs International | Custom basket swap agreements | | | 2,309,456 | | | | — | |
| Morgan Stanley Capital Services LLC | Custom basket swap agreements | | | — | | | | 4,043,030 | |
| | | | | 2,309,456 | | | | 4,043,030 | |
StylePlus—Large Core Fund | Morgan Stanley Capital Services LLC | Futures contracts | | | 330,000 | | | | — | |
| Wells Fargo Bank, N.A. | Total return swap agreements | | | — | | | | 26,450,000 | |
| | | | | 330,000 | | | | 26,450,000 | |
StylePlus—Mid Growth Fund | Wells Fargo Bank, N.A. | Total return swap agreements | | | — | | | | 5,080,000 | |
Fund | Counterparty | Asset Type | | Cash Pledged | | | Cash Received | |
Core Bond Fund | BofA Securities, Inc. | Credit default swap agreements | | $ | 1,530,405 | | | $ | — | |
| BofA Securities, Inc. | Futures contracts | | | 1,791,217 | | | | — | |
| | | | | 3,321,622 | | | | — | |
Limited Duration Fund | BofA Securities, Inc. | Credit default swap agreements | | | 2,632,371 | | | | — | |
| | BofA Securities, Inc. | Futures contracts | | | 1,290,000 | | | | — | |
| | BofA Securities, Inc. | Interest rate swap agreements | | | 1,133,510 | | | | — | |
| | Goldman Sachs International | TBA securities | | | — | | | | 189,999 | |
| Morgan Stanley Capital Services LLC | TBA securities | | | — | | | | 1,215,839 | |
| | | | | 5,055,881 | | | | 1,405,838 | |
296 | THE GUGGENHEIM FUNDS ANNUAL REPORT | |
NOTES TO FINANCIAL STATEMENTS (continued) |
Fund | Counterparty | Asset Type | | Cash Pledged | | | Cash Received | |
Macro Opportunities Fund | Bank of America, N.A. | Total return swap agreements | | $ | 411,070 | | | $ | — | |
| | J.P. Morgan Securities LLC | Credit default swap agreements | | | 9,184,926 | | | | — | |
| | J.P. Morgan Securities LLC | Interest rate swap agreements | | | — | | | | 1,778,403 | |
| JP Morgan Chase and Co. | Futures contracts | | | 4,840,000 | | | | — | |
| | | | | 14,435,996 | | | | 1,778,403 | |
Municipal Income Fund | BofA Securities, Inc. | Interest rate swap agreements | | | 289,174 | | | | — | |
Total Return Bond Fund | BofA Securities, Inc. | Credit default swap agreements, Interest rate swap agreements | | | 56,838,919 | | | | — | |
| | BofA Securities, Inc. | TBA securities | | | — | | | | 930,000 | |
| | Goldman Sachs International | TBA securities | | | — | | | | 740,000 | |
| | J.P. Morgan Securities LLC | TBA securities | | | — | | | | 4,171,000 | |
| Morgan Stanley Capital Services LLC | TBA securities | | | — | | | | 3,371,786 | |
| | | | | 56,838,919 | | | | 9,212,786 | |
Ultra Short Duration Fund | BofA Securities, Inc. | Interest rate swap agreements | | | — | | | | 1,798,848 | |
Note 4 – Fair Value Measurement
In accordance with U.S. GAAP, fair value is defined as the price that the Funds would receive to sell an investment or pay to transfer a liability in an orderly transaction between market participants at the measurement date. U.S. GAAP establishes a three-tier fair value hierarchy based on the types of inputs used to value assets and liabilities and requires corresponding disclosure. The hierarchy and the corresponding inputs are summarized below:
Level 1 — | unadjusted quoted prices in active markets for identical assets or liabilities. |
Level 2 — | significant other observable inputs (for example quoted prices for securities that are similar based on characteristics such as interest rates, prepayment speeds, credit risk, etc.). |
Level 3 — | significant unobservable inputs based on the best information available under the circumstances, to the extent observable inputs are not available, which may include assumptions. |
Rule 2a-5 sets forth a definition of “readily available market quotations,” which is consistent with the definition of a Level 1 input under U.S. GAAP. Rule 2a-5 provides that “a market quotation is readily available only when that quotation is a quoted price (unadjusted) in active markets for identical investments that the fund can access at the measurement date, provided that a quotation will not be readily available if it is not reliable.”
Securities for which market quotations are not readily available must be valued at fair value as determined in good faith. Accordingly, any security priced using inputs other than Level 1 inputs will be subject to fair value requirements. The types of inputs available depend on a variety of factors, such as the type of security and the characteristics of the markets in which it trades, if any. Fair valuation determinations that rely on fewer or no observable inputs require greater judgment. Accordingly, fair value determinations for Level 3 securities require the greatest amount of judgment.
Independent third-party pricing services are used to value a majority of the Funds’ investments. When values are not available from an independent third-party pricing service, they will be determined using a variety of sources and techniques, including: market prices; broker quotes; and models which derive prices based on inputs such as prices of securities with comparable maturities and characteristics or based on inputs such as anticipated cash flows or collateral, spread over U.S. Treasury securities, and other information and analysis. A significant portion of the Funds’ assets and liabilities are categorized as Level 2, as indicated in this report.
Quotes from broker-dealers, adjusted for fluctuations in criteria such as credit spreads and interest rates, may also be used to value the Funds’ assets and liabilities, i.e. prices provided by a broker-dealer or other market participant who has not committed to trade at that price. Although quotes are typically received from established market participants, the Funds may not have the transparency to view the underlying inputs which support the market quotations.
| | THE GUGGENHEIM FUNDS ANNUAL REPORT | 297 |
NOTES TO FINANCIAL STATEMENTS (continued) |
Significant changes in a quote would generally result in significant changes in the fair value of the security. Certain fixed income securities are valued by obtaining a monthly quote from a broker-dealer, adjusted for fluctuations in criteria such as credit spreads and interest rates.
Certain loans and other securities are valued using a single daily broker quote or a price from an independent third-party pricing services based on a single daily or monthly broker quote.
The inputs or methodologies selected and applied for valuing securities or other assets are not necessarily an indication of the risk associated with investing in those securities. The suitability, appropriateness and accuracy of the techniques, methodologies and sources employed to determine fair valuation are periodically reviewed and subject to change.
Note 5 – Investment Advisory Agreement and Other Agreements
Under the terms of an investment advisory contract, the Funds pay GI investment advisory fees on a monthly basis calculated daily at the annualized rates below, based on the average daily net assets of the Funds:
Fund | | Management Fees
(as a % of Net Assets) | |
Alpha Opportunity Fund | | | 0.90 | % |
Large Cap Value Fund | | | 0.65 | % |
Market Neutral Real Estate Fund | | | 1.10 | % |
Risk Managed Real Estate Fund | | | 0.75 | % |
SMid Cap Value Fund | | | 0.75 | % |
StylePlus—Large Core Fund | | | 0.75 | % |
StylePlus—Mid Growth Fund | | | 0.75 | % |
World Equity Income Fund | | | 0.70 | % |
Fund | | Management Fees
(as a % of Net Assets) | |
Core Bond Fund | | | 0.39 | % |
Floating Rate Strategies Fund | | | 0.65 | %* |
High Yield Fund | | | 0.60 | % |
Limited Duration Fund | | | 0.39 | % |
Macro Opportunities Fund | | | 0.89 | %** |
Municipal Income Fund | | | 0.50 | % |
Total Return Bond Fund | | | 0.39 | % |
Ultra Short Duration Fund | | | 0.25 | % |
* | Floating Rate Strategies Fund pays GI investment advisory fees on a monthly basis calculated daily at an annualized rate of 0.65% of the average daily net assets of the Fund up to $5 billion; and 0.60% of the average daily net assets in excess of $5 billion. |
** | Macro Opportunities Fund pays GI investment advisory fees on a monthly basis calculated daily at an annualized rate of 0.89% based on the average daily net assets of the Fund up to $5 billion; and 0.84% on average daily net assets in excess of $5 billion. |
GI has contractually agreed to waive the management fee it receives from each Subsidiary in an amount equal to the management fee paid to GI by the Subsidiary. This undertaking will continue in effect for so long as the Funds invest in the Subsidiary, and may not be terminated by GI unless GI obtains the prior approval of the Funds’ Board for such termination. Fees waived under this arrangement are not subject to reimbursement to GI. For the year ended September 30, 2024, the Macro Opportunities Fund waived $34,024 related to advisory fees in it’s respective Subsidiary.
GI pays operating expenses on behalf of the Trust, such as audit and accounting related services, legal services, custody, printing and mailing, among others, on a pass-through basis. Such expenses are allocated to various Funds within the complex based on relative net assets.
The Board has adopted Distribution Plans related to the offering of Class A, Class C and Class P shares pursuant to Rule 12b-1 under the 1940 Act. The plans provide for payments at an annual rate of 0.25% of the average daily net assets of the Fund’s Class A and Class P shares, and 1.00% of the average daily net assets of the Fund’s Class C shares.
298 | THE GUGGENHEIM FUNDS ANNUAL REPORT | |
NOTES TO FINANCIAL STATEMENTS (continued) |
The investment advisory contract for the Equity Funds provides that the total expenses be limited to a percentage of average net assets for each class of shares, exclusive of brokerage costs, dividends or interest on securities sold short, expenses of other investment companies in which a Fund invests, interest, taxes, litigation, indemnification and extraordinary expenses. The limits are listed below:
| | Limit | | | Effective
Date | | | Contract
End Date | |
Alpha Opportunity Fund – Class A* | | | 1.76 | % | | | 05/31/17 | | | | 02/01/25 | |
Alpha Opportunity Fund – Class C* | | | 2.51 | % | | | 05/31/17 | | | | 02/01/25 | |
Alpha Opportunity Fund – Class P* | | | 1.76 | % | | | 05/31/17 | | | | 02/01/25 | |
Alpha Opportunity Fund – Institutional Class * | | | 1.51 | % | | | 05/31/17 | | | | 02/01/25 | |
Large Cap Value Fund – Class A* | | | 1.15 | % | | | 11/30/12 | | | | 02/01/25 | |
Large Cap Value Fund – Class C* | | | 1.90 | % | | | 11/30/12 | | | | 02/01/25 | |
Large Cap Value Fund – Class P* | | | 1.15 | % | | | 05/01/15 | | | | 02/01/25 | |
Large Cap Value Fund – Institutional Class* | | | 0.90 | % | | | 06/05/13 | | | | 02/01/25 | |
Market Neutral Real Estate Fund – Class A* | | | 1.65 | % | | | 02/26/16 | | | | 02/01/25 | |
Market Neutral Real Estate Fund – Class C* | | | 2.40 | % | | | 02/26/16 | | | | 02/01/25 | |
Market Neutral Real Estate Fund – Class P* | | | 1.65 | % | | | 02/26/16 | | | | 02/01/25 | |
Market Neutral Real Estate Fund – Institutional Class* | | | 1.40 | % | | | 02/26/16 | | | | 02/01/25 | |
Risk Managed Real Estate Fund – Class A* | | | 1.30 | % | | | 03/26/14 | | | | 02/01/25 | |
Risk Managed Real Estate Fund – Class C* | | | 2.05 | % | | | 03/26/14 | | | | 02/01/25 | |
Risk Managed Real Estate Fund – Class P* | | | 1.30 | % | | | 05/01/15 | | | | 02/01/25 | |
Risk Managed Real Estate Fund – Institutional Class* | | | 1.10 | % | | | 03/26/14 | | | | 02/01/25 | |
SMid Cap Value Fund – Class A* | | | 1.30 | %1 | | | 01/03/20 | | | | 02/01/25 | |
SMid Cap Value Fund – Class C* | | | 2.05 | %1 | | | 01/03/20 | | | | 02/01/25 | |
SMid Cap Value Fund – Class P* | | | 1.30 | %1 | | | 01/03/20 | | | | 02/01/25 | |
SMid Cap Value Fund – Institutional Class* | | | 1.05 | % | | | 01/03/20 | | | | 02/01/25 | |
World Equity Income Fund – Class A* | | | 1.22 | % | | | 08/15/13 | | | | 02/01/25 | |
World Equity Income Fund – Class C* | | | 1.97 | % | | | 08/15/13 | | | | 02/01/25 | |
World Equity Income Fund – Class P* | | | 1.22 | % | | | 05/01/15 | | | | 02/01/25 | |
World Equity Income Fund – Institutional Class* | | | 0.97 | % | | | 08/15/13 | | | | 02/01/25 | |
1 | Prior to January 3, 2020, the expense limit for Class A, Class C and Class P shares of the Fund was 1.42%, 2.12% and 1.32%, respectively. |
* | Subsequent to September 30, 2024, the Fund was reorganized into a series of New Age Alpha Funds Trust at which time the existing investment advisory contract was terminated. Please see Note 14 - Subsequent Events for additional information. |
| | THE GUGGENHEIM FUNDS ANNUAL REPORT | 299 |
NOTES TO FINANCIAL STATEMENTS (continued) |
GI and GPIM are entitled to reimbursement by the Equity Funds for fees waived or expenses reimbursed during any of the previous 36 months, beginning on the date of the expense limitation agreement, if on any day the estimated operating expenses are less than the indicated percentages. For purposes of this arrangement, GI and GPIM are entitled to recoupment of previously waived fees or reimbursed expenses for 36 months from the date of the waiver or reimbursement by GI or GPIM. At September 30, 2024, the amount of fees waived or expenses reimbursed that are subject to recoupment and will expire during the years ended September 30, are presented in the following table:
Fund | | 2025 | | | 2026 | | | 2027 | | | Total | |
Alpha Opportunity Fund | | | | | | | | | | | | | | | | |
Class A | | $ | 4,189 | | | $ | 4,612 | | | $ | 5,600 | | | $ | 14,401 | |
Class C | | | 584 | | | | 502 | | | | 492 | | | | 1,578 | |
Class P | | | 971 | | | | 1,774 | | | | 1,350 | | | | 4,095 | |
Institutional Class | | | — | | | | — | | | | 24,066 | | | | 24,066 | |
Large Cap Value Fund | | | | | | | | | | | | | | | | |
Class A | | | 99,071 | | | | 106,239 | | | | 123,947 | | | | 329,257 | |
Class C | | | 5,729 | | | | 5,870 | | | | 5,304 | | | | 16,903 | |
Class P | | | 796 | | | | 522 | | | | 454 | | | | 1,772 | |
Institutional Class | | | 6,589 | | | | 11,209 | | | | 9,421 | | | | 27,219 | |
Market Neutral Real Estate Fund | | | | | | | | | | | | | | | | |
Class A | | | 7,180 | | | | 2,380 | | | | 1,462 | | | | 11,022 | |
Class C | | | 689 | | | | 524 | | | | 428 | | | | 1,641 | |
Class P | | | 6,928 | | | | 3,895 | | | | 1,880 | | | | 12,703 | |
Institutional Class | | | 121,875 | | | | 95,116 | | | | 134,190 | | | | 351,181 | |
Risk Managed Real Estate Fund | | | | | | | | | | | | | | | | |
Class A | | | — | | | | 460 | | | | 198 | | | | 658 | |
Class C | | | — | | | | 270 | | | | 102 | | | | 372 | |
Class P | | | 4,305 | | | | 4,114 | | | | 133 | | | | 8,552 | |
Institutional Class | | | — | | | | — | | | | 2,045 | | | | 2,045 | |
SMid Cap Value Fund | | | | | | | | | | | | | | | | |
Class A | | | 380 | | | | 59,194 | | | | 25,565 | | | | 85,139 | |
Class C | | | 4,648 | | | | 2,172 | | | | 1,653 | | | | 8,473 | |
Class P | | | 2,276 | | | | 104 | | | | 298 | | | | 2,678 | |
Institutional Class | | | 17,866 | | | | 1,842 | | | | 7,733 | | | | 27,441 | |
World Equity Income Fund | | | | | | | | | | | | | | | | |
Class A | | | 78,363 | | | | 111,813 | | | | 145,957 | | | | 336,133 | |
Class C | | | 7,540 | | | | 7,790 | | | | 8,327 | | | | 23,657 | |
Class P | | | 408 | | | | 411 | | | | 427 | | | | 1,246 | |
Institutional Class | | | 7,859 | | | | 8,688 | | | | 8,902 | | | | 25,449 | |
For the year ended September 30, 2024, GI recouped amounts from the Funds as follows:
Alpha Opportunity Fund | | $ | 14,458 | |
Large Cap Value Fund | | | 325 | |
Risk Managed Real Estate Fund | | | 4,869 | |
SMid Cap Value Fund | | | 1,768 | |
World Equity Income Fund | | | 528 | |
300 | THE GUGGENHEIM FUNDS ANNUAL REPORT | |
NOTES TO FINANCIAL STATEMENTS (continued) |
The investment advisory contract for the Fixed Income Funds provides that the total expenses be limited to a percentage of average net assets for each class of shares, exclusive of brokerage costs, dividends or interest on securities sold short, expenses of other investment companies in which a Fund invests, interest, taxes, litigation, indemnification and extraordinary expenses. The limits are listed below:
| Limit | Effective
Date | Contract
End Date |
Core Bond Fund – Class A | 0.79% | 11/30/12 | 02/01/26 |
Core Bond Fund – Class C | 1.54% | 11/30/12 | 02/01/26 |
Core Bond Fund – Class P | 0.79% | 05/01/15 | 02/01/26 |
Core Bond Fund – Institutional Class | 0.50% | 11/30/12 | 02/01/26 |
Floating Rate Strategies Fund – Class A | 1.02% | 11/30/12 | 02/01/26 |
Floating Rate Strategies Fund – Class C | 1.77% | 11/30/12 | 02/01/26 |
Floating Rate Strategies Fund– Class P | 1.02% | 05/01/15 | 02/01/26 |
Floating Rate Strategies Fund– Institutional Class | 0.78% | 11/30/12 | 02/01/26 |
Floating Rate Strategies Fund – Class R6 | 0.78% | 03/13/19 | 02/01/26 |
High Yield Fund – Class A | 0.94%1 | 02/21/24 | 02/01/26 |
High Yield Fund – Class C | 1.69%1 | 02/21/24 | 02/01/26 |
High Yield Fund – Class P | 0.94%1 | 02/21/24 | 02/01/26 |
High Yield Fund – Institutional Class | 0.69%1 | 02/21/24 | 02/01/26 |
High Yield Fund – Class R6 | 0.69%1 | 02/21/24 | 02/01/26 |
Limited Duration Fund – Class A | 0.75% | 12/01/13 | 02/01/26 |
Limited Duration Fund – Class C | 1.50% | 12/01/13 | 02/01/26 |
Limited Duration Fund – Class P | 0.75% | 05/01/15 | 02/01/26 |
Limited Duration Fund – Institutional Class | 0.50% | 12/01/13 | 02/01/26 |
Limited Duration Fund – Class R6 | 0.50% | 03/13/19 | 02/01/26 |
Macro Opportunities Fund – Class A | 1.36% | 11/30/12 | 02/01/26 |
Macro Opportunities Fund – Class C | 2.11% | 11/30/12 | 02/01/26 |
Macro Opportunities Fund – Class P | 1.36% | 05/01/15 | 02/01/26 |
Macro Opportunities Fund – Institutional Class | 0.95% | 11/30/12 | 02/01/26 |
Macro Opportunities Fund – Class R6 | 0.95% | 03/13/19 | 02/01/26 |
Municipal Income Fund – Class A | 0.80% | 11/30/12 | 02/01/26 |
Municipal Income Fund – Class C | 1.55% | 11/30/12 | 02/01/26 |
Municipal Income Fund – Class P | 0.80% | 05/01/15 | 02/01/26 |
Municipal Income Fund – Institutional Class | 0.55% | 11/30/12 | 02/01/26 |
Total Return Bond Fund – Class A | 0.79% | 11/30/12 | 02/01/26 |
Total Return Bond Fund – Class C | 1.54% | 11/30/12 | 02/01/26 |
Total Return Bond Fund – Class P | 0.79% | 05/01/15 | 02/01/26 |
Total Return Bond Fund – Institutional Class | 0.50% | 11/30/12 | 02/01/26 |
Total Return Bond Fund – Class R6 | 0.50% | 10/19/16 | 02/01/26 |
Ultra Short Duration Fund –Class A | 0.58% | 11/30/18 | 02/01/26 |
Ultra Short Duration Fund – Institutional Class | 0.33% | 11/30/18 | 02/01/26 |
1 | Prior to February 21, 2024, the limits for High Yield Fund were 1.16%, 1.91%, 1.16%, 0.91% and 0.91% for Class A, Class C, Class P, Institutional Class, and Class R6, respectively. |
GPIM has contractually agreed through February 1, 2026, to reimburse expenses to the extent necessary to limit the ordinary operating expenses (including distribution (12b-1) fees (if any), but exclusive of brokerage costs, dividends on securities sold short, acquired fund fees and expenses, interest, taxes, litigation, indemnification, and extraordinary expenses) of the Active INvestment Series (GAINS) - Core Plus Fund and the Active INvestment Series (GAINS) - Limited Duration Fund to the annual percentage of average daily net assets for SMA Class shares to 0.00%. The agreement will expire when it reaches its termination or when GPIM ceases to serve as the Investment Adviser and it can be terminated by the Fund’s Board of Trustees.
| | THE GUGGENHEIM FUNDS ANNUAL REPORT | 301 |
NOTES TO FINANCIAL STATEMENTS (continued) |
GI is entitled to reimbursement by the Fixed Income Funds for fees waived or expenses reimbursed during any of the previous 36 months, beginning on the date of the expense limitation agreement, if on any day the estimated operating expenses are less than the indicated percentages. For purposes of this arrangement, GI is entitled to recoupment of previously waived fees or reimbursed expenses for 36 months from the date of the waiver or reimbursement by GI. At September 30, 2024, the amount of fees waived or expenses reimbursed that are subject to recoupment and will expire during the years ended September 30, are presented in the following table:
Fund | | 2025 | | | 2026 | | | 2027 | | | Total | |
Core Bond Fund | | | | | | | | | | | | | | | | |
Class A | | $ | 35,811 | | | $ | 66,528 | | | $ | 80,581 | | | $ | 182,920 | |
Class C | | | 19,268 | | | | 7,997 | | | | 1,505 | | | | 28,770 | |
Class P | | | 114,700 | | | | 56,610 | | | | 563 | | | | 171,873 | |
Institutional Class | | | 1,278,995 | | | | 773,981 | | | | 432,527 | | | | 2,485,503 | |
Floating Rate Strategies Fund | | | | | | | | | | | | | | | | |
Class A | | | 114,896 | | | | 134,479 | | | | 126,706 | | | | 376,081 | |
Class C | | | 63,710 | | | | 33,051 | | | | 23,221 | | | | 119,982 | |
Class P | | | 45,054 | | | | 55,729 | | | | 54,830 | | | | 155,613 | |
Institutional Class | | | 717,446 | | | | 582,868 | | | | 450,359 | | | | 1,750,673 | |
Class R6 | | | 45 | | | | 966 | | | | 338 | | | | 1,349 | |
High Yield Fund | | | | | | | | | | | | | | | | |
Class A | | | — | | | | — | | | | 55,626 | | | | 55,626 | |
Class C | | | — | | | | 2,408 | | | | 12,649 | | | | 15,057 | |
Class P | | | 5,764 | | | | 1,432 | | | | 6,251 | | | | 13,447 | |
Institutional Class | | | — | | | | 6,465 | | | | 120,649 | | | | 127,114 | |
Class R6 | | | 151 | | | | 143 | | | | 566 | | | | 860 | |
Limited Duration Fund | | | | | | | | | | | | | | | | |
Class A | | | 400,848 | | | | 95,368 | | | | 4,277 | | | | 500,493 | |
Class C | | | 68,209 | | | | 36,276 | | | | 3,998 | | | | 108,483 | |
Class P | | | 202,943 | | | | 28,742 | | | | 34,279 | | | | 265,964 | |
Institutional Class | | | 3,164,191 | | | | 2,123,104 | | | | 1,020,934 | | | | 6,308,229 | |
Class R6 | | | — | | | | — | | | | — | | | | — | |
Macro Opportunities Fund | | | | | | | | | | | | | | | | |
Class A | | | 80,282 | | | | 15,216 | | | | 4,236 | | | | 99,734 | |
Class C | | | 37,685 | | | | 6,309 | | | | 1,602 | | | | 45,596 | |
Class P | | | 101,516 | | | | 99,081 | | | | 457 | | | | 201,054 | |
Institutional Class | | | 7,075,307 | | | | 4,861,940 | | | | 4,078,154 | | | | 16,015,401 | |
Class R6 | | | 38,182 | | | | 9,192 | | | | 3,753 | | | | 51,127 | |
Municipal Income Fund | | | | | | | | | | | | | | | | |
Class A | | | 204,036 | | | | 158,775 | | | | 157,994 | | | | 520,805 | |
Class C | | | 6,810 | | | | 4,657 | | | | 7,004 | | | | 18,471 | |
Class P | | | 1,160 | | | | 1,024 | | | | 1,263 | | | | 3,447 | |
Institutional Class | | | 39,988 | | | | 37,249 | | | | 48,401 | | | | 125,638 | |
Total Return Bond Fund | | | | | | | | | | | | | | | | |
Class A | | | 196,304 | | | | 56,238 | | | | 22,931 | | | | 275,473 | |
Class C | | | 167,978 | | | | 42,447 | | | | 49,933 | | | | 260,358 | |
Class P | | | 1,002,868 | | | | 499,250 | | | | 81,455 | | | | 1,583,573 | |
Institutional Class | | | 19,248,693 | | | | 10,006,046 | | | | 5,873,863 | | | | 35,128,602 | |
Class R6 | | | — | | | | — | | | | 2,762 | | | | 2,762 | |
Ultra Short Duration Fund | | | | | | | | | | | | | | | | |
Class A | | | 105,228 | | | | 100,752 | | | | 36,426 | | | | 242,406 | |
Institutional Class | | | 177,223 | | | | 224,523 | | | | 82,349 | | | | 484,095 | |
For the year ended September 30, 2024, GI recouped amounts from the Funds as follows:
Core Bond | | $ | 149,499 | |
Floating Rate Strategies Fund | | | 406 | |
High Yield Fund | | | 54,288 | |
Limited Duration Fund | | | 545,024 | |
Macro Opportunities Fund | | | 220,347 | |
Total Return Bond Fund | | | 2,936,495 | |
Ultra Short Duration Fund | | | 1,261 | |
302 | THE GUGGENHEIM FUNDS ANNUAL REPORT | |
NOTES TO FINANCIAL STATEMENTS (continued) |
If a Fund invests in a fund that is advised by the same adviser or an affiliated adviser, the investing Fund’s adviser has agreed to waive fees at the investing fund level to the extent necessary to offset the proportionate share of any management fee paid by each Fund with respect to its investment in such affiliated fund. Fee waivers will be calculated at the investing fund level without regard to any expense cap in effect for the investing fund. Fees waived under this arrangement are not subject to reimbursement to GI. For the year ended September 30, 2024, the following Funds waived fees related to investments in affiliated funds:
Fund | | Amount Waived | |
StylePlus—Large Core Fund | | $ | 81,725 | |
StylePlus—Mid Growth Fund | | | 5,531 | |
Limited Duration Fund | | | 79,237 | |
Macro Opportunities Fund | | | 1,290,217 | |
Total Return Bond Fund | | | 562,100 | |
For the year ended September 30, 2024, GFD retained sales charges of $185,962 relating to sales of Class A shares of the Trust.
Certain trustees and officers of the Trust are also officers of GI and/or GFD. The Trust does not compensate its officers or trustees who are officers, directors and/or employees of GI or GFD.
MUFG Investor Services (US), LLC (“MUIS”) acts as the Funds’ administrator, transfer agent and accounting agent. As administrator, transfer agent and accounting agent, MUIS maintains the books and records of the Funds’ securities and cash. The Bank of New York Mellon Corp. (“BNY”) acts as the Funds’ custodian. As custodian, BNY is responsible for the custody of the Funds’ assets. For providing the aforementioned administrative and accounting services, MUIS is entitled to receive a monthly fee equal to a percentage of the Funds’ average daily net assets and out of pocket expenses. For providing the aforementioned transfer agent and custodian services, MUIS and BNY are entitled to receive a monthly fee based on the number of transactions during the month and the number of accounts under management, subject to certain minimum monthly fees, and out of pocket expenses.
At September 30, 2024, GI and its affiliates owned over twenty percent of the outstanding shares of the Funds, as follows:
Fund | | Percent of Outstanding
Shares Owned | |
Alpha Opportunity Fund | | | 84 | % |
Active INvestment Series (GAINS) - Core Plus Fund | | | 100 | % |
Active INvestment Series (GAINS) - Limited Duration Fund | | | 100 | % |
Ultra Short Duration Fund | | | 43 | % |
Note 6 – Reverse Repurchase Agreements
Each of the Funds may enter into reverse repurchase agreements. Under a reverse repurchase agreement, a Fund sells securities and agrees to repurchase them at a particular price at a future date. In the event the buyer of securities under a reverse repurchase agreement files for bankruptcy or becomes insolvent, such buyer or its trustee or receiver may receive an extension of time to determine whether to enforce the Fund’s obligation to repurchase the securities, and the Fund’s use of the proceeds of the reverse repurchase agreement may effectively be restricted pending such decision.
For the year ended September 30, 2024, the following funds entered into reverse repurchased agreements:
Fund | | Number of Days
Outstanding | | | Balance at
September 30, 2024 | | | Average Balance
Outstanding | | | Average Interest Rate | |
Active INvestment Series (GAINS) - Core Plus Fund | | | 1 | | | $ | — | * | | $ | 97,500 | | | | 5.20 | % |
Core Bond Fund | | | 74 | | | | — | * | | | 41,101,054 | | | | 5.38 | % |
High Yield Fund | | | 269 | | | | — | * | | | 1,482,073 | | | | 3.38 | % |
Limited Duration Fund | | | 81 | | | | — | * | | | 140,952,348 | | | | 5.42 | % |
Municipal Income Fund | | | 1 | | | | — | * | | | 3,600,000 | | | | 5.85 | % |
Total Return Bond Fund | | | 257 | | | | — | * | | | 482,555,109 | | | | 5.54 | % |
* | As of September 30, 2024, the fund did not have any open reverse repurchase agreements. |
| | THE GUGGENHEIM FUNDS ANNUAL REPORT | 303 |
NOTES TO FINANCIAL STATEMENTS (continued) |
Note 7 – Federal Income Tax Information
The Funds intend to comply with the provisions of Subchapter M of the Internal Revenue Code of 1986, as amended (the “Internal Revenue Code”), applicable to regulated investment companies and will distribute substantially all taxable net investment income and capital gains sufficient to relieve the Funds from all, or substantially all, federal income, excise and state income taxes. Therefore, no provision for federal or state income tax or federal excise tax is required.
Tax positions taken or expected to be taken in the course of preparing the Funds’ tax returns are evaluated to determine whether the tax positions are “more-likely-than-not” of being sustained by the applicable tax authority. Tax positions not deemed to meet the “more-likely-than-not” threshold would be recorded as a tax benefit or expense in the current year. Management has analyzed the Funds’ tax positions taken, or to be taken, on U.S. federal income tax returns for all open tax years, and has concluded that no provision for income tax is required in the Funds’ financial statements. The Funds’ U.S. federal income tax returns are subject to examination by the Internal Revenue Service (“IRS”) for a period of three years after they are filed.
If a Fund makes a distribution to its shareholders in excess of its current and accumulated “earnings and profits” in any taxable year, the excess distribution will be treated as a return of capital to the extent of each shareholder’s basis (for tax purposes) in its shares, and any distribution in excess of basis will be treated as capital gain. A return of capital is not taxable, but it reduces the shareholder’s basis in its shares, which reduces the loss (or increases the gain) on a subsequent taxable disposition by such shareholder of the shares.
The Macro Opportunities Fund intends to invest up to 25% of its assets in the Subsidiary which is expected to provide the Fund with exposure to the commodities markets within the limitations of the U.S. federal income tax requirements under Subchapter M of the Internal Revenue Code. The Fund has received a private letter ruling from the IRS that concludes that the income the Fund receives from the Subsidiary will constitute qualifying income for purposes of Subchapter M of the Internal Revenue Code. The Subsidiary will be classified as a corporation for U.S. federal income tax purposes. A foreign corporation, such as the Subsidiary, will generally not be subject to U.S. federal income taxation unless it is deemed to be engaged in a U.S. trade or business. If, during a taxable year, the Subsidiary’s taxable losses (and other deductible items) exceed its income and gains, the net loss will not pass through to the Fund as a deductible amount for U.S. federal income tax purposes and cannot be carried forward to reduce future income from the Subsidiary in subsequent years.
The tax character of distributions paid during the year ended September 30, 2024 was as follows:
Fund | | Ordinary
Income | | | Long-Term
Capital Gain | | | Return
of Capital | | | Total
Distributions | |
Alpha Opportunity Fund | | $ | 199,681 | | | $ | — | | | $ | — | | | $ | 199,681 | |
Large Cap Value Fund | | | 674,731 | | | | 3,299,408 | | | | — | | | | 3,974,139 | |
Market Neutral Real Estate Fund | | | 1,139,168 | | | | — | | | | — | | | | 1,139,168 | |
Risk Managed Real Estate Fund | | | 10,186,667 | | | | — | | | | — | | | | 10,186,667 | |
SMid Cap Value Fund | | | 2,717,162 | | | | 8,857,859 | | | | — | | | | 11,575,021 | |
StylePlus—Large Core Fund | | | 5,630,586 | | | | — | | | | — | | | | 5,630,586 | |
StylePlus—Mid Growth Fund | | | 1,661,785 | | | | — | | | | — | | | | 1,661,785 | |
World Equity Income Fund | | | 854,827 | | | | — | | | | — | | | | 854,827 | |
Fund | | Ordinary
Income | | | Long-Term
Capital Gain | | | Tax-Exempt
Income | | | Return
of Capital | | | Total
Distributions | |
Active INvestment Series (GAINS) – Core Plus Fund | | $ | 23,432 | | | $ | — | | | $ | — | | | $ | — | | | $ | 23,432 | |
Active INvestment Series (GAINS) – Limited Duration Fund | | | 22,811 | | | | — | | | | — | | | | — | | | | 22,811 | |
Core Bond Fund | | | 89,053,861 | | | | — | | | | — | | | | — | | | | 89,053,861 | |
Floating Rate Strategies Fund | | | 86,712,493 | | | | — | | | | — | | | | — | | | | 86,712,493 | |
High Yield Fund | | | 12,495,651 | | | | — | | | | — | | | | 309,023 | | | | 12,804,674 | |
Limited Duration Fund | | | 197,510,680 | | | | — | | | | — | | | | — | | | | 197,510,680 | |
Macro Opportunities Fund | | | 430,970,769 | | | | — | | | | — | | | | — | | | | 430,970,769 | |
Municipal Income Fund | | | 164,595 | | | | — | | | | 745,790 | | | | 24,077 | | | | 934,462 | |
Total Return Bond Fund | | | 1,104,692,223 | | | | — | | | | — | | | | — | | | | 1,104,692,223 | |
Ultra Short Duration Fund | | | 27,081,533 | | | | — | | | | — | | | | — | | | | 27,081,533 | |
304 | THE GUGGENHEIM FUNDS ANNUAL REPORT | |
NOTES TO FINANCIAL STATEMENTS (continued) |
The tax character of distributions paid during the year ended September 30, 2023 was as follows:
Fund | | Ordinary
Income | | | Long-Term
Capital Gain | | | Return
of Capital | | | Total
Distributions | |
Alpha Opportunity Fund | | $ | 205,930 | | | $ | — | | | $ | — | | | $ | 205,930 | |
Large Cap Value Fund | | | 537,701 | | | | 3,093,835 | | | | — | | | | 3,631,536 | |
Market Neutral Real Estate Fund | | | 111,384 | | | | — | | | | — | | | | 111,384 | |
Risk Managed Real Estate Fund | | | 9,734,314 | | | | 18,153,953 | | | | 2,638,803 | | | | 30,527,070 | |
SMid Cap Value Fund | | | 5,582,517 | | | | 28,323,495 | | | | — | | | | 33,906,012 | |
StylePlus—Large Core Fund | | | 1,947,148 | | | | 57,379,626 | | | | — | | | | 59,326,774 | |
StylePlus—Mid Growth Fund | | | 326,968 | | | | 18,747,109 | | | | — | | | | 19,074,077 | |
World Equity Income Fund | | | 792,315 | | | | 23,830 | | | | — | | | | 816,145 | |
Fund | | Ordinary
Income | | | Long-Term
Capital Gain | | | Tax-Exempt
Income | | | Return
of Capital | | | Total
Distributions | |
Core Bond Fund | | $ | 56,067,246 | | | $ | — | | | $ | — | | | $ | — | | | $ | 56,067,246 | |
Floating Rate Strategies Fund | | | 85,281,735 | | | | — | | | | — | | | | — | | | | 85,281,735 | |
High Yield Fund | | | 11,332,804 | | | | — | | | | — | | | | 114,250 | | | | 11,447,054 | |
Limited Duration Fund | | | 163,997,722 | | | | — | | | | — | | | | — | | | | 163,997,722 | |
Macro Opportunities Fund | | | 346,075,668 | | | | 1,276,126 | | | | — | | | | — | | | | 347,351,794 | |
Municipal Income Fund | | | 832,530 | | | | — | | | | 1,021,378 | | | | — | | | | 1,853,908 | |
Total Return Bond Fund | | | 872,345,018 | | | | — | | | | — | | | | — | | | | 872,345,018 | |
Ultra Short Duration Fund | | | 26,832,386 | | | | — | | | | — | | | | — | | | | 26,832,386 | |
Note: For U.S. federal income tax purposes, short-term capital gain distributions are treated as ordinary income distributions.
The tax components of distributable earnings/(loss) as of September 30, 2024 were as follows:
Fund | | Undistributed
Ordinary
Income | | | Undistributed
Long-Term
Capital Gain | | | Net Unrealized
Appreciation
(Depreciation) | | | Accumulated
Capital and
Other Losses | | | Other
Temporary
Differences | | | Total | |
Alpha Opportunity Fund | | $ | 284,107 | | | $ | — | | | $ | 3,926,931 | | | $ | (24,088,197 | ) | | $ | — | | | $ | (19,877,159 | ) |
Large Cap Value Fund | | | 777,524 | | | | 536,395 | | | | 9,930,648 | | | | — | | | | — | | | | 11,244,567 | |
Market Neutral Real Estate Fund | | | 1,142,616 | | | | — | | | | 888,682 | | | | (3,203,770 | ) | | | — | | | | (1,172,472 | ) |
Risk Managed Real Estate Fund | | | 3,007,949 | | | | 1,277,517 | | | | 28,173,578 | | | | (1,435,653 | ) | | | (2,092,791 | ) | | | 28,930,600 | |
SMid Cap Value Fund | | | 2,767,083 | | | | 21,951,214 | | | | 83,610,068 | | | | — | | | | — | | | | 108,328,365 | |
StylePlus—Large Core Fund | | | 8,416,845 | | | | — | | | | 45,940,930 | | | | — | | | | — | | | | 54,357,775 | |
StylePlus—Mid Growth Fund | | | 1,972,163 | | | | — | | | | 9,501,149 | | | | (13,902,640 | ) | | | — | | | | (2,429,328 | ) |
World Equity Income Fund | | | 749,222 | | | | 1,743,662 | | | | 8,169,647 | | | | — | | | | (136,212 | ) | | | 10,526,319 | |
Fund | | Undistributed
Ordinary
Income | | | Undistributed
Long-Term
Capital Gain | | | Net Unrealized
Appreciation
(Depreciation) | | | Accumulated
Capital and
Other Losses | | | Other
Temporary
Differences | | | Total | |
Active INvestment Series (GAINS) – Core Plus Fund | | $ | 14,339 | | | $ | — | | | $ | 7,603 | | | $ | — | | | $ | (14,480 | ) | | $ | 7,462 | |
Active INvestment Series (GAINS) – Limited Duration Fund | | | 13,726 | | | | — | | | | 4,304 | | | | — | | | | (13,869 | ) | | | 4,161 | |
Core Bond Fund | | | 2,499,000 | | | | — | | | | (38,880,597 | ) | | | (152,589,356 | ) | | | (7,030,153 | ) | | | (196,001,106 | ) |
Floating Rate Strategies Fund | | | 3,831,206 | | | | — | | | | (41,364,262 | ) | | | (173,245,761 | ) | | | (6,464,852 | ) | | | (217,243,669 | ) |
High Yield Fund | | | — | | | | — | | | | (7,837,443 | ) | | | (32,892,062 | ) | | | (1,018,594 | ) | | | (41,748,099 | ) |
Limited Duration Fund | | | 6,771,340 | | | | — | | | | (67,831,638 | ) | | | (94,877,264 | ) | | | (15,339,285 | ) | | | (171,276,847 | ) |
Macro Opportunities Fund | | | 19,601,048 | | | | — | | | | (452,698,861 | ) | | | (285,980,038 | ) | | | (32,598,767 | ) | | | (751,676,618 | ) |
Municipal Income Fund | | | — | | | | — | | | | (493,651 | ) | | | (5,973,300 | ) | | | (47,905 | ) | | | (6,514,856 | ) |
Total Return Bond Fund | | | 25,017,164 | | | | — | | | | (750,209,626 | ) | | | (2,419,523,261 | ) | | | (97,169,081 | ) | | | (3,241,884,804 | ) |
Ultra Short Duration Fund | | | 542,264 | | | | — | | | | (5,513,081 | ) | | | (4,062,162 | ) | | | (2,056,969 | ) | | | (11,089,948 | ) |
| | THE GUGGENHEIM FUNDS ANNUAL REPORT | 305 |
NOTES TO FINANCIAL STATEMENTS (continued) |
For U.S. federal income tax purposes, capital loss carryforwards represent realized losses of the Funds that may be carried forward and applied against future capital gains. The Funds are permitted to carry forward capital losses for an unlimited period and such capital loss carryforwards retain their character as either short-term or long-term capital losses. As of September 30, 2024, capital loss carryforwards for the Funds were as follows:
| | | Unlimited | | | | | |
Fund | | Short-Term | | | Long-Term | | | Total
Capital Loss
Carryforward | |
Alpha Opportunity Fund | | $ | (19,333,798 | ) | | $ | (4,754,399 | ) | | $ | (24,088,197 | ) |
Large Cap Value Fund | | | — | | | | — | | | | — | |
Market Neutral Real Estate Fund | | | (2,266,359 | ) | | | (937,411 | ) | | | (3,203,770 | ) |
Risk Managed Real Estate Fund | | | — | | | | — | | | | — | |
SMid Cap Value Fund | | | — | | | | — | | | | — | |
StylePlus—Large Core Fund | | | — | | | | — | | | | — | |
StylePlus—Mid Growth Fund | | | (5,717,769 | ) | | | (8,184,871 | ) | | | (13,902,640 | ) |
World Equity Income Fund | | | — | | | | — | | | | — | |
| | | Unlimited | | | | | |
Fund | | Short-Term | | | Long-Term | | | Total
Capital Loss
Carryforward | |
Core Bond Fund | | $ | (42,901,495 | ) | | $ | (109,687,861 | ) | | $ | (152,589,356 | ) |
Floating Rate Strategies Fund | | | (7,871,952 | ) | | | (165,373,809 | ) | | | (173,245,761 | ) |
High Yield Fund | | | (1,360,548 | ) | | | (31,531,514 | ) | | | (32,892,062 | ) |
Limited Duration Fund | | | — | | | | (94,877,264 | ) | | | (94,877,264 | ) |
Macro Opportunities Fund | | | — | | | | (285,980,038 | ) | | | (285,980,038 | ) |
Municipal Income Fund | | | — | | | | (5,973,300 | ) | | | (5,973,300 | ) |
Total Return Bond Fund | | | (774,487,969 | ) | | | (1,644,998,915 | ) | | | (2,419,486,884 | ) |
Ultra Short Duration Fund | | | (1,195,509 | ) | | | (2,866,653 | ) | | | (4,062,162 | ) |
For the year ended September 30, 2024, the following capital loss carryforward amounts were utilized:
Fund | | Utilized | |
Alpha Opportunity Fund | | $ | 2,757,331 | |
Large Cap Value Fund | | | — | |
Market Neutral Real Estate Fund | | | 250,638 | |
Risk Managed Real Estate Fund | | | 812,563 | |
SMid Cap Value Fund | | | — | |
StylePlus—Large Core Fund | | | 40,316,747 | |
StylePlus—Mid Growth Fund | | | 12,946,804 | |
World Equity Income Fund | | | 143,428 | |
Net investment income and net realized gains (losses) may differ for financial statement and tax purposes because of temporary or permanent book/tax differences.
For the Equity Funds, these differences are primarily due to investments in real estate investment trusts, foreign currency gains and losses, losses deferred due to wash sales, distributions in connection with redemption of fund shares, and the “mark-to-market,” recharacterization, or disposition of certain Passive Foreign Investment Companies (PFICs). Additional differences may result from the tax treatment of securities sold short, dividends payable, distribution reclasses, and the “mark-to-market” of certain derivatives.
For the Fixed Income Funds, these differences are primarily due to investments in swap agreements, partnerships, and CLO securities, foreign currency gains and losses, the “mark-to-market” of certain derivatives, losses deferred due to wash sales, reclassification of dividends received, distributions payable, and the “mark-to-market,” recharacterization, or disposition of certain Passive Foreign Investment Companies (PFICs).
306 | THE GUGGENHEIM FUNDS ANNUAL REPORT | |
NOTES TO FINANCIAL STATEMENTS (continued) |
Additional differences may result from the tax treatment of bond premium/discount amortization, paydown reclasses, income accruals on certain investments, the deferral of losses related to tax straddle investments, and the “mark-to-market” of certain investments denominated in foreign currencies. In Macro Opportunities Fund, differences may also result from transactions with the Fund’s wholly owned subsidiary.
To the extent these differences are permanent and would require a reclassification between Paid in Capital and Total Distributable Earnings (Loss), such reclassifications are made in the period that the differences arise. These reclassifications have no effect on net assets or NAV per share.
The following adjustments were made on the Statements of Assets and Liabilities, and with respect to Macro Opportunities Fund on the Consolidated Statement of Assets and Liabilities, as of September 30, 2024 for permanent book/tax differences:
Fund | | Paid In
Capital | | | Total
Distributable
Earnings/(Loss) | |
Large Cap Value Fund | | $ | 238,568 | | | $ | (238,568 | ) |
Risk Managed Real Estate Fund | | | (39,770 | ) | | | 39,770 | |
SMid Cap Value Fund | | | 4,117,184 | | | | (4,117,184 | ) |
StylePlus—Large Core Fund | | | 433,560 | | | | (433,560 | ) |
World Equity Income Fund | | | 102,577 | | | | (102,577 | ) |
Fund | | Paid In
Capital | | | Total
Distributable
Earnings/(Loss) | |
Core Bond Fund | | $ | 49,454 | | | $ | (49,454 | ) |
Floating Rate Strategies Fund | | | (5,564 | ) | | | 5,564 | |
Macro Opportunities Fund | | | (1,048,842 | ) | | | 1,048,842 | |
At September 30, 2024, the cost of investments for U.S. federal income tax purposes, the aggregate gross unrealized appreciation for all investments for which there was an excess of value over tax cost and the aggregate gross unrealized depreciation for all investments for which there was an excess of tax cost over value, were as follows:
Fund | | Tax
Cost | | | Tax
Unrealized
Appreciation | | | Tax
Unrealized
Depreciation | | | Net Tax
Unrealized
Appreciation/
(Depreciation) | |
Alpha Opportunity Fund | | $ | 34,293,818 | | | $ | 5,951,878 | | | $ | (2,024,947 | ) | | $ | 3,926,931 | |
Large Cap Value Fund | | | 30,207,742 | | | | 10,641,794 | | | | (711,146 | ) | | | 9,930,648 | |
Market Neutral Real Estate Fund | | | 37,962,919 | | | | 2,179,976 | | | | (1,291,294 | ) | | | 888,682 | |
Risk Managed Real Estate Fund | | | 290,561,590 | | | | 37,875,904 | | | | (9,702,326 | ) | | | 28,173,578 | |
SMid Cap Value Fund | | | 287,862,137 | | | | 97,267,816 | | | | (13,657,748 | ) | | | 83,610,068 | |
StylePlus—Large Core Fund | | | 251,287,488 | | | | 46,052,394 | | | | (111,464 | ) | | | 45,940,930 | |
StylePlus—Mid Growth Fund | | | 73,888,453 | | | | 9,988,144 | | | | (486,995 | ) | | | 9,501,149 | |
World Equity Income Fund | | | 43,787,733 | | | | 8,551,344 | | | | (382,979 | ) | | | 8,168,365 | |
| | THE GUGGENHEIM FUNDS ANNUAL REPORT | 307 |
NOTES TO FINANCIAL STATEMENTS (continued) |
Fund | | Tax
Cost | | | Tax
Unrealized
Appreciation | | | Tax
Unrealized
Depreciation | | | Net Tax
Unrealized
Appreciation/
(Depreciation) | |
Active INvestment Series (GAINS) – Core Plus Fund | | $ | 9,568,265 | | | $ | 11,783 | | | $ | (4,175 | ) | | $ | 7,608 | |
Active INvestment Series (GAINS) – Limited Duration Fund | | | 3,873,364 | | | | 7,194 | | | | (2,885 | ) | | | 4,309 | |
Core Bond Fund | | | 2,372,979,998 | | | | 41,512,585 | | | | (80,383,966 | ) | | | (38,871,381 | ) |
Floating Rate Strategies Fund | | | 1,002,581,237 | | | | 4,052,816 | | | | (45,409,686 | ) | | | (41,356,870 | ) |
High Yield Fund | | | 210,840,311 | | | | 4,553,391 | | | | (12,389,870 | ) | | | (7,836,479 | ) |
Limited Duration Fund | | | 5,085,372,565 | | | | 35,676,945 | | | | (103,527,611 | ) | | | (67,850,666 | ) |
Macro Opportunities Fund | | | 7,968,744,201 | | | | 89,658,694 | | | | (543,690,242 | ) | | | (454,031,548 | ) |
Municipal Income Fund | | | 21,664,154 | | | | 1,749,702 | | | | (2,243,353 | ) | | | (493,651 | ) |
Total Return Bond Fund | | | 30,672,934,750 | | | | 510,574,890 | | | | (1,260,111,286 | ) | | | (749,536,396 | ) |
Ultra Short Duration Fund | | | 521,499,219 | | | | 1,366,415 | | | | (6,879,496 | ) | | | (5,513,081 | ) |
Note 8 – Securities Transactions
For the year ended September 30, 2024, the cost of purchases and proceeds from sales of investment securities, excluding government securities, short-term investments and derivatives, were as follows:
Fund | | Purchases | | | Sales | |
Alpha Opportunity Fund | | $ | 106,109,325 | | | $ | 110,204,109 | |
Large Cap Value Fund | | | 4,919,219 | | | | 7,838,372 | |
Market Neutral Real Estate Fund | | | 37,359,962 | | | | 46,142,938 | |
Risk Managed Real Estate Fund | | | 253,156,725 | | | | 334,962,863 | |
SMid Cap Value Fund | | | 91,095,874 | | | | 162,647,975 | |
StylePlus—Large Core Fund | | | 151,066,917 | | | | 128,008,407 | |
StylePlus—Mid Growth Fund | | | 57,455,453 | | | | 55,539,534 | |
World Equity Income Fund | | | 58,243,646 | | | | 60,973,657 | |
Fund | | Purchases | | | Sales | |
Active INvestment Series (GAINS) - Core Plus Fund | | $ | 4,419,692 | | | $ | 5,099 | |
Active INvestment Series (GAINS) - Limited Duration Fund | | | 3,282,599 | | | | 5,099 | |
Core Bond Fund | | | 736,665,012 | | | | 482,015,566 | |
Floating Rate Strategies Fund | | | 362,891,481 | | | | 416,406,043 | |
High Yield Fund | | | 84,843,386 | | | | 90,562,382 | |
Limited Duration Fund | | | 914,741,809 | | | | 1,138,095,260 | |
Macro Opportunities Fund | | | 2,168,772,780 | | | | 1,403,176,034 | |
Municipal Income Fund | | | 15,186,526 | | | | 37,504,944 | |
Total Return Bond Fund | | | 10,036,847,280 | | | | 6,634,494,772 | |
Ultra Short Duration Fund | | | 36,530,291 | | | | 179,273,979 | |
For the year ended September 30, 2024, the cost of purchases and proceeds from sales of government securities were as follows:
Fund | | Purchases | | | Sales | |
Core Bond Fund | | $ | 1,234,836,031 | | | $ | 1,114,554,237 | |
Limited Duration Fund | | | 1,001,370,968 | | | | 520,805,919 | |
Macro Opportunities Fund | | | 359,296,875 | | | | 22,834,906 | |
Total Return Bond Fund | | | 9,465,767,524 | | | | 9,501,096,369 | |
The Funds are permitted to purchase or sell securities from or to certain affiliated funds under specified conditions outlined in procedures adopted by the Board. The procedures have been designed to ensure that any purchase or sale of securities by a Fund from or to another fund or portfolio that is or could be considered an affiliate by virtue of having a common investment adviser (or affiliated investment advisers), common
308 | THE GUGGENHEIM FUNDS ANNUAL REPORT | |
NOTES TO FINANCIAL STATEMENTS (continued) |
trustees and/or common officers complies with Rule 17a-7 of the 1940 Act. Further, as defined under these procedures, each transaction is effected at the current market price. For the year ended September 30, 2024, the Funds did not engage in purchases and sales of securities pursuant to Rule 17a-7 of the 1940 Act.
Note 9 – Unfunded Loan Commitments
Pursuant to the terms of certain loan agreements, certain Funds held unfunded loan commitments as of September 30, 2024. The Funds are obligated to fund these loan commitments at the borrower’s discretion.
The unfunded loan commitments as of September 30, 2024, were as follows:
Fund | Borrower | | Maturity Date | | | Face Amount* | | | Value | |
Active INvestment Series (GAINS) - Core Plus Fund | | | | | | | | | | | | | |
| | Capstone Acquisition Holdings, Inc. | | | 11/12/29 | | | | 805 | | | $ | 5 | |
Active INvestment Series (GAINS) - Limited Duration Fund | | | | | | | | | | | | | |
| | Capstone Acquisition Holdings, Inc. | | | 11/12/29 | | | | 805 | | | $ | 5 | |
Core Bond Fund | | | | | | | | | | | | | |
| | Eagle Point Holdings Borrower LLC | | | 03/31/28 | | | | 383,333 | | | $ | — | |
| | Lightning A | | | 03/01/37 | | | | 878,889 | | | | — | |
| | Thunderbird A | | | 03/01/37 | | | | 896,667 | | | | — | |
| | Obra Longevity | | | 06/30/39 | | | | 2,040,000 | | | | — | |
| | | | | | | | | | | | $ | — | |
Floating Rate Strategies Fund | | | | | | | | | | | | | |
| | Alter Domus | | | 05/14/31 | | | | 130,081 | | | $ | — | |
| | American Tire Distributors, Inc. | | | 10/22/26 | | | | 272,619 | | | | 19,083 | |
| | DG Investment Intermediate Holdings 2, Inc. | | | 03/31/28 | | | | 55,293 | | | | 242 | |
| | Epicor Software | | | 05/30/31 | | | | 199,525 | | | | — | |
| | Focus Financial Partners LLC | | | 09/10/31 | | | | 345,229 | | | | — | |
| | Hobbs & Associates LLC | | | 07/23/31 | | | | 295,555 | | | | 739 | |
| | | | | | | | | | | | $ | 20,064 | |
High Yield Fund | | | | | | | | | | | | | |
| | Accuride Corp. | | | 10/25/24 | | | | 76,921 | | | $ | 3,663 | |
| | American Tire Distributors, Inc. | | | 10/22/26 | | | | 36,044 | | | | 2,523 | |
| | | | | | | | | | | | $ | 6,186 | |
Limited Duration Fund | | | | | | | | | | | | | |
| | Datix Bidco Ltd. | | | 04/25/31 | | | | 293,000 | | | $ | 2,231 | |
| | Eagle Point Holdings Borrower LLC | | | 03/31/28 | | | | 866,667 | | | | — | |
| | Lightning A | | | 03/01/37 | | | | 1,654,379 | | | | — | |
| | Obra Longevity | | | 06/30/39 | | | | 2,340,000 | | | | — | |
| | RLDatix | | | 10/25/30 | | | | 246,050 | | | | 1,874 | |
| | Thunderbird A | | | 03/01/37 | | | | 1,687,843 | | | | — | |
| | | | | | | | | | | | $ | 4,105 | |
Macro Opportunities Fund | | | | | | | | | | | | | |
| | Accuride Corp. | | | 10/25/24 | | | | 924,055 | | | $ | 44,003 | |
| | Alter Domus | | | 05/14/31 | | | | 232,066 | | | | — | |
| | Avalara, Inc. | | | 10/19/28 | | | | 1,600,000 | | | | 15,460 | |
| | Capstone Acquisition Holdings, Inc. | | | 11/12/29 | | | | 483,022 | | | | 2,738 | |
| | Care BidCo | | | 05/04/28 | | | | EUR 9,200,000 | | | | 489,793 | |
| | Checkers Holdings, Inc. | | | 06/16/27 | | | | 262,053 | | | | — | |
| | Datix Bidco Ltd. | | | 04/25/31 | | | | 3,640,000 | | | | 27,719 | |
| | DG Investment Intermediate Holdings 2, Inc. | | | 03/31/28 | | | | 569,196 | | | | 2,487 | |
| | Finastra USA, Inc. | | | 09/13/29 | | | | 518,564 | | | | 52,844 | |
| | Hobbs & Associates LLC | | | 07/23/31 | | | | 906,364 | | | | 2,266 | |
| | THE GUGGENHEIM FUNDS ANNUAL REPORT | 309 |
NOTES TO FINANCIAL STATEMENTS (continued) |
Fund | Borrower | | Maturity Date | | | Face Amount* | | | Value | |
Macro Opportunities Fund (continued) | | | | | | | | | | | | | |
| | Integrated Power Services Holdings, Inc. | | | 11/22/28 | | | | 3,474,240 | | | $ | — | |
| | Lightning A | | | 03/01/37 | | | | 8,995,686 | | | | — | |
| | Lightning B | | | 03/01/37 | | | | 1,809,477 | | | | — | |
| | MB2 Dental Solutions LLC | | | 02/13/31 | | | | 7,652,128 | | | | 13,421 | |
| | Obra Longevity | | | 06/30/39 | | | | 13,720,000 | | | | — | |
| | Orion Group | | | 03/19/27 | | | | 2,186,606 | | | | 38,738 | |
| | Polaris Newco LLC | | | 06/04/26 | | | | 3,577,070 | | | | 149,861 | |
| | RLDatix | | | 10/25/30 | | | | 3,078,000 | | | | 23,439 | |
| | Shaw Development LLC | | | 10/30/29 | | | | 734,043 | | | | 12,431 | |
| | Thunderbird A | | | 03/01/37 | | | | 9,177,647 | | | | — | |
| | Thunderbird B | | | 03/01/37 | | | | 1,846,078 | | | | — | |
| | TK Elevator Midco GmbH | | | 01/29/27 | | | | EUR 10,182,234 | | | | 450,532 | |
| | | | | | | | | | | | $ | 1,325,732 | |
Total Return Bond Fund | | | | | | | | | | | | | |
| | Capstone Acquisition Holdings, Inc. | | | 11/12/29 | | | | 1,098,875 | | | $ | 6,229 | |
| | Datix Bidco Ltd. | | | 04/25/31 | | | | 3,194,733 | | | | 24,328 | |
| | Eagle Point Holdings Borrower LLC | | | 03/31/28 | | | | 4,959,231 | | | | — | |
| | Higginbotham Insurance Agency, Inc. | | | 11/24/28 | | | | 6,598,611 | | | | 51,973 | |
| | Lightning A | | | 03/01/37 | | | | 14,915,261 | | | | — | |
| | MB2 Dental Solutions LLC | | | 02/13/31 | | | | 10,481,663 | | | | 18,396 | |
| | Obra Longevity | | | 06/30/39 | | | | 26,800,000 | | | | — | |
| | RLDatix | | | 10/25/30 | | | | 2,682,258 | | | | 20,426 | |
| | Thunderbird A | | | 03/01/37 | | | | 15,216,961 | | | | — | |
| | | | | | | | | | | | $ | 121,352 | |
* | The face amount is denominated in U.S. dollars unless otherwise indicated. |
| | EUR — Euro |
Note 10– Restricted Securities
The securities below are considered illiquid and restricted under guidelines established by the Board:
Fund | Restricted Securities | | Acquisition Date | | | Cost | | | Value | |
Core Bond Fund | | | | | | | | | | | | | |
| | Central Storage Safety Project Trust | | | | | | | | | | | | |
| | 4.82% due 02/01/38 | | | 03/20/18 | | | $ | 810,179 | | | $ | 749,577 | |
| | Copper River CLO Ltd. | | | | | | | | | | | | |
| | 2007-1A INC, due 01/20/211 | | | 05/09/14 | | | | — | | | | 70 | |
| | Nassau LLC | | | | | | | | | | | | |
| | 2019-1 3.98% due 08/15/34 | | | 08/16/19 | | | | 538,721 | | | | 493,135 | |
| | | | | | | | $ | 1,348,900 | | | $ | 1,242,782 | |
Floating Rate Strategies Fund | | | | | | | | | | | | | |
| | Mirabela Nickel Ltd. | | | | | | | | | | | | |
| | due 06/24/194 | | | 12/31/13 | | | $ | 1,160,811 | | | $ | 6,399 | |
High Yield Fund | | | | | | | | | | | | | |
| | Endo Luxembourg Finance Co I SARL / Endo US, Inc.* | | | 04/23/24 | | | $ | 7,224 | | | $ | 121 | |
| | Endo Luxembourg Finance Co I SARL / Endo US, | | | | | | | | | | | | |
| | Inc.* | | | 04/23/24 | | | | 5,671 | | | | 95 | |
| | Mirabela Nickel Ltd. | | | | | | | | | | | | |
| | due 06/24/194 | | | 12/31/13 | | | | 252,369 | | | | 1,391 | |
310 | THE GUGGENHEIM FUNDS ANNUAL REPORT | |
NOTES TO FINANCIAL STATEMENTS (continued) |
Fund | Restricted Securities | | Acquisition Date | | | Cost | | | Value | |
High Yield Fund (continued) | | | | | | | | | | | | | |
| | Sabre GLBL, Inc. | | | | | | | | | | | | |
| | 7.38% due 09/01/25 | | | 08/20/20 | | | $ | 320,058 | | | $ | 316,800 | |
| | Sabre GLBL, Inc. | | | | | | | | | | | | |
| | 9.25% due 04/15/25 | | | 01/05/22 | | | | 31,598 | | | | 30,884 | |
| | | | | | | | $ | 616,920 | | | $ | 349,291 | |
Limited Duration Fund | | | | | | | | | | | | | |
| | Cascade Funding Mortgage Trust | | | | | | | | | | | | |
| | 2019-RM3 2.80% due 06/25/693 | | | 06/25/19 | | | $ | 65,854 | | | $ | 65,619 | |
| | Copper River CLO Ltd. | | | | | | | | | | | | |
| | 2007-1A INC, (WAC) due 01/20/211 | | | 05/09/14 | | | | 585,000 | | | | 50 | |
| | | | | | | | $ | 650,854 | | | $ | 65,669 | |
Macro Opportunities Fund | | | | | | | | | | | | | |
| | Copper River CLO Ltd. | | | | | | | | | | | | |
| | 2007-1A INC, due 01/20/211 | | | 05/09/14 | | | $ | — | | | $ | 815 | |
| | Endo Luxembourg Finance Co I SARL / Endo US, Inc.* | | | 05/15/24 | | | | 26,268 | | | | 440 | |
| | Endo Luxembourg Finance Co I SARL / Endo US, Inc.* | | | 05/15/24 | | | | 10,895 | | | | 183 | |
| | Mirabela Nickel Ltd. | | | | | | | | | | | | |
| | due 06/24/194 | | | 12/31/13 | | | | 1,710,483 | | | | 9,427 | |
| | Nassau LLC | | | | | | | | | | | | |
| | 2019-1, 3.98% due 08/15/34 | | | 08/16/19 | | | | 8,942,687 | | | | 8,186,044 | |
| | | | | | | | $ | 10,690,333 | | | $ | 8,196,909 | |
Total Return Bond Fund | | | | | | | | | | | | | |
| | Angel Oak Mortgage Trust | | | | | | | | | | | | |
| | 2024-3 4.80% due 11/26/682 | | | 03/07/24 | | | $ | 2,351,891 | | | $ | 2,431,714 | |
| | ASG Resecuritization Trust | | | | | | | | | | | | |
| | 2010-3 4.91% (1 Month Term SOFR + 0.40%, Rate Cap/Floor: 10.50%/0.29%) due 12/28/453 | | | 10/28/16 | | | | 1,738,038 | | | | 1,812,712 | |
| | Atlantic Marine Corporations Communities LLC | | | | | | | | | | | | |
| | 5.37% due 12/01/50 | | | 02/02/17 | | | | 745,257 | | | | 662,747 | |
| | BRAVO Residential Funding Trust | | | | | | | | | | | | |
| | 2023-NQM5 7.01% due 06/25/632 | | | 08/03/23 | | | | 3,608,151 | | | | 3,664,891 | |
| | BRAVO Residential Funding Trust | | | | | | | | | | | | |
| | 2023-NQM2 4.50% due 05/25/622 | | | 02/22/23 | | | | 2,128,098 | | | | 2,255,025 | |
| | BRAVO Residential Funding Trust | | | | | | | | | | | | |
| | 2024-NQM3 6.39% due 03/25/642 | | | 03/15/24 | | | | 2,193,957 | | | | 2,224,942 | |
| | Cascade Funding Mortgage Trust | | | | | | | | | | | | |
| | 2019-RM3 2.80% due 06/25/693 | | | 06/25/19 | | | | 238,728 | | | | 237,868 | |
| | Central Storage Safety Project Trust | | | | | | | | | | | | |
| | 4.82% due 02/01/38 | | | 02/02/18 | | | | 16,735,894 | | | | 15,366,320 | |
| | Copper River CLO Ltd. | | | | | | | | | | | | |
| | 2007-1A INC, due 01/20/211 | | | 05/09/14 | | | | — | | | | 150 | |
| | FIGRE Trust | | | | | | | | | | | | |
| | 2024-HE3 6.23% due 07/25/543 | | | 07/11/24 | | | | 2,669,232 | | | | 2,707,287 | |
| | GCAT Trust | | | | | | | | | | | | |
| | 2024-NQM2 6.09% due 06/25/592 | | | 05/15/24 | | | | 3,632,568 | | | | 3,684,841 | |
| | GCAT Trust | | | | | | | | | | | | |
| | 2024-NQM2 6.54% due 06/25/592 | | | 05/15/24 | | | | 2,760,690 | | | | 2,802,146 | |
| | GCAT Trust | | | | | | | | | | | | |
| | 2023-NQM2 6.24% due 11/25/672 | | | 01/30/23 | | | | 2,573,753 | | | | 2,580,820 | |
| | Irwin Home Equity Loan Trust | | | | | | | | | | | | |
| | 2007-1 6.35% due 08/25/37 | | | 02/27/15 | | | | 34 | | | | 33 | |
| | Morgan Stanley ABS Capital I Incorporated Trust | | | | | | | | | | | | |
| | 2007-HE3 5.10% (1 Month Term SOFR + 0.24%, Rate Floor: 0.13%) due 12/25/363 | | | 03/10/21 | | | | 1,494,305 | | | | 1,192,937 | |
| | THE GUGGENHEIM FUNDS ANNUAL REPORT | 311 |
NOTES TO FINANCIAL STATEMENTS (continued) |
Fund | Restricted Securities | | Acquisition Date | | | Cost | | | Value | |
Total Return Bond Fund (continued) | | | | | | | | | | | | | |
| | Morgan Stanley Re-REMIC Trust | | | | | | | | | | | | |
| | 2010-R5 5.31% due 06/26/36 | | | 07/18/14 | | | $ | 76,618 | | | $ | 83,657 | |
| | Nassau LLC | | | | | | | | | | | | |
| | 2019-1 3.98% due 08/15/34 | | | 08/16/19 | | | | 9,364,264 | | | | 8,580,553 | |
| | Nomura Resecuritization Trust | | | | | | | | | | | | |
| | 2015-4R 2.71% (1 Month Term SOFR + 0.54%, Rate Floor: 0.43%) due 03/26/363 | | | 03/20/15 | | | | 365,264 | | | | 356,673 | |
| | OBX Trust | | | | | | | | | | | | |
| | 2024-NQM2 6.18% due 12/25/632 | | | 01/25/24 | | | | 3,560,407 | | | | 3,591,858 | |
| | OBX Trust | | | | | | | | | | | | |
| | 2024-NQM9 6.28% due 01/25/642 | | | 06/14/24 | | | | 3,429,607 | | | | 3,477,955 | |
| | OBX Trust | | | | | | | | | | | | |
| | 2022-NQM8 6.10% due 09/25/622 | | | 09/26/22 | | | | 3,338,586 | | | | 3,389,267 | |
| | OBX Trust | | | | | | | | | | | | |
| | 2023-NQM2 6.72% due 01/25/622 | | | 02/21/23 | | | | 3,061,368 | | | | 3,093,873 | |
| | OBX Trust | | | | | | | | | | | | |
| | 2024-NQM12 5.83% due 07/25/642 | | | 08/15/24 | | | | 3,056,929 | | | | 3,076,339 | |
| | OBX Trust | | | | | | | | | | | | |
| | 2022-NQM9 6.45% due 09/25/622 | | | 03/13/24 | | | | 2,063,284 | | | | 2,070,294 | |
| | OBX Trust | | | | | | | | | | | | |
| | 2024-NQM3 6.43% due 12/25/632 | | | 02/14/24 | | | | 1,630,159 | | | | 1,648,994 | |
| | Residential Mortgage Loan Trust | | | | | | | | | | | | |
| | 2020-1 2.68% (WAC) due 01/26/603 | | | 02/06/20 | | | | 390,859 | | | | 380,758 | |
| | SPSS | | | | | | | | | | | | |
| | 5.14% due 11/15/52 | | | 03/30/23 | | | | 123,583 | | | | 127,445 | |
| | Verus Securitization Trust | | | | | | | | | | | | |
| | 2024-1 6.12% due 01/25/692 | | | 01/12/24 | | | | 3,459,815 | | | | 3,484,565 | |
| | Verus Securitization Trust | | | | | | | | | | | | |
| | 2023-2 6.85% due 03/25/682 | | | 03/13/24 | | | | 3,178,722 | | | | 3,202,592 | |
| | Verus Securitization Trust | | | | | | | | | | | | |
| | 2024-5 6.45% due 06/25/692 | | | 06/10/24 | | | | 2,399,192 | | | | 2,438,289 | |
| | Verus Securitization Trust | | | | | | | | | | | | |
| | 2022-8 6.13% due 09/25/672 | | | 10/06/22 | | | | 1,328,334 | | | | 1,357,078 | |
| | | | | | | | $ | 83,697,587 | | | $ | 81,984,623 | |
* | Non-income producing security. |
1 | Security has no stated coupon. However, it is expected to receive residual cash flow payments on defined deal dates. |
2 | Security is a step up/down bond. The coupon increases or decreases at regular intervals until the bond reaches full maturity. Rate indicated is the rate at September 30, 2024. See table below for additional step information for each security. |
3 | Variable rate security. Rate indicated is the rate effective at September 30, 2024. In some instances, the effective rate is limited by a minimum rate floor or a maximum rate cap established by the issuer. The settlement status of a position may also impact the effective rate indicated. In some cases, a position may be unsettled at period end and may not have a stated effective rate. In instances where multiple underlying reference rates and spread amounts are shown, the effective rate is based on a weighted average. |
4 | Security is in default of interest and/or principal obligations. |
Note 11 – Line of Credit
The Trust, along with other affiliated trusts, secured a 364-day committed, $1,165,000,000 line of credit from Citibank, N.A., which was in place through September 29, 2024, at which time the line of credit was renewed as a 364-day committed, $1,115,000,000 line of credit. A Fund may draw (borrow) from the line of credit as a temporary measure for emergency purposes, to facilitate redemption requests, or for other short-term liquidity purposes consistent with the Fund’s investment objective and program. For example, it may be advantageous for the Fund to borrow money rather than sell existing portfolio positions to meet redemption requests. Fees related to borrowings, if any, vary under this arrangement between the greater of Citibank’s “base rate”, SOFR plus 1%, or the federal funds rate plus 1/2 of 1%.
312 | THE GUGGENHEIM FUNDS ANNUAL REPORT | |
NOTES TO FINANCIAL STATEMENTS (continued) |
The commitment fee that may be paid by the Funds is at an annualized rate of 0.15% of the average daily amount of their allocated unused commitment amount. The commitment fee amount is allocated to the individual Funds based on the respective net assets of each participating Fund and is referenced in the Funds’ Statements of Operations under “Line of credit fees”. The Funds did not have any borrowings under this agreement as of and for the year ended September 30, 2024.
Note 12 – Large Shareholder Risk
As of September 30, 2024, 83.7% of the Alpha Opportunity Fund (the “Fund”) was held by Guggenheim Macro Opportunities Fund. The Fund may experience adverse effects if a large number of shares of the Fund are held by a single shareholder (e.g., an institutional investor, financial intermediary or another GI Fund). The Fund is subject to the risk that a redemption by those shareholders of all or a large portion of the Fund could cause the Fund to liquidate its assets at inopportune times, or at a loss or depressed value, which could adversely impact the Fund’s performance and cause the value of a shareholder’s investment to decline. Redemptions of a large number of shares also may increase transaction costs or, by necessitating a sale of portfolio securities, have adverse tax consequences for shareholders. They also potentially limit the use of any capital loss carryforwards and certain other losses to offset future realized capital gains (if any) and may limit or prevent a Fund’s use of tax equalization.
Note 13 – Market Risks
The value of, or income generated by, the investments held by the Funds are subject to the possibility of rapid and unpredictable fluctuation, and loss that may result from various factors. These factors include, among others, developments affecting individual companies, issuers or particular industries or from broader influences, including real or perceived changes in prevailing interest rates (which may change at any time based on changes in monetary policies and various market and other economic conditions), changes in inflation rates or expectations about inflation rates, adverse investor confidence or sentiment, changing economic, political (including geopolitical), social or financial market conditions, increased instability or general uncertainty, environmental disasters, governmental actions, public health emergencies (such as the spread of infectious diseases, pandemics and epidemics), debt crises, actual or threatened wars or other armed conflicts (such as the escalated conflict in the Middle East and the ongoing Russia-Ukraine conflict and its collateral economic and other effects, including, but not limited to, sanctions and other international trade barriers) or ratings downgrades, and other similar events, each of which may be temporary or last for extended periods. Different sectors, industries and security types may react differently to such developments. Moreover, changing economic, political, geopolitical, social, financial market or other conditions in one country, geographic region or industry could adversely affect the value, yield and return of the investments held by the Funds in a different country, geographic region, economy, industry or market because of the increasingly interconnected global economies and financial markets. The duration and extent of the foregoing types of factors or conditions are highly uncertain and difficult to predict and have in the past, and may in the future, cause volatility and distress in economies and financial markets or other adverse circumstances, which may negatively affect the value of the Funds’ investments and performance of the Funds.
Note 14 – Subsequent Events
Reorganizations of Certain Funds. On October 25, 2024 and on November 8, 2024 with respect to Guggenheim World Equity Income Fund, the Funds identified below (the “Acquired Funds”) were reorganized into the series of New Age Alpha Funds Trust identified below (the “Acquiring Funds”) (each, a “Reorganization” and collectively, the “Reorganizations”), pursuant to Agreements and Plans of Reorganization approved by the Board and by shareholders of the Funds. Upon completion of the Reorganizations, shareholders of the Acquired Funds became shareholders of the Acquiring Funds and own shares of the Acquiring Funds equal in value to the shares of the Acquired Funds immediately prior to the Reorganizations.
Acquired Fund | Acquiring Fund |
Guggenheim Alpha Opportunity Fund | New Age Alpha Opportunity Fund |
Guggenheim Large Cap Value Fund | New Age Alpha Large Cap Value Fund* |
Guggenheim Market Neutral Real Estate Fund | New Age Alpha Market Neutral Real Estate Fund |
Guggenheim Risk Managed Real Estate Fund | New Age Alpha Risk Managed Real Estate Fund |
Guggenheim SMid Cap Value Fund | New Age Alpha SMid Cap Value Fund |
Guggenheim StylePlus—Large Core Fund | New Age Alpha Large Core Fund |
Guggenheim StylePlus—Mid Growth Fund | New Age Alpha Mid Growth Fund |
Guggenheim World Equity Income Fund | New Age Alpha World Equity Income Fund |
* | Guggenheim RBP® Large-Cap Defensive Fund, Guggenheim RBP® Dividend Fund and Guggenheim RBP® Large-Cap Value Fund, each a series of Transparent Value Trust, which was part of the Guggenheim Family of Funds, were concurrently reorganized into New Age Alpha Large Cap Value Fund. |
| | THE GUGGENHEIM FUNDS ANNUAL REPORT | 313 |
NOTES TO FINANCIAL STATEMENTS (concluded) |
Replacement of Investment Adviser for Certain Funds. In connection with an internal realignment of Guggenheim Investment’s lines of business, effective on November 29, 2024, GPIM replaced SI as a party to the investment advisory agreements between SI and the Trust with respect to Guggenheim Core Bond Fund, Guggenheim High Yield Fund, and Guggenheim Municipal Income Fund. In addition, effective on November 29, 2024, the sub-advisory agreement between GPIM and SI with respect to Guggenheim Municipal Income Fund was terminated, and it is not currently expected that a separate sub-advisory agreement would be entered into with another party.
The Funds evaluated subsequent events through the date the financial statements are issued and determined there were no additional material events that would require adjustment to or disclosure in the Funds’ financial statements.
314 | THE GUGGENHEIM FUNDS ANNUAL REPORT | |
REPORT OF INDEPENDENT REGISTERED PUBLIC ACCOUNTING FIRM |
To the Shareholders and the Board of Trustees of Guggenheim Funds Trust
Opinion on the Financial Statements
We have audited the accompanying consolidated statement of assets and liabilities of Guggenheim Macro Opportunities Fund (one of the funds constituting Guggenheim Funds Trust ( the “Trust”)), including the consolidated schedule of investments, as of September 30, 2024, and the related consolidated statements of operations, changes in net assets, and the consolidated financial highlights for each of the periods indicated in the table below and the related notes (collectively referred to as the “consolidated financial statements”). We have also audited the accompanying statements of assets and liabilities of Guggenheim Total Return Bond Fund, Guggenheim High Yield Fund, Guggenheim Core Bond Fund, Guggenheim Floating Rate Strategies Fund, Guggenheim Limited Duration Fund, Guggenheim Ultra Short Duration Fund, Guggenheim Active INvestment Series (GAINS) – Core Plus Fund, Guggenheim Active INvestment Series (GAINS) - Limited Duration Fund, Guggenheim Municipal Income Fund, Guggenheim Alpha Opportunity Fund, Guggenheim Large Cap Value Fund, Guggenheim Market Neutral Real Estate Fund, Guggenheim Risk Managed Real Estate Fund, Guggenheim SMid Cap Value Fund, Guggenheim StylePlus - Large Core Fund, Guggenheim StylePlus - Mid Growth Fund and Guggenheim World Equity Income Fund (seventeen of the funds constituting the Trust) (collectively, together with Guggenheim Macro Opportunities Fund, referred to as the “Funds”), including the schedules of investments, as of September 30, 2024, and the related statements of operations, changes in net assets, and the financial highlights for periods indicated in the table below and the related notes (collectively, together with the consolidated financial statements, referred to as the “financial statements”). In our opinion, the financial statements present fairly, in all material respects, the financial position, or the consolidated financial position, of each of the Funds at September 30, 2024, and the results, or the consolidated results, of their operations, changes in net assets and financial highlights for each of the periods indicated in the table below, in conformity with U.S. generally accepted accounting principles.
Funds comprising the Guggenheim Funds Trust | Statements of
operations | Statements of changes in net assets | Financial highlights |
Guggenheim Macro Opportunities Fund Guggenheim Total Return Bond Fund Guggenheim High Yield Fund Guggenheim Core Bond Fund Guggenheim Floating Rate Strategies Fund Guggenheim Limited Duration Fund Guggenheim Municipal Income Fund Guggenheim Ultra Short Duration Fund Guggenheim Alpha Opportunity Fund Guggenheim Large Cap Value Fund Guggenheim Market Neutral Real Estate Fund Guggenheim Risk Managed Real Estate Fund Guggenheim SMid Cap Value Fund Guggenheim StylePlus-Large Core Fund Guggenheim StylePlus-Mid Growth Fund Guggenheim World Equity Income Fund | For the year ended September 30, 2024 | For each of the two years in the period ended September 30, 2024 | For each of the five years in the period ended September 30, 2024 |
Guggenheim Active INvestment Series (GAINS) – Core Plus Fund Guggenheim Active INvestment Series (GAINS) – Limited Duration Fund | For the period from August 14, 2024 (commencement of operations) through September 30, 2024 | For the period from August 14, 2024 (commencement of operations) through September 30, 2024 | For the period from August 14, 2024 (commencement of operations) through September 30, 2024 |
Basis for Opinion
These financial statements are the responsibility of the Trust’s management. Our responsibility is to express an opinion on each of the Funds’ financial statements based on our audits. We are a public accounting firm registered with the Public Company Accounting Oversight Board (United States) (“PCAOB”) and are required to be independent with respect to the Trust in accordance with the U.S. federal securities laws and the applicable rules and regulations of the Securities and Exchange Commission and the PCAOB.
We conducted our audits in accordance with the standards of the PCAOB. Those standards require that we plan and perform the audit to obtain reasonable assurance about whether the financial statements are free of material misstatement, whether due to error or fraud. The Trust is not required to have, nor were we engaged to perform, an audit of the Trust’s internal control over financial reporting. As part of our audits, we are required to obtain an understanding of internal control over financial reporting but not for the purpose of expressing an opinion on the effectiveness of the Trust’s internal control over financial reporting. Accordingly, we express no such opinion.
| | THE GUGGENHEIM FUNDS ANNUAL REPORT | 315 |
REPORT OF INDEPENDENT REGISTERED PUBLIC ACCOUNTING FIRM (concluded) |
Our audits included performing procedures to assess the risks of material misstatement of the financial statements, whether due to error or fraud, and performing procedures that respond to those risks. Such procedures included examining, on a test basis, evidence regarding the amounts and disclosures in the financial statements. Our procedures included confirmation of securities owned as of September 30, 2024, by correspondence with the custodian, transfer agent, brokers, and paying agents; when replies were not received from brokers or paying agents, we performed other auditing procedures. Our audits also included evaluating the accounting principles used and significant estimates made by management, as well as evaluating the overall presentation of the financial statements. We believe that our audits provide a reasonable basis for our opinion.

We have served as the auditor of one or more Guggenheim investment companies since 1979.
Tysons, Virginia
November 27, 2024
316 | THE GUGGENHEIM FUNDS ANNUAL REPORT | |
OTHER INFORMATION (Unaudited) |
Federal Income Tax Information
This information is being provided as required by the Internal Revenue Code. Amounts shown may differ from those elsewhere in the report because of differences in tax and financial reporting practice.
In January 2025, shareholders will be advised on IRS Form 1099 DIV or substitute 1099 DIV as to the federal tax status of the distributions received by shareholders in the calendar year 2024. The Funds’ investment income (dividend income plus short-term capital gains, if any) qualifies as follows:
Municipal Income Fund designates $745,790 as tax-exempt interest income according to IRC Section 852(b)(5)(A).
Of the taxable ordinary income distributions paid during the fiscal year ended September 30, 2024, the following funds had the corresponding percentages qualify for the reduced tax rate pursuant to the Jobs and Growth Tax Relief and Reconciliation Act of 2003 or for the dividends received deduction for corporations. See the qualified dividend income and dividend received deduction columns, respectively, in the table below.
Additionally, of the taxable ordinary income distributions paid during the fiscal year ended September 30, 2024, the following funds had the corresponding percentages qualify as interest related dividends and qualified short-term capital gains as permitted by IRC Section 871(k)(1) and IRC Section 871(k)(2), respectively. See the qualified interest income and qualified short-term capital gain columns, respectively, in the table below.
Fund | | Qualified
Dividend
Income | | | Dividend
Received
Deduction | | | Qualified
Interest
Income | | | Qualified
Short-Term
Capital Gain | |
Alpha Opportunity Fund | | | 100.00 | % | | | 100.00 | % | | | 7.40 | % | | | 0.00 | % |
Large Cap Value Fund | | | 99.97 | % | | | 99.77 | % | | | 5.88 | % | | | 100.00 | % |
Market Neutral Real Estate Fund | | | 0.65 | % | | | 0.65 | % | | | 59.37 | % | | | 0.00 | % |
Risk Managed Real Estate Fund | | | 1.81 | % | | | 1.81 | % | | | 3.20 | % | | | 100.00 | % |
SMid Cap Value Fund | | | 100.00 | % | | | 100.00 | % | | | 3.53 | % | | | 0.00 | % |
StylePlus—Large Core Fund | | | 12.17 | % | | | 11.48 | % | | | 100.00 | % | | | 0.00 | % |
StylePlus—Mid Growth Fund | | | 10.09 | % | | | 7.16 | % | | | 7.45 | % | | | 0.00 | % |
World Equity Income Fund | | | 97.56 | % | | | 43.72 | % | | | 2.09 | % | | | 0.00 | % |
Fund | | Qualified
Dividend
Income | | | Dividend
Received
Deduction | | | Qualified
Interest
Income | | | Qualified
Short-Term
Capital Gain | |
Active INvestment Series (GAINS) – Core Plus Fund | | | 0.00 | % | | | 0.00 | % | | | 99.62 | % | | | 0.00 | % |
Active INvestment Series (GAINS) – Limited Duration Fund | | | 0.00 | % | | | 0.00 | % | | | 99.37 | % | | | 0.00 | % |
Core Bond Fund | | | 0.13 | % | | | 0.12 | % | | | 87.58 | % | | | 0.00 | % |
Floating Rate Strategies Fund | | | 0.00 | % | | | 0.00 | % | | | 99.93 | % | | | 0.00 | % |
High Yield Fund | | | 0.30 | % | | | 0.30 | % | | | 92.72 | % | | | 0.00 | % |
Limited Duration Fund | | | 0.01 | % | | | 0.01 | % | | | 76.01 | % | | | 0.00 | % |
Macro Opportunities Fund | | | 0.61 | % | | | 0.60 | % | | | 81.59 | % | | | 0.00 | % |
Municipal Income Fund | | | 0.00 | % | | | 0.00 | % | | | 79.51 | % | | | 0.00 | % |
Total Return Bond Fund | | | 0.33 | % | | | 0.33 | % | | | 90.42 | % | | | 0.00 | % |
Ultra Short Duration Fund | | | 0.00 | % | | | 0.00 | % | | | 49.89 | % | | | 0.00 | % |
| | THE GUGGENHEIM FUNDS ANNUAL REPORT | 317 |
OTHER INFORMATION (Unaudited)(concluded) |
With respect to the taxable year ended September 30, 2024, the Funds hereby designate as capital gain dividends the amounts listed below, or, if subsequently determined to be different, the net capital gain of such year:
Fund | | From long-term
capital gain: | | | From long-term capital
gain, using proceeds
from shareholder
redemptions: | |
Large Cap Value Fund | | $ | 3,299,408 | | | $ | 238,568 | |
SMid Cap Value Fund | | | 8,857,859 | | | | 4,117,184 | |
World Equity Income Fund | | | — | | | | 102,577 | |
Final regulations dated June 24, 2020 enable a regulated investment company to pay Section 199A dividends to its shareholders. Section 199A, enacted as part of the Tax Cuts and Jobs Act of 2017, may allow non-corporate tax payers a deduction of up to 20% of qualified business income from flow-through entities, including dividends from real estate investment trusts. The qualifying percentage of the Market Neutral Real Estate Fund’s and Risk Managed Real Estate Fund’s ordinary income and short-term capital gain distributions, if any, for the purpose of the Section 199A deduction was 48.03 % and 50.78%, respectively.
Sector Classification
Information in the “Schedule of Investments” is categorized by sectors using sector-level Classifications defined by the Bloomberg Industry Classification System, a widely recognized industry classification system provider. Each Fund’s registration statement has investment policies relating to concentration in specific sectors/industries. For purposes of these investment policies, the Funds usually classify sectors/industries based on industry-level Classifications used by widely recognized industry classification system providers such as Bloomberg Industry Classification System, Global Industry Classification Standards and Barclays Global Classification Scheme.
Quarterly Portfolio Schedules Information
The Trust files its complete schedule of portfolio holdings with the SEC for the first and third quarters of each fiscal year as an exhibit to its reports on Form N-PORT. The Funds’ Form N-PORT is available on the SEC’s website at https://www.sec.gov. The Funds’ complete schedules of securities holdings as of the end of each fiscal quarter will be made available to the public on the SEC’s website at www.sec.gov and on our website at www.guggenheiminvestments.com, and will be made available, upon request and without charge, by calling 800.820.0888.
318 | THE GUGGENHEIM FUNDS ANNUAL REPORT | |
ITEM 8: CHANGES IN AND DISAGREEMENTS WITH ACCOUNTANTS FOR OPEN-END MANAGEMENT INVESTMENT COMPANIES
Note: This is not applicable for any fund included in this document.
| | THE GUGGENHEIM FUNDS ANNUAL REPORT | 319 |
ITEM 9: PROXY DISCLOSURES FOR OPEN-END MANAGEMENT INVESTMENT COMPANIES
At a special meeting of shareholders held on October 24, 2024, the following matters were voted upon and approved by shareholders:
| | ● | An agreement and plan of reorganization providing for the reorganization of Guggenheim Alpha Opportunity Fund into NAA Opportunity Fund (1,037,001 votes for; 47,332 votes against; 693 votes abstain); |
| | ● | An agreement and plan of reorganization providing for the reorganization of Guggenheim Large Cap Value Fund into NAA Large Cap Value Fund (259,040 votes for; 8,234 votes against; 156,490 votes abstain); |
| | ● | An agreement and plan of reorganization providing for the reorganization of Guggenheim Market Neutral Real Estate Fund into NAA Market Neutral Real Estate Fund (764,103 votes for; 138 votes against; 543 votes abstain); |
| | ● | An agreement and plan of reorganization providing for the reorganization of Guggenheim Risk Managed Real Estate Fund into NAA Risk Managed Real Estate Fund (4,058,289 votes for; 27,489 votes against; 102,725 votes abstain); |
| | ● | An agreement and plan of reorganization providing for the reorganization of Guggenheim SMid Cap Value Fund into NAA SMid Cap Value Fund (3,380,093 votes for; 55,570 votes against; 2,975,380 votes abstain); |
| | ● | An agreement and plan of reorganization providing for the reorganization of Guggenheim StylePlus—Large Core Fund into NAA Large Core Fund (3,531,955 votes for; 135,276 votes against; 1,572,894 votes abstain); and |
| | ● | An agreement and plan of reorganization providing for the reorganization of Guggenheim StylePlus—Mid Growth Fund into NAA Mid Growth Fund (812,605 votes for; 32,659 votes against; 264,011 votes abstain); |
At a special meeting of shareholders originally held on October 24, 2024 and reconvened on November 4, 2024, the following matter was voted upon and approved by shareholders:
| | ● | An agreement and plan of reorganization providing for the reorganization of Guggenheim World Equity Income Fund into NAA World Equity Income Fund (922,569 votes for; 19,630 votes against; 110,056 votes abstain). |
320 | THE GUGGENHEIM FUNDS ANNUAL REPORT | |
ITEM 10: RENUMERATION PAID TO DIRECTORS, OFFICERS, AND OTHERS OF OPEN-END MANAGEMENT INVESTMENT COMPANIES
The remuneration paid to directors, officers, and others, if applicable, are included as part of the financial statements included under Item 7 of this Form.
| | THE GUGGENHEIM FUNDS ANNUAL REPORT | 321 |
ITEM 11: STATEMENT REGARDING BASIS FOR APPROVAL OF INVESTMENT ADVISORY CONTRACT
Report of the Guggenheim Funds Trust Board of Trustees
The Board of Trustees of Guggenheim Funds Trust (the “Trust”), including the Independent Trustees, approved the renewal of the investment management agreements (as applicable to a specific Fund, the “Advisory Agreement” and collectively, the “Advisory Agreements”) with Security Investors, LLC (“Security Investors”) and Guggenheim Partners Investment Management, LLC (“GPIM”) on behalf of the applicable series of the Trust listed below (each a “Fund” and collectively, the “Funds”) and the investment sub-advisory agreement between Security Investors and GPIM on behalf of Guggenheim Municipal Income Fund (the “Sub-Advisory Agreement” and together with the “Advisory Agreements,” the “Agreements”):
● | Guggenheim Alpha Opportunity Fund
(“Alpha Opportunity Fund”)* | ● | Guggenheim Core Bond Fund
(“Core Bond Fund”)* |
● | Guggenheim Floating Rate Strategies Fund
(“Floating Rate Strategies Fund”)** | ● | Guggenheim High Yield Fund
(“High Yield Fund”)* |
● | Guggenheim Large Cap Value Fund
(“Large Cap Value Fund”)* | ● | Guggenheim Limited Duration Fund
(“Limited Duration Fund”)** |
● | Guggenheim Macro Opportunities Fund
(“Macro Opportunities Fund”)**1 | ● | Guggenheim Market Neutral Real Estate Fund
(“Market Neutral Real Estate Fund”)** |
● | Guggenheim Municipal Income Fund
(“Municipal Income Fund”)* | ● | Guggenheim Risk Managed Real Estate Fund
(“Risk Managed Real Estate Fund”)** |
● | Guggenheim Small Cap Value Fund
(“Small Cap Value Fund”)* | ● | Guggenheim SMid Cap Value Fund
(“SMid Cap Value Fund”)* |
● | Guggenheim StylePlus—Large Core Fund
(“StylePlus—Large Core Fund”)* | ● | Guggenheim StylePlus—Mid Growth Fund
(“StylePlus—Mid Growth Fund”)* |
● | Guggenheim Total Return Bond Fund
(“Total Return Bond Fund”)** | ● | Guggenheim Ultra Short Duration Fund
(“Ultra Short Duration Fund”)** |
● | Guggenheim World Equity Income Fund
(“World Equity Income Fund”)* | | |
* | Security Investors serves as investment adviser to the Fund. |
** | GPIM serves as investment adviser to the Fund. Unless the context indicates otherwise, GPIM and Security Investors, with respect to their service as investment adviser to the applicable Funds, are each referred to herein as an “Adviser” and together, the “Advisers.” |
Security Investors and GPIM are each an indirect subsidiary of Guggenheim Partners, LLC, a privately-held, global investment and advisory firm (“Guggenheim Partners”). Guggenheim Partners, Security Investors, GPIM and their affiliates may be referred to herein collectively as “Guggenheim.” Security Investors and GPIM are also known as “Guggenheim Investments,” the global asset management and investment advisory division of Guggenheim Partners that includes other affiliated investment management businesses.
At meetings held in person on April 16, 2024 (the “April Meeting”) and on May 20-21, 2024 (the “May Meeting”), the Contracts Review Committee of the Board (the “Committee”), consisting solely of the Independent Trustees, met separately from Guggenheim to consider the proposed renewal of the Agreements. As part of its review process, the Committee was represented by independent legal counsel to the Independent Trustees (“Independent Legal Counsel”), from whom the Independent Trustees received separate legal advice and with whom they met separately. Independent Legal Counsel reviewed and discussed with the Committee various key aspects of the Trustees’ legal responsibilities relating to the proposed renewal of the Agreements and other principal contracts. The Committee took into account various materials
1 | GPIM also serves as investment adviser to Guggenheim Macro Opportunities Fund CFC (the “Subsidiary”), a wholly-owned subsidiary of Macro Opportunities Fund that is organized as a limited company under the laws of the Cayman Islands and used by Macro Opportunities Fund to obtain commodities exposure. Pursuant to a separate investment advisory agreement for the Subsidiary (the “Subsidiary Advisory Agreement”), the Subsidiary pays GPIM an advisory fee at the same rate that Macro Opportunities Fund pays GPIM under its Advisory Agreement. The Subsidiary Advisory Agreement does not require annual renewal by the Board and will continue until it is terminated as provided in the Agreement. In addition, GPIM and Macro Opportunities Fund have entered into a separate fee waiver agreement pursuant to which GPIM has contractually agreed to waive the advisory fee it receives from Macro Opportunities Fund in an amount equal to the advisory fee paid to GPIM by the Subsidiary. This undertaking will continue for so long as Macro Opportunities Fund invests in the Subsidiary, and may be terminated only with the approval of the Board. |
322 | THE GUGGENHEIM FUNDS ANNUAL REPORT | |
ITEM 11: STATEMENT REGARDING BASIS FOR APPROVAL OF INVESTMENT ADVISORY CONTRACT (continued)
received from Guggenheim and Independent Legal Counsel. The Committee also considered the variety of written materials, reports and oral presentations the Board received throughout the year regarding performance and operating results of the Funds, and other information relevant to its evaluation of the Agreements.
In connection with the contract review process, FUSE Research Network LLC (“FUSE”), an independent, third-party research provider, was engaged to prepare advisory contract renewal reports designed specifically to help the Board fulfill its advisory contract renewal responsibilities. The objective of the FUSE reports is to present the subject fund’s relative position regarding fees, expenses and total return performance, with peer group and universe comparisons. The Committee assessed the data provided in the FUSE reports as well as commentary presented by Guggenheim, including, among other things, a summary of notable distinctions between certain Funds and the applicable peer group identified in the FUSE reports and explanations for custom peer groups created for certain Funds that do not fit well into any particular category. The Committee noted that although FUSE’s process typically results in the identification for each Fund of a universe of similar funds for performance comparisons and a narrower group of similar funds from the universe based on asset levels for comparative fee and expense data evaluation (i.e., the peer group), the peer group constituent funds identified by FUSE for Market Neutral Real Estate Fund were the same as the performance universe constituent funds due to the Fund’s investment strategy.
In addition, Guggenheim provided materials and data in response to formal requests for information sent by Independent Legal Counsel on behalf of the Committee. Guggenheim also made a presentation at the April Meeting. Throughout the process, the Committee asked questions of management and requested certain additional information, which Guggenheim provided (collectively with the foregoing reports and materials, the “Contract Review Materials”). The Committee considered the Contract Review Materials in the context of its accumulated experience governing the Trust and other funds in the Guggenheim fund complex and weighed the factors and standards discussed with Independent Legal Counsel.
As a part of its analysis, the Committee considered that Guggenheim had engaged in a strategic review of the Guggenheim fund line-up beginning in 2023, which resulted in recommendations to the Board in 2024 for certain Funds2 to be reorganized into new funds sponsored by a third-party manager (the “Proposed Reorganizations”) and for Small Cap Value Fund to be liquidated and terminated (the “Proposed Liquidation”). The Committee noted that the Board was engaged in an extensive due diligence process to evaluate the Proposed Reorganizations and the Proposed Liquidation, which was ongoing at the time of the May Board Meeting (defined below), at which meeting the Agreements were being considered for renewal. The Committee considered the potential timing of the Proposed Reorganizations and the Proposed Liquidation and that the continuation of the applicable Agreements for the applicable Funds would allow such Funds to operate until the completion of the Proposed Reorganizations or the Proposed Liquidation, if approved by the Board and by shareholders (as applicable), and would provide for the operation of such Funds to continue in the event the Board or shareholders (as applicable) do not approve the Proposed Reorganizations or the Proposed Liquidation.
Following an analysis and discussion of relevant factors, including those identified below, and in the exercise of its business judgment, the Committee concluded that it was in the best interest of each Fund to recommend that the Board approve the renewal of the applicable Agreements for an additional annual term. Following its review of the Committee’s recommendation, the Board approved the renewal of the applicable Agreements for each Fund for a one-year period ending August 1, 2025 at a meeting held on May 20-21, 2024 (the “May Board Meeting” and together with the May Meeting, the “May Meetings”) and determined to adopt the Committee’s considerations and conclusions, which follow.
Advisory Agreements
Nature, Extent and Quality of Services Provided by Each Adviser: With respect to the nature, extent and quality of services currently provided by each Adviser, the Committee considered the qualifications, experience and skills of key personnel performing services for the Funds, including those personnel providing compliance and risk oversight, as well as the supervisors and reporting lines for such personnel. The Committee also considered other information, including Guggenheim’s resources and related efforts to retain, attract and motivate capable personnel to serve the Funds. In evaluating Guggenheim’s resources and capabilities, the Committee considered Guggenheim’s commitment to focusing on, and investing resources in support of, funds in the Guggenheim fund complex. The Committee also considered Guggenheim’s discussions with the Committee and the Board regarding the Proposed Reorganizations and the Proposed Liquidation, including at the April Meeting and the May Meetings. In this regard, the Committee considered Guggenheim’s representation that it continues to manage each Fund included in the Proposed Reorganizations or the Proposed Liquidation in the best interest of such Fund and its shareholders and will continue
2 | Alpha Opportunity Fund, Large Cap Value Fund, Market Neutral Real Estate Fund, Risk Managed Real Estate Fund, SMid Cap Value Fund, StylePlus—Large Core Fund, StylePlus—Mid Growth Fund and World Equity Income Fund. |
| | THE GUGGENHEIM FUNDS ANNUAL REPORT | 323 |
ITEM 11: STATEMENT REGARDING BASIS FOR APPROVAL OF INVESTMENT ADVISORY CONTRACT (continued)
to do so for so long as it serves as investment adviser to such Fund, including until the Proposed Reorganization or the Proposed Liquidation of such Fund, if approved by the Board and by shareholders (as applicable), is completed. In addition, the Committee considered the acceptability of the terms of each Advisory Agreement, including the scope of services required to be performed by each Adviser.
The Committee’s review of the services provided by Guggenheim to the Funds included consideration of Guggenheim’s investment processes and resulting performance, portfolio oversight and risk management, and the related regular quarterly reports and presentations received by the Board. The Committee took into account the risks borne by Guggenheim in sponsoring and providing services to the Funds, including regulatory, operational, legal and entrepreneurial risks. The Committee considered the resources dedicated by Guggenheim to compliance functions and the reporting made to the Board by Guggenheim compliance personnel regarding Guggenheim’s adherence to regulatory requirements. The Committee also considered the regular reports the Board receives from the Trust’s Chief Compliance Officer regarding compliance policies and procedures established pursuant to Rule 38a-1 under the Investment Company Act of 1940, as amended. In connection with the Committee’s evaluation of the overall package of services provided by Guggenheim, the Committee considered Guggenheim’s administrative services, including its role in supervising, monitoring, coordinating and evaluating the various services provided by the fund administrator, transfer agent, distributor, custodian and other service providers to the Funds. The Committee evaluated the Office of Chief Financial Officer (the “OCFO”), which oversees the fund administration, accounting and transfer agency services provided to the Funds and other funds in the Guggenheim fund complex, including the OCFO’s resources, personnel and services provided.
With respect to Municipal Income Fund, the Committee noted that, although Security Investors delegated certain portfolio management responsibilities to the Sub-Adviser, as affiliated companies, both the Adviser and the Sub-Adviser are part of the Guggenheim organization. Further, the Committee took into account Guggenheim’s explanation that investment advisory-related services are provided by many Guggenheim employees under different related legal entities and thus, the services provided by the Adviser on the one hand and the Sub-Adviser on the other, as well as the risks assumed by each party, cannot be ascribed to distinct legal entities.3 As a result, in evaluating the services provided to the Municipal Income Fund under the Sub-Advisory Agreement, the Committee did not separately consider the contributions under the Advisory Agreement and the Sub-Advisory Agreement.
With respect to Guggenheim’s resources and the ability of each Adviser to carry out its responsibilities under the applicable Advisory Agreement, the Chief Financial Officer of Guggenheim Investments reviewed with the Committee financial information concerning the holding company for Guggenheim Investments, Guggenheim Partners Investment Management Holdings, LLC (“GPIMH”), and the various entities comprising Guggenheim Investments, and provided the audited consolidated financial statements of GPIMH. (Thereafter, the Committee received the audited consolidated financial statements of GPIM.)
Based on the foregoing, and based on other information received (both oral and written) at the April Meeting and the May Meetings, as well as other considerations, including the Committee’s knowledge of how each Adviser performs its duties obtained through Board meetings, discussions and reports throughout the year, the Committee concluded that each Adviser and its personnel were qualified to serve the Funds in such capacity and may reasonably be expected to continue to provide a high quality of services under each Advisory Agreement with respect to the Funds.
Investment Performance: The Committee received, for each Fund, investment returns for the since-inception, ten-year, five-year, three-year, one-year and three-month periods ended December 31, 2023, as applicable. In addition, the Committee received a comparison of each Fund’s performance to the performance of a benchmark, a universe of funds and a narrower peer group of similar funds based on asset levels as identified by FUSE (except as noted above with respect to Market Neutral Real Estate Fund), in each case for the same periods, as applicable. The Committee also received from FUSE a description of the methodology for identifying each Fund’s peer group and universe for performance and expense comparisons. The Committee also received certain performance information as of March 31, 2024. In assessing each Fund’s performance, the Committee considered that the Board receives regular reporting from Guggenheim regarding performance and evaluates performance throughout the year.
3 | Consequently, except where the context indicates otherwise, references to “Adviser,” “Advisers” or “Sub-Adviser” should be understood as referring to Guggenheim Investments generally and the services it provides under the Agreements. |
324 | THE GUGGENHEIM FUNDS ANNUAL REPORT | |
ITEM 11: STATEMENT REGARDING BASIS FOR APPROVAL OF INVESTMENT ADVISORY CONTRACT (continued)
In seeking to evaluate Fund performance over a full market cycle, the Committee focused its attention on five-year and three-year performance rankings as compared to the relevant universe of funds. Except as to the individual Funds discussed below, the Committee observed that the returns of each Fund’s Institutional Class shares ranked in the third quartile or better of such Fund’s performance universe for each of the five-year and three-year periods considered. In addition, the Committee made the following observations:
Alpha Opportunity Fund: The returns of the Fund’s Institutional Class shares ranked in the 93rd and 54th percentiles of its performance universe for the five-year and three-year periods ended December 31, 2023, respectively. The Committee noted management’s explanation that the Fund’s relative underperformance over the five-year time period was primarily due to the Fund’s beta profile and fundamental factor tilts. The Committee noted management’s statement that the Fund’s lower beta profile to broad market U.S. equities relative to its peers and long exposure to value and short exposure to growth have detracted from investment performance. The Committee also noted management’s statement that as a result of an update in 2021 to the quantitative investment methodology that the Fund employs, the Fund experienced performance rankings that compare more favorably relative to its performance universe for the three-year and one-year periods ended December 31, 2023.
Core Bond Fund: The returns of the Fund’s Institutional Class shares ranked in the 28th and 80th percentiles of its performance universe for the five-year and three-year periods ended December 31, 2023, respectively. The Committee noted management’s explanation that the Fund’s relative underperformance over the three-year time period was primarily due to the Fund’s overweight credit allocation, noting the widening of credit spreads across all fixed income asset classes—primarily concentrated in 2022—as the Federal Reserve tightened monetary policy in response to inflation. The Committee noted management’s statement that the drawdowns across credit markets were driven mostly by technical factors rather than fundamentals, and the Fund was able to capitalize on this volatility, which contributed to improved performance in the past year. The Committee considered that the returns of the Fund’s Institutional Class shares ranked in the 7th percentile of its performance universe for the one-year period ended December 31, 2023.
Market Neutral Real Estate Fund: The returns of the Fund’s Institutional Class shares ranked in the 88th percentile of its performance universe for the five-year and three-year periods ended December 31, 2023. The Committee noted management’s explanation that the Fund’s relative underperformance over the five-year and three-year time periods was due to underperforming pairs of offsetting long and short positions as well as short positions that were taken private. The Committee considered management’s view that the macroeconomic outlook for real estate investment trusts (“REITs”) should be more favorable going forward due to tailwinds from interest rate stabilization and Federal Reserve rate cuts, as well as more optimistic operating fundamentals given more favorable conditions. The Committee also considered management’s statement that the peer funds do not fully reflect the focus on REITs of the Fund’s strategy.
Municipal Income Fund: The returns of the Fund’s Institutional Class shares ranked in the 100th and 97th percentiles of its performance universe for the five-year and three-year periods ended December 31, 2023, respectively. The Committee noted management’s explanation that as the Federal Reserve began to tighten monetary policy through interest rate hikes and quantitative tightening, long duration assets materially underperformed, which negatively impacted the Fund’s performance given the Fund’s bias towards higher quality long duration assets. The Committee noted management’s statement that the Fund is biased towards higher quality long duration assets because management believes that an economic downturn is likely to weigh on lower quality assets. The Committee also noted management’s explanation that the Fund’s allocations to out-of-index sectors, which lagged traditional municipal securities, particularly in 2023, also negatively impacted the Fund’s performance. The Committee considered recent portfolio enhancements implemented by management to improve the Fund’s performance, including reducing the Fund’s allocations to out-of-index sectors, and took into account certain performance information for the Fund as of March 31, 2024 that reflected significant improvement in short-term performance. The Committee also considered its discussions with management at the April Meeting regarding expectations for continued improved performance for the Fund.
Based on the foregoing, and based on other information received (both oral and written) at the April Meeting and the May Meetings, as well as other considerations, the Committee concluded that, with respect to each Fund other than Municipal Income Fund: (i) the Fund’s performance was acceptable; or (ii) it was satisfied with Guggenheim’s responses and/or efforts to improve investment performance; and, with respect to Municipal Income Fund, it would continue to monitor the Fund’s investment performance.
4 | The “net effective management fee” for each Fund represents the combined effective advisory fee and administration fee as a percentage of average net assets for the latest fiscal year, after any waivers and/or reimbursements. |
| | THE GUGGENHEIM FUNDS ANNUAL REPORT | 325 |
ITEM 11: STATEMENT REGARDING BASIS FOR APPROVAL OF INVESTMENT ADVISORY CONTRACT (continued)
Comparative Fees, Costs of Services Provided and the Benefits Realized by Each Adviser from Its Relationship with the Funds: The Committee compared each Fund’s contractual advisory fee (which, for Municipal Income Fund, includes the sub-advisory fee paid to the Sub-Adviser), net effective management fee4 and total net expense ratio to the applicable peer group. The Committee also reviewed the median advisory fees and expense ratios, including expense ratio components (e.g., transfer agency fees, administration fees, other operating expenses, distribution fees and fee waivers/reimbursements), of the peer group. In addition, the Committee considered information regarding Guggenheim’s process for evaluating the competitiveness of each Fund’s fees and expenses, noting Guggenheim’s statement that evaluations seek to incorporate a variety of factors with a general focus on ensuring fees and expenses: (i) are competitive; (ii) give consideration to resource support requirements; and (iii) ensure Funds are able to deliver on shareholder return expectations.
As part of its evaluation of each Fund’s advisory fee, the Committee considered how such fees compared to the advisory fee charged by Guggenheim to one or more other clients that it manages pursuant to similar investment strategies, to the extent applicable, noting that, in certain instances, Guggenheim charges a lower advisory fee to such other clients. In this connection, the Committee considered, among other things, Guggenheim’s representations about the significant differences between managing mutual funds as compared to other types of accounts. The Committee also considered Guggenheim’s explanation that lower fees are charged in certain instances due to various other factors, including the scope of contract, type of investors, fee structure, applicable legal, governance and capital structures, tax status and historical pricing reasons. In addition, the Committee took into account Guggenheim’s discussion of the regulatory, operational, legal and entrepreneurial risks involved with the Funds as compared to other types of accounts. The Committee concluded that the information it received demonstrated that the aggregate services provided to, or the specific circumstances of, each Fund were sufficiently different from the services provided to, or the specific circumstances of, other clients with similar investment strategies and/or that the risks borne by Guggenheim were sufficiently greater than those associated with managing other clients with similar investment strategies to support the difference in fees.
In further considering the comparative fee and expense data presented in the Contract Review Materials and addressed by Guggenheim, the Committee took into account those Funds with currently effective expense limitation agreements with the Adviser. Except as to the individual Funds discussed below, the Committee observed that the contractual advisory fee, net effective management fee and total net expense ratio for each Fund’s Institutional Class shares each rank in the third quartile or better of such Fund’s peer group. In addition, the Committee made the following observations:
Floating Rate Strategies Fund: The contractual advisory fee for the Fund’s Institutional Class shares ranks in the third quartile (75th percentile) of its peer group. The net effective management fee for the Fund’s Institutional Class shares ranks in the third quartile (67th percentile) of its peer group. The total net expense ratio for the Fund’s Institutional Class shares ranks in the fourth quartile (83rd percentile) of its peer group. The Committee considered the Adviser’s statement explaining the higher expenses that performance is driven by a unique investment approach that requires significant resources. In this regard, the Committee took into consideration the strong investment performance of the Fund’s Institutional Class shares for the three-year period ended December 31, 2023. The Committee also took into account the Fund’s currently effective expense limitation agreement with the Adviser.
High Yield Fund: The contractual advisory fee for the Fund’s Institutional Class shares ranks in the second quartile (36th percentile) of its peer group. The net effective management fee for the Fund’s Institutional Class shares ranks in the second quartile (50th percentile) of its peer group. The total net expense ratio for the Fund’s Institutional Class shares ranks in the fourth quartile (79th percentile) of its peer group. The Committee considered that the Fund’s contractual advisory fee ranks favorably in the second quartile of the peer group and that the net effective management fee ranks in line with the peer group. The Committee also took into account the Fund’s currently effective expense limitation agreement with the Adviser, noting that in early 2024 the Adviser agreed to reduce the expense cap for each share class by 22 basis points to further limit ordinary operating expenses of the Fund.
Limited Duration Fund: The contractual advisory fee for the Fund’s Institutional Class shares ranks in the fourth quartile (87th percentile) of its peer group. The net effective management fee for the Fund’s Institutional Class shares ranks in the third quartile (60th percentile) of its peer group. The total net expense ratio for the Fund’s Institutional Class shares ranks in the third quartile (67th percentile) of its peer group. The Committee considered the Adviser’s statement explaining the higher fees that performance is driven by a unique investment approach that requires significant resources. In this regard, the Committee took into consideration the strong investment performance of the Fund’s Institutional Class shares for the five-year and three-year periods ended December 31, 2023. The Committee also took into account the Fund’s currently effective expense limitation agreement with the Adviser.
326 | THE GUGGENHEIM FUNDS ANNUAL REPORT | |
ITEM 11: STATEMENT REGARDING BASIS FOR APPROVAL OF INVESTMENT ADVISORY CONTRACT (continued)
Macro Opportunities Fund: The contractual advisory fee, net effective management fee and total net expense ratio for the Fund’s Institutional Class shares each rank in the fourth quartile (92nd percentile) of its peer group. The Committee noted that the Fund is categorized as a non-traditional bond fund which seeks to add value by investing in many non-traditional securities within and outside of fixed income, including equities, currencies, commodities and derivatives, and that peer funds have varying degrees of capability, flexibility and associated fees. The Committee considered the Adviser’s statement explaining the higher fees and expenses that performance is driven by a unique investment approach that requires significant resources. The Committee also took into account the Fund’s currently effective expense limitation agreement and contractual advisory fee breakpoint of 5 basis points on average daily net assets above $5 billion.
StylePlus—Large Core Fund: The contractual advisory fee for the Fund’s Institutional Class shares ranks in the third quartile (54th percentile) of its peer group. The net effective management fee and total net expense ratio for the Fund’s Institutional Class shares each rank in the fourth quartile (77th percentile) of its peer group. The Committee considered that the Fund’s contractual advisory fee ranks in line with the peer group. The Committee also took into account the Fund’s currently effective expense limitation agreement with the Adviser.
StylePlus—Mid Growth Fund: The contractual advisory fee for the Fund’s Institutional Class shares ranks in the first quartile (14th percentile) of its peer group. The net effective management fee for the Fund’s Institutional Class shares ranks in the third quartile (57th percentile) of its peer group. The total net expense ratio for the Fund’s Institutional Class shares ranks in the fourth quartile (79th percentile) of its peer group. The Committee considered that the Fund’s contractual advisory fee ranks favorably in the first quartile of its peer group and that the net effective management fee ranks in line with the peer group. The Committee also took into account the Fund’s currently effective expense limitation agreement with the Adviser.
Total Return Bond Fund: The contractual advisory fee for the Fund’s Institutional Class shares ranks in the third quartile (71st percentile) of its peer group. The net effective management fee for the Fund’s Institutional Class shares ranks in the fourth quartile (79th percentile) of its peer group. The total net expense ratio for the Fund’s Institutional Class shares ranks in the third quartile (64th percentile) of its peer group. The Committee considered the Adviser’s statement explaining the higher fees that performance is driven by a unique investment approach that requires significant resources. The Committee also took into account the Fund’s currently effective expense limitation agreement with the Adviser.
With respect to the costs of services provided and benefits realized by Guggenheim Investments from its relationship with the Funds, the Committee reviewed a profitability analysis and data from management for each Fund setting forth the average assets under management for the twelve months ended December 31, 2023, gross revenues received, and expenses incurred directly or through allocations, by Guggenheim Investments, expense waivers (as applicable), earnings and the operating margin/profitability rate, including variance information relative to the foregoing amounts as of December 31, 2022 and December 31, 2021. In addition, the Chief Financial Officer of Guggenheim Investments reviewed with, and addressed questions from, the Committee concerning the expense allocation methodology employed in producing the profitability analysis. In the course of its review of Guggenheim Investments’ profitability, the Committee took into account the methods used by Guggenheim Investments to determine expenses and profit and the representation by the Chief Financial Officer of Guggenheim Investments that such methods provided a reasonable basis for determining the profitability of the applicable Adviser with respect to each Fund. The Committee considered all of the foregoing, among other things, in evaluating the costs of services provided, the profitability to Guggenheim Investments and the profitability rates presented.
The Committee also considered other benefits available to each Adviser because of its relationship with the Funds and noted Guggenheim’s statement that it does not believe the Advisers derive any such “fall-out” benefits. In this regard, the Committee noted Guggenheim’s statement that, although it does not consider such benefits to be fall-out benefits, the Advisers may benefit from certain economies of scale and synergies, such as enhanced visibility of the Advisers, enhanced leverage in fee negotiations and other synergies arising from offering a broad spectrum of products, including the Funds.
Based on the foregoing, and based on other information received (both oral and written) at the April Meeting and the May Meetings, as well as other considerations, the Committee concluded that the comparative fees and the benefits realized by each Adviser from its relationship with the Funds were appropriate and that each Adviser’s profitability from its relationship with the Funds was not unreasonable.
Economies of Scale: The Committee received and considered information regarding whether there have been economies of scale with respect to the management of the Funds as Fund assets grow, whether the Funds have appropriately benefited from any economies of scale, and whether there is potential for realization of any further economies of scale. The Committee considered whether economies of scale in the provision of services to the Funds were being passed along to and shared with the shareholders. The Committee considered that Guggenheim
| | THE GUGGENHEIM FUNDS ANNUAL REPORT | 327 |
ITEM 11: STATEMENT REGARDING BASIS FOR APPROVAL OF INVESTMENT ADVISORY CONTRACT (continued)
believes it is appropriately sharing potential economies of scale and that Guggenheim’s decrease in overall expenses in 2023 was attributable to decreased product and distribution related costs driven by lower average assets under management (which also resulted in decreased revenue from the funds in the Guggenheim fund complex), decreased expense waivers and reimbursements, and decreased expenses associated with non-recurring items.
The Committee also noted the process employed by the Adviser to evaluate whether it would be appropriate to institute a new breakpoint for a Fund, with consideration given to, among other things: (i) the Fund’s size and trends in asset levels over recent years; (ii) the competitiveness of the expense levels; (iii) whether expense waivers are in place; (iv) changes and trends in revenue and expenses; (v) whether there are any anticipated expenditures that may benefit the Fund in the future; (vi) Fund profit level margins; (vii) relative Fund performance; (viii) the nature, extent and quality of services management provides to the Fund; and (ix) the complexity of the Fund’s investment strategy and the resources required to support the Fund.
As part of its assessment of economies of scale, the Committee took into account Guggenheim’s representation that it seeks to share economies of scale through a number of means, including breakpoints, advisory fees set at competitive rates pre-assuming future asset growth, expense waivers and limitations, and investments in personnel, operations and infrastructure to support the fund business. The Committee also received information regarding amounts that had been shared with shareholders through such breakpoints and expense waivers and limitations. The Committee also noted information from Guggenheim regarding certain challenges and costs associated with managing Funds that have achieved significant scale. Thus, the Committee considered the size of the Funds and the competitiveness of and/or other determinations made regarding the current advisory fee for each Fund, as well as whether a Fund is subject to an expense limitation.
Based on the foregoing, and based on other information received (both oral and written) at the April Meeting and the May Meetings, as well as other considerations, the Committee concluded that the advisory fee for each Fund was reasonable.
Sub-Advisory Agreement for Municipal Income Fund
Nature, Extent and Quality of Services Provided by the Sub-Adviser: As noted above, because both the Adviser and the Sub-Adviser for Municipal Income Fund—Security Investors and GPIM, respectively—are part of and do business as Guggenheim Investments and the services provided by the Adviser on the one hand and the Sub-Adviser on the other cannot be ascribed to distinct legal entities, the Committee did not separately evaluate the services provided under the Advisory Agreement and the Sub-Advisory Agreement. Therefore, the Committee considered the qualifications, experience and skills of the Fund’s portfolio management team in connection with the Committee’s evaluation of Guggenheim’s investment professionals under the Advisory Agreement. With respect to Guggenheim’s resources and the Sub-Adviser’s ability to carry out its responsibilities under the Sub-Advisory Agreement, as noted above, the Committee considered the financial condition of GPIMH and the various entities comprising Guggenheim Investments. The Committee also considered the acceptability of the terms of the Sub-Advisory Agreement, including the scope of services required to be performed by the Sub-Adviser.
Investment Performance: The Committee considered the returns of the Fund under its evaluation of the Advisory Agreement.
Comparative Fees, Costs of Services Provided and the Benefits Realized by the Sub-Adviser from Its Relationship with the Fund: The Committee considered that the Sub-Advisory Agreement is with an affiliate of the Adviser, that the Adviser compensates the Sub-Adviser from its own fees so that the sub-advisory fee rate for the Fund does not impact the fees paid by the Fund and that the Sub-Adviser’s revenues were included in the calculation of Guggenheim Investments’ profitability. Given its conclusion of the reasonableness of the advisory fee, the Committee concluded that the sub-advisory fee rate for the Fund was reasonable.
Economies of Scale: The Committee recognized that, because the Sub-Adviser’s fees are paid by the Adviser and not the Fund, the analysis of economies of scale was more appropriate in the context of the Committee’s consideration of the Advisory Agreement, which was separately considered. (See “Advisory Agreements – Economies of Scale” above.)
Overall Conclusions
The Committee concluded that the investment advisory fees are fair and reasonable in light of the extent and quality of the services provided and other benefits received and that the renewal of each applicable Agreement is in the best interest of each Fund. In reaching this conclusion, no single factor was determinative or conclusive and each Committee member, in the exercise of their informed business judgment, may afford different weights to different factors.
328 | THE GUGGENHEIM FUNDS ANNUAL REPORT | |
ITEM 11: STATEMENT REGARDING BASIS FOR APPROVAL OF INVESTMENT ADVISORY CONTRACT (continued)
Following its review of the Committee’s analysis and determinations, the Board adopted the considerations and conclusions of the Committee and determined to approve the renewal of the Agreements. As a part of its considerations, the Board noted its ongoing evaluation of the Proposed Reorganizations for certain Funds and the Proposed Liquidation for Small Cap Value Fund and determined that the renewal of the applicable Agreements for such Funds would allow such Funds to operate until the completion of the Proposed Reorganizations or the Proposed Liquidation, if approved by the Board and by shareholders (as applicable), and would provide for the operation of such Funds to continue in the event the Board or shareholders (as applicable) do not approve the Proposed Reorganizations or the Proposed Liquidation. (Following the May Board Meeting, the Board approved the Proposed Reorganizations, subject to shareholder approval, and the Proposed Liquidation at a reconvening of the May Board Meeting held by videoconference on May 24, 2024.)
Board Considerations Regarding Approval of Investment Advisory Agreement
GUGGENHEIM FUNDS TRUST
Guggenheim Active INvestment Series (GAINS) – Core Plus Fund
Guggenheim Active INvestment Series (GAINS) – Limited Duration Fund
At a meeting held in person on February 28-29, 2024 (the “February Meeting”), the Board of Trustees of Guggenheim Funds Trust (the “Trust”), including the Independent Trustees, unanimously approved the investment advisory agreement (the “Advisory Agreement”) with Guggenheim Partners Investment Management, LLC (“GPIM” or the “Adviser”) on behalf of each of Guggenheim Active INvestment Series (GAINS) – Core Plus Fund and Guggenheim Active INvestment Series (GAINS) – Limited Duration Fund (each a “New Fund” and collectively, the “New Funds”), each a new series of the Trust, for an initial term of up to two years.
GPIM is an indirect subsidiary of Guggenheim Partners, LLC, a privately-held, global investment and advisory firm (“Guggenheim Partners”). Guggenheim Partners, GPIM and their affiliates may be referred to herein collectively as “Guggenheim.” “Guggenheim Investments” refers to the global asset management and investment advisory division of Guggenheim Partners and includes GPIM, Guggenheim Funds Investment Advisors, LLC, Security Investors, LLC and other affiliated investment management businesses of Guggenheim Partners.
At the February Meeting, the Independent Trustees met separately from Guggenheim to consider the approval of the Advisory Agreement with respect to each New Fund. As part of their review process, the Independent Trustees were represented by independent legal counsel (“Independent Legal Counsel”), from whom they received separate legal advice and with whom they met separately. Independent Legal Counsel reviewed and discussed with the Independent Trustees various key aspects of their legal responsibilities relating to their consideration of the Advisory Agreement and other principal contracts for the New Funds. The Independent Trustees took into account various materials received from Guggenheim.
In considering the proposed Advisory Agreement for each New Fund, the Board, including the Independent Trustees, took into account that each New Fund was designed as a “completion” fund to allow Guggenheim to offer its Core Plus strategy or Limited Duration strategy, as applicable, to retail separately managed account (“SMA”) clients, with certain investments to be held in the individual SMA and others to be held in the New Fund to “complete” the portfolio. The Board noted the Adviser’s explanation that “completion” funds provide SMA clients with access to investments for which it is harder to separate ownership among multiple SMA clients, allowing for appropriate diversification and enhanced liquidity, as well as increased asset allocation flexibility for the Adviser.
The Board considered the Advisory Agreement in light of the regulatory requirements and criteria and assessed information concerning each New Fund’s proposed advisory fee, anticipated total expense ratio and proposed expense limitation and affiliated fund reimbursement agreements, investment objective, model portfolio, investment process and portfolio management team, proposed benchmark index, market opportunity, and share class features, among other things. The materials provided by Guggenheim to the Board for its consideration included a report for each New Fund prepared by FUSE Research Network LLC (“FUSE”), an independent, third-party research provider, of comparative information on fees and expenses of each New Fund and a peer group of other fixed-income “completion” funds identified by FUSE with similar pricing characteristics.
The Board also took into account the factors considered and the conclusions reached with respect to the renewal of investment advisory agreements with Guggenheim on behalf of other funds in the Guggenheim fund complex in connection with the Board’s 2023 contract review process (the “2023 Contract Review”), including the reports and materials provided by Guggenheim in response to the Board’s initial and supplemental requests for information (the “Previously Provided 15(c) Materials”). The Board noted that Guggenheim provided additional
| | THE GUGGENHEIM FUNDS ANNUAL REPORT | 329 |
ITEM 11: STATEMENT REGARDING BASIS FOR APPROVAL OF INVESTMENT ADVISORY CONTRACT (continued)
information regarding the New Funds for the February Meeting to supplement the Previously Provided 15(c) Materials and to assist the Board in its evaluation of the proposed Advisory Agreement with respect to each New Fund (the “Supplemental Information”). Among other things, the Board considered the Adviser’s statements that: (a) it believes that there have been no material adverse changes to the Previously Provided 15(c) Materials that would affect the Trustees’ ability to fulfill their obligations under Section 15(c) of the Investment Company Act of 1940, as amended (the “1940 Act”); (b) it is not aware of any additional information, other than the Supplemental Information, that it believes would be relevant to the Trustees’ considerations; and (c) it believes it has fulfilled its obligations under Section 15(c) to provide all information within its control as may reasonably be necessary for the Trustees to evaluate the terms of the Advisory Agreement with respect to each New Fund.
The Board considered the foregoing reports and materials in the context of its accumulated experience governing the Trust and other funds in the Guggenheim fund complex and weighed the factors and standards discussed with Independent Legal Counsel.
Following an analysis and discussion of relevant factors, including those identified below, and in the exercise of its business judgment, the Board concluded that it was in the best interest of each New Fund to approve the Advisory Agreement for the proposed initial term.
Nature, Extent and Quality of Services to Be Provided by the Adviser: With respect to the nature, extent and quality of services to be provided by the Adviser to the New Funds, the Board considered the functions to be performed by the Adviser for the New Funds and the nature and quality of services provided by GPIM in the past, including the firm’s management capabilities demonstrated with respect to other funds in the Guggenheim fund complex. The Board considered the qualifications, experience and skills of key personnel that will perform services for the New Funds, including personnel that will provide compliance and risk oversight, as well as the supervisors and reporting lines for such personnel. The Board also considered other information, including Guggenheim’s resources and related efforts to retain, attract and motivate capable personnel to serve the New Funds. In evaluating Guggenheim’s resources and capabilities, the Board considered Guggenheim’s commitment to focusing on, and investing resources in support of, funds in the Guggenheim fund complex, including for each New Fund the commitment to provide seed capital as needed. In addition, the Board considered the acceptability of the terms of the Advisory Agreement, including the scope of services required to be performed by the Adviser, noting that the terms were consistent with the terms of the investment advisory agreements of other open-end funds in the Guggenheim fund complex.
The Board’s review of the services to be provided by Guggenheim to the New Funds included consideration of Guggenheim’s investment processes, portfolio oversight and risk management, and the related regular quarterly reports and presentations received by the Board. The Board took into account the risks to be borne by Guggenheim in sponsoring and providing services to the New Funds, including regulatory, operational, legal and entrepreneurial risks. The Board considered the resources dedicated by Guggenheim to compliance functions and the reporting made to the Board by Guggenheim compliance personnel regarding Guggenheim’s adherence to regulatory requirements. The Board also considered the regular reports it receives from the Trust’s Chief Compliance Officer regarding compliance policies and procedures established pursuant to Rule 38a-1 under the 1940 Act. In connection with the Board’s evaluation of the overall package of services to be provided by Guggenheim, the Board considered Guggenheim’s administrative services, including its role in supervising, monitoring, coordinating and evaluating the various services to be provided by the fund administrator, transfer agent, distributor, custodian and other proposed service providers to the New Funds. The Board evaluated the Office of Chief Financial Officer (the “OCFO”), which oversees the fund administration, accounting and transfer agency services provided to the funds in the Guggenheim fund complex, including the OCFO’s resources, personnel and services provided.
The Board also noted the distinctive nature of the New Funds as a “completion” funds for retail SMA clients and that the New Funds will be offered solely for use by (i) retail SMA clients within “wrap fee” programs sponsored by unaffiliated investment advisers and broker-dealers and (ii) potentially other funds in the Guggenheim fund complex.
With respect to Guggenheim’s resources and the Adviser’s ability to carry out its responsibilities under the Advisory Agreement, the Board considered the presentation by the Chief Financial Officer of Guggenheim Investments in connection with the 2023 Contract Review and the related financial information received.
Based on the foregoing, and based on other information received (both oral and written) at the February Meeting and in connection with the 2023 Contract Review, as well as other considerations, including the Board’s knowledge of how the Adviser performs its duties obtained through Board meetings, discussions and reports throughout the year, the Board concluded that the Adviser and its personnel were qualified to serve each New Fund in such capacity.
330 | THE GUGGENHEIM FUNDS ANNUAL REPORT | |
ITEM 11: STATEMENT REGARDING BASIS FOR APPROVAL OF INVESTMENT ADVISORY CONTRACT (concluded)
Investment Performance: With respect to investment performance, the Board noted that the New Funds have no operating history. The Board considered the proposed investment objectives, strategies and policies of the New Funds, noting that each New Fund will be an actively-managed fixed income fund. The Board took into account GPIM’s overall performance record in managing other actively-managed fixed-income funds in the Guggenheim fund complex, as well as the portfolio managers’ expertise and experience with this type of investment process, and determined that GPIM’s performance was expected to be acceptable.
Comparative Fees, Costs of Services to Be Provided and the Benefits to Be Realized by the Adviser from Its Relationship with the New Funds: The Board considered that pursuant to the Advisory Agreement, the New Funds will not pay an advisory fee. The Board noted the Adviser’s explanation that “completion” funds are typically offered without charging an advisory fee to the fund, as SMA clients participating in a “wrap fee” program pay a fee to the program sponsor and GPIM receives an advisory fee for advising the SMAs, and the Board considered information regarding GPIM’s SMA advisory fee. The Board compared each New Fund’s proposed contractual advisory fee and total net expense ratio to the peer group identified by FUSE. The Board also reviewed the median advisory fees and expense ratios, including expense ratio components (e.g., transfer agency fees, administration fees, other operating expenses and fee waivers/reimbursements), of the peer group. In addition, the Board considered information regarding Guggenheim’s process for evaluating the competitiveness of each New Fund’s proposed fees and expenses, noting Guggenheim’s statement that its evaluation seeks to incorporate a variety of factors with a general focus on ensuring fees and expenses: (i) are competitive; (ii) give consideration to resource support requirements; and (iii) ensure the New Fund is able to deliver on shareholder return expectations.
In evaluating the proposed advisory fee and anticipated total net expense ratio for each New Fund, the Board considered the Adviser’s proposed expense limitation agreement with respect to each New Fund, pursuant to which the Adviser would reimburse all ordinary operating expenses of each New Fund for the initial term of the Advisory Agreement. In addition, the Board took into account the proposed affiliated fund reimbursement agreement under which the Adviser agreed, through the initial term of the Advisory Agreement, to reimburse ordinary operating expenses of each New Fund to the extent necessary to offset the proportionate share of any advisory fee paid by the New Fund with respect to an investment in an affiliated underlying fund.
With respect to the costs of services to be provided and estimated level of profitability, the Board noted that the New Funds are newly organized, and that they would have the opportunity in the future to periodically reexamine this matter.
The Board considered other benefits expected to be derived by the Adviser from its relationship with the New Funds and noted Guggenheim’s statement that it does not expect to derive any such “fall-out” benefits. As noted above, the Board included in its considerations the fee that the Adviser would receive for advising the SMAs.
Based on the foregoing, and based on other information received (both oral and written) at the February Meeting and in connection with the 2023 Contract Review, as well as other considerations, the Board concluded that the comparative fees and the benefits expected to be realized by the Adviser from its relationship with the New Funds were appropriate.
Economies of Scale to Be Realized: The Board did not consider economies of scale to be relevant given that the New Funds will not pay an advisory fee.
Overall Conclusions
The Board concluded that the proposed Advisory Agreement is in the best interest of each New Fund, in light of the extent and quality of the services expected to be provided and other benefits expected to be received by the Adviser and the advisory fee structure. In reaching this conclusion, no single factor was determinative or conclusive and each Trustee, in the exercise of their informed business judgment, may afford different weights to different factors.
| | THE GUGGENHEIM FUNDS ANNUAL REPORT | 331 |
This page intentionally left blank.
This page intentionally left blank.
| Item 8. | Changes in and Disagreements with Accountants for Open-End Management Investment Companies. |
Not applicable.
| Item 9. | Proxy Disclosures for Open-End Management Investment Companies. |
The information is included as part of the material filed under Item 7 of this Form.
| Item 10. | Remuneration Paid to Directors, Officers, and Others of Open-End Management Investment Companies. |
The information is included as part of the material filed under Item 7 of this Form.
| Item 11. | Statement Regarding Basis for Approval of Investment Advisory Contract. |
The information is included as part of the material filed under Item 7 of this Form.
| Item 12. | Disclosure of Proxy Voting Policies and Procedures for Closed-End Management Investment Companies. |
Not applicable to this registrant.
| Item 13. | Portfolio Managers of Closed-End Management Investment Companies. |
Not applicable to this registrant.
| Item 14. | Purchases of Equity Securities by Closed-End Management Investment Company and Affiliated Purchases. |
Not applicable to this registrant.
| Item 15. | Submission of Matters to a Vote of Security Holders. |
There have been no changes to the procedures by which shareholders may recommend nominees to the registrant’s board of trustees.
| Item 16. | Controls and Procedures. |
(a) The registrant’s President (principal executive officer) and Treasurer (principal financial officer) have evaluated the registrant’s disclosure controls and procedures (as defined in Rule 30a-3(c) under the Investment Company Act) as of a date within 90 days of this filing and have concluded that based on such evaluation as required by Rule 30a-3(b) under the Investment Company Act, that the registrant’s disclosure controls and procedures were effective as of that date in ensuring that information required to be disclosed by the registrant in this Form N-CSR was recorded, processed, summarized, and reported within the time periods specified in the Securities and Exchange Commission’s rules and forms.
(b) There were no changes in the registrant’s internal control over financial reporting (as defined in Rule 30a-3(d) under the Investment Company Act) that occurred during the period covered by this report that the officers listed above believe to have materially affected, or to be reasonably likely to materially affect, the registrant’s internal control over financial reporting.
| Item 17. | Disclosure of Securities Lending Activities for Closed-End Management Investment Companies. |
Not applicable to this registrant.
| Item 18. | Recovery of Erroneously Awarded Compensation. |
(a)(1) The registrant's code of ethics pursuant to Item 2 of Form N-CSR is attached.
(a)(2) Separate certifications by the President (principal executive officer) and Treasurer (principal financial officer) of the registrant as required by Rule 30a-2(a) under the Investment Company Act (17 CFR 270.30a-2(a)) are attached.
(a)(3) Not applicable.
(a)(4) Not applicable.
(a)(5) Not applicable.
(b) A certification by the registrant’s President (principal executive officer) and Treasurer (principal financial officer) as required by Rule 30a-2(b) under the Investment Company Act (17 CFR 270.30a-2(b)) is attached.
SIGNATURES
Pursuant to the requirements of the Securities Exchange Act of 1934 and the Investment Company Act of 1940, the registrant has duly caused this report to be signed on its behalf by the undersigned, thereunto duly authorized.
| (Registrant) | Guggenheim Funds Trust | |
| | | |
| By (Signature and Title) | /s/ Brian E. Binder* | |
| | Brian E. Binder, President and Chief Executive Officer | |
| | | |
| Date | December 6, 2024 | |
Pursuant to the requirements of the Securities Exchange Act of 1934 and the Investment Company Act of 1940, this report has been signed below by the following persons on behalf of the registrant and in the capacities and on the dates indicated.
| By (Signature and Title) | /s/ Brian E. Binder* | |
| | Brian E. Binder, President and Chief Executive Officer | |
| | | |
| Date | December 6, 2024 | |
| By (Signature and Title) | /s/ James Howley* | |
| | James Howley, Chief Financial Officer, Chief Accounting Officer and Treasurer | |
| | | |
| Date | December 6, 2024 | |
* Print the name and title of each signing officer under his or her signature.