 Valeant Pharmaceuticals International, Inc. February 23, 2015 Exhibit 99.1 Fourth Quarter and Full Year 2014 Financial Results and The Acquisition of Salix Pharmaceuticals |
 1 Forward-looking Statements Note 1: The guidance in this presentation is only effective as of the date given, February 23, 2015, and will not be updated or affirmed unless and until the Company publicly announces updated or affirmed guidance. Forward-looking Statements Certain statements made in this presentation may constitute forward-looking statements, including, but not limited to, statements regarding guidance with respect to expected revenues, non-GAAP cash earnings per share, adjusted cash flows from operations and organic product sales growth, future disclosures, patent exclusivity, launches and approvals of products, business development activities, share buybacks, and the 2015 strategic initiatives of Valeant Pharmaceuticals International, Inc. (the “Company”), as well as the proposed acquisition by the Company of Salix Pharmaceuticals, Ltd. (“Salix”), expected timing and benefits of the transaction, as well as the impact of the transaction on the Company’s future cash earnings per share. Forward-looking statements may be identified by the use of the words “anticipates,” “expects,” “intends,” “plans,” “could,” “should,” “would,” “may,” “will,” “believes,” “estimates,” “potential,” or “continue” and variations or similar expressions. These statements are based upon the current expectations and beliefs of management and are subject to certain risks and uncertainties that could cause actual results to differ materially from those described in the forward-looking statements. These risks and uncertainties include, but are not limited to, the risk that the acquisition will not close when expected or at all; the risk that Valeant’s business and/or Salix’s business will be adversely impacted during the pendency of the acquisition; the risk that the operations of the two companies will not be integrated successfully; and risks and uncertainties discussed in the Company's most recent annual or quarterly report filed with the Securities and Exchange Commission ("SEC") and other risks and uncertainties detailed from time to time in the Company's filings with the SEC and the Canadian Securities Administrators ("CSA"), which factors are incorporated herein by reference. Readers are cautioned not to place undue reliance on any of these forward-looking statements. The Company undertakes no obligation to update any of these forward-looking statements to reflect events or circumstances after the date of this presentation or to reflect actual outcomes. To supplement the financial measures prepared in accordance with generally accepted accounting principles (GAAP), the Company uses non- GAAP financial measures that exclude certain items. Management uses non-GAAP financial measures internally for strategic decision making, forecasting future results and evaluating current performance. By disclosing non-GAAP financial measures, management intends to provide investors with a meaningful, consistent comparison of the Company’s core operating results and trends for the periods presented. Non-GAAP financial measures are not prepared in accordance with GAAP; therefore, the information is not necessarily comparable to other companies and should be considered as a supplement to, not a substitute for, or superior to, the corresponding measures calculated in accordance with GAAP. The Company has provided preliminary results and guidance with respect to cash earnings per share, adjusted cash flows from operations and organic product growth rates, which are non-GAAP financial measures. The Company has not provided a reconciliation of these preliminary and forward-looking non-GAAP financial measures due to the difficulty in forecasting and quantifying the exact amount of the items excluded from the non-GAAP financial measures that will be included in the comparable GAAP financial measures. Reconciliations of historical non-GAAP financials can be found at www.valeant.com. Non-GAAP Information |
 2 Additional Information The tender offer described in this presentation has not yet commenced and this presentation is not a recommendation or an offer to purchase or a solicitation of an offer to sell shares of Salix. At the time the tender offer is commenced Sun Merger Sub, Inc. and the Company will file a Tender Offer Statement on Schedule TO, containing an offer to purchase, form of letter of transmittal and related tender offer documents, with the SEC, and Salix will file a Solicitation/Recommendation Statement on Schedule 14D-9 relating to the tender offer with the SEC. The Company and Salix intend to mail these documents to the stockholders of Salix. These documents, as they may be amended from time to time, will contain important information about the tender offer and stockholders of Salix are urged to read them carefully when they become available. Stockholders of Salix will be able to obtain a free copy of these documents, when they become available, at the website maintained by the SEC at www.sec.gov. In addition, the Tender Offer Statement and other documents that the Company files with the SEC will be made available to all stockholders of Salix free of charge at www.valeant.com. The Solicitation/Recommendation Statement and the other documents filed by Salix with the SEC will be made available to all stockholders of Salix free of charge at www.salix.com. Additional Information |
 3 1. Fourth Quarter and Full Year 2014 Results 2. Q1 2015 Guidance 3. Dendreon and Salix Update Agenda |
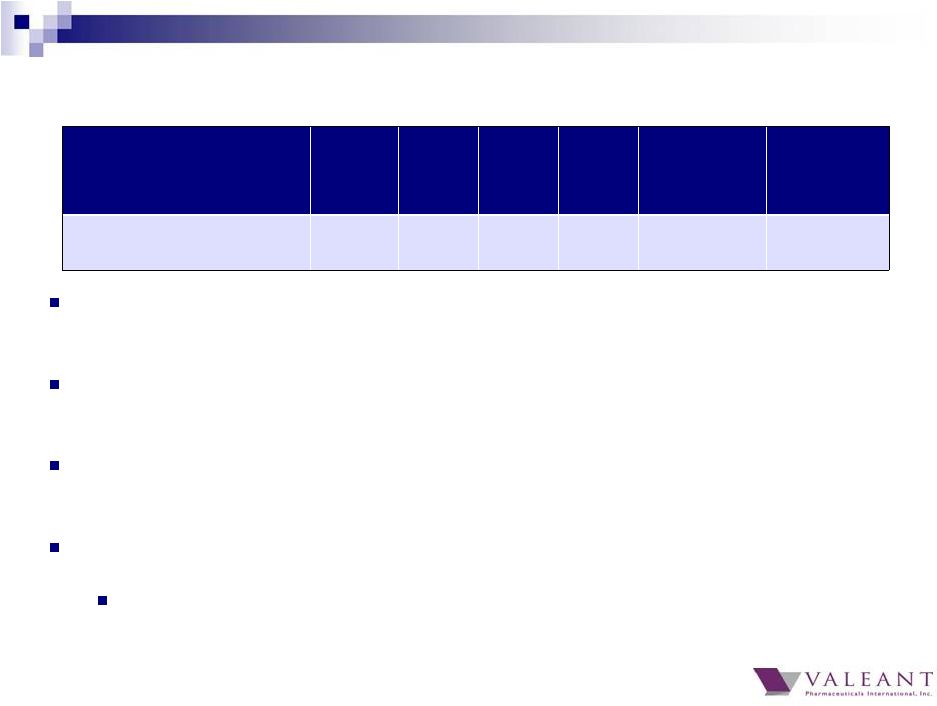
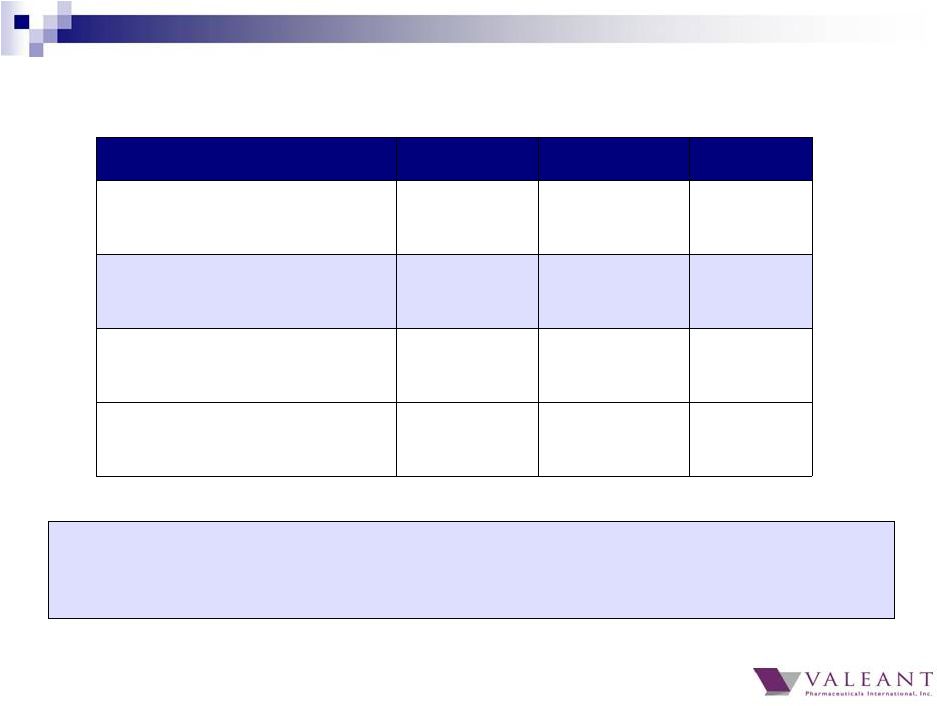 4 Q4 2014 Q4 2013 Y/Y % Total Revenue $2.3B $2.1B 10% Cash EPS (a) $2.58 $2.15 20% GAAP Cash Flow from Operations $816M $280M 191% Adjusted Cash Flow from Operations (a) $624M $607M 3% (a) Excludes $287 million net gain from Allergan transaction, net of fees and out-of-pocket expenses Q4 2014 Financial Results 1) Revenue would be $2.4B, or an increase of 16% Y/Y 2) Cash EPS would be $2.73, or an increase of 27% Y/Y At constant currency rates: |
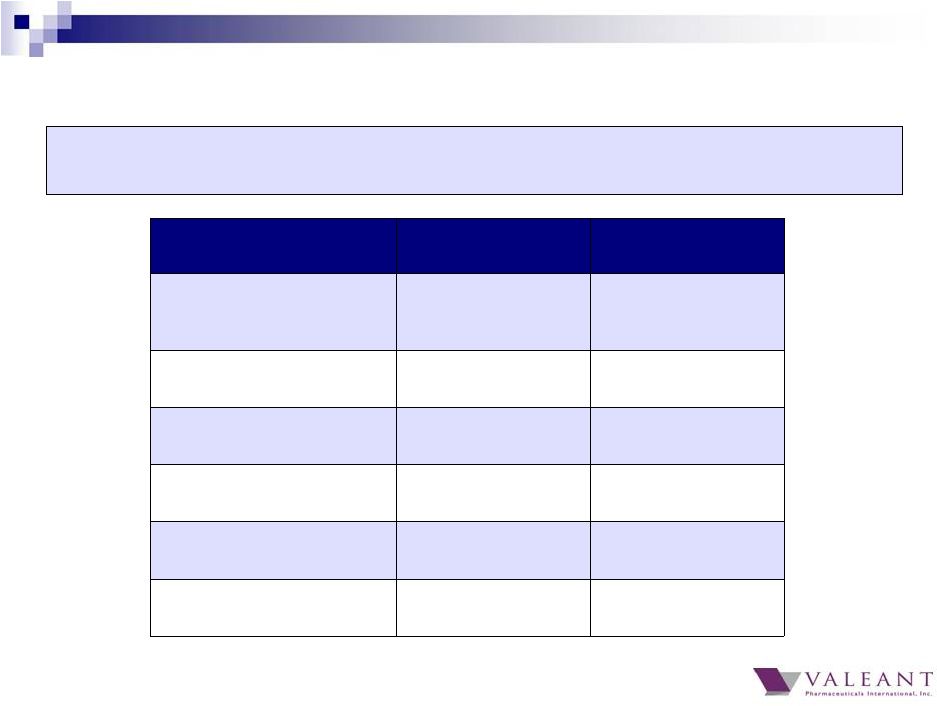 5 Guidance Q4 2014 Results Q4 2014 Organic Growth – Total Company Same Store Sales >12% 16% Organic Growth – Bausch +Lomb >10% full year 2014 Q4 8% Full Year 11% Total Revenue ~$2.2B $2.3B Cash EPS $2.55+ $2.58 Adjusted Cash Flow from Operations ~$600M $624M Restructuring & Integration Costs ~$50M $47M Total revenue and Cash EPS above October guidance, despite FX impact to revenue of $(42M) and Cash EPS impact of $(0.09) Q4 2014 Results |
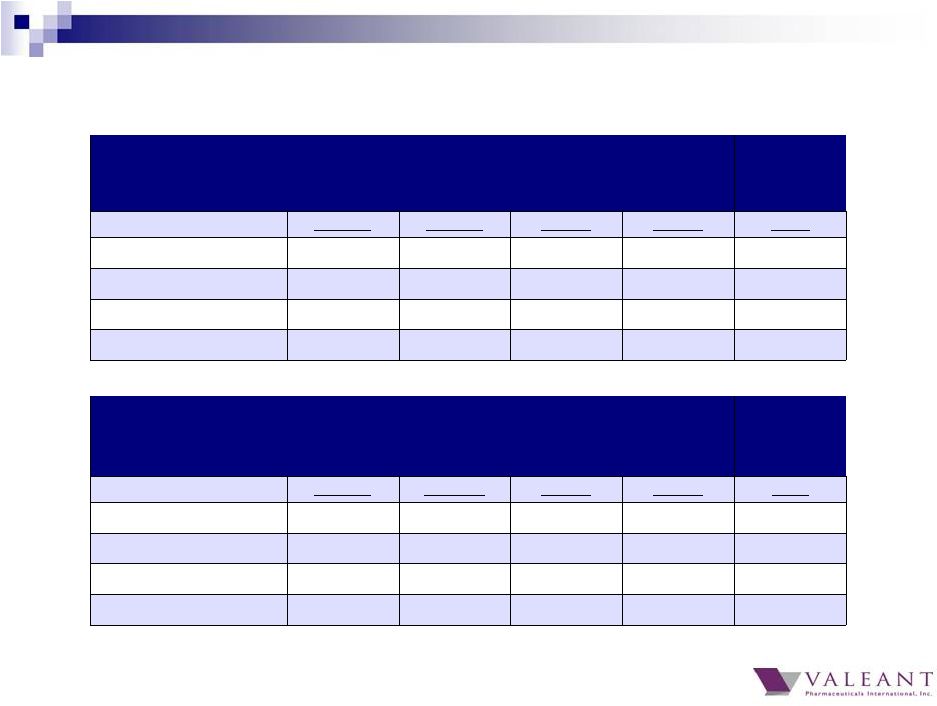 6 (a) As reported. (b) Excludes injectables for Q1 and Q2 in YTD organic growth. Same Store Sales – Y/Y growth rates for businesses that have been owned for one year or more Q1 2014 (a) Q2 2014 (a) Q3 2014 Q4 2014 2014 (b) Total U.S. 2% 5% 29% 28% 19% Total Developed 1% 2% 22% 20% 14% Total Emerging Markets 3% 8% 12% 6% 8% Total Company 1% 4% 19% 16% 13% Pro Forma – Y/Y growth rates for entire business, including businesses that have been acquired within the last year Q1 2014 (a) Q2 2014 (a) Q3 2014 Q4 2014 2014 (b) Total U.S. 3% 9% 24% 27% 17% Total Developed 3% 7% 18% 19% 13% Total Emerging Markets 4% 10% 9% 6% 8% Total Company 4% 8% 16% 15% 11% 2014 Organic Growth Including All Generic Impact |
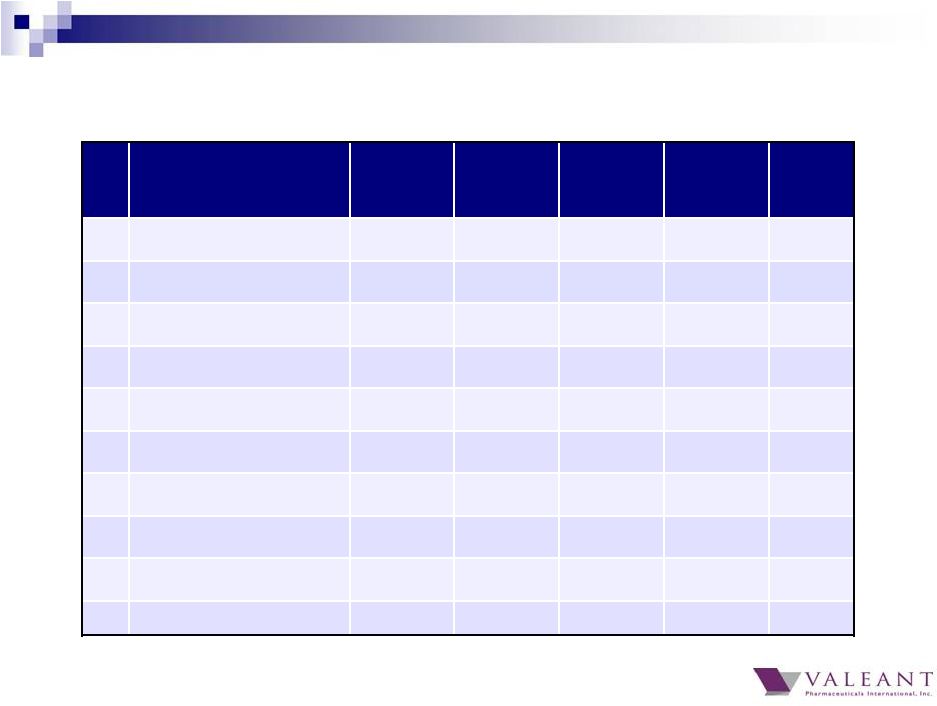
 7 Bausch + Lomb Organic Growth (a) Y/Y growth reflects shift in commercial model from sale of Victus lasers to lease arrangements. Excluding the impact of this change, Q4 organic growth is flat and FY organic growth is 5% Country/Region Q4 2014 Product Sales Y/Y% 2014 Since Acquisition (8/5/13) United States $386M 8% 12% 13% Consumer $102M 4% 12% 11% Rx Pharma $118M 7% 11% 13% Surgical $56M -4% (a) 4% 8% Contact Lens $43M 13% 16% 14% Generics $67M 29% 21% 25% Other Developed Markets $264M 2% 6% 4% Emerging Markets $211M 15% 14% 14% Total $861M 8% 11% 10% |
 8 Top 20 products revenue of $795M in Q4 2014, representing 36% of total revenue Top 20 products grew 28% Q4 2014 over Q4 2013 and 20% YTD All 20 products grew in Q4 2014 over Q4 2013 Jublia now our 4 th largest product Top 20 products demonstrate diversification Largest product contributed ~3.6% of Q4 revenue Top 10 products contributed 24% of Q4 revenue Mix of products includes Rx, OTC, and devices 2014 Top 20 Global Brands |
 9 Q4 2014 Top 20 Global Brands ($M) Product Q1 Q2 Q3 Q4 2014 1) Wellbutrin ® $69 $72 $80 $82 $303 2) Ocuvite ® / PreserVision ® $59 $66 $62 $62 $250 3) Solodyn ® $51 $43 $53 $61 $210 4) Jublia ® $0 $3 $12 $54 $69 5) Xenazine ® $50 $54 $56 $52 $212 6) Targretin ® Capsules $15 $29 $44 $48 $136 7) ReNu Multiplus ® $55 $49 $41 $46 $192 8) Lotemax ® Franchise $26 $45 $35 $45 $151 9) Carac ® $12 $12 $14 $42 $80 10) Arestin ® $15 $30 $30 $38 $113 |
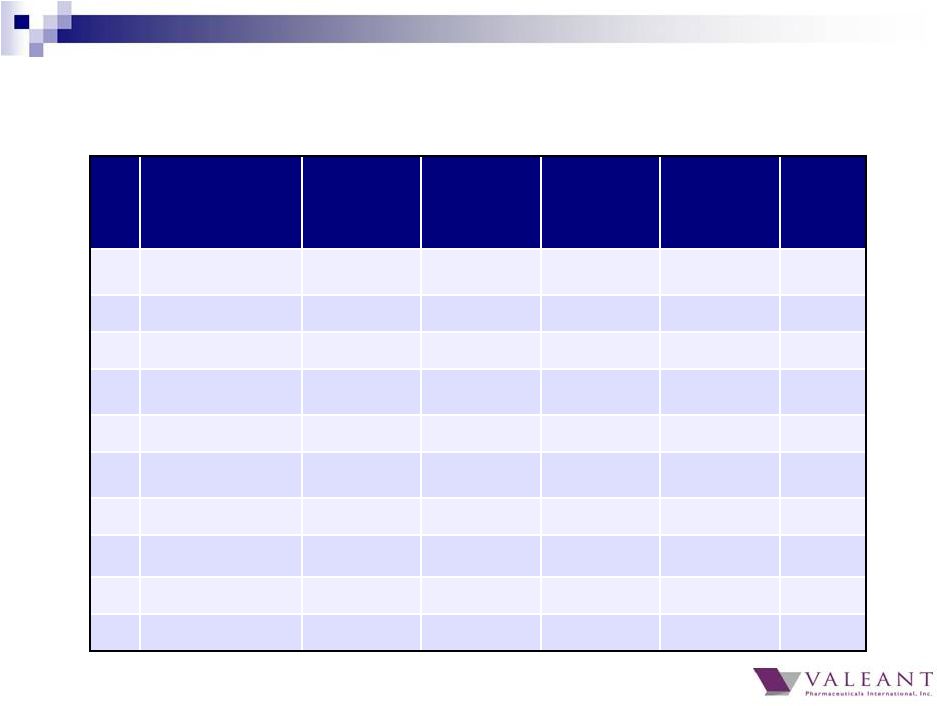 10 Q4 2014 Top 20 Global Brands ($M) Product Q1 Q2 Q3 Q4 2014 11) Zovirax ® Franchise $40 $19 $23 $35 $117 12) Syprine ® $19 $18 $20 $31 $88 13) Elidel ® $26 $25 $22 $31 $103 14) Retin-A ® Franchise $18 $19 $30 $30 $98 15) CeraVe ® $22 $28 $20 $27 $95 16) BioTrue ® Solution $24 $27 $26 $25 $103 17) Artelac TM $24 $27 $25 $24 $100 18) Ziana ® $29 $26 $35 $23 $68 19) Boston ® Solutions $19 $20 $20 $21 $80 20) Prolensa ® $17 $13 $16 $20 $65 |
 11 LUZU TRx up 12%, sequentially Retin-A Micro 0.08% TRx up ~200%, sequentially Consumer, $141M Revenues, 6% Y/Y Growth CeraVe - fastest growing (major) skin care brand: 49% growth Y/Y PreserVision AREDS 2 - #1 selling Vitamin SKU (a) : 17% growth Y/Y based on consumption (a) Source: IRI consumption data. Q4 U.S. Business Highlights (1/3) 4Q sales of $54M; Annualized run rate >$200M Weekly scripts are now above 20,000, yielding an annualized run rate of ~$250M DTC campaign now driving primary care physician prescribing to ~40% of script volume Strong growth for promoted brands, e.g. Solodyn, Elidel, Retin-A Franchise JUBLIA launch continues strong growth trend Entire PreserVision brand grew 14% Y/Y BioTrue Multipurpose Solution: 7% growth Y/Y Dermatology, $425M Revenues, 70% Y/Y Growth |
 12 3rd straight quarter of double digit growth Market share now 10% (a) in the U.S.; 3% point market share improvement since acquisition (8/13) Ultra continues to gain momentum Total revenues for Ultra were $4.2 million – capped due to capacity constraints First Ultra commercial manufacturing line expected to come on-line in Q2, with second line up in Q4 Signed strategic partnership with Vision Source, the largest independent doctor alliance group, across all brands and solutions (a) Source: GfK Q4 U.S. Business Highlights (2/3) Ophthalmology Rx, $132M Revenues, 8% Y/Y Growth Continued strong performance of Prolensa, and Lotemax franchise Contact Lenses, $43M Revenues, 13% Y/Y Growth |
 13 Surgical, $57M Revenues, -5% Y/Y Growth Number of cataract surgeries flat in Q4, continuing into Q1; given demographics, we expect a rebound to historic growth rates Decline in Excimer laser sales Continuing to gain share in IOLs and Femtosecond lasers with increased sales of Victus machines Neuro & Other/Generics, $453M Revenues, 28% Y/Y Growth Neuro & Other growth driven by Xenazine, Wellbutrin XL, Cuprimine/Syprine and Virazole Generics business continues to benefit from competitor stock outs and AG launches Dental, $41M Revenues, 38% Y/Y Growth Continued growth from Arestin and 2014 product launches (Onset, Ossix Plus) Q4 U.S. Business Highlights (3/3) |
 14 Emerging Markets-Europe/Middle East, $267M Revenues, 9% Y/Y Growth Strong performance despite significant FX headwinds 33% Y/Y growth excluding the impact of FX; FX impact on European Emerging Markets: ~ $(60M) in revenue 13% organic growth in Russia > 20% organic growth in Middle East; Medpharma off to a terrific start Emerging Markets-Asia, $143M Revenues, 12% Y/Y Growth 15% Y/Y growth excluding the impact of FX Continued strong growth in a number of countries including China (12%), Korea (15%), and Malaysia (24%) In Q1, Bescon lenses launched in China, Korea, and Japan; expanding capacity to meet demand in Asia and rest of world Armoxindo (Indonesia) acquisition off to a strong start Emerging Markets-Latin America, $113M Revenues, -7% Y/Y Growth 3% Y/Y growth excluding the impact of FX 11% organic growth in Mexico Brazil continues to struggle due to slower market growth and weakness in the Probiotica business ROW Developed, $423M Revenues, -13% Y/Y Growth -5% Y/Y growth excluding the impact of FX Significant currency headwinds: Euro, Yen, Canadian Dollar, Australian Dollar Both Western Europe and Japan grew organically at low single digits Australia and Canada with flat organic growth due to patent expiries: Wellbutrin (Canada) and Aldara and Tambocor (Australia); but we expect to return to growth in the first half of 2015 Q4 Rest of World Business Highlights |
 15 B+L Restructuring and Integration charges were $15M for the quarter, down from $36M in Q3 In Q4, $29 million relates to deals closed in 2014 including Solta (Q1), ECR (Q2), Croma (Q3), Precision (Q3), Bescon (Q3), and MedPharma (Q4) Only $3 million of Q4 restructuring and integration charges relate to deals closed more than 12 months ago and was primarily due to the closure of an Obagi facility Excluding Dendreon and Salix, restructuring and integration charges will continue to trend to zero We expect restructuring and integration charges equivalent to ~65% of annual synergies for both Dendreon and Salix Q1 Q2 Q3 Q1 2015 Q2 2015 Q4 Estimate (a) Estimate (a) Restructuring / Integration Expense $135M $143M $63M $47M < $25M < $15M Restructuring and Integration Charges (a) Excludes Dendreon and Salix restructuring and integration charges |
 16 Adjusted Q4 cash flow impacted by the acceleration of interest payments for the repayment of $945 million of bonds in Q4 and increase in prepaid expenses, including cost of DTC campaigns associated with new product launches Full Year 2014 Cash Flow from Operations (a) Excludes $287 million gain from Allergan transaction in Q4 and YTD 2014 Q1 Q2 Q3 Q4 Full year Adjusted Net Income 600 651 719 880 2,850 GAAP Cash Flow from Operations 484 376 619 816 2,295 Adjusted Cash Flow from Operations (a) 636 500 771 624 2,532 Cash conversion 89% Investment in Working Capital 43 166 13 343 565 |
 17 Significant deleveraging in 2014 from 4.5x adjusted pro forma EBITDA to 3.5x Debt reduced from $17.6B to $15.4B in 2014 Repaid $1.2B debt in Q4, including $945M bonds and $255M Term Loan Accounts Receivable DSO* in line with previous quarters (calculated using gross sales): Q1 2014: 72 Days Q2 2014: 66 Days Q3 2014: 64 Days Q4 2014: 66 Days Due to changes in product mix and higher gross sales, accounts receivable increased by $196M with an offsetting increase in accrued liabilities of ~$123M related to rebates, returns and allowances Net increase of ~$73M in receivables net of accrued liabilities in Q4 vs. Q3 2014 against $224M increase in net sales * Gross revenue is disclosed in 10K for calculation purposes Balance Sheet |
 Q1 2015 |
 19 Organic growth of 10-15% for total company Strong performance in a number of our businesses, including: U.S.: Dermatology, Contact Lenses, Dentistry, Obagi, Consumer Ex-U.S.: China, Thailand, Malaysia, Mexico, Middle East, Poland Continued momentum in 2014 launch brands: Jublia, Ultra, Retin-A Micro 0.08% Strong early days for Onexton Soft market conditions in Western Europe and Russia will result in low single-digit organic growth for both Western Europe and EMENA businesses in Q1 Expect Cash EPS of at least $2.30 per share Outperformance in the U.S. will continue to offset foreign exchange headwinds Plan to update 2015 guidance on Q1 2015 conference call to reflect: Dendreon: expected to be accretive in 2015 Salix: due to work-down of wholesaler inventory levels, expected to be modestly accretive in 2015, but >20% accretive in 2016 Base business outperformance Q1 2015 Guidance |
 Dendreon |
 21 Dendreon Purchased assets for $415M net of cash Represents 1.3x sales The increased $15M from the original $400M was for a pipeline product and tax attributes Oncology is a platform that fits the Valeant business model Strong market growth Concentrated specialist prescribers where relationships matter Some large pharma companies beginning to de-emphasize Favorable reimbursement Opportunity to invest in targeted R&D for additional indications A company that fits our investment criteria Provenge, a unique immunotherapeutic, is durable, and we believe we can accelerate its growth Provides significant optionality, establishing a platform for additional tuck-in acquisitions Under-managed company; infrastructure built for a $1B+ product Financially compelling transaction Synergies of ~$130M+ (including manufacturing) excluding benefit of VRX corporate structure Ability to increase gross margin to approximately 65% by the end of 2015, with a longer term plan to reach ~80% IRR of ~30% at statutory tax rates, with a cash payback of ~5 years |
 Salix |
 23 Transaction Highlights Acquiring all outstanding shares for $158.00 per share in cash Enterprise value of approximately $14.5 billion Fully committed financing from a syndicate of banks led by Deutsche Bank and HSBC Expected to close in the second quarter of 2015 Transaction creates a new specialty platform for growth Branded GI market is growing at 5% Salix’s key promoted products are showing strong double digit growth Expected near-term approval for IBS-D indication of Xifaxan, providing an additional catalyst for future growth The launch of Uceris Foam and the approval of Relistor Oral will also contribute to future growth Attractive near-term pipeline Compelling returns for Valeant shareholders Expected to achieve run rate cost synergies of >$500 million across combined company cost base within six months From a 2015 ~$750M Salix OPEX base and a ~$3.2B combined company OPEX base Does not include any benefits of Valeant’s corporate structure No planned reductions to Salix’s Specialty sales forces or Hospital, Key Account, and Field Reimbursement teams; optimal size of Primary Care sales force to be evaluated IRR and cash payback in-line with our other large transactions Greater than 20% accretive in 2016 |
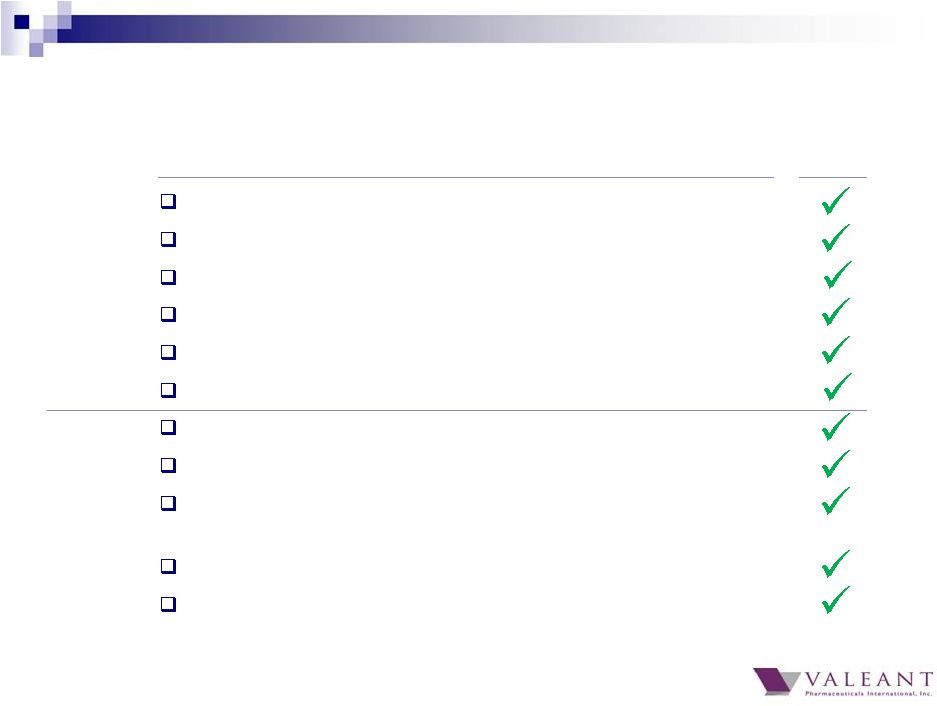 24 Salix is an Attractive Entry Into a Growing Therapeutic Area Concentrated specialist prescriber population Sales representative and prescriber relationship matters Less of a priority for many larger pharmacos Favorable reimbursement Opportunity for low-risk, incremental innovation Market segment growth higher than average Strong underlying volume growth in core products Attractive short-term pipeline Significant opportunity to create value through application of Valeant operating model Financially compelling returns Platform for value-added tuck-in acquisitions Criteria Salix GI market Salix |
 25 Attractive market fundamentals Growing market with attractive sub- segments Significant patient unmet needs, since illnesses are: Typically chronic Damaging to quality of life Undertreated Strong potential to significantly expand the IBS-D market through DTC and other commercial levers Majority of prescribing influenced by a concentrated specialist GI population Competition primarily mid-sized and smaller players Why Gastrointestinal? 1 Excludes gastroesophageal reflux disorder and includes estimated GI revenue of major immunomodulators 2 Other includes opioid induced constipation, ulcers, hemorrhoids, pancreatic insufficiency, etc. SOURCE: EvaluatePharma, CDC +5% CAGR Diarrhea Ulcers Pancreatic insufficiency Constipation 300 2014 2019E Other 2 550 1,600 11,200 5,000 6,700 650 1,200 8,700 U.S. Branded GI drug sales 1 USD MM 800 850 750 750 750 USD MM and Irritable Bowel Syndrome Inflammatory Bowel Disease |
 26 (a) Source: IMS Salix at a Glance Mid-sized specialty pharma company that is a clear leader in the GI market Ranked #1 GI sales force 3 of the past 4 years (a) Xifaxan comprises ~50% revenue Approved for Hepatic Encephalopathy (HE) and Traveler’s Diarrhea PDUFA date for IBS-D – May 27, 2015 Other major products for Ulcerative Colitis (Apriso and Uceris) and opioid induced constipation (Relistor) with attractive growth prospects Attractive, low-risk short-term pipeline Xifaxan IBS-D indication Relistor oral indication (approval expected 2016/2017) Xifaxan Crohn’s indication Xifaxan Early decompensated liver cirrhosis indication Traveler’s Diarrhea & Hepatic Encephalopathy (HE) Ulcerative Colitis Ulcerative Colitis Opioid Induced Constipation |
 27 Recent Salix TRx Growth Xifaxan TRx trends Apriso TRx trends Relistor TRx trends Uceris TRx trends 0 120,000 160,000 140,000 3Q13 1Q13 2Q13 4Q13 2Q14 3Q14 1Q14 4Q14 0 140,000 80,000 100,000 120,000 4Q14 3Q14 2Q14 1Q14 4Q13 3Q13 2Q13 1Q13 9,000 8,500 9,500 10,500 11,000 11,500 0 10,000 4Q14 3Q14 2Q14 1Q14 4Q13 3Q13 2Q13 1Q13 3Q13 4Q13 1Q14 2Q14 4Q14 3Q14 2Q13 1Q13 Sources: SHS PHAST Retail 17% y/y 25% y/y 15% y/y 107% y/y 0 5,000 10,000 15,000 20,000 25,000 30,000 35,000 |
 28 Salix Adds Another Growth Platform in the U.S. 2015(E) Valeant U.S. Revenue 2015(E) Pro Forma U.S. Combined Company Revenue 1 Excludes the impact of wholesaler inventory levels Gastrointestinal 24% 30% Consumer 8% 22% Eye Health 12% Oncology 4% Eye Health 29% 11% 16% 39% 5% Consumer Oncology Total: ~$5.9B Total: ~$7.9B 1 Neurology&Other/ Dental/Gx Neurology&Other/ Dental/Gx Dermatology Rx Dermatology Rx |
 29 On November 6, 2014 Salix disclosed that it had 5-9 months of inventory of its top four products at wholesalers Valeant has conducted extensive due diligence and taken into account Salix’s wholesaler inventory levels and remediation plan, as well as associated potential litigation and regulatory exposure Valeant expects to work down wholesaler inventory and plans to target two months or less of inventory by year-end 2015 The net impact of the plan to reduce wholesaler inventory levels on 2015 revenues is expected to be greater than ~$500 million Wholesaler Inventory Management |
 30 Product Condition/ Indication Patent Expiry Competitive advantage 2015E revenue (% contribution) Base case volume growth assumptions 2015(E) vs. 2014 Xifaxan Hepatic encephalopathy/ Travelers’ diarrhea 2029 Label expansion expected into IBS-D $900 (50%) 30% Uceris Ulcerative colitis 2031 Favorable safety profile Foam formulation to expand usage $195 (10%) 40% Apriso Maintenance of remission UC 2022 3 Strong formulary coverage $150 (8%) 5% Purgatives Colon cleansers Moviprep differentiated by the inclusion of ascorbic acid in its formulation $85 (4%) 0% Relistor Injection OIC 2030 Recent label expansion for treatment of patients on opioids for chronic pain unrelated to cancer; Relistor Oral approval expected 2016/2017 $80 (4%) 5% Glumetza Type 2 diabetes 2016 3 Extended release formulation allows more convenient dosing $200 (10%) 5-10% Key Products ($M) 1 Excludes the impact of wholesaler inventory levels 2 Patent expiry for Moviprep, which has majority of revenue 3 Reflects generic entry settlement date 1 2018 2,3 |
 31 No planned reductions to Salix’s Specialty sales forces or Hospital, Key Account, and Field Reimbursement teams; optimal size of Primary Care sales force to be evaluated Run-rate cost savings achieved within 6 months; expected integration costs of ~65% of total annual synergies Significant Combined Company Synergy Opportunity 2015(E) Combined Cost ($M) Synergies ($M) % Reduction SG&A ~$2,700 ~$350 13% R&D ~$450 ~$150 33% Manufacturing (COGS) ~$2,600 $0 0% Total ~$5,750 >$500 9% |
 32 Transaction is entirely debt financed Transaction will be financed with a combination of bank debt (~35% of total) and bonds (~65% of total) Committed financing from Deutsche Bank, HSBC, MUFG, DNB Bank ASA, and SunTrust Robinson Humphrey, Inc. $22.5B in committed debt consisting of $15B to finance the transaction and $7.5B to backstop VRX’s existing secured debt while seeking amendment to credit agreement ~5.6x Net Debt/ Adjusted Pro Forma EBITDA Negatively impacted by Salix’s artificially low EBITDA due to its plan to reduce wholesaler inventory levels Attractive deleveraging profile – company expects leverage to be below 4.0x by the second half of 2016 In 2016, Valeant expected to have pro-forma EBITDA in excess of $7.5 billion and free cash flow in excess of $4.0 billion before any mandatory repayments BD activity to focus on tuck-ins In the near term, we continue to expect combined company tax rate of ~5% Greater than 20% accretion in 2016 Modestly accretive in 2015 due to the plan to reduce wholesaler inventory levels Financing and Financial Impact |
 33 Enterprise Value ($ M) Salix Equity (65.7M fully diluted shares at $158/share) $10,382 2015 Convertibles $1,181 2019 Convertibles $1,683 Term Loan $1,126 Senior Notes due 2021 (including breakage) $857 Estimated balance sheet cash/convert hedge unwind ~$(660) Total enterprise value ~$14,500 Note: includes accrued interest; excludes fees and expenses |
 34 2015 is off to a strong start Many businesses are over-delivering against high expectations, e.g., U.S. Dermatology (e.g., Jublia, Onexton) U.S. Contact Lens business and U.S. Consumer Middle East and Africa China Salix: A new platform for growth Attractive, growing market Exciting portfolio of growth products Attractive tuck-in opportunities We will report Salix and Dendreon going forward as two U.S. business units, including revenue and restructuring and integration charges; this will enable investors to see the continued strong organic growth performance of our base business Look forward to updating guidance on our Q1 conference call Summary |
 Valeant Pharmaceuticals International, Inc. February 23, 2015 Fourth Quarter and Full Year 2014 Financial Results and The Acquisition of Salix Pharmaceuticals |
 Back Up |
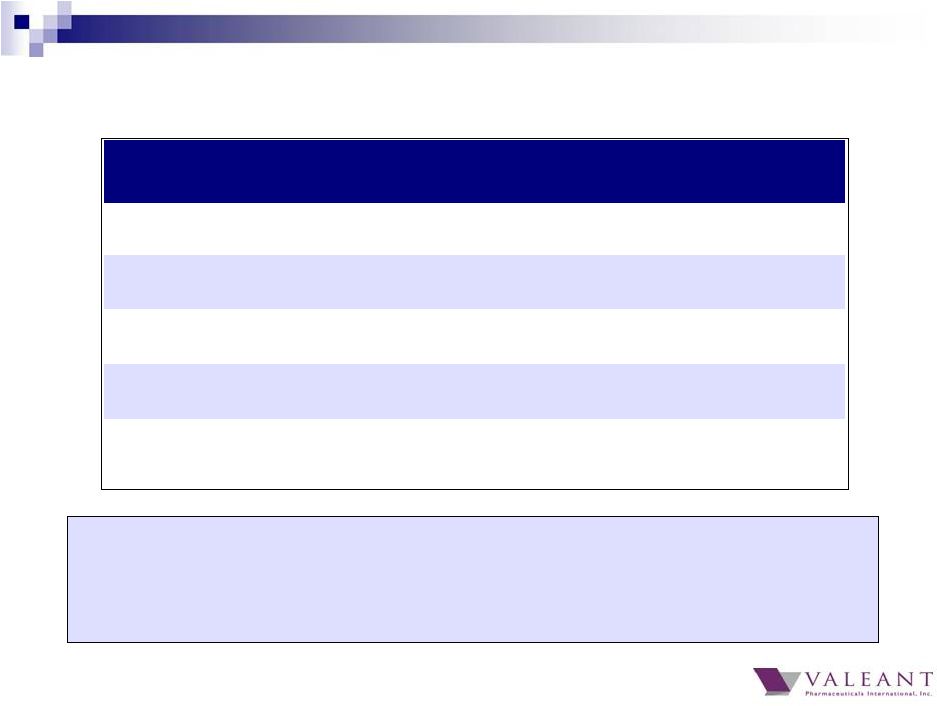
 2014 2013 Y/Y % Total Revenue $8.3B $5.8B 43% Cash EPS $8.34 $6.24 34% GAAP Cash Flow from Operations $2.29B $1.04B 120% Adjusted Cash Flow from Operations* $2.53B $1.78B 42% Cash Conversion 89% 87% N/A * Excludes $287M gain from Allergan transaction Full Year 2014 Financial Results 37 |
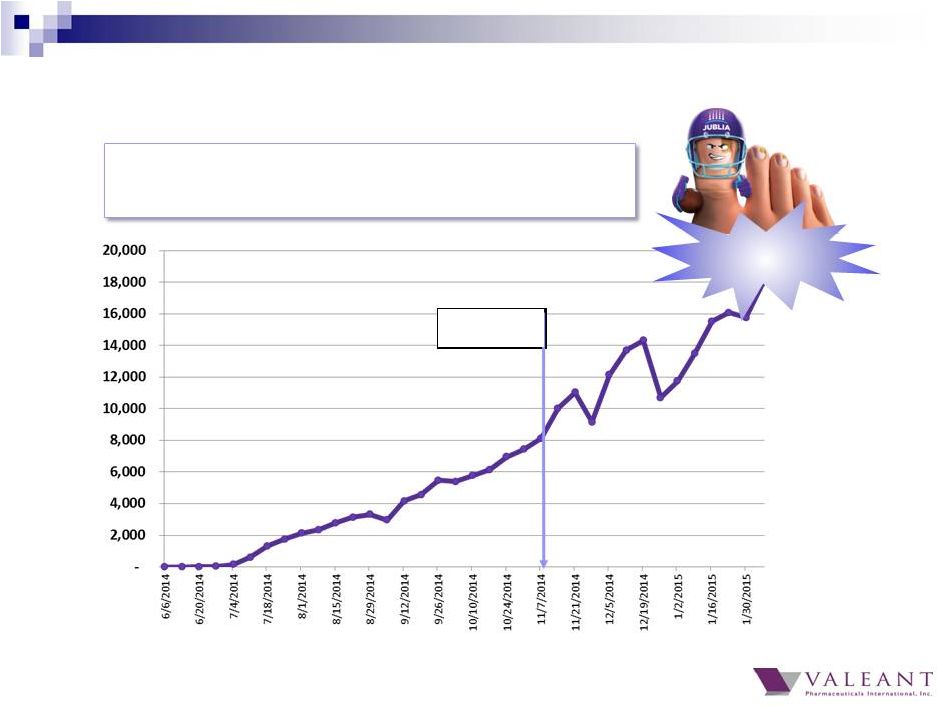 • 4Q 2014 sales >$50 million • Annualized run rate >$200 million DTC TV 20,000+ Jublia Weekly TRx Growth Accelerating from DTC 38 |
 • Strong integrated DTC campaign igniting growth • TV, Print, Digital to maximize Super Bowl airing • Reached an audience of >50M Households, >114M People • Generated more than 1.2 Billion media impressions • DTC activating largest pool of patients who see PCPs • PCPs are now largest group of prescribers New JUBLIA Football Commercial Debuted During Super Bowl 39 |
 Q4 2013 Q1 2014 Q2 2014 Q3 2014 Q4 2014 Total Revenue $2,064M $1,886M $2,041M $2,056M $2,280M Cost of Goods Sold% (% of product sales) 26% 26% 28% 26% 24% SG&A% (% of total revenue) 22% 26% 25% 24% 23% R&D Expense $60M $61M $66M $59M $59M Operating Margin (% of total revenue) (excluding amortization) 49% 45% 44% 47% 50% Cash EPS (Reported) $2.15 $1.76 $1.91 $2.11 $2.58 GAAP Cash Flow from Operations $280M $484M $376M $619M $816M Adjusted Cash Flow from Operations* $607M $636M $500M $771M $624M Fully Diluted Share Count 341M 342M 341M 341M 342M * Excludes $287M gain from Allergan transaction Financial Summary 40 |
   Significant Q4 FX headwinds from October spot rates Q4 impact Russian Ruble (17.6)% Euro (2.8)% Japanese Yen (8.2)% Polish Zloty (2.7)% Mexican Peso (2.6)% Australian Dollar (3.3)% Brazilian Real (3.7)% Serbian Dinar (3.6)% Canadian Dollar (0.9)% Singapore Dollar (2.9)% British Pound (1.2)% South Korean Won (2.2)% Currency Q4 Actual % Change vs. 10/15/14 FX Impact on Q4 versus October Guidance • Revenue: ~$(42)M • Cash EPS: ~$(0.09) 41 |