Exhibit 99.2 Q1 2021 Results Presentation May 20, 2021Exhibit 99.2 Q1 2021 Results Presentation May 20, 2021
Cautionary Statement Regarding Forward-Looking Information This presentation contains forward-looking statements within the meaning of the Private Securities Litigation Reform Act of 1995. Words such as believes, anticipates, plans, may, intends, will, should, expects, and similar expressions are intended to identify forward-looking statements. Forward-looking statements include, but are not limited to, comments about Kohl's future financial plans, capital generation, management and deployment strategies, adequacy of capital resources and the competitive environment. Such statements are subject to certain risks and uncertainties, which could cause Kohl's actual results to differ materially from those anticipated by the forward looking statements. These risks and uncertainties include, but are not limited to, those described in Item 1A in Kohl's Annual Report on Form 10-K, which is expressly incorporated herein by reference, and other factors as may periodically be described in Kohl's filings with the SEC. Any number of risks and uncertainties could cause actual results to differ materially from those Kohl’s expresses in its forward-looking statements, including the short and long-term impact of COVID-19 on the economy and the pace of recovery thereafter. Forward-looking statements speak as of the date they are made, and Kohl’s undertakes no obligation to update them.
Non-GAAP Financial Measures In addition, this presentation contains non-GAAP financial measures, including Adjusted EPS, Adjusted Net Income, and Free Cash Flow. Reconciliations of all non-GAAP measures to the most directly comparable GAAP measures are included in the Appendix of this presentation. 2Cautionary Statement Regarding Forward-Looking Information This presentation contains forward-looking statements within the meaning of the Private Securities Litigation Reform Act of 1995. Words such as believes, anticipates, plans, may, intends, will, should, expects, and similar expressions are intended to identify forward-looking statements. Forward-looking statements include, but are not limited to, comments about Kohl's future financial plans, capital generation, management and deployment strategies, adequacy of capital resources and the competitive environment. Such statements are subject to certain risks and uncertainties, which could cause Kohl's actual results to differ materially from those anticipated by the forward looking statements. These risks and uncertainties include, but are not limited to, those described in Item 1A in Kohl's Annual Report on Form 10-K, which is expressly incorporated herein by reference, and other factors as may periodically be described in Kohl's filings with the SEC. Any number of risks and uncertainties could cause actual results to differ materially from those Kohl’s expresses in its forward-looking statements, including the short and long-term impact of COVID-19 on the economy and the pace of recovery thereafter. Forward-looking statements speak as of the date they are made, and Kohl’s undertakes no obligation to update them. Non-GAAP Financial Measures In addition, this presentation contains non-GAAP financial measures, including Adjusted EPS, Adjusted Net Income, and Free Cash Flow. Reconciliations of all non-GAAP measures to the most directly comparable GAAP measures are included in the Appendix of this presentation. 2
Q1 2021 Results
10 Driving Top Line Growth Presentation Q1 2021 Results 4 Updated 2021 Outlook 9 Our Strategy 11 3Q1 2021 Results 10 Driving Top Line Growth Presentation Q1 2021 Results 4 Updated 2021 Outlook 9 Our Strategy 11 3
Q1 2021 Results 4Q1 2021 Results 4
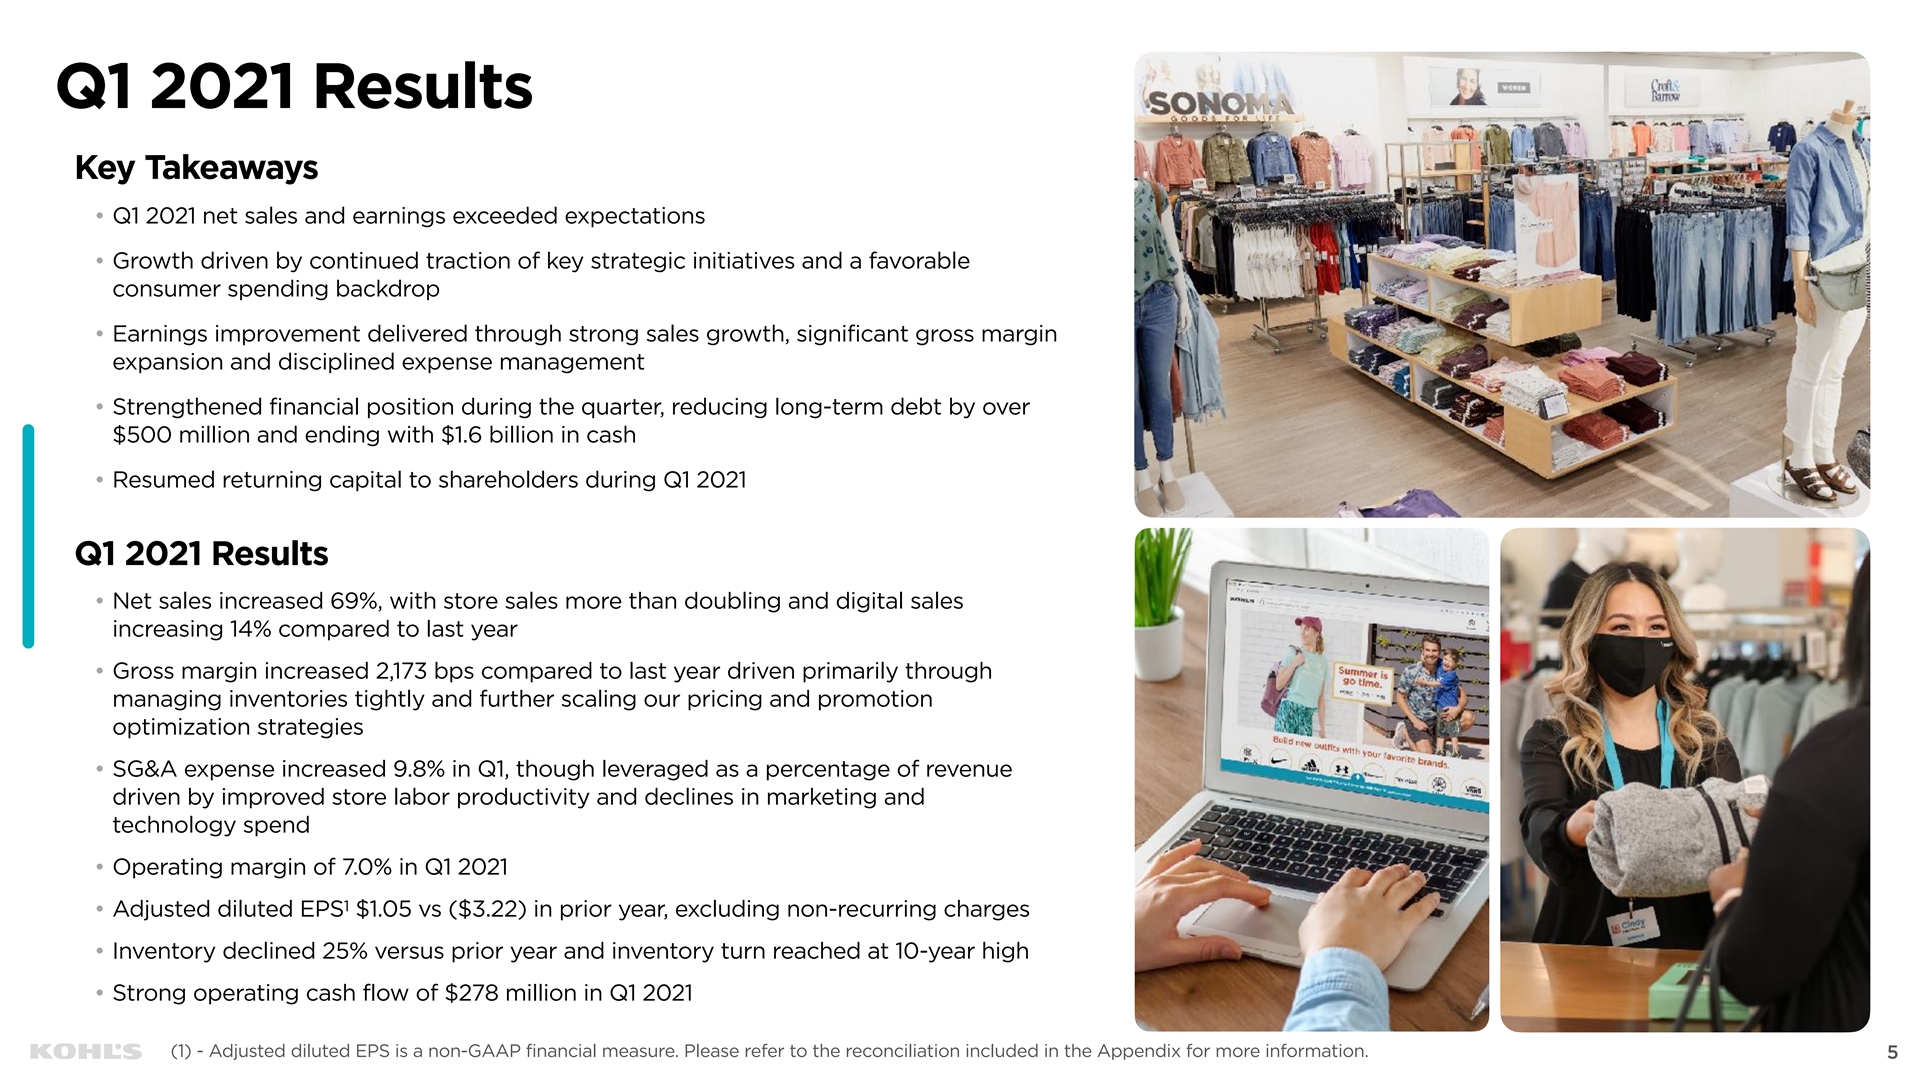
Q1 2021 Results Key Takeaways • Q1 2021 net sales and earnings exceeded expectations • Growth driven by continued traction of key strategic initiatives and a favorable consumer spending backdrop • Earnings improvement delivered through strong sales growth, significant gross margin expansion and disciplined expense management • Strengthened financial position during the quarter, reducing long-term debt by over $500 million and ending with $1.6 billion in cash • Resumed returning capital to shareholders during Q1 2021 Q1 2021 Results • Net sales increased 69%, with store sales more than doubling and digital sales increasing 14% compared to last year • Gross margin increased 2,173 bps compared to last year driven primarily through managing inventories tightly and further scaling our pricing and promotion optimization strategies • SG&A expense increased 9.8% in Q1, though leveraged as a percentage of revenue driven by improved store labor productivity and declines in marketing and technology spend • Operating margin of 7.0% in Q1 2021 1 • Adjusted diluted EPS $1.05 vs ($3.22) in prior year, excluding non-recurring charges • Inventory declined 25% versus prior year and inventory turn reached at 10-year high • Strong operating cash flow of $278 million in Q1 2021 5 (1) - Adjusted diluted EPS is a non-GAAP financial measure. Please refer to the reconciliation included in the Appendix for more information. 5Q1 2021 Results Key Takeaways • Q1 2021 net sales and earnings exceeded expectations • Growth driven by continued traction of key strategic initiatives and a favorable consumer spending backdrop • Earnings improvement delivered through strong sales growth, significant gross margin expansion and disciplined expense management • Strengthened financial position during the quarter, reducing long-term debt by over $500 million and ending with $1.6 billion in cash • Resumed returning capital to shareholders during Q1 2021 Q1 2021 Results • Net sales increased 69%, with store sales more than doubling and digital sales increasing 14% compared to last year • Gross margin increased 2,173 bps compared to last year driven primarily through managing inventories tightly and further scaling our pricing and promotion optimization strategies • SG&A expense increased 9.8% in Q1, though leveraged as a percentage of revenue driven by improved store labor productivity and declines in marketing and technology spend • Operating margin of 7.0% in Q1 2021 1 • Adjusted diluted EPS $1.05 vs ($3.22) in prior year, excluding non-recurring charges • Inventory declined 25% versus prior year and inventory turn reached at 10-year high • Strong operating cash flow of $278 million in Q1 2021 5 (1) - Adjusted diluted EPS is a non-GAAP financial measure. Please refer to the reconciliation included in the Appendix for more information. 5
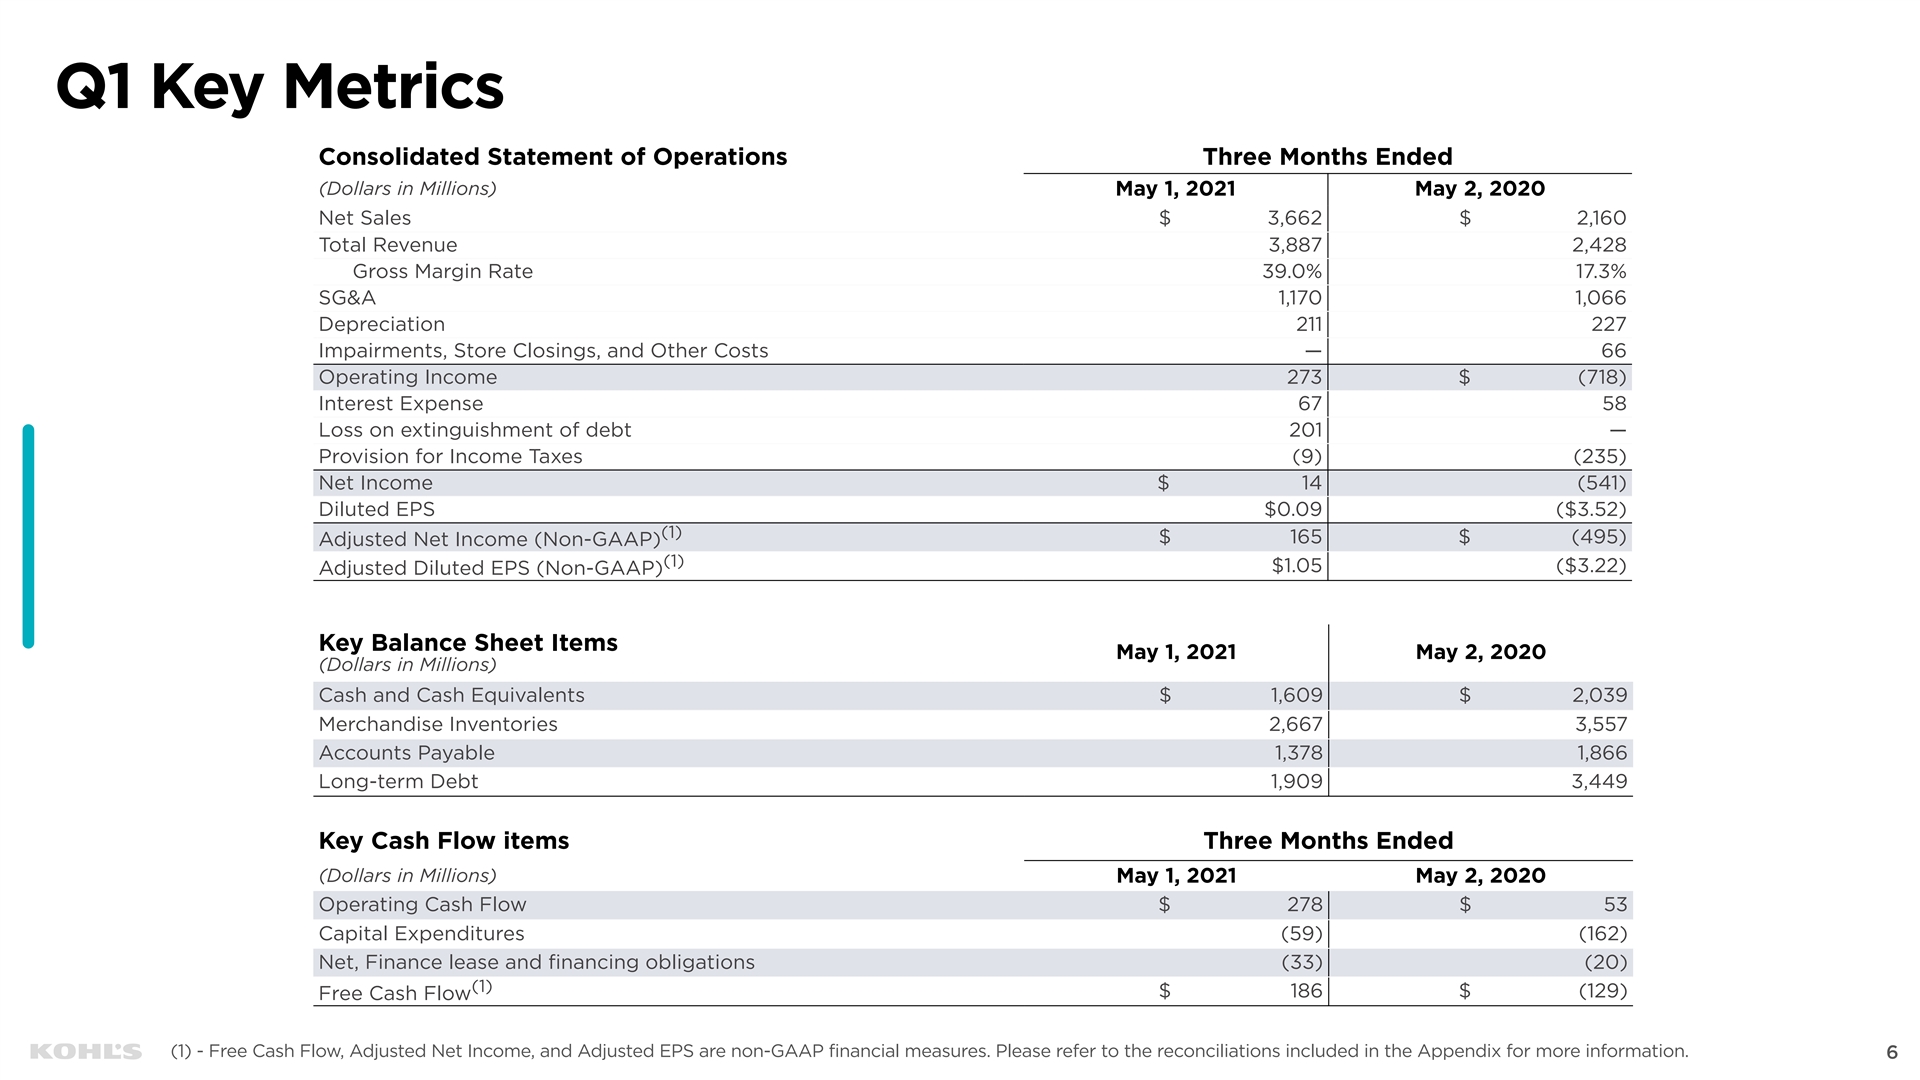
Q1 Key Metrics Consolidated Statement of Operations Three Months Ended (Dollars in Millions) May 1, 2021 May 2, 2020 Net Sales $ 3,662 $ 2,160 Total Revenue 3,887 2,428 Gross Margin Rate 39.0% 17.3% SG&A 1,170 1,066 Depreciation 211 227 Impairments, Store Closings, and Other Costs — 66 Operating Income 273 $ (718) Interest Expense 67 58 Loss on extinguishment of debt 201 — Provision for Income Taxes (9) (235) Net Income $ 14 (541) Diluted EPS $0.09 ($3.52) (1) $ 165 $ (495) Adjusted Net Income (Non-GAAP) (1) $1.05 ($3.22) Adjusted Diluted EPS (Non-GAAP) Key Balance Sheet Items May 1, 2021 May 2, 2020 (Dollars in Millions) Cash and Cash Equivalents $ 1,609 $ 2,039 Merchandise Inventories 2,667 3,557 Accounts Payable 1,378 1,866 Long-term Debt 1,909 3,449 Key Cash Flow items Three Months Ended (Dollars in Millions) May 1, 2021 May 2, 2020 Operating Cash Flow $ 278 $ 53 Capital Expenditures (59) (162) Net, Finance lease and financing obligations (33) (20) (1) $ 186 $ (129) Free Cash Flow 6 6 (1) - Free Cash Flow, Adjusted Net Income, and Adjusted EPS are non-GAAP financial measures. Please refer to the reconciliations included in the Appendix for more information. 6Q1 Key Metrics Consolidated Statement of Operations Three Months Ended (Dollars in Millions) May 1, 2021 May 2, 2020 Net Sales $ 3,662 $ 2,160 Total Revenue 3,887 2,428 Gross Margin Rate 39.0% 17.3% SG&A 1,170 1,066 Depreciation 211 227 Impairments, Store Closings, and Other Costs — 66 Operating Income 273 $ (718) Interest Expense 67 58 Loss on extinguishment of debt 201 — Provision for Income Taxes (9) (235) Net Income $ 14 (541) Diluted EPS $0.09 ($3.52) (1) $ 165 $ (495) Adjusted Net Income (Non-GAAP) (1) $1.05 ($3.22) Adjusted Diluted EPS (Non-GAAP) Key Balance Sheet Items May 1, 2021 May 2, 2020 (Dollars in Millions) Cash and Cash Equivalents $ 1,609 $ 2,039 Merchandise Inventories 2,667 3,557 Accounts Payable 1,378 1,866 Long-term Debt 1,909 3,449 Key Cash Flow items Three Months Ended (Dollars in Millions) May 1, 2021 May 2, 2020 Operating Cash Flow $ 278 $ 53 Capital Expenditures (59) (162) Net, Finance lease and financing obligations (33) (20) (1) $ 186 $ (129) Free Cash Flow 6 6 (1) - Free Cash Flow, Adjusted Net Income, and Adjusted EPS are non-GAAP financial measures. Please refer to the reconciliations included in the Appendix for more information. 6
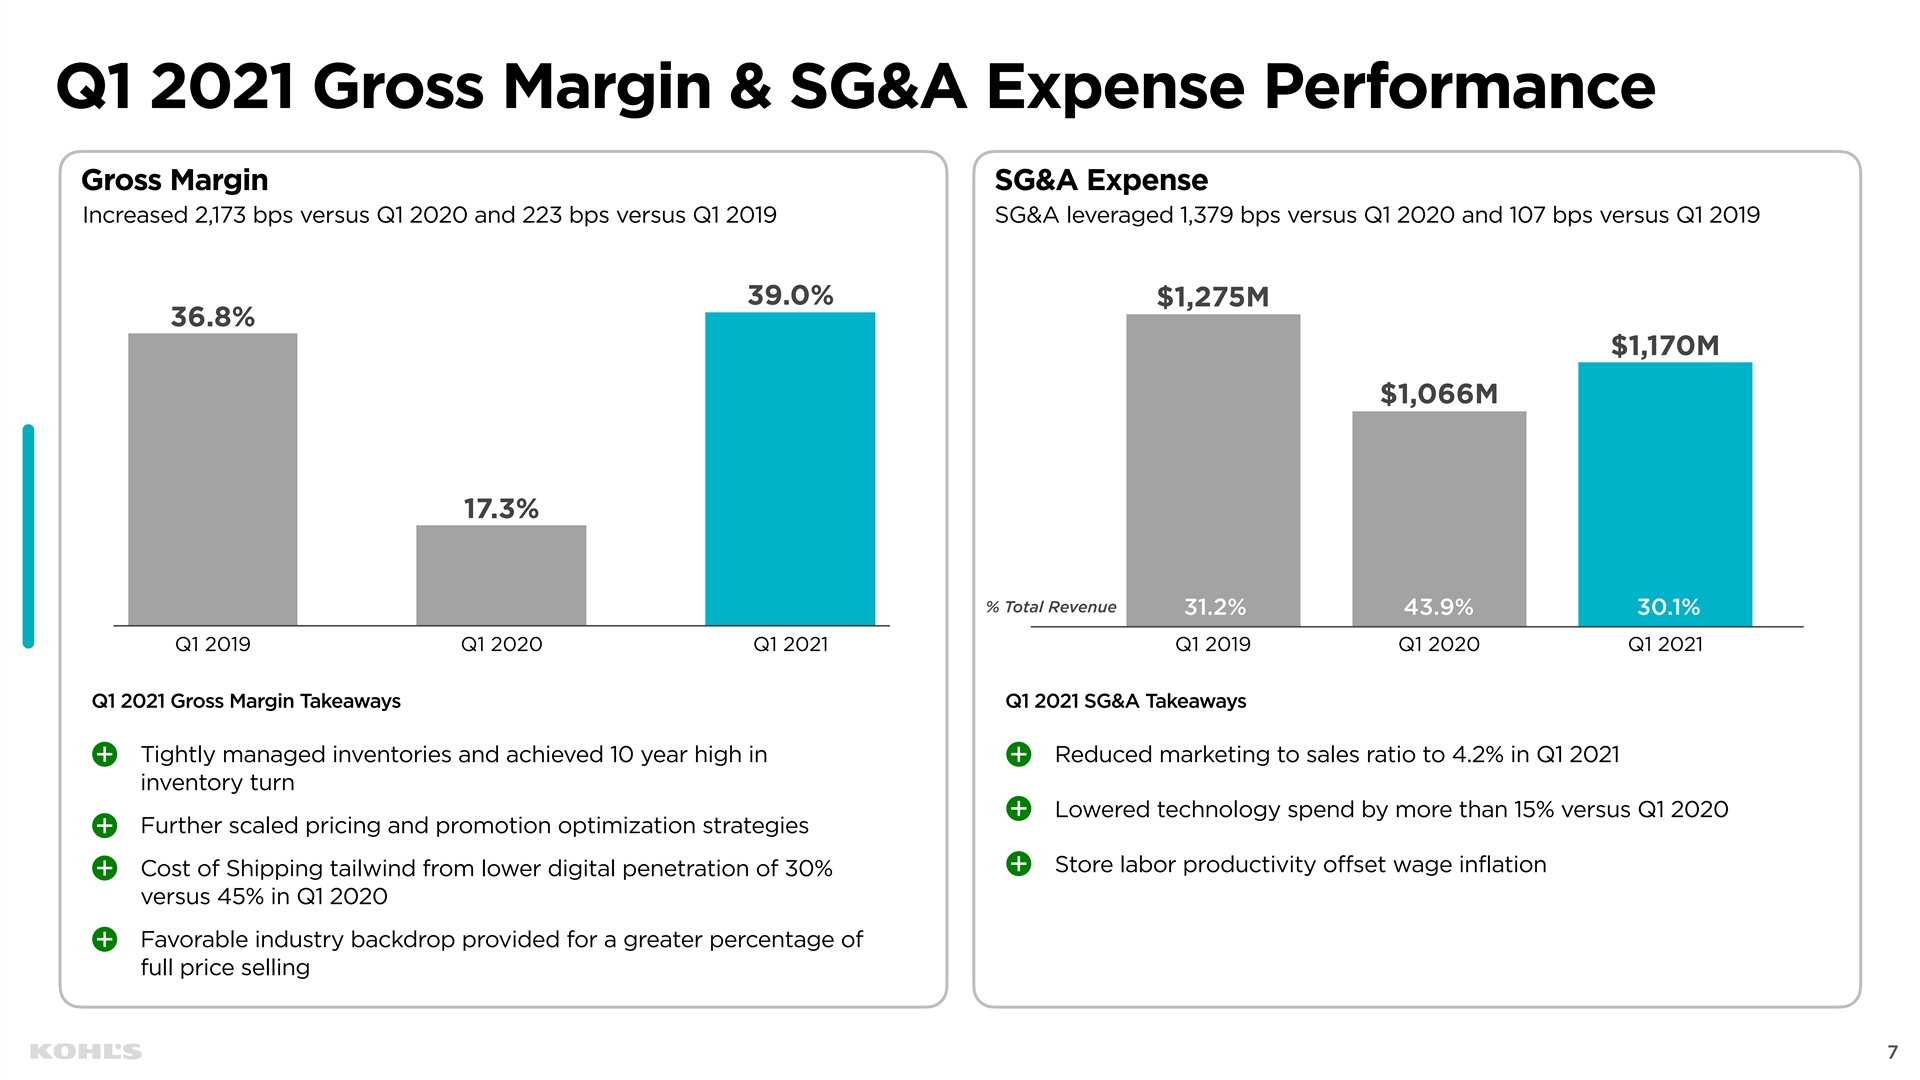
Q1 2021 Gross Margin & SG&A Expense Performance Gross Margin SG&A Expense Increased 2,173 bps versus Q1 2020 and 223 bps versus Q1 2019 SG&A leveraged 1,379 bps versus Q1 2020 and 107 bps versus Q1 2019 39.0% $1,275M 36.8% $1,170M $1,066M 17.3% % Total Revenue 31.2% 43.9% 30.1% Q1 2019 Q1 2020 Q1 2021 Q1 2019 Q1 2020 Q1 2021 Q1 2021 Gross Margin Takeaways Q1 2021 SG&A Takeaways Tightly managed inventories and achieved 10 year high in Reduced marketing to sales ratio to 4.2% in Q1 2021 inventory turn Lowered technology spend by more than 15% versus Q1 2020 Further scaled pricing and promotion optimization strategies Store labor productivity offset wage inflation Cost of Shipping tailwind from lower digital penetration of 30% versus 45% in Q1 2020 Favorable industry backdrop provided for a greater percentage of full price selling
7 7 7Q1 2021 Gross Margin & SG&A Expense Performance Gross Margin SG&A Expense Increased 2,173 bps versus Q1 2020 and 223 bps versus Q1 2019 SG&A leveraged 1,379 bps versus Q1 2020 and 107 bps versus Q1 2019 39.0% $1,275M 36.8% $1,170M $1,066M 17.3% % Total Revenue 31.2% 43.9% 30.1% Q1 2019 Q1 2020 Q1 2021 Q1 2019 Q1 2020 Q1 2021 Q1 2021 Gross Margin Takeaways Q1 2021 SG&A Takeaways Tightly managed inventories and achieved 10 year high in Reduced marketing to sales ratio to 4.2% in Q1 2021 inventory turn Lowered technology spend by more than 15% versus Q1 2020 Further scaled pricing and promotion optimization strategies Store labor productivity offset wage inflation Cost of Shipping tailwind from lower digital penetration of 30% versus 45% in Q1 2020 Favorable industry backdrop provided for a greater percentage of full price selling 7 7 7
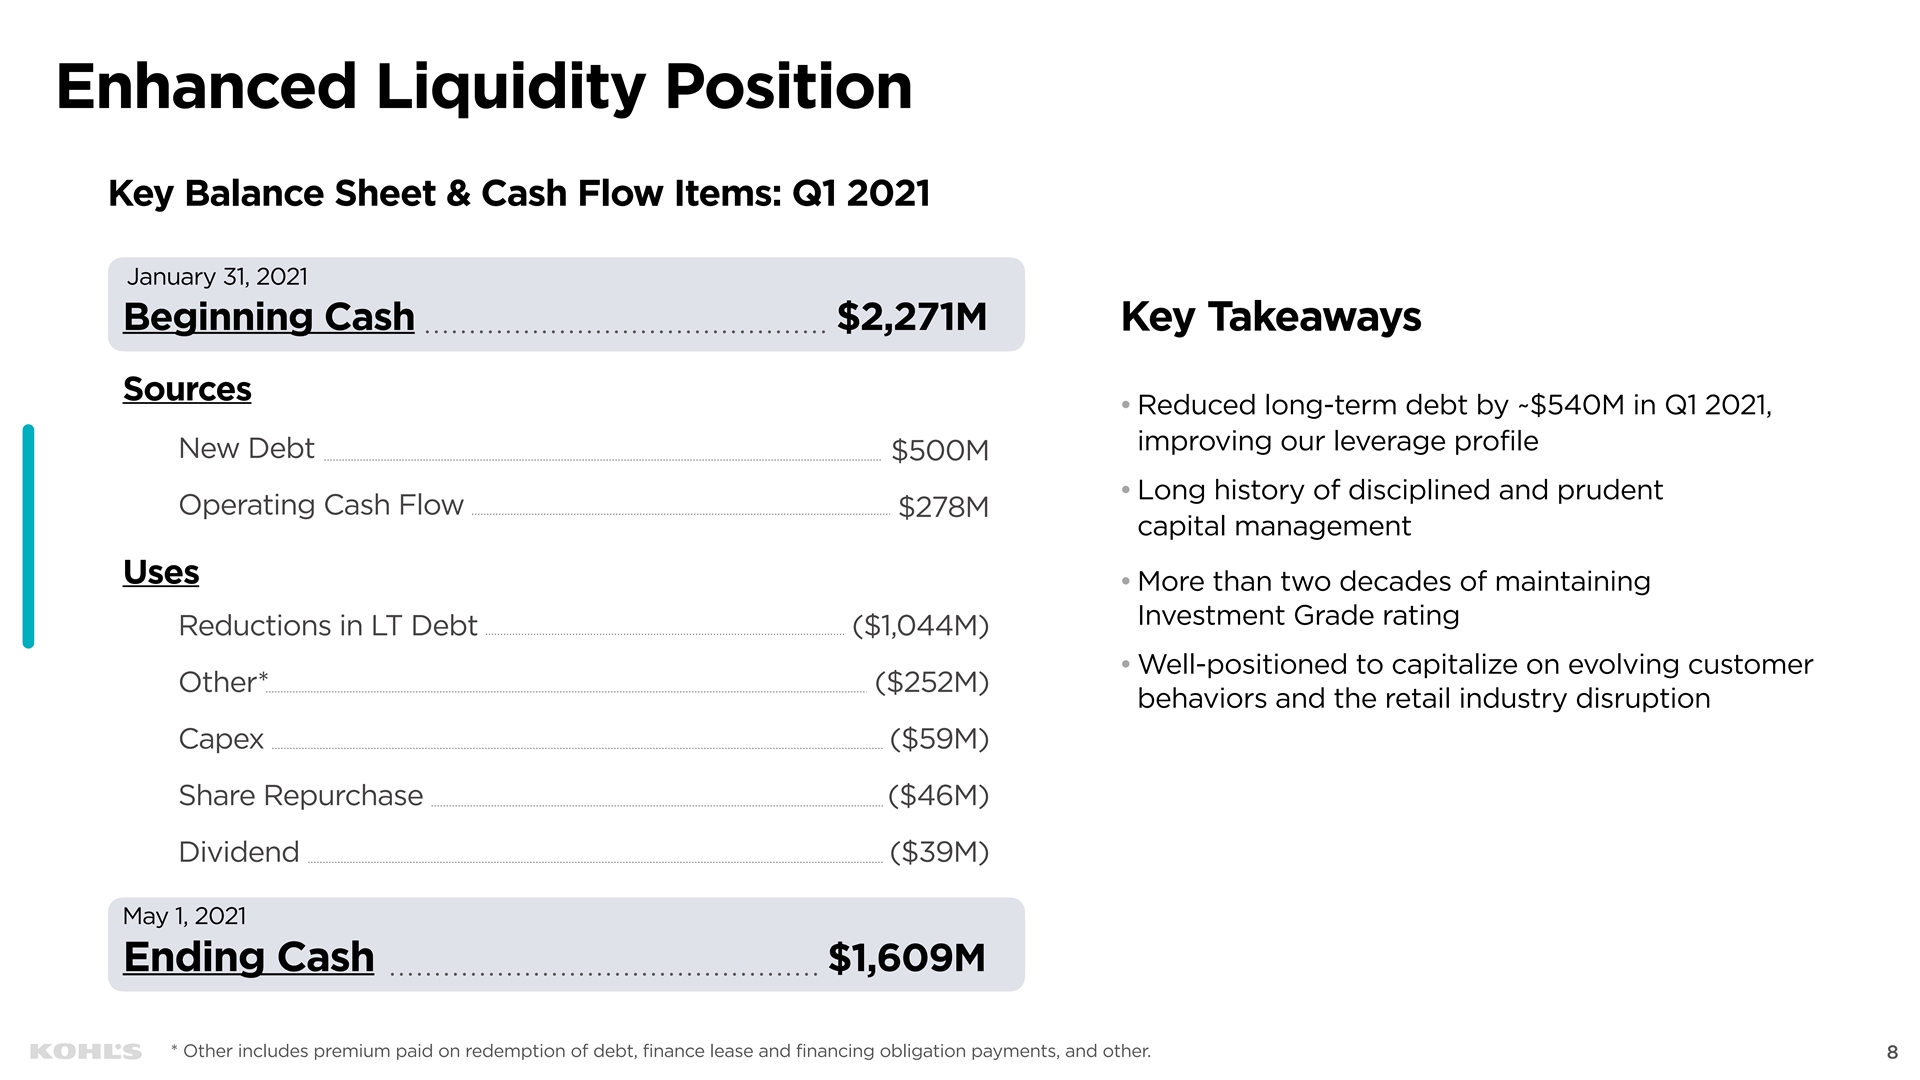
Enhanced Liquidity Position Key Balance Sheet & Cash Flow Items: Q1 2021 January 31, 2021 Beginning Cash $2,271M Key Takeaways Sources • Reduced long-term debt by ~$540M in Q1 2021, improving our leverage profile New Debt $500M • Long history of disciplined and prudent
Operating Cash Flow $278M capital management Uses • More than two decades of maintaining
Investment Grade rating Reductions in LT Debt ($1,044M) • Well-positioned to capitalize on evolving customer Other* ($252M) behaviors and the retail industry disruption
Capex ($59M) Share Repurchase ($46M) Dividend ($39M) May 1, 2021 Ending Cash $1,609M * Other includes premium paid on redemption of debt, finance lease and financing obligation payments, and other. 8Enhanced Liquidity Position Key Balance Sheet & Cash Flow Items: Q1 2021 January 31, 2021 Beginning Cash $2,271M Key Takeaways Sources • Reduced long-term debt by ~$540M in Q1 2021, improving our leverage profile New Debt $500M • Long history of disciplined and prudent Operating Cash Flow $278M capital management Uses • More than two decades of maintaining Investment Grade rating Reductions in LT Debt ($1,044M) • Well-positioned to capitalize on evolving customer Other* ($252M) behaviors and the retail industry disruption Capex ($59M) Share Repurchase ($46M) Dividend ($39M) May 1, 2021 Ending Cash $1,609M * Other includes premium paid on redemption of debt, finance lease and financing obligation payments, and other. 8
Updated 2021 Outlook 9Updated 2021 Outlook 9
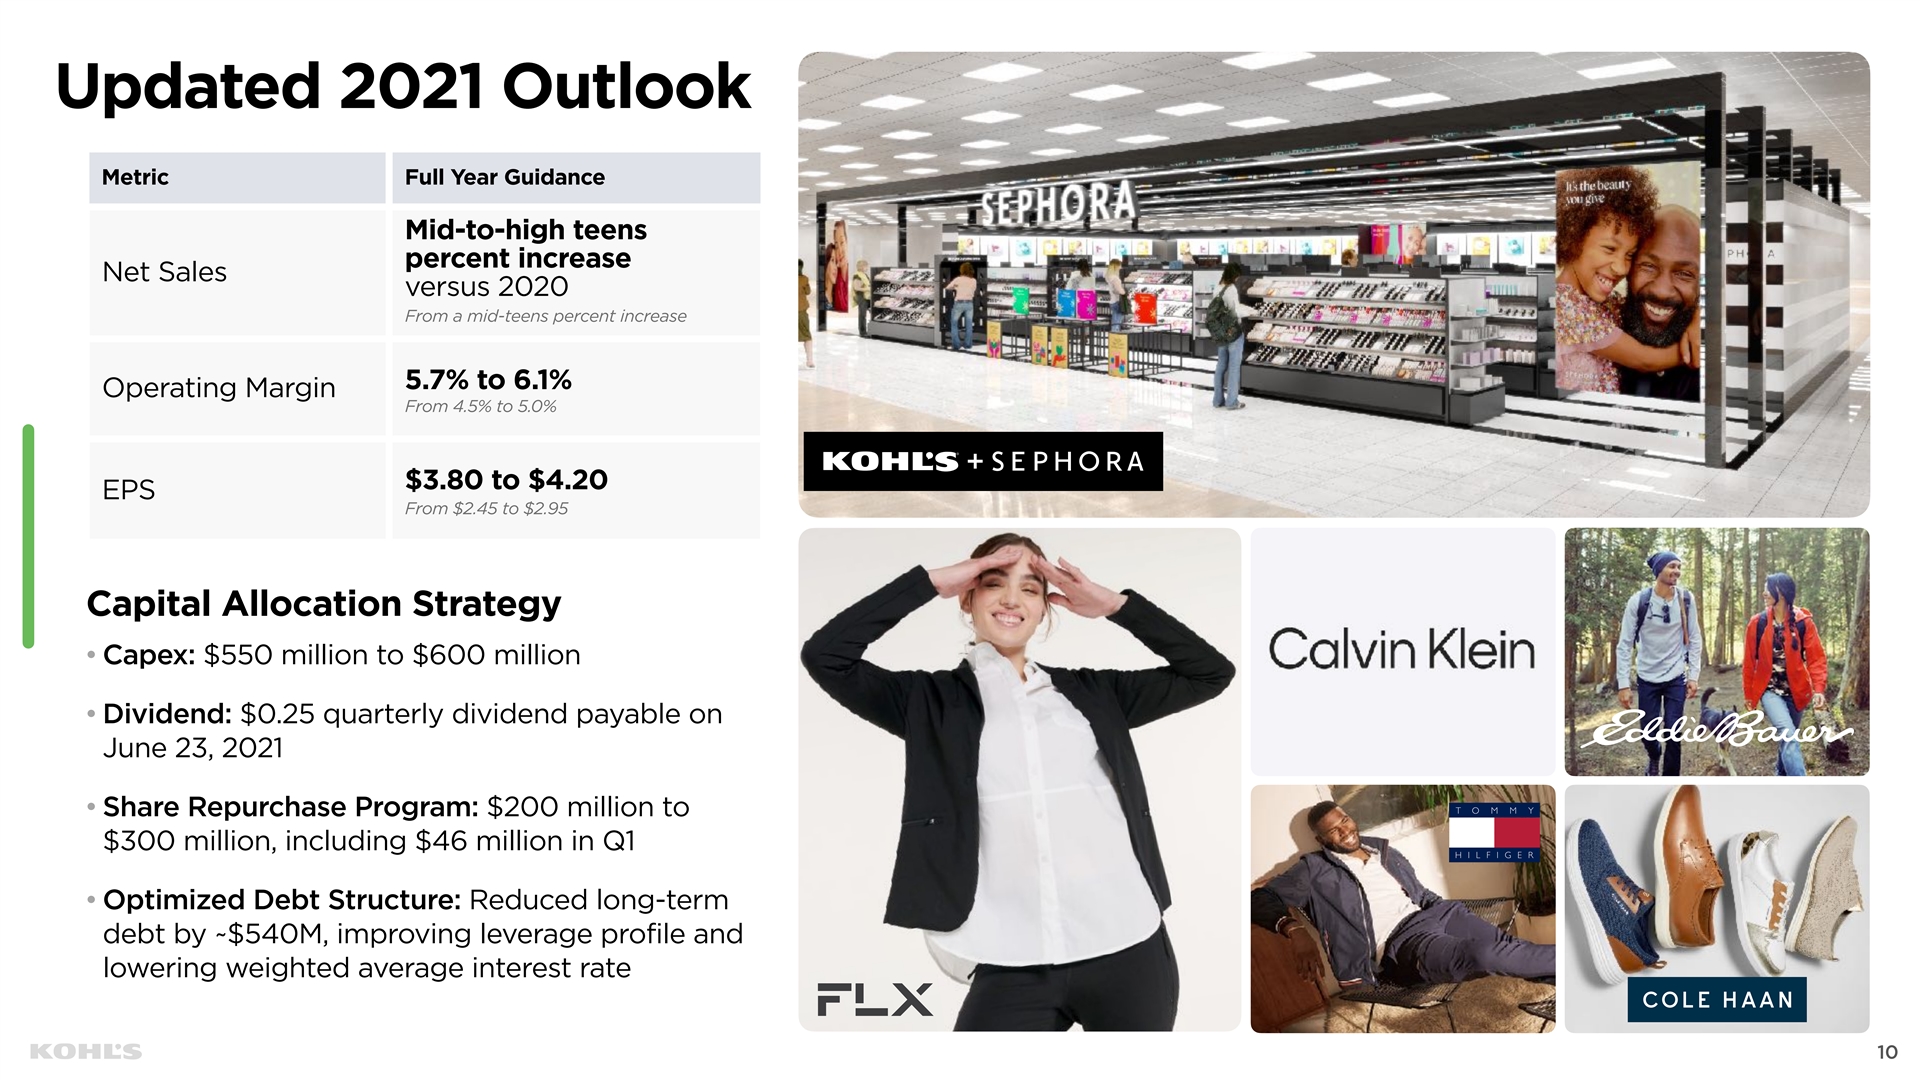
Updated 2021 Outlook Metric Full Year Guidance Mid-to-high teens percent increase Net Sales versus 2020 From a mid-teens percent increase 5.7% to 6.1% Operating Margin From 4.5% to 5.0% $3.80 to $4.20
EPS From $2.45 to $2.95 Capital Allocation Strategy • Capex: $550 million to $600 million • Dividend: $0.25 quarterly dividend payable on June 23, 2021 • Share Repurchase Program: $200 million to $300 million, including $46 million in Q1 • Optimized Debt Structure: Reduced long-term debt by ~$540M, improving leverage profile and lowering weighted average interest rate 10Updated 2021 Outlook Metric Full Year Guidance Mid-to-high teens percent increase Net Sales versus 2020 From a mid-teens percent increase 5.7% to 6.1% Operating Margin From 4.5% to 5.0% $3.80 to $4.20 EPS From $2.45 to $2.95 Capital Allocation Strategy • Capex: $550 million to $600 million • Dividend: $0.25 quarterly dividend payable on June 23, 2021 • Share Repurchase Program: $200 million to $300 million, including $46 million in Q1 • Optimized Debt Structure: Reduced long-term debt by ~$540M, improving leverage profile and lowering weighted average interest rate 10
Our Strategy 11Our Strategy 11
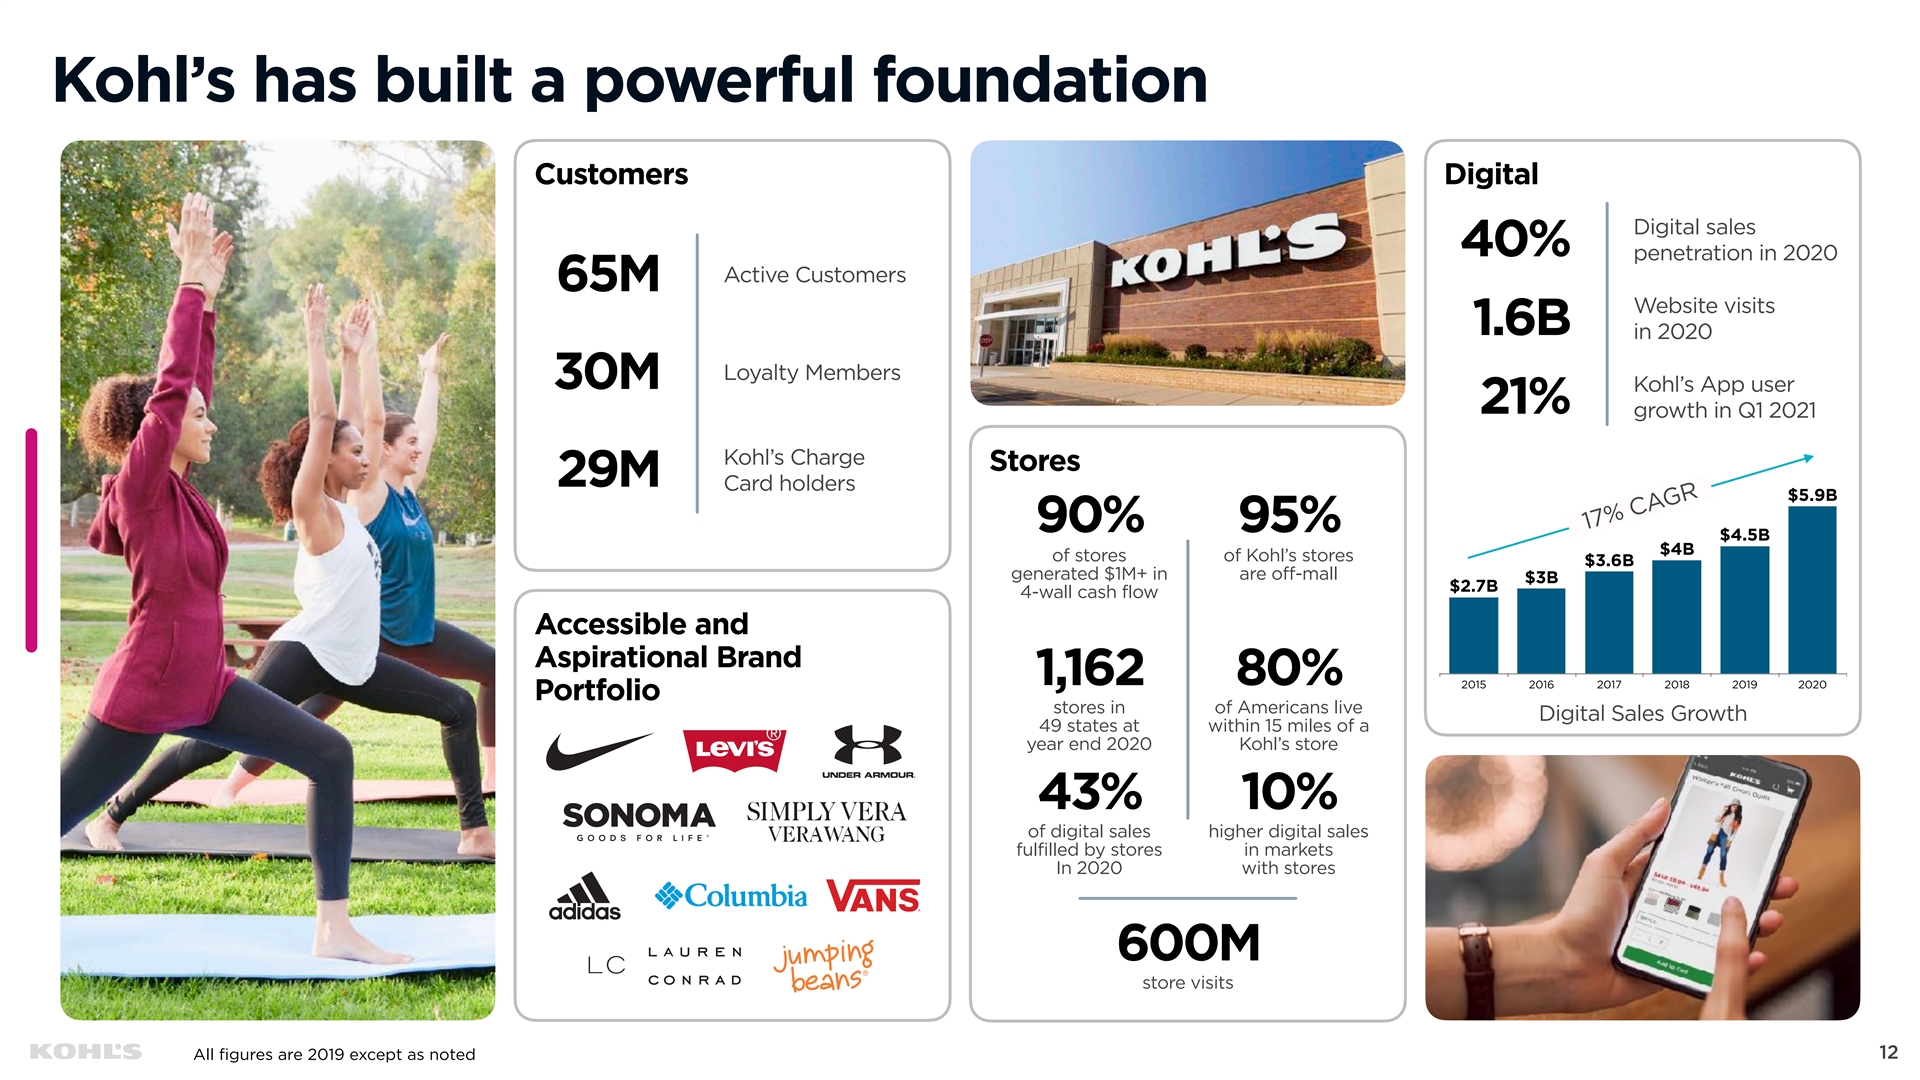
Kohl’s has built a powerful foundation Customers Digital Digital sales 40% penetration in 2020 Active Customers 65M Website visits 1.6B in 2020 Loyalty Members 30M Kohl’s App user 21% growth in Q1 2021 Kohl’s Charge Stores 29M Card holders $5.9B 90% 95% $4.5B $4B of stores of Kohl’s stores $3.6B generated $1M+ in are off-mall $3B $2.7B 4-wall cash flow Accessible and Aspirational Brand 1,162 80% 2015 2016 2017 2018 2019 2020 Portfolio stores in of Americans live Digital Sales Growth 49 states at within 15 miles of a year end 2020 Kohl’s store 43% 10% of digital sales higher digital sales fulfilled by stores in markets In 2020 with stores 600M store visits 12 All figures are 2019 except as noted 17% CAGRKohl’s has built a powerful foundation Customers Digital Digital sales 40% penetration in 2020 Active Customers 65M Website visits 1.6B in 2020 Loyalty Members 30M Kohl’s App user 21% growth in Q1 2021 Kohl’s Charge Stores 29M Card holders $5.9B 90% 95% $4.5B $4B of stores of Kohl’s stores $3.6B generated $1M+ in are off-mall $3B $2.7B 4-wall cash flow Accessible and Aspirational Brand 1,162 80% 2015 2016 2017 2018 2019 2020 Portfolio stores in of Americans live Digital Sales Growth 49 states at within 15 miles of a year end 2020 Kohl’s store 43% 10% of digital sales higher digital sales fulfilled by stores in markets In 2020 with stores 600M store visits 12 All figures are 2019 except as noted 17% CAGR
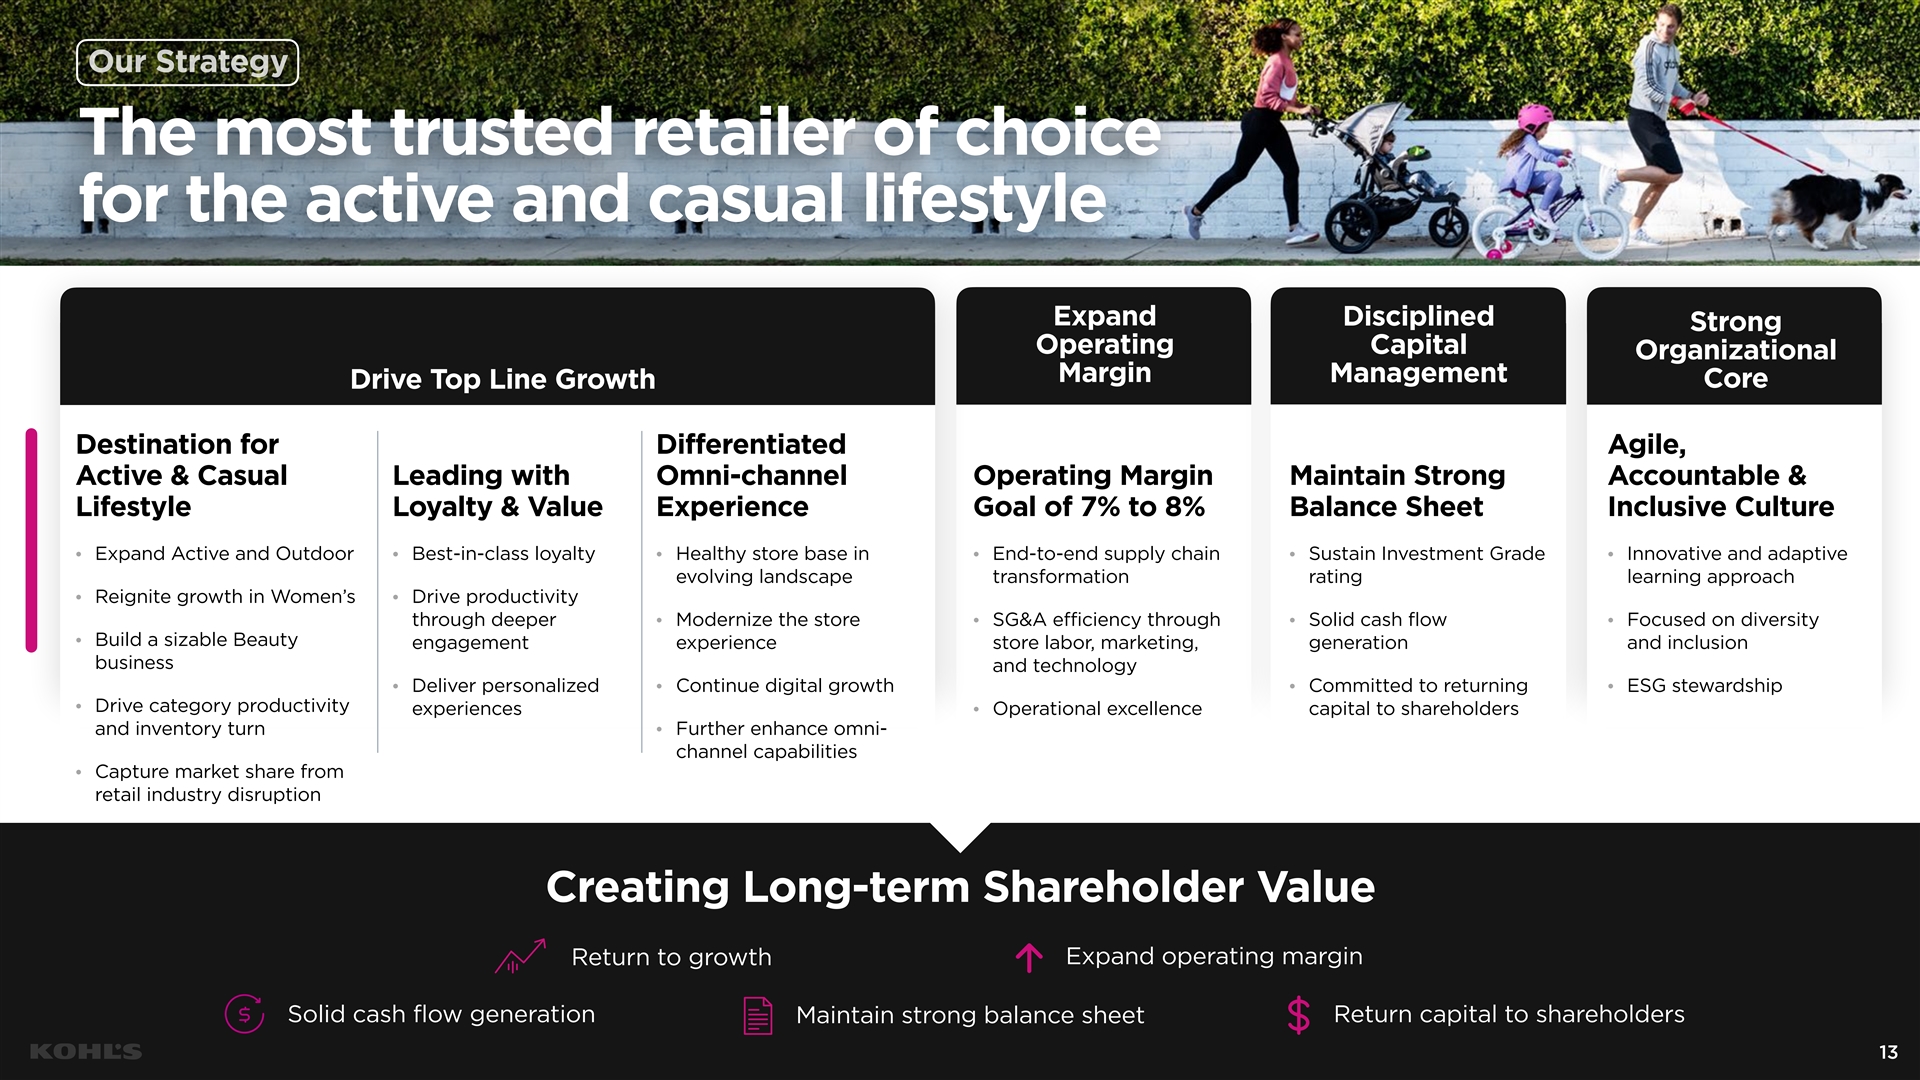
Our Strategy The most trusted retailer of choice for the active and casual lifestyle Expand Disciplined Strong Operating Capital Organizational Margin Management Core Drive Top Line Growth Destination for Differentiated Agile, Active & Casual Leading with Omni-channel Operating Margin Maintain Strong Accountable & Lifestyle Loyalty & Value Experience Goal of 7% to 8% Balance Sheet Inclusive Culture Expand Active and Outdoor Best-in-class loyalty Healthy store base in End-to-end supply chain Sustain Investment Grade Innovative and adaptive • • • • • • evolving landscape transformation rating learning approach Reignite growth in Women’s Drive productivity • • through deeper Modernize the store SG&A efficiency through Solid cash flow Focused on diversity • • • • Build a sizable Beauty • engagement experience store labor, marketing, generation and inclusion business and technology Deliver personalized Continue digital growth Committed to returning ESG stewardship • • • • Drive category productivity • experiences Operational excellence capital to shareholders • and inventory turn Further enhance omni- • channel capabilities Capture market share from • retail industry disruption Creating Long-term Shareholder Value Expand operating margin Return to growth Solid cash flow generation Return capital to shareholders Maintain strong balance sheet 13Our Strategy The most trusted retailer of choice for the active and casual lifestyle Expand Disciplined Strong Operating Capital Organizational Margin Management Core Drive Top Line Growth Destination for Differentiated Agile, Active & Casual Leading with Omni-channel Operating Margin Maintain Strong Accountable & Lifestyle Loyalty & Value Experience Goal of 7% to 8% Balance Sheet Inclusive Culture Expand Active and Outdoor Best-in-class loyalty Healthy store base in End-to-end supply chain Sustain Investment Grade Innovative and adaptive • • • • • • evolving landscape transformation rating learning approach Reignite growth in Women’s Drive productivity • • through deeper Modernize the store SG&A efficiency through Solid cash flow Focused on diversity • • • • Build a sizable Beauty • engagement experience store labor, marketing, generation and inclusion business and technology Deliver personalized Continue digital growth Committed to returning ESG stewardship • • • • Drive category productivity • experiences Operational excellence capital to shareholders • and inventory turn Further enhance omni- • channel capabilities Capture market share from • retail industry disruption Creating Long-term Shareholder Value Expand operating margin Return to growth Solid cash flow generation Return capital to shareholders Maintain strong balance sheet 13
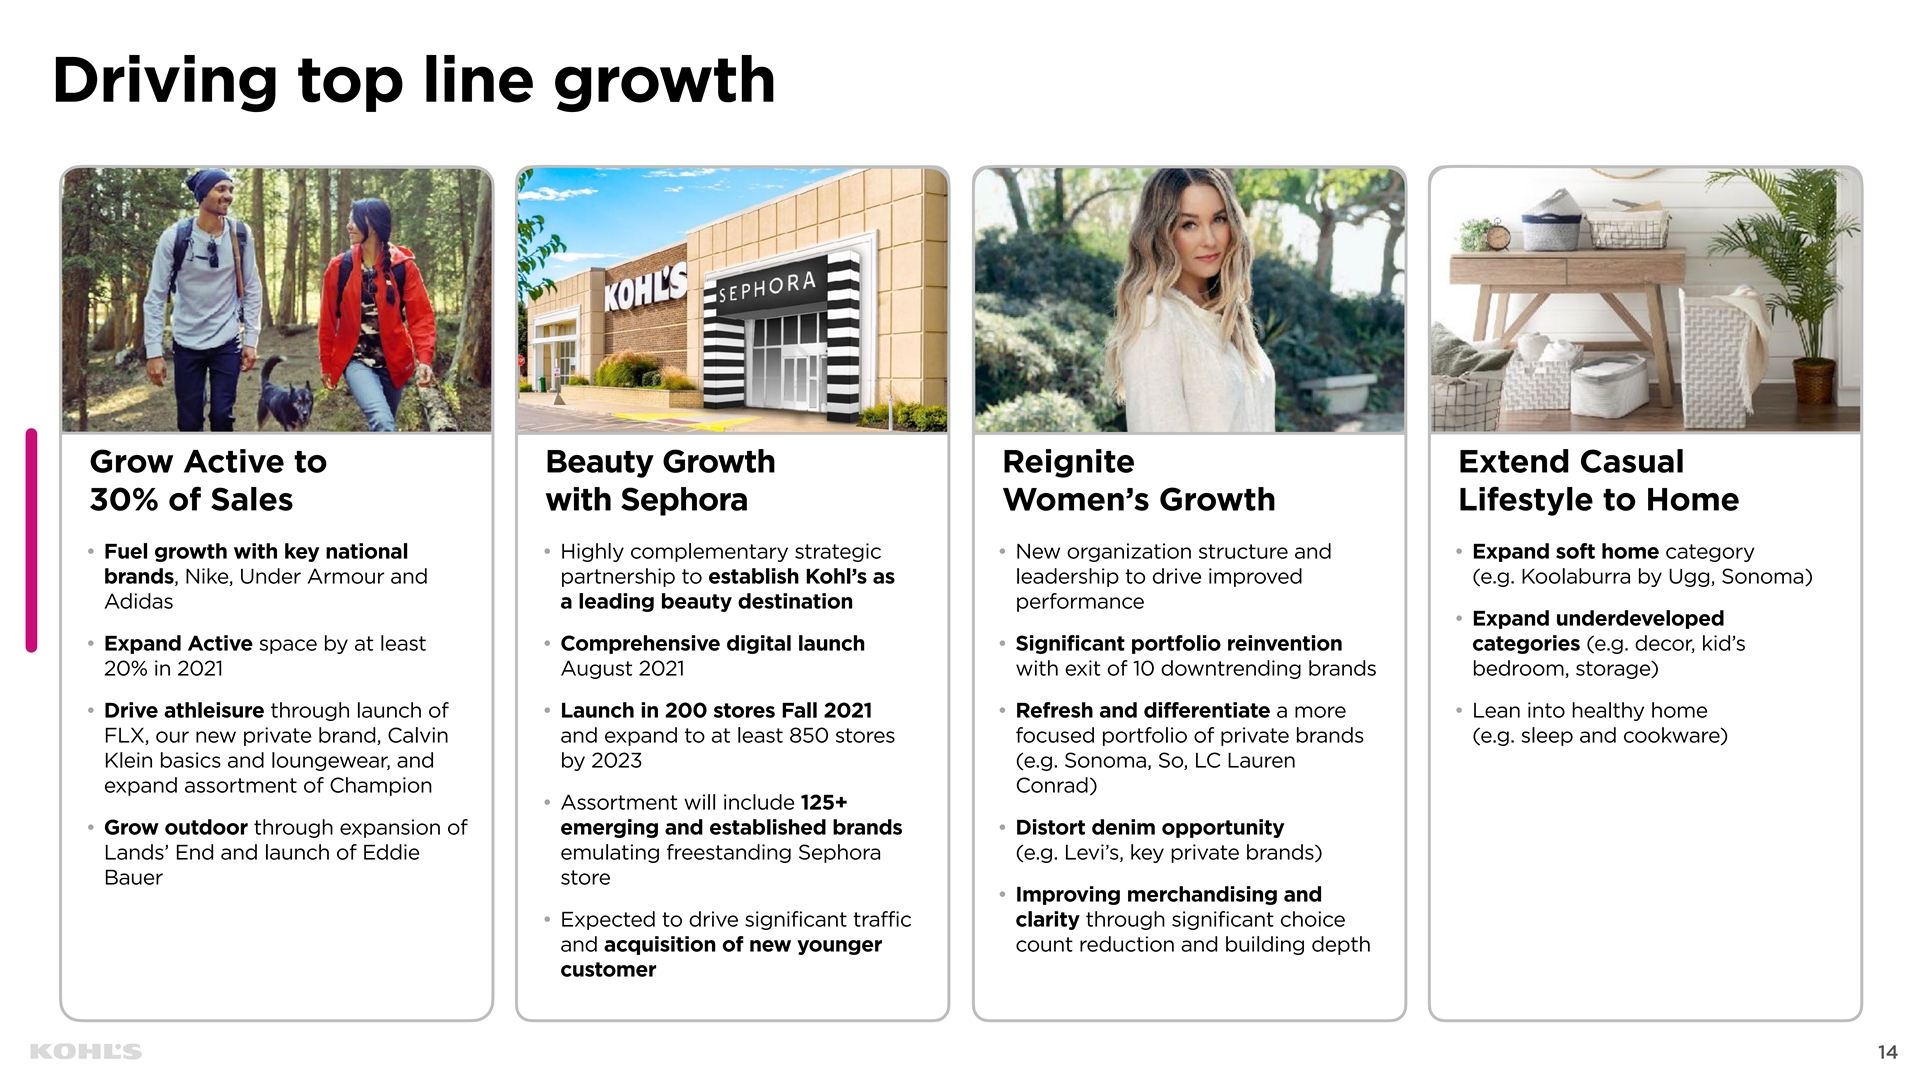
Driving top line growth Grow Active to Beauty Growth Reignite Extend Casual 30% of Sales with Sephora Women’s Growth Lifestyle to Home • Fuel growth with key national • Highly complementary strategic • New organization structure and • Expand soft home category brands, Nike, Under Armour and partnership to establish Kohl’s as leadership to drive improved (e.g. Koolaburra by Ugg, Sonoma) Adidas a leading beauty destination performance • Expand underdeveloped • Expand Active space by at least • Comprehensive digital launch • Significant portfolio reinvention categories (e.g. decor, kid’s 20% in 2021 August 2021 with exit of 10 downtrending brands bedroom, storage) • Drive athleisure through launch of • Launch in 200 stores Fall 2021 • Refresh and differentiate a more • Lean into healthy home FLX, our new private brand, Calvin and expand to at least 850 stores focused portfolio of private brands (e.g. sleep and cookware) Klein basics and loungewear, and by 2023 (e.g. Sonoma, So, LC Lauren expand assortment of Champion Conrad) • Assortment will include 125+ • Grow outdoor through expansion of emerging and established brands • Distort denim opportunity Lands’ End and launch of Eddie emulating freestanding Sephora (e.g. Levi’s, key private brands) Bauer store • Improving merchandising and • Expected to drive significant traffic clarity through significant choice and acquisition of new younger count reduction and building depth customer 14Driving top line growth Grow Active to Beauty Growth Reignite Extend Casual 30% of Sales with Sephora Women’s Growth Lifestyle to Home • Fuel growth with key national • Highly complementary strategic • New organization structure and • Expand soft home category brands, Nike, Under Armour and partnership to establish Kohl’s as leadership to drive improved (e.g. Koolaburra by Ugg, Sonoma) Adidas a leading beauty destination performance • Expand underdeveloped • Expand Active space by at least • Comprehensive digital launch • Significant portfolio reinvention categories (e.g. decor, kid’s 20% in 2021 August 2021 with exit of 10 downtrending brands bedroom, storage) • Drive athleisure through launch of • Launch in 200 stores Fall 2021 • Refresh and differentiate a more • Lean into healthy home FLX, our new private brand, Calvin and expand to at least 850 stores focused portfolio of private brands (e.g. sleep and cookware) Klein basics and loungewear, and by 2023 (e.g. Sonoma, So, LC Lauren expand assortment of Champion Conrad) • Assortment will include 125+ • Grow outdoor through expansion of emerging and established brands • Distort denim opportunity Lands’ End and launch of Eddie emulating freestanding Sephora (e.g. Levi’s, key private brands) Bauer store • Improving merchandising and • Expected to drive significant traffic clarity through significant choice and acquisition of new younger count reduction and building depth customer 14
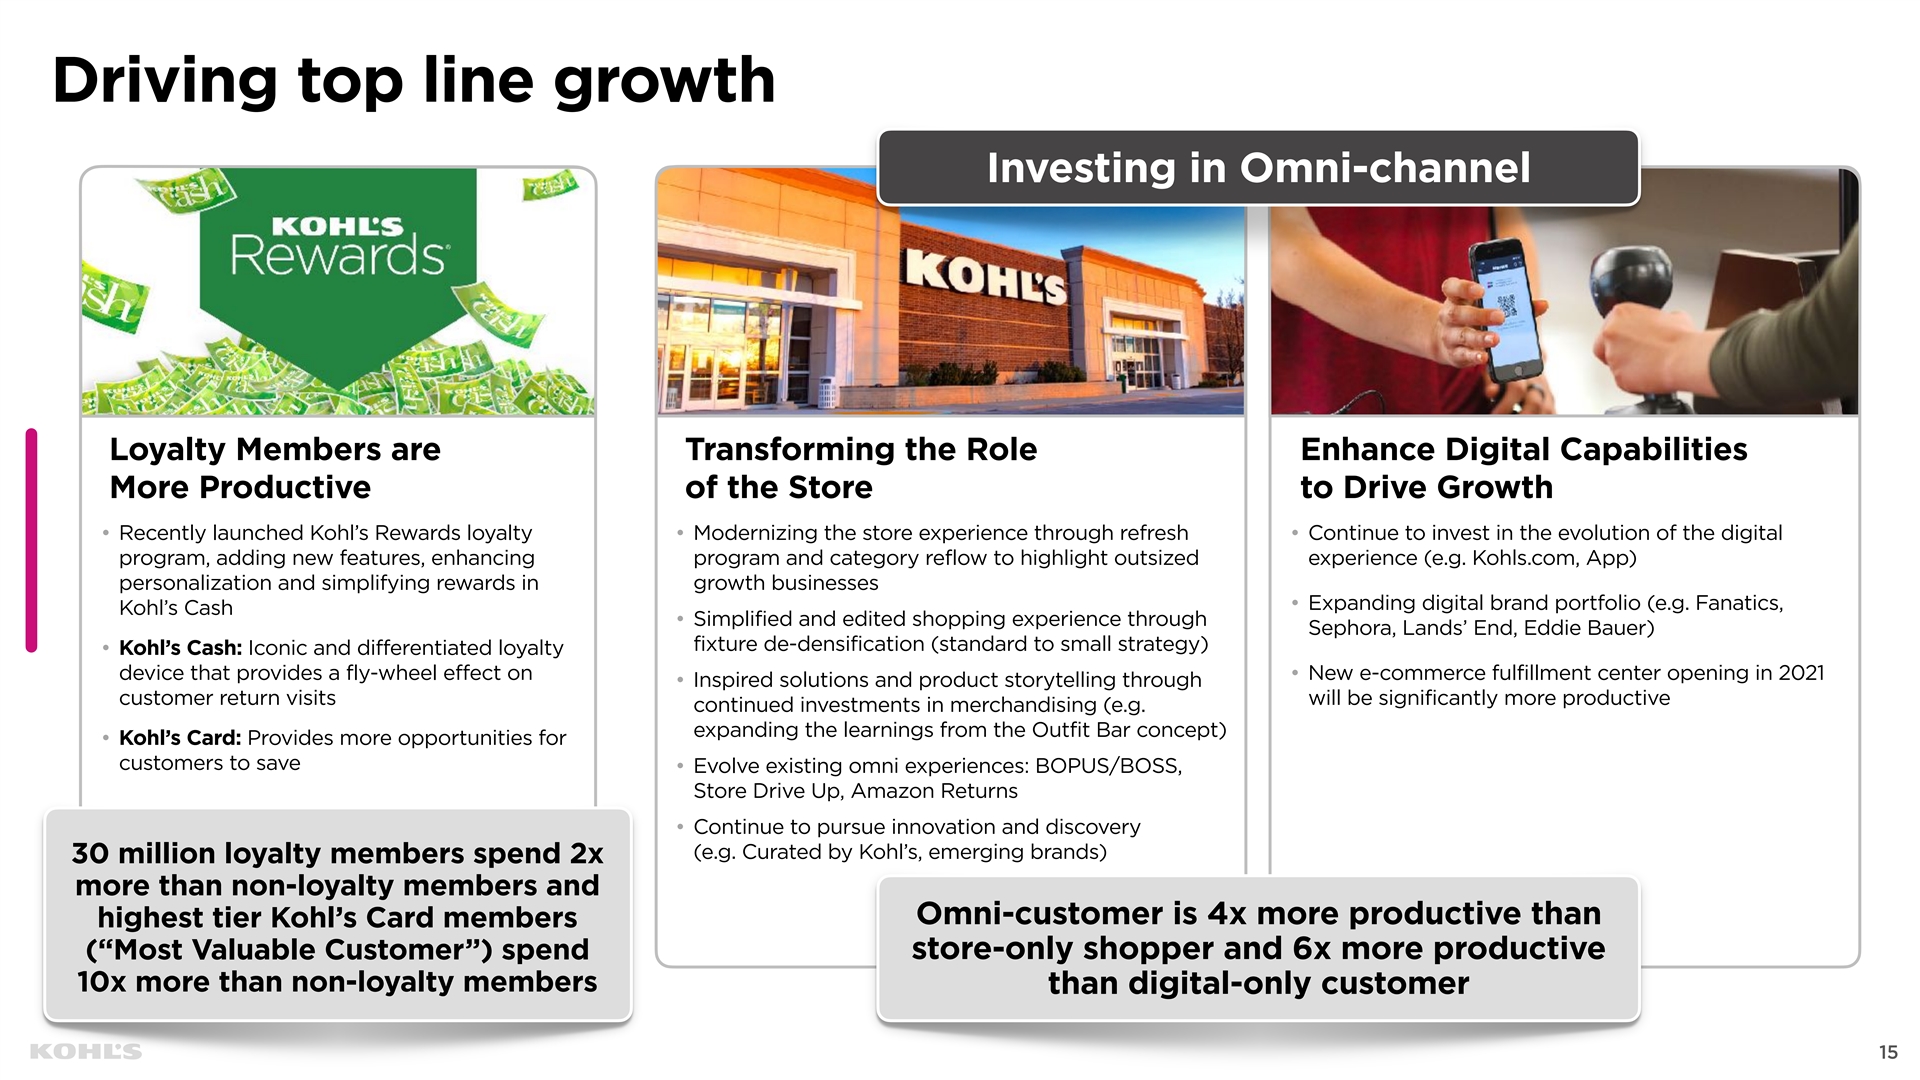
Driving top line growth Investing in Omni-channel Loyalty Members are Transforming the Role Enhance Digital Capabilities More Productive of the Store to Drive Growth • Recently launched Kohl’s Rewards loyalty • Modernizing the store experience through refresh • Continue to invest in the evolution of the digital program, adding new features, enhancing program and category reflow to highlight outsized experience (e.g. Kohls.com, App) personalization and simplifying rewards in growth businesses • Expanding digital brand portfolio (e.g. Fanatics, Kohl’s Cash • Simplified and edited shopping experience through Sephora, Lands’ End, Eddie Bauer) fixture de-densification (standard to small strategy) • Kohl’s Cash: Iconic and differentiated loyalty device that provides a fly-wheel effect on • New e-commerce fulfillment center opening in 2021 • Inspired solutions and product storytelling through customer return visits will be significantly more productive continued investments in merchandising (e.g. expanding the learnings from the Outfit Bar concept) • Kohl’s Card: Provides more opportunities for customers to save • Evolve existing omni experiences: BOPUS/BOSS, Store Drive Up, Amazon Returns • Continue to pursue innovation and discovery (e.g. Curated by Kohl’s, emerging brands) 30 million loyalty members spend 2x more than non-loyalty members and Omni-customer is 4x more productive than highest tier Kohl’s Card members store-only shopper and 6x more productive (“Most Valuable Customer”) spend 10x more than non-loyalty members than digital-only customer 15Driving top line growth Investing in Omni-channel Loyalty Members are Transforming the Role Enhance Digital Capabilities More Productive of the Store to Drive Growth • Recently launched Kohl’s Rewards loyalty • Modernizing the store experience through refresh • Continue to invest in the evolution of the digital program, adding new features, enhancing program and category reflow to highlight outsized experience (e.g. Kohls.com, App) personalization and simplifying rewards in growth businesses • Expanding digital brand portfolio (e.g. Fanatics, Kohl’s Cash • Simplified and edited shopping experience through Sephora, Lands’ End, Eddie Bauer) fixture de-densification (standard to small strategy) • Kohl’s Cash: Iconic and differentiated loyalty device that provides a fly-wheel effect on • New e-commerce fulfillment center opening in 2021 • Inspired solutions and product storytelling through customer return visits will be significantly more productive continued investments in merchandising (e.g. expanding the learnings from the Outfit Bar concept) • Kohl’s Card: Provides more opportunities for customers to save • Evolve existing omni experiences: BOPUS/BOSS, Store Drive Up, Amazon Returns • Continue to pursue innovation and discovery (e.g. Curated by Kohl’s, emerging brands) 30 million loyalty members spend 2x more than non-loyalty members and Omni-customer is 4x more productive than highest tier Kohl’s Card members store-only shopper and 6x more productive (“Most Valuable Customer”) spend 10x more than non-loyalty members than digital-only customer 15
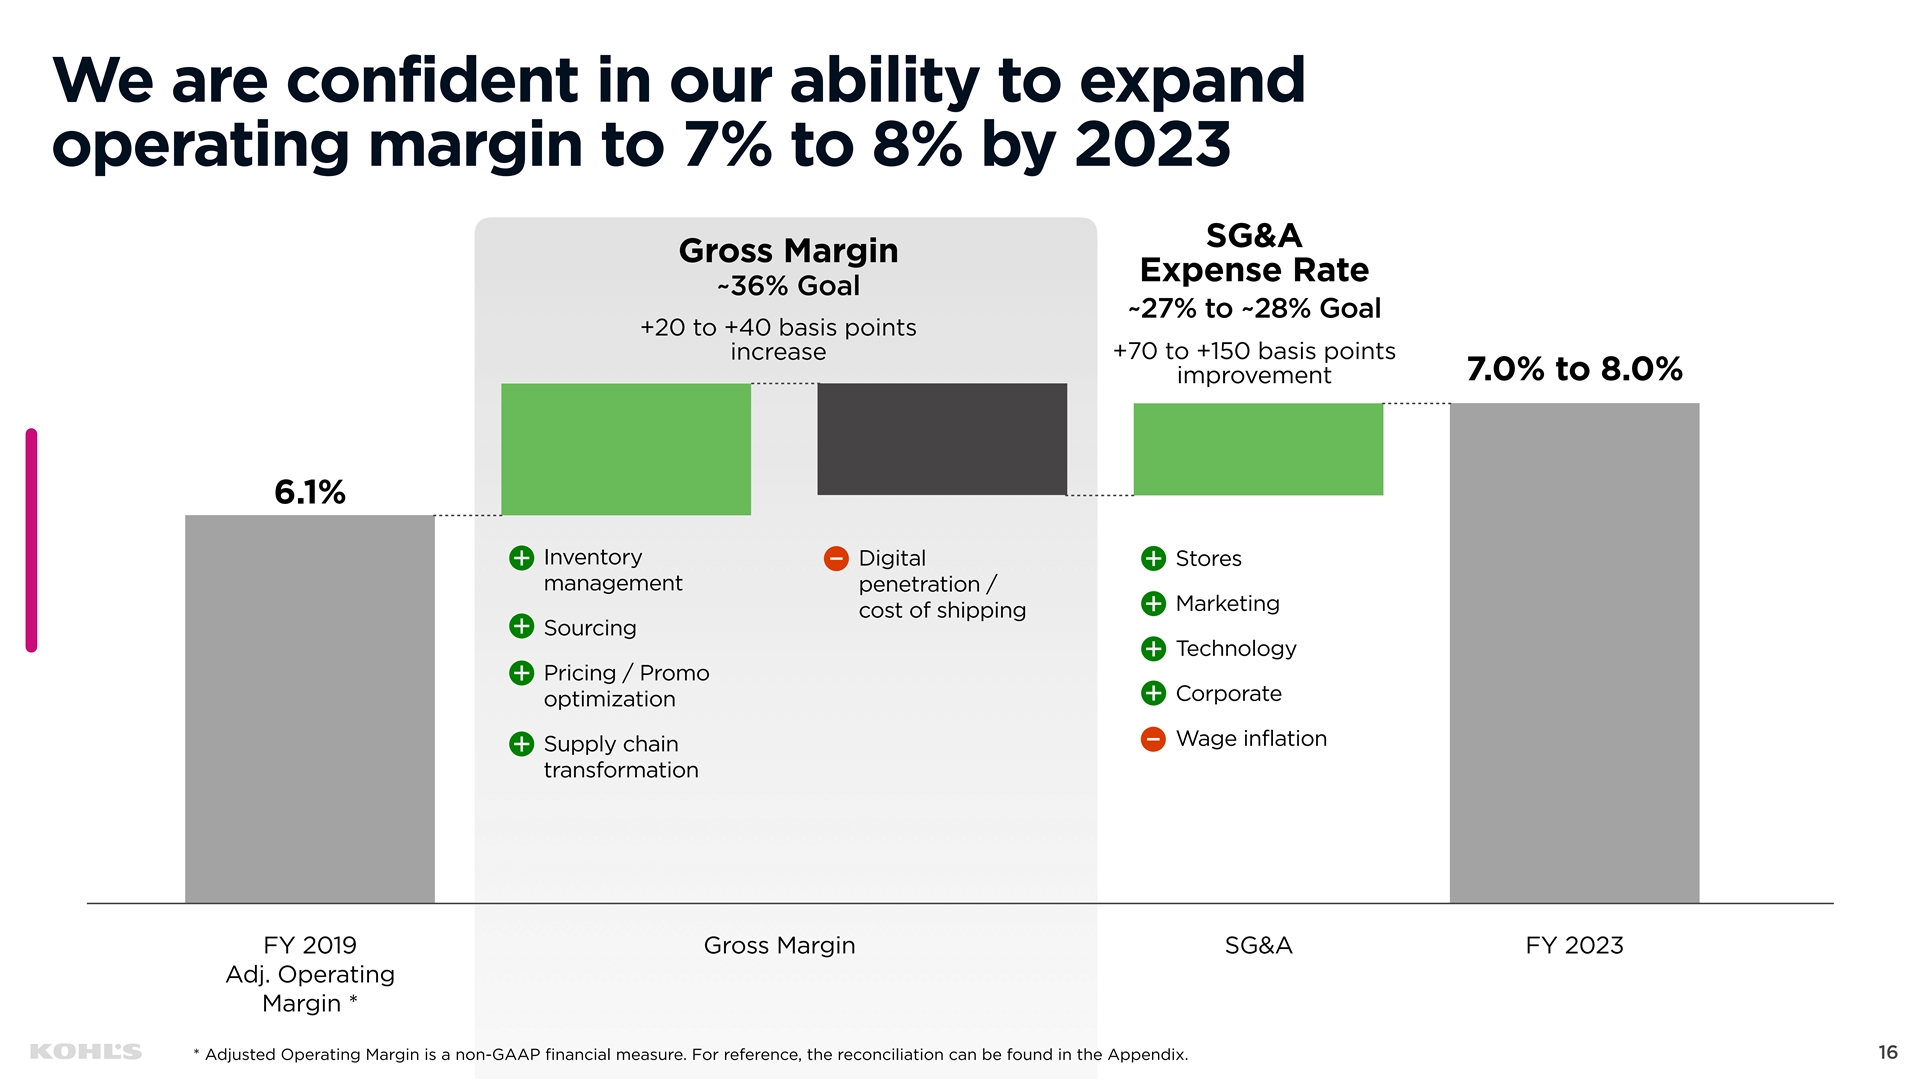
We are confident in our ability to expand operating margin to 7% to 8% by 2023 SG&A Gross Margin Expense Rate ~36% Goal ~27% to ~28% Goal +20 to +40 basis points +70 to +150 basis points increase 7.0% to 8.0% improvement 6.1% Inventory Digital Stores management penetration / Marketing cost of shipping Sourcing Technology Pricing / Promo Corporate optimization Wage inflation Supply chain transformation FY 2019 Gross Margin SG&A FY 2023 Adj. Operating Margin * 16 * Adjusted Operating Margin is a non-GAAP financial measure. For reference, the reconciliation can be found in the Appendix.We are confident in our ability to expand operating margin to 7% to 8% by 2023 SG&A Gross Margin Expense Rate ~36% Goal ~27% to ~28% Goal +20 to +40 basis points +70 to +150 basis points increase 7.0% to 8.0% improvement 6.1% Inventory Digital Stores management penetration / Marketing cost of shipping Sourcing Technology Pricing / Promo Corporate optimization Wage inflation Supply chain transformation FY 2019 Gross Margin SG&A FY 2023 Adj. Operating Margin * 16 * Adjusted Operating Margin is a non-GAAP financial measure. For reference, the reconciliation can be found in the Appendix.
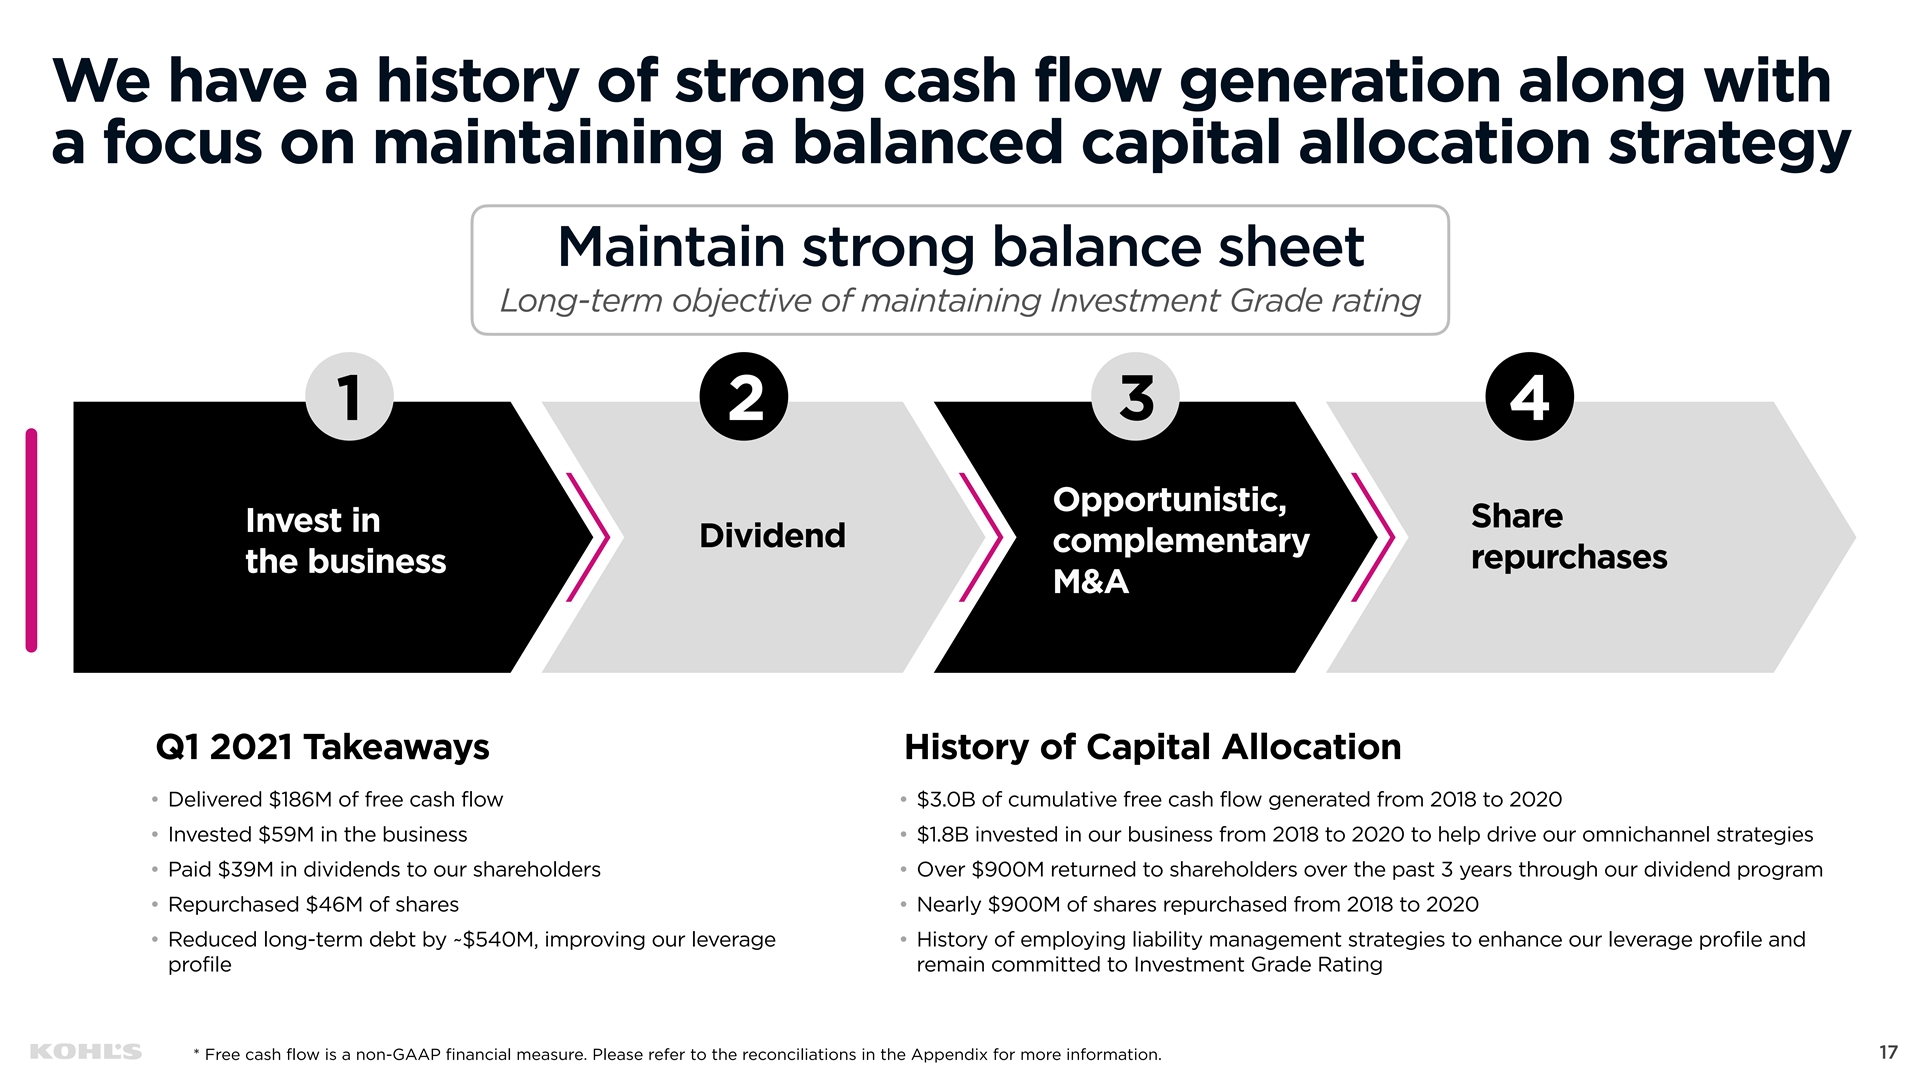
We have a history of strong cash flow generation along with a focus on maintaining a balanced capital allocation strategy Maintain strong balance sheet Long-term objective of maintaining Investment Grade rating 1 2 3 4 Opportunistic, Share
Invest in
Dividend complementary
repurchases the business M&A Q1 2021 Takeaways History of Capital Allocation • Delivered $186M of free cash flow • $3.0B of cumulative free cash flow generated from 2018 to 2020 • Invested $59M in the business • $1.8B invested in our business from 2018 to 2020 to help drive our omnichannel strategies • Paid $39M in dividends to our shareholders • Over $900M returned to shareholders over the past 3 years through our dividend program • Repurchased $46M of shares • Nearly $900M of shares repurchased from 2018 to 2020 • Reduced long-term debt by ~$540M, improving our leverage • History of employing liability management strategies to enhance our leverage profile and profile remain committed to Investment Grade Rating 17 * Free cash flow is a non-GAAP financial measure. Please refer to the reconciliations in the Appendix for more information.We have a history of strong cash flow generation along with a focus on maintaining a balanced capital allocation strategy Maintain strong balance sheet Long-term objective of maintaining Investment Grade rating 1 2 3 4 Opportunistic, Share Invest in Dividend complementary repurchases the business M&A Q1 2021 Takeaways History of Capital Allocation • Delivered $186M of free cash flow • $3.0B of cumulative free cash flow generated from 2018 to 2020 • Invested $59M in the business • $1.8B invested in our business from 2018 to 2020 to help drive our omnichannel strategies • Paid $39M in dividends to our shareholders • Over $900M returned to shareholders over the past 3 years through our dividend program • Repurchased $46M of shares • Nearly $900M of shares repurchased from 2018 to 2020 • Reduced long-term debt by ~$540M, improving our leverage • History of employing liability management strategies to enhance our leverage profile and profile remain committed to Investment Grade Rating 17 * Free cash flow is a non-GAAP financial measure. Please refer to the reconciliations in the Appendix for more information.
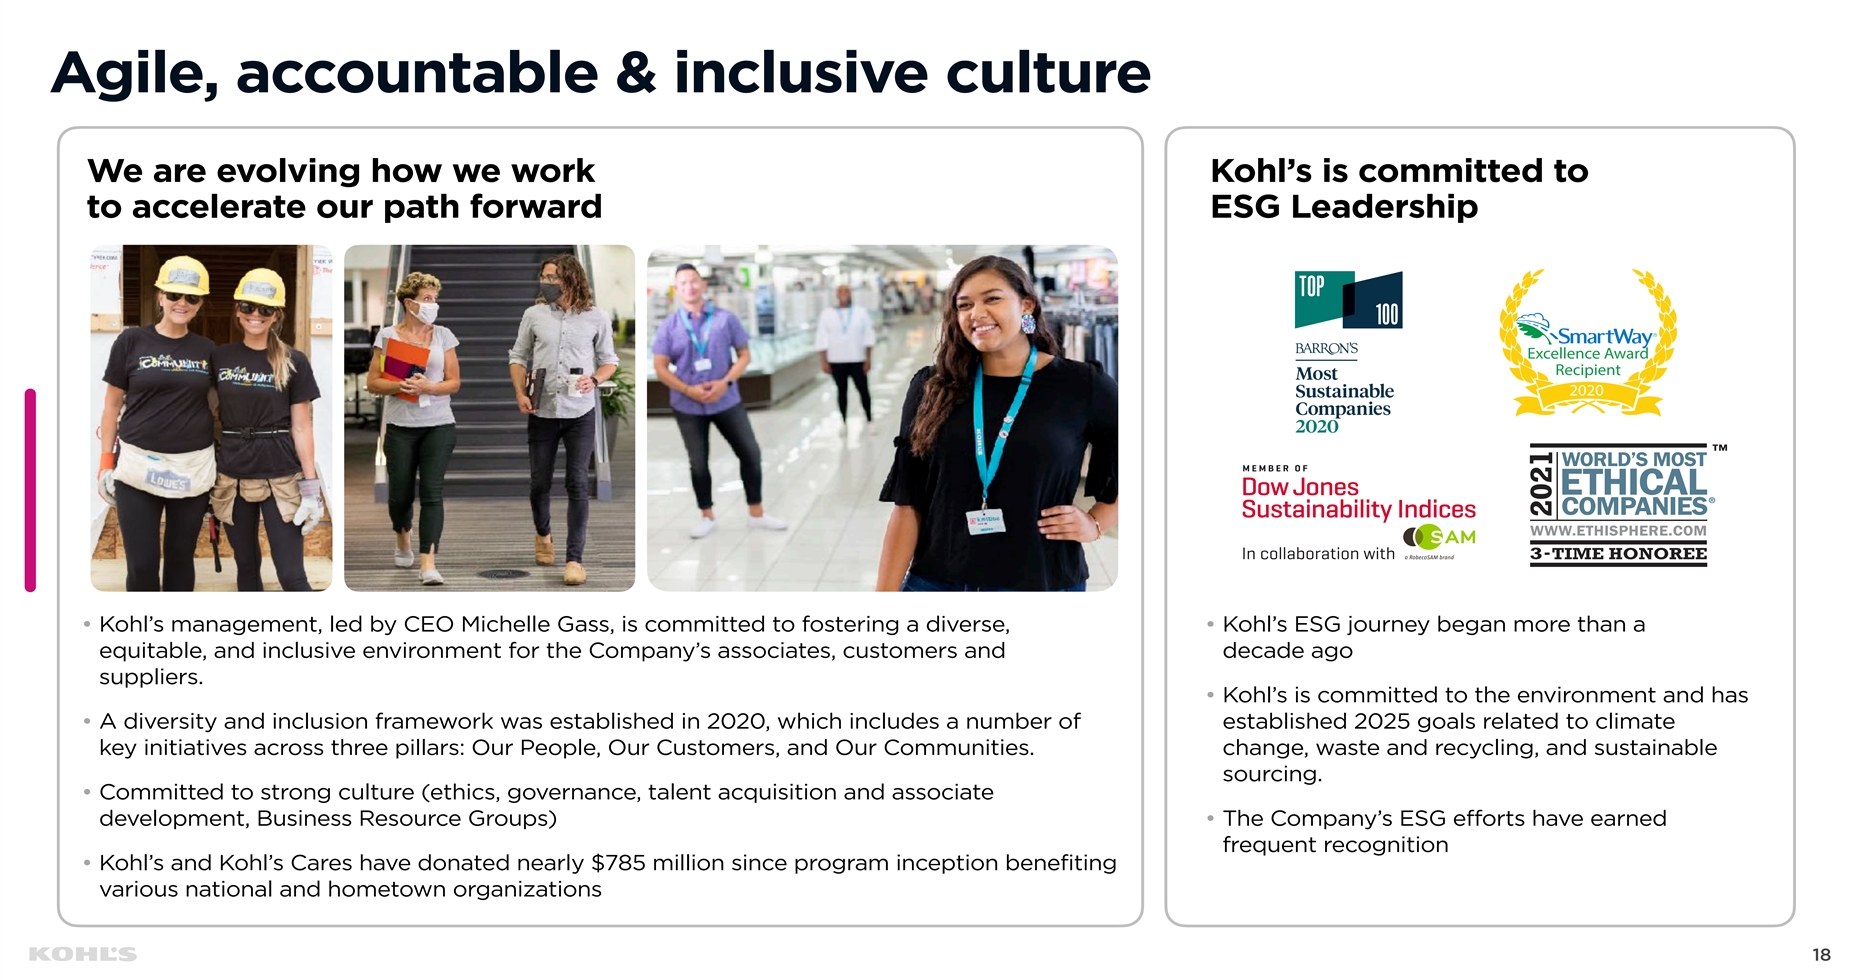
Agile, accountable & inclusive culture We are evolving how we work Kohl’s is committed to to accelerate our path forward ESG Leadership Excellence Award Recipient 2020 • Kohl’s management, led by CEO Michelle Gass, is committed to fostering a diverse, • Kohl’s ESG journey began more than a equitable, and inclusive environment for the Company’s associates, customers and decade ago suppliers. • Kohl’s is committed to the environment and has • A diversity and inclusion framework was established in 2020, which includes a number of established 2025 goals related to climate key initiatives across three pillars: Our People, Our Customers, and Our Communities. change, waste and recycling, and sustainable sourcing. • Committed to strong culture (ethics, governance, talent acquisition and associate development, Business Resource Groups) • The Company’s ESG efforts have earned frequent recognition • Kohl’s and Kohl’s Cares have donated nearly $785 million since program inception benefiting various national and hometown organizations 18Agile, accountable & inclusive culture We are evolving how we work Kohl’s is committed to to accelerate our path forward ESG Leadership Excellence Award Recipient 2020 • Kohl’s management, led by CEO Michelle Gass, is committed to fostering a diverse, • Kohl’s ESG journey began more than a equitable, and inclusive environment for the Company’s associates, customers and decade ago suppliers. • Kohl’s is committed to the environment and has • A diversity and inclusion framework was established in 2020, which includes a number of established 2025 goals related to climate key initiatives across three pillars: Our People, Our Customers, and Our Communities. change, waste and recycling, and sustainable sourcing. • Committed to strong culture (ethics, governance, talent acquisition and associate development, Business Resource Groups) • The Company’s ESG efforts have earned frequent recognition • Kohl’s and Kohl’s Cares have donated nearly $785 million since program inception benefiting various national and hometown organizations 18
Appendix 19Appendix 19
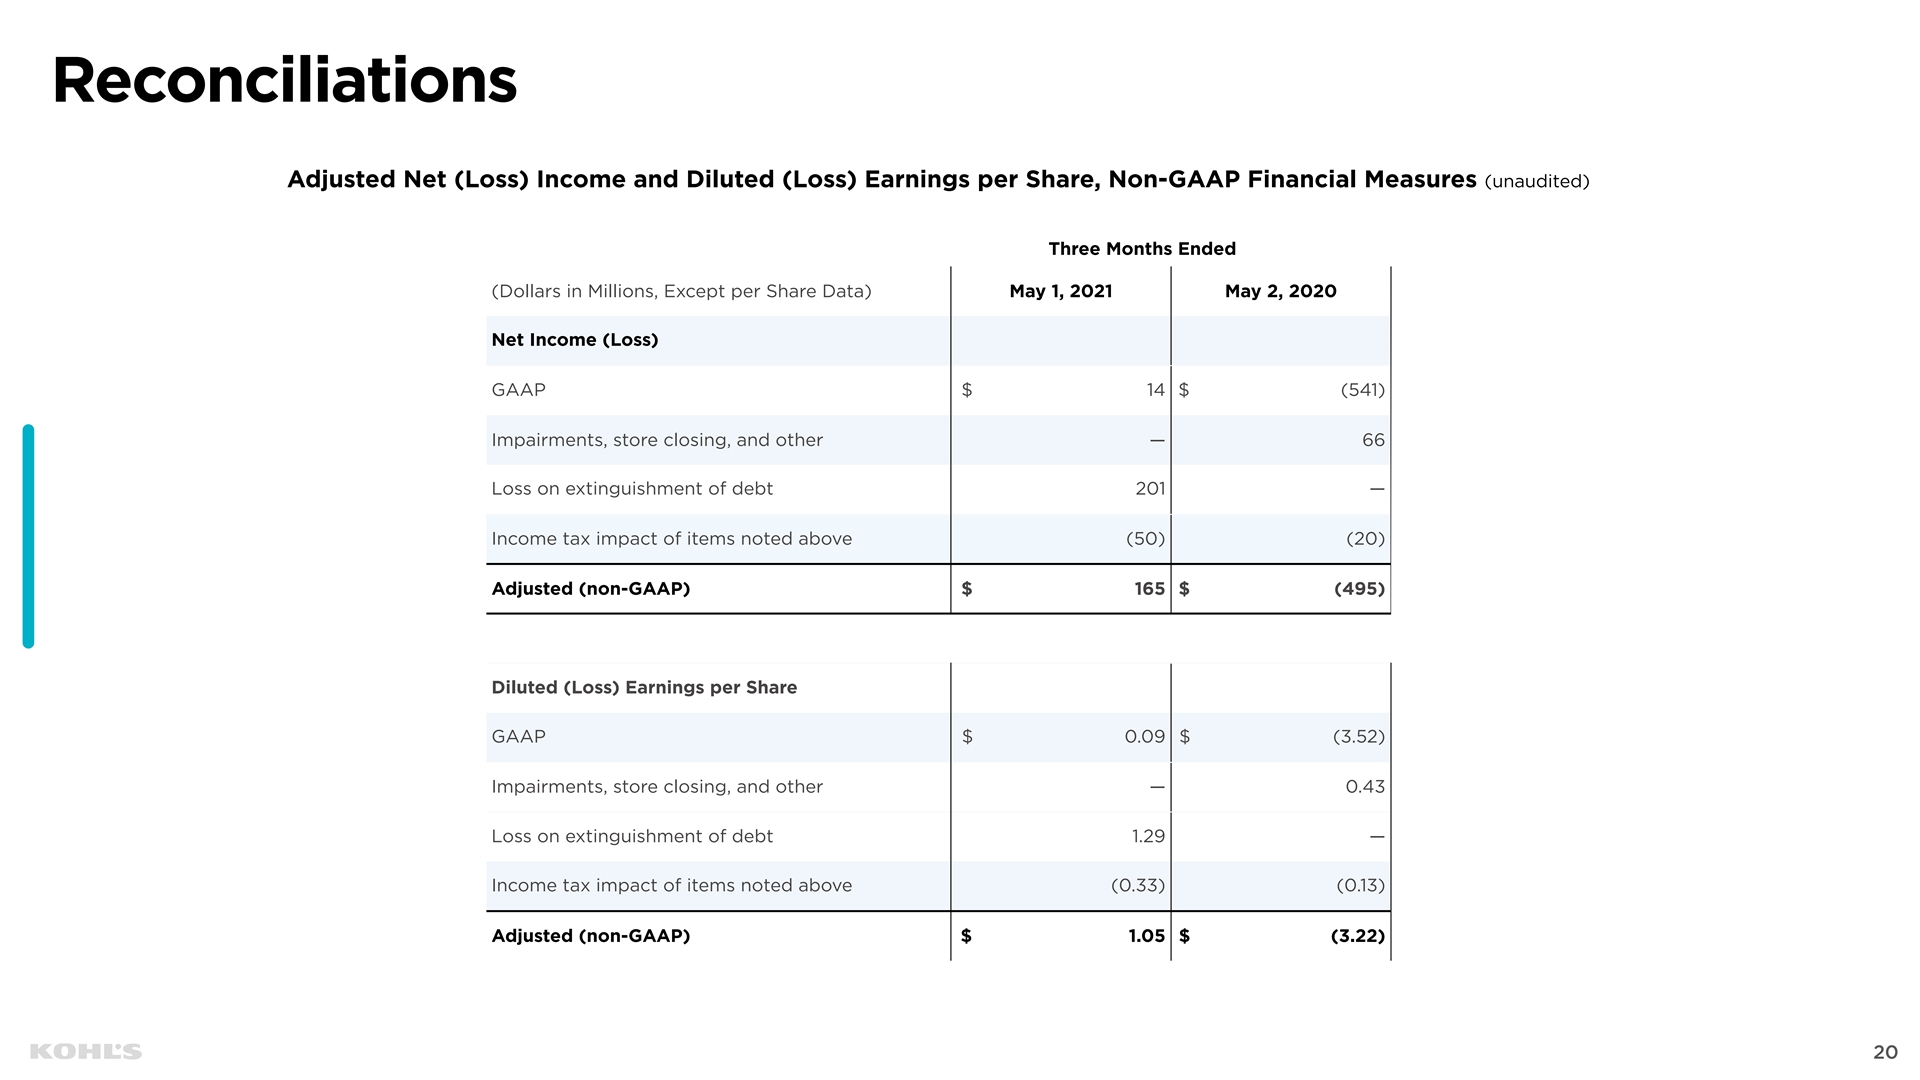
Reconciliations Adjusted Net (Loss) Income and Diluted (Loss) Earnings per Share, Non-GAAP Financial Measures (unaudited) Three Months Ended (Dollars in Millions, Except per Share Data) May 1, 2021 May 2, 2020 Net Income (Loss) GAAP $ 14 $ (541) Impairments, store closing, and other — 66 Loss on extinguishment of debt 201 — Income tax impact of items noted above (50) (20) Adjusted (non-GAAP) $ 165 $ (495) Diluted (Loss) Earnings per Share GAAP $ 0.09 $ (3.52) Impairments, store closing, and other — 0.43 Loss on extinguishment of debt 1.29 — Income tax impact of items noted above (0.33) (0.13) Adjusted (non-GAAP) $ 1.05 $ (3.22) 20Reconciliations Adjusted Net (Loss) Income and Diluted (Loss) Earnings per Share, Non-GAAP Financial Measures (unaudited) Three Months Ended (Dollars in Millions, Except per Share Data) May 1, 2021 May 2, 2020 Net Income (Loss) GAAP $ 14 $ (541) Impairments, store closing, and other — 66 Loss on extinguishment of debt 201 — Income tax impact of items noted above (50) (20) Adjusted (non-GAAP) $ 165 $ (495) Diluted (Loss) Earnings per Share GAAP $ 0.09 $ (3.52) Impairments, store closing, and other — 0.43 Loss on extinguishment of debt 1.29 — Income tax impact of items noted above (0.33) (0.13) Adjusted (non-GAAP) $ 1.05 $ (3.22) 20
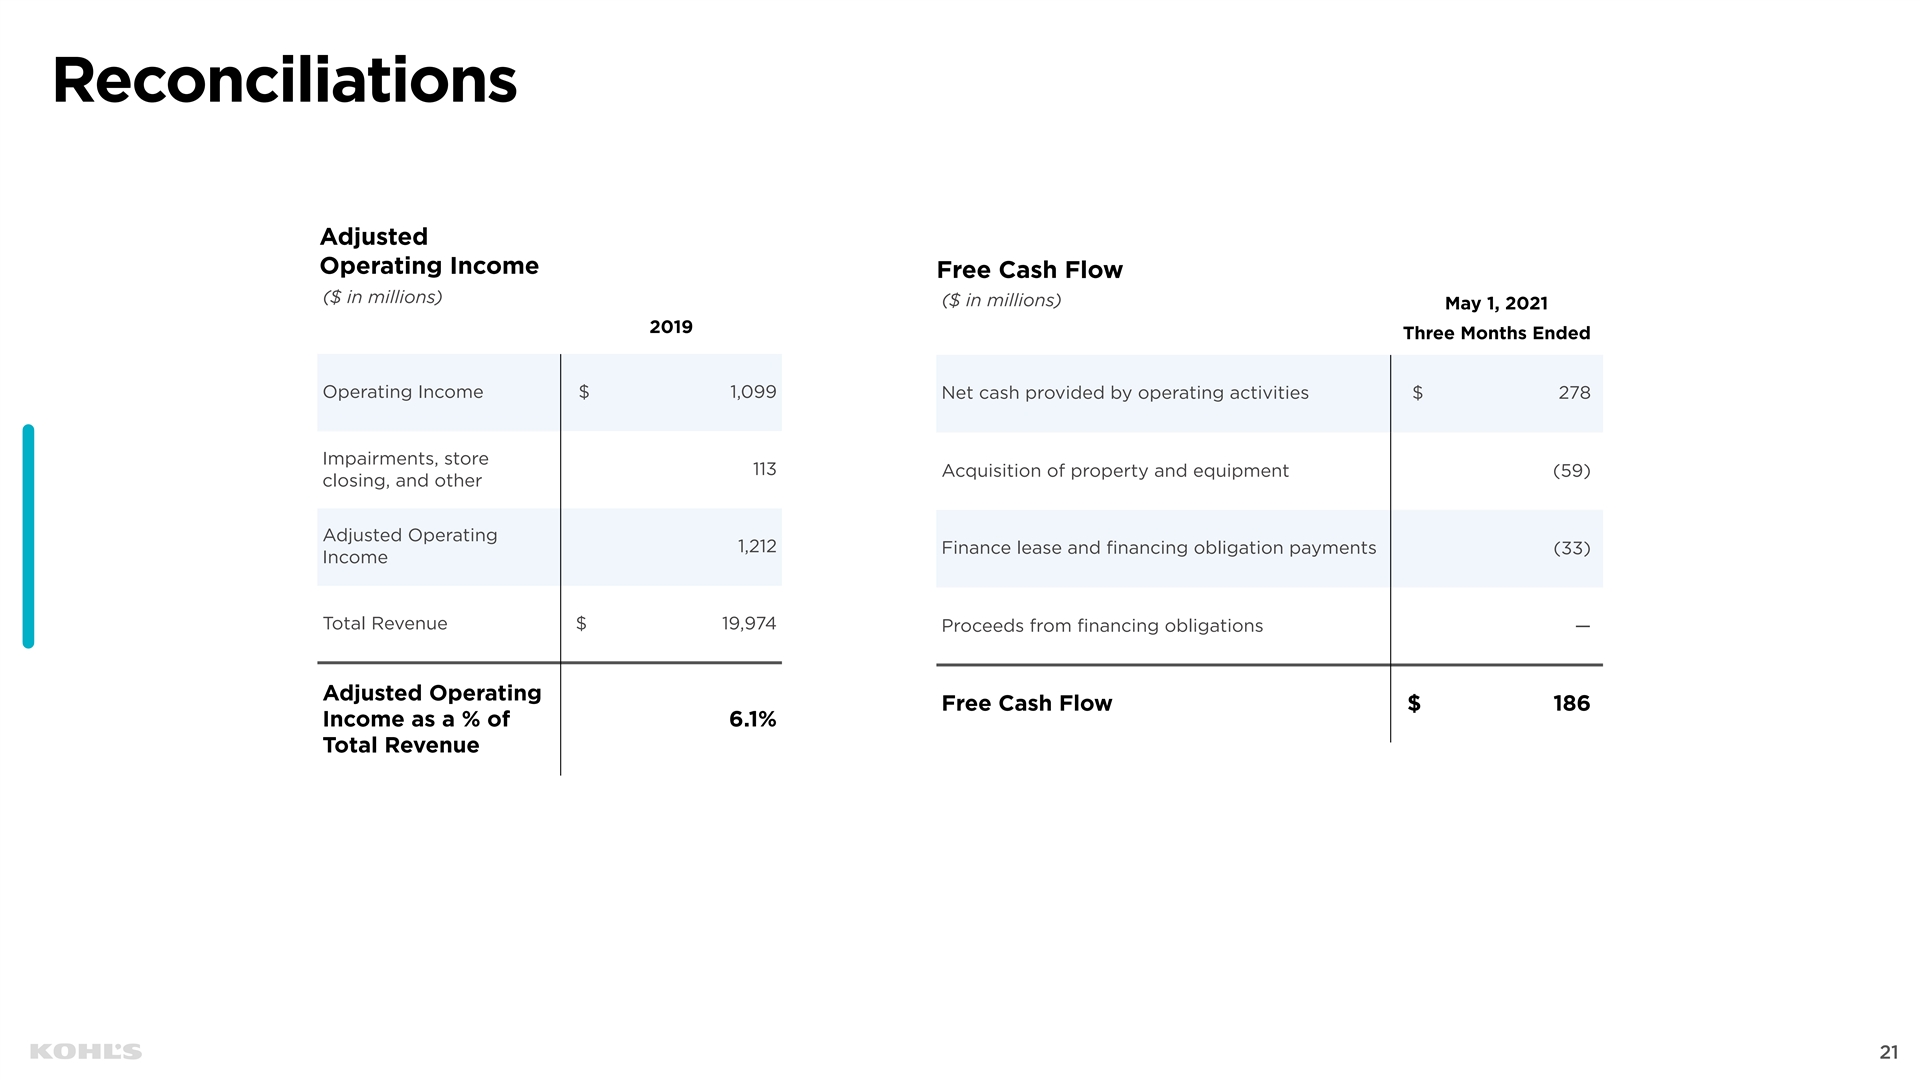
Reconciliations Adjusted Operating Income Free Cash Flow ($ in millions) ($ in millions) May 1, 2021 2019 Three Months Ended Operating Income $ 1,099 Net cash provided by operating activities $ 278 Impairments, store 113 Acquisition of property and equipment (59) closing, and other Adjusted Operating 1,212 Finance lease and financing obligation payments (33) Income Total Revenue $ 19,974 Proceeds from financing obligations — Adjusted Operating Free Cash Flow $ 186 Income as a % of 6.1% Total Revenue 21Reconciliations Adjusted Operating Income Free Cash Flow ($ in millions) ($ in millions) May 1, 2021 2019 Three Months Ended Operating Income $ 1,099 Net cash provided by operating activities $ 278 Impairments, store 113 Acquisition of property and equipment (59) closing, and other Adjusted Operating 1,212 Finance lease and financing obligation payments (33) Income Total Revenue $ 19,974 Proceeds from financing obligations — Adjusted Operating Free Cash Flow $ 186 Income as a % of 6.1% Total Revenue 21