Exhibit 99.2 Q2 2021 Results Presentation August 19, 2021Exhibit 99.2 Q2 2021 Results Presentation August 19, 2021
Cautionary Statement Regarding Forward-Looking Information This presentation contains forward-looking statements within the meaning of the Private Securities Litigation Reform Act of 1995. Words such as believes, anticipates, plans, may, intends, will, should, expects, and similar expressions are intended to identify forward-looking statements. Forward-looking statements include, but are not limited to, comments about Kohl's future financial plans, capital generation, management and deployment strategies, adequacy of capital resources and the competitive environment. Such statements are subject to certain risks and uncertainties, which could cause Kohl's actual results to differ materially from those anticipated by the forward looking statements. These risks and uncertainties include, but are not limited to, those described in Item 1A in Kohl's Annual Report on Form 10-K, which is expressly incorporated herein by reference, and other factors as may periodically be described in Kohl's filings with the SEC. Any number of risks and uncertainties could cause actual results to differ materially from those Kohl’s expresses in its forward-looking statements, including the short and long-term impact of COVID-19 on the economy and the pace of recovery thereafter. Forward-looking statements speak as of the date they are made, and Kohl’s undertakes no obligation to update them.
Non-GAAP Financial Measures In addition, this presentation contains non-GAAP financial measures, including Adjusted EPS, Adjusted Net Income, and Free Cash Flow. Reconciliations of all non-GAAP measures to the most directly comparable GAAP measures are included in the Appendix of this presentation. 2Cautionary Statement Regarding Forward-Looking Information This presentation contains forward-looking statements within the meaning of the Private Securities Litigation Reform Act of 1995. Words such as believes, anticipates, plans, may, intends, will, should, expects, and similar expressions are intended to identify forward-looking statements. Forward-looking statements include, but are not limited to, comments about Kohl's future financial plans, capital generation, management and deployment strategies, adequacy of capital resources and the competitive environment. Such statements are subject to certain risks and uncertainties, which could cause Kohl's actual results to differ materially from those anticipated by the forward looking statements. These risks and uncertainties include, but are not limited to, those described in Item 1A in Kohl's Annual Report on Form 10-K, which is expressly incorporated herein by reference, and other factors as may periodically be described in Kohl's filings with the SEC. Any number of risks and uncertainties could cause actual results to differ materially from those Kohl’s expresses in its forward-looking statements, including the short and long-term impact of COVID-19 on the economy and the pace of recovery thereafter. Forward-looking statements speak as of the date they are made, and Kohl’s undertakes no obligation to update them. Non-GAAP Financial Measures In addition, this presentation contains non-GAAP financial measures, including Adjusted EPS, Adjusted Net Income, and Free Cash Flow. Reconciliations of all non-GAAP measures to the most directly comparable GAAP measures are included in the Appendix of this presentation. 2
Q2 2021 Results
10 Driving Top Line Growth Presentation Q2 2021 Results 4 Updated 2021 Outlook 9 Our Strategy 11 3Q2 2021 Results 10 Driving Top Line Growth Presentation Q2 2021 Results 4 Updated 2021 Outlook 9 Our Strategy 11 3
Q2 2021 Results 4Q2 2021 Results 4
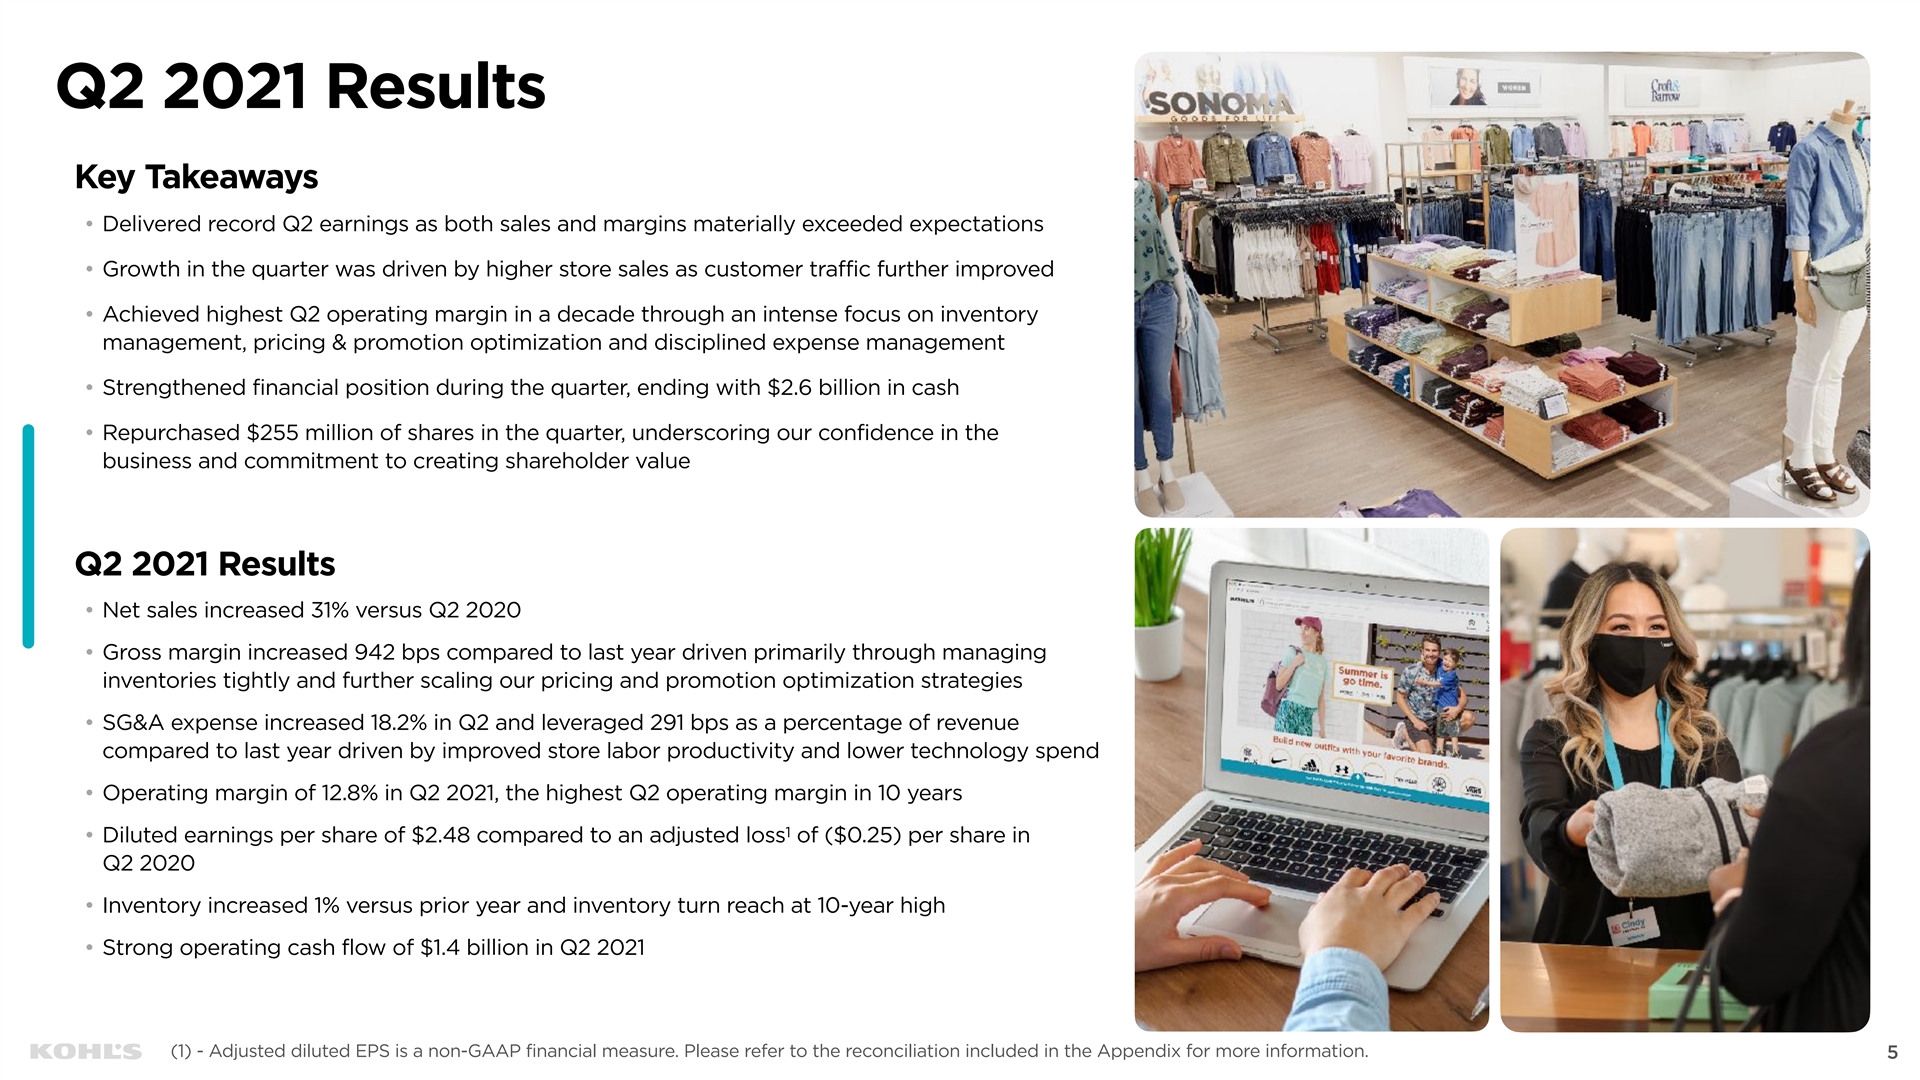
Q2 2021 Results Key Takeaways • Delivered record Q2 earnings as both sales and margins materially exceeded expectations • Growth in the quarter was driven by higher store sales as customer traffic further improved • Achieved highest Q2 operating margin in a decade through an intense focus on inventory management, pricing & promotion optimization and disciplined expense management • Strengthened financial position during the quarter, ending with $2.6 billion in cash • Repurchased $255 million of shares in the quarter, underscoring our confidence in the business and commitment to creating shareholder value Q2 2021 Results • Net sales increased 31% versus Q2 2020 • Gross margin increased 942 bps compared to last year driven primarily through managing inventories tightly and further scaling our pricing and promotion optimization strategies • SG&A expense increased 18.2% in Q2 and leveraged 291 bps as a percentage of revenue compared to last year driven by improved store labor productivity and lower technology spend • Operating margin of 12.8% in Q2 2021, the highest Q2 operating margin in 10 years 1 • Diluted earnings per share of $2.48 compared to an adjusted loss of ($0.25) per share in Q2 2020 • Inventory increased 1% versus prior year and inventory turn reach at 10-year high • Strong operating cash flow of $1.4 billion in Q2 2021 5 (1) - Adjusted diluted EPS is a non-GAAP financial measure. Please refer to the reconciliation included in the Appendix for more information. 5Q2 2021 Results Key Takeaways • Delivered record Q2 earnings as both sales and margins materially exceeded expectations • Growth in the quarter was driven by higher store sales as customer traffic further improved • Achieved highest Q2 operating margin in a decade through an intense focus on inventory management, pricing & promotion optimization and disciplined expense management • Strengthened financial position during the quarter, ending with $2.6 billion in cash • Repurchased $255 million of shares in the quarter, underscoring our confidence in the business and commitment to creating shareholder value Q2 2021 Results • Net sales increased 31% versus Q2 2020 • Gross margin increased 942 bps compared to last year driven primarily through managing inventories tightly and further scaling our pricing and promotion optimization strategies • SG&A expense increased 18.2% in Q2 and leveraged 291 bps as a percentage of revenue compared to last year driven by improved store labor productivity and lower technology spend • Operating margin of 12.8% in Q2 2021, the highest Q2 operating margin in 10 years 1 • Diluted earnings per share of $2.48 compared to an adjusted loss of ($0.25) per share in Q2 2020 • Inventory increased 1% versus prior year and inventory turn reach at 10-year high • Strong operating cash flow of $1.4 billion in Q2 2021 5 (1) - Adjusted diluted EPS is a non-GAAP financial measure. Please refer to the reconciliation included in the Appendix for more information. 5
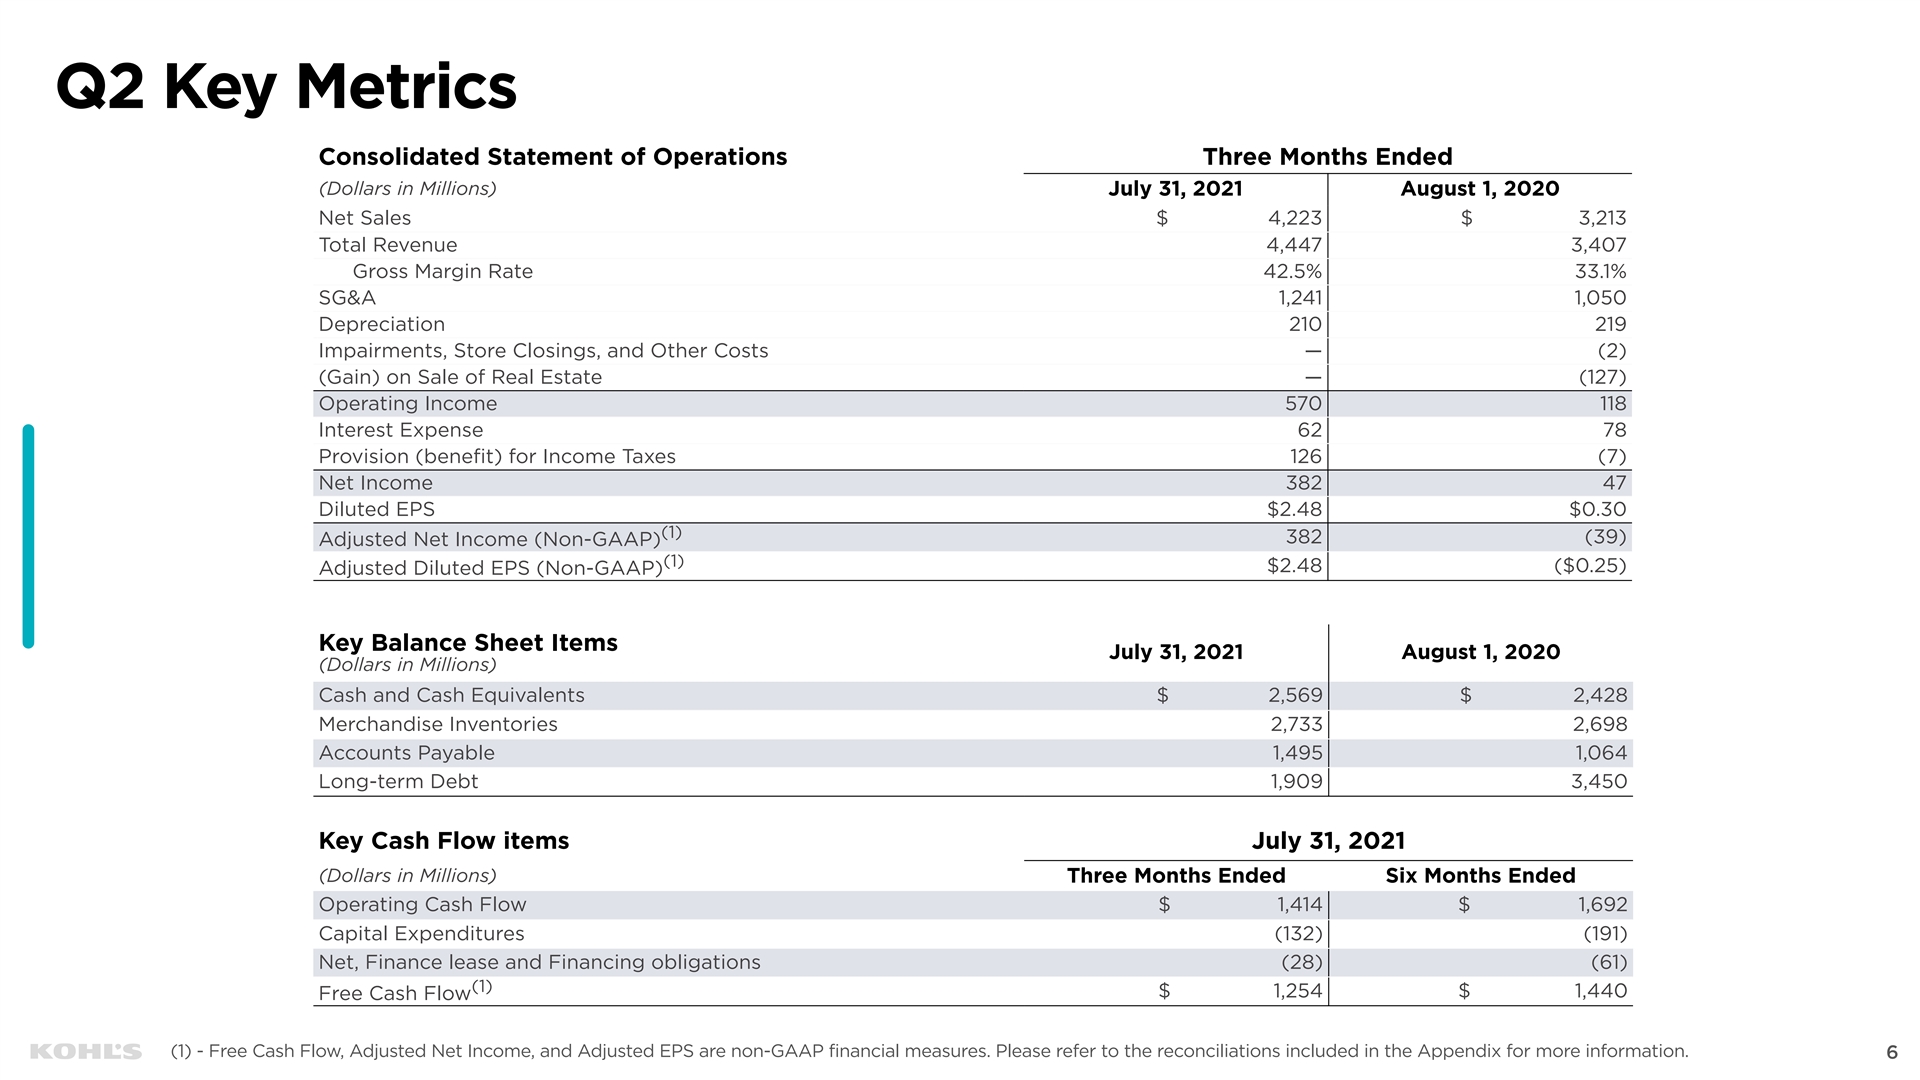
Q2 Key Metrics Consolidated Statement of Operations Three Months Ended (Dollars in Millions) July 31, 2021 August 1, 2020 Net Sales $ 4,223 $ 3,213 Total Revenue 4,447 3,407 Gross Margin Rate 42.5% 33.1% SG&A 1,241 1,050 Depreciation 210 219 Impairments, Store Closings, and Other Costs — (2) (Gain) on Sale of Real Estate — (127) Operating Income 570 118 Interest Expense 62 78 Provision (benefit) for Income Taxes 126 (7) Net Income 382 47 Diluted EPS $2.48 $0.30 (1) 382 (39) Adjusted Net Income (Non-GAAP) (1) $2.48 ($0.25) Adjusted Diluted EPS (Non-GAAP) Key Balance Sheet Items July 31, 2021 August 1, 2020 (Dollars in Millions) Cash and Cash Equivalents $ 2,569 $ 2,428 Merchandise Inventories 2,733 2,698 Accounts Payable 1,495 1,064 Long-term Debt 1,909 3,450 Key Cash Flow items July 31, 2021 (Dollars in Millions) Three Months Ended Six Months Ended Operating Cash Flow $ 1,414 $ 1,692 Capital Expenditures (132) (191) Net, Finance lease and Financing obligations (28) (61) (1) $ 1,254 $ 1,440 Free Cash Flow 6 6 (1) - Free Cash Flow, Adjusted Net Income, and Adjusted EPS are non-GAAP financial measures. Please refer to the reconciliations included in the Appendix for more information. 6
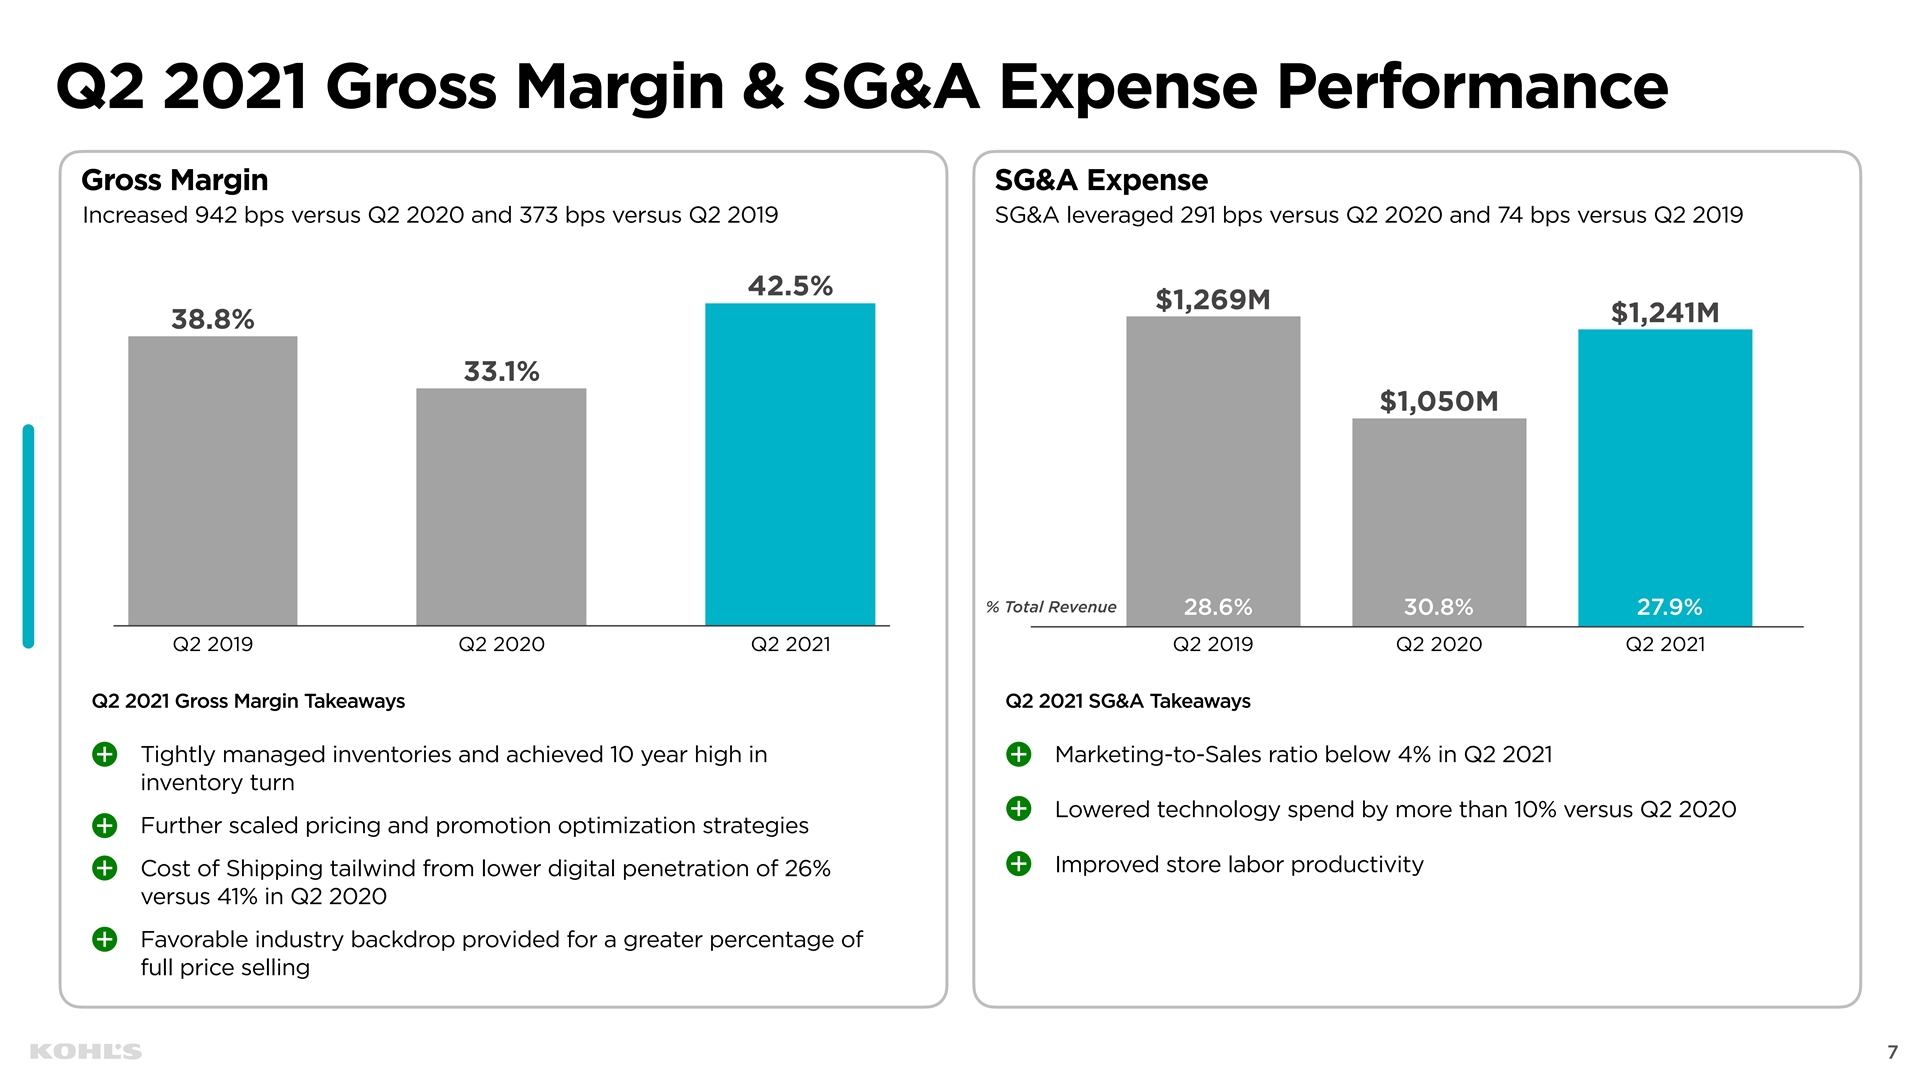
Q2 2021 Gross Margin & SG&A Expense Performance Gross Margin SG&A Expense Increased 942 bps versus Q2 2020 and 373 bps versus Q2 2019 SG&A leveraged 291 bps versus Q2 2020 and 74 bps versus Q2 2019 42.5% $1,269M $1,241M 38.8% 33.1% $1,050M % Total Revenue 28.6% 30.8% 27.9% Q2 2019 Q2 2020 Q2 2021 Q2 2019 Q2 2020 Q2 2021 Q2 2021 Gross Margin Takeaways Q2 2021 SG&A Takeaways Tightly managed inventories and achieved 10 year high in Marketing-to-Sales ratio below 4% in Q2 2021 inventory turn Lowered technology spend by more than 10% versus Q2 2020 Further scaled pricing and promotion optimization strategies Improved store labor productivity Cost of Shipping tailwind from lower digital penetration of 26% versus 41% in Q2 2020 Favorable industry backdrop provided for a greater percentage of full price selling
7 7 7Q2 2021 Gross Margin & SG&A Expense Performance Gross Margin SG&A Expense Increased 942 bps versus Q2 2020 and 373 bps versus Q2 2019 SG&A leveraged 291 bps versus Q2 2020 and 74 bps versus Q2 2019 42.5% $1,269M $1,241M 38.8% 33.1% $1,050M % Total Revenue 28.6% 30.8% 27.9% Q2 2019 Q2 2020 Q2 2021 Q2 2019 Q2 2020 Q2 2021 Q2 2021 Gross Margin Takeaways Q2 2021 SG&A Takeaways Tightly managed inventories and achieved 10 year high in Marketing-to-Sales ratio below 4% in Q2 2021 inventory turn Lowered technology spend by more than 10% versus Q2 2020 Further scaled pricing and promotion optimization strategies Improved store labor productivity Cost of Shipping tailwind from lower digital penetration of 26% versus 41% in Q2 2020 Favorable industry backdrop provided for a greater percentage of full price selling 7 7 7
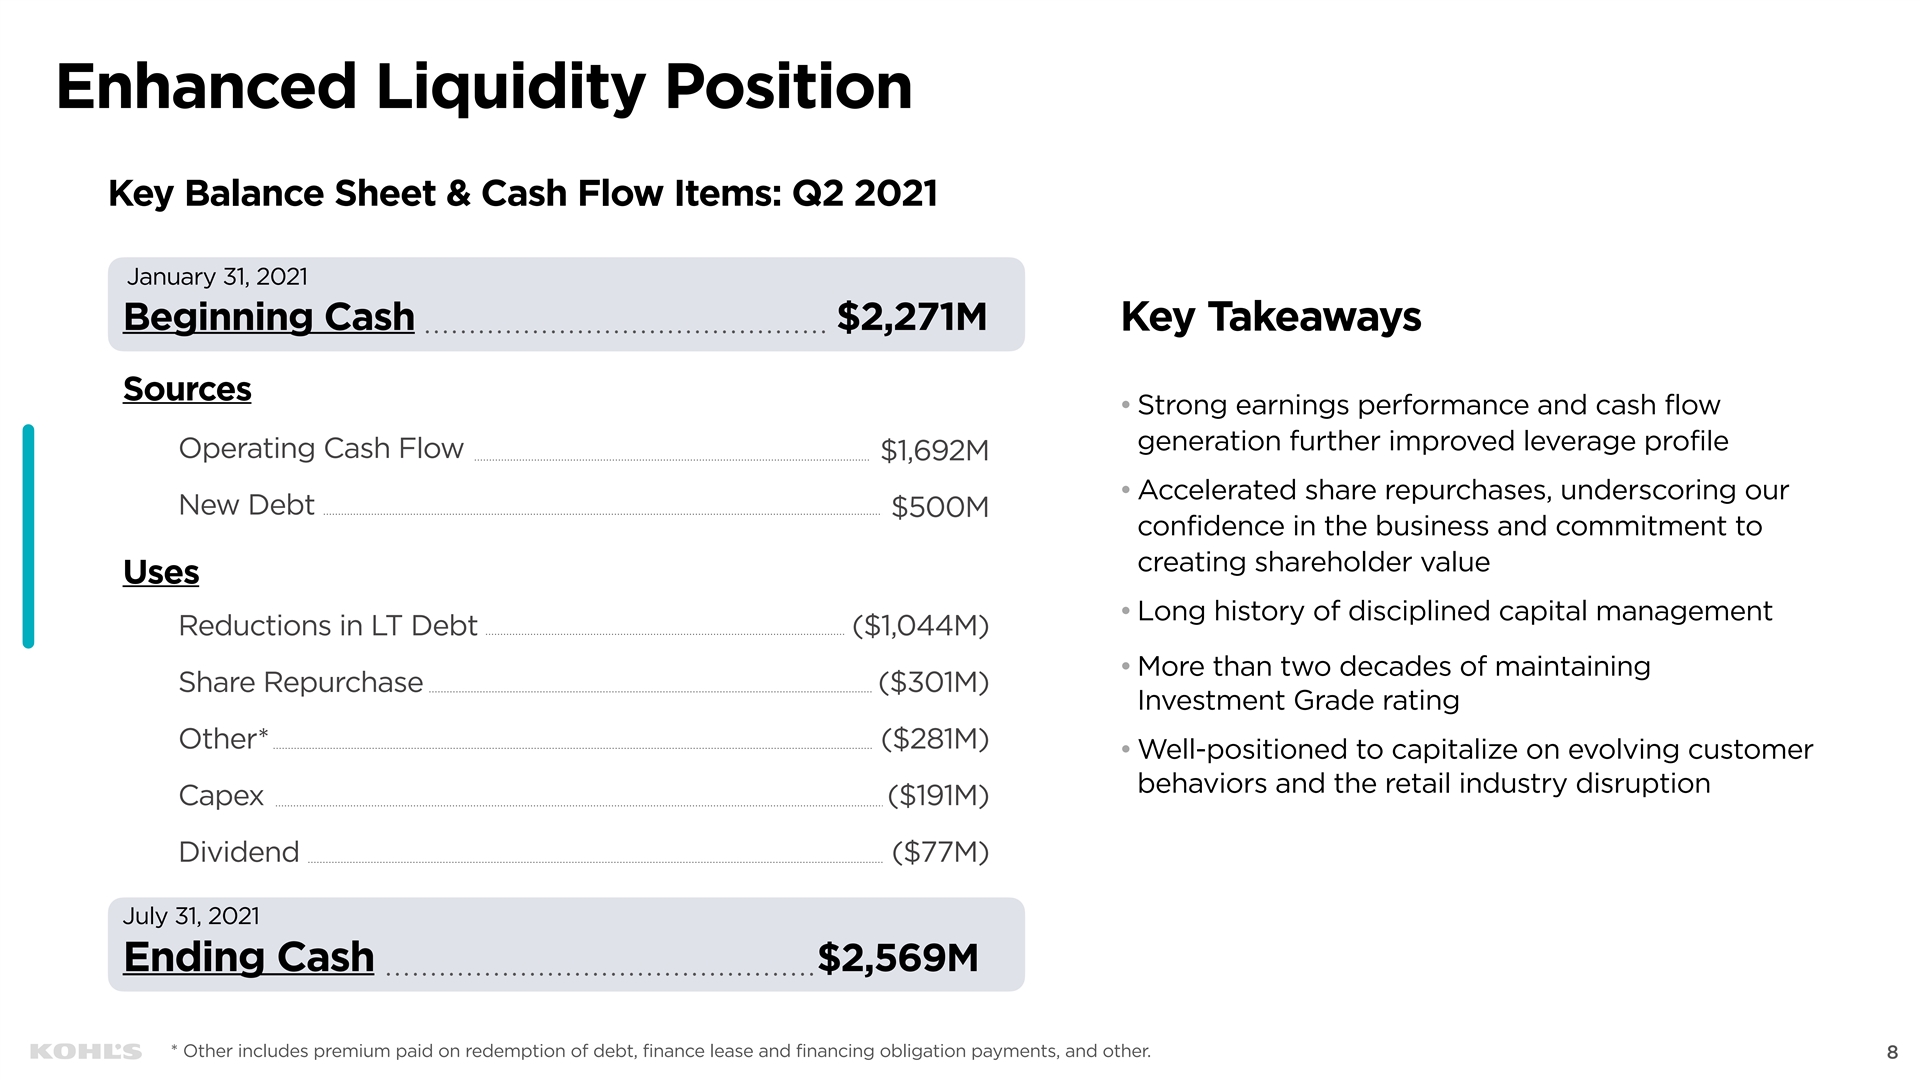
Enhanced Liquidity Position Key Balance Sheet & Cash Flow Items: Q2 2021 January 31, 2021 Beginning Cash $2,271M Key Takeaways Sources • Strong earnings performance and cash flow generation further improved leverage profile Operating Cash Flow $1,692M • Accelerated share repurchases, underscoring our New Debt $500M confidence in the business and commitment to creating shareholder value Uses • Long history of disciplined capital management Reductions in LT Debt ($1,044M) • More than two decades of maintaining Share Repurchase ($301M) Investment Grade rating Other* ($281M) • Well-positioned to capitalize on evolving customer behaviors and the retail industry disruption Capex ($191M) Dividend ($77M) July 31, 2021 Ending Cash $2,569M * Other includes premium paid on redemption of debt, finance lease and financing obligation payments, and other. 8
Updated 2021 Outlook 9

Updated 2021 Outlook Metric Full Year Guidance Low twenties percent increase Net Sales versus 2020 From a mid-to-high teens percent increase 7.4% to 7.6% Operating Margin From 5.7% to 6.1% $5.80 to $6.10
* Adjusted EPS From $3.80 to $4.20 Capital Allocation Strategy • Capex: $600 million to $650 million • Dividend: $0.25 quarterly dividend payable on September 22, 2021 • Share Repurchase Program: $500 million to $700 million, up from $200 million to $300 million * Excludes any non-recurring charges. 10Updated 2021 Outlook Metric Full Year Guidance Low twenties percent increase Net Sales versus 2020 From a mid-to-high teens percent increase 7.4% to 7.6% Operating Margin From 5.7% to 6.1% $5.80 to $6.10 * Adjusted EPS From $3.80 to $4.20 Capital Allocation Strategy • Capex: $600 million to $650 million • Dividend: $0.25 quarterly dividend payable on September 22, 2021 • Share Repurchase Program: $500 million to $700 million, up from $200 million to $300 million * Excludes any non-recurring charges. 10
Our Strategy 11Our Strategy 11
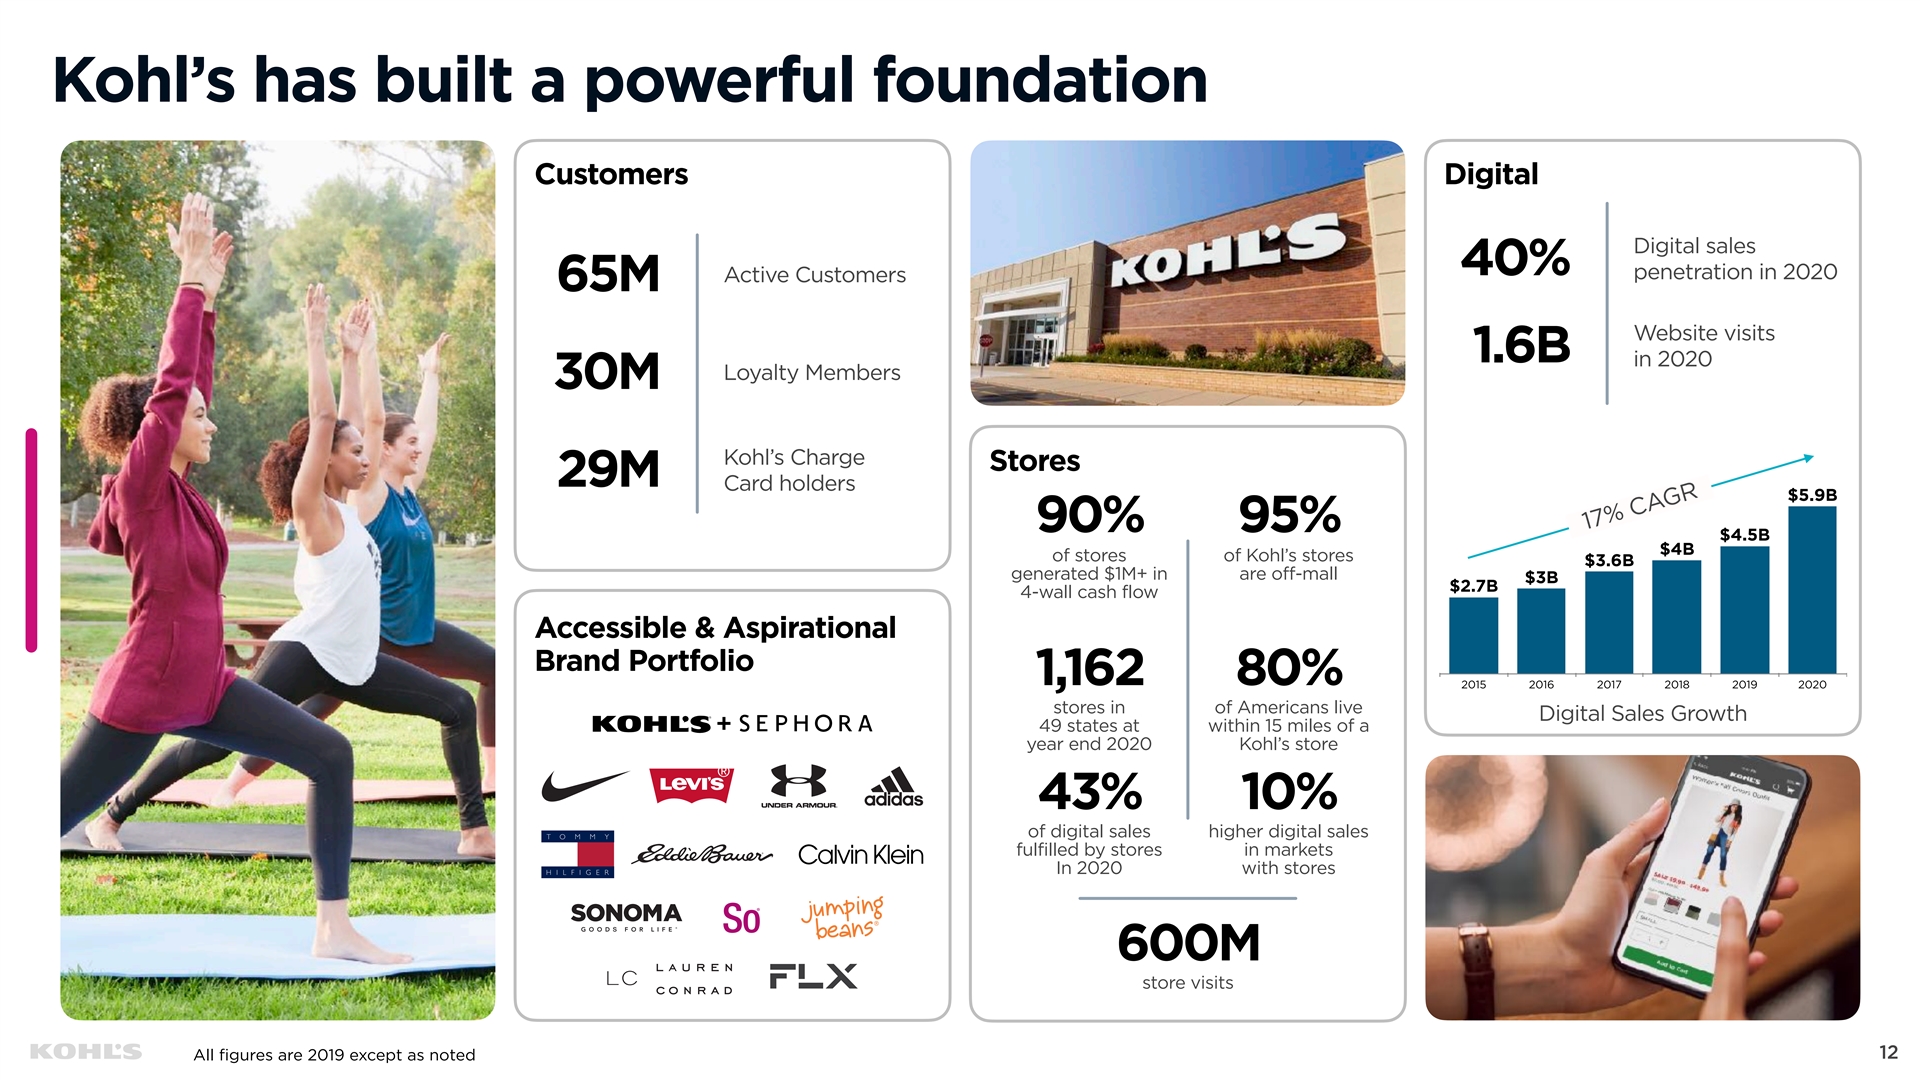
Kohl’s has built a powerful foundation Customers Digital Digital sales 40% penetration in 2020 Active Customers 65M Website visits 1.6B in 2020 Loyalty Members 30M Kohl’s Charge Stores 29M Card holders $5.9B 90% 95% $4.5B $4B of stores of Kohl’s stores $3.6B generated $1M+ in are off-mall $3B $2.7B 4-wall cash flow Accessible & Aspirational Brand Portfolio 1,162 80% 2015 2016 2017 2018 2019 2020 stores in of Americans live Digital Sales Growth 49 states at within 15 miles of a year end 2020 Kohl’s store 43% 10% of digital sales higher digital sales fulfilled by stores in markets In 2020 with stores 600M store visits 12 All figures are 2019 except as noted 17% CAGRKohl’s has built a powerful foundation Customers Digital Digital sales 40% penetration in 2020 Active Customers 65M Website visits 1.6B in 2020 Loyalty Members 30M Kohl’s Charge Stores 29M Card holders $5.9B 90% 95% $4.5B $4B of stores of Kohl’s stores $3.6B generated $1M+ in are off-mall $3B $2.7B 4-wall cash flow Accessible & Aspirational Brand Portfolio 1,162 80% 2015 2016 2017 2018 2019 2020 stores in of Americans live Digital Sales Growth 49 states at within 15 miles of a year end 2020 Kohl’s store 43% 10% of digital sales higher digital sales fulfilled by stores in markets In 2020 with stores 600M store visits 12 All figures are 2019 except as noted 17% CAGR
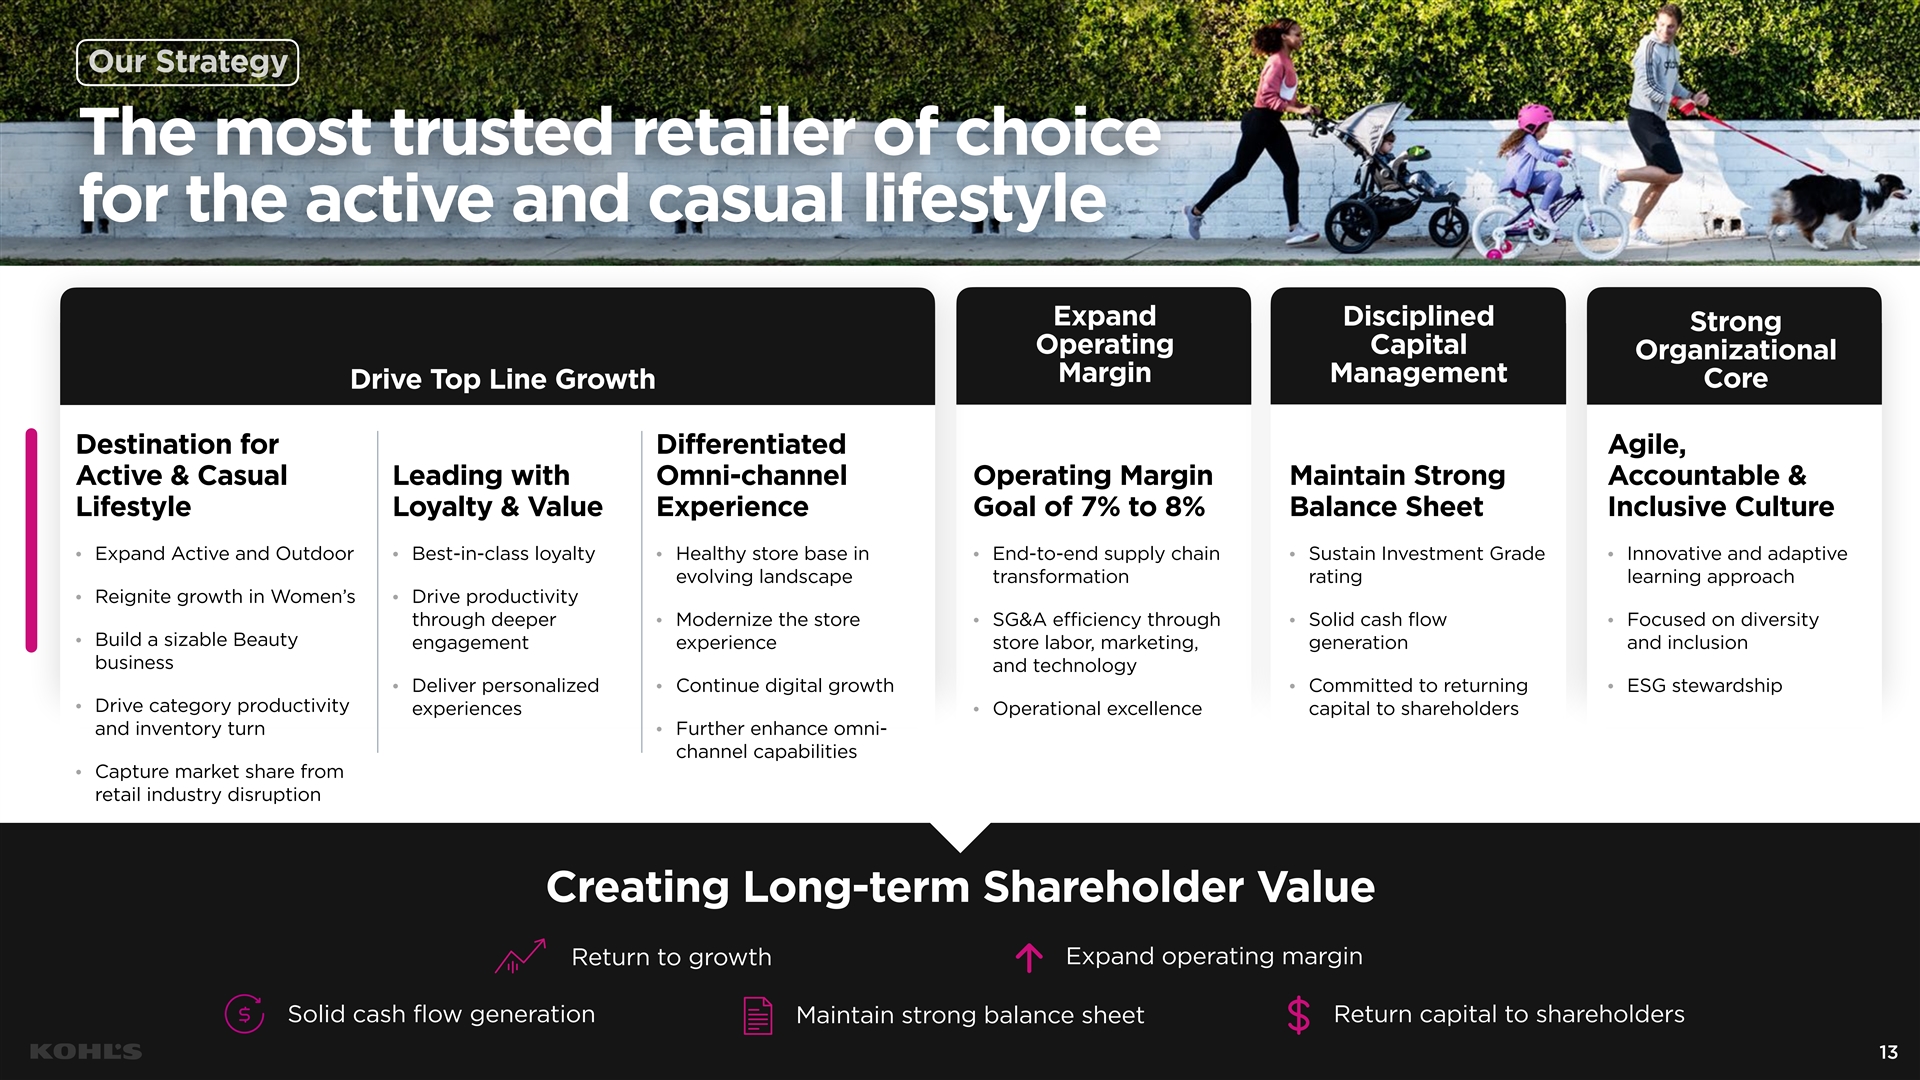
Our Strategy The most trusted retailer of choice for the active and casual lifestyle Expand Disciplined Strong Operating Capital Organizational Margin Management Core Drive Top Line Growth Destination for Differentiated Agile, Active & Casual Leading with Omni-channel Operating Margin Maintain Strong Accountable & Lifestyle Loyalty & Value Experience Goal of 7% to 8% Balance Sheet Inclusive Culture Expand Active and Outdoor Best-in-class loyalty Healthy store base in End-to-end supply chain Sustain Investment Grade Innovative and adaptive • • • • • • evolving landscape transformation rating learning approach Reignite growth in Women’s Drive productivity • • through deeper Modernize the store SG&A efficiency through Solid cash flow Focused on diversity • • • • Build a sizable Beauty • engagement experience store labor, marketing, generation and inclusion business and technology Deliver personalized Continue digital growth Committed to returning ESG stewardship • • • • Drive category productivity • experiences Operational excellence capital to shareholders • and inventory turn Further enhance omni- • channel capabilities Capture market share from • retail industry disruption Creating Long-term Shareholder Value Expand operating margin Return to growth Solid cash flow generation Return capital to shareholders Maintain strong balance sheet 13Our Strategy The most trusted retailer of choice for the active and casual lifestyle Expand Disciplined Strong Operating Capital Organizational Margin Management Core Drive Top Line Growth Destination for Differentiated Agile, Active & Casual Leading with Omni-channel Operating Margin Maintain Strong Accountable & Lifestyle Loyalty & Value Experience Goal of 7% to 8% Balance Sheet Inclusive Culture Expand Active and Outdoor Best-in-class loyalty Healthy store base in End-to-end supply chain Sustain Investment Grade Innovative and adaptive • • • • • • evolving landscape transformation rating learning approach Reignite growth in Women’s Drive productivity • • through deeper Modernize the store SG&A efficiency through Solid cash flow Focused on diversity • • • • Build a sizable Beauty • engagement experience store labor, marketing, generation and inclusion business and technology Deliver personalized Continue digital growth Committed to returning ESG stewardship • • • • Drive category productivity • experiences Operational excellence capital to shareholders • and inventory turn Further enhance omni- • channel capabilities Capture market share from • retail industry disruption Creating Long-term Shareholder Value Expand operating margin Return to growth Solid cash flow generation Return capital to shareholders Maintain strong balance sheet 13

Driving top line growth Grow Active to Beauty Growth Reignite Extend Casual 30% of Sales with Sephora Women’s Growth Lifestyle to Home • Fuel growth with key national • Highly complementary strategic • New organization structure and • Expand soft home category brands, Nike, Under Armour and partnership to establish Kohl’s as leadership to drive improved (e.g. Koolaburra by Ugg, Sonoma) Adidas a leading beauty destination performance • Expand underdeveloped • Expand Active space by at least • Comprehensive digital launch • Significant portfolio reinvention categories (e.g. decor, kid’s 20% in 2021 August 2021 with exit of 10 downtrending brands bedroom, storage) • Drive athleisure through launch of • Launch in 200 stores Fall 2021, • Refresh and differentiate a more • Lean into healthy home FLX, our new private brand, Calvin 400 stores in 2022, and reaching focused portfolio of private brands (e.g. sleep and cookware) Klein basics and loungewear, and at least 850 stores by 2023 (e.g. Sonoma, So, LC Lauren expand assortment of Champion Conrad) • Assortment will include ~125 • Grow outdoor through expansion of emerging and established brands • Distort denim opportunity Lands’ End and launch of Eddie emulating freestanding Sephora (e.g. Levi’s, key private brands) Bauer store • Improving merchandising and • Expected to drive significant traffic clarity through significant choice and acquisition of new younger count reduction and building depth customer 14

Driving top line growth Investing in Omni-channel Loyalty Members are Transforming the Role Enhance Digital Capabilities More Productive of the Store to Drive Growth • New Kohl’s Rewards loyalty program, added • Modernizing the store experience through refresh • Continue to invest in the evolution of the digital new features, enhanced personalization and program and category reflow to highlight outsized experience (e.g. Kohls.com, App) simplified rewards in Kohl’s Cash growth businesses • Expanding digital brand portfolio (e.g. Fanatics, • Simplified and edited shopping experience through • Kohl’s Cash: Iconic and differentiated loyalty Sephora, Lands’ End, Eddie Bauer) fixture de-densification (standard to small strategy) device that provides a fly-wheel effect on customer return visits • Opened our sixth e-commerce fulfillment center • Inspired solutions and product storytelling through in 2021 continued investments in merchandising (e.g. • Kohl’s Card: Provides more opportunities for expanding the learnings from the Outfit Bar concept) customers to save • Evolve existing omni experiences: BOPUS/BOSS, Store Drive Up, Amazon Returns • Continue to pursue innovation and discovery (e.g. Curated by Kohl’s, emerging brands) 30 million loyalty members spend 2x more than non-loyalty members and Omni-customer is 4x more productive than highest tier Kohl’s Card members store-only shopper and 6x more productive (“Most Valuable Customer”) spend 10x more than non-loyalty members than digital-only customer 15Driving top line growth Investing in Omni-channel Loyalty Members are Transforming the Role Enhance Digital Capabilities More Productive of the Store to Drive Growth • New Kohl’s Rewards loyalty program, added • Modernizing the store experience through refresh • Continue to invest in the evolution of the digital new features, enhanced personalization and program and category reflow to highlight outsized experience (e.g. Kohls.com, App) simplified rewards in Kohl’s Cash growth businesses • Expanding digital brand portfolio (e.g. Fanatics, • Simplified and edited shopping experience through • Kohl’s Cash: Iconic and differentiated loyalty Sephora, Lands’ End, Eddie Bauer) fixture de-densification (standard to small strategy) device that provides a fly-wheel effect on customer return visits • Opened our sixth e-commerce fulfillment center • Inspired solutions and product storytelling through in 2021 continued investments in merchandising (e.g. • Kohl’s Card: Provides more opportunities for expanding the learnings from the Outfit Bar concept) customers to save • Evolve existing omni experiences: BOPUS/BOSS, Store Drive Up, Amazon Returns • Continue to pursue innovation and discovery (e.g. Curated by Kohl’s, emerging brands) 30 million loyalty members spend 2x more than non-loyalty members and Omni-customer is 4x more productive than highest tier Kohl’s Card members store-only shopper and 6x more productive (“Most Valuable Customer”) spend 10x more than non-loyalty members than digital-only customer 15
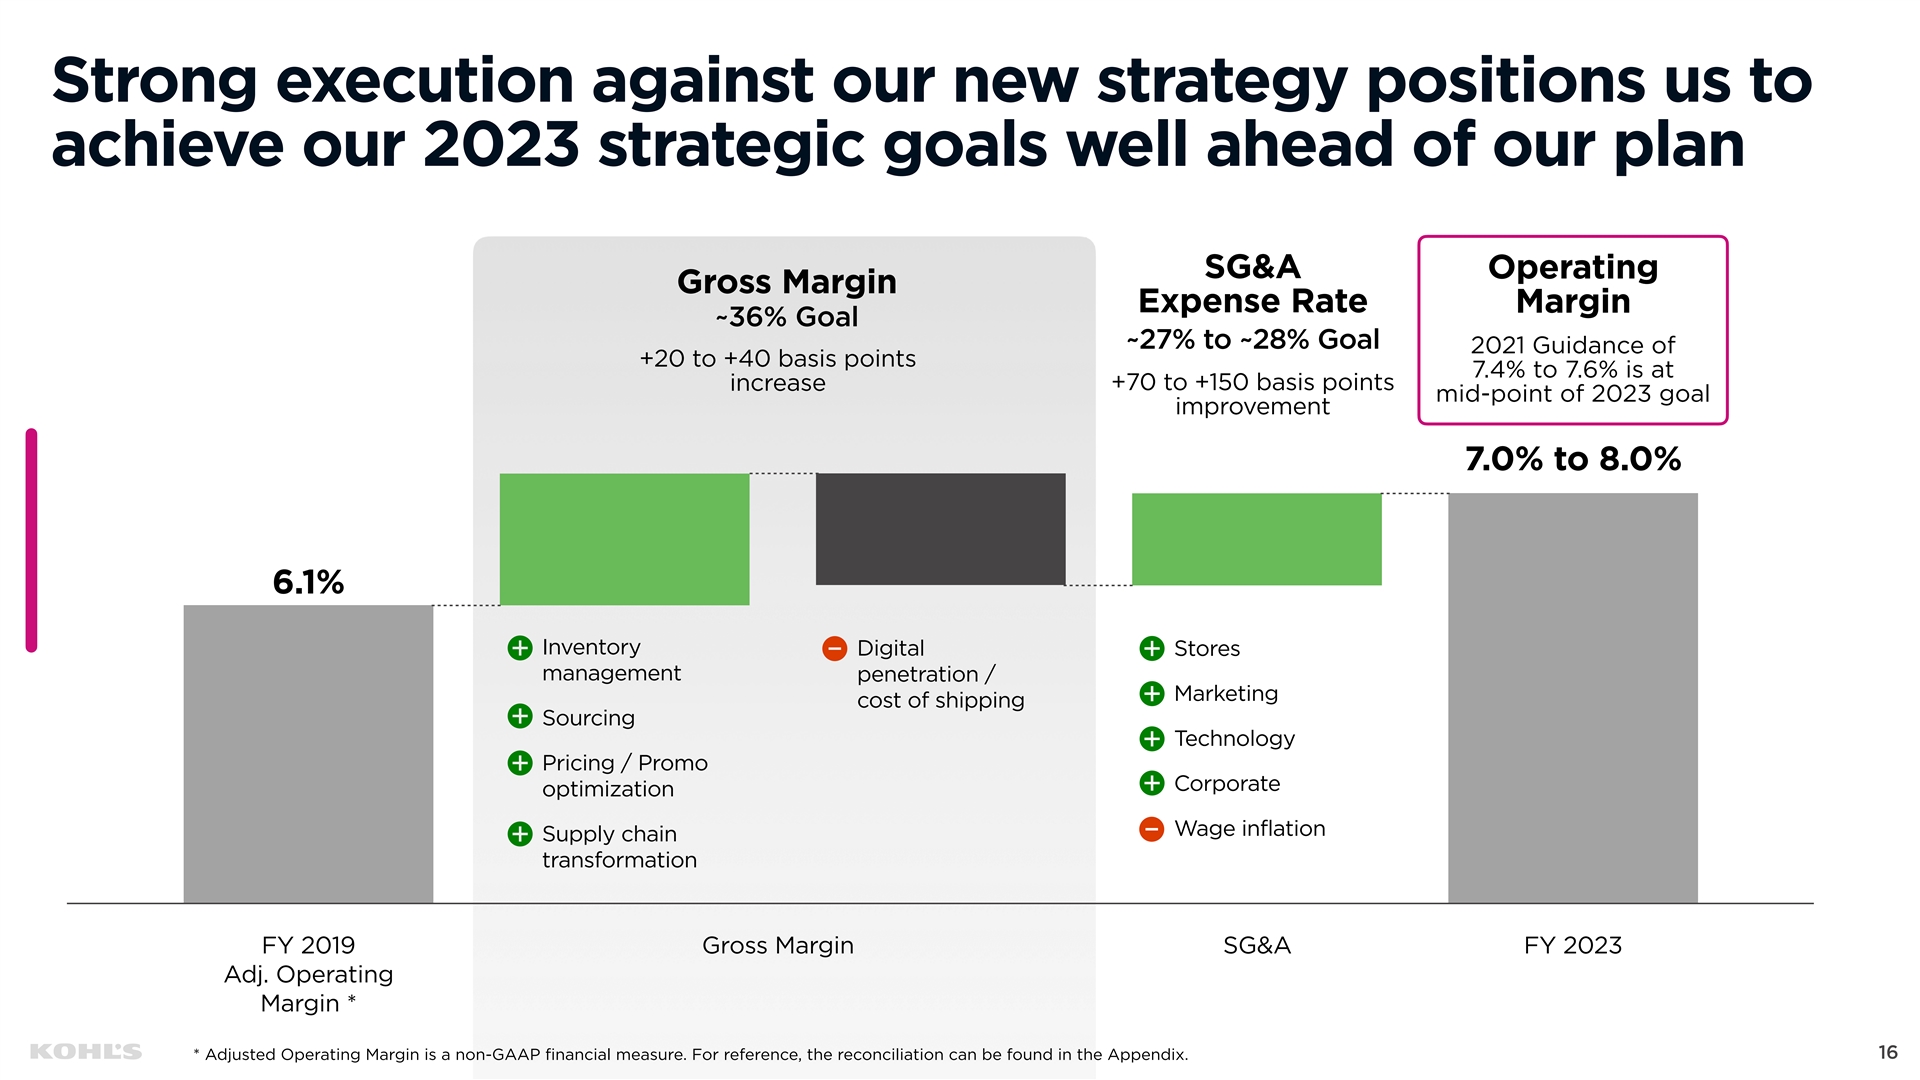
Strong execution against our new strategy positions us to achieve our 2023 strategic goals well ahead of our plan SG&A Operating Gross Margin Expense Rate Margin ~36% Goal ~27% to ~28% Goal 2021 Guidance of +20 to +40 basis points 7.4% to 7.6% is at +70 to +150 basis points increase mid-point of 2023 goal improvement 7.0% to 8.0% 6.1% Inventory Digital Stores management penetration / Marketing cost of shipping Sourcing Technology Pricing / Promo Corporate optimization Wage inflation Supply chain transformation FY 2019 Gross Margin SG&A FY 2023 Adj. Operating Margin * 16 * Adjusted Operating Margin is a non-GAAP financial measure. For reference, the reconciliation can be found in the Appendix.Strong execution against our new strategy positions us to achieve our 2023 strategic goals well ahead of our plan SG&A Operating Gross Margin Expense Rate Margin ~36% Goal ~27% to ~28% Goal 2021 Guidance of +20 to +40 basis points 7.4% to 7.6% is at +70 to +150 basis points increase mid-point of 2023 goal improvement 7.0% to 8.0% 6.1% Inventory Digital Stores management penetration / Marketing cost of shipping Sourcing Technology Pricing / Promo Corporate optimization Wage inflation Supply chain transformation FY 2019 Gross Margin SG&A FY 2023 Adj. Operating Margin * 16 * Adjusted Operating Margin is a non-GAAP financial measure. For reference, the reconciliation can be found in the Appendix.
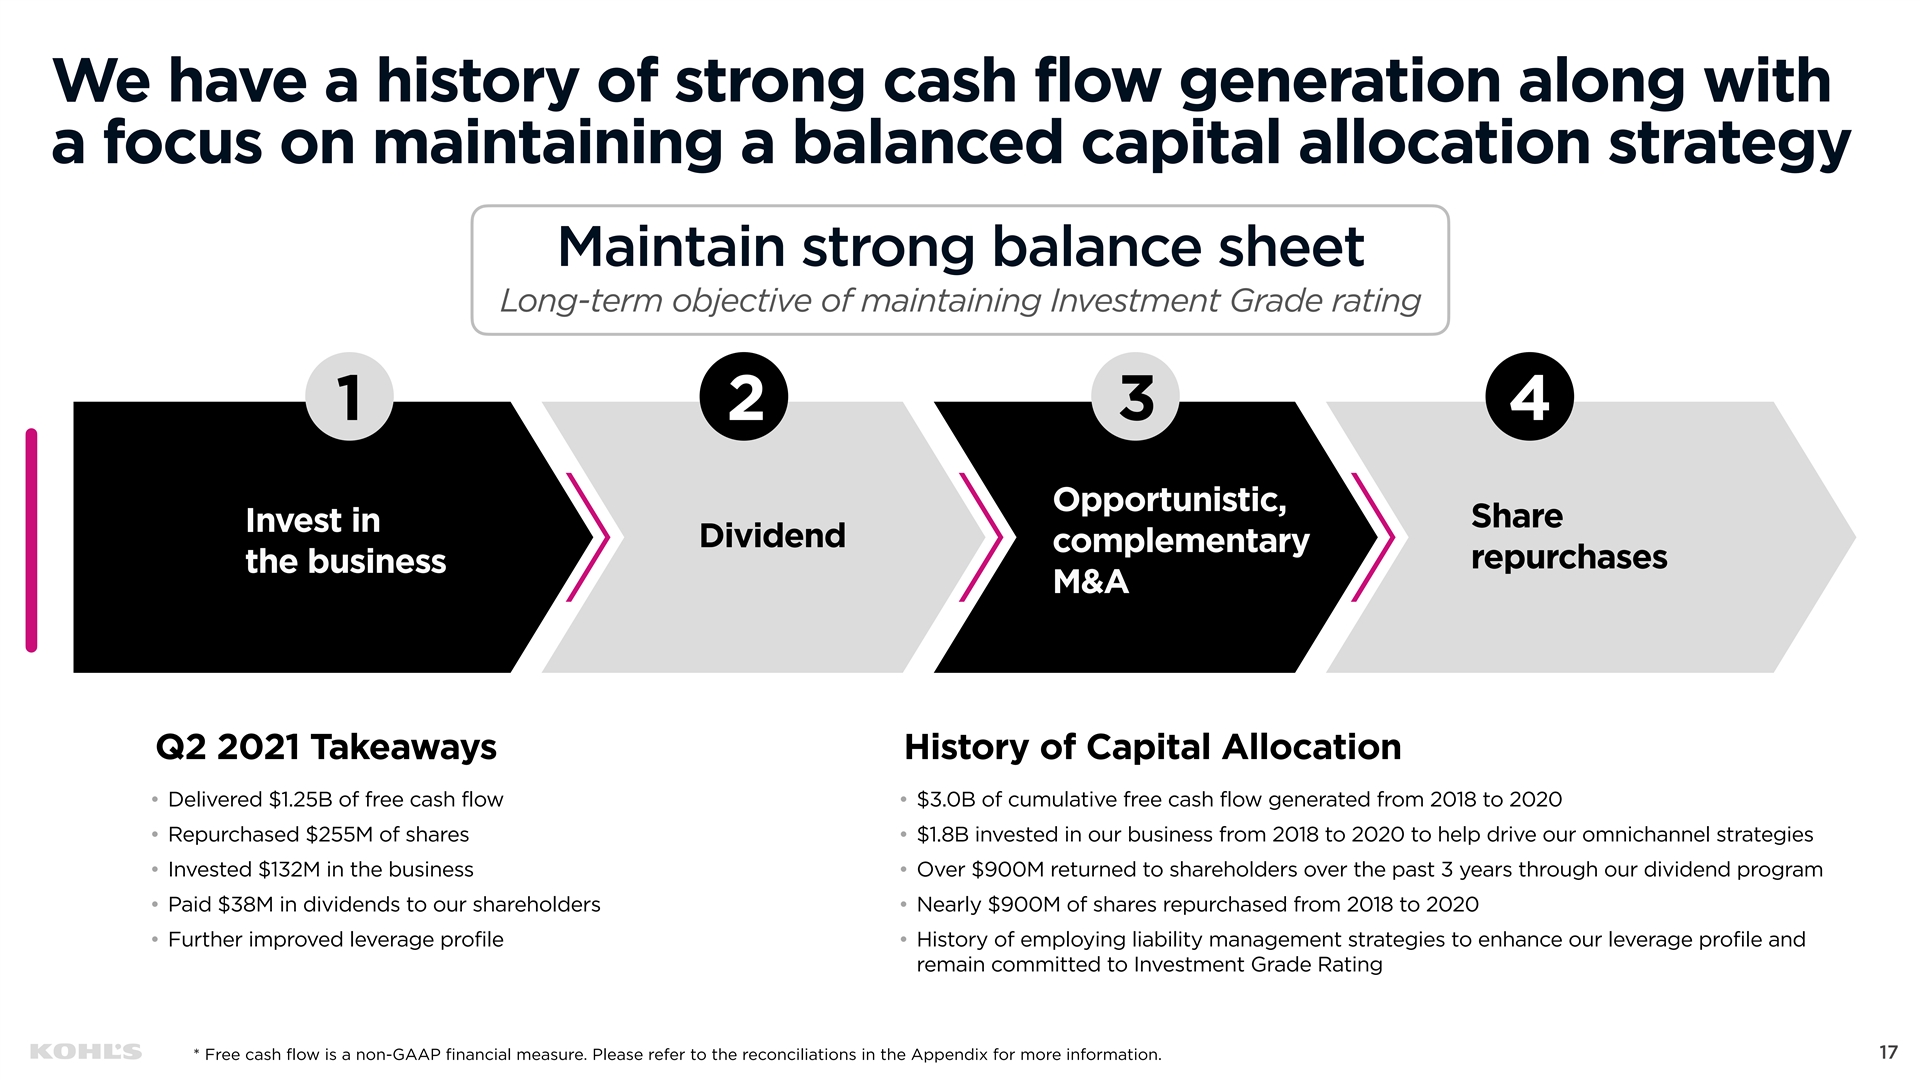
We have a history of strong cash flow generation along with a focus on maintaining a balanced capital allocation strategy Maintain strong balance sheet Long-term objective of maintaining Investment Grade rating 1 2 3 4 Opportunistic, Share
Invest in
Dividend complementary
repurchases the business M&A Q2 2021 Takeaways History of Capital Allocation • Delivered $1.25B of free cash flow • $3.0B of cumulative free cash flow generated from 2018 to 2020 • Repurchased $255M of shares • $1.8B invested in our business from 2018 to 2020 to help drive our omnichannel strategies • Invested $132M in the business • Over $900M returned to shareholders over the past 3 years through our dividend program • Paid $38M in dividends to our shareholders • Nearly $900M of shares repurchased from 2018 to 2020 • Further improved leverage profile • History of employing liability management strategies to enhance our leverage profile and remain committed to Investment Grade Rating 17 * Free cash flow is a non-GAAP financial measure. Please refer to the reconciliations in the Appendix for more information.We have a history of strong cash flow generation along with a focus on maintaining a balanced capital allocation strategy Maintain strong balance sheet Long-term objective of maintaining Investment Grade rating 1 2 3 4 Opportunistic, Share Invest in Dividend complementary repurchases the business M&A Q2 2021 Takeaways History of Capital Allocation • Delivered $1.25B of free cash flow • $3.0B of cumulative free cash flow generated from 2018 to 2020 • Repurchased $255M of shares • $1.8B invested in our business from 2018 to 2020 to help drive our omnichannel strategies • Invested $132M in the business • Over $900M returned to shareholders over the past 3 years through our dividend program • Paid $38M in dividends to our shareholders • Nearly $900M of shares repurchased from 2018 to 2020 • Further improved leverage profile • History of employing liability management strategies to enhance our leverage profile and remain committed to Investment Grade Rating 17 * Free cash flow is a non-GAAP financial measure. Please refer to the reconciliations in the Appendix for more information.
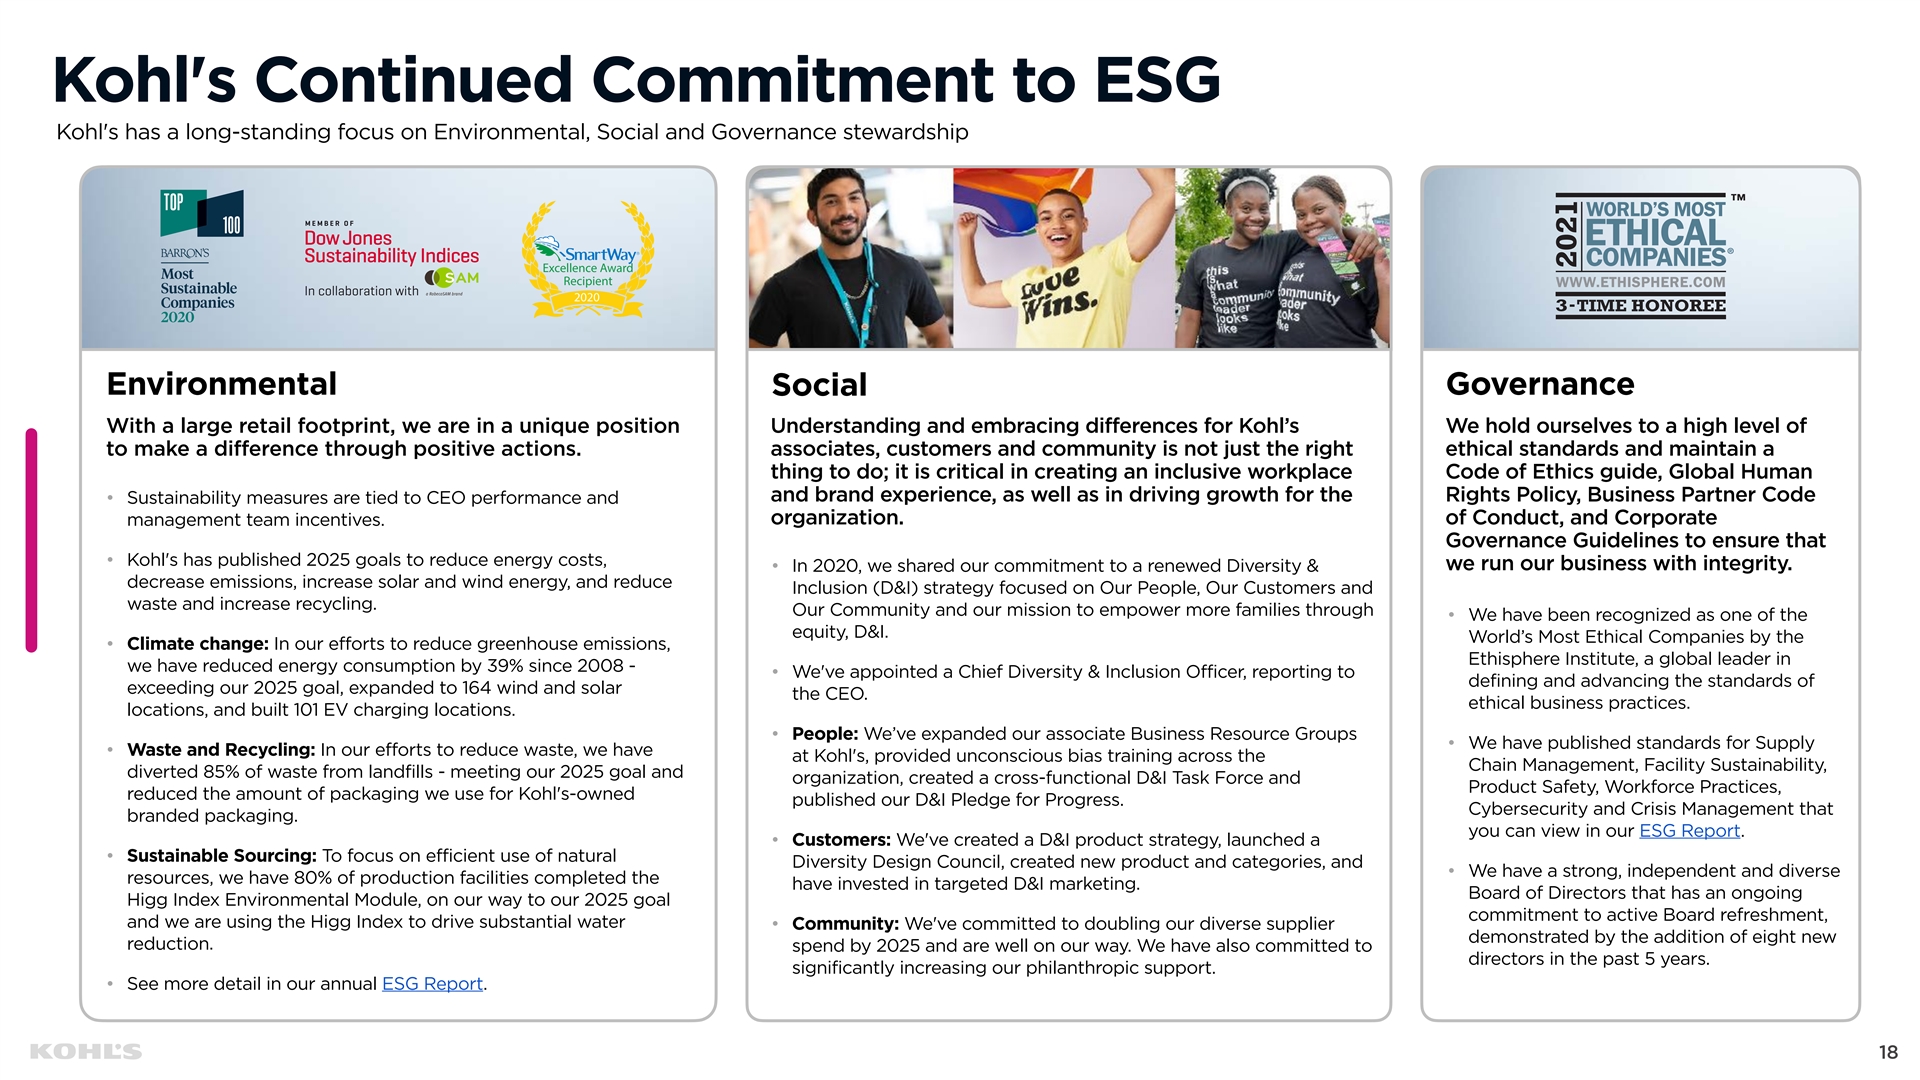
Kohl's Continued Commitment to ESG Kohl's has a long-standing focus on Environmental, Social and Governance stewardship Excellence Award Recipient 2020 Environmental Governance Social With a large retail footprint, we are in a unique position Understanding and embracing differences for Kohl’s We hold ourselves to a high level of to make a difference through positive actions. associates, customers and community is not just the right ethical standards and maintain a thing to do; it is critical in creating an inclusive workplace Code of Ethics guide, Global Human and brand experience, as well as in driving growth for the Rights Policy, Business Partner Code • Sustainability measures are tied to CEO performance and organization. of Conduct, and Corporate management team incentives. Governance Guidelines to ensure that • Kohl's has published 2025 goals to reduce energy costs, we run our business with integrity. • In 2020, we shared our commitment to a renewed Diversity & decrease emissions, increase solar and wind energy, and reduce Inclusion (D&I) strategy focused on Our People, Our Customers and waste and increase recycling. Our Community and our mission to empower more families through • We have been recognized as one of the equity, D&I. World’s Most Ethical Companies by the • Climate change: In our efforts to reduce greenhouse emissions, Ethisphere Institute, a global leader in we have reduced energy consumption by 39% since 2008 - • We've appointed a Chief Diversity & Inclusion Officer, reporting to defining and advancing the standards of exceeding our 2025 goal, expanded to 164 wind and solar the CEO. ethical business practices. locations, and built 101 EV charging locations. • People: We’ve expanded our associate Business Resource Groups • We have published standards for Supply • Waste and Recycling: In our efforts to reduce waste, we have at Kohl's, provided unconscious bias training across the Chain Management, Facility Sustainability, diverted 85% of waste from landfills - meeting our 2025 goal and organization, created a cross-functional D&I Task Force and Product Safety, Workforce Practices, reduced the amount of packaging we use for Kohl's-owned published our D&I Pledge for Progress. Cybersecurity and Crisis Management that branded packaging. you can view in our ESG Report. • Customers: We've created a D&I product strategy, launched a • Sustainable Sourcing: To focus on efficient use of natural Diversity Design Council, created new product and categories, and • We have a strong, independent and diverse resources, we have 80% of production facilities completed the have invested in targeted D&I marketing. Board of Directors that has an ongoing Higg Index Environmental Module, on our way to our 2025 goal commitment to active Board refreshment, and we are using the Higg Index to drive substantial water • Community: We've committed to doubling our diverse supplier demonstrated by the addition of eight new reduction. spend by 2025 and are well on our way. We have also committed to directors in the past 5 years. significantly increasing our philanthropic support. • See more detail in our annual ESG Report. 18Kohl's Continued Commitment to ESG Kohl's has a long-standing focus on Environmental, Social and Governance stewardship Excellence Award Recipient 2020 Environmental Governance Social With a large retail footprint, we are in a unique position Understanding and embracing differences for Kohl’s We hold ourselves to a high level of to make a difference through positive actions. associates, customers and community is not just the right ethical standards and maintain a thing to do; it is critical in creating an inclusive workplace Code of Ethics guide, Global Human and brand experience, as well as in driving growth for the Rights Policy, Business Partner Code • Sustainability measures are tied to CEO performance and organization. of Conduct, and Corporate management team incentives. Governance Guidelines to ensure that • Kohl's has published 2025 goals to reduce energy costs, we run our business with integrity. • In 2020, we shared our commitment to a renewed Diversity & decrease emissions, increase solar and wind energy, and reduce Inclusion (D&I) strategy focused on Our People, Our Customers and waste and increase recycling. Our Community and our mission to empower more families through • We have been recognized as one of the equity, D&I. World’s Most Ethical Companies by the • Climate change: In our efforts to reduce greenhouse emissions, Ethisphere Institute, a global leader in we have reduced energy consumption by 39% since 2008 - • We've appointed a Chief Diversity & Inclusion Officer, reporting to defining and advancing the standards of exceeding our 2025 goal, expanded to 164 wind and solar the CEO. ethical business practices. locations, and built 101 EV charging locations. • People: We’ve expanded our associate Business Resource Groups • We have published standards for Supply • Waste and Recycling: In our efforts to reduce waste, we have at Kohl's, provided unconscious bias training across the Chain Management, Facility Sustainability, diverted 85% of waste from landfills - meeting our 2025 goal and organization, created a cross-functional D&I Task Force and Product Safety, Workforce Practices, reduced the amount of packaging we use for Kohl's-owned published our D&I Pledge for Progress. Cybersecurity and Crisis Management that branded packaging. you can view in our ESG Report. • Customers: We've created a D&I product strategy, launched a • Sustainable Sourcing: To focus on efficient use of natural Diversity Design Council, created new product and categories, and • We have a strong, independent and diverse resources, we have 80% of production facilities completed the have invested in targeted D&I marketing. Board of Directors that has an ongoing Higg Index Environmental Module, on our way to our 2025 goal commitment to active Board refreshment, and we are using the Higg Index to drive substantial water • Community: We've committed to doubling our diverse supplier demonstrated by the addition of eight new reduction. spend by 2025 and are well on our way. We have also committed to directors in the past 5 years. significantly increasing our philanthropic support. • See more detail in our annual ESG Report. 18
Appendix 19Appendix 19
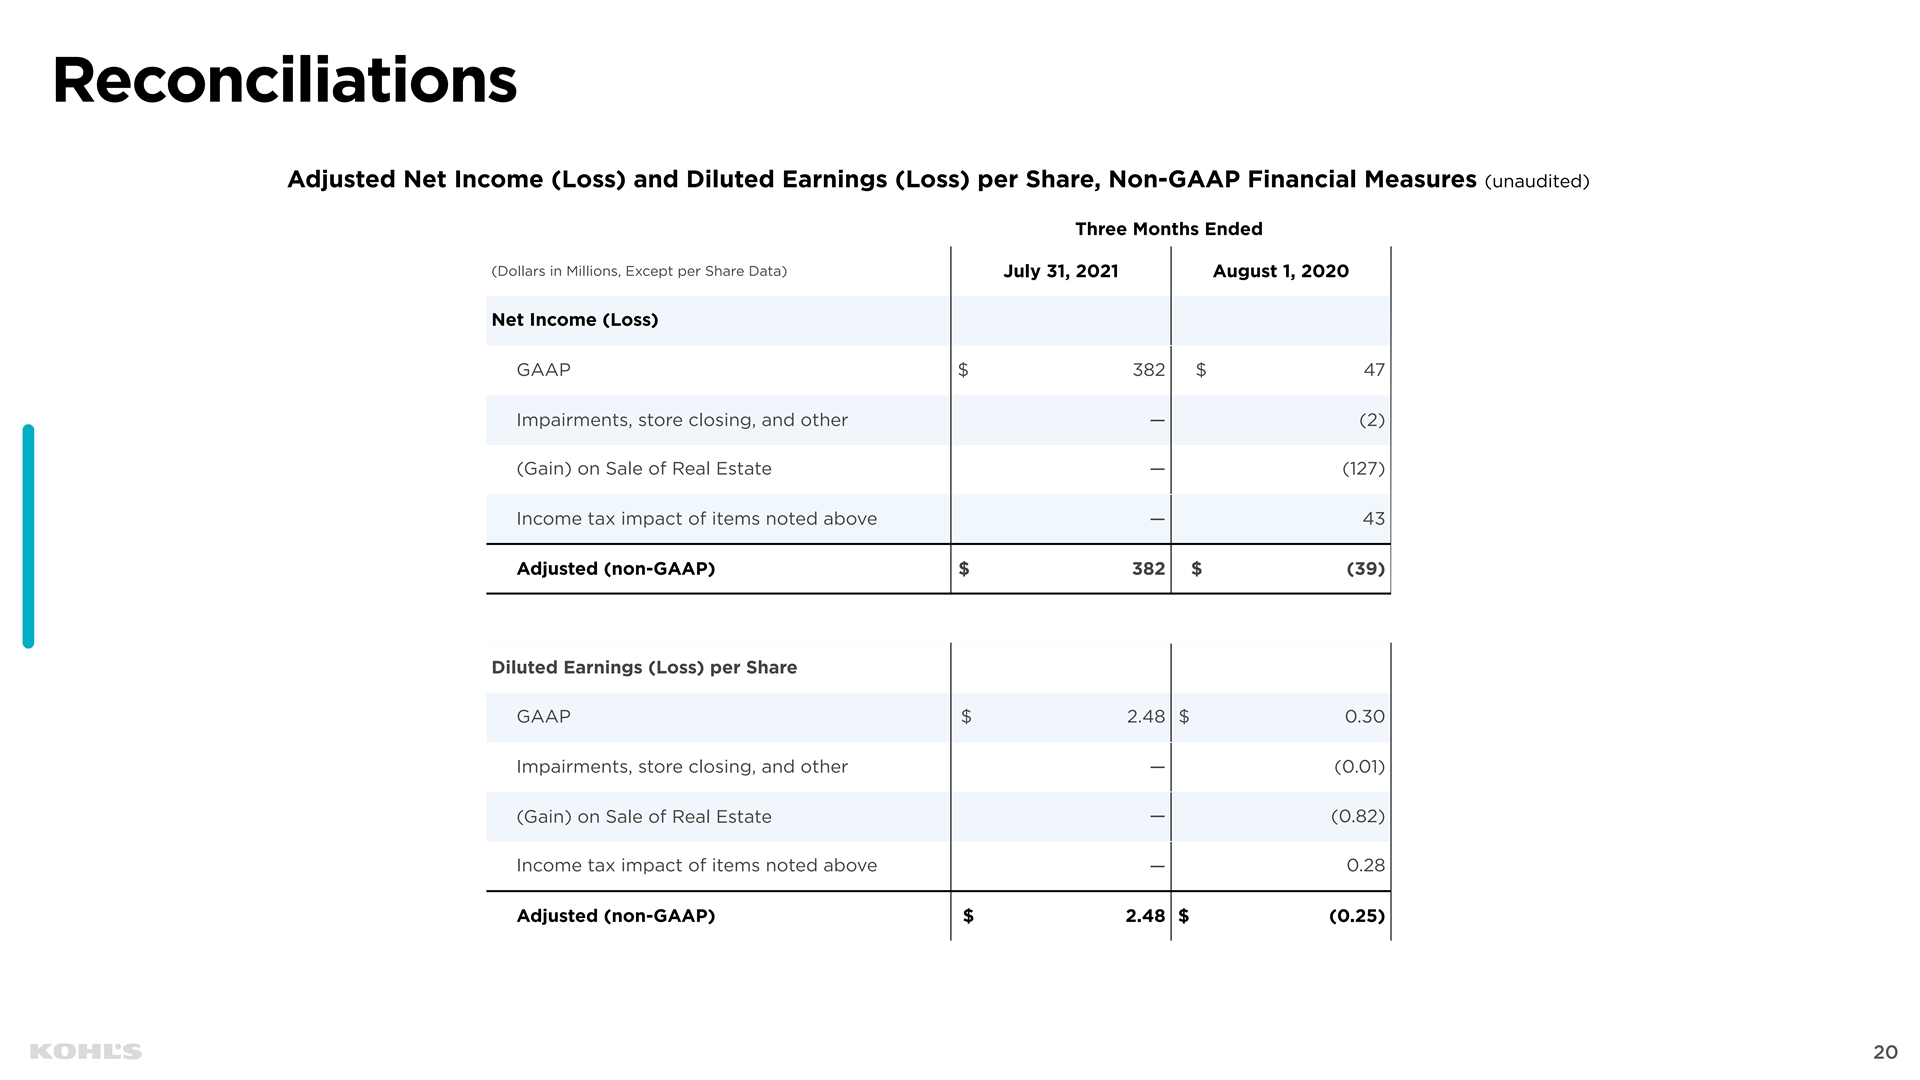
Reconciliations Adjusted Net Income (Loss) and Diluted Earnings (Loss) per Share, Non-GAAP Financial Measures (unaudited) Three Months Ended (Dollars in Millions, Except per Share Data) July 31, 2021 August 1, 2020 Net Income (Loss) GAAP $ 382 $ 47 Impairments, store closing, and other — (2) (Gain) on Sale of Real Estate — (127) Income tax impact of items noted above — 43 Adjusted (non-GAAP) $ 382 $ (39) Diluted Earnings (Loss) per Share GAAP $ 2.48 $ 0.30 Impairments, store closing, and other — (0.01) — (0.82) (Gain) on Sale of Real Estate Income tax impact of items noted above 0.28 — Adjusted (non-GAAP) $ 2.48 $ (0.25) 20
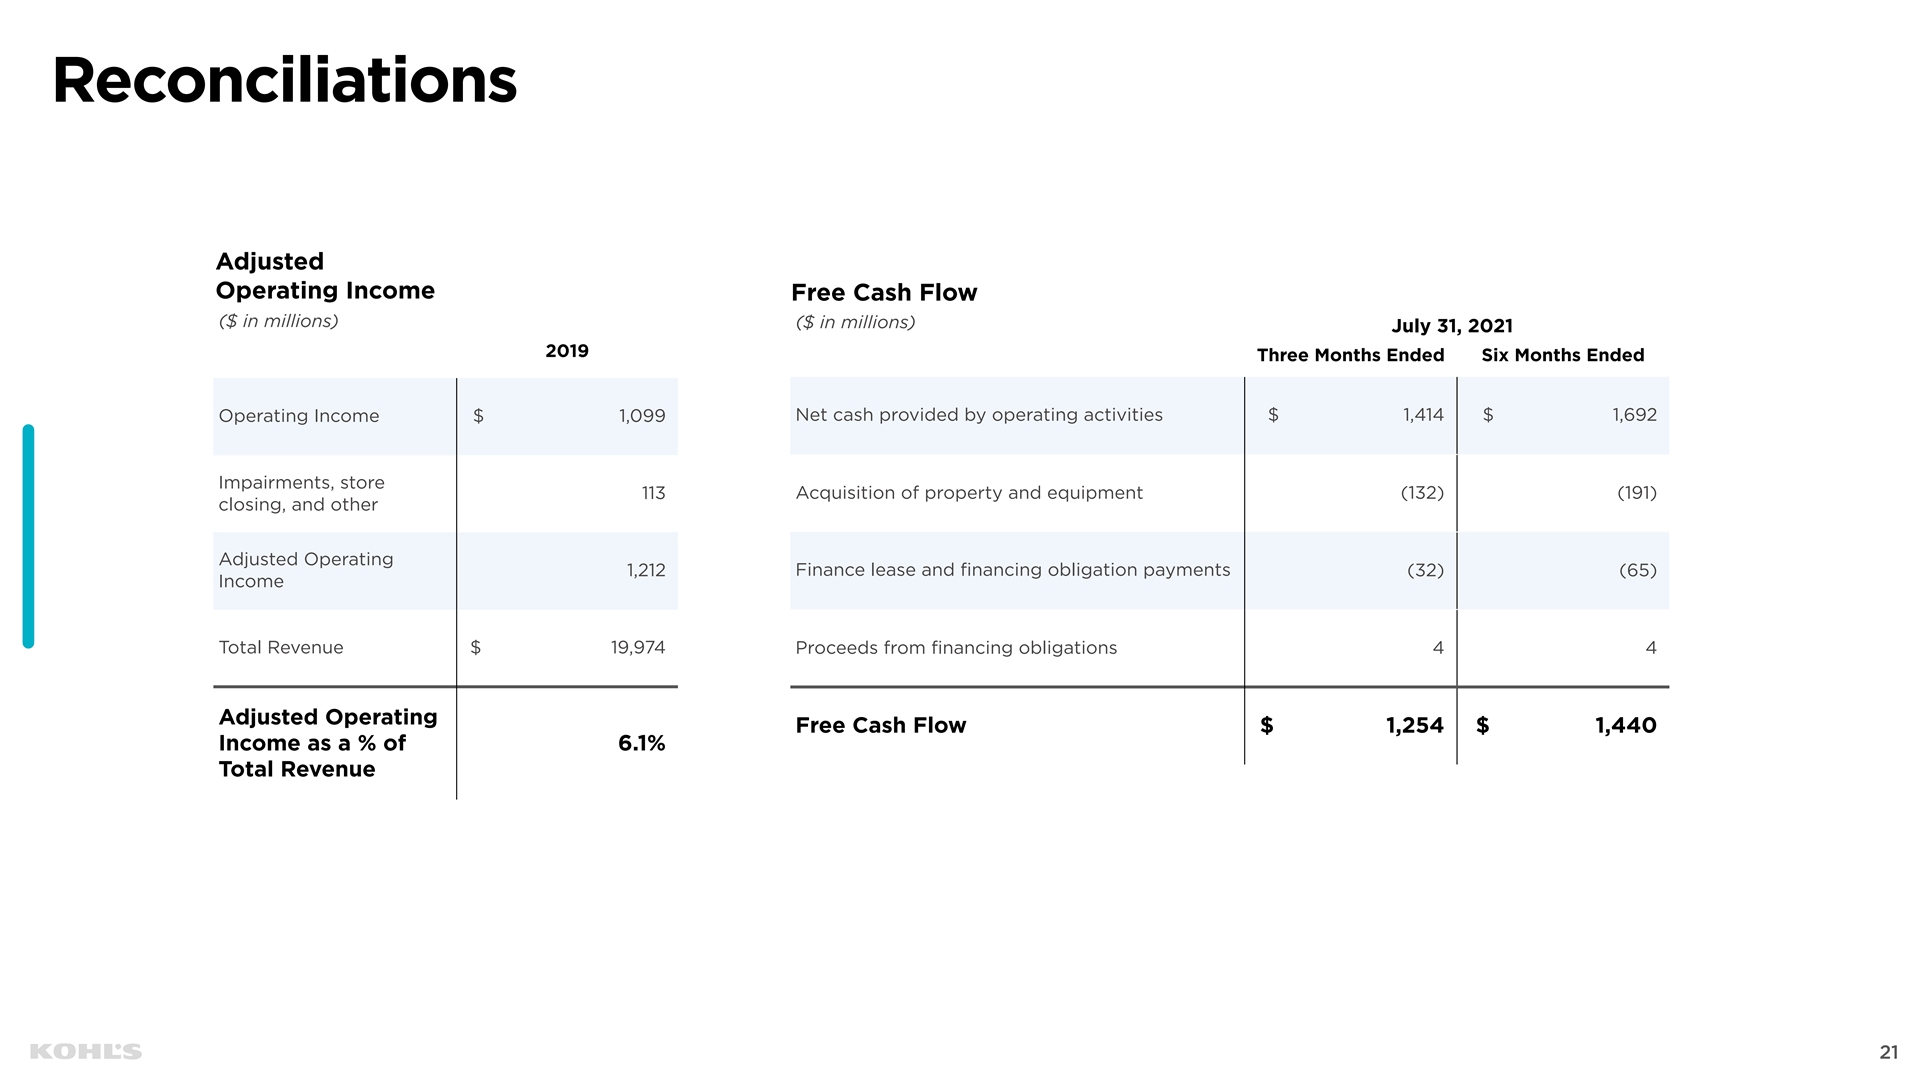
Reconciliations Adjusted Operating Income Free Cash Flow ($ in millions) ($ in millions) July 31, 2021 2019 Three Months Ended Six Months Ended Net cash provided by operating activities $ 1,414 $ 1,692 Operating Income $ 1,099 Impairments, store 113 Acquisition of property and equipment (132) (191) closing, and other Adjusted Operating 1,212 Finance lease and financing obligation payments (32) (65) Income Total Revenue $ 19,974 Proceeds from financing obligations 4 4 Adjusted Operating Free Cash Flow $ 1,254 $ 1,440 Income as a % of 6.1% Total Revenue 21Reconciliations Adjusted Operating Income Free Cash Flow ($ in millions) ($ in millions) July 31, 2021 2019 Three Months Ended Six Months Ended Net cash provided by operating activities $ 1,414 $ 1,692 Operating Income $ 1,099 Impairments, store 113 Acquisition of property and equipment (132) (191) closing, and other Adjusted Operating 1,212 Finance lease and financing obligation payments (32) (65) Income Total Revenue $ 19,974 Proceeds from financing obligations 4 4 Adjusted Operating Free Cash Flow $ 1,254 $ 1,440 Income as a % of 6.1% Total Revenue 21