
Exhibit 99.2 Q4 2021 Results Presentation March 1, 2022
Cautionary Statement Regarding Forward-Looking Information This presentation contains forward-looking statements within the meaning of the Private Securities Litigation Reform Act of 1995. Words such as believes, anticipates, plans, may, intends, will, should, expects, and similar expressions are intended to identify forward-looking statements. Forward-looking statements include, but are not limited to, comments about Kohl's future financial plans, capital generation, management and deployment strategies, adequacy of capital resources and the competitive environment. Such statements are subject to certain risks and uncertainties, which could cause Kohl's actual results to differ materially from those anticipated by the forward looking statements. These risks and uncertainties include, but are not limited to, those described in Item 1A in Kohl's Annual Report on Form 10-K, which is expressly incorporated herein by reference, and other factors as may periodically be described in Kohl's filings with the SEC. Any number of risks and uncertainties could cause actual results to differ materially from those Kohl’s expresses in its forward-looking statements, including the short and long-term impact of COVID-19 on the economy and the pace of recovery thereafter. Forward-looking statements speak as of the date they are made, and Kohl’s undertakes no obligation to update them. Non-GAAP Financial Measures In addition, this presentation contains non-GAAP financial measures, including Adjusted EPS and Adjusted Net Income. Reconciliations of all non-GAAP measures to the most directly comparable GAAP measures are included in the Appendix of this presentation. 2
Q4 2021 R R Re e esults s su ul lt ts s Presentation Key Takeaways and 2022 Outlook 4 Kohl’s Investor Day 2022 10 3
Key Takeaways and 2022 Outlook 4

Key Takeaways Fundamentally restructured business to be more profitable • Delivered all-time record adjusted diluted EPS of $7.33 in 2021, eclipsing previous high of $5.60 in 2018 • Operating margin of 8.6% in 2021 exceeded our goal of 7% to 8% two years ahead of plan Our strategy is building momentum • Sephora continues to drive impressive results, which gives us confidence as we further expand the partnership in 2022 • Ongoing strength in our Active business, which grew more than 40% in 2021 Returning a significant amount of capital to shareholders • Returned $1.5 billion of capital to shareholders in 2021 • Kohl’s Board approved a 100% increase in our dividend, which equates to an annual dividend of $2.00 per share, and a $3.0 billion share repurchase authorization • Plan to repurchase at least $1.0 billion in shares in 2022, of which $500 million is expected to be repurchased through open market transactions or an accelerated share repurchase (ASR) program executed in Q2 2022 5 (1) - Adjusted diluted EPS is a non-GAAP financial measure. Please refer to the reconciliation included in the Appendix for more information. 5
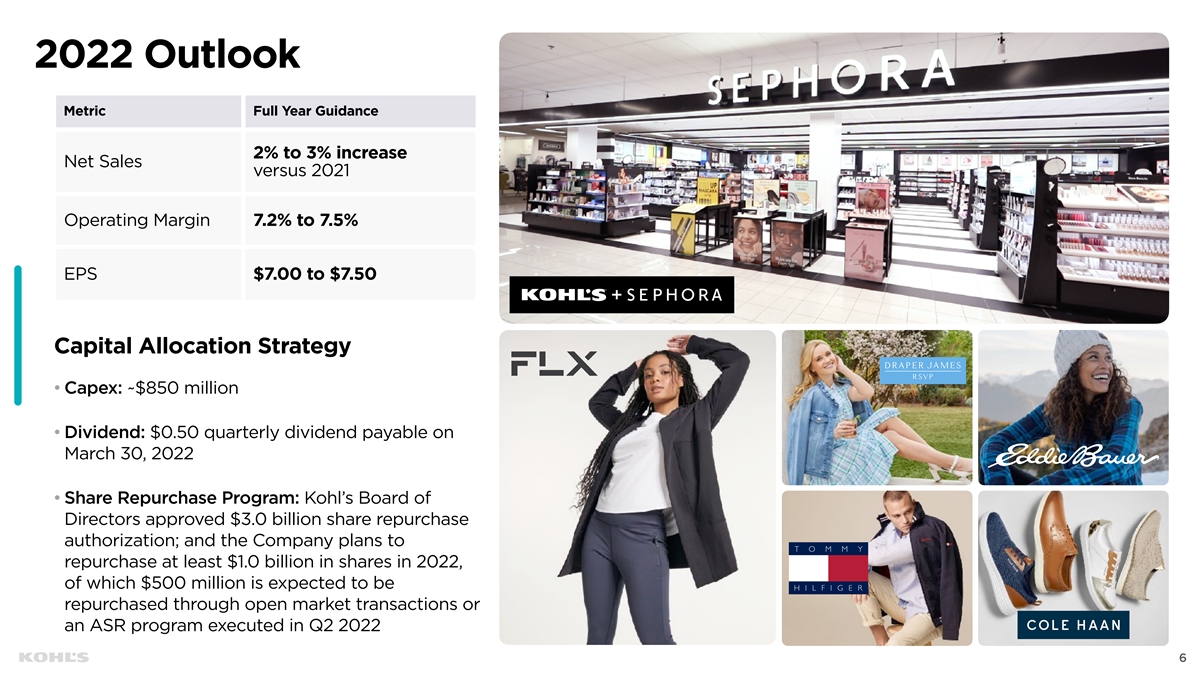
2022 Outlook Metric Full Year Guidance 2% to 3% increase Net Sales versus 2021 Operating Margin 7.2% to 7.5% EPS $7.00 to $7.50 Capital Allocation Strategy • Capex: ~$850 million • Dividend: $0.50 quarterly dividend payable on March 30, 2022 • Share Repurchase Program: Kohl’s Board of Directors approved $3.0 billion share repurchase authorization; and the Company plans to repurchase at least $1.0 billion in shares in 2022, of which $500 million is expected to be repurchased through open market transactions or an ASR program executed in Q2 2022 6
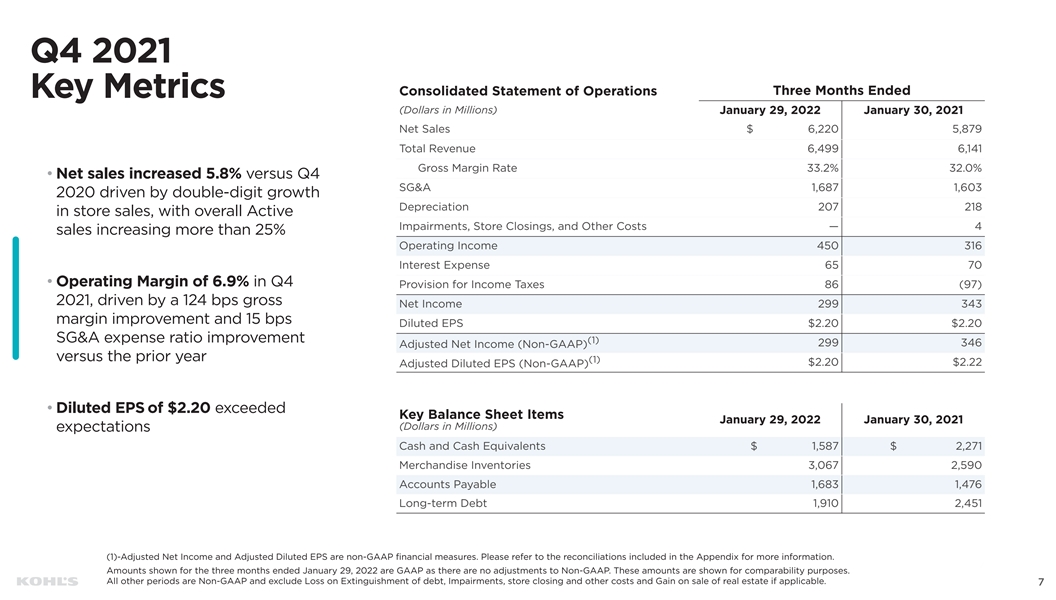
Q4 2021 Three Months Ended Consolidated Statement of Operations Key Metrics (Dollars in Millions) January 29, 2022 January 30, 2021 Net Sales $ 6,220 5,879 Total Revenue 6,499 6,141 Gross Margin Rate 33.2% 32.0% • Net sales increased 5.8% versus Q4 SG&A 1,687 1,603 2020 driven by double-digit growth Depreciation 207 218 in store sales, with overall Active Impairments, Store Closings, and Other Costs — 4 sales increasing more than 25% Operating Income 450 316 Interest Expense 65 70 • Operating Margin of 6.9% in Q4 Provision for Income Taxes 86 (97) 2021, driven by a 124 bps gross Net Income 299 343 margin improvement and 15 bps Diluted EPS $2.20 $2.20 SG&A expense ratio improvement (1) 299 346 Adjusted Net Income (Non-GAAP) versus the prior year (1) $2.20 $2.22 Adjusted Diluted EPS (Non-GAAP) • Diluted EPS of $2.20 exceeded Key Balance Sheet Items January 29, 2022 January 30, 2021 (Dollars in Millions) expectations Cash and Cash Equivalents $ 1,587 $ 2,271 Merchandise Inventories 3,067 2,590 Accounts Payable 1,683 1,476 Long-term Debt 1,910 2,451 (1)-Adjusted Net Income and Adjusted Diluted EPS are non-GAAP financial measures. Please refer to the reconciliations included in the Appendix for more information. 7 7 Amounts shown for the three months ended January 29, 2022 are GAAP as there are no adjustments to Non-GAAP. These amounts are shown for comparability purposes. All other periods are Non-GAAP and exclude Loss on Extinguishment of debt, Impairments, store closing and other costs and Gain on sale of real estate if applicable. 7
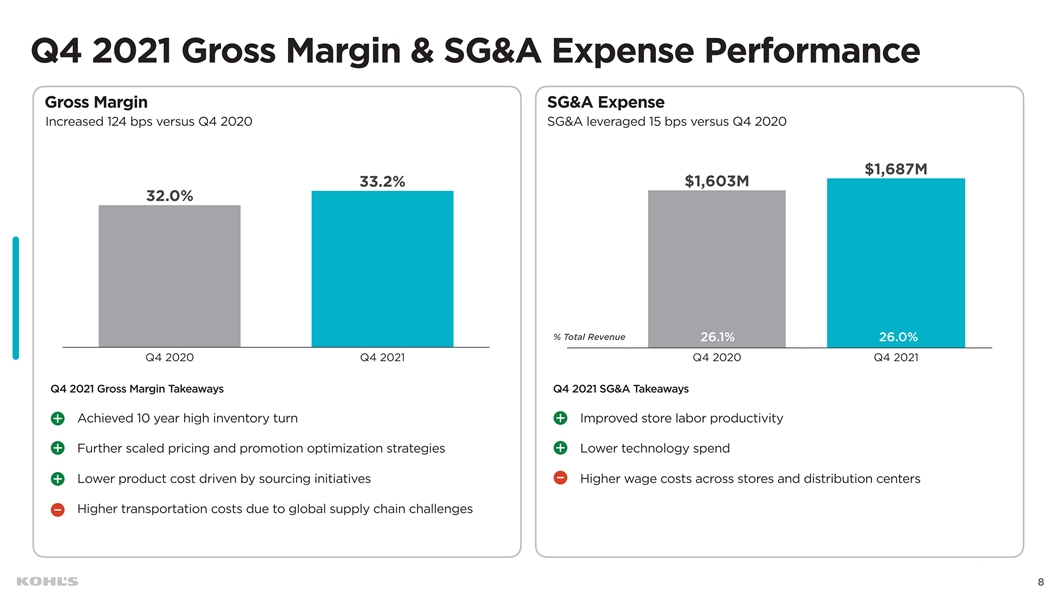
Q4 2021 Gross Margin & SG&A Expense Performance Gross Margin SG&A Expense Increased 124 bps versus Q4 2020 SG&A leveraged 15 bps versus Q4 2020 $1,687M 33.2% $1,603M 32.0% % Total Revenue 26.1% 26.0% Q4 2020 Q4 2021 Q4 2020 Q4 2021 Q4 2021 Gross Margin Takeaways Q4 2021 SG&A Takeaways Achieved 10 year high inventory turn Improved store labor productivity Further scaled pricing and promotion optimization strategies Lower technology spend Lower product cost driven by sourcing initiatives Higher wage costs across stores and distribution centers Higher transportation costs due to global supply chain challenges 8 8 8
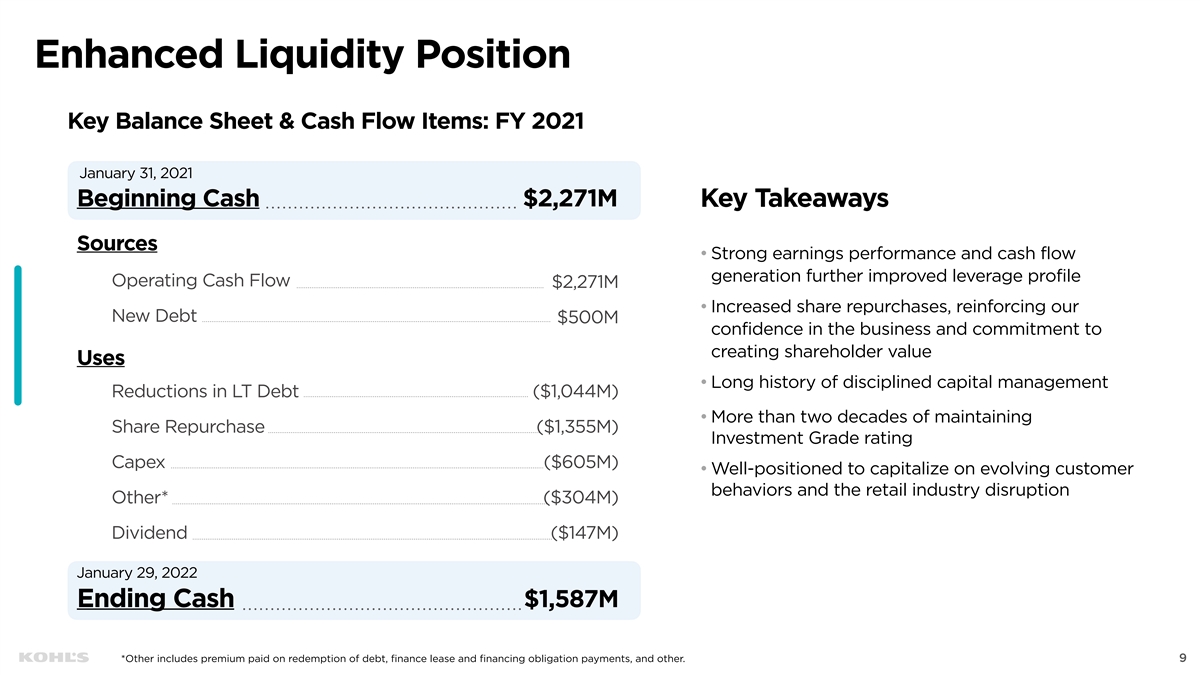
Enhanced Liquidity Position Key Balance Sheet & Cash Flow Items: FY 2021 January 31, 2021 Beginning Cash $2,271M Key Takeaways Sources • Strong earnings performance and cash flow generation further improved leverage profile Operating Cash Flow $2,271M • Increased share repurchases, reinforcing our New Debt $500M confidence in the business and commitment to creating shareholder value Uses • Long history of disciplined capital management Reductions in LT Debt ($1,044M) • More than two decades of maintaining Share Repurchase ($1,355M) Investment Grade rating Capex ($605M) • Well-positioned to capitalize on evolving customer behaviors and the retail industry disruption Other* ($304M) Dividend ($147M) January 29, 2022 Ending Cash $1,587M *Other includes premium paid on redemption of debt, finance lease and financing obligation payments, and other. 9

Investor Day 2022 10

Investor Day 2022 VIRTUAL EVENT Join us Monday, March 7, as CEO Michelle Gass, CFO Jill Timm, and members of our March 7, 2022 executive leadership team provide an update on our strategy and key initiatives, an 9am ET - 12pm ET overview of our financial plan, as well as address participant questions. Registration details can be found on Kohl’s Investor Relations Website: investors.kohls.com 11

Kohl’s Investor Day 2022 Agenda Company Overview Financial & Capital & Strategy Allocation Strategies 1 5 Michelle Gass Jill Timm Chief Executive Officer Chief Financial Officer Merchandising ESG 2 6 Doug Howe Michelle Gass Chief Executive Officer Chief Merchandising Officer Customer & Marketing 3 Greg Revelle Chief Marketing Officer Q&A 7 All Speakers Michelle Gass, Doug Howe, Greg Revelle, Paul Gaffney, Jill Timm Omnichannel & Technology 4 Paul Gaffney Chief Technology & Supply Chain Officer 12
Appendix 13
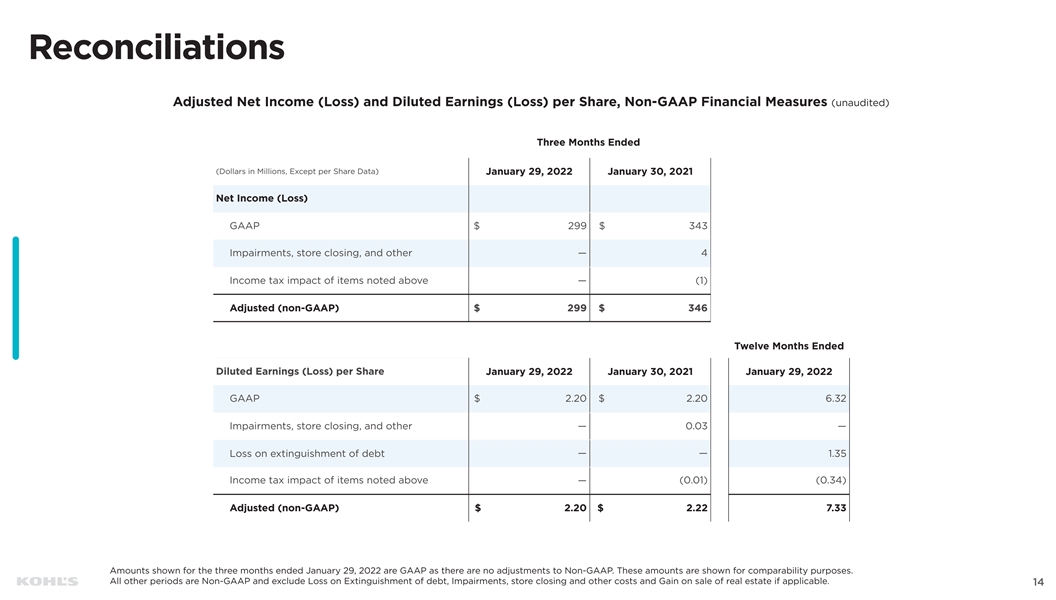
Reconciliations Adjusted Net Income (Loss) and Diluted Earnings (Loss) per Share, Non-GAAP Financial Measures (unaudited) Three Months Ended (Dollars in Millions, Except per Share Data) January 29, 2022 January 30, 2021 Net Income (Loss) GAAP $ 299 $ 343 Impairments, store closing, and other — 4 Income tax impact of items noted above — (1) Adjusted (non-GAAP) $ 299 $ 346 Twelve Months Ended Diluted Earnings (Loss) per Share January 29, 2022 January 30, 2021 January 29, 2022 GAAP $ 2.20 $ 2.20 6.32 Impairments, store closing, and other — 0.03 — Loss on extinguishment of debt —— 1.35 Income tax impact of items noted above — (0.01) (0.34) Adjusted (non-GAAP) $ 2.20 $ 2.22 7.33 Amounts shown for the three months ended January 29, 2022 are GAAP as there are no adjustments to Non-GAAP. These amounts are shown for comparability purposes. All other periods are Non-GAAP and exclude Loss on Extinguishment of debt, Impairments, store closing and other costs and Gain on sale of real estate if applicable. 14