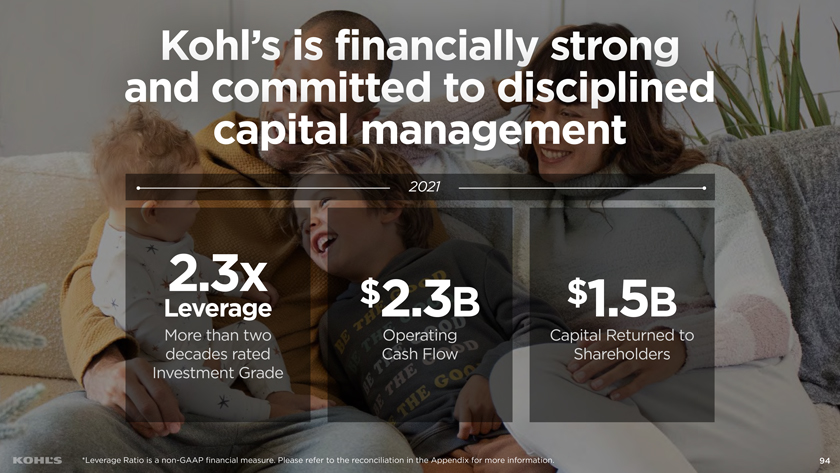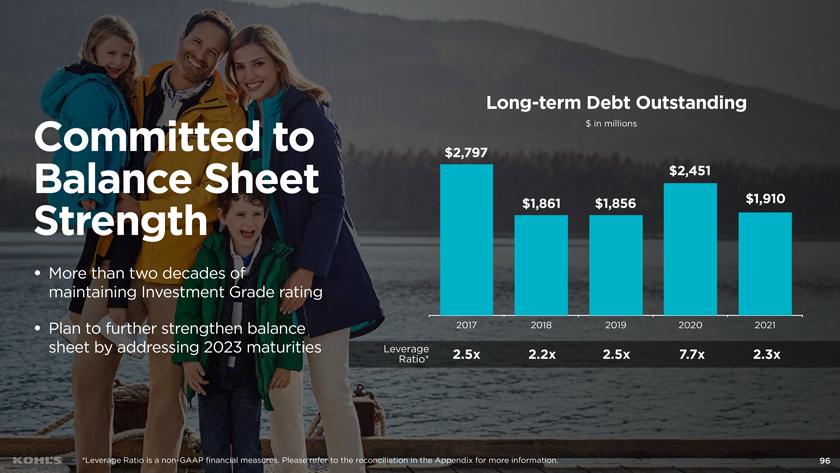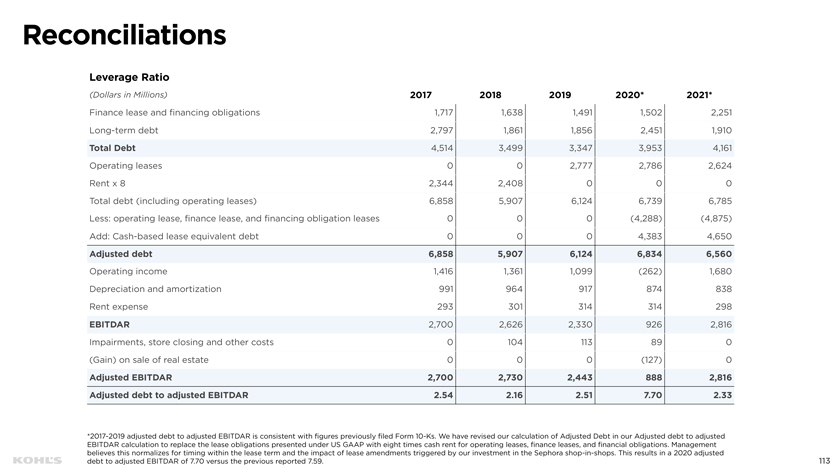
Reconciliations Leverage Ratio (Dollars in Millions) 2017 2018 2019 2020* 2021* Finance lease and financing obligations 1,717 1,638 1,491 1,502 2,251 Long-term debt 2,797 1,861 1,856 2,451 1,910 Total Debt 4,514 3,499 3,347 3,953 4,161 Operating leases 0 0 2,777 2,786 2,624 Rent x 8 2,344 2,408 0 0 0 Total debt (including operating leases) 6,858 5,907 6,124 6,739 6,785 Less: operating lease, finance lease, and financing obligation leases 0 0 0 (4,288) (4,875) Add: Cash-based lease equivalent debt 0 0 0 4,383 4,650 Adjusted debt 6,858 5,907 6,124 6,834 6,560 Operating income 1,416 1,361 1,099 (262) 1,680 Depreciation and amortization 991 964 917 874 838 Rent expense 293 301 314 314 298 EBITDAR 2,700 2,626 2,330 926 2,816 Impairments, store closing and other costs 0 104 113 89 0 (Gain) on sale of real estate 0 0 0 (127) 0 Adjusted EBITDAR 2,700 2,730 2,443 888 2,816 Adjusted debt to adjusted EBITDAR 2.54 2.16 2.51 7.70 2.33 *2017-2019 adjusted debt to adjusted EBITDAR is consistent with figures previously filed Form 10-Ks. We have revised our calculation of Adjusted Debt in our Adjusted debt to adjusted EBITDAR calculation to replace the lease obligations presented under US GAAP with eight times cash rent for operating leases, finance leases, and financial obligations. Management believes this normalizes for timing within the lease term and the impact of lease amendments triggered by our investment in the Sephora shop-in-shops. This results in a 2020 adjusted debt to adjusted EBITDAR of 7.70 versus the previous reported 7.59. 113