SCHEDULE 14A
(RULE 14a-101)
INFORMATION REQUIRED IN PROXY STATEMENT
SCHEDULE 14A INFORMATION
Proxy Statement Pursuant to Section 14(a) of
the Securities Exchange Act of 1934
Filed by the Registrant [X]
Filed by a Party other than the Registrant [ ]
Check the appropriate box:
| [ ] | Preliminary Proxy Statement |
| [ ] | Confidential, For Use of the Commission Only |
| | (as permitted by Rule 14a-6(e)(2)) |
| [ ] | Definitive Proxy Statement |
| [X] | Definitive Additional Materials |
| [ ] | Soliciting Material Under Rule 14a-12 |
| Nuveen Investments, Inc. |
| (Name of Registrant as Specified in Its Charter) |
| |
| (Name of Person(s) Filing Proxy Statement, if Other Than the Registrant) |
Payment of Filing Fee (Check the appropriate box):
| [ ] | Fee computed on table below per Exchange Act Rules 14a-6(i)(1) and 0-11. |
| | (1) | Title of each class of securities to which transaction applies: |
| | (2) | Aggregate number of securities to which transaction applies: |
| | (3) | Per unit price or other underlying value of transaction computed pursuant to Exchange Act Rule 0-11 (set forth the amount on which the filing fee is calculated and state how it was determined): |
| | (4) | Proposed maximum aggregate value of transaction: |
| | (5) | Total fee paid: |
| [ ] | Fee paid previously with preliminary materials: |
| [ ] | Check box if any part of the fee is offset as provided by Exchange Act Rule 0-11(a)(2) and identify the filing for which the offsetting fee was paid previously. Identify the previous filing by registration statement number, or the form or schedule and the date of its filing. |
| | (1) | Amount |
| | (2) | Form, Schedule or Registration Statement No.: |
| | (3) | Filing Party: |
| | (4) | Date Filed: |
The following presentation was distributed to Institutional Shareholder Services (ISS) in preparation for a meeting of officers and board directors of Nuveen Investments, Inc. with ISS on August 30, 2007. Nuveen Investments may also use the presentation in connection with meetings with certain of its stockholders:
Nuveen Investments Presentation to Institutional Shareholder Services August 2007
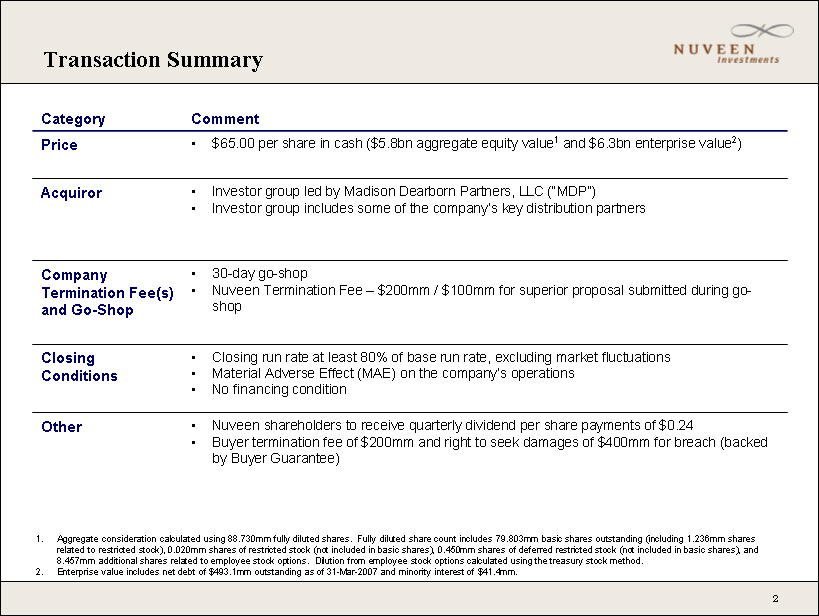
Price • $65.00 per share in cash ($5.8bn aggregate equity value1 and $6.3bn enterprise value2 Acquiror • Investor group led by Madison Dearborn Partners, LLC (“MDP”) • Investor group includes some of the company’s key distribution partners Company Termination Fee(s) and Go-Shop • 30-day go-shop • Nuveen Termination Fee – $200mm / $100mm for superior proposal submitted during go-shop Closing Conditions • Closing run rate at least 80% of base run rate, excluding market fluctuations • Material Adverse Effect (MAE) on the company’s operations • No financing condition Other • Nuveen shareholders to receive quarterly dividend per share payments of $0.24 • Buyer termination fee of $200mm and right to seek damages of $400mm for breach (backed by Buyer Guarantee) 1. Aggregate consideration calculated using 88.730mm fully diluted shares. Fully diluted share count includes 79.803mm basic shares outstanding (including 1.236mm shares related to restricted stock), 0.020mm shares of restricted stock (not included in basic shares), 0.450mm shares of deferred restricted stock (not included in basic shares), and 8.457mm additional shares related to employee stock options. Dilution from employee stock options calculated using the treasury stock method. 2. Enterprise value includes net debt of $493.1mm outstanding as of 31-Mar-2007 and minority interest of $41.4mm.
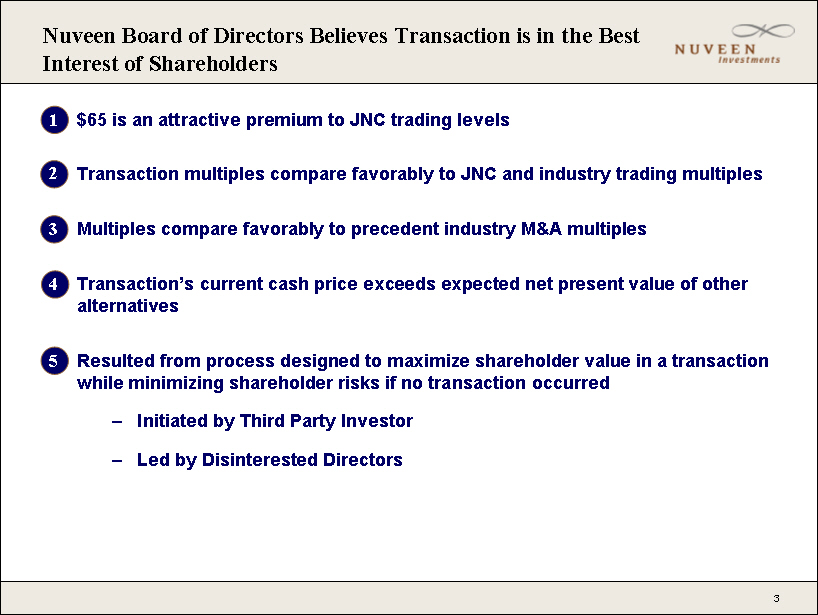
Nuveen Board of Directors Believes Transaction is in the Best Interest of Shareholders 1 $65 is an attractive premium to JNC trading levels 2 Transaction multiples compare favorably to JNC and industry trading multiples 3 Multiples compare favorably to precedent industry M&A multiples 4 Transaction’s current cash price exceeds expected net present value of other alternatives 5 Resulted from process designed to maximize shareholder value in a transaction while minimizing shareholder risks if no transaction occurred – Initiated by Third Party Investor – Led by Disinterested Directors
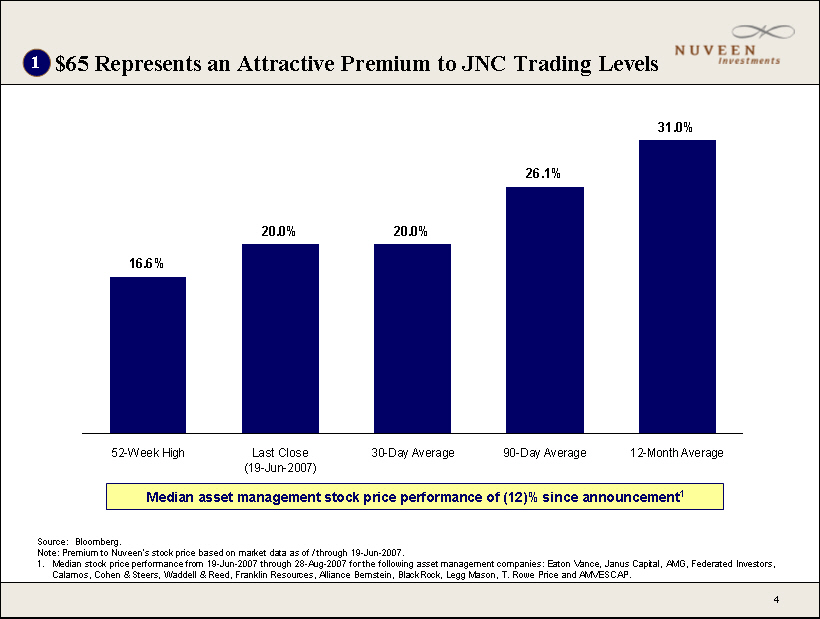
$65 Represents an Attractive Premium to JNC Trading Levels 16.6% 20.0% 20.0% 26.1% 31.0% 52-Week High Last Close (19-Jun-2007) 30-Day Average 90-Day Average 12-Month Average Median asset management stock price performance of (12)% since announcement1 Source: Bloomberg. Note: Premium to Nuveen’s stock price based on market data as of / through 19-Jun-2007. 1. Median stock price performance from 19-Jun-2007 through 28-Aug-2007 for the following asset management companies: Eaton Vance, Janus Capital, AMG, Federated Investors, Calamos, Cohen & Steers, Waddell & Reed, Franklin Resources, Alliance Bernstein, BlackRock, Legg Mason, T. Rowe Price and AMVESCAP.

Transaction Multiples Compare Favorably to JNC and Industry Trading Multiples Nuveen Industry Peers1 Transaction Price / Next Twelve Months Estimated Earnings As of June 19, 2007 19.8 x 18.7 x 23.8 x Five-Year Average 18.3 18.1 Price / Last Twelve Months Earnings As of June 19, 2007 23.0 x 23.1 x Five-Year Average 19.6 21.9 27.7 Enterprise Value Multiples (As of June 19, 2007) Last Quarter Annualized EBITDA 13.8 x 13.7 x 16.5 x Last Quarter Annualized Revenue 6.6 4.8 7.9 Assets Under Management 3.2% 3.2% 3.8% Since June 19, 2007, median industry peer multiples have contracted1– Price / Next Twelve Months Estimated Earnings: 16.7x (down 10.7%) – Enterprise Value / Last Quarter Annualized EBITDA: 12.0x (down 12.4%) Source: FactSet, Capital IQ, Bloomberg, Thomson Financial and latest available public filings. Forward EPS estimates based on median analyst estimate from the Institutional Brokers’ Estimate System (IBES). 1. Median industry peer multiples as of 28-Aug-2007. Industry Peers include: Eaton Vance, Janus Capital, AMG, Federated Investors, Calamos, Cohen & Steers, Waddell & Reed, Franklin Resources, Alliance Bernstein, BlackRock, Legg Mason, T. Rowe Price and AMVESCAP.
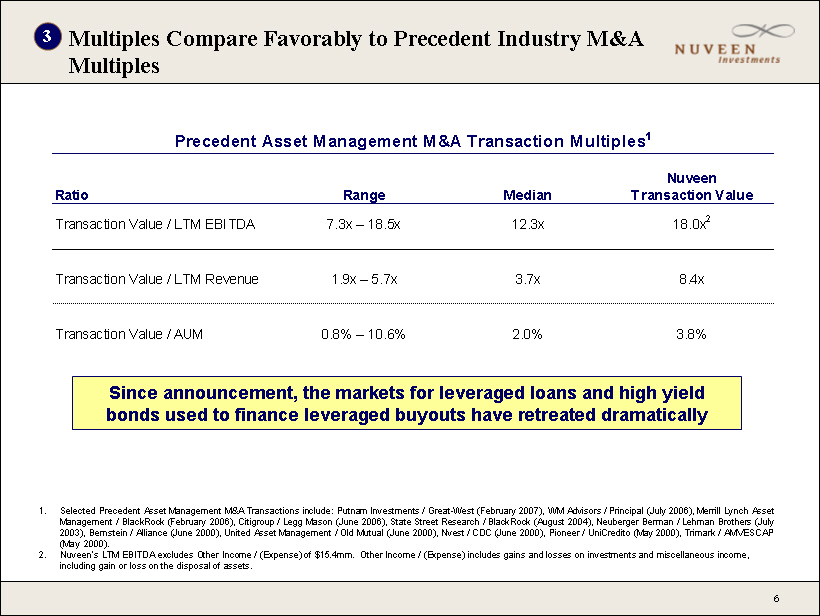
Multiples Compare Favorably to Precedent Industry M&A Multiples Precedent Asset Management M&A Transaction Multiples1 Ratio Range Median Nuveen Transaction Value
Transaction Value / LTM EBITDA 7.3x – 18.5x 12.3x 18.0x2 Transaction Value / LTM Revenue 1.9x – 5.7x 3.7x 8.4x Transaction Value / AUM 0.8% – 10.6% 2.0% 3.8% Since announcement, the markets for leveraged loans and high yield bonds used to finance leveraged buyouts have retreated dramatically 1. Selected Precedent Asset Management M&A Transactions include: Putnam Investments / Great-West (February 2007), WM Advisors / Principal (July 2006), Merrill Lynch Asset Management / BlackRock (February 2006), Citigroup / Legg Mason (June 2006), State Street Research / BlackRock (August 2004), Neuberger Berman / Lehman Brothers (July 2003), Bernstein / Alliance (June 2000), United Asset Management / Old Mutual (June 2000), Nvest / CDC (June 2000), Pioneer / UniCredito (May 2000), Trimark / AMVESCAP (May 2000). 2. Nuveen’s LTM EBITDA excludes Other Income / (Expense) of $15.4mm. Other Income / (Expense) includes gains and losses on investments and miscellaneous income, including gain or loss on the disposal of assets.

Transaction’s Current Cash Price Exceeds Expected Net Present Value of Other Alternatives • Transaction price of $65 per share exceeds net present value of Status Quo alternative
Illustrative Discounted Cash Flow Analysis1 Illustrative Future Stock Price Analysis Assuming Constant P/E Multiples2 as of June 19, 2007 Management Projections Analyst Median Projections Present Value of Implied Future Price3 1 Year 2 Years 3 Years Range of Values $45.15 – $65.84 $49.17 – $71.47 Management Forecast $ 55.00 $ 55.60 $ 56.33 Analyst Median Forecast 58.64 60.66 61.10 • Standalone scenarios face several challenges: – Ability to grow closed-end fund business – Competitive pressures in retail separately managed accounts (SMA) business – Capacity constraints on value and international strategies – Limited scale in the mutual fund business • Also considered and analyzed range of alternatives including a leveraged recapitalization and strategic merger scenarios 1. Range of DCF values based on illustrative discount rates ranging from 11% to 13% and illustrative LTM EBITDA terminal multiples ranging from 11x to 15x. 2. Analysis applies Nuveen’s P/E ratios as of 19-Jun-2007 to forward EPS estimates to calculate implied stock prices at dates in the future. P/E ratios based on management forecasts are equal to 20.7x (FY1) and 19.0x (FY2). P/E ratios based on analyst median forecasts are equal to 20.5x (FY1) and 17.4x (FY2).
3. Assumes discount rate is equal to 12%.
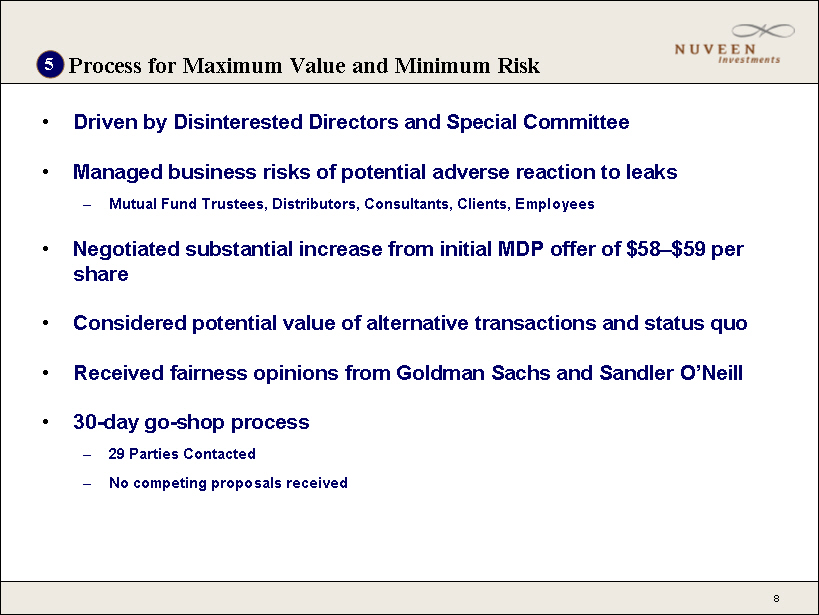
Process for Maximum Value and Minimum Risk • Driven by Disinterested Directors and Special Committee • Managed business risks of potential adverse reaction to leaks – Mutual Fund Trustees, Distributors, Consultants, Clients, Employees • Negotiated substantial increase from initial MDP offer of $58–$59 per share • Considered potential value of alternative transactions and status quo • Received fairness opinions from Goldman Sachs and Sandler O’Neill • 30-day go-shop process – 29 Parties Contacted – No competing proposals received
IMPORTANT LEGAL INFORMATION
On August 15, 2007 Nuveen Investments, Inc. (Nuveen) began mailing the definitive proxy statement (the proxy statement) and other related documents regarding the proposed acquisition of Nuveen by a group of equity investors led by Madison Dearborn Partners, LLC. WE URGE INVESTORS TO READ THE PROXY STATEMENT AND THE OTHER RELATED DOCUMENTS BECAUSE THEY CONTAIN IMPORTANT INFORMATION ABOUT NUVEEN, THE PROPOSED TRANSACTION AND RELATED MATTERS. This communication is not a solicitation of a proxy from any security holder of Nuveen.
Investors may obtain the proxy statement, the other related documents and other documents filed with the SEC free of charge at the SEC’s website at www.sec.gov. In addition, the proxy statement may be obtained free of charge by directing a request to Nuveen Investments, Inc., 333 West Wacker Drive, Chicago, Illinois 60606, Attention of Corporate Secretary.
Nuveen, its directors and executive officers and certain other persons may be deemed to be participants in the solicitation of proxies in respect of the proposed transaction. Such persons may have interests in the proposed transaction, including as a result of holding options or shares of Nuveen’s common stock. Information regarding Nuveen’s directors and executive officers is available in the proxy statement filed with the SEC by Nuveen on April 6, 2007. Information regarding the participants in the proxy solicitation and a description of their direct and indirect interests, by security holdings or otherwise, are contained in the proxy statement and other relevant materials filed or to be filed with the SEC.
FORWARD-LOOKING STATEMENTS
Certain statements made by Nuveen Investments in this release are forward-looking statements. Nuveen Investments’ actual future results may differ significantly from those anticipated in any forward-looking statements due to numerous factors. These include, but are not limited to, the effects of the substantial competition in the investment management business, including competition for access to brokerage firms’ retail distribution systems, Nuveen Investments’ reliance on revenues from investment management contracts which renew annually, regulatory developments, accounting pronouncements, and other additional risks and uncertainties as set forth in Nuveen Investments’ filings with the SEC. Nuveen Investments undertakes no responsibility to update publicly or revise any forward-looking statements.